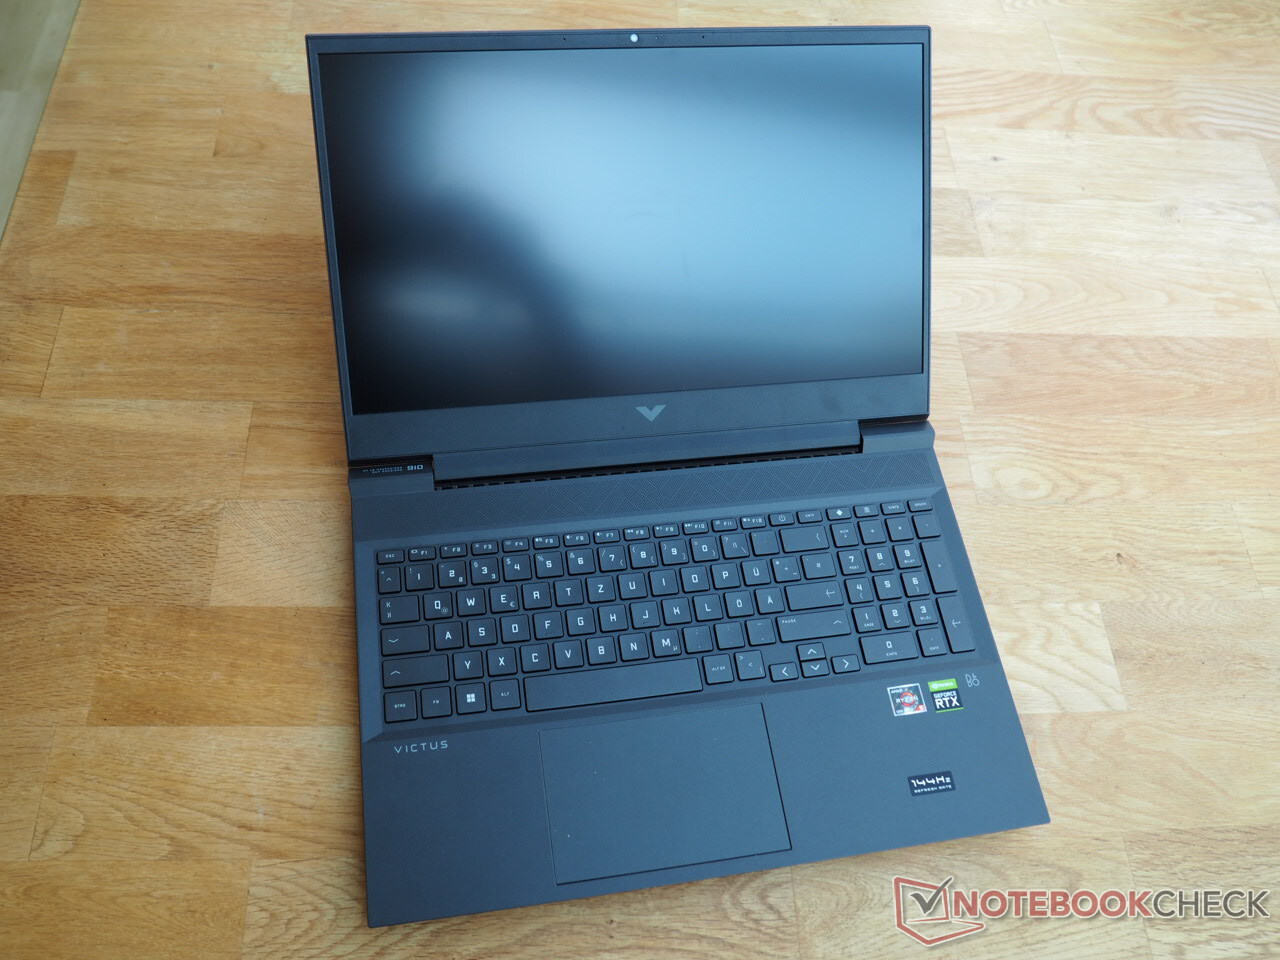
Revisão da HP Victus 16: Laptop para jogos de baixo custo com CPU AMD e GPU Nvidia

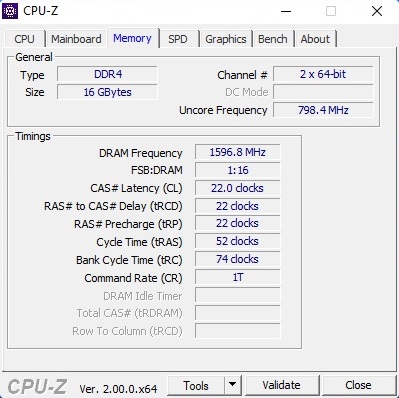
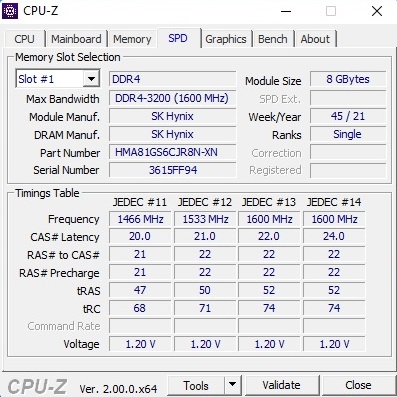
Depois de já termos testado uma versão mais cara do Victus 16 com umRyzen 7 5800He GeForce RTX 3060há vários meses, estamos agora colocando à prova o modelo acessível do Victus 16-0145ng. Apesar de a HP cortar custos não incluindo um sistema operacional Windows (instalamos o Windows 11 Home), um Ryzen 5 5600He um GeForce RTX 3050 Tipor cerca de 920 euros (US$ 975) ainda é impressionante. Da mesma forma, incluindo 16 GB de DDR4-RAM e uma SSD NVMe 512-GB a esse preço também não dá motivo para reclamação. Pelo menos no papel, a tela IPS também atinge um bom número, já que 144 Hz indicam uma reprodução adequada de jogos rápidos.
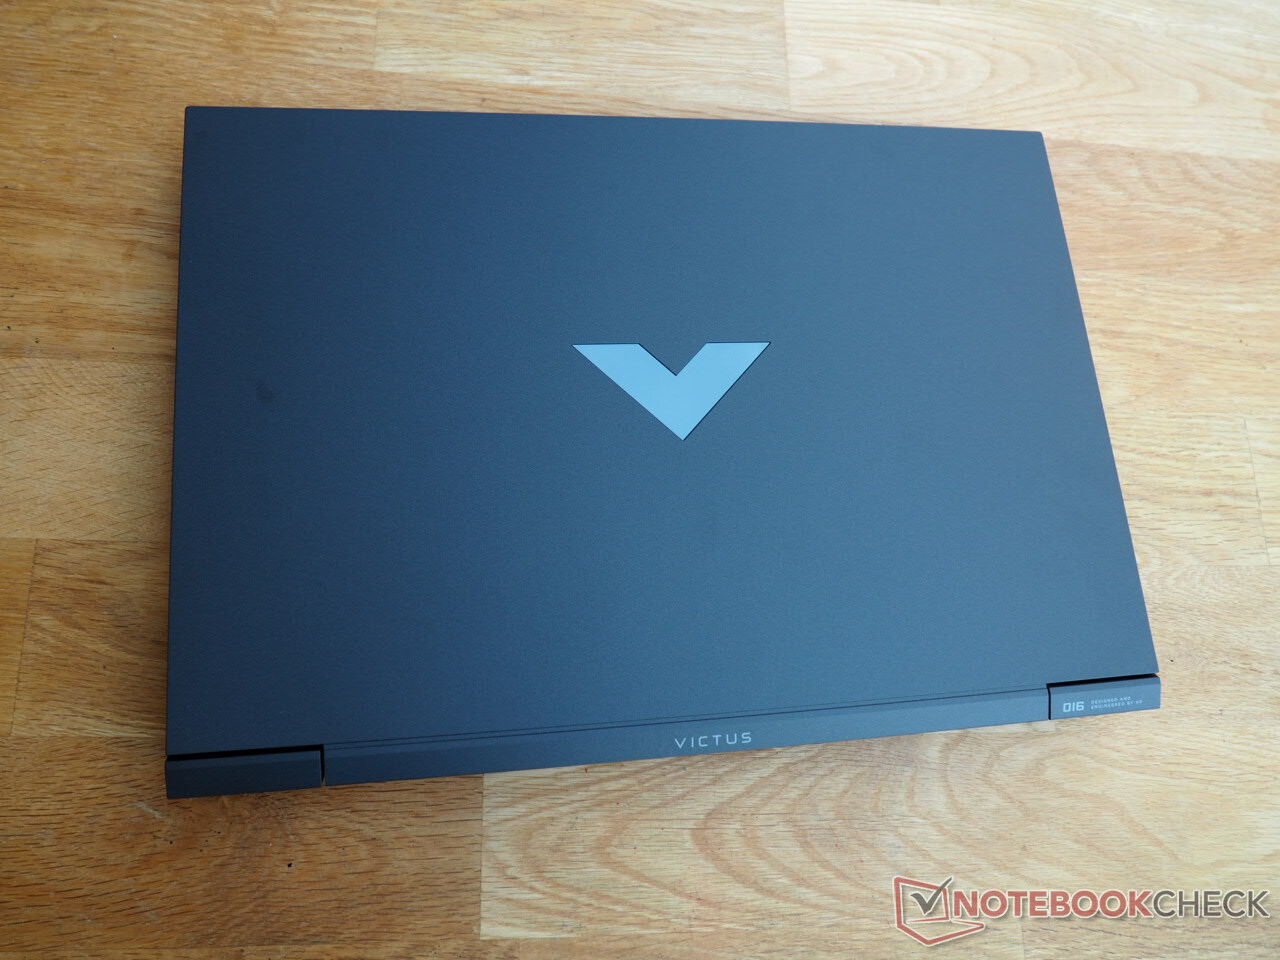
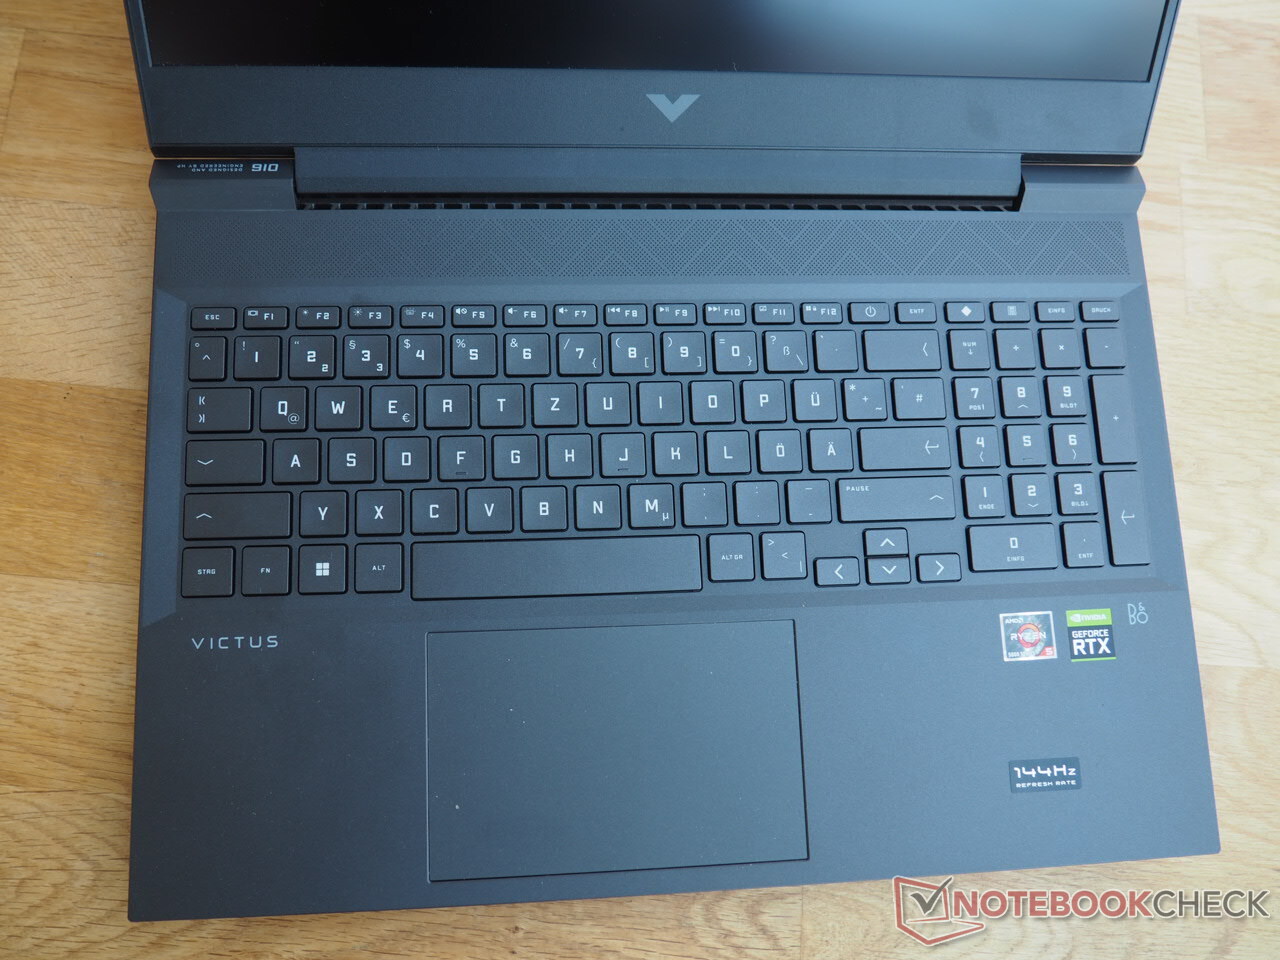
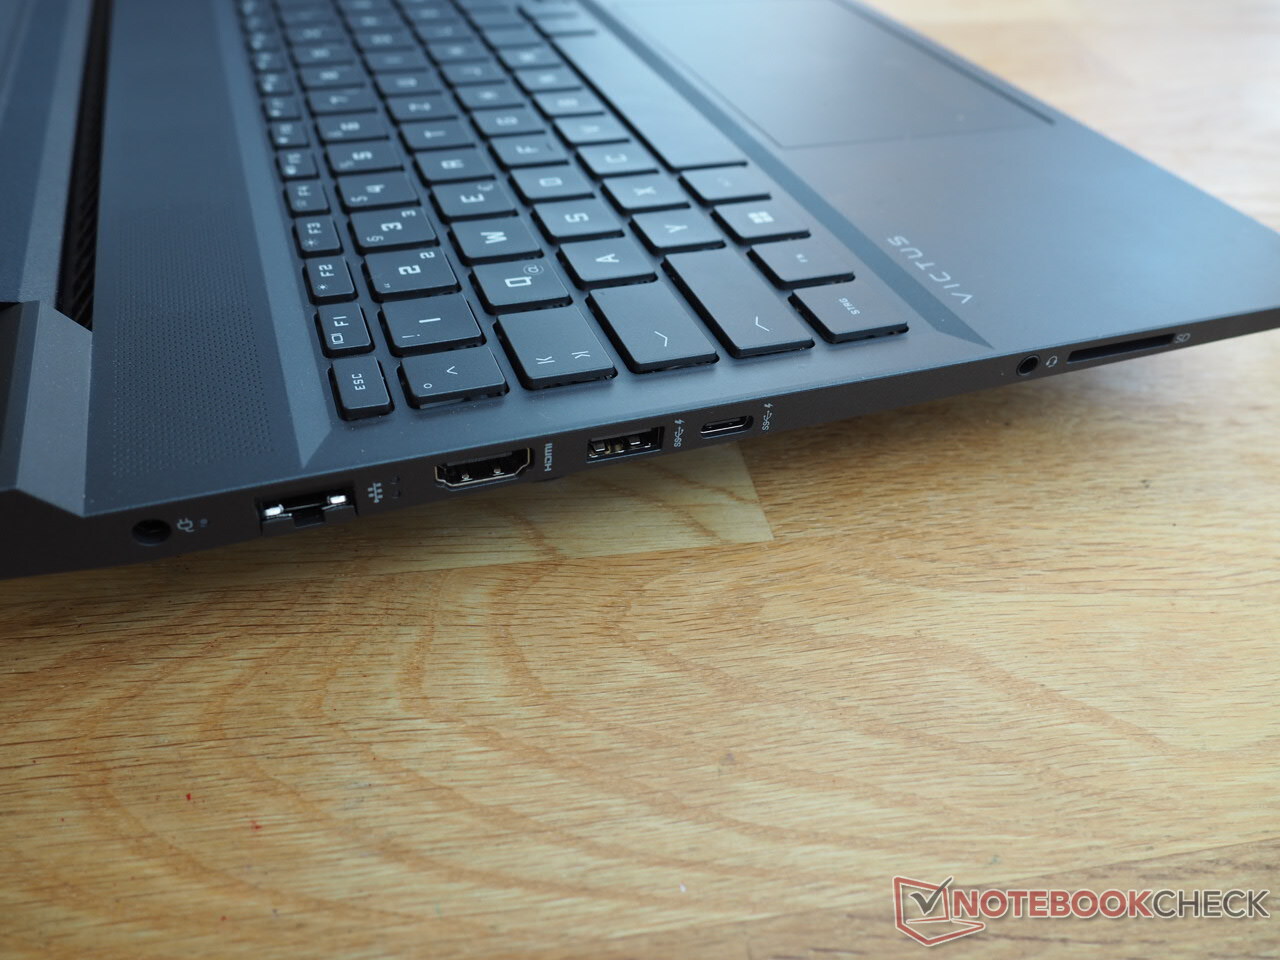
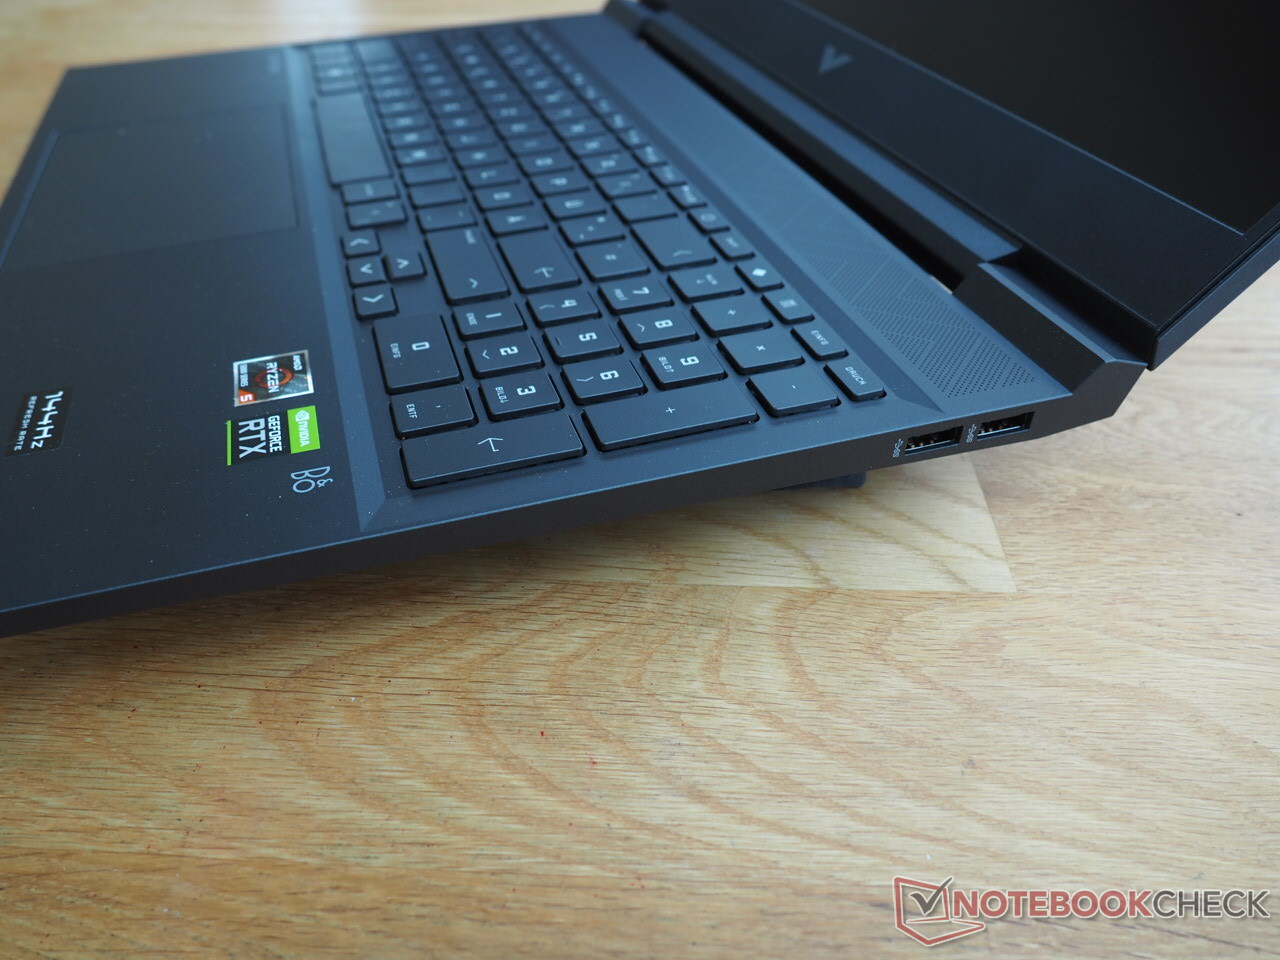
Como, além de alguns detalhes menores, o caso é idêntico ao modelo que testamos anteriormente, não discutiremos o caso, equipamentos (conexões, etc.) e dispositivos de entrada mais adiante aqui. Você pode encontrar as informações correspondentes na revisão do Vitória 16-e0179ng.
Possíveis concorrentes em comparação
Avaliação | Data | Modelo | Peso | Altura | Size | Resolução | Preço |
|---|---|---|---|---|---|---|---|
| 82.3 % v7 (old) | 05/2022 | HP Victus 16-e0145ng R5 5600H, GeForce RTX 3050 Ti Laptop GPU | 2.4 kg | 23.5 mm | 16.10" | 1920x1080 | |
| 84.3 % v7 (old) | 09/2021 | HP Victus 16-e0179ng R7 5800H, GeForce RTX 3060 Laptop GPU | 2.5 kg | 23.5 mm | 16.10" | 1920x1080 | |
| 79.7 % v7 (old) | 03/2022 | Lenovo Ideapad Gaming 3 15IHU-82K1002RGE i5-11300H, GeForce RTX 3050 Ti Laptop GPU | 2 kg | 24.2 mm | 15.60" | 1920x1080 | |
| 82.7 % v7 (old) | 10/2021 | Dell G15 5515 R7 5800H, GeForce RTX 3050 Ti Laptop GPU | 2.4 kg | 24.9 mm | 15.60" | 1920x1080 | |
| 83.4 % v7 (old) | 08/2021 | Asus ROG Strix G17 G713QE-RB74 R7 5800H, GeForce RTX 3050 Ti Laptop GPU | 2.5 kg | 24.6 mm | 17.30" | 1920x1080 |
Os concorrentes do equipamento de 16 polegadas incluem outros laptops de jogos acessíveis com um GeForce RTX 3050 Ti, como o Lenovo Ideapad Gaming 3 15IHUoDell G15 5515e o Asus Strix G17 G713QE. Estes laptops aparecem nos gráficos como dispositivos de comparação - desde que os valores para eles estejam disponíveis.
Leitor de cartões SD
| SD Card Reader - average JPG Copy Test (av. of 3 runs) | |
| Média da turma Gaming (20.9 - 210, n=54, últimos 2 anos) | |
| HP Victus 16-e0179ng (AV PRO microSD 128 GB V60) | |
| HP Victus 16-e0145ng (AV PRO microSD 128 GB V60) | |
Comunicação
| Networking | |
| iperf3 transmit AXE11000 | |
| Média da turma Gaming (560 - 1862, n=88, últimos 2 anos) | |
| HP Victus 16-e0145ng | |
| iperf3 receive AXE11000 | |
| Média da turma Gaming (680 - 1745, n=88, últimos 2 anos) | |
| HP Victus 16-e0145ng | |
Webcam


Mostrar
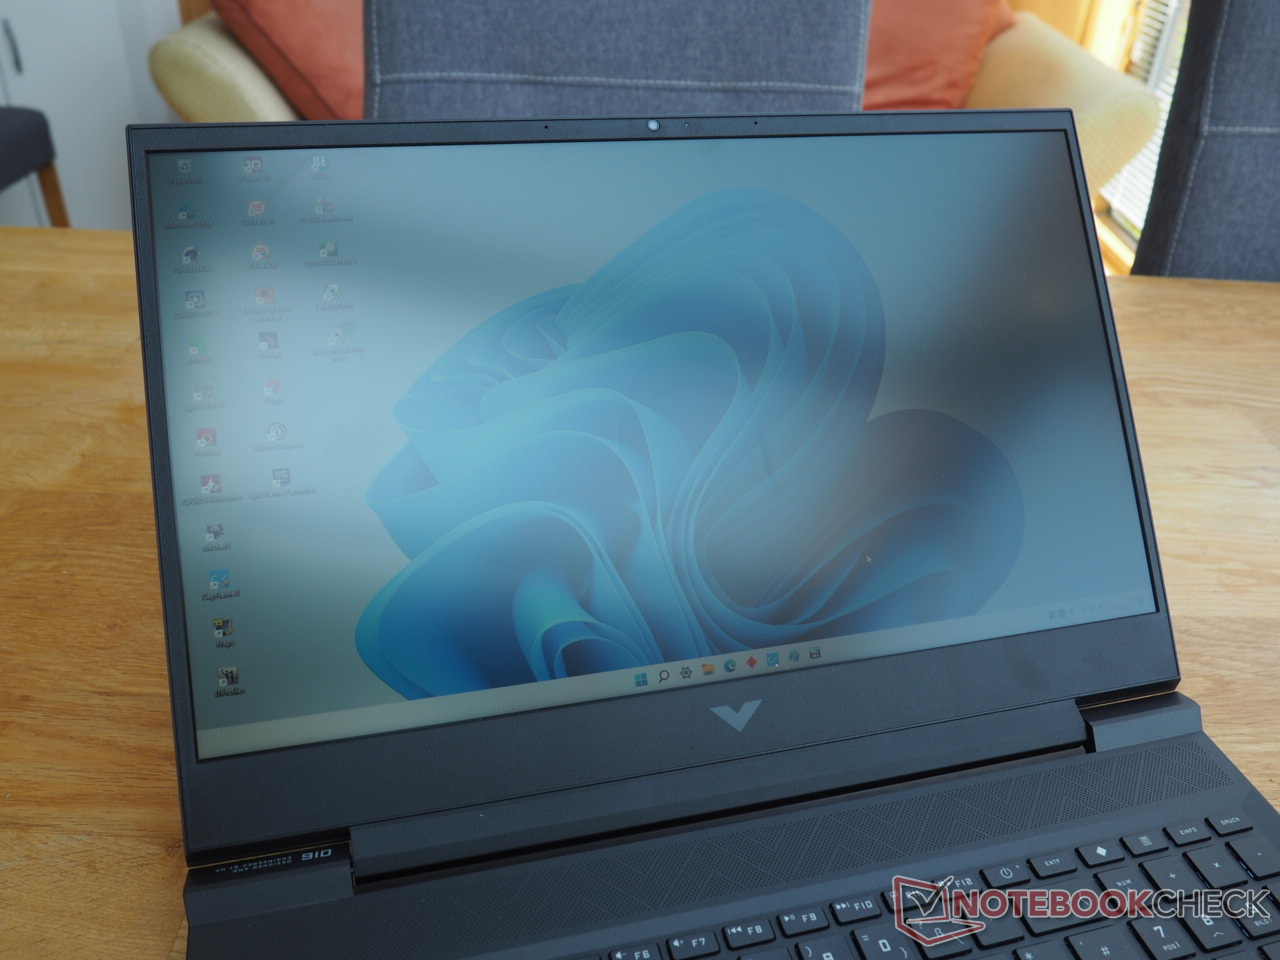
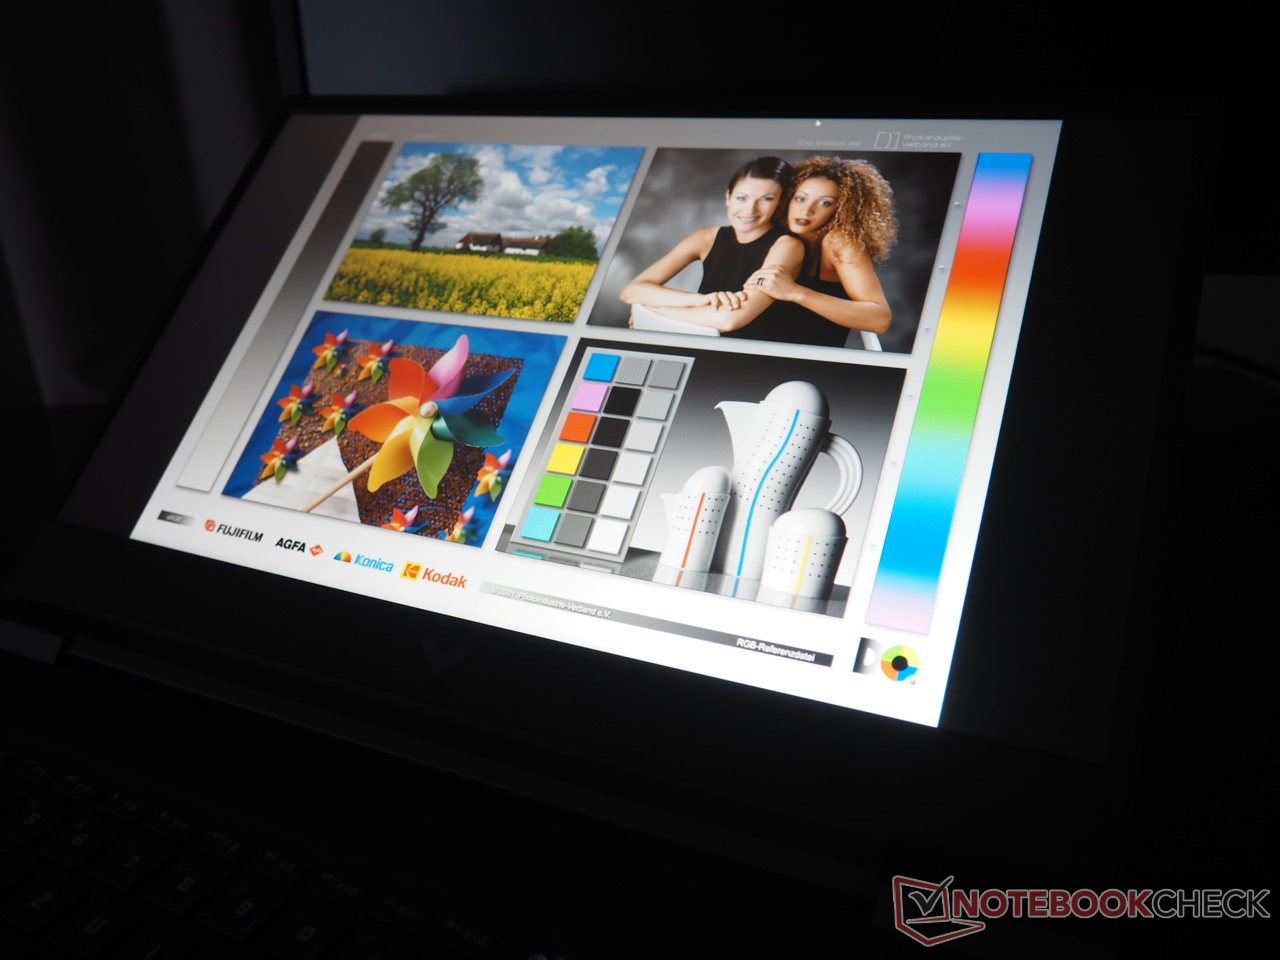
Embora o irmão mais caro esteja equipado com um bom visor Full-HD, infelizmente algumas medidas de corte de custos do fabricante são claramente perceptíveis na Victus 16-e0145ng.
| |||||||||||||||||||||||||
iluminação: 88 %
iluminação com acumulador: 257 cd/m²
Contraste: 1028:1 (Preto: 0.25 cd/m²)
ΔE ColorChecker Calman: 6.91 | ∀{0.5-29.43 Ø4.72}
calibrated: 3.61
ΔE Greyscale Calman: 7.5 | ∀{0.09-98 Ø4.97}
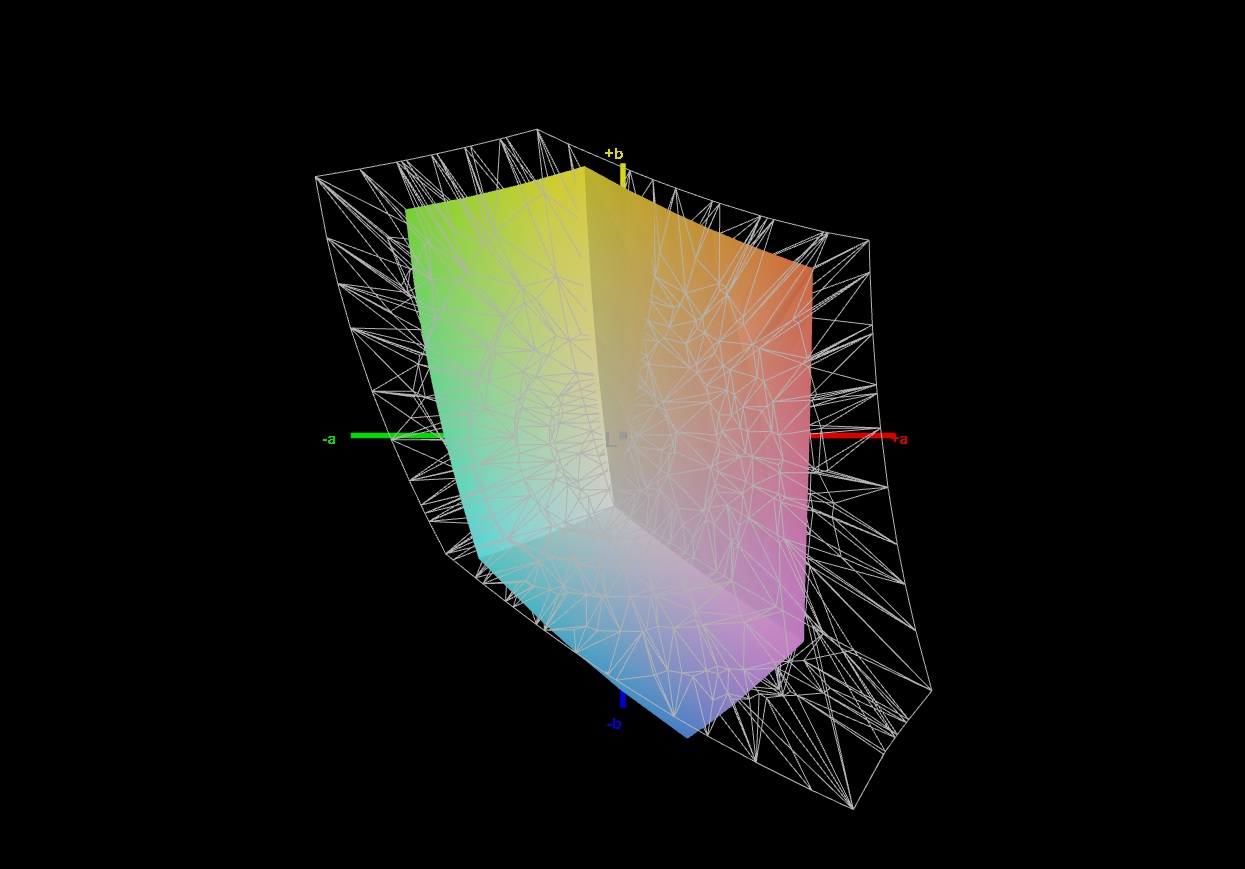
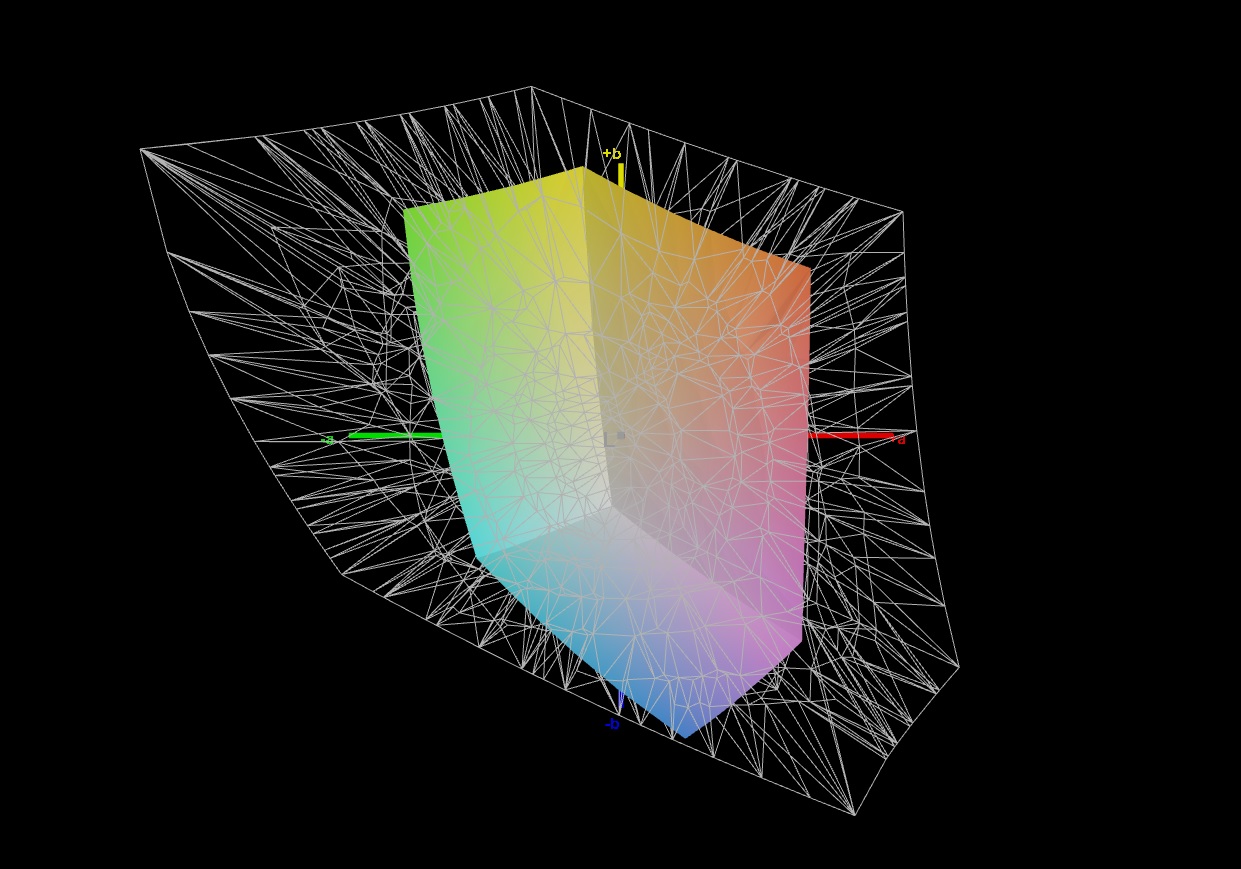
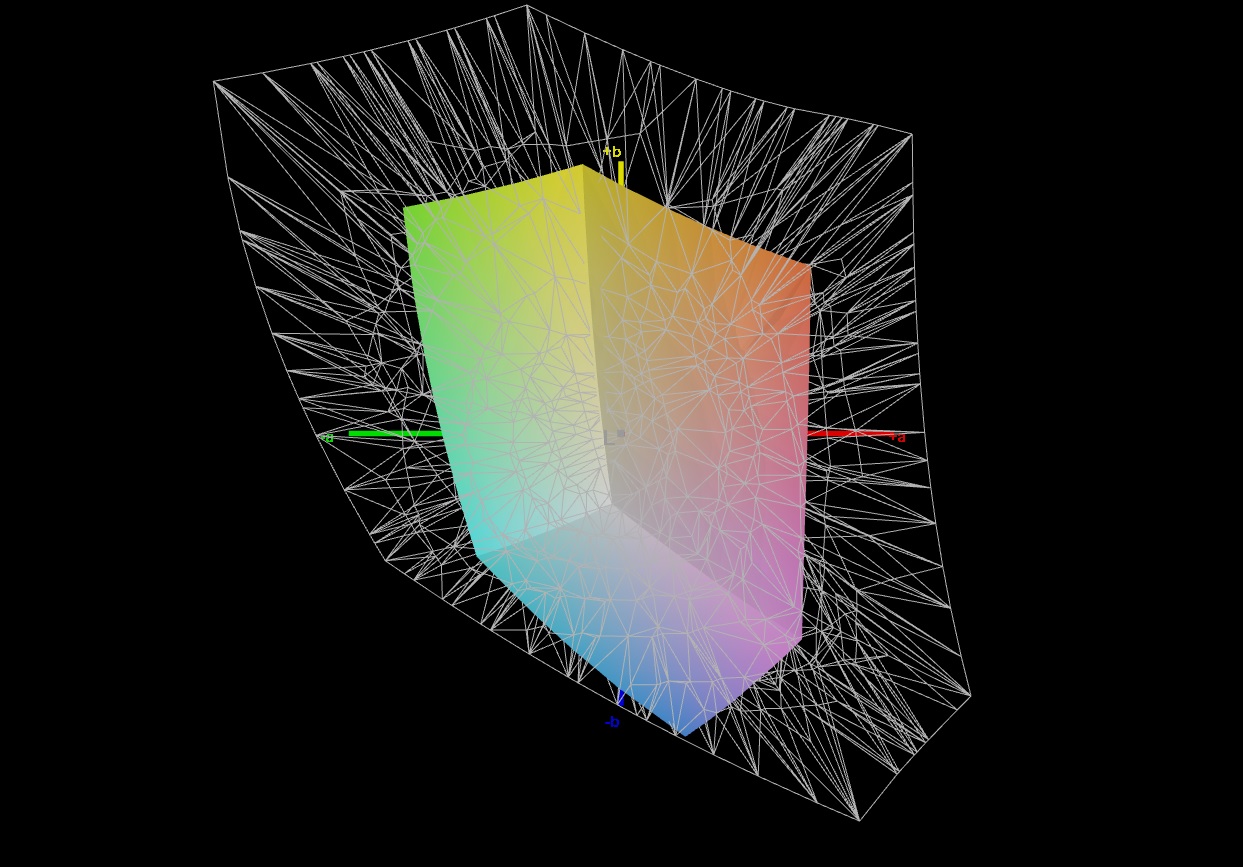
43% AdobeRGB 1998 (Argyll 3D)
61.9% sRGB (Argyll 3D)
41.6% Display P3 (Argyll 3D)
Gamma: 2.125
CCT: 6025 K
| HP Victus 16-e0145ng CMN1609, IPS, 1920x1080, 16.1" | HP Victus 16-e0179ng BOE09BE, IPS, 1920x1080, 16.1" | Lenovo Ideapad Gaming 3 15IHU-82K1002RGE LEN156FHD, IPS, 1920x1080, 15.6" | Dell G15 5515 BOE092A, IPS, 1920x1080, 15.6" | Asus ROG Strix G17 G713QE-RB74 AU Optronics B173HAN04.9, IPS, 1920x1080, 17.3" | |
|---|---|---|---|---|---|
| Display | 69% | -4% | -7% | -3% | |
| Display P3 Coverage (%) | 41.6 | 72.6 75% | 39.7 -5% | 39.1 -6% | 40.2 -3% |
| sRGB Coverage (%) | 61.9 | 100 62% | 59.6 -4% | 56.9 -8% | 60.3 -3% |
| AdobeRGB 1998 Coverage (%) | 43 | 73.5 71% | 41.1 -4% | 40.4 -6% | 41.6 -3% |
| Response Times | 47% | -69% | 14% | 5% | |
| Response Time Grey 50% / Grey 80% * (ms) | 29.6 ? | 9.6 ? 68% | 46.4 ? -57% | 25.2 ? 15% | 26.8 ? 9% |
| Response Time Black / White * (ms) | 19.4 ? | 14.4 ? 26% | 35.2 ? -81% | 16.8 ? 13% | 19.2 ? 1% |
| PWM Frequency (Hz) | 200 ? | ||||
| Screen | 36% | 13% | 0% | 27% | |
| Brightness middle (cd/m²) | 257 | 361 40% | 307 19% | 278 8% | 270.5 5% |
| Brightness (cd/m²) | 239 | 341 43% | 292 22% | 262 10% | 269 13% |
| Brightness Distribution (%) | 88 | 88 0% | 88 0% | 83 -6% | 92 5% |
| Black Level * (cd/m²) | 0.25 | 0.3 -20% | 0.21 16% | 0.36 -44% | 0.19 24% |
| Contrast (:1) | 1028 | 1203 17% | 1462 42% | 772 -25% | 1424 39% |
| Colorchecker dE 2000 * | 6.91 | 2.44 65% | 5.9 15% | 5.74 17% | 4.39 36% |
| Colorchecker dE 2000 max. * | 22.27 | 6.37 71% | 21.6 3% | 19.63 12% | 20.8 7% |
| Colorchecker dE 2000 calibrated * | 3.61 | 1.26 65% | 4.8 -33% | 4.7 -30% | 1.56 57% |
| Greyscale dE 2000 * | 7.5 | 4.6 39% | 4.9 35% | 3.1 59% | 3.1 59% |
| Gamma | 2.125 104% | 2.268 97% | 2.26 97% | 2.011 109% | 2.14 103% |
| CCT | 6025 108% | 6609 98% | 6504 100% | 6207 105% | 6927 94% |
| Média Total (Programa/Configurações) | 51% /
44% | -20% /
-2% | 2% /
1% | 10% /
18% |
* ... menor é melhor
Mesmo que os concorrentes também não sejam exemplares neste aspecto, apresentando resultados igualmente escassos, nem o brilho nem a cobertura do espaço de cor são mais adequados em 2022. Apenas 62% do espaço de cor sRGB e uma luminosidade média de 239 cd/m² proporcionam uma imagem muito pálida e escura, particularmente em ambientes brilhantes.
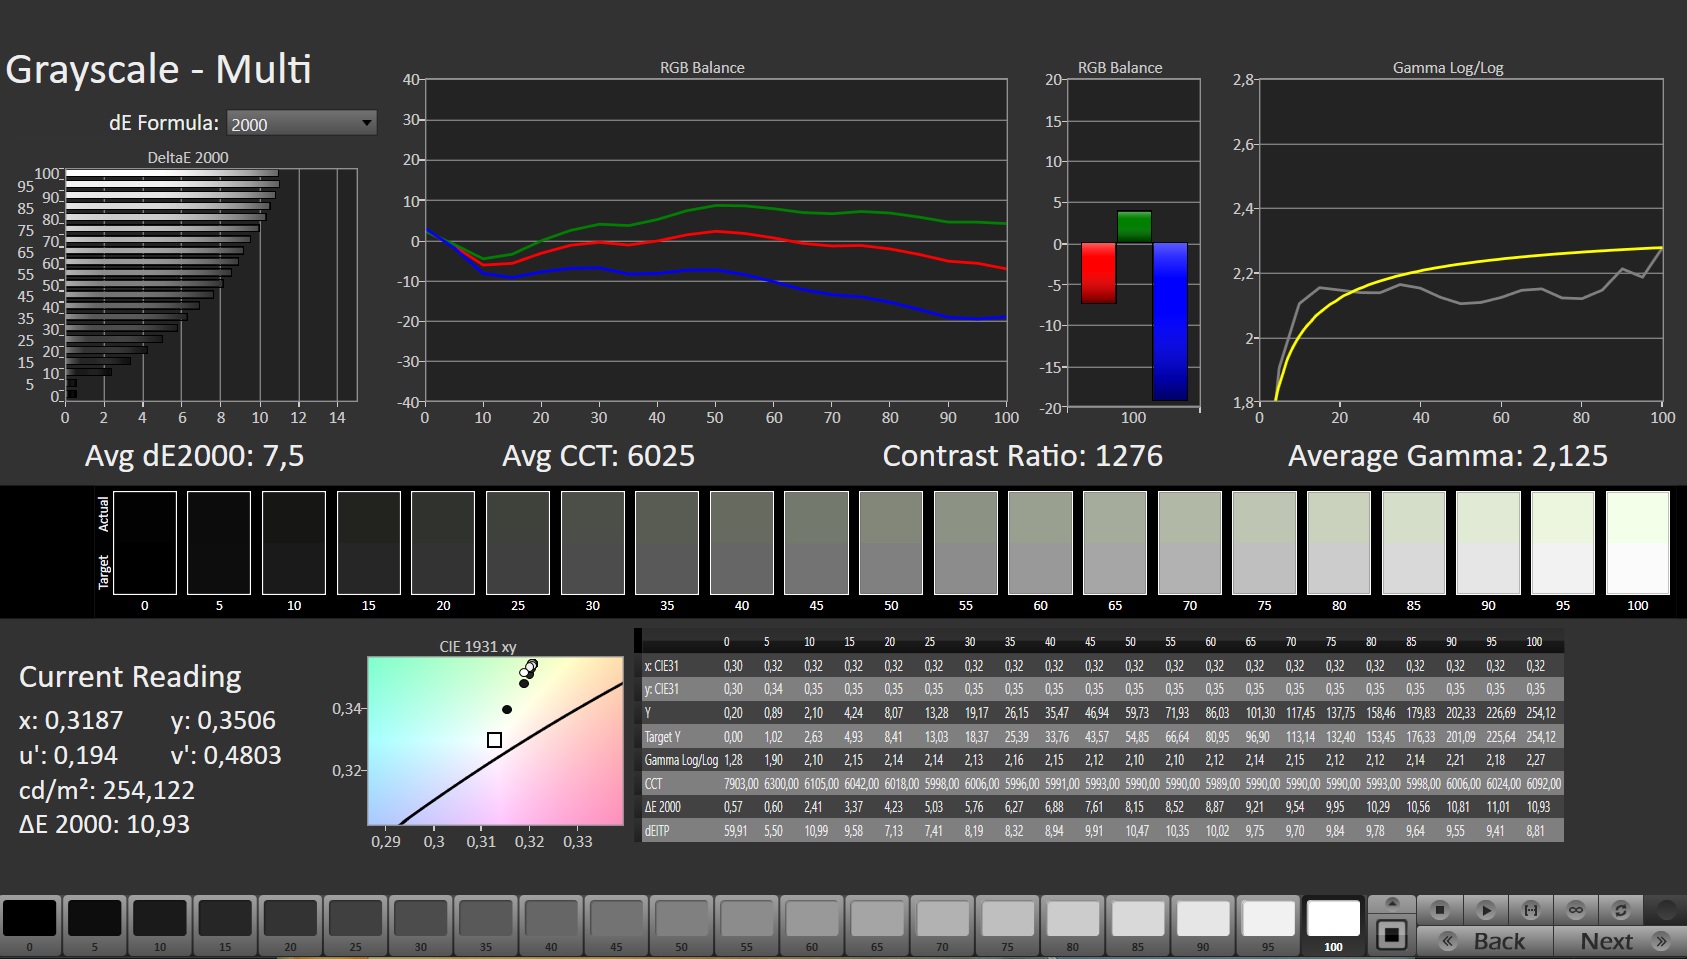
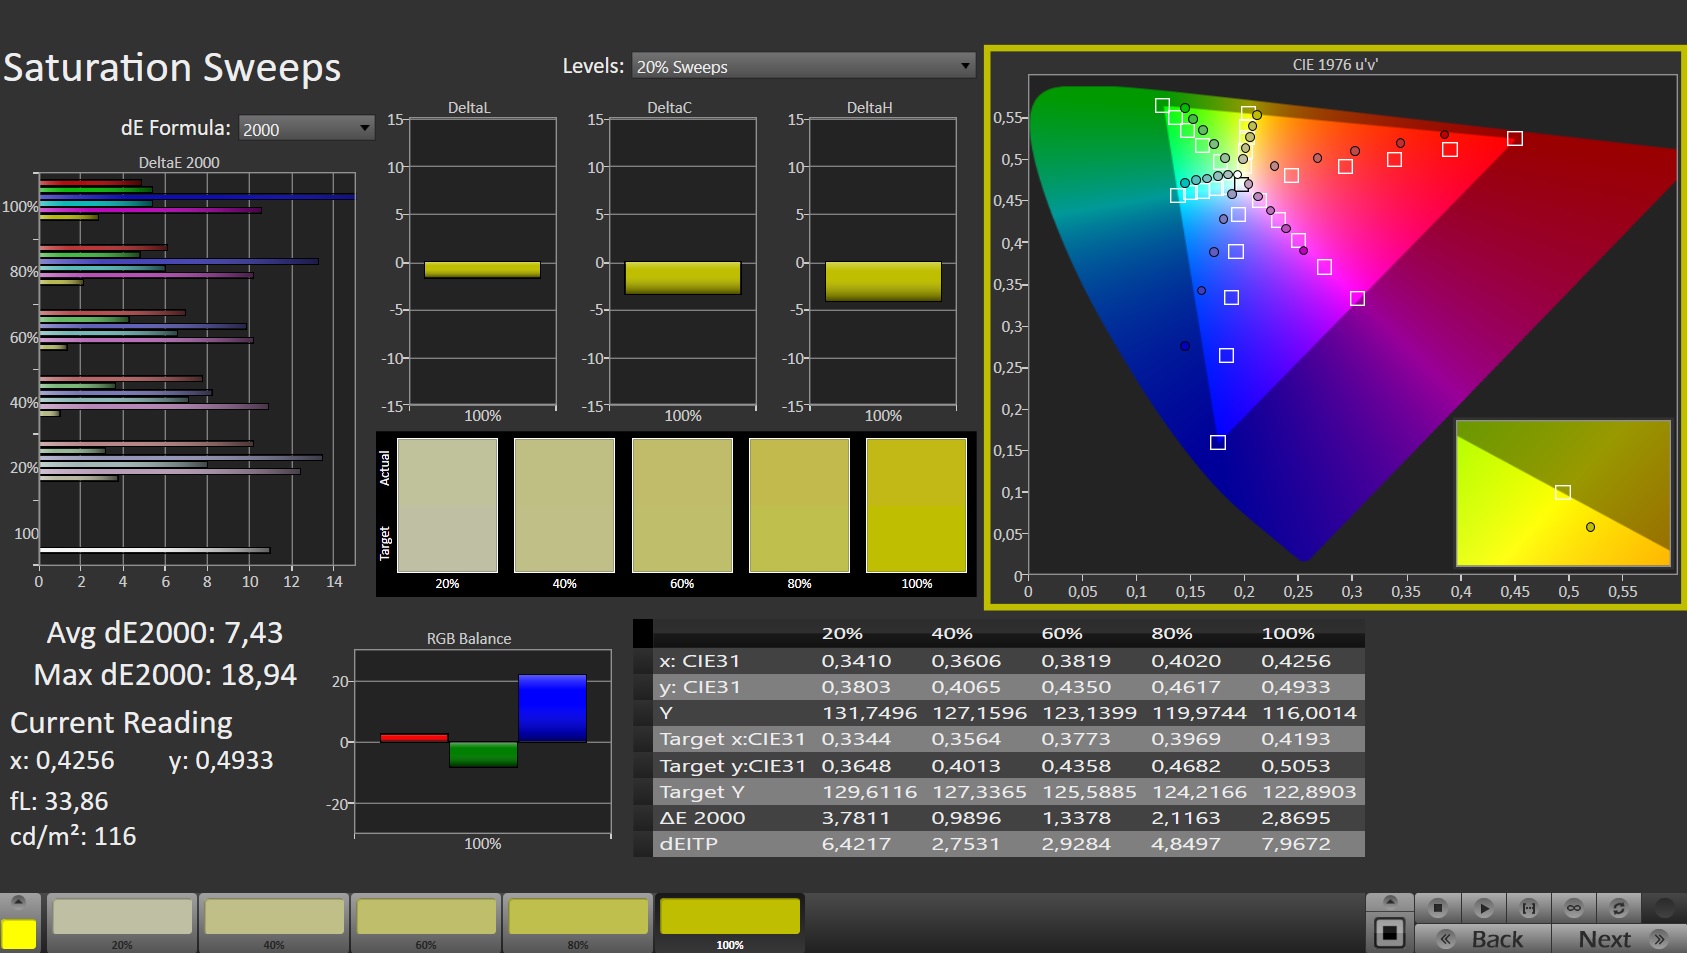
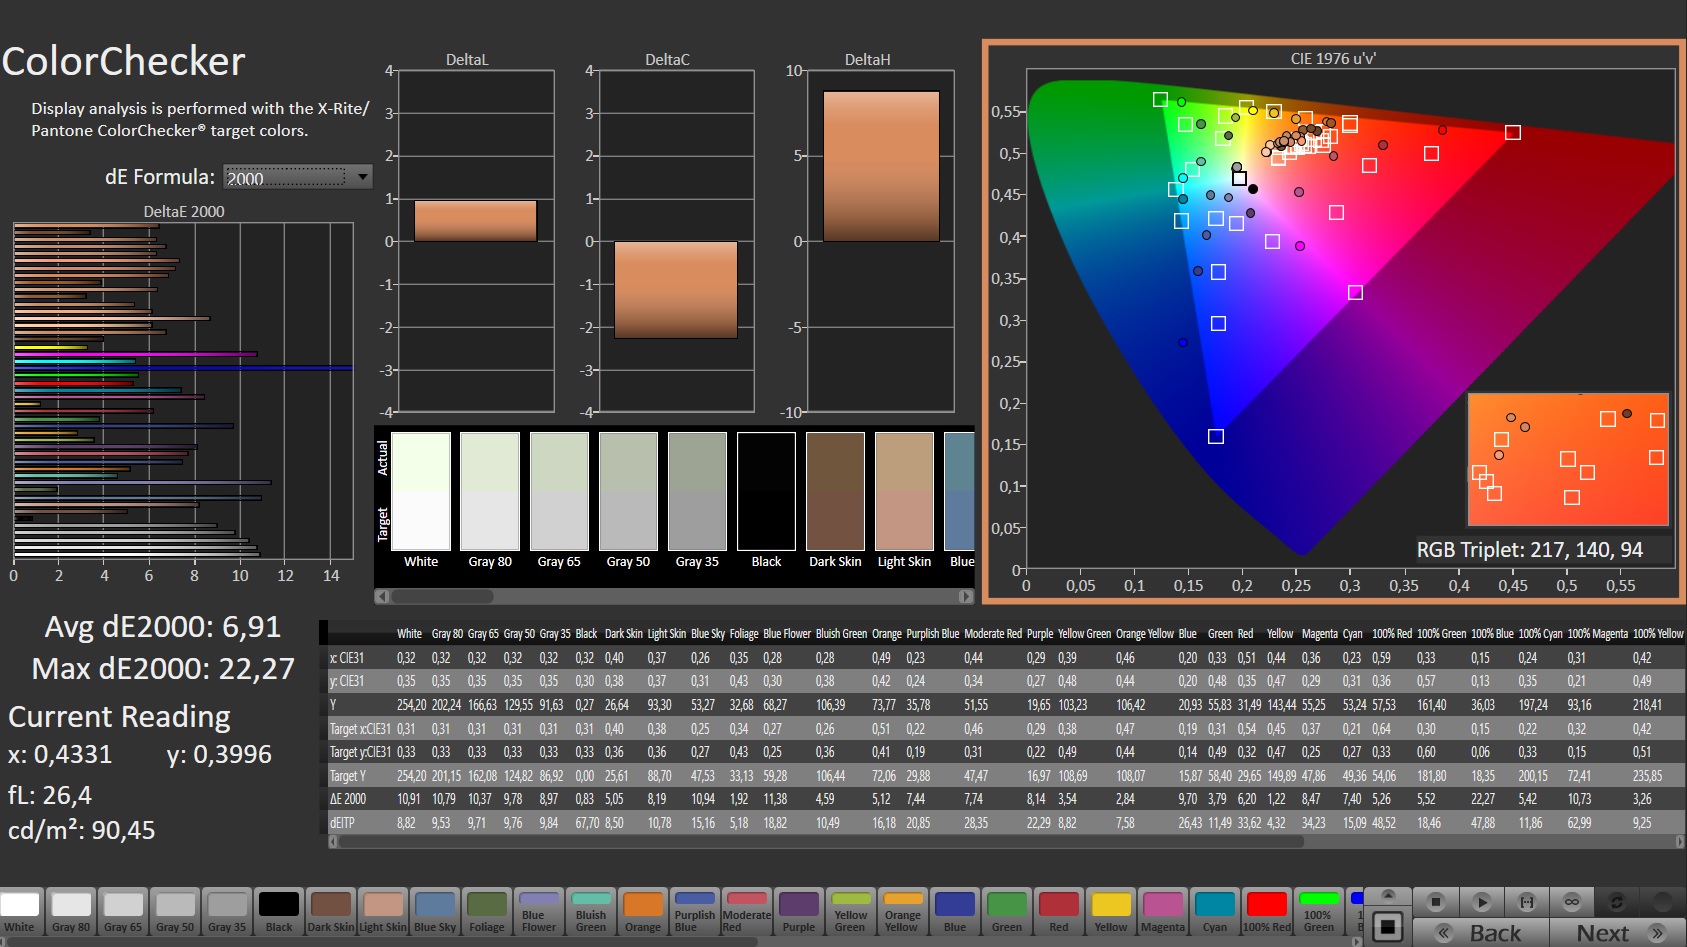
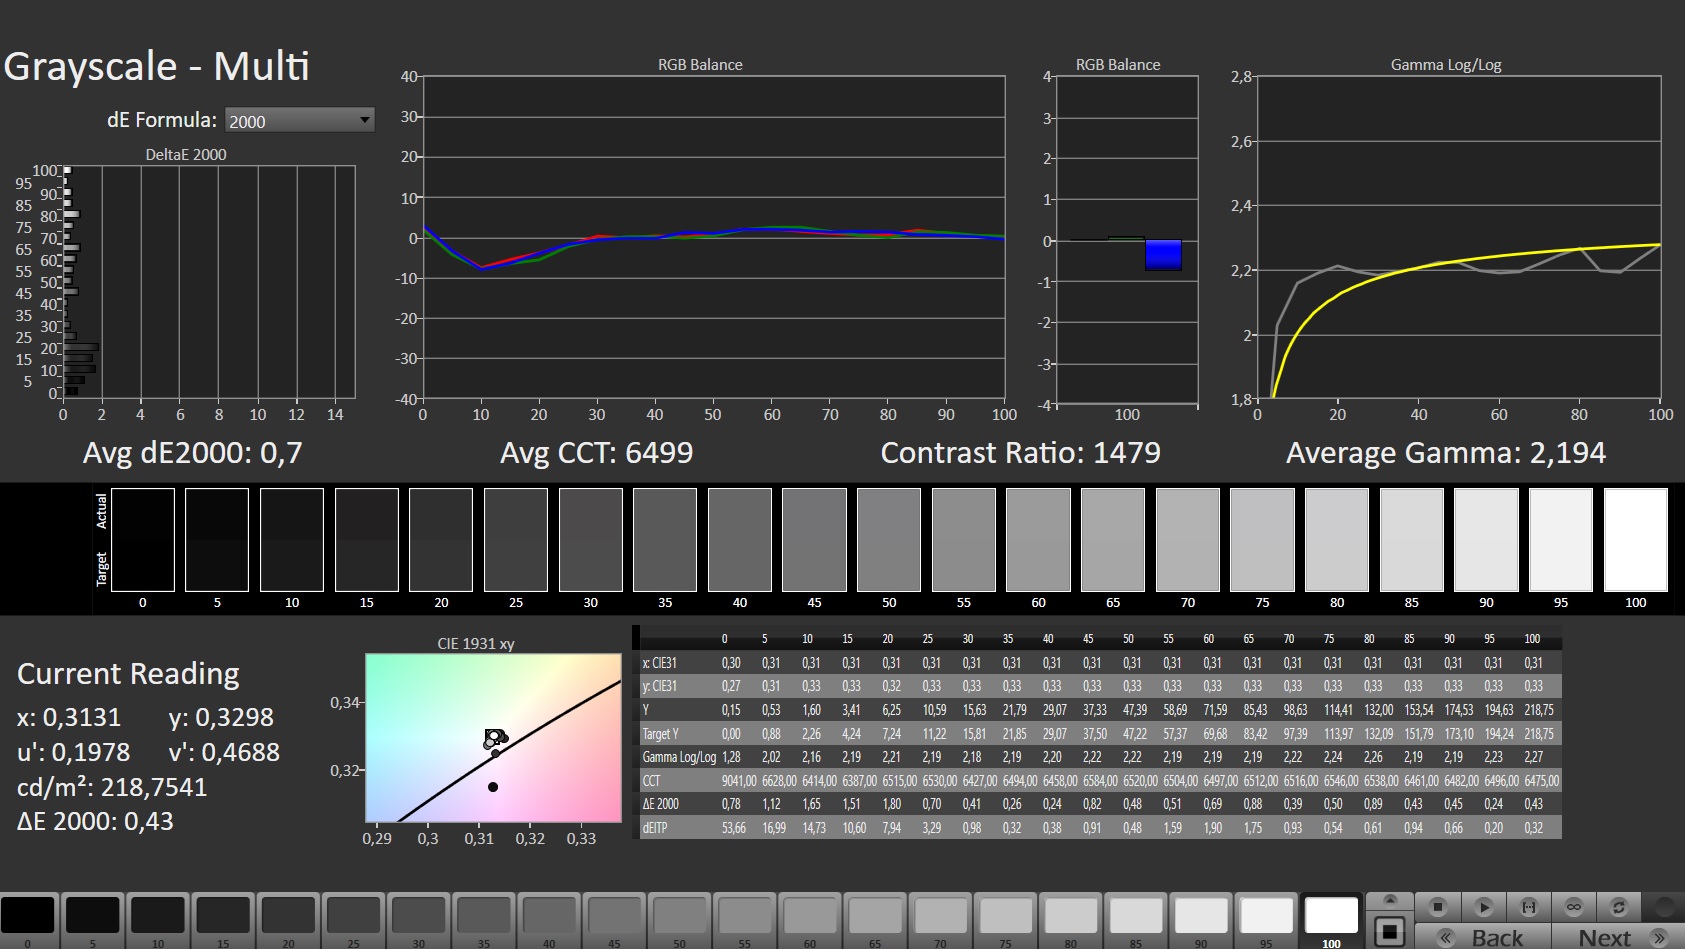
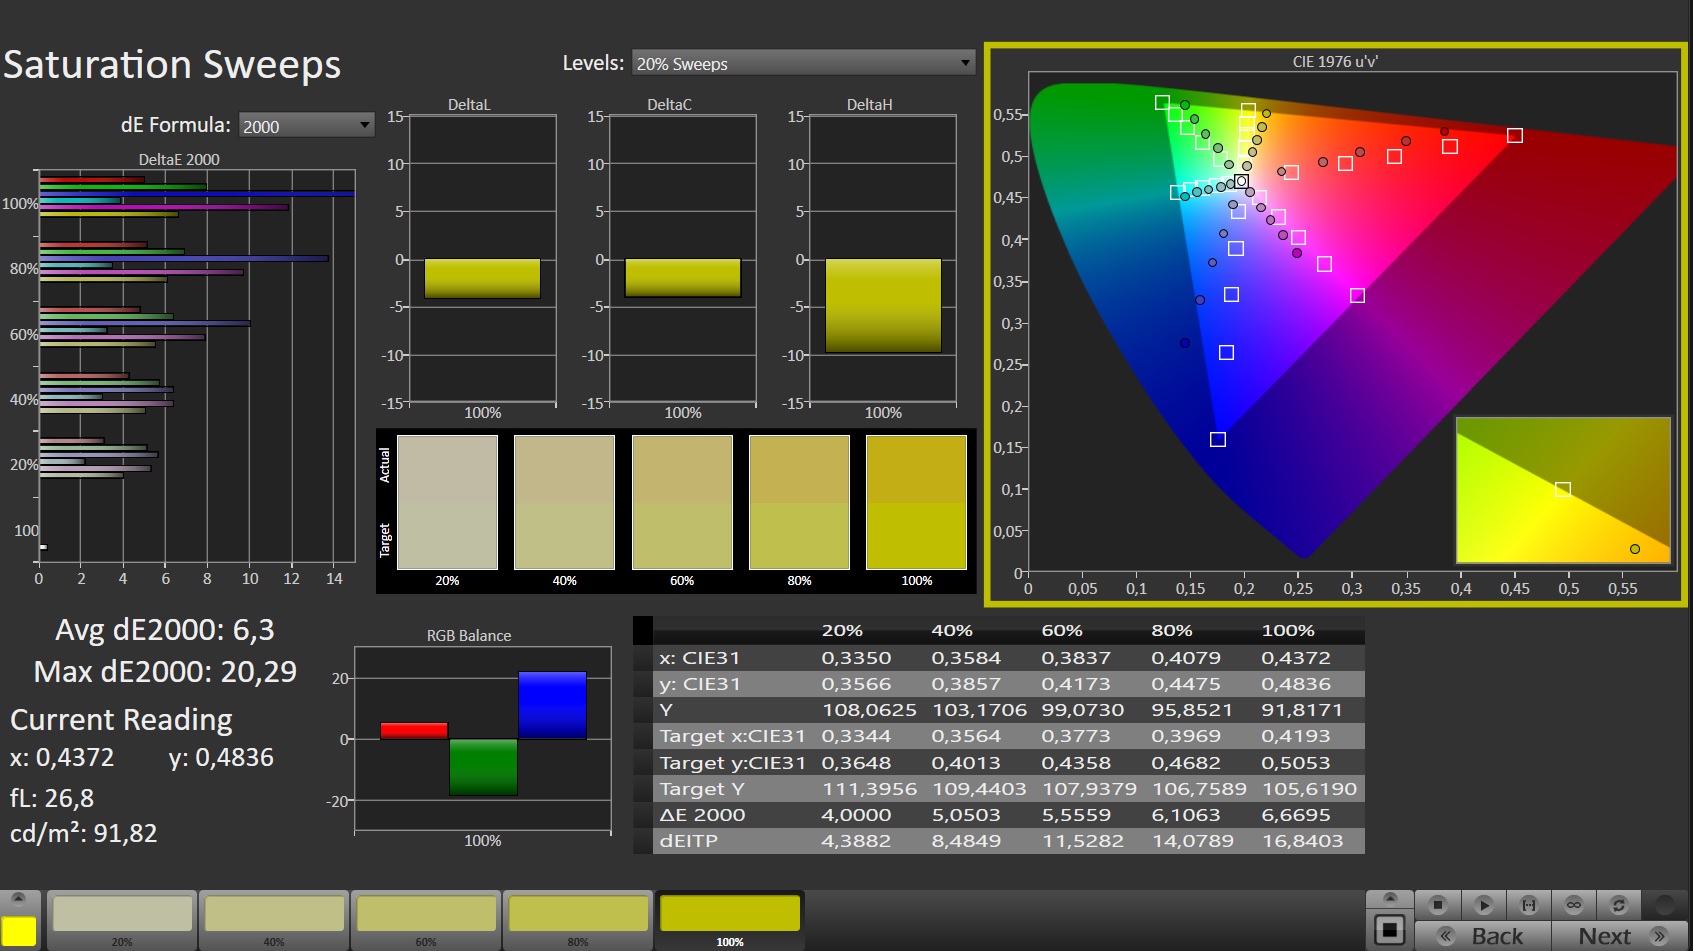
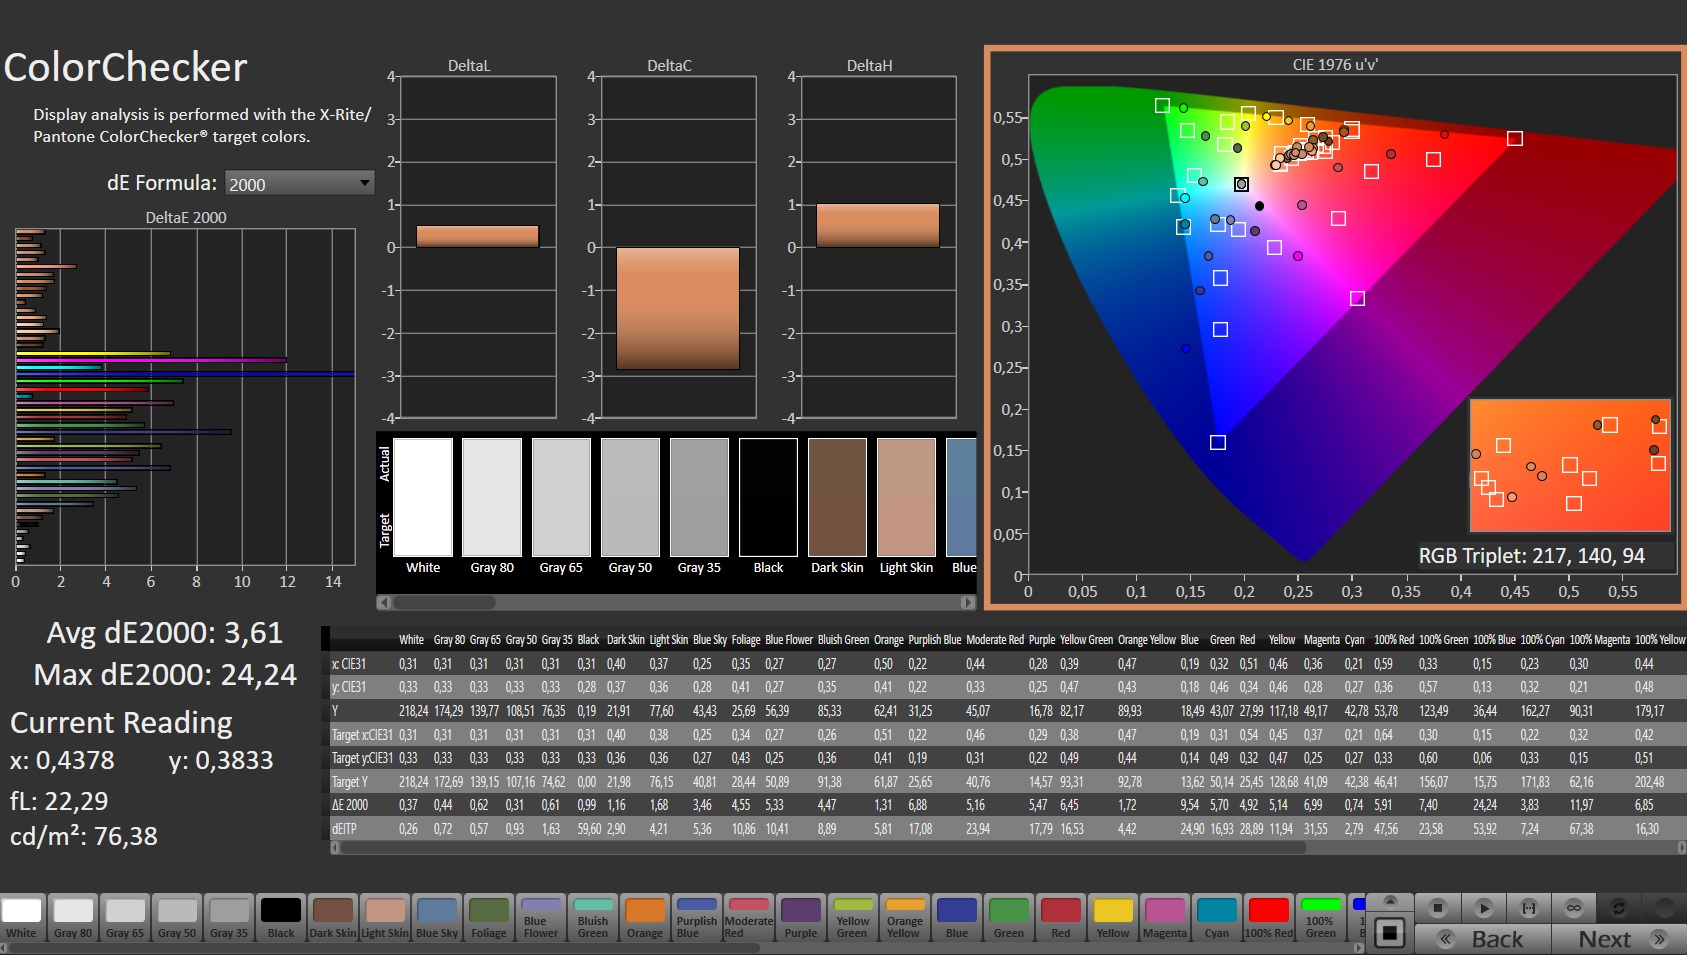
A precisão da cor acaba sendo igualmente decepcionante. No estado de entrega, o painel luta com uma tonalidade verde, mas pelo menos você pode aliviar isto com uma calibração (como de costume, você pode baixar nosso arquivo ICC do link à direita do esquema de distribuição de brilho acima).
O assunto dos tempos de resposta nos dá menos motivos de reclamação. Considerando o preço, quase 19 ms de preto-e-branco e 30 ms de cinzento a cinzento são aceitáveis. O mesmo vale para a estabilidade do ângulo de visão, que varia a um nível típico para as telas IPS.
Exibir tempos de resposta
| ↔ Tempo de resposta preto para branco | ||
|---|---|---|
| 19.4 ms ... ascensão ↗ e queda ↘ combinadas | ↗ 9.7 ms ascensão | 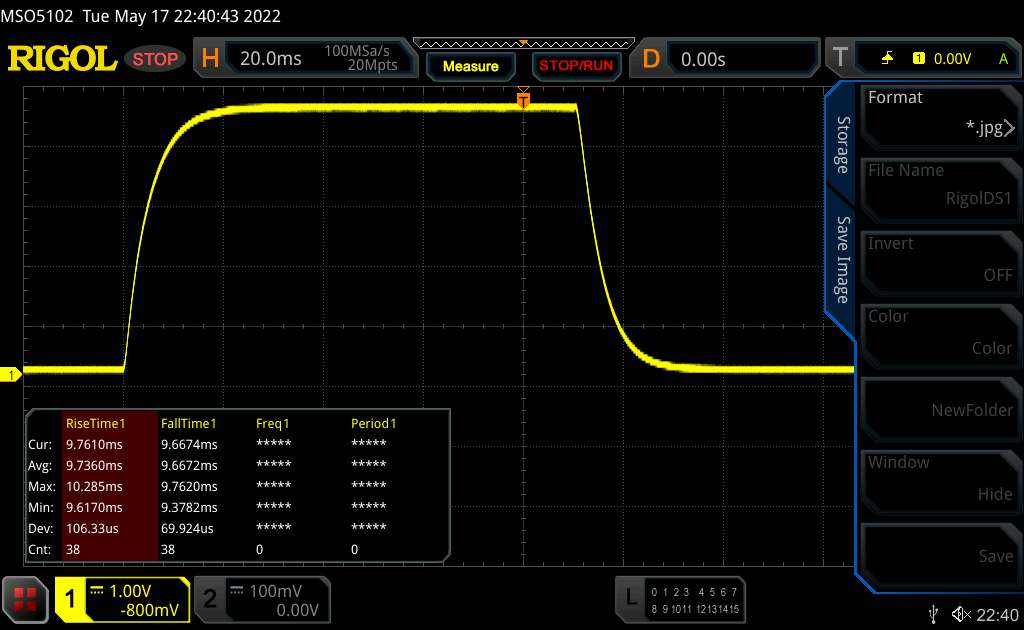 |
| ↘ 9.7 ms queda | ||
| A tela mostra boas taxas de resposta em nossos testes, mas pode ser muito lenta para jogadores competitivos. Em comparação, todos os dispositivos testados variam de 0.1 (mínimo) a 240 (máximo) ms. » 43 % de todos os dispositivos são melhores. Isso significa que o tempo de resposta medido é semelhante à média de todos os dispositivos testados (19.8 ms). | ||
| ↔ Tempo de resposta 50% cinza a 80% cinza | ||
| 29.6 ms ... ascensão ↗ e queda ↘ combinadas | ↗ 13.8 ms ascensão | 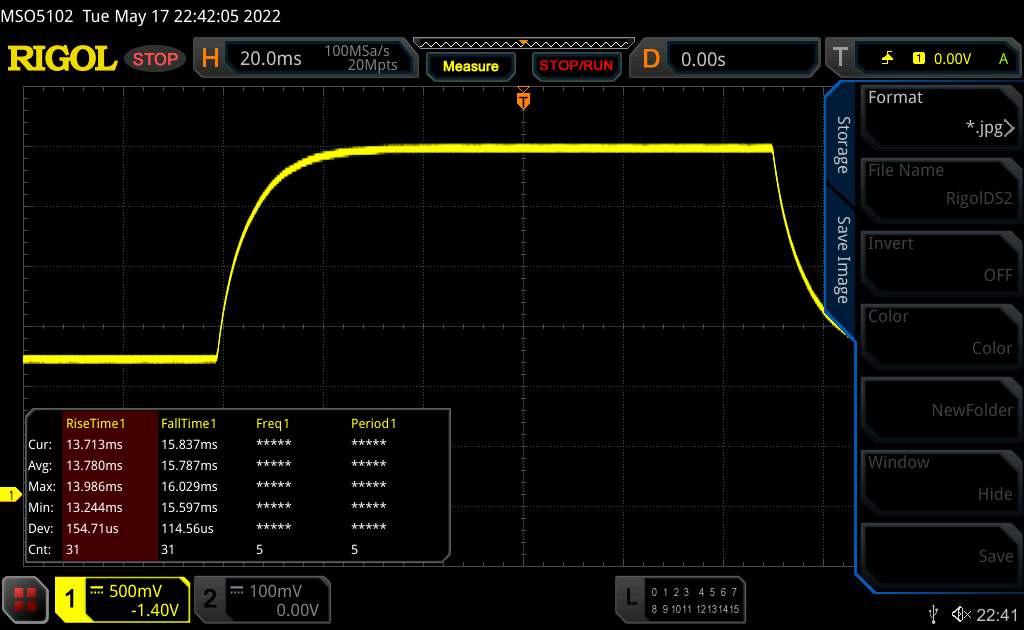 |
| ↘ 15.8 ms queda | ||
| A tela mostra taxas de resposta relativamente lentas em nossos testes e pode ser muito lenta para os jogadores. Em comparação, todos os dispositivos testados variam de 0.165 (mínimo) a 636 (máximo) ms. » 40 % de todos os dispositivos são melhores. Isso significa que o tempo de resposta medido é semelhante à média de todos os dispositivos testados (31 ms). | ||
Cintilação da tela / PWM (modulação por largura de pulso)
| Tela tremeluzindo / PWM não detectado | 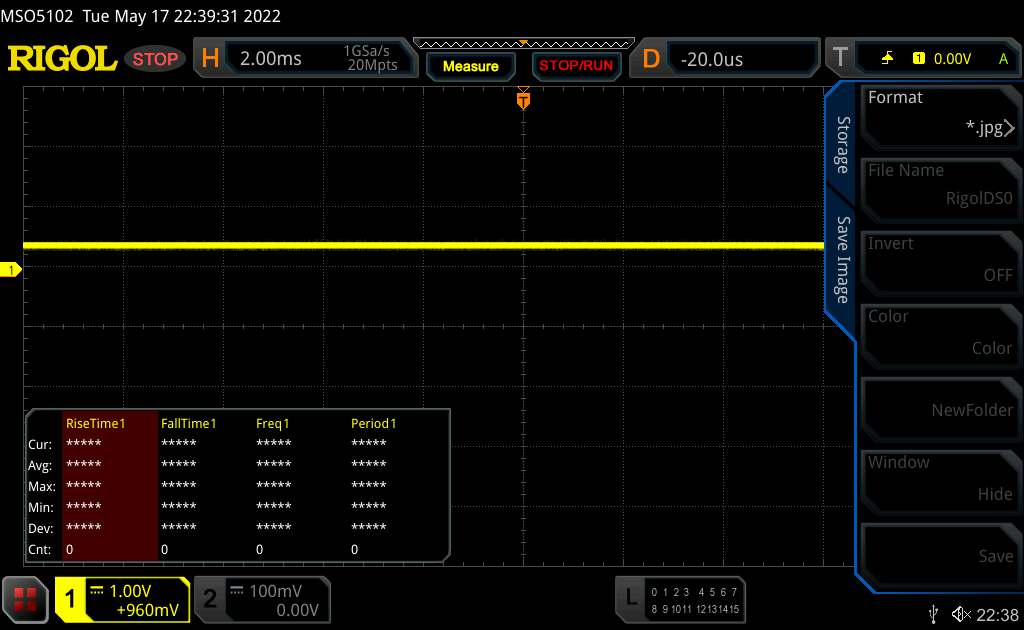 | ||
[pwm_comparison] Em comparação: 52 % de todos os dispositivos testados não usam PWM para escurecer a tela. Se PWM foi detectado, uma média de 7747 (mínimo: 5 - máximo: 343500) Hz foi medida. | |||
Desempenho
Com o equipamento de nossa unidade de teste, o Victus 16 pertence à gama média do jogo. Os componentes utilizados são equilibrados e devem atrair jogadores conscientes do preço.
Condições de teste
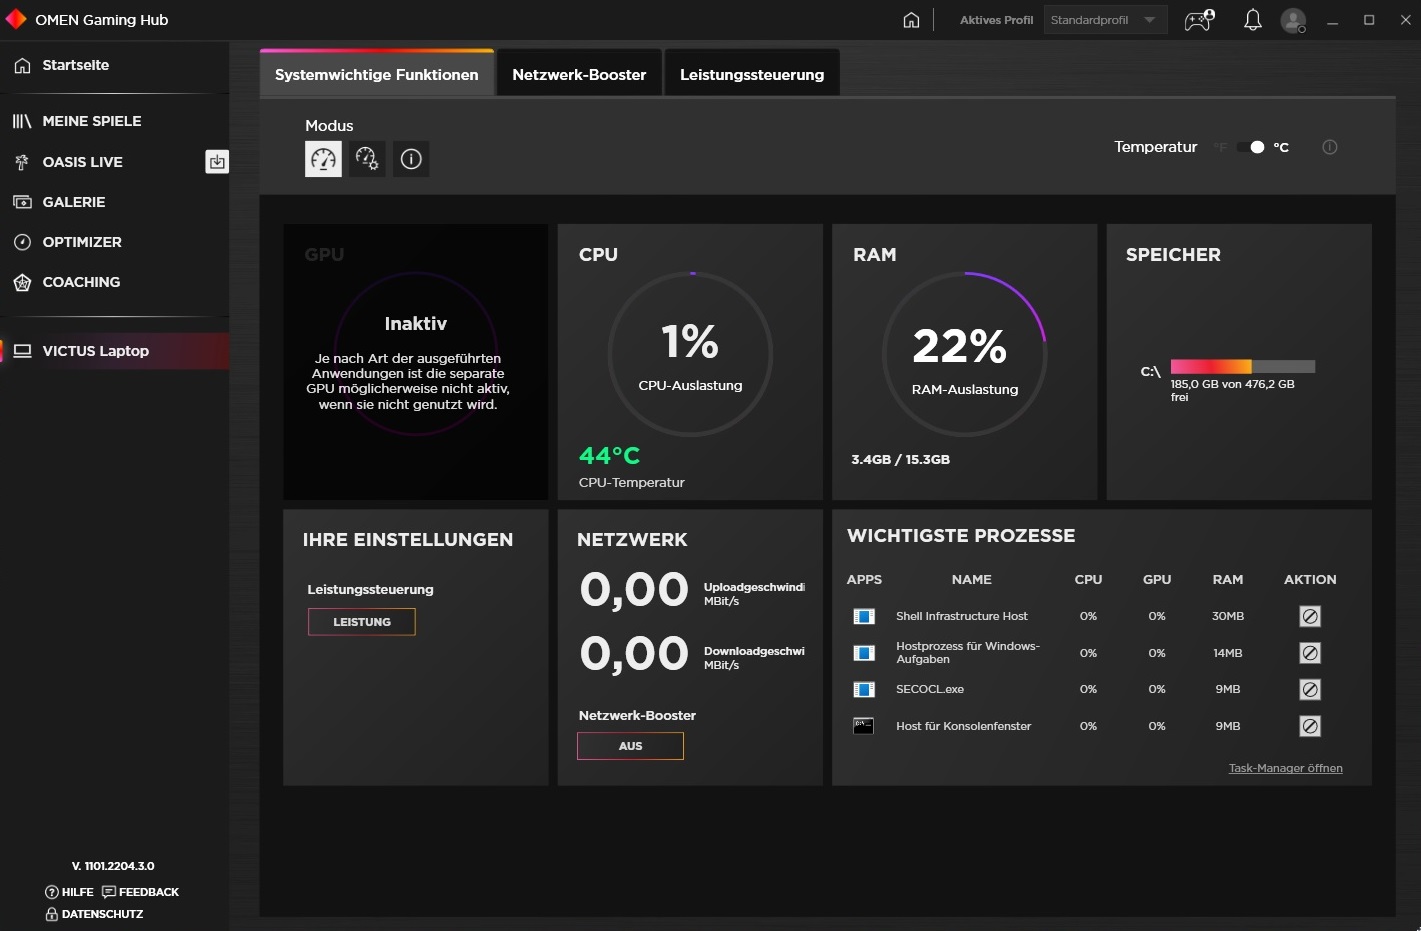
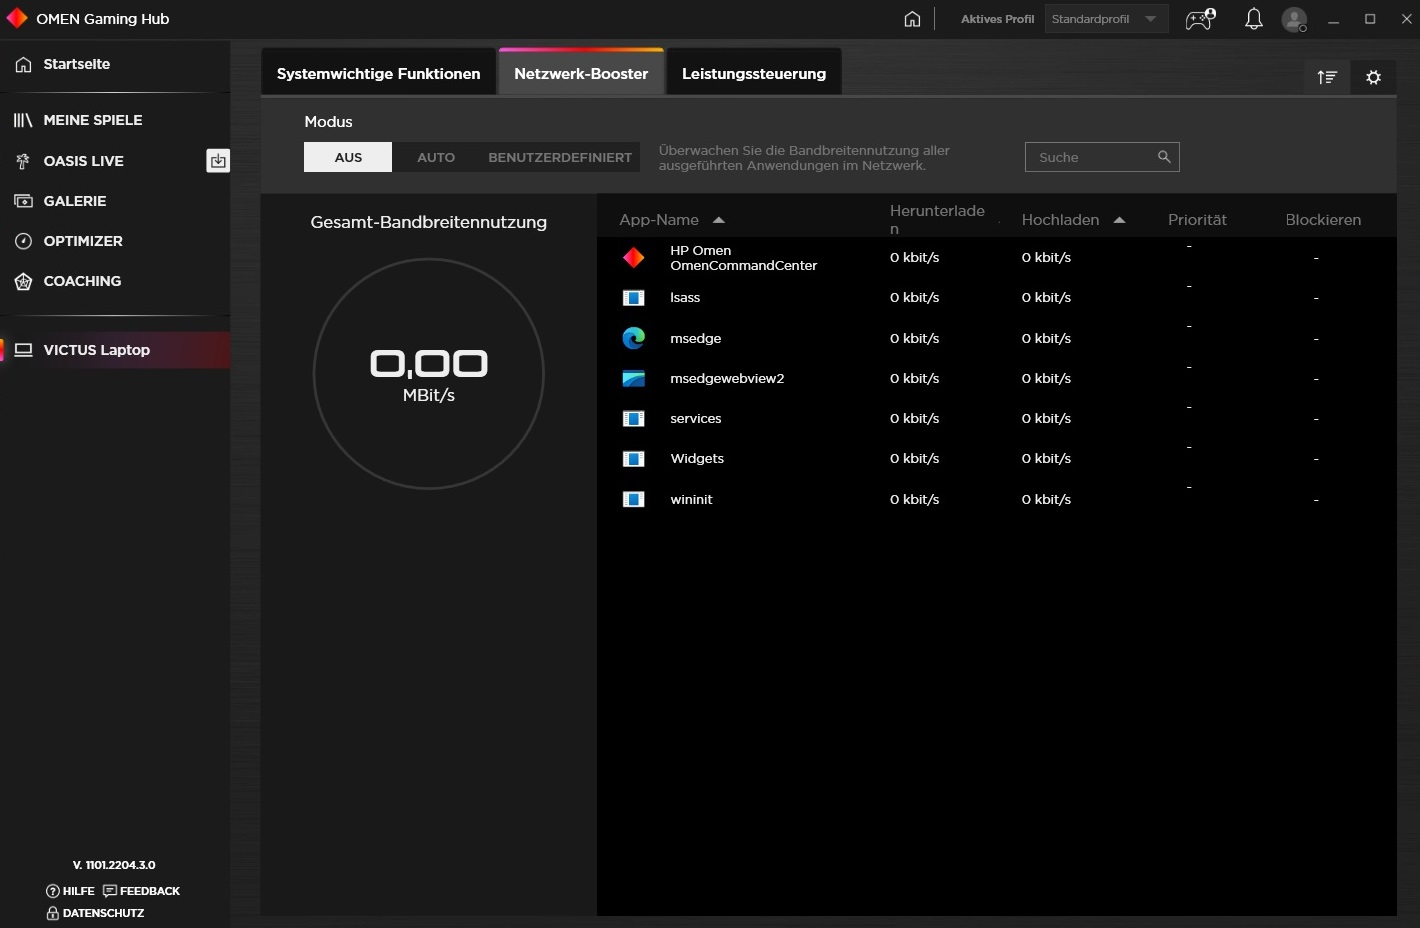
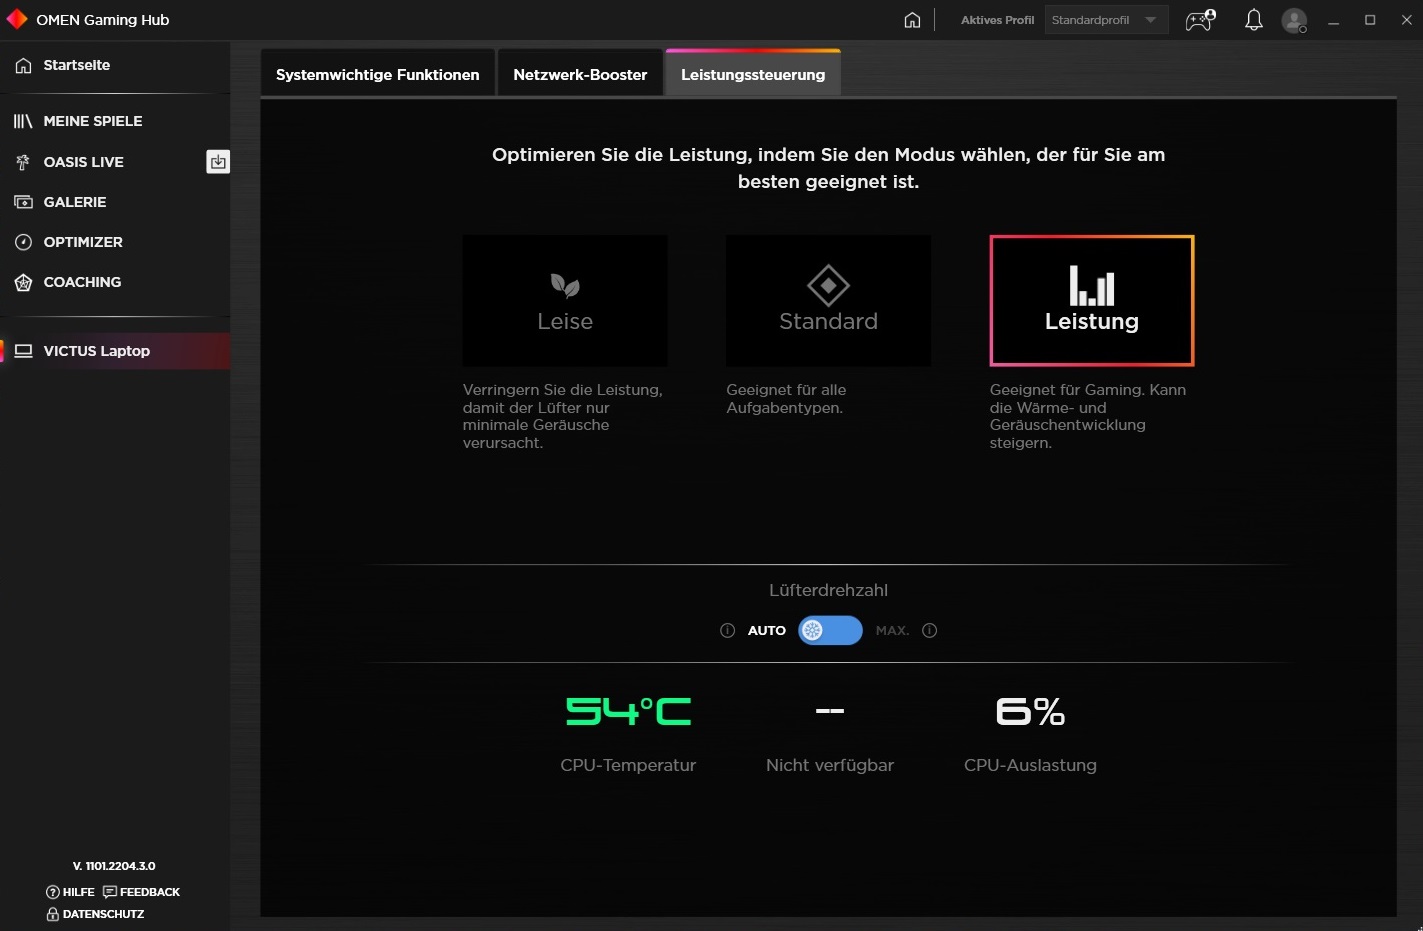
O Omen Gaming Hub, que deve ser pré-instalado em modelos com Windows, oferece três perfis de desempenho diferentes. Com exceção dos testes de bateria, todas as medições foram realizadas utilizando o modo mais alto (ver captura de tela nº 3). O controle do ventilador foi sempre ajustado para a configuração automática.
Processador
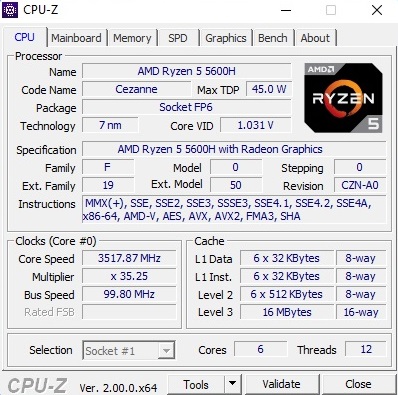
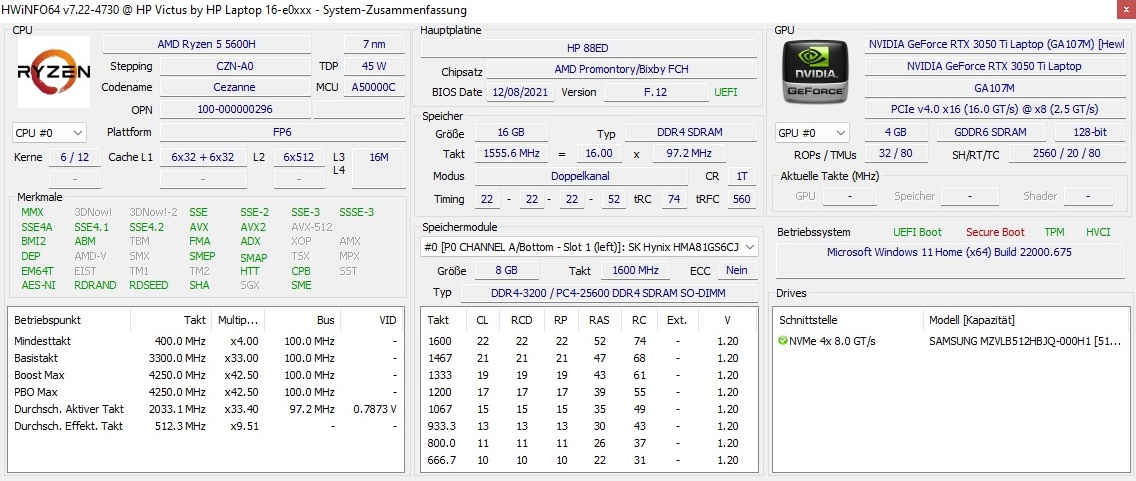
O Ryzen 5 5600H é um processador hexacore que é especificado a 45 watts e capaz de operar com até 12 roscas simultaneamente. Sob carga, o modelo 7-nm tem uma velocidade de relógio de 3,3 a 4,2 GHz
Em nosso loop Cinebench, o desempenho se desenvolve de forma muito uniforme, de forma semelhante aos concorrentes. Como você pode ver na tabela, o Ryzen 5600H é significativamente mais rápido que o da Intel Núcleo i5-11300Hque contém apenas 4 núcleos, no entanto (máx. 8 fios). Graças ao uso do Ryzen 7 5800H (8C/16T), os outros concorrentes são ligeiramente mais rápidos.
Cinebench R15 Multi Constant Load Test
* ... menor é melhor
AIDA64: FP32 Ray-Trace | FPU Julia | CPU SHA3 | CPU Queen | FPU SinJulia | FPU Mandel | CPU AES | CPU ZLib | FP64 Ray-Trace | CPU PhotoWorxx
| Performance rating | |
| Média da turma Gaming | |
| Asus ROG Strix G17 G713QE-RB74 | |
| HP Victus 16-e0179ng | |
| Dell G15 5515 | |
| Média AMD Ryzen 5 5600H | |
| HP Victus 16-e0145ng | |
| Lenovo Ideapad Gaming 3 15IHU-82K1002RGE | |
| AIDA64 / FP32 Ray-Trace | |
| Média da turma Gaming (10227 - 85542, n=103, últimos 2 anos) | |
| Asus ROG Strix G17 G713QE-RB74 | |
| HP Victus 16-e0179ng | |
| Dell G15 5515 | |
| HP Victus 16-e0145ng | |
| Média AMD Ryzen 5 5600H (9181 - 12636, n=14) | |
| Lenovo Ideapad Gaming 3 15IHU-82K1002RGE | |
| AIDA64 / FPU Julia | |
| Média da turma Gaming (51376 - 238426, n=103, últimos 2 anos) | |
| Asus ROG Strix G17 G713QE-RB74 | |
| HP Victus 16-e0179ng | |
| Dell G15 5515 | |
| HP Victus 16-e0145ng | |
| Média AMD Ryzen 5 5600H (51994 - 78250, n=14) | |
| Lenovo Ideapad Gaming 3 15IHU-82K1002RGE | |
| AIDA64 / CPU SHA3 | |
| Média da turma Gaming (2180 - 9817, n=103, últimos 2 anos) | |
| Asus ROG Strix G17 G713QE-RB74 | |
| HP Victus 16-e0179ng | |
| Dell G15 5515 | |
| HP Victus 16-e0145ng | |
| Média AMD Ryzen 5 5600H (1587 - 2675, n=14) | |
| Lenovo Ideapad Gaming 3 15IHU-82K1002RGE | |
| AIDA64 / CPU Queen | |
| Média da turma Gaming (49785 - 173351, n=89, últimos 2 anos) | |
| Asus ROG Strix G17 G713QE-RB74 | |
| HP Victus 16-e0179ng | |
| Dell G15 5515 | |
| HP Victus 16-e0145ng | |
| Média AMD Ryzen 5 5600H (66699 - 77213, n=14) | |
| Lenovo Ideapad Gaming 3 15IHU-82K1002RGE | |
| AIDA64 / FPU SinJulia | |
| Média da turma Gaming (4424 - 33636, n=103, últimos 2 anos) | |
| Dell G15 5515 | |
| HP Victus 16-e0179ng | |
| Asus ROG Strix G17 G713QE-RB74 | |
| HP Victus 16-e0145ng | |
| Média AMD Ryzen 5 5600H (8340 - 9159, n=14) | |
| Lenovo Ideapad Gaming 3 15IHU-82K1002RGE | |
| AIDA64 / FPU Mandel | |
| Média da turma Gaming (25115 - 128721, n=103, últimos 2 anos) | |
| Asus ROG Strix G17 G713QE-RB74 | |
| HP Victus 16-e0179ng | |
| Dell G15 5515 | |
| HP Victus 16-e0145ng | |
| Média AMD Ryzen 5 5600H (28268 - 43274, n=14) | |
| Lenovo Ideapad Gaming 3 15IHU-82K1002RGE | |
| AIDA64 / CPU AES | |
| Asus ROG Strix G17 G713QE-RB74 | |
| HP Victus 16-e0179ng | |
| Dell G15 5515 | |
| Média da turma Gaming (39258 - 247074, n=103, últimos 2 anos) | |
| Média AMD Ryzen 5 5600H (39852 - 98939, n=14) | |
| Lenovo Ideapad Gaming 3 15IHU-82K1002RGE | |
| HP Victus 16-e0145ng | |
| AIDA64 / CPU ZLib | |
| Média da turma Gaming (574 - 2531, n=103, últimos 2 anos) | |
| Asus ROG Strix G17 G713QE-RB74 | |
| HP Victus 16-e0179ng | |
| Dell G15 5515 | |
| HP Victus 16-e0145ng | |
| Média AMD Ryzen 5 5600H (507 - 649, n=14) | |
| Lenovo Ideapad Gaming 3 15IHU-82K1002RGE | |
| AIDA64 / FP64 Ray-Trace | |
| Média da turma Gaming (5509 - 45446, n=103, últimos 2 anos) | |
| Asus ROG Strix G17 G713QE-RB74 | |
| HP Victus 16-e0179ng | |
| Dell G15 5515 | |
| HP Victus 16-e0145ng | |
| Média AMD Ryzen 5 5600H (4811 - 6652, n=14) | |
| Lenovo Ideapad Gaming 3 15IHU-82K1002RGE | |
| AIDA64 / CPU PhotoWorxx | |
| Média da turma Gaming (12271 - 89891, n=103, últimos 2 anos) | |
| HP Victus 16-e0145ng | |
| HP Victus 16-e0179ng | |
| Média AMD Ryzen 5 5600H (7419 - 24746, n=14) | |
| Asus ROG Strix G17 G713QE-RB74 | |
| Dell G15 5515 | |
| Lenovo Ideapad Gaming 3 15IHU-82K1002RGE | |
Desempenho do sistema
Apesar de estar equipado com o SSD superior, ele só é suficiente para o próximo ao último lugar de nosso campo de teste no desempenho do sistema. Entretanto, 6076 pontos no PCMark 10 ainda é um bom resultado e indica um allrounder capaz.
CrossMark: Overall | Productivity | Creativity | Responsiveness
| PCMark 10 / Score | |
| Média da turma Gaming (5828 - 11730, n=92, últimos 2 anos) | |
| HP Victus 16-e0179ng | |
| Asus ROG Strix G17 G713QE-RB74 | |
| Dell G15 5515 | |
| HP Victus 16-e0145ng | |
| Lenovo Ideapad Gaming 3 15IHU-82K1002RGE | |
| PCMark 10 / Essentials | |
| Média da turma Gaming (8810 - 11935, n=96, últimos 2 anos) | |
| Asus ROG Strix G17 G713QE-RB74 | |
| HP Victus 16-e0179ng | |
| HP Victus 16-e0145ng | |
| Dell G15 5515 | |
| Lenovo Ideapad Gaming 3 15IHU-82K1002RGE | |
| PCMark 10 / Productivity | |
| Média da turma Gaming (6845 - 21327, n=94, últimos 2 anos) | |
| Asus ROG Strix G17 G713QE-RB74 | |
| Lenovo Ideapad Gaming 3 15IHU-82K1002RGE | |
| HP Victus 16-e0179ng | |
| Dell G15 5515 | |
| HP Victus 16-e0145ng | |
| PCMark 10 / Digital Content Creation | |
| Média da turma Gaming (7602 - 19954, n=94, últimos 2 anos) | |
| HP Victus 16-e0179ng | |
| Asus ROG Strix G17 G713QE-RB74 | |
| HP Victus 16-e0145ng | |
| Dell G15 5515 | |
| Lenovo Ideapad Gaming 3 15IHU-82K1002RGE | |
| CrossMark / Overall | |
| Média da turma Gaming (1366 - 2409, n=93, últimos 2 anos) | |
| Lenovo Ideapad Gaming 3 15IHU-82K1002RGE | |
| CrossMark / Productivity | |
| Média da turma Gaming (1386 - 2254, n=93, últimos 2 anos) | |
| Lenovo Ideapad Gaming 3 15IHU-82K1002RGE | |
| CrossMark / Creativity | |
| Média da turma Gaming (1343 - 2729, n=93, últimos 2 anos) | |
| Lenovo Ideapad Gaming 3 15IHU-82K1002RGE | |
| CrossMark / Responsiveness | |
| Média da turma Gaming (1226 - 2334, n=93, últimos 2 anos) | |
| Lenovo Ideapad Gaming 3 15IHU-82K1002RGE | |
| PCMark 10 Score | 6076 pontos | |
Ajuda | ||
| AIDA64 / Memory Copy | |
| Média da turma Gaming (21750 - 129946, n=103, últimos 2 anos) | |
| HP Victus 16-e0145ng | |
| HP Victus 16-e0179ng | |
| Dell G15 5515 | |
| Asus ROG Strix G17 G713QE-RB74 | |
| Média AMD Ryzen 5 5600H (20549 - 42141, n=14) | |
| Lenovo Ideapad Gaming 3 15IHU-82K1002RGE | |
| AIDA64 / Memory Read | |
| Média da turma Gaming (22956 - 118858, n=103, últimos 2 anos) | |
| HP Victus 16-e0145ng | |
| HP Victus 16-e0179ng | |
| Dell G15 5515 | |
| Asus ROG Strix G17 G713QE-RB74 | |
| Média AMD Ryzen 5 5600H (22917 - 47595, n=14) | |
| Lenovo Ideapad Gaming 3 15IHU-82K1002RGE | |
| AIDA64 / Memory Write | |
| Média da turma Gaming (22297 - 135096, n=103, últimos 2 anos) | |
| HP Victus 16-e0145ng | |
| HP Victus 16-e0179ng | |
| Média AMD Ryzen 5 5600H (20226 - 44872, n=14) | |
| Dell G15 5515 | |
| Asus ROG Strix G17 G713QE-RB74 | |
| Lenovo Ideapad Gaming 3 15IHU-82K1002RGE | |
| AIDA64 / Memory Latency | |
| Média da turma Gaming (75.3 - 259, n=103, últimos 2 anos) | |
| Lenovo Ideapad Gaming 3 15IHU-82K1002RGE | |
| HP Victus 16-e0179ng | |
| Asus ROG Strix G17 G713QE-RB74 | |
| Média AMD Ryzen 5 5600H (75 - 89.1, n=14) | |
| Dell G15 5515 | |
| HP Victus 16-e0145ng | |
* ... menor é melhor
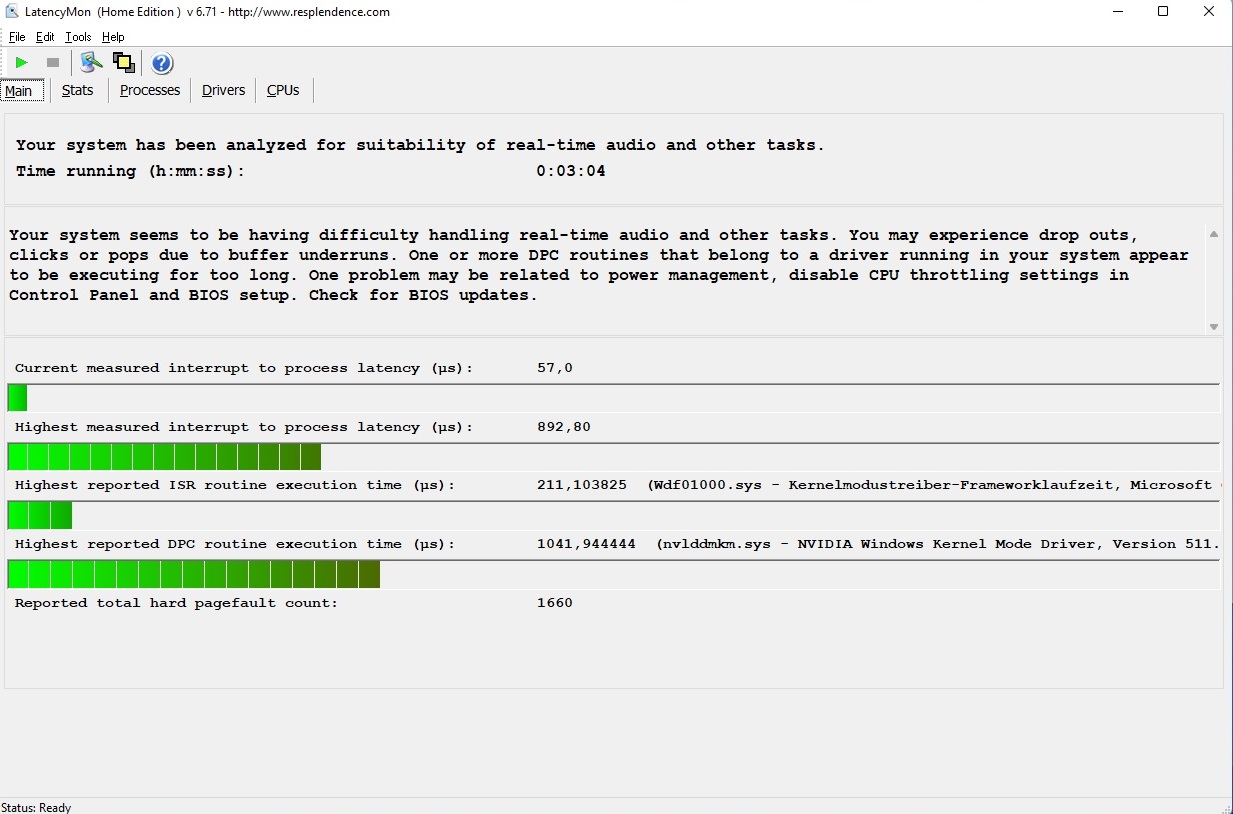
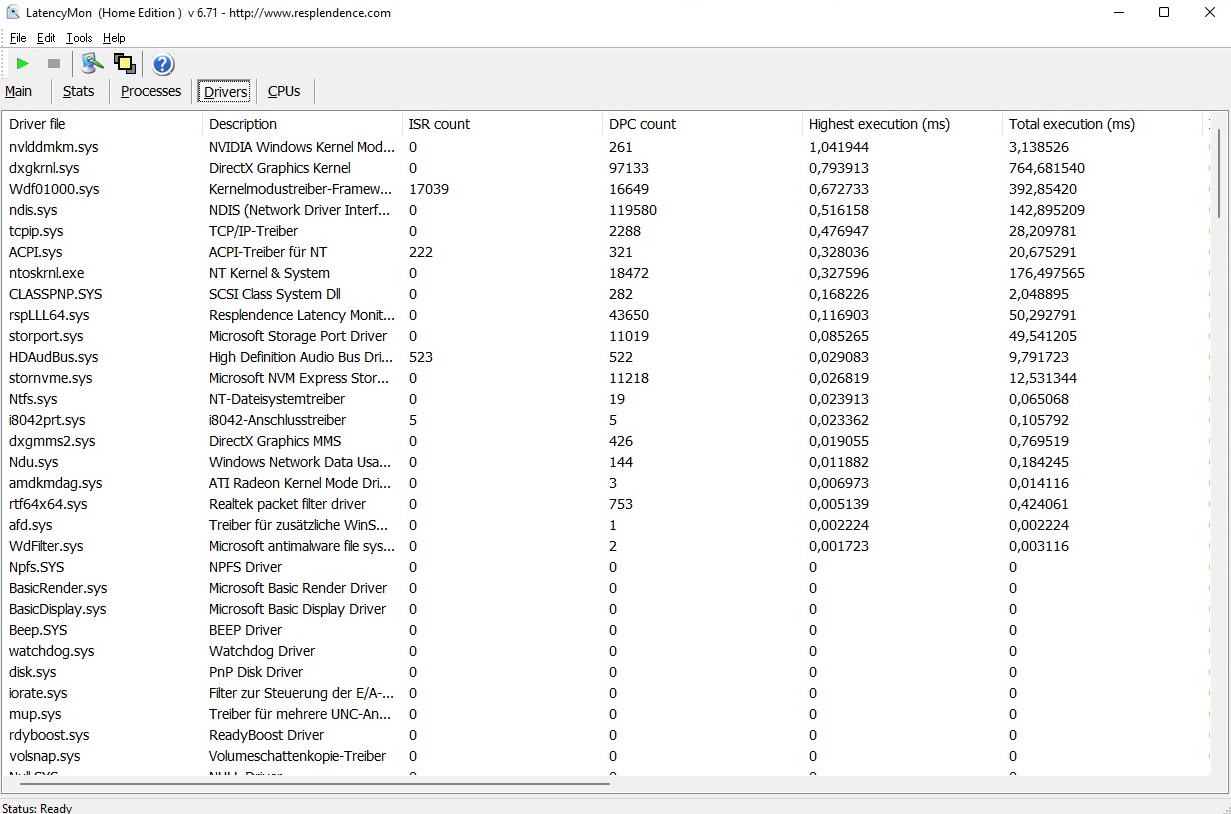
Latências DPC
Como acontece com tanta freqüência, há alguma necessidade de melhorar as latências. De acordo com a ferramenta LatencyMon, o Victus 16 sem nenhum outro ajuste não é ideal para o processamento de áudio e vídeo em tempo real.
| DPC Latencies / LatencyMon - interrupt to process latency (max), Web, Youtube, Prime95 | |
| HP Victus 16-e0179ng | |
| Asus ROG Strix G17 G713QE-RB74 | |
| Lenovo Ideapad Gaming 3 15IHU-82K1002RGE | |
| HP Victus 16-e0145ng | |
| Dell G15 5515 | |
* ... menor é melhor
Solução de armazenamento
Nossa configuração de teste coleta alguns pontos positivos com sua solução de armazenamento. Embora a capacidade de armazenamento do Samsung PM981a com seus 512 GB não crie nenhum entusiasmo, o drive M.2 com base em NVMe se sai muito bem nos benchmarks, deixando até mesmo o drive de 1 TB do modelo mais caro Victus 16 logo atrás.

| Drive Performance rating - Percent | |
| Média da turma Gaming | |
| HP Victus 16-e0179ng | |
| HP Victus 16-e0145ng | |
| Dell G15 5515 | |
| Asus ROG Strix G17 G713QE-RB74 | |
| Lenovo Ideapad Gaming 3 15IHU-82K1002RGE | |
* ... menor é melhor
Constant Performance Reading: DiskSpd Read Loop, Queue Depth 8
Placa Gráfica
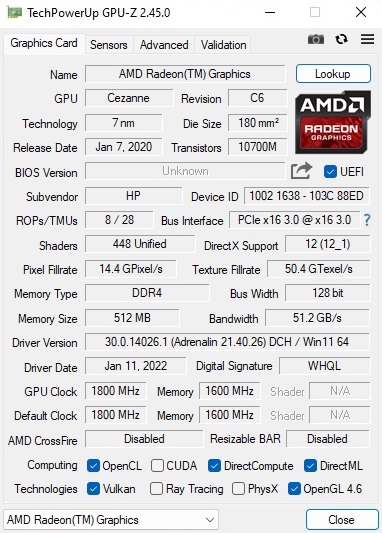
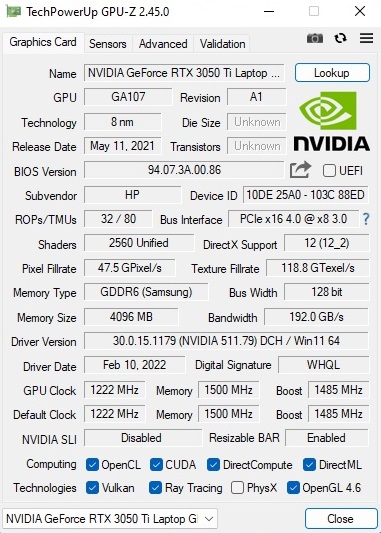
Com o GeForce RTX 3050 Ti, a Nvidia oferece uma GPU de médio alcance bem sucedida, desde que você desconsidere o desempenho medíocre do raytracing. O modelo DirectX-12 é capaz de usar 2560 shaders e inclui 4 GB de GDDR6-VRAM. Infelizmente, este último não está mais atualizado neste momento. Esperamos atualmente pelo menos 6 GB de dispositivos de médio alcance. Portanto, os jogos exigentes atingirão seus limites em resoluções e configurações mais altas.
Geralmente, o desempenho dos chips Ampere da Nvidia depende muito do TGP configurado. Com 75 watts (incluindo o Dynamic Boost), o HD escolheu um valor bastante alto para o RTX 3050 Ti, o que também se reflete nas pontuações acima da média nos benchmarks gráficos sintéticos e testes que utilizam jogos reais. No entanto, o Victus 16 ainda tem dificuldades contra os concorrentes. Tanto a Asus Strix G17 G713QE quanto a Dell G5 5515 são capazes de alcançar uma pequena vantagem na maioria dos casos. O GeForce RTX 3060 do mais caro Victus 16 avança em cerca de 30% na maior parte do tempo.
| 3DMark 11 Performance | 17816 pontos | |
| 3DMark Cloud Gate Standard Score | 36899 pontos | |
| 3DMark Fire Strike Score | 13022 pontos | |
| 3DMark Time Spy Score | 5910 pontos | |
Ajuda | ||
Desempenho nos jogos
Jogos menos exigentes ou não extremamente intensivos em computação não criam nenhum desafio insuperável para o GeForce RTX 3050 Ti, e configurações altas a máximas na resolução nativa de 1920 x 1080 não são problema na maior parte do tempo. As coisas só se tornam apertadas em jogos exigentes, tais como Forza Horizon 5, Luz Morrendo 2ou Deus da Guerraonde nem sempre é suficiente para taxas de quadros suaves, com todos os controles definidos ao máximo.
| The Witcher 3 | |
| 1920x1080 High Graphics & Postprocessing (Nvidia HairWorks Off) | |
| Média da turma Gaming (n=1últimos 2 anos) | |
| HP Victus 16-e0179ng | |
| Asus ROG Strix G17 G713QE-RB74 | |
| HP Victus 16-e0145ng | |
| Dell G15 5515 | |
| Lenovo Ideapad Gaming 3 15IHU-82K1002RGE | |
| Média NVIDIA GeForce RTX 3050 Ti Laptop GPU (30 - 110, n=26) | |
| 1920x1080 Ultra Graphics & Postprocessing (HBAO+) | |
| Média da turma Gaming (104.7 - 240, n=6, últimos 2 anos) | |
| HP Victus 16-e0179ng | |
| Asus ROG Strix G17 G713QE-RB74 | |
| Dell G15 5515 | |
| HP Victus 16-e0145ng | |
| Média NVIDIA GeForce RTX 3050 Ti Laptop GPU (19 - 58.5, n=29) | |
| Lenovo Ideapad Gaming 3 15IHU-82K1002RGE | |
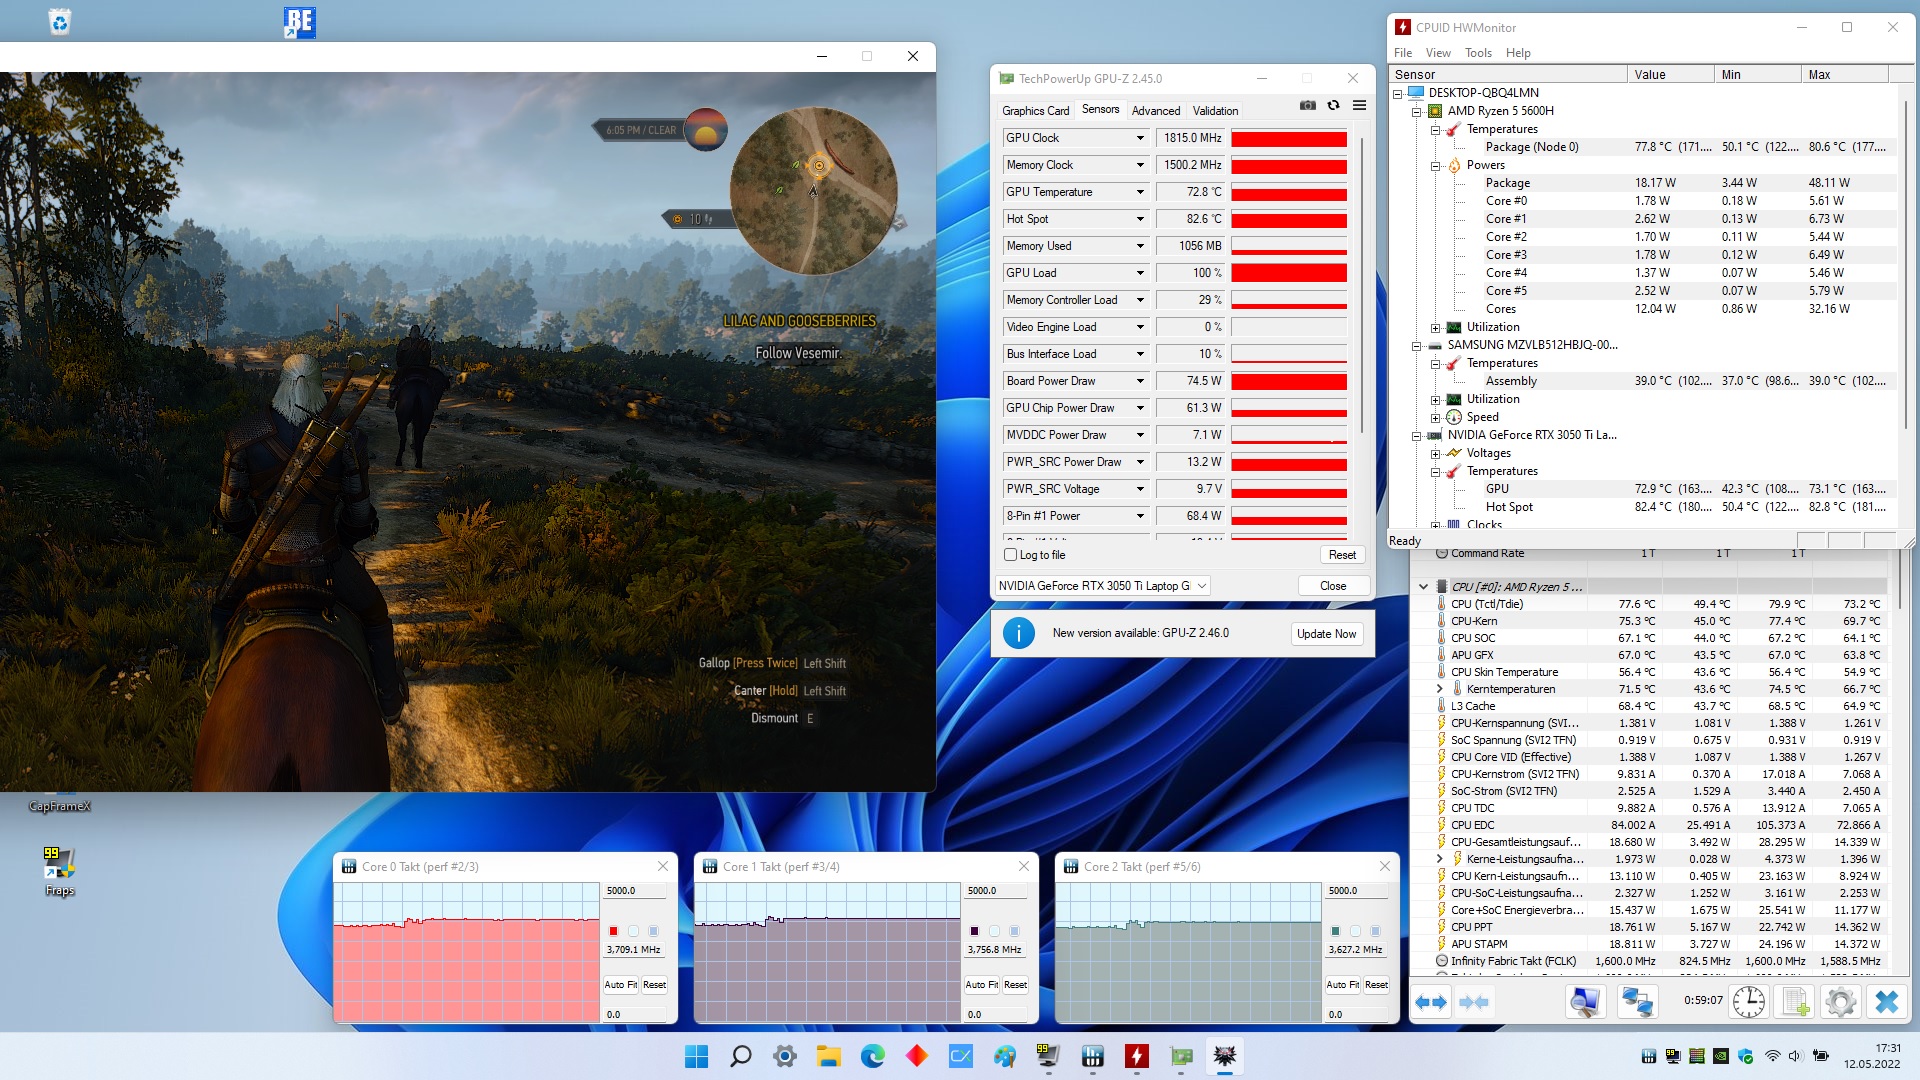
Durante o teste de carga constante comO Witcher 3 (1 hora @FHD/Ultra), não vemos nenhum comportamento conspícuo. O desempenho permanece bastante estável durante todo o tempo.
The Witcher 3 FPS Chart
| baixo | média | alto | ultra | |
|---|---|---|---|---|
| GTA V (2015) | 167.7 | 131.4 | 73.7 | |
| The Witcher 3 (2015) | 176 | 104 | 54.9 | |
| Dota 2 Reborn (2015) | 139.6 | 125.3 | 118 | 113 |
| Final Fantasy XV Benchmark (2018) | 76.4 | 54.9 | ||
| X-Plane 11.11 (2018) | 99.3 | 91.2 | 74.2 | |
| Strange Brigade (2018) | 140.1 | 114.5 | 98.9 | |
| Alan Wake Remastered (2021) | 105.4 | 95.3 | ||
| Back 4 Blood (2021) | 142.8 | 123.8 | 116.2 | |
| Guardians of the Galaxy (2021) | 83 | 82 | 79 | |
| Riders Republic (2021) | 88 | 69 | 54 | |
| Forza Horizon 5 (2021) | 93 | 84 | 19 | |
| Farming Simulator 22 (2021) | 130 | 104.8 | 92.3 | |
| Halo Infinite (2021) | 89.1 | 59 | 51.5 | |
| God of War (2022) | 64.3 | 50.3 | 31.3 | |
| Rainbow Six Extraction (2022) | 116 | 112 | 86 | |
| Dying Light 2 (2022) | 47 | 39.6 | ||
| Elden Ring (2022) | 59.6 | 59.6 | 56.2 | |
| Ghostwire Tokyo (2022) | 91.1 | 90 | 88.2 | |
| Tiny Tina's Wonderlands (2022) | 99.3 | 68.6 | 51.8 | |
| Vampire Bloodhunt (2022) | 132.4 | 86.2 | 86.1 |
Emissões
Emissões sonoras
O desenvolvimento do ruído deixa alguns sentimentos mistos. Embora alguns outros laptops para jogos se tornem ainda mais ruidosos sob carga, 44 a 53 dB(A) em operação 3D também não são muito bons. Com estes valores, o Victus 16 se aproxima de seu irmão mais rápido. Surpreendentemente, medimos até mesmo um nível de ruído ligeiramente mais alto durante a operação ociosa. Quando o laptop não está ocupado por um momento, os ventiladores ou são desligados ou já estão funcionando a um nível de ruído muito audível. Uma velocidade constante e discreta dos ventiladores teria sido preferível aqui.
Barulho
| Ocioso |
| 26 / 28 / 34 dB |
| Carga |
| 44 / 53 dB |
 | ||
30 dB silencioso 40 dB(A) audível 50 dB(A) ruidosamente alto |
||
min: | ||
| HP Victus 16-e0145ng R5 5600H, GeForce RTX 3050 Ti Laptop GPU | HP Victus 16-e0179ng R7 5800H, GeForce RTX 3060 Laptop GPU | Lenovo Ideapad Gaming 3 15IHU-82K1002RGE i5-11300H, GeForce RTX 3050 Ti Laptop GPU | Dell G15 5515 R7 5800H, GeForce RTX 3050 Ti Laptop GPU | Asus ROG Strix G17 G713QE-RB74 R7 5800H, GeForce RTX 3050 Ti Laptop GPU | |
|---|---|---|---|---|---|
| Noise | 4% | 7% | 7% | 9% | |
| desligado / ambiente * (dB) | 26 | 24 8% | 23.9 8% | 24 8% | 24.9 4% |
| Idle Minimum * (dB) | 26 | 24 8% | 23.9 8% | 25 4% | 25.1 3% |
| Idle Average * (dB) | 28 | 25 11% | 26.8 4% | 26 7% | 25.1 10% |
| Idle Maximum * (dB) | 34 | 34 -0% | 26.8 21% | 30 12% | 25.1 26% |
| Load Average * (dB) | 44 | 44 -0% | 43.5 1% | 44 -0% | 36.3 17% |
| Witcher 3 ultra * (dB) | 48 | 50 -4% | 43.5 9% | 44 8% | 49.9 -4% |
| Load Maximum * (dB) | 53 | 52 2% | 53.1 -0% | 48 9% | 49.9 6% |
* ... menor é melhor
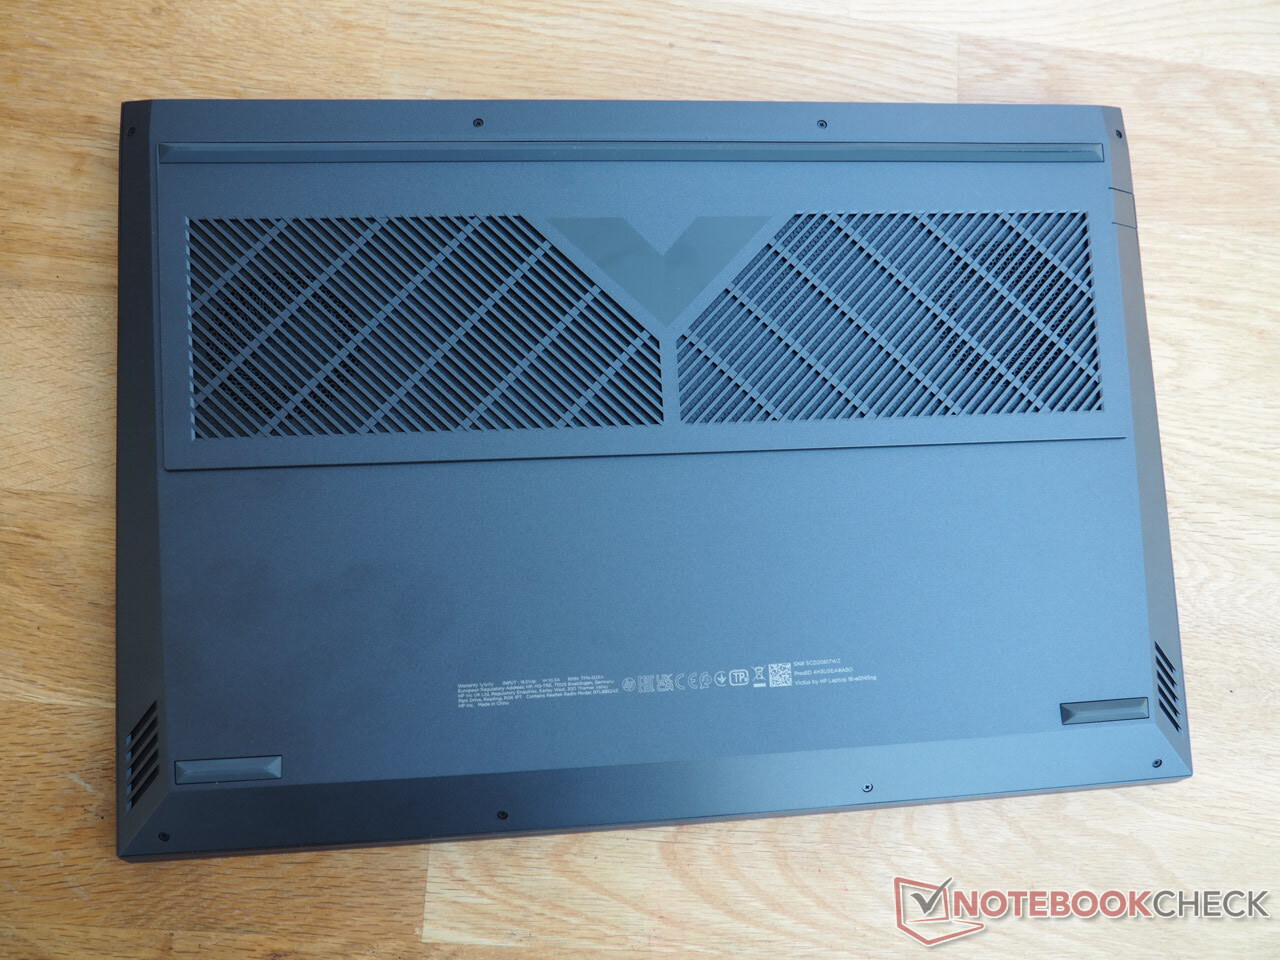
Temperaturas
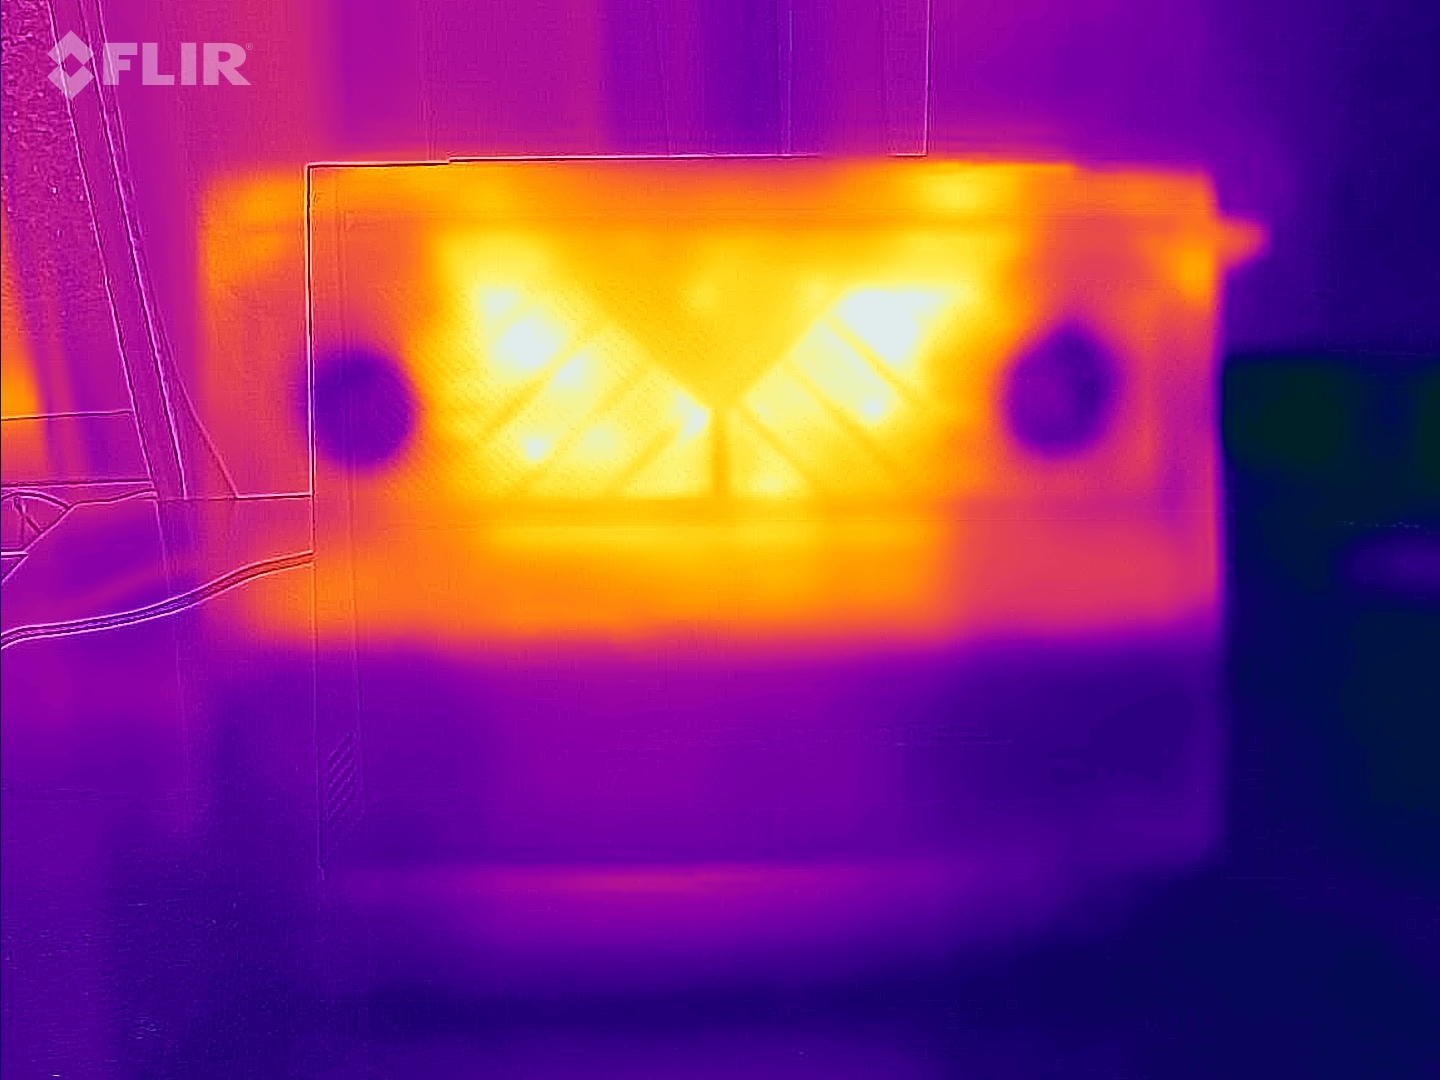
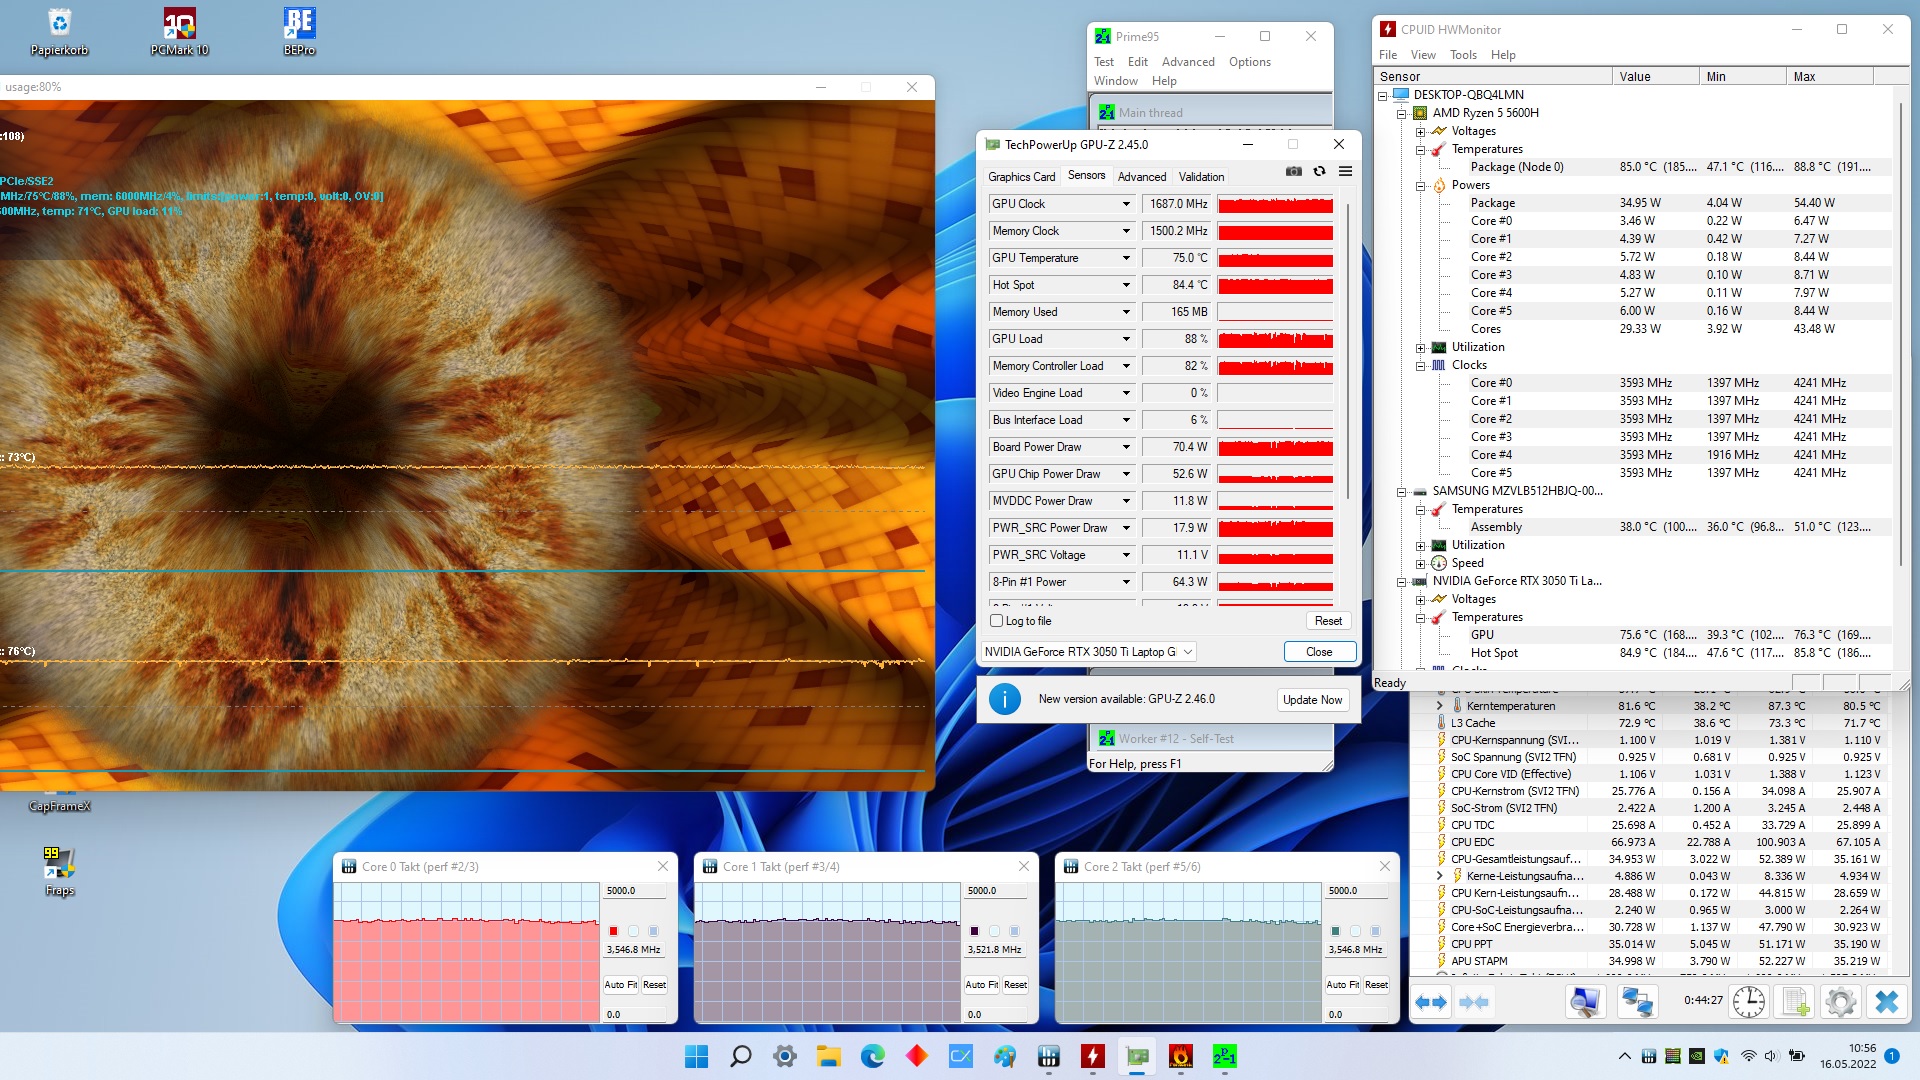
Como de costume, o caso aquece particularmente na parte de trás. Em dois pontos do Victus 16, medimos mais de 50 °C (122 °F) sob carga. Entretanto, este valor ainda está dentro da faixa típica para laptops de jogos. Dentro da caixa, principalmente o processador aquece. Após uma hora de teste de estresse com as ferramentas Furmark e Prime95, o Ryzen 5 5600H permanece a uma confortável temperatura de 85 °C (185 °F). O GeForce RTX 3050 Ti atinge uma temperatura moderada de 75 °C (167 °F).
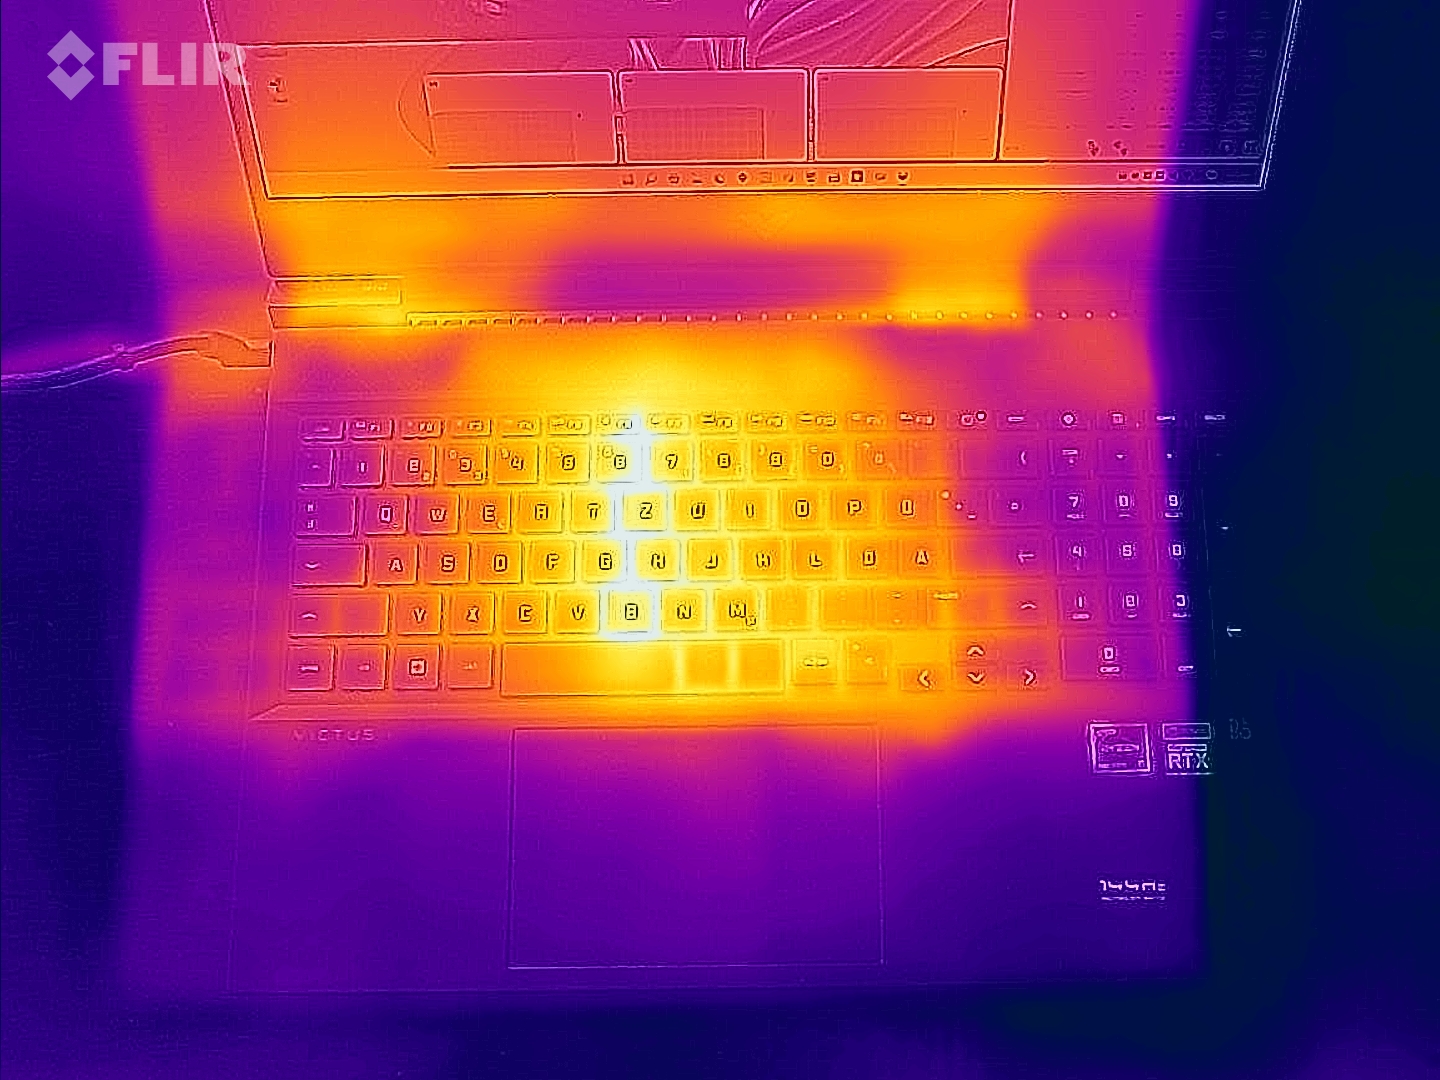
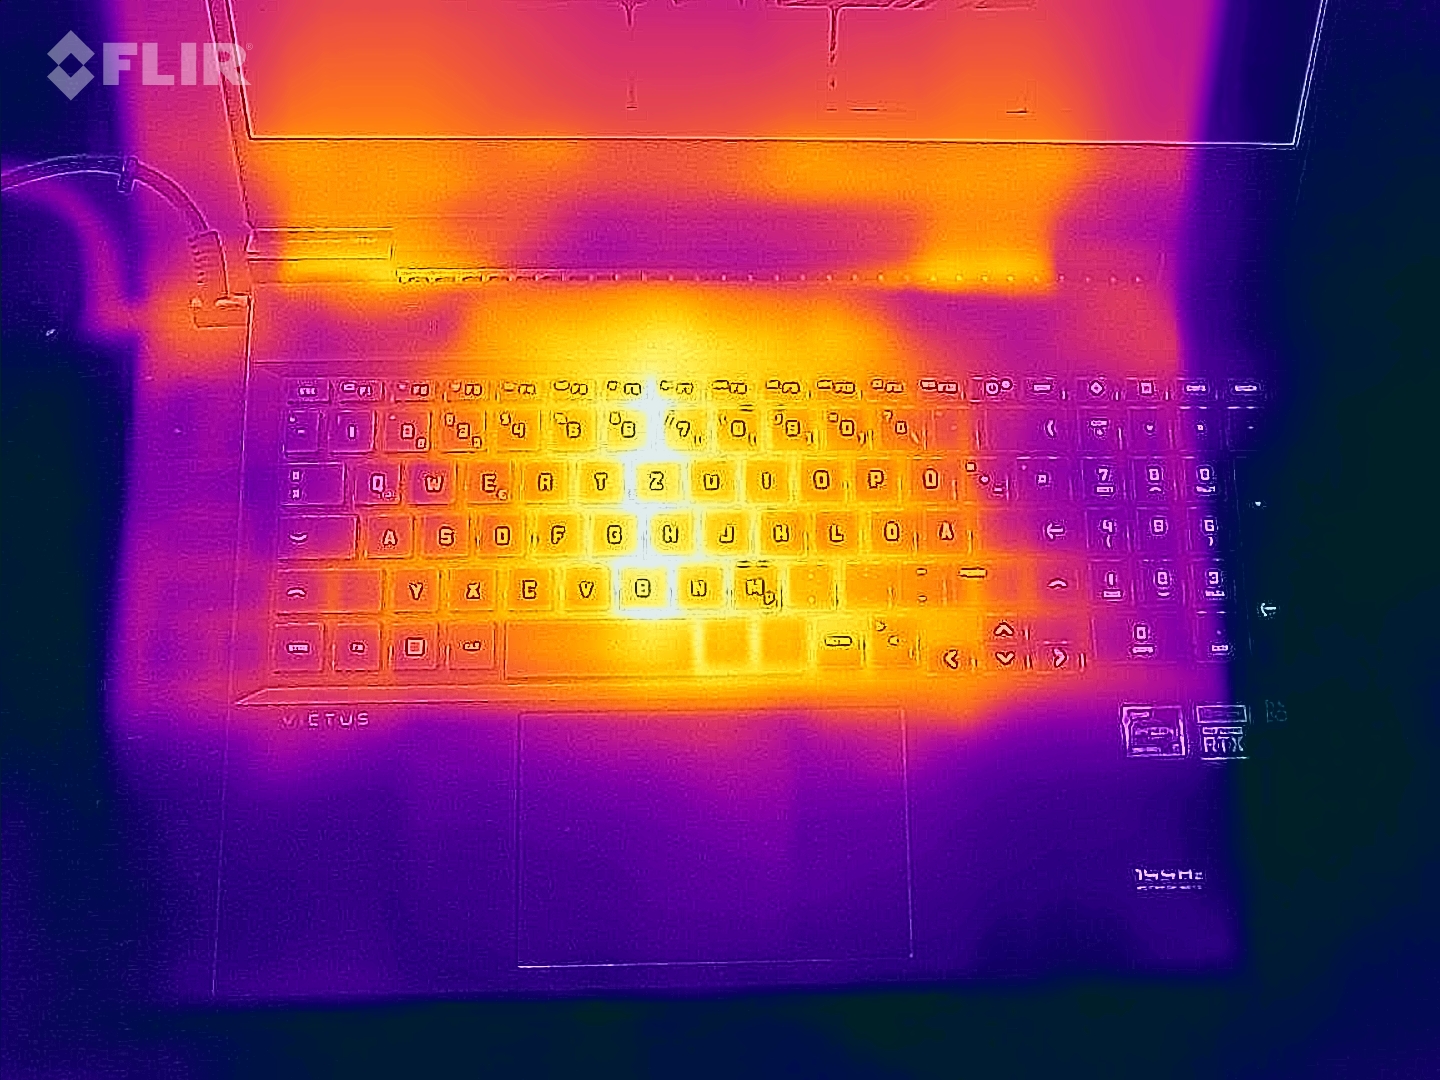
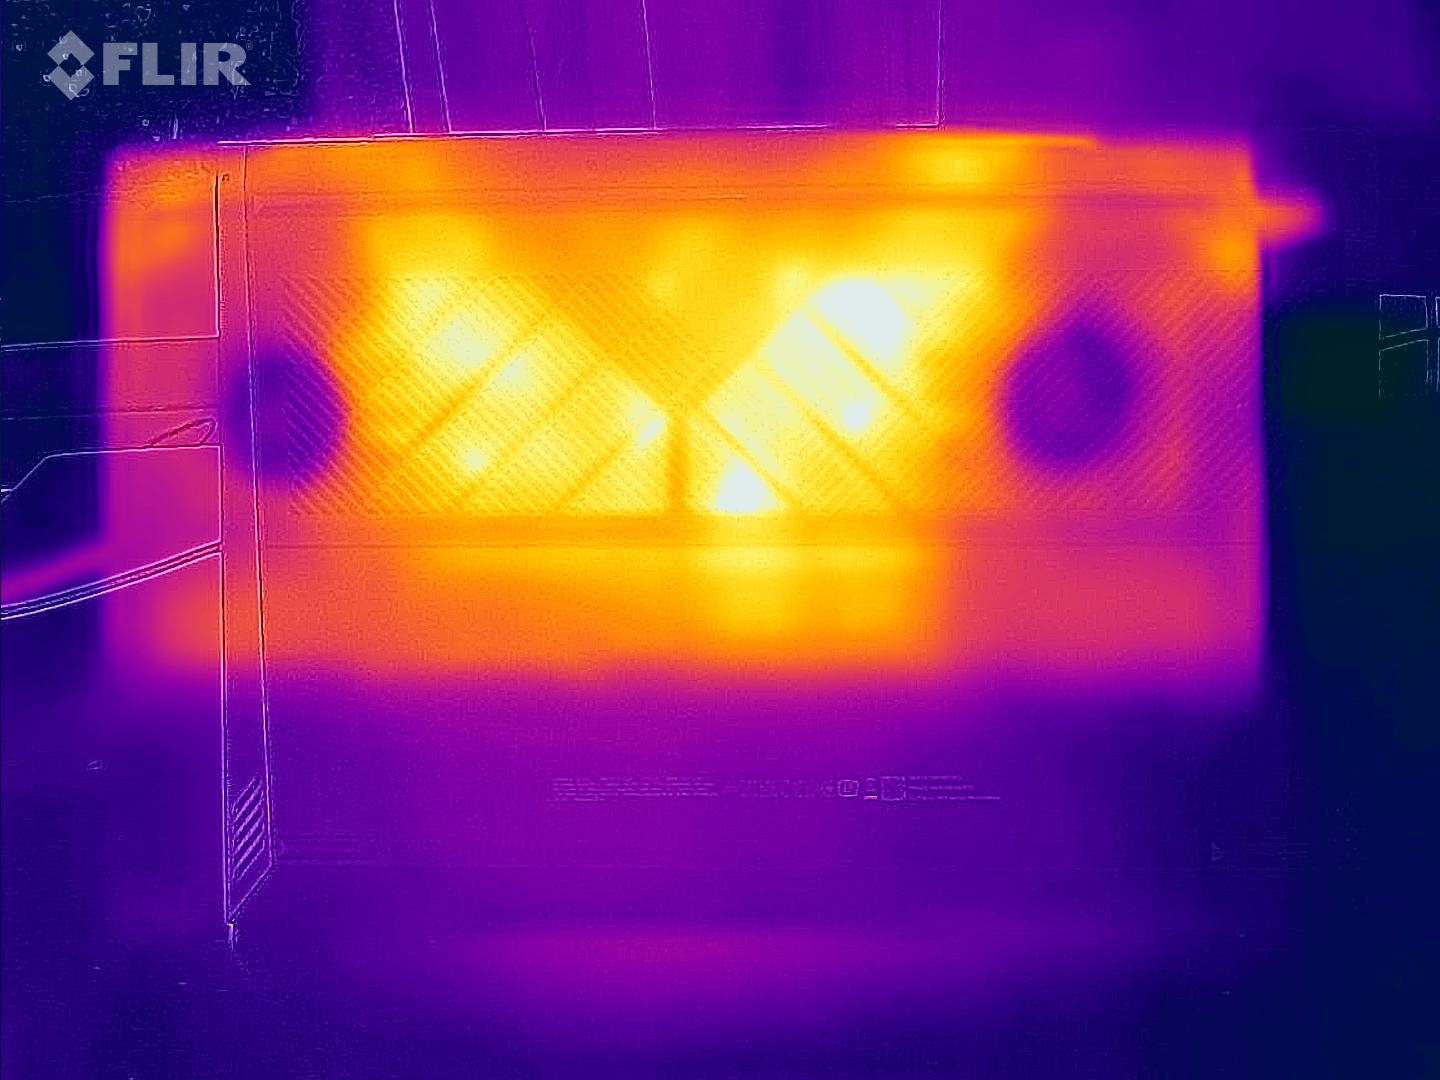
(-) A temperatura máxima no lado superior é 54 °C / 129 F, em comparação com a média de 40.4 °C / 105 F , variando de 21.2 a 68.8 °C para a classe Gaming.
(-) A parte inferior aquece até um máximo de 47 °C / 117 F, em comparação com a média de 43.2 °C / 110 F
(+) Em uso inativo, a temperatura média para o lado superior é 31.7 °C / 89 F, em comparação com a média do dispositivo de 33.9 °C / ### class_avg_f### F.
(-) Jogando The Witcher 3, a temperatura média para o lado superior é 40 °C / 104 F, em comparação com a média do dispositivo de 33.9 °C / ## #class_avg_f### F.
(±) Os apoios para as mãos e o touchpad podem ficar muito quentes ao toque, com um máximo de 37 °C / 98.6 F.
(-) A temperatura média da área do apoio para as mãos de dispositivos semelhantes foi 28.8 °C / 83.8 F (-8.2 °C / -14.8 F).
| HP Victus 16-e0145ng R5 5600H, GeForce RTX 3050 Ti Laptop GPU | HP Victus 16-e0179ng R7 5800H, GeForce RTX 3060 Laptop GPU | Lenovo Ideapad Gaming 3 15IHU-82K1002RGE i5-11300H, GeForce RTX 3050 Ti Laptop GPU | Dell G15 5515 R7 5800H, GeForce RTX 3050 Ti Laptop GPU | Asus ROG Strix G17 G713QE-RB74 R7 5800H, GeForce RTX 3050 Ti Laptop GPU | |
|---|---|---|---|---|---|
| Heat | -12% | 18% | 14% | 3% | |
| Maximum Upper Side * (°C) | 54 | 51 6% | 43.2 20% | 50 7% | 43.8 19% |
| Maximum Bottom * (°C) | 47 | 52 -11% | 47.9 -2% | 49 -4% | 47.2 -0% |
| Idle Upper Side * (°C) | 41 | 46 -12% | 24.9 39% | 26 37% | 33.4 19% |
| Idle Bottom * (°C) | 31 | 41 -32% | 27 13% | 26 16% | 39.4 -27% |
* ... menor é melhor
Oradores
HP Victus 16-e0145ng análise de áudio
(±) | o volume do alto-falante é médio, mas bom (###valor### dB)
Graves 100 - 315Hz
(-) | quase nenhum baixo - em média 21% menor que a mediana
(±) | a linearidade dos graves é média (12.6% delta para a frequência anterior)
Médios 400 - 2.000 Hz
(+) | médios equilibrados - apenas 1.1% longe da mediana
(+) | médios são lineares (3.6% delta para frequência anterior)
Altos 2 - 16 kHz
(+) | agudos equilibrados - apenas 4.2% longe da mediana
(+) | os máximos são lineares (5.3% delta da frequência anterior)
Geral 100 - 16.000 Hz
(±) | a linearidade do som geral é média (16.2% diferença em relação à mediana)
Comparado com a mesma classe
» 40% de todos os dispositivos testados nesta classe foram melhores, 7% semelhantes, 53% piores
» O melhor teve um delta de 6%, a média foi 18%, o pior foi 132%
Comparado com todos os dispositivos testados
» 26% de todos os dispositivos testados foram melhores, 6% semelhantes, 68% piores
» O melhor teve um delta de 4%, a média foi 23%, o pior foi 134%
Lenovo Ideapad Gaming 3 15IHU-82K1002RGE análise de áudio
(±) | o volume do alto-falante é médio, mas bom (###valor### dB)
Graves 100 - 315Hz
(-) | quase nenhum baixo - em média 23.8% menor que a mediana
(±) | a linearidade dos graves é média (10.3% delta para a frequência anterior)
Médios 400 - 2.000 Hz
(±) | médios mais altos - em média 6.7% maior que a mediana
(+) | médios são lineares (6% delta para frequência anterior)
Altos 2 - 16 kHz
(+) | agudos equilibrados - apenas 3.6% longe da mediana
(±) | a linearidade dos máximos é média (7.4% delta para frequência anterior)
Geral 100 - 16.000 Hz
(±) | a linearidade do som geral é média (20.7% diferença em relação à mediana)
Comparado com a mesma classe
» 74% de todos os dispositivos testados nesta classe foram melhores, 4% semelhantes, 21% piores
» O melhor teve um delta de 6%, a média foi 18%, o pior foi 132%
Comparado com todos os dispositivos testados
» 56% de todos os dispositivos testados foram melhores, 8% semelhantes, 36% piores
» O melhor teve um delta de 4%, a média foi 23%, o pior foi 134%
Gerenciamento de energia
Consumo de energia
O consumo de energia é incomparável. Entre 7 e 15 watts durante a operação ociosa e entre 93 e 185 watts em operação 3D é relativamente eficiente para um laptop de jogos e apropriado para o hardware utilizado.
| desligado | |
| Ocioso | |
| Carga |
|
Key:
min: | |
| HP Victus 16-e0145ng R5 5600H, GeForce RTX 3050 Ti Laptop GPU | HP Victus 16-e0179ng R7 5800H, GeForce RTX 3060 Laptop GPU | Lenovo Ideapad Gaming 3 15IHU-82K1002RGE i5-11300H, GeForce RTX 3050 Ti Laptop GPU | Dell G15 5515 R7 5800H, GeForce RTX 3050 Ti Laptop GPU | Asus ROG Strix G17 G713QE-RB74 R7 5800H, GeForce RTX 3050 Ti Laptop GPU | Média da turma Gaming | |
|---|---|---|---|---|---|---|
| Power Consumption | -7% | 19% | 2% | -19% | -63% | |
| Idle Minimum * (Watt) | 7 | 5 29% | 4.9 30% | 5 29% | 9.2 -31% | 13 ? -86% |
| Idle Average * (Watt) | 9 | 10 -11% | 8.3 8% | 9 -0% | 12.6 -40% | 18.7 ? -108% |
| Idle Maximum * (Watt) | 15 | 20 -33% | 8.9 41% | 20 -33% | 23.3 -55% | 24.3 ? -62% |
| Load Average * (Watt) | 93 | 108 -16% | 81 13% | 94 -1% | 89.3 4% | 110.2 ? -18% |
| Witcher 3 ultra * (Watt) | 134.5 | 145 -8% | 119 12% | 123 9% | 136 -1% | |
| Load Maximum * (Watt) | 185 | 189 -2% | 172 7% | 172 7% | 162.7 12% | 258 ? -39% |
* ... menor é melhor
Power Consumption The Witcher 3 / Stress Test
Power Consumption With External Monitor
Vida útil da bateria
A capacidade da bateria é a mesma que a do modelo mais caro Victus 16. 70 Wh em combinação com a comutação gráfica automática garante uma sólida vida útil da bateria. O laptop de 16 polegadas dura umas boas 7 horas em nosso teste WLAN com o brilho reduzido a 150 cd/m².
| HP Victus 16-e0145ng R5 5600H, GeForce RTX 3050 Ti Laptop GPU, 70 Wh | HP Victus 16-e0179ng R7 5800H, GeForce RTX 3060 Laptop GPU, 70 Wh | Lenovo Ideapad Gaming 3 15IHU-82K1002RGE i5-11300H, GeForce RTX 3050 Ti Laptop GPU, 45 Wh | Dell G15 5515 R7 5800H, GeForce RTX 3050 Ti Laptop GPU, 56 Wh | Asus ROG Strix G17 G713QE-RB74 R7 5800H, GeForce RTX 3050 Ti Laptop GPU, 56 Wh | Média da turma Gaming | |
|---|---|---|---|---|---|---|
| Duração da bateria | -17% | -7% | 13% | -15% | 1% | |
| WiFi v1.3 (h) | 7.1 | 5.9 -17% | 6.6 -7% | 8 13% | 6 -15% | 7.15 ? 1% |
| Reader / Idle (h) | 8.5 | 13.5 | 11.1 | 8.71 ? | ||
| Load (h) | 1.3 | 1.1 | 1.5 | 1.1 | 1.502 ? | |
| H.264 (h) | 7.7 | 8.8 | 8.64 ? |
Pro
Contra
Veredicto
Jogadores que consideram seu orçamento e não têm altas exigências na qualidade da imagem podem gostar da Victus 16-e0145ng que testamos aqui.
ORyzen 5 5600HoGeForce RTX 3050 Tie o SSD NVMe juntos formam um pacote equilibrado e bastante poderoso, que é adequado para diversas áreas de aplicação. Além do desempenho medíocre da tela (baixa cobertura de espaço colorido, brilho escasso, etc.), o laptop HP não apresenta maiores fraquezas. A elegante caixa abriga dispositivos de entrada relativamente bons e um número decente de portas, embora você tenha que viver sem Thunderbolt. A vida útil da bateria e o som também são apropriados para o preço, mesmo que não inspirem entusiasmo.
No geral, gostamos um pouco mais da Victus 16-e0145ng do que da Lenovo Ideapad Gaming 3 15IHU. Por outro lado, os comparavelmente equipados Dell G15 5515e Asus ROG Strix G17 G713QEos concorrentes estão um pouco à frente em nossa avaliação.
Preço e Disponibilidade
Uma versão semelhante da HP Victus 16, apenas com um Ryzen 7, está disponível na loja HP por cerca de $950.
HP Victus 16-e0145ng
- 05/18/2022 v7 (old)
Florian Glaser
Price comparison

