Lenovo ThinkPad P73 Revisão - Estação de trabalho móvel com Core i9, RTX 4000 e 4K
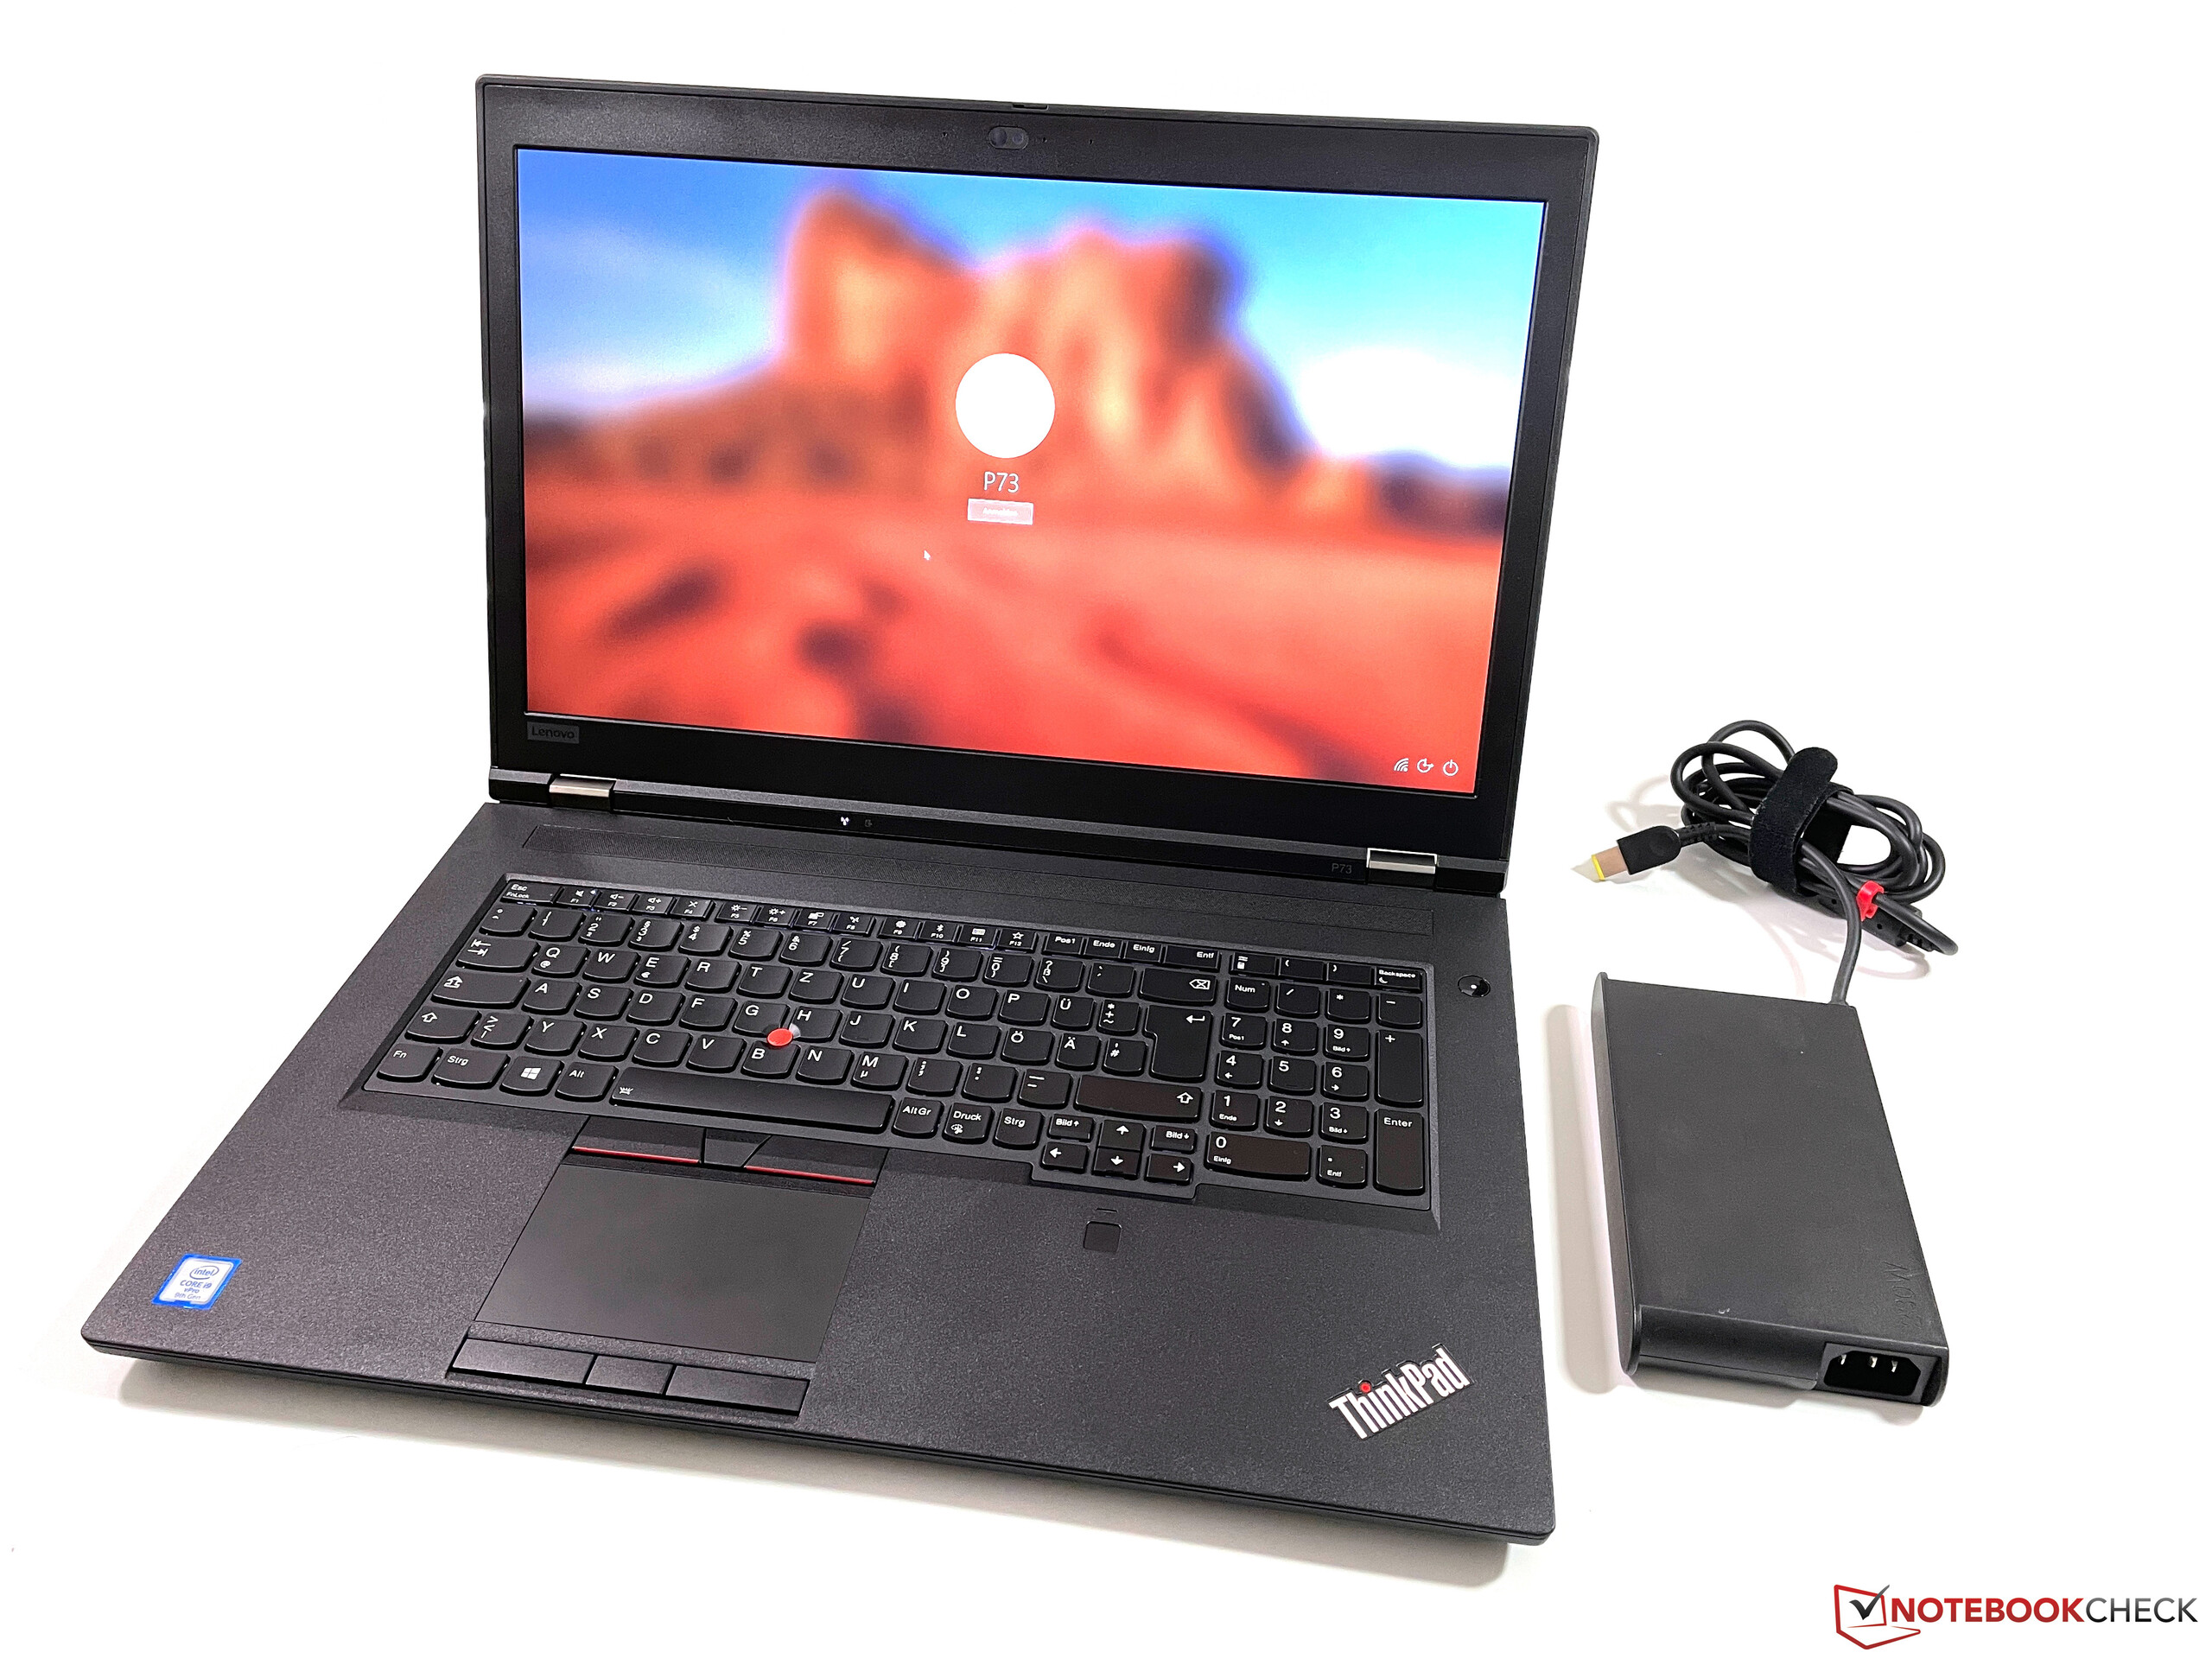
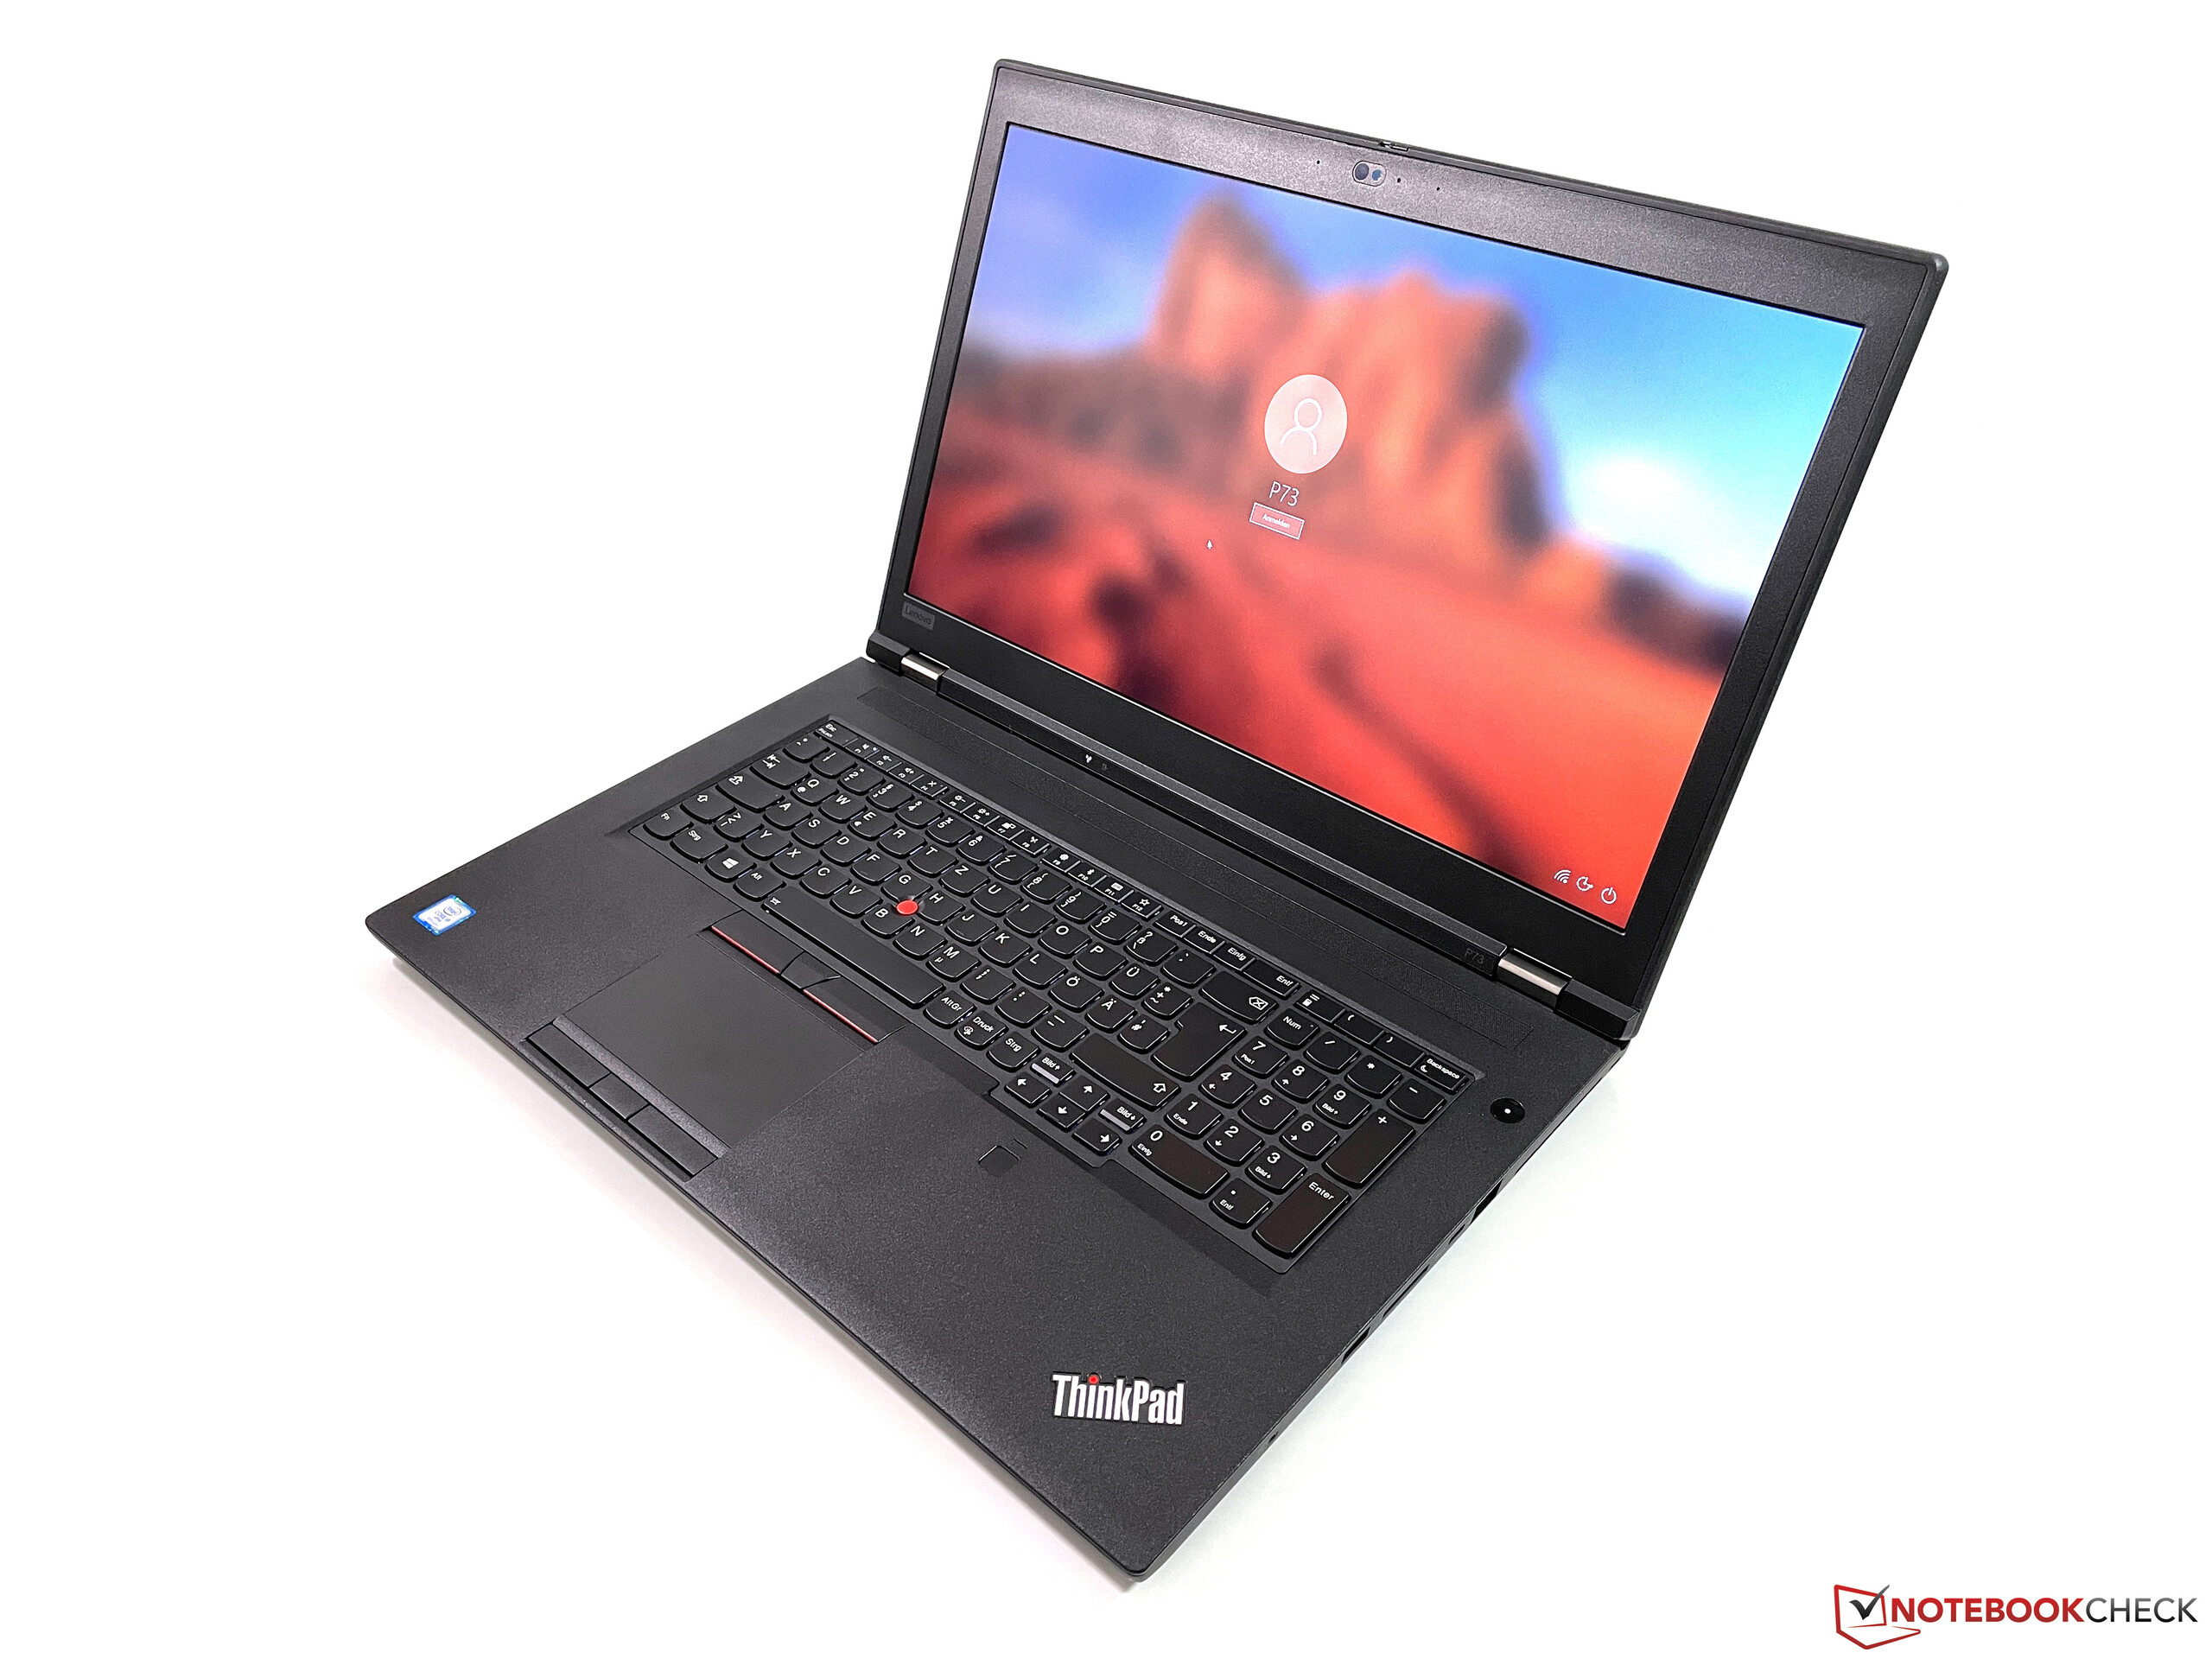
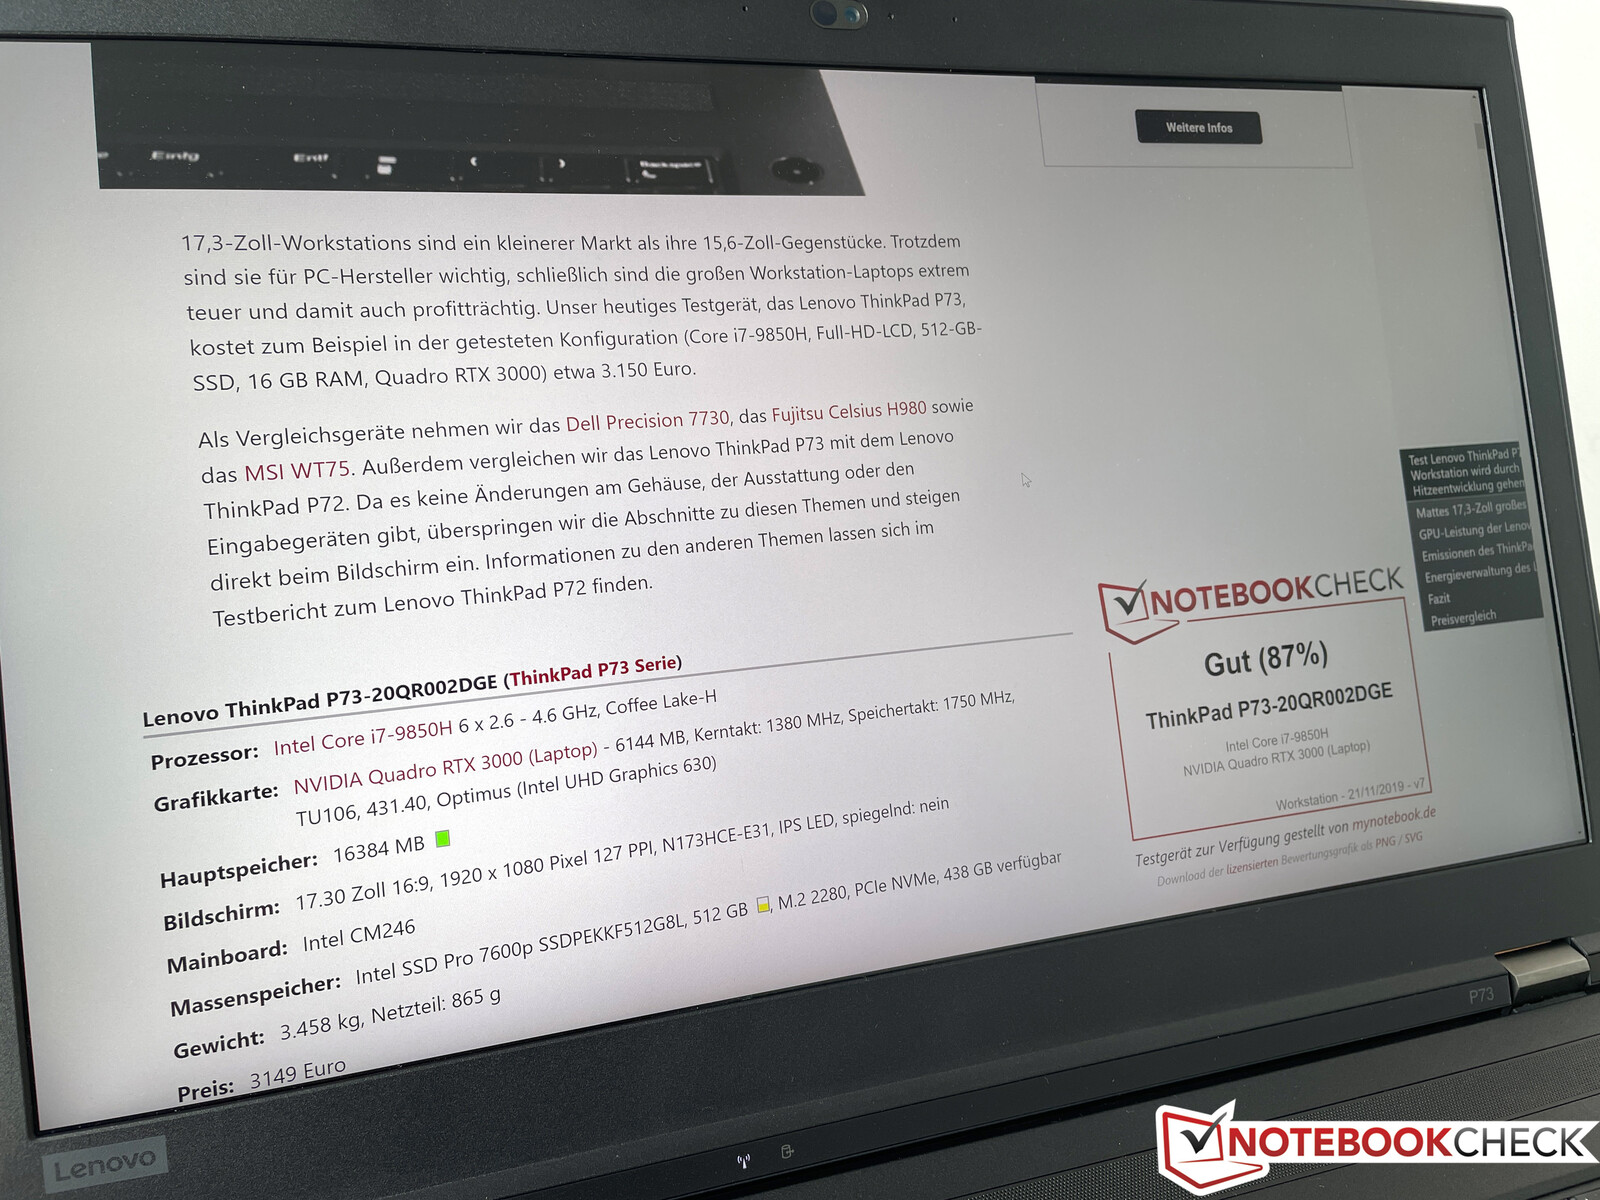
O ThinkPad P73 é a maior estação de trabalho móvel da Lenovo, mas teve dificuldades com o desempenho. Especialmente as poderosas GPUs Nvidia Quadro RTX não utilizaram todo o seu potencial. A Lenovo teve que lançar algumas atualizações de BIOS para melhorar a situação. A Lenovo já lançou o sucessor ThinkPad P17 até agora, mas os componentes ainda são praticamente os mesmos. Agora você obtém chips Intel de 10ª geração, que não oferecem nenhum ganho notável de desempenho, e até mesmo as GPUs Nvidia Quadro idênticas. Com o P73 equipado com um Core i9 e o RTX 4000, queremos mais uma vez verificar se o desempenho agora atende às expectativas. Consulte nossa revisão abrangente do ThinkPad P73 com o RTX 3000 para obter mais informações sobre a caixa, portas, dispositivos de entrada e os alto-falantes
Possible competitors in comparison
Avaliação | Data | Modelo | Peso | Altura | Size | Resolução | Preço |
|---|---|---|---|---|---|---|---|
| 88.2 % v7 (old) | 01/2021 | Lenovo ThinkPad P73-20QR0030GE i9-9880H, Quadro RTX 4000 (Laptop) | 3.5 kg | 31 mm | 17.30" | 3840x2160 | |
| 86.2 % v7 (old) | 03/2020 | Acer ConceptD 9 Pro i9-9980HK, Quadro RTX 5000 (Laptop) | 4.5 kg | 26.5 mm | 17.30" | 3840x2160 | |
| 86.4 % v7 (old) | 05/2020 | Asus ProArt StudioBook Pro 17 W700G3T i7-9750H, Quadro RTX 3000 Max-Q | 2.5 kg | 18.4 mm | 17.00" | 1920x1200 | |
| 84.8 % v7 (old) | 12/2019 | MSI WE75 9TK i7-9750H, Quadro RTX 3000 (Laptop) | 2.6 kg | 27.5 mm | 17.30" | 1920x1080 | |
| 86.6 % v7 (old) | Lenovo ThinkPad P73-20QR002DGE i7-9850H, Quadro RTX 3000 (Laptop) | 3.5 kg | 31 mm | 17.30" | 1920x1080 |
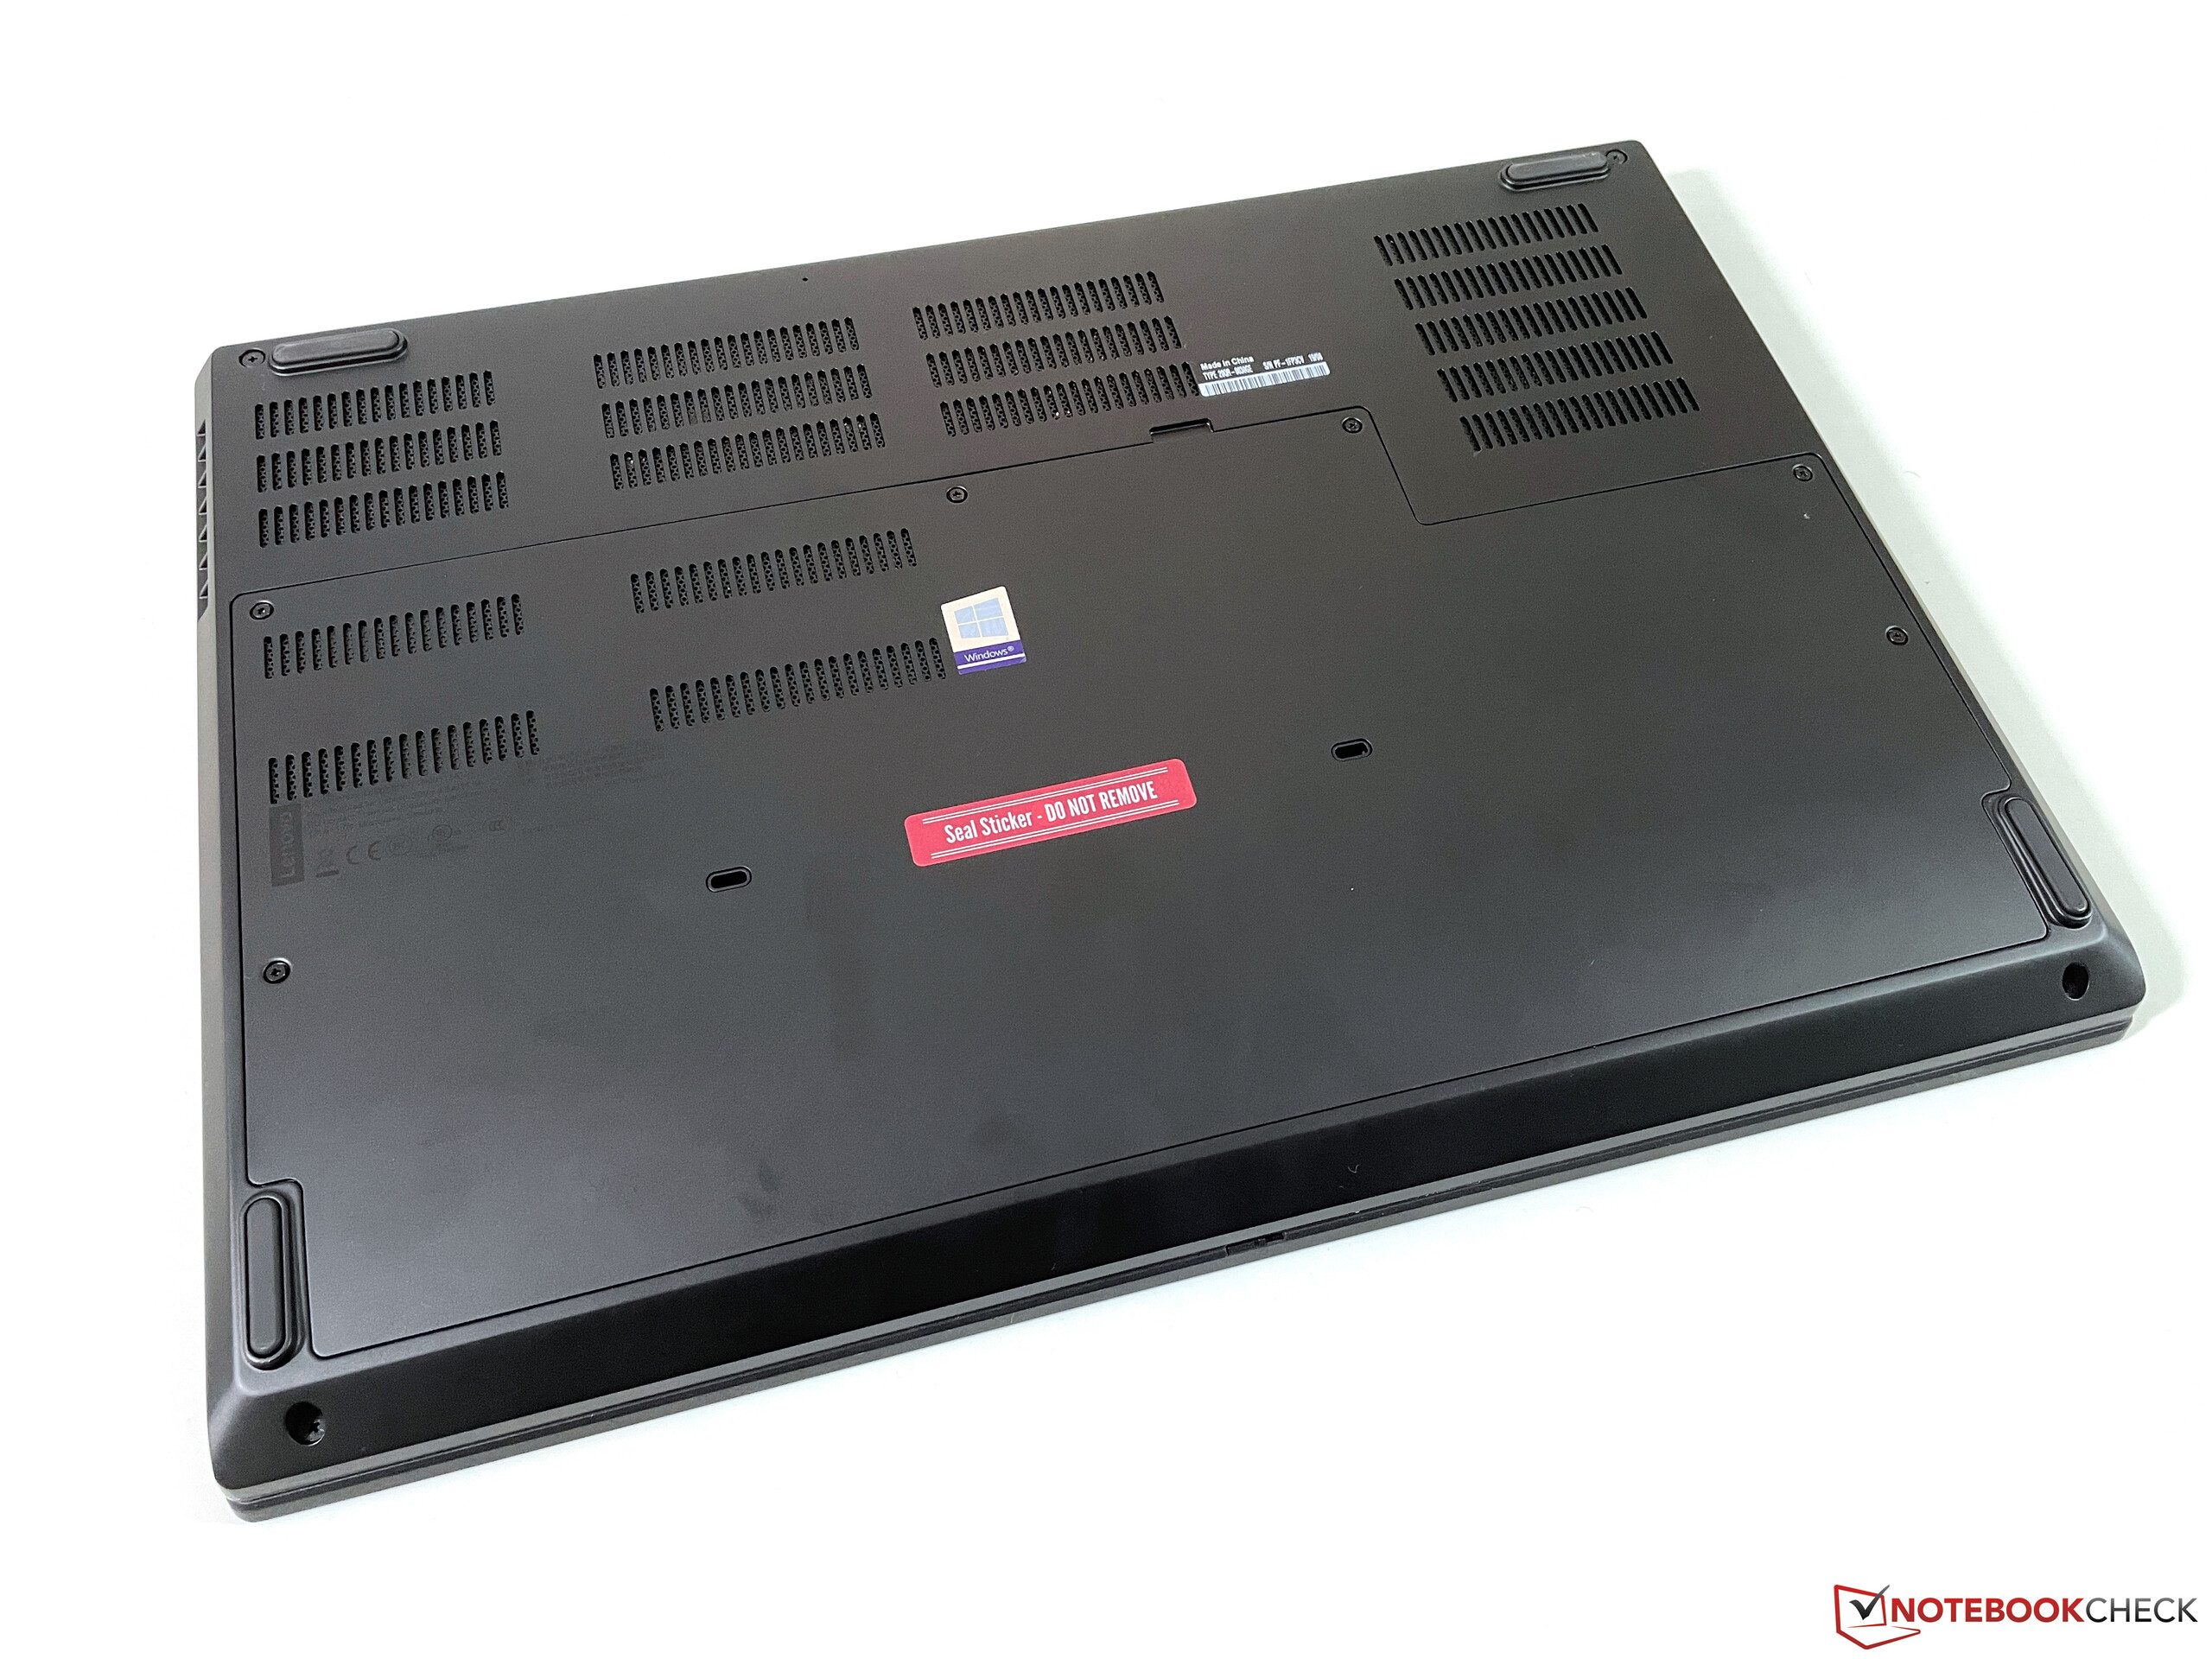
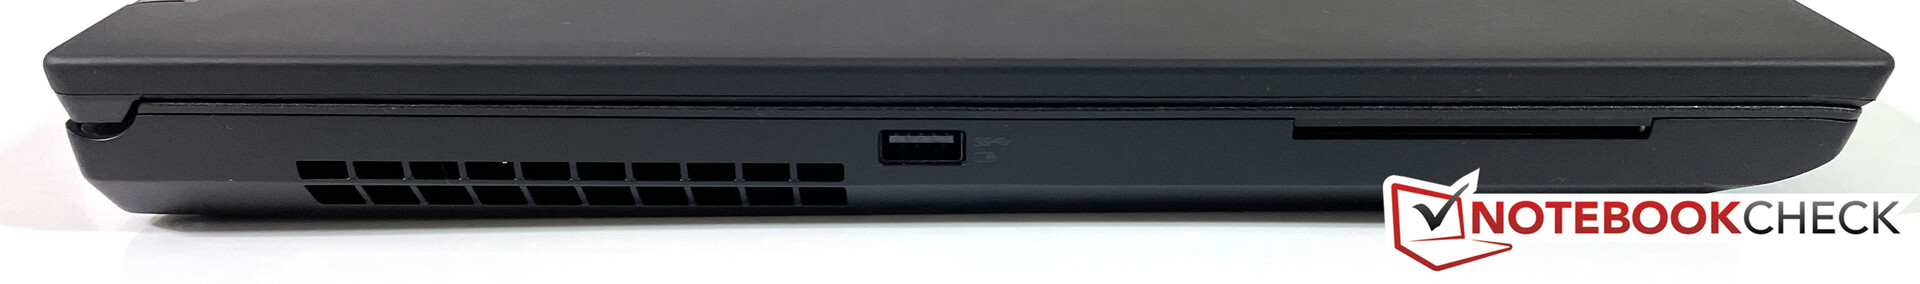
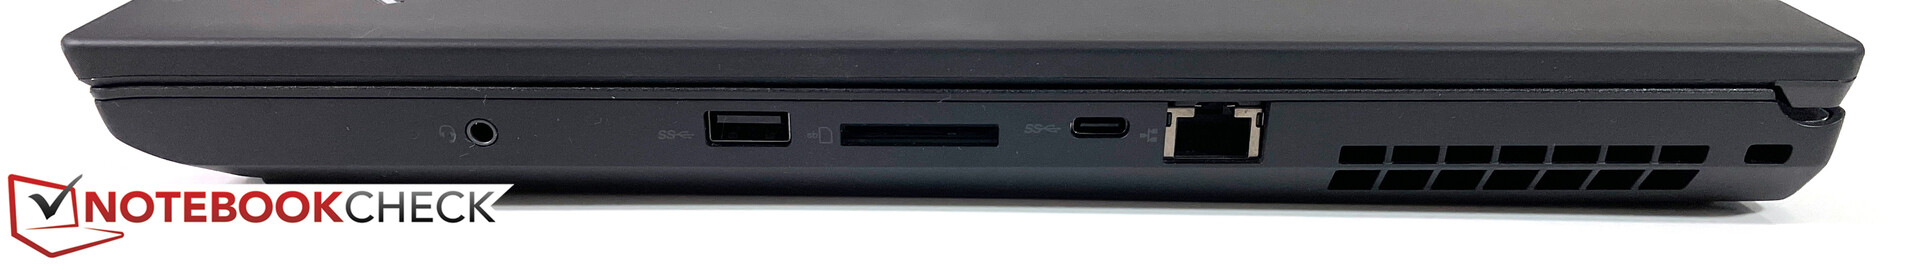
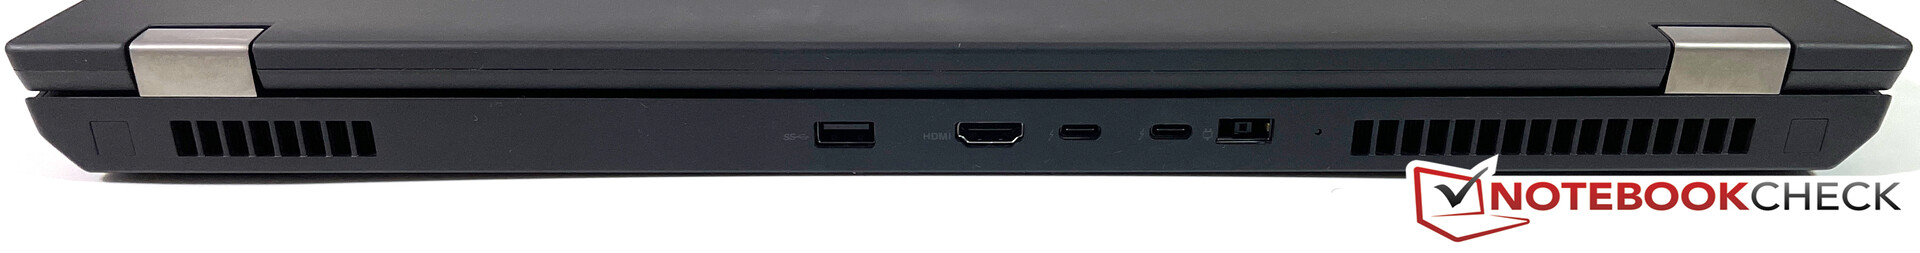
Estojo e Conectividade
| SD Card Reader | |
| average JPG Copy Test (av. of 3 runs) | |
| Lenovo ThinkPad P73-20QR002DGE (Toshiba Exceria Pro SDXC 64 GB UHS-II) | |
| Lenovo ThinkPad P73-20QR0030GE (Toshiba Exceria Pro SDXC 64 GB UHS-II) | |
| Asus ProArt StudioBook Pro 17 W700G3T (Toshiba Exceria Pro SDXC 64 GB UHS-II) | |
| Média da turma Workstation (49.6 - 681, n=14, últimos 2 anos) | |
| MSI WE75 9TK (Toshiba Exceria Pro SDXC 64 GB UHS-II) | |
| maximum AS SSD Seq Read Test (1GB) | |
| Asus ProArt StudioBook Pro 17 W700G3T (Toshiba Exceria Pro SDXC 64 GB UHS-II) | |
| Média da turma Workstation (87.6 - 1455, n=14, últimos 2 anos) | |
| Lenovo ThinkPad P73-20QR002DGE (Toshiba Exceria Pro SDXC 64 GB UHS-II) | |
| Lenovo ThinkPad P73-20QR0030GE (Toshiba Exceria Pro SDXC 64 GB UHS-II) | |
| MSI WE75 9TK (Toshiba Exceria Pro SDXC 64 GB UHS-II) | |
| Networking | |
| iperf3 transmit AX12 | |
| Lenovo ThinkPad P73-20QR0030GE | |
| Asus ProArt StudioBook Pro 17 W700G3T | |
| Média Intel Wi-Fi 6 AX200 (447 - 1645, n=127) | |
| Acer ConceptD 9 Pro | |
| Lenovo ThinkPad P73-20QR002DGE | |
| iperf3 receive AX12 | |
| Asus ProArt StudioBook Pro 17 W700G3T | |
| Lenovo ThinkPad P73-20QR0030GE | |
| Média Intel Wi-Fi 6 AX200 (523 - 1684, n=128) | |
| Acer ConceptD 9 Pro | |
| Lenovo ThinkPad P73-20QR002DGE | |

, i9-9880H, Samsung PM981a MZVLB1T0HBLR")
, i9-9880H, Samsung PM981a MZVLB1T0HBLR")
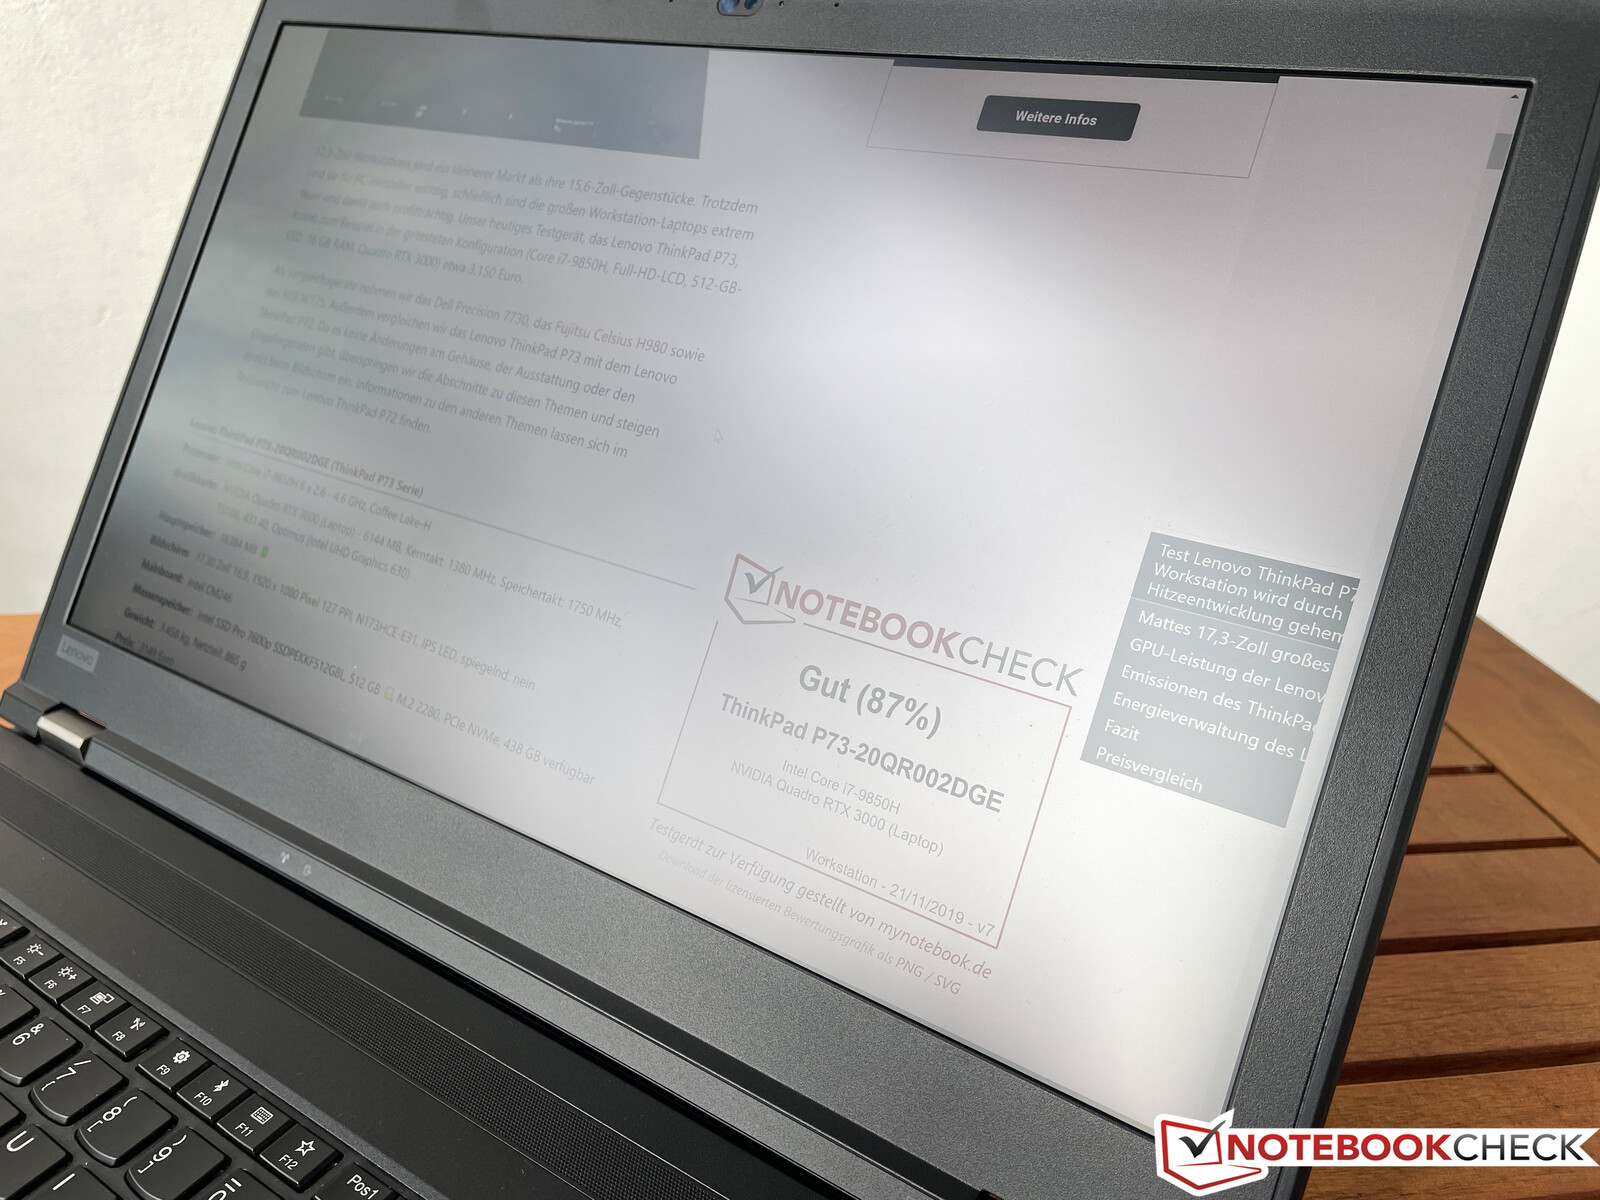
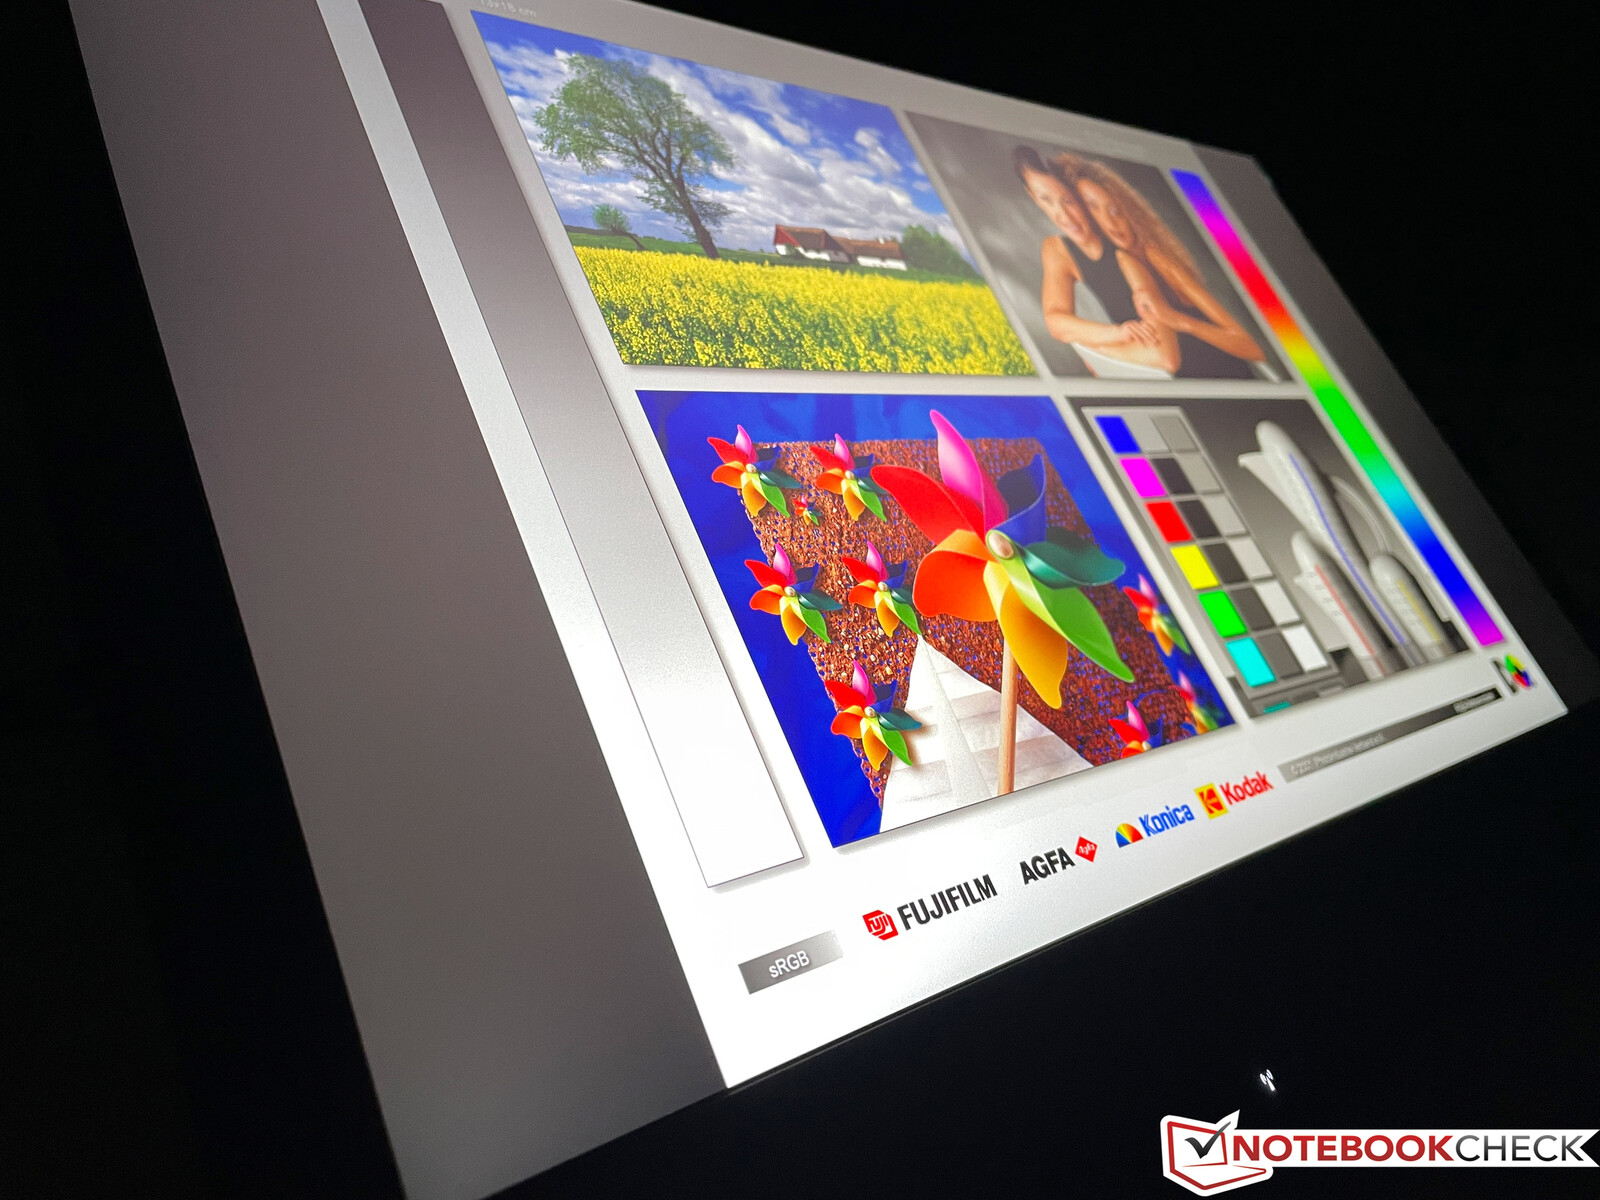
Display - Painel 4K com inconvenientes
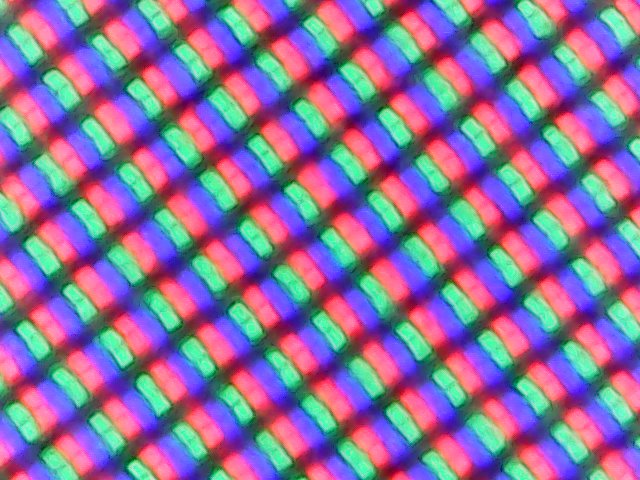
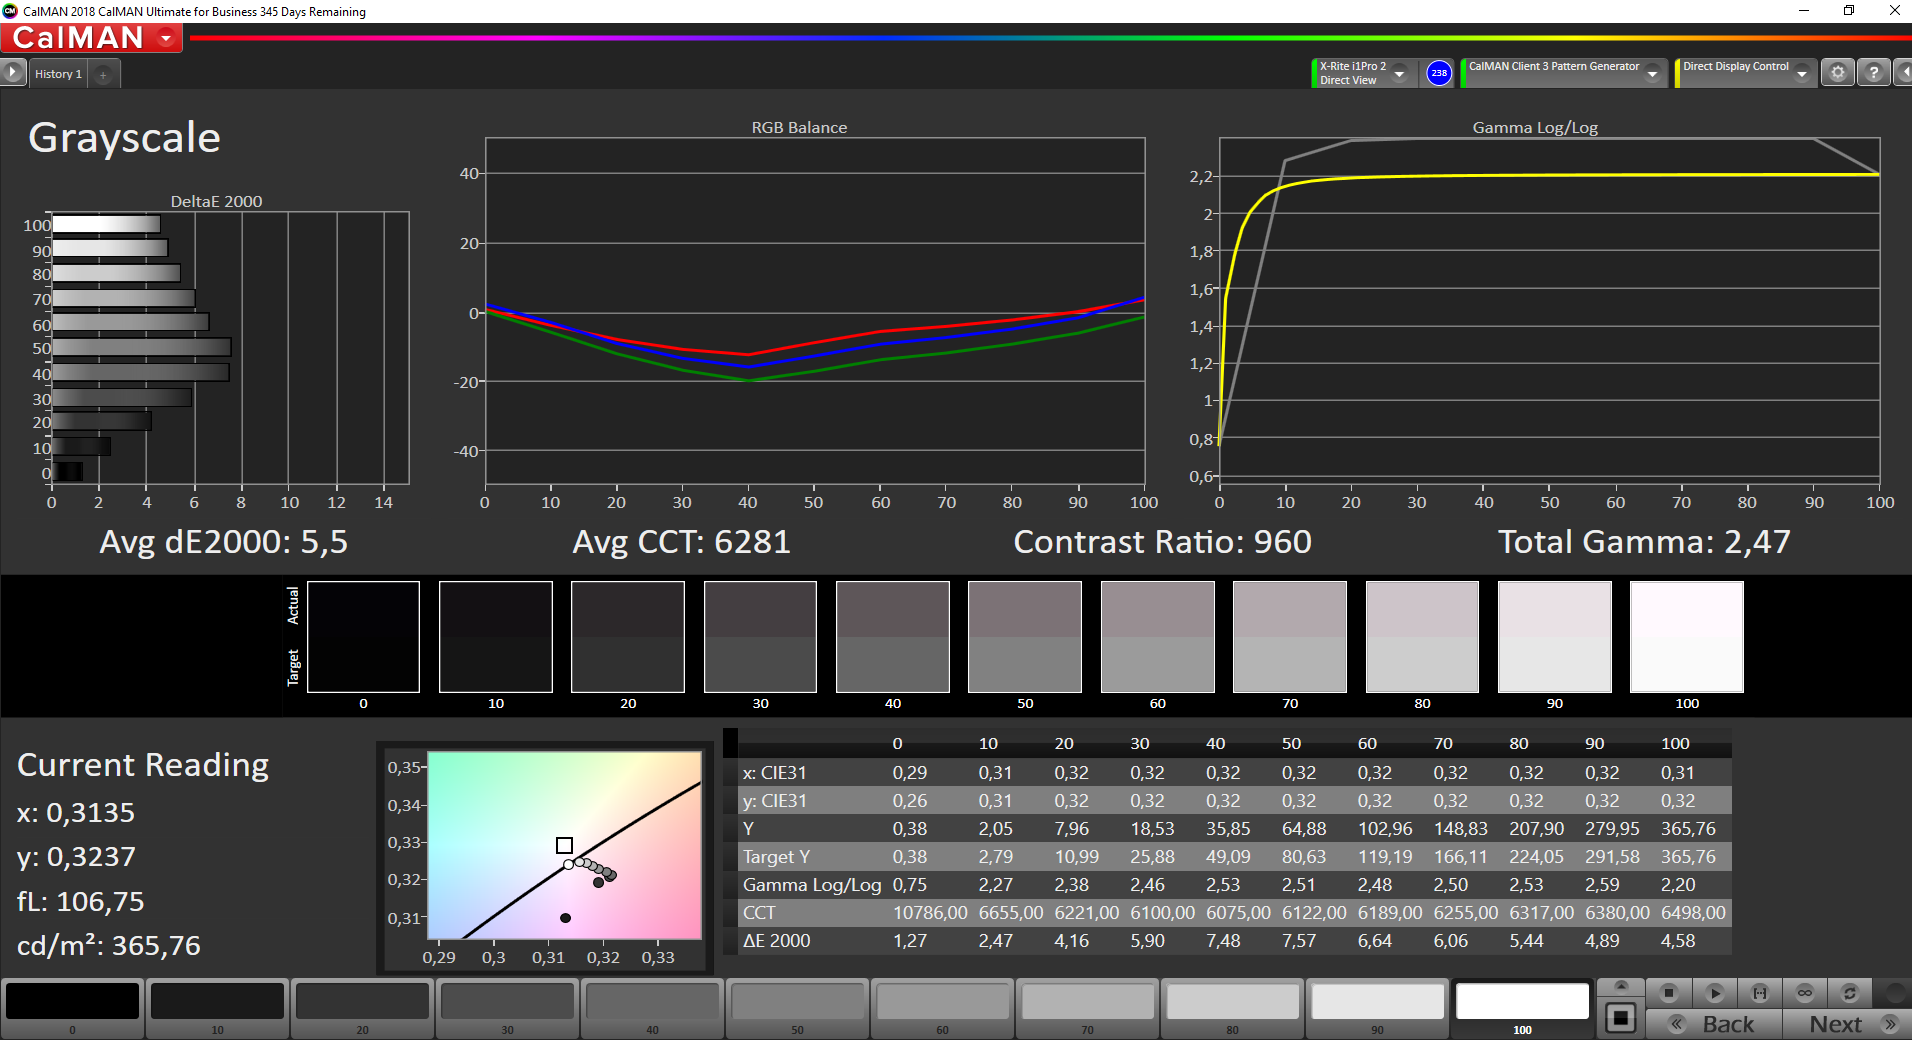
Nossa unidade de teste está equipada com o painel 4K mate. Não podemos confirmar a luminosidade anunciada de 400 lêndeas em nenhum ponto de medição. A Lenovo ainda usa painéis 16:9 para o sucessor ThinkPad P17, mas o brilho da tela 4K é agora avaliado em cerca de 500 lêndeas.
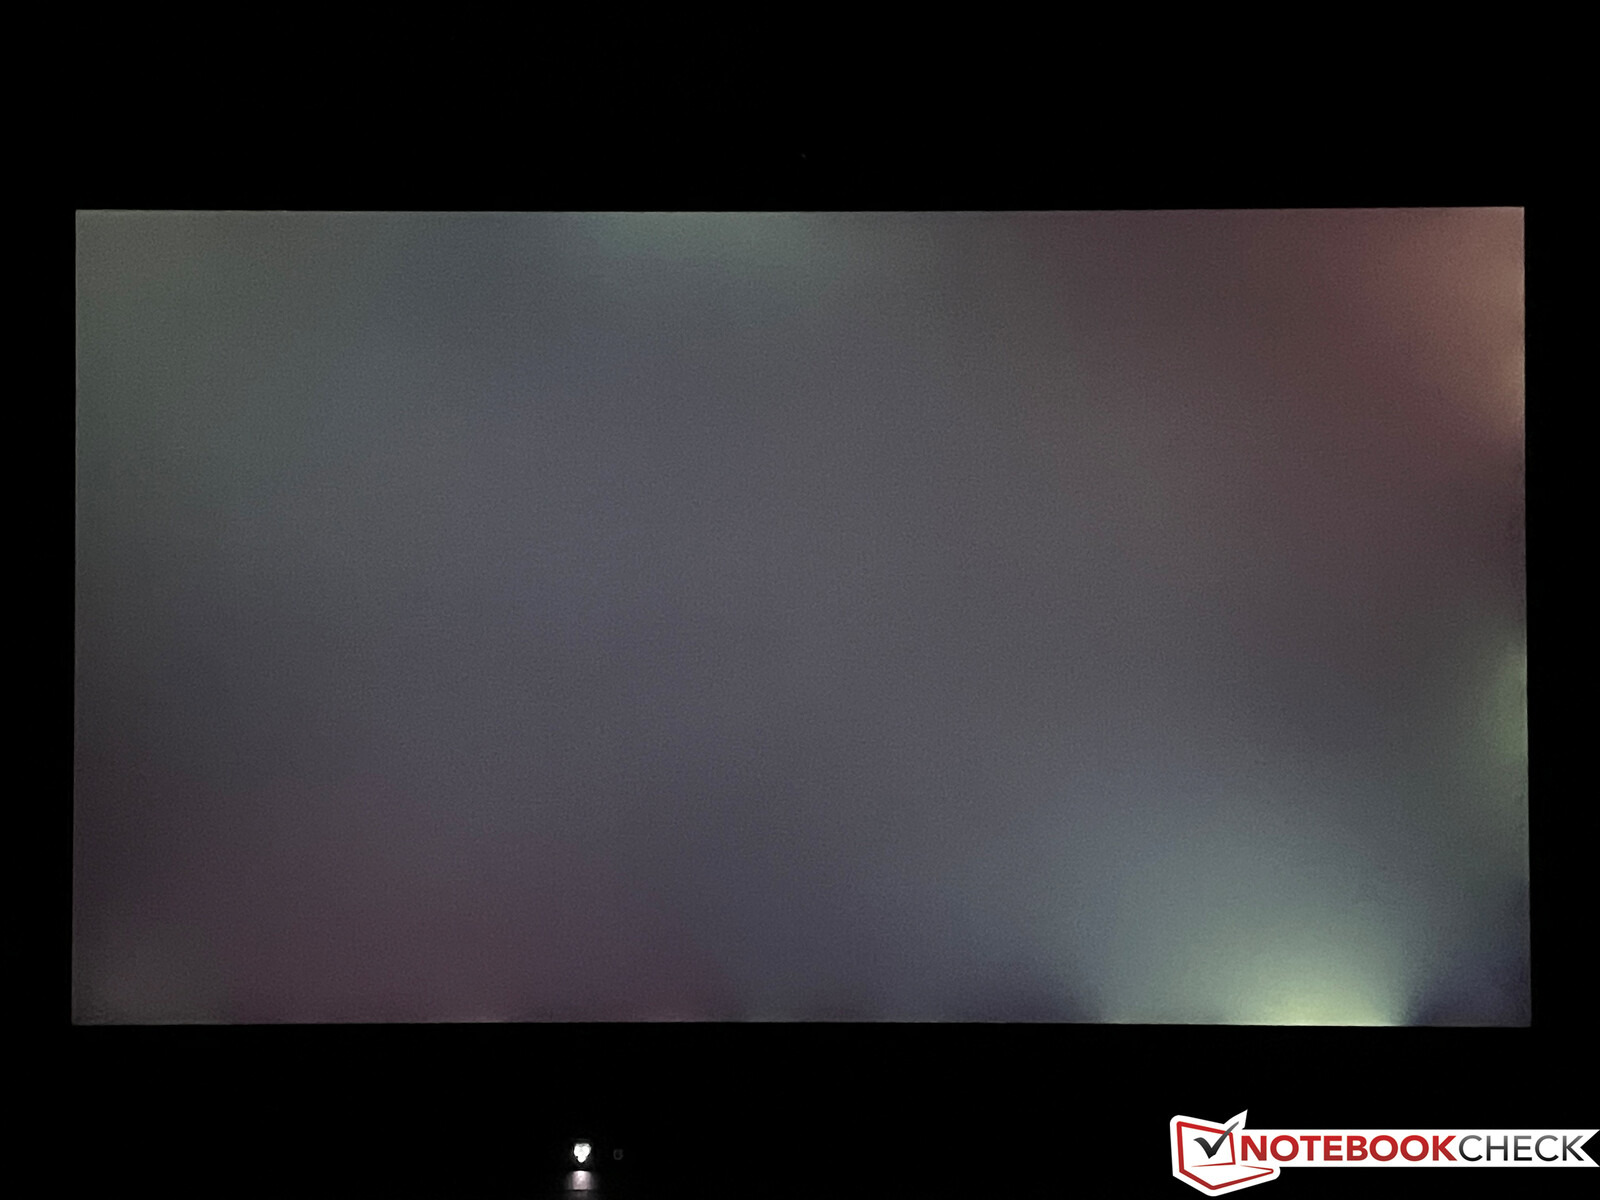
A impressão subjetiva da imagem é decente, mas não é grande. As superfícies brilhantes parecem um pouco granulosas e a relação de contraste é inferior a 1000:1 devido ao alto valor de preto (0,38 cd/m²). Este painel da AU Optronics (B173ZAN01.0) não usa PWM. Nossa unidade de teste sofre de sangramento de luz de fundo claramente visível, especialmente na borda inferior, que também é perceptível em superfícies escuras em cenários cotidianos.
| |||||||||||||||||||||||||
iluminação: 88 %
iluminação com acumulador: 363 cd/m²
Contraste: 963:1 (Preto: 0.38 cd/m²)
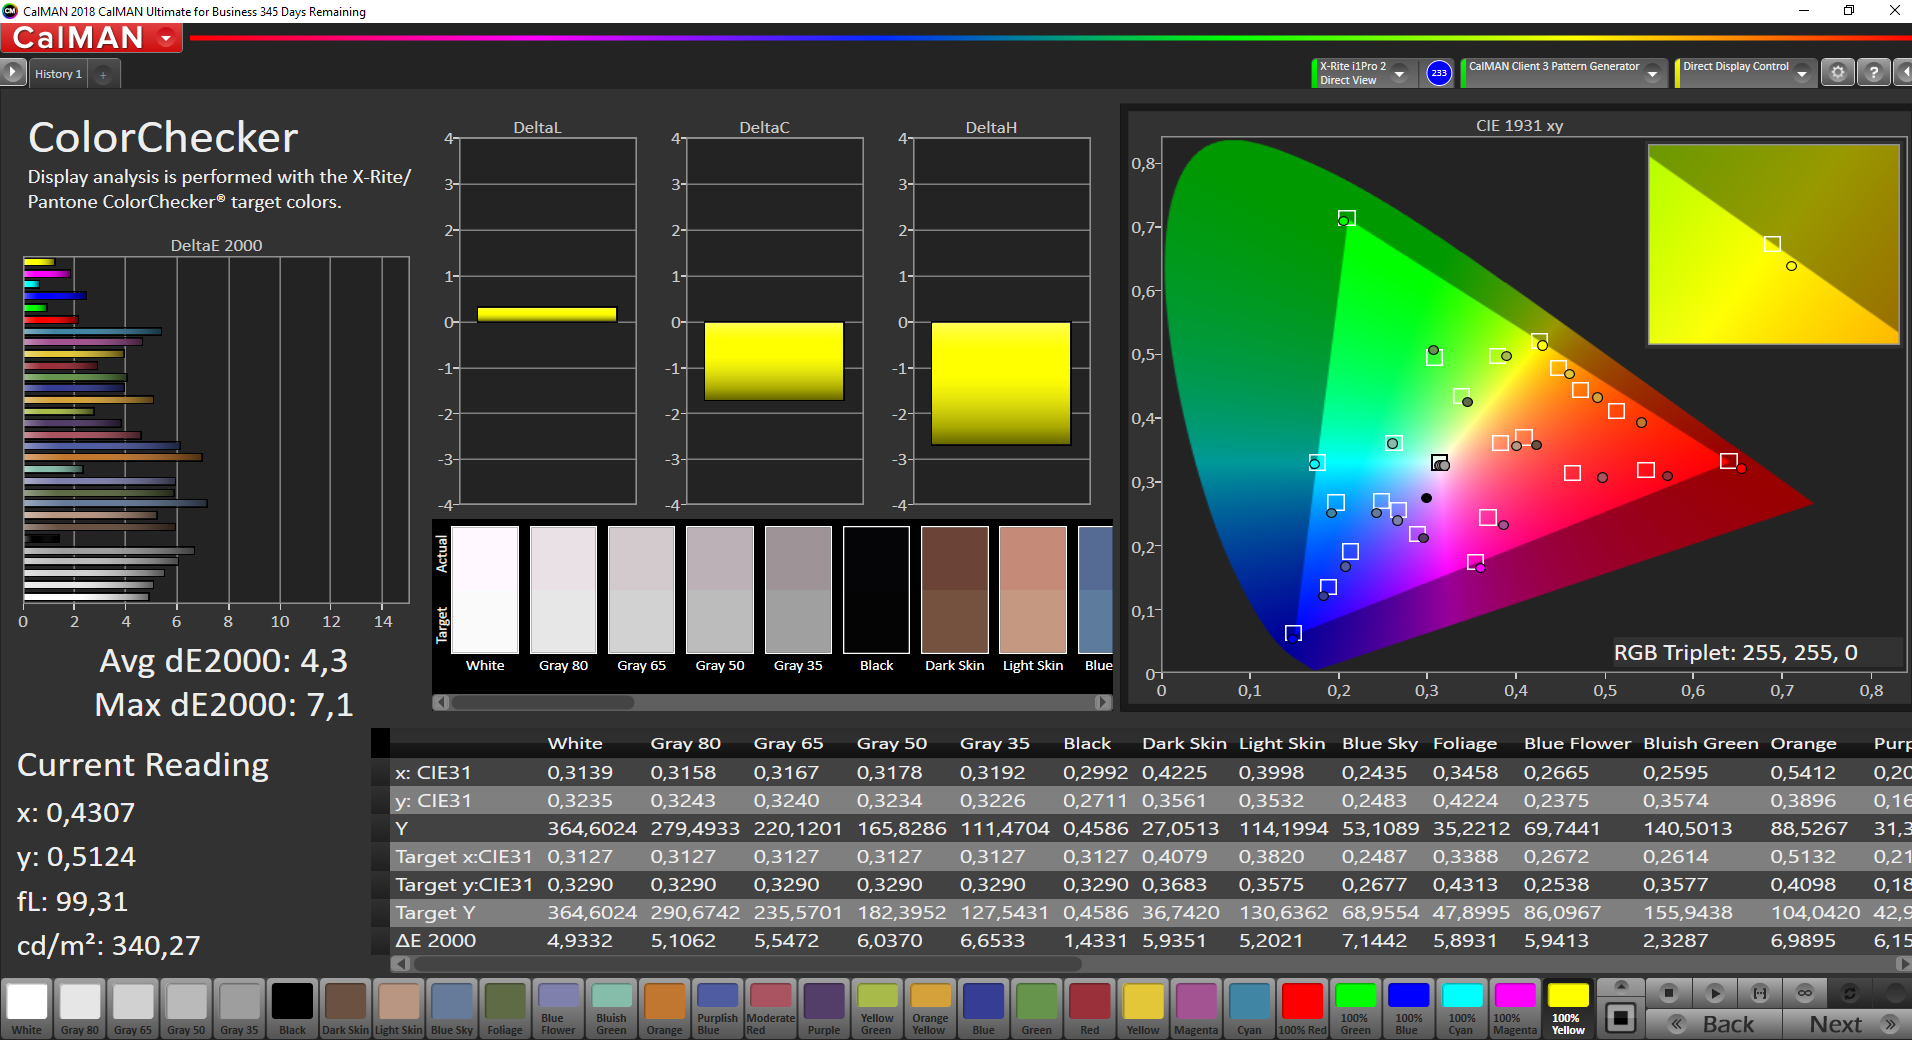
ΔE ColorChecker Calman: 4.3 | ∀{0.5-29.43 Ø4.73}
calibrated: 1.1
ΔE Greyscale Calman: 5.5 | ∀{0.09-98 Ø4.97}
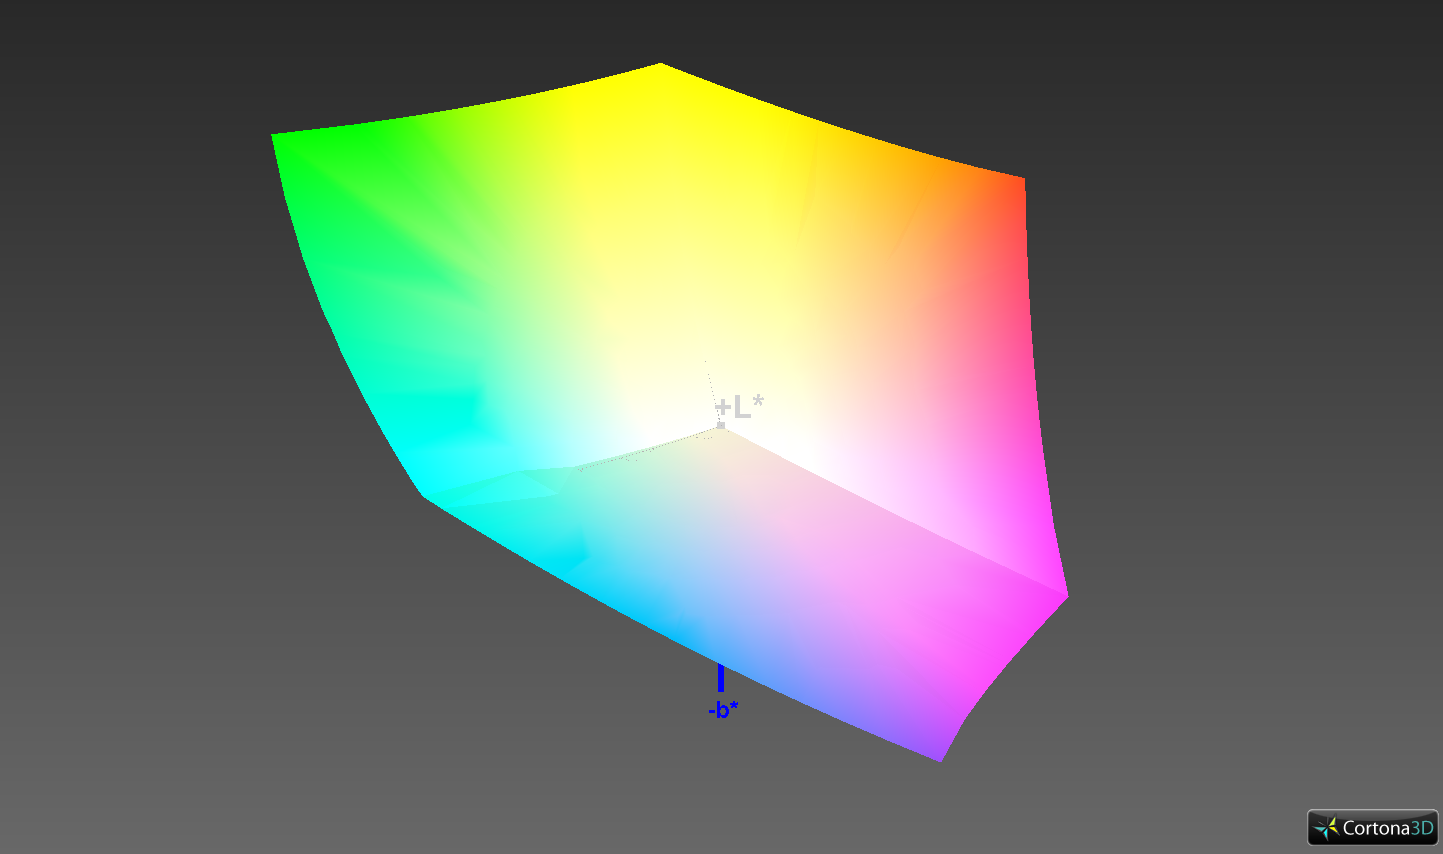
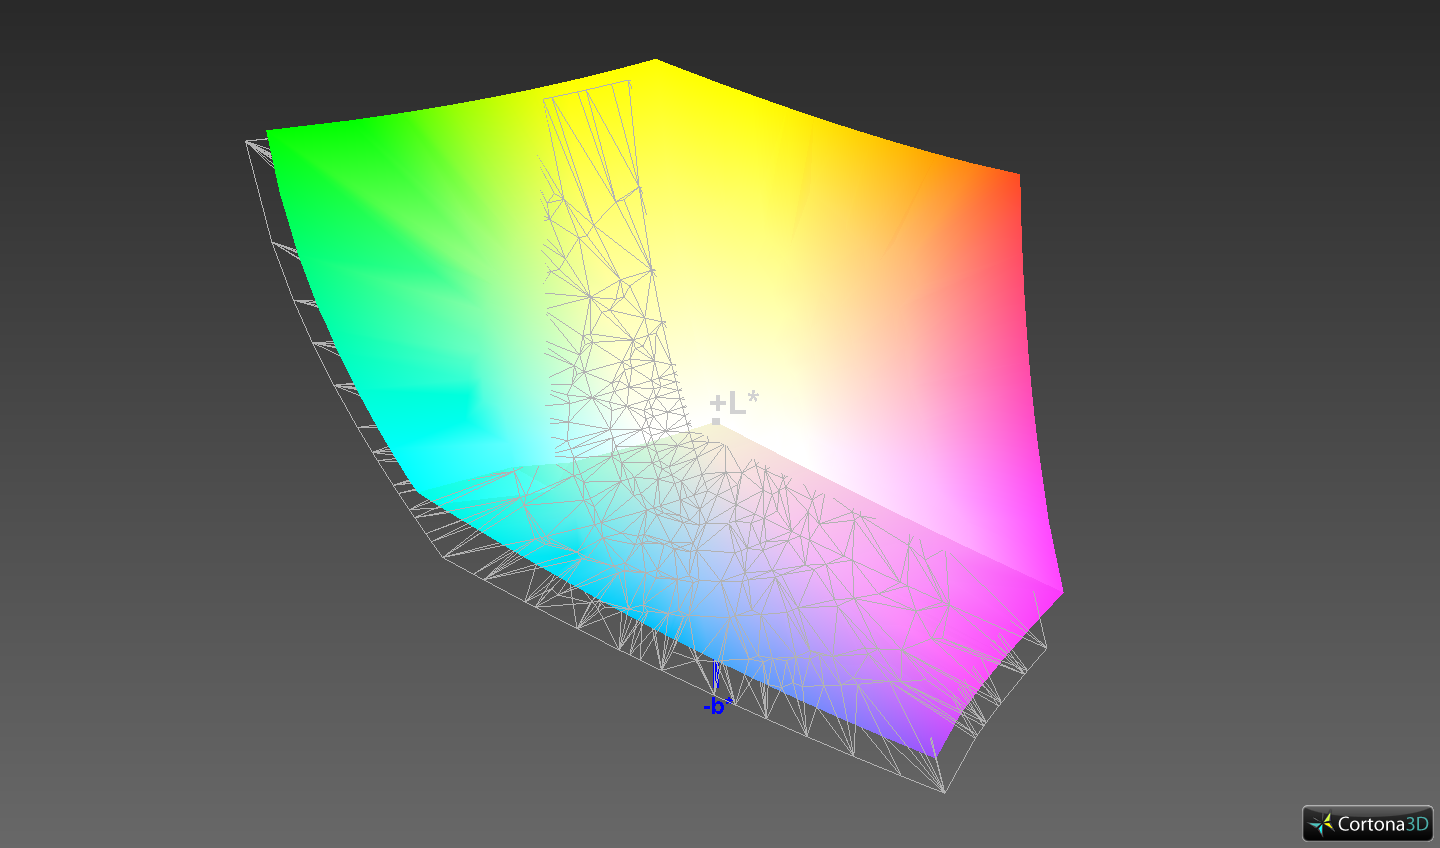
100% sRGB (Argyll 1.6.3 3D)
86% AdobeRGB 1998 (Argyll 1.6.3 3D)
98.8% AdobeRGB 1998 (Argyll 3D)
100% sRGB (Argyll 3D)
86.8% Display P3 (Argyll 3D)
Gamma: 2.47
CCT: 6281 K
| Lenovo ThinkPad P73-20QR0030GE B173ZAN01.0, IPS, 3840x2160, 17.3" | Acer ConceptD 9 Pro AU Optronics B173ZAN03.1, IPS, 3840x2160, 17.3" | Asus ProArt StudioBook Pro 17 W700G3T 170PUW1-A00, IPS, 1920x1200, 17" | MSI WE75 9TK AU Optronics B173HAN04.2, IPS, 1920x1080, 17.3" | Lenovo ThinkPad P73-20QR002DGE N173HCE-E31, IPS LED, 1920x1080, 17.3" | |
|---|---|---|---|---|---|
| Display | -4% | -1% | -24% | -20% | |
| Display P3 Coverage (%) | 86.8 | 80.9 -7% | 96.2 11% | 63.2 -27% | 67.5 -22% |
| sRGB Coverage (%) | 100 | 97.9 -2% | 99.8 0% | 89.9 -10% | 94.2 -6% |
| AdobeRGB 1998 Coverage (%) | 98.8 | 95.1 -4% | 84.7 -14% | 64.3 -35% | 67.8 -31% |
| Response Times | -30% | -3% | 6% | 2% | |
| Response Time Grey 50% / Grey 80% * (ms) | 44 ? | 53 ? -20% | 41.2 ? 6% | 30.8 ? 30% | 40 ? 9% |
| Response Time Black / White * (ms) | 26.4 ? | 37 ? -40% | 29.6 ? -12% | 31.2 ? -18% | 28 ? -6% |
| PWM Frequency (Hz) | 25000 ? | ||||
| Screen | 9% | 18% | -10% | -14% | |
| Brightness middle (cd/m²) | 366 | 377 3% | 323 -12% | 287.3 -22% | 333 -9% |
| Brightness (cd/m²) | 349 | 368 5% | 308 -12% | 280 -20% | 310 -11% |
| Brightness Distribution (%) | 88 | 83 -6% | 88 0% | 89 1% | 83 -6% |
| Black Level * (cd/m²) | 0.38 | 0.37 3% | 0.36 5% | 0.26 32% | 0.39 -3% |
| Contrast (:1) | 963 | 1019 6% | 897 -7% | 1105 15% | 854 -11% |
| Colorchecker dE 2000 * | 4.3 | 2.52 41% | 1.1 74% | 2.98 31% | 4.4 -2% |
| Colorchecker dE 2000 max. * | 7.1 | 5.55 22% | 3.3 54% | 5.08 28% | 7.5 -6% |
| Colorchecker dE 2000 calibrated * | 1.1 | 1.08 2% | 0.8 27% | 3.06 -178% | 2 -82% |
| Greyscale dE 2000 * | 5.5 | 3.83 30% | 0.8 85% | 3 45% | 5.1 7% |
| Gamma | 2.47 89% | 2.19 100% | 2.23 99% | 2.28 96% | 2.39 92% |
| CCT | 6281 103% | 6323 103% | 6479 100% | 6993 93% | 7061 92% |
| Color Space (Percent of AdobeRGB 1998) (%) | 86 | 84 -2% | 75.7 -12% | 58.1 -32% | 61.1 -29% |
| Color Space (Percent of sRGB) (%) | 100 | 98 -2% | 99.8 0% | 89.5 -10% | 94 -6% |
| Média Total (Programa/Configurações) | -8% /
2% | 5% /
12% | -9% /
-11% | -11% /
-13% |
* ... menor é melhor
Utilizamos o software profissional CalMAN em combinação com o espectrofotômetro X-Rite i1 Pro 2 para a análise da tela. A calibração de fábrica não é grande, porque tanto a escala de cinza quanto as cores mostram desvios significativos em relação à referência AdobeRGB. A escala de cinza também mostra um leve elenco de cores em direção ao vermelho. Ao contrário dos ThinkPad P15s recentemente revisados com a tela 4K, o P73 não suporta perfis de cor pré-instalados para alternar os espaços entre as cores
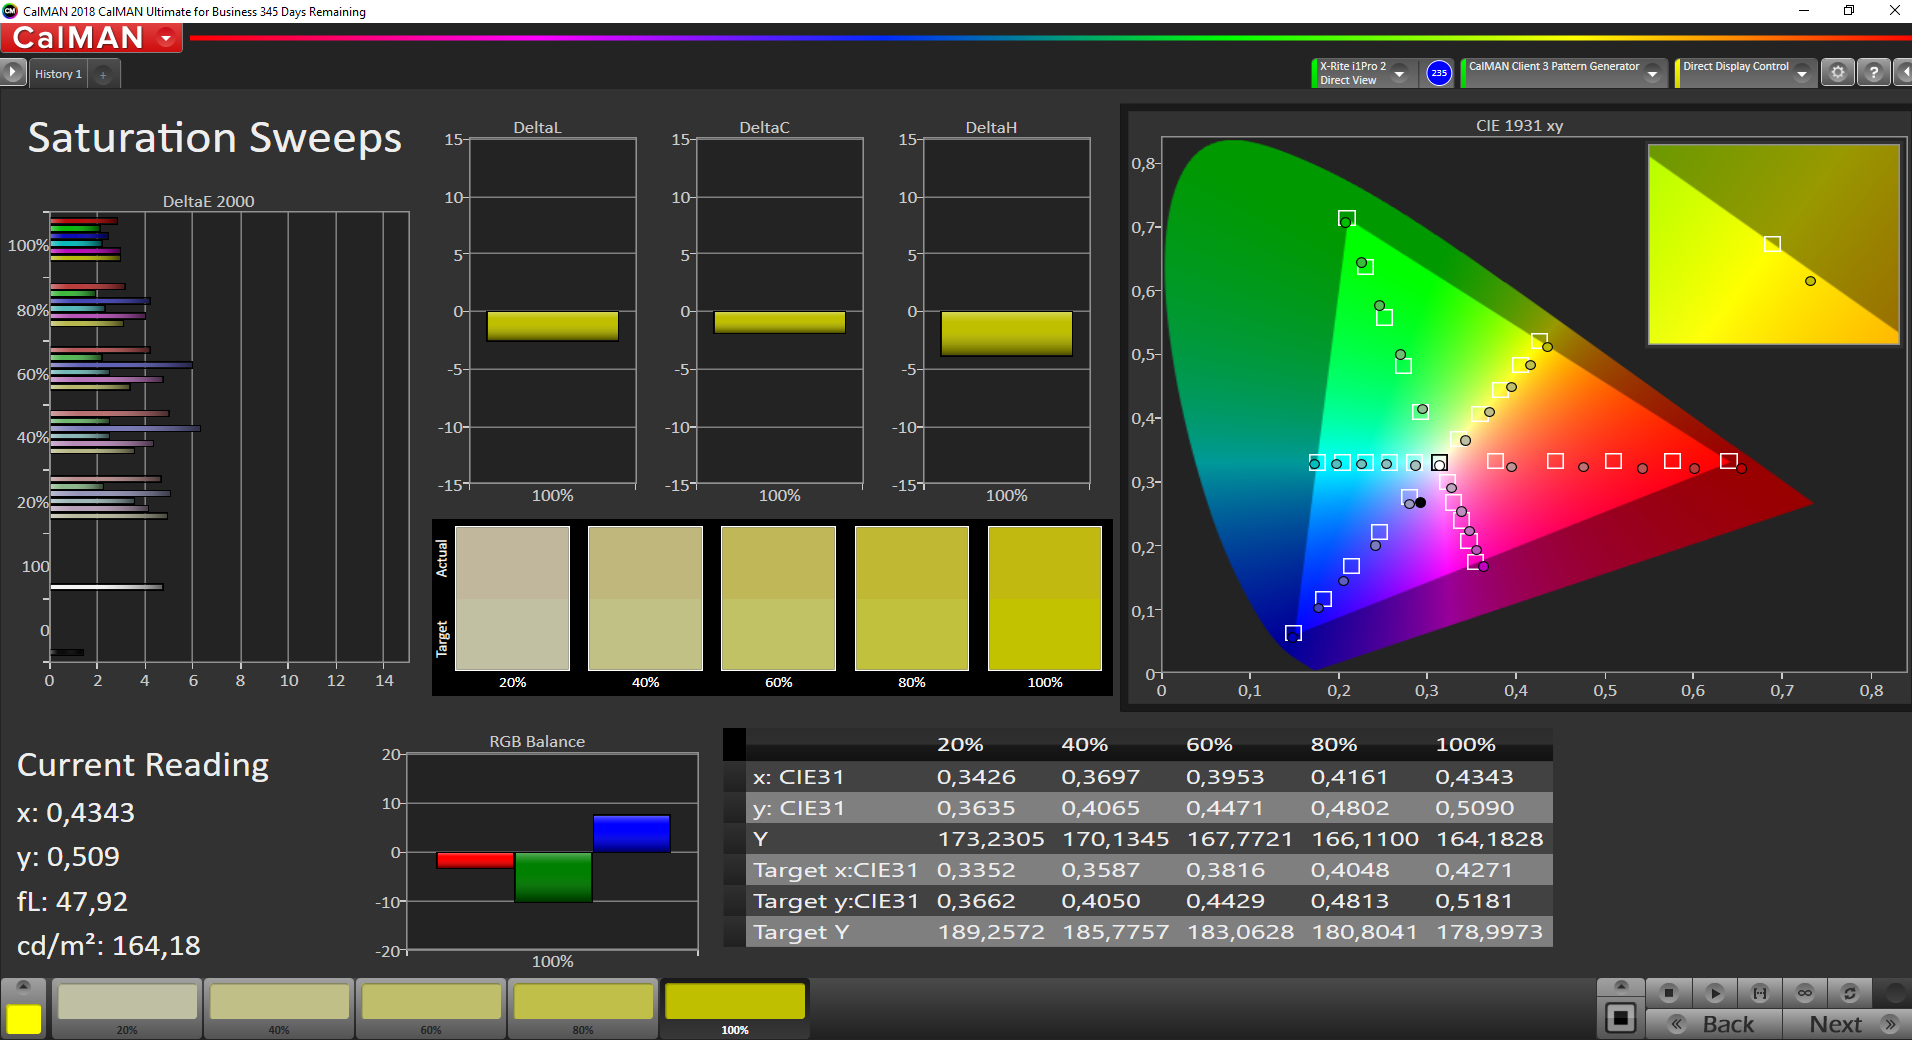
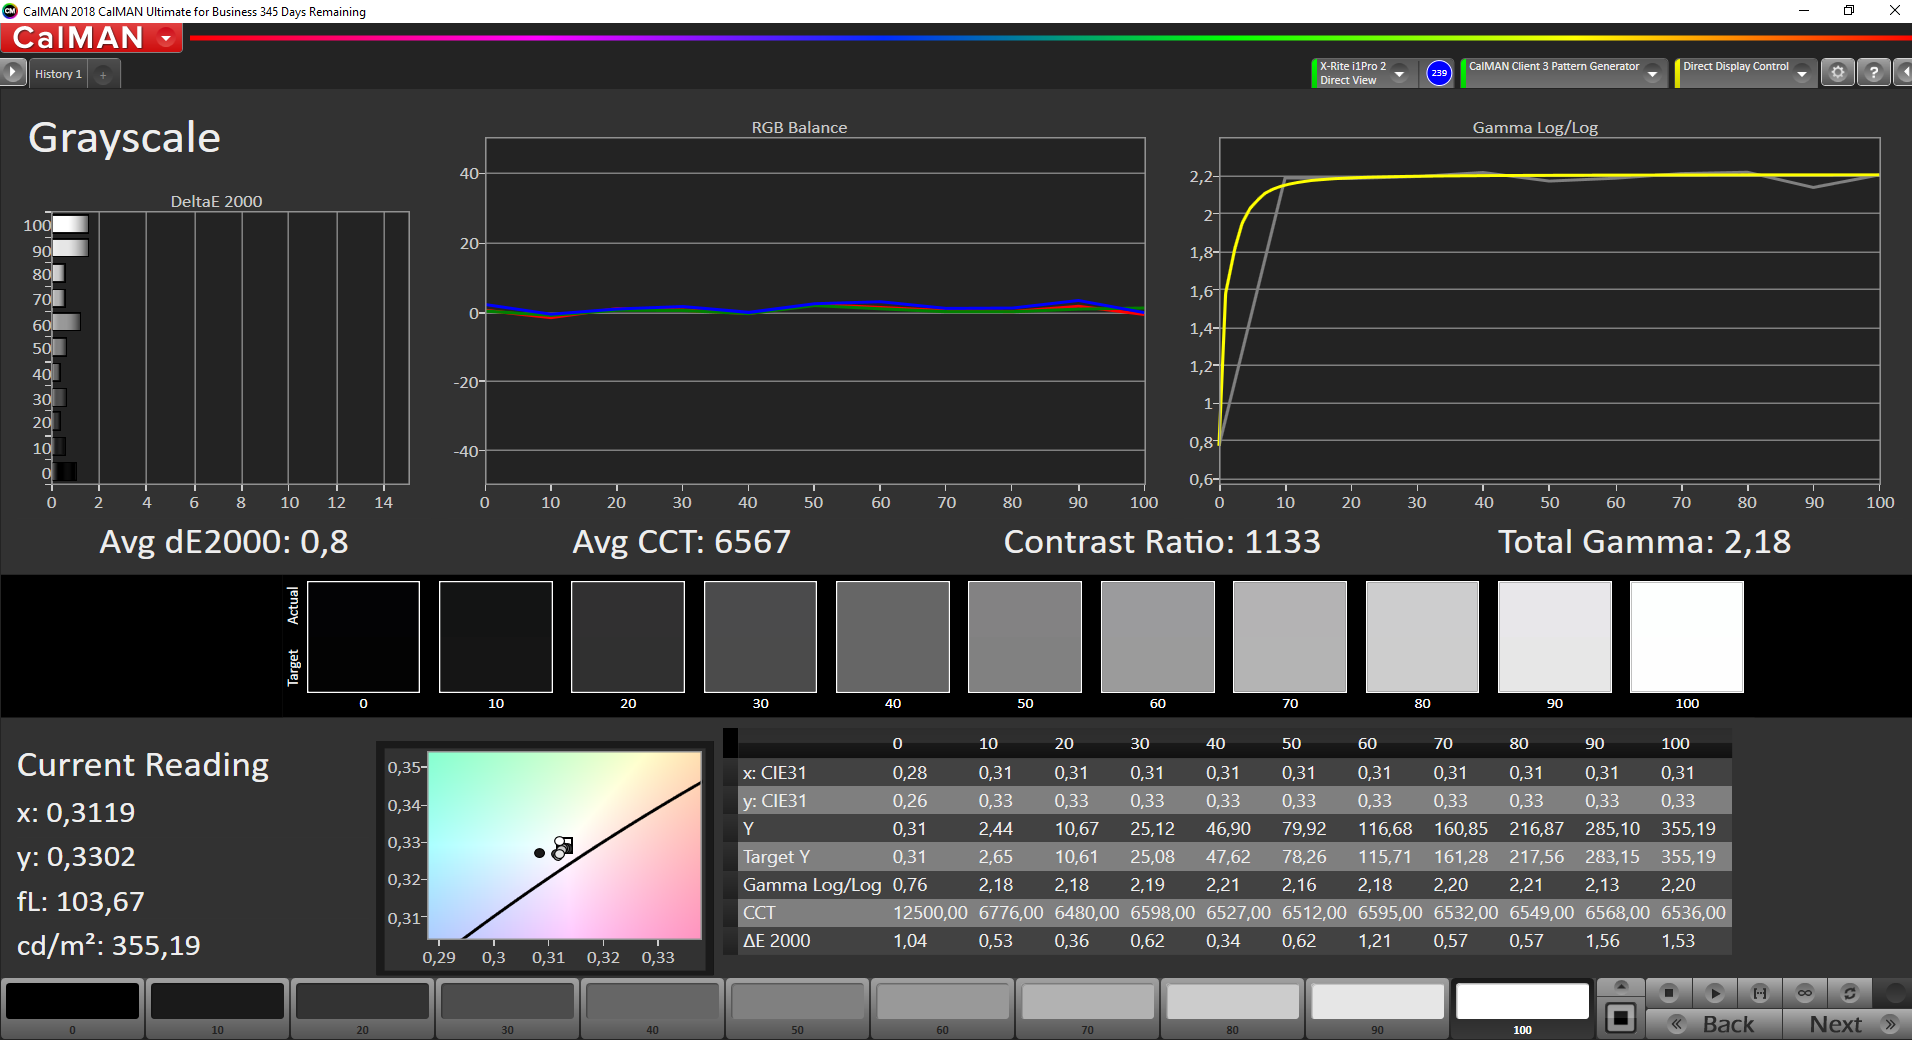
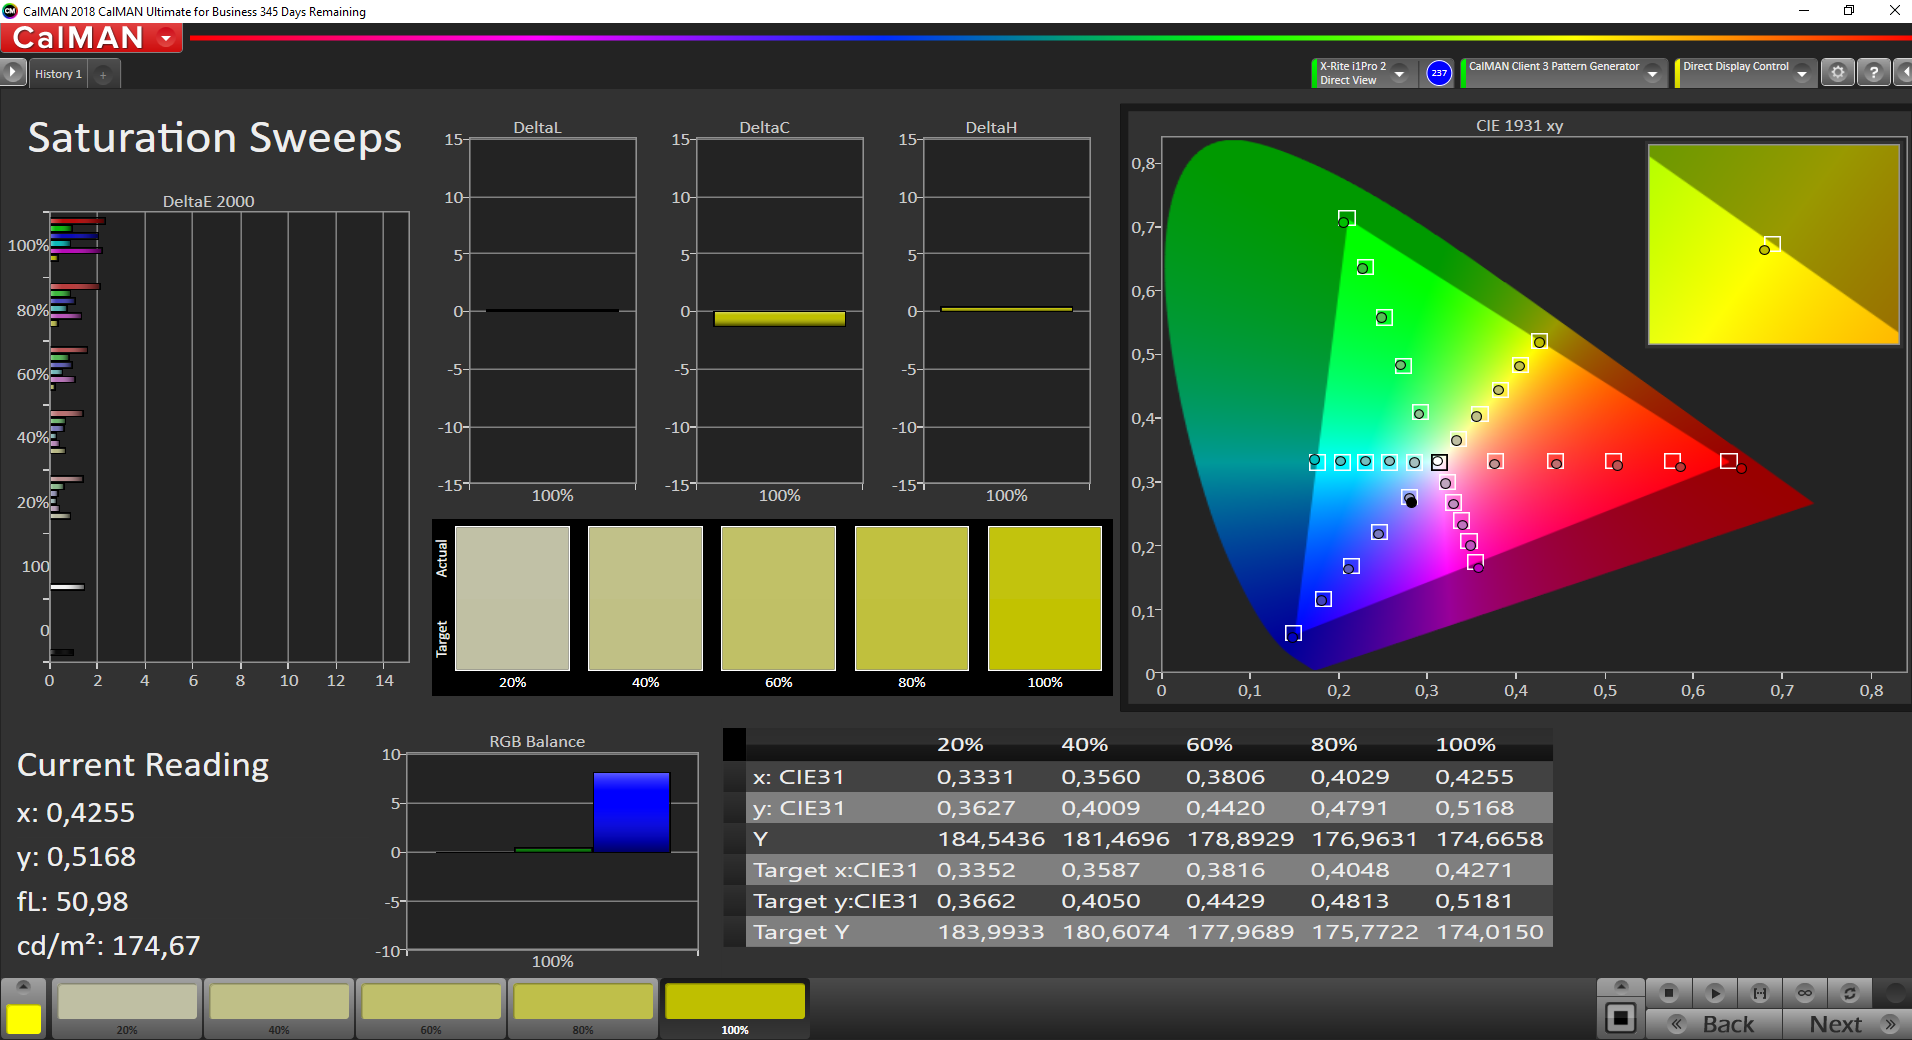
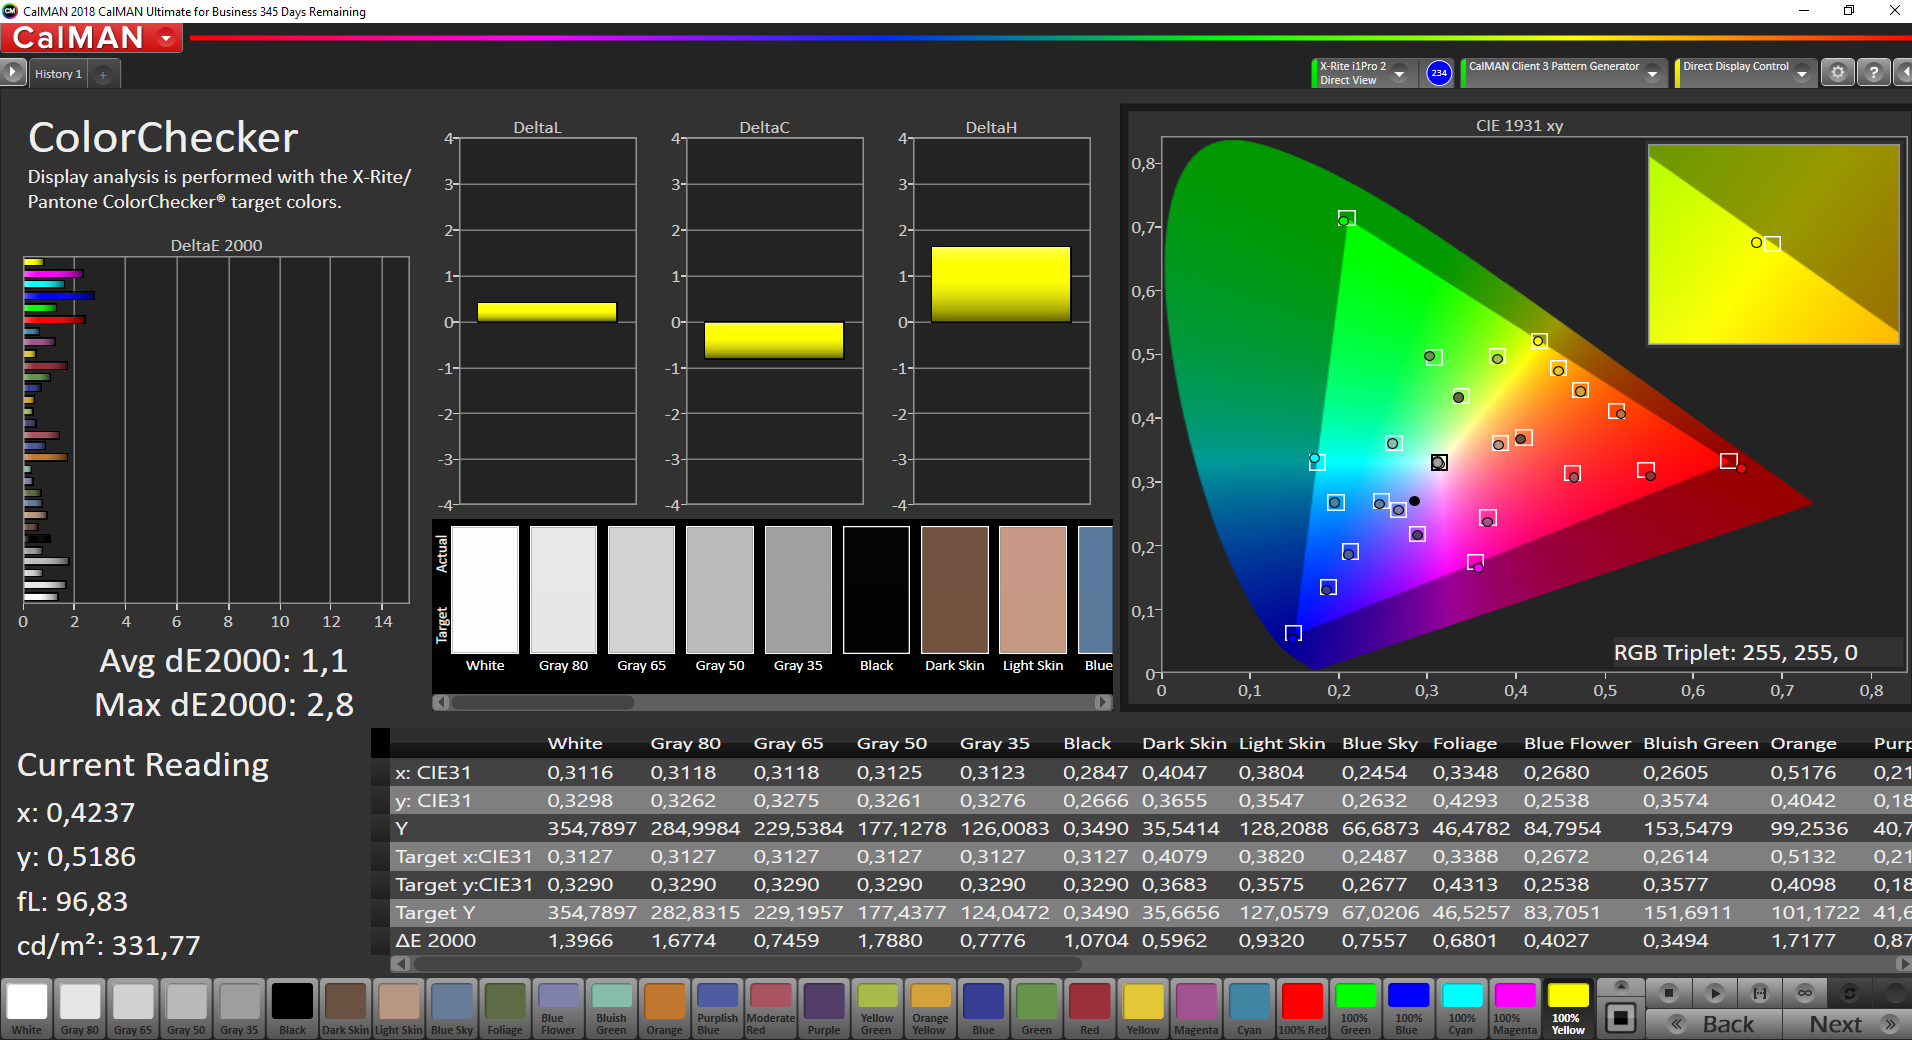
A situação é muito melhor após nossa calibração (o perfil pode ser baixado gratuitamente na caixa acima), e tanto a escala de cinza quanto os desvios de cor estão abaixo da marca importante de 3. A ampla gama de cores AdobeRGB é quase totalmente coberta (88%), o que significa que o painel calibrado é adequado para edição de imagem/vídeo
Exibir tempos de resposta
| ↔ Tempo de resposta preto para branco | ||
|---|---|---|
| 26.4 ms ... ascensão ↗ e queda ↘ combinadas | ↗ 14 ms ascensão | 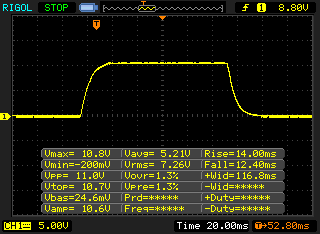 |
| ↘ 12.4 ms queda | ||
| A tela mostra taxas de resposta relativamente lentas em nossos testes e pode ser muito lenta para os jogadores. Em comparação, todos os dispositivos testados variam de 0.1 (mínimo) a 240 (máximo) ms. » 66 % de todos os dispositivos são melhores. Isso significa que o tempo de resposta medido é pior que a média de todos os dispositivos testados (19.9 ms). | ||
| ↔ Tempo de resposta 50% cinza a 80% cinza | ||
| 44 ms ... ascensão ↗ e queda ↘ combinadas | ↗ 22 ms ascensão | 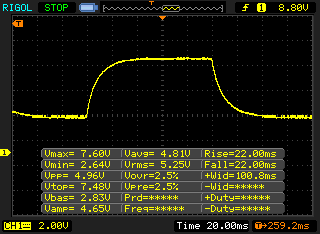 |
| ↘ 22 ms queda | ||
| A tela mostra taxas de resposta lentas em nossos testes e será insatisfatória para os jogadores. Em comparação, todos os dispositivos testados variam de 0.165 (mínimo) a 636 (máximo) ms. » 73 % de todos os dispositivos são melhores. Isso significa que o tempo de resposta medido é pior que a média de todos os dispositivos testados (31.1 ms). | ||
Cintilação da tela / PWM (modulação por largura de pulso)
| Tela tremeluzindo / PWM não detectado | 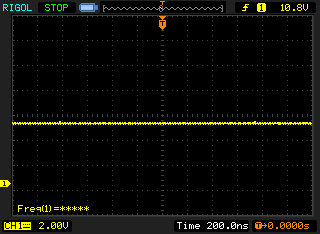 | ||
[pwm_comparison] Em comparação: 52 % de todos os dispositivos testados não usam PWM para escurecer a tela. Se PWM foi detectado, uma média de 7798 (mínimo: 5 - máximo: 343500) Hz foi medida. | |||
Você só pode usar o P73 confortável ao ar livre quando puder evitar reflexos de fontes de luz e ambientes mais brilhantes. O painel grande é fosco, mas poderia ter sido muito mais brilhante. A estabilidade do ângulo de visão do painel IPS é boa
Desempenho - ThinkPad P73 com Core i9 e RTX4000
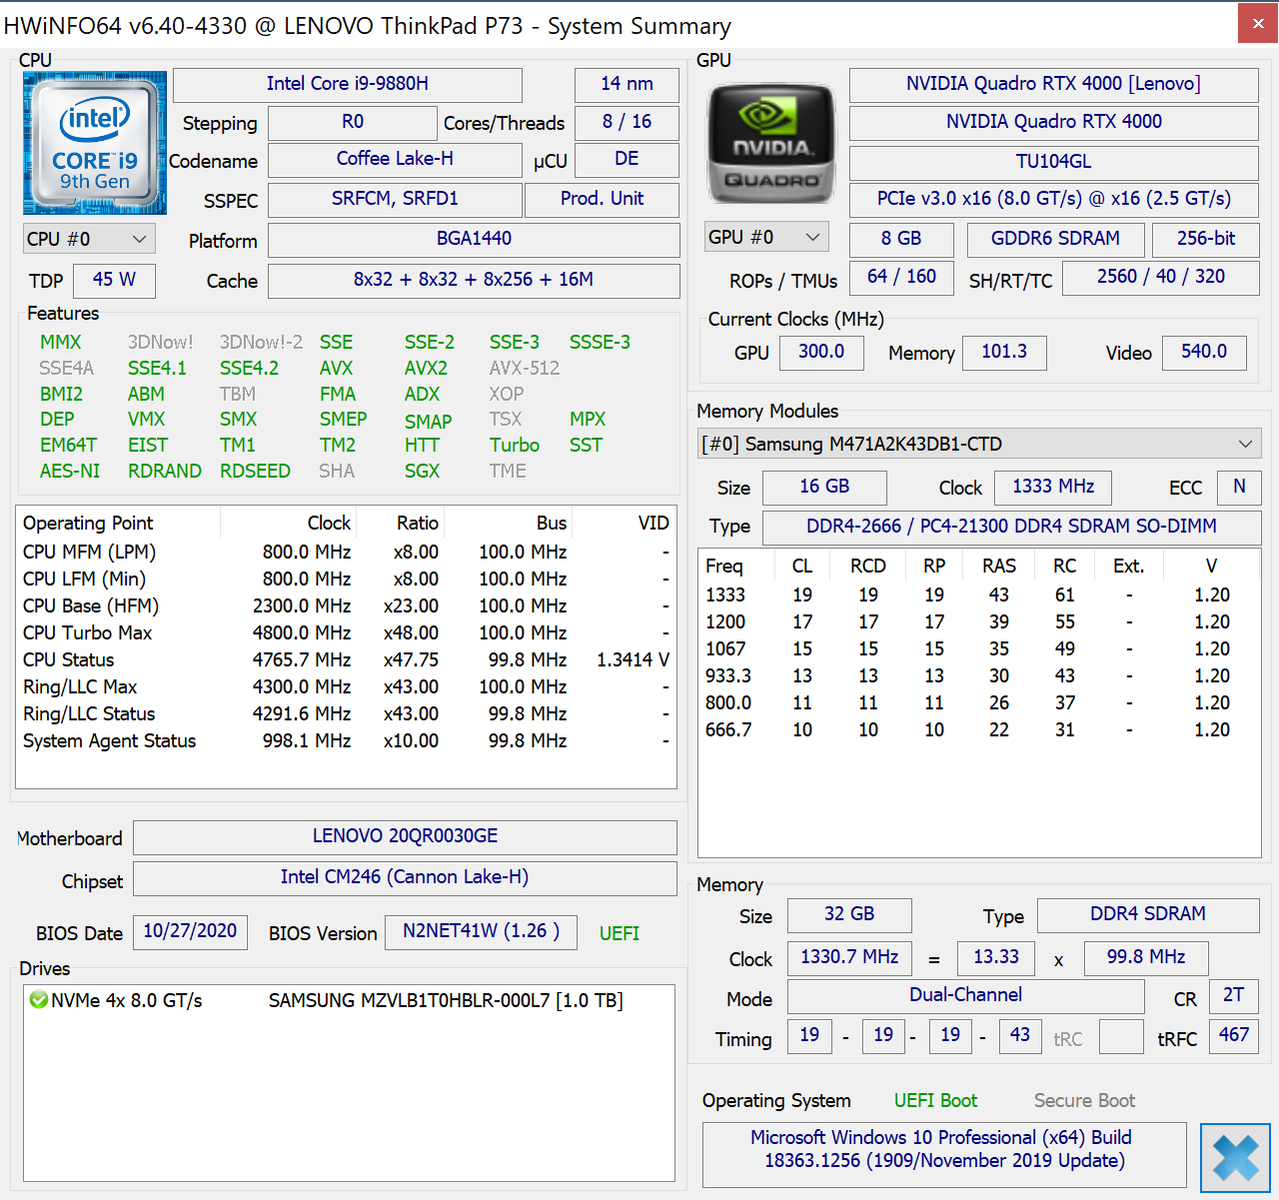
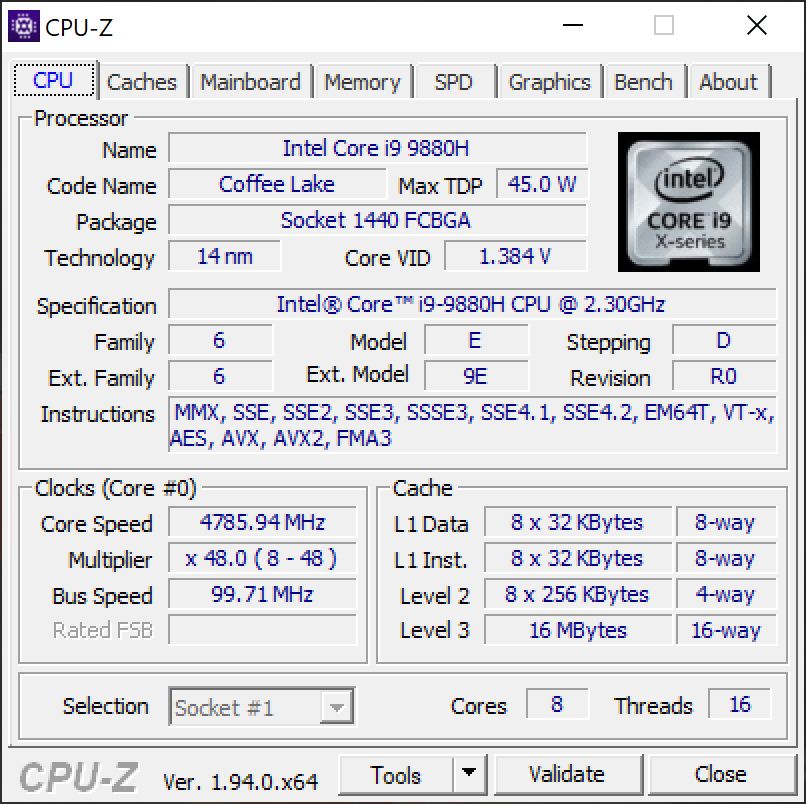
Processador - Intel Core i9-9880H
O Core i9-9880H (Coffee Lake-H) tem 8 núcleos (16 fios) e pode atingir até 4,8 GHz (1 ou 2 núcleos) ou até 4,1 GHz em todos os oito núcleos, respectivamente. Como esperado para uma grande estação de trabalho móvel, a Lenovo implementa generosas limitações de TDP a 70/107 Watts.
Ainda não podemos ver o relógio máximo de 4,1 GHz em todos os núcleos nos referenciais, mas "apenas" 8x 3,8 GHz (102 W) e depois 8x 3,1 GHz sob cargas de trabalho sustentadas. Este valor pode ser mantido e o desempenho geral no grupo de comparação é bom, mesmo que as estações de trabalho móveis atuais ainda dispensem as opções de CPU da AMD.
As limitações do TDP são um pouco menores na potência da bateria (51/60 W), portanto o desempenho cai em cerca de 20%
Cinebench R15: CPU Single 64Bit | CPU Multi 64Bit
Blender: v2.79 BMW27 CPU
7-Zip 18.03: 7z b 4 -mmt1 | 7z b 4
Geekbench 5.5: Single-Core | Multi-Core
HWBOT x265 Benchmark v2.2: 4k Preset
LibreOffice : 20 Documents To PDF
R Benchmark 2.5: Overall mean
| Cinebench R20 / CPU (Single Core) | |
| Média da turma Workstation (671 - 857, n=25, últimos 2 anos) | |
| Acer ConceptD 9 Pro | |
| Lenovo ThinkPad P73-20QR0030GE | |
| MSI WE75 9TK | |
| Asus ProArt StudioBook Pro 17 W700G3T | |
| Média Intel Core i9-9880H (441 - 474, n=7) | |
| Lenovo ThinkPad P73-20QR002DGE | |
| Cinebench R20 / CPU (Multi Core) | |
| Média da turma Workstation (5471 - 15043, n=25, últimos 2 anos) | |
| Média Intel Core i9-9880H (2953 - 3712, n=7) | |
| Lenovo ThinkPad P73-20QR0030GE | |
| Acer ConceptD 9 Pro | |
| Asus ProArt StudioBook Pro 17 W700G3T | |
| MSI WE75 9TK | |
| Lenovo ThinkPad P73-20QR002DGE | |
| Cinebench R15 / CPU Single 64Bit | |
| Média da turma Workstation (191.4 - 328, n=25, últimos 2 anos) | |
| Acer ConceptD 9 Pro | |
| Lenovo ThinkPad P73-20QR002DGE | |
| Lenovo ThinkPad P73-20QR0030GE | |
| Asus ProArt StudioBook Pro 17 W700G3T | |
| MSI WE75 9TK | |
| Média Intel Core i9-9880H (181 - 198, n=11) | |
| Cinebench R15 / CPU Multi 64Bit | |
| Média da turma Workstation (2489 - 5810, n=25, últimos 2 anos) | |
| Acer ConceptD 9 Pro | |
| Lenovo ThinkPad P73-20QR0030GE | |
| Média Intel Core i9-9880H (1317 - 1721, n=11) | |
| Lenovo ThinkPad P73-20QR002DGE | |
| Asus ProArt StudioBook Pro 17 W700G3T | |
| Asus ProArt StudioBook Pro 17 W700G3T | |
| MSI WE75 9TK | |
| Blender / v2.79 BMW27 CPU | |
| Lenovo ThinkPad P73-20QR002DGE | |
| Asus ProArt StudioBook Pro 17 W700G3T | |
| Média Intel Core i9-9880H (293 - 384, n=4) | |
| Lenovo ThinkPad P73-20QR0030GE | |
| Média da turma Workstation (91 - 261, n=25, últimos 2 anos) | |
| 7-Zip 18.03 / 7z b 4 -mmt1 | |
| Média da turma Workstation (5126 - 6960, n=25, últimos 2 anos) | |
| Acer ConceptD 9 Pro | |
| Lenovo ThinkPad P73-20QR0030GE | |
| Lenovo ThinkPad P73-20QR002DGE | |
| Média Intel Core i9-9880H (4837 - 5068, n=3) | |
| Asus ProArt StudioBook Pro 17 W700G3T | |
| 7-Zip 18.03 / 7z b 4 | |
| Média da turma Workstation (54741 - 116969, n=25, últimos 2 anos) | |
| Média Intel Core i9-9880H (39455 - 46591, n=3) | |
| Lenovo ThinkPad P73-20QR0030GE | |
| Acer ConceptD 9 Pro | |
| Asus ProArt StudioBook Pro 17 W700G3T | |
| Lenovo ThinkPad P73-20QR002DGE | |
| Geekbench 5.5 / Single-Core | |
| Média da turma Workstation (1781 - 2183, n=25, últimos 2 anos) | |
| Acer ConceptD 9 Pro | |
| Lenovo ThinkPad P73-20QR0030GE | |
| Asus ProArt StudioBook Pro 17 W700G3T | |
| Média Intel Core i9-9880H (1115 - 1237, n=2) | |
| Lenovo ThinkPad P73-20QR002DGE | |
| Geekbench 5.5 / Multi-Core | |
| Média da turma Workstation (11542 - 25554, n=25, últimos 2 anos) | |
| Acer ConceptD 9 Pro | |
| Lenovo ThinkPad P73-20QR0030GE | |
| Média Intel Core i9-9880H (7109 - 7353, n=2) | |
| Asus ProArt StudioBook Pro 17 W700G3T | |
| Lenovo ThinkPad P73-20QR002DGE | |
| HWBOT x265 Benchmark v2.2 / 4k Preset | |
| Média da turma Workstation (14.4 - 40.5, n=25, últimos 2 anos) | |
| Média Intel Core i9-9880H (10.6 - 11.9, n=3) | |
| Lenovo ThinkPad P73-20QR0030GE | |
| Lenovo ThinkPad P73-20QR002DGE | |
| Asus ProArt StudioBook Pro 17 W700G3T | |
| LibreOffice / 20 Documents To PDF | |
| Asus ProArt StudioBook Pro 17 W700G3T | |
| Acer ConceptD 9 Pro | |
| Lenovo ThinkPad P73-20QR0030GE | |
| Média da turma Workstation (37.1 - 74.7, n=25, últimos 2 anos) | |
| Média Intel Core i9-9880H (16.5 - 58.9, n=3) | |
| R Benchmark 2.5 / Overall mean | |
| Média Intel Core i9-9880H (0.621 - 0.69, n=3) | |
| Asus ProArt StudioBook Pro 17 W700G3T | |
| Lenovo ThinkPad P73-20QR0030GE | |
| Média da turma Workstation (0.3825 - 0.603, n=25, últimos 2 anos) | |
* ... menor é melhor
Desempenho do sistema
O ThinkPad P73 só é batido pelo Acer ConceptD 9 Pro com a mais poderosa GPU Quadro RTX 5000 em algumas categorias do PCMark sintético, mas todos os outros dispositivos de comparação são batidos. Nossa impressão de desempenho subjetivo suporta os resultados, porque a estação de trabalho móvel é apenas um dispositivo muito poderoso e responsivo na prática
| PCMark 10 Score | 6491 pontos | |
Ajuda | ||
Latência do DPC
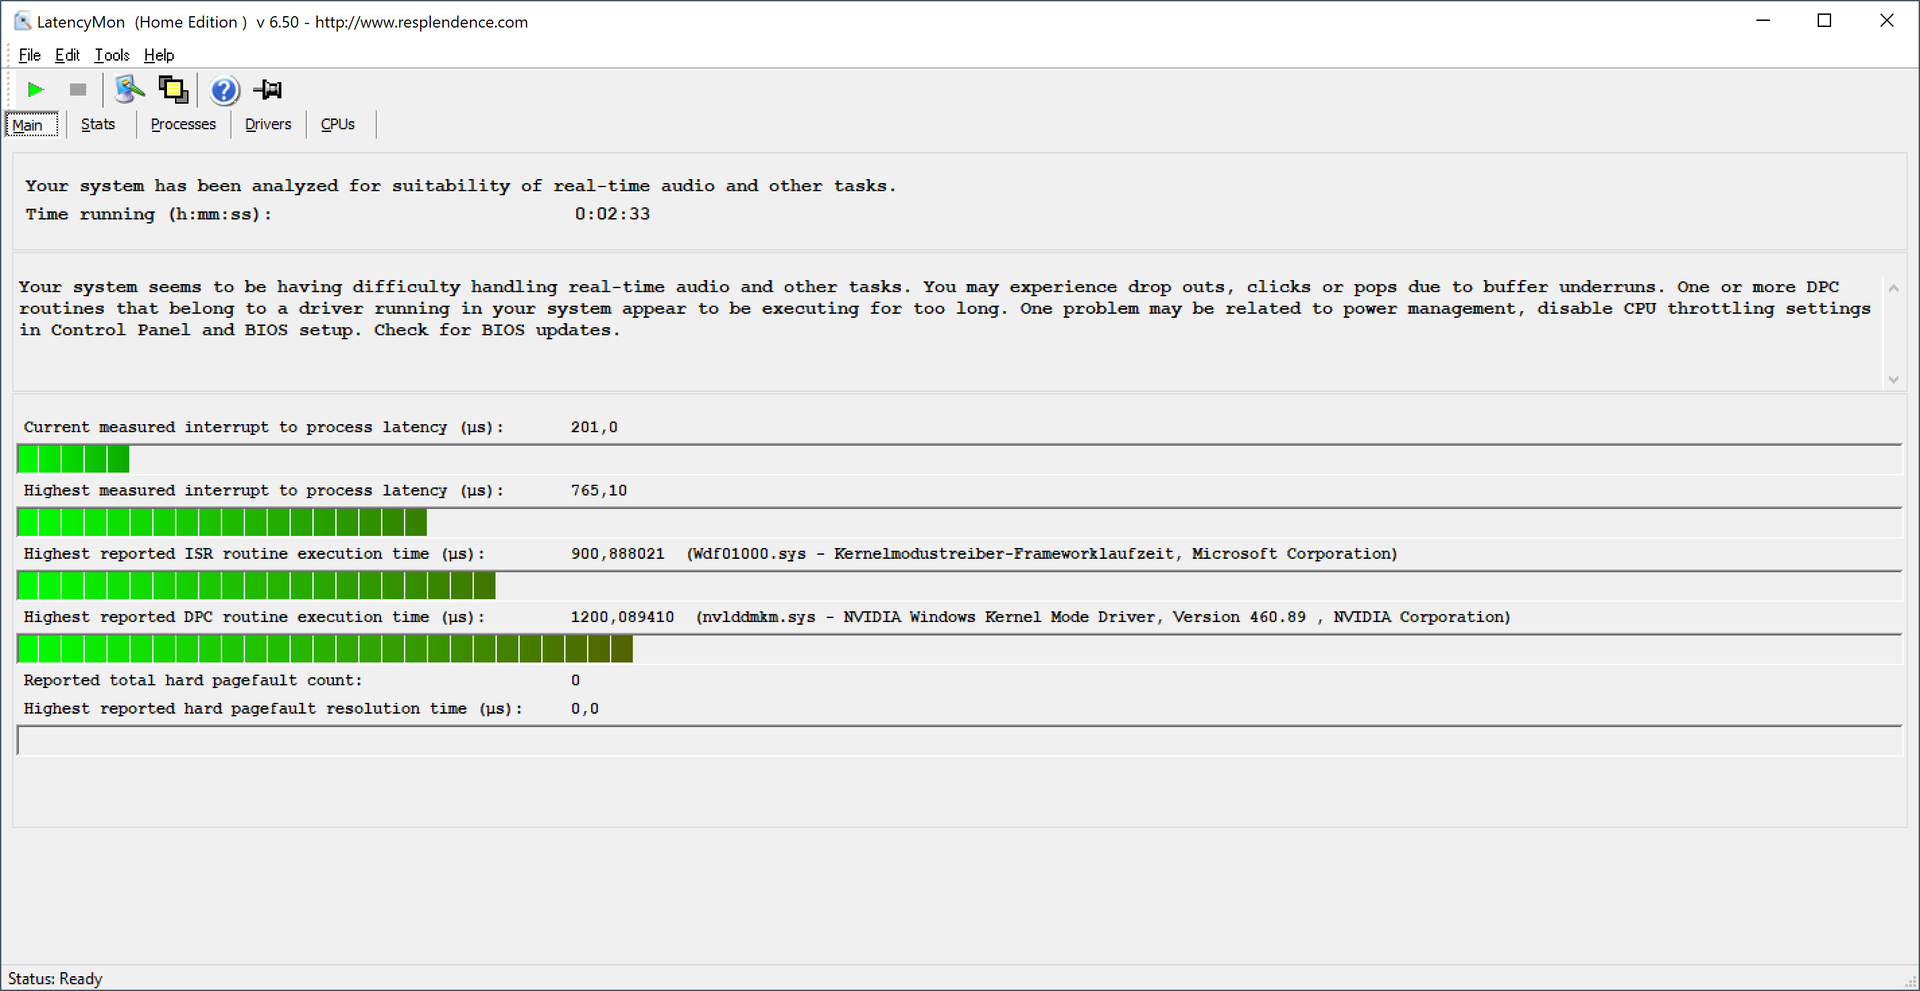
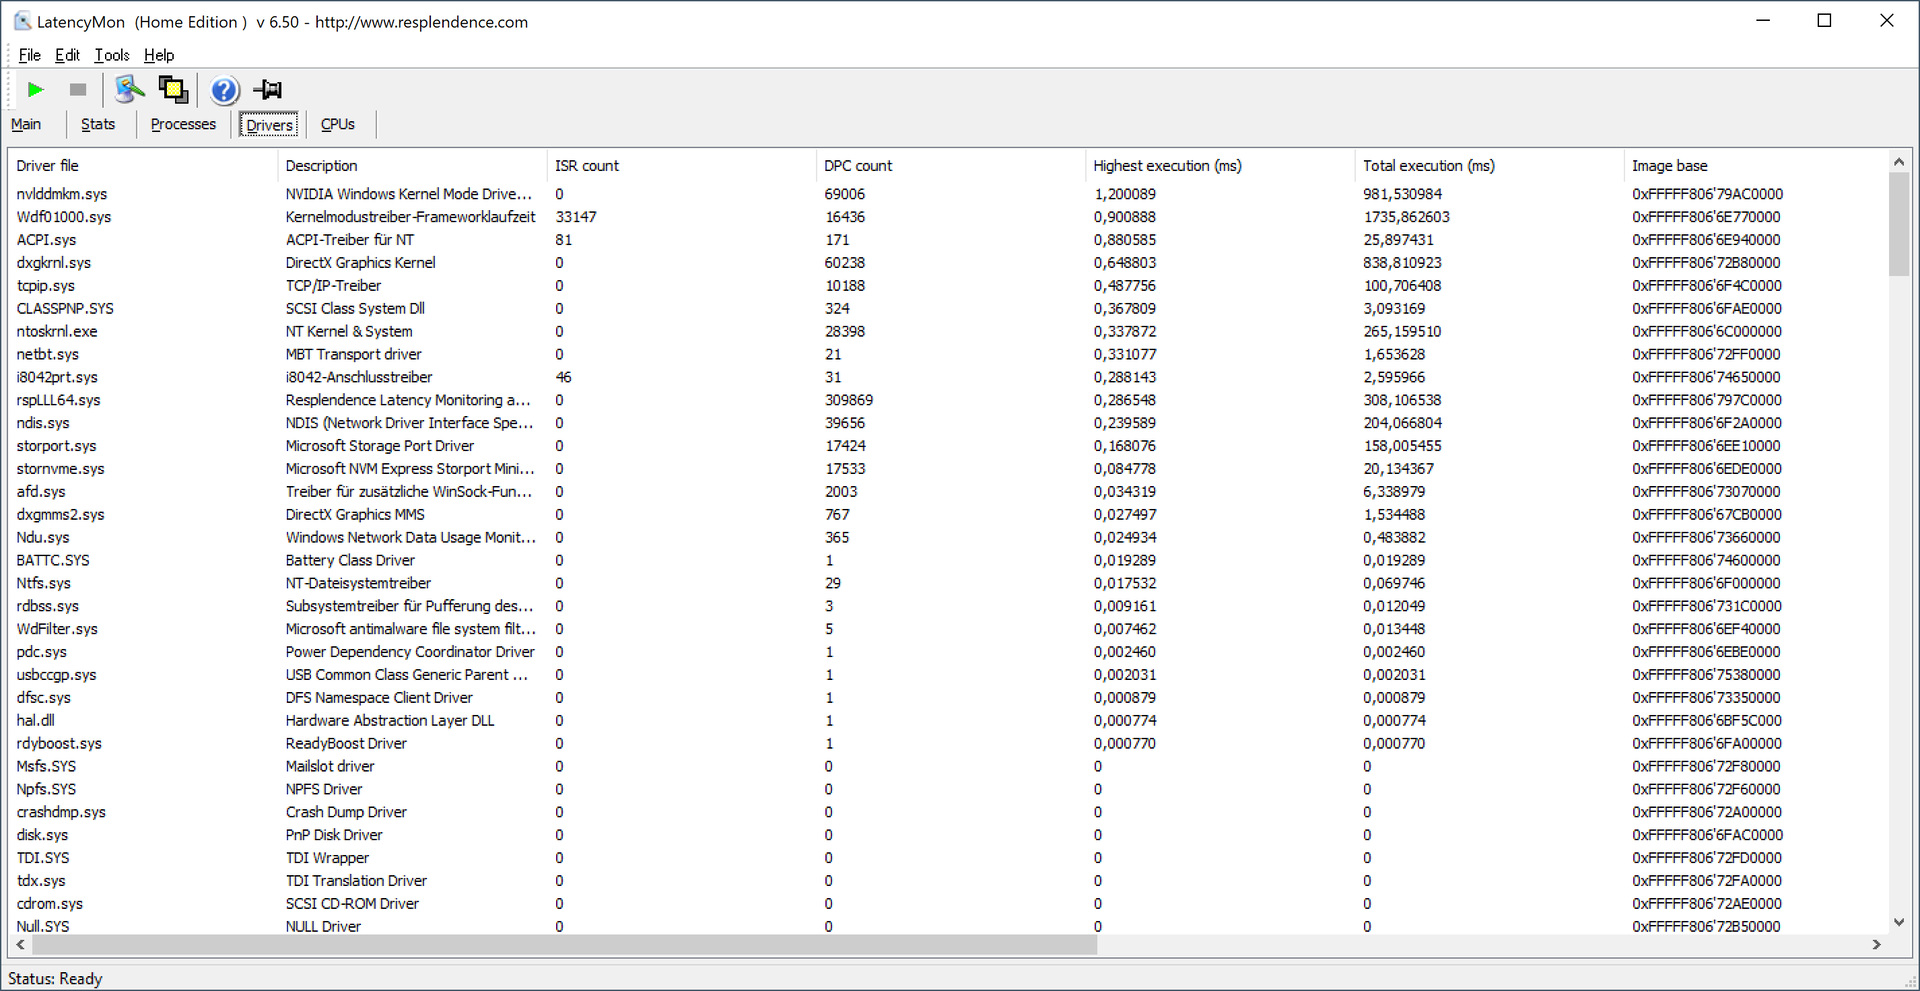
| DPC Latencies / LatencyMon - interrupt to process latency (max), Web, Youtube, Prime95 | |
| Acer ConceptD 9 Pro | |
| Lenovo ThinkPad P73-20QR0030GE | |
* ... menor é melhor
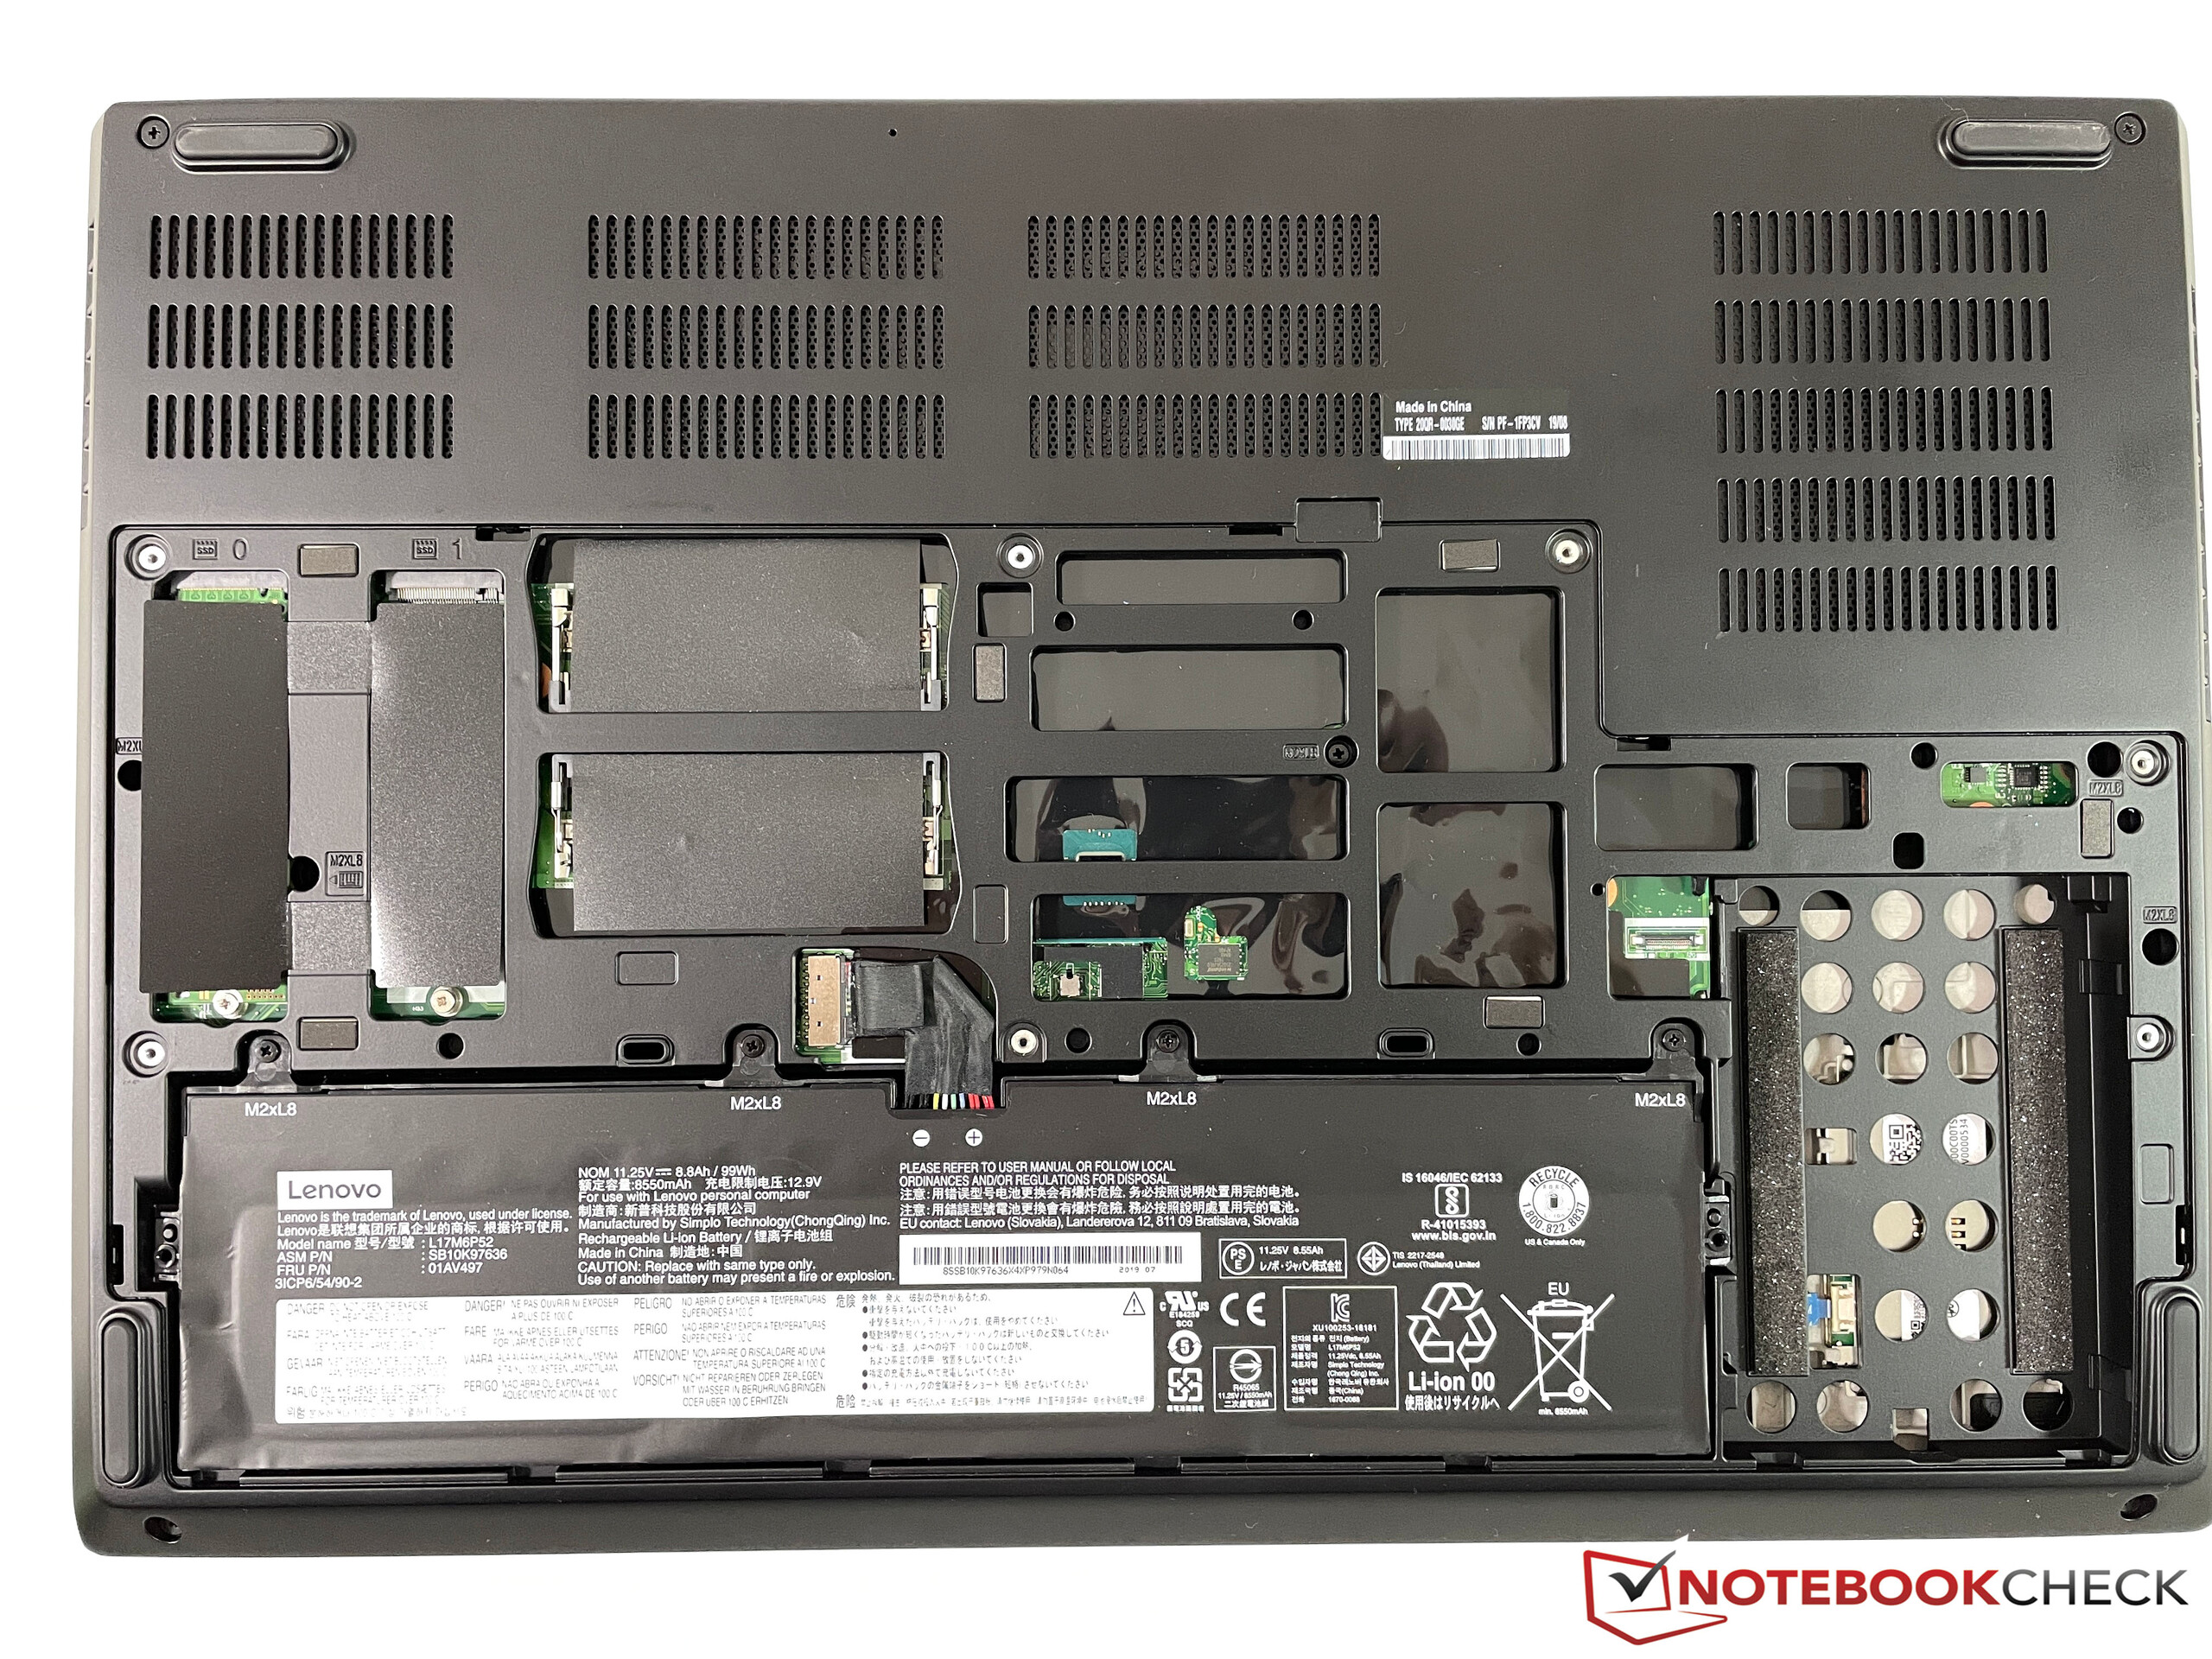
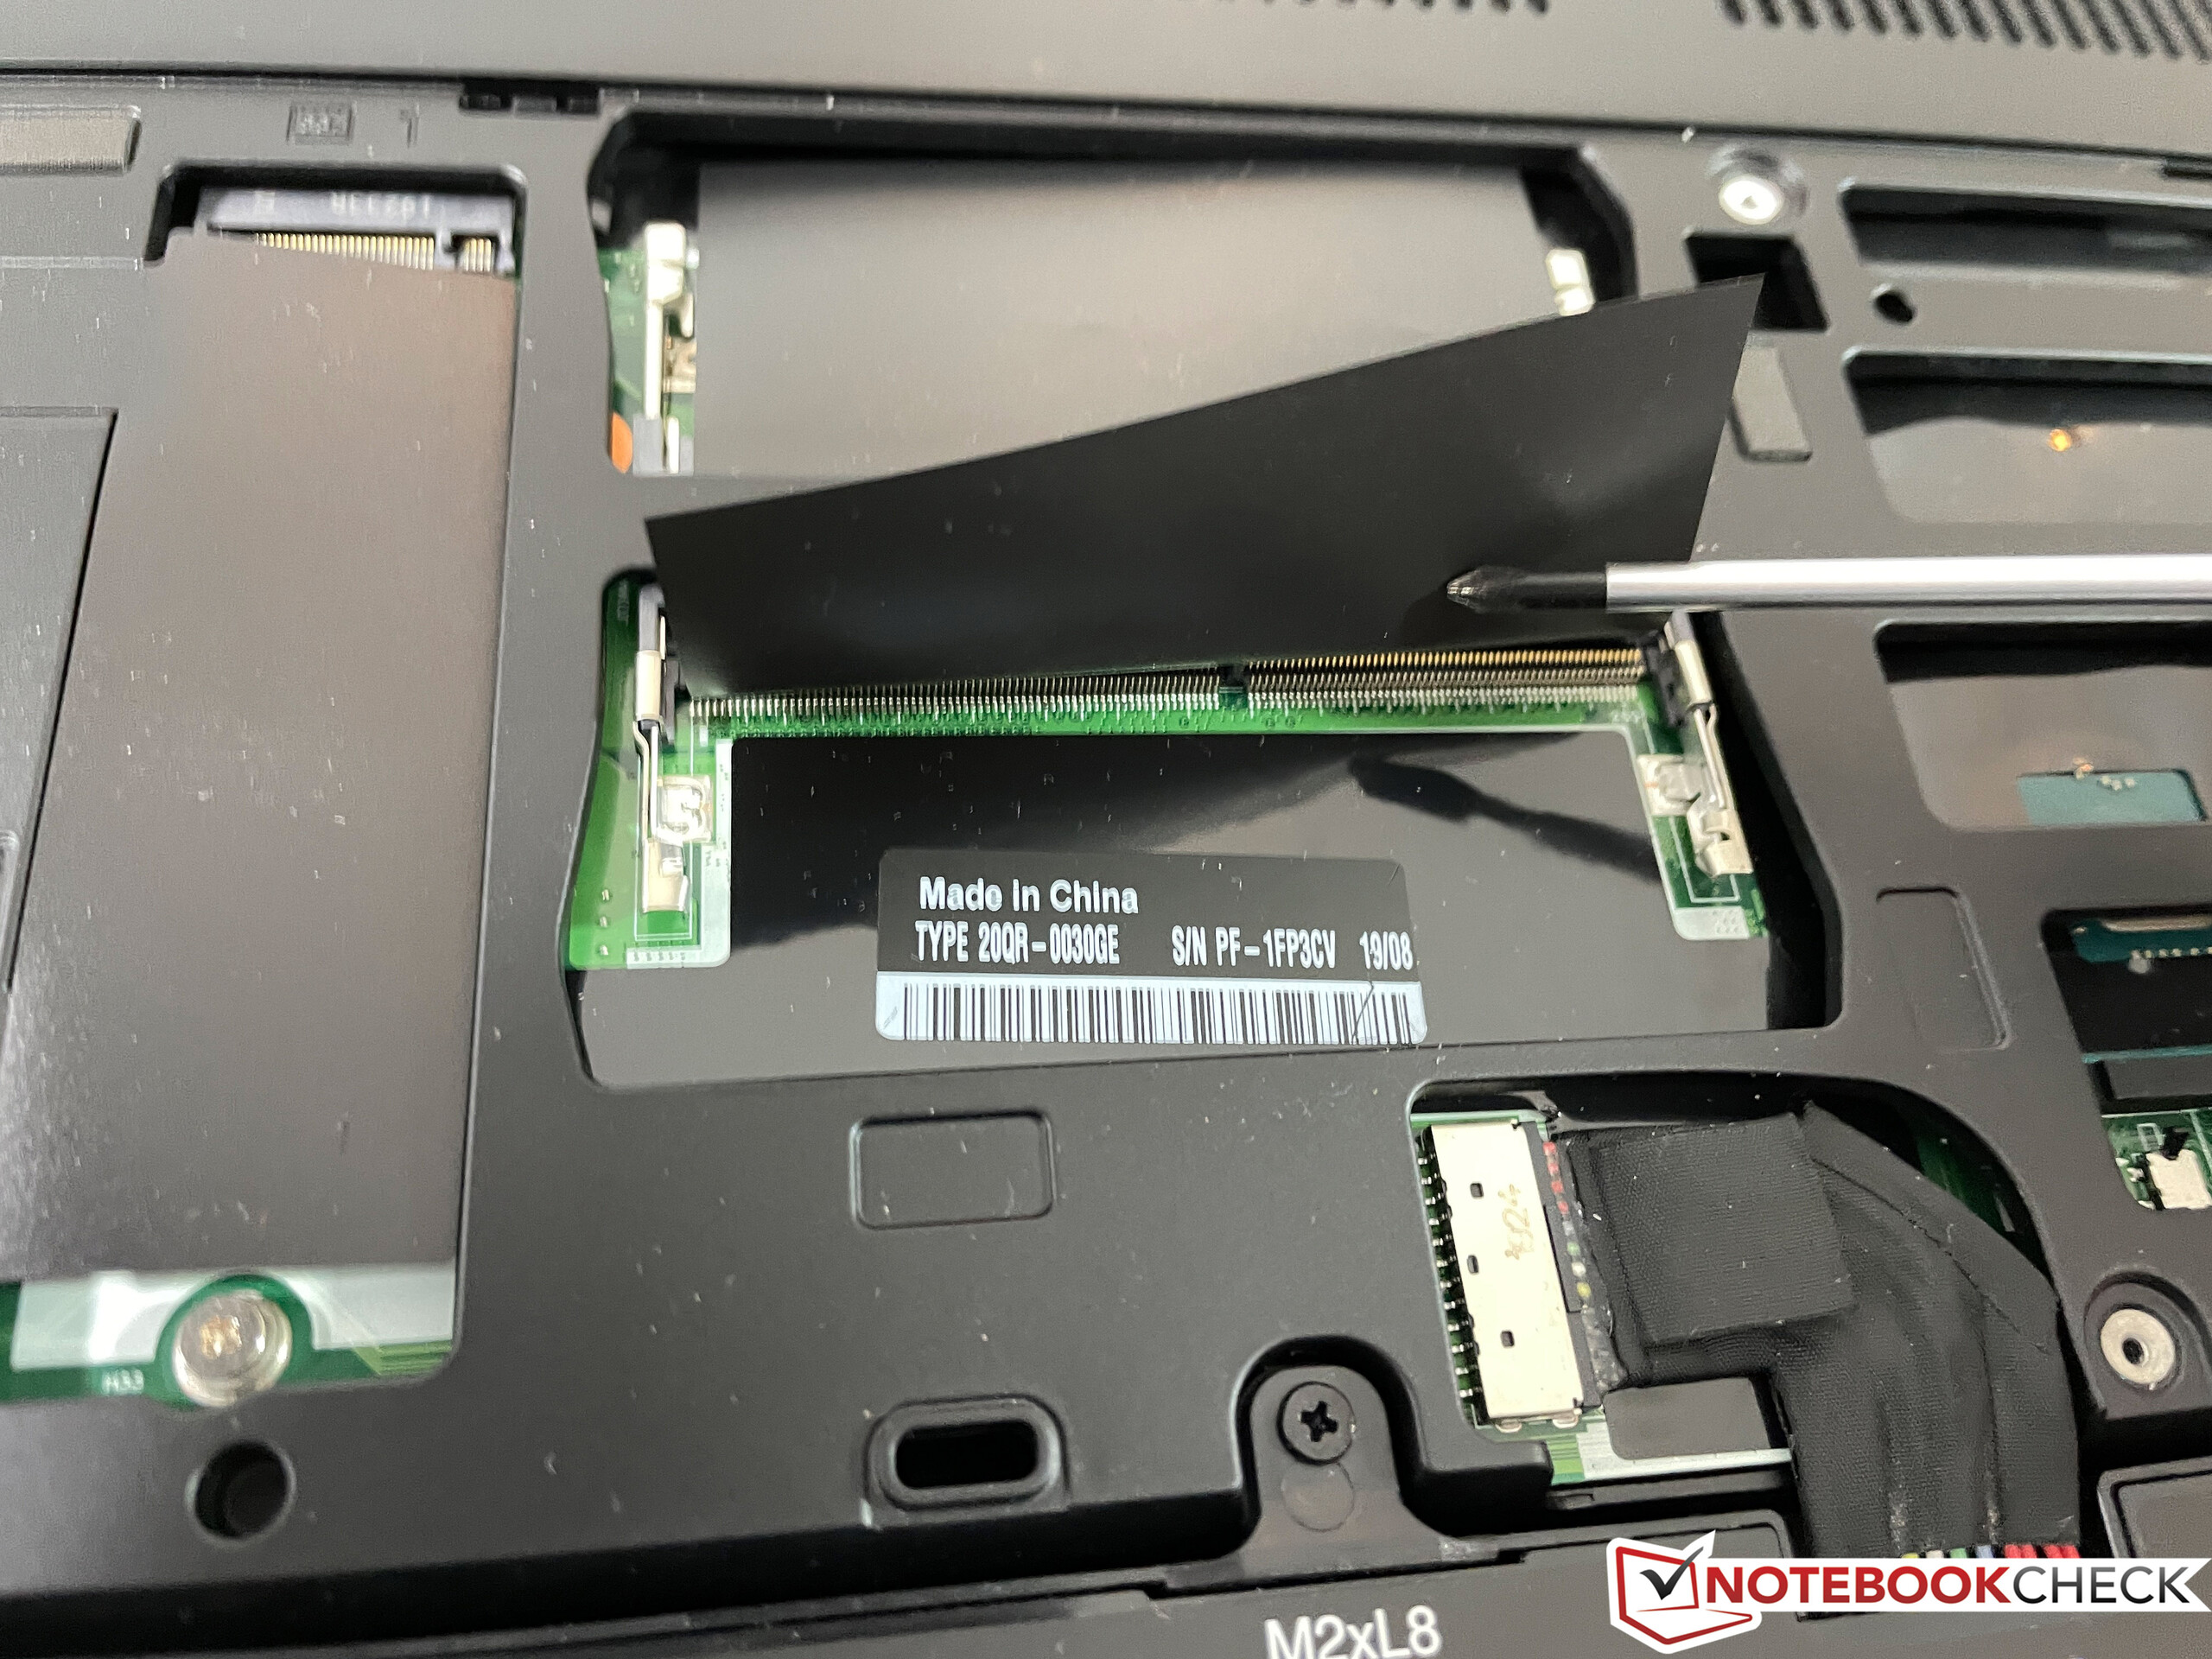
Dispositivos de armazenamento - 2x PCIe-SSD
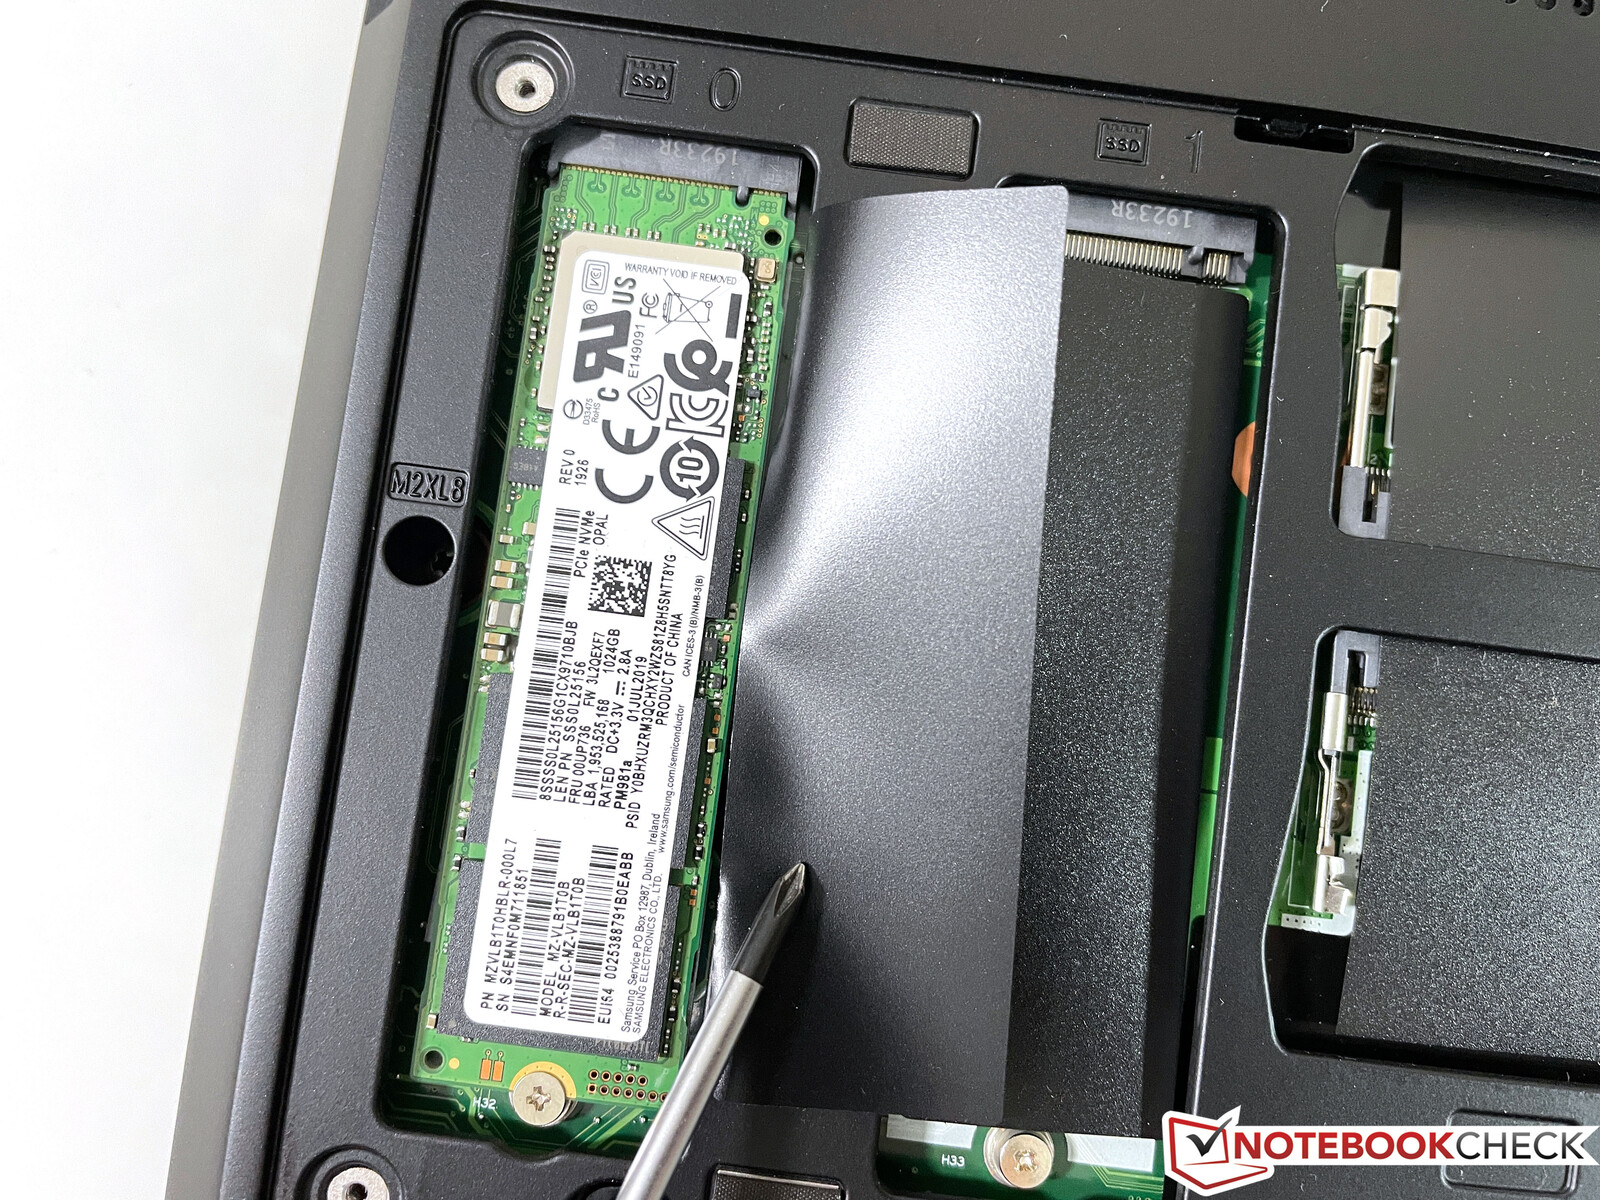
O ThinkPad P73 oferece dois slots para SSDs M.2-2282 com interface rápida PCIe-x4-3.0. Nossa unidade de teste é equipada com um único drive PM981a da Samsung com capacidade de armazenamento de 1 TB, e você pode usar 900 GB após a configuração inicial. O desempenho do SSD NVMe é muito bom em todos os testes.
O chassi tem espaço para um drive adicional de 2,5 polegadas, mas os cabos e ferramentas de montagem necessários não são fornecidos
| Lenovo ThinkPad P73-20QR0030GE Samsung PM981a MZVLB1T0HBLR | Acer ConceptD 9 Pro WDC PC SN720 SDAQNTW-1T00 | Asus ProArt StudioBook Pro 17 W700G3T Samsung SSD PM981 MZVLB1T0HALR | MSI WE75 9TK Samsung SSD PM981 MZVLB512HAJQ | Lenovo ThinkPad P73-20QR002DGE Intel SSD Pro 7600p SSDPEKKF512G8L | Média Samsung PM981a MZVLB1T0HBLR | |
|---|---|---|---|---|---|---|
| CrystalDiskMark 5.2 / 6 | 21% | 16% | 13% | 10% | 12% | |
| Write 4K (MB/s) | 150.1 | 176 17% | 147.6 -2% | 135.4 -10% | 154.3 3% | 139.7 ? -7% |
| Read 4K (MB/s) | 48.48 | 48.06 -1% | 47.57 -2% | 56.6 17% | 66.4 37% | 49.9 ? 3% |
| Write Seq (MB/s) | 1414 | 2736 93% | 2222 57% | 1972 39% | 1561 10% | 2036 ? 44% |
| Read Seq (MB/s) | 1262 | 2381 89% | 2543 102% | 2101 66% | 2460 95% | 2014 ? 60% |
| Write 4K Q32T1 (MB/s) | 430.7 | 418.6 -3% | 459.2 7% | 527 22% | 438 2% | 461 ? 7% |
| Read 4K Q32T1 (MB/s) | 539 | 460.8 -15% | 515 -4% | 578 7% | 568 5% | 499 ? -7% |
| Write Seq Q32T1 (MB/s) | 2983 | 2791 -6% | 2167 -27% | 1985 -33% | 1581 -47% | 2903 ? -3% |
| Read Seq Q32T1 (MB/s) | 3549 | 3430 -3% | 3430 -3% | 3358 -5% | 2724 -23% | 3479 ? -2% |
| Write 4K Q8T8 (MB/s) | 1000 | 1491 ? | ||||
| Read 4K Q8T8 (MB/s) | 928 | 1499 ? | ||||
| AS SSD | -15% | -6% | -41% | -31% | -13% | |
| Seq Read (MB/s) | 2627 | 2995 14% | 2958 13% | 1308 -50% | 2693 3% | 2553 ? -3% |
| Seq Write (MB/s) | 2375 | 2640 11% | 2350 -1% | 1871 -21% | 1542 -35% | 2084 ? -12% |
| 4K Read (MB/s) | 53.5 | 22.54 -58% | 56.6 6% | 48.35 -10% | 62.6 17% | 53.1 ? -1% |
| 4K Write (MB/s) | 139.4 | 103.2 -26% | 106.1 -24% | 106.6 -24% | 149.5 7% | 131.2 ? -6% |
| 4K-64 Read (MB/s) | 1779 | 1570 -12% | 1836 3% | 1510 -15% | 871 -51% | 1477 ? -17% |
| 4K-64 Write (MB/s) | 1955 | 1540 -21% | 1789 -8% | 1715 -12% | 1006 -49% | 1805 ? -8% |
| Access Time Read * (ms) | 0.055 | 0.061 -11% | 0.103 -87% | 0.058 -5% | 0.04983 ? 9% | |
| Access Time Write * (ms) | 0.027 | 0.036 -33% | 0.036 -33% | 0.106 -293% | 0.067 -148% | 0.04222 ? -56% |
| Score Read (Points) | 2095 | 1892 -10% | 2189 4% | 1689 -19% | 1203 -43% | 1786 ? -15% |
| Score Write (Points) | 2332 | 1907 -18% | 2130 -9% | 2008 -14% | 1309 -44% | 2144 ? -8% |
| Score Total (Points) | 5489 | 4739 -14% | 5411 -1% | 4594 -16% | 3088 -44% | 4826 ? -12% |
| Copy ISO MB/s (MB/s) | 2932 | 2212 -25% | 2343 -20% | 1716 -41% | 2098 ? -28% | |
| Copy Program MB/s (MB/s) | 595 | 537 -10% | 526 -12% | 542 -9% | 500 ? -16% | |
| Copy Game MB/s (MB/s) | 1264 | 1335 6% | 1506 19% | 1375 9% | 1132 ? -10% | |
| Média Total (Programa/Configurações) | 3% /
-1% | 5% /
4% | -14% /
-21% | -11% /
-16% | -1% /
-4% |
* ... menor é melhor

DiskSpd Read Loop, Queue Depth 8
GPU Performance - Quadro RTX 4000 com 8 GB de VRAM
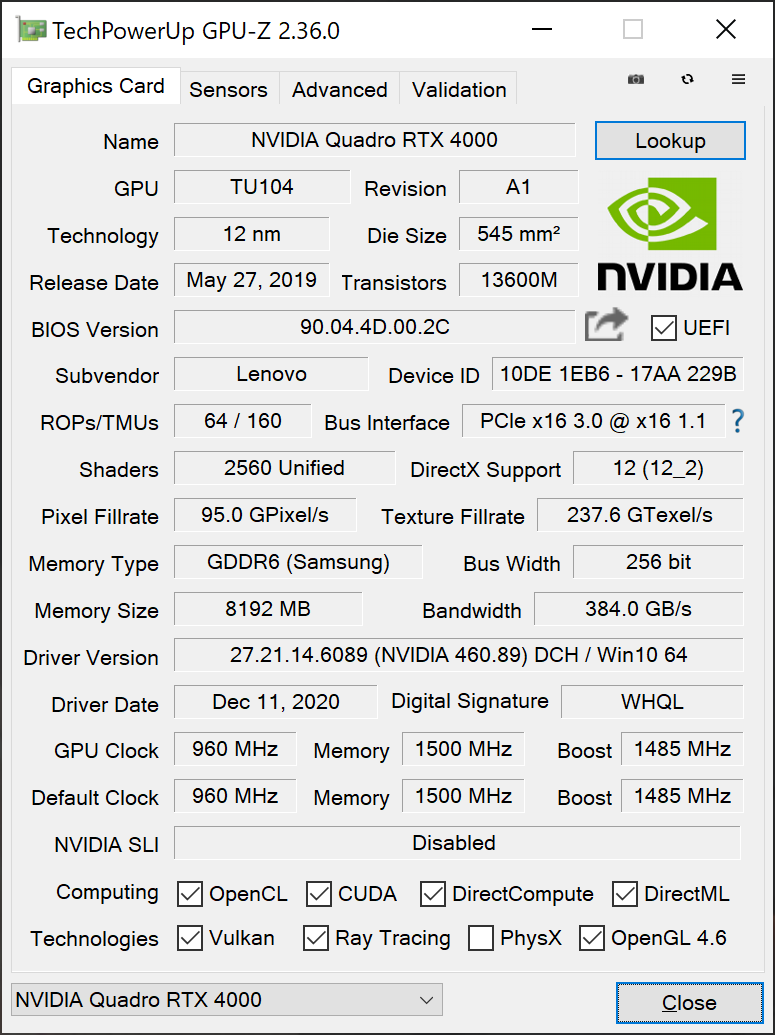
A Lenovo não utiliza o adaptador gráfico integrado do processador. Ao invés disso, a Nvidia Quadro RTX 4000 dedicada cuida dos cálculos gráficos o tempo todo. O RTX 4000 existe desde meados de 2019, mas ainda é uma GPU de alta qualidade
Algumas atualizações de BIOS foram necessárias, mas a P73 pode agora utilizar todo o potencial do RTX 4000 e os resultados também são ligeiramente melhores que os valores médios de outros dispositivos RTX 4000 em nosso banco de dados. Como esperado, o desempenho está bem no meio entre o RTX 3000 e o RTX 5000
, embora possa haver diferenças dependendo das versões individuais. Este não é apenas o caso dos testes 3DMark, mas também dos cenários profissionais que testamos com o SPECviewperf.Também verificamos o desempenho sob cargas de trabalho sustentadas com o exigente teste de estresse 3DMark Time Spy, e o P73 passou no teste (98,3 %). O desempenho é, no entanto, significativamente menor com relação à energia da bateria, e você tem que esperar um déficit de ~70 %.
| 3DMark 11 - 1280x720 Performance GPU | |
| Média da turma Workstation (10888 - 69594, n=25, últimos 2 anos) | |
| Acer ConceptD 9 Pro | |
| Lenovo ThinkPad P73-20QR0030GE | |
| Média NVIDIA Quadro RTX 4000 (Laptop) (23739 - 27002, n=2) | |
| MSI WE75 9TK | |
| Lenovo ThinkPad P73-20QR002DGE | |
| Asus ProArt StudioBook Pro 17 W700G3T | |
| 3DMark | |
| 1920x1080 Fire Strike Graphics | |
| Média da turma Workstation (7578 - 52560, n=25, últimos 2 anos) | |
| Acer ConceptD 9 Pro | |
| Lenovo ThinkPad P73-20QR0030GE | |
| Média NVIDIA Quadro RTX 4000 (Laptop) (17619 - 20079, n=2) | |
| MSI WE75 9TK | |
| Lenovo ThinkPad P73-20QR002DGE | |
| Asus ProArt StudioBook Pro 17 W700G3T | |
| 2560x1440 Time Spy Graphics | |
| Média da turma Workstation (2725 - 24806, n=25, últimos 2 anos) | |
| Acer ConceptD 9 Pro | |
| Lenovo ThinkPad P73-20QR0030GE | |
| Média NVIDIA Quadro RTX 4000 (Laptop) (6851 - 7717, n=2) | |
| MSI WE75 9TK | |
| Lenovo ThinkPad P73-20QR002DGE | |
| Asus ProArt StudioBook Pro 17 W700G3T | |
| 3DMark 11 Performance | 23310 pontos | |
| 3DMark Fire Strike Score | 17894 pontos | |
| 3DMark Time Spy Score | 7901 pontos | |
Ajuda | ||
Desempenho nos jogos
O desempenho do Quadro RTX 4000 é aproximadamente comparável com um RTX 207GeForce 0 ou 2080 Max-Q. Os pilotos Quadro trabalham muito bem com jogos nos últimos dois anos, apenas títulos novinhos em folha podem mostrar uma mensagem de aviso para os pilotos (mas os jogos normalmente ainda rodam). Não tivemos nenhum problema e o desempenho dos jogos é, como esperado, muito bom. Muitos jogos podem ser jogados com a resolução nativa de 4K e detalhes máximos; apenas títulos muito exigentes requerem uma redução da resolução ou das configurações
| baixo | média | alto | ultra | QHD | 4K | |
|---|---|---|---|---|---|---|
| The Witcher 3 (2015) | 345 | 254 | 153 | 79 | 56 | |
| Dota 2 Reborn (2015) | 146 | 135 | 130 | 124 | 111 | |
| X-Plane 11.11 (2018) | 122 | 110 | 90.2 | 76.6 | ||
| Far Cry New Dawn (2019) | 118 | 104 | 103 | 94 | 82 | 46 |
| F1 2020 (2020) | 283 | 207 | 171 | 121 | 89 | 50 |
Emissões - Ventiladores silenciosos
Ruído do sistema
Os ventiladores permanecem bastante silenciosos sob carga a cerca de 40 dB(A) quando se considera o desempenho. O murmúrio dos ventiladores dificilmente é irritante ou agudo. Na prática, você pode notar a falta do iGPU, porque um dos ventiladores frequentemente começa a girar quando você enfatiza um pouco o GPU da Nvidia, o que não seria o caso com um iGPU eficiente
Os ventiladores eram mais silenciosos em geral antes das atualizações da BIOS, mas isto obviamente afetou o desempenho. Não notamos nenhum som eletrônico ou lamúria da bobina durante nosso período de revisão
Barulho
| Ocioso |
| 29.5 / 29.5 / 30.2 dB |
| Carga |
| 36.5 / 39.6 dB |
 | ||
30 dB silencioso 40 dB(A) audível 50 dB(A) ruidosamente alto |
||
min: | ||
| Lenovo ThinkPad P73-20QR0030GE Quadro RTX 4000 (Laptop), i9-9880H, Samsung PM981a MZVLB1T0HBLR | Acer ConceptD 9 Pro Quadro RTX 5000 (Laptop), i9-9980HK, WDC PC SN720 SDAQNTW-1T00 | Asus ProArt StudioBook Pro 17 W700G3T Quadro RTX 3000 Max-Q, i7-9750H, Samsung SSD PM981 MZVLB1T0HALR | MSI WE75 9TK Quadro RTX 3000 (Laptop), i7-9750H, Samsung SSD PM981 MZVLB512HAJQ | Lenovo ThinkPad P73-20QR002DGE Quadro RTX 3000 (Laptop), i7-9850H, Intel SSD Pro 7600p SSDPEKKF512G8L | |
|---|---|---|---|---|---|
| Noise | -9% | 8% | -6% | 9% | |
| desligado / ambiente * (dB) | 29.5 | 30.8 -4% | 29.4 -0% | 28.5 3% | 29.3 1% |
| Idle Minimum * (dB) | 29.5 | 31.6 -7% | 29.4 -0% | 29 2% | 29.3 1% |
| Idle Average * (dB) | 29.5 | 31.6 -7% | 29.9 -1% | 29 2% | 29.3 1% |
| Idle Maximum * (dB) | 30.2 | 31.9 -6% | 29.9 1% | 31.5 -4% | 29.3 3% |
| Load Average * (dB) | 36.5 | 41.2 -13% | 31.6 13% | 32 12% | 30.2 17% |
| Witcher 3 ultra * (dB) | 39.6 | 44.6 -13% | 31.6 20% | 44.7 -13% | 30.7 22% |
| Load Maximum * (dB) | 39.6 | 44.1 -11% | 31.6 20% | 56.5 -43% | 33.1 16% |
* ... menor é melhor
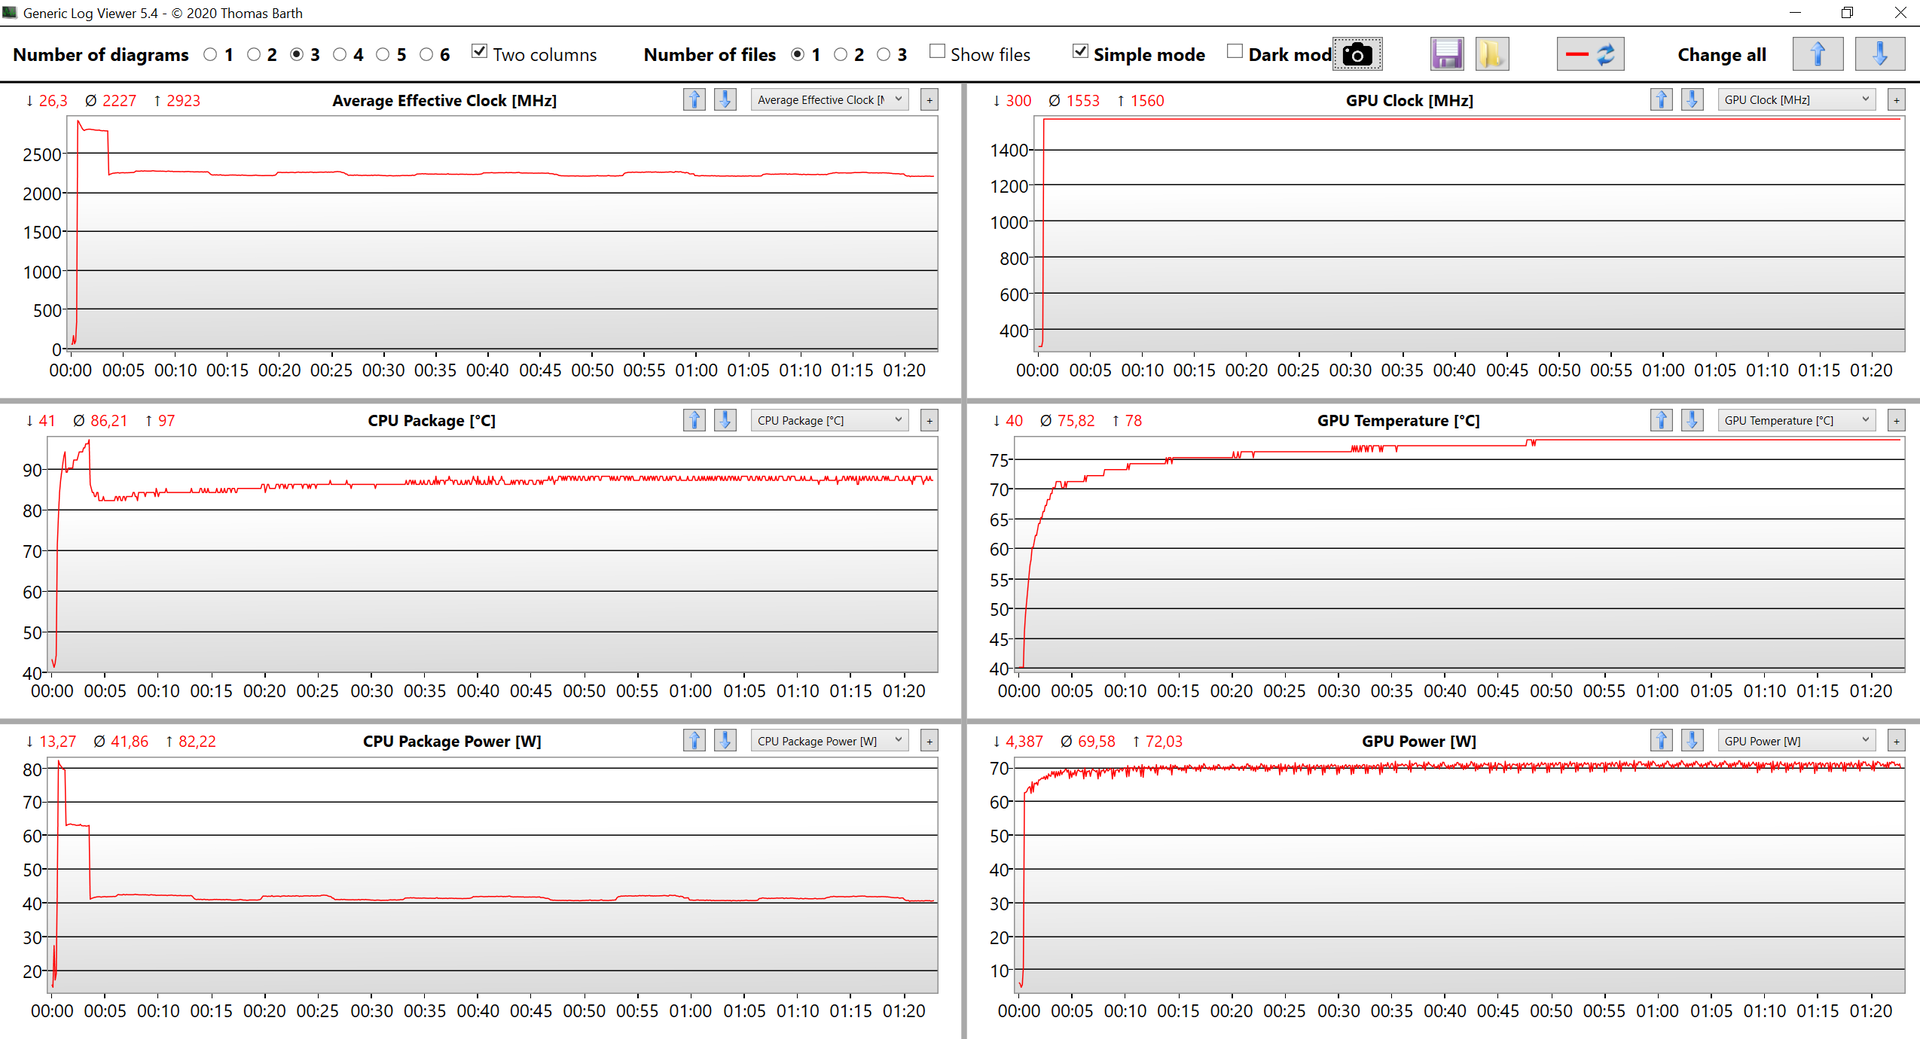
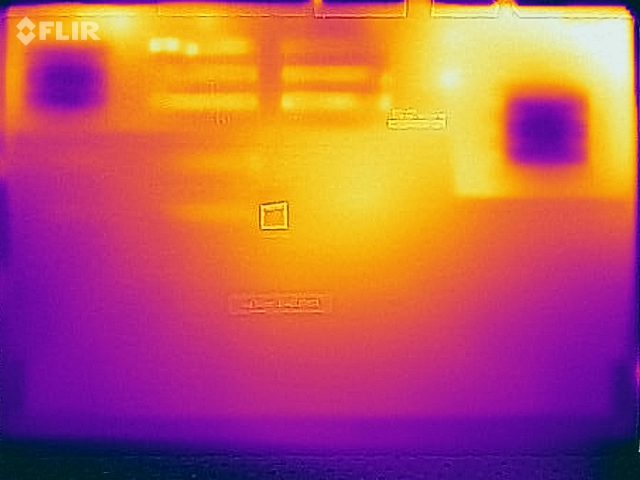
Temperatura
A Lenovo faz um bom trabalho com as temperaturas da superfície, pois ainda é possível colocar o dispositivo no colo durante o teste de estresse (embora isto seja improvável devido às dimensões do caderno). É interessante que o canto superior esquerdo sobre a unidade base é um pouco mais quente a quase 50 °C, mas o hotspot está localizado acima do teclado, portanto não há limitações. A parte traseira do notebook também aquece visivelmente enquanto ocioso, o que é mais uma vez causado pela falta do iGPU.
Nosso teste de estresse mostra que o desempenho das placas gráficas é estável, mesmo em cenários de carga de trabalho combinada. O desempenho da CPU, entretanto, é reduzido, e os 70 W que vimos durante a carga da CPU apenas não podem ser mantidos. Uma olhada no diagrama a seguir mostra que o consumo da CPU cai para cerca de 42 W e 8x ~2,2 GHz após alguns minutos. Não há limitações de desempenho imediatamente após o teste de estresse
(-) A temperatura máxima no lado superior é 49.2 °C / 121 F, em comparação com a média de 38.2 °C / 101 F , variando de 22.2 a 69.8 °C para a classe Workstation.
(-) A parte inferior aquece até um máximo de 45.2 °C / 113 F, em comparação com a média de 41.1 °C / 106 F
(+) Em uso inativo, a temperatura média para o lado superior é 30.5 °C / 87 F, em comparação com a média do dispositivo de 32 °C / ### class_avg_f### F.
(+) Os apoios para as mãos e o touchpad estão atingindo a temperatura máxima da pele (32.6 °C / 90.7 F) e, portanto, não estão quentes.
(-) A temperatura média da área do apoio para as mãos de dispositivos semelhantes foi 27.8 °C / 82 F (-4.8 °C / -8.7 F).

Oradores
Lenovo ThinkPad P73-20QR0030GE análise de áudio
(±) | o volume do alto-falante é médio, mas bom (###valor### dB)
Graves 100 - 315Hz
(-) | quase nenhum baixo - em média 16.2% menor que a mediana
(±) | a linearidade dos graves é média (13% delta para a frequência anterior)
Médios 400 - 2.000 Hz
(±) | médios mais altos - em média 5.4% maior que a mediana
(+) | médios são lineares (5.6% delta para frequência anterior)
Altos 2 - 16 kHz
(+) | agudos equilibrados - apenas 4.9% longe da mediana
(+) | os máximos são lineares (6.2% delta da frequência anterior)
Geral 100 - 16.000 Hz
(±) | a linearidade do som geral é média (25.8% diferença em relação à mediana)
Comparado com a mesma classe
» 87% de todos os dispositivos testados nesta classe foram melhores, 6% semelhantes, 7% piores
» O melhor teve um delta de 7%, a média foi 17%, o pior foi 35%
Comparado com todos os dispositivos testados
» 79% de todos os dispositivos testados foram melhores, 4% semelhantes, 17% piores
» O melhor teve um delta de 4%, a média foi 24%, o pior foi 134%
Acer ConceptD 9 Pro análise de áudio
(-) | alto-falantes não muito altos (###valor### dB)
Graves 100 - 315Hz
(-) | quase nenhum baixo - em média 22.1% menor que a mediana
(±) | a linearidade dos graves é média (11.8% delta para a frequência anterior)
Médios 400 - 2.000 Hz
(+) | médios equilibrados - apenas 3.4% longe da mediana
(±) | a linearidade dos médios é média (7.2% delta para frequência anterior)
Altos 2 - 16 kHz
(+) | agudos equilibrados - apenas 3.3% longe da mediana
(±) | a linearidade dos máximos é média (10.1% delta para frequência anterior)
Geral 100 - 16.000 Hz
(±) | a linearidade do som geral é média (20.8% diferença em relação à mediana)
Comparado com a mesma classe
» 75% de todos os dispositivos testados nesta classe foram melhores, 6% semelhantes, 18% piores
» O melhor teve um delta de 7%, a média foi 17%, o pior foi 35%
Comparado com todos os dispositivos testados
» 56% de todos os dispositivos testados foram melhores, 8% semelhantes, 36% piores
» O melhor teve um delta de 4%, a média foi 24%, o pior foi 134%
Gerenciamento de energia - A falta de iGPU prejudica o tempo de funcionamento da bateria
Consumo de energia
Já mencionamos o iGPU desativado do processador. A utilização constante da GPU Quadro dedicada em combinação com o painel 4K aumenta notavelmente o consumo de energia em cenários de inatividade. Dependendo do nível de brilho, podemos medir entre 21-36 W, e portanto quase o dobro da unidade de revisão anterior do ThinkPad P73.
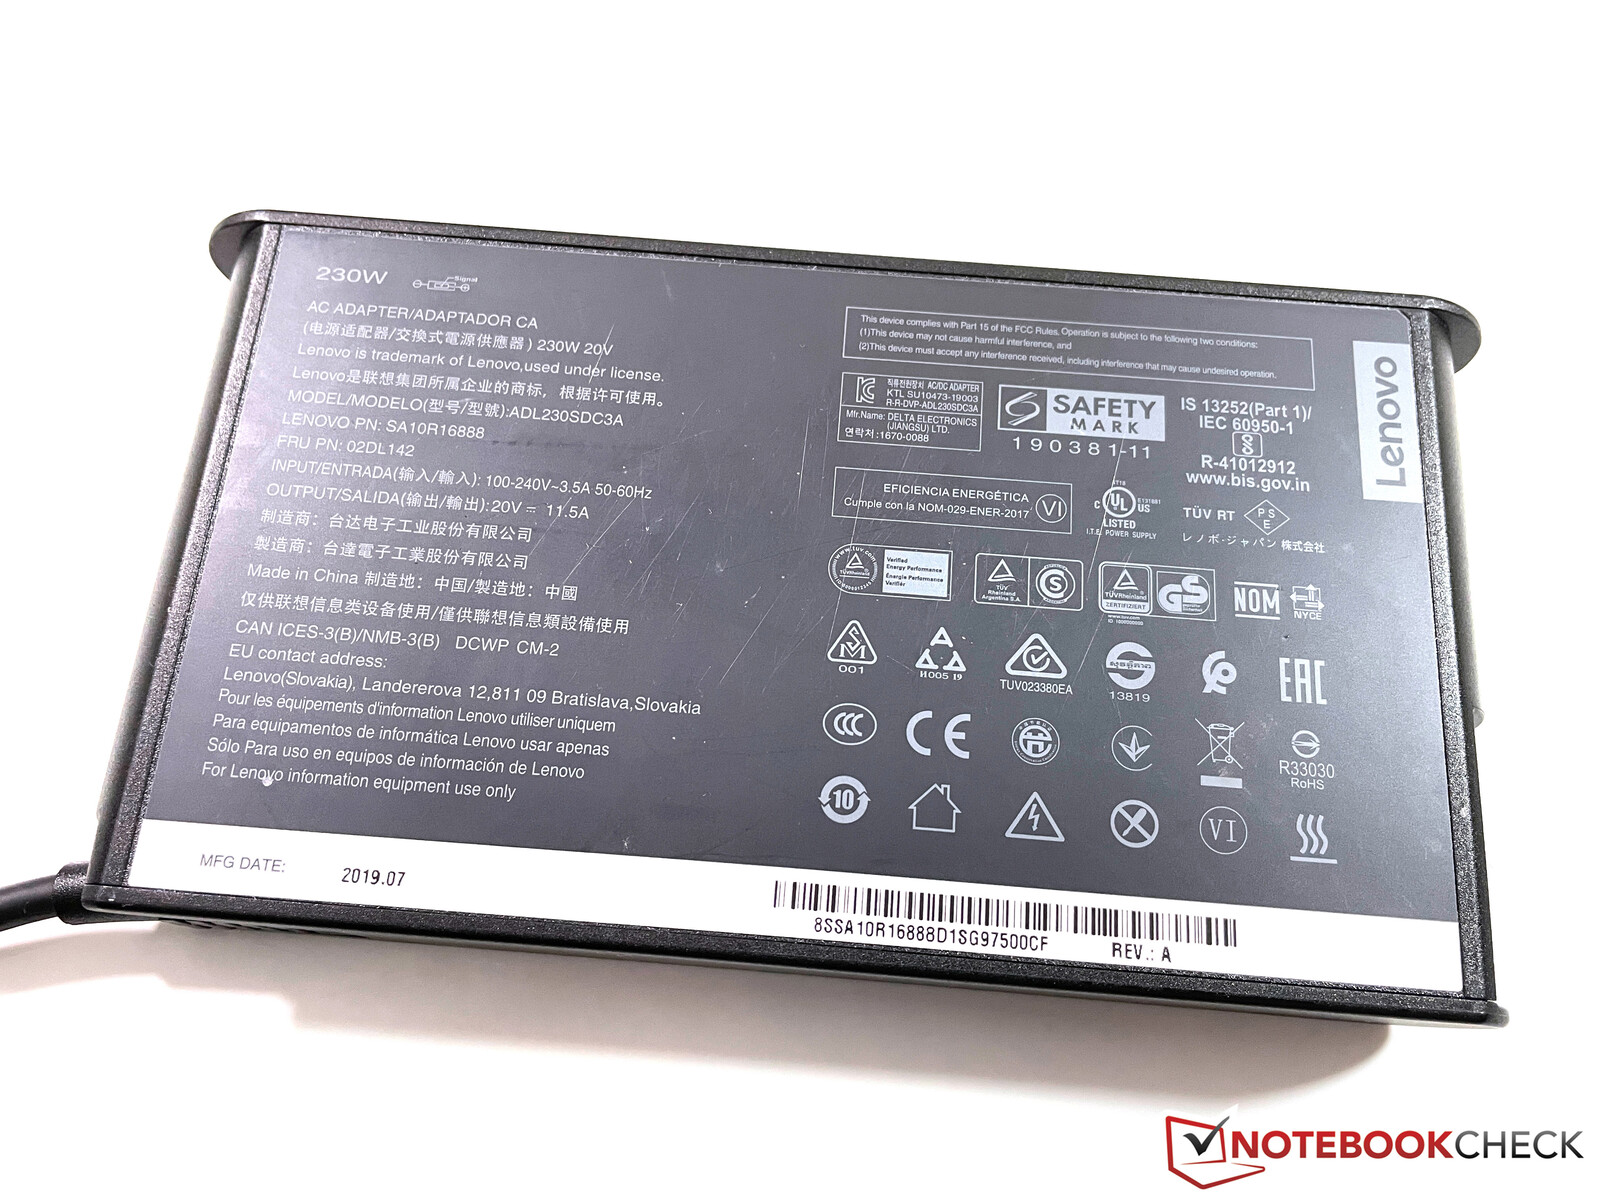
O consumo máximo é de cerca de 215 W, mas este valor se estabilizará em torno de 170 W. Isto significa que o adaptador de energia de 230 W fornecido é completamente suficiente. a propósito, não é possível carregar o dispositivo via USB-C
| desligado | |
| Ocioso | |
| Carga |
|
Key:
min: | |
| Lenovo ThinkPad P73-20QR0030GE i9-9880H, Quadro RTX 4000 (Laptop), Samsung PM981a MZVLB1T0HBLR, IPS, 3840x2160, 17.3" | Acer ConceptD 9 Pro i9-9980HK, Quadro RTX 5000 (Laptop), WDC PC SN720 SDAQNTW-1T00, IPS, 3840x2160, 17.3" | Asus ProArt StudioBook Pro 17 W700G3T i7-9750H, Quadro RTX 3000 Max-Q, Samsung SSD PM981 MZVLB1T0HALR, IPS, 1920x1200, 17" | MSI WE75 9TK i7-9750H, Quadro RTX 3000 (Laptop), Samsung SSD PM981 MZVLB512HAJQ, IPS, 1920x1080, 17.3" | Lenovo ThinkPad P73-20QR002DGE i7-9850H, Quadro RTX 3000 (Laptop), Intel SSD Pro 7600p SSDPEKKF512G8L, IPS LED, 1920x1080, 17.3" | Média NVIDIA Quadro RTX 4000 (Laptop) | Média da turma Workstation | |
|---|---|---|---|---|---|---|---|
| Power Consumption | 1% | 36% | 29% | 35% | 12% | 39% | |
| Idle Minimum * (Watt) | 21 | 18.8 10% | 11.3 46% | 12.1 42% | 8.9 58% | 18.7 ? 11% | 8.94 ? 57% |
| Idle Average * (Watt) | 30.4 | 25 18% | 16 47% | 18.4 39% | 12.8 58% | 26 ? 14% | 13.8 ? 55% |
| Idle Maximum * (Watt) | 35.8 | 30 16% | 16.8 53% | 18.8 47% | 16.4 54% | 29.3 ? 18% | 17.5 ? 51% |
| Load Average * (Watt) | 110 | 116 -5% | 93.6 15% | 95.1 14% | 108.4 1% | 99 ? 10% | 95 ? 14% |
| Witcher 3 ultra * (Watt) | 182 | 221 -21% | 106 42% | 135.5 26% | 153 16% | ||
| Load Maximum * (Watt) | 215.4 | 241 -12% | 186.6 13% | 203.7 5% | 166 23% | 204 ? 5% | 175.2 ? 19% |
* ... menor é melhor
Tempo de funcionamento da bateria - P73 com 99 Wh de bateria
A Lenovo integra uma grande bateria de 99 Wh, mas os tempos de funcionamento ainda são bastante curtos devido ao alto consumo de energia. É obviamente questionável a freqüência com que você realmente usará um dispositivo tão grande como o P73 sem um adaptador de energia. Você pode esperar entre 3-4 horas na prática, dependendo do brilho, o que deve ser suficiente para muitas reuniões. Se você realmente enfatizar o dispositivo, a bateria durará pouco mais de 70 minutos
| Lenovo ThinkPad P73-20QR0030GE i9-9880H, Quadro RTX 4000 (Laptop), 99 Wh | Acer ConceptD 9 Pro i9-9980HK, Quadro RTX 5000 (Laptop), 71.9 Wh | Asus ProArt StudioBook Pro 17 W700G3T i7-9750H, Quadro RTX 3000 Max-Q, 57 Wh | MSI WE75 9TK i7-9750H, Quadro RTX 3000 (Laptop), 65 Wh | Lenovo ThinkPad P73-20QR002DGE i7-9850H, Quadro RTX 3000 (Laptop), 99 Wh | Média da turma Workstation | |
|---|---|---|---|---|---|---|
| Duração da bateria | -16% | 54% | 5% | 114% | 90% | |
| H.264 (h) | 4.1 | 3.5 -15% | 6.9 68% | 9.8 139% | 9.51 ? 132% | |
| WiFi v1.3 (h) | 3.9 | 3.6 -8% | 5.9 51% | 4.9 26% | 11.1 185% | 8.53 ? 119% |
| Load (h) | 1.2 | 0.9 -25% | 1.7 42% | 1 -17% | 1.4 17% | 1.429 ? 19% |
Pro
Contra
Veredicto - O desempenho foi melhorado

A utilização do desempenho foi a maior desvantagem em nossa revisão inicial do ThinkPad P73. Levou alguns meses e várias atualizações de BIOS, mas o desempenho da placa gráfica Quadro dedicada está agora no nível esperado
O novo ThinkPad P17 não oferece nenhuma melhoria perceptível em termos de potência de componentes brutos, portanto, o desempenho do P73 ainda é realmente competitivo. O processador Core i9 se beneficia dos altos limites do TDP e oferece desempenho estável, assim como o Quadro RTX 4000 da Nvidia. Aqui não há problemas.
A Lenovo conseguiu melhorar a utilização do desempenho dos componentes graças a várias atualizações da BIOS. Equipado com o Core i9 (9ª geração) e o Nvidia Quadro RTX 4000, o ThinkPad P73 ainda é uma estação de trabalho móvel muito competitiva.
Não estamos completamente convencidos com o painel 4K. A qualidade do quadro subjetivo é boa em geral, mas nossa unidade de revisão sofreu um sangramento visível de luz de fundo e a calibração de fábrica também não é grande. O brilho também é menor do que o anunciado. A Lenovo quer abordar este último com o sucessor ThinkPad P17, mas obviamente ainda temos que testar isso
Lenovo ThinkPad P73-20QR0030GE
- 01/20/2021 v7 (old)
Andreas Osthoff
Price comparison

