Breve Análise do Acer ConceptD 9 Pro: Workstation conversível para profissionais criativos
Avaliação | Data | Modelo | Peso | Altura | Size | Resolução | Preço |
|---|---|---|---|---|---|---|---|
| 86.2 % v7 (old) | 03/2020 | Acer ConceptD 9 Pro i9-9980HK, Quadro RTX 5000 (Laptop) | 4.5 kg | 26.5 mm | 17.30" | 3840x2160 | |
| 86.6 % v7 (old) | Lenovo ThinkPad P73-20QR002DGE i7-9850H, Quadro RTX 3000 (Laptop) | 3.5 kg | 31 mm | 17.30" | 1920x1080 | ||
| 84.8 % v7 (old) | 12/2019 | MSI WE75 9TK i7-9750H, Quadro RTX 3000 (Laptop) | 2.6 kg | 27.5 mm | 17.30" | 1920x1080 | |
| 85.7 % v7 (old) | 05/2019 | Dell Precision 7730 i7-8850H, Quadro P3200 | 3.3 kg | 30 mm | 17.30" | 1920x1080 | |
| 86.3 % v6 (old) | 12/2018 | Eurocom Tornado F7W i9-9900K, Quadro P5200 | 4.2 kg | 51 mm | 17.30" | 3840x2160 | |
| 84.6 % v7 (old) | 02/2019 | Fujitsu Celsius H980 i7-8750H, Quadro P3200 | 3.5 kg | 30 mm | 17.30" | 1920x1080 |


| Networking | |
| iperf3 transmit AX12 | |
| Acer ConceptD 9 Pro | |
| Dell Precision 7730 | |
| Lenovo ThinkPad P73-20QR002DGE | |
| Fujitsu Celsius H980 | |
| Eurocom Tornado F7W | |
| iperf3 receive AX12 | |
| Acer ConceptD 9 Pro | |
| Fujitsu Celsius H980 | |
| Eurocom Tornado F7W | |
| Dell Precision 7730 | |
| Lenovo ThinkPad P73-20QR002DGE | |

, i9-9980HK, WDC PC SN720 SDAQNTW-1T00")
, i9-9980HK, WDC PC SN720 SDAQNTW-1T00")
| |||||||||||||||||||||||||
iluminação: 83 %
iluminação com acumulador: 381 cd/m²
Contraste: 1019:1 (Preto: 0.37 cd/m²)
ΔE ColorChecker Calman: 2.52 | ∀{0.5-29.43 Ø4.71}
calibrated: 1.08
ΔE Greyscale Calman: 3.83 | ∀{0.09-98 Ø4.96}
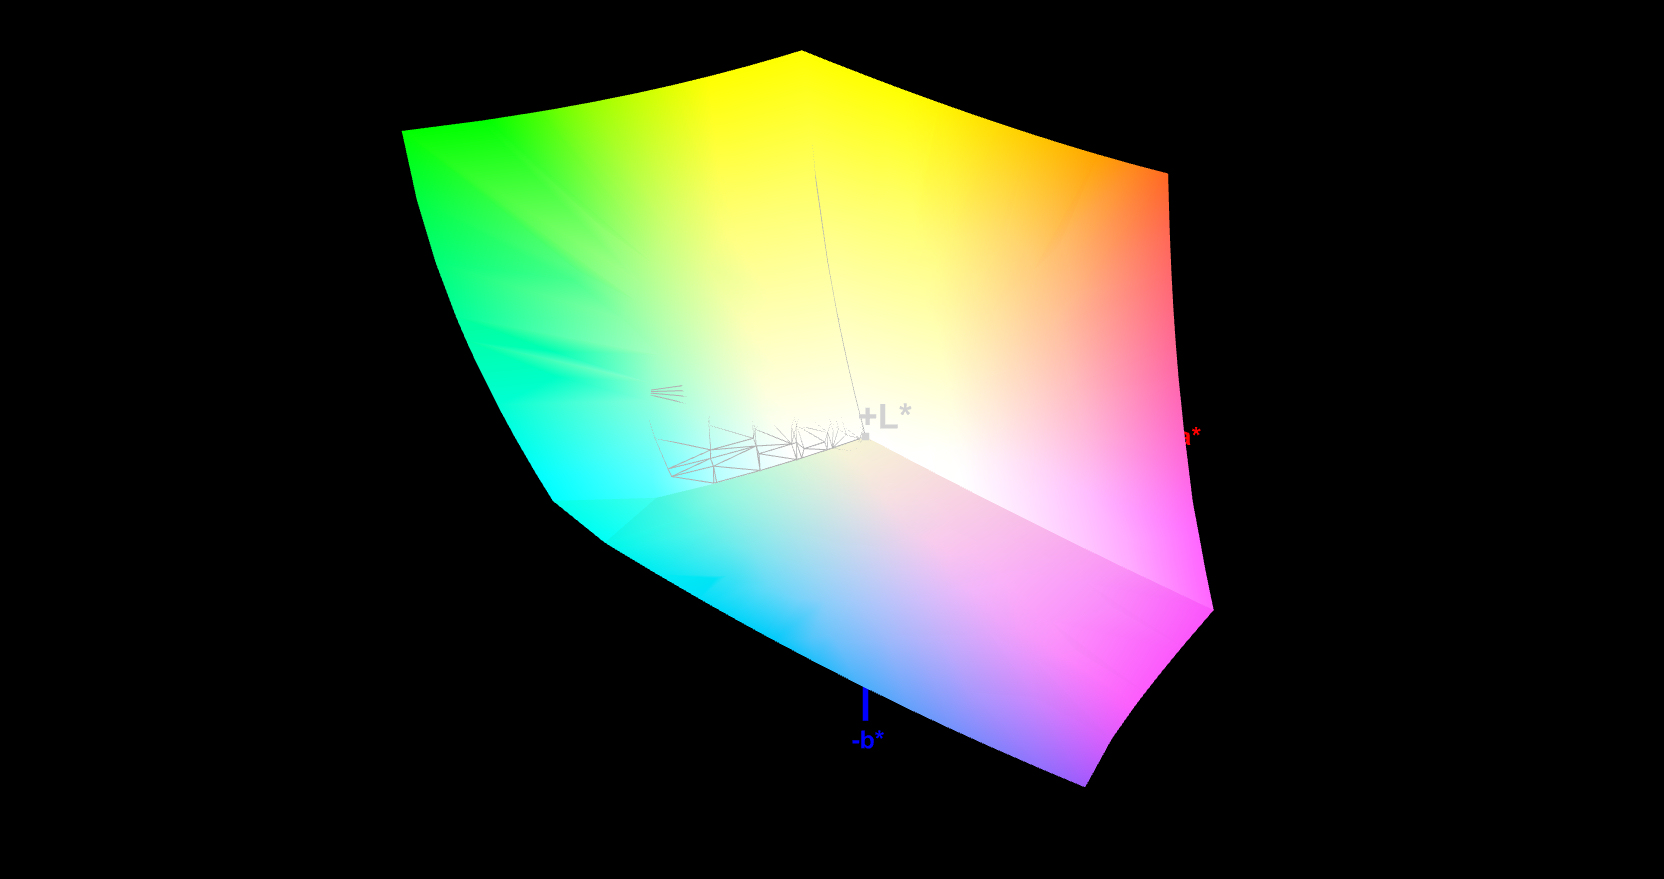
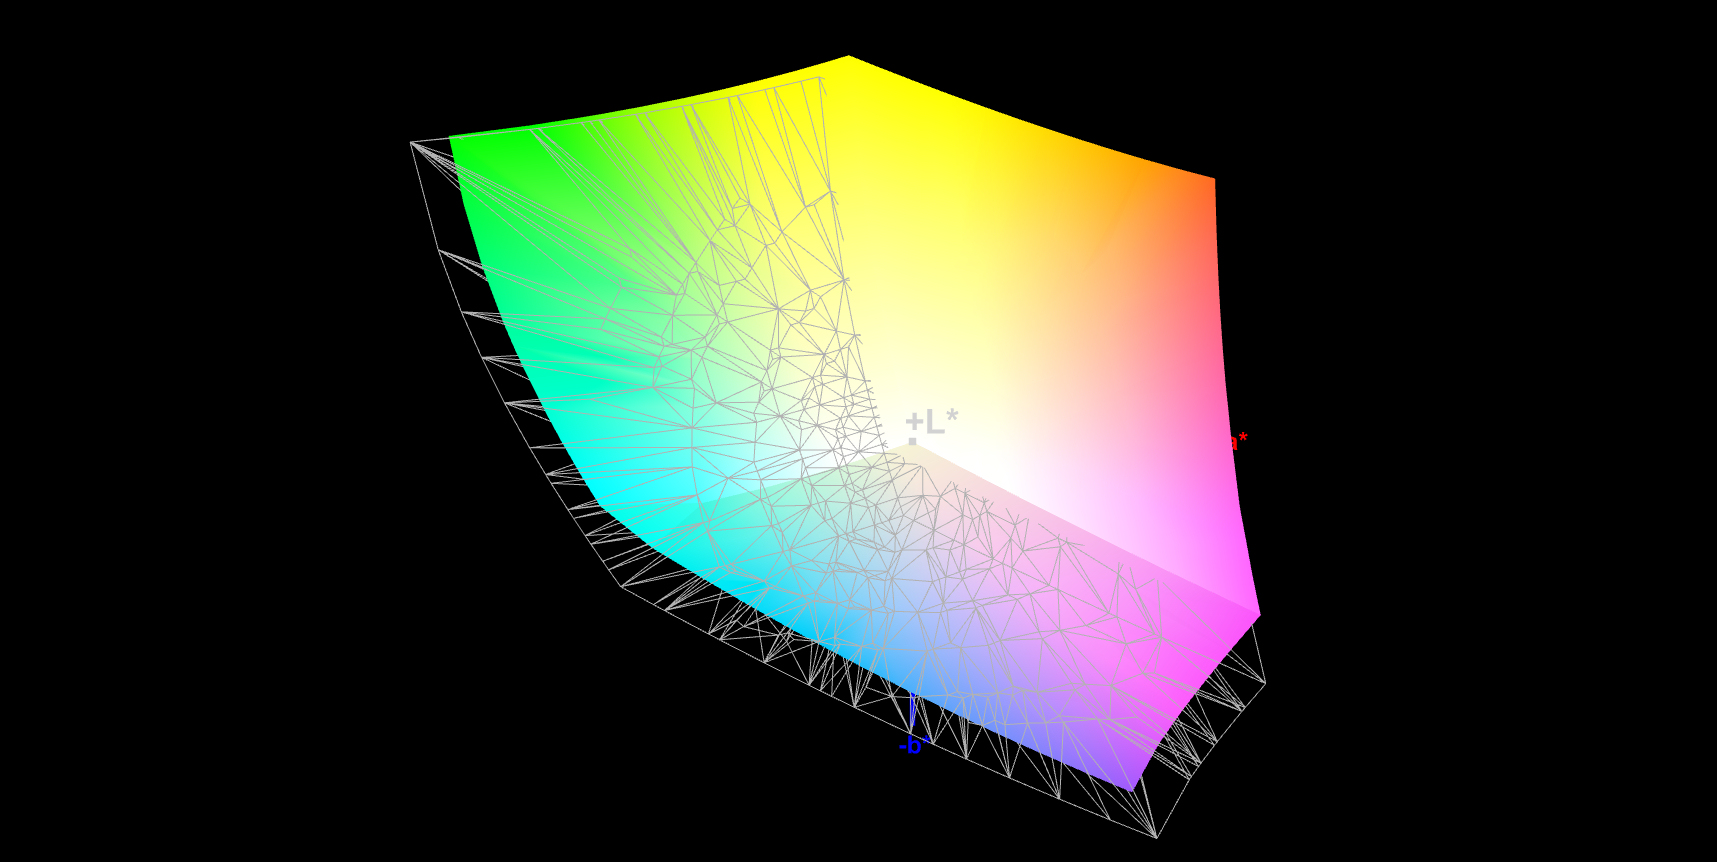
98% sRGB (Argyll 1.6.3 3D)
84% AdobeRGB 1998 (Argyll 1.6.3 3D)
95.1% AdobeRGB 1998 (Argyll 3D)
97.9% sRGB (Argyll 3D)
80.9% Display P3 (Argyll 3D)
Gamma: 2.19
CCT: 6323 K
| Acer ConceptD 9 Pro IPS, 3840x2160, 17.3" | Lenovo ThinkPad P73-20QR002DGE IPS LED, 1920x1080, 17.3" | MSI WE75 9TK IPS, 1920x1080, 17.3" | Dell Precision 7730 IPS LED, 1920x1080, 17.3" | Eurocom Tornado F7W IPS, 3840x2160, 17.3" | Fujitsu Celsius H980 IPS, 1920x1080, 17.3" | |
|---|---|---|---|---|---|---|
| Display | -17% | -21% | -18% | 4% | -22% | |
| Display P3 Coverage (%) | 80.9 | 67.5 -17% | 63.2 -22% | 65 -20% | 85.9 6% | 67.3 -17% |
| sRGB Coverage (%) | 97.9 | 94.2 -4% | 89.9 -8% | 93.4 -5% | 100 2% | 85 -13% |
| AdobeRGB 1998 Coverage (%) | 95.1 | 67.8 -29% | 64.3 -32% | 66.3 -30% | 98.3 3% | 62.2 -35% |
| Response Times | 25% | 29% | 10% | 20% | 33% | |
| Response Time Grey 50% / Grey 80% * (ms) | 53 ? | 40 ? 25% | 30.8 ? 42% | 48.8 ? 8% | 40 ? 25% | 38 ? 28% |
| Response Time Black / White * (ms) | 37 ? | 28 ? 24% | 31.2 ? 16% | 32.8 ? 11% | 31.6 ? 15% | 23.2 ? 37% |
| PWM Frequency (Hz) | 25000 ? | 120500 ? | ||||
| Screen | -28% | -19% | 2% | -54% | -51% | |
| Brightness middle (cd/m²) | 377 | 333 -12% | 287.3 -24% | 322 -15% | 328.2 -13% | 400 6% |
| Brightness (cd/m²) | 368 | 310 -16% | 280 -24% | 316 -14% | 310 -16% | 394 7% |
| Brightness Distribution (%) | 83 | 83 0% | 89 7% | 84 1% | 92 11% | 92 11% |
| Black Level * (cd/m²) | 0.37 | 0.39 -5% | 0.26 30% | 0.24 35% | 0.37 -0% | 0.51 -38% |
| Contrast (:1) | 1019 | 854 -16% | 1105 8% | 1342 32% | 887 -13% | 784 -23% |
| Colorchecker dE 2000 * | 2.52 | 4.4 -75% | 2.98 -18% | 2.2 13% | 6.62 -163% | 5.3 -110% |
| Colorchecker dE 2000 max. * | 5.55 | 7.5 -35% | 5.08 8% | 4.6 17% | 9.49 -71% | 9.3 -68% |
| Colorchecker dE 2000 calibrated * | 1.08 | 2 -85% | 3.06 -183% | 1.9 -76% | 3.93 -264% | 3.8 -252% |
| Greyscale dE 2000 * | 3.83 | 5.1 -33% | 3 22% | 1.6 58% | 6.7 -75% | 5.5 -44% |
| Gamma | 2.19 100% | 2.39 92% | 2.28 96% | 2.19 100% | 2.44 90% | 2.17 101% |
| CCT | 6323 103% | 7061 92% | 6993 93% | 6621 98% | 6462 101% | 6686 97% |
| Color Space (Percent of AdobeRGB 1998) (%) | 84 | 61.1 -27% | 58.1 -31% | 60.4 -28% | 87.9 5% | 55.8 -34% |
| Color Space (Percent of sRGB) (%) | 98 | 94 -4% | 89.5 -9% | 93.3 -5% | 100 2% | 84.9 -13% |
| Média Total (Programa/Configurações) | -7% /
-19% | -4% /
-14% | -2% /
-1% | -10% /
-34% | -13% /
-35% |
* ... menor é melhor
Exibir tempos de resposta
| ↔ Tempo de resposta preto para branco | ||
|---|---|---|
| 37 ms ... ascensão ↗ e queda ↘ combinadas | ↗ 21 ms ascensão | 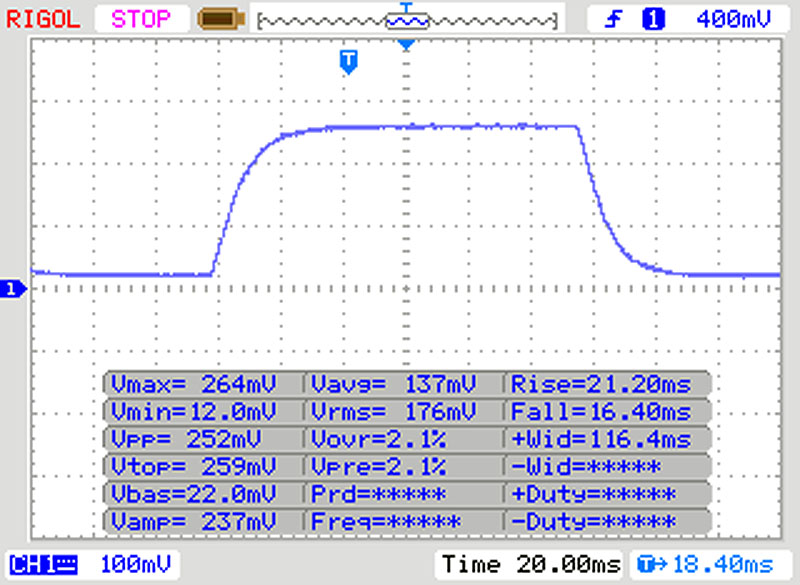 |
| ↘ 16 ms queda | ||
| A tela mostra taxas de resposta lentas em nossos testes e será insatisfatória para os jogadores. Em comparação, todos os dispositivos testados variam de 0.1 (mínimo) a 240 (máximo) ms. » 95 % de todos os dispositivos são melhores. Isso significa que o tempo de resposta medido é pior que a média de todos os dispositivos testados (19.8 ms). | ||
| ↔ Tempo de resposta 50% cinza a 80% cinza | ||
| 53 ms ... ascensão ↗ e queda ↘ combinadas | ↗ 27 ms ascensão | 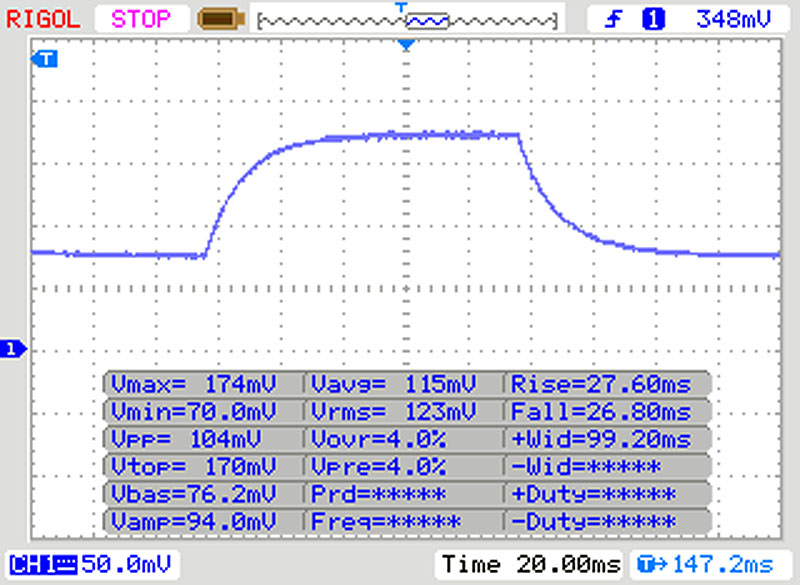 |
| ↘ 26 ms queda | ||
| A tela mostra taxas de resposta lentas em nossos testes e será insatisfatória para os jogadores. Em comparação, todos os dispositivos testados variam de 0.165 (mínimo) a 636 (máximo) ms. » 90 % de todos os dispositivos são melhores. Isso significa que o tempo de resposta medido é pior que a média de todos os dispositivos testados (30.9 ms). | ||
Cintilação da tela / PWM (modulação por largura de pulso)
| Tela tremeluzindo / PWM não detectado |  | ||
[pwm_comparison] Em comparação: 52 % de todos os dispositivos testados não usam PWM para escurecer a tela. Se PWM foi detectado, uma média de 7748 (mínimo: 5 - máximo: 343500) Hz foi medida. | |||


| Cinebench R15 | |
| CPU Single 64Bit | |
| Média da turma Workstation (191.4 - 328, n=23, últimos 2 anos) | |
| Eurocom Tornado F7W | |
| Acer ConceptD 9 Pro | |
| Média Intel Core i9-9980HK (181 - 215, n=13) | |
| Lenovo ThinkPad P73-20QR002DGE | |
| MSI WE75 9TK | |
| Dell Precision 7730 | |
| Fujitsu Celsius H980 | |
| CPU Multi 64Bit | |
| Média da turma Workstation (2489 - 5810, n=23, últimos 2 anos) | |
| Média Intel Core i9-9980HK (1327 - 1930, n=14) | |
| Eurocom Tornado F7W | |
| Acer ConceptD 9 Pro | |
| Dell Precision 7730 | |
| Lenovo ThinkPad P73-20QR002DGE | |
| MSI WE75 9TK | |
| Fujitsu Celsius H980 | |
| Cinebench R10 | |
| Rendering Single 32Bit | |
| Média da turma Workstation (n=1últimos 2 anos) | |
| Média Intel Core i9-9980HK (7709 - 9734, n=4) | |
| Eurocom Tornado F7W | |
| Acer ConceptD 9 Pro | |
| Fujitsu Celsius H980 | |
| Rendering Multiple CPUs 32Bit | |
| Média da turma Workstation (n=1últimos 2 anos) | |
| Média Intel Core i9-9980HK (39440 - 50439, n=4) | |
| Acer ConceptD 9 Pro | |
| Eurocom Tornado F7W | |
| Fujitsu Celsius H980 | |
| Cinebench R20 | |
| CPU (Single Core) | |
| Média da turma Workstation (671 - 857, n=23, últimos 2 anos) | |
| Acer ConceptD 9 Pro | |
| Média Intel Core i9-9980HK (431 - 505, n=10) | |
| MSI WE75 9TK | |
| Lenovo ThinkPad P73-20QR002DGE | |
| Dell Precision 7730 | |
| CPU (Multi Core) | |
| Média da turma Workstation (5760 - 15043, n=23, últimos 2 anos) | |
| Média Intel Core i9-9980HK (2974 - 4150, n=10) | |
| Acer ConceptD 9 Pro | |
| Dell Precision 7730 | |
| MSI WE75 9TK | |
| Lenovo ThinkPad P73-20QR002DGE | |
| Geekbench 3 | |
| 32 Bit Multi-Core Score | |
| Acer ConceptD 9 Pro | |
| Média Intel Core i9-9980HK (n=1) | |
| 32 Bit Single-Core Score | |
| Acer ConceptD 9 Pro | |
| Média Intel Core i9-9980HK (n=1) | |
| Geekbench 4.4 | |
| 64 Bit Multi-Core Score | |
| Média da turma Workstation (n=1últimos 2 anos) | |
| Acer ConceptD 9 Pro | |
| Média Intel Core i9-9980HK (28625 - 30849, n=3) | |
| Eurocom Tornado F7W | |
| Lenovo ThinkPad P73-20QR002DGE | |
| Dell Precision 7730 | |
| 64 Bit Single-Core Score | |
| Média da turma Workstation (n=1últimos 2 anos) | |
| Eurocom Tornado F7W | |
| Acer ConceptD 9 Pro | |
| Média Intel Core i9-9980HK (5617 - 5972, n=3) | |
| Lenovo ThinkPad P73-20QR002DGE | |
| Dell Precision 7730 | |
| Geekbench 5.0 | |
| 5.0 Multi-Core | |
| Média da turma Workstation (n=1últimos 2 anos) | |
| Acer ConceptD 9 Pro | |
| Média Intel Core i9-9980HK (7072 - 7805, n=4) | |
| Lenovo ThinkPad P73-20QR002DGE | |
| 5.0 Single-Core | |
| Média da turma Workstation (n=1últimos 2 anos) | |
| Acer ConceptD 9 Pro | |
| Média Intel Core i9-9980HK (1171 - 1355, n=4) | |
| Lenovo ThinkPad P73-20QR002DGE | |
| Mozilla Kraken 1.1 - Total | |
| Fujitsu Celsius H980 (EDGE: 42.17134.1.0) | |
| Dell Precision 7730 (Edge) | |
| MSI WE75 9TK (Edge 44.17763.831.0) | |
| MSI WE75 9TK | |
| Lenovo ThinkPad P73-20QR002DGE (Edge) | |
| Acer ConceptD 9 Pro (Edge 44) | |
| Média Intel Core i9-9980HK (705 - 999, n=9) | |
| Média da turma Workstation (411 - 538, n=23, últimos 2 anos) | |
| Octane V2 - Total Score | |
| Média da turma Workstation (112382 - 129420, n=3, últimos 2 anos) | |
| Média Intel Core i9-9980HK (40364 - 46473, n=8) | |
| Acer ConceptD 9 Pro (Edge 44) | |
| Lenovo ThinkPad P73-20QR002DGE (Edge) | |
| MSI WE75 9TK (Edge 44.17763.831.0) | |
| Dell Precision 7730 (Edge) | |
| Fujitsu Celsius H980 (EDGE: 42.17134.1.0) | |
| JetStream 1.1 - 1.1 Total | |
| Eurocom Tornado F7W (Edge 42.17134.1.0) | |
| Acer ConceptD 9 Pro (Edge 44) | |
| Média Intel Core i9-9980HK (257 - 318, n=8) | |
| MSI WE75 9TK (Edge 44.17763.831.0) | |
| Fujitsu Celsius H980 (EDGE: 42.17134.1.0) | |
* ... menor é melhor
| PCMark 8 Home Score Accelerated v2 | 4487 pontos | |
| PCMark 8 Creative Score Accelerated v2 | 6412 pontos | |
| PCMark 8 Work Score Accelerated v2 | 4884 pontos | |
| PCMark 10 Score | 6939 pontos | |
Ajuda | ||
| PCMark 8 | |
| Home Score Accelerated v2 | |
| Eurocom Tornado F7W | |
| Dell Precision 7730 | |
| Acer ConceptD 9 Pro | |
| Média Intel Core i9-9980HK, NVIDIA Quadro RTX 5000 (Laptop) (n=1) | |
| Fujitsu Celsius H980 | |
| MSI WE75 9TK | |
| Lenovo ThinkPad P73-20QR002DGE | |
| Work Score Accelerated v2 | |
| MSI WE75 9TK | |
| Dell Precision 7730 | |
| Lenovo ThinkPad P73-20QR002DGE | |
| Fujitsu Celsius H980 | |
| Acer ConceptD 9 Pro | |
| Média Intel Core i9-9980HK, NVIDIA Quadro RTX 5000 (Laptop) (n=1) | |

| Acer ConceptD 9 Pro WDC PC SN720 SDAQNTW-1T00 | Lenovo ThinkPad P73-20QR002DGE Intel SSD Pro 7600p SSDPEKKF512G8L | MSI WE75 9TK Samsung SSD PM981 MZVLB512HAJQ | Dell Precision 7730 Samsung SSD PM981 MZVLB512HAJQ | Eurocom Tornado F7W 3x Samsung SSD 970 Pro 512GB (RAID 0) | Fujitsu Celsius H980 Samsung SSD PM981 MZVLB512HAJQ | Média WDC PC SN720 SDAQNTW-1T00 | |
|---|---|---|---|---|---|---|---|
| CrystalDiskMark 5.2 / 6 | -6% | -3% | -24% | 2% | -30% | -3% | |
| Write 4K (MB/s) | 176 | 154.3 -12% | 135.4 -23% | 103.2 -41% | 116.3 -34% | 111.8 -36% | 168.6 ? -4% |
| Read 4K (MB/s) | 48.06 | 66.4 38% | 56.6 18% | 41.39 -14% | 52.7 10% | 32.02 -33% | 47.6 ? -1% |
| Write Seq (MB/s) | 2736 | 1561 -43% | 1972 -28% | 1880 -31% | 2539 -7% | 1539 -44% | 2602 ? -5% |
| Read Seq (MB/s) | 2381 | 2460 3% | 2101 -12% | 2350 -1% | 2972 25% | 1252 -47% | 2084 ? -12% |
| Write 4K Q32T1 (MB/s) | 418.6 | 438 5% | 527 26% | 282.3 -33% | 454.6 9% | 355.4 -15% | 391 ? -7% |
| Read 4K Q32T1 (MB/s) | 460.8 | 568 23% | 578 25% | 314.3 -32% | 515 12% | 408.7 -11% | 481 ? 4% |
| Write Seq Q32T1 (MB/s) | 2791 | 1581 -43% | 1985 -29% | 1881 -33% | 3101 11% | 1913 -31% | 2792 ? 0% |
| Read Seq Q32T1 (MB/s) | 3430 | 2724 -21% | 3358 -2% | 3216 -6% | 3078 -10% | 2530 -26% | 3377 ? -2% |
| 3DMark 06 Standard Score | 45180 pontos | |
| 3DMark 11 Performance | 26416 pontos | |
| 3DMark Ice Storm Standard Score | 184872 pontos | |
| 3DMark Cloud Gate Standard Score | 44296 pontos | |
| 3DMark Fire Strike Score | 20374 pontos | |
| 3DMark Time Spy Score | 9779 pontos | |
Ajuda | ||
| 3DMark 11 - 1280x720 Performance GPU | |
| Média da turma Workstation (12535 - 69594, n=23, últimos 2 anos) | |
| Acer ConceptD 9 Pro | |
| Razer Blade 15 Studio Edition | |
| Média NVIDIA Quadro RTX 5000 (Laptop) (18233 - 32999, n=5) | |
| Eurocom Tornado F7W | |
| Lenovo ThinkPad P53-20QN000YGE | |
| MSI WE75 9TK | |
| Lenovo ThinkPad P73-20QR002DGE | |
| Fujitsu Celsius H980 | |
| Dell Precision 7730 | |
| 3DMark | |
| 1280x720 Cloud Gate Standard Graphics | |
| Acer ConceptD 9 Pro | |
| Média NVIDIA Quadro RTX 5000 (Laptop) (100792 - 133756, n=2) | |
| Lenovo ThinkPad P53-20QN000YGE | |
| Média da turma Workstation (58392 - 152418, n=14, últimos 2 anos) | |
| MSI WE75 9TK | |
| Eurocom Tornado F7W | |
| Lenovo ThinkPad P73-20QR002DGE | |
| Dell Precision 7730 | |
| Fujitsu Celsius H980 | |
| Razer Blade 15 Studio Edition | |
| 1920x1080 Fire Strike Graphics | |
| Média da turma Workstation (8293 - 52560, n=23, últimos 2 anos) | |
| Acer ConceptD 9 Pro | |
| Média NVIDIA Quadro RTX 5000 (Laptop) (21715 - 24354, n=2) | |
| Razer Blade 15 Studio Edition | |
| Eurocom Tornado F7W | |
| Lenovo ThinkPad P53-20QN000YGE | |
| MSI WE75 9TK | |
| Lenovo ThinkPad P73-20QR002DGE | |
| Dell Precision 7730 | |
| Fujitsu Celsius H980 | |
| 2560x1440 Time Spy Graphics | |
| Média da turma Workstation (2725 - 24806, n=23, últimos 2 anos) | |
| Acer ConceptD 9 Pro | |
| Média NVIDIA Quadro RTX 5000 (Laptop) (8708 - 9956, n=2) | |
| Razer Blade 15 Studio Edition | |
| Lenovo ThinkPad P53-20QN000YGE | |
| Eurocom Tornado F7W | |
| MSI WE75 9TK | |
| Lenovo ThinkPad P73-20QR002DGE | |
| Fujitsu Celsius H980 | |
| GFXBench (DX / GLBenchmark) 2.7 | |
| 1920x1080 T-Rex Offscreen | |
| Acer ConceptD 9 Pro | |
| Média NVIDIA Quadro RTX 5000 (Laptop) (n=1) | |
| Razer Blade 15 Studio Edition | |
| Lenovo ThinkPad P53-20QN000YGE | |
| Média da turma Workstation (497 - 2251, n=6, últimos 2 anos) | |
| Lenovo ThinkPad P73-20QR002DGE | |
| T-Rex Onscreen | |
| Acer ConceptD 9 Pro | |
| Média NVIDIA Quadro RTX 5000 (Laptop) (n=1) | |
| Razer Blade 15 Studio Edition | |
| Média da turma Workstation (59 - 1303, n=6, últimos 2 anos) | |
| Lenovo ThinkPad P53-20QN000YGE | |
| Lenovo ThinkPad P73-20QR002DGE | |
| GFXBench 3.0 | |
| 1920x1080 1080p Manhattan Offscreen | |
| Acer ConceptD 9 Pro | |
| Média NVIDIA Quadro RTX 5000 (Laptop) (n=1) | |
| Razer Blade 15 Studio Edition | |
| Média da turma Workstation (309 - 756, n=6, últimos 2 anos) | |
| Lenovo ThinkPad P53-20QN000YGE | |
| Lenovo ThinkPad P73-20QR002DGE | |
| on screen Manhattan Onscreen OGL | |
| Razer Blade 15 Studio Edition | |
| Acer ConceptD 9 Pro | |
| Média NVIDIA Quadro RTX 5000 (Laptop) (n=1) | |
| Média da turma Workstation (59 - 703, n=6, últimos 2 anos) | |
| Lenovo ThinkPad P53-20QN000YGE | |
| Lenovo ThinkPad P73-20QR002DGE | |
| GFXBench 3.1 | |
| 1920x1080 Manhattan ES 3.1 Offscreen | |
| Acer ConceptD 9 Pro | |
| Média NVIDIA Quadro RTX 5000 (Laptop) (n=1) | |
| Razer Blade 15 Studio Edition | |
| Lenovo ThinkPad P53-20QN000YGE | |
| Lenovo ThinkPad P73-20QR002DGE | |
| Média da turma Workstation (225 - 595, n=6, últimos 2 anos) | |
| on screen Manhattan ES 3.1 Onscreen | |
| Razer Blade 15 Studio Edition | |
| Média da turma Workstation (59 - 563, n=6, últimos 2 anos) | |
| Acer ConceptD 9 Pro | |
| Média NVIDIA Quadro RTX 5000 (Laptop) (n=1) | |
| Lenovo ThinkPad P53-20QN000YGE | |
| Lenovo ThinkPad P73-20QR002DGE | |
| LuxMark v2.0 64Bit | |
| Room GPUs-only | |
| Média da turma Workstation (2952 - 6990, n=3, últimos 2 anos) | |
| Acer ConceptD 9 Pro | |
| Média NVIDIA Quadro RTX 5000 (Laptop) (n=1) | |
| Lenovo ThinkPad P73-20QR002DGE | |
| Eurocom Tornado F7W | |
| Dell Precision 7730 | |
| Fujitsu Celsius H980 | |
| Razer Blade 15 Studio Edition | |
| Lenovo ThinkPad P53-20QN000YGE | |
| Sala GPUs-only | |
| Média da turma Workstation (6574 - 13967, n=3, últimos 2 anos) | |
| Acer ConceptD 9 Pro | |
| Média NVIDIA Quadro RTX 5000 (Laptop) (n=1) | |
| Lenovo ThinkPad P73-20QR002DGE | |
| Eurocom Tornado F7W | |
| Razer Blade 15 Studio Edition | |
| Lenovo ThinkPad P53-20QN000YGE | |
| Fujitsu Celsius H980 | |
| Dell Precision 7730 | |
| Geekbench 4.4 - Compute OpenCL Score | |
| Acer ConceptD 9 Pro | |
| Média NVIDIA Quadro RTX 5000 (Laptop) (n=1) | |
| Média da turma Workstation (n=1últimos 2 anos) | |
| Razer Blade 15 Studio Edition | |
| Lenovo ThinkPad P53-20QN000YGE | |
| Eurocom Tornado F7W | |
| Lenovo ThinkPad P73-20QR002DGE | |
| Dell Precision 7730 | |
| Geekbench 5.0 | |
| Vulkan Score 5.0 | |
| Acer ConceptD 9 Pro | |
| Média NVIDIA Quadro RTX 5000 (Laptop) (n=1) | |
| Razer Blade 15 Studio Edition | |
| OpenCL Score 5.0 | |
| Acer ConceptD 9 Pro | |
| Média NVIDIA Quadro RTX 5000 (Laptop) (n=1) | |
| Média da turma Workstation (n=1últimos 2 anos) | |
| Lenovo ThinkPad P53-20QN000YGE | |
| Razer Blade 15 Studio Edition | |
| Lenovo ThinkPad P73-20QR002DGE | |
| Geekbench 5.5 | |
| Vulkan Score 5.1 | |
| Acer ConceptD 9 Pro | |
| Média NVIDIA Quadro RTX 5000 (Laptop) (n=1) | |
| OpenCL Score 5.1 | |
| Acer ConceptD 9 Pro | |
| Média NVIDIA Quadro RTX 5000 (Laptop) (n=1) | |
| VRMark | |
| Cyan Room | |
| Acer ConceptD 9 Pro | |
| Média NVIDIA Quadro RTX 5000 (Laptop) (n=1) | |
| Blue Room | |
| Acer ConceptD 9 Pro | |
| Média NVIDIA Quadro RTX 5000 (Laptop) (n=1) | |
| Orange Room | |
| Acer ConceptD 9 Pro | |
| Média NVIDIA Quadro RTX 5000 (Laptop) (n=1) | |
| Basemark GPU 1.2 | |
| 1920x1080 OpenGL Medium Offscreen | |
| Acer ConceptD 9 Pro | |
| Média NVIDIA Quadro RTX 5000 (Laptop) (n=1) | |
| 3840x2160 Vulkan High Offscreen | |
| Acer ConceptD 9 Pro | |
| Média NVIDIA Quadro RTX 5000 (Laptop) (n=1) | |
| Média da turma Workstation (3.64 - 3.64, n=10, últimos 2 anos) | |
| 1920x1080 Vulkan Medium Offscreen | |
| Acer ConceptD 9 Pro | |
| Média NVIDIA Quadro RTX 5000 (Laptop) (n=1) | |
| Média da turma Workstation (104.6 - 2585, n=21, últimos 2 anos) | |
| The Witcher 3 - 1920x1080 Ultra Graphics & Postprocessing (HBAO+) | |
| Acer ConceptD 9 Pro | |
| Média NVIDIA Quadro RTX 5000 (Laptop) (90.4 - 109.9, n=2) | |
| Média da turma Workstation (n=1últimos 2 anos) | |
| Razer Blade 15 Studio Edition | |
| Lenovo ThinkPad P53-20QN000YGE | |
| Eurocom Tornado F7W | |
| MSI WE75 9TK | |
| Lenovo ThinkPad P73-20QR002DGE | |
| Dell Precision 7730 | |
| BioShock Infinite - 1920x1080 Ultra Preset, DX11 (DDOF) | |
| Acer ConceptD 9 Pro | |
| Média NVIDIA Quadro RTX 5000 (Laptop) (n=1) | |
| Razer Blade 15 Studio Edition | |
| MSI WE75 9TK | |
| Lenovo ThinkPad P73-20QR002DGE | |
| Dell Precision 7730 | |
| Fujitsu Celsius H980 | |
| Far Cry 5 - 1920x1080 Ultra Preset AA:T | |
| Acer ConceptD 9 Pro | |
| Média NVIDIA Quadro RTX 5000 (Laptop) (n=1) | |
| Média da turma Workstation (37 - 128, n=9, últimos 2 anos) | |
| Fujitsu Celsius H980 | |
| Shadow of the Tomb Raider - 1920x1080 Highest Preset AA:T | |
| Acer ConceptD 9 Pro | |
| Média NVIDIA Quadro RTX 5000 (Laptop) (73.1 - 118, n=2) | |
| Lenovo ThinkPad P53-20QN000YGE | |
| MSI WE75 9TK | |
| Eurocom Tornado F7W | |
| Borderlands 3 - 1920x1080 Badass Overall Quality (DX11) | |
| Acer ConceptD 9 Pro | |
| Média NVIDIA Quadro RTX 5000 (Laptop) (n=1) | |
| Razer Blade 15 Studio Edition | |
| baixo | média | alto | ultra | QHD | 4K | |
|---|---|---|---|---|---|---|
| Tomb Raider (2013) | 757 | 681 | 625 | 319.6 | ||
| BioShock Infinite (2013) | 458 | 396.9 | 367.9 | 216.3 | ||
| The Witcher 3 (2015) | 375.3 | 308.5 | 198.6 | 109.9 | 71 | |
| Rainbow Six Siege (2015) | 350.2 | 296.1 | 279.6 | 266.2 | 138 | |
| For Honor (2017) | 329.3 | 216.9 | 206.8 | 160.4 | 68.4 | |
| Far Cry 5 (2018) | 150 | 128 | 123 | 115 | 102 | 56 |
| Shadow of the Tomb Raider (2018) | 147 | 130 | 126 | 118 | 87 | 47 |
| Assassin´s Creed Odyssey (2018) | 113 | 104 | 94 | 73 | 63 | 40 |
| Battlefield V (2018) | 187 | 164.6 | 161.7 | 151.9 | 123.9 | 72.7 |
| Apex Legends (2019) | 144 | 144 | 144 | 143.9 | 135 | 76.3 |
| Metro Exodus (2019) | 161 | 124.4 | 95.2 | 77 | 59.3 | 36.7 |
| Dirt Rally 2.0 (2019) | 289.3 | 208.4 | 200.1 | 115.5 | 84.3 | 51.2 |
| The Division 2 (2019) | 178 | 156 | 131 | 55 | 55 | 38 |
| Anno 1800 (2019) | 119.2 | 118.8 | 93.1 | 51.1 | 46.9 | 30.3 |
| Rage 2 (2019) | 303.8 | 160.4 | 137.1 | 133.8 | 85.8 | 42.2 |
| Total War: Three Kingdoms (2019) | 271.6 | 154.6 | 113.7 | 83.6 | 53.3 | 25.9 |
| F1 2019 (2019) | 243 | 210 | 182 | 144 | 146 | 78 |
| Control (2019) | 239 | 123.7 | 93.3 | 60.5 | 30.1 | |
| Borderlands 3 (2019) | 153.8 | 130.2 | 104.5 | 85.5 | 59.8 | 31.5 |
| Ghost Recon Breakpoint (2019) | 152 | 125 | 118 | 88 | 66 | 38 |
| GRID 2019 (2019) | 186.6 | 144.5 | 142.5 | 100.7 | 80.7 | 54.9 |
| Call of Duty Modern Warfare 2019 (2019) | 232.6 | 156.2 | 144.9 | 119.3 | 86.6 | 48.8 |
| Need for Speed Heat (2019) | 109.9 | 104.9 | 98.7 | 95.9 | 89 | 52.7 |
| Star Wars Jedi Fallen Order (2019) | 112.8 | 112.1 | 107.5 | 89.6 | 50.2 | |
| Red Dead Redemption 2 (2019) | 145.6 | 125.9 | 87.4 | 54.1 | 43.7 | 28.1 |
| Escape from Tarkov (2020) | 121 | 121 | 120.3 | 110.6 | 106.6 | 53.8 |
| Hunt Showdown (2020) | 231.1 | 163.8 | 130.4 | 87.8 | 77.1 | |
| Doom Eternal (2020) | 234.5 | 200.2 | 183.7 | 180.8 | 128.5 | 68.6 |
Barulho
| Ocioso |
| 31.6 / 31.6 / 31.9 dB |
| Carga |
| 41.2 / 44.1 dB |
 | ||
30 dB silencioso 40 dB(A) audível 50 dB(A) ruidosamente alto |
||
min: | ||
| Acer ConceptD 9 Pro i9-9980HK, Quadro RTX 5000 (Laptop) | Lenovo ThinkPad P73-20QR002DGE i7-9850H, Quadro RTX 3000 (Laptop) | MSI WE75 9TK i7-9750H, Quadro RTX 3000 (Laptop) | Dell Precision 7730 i7-8850H, Quadro P3200 | Eurocom Tornado F7W i9-9900K, Quadro P5200 | Fujitsu Celsius H980 i7-8750H, Quadro P3200 | Média NVIDIA Quadro RTX 5000 (Laptop) | Média da turma Workstation | |
|---|---|---|---|---|---|---|---|---|
| Noise | 16% | 3% | 9% | -12% | 2% | 4% | 12% | |
| desligado / ambiente * (dB) | 30.8 | 29.3 5% | 28.5 7% | 29.7 4% | 28.2 8% | 29.6 4% | 30.1 ? 2% | 24.1 ? 22% |
| Idle Minimum * (dB) | 31.6 | 29.3 7% | 29 8% | 29.7 6% | 33.2 -5% | 29.6 6% | 30.5 ? 3% | 24.8 ? 22% |
| Idle Average * (dB) | 31.6 | 29.3 7% | 29 8% | 29.7 6% | 33.2 -5% | 32.5 -3% | 30.5 ? 3% | 25.5 ? 19% |
| Idle Maximum * (dB) | 31.9 | 29.3 8% | 31.5 1% | 29.7 7% | 33.2 -4% | 32.5 -2% | 31.2 ? 2% | 26.7 ? 16% |
| Load Average * (dB) | 41.2 | 30.2 27% | 32 22% | 31.4 24% | 47 -14% | 34.9 15% | 36.9 ? 10% | 39.2 ? 5% |
| Witcher 3 ultra * (dB) | 44.6 | 30.7 31% | 44.7 -0% | 37.9 15% | 52.2 -17% | |||
| Load Maximum * (dB) | 44.1 | 33.1 25% | 56.5 -28% | 44.2 -0% | 64 -45% | 49.1 -11% | 41.6 ? 6% | 50.7 ? -15% |
* ... menor é melhor
(±) A temperatura máxima no lado superior é 43 °C / 109 F, em comparação com a média de 38.2 °C / 101 F , variando de 22.2 a 69.8 °C para a classe Workstation.
(-) A parte inferior aquece até um máximo de 53 °C / 127 F, em comparação com a média de 41.1 °C / 106 F
(+) Em uso inativo, a temperatura média para o lado superior é 23.9 °C / 75 F, em comparação com a média do dispositivo de 32 °C / ### class_avg_f### F.
(±) Jogando The Witcher 3, a temperatura média para o lado superior é 34.8 °C / 95 F, em comparação com a média do dispositivo de 32 °C / ## #class_avg_f### F.
(+) Os apoios para as mãos e o touchpad estão atingindo a temperatura máxima da pele (32.2 °C / 90 F) e, portanto, não estão quentes.
(-) A temperatura média da área do apoio para as mãos de dispositivos semelhantes foi 27.8 °C / 82 F (-4.4 °C / -8 F).
| Acer ConceptD 9 Pro i9-9980HK, Quadro RTX 5000 (Laptop) | Lenovo ThinkPad P73-20QR002DGE i7-9850H, Quadro RTX 3000 (Laptop) | MSI WE75 9TK i7-9750H, Quadro RTX 3000 (Laptop) | Dell Precision 7730 i7-8850H, Quadro P3200 | Eurocom Tornado F7W i9-9900K, Quadro P5200 | Fujitsu Celsius H980 i7-8750H, Quadro P3200 | Média NVIDIA Quadro RTX 5000 (Laptop) | Média da turma Workstation | |
|---|---|---|---|---|---|---|---|---|
| Heat | -7% | -7% | -16% | 12% | 2% | -1% | -8% | |
| Maximum Upper Side * (°C) | 43 | 52.2 -21% | 40.6 6% | 50 -16% | 34 21% | 41.8 3% | 43.5 ? -1% | 44 ? -2% |
| Maximum Bottom * (°C) | 53 | 47.8 10% | 46 13% | 59.8 -13% | 47.6 10% | 46.2 13% | 54.3 ? -2% | 45 ? 15% |
| Idle Upper Side * (°C) | 24.8 | 26.9 -8% | 29.2 -18% | 27.9 -13% | 23 7% | 25.6 -3% | 25.1 ? -1% | 30.6 ? -23% |
| Idle Bottom * (°C) | 25.6 | 28 -9% | 32.4 -27% | 31.4 -23% | 23.4 9% | 26.6 -4% | 25.8 ? -1% | 31.6 ? -23% |
* ... menor é melhor
Acer ConceptD 9 Pro análise de áudio
(-) | alto-falantes não muito altos (###valor### dB)
Graves 100 - 315Hz
(-) | quase nenhum baixo - em média 22.1% menor que a mediana
(±) | a linearidade dos graves é média (11.8% delta para a frequência anterior)
Médios 400 - 2.000 Hz
(+) | médios equilibrados - apenas 3.4% longe da mediana
(±) | a linearidade dos médios é média (7.2% delta para frequência anterior)
Altos 2 - 16 kHz
(+) | agudos equilibrados - apenas 3.3% longe da mediana
(±) | a linearidade dos máximos é média (10.1% delta para frequência anterior)
Geral 100 - 16.000 Hz
(±) | a linearidade do som geral é média (20.8% diferença em relação à mediana)
Comparado com a mesma classe
» 75% de todos os dispositivos testados nesta classe foram melhores, 6% semelhantes, 18% piores
» O melhor teve um delta de 7%, a média foi 17%, o pior foi 35%
Comparado com todos os dispositivos testados
» 56% de todos os dispositivos testados foram melhores, 8% semelhantes, 36% piores
» O melhor teve um delta de 4%, a média foi 23%, o pior foi 134%
| desligado | |
| Ocioso | |
| Carga |
|
Key:
min: | |
| Acer ConceptD 9 Pro i9-9980HK, Quadro RTX 5000 (Laptop) | Lenovo ThinkPad P73-20QR002DGE i7-9850H, Quadro RTX 3000 (Laptop) | MSI WE75 9TK i7-9750H, Quadro RTX 3000 (Laptop) | Dell Precision 7730 i7-8850H, Quadro P3200 | Eurocom Tornado F7W i9-9900K, Quadro P5200 | Fujitsu Celsius H980 i7-8750H, Quadro P3200 | Média NVIDIA Quadro RTX 5000 (Laptop) | Média da turma Workstation | |
|---|---|---|---|---|---|---|---|---|
| Power Consumption | 36% | 29% | 31% | -31% | 19% | 6% | 36% | |
| Idle Minimum * (Watt) | 18.8 | 8.9 53% | 12.1 36% | 10.1 46% | 28.5 -52% | 14.8 21% | 16.6 ? 12% | 9.11 ? 52% |
| Idle Average * (Watt) | 25 | 12.8 49% | 18.4 26% | 18 28% | 36.7 -47% | 20.4 18% | 22.1 ? 12% | 13.8 ? 45% |
| Idle Maximum * (Watt) | 30 | 16.4 45% | 18.8 37% | 19.7 34% | 37.8 -26% | 21.5 28% | 27.3 ? 9% | 17.9 ? 40% |
| Load Average * (Watt) | 116 | 108.4 7% | 95.1 18% | 89.6 23% | 144.6 -25% | 98.4 15% | 124.5 ? -7% | 96 ? 17% |
| Witcher 3 ultra * (Watt) | 221 | 153 31% | 135.5 39% | 134 39% | 218.9 1% | |||
| Load Maximum * (Watt) | 241 | 166 31% | 203.7 15% | 204 15% | 336 -39% | 213.5 11% | 232 ? 4% | 180.3 ? 25% |
* ... menor é melhor
| Acer ConceptD 9 Pro i9-9980HK, Quadro RTX 5000 (Laptop), 71.9 Wh | Lenovo ThinkPad P73-20QR002DGE i7-9850H, Quadro RTX 3000 (Laptop), 99 Wh | MSI WE75 9TK i7-9750H, Quadro RTX 3000 (Laptop), 65 Wh | Dell Precision 7730 i7-8850H, Quadro P3200, 92 Wh | Eurocom Tornado F7W i9-9900K, Quadro P5200, 90 Wh | Fujitsu Celsius H980 i7-8750H, Quadro P3200, 96 Wh | Média da turma Workstation | |
|---|---|---|---|---|---|---|---|
| Duração da bateria | 148% | 53% | 63% | -17% | 104% | 197% | |
| Reader / Idle (h) | 5.2 | 11 112% | 13.5 160% | 26.1 ? 402% | |||
| H.264 (h) | 3.5 | 9.8 180% | 5.8 66% | 5.9 69% | 10.1 ? 189% | ||
| WiFi v1.3 (h) | 3.6 | 11.1 208% | 4.9 36% | 5.6 56% | 3 -17% | 8.3 131% | 8.55 ? 138% |
| Load (h) | 0.9 | 1.4 56% | 1 11% | 1.5 67% | 1.4 56% | 1.441 ? 60% |
Pro
Contra
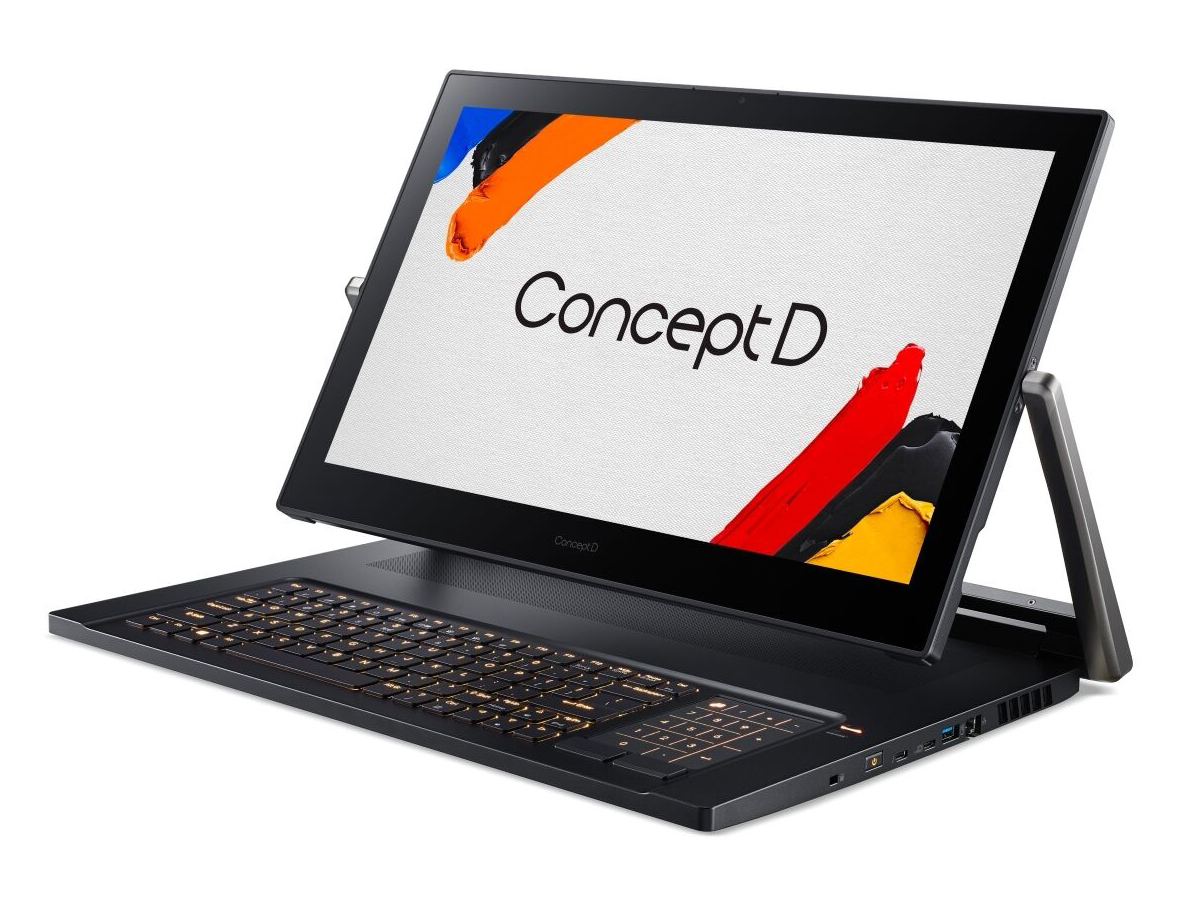
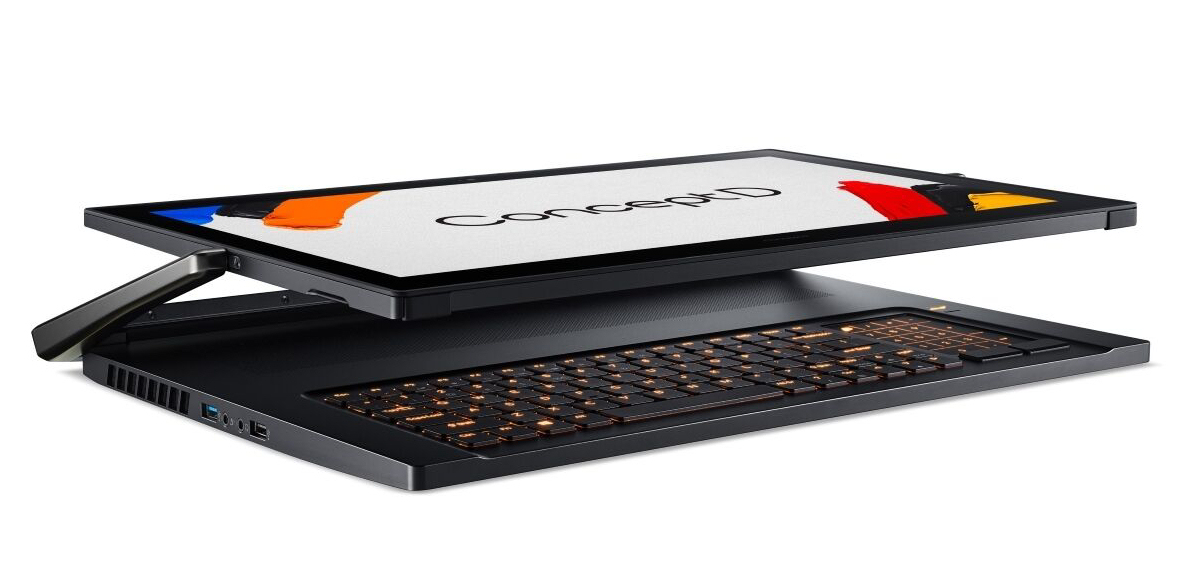
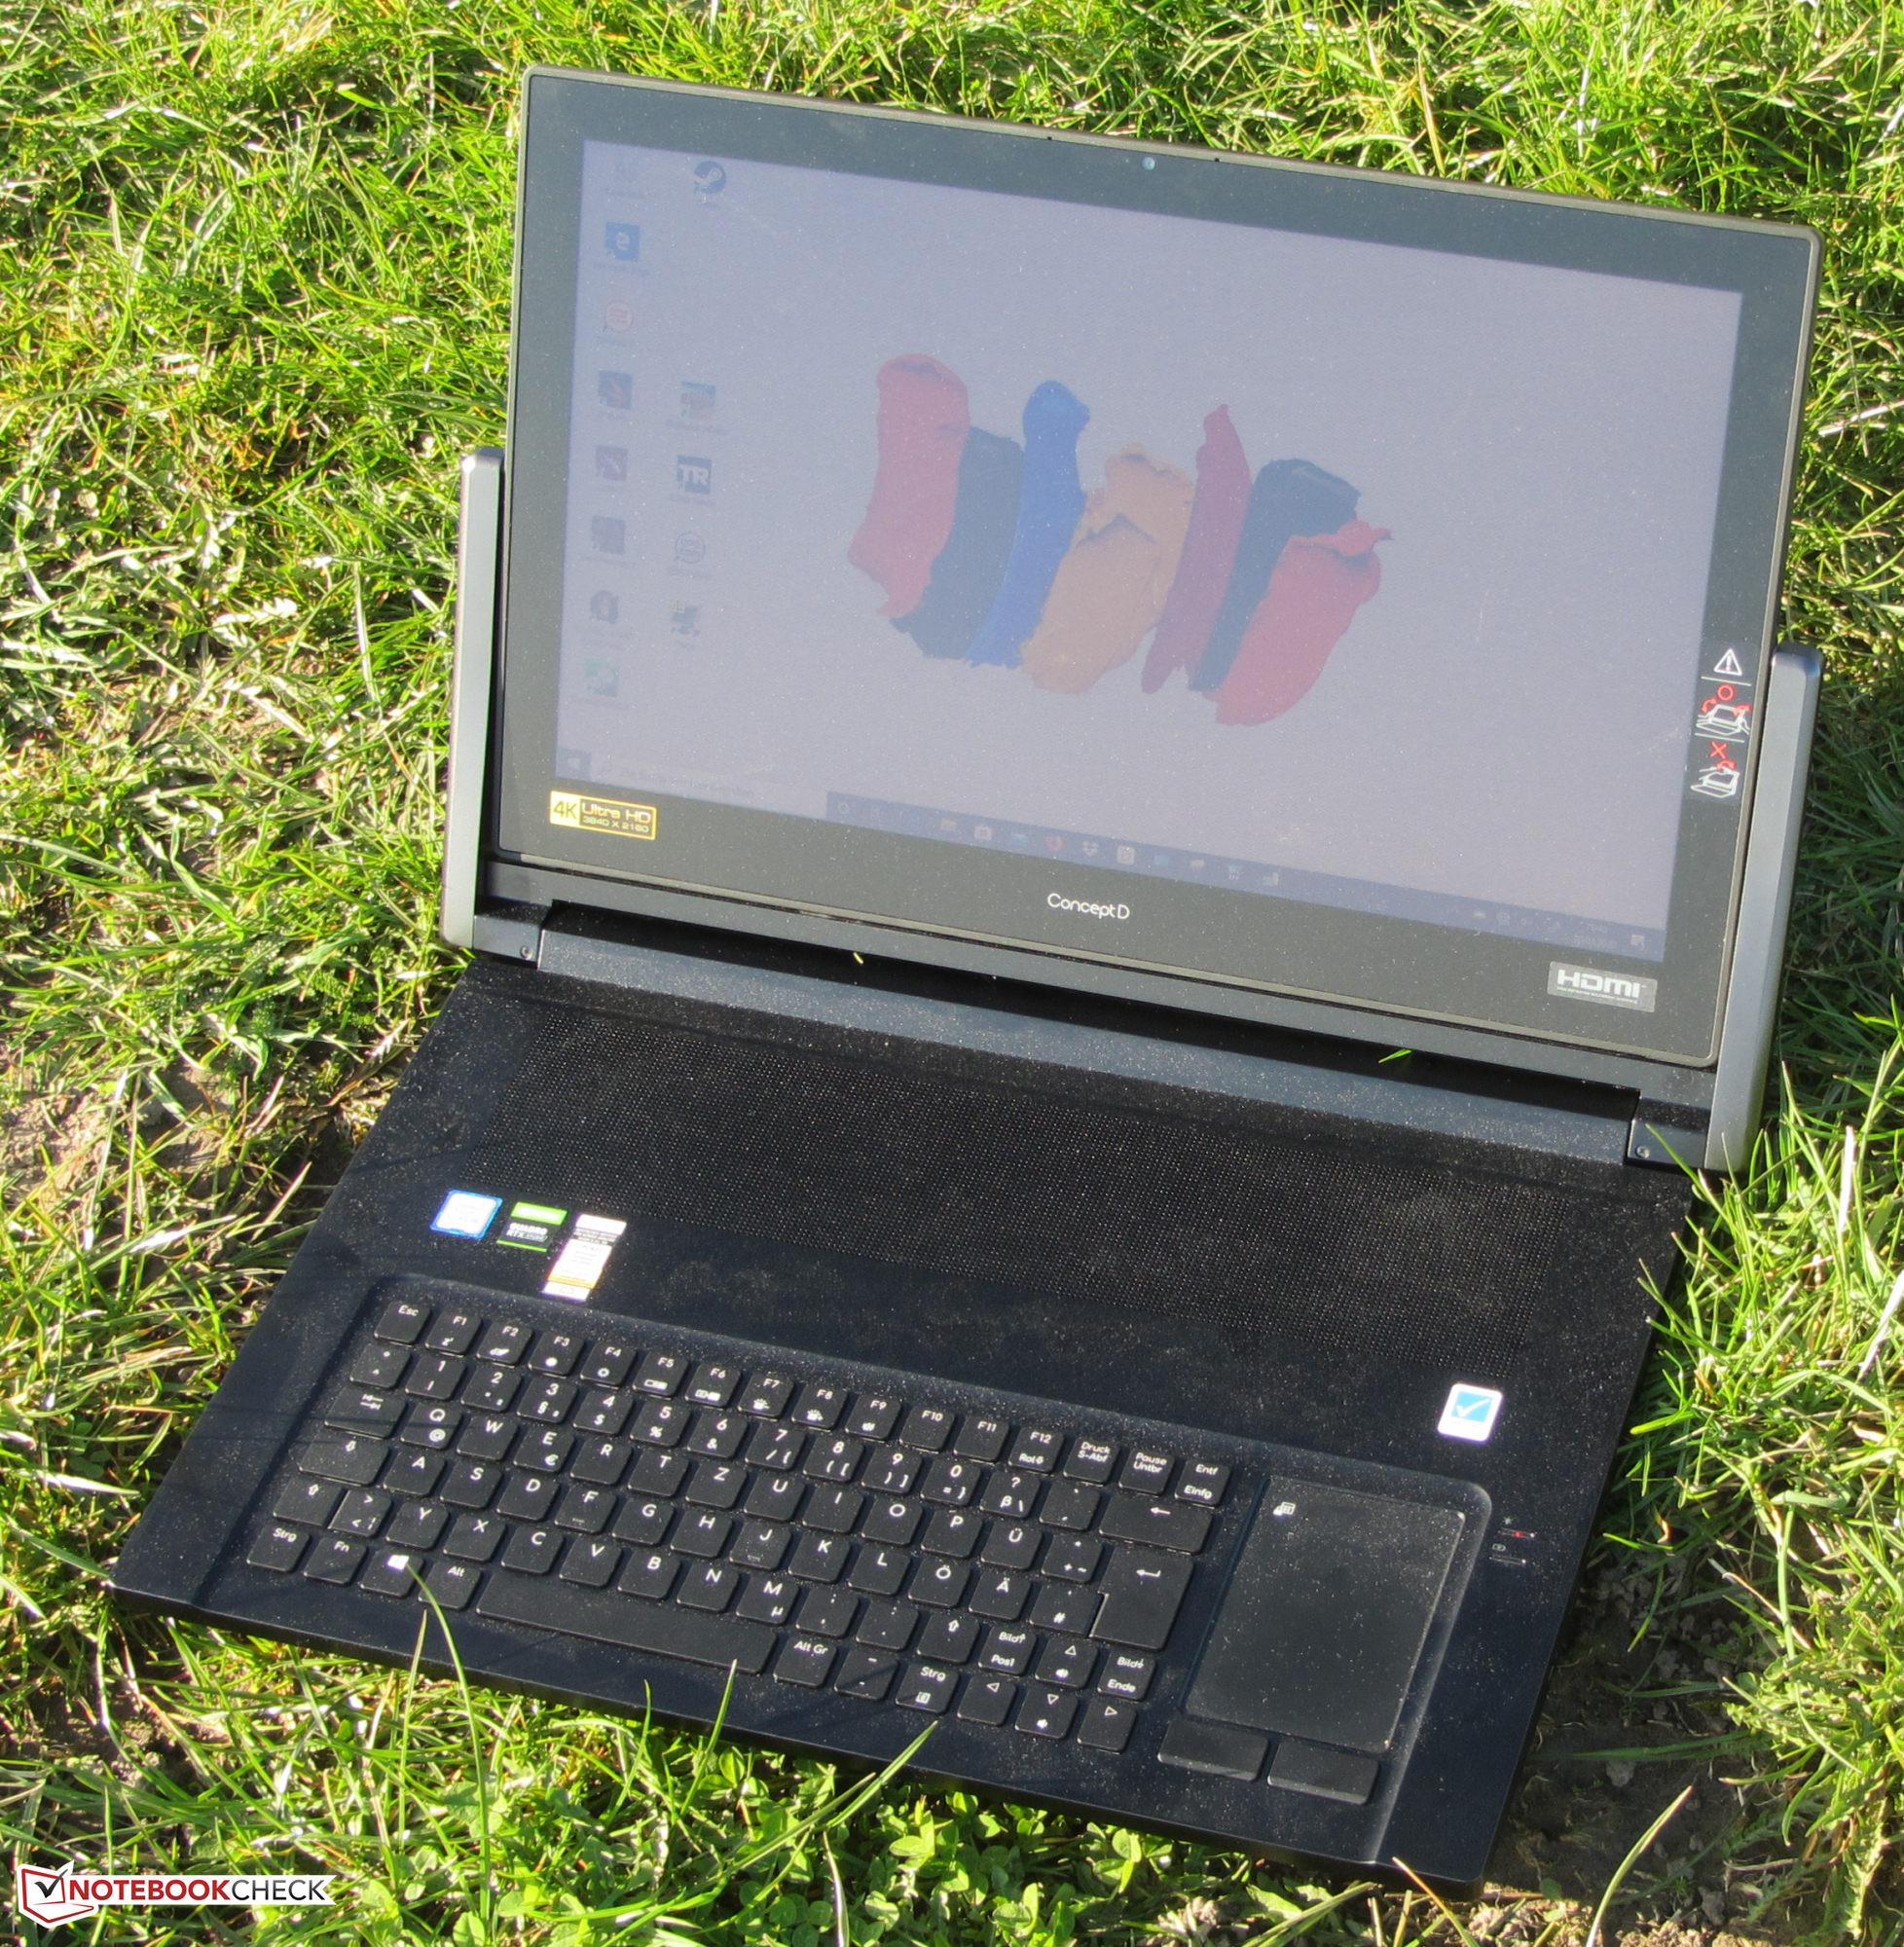
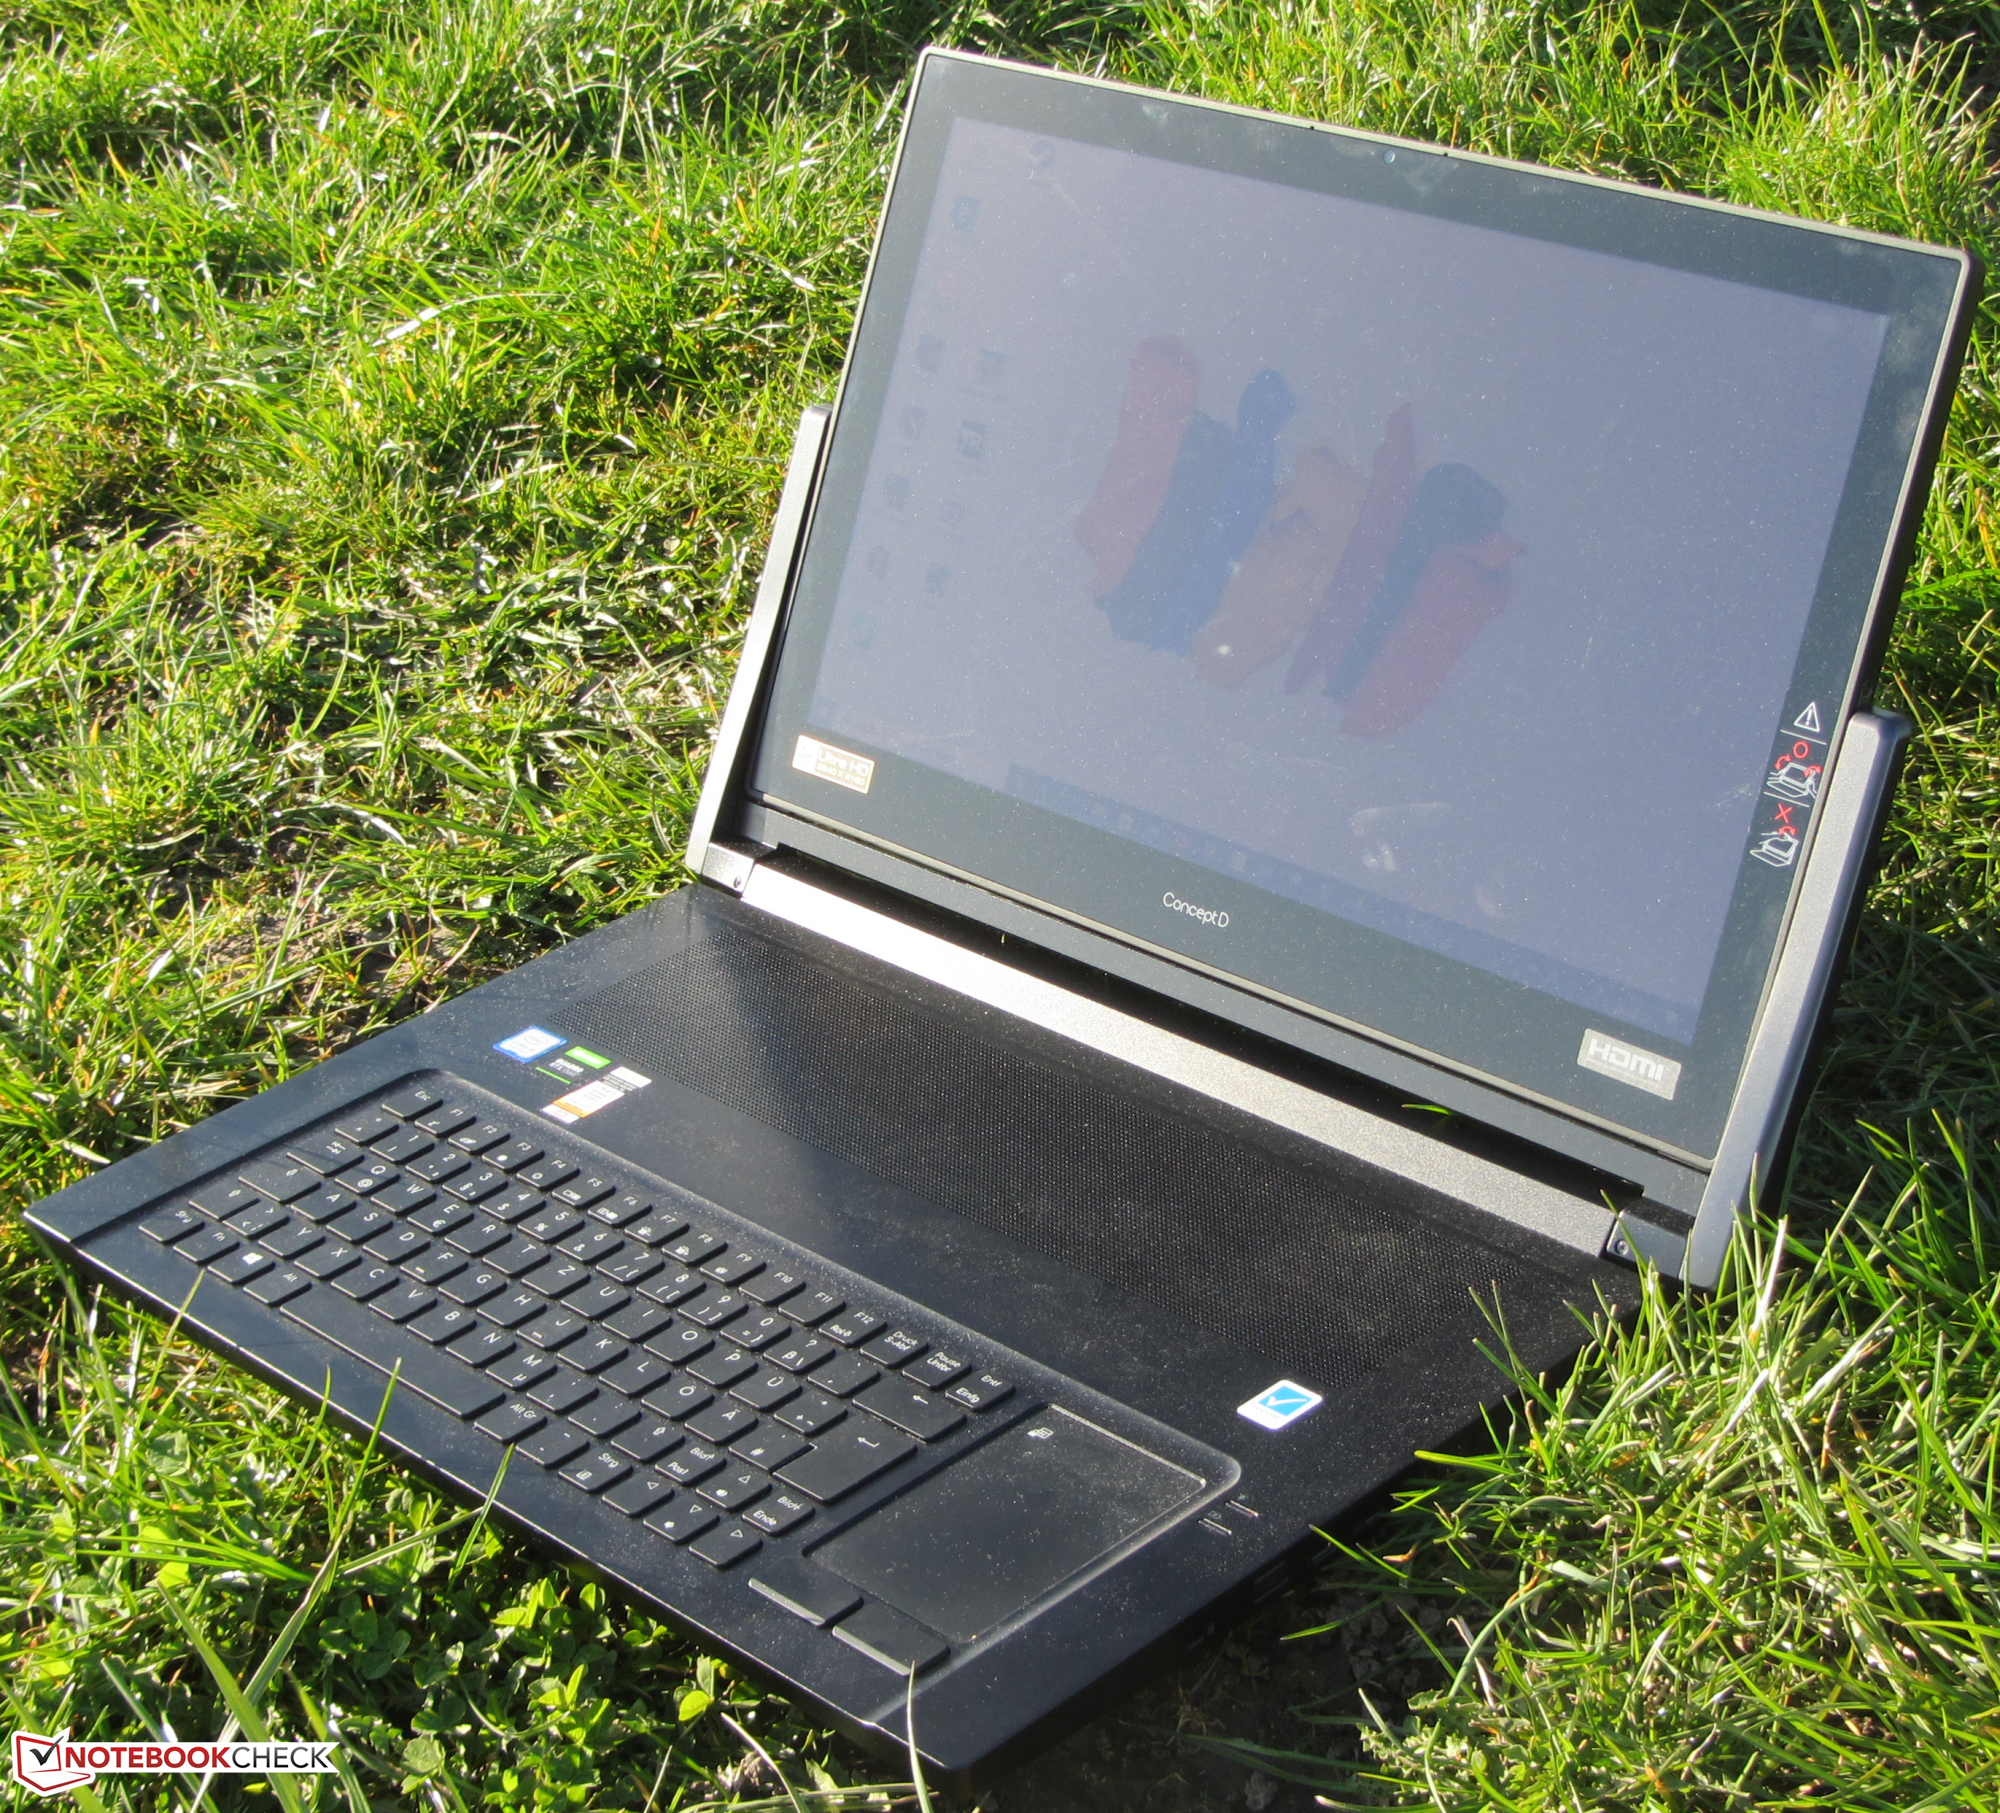
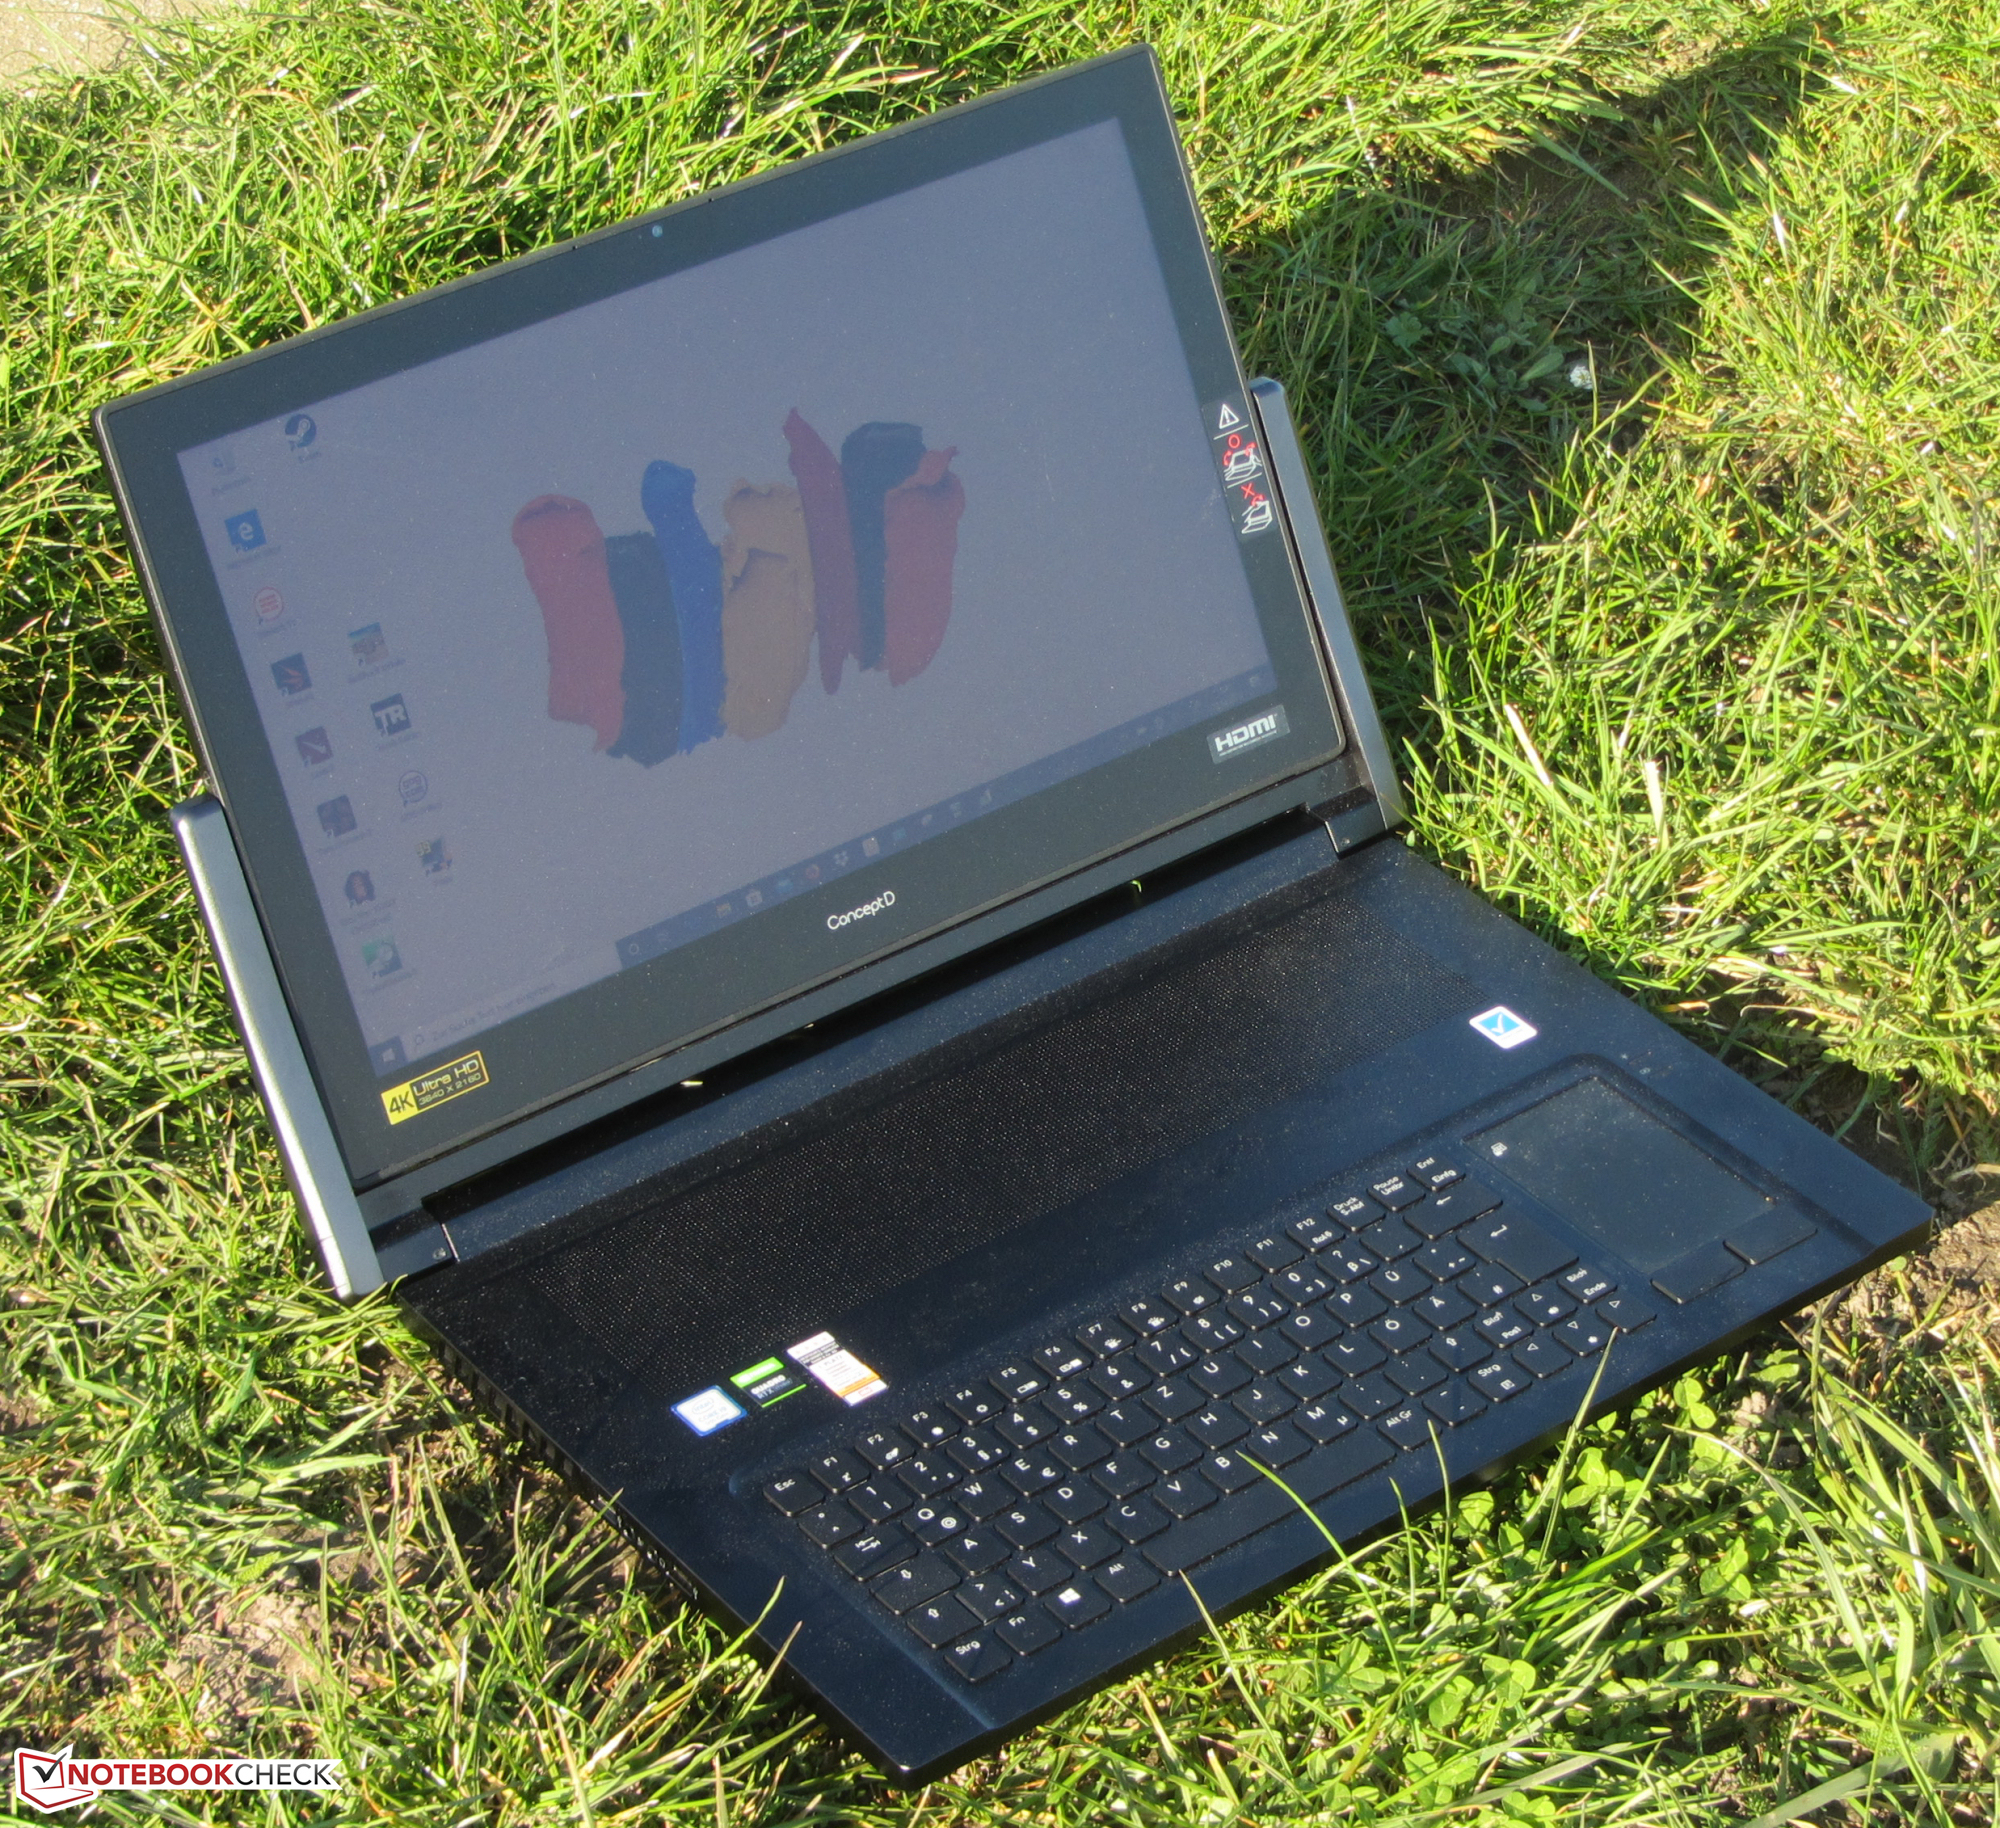
Com o ConceptD 9 Pro CN917-71P, a Acer entregou um workstation móvel conversível no formato de 17,3 polegadas. Nesse caso, o termo "móvel" deve ser usado apenas em uma capacidade limitada, pois o dispositivo pesa quase 4,5 kg e oferece curta duração da bateria. Dito isto, movê-lo de uma mesa para outra não é um problema.
O ConceptD 9 Pro é uma ferramenta para usuários criativos que causa uma boa impressão geral.
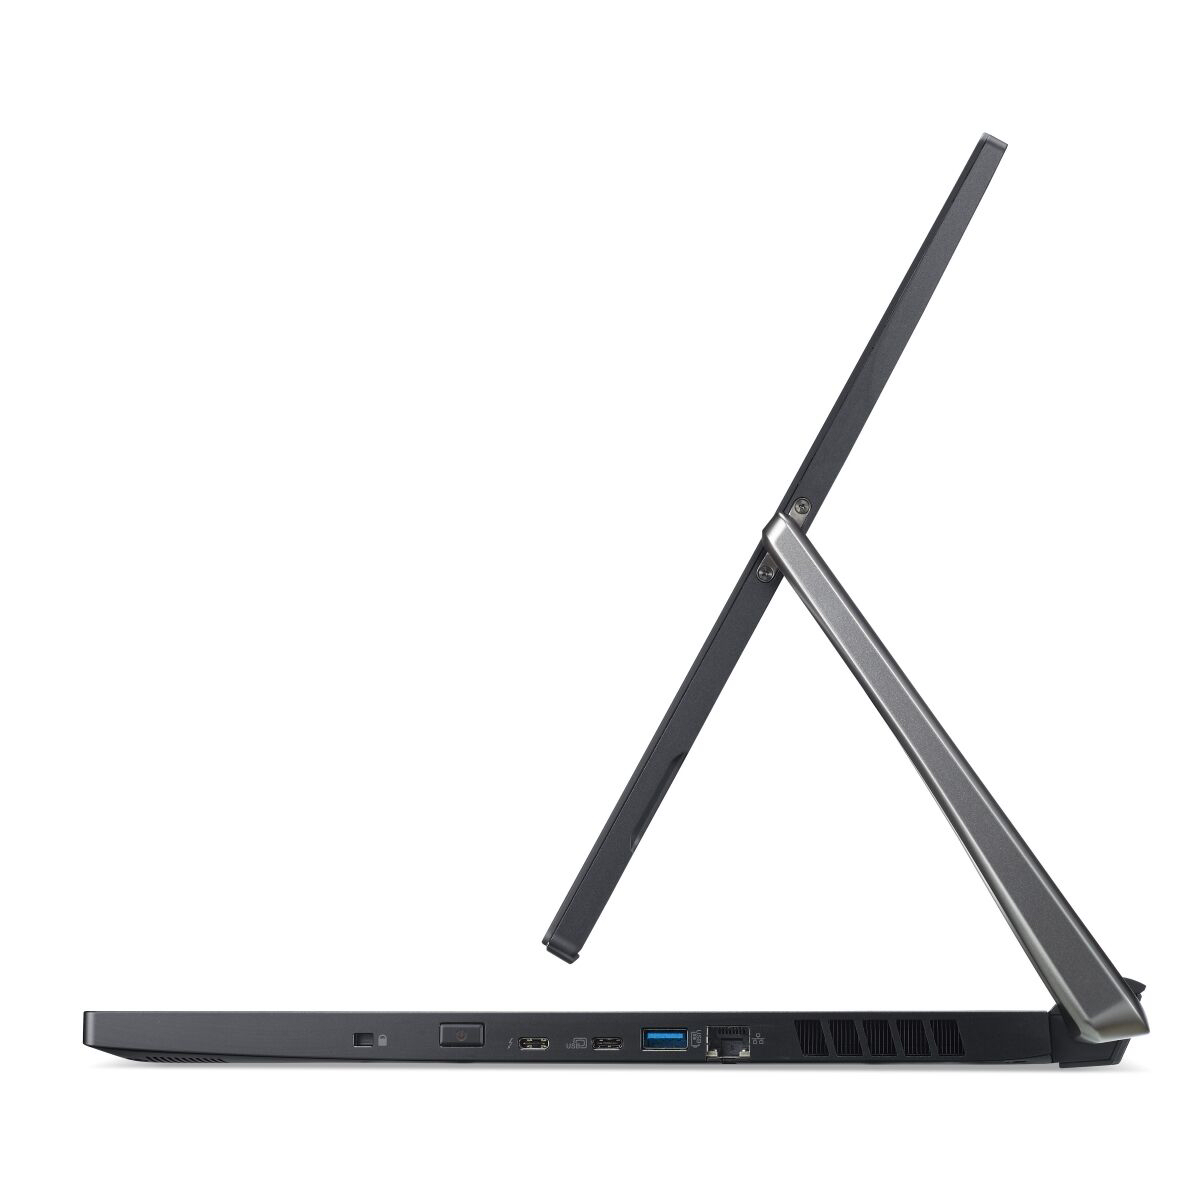
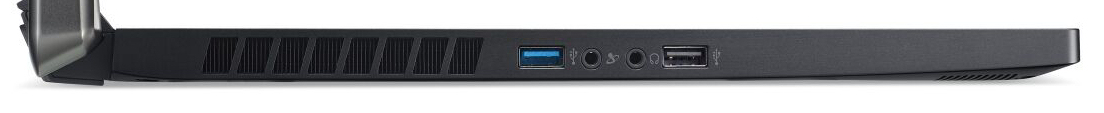
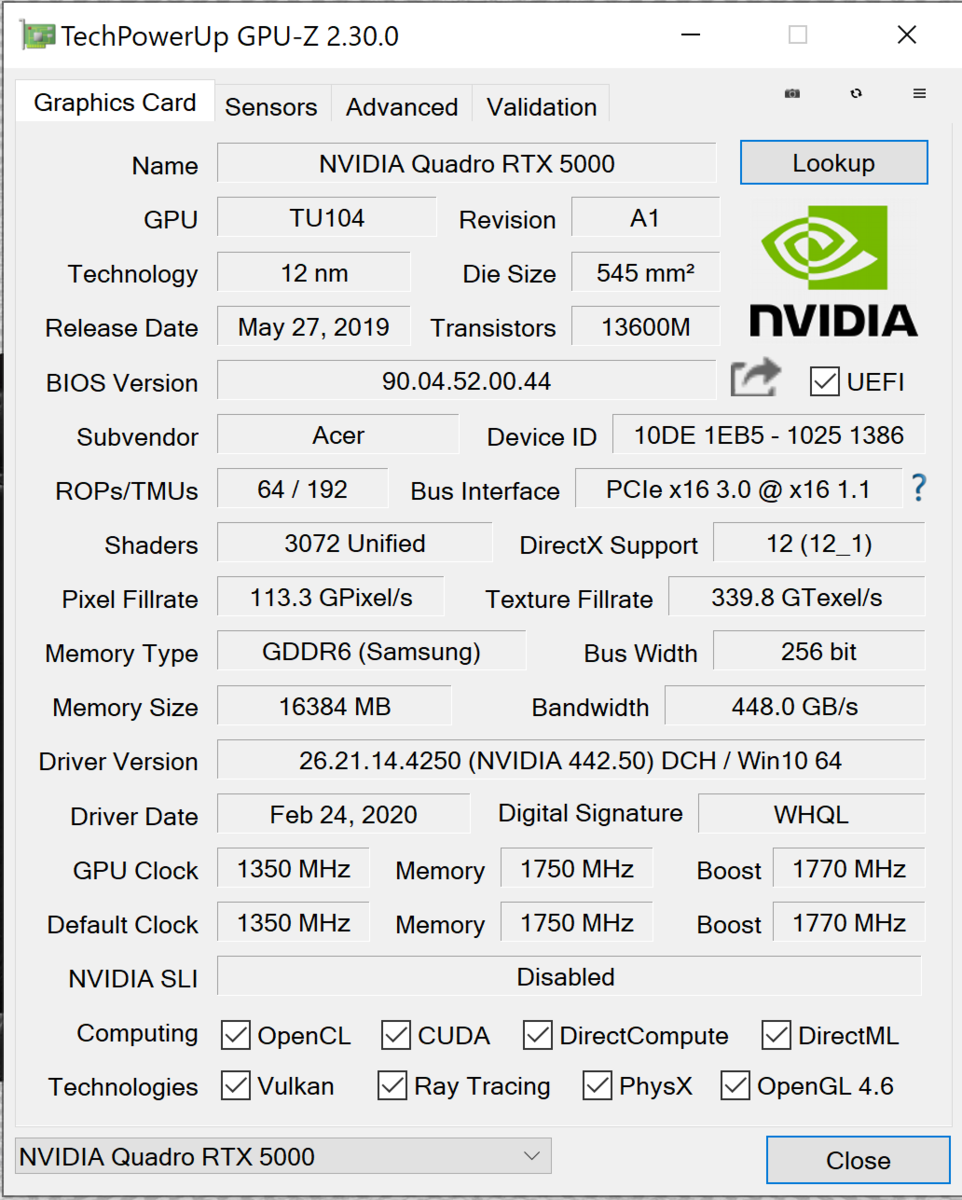
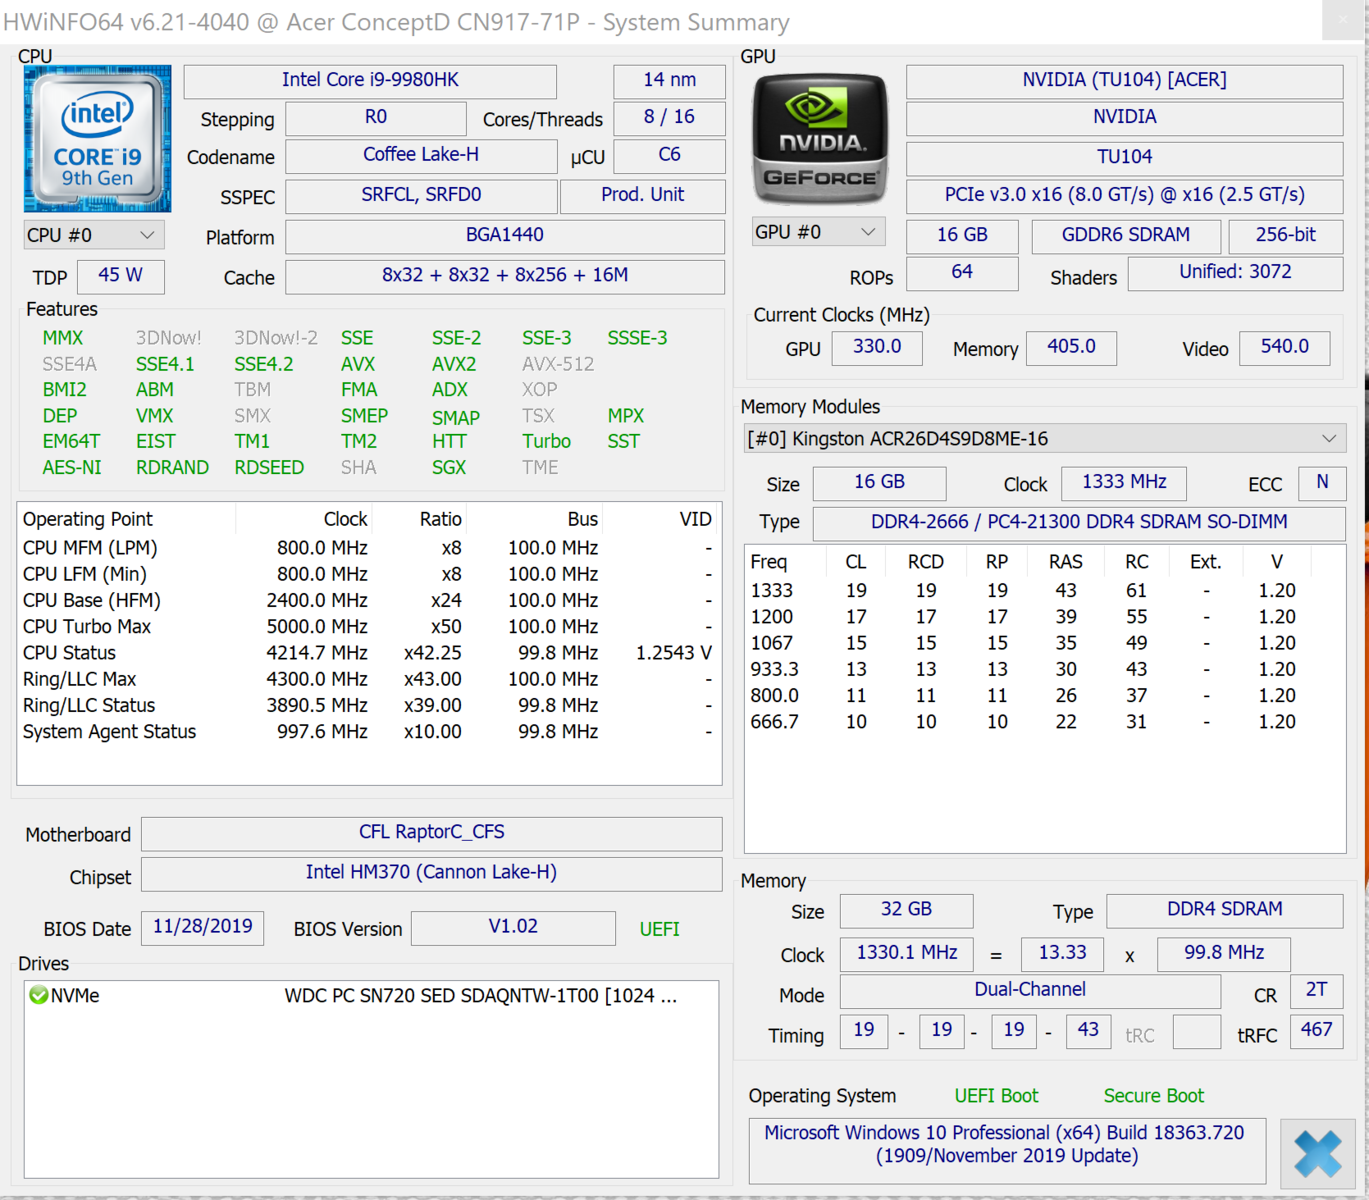
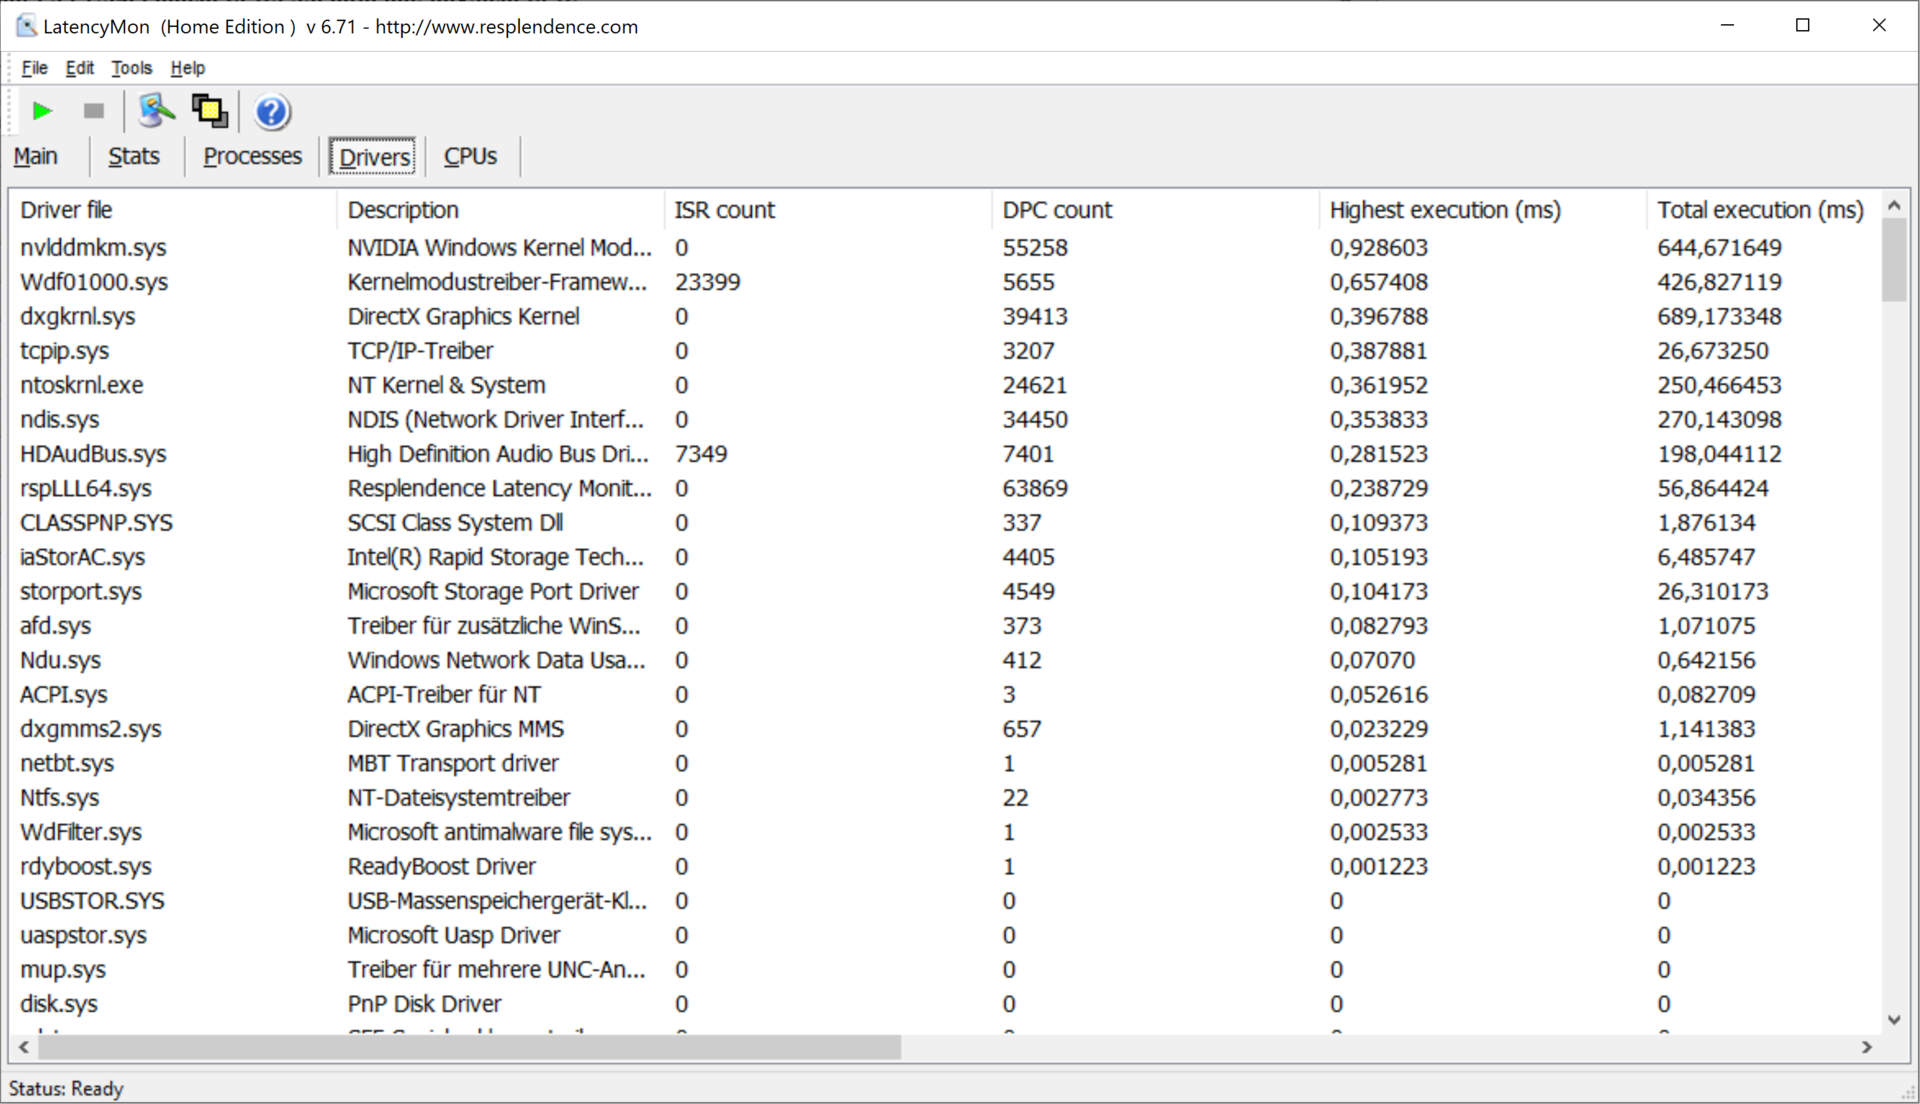
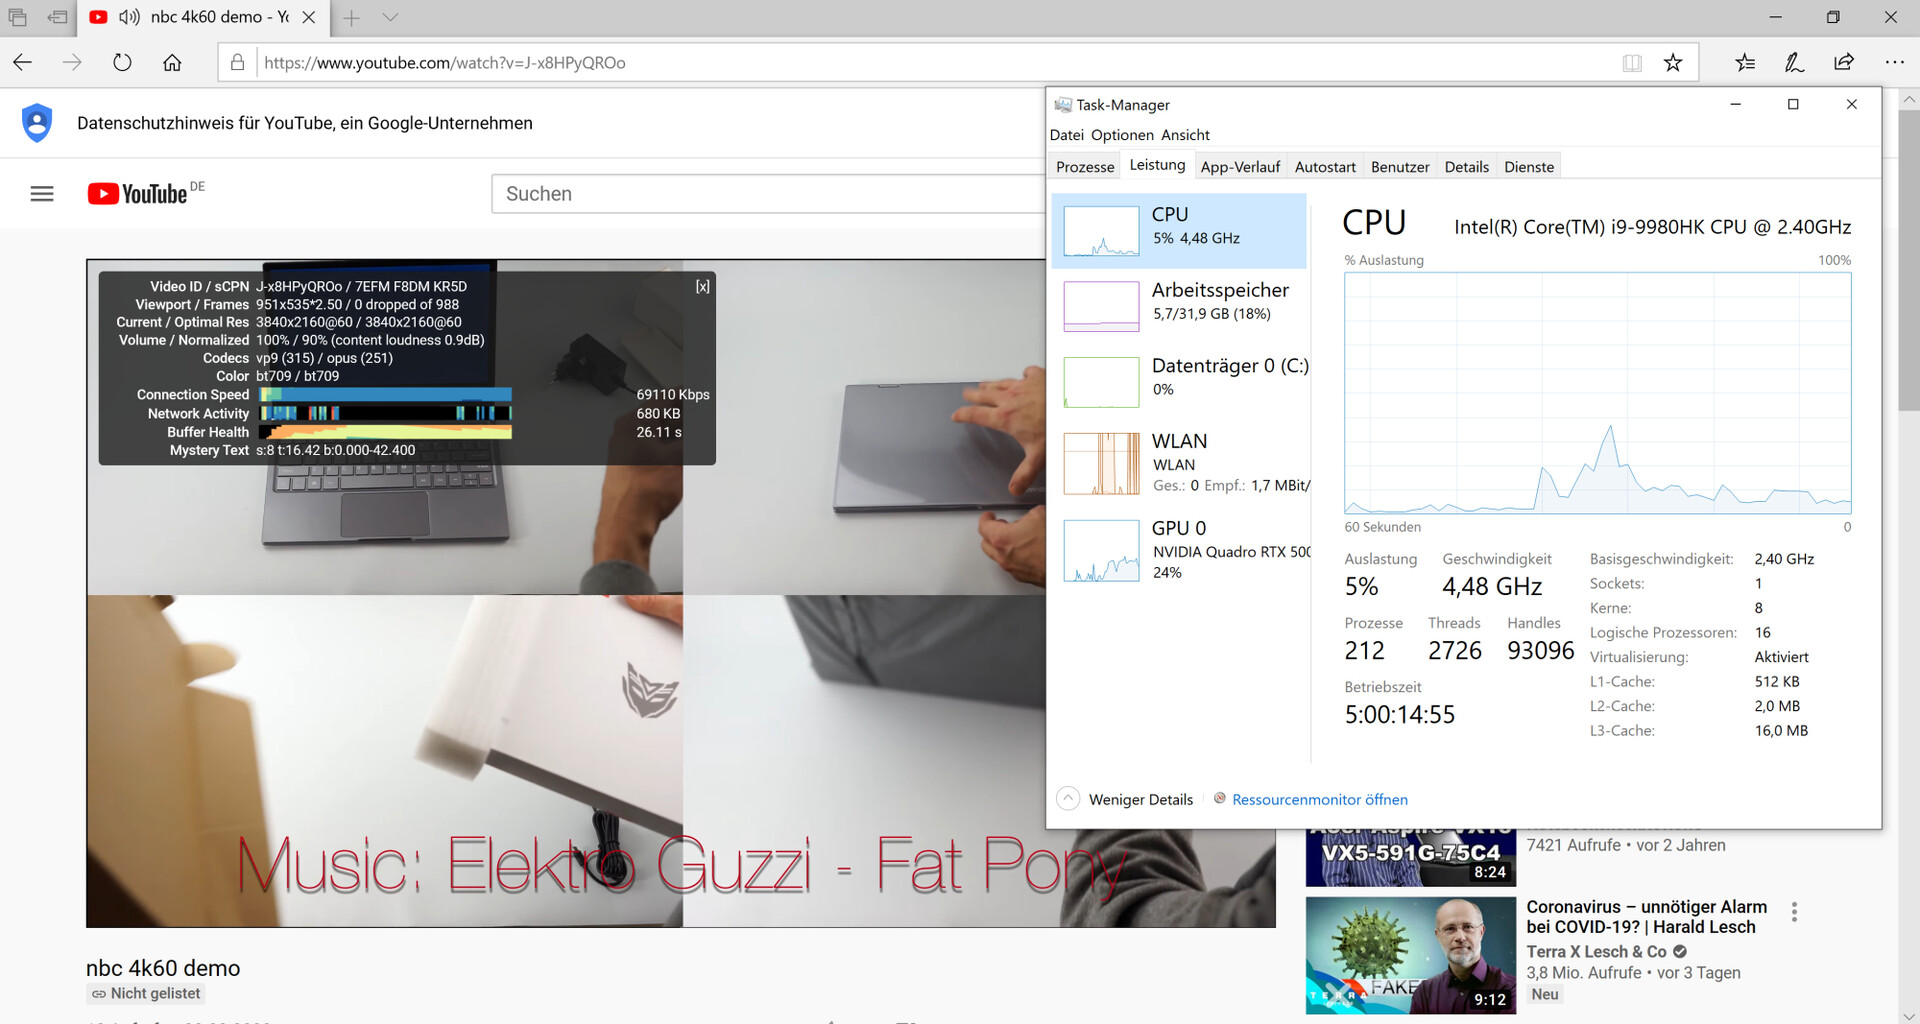
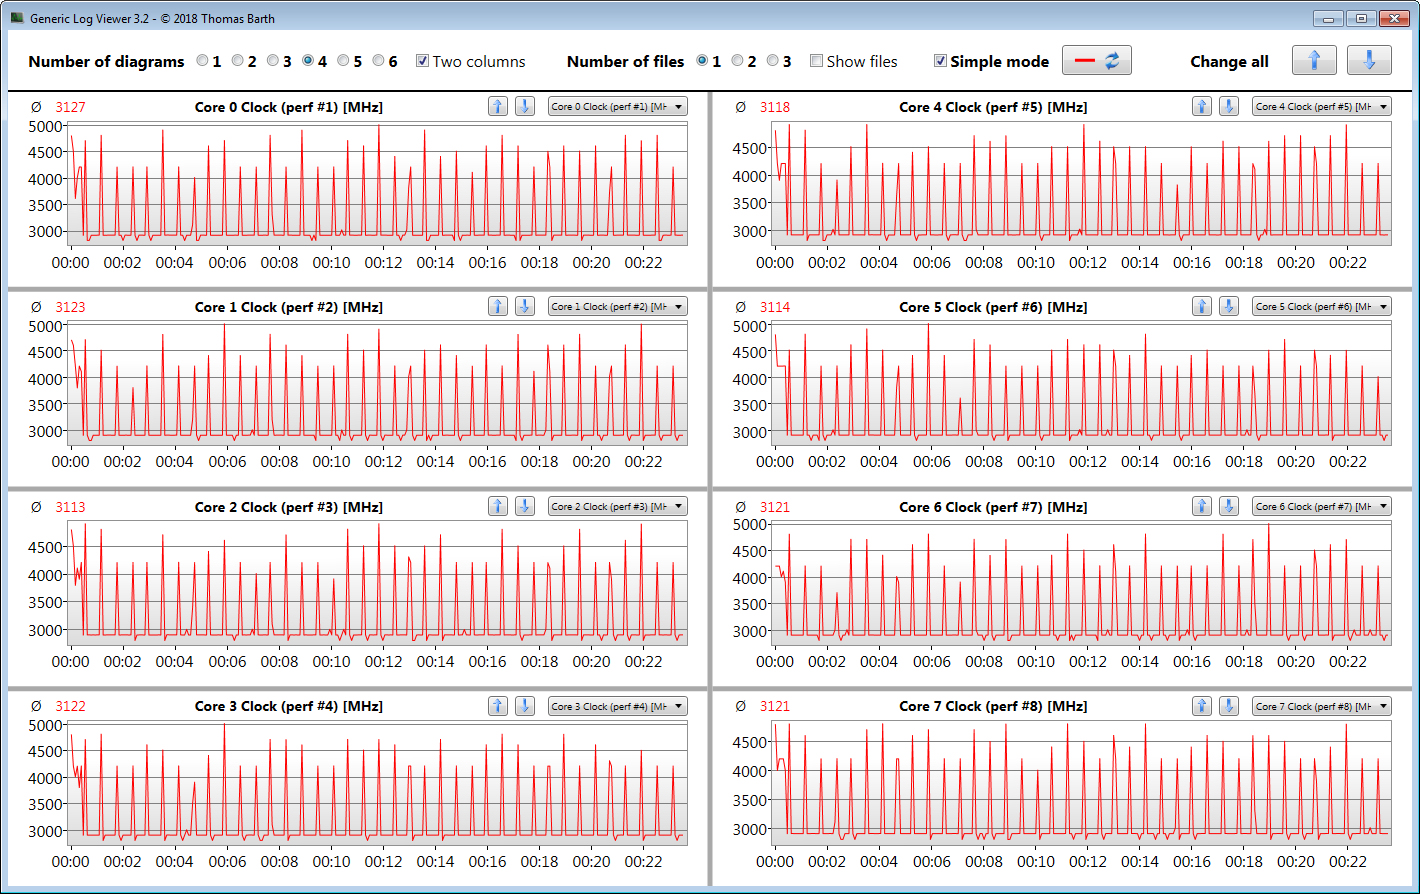
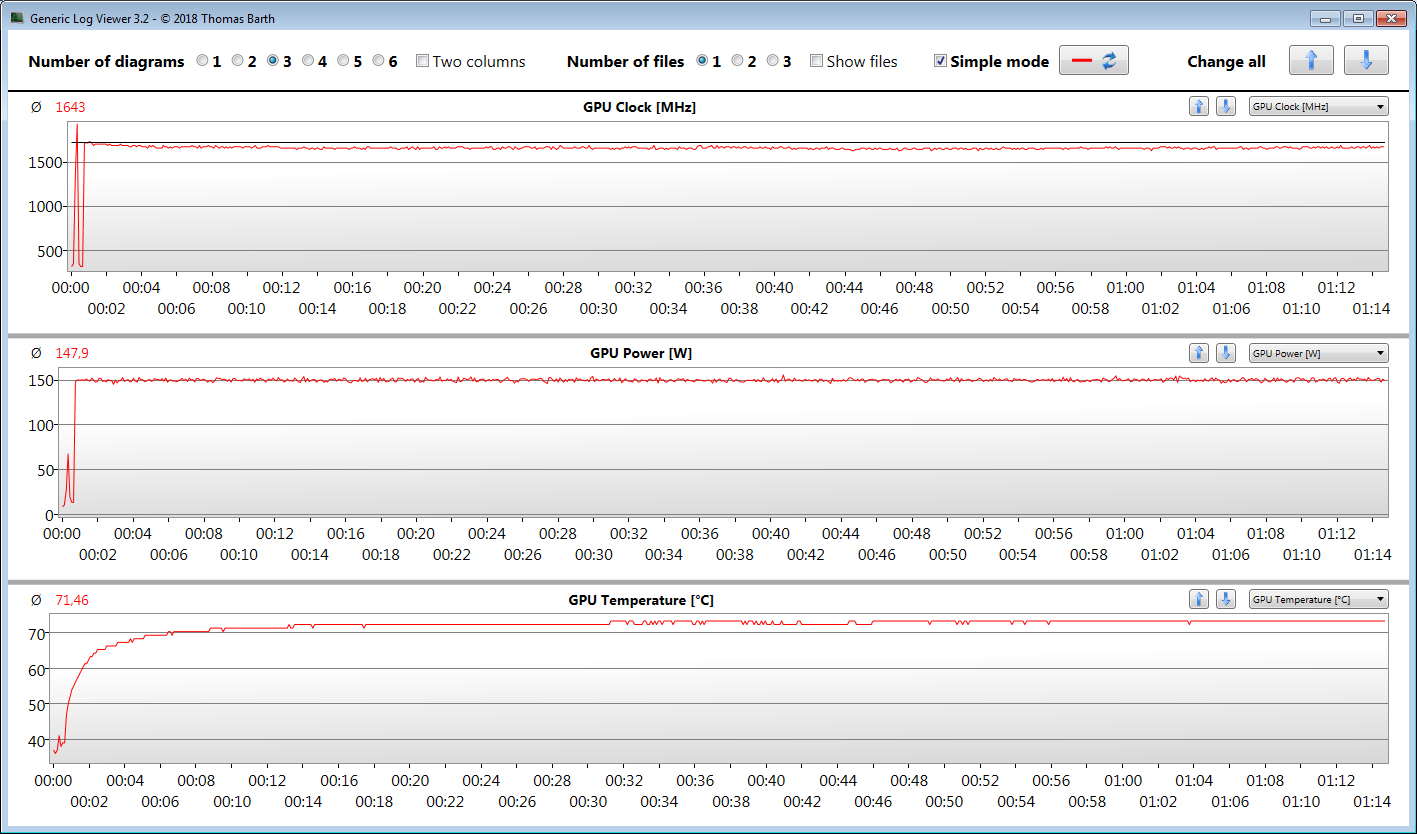
O processador Intel Core i9-9980HK e a GPU GeForce GTX 5000 dentro do portátil são um dos componentes mais recentes. Embora a CPU tenha que reduzir sua velocidade após um curto período de estresse, a placa de vídeo é capaz de funcionar em velocidades turbo consistentemente altas. Via a porta Thunderbolt 3, pode se conectar uma GPU externa poderosa.
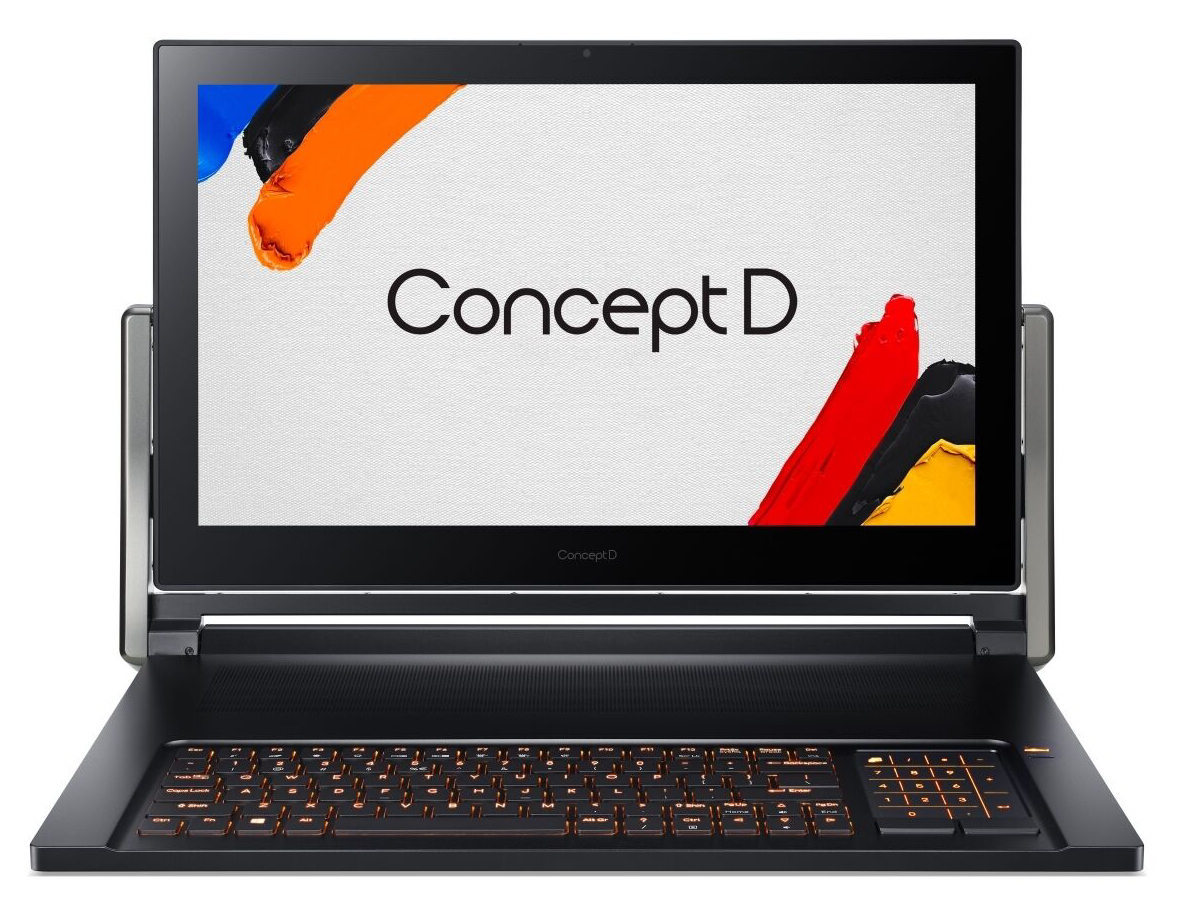
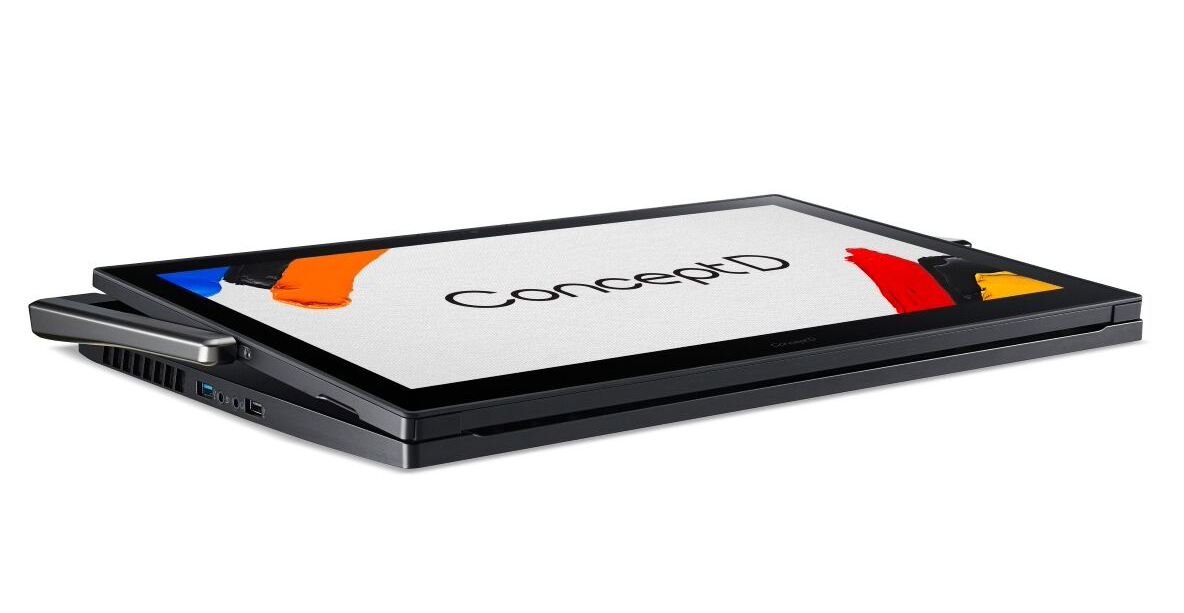
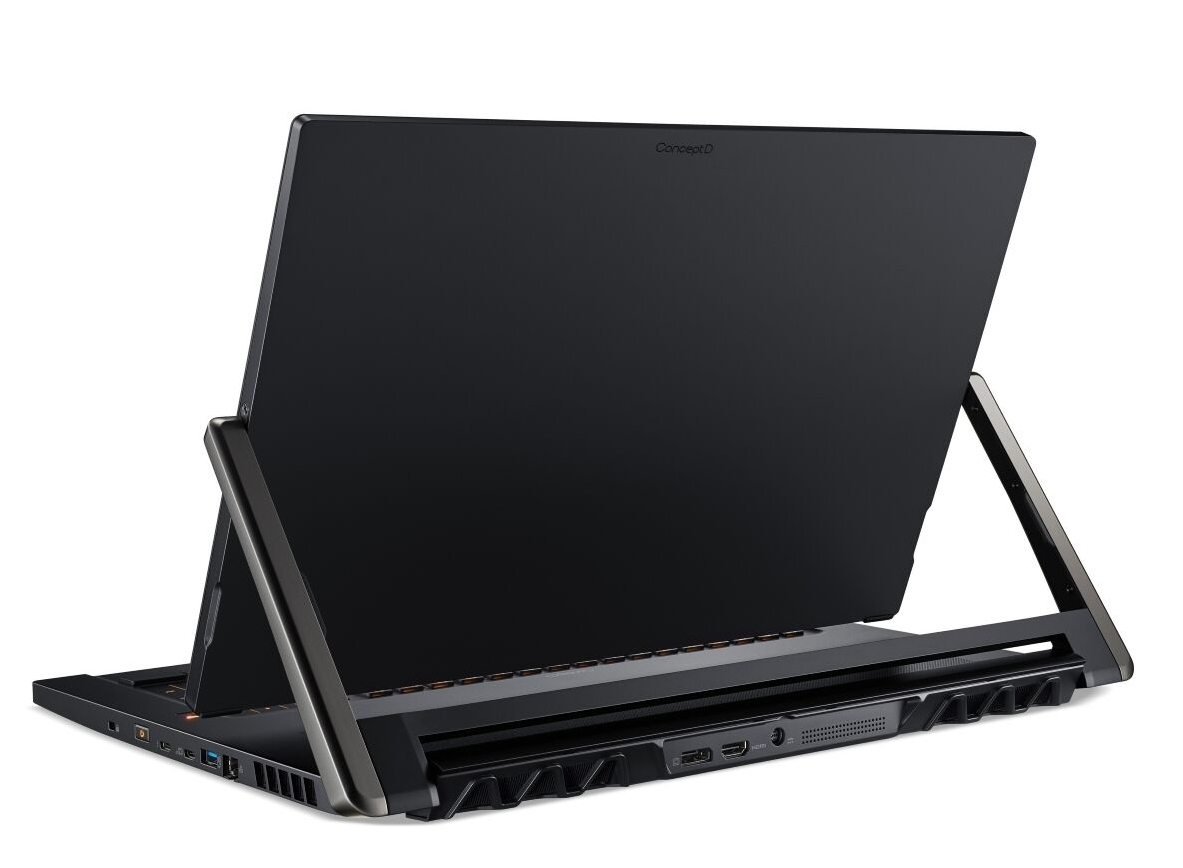
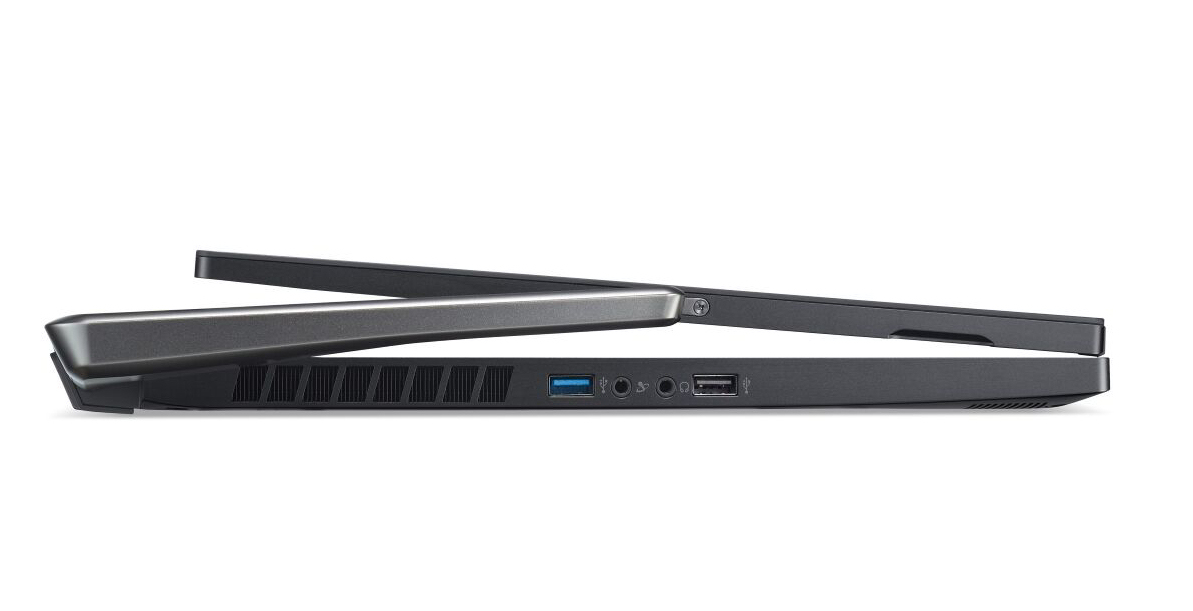
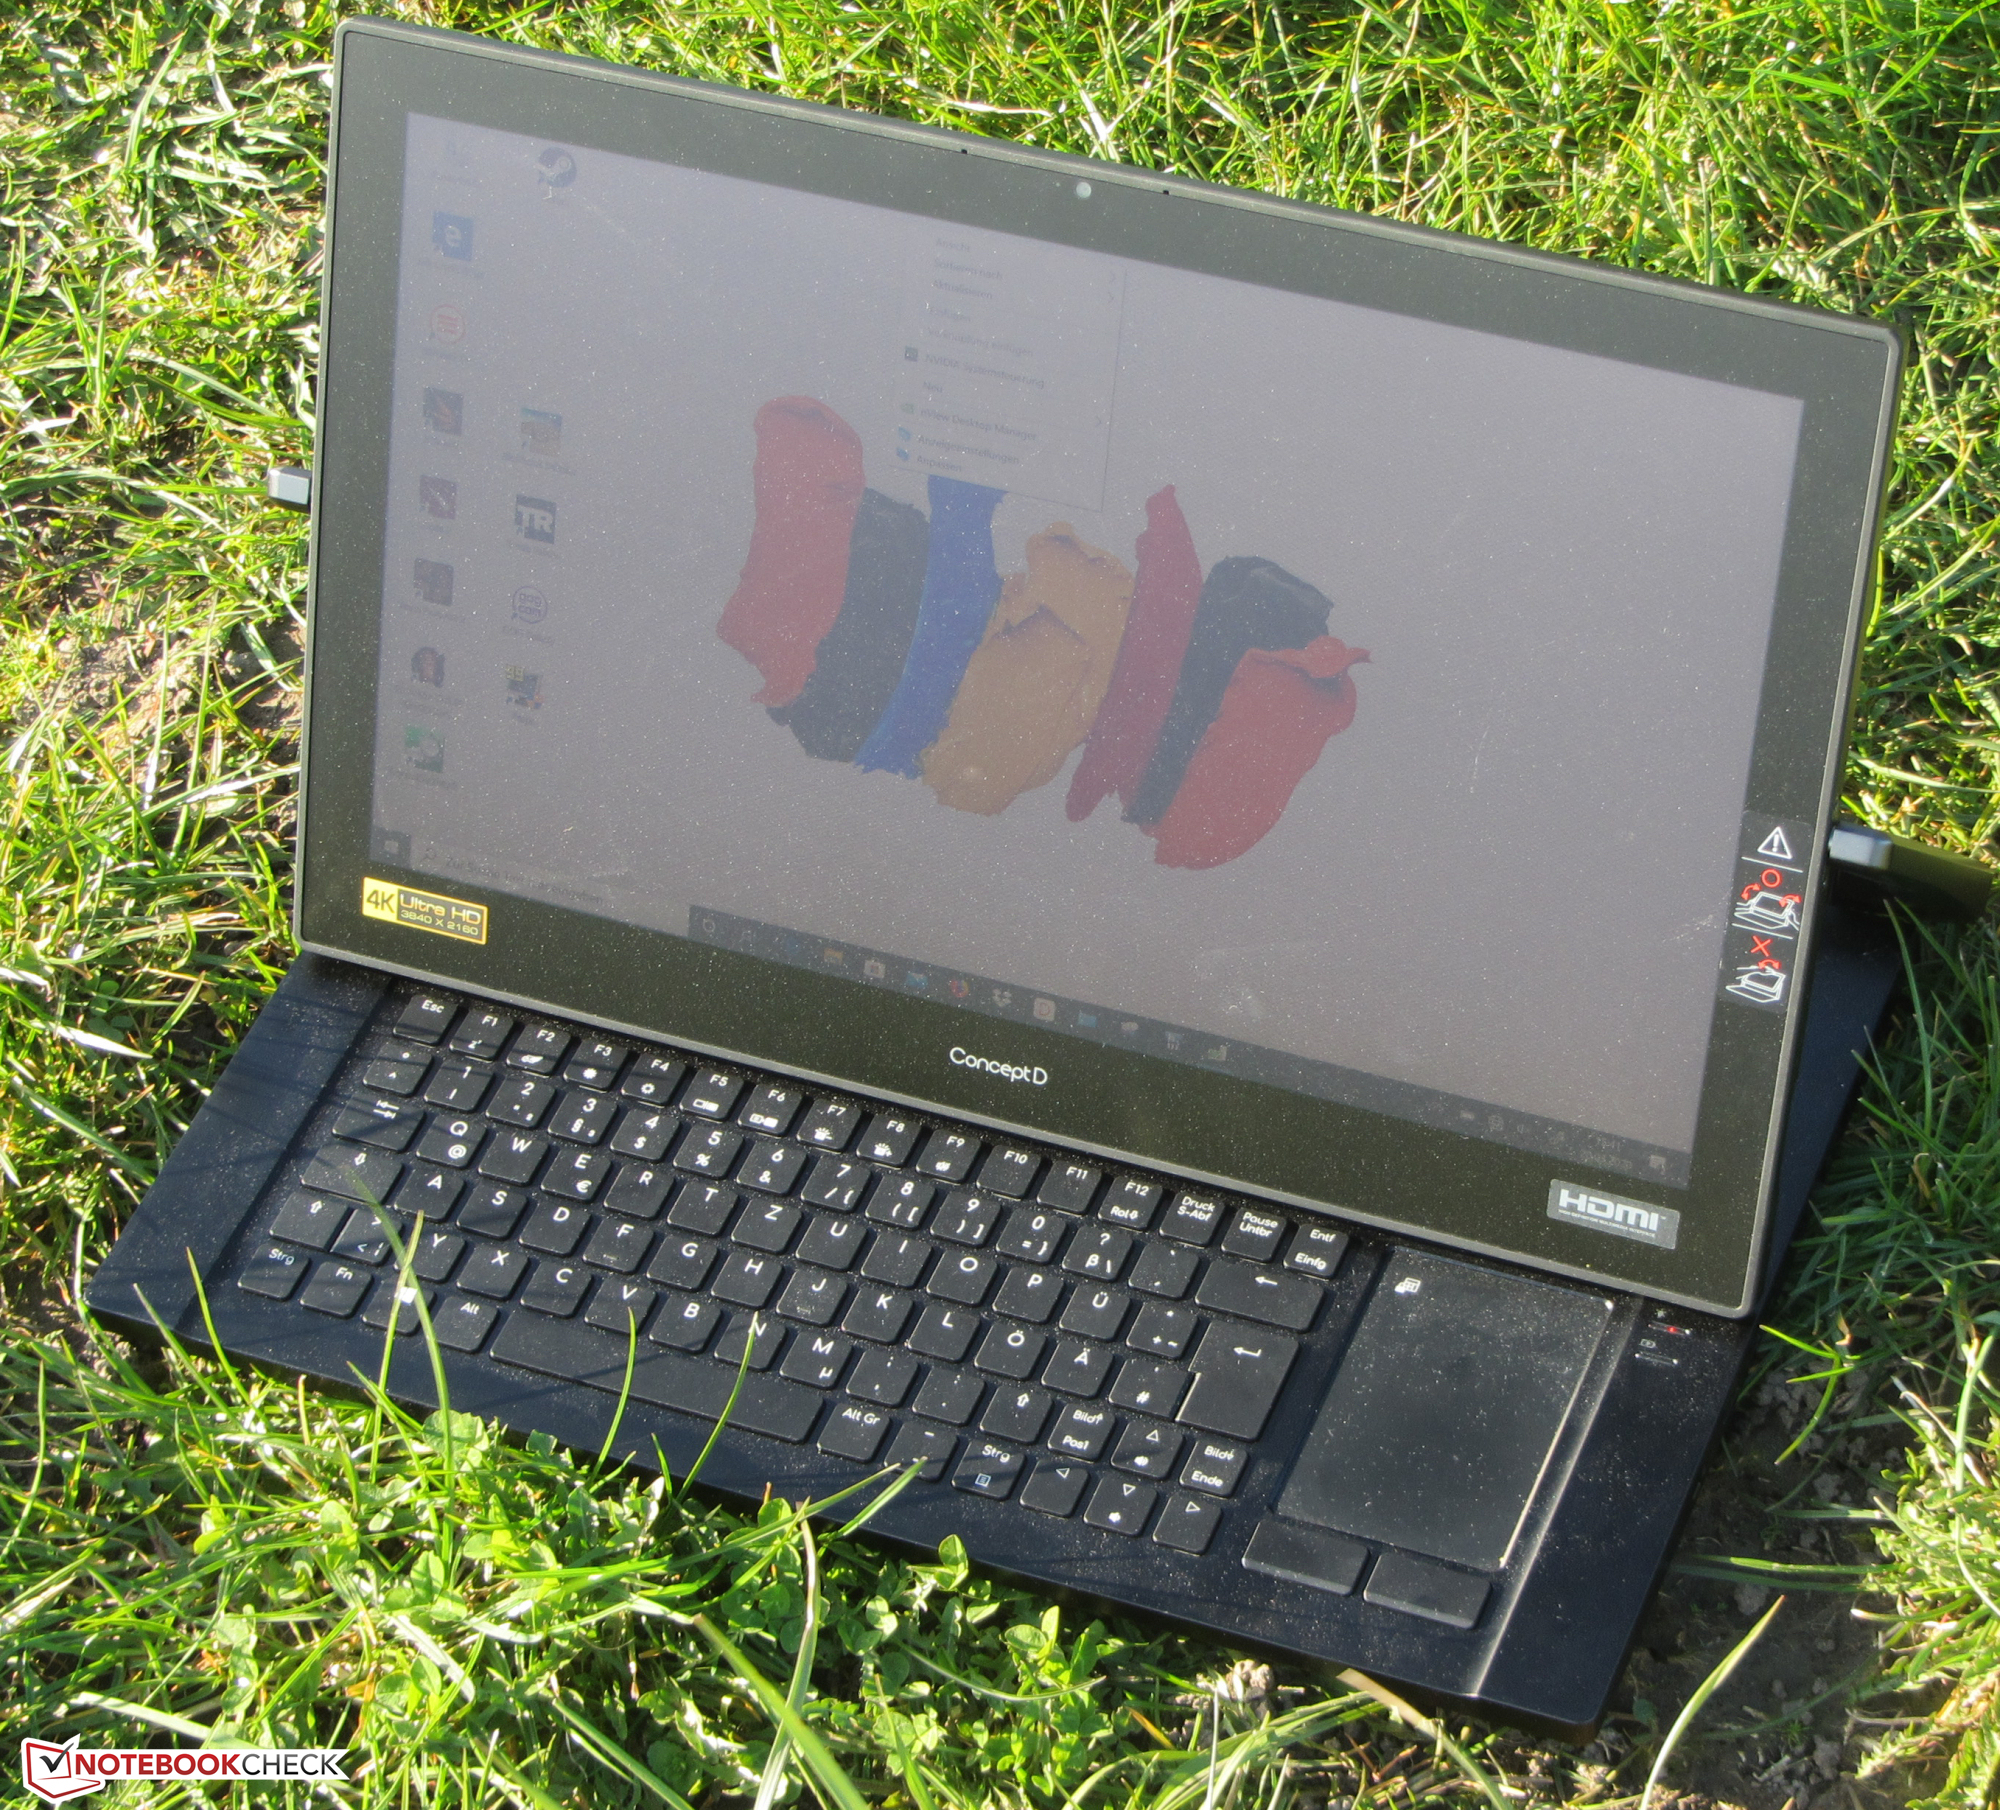
Um chassi de metal sólido, elegante e bem construído, abriga o hardware do ConceptD. As dobradiças maciças do dispositivo são uma característica física impressionante. Elas seguram a tela firmemente no lugar, independentemente de como ela esteja inclinada para entradas de caneta digital confortáveis.
A impressionante tela táctil IPS 4K possui uma boa relação de contraste, bons ângulos de visão, bom brilho e - graças à validação Pantone - ótimas cores. No entanto, não foi possível confirmar a cobertura completa do espaço de cores AdobeRGB anunciada pelo fabricante. De acordo com nossas medições, apenas 84% é coberto (98% de sRGB).
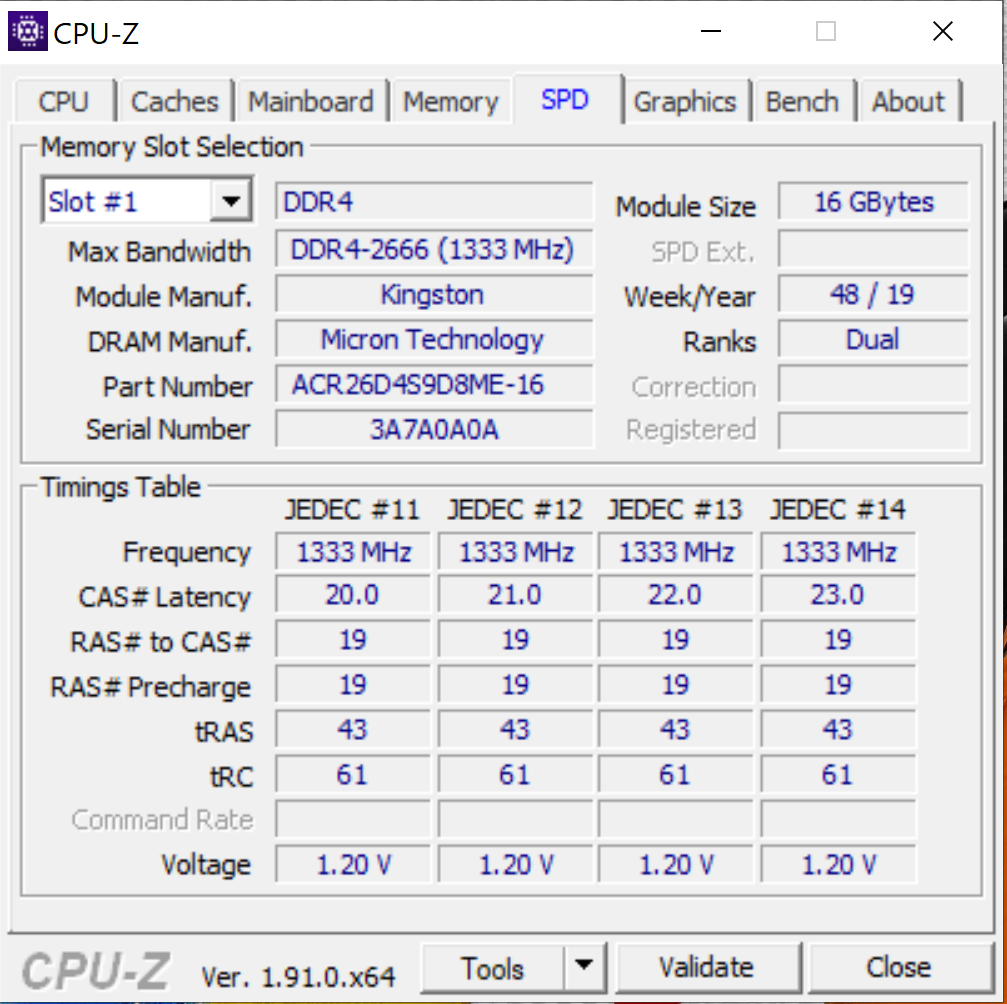
Enquanto isso, o SSD NVMe instalado não oferece apenas boas taxas de transferência, mas também possui muito espaço de armazenamento (1 TB). Também há um slot para um SSD M.2 2280 secundário. Se duas unidades estiverem instaladas, elas poderão ser usadas em RAID 0.
Acer ConceptD 9 Pro
- 03/30/2020 v7 (old)
Sascha Mölck
Price comparison
