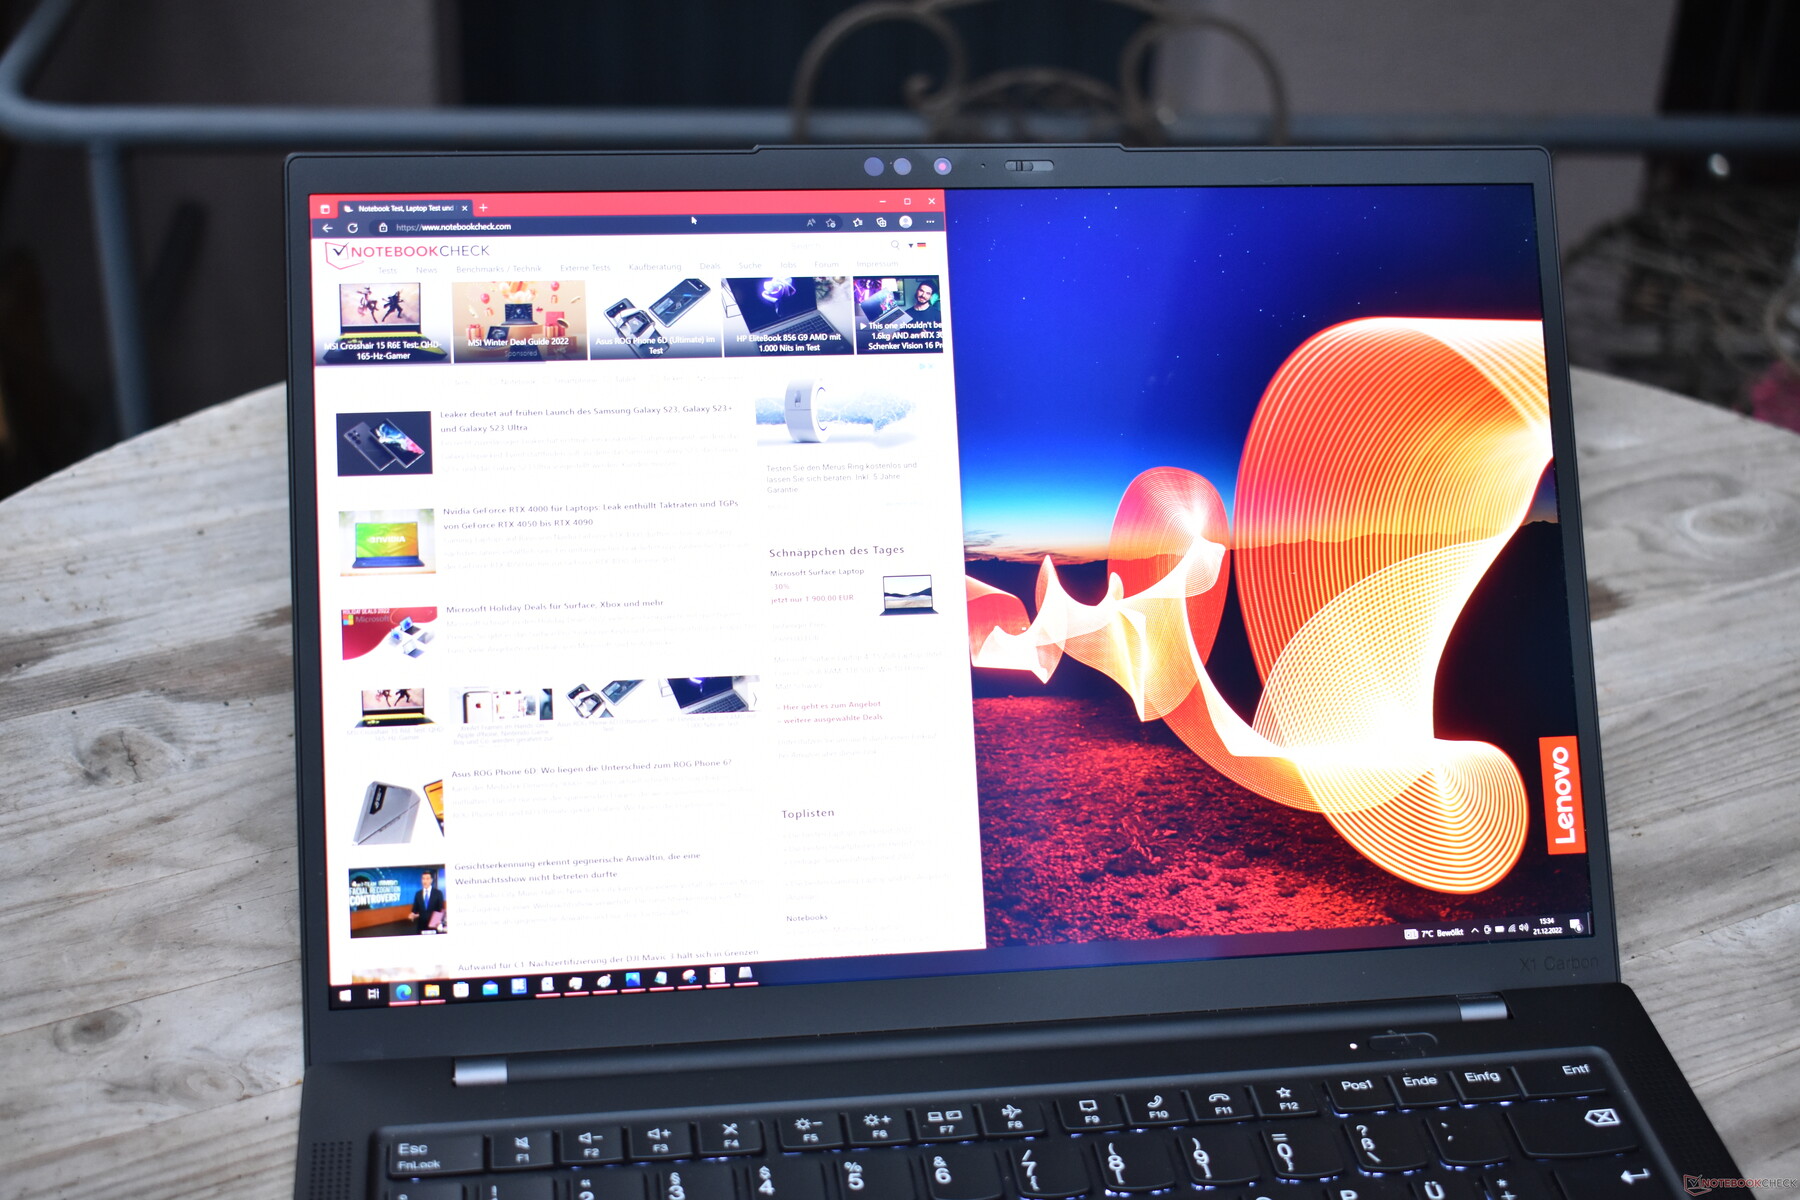
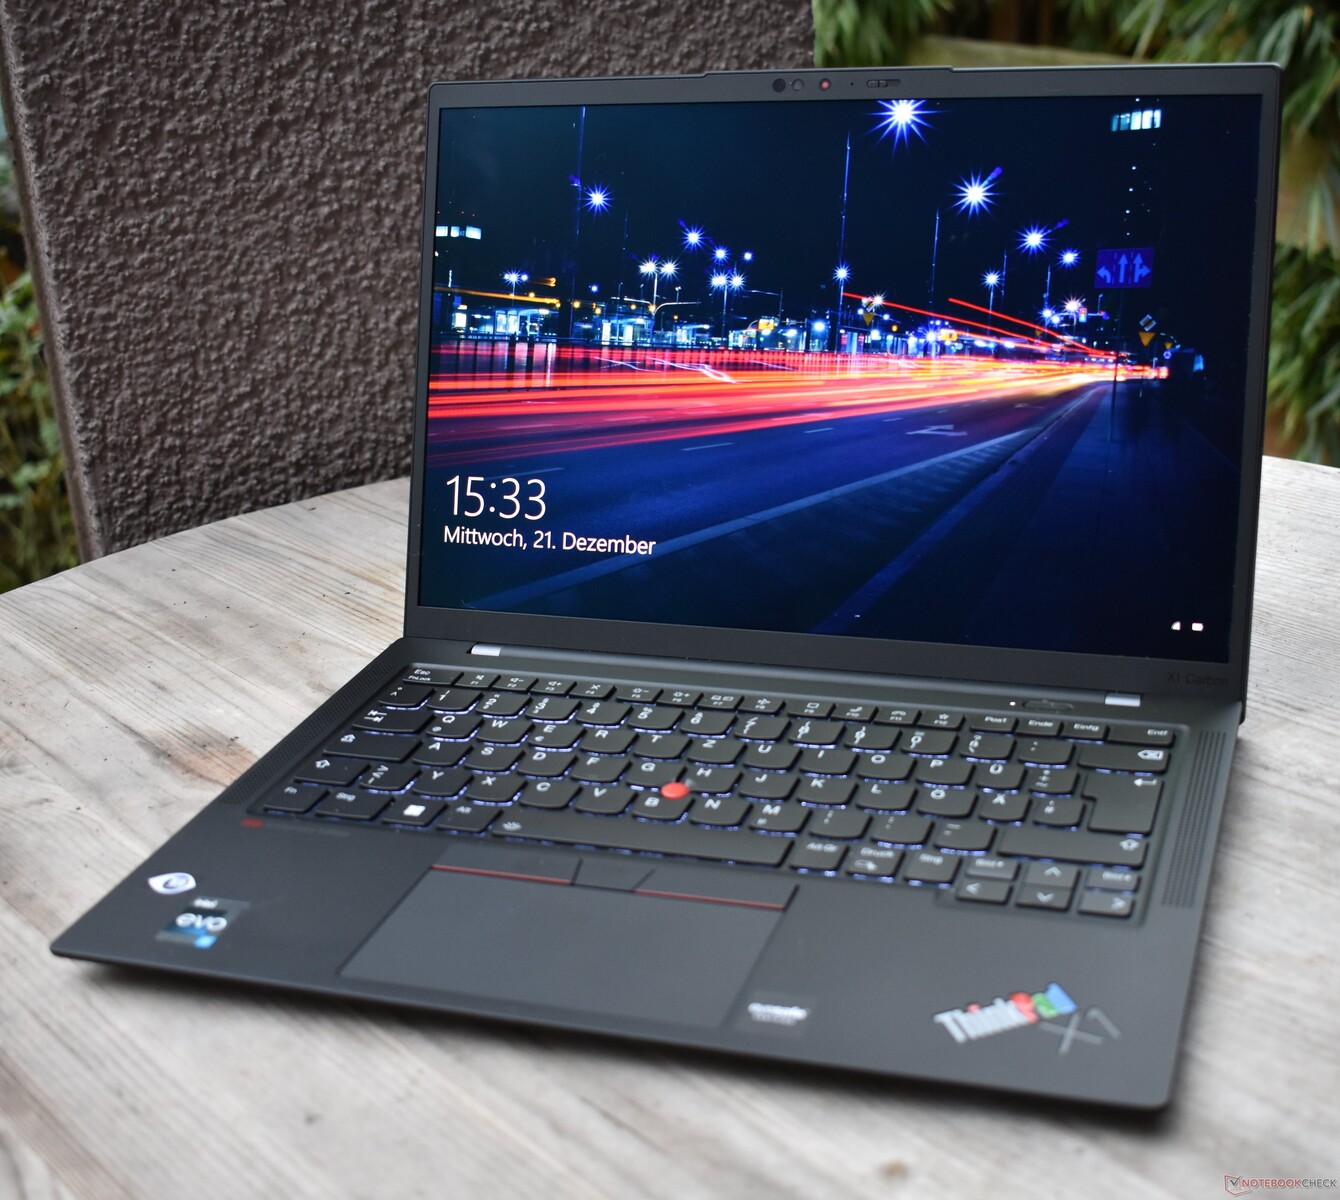
Lenovo ThinkPad X1 Carbono G10 30th Anniversary Laptop review: Edição OLED com edições de resistência
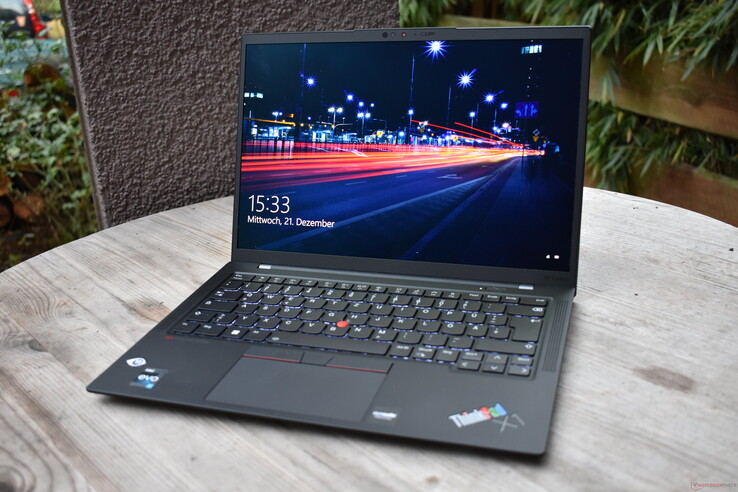
30 anos é uma eternidade no negócio da tecnologia e também um longo período de tempo na vida humana. A Lenovo está comemorando este marco com um modelo especial: O Lenovo ThinkPad X1 Carbon G10 30th Anniversary Edition, que é o tema da revisão de hoje.
É claro que este não é o primeiro ThinkPad X1 Carbon Gen 10 a ser submetido a nossa lupa, e é por isso que este é um teste de atualização. Em termos de especificações, o modelo em questão é particularmente interessante por causa da tela OLED. Também será emocionante ver se a Lenovo melhorou o desempenho das CPUs Intel Alder Lake P28desde a primeira revisão do ThinkPad X1 Carbon G10e, em seguida, com um processador i5.
Possíveis concorrentes em comparação
Avaliação | Data | Modelo | Peso | Altura | Size | Resolução | Preço |
|---|---|---|---|---|---|---|---|
| 88.9 % v7 (old) | 12/2022 | Lenovo ThinkPad X1 Carbon G10 21CB00DCGE i7-1260P, Iris Xe G7 96EUs | 1.2 kg | 15.36 mm | 14.00" | 2880x1800 | |
| 90.2 % v7 (old) | 06/2022 | Lenovo ThinkPad X1 Carbon G10 21CC001RGE i5-1250P, Iris Xe G7 80EUs | 1.2 kg | 15.36 mm | 14.00" | 1920x1200 | |
| 90.3 % v7 (old) | 05/2021 | Lenovo ThinkPad X1 Carbon G9-20XWCTO1WW i7-1165G7, Iris Xe G7 96EUs | 1.2 kg | 14.9 mm | 14.00" | 3840x2400 | |
| 88.8 % v7 (old) | 10/2022 | Lenovo ThinkPad Z13 G1-21D20016GE R7 PRO 6860Z, Radeon 680M | 1.3 kg | 14 mm | 13.30" | 2880x1800 | |
| 91 % v7 (old) | 08/2022 | HP Elite Dragonfly G3 i7-1265U, Iris Xe G7 96EUs | 1.2 kg | 16.3 mm | 13.50" | 1920x1280 | |
| 89.8 % v7 (old) | 08/2022 | Dell Latitude 9430 2-in-1 i7-1265U, Iris Xe G7 96EUs | 1.5 kg | 13.94 mm | 14.00" | 2560x1600 |
Diferenças em relação ao modelo normal
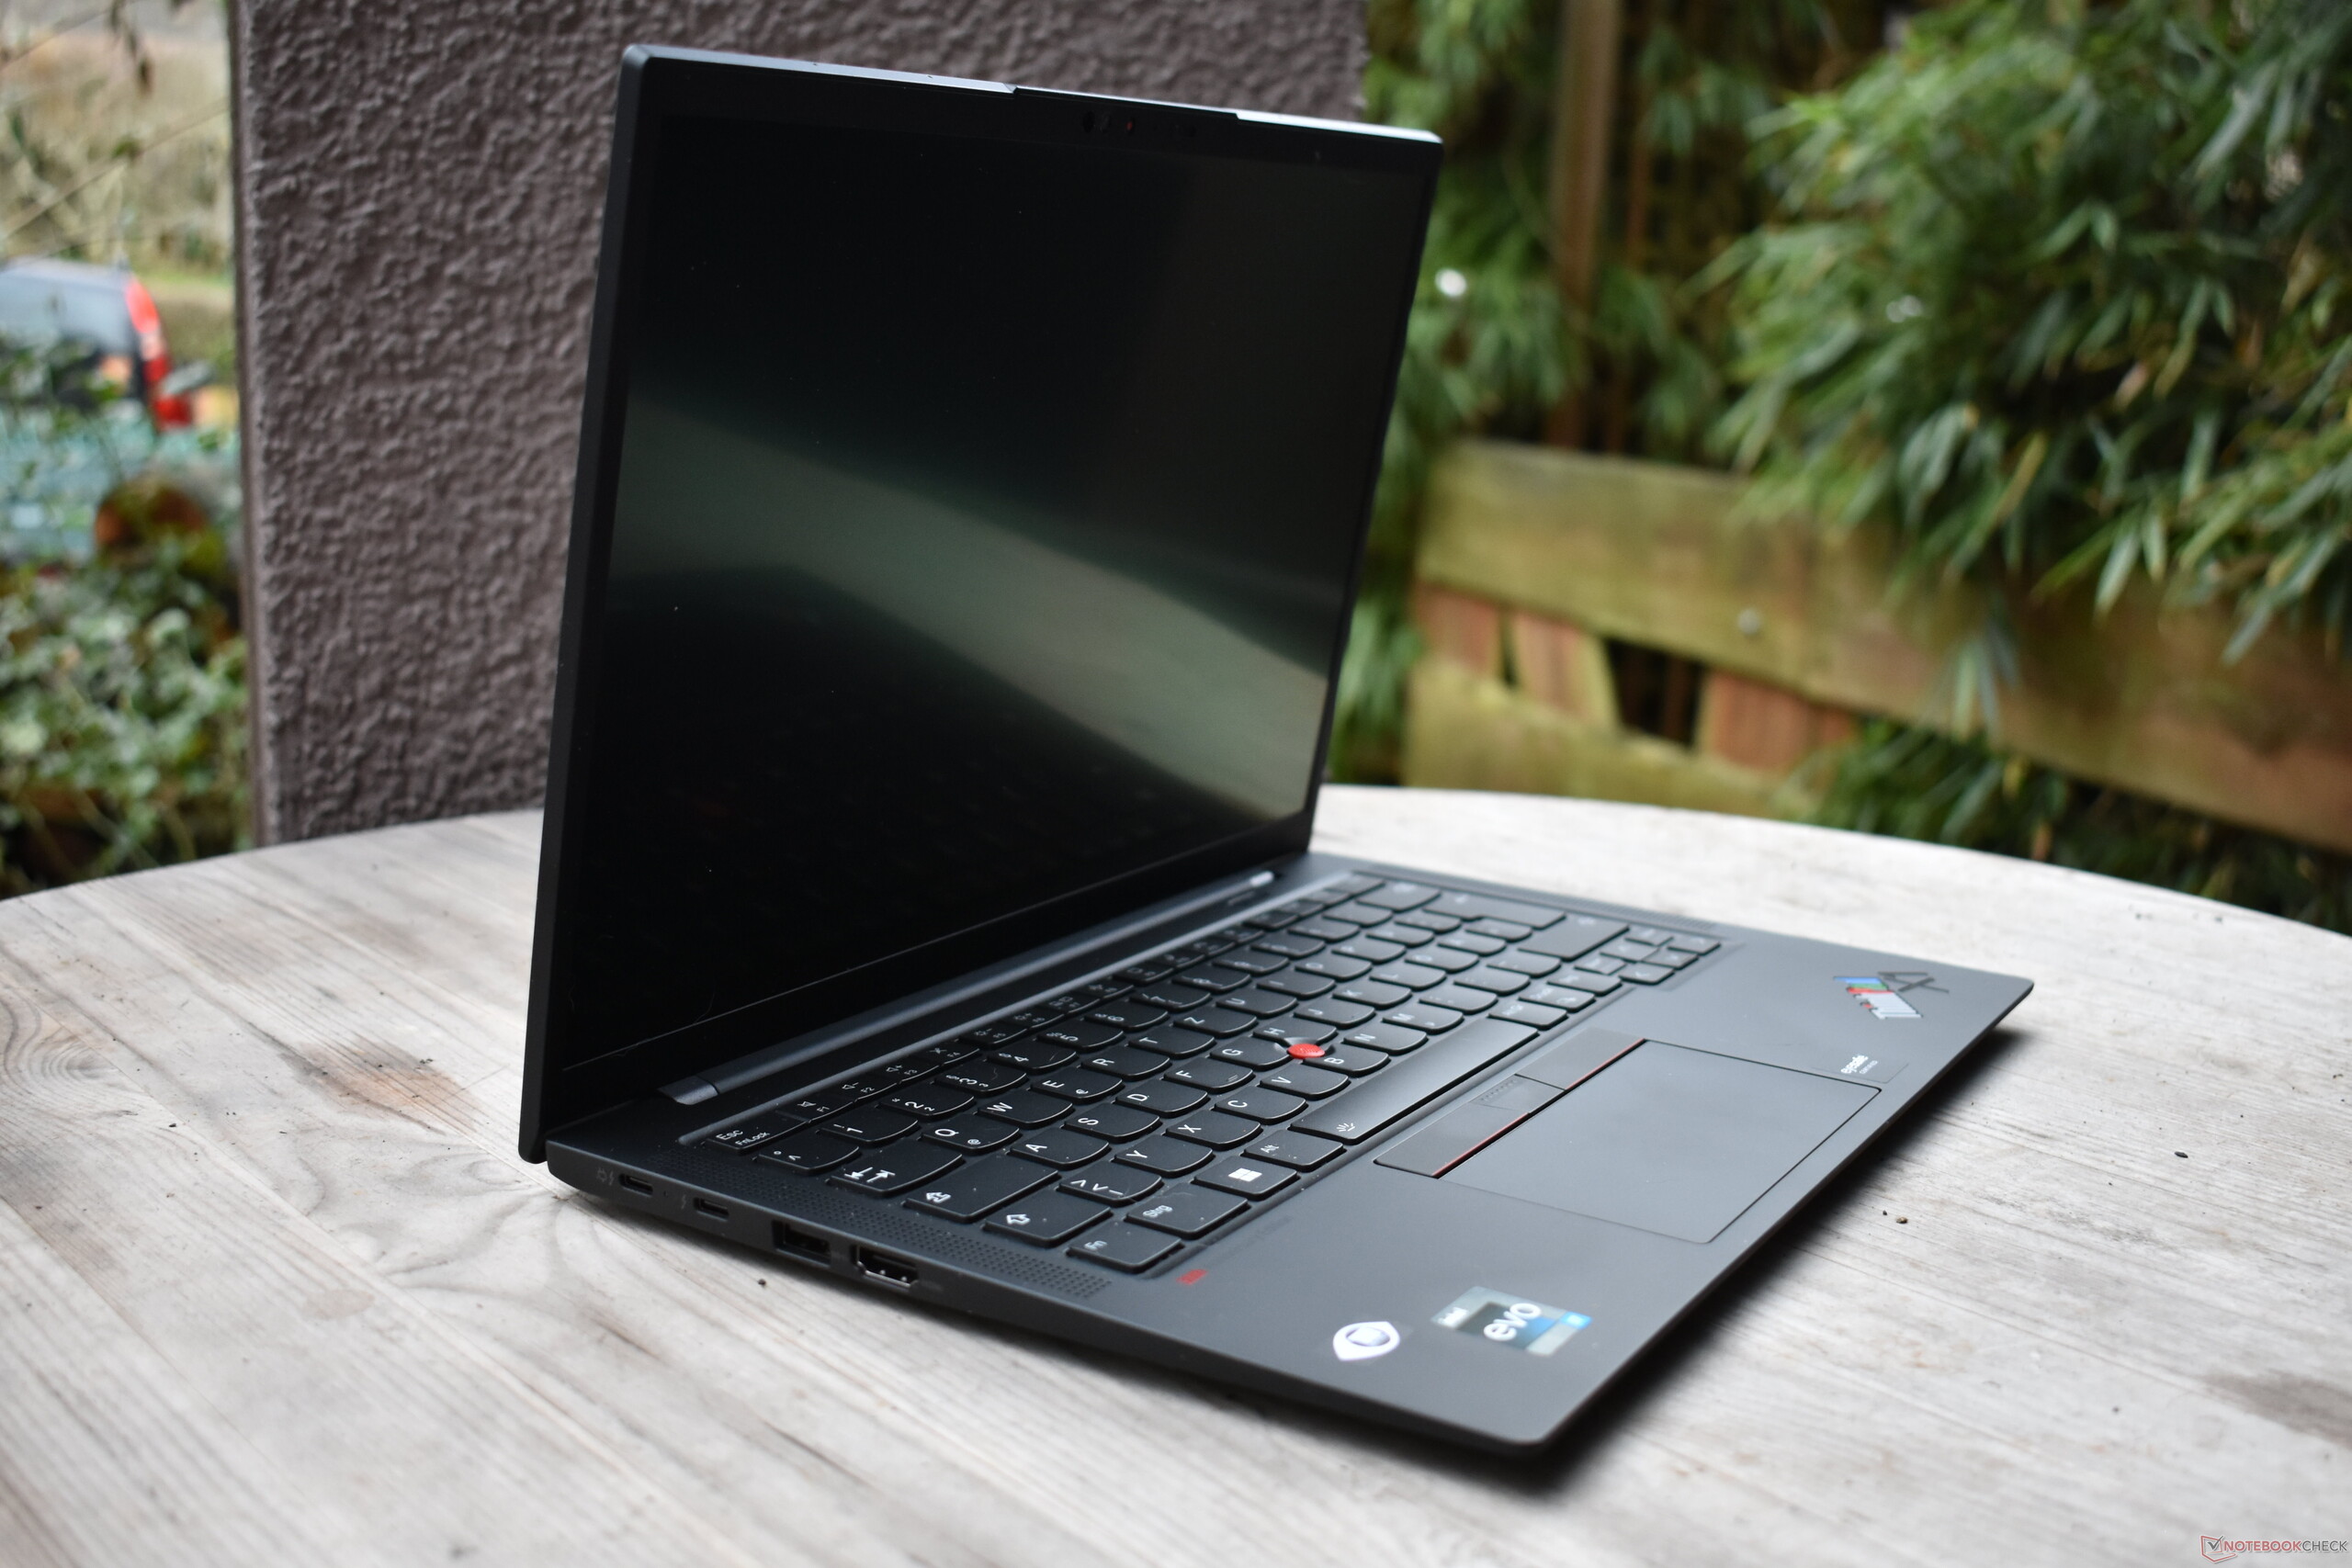
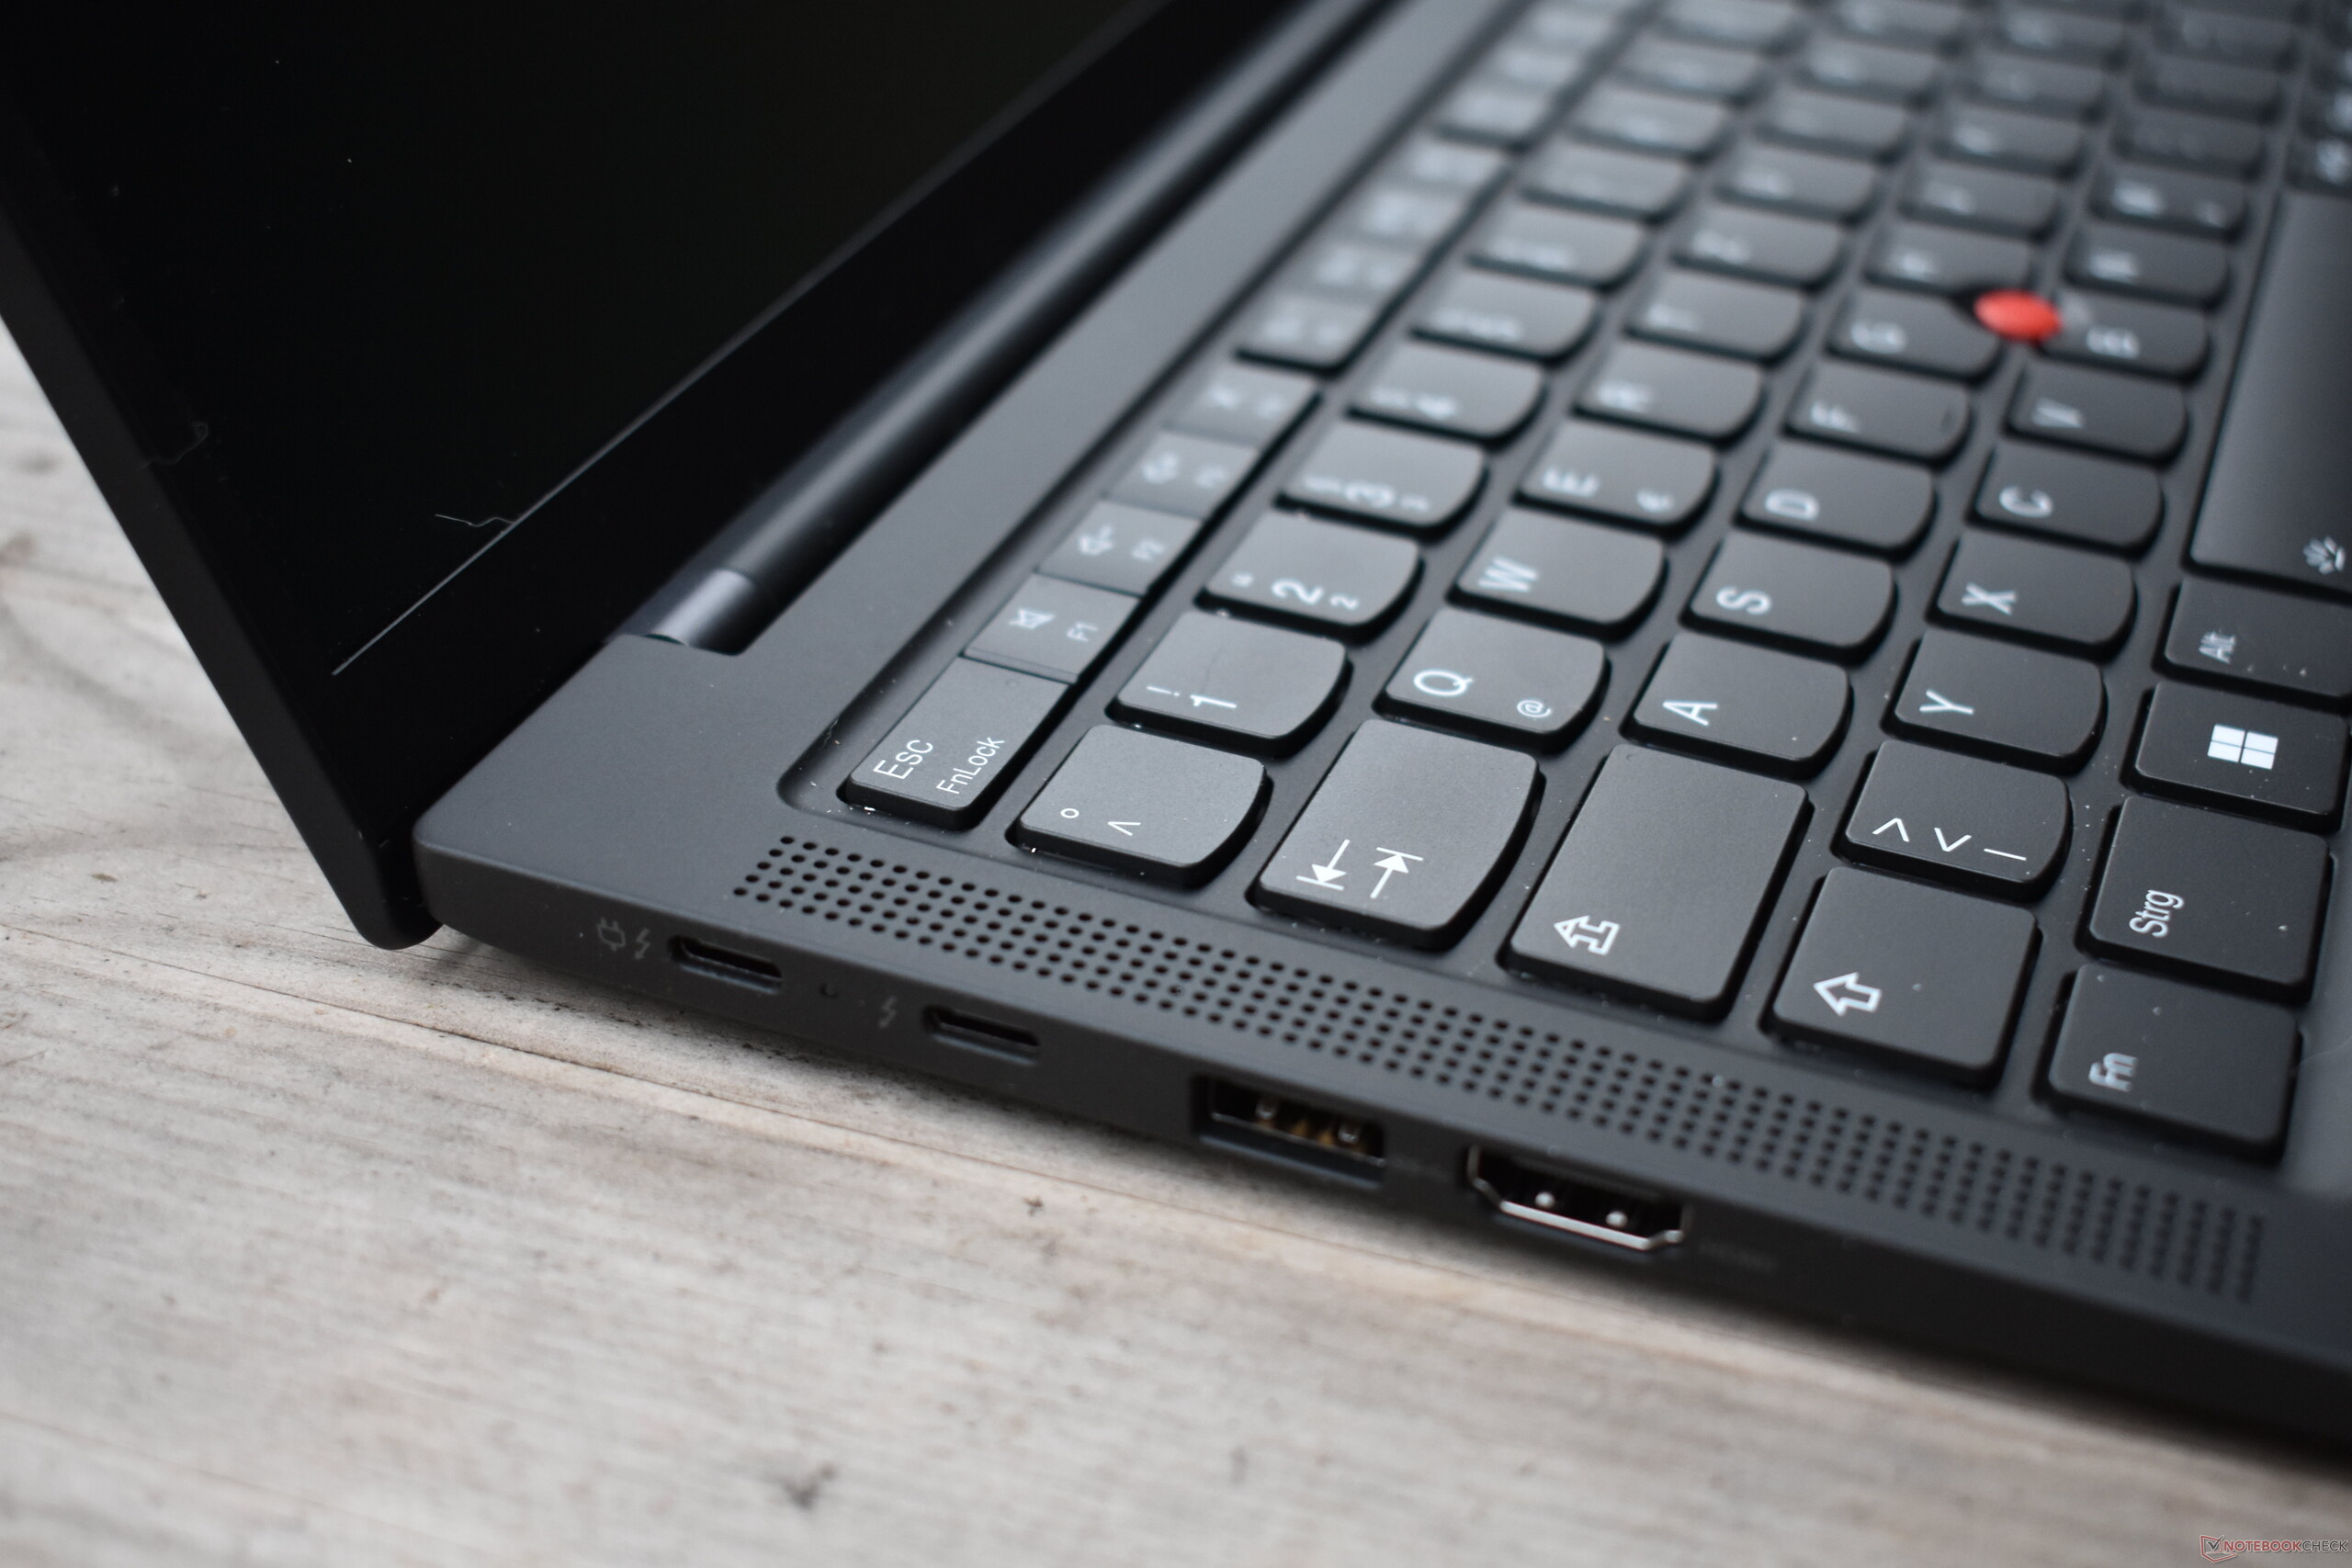
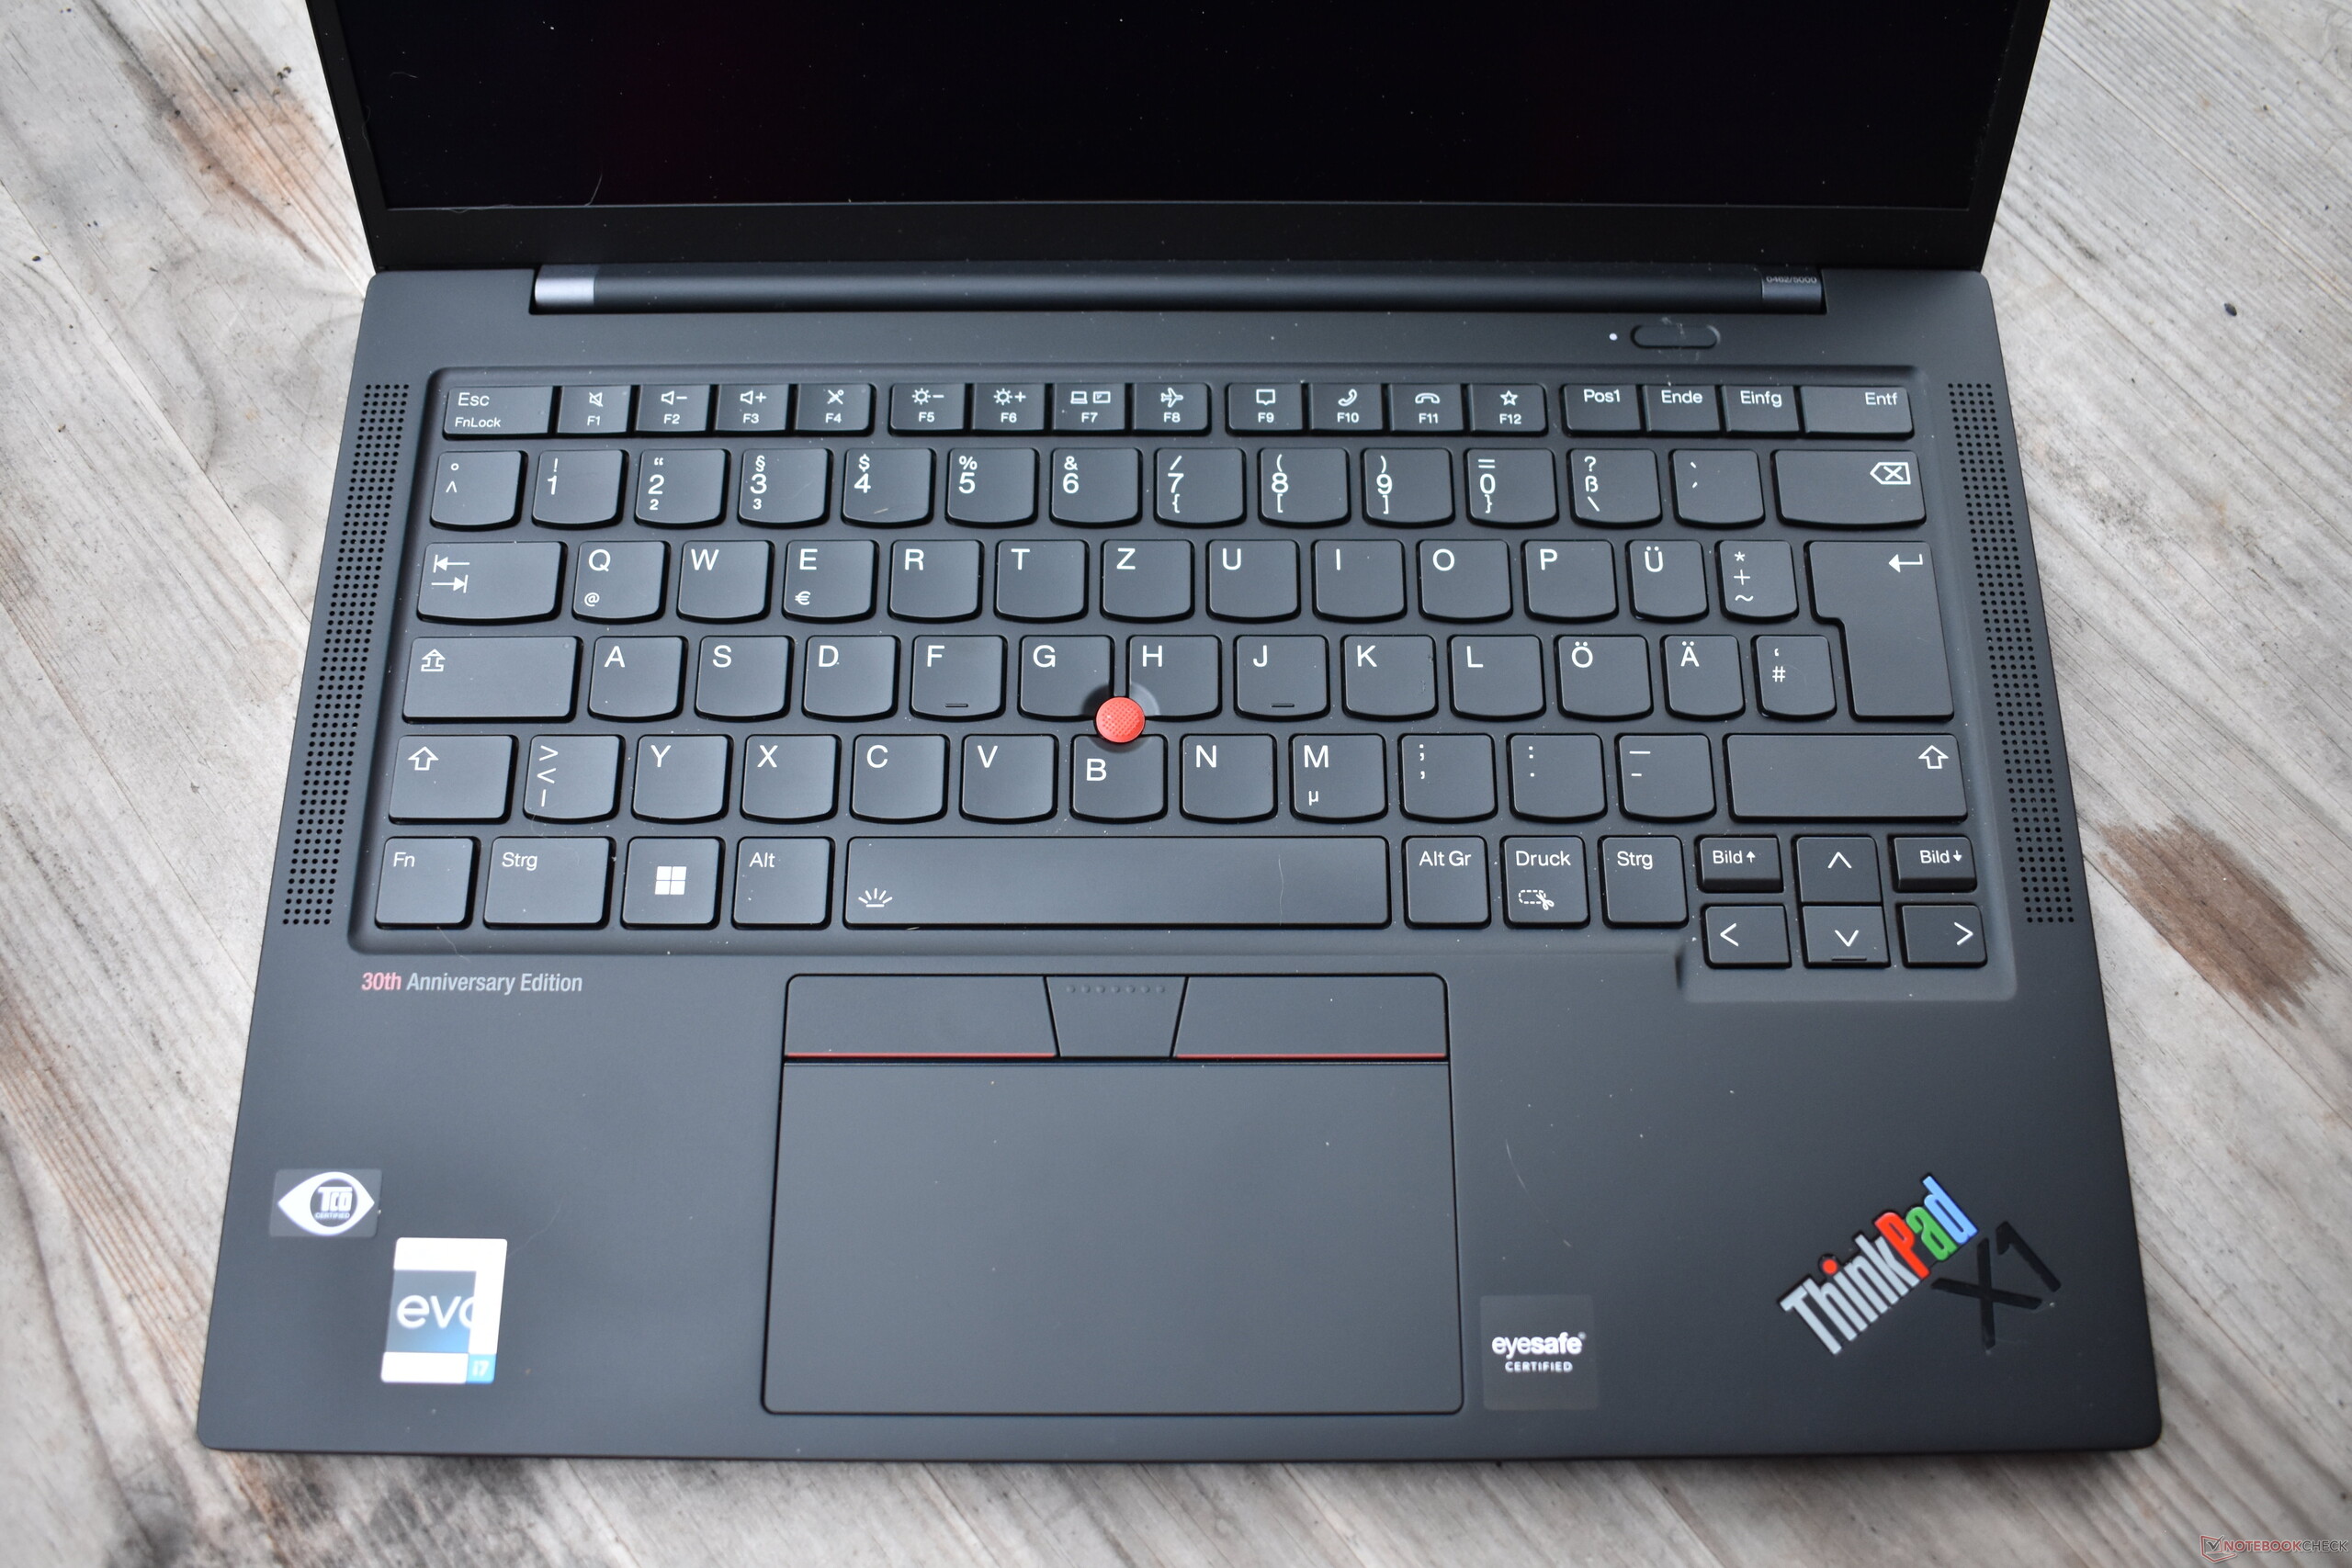
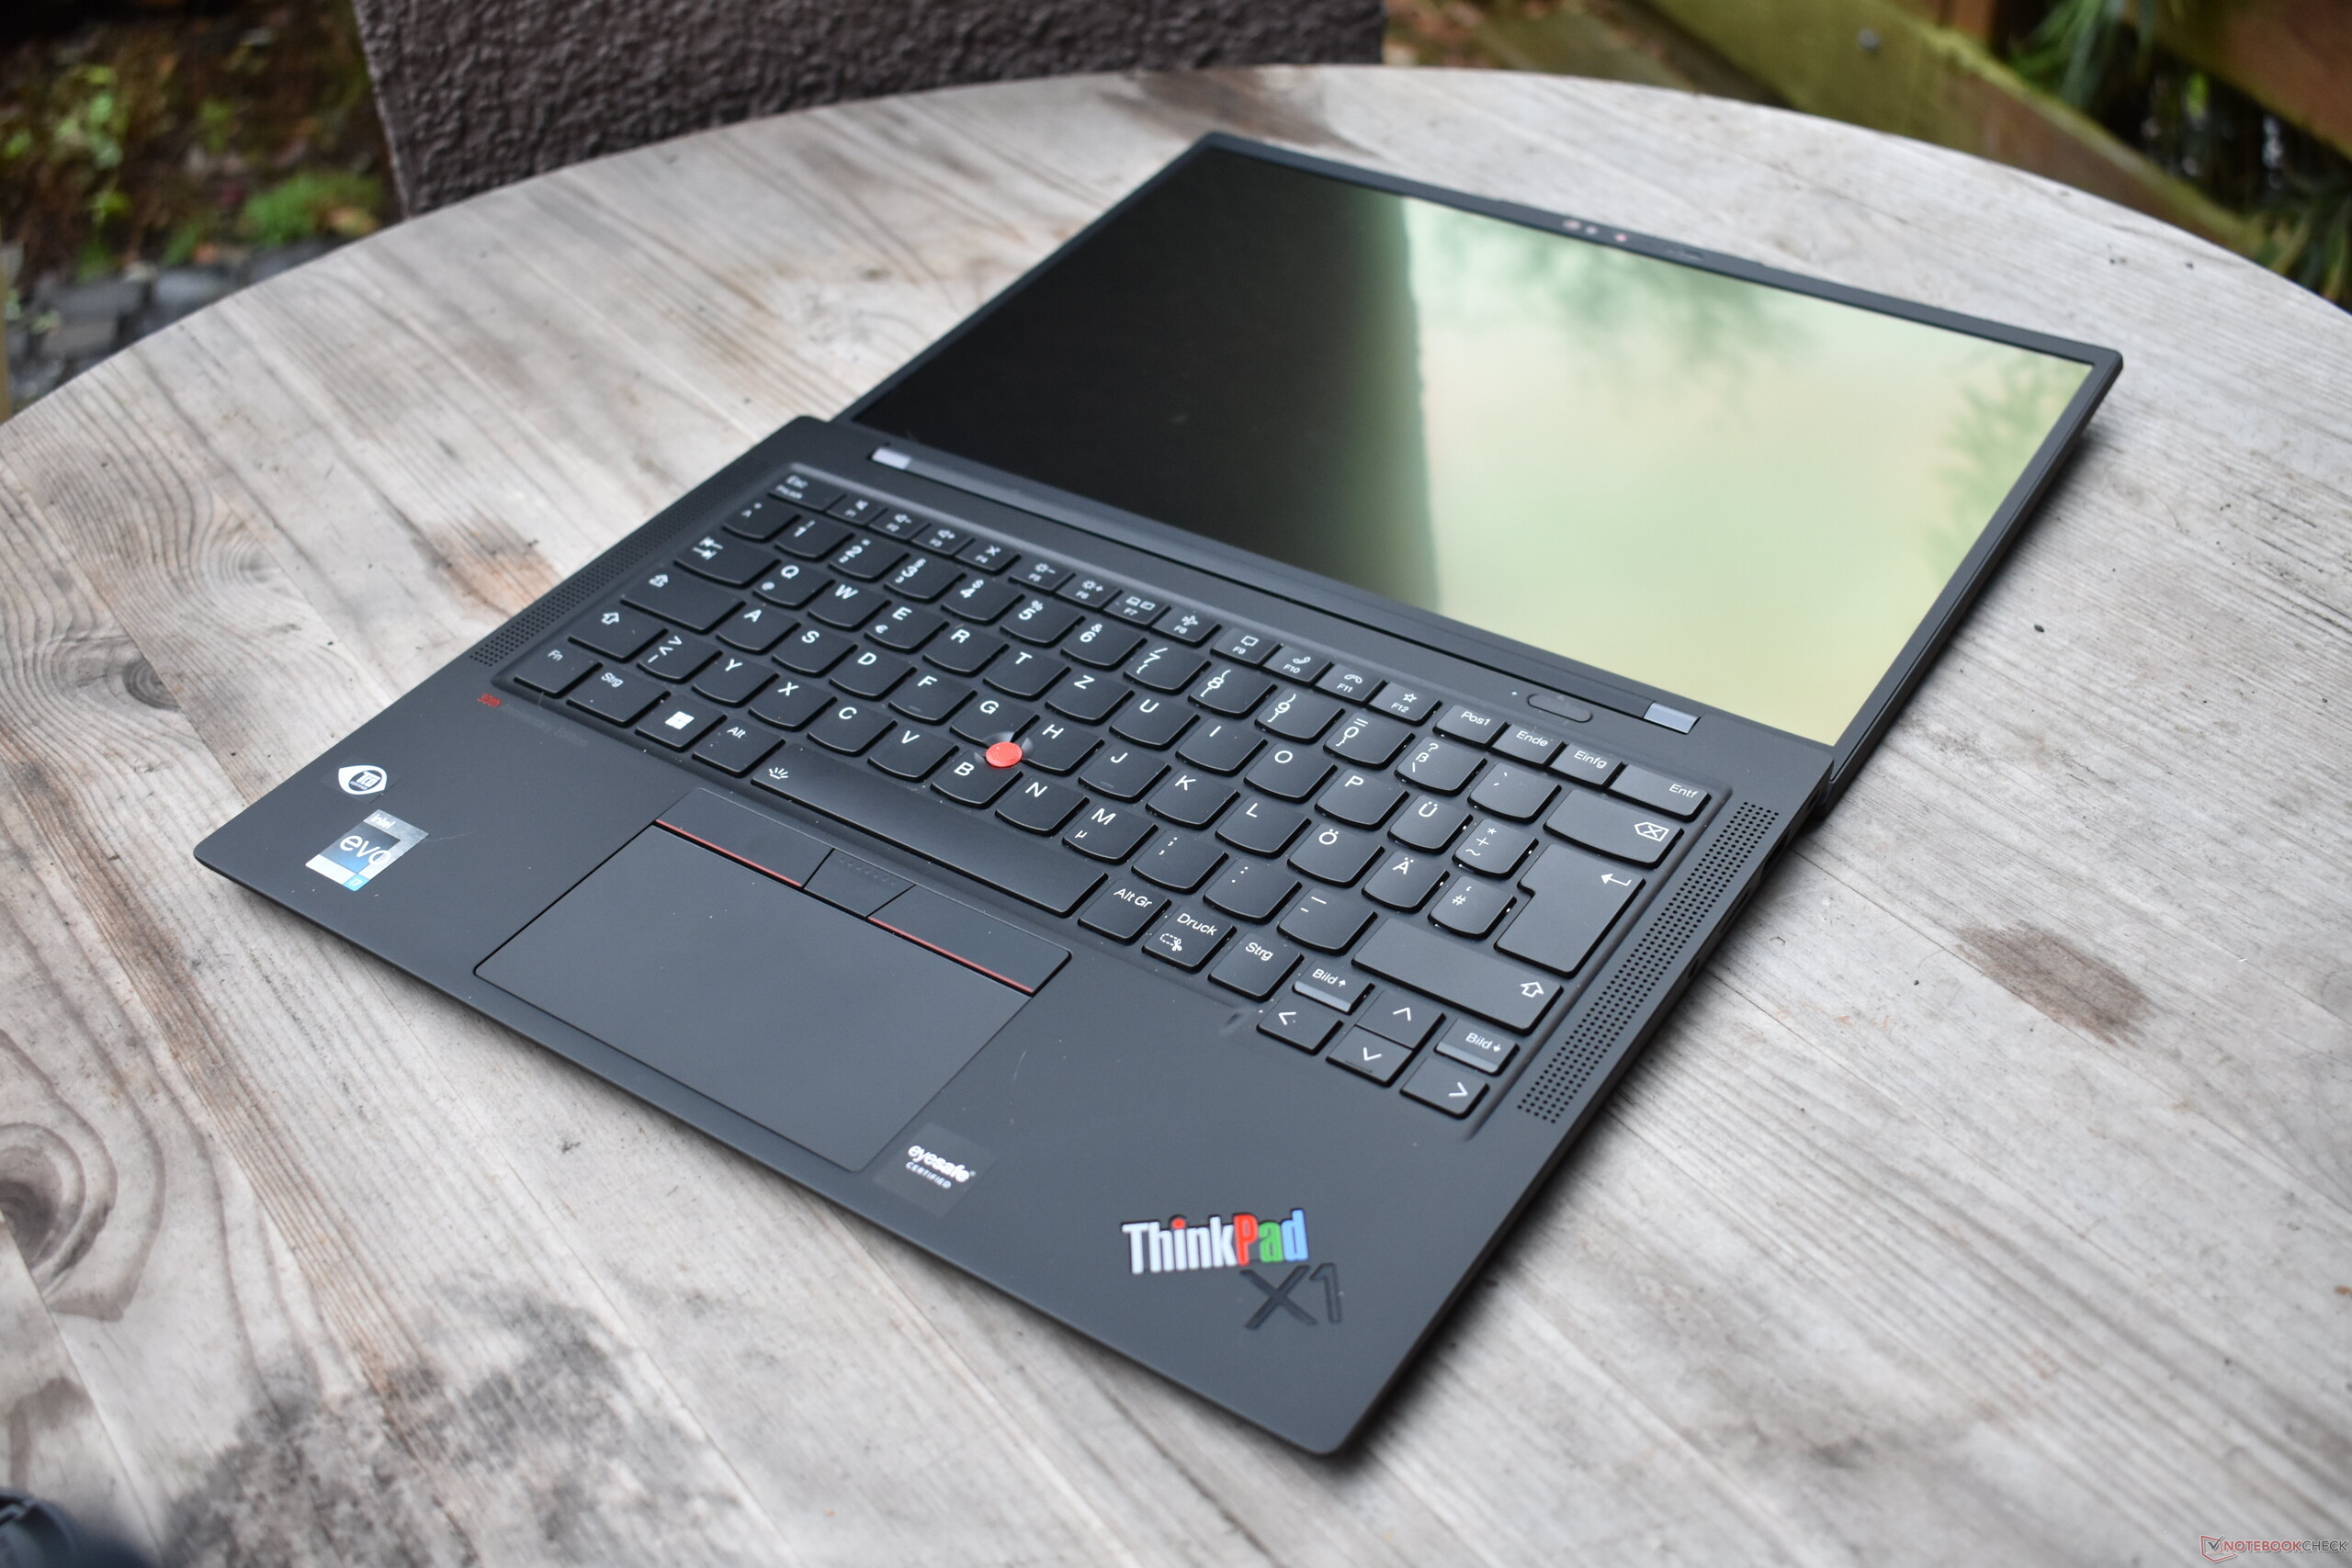
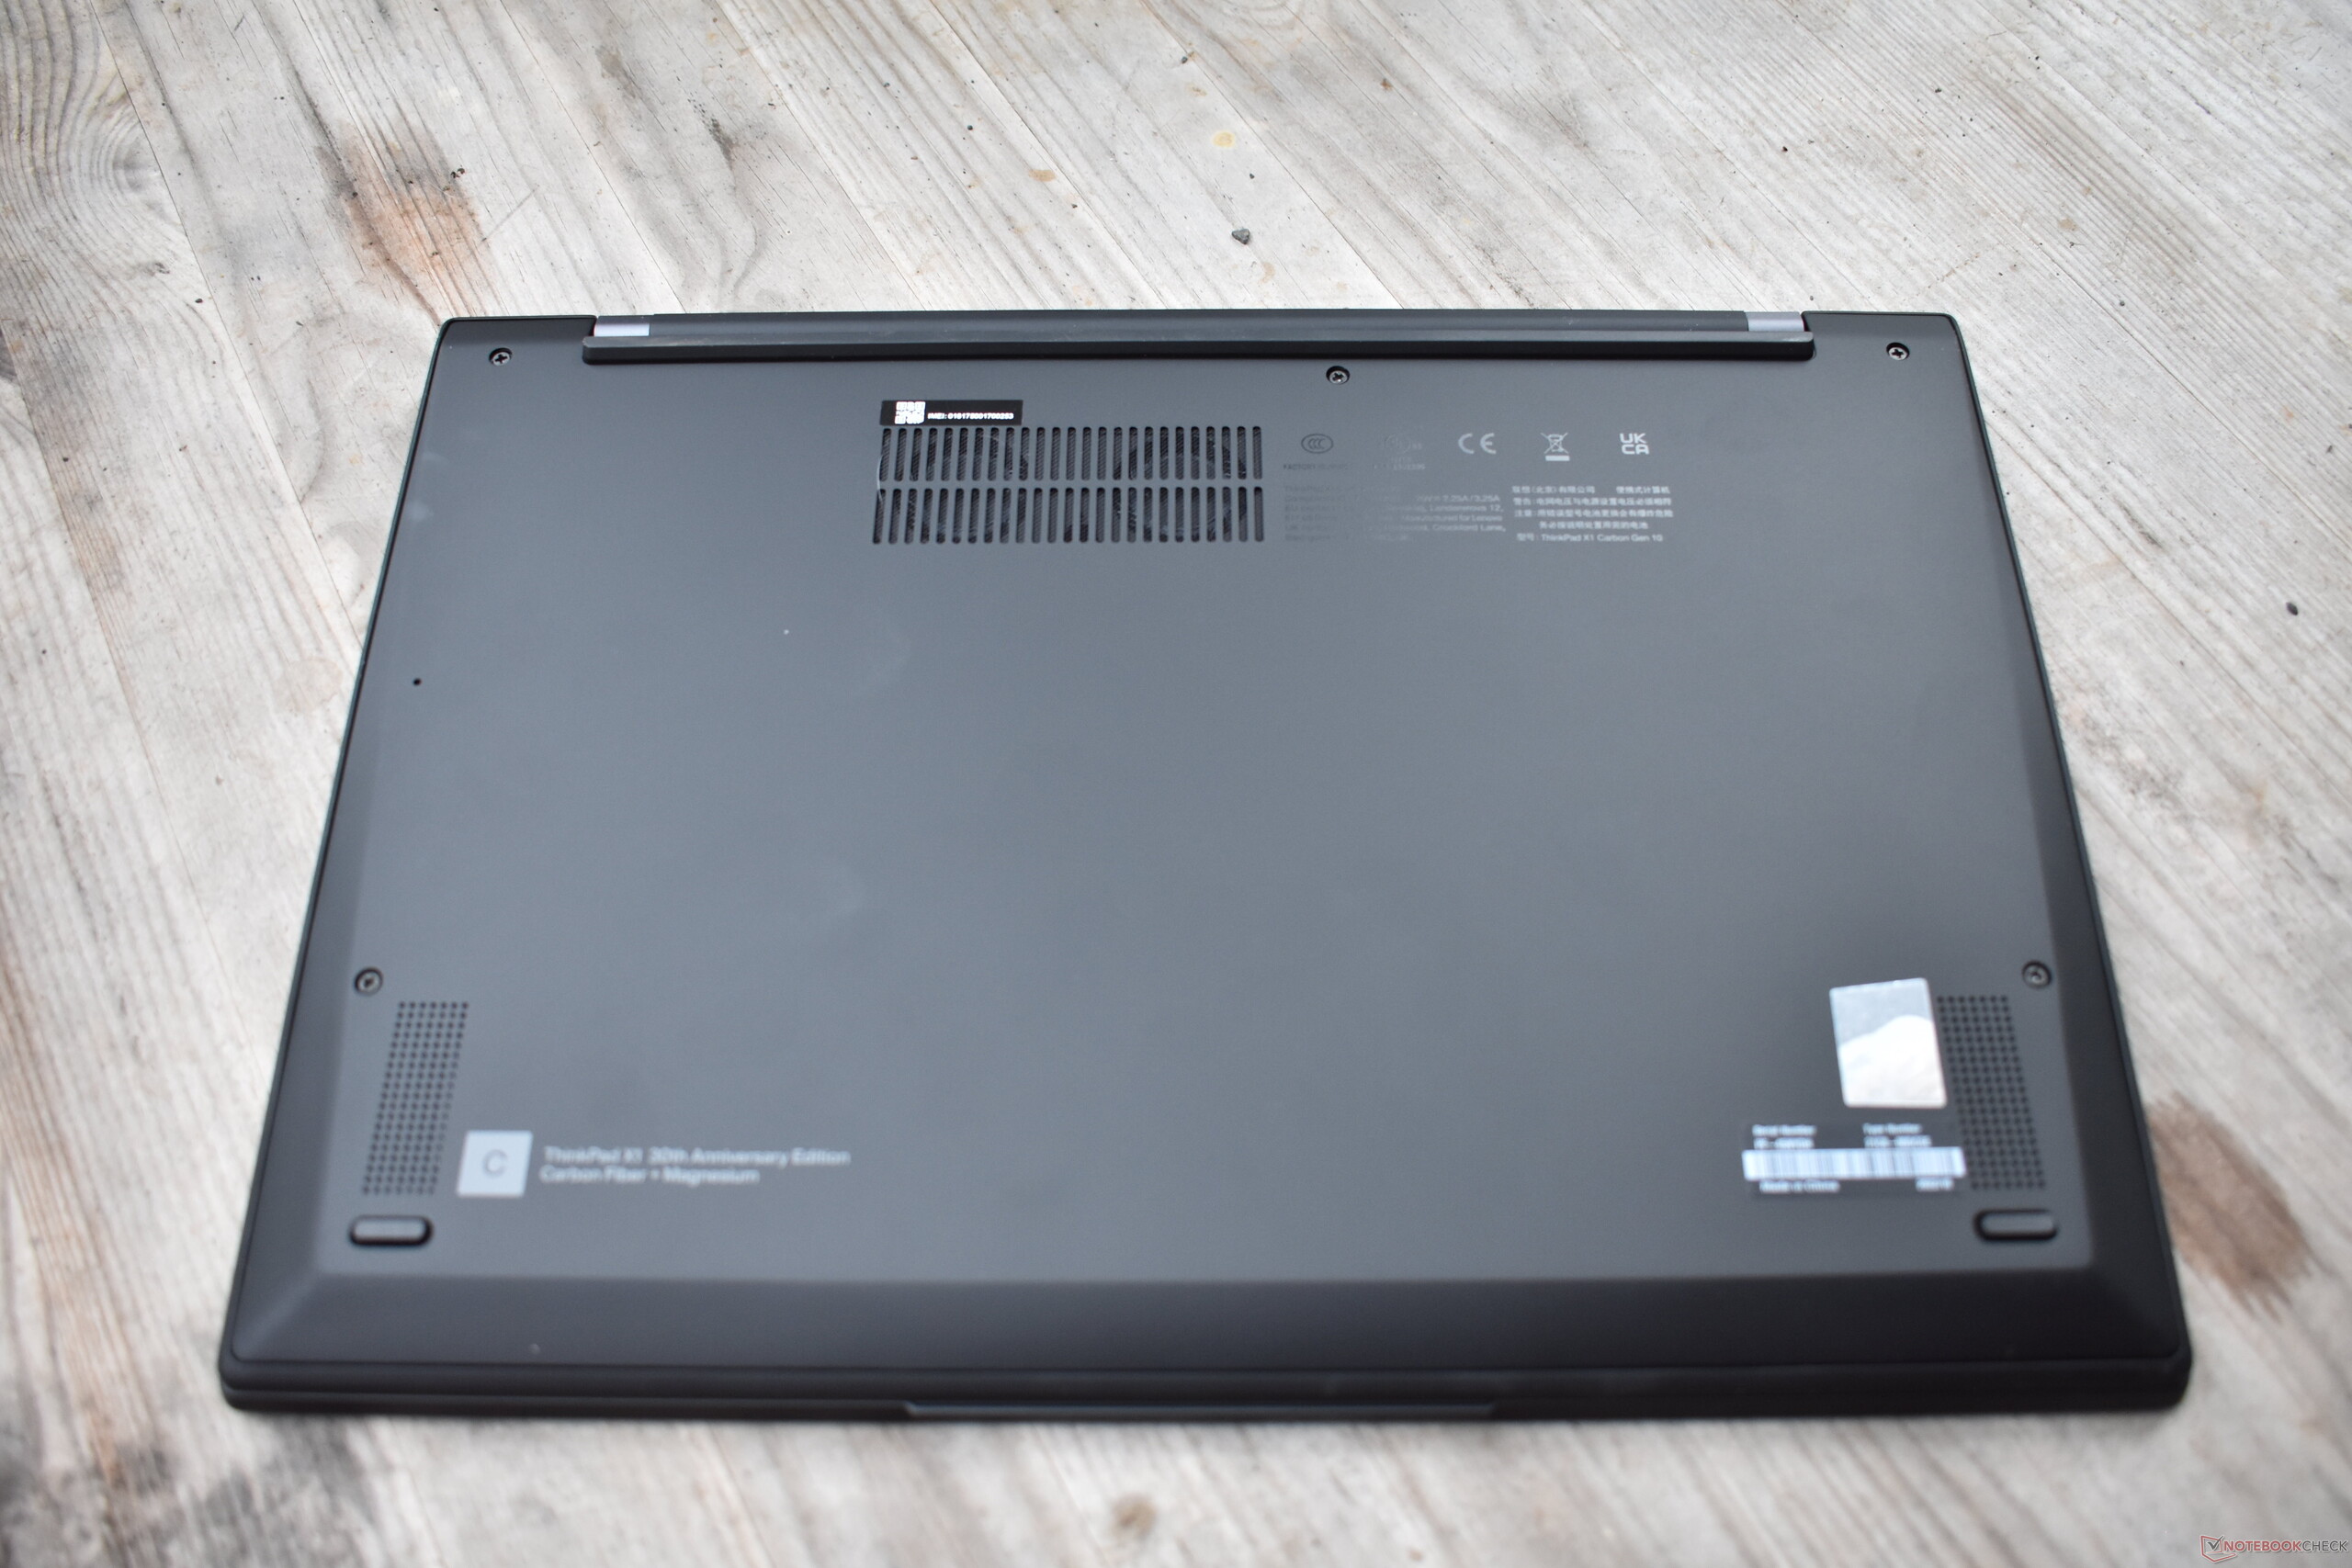
Ao contrário dos PensePad 25há cinco anos, a Lenovo renunciou a grandes mudanças no hardware do X1 Carbon Gen 10 30th Anniversary Edition. Em vez disso, há algumas modificações cosméticas, como o logotipo "30th Anniversary Edition" no apoio de palma, o número da unidade gravada a laser na dobradiça (há 5.000 modelos no total), e o logotipo especial ThinkPad de aniversário com a parte "Pad" no esquema de cores do IBM RGB Tricolor - inspirado no antigo Logotipo do IBM ThinkPadalém disso, o escopo da entrega inclui uma embalagem de edição especial e três tampas TrackPoint extras, com cada uma sendo vermelha, verde e azul. Caso contrário, trata-se de um ThinkPad X1 Carbon G10 regular. A Lenovo não tenta reviver o clássico teclado ThinkPad com sete fileiras desta vez.


Nenhuma mudança no equipamento foi feita, e os resultados do WiFi e da webcam são praticamente idênticos aos do primeira revisão do ThinkPad X1 Carbon G10exceção: A versão testada aqui roda Windows 10, e é por isso que não conseguimos testar WiFi 6E.


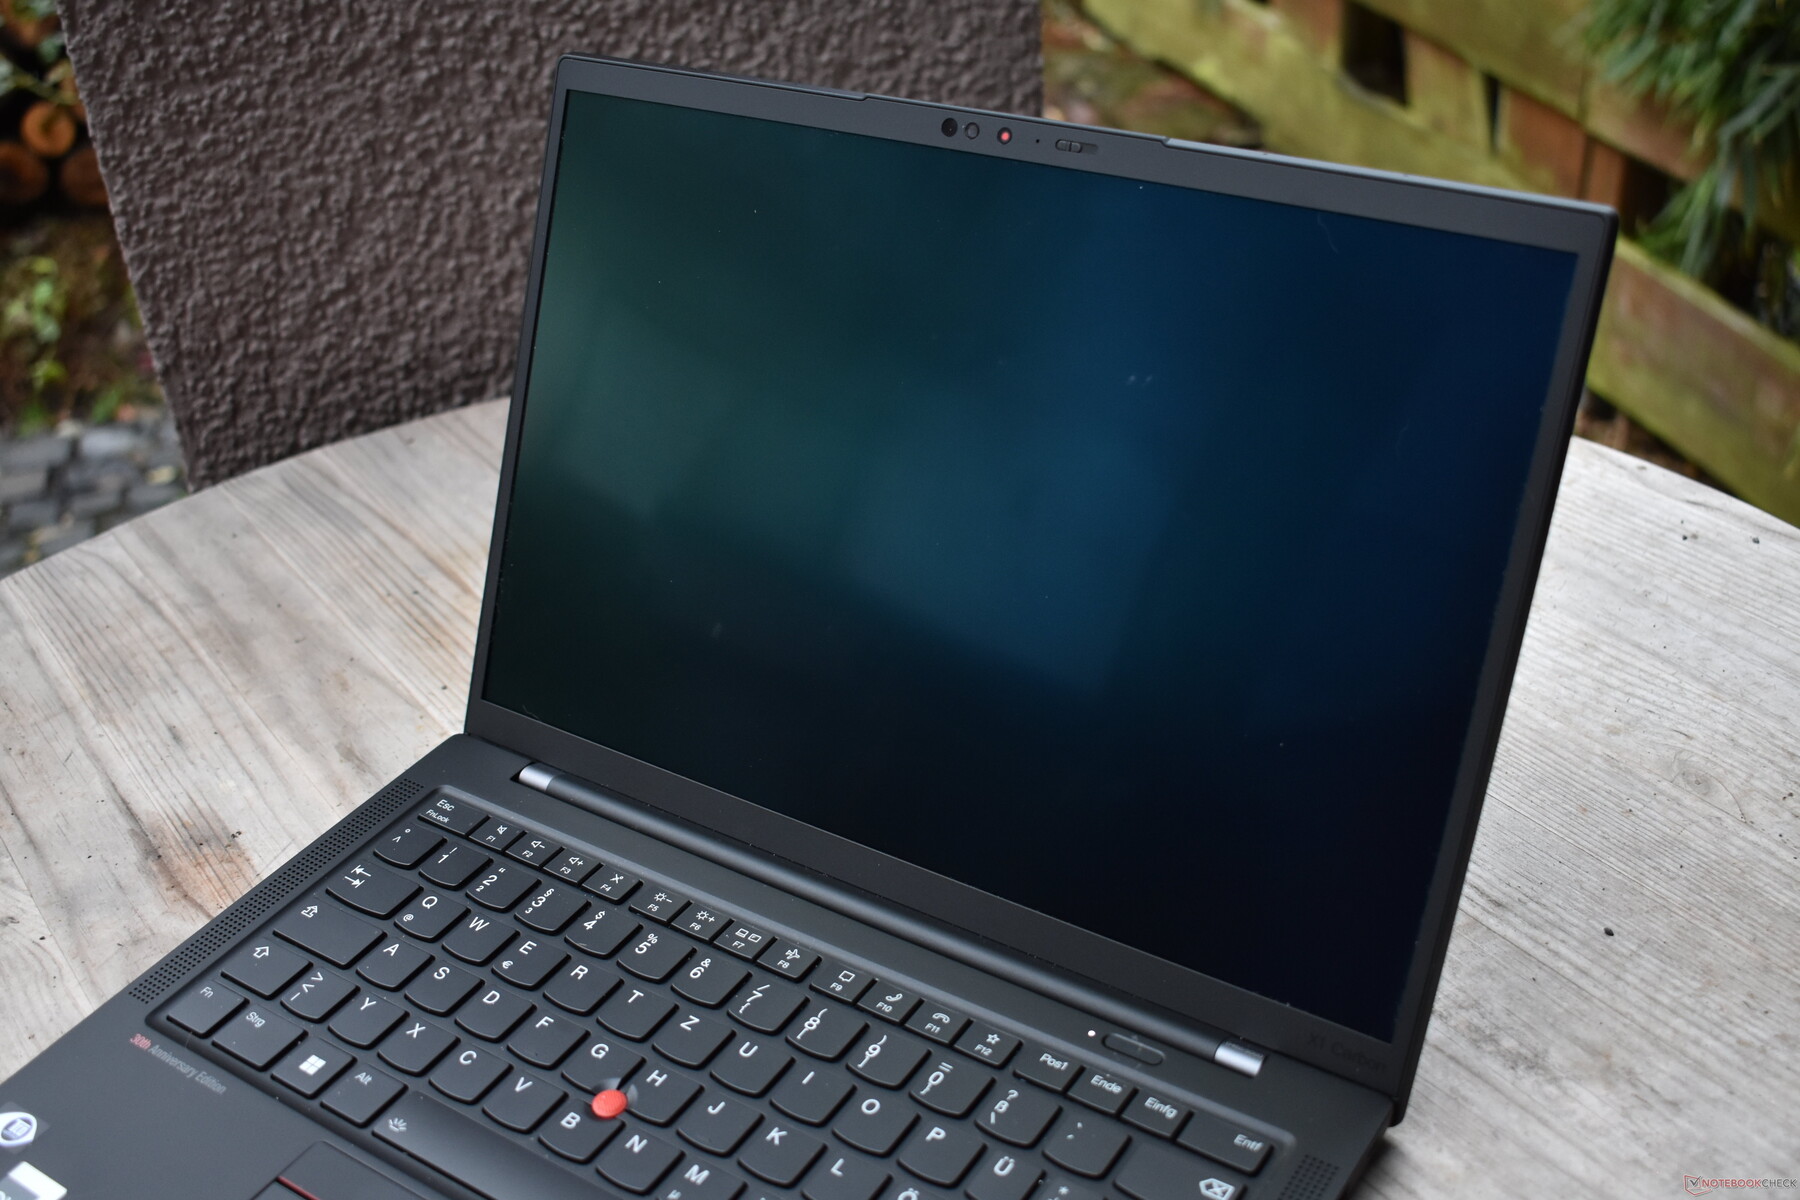
O visor OLED no X1 Carbono é quase fosco

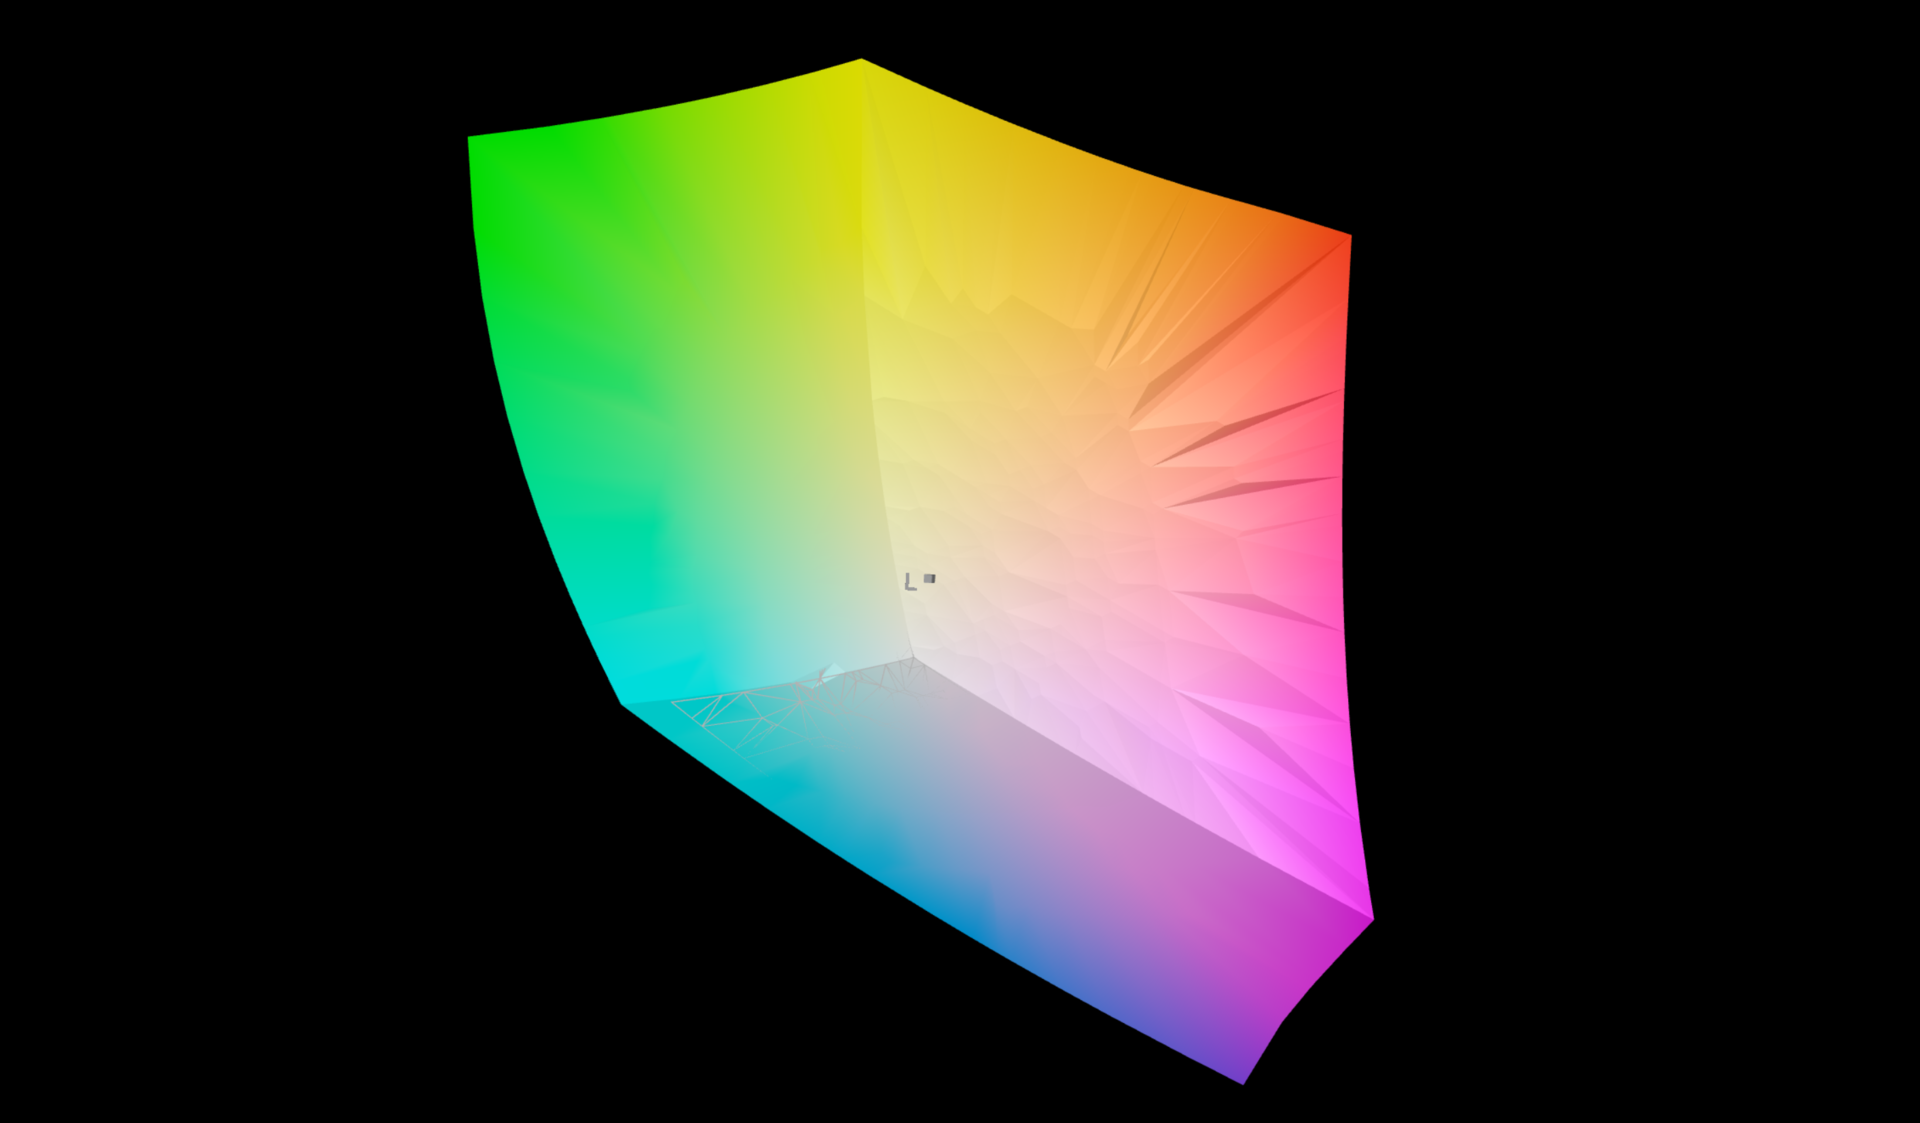
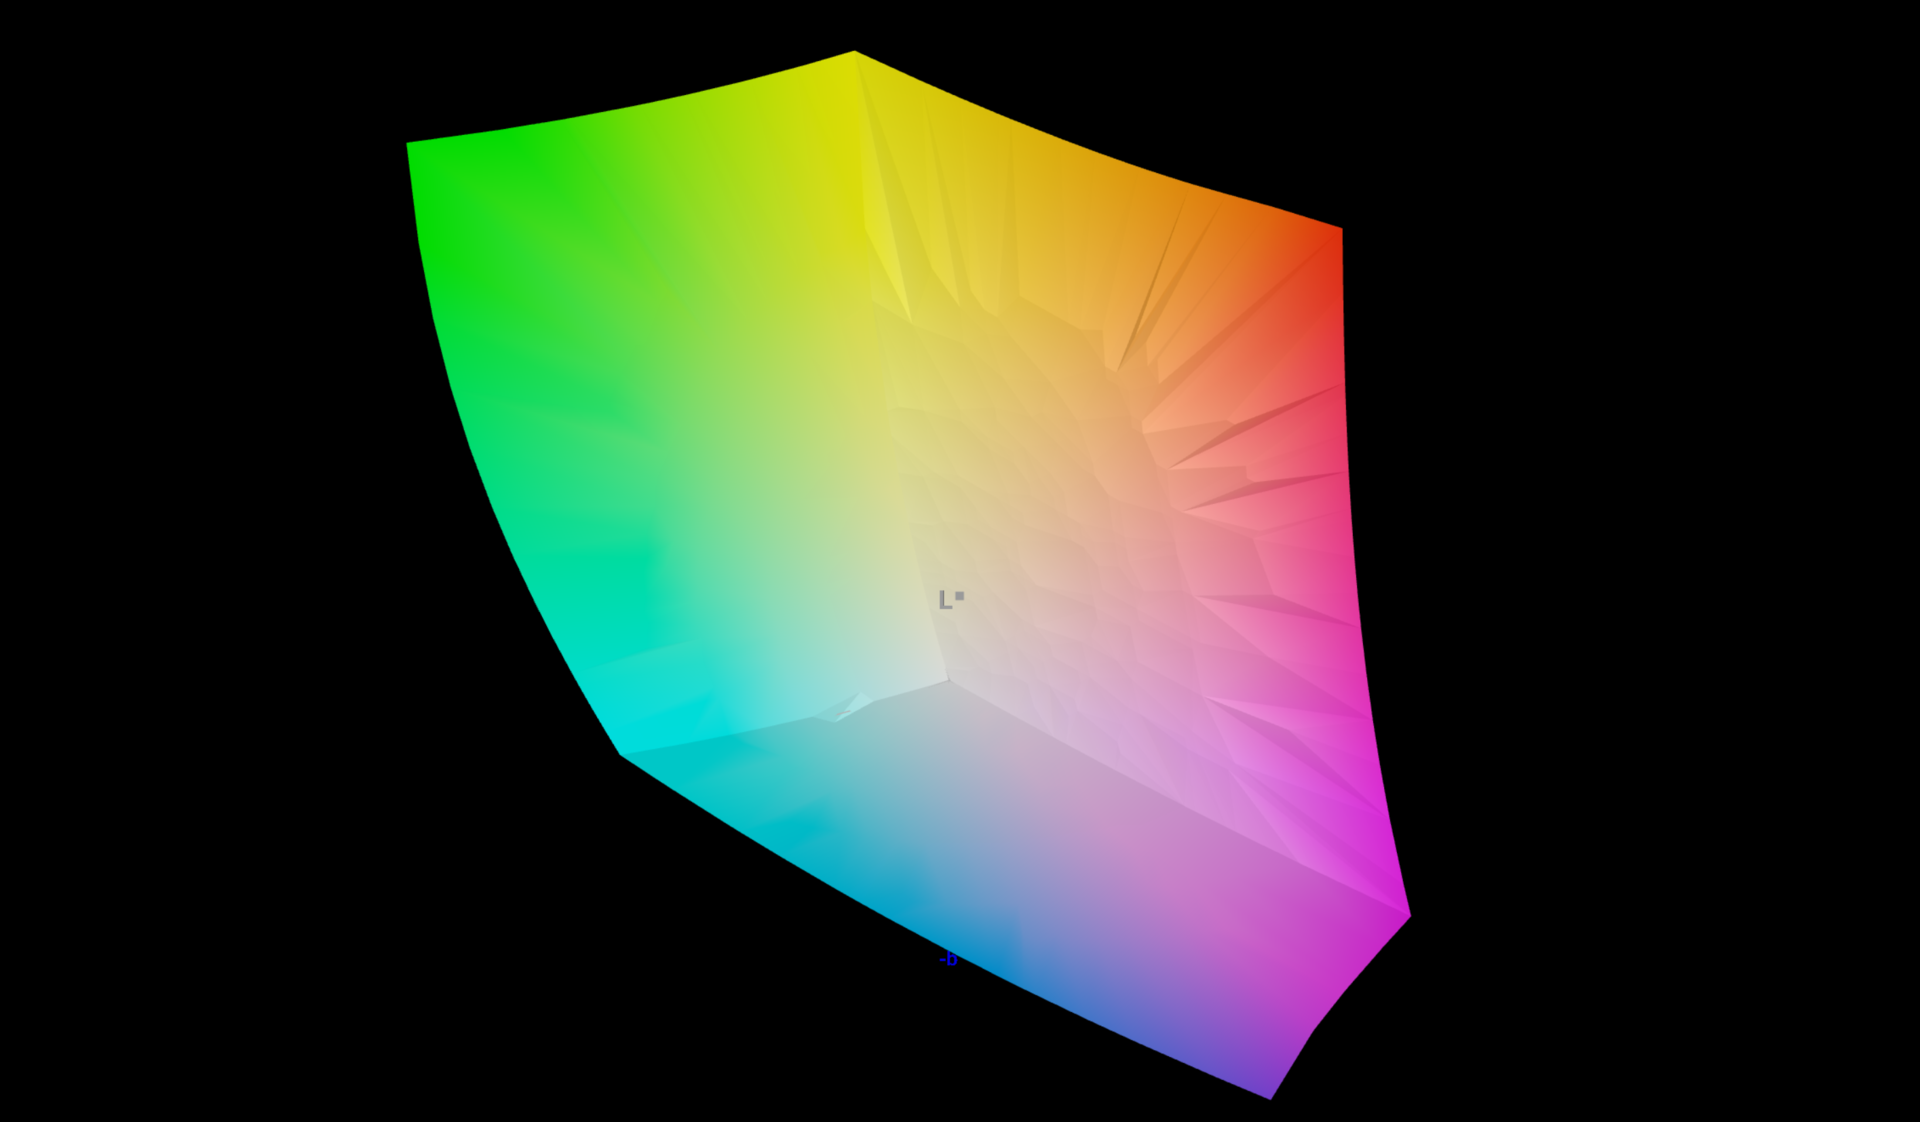
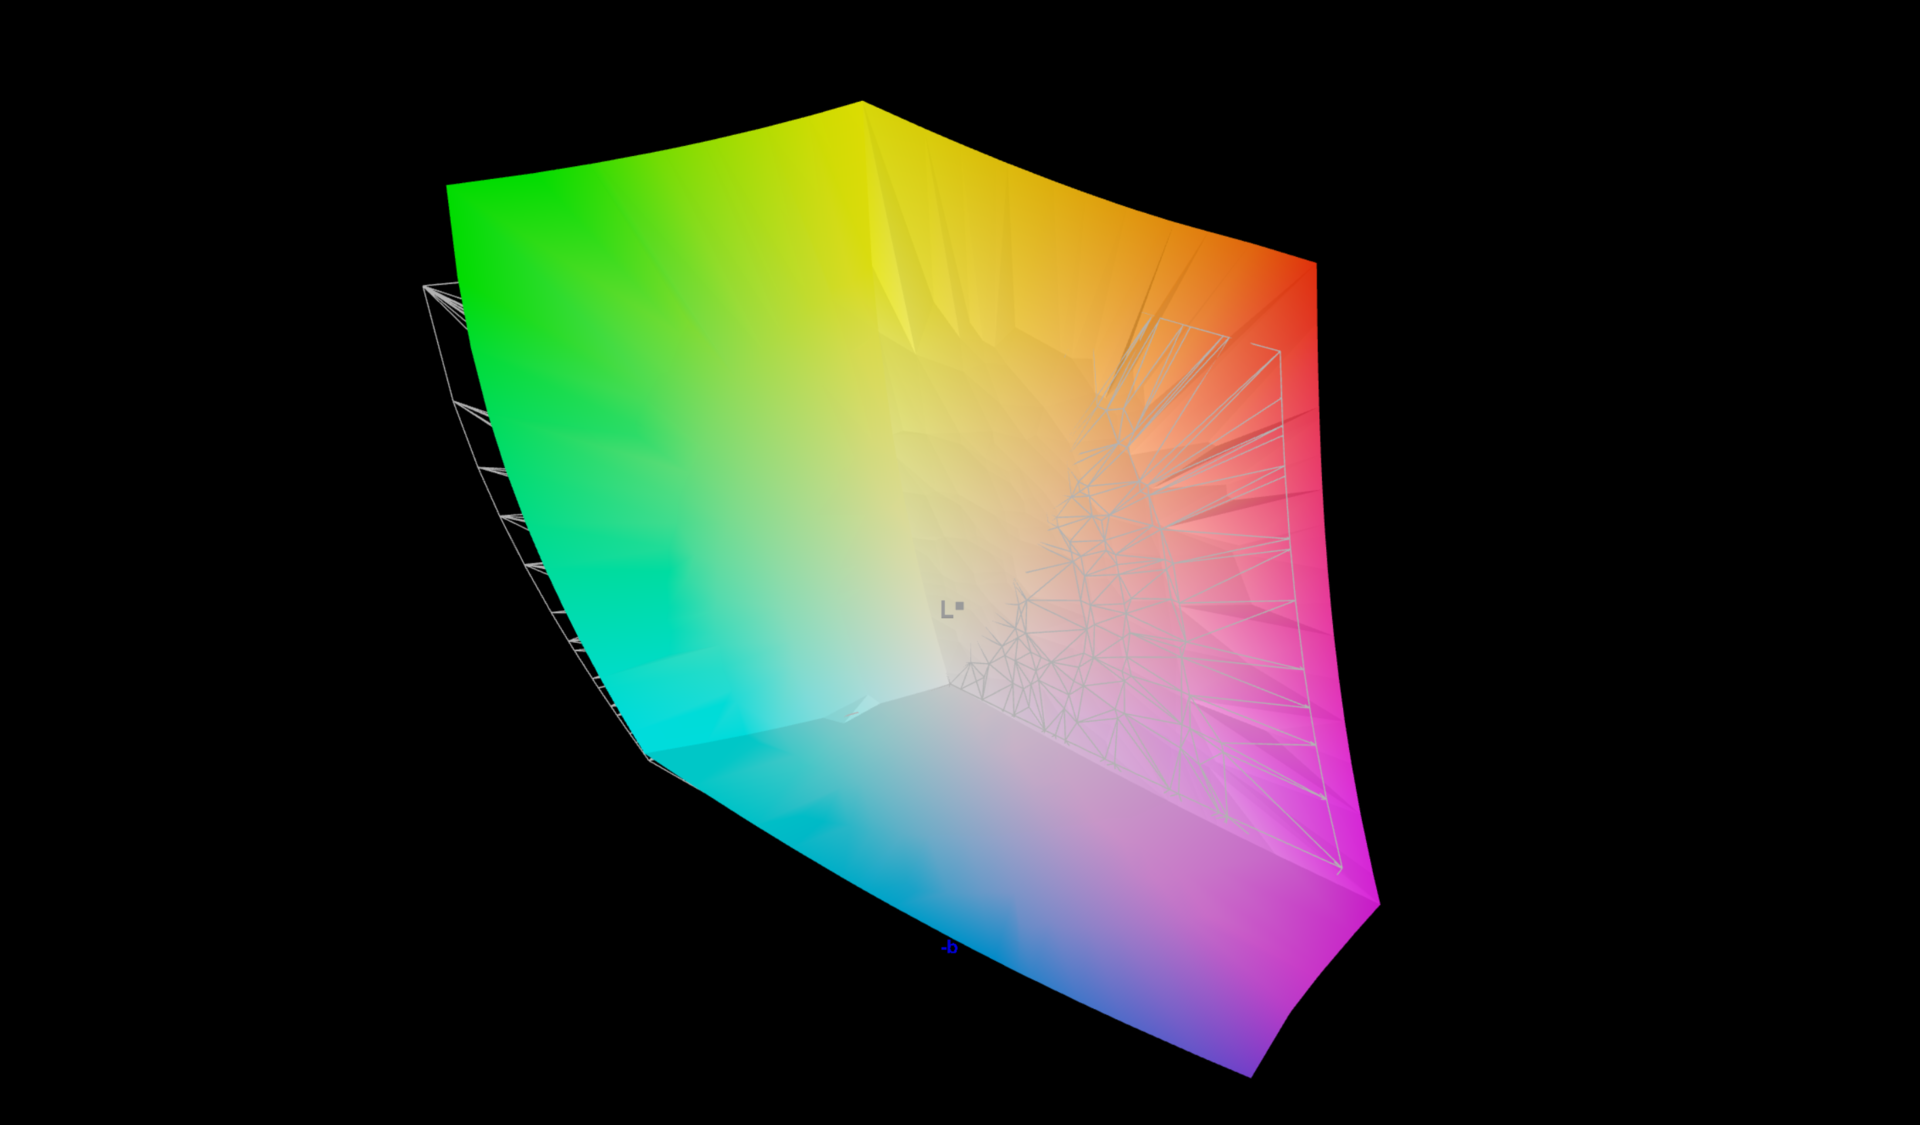
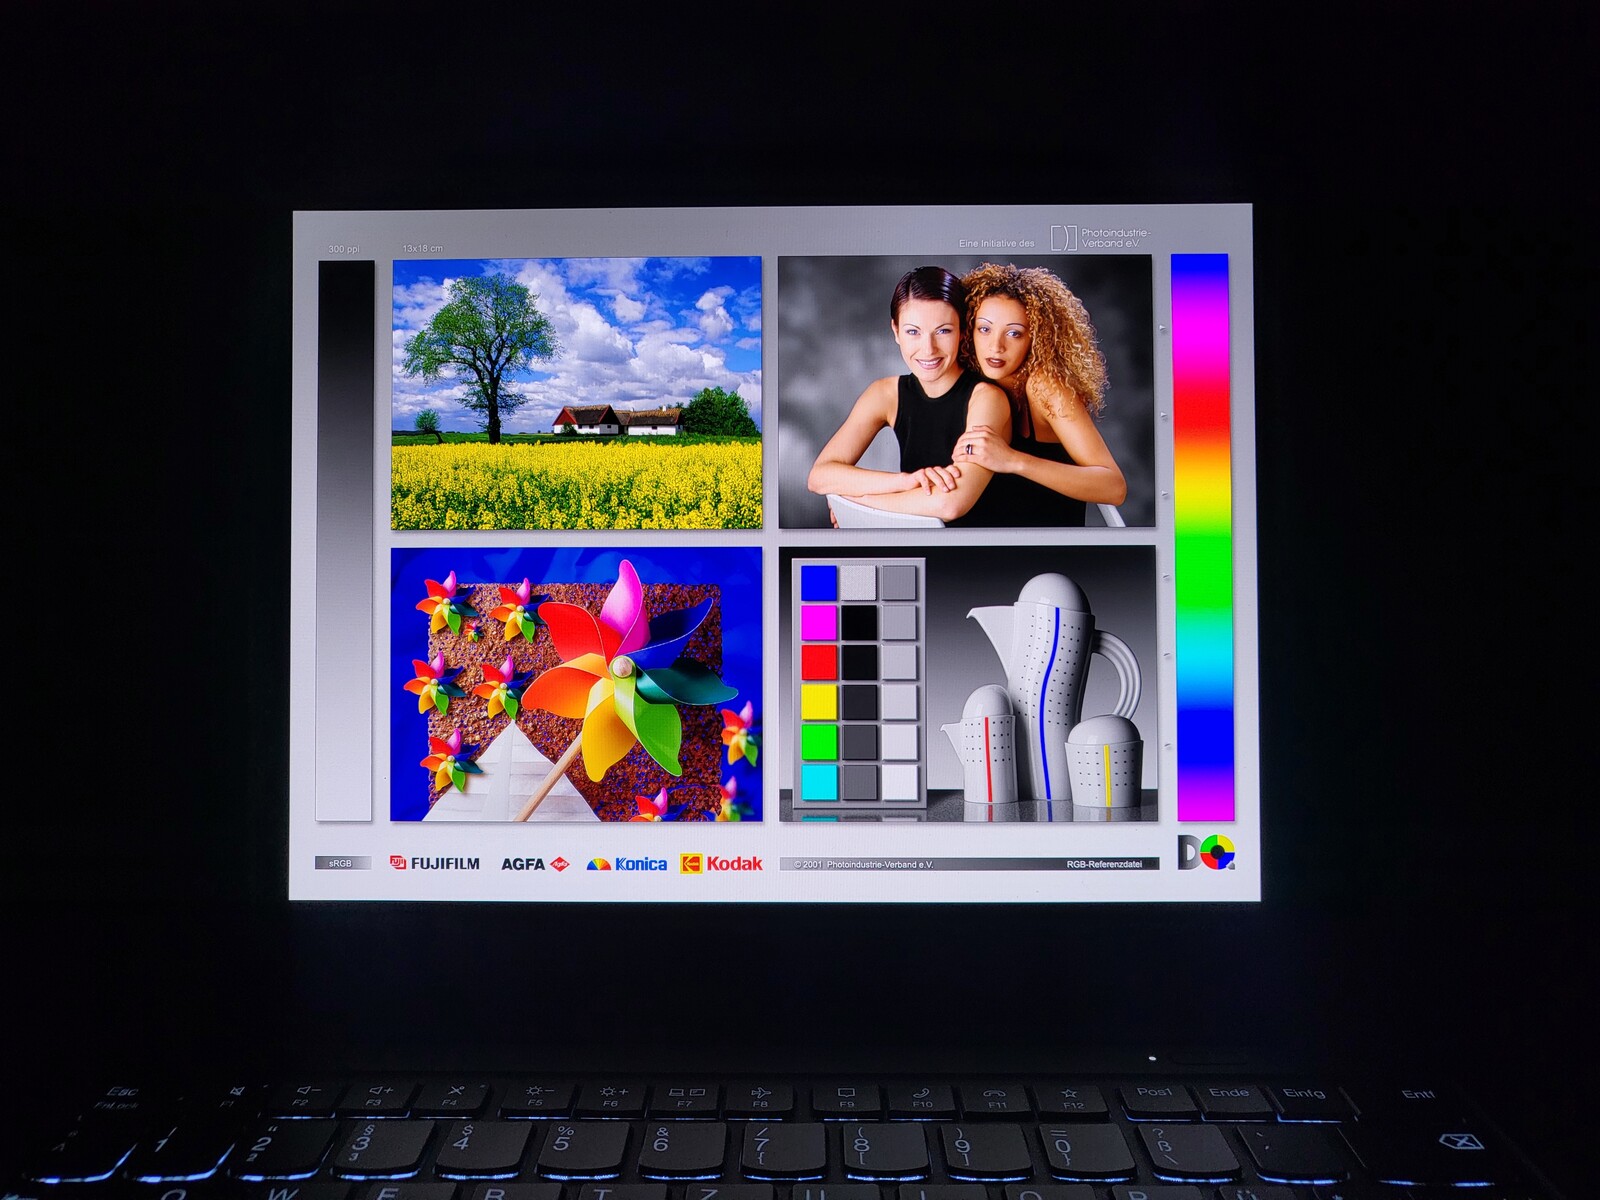
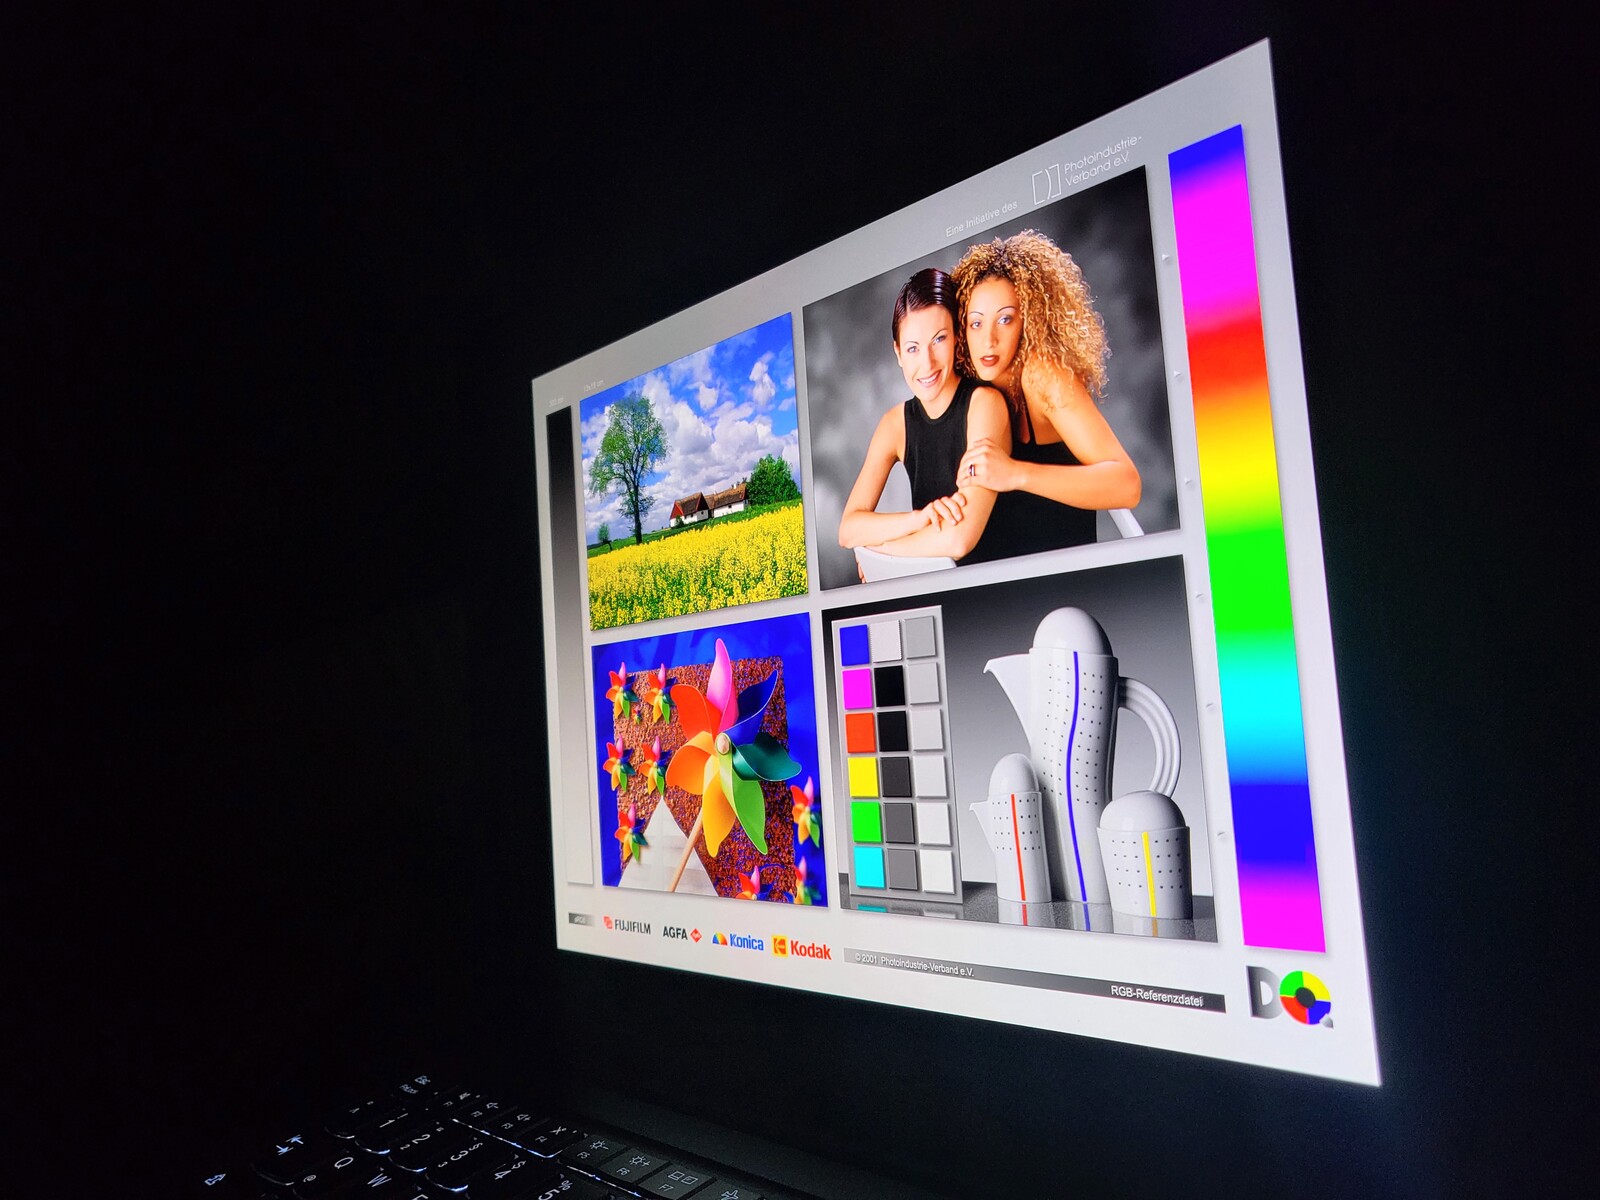
A peça central desta versão do Lenovo ThinkPad X1 Carbon Gen 10 é, sem dúvida, a tela. Como em quase todos os ThinkPad, há várias opções, que também listamos em nossa primeira revisão do Carbono X1 G10. A unidade de revisão de hoje abriga a tela de 2,8K de 14 polegadas (2.880 x 1.800) - o painel (número do modelo ATNA40YK01-1) vem da Samsung, e é uma tela OLED.
De acordo com a Lenovo, a tela é alegadamente capaz de exibir conteúdo SDR a 400 cd/m² e HDR a 500 cd/m². Embora não tenhamos medido este último, podemos confirmar definitivamente o valor de SDR. Isto torna a tela mais escura do que a tela de 4K UHD doX1 Carbono G9 e o LCD 2,5K do Dell Latitude 9430mas, em troca, o visor OLED tem outras vantagens: O brilho é distribuído de forma muito uniforme, não há sangramento de luz de fundo e os tempos de resposta são significativamente melhores do que os dos rivais IPS. Uma pena, porém, que a Lenovo tenha deixado a taxa de atualização em 60 Hz, já que 90 Hz teria sido um bom passo à frente.
Uma desvantagem da tecnologia OLED: O PWM está sempre presente. A freqüência PWM de cerca de 342 Hz em todos os níveis de brilho pode causar dores de cabeça em pessoas sensíveis, mesmo que nenhuma cintilação seja visível a olho nu.
| |||||||||||||||||||||||||
iluminação: 97 %
iluminação com acumulador: 400 cd/m²
Contraste: ∞:1 (Preto: 0 cd/m²)
ΔE ColorChecker Calman: 2.2 | ∀{0.5-29.43 Ø4.73}
calibrated: 2.6
ΔE Greyscale Calman: 1.2 | ∀{0.09-98 Ø4.97}
96.5% AdobeRGB 1998 (Argyll 3D)
100% sRGB (Argyll 3D)
99.7% Display P3 (Argyll 3D)
Gamma: 2.22
CCT: 6364 K
| Lenovo ThinkPad X1 Carbon G10 21CB00DCGE ATNA40YK01-1, OLED, 2880x1800, 14" | Lenovo ThinkPad X1 Carbon G10 21CC001RGE B140UAN02.1, IPS LED, 1920x1200, 14" | Lenovo ThinkPad X1 Carbon G9-20XWCTO1WW MNE007A1-2, IPS LED, 3840x2400, 14" | Lenovo ThinkPad Z13 G1-21D20016GE ATNA33AA02-0, OLED, 2880x1800, 13.3" | HP Elite Dragonfly G3 Chi Mei CMN13C0, IPS, 1920x1280, 13.5" | Dell Latitude 9430 2-in-1 AU Optronics B140QAN, IPS, 2560x1600, 14" | |
|---|---|---|---|---|---|---|
| Display | -16% | -4% | 0% | -21% | -13% | |
| Display P3 Coverage (%) | 99.7 | 74.6 -25% | 95.2 -5% | 99.9 0% | 68 -32% | 79.4 -20% |
| sRGB Coverage (%) | 100 | 98.6 -1% | 99.8 0% | 100 0% | 98.3 -2% | 100 0% |
| AdobeRGB 1998 Coverage (%) | 96.5 | 76.5 -21% | 89.2 -8% | 97.5 1% | 69.9 -28% | 79.4 -18% |
| Response Times | -2546% | -2754% | -29% | -3117% | -3600% | |
| Response Time Grey 50% / Grey 80% * (ms) | 1.2 ? | 45.5 ? -3692% | 46 ? -3733% | 1.9 ? -58% | 50.8 ? -4133% | 63.6 ? -5200% |
| Response Time Black / White * (ms) | 1.6 ? | 24 ? -1400% | 30 ? -1775% | 1.6 ? -0% | 35.2 ? -2100% | 33.6 ? -2000% |
| PWM Frequency (Hz) | 342 ? | 53050 ? | 240 ? | |||
| Screen | -51% | 27% | -10% | -18% | -29% | |
| Brightness middle (cd/m²) | 400 | 372 -7% | 497 24% | 371 -7% | 387.2 -3% | 517.7 29% |
| Brightness (cd/m²) | 401 | 362 -10% | 488 22% | 378 -6% | 360 -10% | 493 23% |
| Brightness Distribution (%) | 97 | 94 -3% | 87 -10% | 98 1% | 80 -18% | 90 -7% |
| Black Level * (cd/m²) | 0.18 | 0.35 | 0.04 | 0.26 | 0.33 | |
| Colorchecker dE 2000 * | 2.2 | 3.4 -55% | 1.2 45% | 2.5 -14% | 2.36 -7% | 3.38 -54% |
| Colorchecker dE 2000 max. * | 4.3 | 6.7 -56% | 2.1 51% | 4.4 -2% | 4.79 -11% | 6.25 -45% |
| Colorchecker dE 2000 calibrated * | 2.6 | 1.8 31% | 0.9 65% | 1.9 27% | 0.63 76% | 0.41 84% |
| Greyscale dE 2000 * | 1.2 | 4.3 -258% | 1.3 -8% | 2 -67% | 3 -150% | 4 -233% |
| Gamma | 2.22 99% | 2.13 103% | 2.16 102% | 2.17 101% | 2.17 101% | 2.13 103% |
| CCT | 6364 102% | 6158 106% | 6690 97% | 6228 104% | 6137 106% | 6186 105% |
| Contrast (:1) | 2067 | 1420 | 9275 | 1489 | 1569 | |
| Color Space (Percent of AdobeRGB 1998) (%) | 79.37 | |||||
| Color Space (Percent of sRGB) (%) | 99.78 | |||||
| Média Total (Programa/Configurações) | -871% /
-458% | -910% /
-444% | -13% /
-10% | -1052% /
-535% | -1214% /
-620% |
* ... menor é melhor
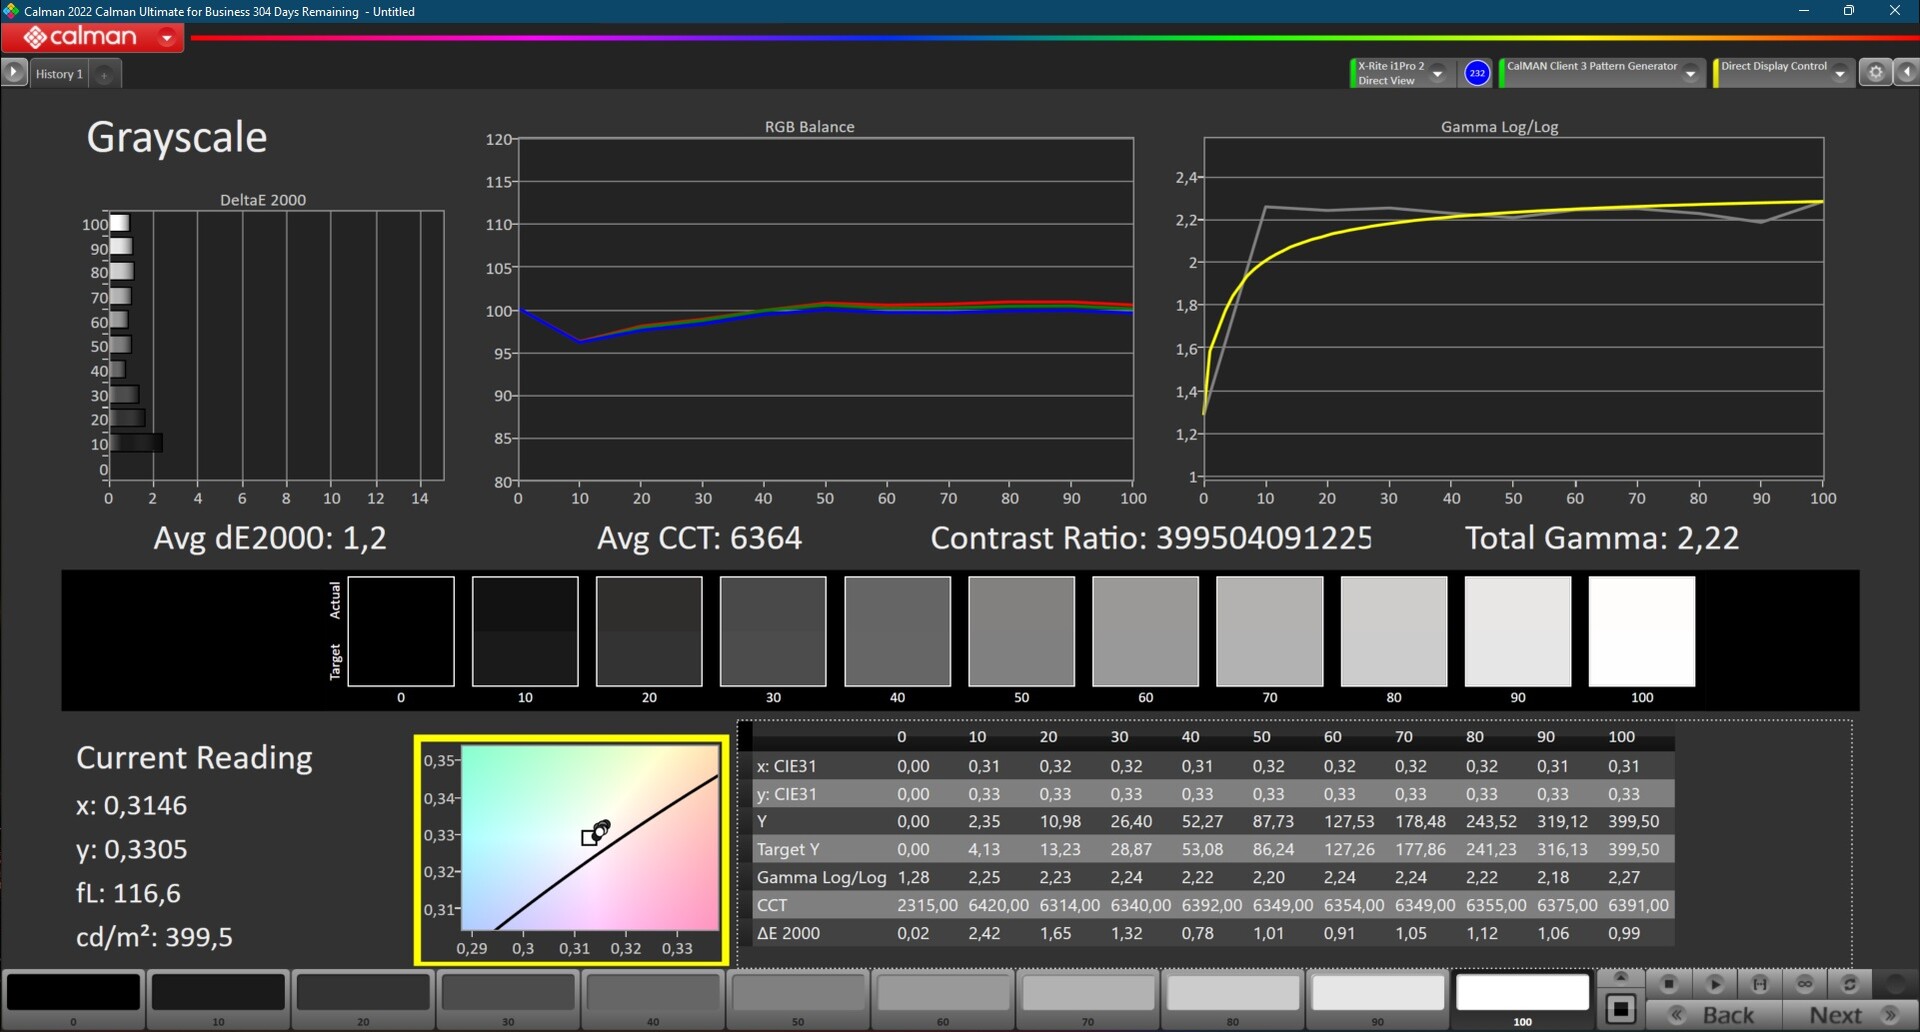
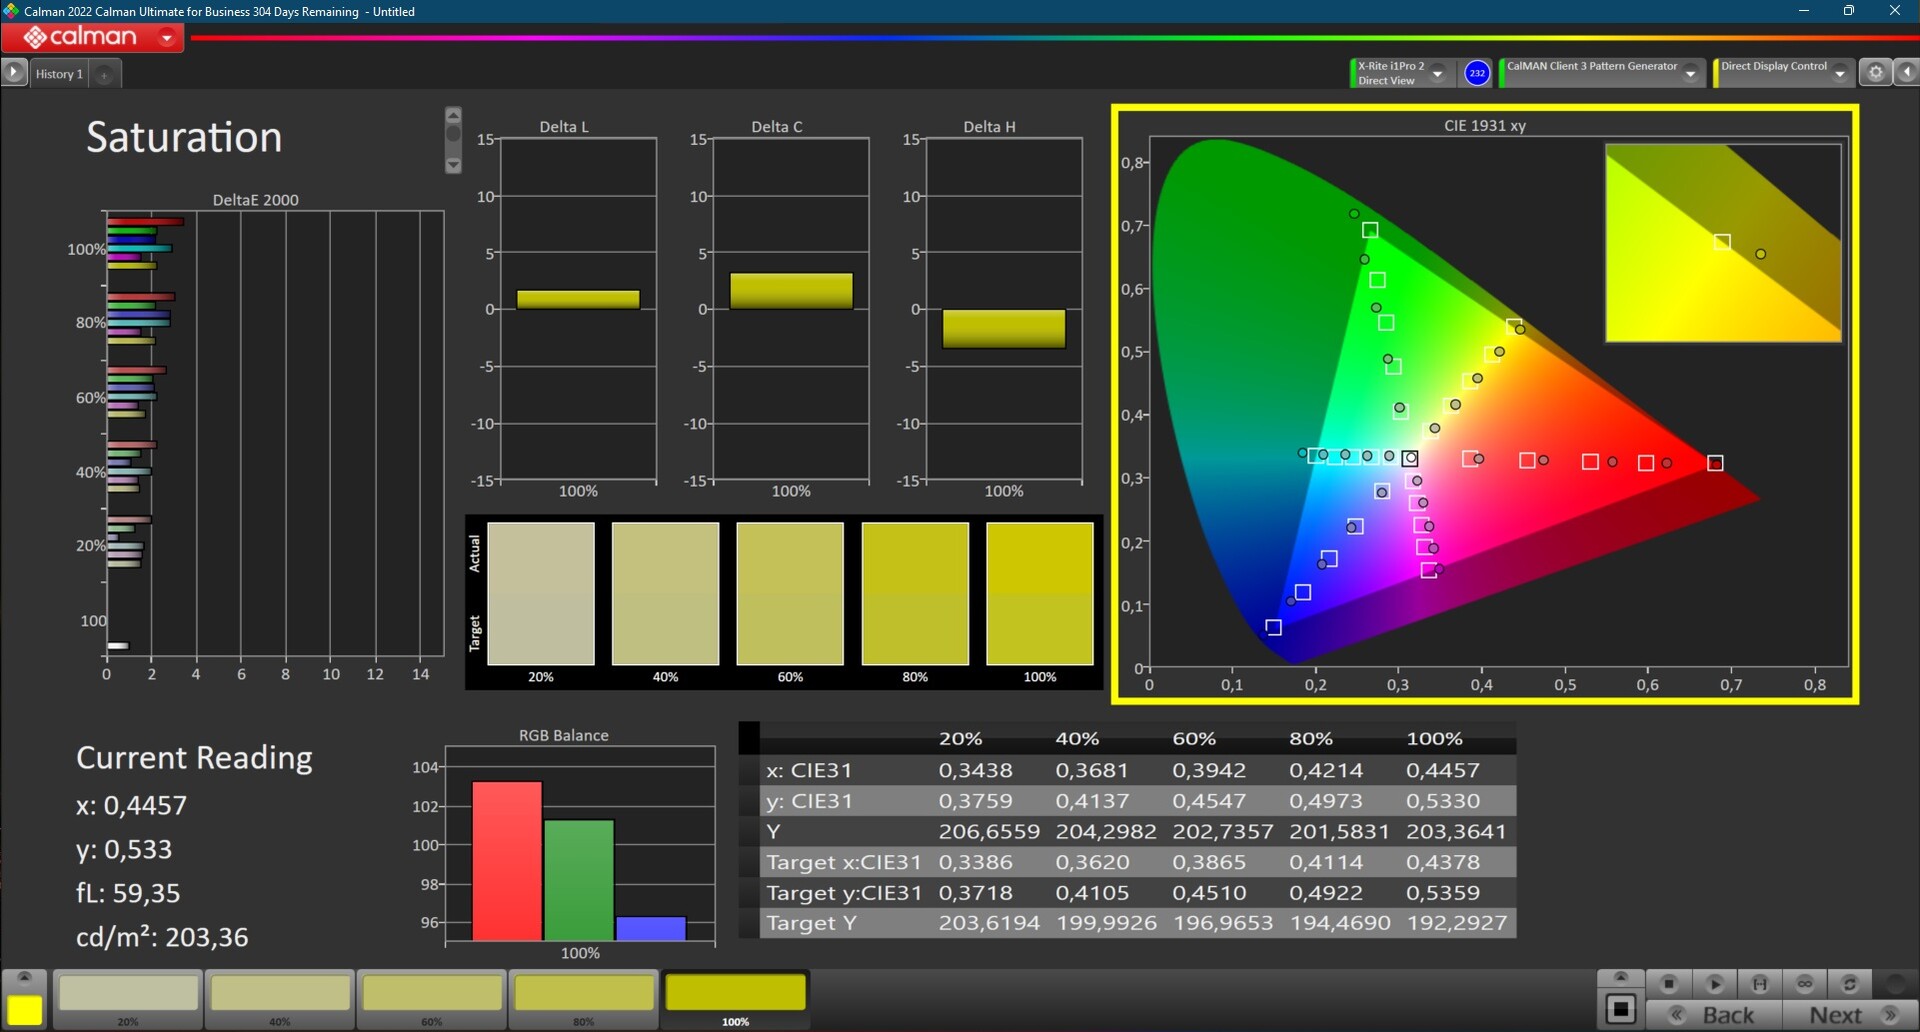
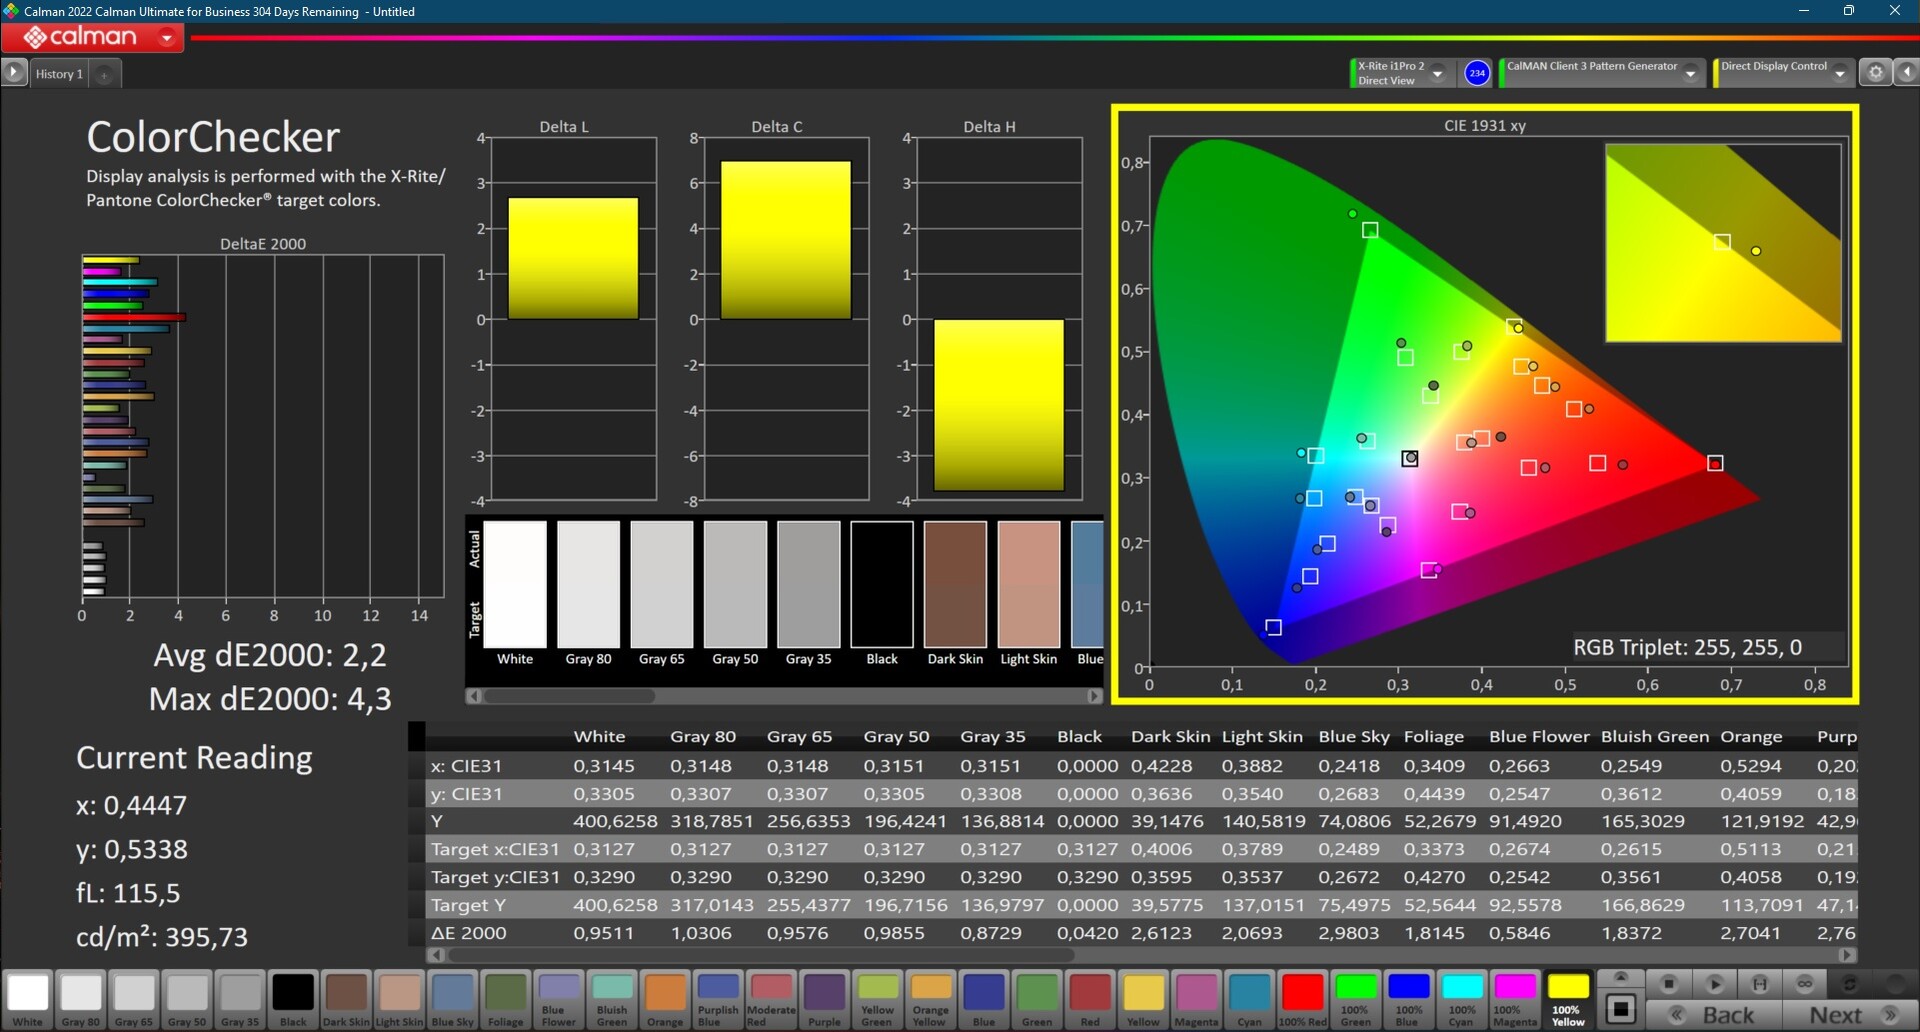
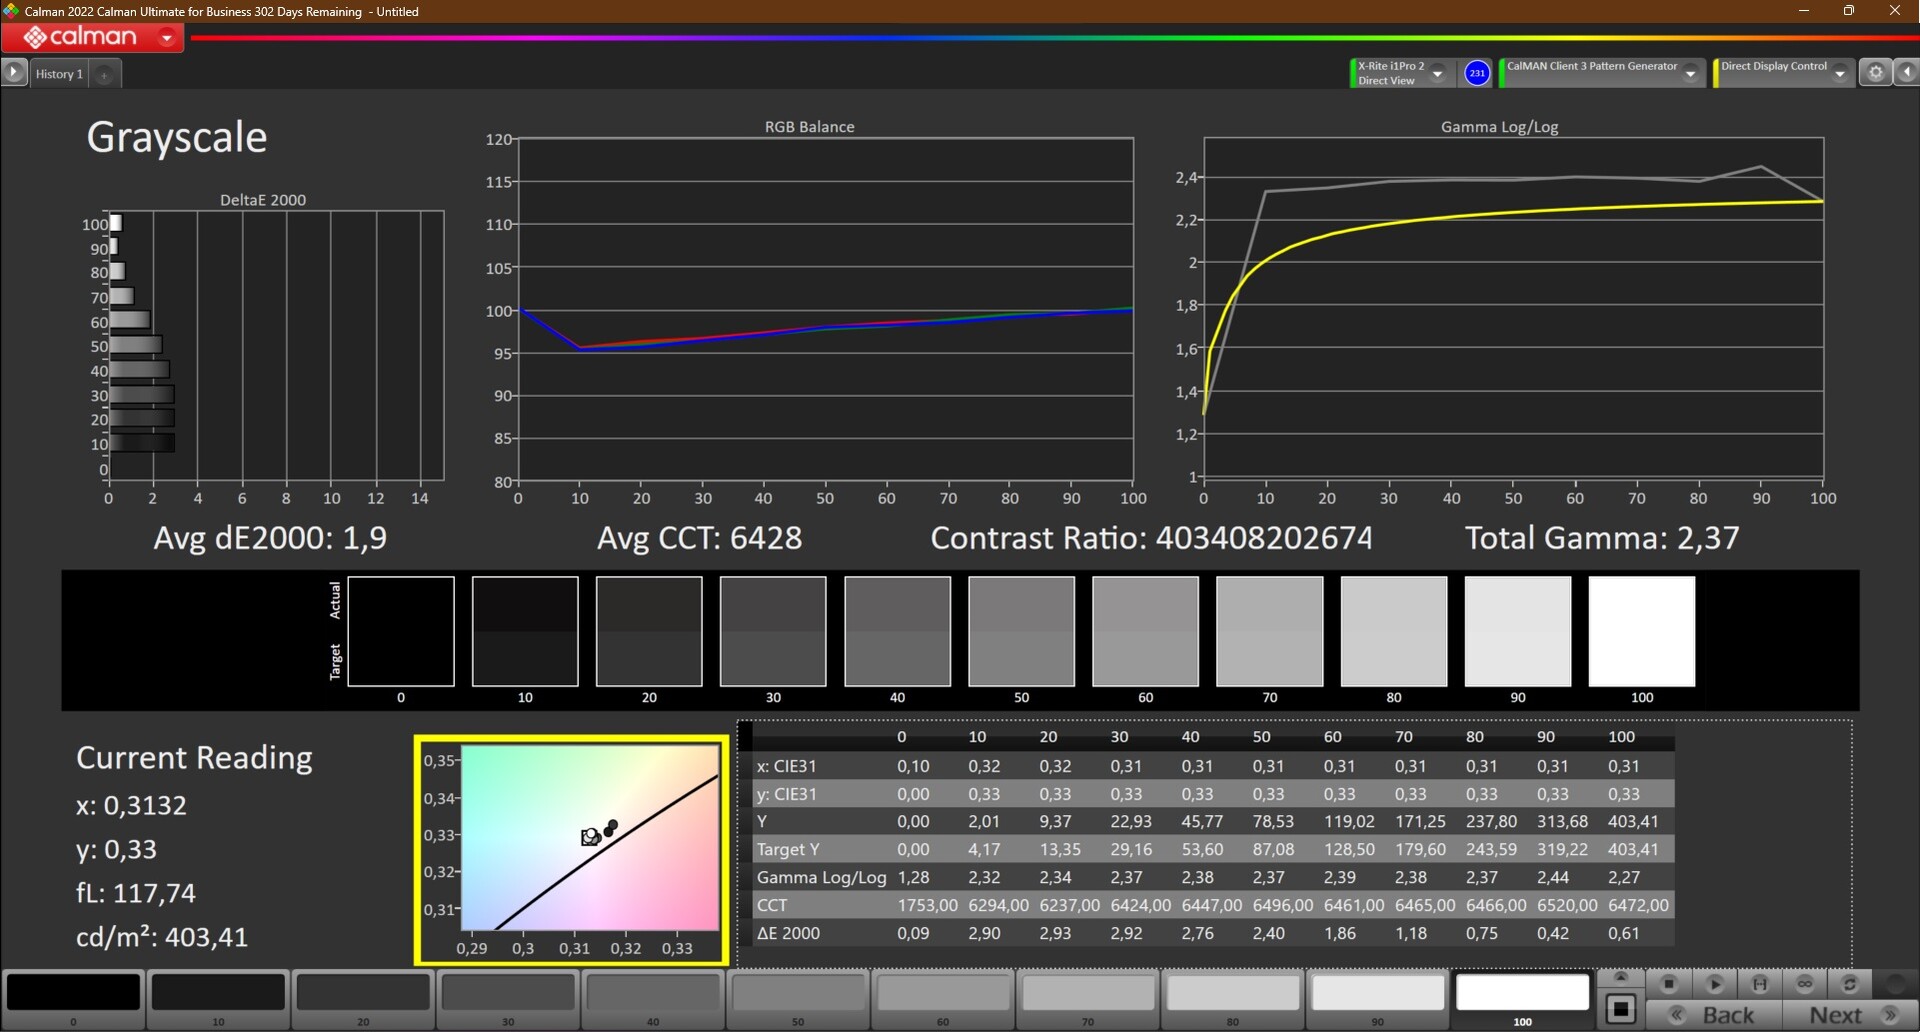
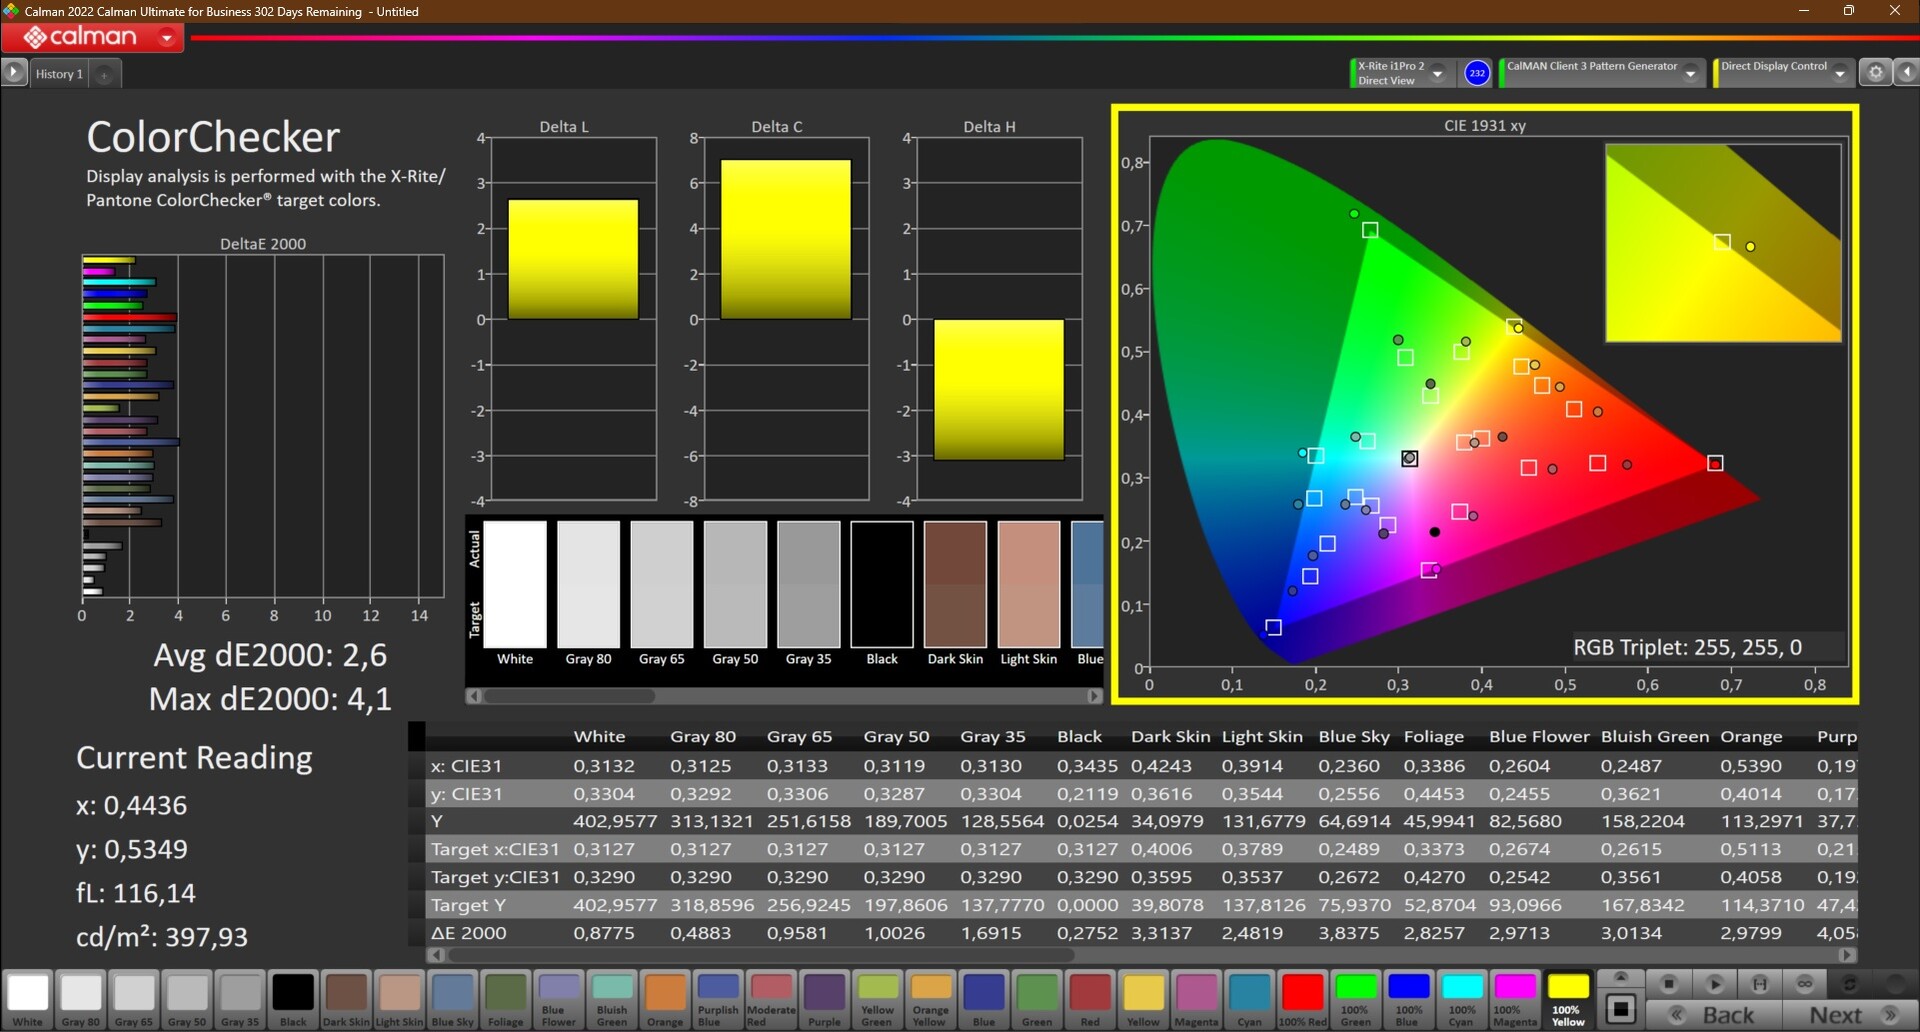
A qualidade das cores da tela já é extremamente alta no estado de fábrica; o valor de contraste praticamente infinitamente alto resulta em cores vivas e acentuadas. Os desvios em relação ao ideal já são comparativamente pequenos para a maioria das cores ex-works - e dificilmente conseguimos melhorar a qualidade através da calibração.
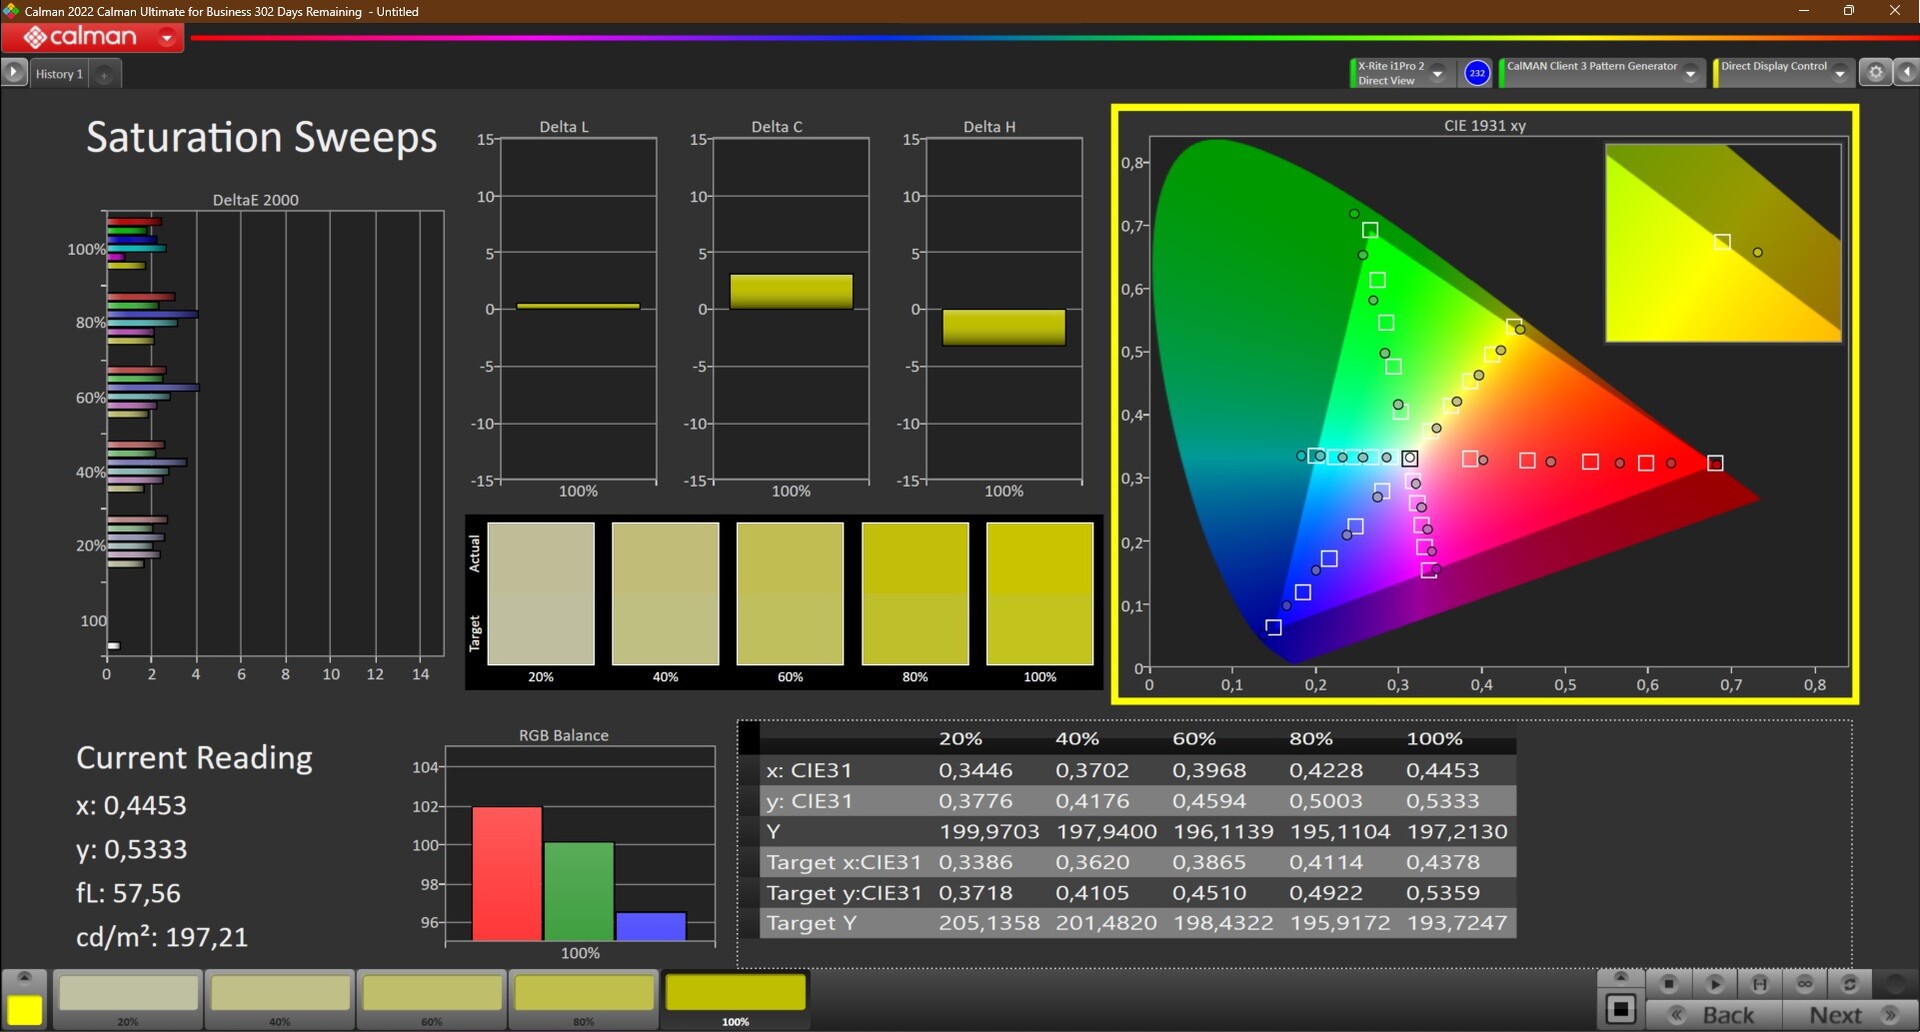
Um ponto forte da tela OLED é a muito boa cobertura do espaço de cores. A Lenovo promete 100% DCI-P3, o que na verdade se revela ser 99,7%. O painel é capaz de reproduzir totalmente o pequeno espaço de cores sRGB, e mesmo o AdobeRGB não está faltando muito a 96,5%.
As telas OLED são geralmente brilhantes - a tela do ThinkPad X1 Carbon G10 da Lenovo também é brilhante, mas apenas muito ligeiramente, e é também um painel anti-reflexo. Em combinação com um brilho de cerca de 400 cd/m² e a alta relação de contraste, a tela pode ser usada ao ar livre sem problemas.
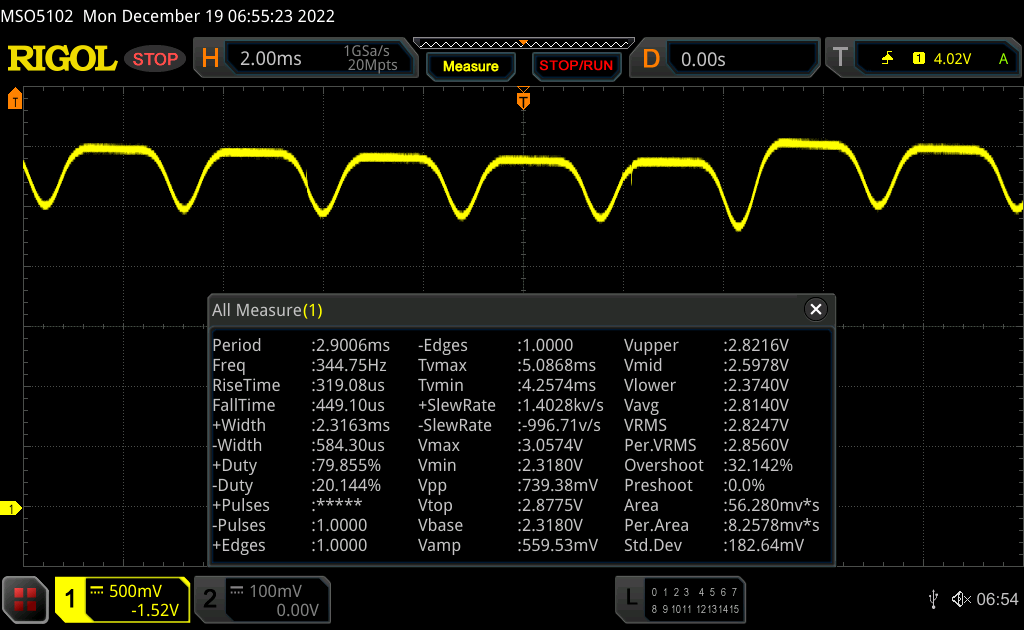
Exibir tempos de resposta
| ↔ Tempo de resposta preto para branco | ||
|---|---|---|
| 1.6 ms ... ascensão ↗ e queda ↘ combinadas | ↗ 0.9 ms ascensão | 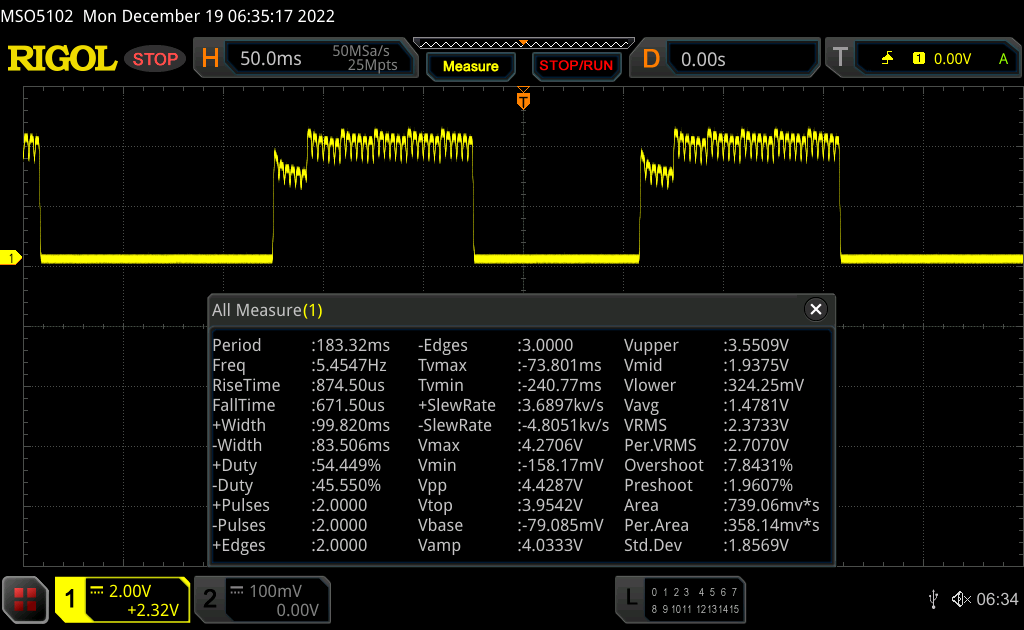 |
| ↘ 0.7 ms queda | ||
| A tela mostra taxas de resposta muito rápidas em nossos testes e deve ser muito adequada para jogos em ritmo acelerado. Em comparação, todos os dispositivos testados variam de 0.1 (mínimo) a 240 (máximo) ms. » 9 % de todos os dispositivos são melhores. Isso significa que o tempo de resposta medido é melhor que a média de todos os dispositivos testados (19.9 ms). | ||
| ↔ Tempo de resposta 50% cinza a 80% cinza | ||
| 1.2 ms ... ascensão ↗ e queda ↘ combinadas | ↗ 0.6 ms ascensão | 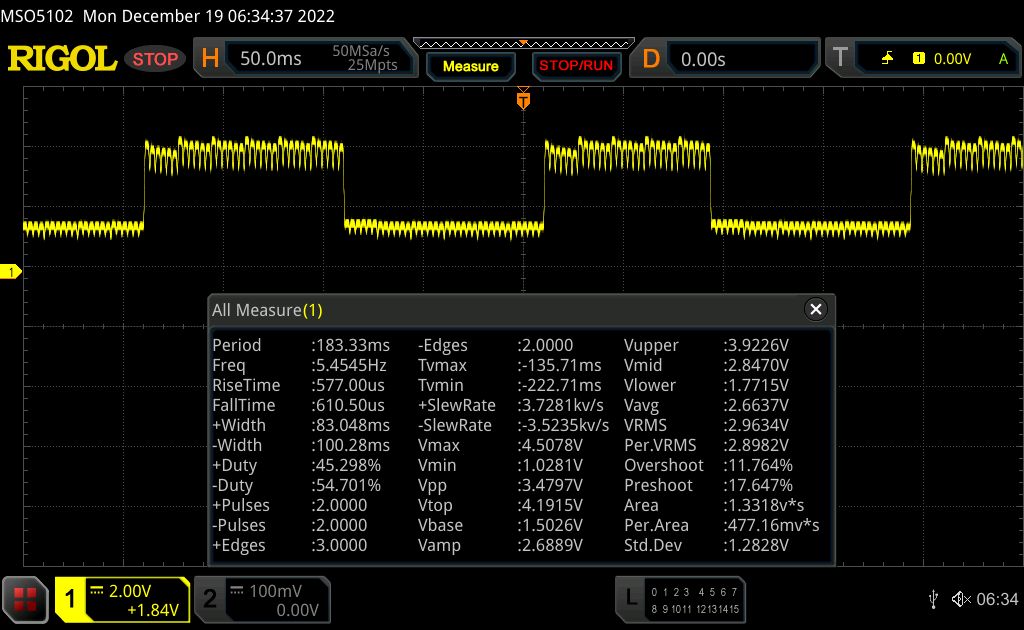 |
| ↘ 0.6 ms queda | ||
| A tela mostra taxas de resposta muito rápidas em nossos testes e deve ser muito adequada para jogos em ritmo acelerado. Em comparação, todos os dispositivos testados variam de 0.165 (mínimo) a 636 (máximo) ms. » 5 % de todos os dispositivos são melhores. Isso significa que o tempo de resposta medido é melhor que a média de todos os dispositivos testados (31.1 ms). | ||
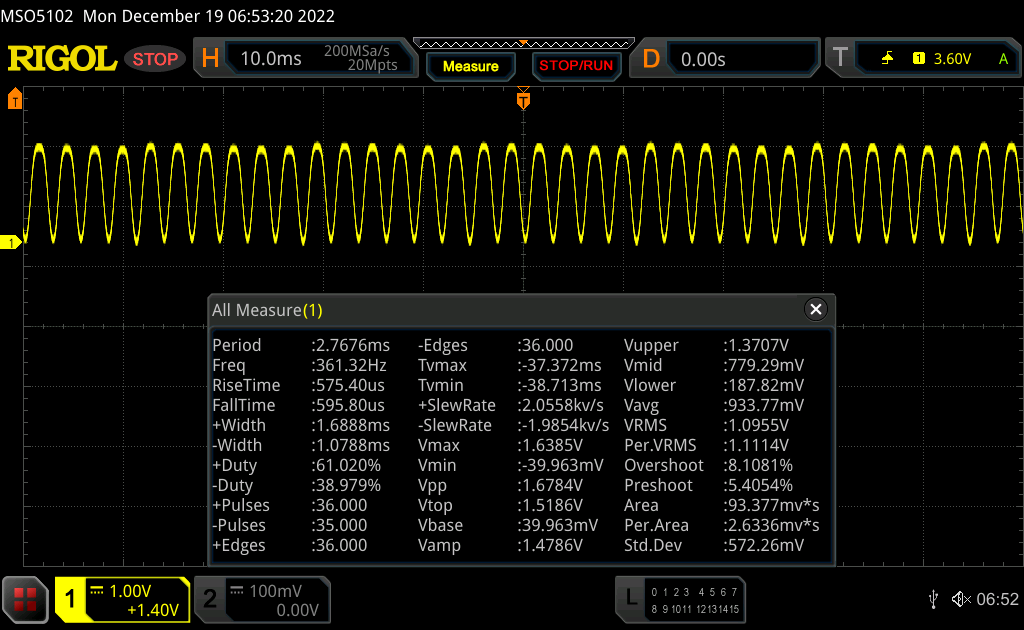
Cintilação da tela / PWM (modulação por largura de pulso)
| Tela tremeluzindo/PWM detectado | 342 Hz | ≤ 100 % configuração de brilho | 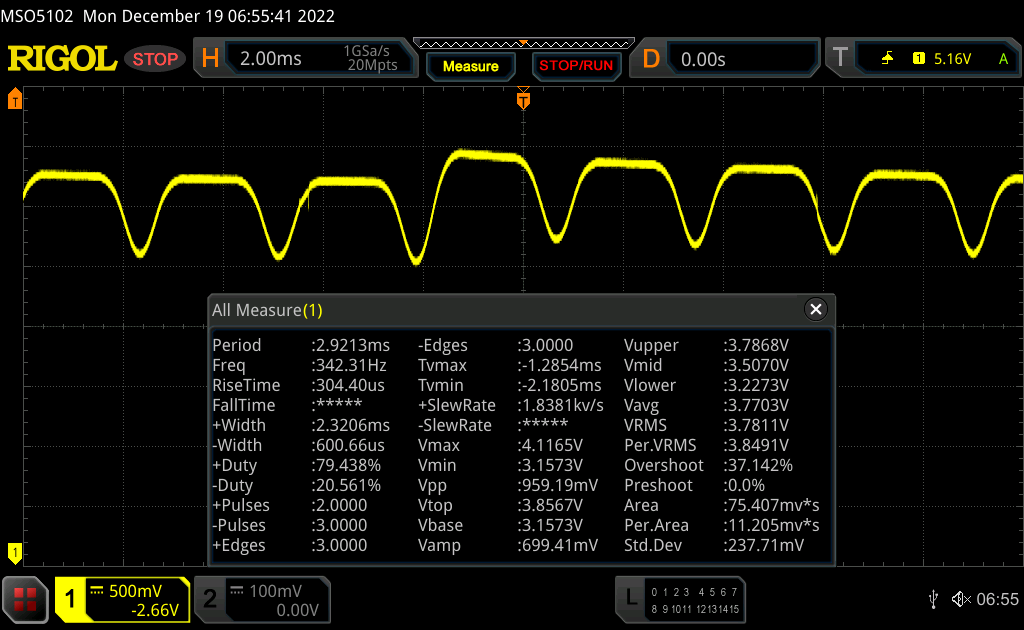 |
A luz de fundo da tela pisca em 342 Hz (pior caso, por exemplo, utilizando PWM) Cintilação detectada em uma configuração de brilho de 100 % e abaixo. Não deve haver cintilação ou PWM acima desta configuração de brilho. A frequência de 342 Hz é relativamente alta, portanto, a maioria dos usuários sensíveis ao PWM não deve notar nenhuma oscilação. No entanto, há relatos de que alguns usuários ainda são sensíveis ao PWM em 500 Hz e acima, portanto, esteja atento. [pwm_comparison] Em comparação: 52 % de todos os dispositivos testados não usam PWM para escurecer a tela. Se PWM foi detectado, uma média de 7798 (mínimo: 5 - máximo: 343500) Hz foi medida. | |||

Desempenho: A Lenovo estabelece um limite de TDP mais alto desta vez
Uma descrição das opções de componentes pode ser encontrada em nossa primeira revisão do Lenovo ThinkPad X1 Carbono G10.
Condições de teste
Como sempre com os ThinkPads, a Lenovo usa os modos de desempenho do Windows que podem ser definidos nas configurações do Windows. O modo "Maior vida útil da bateria" limita permanentemente o processador a 11 watts. No nível médio "Melhor Desempenho", até 50 watts é possível como um impulso, e o processador é limitado a 19 watts por longos períodos de tempo. Este limite de longo prazo também se aplica à configuração "Melhor Desempenho", onde é possível até 56 watts para rajadas curtas e 28 watts para estágios intermediários.
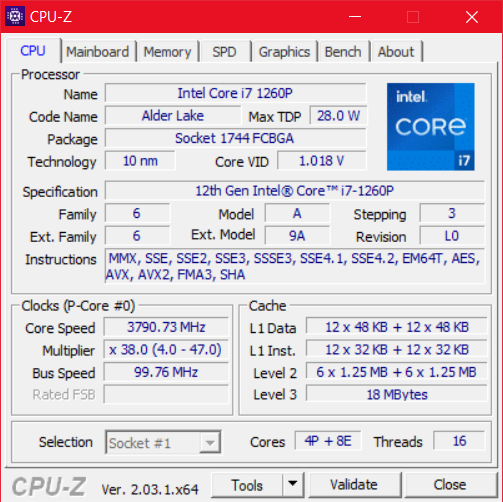
Processador
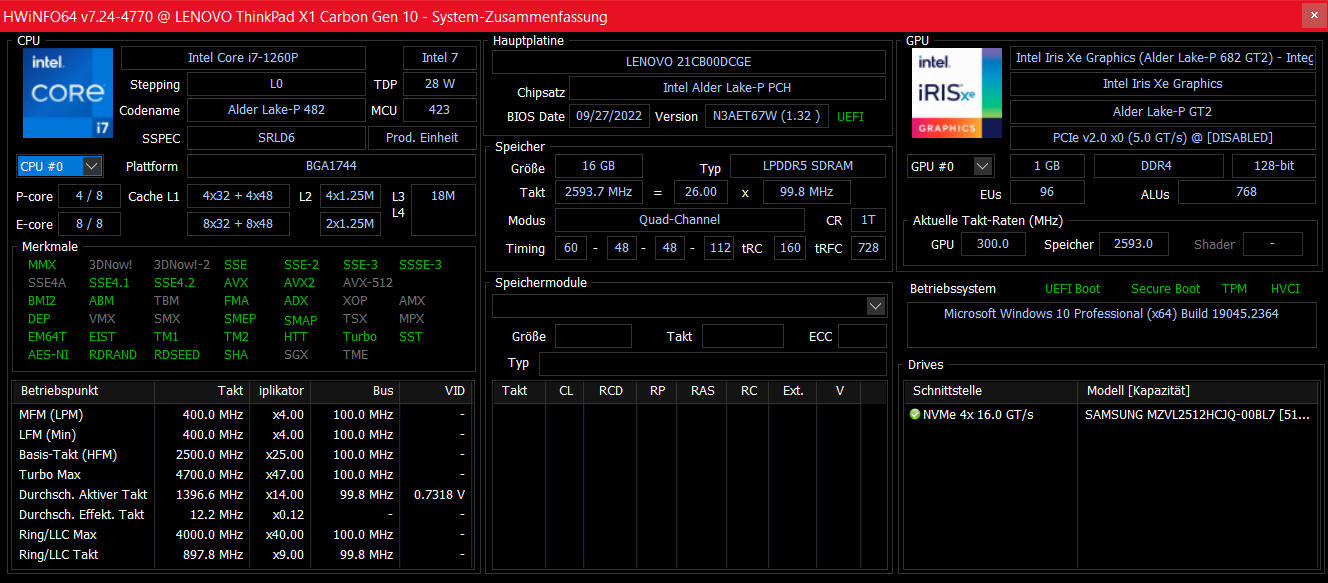
O Intel Core i7-1260Pé um processador da série "Alder-Lake-P28". Como o nome sugere, um total de doze núcleos, quatro deles de desempenho e oito de eficiência, são projetados para um consumo de 28 watts. Nosso lista de processadores pode ser usado para comparações de benchmark mais extensas com outras CPUs.
O consumo permanente de 19 watts está bem abaixo da marca de 28 watts para a qual este processador é realmente destinado. Por outro lado, isto ainda é uma melhoria em comparação comnossa primeira amostra de revisão do Carbono X1 G10cujo Intel Core i5-1250P estava permanentemente limitado a apenas 15 watts. Além disso, o processador pode manter os 28 watts como um estágio intermediário por mais tempo do que em nossa primeira revisão. Em termos de desempenho da CPU, o X1 Carbon Gen 10 é, portanto, significativamente mais competitivo. Entretanto, ele ainda é claramente inferior ao Lenovo ThinkPad Z13 com seu processador AMD.
O desempenho da CPU também está totalmente disponível no modo de bateria.
Cinebench R15 Multi Sustained Load
Cinebench R23: Multi Core | Single Core
Cinebench R20: CPU (Multi Core) | CPU (Single Core)
Cinebench R15: CPU Multi 64Bit | CPU Single 64Bit
Blender: v2.79 BMW27 CPU
7-Zip 18.03: 7z b 4 | 7z b 4 -mmt1
Geekbench 5.5: Multi-Core | Single-Core
HWBOT x265 Benchmark v2.2: 4k Preset
LibreOffice : 20 Documents To PDF
R Benchmark 2.5: Overall mean
| CPU Performance rating | |
| Lenovo ThinkPad Z13 G1-21D20016GE | |
| Dell Latitude 9430 2-in-1 -1! | |
| Média da turma Office | |
| Média Intel Core i7-1260P | |
| Lenovo ThinkPad X1 Carbon G10 21CB00DCGE | |
| HP Elite Dragonfly G3 | |
| Lenovo ThinkPad X1 Carbon G10 21CC001RGE | |
| Lenovo ThinkPad X1 Carbon G9-20XWCTO1WW | |
| Cinebench R23 / Multi Core | |
| Lenovo ThinkPad Z13 G1-21D20016GE | |
| Média da turma Office (1673 - 22808, n=73, últimos 2 anos) | |
| Lenovo ThinkPad X1 Carbon G10 21CB00DCGE | |
| Média Intel Core i7-1260P (3173 - 12150, n=27) | |
| Dell Latitude 9430 2-in-1 | |
| Lenovo ThinkPad X1 Carbon G10 21CC001RGE | |
| HP Elite Dragonfly G3 | |
| Lenovo ThinkPad X1 Carbon G9-20XWCTO1WW | |
| Cinebench R23 / Single Core | |
| Dell Latitude 9430 2-in-1 | |
| Média Intel Core i7-1260P (1155 - 1812, n=25) | |
| Média da turma Office (708 - 2130, n=73, últimos 2 anos) | |
| Lenovo ThinkPad X1 Carbon G10 21CB00DCGE | |
| HP Elite Dragonfly G3 | |
| Lenovo ThinkPad X1 Carbon G10 21CC001RGE | |
| Lenovo ThinkPad X1 Carbon G9-20XWCTO1WW | |
| Lenovo ThinkPad Z13 G1-21D20016GE | |
| Cinebench R20 / CPU (Multi Core) | |
| Lenovo ThinkPad Z13 G1-21D20016GE | |
| Média da turma Office (648 - 8840, n=72, últimos 2 anos) | |
| Lenovo ThinkPad X1 Carbon G10 21CB00DCGE | |
| Média Intel Core i7-1260P (1234 - 4748, n=25) | |
| Dell Latitude 9430 2-in-1 | |
| HP Elite Dragonfly G3 | |
| Lenovo ThinkPad X1 Carbon G10 21CC001RGE | |
| Lenovo ThinkPad X1 Carbon G9-20XWCTO1WW | |
| Cinebench R20 / CPU (Single Core) | |
| Dell Latitude 9430 2-in-1 | |
| Média da turma Office (345 - 816, n=72, últimos 2 anos) | |
| Média Intel Core i7-1260P (448 - 698, n=25) | |
| Lenovo ThinkPad X1 Carbon G10 21CB00DCGE | |
| Lenovo ThinkPad Z13 G1-21D20016GE | |
| HP Elite Dragonfly G3 | |
| Lenovo ThinkPad X1 Carbon G9-20XWCTO1WW | |
| Lenovo ThinkPad X1 Carbon G10 21CC001RGE | |
| Cinebench R15 / CPU Multi 64Bit | |
| Lenovo ThinkPad Z13 G1-21D20016GE | |
| Média da turma Office (250 - 3380, n=74, últimos 2 anos) | |
| Lenovo ThinkPad X1 Carbon G10 21CB00DCGE | |
| Dell Latitude 9430 2-in-1 | |
| Média Intel Core i7-1260P (549 - 2034, n=29) | |
| Lenovo ThinkPad X1 Carbon G10 21CC001RGE | |
| HP Elite Dragonfly G3 | |
| Lenovo ThinkPad X1 Carbon G9-20XWCTO1WW | |
| Cinebench R15 / CPU Single 64Bit | |
| Dell Latitude 9430 2-in-1 | |
| Média da turma Office (99.5 - 312, n=74, últimos 2 anos) | |
| Lenovo ThinkPad Z13 G1-21D20016GE | |
| Média Intel Core i7-1260P (165.4 - 260, n=27) | |
| HP Elite Dragonfly G3 | |
| Lenovo ThinkPad X1 Carbon G9-20XWCTO1WW | |
| Lenovo ThinkPad X1 Carbon G10 21CC001RGE | |
| Lenovo ThinkPad X1 Carbon G10 21CB00DCGE | |
| Blender / v2.79 BMW27 CPU | |
| Lenovo ThinkPad X1 Carbon G9-20XWCTO1WW | |
| Lenovo ThinkPad X1 Carbon G10 21CC001RGE | |
| HP Elite Dragonfly G3 | |
| Média Intel Core i7-1260P (264 - 906, n=26) | |
| Média da turma Office (158 - 1940, n=73, últimos 2 anos) | |
| Lenovo ThinkPad X1 Carbon G10 21CB00DCGE | |
| Lenovo ThinkPad Z13 G1-21D20016GE | |
| 7-Zip 18.03 / 7z b 4 | |
| Lenovo ThinkPad Z13 G1-21D20016GE | |
| Média da turma Office (7098 - 76886, n=75, últimos 2 anos) | |
| Lenovo ThinkPad X1 Carbon G10 21CB00DCGE | |
| Média Intel Core i7-1260P (16146 - 47064, n=25) | |
| Dell Latitude 9430 2-in-1 | |
| HP Elite Dragonfly G3 | |
| Lenovo ThinkPad X1 Carbon G10 21CC001RGE | |
| Lenovo ThinkPad X1 Carbon G9-20XWCTO1WW | |
| 7-Zip 18.03 / 7z b 4 -mmt1 | |
| Dell Latitude 9430 2-in-1 | |
| Média da turma Office (3387 - 6469, n=74, últimos 2 anos) | |
| Lenovo ThinkPad Z13 G1-21D20016GE | |
| Média Intel Core i7-1260P (4064 - 5791, n=25) | |
| Lenovo ThinkPad X1 Carbon G10 21CB00DCGE | |
| Lenovo ThinkPad X1 Carbon G9-20XWCTO1WW | |
| HP Elite Dragonfly G3 | |
| Lenovo ThinkPad X1 Carbon G10 21CC001RGE | |
| Geekbench 5.5 / Multi-Core | |
| Dell Latitude 9430 2-in-1 | |
| Média da turma Office (1483 - 16999, n=71, últimos 2 anos) | |
| Média Intel Core i7-1260P (3866 - 10570, n=25) | |
| Lenovo ThinkPad X1 Carbon G10 21CB00DCGE | |
| Lenovo ThinkPad Z13 G1-21D20016GE | |
| HP Elite Dragonfly G3 | |
| Lenovo ThinkPad X1 Carbon G10 21CC001RGE | |
| Lenovo ThinkPad X1 Carbon G9-20XWCTO1WW | |
| Geekbench 5.5 / Single-Core | |
| Média da turma Office (811 - 2128, n=71, últimos 2 anos) | |
| Dell Latitude 9430 2-in-1 | |
| Lenovo ThinkPad X1 Carbon G10 21CB00DCGE | |
| Média Intel Core i7-1260P (1436 - 1786, n=25) | |
| Lenovo ThinkPad X1 Carbon G10 21CC001RGE | |
| Lenovo ThinkPad X1 Carbon G9-20XWCTO1WW | |
| HP Elite Dragonfly G3 | |
| Lenovo ThinkPad Z13 G1-21D20016GE | |
| HWBOT x265 Benchmark v2.2 / 4k Preset | |
| Lenovo ThinkPad Z13 G1-21D20016GE | |
| Média da turma Office (2.21 - 26, n=73, últimos 2 anos) | |
| Média Intel Core i7-1260P (3.45 - 13.6, n=26) | |
| Dell Latitude 9430 2-in-1 | |
| Lenovo ThinkPad X1 Carbon G10 21CB00DCGE | |
| HP Elite Dragonfly G3 | |
| Lenovo ThinkPad X1 Carbon G10 21CC001RGE | |
| Lenovo ThinkPad X1 Carbon G9-20XWCTO1WW | |
| LibreOffice / 20 Documents To PDF | |
| HP Elite Dragonfly G3 | |
| Média da turma Office (41.5 - 102.3, n=73, últimos 2 anos) | |
| Lenovo ThinkPad X1 Carbon G10 21CC001RGE | |
| Lenovo ThinkPad Z13 G1-21D20016GE | |
| Média Intel Core i7-1260P (40.2 - 65.7, n=25) | |
| Lenovo ThinkPad X1 Carbon G10 21CB00DCGE | |
| Dell Latitude 9430 2-in-1 | |
| Lenovo ThinkPad X1 Carbon G9-20XWCTO1WW | |
| R Benchmark 2.5 / Overall mean | |
| Lenovo ThinkPad X1 Carbon G9-20XWCTO1WW | |
| Lenovo ThinkPad X1 Carbon G10 21CC001RGE | |
| HP Elite Dragonfly G3 | |
| Média da turma Office (0.4098 - 0.888, n=73, últimos 2 anos) | |
| Lenovo ThinkPad X1 Carbon G10 21CB00DCGE | |
| Lenovo ThinkPad Z13 G1-21D20016GE | |
| Média Intel Core i7-1260P (0.4559 - 0.727, n=25) | |
| Dell Latitude 9430 2-in-1 | |
* ... menor é melhor
AIDA64: FP32 Ray-Trace | FPU Julia | CPU SHA3 | CPU Queen | FPU SinJulia | FPU Mandel | CPU AES | CPU ZLib | FP64 Ray-Trace | CPU PhotoWorxx
| Performance rating | |
| Lenovo ThinkPad Z13 G1-21D20016GE | |
| Média da turma Office | |
| Dell Latitude 9430 2-in-1 | |
| Média Intel Core i7-1260P | |
| Lenovo ThinkPad X1 Carbon G9-20XWCTO1WW | |
| Lenovo ThinkPad X1 Carbon G10 21CB00DCGE | |
| HP Elite Dragonfly G3 | |
| Lenovo ThinkPad X1 Carbon G10 21CC001RGE | |
| AIDA64 / FP32 Ray-Trace | |
| Média da turma Office (2083 - 31245, n=79, últimos 2 anos) | |
| Lenovo ThinkPad Z13 G1-21D20016GE | |
| Dell Latitude 9430 2-in-1 | |
| Lenovo ThinkPad X1 Carbon G9-20XWCTO1WW | |
| Lenovo ThinkPad X1 Carbon G10 21CB00DCGE | |
| Média Intel Core i7-1260P (2176 - 10898, n=26) | |
| HP Elite Dragonfly G3 | |
| Lenovo ThinkPad X1 Carbon G10 21CC001RGE | |
| AIDA64 / FPU Julia | |
| Lenovo ThinkPad Z13 G1-21D20016GE | |
| Média da turma Office (8191 - 125394, n=79, últimos 2 anos) | |
| Dell Latitude 9430 2-in-1 | |
| Lenovo ThinkPad X1 Carbon G10 21CB00DCGE | |
| Média Intel Core i7-1260P (11015 - 56906, n=26) | |
| HP Elite Dragonfly G3 | |
| Lenovo ThinkPad X1 Carbon G9-20XWCTO1WW | |
| Lenovo ThinkPad X1 Carbon G10 21CC001RGE | |
| AIDA64 / CPU SHA3 | |
| Lenovo ThinkPad Z13 G1-21D20016GE | |
| Média da turma Office (433 - 5755, n=79, últimos 2 anos) | |
| Dell Latitude 9430 2-in-1 | |
| Lenovo ThinkPad X1 Carbon G9-20XWCTO1WW | |
| Média Intel Core i7-1260P (669 - 2709, n=26) | |
| HP Elite Dragonfly G3 | |
| Lenovo ThinkPad X1 Carbon G10 21CB00DCGE | |
| Lenovo ThinkPad X1 Carbon G10 21CC001RGE | |
| AIDA64 / CPU Queen | |
| Lenovo ThinkPad Z13 G1-21D20016GE | |
| Lenovo ThinkPad X1 Carbon G10 21CB00DCGE | |
| Média Intel Core i7-1260P (42571 - 82493, n=26) | |
| Lenovo ThinkPad X1 Carbon G10 21CC001RGE | |
| Dell Latitude 9430 2-in-1 | |
| Média da turma Office (22784 - 115197, n=69, últimos 2 anos) | |
| HP Elite Dragonfly G3 | |
| Lenovo ThinkPad X1 Carbon G9-20XWCTO1WW | |
| AIDA64 / FPU SinJulia | |
| Lenovo ThinkPad Z13 G1-21D20016GE | |
| Média da turma Office (1378 - 18321, n=79, últimos 2 anos) | |
| Média Intel Core i7-1260P (2901 - 6975, n=26) | |
| Dell Latitude 9430 2-in-1 | |
| Lenovo ThinkPad X1 Carbon G10 21CB00DCGE | |
| Lenovo ThinkPad X1 Carbon G10 21CC001RGE | |
| Lenovo ThinkPad X1 Carbon G9-20XWCTO1WW | |
| HP Elite Dragonfly G3 | |
| AIDA64 / FPU Mandel | |
| Lenovo ThinkPad Z13 G1-21D20016GE | |
| Média da turma Office (4601 - 66922, n=79, últimos 2 anos) | |
| Dell Latitude 9430 2-in-1 | |
| Lenovo ThinkPad X1 Carbon G9-20XWCTO1WW | |
| Lenovo ThinkPad X1 Carbon G10 21CB00DCGE | |
| Média Intel Core i7-1260P (5950 - 26376, n=26) | |
| HP Elite Dragonfly G3 | |
| Lenovo ThinkPad X1 Carbon G10 21CC001RGE | |
| AIDA64 / CPU AES | |
| Lenovo ThinkPad X1 Carbon G9-20XWCTO1WW | |
| Lenovo ThinkPad Z13 G1-21D20016GE | |
| Média da turma Office (4854 - 155900, n=79, últimos 2 anos) | |
| Média Intel Core i7-1260P (16041 - 92356, n=26) | |
| Dell Latitude 9430 2-in-1 | |
| Lenovo ThinkPad X1 Carbon G10 21CB00DCGE | |
| HP Elite Dragonfly G3 | |
| Lenovo ThinkPad X1 Carbon G10 21CC001RGE | |
| AIDA64 / CPU ZLib | |
| Média da turma Office (114.6 - 1366, n=79, últimos 2 anos) | |
| Lenovo ThinkPad Z13 G1-21D20016GE | |
| Dell Latitude 9430 2-in-1 | |
| Média Intel Core i7-1260P (259 - 771, n=26) | |
| Lenovo ThinkPad X1 Carbon G10 21CC001RGE | |
| HP Elite Dragonfly G3 | |
| Lenovo ThinkPad X1 Carbon G10 21CB00DCGE | |
| Lenovo ThinkPad X1 Carbon G9-20XWCTO1WW | |
| AIDA64 / FP64 Ray-Trace | |
| Média da turma Office (1109 - 17834, n=79, últimos 2 anos) | |
| Lenovo ThinkPad Z13 G1-21D20016GE | |
| Dell Latitude 9430 2-in-1 | |
| Lenovo ThinkPad X1 Carbon G9-20XWCTO1WW | |
| Média Intel Core i7-1260P (1237 - 5858, n=26) | |
| Lenovo ThinkPad X1 Carbon G10 21CB00DCGE | |
| HP Elite Dragonfly G3 | |
| Lenovo ThinkPad X1 Carbon G10 21CC001RGE | |
| AIDA64 / CPU PhotoWorxx | |
| Dell Latitude 9430 2-in-1 | |
| HP Elite Dragonfly G3 | |
| Lenovo ThinkPad X1 Carbon G9-20XWCTO1WW | |
| Lenovo ThinkPad X1 Carbon G10 21CB00DCGE | |
| Média da turma Office (11090 - 65229, n=79, últimos 2 anos) | |
| Lenovo ThinkPad X1 Carbon G10 21CC001RGE | |
| Média Intel Core i7-1260P (13261 - 43652, n=26) | |
| Lenovo ThinkPad Z13 G1-21D20016GE | |
Desempenho do sistema
Os benchmarks de desempenho do sistema sintético são similares aos testes de CPU. O Lenovo ThinkPad X1 Carbon Gen 10 30th Anniversary Edition funciona rápido, mas não toma posição de pólo. No uso diário, ele se mostra um dispositivo muito responsivo.
CrossMark: Overall | Productivity | Creativity | Responsiveness
| PCMark 10 / Score | |
| Média da turma Office (2601 - 9298, n=63, últimos 2 anos) | |
| Lenovo ThinkPad Z13 G1-21D20016GE | |
| Média Intel Core i7-1260P, Intel Iris Xe Graphics G7 96EUs (4796 - 6068, n=17) | |
| Dell Latitude 9430 2-in-1 | |
| Lenovo ThinkPad X1 Carbon G10 21CB00DCGE | |
| Lenovo ThinkPad X1 Carbon G10 21CC001RGE | |
| Lenovo ThinkPad X1 Carbon G9-20XWCTO1WW | |
| HP Elite Dragonfly G3 | |
| PCMark 10 / Essentials | |
| Dell Latitude 9430 2-in-1 | |
| Média Intel Core i7-1260P, Intel Iris Xe Graphics G7 96EUs (9260 - 11251, n=17) | |
| Lenovo ThinkPad Z13 G1-21D20016GE | |
| Lenovo ThinkPad X1 Carbon G10 21CC001RGE | |
| Lenovo ThinkPad X1 Carbon G9-20XWCTO1WW | |
| Média da turma Office (3245 - 11594, n=63, últimos 2 anos) | |
| Lenovo ThinkPad X1 Carbon G10 21CB00DCGE | |
| HP Elite Dragonfly G3 | |
| PCMark 10 / Productivity | |
| Média da turma Office (5336 - 17243, n=63, últimos 2 anos) | |
| Lenovo ThinkPad Z13 G1-21D20016GE | |
| Dell Latitude 9430 2-in-1 | |
| Média Intel Core i7-1260P, Intel Iris Xe Graphics G7 96EUs (6167 - 8629, n=17) | |
| Lenovo ThinkPad X1 Carbon G9-20XWCTO1WW | |
| Lenovo ThinkPad X1 Carbon G10 21CB00DCGE | |
| Lenovo ThinkPad X1 Carbon G10 21CC001RGE | |
| HP Elite Dragonfly G3 | |
| PCMark 10 / Digital Content Creation | |
| Média da turma Office (2049 - 13541, n=63, últimos 2 anos) | |
| Lenovo ThinkPad Z13 G1-21D20016GE | |
| Lenovo ThinkPad X1 Carbon G10 21CB00DCGE | |
| Média Intel Core i7-1260P, Intel Iris Xe Graphics G7 96EUs (5231 - 6908, n=17) | |
| Dell Latitude 9430 2-in-1 | |
| HP Elite Dragonfly G3 | |
| Lenovo ThinkPad X1 Carbon G10 21CC001RGE | |
| Lenovo ThinkPad X1 Carbon G9-20XWCTO1WW | |
| CrossMark / Overall | |
| Média Intel Core i7-1260P, Intel Iris Xe Graphics G7 96EUs (1484 - 1811, n=16) | |
| Dell Latitude 9430 2-in-1 | |
| Lenovo ThinkPad X1 Carbon G10 21CB00DCGE | |
| Lenovo ThinkPad X1 Carbon G10 21CC001RGE | |
| Lenovo ThinkPad Z13 G1-21D20016GE | |
| Média da turma Office (381 - 2010, n=74, últimos 2 anos) | |
| HP Elite Dragonfly G3 | |
| CrossMark / Productivity | |
| Média Intel Core i7-1260P, Intel Iris Xe Graphics G7 96EUs (1486 - 1755, n=16) | |
| Dell Latitude 9430 2-in-1 | |
| Lenovo ThinkPad Z13 G1-21D20016GE | |
| Lenovo ThinkPad X1 Carbon G10 21CB00DCGE | |
| Lenovo ThinkPad X1 Carbon G10 21CC001RGE | |
| Média da turma Office (464 - 1880, n=74, últimos 2 anos) | |
| HP Elite Dragonfly G3 | |
| CrossMark / Creativity | |
| Média Intel Core i7-1260P, Intel Iris Xe Graphics G7 96EUs (1451 - 1872, n=16) | |
| Lenovo ThinkPad X1 Carbon G10 21CB00DCGE | |
| Dell Latitude 9430 2-in-1 | |
| Lenovo ThinkPad X1 Carbon G10 21CC001RGE | |
| Média da turma Office (319 - 2361, n=74, últimos 2 anos) | |
| Lenovo ThinkPad Z13 G1-21D20016GE | |
| HP Elite Dragonfly G3 | |
| CrossMark / Responsiveness | |
| Média Intel Core i7-1260P, Intel Iris Xe Graphics G7 96EUs (1253 - 1807, n=16) | |
| Dell Latitude 9430 2-in-1 | |
| Lenovo ThinkPad X1 Carbon G10 21CC001RGE | |
| Lenovo ThinkPad X1 Carbon G10 21CB00DCGE | |
| Lenovo ThinkPad Z13 G1-21D20016GE | |
| Média da turma Office (360 - 1690, n=74, últimos 2 anos) | |
| HP Elite Dragonfly G3 | |
| PCMark 10 Score | 5411 pontos | |
Ajuda | ||
| AIDA64 / Memory Copy | |
| Dell Latitude 9430 2-in-1 | |
| HP Elite Dragonfly G3 | |
| Média da turma Office (20075 - 110930, n=76, últimos 2 anos) | |
| Lenovo ThinkPad X1 Carbon G10 21CC001RGE | |
| Lenovo ThinkPad X1 Carbon G10 21CB00DCGE | |
| Lenovo ThinkPad X1 Carbon G9-20XWCTO1WW | |
| Média Intel Core i7-1260P (25125 - 71544, n=25) | |
| Lenovo ThinkPad Z13 G1-21D20016GE | |
| AIDA64 / Memory Read | |
| Lenovo ThinkPad X1 Carbon G10 21CC001RGE | |
| Lenovo ThinkPad X1 Carbon G10 21CB00DCGE | |
| Média da turma Office (10084 - 128030, n=77, últimos 2 anos) | |
| HP Elite Dragonfly G3 | |
| Dell Latitude 9430 2-in-1 | |
| Lenovo ThinkPad X1 Carbon G9-20XWCTO1WW | |
| Média Intel Core i7-1260P (24983 - 72065, n=25) | |
| Lenovo ThinkPad Z13 G1-21D20016GE | |
| AIDA64 / Memory Write | |
| Média da turma Office (20073 - 119858, n=77, últimos 2 anos) | |
| Dell Latitude 9430 2-in-1 | |
| Lenovo ThinkPad X1 Carbon G10 21CB00DCGE | |
| Lenovo ThinkPad X1 Carbon G9-20XWCTO1WW | |
| Lenovo ThinkPad X1 Carbon G10 21CC001RGE | |
| HP Elite Dragonfly G3 | |
| Média Intel Core i7-1260P (23512 - 66799, n=25) | |
| Lenovo ThinkPad Z13 G1-21D20016GE | |
| AIDA64 / Memory Latency | |
| Lenovo ThinkPad Z13 G1-21D20016GE | |
| HP Elite Dragonfly G3 | |
| Dell Latitude 9430 2-in-1 | |
| Média da turma Office (7.6 - 162.9, n=72, últimos 2 anos) | |
| Lenovo ThinkPad X1 Carbon G10 21CB00DCGE | |
| Lenovo ThinkPad X1 Carbon G9-20XWCTO1WW | |
| Média Intel Core i7-1260P (77.9 - 118.4, n=21) | |
| Lenovo ThinkPad X1 Carbon G10 21CC001RGE | |
| Lenovo ThinkPad X1 Carbon G10 21CC001RGE | |
* ... menor é melhor
Latência do DPC
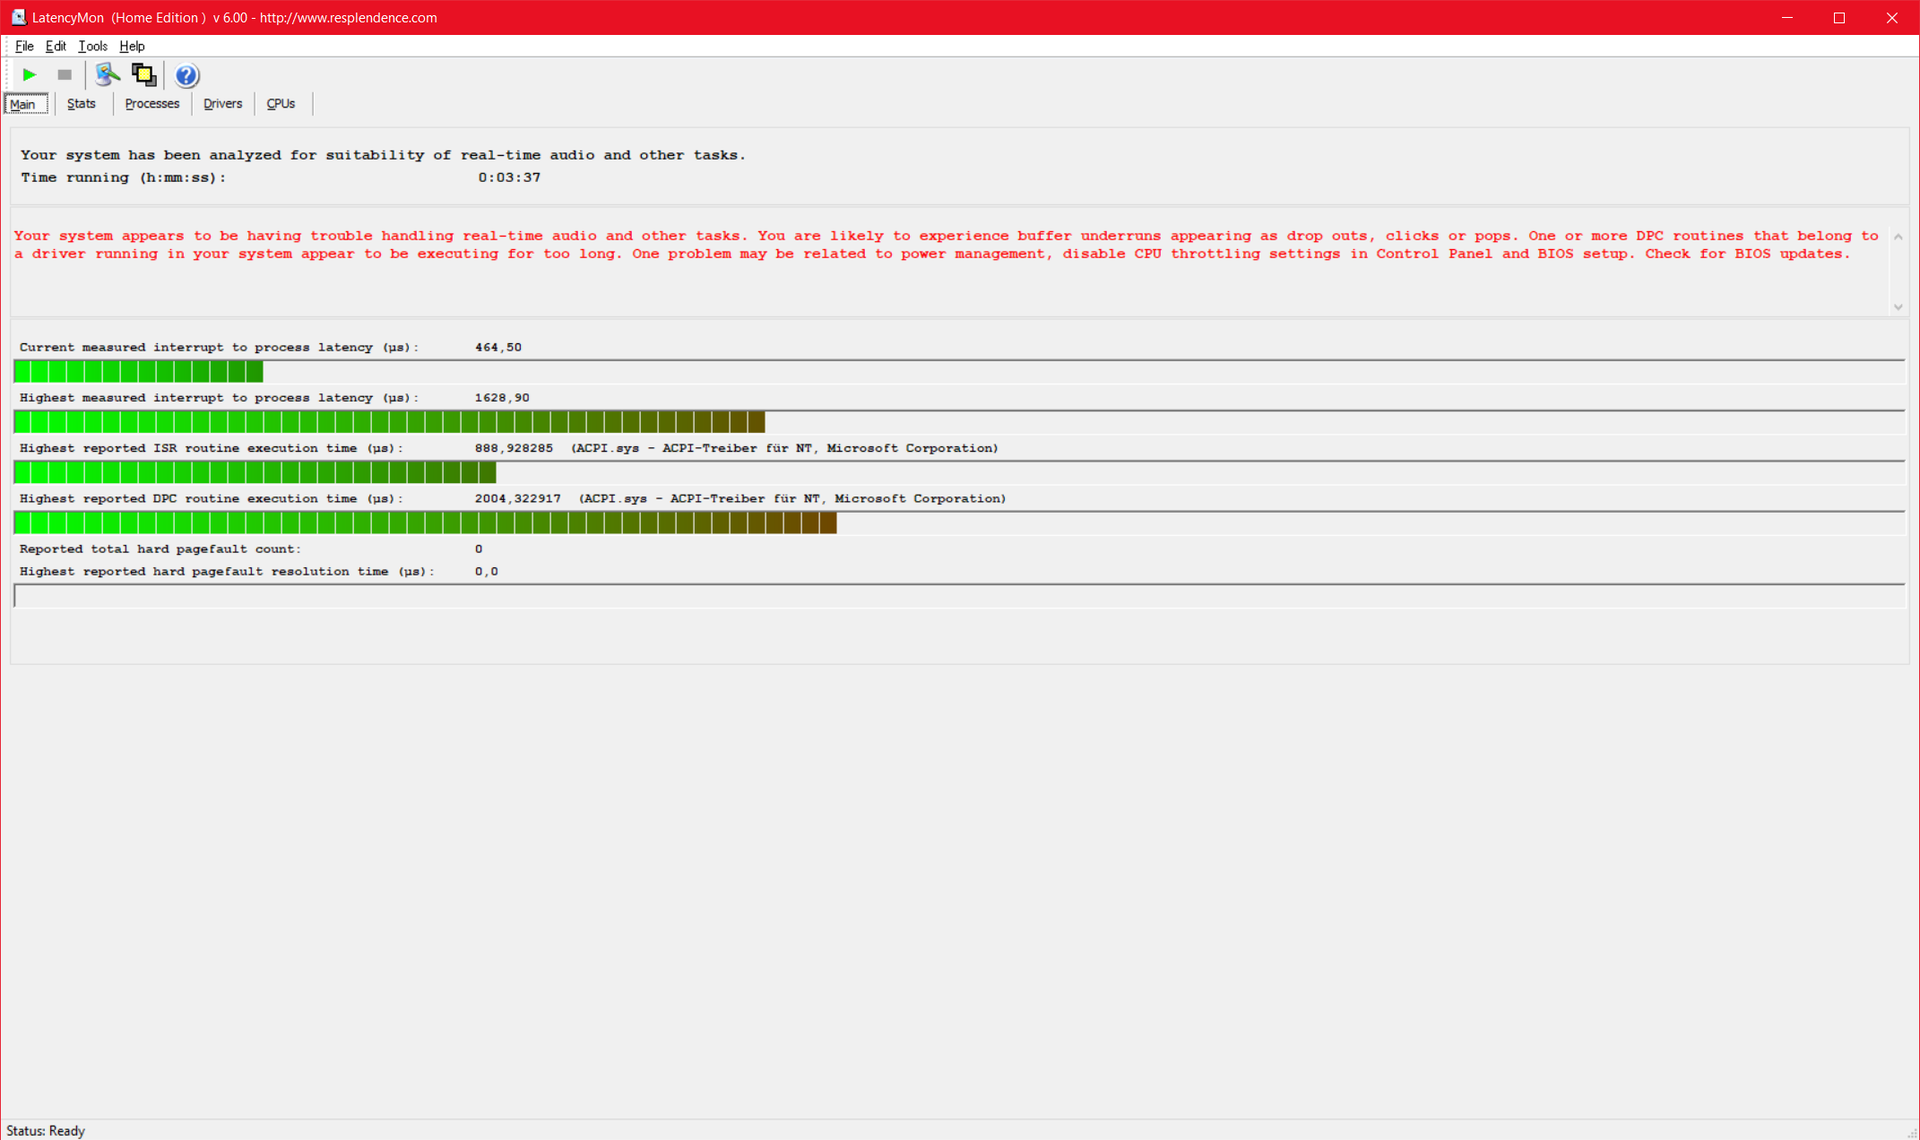
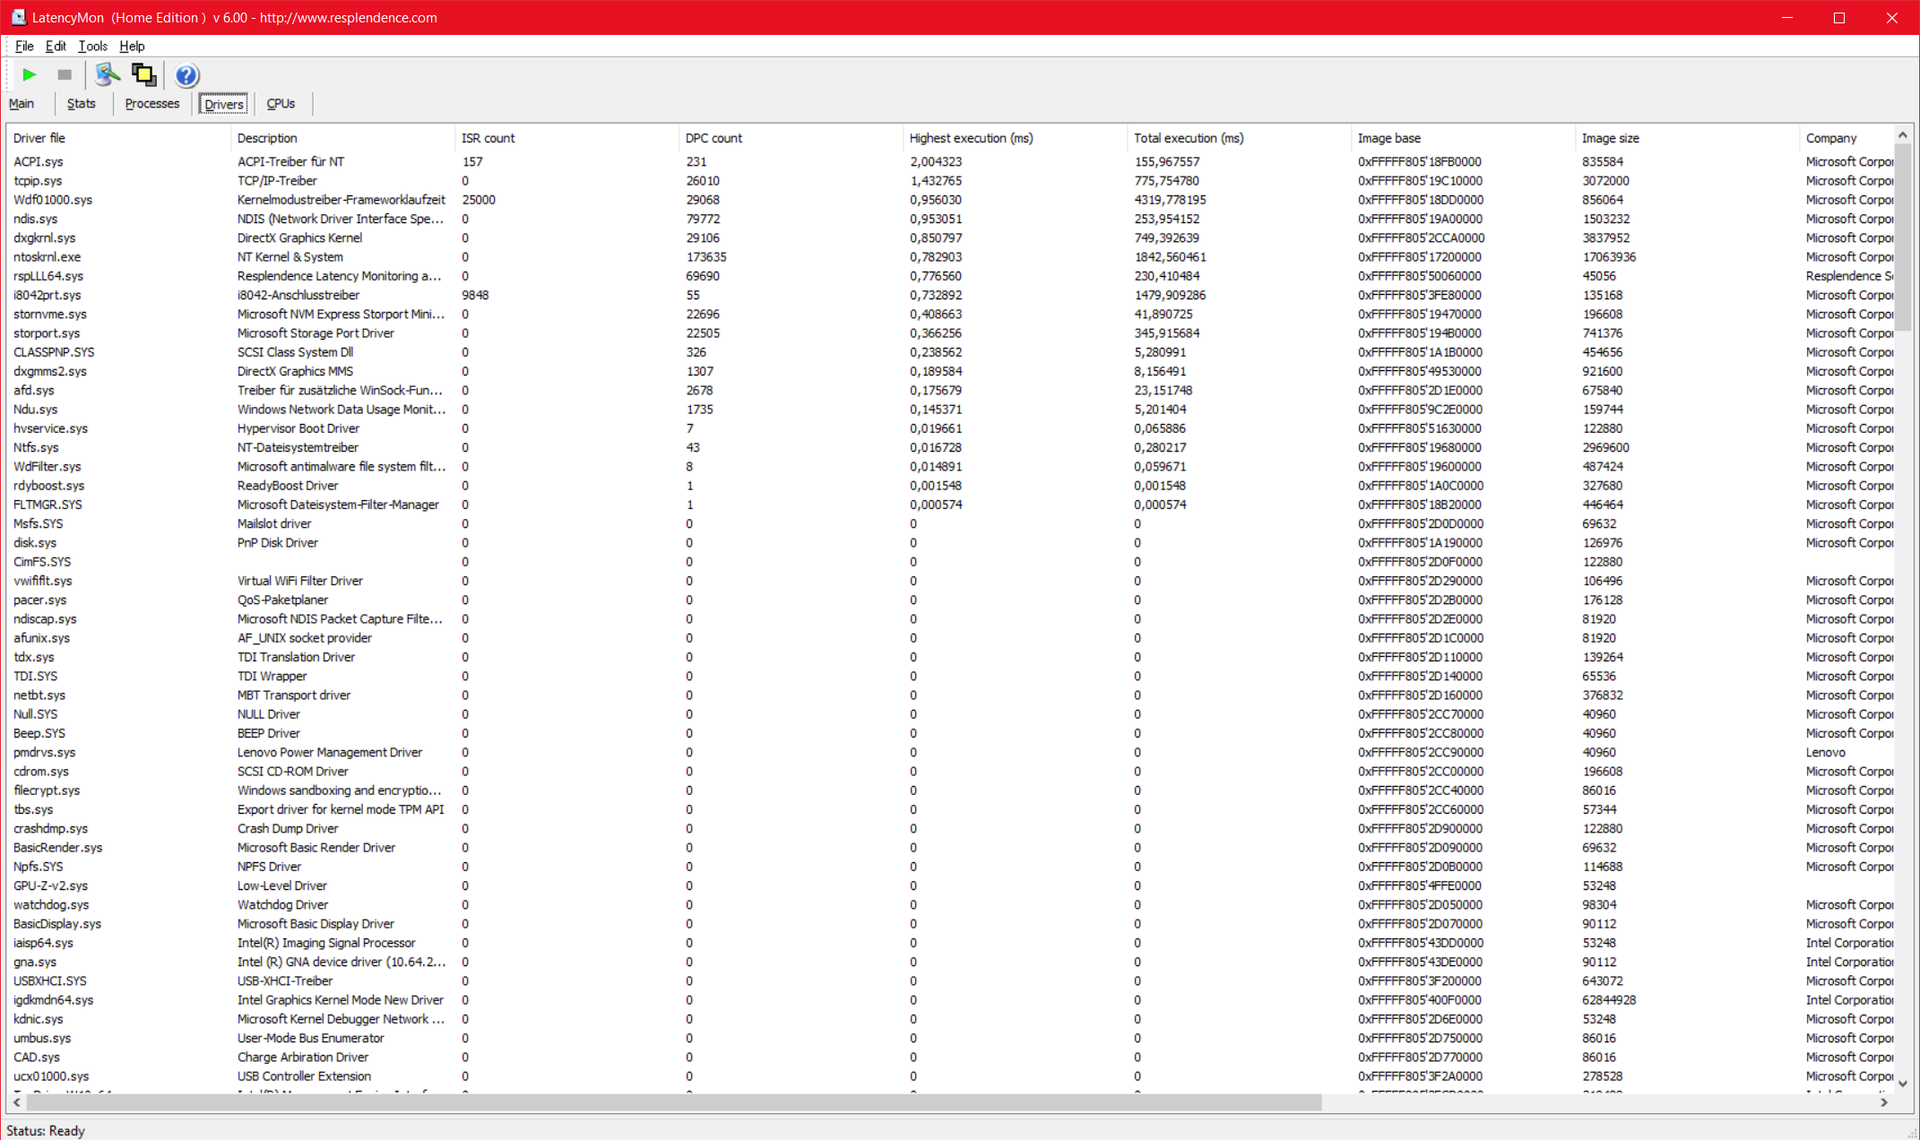
| DPC Latencies / LatencyMon - interrupt to process latency (max), Web, Youtube, Prime95 | |
| Lenovo ThinkPad X1 Carbon G10 21CC001RGE | |
| Lenovo ThinkPad X1 Carbon G10 21CB00DCGE | |
| HP Elite Dragonfly G3 | |
| Dell Latitude 9430 2-in-1 | |
| Lenovo ThinkPad Z13 G1-21D20016GE | |
| Lenovo ThinkPad X1 Carbon G9-20XWCTO1WW | |
* ... menor é melhor
Dispositivos de armazenamento
O M.2 SSD PM91A com uma capacidade de 512 GB vem da Samsung. Está conectado ao padrão NVMe PCIe 4.0 e funciona rapidamente, embora ligeiramente abaixo da média para este SSD. Pelo menos o desempenho é completamente estável, mesmo sob carga permanente.

* ... menor é melhor
Sustained Read Performance: DiskSpd Read Loop, Queue Depth 8
Placa Gráfica
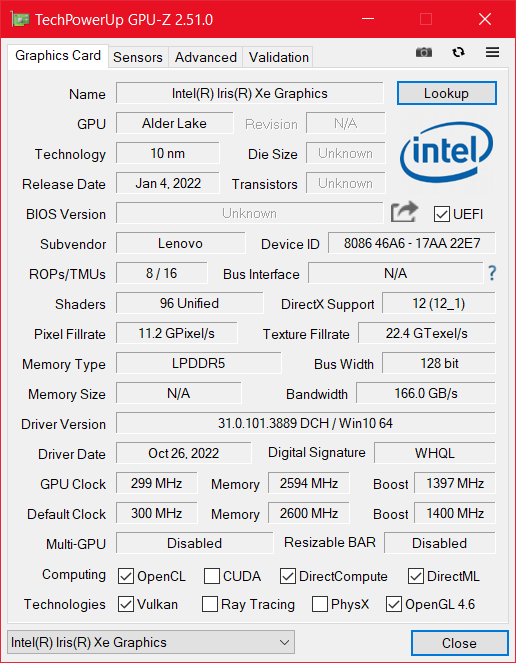
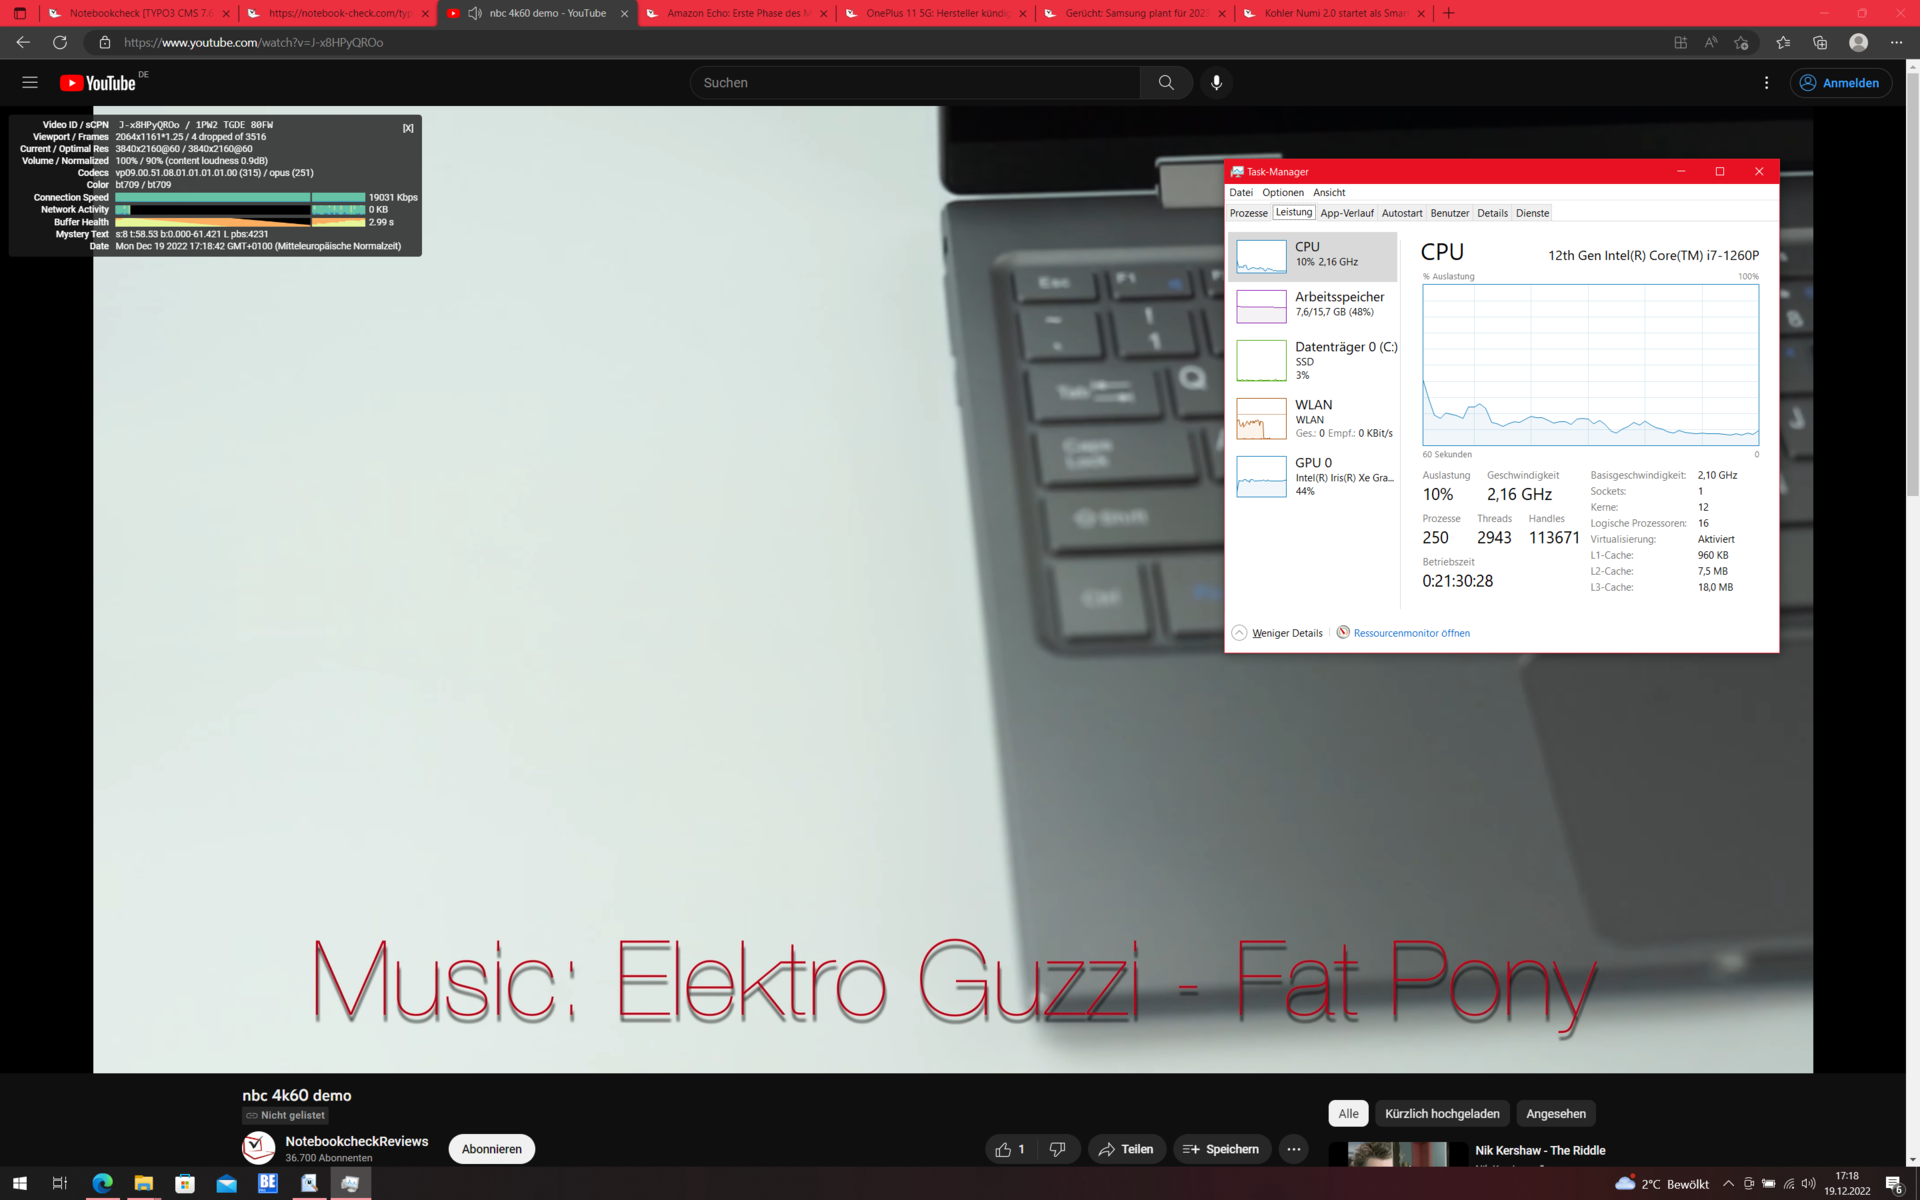
Em comparação com nossa primeira amostra de revisão do Carbono X1 2022, também houve uma mudança na GPU, porque a IntelIris Xe instalado aqui tem 96 ao invés de 80 unidades de execução. Isto resulta em um leve aumento de desempenho, mas não faz realmente uma grande diferença. A GPU é suficiente para tarefas simples, mas o X1 Carbon G10 é o notebook errado para tudo o mais, incluindo tanto jogos quanto CAD.
| 3DMark 11 Performance | 5769 pontos | |
| 3DMark Cloud Gate Standard Score | 14688 pontos | |
| 3DMark Fire Strike Score | 4154 pontos | |
| 3DMark Time Spy Score | 1722 pontos | |
Ajuda | ||
* ... menor é melhor
| The Witcher 3 - 1920x1080 Ultra Graphics & Postprocessing (HBAO+) | |
| Lenovo ThinkPad Z13 G1-21D20016GE | |
| Média da turma Office (14.8 - 18.1, n=4, últimos 2 anos) | |
| Dell Latitude 9430 2-in-1 | |
| HP Elite Dragonfly G3 | |
| Lenovo ThinkPad X1 Carbon G10 21CB00DCGE | |
| Lenovo ThinkPad X1 Carbon G10 21CC001RGE | |
| Final Fantasy XV Benchmark - 1920x1080 High Quality | |
| Média da turma Office (8.09 - 79.5, n=67, últimos 2 anos) | |
| Lenovo ThinkPad Z13 G1-21D20016GE | |
| Dell Latitude 9430 2-in-1 | |
| HP Elite Dragonfly G3 | |
| Lenovo ThinkPad X1 Carbon G10 21CB00DCGE | |
| Lenovo ThinkPad X1 Carbon G10 21CC001RGE | |
| Strange Brigade - 1920x1080 ultra AA:ultra AF:16 | |
| Lenovo ThinkPad Z13 G1-21D20016GE | |
| Média da turma Office (12.9 - 142.1, n=50, últimos 2 anos) | |
| Dell Latitude 9430 2-in-1 | |
| HP Elite Dragonfly G3 | |
| Lenovo ThinkPad X1 Carbon G10 21CB00DCGE | |
| Dota 2 Reborn - 1920x1080 ultra (3/3) best looking | |
| Lenovo ThinkPad Z13 G1-21D20016GE | |
| Dell Latitude 9430 2-in-1 | |
| Média da turma Office (14.6 - 135, n=73, últimos 2 anos) | |
| HP Elite Dragonfly G3 | |
| Lenovo ThinkPad X1 Carbon G10 21CB00DCGE | |
| Lenovo ThinkPad X1 Carbon G10 21CC001RGE | |
Witcher 3 FPS Chart
| baixo | média | alto | ultra | QHD | |
|---|---|---|---|---|---|
| The Witcher 3 (2015) | 83.3 | 51 | 27.2 | 12.9 | |
| Dota 2 Reborn (2015) | 99.8 | 74.7 | 50.3 | 43.5 | |
| Final Fantasy XV Benchmark (2018) | 39.8 | 18.6 | 13 | 9.59 | |
| X-Plane 11.11 (2018) | 38.1 | 38.2 | 34.2 | ||
| Strange Brigade (2018) | 79.2 | 34.2 | 25.8 | 19.8 |
Emissões: Maior desempenho significa maior ruído do ventilador
Ruído
Embora os valores de desempenho tenham melhorado, é o oposto com o ruído do ventilador, que é mais alto do que em nossa primeira amostra de revisão e também funciona com mais freqüência. Mesmo no modo ocioso, o sistema de resfriamento ocasionalmente entra em funcionamento. Em comparação, somente o Lenovo ThinkPad Z13 tem um resfriamento mais alto sob carga. O ThinkPad X1 Carbon G10 não é, portanto, necessariamente a escolha certa para os amantes do silêncio, especialmente porque os ventiladores também são relativamente de alta freqüência.
Não foi detectado nenhum lamento da bobina.
Barulho
| Ocioso |
| 22.8 / 22.8 / 24.6 dB |
| Carga |
| 38.2 / 38.2 dB |
 | ||
30 dB silencioso 40 dB(A) audível 50 dB(A) ruidosamente alto |
||
min: | ||
| Lenovo ThinkPad X1 Carbon G10 21CB00DCGE Iris Xe G7 96EUs, i7-1260P, Samsung PM9A1 MZVL2512HCJQ | Lenovo ThinkPad X1 Carbon G10 21CC001RGE Iris Xe G7 80EUs, i5-1250P, Samsung PM9A1 MZVL2512HCJQ | Lenovo ThinkPad X1 Carbon G9-20XWCTO1WW Iris Xe G7 96EUs, i7-1165G7, Samsung PM9A1 MZVL21T0HCLR | Lenovo ThinkPad Z13 G1-21D20016GE Radeon 680M, R7 PRO 6860Z, Micron 2450 1TB MTFDKCD1T0TFK | HP Elite Dragonfly G3 Iris Xe G7 96EUs, i7-1265U, Micron 3400 MTFDKBA512TFH 512GB | Dell Latitude 9430 2-in-1 Iris Xe G7 96EUs, i7-1265U | |
|---|---|---|---|---|---|---|
| Noise | 5% | 2% | -6% | 9% | -4% | |
| desligado / ambiente * (dB) | 22.8 | 22.81 -0% | 23.66 -4% | 24.3 -7% | 22.8 -0% | 23.7 -4% |
| Idle Minimum * (dB) | 22.8 | 22.81 -0% | 23.6 -4% | 24.3 -7% | 23.2 -2% | 23.7 -4% |
| Idle Average * (dB) | 22.8 | 22.81 -0% | 23.6 -4% | 24.3 -7% | 23.2 -2% | 23.7 -4% |
| Idle Maximum * (dB) | 24.6 | 22.81 7% | 23.6 4% | 24.3 1% | 23.2 6% | 23.7 4% |
| Load Average * (dB) | 38.2 | 31.59 17% | 33.5 12% | 41 -7% | 25.1 34% | 35.1 8% |
| Witcher 3 ultra * (dB) | 38.1 | 35.59 7% | 41 -8% | 32 16% | 43.3 -14% | |
| Load Maximum * (dB) | 38.2 | 35.47 7% | 34.3 10% | 41 -7% | 35.2 8% | 43 -13% |
* ... menor é melhor
Temperatura
A maior parte do desenvolvimento de calor se concentra no canto superior esquerdo da caixa. Cerca de 50 graus Celsius é alcançado aqui sob carga, tanto na parte superior quanto na inferior, e até um pouco mais no teste Witcher 3. Felizmente, estas são áreas que normalmente não são tocadas durante o uso, mas o Lenovo ThinkPad X1 Carbon G10 30th Anniversary Edition certamente não pode ser descrito como um laptop de funcionamento frio.
Durante o teste de estresse, ou seja, a carga simultânea de GPU e CPU, o processador é permanentemente limitado a apenas 17 watts. Este estrangulamento relacionado ao TDP não tem mais impacto no uso diário, além da limitação já existente do desempenho da CPU. Neste caso, a GPU consome uma parte adicional do orçamento do TDP.
(-) A temperatura máxima no lado superior é 50 °C / 122 F, em comparação com a média de 34.3 °C / 94 F , variando de 21.2 a 62.5 °C para a classe Office.
(-) A parte inferior aquece até um máximo de 49.7 °C / 121 F, em comparação com a média de 36.8 °C / 98 F
(+) Em uso inativo, a temperatura média para o lado superior é 27.1 °C / 81 F, em comparação com a média do dispositivo de 29.5 °C / ### class_avg_f### F.
(±) Jogando The Witcher 3, a temperatura média para o lado superior é 35.7 °C / 96 F, em comparação com a média do dispositivo de 29.5 °C / ## #class_avg_f### F.
(+) Os apoios para as mãos e o touchpad são mais frios que a temperatura da pele, com um máximo de 28.8 °C / 83.8 F e, portanto, são frios ao toque.
(±) A temperatura média da área do apoio para as mãos de dispositivos semelhantes foi 27.5 °C / 81.5 F (-1.3 °C / -2.3 F).
| Lenovo ThinkPad X1 Carbon G10 21CB00DCGE Intel Core i7-1260P, Intel Iris Xe Graphics G7 96EUs | Lenovo ThinkPad X1 Carbon G10 21CC001RGE Intel Core i5-1250P, Intel Iris Xe Graphics G7 80EUs | Lenovo ThinkPad X1 Carbon G9-20XWCTO1WW Intel Core i7-1165G7, Intel Iris Xe Graphics G7 96EUs | Lenovo ThinkPad Z13 G1-21D20016GE AMD Ryzen 7 PRO 6860Z, AMD Radeon 680M | HP Elite Dragonfly G3 Intel Core i7-1265U, Intel Iris Xe Graphics G7 96EUs | Dell Latitude 9430 2-in-1 Intel Core i7-1265U, Intel Iris Xe Graphics G7 96EUs | |
|---|---|---|---|---|---|---|
| Heat | 6% | 6% | 9% | 17% | 24% | |
| Maximum Upper Side * (°C) | 50 | 45 10% | 51.5 -3% | 45.6 9% | 39 22% | 39.2 22% |
| Maximum Bottom * (°C) | 49.7 | 44 11% | 45.3 9% | 51 -3% | 42.2 15% | 44.8 10% |
| Idle Upper Side * (°C) | 32.4 | 31.2 4% | 29.6 9% | 27 17% | 26.8 17% | 21.4 34% |
| Idle Bottom * (°C) | 32.3 | 33.2 -3% | 30 7% | 27.9 14% | 28.2 13% | 22.4 31% |
* ... menor é melhor
Oradores
Em comparação com os alto-falantes noDell Latitude 9430os quatro alto-falantes do Lenovo ThinkPad X1 Carbon G10 são consideravelmente mais silenciosos, mas um pouco mais equilibrados. A combinação de dois woofers na parte inferior e dois tweeters na parte superior é potente o suficiente para encher uma pequena sala com som.
Lenovo ThinkPad X1 Carbon G10 21CB00DCGE análise de áudio
(±) | o volume do alto-falante é médio, mas bom (###valor### dB)
Graves 100 - 315Hz
(±) | graves reduzidos - em média 12.8% menor que a mediana
(±) | a linearidade dos graves é média (14.9% delta para a frequência anterior)
Médios 400 - 2.000 Hz
(+) | médios equilibrados - apenas 2.5% longe da mediana
(+) | médios são lineares (4.8% delta para frequência anterior)
Altos 2 - 16 kHz
(+) | agudos equilibrados - apenas 1.1% longe da mediana
(+) | os máximos são lineares (2.8% delta da frequência anterior)
Geral 100 - 16.000 Hz
(+) | o som geral é linear (12.2% diferença em relação à mediana)
Comparado com a mesma classe
» 5% de todos os dispositivos testados nesta classe foram melhores, 2% semelhantes, 94% piores
» O melhor teve um delta de 7%, a média foi 21%, o pior foi 53%
Comparado com todos os dispositivos testados
» 10% de todos os dispositivos testados foram melhores, 2% semelhantes, 88% piores
» O melhor teve um delta de 4%, a média foi 24%, o pior foi 134%
Dell Latitude 9430 2-in-1 análise de áudio
(+) | os alto-falantes podem tocar relativamente alto (###valor### dB)
Graves 100 - 315Hz
(±) | graves reduzidos - em média 12.3% menor que a mediana
(+) | o baixo é linear (5.3% delta para a frequência anterior)
Médios 400 - 2.000 Hz
(+) | médios equilibrados - apenas 2% longe da mediana
(+) | médios são lineares (4.7% delta para frequência anterior)
Altos 2 - 16 kHz
(±) | máximos mais altos - em média 5.4% maior que a mediana
(+) | os máximos são lineares (3% delta da frequência anterior)
Geral 100 - 16.000 Hz
(+) | o som geral é linear (11.6% diferença em relação à mediana)
Comparado com a mesma classe
» 10% de todos os dispositivos testados nesta classe foram melhores, 4% semelhantes, 87% piores
» O melhor teve um delta de 6%, a média foi 20%, o pior foi 57%
Comparado com todos os dispositivos testados
» 8% de todos os dispositivos testados foram melhores, 2% semelhantes, 90% piores
» O melhor teve um delta de 4%, a média foi 24%, o pior foi 134%
Gerenciamento de energia: OLED reduz a vida útil da bateria do X1 Carbono G10
Consumo de energia
O efeito da tela OLED de maior resolução sobre o consumo é claramente um aspecto negativo. O consumo ocioso mínimo é mais que o dobro do primeiro modelo do ThinkPad X1 Carbon G10, que foi equipado com um painel IPS WUXGA. Pelo menos o Carbono X1 está quase ao mesmo nível do ThinkPad Z13, que também tem uma tela OLED.
A fonte de alimentação está mais do que adequadamente dimensionada para o consumo máximo de 62,5 watts, o que também representa apenas o pico de carga.
| desligado | |
| Ocioso | |
| Carga |
|
Key:
min: | |
| Lenovo ThinkPad X1 Carbon G10 21CB00DCGE i7-1260P, Iris Xe G7 96EUs, Samsung PM9A1 MZVL2512HCJQ, OLED, 2880x1800, 14" | Lenovo ThinkPad X1 Carbon G10 21CC001RGE i5-1250P, Iris Xe G7 80EUs, Samsung PM9A1 MZVL2512HCJQ, IPS LED, 1920x1200, 14" | Lenovo ThinkPad X1 Carbon G9-20XWCTO1WW i7-1165G7, Iris Xe G7 96EUs, Samsung PM9A1 MZVL21T0HCLR, IPS LED, 3840x2400, 14" | Lenovo ThinkPad Z13 G1-21D20016GE R7 PRO 6860Z, Radeon 680M, Micron 2450 1TB MTFDKCD1T0TFK, OLED, 2880x1800, 13.3" | HP Elite Dragonfly G3 i7-1265U, Iris Xe G7 96EUs, Micron 3400 MTFDKBA512TFH 512GB, IPS, 1920x1280, 13.5" | Dell Latitude 9430 2-in-1 i7-1265U, Iris Xe G7 96EUs, , IPS, 2560x1600, 14" | Média Intel Iris Xe Graphics G7 96EUs | Média da turma Office | |
|---|---|---|---|---|---|---|---|---|
| Power Consumption | 28% | -10% | -3% | 16% | 19% | -5% | 10% | |
| Idle Minimum * (Watt) | 6.4 | 2.9 55% | 5 22% | 5.7 11% | 3.4 47% | 2.9 55% | 5.51 ? 14% | 4.4 ? 31% |
| Idle Average * (Watt) | 7.4 | 4.9 34% | 10.2 -38% | 7.6 -3% | 5.6 24% | 5.8 22% | 8.66 ? -17% | 7.32 ? 1% |
| Idle Maximum * (Watt) | 8.3 | 6 28% | 11 -33% | 8.4 -1% | 8.4 -1% | 6.6 20% | 10.9 ? -31% | 8.56 ? -3% |
| Load Average * (Watt) | 56.5 | 29.3 48% | 51.7 8% | 54.4 4% | 40.8 28% | 49.2 13% | 45.6 ? 19% | 42.5 ? 25% |
| Witcher 3 ultra * (Watt) | 37.5 | 36.6 2% | 48.1 -28% | 35.5 5% | 35.3 6% | |||
| Load Maximum * (Watt) | 62.5 | 63.3 -1% | 67.5 -8% | 62.7 -0% | 68.4 -9% | 63.1 -1% | 67.8 ? -8% | 64.1 ? -3% |
* ... menor é melhor
Power consumption Witcher 3 / Stress test
Power Consumption with an external monitor
Vida útil da bateria
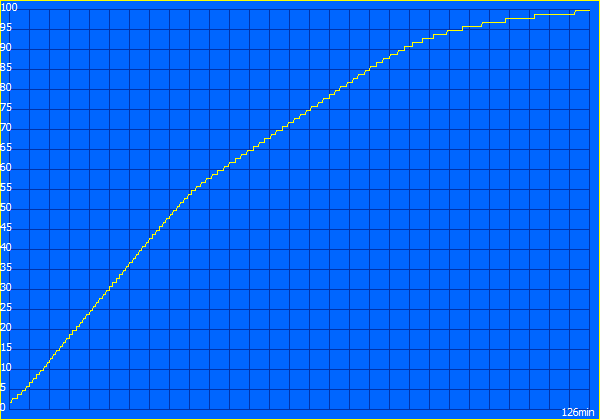
A capacidade da bateria de 57 horas watt permanece inalterada. O maior consumo da tela OLED afeta significativamente os tempos de funcionamento da bateria: O Lenovo ThinkPad X1 Carbon G10 30th Anniversary Edition fica sem energia após apenas cinco horas em nosso teste Wi-Fi (150 cd/m² de brilho). Isto é muito fraco. Em comparação: O ThinkPad Z13, também com um visor OLED com consumo de energia, alcançou mais de sete horas no mesmo teste.
Uma maneira de conseguir tempos de funcionamento mais longos da bateria nos laptops OLED é o modo escuro. Nosso teste WiFi consiste principalmente em websites com fundos brilhantes, o que significa maior consumo em parte dos pixels auto-iluminantes. Os modernos navegadores web podem ser configurados para que todos os sites sejam exibidos no modo escuro. Repetimos o teste Wi-Fi sob estas condições. No modo escuro, o Lenovo ThinkPad X1 Carbon G10 OLED alcança um tempo de execução de aproximadamente sete horas no teste Wi-Fi. Os compradores deste modelo e de outros laptops OLED devem usar o modo escuro sempre que possível.
Pro
Contra
Veredicto: visor OLED de alta qualidade encurta a vida útil da bateria
Mesmo sem um visor OLED, o Lenovo ThinkPad X1 Carbon Gen 10 é um excelente caderno de negócios. Nosso primeiro dispositivo de revisão, com um painel IPS, alcançou uma classificação geral de 90 por cento. Com o OLED, a qualidade da tela aumenta significativamente, mas é preciso fazer concessões em outros lugares: A vida útil da bateria sofre consideravelmente devido ao maior consumo, e o OLED X1 Carbon G10 dificilmente pode ser usado em movimento por longos períodos de tempo sem o modo escuro ativado para todos os aplicativos e websites. Uma pena, já que o painel OLED anti-reflexo é na verdade muito bem adequado para uso ao ar livre.
Outro aspecto excitante desta revisão atualizada foi o desempenho da CPU, que foi considerado insuficiente em nossa primeira revisão do X1 Carbono G10 mit i5-CPU. Felizmente, isto melhorou e a Lenovo resolveu o problema com atualizações de firmware. Entretanto, o ventilador funciona um pouco mais alto sob carga do que antes.
Um pouco de espírito de aniversário, mas uma muito boa exibição OLED: O Lenovo ThinkPad X1 Carbon Gen 10 30th Anniversary Edition
Você mal percebe que esta é uma edição de aniversário em uso diário, além do logotipo colorido como um lembrete. A Lenovo desperdiçou a chance de criar algo único aqui, o que significa que o display OLED é o foco principal neste modelo. Na verdade, esta ainda é uma característica bastante rara entre os laptops comerciais, e a alta qualidade de imagem é um argumento muito bom para a edição do 30º aniversário do X1 Carbon Gen 10. Pode não ser tão prático quanto outros modelos comerciais devido à menor vida útil da bateria, mas o uso do monitor OLED é um prazer.
Se os portos e o design mais clássico do ThinkPad não são tão importantes, o Lenovo ThinkPad Z13 OLED pode ser uma boa alternativa. Ela é ainda mais potente e tem uma bateria com maior vida útil. A concorrência comercial dos outros fabricantes não oferece o OLED, mas o HP Elite Libélula de Elite G3 tem um bom LCD IPS no formato 3:2, o que pode ser interessante para alguns leitores. O Dell Latitude 9430 2 em 1 é significativamente mais pesada, mas tem uma tela mais brilhante em troca. Tanto os laptops Dell quanto os HP também têm uma vida útil de bateria muito melhor.
Preço e Disponibilidade
Dependendo de sua localização, o Lenovo ThinkPad X1 Carbon Gen 10 30th Anniversary Edition está disponível através do website oficial da Lenovo como um laptop livremente configurável. Os preços no USA começam em US$1.397,40. Os preços iniciais em no Reino Unido e Cingapura são £2.310,00 e SG$2.303,74, respectivamente (esta não é uma lista exaustiva).
Os preços são a partir de 22.12.2022 e estão sujeitos a alterações.
Lenovo ThinkPad X1 Carbon G10 21CB00DCGE
- 12/21/2022 v7 (old)
Benjamin Herzig
Price comparison

