Breve Análise do Portátil Lenovo ThinkPad 25 Edição de Aniversário


| SD Card Reader | |
| average JPG Copy Test (av. of 3 runs) | |
| Dell XPS 15 9560 (i7-7700HQ, UHD) | |
| Lenovo ThinkPad 25 | |
| Lenovo ThinkPad T470s-20HF0012US | |
| maximum AS SSD Seq Read Test (1GB) | |
| Dell XPS 15 9560 (i7-7700HQ, UHD) | |
| Lenovo ThinkPad T470s-20HF0012US | |
| Lenovo ThinkPad 25 | |
| Networking | |
| iperf3 transmit AX12 | |
| Dell XPS 15 9560 (i7-7700HQ, UHD) | |
| Lenovo ThinkPad 25 | |
| Lenovo ThinkPad T470s-20HF0012US | |
| iperf3 receive AX12 | |
| Lenovo ThinkPad 25 | |
| Dell XPS 15 9560 (i7-7700HQ, UHD) | |
| Lenovo ThinkPad T470s-20HF0012US | |
| |||||||||||||||||||||||||
iluminação: 84 %
iluminação com acumulador: 240.1 cd/m²
Contraste: 1091:1 (Preto: 0.22 cd/m²)
ΔE ColorChecker Calman: 6.3 | ∀{0.5-29.43 Ø4.71}
ΔE Greyscale Calman: 3.3 | ∀{0.09-98 Ø4.96}
63% sRGB (Argyll 1.6.3 3D)
40.6% AdobeRGB 1998 (Argyll 1.6.3 3D)
44.07% AdobeRGB 1998 (Argyll 3D)
63.3% sRGB (Argyll 3D)
42.57% Display P3 (Argyll 3D)
Gamma: 2.26
CCT: 6081 K
| Lenovo ThinkPad 25 ID: LEN40A9, Name: R140NWF5 R1, IPS, 14", 1920x1080 | Lenovo ThinkPad T470s-20HF0012US LEN40A9 (R140NWF5 R1), IPS, 14", 1920x1080 | Lenovo ThinkPad T470-20HD002HGE N140HCA-EAB, IPS, 14", 1920x1080 | Lenovo ThinkPad T470p-20J7S00000 LEN40AA, B140QAN01.5, IPS, 14", 2560x1440 | Apple MacBook Pro 13 2017 APPA033, IPS, 13.3", 2560x1600 | Samsung Notebook 9 NP900X5N-X01US ID: BOE06E8, Name: BOE HF NV150FHB-N31, IPS, 15", 1920x1080 | |
|---|---|---|---|---|---|---|
| Display | -5% | -2% | 57% | 96% | 53% | |
| Display P3 Coverage (%) | 42.57 | 40.35 -5% | 41.6 -2% | 69.3 63% | 99.2 133% | 65.2 53% |
| sRGB Coverage (%) | 63.3 | 60.3 -5% | 61.9 -2% | 94.9 50% | 99.9 58% | 97.7 54% |
| AdobeRGB 1998 Coverage (%) | 44.07 | 41.72 -5% | 43.06 -2% | 69.5 58% | 87.1 98% | 67.2 52% |
| Response Times | 17% | 10% | 7% | 15% | 13% | |
| Response Time Grey 50% / Grey 80% * (ms) | 45.6 ? | 40.8 ? 11% | 41.6 ? 9% | 52.8 ? -16% | 42.8 ? 6% | 40.8 ? 11% |
| Response Time Black / White * (ms) | 37.6 ? | 28.8 ? 23% | 34 ? 10% | 26.8 ? 29% | 28.8 ? 23% | 32.4 ? 14% |
| PWM Frequency (Hz) | 1000 ? | 219.3 ? | 208.3 ? | |||
| Screen | 2% | -1% | -1% | 57% | 44% | |
| Brightness middle (cd/m²) | 240.1 | 271.6 13% | 306 27% | 271 13% | 588 145% | 565.6 136% |
| Brightness (cd/m²) | 227 | 264 16% | 287 26% | 266 17% | 561 147% | 524 131% |
| Brightness Distribution (%) | 84 | 88 5% | 88 5% | 87 4% | 92 10% | 88 5% |
| Black Level * (cd/m²) | 0.22 | 0.24 -9% | 0.3 -36% | 0.25 -14% | 0.45 -105% | 0.49 -123% |
| Contrast (:1) | 1091 | 1132 4% | 1020 -7% | 1084 -1% | 1307 20% | 1154 6% |
| Colorchecker dE 2000 * | 6.3 | 6.1 3% | 6.2 2% | 6.68 -6% | 1.7 73% | 2 68% |
| Colorchecker dE 2000 max. * | 28.9 | 28.6 1% | 13.6 53% | 12.96 55% | 3.5 88% | 5 83% |
| Greyscale dE 2000 * | 3.3 | 3.4 -3% | 5.8 -76% | 9.21 -179% | 1.9 42% | 2.5 24% |
| Gamma | 2.26 97% | 2.12 104% | 2.04 108% | 2.42 91% | 2.33 94% | 2.21 100% |
| CCT | 6081 107% | 6077 107% | 6277 104% | 6018 108% | 6738 96% | 6896 94% |
| Color Space (Percent of AdobeRGB 1998) (%) | 40.6 | 38 -6% | 39.62 -2% | 61.49 51% | 77.92 92% | 61.2 51% |
| Color Space (Percent of sRGB) (%) | 63 | 60 -5% | 61.44 -2% | 94.72 50% | 99.94 59% | 97.5 55% |
| Média Total (Programa/Configurações) | 5% /
3% | 2% /
0% | 21% /
12% | 56% /
59% | 37% /
41% |
* ... menor é melhor
Exibir tempos de resposta
| ↔ Tempo de resposta preto para branco | ||
|---|---|---|
| 37.6 ms ... ascensão ↗ e queda ↘ combinadas | ↗ 22 ms ascensão | 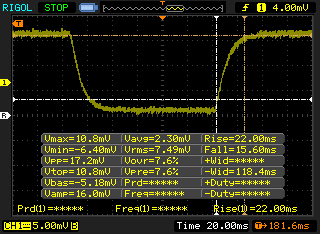 |
| ↘ 15.6 ms queda | ||
| A tela mostra taxas de resposta lentas em nossos testes e será insatisfatória para os jogadores. Em comparação, todos os dispositivos testados variam de 0.1 (mínimo) a 240 (máximo) ms. » 95 % de todos os dispositivos são melhores. Isso significa que o tempo de resposta medido é pior que a média de todos os dispositivos testados (19.8 ms). | ||
| ↔ Tempo de resposta 50% cinza a 80% cinza | ||
| 45.6 ms ... ascensão ↗ e queda ↘ combinadas | ↗ 18 ms ascensão | 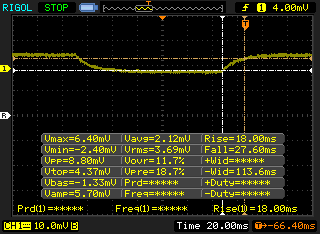 |
| ↘ 27.6 ms queda | ||
| A tela mostra taxas de resposta lentas em nossos testes e será insatisfatória para os jogadores. Em comparação, todos os dispositivos testados variam de 0.165 (mínimo) a 636 (máximo) ms. » 78 % de todos os dispositivos são melhores. Isso significa que o tempo de resposta medido é pior que a média de todos os dispositivos testados (31 ms). | ||
Cintilação da tela / PWM (modulação por largura de pulso)
| Tela tremeluzindo/PWM detectado | 1000 Hz | ≤ 99 % configuração de brilho | 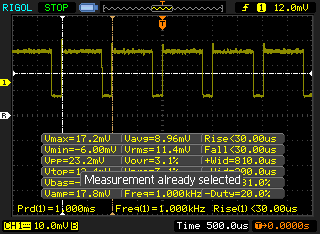 |
A luz de fundo da tela pisca em 1000 Hz (pior caso, por exemplo, utilizando PWM) Cintilação detectada em uma configuração de brilho de 99 % e abaixo. Não deve haver cintilação ou PWM acima desta configuração de brilho. A frequência de 1000 Hz é bastante alta, então a maioria dos usuários sensíveis ao PWM não deve notar nenhuma oscilação. [pwm_comparison] Em comparação: 52 % de todos os dispositivos testados não usam PWM para escurecer a tela. Se PWM foi detectado, uma média de 7754 (mínimo: 5 - máximo: 343500) Hz foi medida. | |||
| Cinebench R15 | |
| CPU Single 64Bit | |
| Acer Swift 3 Pre-Sample Intel | |
| Eurocom Q5 | |
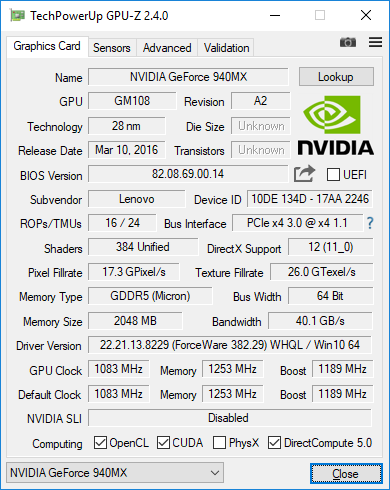
| Huawei MateBook D 15, i7-7500U 940MX | |
| Toshiba Tecra X40-D | |
| Lenovo ThinkPad 25 | |
| Asus Zenbook UX310UQ-GL011T | |
| Lenovo ThinkPad T470-20HD002HGE | |
| Lenovo ThinkPad E550-20DF00CNGE | |
| Lenovo Y40-59423035 | |
| Asus FX550IU-WSFX | |
| CPU Multi 64Bit | |
| Eurocom Q5 | |
| Acer Swift 3 Pre-Sample Intel | |
| Lenovo ThinkPad 25 | |
| Toshiba Tecra X40-D | |
| Huawei MateBook D 15, i7-7500U 940MX | |
| Asus Zenbook UX310UQ-GL011T | |
| Lenovo ThinkPad T470-20HD002HGE | |
| Asus FX550IU-WSFX | |
| Lenovo ThinkPad E550-20DF00CNGE | |
| Lenovo Y40-59423035 | |
| wPrime 2.10 - 1024m | |
| Lenovo Y40-59423035 | |
| Lenovo Thinkpad T420 4236-NGG | |
| Huawei MateBook D 15, i7-7500U 940MX | |
| Toshiba Tecra X40-D | |
| Lenovo ThinkPad 25 | |
| Asus FX550IU-WSFX | |
| Eurocom Q5 | |
* ... menor é melhor
| PCMark 8 | |
| Home Score Accelerated v2 | |
| Lenovo ThinkPad T470s-20HF0012US | |
| Samsung Notebook 9 NP900X5N-X01US | |
| Lenovo ThinkPad 25 | |
| Lenovo ThinkPad T470p-20J7S00000 | |
| Work Score Accelerated v2 | |
| Lenovo ThinkPad T470s-20HF0012US | |
| Samsung Notebook 9 NP900X5N-X01US | |
| Lenovo ThinkPad 25 | |
| Lenovo ThinkPad T470p-20J7S00000 | |
| Creative Score Accelerated v2 | |
| Lenovo ThinkPad T470s-20HF0012US | |
| Lenovo ThinkPad T470p-20J7S00000 | |
| Samsung Notebook 9 NP900X5N-X01US | |
| Lenovo ThinkPad 25 | |
| PCMark 8 Home Score Accelerated v2 | 3764 pontos | |
| PCMark 8 Creative Score Accelerated v2 | 4693 pontos | |
| PCMark 8 Work Score Accelerated v2 | 4894 pontos | |
| PCMark 10 Score | 3035 pontos | |
Ajuda | ||
| Lenovo ThinkPad 25 Samsung SM961 MZVKW512HMJP m.2 PCI-e | Lenovo ThinkPad T470s-20HF0012US Samsung PM961 MZVLW256HEHP | Lenovo ThinkPad T470p-20J7S00000 Samsung PM961 NVMe MZVLW512HMJP | Lenovo ThinkPad X1 Carbon 2017-20HR0021GE Toshiba THNSF5256GPUK | Dell XPS 15 9560 (i7-7700HQ, UHD) Lite-On CX2-8B512-Q11 | |
|---|---|---|---|---|---|
| AS SSD | 11% | 17% | -46% | 7% | |
| Copy Game MB/s (MB/s) | 598 | 309.9 -48% | 586 -2% | 229 -62% | 540 -10% |
| Copy Program MB/s (MB/s) | 400.6 | 291 -27% | 347.7 -13% | 172.4 -57% | 411.5 3% |
| Copy ISO MB/s (MB/s) | 1272 | 797 -37% | 673 -47% | 623 -51% | 1272 0% |
| Score Total (Points) | 2811 | 3875 38% | 3606 28% | 1398 -50% | 2810 0% |
| Score Write (Points) | 837 | 803 -4% | 1272 52% | 337 -60% | 1022 22% |
| Score Read (Points) | 1317 | 2083 58% | 1546 17% | 726 -45% | 1206 -8% |
| Access Time Write * (ms) | 0.031 | 0.025 19% | 0.024 23% | 0.034 -10% | 0.034 -10% |
| Access Time Read * (ms) | 0.04 | 0.06 -50% | 0.035 12% | 0.102 -155% | 0.034 15% |
| 4K-64 Write (MB/s) | 640 | 538 -16% | 1007 57% | 149.6 -77% | 789 23% |
| 4K-64 Read (MB/s) | 1130 | 1765 56% | 1344 19% | 526 -53% | 962 -15% |
| 4K Write (MB/s) | 113 | 147.9 31% | 147.3 30% | 109.4 -3% | 112.2 -1% |
| 4K Read (MB/s) | 50.4 | 48.84 -3% | 56.4 12% | 34.34 -32% | 41.34 -18% |
| Seq Write (MB/s) | 840 | 1170 39% | 1176 40% | 775 -8% | 1207 44% |
| Seq Read (MB/s) | 1369 | 2691 97% | 1455 6% | 1649 20% | 2026 48% |
* ... menor é melhor
| 3DMark 11 Performance | 3063 pontos | |
| 3DMark Ice Storm Standard Score | 47070 pontos | |
| 3DMark Cloud Gate Standard Score | 8889 pontos | |
| 3DMark Fire Strike Score | 2129 pontos | |
| 3DMark Fire Strike Extreme Score | 1071 pontos | |
Ajuda | ||
| baixo | média | alto | ultra | |
|---|---|---|---|---|
| BioShock Infinite (2013) | 126.1 | 72.1 | 61.7 | 23.9 |
| The Witcher 3 (2015) | 45.4 | 26 | 15.1 | |
| Rise of the Tomb Raider (2016) | 52.8 | 30 | 16.4 | 13.3 |
Barulho
| Ocioso |
| 27.9 / 27.9 / 30 dB |
| Carga |
| 37.6 / 37.6 dB |
 | ||
30 dB silencioso 40 dB(A) audível 50 dB(A) ruidosamente alto |
||
min: | ||
| Lenovo ThinkPad 25 GeForce 940MX, i7-7500U, Samsung SM961 MZVKW512HMJP m.2 PCI-e | Lenovo ThinkPad T470s-20HF0012US HD Graphics 620, i5-7300U, Samsung PM961 MZVLW256HEHP | Lenovo ThinkPad T470p-20J7S00000 GeForce 940MX, i7-7700HQ, Samsung PM961 NVMe MZVLW512HMJP | Apple MacBook Pro 13 2017 Iris Plus Graphics 640, i5-7360U, Apple SSD AP0128 | Lenovo ThinkPad T470-20HD002HGE HD Graphics 620, i5-7200U, Samsung PM961 NVMe MZVLW512HMJP | |
|---|---|---|---|---|---|
| Noise | -1% | -2% | -3% | 4% | |
| desligado / ambiente * (dB) | 27.9 | 27.8 -0% | 29 -4% | 30.2 -8% | 28 -0% |
| Idle Minimum * (dB) | 27.9 | 27.8 -0% | 29 -4% | 30.2 -8% | 28 -0% |
| Idle Average * (dB) | 27.9 | 27.8 -0% | 29 -4% | 30.2 -8% | 28 -0% |
| Idle Maximum * (dB) | 30 | 27.8 7% | 29 3% | 30.2 -1% | 29.4 2% |
| Load Average * (dB) | 37.6 | 34.8 7% | 35.6 5% | 32.9 13% | 31.4 16% |
| Witcher 3 ultra * (dB) | 37.6 | 42 -12% | |||
| Load Maximum * (dB) | 37.6 | 42 -12% | 39.7 -6% | 39.3 -5% | 34.6 8% |
* ... menor é melhor
(±) A temperatura máxima no lado superior é 43.6 °C / 110 F, em comparação com a média de 34.3 °C / 94 F , variando de 21.2 a 62.5 °C para a classe Office.
(-) A parte inferior aquece até um máximo de 57.2 °C / 135 F, em comparação com a média de 36.8 °C / 98 F
(+) Em uso inativo, a temperatura média para o lado superior é 27.2 °C / 81 F, em comparação com a média do dispositivo de 29.5 °C / ### class_avg_f### F.
(±) Jogando The Witcher 3, a temperatura média para o lado superior é 33.6 °C / 92 F, em comparação com a média do dispositivo de 29.5 °C / ## #class_avg_f### F.
(±) Os apoios para as mãos e o touchpad podem ficar muito quentes ao toque, com um máximo de 36.6 °C / 97.9 F.
(-) A temperatura média da área do apoio para as mãos de dispositivos semelhantes foi 27.5 °C / 81.5 F (-9.1 °C / -16.4 F).
Lenovo ThinkPad 25 análise de áudio
(±) | o volume do alto-falante é médio, mas bom (###valor### dB)
Graves 100 - 315Hz
(-) | quase nenhum baixo - em média 22% menor que a mediana
(±) | a linearidade dos graves é média (9.9% delta para a frequência anterior)
Médios 400 - 2.000 Hz
(+) | médios equilibrados - apenas 3.7% longe da mediana
(±) | a linearidade dos médios é média (10.7% delta para frequência anterior)
Altos 2 - 16 kHz
(+) | agudos equilibrados - apenas 2.3% longe da mediana
(±) | a linearidade dos máximos é média (8.3% delta para frequência anterior)
Geral 100 - 16.000 Hz
(±) | a linearidade do som geral é média (22.6% diferença em relação à mediana)
Comparado com a mesma classe
» 61% de todos os dispositivos testados nesta classe foram melhores, 8% semelhantes, 31% piores
» O melhor teve um delta de 7%, a média foi 21%, o pior foi 53%
Comparado com todos os dispositivos testados
» 67% de todos os dispositivos testados foram melhores, 6% semelhantes, 28% piores
» O melhor teve um delta de 4%, a média foi 23%, o pior foi 134%
Apple MacBook 12 (Early 2016) 1.1 GHz análise de áudio
(+) | os alto-falantes podem tocar relativamente alto (###valor### dB)
Graves 100 - 315Hz
(±) | graves reduzidos - em média 11.3% menor que a mediana
(±) | a linearidade dos graves é média (14.2% delta para a frequência anterior)
Médios 400 - 2.000 Hz
(+) | médios equilibrados - apenas 2.4% longe da mediana
(+) | médios são lineares (5.5% delta para frequência anterior)
Altos 2 - 16 kHz
(+) | agudos equilibrados - apenas 2% longe da mediana
(+) | os máximos são lineares (4.5% delta da frequência anterior)
Geral 100 - 16.000 Hz
(+) | o som geral é linear (10.2% diferença em relação à mediana)
Comparado com a mesma classe
» 7% de todos os dispositivos testados nesta classe foram melhores, 2% semelhantes, 90% piores
» O melhor teve um delta de 5%, a média foi 18%, o pior foi 53%
Comparado com todos os dispositivos testados
» 5% de todos os dispositivos testados foram melhores, 1% semelhantes, 94% piores
» O melhor teve um delta de 4%, a média foi 23%, o pior foi 134%
| desligado | |
| Ocioso | |
| Carga |
|
Key:
min: | |
| Lenovo ThinkPad 25 i7-7500U, GeForce 940MX, Samsung SM961 MZVKW512HMJP m.2 PCI-e, IPS, 1920x1080, 14" | Lenovo ThinkPad T470s-20HF0012US i5-7300U, HD Graphics 620, Samsung PM961 MZVLW256HEHP, IPS, 1920x1080, 14" | Lenovo ThinkPad T470p-20J7S00000 i7-7700HQ, GeForce 940MX, Samsung PM961 NVMe MZVLW512HMJP, IPS, 2560x1440, 14" | Apple MacBook Pro 13 2017 i5-7360U, Iris Plus Graphics 640, Apple SSD AP0128, IPS, 2560x1600, 13.3" | Lenovo ThinkPad T470-20HD002HGE i5-7200U, HD Graphics 620, Samsung PM961 NVMe MZVLW512HMJP, IPS, 1920x1080, 14" | |
|---|---|---|---|---|---|
| Power Consumption | 13% | -8% | 18% | 29% | |
| Idle Minimum * (Watt) | 4.2 | 4.8 -14% | 3.8 10% | 3.7 12% | 3.21 24% |
| Idle Average * (Watt) | 7.3 | 6.6 10% | 6.5 11% | 5.2 29% | 6.15 16% |
| Idle Maximum * (Watt) | 7.7 | 7 9% | 7.2 6% | 7.6 1% | 6.82 11% |
| Load Average * (Watt) | 55.4 | 39.2 29% | 62.5 -13% | 41.6 25% | 28.5 49% |
| Witcher 3 ultra * (Watt) | 49.1 | ||||
| Load Maximum * (Watt) | 64.4 | 44.8 30% | 99.6 -55% | 50.5 22% | 34.5 46% |
* ... menor é melhor
| Lenovo ThinkPad 25 i7-7500U, GeForce 940MX, 48 Wh | Lenovo ThinkPad T470s-20HF0012US i5-7300U, HD Graphics 620, 51 Wh | Lenovo ThinkPad T470p-20J7S00000 i7-7700HQ, GeForce 940MX, 72 Wh | Apple MacBook Pro 13 2017 i5-7360U, Iris Plus Graphics 640, 54.5 Wh | Lenovo ThinkPad X1 Carbon 2017-20HR0021GE i5-7200U, HD Graphics 620, 57 Wh | Lenovo ThinkPad T470-20HD002HGE i5-7200U, HD Graphics 620, 48 Wh | |
|---|---|---|---|---|---|---|
| Duração da bateria | 37% | 15% | 21% | 14% | 8% | |
| Reader / Idle (h) | 15.3 | 17.7 16% | 17.7 16% | 13.7 -10% | ||
| WiFi v1.3 (h) | 7.1 | 8.1 14% | 10 41% | 11.4 61% | 9.1 28% | 7.3 3% |
| Load (h) | 1.6 | 2.9 81% | 1.4 -13% | 1.3 -19% | 2 25% | 1.8 13% |
Pro
Contra
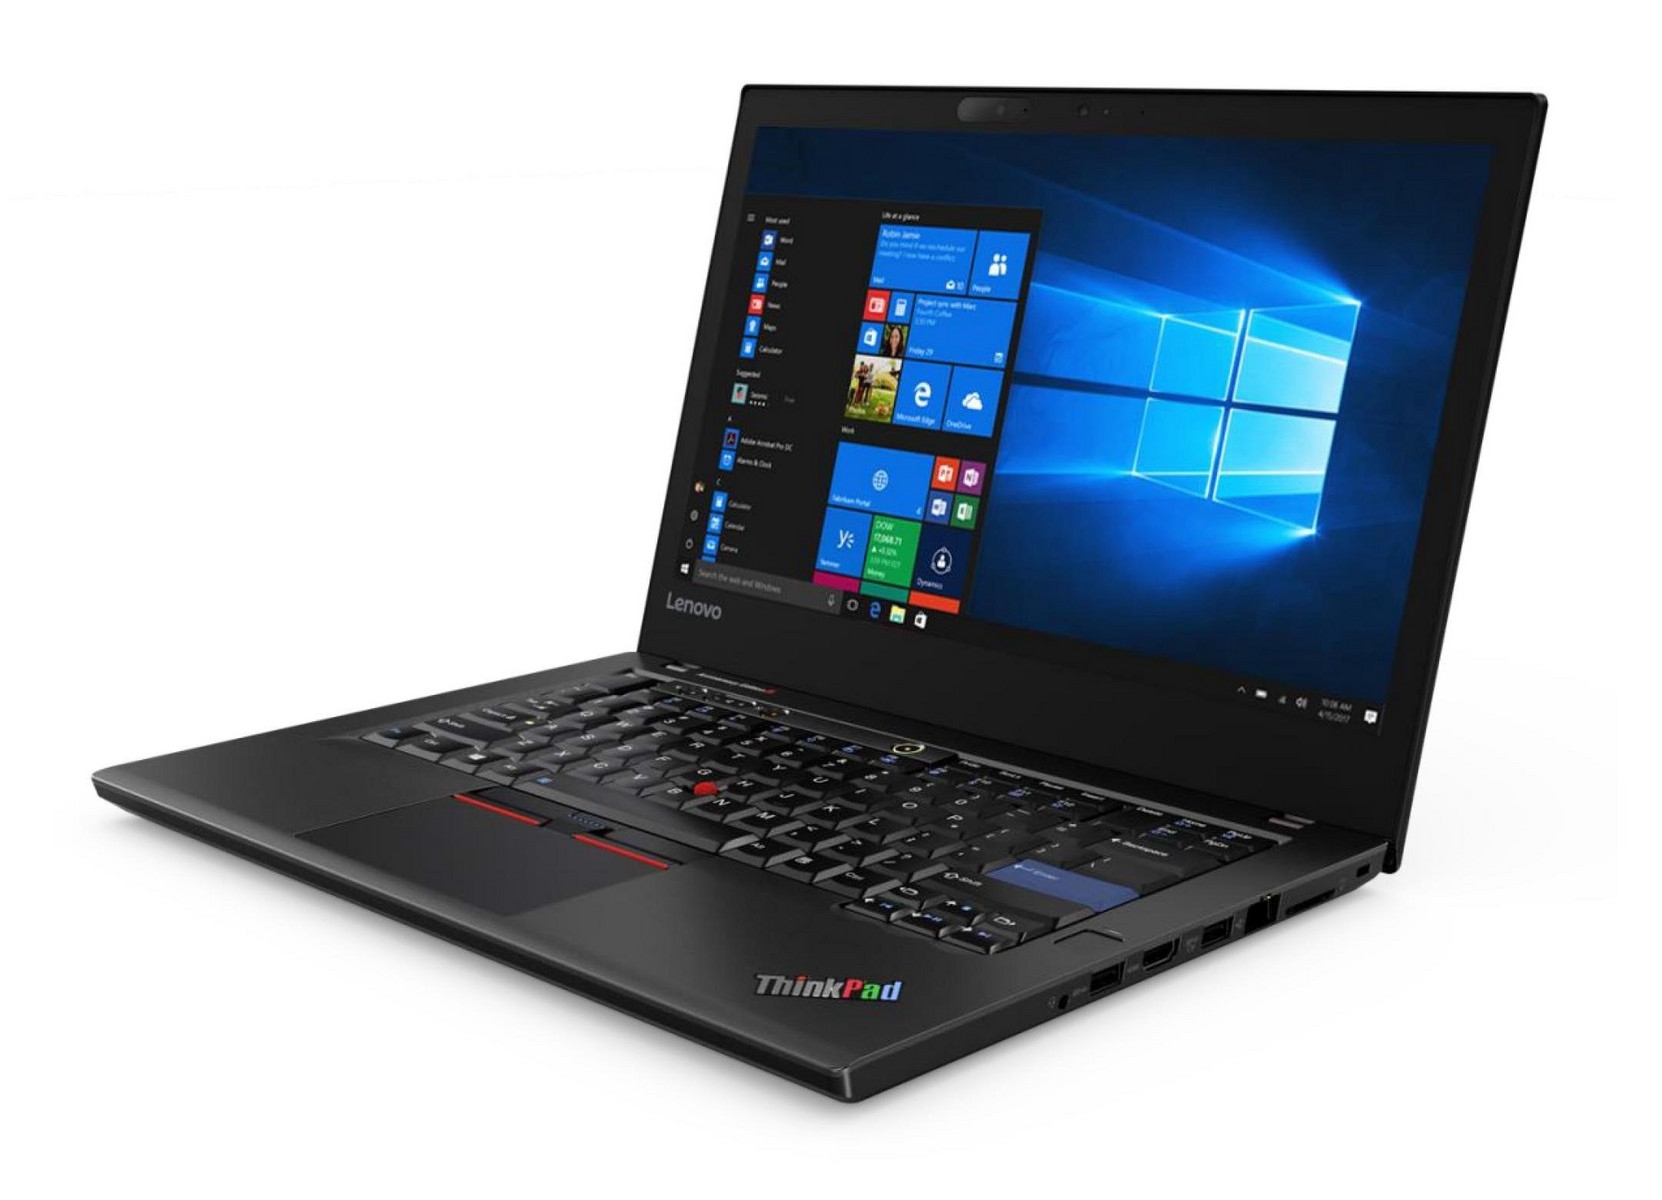
O ThinkPad 25 atende àqueles que sentem saudade do clássico teclado ThinkPad ou são super fanáticos de série. Os usuários que de outra forma estejam satisfeitos com o teclado AccuType em ThinkPads mais recentes terão alguns motivos para escolher o ThinkPad 25 em relação ao T470 padrão.
Curiosamente, configurar o T470 o mais próximo possível do ThinkPad 25 será vendido por aproximadamente o mesmo preço de $ 1900 USD. O T470 não terá GPU GeForce 940MX e teclado clássico, mas ganhará um leitor de cartão inteligente, um trackpad ligeiramente mais alto e uma luz de fundo mais brilhante da tela. Como tal, o ThinkPad 25 mais parece um passo para o lado para a série ThinkPad, em vez de uma atualização completa da próxima geração. Sua existência é apenas para comemorar o 25º aniversário do ThinkPad, em vez de competir diretamente com os últimos e melhores portáteis, como é evidente pela sua última geração de CPU e GPU. Os usuários empresariais que podem estar clamando por mais desempenho de hardware terão que aguardar mais tempo para a inevitável atualização de Kaby Lake-R e Pascal ou saltar para o Yoga 920, Spectre 13 2017, ou XPS 13. O desempenho do Turbo Boost, o desempenho da GPU, o ruído da ventoinha e, claro, o teclado são de outra forma excelentes, com pouco para reclamar.
Apesar de ser um dos melhores portáteis empresariais de 14 polegadas atualmente, não há como ignorar a pequena decepção desde uma perspectiva de aniversário. O ThinkPad 25 parece um T470 refeito em vez de algo realmente único. Novamente, isso não é necessariamente ruim porque o T470 é excelente para começar, mas o teclado como tal pode não ser especial o suficiente para satisfazer os entusiastas do ThinkPad, pois os modelos clássicos eram muito mais do que apenas o teclado.
A Edição de Aniversário se sente mais como um ThinkPad T470 flexível do que o singular ThinkPad que a Lenovo esta anunciando. A menos que o teclado clássico seja imprescindível, os usuários existentes do ThinkPad devem esperar até a próxima atualização principal da série T4x0, especialmente porque a Edição de Aniversário está com um preço muito alto.
Lenovo ThinkPad 25
- 10/05/2017 v6 (old)
Allen Ngo
Price comparison
