Dell Latitude 9430 Revisão 2 em 1 conversível: A atualização da 12ª geração da Intel
Depois de ter atualizado completamente a série no ano passado com o Latitude 9420 2 em 1a série Latitude 9430 2 em 1 deste ano é um passo relativamente menor para a série. O último modelo incorpora as CPUs Intel 12ª geração Alder Lake-U para substituir as opções da 11ª geração Tiger Lake-U no Latitude 9420 2 em 1. Há também algumas outras atualizações que revisaremos na revisão, mas o projeto do chassi permanece inalterado e por isso a maioria de nossos comentários existentes sobre o Latitude 9420 2 em 1 também se aplica aqui para o Latitude 9430 2 em 1.
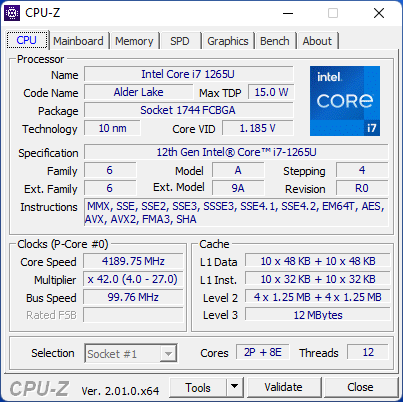
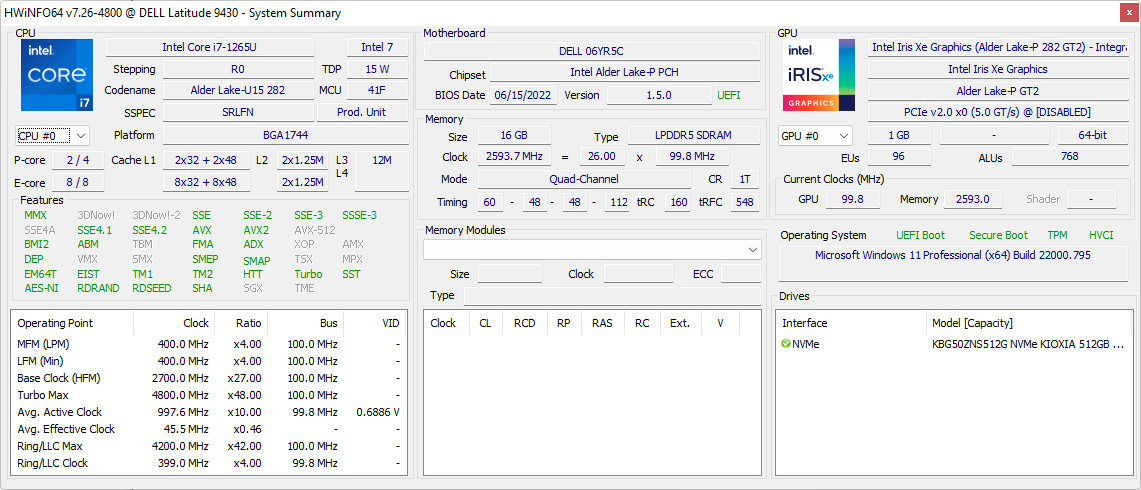
Nossa unidade de teste com a CPU Core i7-1265U, 16 GB de RAM soldada, QHD+ 1600p touchscreen, e 512 GB NVMe SSD pode ser encontrada online por aproximadamente $2700 USD. SKUs Core i5-1245U também estão disponíveis, mas o painel QHD+ é fixo para o fator de forma 2 em 1. Os concorrentes neste espaço incluem outros laptops de 14 polegadas centrados em escritório, como oLenovo ThinkPad X1 Yoga G7, HP EliteBook série 840,MSI Summit E14 Flip, LG Gram 14T90Pou Huawei MateBook 14.
Mais análises da Dell:
Possíveis concorrentes em comparação
Avaliação | Data | Modelo | Peso | Altura | Size | Resolução | Preço |
|---|---|---|---|---|---|---|---|
| 89.8 % v7 (old) | 08/2022 | Dell Latitude 9430 2-in-1 i7-1265U, Iris Xe G7 96EUs | 1.5 kg | 13.94 mm | 14.00" | 2560x1600 | |
| 89 % v7 (old) | 07/2021 | Dell Latitude 9420 2-in-1 i7-1185G7, Iris Xe G7 96EUs | 1.5 kg | 13.94 mm | 14.00" | 2560x1600 | |
| 86.1 % v7 (old) | 07/2022 | MSI Summit E14 Flip Evo A12MT i7-1260P, Iris Xe G7 96EUs | 1.6 kg | 17.9 mm | 14.00" | 2880x1800 | |
| 87.5 % v7 (old) | 05/2022 | LG Gram 14T90P i5-1135G7, Iris Xe G7 80EUs | 1.2 kg | 17 mm | 14.00" | 1900x1200 | |
| 89.4 % v7 (old) | 05/2022 | Lenovo ThinkPad X1 Yoga G7 21CE002HGE i7-1270P, Iris Xe G7 96EUs | 1.5 kg | 15.53 mm | 14.00" | 1920x1200 | |
| 86.5 % v7 (old) | 05/2022 | Asus ZenBook Flip 14 UN5401QA-KN085W R7 5800H, Vega 8 | 1.4 kg | 15.9 mm | 14.00" | 2880x1800 |
Caso
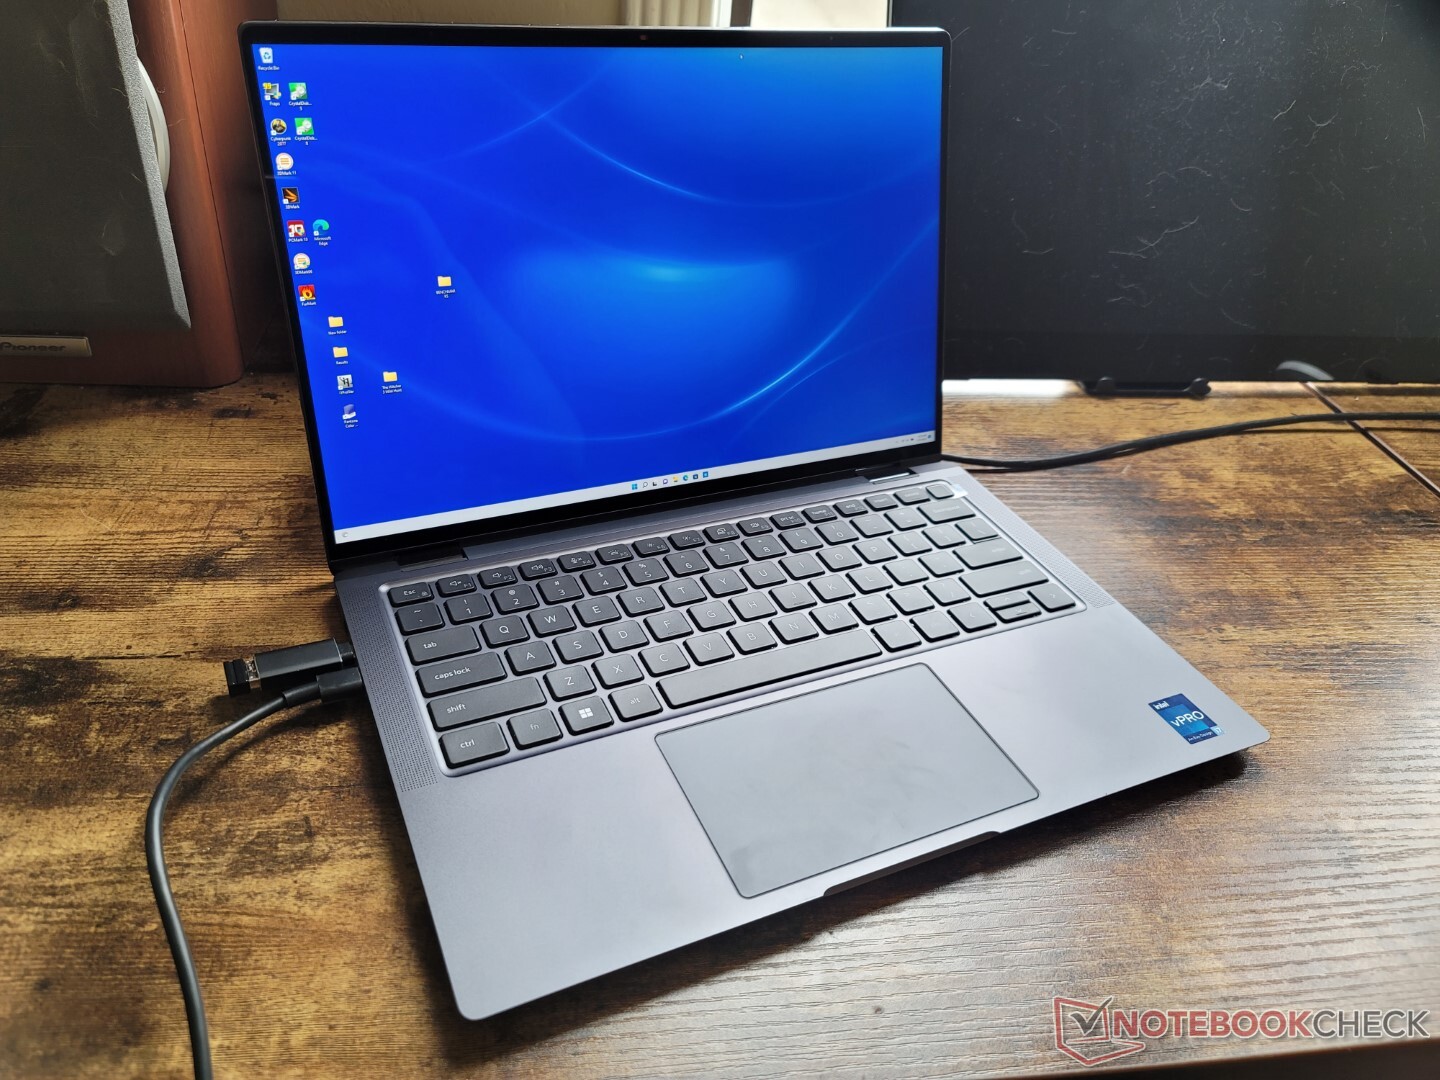
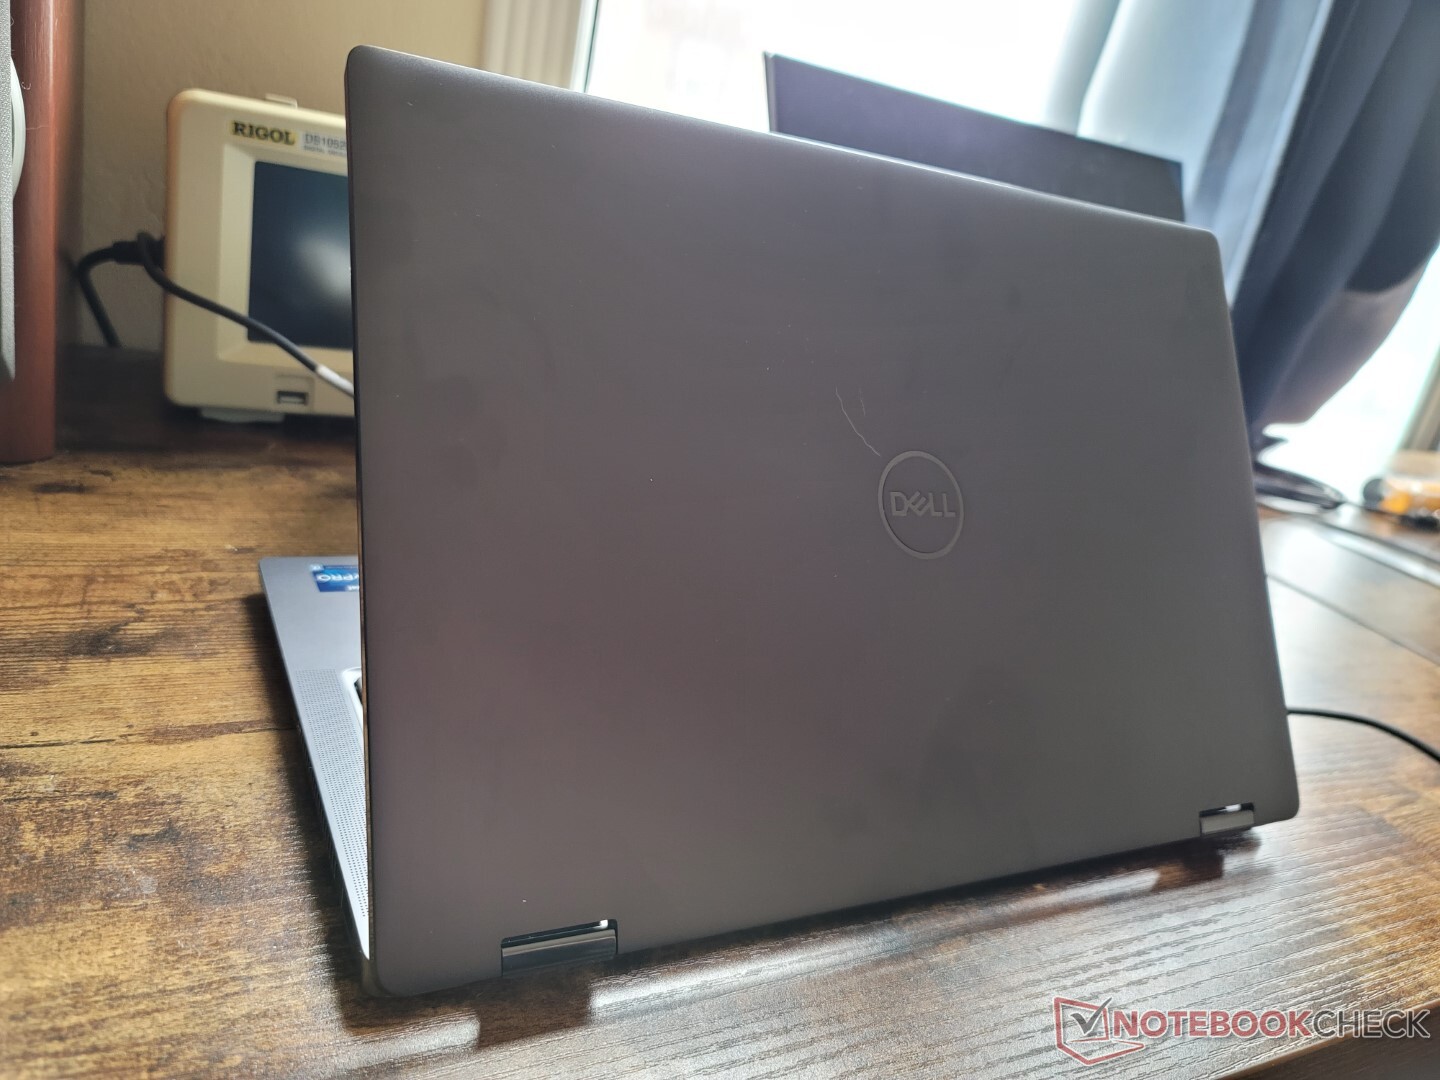
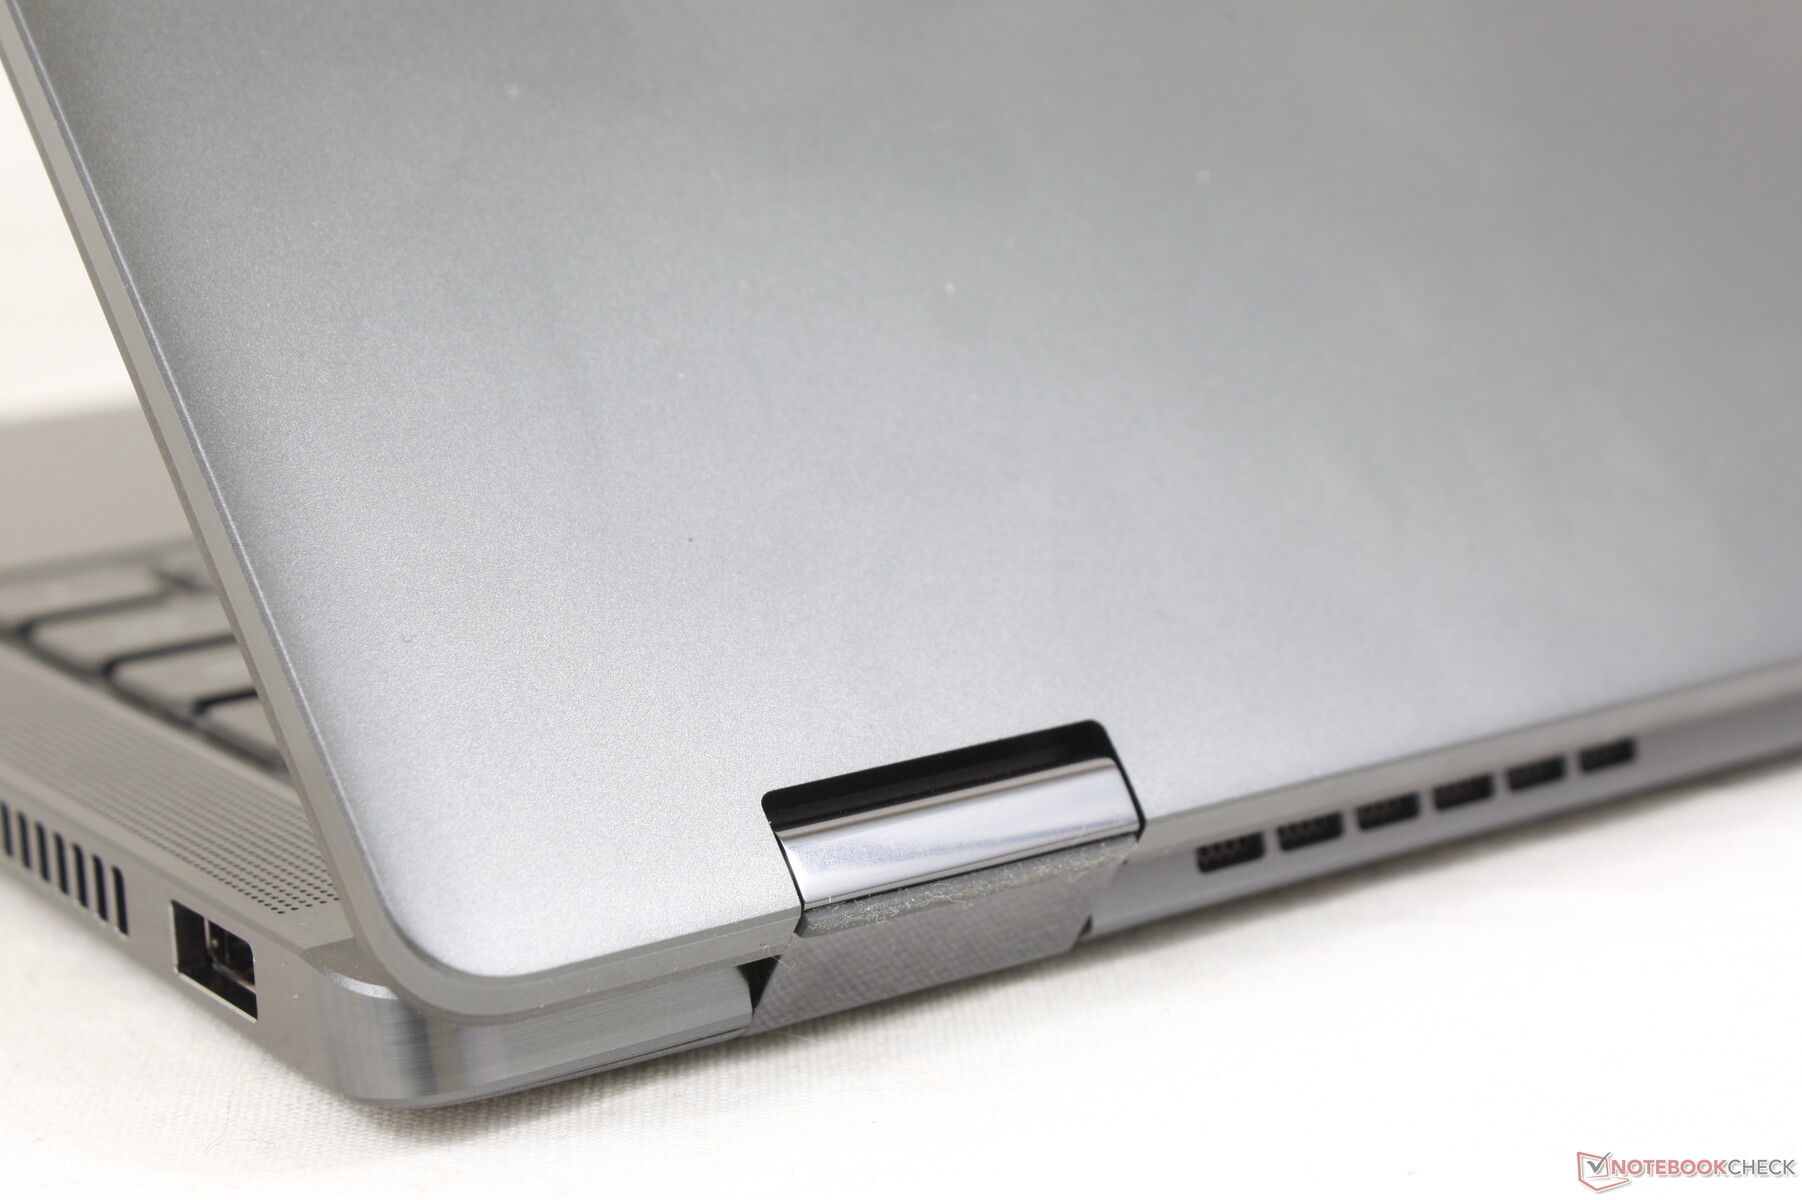
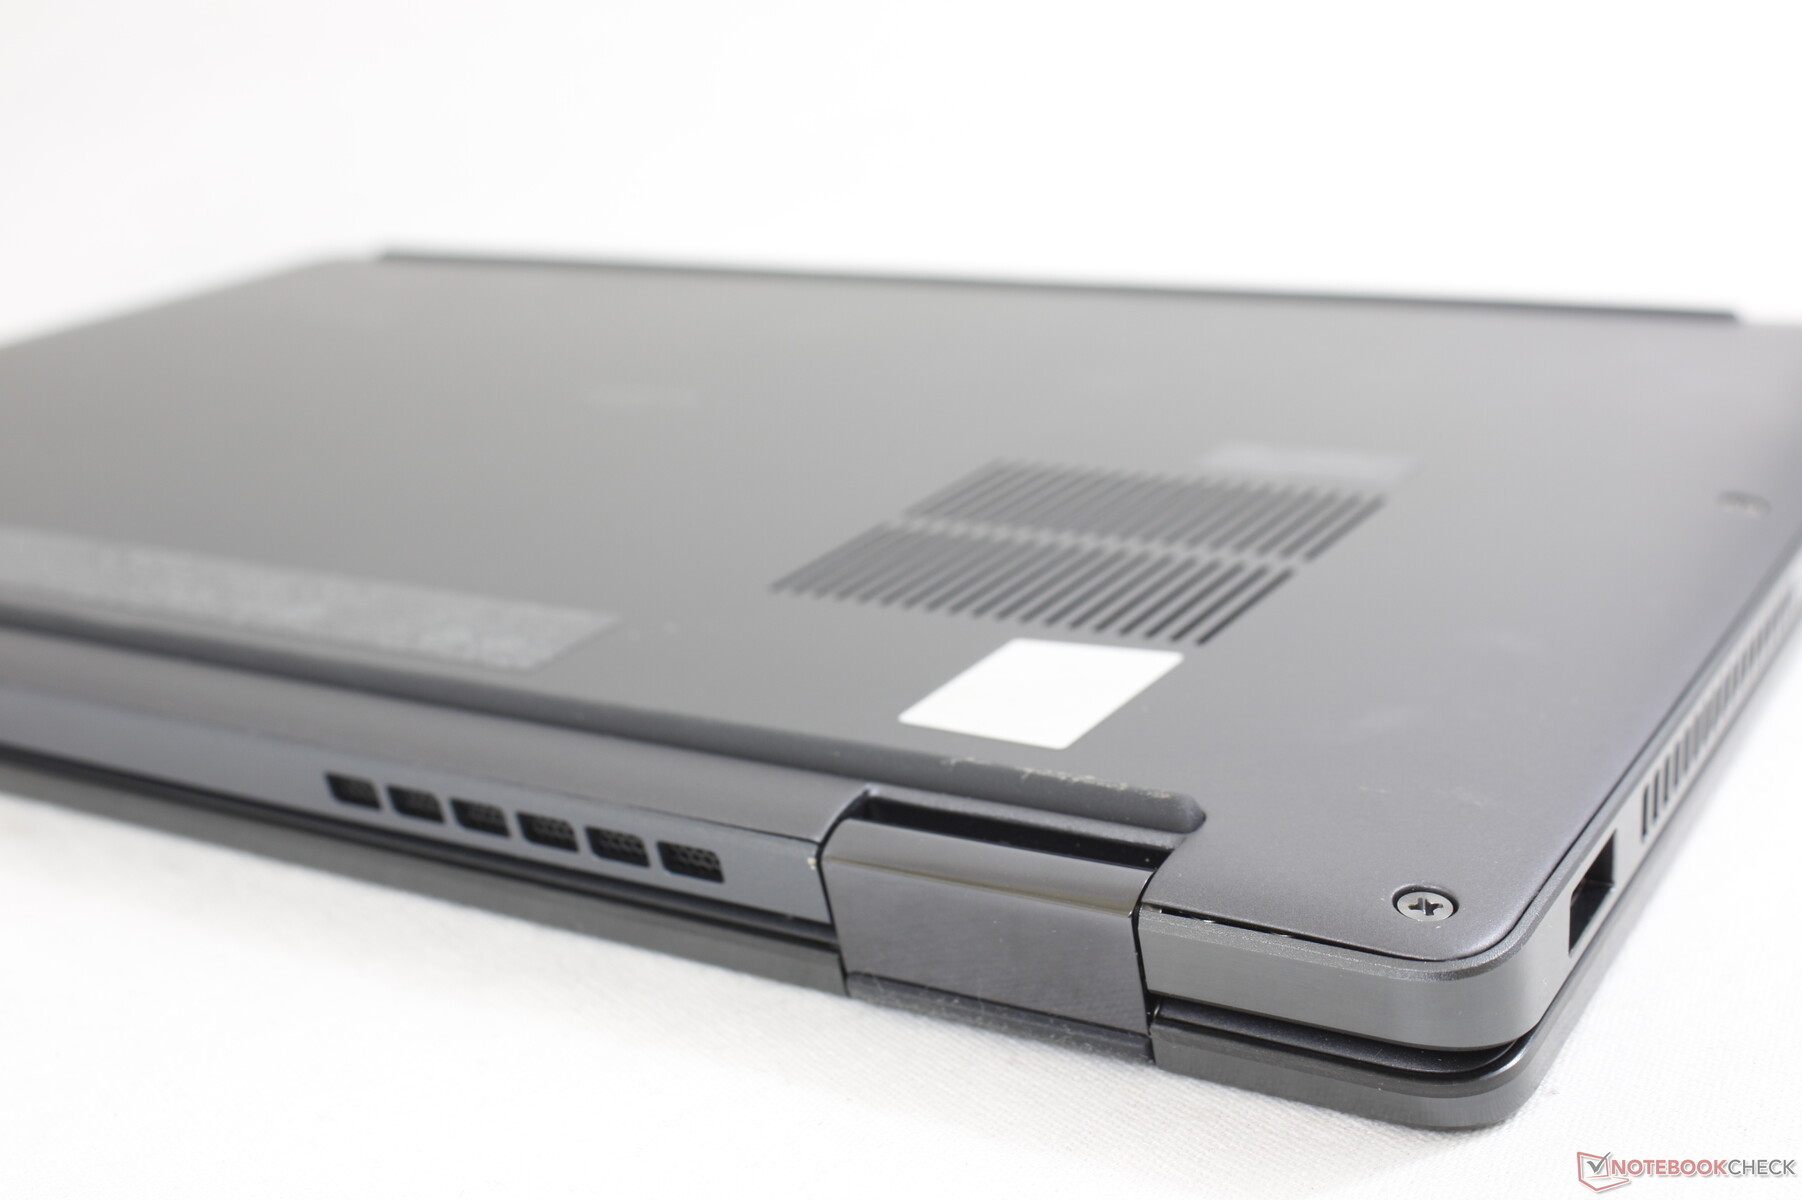
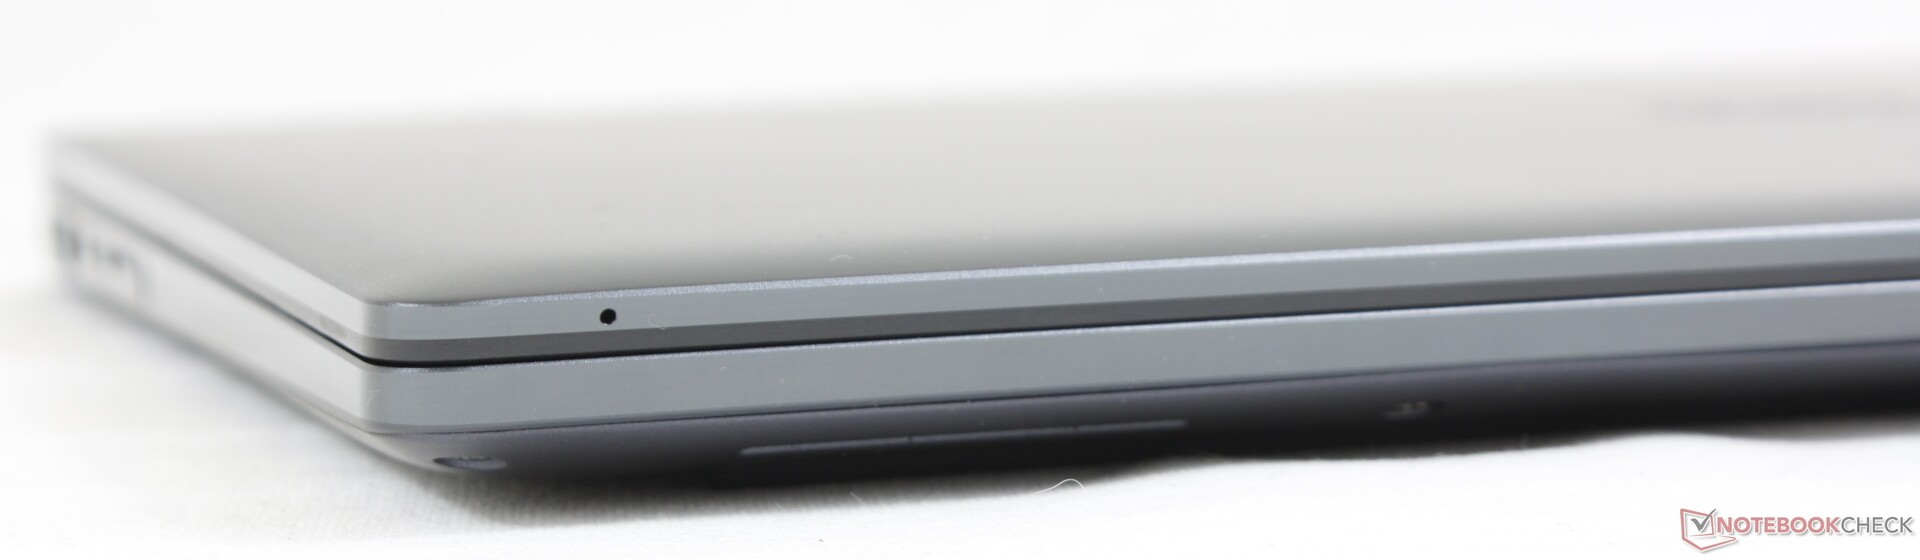
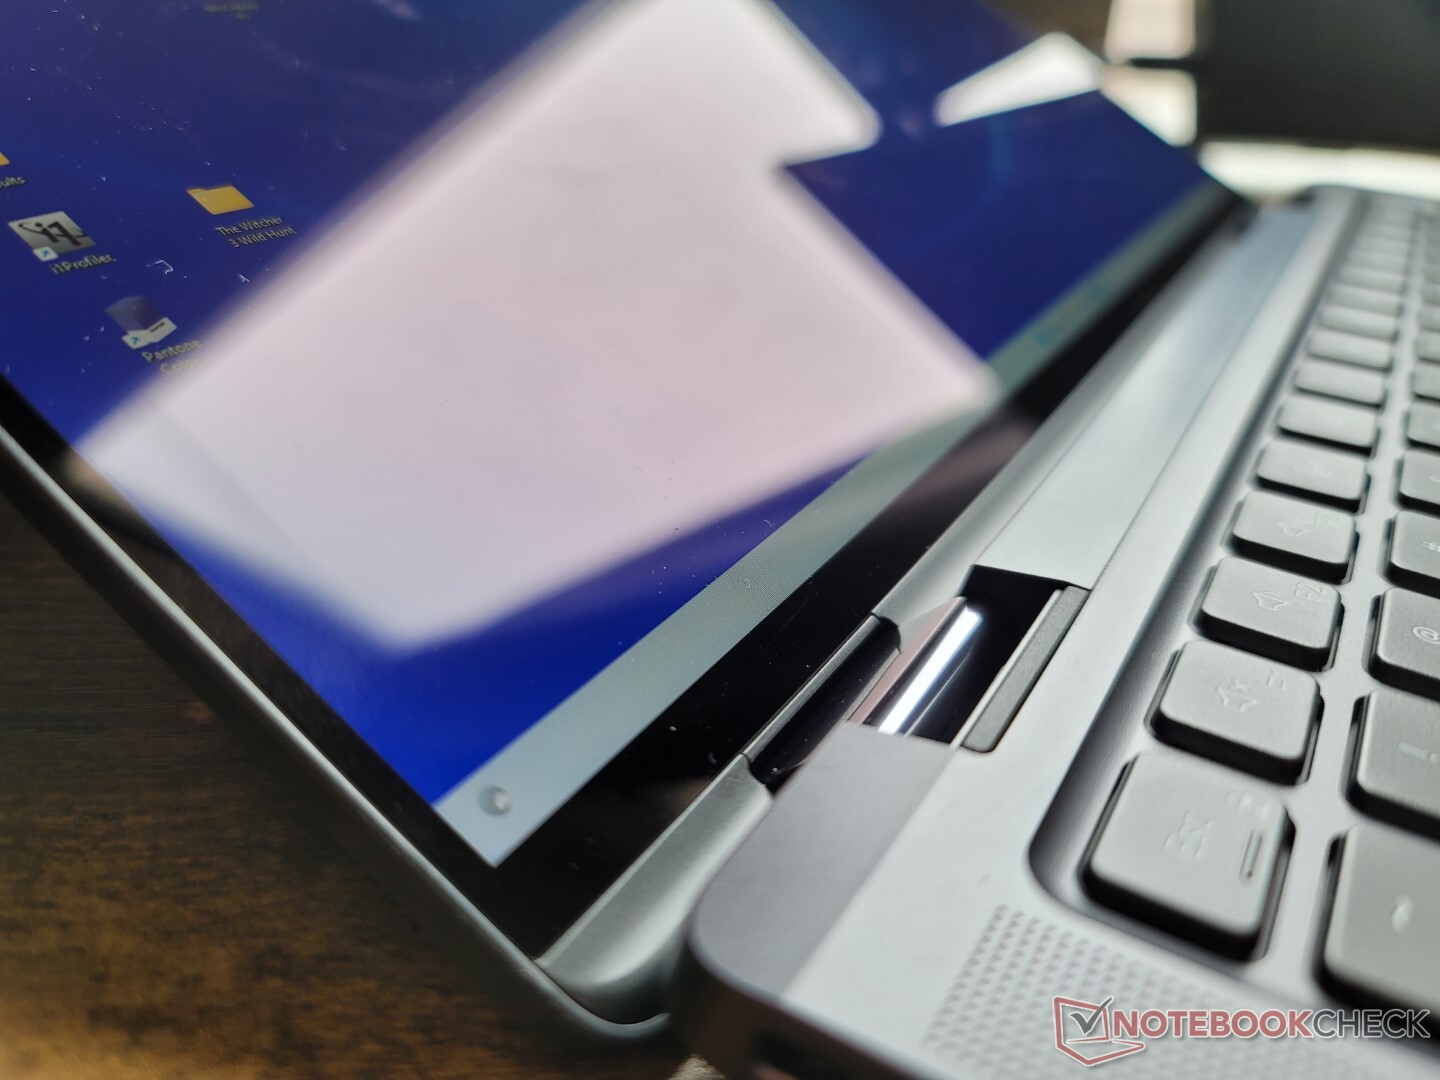
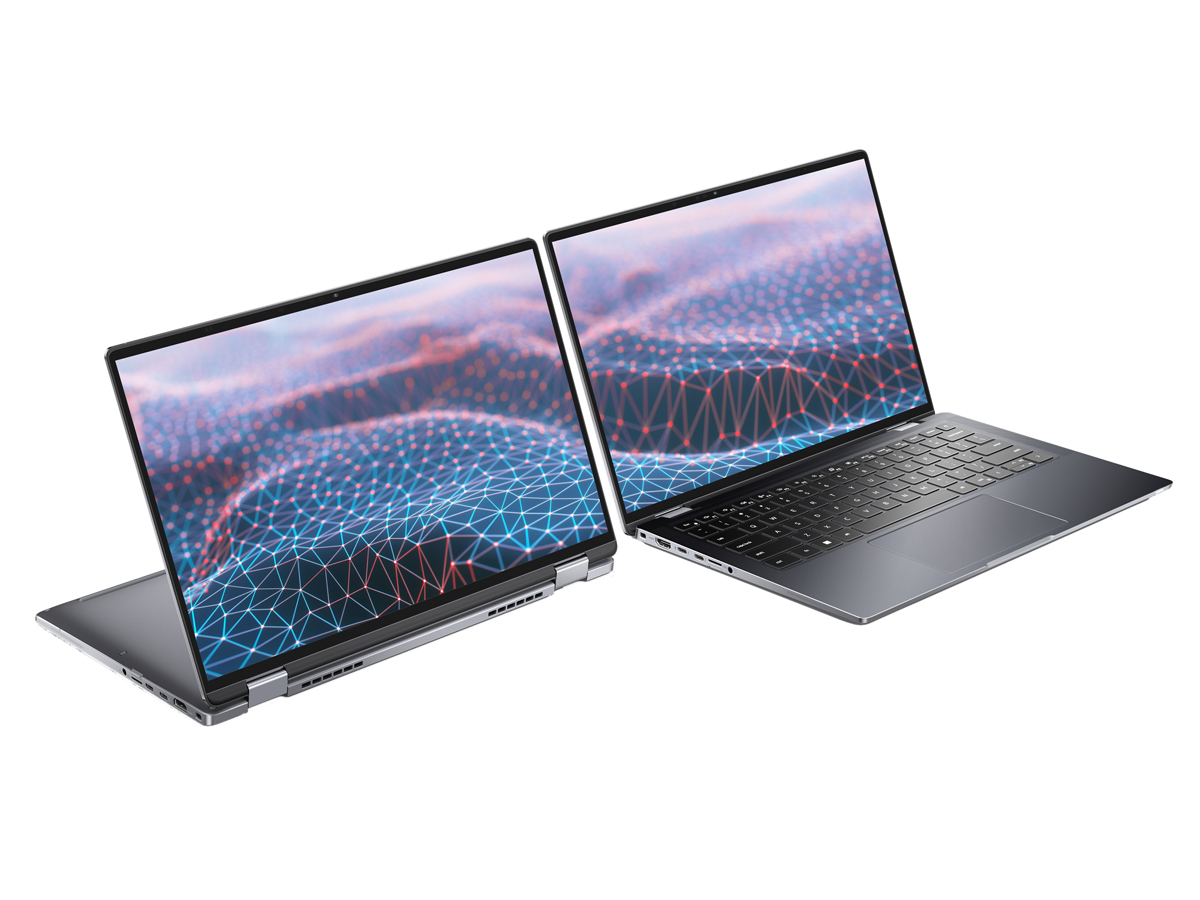
A Dell aparentemente deixou cair a cor cinza claro do Latitude 9420 2 em 1 para tons mais escuros no Latitude 9430 2 em 1. Caso contrário, não há grandes mudanças visuais além da nova cor distintiva
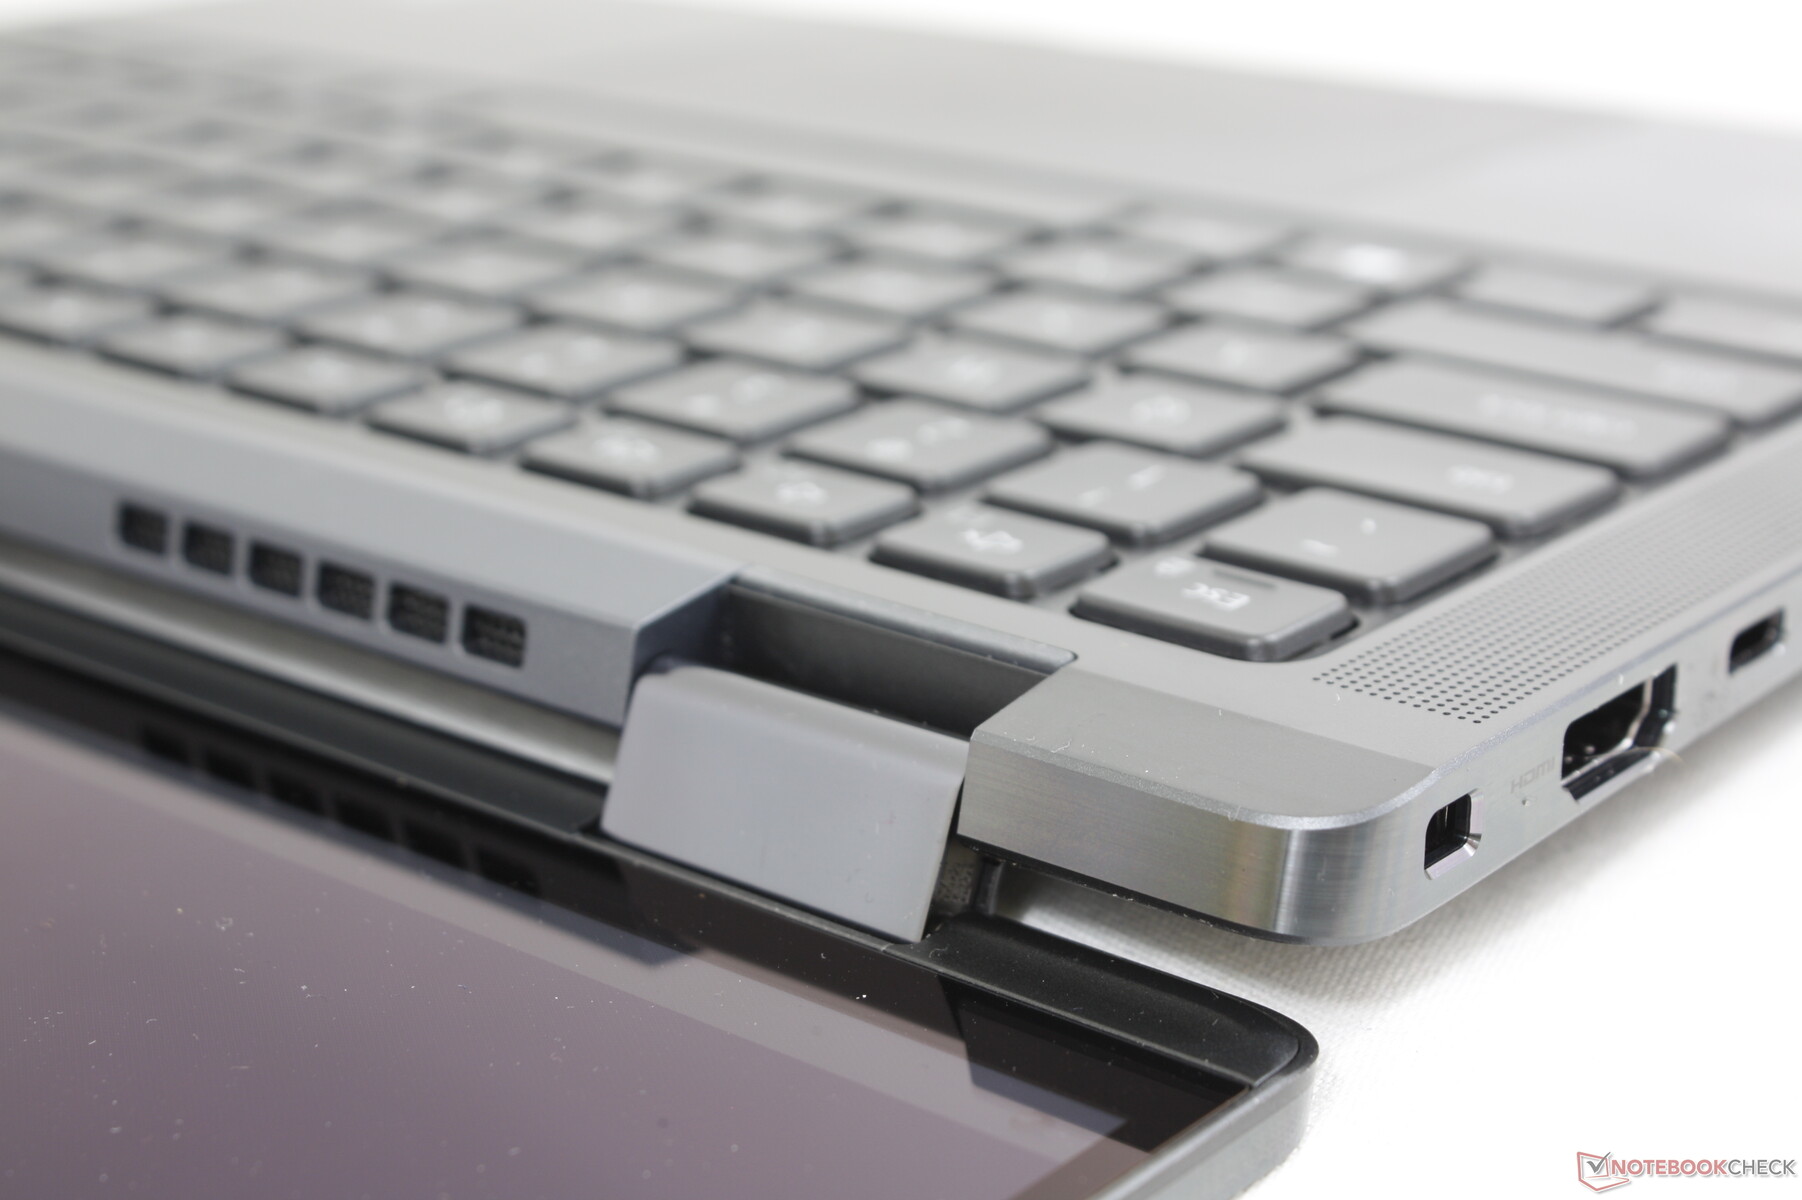
O design ainda é um dos menores e mais finos na categoria de tamanho de 14 polegadas, mesmo depois de um ano no mercado. No entanto, não é mais leve, uma vez que o modelo geralmente é embalado com mais características, incluindo a conectividade opcional de 5G
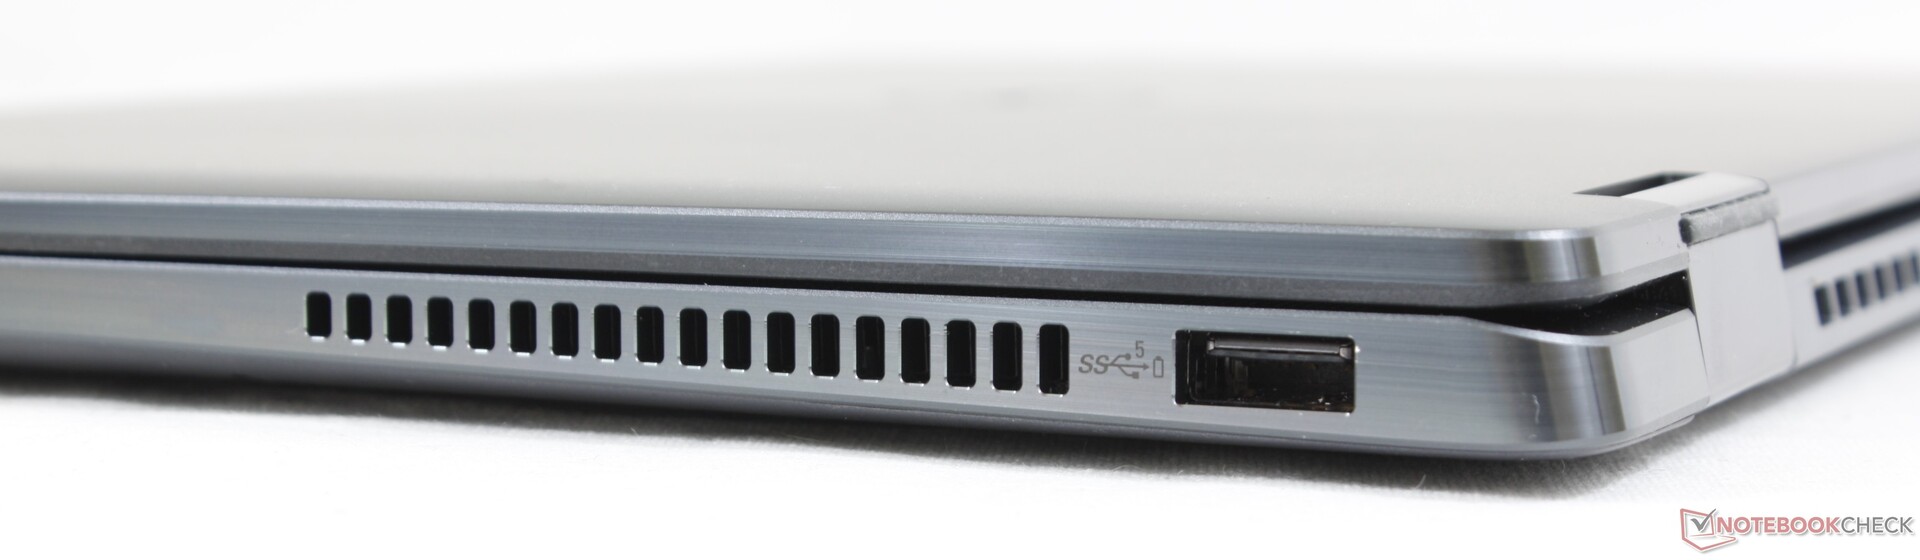
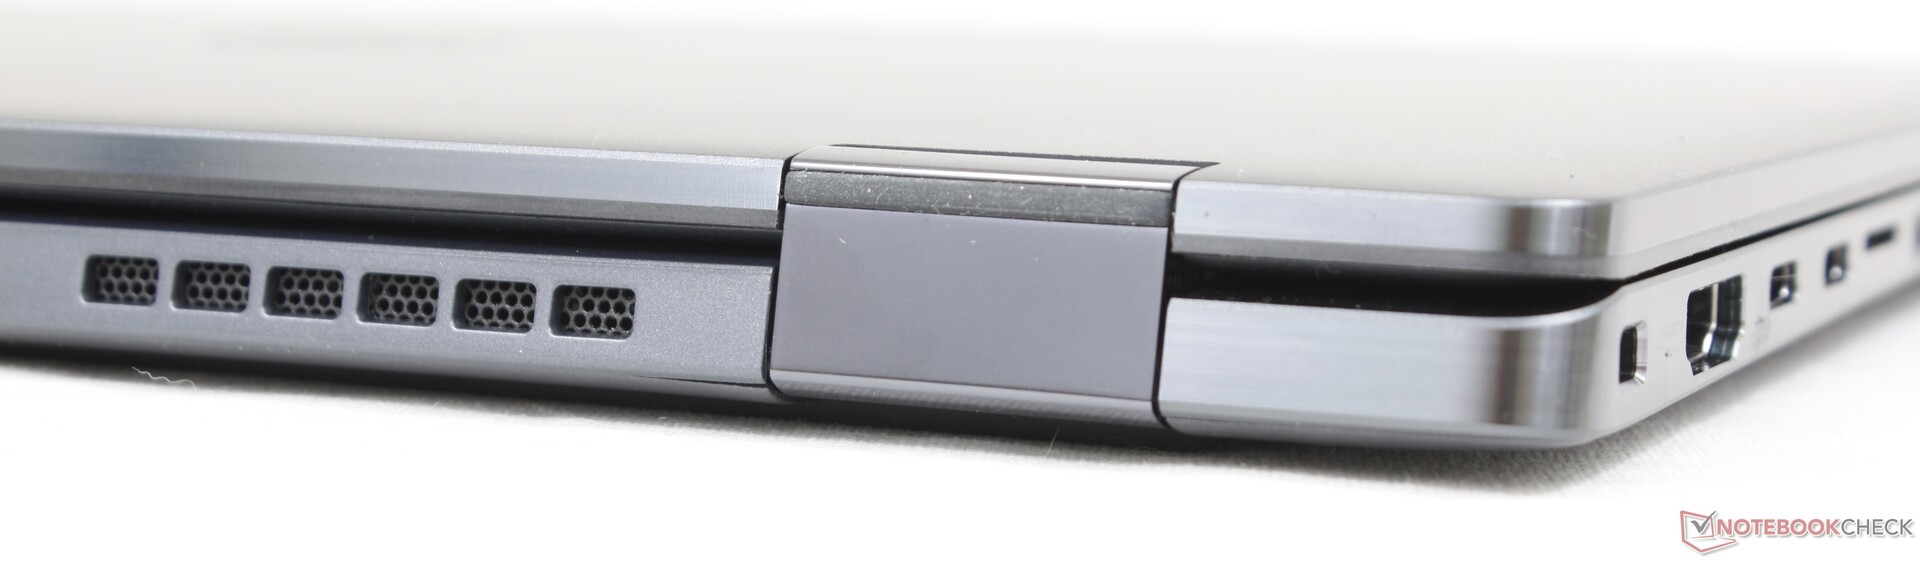
Conectividade
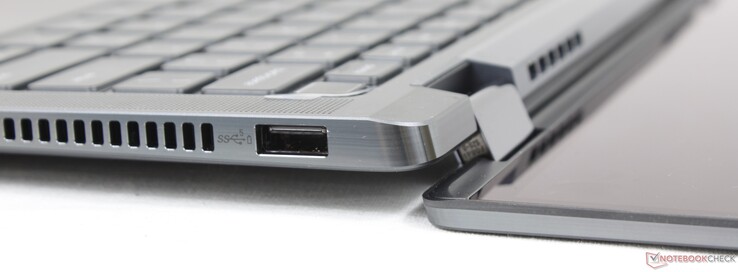
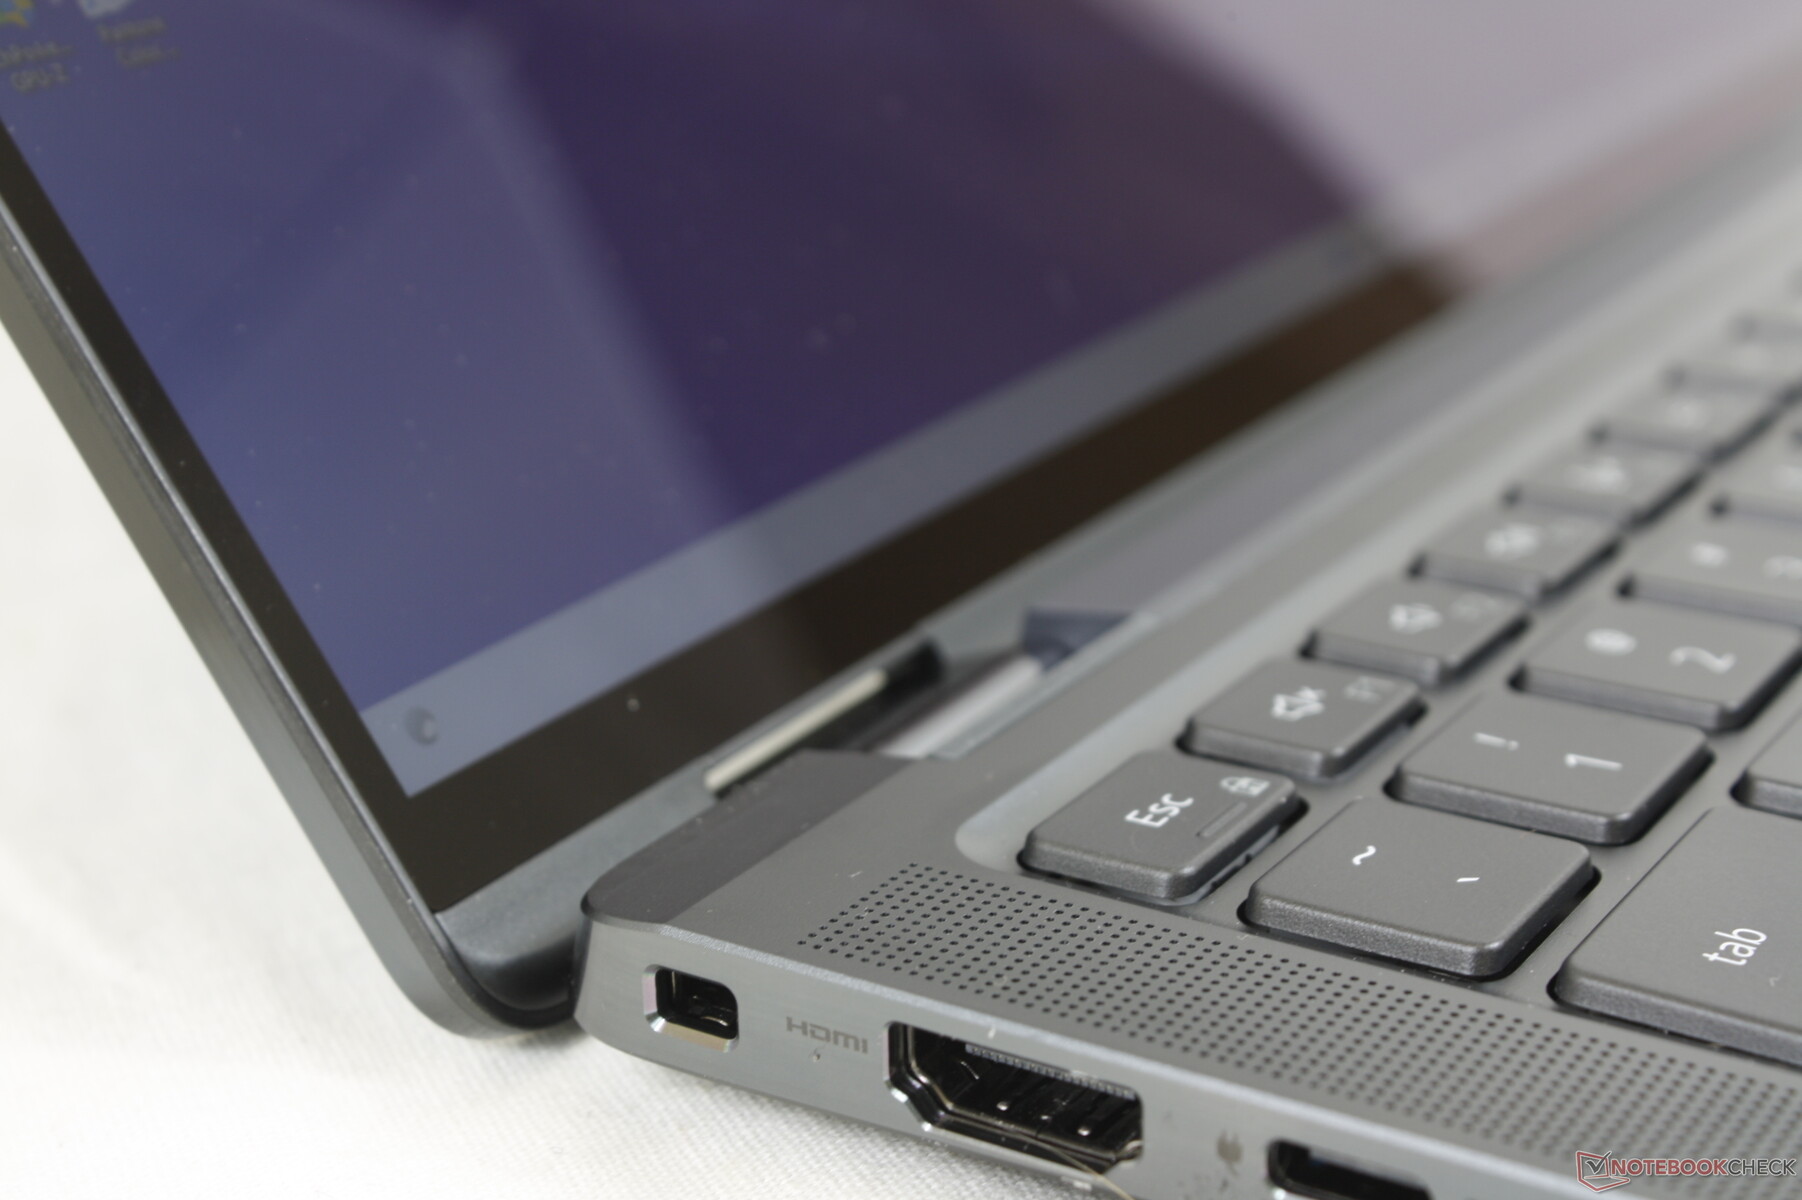
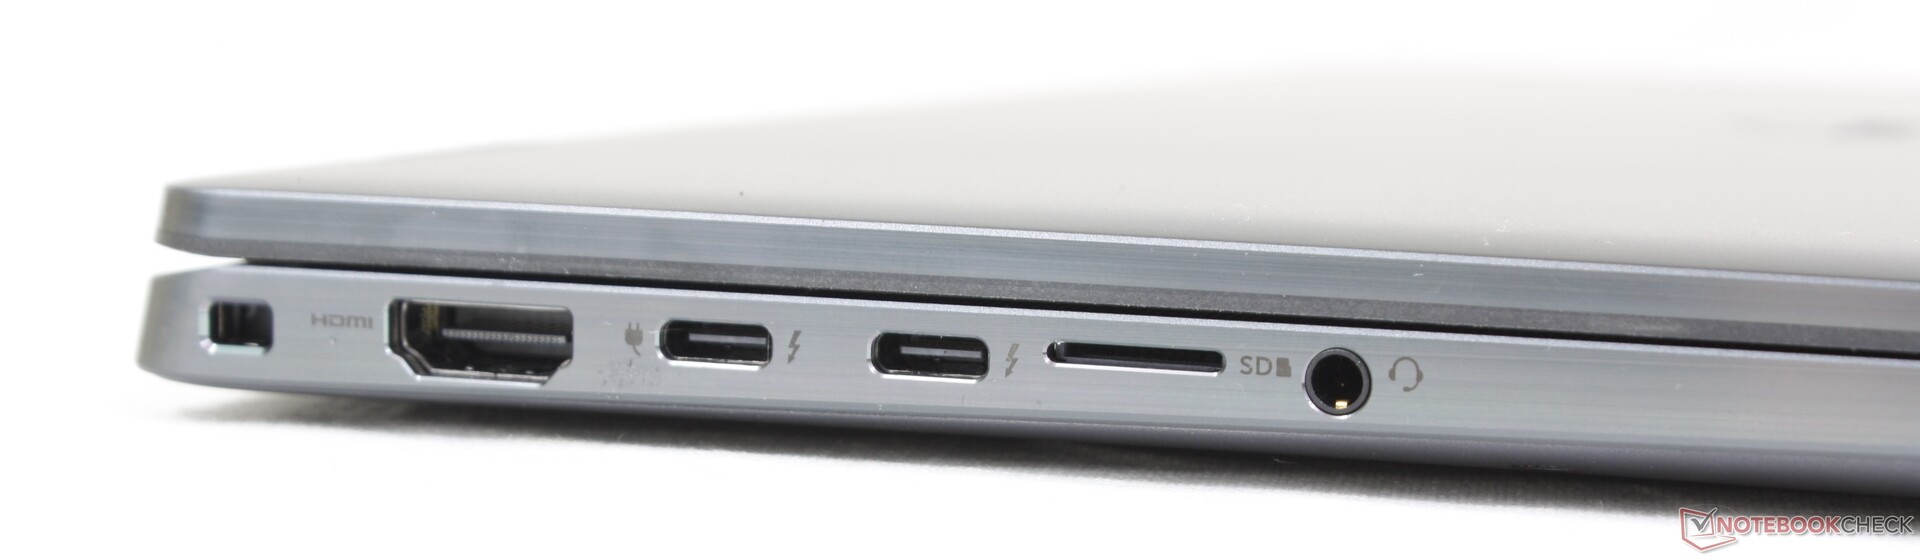
As opções de porto não foram alteradas a partir do Latitude 9420 2 em 1. Teria sido ótimo ver portas USB-A 3.2 Gen. 2 em vez de Gen. 1, mas não há muitos dispositivos que tirem vantagem das velocidades da Gen. 2, de qualquer forma.
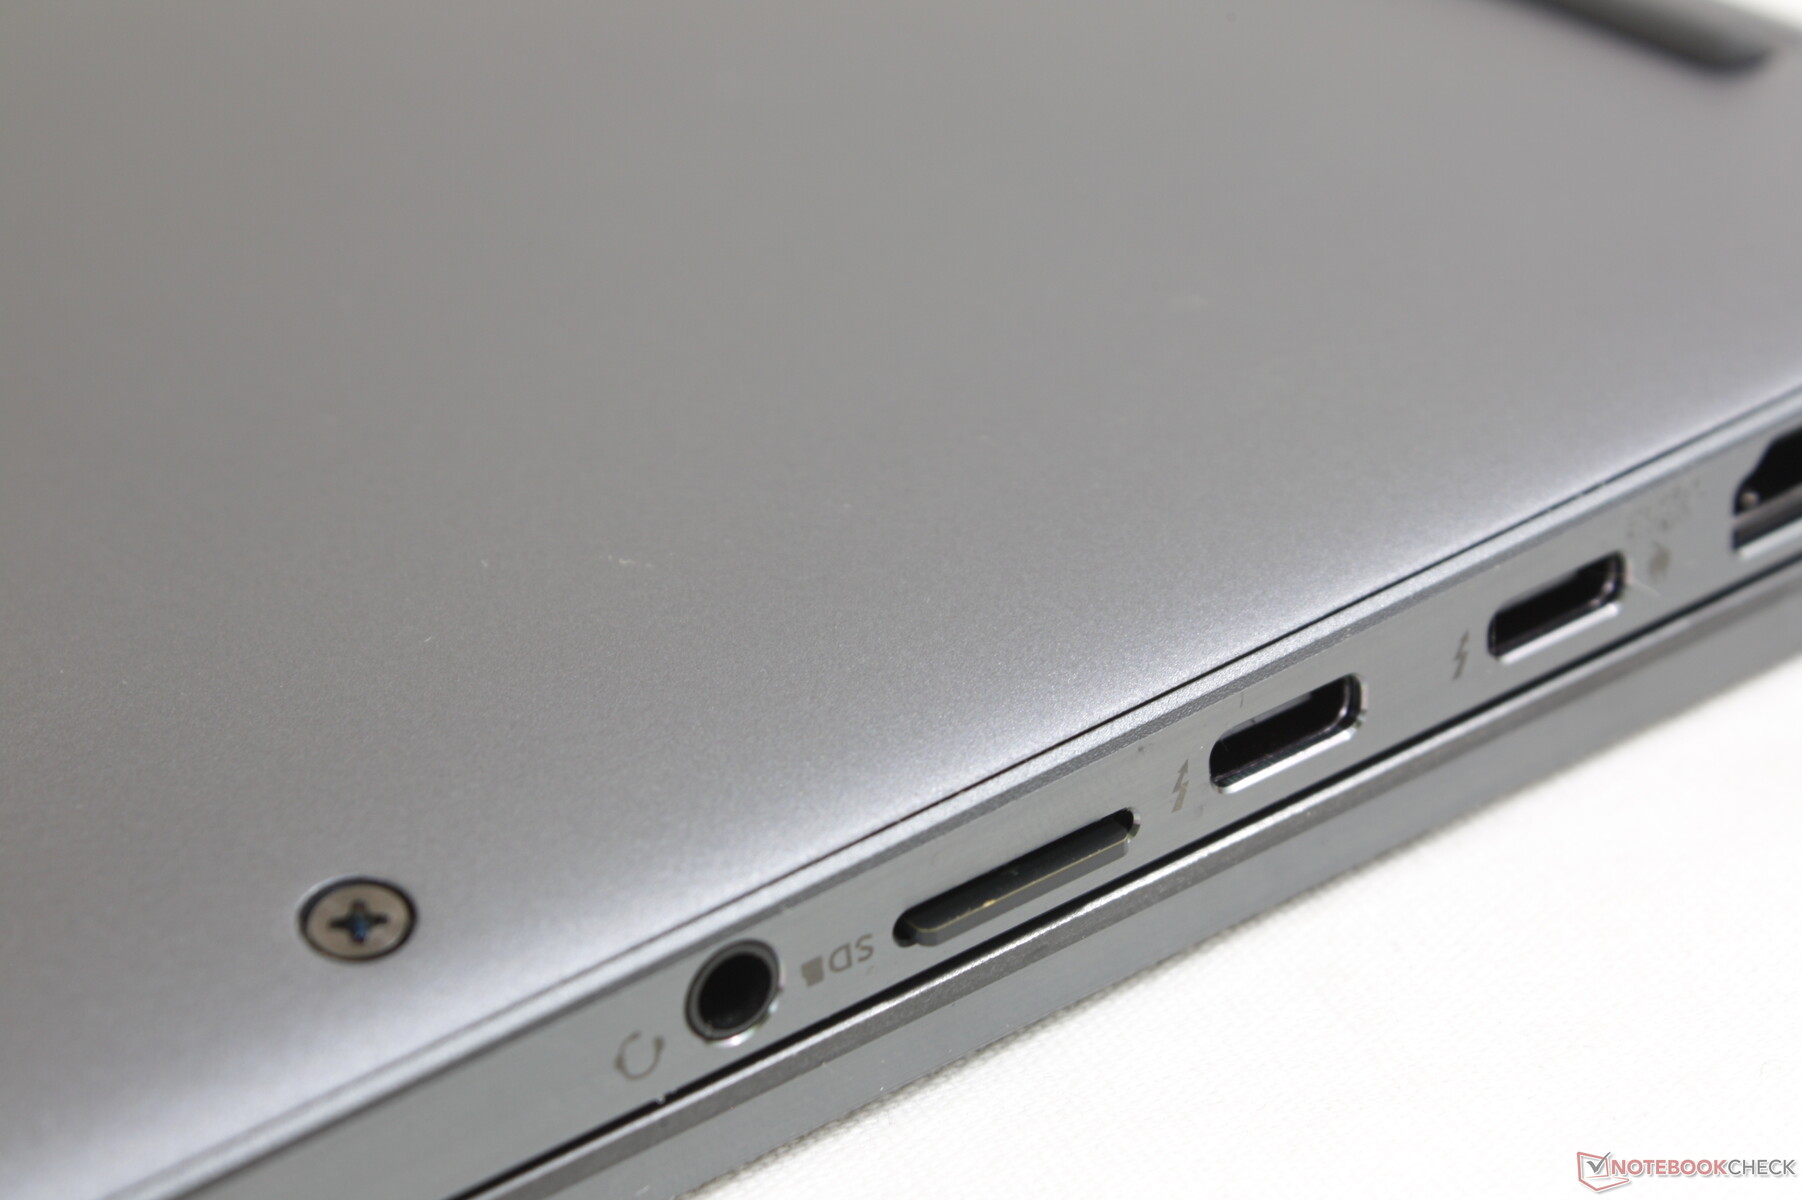
Leitor de cartões SD
As taxas de transferência do leitor de cartões MicroSD são algumas das mais rápidas em um sub-portátil. Quando comparado com oAsus ZenBook Flip 14por exemplo, as transferências de arquivos são cerca de 2x mais rápidas na Dell quando se usa uma placa UHS-II.
| SD Card Reader | |
| average JPG Copy Test (av. of 3 runs) | |
| Dell Latitude 9430 2-in-1 (AV Pro UHS-II V60) | |
| Dell Latitude 9420 2-in-1 (AV PRO microSD 128 GB V60) | |
| Asus ZenBook Flip 14 UN5401QA-KN085W (AV Pro SD microSD 128 GB V60) | |
| LG Gram 14T90P (AV Pro V60) | |
| MSI Summit E14 Flip Evo A12MT (AV Pro V60) | |
| maximum AS SSD Seq Read Test (1GB) | |
| Dell Latitude 9420 2-in-1 (AV PRO microSD 128 GB V60) | |
| Dell Latitude 9430 2-in-1 (AV Pro UHS-II V60) | |
| Asus ZenBook Flip 14 UN5401QA-KN085W (AV Pro SD microSD 128 GB V60) | |
| LG Gram 14T90P (AV Pro V60) | |
| MSI Summit E14 Flip Evo A12MT (AV Pro V60) | |
Comunicação
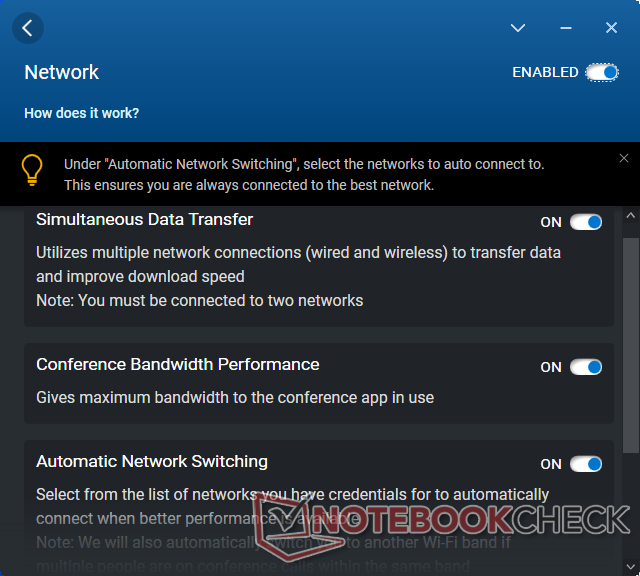
5G é agora uma opção para a série. Entretanto, o recurso deve ser configurado antes da compra, pois de outra forma as antenas não estão incluídas para desencorajar os usuários de instalar seus próprios módulos 4G ou 5G.
| Networking | |
| iperf3 transmit AX12 | |
| Asus ZenBook Flip 14 UN5401QA-KN085W | |
| Dell Latitude 9420 2-in-1 | |
| iperf3 receive AX12 | |
| Asus ZenBook Flip 14 UN5401QA-KN085W | |
| Dell Latitude 9420 2-in-1 | |
| iperf3 receive AXE11000 6GHz | |
| Lenovo ThinkPad X1 Yoga G7 21CE002HGE | |
| Dell Latitude 9430 2-in-1 | |
| MSI Summit E14 Flip Evo A12MT | |
| iperf3 transmit AXE11000 6GHz | |
| Lenovo ThinkPad X1 Yoga G7 21CE002HGE | |
| MSI Summit E14 Flip Evo A12MT | |
| Dell Latitude 9430 2-in-1 | |
Webcam
A Dell elevou a resolução da webcam de 720p para 1080p para uma imagem mais nítida. A HP está um passo à frente neste aspecto como um número de Spectre e os modelos EliteBook já começaram a ser enviados com webcams de 5 MP.


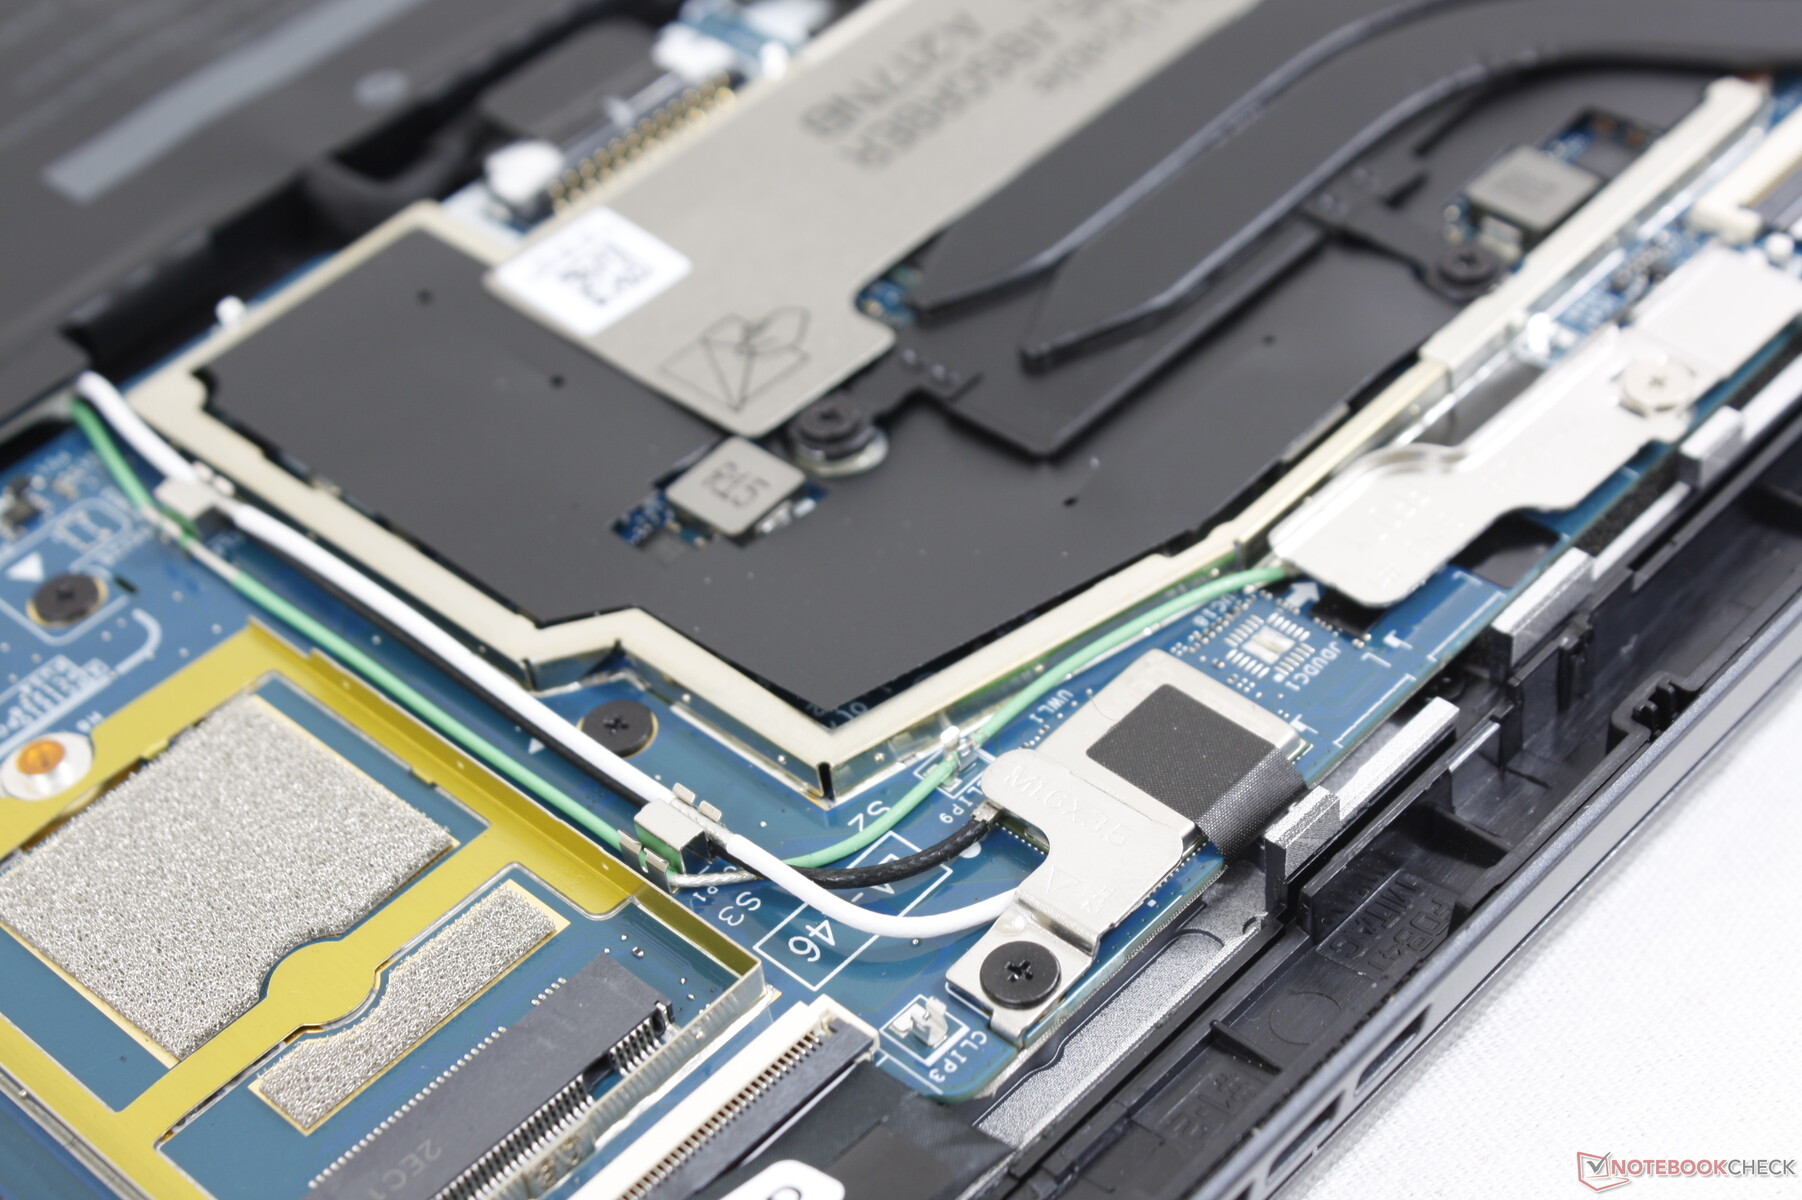
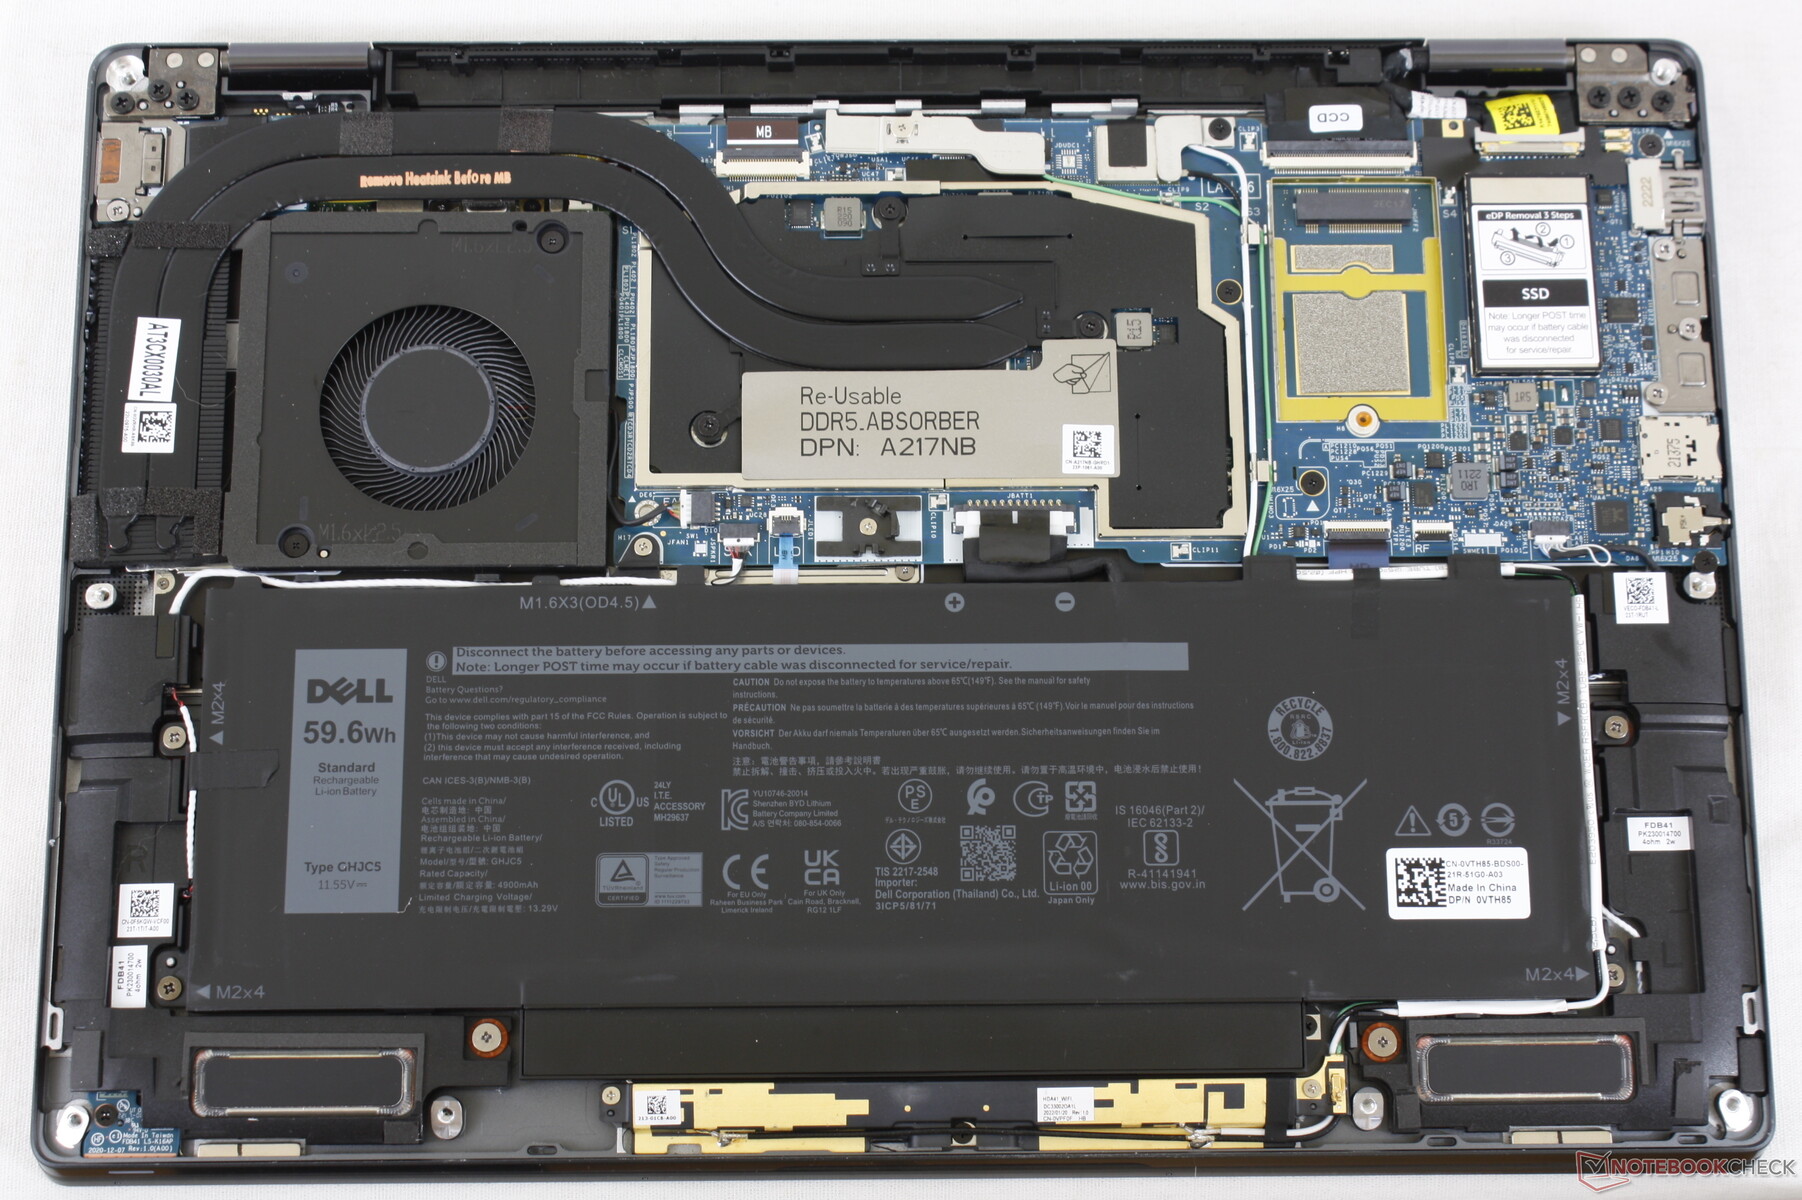
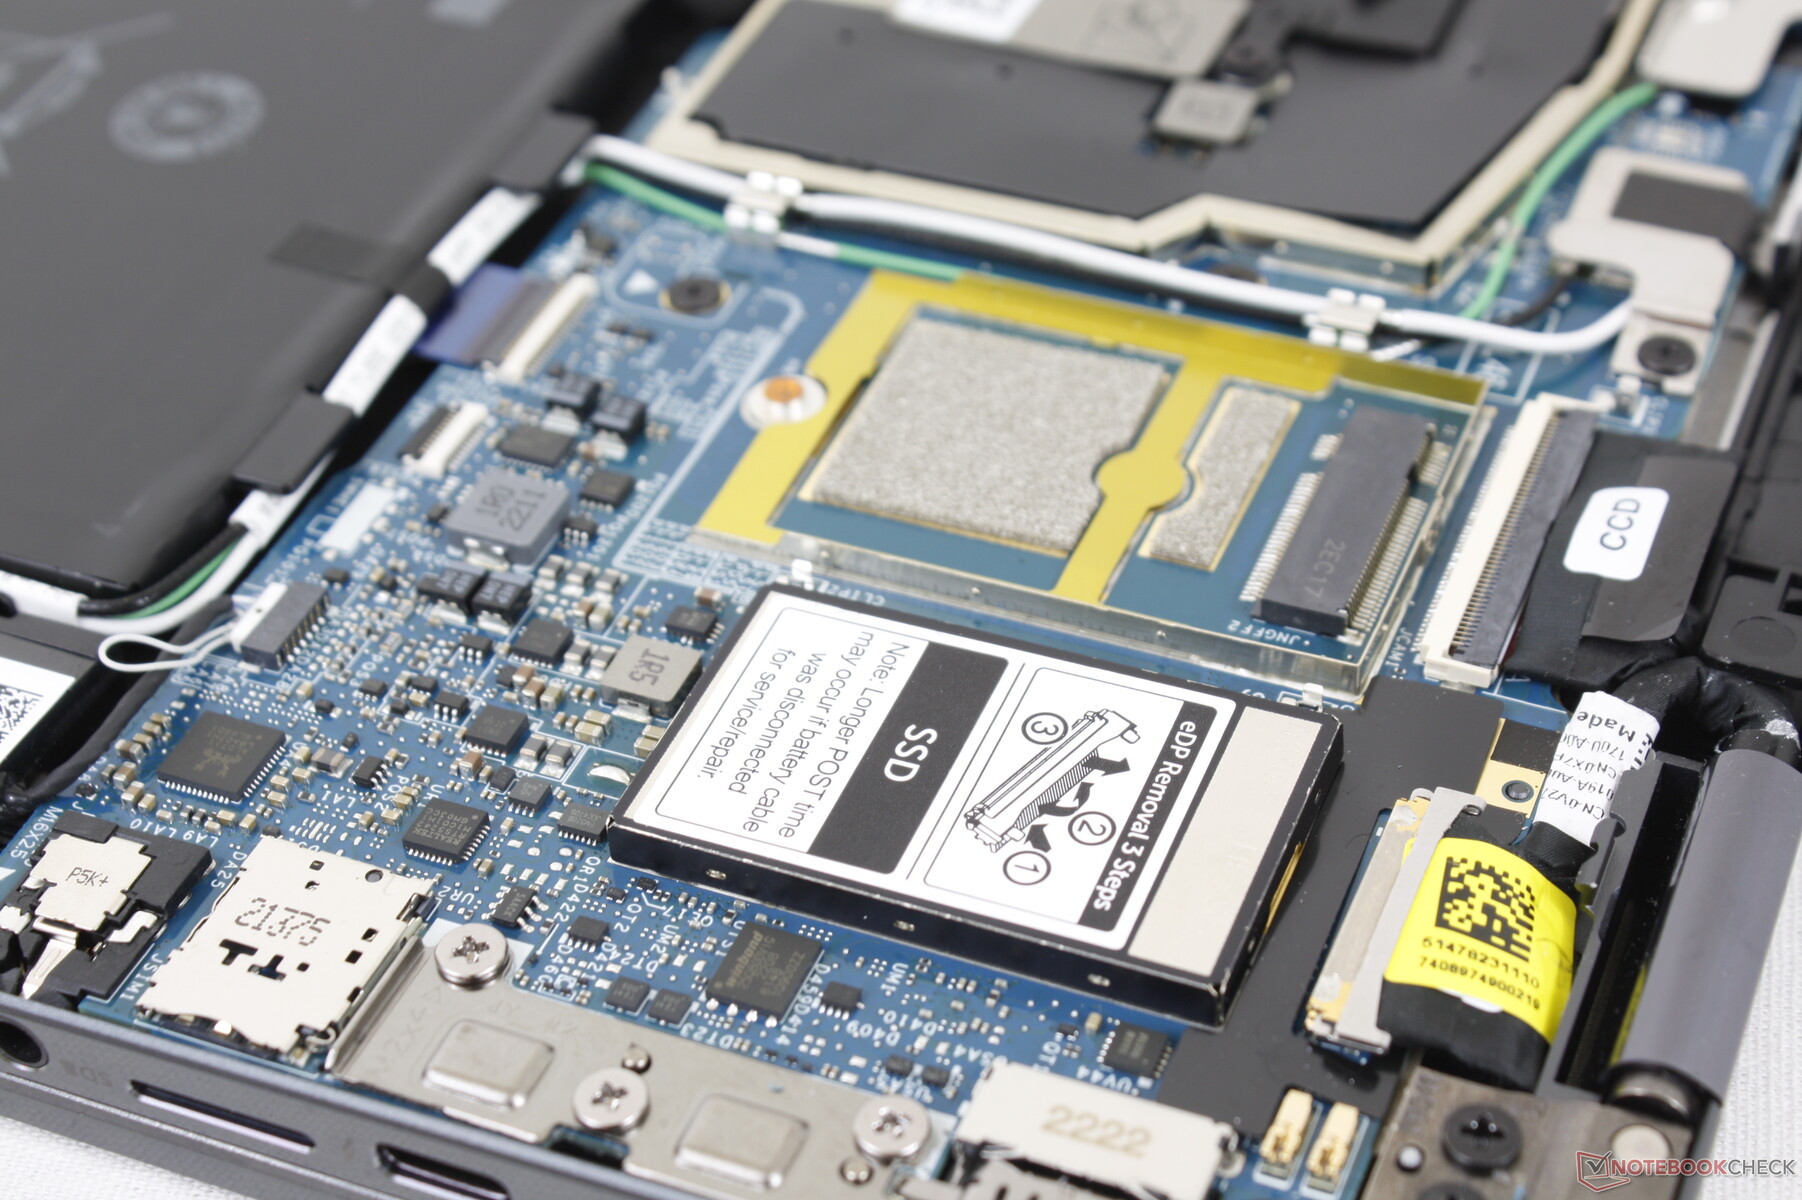
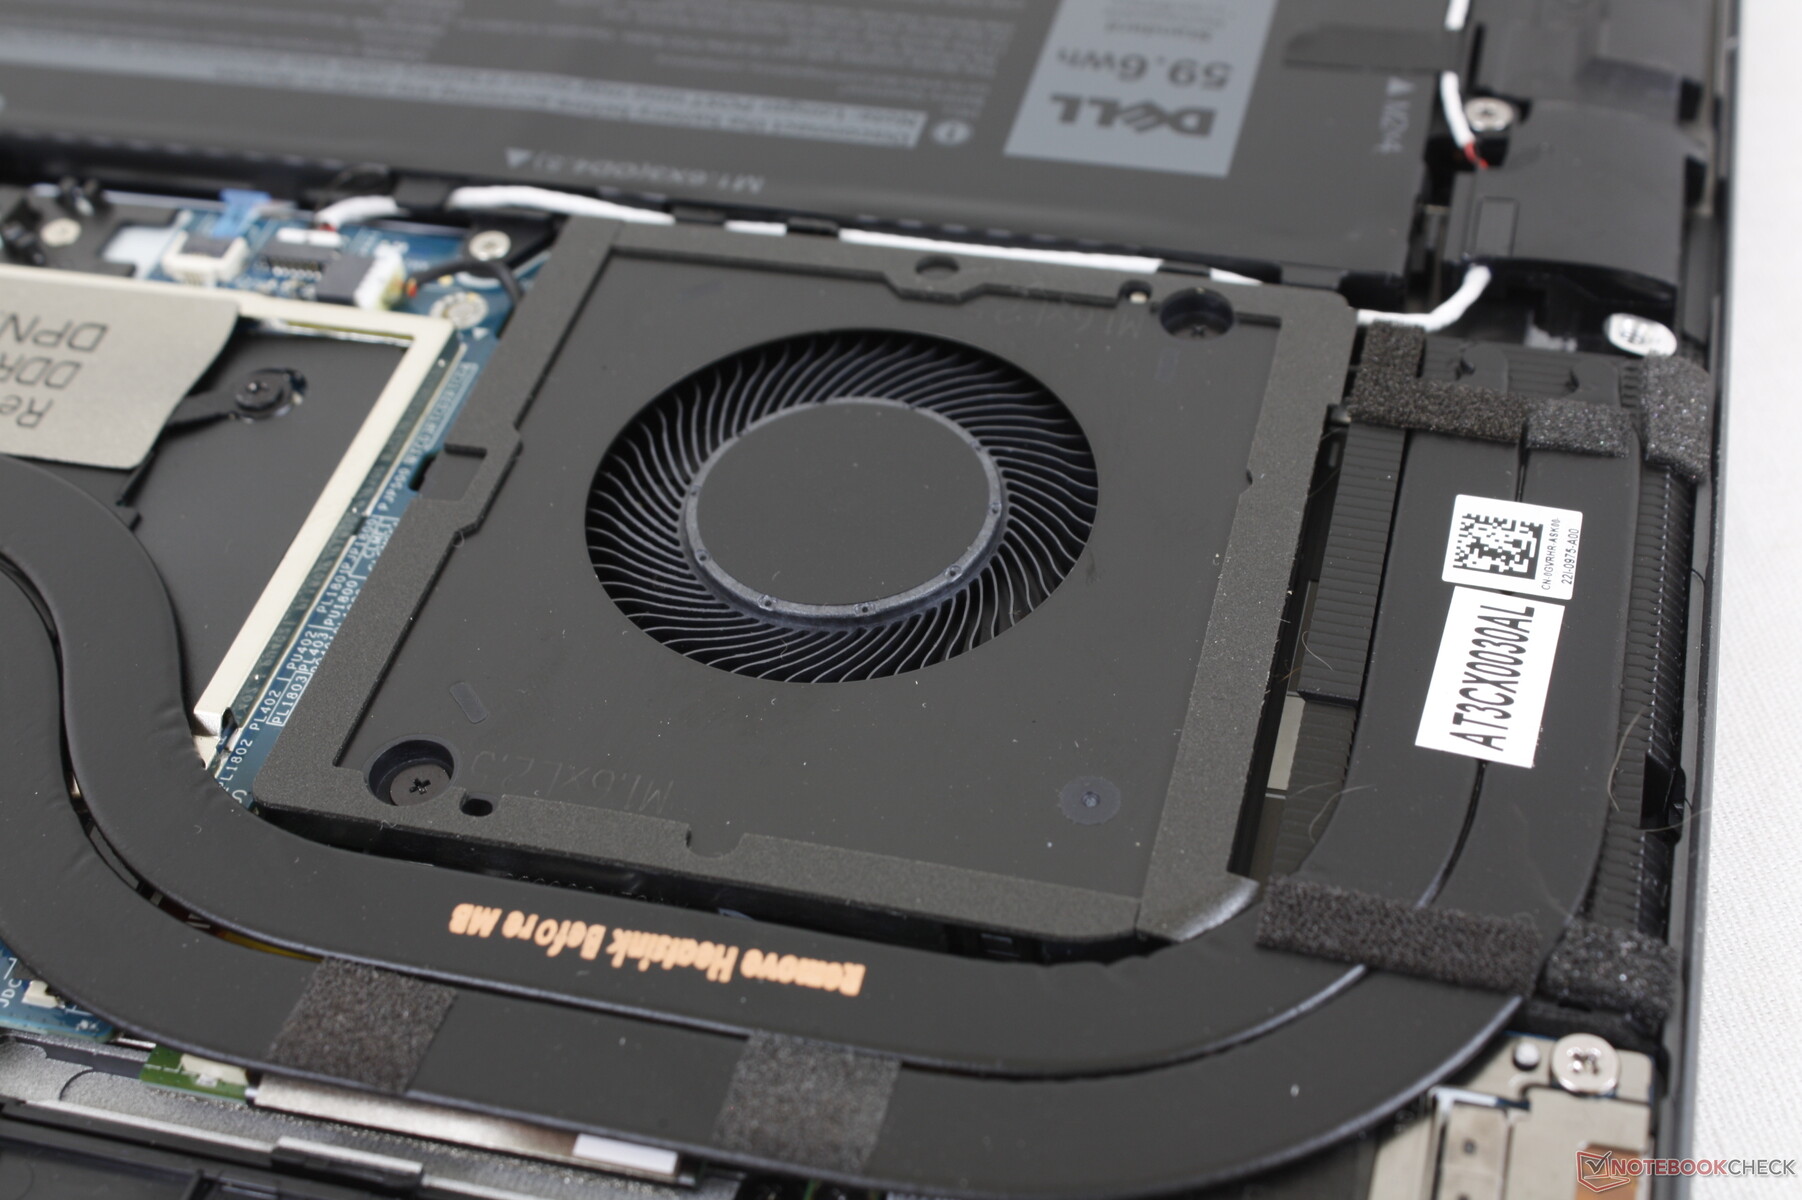
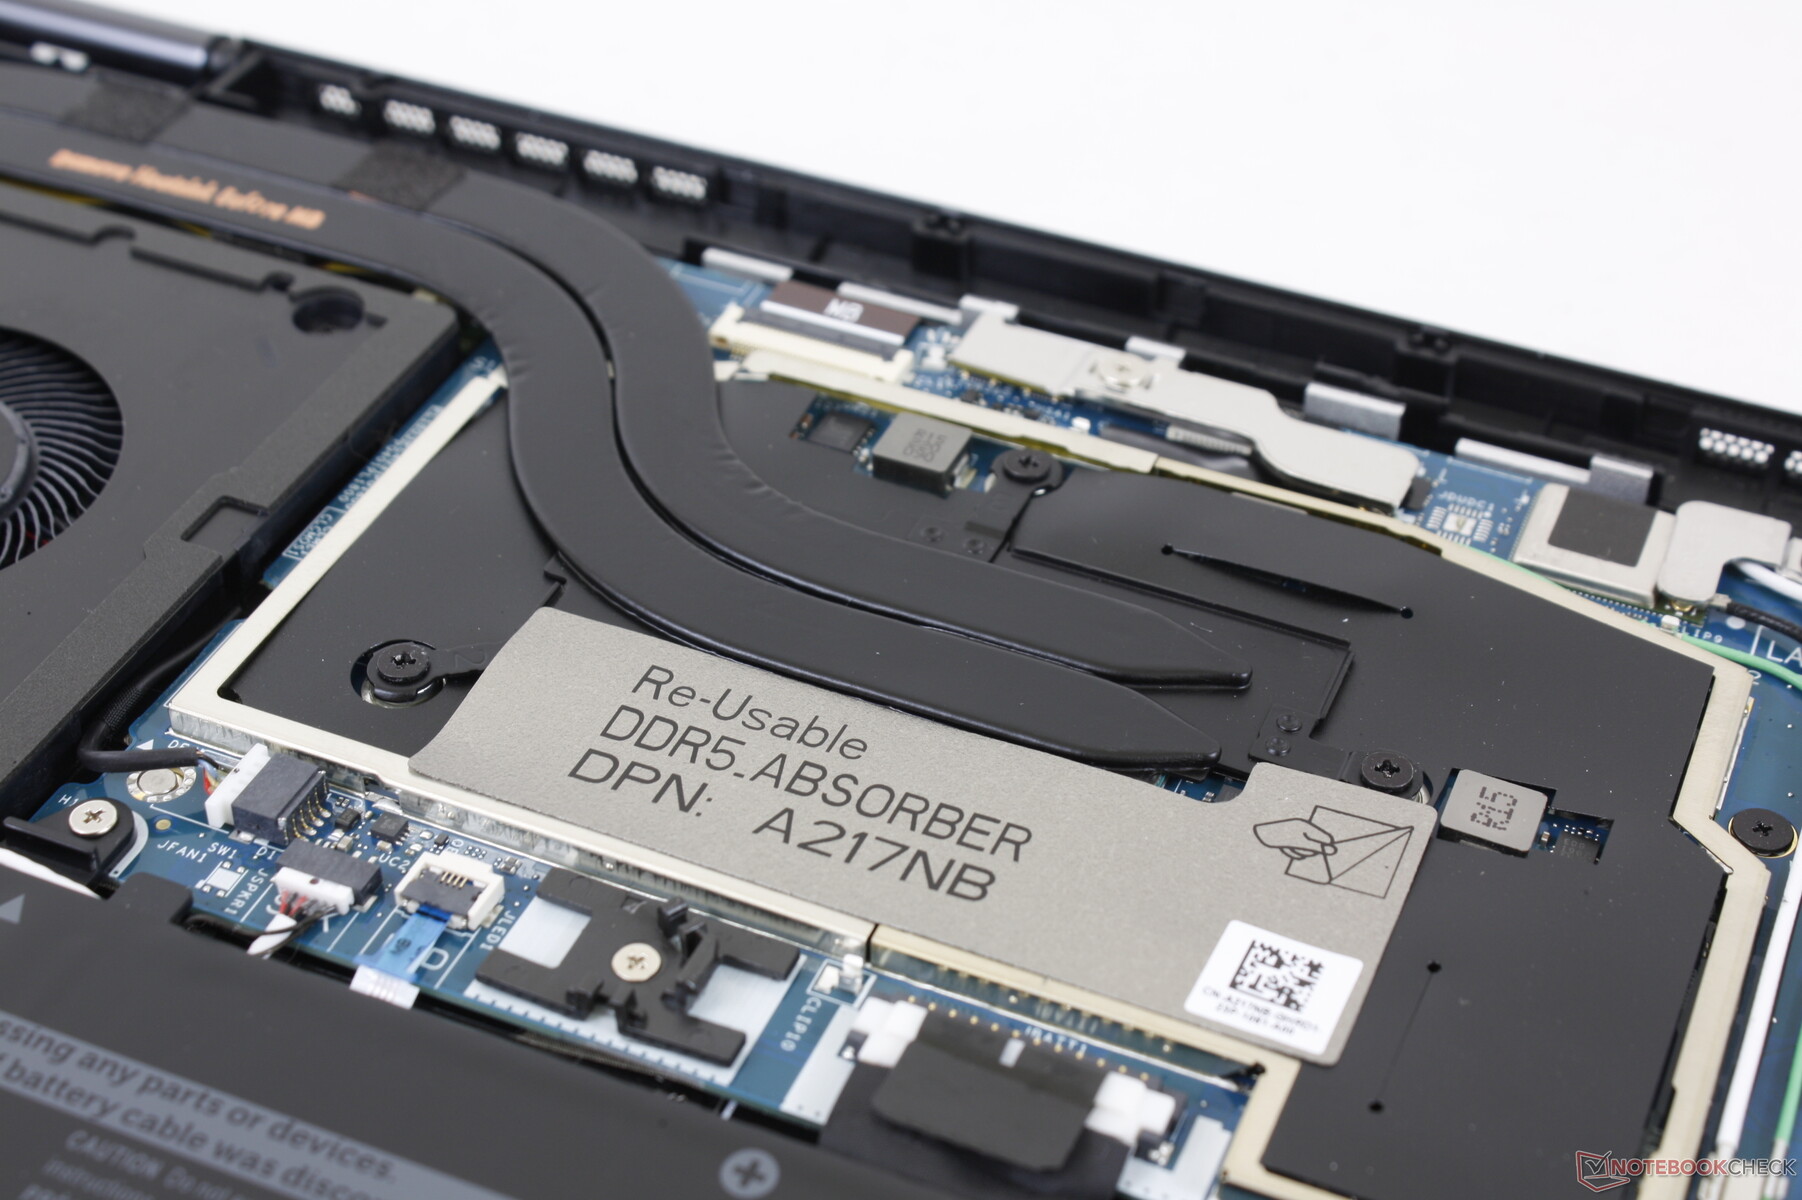
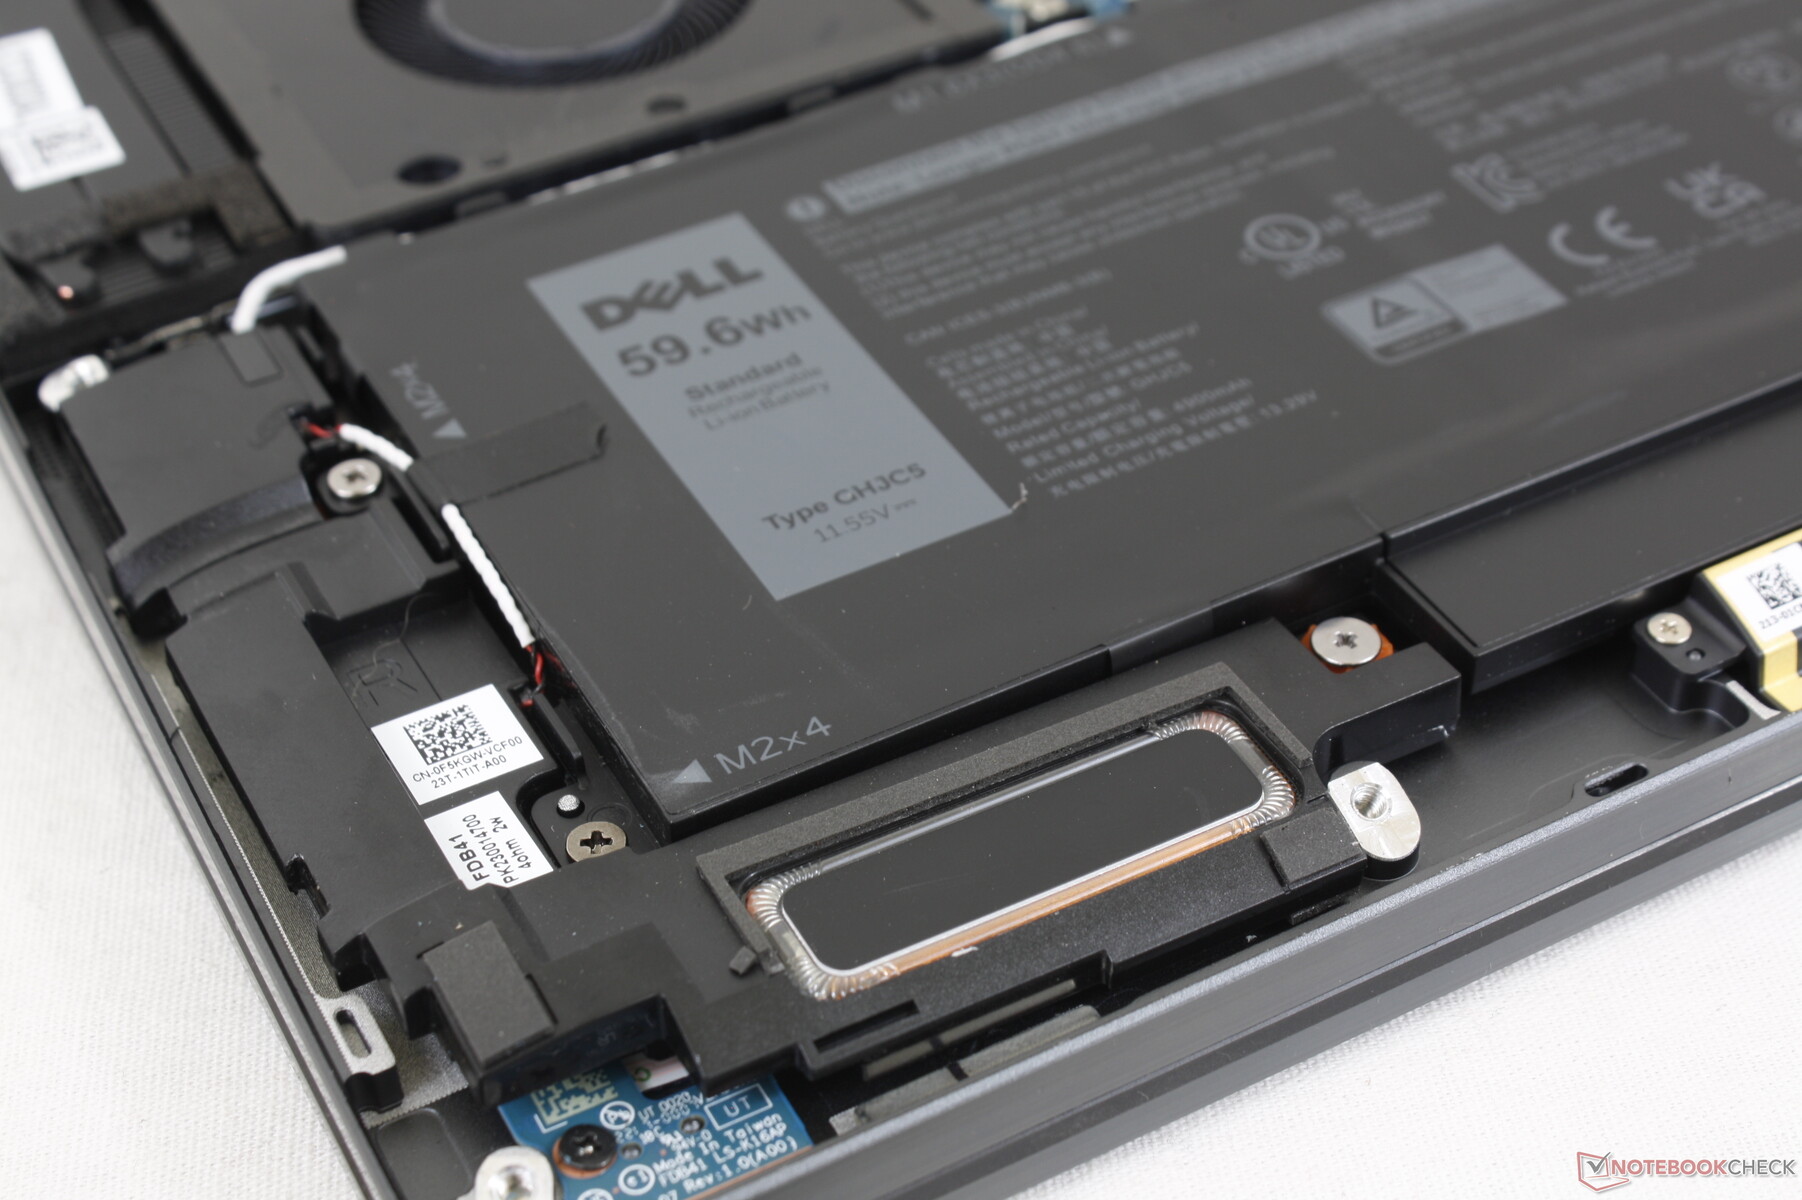
Manutenção
O painel inferior permanece muito fácil de remover. Entretanto, não há muito a ser reparado além do SSD e da bateria, já que os módulos WLAN e RAM são soldados.
Acessórios e Garantia
Não há extras na caixa além do adaptador AC e da papelada. A caneta ativa PN7522W deve ser comprada separadamente por $80 a $110 USD.
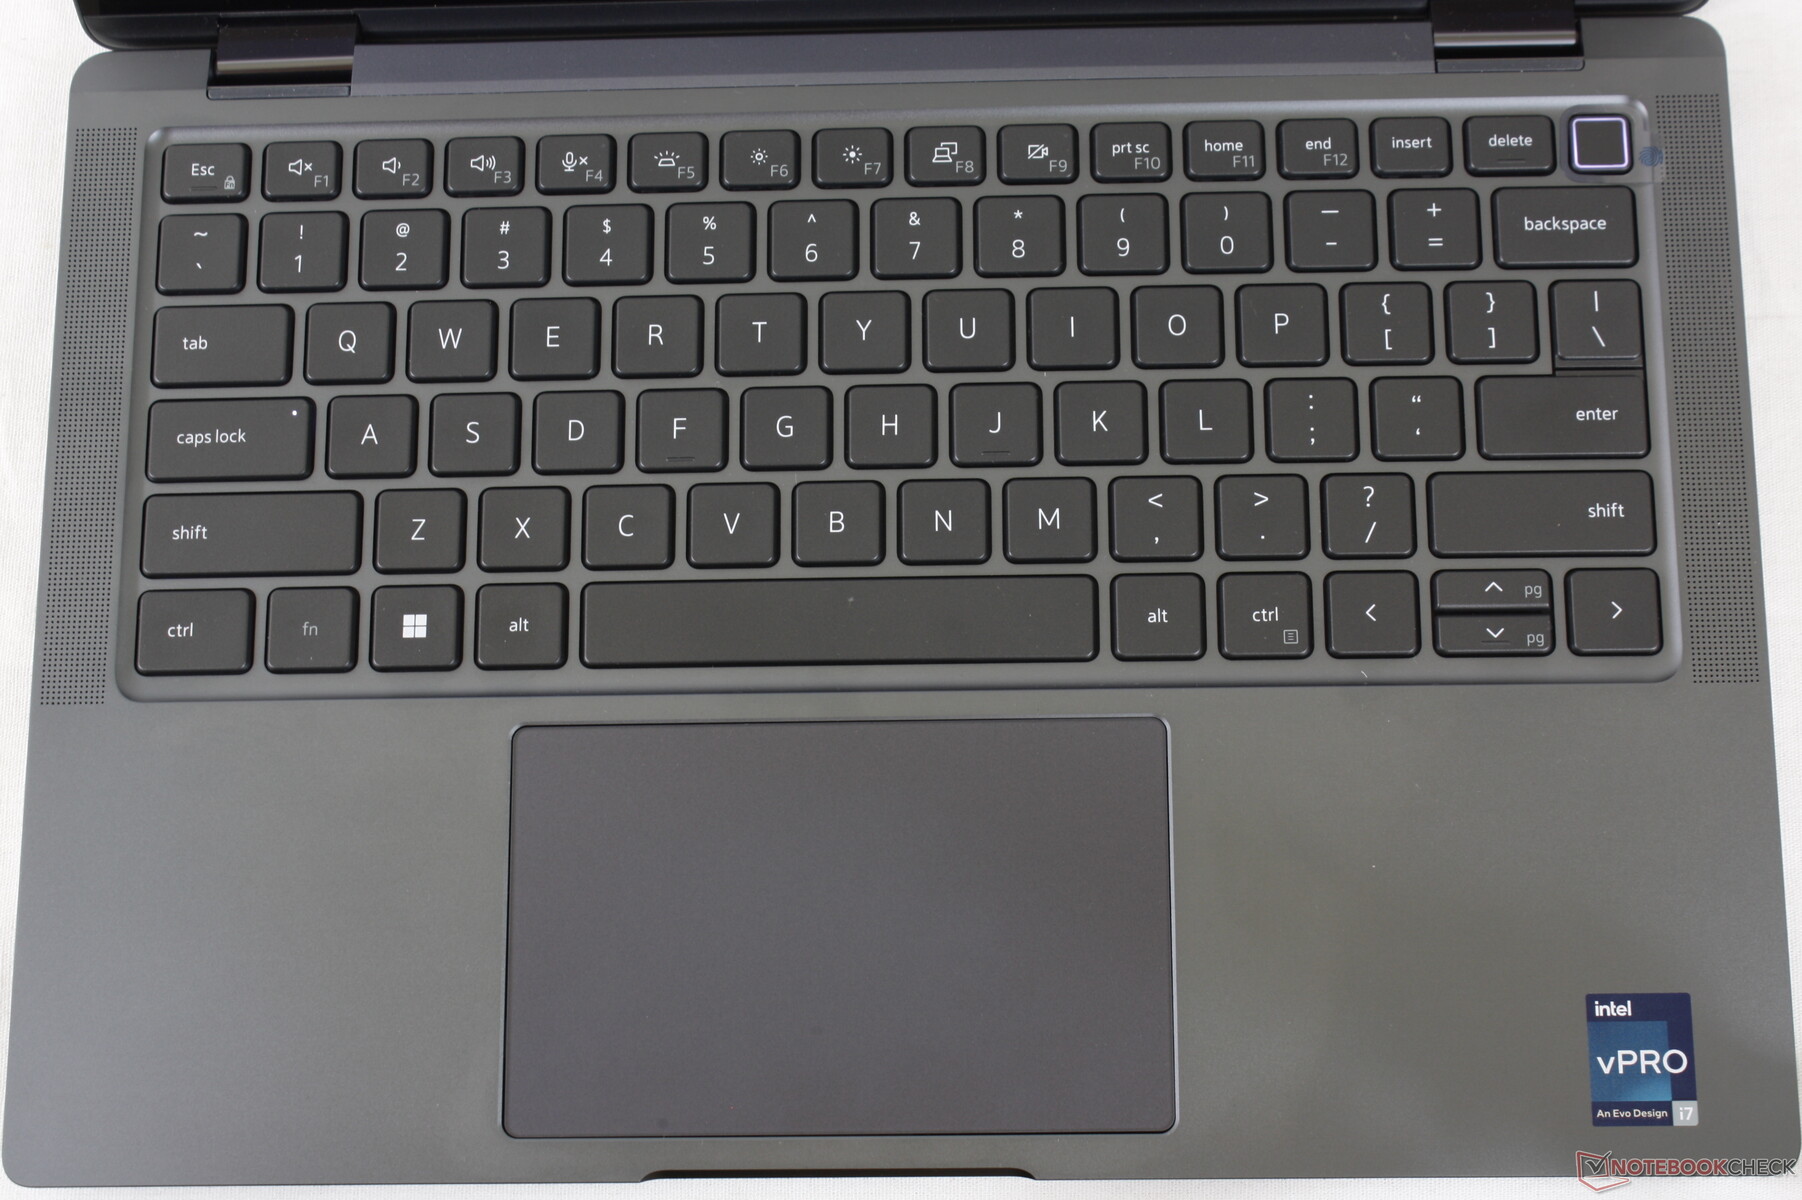
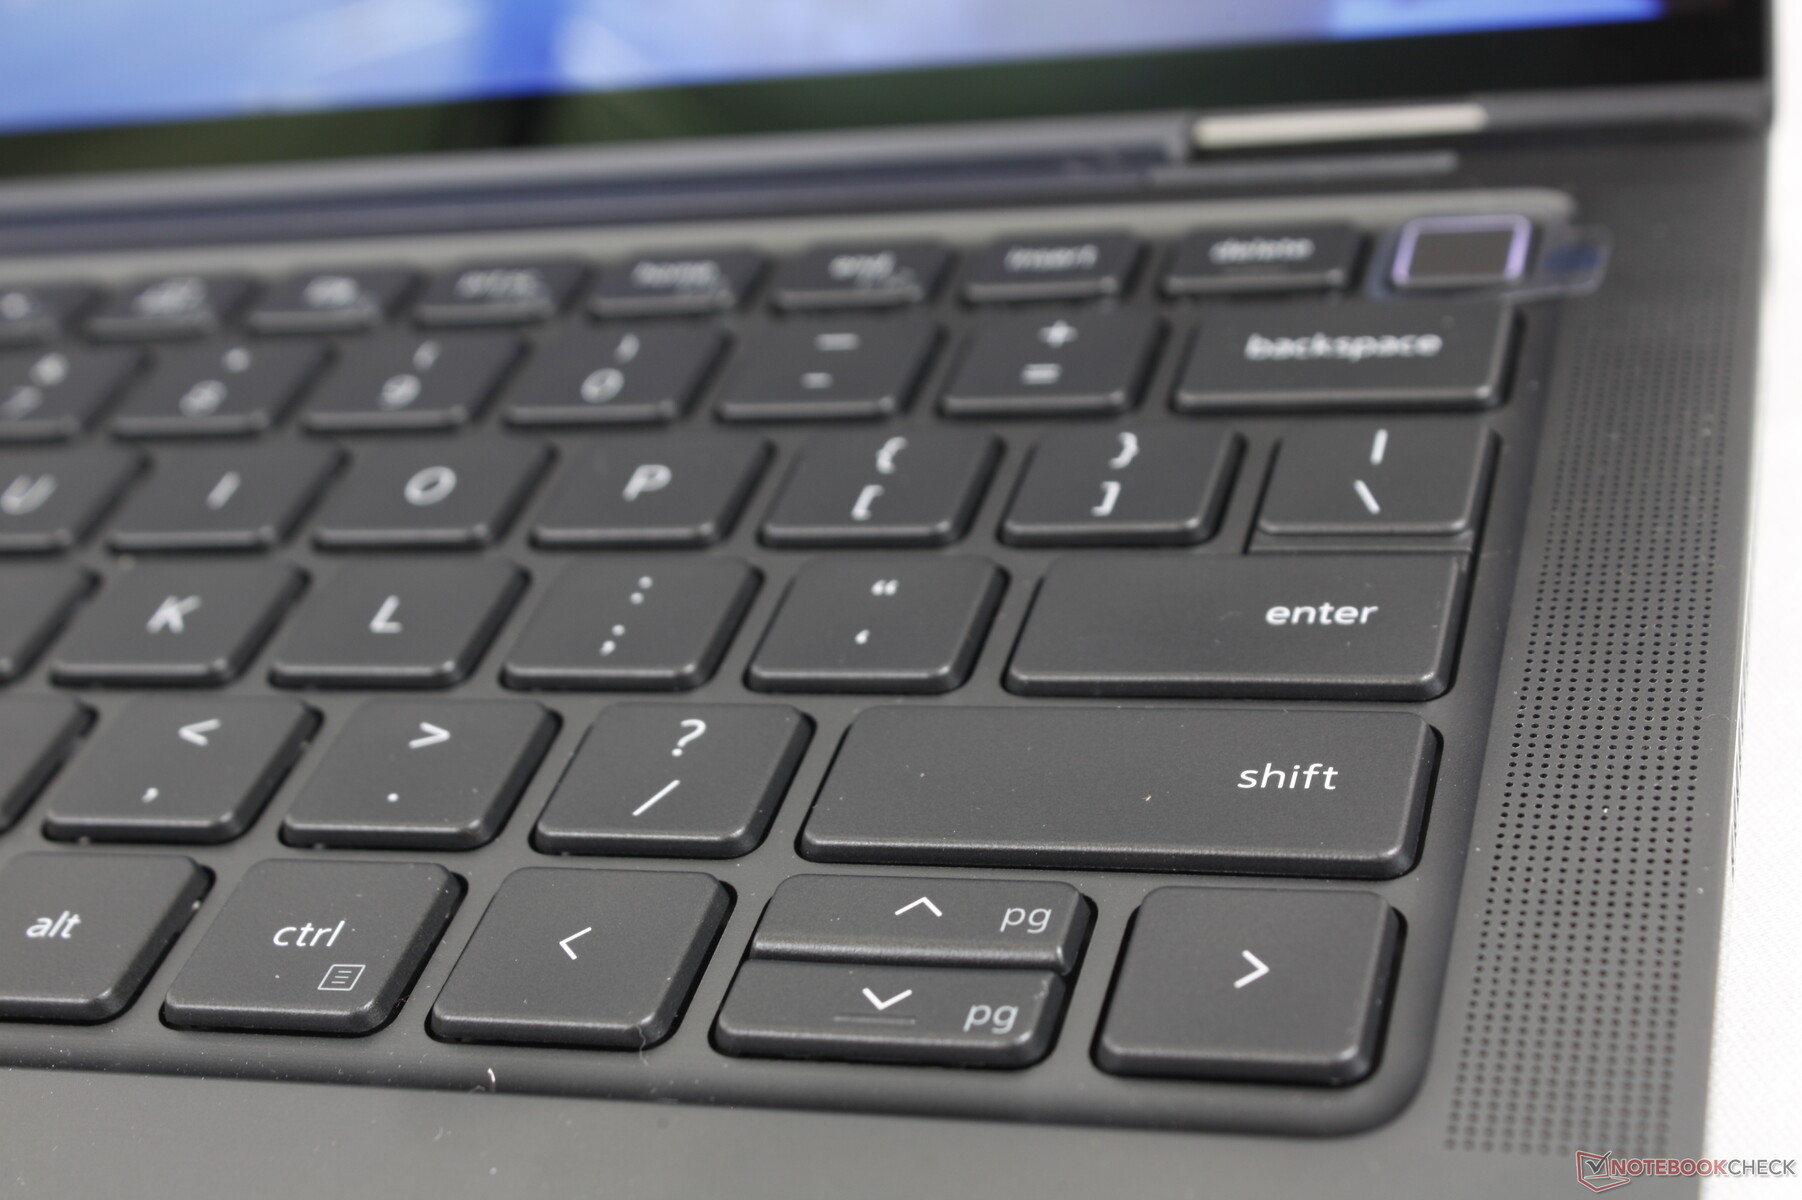
Dispositivos de entrada
Teclado e Touchpad
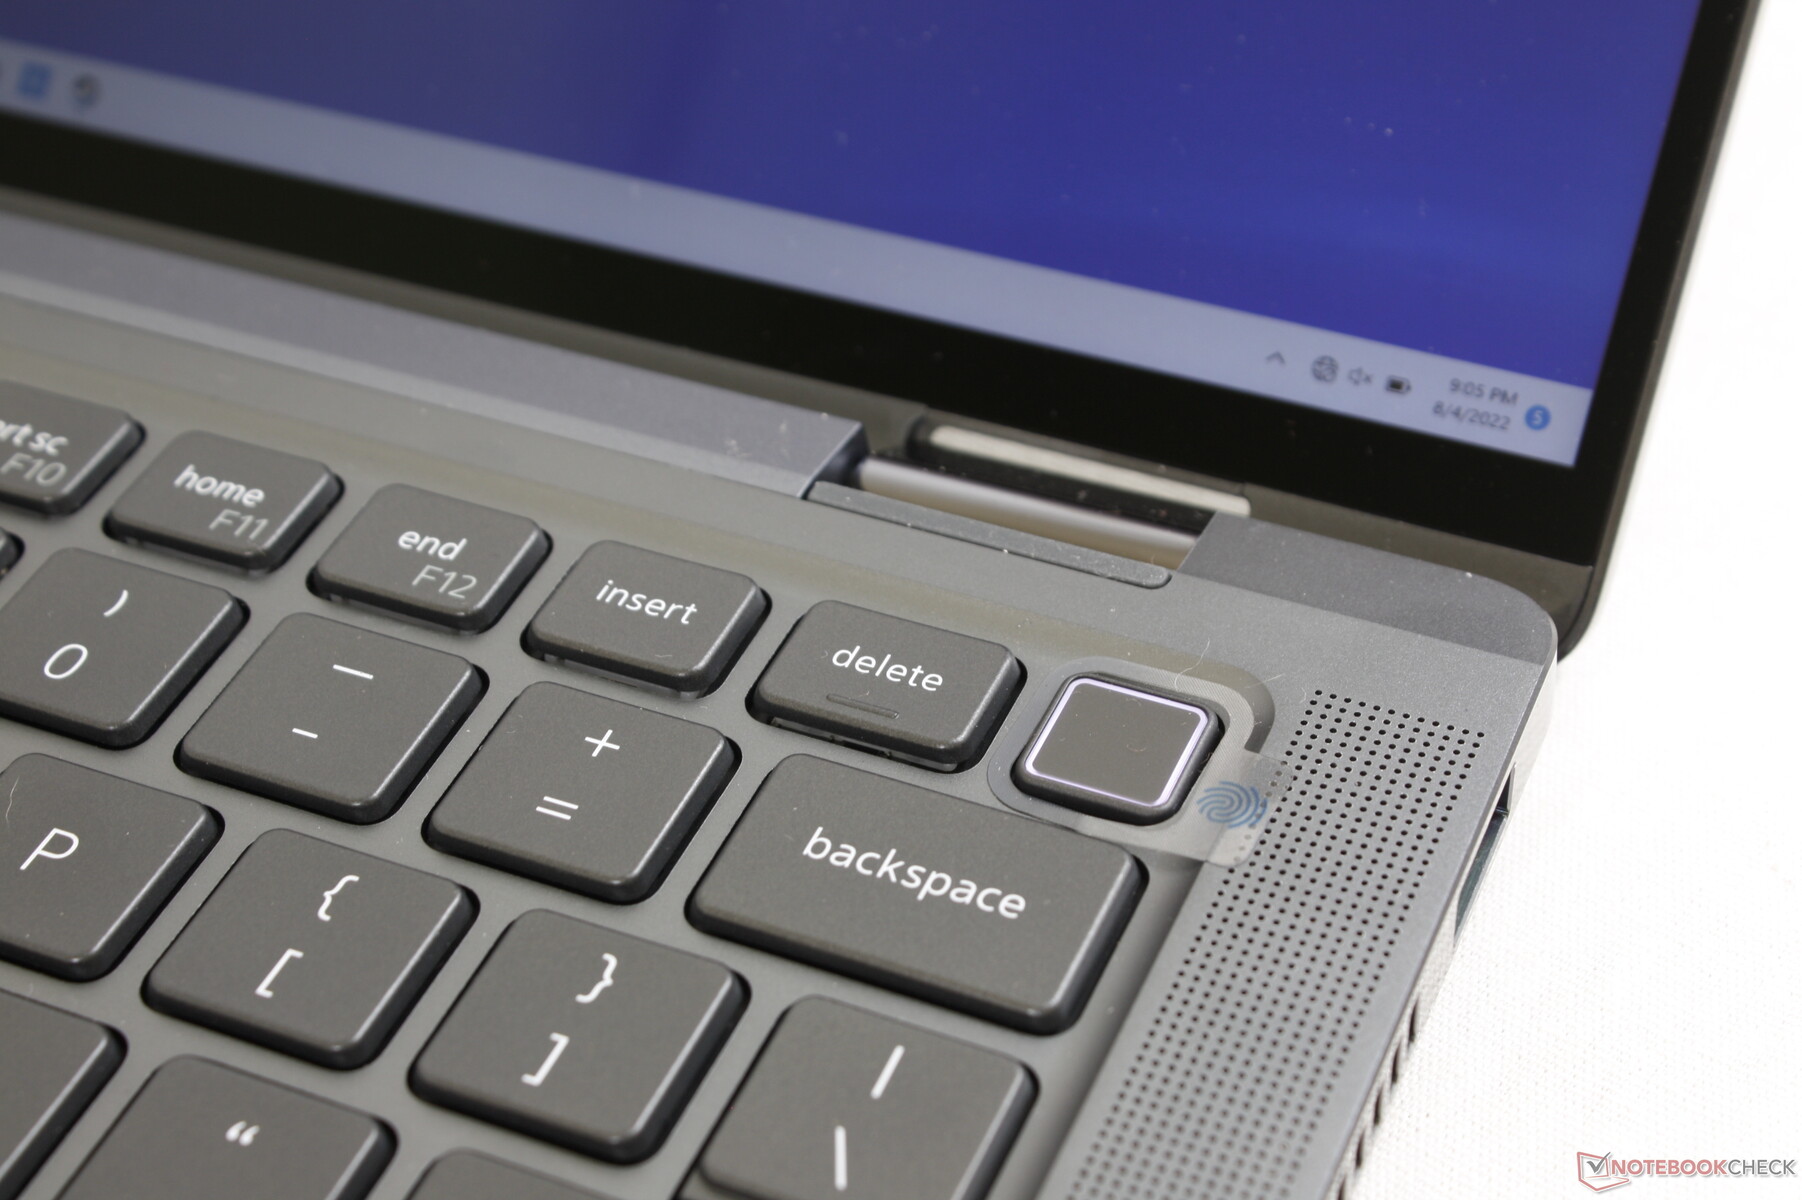
Quando comparado com os teclados de um HP EliteBook ou Spectre, o teclado em nosso Latitude é um pouco mais silencioso, mas mais suave. Não é menos confortável, pois se resume principalmente à preferência do usuário. No entanto, um ponto extra vai para os modelos HP, pois eles incorporam uma chave dedicada para lançar aplicativos específicos HP como o Command Center ou o myHP. Tal chave no Dell Latitude para o lançamento do Optimizer ou Power Manager teria sido muito útil.

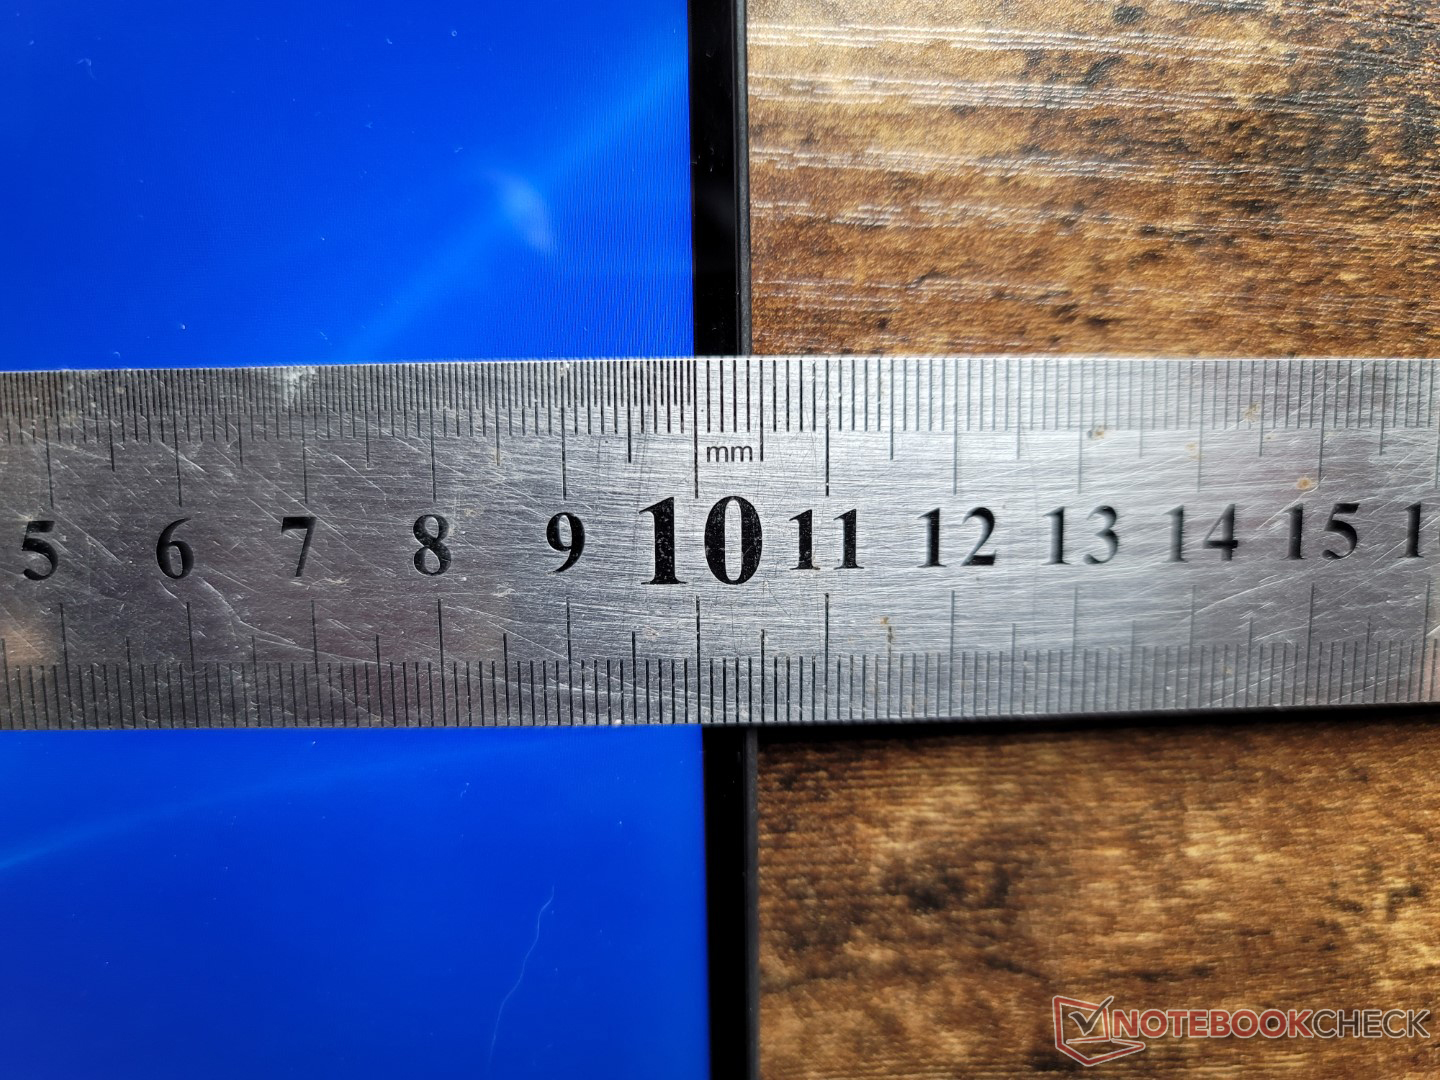
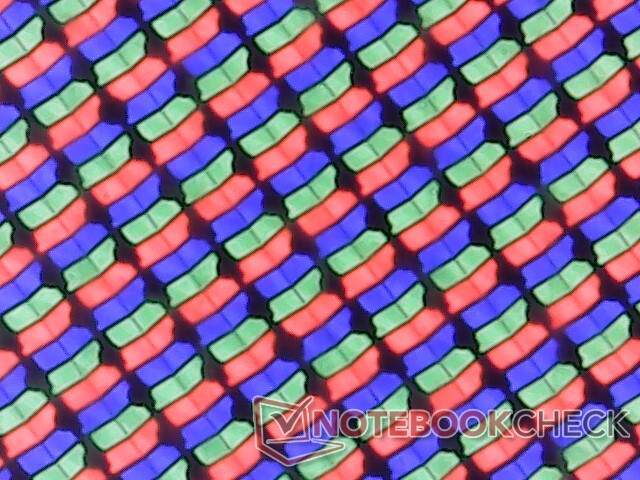
Mostrar
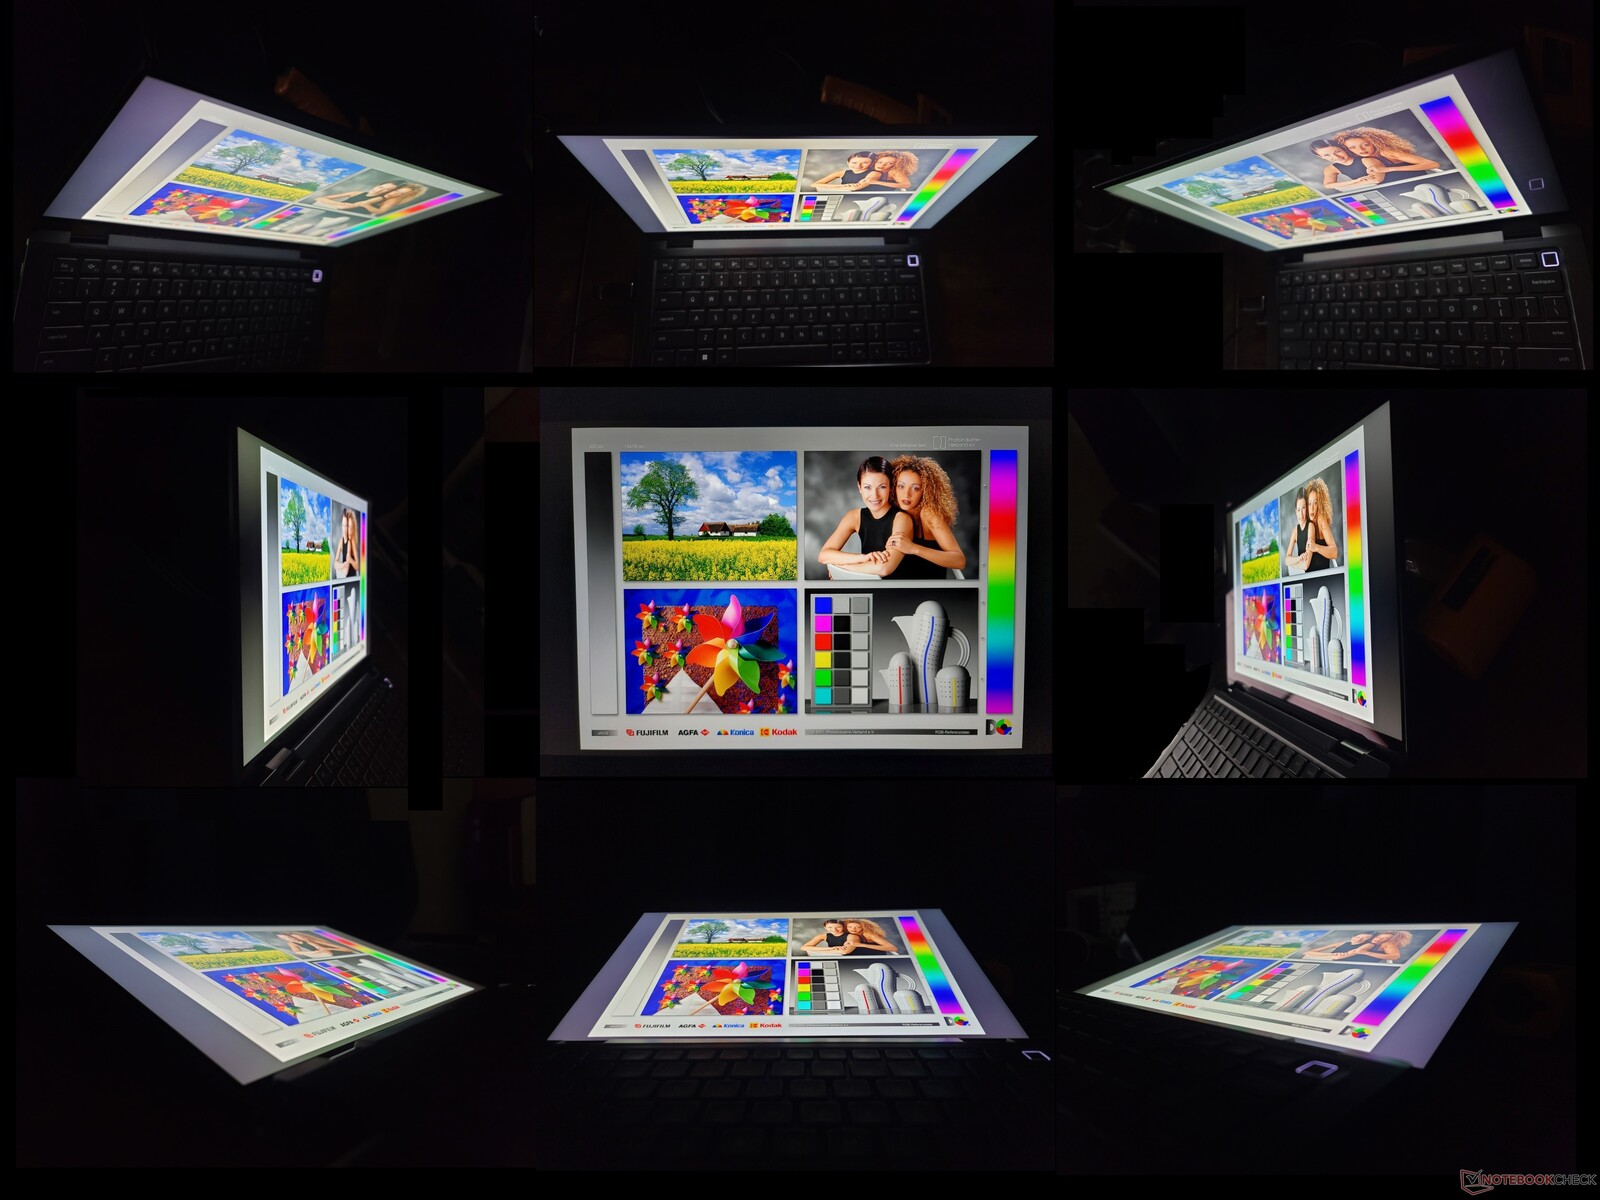
O painel IPS da AU Optronics B140QAN no modelo do ano passado voltou, o que significa que os usuários podem esperar a mesma experiência de visualização entre Latitude 9420 2 em 1 e Latitude 9430 2 em 1. Ainda assim, teria sido ótimo ver ao menos novas opções com taxas de atualização mais rápidas ou mesmo OLED como na última série Asus ZenBook 14 ou HP Spectre. Os tempos de resposta muito lentos de preto e branco e cinza em particular continuam a ser perceptíveis. No entanto, o painel é excelente para cargas de trabalho do tipo escritório, onde os tempos de resposta lentos têm menos impacto.
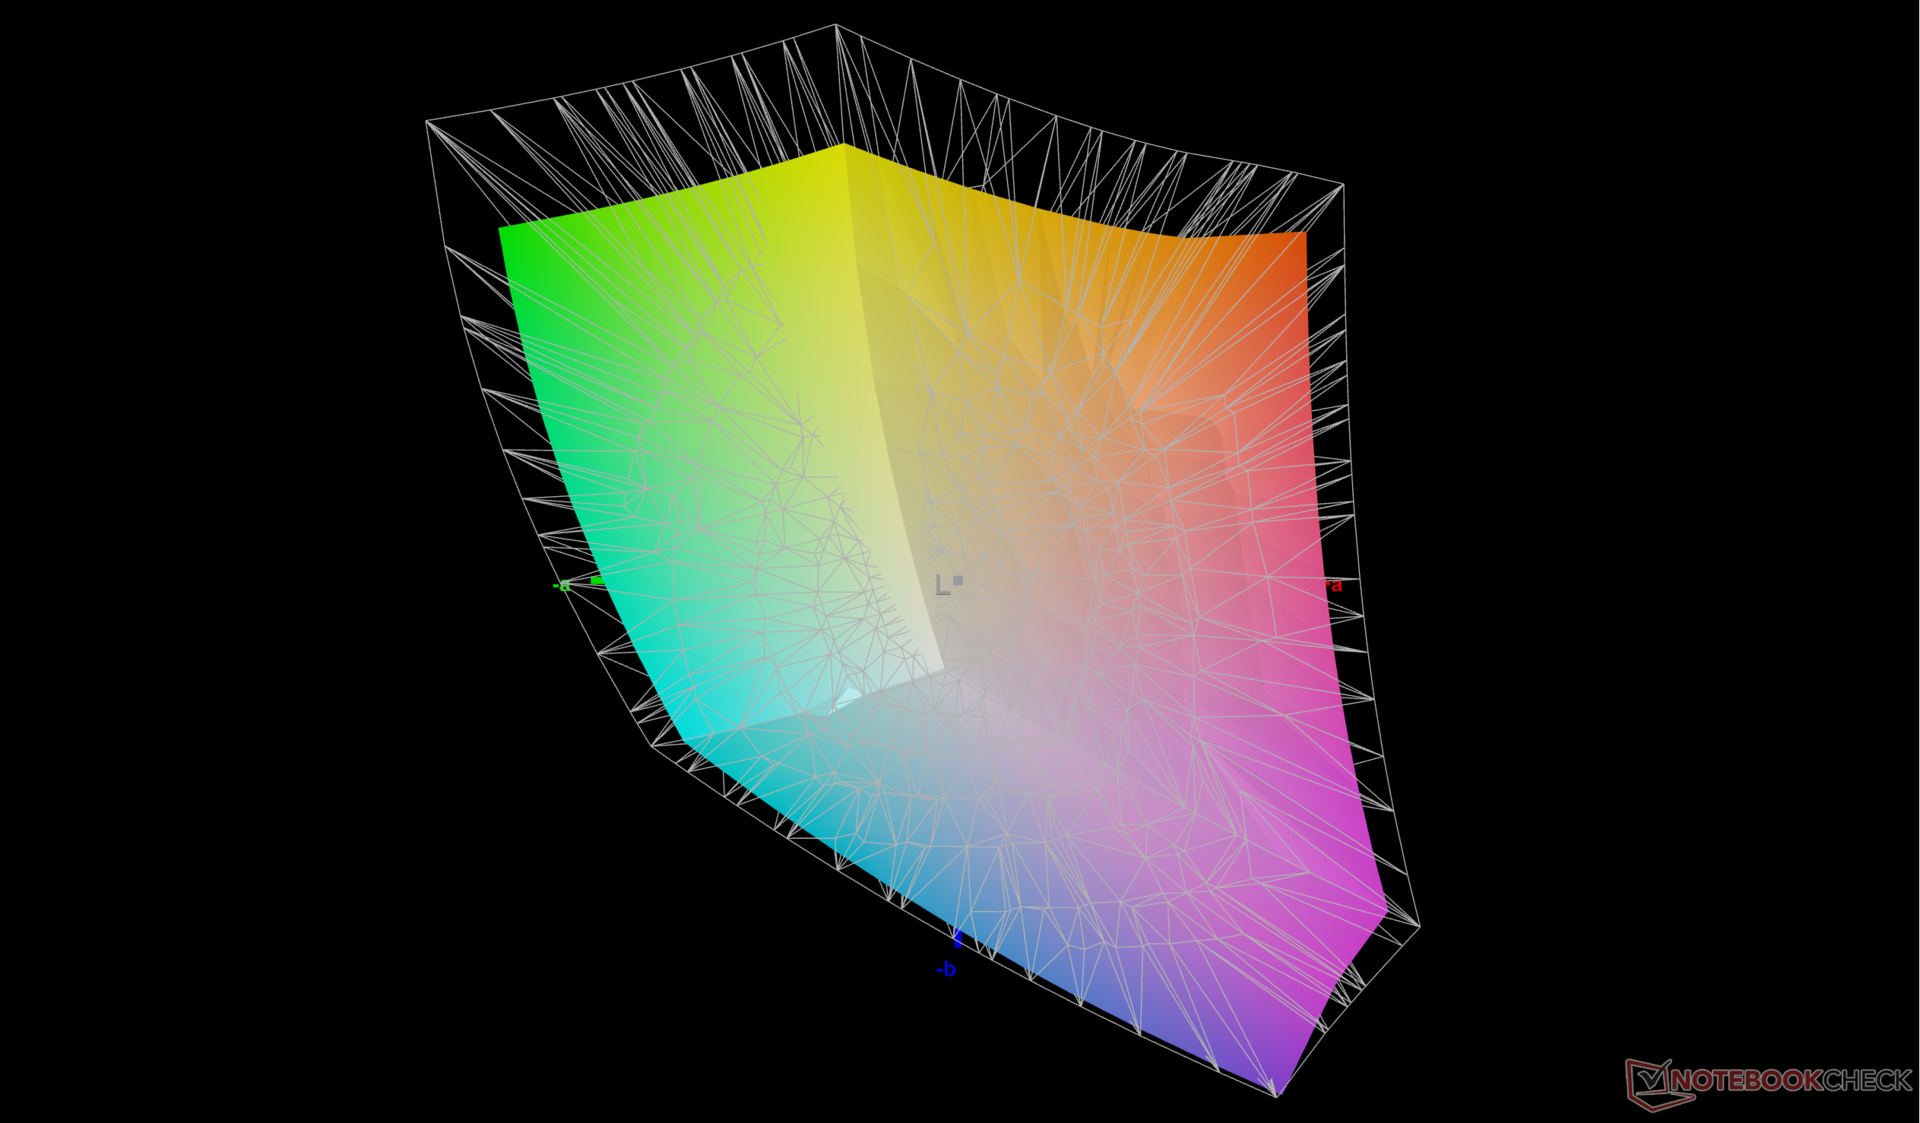
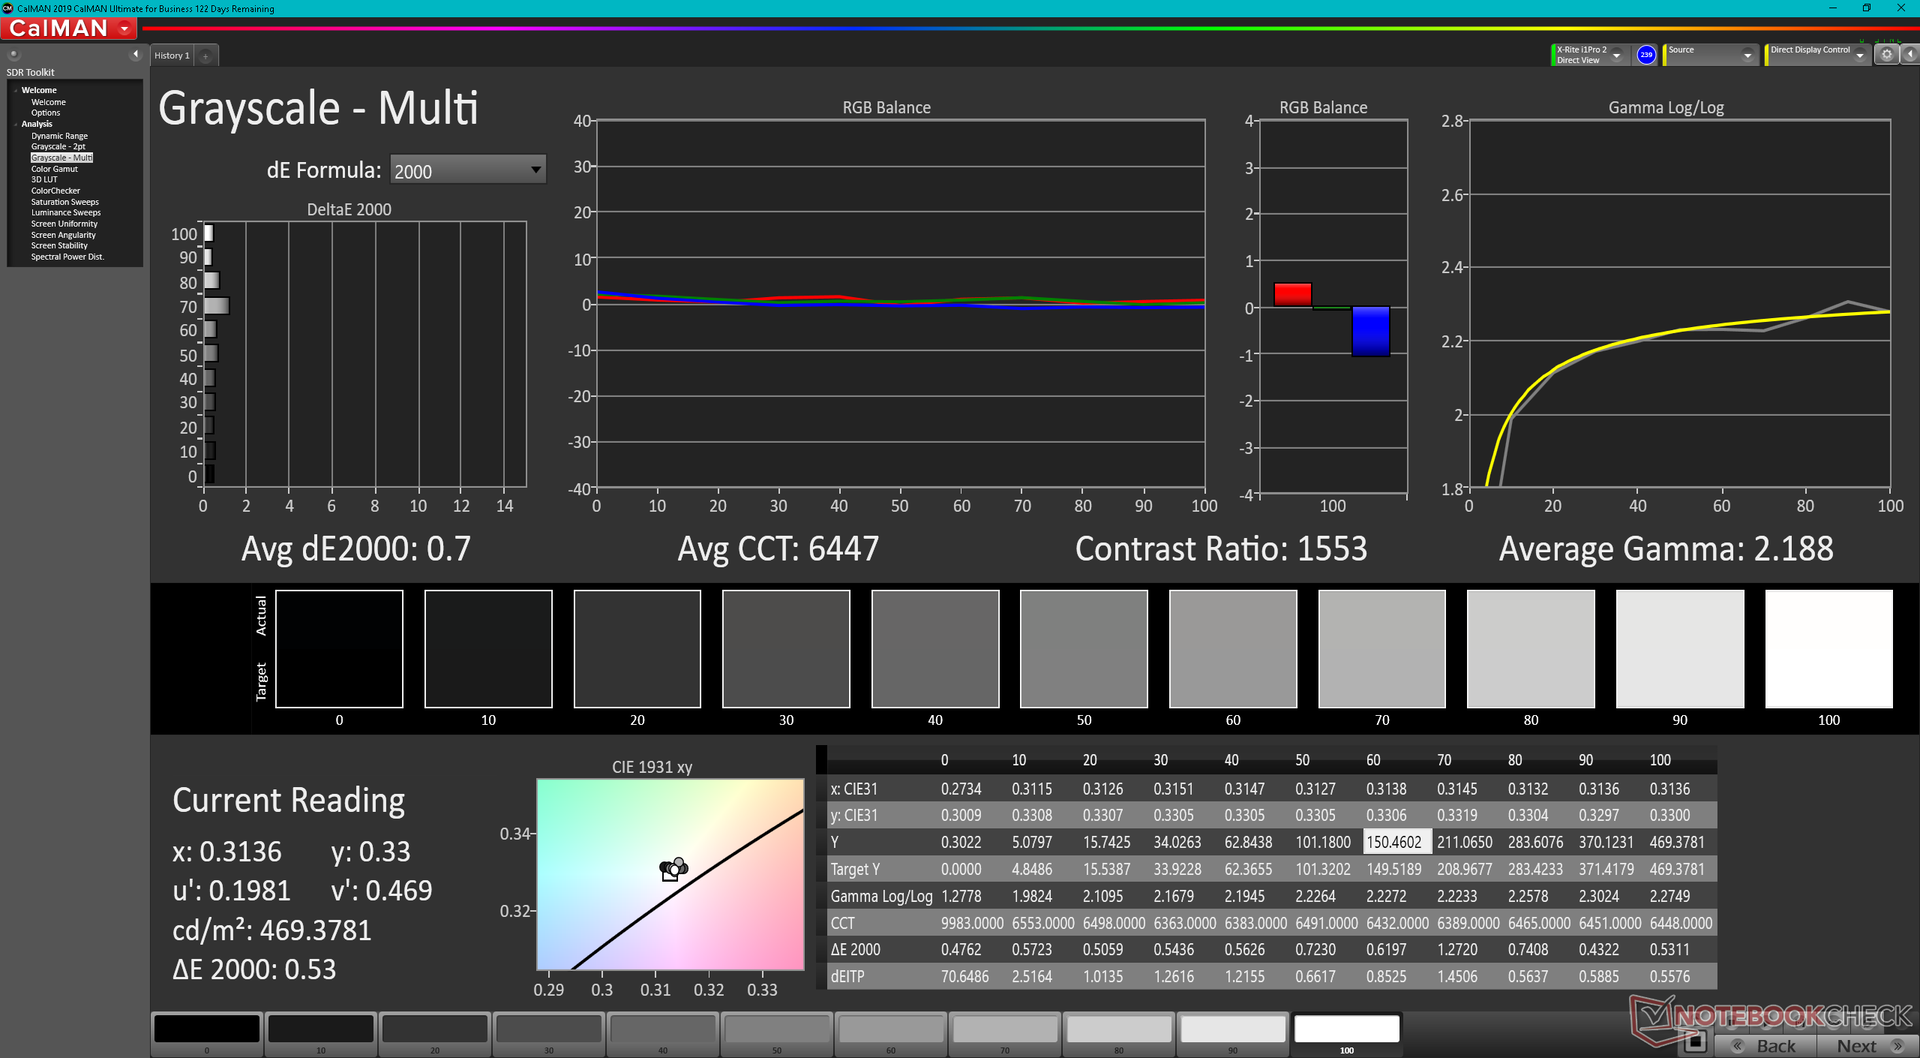
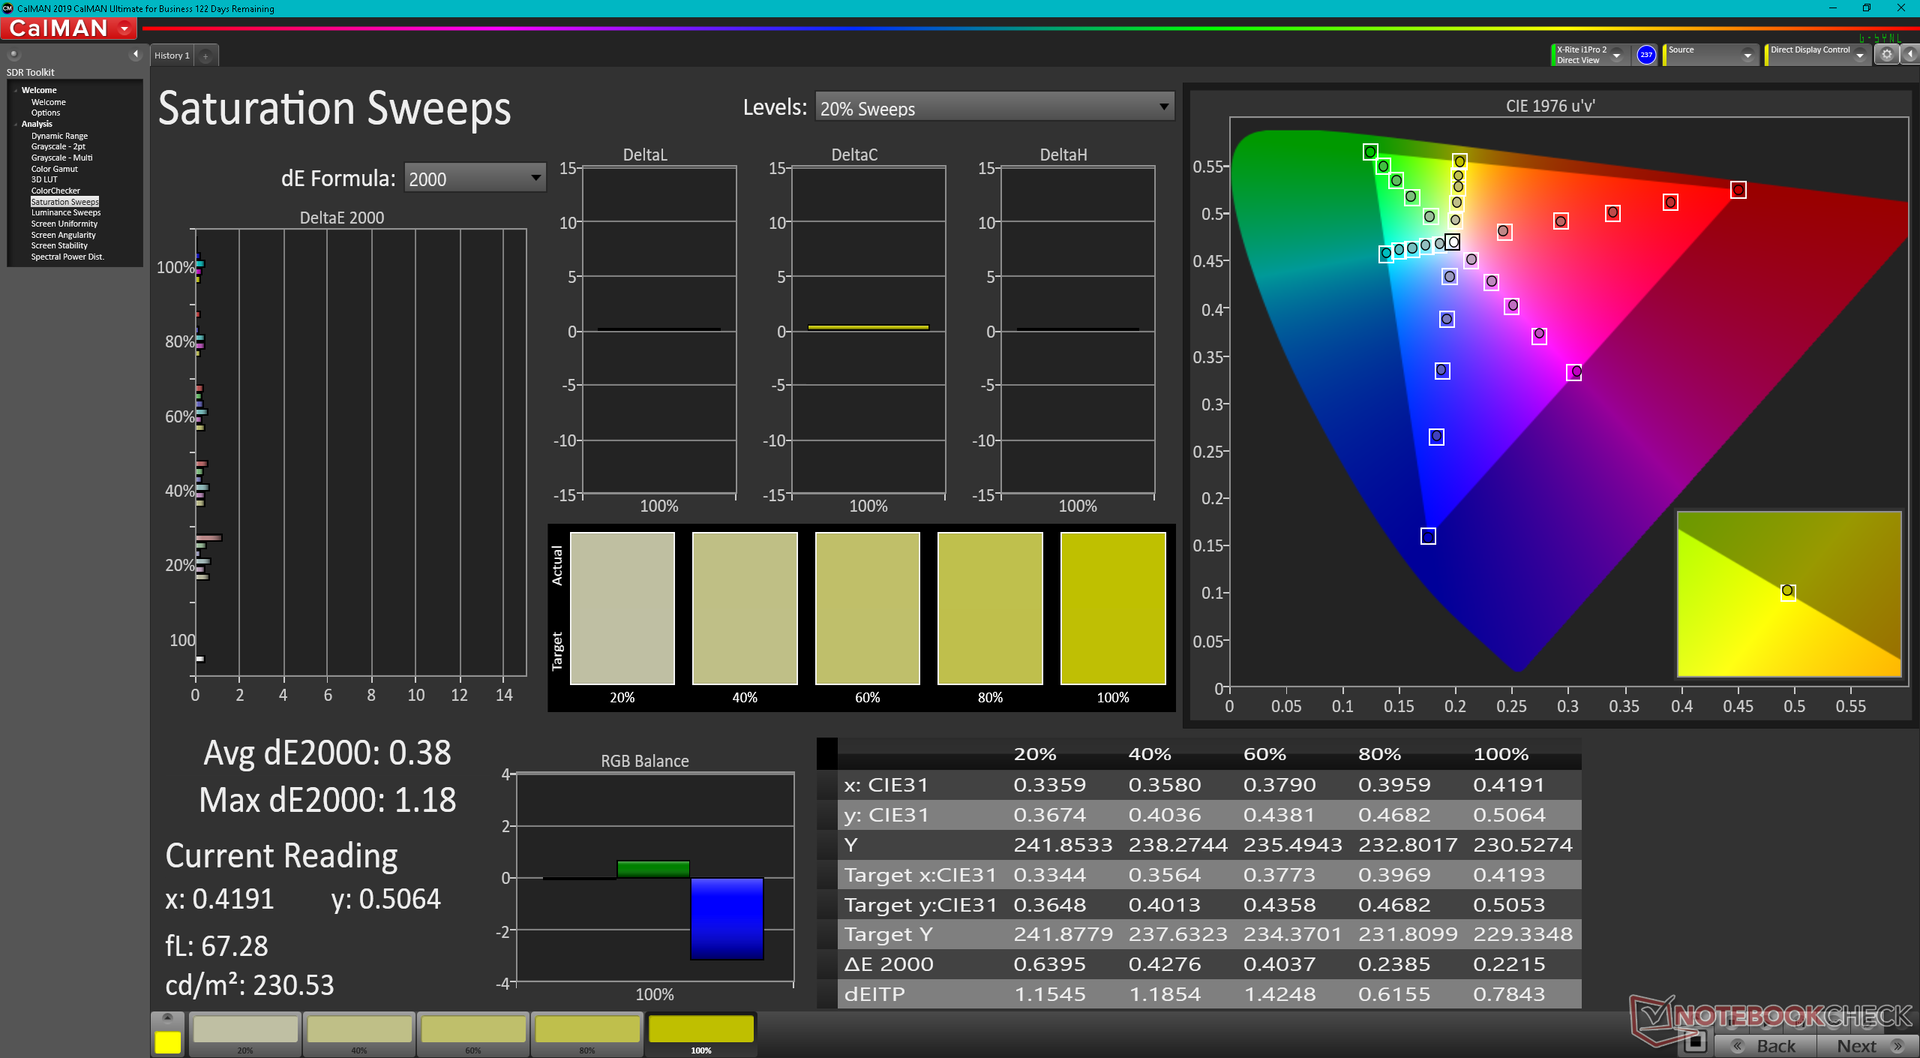
A Dell anuncia uma cobertura completa de sRGB que podemos confirmar independentemente. Não esperaríamos nada menos de um modelo topo de gama Latitude série 9000.
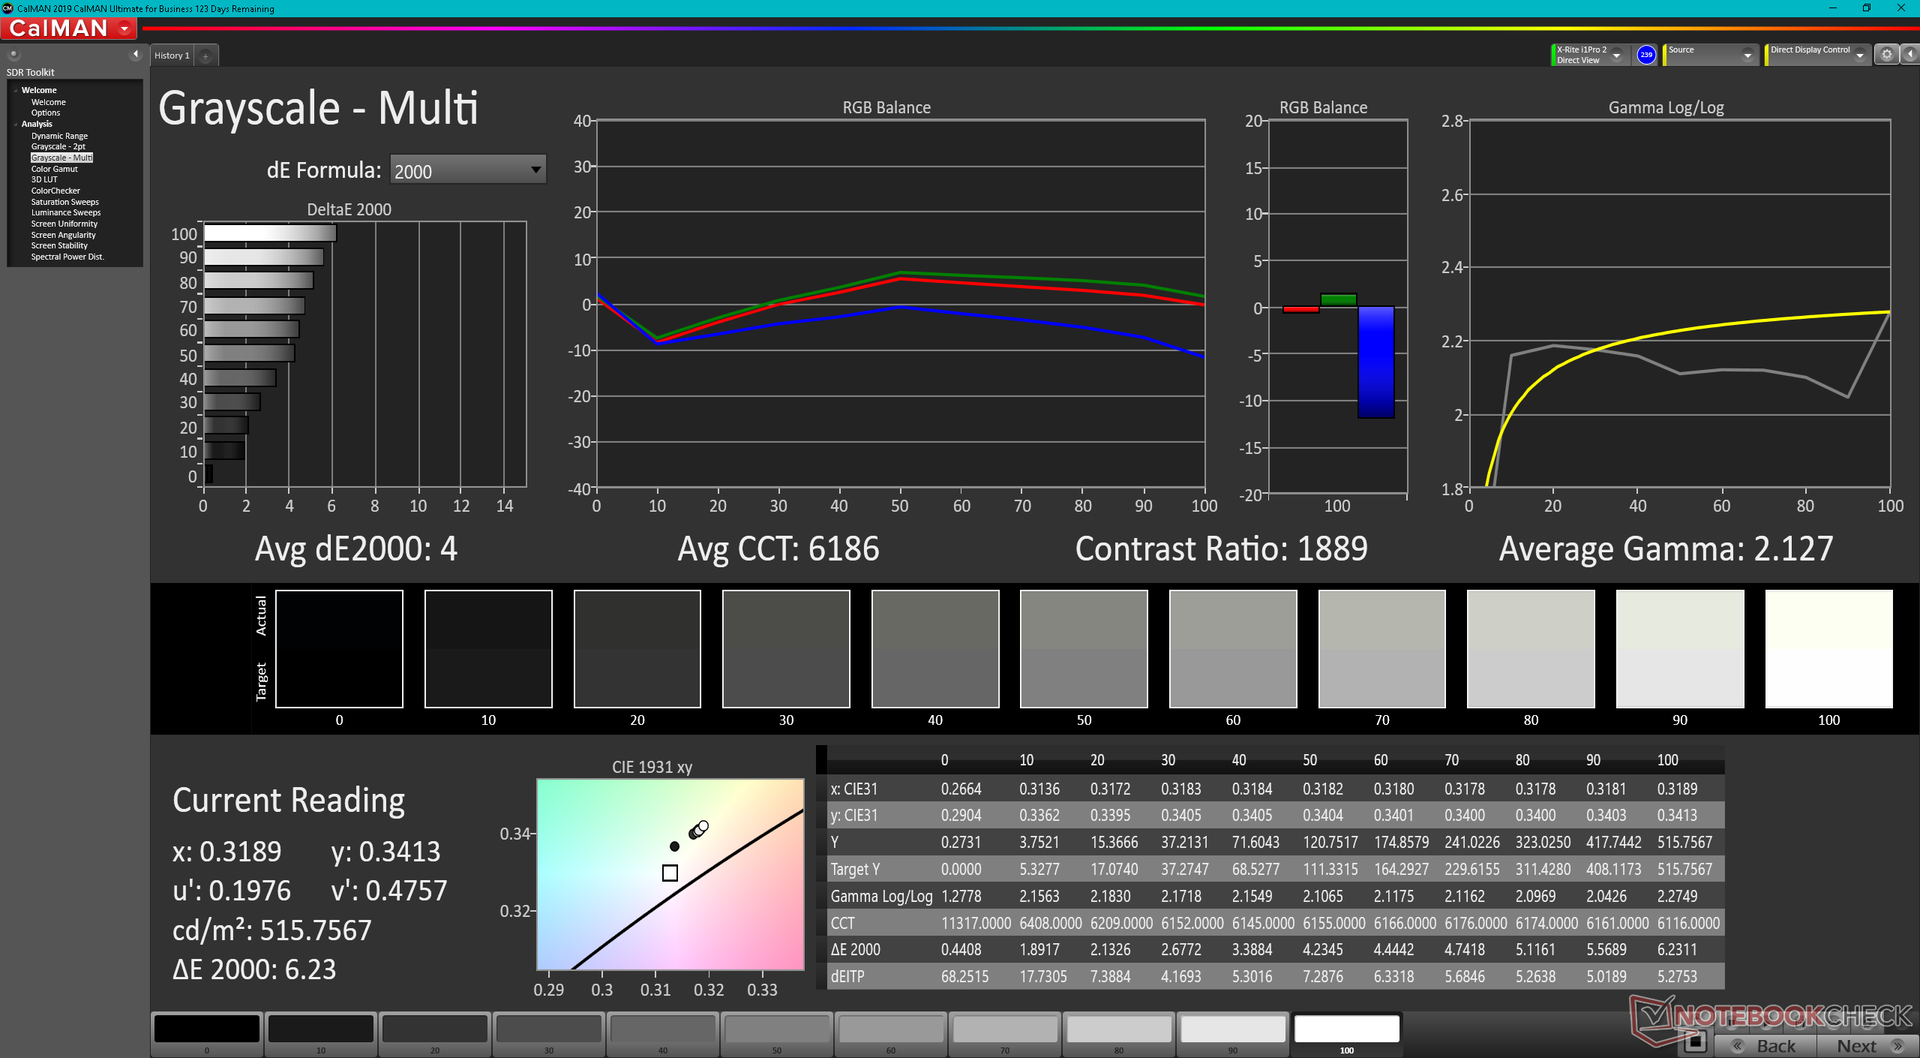
Encontramos um bug em nossa unidade onde o brilho não mudaria dentro da faixa de ajuste de brilho de 0 a 28%. O brilho ficaria preso a 32 lêndeas até que o ajuste atingisse 29 por cento ou mais. A Dell está ciente deste problema.
| |||||||||||||||||||||||||
iluminação: 90 %
iluminação com acumulador: 517.7 cd/m²
Contraste: 1569:1 (Preto: 0.33 cd/m²)
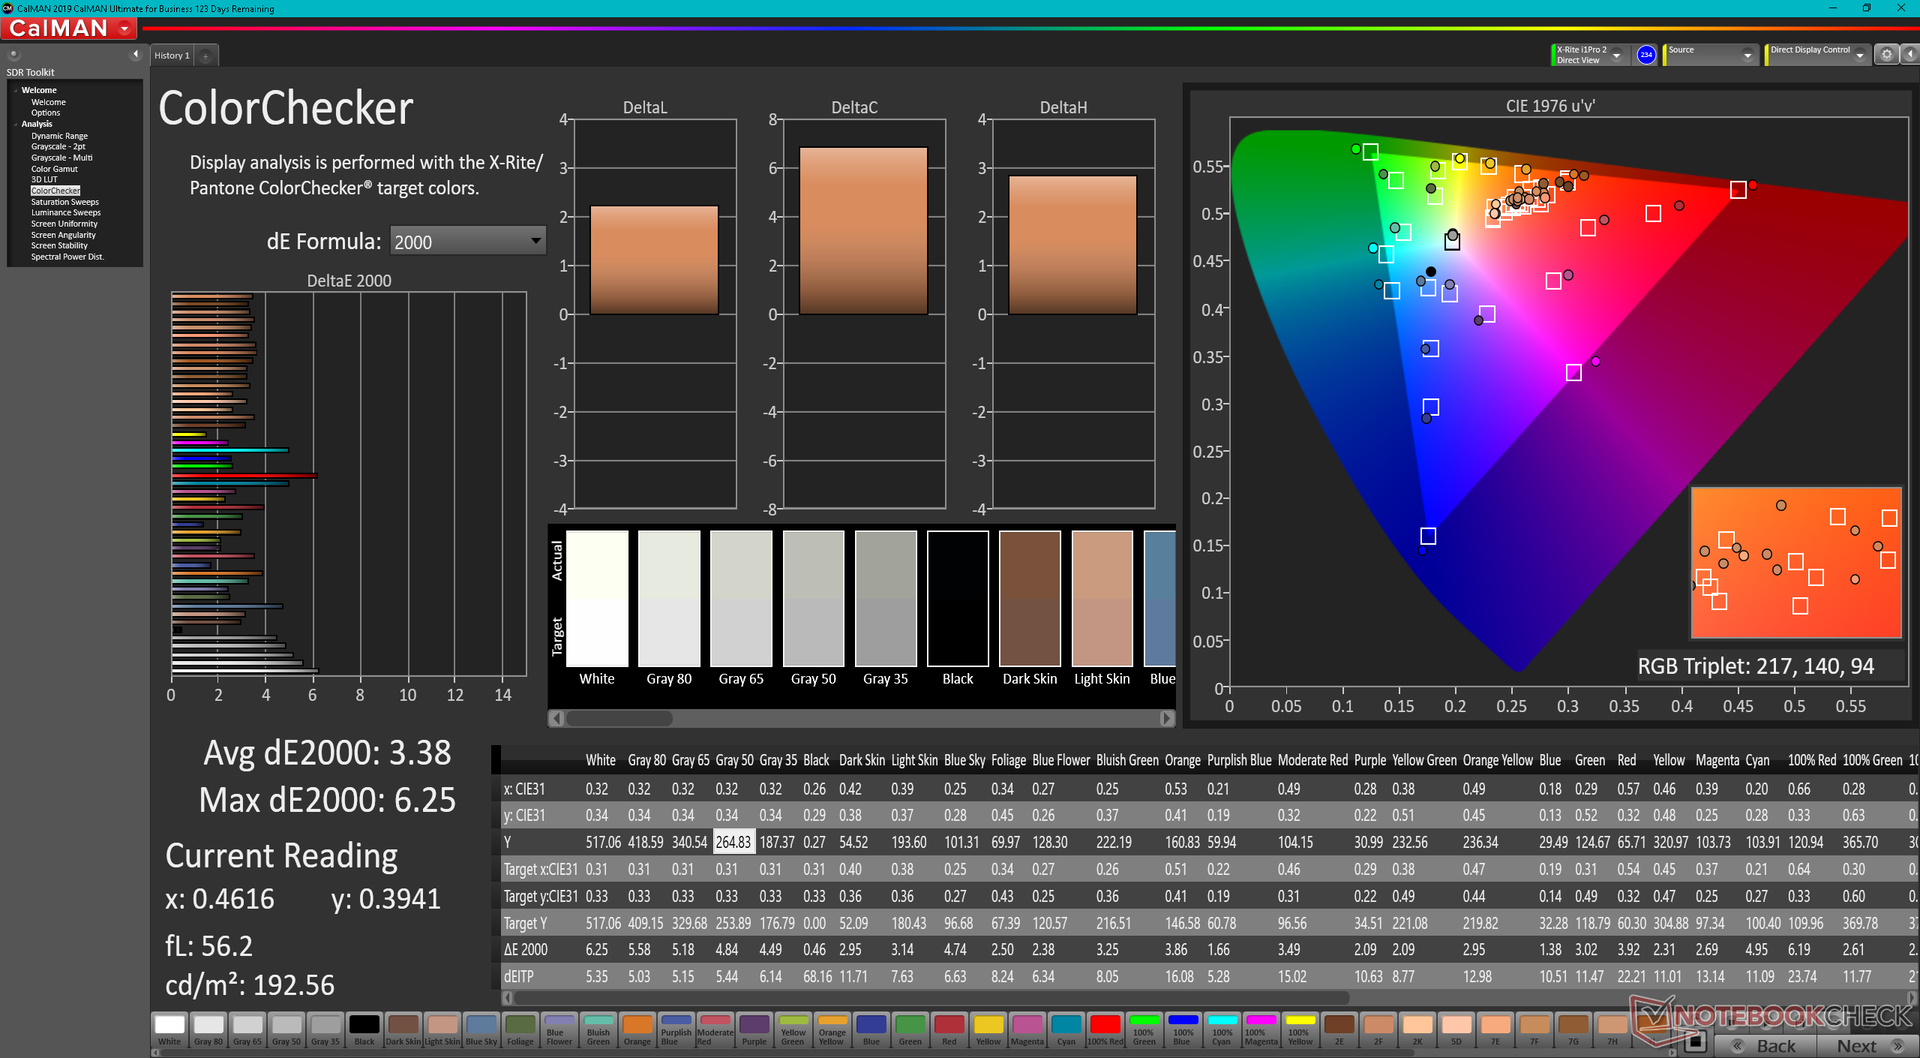
ΔE ColorChecker Calman: 3.38 | ∀{0.5-29.43 Ø4.71}
calibrated: 0.41
ΔE Greyscale Calman: 4 | ∀{0.09-98 Ø4.96}
79.4% AdobeRGB 1998 (Argyll 3D)
100% sRGB (Argyll 3D)
79.4% Display P3 (Argyll 3D)
Gamma: 2.13
CCT: 6186 K
| Dell Latitude 9430 2-in-1 AU Optronics B140QAN, IPS, 2560x1600, 14" | Dell Latitude 9420 2-in-1 AU Optronics B140QAN, IPS, 2560x1600, 14" | MSI Summit E14 Flip Evo A12MT AU Optronics B140QAN04.R, IPS, 2880x1800, 14" | LG Gram 14T90P LG Philips LP140WU1-SPA1, IPS, 1900x1200, 14" | Lenovo ThinkPad X1 Yoga G7 21CE002HGE MNE007JA1-1, IPS, 1920x1200, 14" | Asus ZenBook Flip 14 UN5401QA-KN085W SDC4154, OLED, 2880x1800, 14" | |
|---|---|---|---|---|---|---|
| Display | 1% | 10% | 12% | -8% | 17% | |
| Display P3 Coverage (%) | 79.4 | 80.7 2% | 97.8 23% | 98.8 24% | 69.3 -13% | 99.7 26% |
| sRGB Coverage (%) | 100 | 100 0% | 99.9 0% | 100 0% | 99.7 0% | 100 0% |
| AdobeRGB 1998 Coverage (%) | 79.4 | 79.7 0% | 85.9 8% | 71.3 -10% | 98.6 24% | |
| Response Times | 9% | 64% | 21% | 34% | 96% | |
| Response Time Grey 50% / Grey 80% * (ms) | 63.6 ? | 54 ? 15% | 16.9 ? 73% | 44 ? 31% | 42 ? 34% | 2 ? 97% |
| Response Time Black / White * (ms) | 33.6 ? | 32.8 ? 2% | 15.4 ? 54% | 30 ? 11% | 22.4 ? 33% | 2 ? 94% |
| PWM Frequency (Hz) | ||||||
| Screen | -45% | -33% | -5% | 8% | -80% | |
| Brightness middle (cd/m²) | 517.7 | 483.6 -7% | 496.7 -4% | 305.5 -41% | 371 -28% | 366 -29% |
| Brightness (cd/m²) | 493 | 465 -6% | 468 -5% | 289 -41% | 363 -26% | 369 -25% |
| Brightness Distribution (%) | 90 | 92 2% | 87 -3% | 87 -3% | 92 2% | 96 7% |
| Black Level * (cd/m²) | 0.33 | 0.32 3% | 0.3 9% | 0.27 18% | 0.21 36% | |
| Contrast (:1) | 1569 | 1511 -4% | 1656 6% | 1131 -28% | 1767 13% | |
| Colorchecker dE 2000 * | 3.38 | 3.69 -9% | 3.93 -16% | 3.31 2% | 1.3 62% | 2.84 16% |
| Colorchecker dE 2000 max. * | 6.25 | 5.97 4% | 7.9 -26% | 6.12 2% | 2.6 58% | 5.29 15% |
| Colorchecker dE 2000 calibrated * | 0.41 | 2.05 -400% | 1.27 -210% | 0.8 -95% | 2.81 -585% | |
| Greyscale dE 2000 * | 4 | 3.5 12% | 5.9 -48% | 1.9 52% | 2.1 47% | 2.32 42% |
| Gamma | 2.13 103% | 2.04 108% | 2.04 108% | 2.04 108% | 2.15 102% | 2.44 90% |
| CCT | 6186 105% | 6158 106% | 7618 85% | 6706 97% | 6759 96% | 6170 105% |
| Média Total (Programa/Configurações) | -12% /
-28% | 14% /
-10% | 9% /
2% | 11% /
8% | 11% /
-27% |
* ... menor é melhor
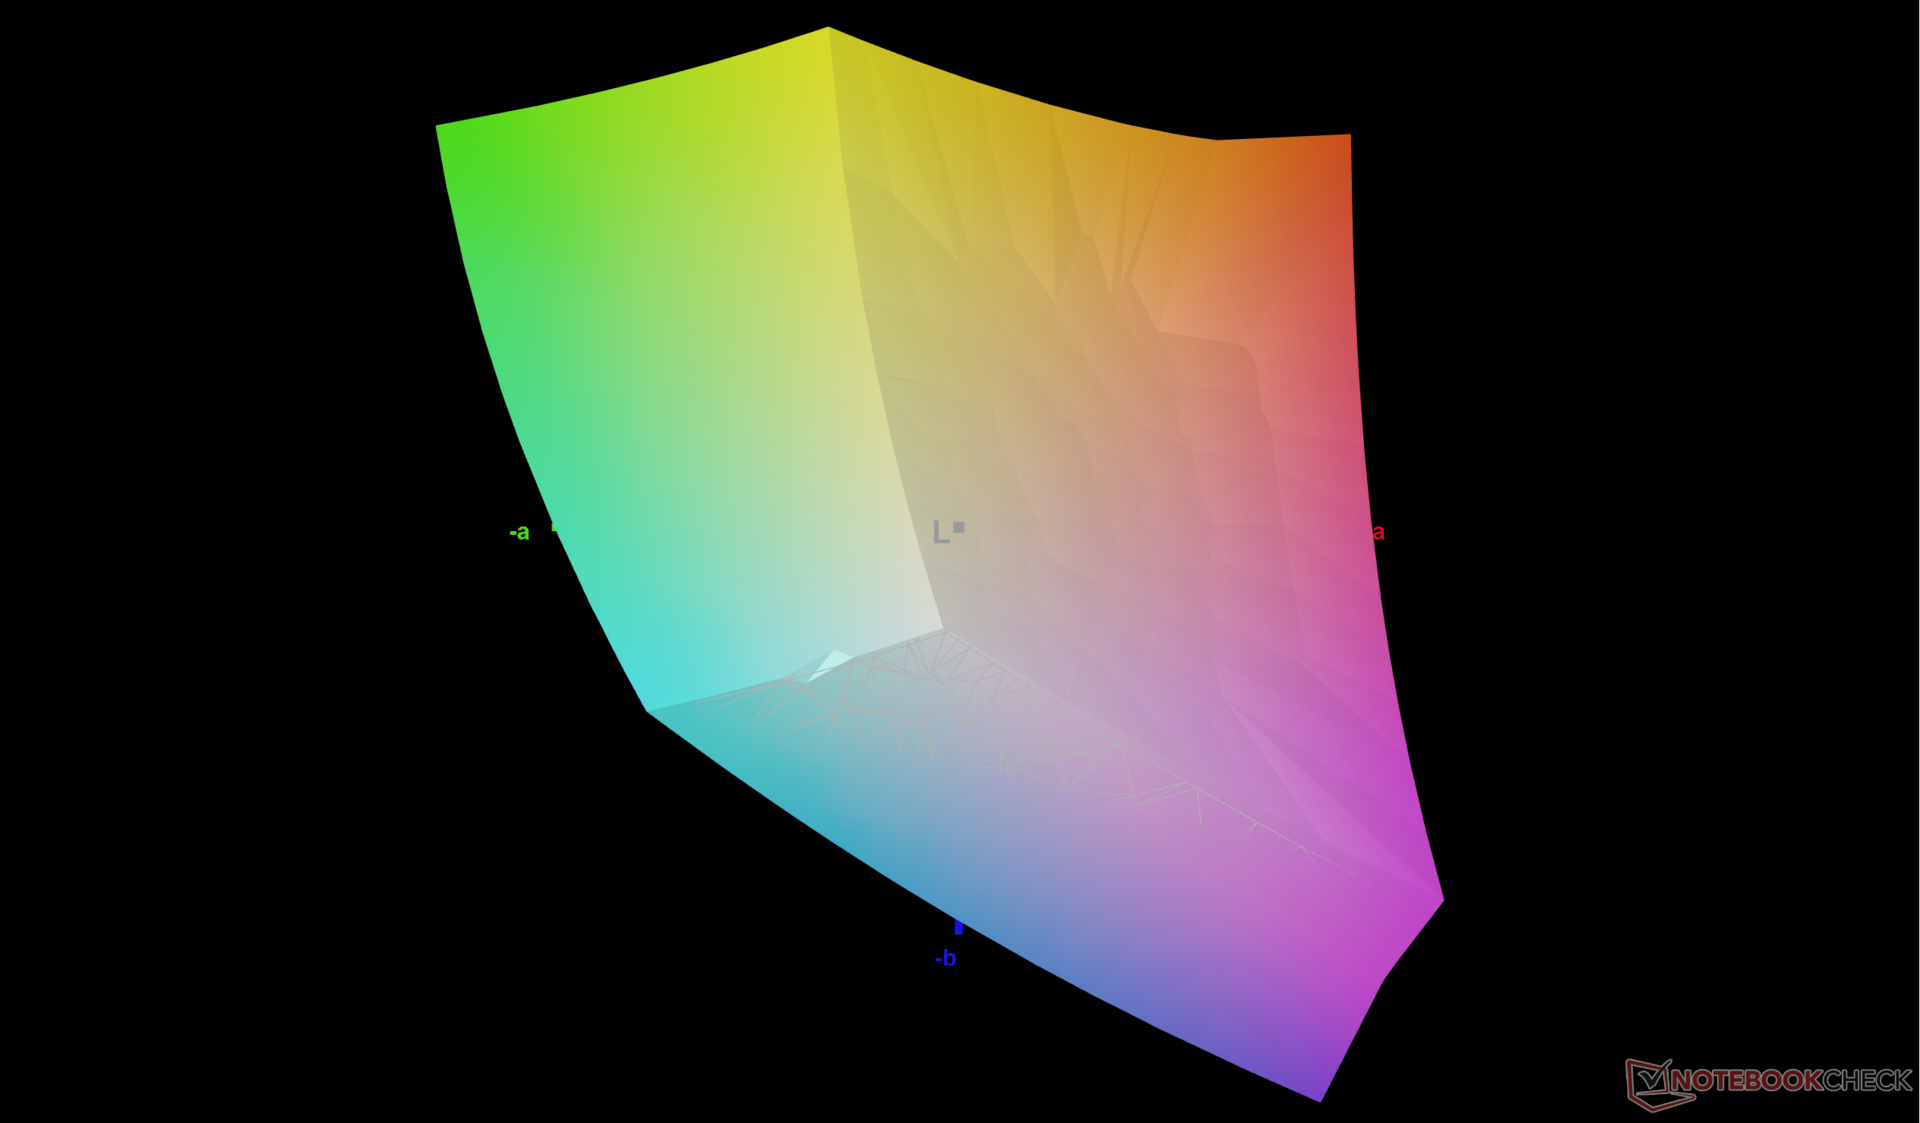
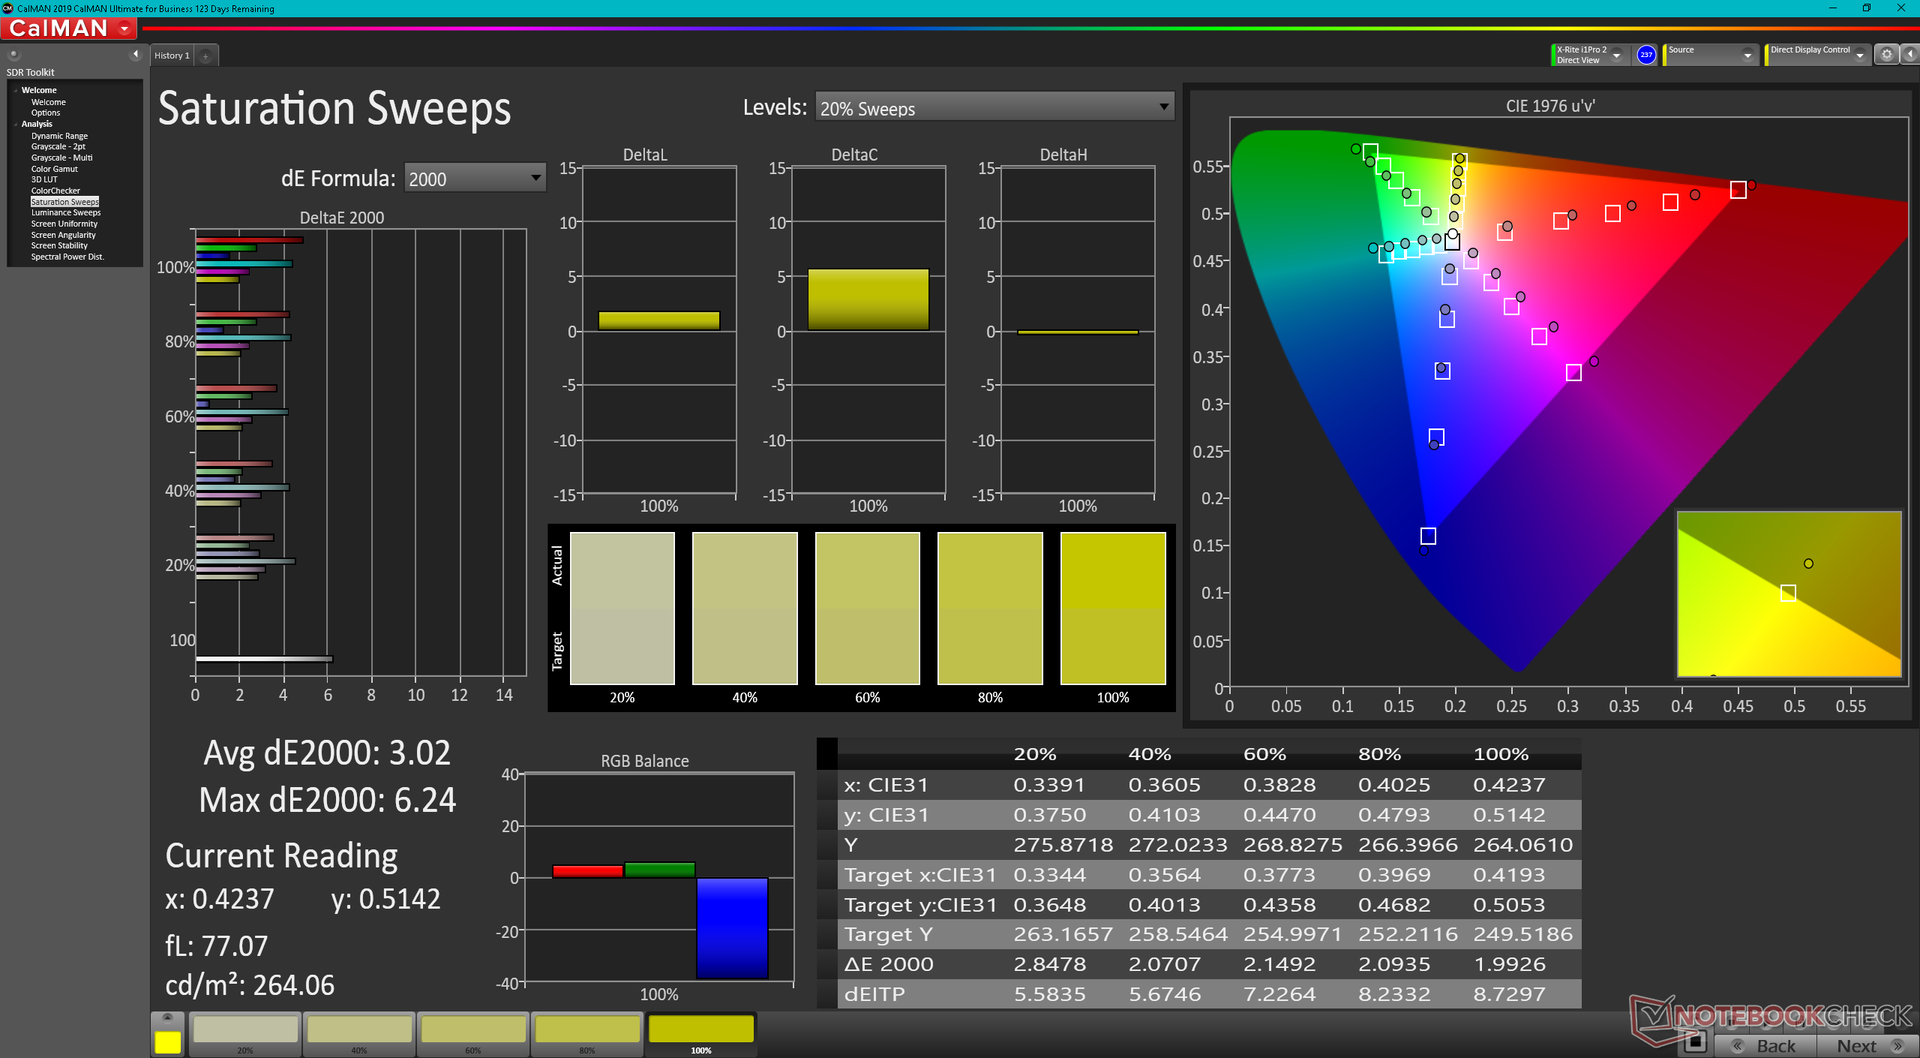
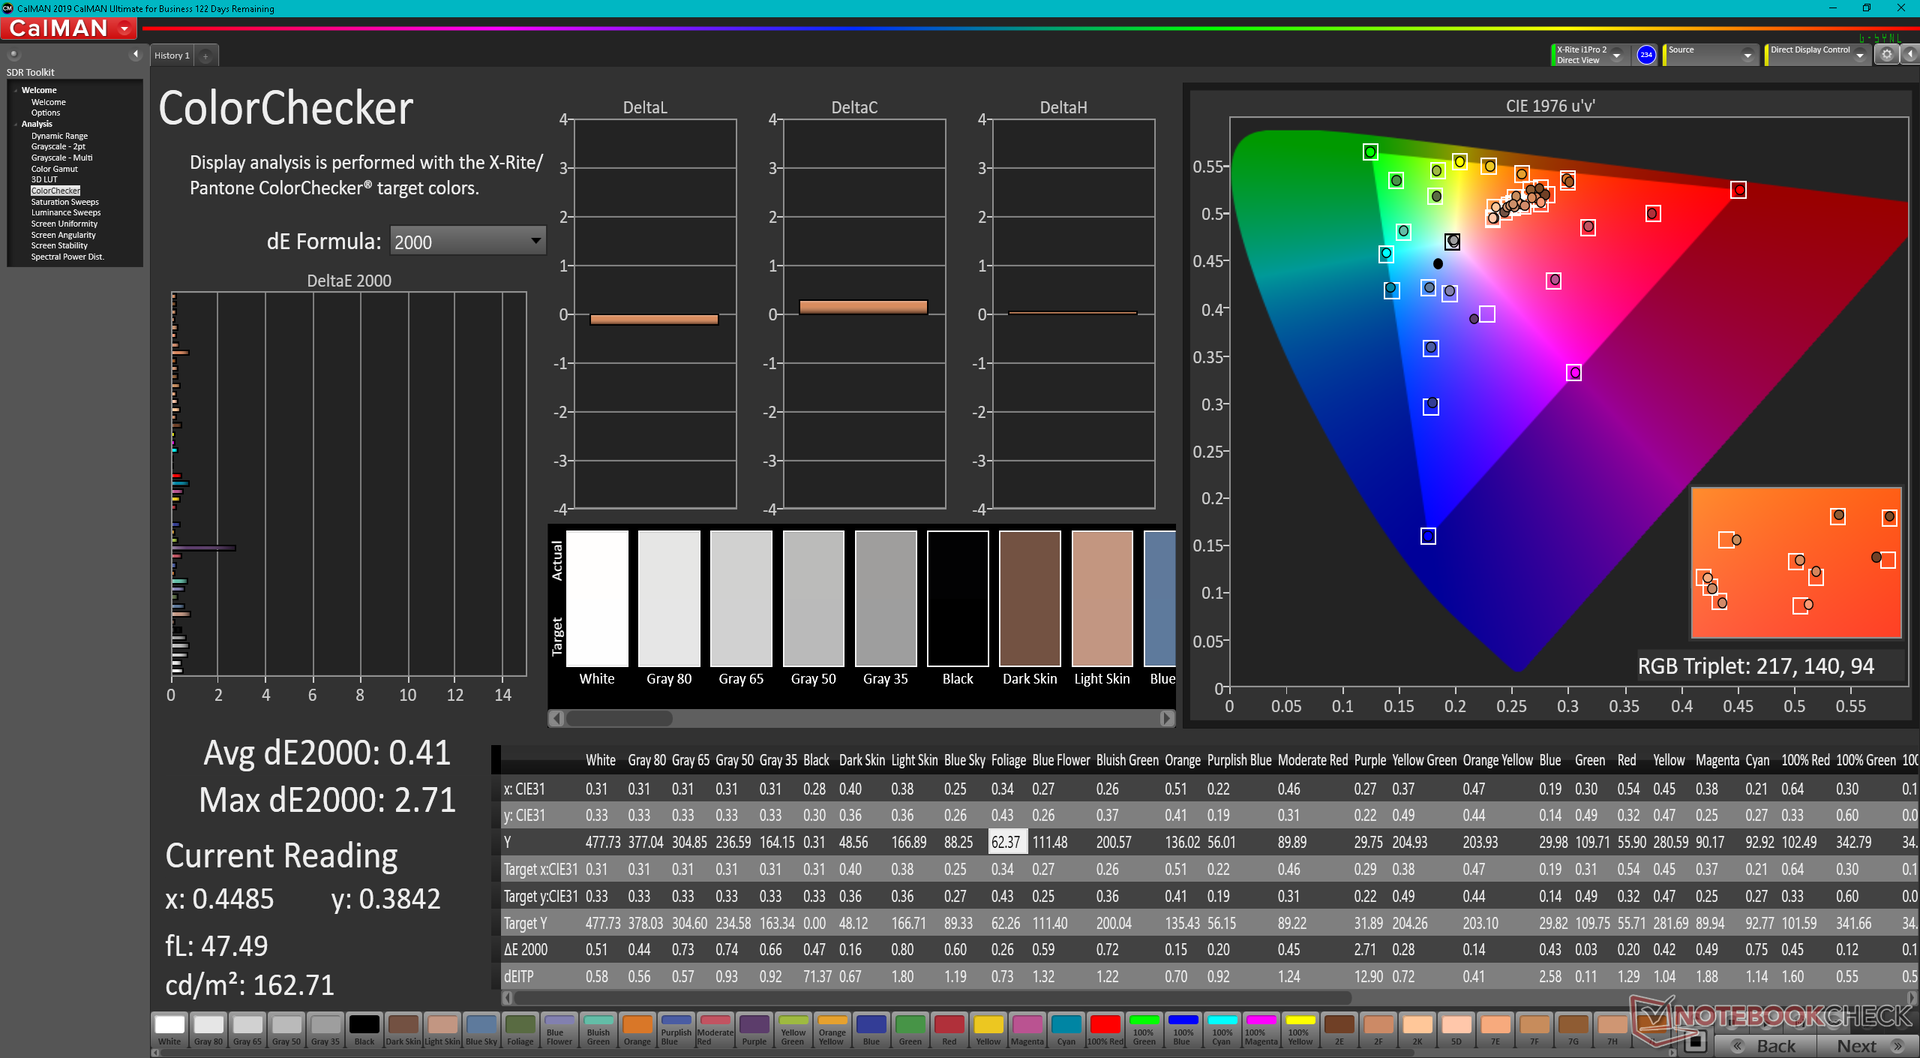
O display não está muito bem calibrado fora da caixa com valores médios de escala de cinza e cor DeltaE em 4 e 3,38, respectivamente. Conseguimos baixar estes valores médios para apenas 0,7 e 0,41 com um colorímetro X-Rite. Recomendamos instalar nosso perfil ICM acima para melhor explorar toda a cobertura sRGB do painel.
Exibir tempos de resposta
| ↔ Tempo de resposta preto para branco | ||
|---|---|---|
| 33.6 ms ... ascensão ↗ e queda ↘ combinadas | ↗ 17.2 ms ascensão | 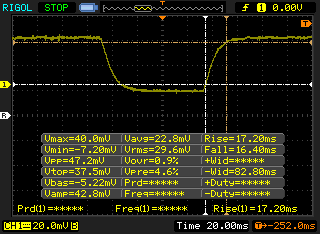 |
| ↘ 16.4 ms queda | ||
| A tela mostra taxas de resposta lentas em nossos testes e será insatisfatória para os jogadores. Em comparação, todos os dispositivos testados variam de 0.1 (mínimo) a 240 (máximo) ms. » 90 % de todos os dispositivos são melhores. Isso significa que o tempo de resposta medido é pior que a média de todos os dispositivos testados (19.8 ms). | ||
| ↔ Tempo de resposta 50% cinza a 80% cinza | ||
| 63.6 ms ... ascensão ↗ e queda ↘ combinadas | ↗ 33.2 ms ascensão | 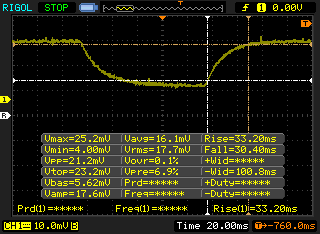 |
| ↘ 30.4 ms queda | ||
| A tela mostra taxas de resposta lentas em nossos testes e será insatisfatória para os jogadores. Em comparação, todos os dispositivos testados variam de 0.165 (mínimo) a 636 (máximo) ms. » 97 % de todos os dispositivos são melhores. Isso significa que o tempo de resposta medido é pior que a média de todos os dispositivos testados (31 ms). | ||
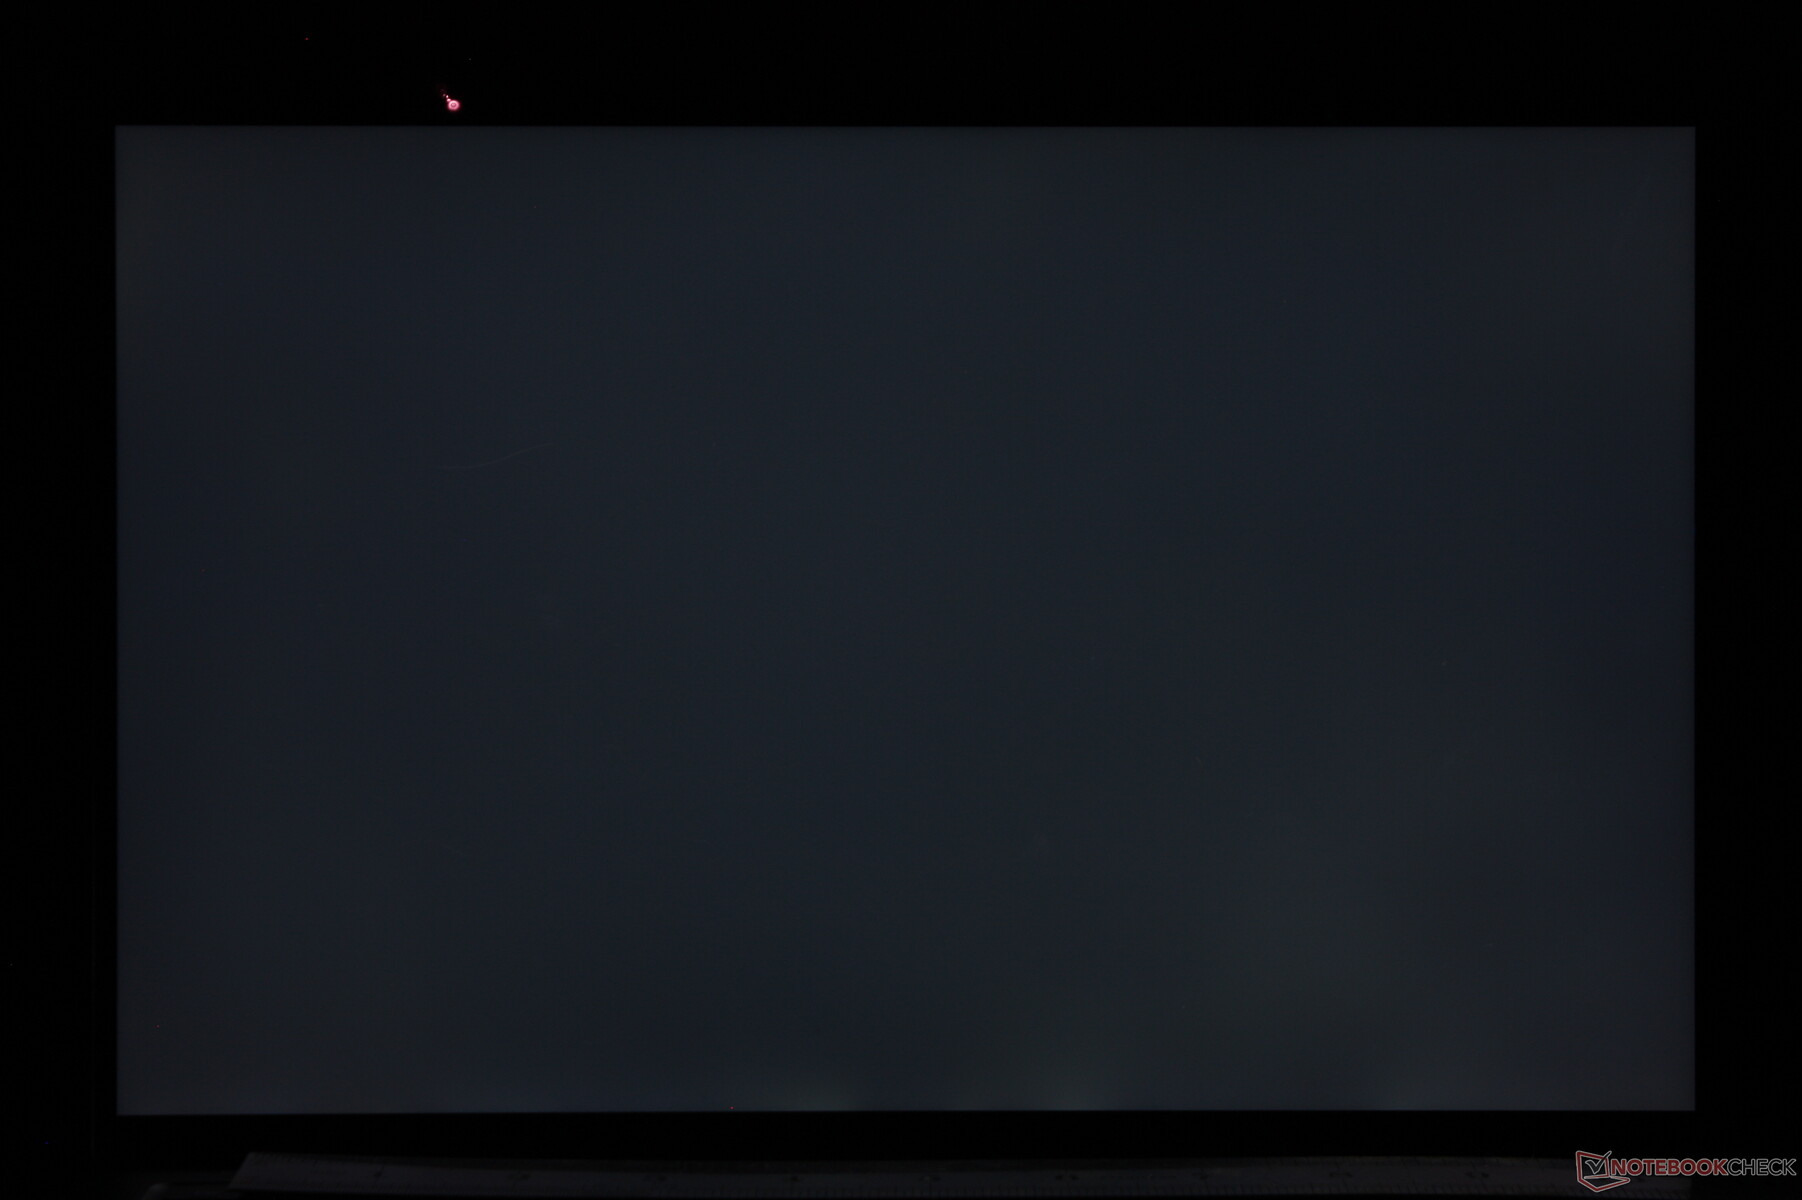
Cintilação da tela / PWM (modulação por largura de pulso)
| Tela tremeluzindo / PWM não detectado | 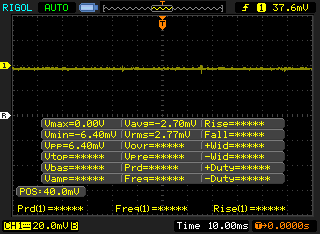 | ||
[pwm_comparison] Em comparação: 52 % de todos os dispositivos testados não usam PWM para escurecer a tela. Se PWM foi detectado, uma média de 7757 (mínimo: 5 - máximo: 343500) Hz foi medida. | |||
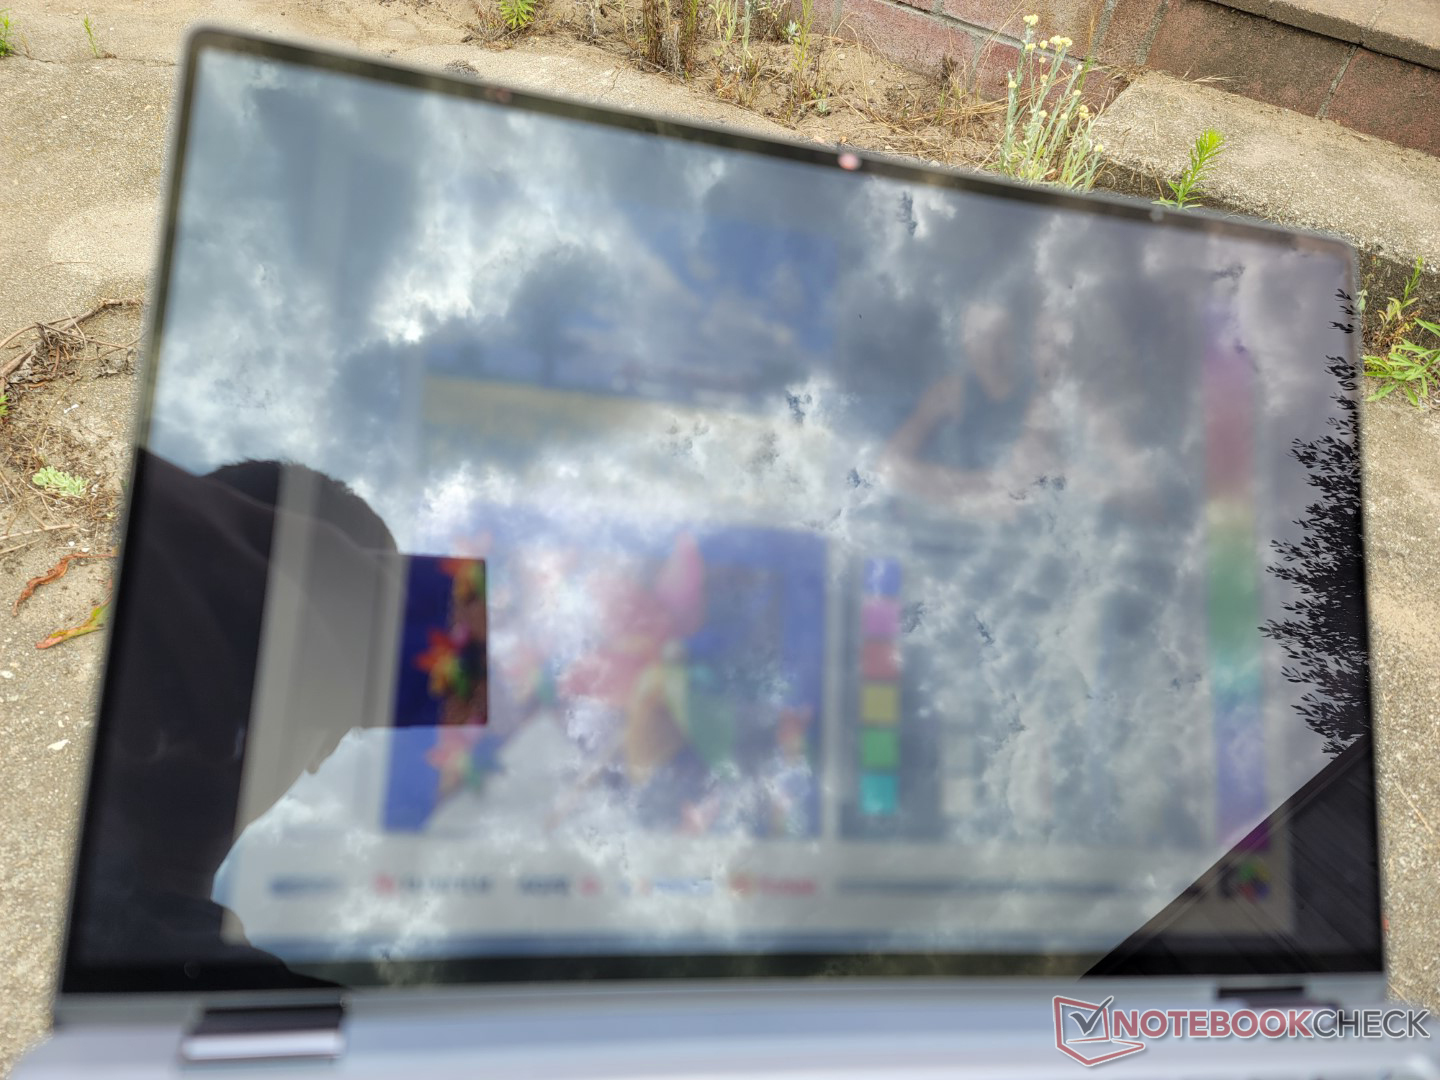
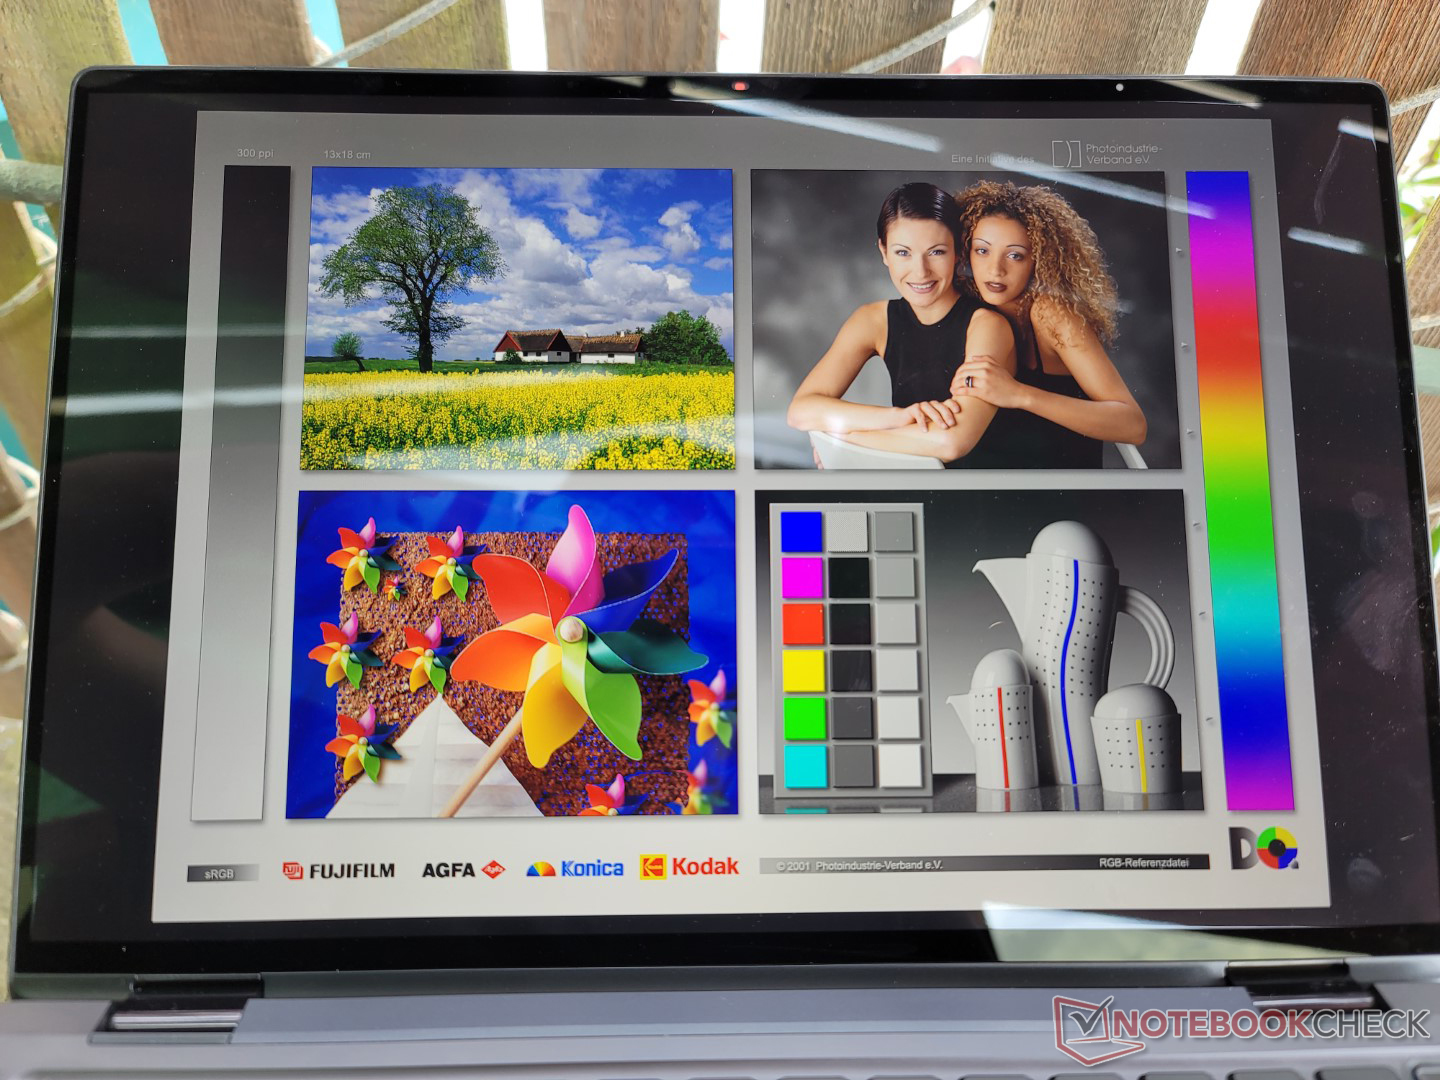
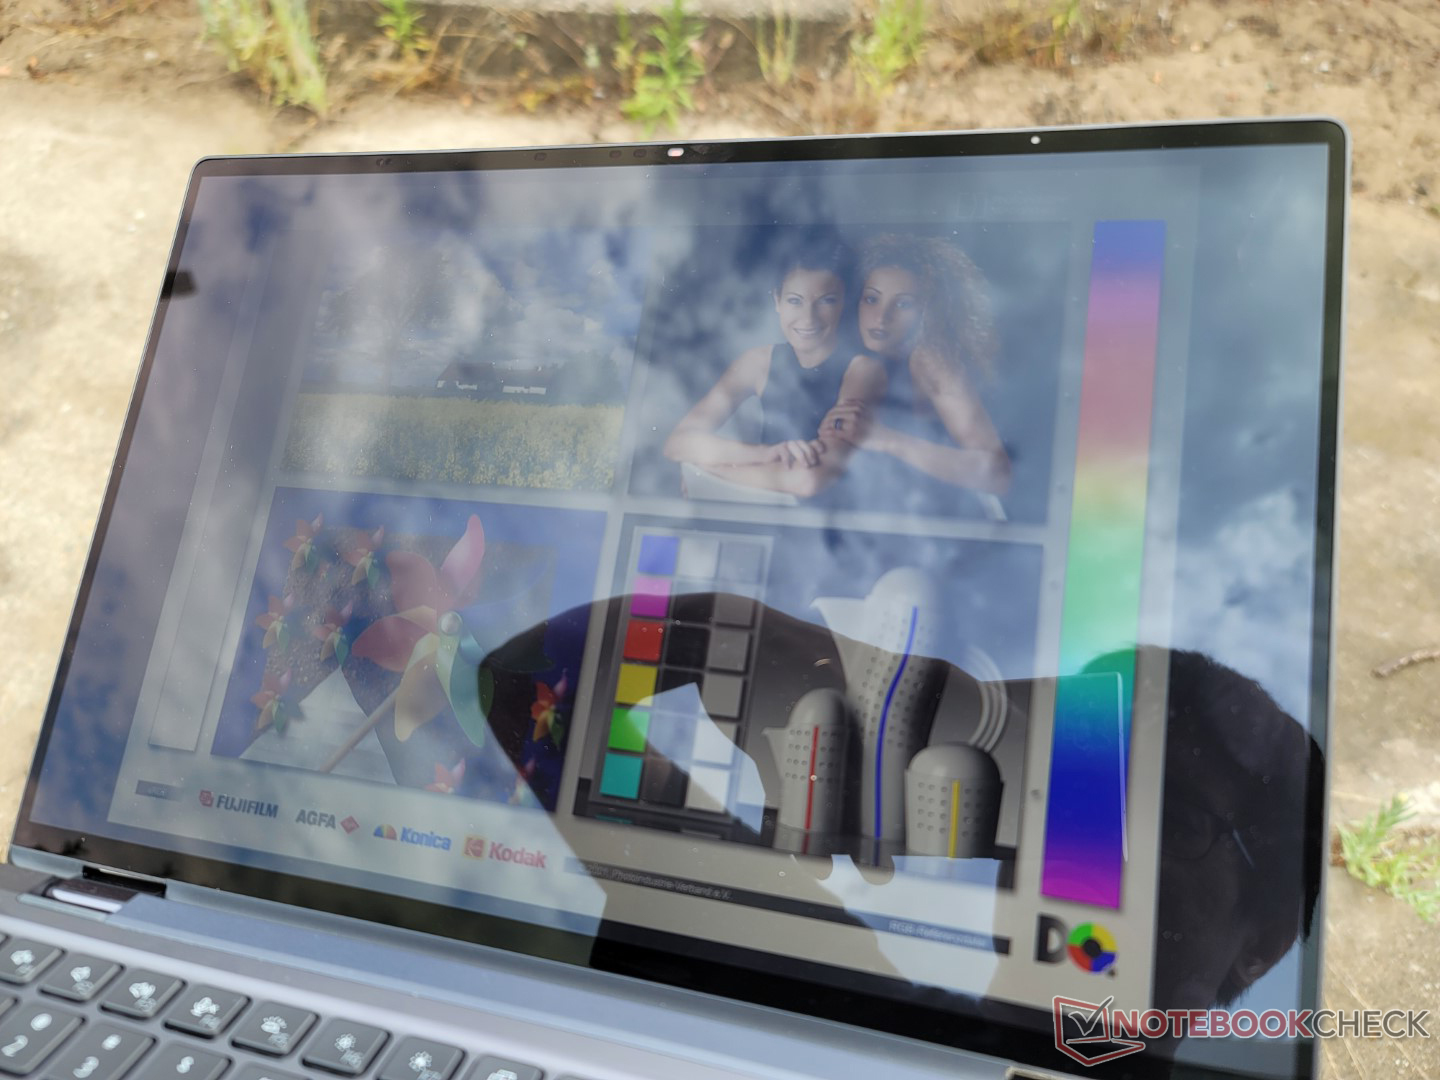
Com 500 lêndeas, a tela é mais brilhante do que em muitos outros laptops de 14 polegadas para uma melhor visibilidade externa do que oLenovo ThinkPad X1 Yoga G7 ou LG Gram 16 2 em 1. No entanto, o brilho ainda é inevitável na maioria dos cenários, mas na tela o texto e as imagens permanecem claros e coloridos se trabalharem sob a sombra.
Desempenho
Condições de teste
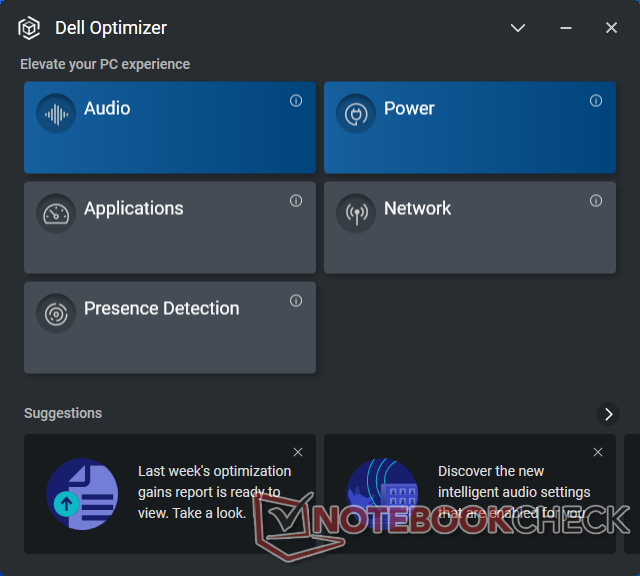
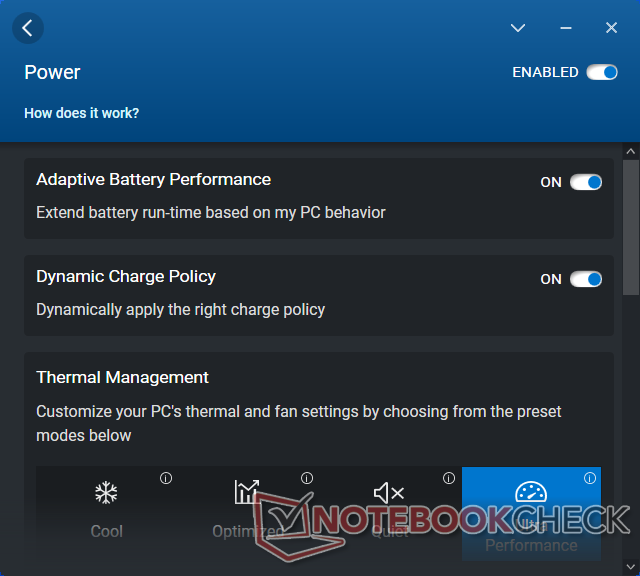
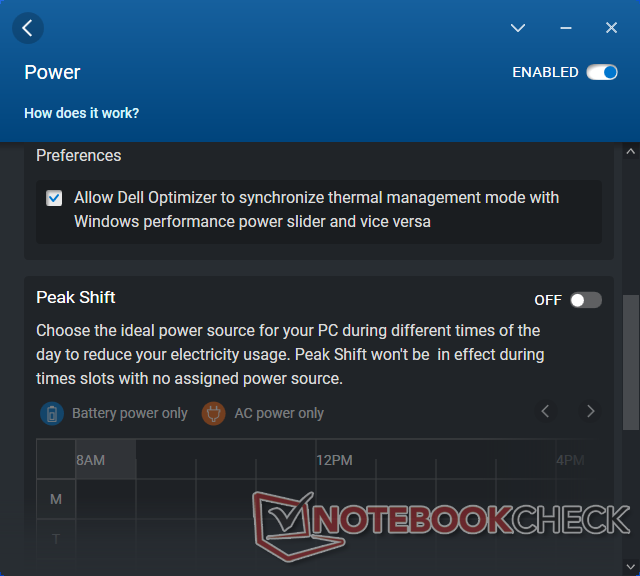
Ajustamos nossa unidade para o modo Ultra Performance através do software Dell Optimizer antes de executar quaisquer benchmarks abaixo. Adoramos que o Optimizer tenha uma configuração para sincronizar as configurações de perfil de potência do Windows com a configuração atual de desempenho do Optimizer. Por exemplo, se o Otimizador estiver configurado para o modo Silencioso, então o perfil de potência do Windows mudará automaticamente para o modo Power Saver. Se o Otimizador estiver configurado para o modo Ultra Performance, então o Windows mudará automaticamente para seu modo de Performance equivalente e assim por diante. Isto resolve o problema de ter configurações térmicas conflitantes em múltiplas aplicações (ou seja, Windows ajustado para o modo Power Saver enquanto o Optimizer está ajustado para o modo Ultra Performance)
Curiosamente, o Otimizador não pode ser maximizado e, portanto, seu tamanho de janela muito pequeno é corrigido. Por ter tantos botões e opções, o aplicativo poderia definitivamente se beneficiar de uma IU maior.
Processador
Ganhos da CPU sobre a 11ª geração Núcleo i7-1185G7 no ano passado Latitude 9420 2 em 1 são significativos, especialmente em termos de desempenho multi-tarefa. Nosso Core i7-1265U oferece um desempenho de rosca única e rosca múltipla 20% e 55% mais rápido, respectivamente, quando comparado com o Core i7-1185G7. A CPU é até mesmo capaz de ficar de pé, do pescoço para o pescoço, com o Núcleo i7-1260P apesar do fato de que a série Core P é comercializada como a família mais rápida. Os resultados são especialmente bons depois de ter experimentado a decepcionante Núcleo i5-1235U.
A sustentabilidade do desempenho poderia ter sido melhor. Ao rodar o CineBench R15 xT em loop, a pontuação inicial de 1572 pontos cairia constantemente e se estabilizaria em torno de 1230 pontos para representar uma queda de desempenho de cerca de 20% ao longo do tempo devido a limitações térmicas.
Cinebench R15 Multi Loop
Cinebench R23: Multi Core | Single Core
Cinebench R15: CPU Multi 64Bit | CPU Single 64Bit
Blender: v2.79 BMW27 CPU
7-Zip 18.03: 7z b 4 | 7z b 4 -mmt1
Geekbench 5.5: Multi-Core | Single-Core
HWBOT x265 Benchmark v2.2: 4k Preset
LibreOffice : 20 Documents To PDF
R Benchmark 2.5: Overall mean
Cinebench R23: Multi Core | Single Core
Cinebench R15: CPU Multi 64Bit | CPU Single 64Bit
Blender: v2.79 BMW27 CPU
7-Zip 18.03: 7z b 4 | 7z b 4 -mmt1
Geekbench 5.5: Multi-Core | Single-Core
HWBOT x265 Benchmark v2.2: 4k Preset
LibreOffice : 20 Documents To PDF
R Benchmark 2.5: Overall mean
* ... menor é melhor
AIDA64: FP32 Ray-Trace | FPU Julia | CPU SHA3 | CPU Queen | FPU SinJulia | FPU Mandel | CPU AES | CPU ZLib | FP64 Ray-Trace | CPU PhotoWorxx
| Performance rating | |
| Asus ZenBook Flip 14 UN5401QA-KN085W | |
| Dell Latitude 9430 2-in-1 | |
| Dell Latitude 9420 2-in-1 | |
| MSI Summit E14 Flip Evo A12MT | |
| LG Gram 14T90P | |
| Média Intel Core i7-1265U | |
| Lenovo ThinkPad X1 Yoga G7 21CE002HGE | |
| AIDA64 / FP32 Ray-Trace | |
| Asus ZenBook Flip 14 UN5401QA-KN085W | |
| Dell Latitude 9430 2-in-1 | |
| Dell Latitude 9420 2-in-1 | |
| LG Gram 14T90P | |
| Média Intel Core i7-1265U (2619 - 8178, n=10) | |
| MSI Summit E14 Flip Evo A12MT | |
| Lenovo ThinkPad X1 Yoga G7 21CE002HGE | |
| AIDA64 / FPU Julia | |
| Asus ZenBook Flip 14 UN5401QA-KN085W | |
| Dell Latitude 9430 2-in-1 | |
| Média Intel Core i7-1265U (12909 - 41649, n=10) | |
| Dell Latitude 9420 2-in-1 | |
| LG Gram 14T90P | |
| MSI Summit E14 Flip Evo A12MT | |
| Lenovo ThinkPad X1 Yoga G7 21CE002HGE | |
| AIDA64 / CPU SHA3 | |
| Asus ZenBook Flip 14 UN5401QA-KN085W | |
| Dell Latitude 9430 2-in-1 | |
| Dell Latitude 9420 2-in-1 | |
| LG Gram 14T90P | |
| MSI Summit E14 Flip Evo A12MT | |
| Média Intel Core i7-1265U (824 - 2183, n=10) | |
| Lenovo ThinkPad X1 Yoga G7 21CE002HGE | |
| AIDA64 / CPU Queen | |
| Asus ZenBook Flip 14 UN5401QA-KN085W | |
| MSI Summit E14 Flip Evo A12MT | |
| Dell Latitude 9430 2-in-1 | |
| Média Intel Core i7-1265U (63615 - 67065, n=10) | |
| Lenovo ThinkPad X1 Yoga G7 21CE002HGE | |
| Dell Latitude 9420 2-in-1 | |
| LG Gram 14T90P | |
| AIDA64 / FPU SinJulia | |
| Asus ZenBook Flip 14 UN5401QA-KN085W | |
| MSI Summit E14 Flip Evo A12MT | |
| Lenovo ThinkPad X1 Yoga G7 21CE002HGE | |
| Dell Latitude 9430 2-in-1 | |
| Dell Latitude 9420 2-in-1 | |
| LG Gram 14T90P | |
| Média Intel Core i7-1265U (3105 - 5135, n=10) | |
| AIDA64 / FPU Mandel | |
| Asus ZenBook Flip 14 UN5401QA-KN085W | |
| Dell Latitude 9430 2-in-1 | |
| Dell Latitude 9420 2-in-1 | |
| LG Gram 14T90P | |
| Média Intel Core i7-1265U (6967 - 20804, n=10) | |
| MSI Summit E14 Flip Evo A12MT | |
| Lenovo ThinkPad X1 Yoga G7 21CE002HGE | |
| AIDA64 / CPU ZLib | |
| Asus ZenBook Flip 14 UN5401QA-KN085W | |
| Dell Latitude 9430 2-in-1 | |
| MSI Summit E14 Flip Evo A12MT | |
| Lenovo ThinkPad X1 Yoga G7 21CE002HGE | |
| Média Intel Core i7-1265U (314 - 632, n=10) | |
| Dell Latitude 9420 2-in-1 | |
| LG Gram 14T90P | |
| AIDA64 / FP64 Ray-Trace | |
| Asus ZenBook Flip 14 UN5401QA-KN085W | |
| Dell Latitude 9430 2-in-1 | |
| Dell Latitude 9420 2-in-1 | |
| LG Gram 14T90P | |
| Média Intel Core i7-1265U (1473 - 4376, n=10) | |
| MSI Summit E14 Flip Evo A12MT | |
| Lenovo ThinkPad X1 Yoga G7 21CE002HGE | |
| AIDA64 / CPU PhotoWorxx | |
| Dell Latitude 9430 2-in-1 | |
| Dell Latitude 9420 2-in-1 | |
| LG Gram 14T90P | |
| MSI Summit E14 Flip Evo A12MT | |
| Média Intel Core i7-1265U (20213 - 47031, n=10) | |
| Lenovo ThinkPad X1 Yoga G7 21CE002HGE | |
| Asus ZenBook Flip 14 UN5401QA-KN085W | |
Desempenho do sistema
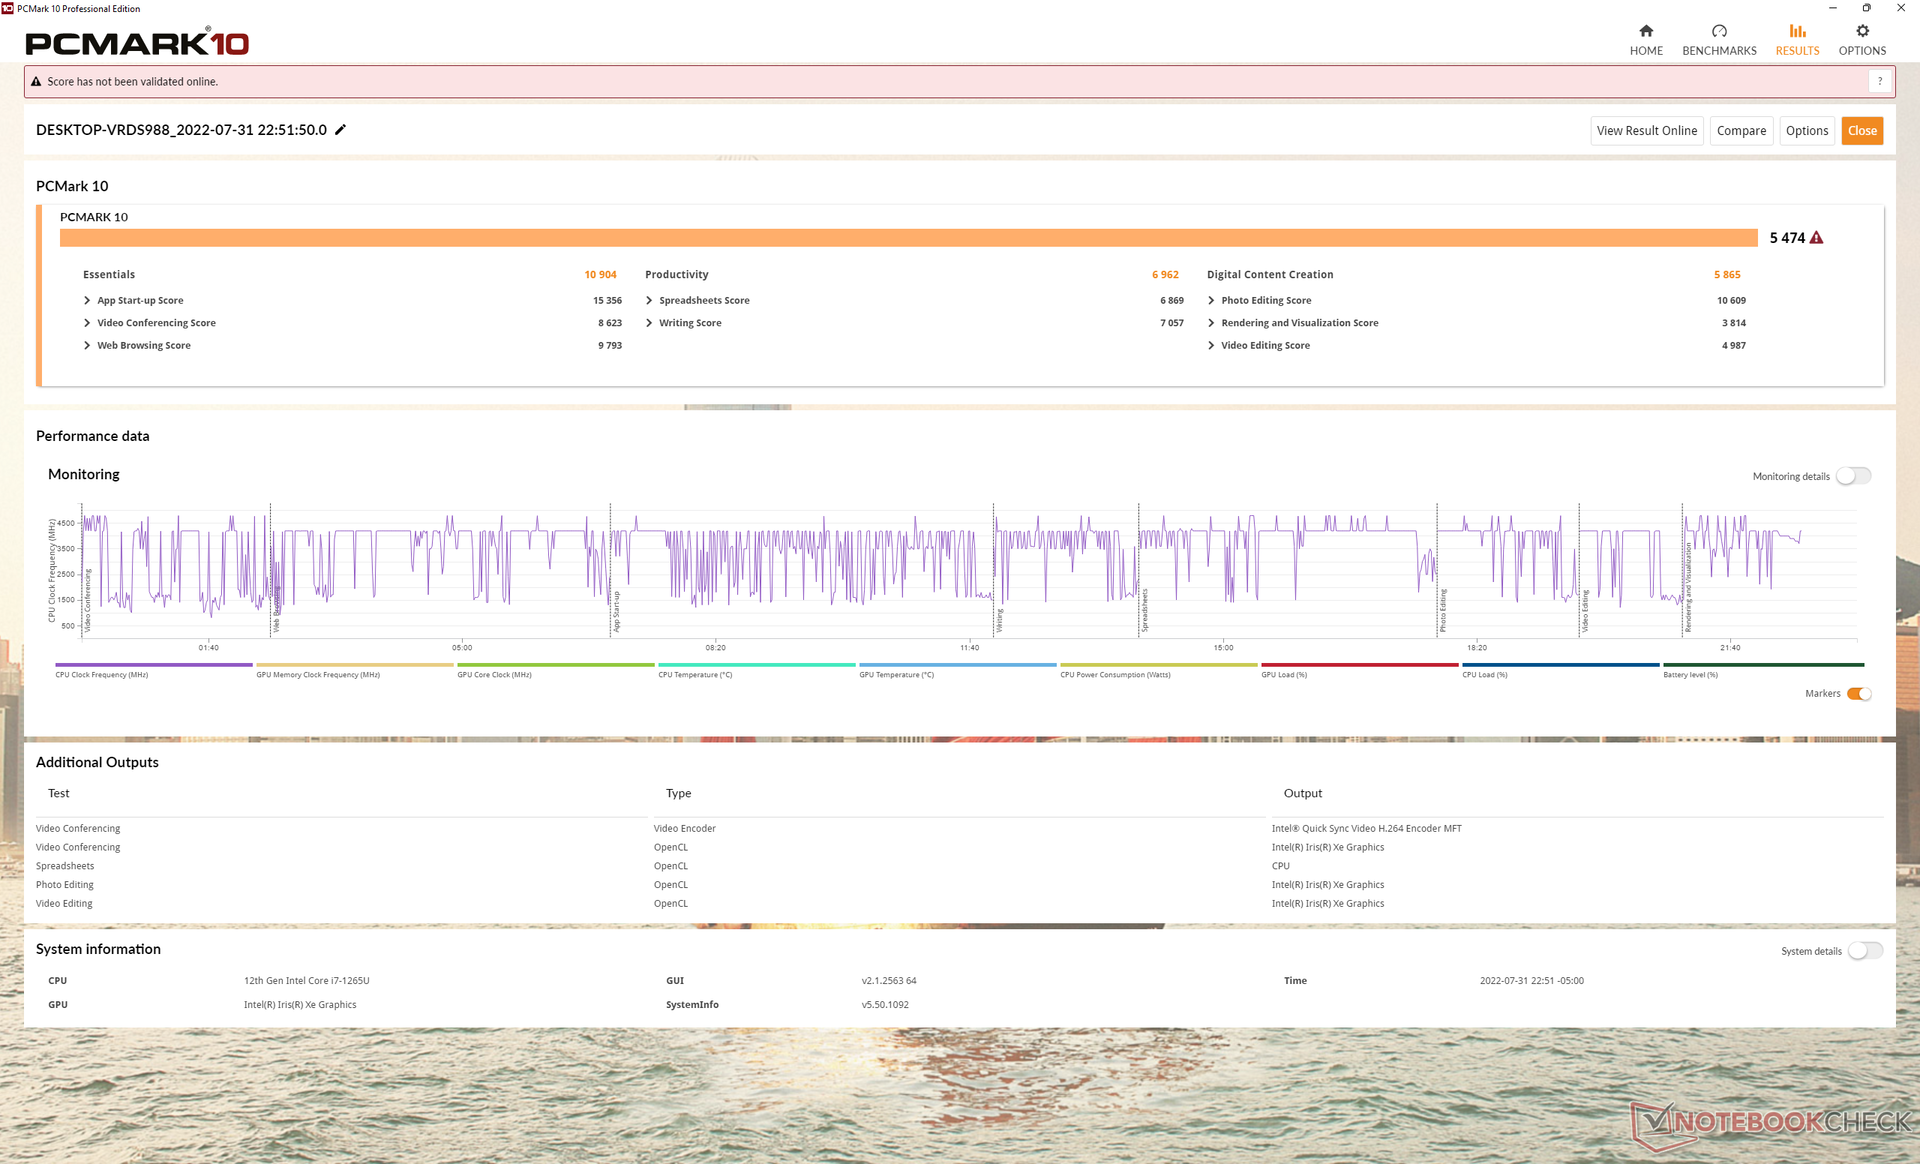
As pontuações do PCMark 10 são consistentemente mais altas do que as que registramos no antigo Latitude 9420 2 em 1, embora por apenas alguns pontos percentuais. As cargas típicas de escritório como navegação na web, streaming de vídeo ou edição leve não vão se sentir muito mais rápidas quando comparadas à maioria dos laptops Core i7-1165G7 da 11ª geração como resultado.
CrossMark: Overall | Productivity | Creativity | Responsiveness
| PCMark 10 / Score | |
| Asus ZenBook Flip 14 UN5401QA-KN085W | |
| Lenovo ThinkPad X1 Yoga G7 21CE002HGE | |
| Dell Latitude 9430 2-in-1 | |
| MSI Summit E14 Flip Evo A12MT | |
| Média Intel Core i7-1265U, Intel Iris Xe Graphics G7 96EUs (4753 - 5766, n=7) | |
| Dell Latitude 9420 2-in-1 | |
| LG Gram 14T90P | |
| PCMark 10 / Essentials | |
| Lenovo ThinkPad X1 Yoga G7 21CE002HGE | |
| Dell Latitude 9430 2-in-1 | |
| MSI Summit E14 Flip Evo A12MT | |
| Média Intel Core i7-1265U, Intel Iris Xe Graphics G7 96EUs (9278 - 11418, n=7) | |
| Dell Latitude 9420 2-in-1 | |
| Asus ZenBook Flip 14 UN5401QA-KN085W | |
| LG Gram 14T90P | |
| PCMark 10 / Productivity | |
| Asus ZenBook Flip 14 UN5401QA-KN085W | |
| Dell Latitude 9430 2-in-1 | |
| Dell Latitude 9420 2-in-1 | |
| MSI Summit E14 Flip Evo A12MT | |
| Lenovo ThinkPad X1 Yoga G7 21CE002HGE | |
| Média Intel Core i7-1265U, Intel Iris Xe Graphics G7 96EUs (5828 - 7311, n=7) | |
| LG Gram 14T90P | |
| PCMark 10 / Digital Content Creation | |
| Lenovo ThinkPad X1 Yoga G7 21CE002HGE | |
| Asus ZenBook Flip 14 UN5401QA-KN085W | |
| Dell Latitude 9430 2-in-1 | |
| MSI Summit E14 Flip Evo A12MT | |
| Média Intel Core i7-1265U, Intel Iris Xe Graphics G7 96EUs (5127 - 6330, n=7) | |
| Dell Latitude 9420 2-in-1 | |
| LG Gram 14T90P | |
| CrossMark / Overall | |
| MSI Summit E14 Flip Evo A12MT | |
| Lenovo ThinkPad X1 Yoga G7 21CE002HGE | |
| Dell Latitude 9430 2-in-1 | |
| Média Intel Core i7-1265U, Intel Iris Xe Graphics G7 96EUs (1301 - 1615, n=7) | |
| LG Gram 14T90P | |
| CrossMark / Productivity | |
| MSI Summit E14 Flip Evo A12MT | |
| Lenovo ThinkPad X1 Yoga G7 21CE002HGE | |
| Dell Latitude 9430 2-in-1 | |
| Média Intel Core i7-1265U, Intel Iris Xe Graphics G7 96EUs (1230 - 1586, n=7) | |
| LG Gram 14T90P | |
| CrossMark / Creativity | |
| MSI Summit E14 Flip Evo A12MT | |
| Lenovo ThinkPad X1 Yoga G7 21CE002HGE | |
| Dell Latitude 9430 2-in-1 | |
| Média Intel Core i7-1265U, Intel Iris Xe Graphics G7 96EUs (1413 - 1706, n=7) | |
| LG Gram 14T90P | |
| CrossMark / Responsiveness | |
| MSI Summit E14 Flip Evo A12MT | |
| Lenovo ThinkPad X1 Yoga G7 21CE002HGE | |
| Dell Latitude 9430 2-in-1 | |
| Média Intel Core i7-1265U, Intel Iris Xe Graphics G7 96EUs (1193 - 1521, n=7) | |
| LG Gram 14T90P | |
| PCMark 10 Score | 5474 pontos | |
Ajuda | ||
| AIDA64 / Memory Copy | |
| Dell Latitude 9430 2-in-1 | |
| MSI Summit E14 Flip Evo A12MT | |
| Dell Latitude 9420 2-in-1 | |
| LG Gram 14T90P | |
| Lenovo ThinkPad X1 Yoga G7 21CE002HGE | |
| Média Intel Core i7-1265U (40212 - 72204, n=10) | |
| Asus ZenBook Flip 14 UN5401QA-KN085W | |
| AIDA64 / Memory Read | |
| Lenovo ThinkPad X1 Yoga G7 21CE002HGE | |
| MSI Summit E14 Flip Evo A12MT | |
| Dell Latitude 9420 2-in-1 | |
| LG Gram 14T90P | |
| Média Intel Core i7-1265U (41808 - 69493, n=10) | |
| Dell Latitude 9430 2-in-1 | |
| Asus ZenBook Flip 14 UN5401QA-KN085W | |
| AIDA64 / Memory Write | |
| LG Gram 14T90P | |
| Dell Latitude 9420 2-in-1 | |
| Dell Latitude 9430 2-in-1 | |
| Lenovo ThinkPad X1 Yoga G7 21CE002HGE | |
| Média Intel Core i7-1265U (41382 - 76027, n=10) | |
| MSI Summit E14 Flip Evo A12MT | |
| Asus ZenBook Flip 14 UN5401QA-KN085W | |
| AIDA64 / Memory Latency | |
| Asus ZenBook Flip 14 UN5401QA-KN085W | |
| Dell Latitude 9430 2-in-1 | |
| Média Intel Core i7-1265U (74.6 - 112.4, n=10) | |
| Dell Latitude 9420 2-in-1 | |
| LG Gram 14T90P | |
| Lenovo ThinkPad X1 Yoga G7 21CE002HGE | |
| MSI Summit E14 Flip Evo A12MT | |
* ... menor é melhor
Latência do DPC
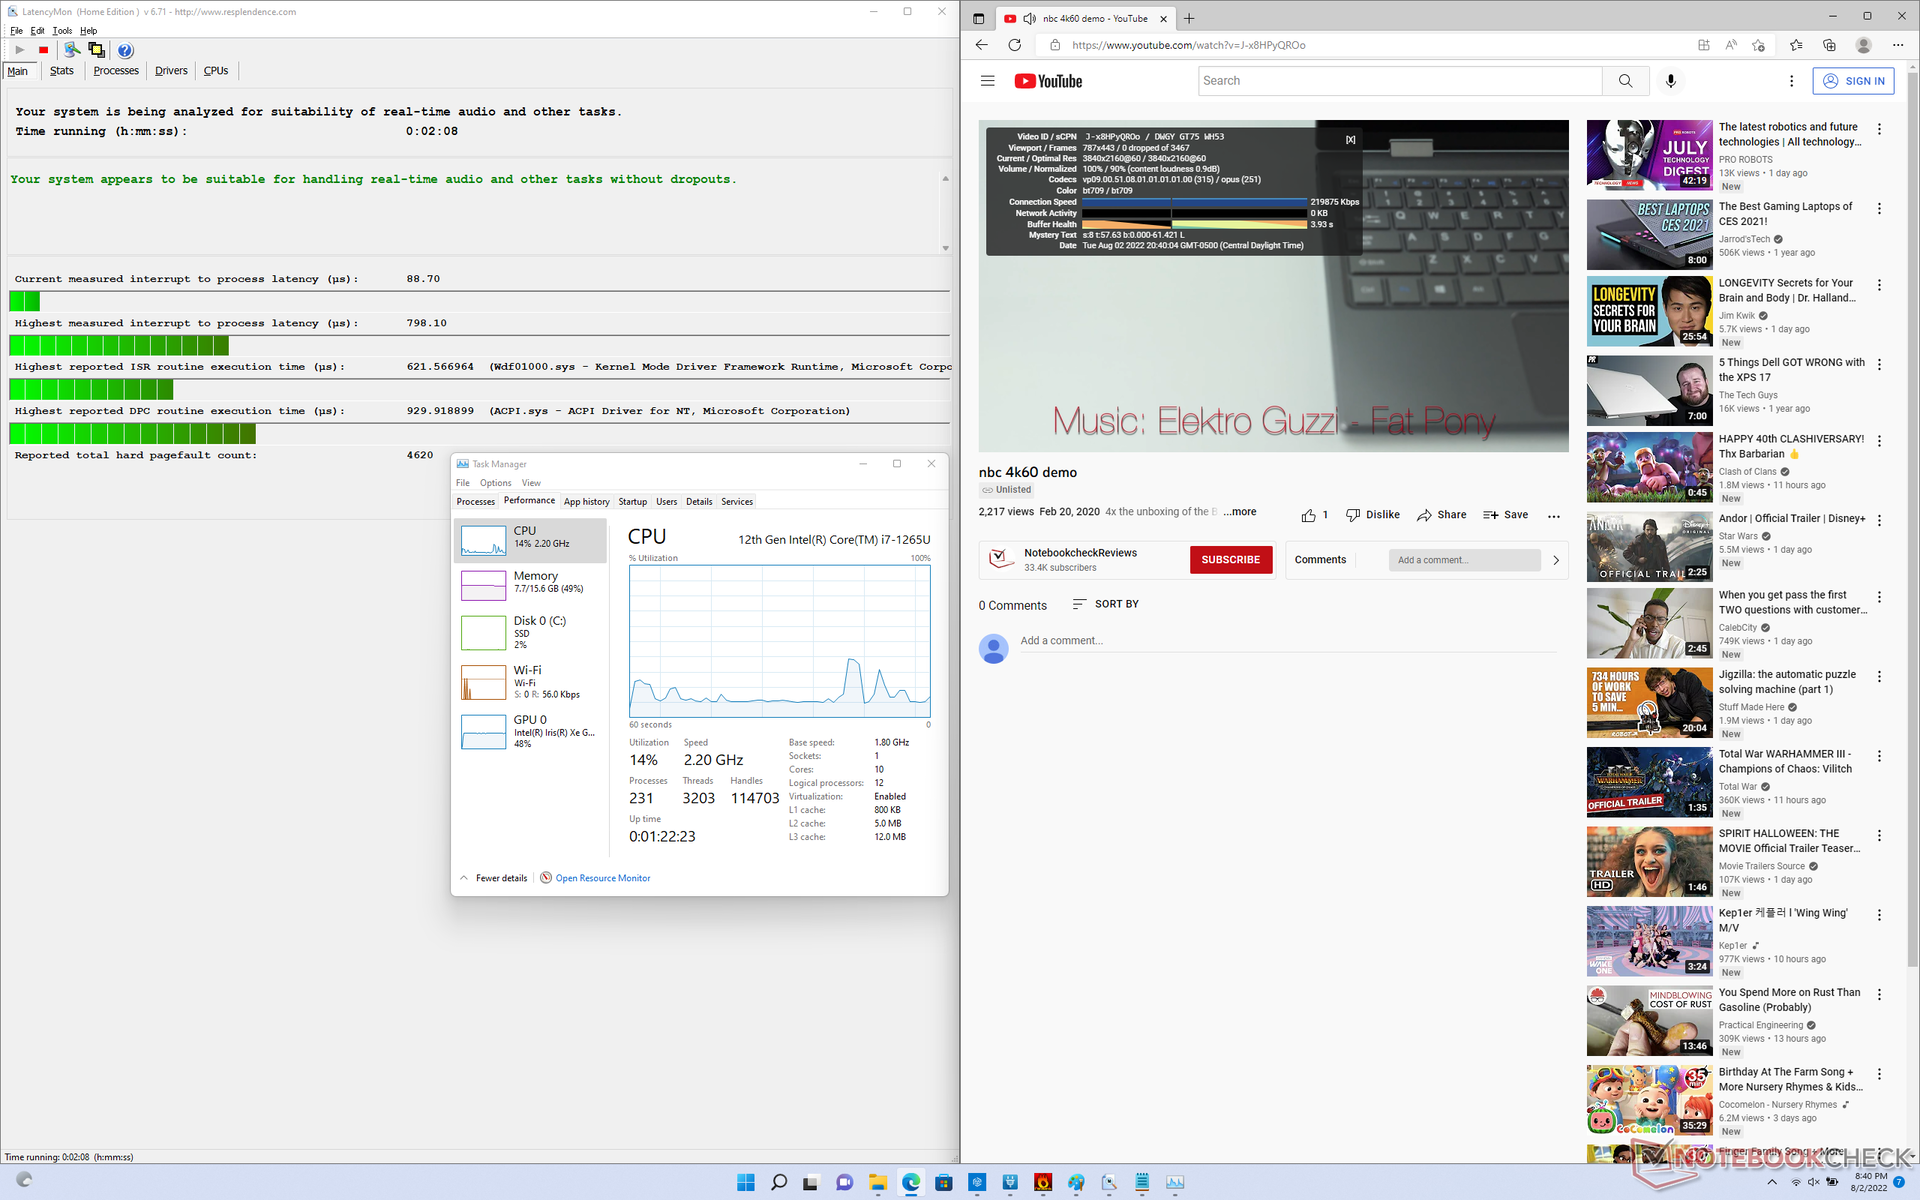
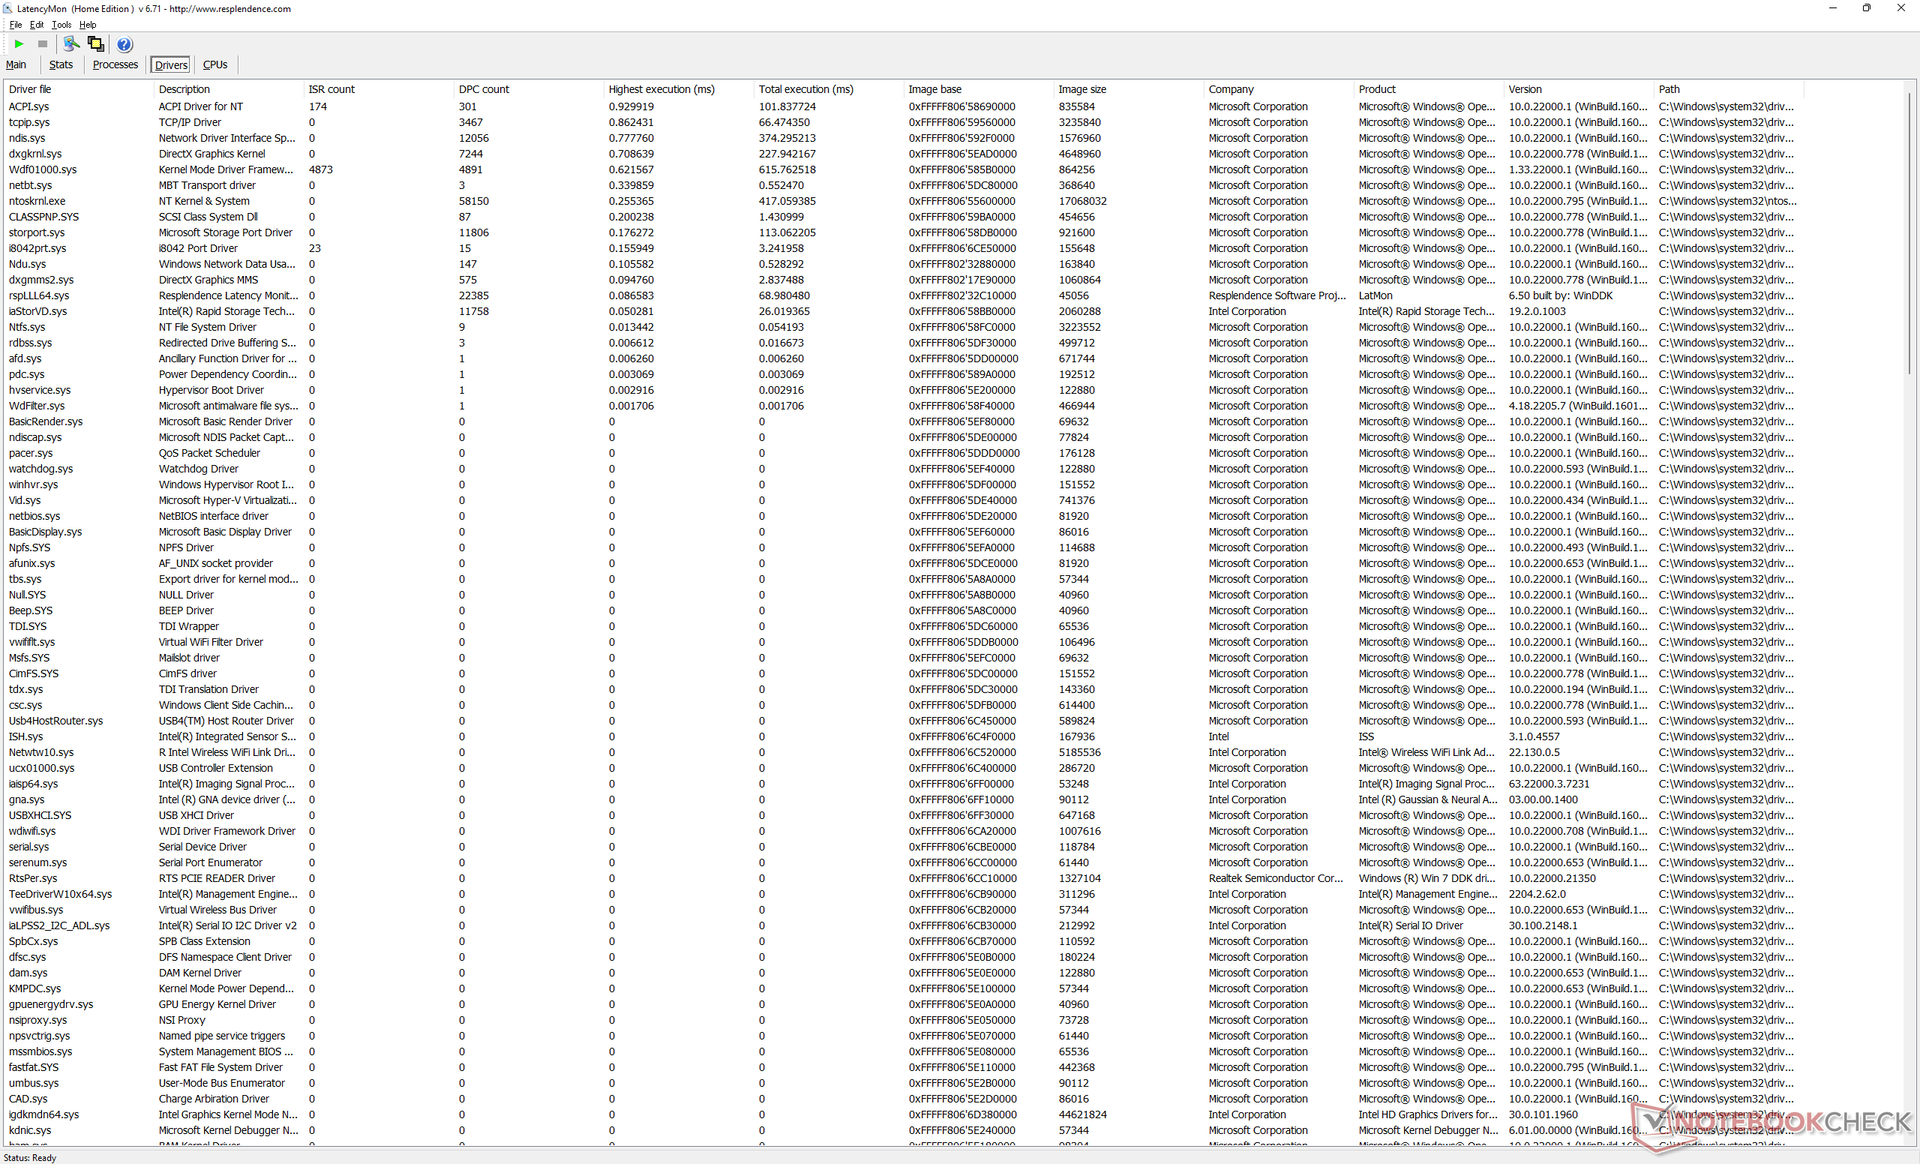
LatencyMon não revela grandes problemas de DPC ao abrir várias abas de nossa página inicial ou ao executar Prime95 stress. a reprodução do vídeo 4K a 60 FPS também é perfeita, sem queda de quadros.
| DPC Latencies / LatencyMon - interrupt to process latency (max), Web, Youtube, Prime95 | |
| MSI Summit E14 Flip Evo A12MT | |
| Lenovo ThinkPad X1 Yoga G7 21CE002HGE | |
| LG Gram 14T90P | |
| Asus ZenBook Flip 14 UN5401QA-KN085W | |
| Dell Latitude 9430 2-in-1 | |
| Dell Latitude 9420 2-in-1 | |
* ... menor é melhor
Dispositivos de armazenamento
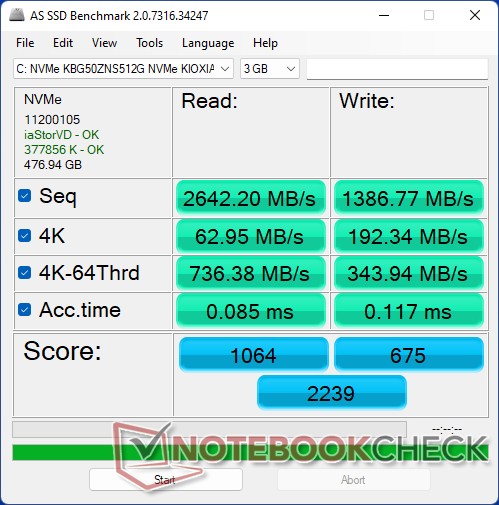
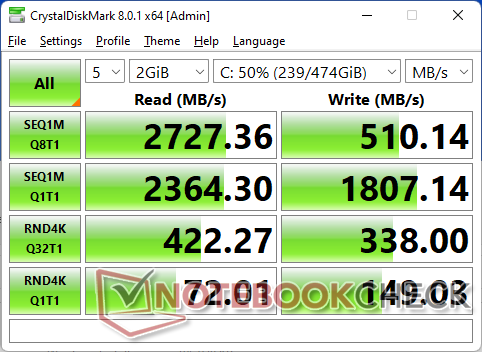
Nossa unidade de teste utiliza um 512 GB Toshiba Kioxia NVMe SSD com autoencriptação Opala opcional. As taxas de transferência são boas e relativamente estáveis, mas as taxas de escrita são muito mais lentas do que no Samsung PM981a comumente encontrado no navio de bandeira Ultrabooks.

* ... menor é melhor
Disk Throttling: DiskSpd Read Loop, Queue Depth 8
Desempenho da GPU
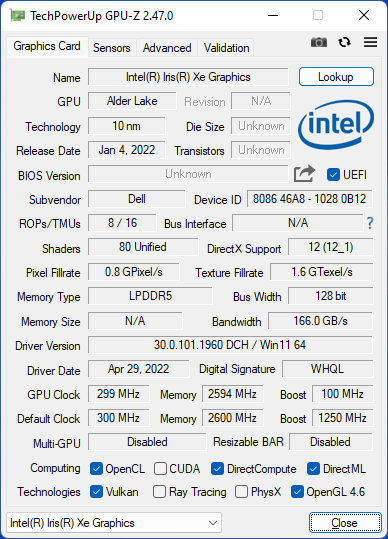
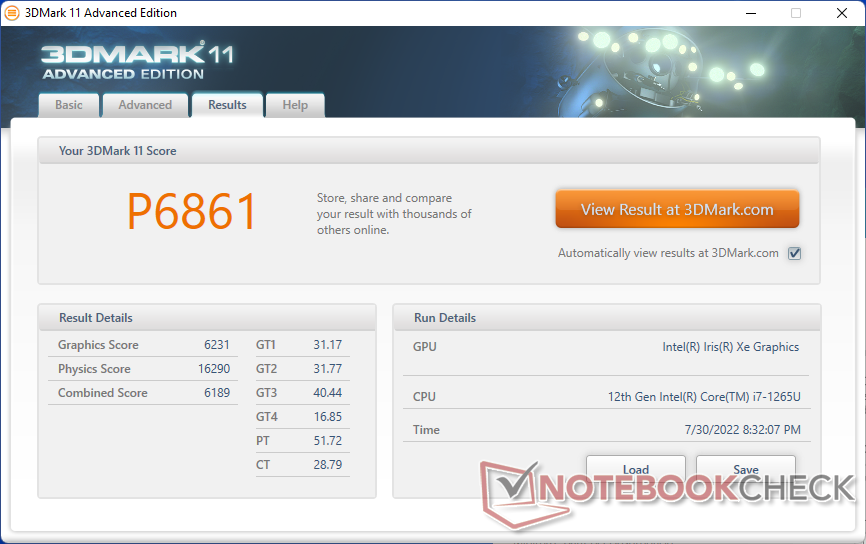
O desempenho gráfico é aproximadamente onde esperamos que esteja quando comparado com outros laptops com o mesmo Iris Xe 96 EUs mesmo que a Latitude esteja carregando uma CPU Intel de 12ª geração mais recente. Assim, os usuários devem esperar apenas melhorias marginais no desempenho da GPU na melhor das hipóteses, ano após ano. Os concorrentes Radeon 680M ou GeForce MX450/550 são capazes de oferecer um desempenho significativamente mais rápido do que os Iris Xe 96 EUs.
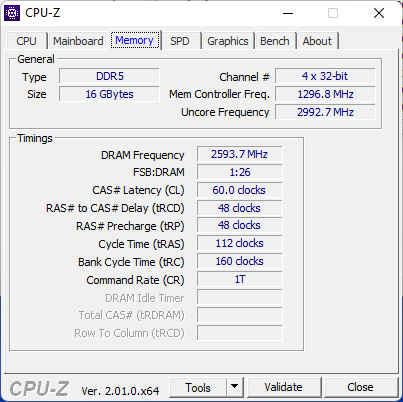
O modelo utiliza RAM LPDDR5 mais rápida em comparação com LPDDR4 no Latitude 9420 2 em 1, mas o aumento de desempenho é menor.
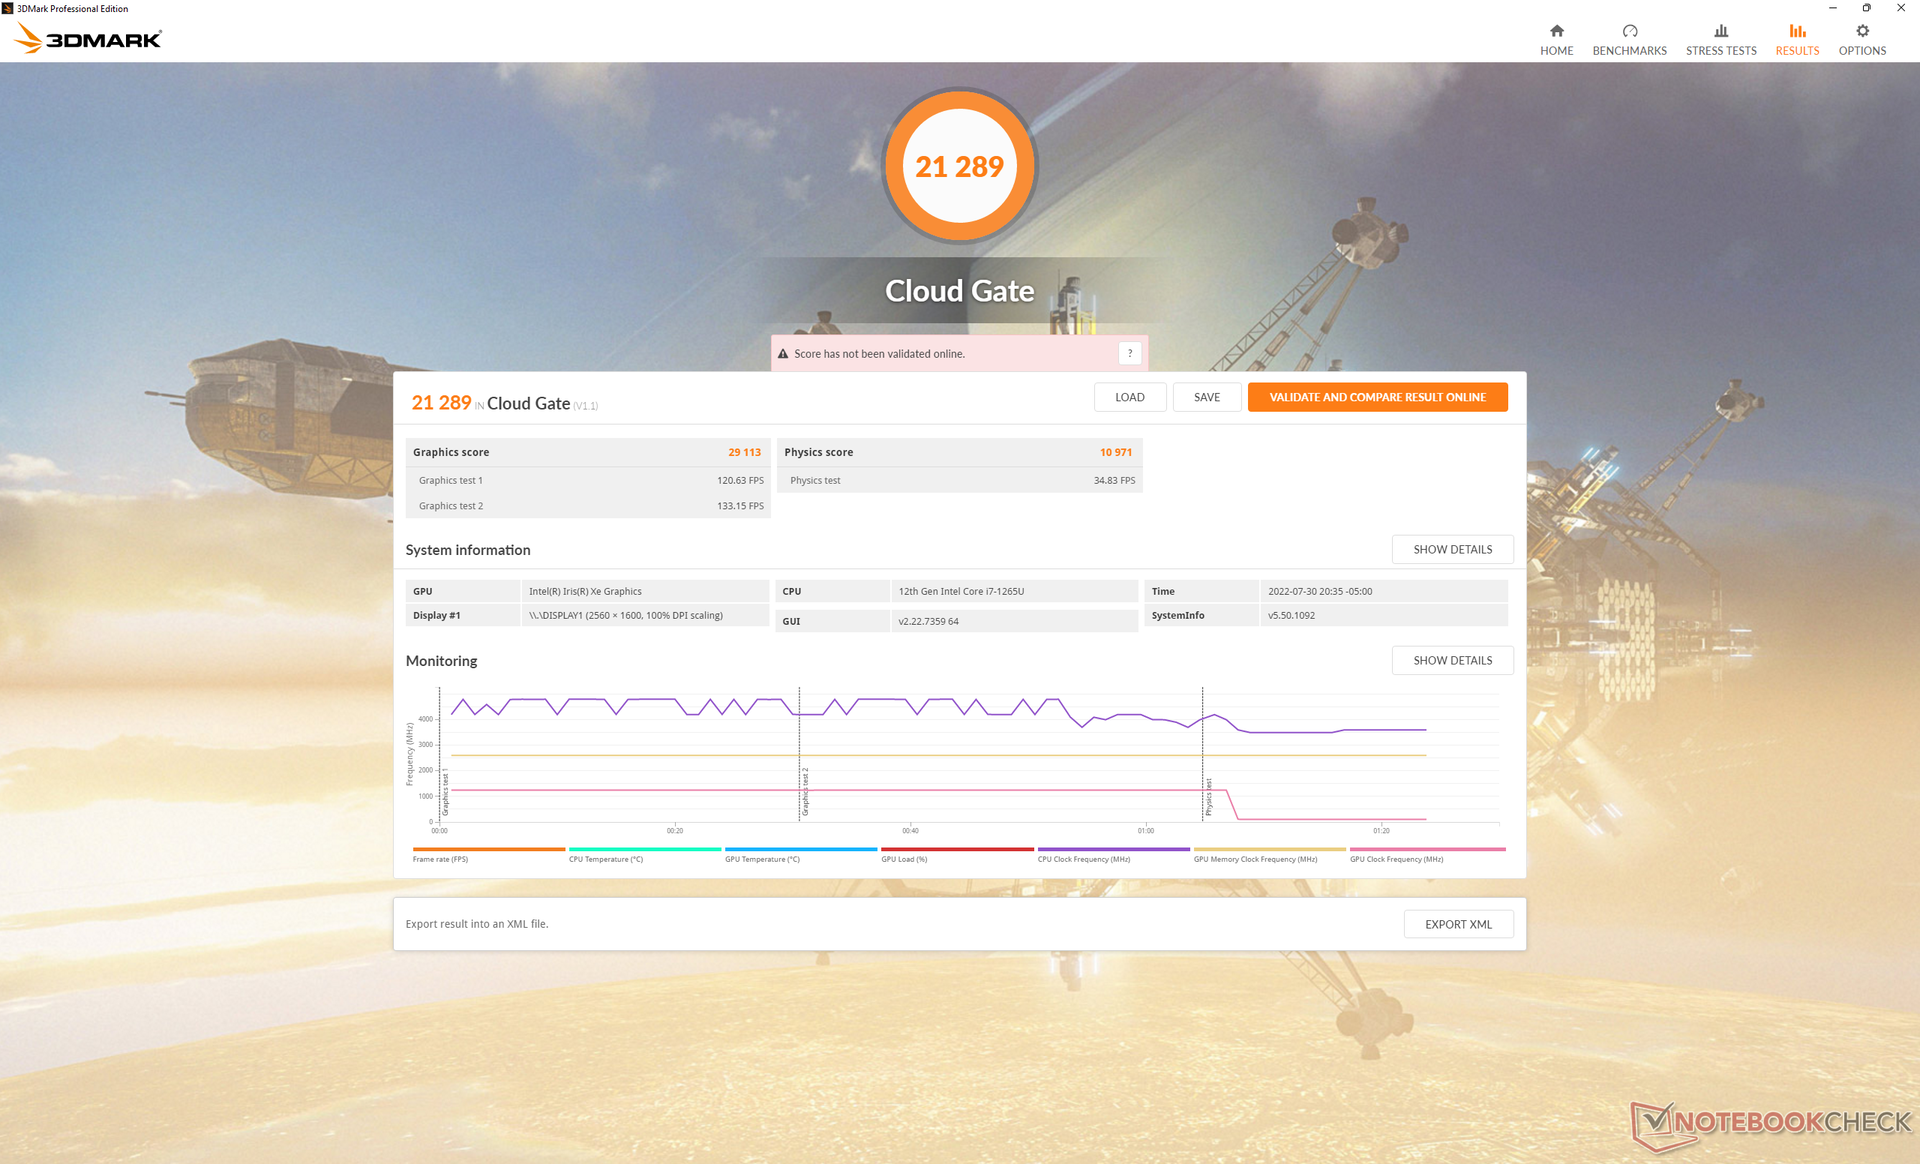
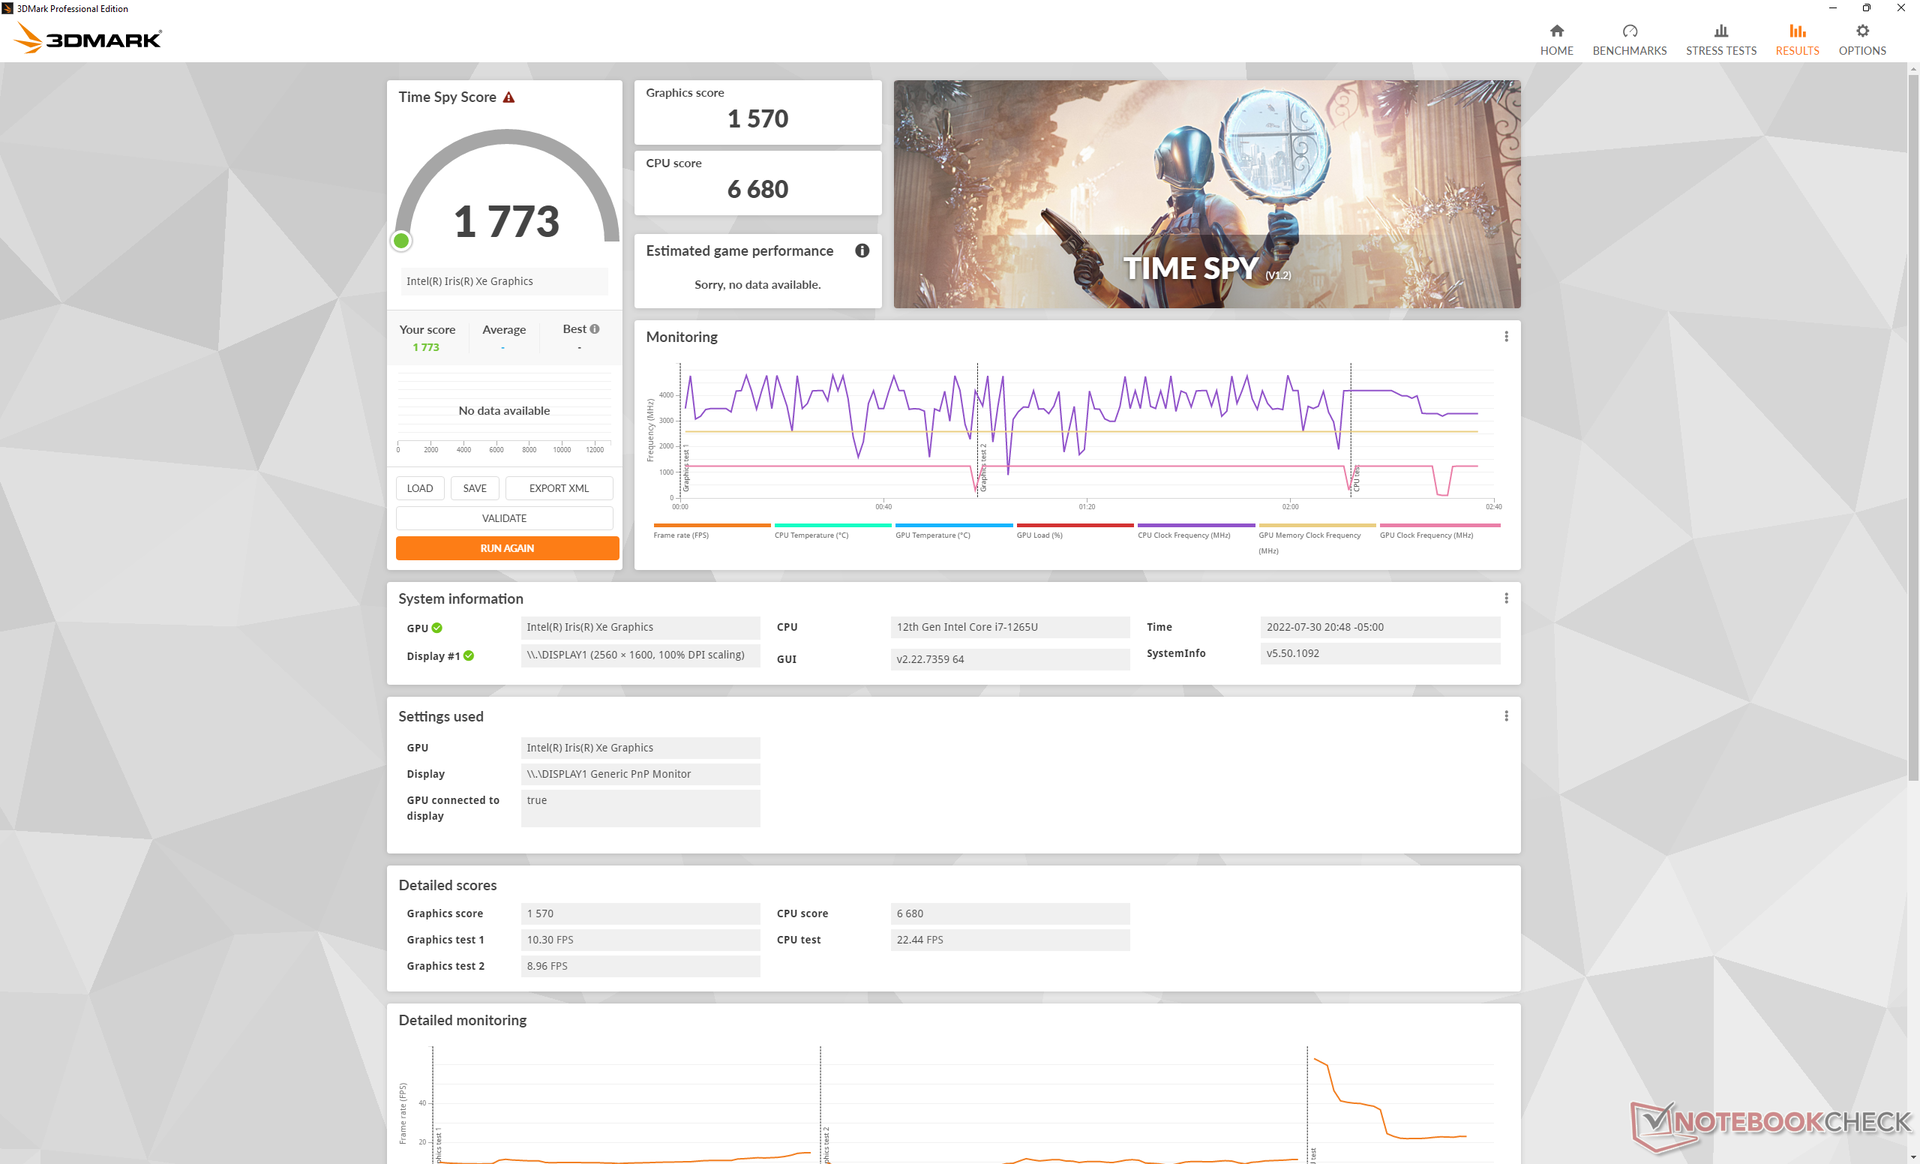
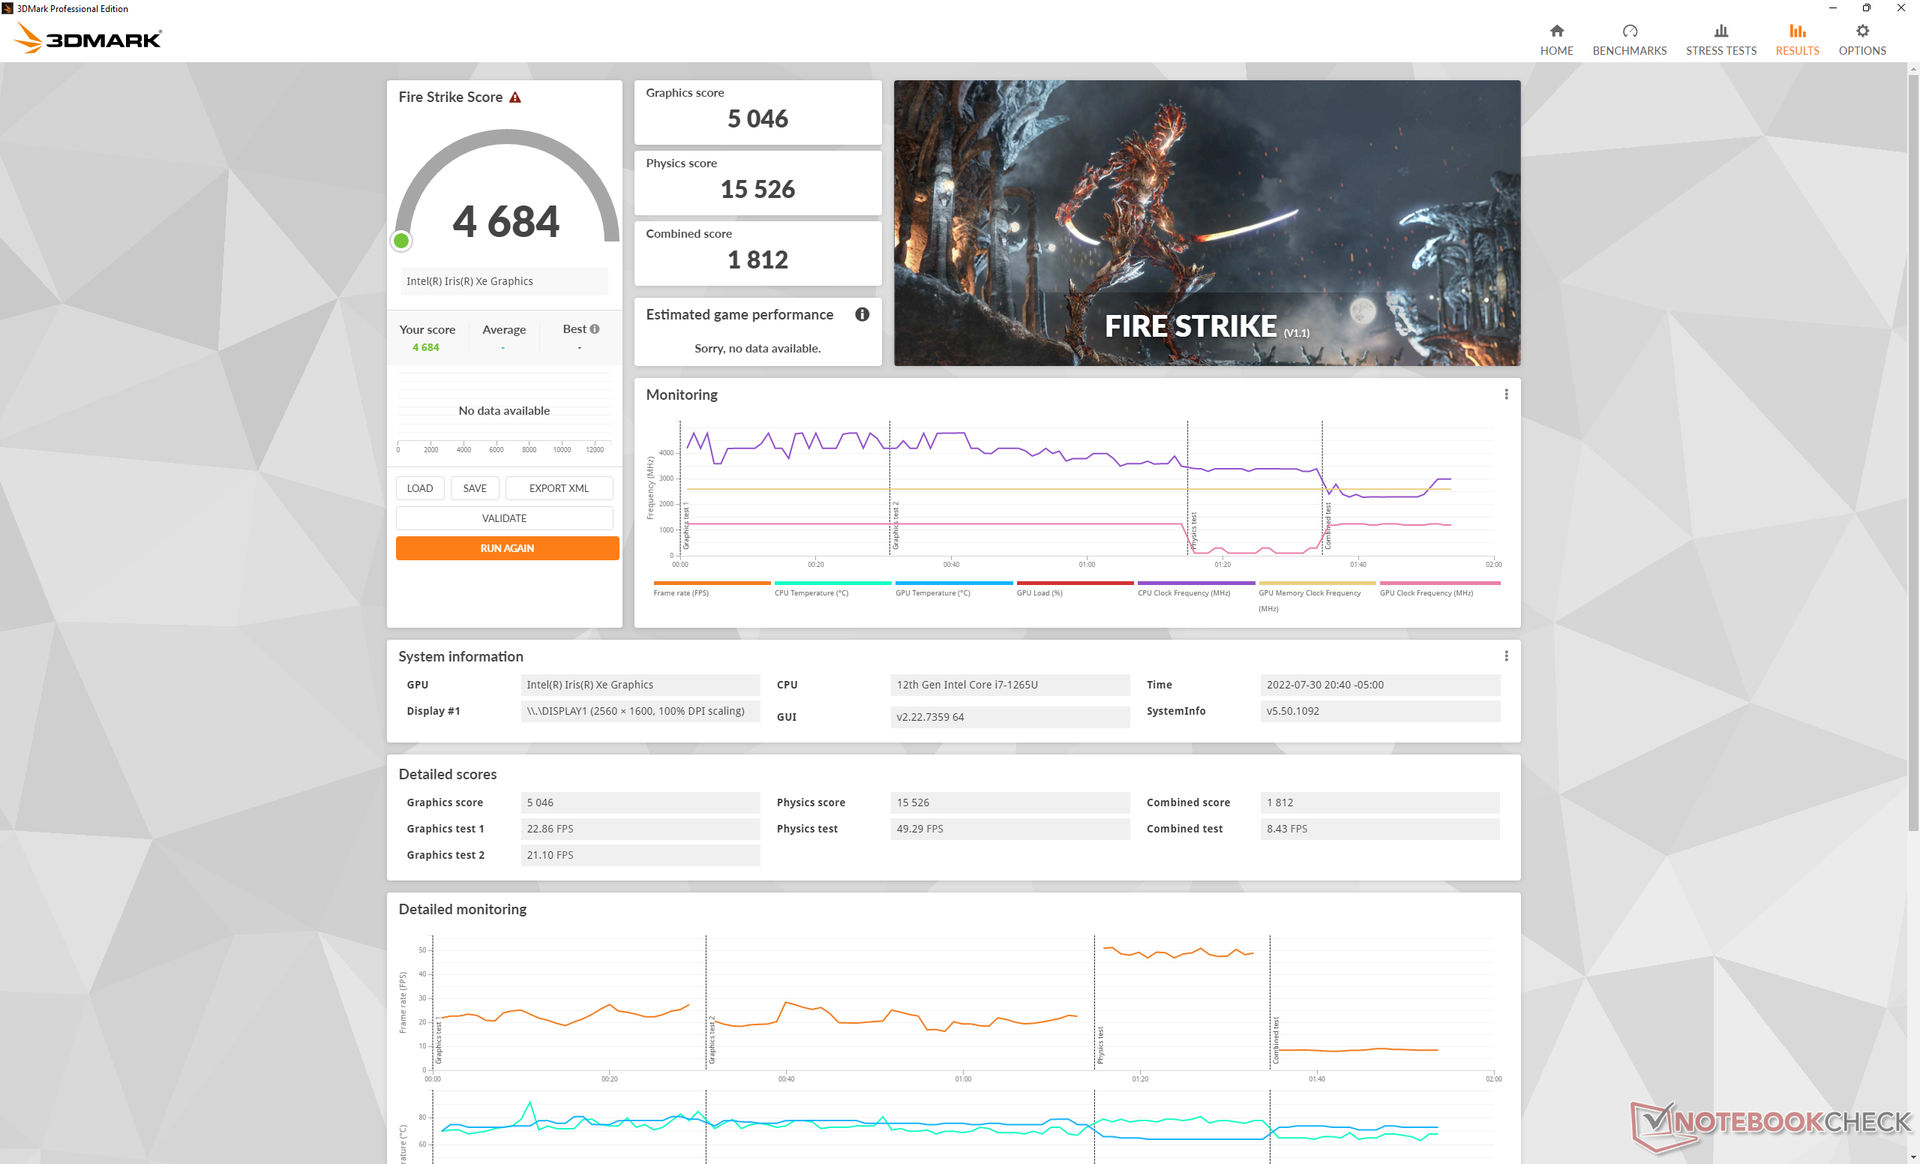
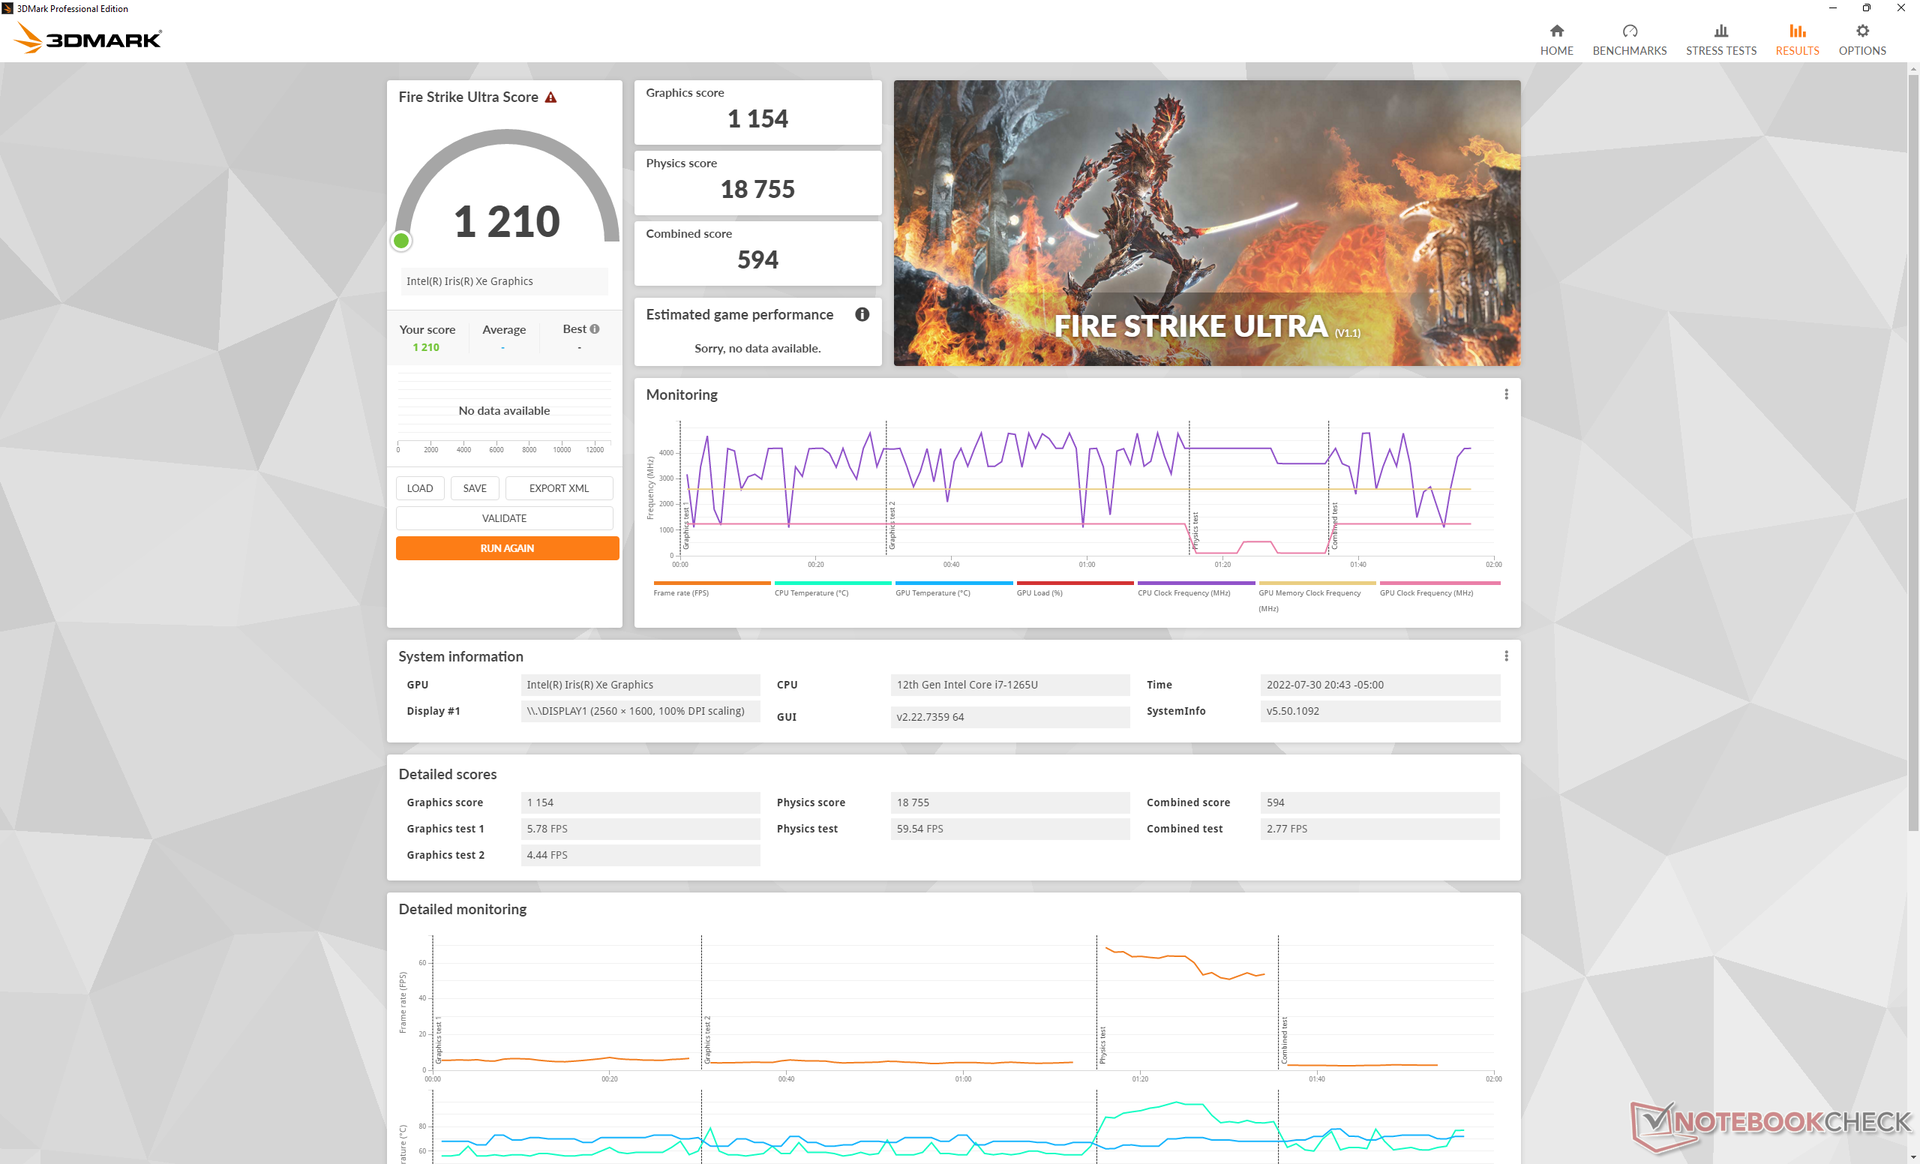
| 3DMark 11 Performance | 6861 pontos | |
| 3DMark Cloud Gate Standard Score | 21289 pontos | |
| 3DMark Fire Strike Score | 4684 pontos | |
| 3DMark Time Spy Score | 1773 pontos | |
Ajuda | ||
| Cyberpunk 2077 1.6 | |
| 1920x1080 Low Preset | |
| MSI Summit E14 Flip Evo A12MT | |
| Dell Latitude 9430 2-in-1 | |
| Média Intel Iris Xe Graphics G7 96EUs (13 - 25.9, n=42) | |
| 1920x1080 Medium Preset | |
| MSI Summit E14 Flip Evo A12MT | |
| Dell Latitude 9430 2-in-1 | |
| Média Intel Iris Xe Graphics G7 96EUs (10.8 - 21.7, n=37) | |
| 1920x1080 High Preset | |
| MSI Summit E14 Flip Evo A12MT | |
| Dell Latitude 9430 2-in-1 | |
| Média Intel Iris Xe Graphics G7 96EUs (9.8 - 16.9, n=34) | |
| 1920x1080 Ultra Preset | |
| MSI Summit E14 Flip Evo A12MT | |
| Dell Latitude 9430 2-in-1 | |
| Média Intel Iris Xe Graphics G7 96EUs (7.4 - 16.8, n=32) | |
Witcher 3 FPS Chart
| baixo | média | alto | ultra | |
|---|---|---|---|---|
| GTA V (2015) | 111.6 | 93.9 | 24.8 | 10.7 |
| The Witcher 3 (2015) | 88 | 55.8 | 29.9 | 14.4 |
| Dota 2 Reborn (2015) | 114 | 87.9 | 67.6 | 57.4 |
| Final Fantasy XV Benchmark (2018) | 43.3 | 24.6 | 17 | |
| X-Plane 11.11 (2018) | 37.9 | 41.2 | 36.6 | |
| Strange Brigade (2018) | 89.6 | 41.7 | 32.5 | 26.4 |
| Cyberpunk 2077 1.6 (2022) | 22.2 | 18.8 | 14.1 | 11.3 |
Emissões
Ruído do sistema
O sistema é silencioso ou quase silencioso na maioria das condições de navegação ou streaming da web. Entretanto, o ventilador começaria a subir mais cedo do que o que experimentamos no Latitude 9420 2 em 1. Por exemplo, ao rodar a primeira cena de referência de 90 segundos do 3DMark 06, o ventilador no Latitude 9420 2 em 1 permaneceria silencioso durante toda a corrida. Em contraste, o ventilador no Latitude 9430 2-em-1 se tornaria audível a 35 dB(A) contra um fundo silencioso de 23,7 dB(A)
A execução de cargas exigentes como jogos no modo Ultra Performance resultaria em um ruído mais alto do ventilador do que no modoThinkPad X1 Yoga G7 ou LG Gram 14T90P.
Barulho
| Ocioso |
| 23.7 / 23.7 / 23.7 dB |
| Carga |
| 35.1 / 43 dB |
 | ||
30 dB silencioso 40 dB(A) audível 50 dB(A) ruidosamente alto |
||
min: | ||
| Dell Latitude 9430 2-in-1 Iris Xe G7 96EUs, i7-1265U | Dell Latitude 9420 2-in-1 Iris Xe G7 96EUs, i7-1185G7, WDC PC SN530 SDBPNPZ-512G | MSI Summit E14 Flip Evo A12MT Iris Xe G7 96EUs, i7-1260P, Samsung PM9A1 MZVL21T0HCLR | LG Gram 14T90P Iris Xe G7 80EUs, i5-1135G7, Samsung SSD PM981a MZVLB512HBJQ | Lenovo ThinkPad X1 Yoga G7 21CE002HGE Iris Xe G7 96EUs, i7-1270P, Samsung PM9A1 MZVL2512HCJQ | Asus ZenBook Flip 14 UN5401QA-KN085W Vega 8, R7 5800H, Intel SSD 600p SSDPEKKW512G7 | |
|---|---|---|---|---|---|---|
| Noise | 1% | 4% | 4% | 4% | -10% | |
| desligado / ambiente * (dB) | 23.7 | 25.4 -7% | 23.3 2% | 25.4 -7% | 22.7 4% | 26 -10% |
| Idle Minimum * (dB) | 23.7 | 25.4 -7% | 23.3 2% | 25.5 -8% | 22.7 4% | 26 -10% |
| Idle Average * (dB) | 23.7 | 25.4 -7% | 23.3 2% | 25.5 -8% | 22.7 4% | 26 -10% |
| Idle Maximum * (dB) | 23.7 | 25.4 -7% | 23.3 2% | 25.5 -8% | 27.1 -14% | 27.3 -15% |
| Load Average * (dB) | 35.1 | 25.4 28% | 24 32% | 28.3 19% | 34.5 2% | 39.8 -13% |
| Witcher 3 ultra * (dB) | 43.3 | 41.3 5% | 35.6 18% | 35 19% | 34.5 20% | |
| Load Maximum * (dB) | 43 | 41.3 4% | 55.8 -30% | 35 19% | 38.7 10% | 42.4 1% |
* ... menor é melhor
Temperatura
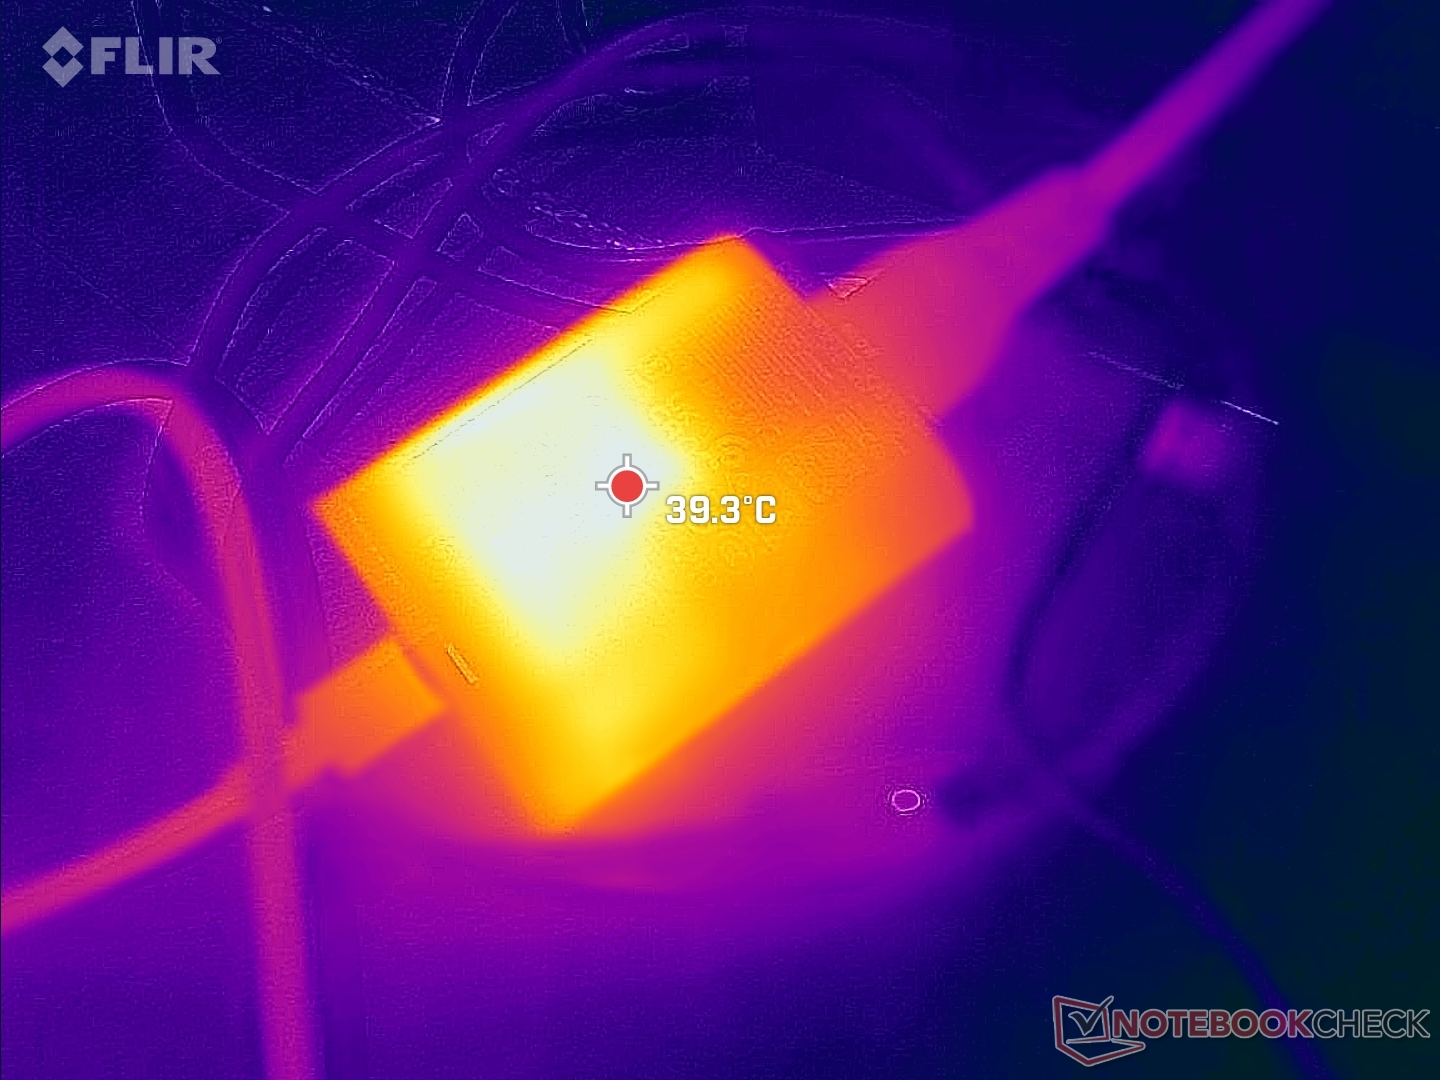
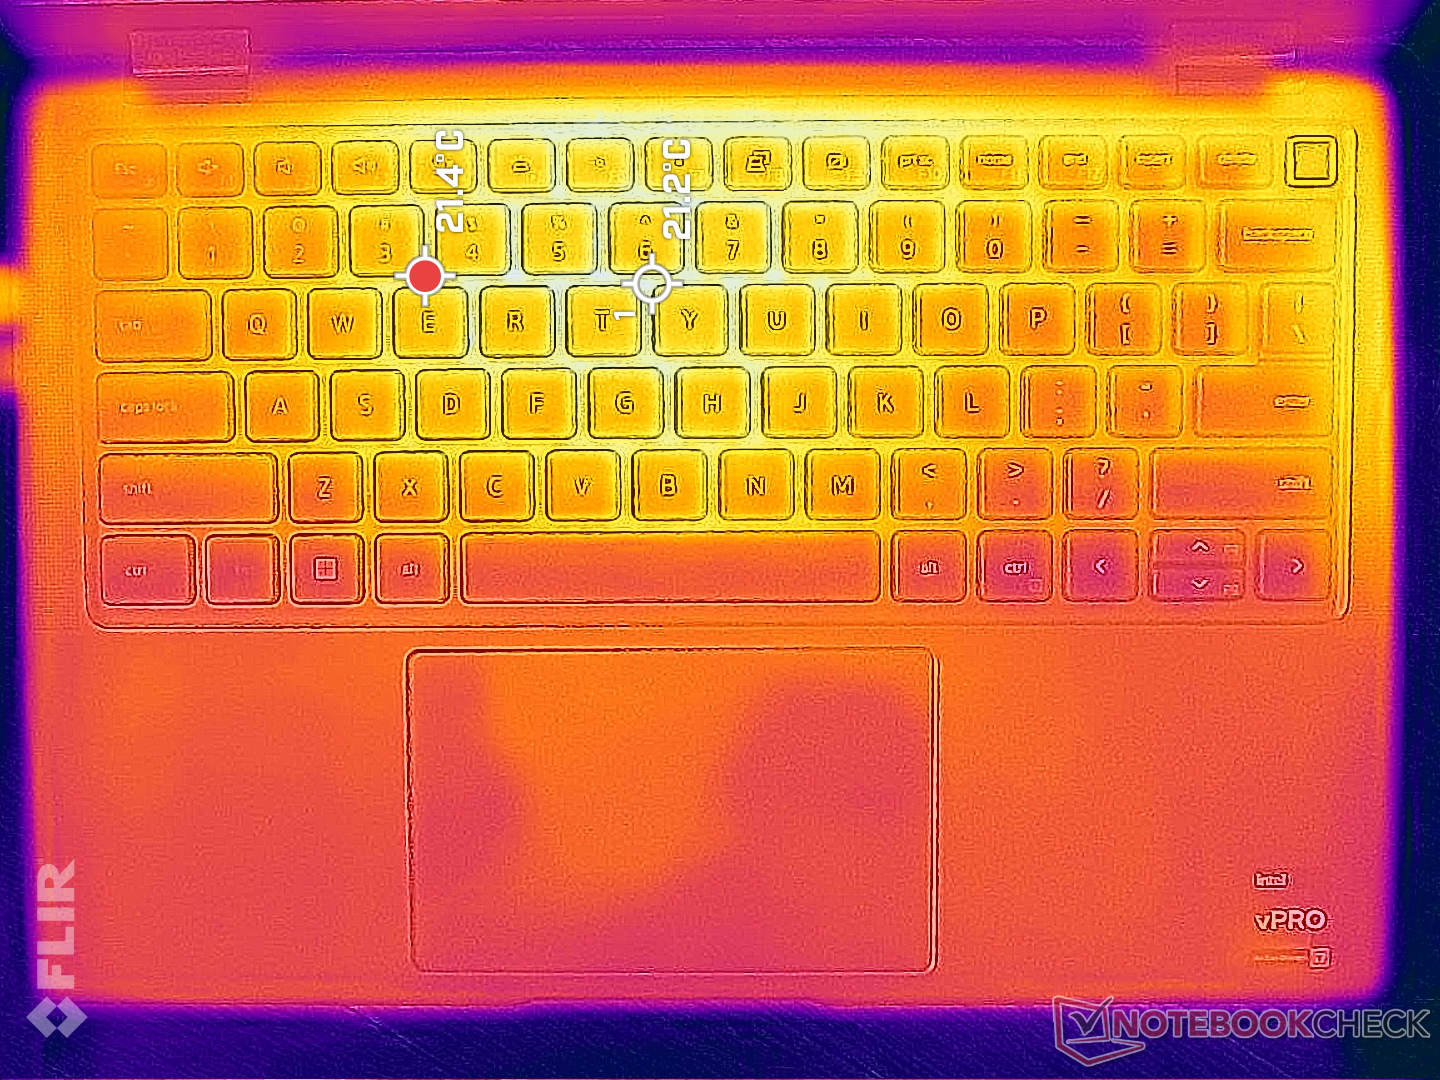
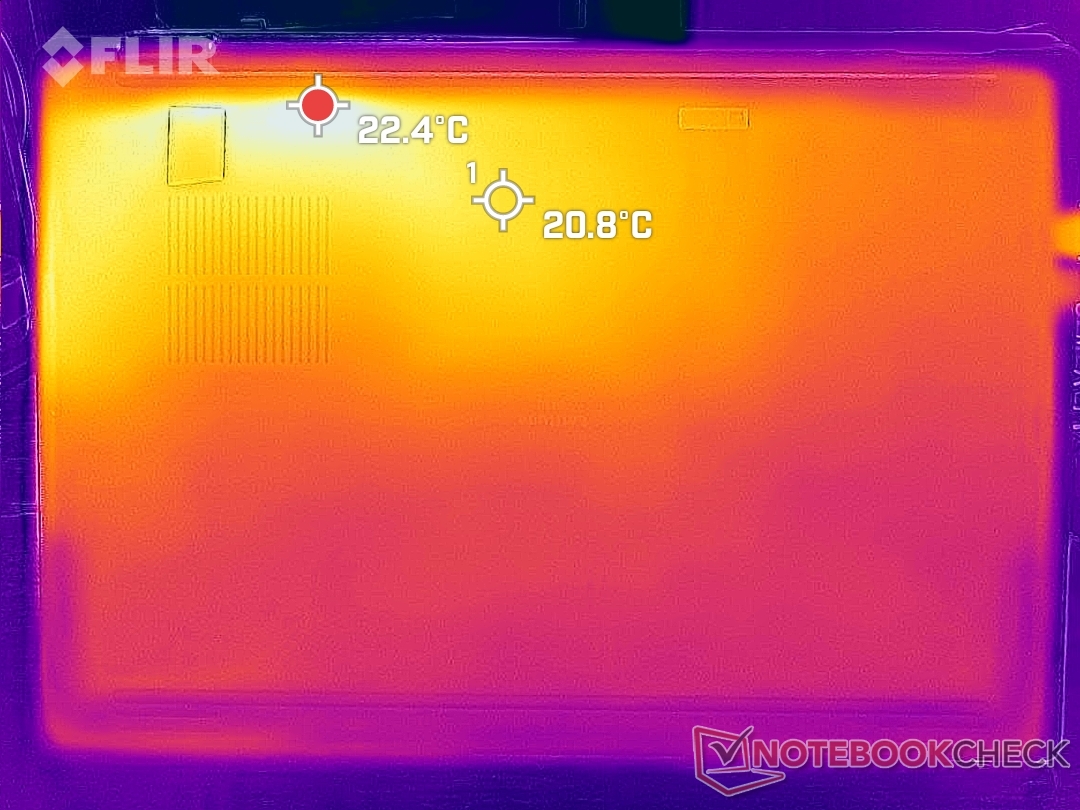
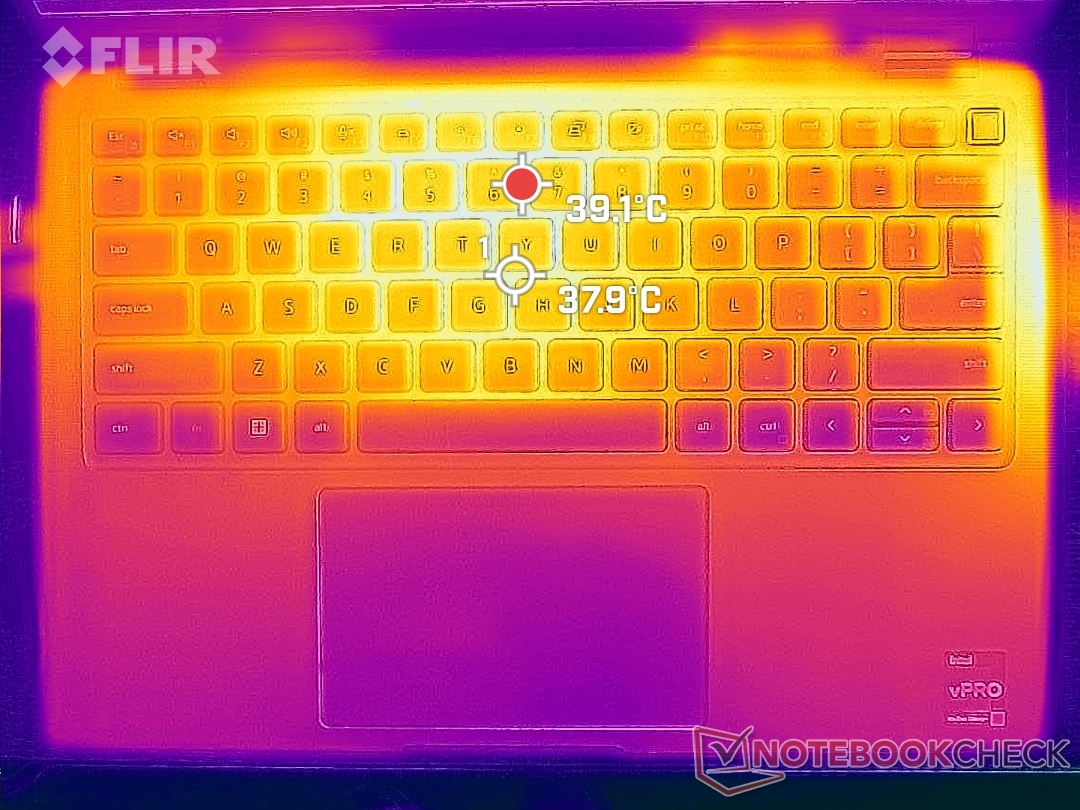
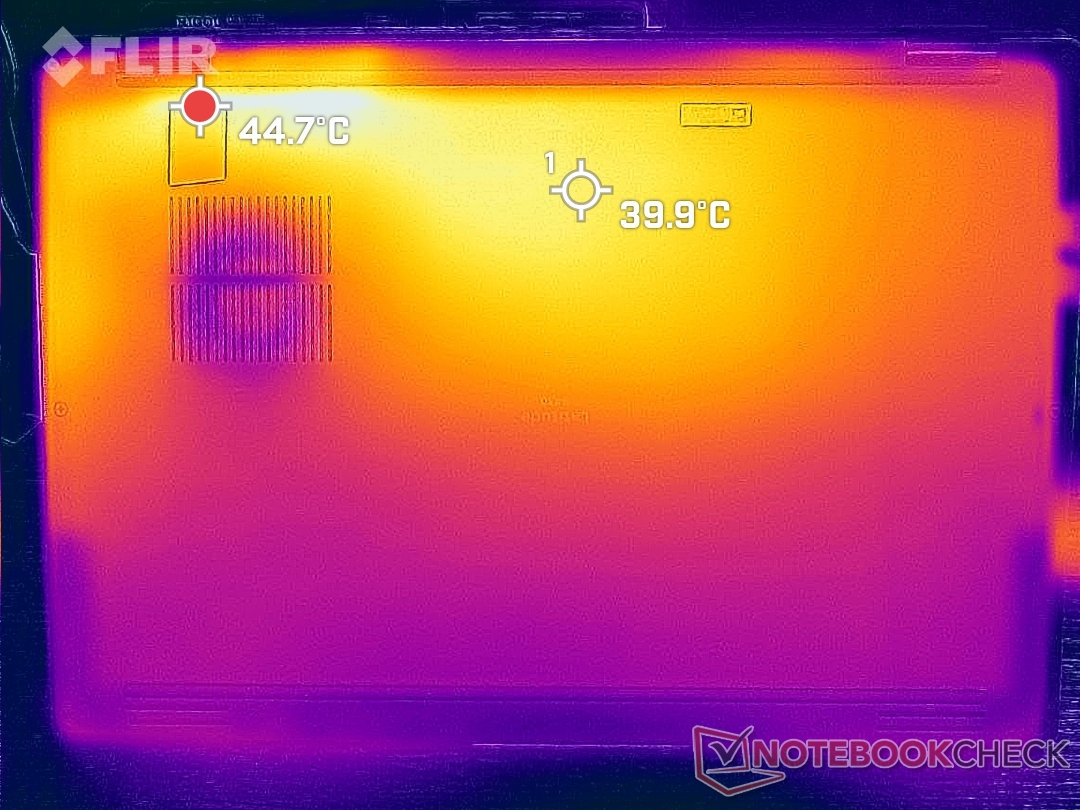
As temperaturas superficiais são mais quentes perto do centro do teclado e da metade traseira do laptop, onde os pontos quentes podem chegar a 40 C tanto na parte superior quanto na inferior. Os resultados são mais frios do que o observado no Latitude 9420 2 em 1 e mais ou menos o mesmo que no MSI Summit E14 Flip quando sob cargas similares. O calor escapa ao longo da borda direita e da traseira do chassi.
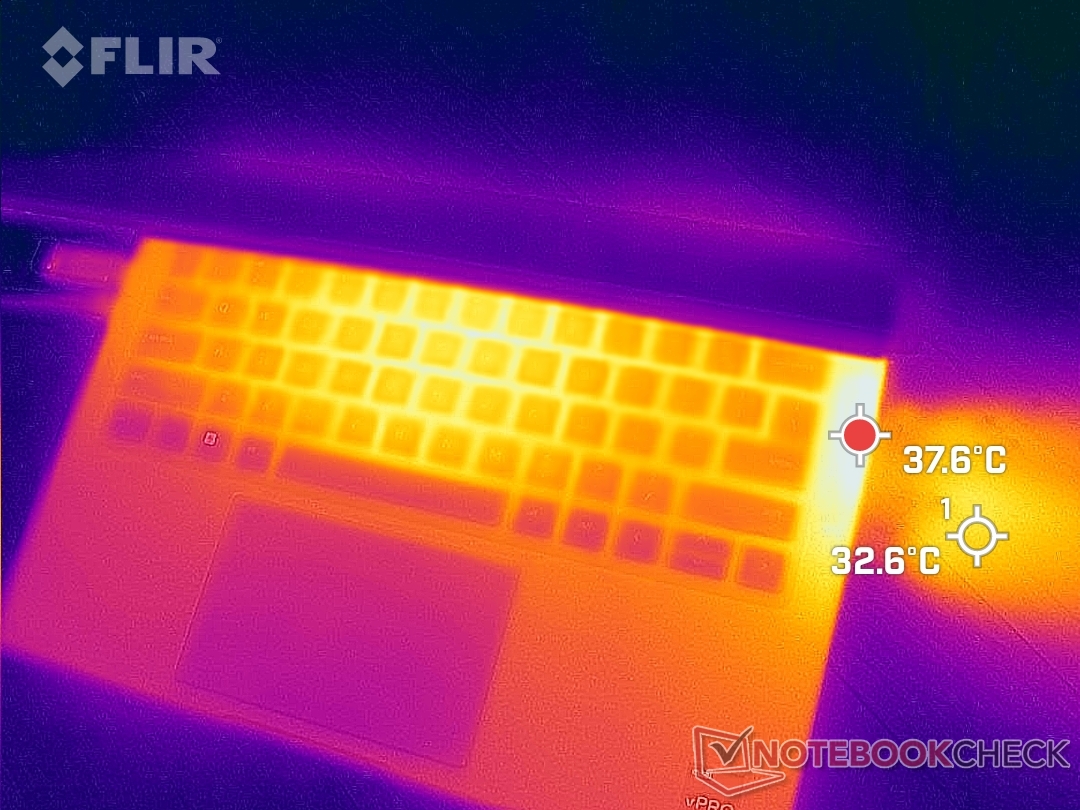
(+) A temperatura máxima no lado superior é 39.2 °C / 103 F, em comparação com a média de 35.4 °C / 96 F , variando de 19.6 a 60 °C para a classe Convertible.
(±) A parte inferior aquece até um máximo de 44.8 °C / 113 F, em comparação com a média de 36.9 °C / 98 F
(+) Em uso inativo, a temperatura média para o lado superior é 19.7 °C / 67 F, em comparação com a média do dispositivo de 30.3 °C / ### class_avg_f### F.
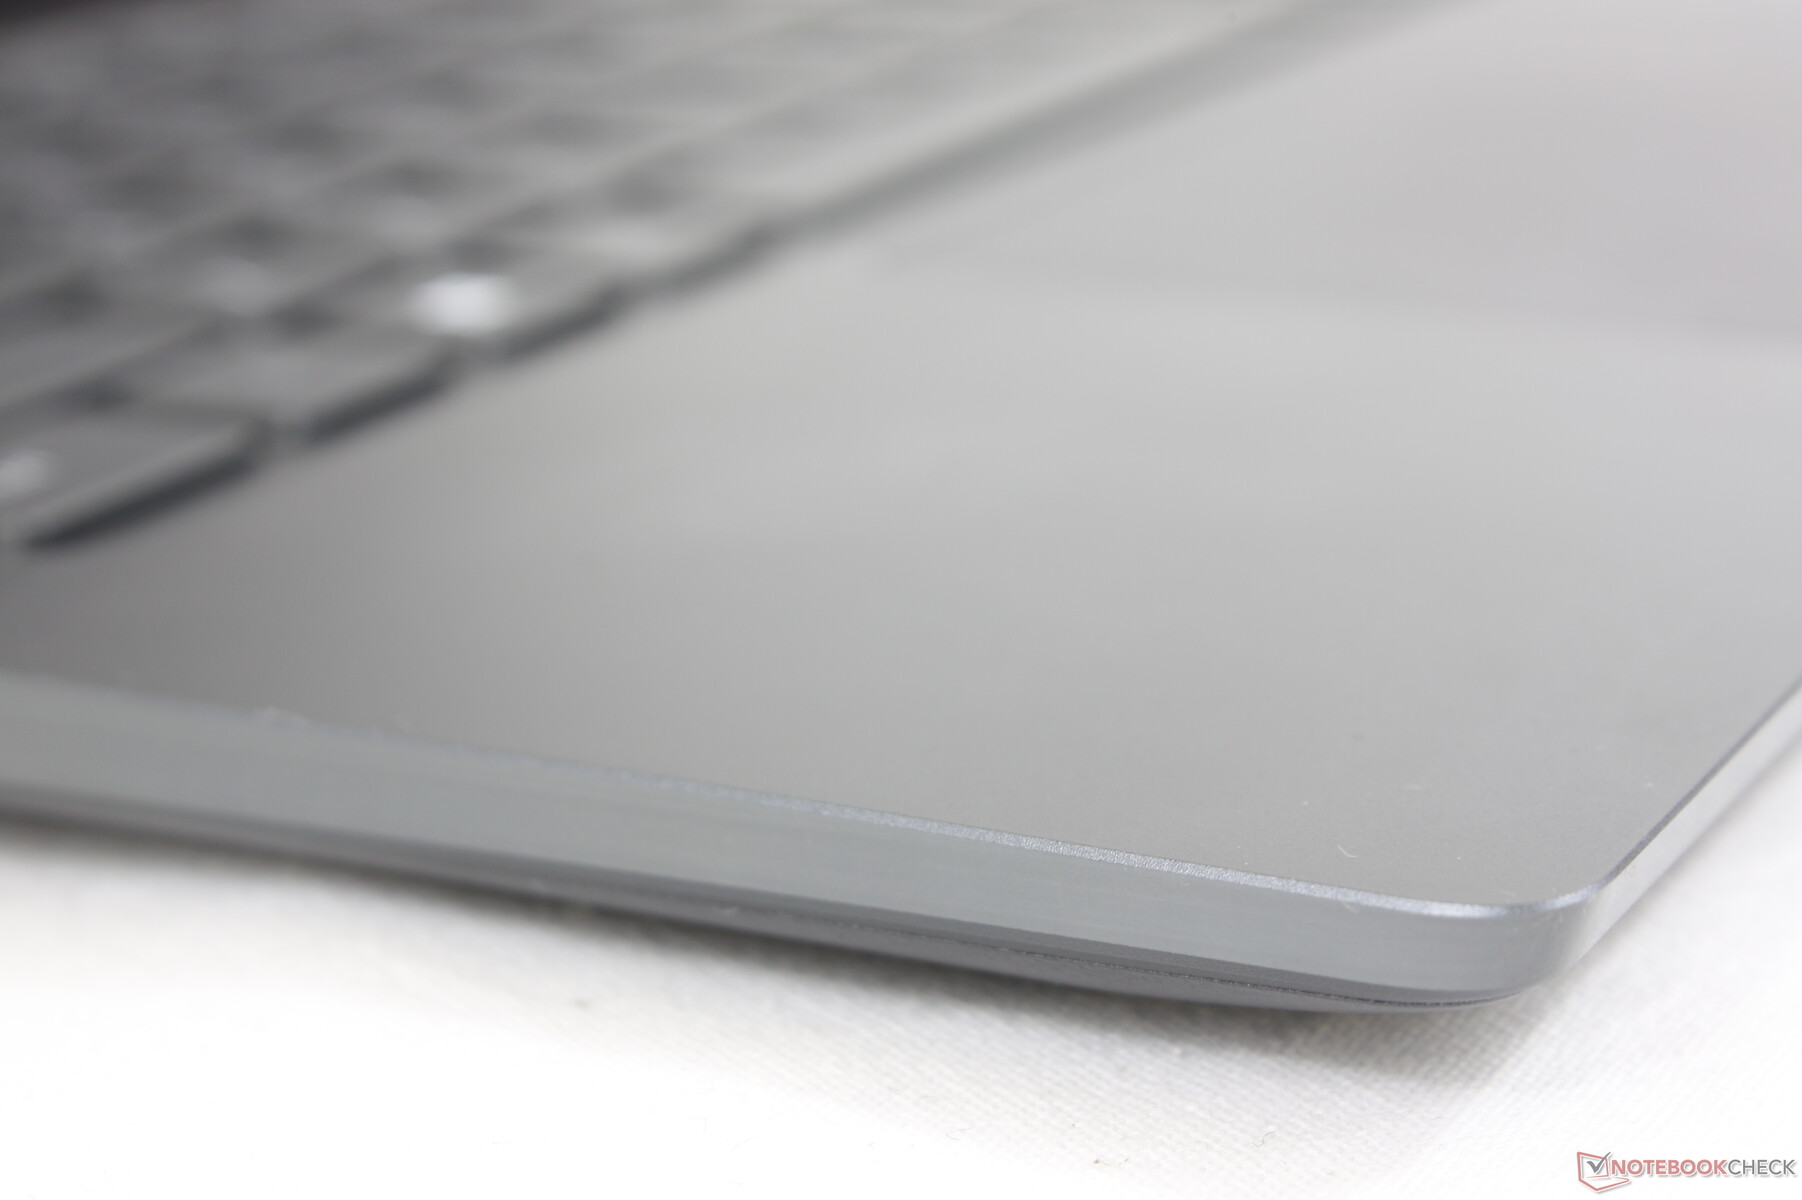
(+) Os apoios para as mãos e o touchpad são mais frios que a temperatura da pele, com um máximo de 28.4 °C / 83.1 F e, portanto, são frios ao toque.
(±) A temperatura média da área do apoio para as mãos de dispositivos semelhantes foi 28 °C / 82.4 F (-0.4 °C / -0.7 F).
| Dell Latitude 9430 2-in-1 Intel Core i7-1265U, Intel Iris Xe Graphics G7 96EUs | Dell Latitude 9420 2-in-1 Intel Core i7-1185G7, Intel Iris Xe Graphics G7 96EUs | MSI Summit E14 Flip Evo A12MT Intel Core i7-1260P, Intel Iris Xe Graphics G7 96EUs | LG Gram 14T90P Intel Core i5-1135G7, Intel Iris Xe Graphics G7 80EUs | Lenovo ThinkPad X1 Yoga G7 21CE002HGE Intel Core i7-1270P, Intel Iris Xe Graphics G7 96EUs | Asus ZenBook Flip 14 UN5401QA-KN085W AMD Ryzen 7 5800H, AMD Radeon RX Vega 8 (Ryzen 4000/5000) | |
|---|---|---|---|---|---|---|
| Heat | -21% | -1% | -5% | -15% | -35% | |
| Maximum Upper Side * (°C) | 39.2 | 43.4 -11% | 44.2 -13% | 41.6 -6% | 43.3 -10% | 42.7 -9% |
| Maximum Bottom * (°C) | 44.8 | 48 -7% | 45.8 -2% | 46.2 -3% | 45.1 -1% | 53.1 -19% |
| Idle Upper Side * (°C) | 21.4 | 29.8 -39% | 19.6 8% | 22.6 -6% | 26.5 -24% | 32.9 -54% |
| Idle Bottom * (°C) | 22.4 | 28 -25% | 22 2% | 23.2 -4% | 27.6 -23% | 35.2 -57% |
* ... menor é melhor
Teste de estresse
As taxas de relógio, a temperatura central e o consumo de energia da placa aumentariam para 3,6 GHz, 98 C e 48 W, respectivamente, por apenas alguns breves segundos quando o Prime95 funciona. As taxas de relógio cairiam então de forma constante antes de finalmente estabilizarem em 2,4 GHz, a fim de manter uma absorção de potência mais manejável da placa e uma temperatura central de 24 W e 74 C, respectivamente. Apreciamos o desempenho estável e mais previsível desta vez, enquanto as taxas de relógio e a temperatura no Latitude 9420 2 em 1 flutuariam de forma mais selvagem sob condições semelhantes.
Taxas de relógio e temperatura da GPU quando em funcionamento Witcher 3 se estabilizariam em 1097 MHz e 66 C, respectivamente, em comparação com ~1200 MHz e 73 C na Latitude 9420 2 em 1 ou 1197 MHz e 85 C na MSI Summit E14 Flip.
Funcionando com a energia da bateria limita o desempenho. Um teste 3DMark 11 com baterias retornaria pontuações de Física e Gráficos de 9711 e 5679 pontos, respectivamente, em comparação com 16290 e 6231 pontos quando em rede elétrica.
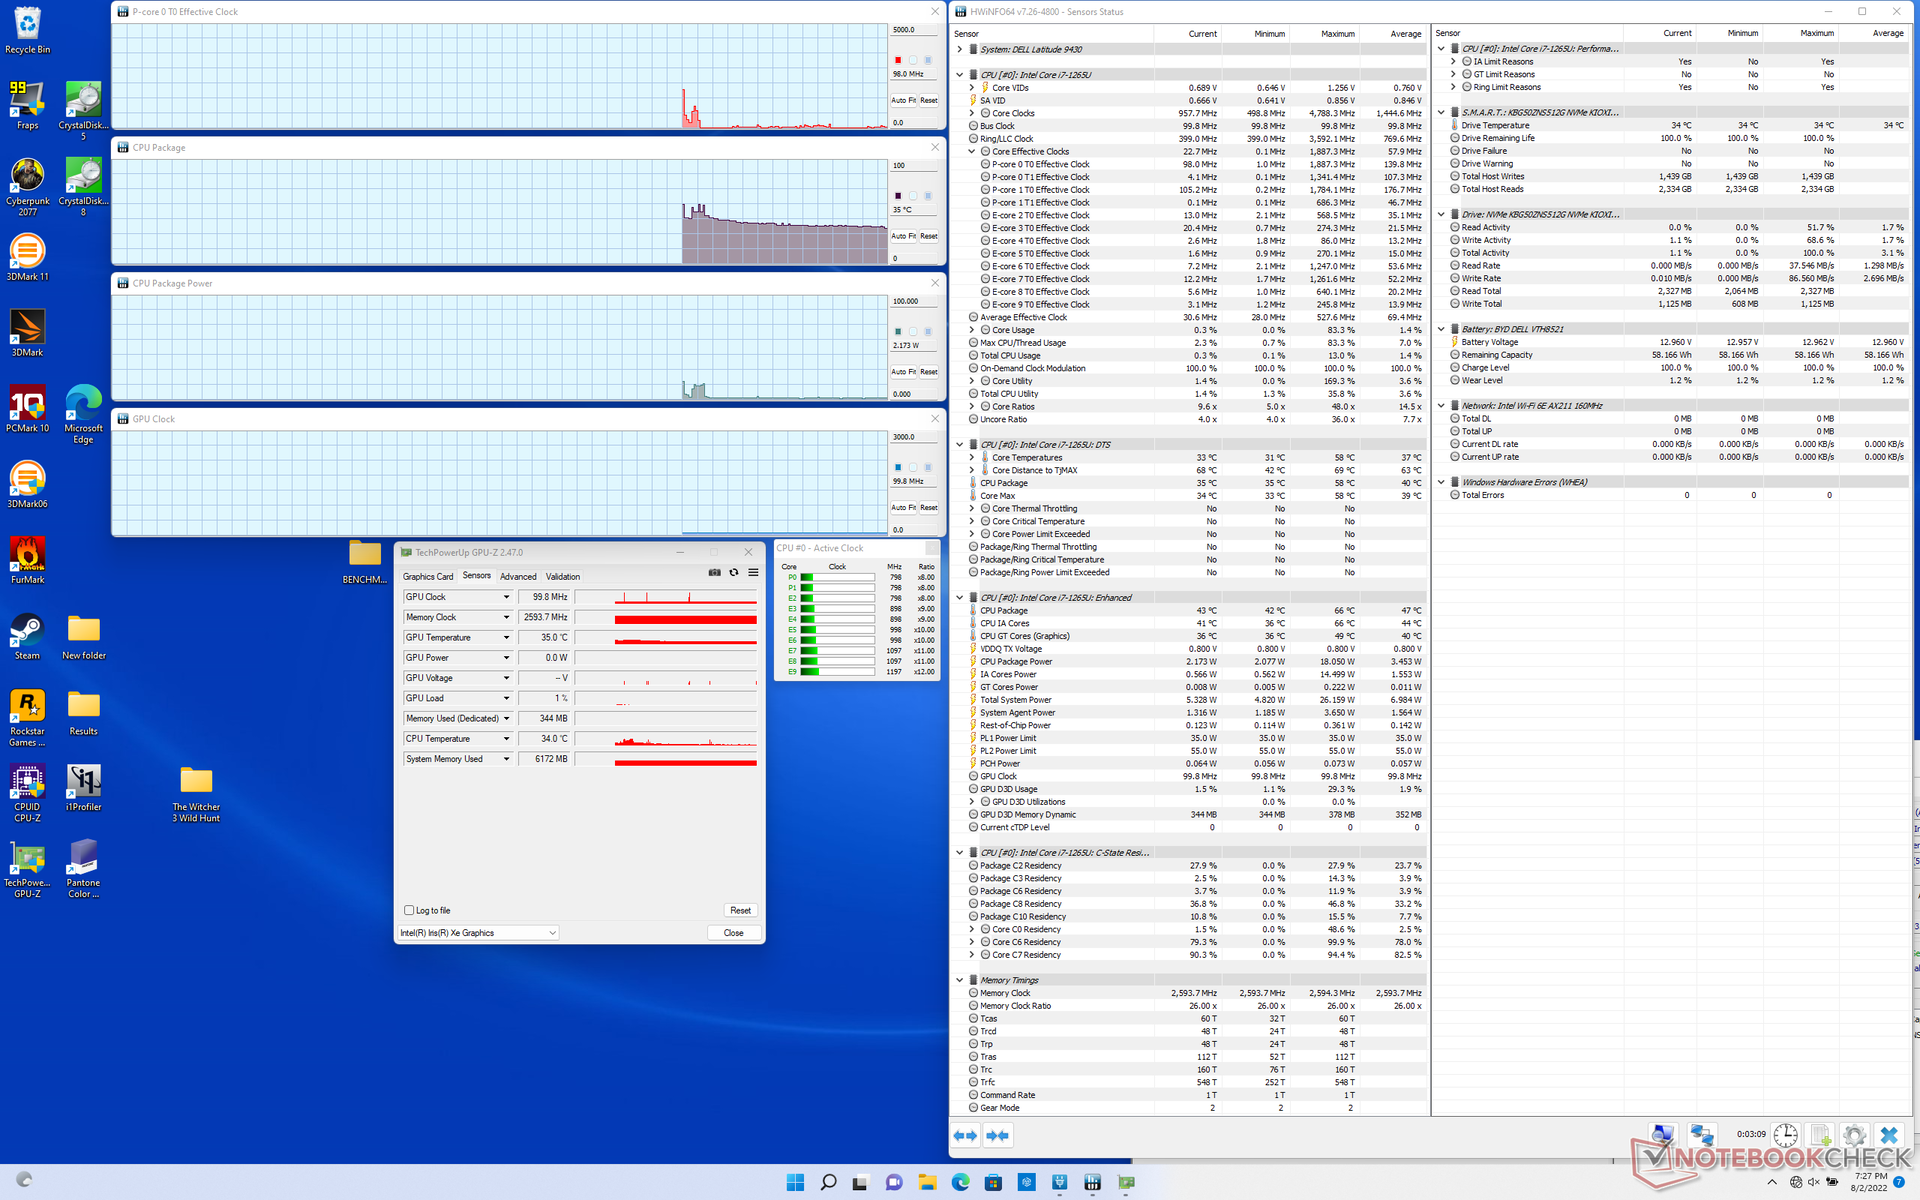
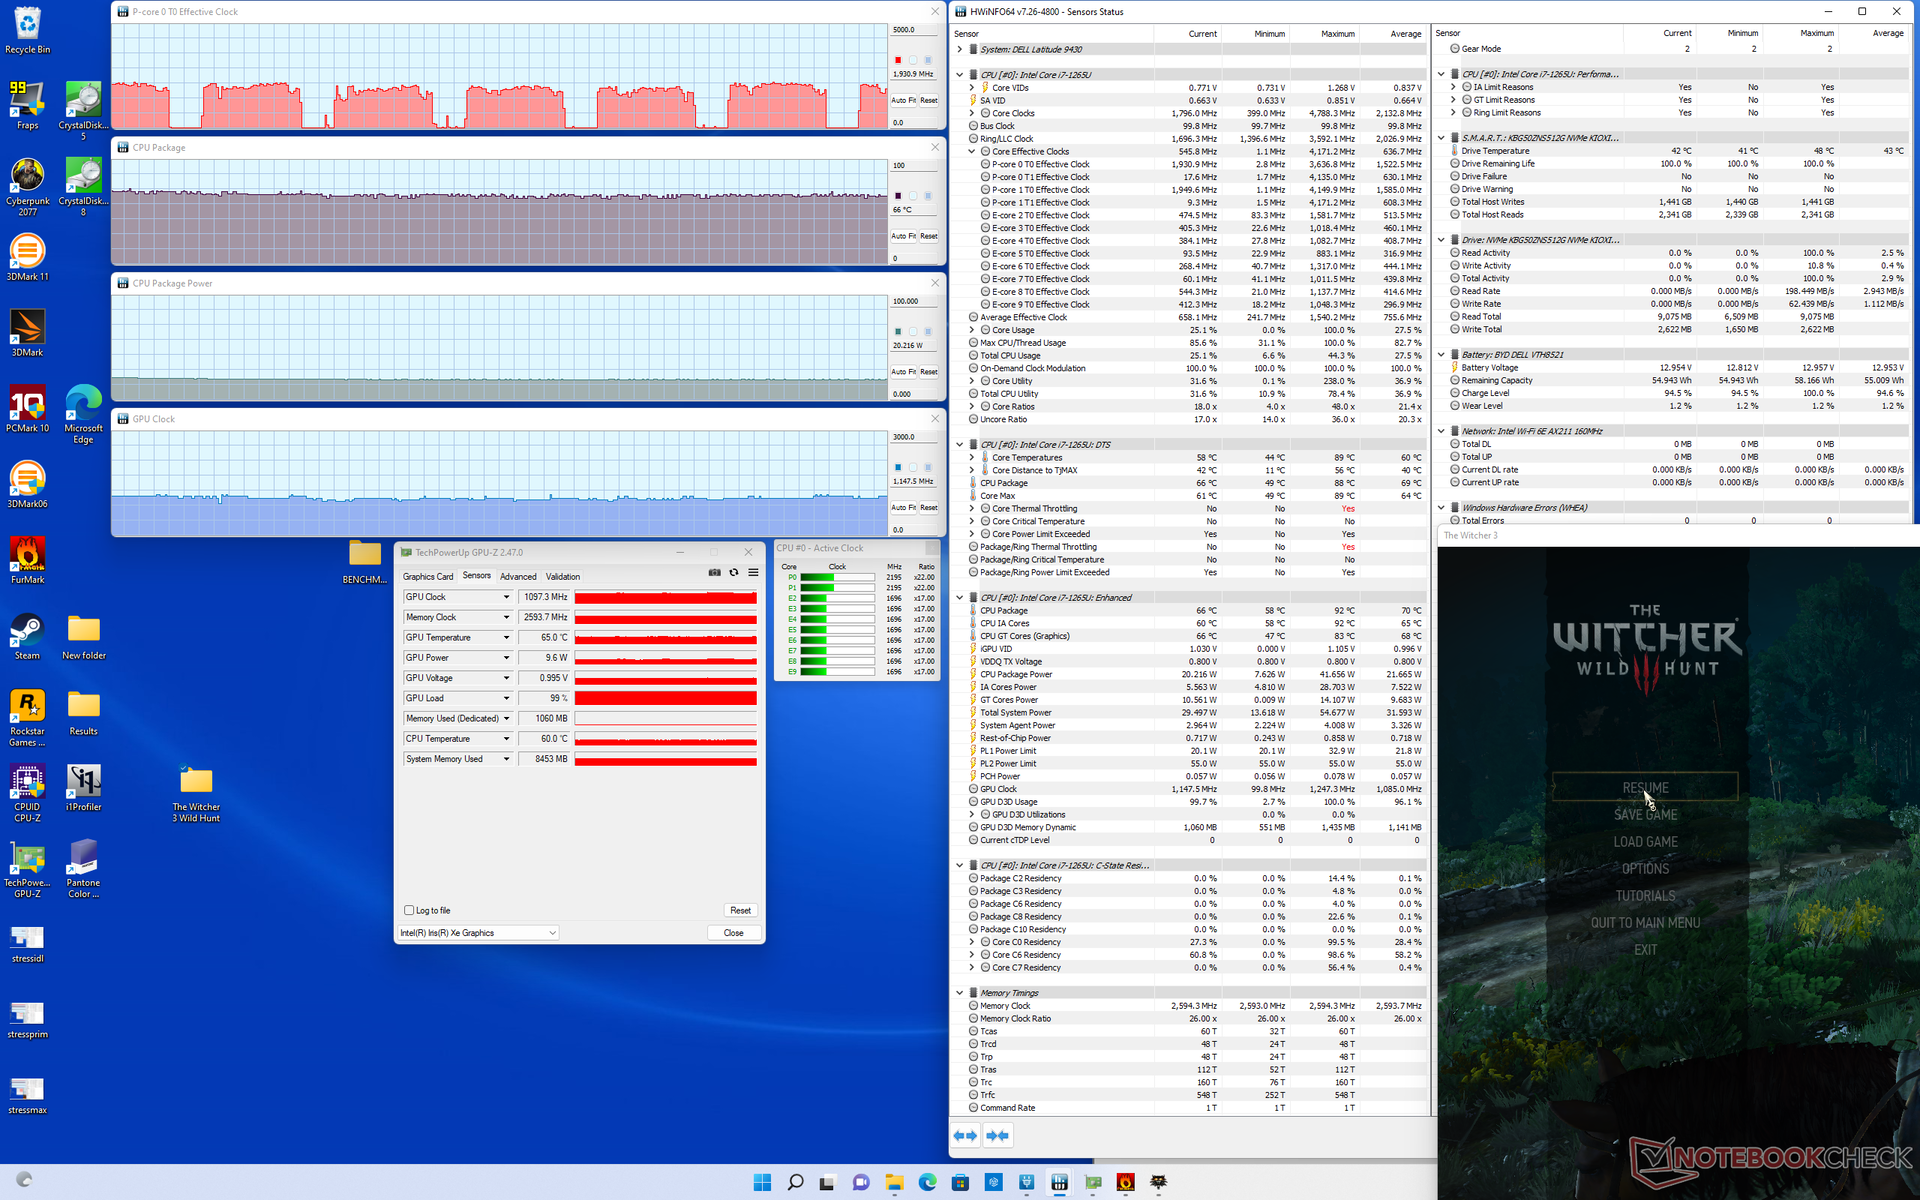
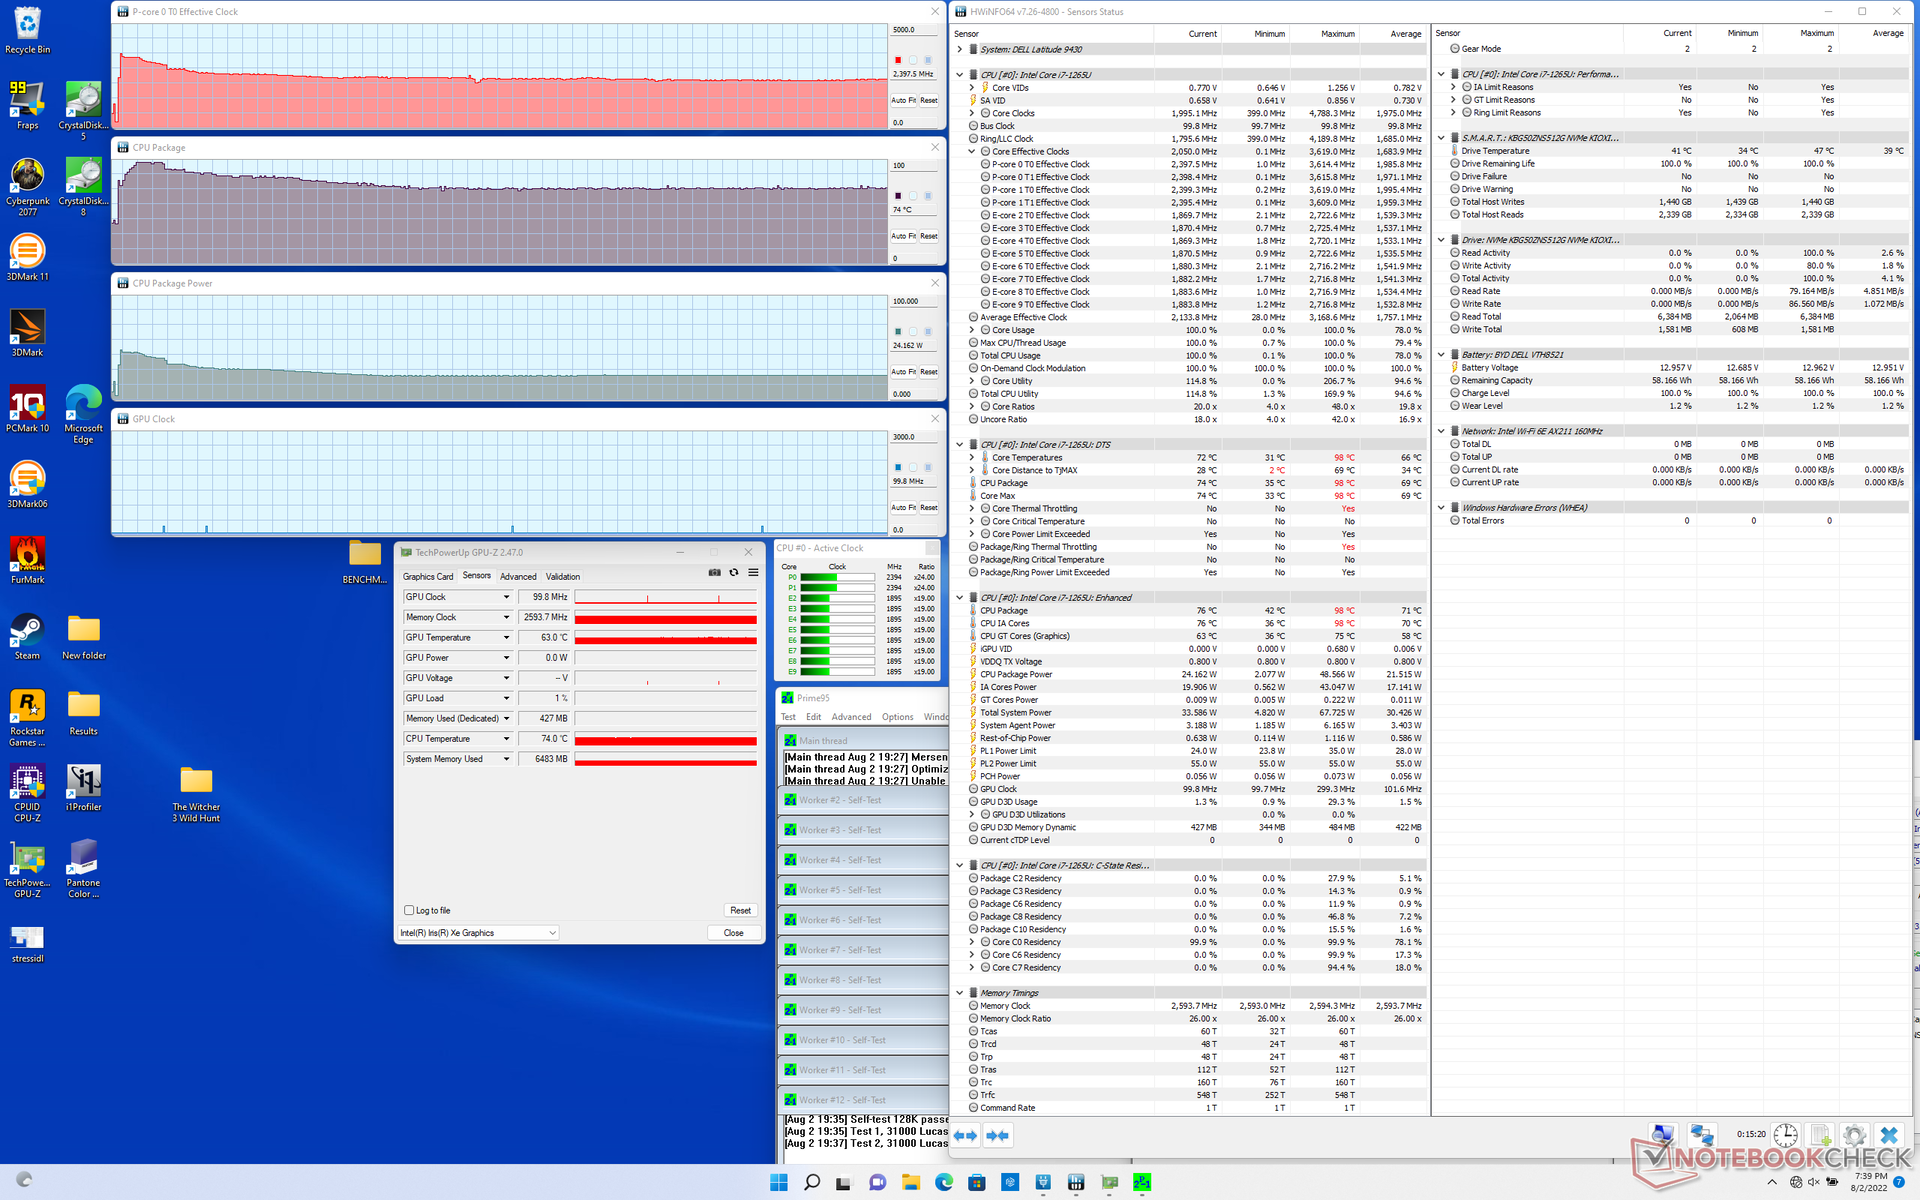
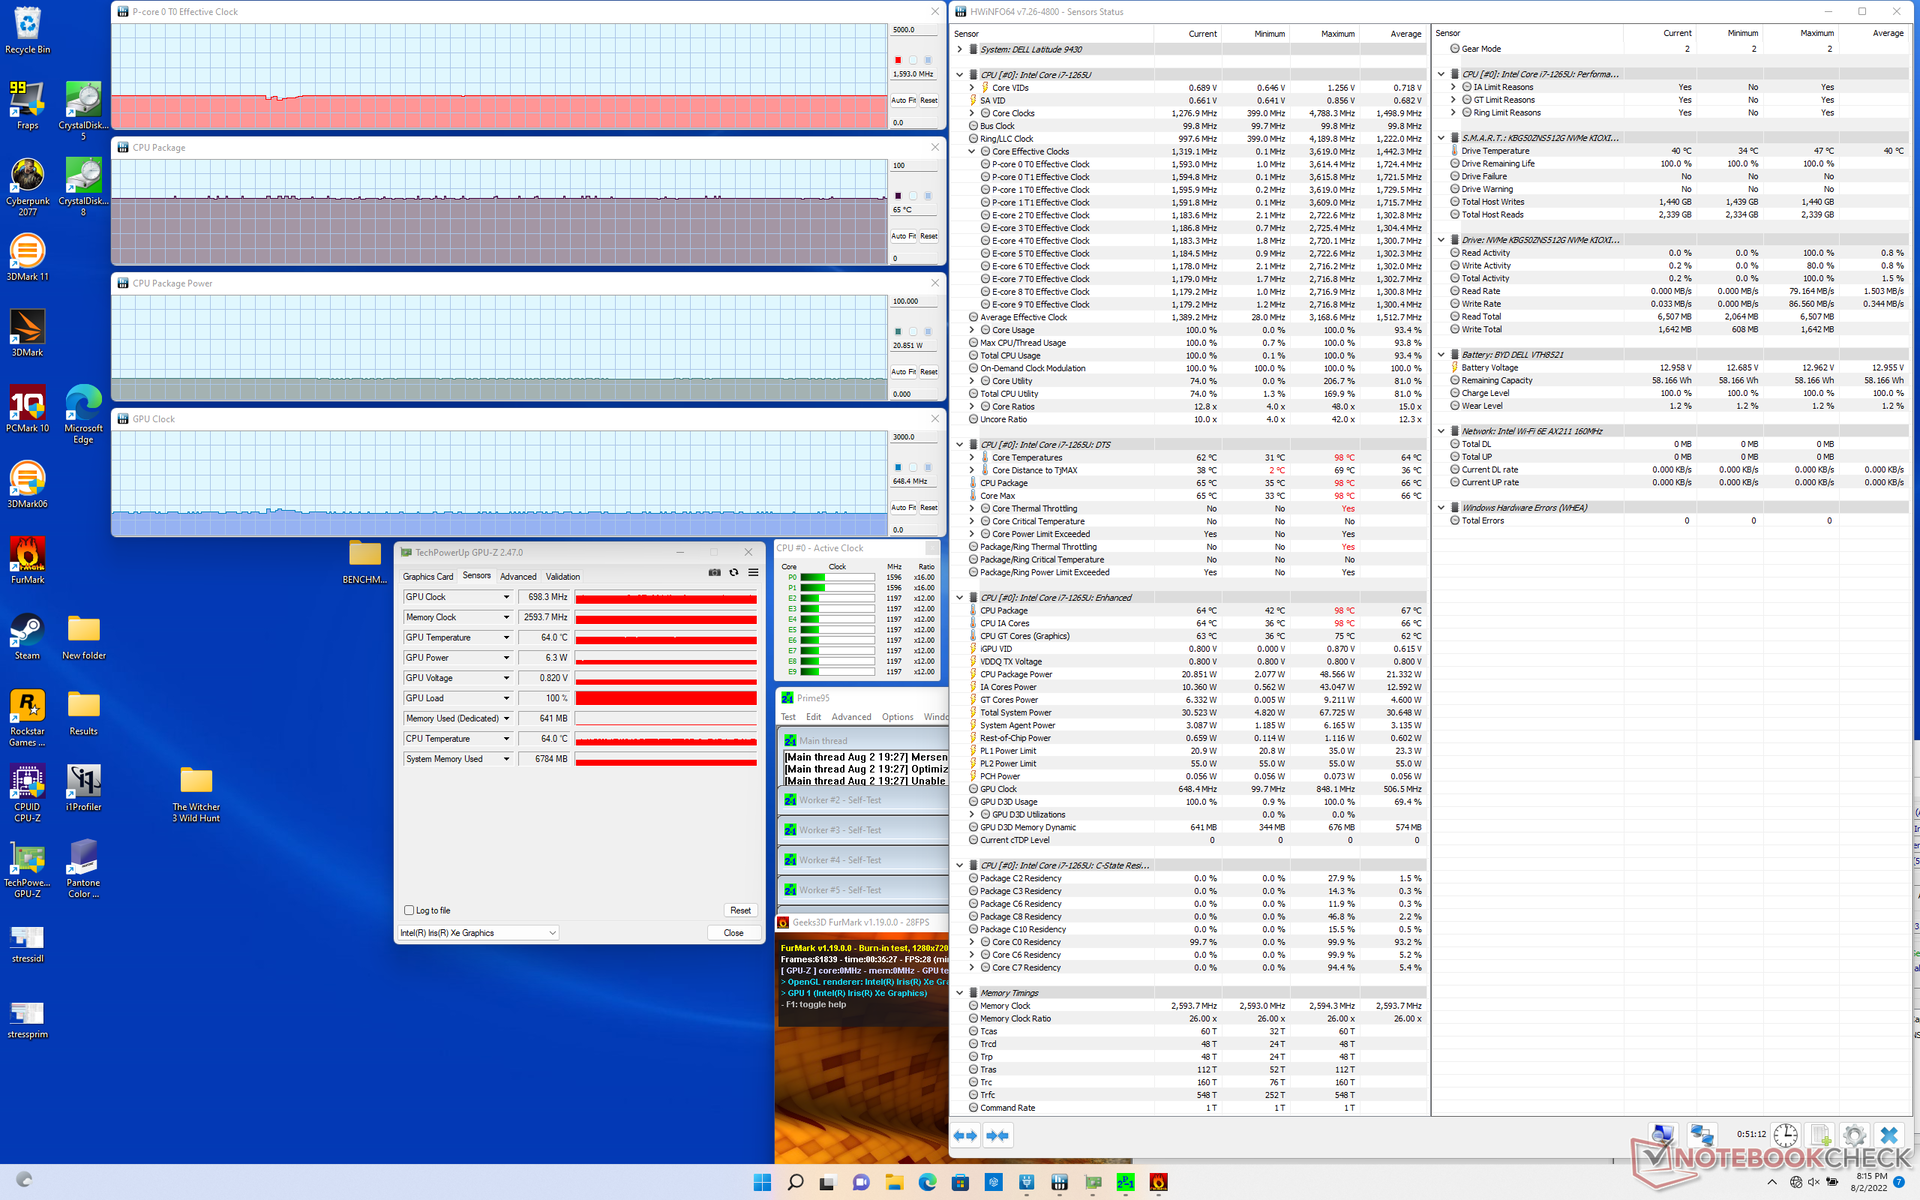
| Relógio CPU (GHz) | Relógio GPU (MHz) | Temperatura média da CPU (°C) | |
| System Idle | -- | -- | 35 |
| Prime95 Stress | 2.4 | -- | 74 |
| Prime95 + FurMark Stress | 1.6 | 698 | 65 |
| Witcher 3 Estresse | ~2.0 | 1097 | 66 |
Oradores
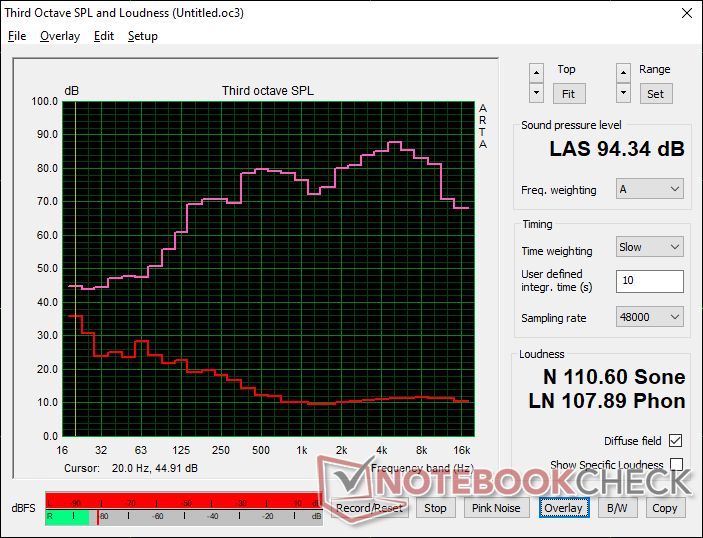
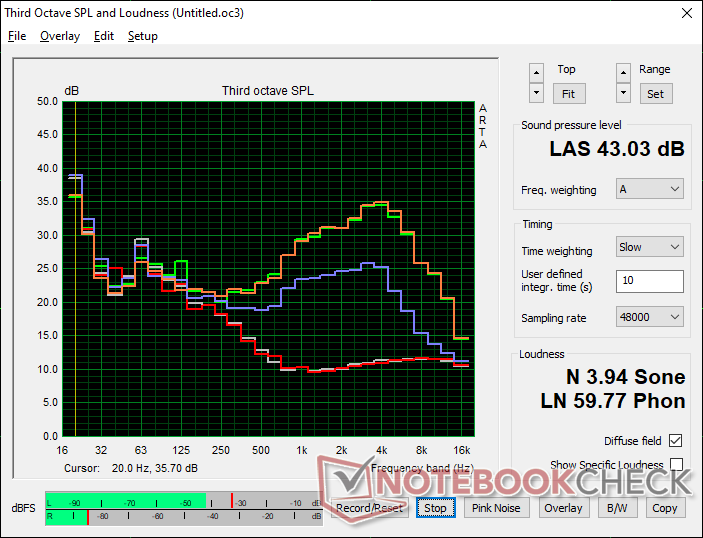
Dell Latitude 9430 2-in-1 análise de áudio
(+) | os alto-falantes podem tocar relativamente alto (###valor### dB)
Graves 100 - 315Hz
(±) | graves reduzidos - em média 12.3% menor que a mediana
(+) | o baixo é linear (5.3% delta para a frequência anterior)
Médios 400 - 2.000 Hz
(+) | médios equilibrados - apenas 2% longe da mediana
(+) | médios são lineares (4.7% delta para frequência anterior)
Altos 2 - 16 kHz
(±) | máximos mais altos - em média 5.4% maior que a mediana
(+) | os máximos são lineares (3% delta da frequência anterior)
Geral 100 - 16.000 Hz
(+) | o som geral é linear (11.6% diferença em relação à mediana)
Comparado com a mesma classe
» 10% de todos os dispositivos testados nesta classe foram melhores, 4% semelhantes, 86% piores
» O melhor teve um delta de 6%, a média foi 20%, o pior foi 57%
Comparado com todos os dispositivos testados
» 8% de todos os dispositivos testados foram melhores, 2% semelhantes, 90% piores
» O melhor teve um delta de 4%, a média foi 23%, o pior foi 134%
Apple MacBook Pro 16 2021 M1 Pro análise de áudio
(+) | os alto-falantes podem tocar relativamente alto (###valor### dB)
Graves 100 - 315Hz
(+) | bons graves - apenas 3.8% longe da mediana
(+) | o baixo é linear (5.2% delta para a frequência anterior)
Médios 400 - 2.000 Hz
(+) | médios equilibrados - apenas 1.3% longe da mediana
(+) | médios são lineares (2.1% delta para frequência anterior)
Altos 2 - 16 kHz
(+) | agudos equilibrados - apenas 1.9% longe da mediana
(+) | os máximos são lineares (2.7% delta da frequência anterior)
Geral 100 - 16.000 Hz
(+) | o som geral é linear (4.6% diferença em relação à mediana)
Comparado com a mesma classe
» 0% de todos os dispositivos testados nesta classe foram melhores, 0% semelhantes, 100% piores
» O melhor teve um delta de 5%, a média foi 17%, o pior foi 45%
Comparado com todos os dispositivos testados
» 0% de todos os dispositivos testados foram melhores, 0% semelhantes, 100% piores
» O melhor teve um delta de 4%, a média foi 23%, o pior foi 134%
Gestão de energia
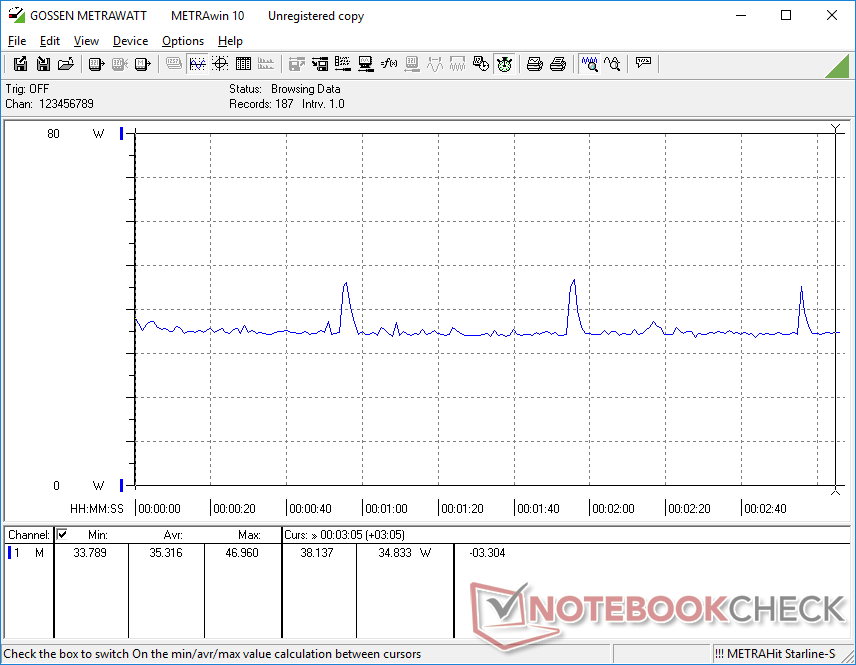
Consumo de energia
A movimentação na área de trabalho exige entre 3 W e 7 W, dependendo do perfil de brilho e do ajuste de potência, que é um pouco menor do que o que gravamos no Latitude 9420 2 em 1. Enquanto isso, rodar Prime95 consome cerca de 62 W em comparação com apenas 32 W no modelo do ano passado para um aumento de 94 por cento no consumo de energia quando a CPU está estressada. O desempenho multi-linha 50% maior ao saltar do Core i7-1185G7 para o Núcleo i7-1265U não é livre a este respeito.
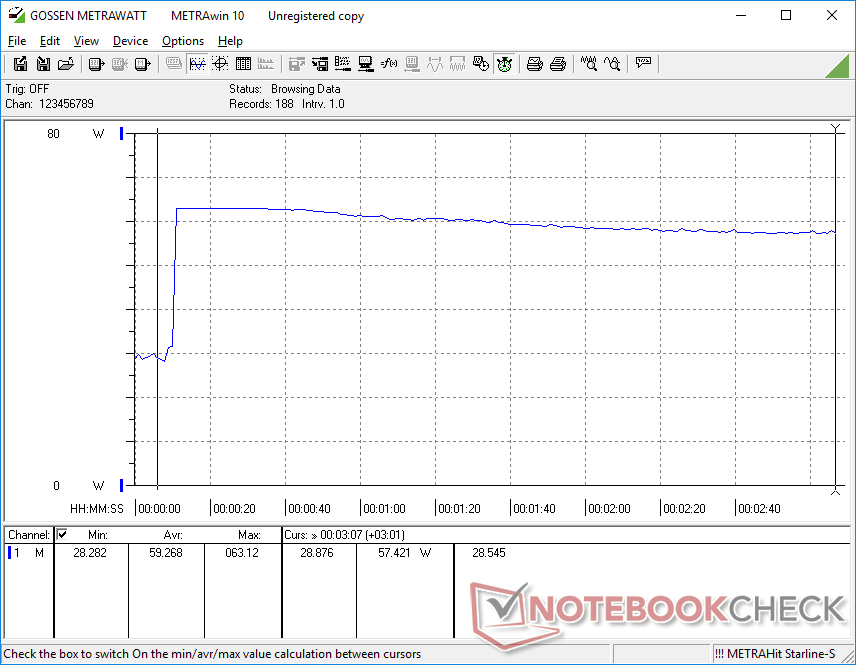
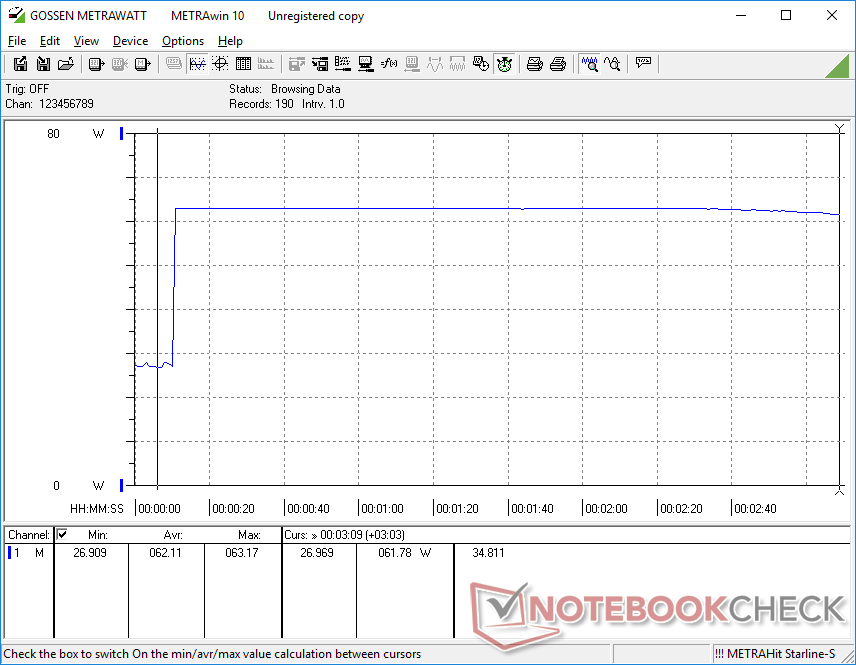
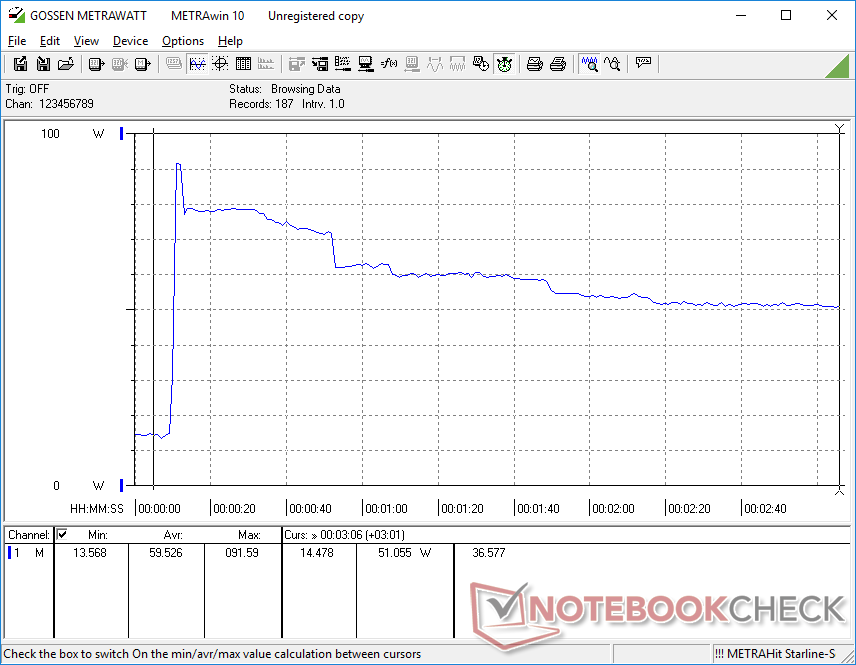
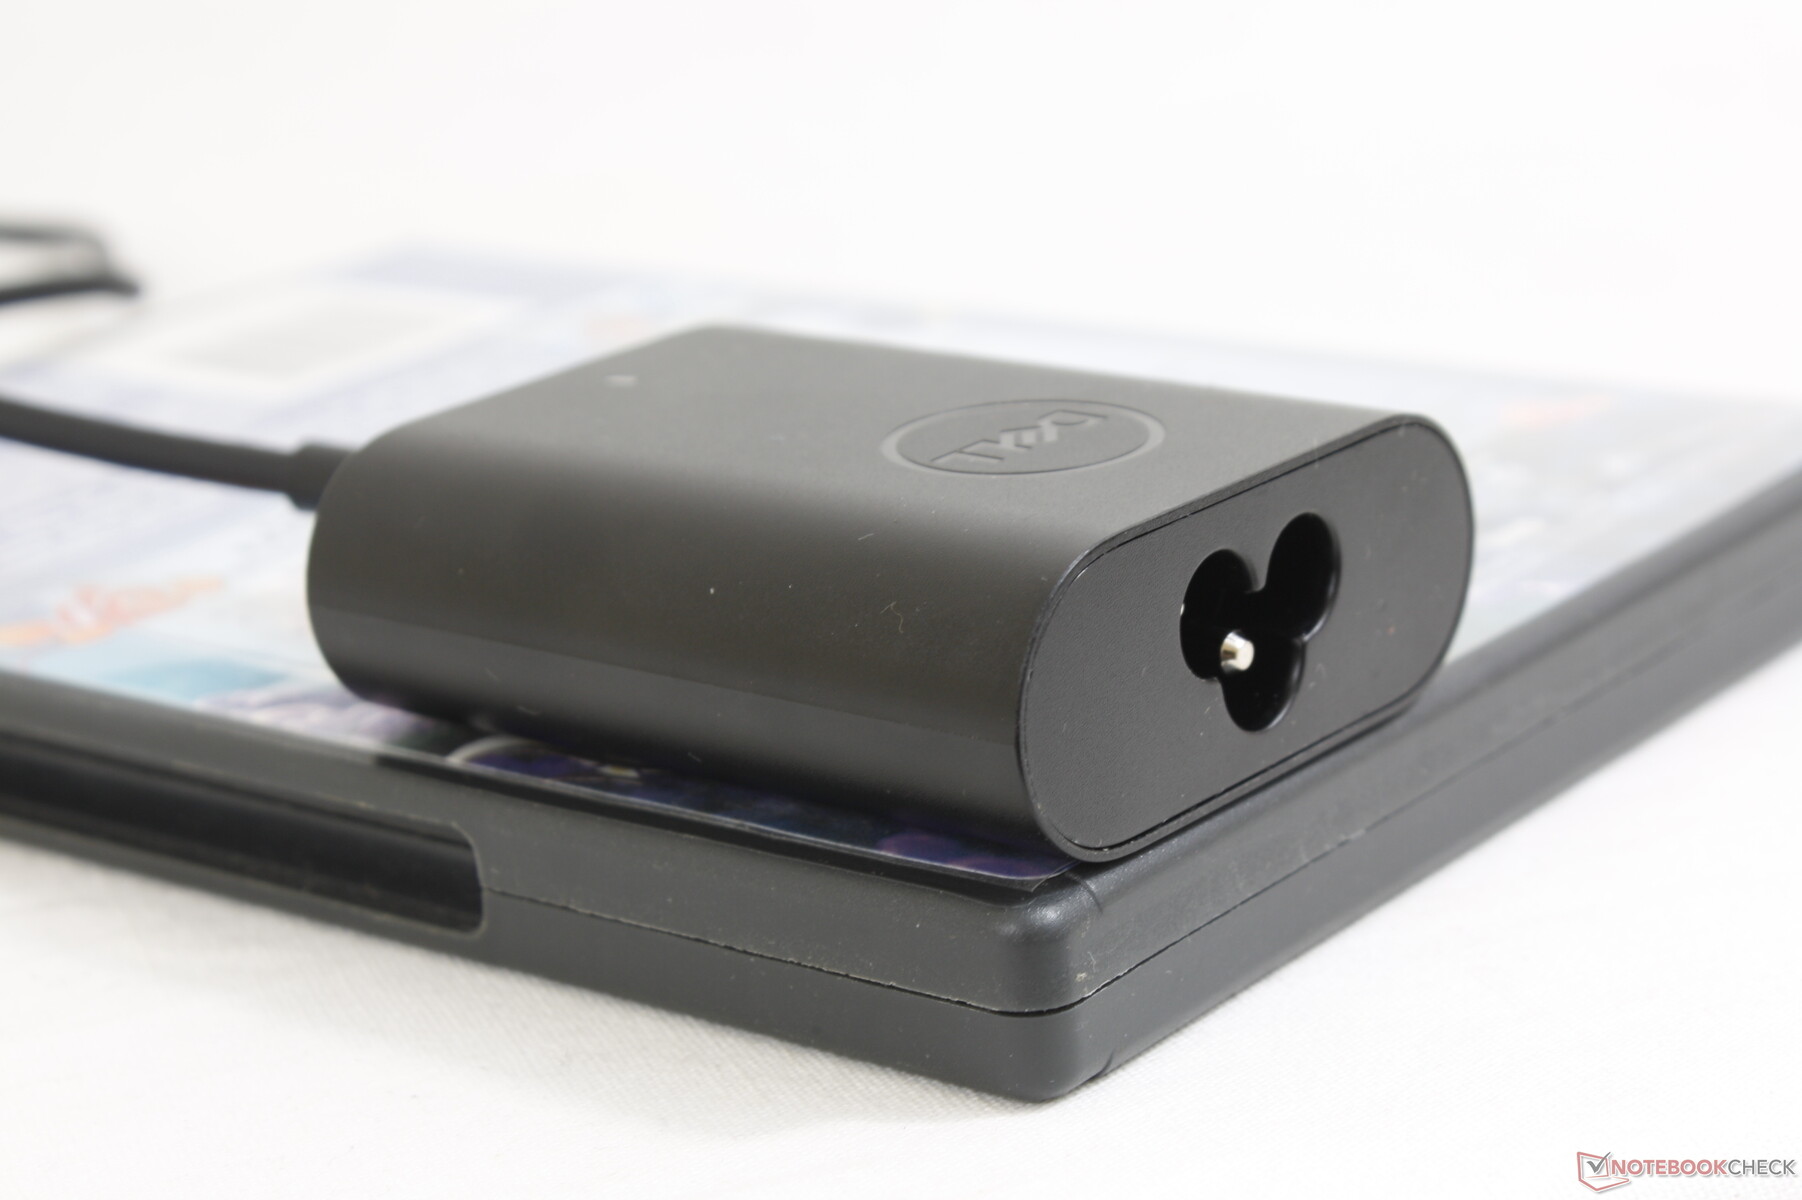
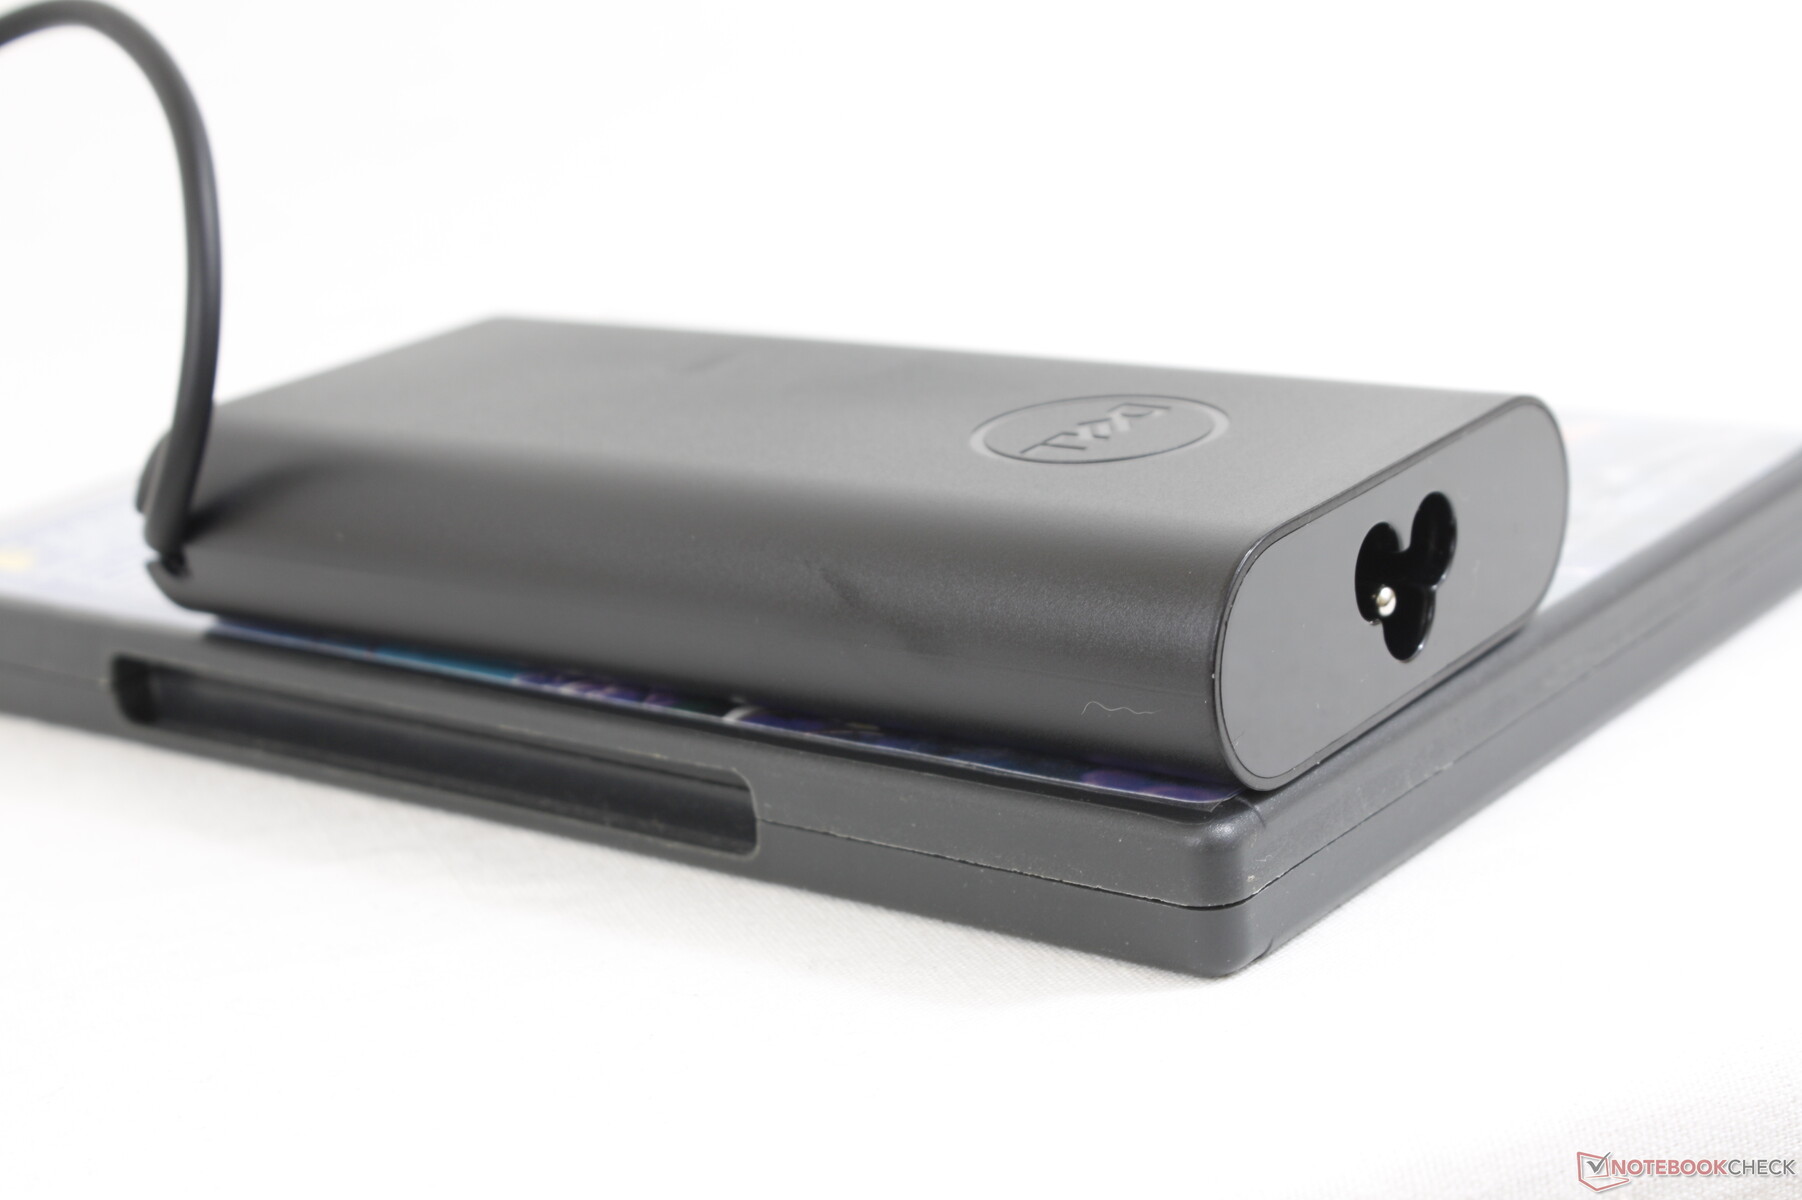
Ao contrário da maioria dos outros laptops, a Dell oferece três opções de adaptador AC no checkout: 60 W, 65 W, e 90 W. A opção de 90 W é útil para alimentar a CPU com mais energia para taxas de relógio Turbo Boost mais altas e, portanto, maior desempenho. Entretanto, nossos testes de estresse mostraram que o sistema não consegue manter taxas de relógio Turbo Boost muito altas por longos períodos e, portanto, qualquer aumento de desempenho do adaptador AC de 90 W será de curta duração. Por exemplo, o consumo de energia se estabilizaria em 61 W ao executar Prime95 no pequeno (~6,7 x 5,5 x 2,2 cm) adaptador CA de 60 W. Repetir este teste com o maior (~13 x 6,5 x 2,3 cm) adaptador CA de 90 W faria com que o consumo chegasse a 91,6 W durante o início do teste antes de eventualmente cair e se estabilizar em 51 W após cerca de 90 segundos, como mostrado por nossos gráficos abaixo. O adaptador de 90 W ainda é uma boa opção se você planeja executar programas exigentes, pois as breves explosões no desempenho da CPU podem economizar tempo ao carregar aplicações ou processar imagens.
| desligado | |
| Ocioso | |
| Carga |
|
Key:
min: | |
| Dell Latitude 9430 2-in-1 i7-1265U, Iris Xe G7 96EUs, , IPS, 2560x1600, 14" | Dell Latitude 9420 2-in-1 i7-1185G7, Iris Xe G7 96EUs, WDC PC SN530 SDBPNPZ-512G, IPS, 2560x1600, 14" | MSI Summit E14 Flip Evo A12MT i7-1260P, Iris Xe G7 96EUs, Samsung PM9A1 MZVL21T0HCLR, IPS, 2880x1800, 14" | LG Gram 14T90P i5-1135G7, Iris Xe G7 80EUs, Samsung SSD PM981a MZVLB512HBJQ, IPS, 1900x1200, 14" | Lenovo ThinkPad X1 Yoga G7 21CE002HGE i7-1270P, Iris Xe G7 96EUs, Samsung PM9A1 MZVL2512HCJQ, IPS, 1920x1200, 14" | Asus ZenBook Flip 14 UN5401QA-KN085W R7 5800H, Vega 8, Intel SSD 600p SSDPEKKW512G7, OLED, 2880x1800, 14" | |
|---|---|---|---|---|---|---|
| Power Consumption | -27% | -49% | 3% | -13% | -52% | |
| Idle Minimum * (Watt) | 2.9 | 4.6 -59% | 5.4 -86% | 2.8 3% | 4.2 -45% | 6.4 -121% |
| Idle Average * (Watt) | 5.8 | 7.8 -34% | 9.5 -64% | 5.5 5% | 6.9 -19% | 9.4 -62% |
| Idle Maximum * (Watt) | 6.6 | 8.2 -24% | 12.4 -88% | 6.4 3% | 7.6 -15% | 10.7 -62% |
| Load Average * (Watt) | 49.2 | 47.9 3% | 54.7 -11% | 45.4 8% | 36.2 26% | 52.2 -6% |
| Witcher 3 ultra * (Watt) | 35.3 | 38.8 -10% | 52 -47% | 34 4% | 43.2 -22% | 53 -50% |
| Load Maximum * (Watt) | 63.1 | 87.1 -38% | 63.4 -0% | 65.9 -4% | 63.5 -1% | 69 -9% |
* ... menor é melhor
Power Consumption Witcher 3 / Stresstest
Power Consumption external Monitor
Vida útil da bateria
Espere mais de 12 horas de uso da WLAN no mundo real antes de precisar recarregar a bateria de 60 Wh. Uma opção menor de 40 Wh está disponível também para um peso total mais leve e aproximadamente dois terços do tempo de execução.
O carregamento da capacidade vazia à plena com o adaptador CA de 60 W incluído leva pouco menos de 2 horas.
| Dell Latitude 9430 2-in-1 i7-1265U, Iris Xe G7 96EUs, 60 Wh | Dell Latitude 9420 2-in-1 i7-1185G7, Iris Xe G7 96EUs, 60 Wh | MSI Summit E14 Flip Evo A12MT i7-1260P, Iris Xe G7 96EUs, 72 Wh | LG Gram 14T90P i5-1135G7, Iris Xe G7 80EUs, 72 Wh | Lenovo ThinkPad X1 Yoga G7 21CE002HGE i7-1270P, Iris Xe G7 96EUs, 57 Wh | Asus ZenBook Flip 14 UN5401QA-KN085W R7 5800H, Vega 8, 63 Wh | |
|---|---|---|---|---|---|---|
| Duração da bateria | -2% | -26% | -5% | -30% | -22% | |
| Reader / Idle (h) | 27.8 | 28.7 3% | 22.1 -21% | |||
| WiFi v1.3 (h) | 12.8 | 11.7 -9% | 8.2 -36% | 12.1 -5% | 8.9 -30% | 8.7 -32% |
| Load (h) | 2.4 | 2.4 0% | 1.9 -21% | 2.3 -4% | 1.7 -29% | 2.1 -12% |
| H.264 (h) | 12.2 | 9 |
Pro
Contra
Veredicto - Mesma embalagem, Novo nome
Tudo o que adorávamos no Latitude 9420 2 em 1 está de volta em força total para o Latitude 9430 2 em 1 uma vez que o modelo mais novo é principalmente uma atualização do processador. A CPU traz um desempenho muito mais rápido, embora com níveis mais altos de consumo de energia, o que está de acordo com o que temos observado em outros laptops do Lago Alder em geral. Se a CPU mais rápida, opções de 5G, ou webcam de 2 MP não atraem suas cargas de trabalho diárias, então o Latitude 9420 2 em 1 pode proporcionar essencialmente a mesma experiência por menos.
O Latitude 9430 2 em 1 é para usuários avançados que sabem que podem explorar a CPU Intel do 12º gênero. Caso contrário, o Latitude 9420 2-em-1 fisicamente idêntico já é suficiente para o usuário do escritório alvo.
Alguns inconvenientes menores a ter em mente incluem a falta de suporte para SSDs M.2 de 80 mm e antenas WAN se a configuração for feita sem suporte WAN. O Turbo Boost da CPU é limitado enquanto o desempenho é reduzido se estiver funcionando com energia de bateria. É também uma chatice que a caneta stylus ativa seja vendida separadamente, enquanto concorrentes como aLenovo ThinkPad X1 Yoga G7 incluir o estilete para cada compra. A maioria dos laptops suporta o mais comum SSD de 80 mm que pode tornar a troca de SSD um pouco mais difícil na Dell. Enquanto isso, o HP EliteBook 1040 carrega uma tela sensível ao toque muito mais brilhante, embora com uma resolução menor de 1200p. Talvez a Dell possa tornar o modelo eventual do próximo ano mais atraente com webcams de 5 MP e telas OLED de alta taxa de atualização para melhorar a experiência visual.
Preço e Disponibilidade
A Dell está enviando atualmente a clamshell Latitude 9430 e 2 em 1. Nossa configuração específica com o Core i7-1265U e 16 GB de RAM por aproximadamente US$2800 USD.
Dell Latitude 9430 2-in-1
- 08/05/2022 v7 (old)
Allen Ngo
Price comparison

