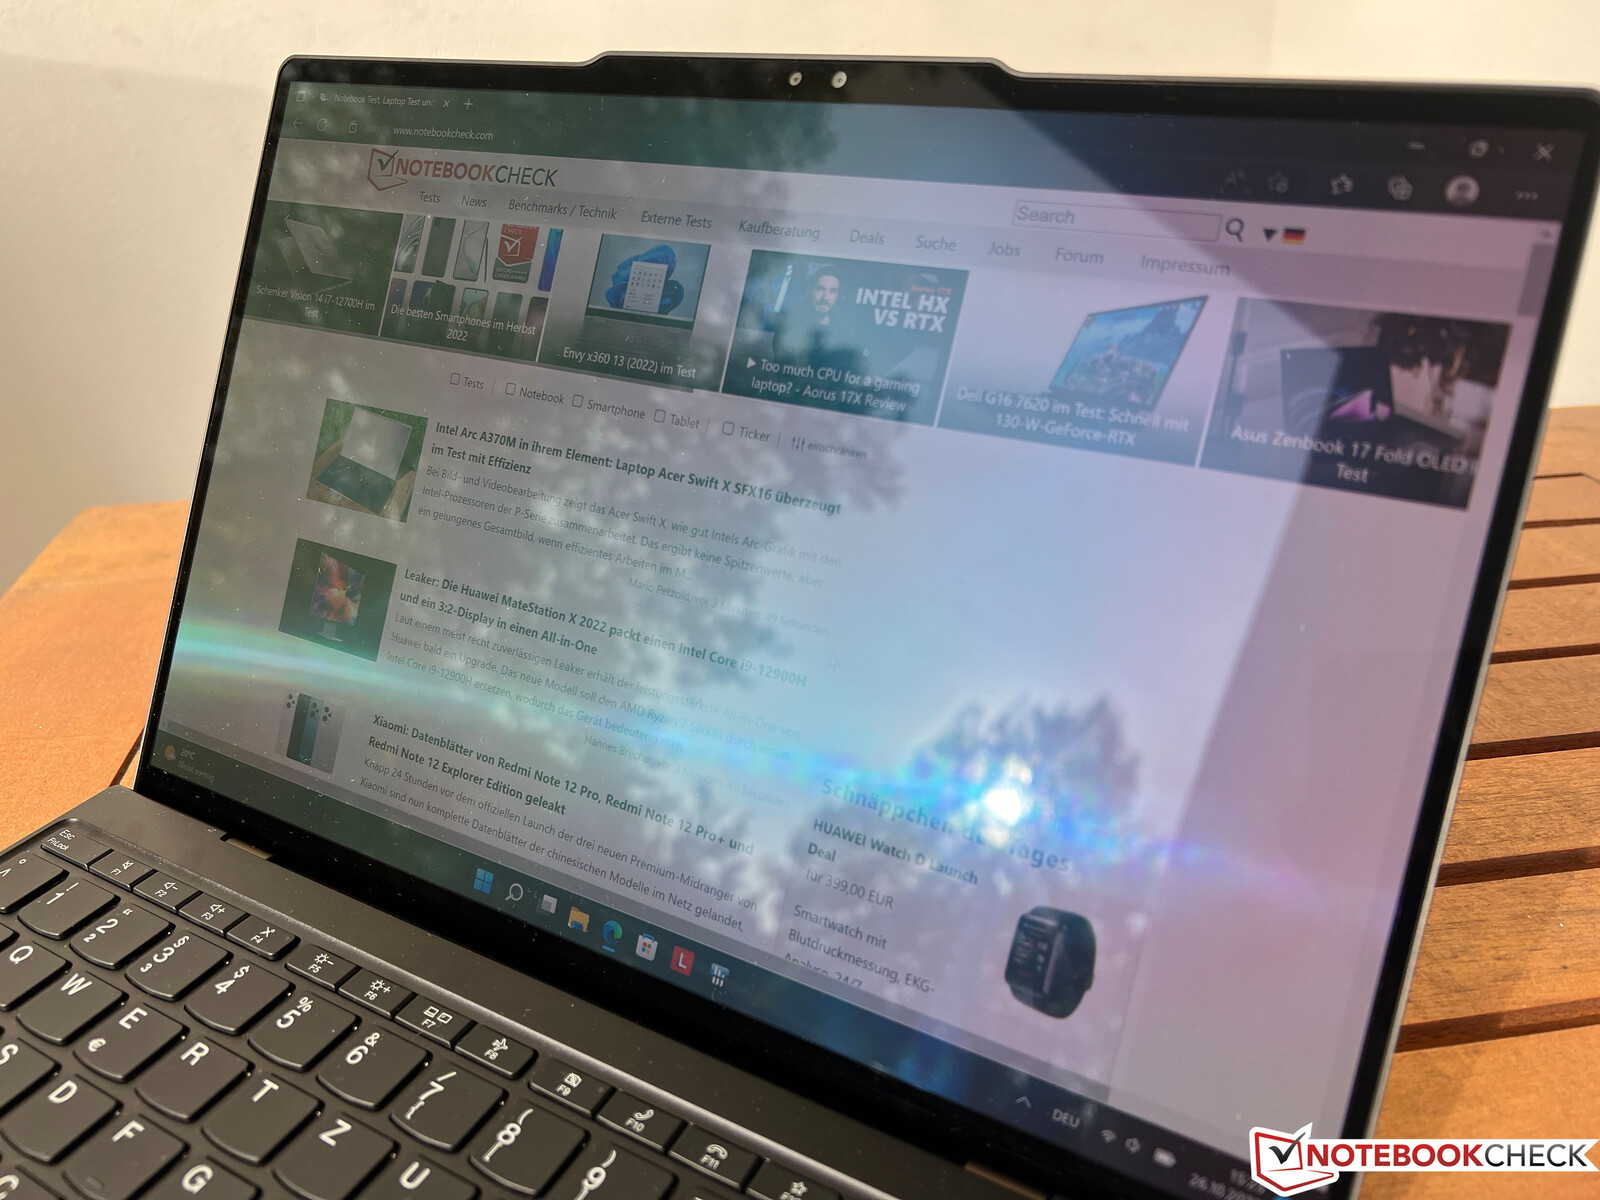
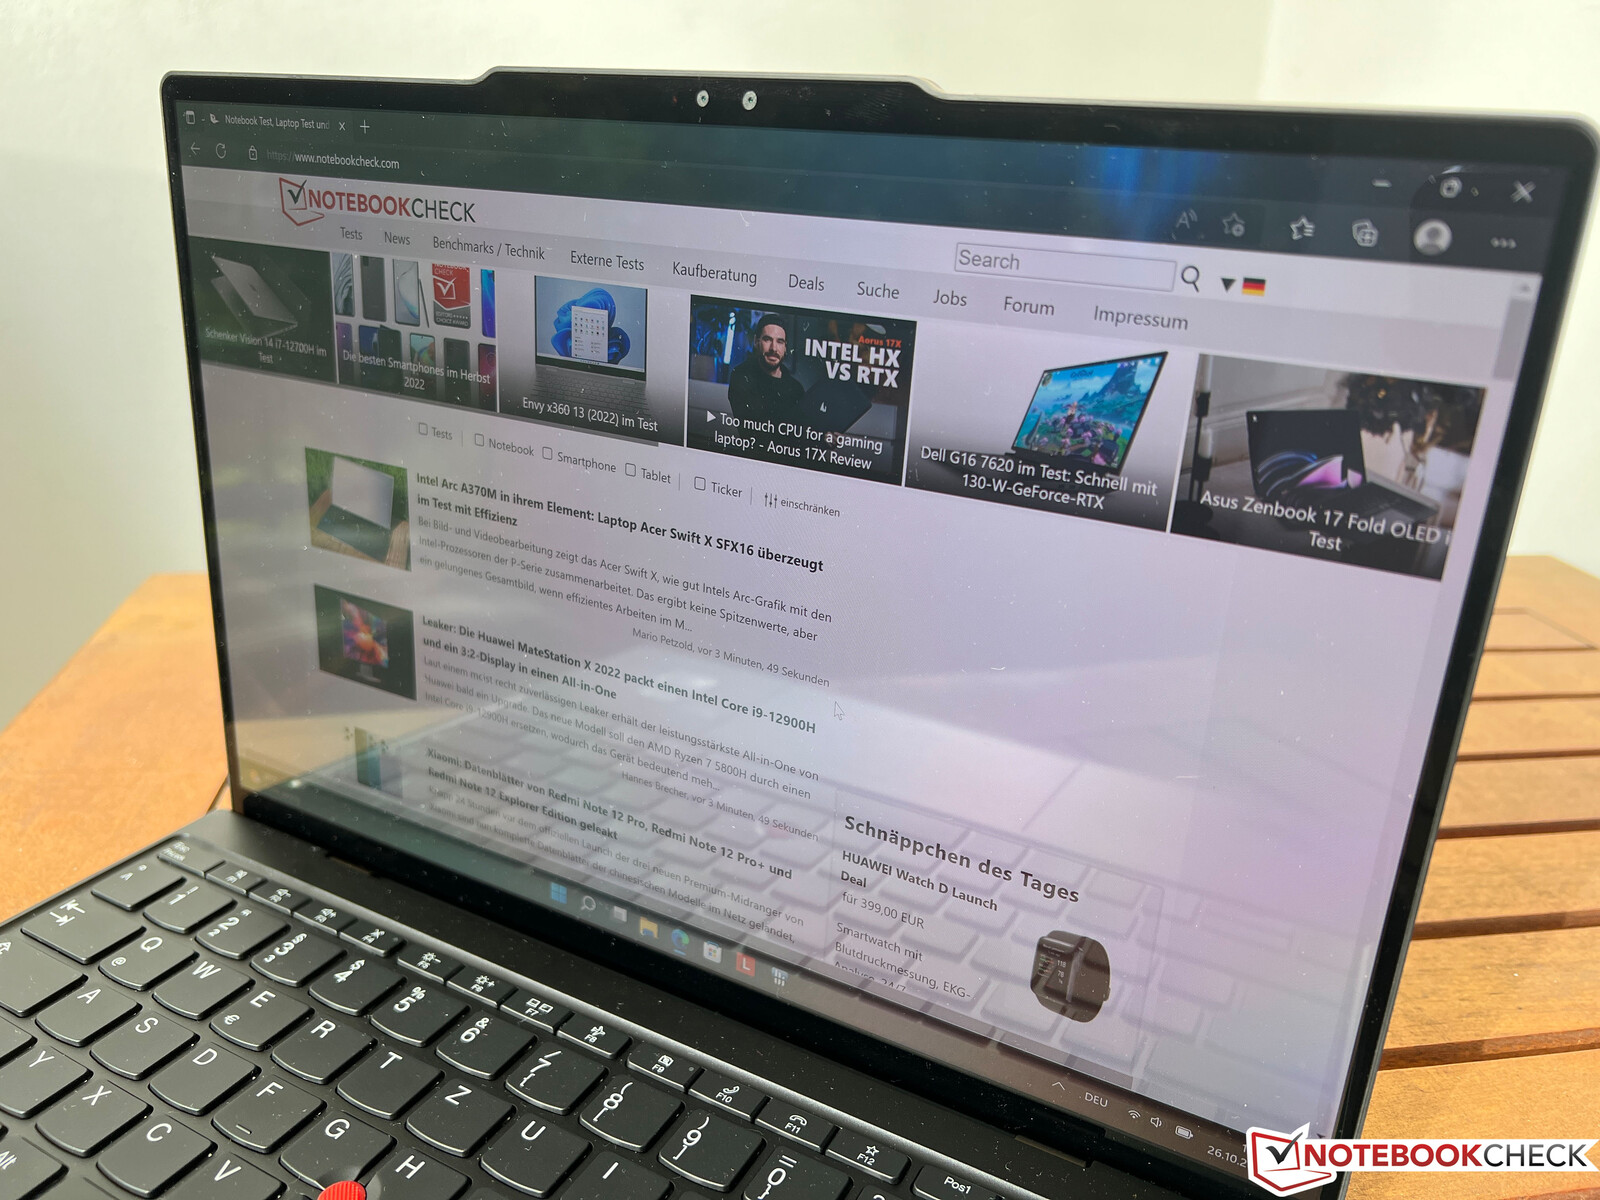
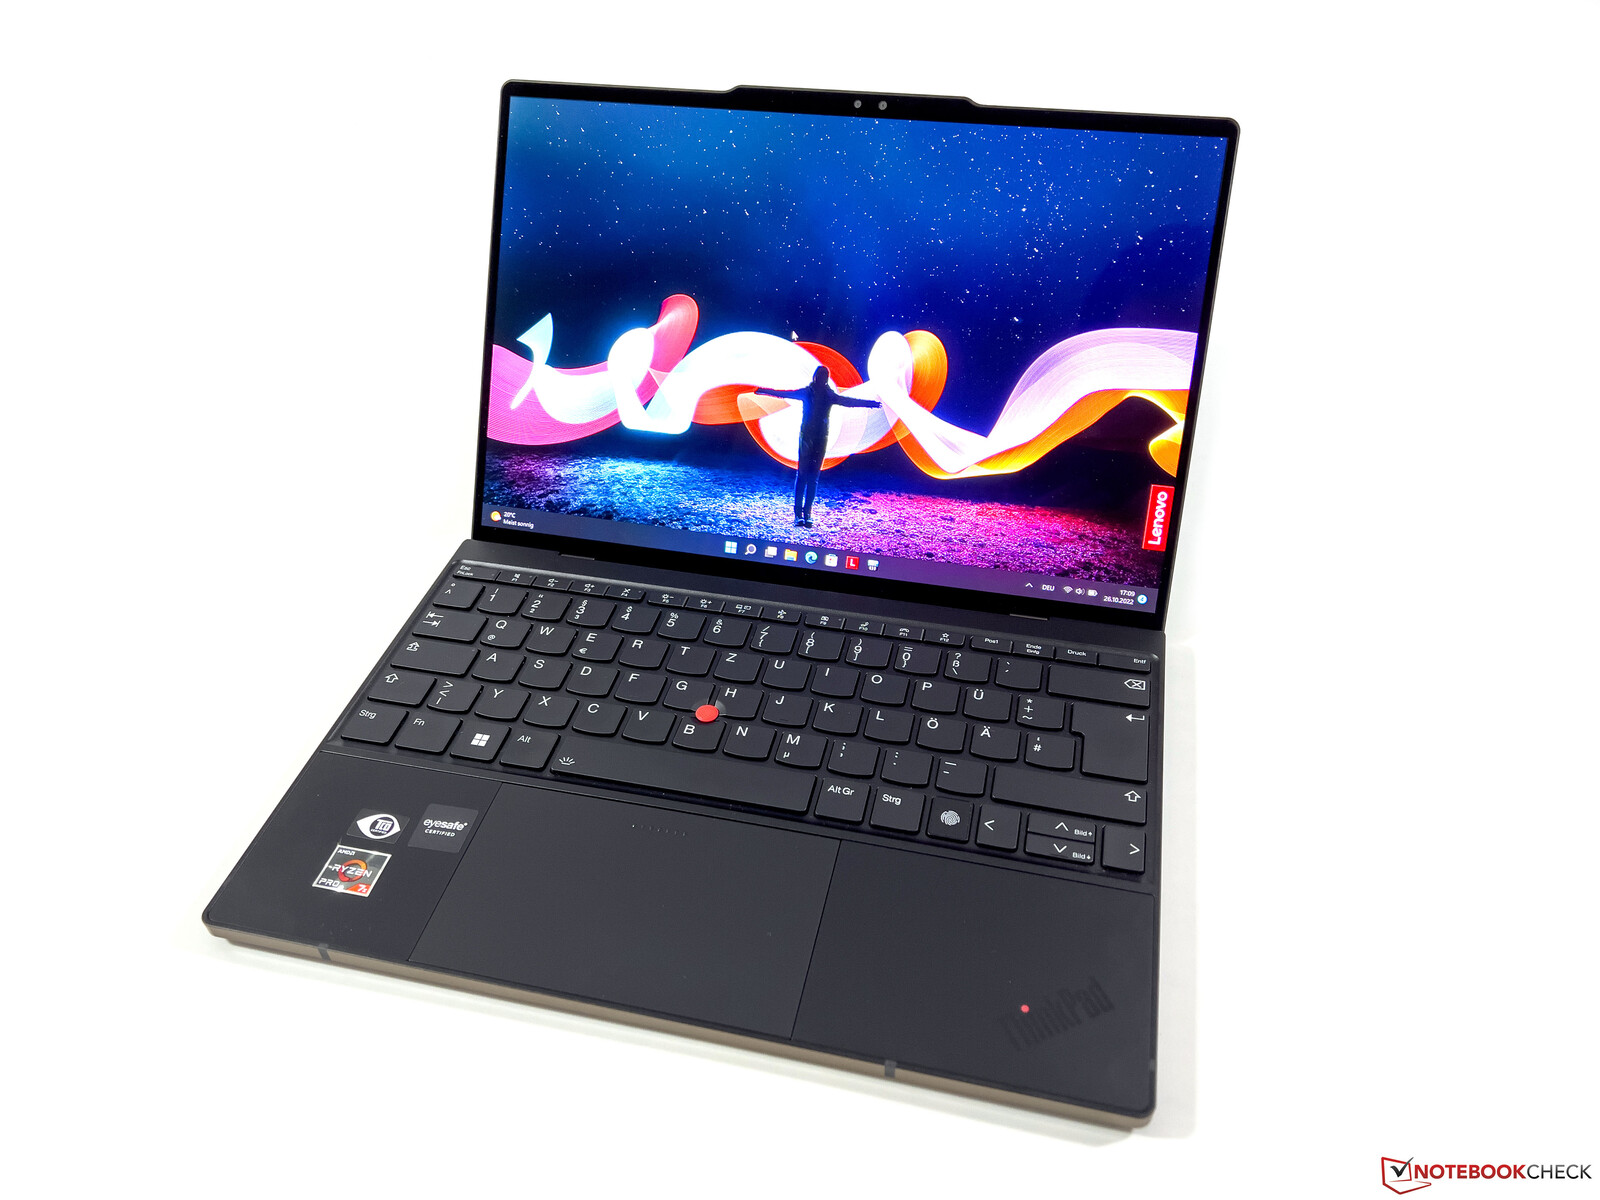
Lenovo ThinkPad Z13 G1 Revisão OLED - Laptop comercial com um AMD Ryzen 7 Pro 6860Z
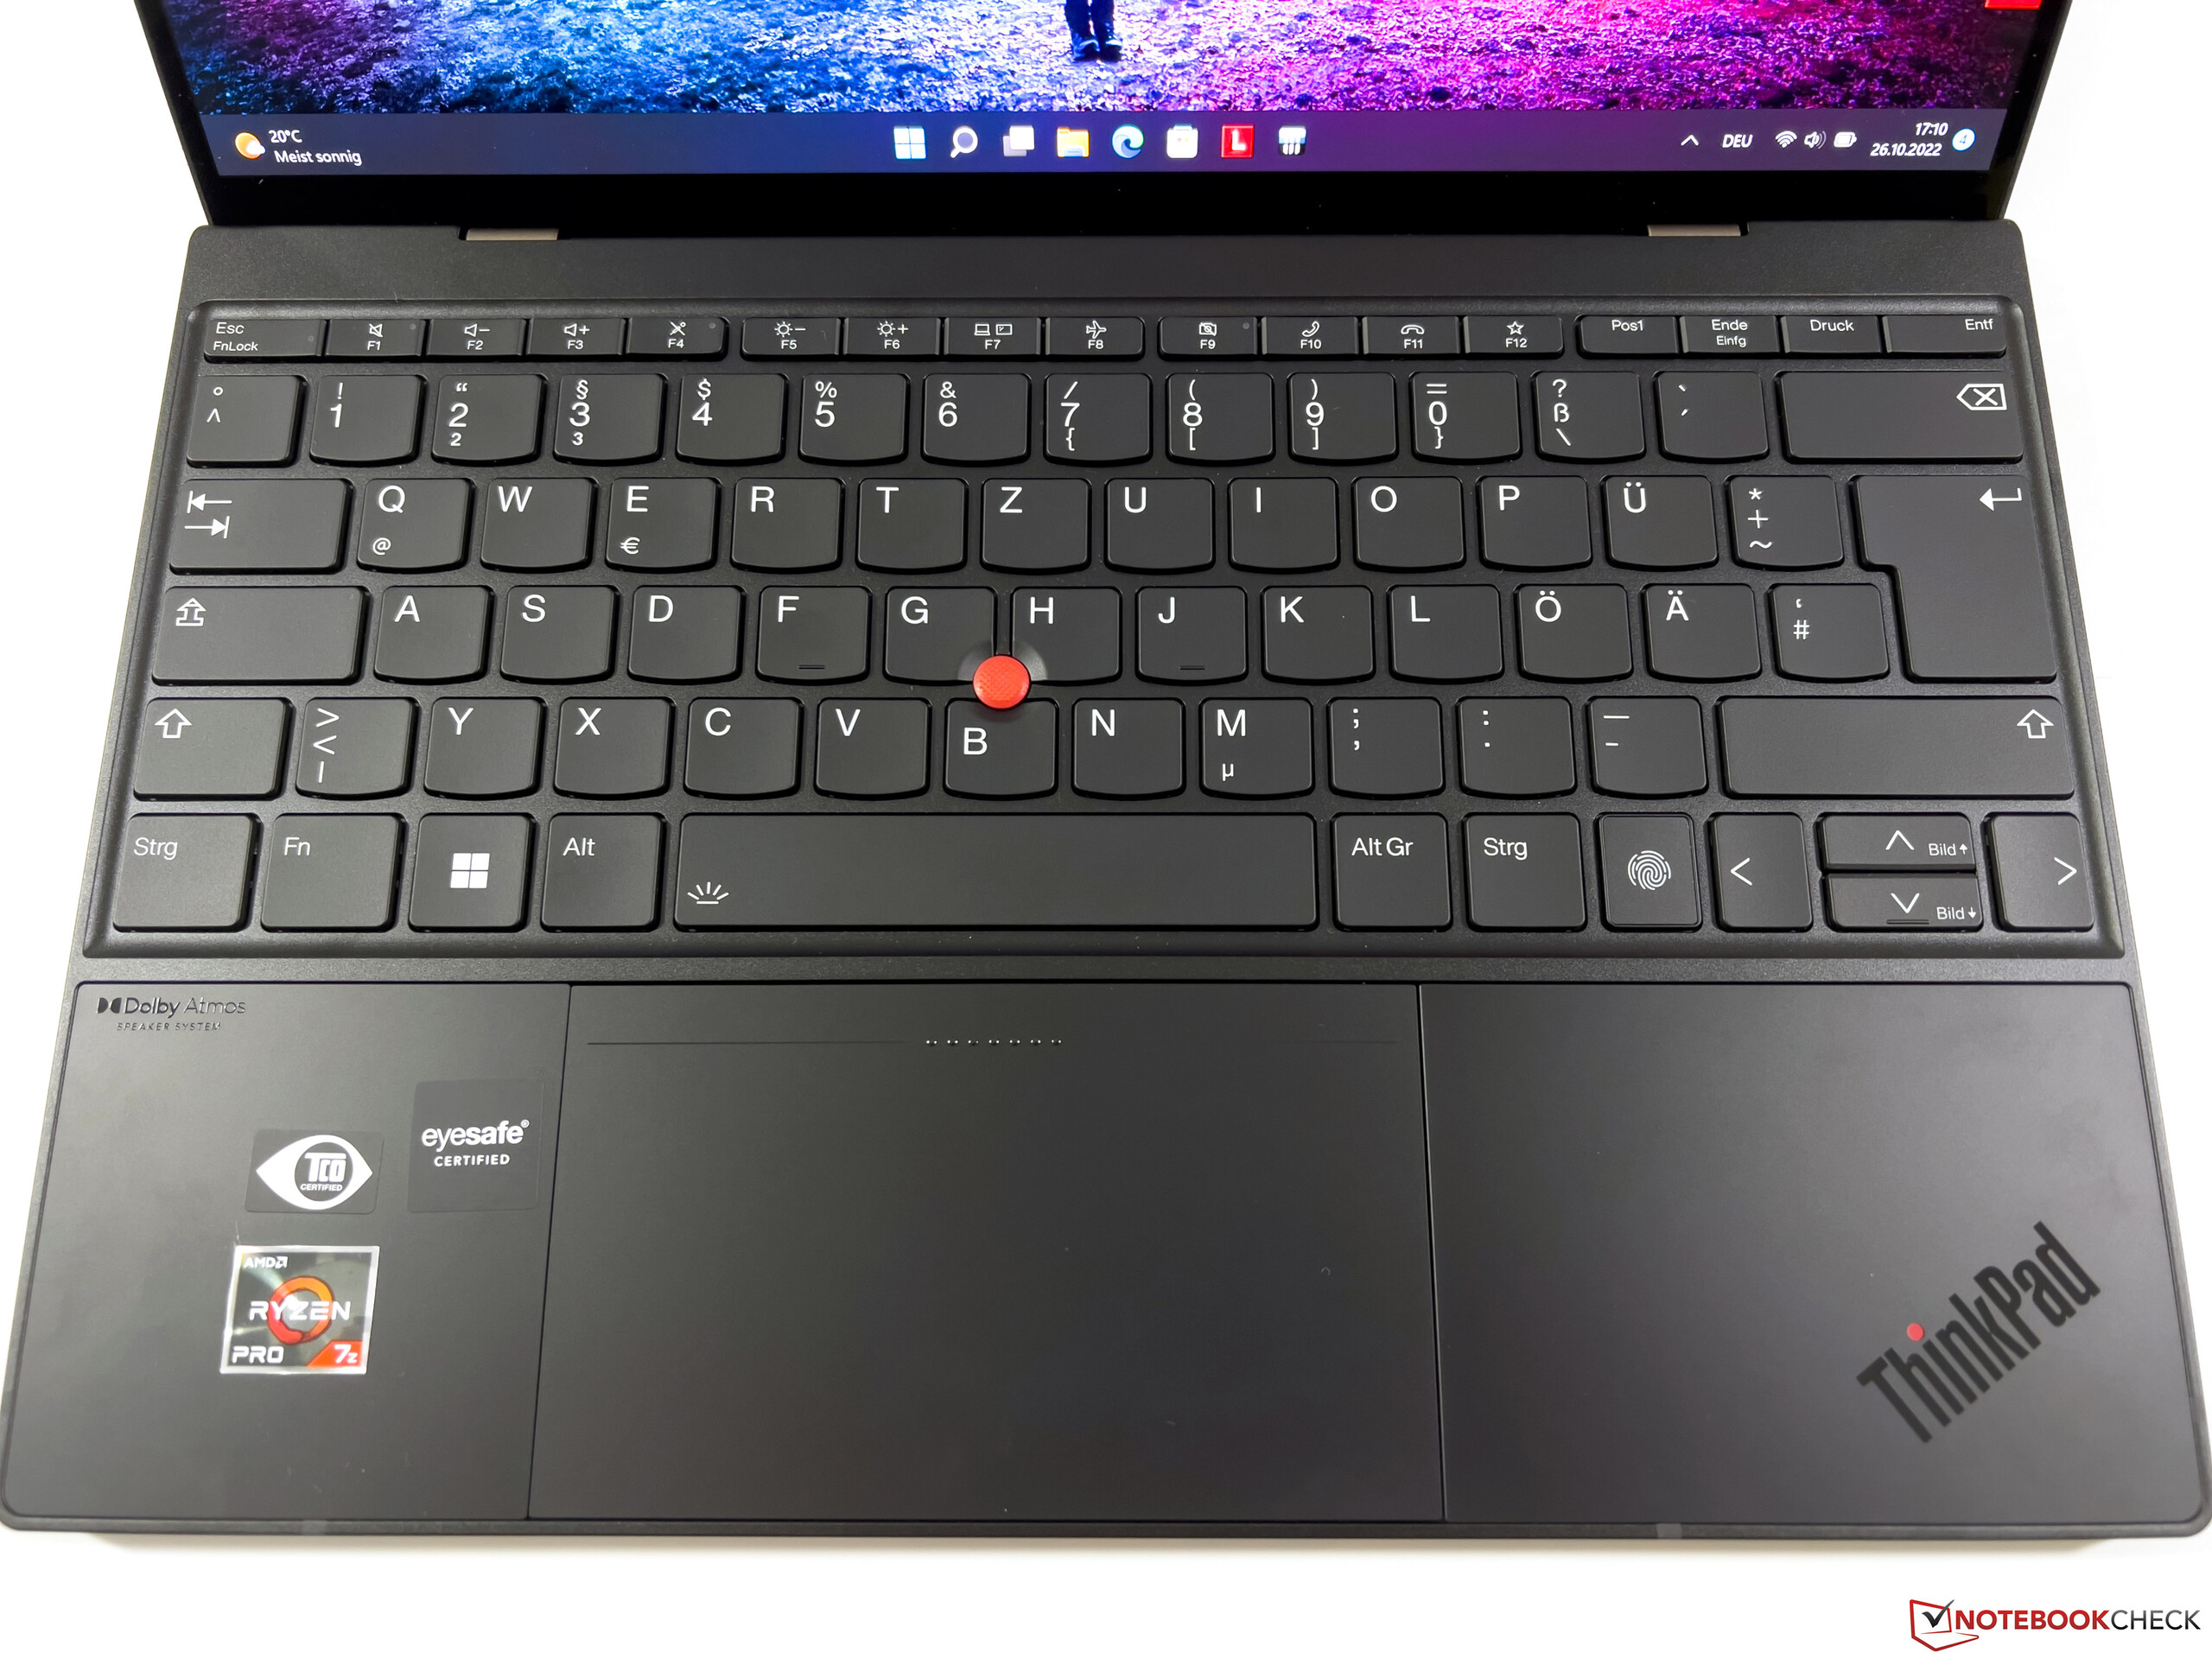
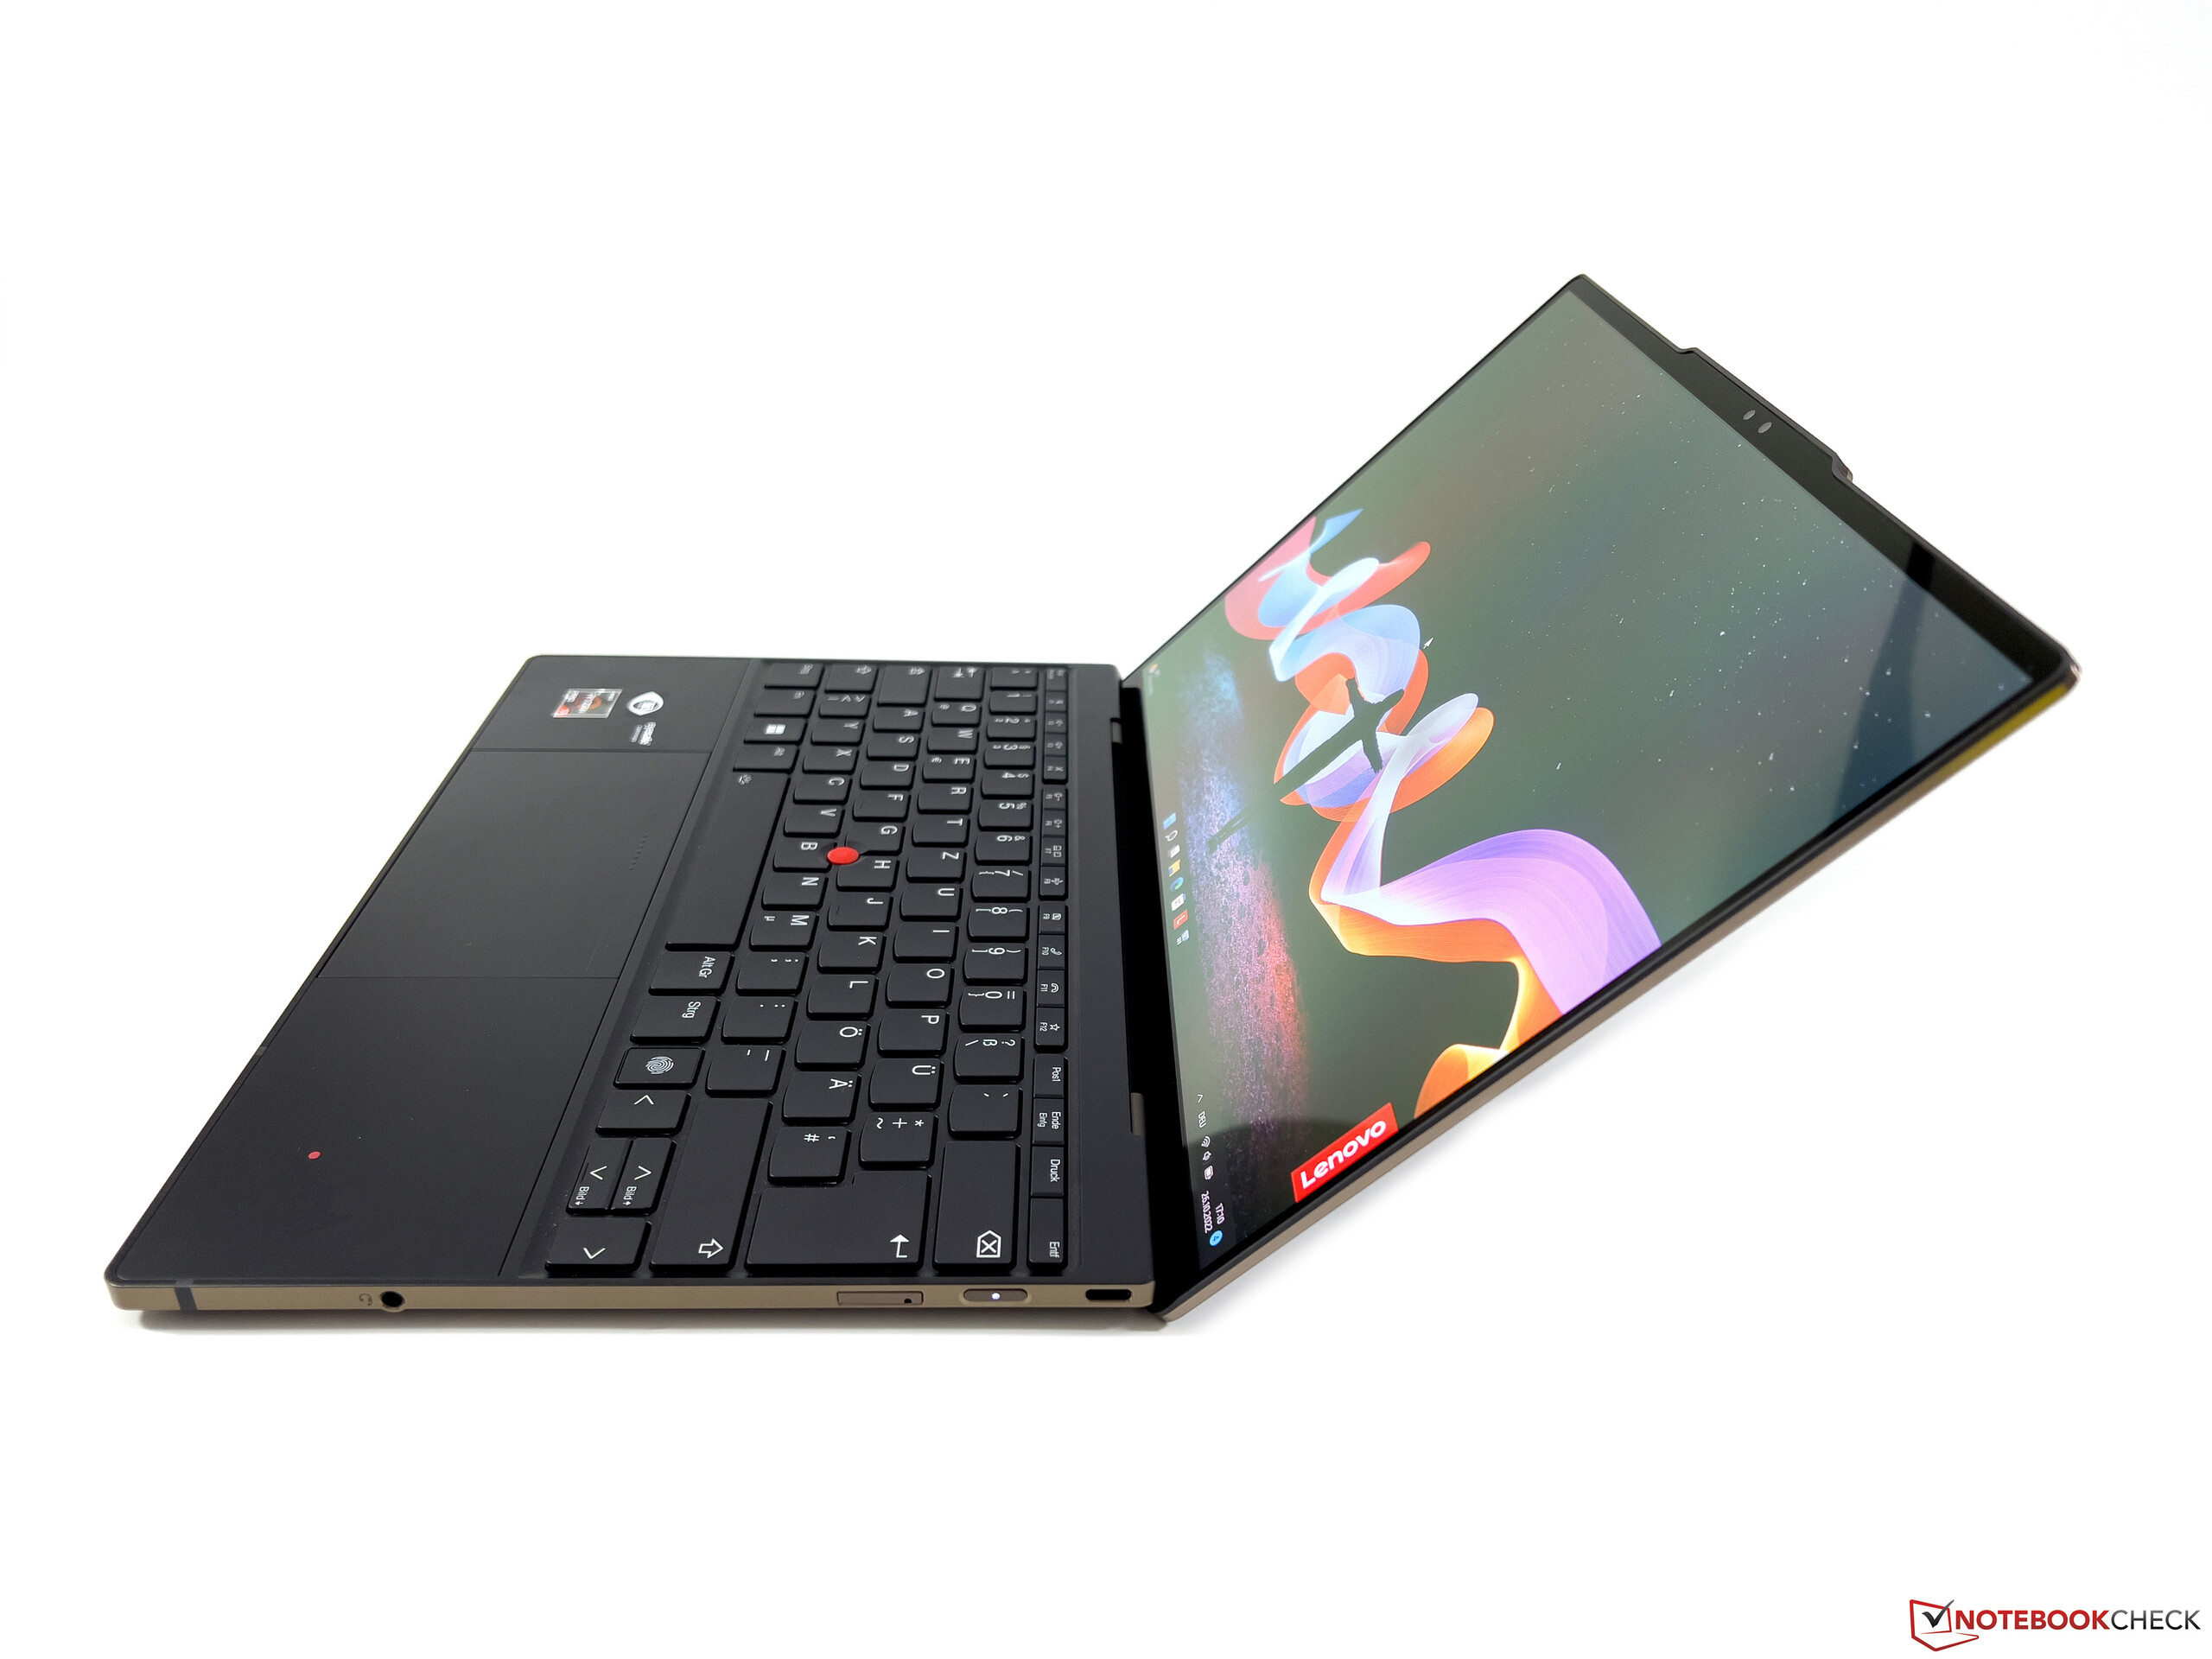
Com sua série ThinkPad Z, a Lenovo tem uma linha de produtos dedicada para seus modelos AMD há vários meses. Já testamos extensivamente os modelo de nível básico do ThinkPad Z13 com um Ryzen 5 Pro e um painel IPS Full HD normal. O projeto completamente novo oferece algumas novas abordagens e os usuários do ThinkPad de longa data terão que se acostumar a algumas mudanças (TrackPoint sem chaves dedicadas, dobradiça só abre até 135 graus, reposicionamento da chave Fn, sem fechadura Kensington).
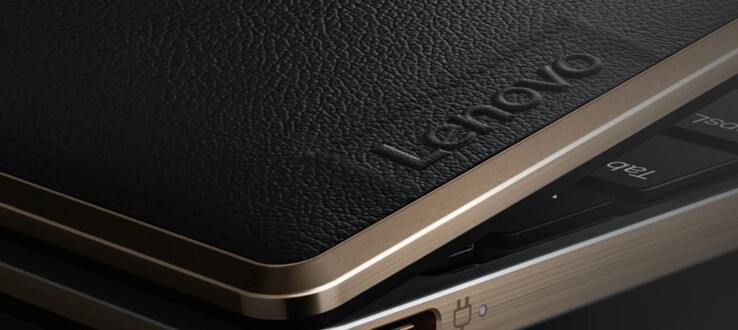
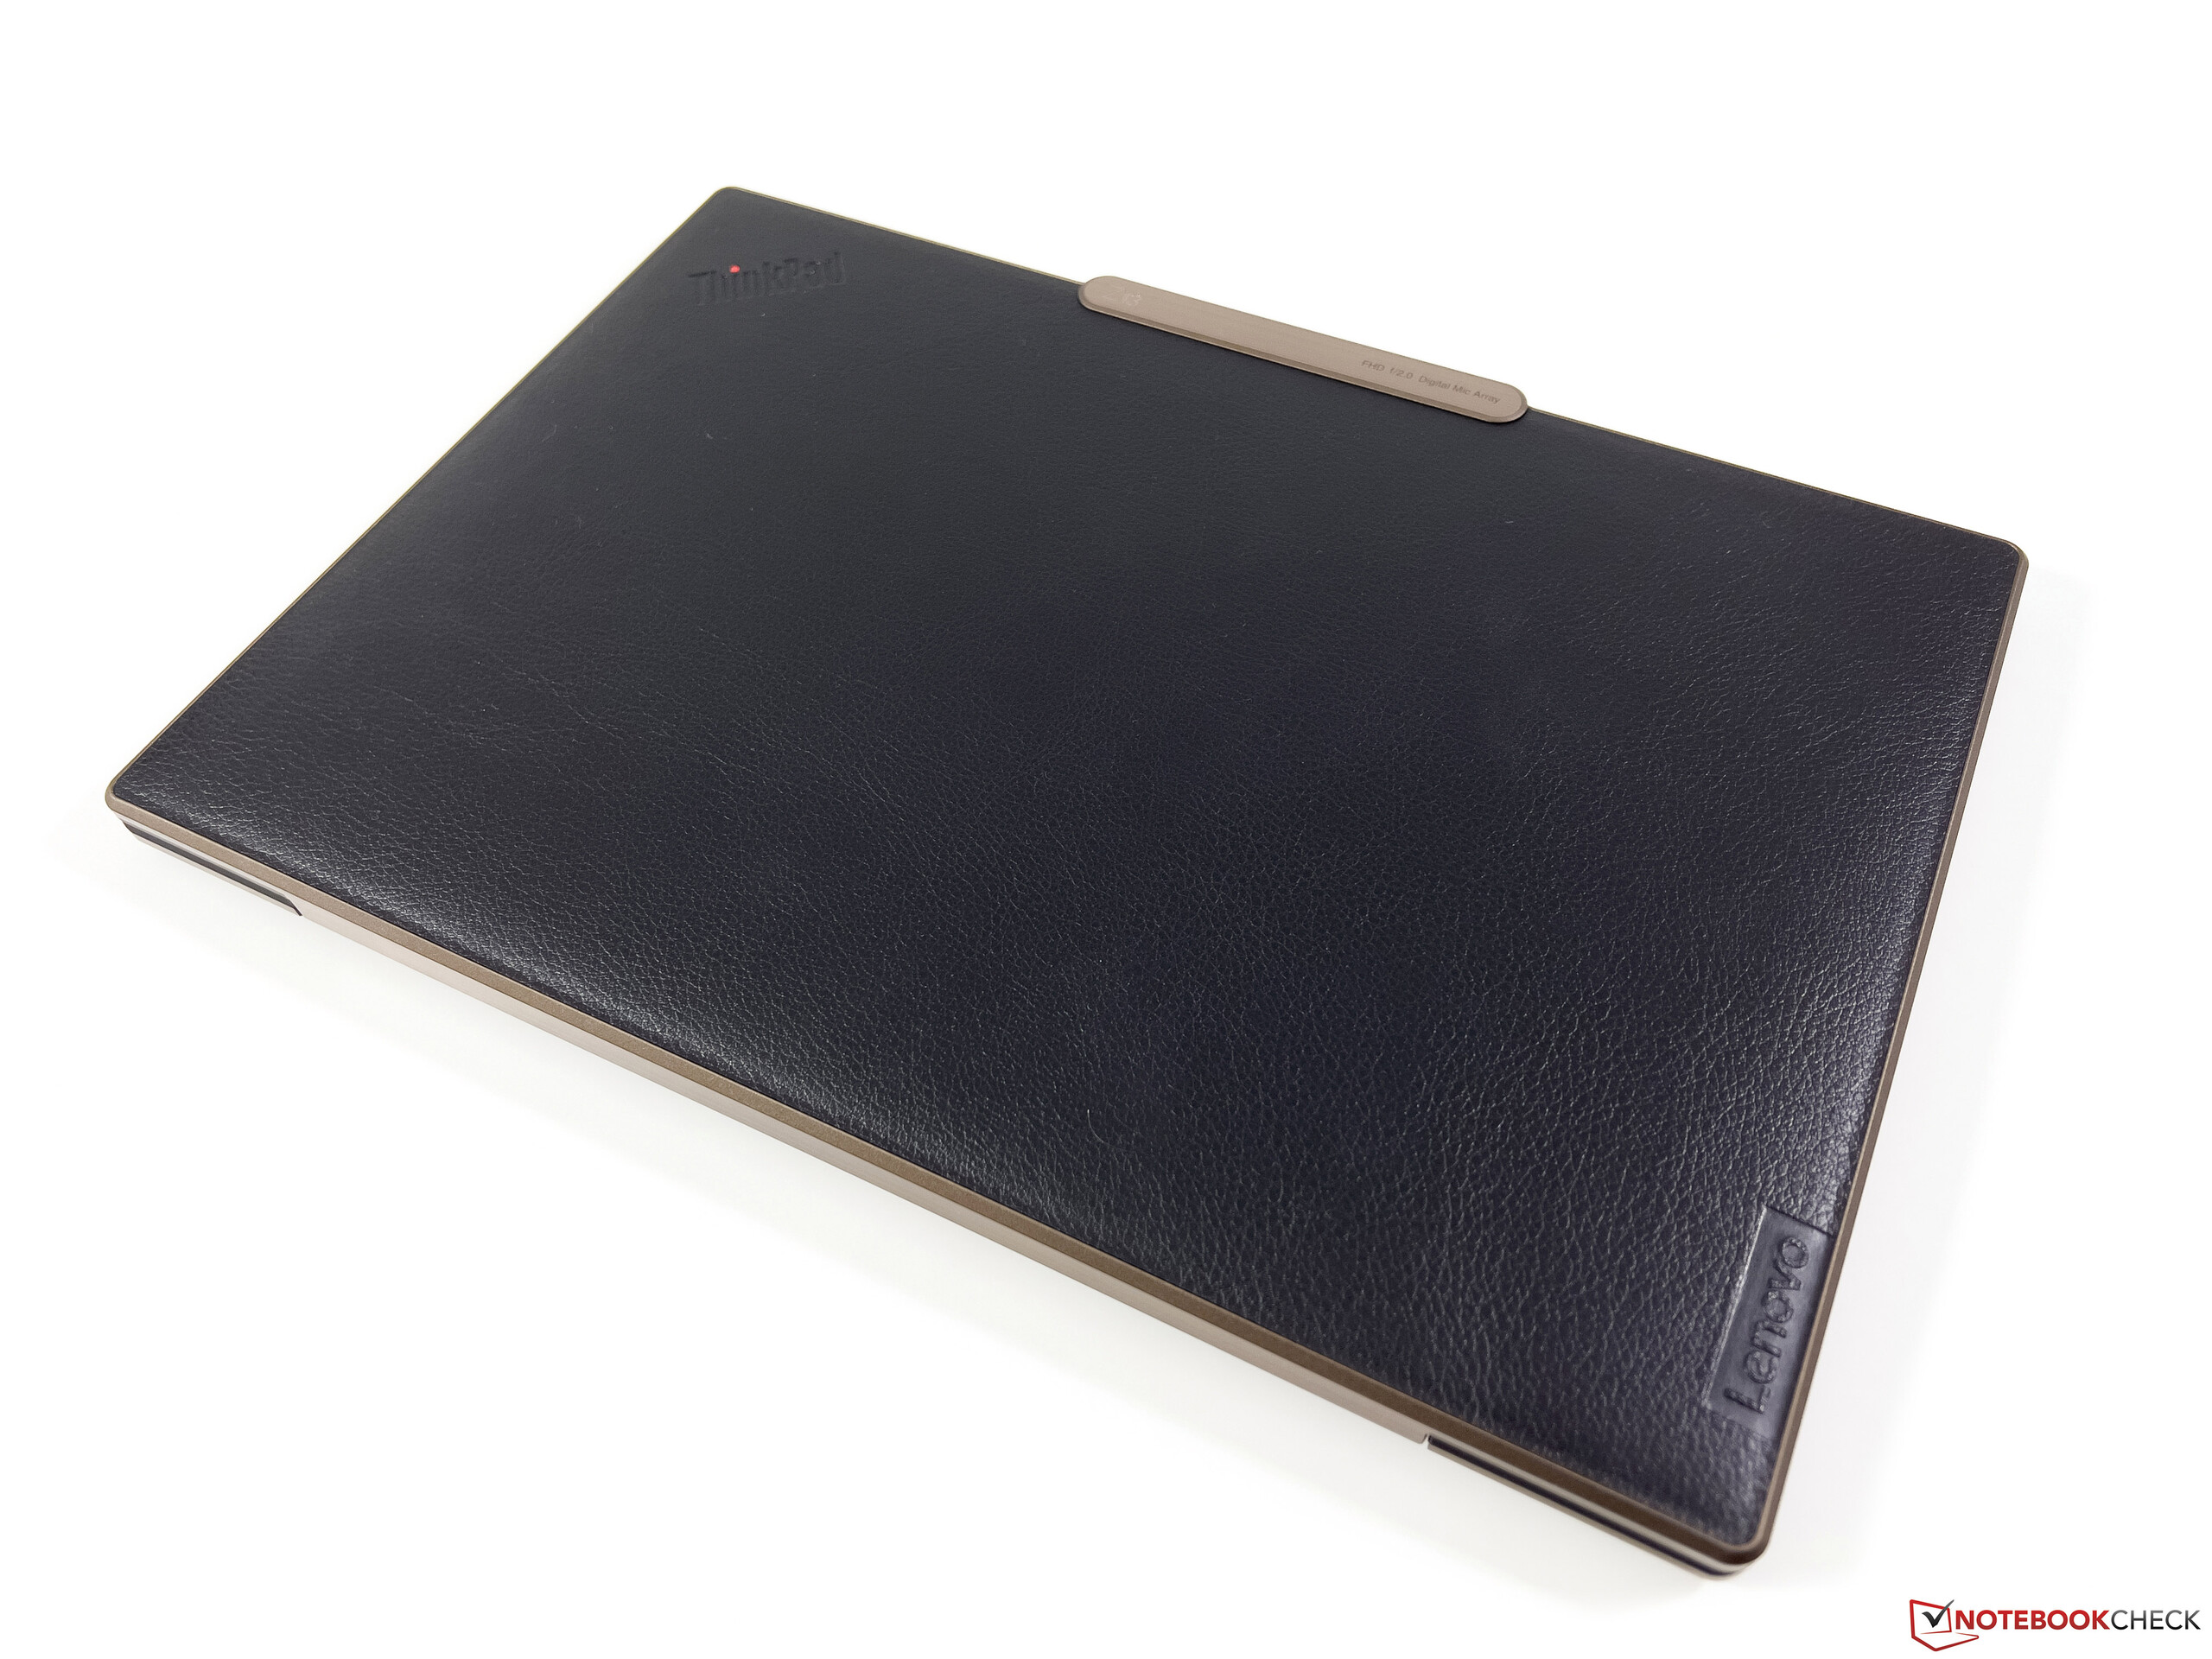
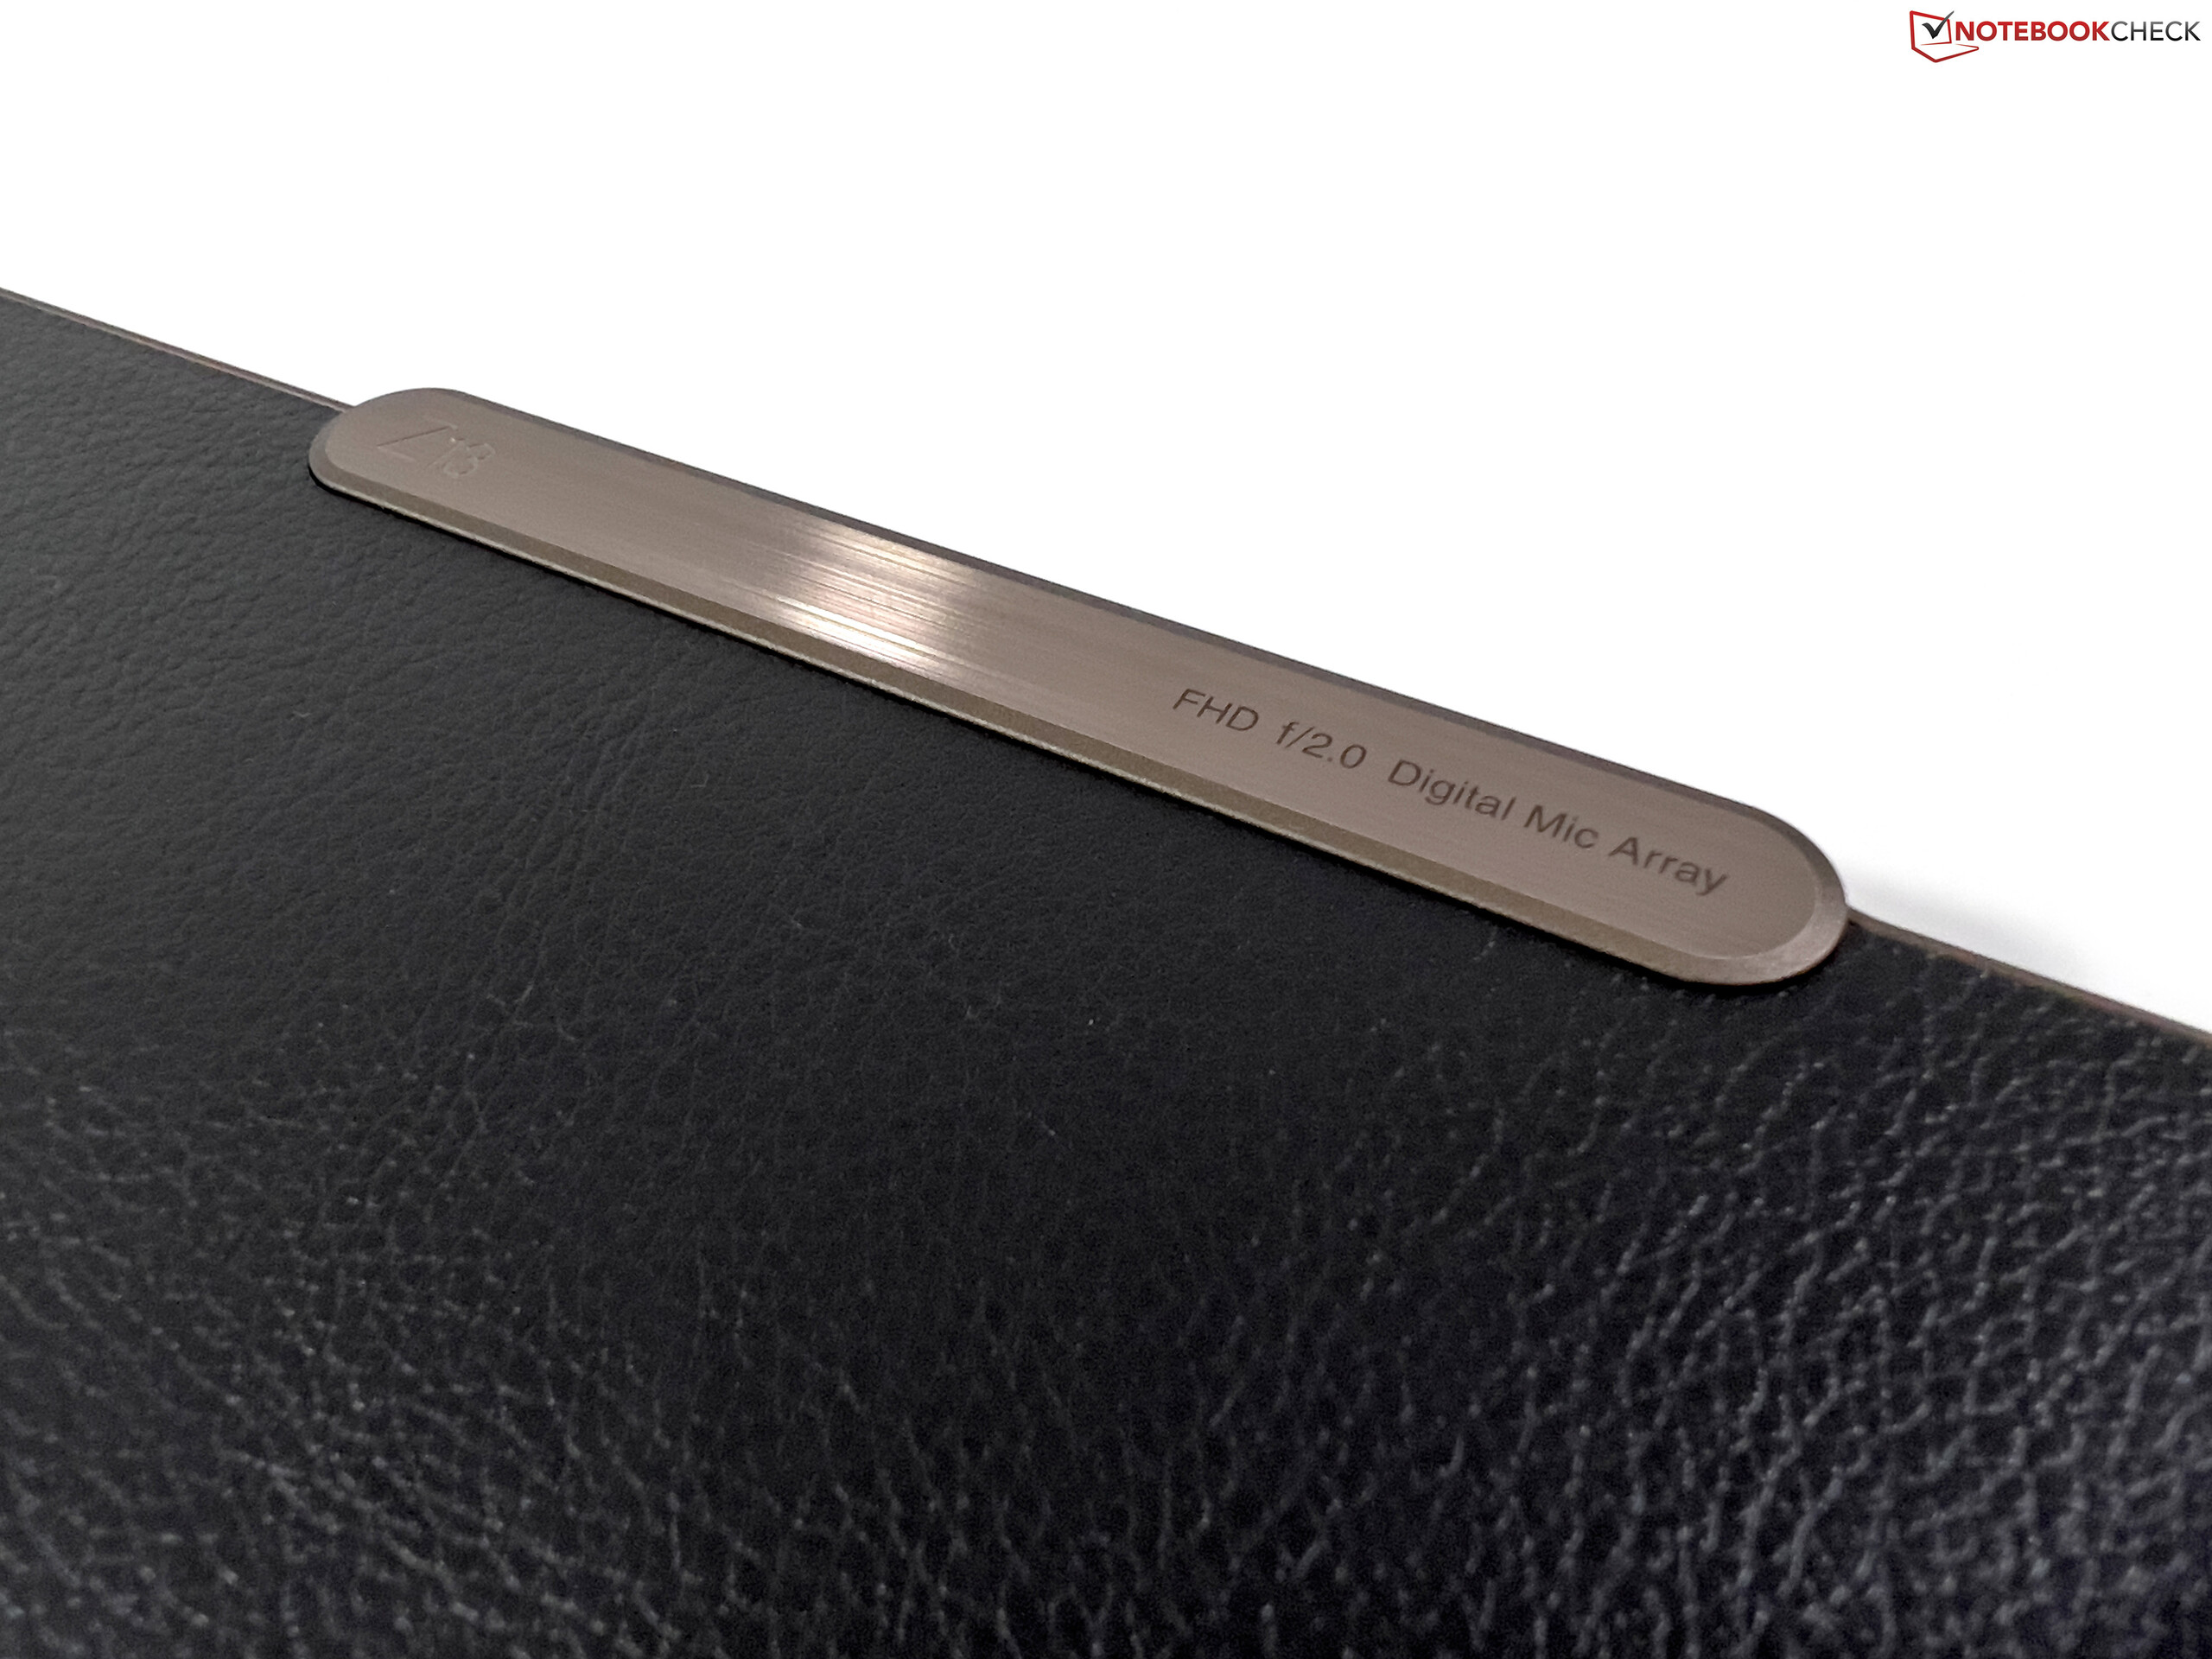
Hoje nós damos uma olhada no modelo high-end do ThinkPad Z13 com seu AMD Ryzen 7 Pro 6860Z que é oferecido exclusivamente no ThinkPad Z13. Esta configuração tem uma tela OLED, um módulo LTE e um design especial com uma tampa de imitação de tela de couro com destaque em bronze. Neste relatório, nos concentramos principalmente nas diferenças do modelo de nível de entrada e não vamos passar por cima de suas semelhanças. Informações pertinentes estão disponíveis em nossa revisão detalhada do ThinkPad Z13 com o Ryzen 5 Pro 6650U
-• Revisão do laptop Lenovo ThinkPad Z13: ThinkPad premium da AMD com longa duração da bateria
- Lenovo ThinkPad Z16 G1 revisão de laptop: Poderoso porta-estandarte da AMD com uma camionete
Possíveis concorrentes em comparação
Avaliação | Data | Modelo | Peso | Altura | Size | Resolução | Preço |
|---|---|---|---|---|---|---|---|
| 88.8 % v7 (old) | 10/2022 | Lenovo ThinkPad Z13 G1-21D20016GE R7 PRO 6860Z, Radeon 680M | 1.3 kg | 14 mm | 13.30" | 2880x1800 | |
| 90.1 % v7 (old) | 07/2022 | Asus Zenbook S 13 OLED R7 6800U, Radeon 680M | 1.1 kg | 14.9 mm | 13.30" | 2880x1800 | |
| 87.3 % v7 (old) | 09/2022 | Dell XPS 13 Plus 9320 i7-1280P OLED i7-1280P, Iris Xe G7 96EUs | 1.3 kg | 15.28 mm | 13.40" | 3456x2160 | |
| 92 % v7 (old) | 08/2022 | Apple MacBook Air M2 10C GPU M2, M2 10-Core GPU | 1.2 kg | 11.3 mm | 13.60" | 2560x1664 | |
| 90.5 % v7 (old) | 08/2022 | Lenovo ThinkPad Z13 21D2CTO1WW R5 PRO 6650U, Radeon 660M | 1.2 kg | 13.99 mm | 13.30" | 1920x1200 |
Caso
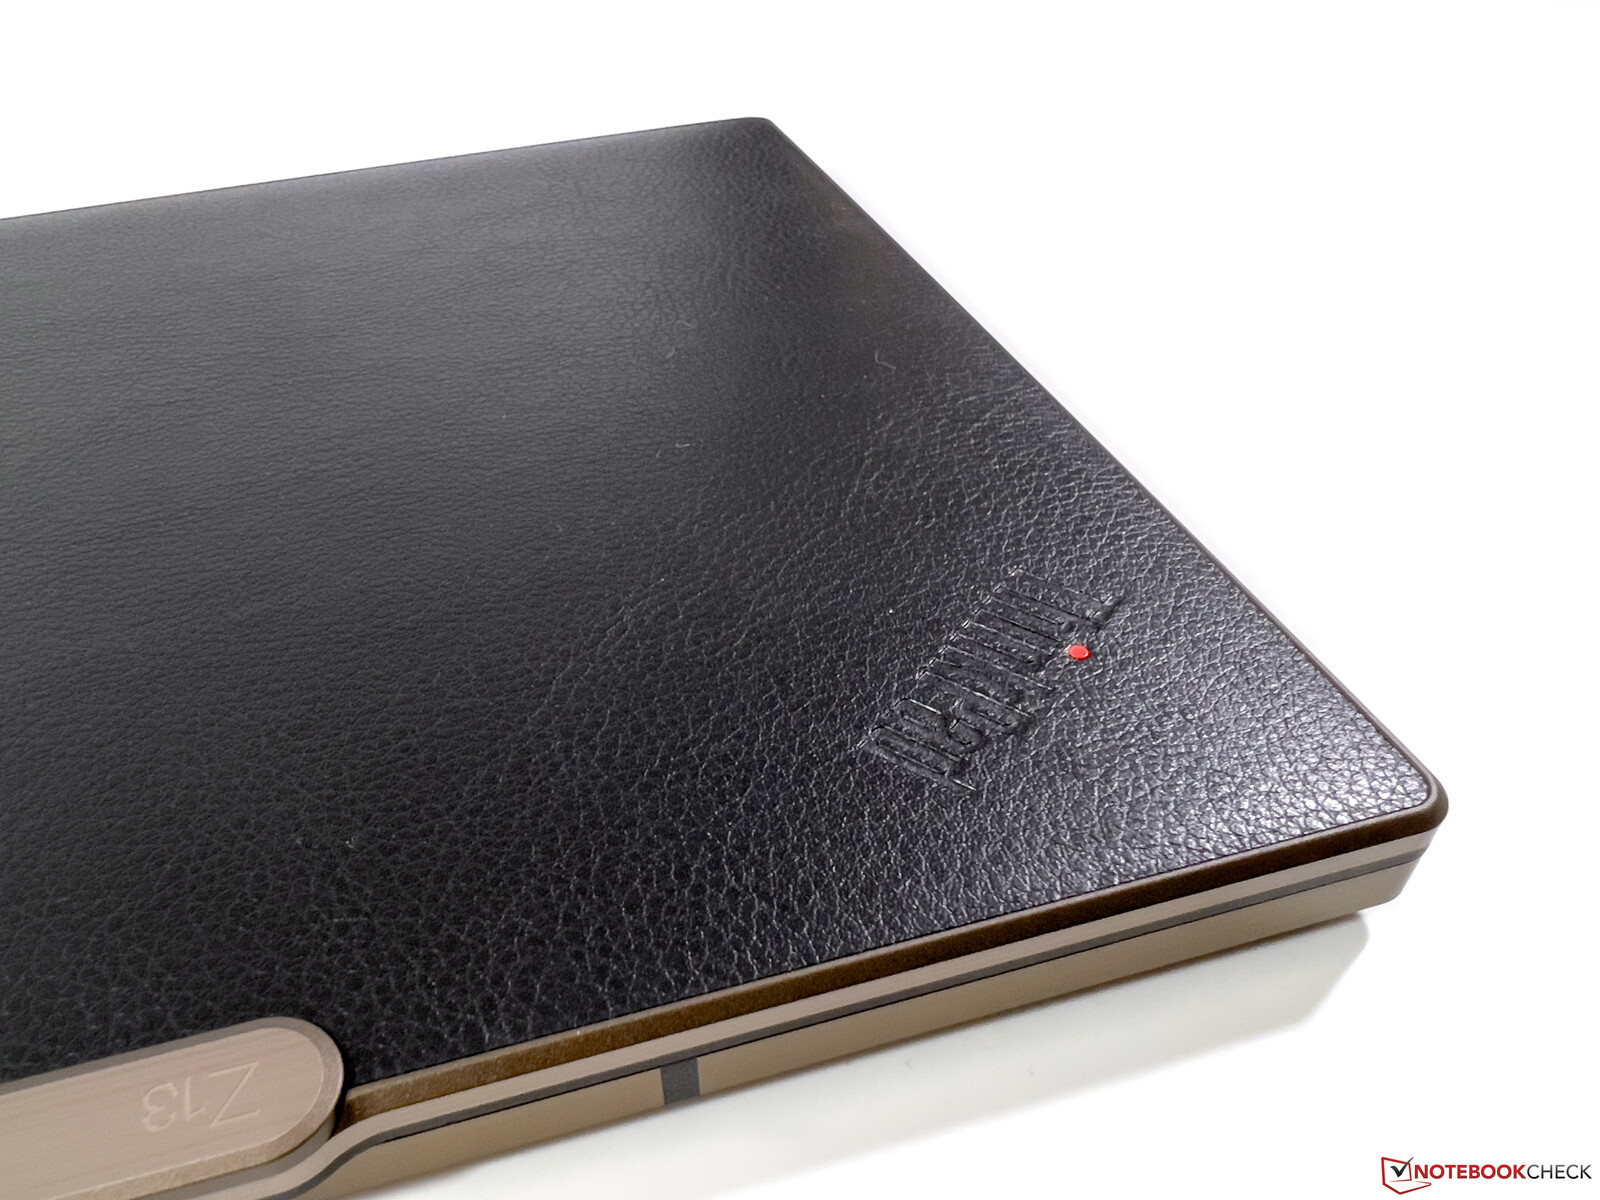
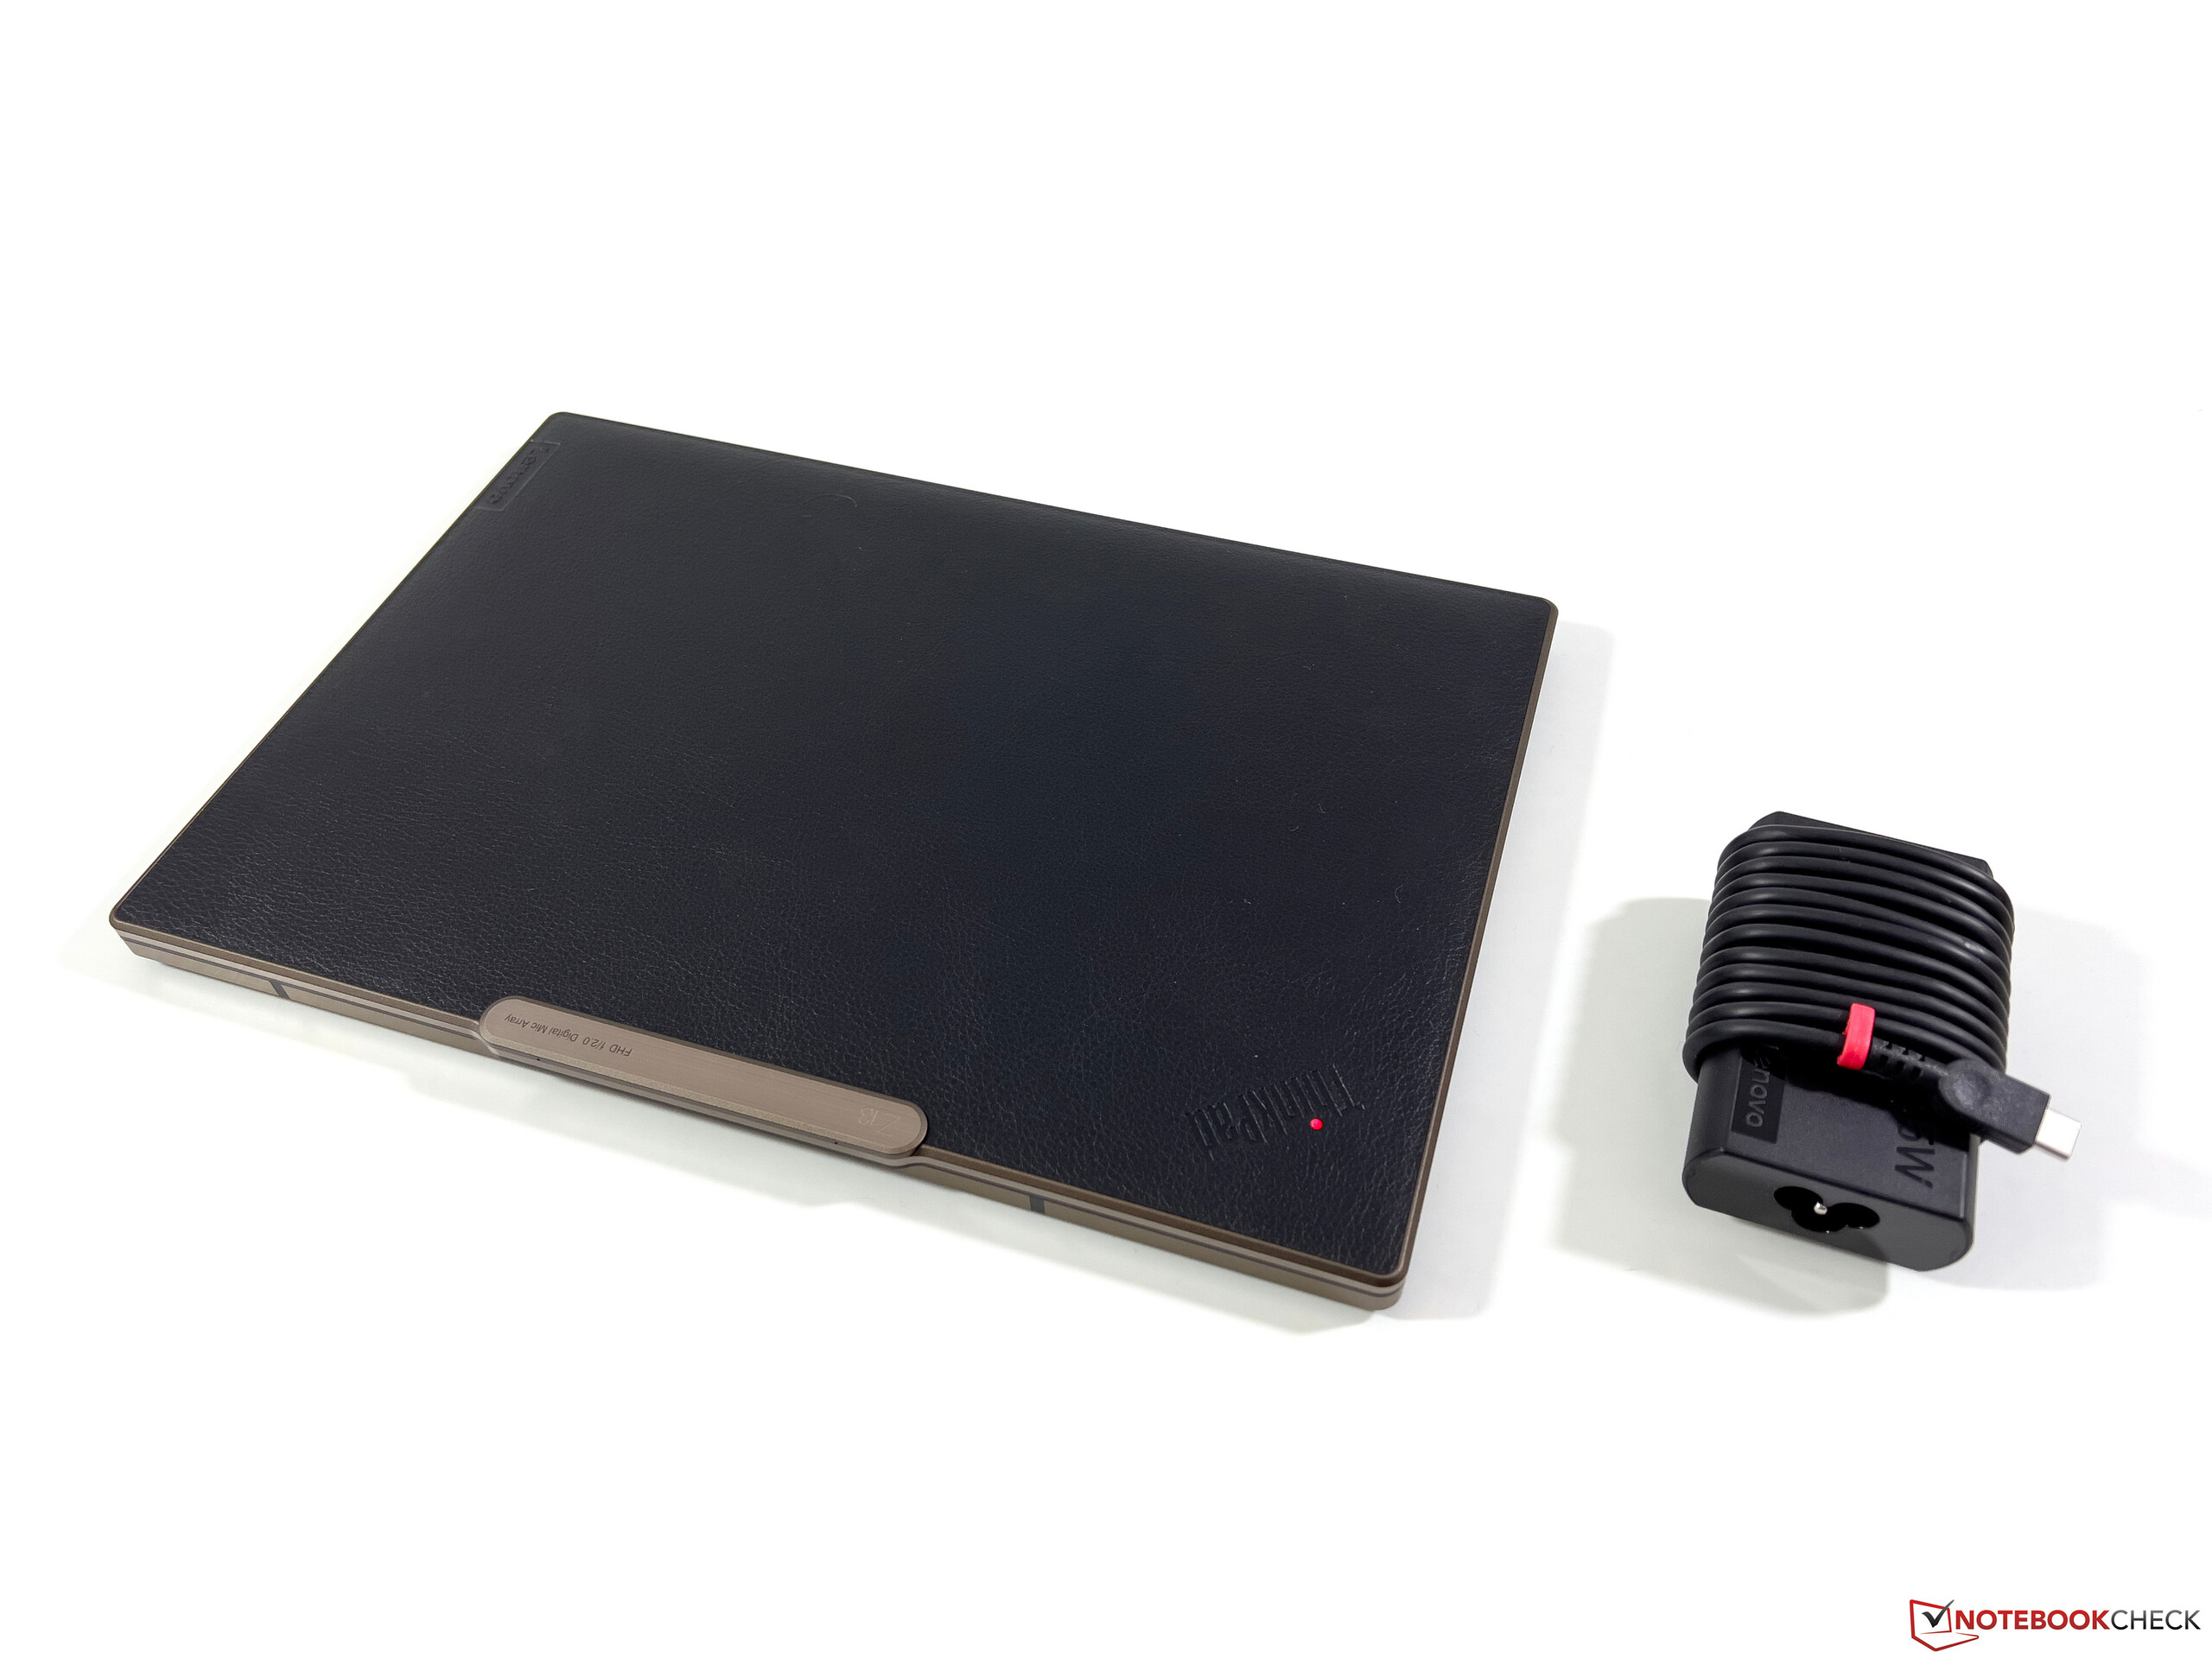
O caso é basicamente idêntico ao modelo de nível básico do ThinkPad Z13mas na versão high-end há uma tampa de tela com uma superfície preta de imitação de couro com reflexos em bronze. É sem dúvida uma questão de gosto pessoal e a Lenovo oferece alternativas, mas a comparação com uma bolsa de mão é difícil de evitar. Se o Z13 atual se tornou mais um item de moda ou se ainda se encaixa visualmente em um ambiente comercial, é uma questão de escolha pessoal. De uma perspectiva de qualidade, entretanto, não há nada de errado com o caso e o ThinkPad Z13 é de fato de extrema qualidade.
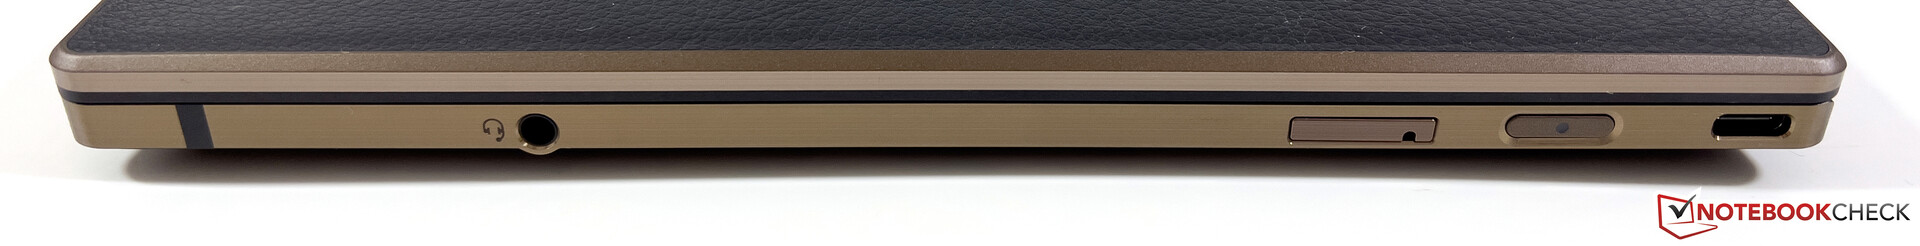
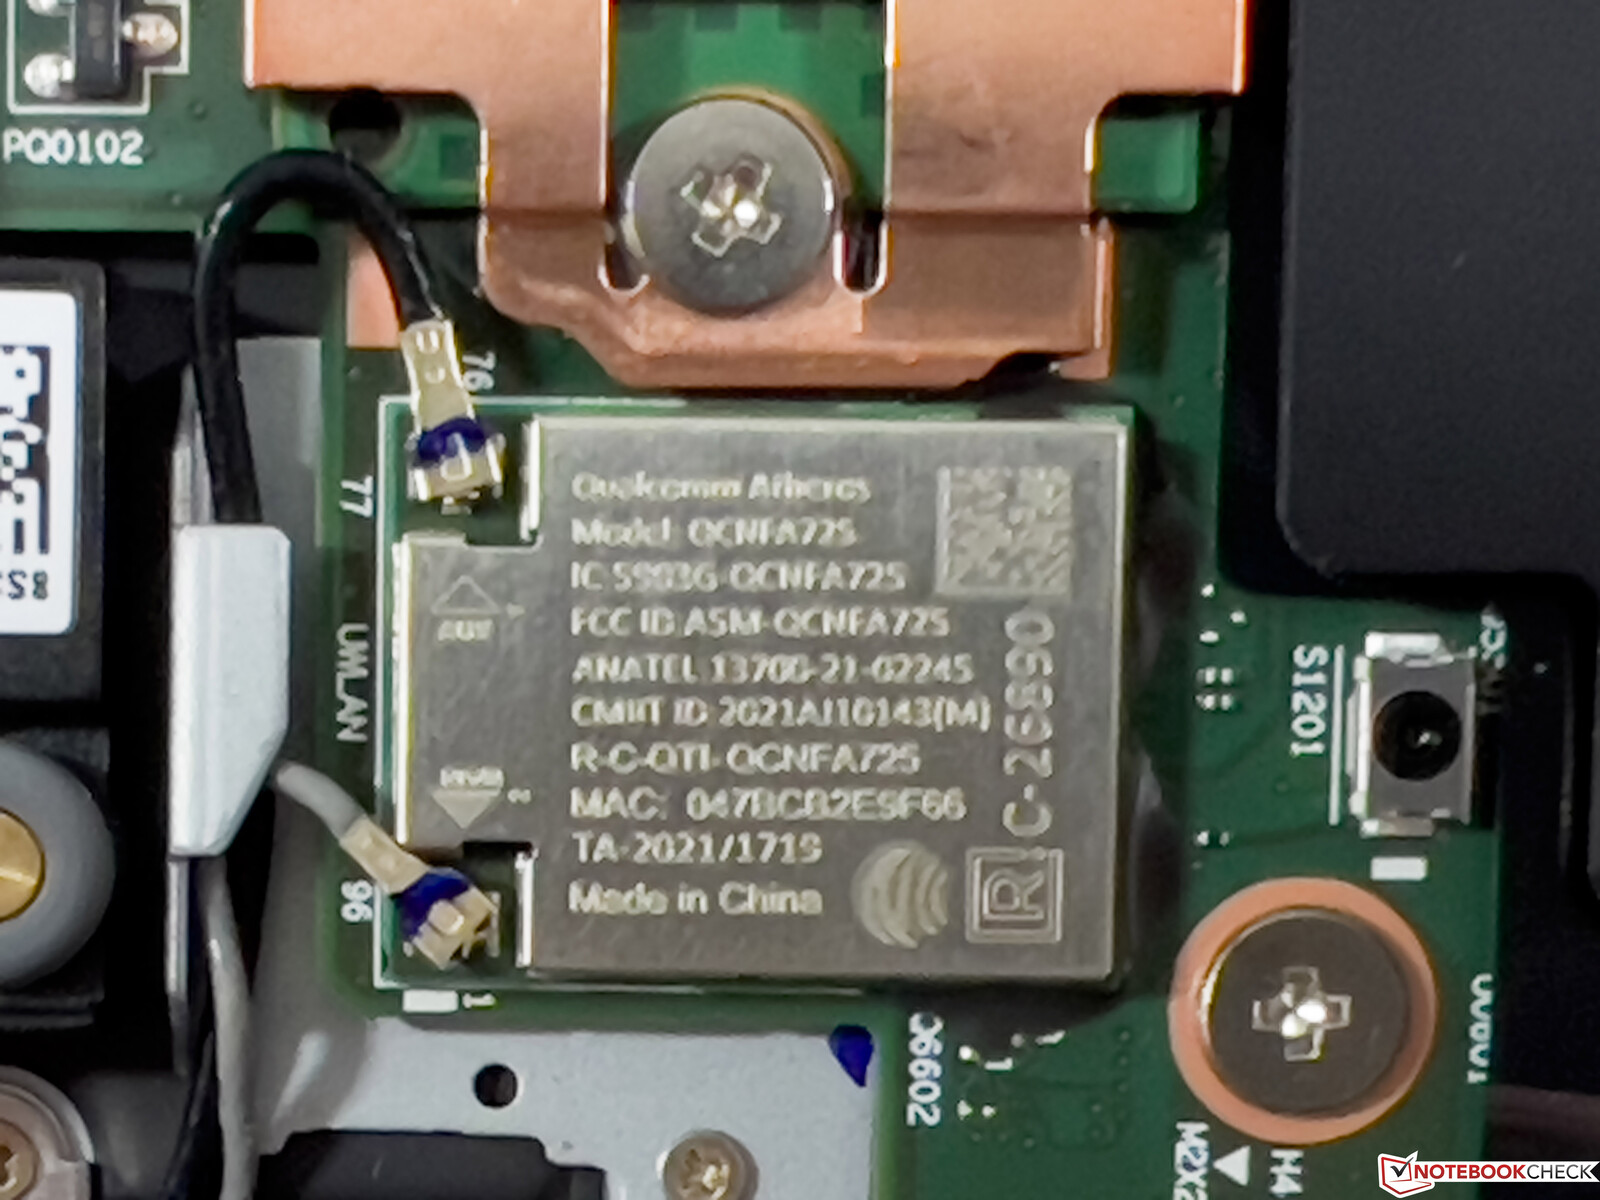
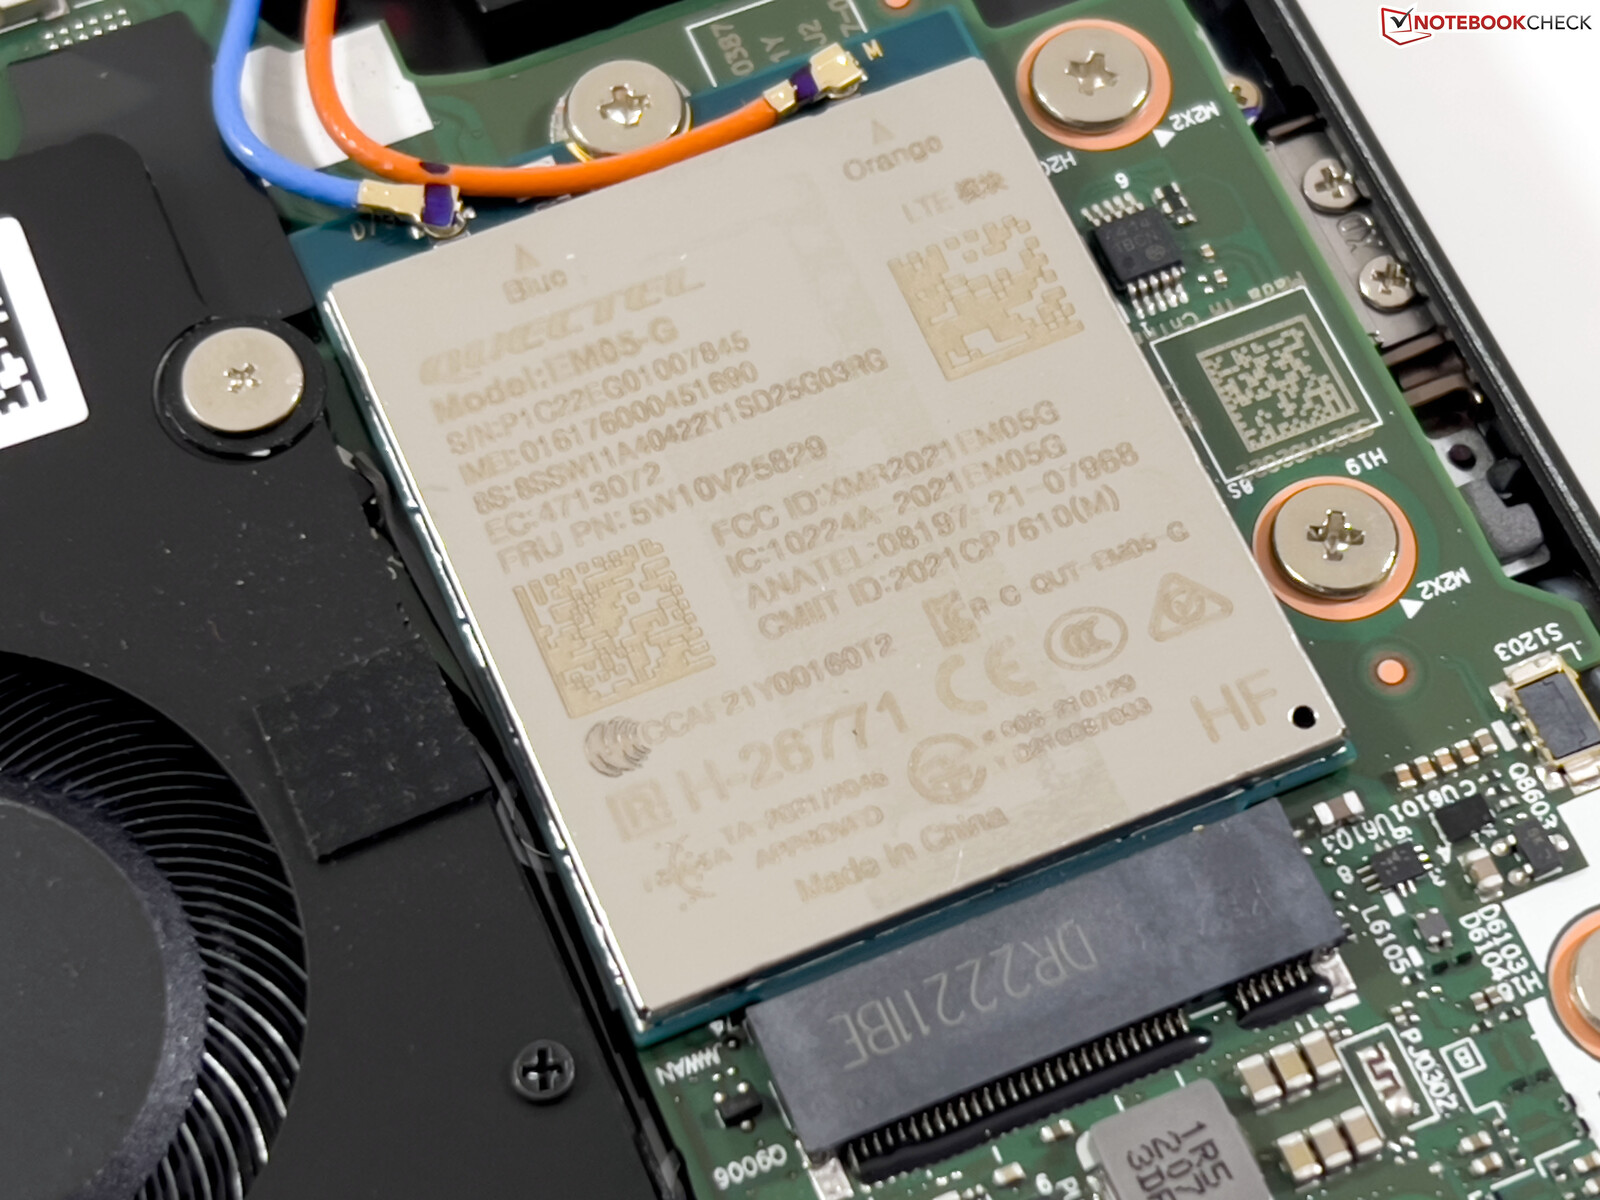
Conectividade - Z13 com Wi-Fi 6E e LTE
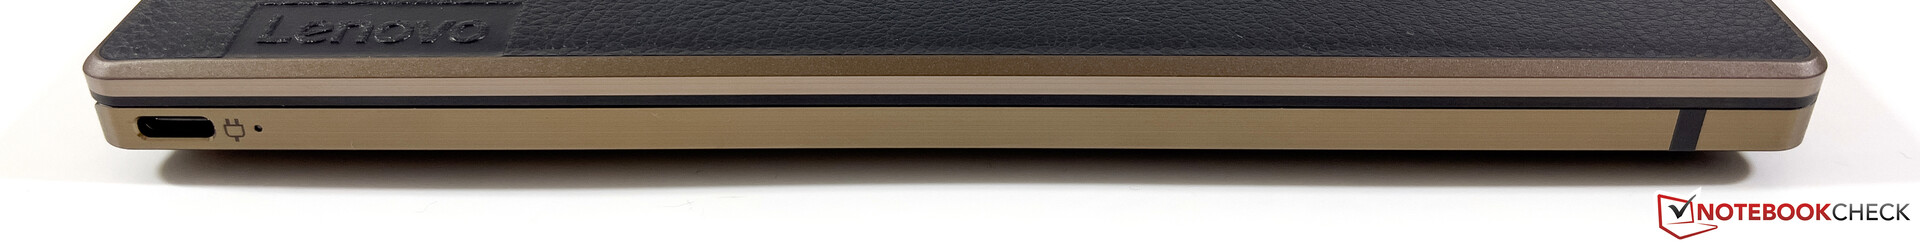
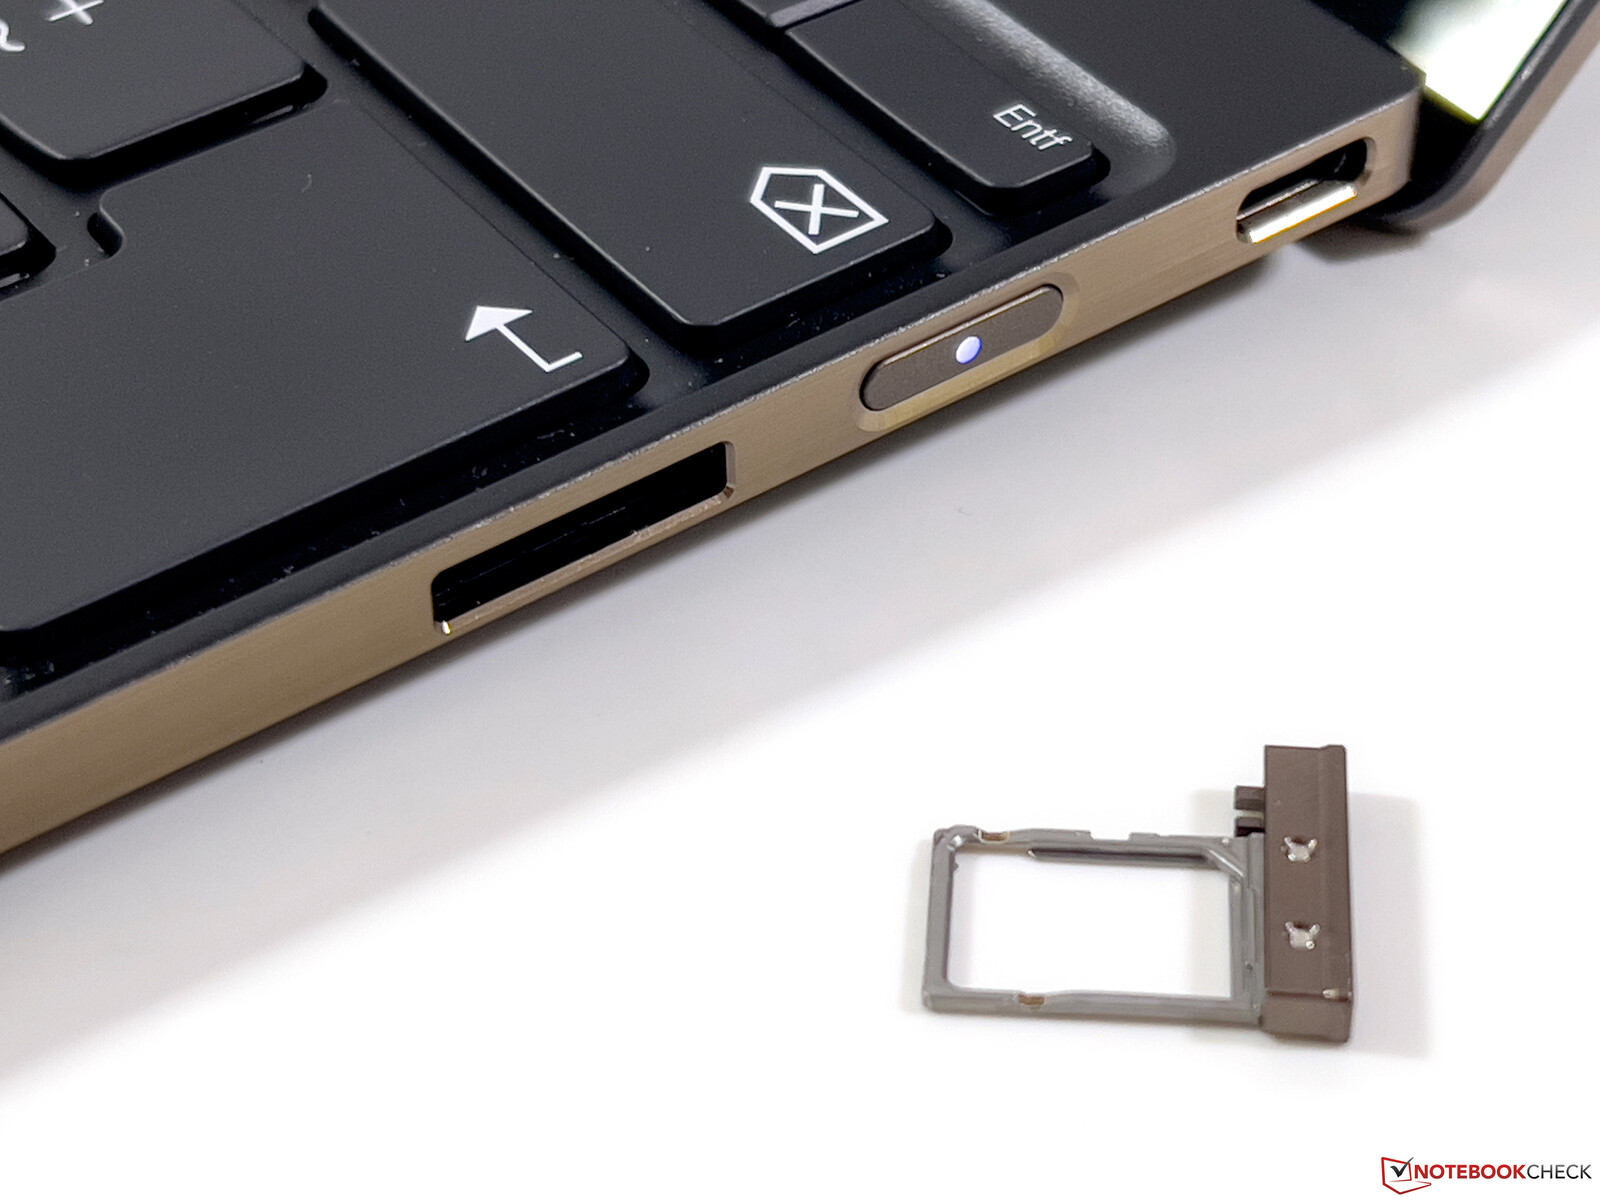
Nossa unidade de revisão foi equipada com um módulo Wi-Fi 6E (Qualcomm WCN685x) e conseguimos nos conectar facilmente à rede de 6 GHz em nosso roteador de referência Asus. As taxas de transferência no teste foram muito altas e também estáveis. Um módulo WWAN da Quectel também foi instalado no dispositivo de teste, que suporta apenas o LTE Cat.4. Além de um eSIM, uma placa nano-SIM também pode ser inserida na borda direita. Foi possível utilizar um cartão SIM da Telekom (Alemanha) na rede LTE sem problemas. Entretanto, um módulo 5G não está disponível.
| Networking | |
| Lenovo ThinkPad Z13 G1-21D20016GE | |
| iperf3 receive AXE11000 6GHz | |
| iperf3 transmit AXE11000 6GHz | |
| Asus Zenbook S 13 OLED | |
| iperf3 receive AXE11000 | |
| iperf3 transmit AXE11000 | |
| Lenovo ThinkPad Z13 21D2CTO1WW | |
| iperf3 receive AXE11000 6GHz | |
| iperf3 transmit AXE11000 6GHz | |
| Apple MacBook Air M2 Entry | |
| iperf3 receive AXE11000 | |
| iperf3 transmit AXE11000 | |
| Dell XPS 13 Plus 9320 4K | |
| iperf3 receive AXE11000 | |
| iperf3 transmit AXE11000 | |
| Média Qualcomm WCN685x | |
| iperf3 receive AXE11000 6GHz | |
| iperf3 transmit AXE11000 6GHz | |
| iperf3 receive AXE11000 | |
| iperf3 transmit AXE11000 | |


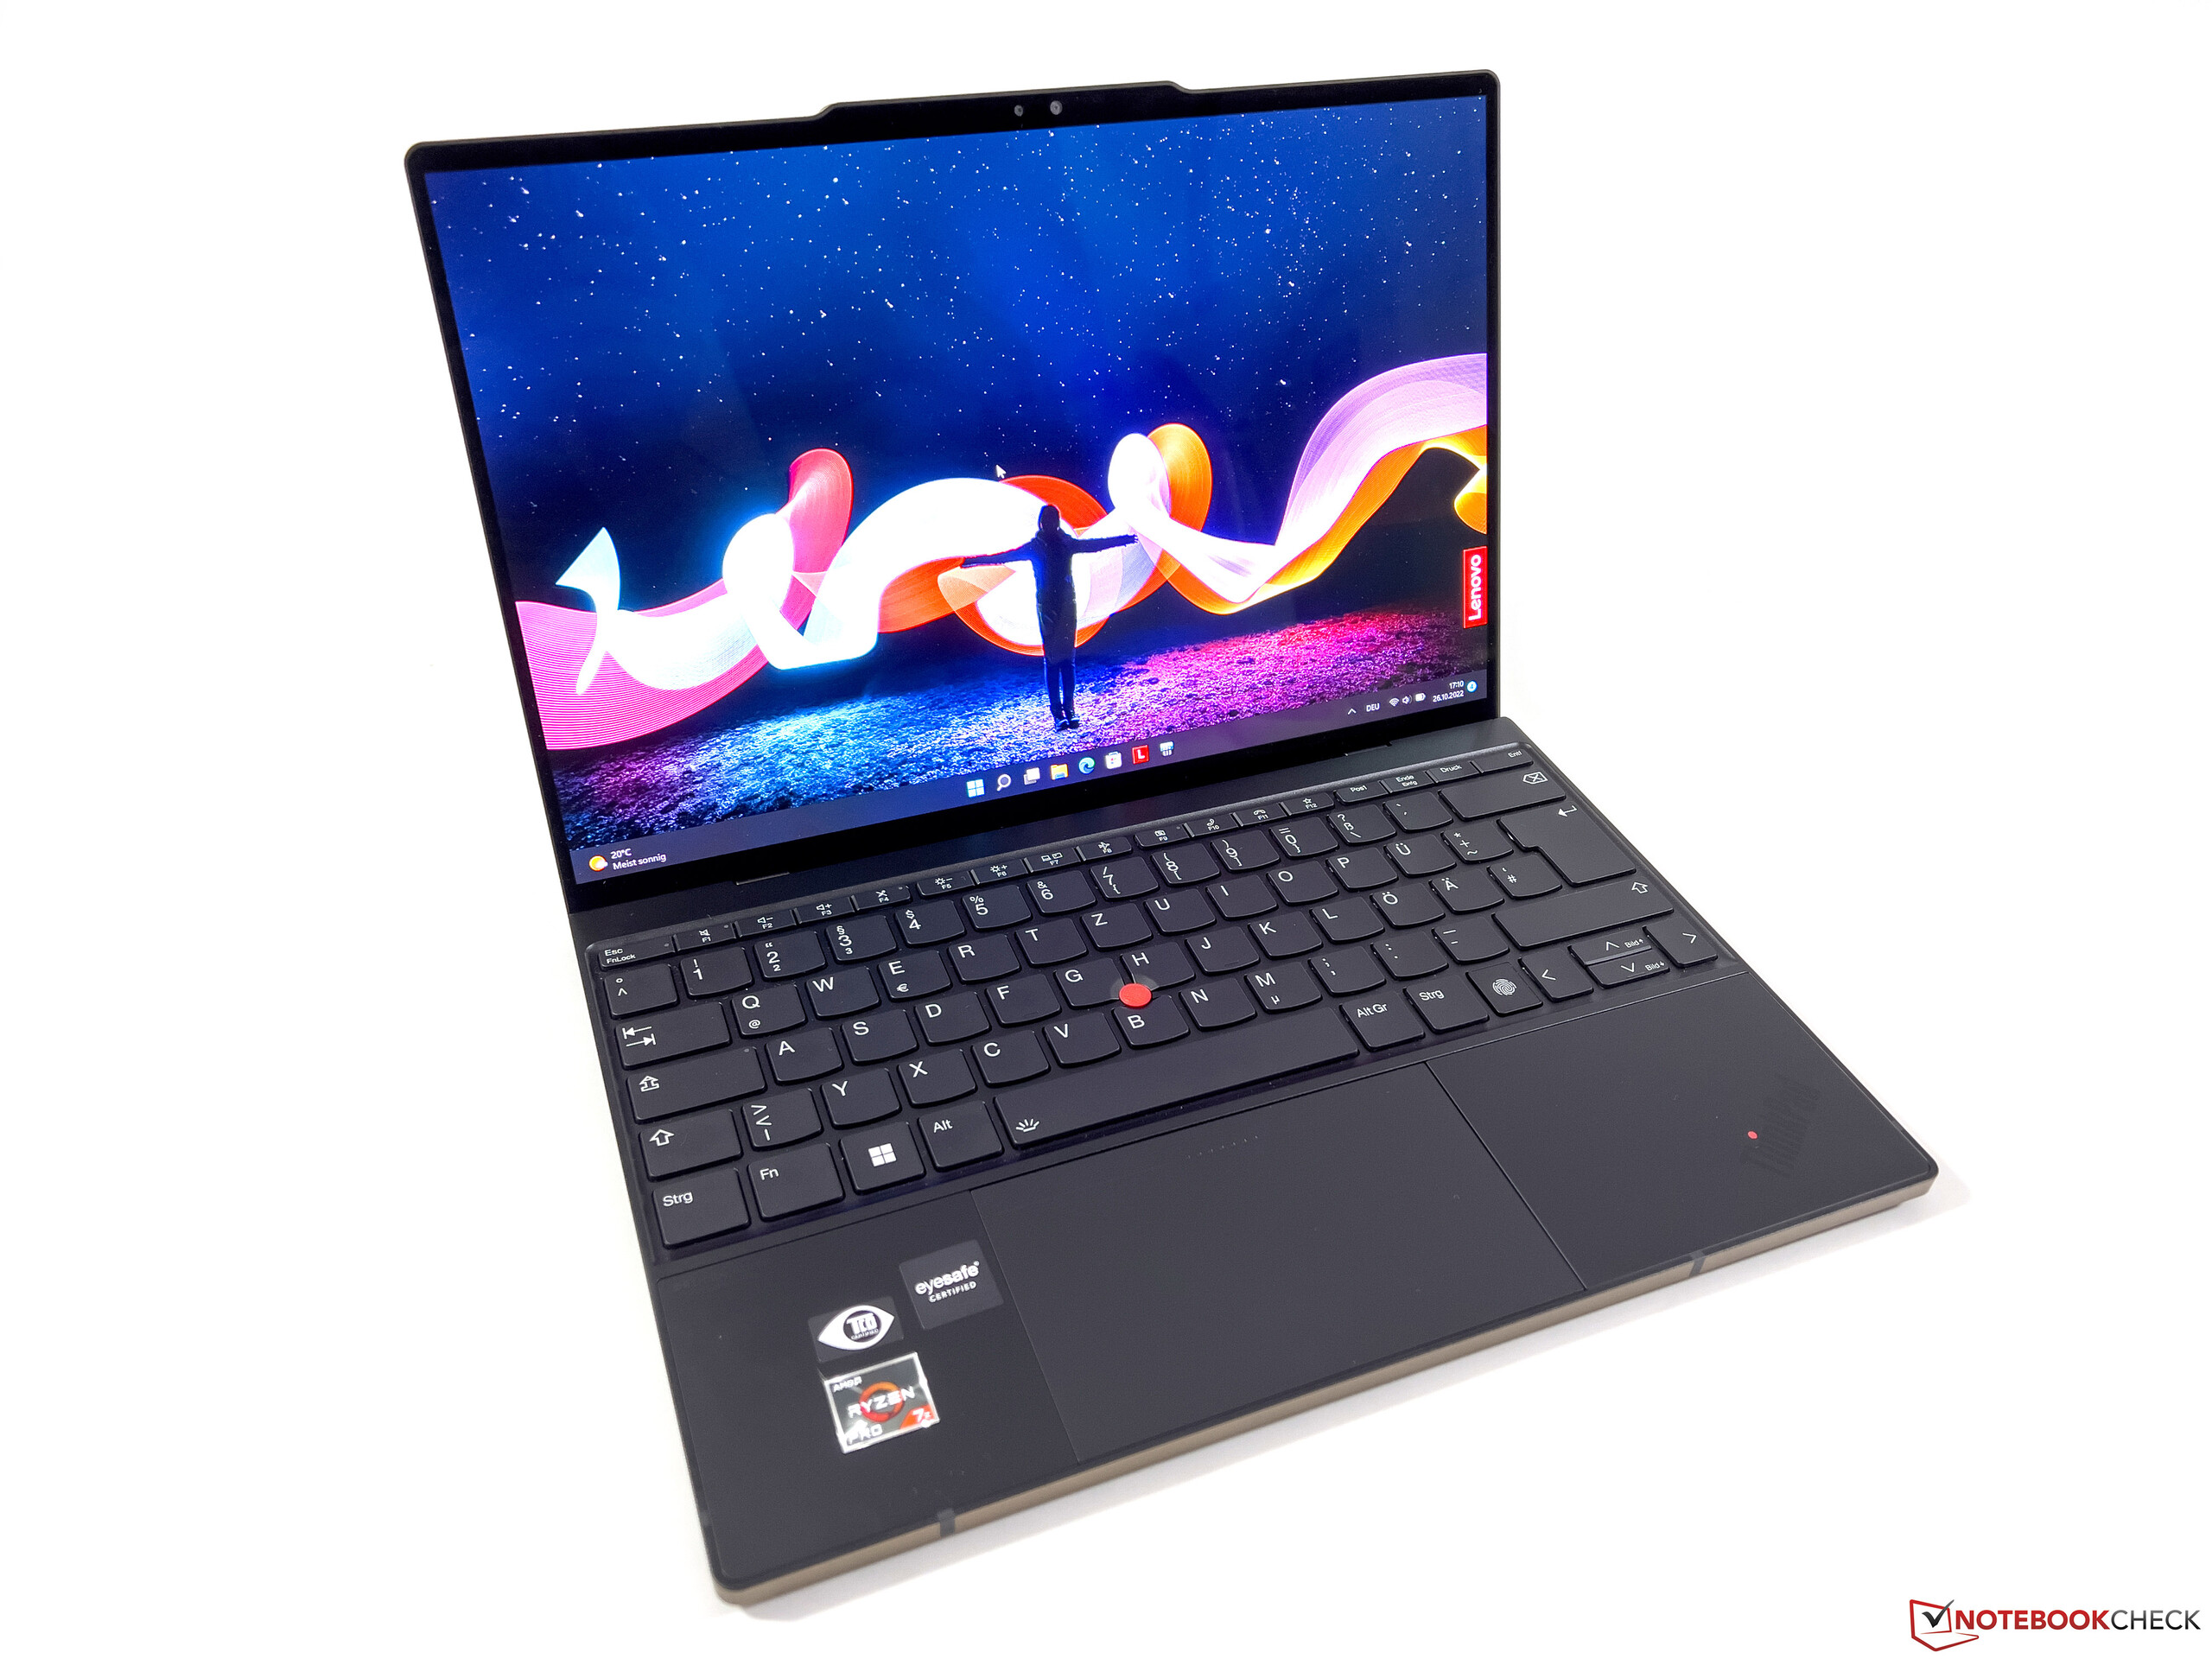
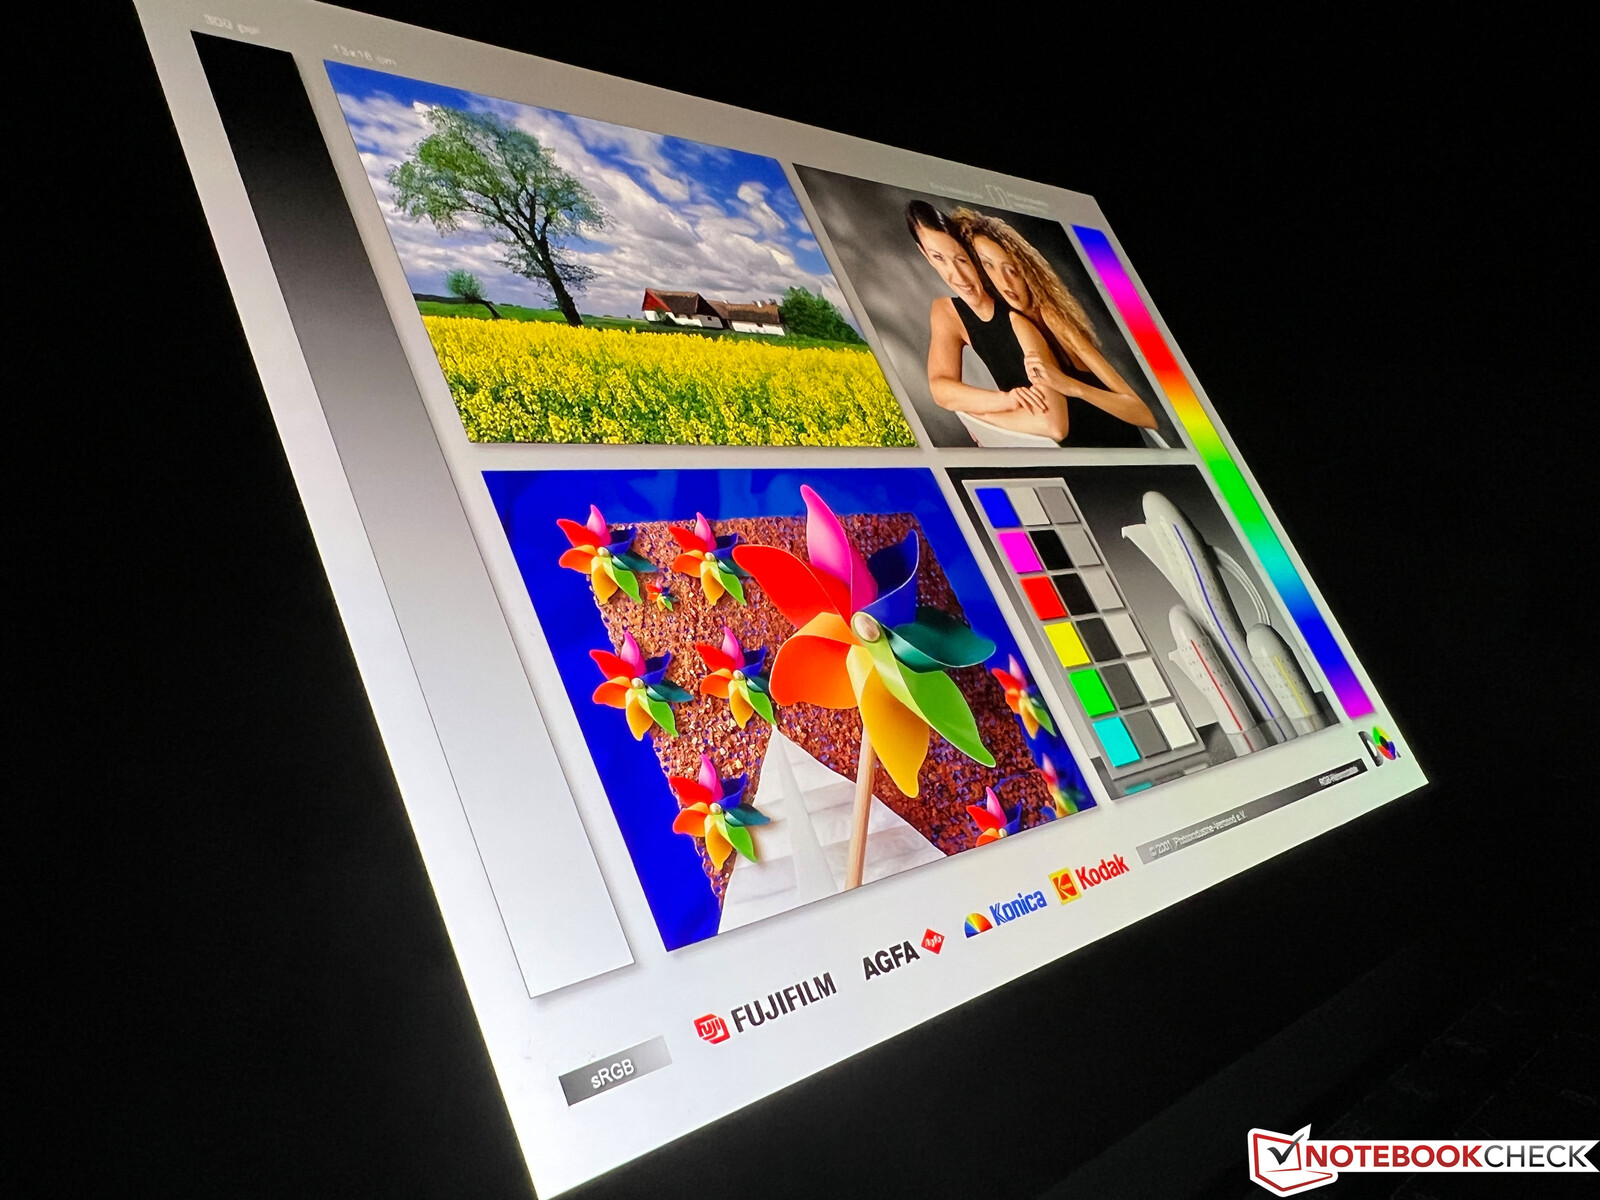
Tela - 2.8K OLED Touchscreen
Nosso dispositivo de teste utiliza a tela opcional OLED de 13,3 polegadas com uma resolução de 2.880 x 1.800 pixels. Subjetivamente, a imagem do painel refletor causa, em princípio, uma boa impressão. O conteúdo é exibido de forma muito nítida e as cores são muito fortes. Com conteúdo brilhante, porém, um efeito de grade (efeito moiré) é visível e requer que se sente relativamente perto da tela. O Windows usa seu modo de cor escura por padrão para economizar energia, portanto, na prática, o efeito não é perceptível.
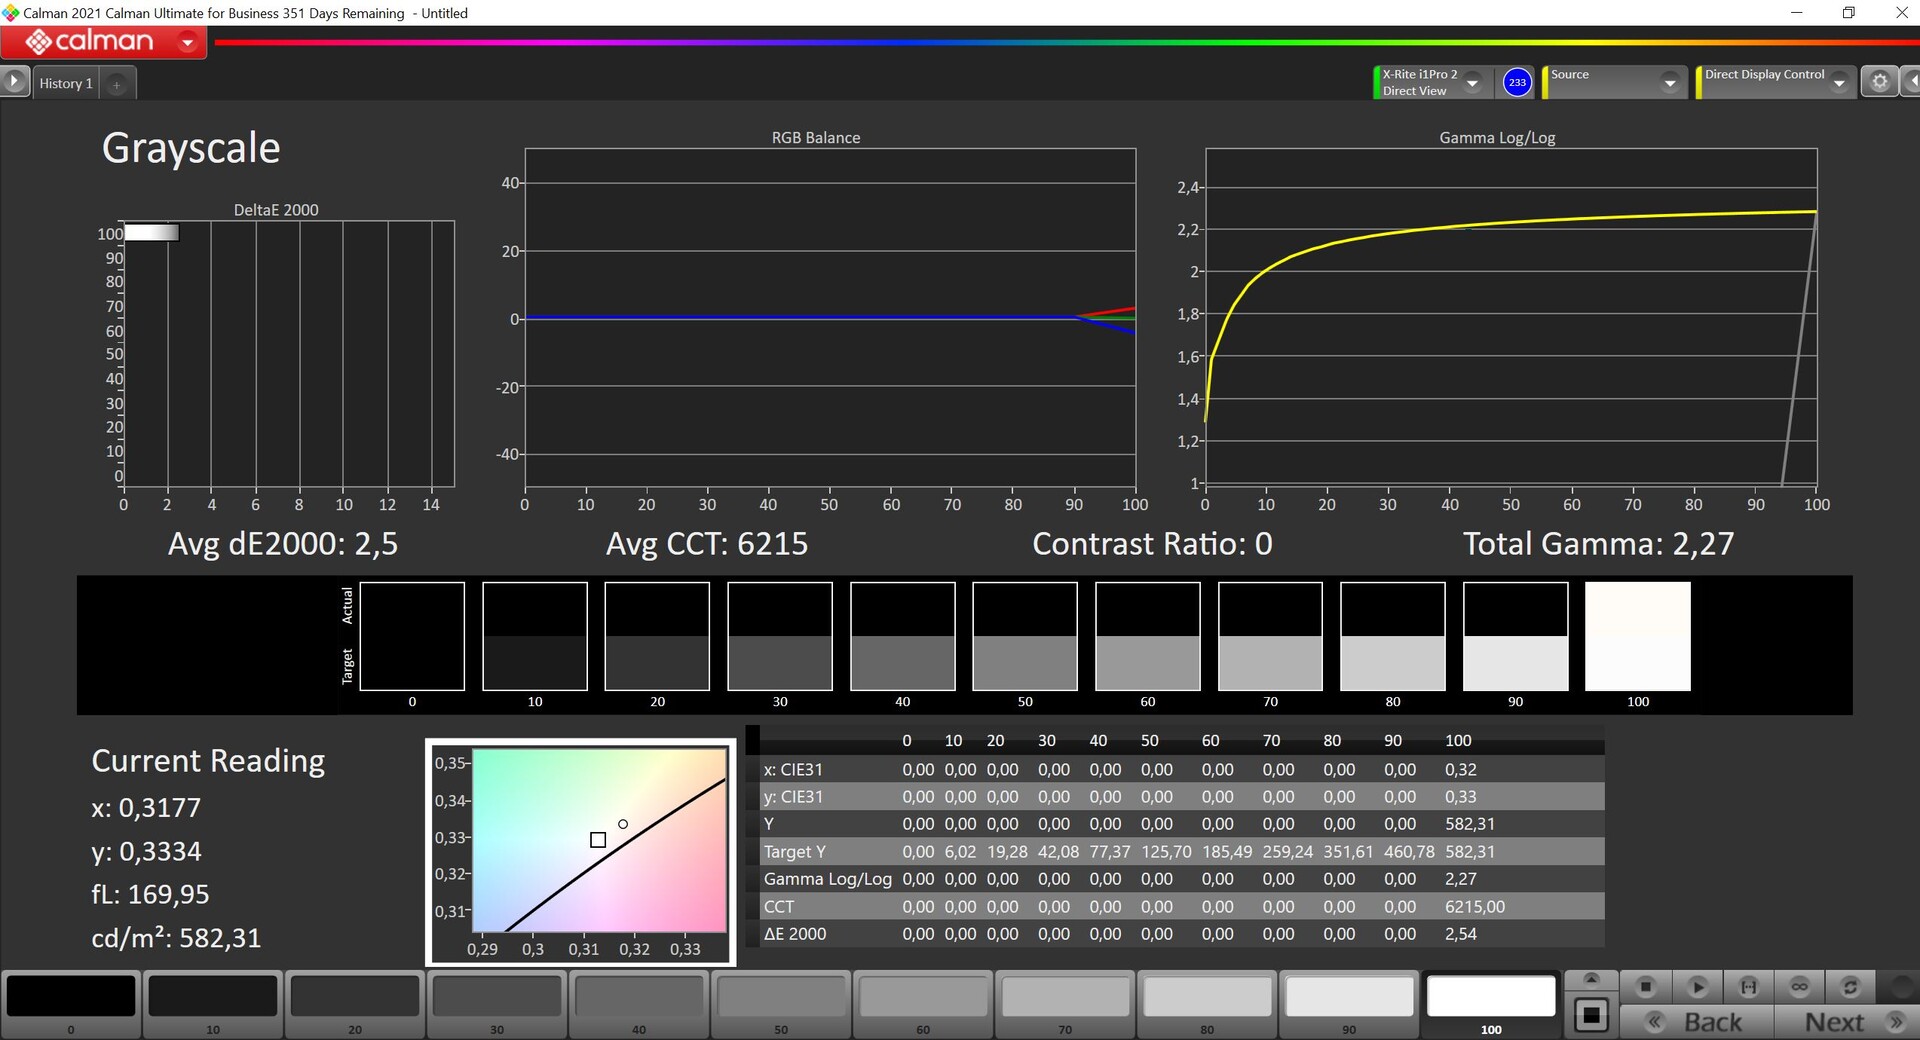
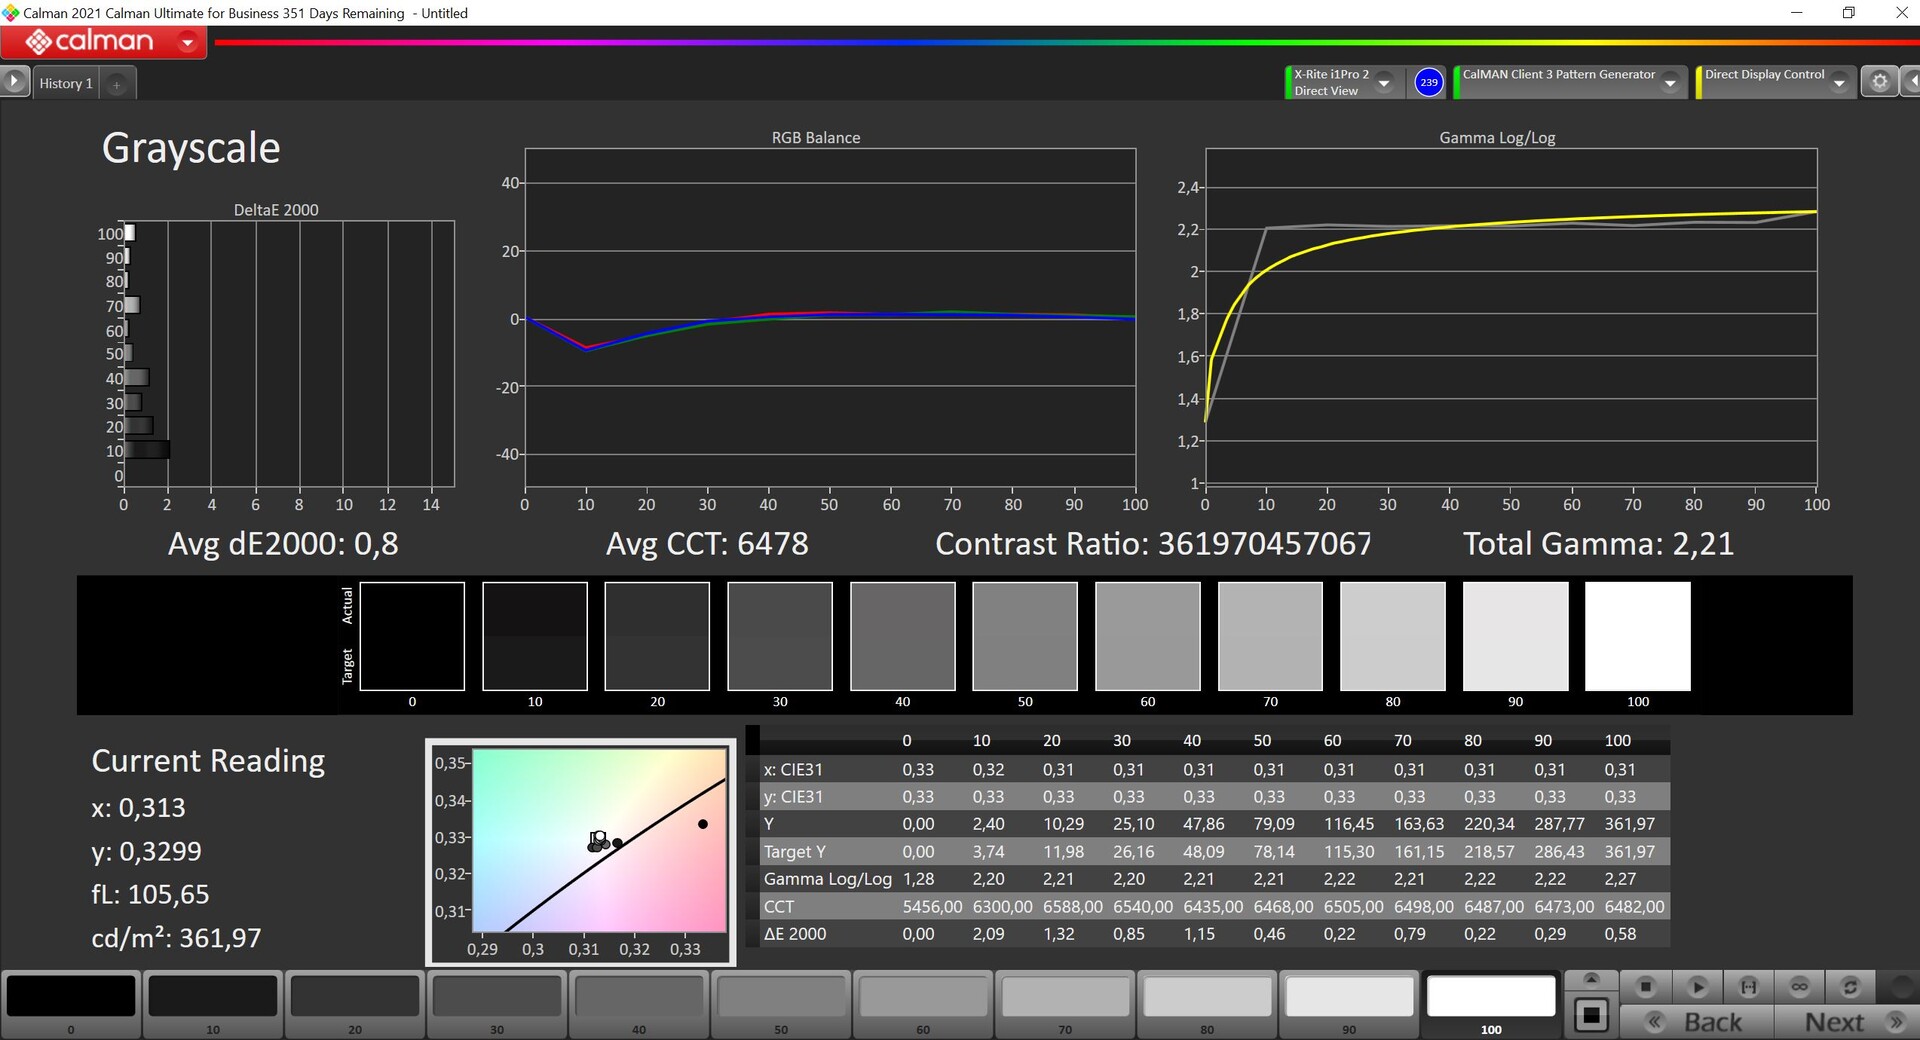
A Lenovo anuncia um brilho de 400 cd/m², sendo necessário distinguir aqui (como é a norma com painéis OLED) entre conteúdo SDR e HDR. No modo SDR normal, determinamos um brilho de cerca de 380 cd/m² e junto com o nível extremamente baixo de preto, obtém-se uma relação de contraste extremamente alta. No modo HDR (que tem que ser ativado manualmente), ele atinge um máximo de 582 cd/m² para pequenas seções de imagem e cerca de 470 cd/m² para uma imagem quase completamente brilhante. A estabilidade do ângulo de visão é muito boa e os tempos de resposta são extremamente rápidos. Não há halos nos painéis OLED.
| |||||||||||||||||||||||||
iluminação: 98 %
iluminação com acumulador: 373 cd/m²
Contraste: 9275:1 (Preto: 0.04 cd/m²)
ΔE ColorChecker Calman: 2.5 | ∀{0.5-29.43 Ø4.71}
calibrated: 1.9
ΔE Greyscale Calman: 2 | ∀{0.09-98 Ø4.96}
97.5% AdobeRGB 1998 (Argyll 3D)
100% sRGB (Argyll 3D)
99.9% Display P3 (Argyll 3D)
Gamma: 2.17
CCT: 6228 K
| Lenovo ThinkPad Z13 G1-21D20016GE ATNA33AA02-0, OLED, 2880x1800, 13.3" | Asus Zenbook S 13 OLED SDC4172, OLED, 2880x1800, 13.3" | Dell XPS 13 Plus 9320 i7-1280P OLED Samsung 134XK04, OLED, 3456x2160, 13.4" | Lenovo ThinkPad Z13 21D2CTO1WW NV133WUM-N63, IPS LED, 1920x1200, 13.3" | Apple MacBook Air M2 Entry IPS, 2560x1664, 13.6" | |
|---|---|---|---|---|---|
| Display | 0% | 0% | -21% | -4% | |
| Display P3 Coverage (%) | 99.9 | 99.8 0% | 99.5 0% | 67.7 -32% | 98.4 -2% |
| sRGB Coverage (%) | 100 | 100 0% | 100 0% | 96.5 -3% | 99.9 0% |
| AdobeRGB 1998 Coverage (%) | 97.5 | 97.8 0% | 98.4 1% | 69.7 -29% | 87.6 -10% |
| Response Times | -8% | -34% | -1909% | -1544% | |
| Response Time Grey 50% / Grey 80% * (ms) | 1.9 ? | 2.1 ? -11% | 2.6 ? -37% | 49 ? -2479% | 32.9 ? -1632% |
| Response Time Black / White * (ms) | 1.6 ? | 1.68 ? -5% | 2.1 ? -31% | 23 ? -1338% | 24.9 ? -1456% |
| PWM Frequency (Hz) | 240 ? | 240.4 ? | 59.5 | ||
| Screen | 24% | -6% | -81% | -81% | |
| Brightness middle (cd/m²) | 371 | 336 -9% | 371.8 0% | 418 13% | 526 42% |
| Brightness (cd/m²) | 378 | 338 -11% | 374 -1% | 379 0% | 486 29% |
| Brightness Distribution (%) | 98 | 99 1% | 98 0% | 81 -17% | 87 -11% |
| Black Level * (cd/m²) | 0.04 | 0.02 50% | 0.33 -725% | 0.38 -850% | |
| Contrast (:1) | 9275 | 16800 81% | 1267 -86% | 1384 -85% | |
| Colorchecker dE 2000 * | 2.5 | 1.8 28% | 2.37 5% | 1.7 32% | 1.3 48% |
| Colorchecker dE 2000 max. * | 4.4 | 3.8 14% | 6.1 -39% | 3.3 25% | 2.7 39% |
| Colorchecker dE 2000 calibrated * | 1.9 | 1.8 5% | 1.1 42% | 0.7 63% | |
| Greyscale dE 2000 * | 2 | 0.9 55% | 2 -0% | 2.3 -15% | 2 -0% |
| Gamma | 2.17 101% | 2.22 99% | 2.29 96% | 2.14 103% | 2.25 98% |
| CCT | 6228 104% | 6580 99% | 6261 104% | 6499 100% | 6858 95% |
| Média Total (Programa/Configurações) | 5% /
14% | -13% /
-9% | -670% /
-329% | -543% /
-273% |
* ... menor é melhor
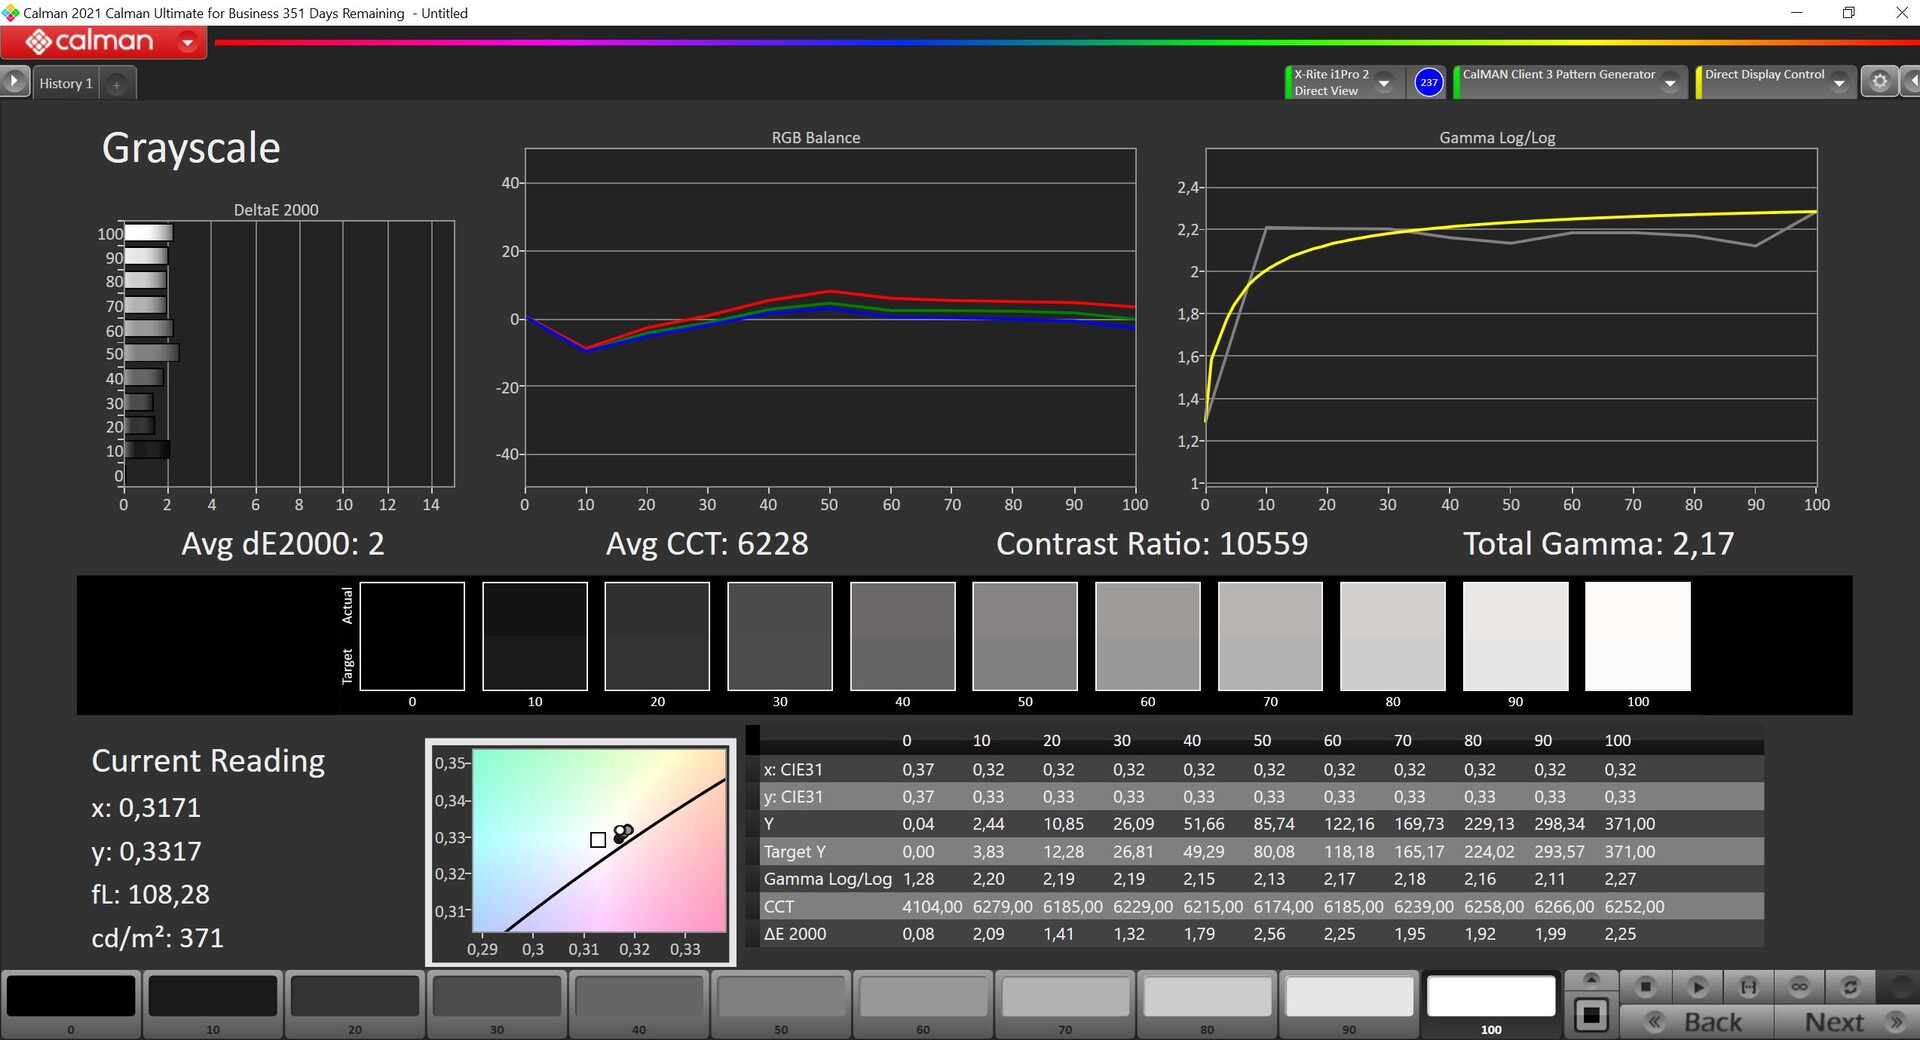
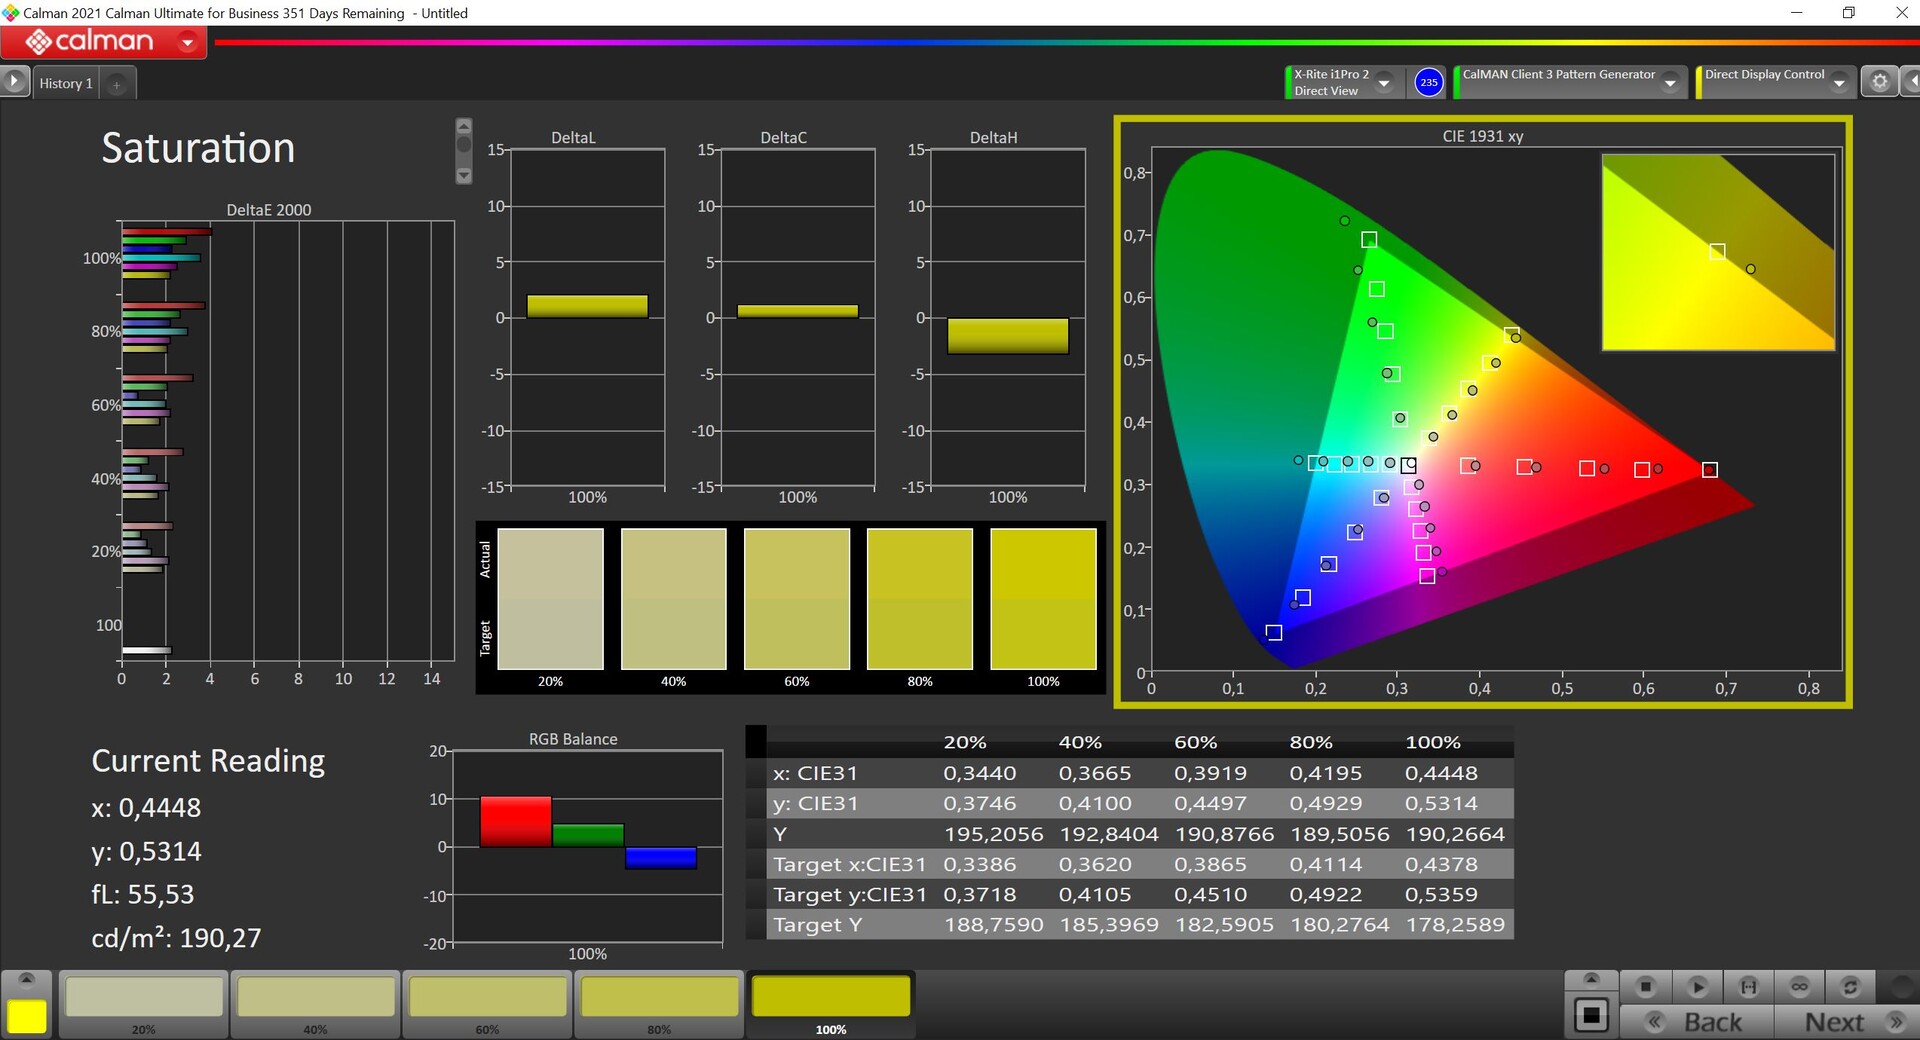
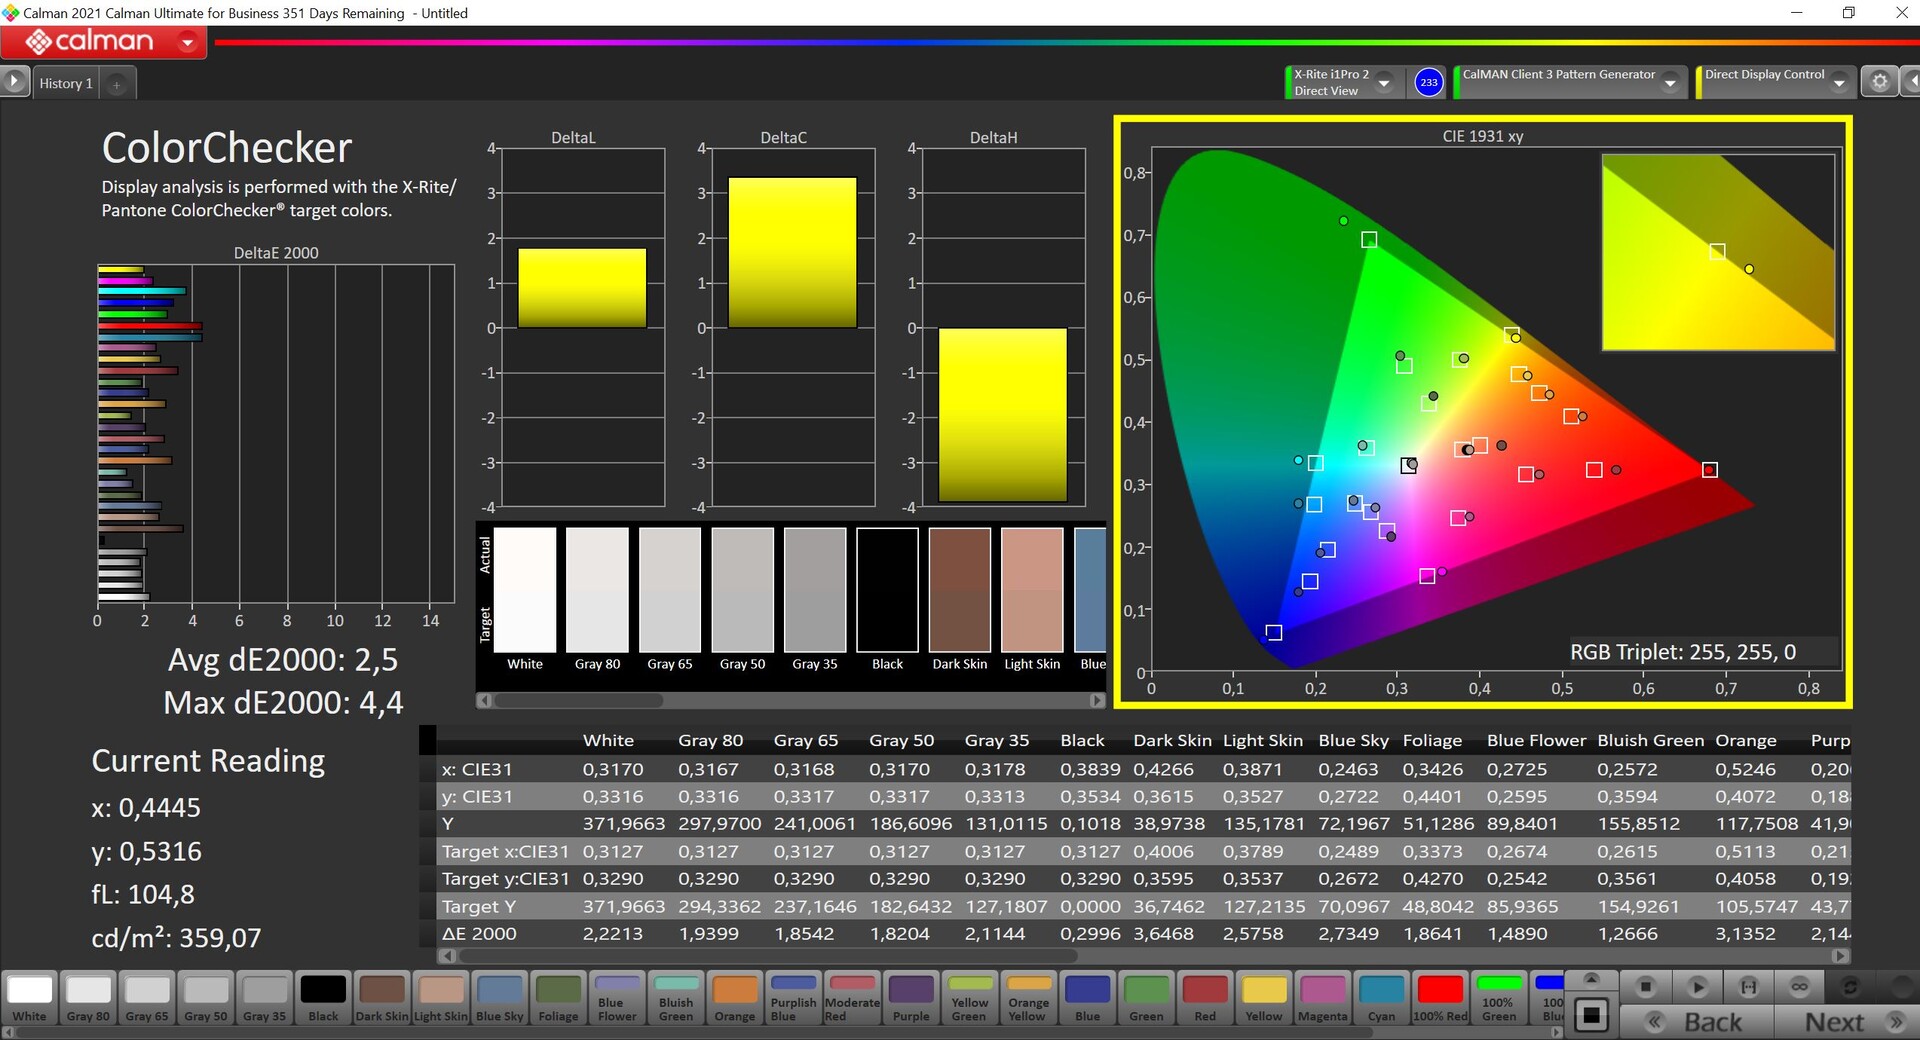
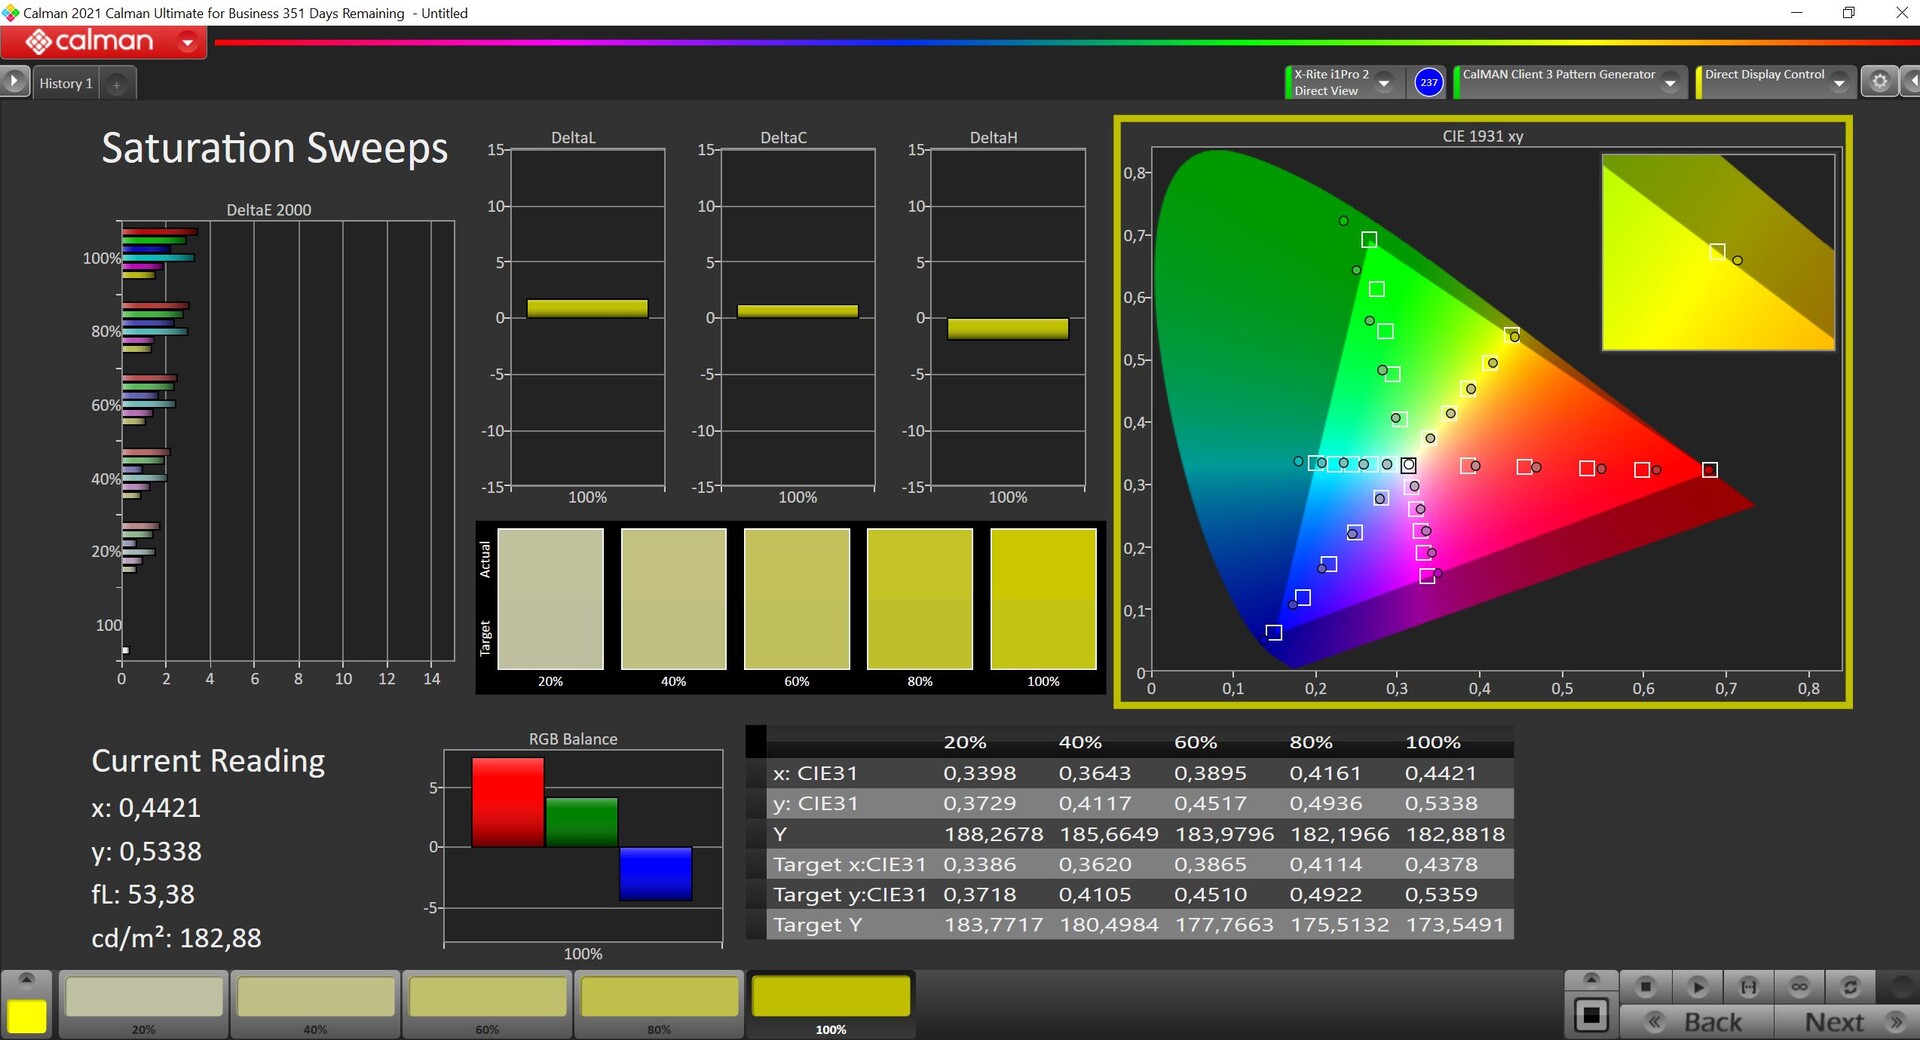
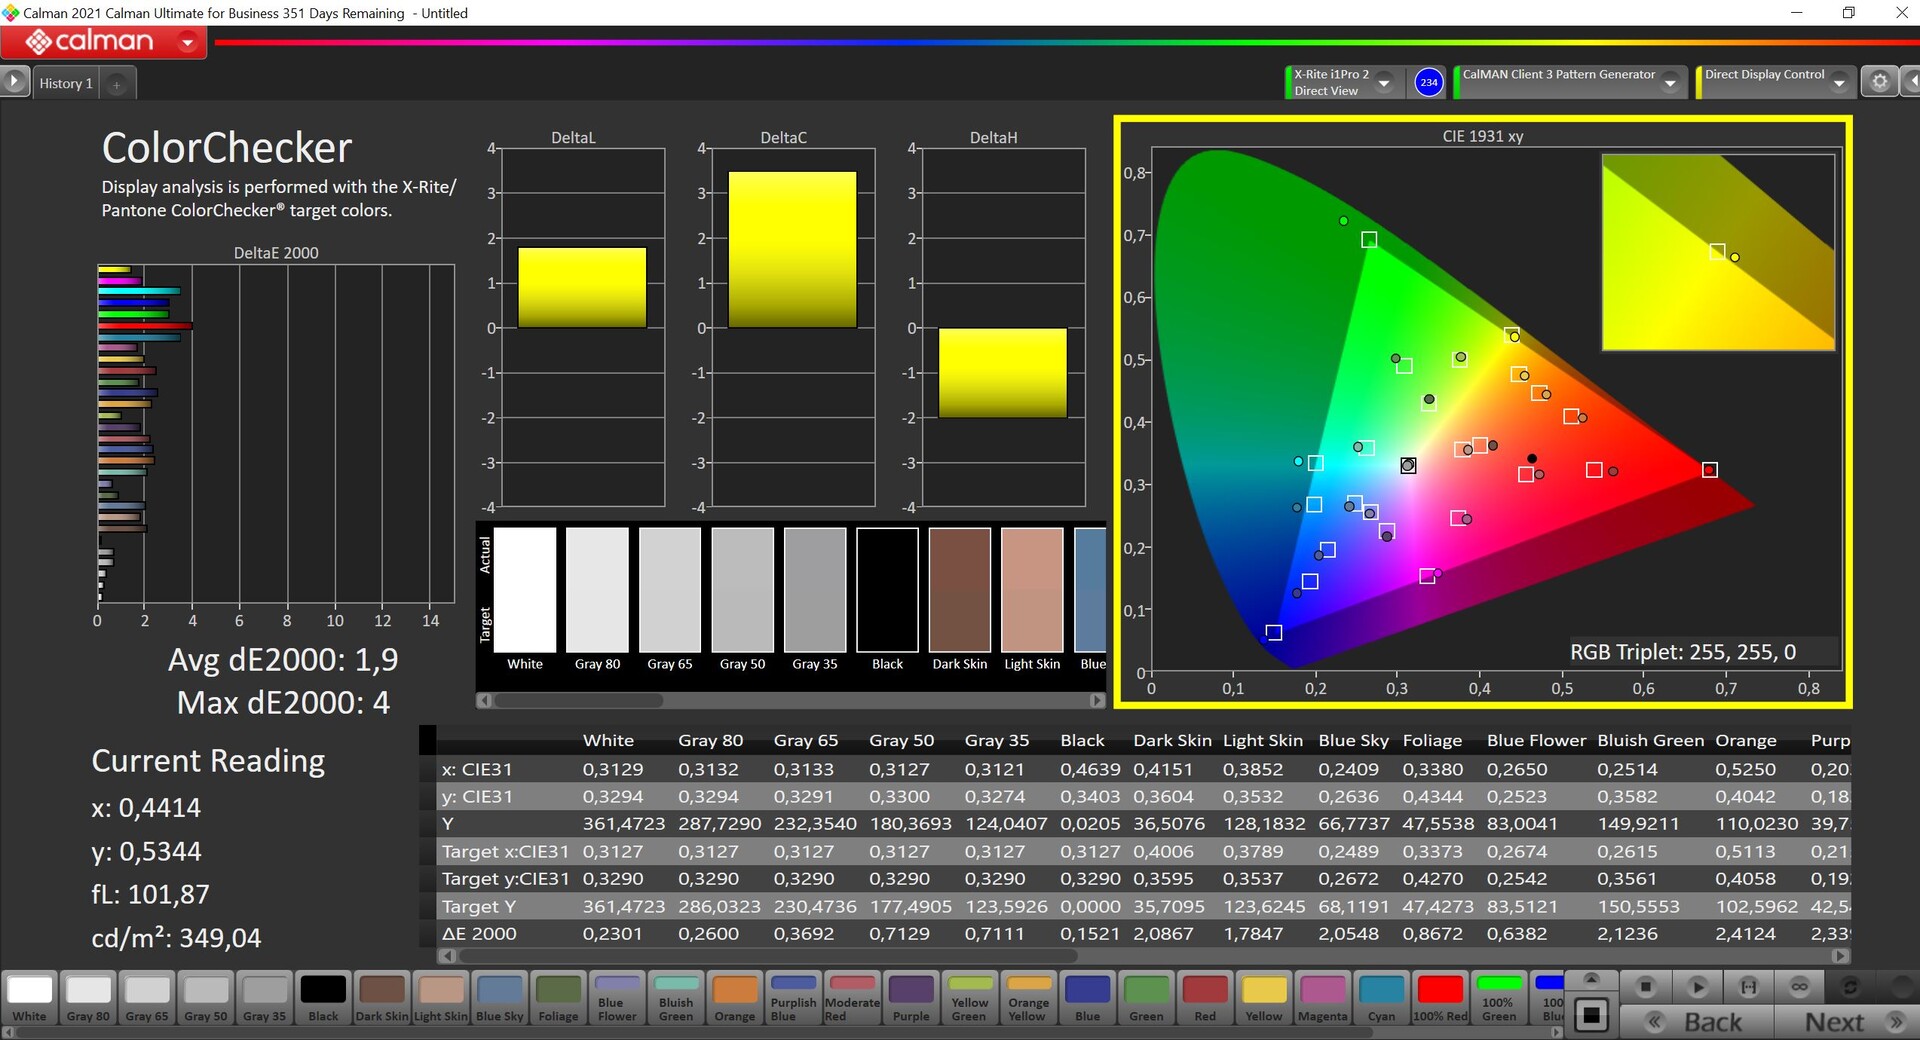
Nossa análise utilizando o software profissional CalMAN (X-Rite i1 Pro 2) mostra que a tela OLED, conforme entregue, já está devidamente calibrada. Há uma cor mínima fundida em vermelho verdadeiro em conjunto com uma temperatura de cor que é ligeiramente quente demais. Conseguimos melhorar ainda mais a tela com nossa própria calibração (o perfil está disponível para download acima) e a maioria das cores está abaixo do importante limite de 3. O espaço de cor P3 está totalmente coberto
Exibir tempos de resposta
| ↔ Tempo de resposta preto para branco | ||
|---|---|---|
| 1.6 ms ... ascensão ↗ e queda ↘ combinadas | ↗ 0.8 ms ascensão | 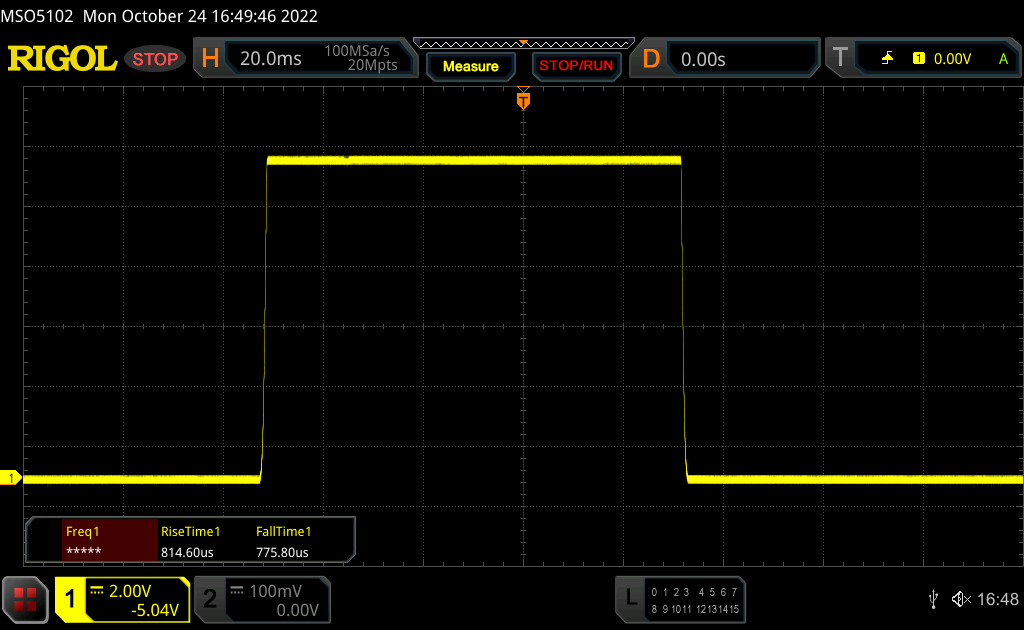 |
| ↘ 0.8 ms queda | ||
| A tela mostra taxas de resposta muito rápidas em nossos testes e deve ser muito adequada para jogos em ritmo acelerado. Em comparação, todos os dispositivos testados variam de 0.1 (mínimo) a 240 (máximo) ms. » 10 % de todos os dispositivos são melhores. Isso significa que o tempo de resposta medido é melhor que a média de todos os dispositivos testados (19.8 ms). | ||
| ↔ Tempo de resposta 50% cinza a 80% cinza | ||
| 1.9 ms ... ascensão ↗ e queda ↘ combinadas | ↗ 1 ms ascensão | 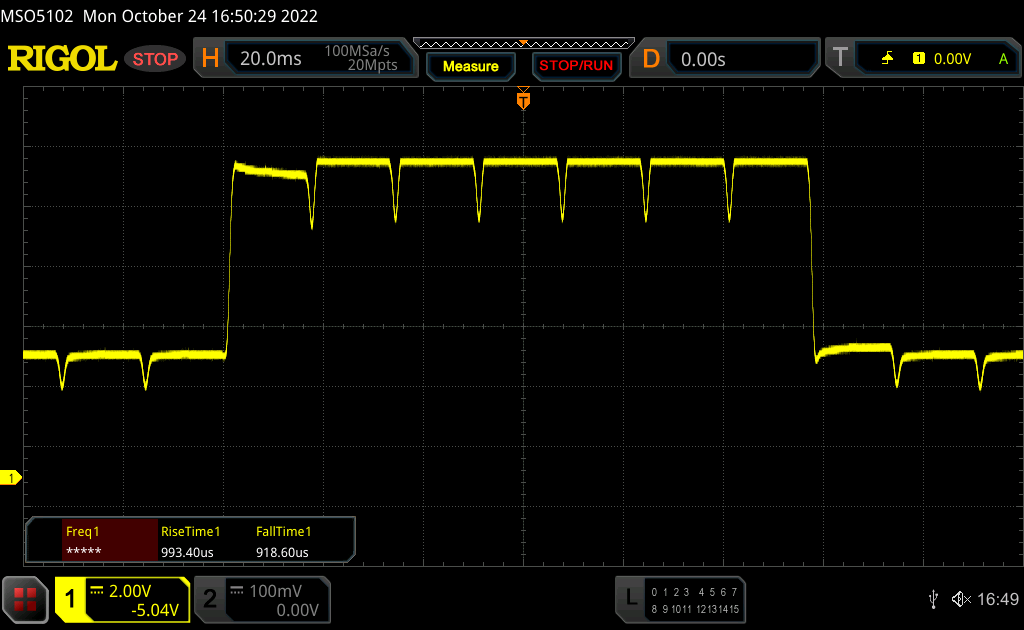 |
| ↘ 0.9 ms queda | ||
| A tela mostra taxas de resposta muito rápidas em nossos testes e deve ser muito adequada para jogos em ritmo acelerado. Em comparação, todos os dispositivos testados variam de 0.165 (mínimo) a 636 (máximo) ms. » 9 % de todos os dispositivos são melhores. Isso significa que o tempo de resposta medido é melhor que a média de todos os dispositivos testados (31 ms). | ||
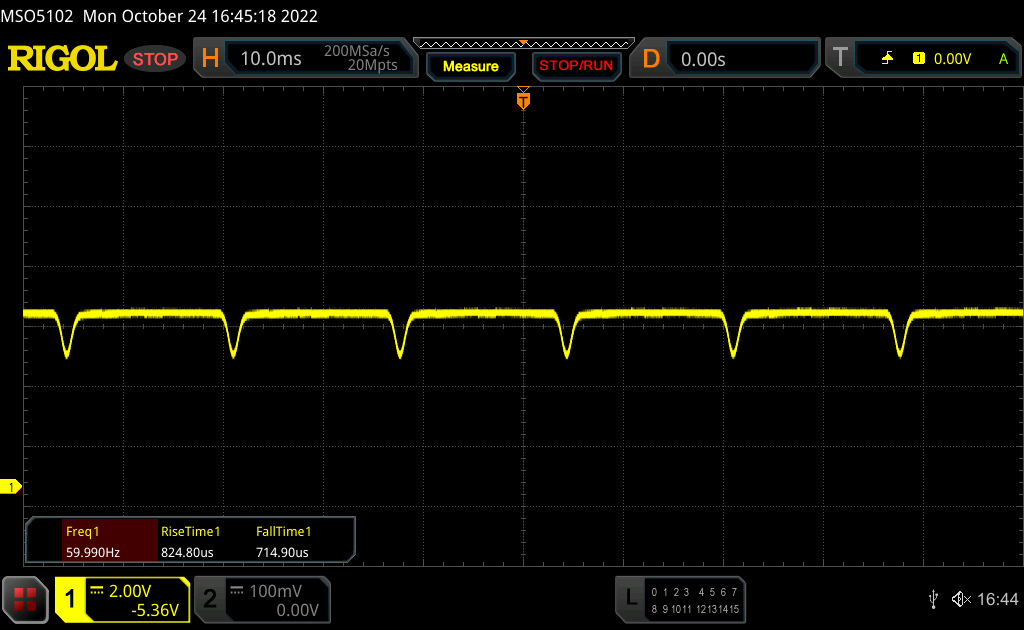
Cintilação da tela / PWM (modulação por largura de pulso)
| Tela tremeluzindo/PWM detectado | 240 Hz | ≤ 50 % configuração de brilho | 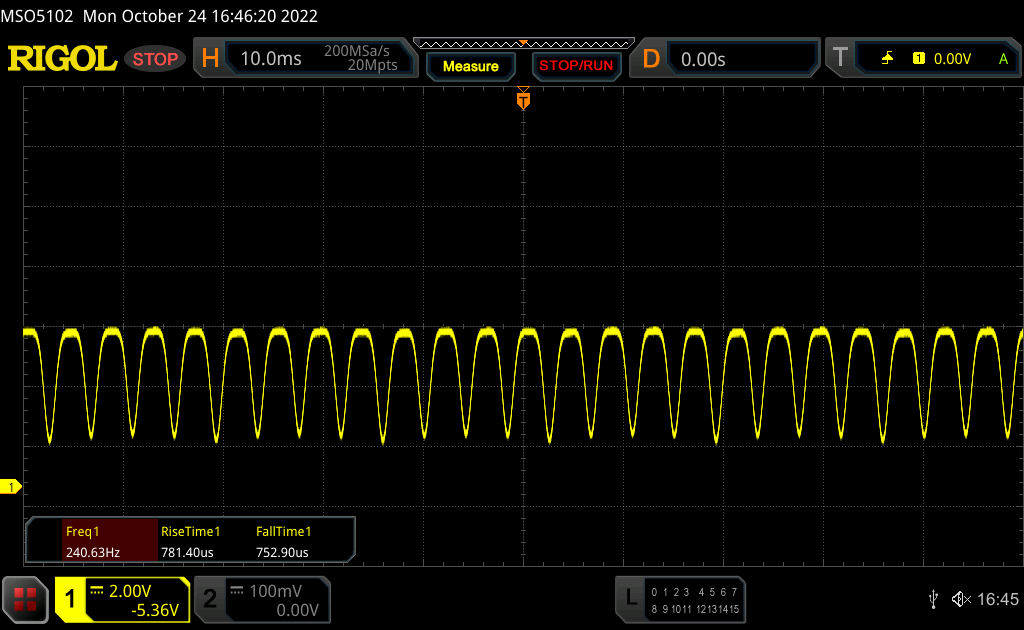 |
| ≤ 86 brilho cd/m² | |||
A luz de fundo da tela pisca em 240 Hz (pior caso, por exemplo, utilizando PWM) Cintilação detectada em uma configuração de brilho de 50 % (86 cd/m²) e abaixo. Não deve haver cintilação ou PWM acima desta configuração de brilho. A frequência de 240 Hz é relativamente baixa, portanto, usuários sensíveis provavelmente notarão cintilação e sentirão fadiga ocular na configuração de brilho indicada e abaixo. A cintilação ocorre em configurações de brilho relativamente baixas, portanto, o uso prolongado nesta configuração de brilho ou inferior pode causar fadiga ocular. [pwm_comparison] Em comparação: 52 % de todos os dispositivos testados não usam PWM para escurecer a tela. Se PWM foi detectado, uma média de 7747 (mínimo: 5 - máximo: 343500) Hz foi medida. | |||
Na faixa de 51-90% de brilho, o escurecimento DC com uma freqüência de 60 Hz é implantado, mas como a amplitude é muito baixa aqui, não deve haver nenhum problema. Começando com um brilho de 50 % (~86 cd/m²) e menos podemos detectar o conhecido PWM cintilando a 240 Hz. A Lenovo não oferece uma solução de software como o Asus Zenbook S 13 para permitir o escurecimento DC mesmo com níveis de brilho mais baixos.

As reflexões são obviamente um problema na tela refletiva quando ocorrem, mas desde que se possa evitá-las, o conteúdo da tela pode ser lido adequadamente ao ar livre graças à relação de contraste extremamente alta, mesmo em dias brilhantes.
Desempenho - AMD Ryzen 7 Pro 6860Z
Condições de teste
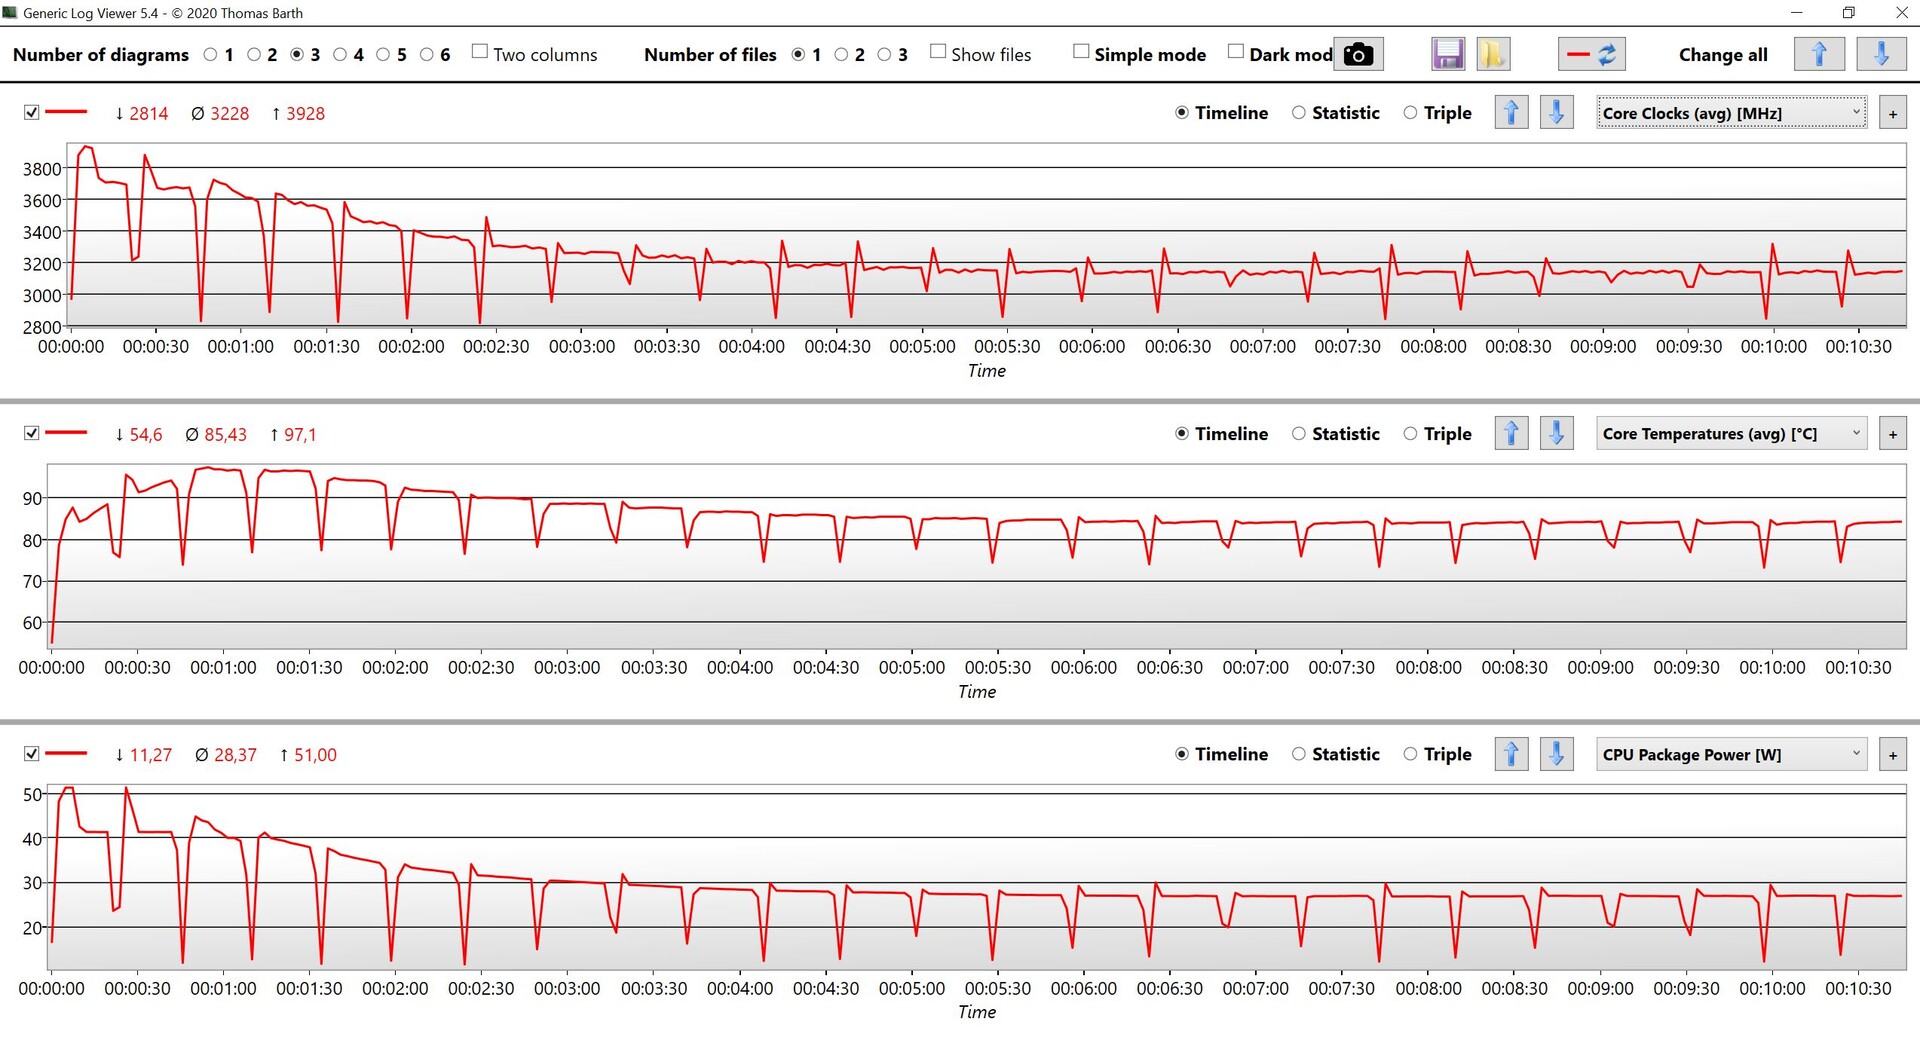
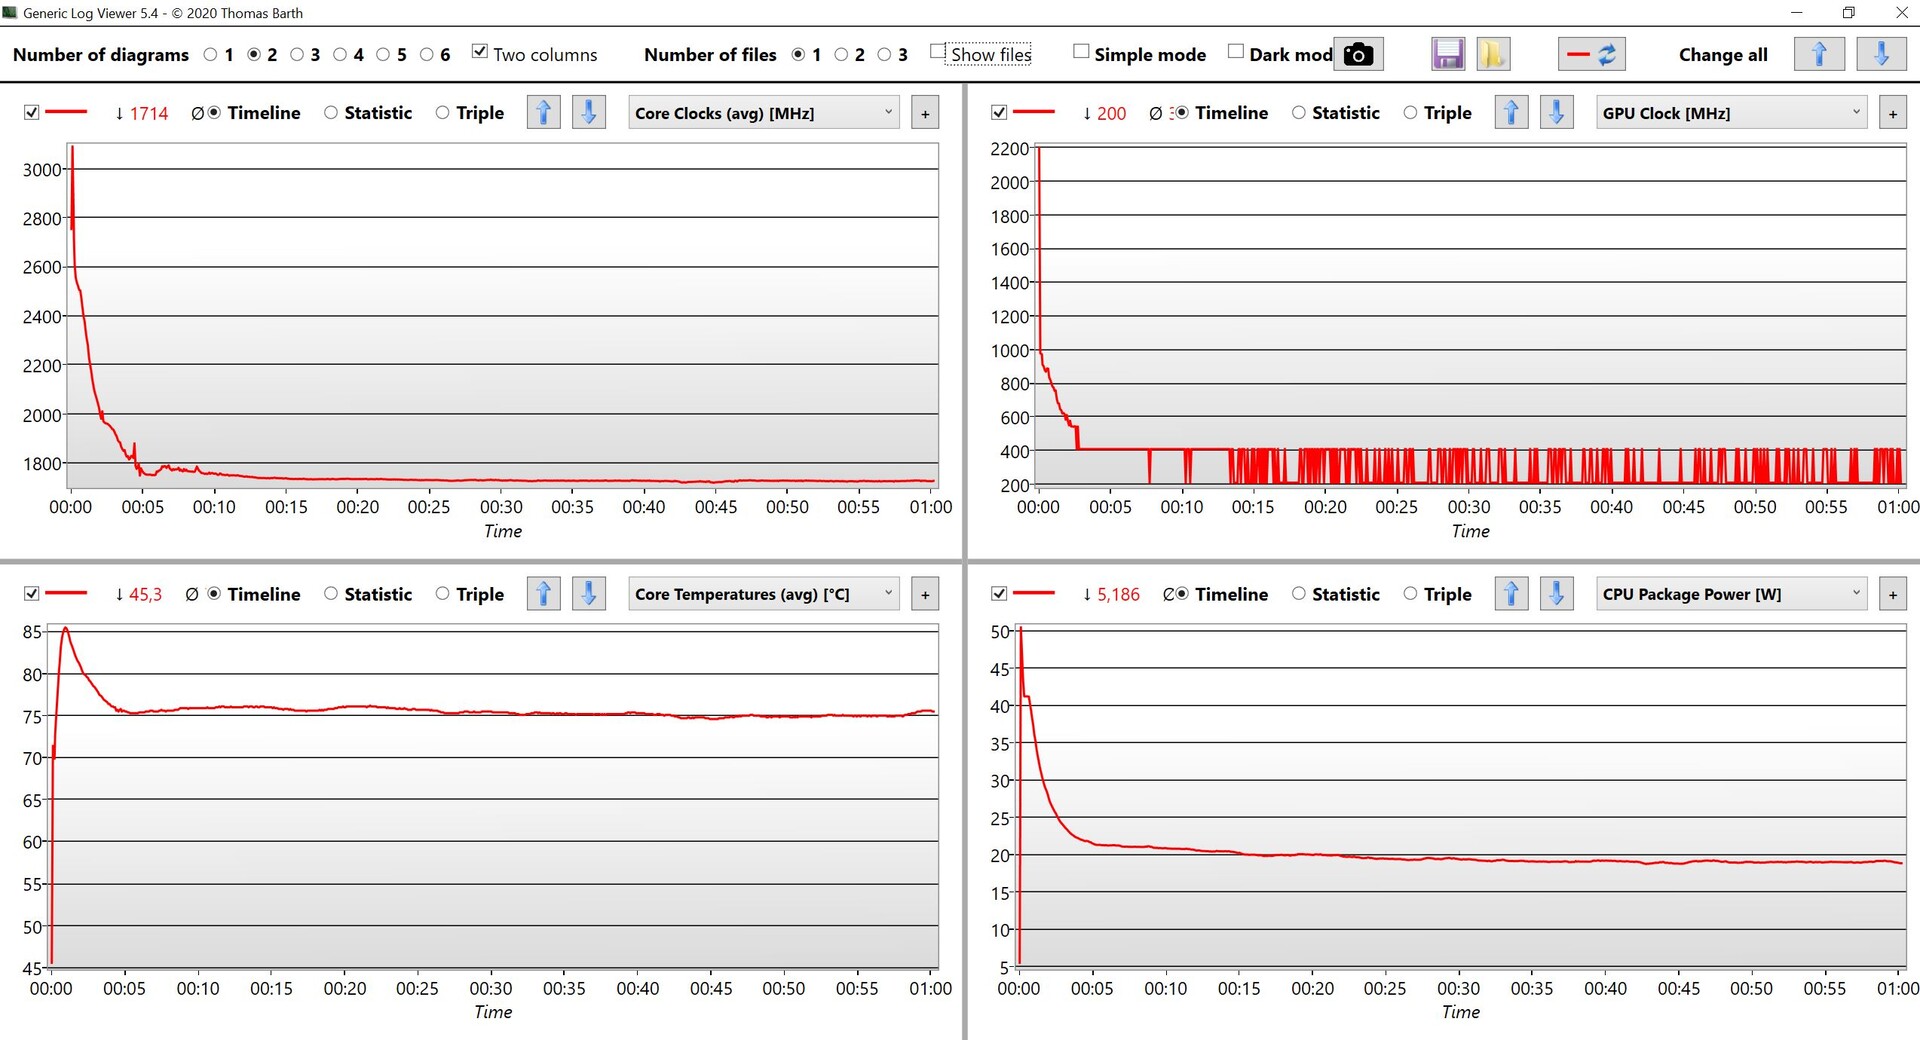
Além das configurações normais de desempenho do Windows, o AMD ThinkPad oferece refrigeração inteligente, que pode ser desativada através da combinação de teclas Fn+T. Em nossos testes com o Ryzen 7 Pro, obtivemos resultados ligeiramente melhores quando a função foi ativada. Basicamente, o processador é alocado 51 watts por um curto período de tempo e, em seguida, se instala até 27 watts.
Processador
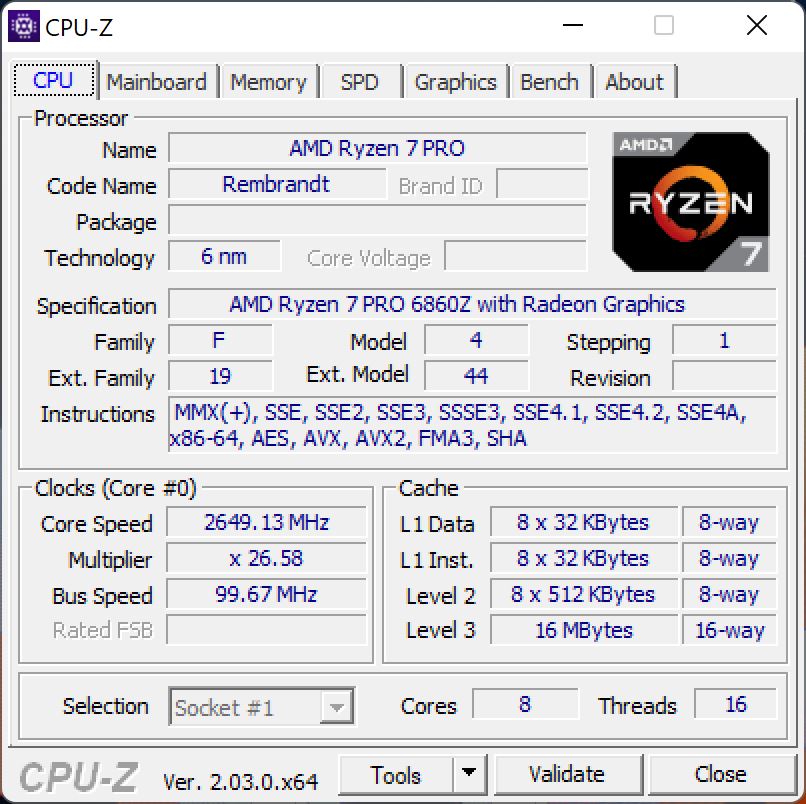
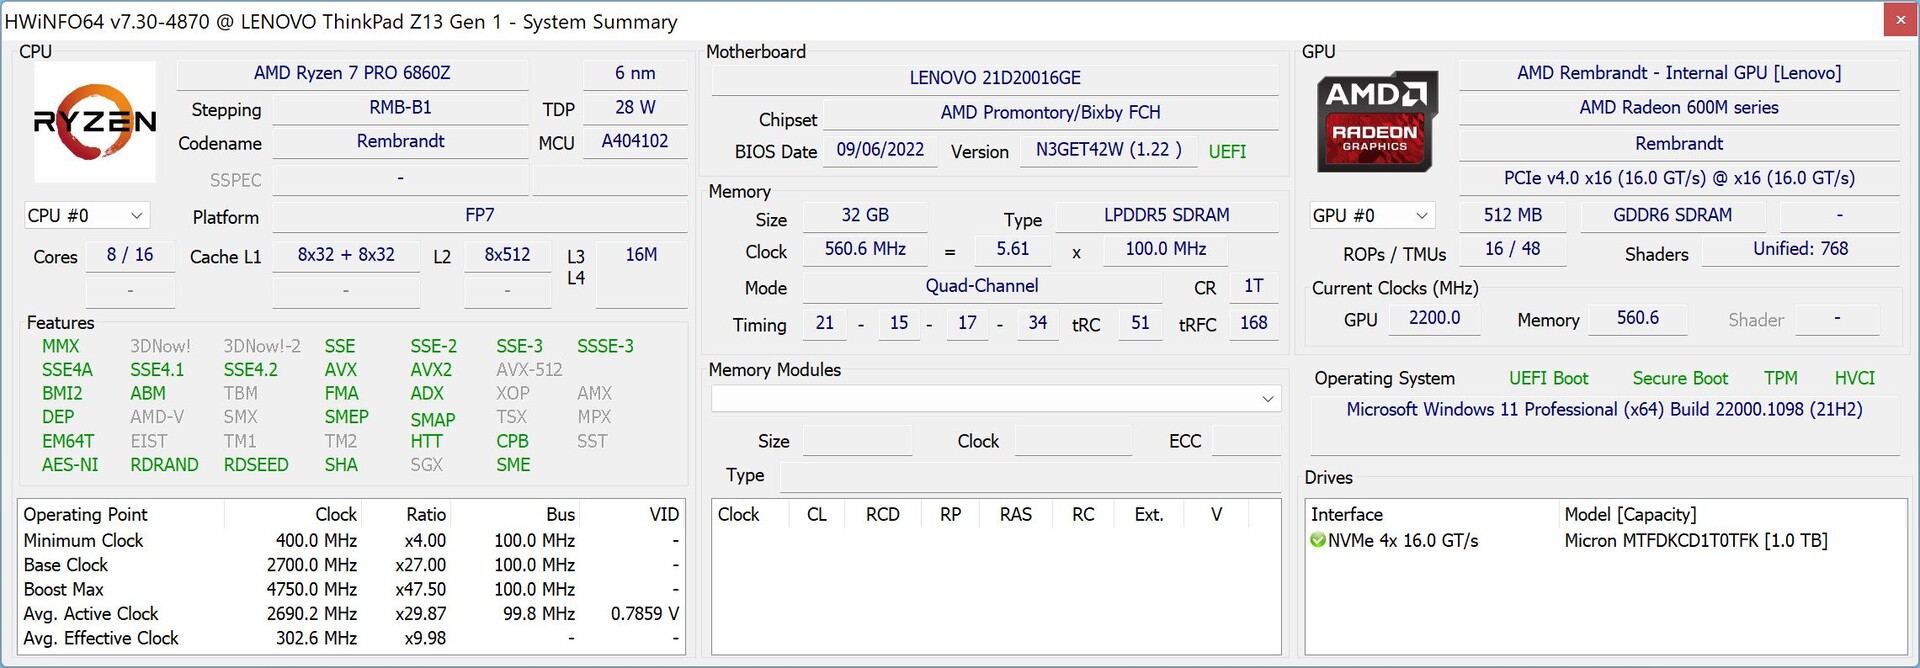
A Lenovo equipa o modelo superior do ThinkPad Z13 com um AMD Ryzen 7 Pro 6860Z, que é exclusivo deste modelo. Muito pouca documentação sobre ajustes para este chip está disponível e mesmo após nosso teste, não somos muito mais sábios. Em princípio, é um Ryzen 7 Pro 6850U padrão (que também está disponível para o Z13), apenas o relógio de impulso máximo está ajustado 50 MHz mais alto em 4,75 GHz. Ambos os modelos Ryzen 7 Pro podem ser configurados com até 32GB de RAM.
O desempenho da CPU é muito bom, especialmente nos primeiros minutos, pois o consumo de energia não cai imediatamente. Sob carga permanente, porém, o Ryzen 7 Pro 6860Z está no mesmo nível do Ryzen 7 Pro 6850U e também do consumidor Ryzen 7 6800U, se forem operados com o mesmo TDP/similar (geralmente 25 watts). O Ryzen 5 Pro 6650U no ThinkPad Z13 é 19% mais lento, em média, em todos os nossos benchmarks de CPU.
Cinebench R15 score
Na potência da bateria, o desempenho de múltiplos núcleos é cerca de 30% menor, mas o desempenho de um único núcleo permanece estável. Mais referências de CPU estão disponíveis em nossa seção técnica.
Cinebench R23: Multi Core | Single Core
Cinebench R20: CPU (Multi Core) | CPU (Single Core)
Cinebench R15: CPU Multi 64Bit | CPU Single 64Bit
Blender: v2.79 BMW27 CPU
7-Zip 18.03: 7z b 4 | 7z b 4 -mmt1
Geekbench 5.5: Multi-Core | Single-Core
HWBOT x265 Benchmark v2.2: 4k Preset
LibreOffice : 20 Documents To PDF
R Benchmark 2.5: Overall mean
| CPU Performance rating | |
| Lenovo ThinkPad Z16 G1 21D5S00T00 | |
| Dell XPS 13 Plus 9320 i7-1280P OLED | |
| Média da turma Subnotebook | |
| Lenovo ThinkPad Z13 G1-21D20016GE | |
| Média AMD Ryzen 7 PRO 6860Z | |
| Lenovo ThinkPad T14 G3-21CF004NGE | |
| Asus Zenbook S 13 OLED | |
| Apple MacBook Air M2 10C GPU -5! | |
| Lenovo ThinkPad Z13 21D2CTO1WW | |
| Cinebench R23 / Multi Core | |
| Média da turma Subnotebook (1555 - 21812, n=60, últimos 2 anos) | |
| Lenovo ThinkPad Z16 G1 21D5S00T00 | |
| Dell XPS 13 Plus 9320 i7-1280P OLED | |
| Lenovo ThinkPad Z13 G1-21D20016GE | |
| Média AMD Ryzen 7 PRO 6860Z (n=1) | |
| Asus Zenbook S 13 OLED | |
| Lenovo ThinkPad T14 G3-21CF004NGE | |
| Lenovo ThinkPad Z13 21D2CTO1WW | |
| Apple MacBook Air M2 10C GPU | |
| Cinebench R23 / Single Core | |
| Média da turma Subnotebook (358 - 2213, n=61, últimos 2 anos) | |
| Dell XPS 13 Plus 9320 i7-1280P OLED | |
| Apple MacBook Air M2 10C GPU | |
| Lenovo ThinkPad T14 G3-21CF004NGE | |
| Lenovo ThinkPad Z16 G1 21D5S00T00 | |
| Asus Zenbook S 13 OLED | |
| Lenovo ThinkPad Z13 G1-21D20016GE | |
| Média AMD Ryzen 7 PRO 6860Z (n=1) | |
| Lenovo ThinkPad Z13 21D2CTO1WW | |
| Cinebench R20 / CPU (Multi Core) | |
| Lenovo ThinkPad Z16 G1 21D5S00T00 | |
| Média da turma Subnotebook (579 - 8541, n=57, últimos 2 anos) | |
| Dell XPS 13 Plus 9320 i7-1280P OLED | |
| Lenovo ThinkPad Z13 G1-21D20016GE | |
| Média AMD Ryzen 7 PRO 6860Z (n=1) | |
| Lenovo ThinkPad T14 G3-21CF004NGE | |
| Asus Zenbook S 13 OLED | |
| Lenovo ThinkPad Z13 21D2CTO1WW | |
| Apple MacBook Air M2 10C GPU | |
| Cinebench R20 / CPU (Single Core) | |
| Média da turma Subnotebook (128 - 832, n=57, últimos 2 anos) | |
| Dell XPS 13 Plus 9320 i7-1280P OLED | |
| Lenovo ThinkPad Z13 G1-21D20016GE | |
| Média AMD Ryzen 7 PRO 6860Z (n=1) | |
| Lenovo ThinkPad T14 G3-21CF004NGE | |
| Lenovo ThinkPad Z16 G1 21D5S00T00 | |
| Lenovo ThinkPad Z13 21D2CTO1WW | |
| Asus Zenbook S 13 OLED | |
| Apple MacBook Air M2 10C GPU | |
| Cinebench R15 / CPU Multi 64Bit | |
| Lenovo ThinkPad Z16 G1 21D5S00T00 | |
| Média da turma Subnotebook (327 - 3345, n=57, últimos 2 anos) | |
| Lenovo ThinkPad Z13 G1-21D20016GE | |
| Média AMD Ryzen 7 PRO 6860Z (n=1) | |
| Dell XPS 13 Plus 9320 i7-1280P OLED | |
| Lenovo ThinkPad T14 G3-21CF004NGE | |
| Asus Zenbook S 13 OLED | |
| Lenovo ThinkPad Z13 21D2CTO1WW | |
| Apple MacBook Air M2 10C GPU | |
| Cinebench R15 / CPU Single 64Bit | |
| Média da turma Subnotebook (72.4 - 322, n=57, últimos 2 anos) | |
| Lenovo ThinkPad Z16 G1 21D5S00T00 | |
| Asus Zenbook S 13 OLED | |
| Lenovo ThinkPad T14 G3-21CF004NGE | |
| Lenovo ThinkPad Z13 21D2CTO1WW | |
| Lenovo ThinkPad Z13 G1-21D20016GE | |
| Média AMD Ryzen 7 PRO 6860Z (n=1) | |
| Dell XPS 13 Plus 9320 i7-1280P OLED | |
| Apple MacBook Air M2 10C GPU | |
| Blender / v2.79 BMW27 CPU | |
| Apple MacBook Air M2 10C GPU | |
| Lenovo ThinkPad Z13 21D2CTO1WW | |
| Média da turma Subnotebook (159 - 2271, n=58, últimos 2 anos) | |
| Asus Zenbook S 13 OLED | |
| Lenovo ThinkPad T14 G3-21CF004NGE | |
| Lenovo ThinkPad Z13 G1-21D20016GE | |
| Média AMD Ryzen 7 PRO 6860Z (n=1) | |
| Dell XPS 13 Plus 9320 i7-1280P OLED | |
| Lenovo ThinkPad Z16 G1 21D5S00T00 | |
| 7-Zip 18.03 / 7z b 4 | |
| Lenovo ThinkPad Z16 G1 21D5S00T00 | |
| Lenovo ThinkPad Z13 G1-21D20016GE | |
| Média AMD Ryzen 7 PRO 6860Z (n=1) | |
| Lenovo ThinkPad T14 G3-21CF004NGE | |
| Dell XPS 13 Plus 9320 i7-1280P OLED | |
| Asus Zenbook S 13 OLED | |
| Média da turma Subnotebook (11668 - 77867, n=57, últimos 2 anos) | |
| Lenovo ThinkPad Z13 21D2CTO1WW | |
| 7-Zip 18.03 / 7z b 4 -mmt1 | |
| Média da turma Subnotebook (2643 - 6699, n=59, últimos 2 anos) | |
| Asus Zenbook S 13 OLED | |
| Lenovo ThinkPad Z16 G1 21D5S00T00 | |
| Lenovo ThinkPad T14 G3-21CF004NGE | |
| Lenovo ThinkPad Z13 G1-21D20016GE | |
| Média AMD Ryzen 7 PRO 6860Z (n=1) | |
| Lenovo ThinkPad Z13 21D2CTO1WW | |
| Dell XPS 13 Plus 9320 i7-1280P OLED | |
| Geekbench 5.5 / Multi-Core | |
| Dell XPS 13 Plus 9320 i7-1280P OLED | |
| Média da turma Subnotebook (2557 - 17218, n=48, últimos 2 anos) | |
| Apple MacBook Air M2 10C GPU | |
| Lenovo ThinkPad Z16 G1 21D5S00T00 | |
| Lenovo ThinkPad Z13 G1-21D20016GE | |
| Média AMD Ryzen 7 PRO 6860Z (n=1) | |
| Lenovo ThinkPad T14 G3-21CF004NGE | |
| Asus Zenbook S 13 OLED | |
| Lenovo ThinkPad Z13 21D2CTO1WW | |
| Geekbench 5.5 / Single-Core | |
| Apple MacBook Air M2 10C GPU | |
| Média da turma Subnotebook (726 - 2224, n=48, últimos 2 anos) | |
| Dell XPS 13 Plus 9320 i7-1280P OLED | |
| Asus Zenbook S 13 OLED | |
| Lenovo ThinkPad T14 G3-21CF004NGE | |
| Lenovo ThinkPad Z16 G1 21D5S00T00 | |
| Lenovo ThinkPad Z13 21D2CTO1WW | |
| Lenovo ThinkPad Z13 G1-21D20016GE | |
| Média AMD Ryzen 7 PRO 6860Z (n=1) | |
| HWBOT x265 Benchmark v2.2 / 4k Preset | |
| Lenovo ThinkPad Z16 G1 21D5S00T00 | |
| Lenovo ThinkPad Z13 G1-21D20016GE | |
| Média AMD Ryzen 7 PRO 6860Z (n=1) | |
| Dell XPS 13 Plus 9320 i7-1280P OLED | |
| Lenovo ThinkPad T14 G3-21CF004NGE | |
| Média da turma Subnotebook (0.97 - 25.1, n=57, últimos 2 anos) | |
| Asus Zenbook S 13 OLED | |
| Lenovo ThinkPad Z13 21D2CTO1WW | |
| LibreOffice / 20 Documents To PDF | |
| Lenovo ThinkPad Z13 21D2CTO1WW | |
| Média da turma Subnotebook (39.9 - 220, n=56, últimos 2 anos) | |
| Asus Zenbook S 13 OLED | |
| Lenovo ThinkPad T14 G3-21CF004NGE | |
| Lenovo ThinkPad Z16 G1 21D5S00T00 | |
| Lenovo ThinkPad Z13 G1-21D20016GE | |
| Média AMD Ryzen 7 PRO 6860Z (n=1) | |
| Dell XPS 13 Plus 9320 i7-1280P OLED | |
| R Benchmark 2.5 / Overall mean | |
| Lenovo ThinkPad Z13 21D2CTO1WW | |
| Asus Zenbook S 13 OLED | |
| Média da turma Subnotebook (0.4024 - 1.456, n=58, últimos 2 anos) | |
| Lenovo ThinkPad T14 G3-21CF004NGE | |
| Lenovo ThinkPad Z13 G1-21D20016GE | |
| Média AMD Ryzen 7 PRO 6860Z (n=1) | |
| Lenovo ThinkPad Z16 G1 21D5S00T00 | |
| Dell XPS 13 Plus 9320 i7-1280P OLED | |
* ... menor é melhor
No entanto, os altos valores de consumo de energia também têm um efeito negativo na eficiência e você pode ver claramente que as CPUs Ryzen 7 funcionam muito mais eficientemente na faixa de 25-30 watts. Na análise seguinte, analisamos a eficiência nos dois benchmarks de CPU Cinebench R15 & Cinebench R23 Multi cada um rodando em um monitor externo. Dessa forma, podemos excluir a variação do desempenho do monitor como fatores de influência. Aqui você pode ver claramente que o Ryzen 7 Pro 6860Z fica atrás do Asus Zenbook S 13 (Ryzen 7 6800U) e o Lenovo ThinkPad T14 G3 (Ryzen 7 Pro 6850U).
| Power Consumption / Cinebench R23 Multi Power Efficiency - external Monitor | |
| Apple MacBook Air M2 10C GPU | |
| Lenovo ThinkPad T14 G3-21CF004NGE | |
| Lenovo Yoga 7-14ARB G7 | |
| Lenovo Yoga Slim 7 Carbon 13IAP7-82U9005FGE | |
| Lenovo ThinkPad Z13 G1-21D20016GE | |
| Schenker Vision 14 2022 RTX 3050 Ti | |
AIDA64: FP32 Ray-Trace | FPU Julia | CPU SHA3 | CPU Queen | FPU SinJulia | FPU Mandel | CPU AES | CPU ZLib | FP64 Ray-Trace | CPU PhotoWorxx
| Performance rating | |
| Lenovo ThinkPad Z16 G1 21D5S00T00 | |
| Lenovo ThinkPad Z13 G1-21D20016GE | |
| Média AMD Ryzen 7 PRO 6860Z | |
| Asus Zenbook S 13 OLED | |
| Média da turma Subnotebook | |
| Lenovo ThinkPad T14 G3-21CF004NGE | |
| Dell XPS 13 Plus 9320 i7-1280P OLED | |
| Lenovo ThinkPad Z13 21D2CTO1WW | |
| AIDA64 / FP32 Ray-Trace | |
| Lenovo ThinkPad Z16 G1 21D5S00T00 | |
| Média da turma Subnotebook (1135 - 32888, n=58, últimos 2 anos) | |
| Lenovo ThinkPad Z13 G1-21D20016GE | |
| Média AMD Ryzen 7 PRO 6860Z (n=1) | |
| Lenovo ThinkPad T14 G3-21CF004NGE | |
| Asus Zenbook S 13 OLED | |
| Dell XPS 13 Plus 9320 i7-1280P OLED | |
| Lenovo ThinkPad Z13 21D2CTO1WW | |
| AIDA64 / FPU Julia | |
| Lenovo ThinkPad Z16 G1 21D5S00T00 | |
| Lenovo ThinkPad Z13 G1-21D20016GE | |
| Média AMD Ryzen 7 PRO 6860Z (n=1) | |
| Lenovo ThinkPad T14 G3-21CF004NGE | |
| Asus Zenbook S 13 OLED | |
| Média da turma Subnotebook (5218 - 123315, n=58, últimos 2 anos) | |
| Lenovo ThinkPad Z13 21D2CTO1WW | |
| Dell XPS 13 Plus 9320 i7-1280P OLED | |
| AIDA64 / CPU SHA3 | |
| Lenovo ThinkPad Z16 G1 21D5S00T00 | |
| Média da turma Subnotebook (444 - 5287, n=58, últimos 2 anos) | |
| Lenovo ThinkPad Z13 G1-21D20016GE | |
| Média AMD Ryzen 7 PRO 6860Z (n=1) | |
| Dell XPS 13 Plus 9320 i7-1280P OLED | |
| Lenovo ThinkPad T14 G3-21CF004NGE | |
| Asus Zenbook S 13 OLED | |
| Lenovo ThinkPad Z13 21D2CTO1WW | |
| AIDA64 / CPU Queen | |
| Lenovo ThinkPad Z16 G1 21D5S00T00 | |
| Lenovo ThinkPad Z13 G1-21D20016GE | |
| Média AMD Ryzen 7 PRO 6860Z (n=1) | |
| Dell XPS 13 Plus 9320 i7-1280P OLED | |
| Lenovo ThinkPad T14 G3-21CF004NGE | |
| Asus Zenbook S 13 OLED | |
| Lenovo ThinkPad Z13 21D2CTO1WW | |
| Média da turma Subnotebook (10579 - 95002, n=49, últimos 2 anos) | |
| AIDA64 / FPU SinJulia | |
| Lenovo ThinkPad Z16 G1 21D5S00T00 | |
| Lenovo ThinkPad Z13 G1-21D20016GE | |
| Média AMD Ryzen 7 PRO 6860Z (n=1) | |
| Lenovo ThinkPad T14 G3-21CF004NGE | |
| Asus Zenbook S 13 OLED | |
| Lenovo ThinkPad Z13 21D2CTO1WW | |
| Dell XPS 13 Plus 9320 i7-1280P OLED | |
| Média da turma Subnotebook (744 - 18418, n=58, últimos 2 anos) | |
| AIDA64 / FPU Mandel | |
| Lenovo ThinkPad Z16 G1 21D5S00T00 | |
| Lenovo ThinkPad Z13 G1-21D20016GE | |
| Média AMD Ryzen 7 PRO 6860Z (n=1) | |
| Lenovo ThinkPad T14 G3-21CF004NGE | |
| Asus Zenbook S 13 OLED | |
| Lenovo ThinkPad Z13 21D2CTO1WW | |
| Média da turma Subnotebook (3341 - 65433, n=58, últimos 2 anos) | |
| Dell XPS 13 Plus 9320 i7-1280P OLED | |
| AIDA64 / CPU AES | |
| Asus Zenbook S 13 OLED | |
| Lenovo ThinkPad Z16 G1 21D5S00T00 | |
| Lenovo ThinkPad Z13 G1-21D20016GE | |
| Média AMD Ryzen 7 PRO 6860Z (n=1) | |
| Dell XPS 13 Plus 9320 i7-1280P OLED | |
| Média da turma Subnotebook (638 - 96917, n=58, últimos 2 anos) | |
| Lenovo ThinkPad T14 G3-21CF004NGE | |
| Lenovo ThinkPad Z13 21D2CTO1WW | |
| AIDA64 / CPU ZLib | |
| Lenovo ThinkPad Z16 G1 21D5S00T00 | |
| Média da turma Subnotebook (164.9 - 1379, n=58, últimos 2 anos) | |
| Dell XPS 13 Plus 9320 i7-1280P OLED | |
| Lenovo ThinkPad T14 G3-21CF004NGE | |
| Lenovo ThinkPad Z13 G1-21D20016GE | |
| Média AMD Ryzen 7 PRO 6860Z (n=1) | |
| Asus Zenbook S 13 OLED | |
| Lenovo ThinkPad Z13 21D2CTO1WW | |
| AIDA64 / FP64 Ray-Trace | |
| Lenovo ThinkPad Z16 G1 21D5S00T00 | |
| Média da turma Subnotebook (610 - 17495, n=58, últimos 2 anos) | |
| Lenovo ThinkPad Z13 G1-21D20016GE | |
| Média AMD Ryzen 7 PRO 6860Z (n=1) | |
| Lenovo ThinkPad T14 G3-21CF004NGE | |
| Dell XPS 13 Plus 9320 i7-1280P OLED | |
| Asus Zenbook S 13 OLED | |
| Lenovo ThinkPad Z13 21D2CTO1WW | |
| AIDA64 / CPU PhotoWorxx | |
| Média da turma Subnotebook (6569 - 85600, n=58, últimos 2 anos) | |
| Dell XPS 13 Plus 9320 i7-1280P OLED | |
| Lenovo ThinkPad Z16 G1 21D5S00T00 | |
| Lenovo ThinkPad Z13 21D2CTO1WW | |
| Lenovo ThinkPad T14 G3-21CF004NGE | |
| Asus Zenbook S 13 OLED | |
| Lenovo ThinkPad Z13 G1-21D20016GE | |
| Média AMD Ryzen 7 PRO 6860Z (n=1) | |
Desempenho do sistema
O ThinkPad Z13 é um dispositivo muito ágil e os resultados do benchmark sintético também são muito bons. Não pudemos detectar nenhum problema durante a execução do teste.
CrossMark: Overall | Productivity | Creativity | Responsiveness
| PCMark 10 / Score | |
| Média da turma Subnotebook (4920 - 9939, n=45, últimos 2 anos) | |
| Lenovo ThinkPad Z16 G1 21D5S00T00 | |
| Asus Zenbook S 13 OLED | |
| Lenovo ThinkPad Z13 G1-21D20016GE | |
| Média AMD Ryzen 7 PRO 6860Z, AMD Radeon 680M (n=1) | |
| Lenovo ThinkPad T14 G3-21CF004NGE | |
| Dell XPS 13 Plus 9320 i7-1280P OLED | |
| Lenovo ThinkPad Z13 21D2CTO1WW | |
| PCMark 10 / Essentials | |
| Asus Zenbook S 13 OLED | |
| Dell XPS 13 Plus 9320 i7-1280P OLED | |
| Média da turma Subnotebook (8552 - 11646, n=45, últimos 2 anos) | |
| Lenovo ThinkPad Z13 G1-21D20016GE | |
| Média AMD Ryzen 7 PRO 6860Z, AMD Radeon 680M (n=1) | |
| Lenovo ThinkPad Z16 G1 21D5S00T00 | |
| Lenovo ThinkPad T14 G3-21CF004NGE | |
| Lenovo ThinkPad Z13 21D2CTO1WW | |
| PCMark 10 / Productivity | |
| Média da turma Subnotebook (5435 - 16606, n=45, últimos 2 anos) | |
| Asus Zenbook S 13 OLED | |
| Lenovo ThinkPad T14 G3-21CF004NGE | |
| Lenovo ThinkPad Z16 G1 21D5S00T00 | |
| Lenovo ThinkPad Z13 G1-21D20016GE | |
| Média AMD Ryzen 7 PRO 6860Z, AMD Radeon 680M (n=1) | |
| Lenovo ThinkPad Z13 21D2CTO1WW | |
| Dell XPS 13 Plus 9320 i7-1280P OLED | |
| PCMark 10 / Digital Content Creation | |
| Média da turma Subnotebook (5722 - 13779, n=45, últimos 2 anos) | |
| Lenovo ThinkPad Z16 G1 21D5S00T00 | |
| Lenovo ThinkPad Z13 G1-21D20016GE | |
| Média AMD Ryzen 7 PRO 6860Z, AMD Radeon 680M (n=1) | |
| Lenovo ThinkPad T14 G3-21CF004NGE | |
| Asus Zenbook S 13 OLED | |
| Dell XPS 13 Plus 9320 i7-1280P OLED | |
| Lenovo ThinkPad Z13 21D2CTO1WW | |
| CrossMark / Overall | |
| Dell XPS 13 Plus 9320 i7-1280P OLED | |
| Média da turma Subnotebook (365 - 2356, n=60, últimos 2 anos) | |
| Lenovo ThinkPad Z13 G1-21D20016GE | |
| Média AMD Ryzen 7 PRO 6860Z, AMD Radeon 680M (n=1) | |
| Apple MacBook Air M2 10C GPU | |
| Asus Zenbook S 13 OLED | |
| Lenovo ThinkPad Z16 G1 21D5S00T00 | |
| Lenovo ThinkPad Z13 21D2CTO1WW | |
| Lenovo ThinkPad T14 G3-21CF004NGE | |
| CrossMark / Productivity | |
| Dell XPS 13 Plus 9320 i7-1280P OLED | |
| Média da turma Subnotebook (364 - 2277, n=60, últimos 2 anos) | |
| Lenovo ThinkPad Z13 G1-21D20016GE | |
| Média AMD Ryzen 7 PRO 6860Z, AMD Radeon 680M (n=1) | |
| Asus Zenbook S 13 OLED | |
| Lenovo ThinkPad Z16 G1 21D5S00T00 | |
| Lenovo ThinkPad Z13 21D2CTO1WW | |
| Lenovo ThinkPad T14 G3-21CF004NGE | |
| Apple MacBook Air M2 10C GPU | |
| CrossMark / Creativity | |
| Dell XPS 13 Plus 9320 i7-1280P OLED | |
| Média da turma Subnotebook (372 - 2743, n=60, últimos 2 anos) | |
| Apple MacBook Air M2 10C GPU | |
| Lenovo ThinkPad Z16 G1 21D5S00T00 | |
| Lenovo ThinkPad Z13 G1-21D20016GE | |
| Média AMD Ryzen 7 PRO 6860Z, AMD Radeon 680M (n=1) | |
| Asus Zenbook S 13 OLED | |
| Lenovo ThinkPad Z13 21D2CTO1WW | |
| Lenovo ThinkPad T14 G3-21CF004NGE | |
| CrossMark / Responsiveness | |
| Dell XPS 13 Plus 9320 i7-1280P OLED | |
| Média da turma Subnotebook (312 - 1854, n=60, últimos 2 anos) | |
| Asus Zenbook S 13 OLED | |
| Lenovo ThinkPad Z13 G1-21D20016GE | |
| Média AMD Ryzen 7 PRO 6860Z, AMD Radeon 680M (n=1) | |
| Lenovo ThinkPad Z16 G1 21D5S00T00 | |
| Lenovo ThinkPad T14 G3-21CF004NGE | |
| Lenovo ThinkPad Z13 21D2CTO1WW | |
| Apple MacBook Air M2 10C GPU | |
| PCMark 10 Score | 6240 pontos | |
Ajuda | ||
| AIDA64 / Memory Copy | |
| Média da turma Subnotebook (14554 - 131023, n=58, últimos 2 anos) | |
| Dell XPS 13 Plus 9320 i7-1280P OLED | |
| Lenovo ThinkPad T14 G3-21CF004NGE | |
| Lenovo ThinkPad Z13 21D2CTO1WW | |
| Lenovo ThinkPad Z16 G1 21D5S00T00 | |
| Lenovo ThinkPad Z13 G1-21D20016GE | |
| Média AMD Ryzen 7 PRO 6860Z (n=1) | |
| Asus Zenbook S 13 OLED | |
| AIDA64 / Memory Read | |
| Média da turma Subnotebook (15948 - 127174, n=58, últimos 2 anos) | |
| Dell XPS 13 Plus 9320 i7-1280P OLED | |
| Lenovo ThinkPad Z16 G1 21D5S00T00 | |
| Lenovo ThinkPad T14 G3-21CF004NGE | |
| Lenovo ThinkPad Z13 21D2CTO1WW | |
| Asus Zenbook S 13 OLED | |
| Lenovo ThinkPad Z13 G1-21D20016GE | |
| Média AMD Ryzen 7 PRO 6860Z (n=1) | |
| AIDA64 / Memory Write | |
| Média da turma Subnotebook (15709 - 135141, n=58, últimos 2 anos) | |
| Dell XPS 13 Plus 9320 i7-1280P OLED | |
| Lenovo ThinkPad Z16 G1 21D5S00T00 | |
| Lenovo ThinkPad Z13 21D2CTO1WW | |
| Lenovo ThinkPad Z13 G1-21D20016GE | |
| Média AMD Ryzen 7 PRO 6860Z (n=1) | |
| Lenovo ThinkPad T14 G3-21CF004NGE | |
| Asus Zenbook S 13 OLED | |
| AIDA64 / Memory Latency | |
| Lenovo ThinkPad Z16 G1 21D5S00T00 | |
| Lenovo ThinkPad Z13 21D2CTO1WW | |
| Lenovo ThinkPad Z13 G1-21D20016GE | |
| Média AMD Ryzen 7 PRO 6860Z (n=1) | |
| Asus Zenbook S 13 OLED | |
| Lenovo ThinkPad T14 G3-21CF004NGE | |
| Dell XPS 13 Plus 9320 i7-1280P OLED | |
| Média da turma Subnotebook (6.1 - 159.9, n=56, últimos 2 anos) | |
* ... menor é melhor
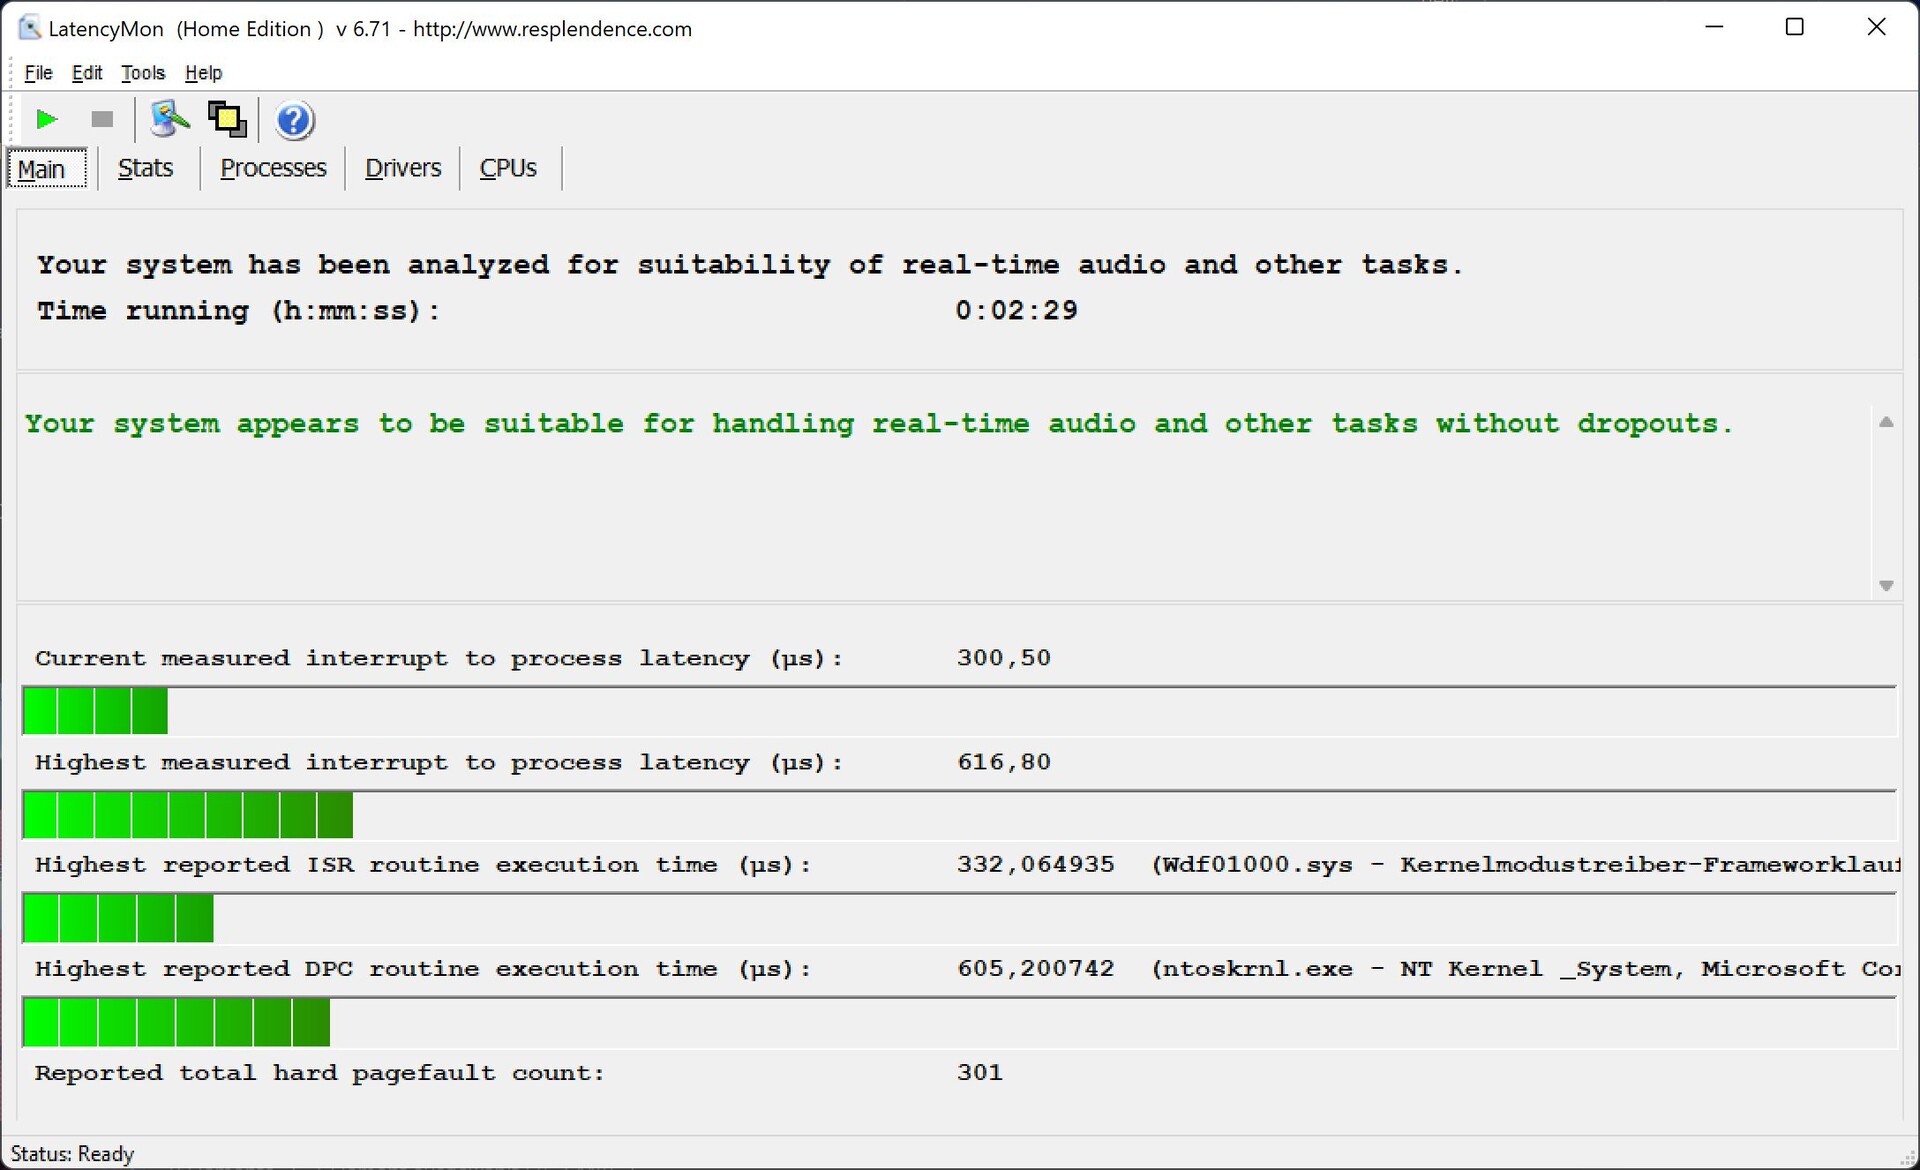
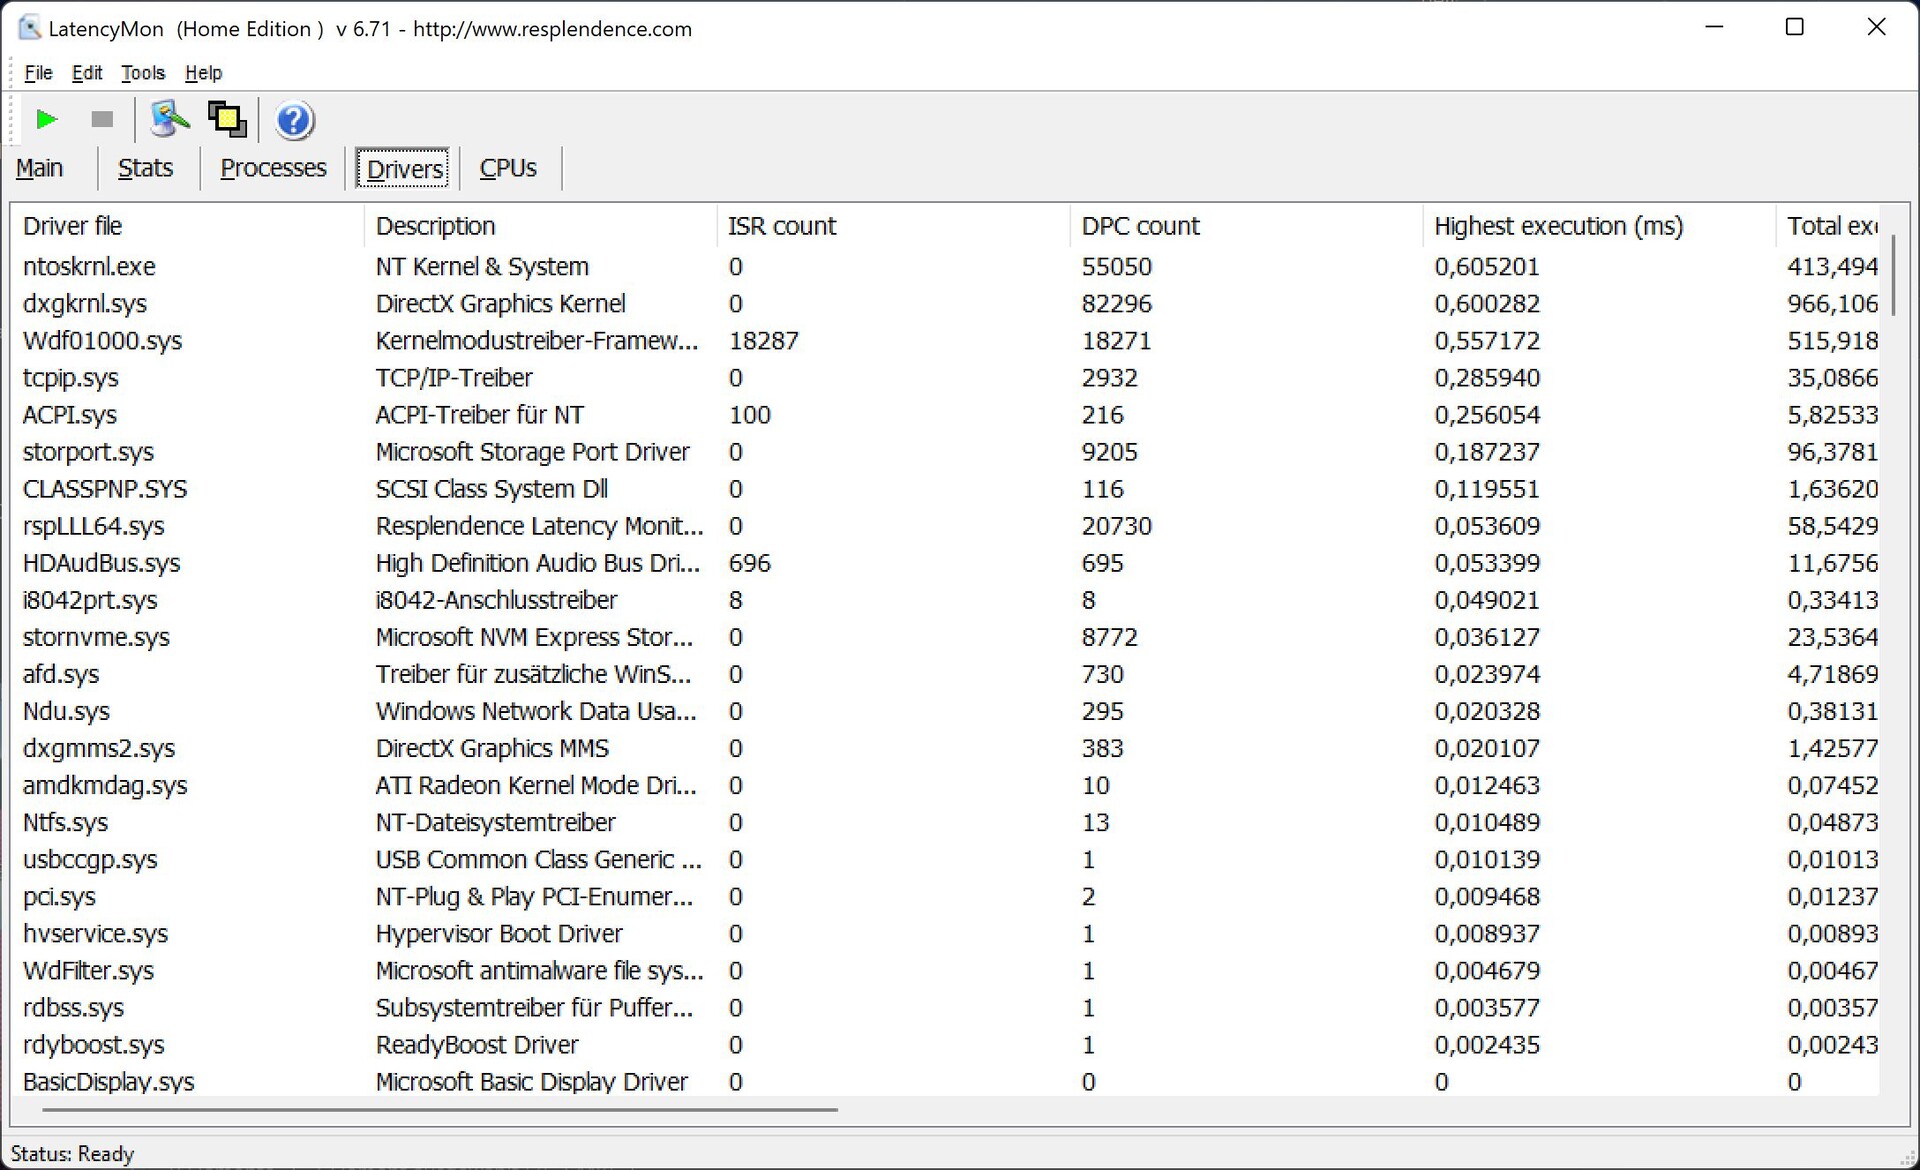
Latência do DPC
Em nosso teste de latência padronizado (navegação na web, reprodução 4K no YouTube, carga de CPU), o dispositivo de teste teve um desempenho muito bom na versão atual da BIOS e não apresentou nenhuma evidência de deficiência técnica de desempenho.
| DPC Latencies / LatencyMon - interrupt to process latency (max), Web, Youtube, Prime95 | |
| Lenovo ThinkPad Z13 21D2CTO1WW | |
| Lenovo ThinkPad T14 G3-21CF004NGE | |
| Lenovo ThinkPad Z16 G1 21D5S00T00 | |
| Lenovo ThinkPad Z13 G1-21D20016GE | |
| Asus Zenbook S 13 OLED | |
| Dell XPS 13 Plus 9320 i7-1280P OLED | |
* ... menor é melhor
Dispositivos de armazenamento
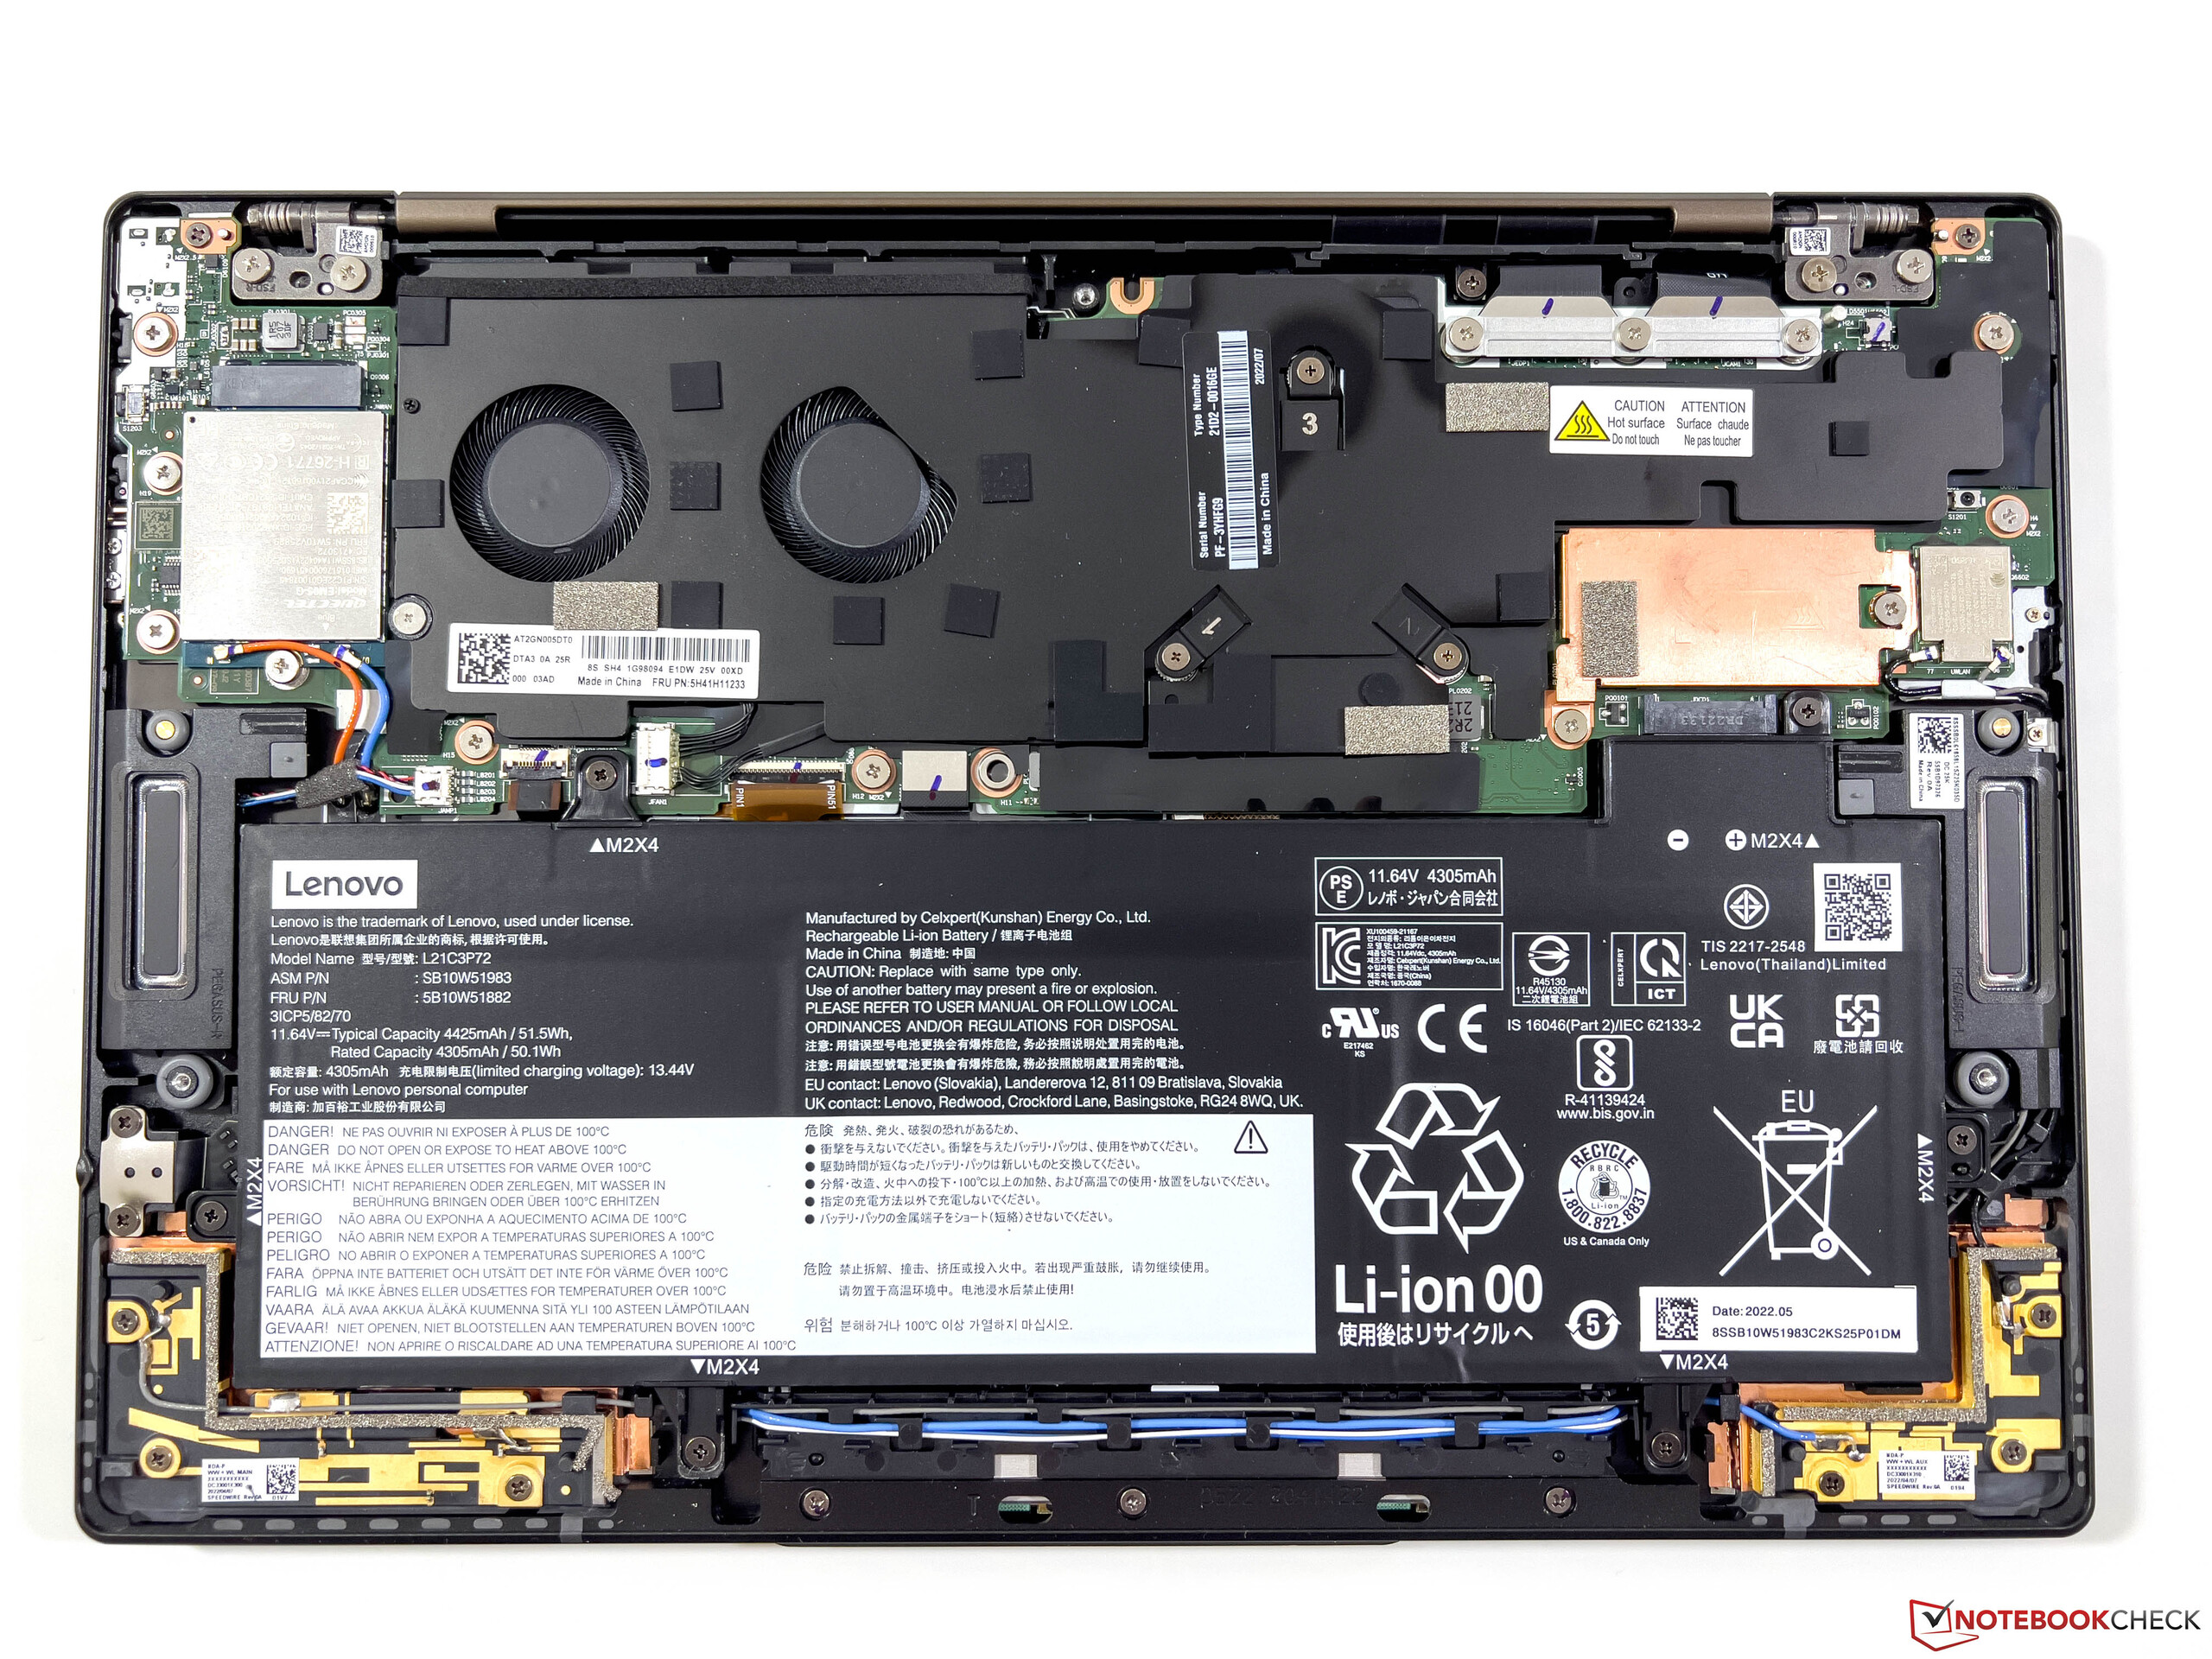
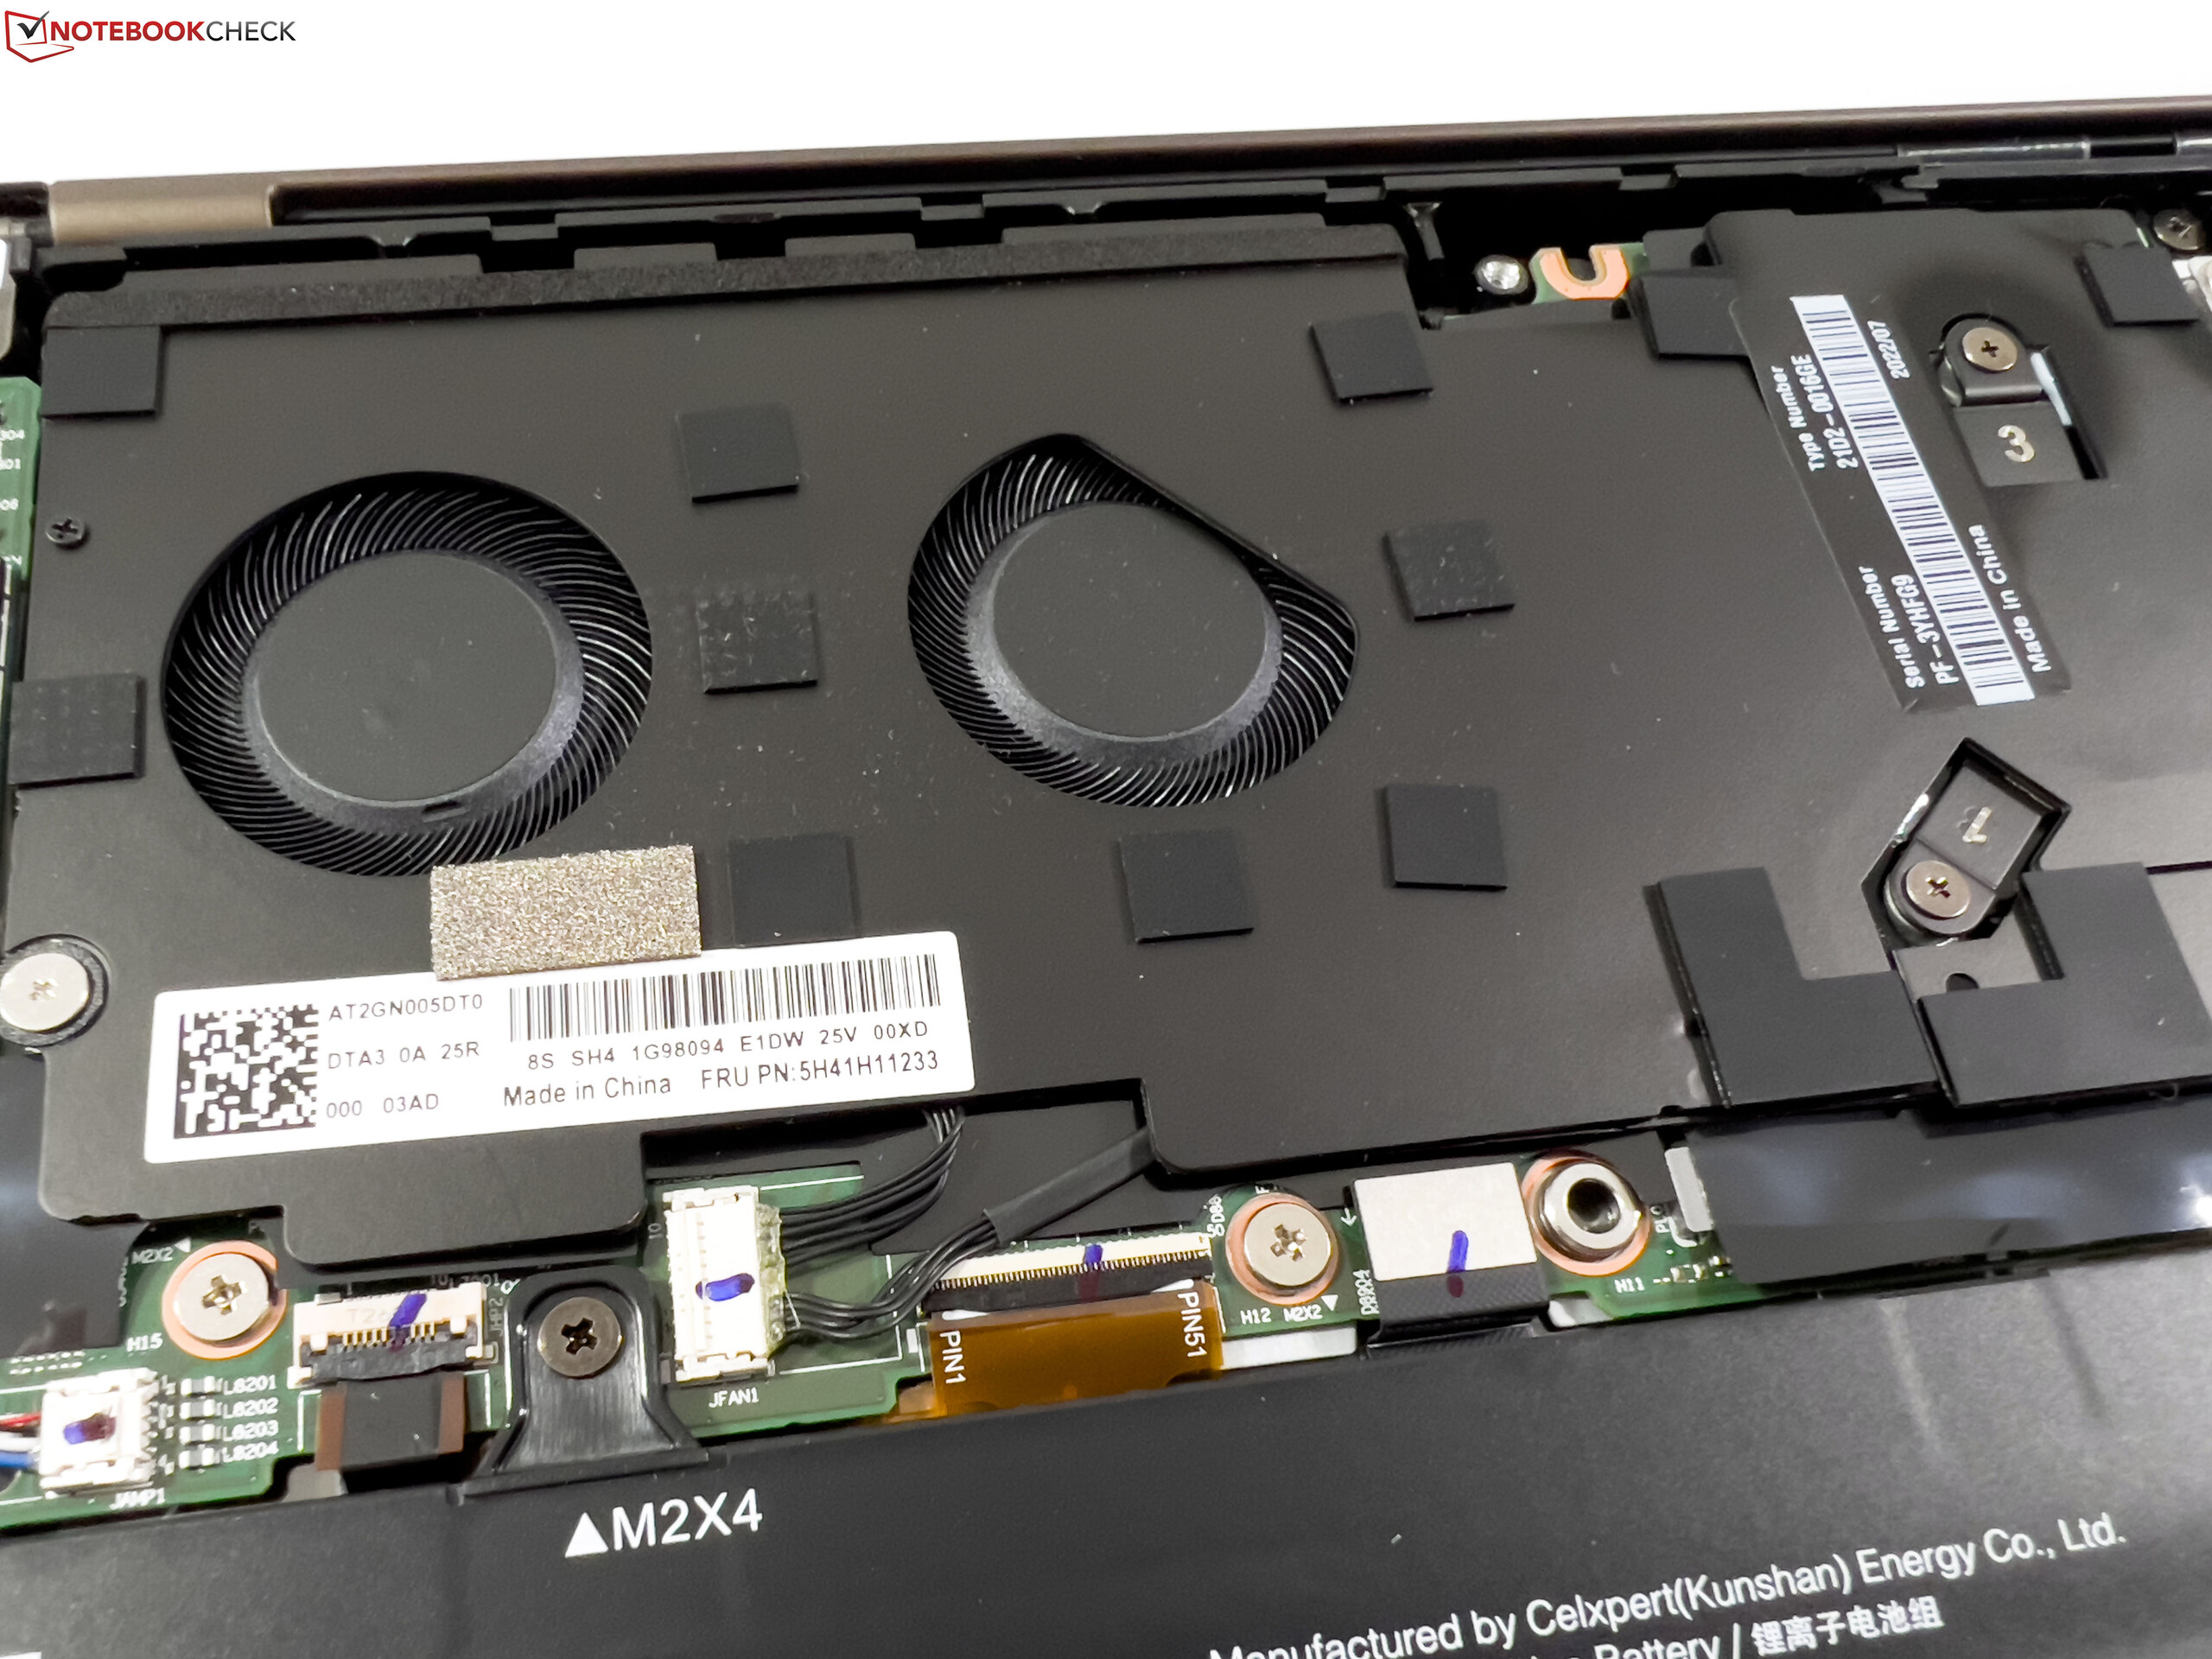
O ThinkPad Z13 só tem espaço para um SSD M.2-2242 compacto, que é pelo menos conectado através de uma interface PCIe 4.0 atual. O Micron 2450, permite a instalação de um SSD PCIe 4.0 com taxas máximas de transferência de cerca de 3,3 GB/s. Isto pode desperdiçar alguma capacidade potencial, mas pelo menos o desempenho permanece constante mesmo sob carga permanente. Dos 1 TB, cerca de 900 GB ainda estão disponíveis gratuitamente para o usuário no primeiro uso do laptop. Mais pontos de referência SSD podem ser encontrados aqui.

* ... menor é melhor
Disk Throttling: DiskSpd Read Loop, Queue Depth 8
Placa Gráfica
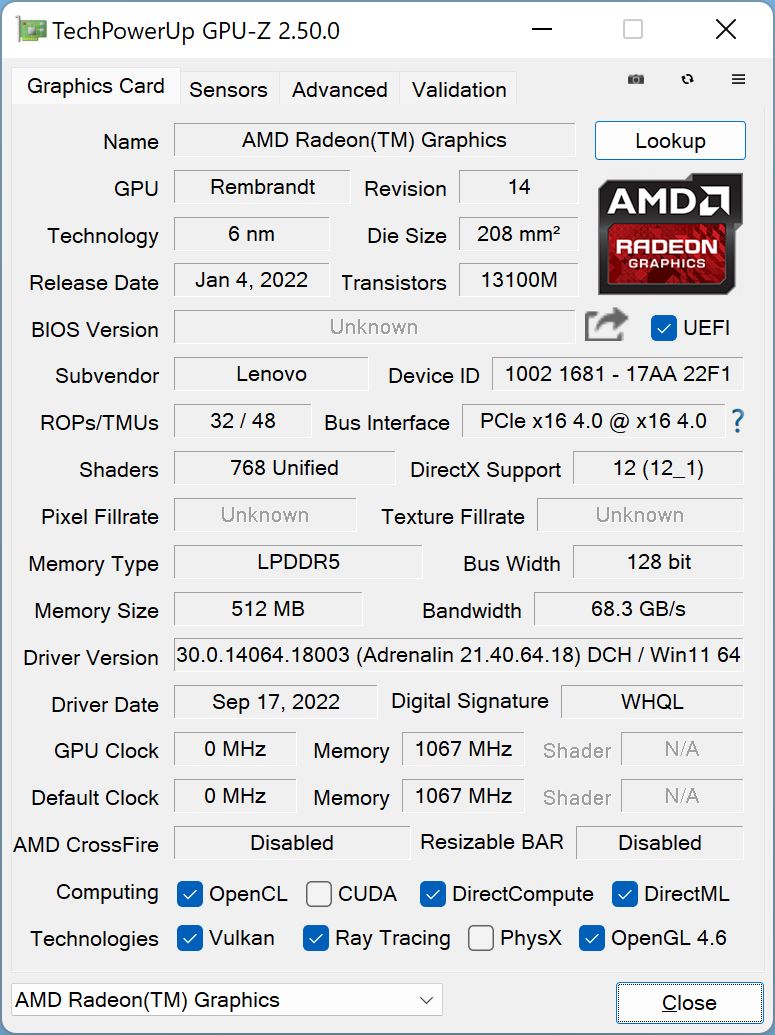
Os Ryzen 7 Pro 6860Z utiliza a conhecida GPU integrada Radeon 680M com uma velocidade máxima de relógio de 2,2 GHz como com as CPUs convencionais Ryzen 7. Nos benchmarks sintéticos, os resultados também são muito bons inicialmente, mas o desempenho não permanece estável. O teste de estresse 3DMark (Time Spy) falha com 82,7% e ao experimentar (o que seria bem possível com o Radeon 680M) com carga de CPU simultânea, o chip foi acionado ainda mais (para um total de cerca de 19 watts). O Asus Zenbook S 13 ou o próprio Lenovo PensePad T14 G3 têm um desempenho significativamente melhor sob carga simultânea.
O Radeon 660M no nível de entrada ThinkPad Z13 é cerca de 35% mais lento e também é afetado por estrangulamento. A energia da bateria não reduz o desempenho gráfico. Mais referências de GPU estão disponíveis aqui
| 3DMark 11 Performance | 10387 pontos | |
| 3DMark Cloud Gate Standard Score | 31075 pontos | |
| 3DMark Fire Strike Score | 6287 pontos | |
| 3DMark Time Spy Score | 2416 pontos | |
Ajuda | ||
* ... menor é melhor
Witcher 3 FPS-Diagramm
| baixo | média | alto | ultra | QHD | |
|---|---|---|---|---|---|
| GTA V (2015) | 136.9 | 122.7 | 46.8 | 20.9 | |
| The Witcher 3 (2015) | 131 | 78 | 33 | 18.3 | |
| Dota 2 Reborn (2015) | 107.7 | 91.8 | 72.2 | 60.6 | |
| Final Fantasy XV Benchmark (2018) | 59.3 | 30.5 | 21.7 | ||
| X-Plane 11.11 (2018) | 51.8 | 40.6 | 34.3 | ||
| Far Cry 5 (2018) | 55 | 34 | 30 | 28 | |
| Strange Brigade (2018) | 133.5 | 55.3 | 44.8 | 38.9 | |
| F1 2021 (2021) | 155.3 | 75.1 | 54.9 | 23 | 15.8 |
| F1 22 (2022) | 71.4 | 61.1 | 44.5 | 9.35 |
Emissões e consumo de energia
Ruído do sistema
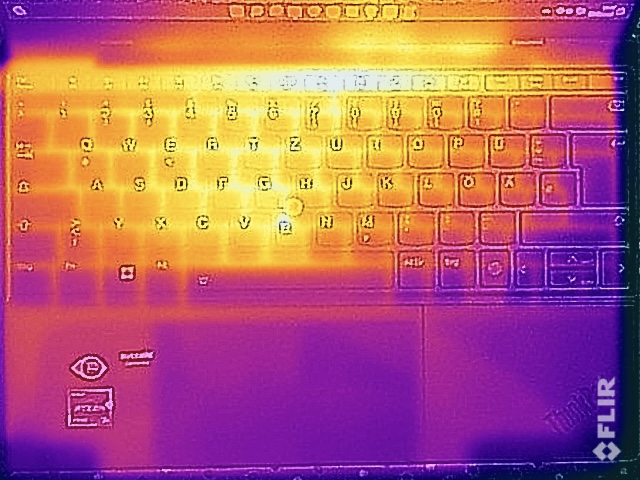
O ThinkPad Z13 usa refrigeração com dois pequenos ventiladores. Estes são normalmente ociosos e, para tarefas muito leves, geralmente são silenciosos. Mas os ventiladores às vezes começam a funcionar mesmo quando apenas navegando. Devido aos altos valores de TDP, os ventiladores atingem sua velocidade máxima quase imediatamente sob carga aumentada, o que corresponde a cerca de 41 dB(A). O ruído é claramente audível, mas não há freqüências irritantes. Não pudemos detectar nenhum outro ruído de origem eletrônica.
Barulho
| Ocioso |
| 24.3 / 24.3 / 24.3 dB |
| Carga |
| 41 / 41 dB |
 | ||
30 dB silencioso 40 dB(A) audível 50 dB(A) ruidosamente alto |
||
min: | ||
| Lenovo ThinkPad Z13 G1-21D20016GE Radeon 680M, R7 PRO 6860Z, Micron 2450 1TB MTFDKCD1T0TFK | Asus Zenbook S 13 OLED Radeon 680M, R7 6800U, Samsung PM9A1 MZVL21T0HCLR | Dell XPS 13 Plus 9320 i7-1280P OLED Iris Xe G7 96EUs, i7-1280P, WDC PC SN810 512GB | Lenovo ThinkPad Z13 21D2CTO1WW Radeon 660M, R5 PRO 6650U, Lenovo UMIS AM630 RPJTJ512MGE1QDQ | Lenovo ThinkPad T14 G3-21CF004NGE Radeon 680M, R7 PRO 6850U, Kioxia BG5 KBG5AZNV512G | |
|---|---|---|---|---|---|
| Noise | 3% | 5% | 5% | 5% | |
| desligado / ambiente * (dB) | 24.3 | 24 1% | 23.4 4% | 23.71 2% | 24.2 -0% |
| Idle Minimum * (dB) | 24.3 | 24 1% | 23.4 4% | 23.71 2% | 24.2 -0% |
| Idle Average * (dB) | 24.3 | 24 1% | 23.4 4% | 23.71 2% | 24.2 -0% |
| Idle Maximum * (dB) | 24.3 | 24 1% | 23.4 4% | 23.71 2% | 25.8 -6% |
| Load Average * (dB) | 41 | 33.1 19% | 35 15% | 32.35 21% | 32.2 21% |
| Witcher 3 ultra * (dB) | 41 | 40.2 2% | 41.6 -1% | 38.8 5% | 34.1 17% |
| Load Maximum * (dB) | 41 | 41.7 -2% | 39.9 3% | 39.53 4% | 38.8 5% |
* ... menor é melhor
Temperatura
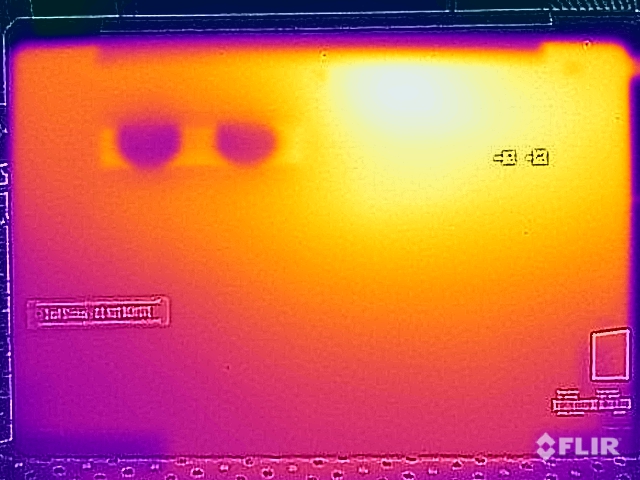
As temperaturas de superfície do ThinkPad Z13 são inconseqüentes sob carga baixa, mas sob carga medimos valores mais altos do que a modelo de nível básico. Isto não é surpreendente, já que o resfriamento é idêntico e os ventiladores também trabalham em um nível comparável, mas o TDP do processador é mais alto. As temperaturas na superfície da tampa superior permanecem dentro dos limites normais que não excedem 45 °C e permanecem seguras. Mas medimos mais de 50 °C na área central superior da superfície inferior. Com contato direto com a pele, isto pode rapidamente se tornar desconfortável.
Enquanto o consumo de energia do Ryzen 7 Pro se estabiliza em 27 watts sob carga pura de CPU, no teste de estresse com carga combinada CPU/GPU é de apenas 19 watts (no Z13 com o Ryzen 5 Pro era de cerca de 14 watts). Em vista destes baixos valores, as temperaturas de superfície já são bastante altas. Leva alguns minutos até que a potência total esteja novamente disponível imediatamente após o teste de estresse.
(-) A temperatura máxima no lado superior é 45.6 °C / 114 F, em comparação com a média de 35.9 °C / 97 F , variando de 21.4 a 59 °C para a classe Subnotebook.
(-) A parte inferior aquece até um máximo de 51 °C / 124 F, em comparação com a média de 39.2 °C / 103 F
(+) Em uso inativo, a temperatura média para o lado superior é 25.9 °C / 79 F, em comparação com a média do dispositivo de 30.8 °C / ### class_avg_f### F.
(-) Jogando The Witcher 3, a temperatura média para o lado superior é 38.9 °C / 102 F, em comparação com a média do dispositivo de 30.8 °C / ## #class_avg_f### F.
(+) Os apoios para as mãos e o touchpad estão atingindo a temperatura máxima da pele (33 °C / 91.4 F) e, portanto, não estão quentes.
(-) A temperatura média da área do apoio para as mãos de dispositivos semelhantes foi 28.2 °C / 82.8 F (-4.8 °C / -8.6 F).
| Lenovo ThinkPad Z13 G1-21D20016GE AMD Ryzen 7 PRO 6860Z, AMD Radeon 680M | Asus Zenbook S 13 OLED AMD Ryzen 7 6800U, AMD Radeon 680M | Apple MacBook Air M2 10C GPU Apple M2, Apple M2 10-Core GPU | Lenovo ThinkPad Z13 21D2CTO1WW AMD Ryzen 5 PRO 6650U, AMD Radeon 660M | Lenovo ThinkPad T14 G3-21CF004NGE AMD Ryzen 7 PRO 6850U, AMD Radeon 680M | Dell XPS 13 Plus 9320 4K Intel Core i7-1260P, Intel Iris Xe Graphics G7 96EUs | |
|---|---|---|---|---|---|---|
| Heat | -3% | 8% | -4% | 3% | 1% | |
| Maximum Upper Side * (°C) | 45.6 | 47.9 -5% | 44.7 2% | 44.9 2% | 48.2 -6% | 41.1 10% |
| Maximum Bottom * (°C) | 51 | 56.1 -10% | 44.6 13% | 44.3 13% | 52.8 -4% | 48.8 4% |
| Idle Upper Side * (°C) | 27 | 26.8 1% | 25.1 7% | 31.4 -16% | 24.4 10% | 28 -4% |
| Idle Bottom * (°C) | 27.9 | 27.3 2% | 25.3 9% | 31.5 -13% | 24.5 12% | 29.3 -5% |
* ... menor é melhor
Oradores
Lenovo ThinkPad Z13 G1-21D20016GE análise de áudio
(±) | o volume do alto-falante é médio, mas bom (###valor### dB)
Graves 100 - 315Hz
(-) | quase nenhum baixo - em média 15.4% menor que a mediana
(±) | a linearidade dos graves é média (9.5% delta para a frequência anterior)
Médios 400 - 2.000 Hz
(+) | médios equilibrados - apenas 3.2% longe da mediana
(+) | médios são lineares (5.1% delta para frequência anterior)
Altos 2 - 16 kHz
(+) | agudos equilibrados - apenas 3.1% longe da mediana
(+) | os máximos são lineares (3.8% delta da frequência anterior)
Geral 100 - 16.000 Hz
(+) | o som geral é linear (14.7% diferença em relação à mediana)
Comparado com a mesma classe
» 31% de todos os dispositivos testados nesta classe foram melhores, 5% semelhantes, 64% piores
» O melhor teve um delta de 5%, a média foi 18%, o pior foi 53%
Comparado com todos os dispositivos testados
» 19% de todos os dispositivos testados foram melhores, 4% semelhantes, 77% piores
» O melhor teve um delta de 4%, a média foi 23%, o pior foi 134%
Apple MacBook Air M2 10C GPU análise de áudio
(+) | os alto-falantes podem tocar relativamente alto (###valor### dB)
Graves 100 - 315Hz
(±) | graves reduzidos - em média 12.2% menor que a mediana
(±) | a linearidade dos graves é média (12.6% delta para a frequência anterior)
Médios 400 - 2.000 Hz
(+) | médios equilibrados - apenas 1.1% longe da mediana
(+) | médios são lineares (3.1% delta para frequência anterior)
Altos 2 - 16 kHz
(+) | agudos equilibrados - apenas 2.4% longe da mediana
(+) | os máximos são lineares (1.9% delta da frequência anterior)
Geral 100 - 16.000 Hz
(+) | o som geral é linear (9.5% diferença em relação à mediana)
Comparado com a mesma classe
» 5% de todos os dispositivos testados nesta classe foram melhores, 2% semelhantes, 93% piores
» O melhor teve um delta de 5%, a média foi 18%, o pior foi 53%
Comparado com todos os dispositivos testados
» 4% de todos os dispositivos testados foram melhores, 1% semelhantes, 95% piores
» O melhor teve um delta de 4%, a média foi 23%, o pior foi 134%
Consumo de energia
Nas medições de consumo de energia, o impacto da tela OLED é claramente perceptível. Mesmo com a imagem de fundo bastante escura, medimos um máximo de 8,4 watts quando ociosos, mas com uma imagem brilhante foi de 11-12 watts. Sob carga, é um máximo de cerca de 63 watts, embora o valor cai rapidamente para cerca de 46 watts sob carga contínua e depois se estabiliza em torno de 30 watts. A fonte de alimentação fornecida de 65 watts é, portanto, completamente adequada.
| desligado | |
| Ocioso | |
| Carga |
|
Key:
min: | |
Power Consumption Witcher 3 / Stresstest
Power Consumption external Monitor
Vida útil da bateria
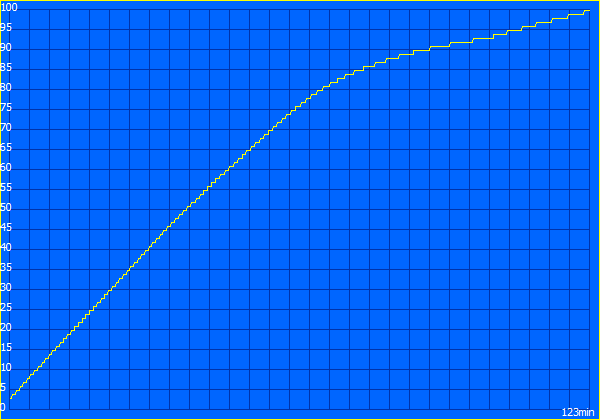
A tela OLED reduz significativamente a duração da bateria, e nosso teste WLAN que inclui um grande número de websites evoca um cenário de pior caso para os painéis OLED. A vida útil da bateria é significativamente pior do que para o modelo básico do Z13 com o painel IPSque conseguiu mais de 10 horas mesmo em plena luminosidade. O modelo OLED, por outro lado, atinge apenas 7,5 horas a 150 cd/m² e menos de 6 horas a pleno brilho SDR e, portanto, também um tempo de execução significativamente menor do que o Zenbook S 13 com a bateria maior de 67 Wh.
O carregamento completo leva pouco mais de duas horas quando o dispositivo está ligado; 80% da capacidade está novamente disponível após cerca de 64 minutos.
Pro
Contra
Veredicto - ThinkPad Z13 coloca algumas questões
Depois de testar a versão high-end do ThinkPad Z13, nos perguntamos se este ainda é realmente um laptop comercial, se ainda é realmente um ThinkPad. Na configuração com a tela OLED e a tampa de couro, ele é de fato um concorrente ideal para o modelo de consumo Asus Zenbook S 13. Além disso, você tem que fazer sem algumas características do ThinkPad-typical. Estas incluem um ângulo de abertura limitado da tela, a omissão do slot para uma fechadura Kensington e também um layout de botões alterado que não inclui botões dedicados para Page Up & Page Off. O maior problema para usuários de longa data do ThinkPad, no entanto, é a eliminação das teclas dedicadas do TrackPoint. Só podemos esperar que a Lenovo não adote esta solução para outras séries de modelos.
O próprio notebook se mostra convincente para o uso diário com sua caixa de alta qualidade, seu excelente teclado e touchpad de vidro e também seu excelente desempenho do sistema. No entanto, é preciso questionar seriamente por que o Ryzen 7 Pro 6860Z existe como processador em primeiro lugar, uma vez que ele é de fato um 6850U regular. E embora o limite de alta potência garanta bons resultados de referência, ele também leva a mais atividade do ventilador e inconsistências de desempenho. Acima de tudo, o desempenho gráfico tende a ser um pouco irregular sob carga permanente, algo pelo qual outros dispositivos como o ThinkPad T14 G3 ou o Asus Zenbook S 13 não são afetados. A tela OLED com sua relação de contraste extremamente alta proporciona basicamente uma qualidade de imagem muito boa, mas um leve efeito de grade é perceptível em áreas brilhantes. Há um PWM cintilante, e a tela OLED se desenha fortemente sobre a bateria
Com o painel OLED e o uso de imitação de couro, o modelo ThinkPad Z13 high-end parece mais um item de moda do que um laptop comercial. No geral, é um sub-portátil muito bom, mas não necessariamente um notebook comercial muito bom.
Para uso produtivo, o ThinkPad Z13 com um painel IPS regular é a melhor escolha, pois permite tempos de funcionamento da bateria significativamente mais longos. Se você tem usado e gostado do TrackPoint como um usuário do ThinkPad, você deve experimentar o novo Z13 antes de comprá-lo, pois a omissão das teclas dedicadas do TrackPoint seria um motivo para não comprar para muitos usuários. Por outro lado, se você estiver procurando um sub-portátil com painel OLED e CPU AMD, você deve dar uma olhada no Asus Zenbook S13o PWM tem um bom teclado, um desempenho mais estável e uma solução de software para a irritante cintilação do PWM. É simplesmente o melhor pacote geral.
Preço e Disponibilidade
O ThinkPad Z13 com um AMD Ryzen 7 Pro 6860Z pode ser configurado no site da Lenovo com preços a partir de cerca de 2.700 euros (US$ 2.700).
Lenovo ThinkPad Z13 G1-21D20016GE
- 10/28/2022 v7 (old)
Andreas Osthoff
Price comparison

