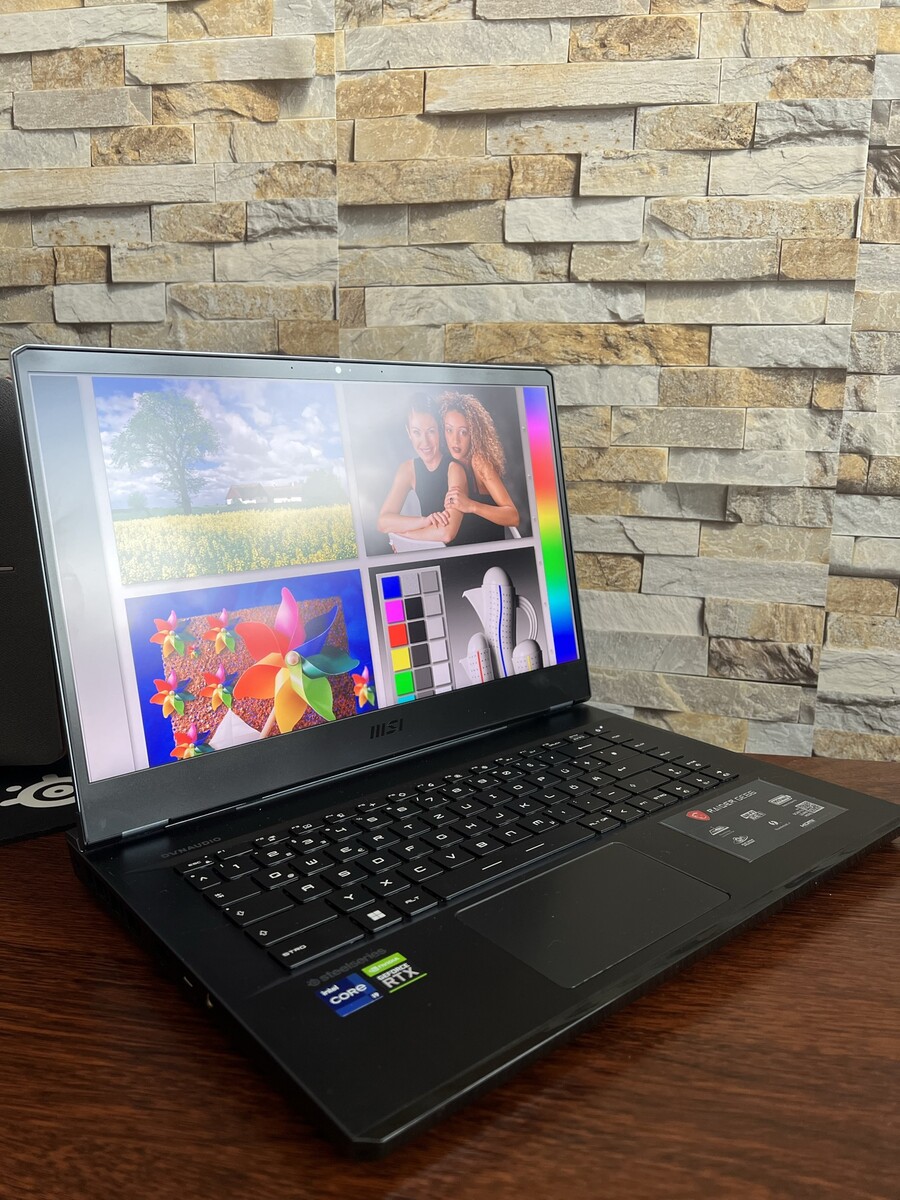
MSI Raider GE66 12UHS Revisão do caderno de notas: Passes com cores vivas
A MSI continua a expandir seu repertório de notebooks de alta qualidade para jogos. Com o GE66 12UHS, a empresa taiwanesa pretende aproveitar o poder de ambosIntel Core i9 12900HK e o Nvidia RTX 3080 Ti com a ajuda de um "Phase-Change Liquid Metal Pad" na CPU, bem como um dissipador de calor melhorado. Embora o projeto geral tenha mudado pouco em comparação com o predecessor (o MSI GE66 10SFS), o fabricante fez, no entanto, muitos ajustes sob o capô
Na revisão seguinte, descobrimos se o dispositivo pode acompanhar a concorrência sob a forma do Lâmina Razer 15 Advanced Early 2022o Schenker XMG Neo 15 Início de 2022 e o Lenovo Legion 5 Pro 16 G7.
Possíveis concorrentes em comparação
Avaliação | Data | Modelo | Peso | Altura | Size | Resolução | Preço |
|---|---|---|---|---|---|---|---|
| 87.4 % v7 (old) | 06/2022 | MSI Raider GE66 12UHS i9-12900HK, GeForce RTX 3080 Ti Laptop GPU | 2.4 kg | 23.4 mm | 15.60" | 3840x2160 | |
| 84.6 % v7 (old) | 07/2020 | MSI GE66 Raider 10SFS i9-10980HK, GeForce RTX 2070 Super Mobile | 2.4 kg | 23 mm | 15.60" | 1920x1080 | |
| 89.1 % v7 (old) | 03/2022 | Razer Blade 15 2022 i7-12800H, GeForce RTX 3080 Ti Laptop GPU | 2.1 kg | 16.99 mm | 15.60" | 2560x1440 | |
v (old) | 03/2022 | Schenker XMG Neo 15 E22 (Early 2022, RTX 3080 Ti) i7-12700H, GeForce RTX 3080 Ti Laptop GPU | 2.2 kg | 26.6 mm | 15.60" | 2560x1440 | |
| 88 % v7 (old) | 03/2022 | Lenovo Legion 5 Pro 16 G7 i7 RTX 3070Ti i7-12700H, GeForce RTX 3070 Ti Laptop GPU | 2.6 kg | 26.6 mm | 16.00" | 2560x1600 |
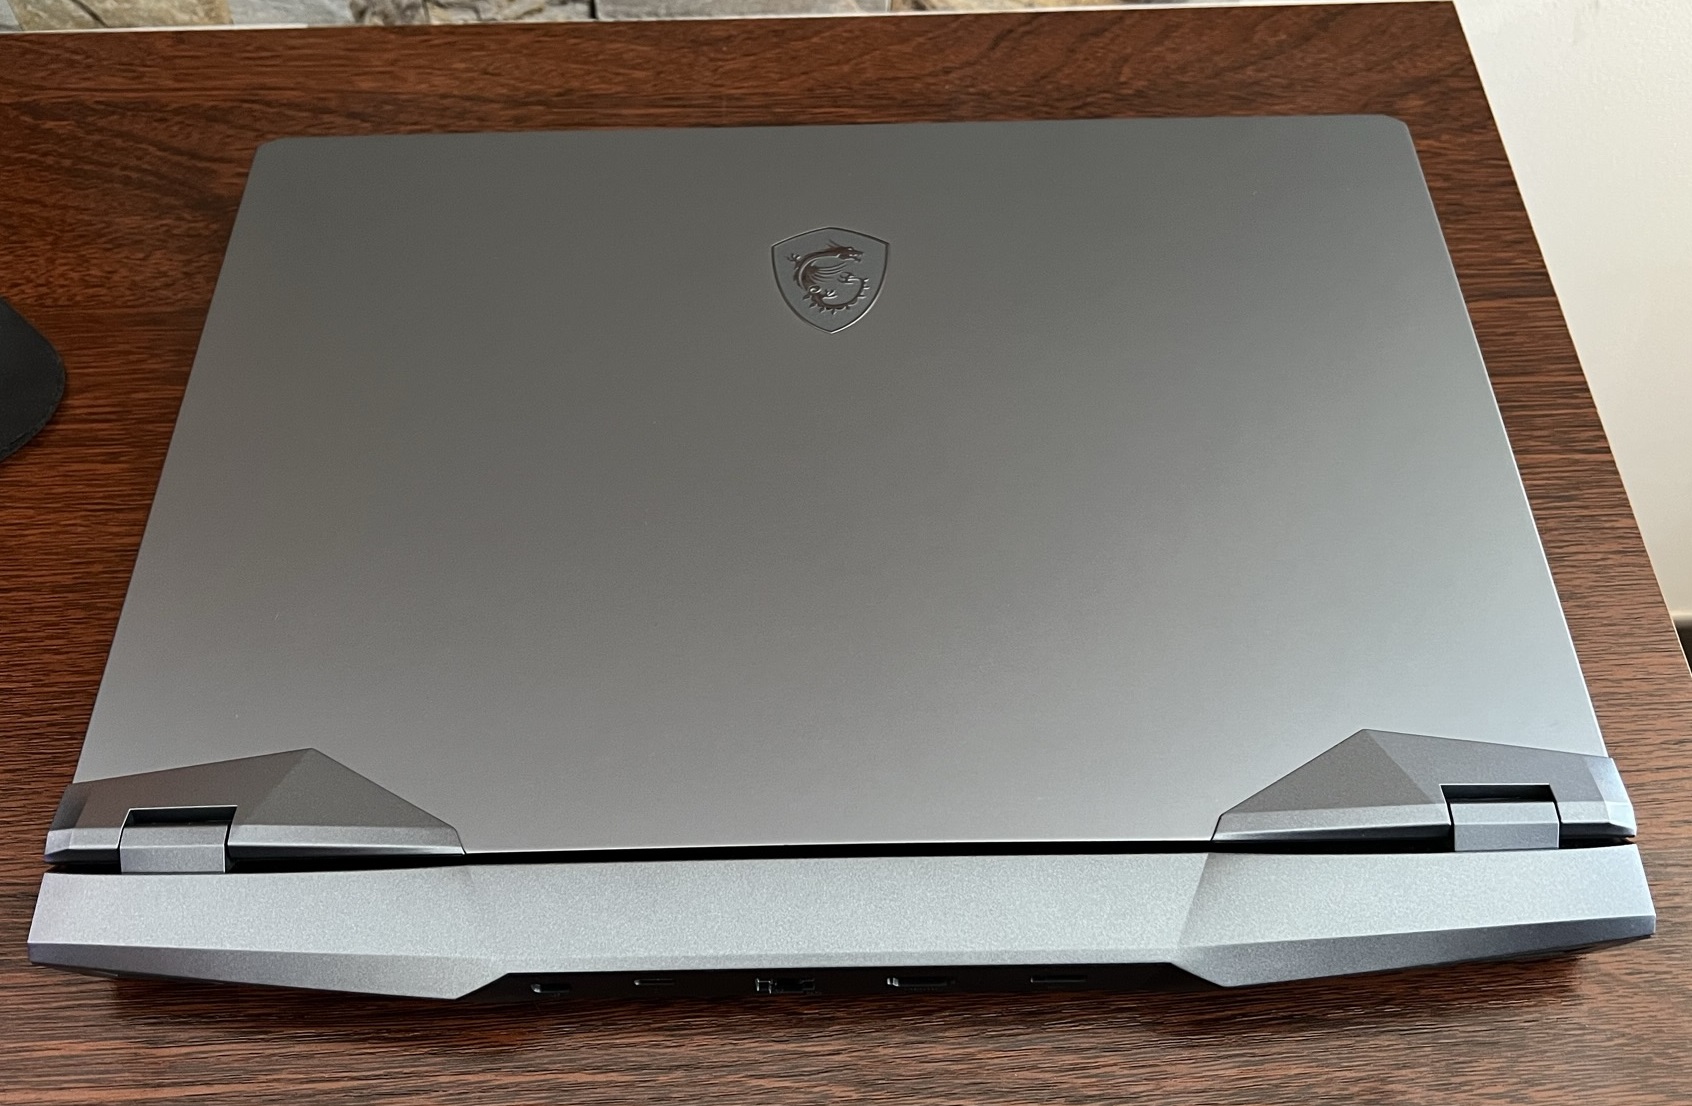
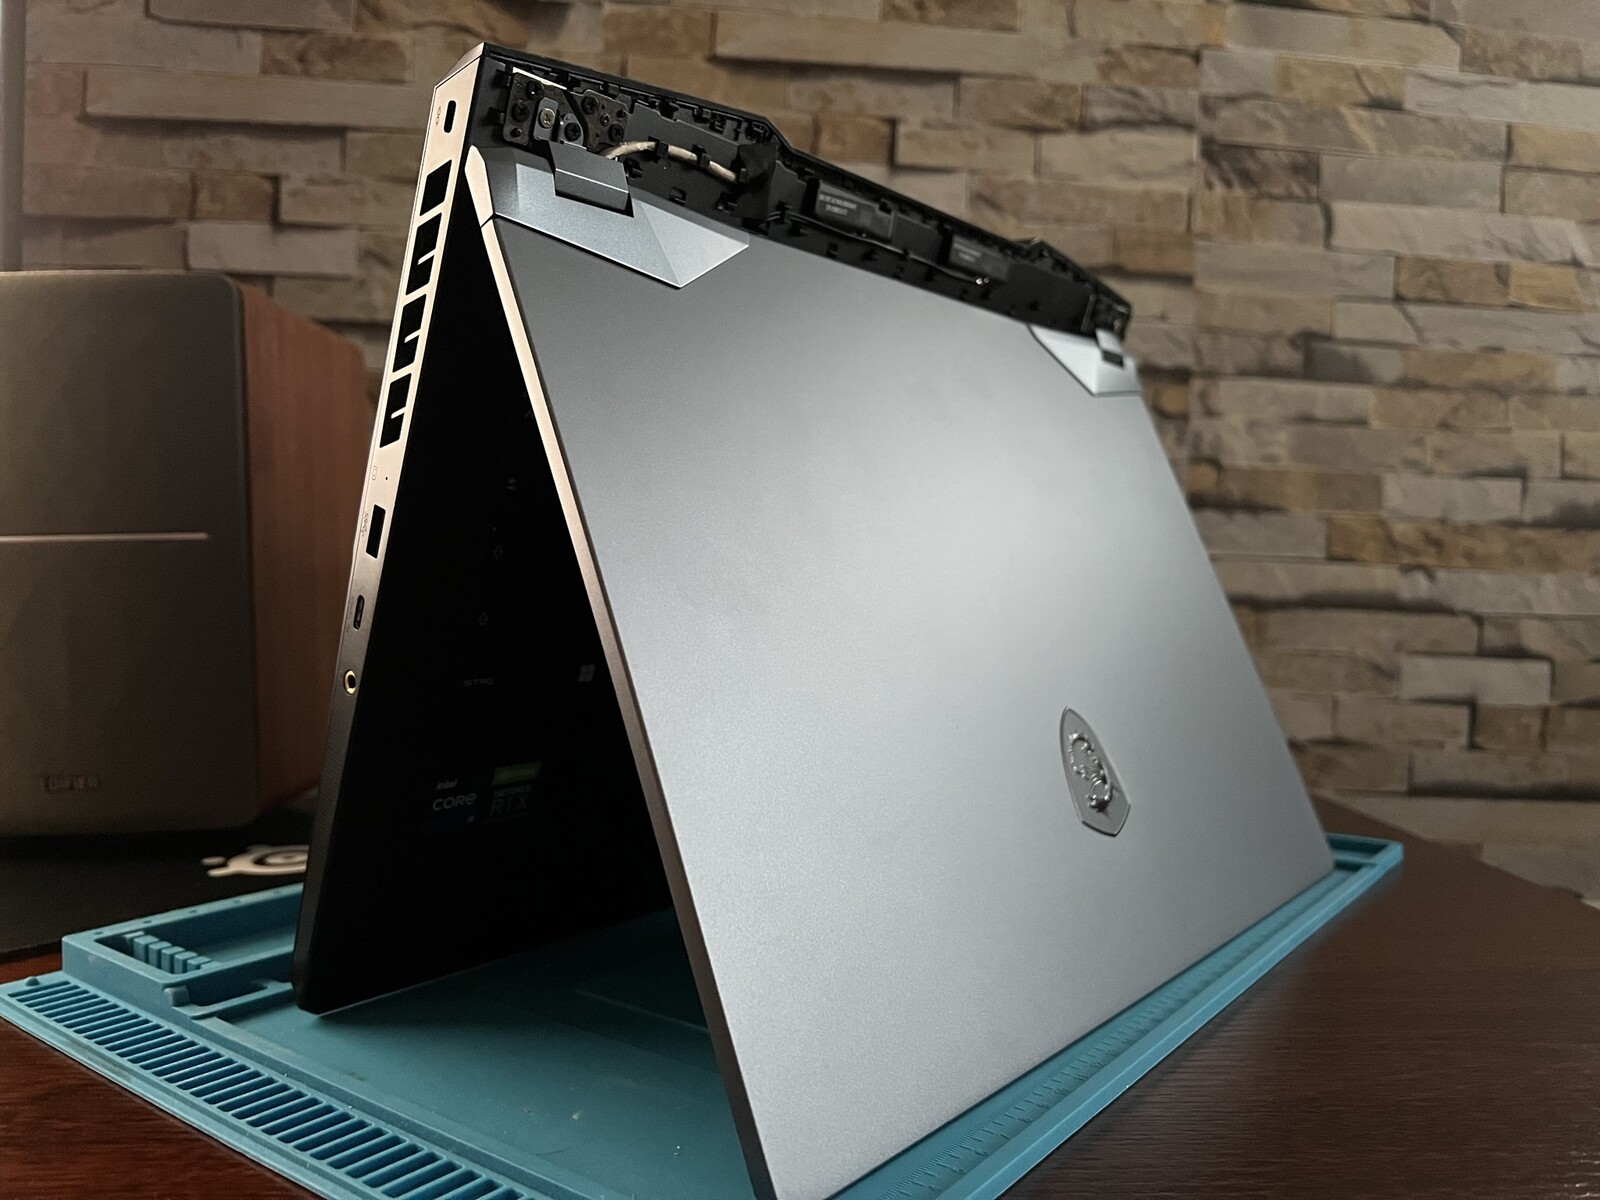
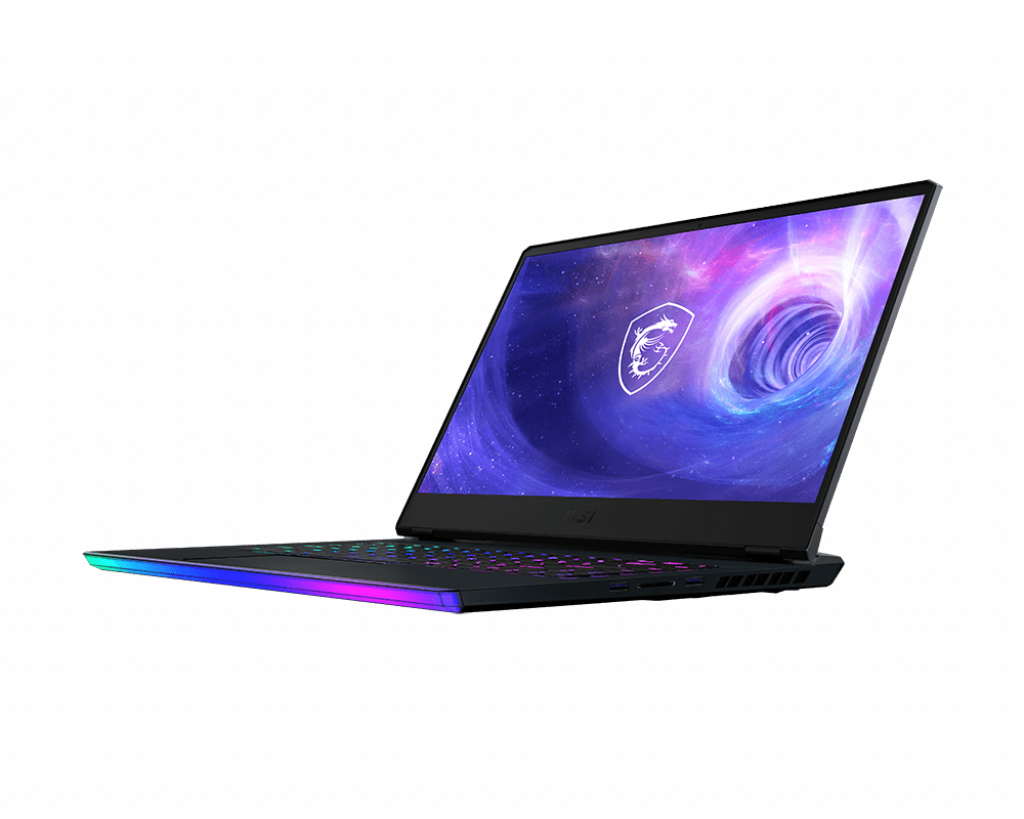
Estojo: Laptop MSI com aparência ligeiramente alterada
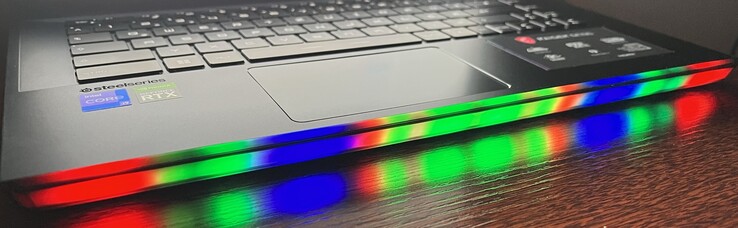
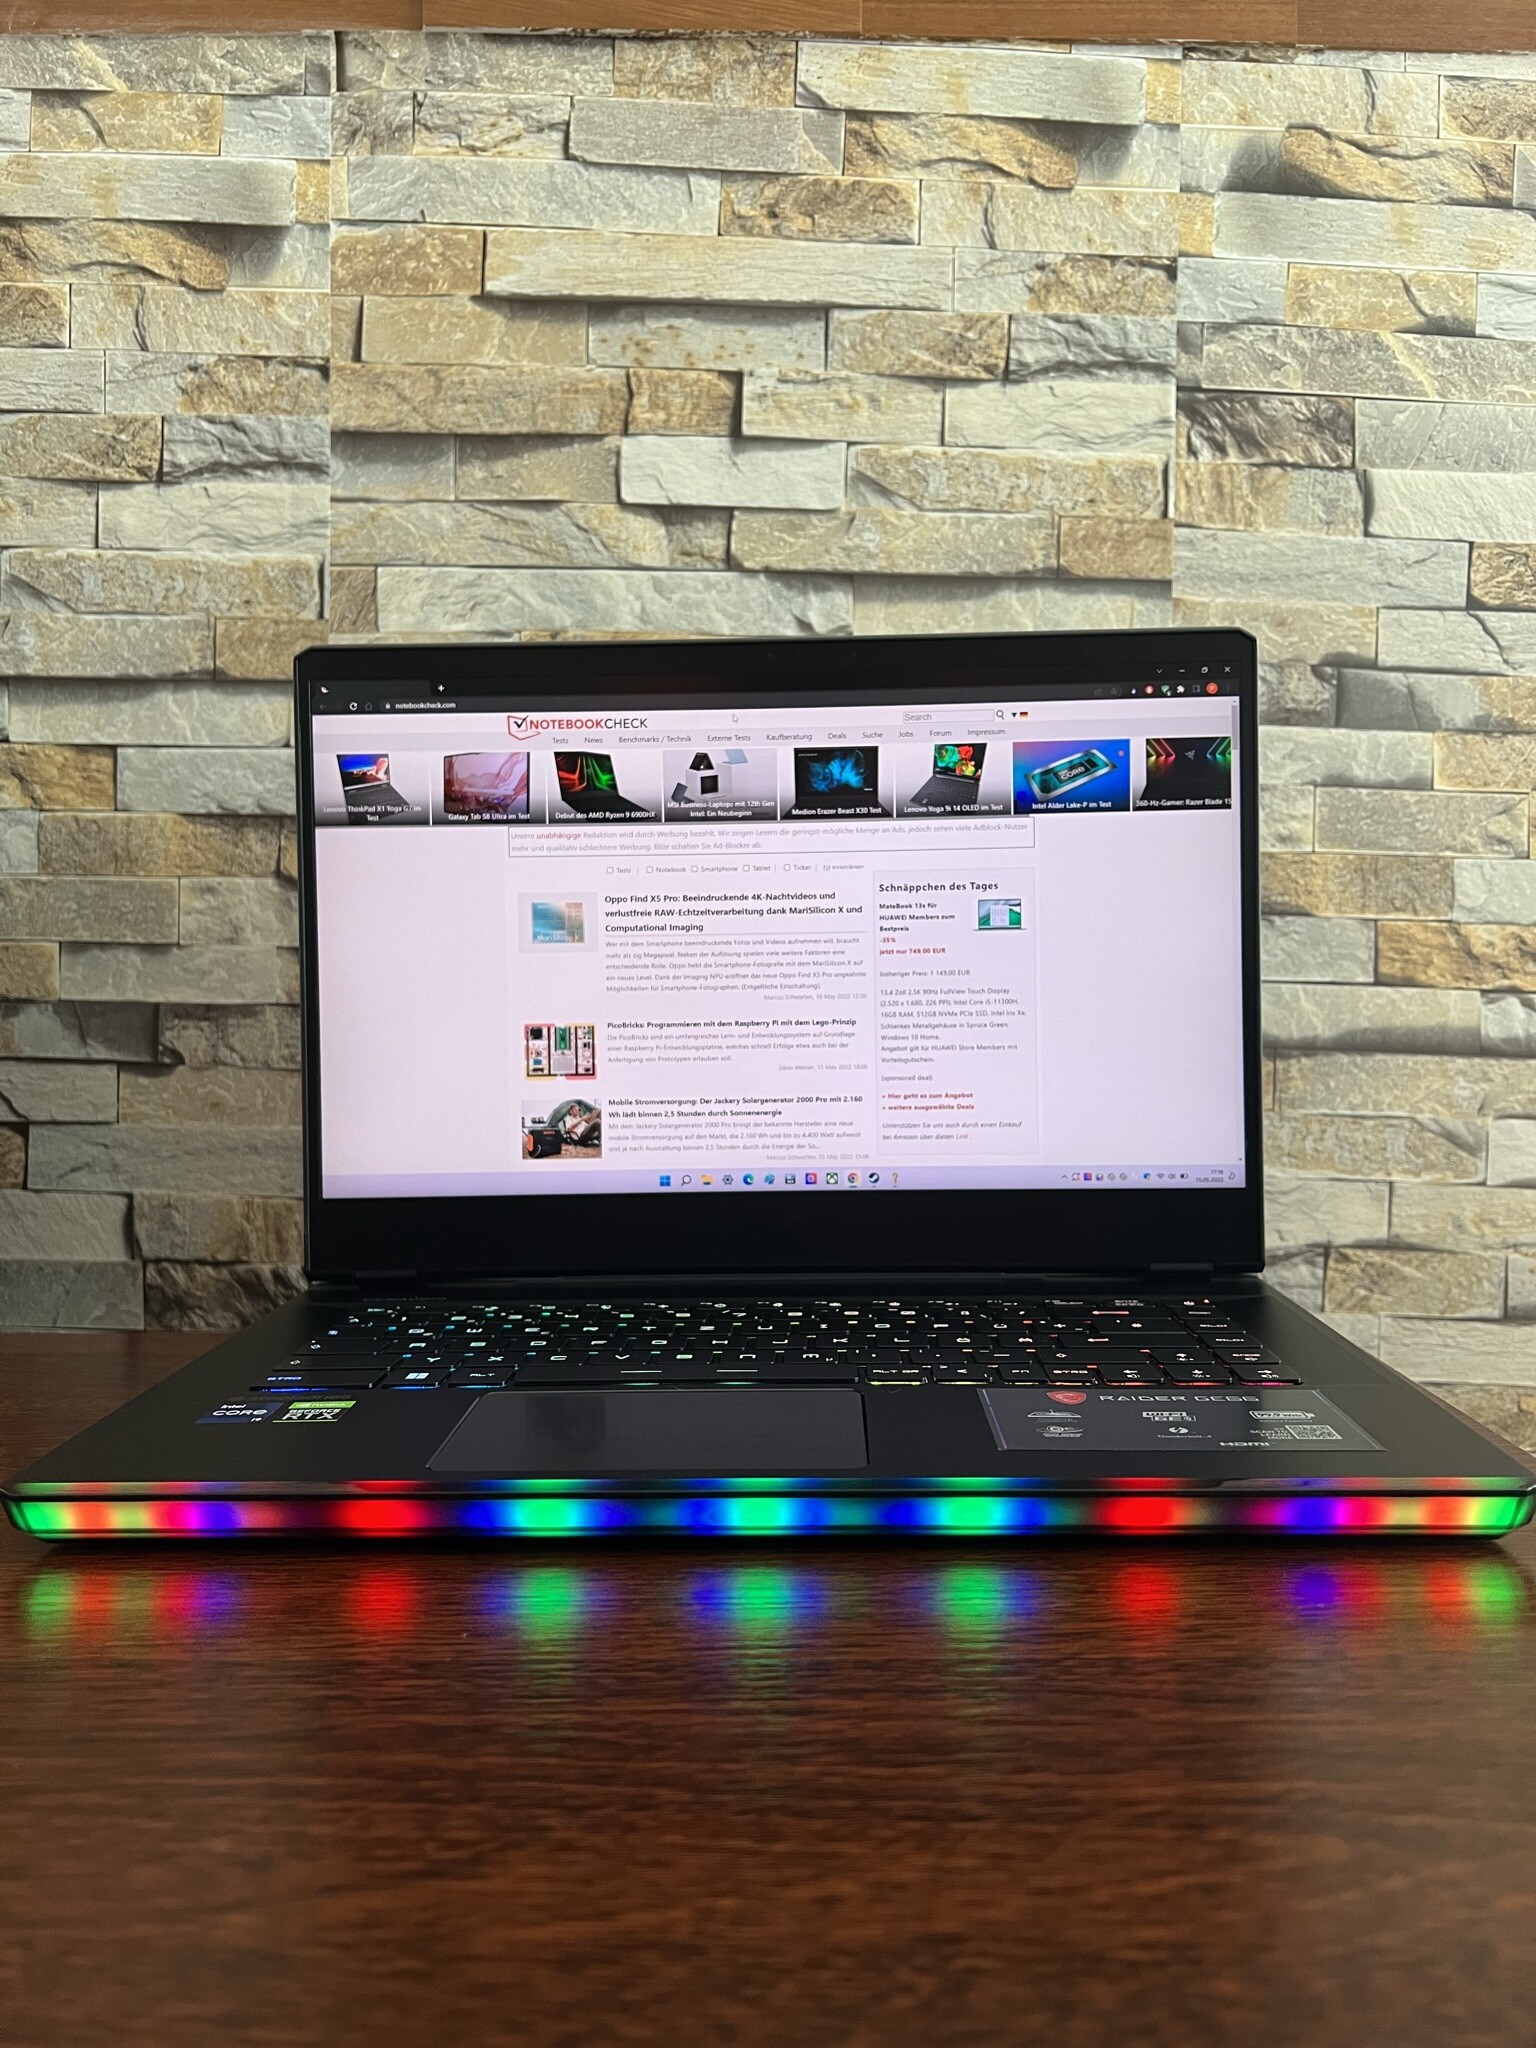
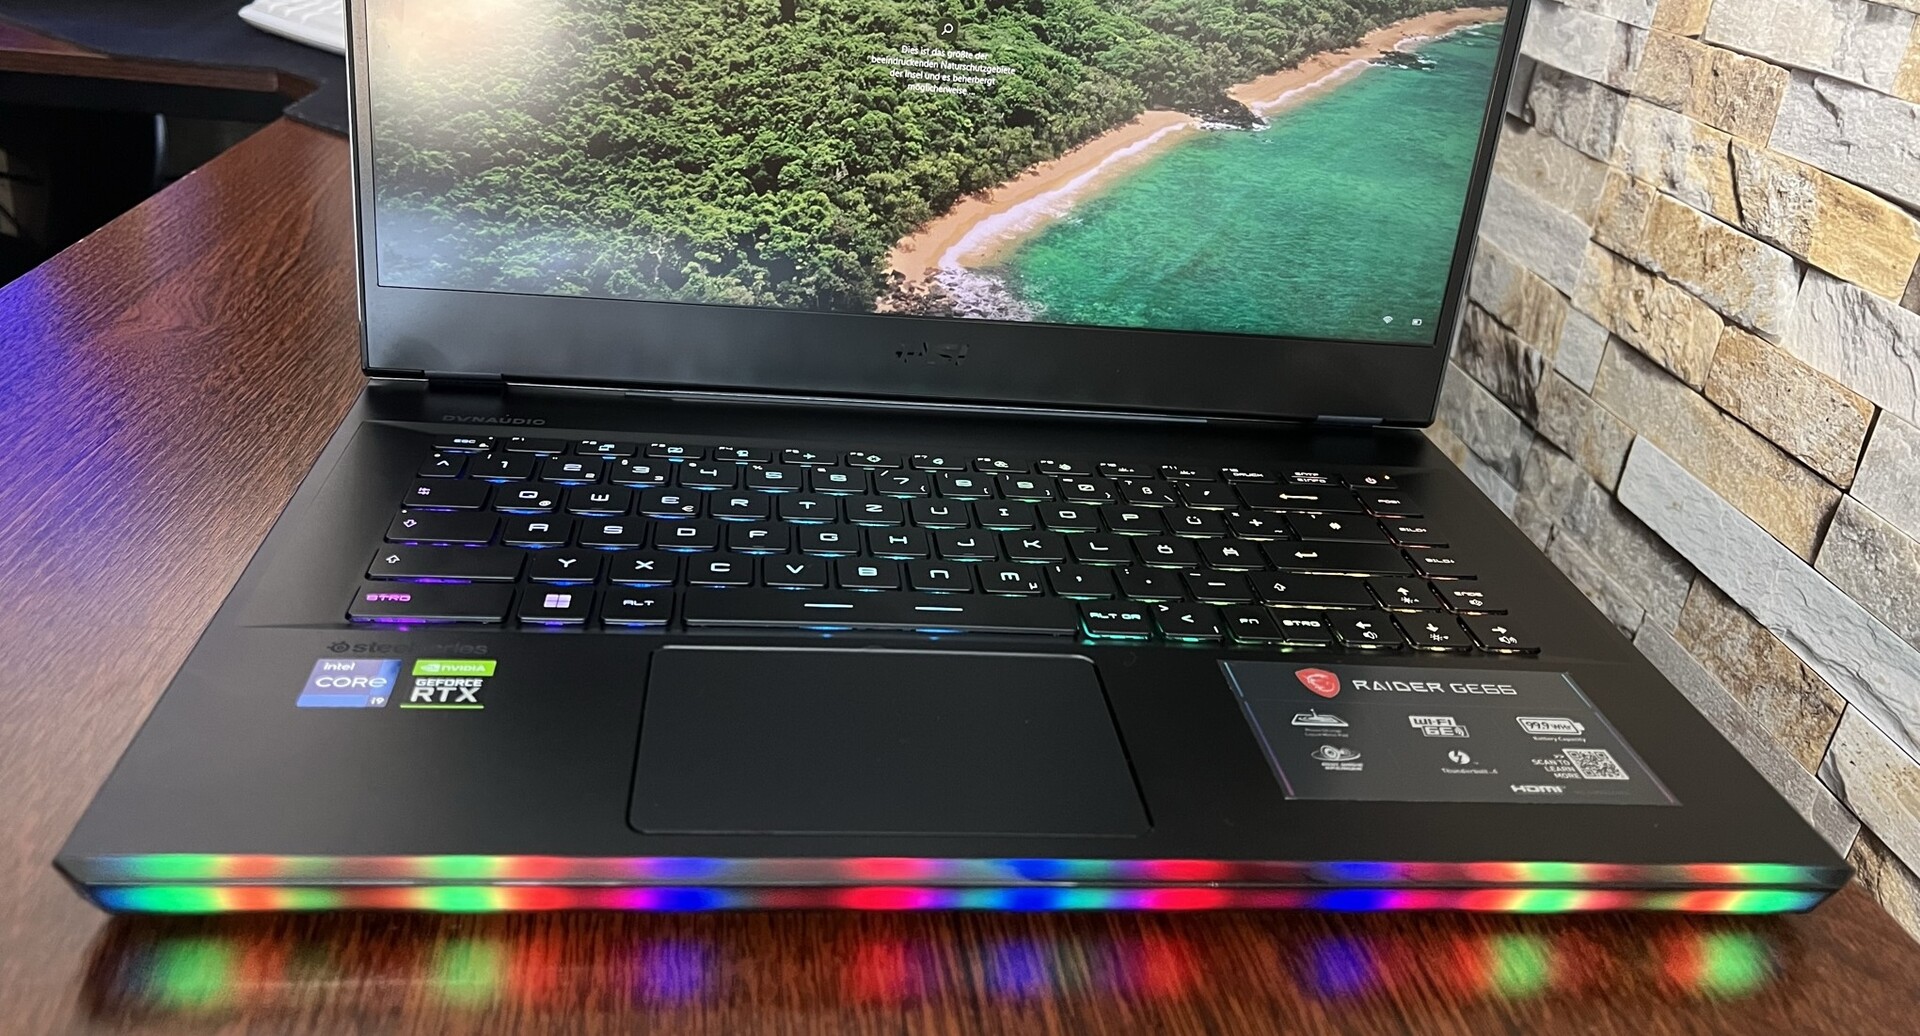
A caixa e o projeto do MSI Raider GE66 12 UHS não mudaram em comparação com o predecessor, exceto por uma barra de luz mais agradável e de maior qualidade na frente. Assim, remetemos você à revisão do antecessor para obter mais detalhes sobre o caso:MSI GE66 10SFS.
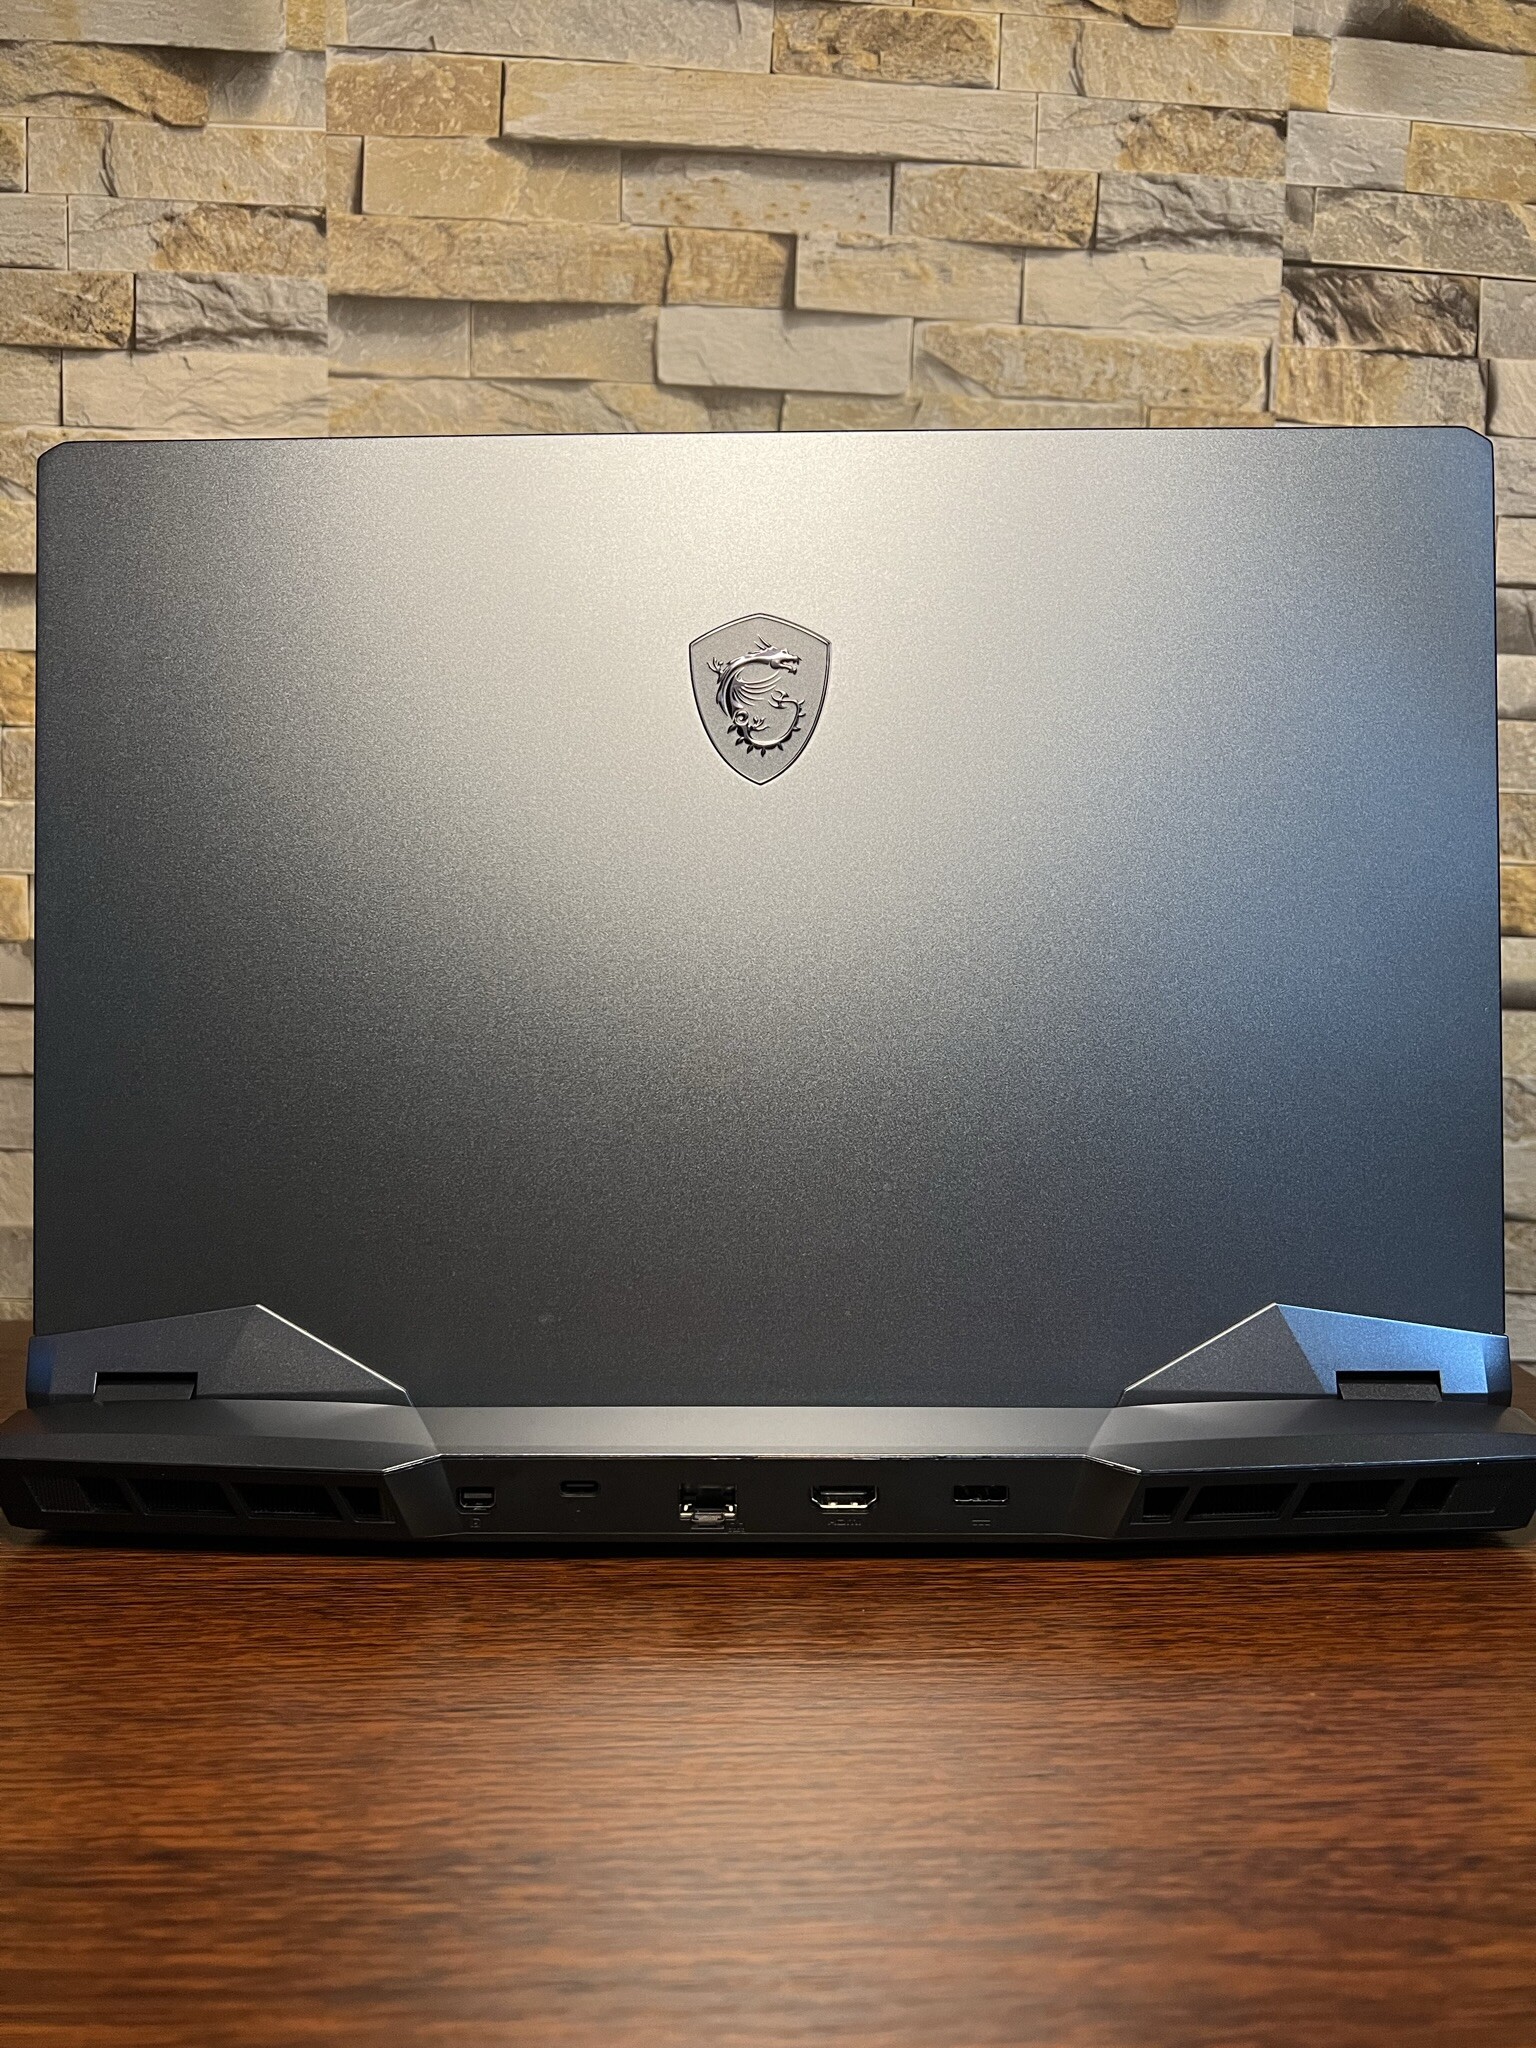
Em comparação com outros cadernos de jogos, nosso dispositivo de revisão tem o segundo maior peso (2,4 kg). Em termos de tamanho, o GE66 é mais um gigante dos portáteis. O Razer Blade demonstra o que é possível em termos de mobilidade.
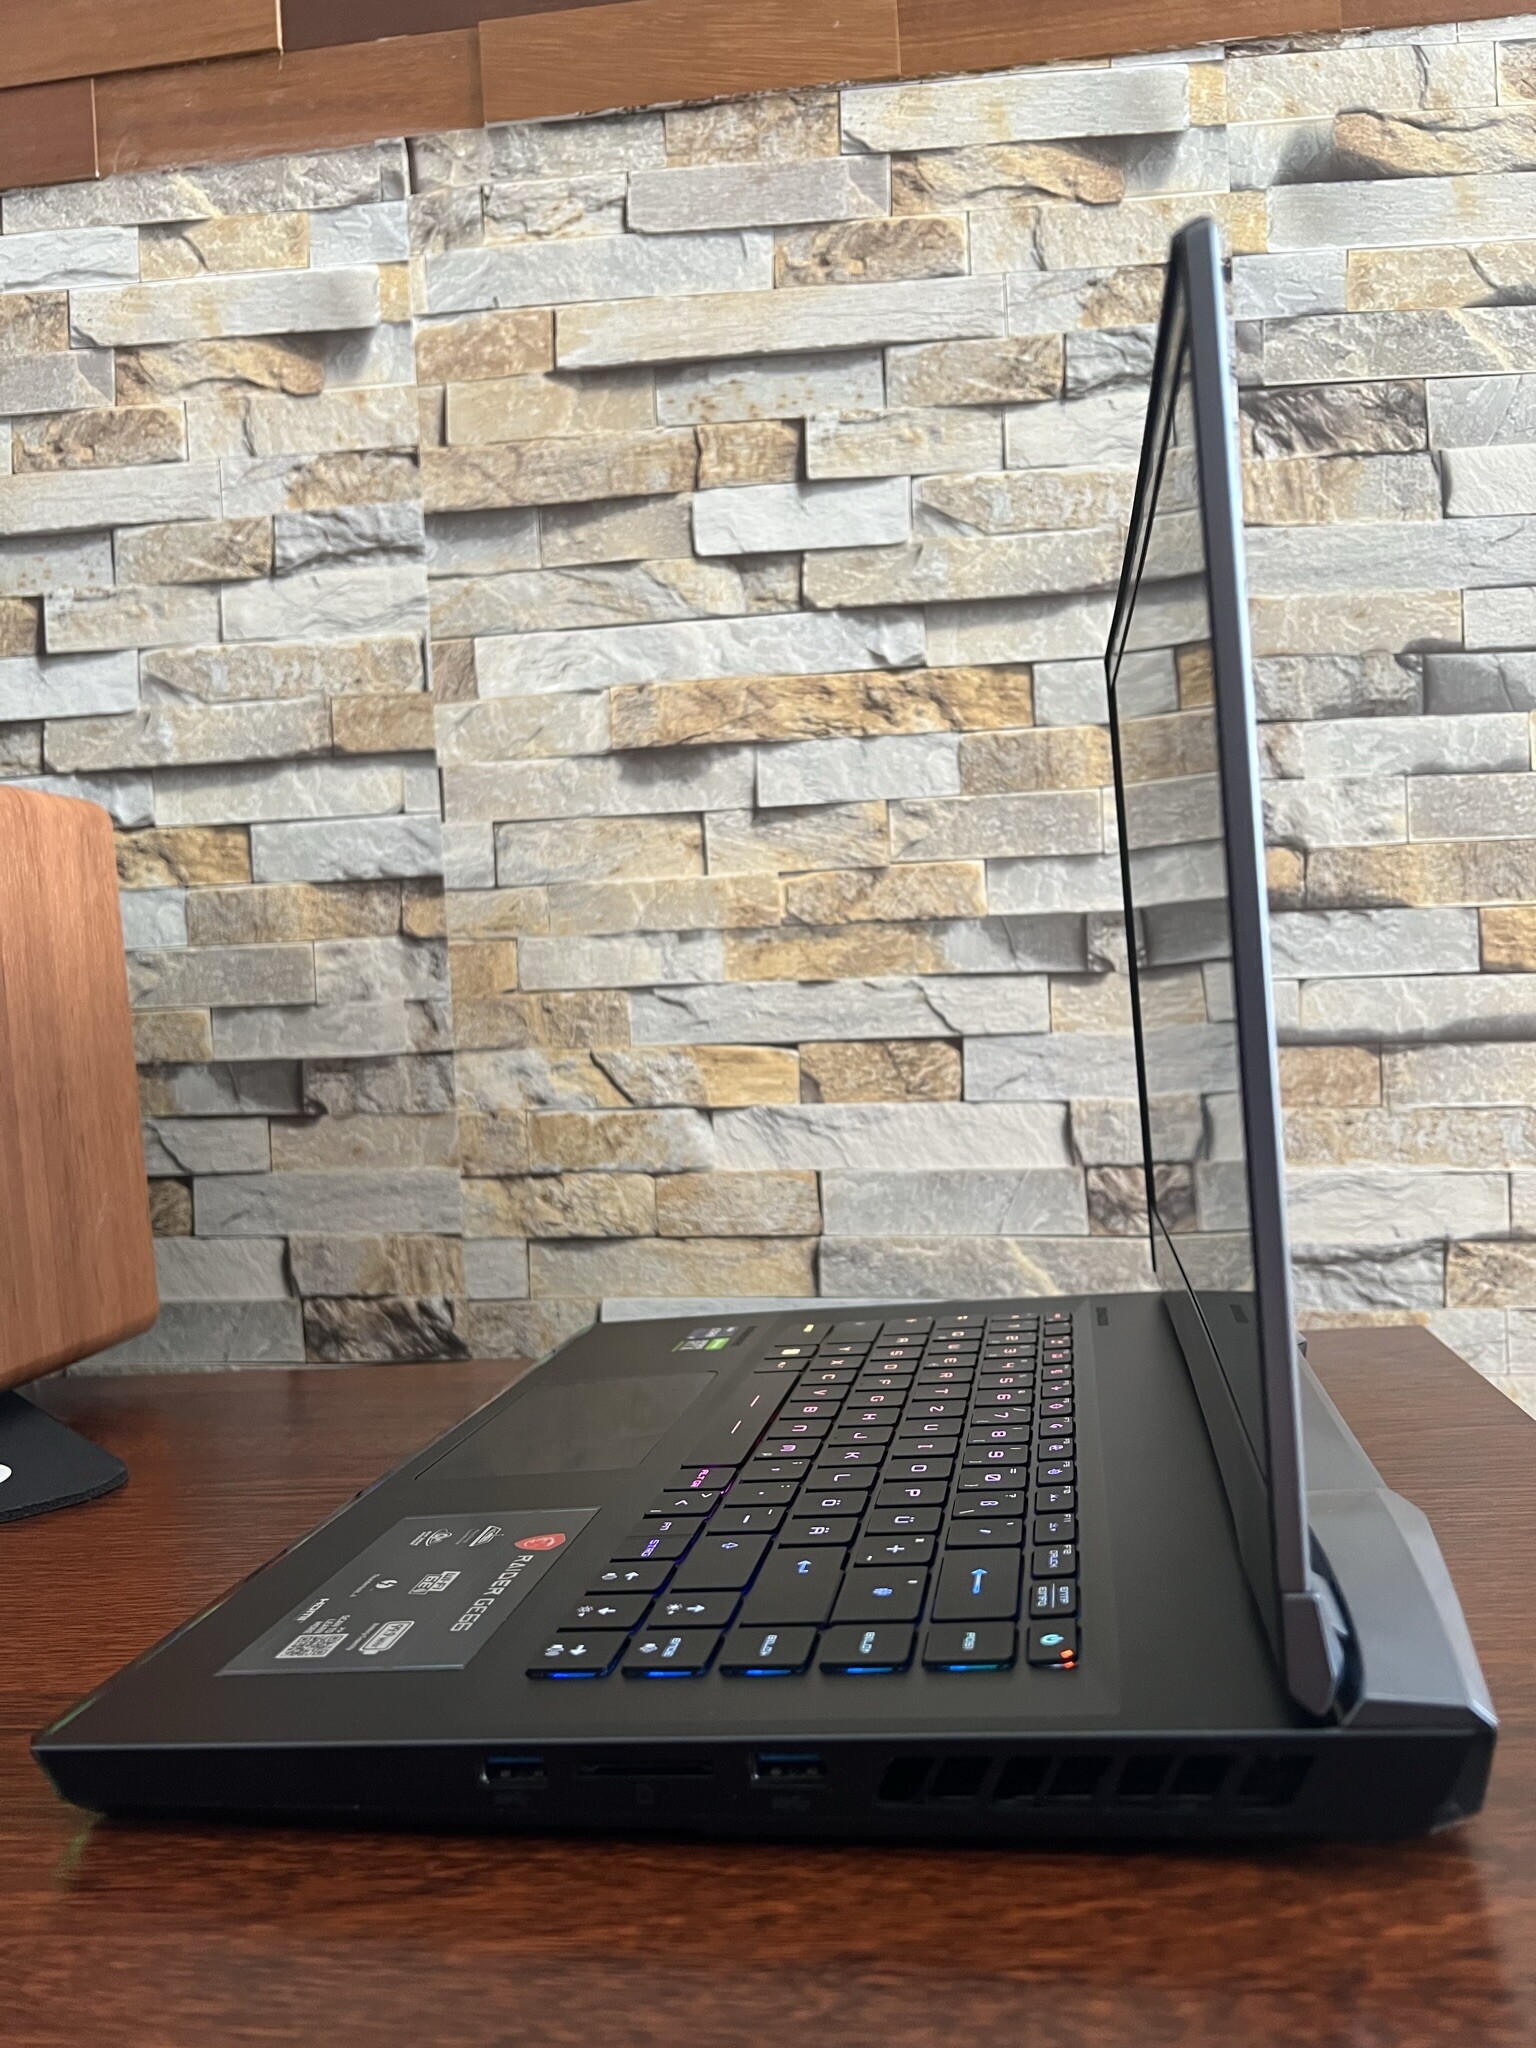
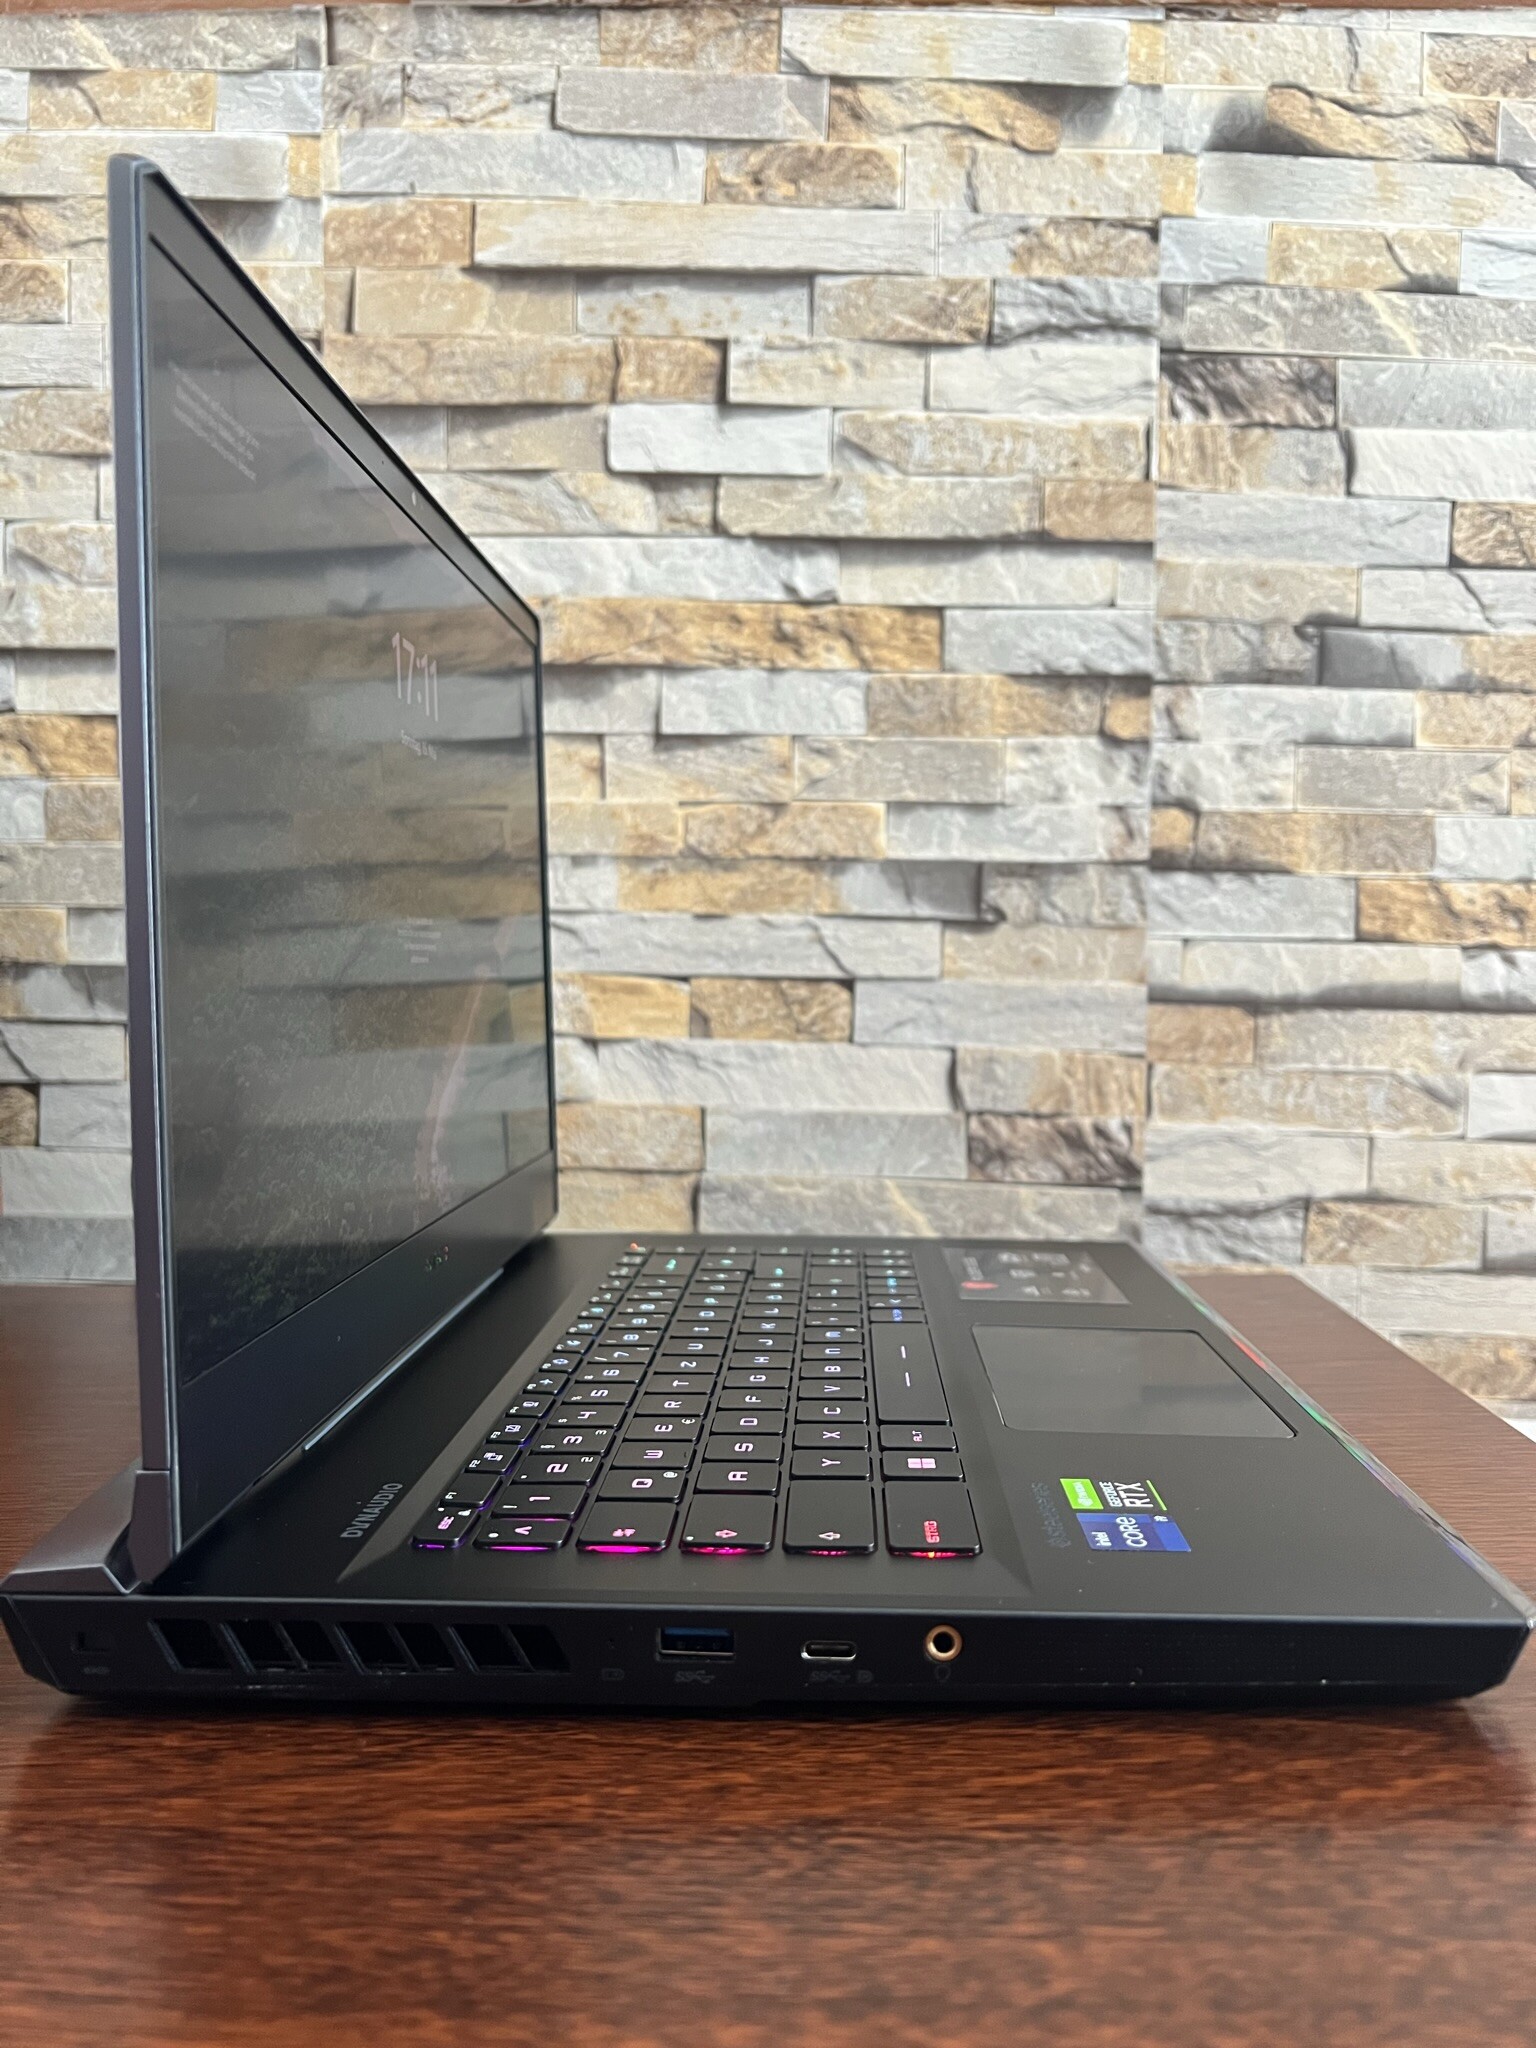
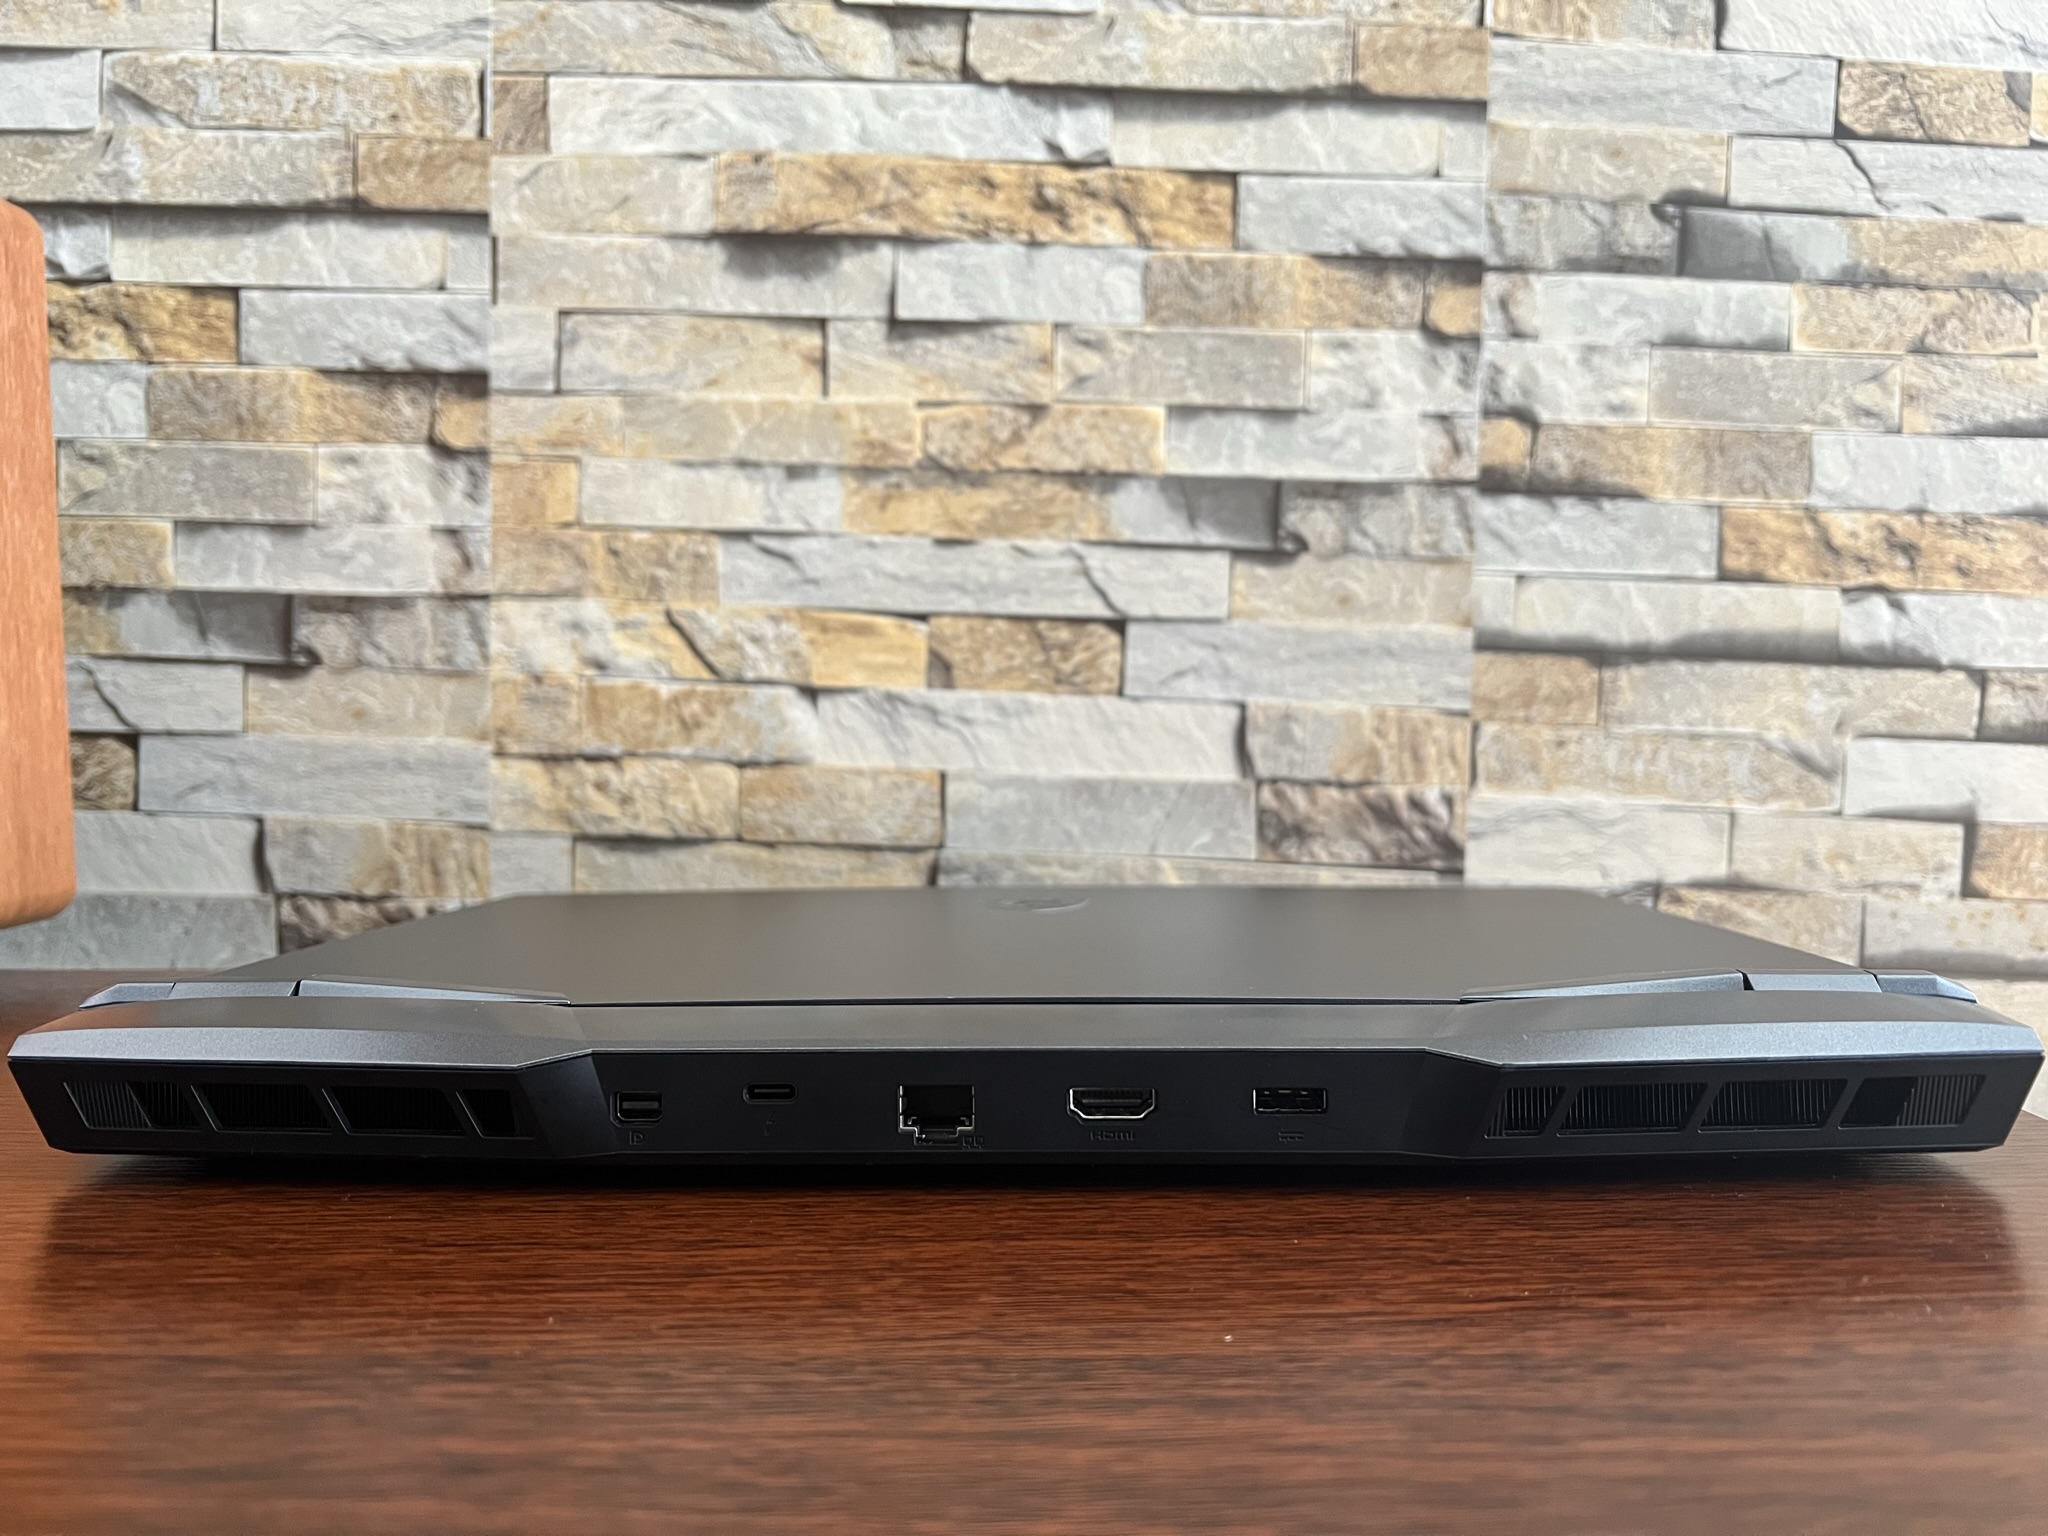
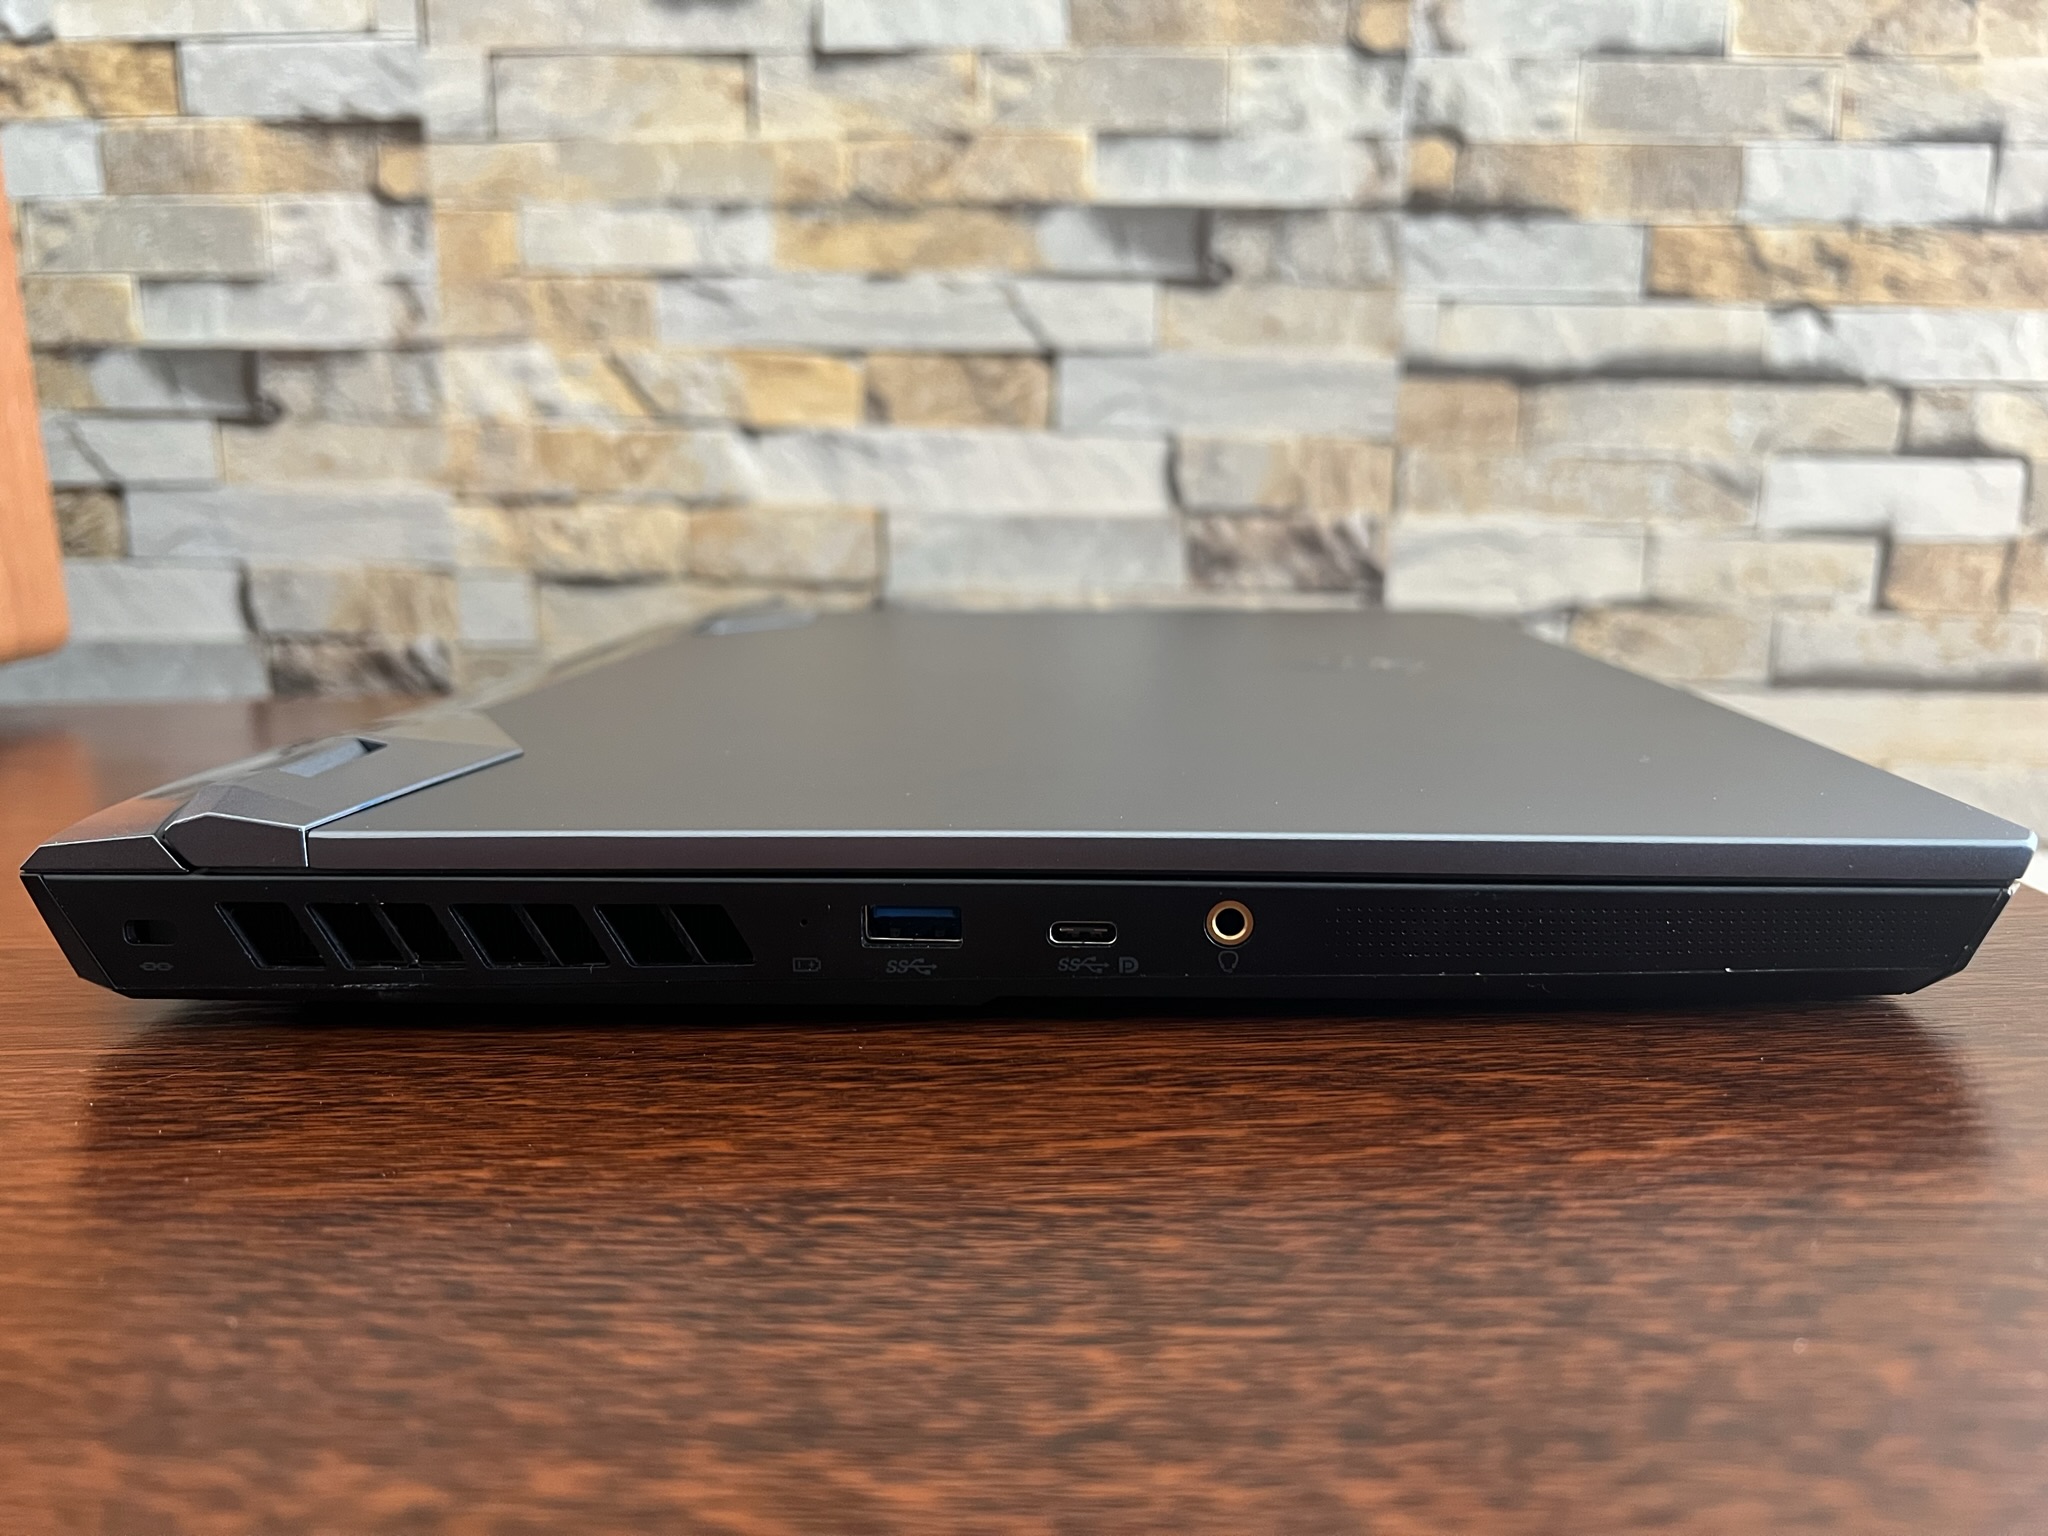
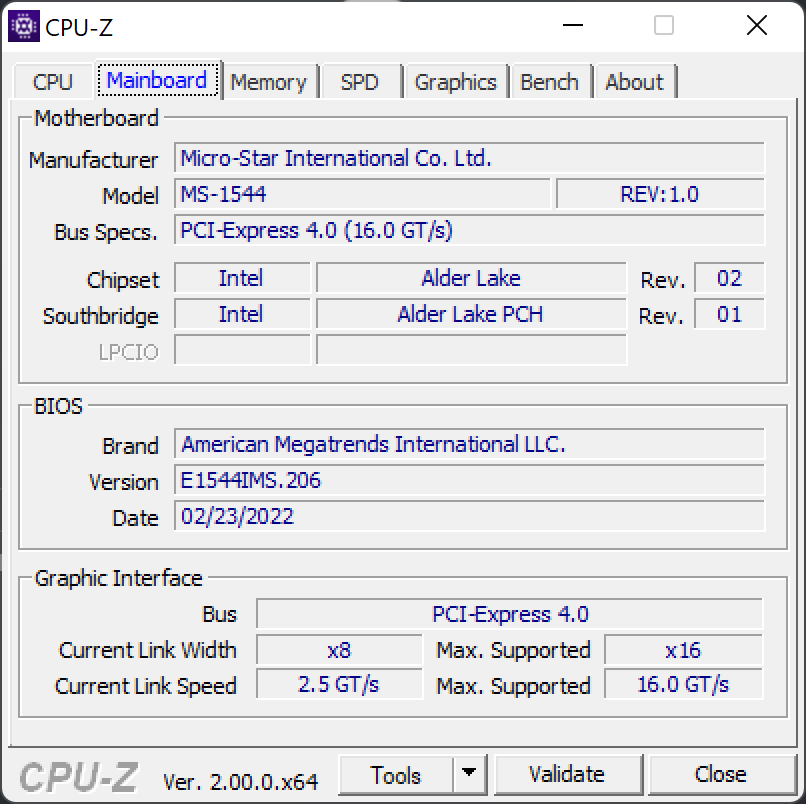
Conectividade: Atualizada para portos modernos
Todas as posições portuárias também permaneceram inalteradas em relação aoMSI GE66 10SFSsomente a porta USB-C na parte traseira foi atualizada para Thunderbolt 4, e a porta USB-C 3.2 no lado esquerdo agora suporta a função DisplayPort.
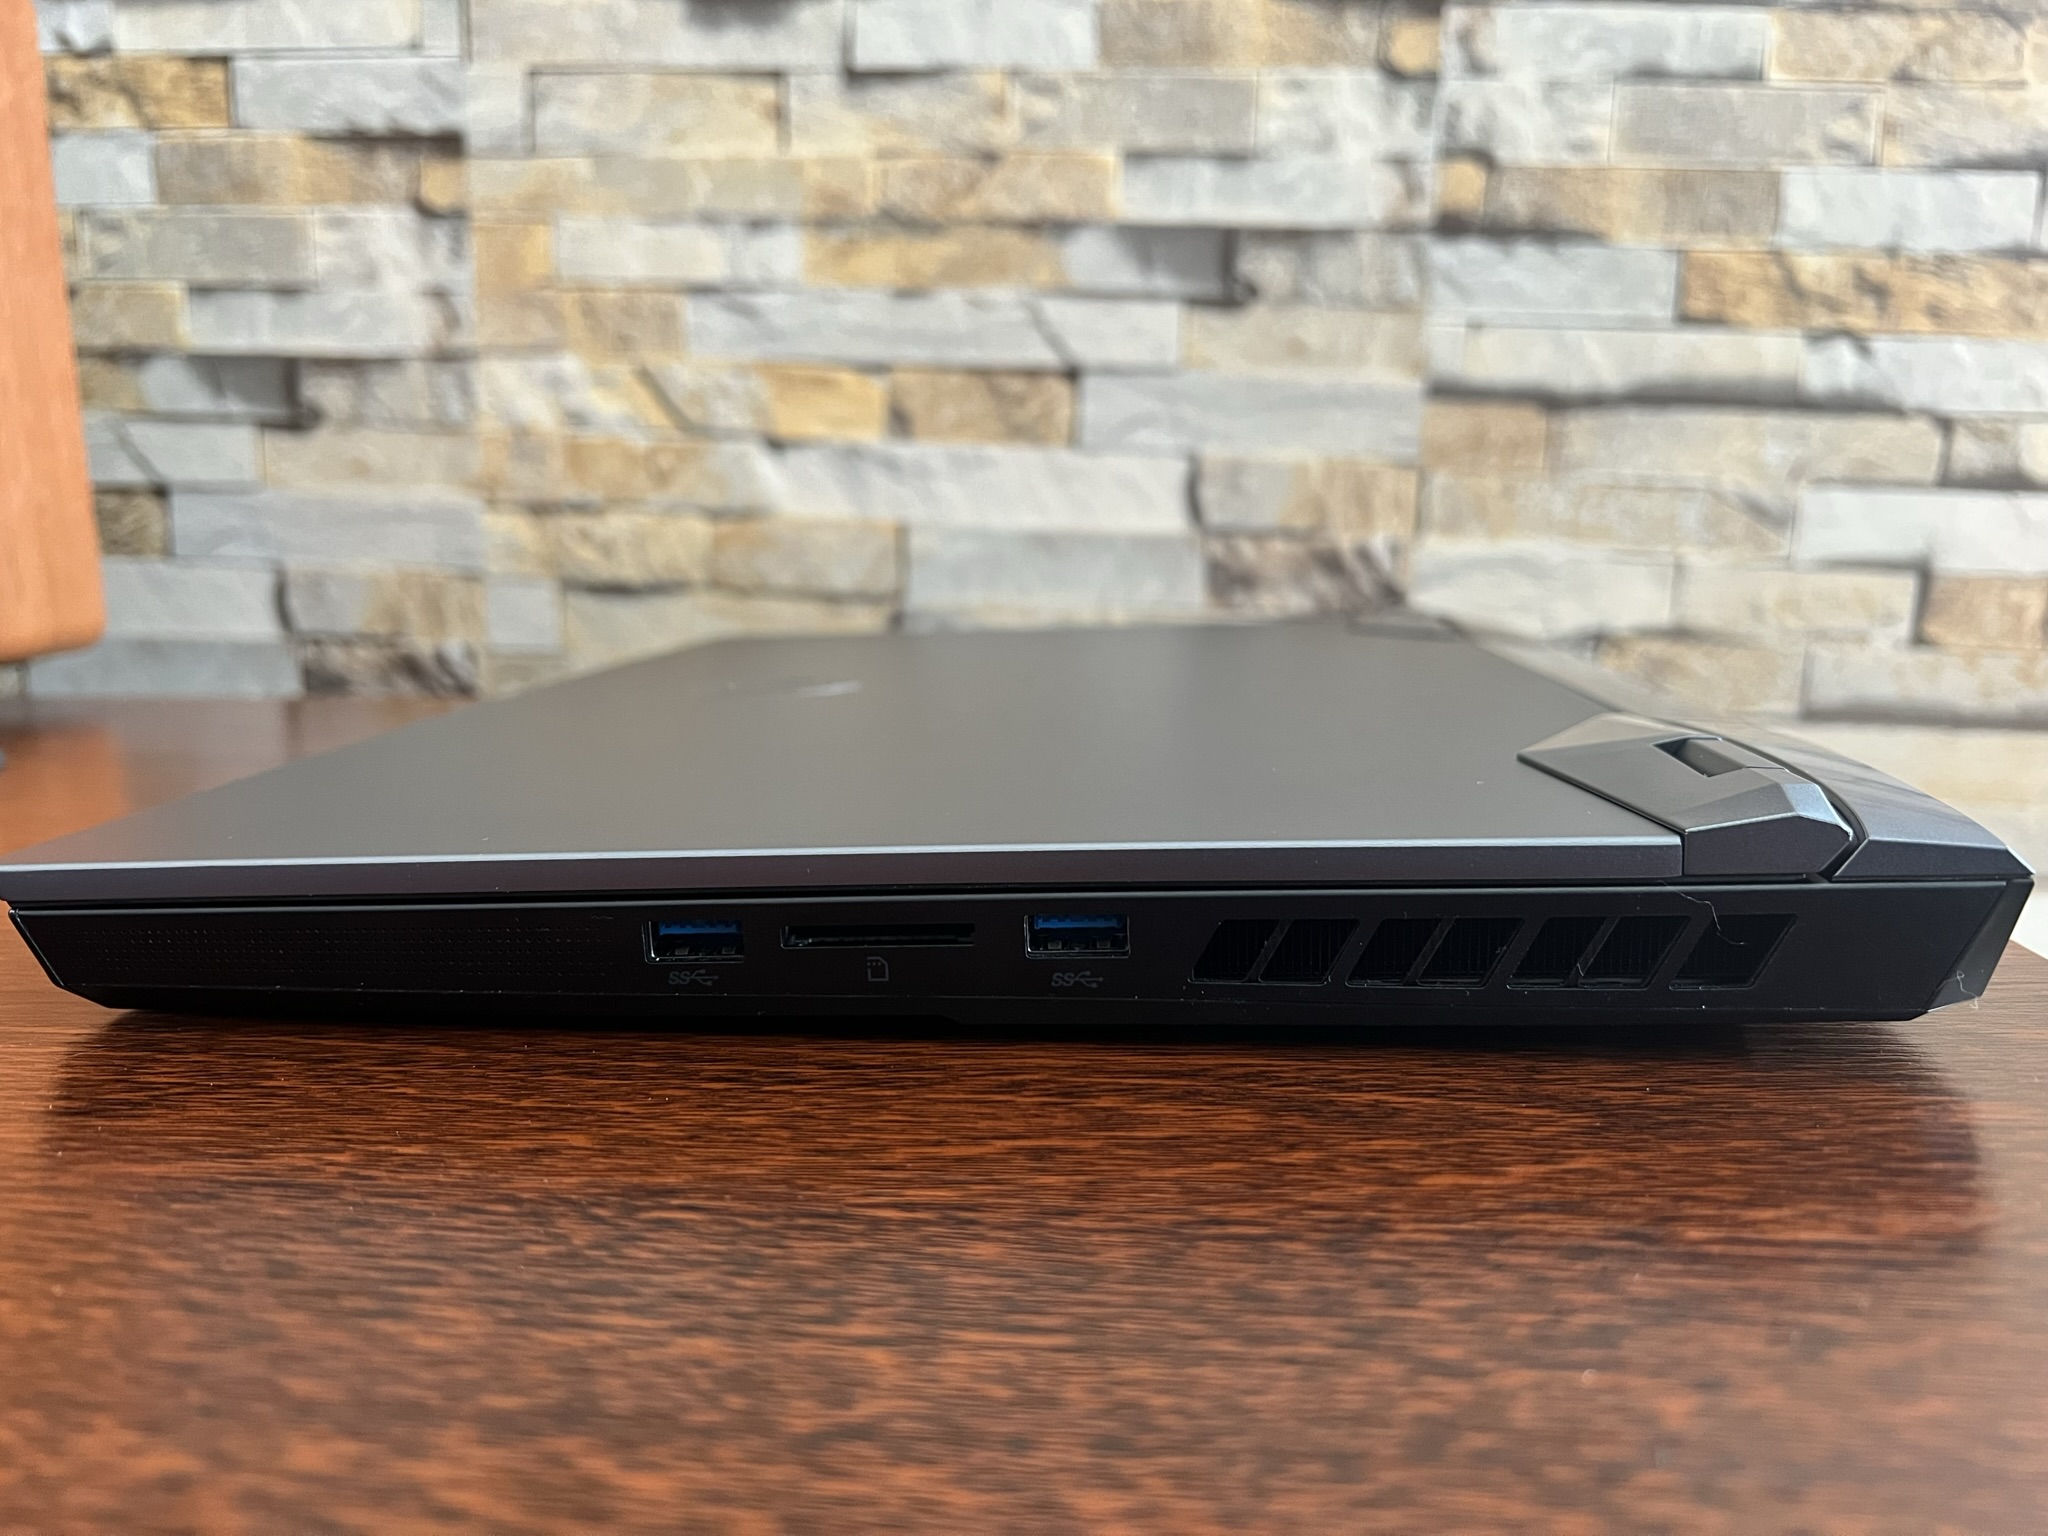
Leitor de cartões SD
O desempenho do leitor de cartões SD fica aquém das expectativas nos testes com nosso cartão de referência AV PRO V60 microSD. Somente o Schenker XMG Neo 15 Início de 2022 tem um desempenho pior no campo da comparação.
| SD Card Reader - average JPG Copy Test (av. of 3 runs) | |
| MSI GE66 Raider 10SFS (Toshiba Exceria Pro SDXC 64 GB UHS-II) | |
| Razer Blade 15 2022 (Toshiba Exceria Pro SDXC 64 GB UHS-II) | |
| Média da turma Gaming (20.9 - 210, n=54, últimos 2 anos) | |
| MSI Raider GE66 12UHS (AV PRO microSD 128 GB V60) | |
| Schenker XMG Neo 15 E22 (Early 2022, RTX 3080 Ti) | |
Comunicação
Nosso dispositivo de revisão sai no topo em desempenho Wi-Fi e mostra excelentes taxas que só agora são superadas peloLâmina Razer 15 Advanced Early 2022.
Webcam
A webcam oferece Full HD e fornece imagens decentes para uma webcam para notebook. Enquanto estas tendem a ser ruidosas e desfocadas em condições de pouca luz, a qualidade geral da imagem deve ser suficiente para tarefas diárias, como videoconferência


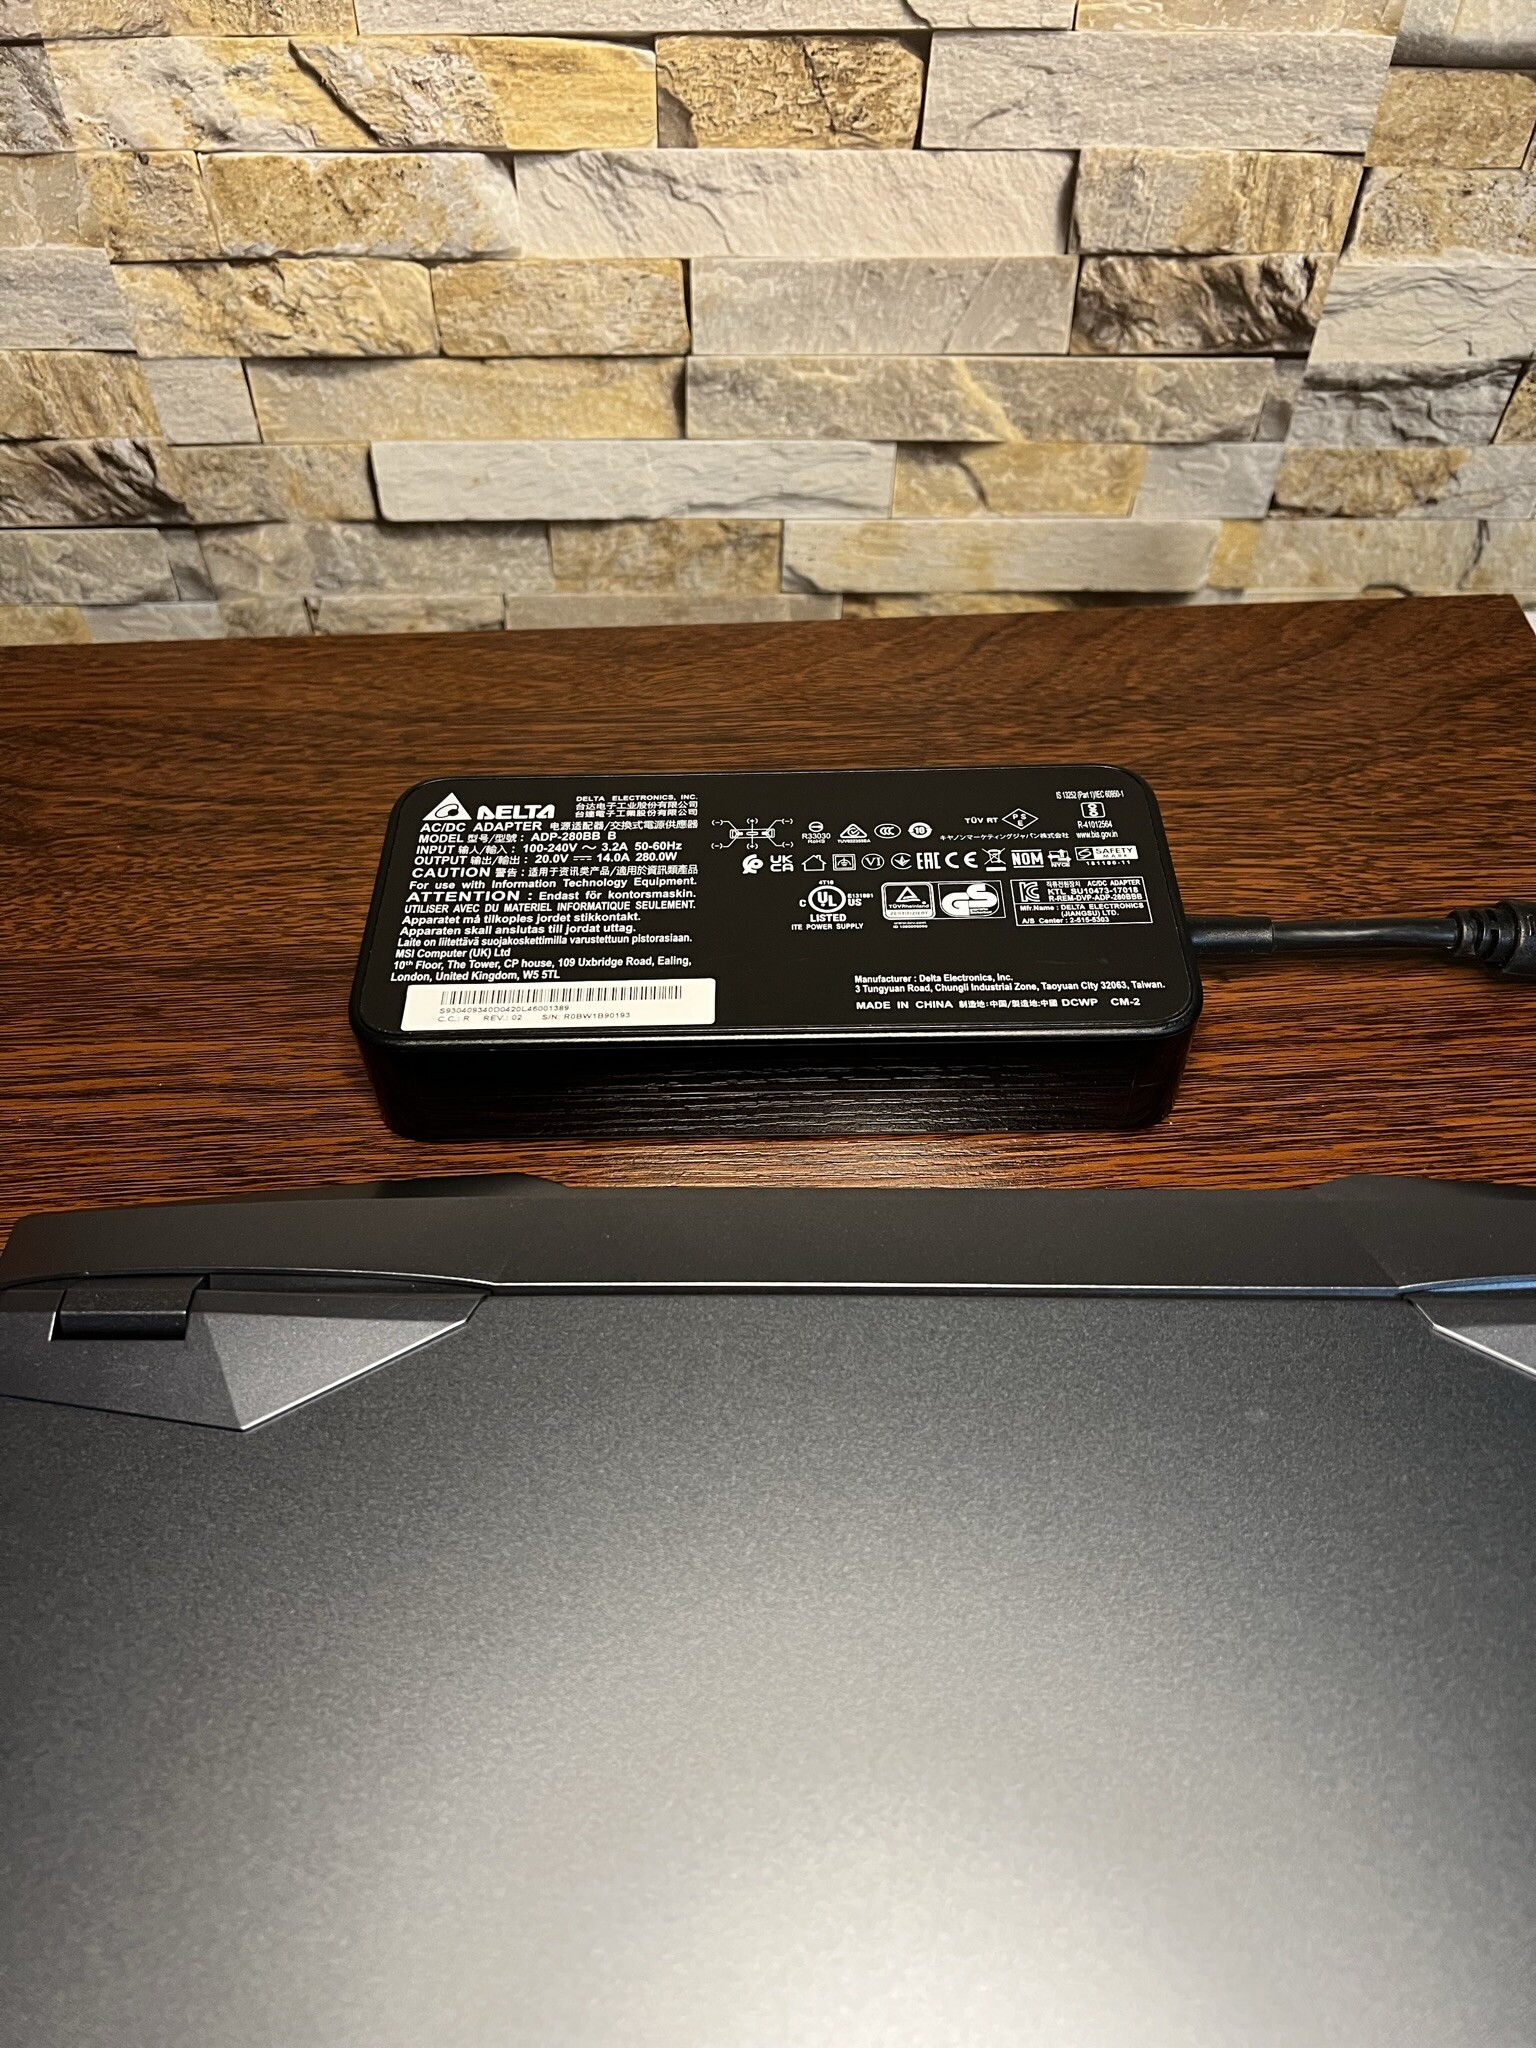
Acessórios
Excluindo o notebook, o escopo da entrega inclui a documentação necessária para o dispositivo, bem como o adaptador de energia. Como os 280 watts do seu predecessor, a fonte de alimentação inalterada ainda fornece energia suficiente para o hardware instalado.
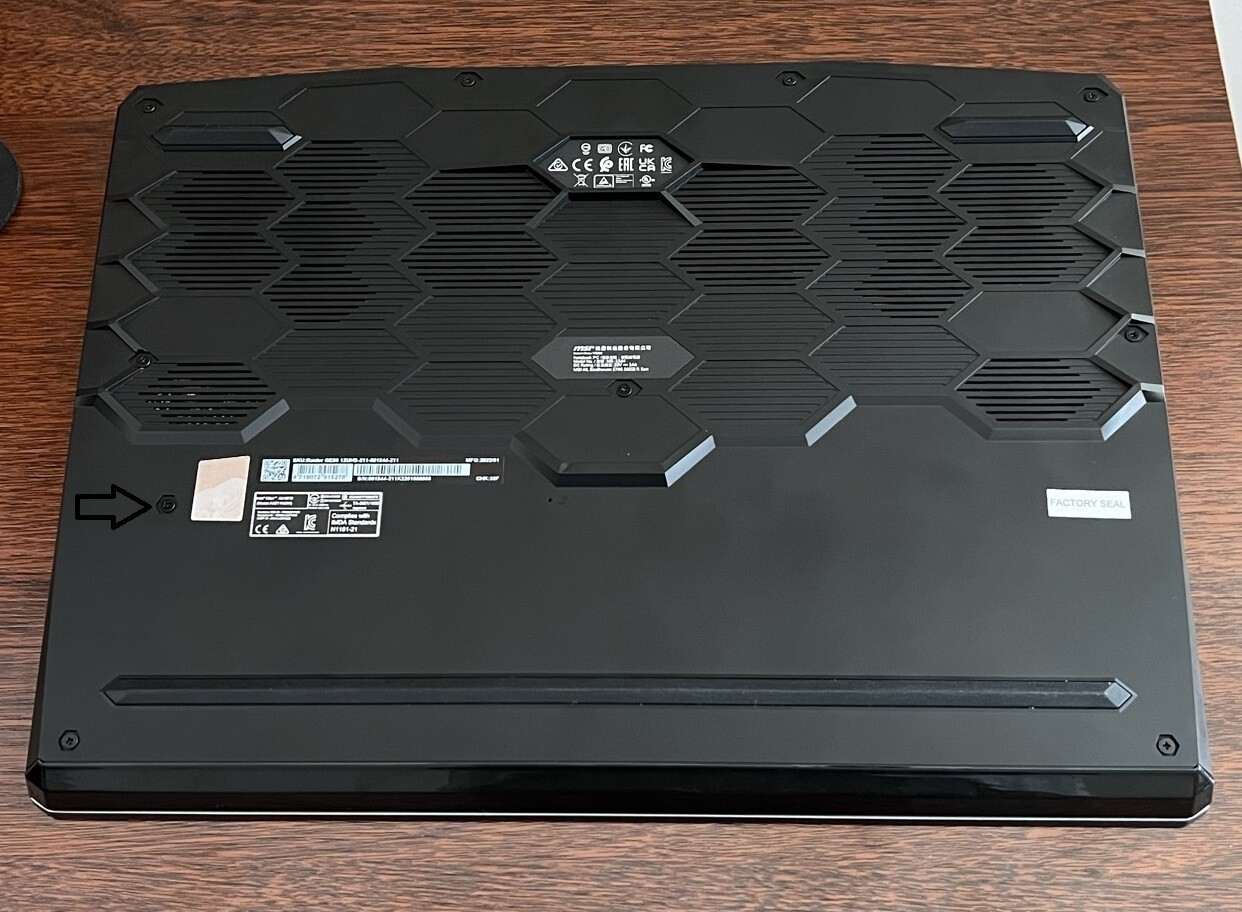
Manutenção
Em 2022, o suporte de serviço nem sempre é um dado adquirido para cada dispositivo. Alguns fabricantes dificultam deliberadamente a manutenção de seus dispositivos para os usuários que desejam ser eles próprios a mantê-los. A Dell, por exemplo, instala a placa-mãe back-tofront em seus laptops Alienware (ventilador e dissipador de calor estão diretamente abaixo do teclado e são de difícil acesso). Aqueles que desejam substituir as almofadas ou pasta de condução de calor se deparam, portanto, com um procedimento pesado.
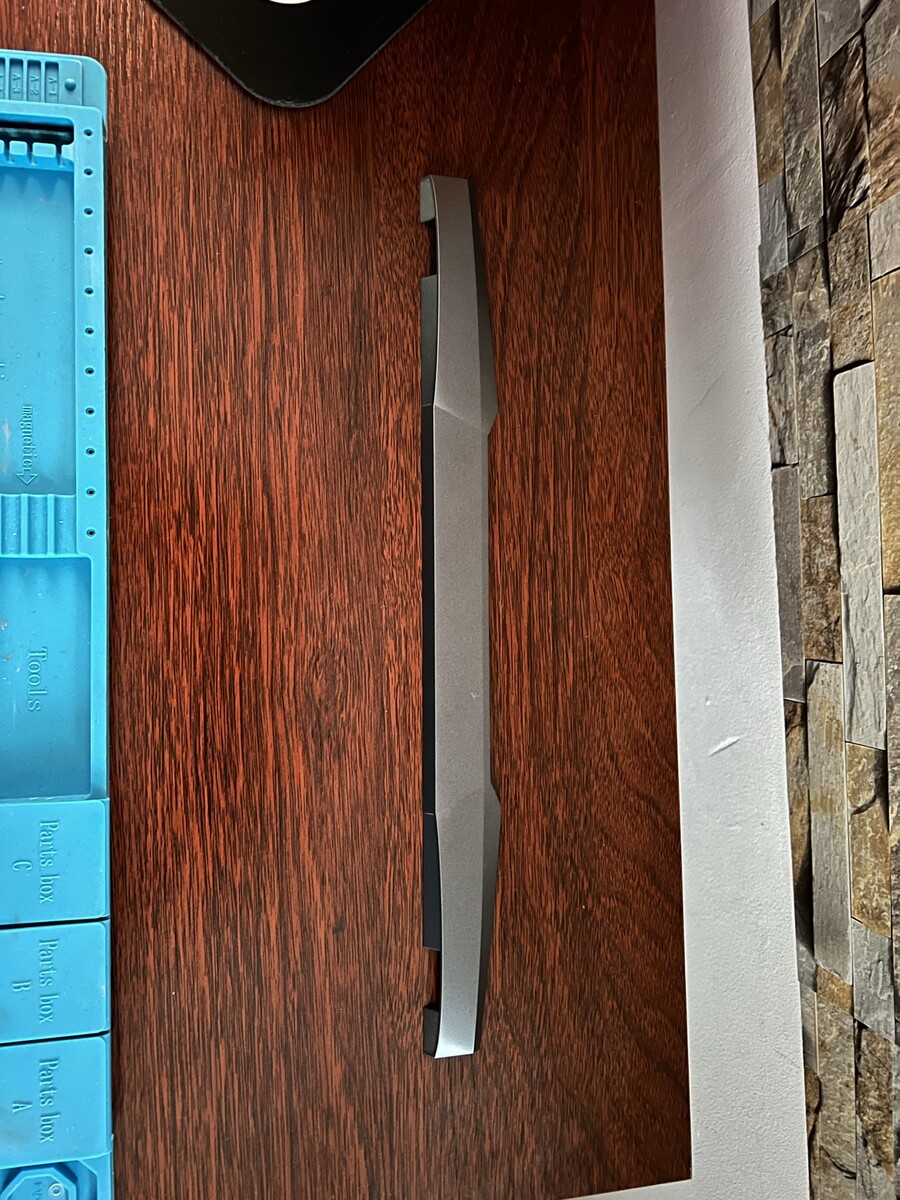
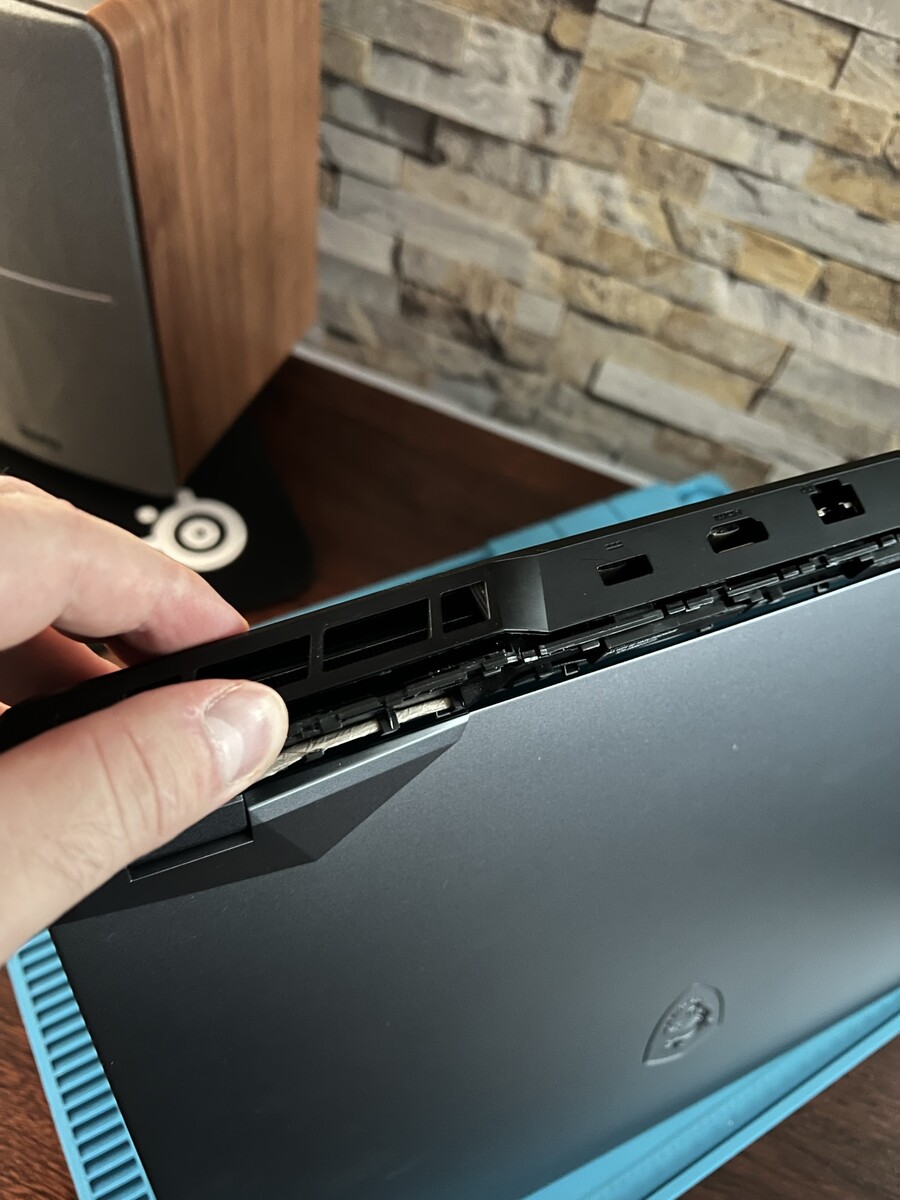
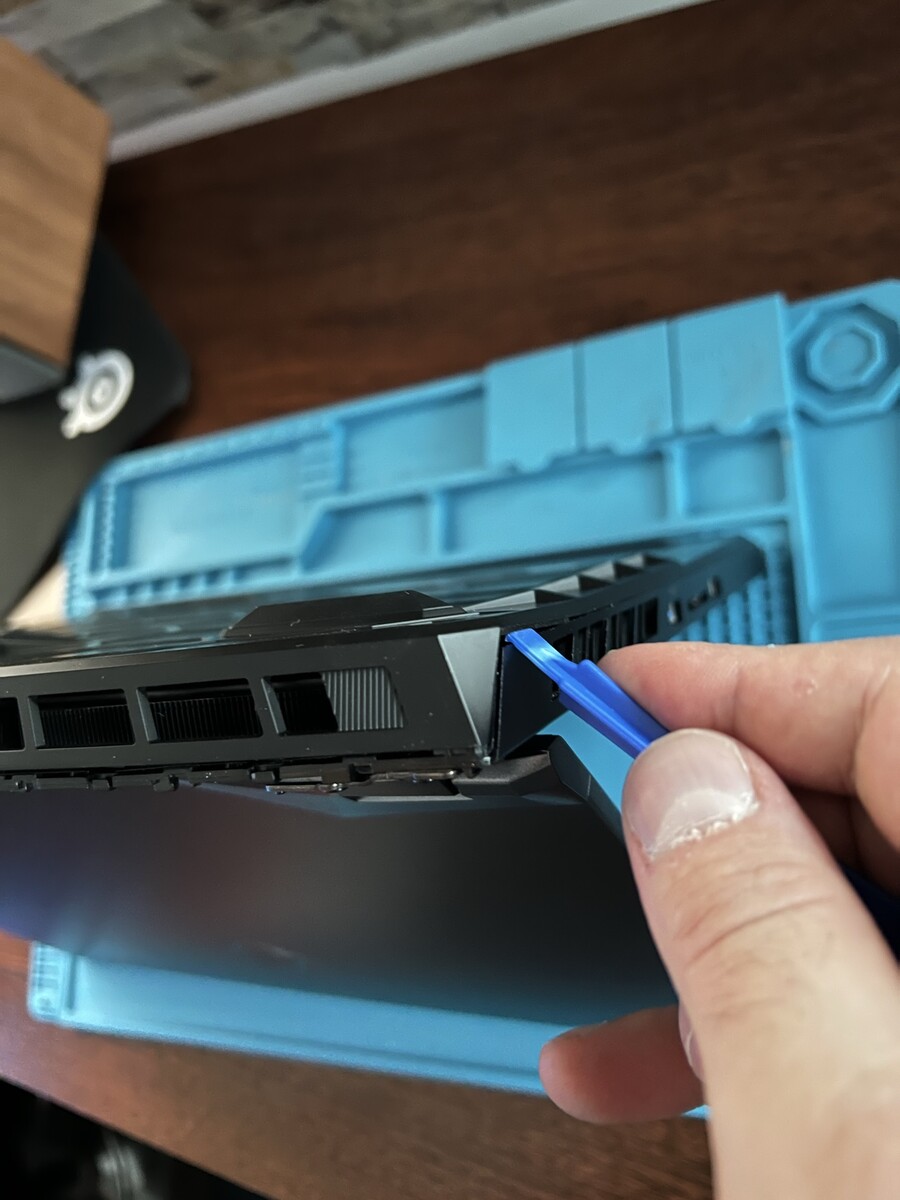
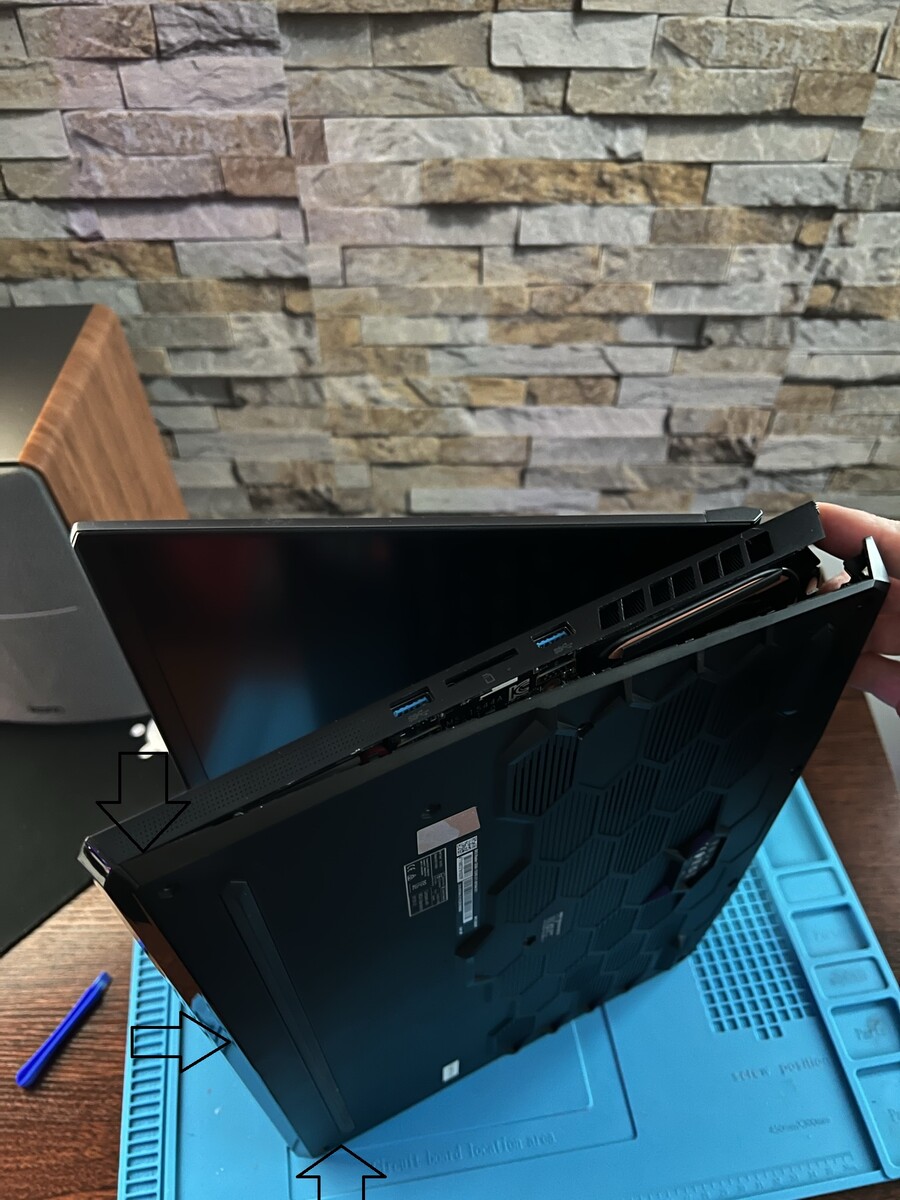
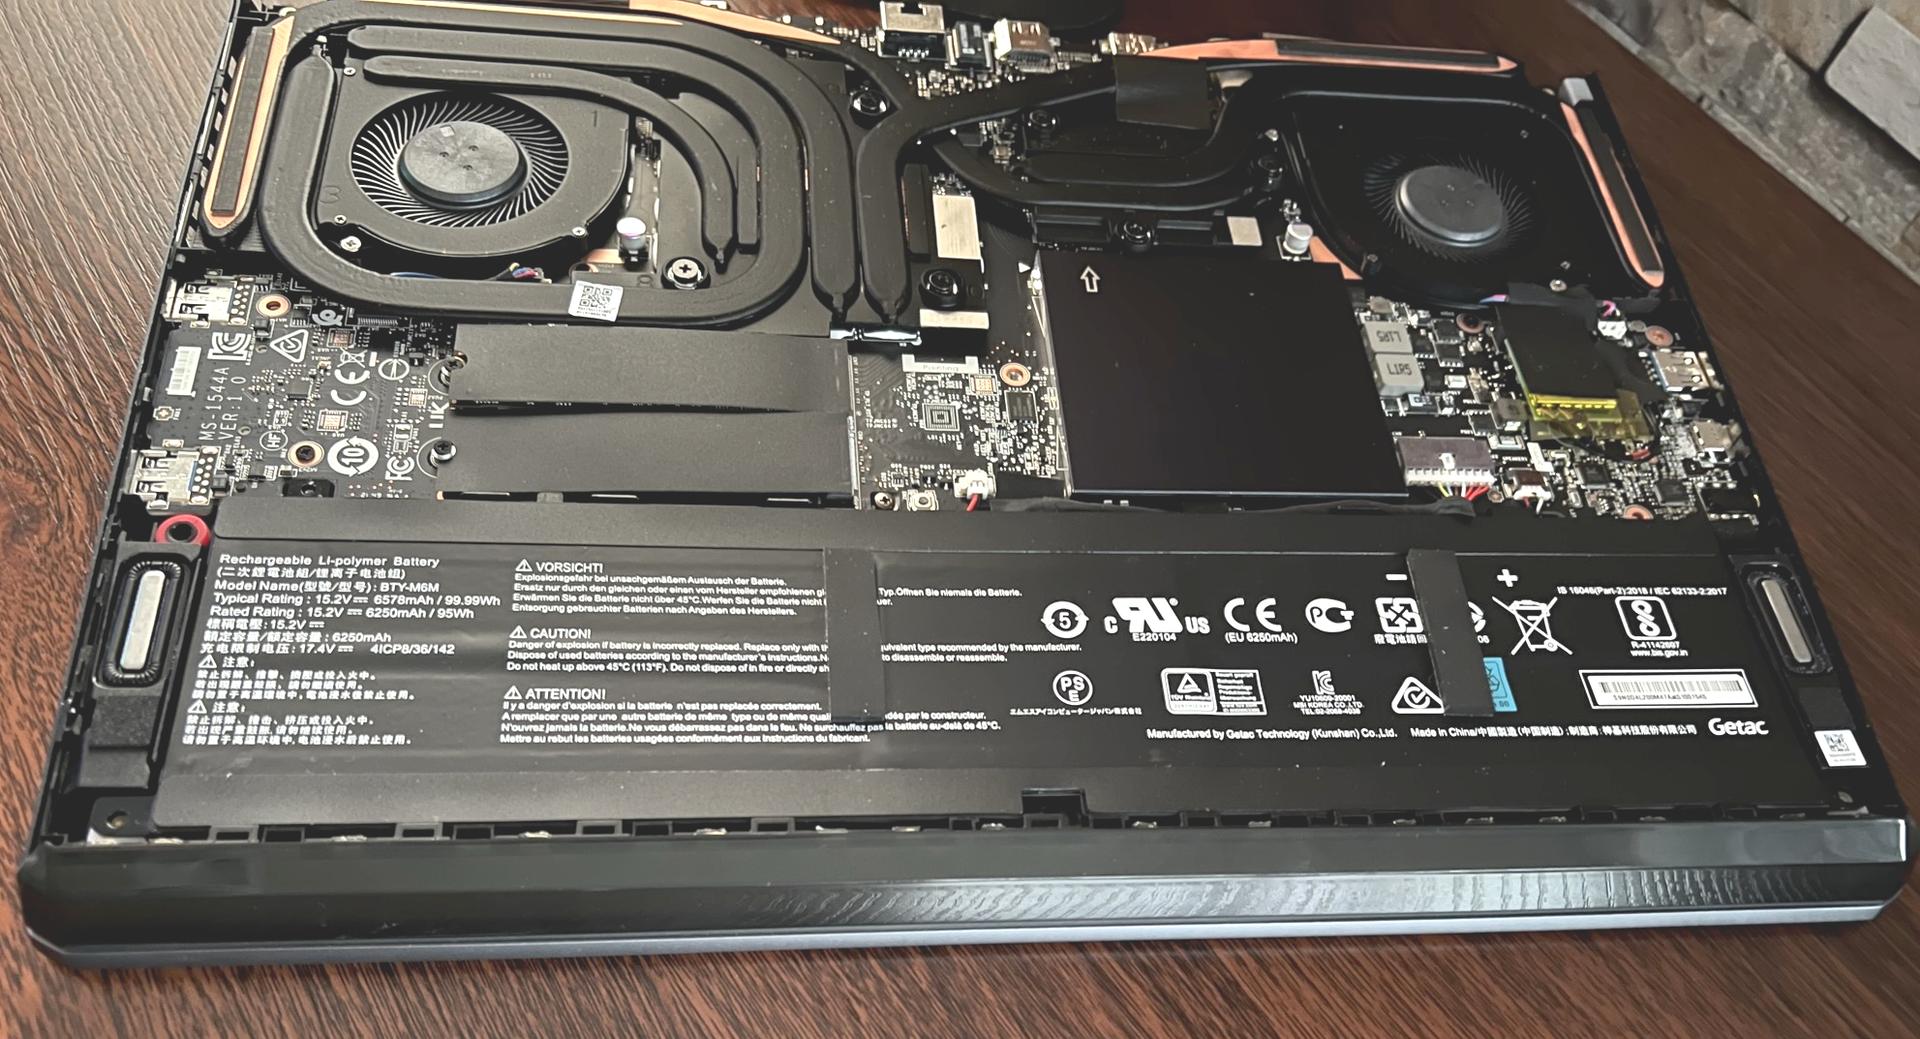
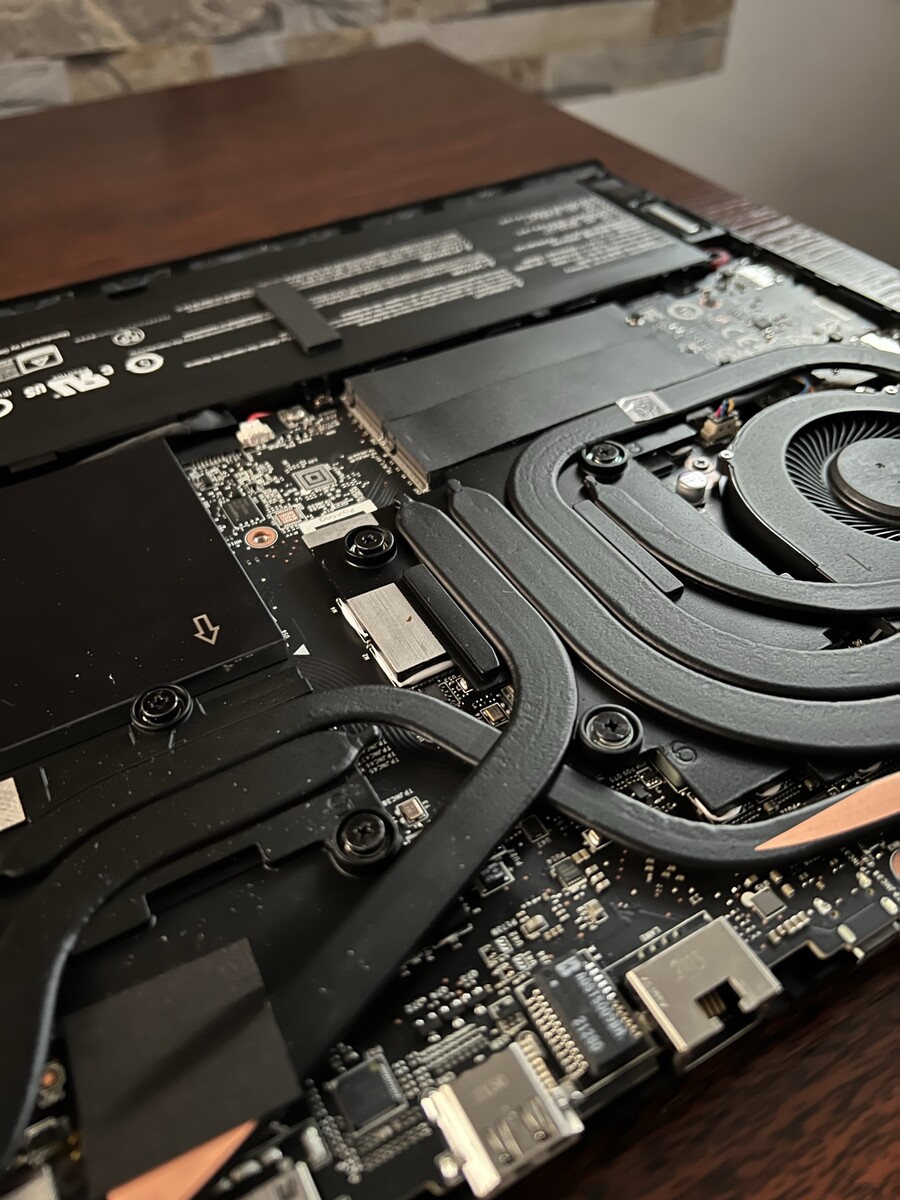
Este não é o caso de nosso MSI Raider GE66 12 UHS, onde a única tarefa remotamente difícil é remover 11 parafusos Phillips para destacar a placa de base. Isto também se aplica à tampa plástica atrás do visor. Para os interessados, há uma pequena série de fotos abaixo que mostram como acessar o funcionamento interno do MSI Raider GE66 12 UHS sem danificar as partes plásticas sensíveis.
Uma vez removida a tampa superior e a tampa inferior, você tem acesso direto aos dois slots do PCI Gen 4. Você também pode substituir o cartão Wi-Fi, limpar os ventiladores e, se necessário, substituir o sistema de resfriamento e os módulos SO-DIMM, que estão localizados debaixo de um bloco de resfriamento passivo.
Garantia
Como no caso do predecessor, a MSI concede ao Raider GE66 uma garantia de 24 meses com serviço de coleta e devolução. Isto se aplica somente à Alemanha, portanto a política de garantia pode diferir em outros países. É importante observar que o selo de garantia não tem relevância para países de língua alemã, na medida em que o usuário tem permissão para abrir o dispositivo para atualização e manutenção sem que a garantia se torne nula. Entretanto, isto se aplica somente sob a condição de que o trabalho seja realizado de forma profissional. Se danos ou defeitos indicarem que o trabalho não foi realizado profissionalmente, isto pode tornar a garantia inválida. Além disso, o dispositivo deve ser restaurado à sua configuração original se a manutenção for necessária, uma vez que as peças podem ter que ser substituídas para o reparo e a MSI exige as peças originais.
Dispositivos de entrada: Ótimo teclado para jogos com barra de luz elegante
O teclado e o layout, bem como o touchpad, não mudaram em comparação com o MSI GE66 10SFS. Portanto, remetemos novamente para a revisão do predecessor modelo.
Um ponto que vale a pena mencionar é a barra de luz, que foi ampliada e oferece ainda mais iluminação no chassi e na frente para os ventiladores RGB. A iluminação também parece mais agradável e de maior qualidade.
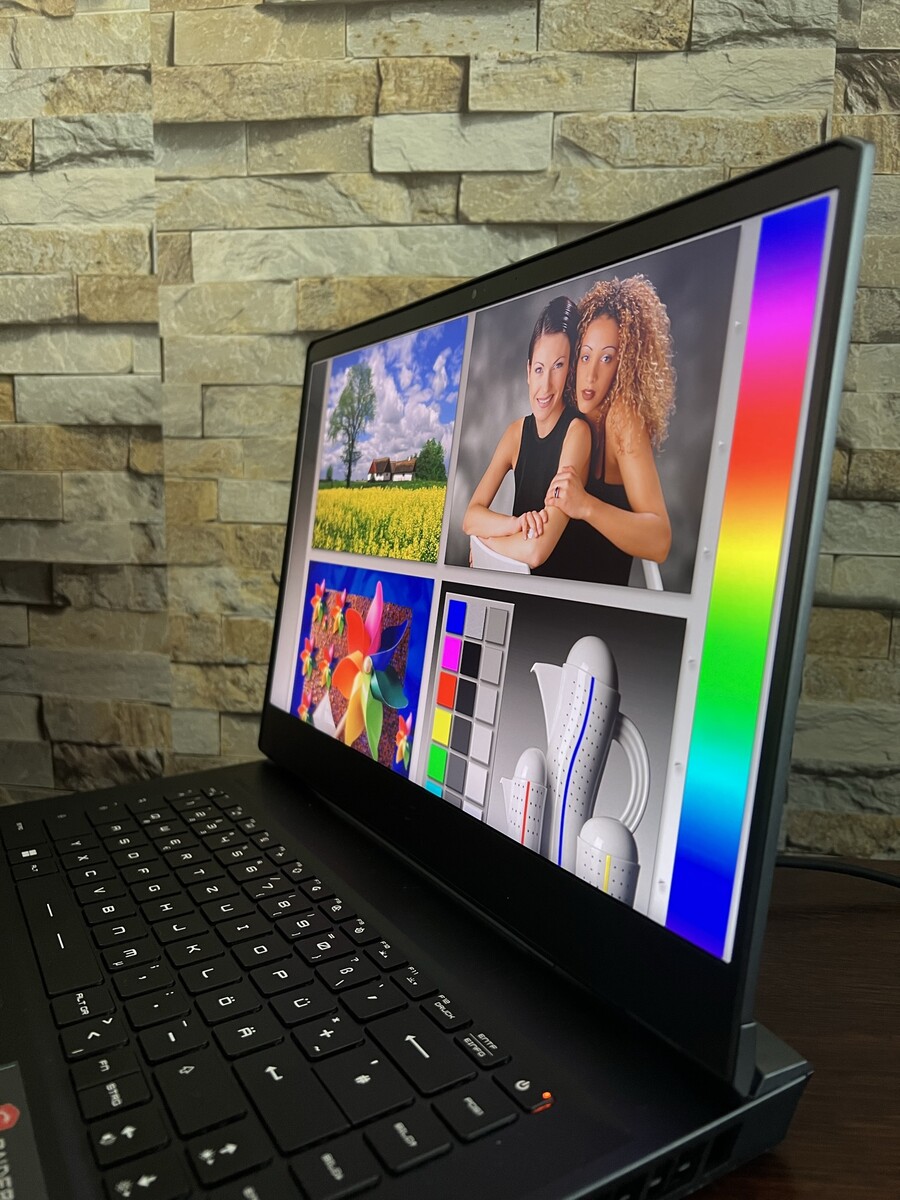
Mostrar: painel 4K com 120 Hz

A MSI instalou um painel IPS não reflexivo com uma taxa de atualização de 120 Hz no Raider GE66 12UHS, que tem uma resolução de 4K e, subjetivamente, parece excelente. Se um painel de 4K é adequado para um equipamento de 15 polegadas é discutível: é definitivamente uma vantagem para os usuários profissionais que também estão interessados em jogos. Além disso, o hardware instalado cai na faixa de alta qualidade absoluta e é definitivamente configurado para executar jogos sem problemas em resolução de 4K. A MSI também oferece alternativas, começando com um painel QHD com 240 Hz ou 165 Hz (e 100% de cobertura DCI-P3 em cada caso), até um painel Full HD com 360 Hz.
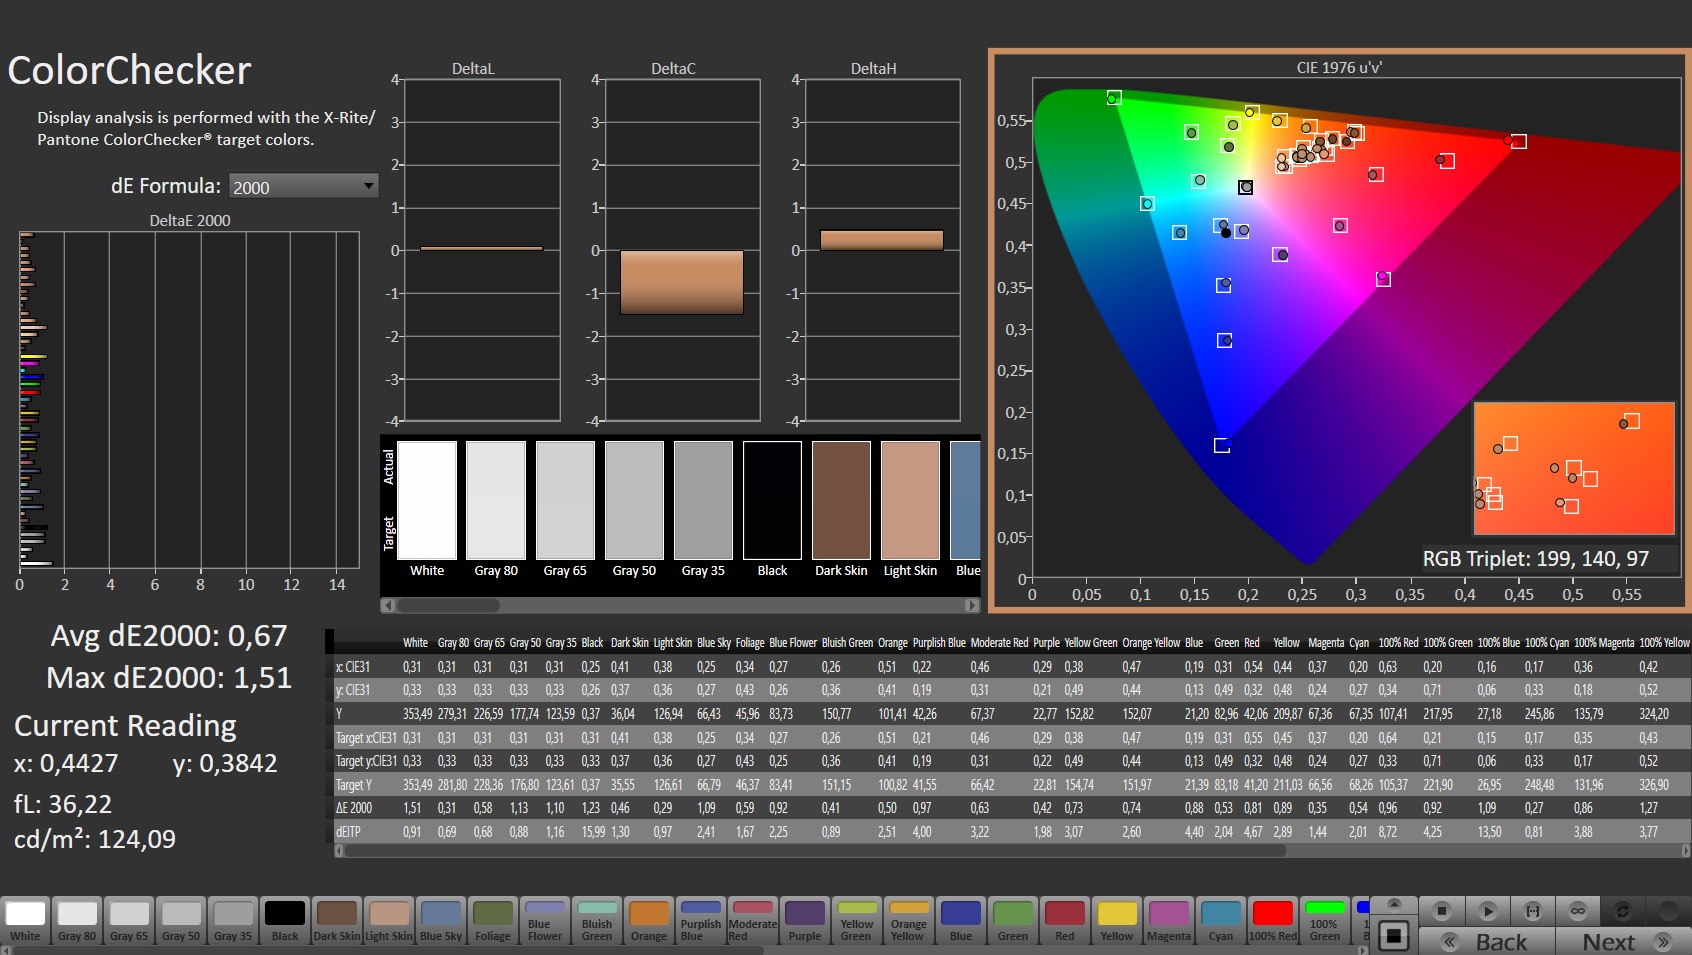
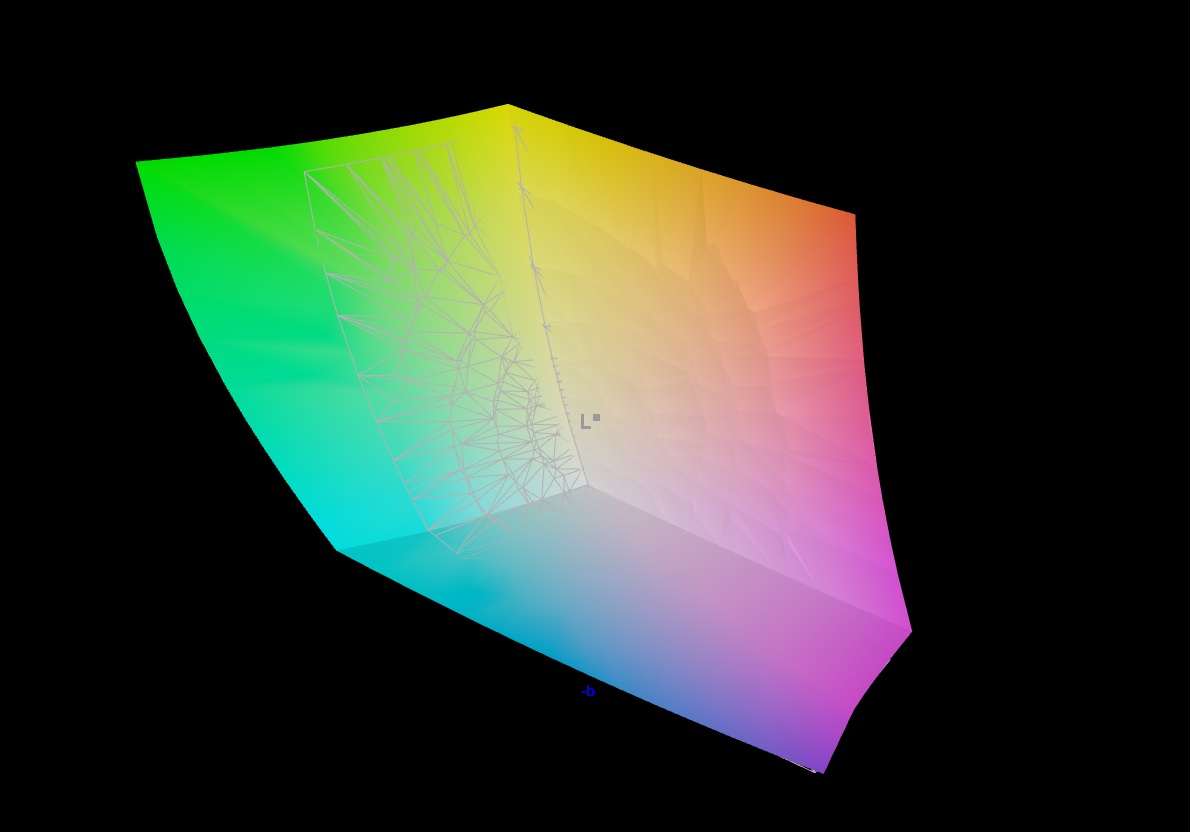
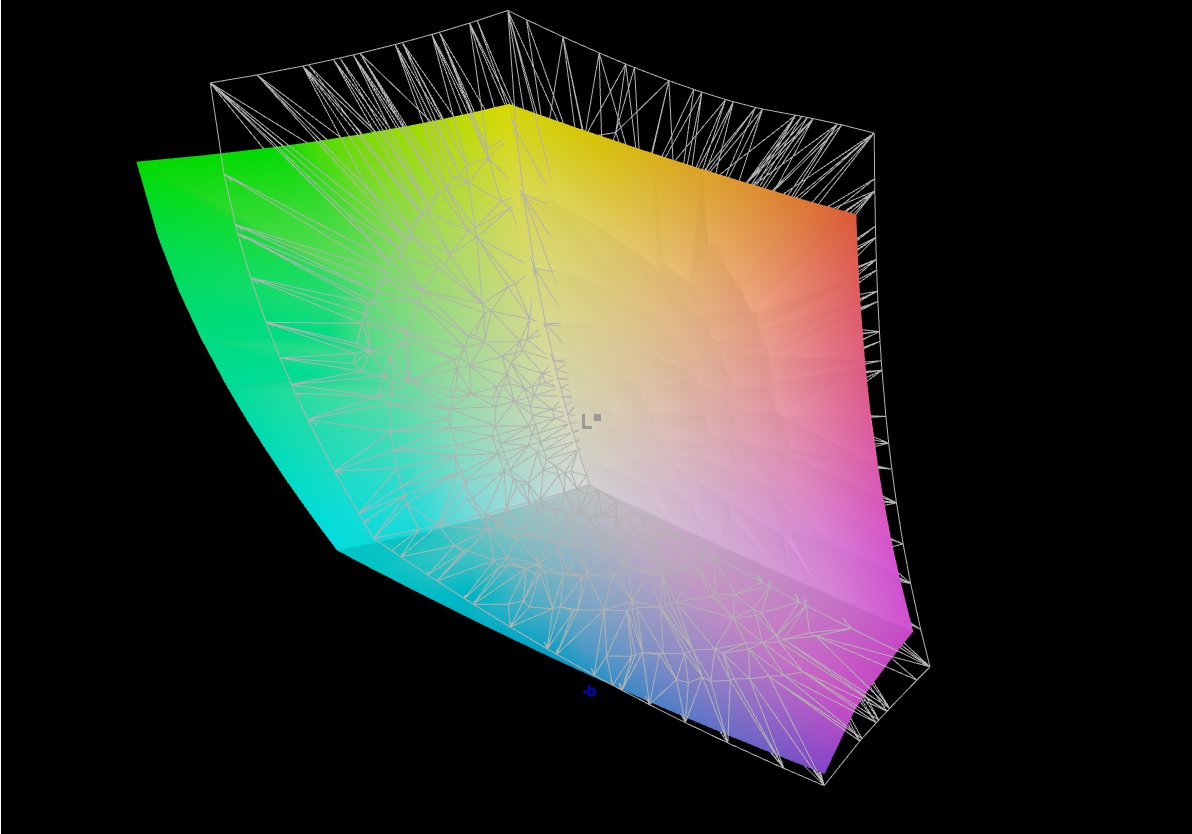
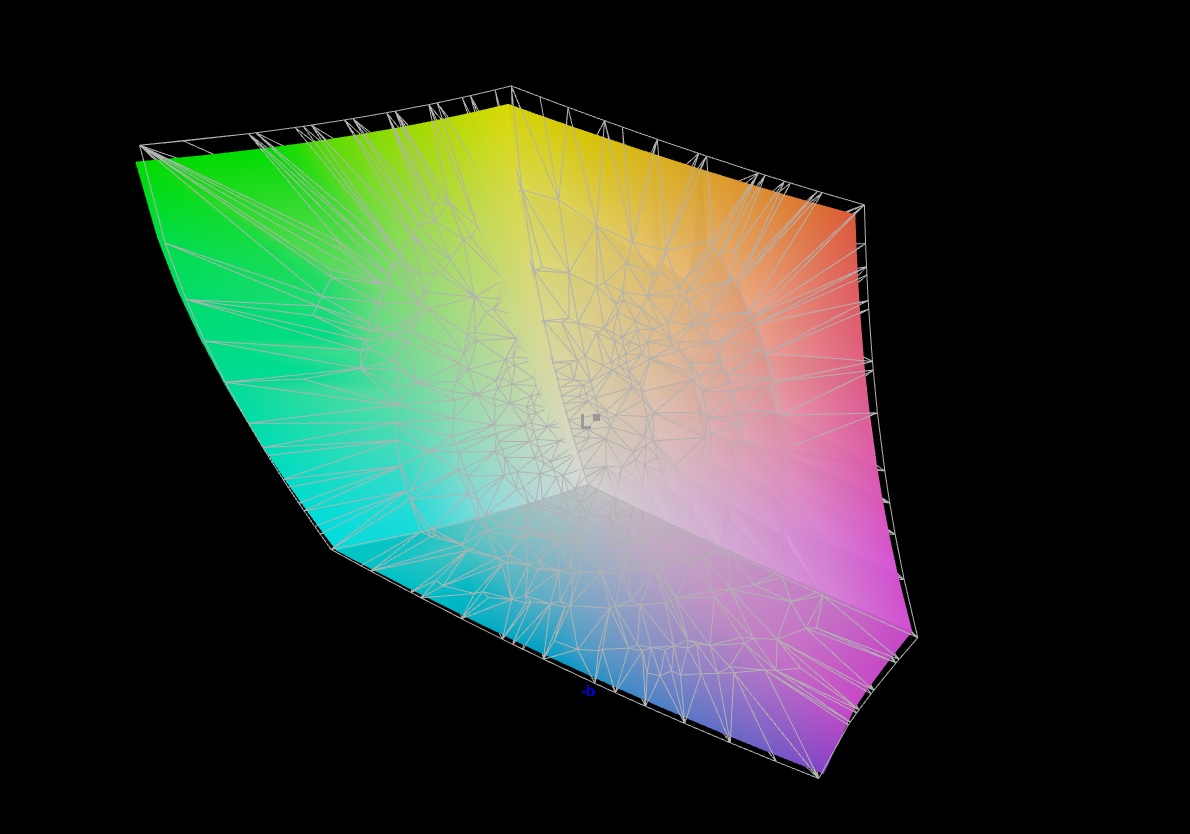
Comparando os valores da tela de 4K no dispositivo de revisão com os do painel FHD (240 Hz) no predecessor, surge a seguinte imagem: O GE66 12UHS com seu painel 4K é 20% mais brilhante a 347 cd/m² e oferece uma maior cobertura de espaço de cor a 80,4% DCI-P3 contra 68%, assim como 94,7% AdobeRGB contra 69,8%. O dispositivo de revisão com seu display 4K não usa PWM, embora o predecessor tivesse isto somente em uma freqüência muito alta. Entretanto, há também desvantagens, tais como tempos de resposta mais altos e valores mais pobres de preto e contraste.
| |||||||||||||||||||||||||
iluminação: 90 %
iluminação com acumulador: 351 cd/m²
Contraste: 1003:1 (Preto: 0.35 cd/m²)
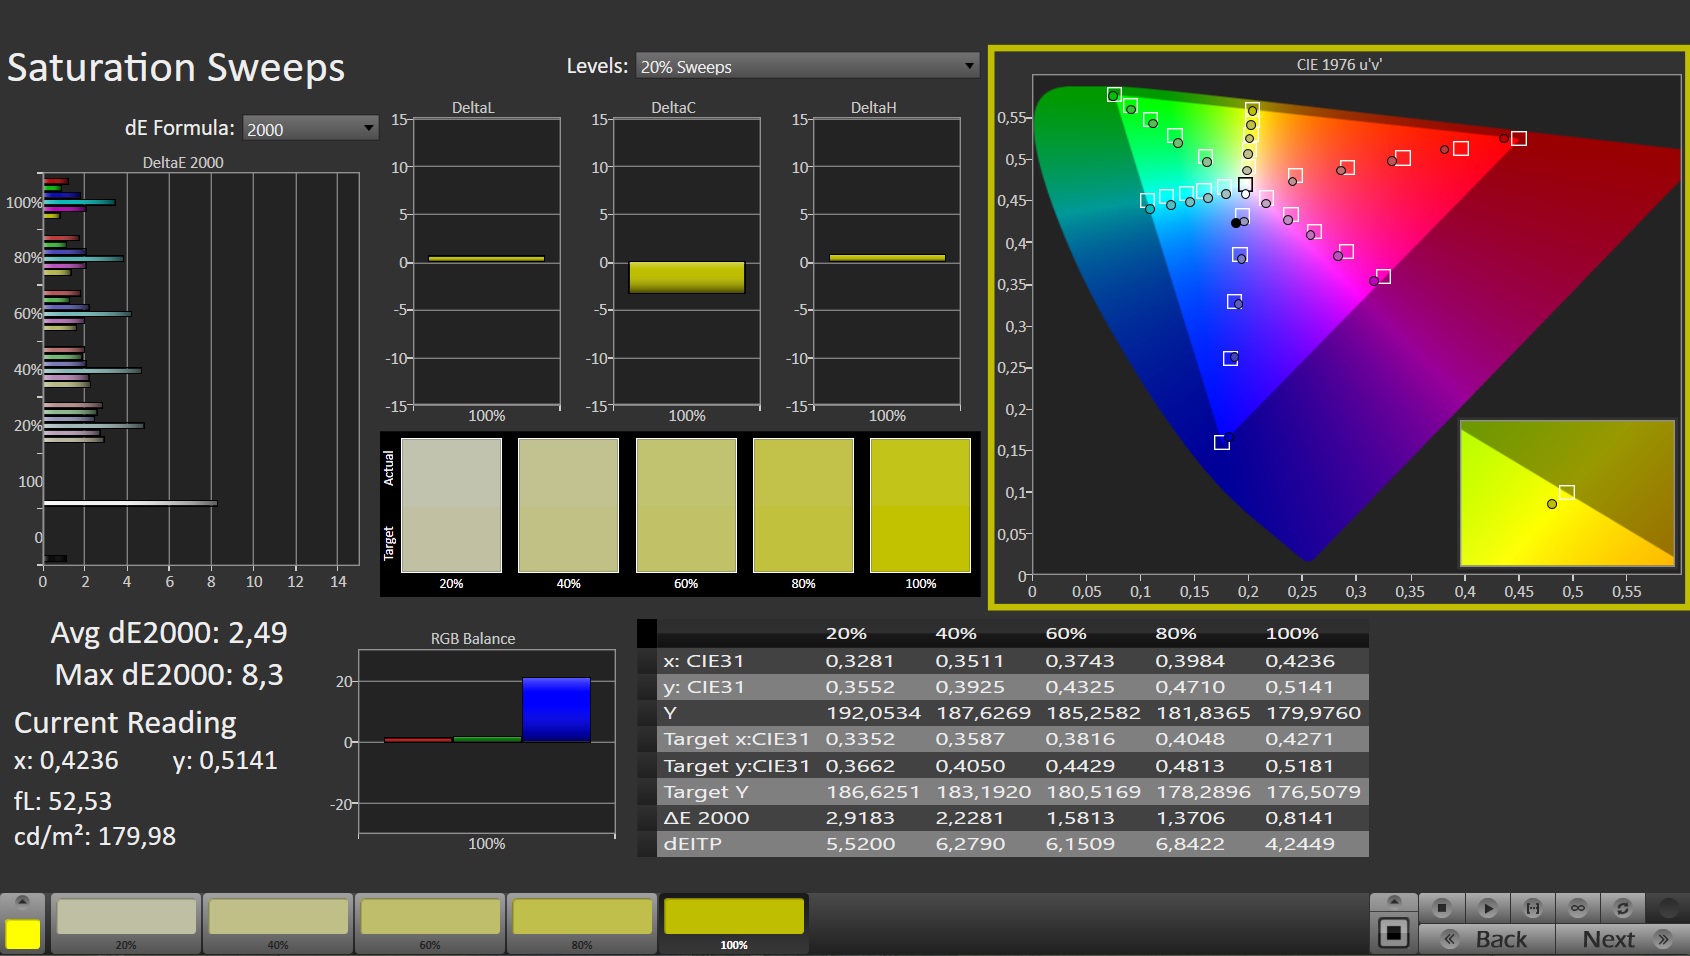
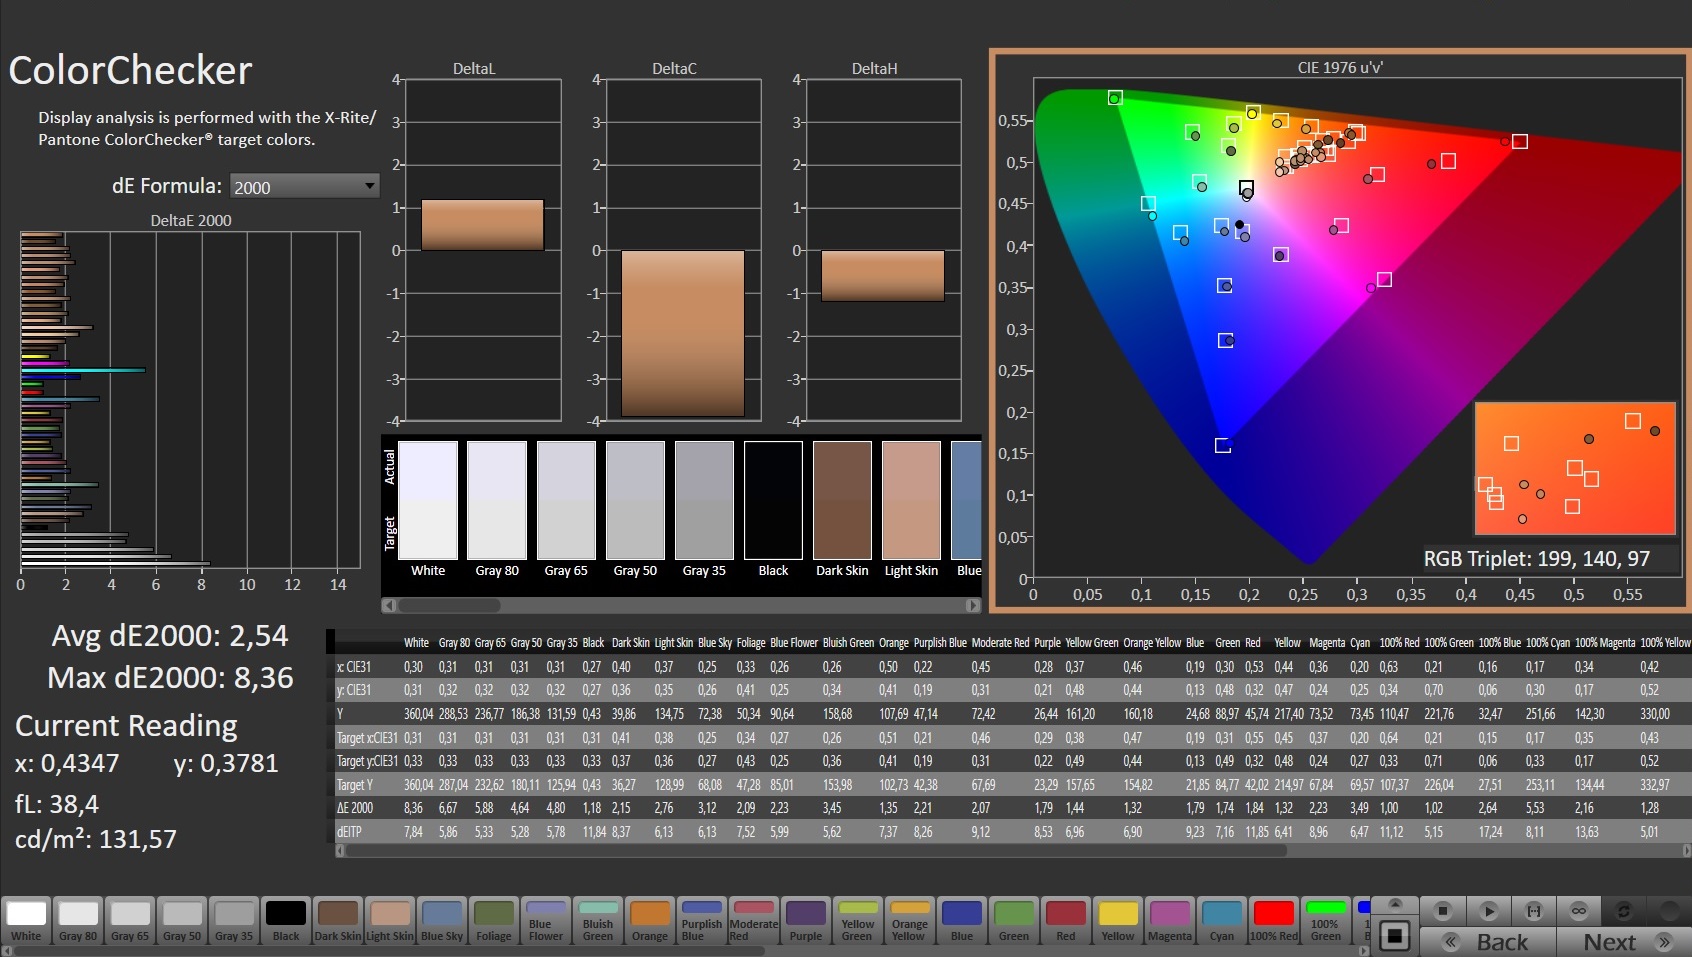
ΔE ColorChecker Calman: 2.54 | ∀{0.5-29.43 Ø4.71}
calibrated: 0.67
ΔE Greyscale Calman: 4.1 | ∀{0.09-98 Ø4.96}
94.7% AdobeRGB 1998 (Argyll 3D)
98.4% sRGB (Argyll 3D)
80.4% Display P3 (Argyll 3D)
Gamma: 2.089
CCT: 7036 K
| MSI Raider GE66 12UHS AUO51EB, IPS, 3840x2160, 15.6" | MSI GE66 Raider 10SFS Sharp LQ156M1JW03 (SHP14C5), IPS-Level, 1920x1080, 15.6" | Razer Blade 15 2022 Sharp LQ156T1JW03, IPS, 2560x1440, 15.6" | Schenker XMG Neo 15 E22 (Early 2022, RTX 3080 Ti) BOE0A67 (BOE CQ NE156QHM-NZ1), IPS, 2560x1440, 15.6" | Lenovo Legion 5 Pro 16 G7 i7 RTX 3070Ti NE160QDM-NY1, IPS, 2560x1600, 16" | |
|---|---|---|---|---|---|
| Display | -13% | 6% | -14% | ||
| Display P3 Coverage (%) | 80.4 | 68 -15% | 99.1 23% | 68.7 -15% | |
| sRGB Coverage (%) | 98.4 | 99 1% | 99.9 2% | 97.6 -1% | |
| AdobeRGB 1998 Coverage (%) | 94.7 | 69.8 -26% | 86.8 -8% | 70.9 -25% | |
| Response Times | 16% | 16% | 20% | 24% | |
| Response Time Grey 50% / Grey 80% * (ms) | 18.8 ? | 16.4 ? 13% | 14.4 ? 23% | 14.4 ? 23% | 17.6 ? 6% |
| Response Time Black / White * (ms) | 12.8 ? | 10.4 ? 19% | 11.6 ? 9% | 10.8 ? 16% | 7.6 ? 41% |
| PWM Frequency (Hz) | 23580 ? | ||||
| Screen | 23% | -19% | 4% | 9% | |
| Brightness middle (cd/m²) | 351 | 291 -17% | 286 -19% | 295 -16% | 502 43% |
| Brightness (cd/m²) | 347 | 278 -20% | 271 -22% | 277 -20% | 491 41% |
| Brightness Distribution (%) | 90 | 91 1% | 89 -1% | 62 -31% | 91 1% |
| Black Level * (cd/m²) | 0.35 | 0.25 29% | 0.25 29% | 0.28 20% | 0.37 -6% |
| Contrast (:1) | 1003 | 1164 16% | 1144 14% | 1054 5% | 1357 35% |
| Colorchecker dE 2000 * | 2.54 | 1.19 53% | 2.74 -8% | 2.36 7% | 2.7 -6% |
| Colorchecker dE 2000 max. * | 8.36 | 3.04 64% | 5.21 38% | 4.24 49% | 4.5 46% |
| Colorchecker dE 2000 calibrated * | 0.67 | 2.52 -276% | 1.4 -109% | ||
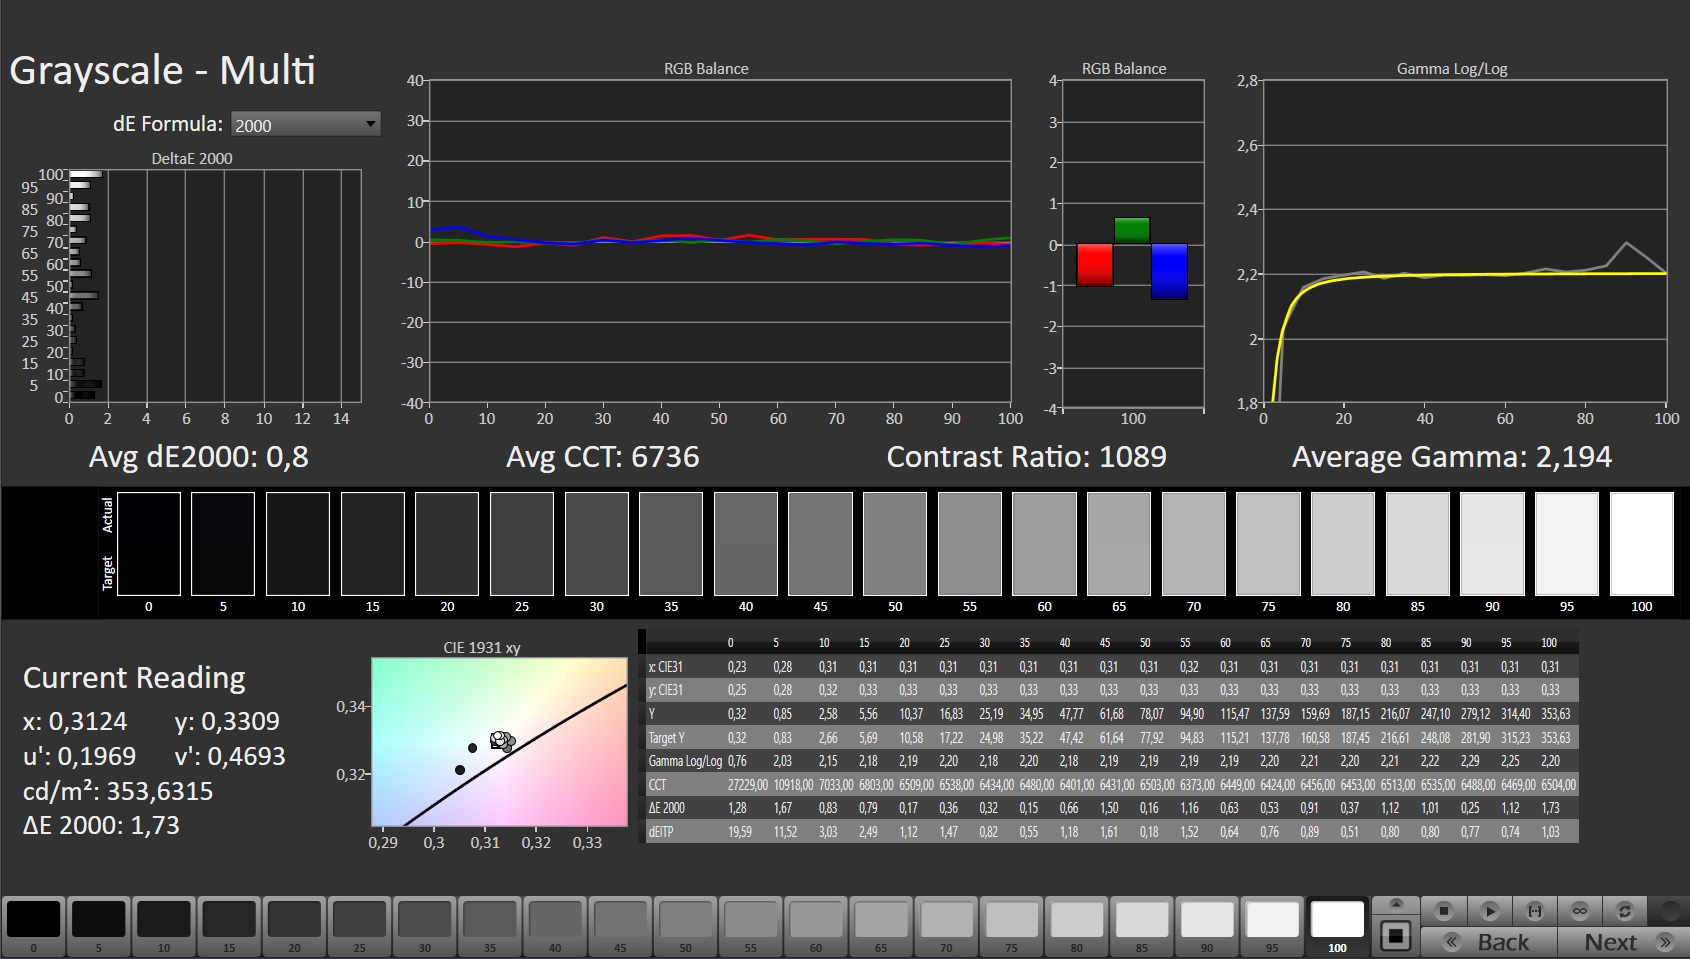
| Greyscale dE 2000 * | 4.1 | 1.9 54% | 1.1 73% | 3.43 16% | 2.7 34% |
| Gamma | 2.089 105% | 2.216 99% | 2.2 100% | 2.44 90% | 2.44 90% |
| CCT | 7036 92% | 7018 93% | 6408 101% | 6266 104% | 6326 103% |
| Color Space (Percent of AdobeRGB 1998) (%) | 70 | ||||
| Color Space (Percent of sRGB) (%) | 92 | ||||
| Média Total (Programa/Configurações) | 9% /
13% | 1% /
-9% | 12% /
7% | 6% /
6% |
* ... menor é melhor
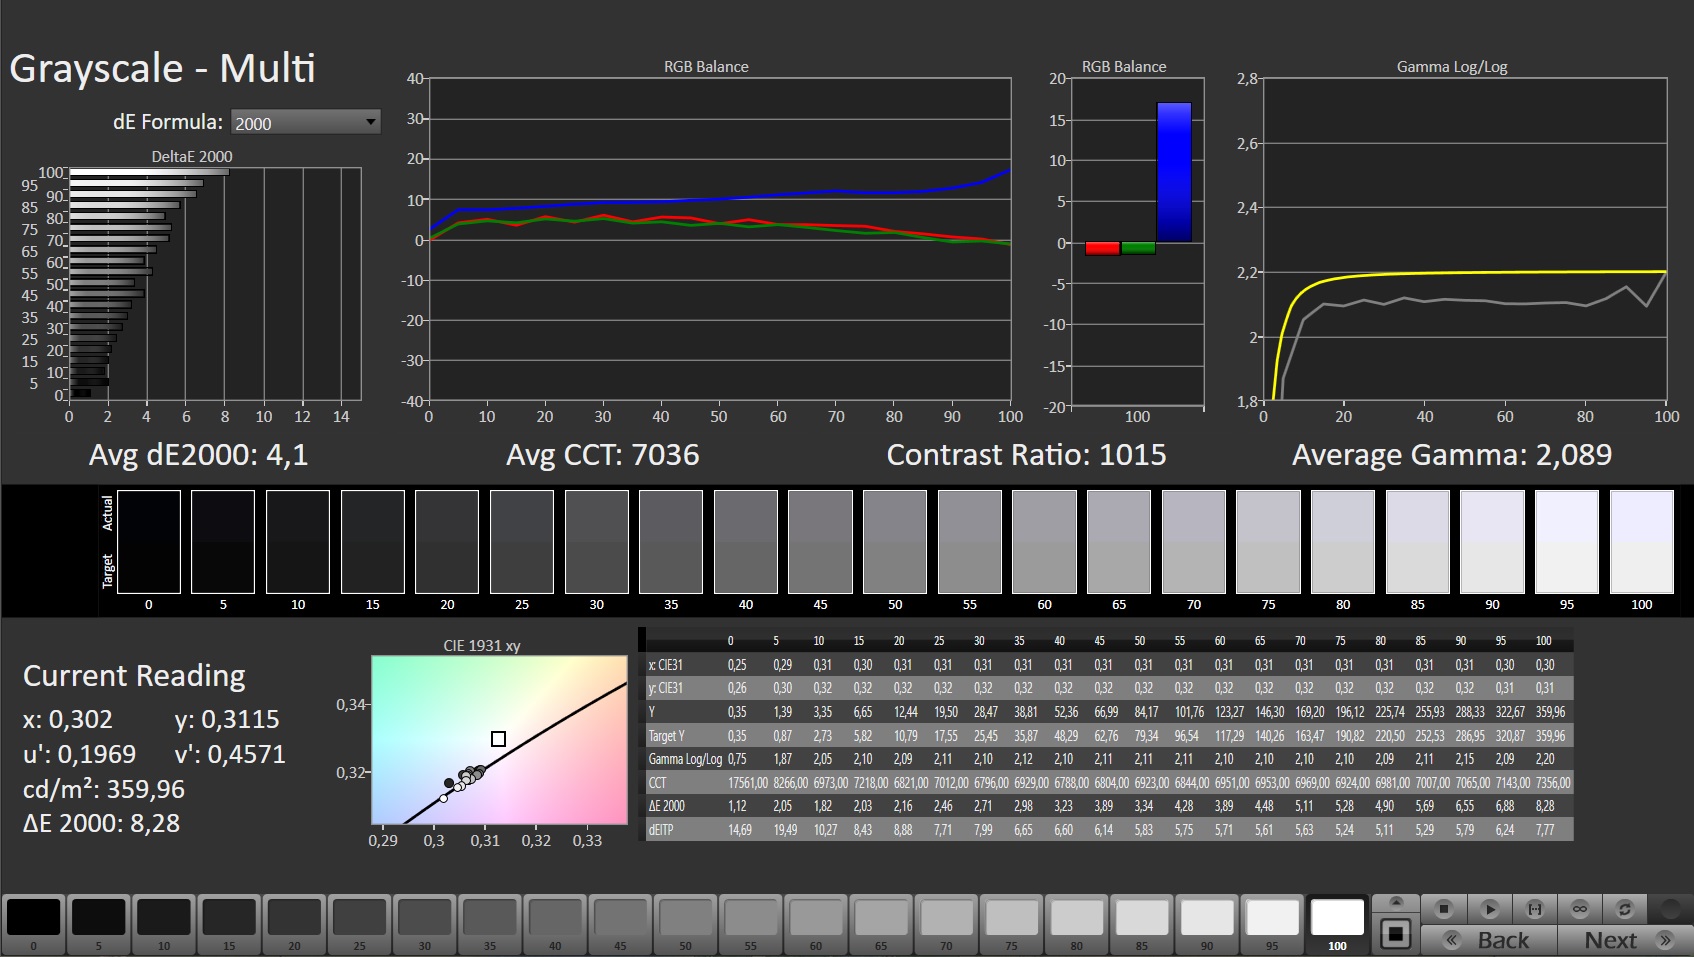
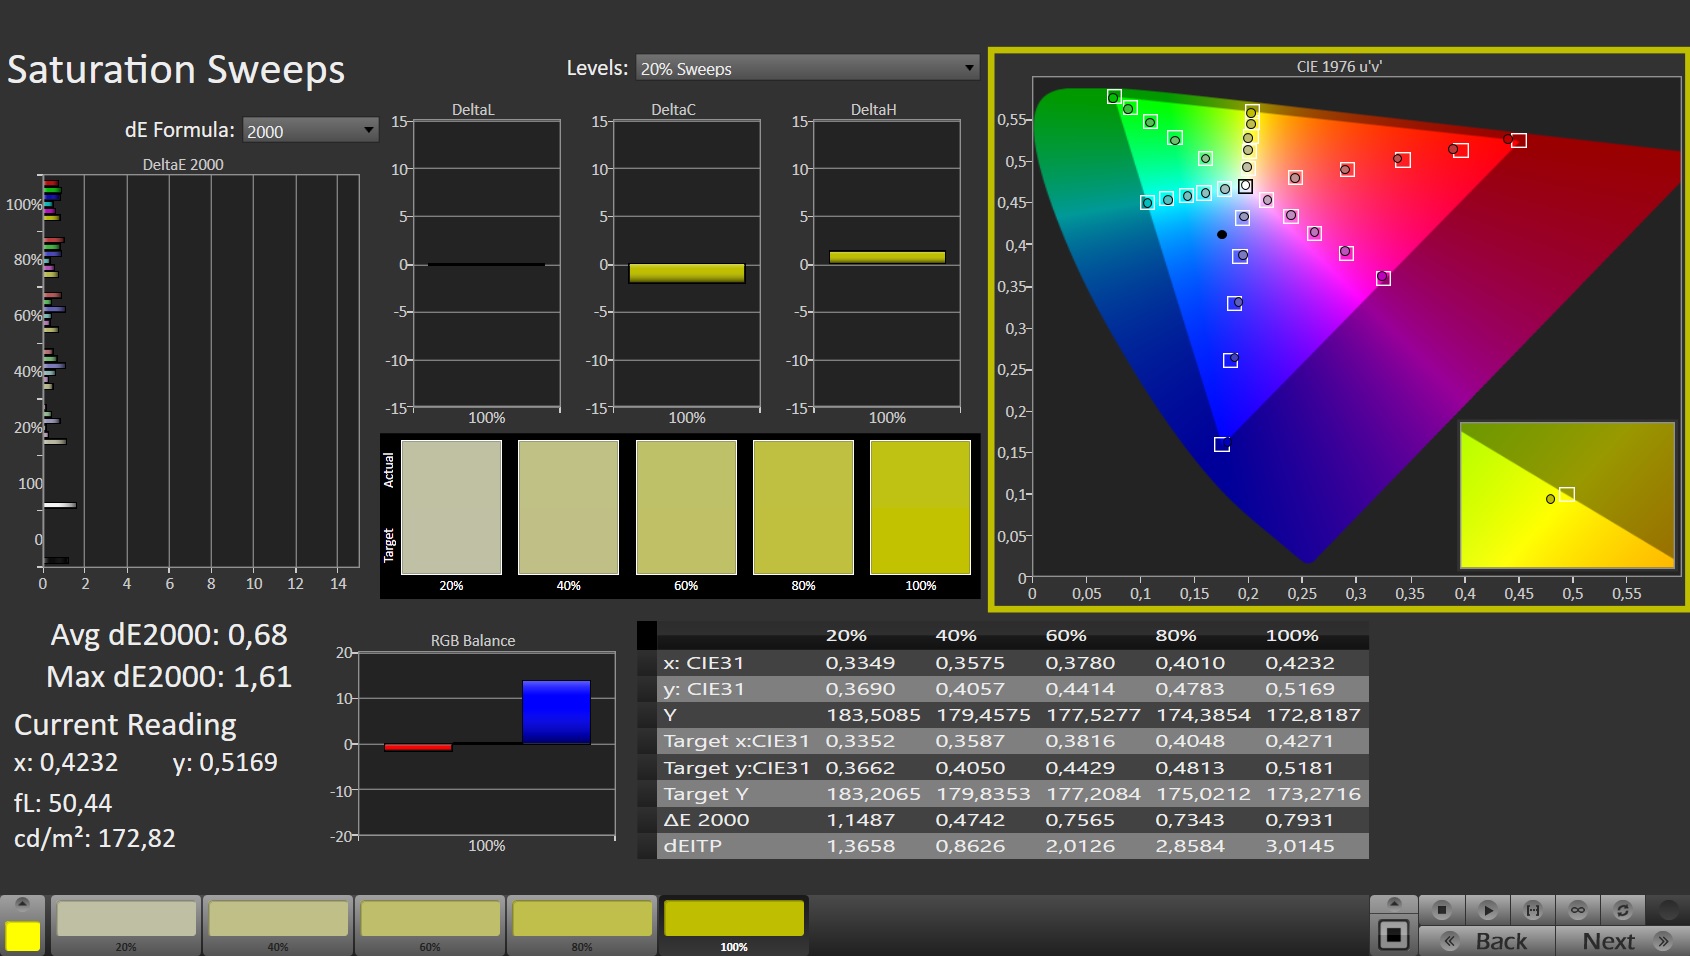
A precisão das cores do display ex werks pode ser melhorada, especialmente em escala de cinza. Após a calibração com o fotostostômetro, alcançamos valores médios de escala de cinza e DeltaE de cor muito bons de 0,8 e 0,67, respectivamente. O perfil ICC de nossa calibração está disponível para faça o download aqui.
Exibir tempos de resposta
| ↔ Tempo de resposta preto para branco | ||
|---|---|---|
| 12.8 ms ... ascensão ↗ e queda ↘ combinadas | ↗ 6.8 ms ascensão | 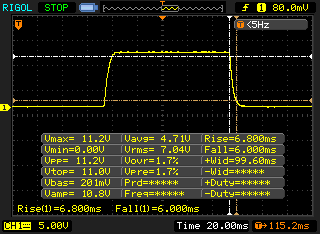 |
| ↘ 6 ms queda | ||
| A tela mostra boas taxas de resposta em nossos testes, mas pode ser muito lenta para jogadores competitivos. Em comparação, todos os dispositivos testados variam de 0.1 (mínimo) a 240 (máximo) ms. » 33 % de todos os dispositivos são melhores. Isso significa que o tempo de resposta medido é melhor que a média de todos os dispositivos testados (19.8 ms). | ||
| ↔ Tempo de resposta 50% cinza a 80% cinza | ||
| 18.8 ms ... ascensão ↗ e queda ↘ combinadas | ↗ 9.2 ms ascensão | 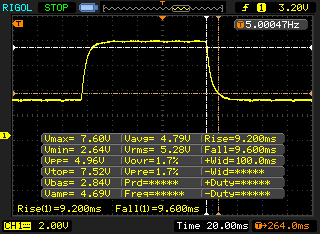 |
| ↘ 9.6 ms queda | ||
| A tela mostra boas taxas de resposta em nossos testes, mas pode ser muito lenta para jogadores competitivos. Em comparação, todos os dispositivos testados variam de 0.165 (mínimo) a 636 (máximo) ms. » 32 % de todos os dispositivos são melhores. Isso significa que o tempo de resposta medido é melhor que a média de todos os dispositivos testados (31 ms). | ||
Cintilação da tela / PWM (modulação por largura de pulso)
| Tela tremeluzindo / PWM não detectado | 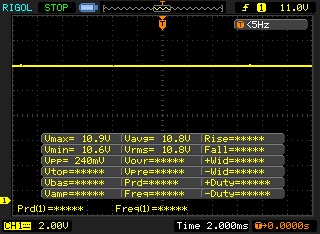 | ||
[pwm_comparison] Em comparação: 52 % de todos os dispositivos testados não usam PWM para escurecer a tela. Se PWM foi detectado, uma média de 7757 (mínimo: 5 - máximo: 343500) Hz foi medida. | |||
Mesmo com uma tela não reflexiva e um brilho de 347 cd/m², não podemos recomendar o Raider GE66 12UHS para uso com luz solar direta, pelo menos quando trabalhamos sem o MSI True Color. Com esta ferramenta e suas diversas configurações, a legibilidade do conteúdo da tela pode ser um pouco melhorada. Mas em termos de uso geral ao ar livre, você deve procurar um ponto sombreado para condições ideais
O painel IPS embutido de nosso dispositivo de revisão permanece estável mesmo quando visto de um ângulo extremamente amplo. O brilho permanece inalterado e as cores também não se tornam distorcidas.
Desempenho: Solução inteligente de refrigeração de metal líquido para o MSI GE66 12UHS
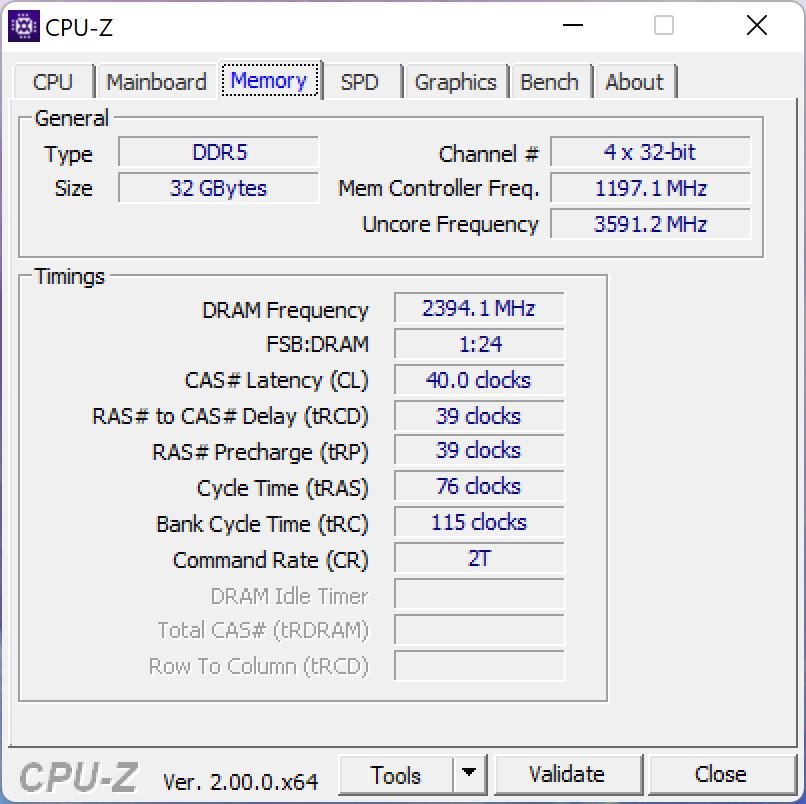
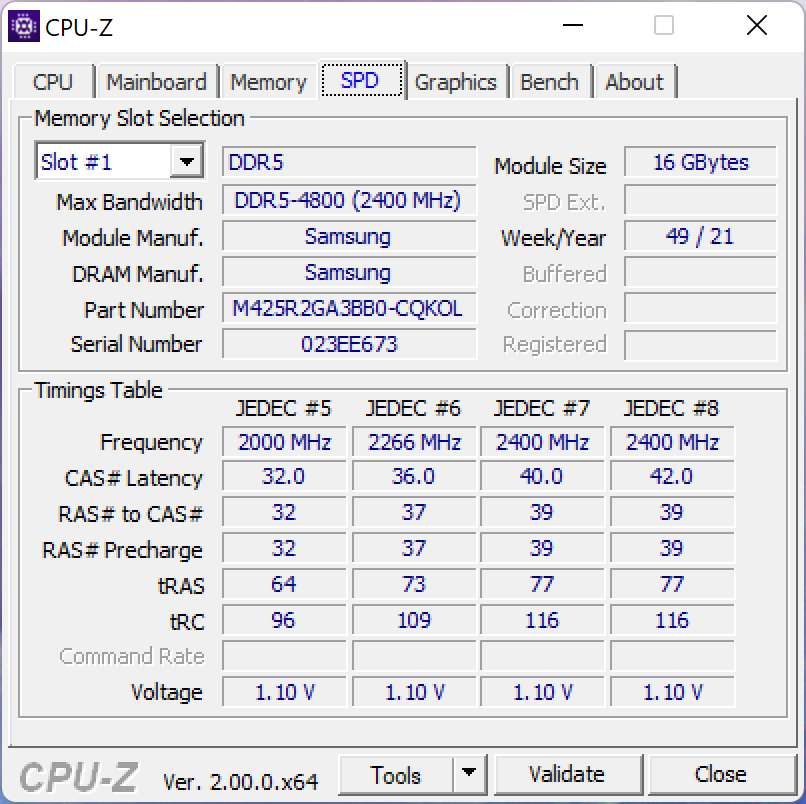
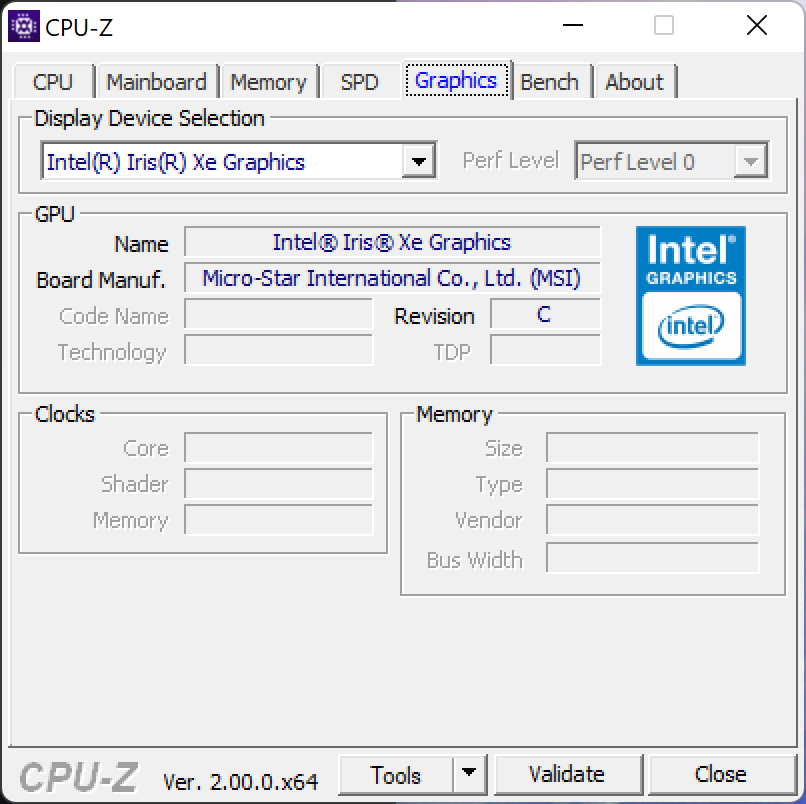
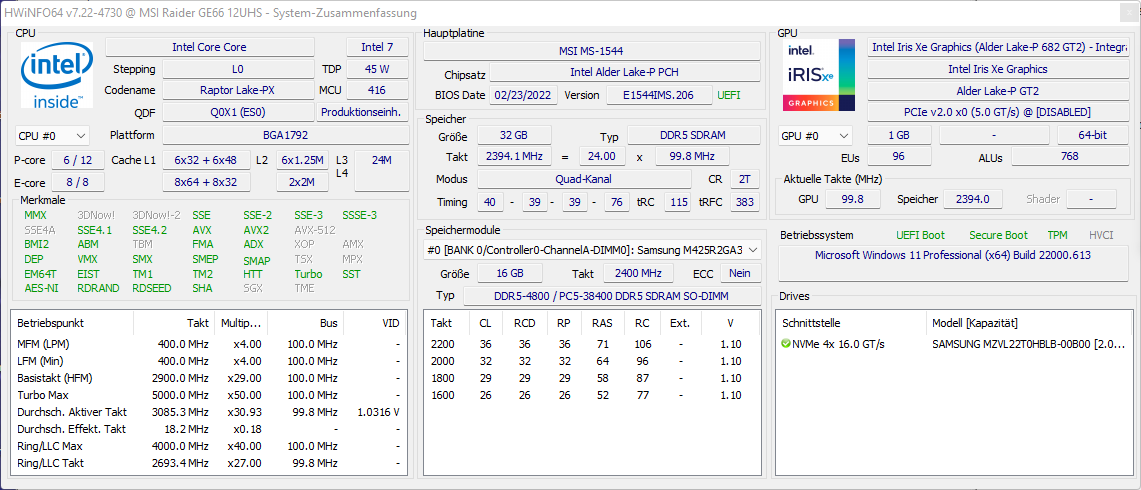
O MSI GE66 12UHS está disponível em várias configurações. Assim, você pode adquirir o sistema com um Intel Core i7 12700Hao invés do Intel Core i9 12900HK. Quanto à configuração da GPU, o sistema está disponível com o RTX 3080 com 8 GB de VRAM e 150 watts de TDP (Total Dynamic Power) ou com o RTX 3080 Ti, que está equipado com 16 GB de VRAM e também tem TDP de 150 watts. Ambas as configurações usam 16 GB de RAM DDR5 a 4.800 MHz ou 32 GB de RAM DDR5 na mesma freqüência de clock, cada uma rodando em modo de canal duplo. Os SSDs são instalados no tamanho de 1 TB ou 2 TB.
Nosso dispositivo de revisão é a versão top-end com o Intel Core i9 12900HKo RTX 3080 Ti e 32 GB DDR5 RAM, complementado por um SSD de 2 TB.
Condições de teste
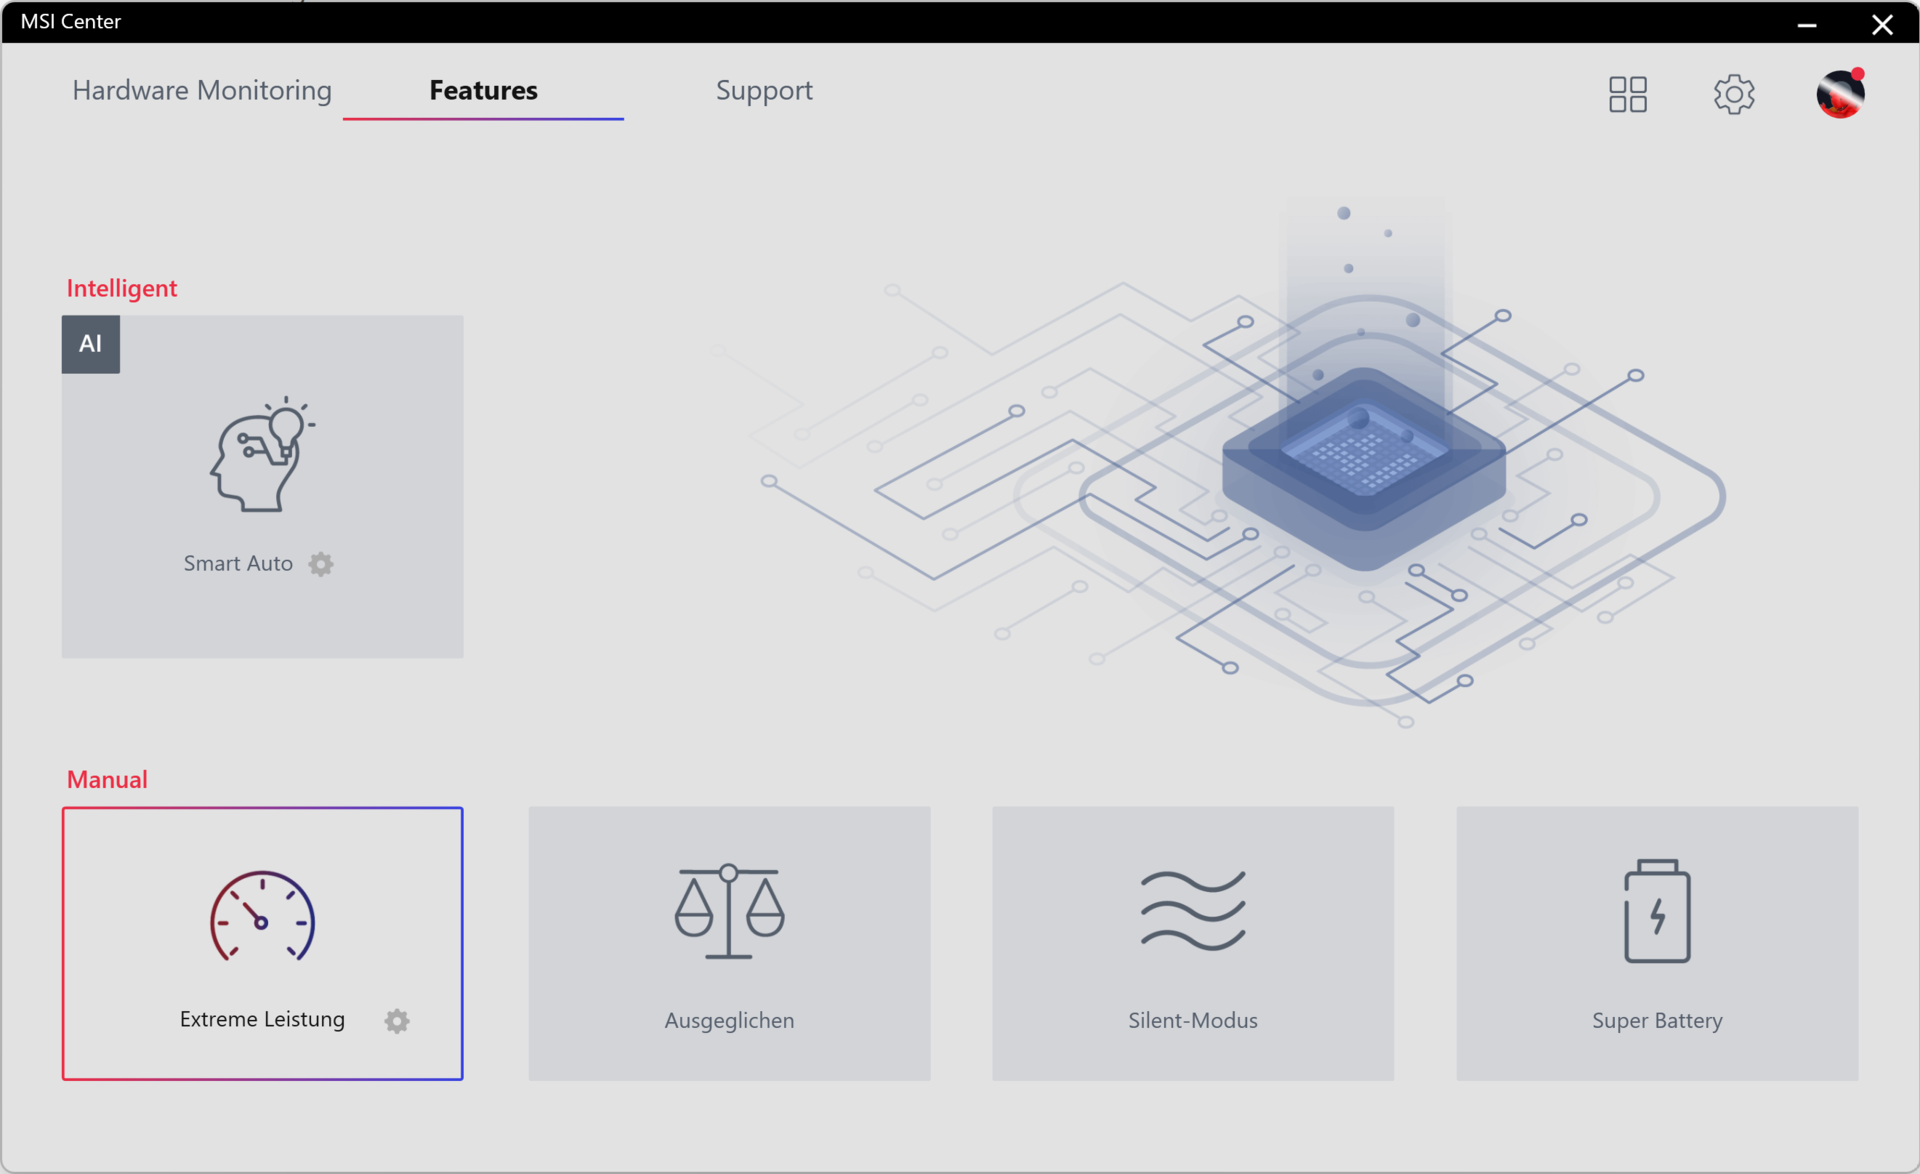
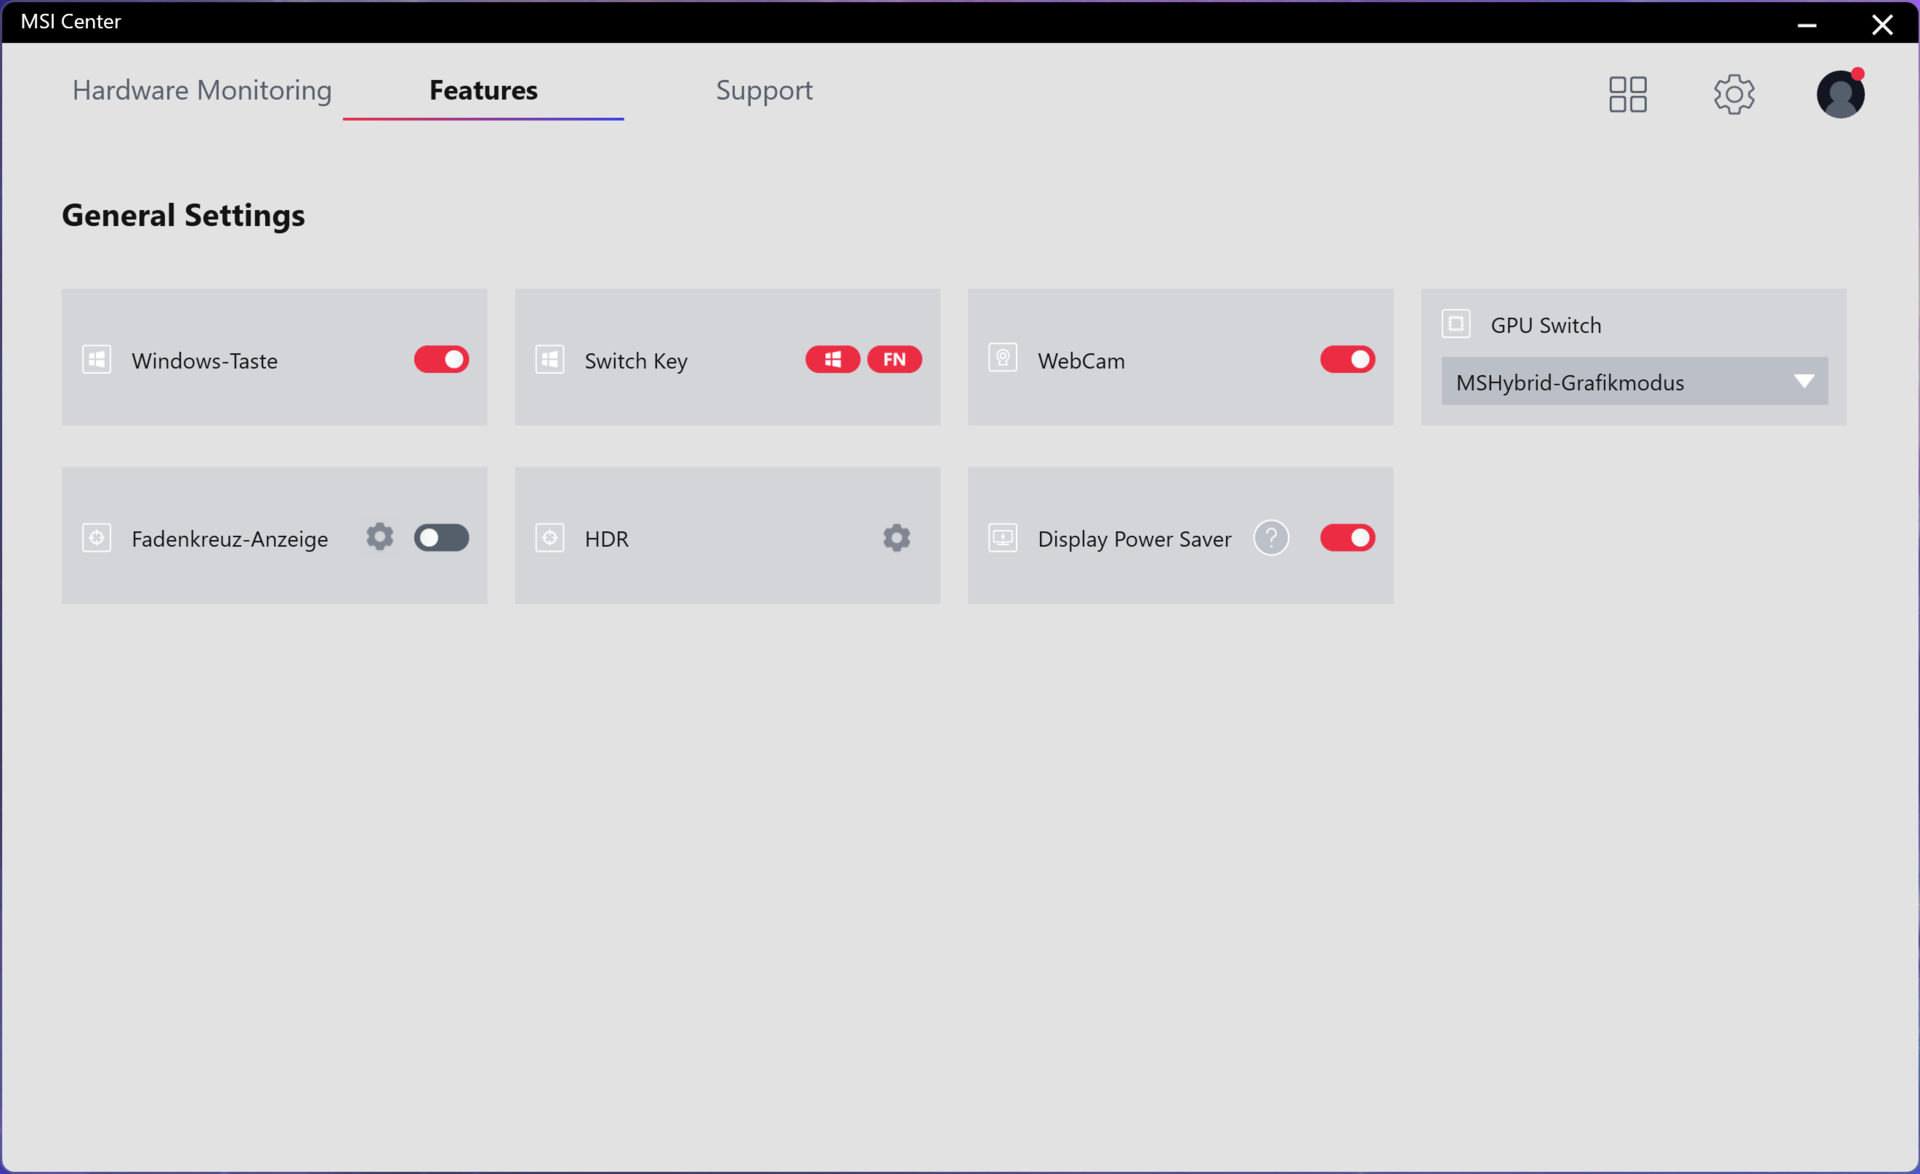
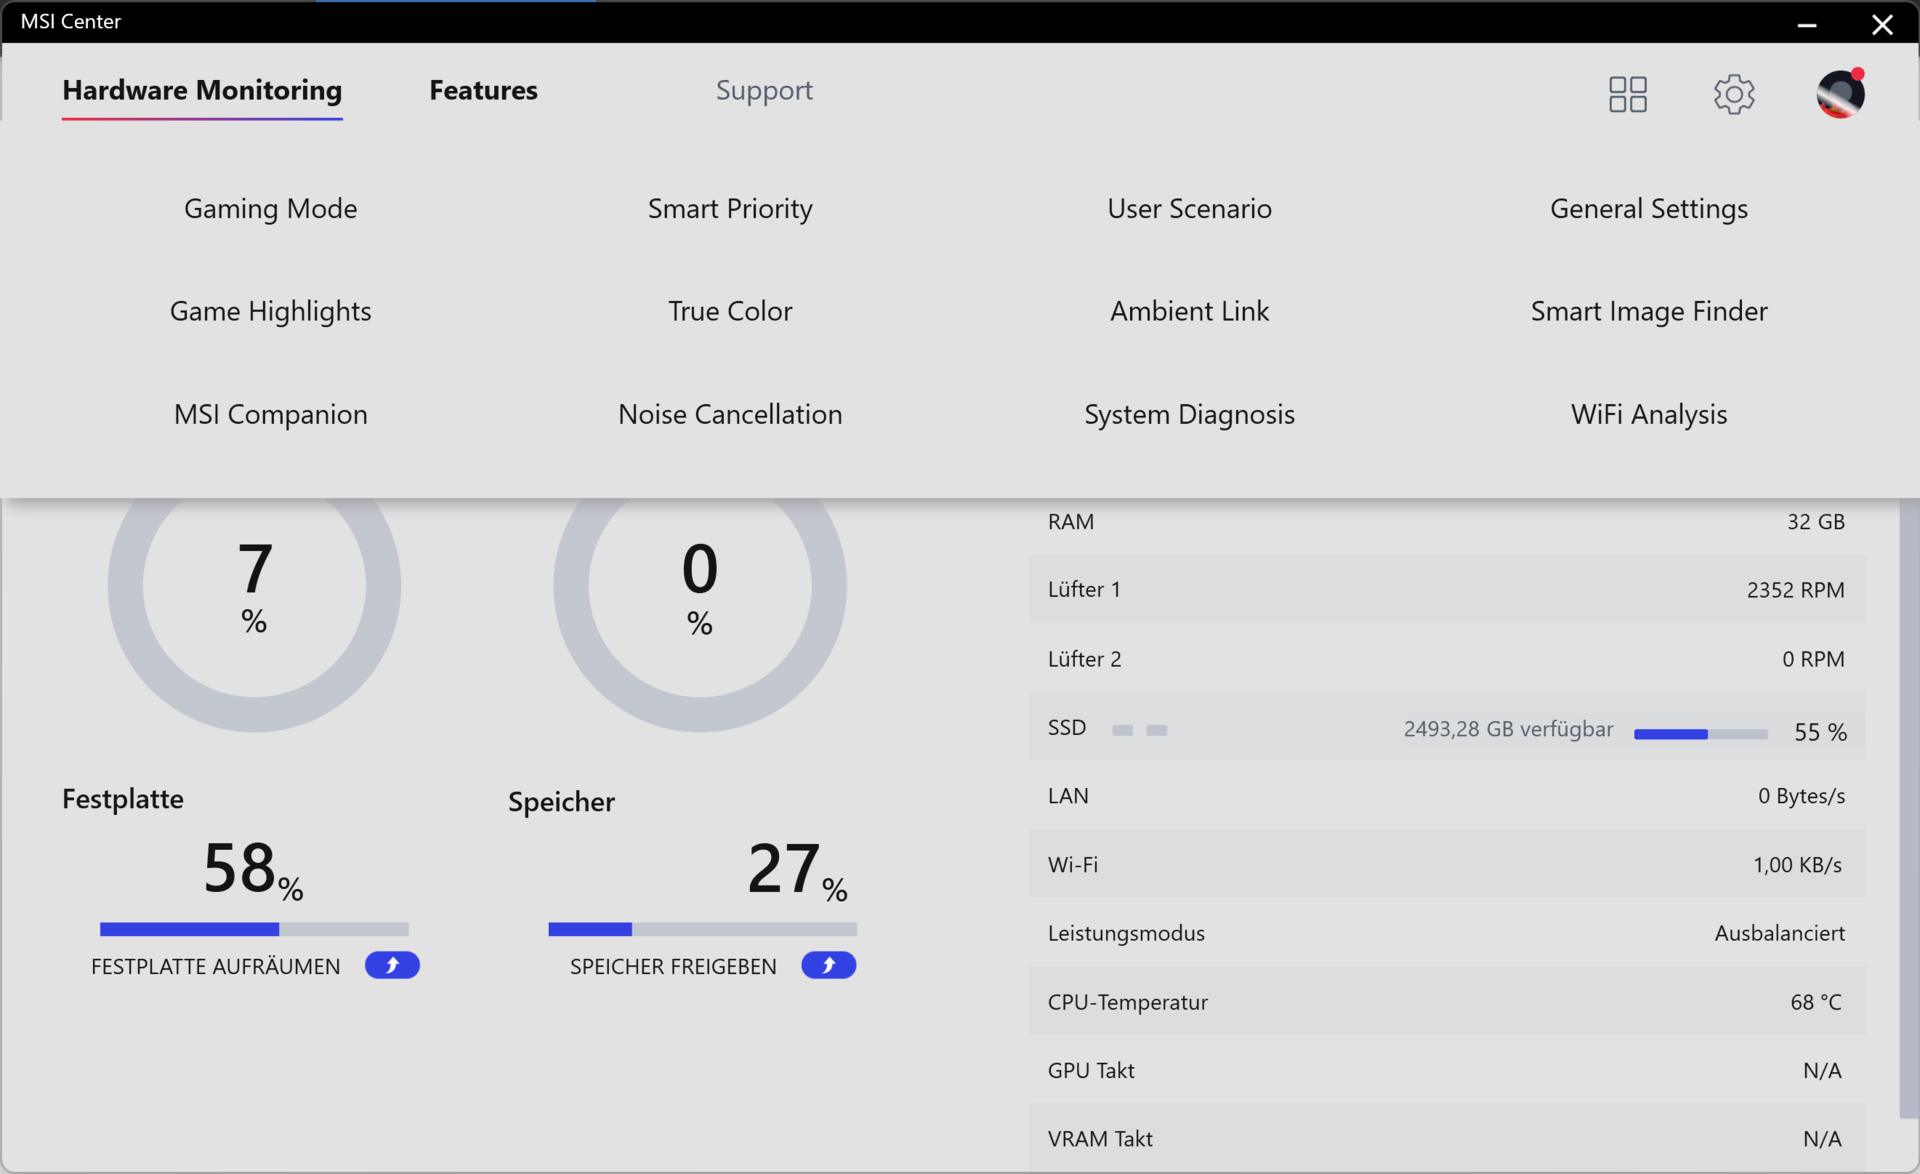
Para obter resultados de referência ideais, definimos nosso laptop para o modo "Desempenho Extremo" através do MSI Center (caso contrário, definimos "Automático Inteligente" como a configuração padrão). Muitas configurações importantes do sistema podem ser ajustadas através da plataforma (não é necessário criar uma conta). Estas incluem os perfis dos ventiladores, bem como configurações gerais e outras características como "Live Update" para encontrar os últimos drivers do sistema. Infelizmente, nem todos os drivers podem ser instalados automaticamente e alguns têm que ser instalados manualmente. Também gostamos da opção de executar a GPU no "Modo Gráfico Discreto" (RTX 3080 Ti somente) ou no "MSHybrid Graphics Mode" (Advanced-Optimus) para não somente salvar a vida útil da bateria, mas também para poder usar a saída de vídeo Thunderbolt 4, uma vez que esta está desabilitada no "Discrete Graphics Mode". Um reinício do sistema é necessário em cada caso.
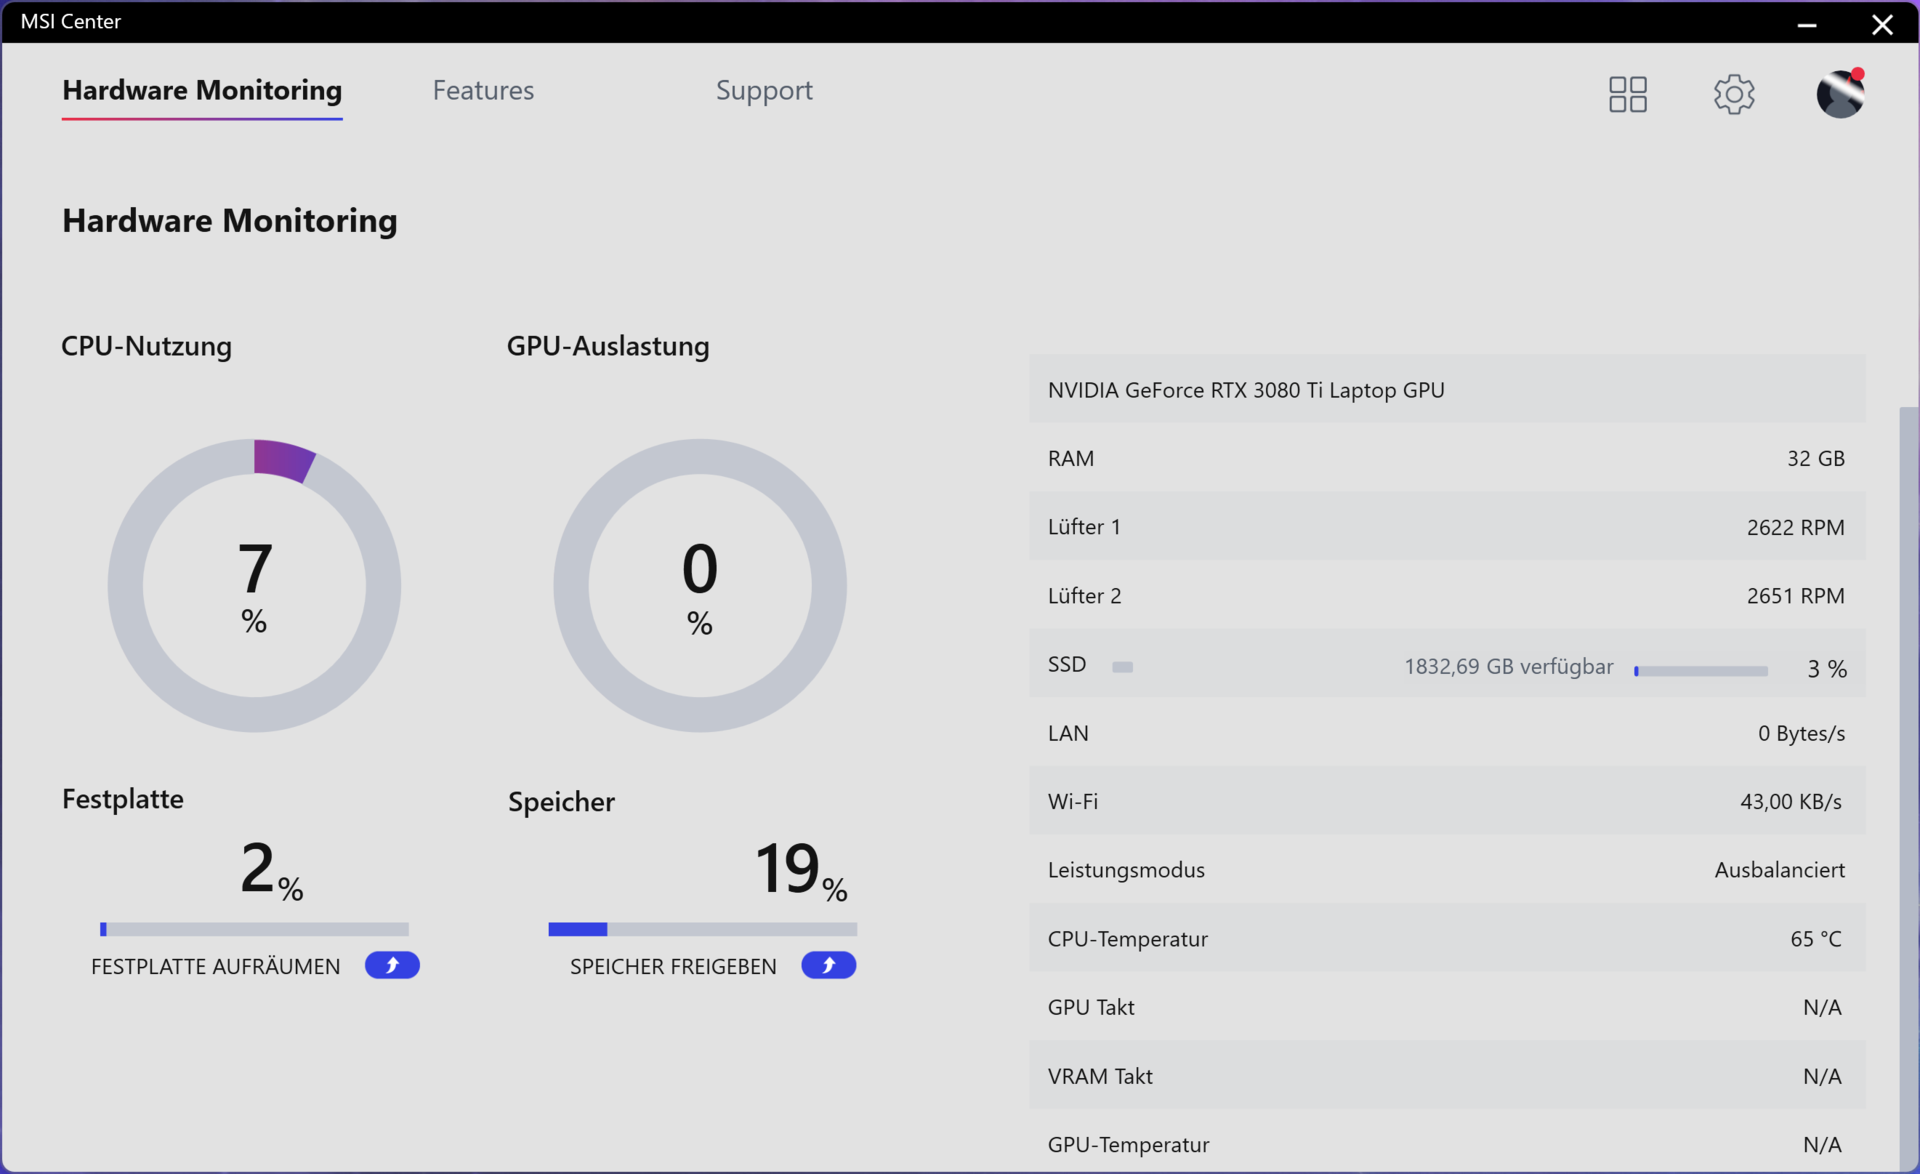
Várias falhas foram observadas na forma de tempos de espera ocasionalmente longos durante a inicialização do MSI Center, que também freqüentemente falhou sem razão aparente, e o constante congelamento da ferramenta "Monitoramento de Hardware" em nosso dispositivo de revisão.
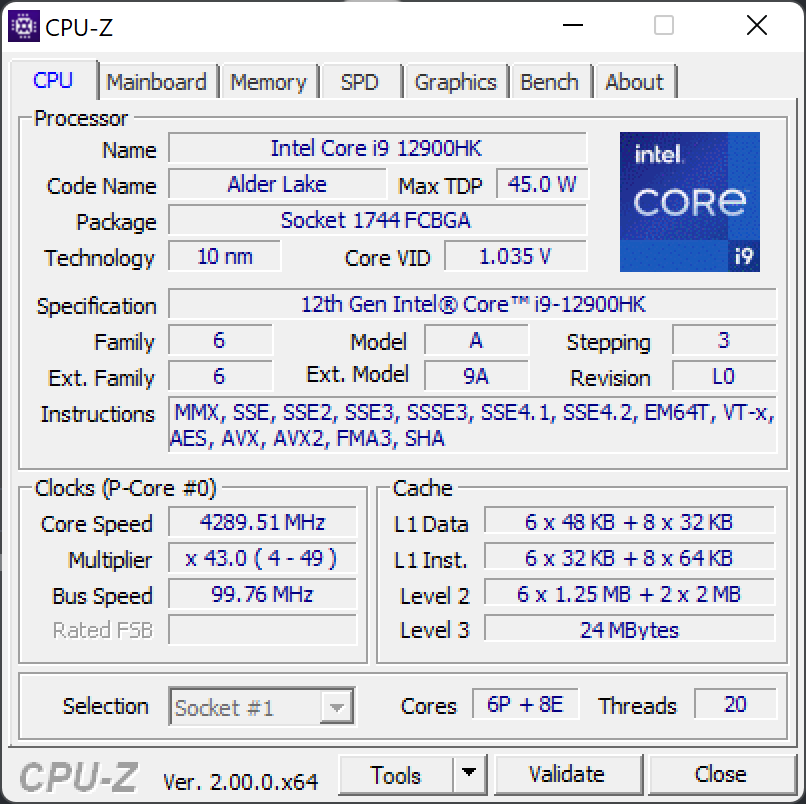
Processador
Nosso dispositivo de revisão utiliza umIntel Core i9 12900HK, uma das CPUs móveis mais fortes da Intel, juntamente com as que serão lançadas em breve Intel Core i9 12950HXo Intel Core i9 12900HK tem 14 núcleos (20 roscas), 6 núcleos de desempenho e 8 núcleos de eficiência, que oferecem um Turbo Boost de até 5 GHz e 24 MB de cache L3.
No benchmark Cinebench R23 com controle automático do ventilador, assim como no perfil "Extreme Performance", a CPU consome brevemente 86 watts antes de ser termicamente acionada. A pontuação máxima neste cenário é de 16.236 pontos no benchmark multi-core. Esta pontuação cai para 12.729 pontos no modo bateria sob as mesmas condições. Se você deixar o desempenho e o controle do ventilador para a IA (inteligência artificial) no "Modo Automático Inteligente", a pontuação aumenta apenas marginalmente para 16.533 pontos e a CPU consome brevemente 90 watts em vez de 86 watts. Se você mudar o modo ventilador para "Cooler Boost" no perfil "Desempenho Extremo", você atinge quase 17.000 pontos e um pico de carga de 92 watts, mas você tem que suportar níveis de ruído consideravelmente mais altos.
A MSI equipa o processador instalado com um "Phase-Change Liquid Metal Pad", cuja função é atuar como uma almofada de condução de calor em forma sólida até fundir a 58 graus Celsius e se transformar em metal líquido, o que supostamente melhora significativamente a condutividade térmica a altas temperaturas
Nossos resultados dos testes: Mesmo com metal líquido, o equipamento de 15 polegadas não esgota totalmente o potencial de seu Intel Core i9 12900HK e é até mesmo derrotado peloIntel Core i7 12700Hde certos dispositivos de comparação. O irmão mais velho do MSI GE66 12UHS, o GE76 12UHSa unidade de carga de carga de nosso Cinebench R15 também gerencia "apenas" 2.722 pontos em nosso teste de carga sustentada múltipla Cinebench R15 com a mesma CPU. O Lenovo Legion 5 Pro 16 G7 e o Schenker Neo 15ambos com processadores 12700H, superam tanto o GE66 quanto o maior MSI GE76 12UHS. Em comparação com o predecessor com a Intel Núcleo i9 10980HKnosso dispositivo de revisão, no entanto, gerencia um notável aumento de desempenho de mais de 50%.
Cinebench R15 Multi Sustained Load
* ... menor é melhor
AIDA64: FP32 Ray-Trace | FPU Julia | CPU SHA3 | CPU Queen | FPU SinJulia | FPU Mandel | CPU AES | CPU ZLib | FP64 Ray-Trace | CPU PhotoWorxx
| Performance rating | |
| Média da turma Gaming | |
| Lenovo Legion 5 Pro 16 G7 i7 RTX 3070Ti | |
| MSI Raider GE66 12UHS | |
| Schenker XMG Neo 15 E22 (Early 2022, RTX 3080 Ti) | |
| Média Intel Core i9-12900HK | |
| MSI GE66 Raider 10SFS | |
| Razer Blade 15 2022 | |
| AIDA64 / FP32 Ray-Trace | |
| Média da turma Gaming (10227 - 85542, n=105, últimos 2 anos) | |
| MSI GE66 Raider 10SFS | |
| Média Intel Core i9-12900HK (2677 - 13948, n=15) | |
| Lenovo Legion 5 Pro 16 G7 i7 RTX 3070Ti | |
| Schenker XMG Neo 15 E22 (Early 2022, RTX 3080 Ti) | |
| MSI Raider GE66 12UHS | |
| Razer Blade 15 2022 | |
| AIDA64 / FPU Julia | |
| Média da turma Gaming (51376 - 238426, n=105, últimos 2 anos) | |
| MSI GE66 Raider 10SFS | |
| Média Intel Core i9-12900HK (12762 - 70764, n=15) | |
| Schenker XMG Neo 15 E22 (Early 2022, RTX 3080 Ti) | |
| Lenovo Legion 5 Pro 16 G7 i7 RTX 3070Ti | |
| MSI Raider GE66 12UHS | |
| Razer Blade 15 2022 | |
| AIDA64 / CPU SHA3 | |
| Média da turma Gaming (2180 - 10115, n=105, últimos 2 anos) | |
| Lenovo Legion 5 Pro 16 G7 i7 RTX 3070Ti | |
| Schenker XMG Neo 15 E22 (Early 2022, RTX 3080 Ti) | |
| MSI Raider GE66 12UHS | |
| Média Intel Core i9-12900HK (841 - 3504, n=15) | |
| MSI GE66 Raider 10SFS | |
| Razer Blade 15 2022 | |
| AIDA64 / CPU Queen | |
| Média da turma Gaming (49785 - 173351, n=90, últimos 2 anos) | |
| MSI Raider GE66 12UHS | |
| Lenovo Legion 5 Pro 16 G7 i7 RTX 3070Ti | |
| Schenker XMG Neo 15 E22 (Early 2022, RTX 3080 Ti) | |
| Média Intel Core i9-12900HK (60202 - 107161, n=15) | |
| MSI GE66 Raider 10SFS | |
| Razer Blade 15 2022 | |
| AIDA64 / FPU SinJulia | |
| Média da turma Gaming (4424 - 33636, n=105, últimos 2 anos) | |
| MSI GE66 Raider 10SFS | |
| Schenker XMG Neo 15 E22 (Early 2022, RTX 3080 Ti) | |
| Lenovo Legion 5 Pro 16 G7 i7 RTX 3070Ti | |
| MSI Raider GE66 12UHS | |
| Razer Blade 15 2022 | |
| Média Intel Core i9-12900HK (3225 - 10402, n=15) | |
| AIDA64 / FPU Mandel | |
| Média da turma Gaming (25115 - 128721, n=105, últimos 2 anos) | |
| MSI GE66 Raider 10SFS | |
| Lenovo Legion 5 Pro 16 G7 i7 RTX 3070Ti | |
| Schenker XMG Neo 15 E22 (Early 2022, RTX 3080 Ti) | |
| Média Intel Core i9-12900HK (7417 - 34233, n=15) | |
| MSI Raider GE66 12UHS | |
| Razer Blade 15 2022 | |
| AIDA64 / CPU AES | |
| Média da turma Gaming (39258 - 247074, n=105, últimos 2 anos) | |
| Lenovo Legion 5 Pro 16 G7 i7 RTX 3070Ti | |
| MSI Raider GE66 12UHS | |
| Média Intel Core i9-12900HK (32382 - 112498, n=15) | |
| Schenker XMG Neo 15 E22 (Early 2022, RTX 3080 Ti) | |
| Razer Blade 15 2022 | |
| MSI GE66 Raider 10SFS | |
| AIDA64 / CPU ZLib | |
| Média da turma Gaming (574 - 2531, n=105, últimos 2 anos) | |
| Lenovo Legion 5 Pro 16 G7 i7 RTX 3070Ti | |
| Schenker XMG Neo 15 E22 (Early 2022, RTX 3080 Ti) | |
| MSI Raider GE66 12UHS | |
| Média Intel Core i9-12900HK (314 - 1209, n=15) | |
| Razer Blade 15 2022 | |
| MSI GE66 Raider 10SFS | |
| AIDA64 / FP64 Ray-Trace | |
| Média da turma Gaming (5509 - 45446, n=105, últimos 2 anos) | |
| MSI GE66 Raider 10SFS | |
| Lenovo Legion 5 Pro 16 G7 i7 RTX 3070Ti | |
| Schenker XMG Neo 15 E22 (Early 2022, RTX 3080 Ti) | |
| Média Intel Core i9-12900HK (1501 - 7616, n=15) | |
| MSI Raider GE66 12UHS | |
| Razer Blade 15 2022 | |
| AIDA64 / CPU PhotoWorxx | |
| Média da turma Gaming (12271 - 89891, n=105, últimos 2 anos) | |
| Razer Blade 15 2022 | |
| MSI Raider GE66 12UHS | |
| Schenker XMG Neo 15 E22 (Early 2022, RTX 3080 Ti) | |
| Média Intel Core i9-12900HK (24446 - 42462, n=15) | |
| Lenovo Legion 5 Pro 16 G7 i7 RTX 3070Ti | |
| MSI GE66 Raider 10SFS | |
Desempenho do sistema
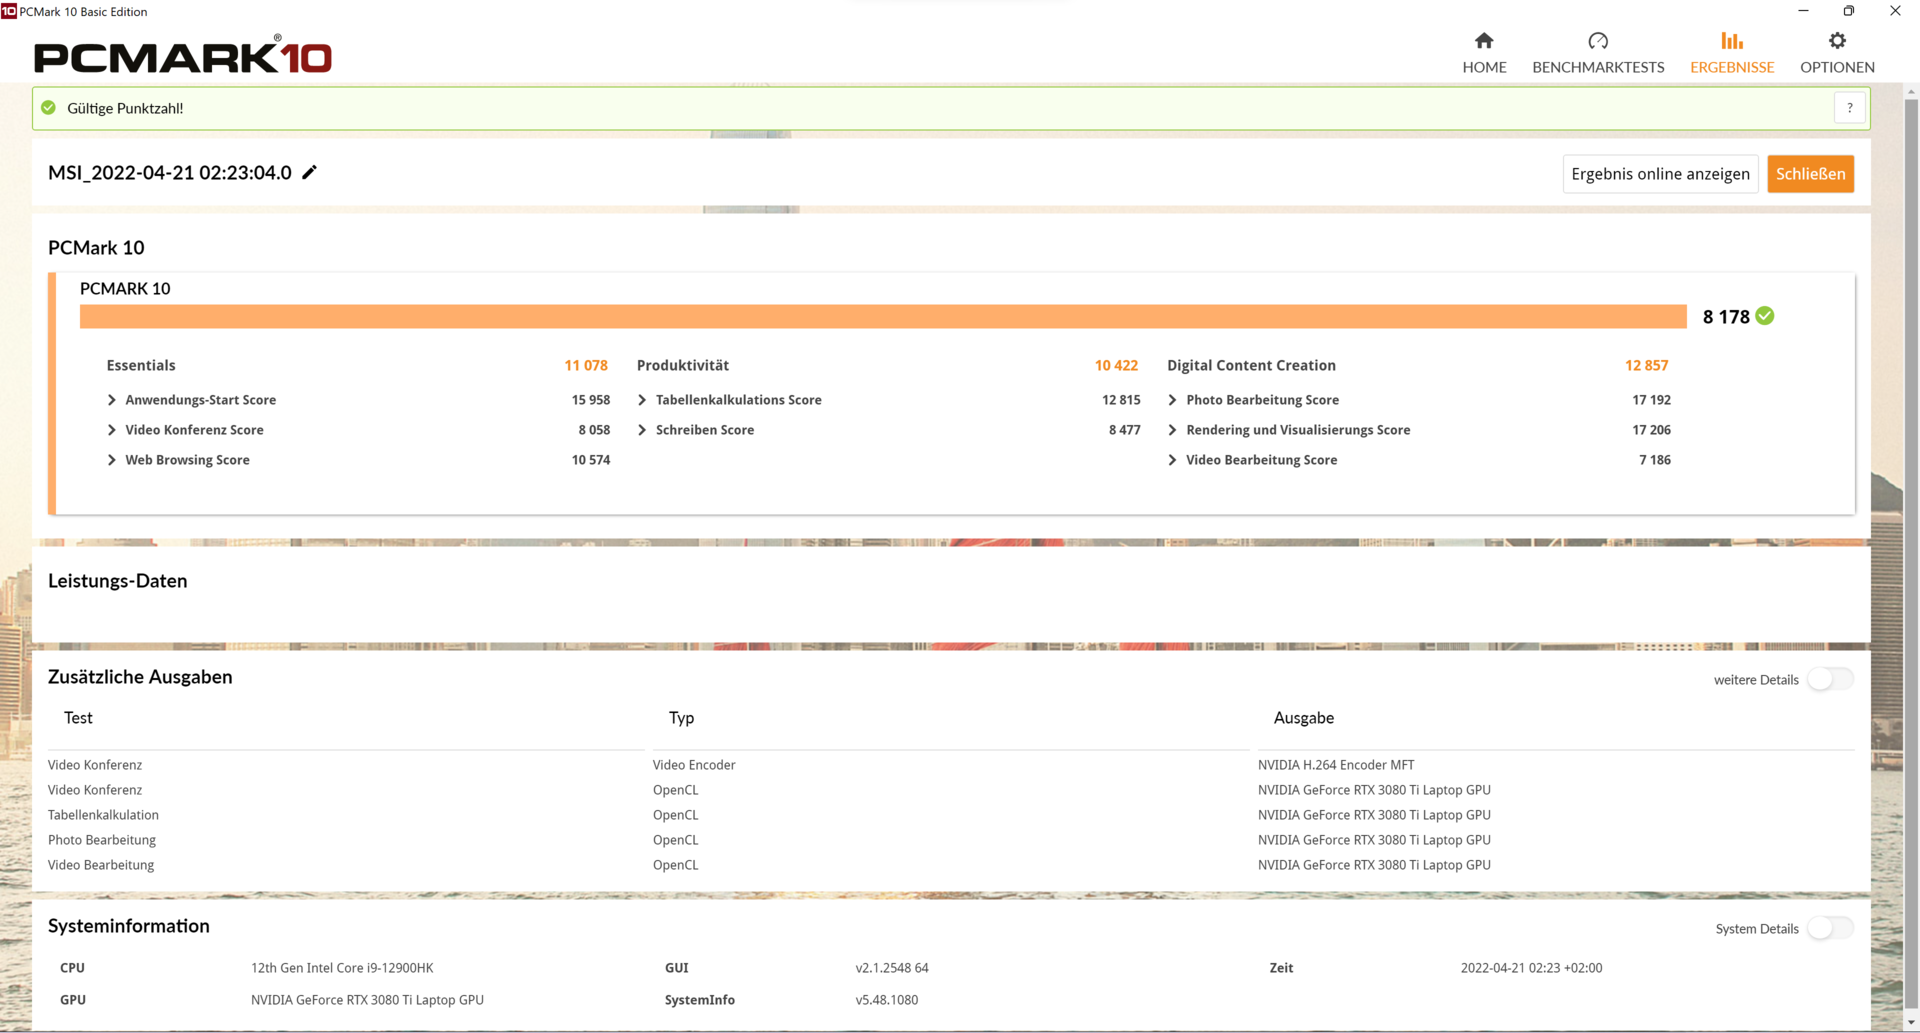
Como esperado, o desempenho do sistema revela-se elevado. Nosso MSI GE66 12UHS limpa o piso com a concorrência e exibe excelente desempenho em todas as categorias testadas
CrossMark: Overall | Productivity | Creativity | Responsiveness
| PCMark 10 / Score | |
| Média da turma Gaming (5828 - 12414, n=93, últimos 2 anos) | |
| MSI Raider GE66 12UHS | |
| Média Intel Core i9-12900HK, NVIDIA GeForce RTX 3080 Ti Laptop GPU (7149 - 8186, n=5) | |
| Razer Blade 15 2022 | |
| Lenovo Legion 5 Pro 16 G7 i7 RTX 3070Ti | |
| Schenker XMG Neo 15 E22 (Early 2022, RTX 3080 Ti) | |
| MSI GE66 Raider 10SFS | |
| PCMark 10 / Essentials | |
| MSI Raider GE66 12UHS | |
| Média Intel Core i9-12900HK, NVIDIA GeForce RTX 3080 Ti Laptop GPU (9870 - 11205, n=5) | |
| Razer Blade 15 2022 | |
| Média da turma Gaming (8810 - 11935, n=97, últimos 2 anos) | |
| Schenker XMG Neo 15 E22 (Early 2022, RTX 3080 Ti) | |
| Lenovo Legion 5 Pro 16 G7 i7 RTX 3070Ti | |
| MSI GE66 Raider 10SFS | |
| PCMark 10 / Productivity | |
| Média da turma Gaming (6845 - 25323, n=95, últimos 2 anos) | |
| MSI Raider GE66 12UHS | |
| Média Intel Core i9-12900HK, NVIDIA GeForce RTX 3080 Ti Laptop GPU (9173 - 10422, n=5) | |
| Lenovo Legion 5 Pro 16 G7 i7 RTX 3070Ti | |
| Razer Blade 15 2022 | |
| Schenker XMG Neo 15 E22 (Early 2022, RTX 3080 Ti) | |
| MSI GE66 Raider 10SFS | |
| PCMark 10 / Digital Content Creation | |
| Média da turma Gaming (7602 - 19954, n=95, últimos 2 anos) | |
| MSI Raider GE66 12UHS | |
| Média Intel Core i9-12900HK, NVIDIA GeForce RTX 3080 Ti Laptop GPU (10951 - 13098, n=5) | |
| Razer Blade 15 2022 | |
| Lenovo Legion 5 Pro 16 G7 i7 RTX 3070Ti | |
| Schenker XMG Neo 15 E22 (Early 2022, RTX 3080 Ti) | |
| MSI GE66 Raider 10SFS | |
| CrossMark / Overall | |
| Média da turma Gaming (1366 - 2409, n=94, últimos 2 anos) | |
| Lenovo Legion 5 Pro 16 G7 i7 RTX 3070Ti | |
| Média Intel Core i9-12900HK, NVIDIA GeForce RTX 3080 Ti Laptop GPU (970 - 2138, n=5) | |
| CrossMark / Productivity | |
| Lenovo Legion 5 Pro 16 G7 i7 RTX 3070Ti | |
| Média da turma Gaming (1386 - 2254, n=94, últimos 2 anos) | |
| Média Intel Core i9-12900HK, NVIDIA GeForce RTX 3080 Ti Laptop GPU (921 - 2038, n=5) | |
| CrossMark / Creativity | |
| Média da turma Gaming (1343 - 2786, n=94, últimos 2 anos) | |
| Lenovo Legion 5 Pro 16 G7 i7 RTX 3070Ti | |
| Média Intel Core i9-12900HK, NVIDIA GeForce RTX 3080 Ti Laptop GPU (1007 - 2210, n=5) | |
| CrossMark / Responsiveness | |
| Lenovo Legion 5 Pro 16 G7 i7 RTX 3070Ti | |
| Média Intel Core i9-12900HK, NVIDIA GeForce RTX 3080 Ti Laptop GPU (1012 - 2234, n=5) | |
| Média da turma Gaming (1226 - 2334, n=94, últimos 2 anos) | |
| PCMark 10 Score | 8178 pontos | |
Ajuda | ||
| AIDA64 / Memory Copy | |
| Média da turma Gaming (21750 - 129946, n=105, últimos 2 anos) | |
| Schenker XMG Neo 15 E22 (Early 2022, RTX 3080 Ti) | |
| MSI Raider GE66 12UHS | |
| Razer Blade 15 2022 | |
| Média Intel Core i9-12900HK (42967 - 62959, n=15) | |
| Lenovo Legion 5 Pro 16 G7 i7 RTX 3070Ti | |
| MSI GE66 Raider 10SFS | |
| AIDA64 / Memory Read | |
| Média da turma Gaming (22956 - 118858, n=105, últimos 2 anos) | |
| MSI Raider GE66 12UHS | |
| Schenker XMG Neo 15 E22 (Early 2022, RTX 3080 Ti) | |
| Razer Blade 15 2022 | |
| Média Intel Core i9-12900HK (44419 - 66989, n=15) | |
| Lenovo Legion 5 Pro 16 G7 i7 RTX 3070Ti | |
| MSI GE66 Raider 10SFS | |
| AIDA64 / Memory Write | |
| Média da turma Gaming (22297 - 135096, n=105, últimos 2 anos) | |
| Razer Blade 15 2022 | |
| Schenker XMG Neo 15 E22 (Early 2022, RTX 3080 Ti) | |
| MSI Raider GE66 12UHS | |
| Lenovo Legion 5 Pro 16 G7 i7 RTX 3070Ti | |
| Média Intel Core i9-12900HK (42144 - 65268, n=15) | |
| MSI GE66 Raider 10SFS | |
| AIDA64 / Memory Latency | |
| Média da turma Gaming (75.3 - 259, n=105, últimos 2 anos) | |
| Lenovo Legion 5 Pro 16 G7 i7 RTX 3070Ti | |
| MSI Raider GE66 12UHS | |
| Média Intel Core i9-12900HK (79.9 - 109, n=15) | |
| MSI GE66 Raider 10SFS | |
| Schenker XMG Neo 15 E22 (Early 2022, RTX 3080 Ti) | |
| Razer Blade 15 2022 | |
* ... menor é melhor
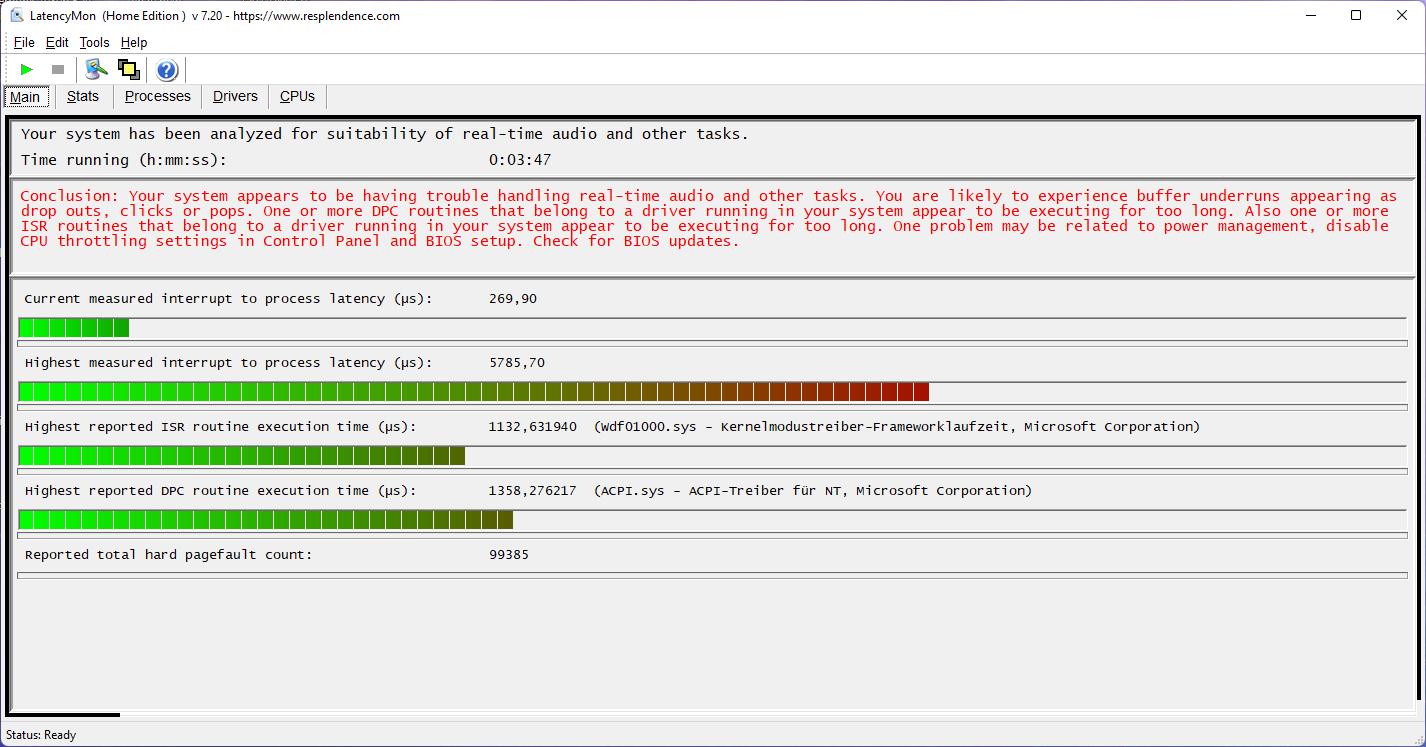
Latências DPC
O teste das latências do DPC revela que nosso dispositivo de revisão não é adequado para o processamento de vídeo em tempo real com os drivers atuais e o software do sistema. Foram detectados problemas de latência tanto no vídeo 4K do YouTube quanto no processamento de áudio em tempo real
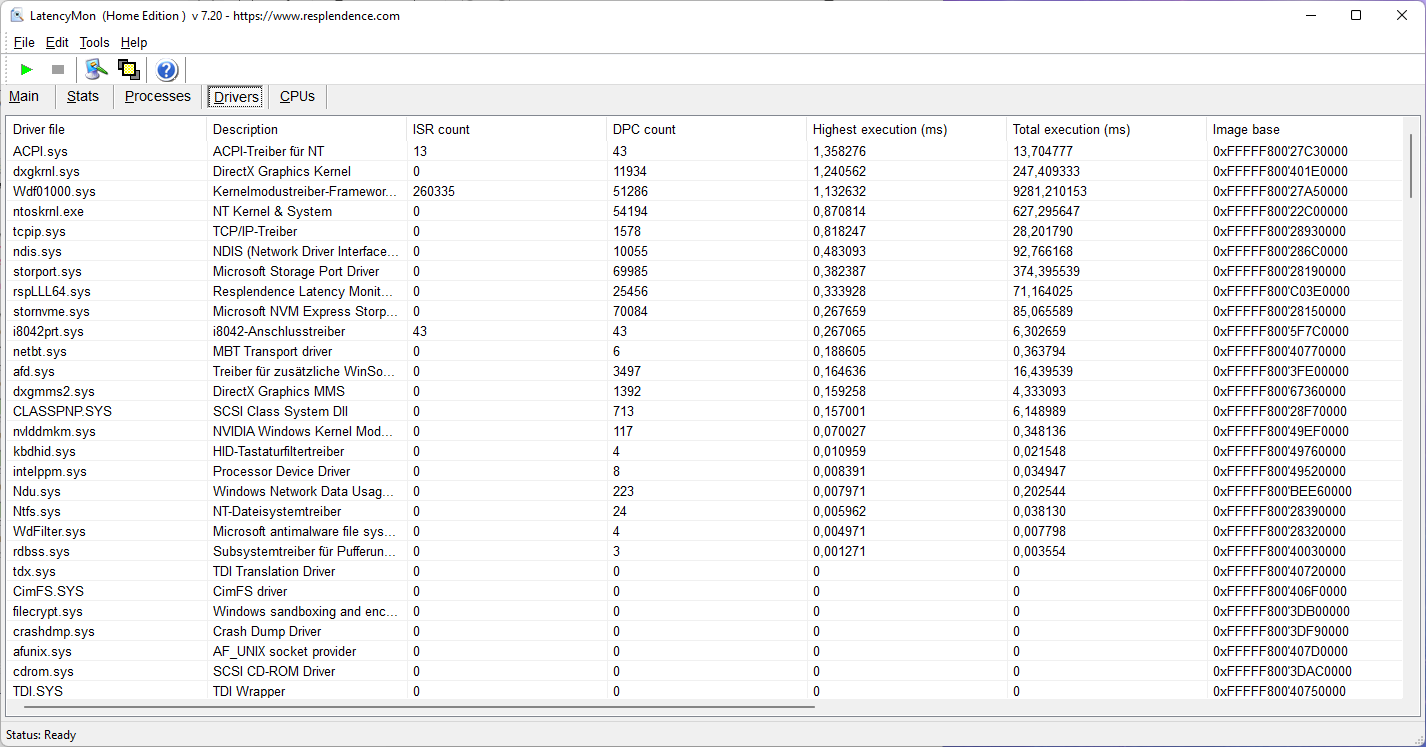
| DPC Latencies / LatencyMon - interrupt to process latency (max), Web, Youtube, Prime95 | |
| MSI Raider GE66 12UHS | |
| Razer Blade 15 2022 | |
| MSI GE66 Raider 10SFS | |
| Schenker XMG Neo 15 E22 (Early 2022, RTX 3080 Ti) | |
| Lenovo Legion 5 Pro 16 G7 i7 RTX 3070Ti | |
* ... menor é melhor
Dispositivos de armazenamento
O SSD de 2 TB (designação PM9A1, equivalente OEM do Samsung Evo 980 Pro) instalado em nosso sistema oferece muito bom desempenho e só é superado pela versão de 1 TB do mesmo SSD, que também é instalado emLenovo's Legion 5 Pro 16 G7. Entretanto, nosso benchmark de velocidade do disco mostrou uma queda maciça no desempenho que persistiu durante todo o período de teste. Também observamos o mesmo problema em nossa revisão do Asus ROG Strix Scar 15 G533ZW, equipado com o mesmo SSD. A MSI foi informada sobre o assunto.
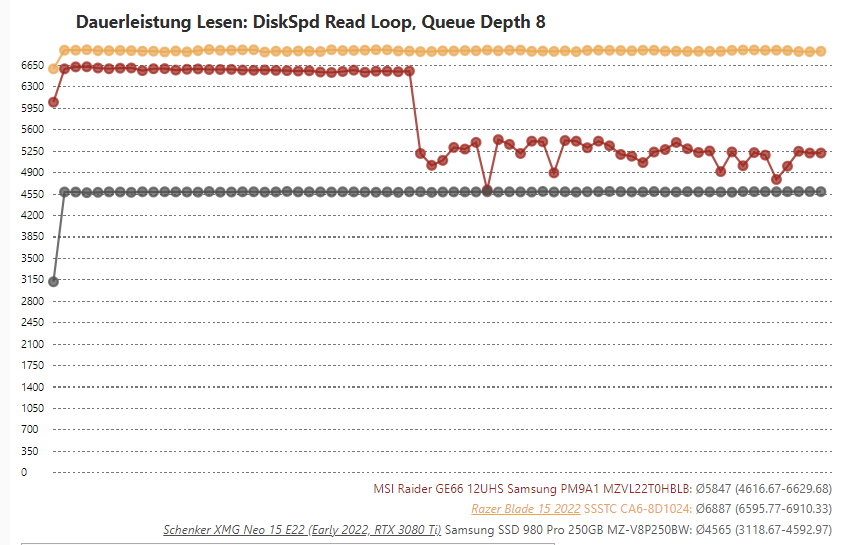
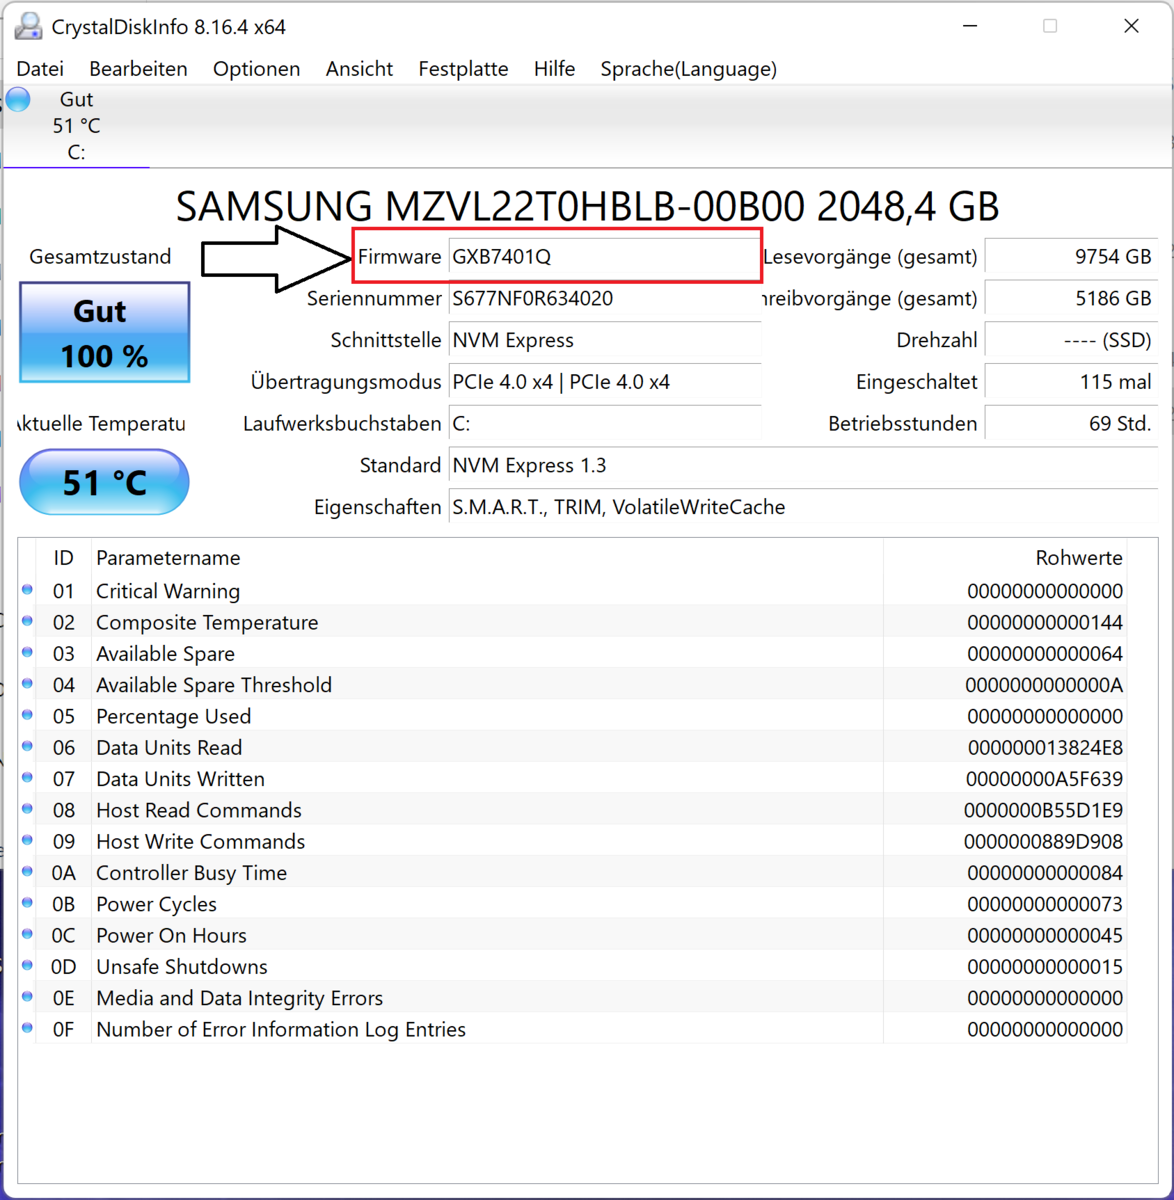
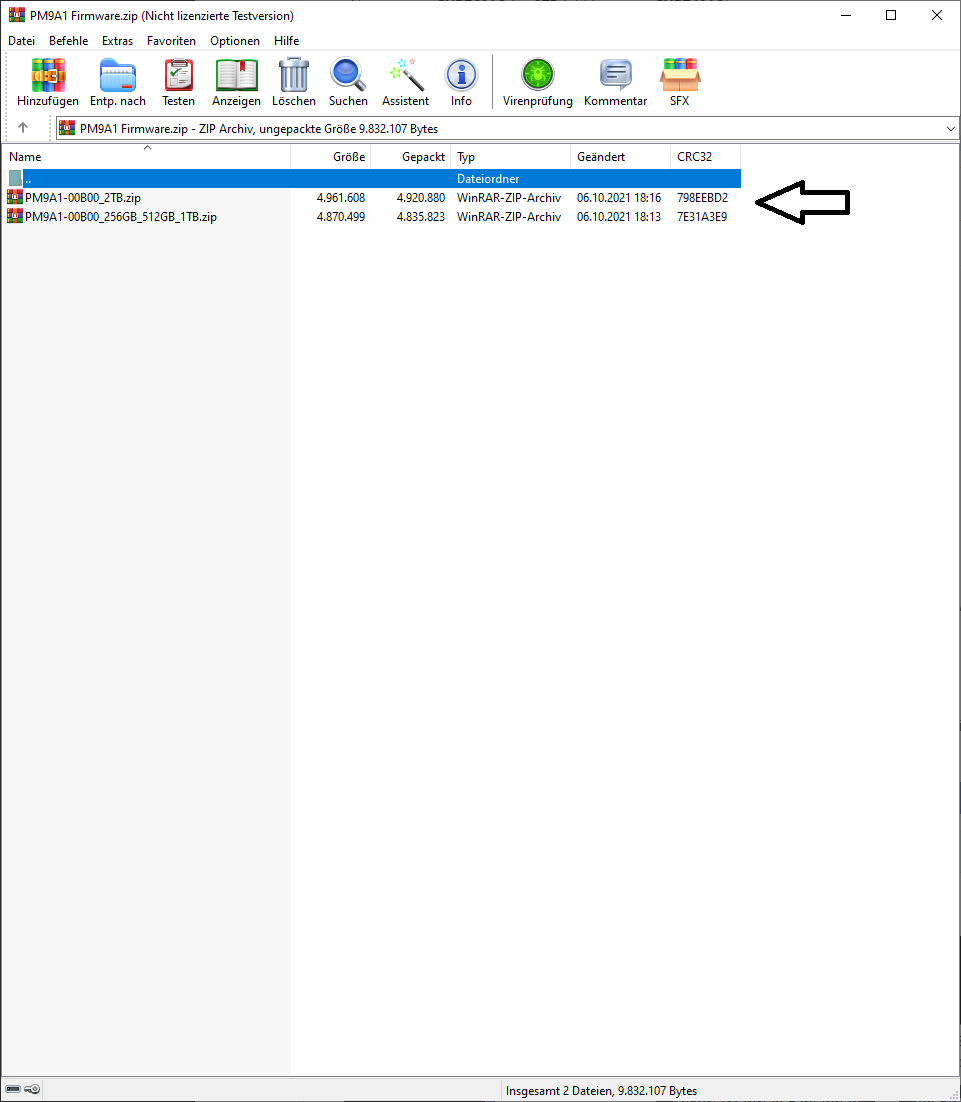
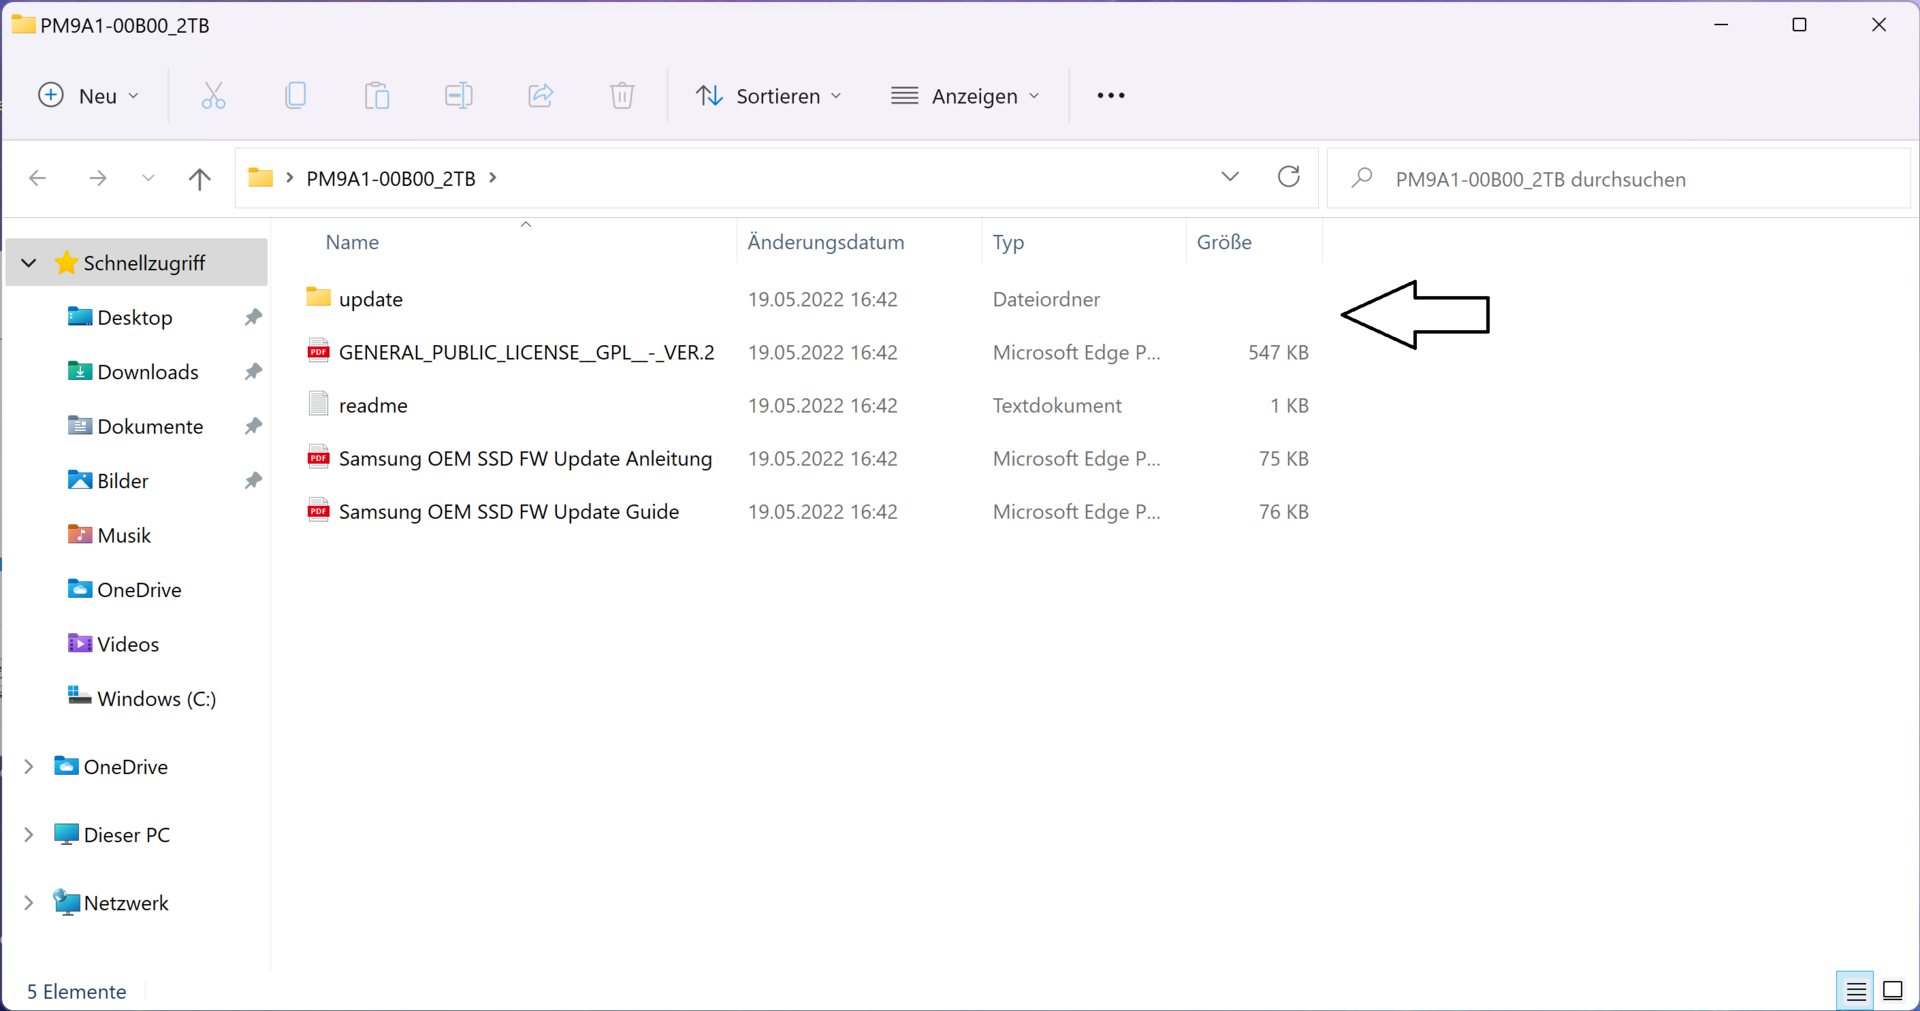
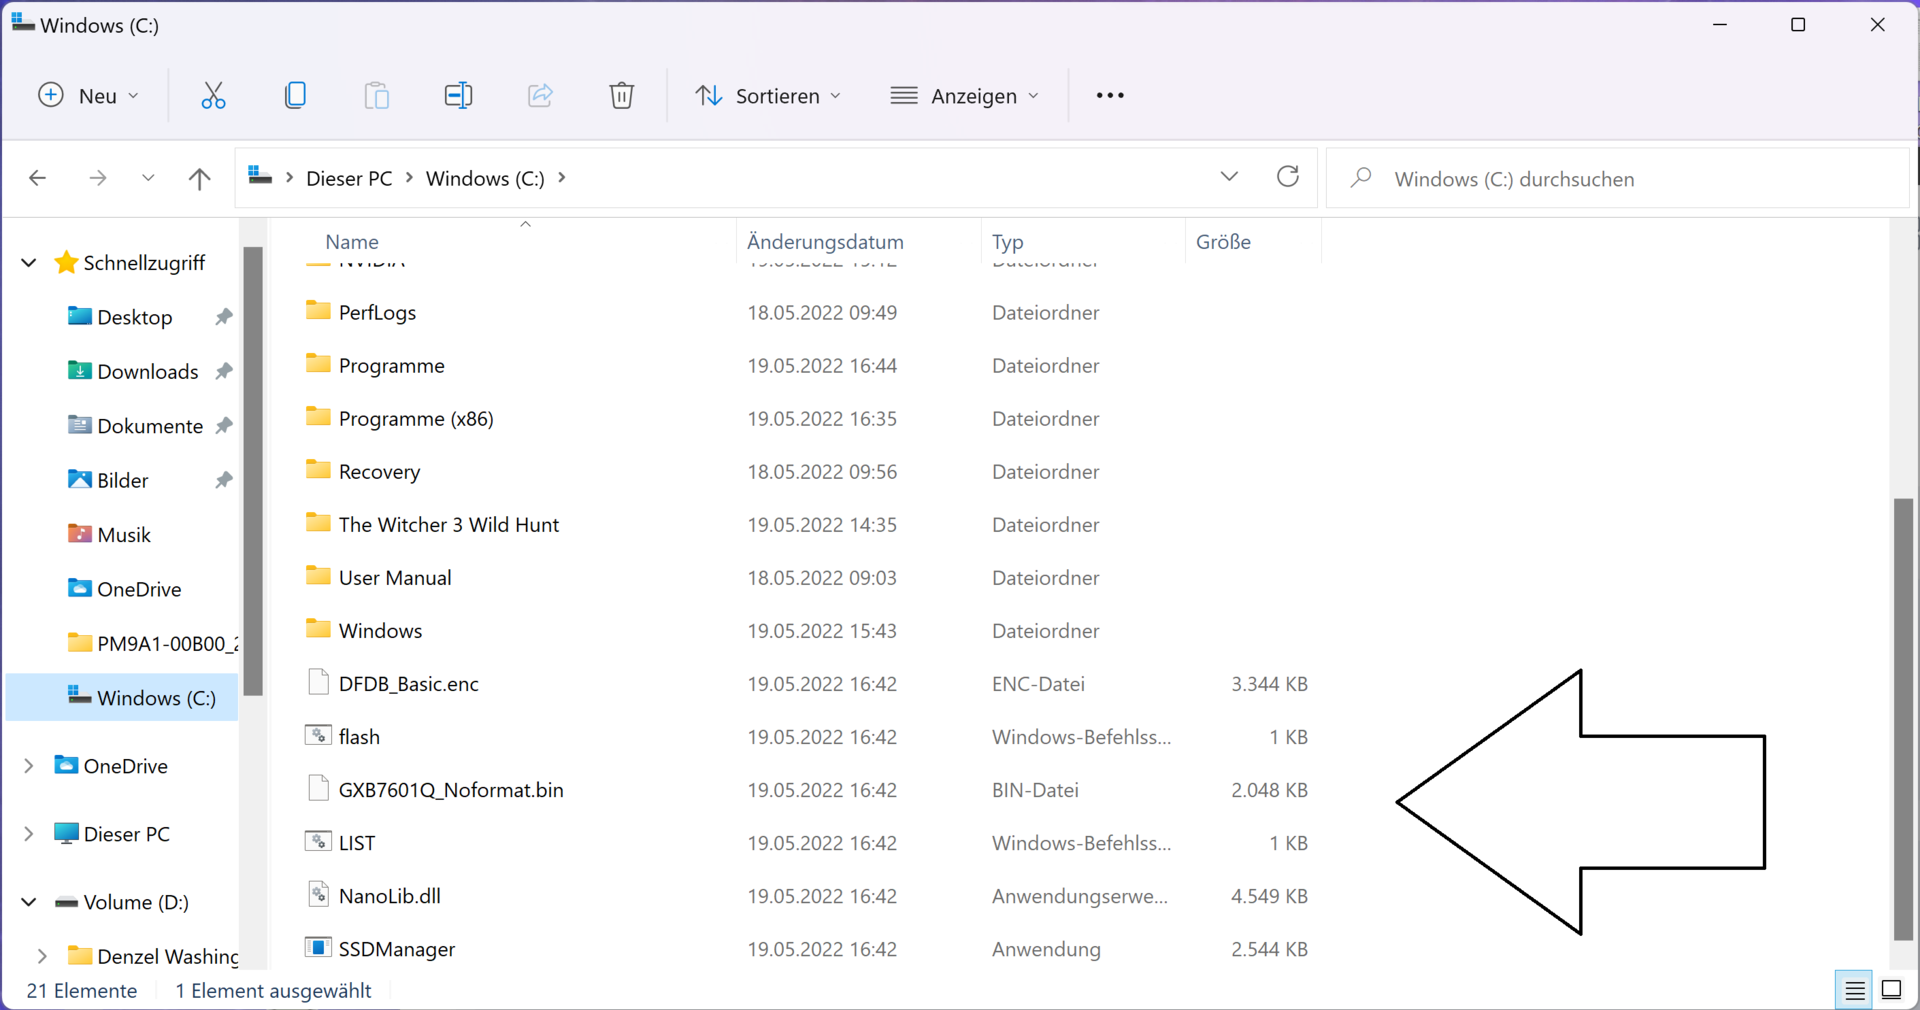
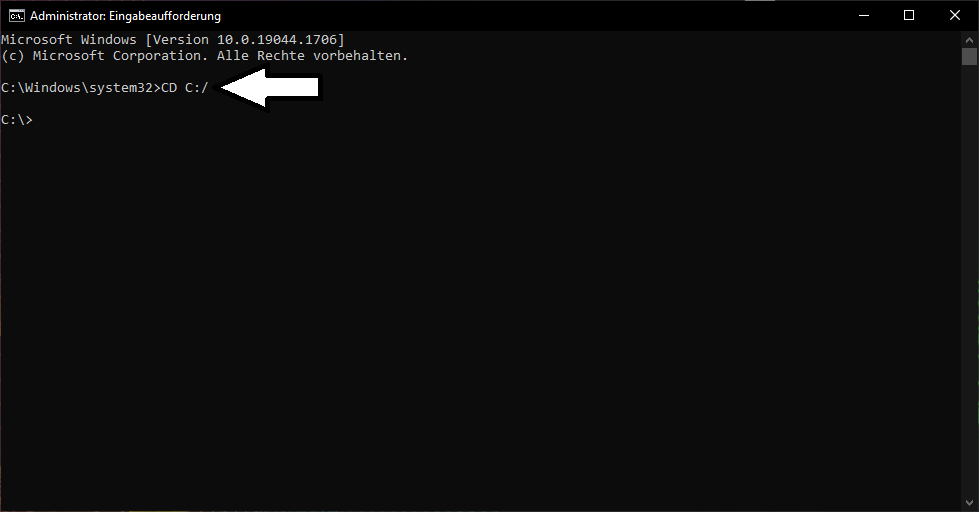
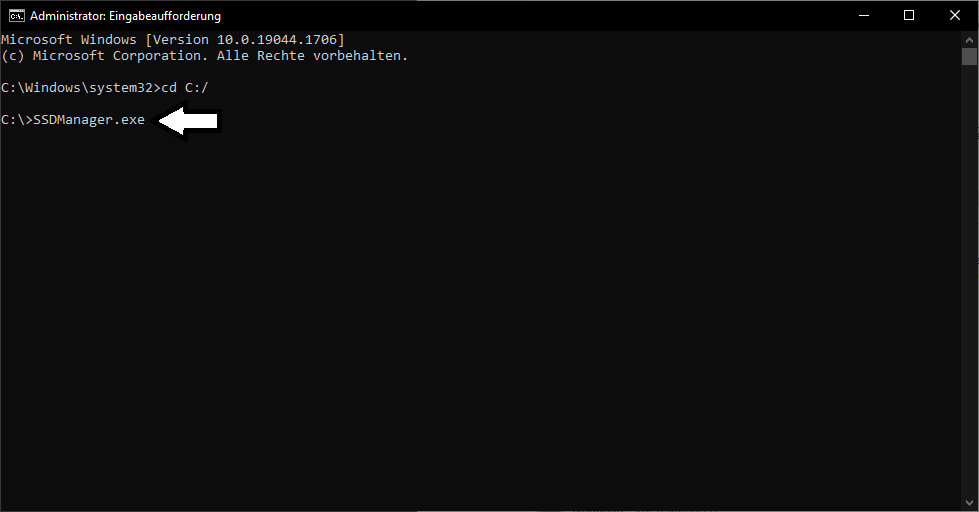
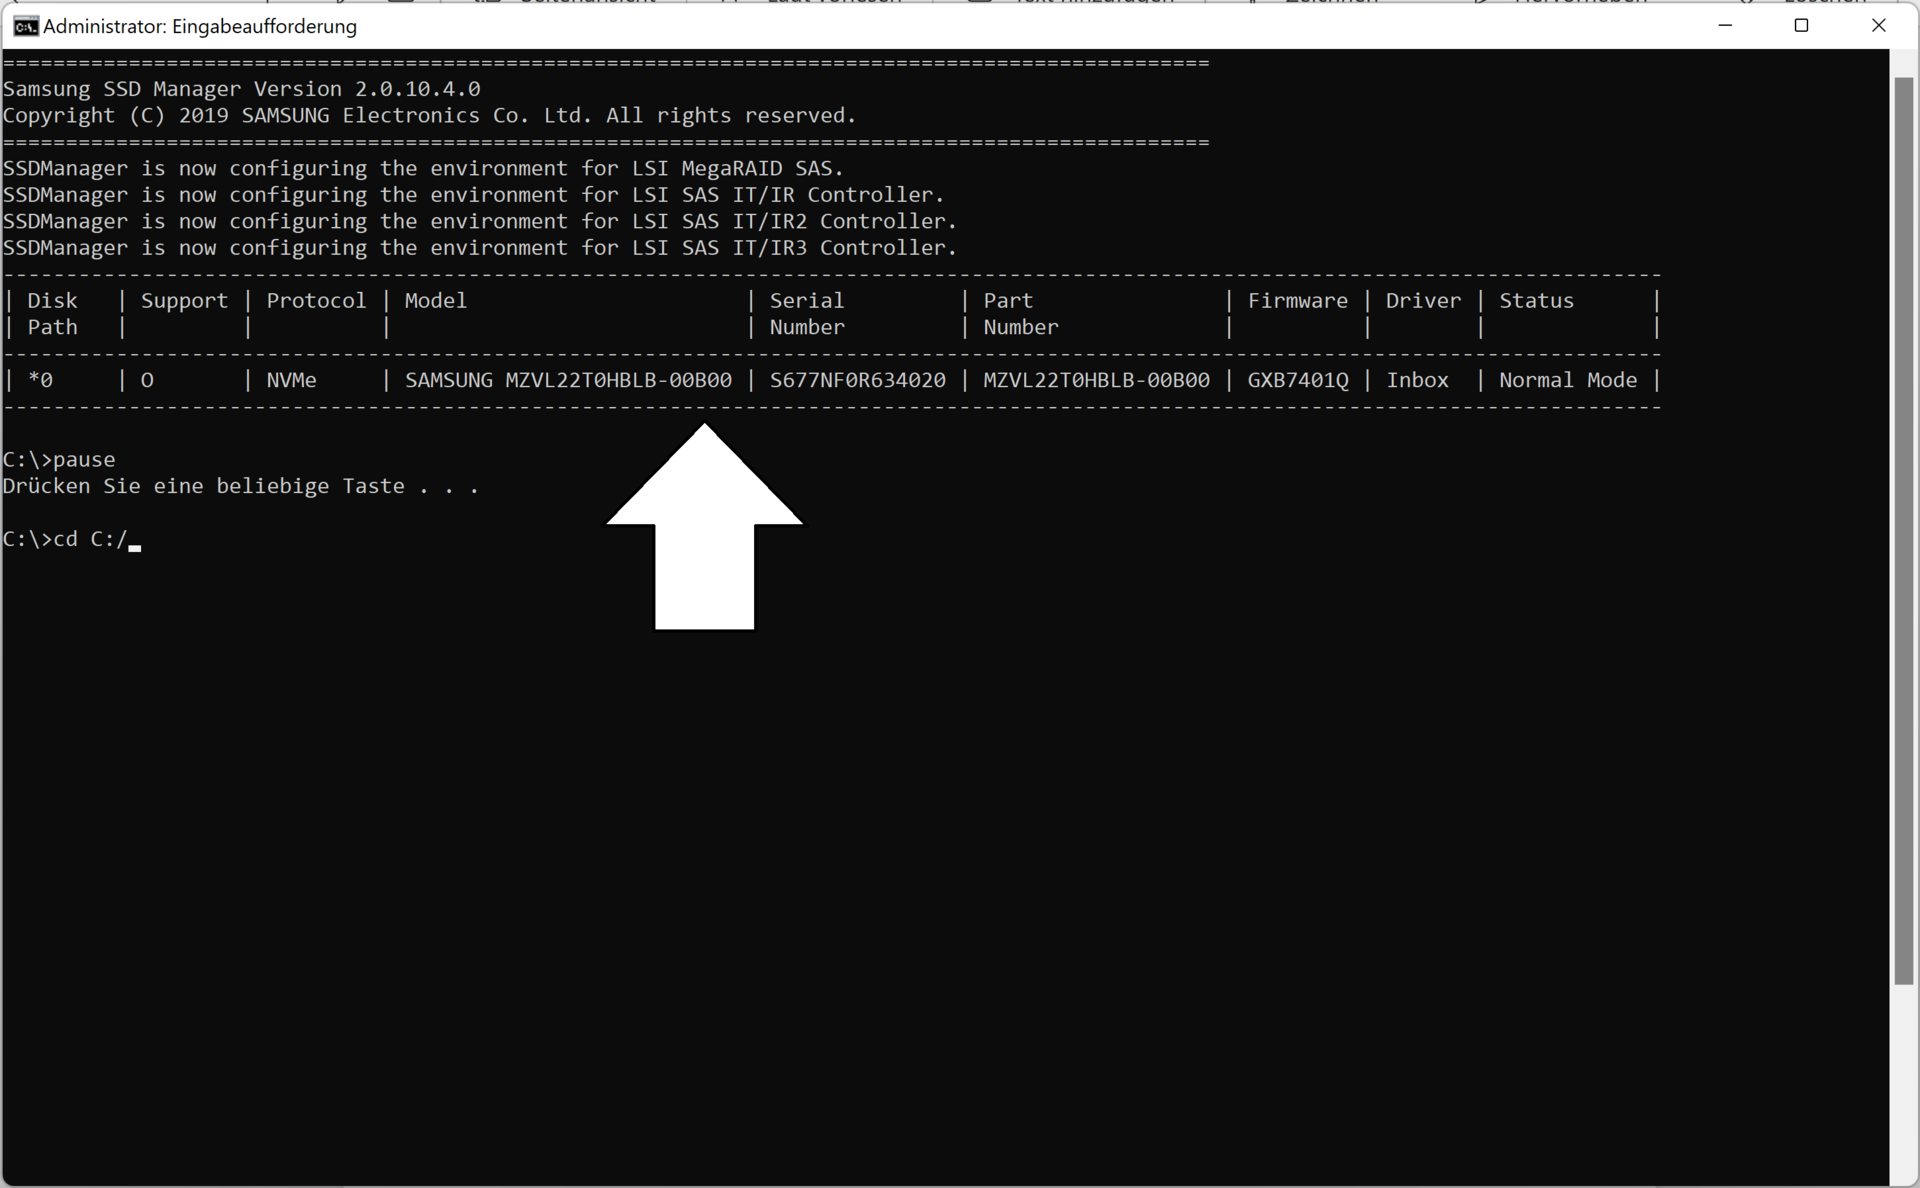
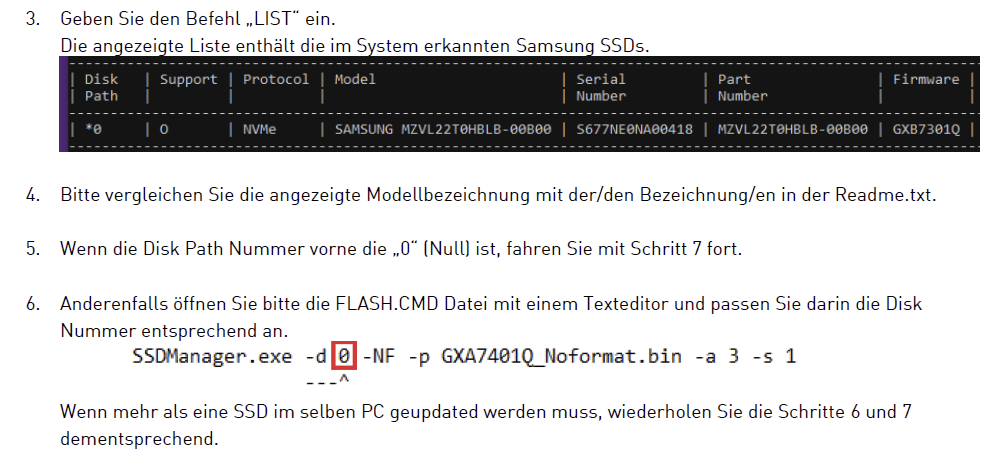
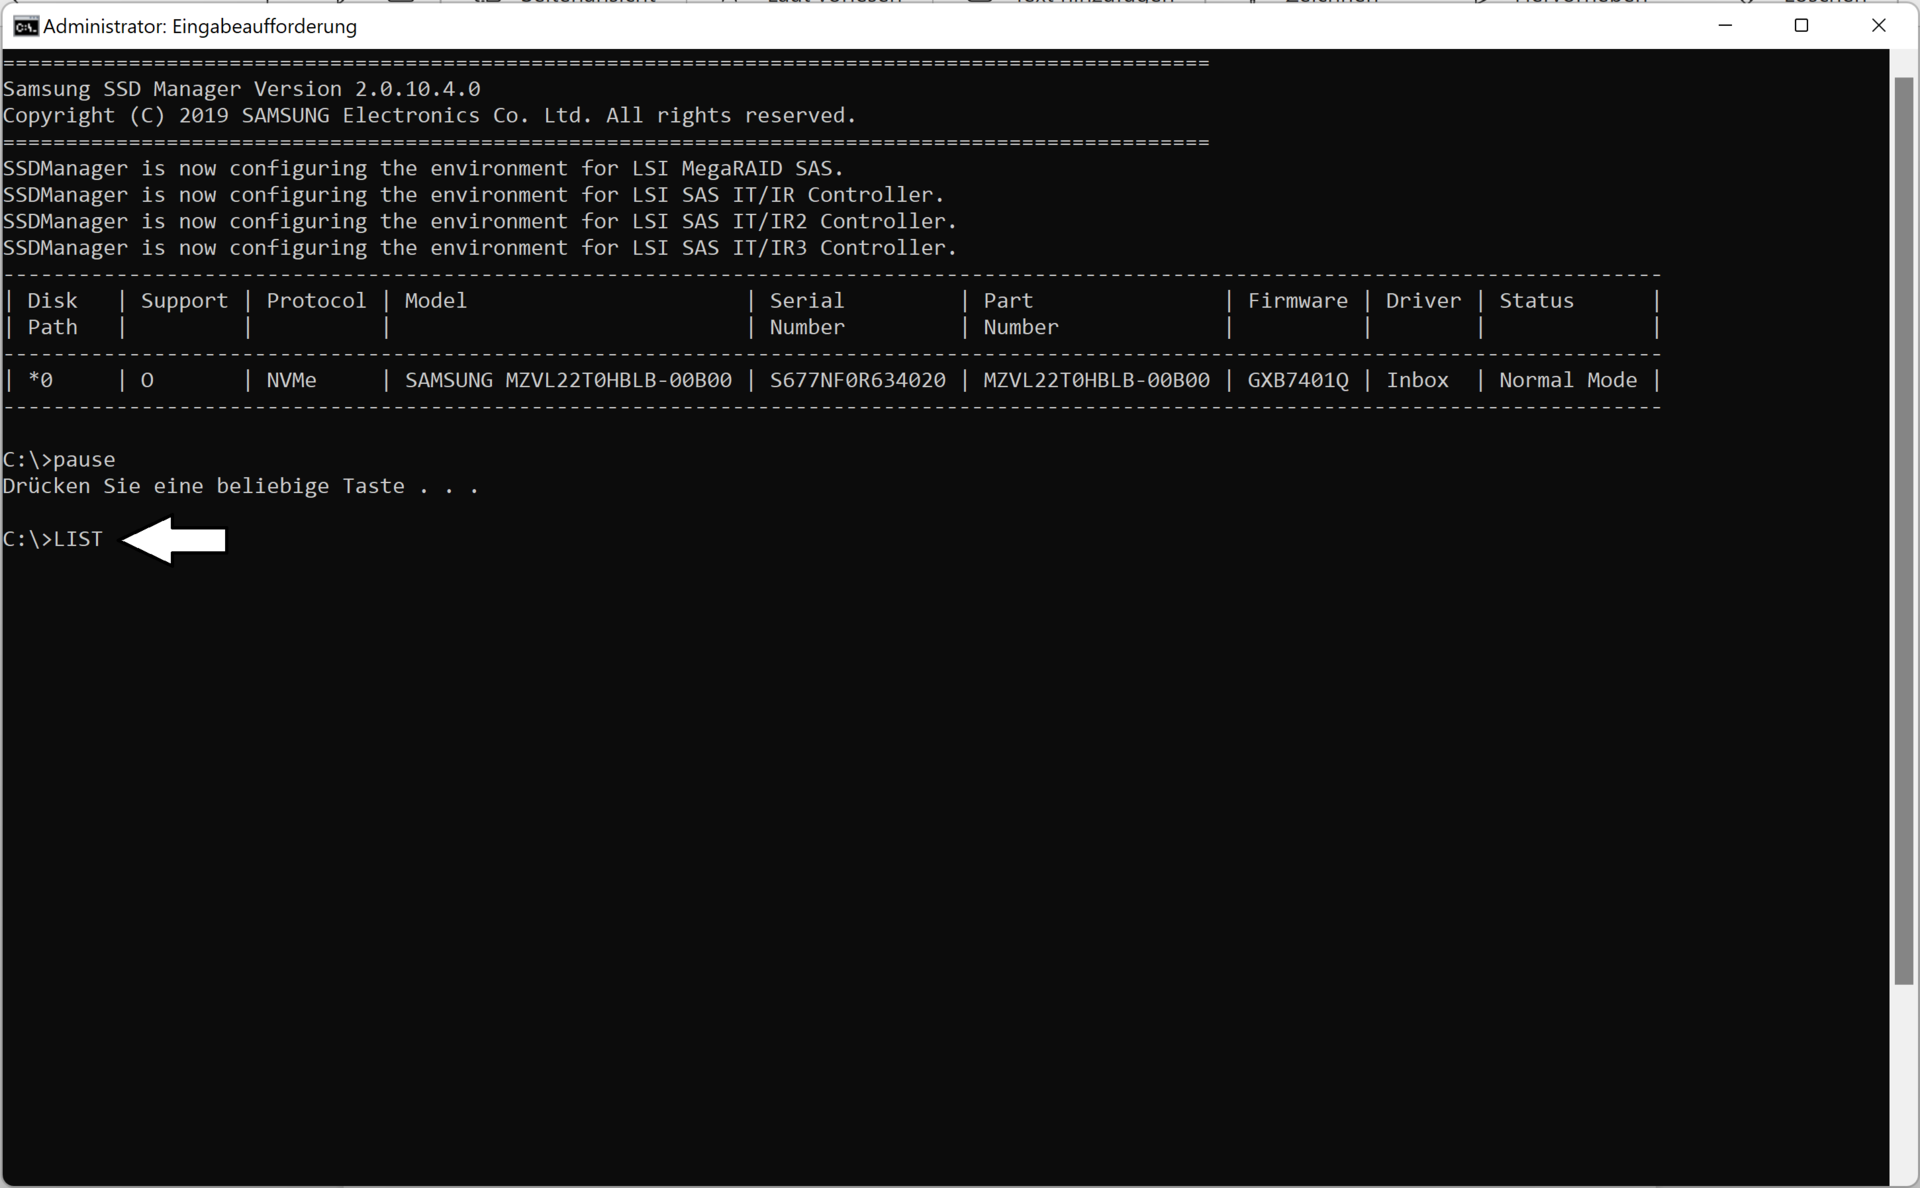
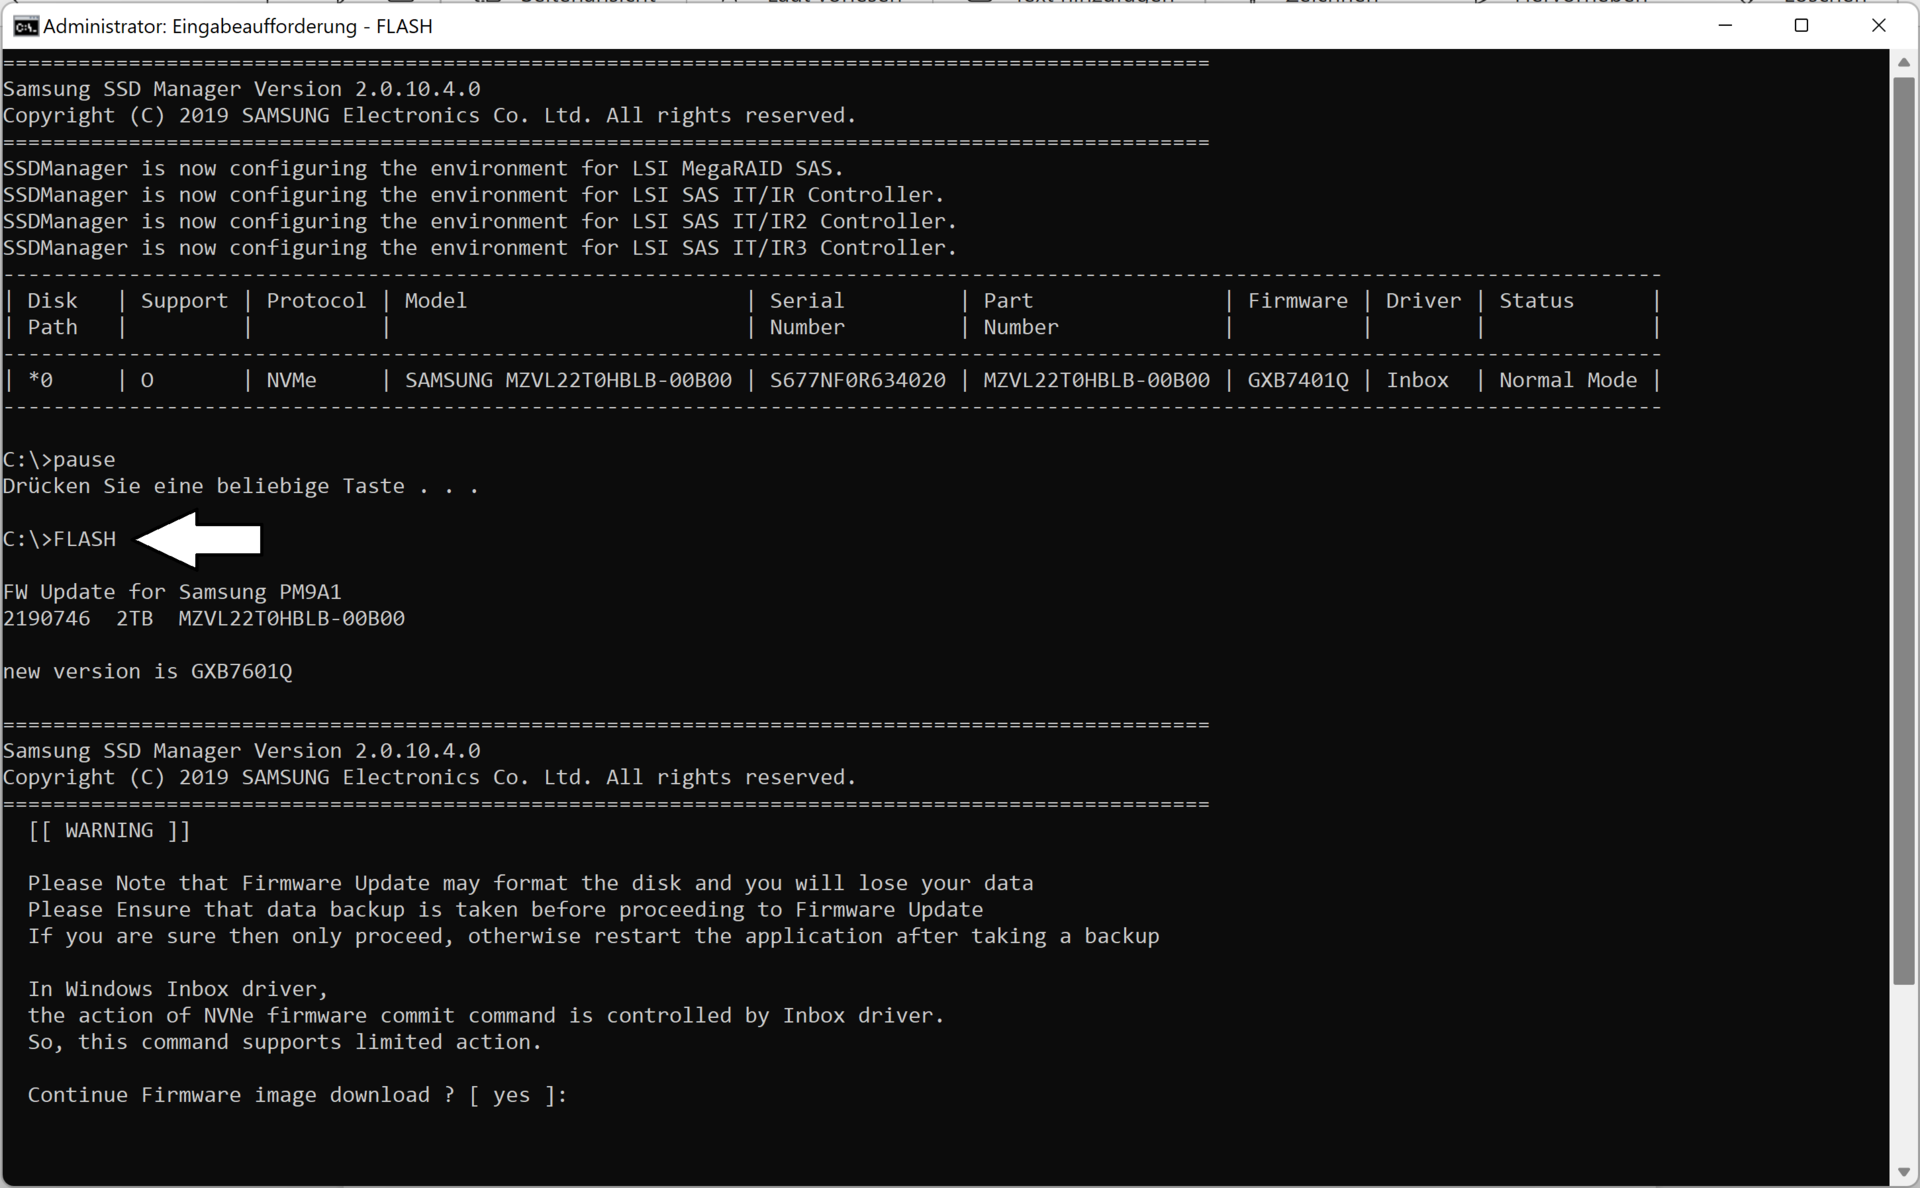
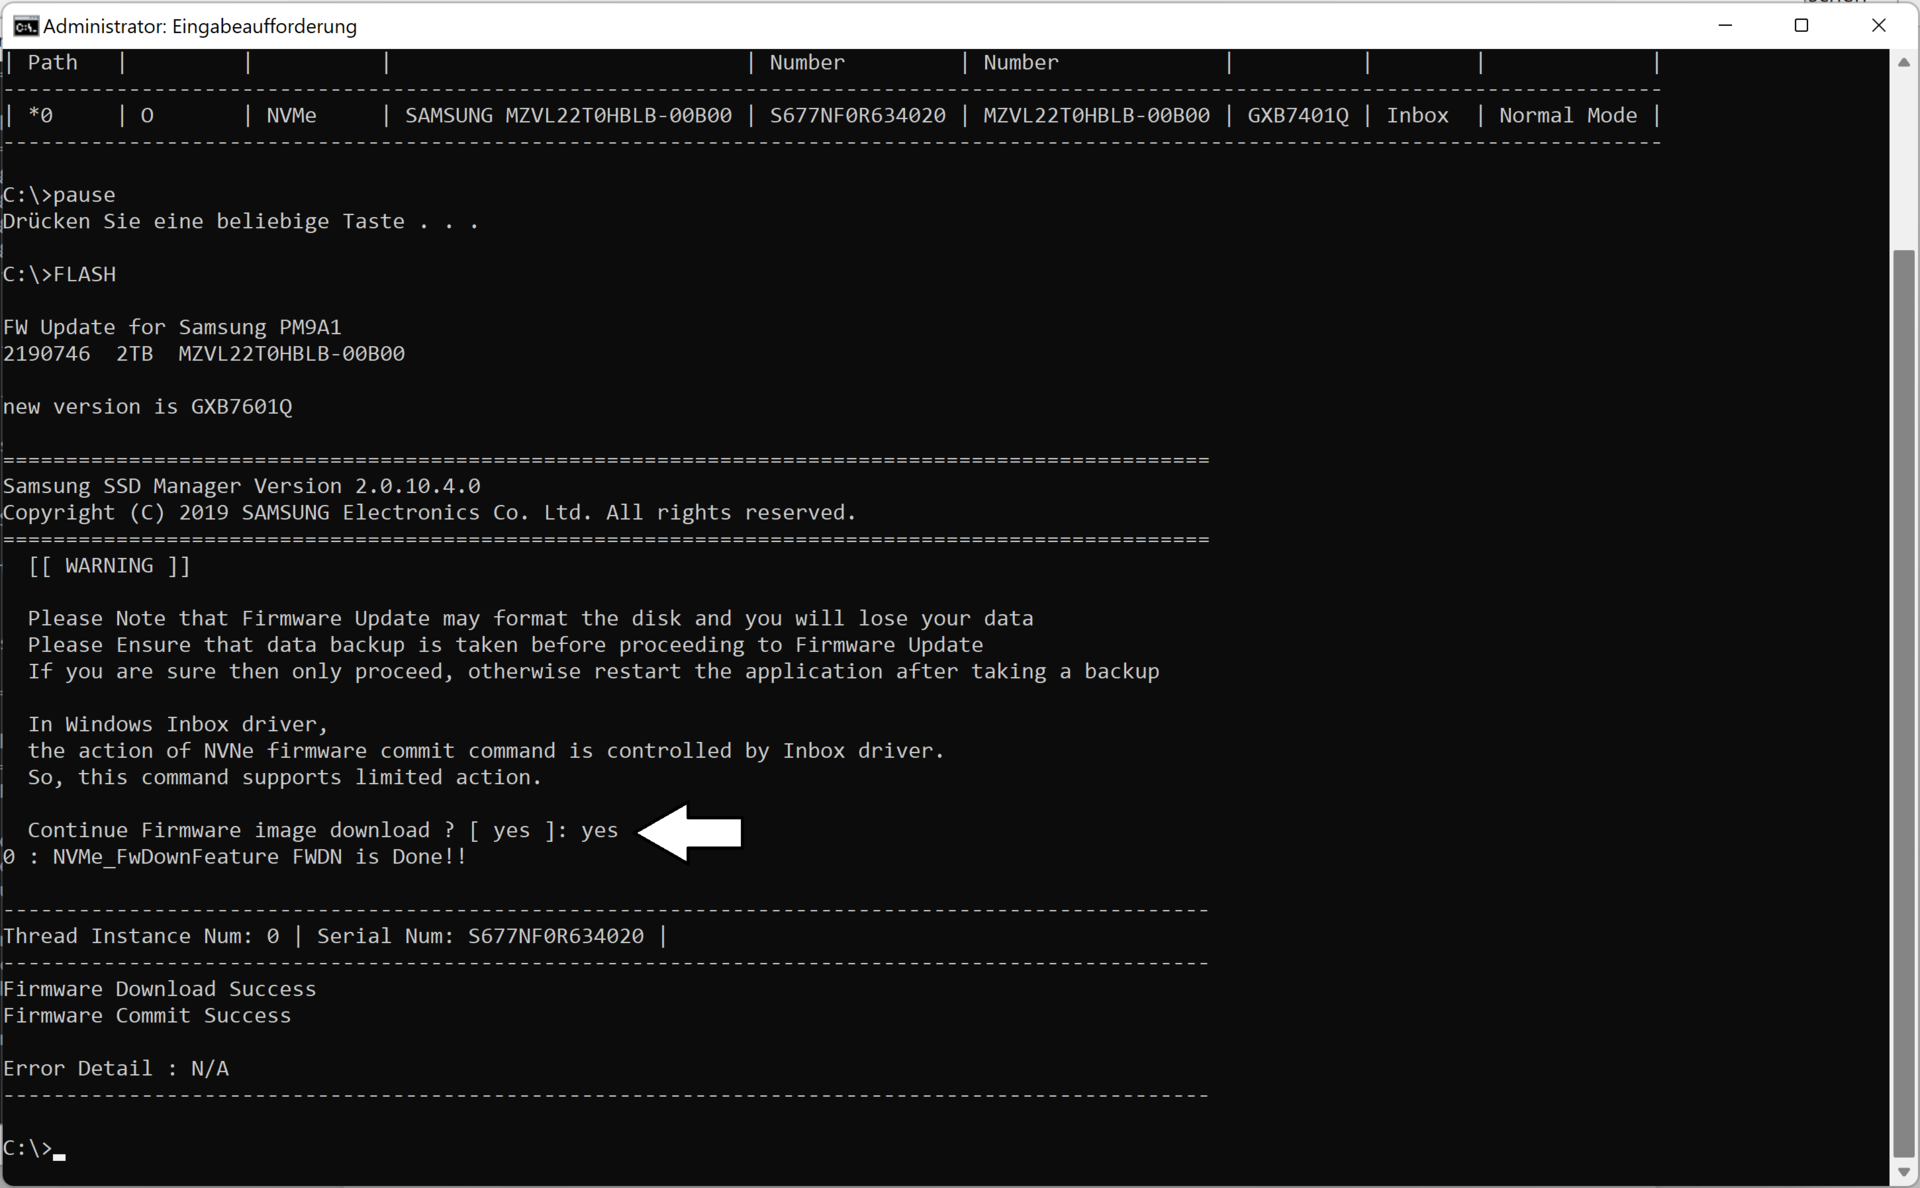
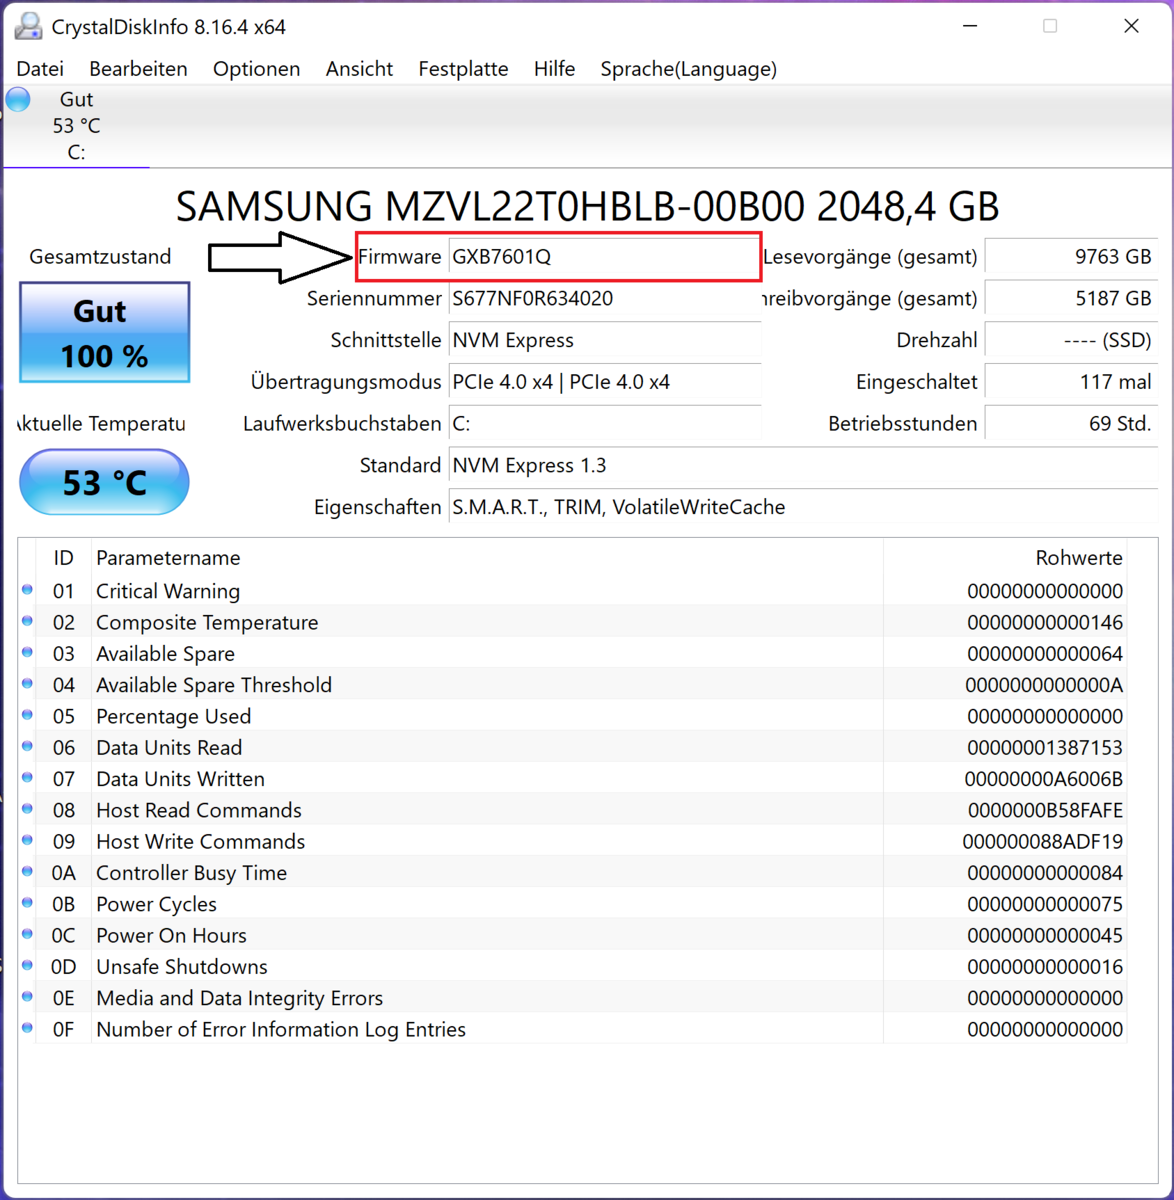
Duas razões para os fracos valores: a principal razão é um problema com o firmware que não pode ser resolvido automaticamente via Windows ou através da página de suporte da MSI. Para o firmware desatualizado (versão: GXB7401Q), há agora uma correção com a qual você pode atualizar para a versão atual (GXB7601Q) através do prompt de comando. Infelizmente, o driver não pode ser instalado através do gerenciador do dispositivo. Pesquisas posteriores revelaram que este é um problema bem conhecido do Samsung PM9A1 nos formatos 256 GB, 512 GB, 1 TB e 2 TB.
A segunda causa para a queda de desempenho do SDD durante cargas mais prolongadas é devido ao seu resfriamento passivo. Isto não pode ser suficientemente resfriado mesmo no "Cooler Boost Mode", então o controlador Samsung Elpis S4LV003, que é o coração do SSD, começa a acelerar a partir de 74 graus Celsius. Usuários experientes que estão suficientemente confiantes para abrir seu dispositivo podem ser capazes de solucionar o problema colocando uma boa almofada térmica para SSDs sob a placa de resfriamento passivo.
Na série de imagens a seguir, mostramos como instalar a atualização sem perda de dados. O firmware pode ser baixadoaqui (fonte: Reddit)
. Cuidado: O flashing do firmware é feito por sua própria conta e risco.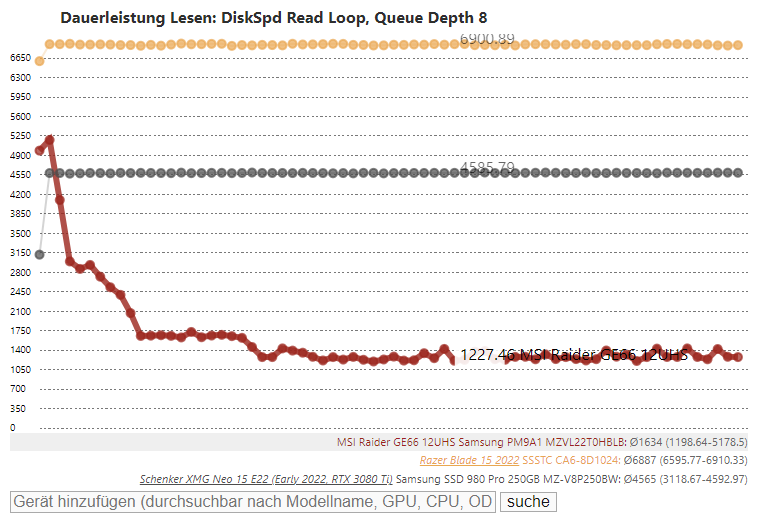

* ... menor é melhor
Leitura sustentada antes da atualização: DiskSpd Read Loop, Queue Depth 8
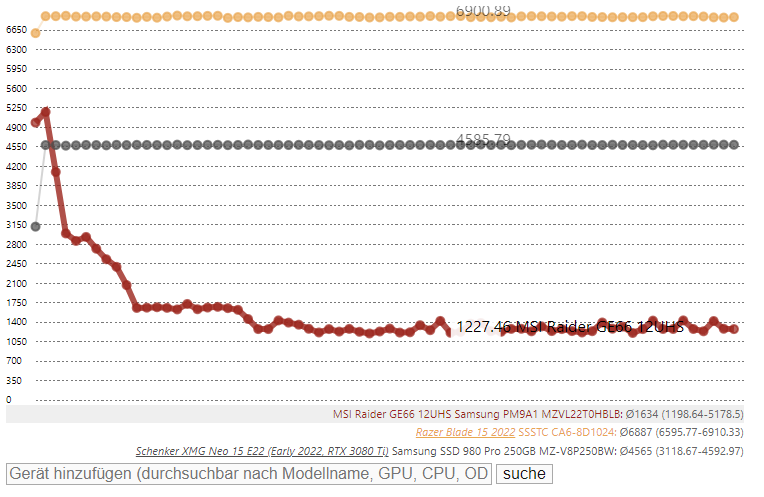
Sustained Read after the update: DiskSpd Read Loop, Queue Depth 8
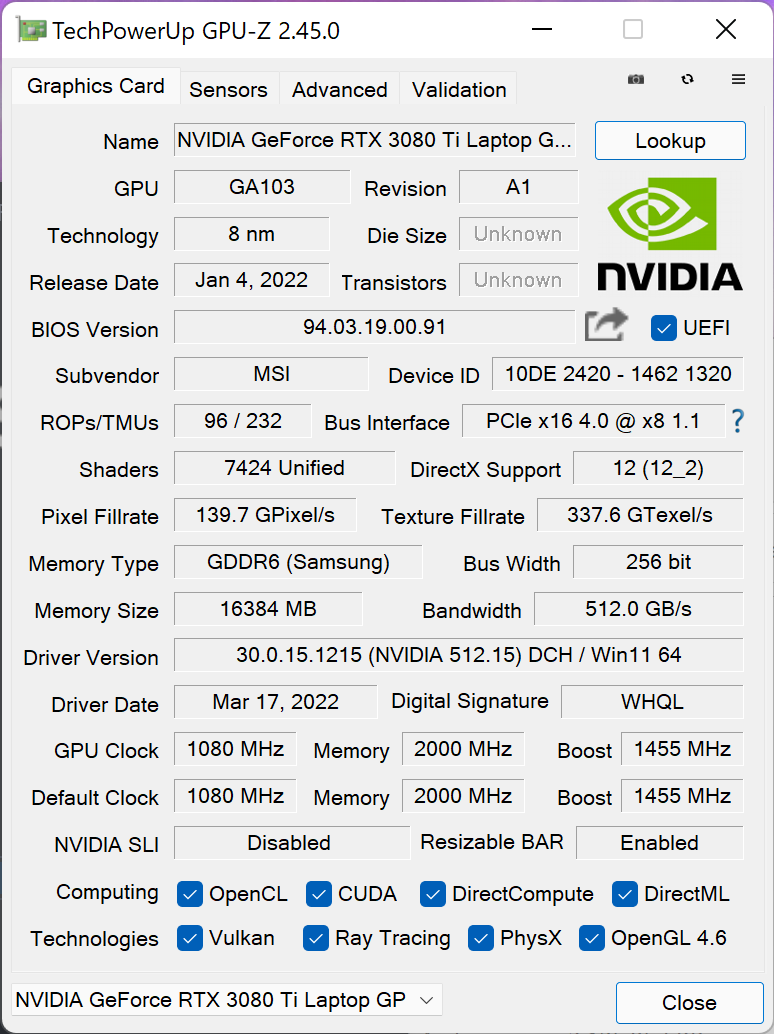
Placa Gráfica
A MSI utiliza a solução gráfica móvel mais poderosa atualmente disponível em nosso dispositivo de revisão: o Nvidia Geforce RTX 3080 Ti, que vem com 16 GB de memória GDDR6 e uma potência gráfica máxima de 150 watts.
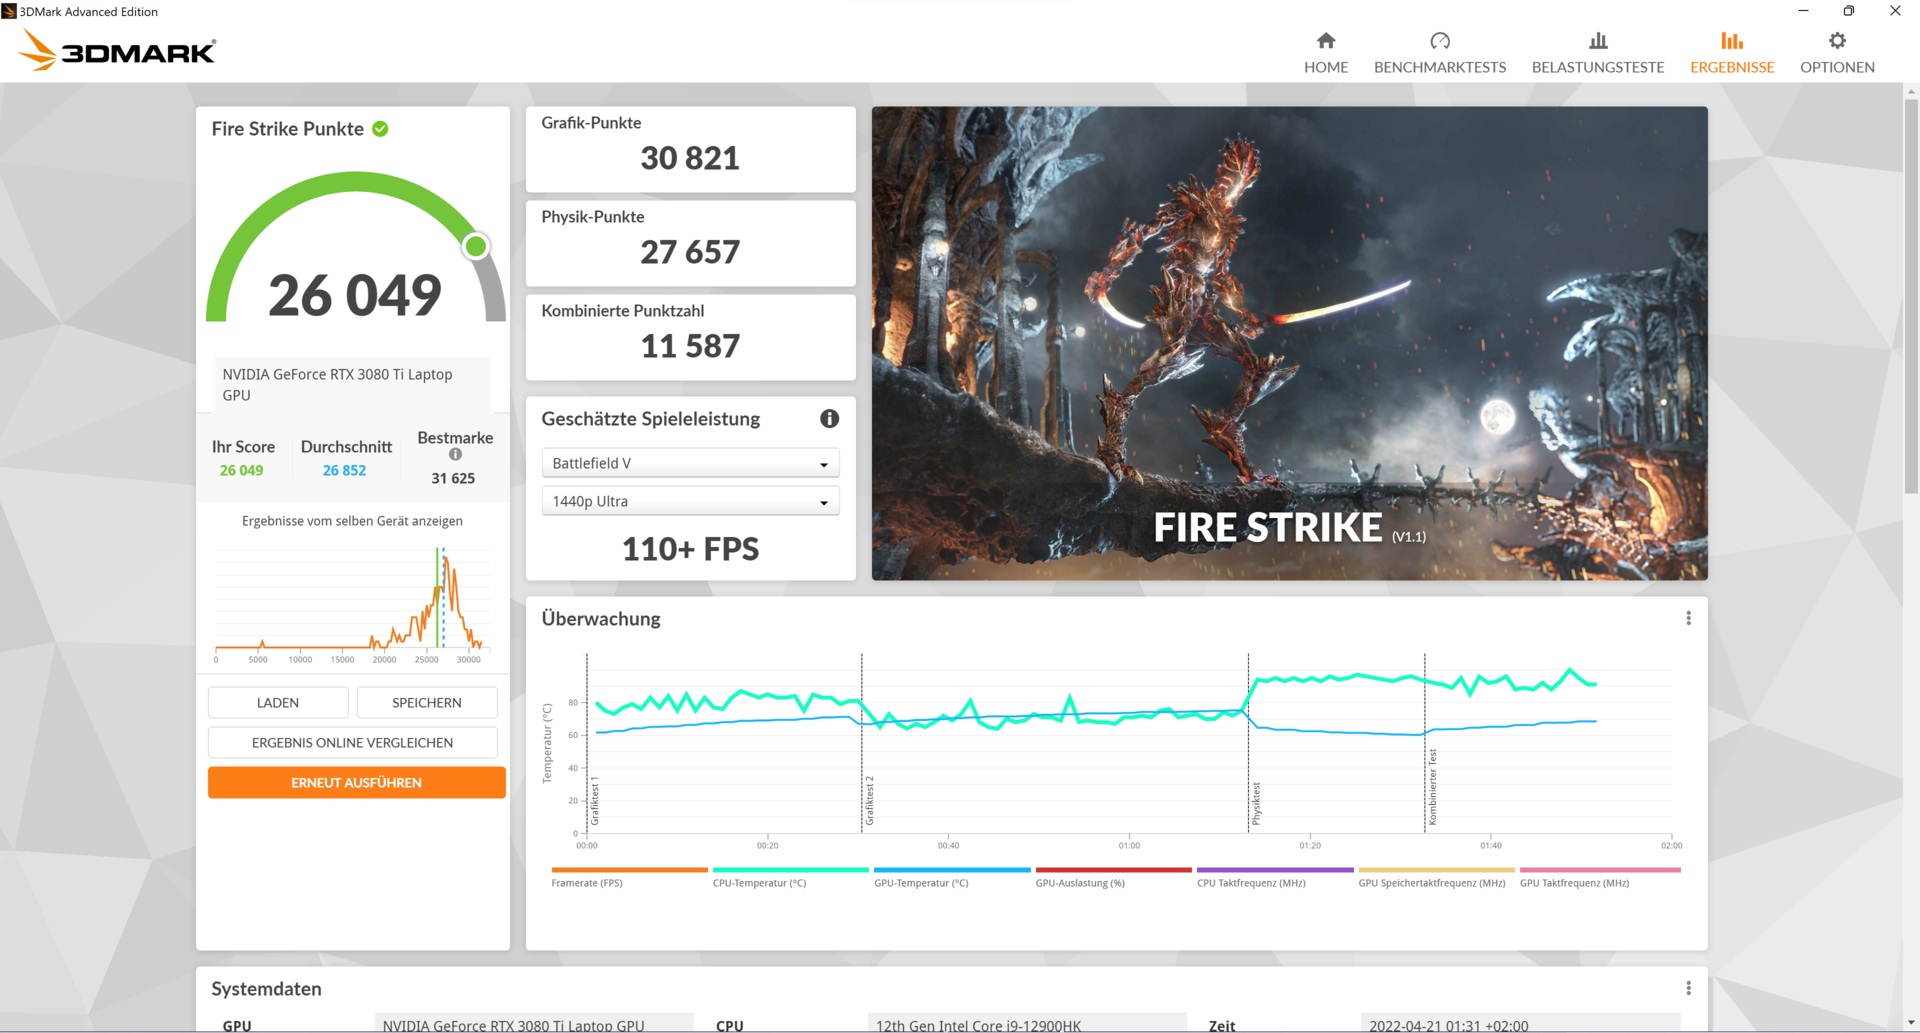
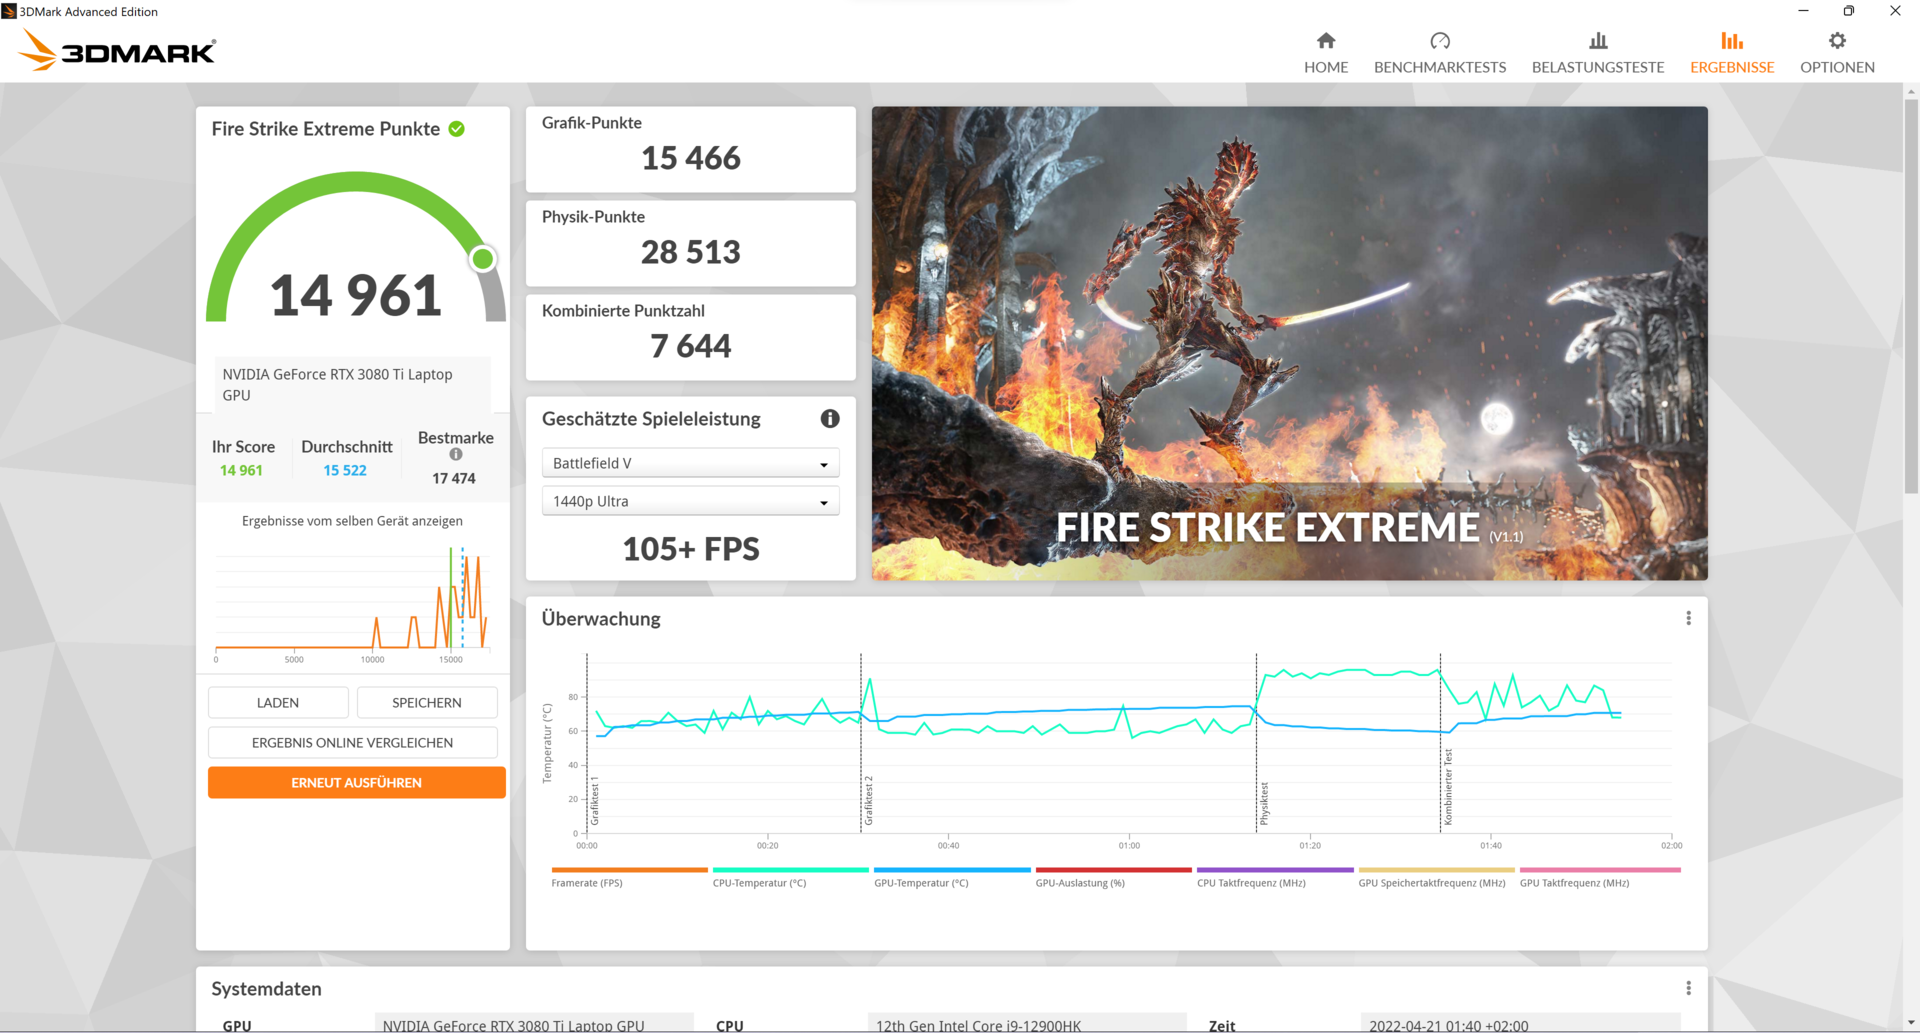
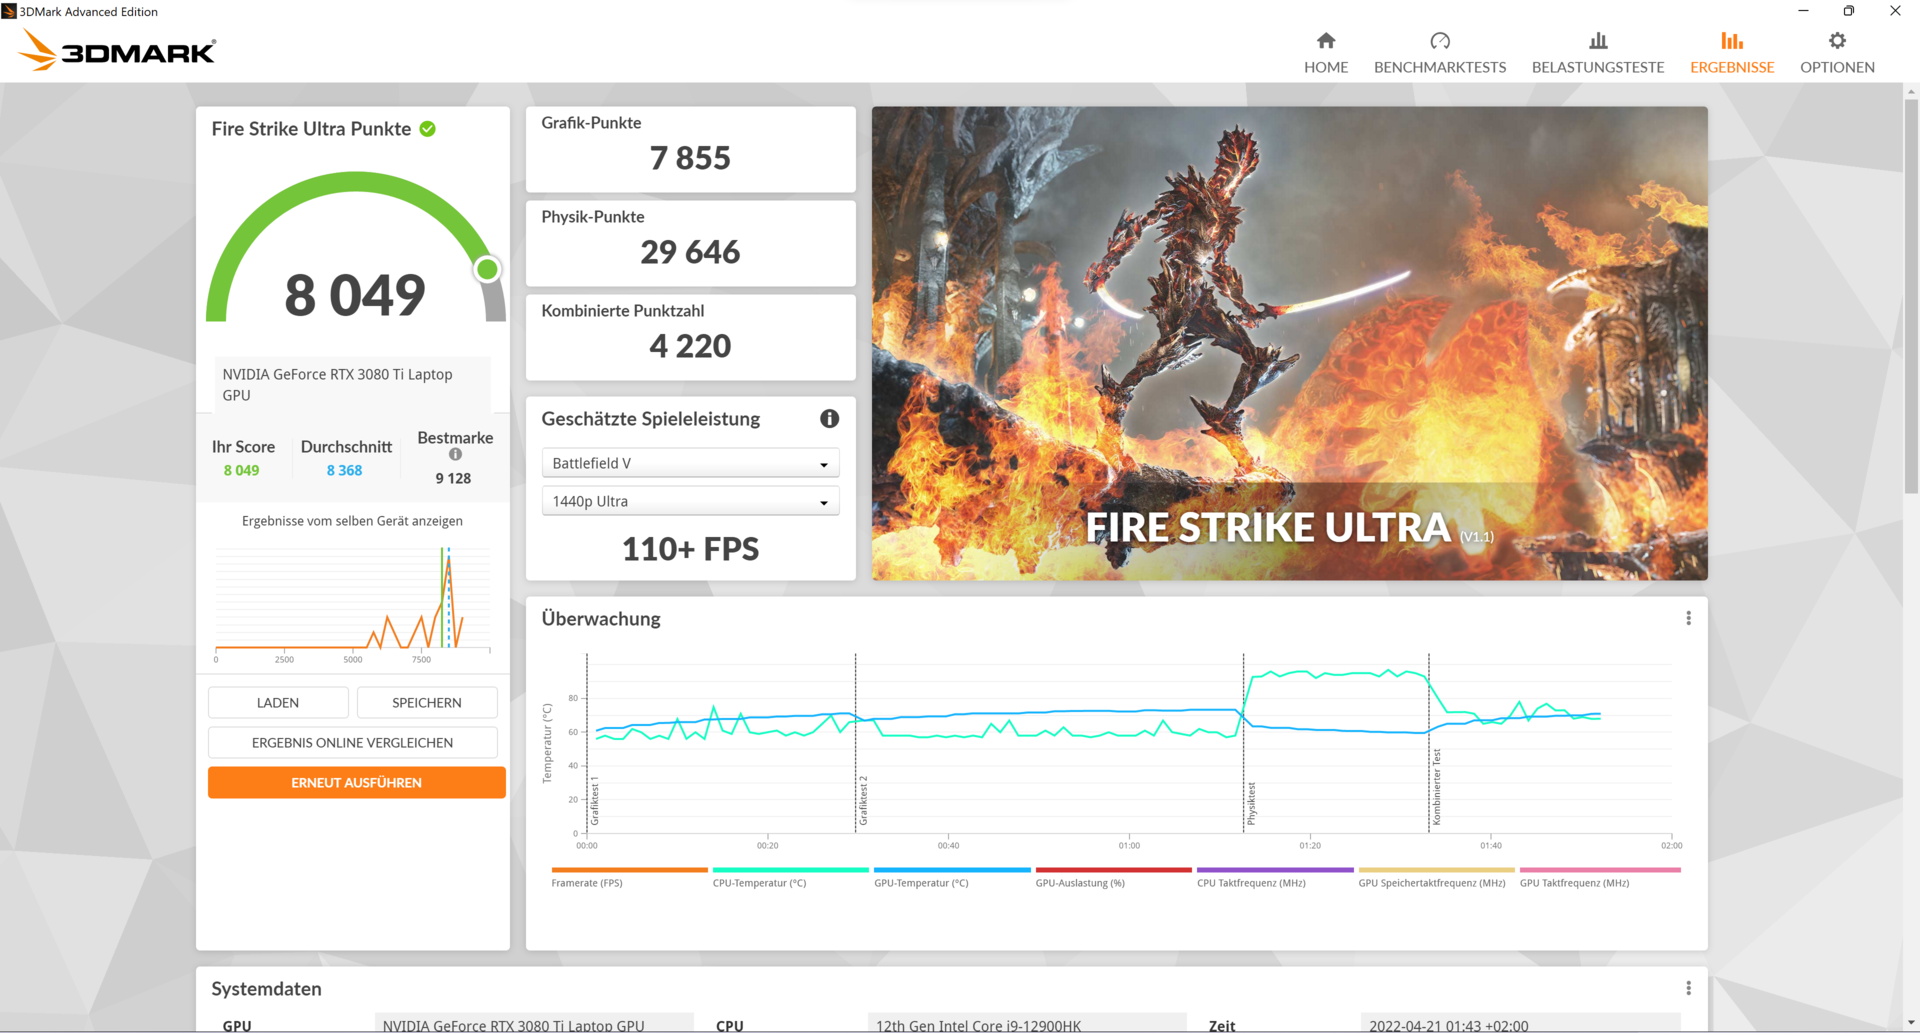
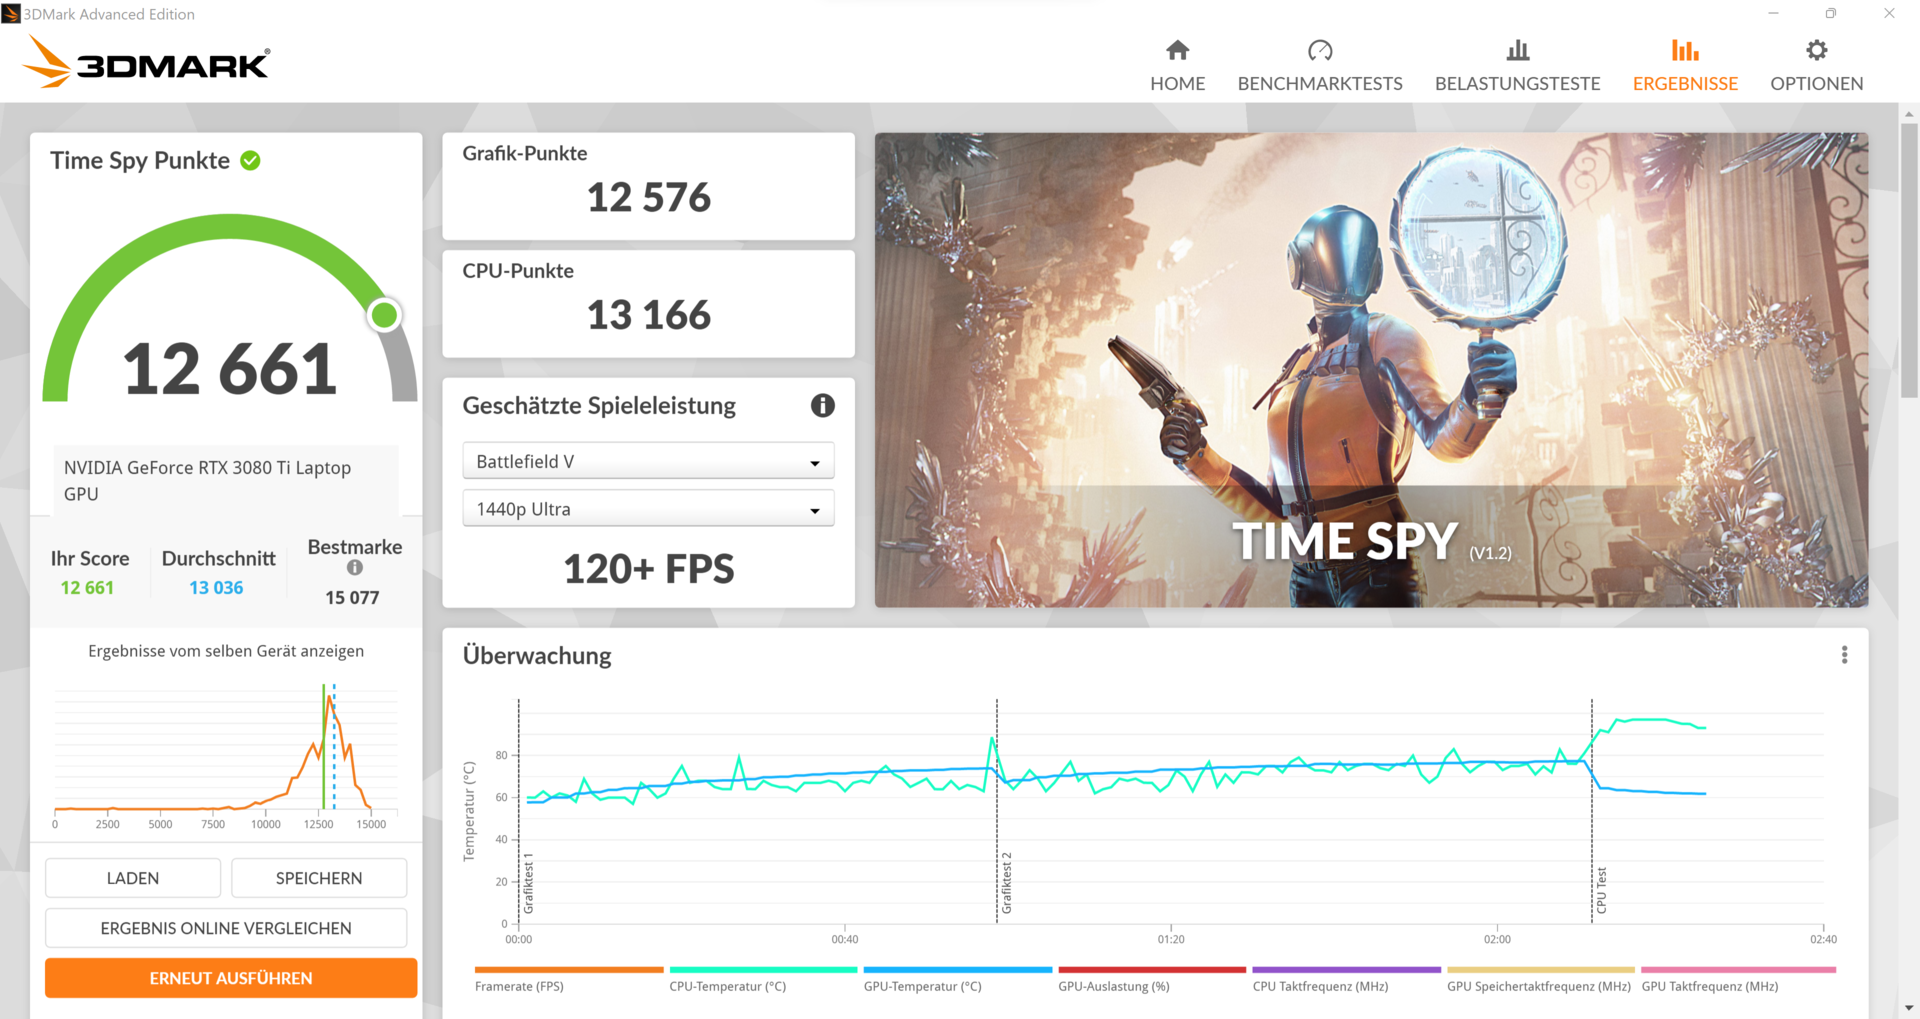
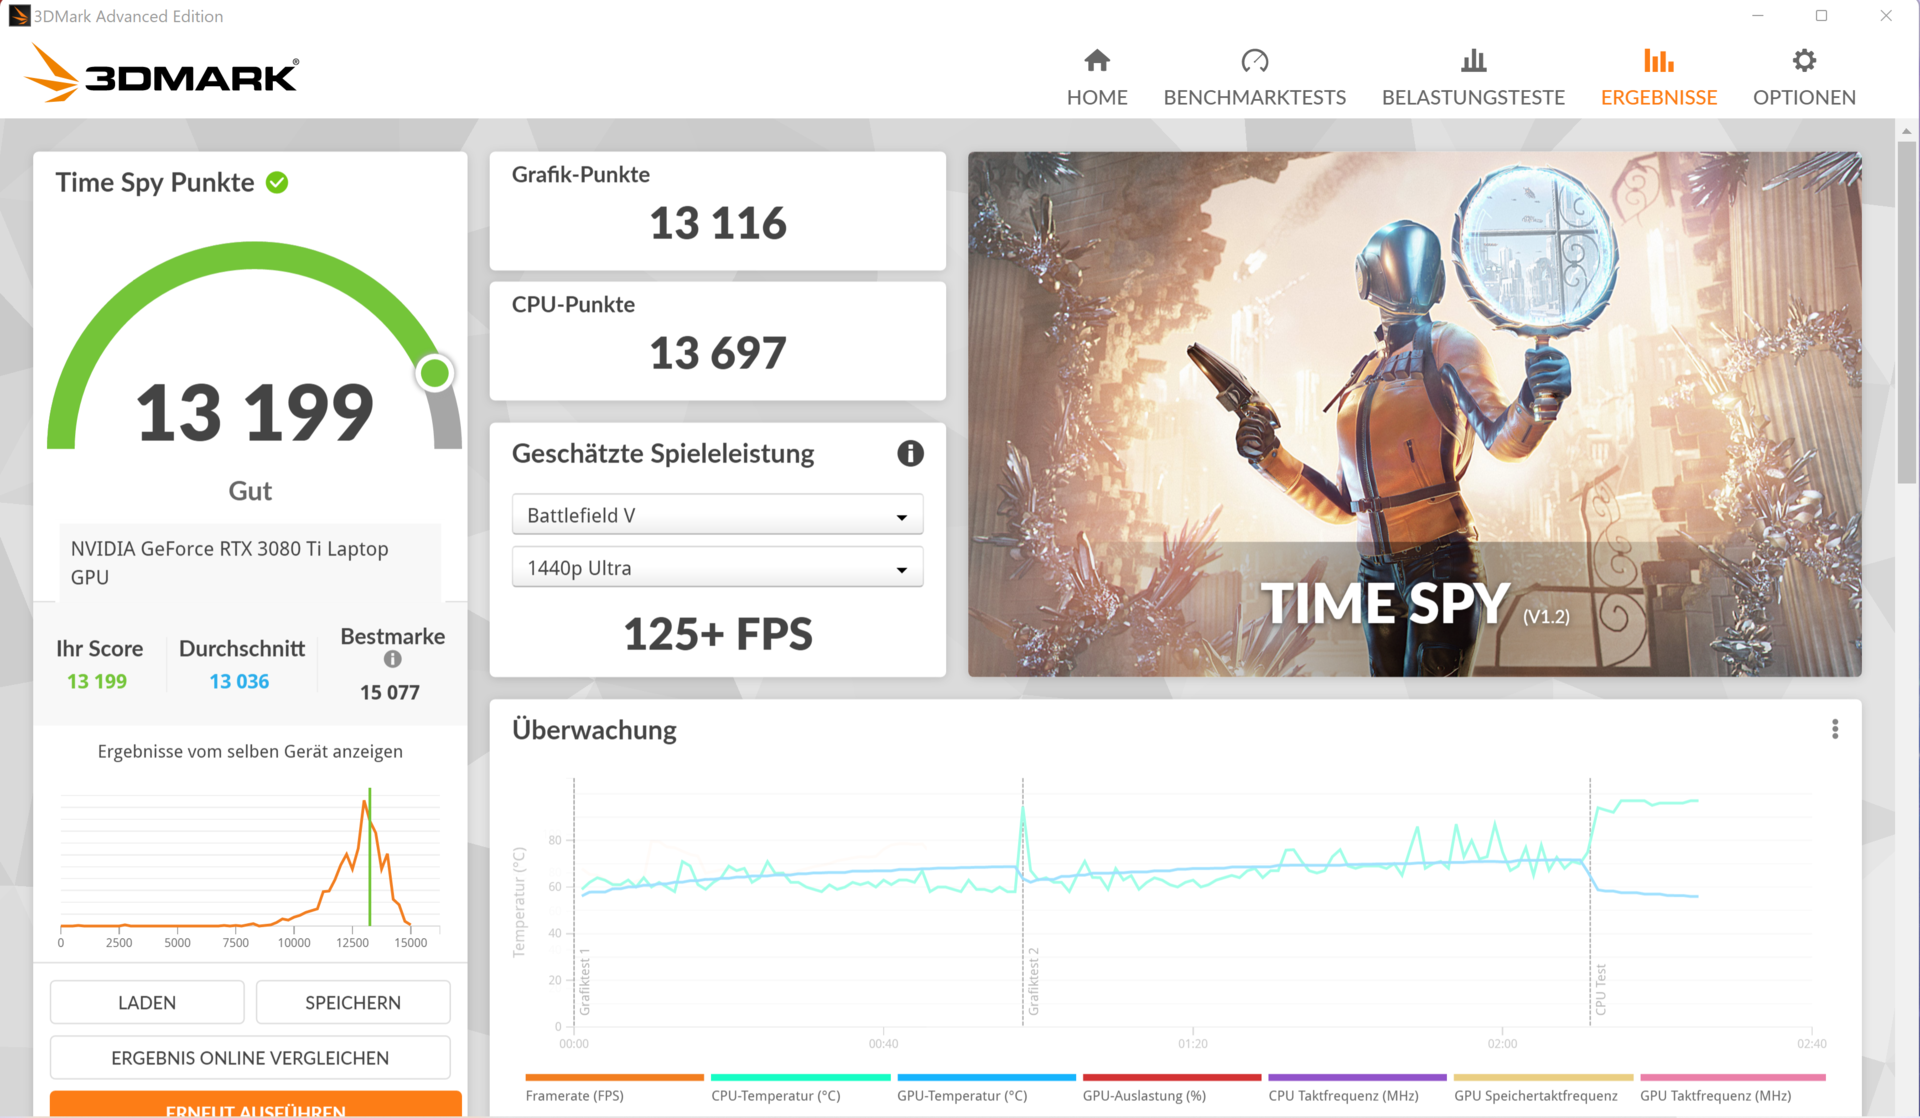
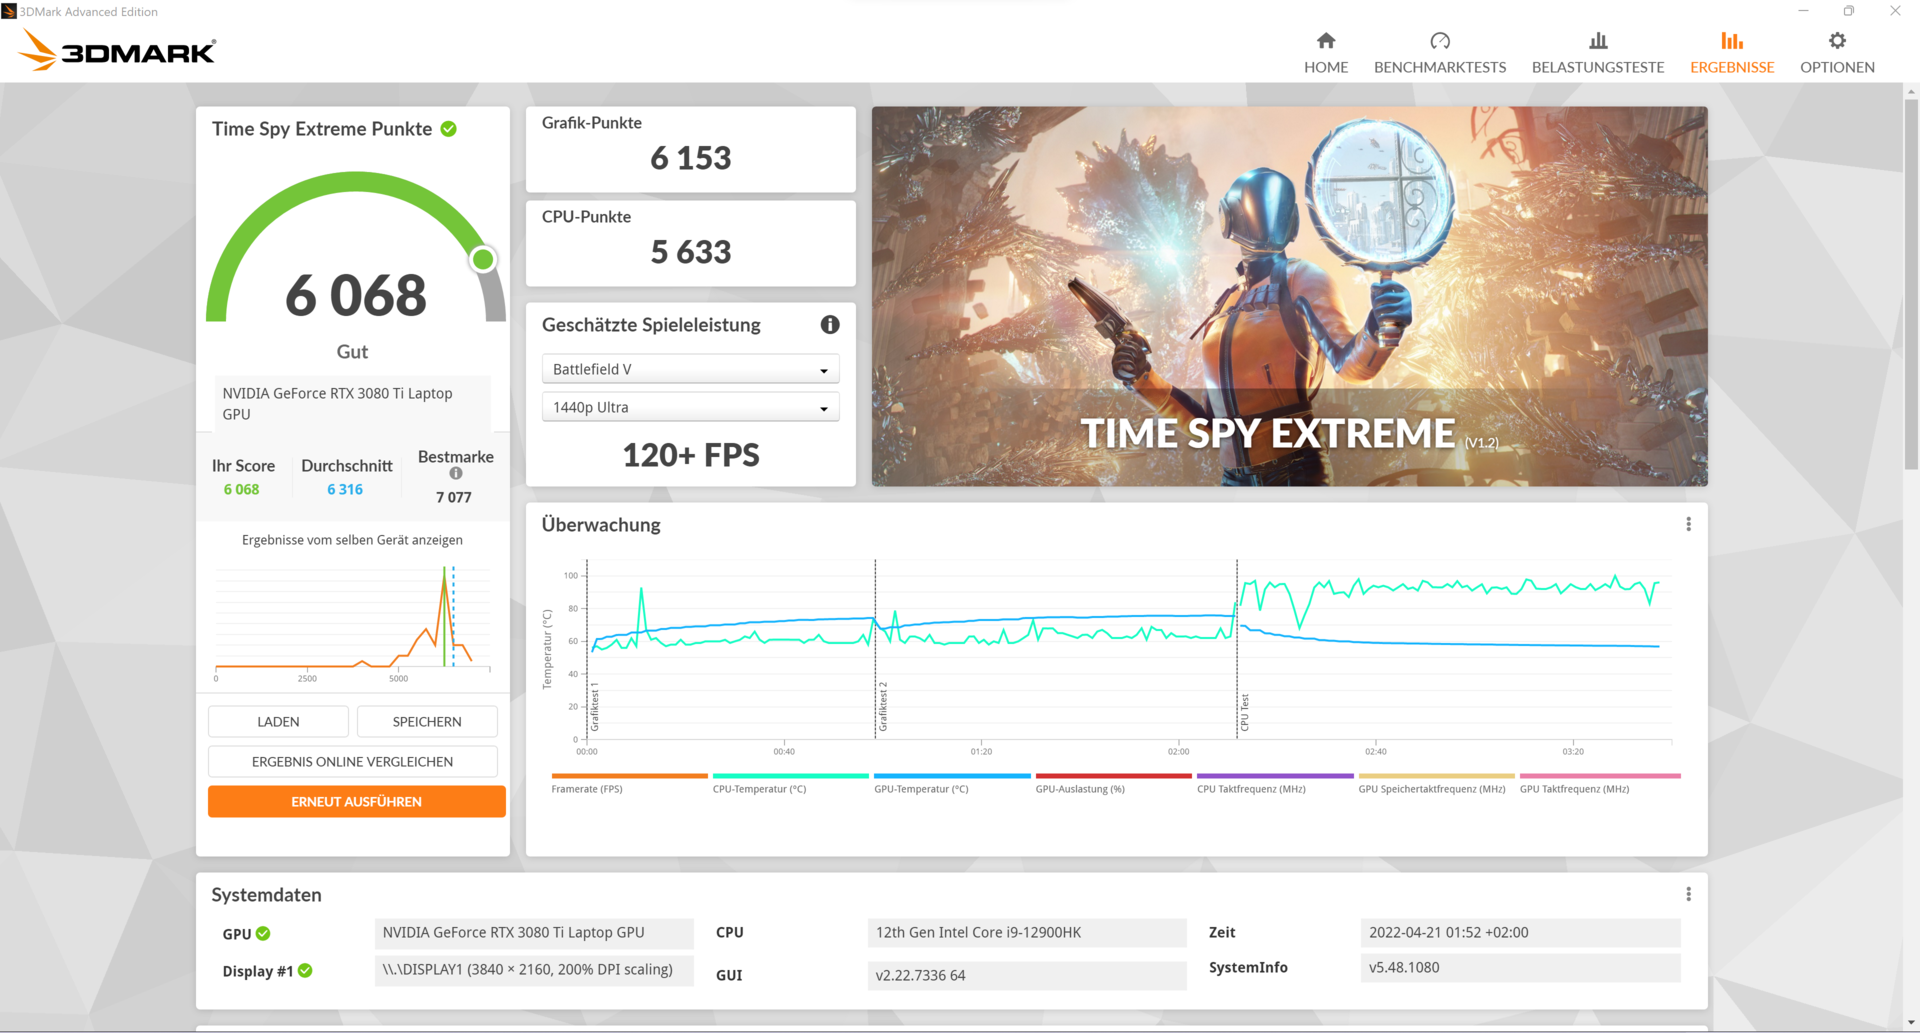
A especificação de 150 watts da MSI também é atingida em nossos benchmarks, o que se reflete nos excelentes resultados. Nosso MSI GE66 12UHS supera toda a concorrência nos benchmarks sintéticos. Uma exceção é o Schenker XMG Neo 15 Início de 2022(i7-12700H e RTX 3080 Ti) com um TDP de 175 watts, que supera nosso dispositivo de revisão em 6% no benchmark 3DMark Fire Strike. Por outro lado, o MSI GE66 bate o Neo 15 em todos os outros referenciais sintéticos.
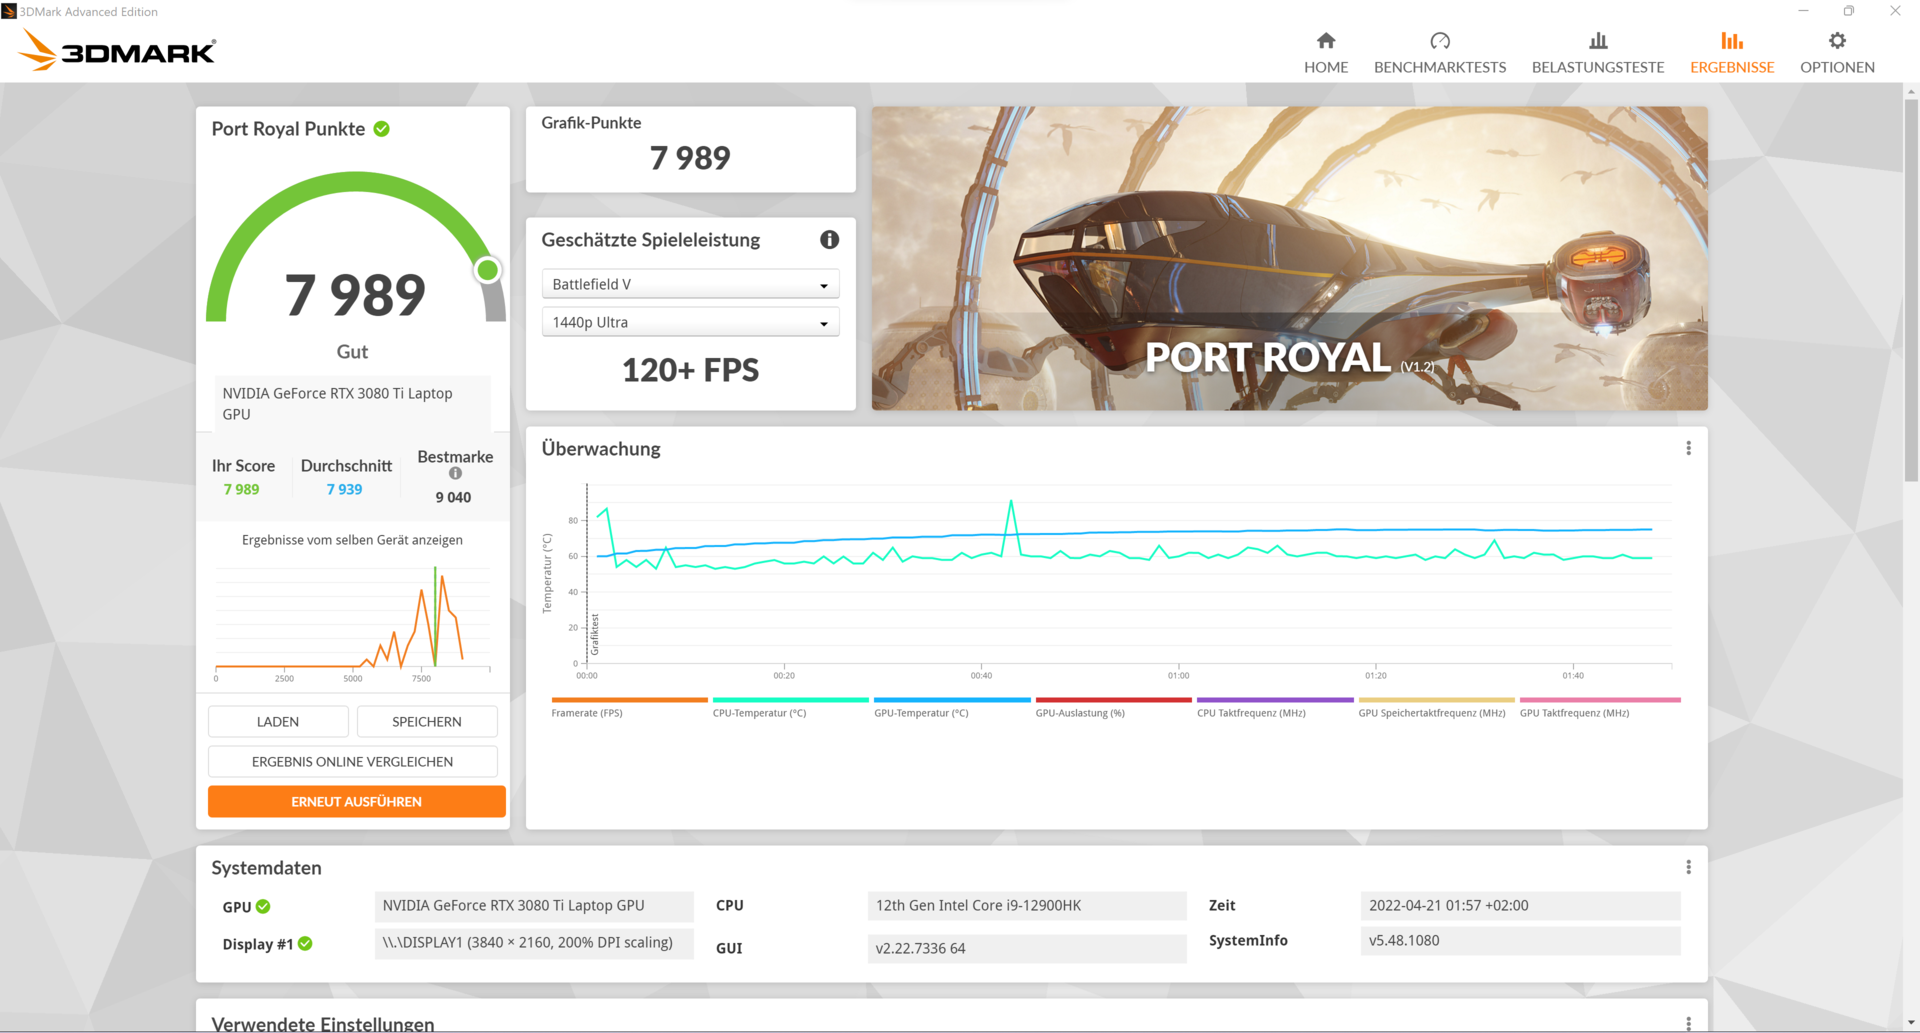
Se mudarmos nosso GE66 12UHS de "MSHybrid" para "Discrete Graphics" através da chave GPU no MSI Center, vemos um ganho de performance de mais de 500 pontos no benchmark 3DMark Time Spy. Entretanto, se desconectarmos a fonte de alimentação, vemos uma queda de desempenho de 80%. Os jogos com bateria não devem, portanto, estar na lista de desejos.
| 3DMark Performance rating - Percent | |
| Média da turma Gaming | |
| Schenker XMG Neo 15 E22 (Early 2022, RTX 3080 Ti) -2! | |
| MSI Raider GE66 12UHS | |
| Razer Blade 15 2022 -1! | |
| Média NVIDIA GeForce RTX 3080 Ti Laptop GPU | |
| Lenovo Legion 5 Pro 16 G7 i7 RTX 3070Ti -3! | |
| MSI GE66 Raider 10SFS -1! | |
| 3DMark 11 Performance | 35599 pontos | |
| 3DMark Cloud Gate Standard Score | 65582 pontos | |
| 3DMark Fire Strike Score | 26049 pontos | |
| 3DMark Fire Strike Extreme Score | 14961 pontos | |
| 3DMark Time Spy Score | 12848 pontos | |
Ajuda | ||
Desempenho nos jogos
O desempenho de jogo do MSI GE66 12 UHS no teste prático é excelente. A MSI retira tudo do RTX 3080 Ti instalado com sua capacidade máxima de 150 watts e até supera dispositivos como o Schenker XMG Neo 15, cujo RTX 3080 Ti tem até 25 watts adicionais à sua disposição.
| The Witcher 3 | |
| 3840x2160 High Graphics & Postprocessing (Nvidia HairWorks Off) | |
| Média da turma Gaming (114 - 170.9, n=4, últimos 2 anos) | |
| Média NVIDIA GeForce RTX 3080 Ti Laptop GPU (62.1 - 94.3, n=8) | |
| MSI Raider GE66 12UHS | |
| MSI GE66 Raider 10SFS | |
| 1920x1080 Ultra Graphics & Postprocessing (HBAO+) | |
| Média da turma Gaming (104.7 - 240, n=7, últimos 2 anos) | |
| Schenker XMG Neo 15 E22 (Early 2022, RTX 3080 Ti) | |
| Média NVIDIA GeForce RTX 3080 Ti Laptop GPU (30 - 130.6, n=43) | |
| MSI Raider GE66 12UHS | |
| Razer Blade 15 2022 | |
| Lenovo Legion 5 Pro 16 G7 i7 RTX 3070Ti | |
| MSI GE66 Raider 10SFS | |
| F1 2021 | |
| 2560x1440 Ultra High Preset + Raytracing AA:T AF:16x | |
| Lenovo Legion 5 Pro 16 G7 i7 RTX 3070Ti | |
| Média NVIDIA GeForce RTX 3080 Ti Laptop GPU (30 - 120.1, n=19) | |
| 1920x1080 Ultra High Preset + Raytracing AA:T AF:16x | |
| MSI Raider GE66 12UHS | |
| Lenovo Legion 5 Pro 16 G7 i7 RTX 3070Ti | |
| Média NVIDIA GeForce RTX 3080 Ti Laptop GPU (30.2 - 160.6, n=30) | |
| F1 2020 - 1920x1080 Ultra High Preset AA:T AF:16x | |
| Média NVIDIA GeForce RTX 3080 Ti Laptop GPU (190.4 - 197.9, n=2) | |
| MSI Raider GE66 12UHS | |
| Horizon Zero Dawn | |
| 3840x2160 Ultimate Quality | |
| Média NVIDIA GeForce RTX 3080 Ti Laptop GPU (56 - 61, n=2) | |
| MSI Raider GE66 12UHS | |
| 2560x1440 Ultimate Quality | |
| Média NVIDIA GeForce RTX 3080 Ti Laptop GPU (98 - 109, n=3) | |
| MSI Raider GE66 12UHS | |
| 1920x1080 Ultimate Quality | |
| Média NVIDIA GeForce RTX 3080 Ti Laptop GPU (118 - 128, n=3) | |
| MSI Raider GE66 12UHS | |
| 1920x1080 Favor Quality | |
| MSI Raider GE66 12UHS | |
| Média NVIDIA GeForce RTX 3080 Ti Laptop GPU (130 - 141, n=3) | |
| Far Cry 6 | |
| 1920x1080 Ultra Graphics Quality + HD Textures + DXR AA:T | |
| Média da turma Gaming (n=1últimos 2 anos) | |
| MSI Raider GE66 12UHS | |
| Média NVIDIA GeForce RTX 3080 Ti Laptop GPU (91 - 92, n=3) | |
| 3840x2160 Ultra Graphics Quality + HD Textures AA:T | |
| MSI Raider GE66 12UHS | |
| Média NVIDIA GeForce RTX 3080 Ti Laptop GPU (46.2 - 57, n=4) | |
| 2560x1440 Ultra Graphics Quality + HD Textures AA:T | |
| Média da turma Gaming (n=1últimos 2 anos) | |
| MSI Raider GE66 12UHS | |
| Média NVIDIA GeForce RTX 3080 Ti Laptop GPU (75.2 - 93, n=5) | |
| 1920x1080 Ultra Graphics Quality + HD Textures AA:T | |
| Média da turma Gaming (n=1últimos 2 anos) | |
| MSI Raider GE66 12UHS | |
| Média NVIDIA GeForce RTX 3080 Ti Laptop GPU (71.3 - 114, n=6) | |
| Assassin´s Creed Valhalla | |
| 3840x2160 Ultra High Preset | |
| Média NVIDIA GeForce RTX 3080 Ti Laptop GPU (45 - 50, n=2) | |
| MSI Raider GE66 12UHS | |
| 2560x1440 Ultra High Preset | |
| Média NVIDIA GeForce RTX 3080 Ti Laptop GPU (68 - 74, n=3) | |
| MSI Raider GE66 12UHS | |
| 1920x1080 Ultra High Preset | |
| Média NVIDIA GeForce RTX 3080 Ti Laptop GPU (85 - 93, n=3) | |
| MSI Raider GE66 12UHS | |
| 1920x1080 High Preset | |
| Média NVIDIA GeForce RTX 3080 Ti Laptop GPU (99 - 103, n=3) | |
| MSI Raider GE66 12UHS | |
Em outros benchmarks relativos ao desempenho sob carga contínua, registramos uma queda no desempenho do jogo de até 12%. No perfil "Performance Extrema" com controle automático do ventilador, os ventiladores são limitados a um máximo de 5.100 RPM (rodadas por minuto), o que foi claramente insuficiente para manter a CPU e GPU adequadamente frias durante períodos de jogo mais longos e assim resultou em eventual estrangulamento. Repetimos tudo sob o mesmo perfil e ativamos o "Cooler Boost Mode" (ventiladores funcionando a 6.000 RPM). O resultado: o calor residual dos componentes foi suficientemente dissipado sob estas condições e não observamos mais nenhuma redução nas taxas de FPS durante o período de teste.
Witcher 3 FPS Chart
| baixo | média | alto | ultra | QHD | 4K | |
|---|---|---|---|---|---|---|
| GTA V (2015) | 187 | 181 | 172.6 | 109.4 | ||
| The Witcher 3 (2015) | 411 | 344 | 223 | 110 | 77.49 | |
| Dota 2 Reborn (2015) | 187.4 | 170.8 | 166.9 | 156.8 | 142.3 | |
| Final Fantasy XV Benchmark (2018) | 212 | 160.3 | 119.6 | 89.5 | 52.1 | |
| X-Plane 11.11 (2018) | 170 | 149.6 | 117.5 | 102.1 | ||
| Far Cry 5 (2018) | 164 | 153 | 144 | 124 | 70 | |
| Strange Brigade (2018) | 490 | 284 | 224 | 199.8 | 146.9 | 86.9 |
| F1 2020 (2020) | 345 | 303 | 270 | 190.4 | ||
| Horizon Zero Dawn (2020) | 168 | 156 | 141 | 122 | 98 | 56 |
| Assassin´s Creed Valhalla (2020) | 115 | 100 | 87 | 70 | 45 | |
| F1 2021 (2021) | 394 | 351 | 292 | 142.7 | ||
| Far Cry 6 (2021) | 143 | 126 | 114 | 92 | 54 | |
| Cyberpunk 2077 1.6 (2022) | 158.75 | 159.68 | 145.61 | 144.08 | 56.83 | 27.62 |
Emissões: GE66 atinge um bom equilíbrio entre desempenho e volume
Ruído
Para o hardware instalado, o MSI GE 66 12UHS dá uma imagem geral equilibrada em termos de ruído do ventilador. Durante o uso diário, os ventiladores ocasionalmente se renovam, dependendo da atividade e do perfil do ventilador. Sob carga, o controle do ventilador reage rapidamente para evitar quedas de desempenho devido ao aumento muito rápido da temperatura. Mesmo sob "Desempenho extremo", ambos os ventiladores são limitados a um máximo de 5.100 RPM, embora um máximo de 6.000 RPM seja possível, mas isto é reservado para o modo "Cooler Boost". Dito isto, os usuários também podem criar um perfil de ventilador personalizado para CPU e GPU e assim ajustar o volume às suas necessidades. Além disso, há a possibilidade de gerenciar o controle do ventilador automaticamente via AI. Isto funcionou muito bem no uso diário, mas os ventiladores às vezes reagiam muito lentamente diante de aumentos rápidos de temperatura e cargas altas. No geral, mesmo os 45 dB a 5.100 RPM parecem toleráveis quando se joga. Isto se deve em parte ao fato de que os ventiladores instalados não tendem a emitir ruídos de alta freqüência ou lamentos de bobina.
Barulho
| Ocioso |
| 27 / 30 / 39 dB |
| Carga |
| 45 / 47 dB |
 | ||
30 dB silencioso 40 dB(A) audível 50 dB(A) ruidosamente alto |
||
min: | ||
| MSI Raider GE66 12UHS Intel Core i9-12900HK, NVIDIA GeForce RTX 3080 Ti Laptop GPU | MSI GE66 Raider 10SFS Intel Core i9-10980HK, NVIDIA GeForce RTX 2070 Super Mobile | Razer Blade 15 2022 Intel Core i7-12800H, NVIDIA GeForce RTX 3080 Ti Laptop GPU | Schenker XMG Neo 15 E22 (Early 2022, RTX 3080 Ti) Intel Core i7-12700H, NVIDIA GeForce RTX 3080 Ti Laptop GPU | Lenovo Legion 5 Pro 16 G7 i7 RTX 3070Ti Intel Core i7-12700H, NVIDIA GeForce RTX 3070 Ti Laptop GPU | |
|---|---|---|---|---|---|
| Noise | -16% | 5% | 7% | -1% | |
| desligado / ambiente * (dB) | 26 | 30 -15% | 25.4 2% | 24 8% | 24.6 5% |
| Idle Minimum * (dB) | 27 | 30 -11% | 26.2 3% | 24 11% | 28.4 -5% |
| Idle Average * (dB) | 30 | 35 -17% | 26.2 13% | 24 20% | 28.4 5% |
| Idle Maximum * (dB) | 39 | 44 -13% | 28.4 27% | 27.76 29% | 28.4 27% |
| Load Average * (dB) | 45 | 53 -18% | 44.7 1% | 38.81 14% | 49.4 -10% |
| Witcher 3 ultra * (dB) | 45 | 53 -18% | 44.7 1% | 54.2 -20% | 49.4 -10% |
| Load Maximum * (dB) | 47 | 55 -17% | 51.9 -10% | 54.18 -15% | 54.7 -16% |
* ... menor é melhor
Temperatura
Durante o trabalho diário, como navegação na web, trabalho com Office, ou reprodução de mídia, o trackpad e o descanso para as mãos permanecem sempre agradavelmente frescos. O teclado, por outro lado, aquece levemente, mas isto não afeta a experiência da digitação. Mesmo a operação na volta é teoricamente possível nas temperaturas de verão neste cenário, embora isto seja bastante improvável devido ao tamanho e peso do laptop. Entre outras coisas, o controle do ventilador garante que a parte inferior do aparelho aqueça apenas levemente durante tarefas não exigentes.
Sob carga (teste de estresse, Witcher 3 teste), o notebook aquece consideravelmente. A parte inferior aquece até uma média de 52 graus Celsius e mostra taxas máximas de 62 a 65 graus Celsius. Registramos uma temperatura média de 45 graus Celsius no lado superior, com a maior parte do calor residual concentrado na área traseira, bem como no teclado. As teclas também esquentam, mas ainda podem ser usadas sem desconforto. Uma média de apenas 34 graus Celsius foi medida nos apoios das palmas e no touchpad, mesmo sob carga alta.
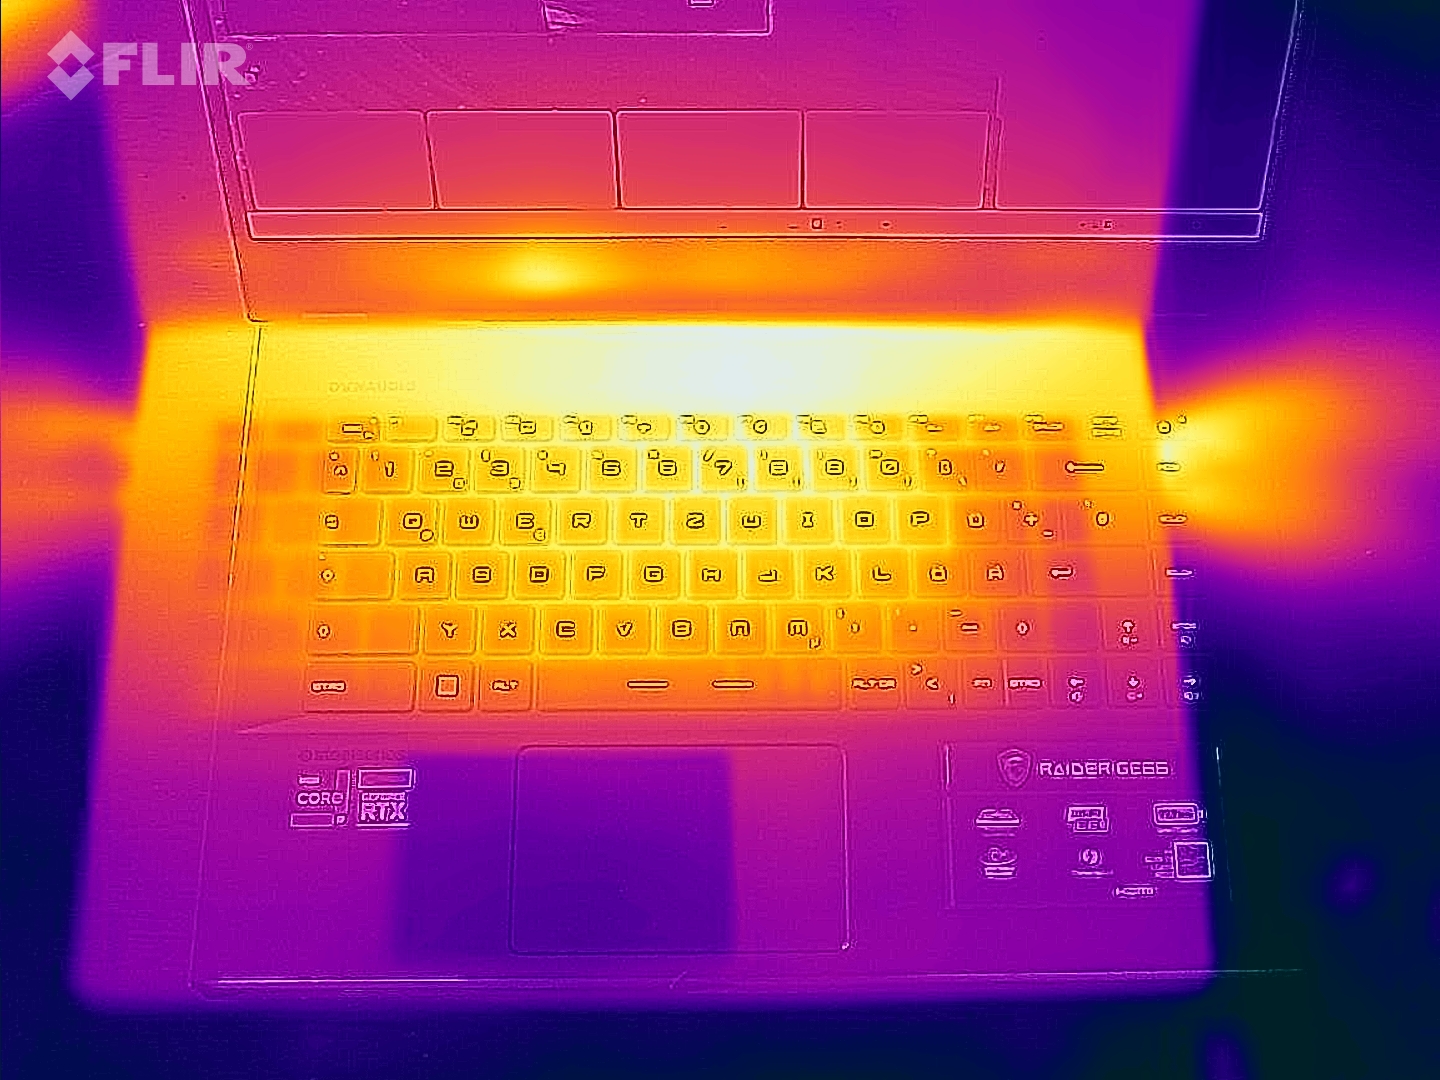
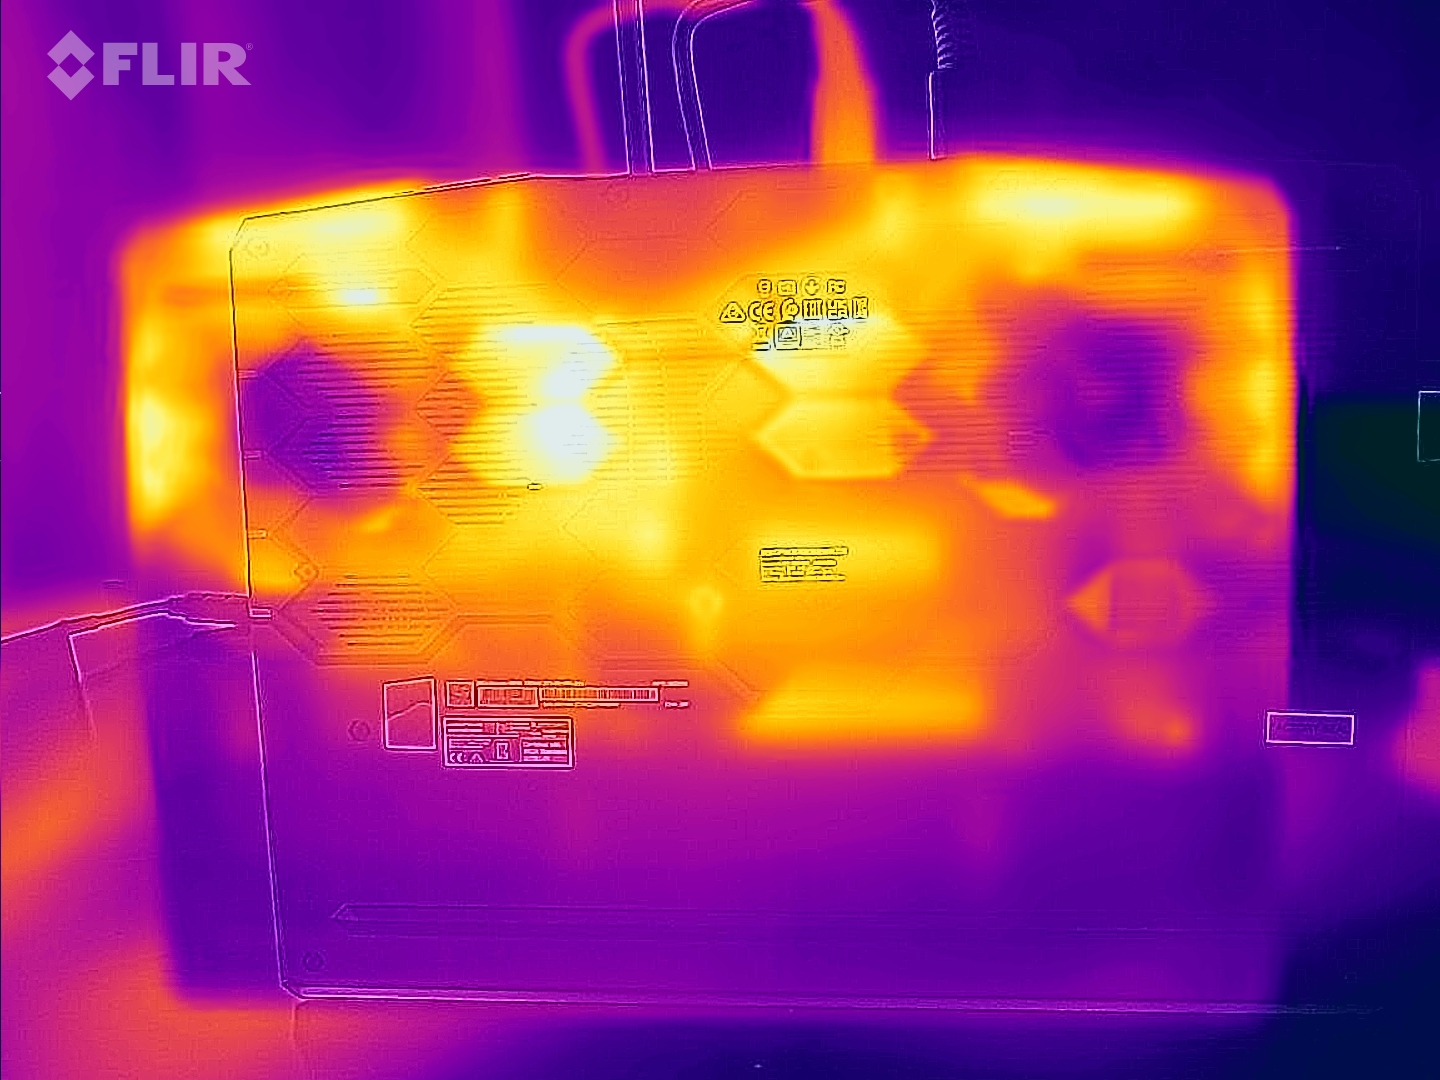
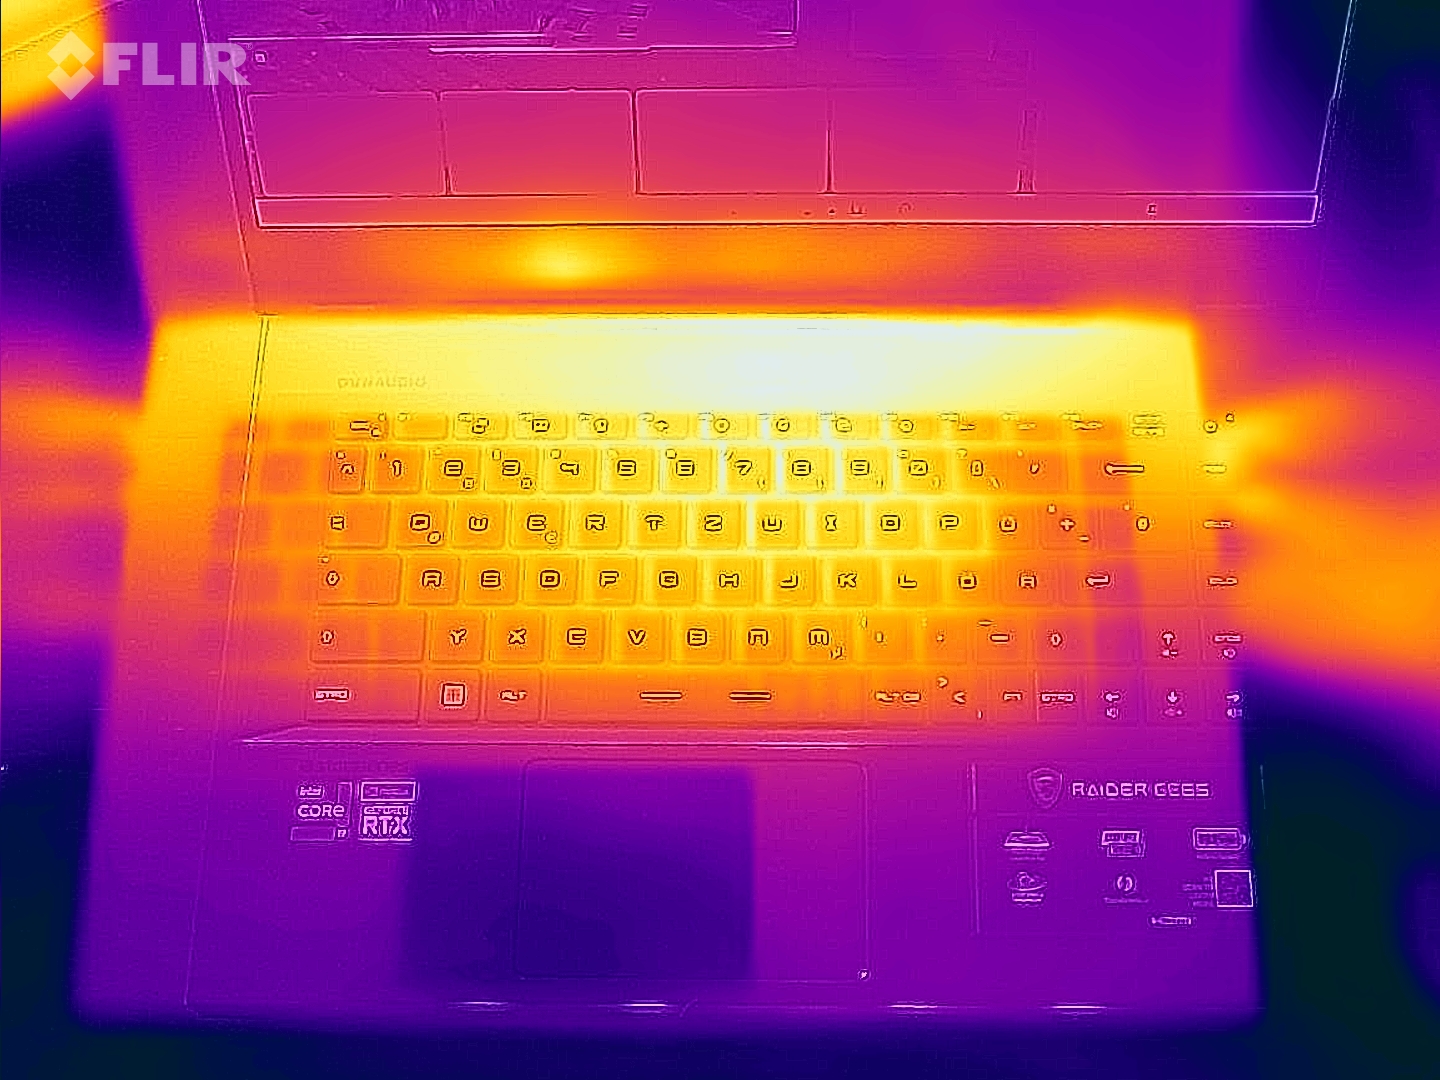
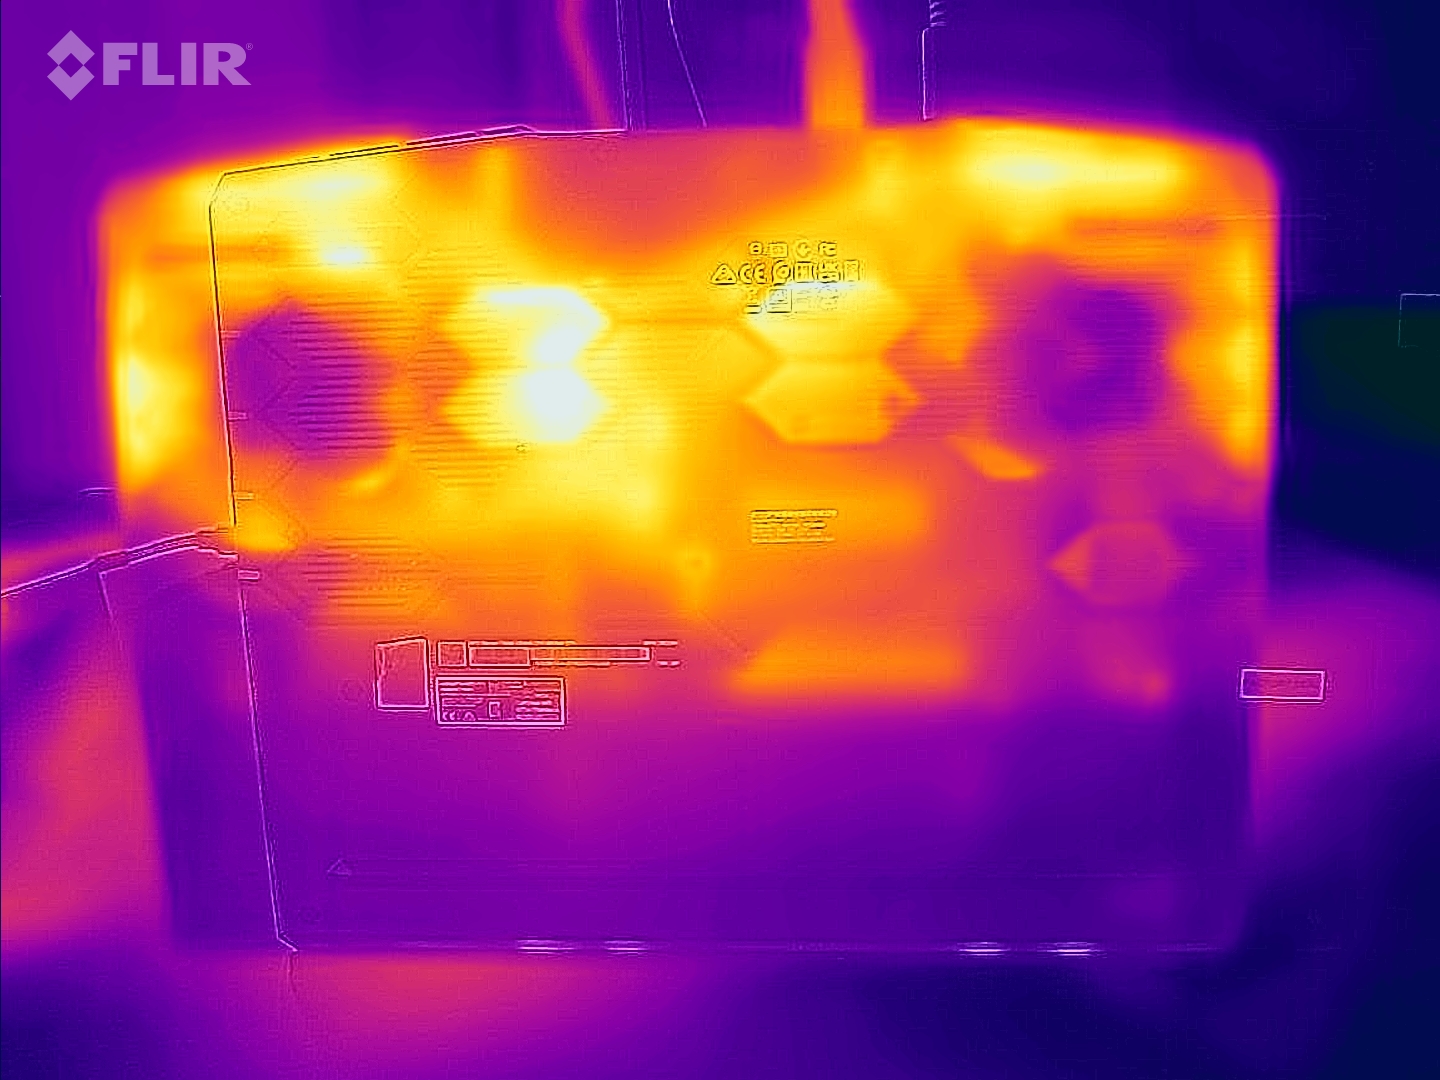
(-) A temperatura máxima no lado superior é 54 °C / 129 F, em comparação com a média de 40.4 °C / 105 F , variando de 21.2 a 68.8 °C para a classe Gaming.
(-) A parte inferior aquece até um máximo de 65 °C / 149 F, em comparação com a média de 43.2 °C / 110 F
(+) Em uso inativo, a temperatura média para o lado superior é 28.7 °C / 84 F, em comparação com a média do dispositivo de 33.9 °C / ### class_avg_f### F.
(-) Jogando The Witcher 3, a temperatura média para o lado superior é 45.4 °C / 114 F, em comparação com a média do dispositivo de 33.9 °C / ## #class_avg_f### F.
(±) Os apoios para as mãos e o touchpad podem ficar muito quentes ao toque, com um máximo de 36 °C / 96.8 F.
(-) A temperatura média da área do apoio para as mãos de dispositivos semelhantes foi 28.8 °C / 83.8 F (-7.2 °C / -13 F).
| MSI Raider GE66 12UHS Intel Core i9-12900HK, NVIDIA GeForce RTX 3080 Ti Laptop GPU | MSI GE66 Raider 10SFS Intel Core i9-10980HK, NVIDIA GeForce RTX 2070 Super Mobile | Razer Blade 15 2022 Intel Core i7-12800H, NVIDIA GeForce RTX 3080 Ti Laptop GPU | Schenker XMG Neo 15 E22 (Early 2022, RTX 3080 Ti) Intel Core i7-12700H, NVIDIA GeForce RTX 3080 Ti Laptop GPU | Lenovo Legion 5 Pro 16 G7 i7 RTX 3070Ti Intel Core i7-12700H, NVIDIA GeForce RTX 3070 Ti Laptop GPU | |
|---|---|---|---|---|---|
| Heat | 8% | 0% | -3% | 9% | |
| Maximum Upper Side * (°C) | 54 | 49 9% | 50 7% | 52 4% | 45.3 16% |
| Maximum Bottom * (°C) | 65 | 52 20% | 47 28% | 68 -5% | 61.2 6% |
| Idle Upper Side * (°C) | 30 | 30 -0% | 37.4 -25% | 32 -7% | 28.6 5% |
| Idle Bottom * (°C) | 35 | 34 3% | 38.4 -10% | 36 -3% | 31.4 10% |
* ... menor é melhor
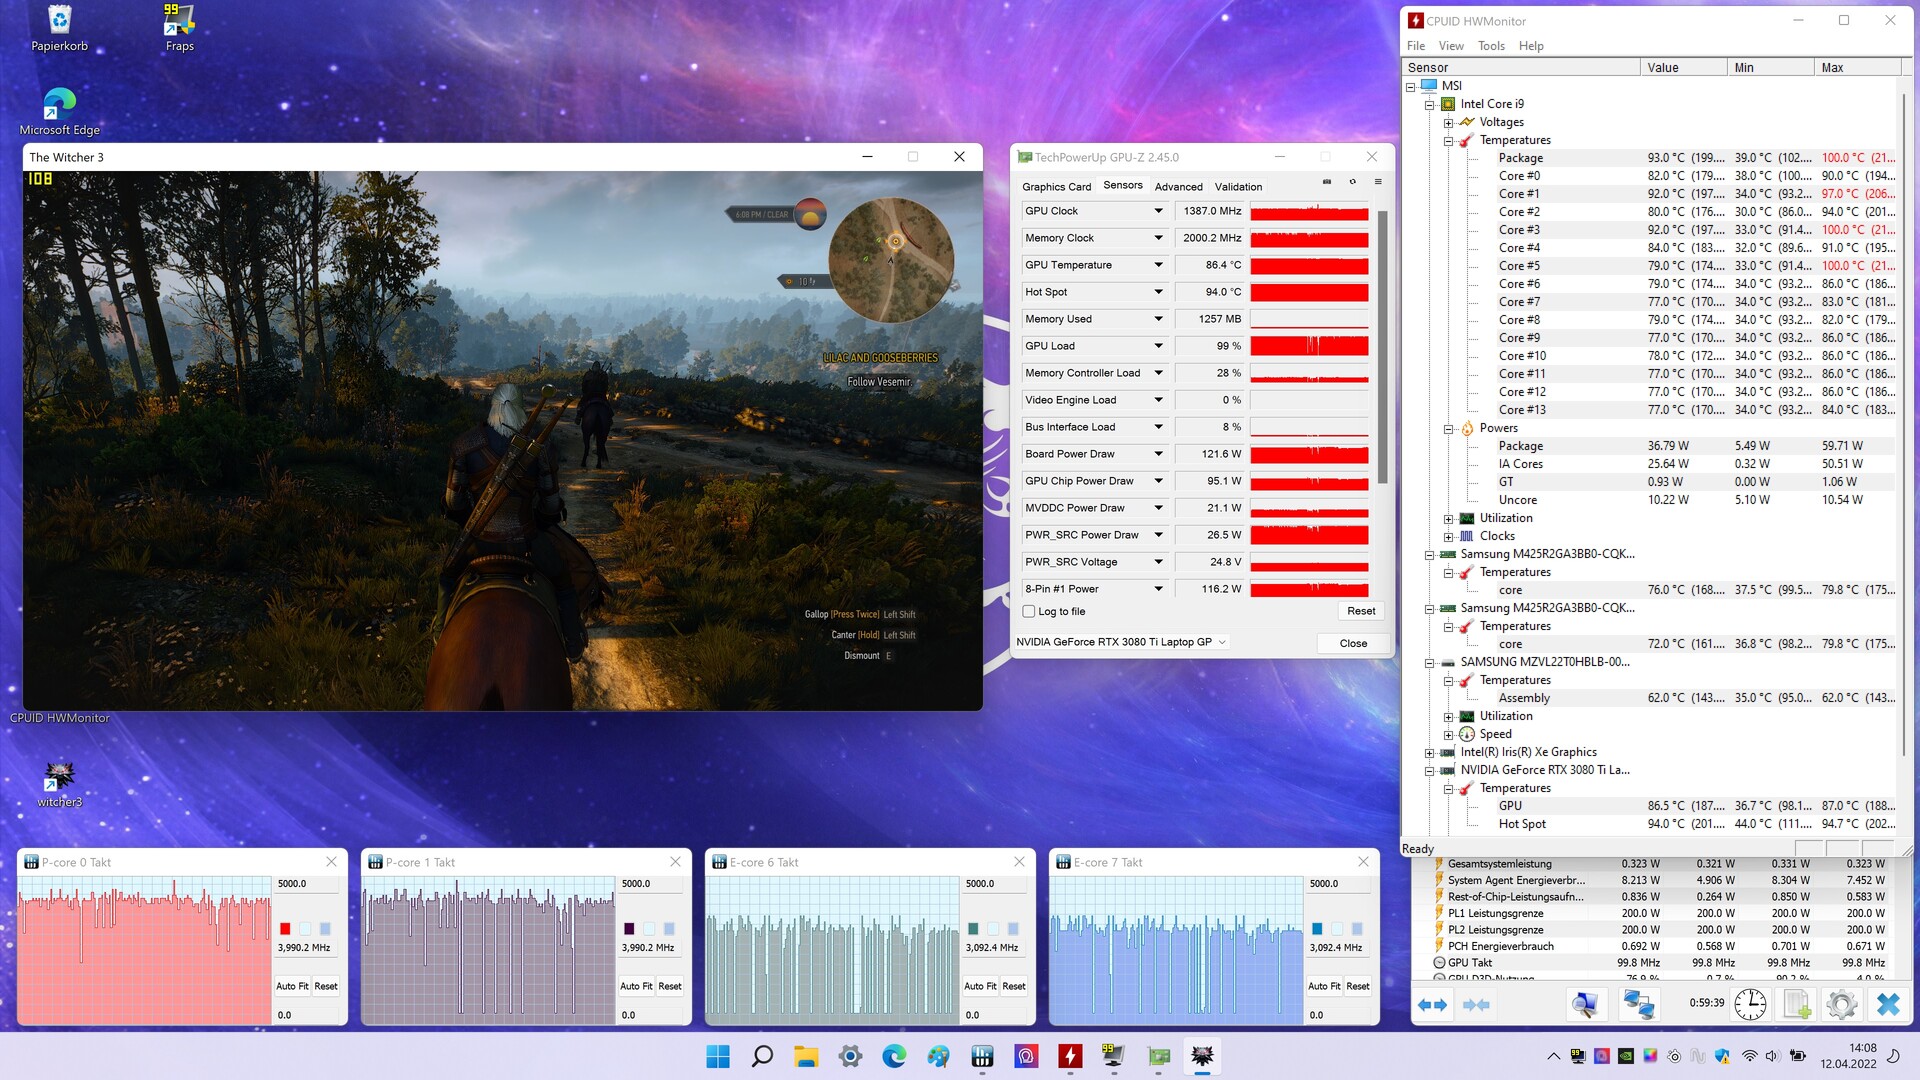
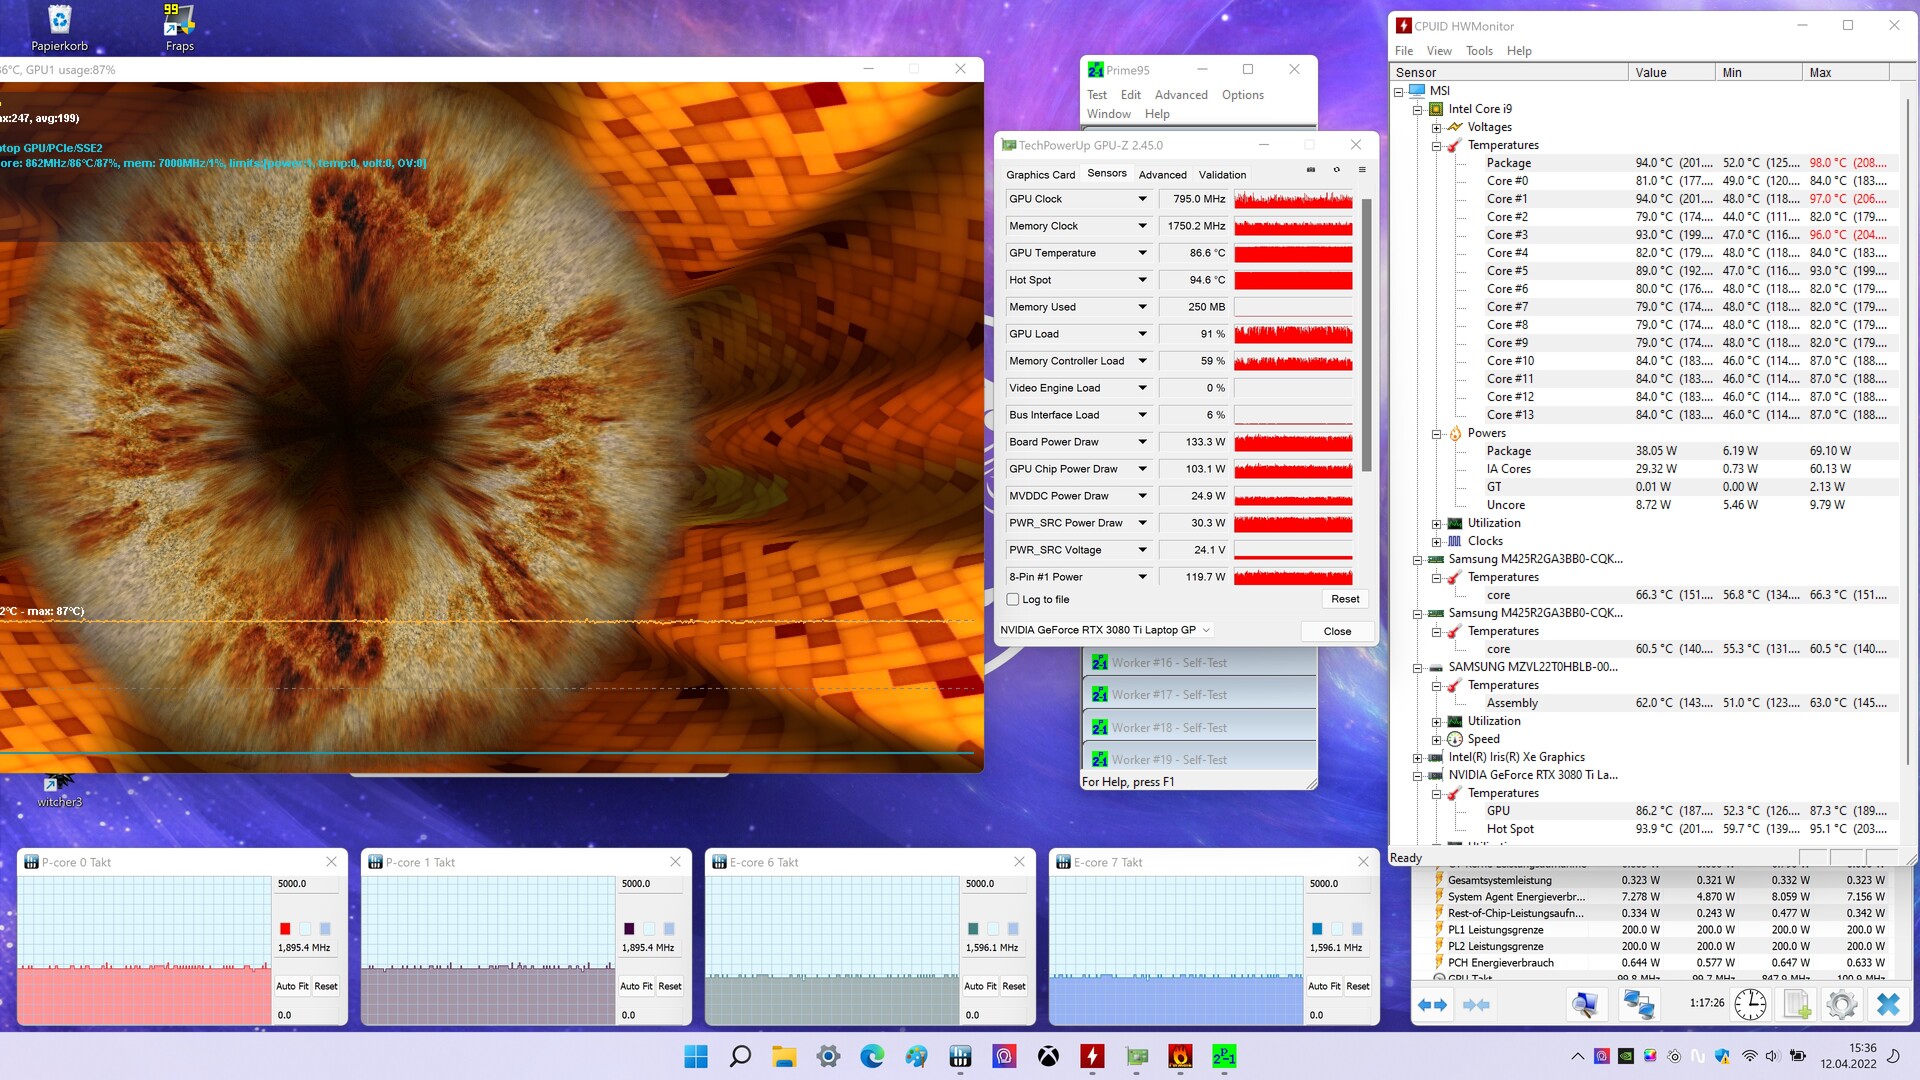
Teste de estresse
No teste Witcher 3, o sistema é capaz de descarregar um máximo de cerca de 160 watts simultaneamente. Isto é dividido em 122 watts de potência da GPU e 37 watts para a CPU. As temperaturas neste cenário são em média 93 graus Celsius no lado da CPU, com valores máximos de até 100 graus Celsius. Para a placa gráfica, vemos temperaturas médias de 86 graus Celsius. O relógio da CPU funciona inicialmente a 4.800 MHz nos núcleos P antes de se assentar a 3.990 MHz. Os núcleos E rodam brevemente a 3.800 MHz antes de diminuir para 3.100 MHz. A velocidade média do relógio da placa gráfica era de 1.387 MHz.
No teste de estresse com Furmark e Prime 95 rodando ao mesmo tempo, o dispositivo se trata de 133 watts de potência GPU. A CPU consome 38 watts, então o sistema de teste é capaz de dissipar um pouco mais de 170 watts com o sistema de resfriamento. Ao contrário do teste Witcher 3, a temperatura do processador aumenta até um máximo de 98 graus Celsius antes de se assentar a 94 graus Celsius. Os valores de temperatura da placa gráfica se estabilizam novamente a uma média de 86 graus Celsius. O relógio da CPU funcionou inicialmente nas mesmas velocidades do primeiro cenário antes de nivelar em 1.900 MHz para os núcleos P e 1.600 MHz para os núcleos E. A taxa de clock do RTX 3080 Ti cai para 795 MHz. Os dois ventiladores funcionaram a um máximo de 5.100 RPM no teste de estresse. O ventilador da GPU se comportou dinamicamente apesar das condições extremas e se moveu entre 4.000 RPM e 5.100 RPM durante o período de teste.
Oradores
Os alto-falantes de ondas duplas instalados pela MSI têm mais graves, mais médios equilibrados, bem como tons altos em relação ao predecessor, tornando-os adequados para consumo de mídia de todos os tipos e resultando em uma boa quantidade de volume. No entanto, achamos que faltava um pouco o baixo quando jogávamos jogos e ouvíamos música.
MSI Raider GE66 12UHS análise de áudio
(+) | os alto-falantes podem tocar relativamente alto (###valor### dB)
Graves 100 - 315Hz
(-) | quase nenhum baixo - em média 17% menor que a mediana
(±) | a linearidade dos graves é média (11% delta para a frequência anterior)
Médios 400 - 2.000 Hz
(±) | médios mais altos - em média 5.6% maior que a mediana
(+) | médios são lineares (3.9% delta para frequência anterior)
Altos 2 - 16 kHz
(+) | agudos equilibrados - apenas 4.6% longe da mediana
(+) | os máximos são lineares (6.3% delta da frequência anterior)
Geral 100 - 16.000 Hz
(±) | a linearidade do som geral é média (17.1% diferença em relação à mediana)
Comparado com a mesma classe
» 46% de todos os dispositivos testados nesta classe foram melhores, 12% semelhantes, 43% piores
» O melhor teve um delta de 6%, a média foi 18%, o pior foi 132%
Comparado com todos os dispositivos testados
» 31% de todos os dispositivos testados foram melhores, 8% semelhantes, 61% piores
» O melhor teve um delta de 4%, a média foi 23%, o pior foi 134%
MSI GE66 Raider 10SFS análise de áudio
(+) | os alto-falantes podem tocar relativamente alto (###valor### dB)
Graves 100 - 315Hz
(-) | quase nenhum baixo - em média 32.4% menor que a mediana
(+) | o baixo é linear (5.9% delta para a frequência anterior)
Médios 400 - 2.000 Hz
(±) | médios mais altos - em média 7.4% maior que a mediana
(±) | a linearidade dos médios é média (8.9% delta para frequência anterior)
Altos 2 - 16 kHz
(±) | máximos mais altos - em média 5.3% maior que a mediana
(±) | a linearidade dos máximos é média (8.9% delta para frequência anterior)
Geral 100 - 16.000 Hz
(±) | a linearidade do som geral é média (26.7% diferença em relação à mediana)
Comparado com a mesma classe
» 93% de todos os dispositivos testados nesta classe foram melhores, 1% semelhantes, 6% piores
» O melhor teve um delta de 6%, a média foi 18%, o pior foi 132%
Comparado com todos os dispositivos testados
» 82% de todos os dispositivos testados foram melhores, 4% semelhantes, 14% piores
» O melhor teve um delta de 4%, a média foi 23%, o pior foi 134%
Manejo de Energia: Bons tempos de execução
Consumo de energia
O consumo de energia do MSI GE66 12UHS é aceitável em modo inativo, sob carga e no teste de estresse Witcher 3. Embora nosso dispositivo consuma mais energia do que seu predecessor, ele também tem instalado hardware consideravelmente mais potente. A capacidade máxima da fonte de alimentação de 280 watts não se esgota com um pico de consumo registrado de 242 watts. No teste Witcher 3, o consumo de 202 watts está em sua maioria abaixo dos valores da concorrência. O é o teste.Lenovo Legion com o Intel Core i7 12700H e o RTX 3070 Ti consome 227 watts, 12% a mais do que nosso dispositivo de revisão com o Intel Core i9 12900HK e o RTX 3080 Ti.
| desligado | |
| Ocioso | |
| Carga |
|
Key:
min: | |
| MSI Raider GE66 12UHS Intel Core i9-12900HK, | MSI GE66 Raider 10SFS Intel Core i9-10980HK, | Razer Blade 15 2022 Intel Core i7-12800H, | Schenker XMG Neo 15 E22 (Early 2022, RTX 3080 Ti) Intel Core i7-12700H, | Lenovo Legion 5 Pro 16 G7 i7 RTX 3070Ti Intel Core i7-12700H, | Média da turma Gaming | |
|---|---|---|---|---|---|---|
| Power Consumption | 14% | -38% | -0% | 8% | 3% | |
| Idle Minimum * (Watt) | 16 | 6 62% | 33.2 -108% | 14 12% | 8.6 46% | 13 ? 19% |
| Idle Average * (Watt) | 19 | 14 26% | 36.4 -92% | 18 5% | 17.6 7% | 19 ? -0% |
| Idle Maximum * (Watt) | 26 | 25 4% | 37.6 -45% | 19 27% | 18.5 29% | 24.6 ? 5% |
| Load Average * (Watt) | 110 | 108 2% | 116.7 -6% | 115 -5% | 110 -0% | 110.7 ? -1% |
| Witcher 3 ultra * (Watt) | 202 | 195 3% | 172 15% | 228 -13% | 227 -12% | |
| Load Maximum * (Watt) | 242 | 280 -16% | 228.6 6% | 307 -27% | 294.6 -22% | 259 ? -7% |
* ... menor é melhor
Power Consumption Witcher 3 / Stress Test
Use with an external monitor
Vida útil da bateria
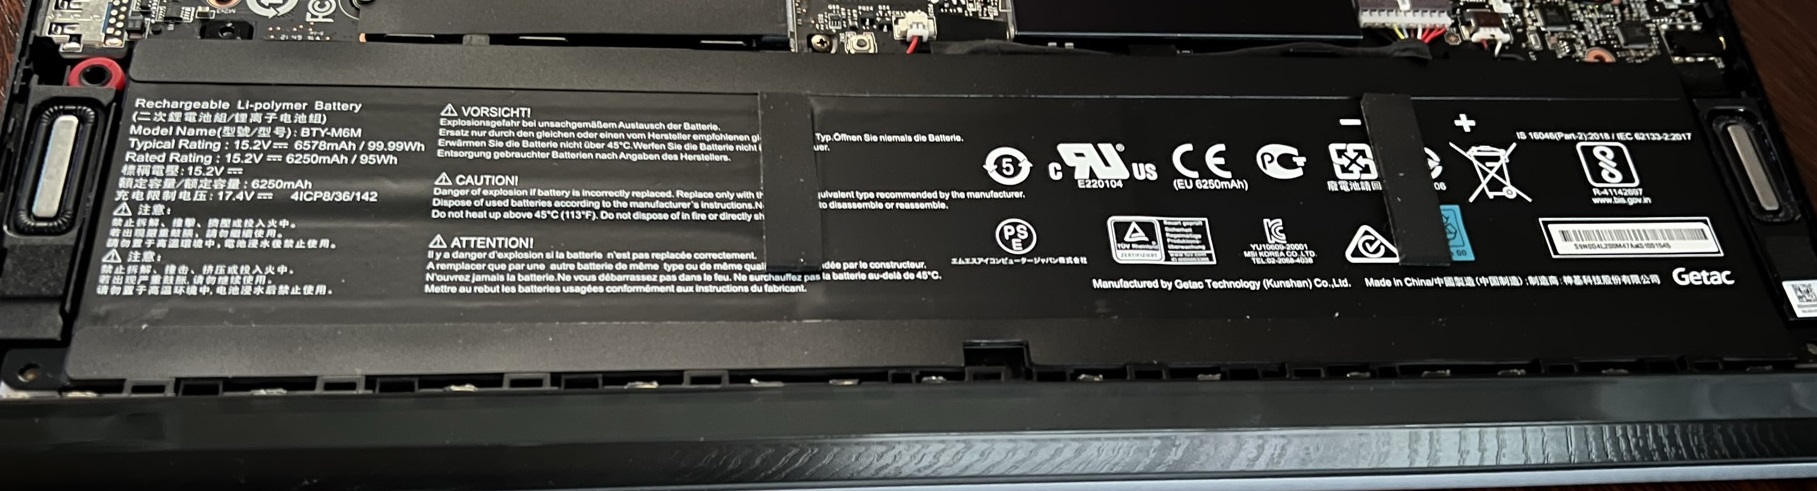
Em comparação com o MSI GE66 10SFSnosso dispositivo de revisão oferece um tempo de execução um pouco menor no teste Wi-Fi com muito melhor desempenho e a mesma capacidade da bateria. O Lâmina Razer 15 2022 e o Lenovo Legion 5 Procom seu hardware nominalmente mais fraco são superados por nosso MSI GE66 12UHS. Somente o Schenker XMG Neo 15 Início de 2022 com uma bateria menor e um processador mais fraco consegue superar em cerca de 20% o desempenho de nossa amostra de revisão.
| MSI Raider GE66 12UHS i9-12900HK, GeForce RTX 3080 Ti Laptop GPU, 99 Wh | MSI GE66 Raider 10SFS i9-10980HK, GeForce RTX 2070 Super Mobile, 99.99 Wh | Razer Blade 15 2022 i7-12800H, GeForce RTX 3080 Ti Laptop GPU, 80 Wh | Schenker XMG Neo 15 E22 (Early 2022, RTX 3080 Ti) i7-12700H, GeForce RTX 3080 Ti Laptop GPU, 93 Wh | Lenovo Legion 5 Pro 16 G7 i7 RTX 3070Ti i7-12700H, GeForce RTX 3070 Ti Laptop GPU, 80 Wh | Média da turma Gaming | |
|---|---|---|---|---|---|---|
| Duração da bateria | 7% | -14% | 46% | -27% | 10% | |
| H.264 (h) | 7.1 | 6.9 -3% | 6.3 -11% | 8.32 ? 17% | ||
| WiFi v1.3 (h) | 5.7 | 6.1 7% | 4.9 -14% | 6.7 18% | 5.4 -5% | 7.11 ? 25% |
| Load (h) | 1.7 | 1.8 6% | 3.8 124% | 0.6 -65% | 1.502 ? -12% | |
| Reader / Idle (h) | 7.6 | 8.27 ? |
Pro
Contra
Veredicto: Caderno high-end com forte desempenho
Em comparação com seu predecessor, a saber, o MSI GE66 10SFS, descobrimos que o MSI GE66 12UHS é visualmente idêntico, com exceção da barra de luz modificada. O teclado e o trackpad ainda são muito bons e pontuam bem com entradas precisas, assim como alta qualidade de construção. Graças a uma nova solução de resfriamento de metal líquido, o Intel Core i9 12900HK traz um aumento de desempenho de cerca de 50% sobre o anterior Intel Core i9 10980HK. A placa gráfica instalada em nosso dispositivo oferece taxas de quadros até 30% mais altas do que a RTX 2070 Super no MSI GE66 10SFS. A abertura do notebook, entretanto, ainda não é uma questão fácil. Outro pequeno inconveniente é que se você jogar por várias horas, as teclas em particular aquecem visivelmente. Nosso dispositivo de teste forneceu boas taxas com seu painel IPS 120 Hz 4K. A possibilidade de atualizar para DDR5 RAM e a opção de conectar dois SSDs NVMe através da interface PCI Gen 4 assegura a viabilidade futura do dispositivo.
O desempenho de jogo do MSI GE66 12UHS é excelente. Todos os títulos em nossa revisão funcionaram sem problemas na resolução de 4K com o máximo de detalhes
Outro aspecto positivo é o sistema de resfriamento melhorado. O controle automático do ventilador com suporte de IA proporciona um bom compromisso entre desempenho e ruído. Infelizmente, o sistema é incapaz de dissipar o calor gerado com rapidez suficiente durante sessões de jogo mais longas, o que leva a quedas de desempenho de cerca de 10%. Mais uma vez, este problema pode ser resolvido ajustando manualmente os ventiladores à velocidade máxima (Cooler Boost). O MSI Center pode ser usado para controlar muitas das funções principais do notebook e fornece ao usuário recursos adicionais úteis. Entretanto, o MSI Center continua a ser propenso a erros, colidindo aleatoriamente em nossos testes e redefinindo perfis de desempenho previamente definidos. Também observamos perdas de desempenho de até 80% no SSD Samsung PM9A1 instalado sob carga contínua
Preço e Disponibilidade
MSI Raider GE66 12UHS
- 05/30/2022 v7 (old)
Patrick Schüdzig
Price comparison

