Asus ROG Strix Scar 15 G533ZW Revisão de Laptop: 1440p 240 Hz com Alder Lake Core i9 e 150 W RTX 3070 Ti
A série Asus ROG Strix é uma das linhas de computadores portáteis para jogos altamente aguardadas para o início de cada ano. O ROG Strix Scar 15 (2022) foi anunciado durante o CES 2022 com atualizações para o Intel Alder Lake-H e opções gráficas até o Nvidia GeForce RTX 3080 Ti GPU Portátil. Asus continua a transportar a nomenclatura G533 para 2022, mas fez algumas mudanças na marca.
Enquanto a Asus mudou completamente para as ofertas da série AMD Ryzen 5000 com a ROG Strix Scar 15 em 2021, a empresa agora bifurcou a linha de produtos em ofertas distintas da Intel Alder Lake e AMD Ryzen 6000.
No formato de 15,6 polegadas, temos ofertas como nossa unidade de teste atual, a ROG Strix Scar 15 G533ZW. No lado da AMD, a Asus deixa cair a marca "Scar" (juntamente com o design da assinatura e Keystone) com a série Strix G15 G513 sendo alimentada por opções de CPU até um Ryzen 9 6900HX e até 150 WGPU para notebook RTX 3080.
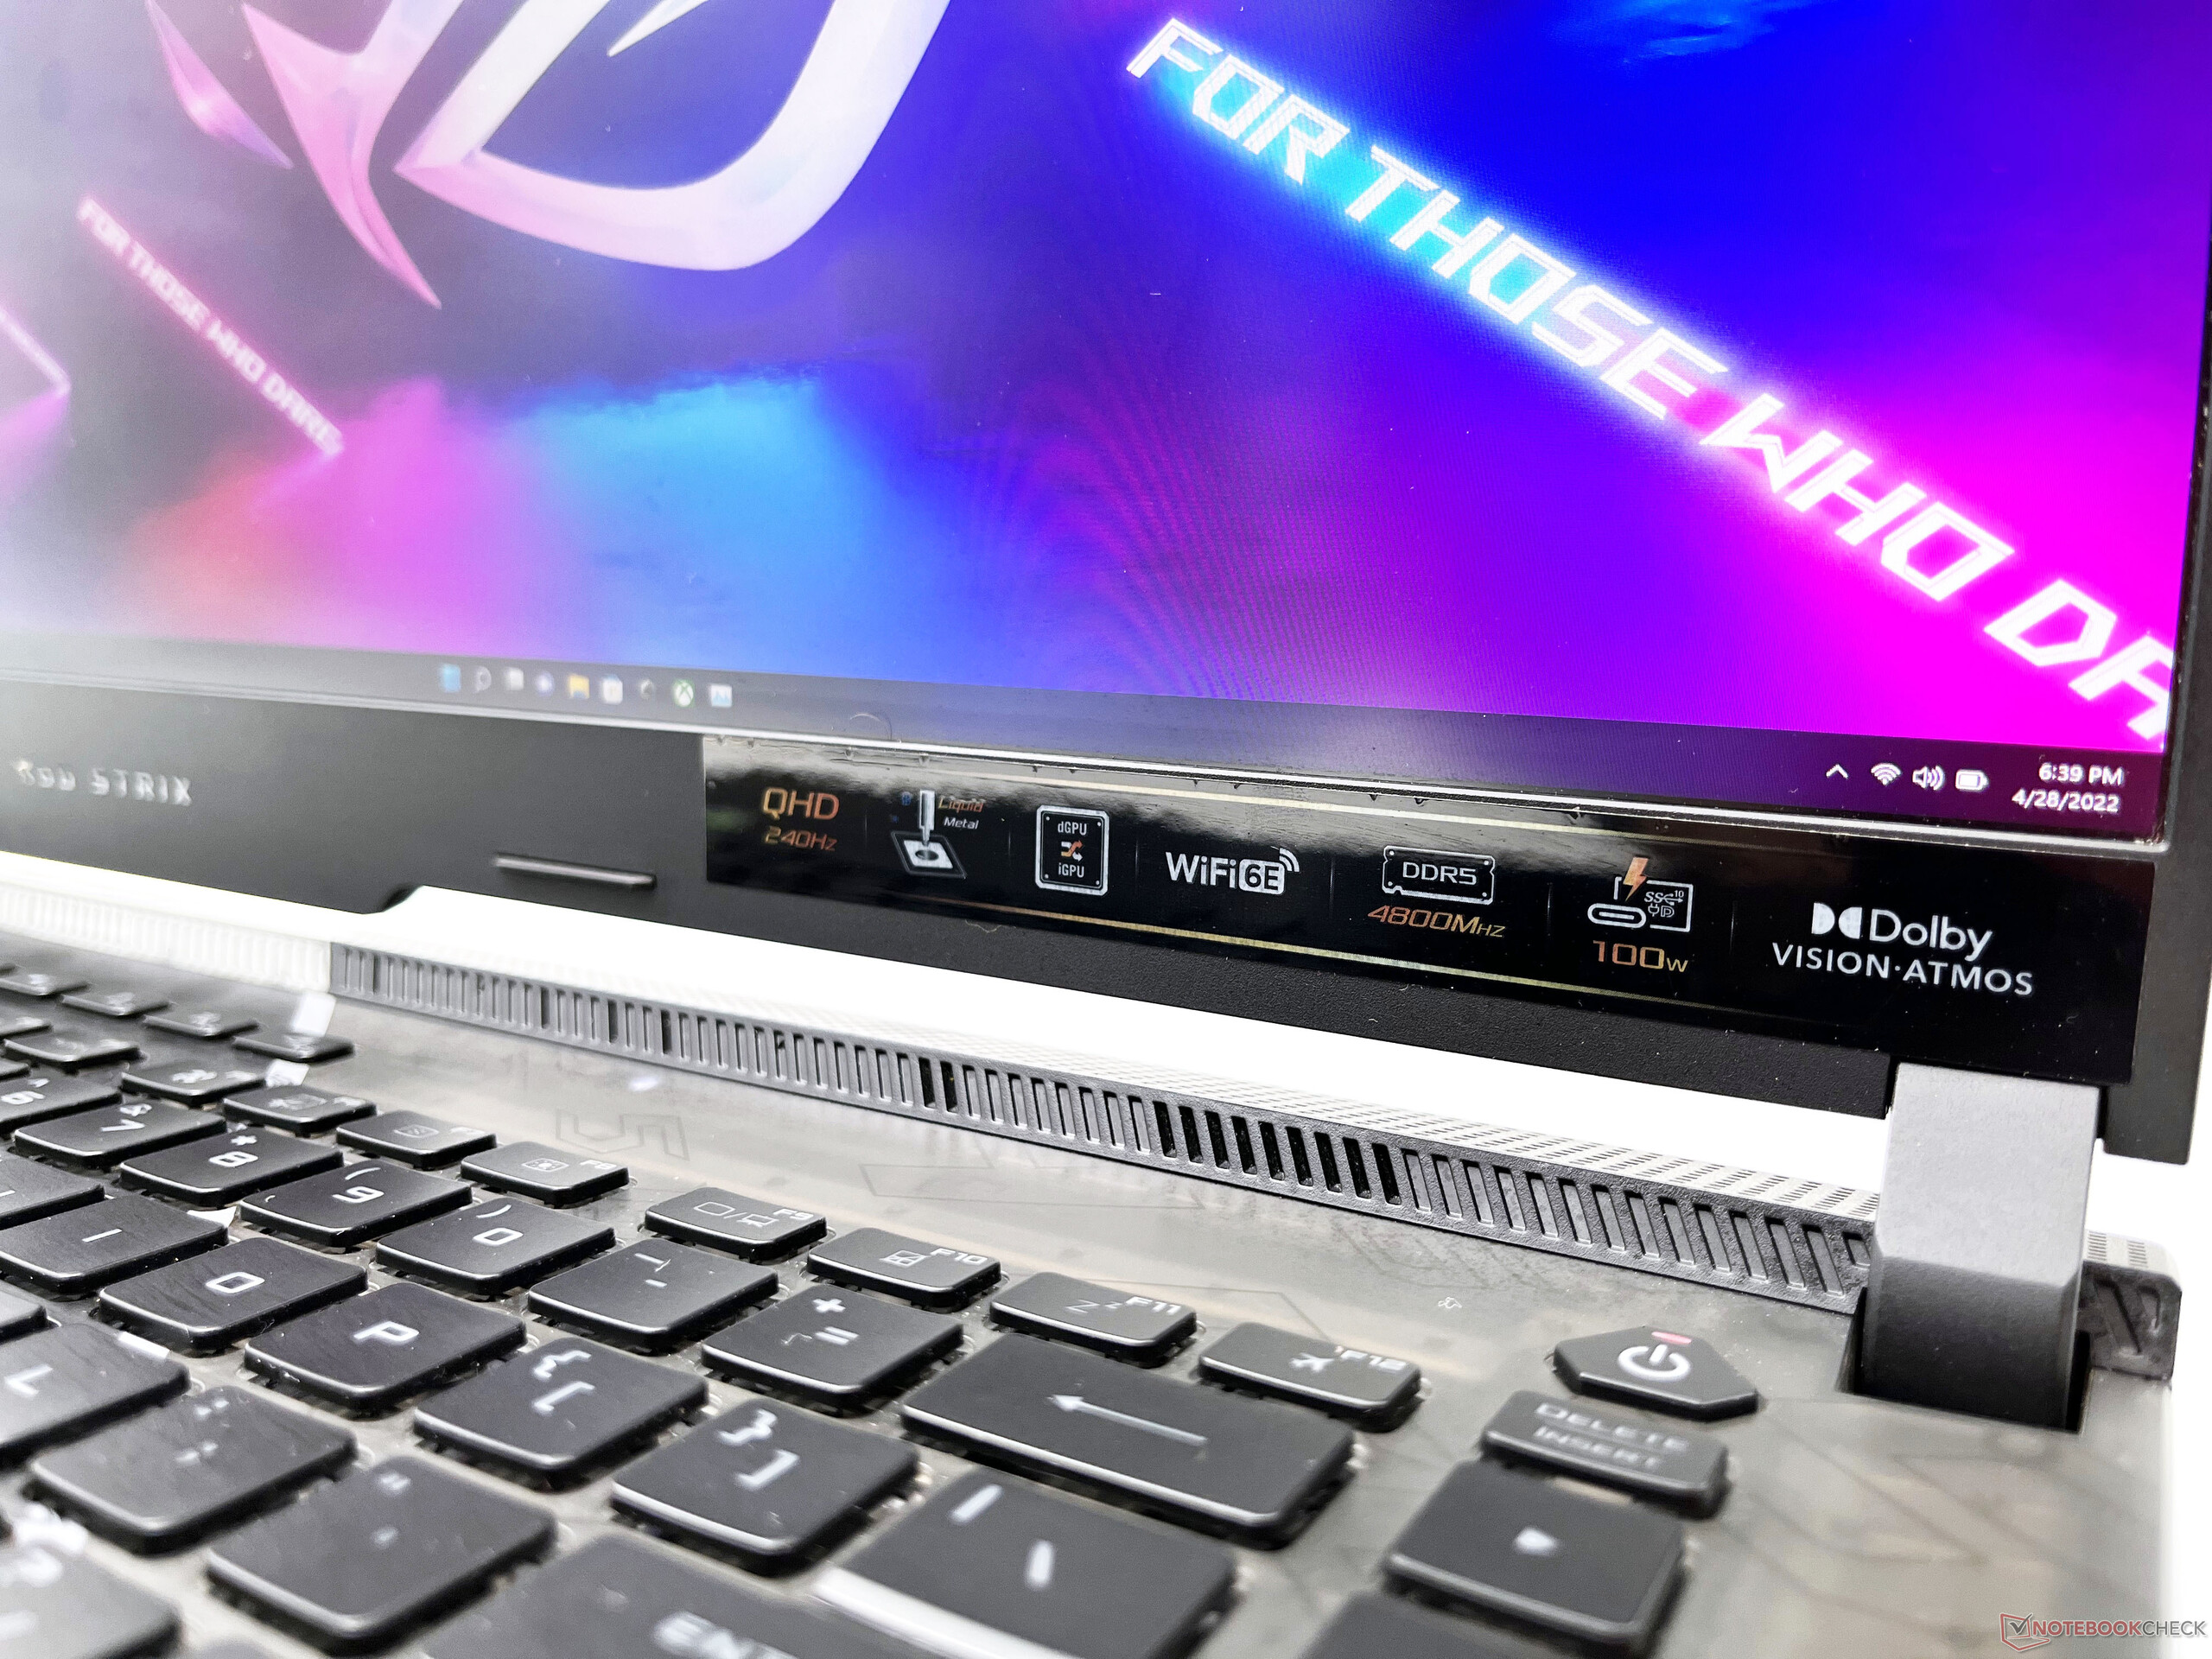
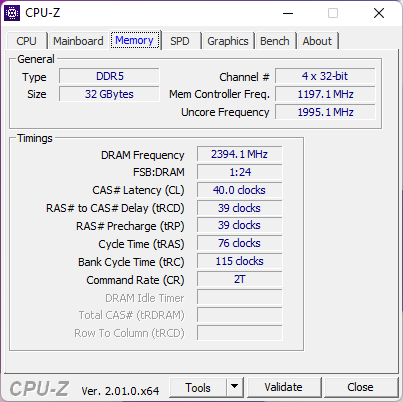
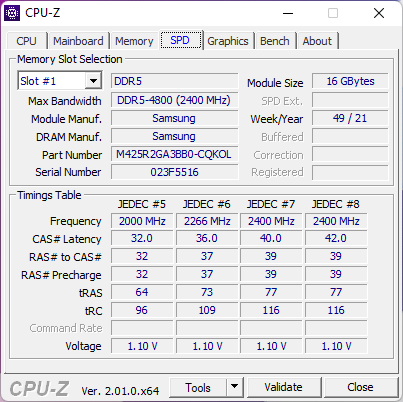
O ROG Strix Scar 15 G533ZW (2022) introduz algumas características novas e atraentes na linha. Todos os notebooks ROG 2022 vêm agora com um interruptor MUX que pode ser ativado dentro do Armory Crate. Também podemos ver opções de exibição até painéis WQHD 240 Hz, memória DDR5-4800, SSDs PCIe Gen 4, portas USB mais rápidas, LAN 2.5G, e Wi-Fi 6E.
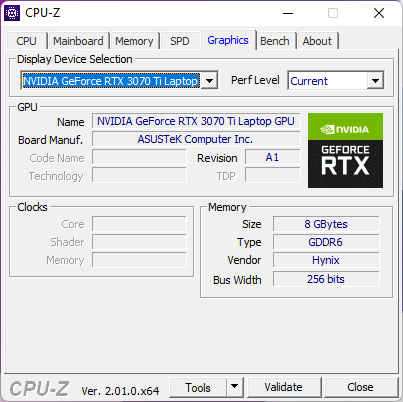
Nosso dispositivo de teste ROG Strix Scar 15 G533ZW é alimentado peloNúcleo i9-12900He um 150 WGPU para notebook RTX 3070 Ti. Há 32 GB de RAM DDR5-4800 a bordo juntamente com um SSD NVMe 2 TB Gen 4 NVMe. Esta configuração lhe dará retorno até ₹2,64.990 (US$3.419).
Nesta revisão, levamos o ROG Strix Scar 15 G533ZW para dar uma volta e ver se as novas atualizações merecem sua consideração.
Possíveis concorrentes em comparação
Avaliação | Data | Modelo | Peso | Altura | Size | Resolução | Preço |
|---|---|---|---|---|---|---|---|
| 86.3 % v7 (old) | 06/2022 | Asus ROG Strix Scar 15 G533ZW-LN106WS i9-12900H, GeForce RTX 3070 Ti Laptop GPU | 2.3 kg | 27.2 mm | 15.60" | 2560x1440 | |
| 80.7 % v7 (old) | 04/2022 | MSI Pulse GL66 12UEK i9-12900H, GeForce RTX 3060 Laptop GPU | 2.3 kg | 25 mm | 15.60" | 1920x1080 | |
| 84.7 % v7 (old) | 03/2022 | Gigabyte Aero 16 YE5 i9-12900HK, GeForce RTX 3080 Ti Laptop GPU | 2.3 kg | 22.4 mm | 16.00" | 3840x2400 | |
| 86.9 % v7 (old) | 03/2022 | MSI Vector GP66 12UGS i9-12900H, GeForce RTX 3070 Ti Laptop GPU | 2.3 kg | 23.4 mm | 15.60" | 1920x1080 | |
| 87.4 % v7 (old) | 06/2022 | MSI Raider GE66 12UHS i9-12900HK, GeForce RTX 3080 Ti Laptop GPU | 2.4 kg | 23.4 mm | 15.60" | 3840x2160 | |
| 85.5 % v7 (old) | 05/2022 | HP Omen 16-b1090ng i7-12700H, GeForce RTX 3070 Ti Laptop GPU | 2.3 kg | 23 mm | 16.10" | 2560x1440 | |
| 88 % v7 (old) | 03/2022 | Lenovo Legion 5 Pro 16 G7 i7 RTX 3070Ti i7-12700H, GeForce RTX 3070 Ti Laptop GPU | 2.6 kg | 26.6 mm | 16.00" | 2560x1600 | |
| 89.4 % v7 (old) | 05/2022 | Razer Blade 14 Ryzen 9 6900HX R9 6900HX, GeForce RTX 3070 Ti Laptop GPU | 1.8 kg | 16.8 mm | 14.00" | 2560x1440 | |
| 86.7 % v7 (old) | 03/2022 | Asus ROG Zephyrus G14 GA402RK R9 6900HS, Radeon RX 6800S | 1.7 kg | 19.5 mm | 14.00" | 2560x1600 | |
| 89.1 % v7 (old) | 03/2022 | Razer Blade 15 2022 i7-12800H, GeForce RTX 3080 Ti Laptop GPU | 2.1 kg | 16.99 mm | 15.60" | 2560x1440 |
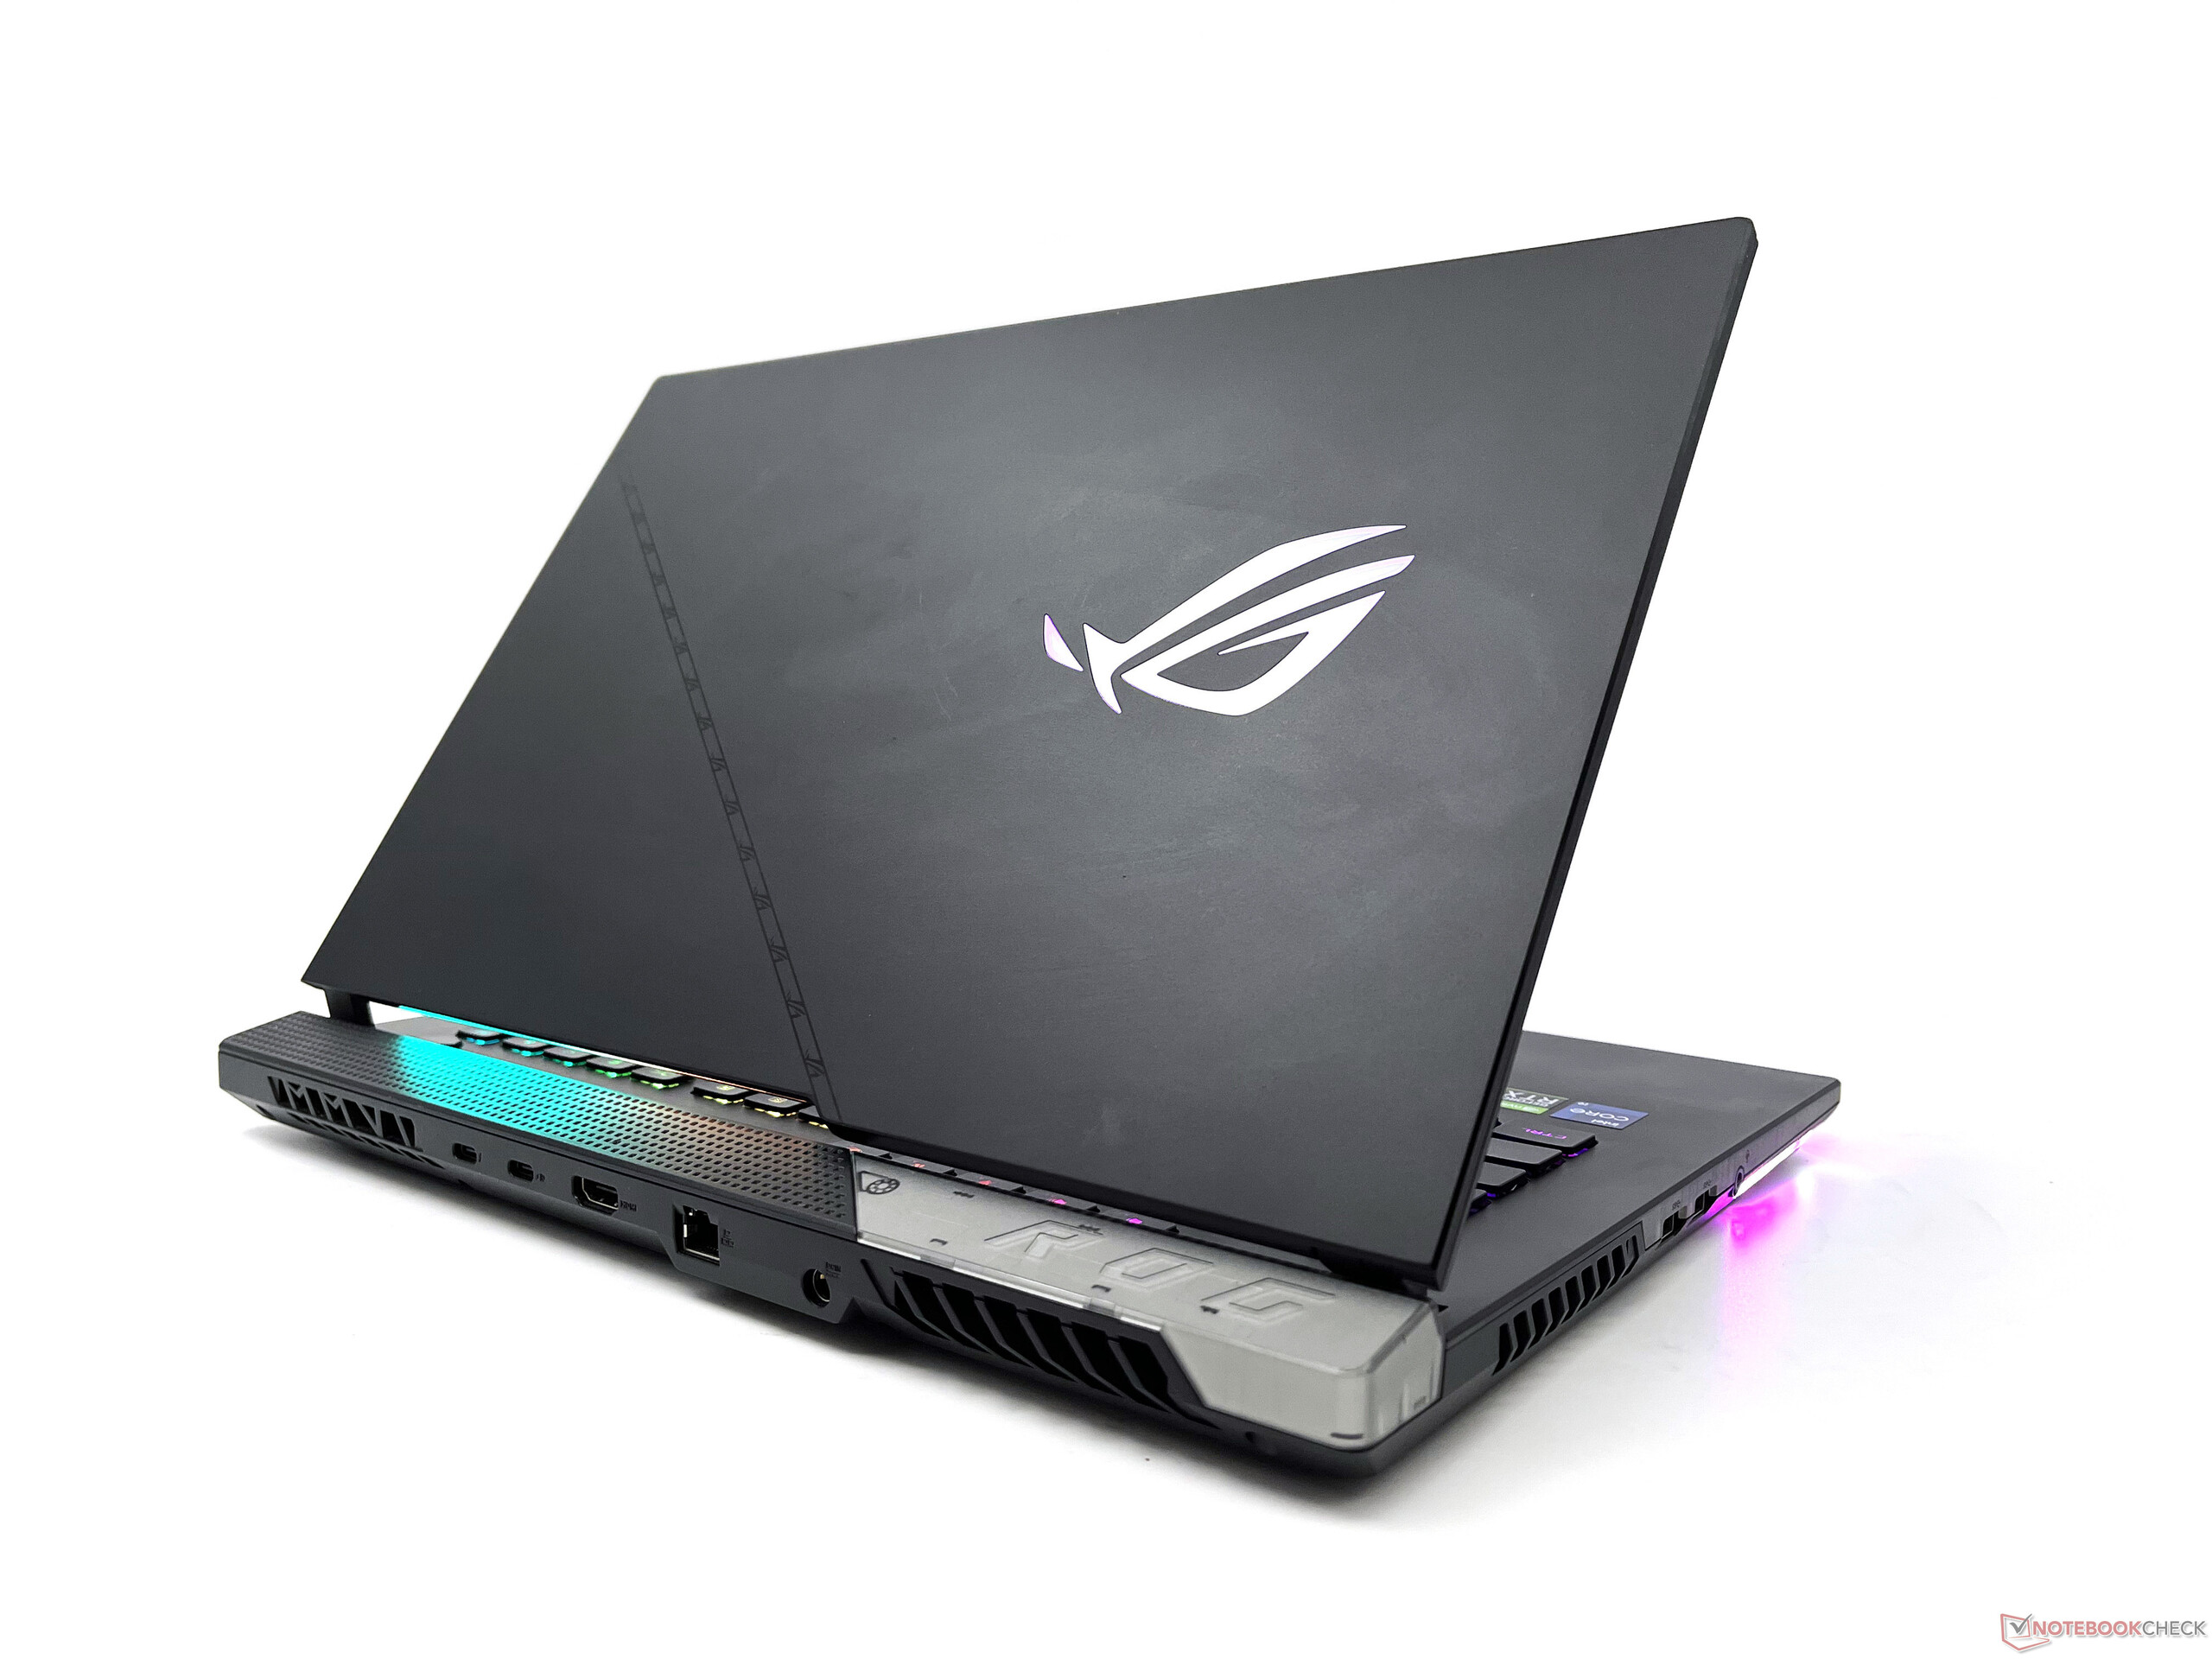
Estojo: Inalterado em relação ao ano passado
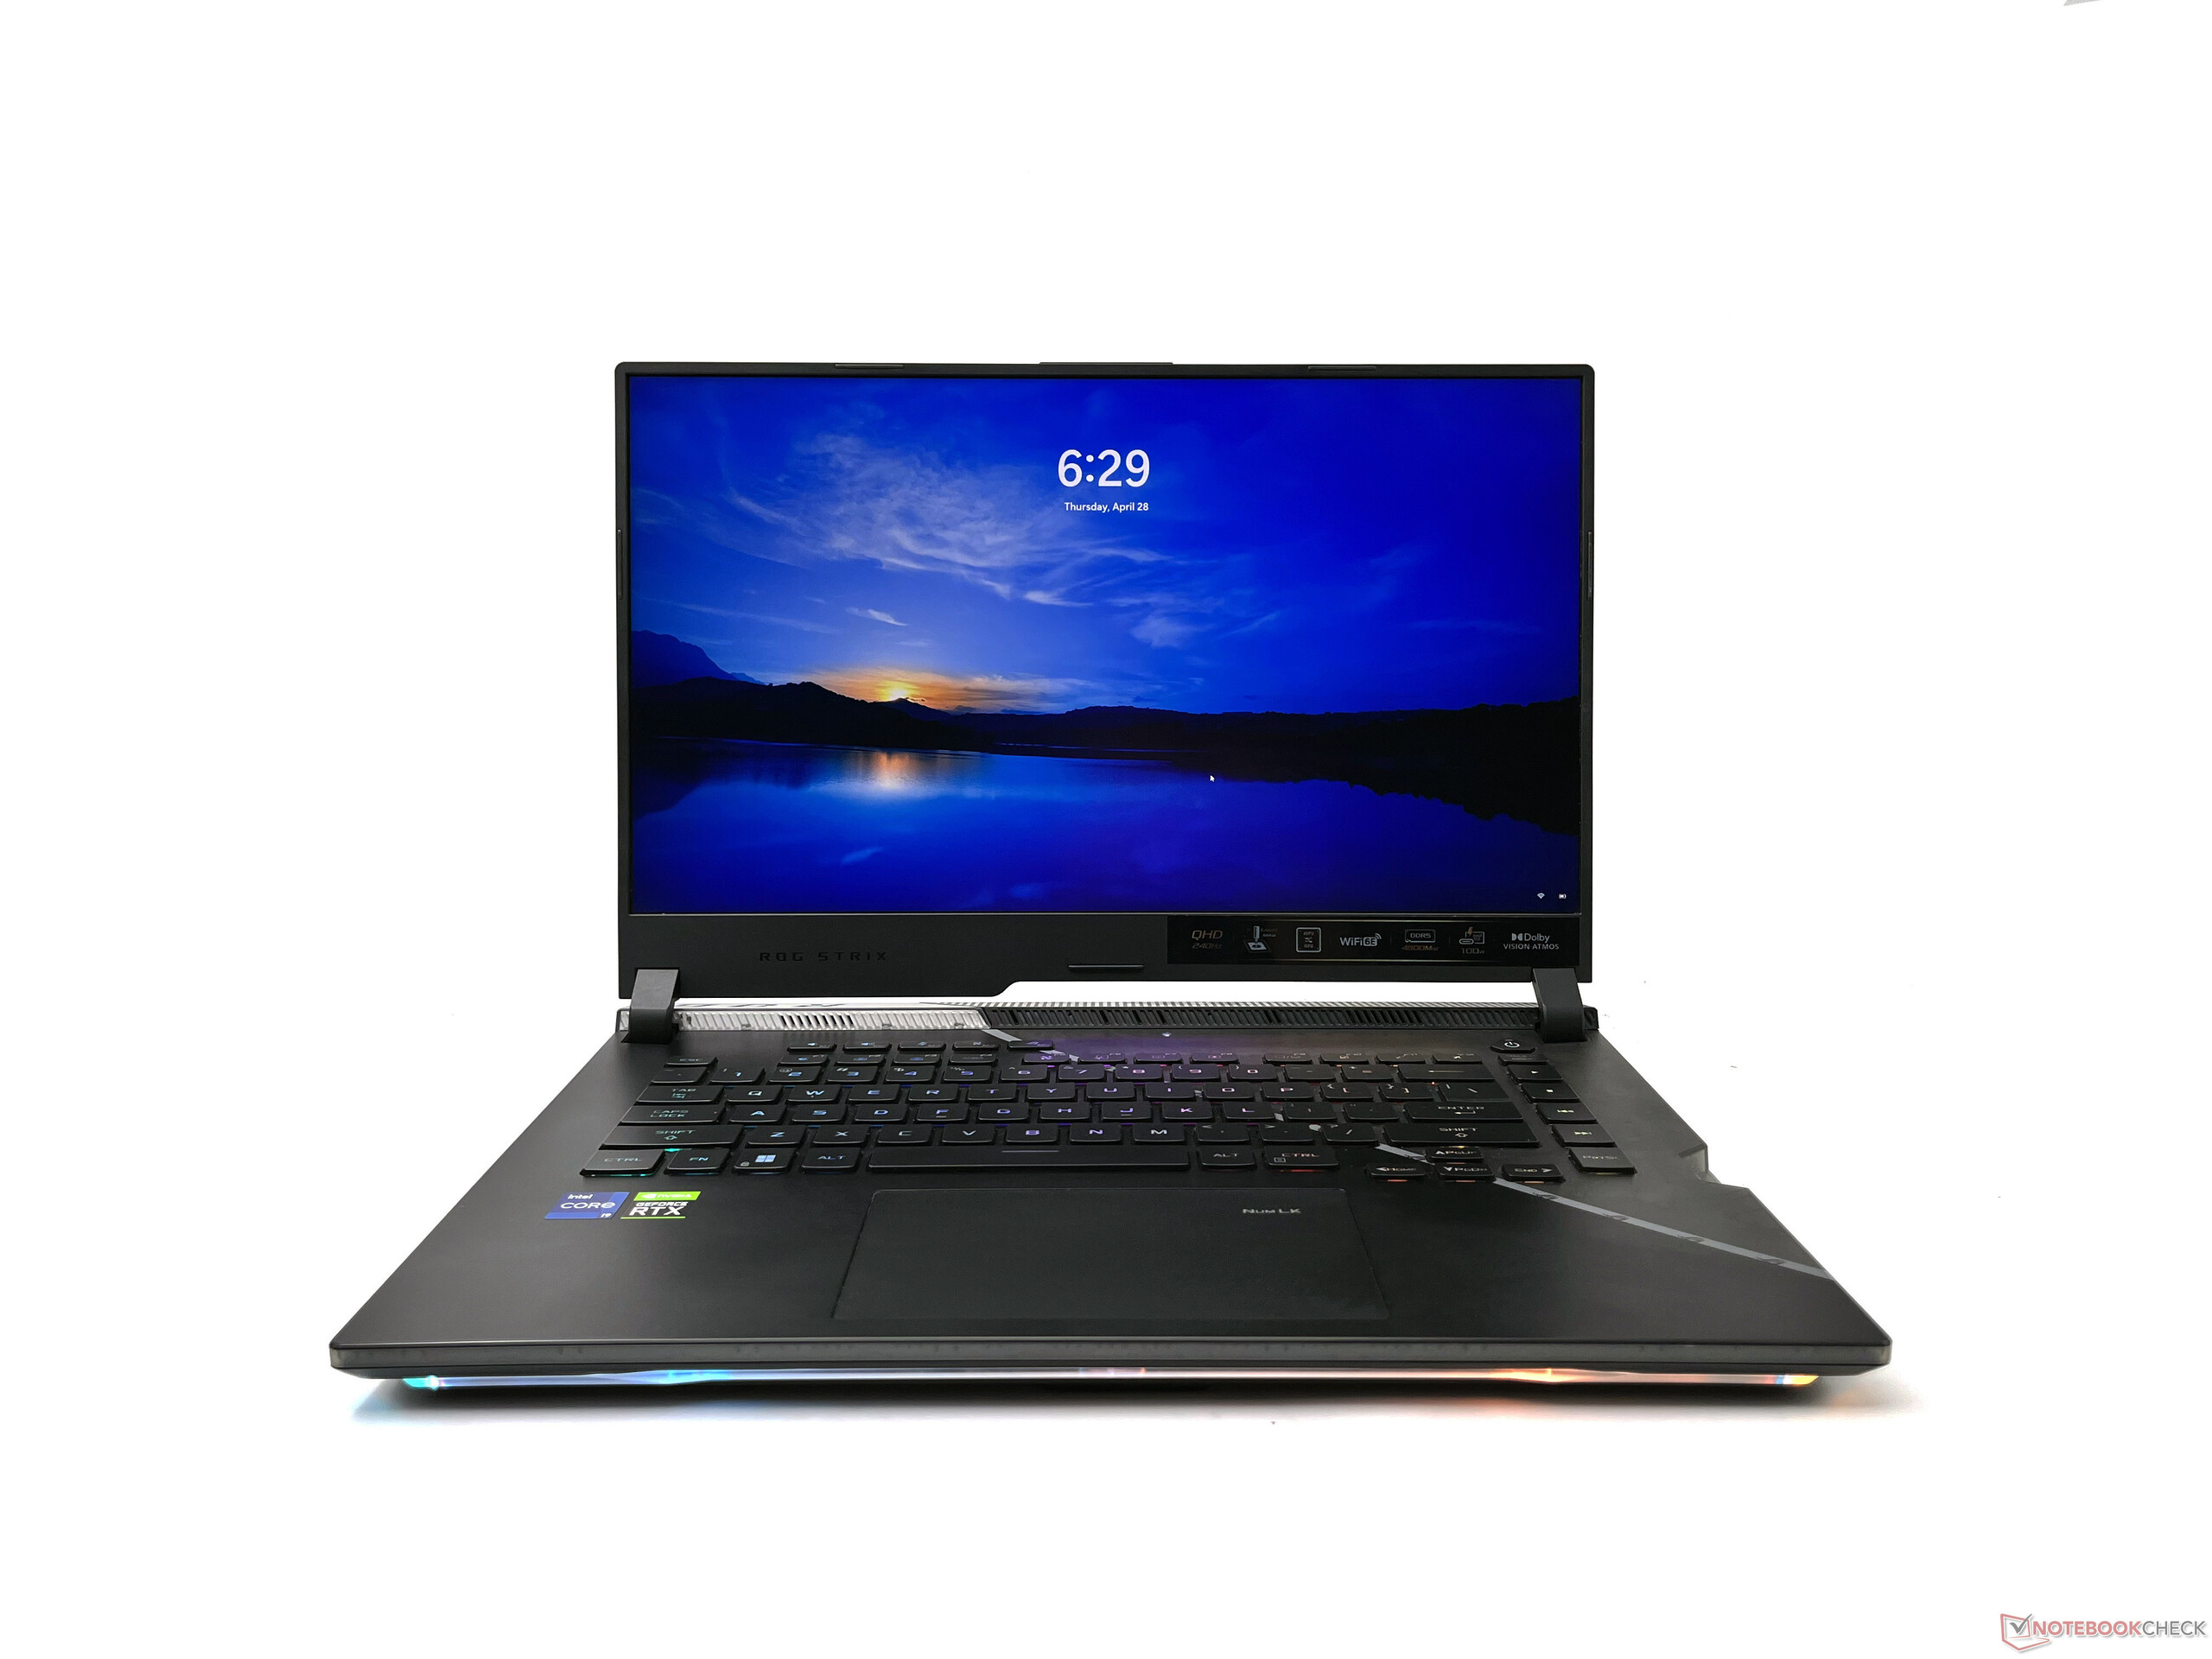
O ROG Strix Scar 15 G533ZW é praticamente indistinguível do modelo do ano passado em termos de design, dimensões e peso. O corpo principal é feito principalmente de plástico - não parece barato ou pegajoso, mas pode reunir rapidamente várias impressões digitais e manchas.
Há alguma flexibilidade perceptível no deck do teclado se pressionado com força, mas nada em particular. A borda direita do deck do teclado é translúcida em estilo Scar, deixando ver as entranhas de forma sorrateira.
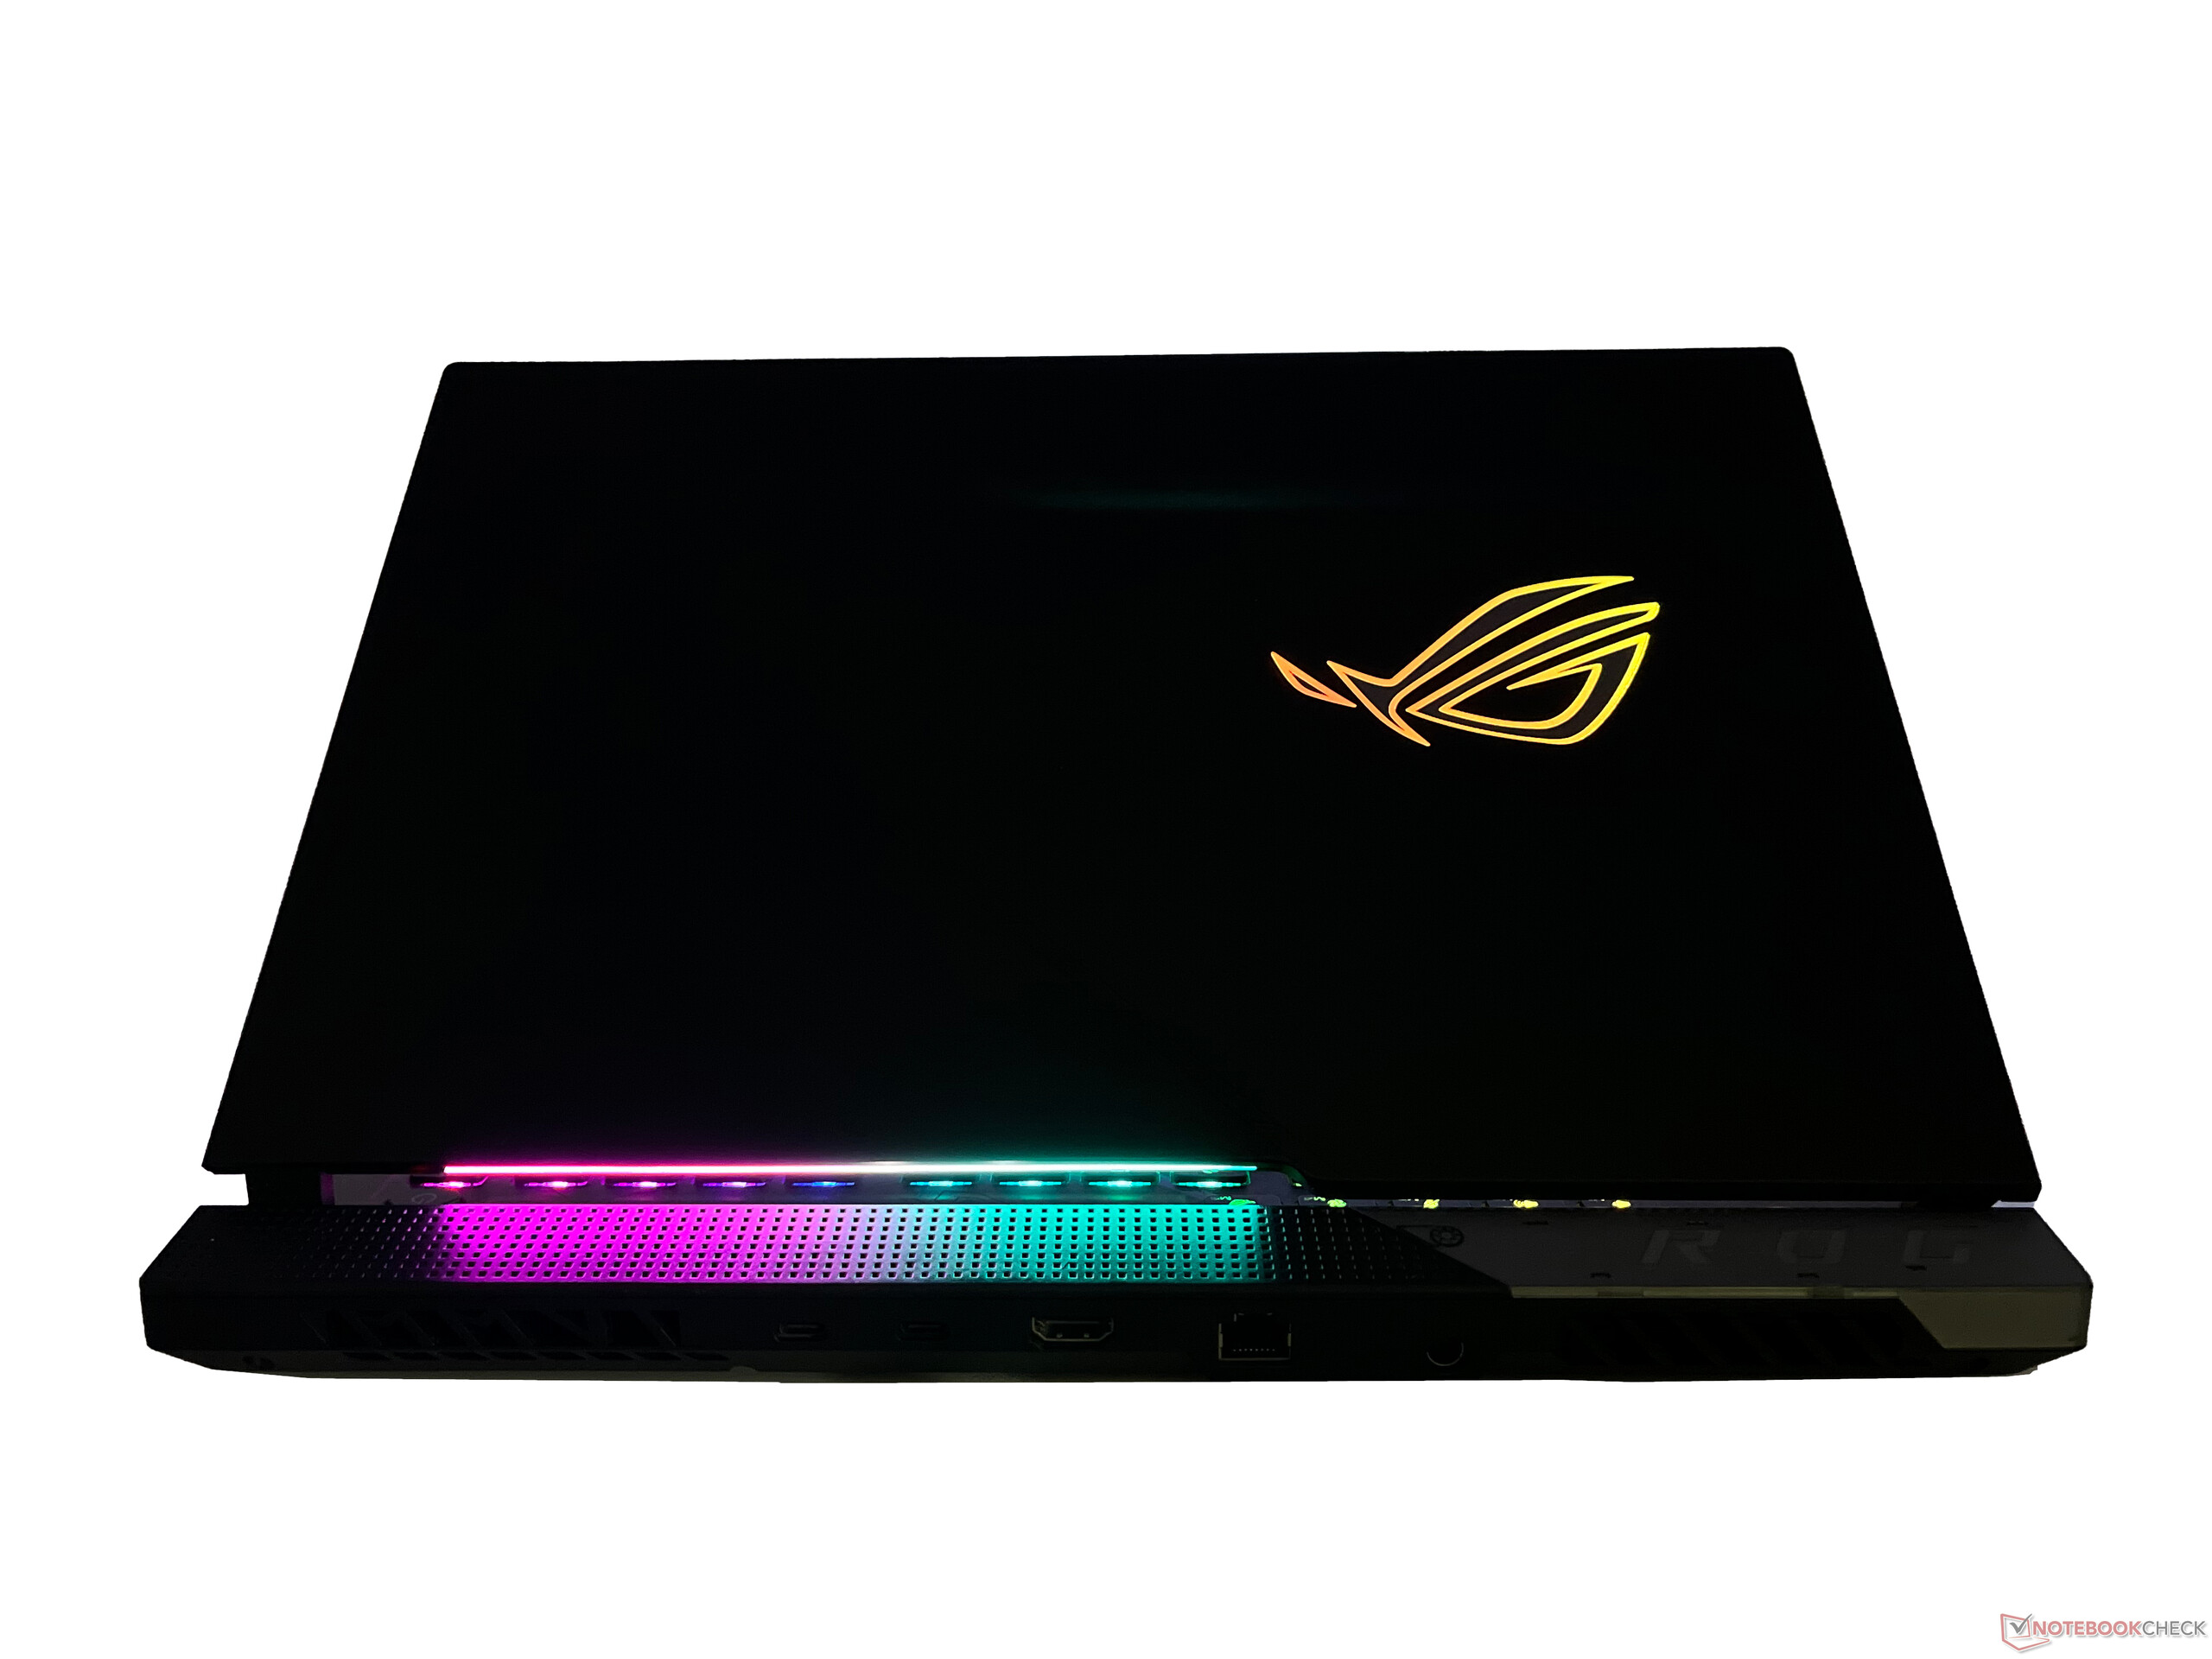
A tampa é feita de alumínio e pode ser aberta com um dedo, mas ela flexiona um pouco demais para nosso gosto. A parte de trás da tampa ostenta o logotipo ROG, cujo contorno recebe algum amor da RGB. Há também LEDs na base do visor para alguns bling adicionais. A tampa só pode abrir até cerca de 130°, o que pode ser um pouco incômodo ao usar o dispositivo na volta.
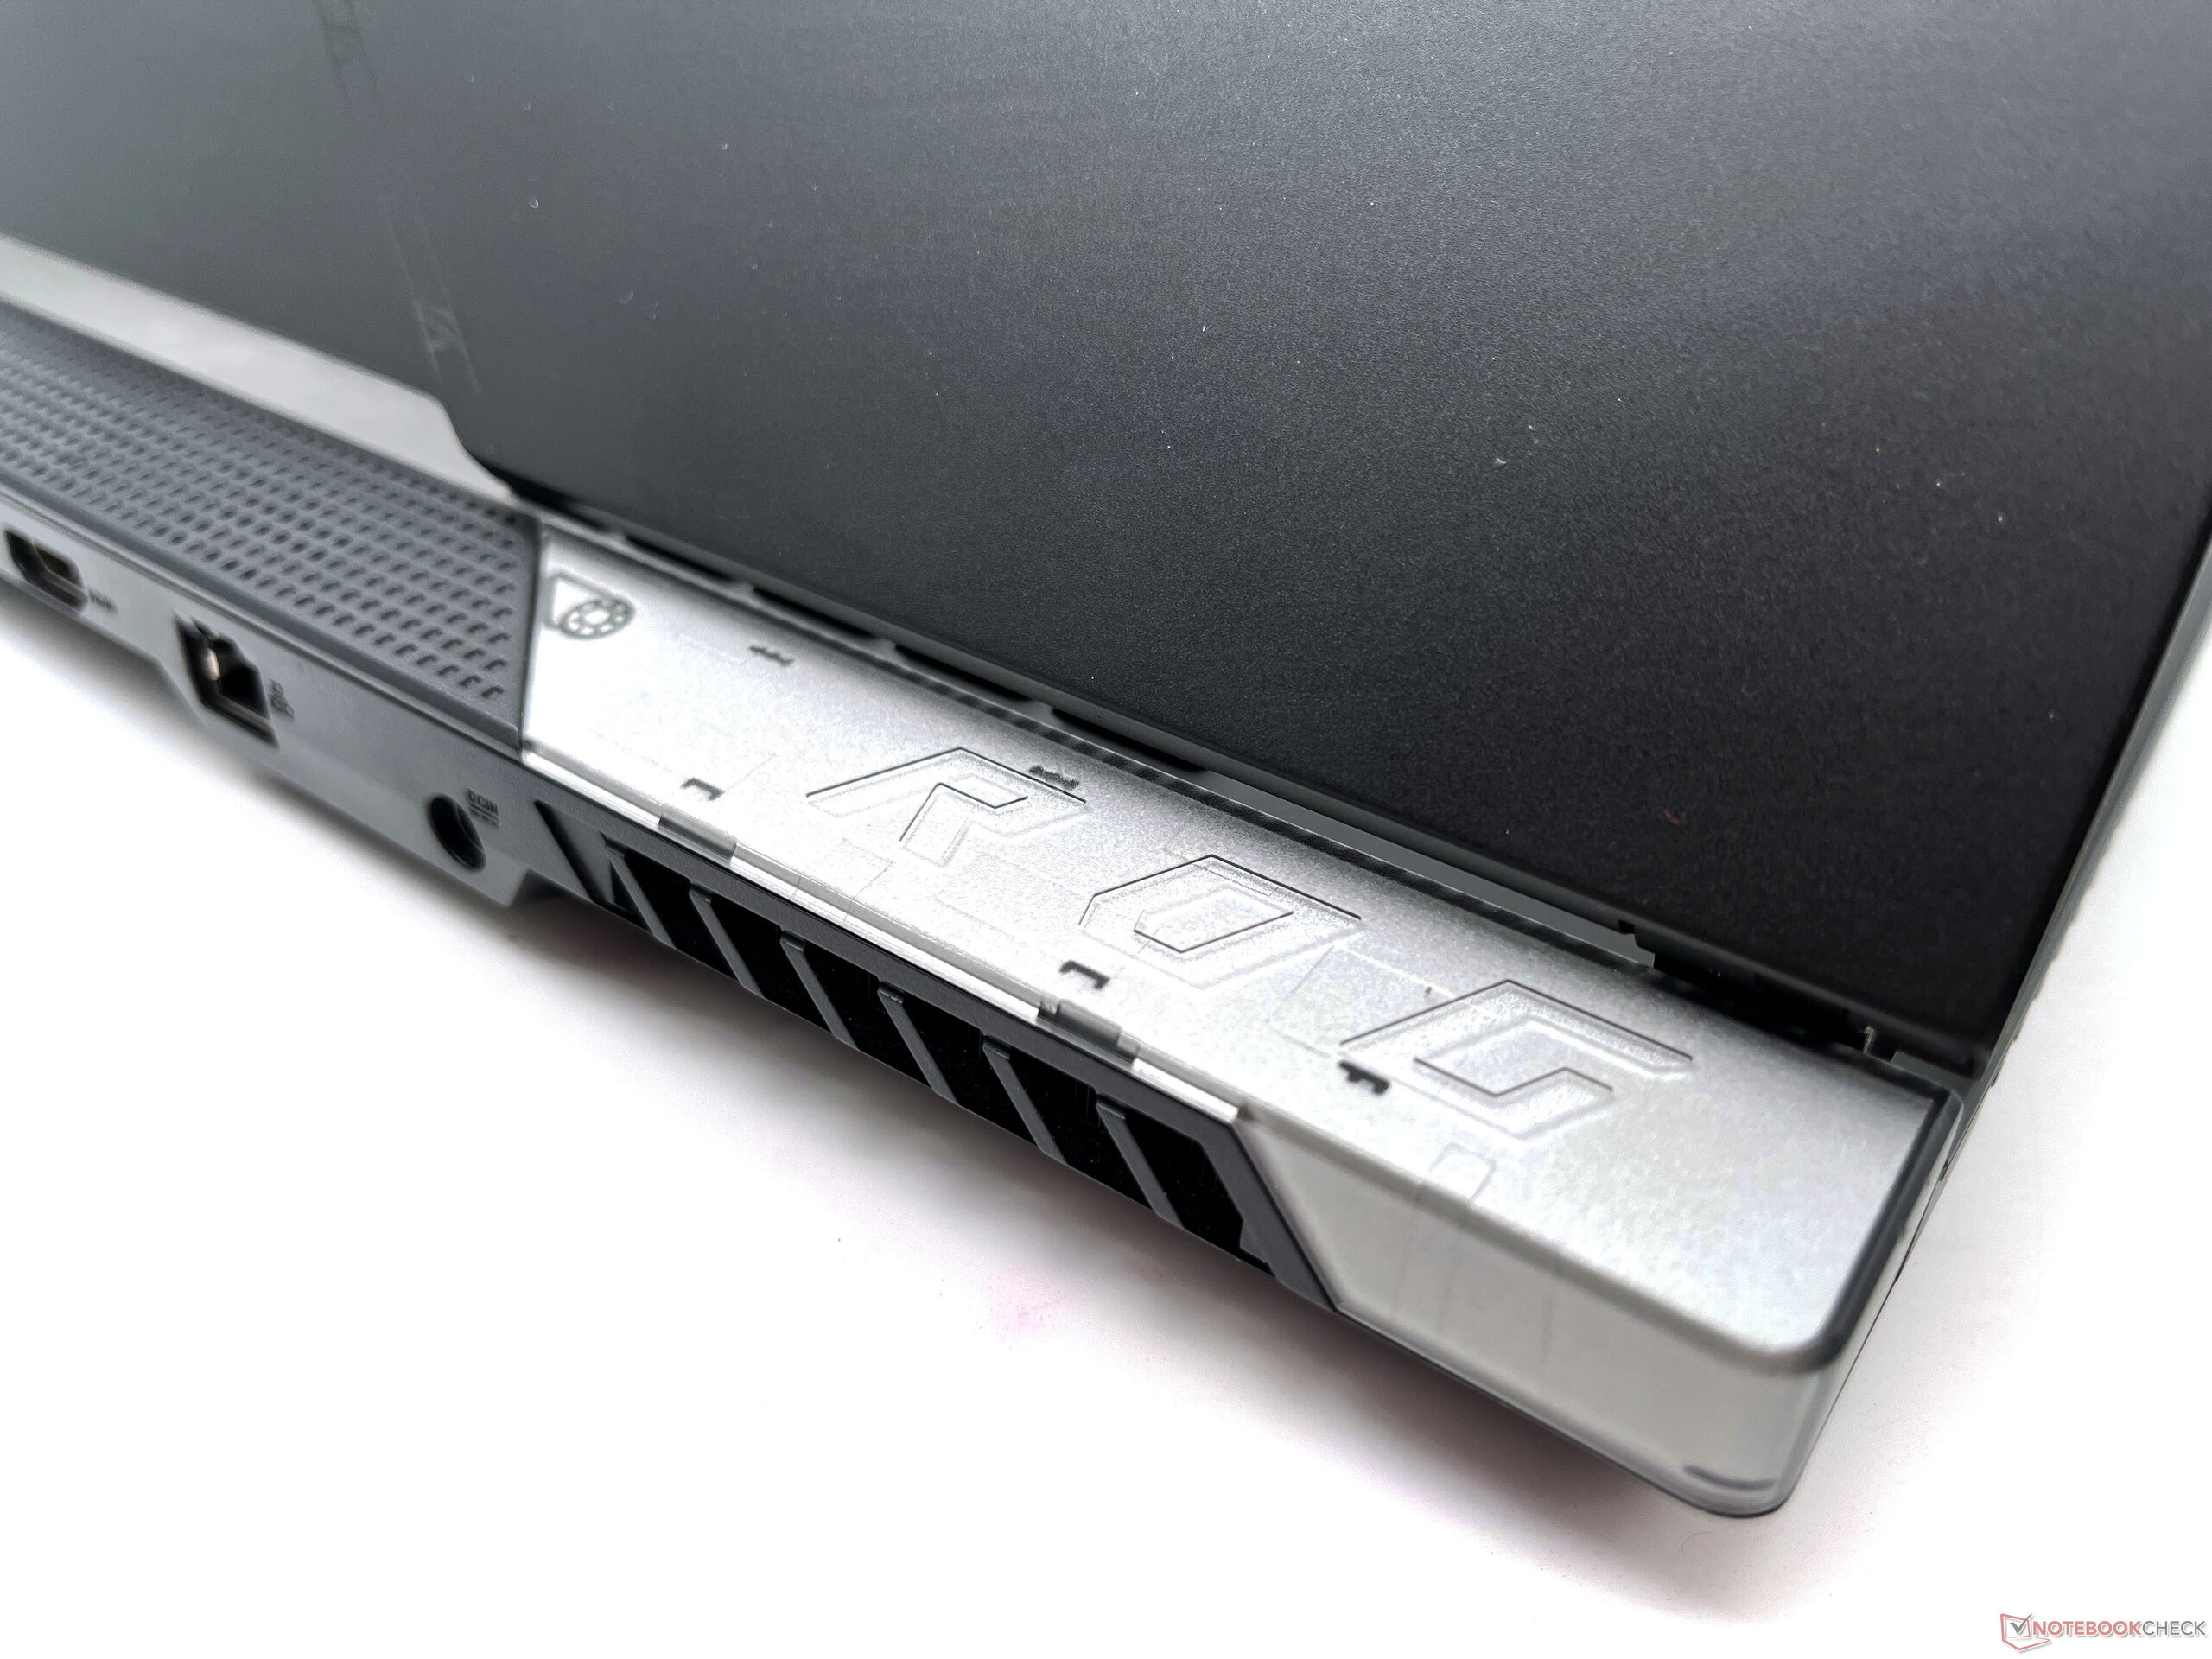
A base é emborrachada para uma aderência firme. Há também alguma personalização na forma de tampas de armadura ROG - um par delas vem na caixa, mas você pode imprimir em 3D tampas personalizadas se quiser.
Em geral, a qualidade de construção do Asus ROG Strix Scar 15 G533ZW é robusta na maioria das vezes, exceto por um pouco de flexibilidade no teclado e na tampa.
Conectividade: Thunderbolt 4 e Wi-Fi 6E a bordo
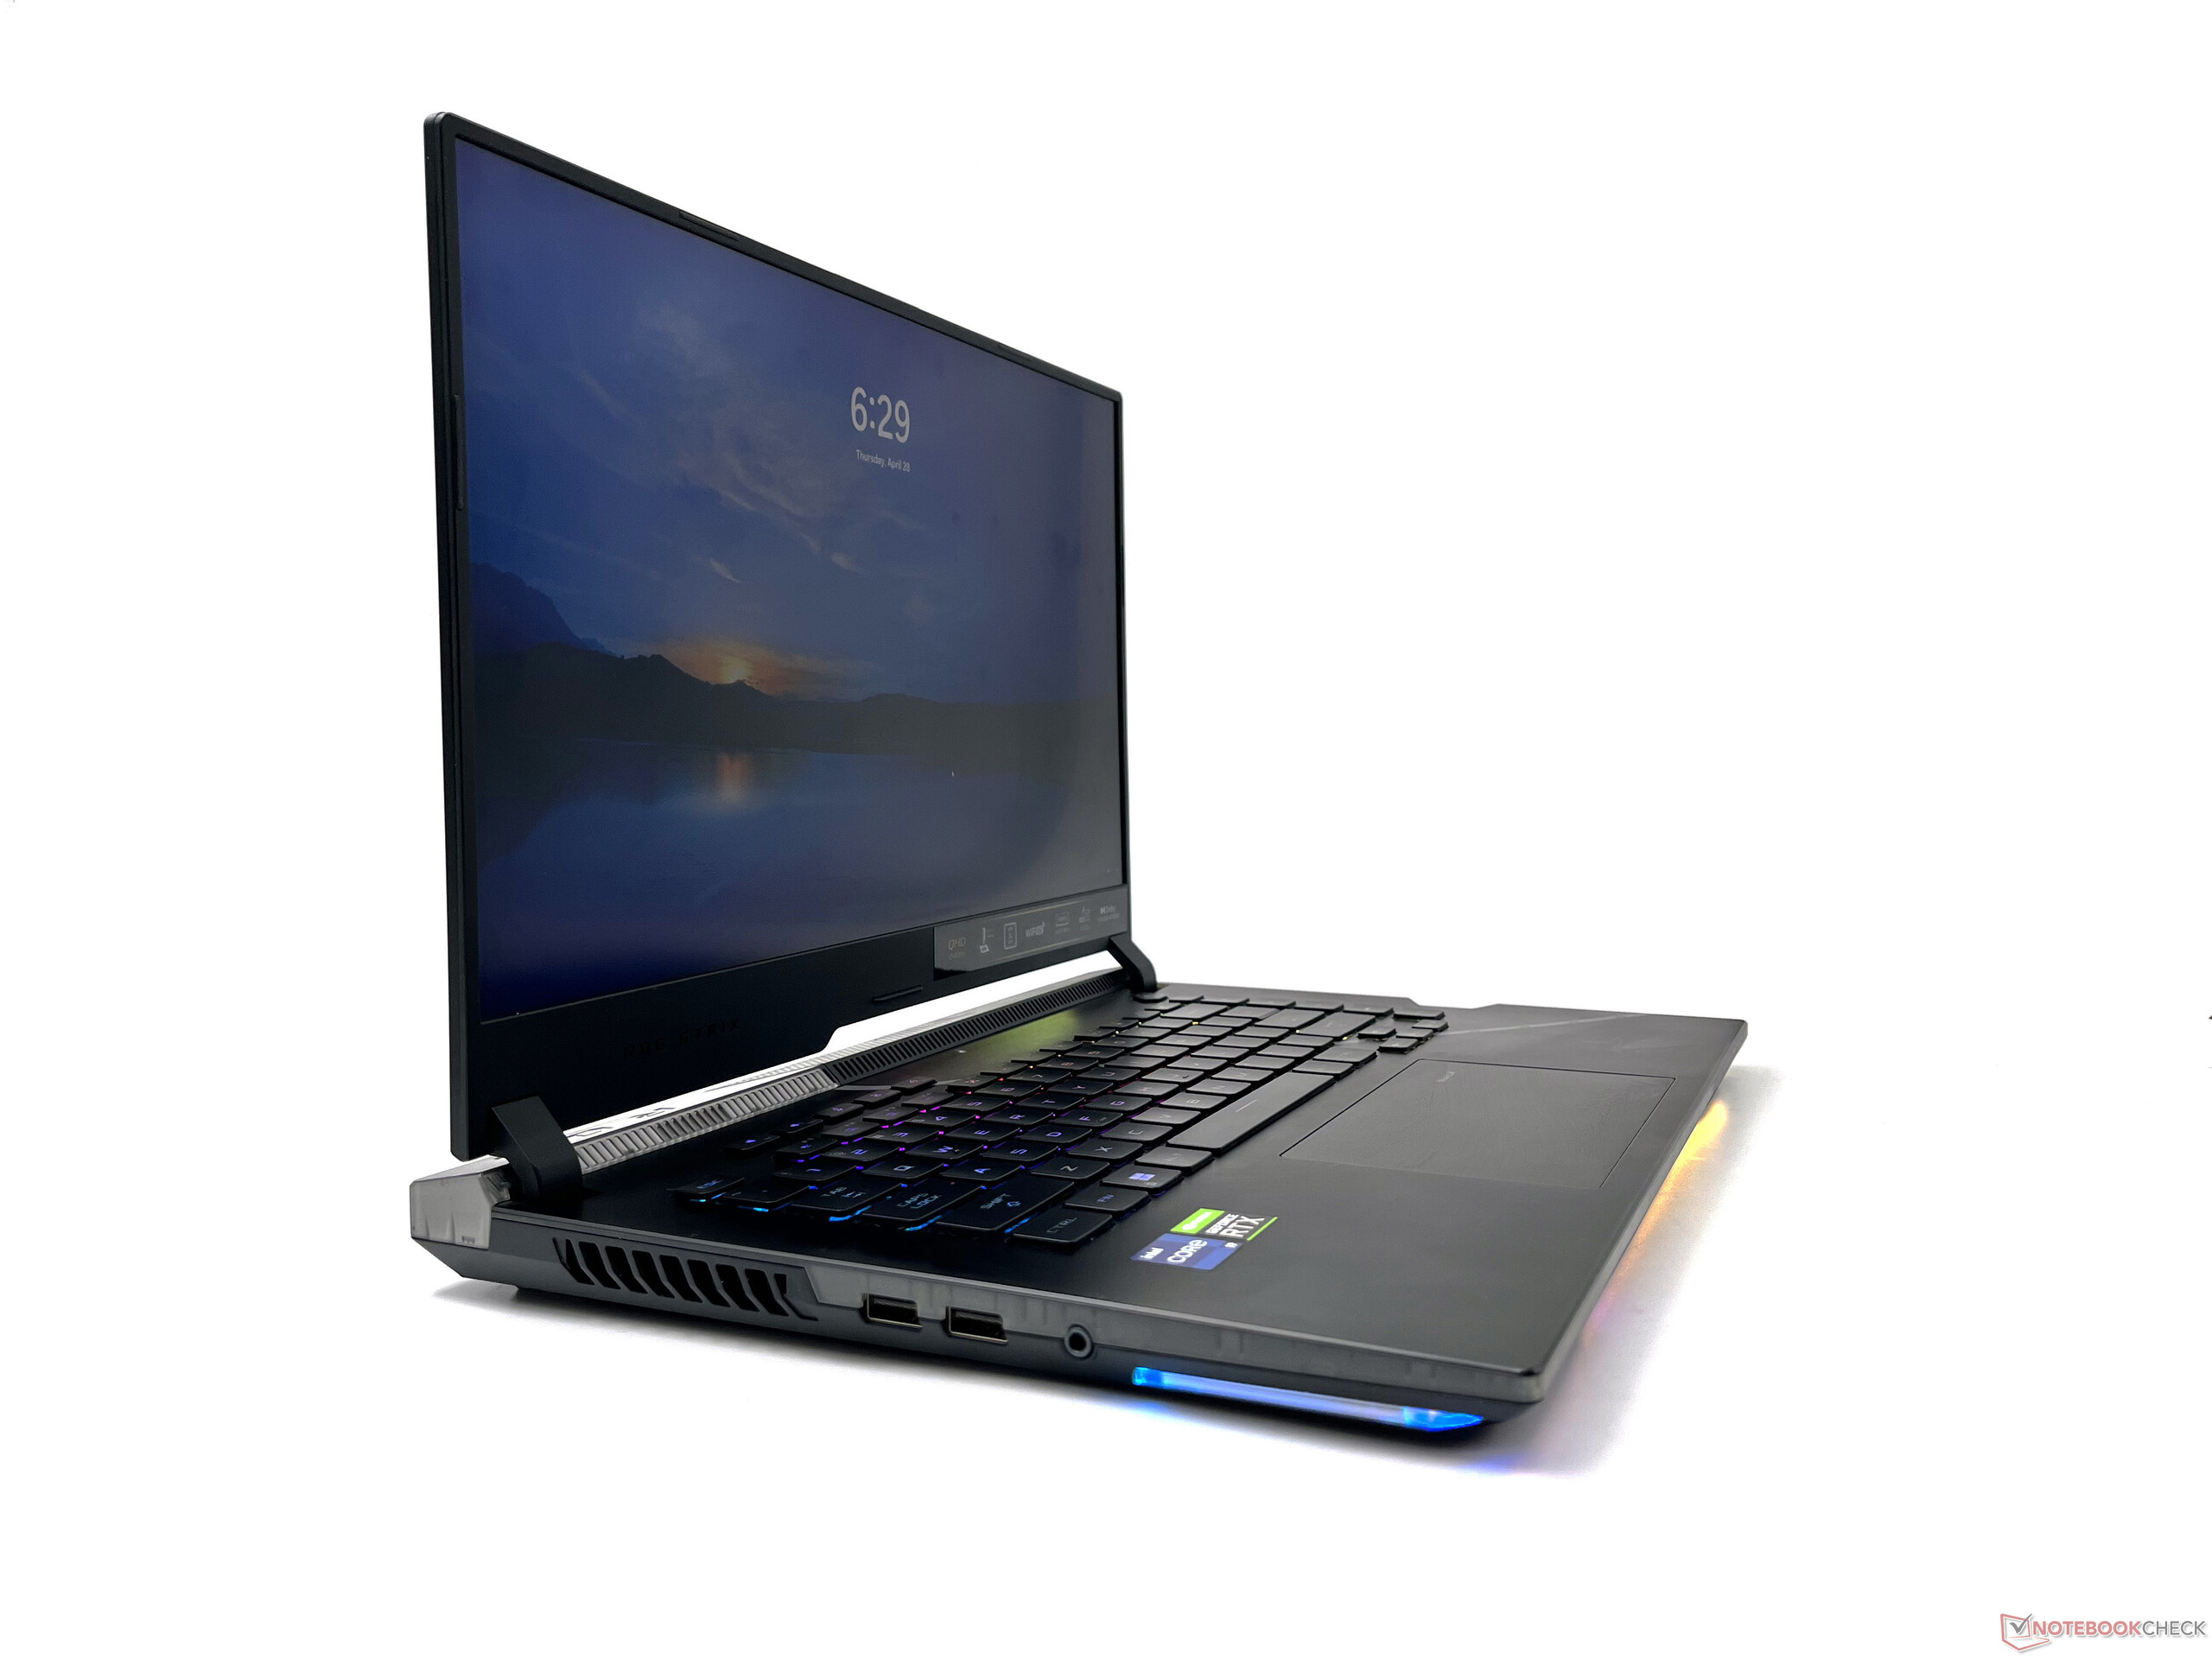
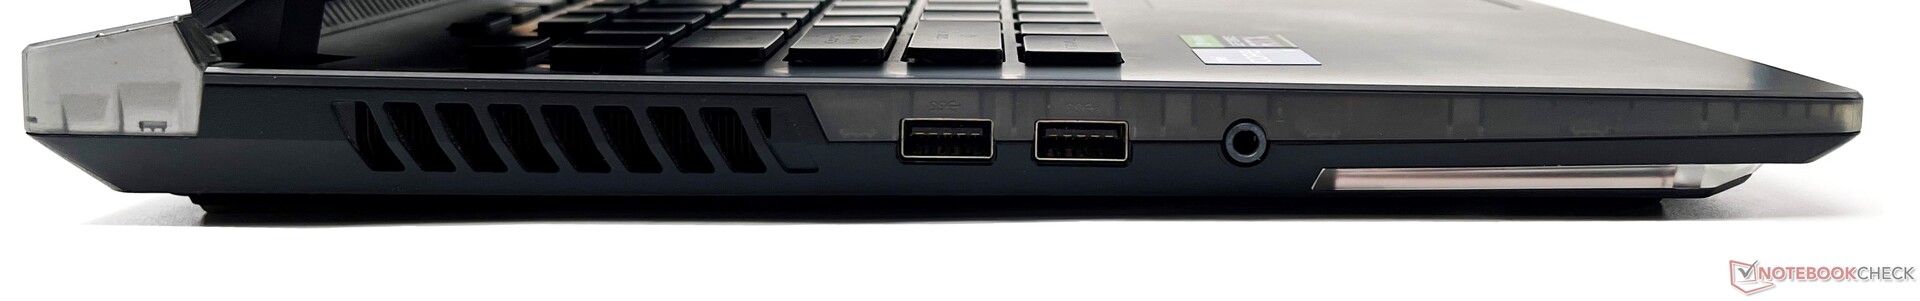
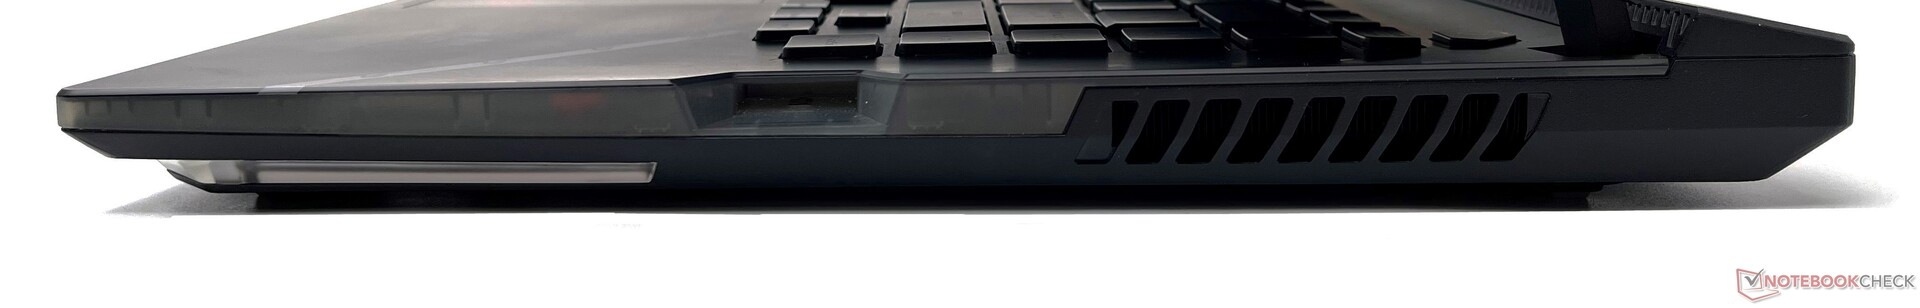
O ROG Strix Scar 15 G533 cobre o essencial quando se trata de E/S. À esquerda, há dois USB 3.2 Gen 1 Type-As e uma tomada de áudio combinada, enquanto a direita tem apenas um slot para o ROG Keystone 2. A Keystone 2 é uma chave NFC que trabalha com o aplicativo Armory Crate para aplicar vários perfis de desempenho e RGB e também para desbloquear um Shadow Drive oculto.
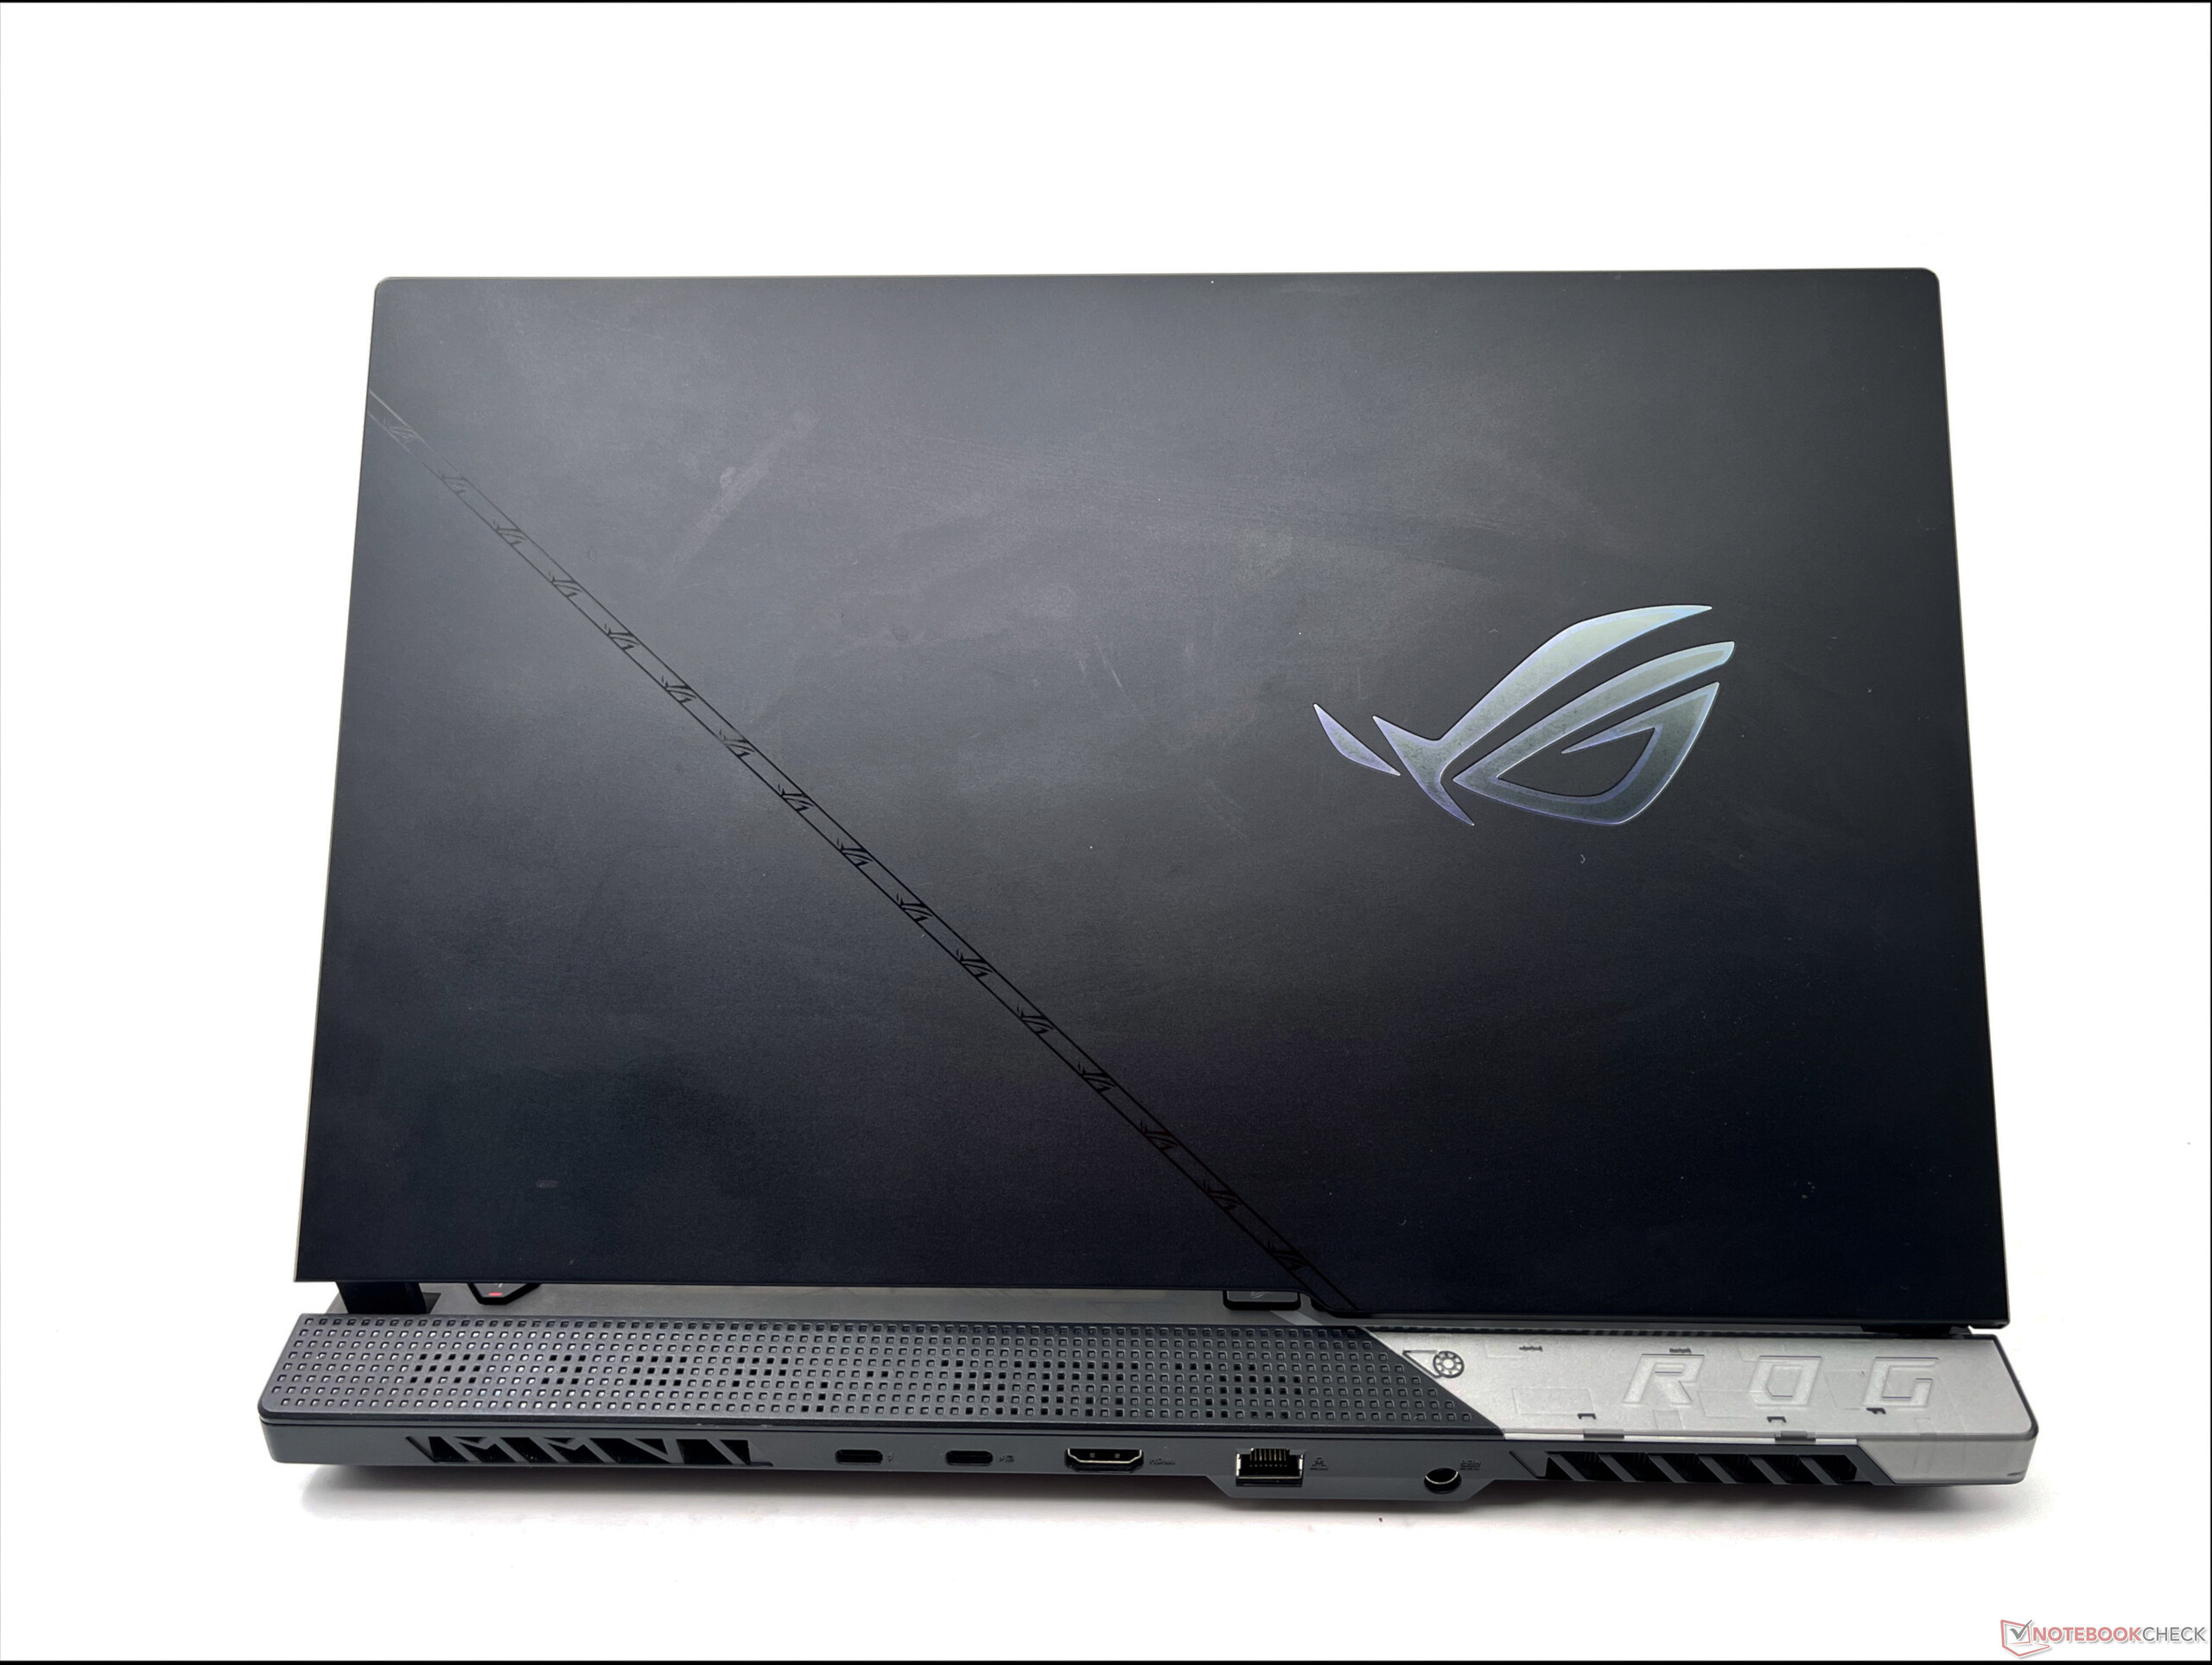
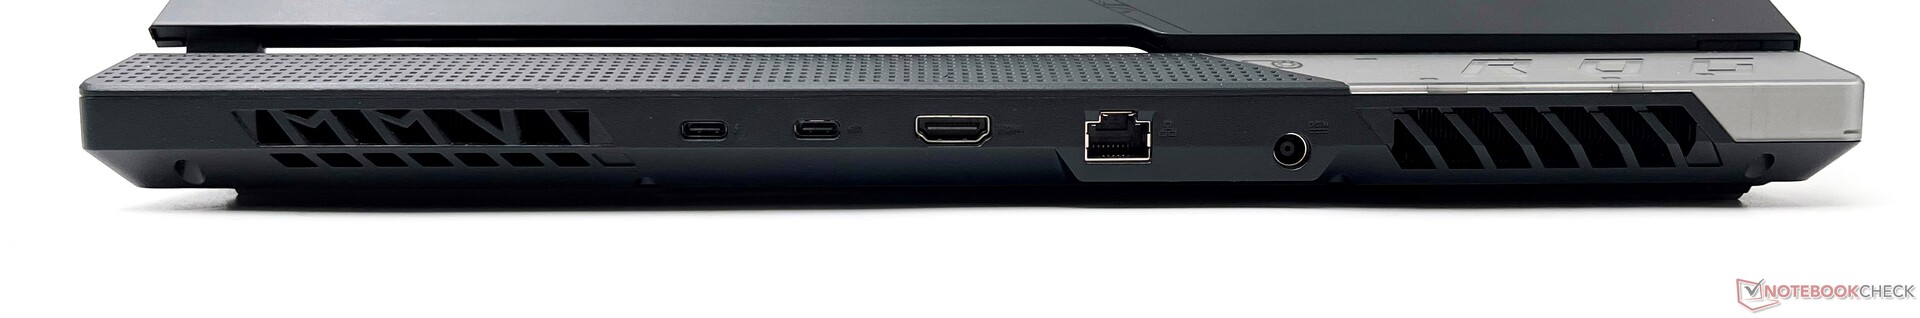
A maioria dos portos está localizada na parte de trás. Estas incluem uma porta Thunderbolt 4, uma USB 3.2 Gen2 Tipo-C que suporta DisplayPort-out e Power Delivery, HDMI 2.1-out, uma porta Ethernet 2.5G, e DC power-in.
A colocação da porta é conveniente e não dificulta os movimentos de um mouse externo. Infelizmente, o Scar 15 não oferece um slot de cartão SD ou um slot de trava Kensington.
Comunicação
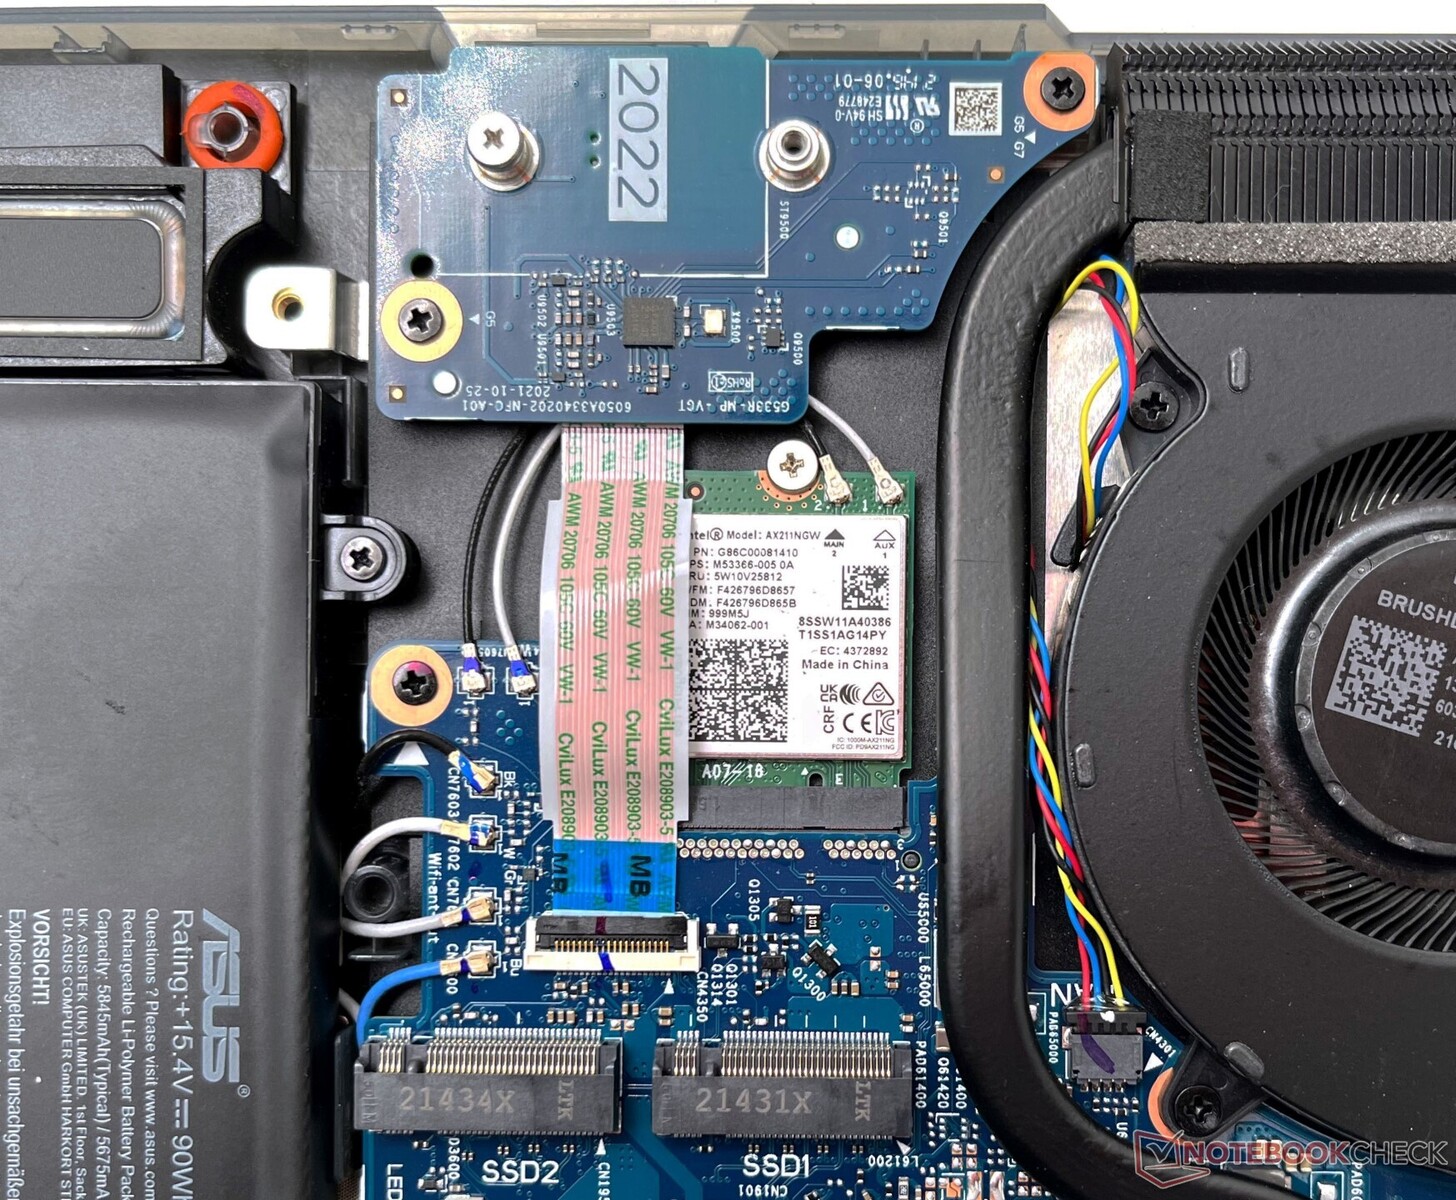
O ROG Strix Scar 15 oferece conectividade Wi-Fi 6E através da placa Intel Wi-Fi 6E AX211. Já vimosvários laptopscom o chipset AX211 antes, mas o ROG Strix Scar 15 é provavelmente o primeiro laptop a ser lançado na Índia que suporta o novo padrão sem fio.
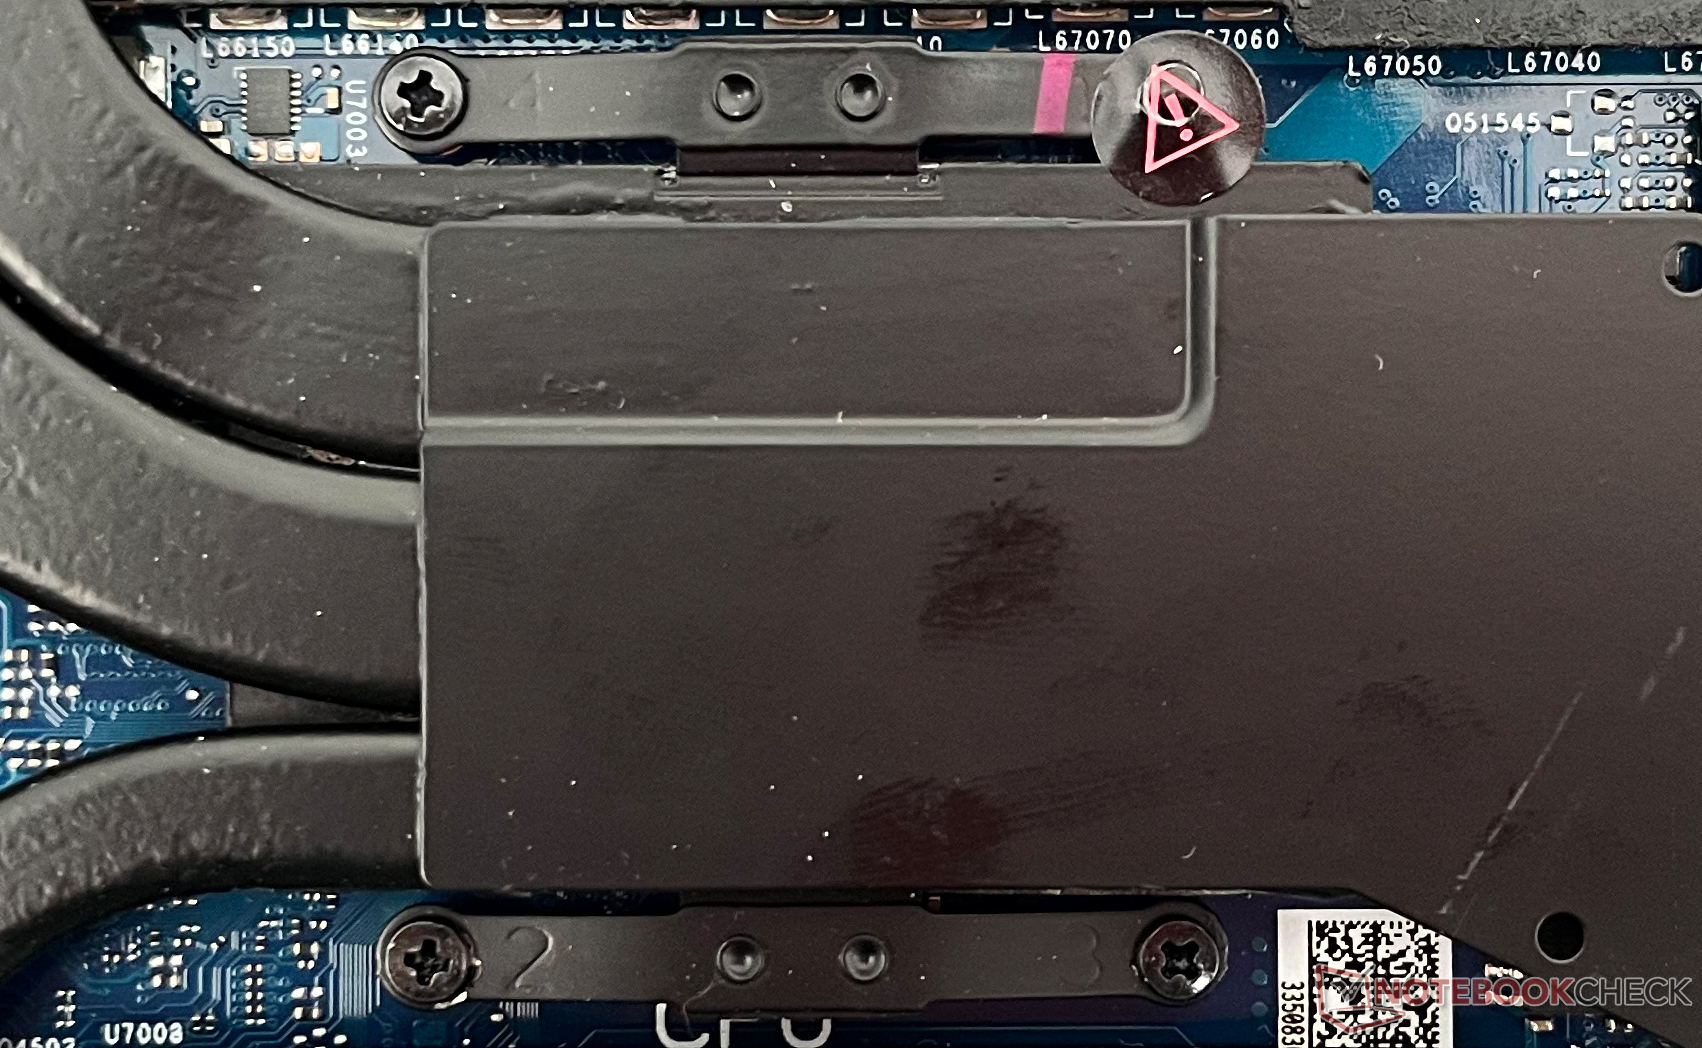
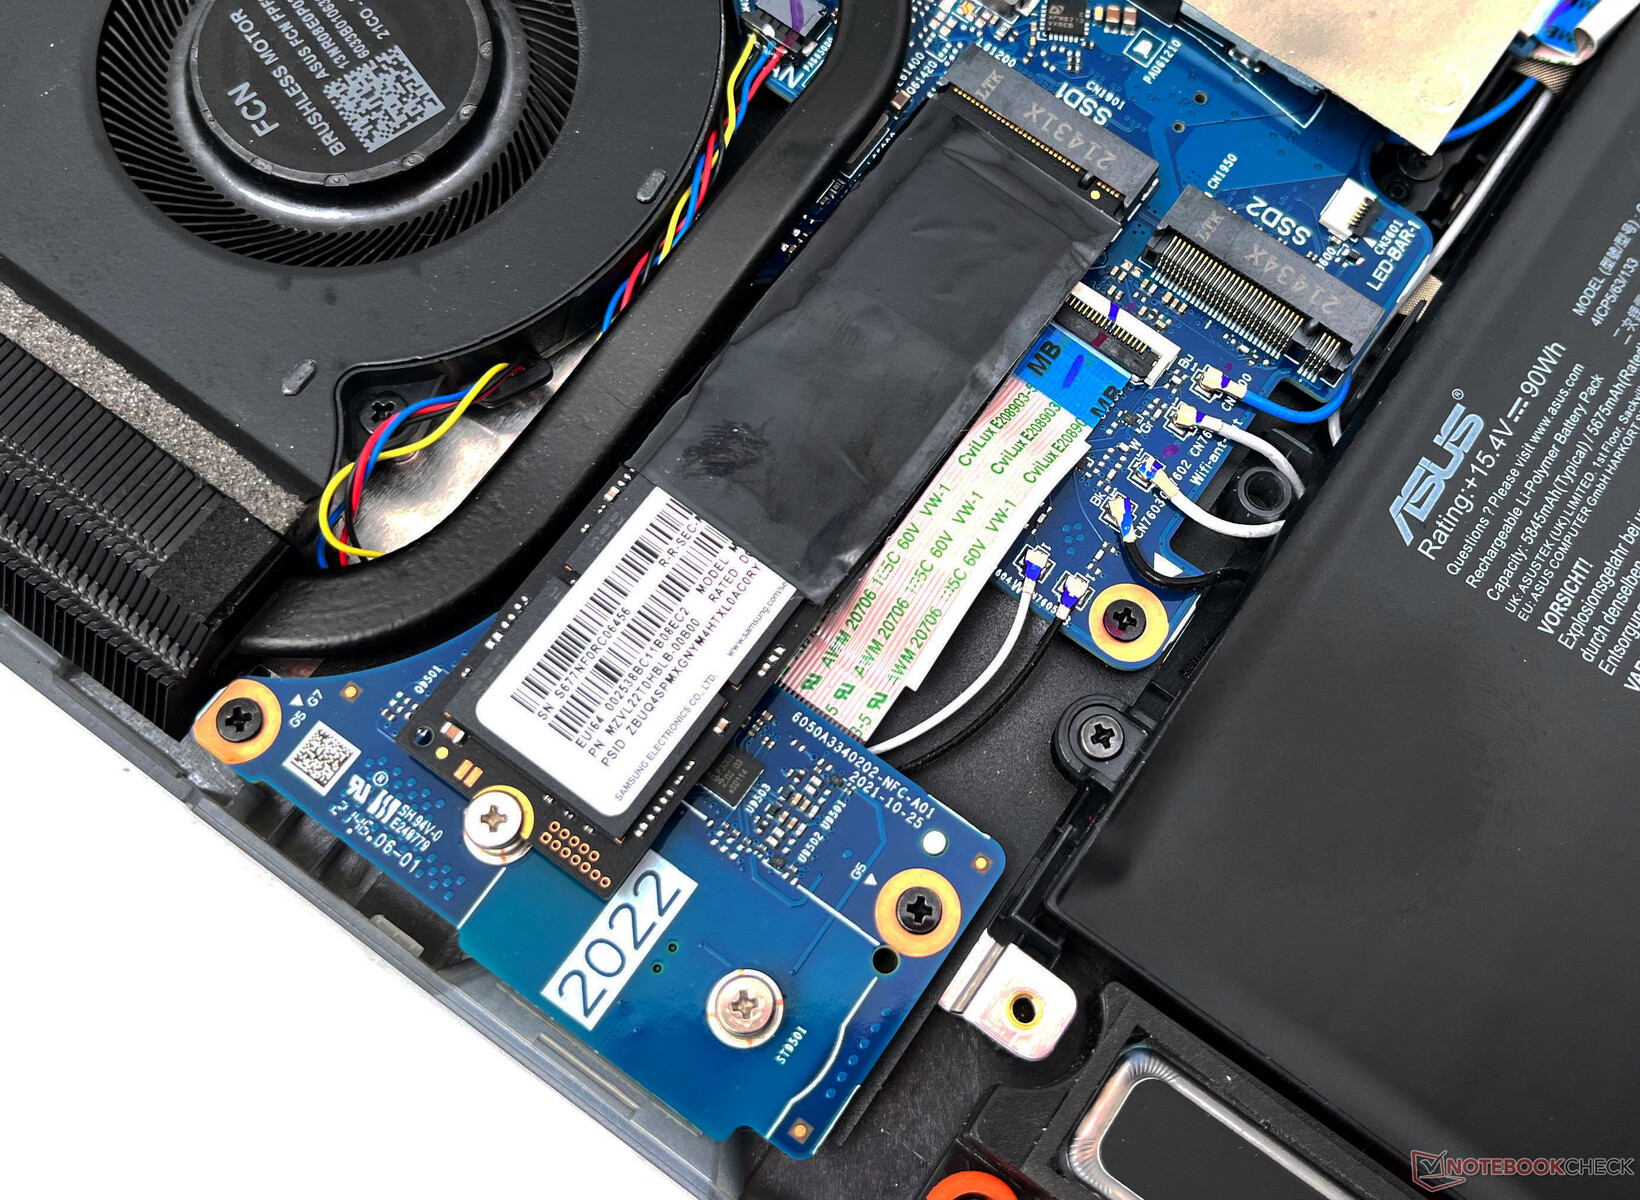
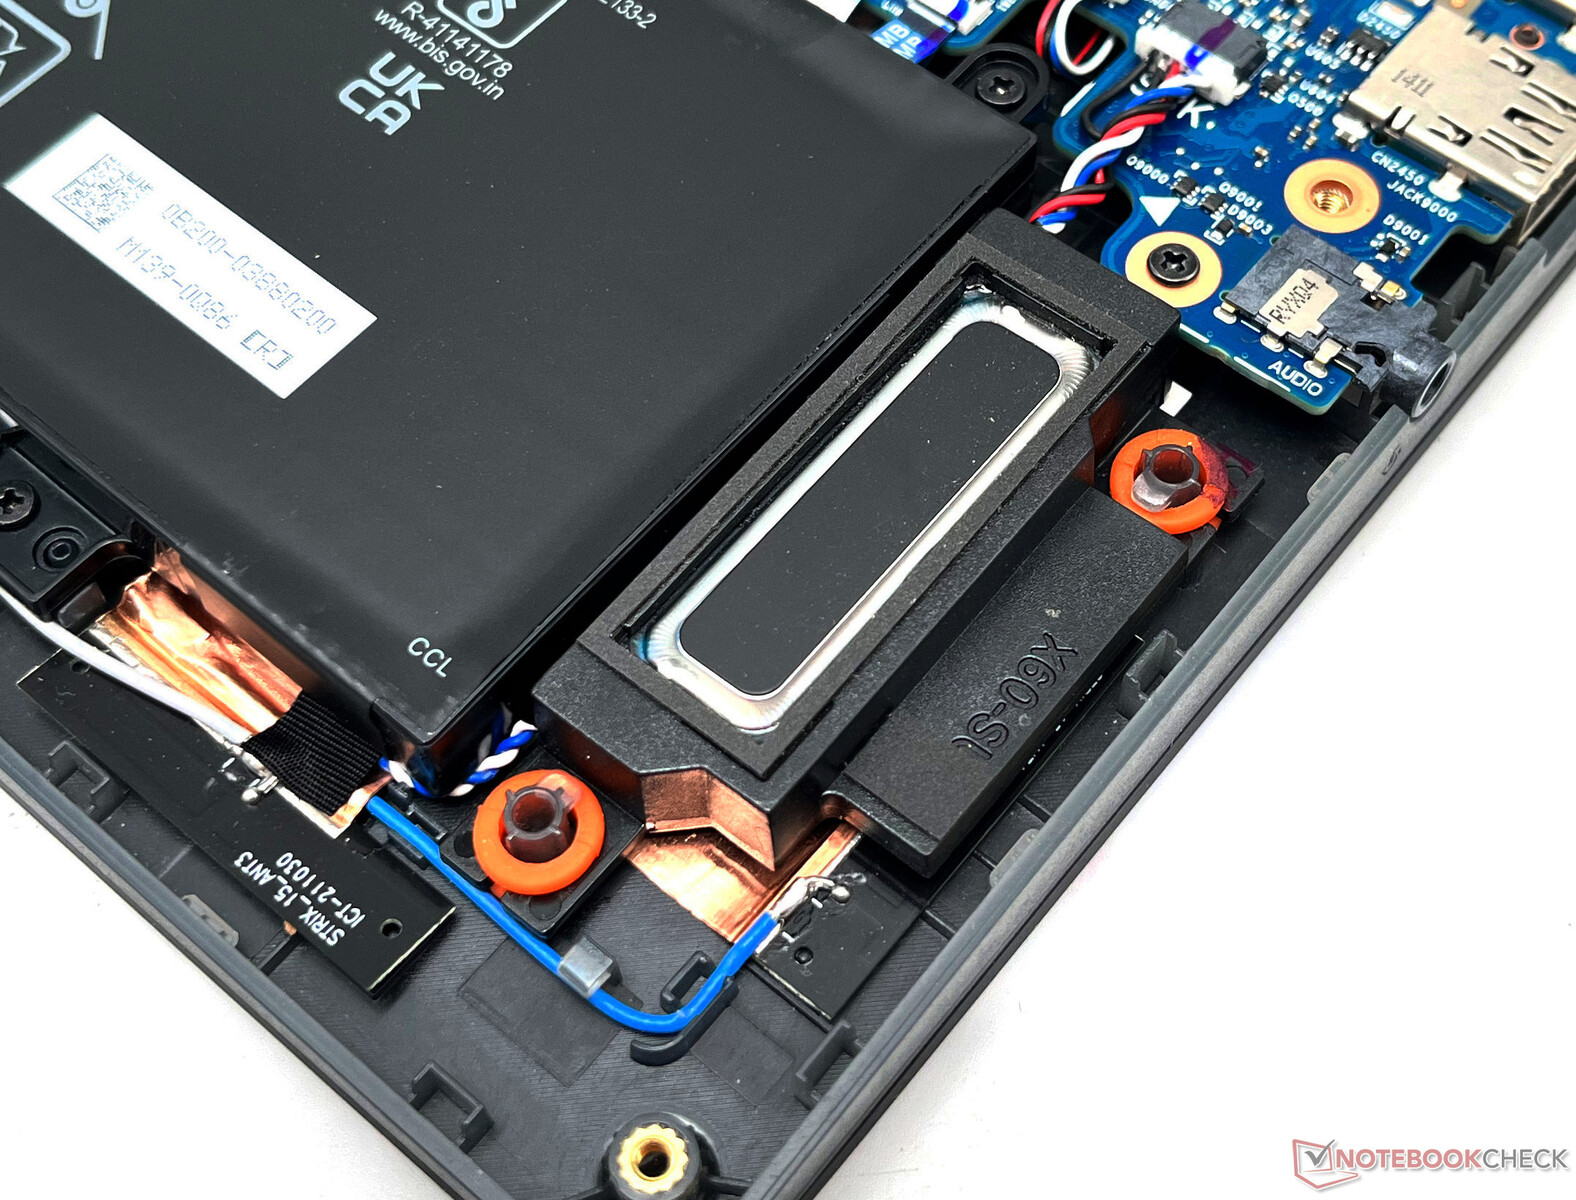
O cartão Wi-Fi do Scar 15 pode ser trocado se necessário, mas nós não somos realmente fãs de sua colocação. O cartão WLAN é na verdade colocado sob o SSD M.2 primário e requer a remoção do drive para poder acessá-lo para atualizações ou substituições. Você também deve ter cuidado com o cabo de dados que vem da placa de circuito impresso Keystone que funciona diretamente acima da placa.
Assim, testamos tanto o desempenho Wi-Fi 5 GHz quanto Wi-Fi 6E com nosso roteador de referência Asus ROG Rapture GT-AXE11000 a uma distância de 1 m do dispositivo em clara linha de visão. Nosso dispositivo de teste mostra velocidades médias de recepção até 6% mais altas com 6E no teste de recepção e uma produção média similar a 5 GHz no teste de transmissão. A banda 6E também permite valores máximos de recepção mais altos próximos a 2 Gbit/s.
Observamos que leva algum tempo para que a opção de 6 GHz fique disponível para conexão após um novo arranque no Windows. Durante os testes não foram observados grandes diminuições na taxa de transferência.
Webcam
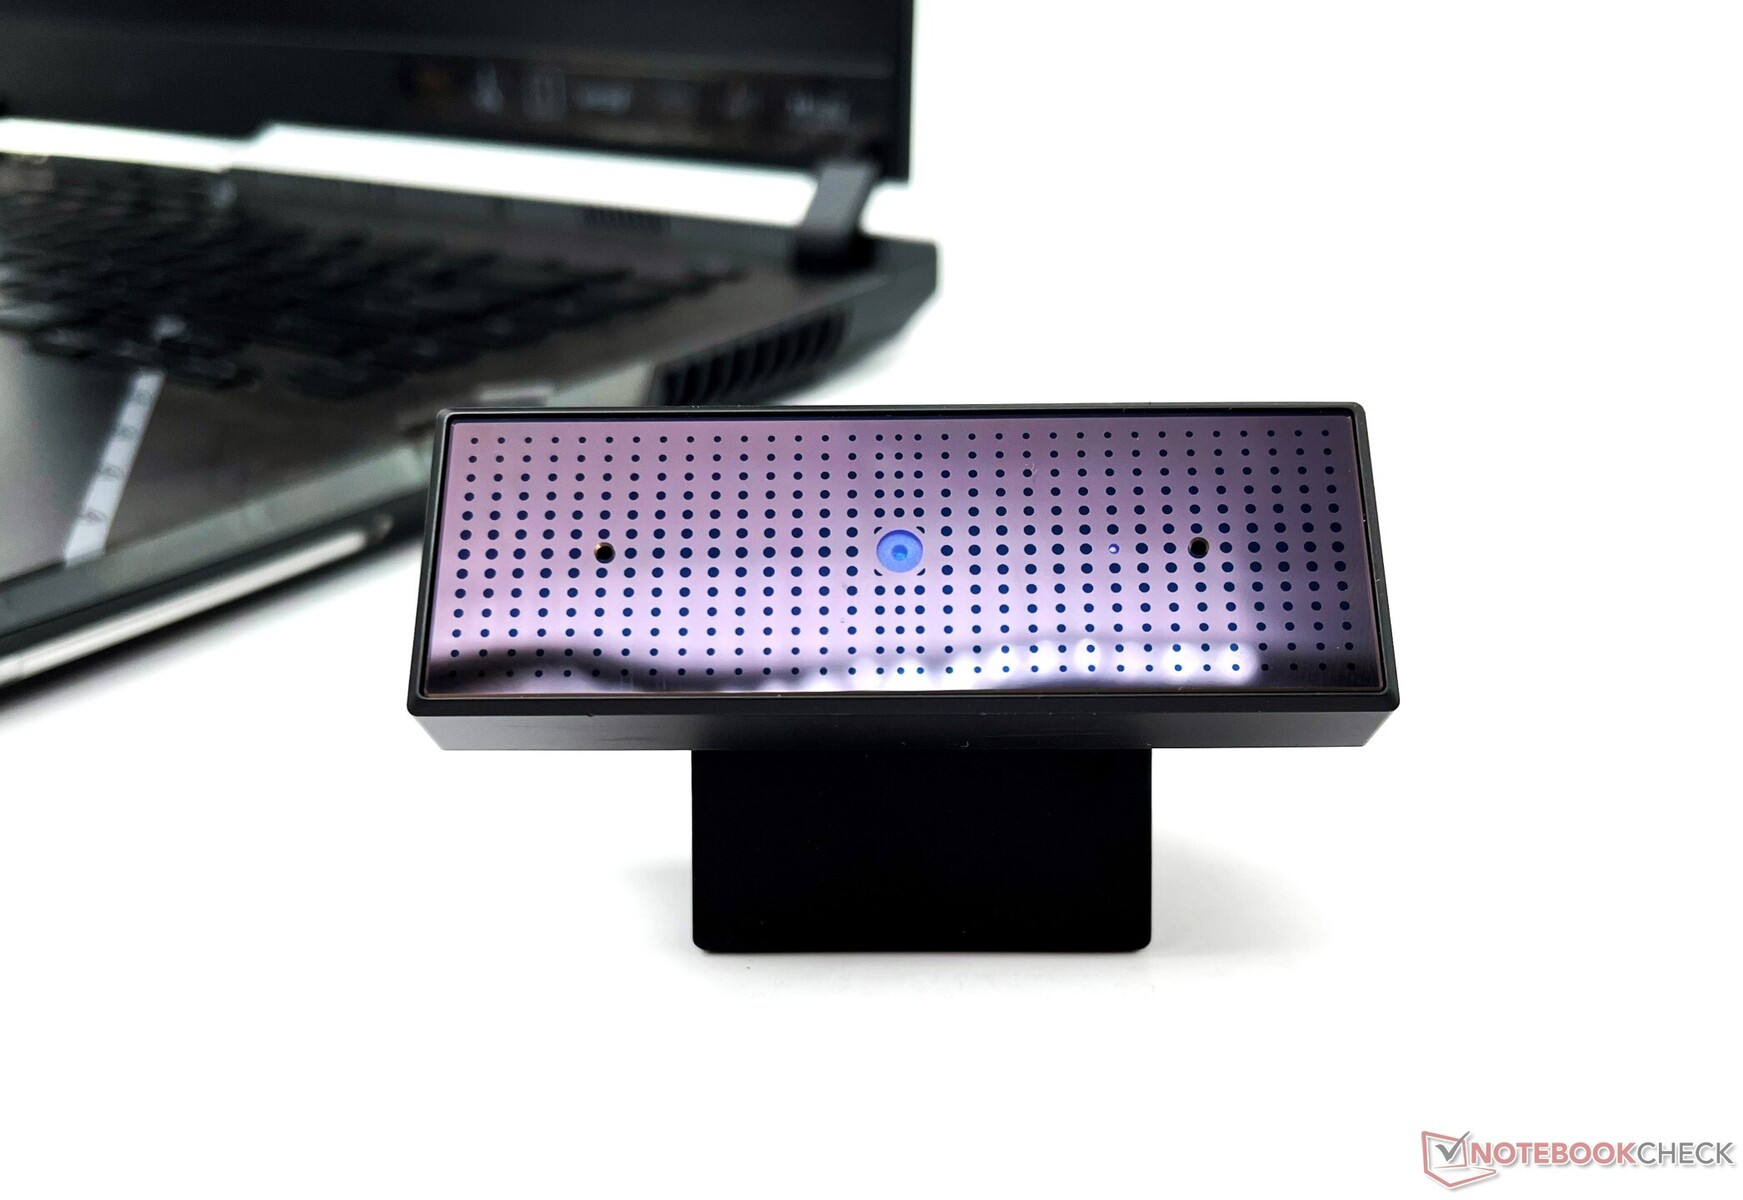
O ROG Strix Scar 15 não possui uma webcam. No entanto, nossa unidade de revisão veio com uma webcam externa ROG Eye 1080p 60 fps com microfones duplos em forma de feixe embutidos. A webcam pode ser usada sobre a mesa ou montada na moldura superior do Scar 15.
A qualidade da imagem do ROG Eye é bastante utilizável na maior parte das vezes. A câmera ROG Eye mostra uma precisão média de cor Delta E de 15,12 com nosso Passaporte ColorChecker em uma sala bem iluminada, com os valores mais baixos de Delta E vistos nas manchas brancas e pretas.
O gráfico de teste mostra detalhes decentes, mas há uma falta de nitidez e clareza na imagem. A webcam ROG Eye irá atrasá-lo por cerca de ₹5,800 (~US$75 ou menos) se comprada separadamente.


Segurança
Desde que o ROG Strix Scar 15 está voltado para a multidão de jogos, o Asus tem escamoteado recursos de segurança como um leitor de impressões digitais ou uma câmera IR. Há um módulo TPM 2.0 presente, no entanto.
Acessórios
A caixa contém o adaptador de energia e a papelada usual. Você também recebe a chave ROG Keystone 2 e duas tampas de armadura ROG substituíveis. Nossa unidade é fornecida com a webcam externa ROG Eye, mas algumas unidades de varejo podem não ser oferecidas com uma, dependendo do SKU e da região.
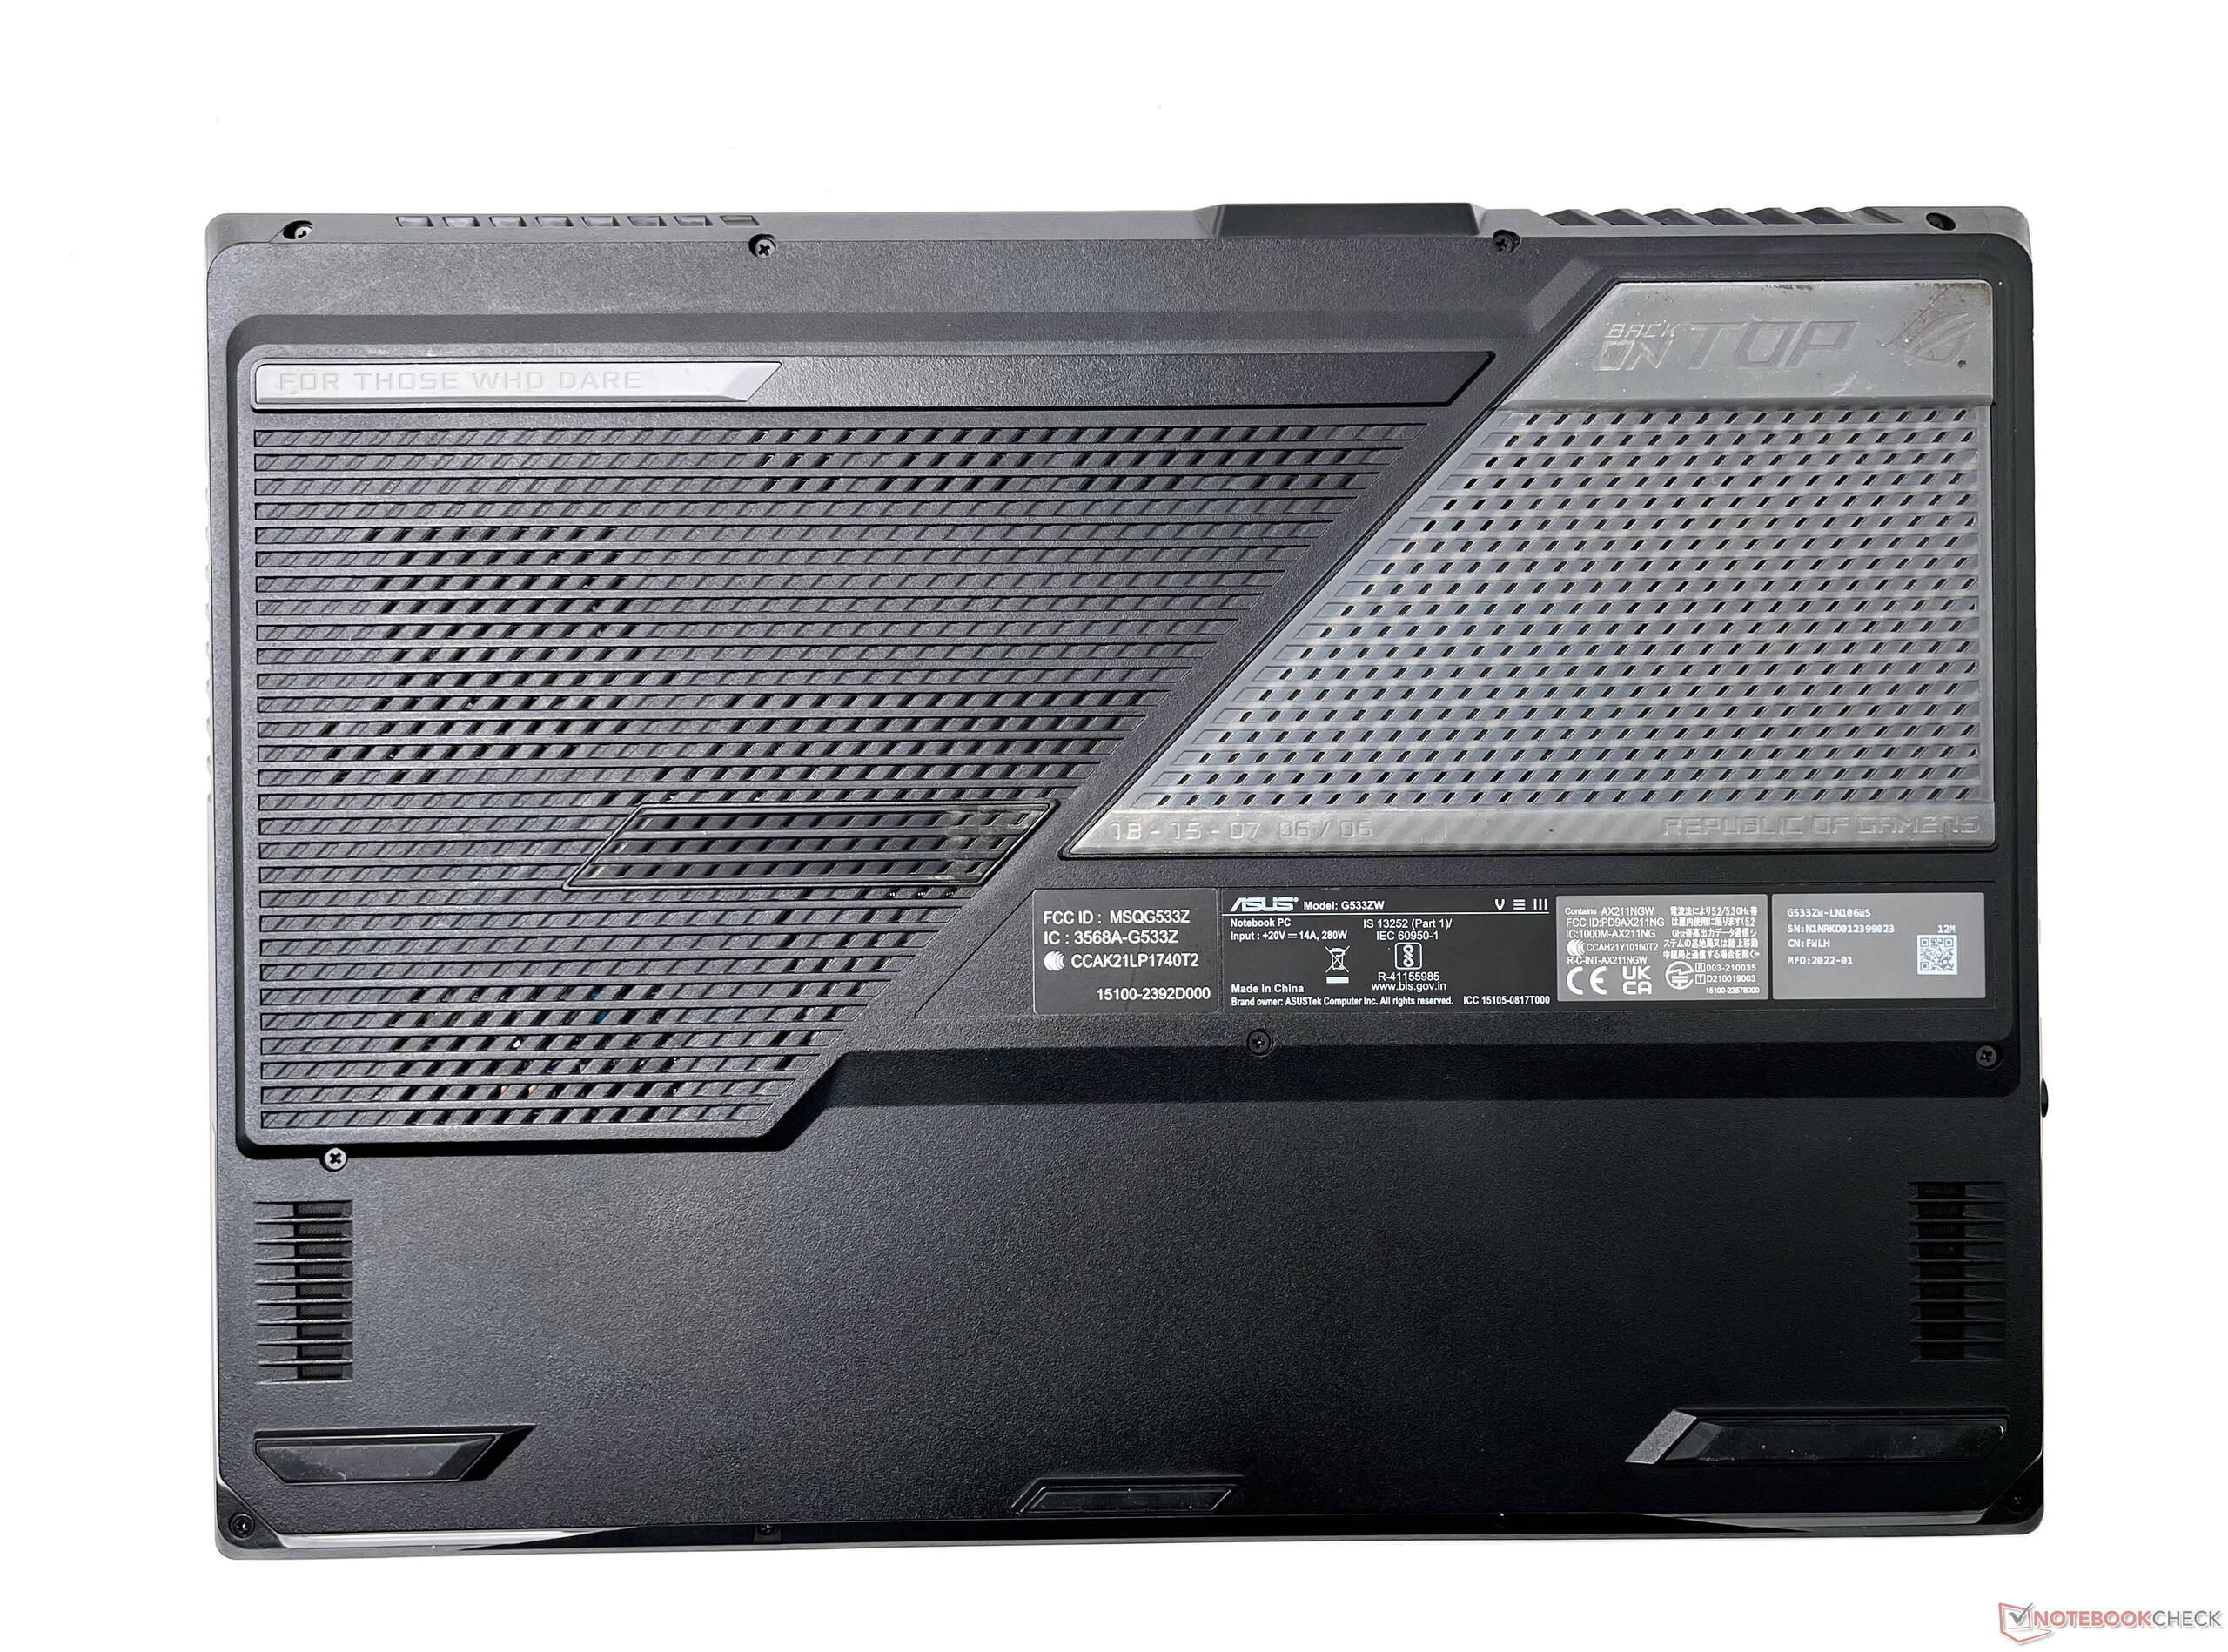
Manutenção
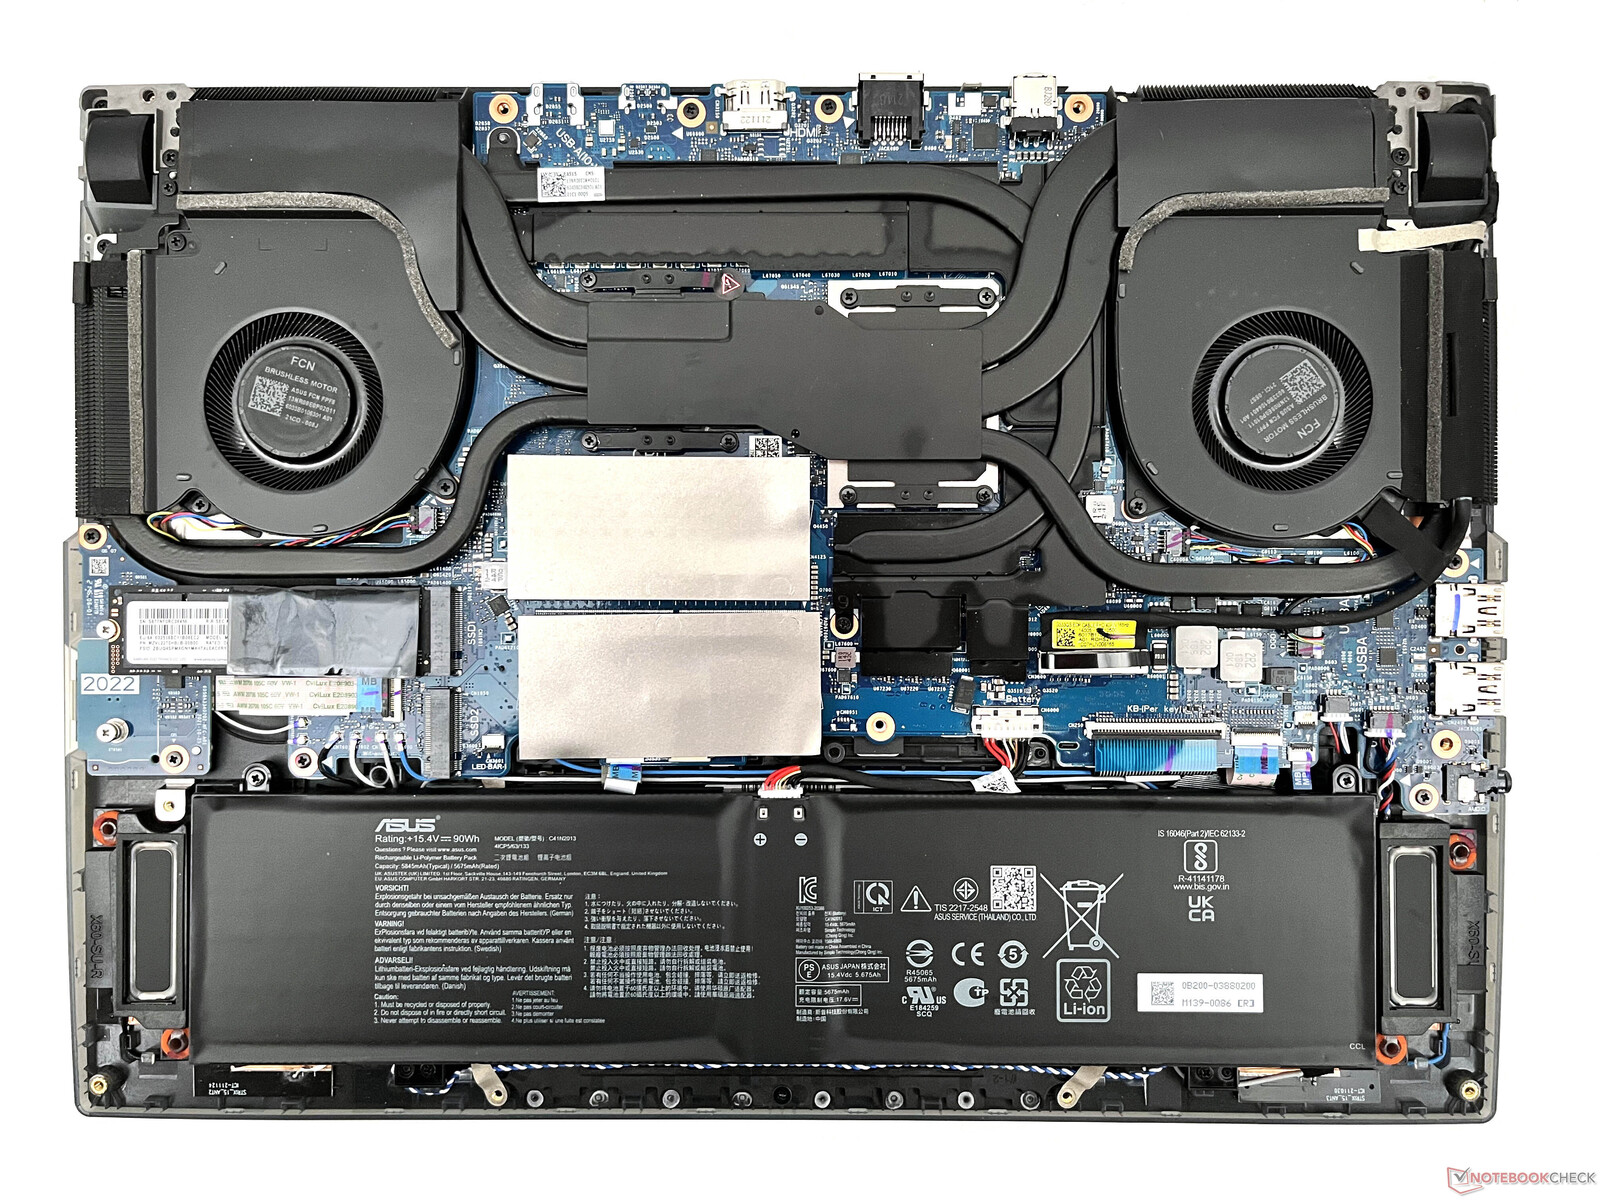
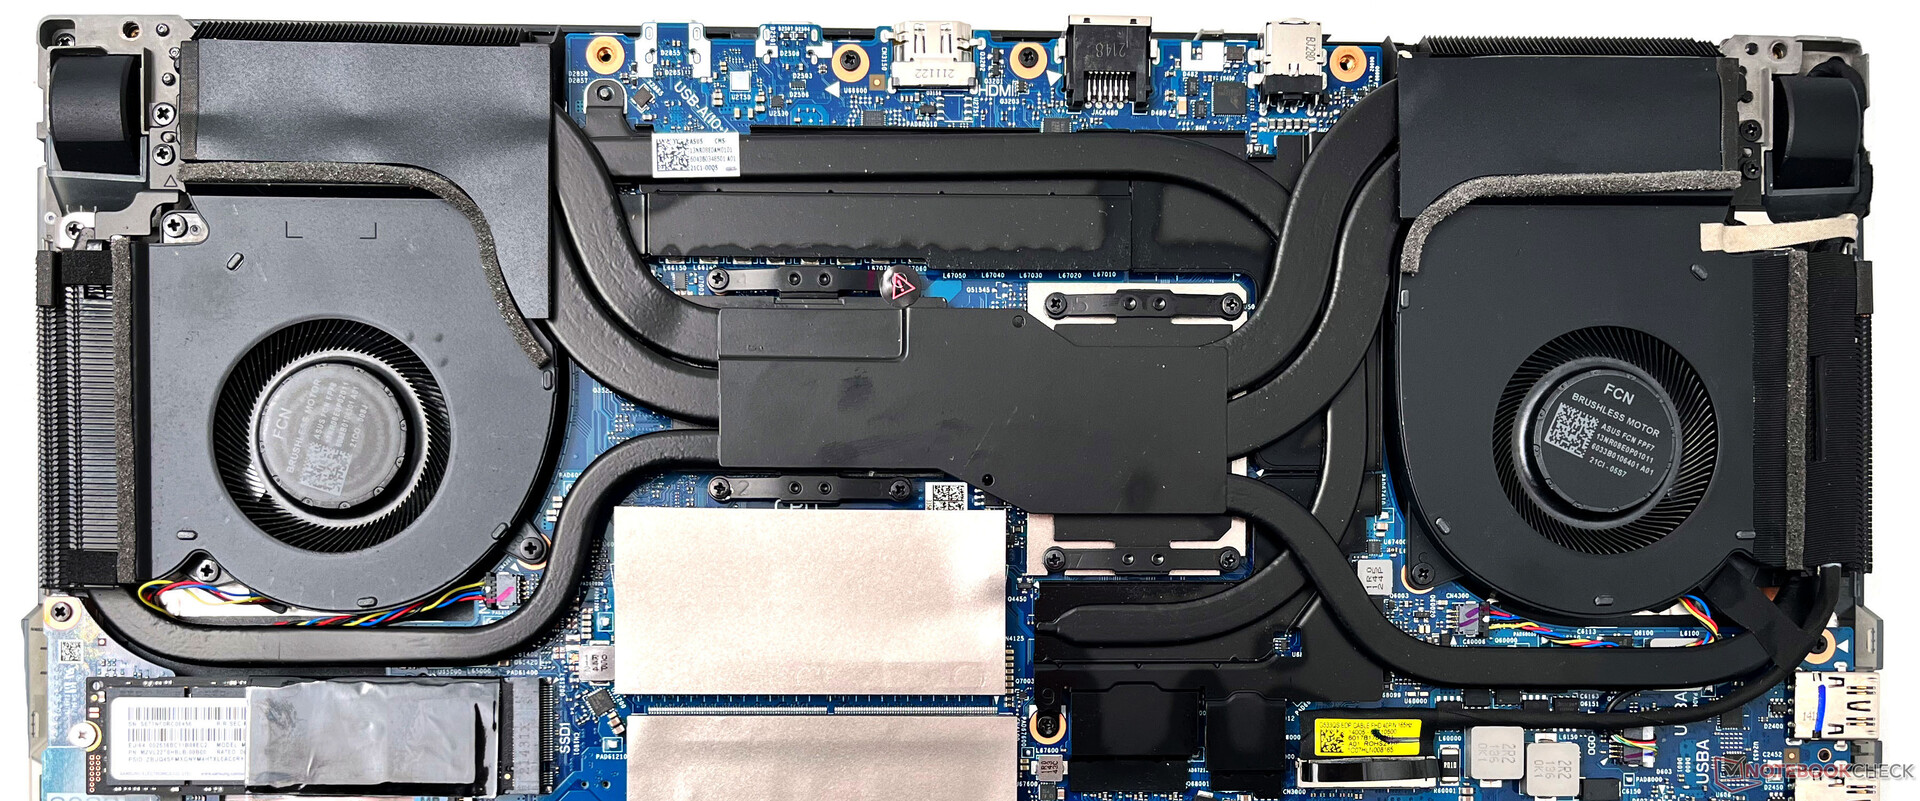
O painel inferior pode ser facilmente aberto após a remoção dos parafusos de 10 PH0. Entretanto, é preciso ter cuidado aqui, pois há cabos de fita frágeis que vão do painel inferior até a placa-mãe. Estes cabos controlam a barra de luz RGB na borda frontal do painel inferior.
Ter a faixa RGB de chassis neste local não é uma boa idéia em nossa opinião, pois dificulta o acesso ao interior devido a cabos finos que podem se quebrar se você não tiver cuidado ao desalojar o painel inferior. Os LEDs deveriam ter sido parte do próprio chassi principal, idealmente como o MSI GE76 Raider, por exemplo
.
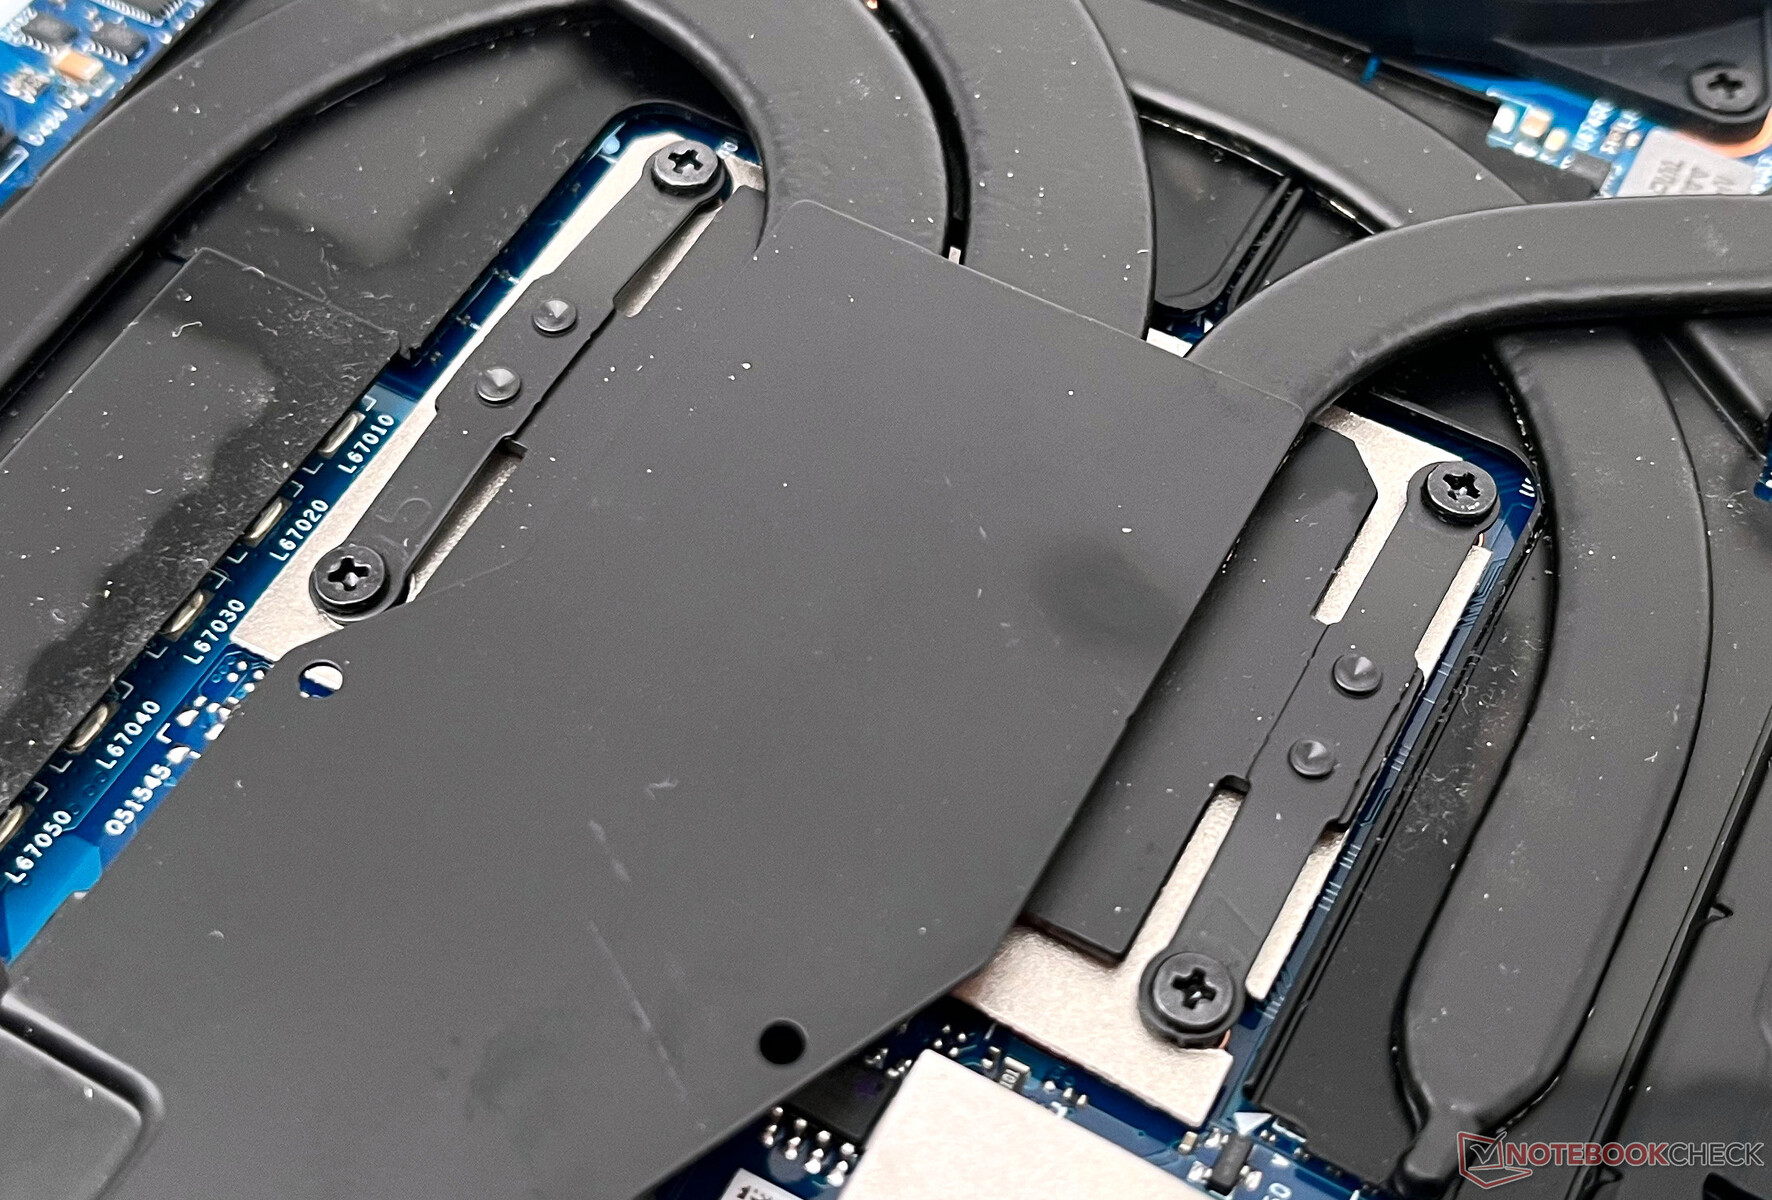
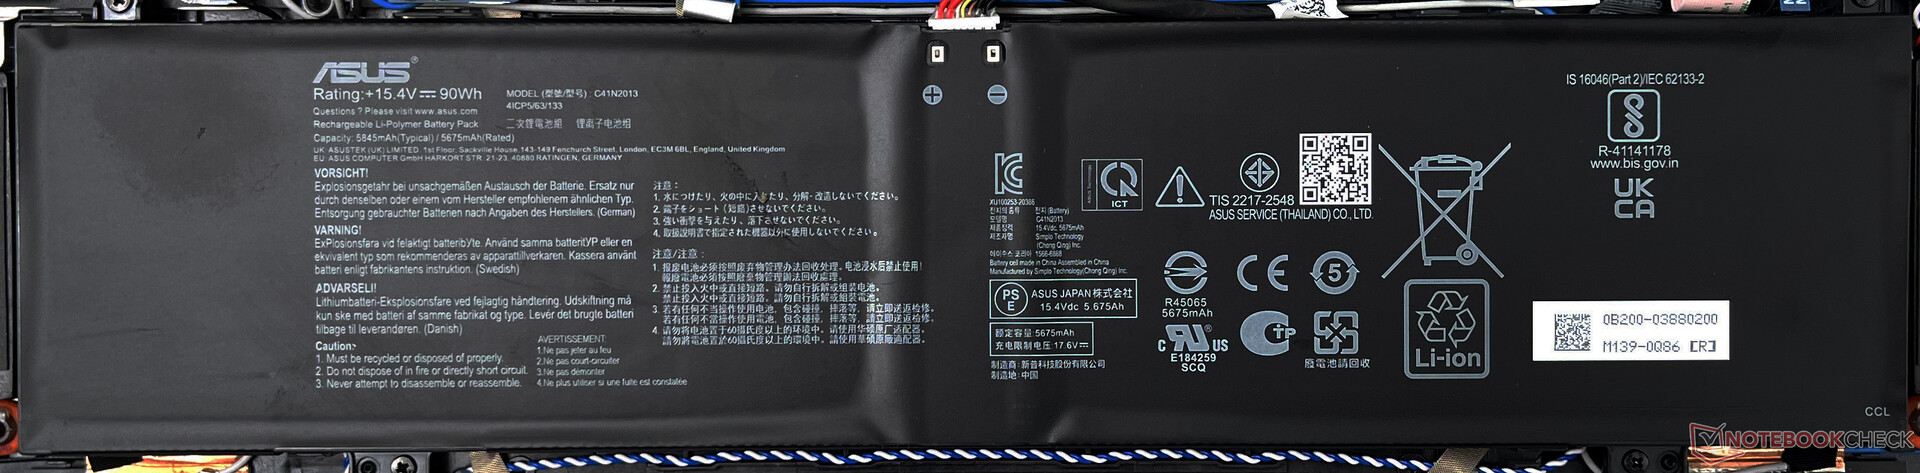
As vísceras não apresentam nenhuma surpresa em particular. Você recebe SO-DIMMs, M.2 SSDs e cartão WLAN intercambiáveis, uma grande bateria de 90 Whr, e um sistema de resfriamento de tubos de oito aquecedores com ventilador duplo.
Garantia
A Asus oferece uma garantia padrão de um ano para o ROG Strix Scar 15 na Índia. Adicional Premium Care as extensões de garantia podem ser adquiridas através do aplicativo MyAsus ou em uma loja Asus.
Os compradores indianos podem atualmente dispor de Ofertas Back to School para extensões de garantia de dois e três anos e proteção contra danos acidentais em vários portfólios de laptops Asus, incluindo a série ROG, dentro de 15 dias após a compra.
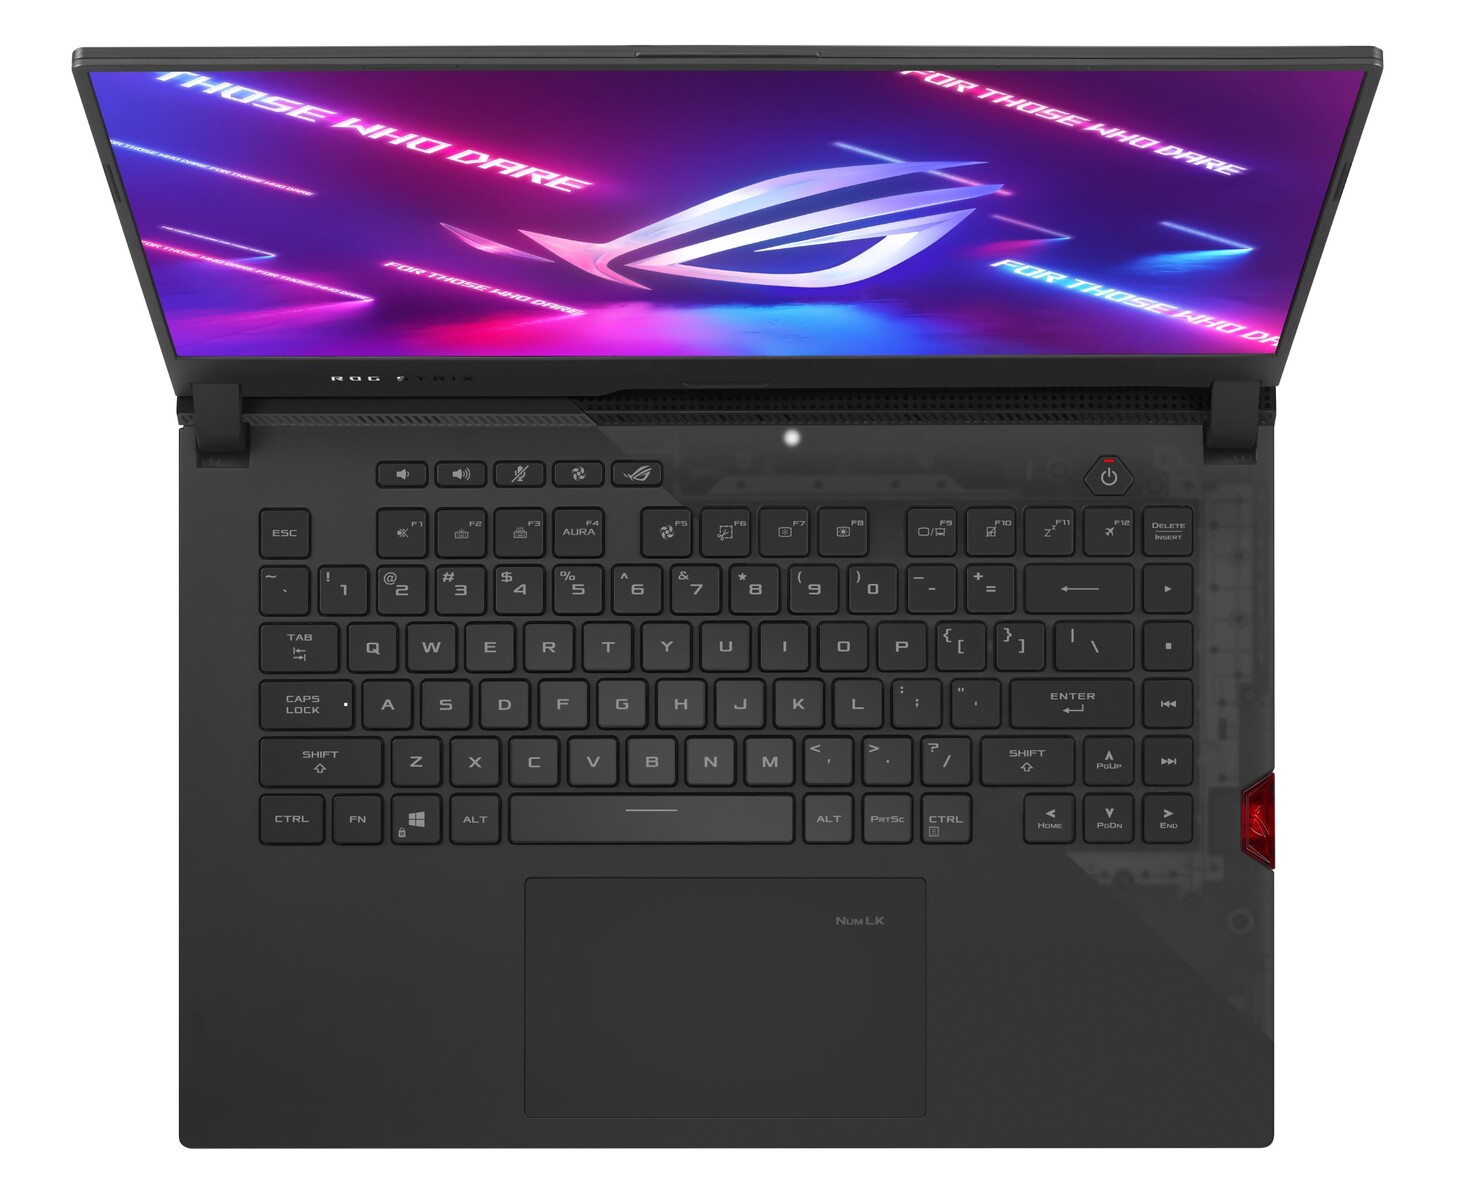
Dispositivos de entrada: Voltar aos interruptores de membrana
Teclado
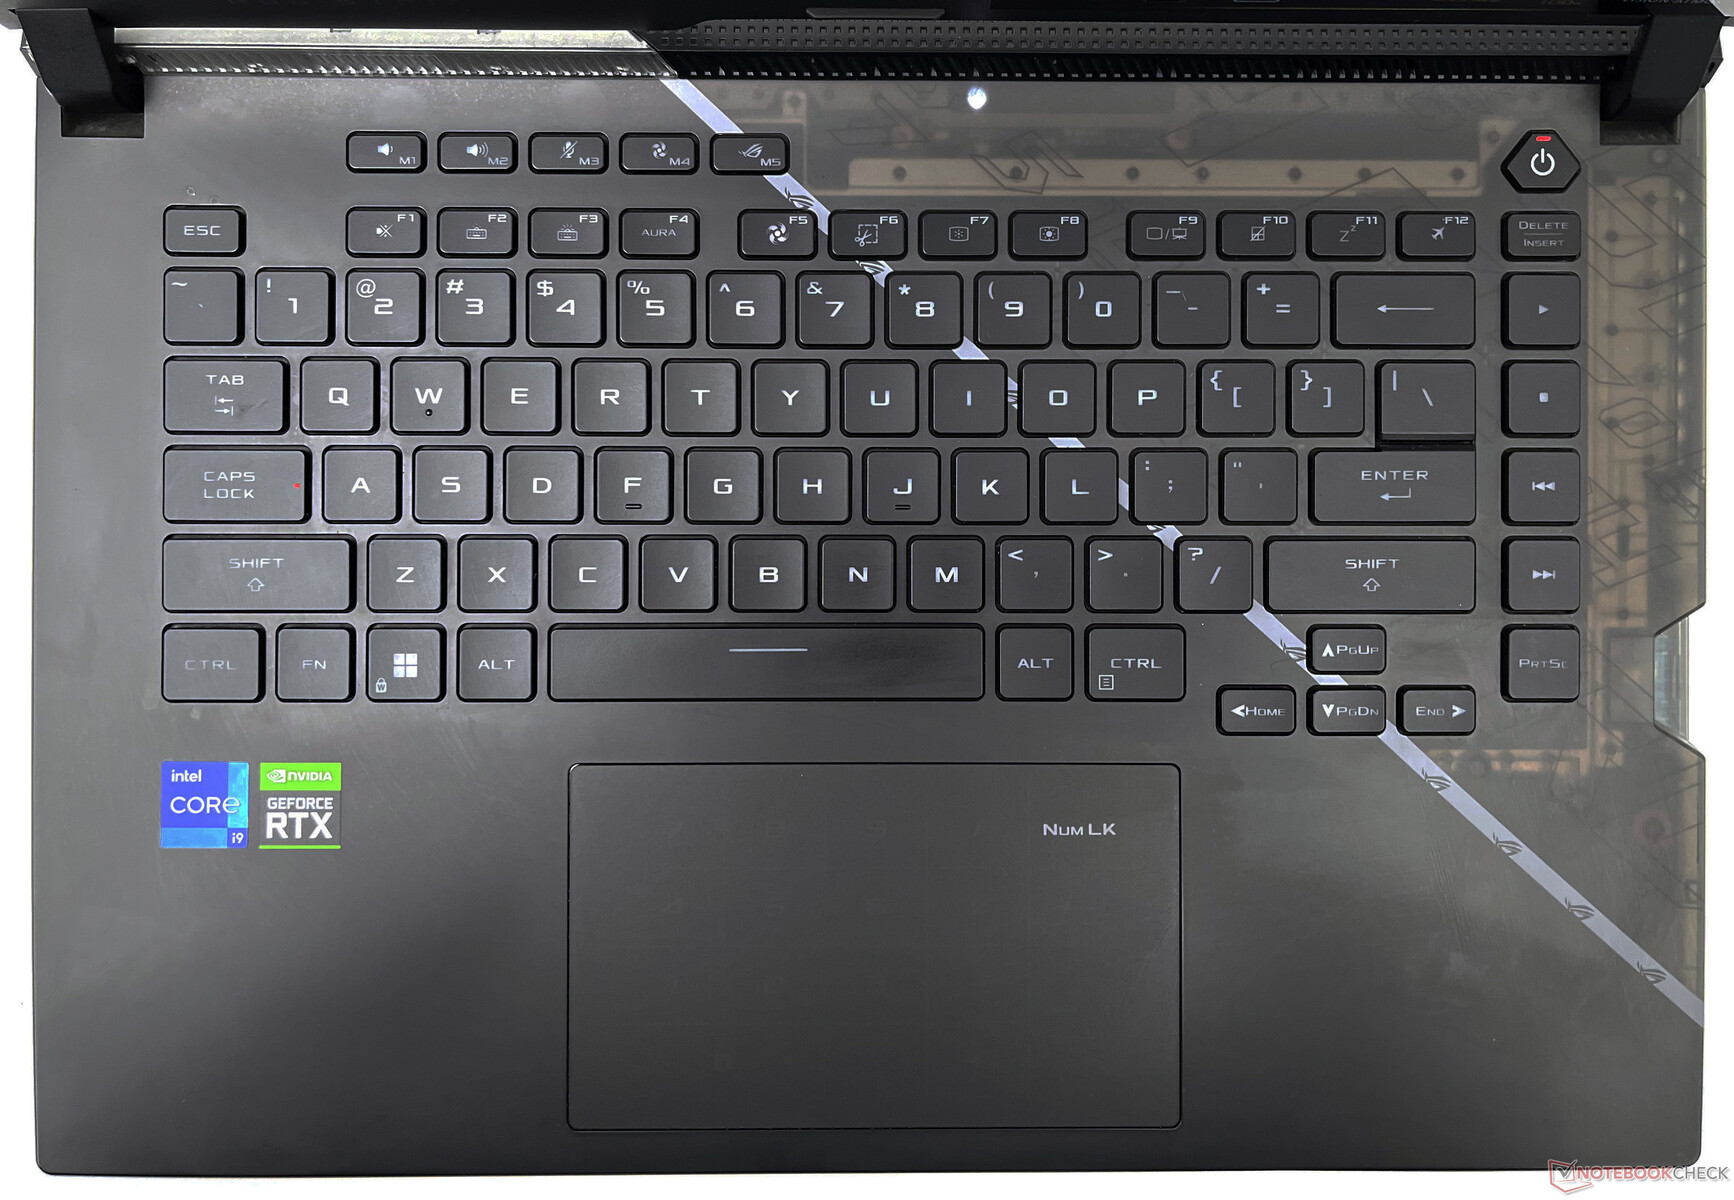
O teclado mate é um imã de manchas e graxa, apesar das afirmações do Asus em contrário. O2021 ROG Strix Scar 15o teclado do Asus apresentava interruptores opto-mecânicos, mas o Asus reverteu para o clássico interruptor de cúpula de membrana para o Scar 15 deste ano. Para compensar, o Asus está usando o que ele chama de ROG Overstroke que registra um pressionamento de tecla mais cedo no curso. As teclas estão adequadamente espaçadas e a digitação, em geral, é bastante confortável com uma tática decente
A linha mais alta tem atalhos rápidos para volume, microfone mudo, velocidade do ventilador, e o aplicativo Armory Crate. Estas teclas também podem ser mapeadas para atalhos e macros personalizados através do Armory Crate. As setas das teclas são menores do que gostaríamos, mas faz-se o trabalho. Asus diz que há pequenas aberturas ao redor das teclas WASD para atrair ar para dentro do chassi e evitar o aquecimento do teclado.
O brilho do RGB é mais que adequado para desfrutar de vários efeitos de iluminação via Aura Sync. Todas as teclas podem ser iluminadas individualmente, mas o Asus gosta de manter as letras F1-F12 no escuro por algum motivo.
Touchpad
O touchpad de 13 cm x 7,5 cm é espaçoso e oferece um deslizamento suave. Entretanto, os cliques são rasos e um pouco barulhentos para nosso gosto. Os gamers ficariam melhor com um mouse adequado.
Há uma alternância suave de toque no touchpad para um teclado numérico digital, que brilha apenas em branco.
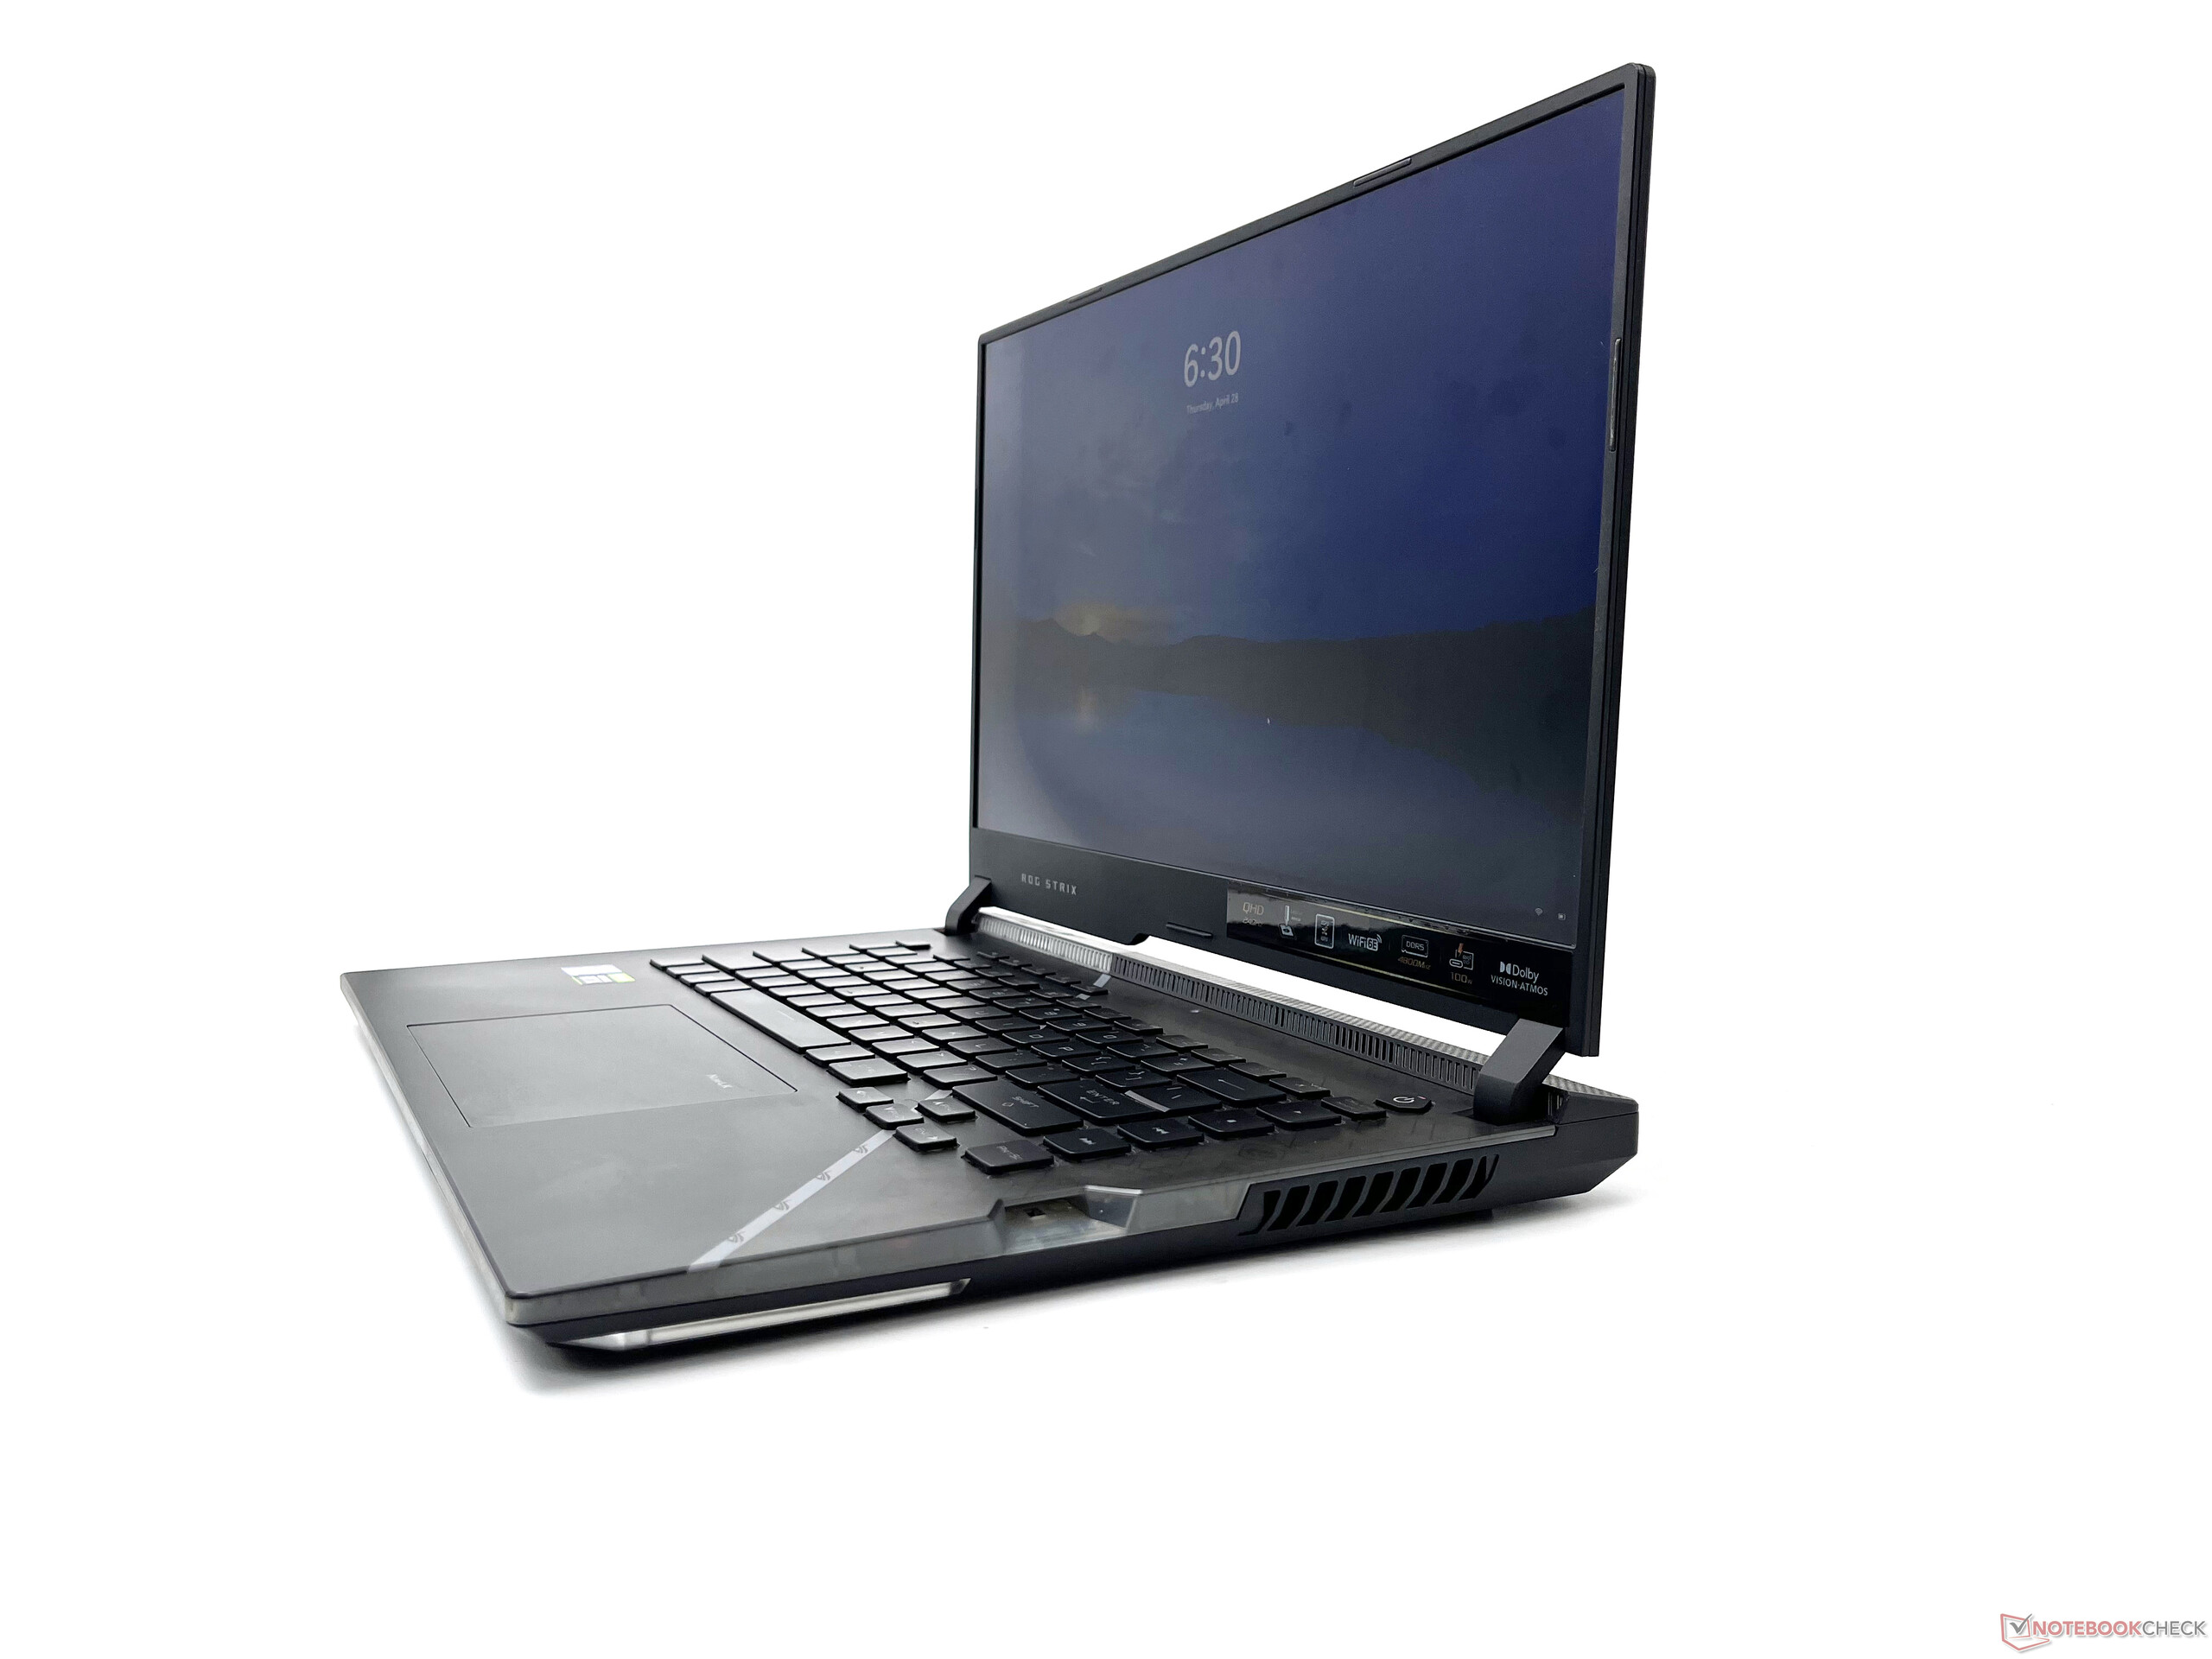
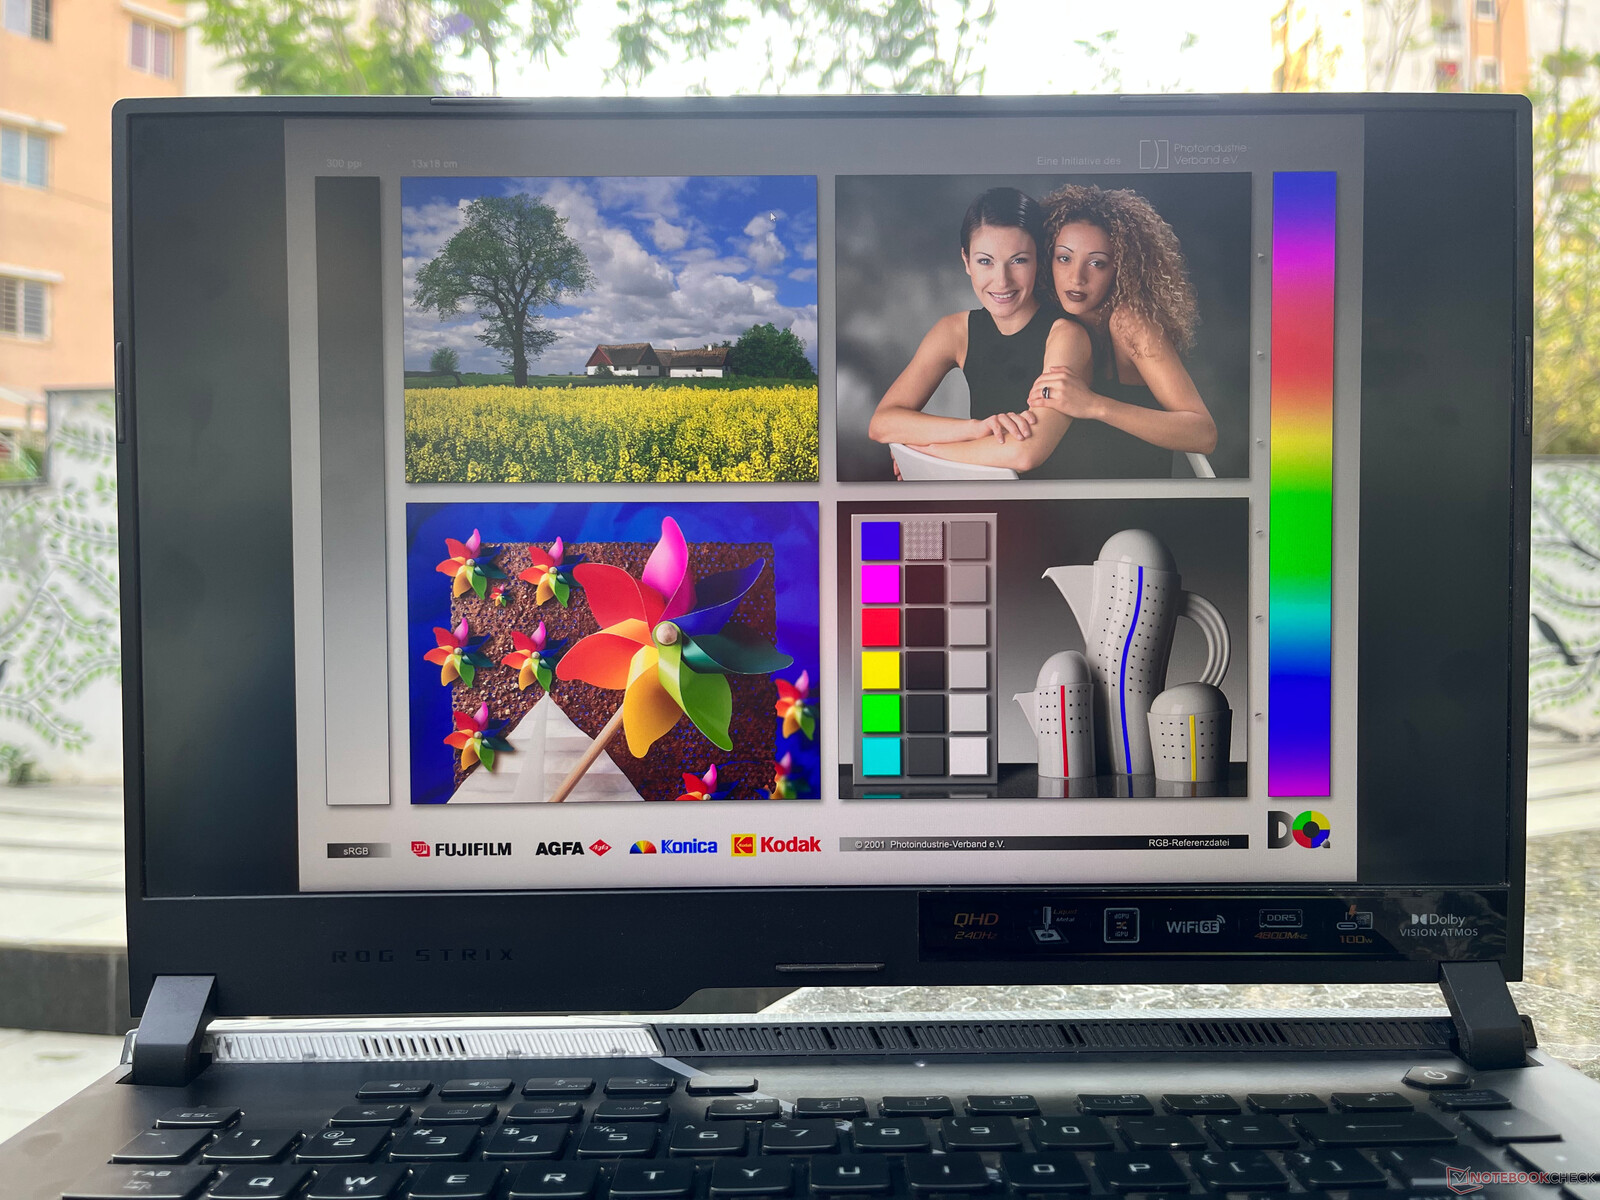
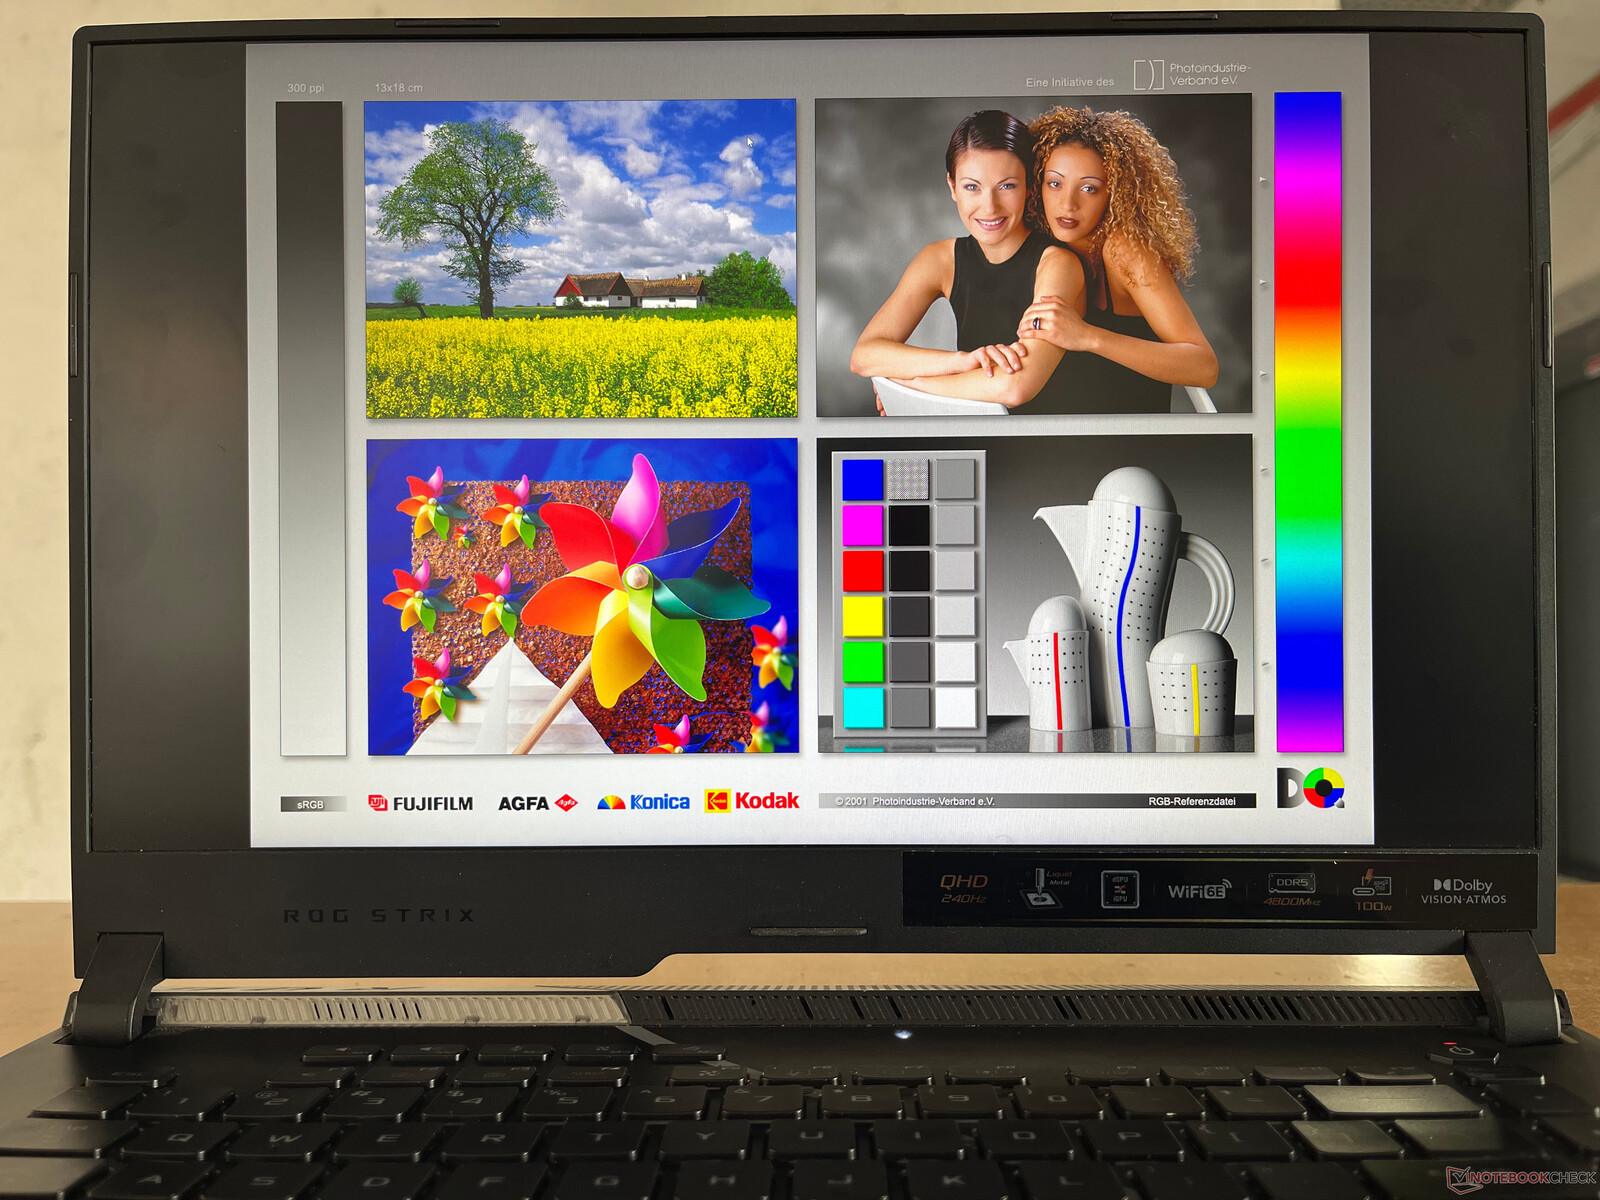
Mostrar: Dolby Vision com má relação de contraste, mas tempos de resposta melhorados
A Asus utiliza essencialmente o mesmo painel QHD IPS BOE do ano passado no novo Scar 15, mas com uma ligeira revisão no número do modelo e uma taxa de atualização de 240 Hz em todas as SKUs de 15 e 17 polegadas.
A tela do Scar 15 suporta Dolby Vision HDR e Adaptive Sync. Usamos o perfil padrão "Bright" nas configurações do Dolby Vision para as medidas subsequentes.
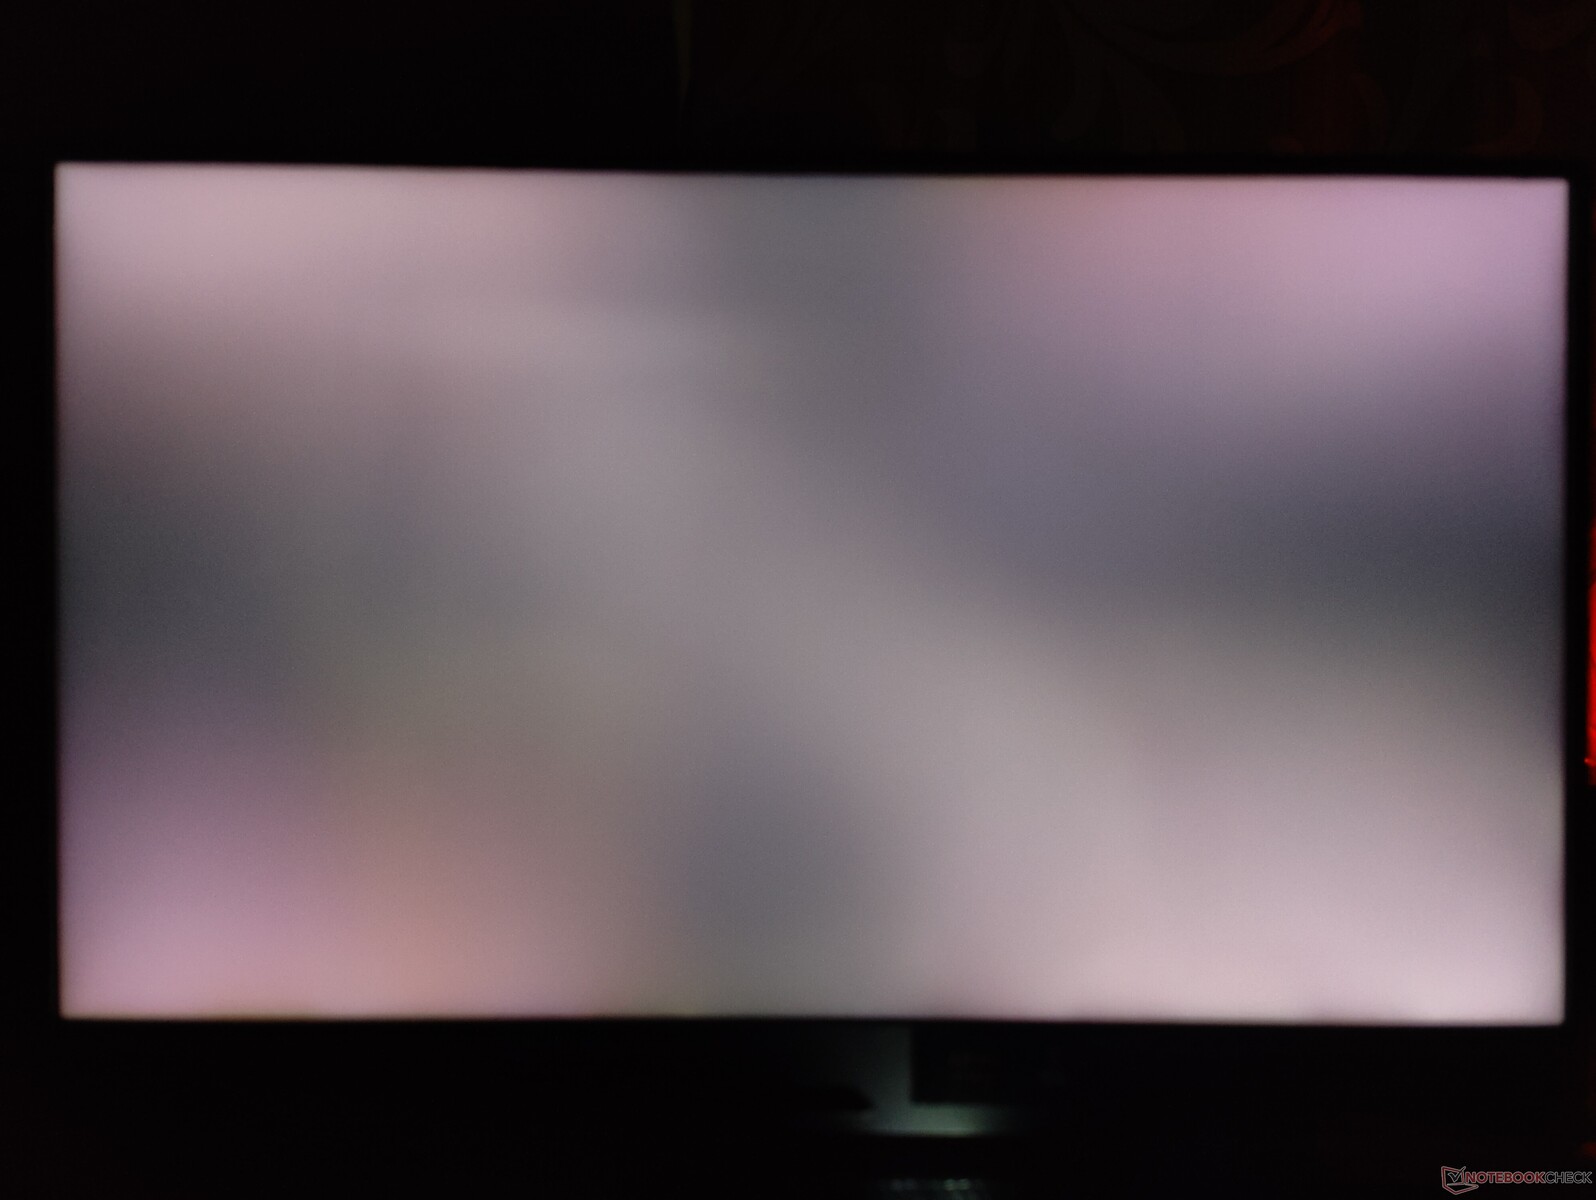
A disposição do subpixel parece um pouco confusa devido ao revestimento fosco. Observamos um sangramento significativo de luz de fundo sob exposições longas.
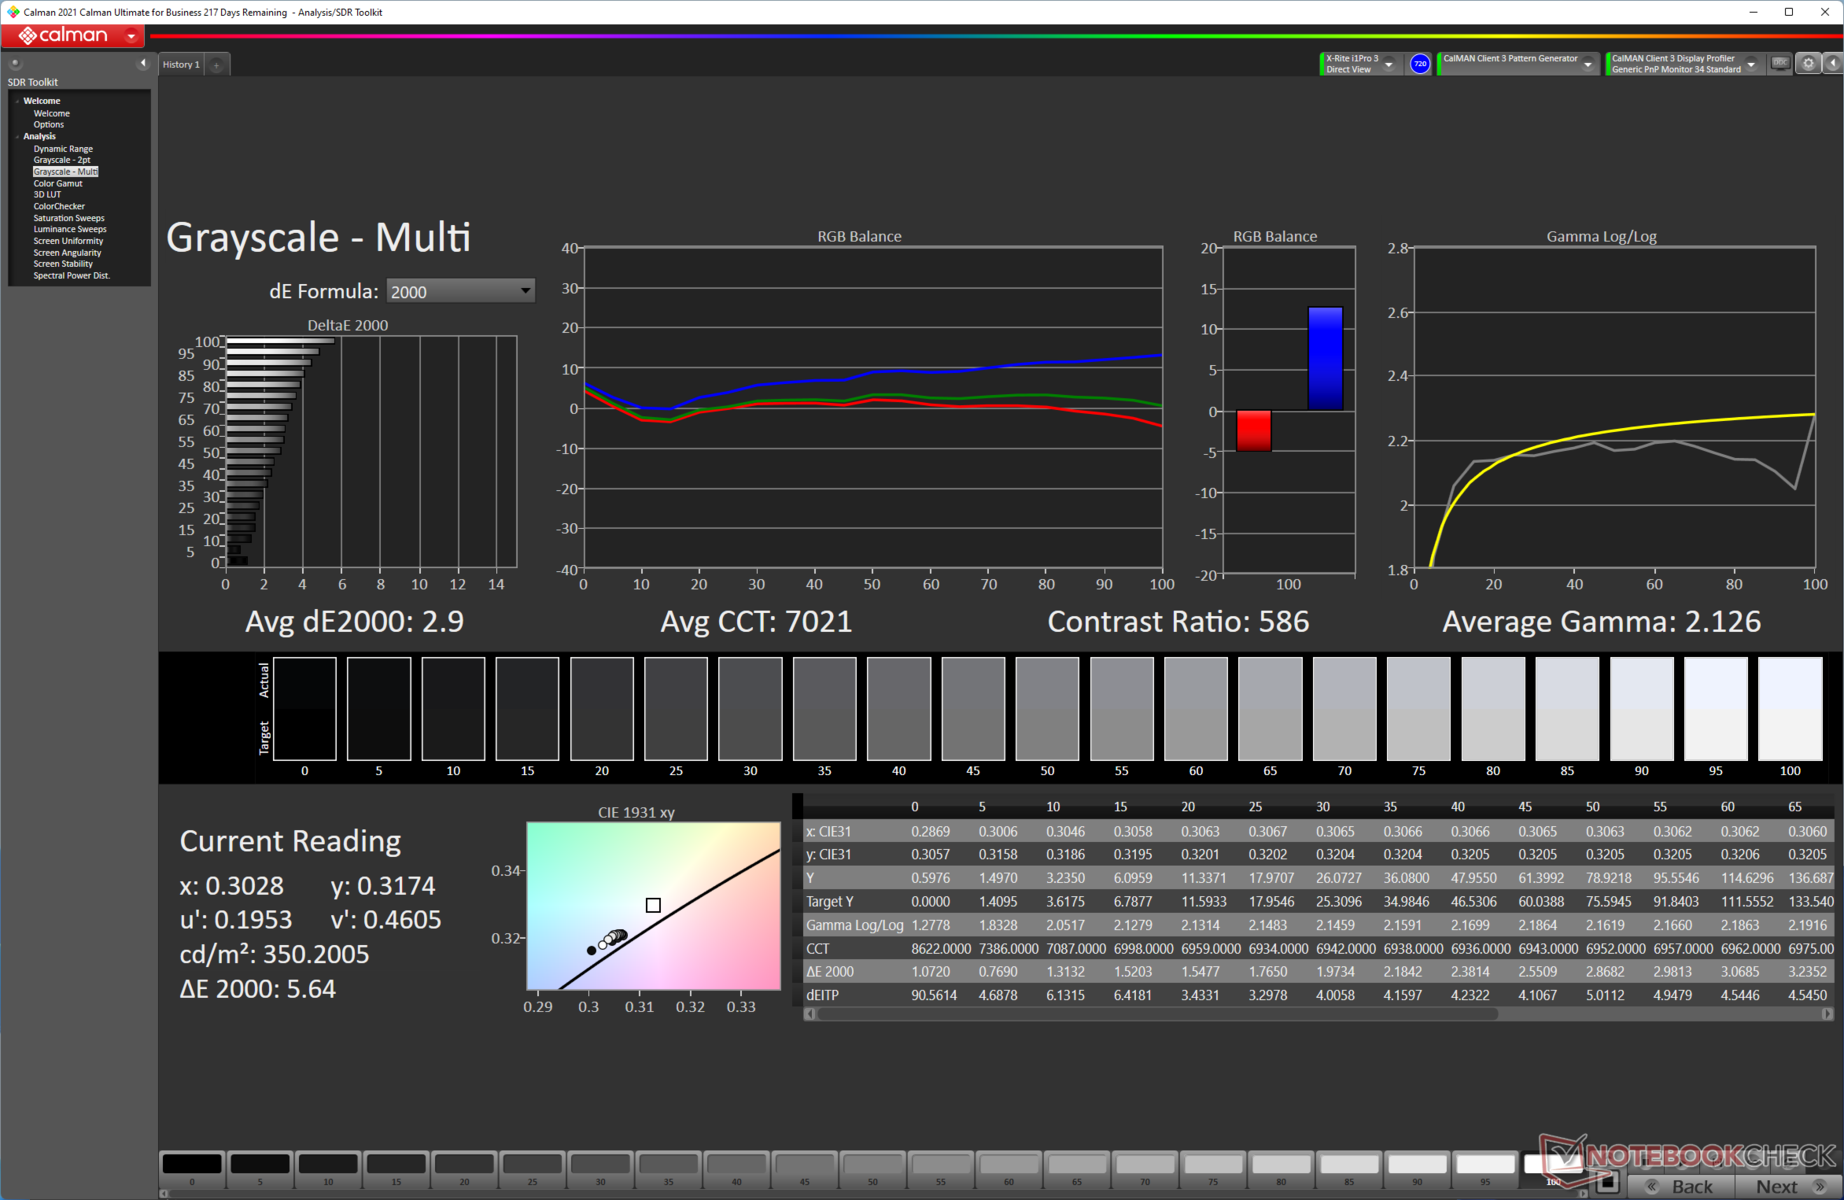
A distribuição de luminosidade é decente, com 91%. No entanto, o painel sofre de uma baixa relação de contraste de apenas 586:1. A experiência geral de visualização subjetiva ainda é muito boa para um painel IPS.

| |||||||||||||||||||||||||
iluminação: 91 %
iluminação com acumulador: 346 cd/m²
Contraste: 586:1 (Preto: 0.59 cd/m²)
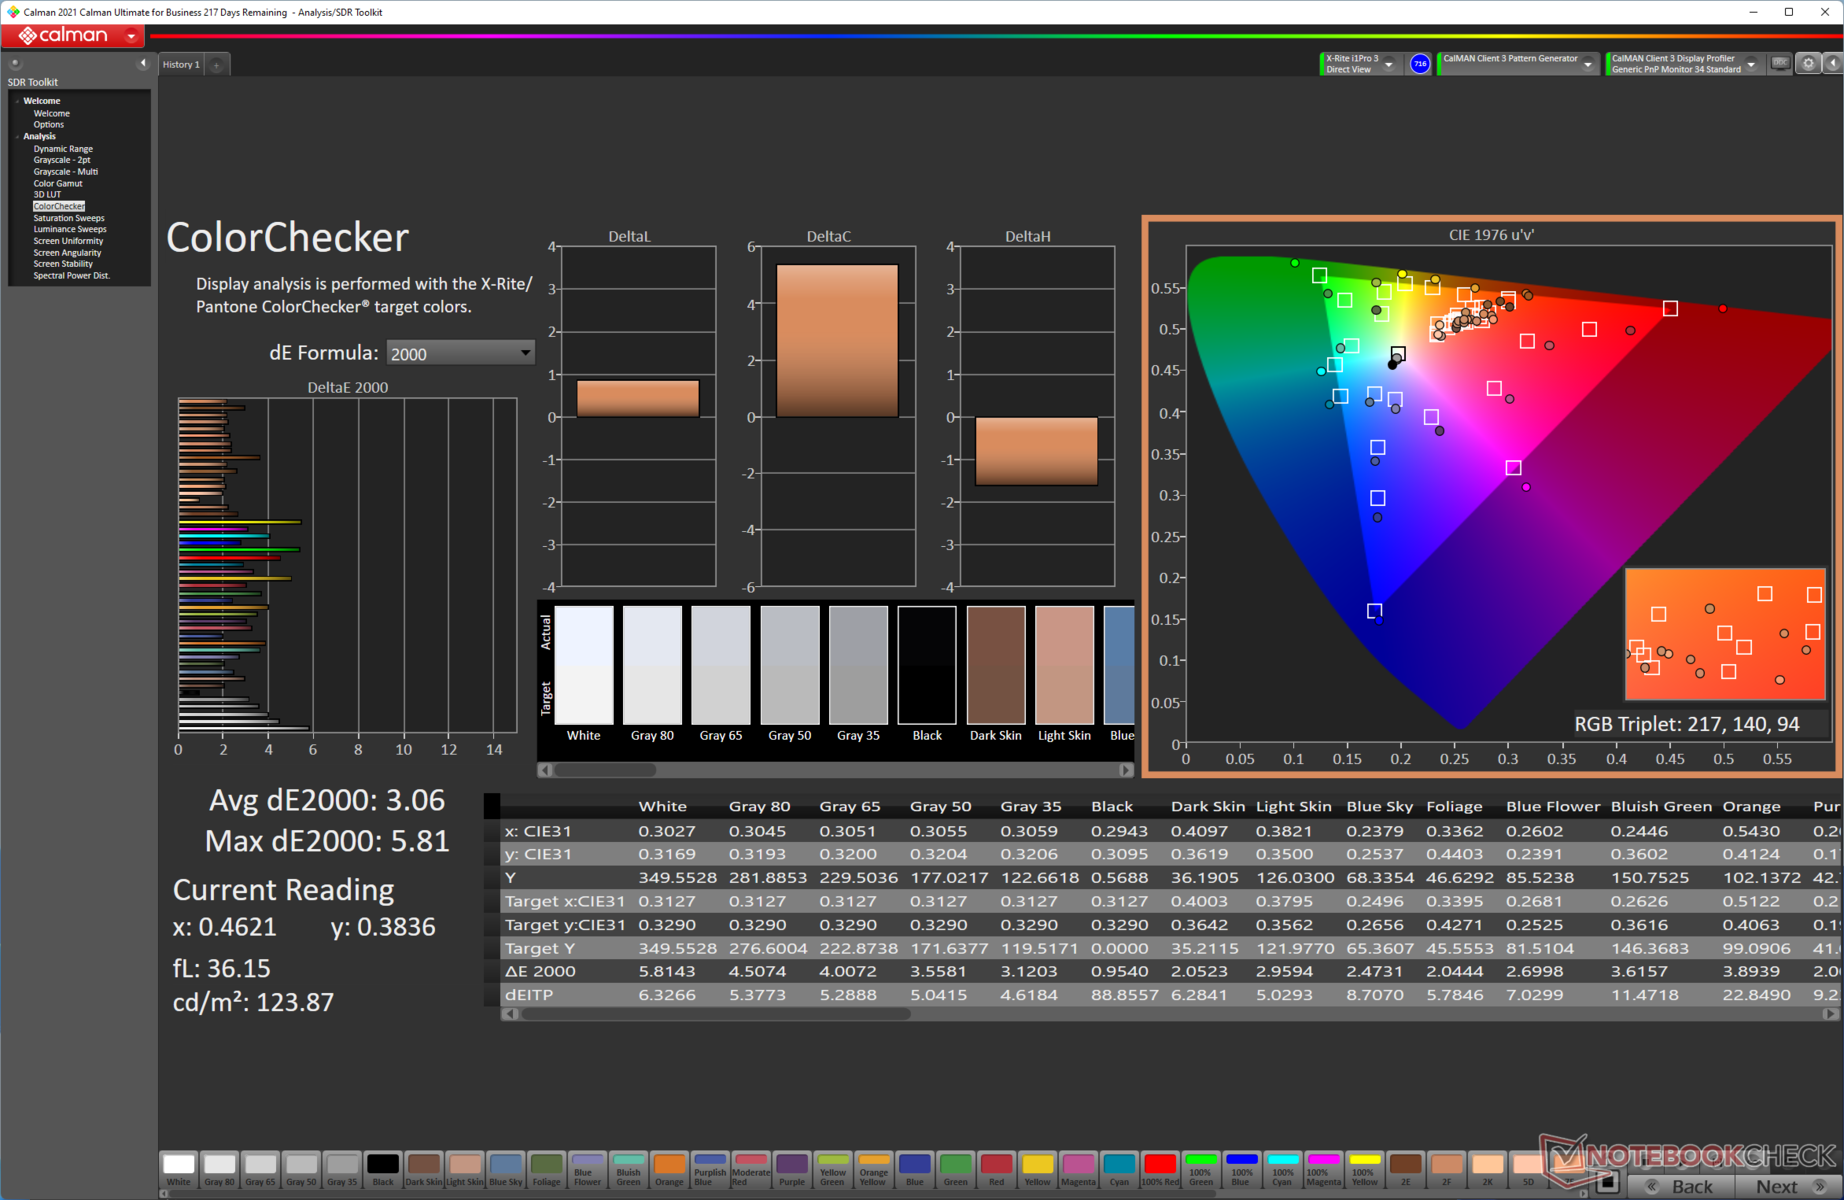
ΔE ColorChecker Calman: 3.06 | ∀{0.5-29.43 Ø4.71}
calibrated: 2.57
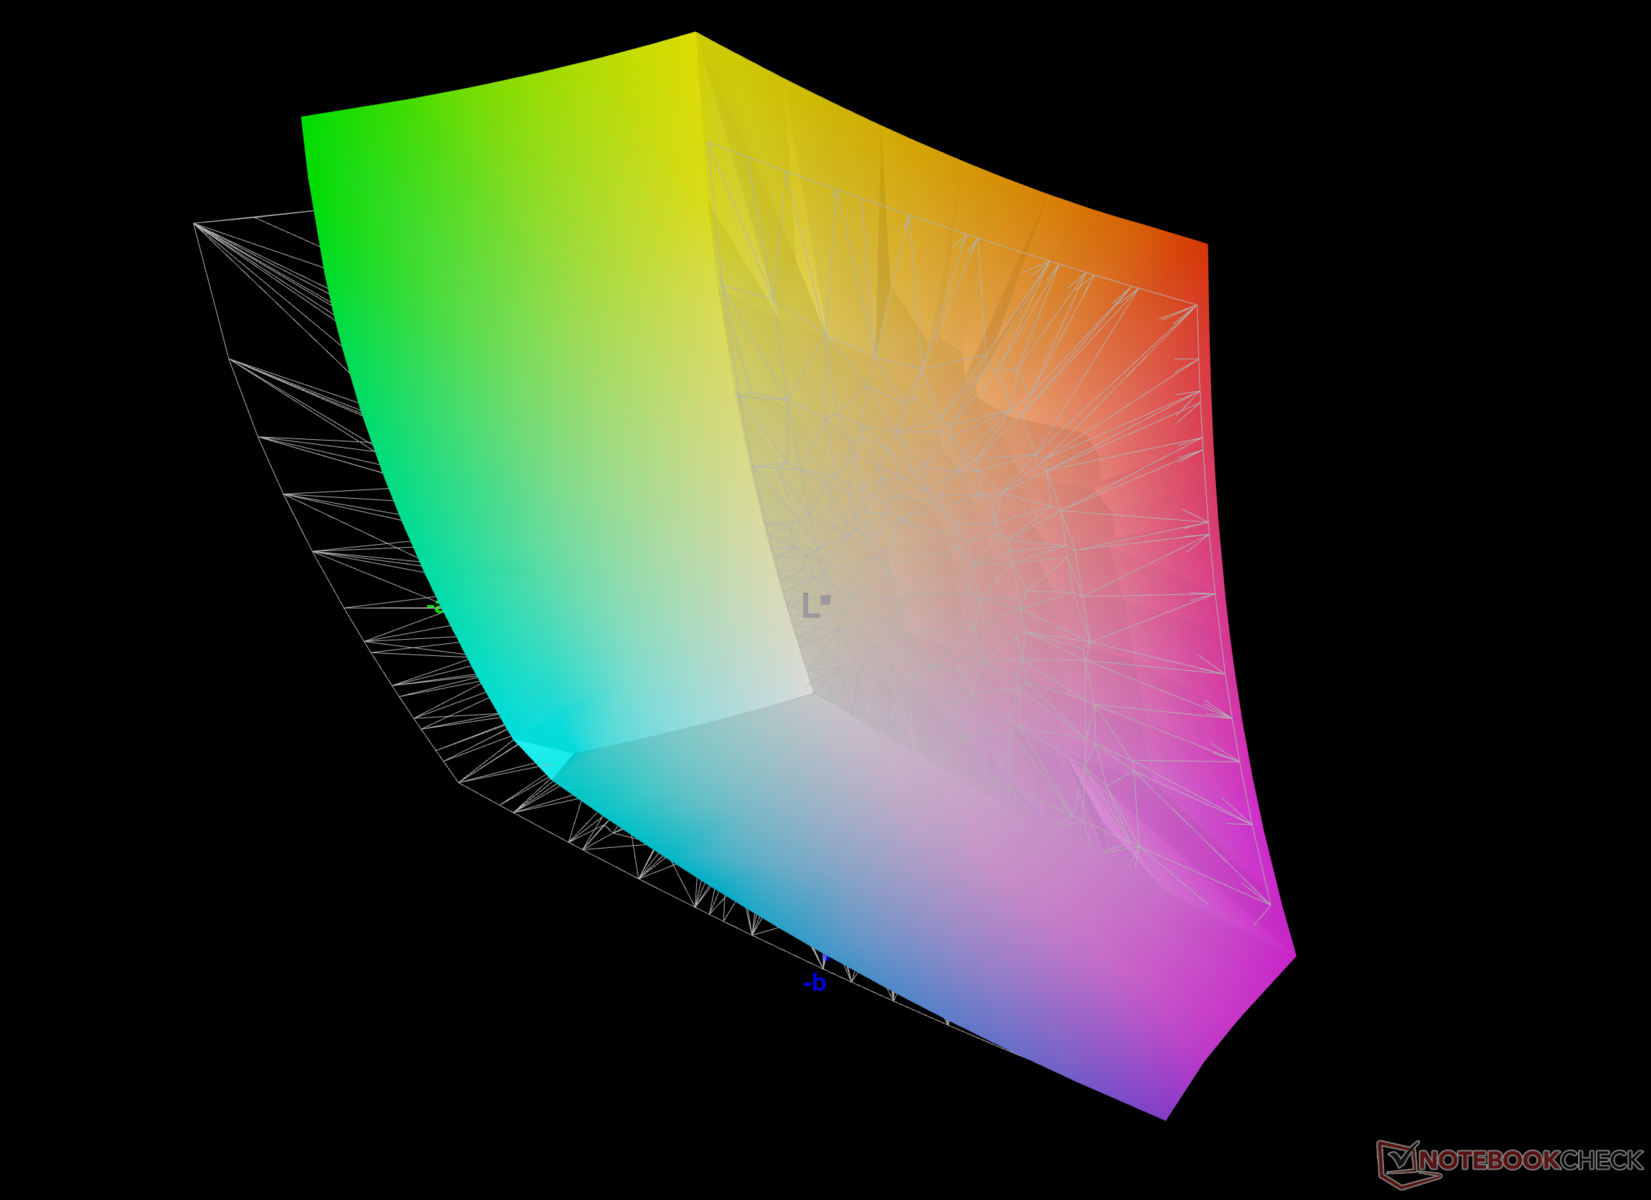
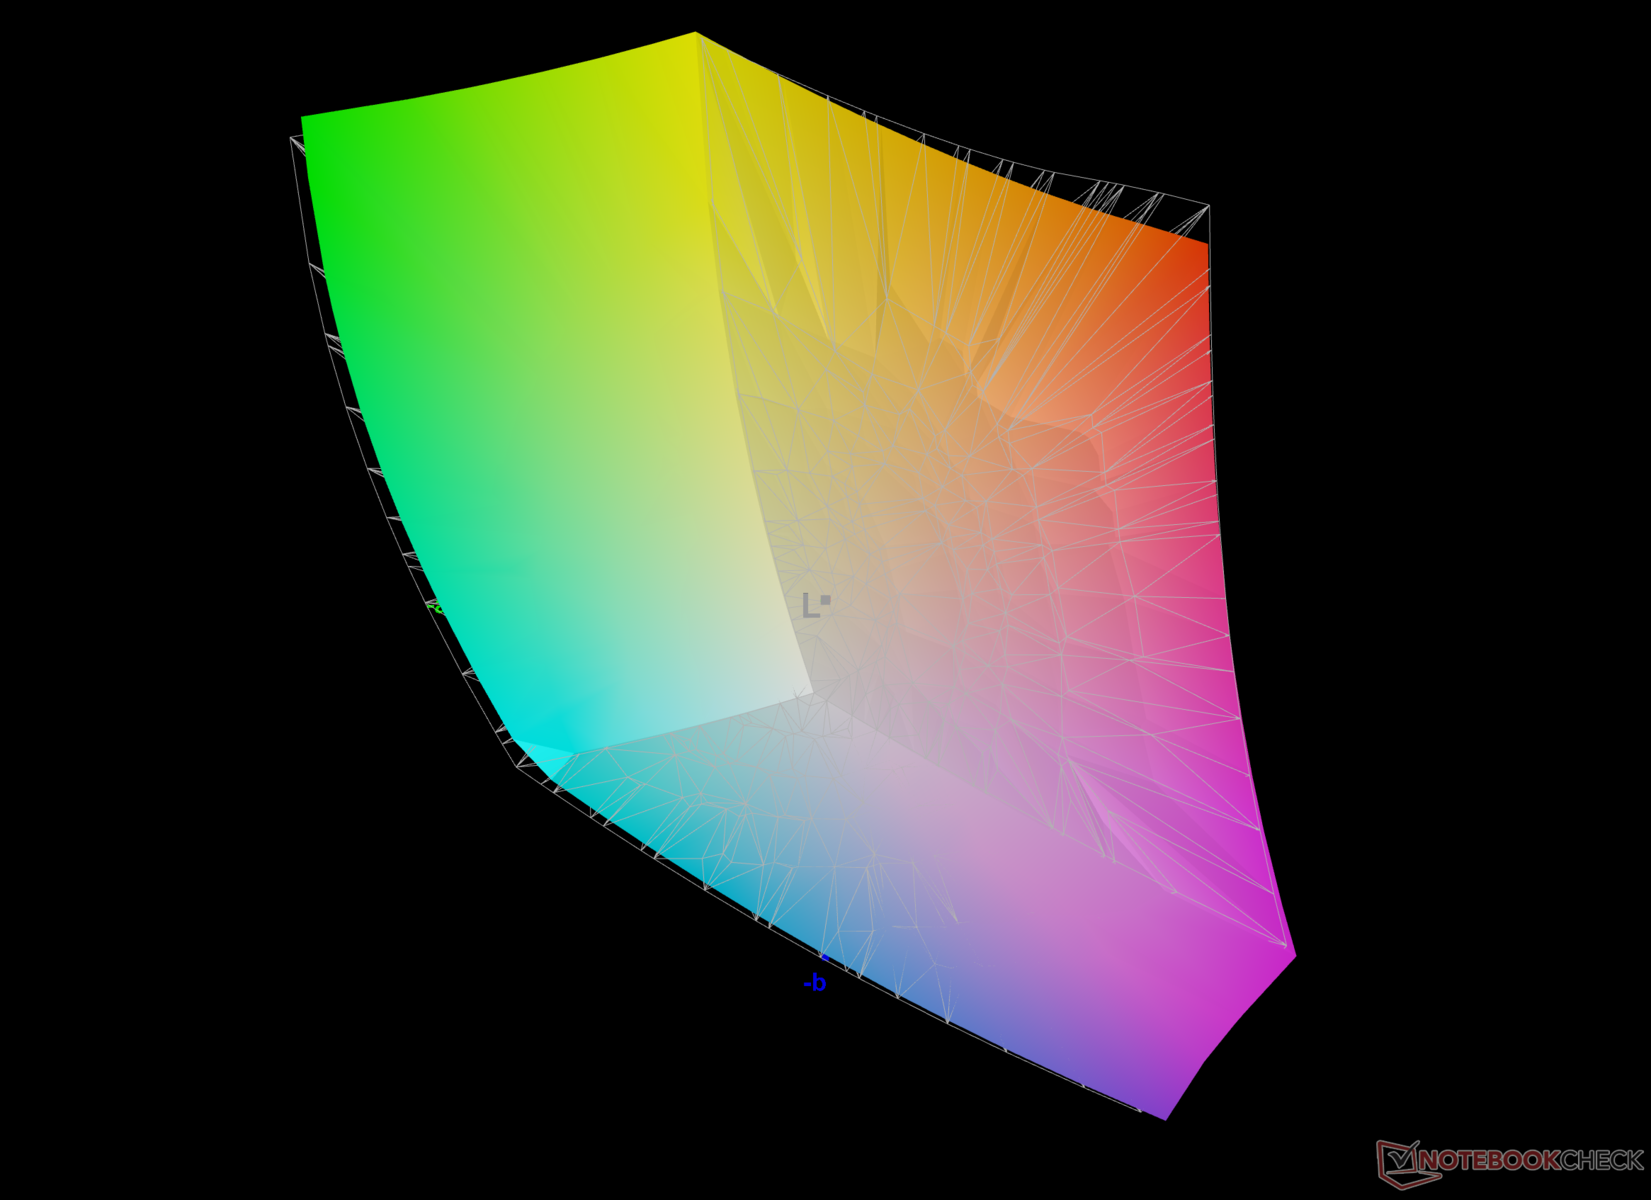
84.5% AdobeRGB 1998 (Argyll 3D)
99.9% sRGB (Argyll 3D)
96.2% Display P3 (Argyll 3D)
Gamma: 2.12
CCT: 7021 K
| Asus ROG Strix Scar 15 G533ZW BOE CQ NE156QHM-NZ2, IPS-level, 2560x1440, 15.6" | MSI Pulse GL66 12UEK AU Optronics B156HAN08.4 (AUOAF90), IPS, 1920x1080, 15.6" | MSI Vector GP66 12UGS BOE NE156FHM-NZ3, IPS, 1920x1080, 15.6" | MSI Raider GE66 12UHS AUO51EB, IPS, 3840x2160, 15.6" | HP Omen 16-b1090ng BOE09E5, IPS, 2560x1440, 16.1" | Lenovo Legion 5 Pro 16 G7 i7 RTX 3070Ti NE160QDM-NY1, IPS, 2560x1600, 16" | Razer Blade 15 2022 Sharp LQ156T1JW03, IPS, 2560x1440, 15.6" | |
|---|---|---|---|---|---|---|---|
| Display | -51% | -14% | -2% | -14% | -16% | 2% | |
| Display P3 Coverage (%) | 96.2 | 39 -59% | 70.1 -27% | 80.4 -16% | 71 -26% | 68.7 -29% | 99.1 3% |
| sRGB Coverage (%) | 99.9 | 58.4 -42% | 99.5 0% | 98.4 -2% | 97.9 -2% | 97.6 -2% | 99.9 0% |
| AdobeRGB 1998 Coverage (%) | 84.5 | 40.3 -52% | 72.1 -15% | 94.7 12% | 73.3 -13% | 70.9 -16% | 86.8 3% |
| Response Times | -334% | -1% | -105% | -55% | -63% | -69% | |
| Response Time Grey 50% / Grey 80% * (ms) | 7.86 ? 4.21 ? | 38.8 ? -394% | 5.8 ? 26% | 18.8 ? -139% | 14.5 ? -84% | 17.6 ? -124% | 14.4 ? -83% |
| Response Time Black / White * (ms) | 7.5 ? | 28 ? -273% | 9.6 ? -28% | 12.8 ? -71% | 9.4 ? -25% | 7.6 ? -1% | 11.6 ? -55% |
| PWM Frequency (Hz) | |||||||
| Screen | 28% | 24% | 21% | 12% | 43% | 17% | |
| Brightness middle (cd/m²) | 346 | 248 -28% | 353.1 2% | 351 1% | 335 -3% | 502 45% | 286 -17% |
| Brightness (cd/m²) | 329 | 245 -26% | 325 -1% | 347 5% | 319 -3% | 491 49% | 271 -18% |
| Brightness Distribution (%) | 91 | 86 -5% | 85 -7% | 90 -1% | 90 -1% | 91 0% | 89 -2% |
| Black Level * (cd/m²) | 0.59 | 0.13 78% | 0.38 36% | 0.35 41% | 0.28 53% | 0.37 37% | 0.25 58% |
| Contrast (:1) | 586 | 1908 226% | 929 59% | 1003 71% | 1196 104% | 1357 132% | 1144 95% |
| Colorchecker dE 2000 * | 3.06 | 3.14 -3% | 2.24 27% | 2.54 17% | 4.38 -43% | 2.7 12% | 2.74 10% |
| Colorchecker dE 2000 max. * | 5.81 | 5.82 -0% | 5 14% | 8.36 -44% | 9.48 -63% | 4.5 23% | 5.21 10% |
| Colorchecker dE 2000 calibrated * | 2.57 | 3.14 -22% | 1.02 60% | 0.67 74% | 1.33 48% | 1.4 46% | 2.52 2% |
| Gamma | 2.12 104% | 2.49 88% | 2.24 98% | 2.089 105% | 2.103 105% | 2.44 90% | 2.2 100% |
| CCT | 7021 93% | 6468 100% | 6864 95% | 7036 92% | 6244 104% | 6326 103% | 6408 101% |
| Greyscale dE 2000 * | 1.2 | 4 | 4.1 | 7 | 2.7 | 1.1 | |
| Média Total (Programa/Configurações) | -119% /
-46% | 3% /
11% | -29% /
-4% | -19% /
-4% | -12% /
13% | -17% /
0% |
* ... menor é melhor
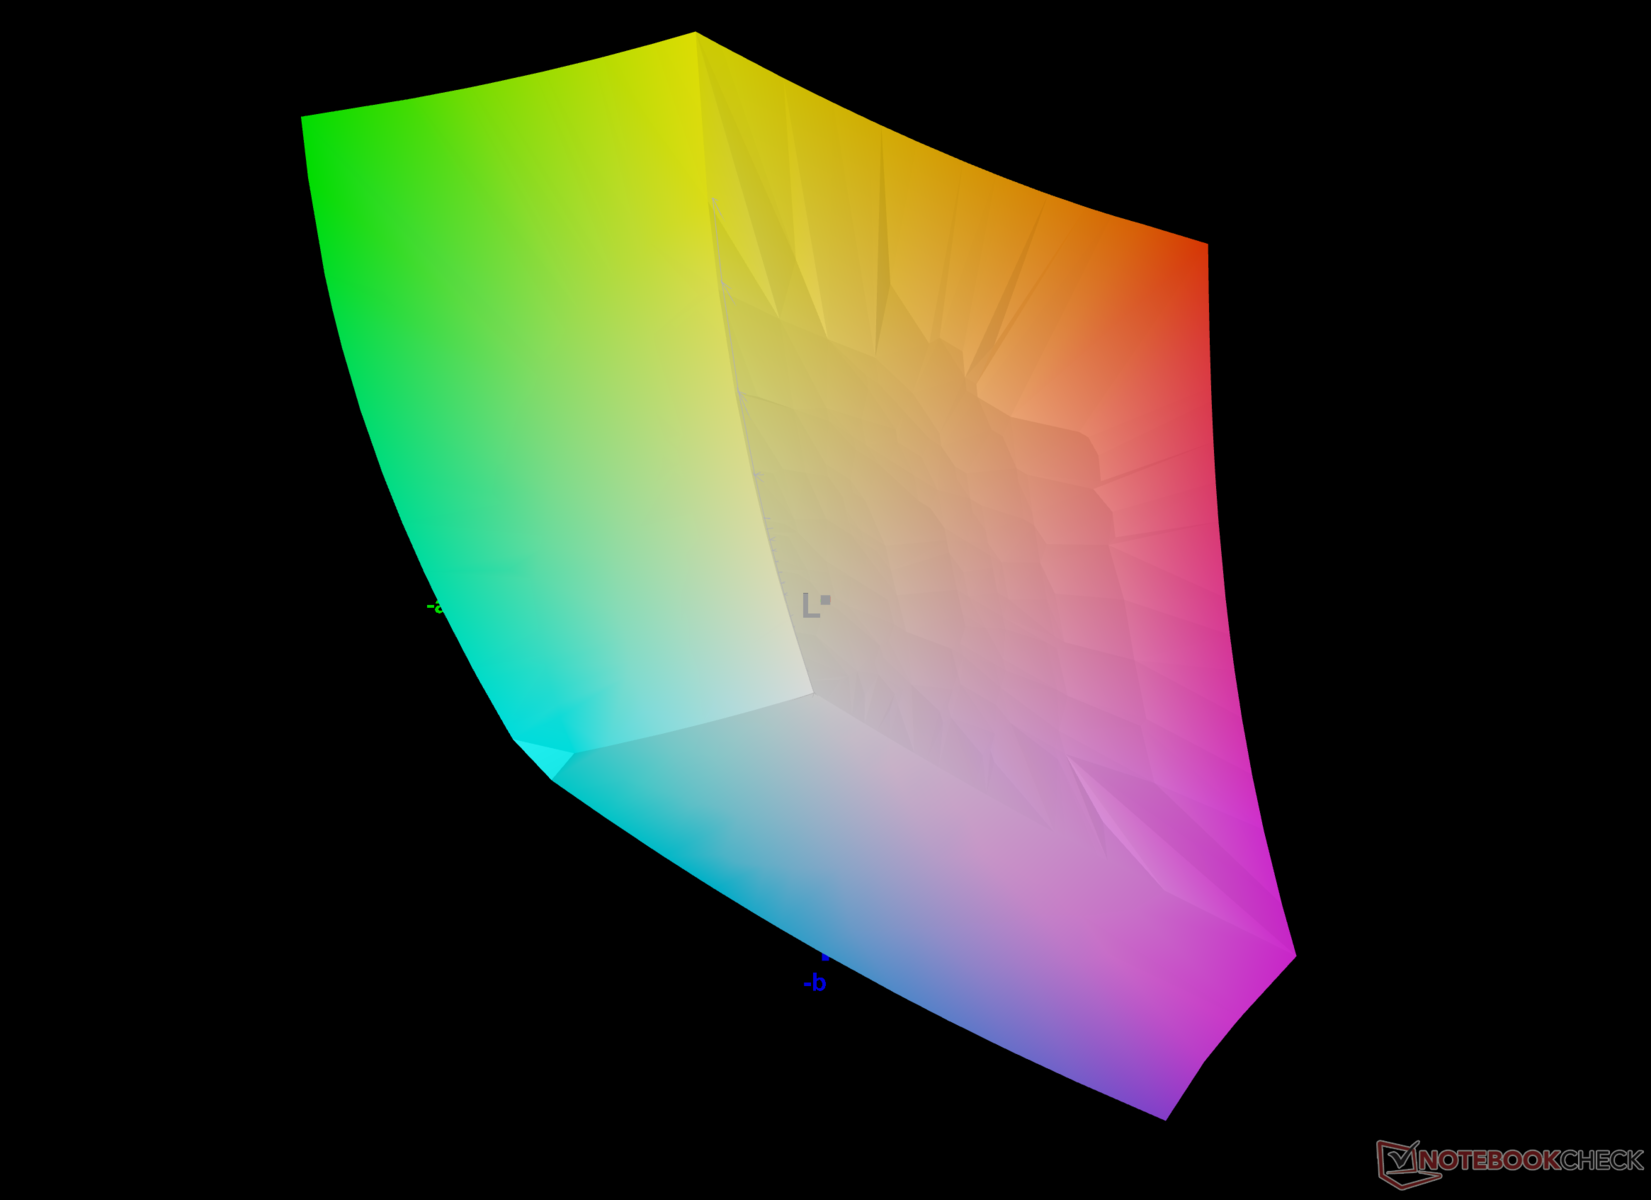
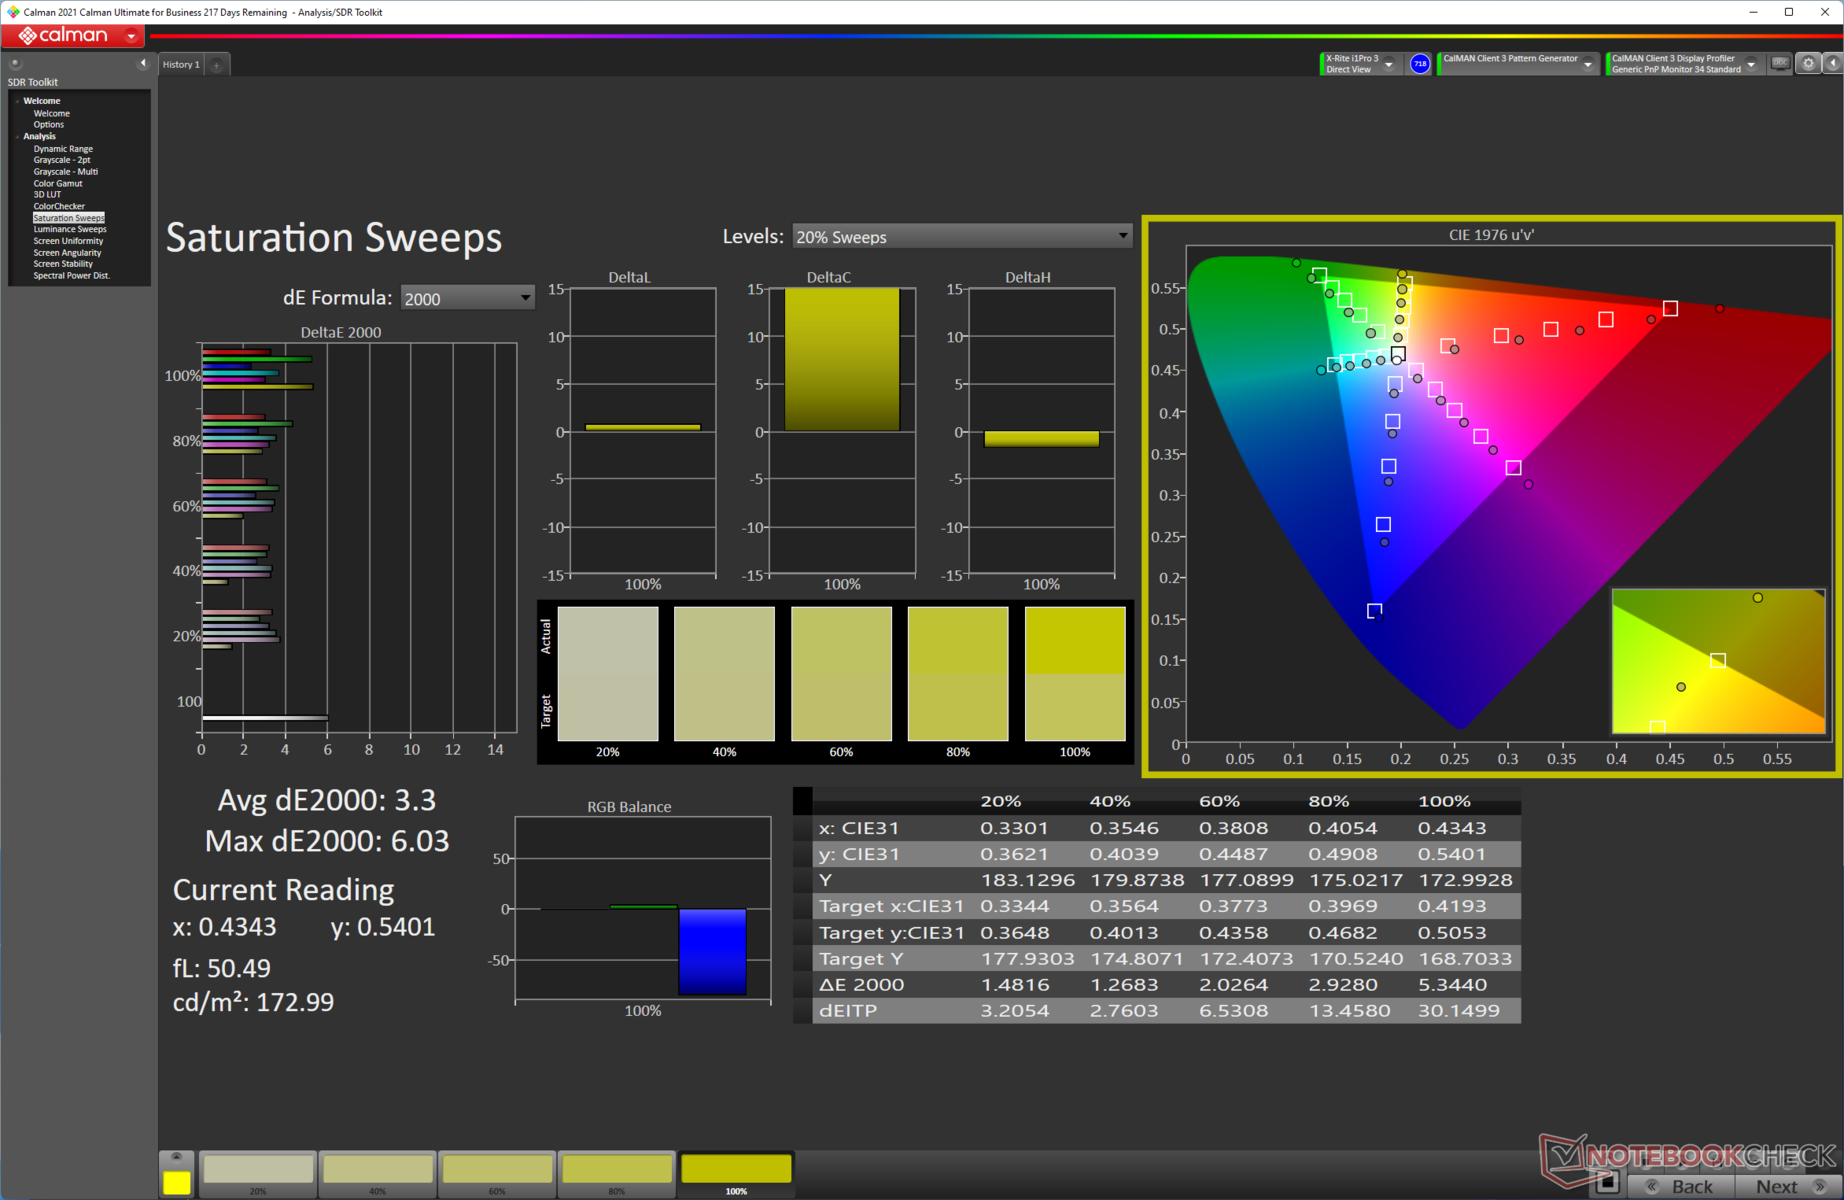
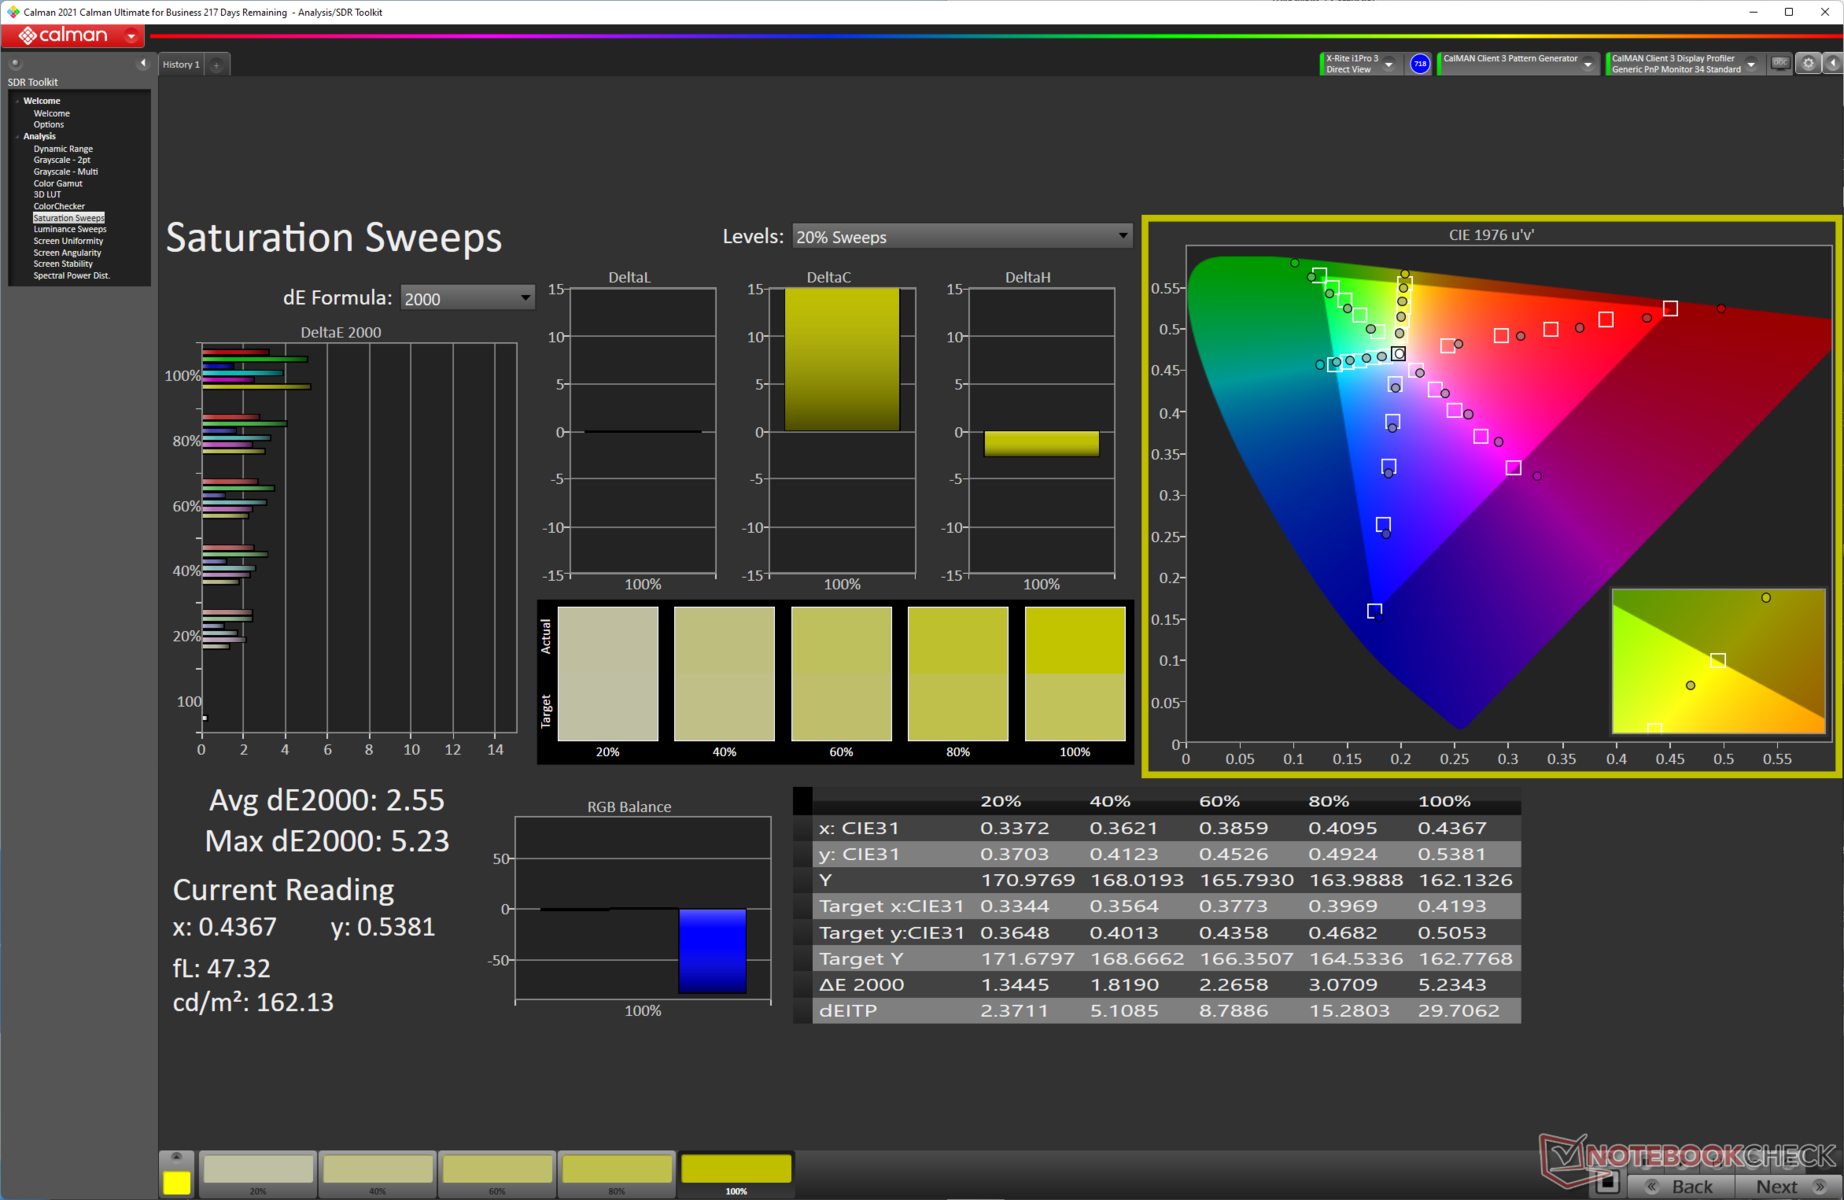
A tela do ROG Strix Scar 15 tem um desempenho muito bom para um laptop de jogos quando se trata de cobertura de gama colorida. O painel cobre o espectro completo do sRGB e quase todo o DCI-P3. A cobertura AdobeRGB é boa demais em quase 85%, tornando a tela do Scar 15 bastante favorável aos fluxos de trabalho de edição de fotos e vídeos profissionais.
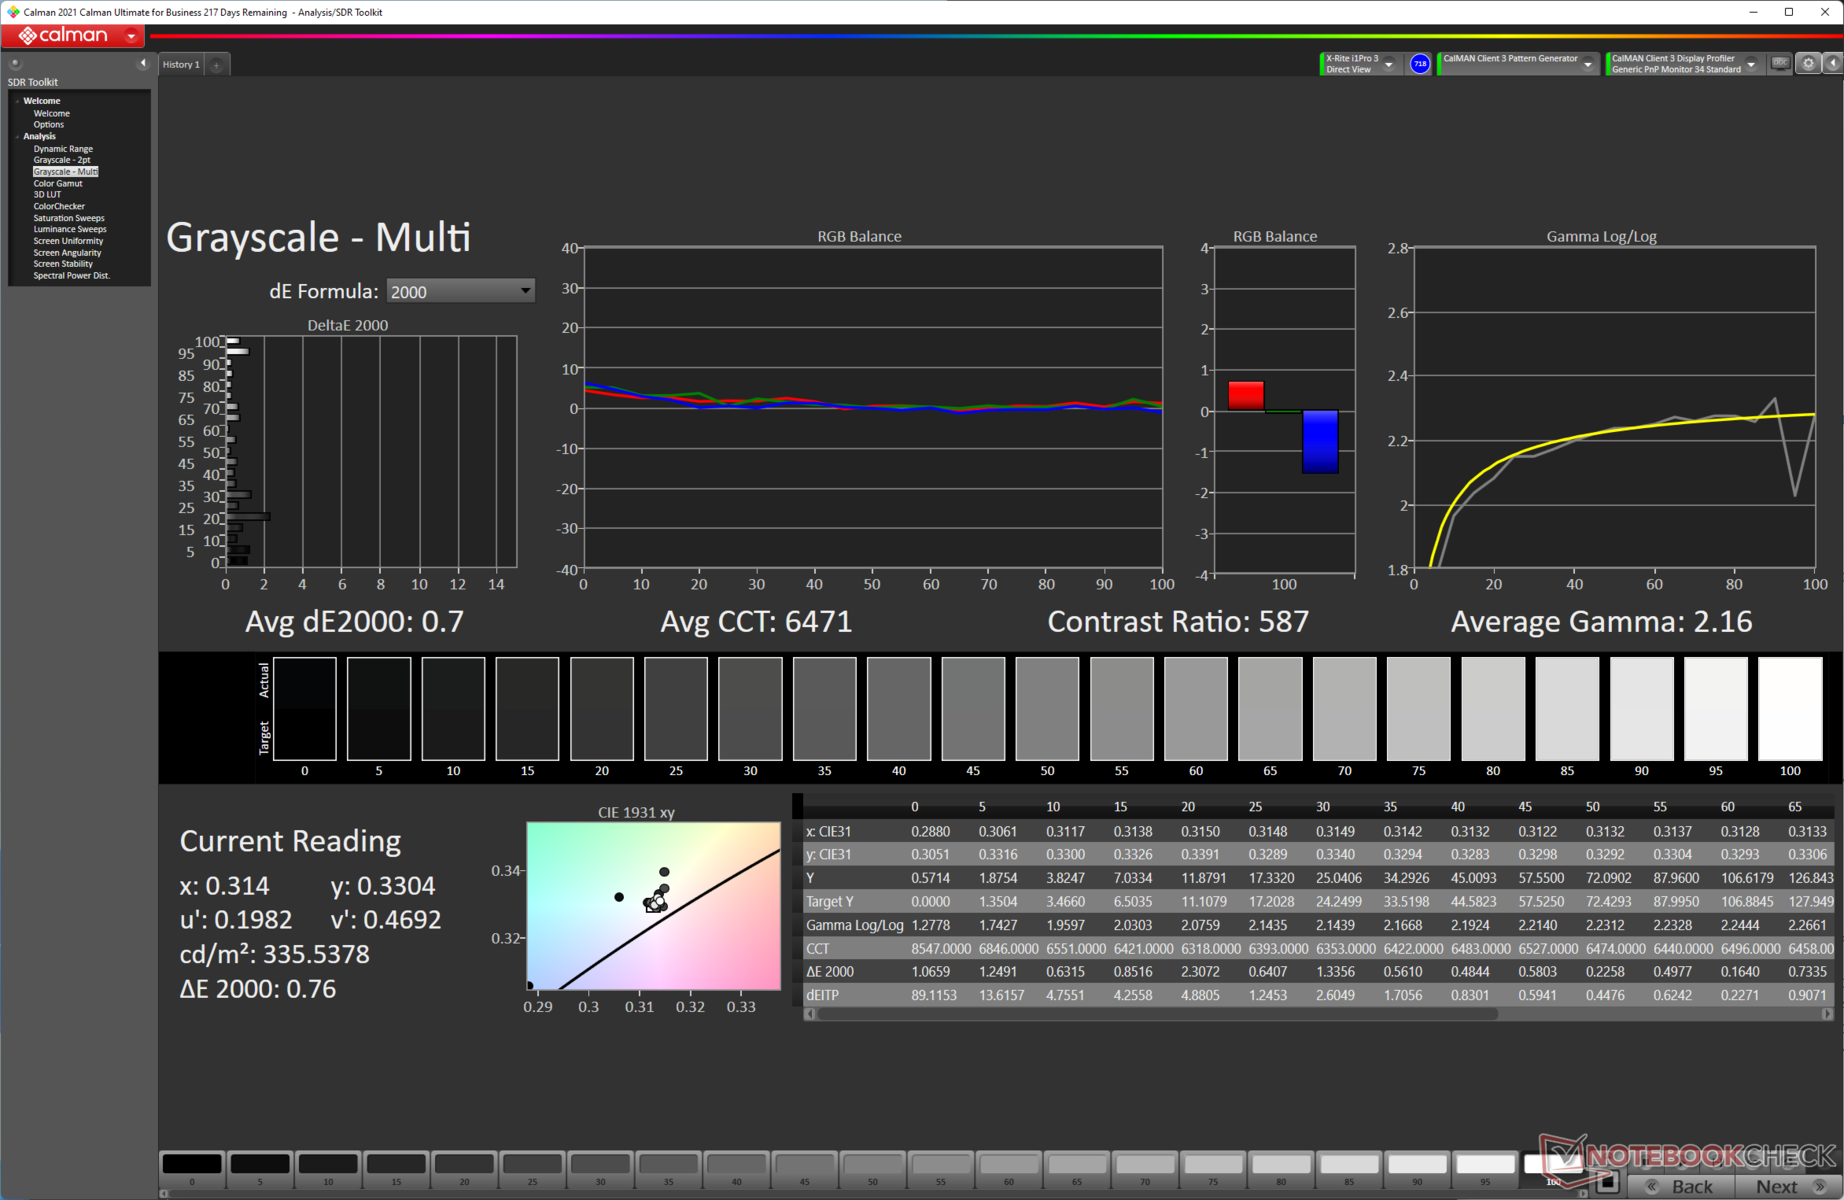
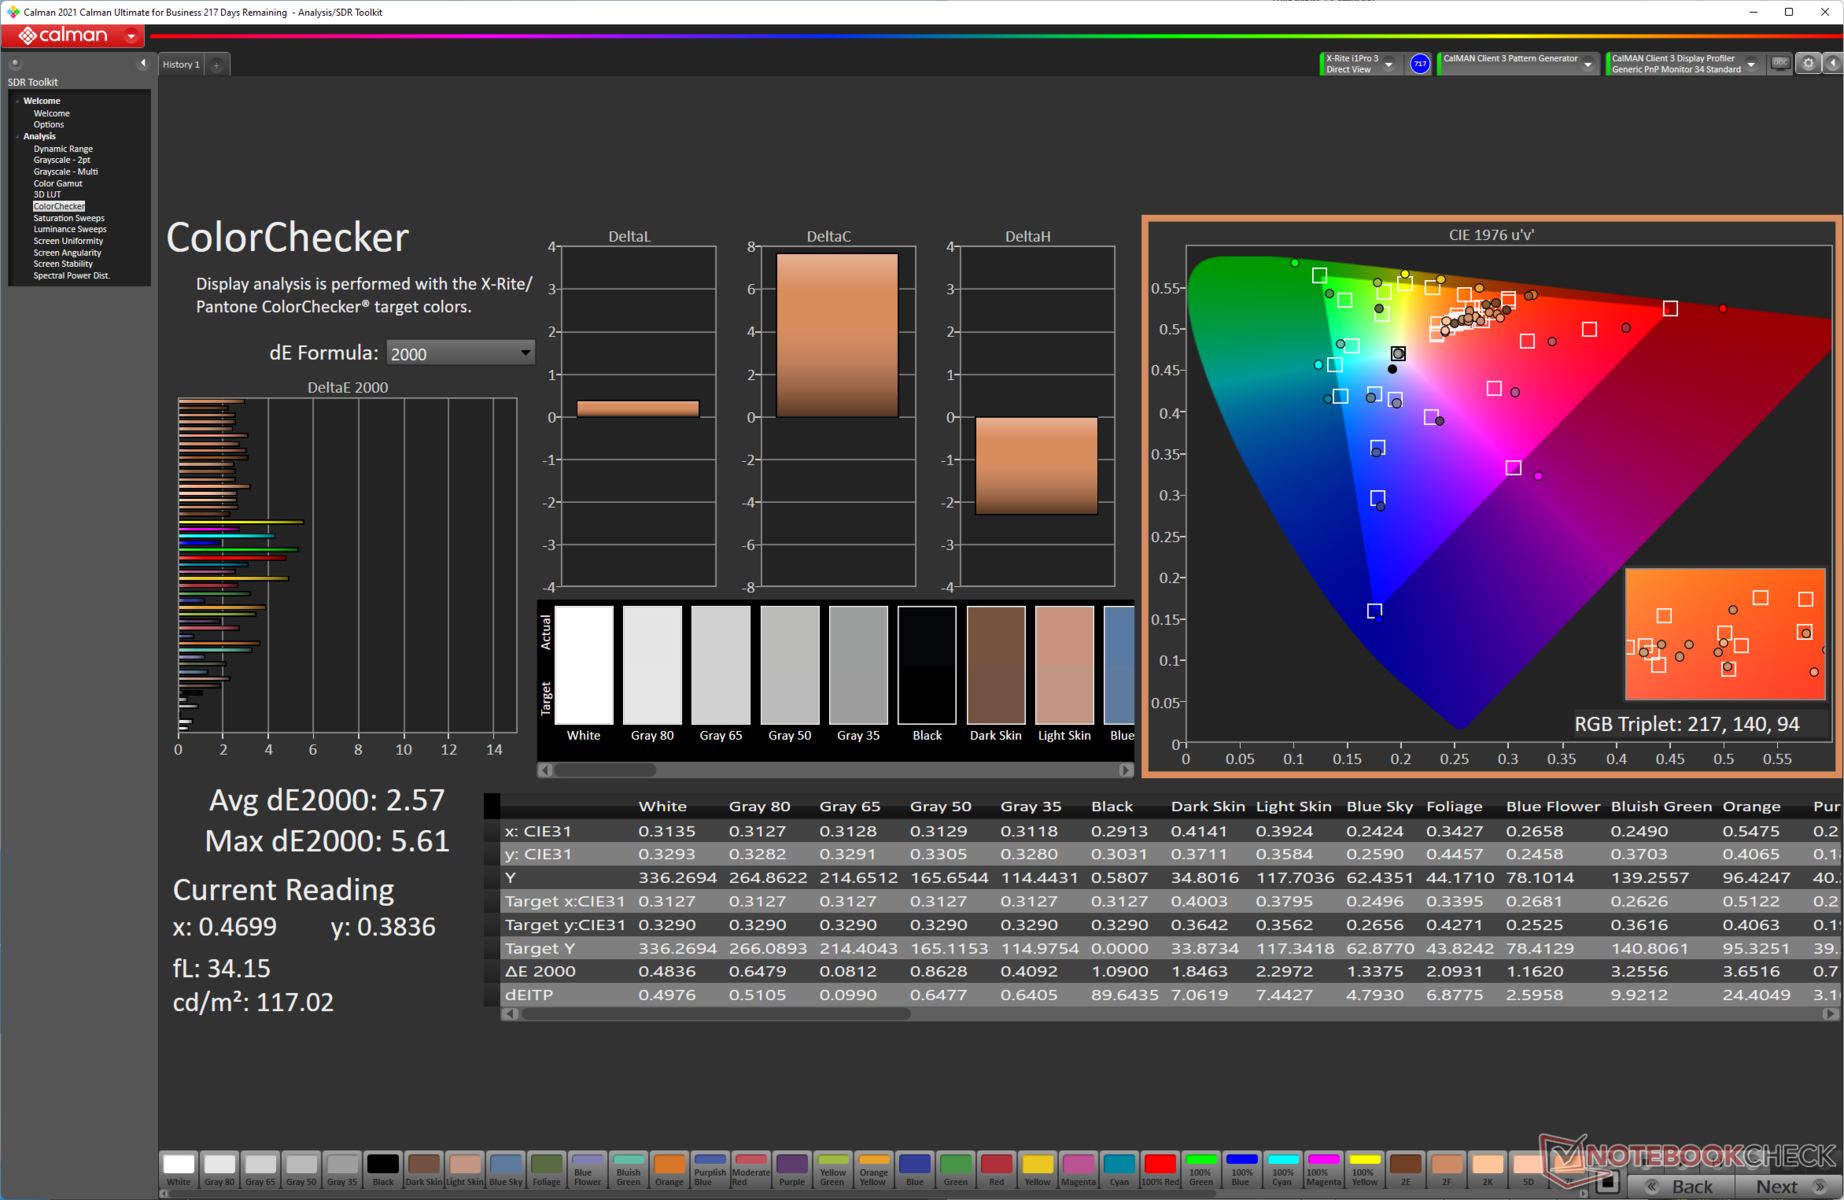
A calibração de cor out-of-the-box já é bastante boa com um Delta E médio de 2,9 em escala de cinza e 3,06 em ColorChecker Nossa rotina de calibração ajuda a reduzir ainda mais o Delta E médio em escala de cinza para 0,7 e o ColorChecker Delta E para 2,57. Desvios maiores são observados nas partes vermelha e azul do espectro de cores.
Nosso arquivo ICC calibrado pode ser baixado a partir do link acima.
O painel BOE CQ NE156QHM-NZ2 parece oferecer tempos de resposta muito melhores do que a variante do ano passado, o que deve agradar aos jogadores. Nós medimos um tempo de resposta combinado de 100% preto a 100% branco de 7,5 ms e um tempo de resposta combinado de 50% a 80% cinza de 4,21 ms.
O Asus permite o modo overdrive por padrão, o que se reflete no sinal de "buzina" visto nos dados cinza 50% a 80% cinza. O overdrive do painel pode ser desativado no aplicativo Armory Crate. Isto aumenta o tempo de resposta cinzento a cinzento para 7,86 ms.
Não observamos nenhum PWM ou tela cintilando em todos os níveis de brilho, portanto, o uso prolongado desta tela não deve causar fadiga ocular.
Para mais informações, consulte o nosso artigo "Por que a Modulação da Largura de Pulso (PWM) é uma dor de cabeça tão grande?", e confira também nosso Tabela de classificação PWM para comparação de freqüência PWM em todos os dispositivos revisados.
Exibir tempos de resposta
| ↔ Tempo de resposta preto para branco | ||
|---|---|---|
| 7.5 ms ... ascensão ↗ e queda ↘ combinadas | ↗ 3.89 ms ascensão | 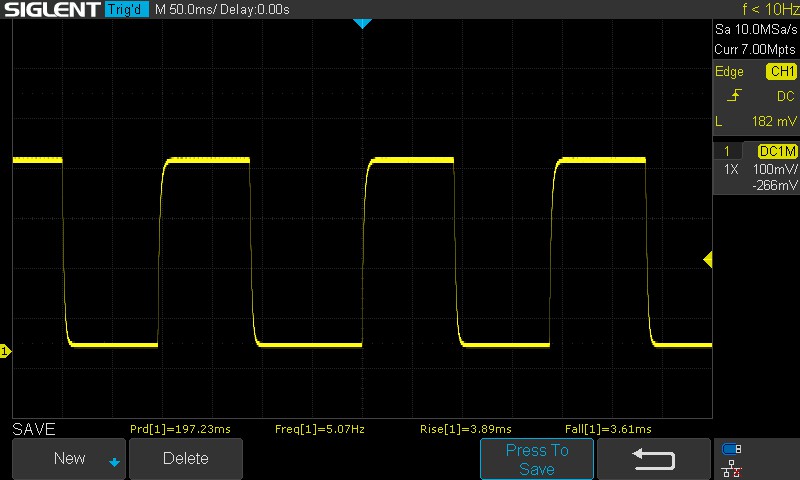 |
| ↘ 3.61 ms queda | ||
| A tela mostra taxas de resposta muito rápidas em nossos testes e deve ser muito adequada para jogos em ritmo acelerado. Em comparação, todos os dispositivos testados variam de 0.1 (mínimo) a 240 (máximo) ms. » 22 % de todos os dispositivos são melhores. Isso significa que o tempo de resposta medido é melhor que a média de todos os dispositivos testados (19.8 ms). | ||
| ↔ Tempo de resposta 50% cinza a 80% cinza | ||
| 4.21 ms ... ascensão ↗ e queda ↘ combinadas | ↗ 1.98 ms ascensão | 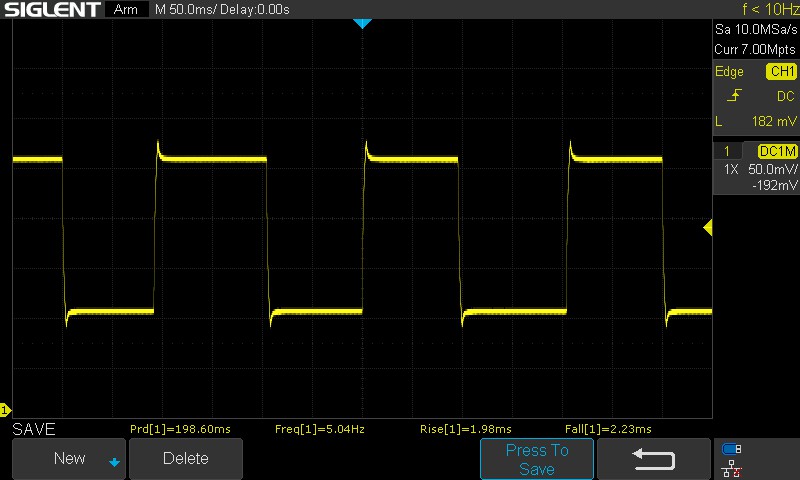 |
| ↘ 2.23 ms queda | ||
| A tela mostra taxas de resposta muito rápidas em nossos testes e deve ser muito adequada para jogos em ritmo acelerado. Em comparação, todos os dispositivos testados variam de 0.165 (mínimo) a 636 (máximo) ms. » 16 % de todos os dispositivos são melhores. Isso significa que o tempo de resposta medido é melhor que a média de todos os dispositivos testados (31 ms). | ||
| ↔ Tempo de resposta 50% cinza a 80% cinza | ||
| 7.86 ms ... ascensão ↗ e queda ↘ combinadas | ↗ 4.02 ms ascensão | 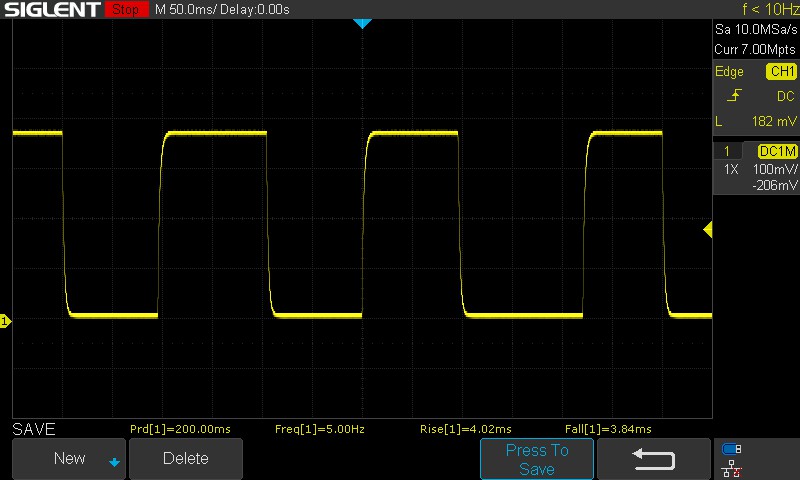 |
| ↘ 3.84 ms queda | ||
| A tela mostra taxas de resposta muito rápidas em nossos testes e deve ser muito adequada para jogos em ritmo acelerado. Em comparação, todos os dispositivos testados variam de 0.165 (mínimo) a 636 (máximo) ms. » 21 % de todos os dispositivos são melhores. Isso significa que o tempo de resposta medido é melhor que a média de todos os dispositivos testados (31 ms). | ||
Cintilação da tela / PWM (modulação por largura de pulso)
| Tela tremeluzindo / PWM não detectado | 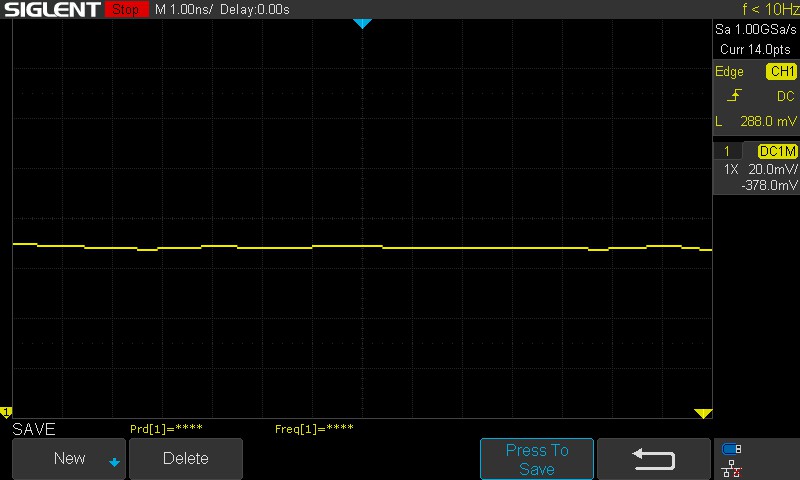 | ||
[pwm_comparison] Em comparação: 52 % de todos os dispositivos testados não usam PWM para escurecer a tela. Se PWM foi detectado, uma média de 7757 (mínimo: 5 - máximo: 343500) Hz foi medida. | |||
A visualização ao ar livre é decente desde que não haja luz solar intensa caindo sobre a tela. Os ângulos de visão são amplos, mas observamos perda de brilho e informações de cor quando vistos de ângulos extremos.

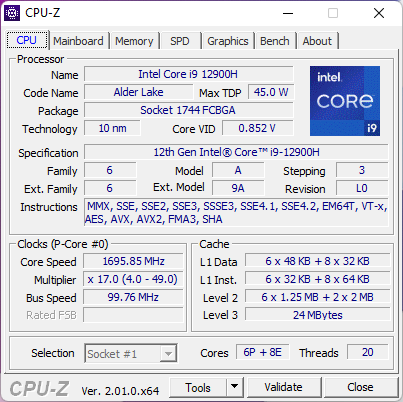
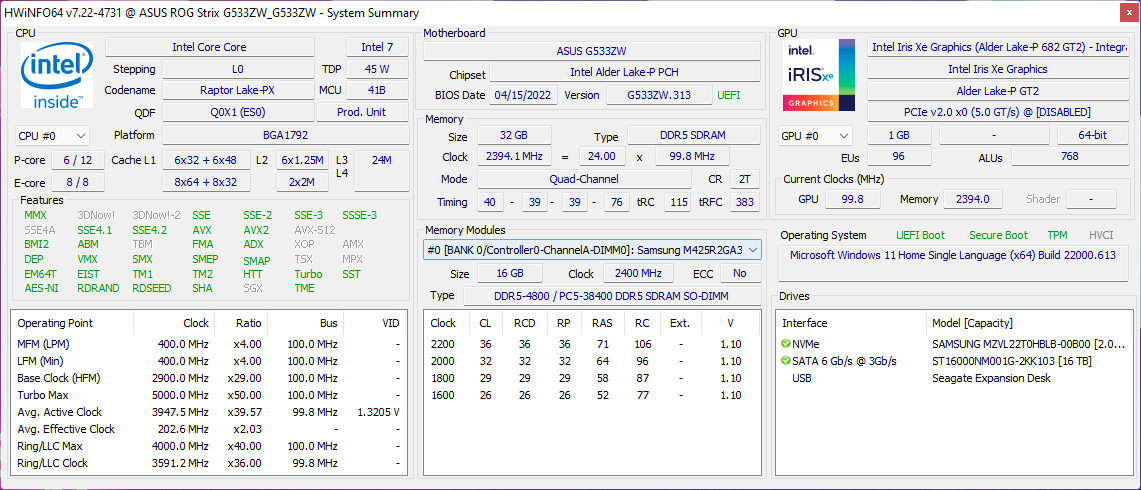
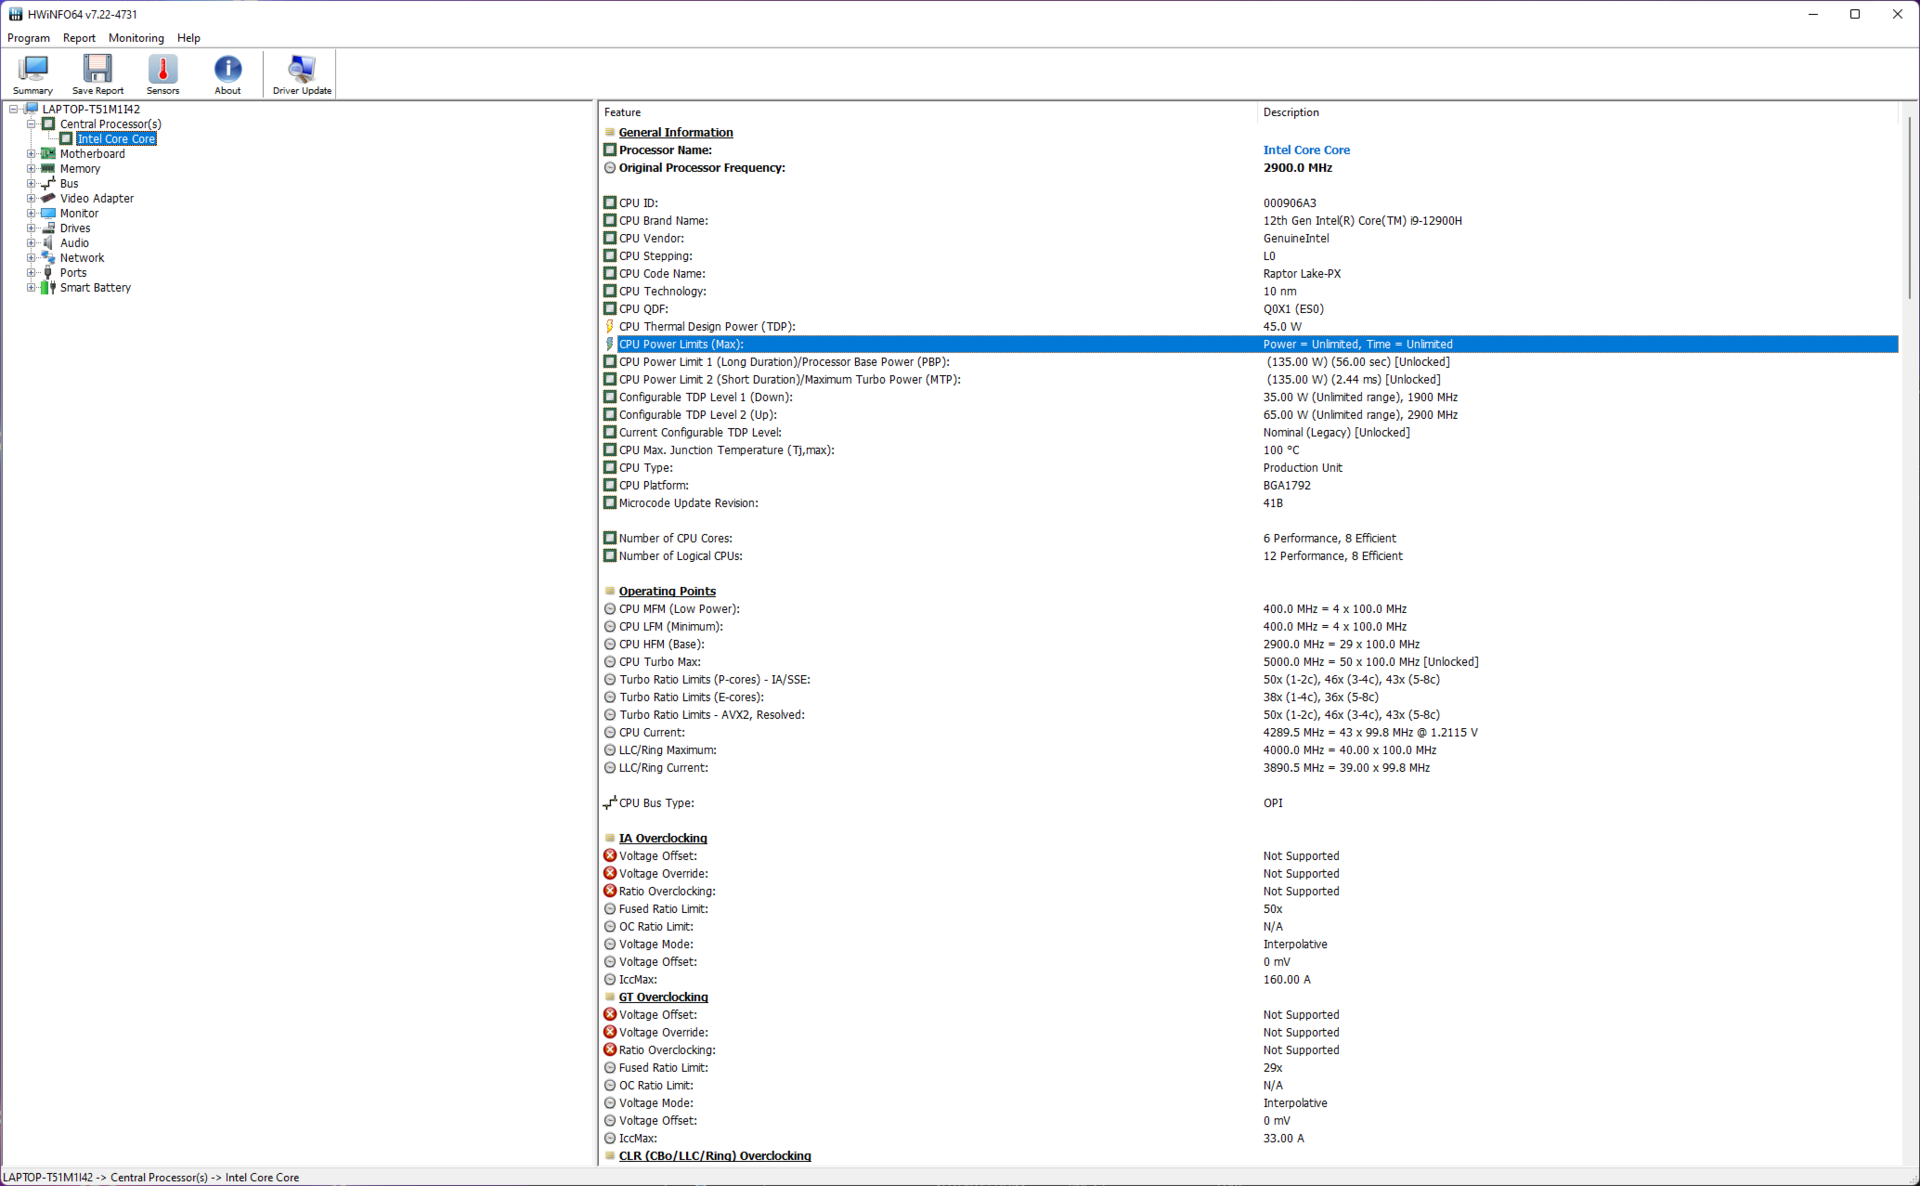
Desempenho: O núcleo i9-12900H recebe asas a 135 W
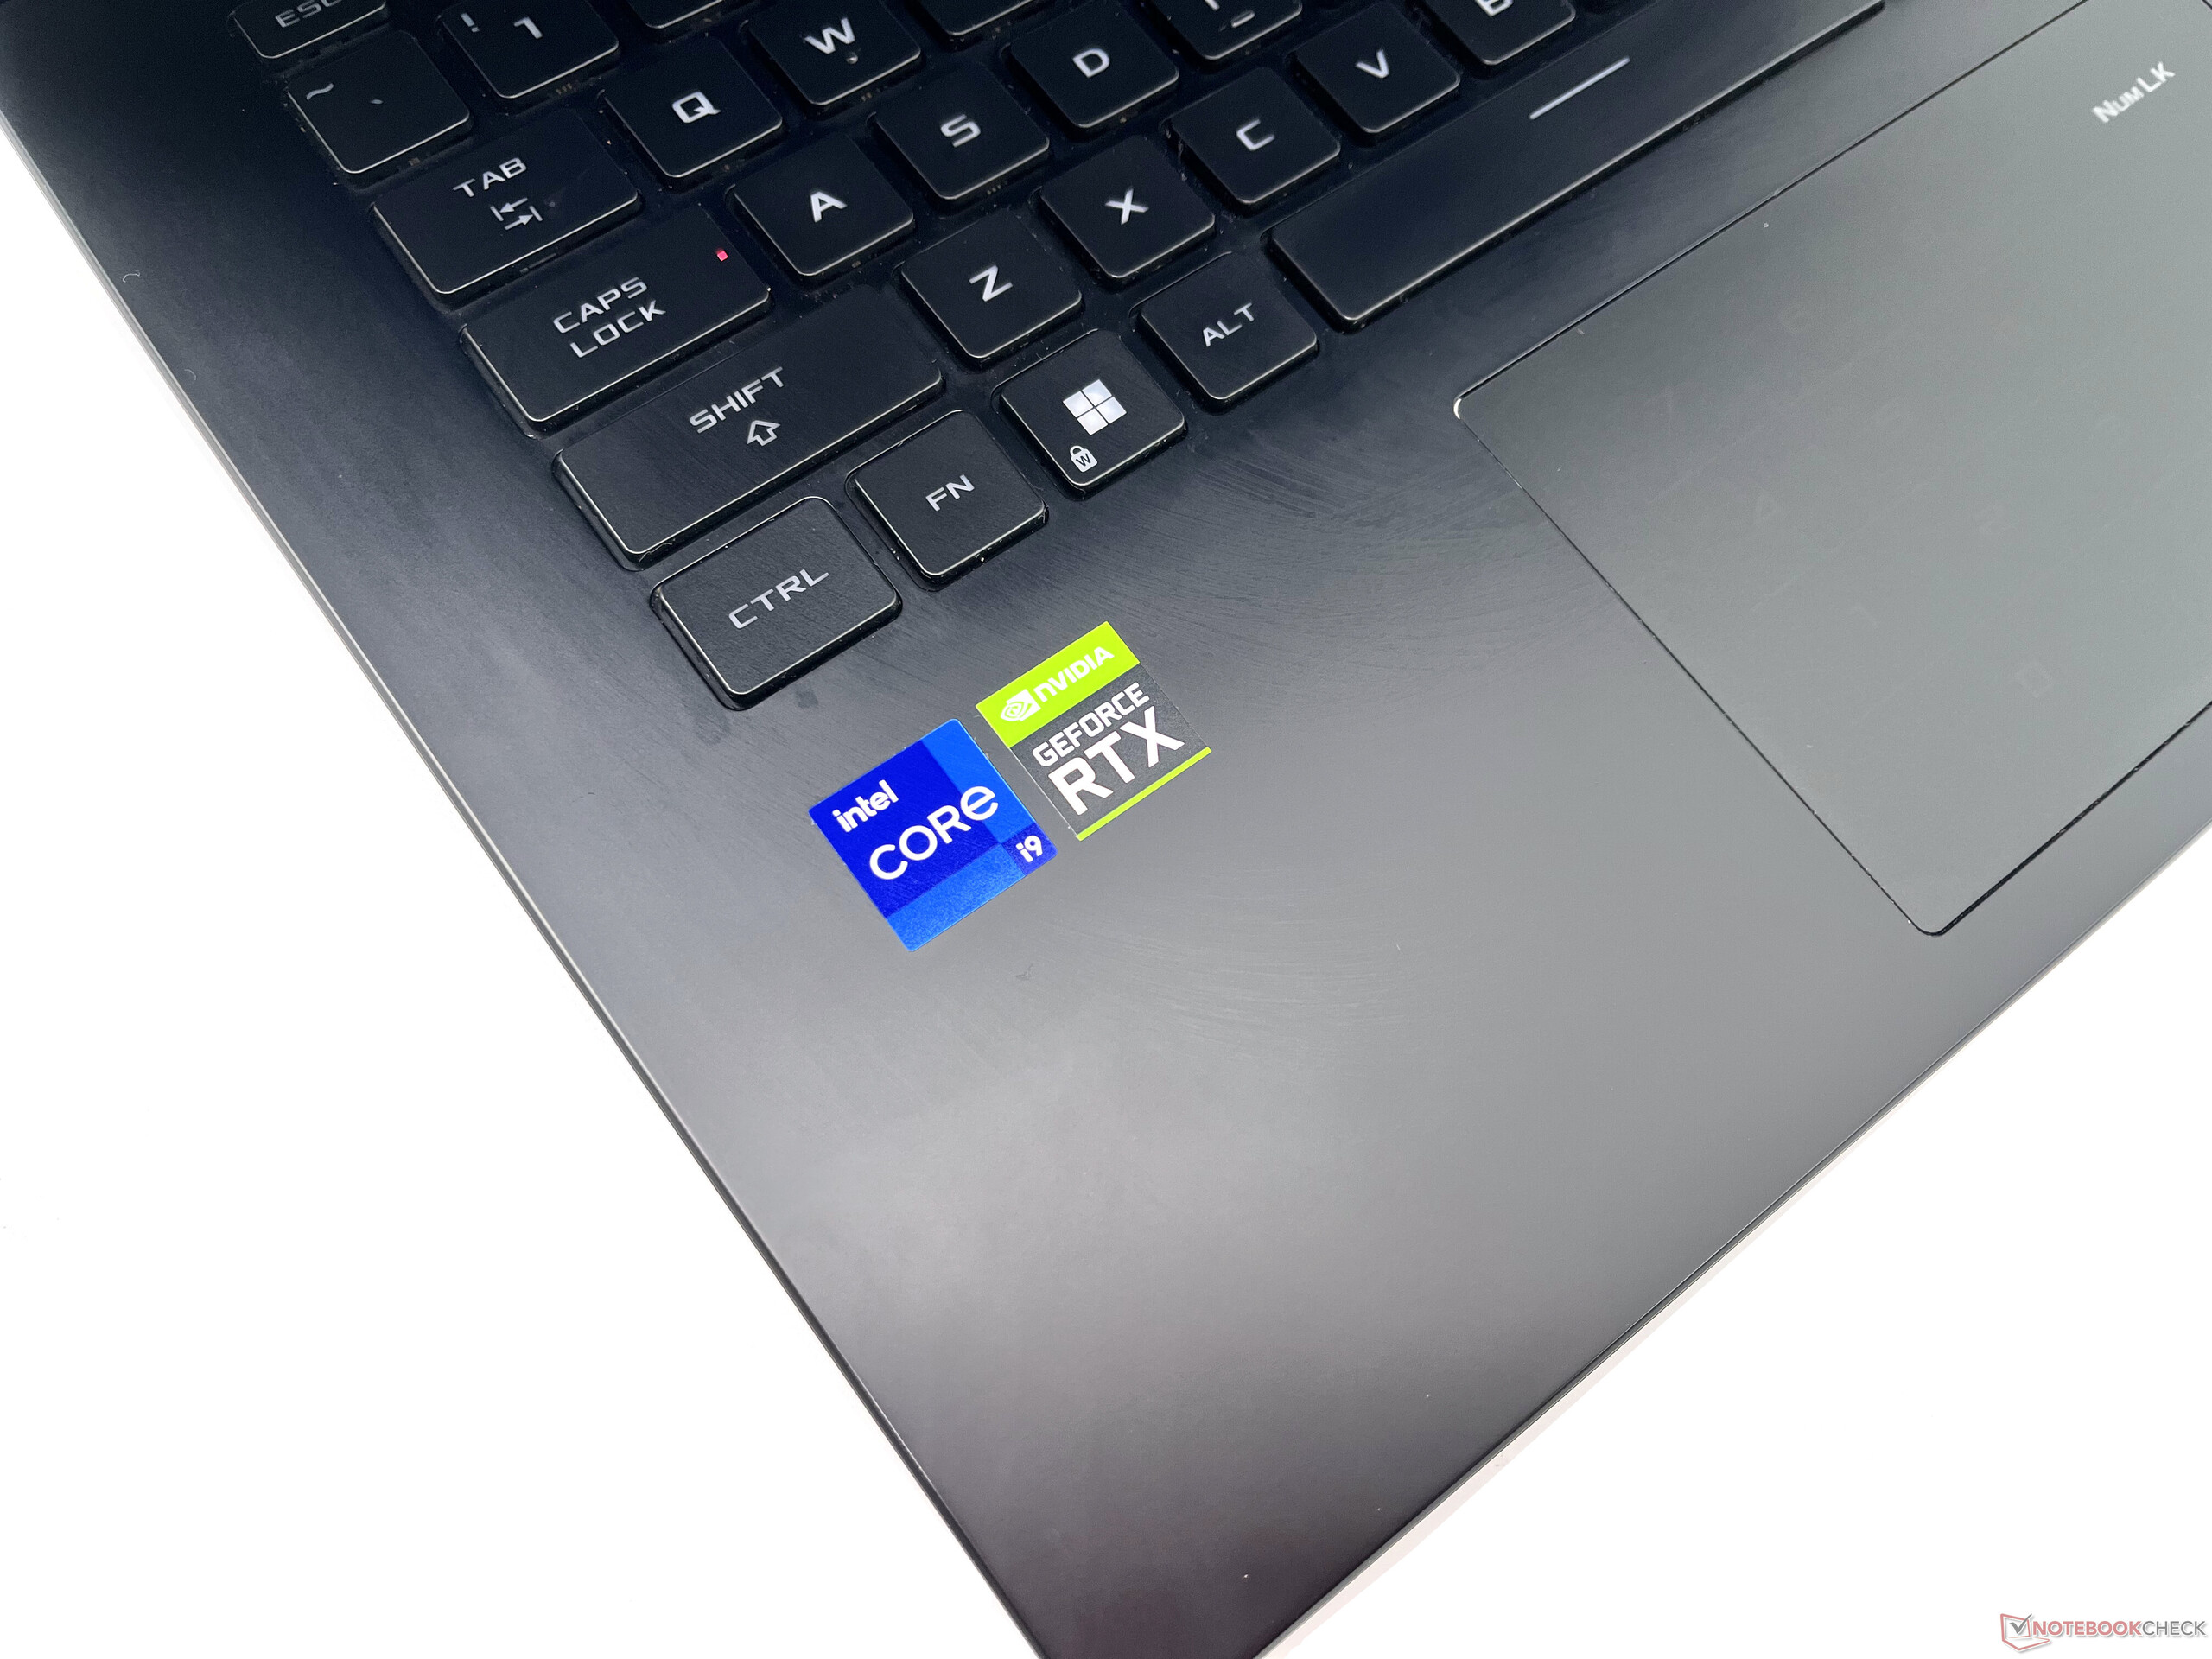
Asus equipou nossa unidade de teste ROG Strix Scar 15 com um Intel Core i9-12900H CPU e uma CPU de 150 WNvidia GeForce RTX 3070 Ti GPU para notebook.
Aparentemente, o Core i9-12900H com um material de interface térmica de metal líquido (TIM) é a opção de processamento de fato em todos os Scar 15 SKUs 2022, pelo menos na Índia. As opções de GPU, no entanto, variam entre os 140 WRTX 3060 para os 150 WRTX 3080 Ti.
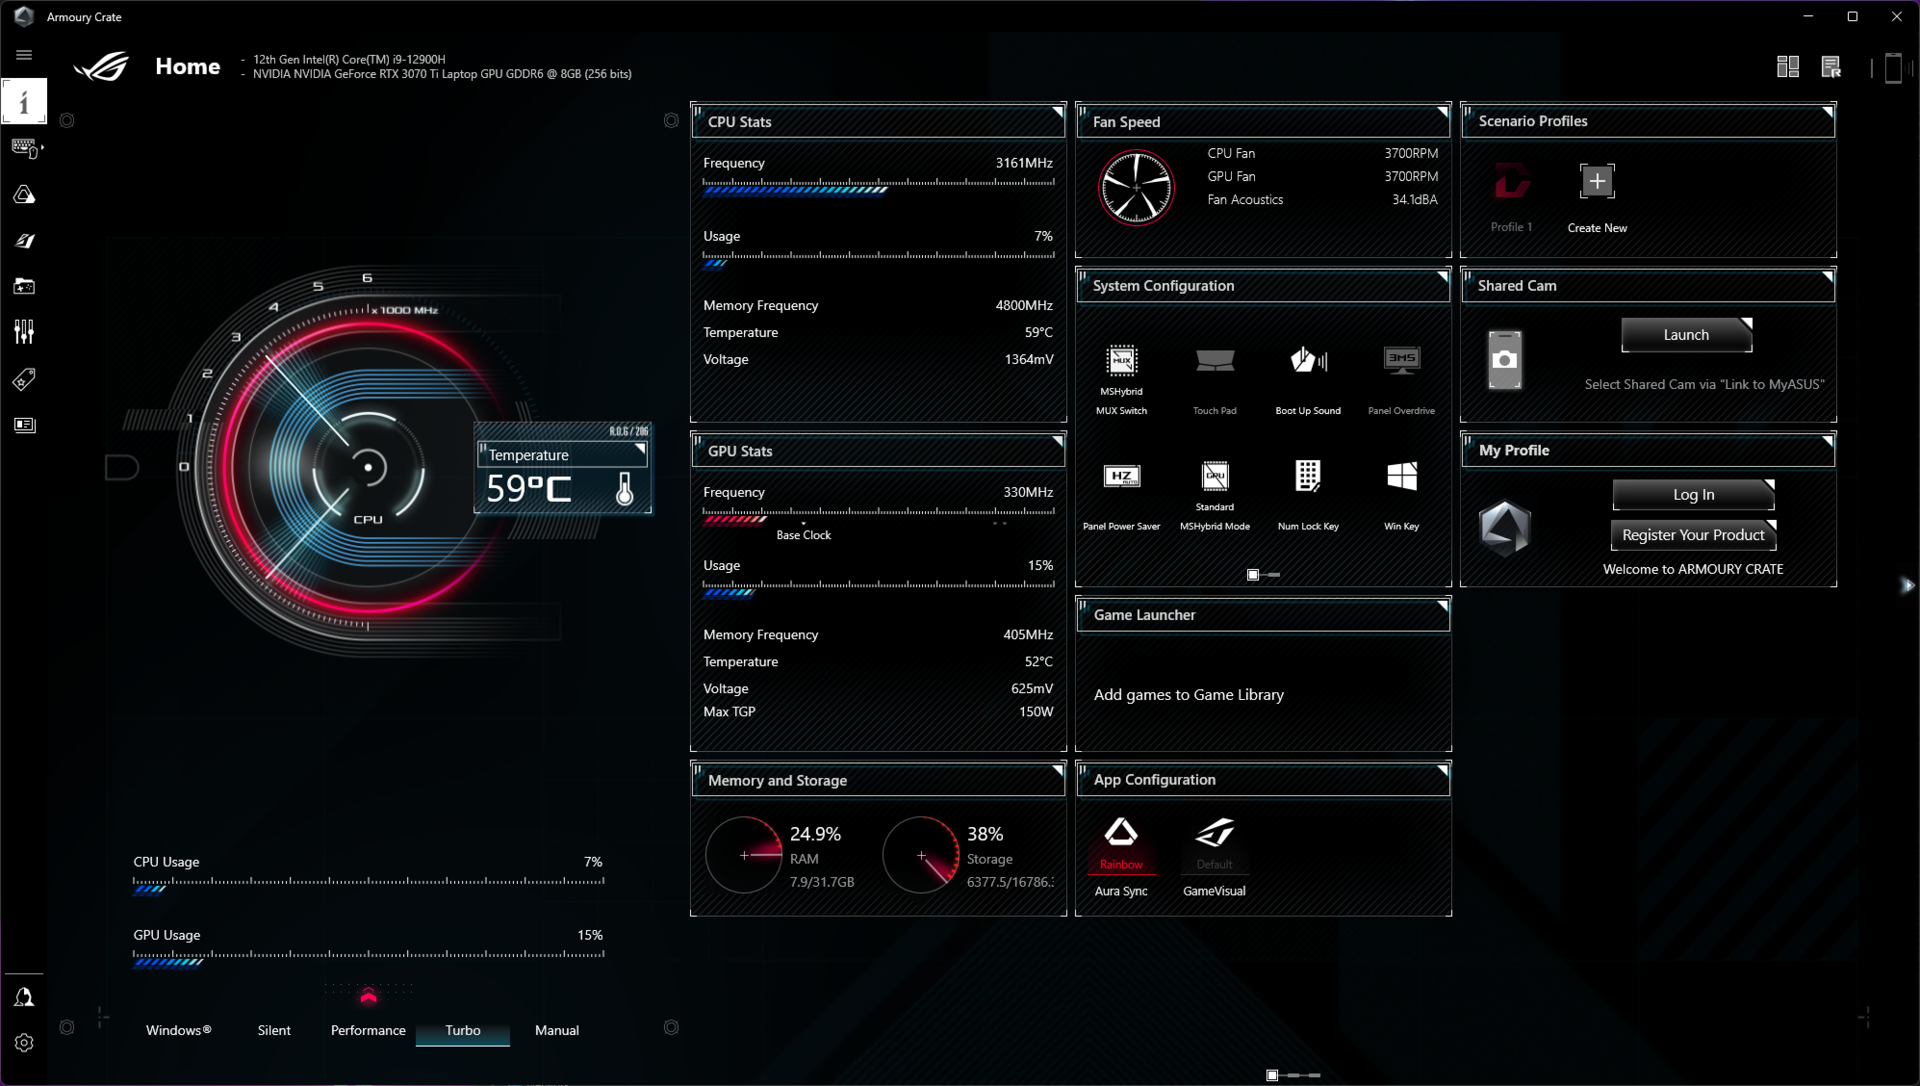
Condições de teste
O aplicativo Armory Crate permite a seleção de um dos três modos primários de desempenho - Silent, Performance, e Turbo. Você também pode sintonizar manualmente as configurações do relógio e do ventilador no modo Manual ou simplesmente deixar os perfis de potência do Windows assumirem o controle com o modo Windows.
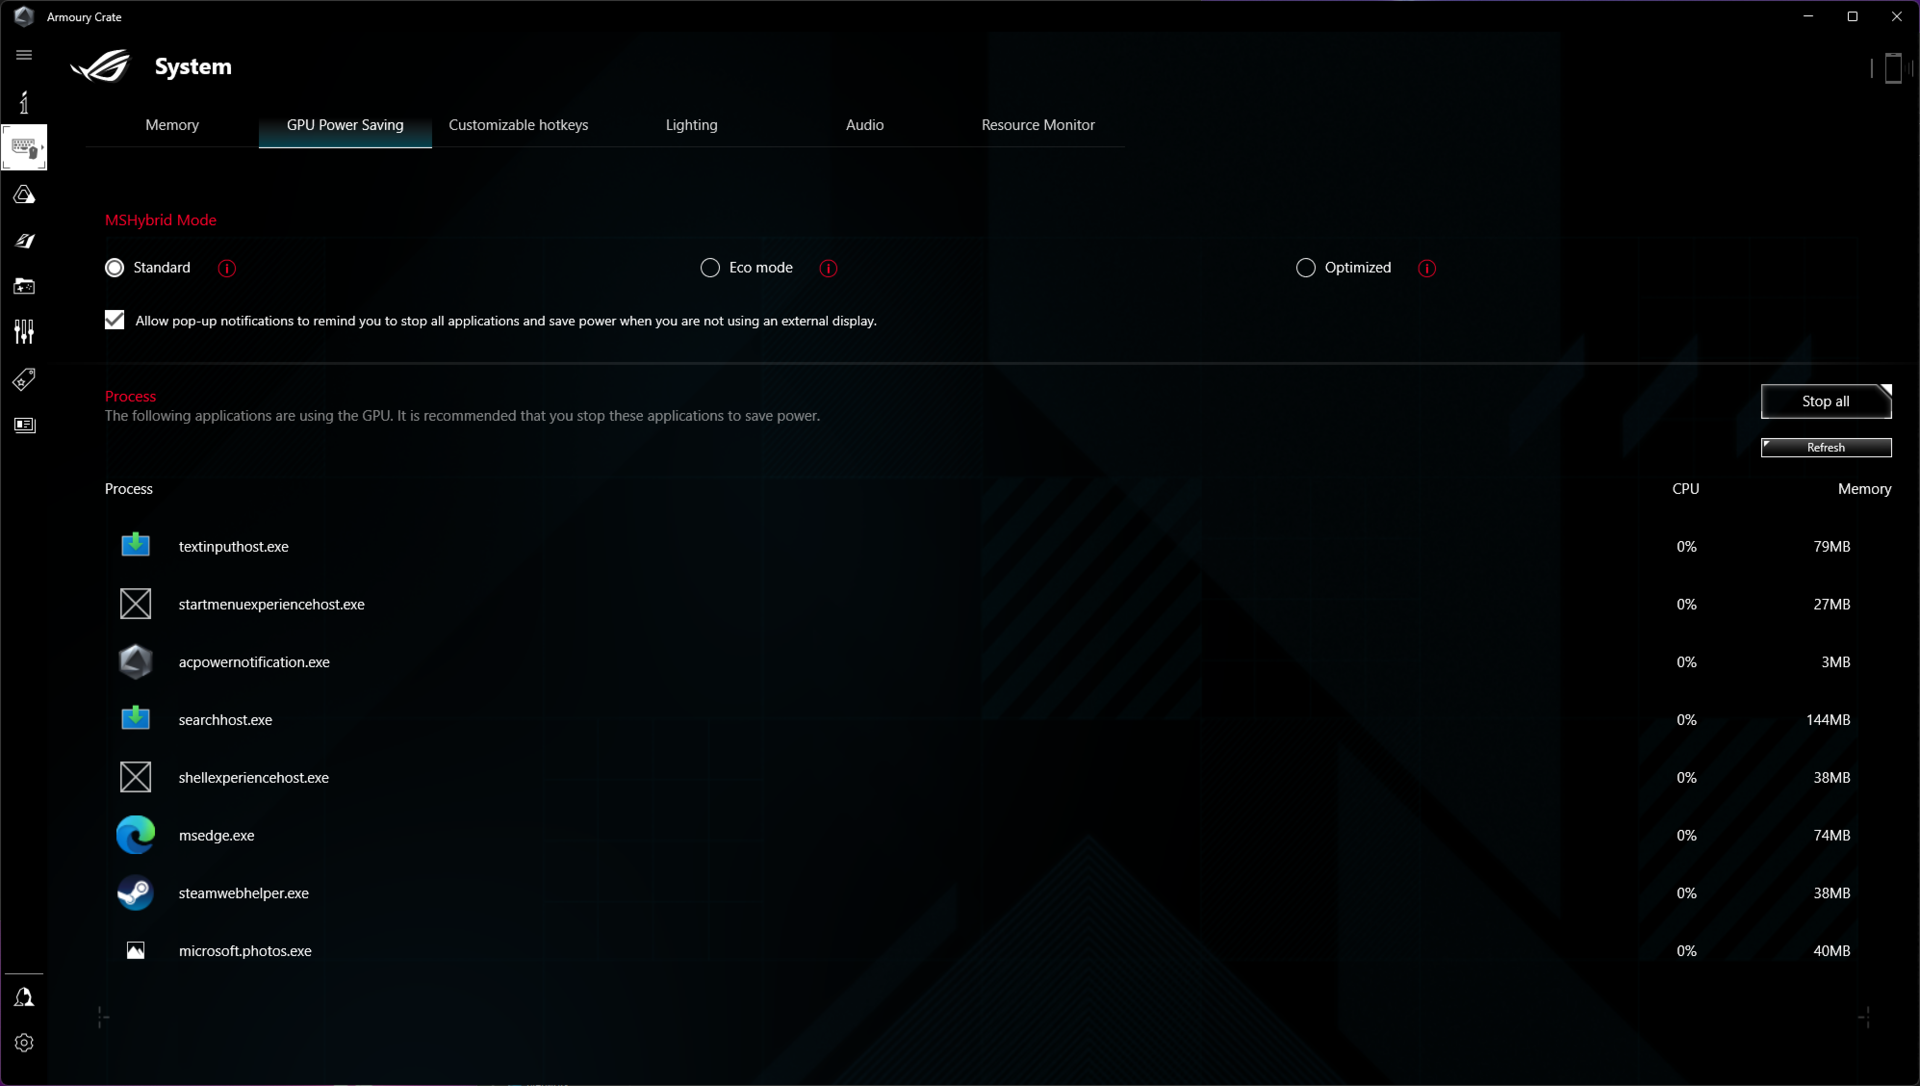
Para a GPU, o Asus permite escolher entre o modo MSHybrid padrão e um modo MUX. A chave MUX permite direcionar o sinal dGPU diretamente para a tela interna contornando o iGPU. Isto pode proporcionar um leve benefício de performance, que veremos na seção Performance da GPU. Entretanto, para fins de comparação, usamos o modo MSHybrid padrão, uma vez que esta é a configuração padrão.
A tabela abaixo ilustra como os valores PL1 e PL2 mudam com cada perfil de potência escolhido. Recomendamos que se utilize o perfil Turbo para cargas pesadas de trabalho e jogos, se os altos níveis de ruído dos ventiladores não forem problema.
| Performance Mode | PL1 / Tau | PL2 / Tau |
|---|---|---|
| Silencioso | 45 W / 56 s | 70 W / 2,44 ms |
| Desempenho | 80 W / 56 s | 90 W / 2,44 ms |
| Turbo | 135 W / 56 s | 135 W / 2,44 ms |
Para nossos testes, escolhemos o modo Turbo, pois ele permite que o Core i9-12900H flexione totalmente seus músculos com um PL1/PL2 desbloqueado de 135 W. Dados comparativos entre os vários modos de desempenho são fornecidos sempre que aplicável.
Processador
O Core i9-12900H é uma peça do 12º gênero Alder Lake com 14 núcleos (6P+8E) e 20 fios. A implementação pela Asus de um sistema de resfriamento robusto garante que o Core i9-12900H seja capaz de oferecer desempenho sustentado sem muito estrangulamento no teste de loop multi-core Cinebench R15.
Curiosamente, observamos o Núcleo i7-12700H no Lenovo Legion 5i Pro 16 G7 para oferecer um desempenho multi-core ligeiramente superior em todos os níveis. Entretanto, o Core i9-12900H tem a vantagem em cargas com um único núcleo.
Cinebench R15 Multi Loop
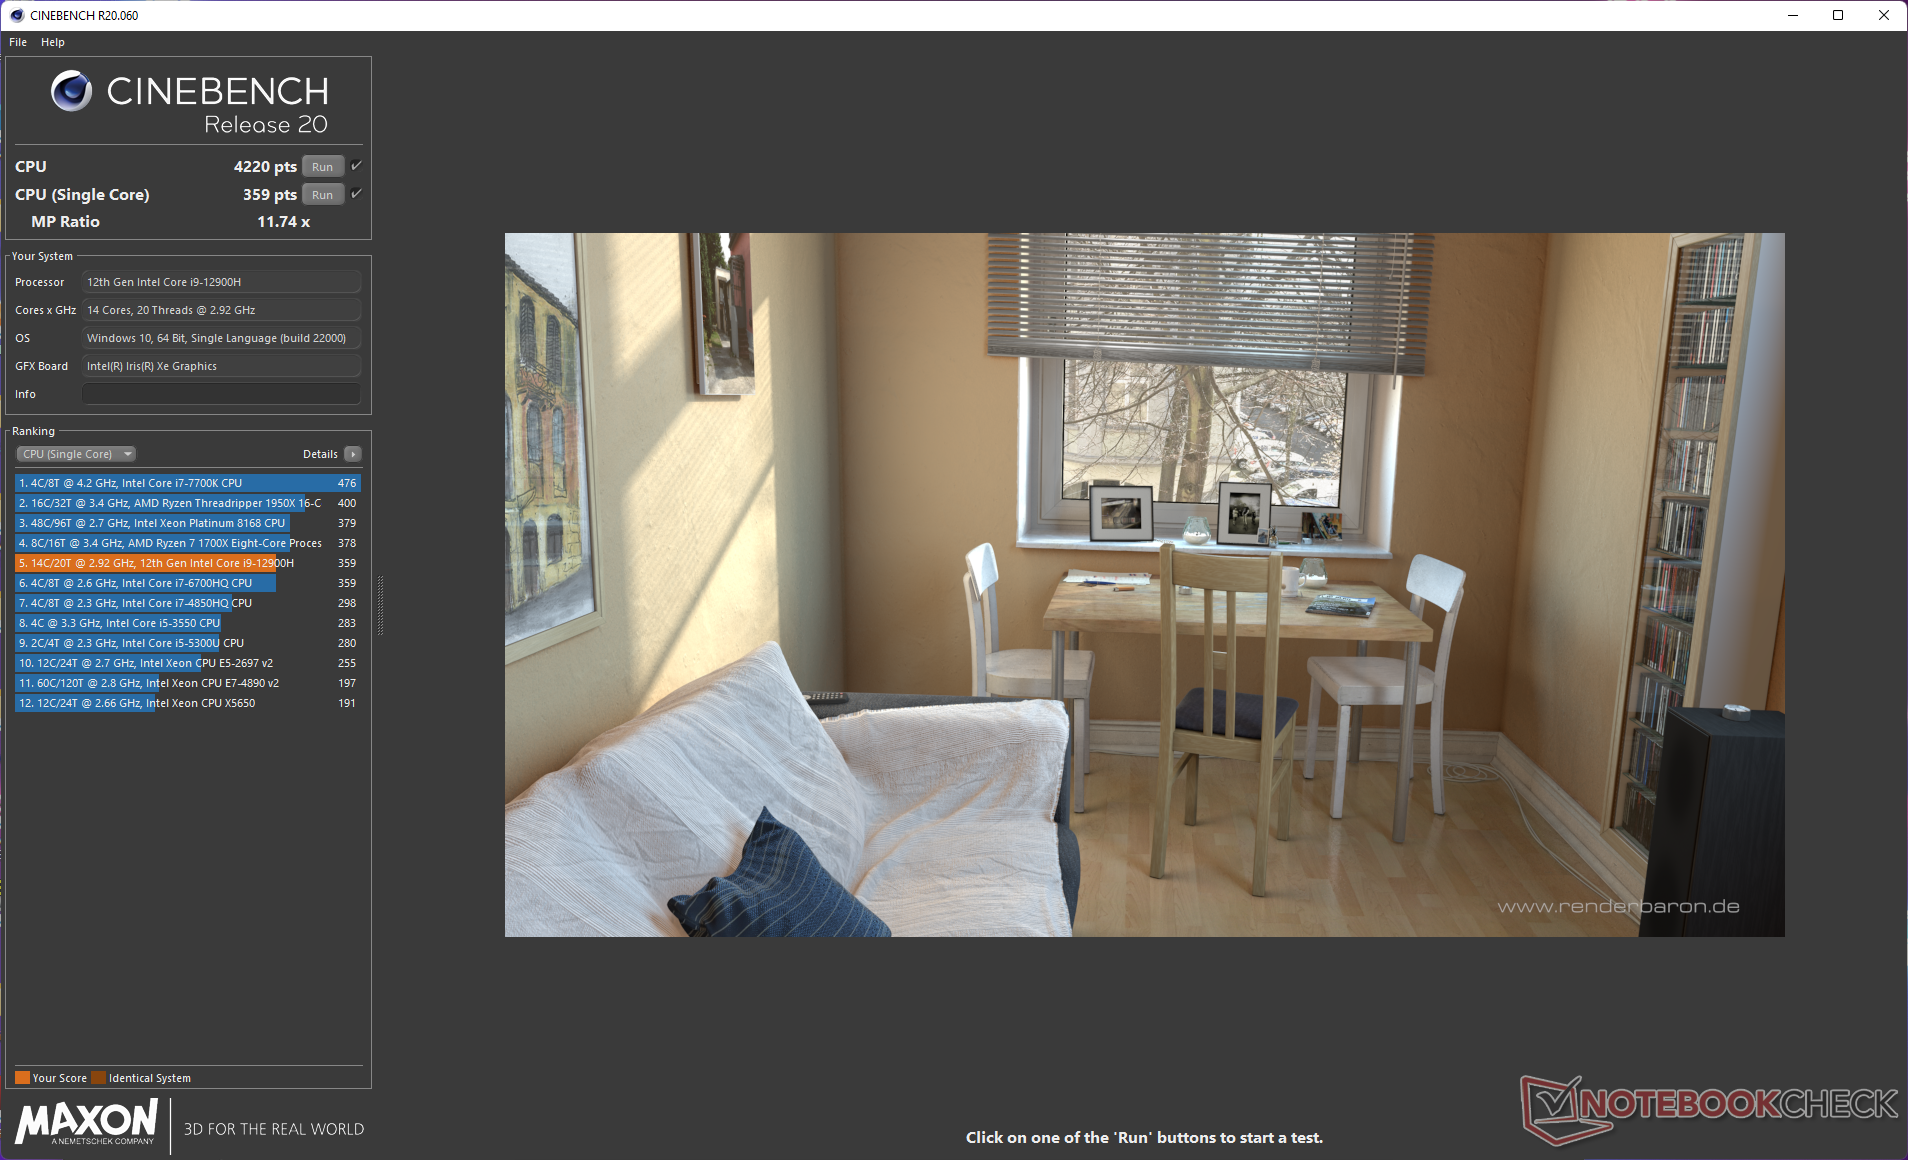
O Core i9-12900H também parece ter uma ligeira vantagem sobre o Núcleo i9-12900HK no MSI Raider GE66 12UHS, mas se relaciona com o chip multiplicador do Alder Lake no Gigabyte Aero 16 YE5 em testes Single-core Cinebench.
Na bateria, o ROG Strix Scar 15 muda para o plano de energia Silent. Isto resulta em uma redução maciça de 40% no desempenho de múltiplos núcleos e uma queda de 50% no número de núcleos simples no Cinebench R20.
Cinebench R23: Multi Core | Single Core
Cinebench R20: CPU (Multi Core) | CPU (Single Core)
Cinebench R15: CPU Multi 64Bit | CPU Single 64Bit
Blender: v2.79 BMW27 CPU
7-Zip 18.03: 7z b 4 | 7z b 4 -mmt1
Geekbench 5.5: Multi-Core | Single-Core
HWBOT x265 Benchmark v2.2: 4k Preset
LibreOffice : 20 Documents To PDF
R Benchmark 2.5: Overall mean
| CPU Performance rating | |
| Média da turma Gaming | |
| Asus ROG Strix Scar 15 G533ZW-LN106WS | |
| Gigabyte Aero 16 YE5 | |
| Lenovo Legion 5 Pro 16 G7 i7 RTX 3070Ti | |
| MSI Pulse GL66 12UEK | |
| MSI Raider GE66 12UHS | |
| MSI Vector GP66 12UGS | |
| HP Omen 16-b1090ng | |
| Média Intel Core i9-12900H | |
| Razer Blade 15 2022 | |
| Razer Blade 14 Ryzen 9 6900HX | |
| Asus ROG Zephyrus G14 GA402RK | |
| Cinebench R23 / Multi Core | |
| Média da turma Gaming (10488 - 42661, n=107, últimos 2 anos) | |
| Lenovo Legion 5 Pro 16 G7 i7 RTX 3070Ti | |
| Asus ROG Strix Scar 15 G533ZW-LN106WS | |
| Gigabyte Aero 16 YE5 | |
| MSI Pulse GL66 12UEK | |
| MSI Vector GP66 12UGS | |
| MSI Raider GE66 12UHS | |
| HP Omen 16-b1090ng | |
| Média Intel Core i9-12900H (7359 - 19648, n=28) | |
| Razer Blade 15 2022 | |
| Razer Blade 14 Ryzen 9 6900HX | |
| Asus ROG Zephyrus G14 GA402RK | |
| Cinebench R23 / Single Core | |
| Média da turma Gaming (1166 - 2415, n=107, últimos 2 anos) | |
| Gigabyte Aero 16 YE5 | |
| Asus ROG Strix Scar 15 G533ZW-LN106WS | |
| MSI Pulse GL66 12UEK | |
| MSI Vector GP66 12UGS | |
| MSI Raider GE66 12UHS | |
| Média Intel Core i9-12900H (1634 - 1930, n=28) | |
| Lenovo Legion 5 Pro 16 G7 i7 RTX 3070Ti | |
| HP Omen 16-b1090ng | |
| Razer Blade 15 2022 | |
| Asus ROG Zephyrus G14 GA402RK | |
| Razer Blade 14 Ryzen 9 6900HX | |
| Cinebench R20 / CPU (Multi Core) | |
| Média da turma Gaming (4029 - 16433, n=106, últimos 2 anos) | |
| Lenovo Legion 5 Pro 16 G7 i7 RTX 3070Ti | |
| Asus ROG Strix Scar 15 G533ZW-LN106WS | |
| Gigabyte Aero 16 YE5 | |
| MSI Pulse GL66 12UEK | |
| MSI Vector GP66 12UGS | |
| MSI Raider GE66 12UHS | |
| HP Omen 16-b1090ng | |
| Razer Blade 15 2022 | |
| Média Intel Core i9-12900H (2681 - 7471, n=28) | |
| Razer Blade 14 Ryzen 9 6900HX | |
| Asus ROG Zephyrus G14 GA402RK | |
| Cinebench R20 / CPU (Single Core) | |
| Média da turma Gaming (442 - 913, n=106, últimos 2 anos) | |
| MSI Pulse GL66 12UEK | |
| MSI Vector GP66 12UGS | |
| Asus ROG Strix Scar 15 G533ZW-LN106WS | |
| MSI Raider GE66 12UHS | |
| Média Intel Core i9-12900H (624 - 738, n=28) | |
| Lenovo Legion 5 Pro 16 G7 i7 RTX 3070Ti | |
| HP Omen 16-b1090ng | |
| Razer Blade 15 2022 | |
| Gigabyte Aero 16 YE5 | |
| Asus ROG Zephyrus G14 GA402RK | |
| Razer Blade 14 Ryzen 9 6900HX | |
| Cinebench R15 / CPU Multi 64Bit | |
| Média da turma Gaming (1578 - 6330, n=105, últimos 2 anos) | |
| Asus ROG Strix Scar 15 G533ZW-LN106WS | |
| Lenovo Legion 5 Pro 16 G7 i7 RTX 3070Ti | |
| HP Omen 16-b1090ng | |
| Gigabyte Aero 16 YE5 | |
| MSI Pulse GL66 12UEK | |
| MSI Raider GE66 12UHS | |
| Média Intel Core i9-12900H (1395 - 3077, n=28) | |
| MSI Vector GP66 12UGS | |
| Razer Blade 14 Ryzen 9 6900HX | |
| Razer Blade 15 2022 | |
| Asus ROG Zephyrus G14 GA402RK | |
| Cinebench R15 / CPU Single 64Bit | |
| Média da turma Gaming (188.8 - 350, n=106, últimos 2 anos) | |
| Gigabyte Aero 16 YE5 | |
| MSI Pulse GL66 12UEK | |
| Asus ROG Strix Scar 15 G533ZW-LN106WS | |
| MSI Vector GP66 12UGS | |
| MSI Raider GE66 12UHS | |
| Lenovo Legion 5 Pro 16 G7 i7 RTX 3070Ti | |
| Média Intel Core i9-12900H (235 - 277, n=29) | |
| HP Omen 16-b1090ng | |
| Razer Blade 15 2022 | |
| Asus ROG Zephyrus G14 GA402RK | |
| Razer Blade 14 Ryzen 9 6900HX | |
| Blender / v2.79 BMW27 CPU | |
| Asus ROG Zephyrus G14 GA402RK | |
| Média Intel Core i9-12900H (160 - 451, n=28) | |
| Razer Blade 15 2022 | |
| Razer Blade 14 Ryzen 9 6900HX | |
| Gigabyte Aero 16 YE5 | |
| MSI Vector GP66 12UGS | |
| MSI Raider GE66 12UHS | |
| MSI Pulse GL66 12UEK | |
| HP Omen 16-b1090ng | |
| Asus ROG Strix Scar 15 G533ZW-LN106WS | |
| Lenovo Legion 5 Pro 16 G7 i7 RTX 3070Ti | |
| Média da turma Gaming (79 - 330, n=104, últimos 2 anos) | |
| 7-Zip 18.03 / 7z b 4 -mmt1 | |
| Média da turma Gaming (4199 - 7436, n=105, últimos 2 anos) | |
| Gigabyte Aero 16 YE5 | |
| MSI Vector GP66 12UGS | |
| MSI Pulse GL66 12UEK | |
| MSI Raider GE66 12UHS | |
| Asus ROG Strix Scar 15 G533ZW-LN106WS | |
| HP Omen 16-b1090ng | |
| Asus ROG Zephyrus G14 GA402RK | |
| Média Intel Core i9-12900H (5302 - 6289, n=28) | |
| Razer Blade 14 Ryzen 9 6900HX | |
| Lenovo Legion 5 Pro 16 G7 i7 RTX 3070Ti | |
| Razer Blade 15 2022 | |
| Geekbench 5.5 / Multi-Core | |
| Média da turma Gaming (6460 - 28263, n=105, últimos 2 anos) | |
| Asus ROG Strix Scar 15 G533ZW-LN106WS | |
| Gigabyte Aero 16 YE5 | |
| MSI Raider GE66 12UHS | |
| HP Omen 16-b1090ng | |
| Lenovo Legion 5 Pro 16 G7 i7 RTX 3070Ti | |
| Razer Blade 15 2022 | |
| MSI Vector GP66 12UGS | |
| Média Intel Core i9-12900H (8519 - 14376, n=31) | |
| MSI Pulse GL66 12UEK | |
| Asus ROG Zephyrus G14 GA402RK | |
| Razer Blade 14 Ryzen 9 6900HX | |
| Geekbench 5.5 / Single-Core | |
| Média da turma Gaming (986 - 2474, n=105, últimos 2 anos) | |
| MSI Vector GP66 12UGS | |
| Gigabyte Aero 16 YE5 | |
| MSI Raider GE66 12UHS | |
| Asus ROG Strix Scar 15 G533ZW-LN106WS | |
| MSI Pulse GL66 12UEK | |
| HP Omen 16-b1090ng | |
| Média Intel Core i9-12900H (1631 - 1897, n=31) | |
| Razer Blade 15 2022 | |
| Lenovo Legion 5 Pro 16 G7 i7 RTX 3070Ti | |
| Asus ROG Zephyrus G14 GA402RK | |
| Razer Blade 14 Ryzen 9 6900HX | |
| HWBOT x265 Benchmark v2.2 / 4k Preset | |
| Média da turma Gaming (11.5 - 44.4, n=105, últimos 2 anos) | |
| Lenovo Legion 5 Pro 16 G7 i7 RTX 3070Ti | |
| Asus ROG Strix Scar 15 G533ZW-LN106WS | |
| HP Omen 16-b1090ng | |
| MSI Vector GP66 12UGS | |
| MSI Pulse GL66 12UEK | |
| MSI Raider GE66 12UHS | |
| Gigabyte Aero 16 YE5 | |
| Razer Blade 14 Ryzen 9 6900HX | |
| Razer Blade 15 2022 | |
| Média Intel Core i9-12900H (8.05 - 22.5, n=28) | |
| Asus ROG Zephyrus G14 GA402RK | |
| LibreOffice / 20 Documents To PDF | |
| Razer Blade 15 2022 | |
| Razer Blade 14 Ryzen 9 6900HX | |
| Média da turma Gaming (33.2 - 88.8, n=105, últimos 2 anos) | |
| Asus ROG Zephyrus G14 GA402RK | |
| Média Intel Core i9-12900H (36.8 - 59.8, n=28) | |
| Lenovo Legion 5 Pro 16 G7 i7 RTX 3070Ti | |
| MSI Pulse GL66 12UEK | |
| HP Omen 16-b1090ng | |
| MSI Vector GP66 12UGS | |
| Asus ROG Strix Scar 15 G533ZW-LN106WS | |
| Gigabyte Aero 16 YE5 | |
| MSI Raider GE66 12UHS | |
| R Benchmark 2.5 / Overall mean | |
| Razer Blade 14 Ryzen 9 6900HX | |
| Asus ROG Zephyrus G14 GA402RK | |
| Razer Blade 15 2022 | |
| Média Intel Core i9-12900H (0.4218 - 0.506, n=28) | |
| Lenovo Legion 5 Pro 16 G7 i7 RTX 3070Ti | |
| HP Omen 16-b1090ng | |
| MSI Raider GE66 12UHS | |
| Asus ROG Strix Scar 15 G533ZW-LN106WS | |
| Média da turma Gaming (0.3439 - 0.759, n=106, últimos 2 anos) | |
| MSI Pulse GL66 12UEK | |
| MSI Vector GP66 12UGS | |
| Gigabyte Aero 16 YE5 | |
* ... menor é melhor
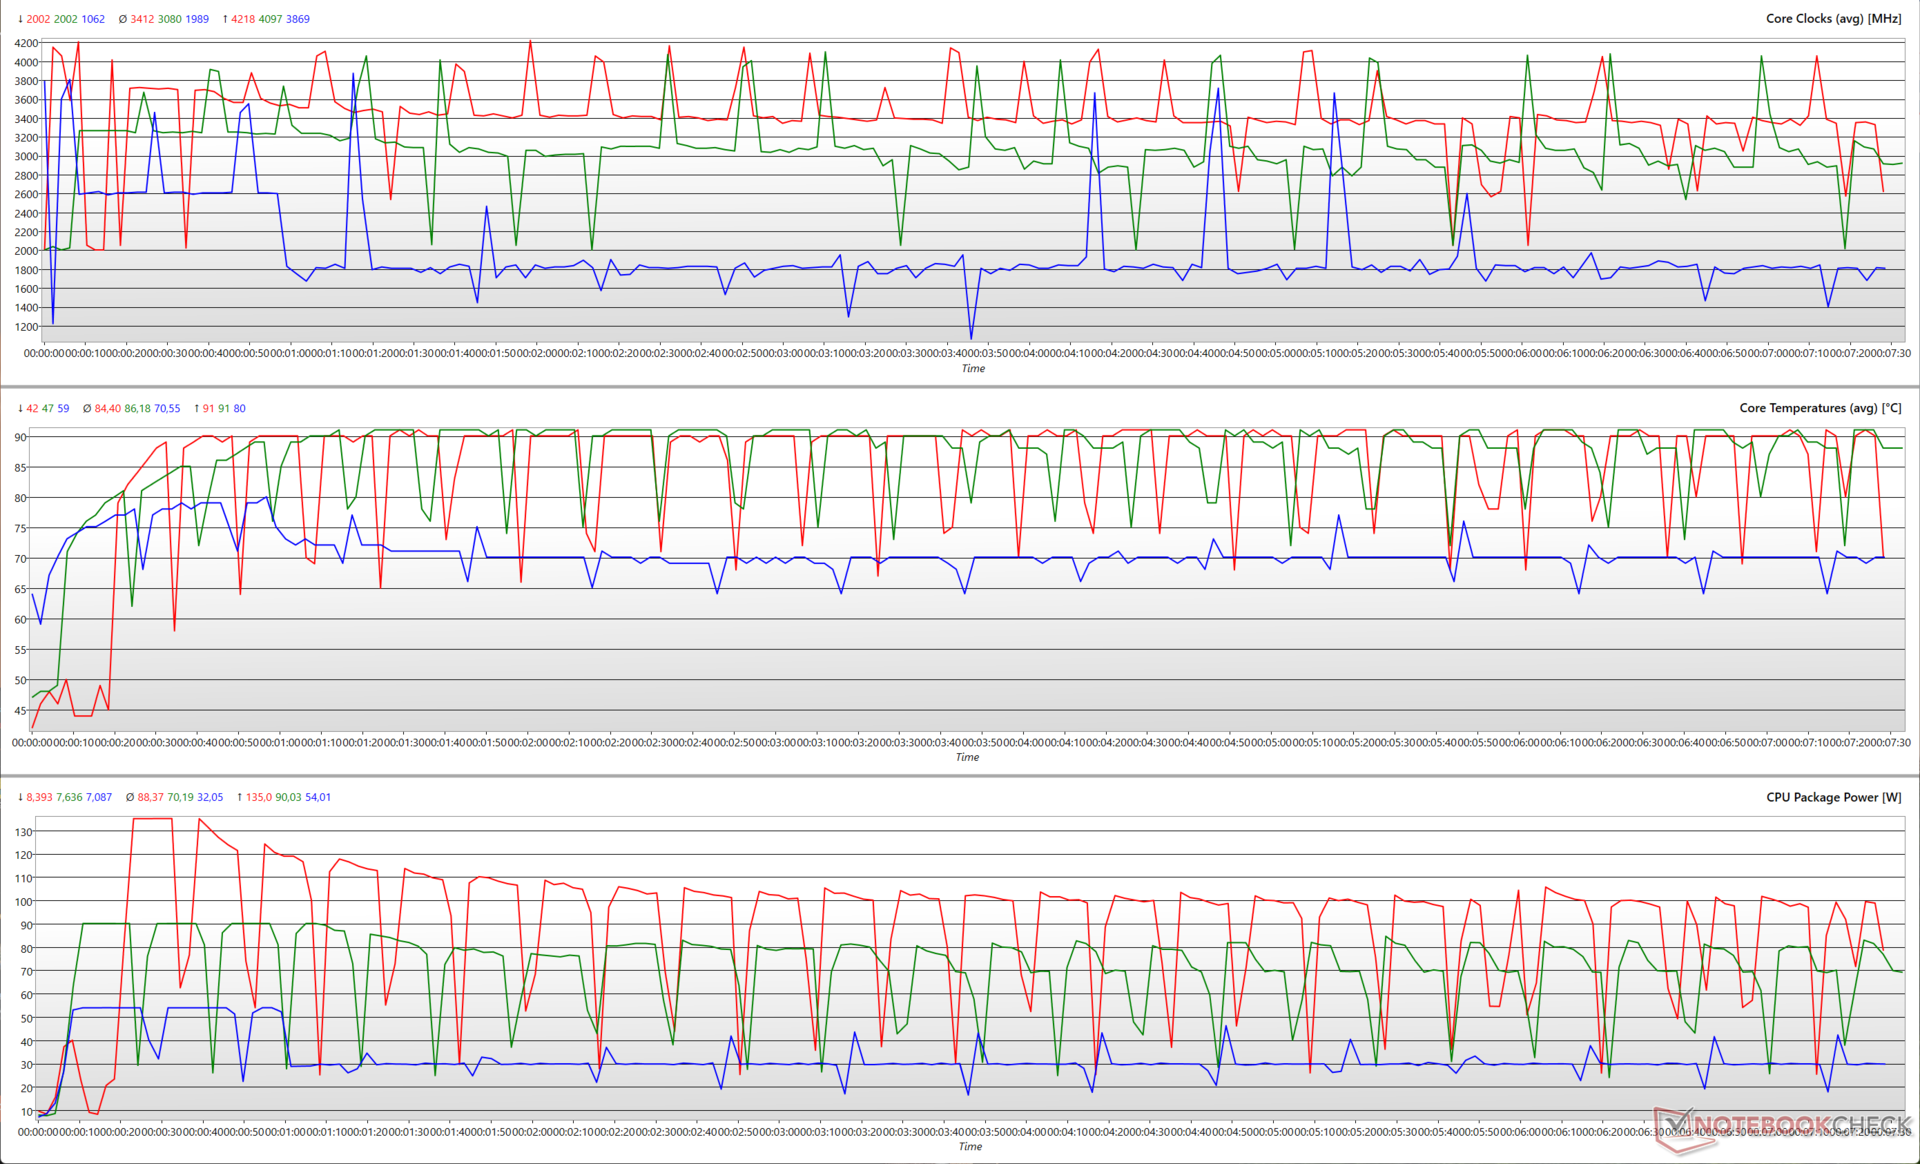
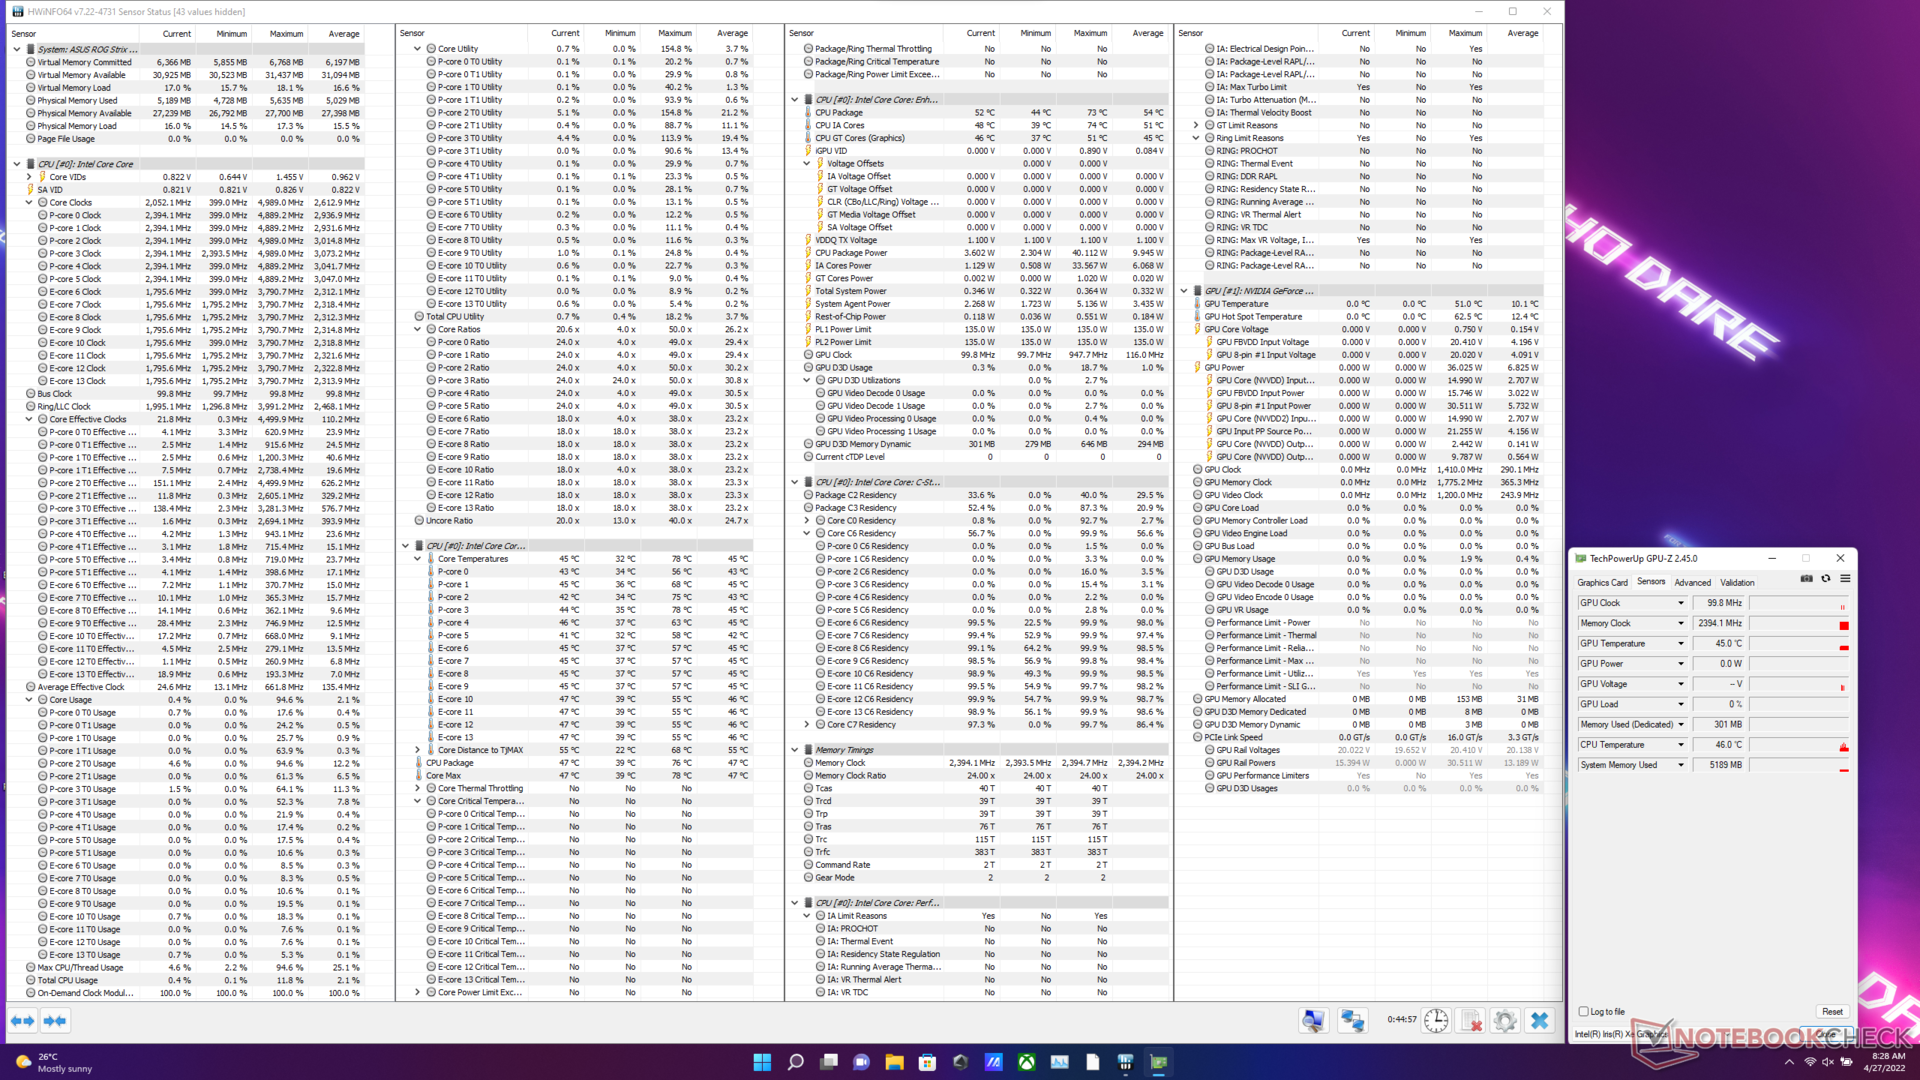
O gráfico seguinte ilustra como diferentes parâmetros de CPU variam durante um loop multi-core Cinebench R15 em cada um dos modos de desempenho. O Turbo permite que o Core i9-12900H utilize 135 W, mas isto não dura mais de 10 segundos. A CPU eventualmente se fixa em ~100 W durante a maior parte do loop. Durante este processo, as temperaturas médias do núcleo atingem 90 °C enquanto os relógios atingem entre 4,1 GHz a 4,2 GHz.
O modo de desempenho vê 90 W de potência do pacote ser puxado inicialmente, mas isto se fixa em 80 W a partir do sexto loop. As temperaturas centrais atingem 90 °C aqui também, mas o processador pode tocar 4 GHz+ apenas em alguns intervalos.
O modo silencioso começa próximo a 60 W, mas se instala próximo à marca de 30 W. Como esperado, isto resulta em relógios de CPU mais baixos geralmente perto da marca de 2 GHz com picos ocasionais para a marca de 3,5 GHz. As temperaturas neste modo são bastante baixas a 70 °C.
AIDA64: FP32 Ray-Trace | FPU Julia | CPU SHA3 | CPU Queen | FPU SinJulia | FPU Mandel | CPU AES | CPU ZLib | FP64 Ray-Trace | CPU PhotoWorxx
| Performance rating | |
| Média da turma Gaming | |
| Razer Blade 14 Ryzen 9 6900HX | |
| Asus ROG Zephyrus G14 GA402RK | |
| Asus ROG Strix Scar 15 G533ZW-LN106WS | |
| Lenovo Legion 5 Pro 16 G7 i7 RTX 3070Ti | |
| Média Intel Core i9-12900H | |
| MSI Raider GE66 12UHS | |
| Gigabyte Aero 16 YE5 | |
| MSI Pulse GL66 12UEK | |
| MSI Vector GP66 12UGS | |
| HP Omen 16-b1090ng | |
| Razer Blade 15 2022 | |
| AIDA64 / FP32 Ray-Trace | |
| Média da turma Gaming (10227 - 85542, n=105, últimos 2 anos) | |
| Razer Blade 14 Ryzen 9 6900HX | |
| Asus ROG Zephyrus G14 GA402RK | |
| Média Intel Core i9-12900H (4074 - 18289, n=29) | |
| Asus ROG Strix Scar 15 G533ZW-LN106WS | |
| Lenovo Legion 5 Pro 16 G7 i7 RTX 3070Ti | |
| MSI Pulse GL66 12UEK | |
| MSI Raider GE66 12UHS | |
| MSI Vector GP66 12UGS | |
| Gigabyte Aero 16 YE5 | |
| Razer Blade 15 2022 | |
| HP Omen 16-b1090ng | |
| AIDA64 / FP64 Ray-Trace | |
| Média da turma Gaming (5509 - 45446, n=105, últimos 2 anos) | |
| Razer Blade 14 Ryzen 9 6900HX | |
| Asus ROG Zephyrus G14 GA402RK | |
| Média Intel Core i9-12900H (2235 - 10511, n=29) | |
| Lenovo Legion 5 Pro 16 G7 i7 RTX 3070Ti | |
| Asus ROG Strix Scar 15 G533ZW-LN106WS | |
| MSI Pulse GL66 12UEK | |
| MSI Raider GE66 12UHS | |
| MSI Vector GP66 12UGS | |
| Gigabyte Aero 16 YE5 | |
| HP Omen 16-b1090ng | |
| Razer Blade 15 2022 | |
| AIDA64 / CPU PhotoWorxx | |
| Média da turma Gaming (12271 - 89891, n=105, últimos 2 anos) | |
| Razer Blade 15 2022 | |
| HP Omen 16-b1090ng | |
| MSI Raider GE66 12UHS | |
| Asus ROG Strix Scar 15 G533ZW-LN106WS | |
| Gigabyte Aero 16 YE5 | |
| Média Intel Core i9-12900H (20960 - 48269, n=30) | |
| Lenovo Legion 5 Pro 16 G7 i7 RTX 3070Ti | |
| Asus ROG Zephyrus G14 GA402RK | |
| Razer Blade 14 Ryzen 9 6900HX | |
| MSI Vector GP66 12UGS | |
| MSI Pulse GL66 12UEK | |
Confira nossos dedicados Intel Core i9-12900H para mais benchmarks e comparações de desempenho.
Desempenho do sistema
O desempenho do sistema está nas linhas previstas e no mesmo nível dos dispositivos configurados de forma semelhante. Não notamos nenhum soluço na produtividade geral ou nas tarefas de navegação na web.
CrossMark: Overall | Productivity | Creativity | Responsiveness
| PCMark 10 / Score | |
| Média da turma Gaming (5828 - 12414, n=93, últimos 2 anos) | |
| MSI Raider GE66 12UHS | |
| MSI Vector GP66 12UGS | |
| Asus ROG Strix Scar 15 G533ZW-LN106WS | |
| Gigabyte Aero 16 YE5 | |
| Asus ROG Zephyrus G14 GA402RK | |
| Média Intel Core i9-12900H, NVIDIA GeForce RTX 3070 Ti Laptop GPU (7087 - 8072, n=6) | |
| Razer Blade 15 2022 | |
| Lenovo Legion 5 Pro 16 G7 i7 RTX 3070Ti | |
| Razer Blade 14 Ryzen 9 6900HX | |
| HP Omen 16-b1090ng | |
| MSI Pulse GL66 12UEK | |
| PCMark 10 / Essentials | |
| MSI Raider GE66 12UHS | |
| Gigabyte Aero 16 YE5 | |
| MSI Vector GP66 12UGS | |
| Razer Blade 14 Ryzen 9 6900HX | |
| Asus ROG Zephyrus G14 GA402RK | |
| Média Intel Core i9-12900H, NVIDIA GeForce RTX 3070 Ti Laptop GPU (10266 - 11663, n=6) | |
| Razer Blade 15 2022 | |
| Asus ROG Strix Scar 15 G533ZW-LN106WS | |
| Média da turma Gaming (8810 - 11935, n=97, últimos 2 anos) | |
| MSI Pulse GL66 12UEK | |
| HP Omen 16-b1090ng | |
| Lenovo Legion 5 Pro 16 G7 i7 RTX 3070Ti | |
| PCMark 10 / Productivity | |
| Média da turma Gaming (6845 - 25323, n=95, últimos 2 anos) | |
| Asus ROG Strix Scar 15 G533ZW-LN106WS | |
| MSI Raider GE66 12UHS | |
| Média Intel Core i9-12900H, NVIDIA GeForce RTX 3070 Ti Laptop GPU (9402 - 10742, n=6) | |
| MSI Vector GP66 12UGS | |
| Gigabyte Aero 16 YE5 | |
| Lenovo Legion 5 Pro 16 G7 i7 RTX 3070Ti | |
| Asus ROG Zephyrus G14 GA402RK | |
| MSI Pulse GL66 12UEK | |
| Razer Blade 15 2022 | |
| HP Omen 16-b1090ng | |
| Razer Blade 14 Ryzen 9 6900HX | |
| PCMark 10 / Digital Content Creation | |
| Média da turma Gaming (7602 - 19954, n=95, últimos 2 anos) | |
| MSI Raider GE66 12UHS | |
| MSI Vector GP66 12UGS | |
| Razer Blade 15 2022 | |
| Asus ROG Strix Scar 15 G533ZW-LN106WS | |
| Lenovo Legion 5 Pro 16 G7 i7 RTX 3070Ti | |
| Gigabyte Aero 16 YE5 | |
| Asus ROG Zephyrus G14 GA402RK | |
| Média Intel Core i9-12900H, NVIDIA GeForce RTX 3070 Ti Laptop GPU (10009 - 12541, n=6) | |
| HP Omen 16-b1090ng | |
| Razer Blade 14 Ryzen 9 6900HX | |
| MSI Pulse GL66 12UEK | |
| CrossMark / Overall | |
| Gigabyte Aero 16 YE5 | |
| MSI Pulse GL66 12UEK | |
| Asus ROG Strix Scar 15 G533ZW-LN106WS | |
| Média da turma Gaming (1366 - 2409, n=94, últimos 2 anos) | |
| Lenovo Legion 5 Pro 16 G7 i7 RTX 3070Ti | |
| Média Intel Core i9-12900H, NVIDIA GeForce RTX 3070 Ti Laptop GPU (1664 - 2044, n=6) | |
| CrossMark / Productivity | |
| MSI Pulse GL66 12UEK | |
| Gigabyte Aero 16 YE5 | |
| Asus ROG Strix Scar 15 G533ZW-LN106WS | |
| Lenovo Legion 5 Pro 16 G7 i7 RTX 3070Ti | |
| Média da turma Gaming (1386 - 2254, n=94, últimos 2 anos) | |
| Média Intel Core i9-12900H, NVIDIA GeForce RTX 3070 Ti Laptop GPU (1591 - 1968, n=6) | |
| CrossMark / Creativity | |
| Média da turma Gaming (1343 - 2786, n=94, últimos 2 anos) | |
| Gigabyte Aero 16 YE5 | |
| Asus ROG Strix Scar 15 G533ZW-LN106WS | |
| MSI Pulse GL66 12UEK | |
| Lenovo Legion 5 Pro 16 G7 i7 RTX 3070Ti | |
| Média Intel Core i9-12900H, NVIDIA GeForce RTX 3070 Ti Laptop GPU (1797 - 2148, n=6) | |
| CrossMark / Responsiveness | |
| MSI Pulse GL66 12UEK | |
| Gigabyte Aero 16 YE5 | |
| Asus ROG Strix Scar 15 G533ZW-LN106WS | |
| Lenovo Legion 5 Pro 16 G7 i7 RTX 3070Ti | |
| Média Intel Core i9-12900H, NVIDIA GeForce RTX 3070 Ti Laptop GPU (1514 - 2069, n=6) | |
| Média da turma Gaming (1226 - 2334, n=94, últimos 2 anos) | |
| PCMark 8 Home Score Accelerated v2 | 6245 pontos | |
| PCMark 8 Work Score Accelerated v2 | 6416 pontos | |
| PCMark 10 Score | 7904 pontos | |
Ajuda | ||
| AIDA64 / Memory Latency | |
| Média da turma Gaming (75.3 - 259, n=105, últimos 2 anos) | |
| Asus ROG Strix Scar 15 G533ZW-LN106WS | |
| Lenovo Legion 5 Pro 16 G7 i7 RTX 3070Ti | |
| MSI Raider GE66 12UHS | |
| MSI Pulse GL66 12UEK | |
| MSI Vector GP66 12UGS | |
| HP Omen 16-b1090ng | |
| Gigabyte Aero 16 YE5 | |
| Média Intel Core i9-12900H (74.7 - 118.1, n=28) | |
| Razer Blade 14 Ryzen 9 6900HX | |
| Asus ROG Zephyrus G14 GA402RK | |
| Razer Blade 15 2022 | |
* ... menor é melhor
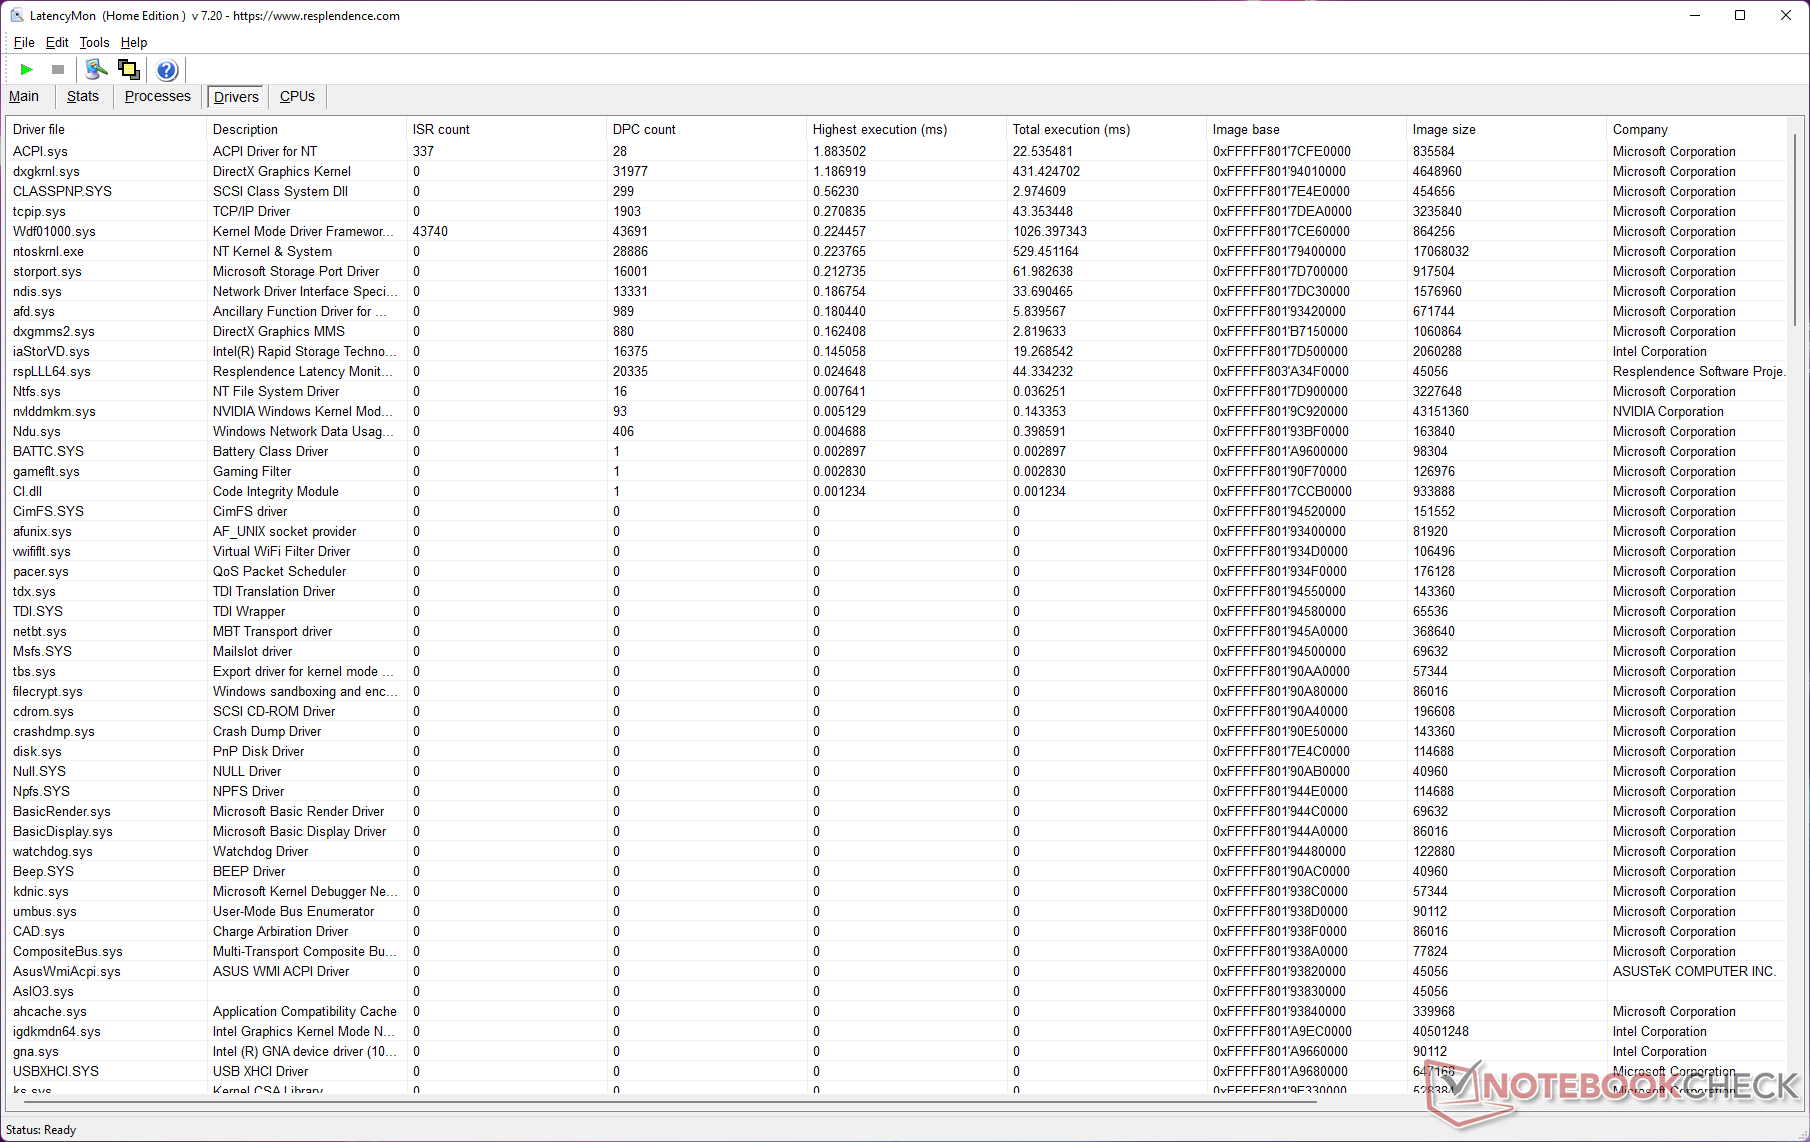
Latência do DPC
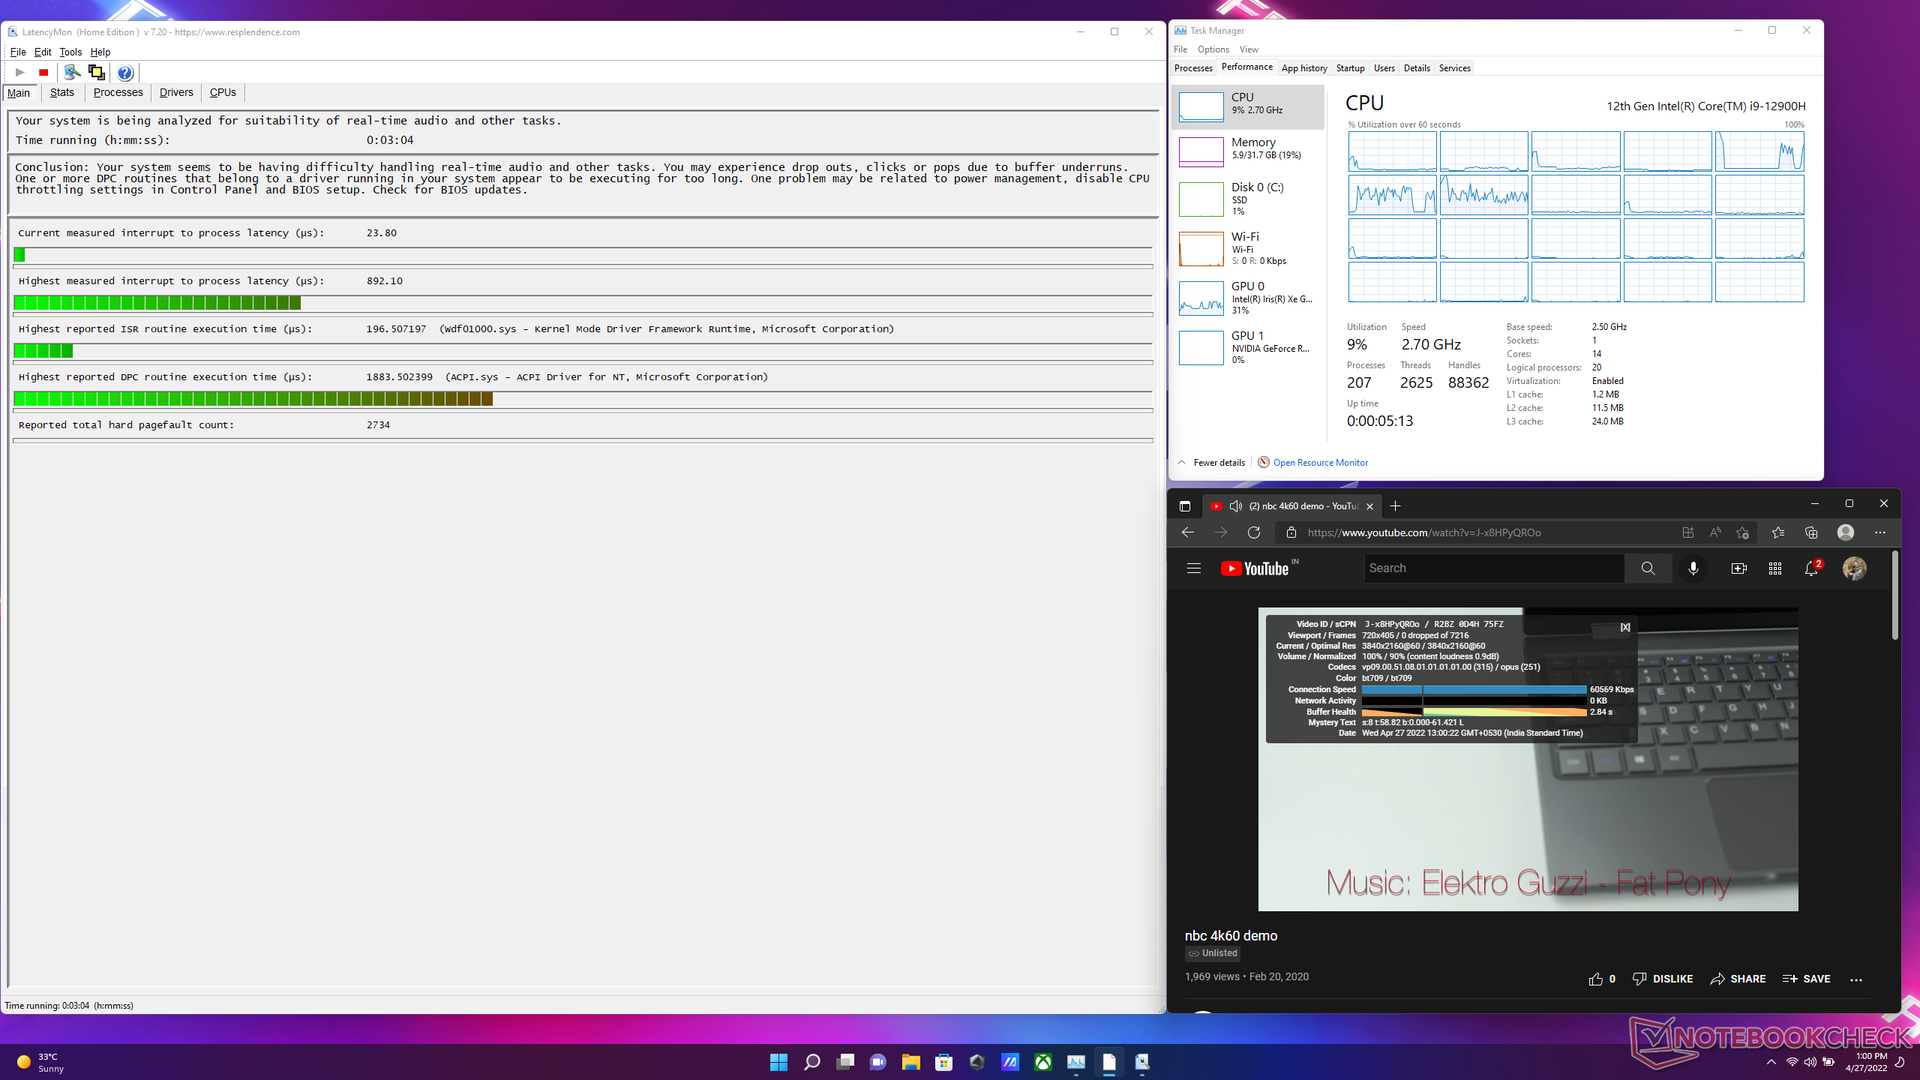
A latência medida do DPC do Scar 15 é menor que a da maioria de sua concorrência. Dito isto, você ainda pode encontrar soluços potenciais quando se trata de fluxos de trabalho de áudio e vídeo em tempo real. O componente de gerenciamento de energia do Windows, ACPI.sys, parece ser a razão para a alta latência de DPC observada.
| DPC Latencies / LatencyMon - interrupt to process latency (max), Web, Youtube, Prime95 | |
| MSI Raider GE66 12UHS | |
| Asus ROG Zephyrus G14 GA402RK | |
| MSI Vector GP66 12UGS | |
| Razer Blade 15 2022 | |
| Razer Blade 14 Ryzen 9 6900HX | |
| MSI Pulse GL66 12UEK | |
| Asus ROG Strix Scar 15 G533ZW-LN106WS | |
| Lenovo Legion 5 Pro 16 G7 i7 RTX 3070Ti | |
| HP Omen 16-b1090ng | |
| Gigabyte Aero 16 YE5 | |
* ... menor é melhor
Nosso dedicado Ranking de Latência DPC fornece mais comparações de latência entre os dispositivos revisados.
Dispositivos de armazenamento
Nossa unidade ROG Strix Scar 15 veio com um SSD 2 TB Samsung PM9A1 NVMe SSD. Seu desempenho de referência é comparável a outros laptops equipados com PM9A1.
Entretanto, o acionamento acelera significativamente após o sexto loop no DiskSpd sustentado lê a uma profundidade de 8 da fila, pois não há solução térmica fornecida nem no acionamento nem no painel inferior.
Não há espaço para a instalação de unidades SATA de 2,5 polegadas. Entretanto, o Asus fornece um slot M.2 secundário para adicionar outra expansão de armazenamento NVMe.

| Asus ROG Strix Scar 15 G533ZW Samsung PM9A1 MZVL22T0HBLB | MSI Pulse GL66 12UEK Micron 2450 512GB MTFDKBA512TFK | Gigabyte Aero 16 YE5 Phison ESR01TBMFCT | MSI Vector GP66 12UGS | MSI Raider GE66 12UHS Samsung PM9A1 MZVL22T0HBLB | HP Omen 16-b1090ng WDC PC SN810 1TB | Lenovo Legion 5 Pro 16 G7 i7 RTX 3070Ti Samsung PM9A1 MZVL21T0HCLR | Razer Blade 14 Ryzen 9 6900HX Samsung PM9A1 MZVL21T0HCLR | Asus ROG Zephyrus G14 GA402RK Micron 2450 1TB MTFDKBK1T0TFK | Razer Blade 15 2022 SSSTC CA6-8D1024 | Média Samsung PM9A1 MZVL22T0HBLB | Média da turma Gaming | |
|---|---|---|---|---|---|---|---|---|---|---|---|---|
| Drive Performance rating | ||||||||||||
| Percent (pt) | 87.6 | 60.6 -31% | 89.4 2% | 62.8 -28% | 85.2 -3% | 67.3 -23% | 89.8 3% | 85.1 -3% | 64.2 -27% | 78.8 -10% | 76.2 -13% | 71.9 -18% |
| DiskSpd | -21% | 9% | -20% | 1% | -16% | 11% | 4% | -27% | -3% | -6% | -11% | |
| seq read (MB/s) | 2397 | 2038 -15% | 3819 59% | 2119 -12% | 3813 59% | 3928 64% | 4486 87% | 4352 82% | 2262 -6% | 4119 72% | 3903 ? 63% | 3556 ? 48% |
| seq write (MB/s) | 4488 | 3275 -27% | 4457 -1% | 3405 -24% | 3838 -14% | 4033 -10% | 4368 -3% | 4240 -6% | 3454 -23% | 4167 -7% | 4101 ? -9% | 3957 ? -12% |
| seq q8 t1 read (MB/s) | 7006 | 3613 -48% | 7028 0% | 3563 -49% | 5358 -24% | 6867 -2% | 6637 -5% | 6670 -5% | 3563 -49% | 6921 -1% | 7079 ? 1% | 7552 ? 8% |
| seq q8 t1 write (MB/s) | 5263 | 3351 -36% | 5004 -5% | 3448 -34% | 4951 -6% | 5412 3% | 4940 -6% | 4995 -5% | 3455 -34% | 4740 -10% | 5439 ? 3% | 5961 ? 13% |
| 4k q1 t1 read (MB/s) | 86.8 | 71.5 -18% | 88.7 2% | 69.5 -20% | 88.3 2% | 77.1 -11% | 97.4 12% | 79.8 -8% | 62.4 -28% | 79.6 -8% | 77.3 ? -11% | 70.3 ? -19% |
| 4k q1 t1 write (MB/s) | 294 | 421 43% | 373 27% | 408 39% | 273 -7% | 205 -30% | 274 -7% | 196.8 -33% | 249 -15% | 256 -13% | 212 ? -28% | 195.9 ? -33% |
| 4k q32 t16 read (MB/s) | 3975 | 1550 -61% | 3555 -11% | 1844 -54% | 4068 2% | 1528 -62% | 4158 5% | 4174 5% | 1841 -54% | 3184 -20% | 2860 ? -28% | 2264 ? -43% |
| 4k q32 t16 write (MB/s) | 3509 | 3249 -7% | 3612 3% | 3354 -4% | 3478 -1% | 585 -83% | 3544 1% | 3559 1% | 3364 -4% | 2141 -39% | 2177 ? -38% | 1832 ? -48% |
| AS SSD | -116% | -6% | -242% | -6% | -29% | -0% | -37% | -116% | -33% | -28% | -42% | |
| Score Total (Points) | 9031 | 4693 -48% | 9380 4% | 6130 -32% | 8959 -1% | 5985 -34% | 9094 1% | 9147 1% | 7568 -16% | 7659 -15% | 7177 ? -21% | 6872 ? -24% |
| Score Read (Points) | 3378 | 1878 -44% | 3634 8% | 2008 -41% | 3341 -1% | 1994 -41% | 3380 0% | 3439 2% | 2722 -19% | 3431 2% | 2615 ? -23% | 2248 ? -33% |
| Score Write (Points) | 3999 | 1837 -54% | 3991 0% | 3087 -23% | 3977 -1% | 3093 -23% | 4043 1% | 4026 1% | 3451 -14% | 2563 -36% | 3292 ? -18% | 3547 ? -11% |
| Seq Read (MB/s) | 5563.48 | 3127 -44% | 5588 0% | 3080 -45% | 5098.97 -8% | 5396.69 -3% | 5036 -9% | 5482.07 -1% | 3209 -42% | 5750 3% | 5454 ? -2% | 5591 ? 0% |
| Seq Write (MB/s) | 4045.87 | 2977 -26% | 3267 -19% | 2997 -26% | 3667.77 -9% | 2667.04 -34% | 3784 -6% | 4007.19 -1% | 3131 -23% | 4073 1% | 3968 ? -2% | 3972 ? -2% |
| 4K Read (MB/s) | 81.3 | 95.9 18% | 109.4 35% | 70 -14% | 84.06 3% | 73.81 -9% | 88.1 8% | 73.78 -9% | 77.7 -4% | 67.2 -17% | 72 ? -11% | 71.1 ? -13% |
| 4K Write (MB/s) | 248.96 | 363.5 46% | 321.6 29% | 352 41% | 244.47 -2% | 247.26 -1% | 240.4 -3% | 174.19 -30% | 218.3 -12% | 221.3 -11% | 195.9 ? -21% | 215 ? -14% |
| 4K-64 Read (MB/s) | 2740.24 | 1469 -46% | 2966 8% | 1630 -41% | 2747.2 0% | 1380.56 -50% | 2788 2% | 2816.7 3% | 2323 -15% | 2789 2% | 1998 ? -27% | 1618 ? -41% |
| 4K-64 Write (MB/s) | 3345.62 | 1175 -65% | 3342 0% | 2435 -27% | 3365.94 1% | 2579.14 -23% | 3424 2% | 3450.87 3% | 2920 -13% | 1934 -42% | 2700 ? -19% | 2935 ? -12% |
| Access Time Read * (ms) | 0.022 | 0.051 -132% | 0.056 -155% | 0.033 -50% | 0.032 -45% | 0.045 -105% | 0.02 9% | 0.035 -59% | 0.065 -195% | 0.023 -5% | 0.03461 ? -57% | 0.06364 ? -189% |
| Access Time Write * (ms) | 0.017 | 0.167 -882% | 0.012 29% | 0.425 -2400% | 0.018 -6% | 0.016 6% | 0.018 -6% | 0.07 -312% | 0.174 -924% | 0.058 -241% | 0.03473 ? -104% | 0.03794 ? -123% |
| Média Total (Programa/Configurações) | -56% /
-74% | 2% /
1% | -97% /
-142% | -3% /
-3% | -23% /
-24% | 5% /
4% | -12% /
-19% | -57% /
-76% | -15% /
-20% | -16% /
-18% | -24% /
-28% |
* ... menor é melhor
Disk Throttling: DiskSpd Read Loop, Queue Depth 8
Consulte nosso SSD e HDD Benchmarks para mais comparações de dispositivos de armazenamento.
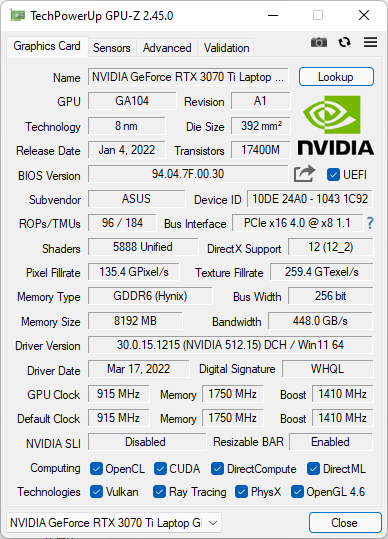
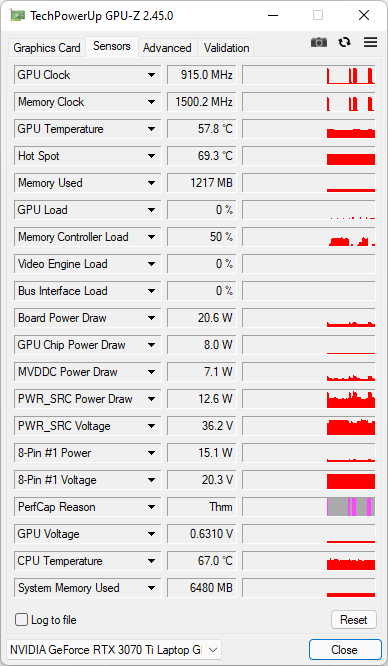
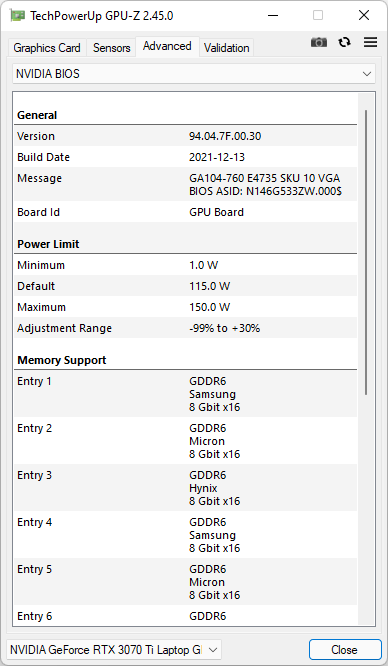
Desempenho da GPU
Nossa unidade ROG Strix Scar 15 apresenta um Nvidia GeForce RTX 3070 Ti GPU para notebook com uma potência gráfica total (TGP) de 150 W (125 W + 25 W Dynamic Boost)
O desempenho geral do 3DMark está no mesmo nível de um Radeon RX 6800S no Asus ROG Zephyrus G14. Desempenho no 3DMark Fire Strike Gráficos e 3DMark Time Spy Trilhas gráficas em 5% e 12%, respectivamente, quando comparadas com oGPU para laptop RTX 3080 Ti no MSI Raider GE66 12UHS.
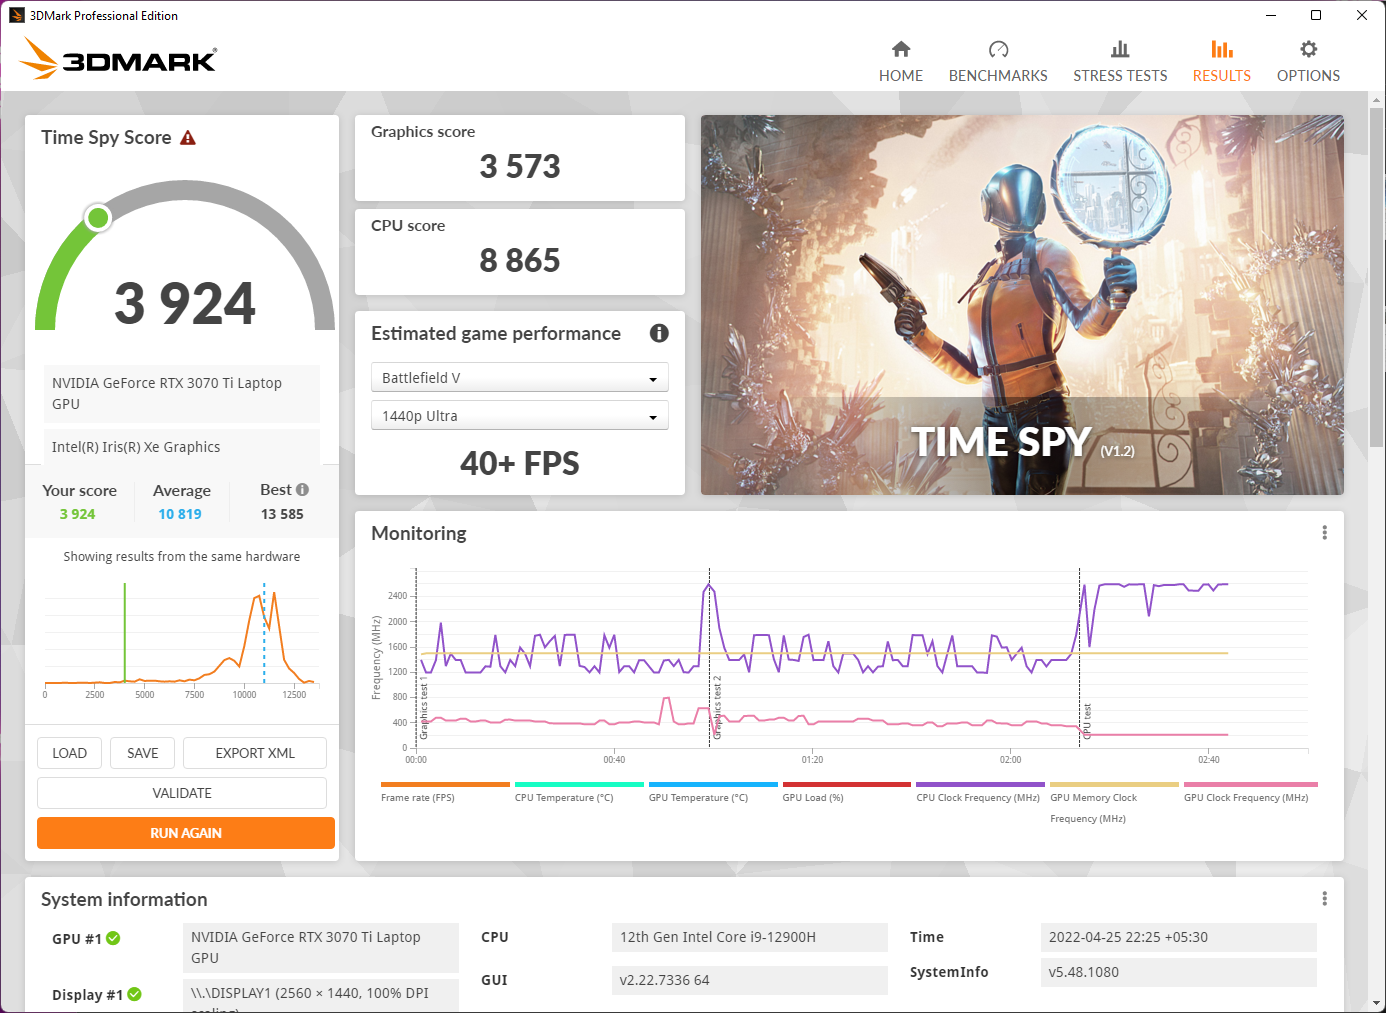
O desempenho da GPU leva uma grande batida na energia da bateria. Observamos uma redução de 68% na pontuação da Time Spy Graphics. O notebook muda automaticamente para o modo de desempenho Silent e a taxa de atualização do display é reduzida de 240 Hz para 60 Hz ao desconectar o adaptador de energia. De acordo com o 3DMark, as pontuações baixas na bateria ainda se correlacionam com um desempenho equivalente a 40+ fps em um título como
a 1440p Ultra.Como mencionado anteriormente, o Asus permite usar um interruptor MUX via Armory Crate para contornar o iGPU. O Asus reivindica até 9% de benefício de desempenho ao fazê-lo, mas sua quilometragem irá variar dependendo do jogo ou da carga gráfica.
A tabela abaixo mostra uma comparação entre os modos padrão MSHybrid e MUX no 3DMark Time Spy e Fire Strike testes gráficos. Embora vejamos uma pequena vantagem, a diferença está bem dentro da margem de erro para ser considerada significativa.
O interruptor MUX dedicado ainda é um recurso agradável de se ter, no entanto, e pode vir a calhar com jogos do mundo real, particularmente para empurrar mais quadros a 1080p.
| 3DMark Test | Standard MSHybrid | MUX Switch |
|---|---|---|
| Fire Strike Pontuação | 24123 | 25390 (+1,1%) |
| Fire Strike Gráficos | 29292 | 29811 (+1,77%) |
| Fire Strike Física | 30624 | 30101 (-1,70%) |
| Time Spy Pontuação | 11481 | 11724 (+2,11%) |
| Time Spy Gráficos | 11197 | 11374 (+1,58%) |
| Time Spy CPU | 13413 | 14204 (+5,9%) |
| 3DMark 11 Performance | 34211 pontos | |
| 3DMark Ice Storm Standard Score | 118774 pontos | |
| 3DMark Cloud Gate Standard Score | 58464 pontos | |
| 3DMark Fire Strike Score | 24123 pontos | |
| 3DMark Fire Strike Extreme Score | 13949 pontos | |
| 3DMark Time Spy Score | 11481 pontos | |
Ajuda | ||
Desempenho nos jogos
O desempenho em jogos testados está nas linhas previstas. A GPU para laptop RTX 3070 Ti é bastante capaz de 4K jogos em um display externo pelo menos em configurações High se não em Ultra. Os jogos de QHD são totalmente possíveis com todos os detalhes acionados até o máximo. O rastreamento de raios é um sucesso quando comparado a uma GPU por laptop RTX 3080 Ti, mas quadros jogáveis devem ser alcançáveis com DLSS em títulos suportados.
| The Witcher 3 | |
| 1920x1080 Ultra Graphics & Postprocessing (HBAO+) | |
| Média da turma Gaming (104.7 - 240, n=7, últimos 2 anos) | |
| MSI Vector GP66 12UGS | |
| Asus ROG Strix Scar 15 G533ZW-LN106WS | |
| MSI Raider GE66 12UHS | |
| Razer Blade 15 2022 | |
| Lenovo Legion 5 Pro 16 G7 i7 RTX 3070Ti | |
| Média NVIDIA GeForce RTX 3070 Ti Laptop GPU (76.8 - 124.1, n=39) | |
| HP Omen 16-b1090ng | |
| Razer Blade 14 Ryzen 9 6900HX | |
| Asus ROG Zephyrus G14 GA402RK | |
| Gigabyte Aero 16 YE5 | |
| MSI Pulse GL66 12UEK | |
| 3840x2160 High Graphics & Postprocessing (Nvidia HairWorks Off) | |
| Média da turma Gaming (114 - 170.9, n=4, últimos 2 anos) | |
| Asus ROG Strix Scar 15 G533ZW-LN106WS | |
| MSI Raider GE66 12UHS | |
| Média NVIDIA GeForce RTX 3070 Ti Laptop GPU (73.2 - 78, n=2) | |
| Gigabyte Aero 16 YE5 | |
| 3840x2160 Ultra Graphics & Postprocessing (HBAO+) | |
| Média da turma Gaming (112.4 - 114.8, n=2, últimos 2 anos) | |
| Asus ROG Strix Scar 15 G533ZW-LN106WS | |
| Média NVIDIA GeForce RTX 3070 Ti Laptop GPU (48.4 - 52.3, n=2) | |
| Gigabyte Aero 16 YE5 | |
| F1 2021 | |
| 1920x1080 Ultra High Preset + Raytracing AA:T AF:16x | |
| MSI Raider GE66 12UHS | |
| Asus ROG Strix Scar 15 G533ZW-LN106WS | |
| Lenovo Legion 5 Pro 16 G7 i7 RTX 3070Ti | |
| Asus ROG Zephyrus G14 GA402RK | |
| Média NVIDIA GeForce RTX 3070 Ti Laptop GPU (67.3 - 134.2, n=13) | |
| Gigabyte Aero 16 YE5 | |
| 2560x1440 Ultra High Preset + Raytracing AA:T AF:16x | |
| Lenovo Legion 5 Pro 16 G7 i7 RTX 3070Ti | |
| Asus ROG Strix Scar 15 G533ZW-LN106WS | |
| Gigabyte Aero 16 YE5 | |
| Média NVIDIA GeForce RTX 3070 Ti Laptop GPU (47.5 - 99.2, n=11) | |
| Asus ROG Zephyrus G14 GA402RK | |
| 3840x2160 Ultra High Preset + Raytracing AA:T AF:16x | |
| Asus ROG Strix Scar 15 G533ZW-LN106WS | |
| Média NVIDIA GeForce RTX 3070 Ti Laptop GPU (47 - 56.8, n=3) | |
| Gigabyte Aero 16 YE5 | |
| Asus ROG Zephyrus G14 GA402RK | |
| Assassin´s Creed Valhalla | |
| 1920x1080 Ultra High Preset | |
| Asus ROG Zephyrus G14 GA402RK | |
| MSI Raider GE66 12UHS | |
| Asus ROG Strix Scar 15 G533ZW-LN106WS | |
| Média NVIDIA GeForce RTX 3070 Ti Laptop GPU (73 - 80, n=4) | |
| 2560x1440 Ultra High Preset | |
| MSI Raider GE66 12UHS | |
| Asus ROG Zephyrus G14 GA402RK | |
| Asus ROG Strix Scar 15 G533ZW-LN106WS | |
| Média NVIDIA GeForce RTX 3070 Ti Laptop GPU (56 - 62, n=3) | |
| 3840x2160 Ultra High Preset | |
| MSI Raider GE66 12UHS | |
| Asus ROG Strix Scar 15 G533ZW-LN106WS | |
| Média NVIDIA GeForce RTX 3070 Ti Laptop GPU (35 - 37, n=2) | |
| Asus ROG Zephyrus G14 GA402RK | |
A Carta de FPS Witcher 3
Taxas de moldura emO Witcher 3 teste de estresse a 1080p Ultra flutua entre 103 a 113 fps e parece relativamente estável na maior parte do tempo.
| baixo | média | alto | ultra | QHD | 4K | |
|---|---|---|---|---|---|---|
| GTA V (2015) | 182.7 | 184.5 | 172.2 | 123.9 | 101.9 | 98 |
| The Witcher 3 (2015) | 441 | 251 | 209 | 111 | 78 | |
| Dota 2 Reborn (2015) | 187 | 173.3 | 164.8 | 158.4 | 130.2 | |
| Final Fantasy XV Benchmark (2018) | 202 | 129.7 | 95.7 | 72.2 | 43.9 | |
| Far Cry 5 (2018) | 160 | 143 | 138 | 130 | 107 | 61 |
| Strange Brigade (2018) | 519 | 274 | 235 | 196.2 | 148.5 | 87.9 |
| Assassin´s Creed Valhalla (2020) | 160 | 111 | 94 | 80 | 62 | 37 |
| F1 2021 (2021) | 405 | 317 | 238 | 134.2 | 98.4 | 56.8 |
| Cyberpunk 2077 1.6 (2022) | 140.3 | 114.6 | 89.5 | 76 | 46 | 24.6 |
Confira o Nvidia GeForce RTX 3070 Ti GPU para notebook e referência do jogo páginas para mais informações e comparações de desempenho.
Emissões: 150 W RTX 3070 Ti às custas do alto ruído do ventilador
Ruído do sistema
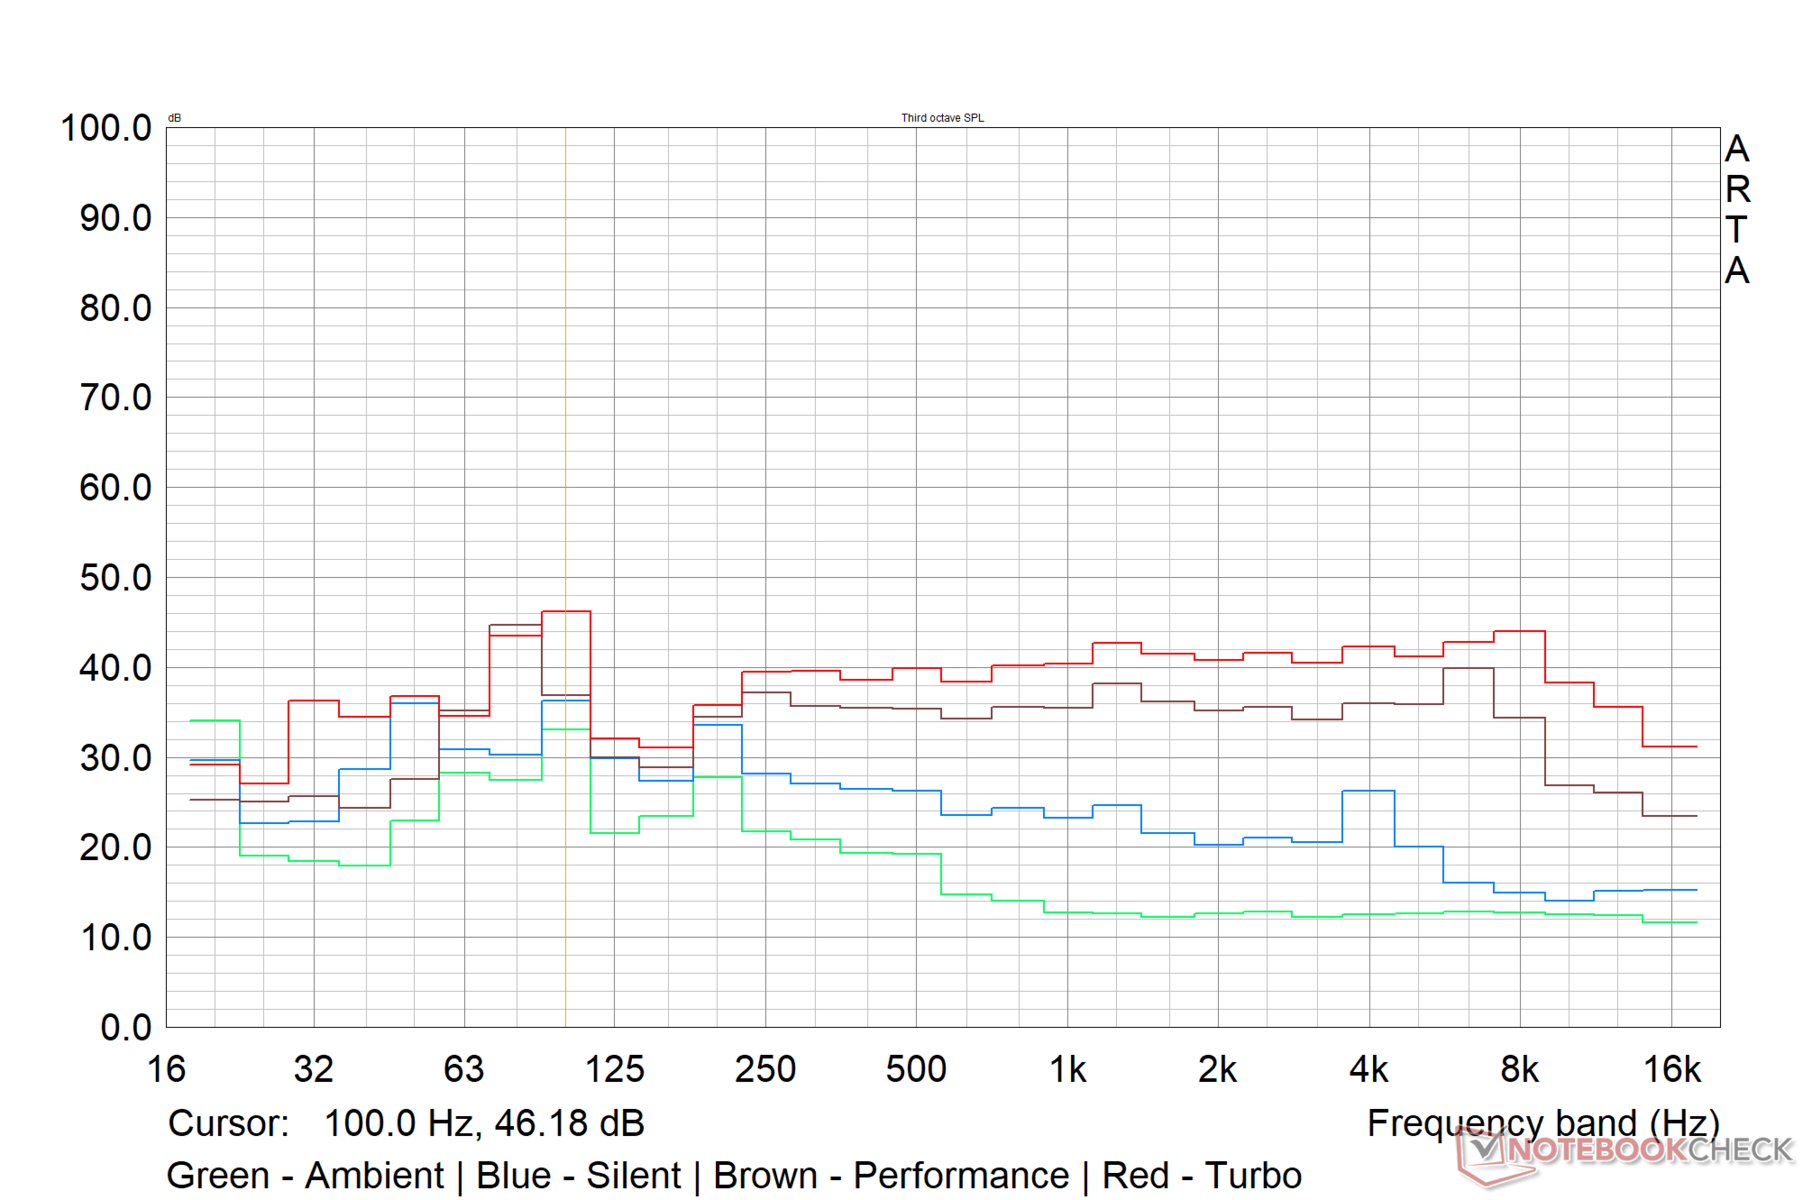
Os ventiladores duplos do ROG Strix Scar 15 são capazes de manter o laptop com bom desempenho sob carga. No entanto, isto se dá às custas de níveis de ruído mais altos, particularmente no modo de desempenho Turbo.
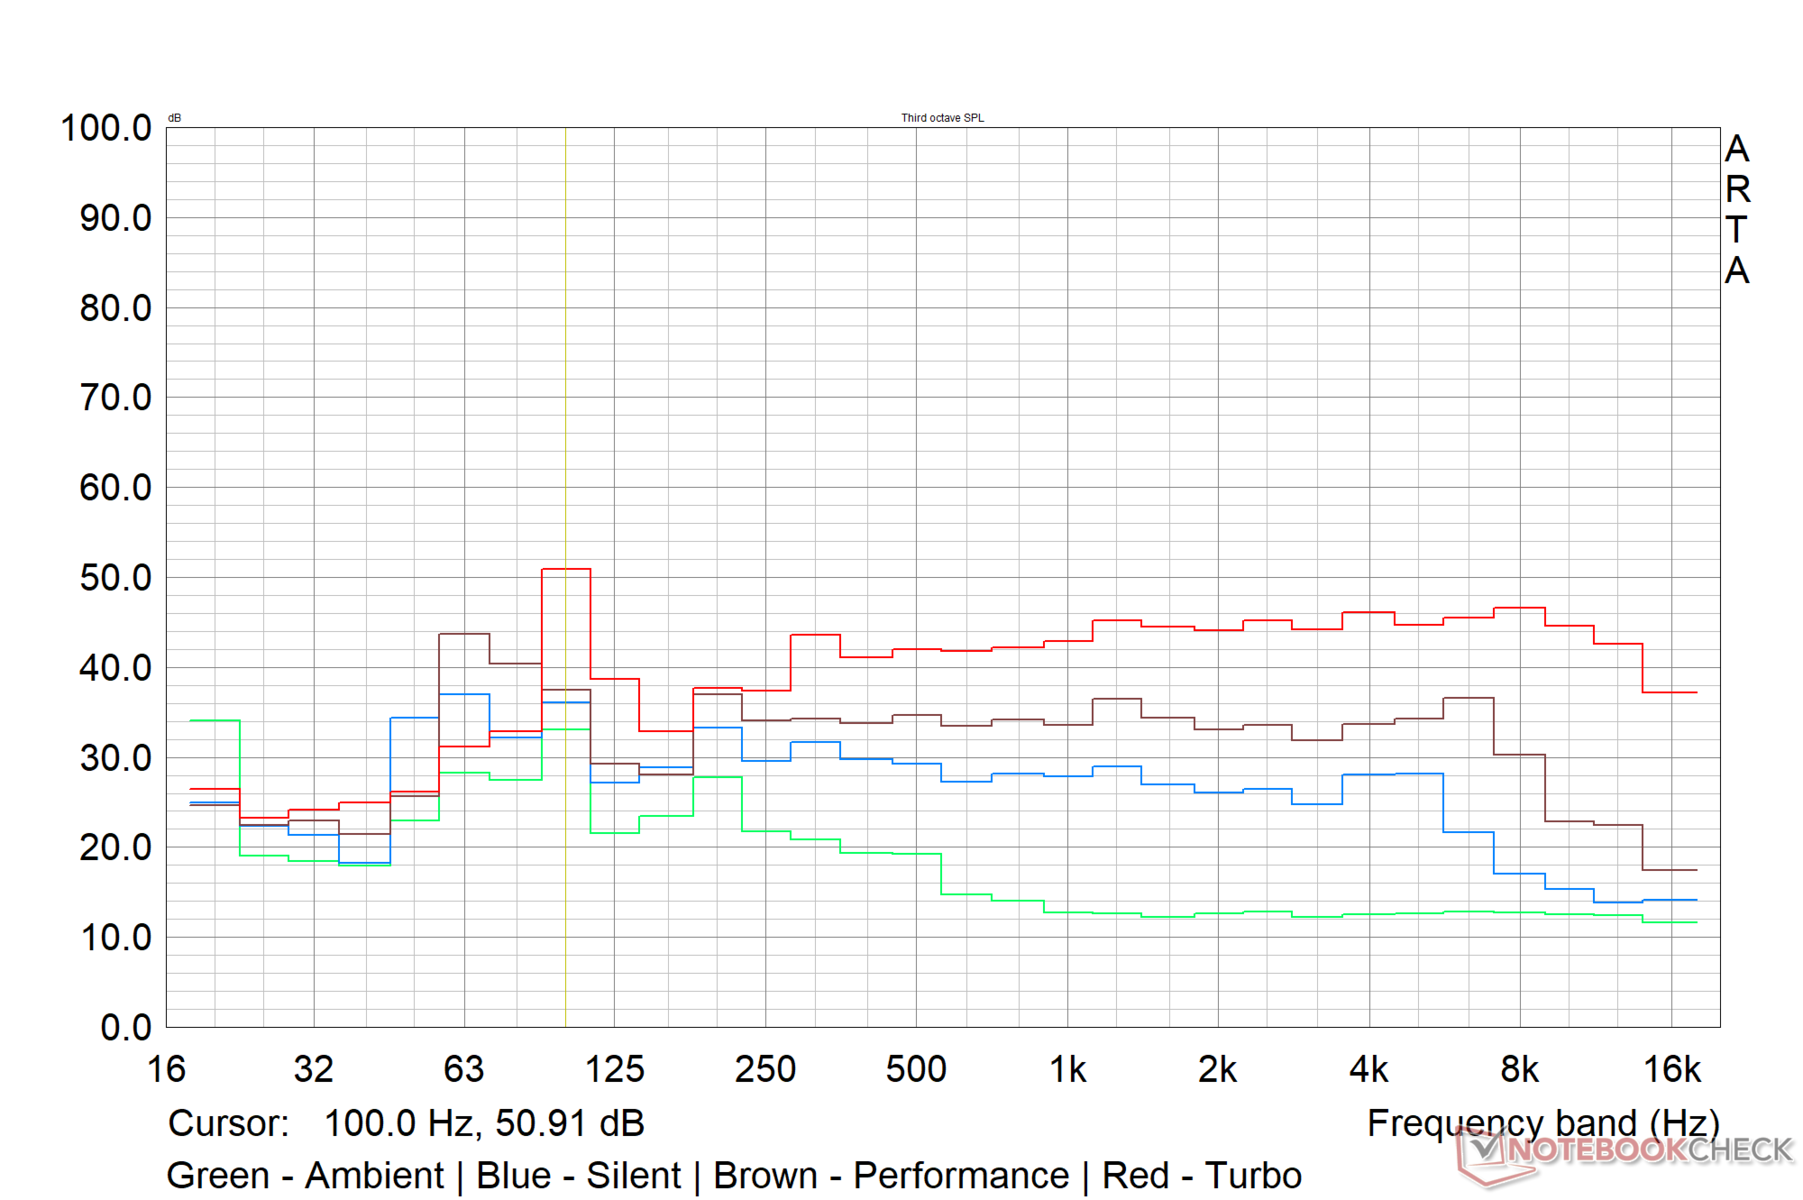
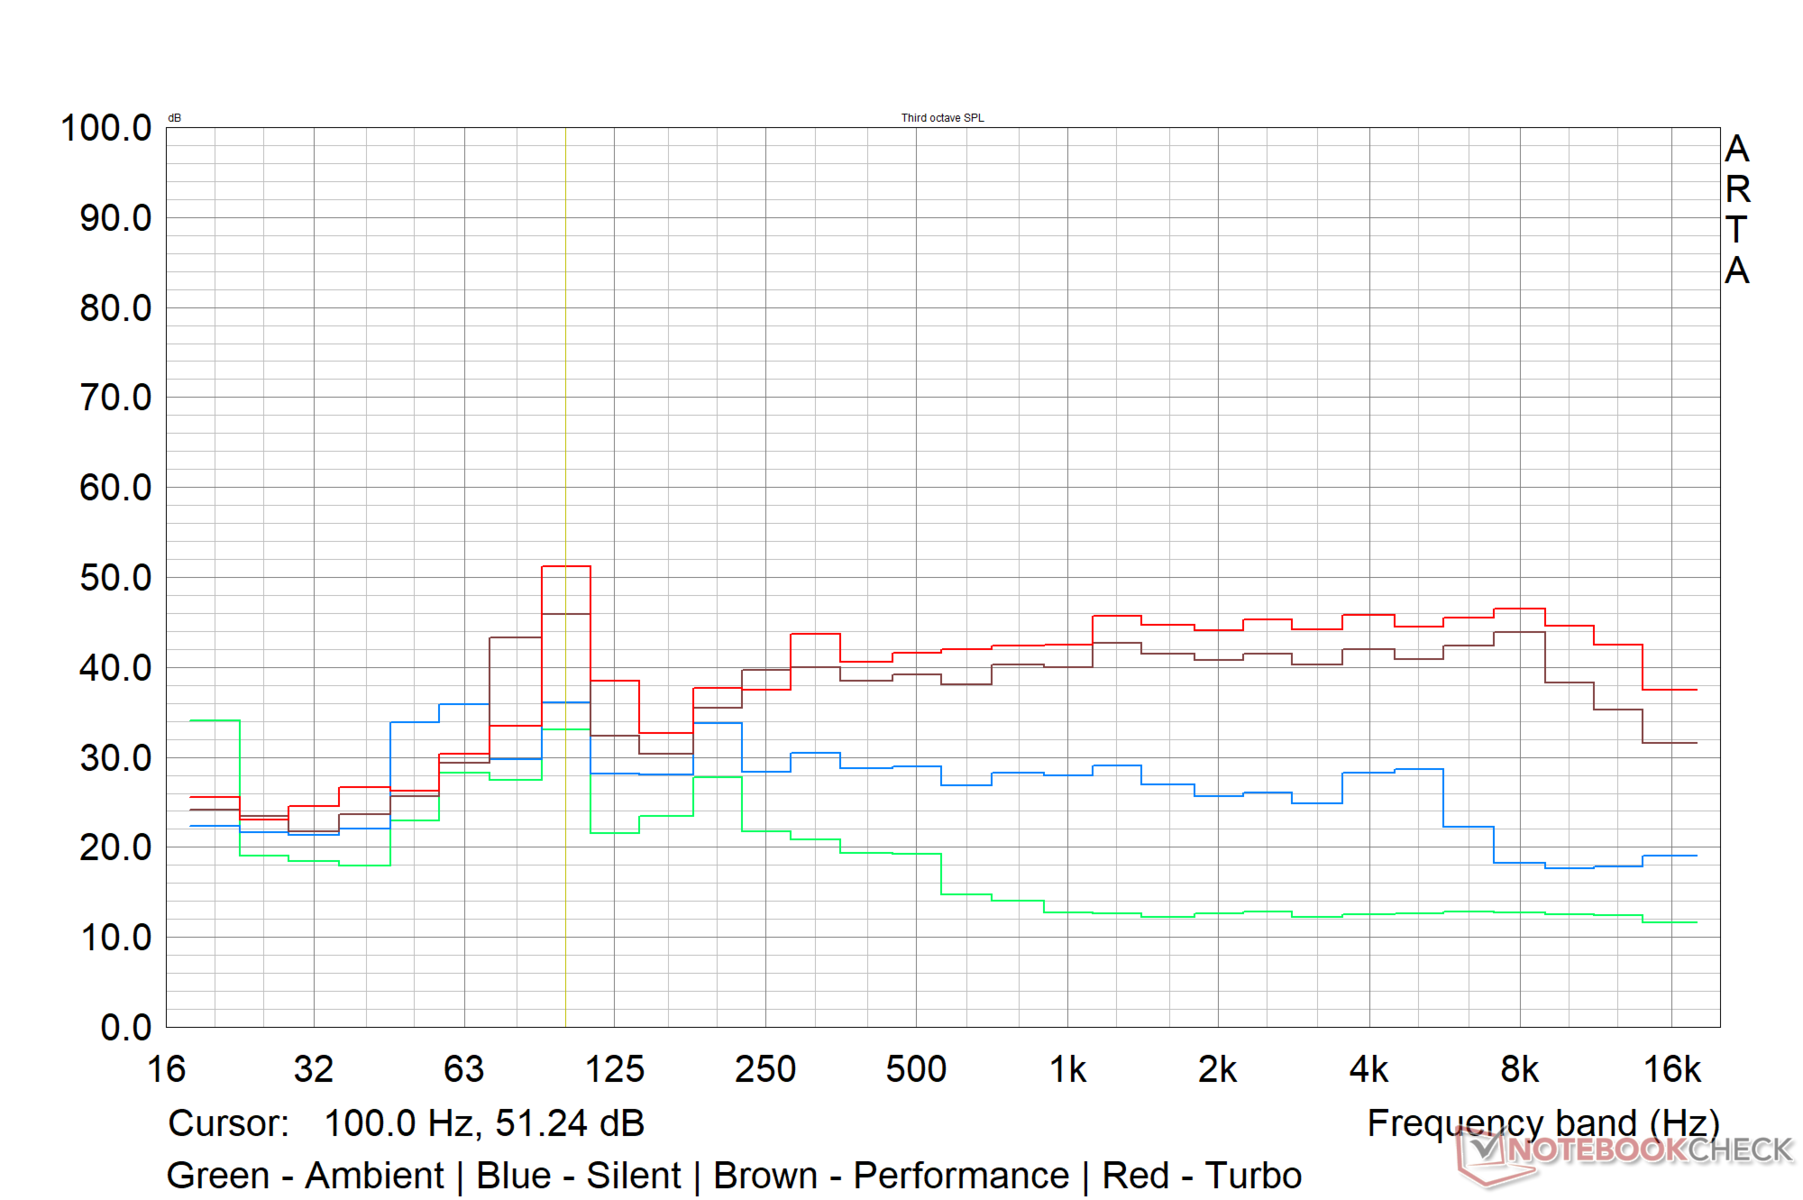
Para medir o ruído dos ventiladores, usamos o microfone de referência omnidirecional Earthworks M23R conectado a uma interface de áudio USB Focusrite Scarlett 2i2 de 3º gênero e calibrado para um nível de pressão sonora de 94 dB(A). A configuração foi colocada a uma distância fixa de 15 cm do laptop durante a gravação.
A Asus afirma que o ruído máximo de operação sob carga nos modos Turbo e Performance seria 48 dB(A), mas registramos níveis de ruído do ventilador de até 56,6 dB(A) tanto na carga máxima quanto nos cenários de ultra tensão
Witcher 3. Os níveis de ruído ocioso também estavam no lado mais alto em Turbo, mas estavam em torno da marca de 29 dB(A) nos modos Silencioso e Performance.
Registramos 39,01 dB(A) como o nível máximo de ruído do ventilador sob carga máxima no perfil Silencioso.
Barulho
| Ocioso |
| 39.07 / 39.07 / 39.07 dB |
| Carga |
| 53.34 / 56.6 dB |
 | ||
30 dB silencioso 40 dB(A) audível 50 dB(A) ruidosamente alto |
||
min: | ||
| Asus ROG Strix Scar 15 G533ZW Intel Core i9-12900H, NVIDIA GeForce RTX 3070 Ti Laptop GPU | MSI Raider GE66 12UHS Intel Core i9-12900HK, NVIDIA GeForce RTX 3080 Ti Laptop GPU | Lenovo Legion 5 Pro 16 G7 i7 RTX 3070Ti Intel Core i7-12700H, NVIDIA GeForce RTX 3070 Ti Laptop GPU | Asus ROG Zephyrus G14 GA402RK AMD Ryzen 9 6900HS, AMD Radeon RX 6800S | Razer Blade 15 2022 Intel Core i7-12800H, NVIDIA GeForce RTX 3080 Ti Laptop GPU | |
|---|---|---|---|---|---|
| Noise | 16% | 16% | 23% | 20% | |
| desligado / ambiente * (dB) | 26.86 | 26 3% | 24.6 8% | 24 11% | 25.4 5% |
| Idle Minimum * (dB) | 39.07 | 27 31% | 28.4 27% | 24 39% | 26.2 33% |
| Idle Average * (dB) | 39.07 | 30 23% | 28.4 27% | 26 33% | 26.2 33% |
| Idle Maximum * (dB) | 39.07 | 39 -0% | 28.4 27% | 31 21% | 28.4 27% |
| Load Average * (dB) | 53.34 | 45 16% | 49.4 7% | 45 16% | 44.7 16% |
| Witcher 3 ultra * (dB) | 56.6 | 45 20% | 49.4 13% | 43 24% | 44.7 21% |
| Load Maximum * (dB) | 56.6 | 47 17% | 54.7 3% | 45 20% | 51.9 8% |
* ... menor é melhor
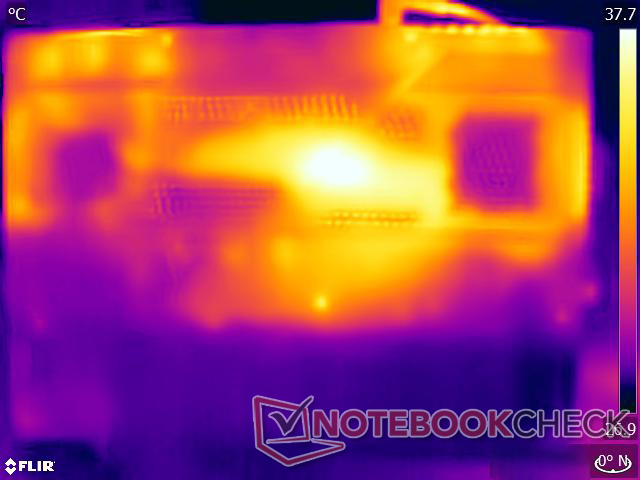
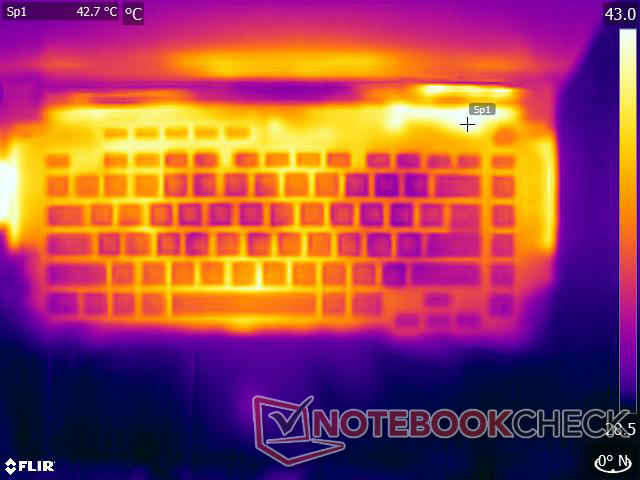
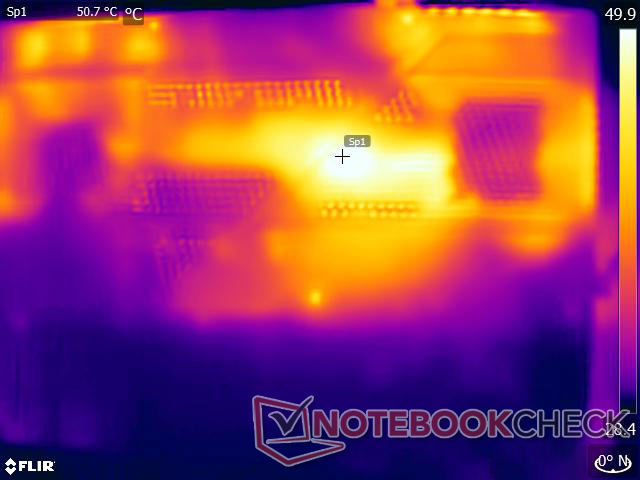
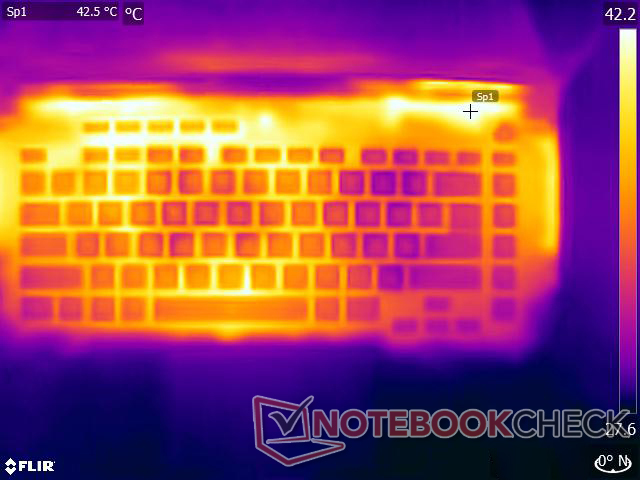
Temperatura
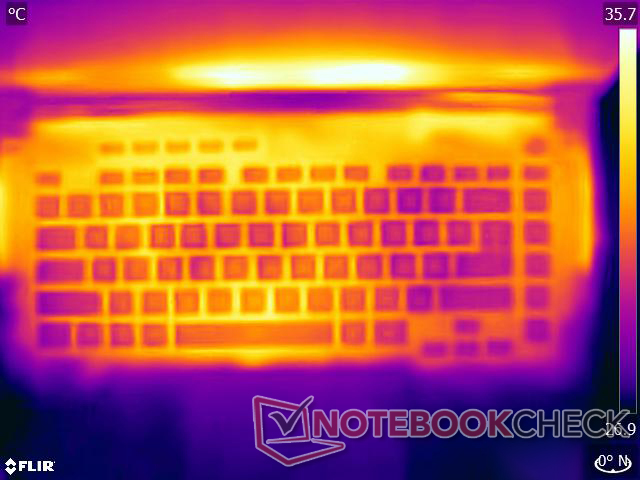
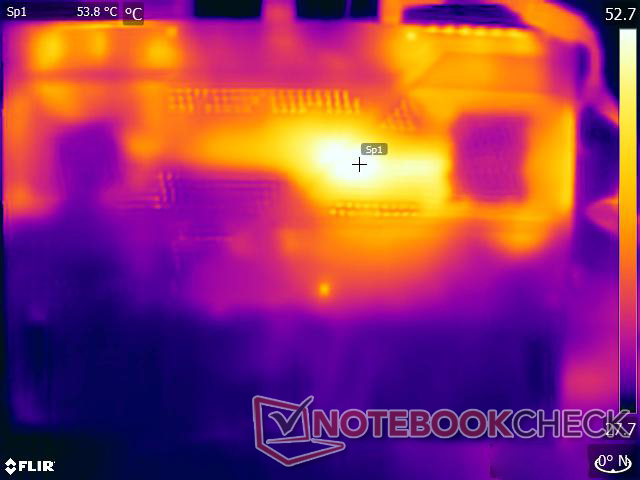
Mesmo com um ventilador duplo e uma tubulação de oito aquecedores, as temperaturas de superfície podem ficar altas sob carga, como geralmente é a norma quando se trata de laptops para jogos. Registramos um máximo de 42,6 °C na parte superior e 50,2 °C nas superfícies inferiores sob uma carga combinada Prime95 + FurMark. Com o Witcher 3, os hotspots superior e inferior foram 48,4 °C e 54,4 °C, respectivamente.
Apesar das temperaturas mais altas da superfície em outros lugares do chassi, o Asus faz um bom trabalho para manter as áreas de descanso das palmas relativamente frias. Se você quiser usar o dispositivo na volta, recomendamos mudar para o perfil Silencioso e não enfatizar muito o dispositivo.
(±) A temperatura máxima no lado superior é 42.6 °C / 109 F, em comparação com a média de 40.4 °C / 105 F , variando de 21.2 a 68.8 °C para a classe Gaming.
(-) A parte inferior aquece até um máximo de 50.2 °C / 122 F, em comparação com a média de 43.2 °C / 110 F
(±) Em uso inativo, a temperatura média para o lado superior é 33.4 °C / 92 F, em comparação com a média do dispositivo de 33.9 °C / ### class_avg_f### F.
(-) Jogando The Witcher 3, a temperatura média para o lado superior é 41.3 °C / 106 F, em comparação com a média do dispositivo de 33.9 °C / ## #class_avg_f### F.
(+) Os apoios para as mãos e o touchpad estão atingindo a temperatura máxima da pele (33.4 °C / 92.1 F) e, portanto, não estão quentes.
(-) A temperatura média da área do apoio para as mãos de dispositivos semelhantes foi 28.8 °C / 83.8 F (-4.6 °C / -8.3 F).
| Asus ROG Strix Scar 15 G533ZW Intel Core i9-12900H, NVIDIA GeForce RTX 3070 Ti Laptop GPU | MSI Raider GE66 12UHS Intel Core i9-12900HK, NVIDIA GeForce RTX 3080 Ti Laptop GPU | Lenovo Legion 5 Pro 16 G7 i7 RTX 3070Ti Intel Core i7-12700H, NVIDIA GeForce RTX 3070 Ti Laptop GPU | Asus ROG Zephyrus G14 GA402RK AMD Ryzen 9 6900HS, AMD Radeon RX 6800S | Razer Blade 15 2022 Intel Core i7-12800H, NVIDIA GeForce RTX 3080 Ti Laptop GPU | |
|---|---|---|---|---|---|
| Heat | -7% | 4% | -1% | -3% | |
| Maximum Upper Side * (°C) | 42.6 | 54 -27% | 45.3 -6% | 55 -29% | 50 -17% |
| Maximum Bottom * (°C) | 50.2 | 65 -29% | 61.2 -22% | 55 -10% | 47 6% |
| Idle Upper Side * (°C) | 36.2 | 30 17% | 28.6 21% | 30 17% | 37.4 -3% |
| Idle Bottom * (°C) | 40.2 | 35 13% | 31.4 22% | 32 20% | 38.4 4% |
* ... menor é melhor
Teste de estresse
Enfatizando o Scar 15 no perfil do Turbo revela insights sobre como os TDPs, temperaturas e relógios variam e como a energia disponível é distribuída entre a CPU e a GPU.
Somente com Prime95, observamos que o Core i9-12900H é capaz de extrair 130 W por um curto período de tempo antes de descer para 120 W e eventualmente assentar entre 100 a 110 W; vimos uma utilização semelhante do TDP durante o teste de loop do Cinebench R15 acima no modo Turbo. Como resultado, a temperatura da CPU pode se manter próxima à marca de 90 °C, com relógios consistentes em quase 3,5 GHz.
Adicionando FurMark à mistura, o RTX 3070 Ti entra em ação. A CPU TDP agora cai apenas um pouco abaixo da marca de 60 W, deixando mais espaço térmico e de energia para a GPU, permitindo que esta última aumente para um pouco acima da marca de 1.500 MHz, embora apenas por um breve período.
O Witcher 3
apresenta uma imagem mais real de como as métricas da CPU e da GPU podem mudar durante os jogos. Aqui, vemos também o Dynamic Boost entrando em ação com o RTX 3070 Ti agora capaz de sustentar razoavelmente bem entre 140 W e 150 W TGP e relógios de impulso a 1.800 MHz. O Core i9-12900H se acomoda a um relógio de 3 GHz com uma necessidade muito menor de TDP de apenas cerca de 25 W.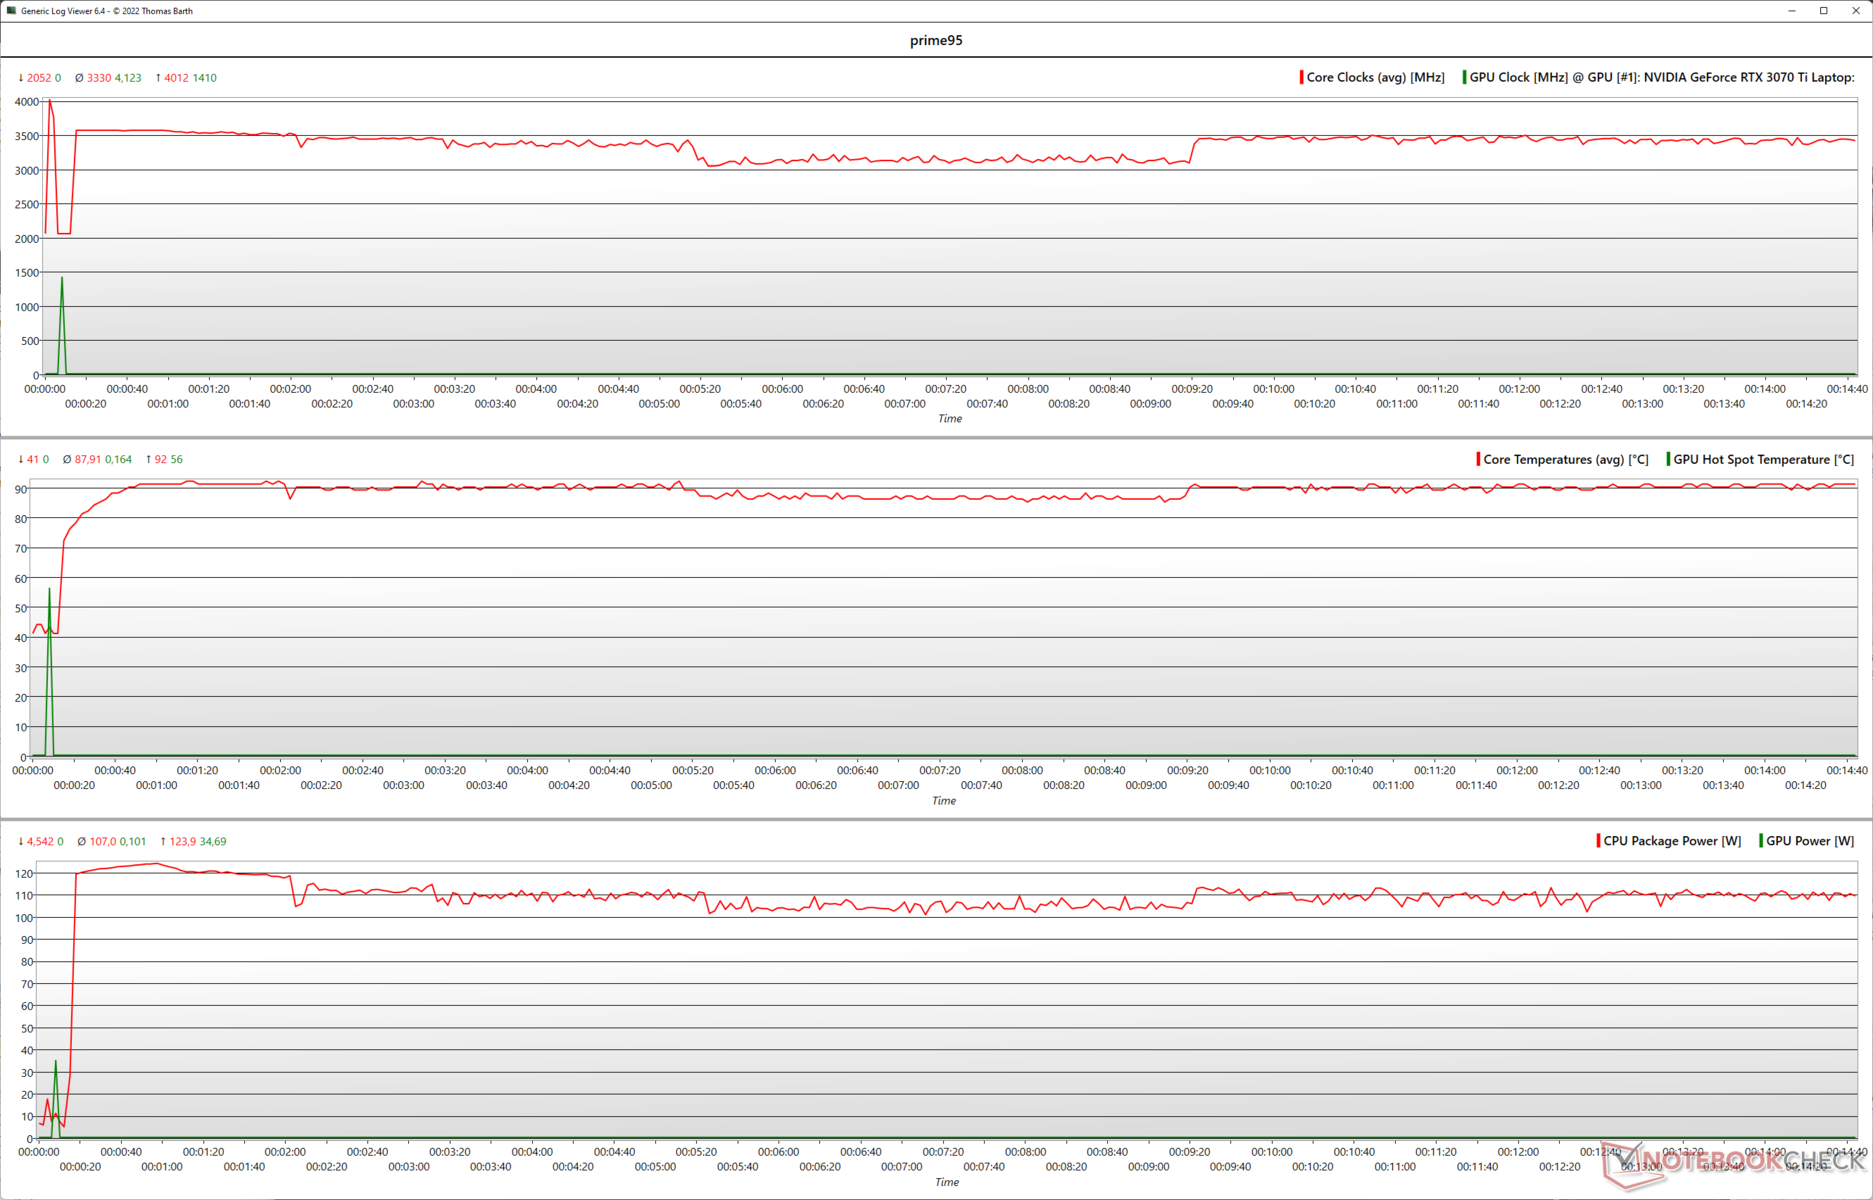
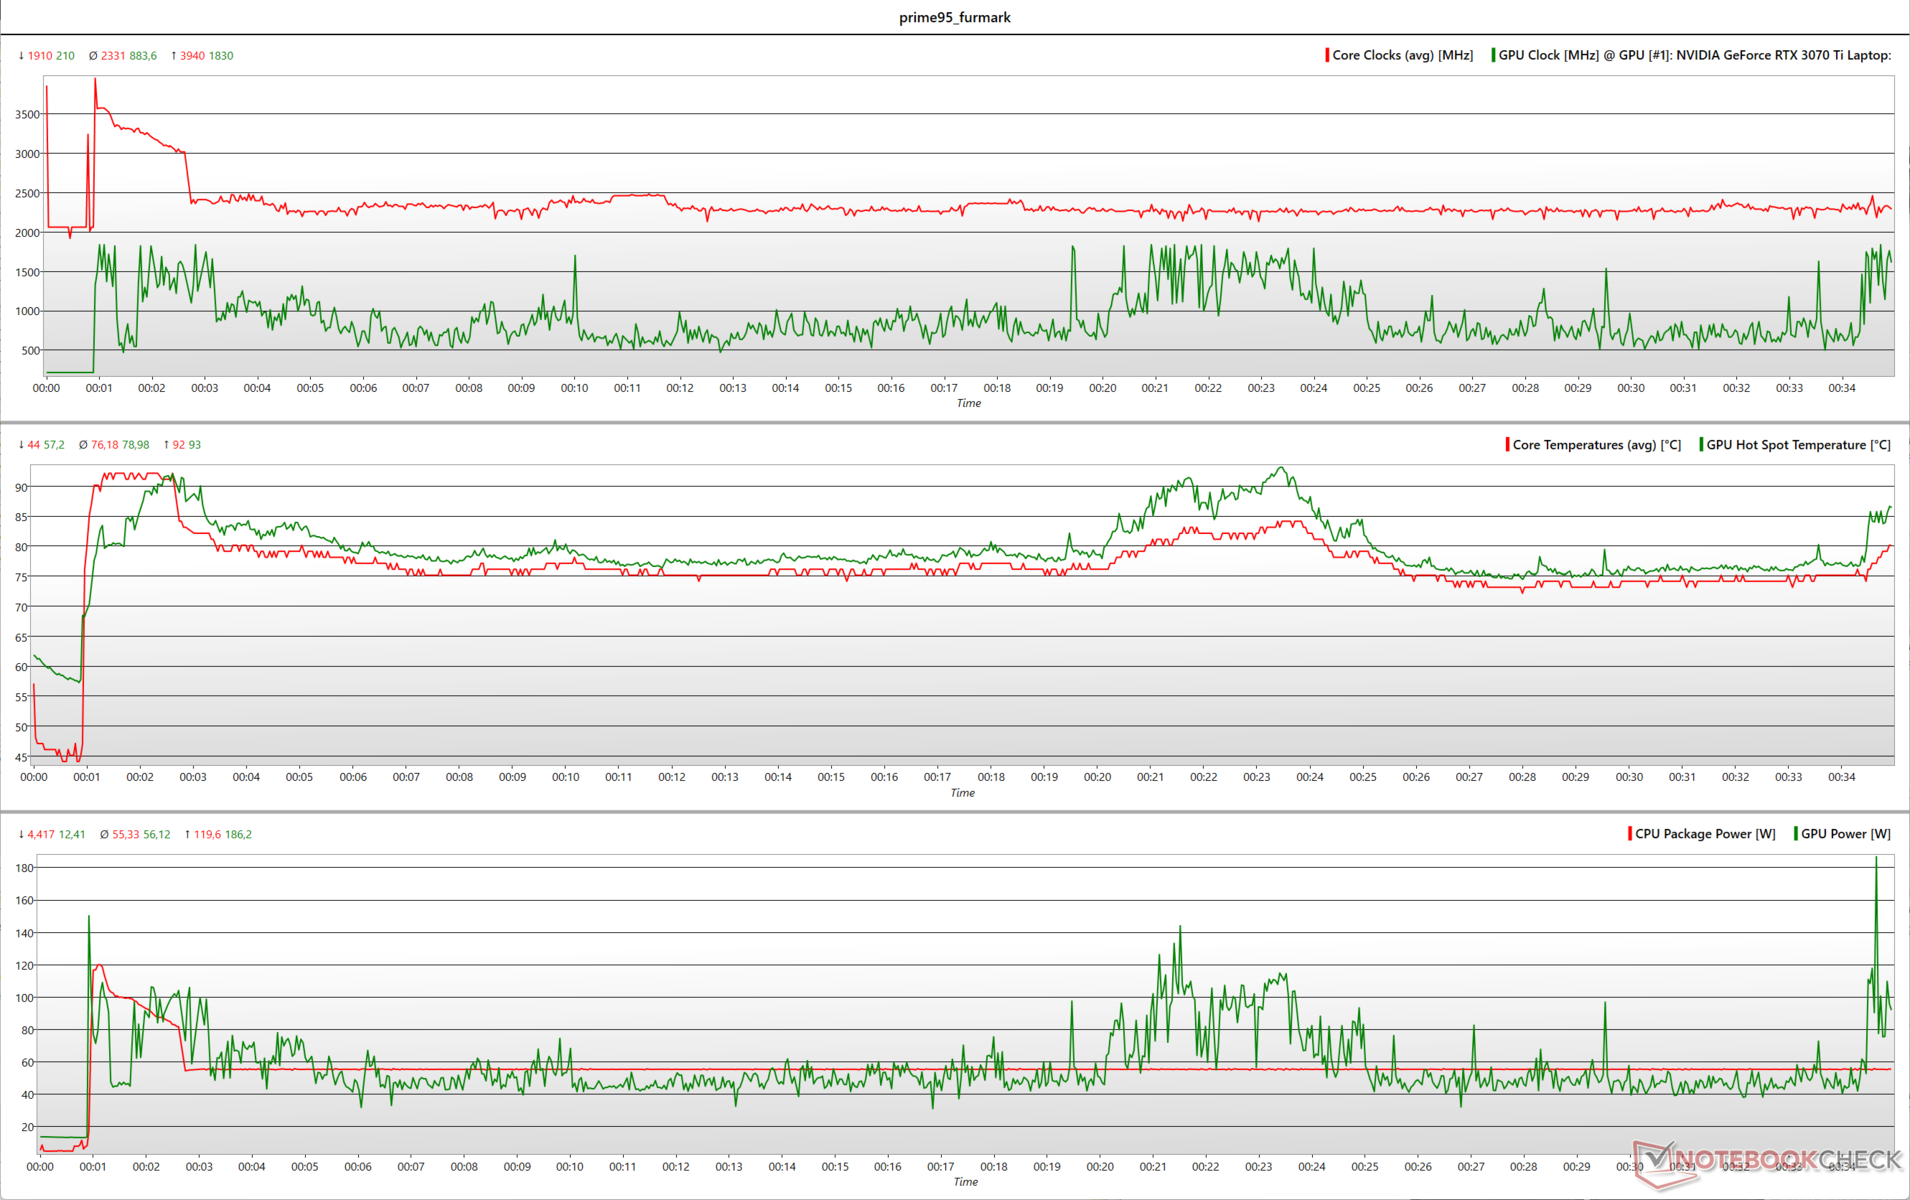
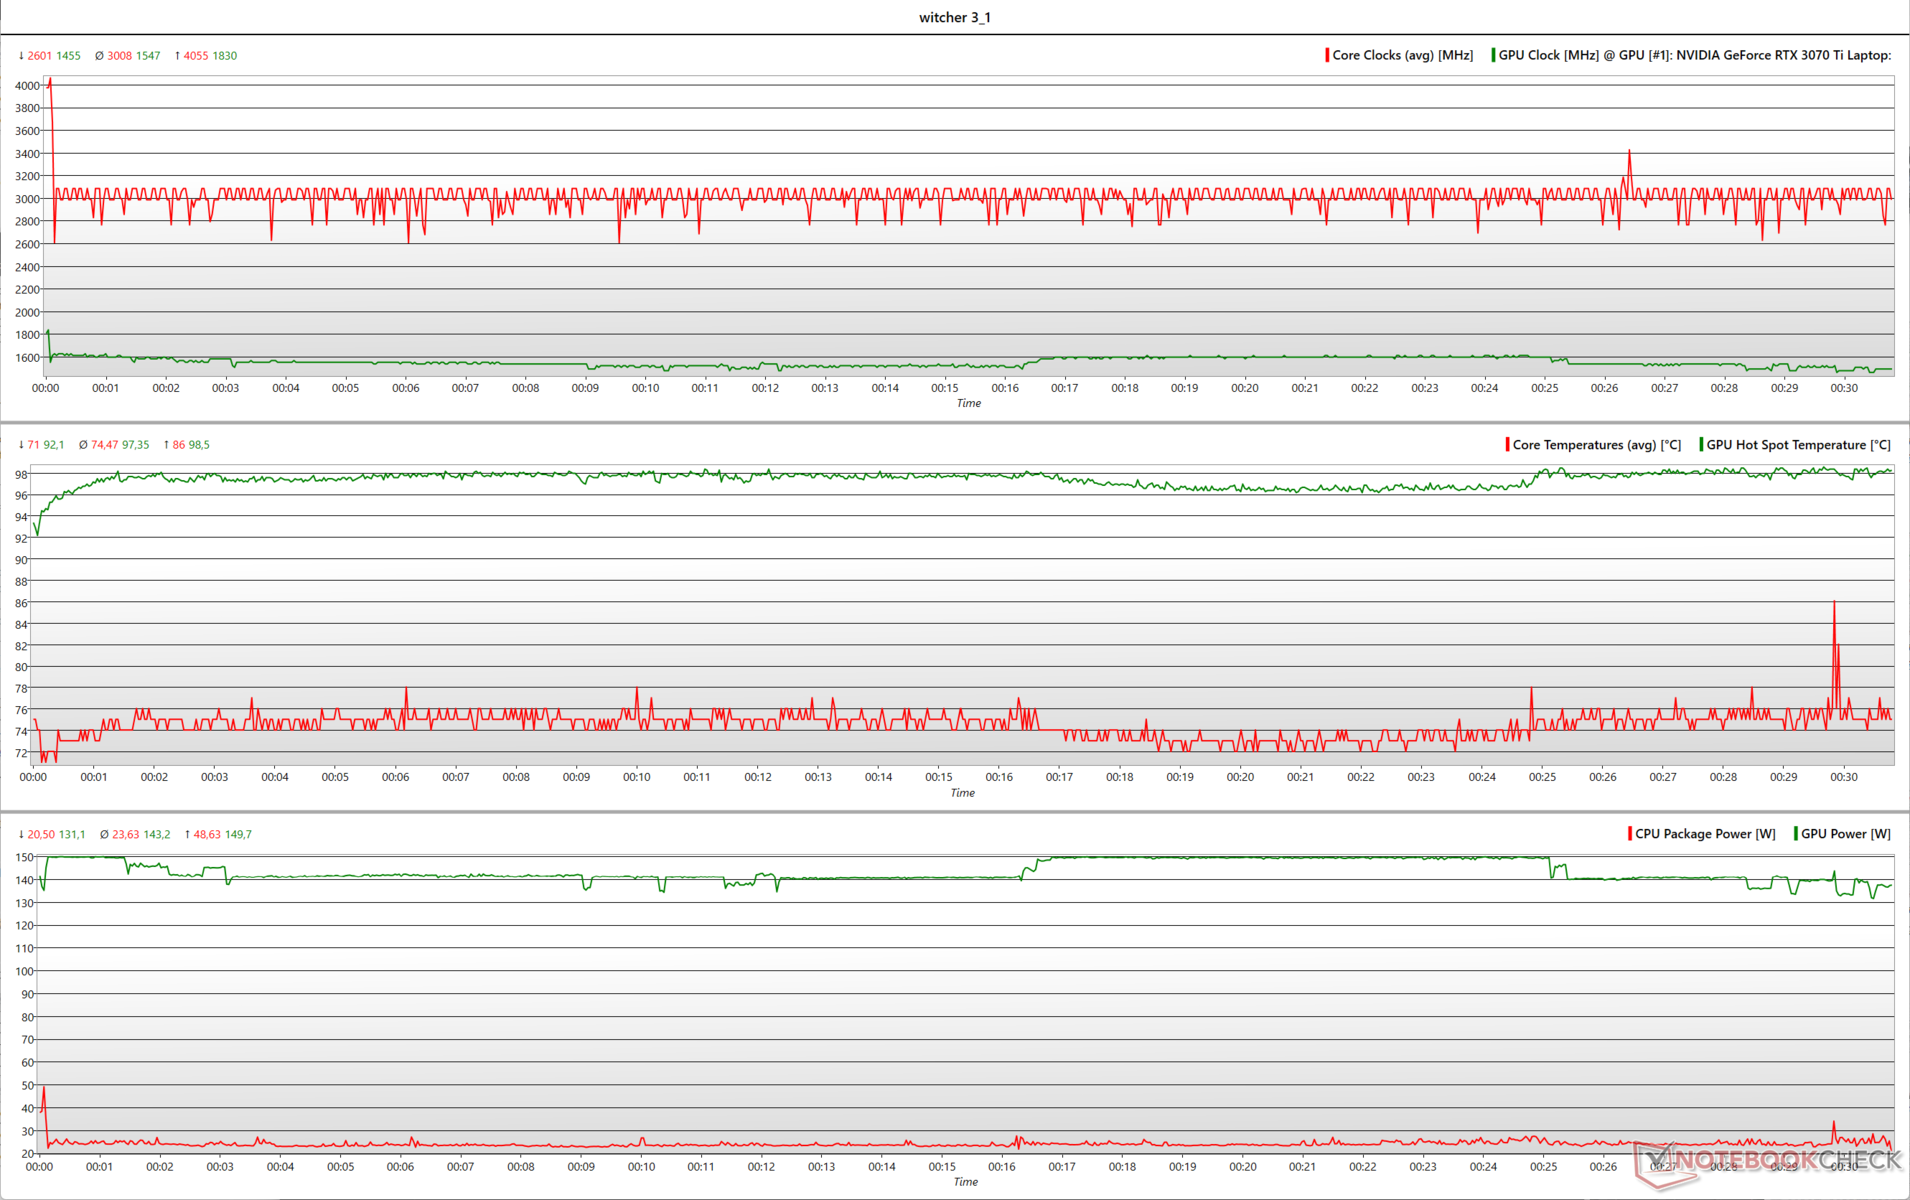
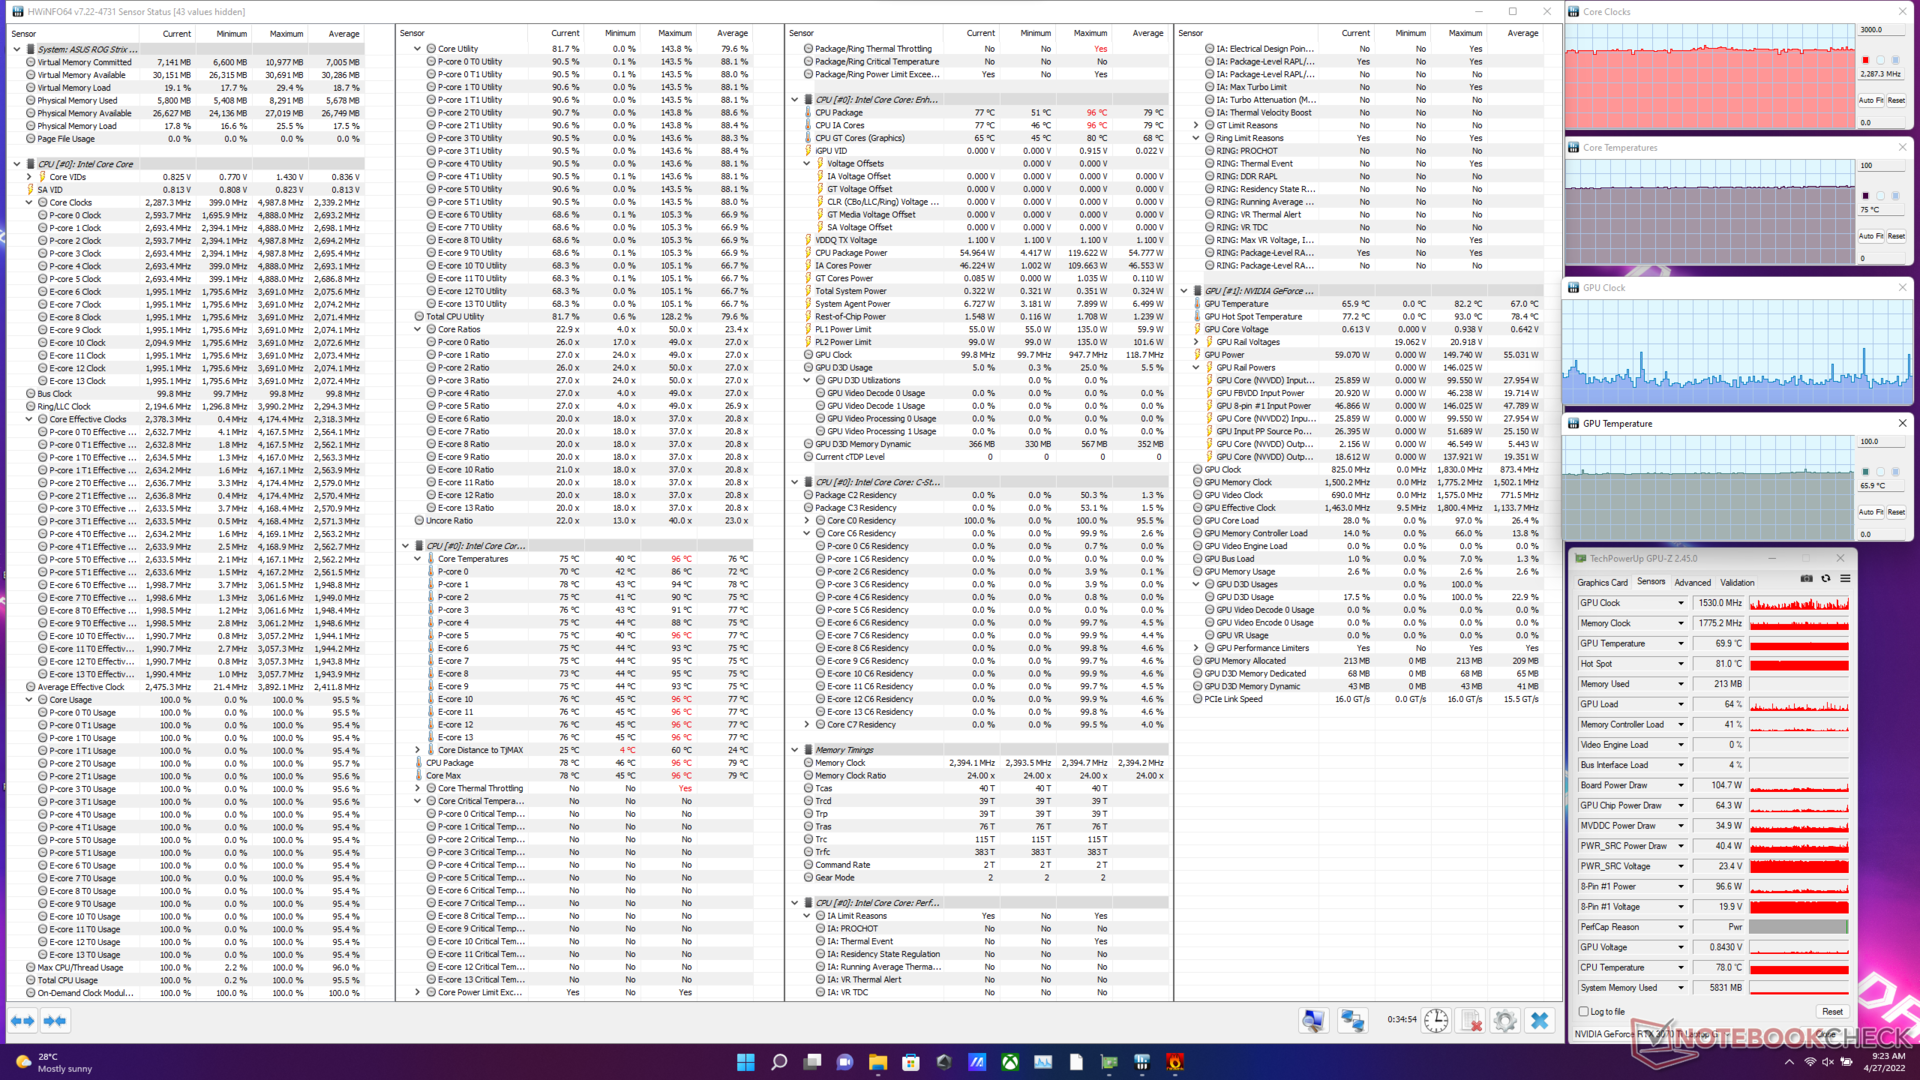
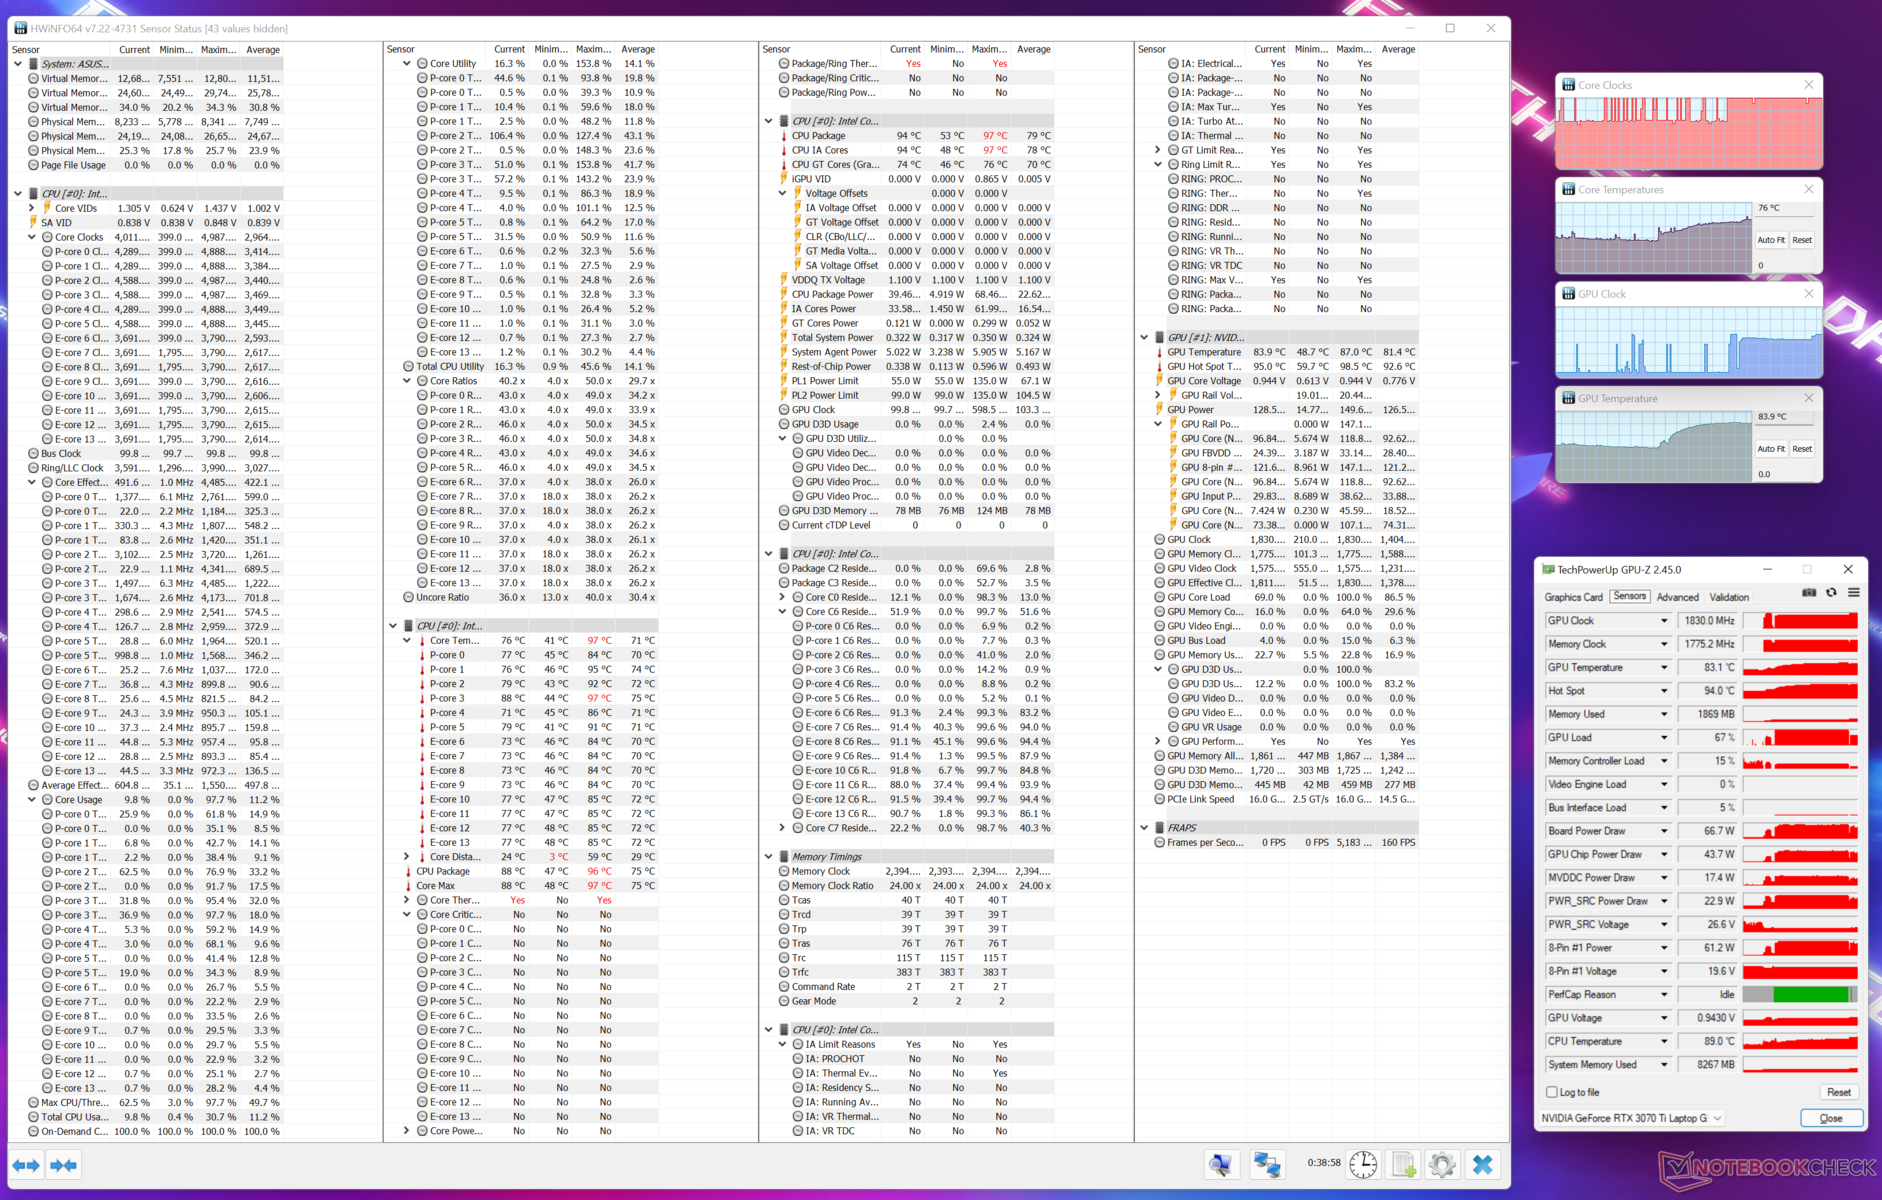
| Teste de estresse | Relógio da CPU (GHz) | Relógio da GPU (MHz) | Temperatura média da CPU (°C) | Temperatura média da GPU (°C) |
| Sistema ocioso | 2.05 | 99.8 | 45 | 45 |
| Prime95 | 3.49 | 99.8 | 87.9 | 44.8 |
| Prime95 + FurMark | 2.28 | 1.530 | 76 | 67 |
| O Witcher 3 | 4.0 | 1.830 | 71 | 81.4 |
Oradores
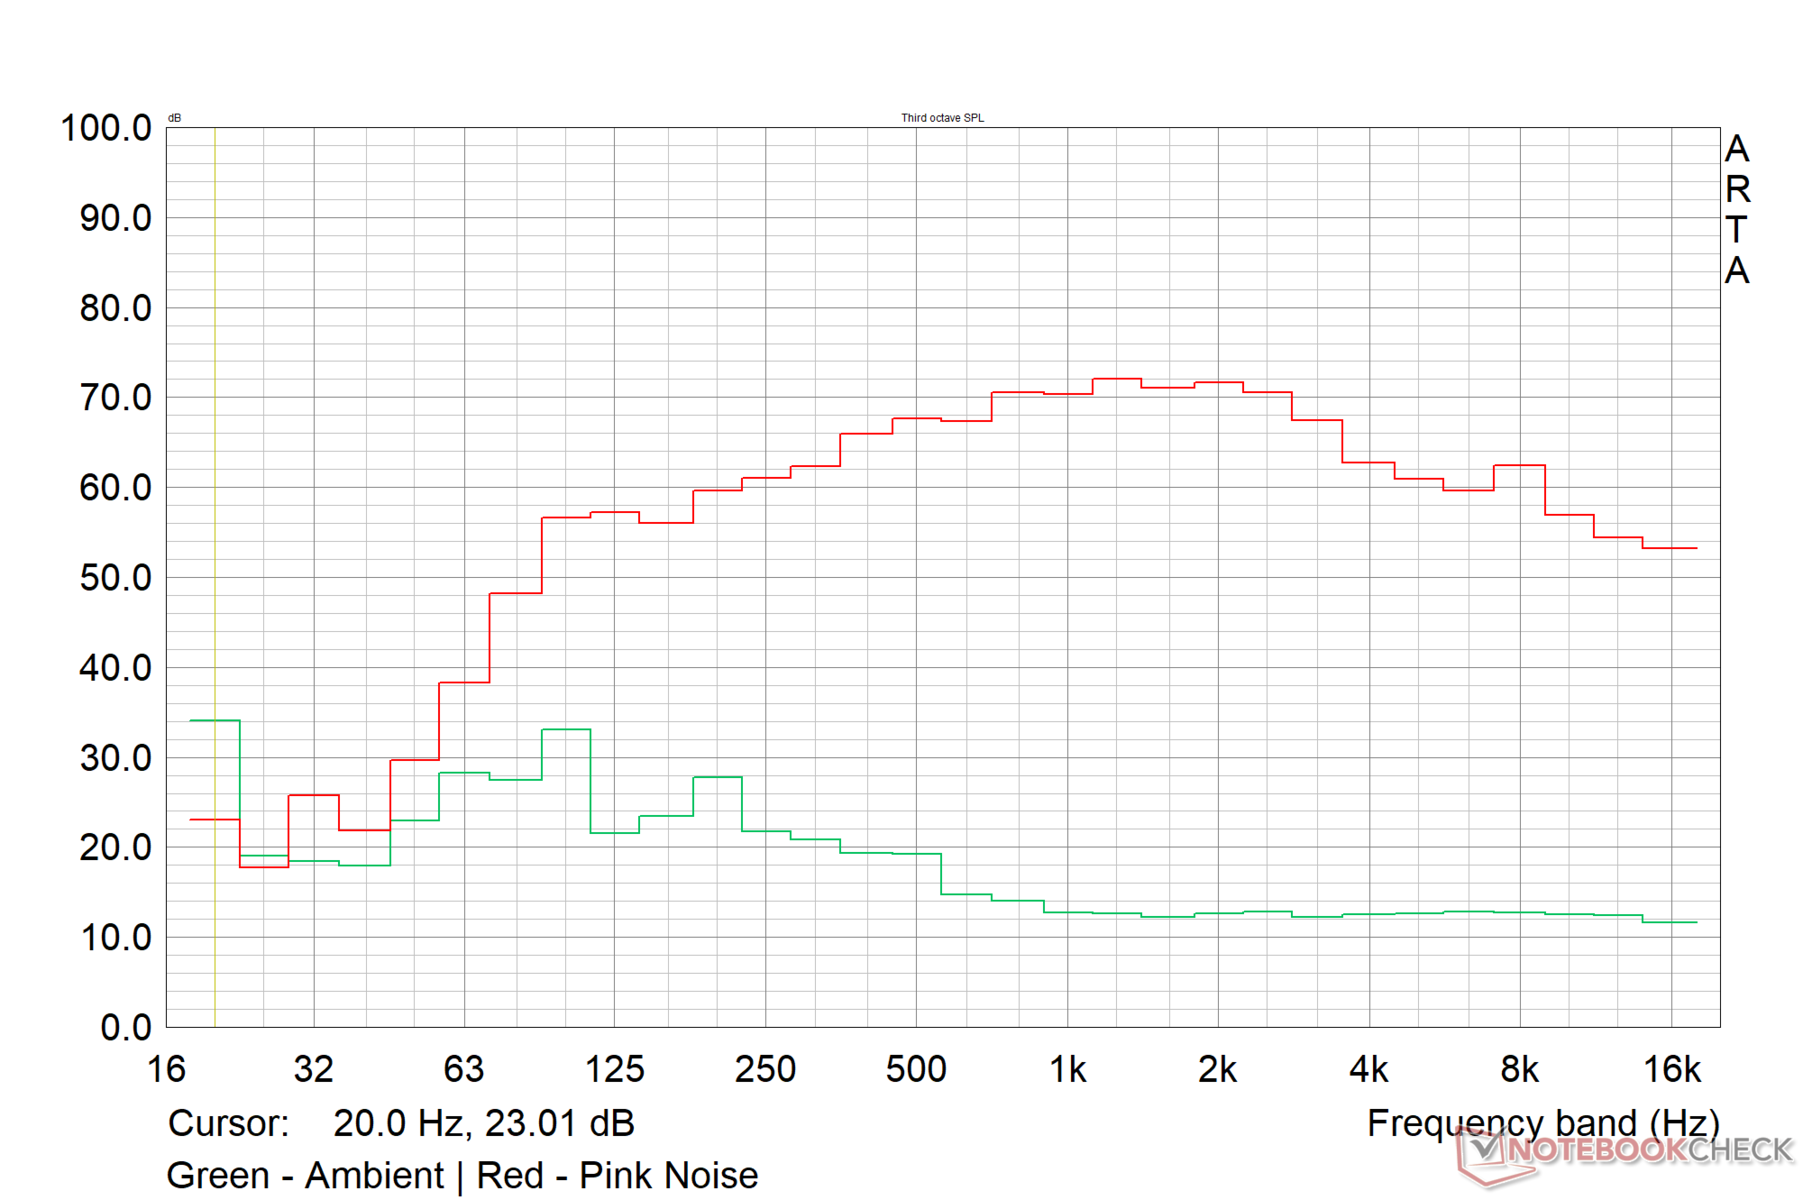
O Asus na verdade não menciona a potência do alto-falante do Scar 15 em seus materiais e apenas indica que o laptop usa um sistema quad-falante com Dolby Atmos e Smart Amp. O mais provável é que o sistema de alto-falantes não tenha sofrido alterações em relação à versão 2021, que tinha alto-falantes de 2x 4 W para baixo na frente e tweeters de 2x 2W perto da área da dobradiça abaixo do visor. Os alto-falantes têm uma altura de cerca de 80,5 dB em uma sala fechada de tamanho médio, o que é decente.
A separação dos woofers passivamente irradiados e dos tweeters resulta em uma resposta de graves decente, dadas as restrições do chassi. Os médios são lineares e os altos, equilibrados. Subjetivamente, a qualidade de áudio do ROG Strix Scar 15 é bastante útil para a maioria das finalidades. Não há distorção perceptível em volumes maiores.
Os alto-falantes são certificados para Dolby Atmos, e o aplicativo oficial Dolby Access vem pré-instalado com licenças totalmente habilitadas para Dolby Atmos para fones de ouvido e Dolby Atmos para alto-falantes embutidos. O aplicativo permite mudar entre vários perfis de som disponíveis e criar até três pré-configurações personalizadas de EQ.
Asus ROG Strix Scar 15 G533ZW-LN106WS análise de áudio
(±) | o volume do alto-falante é médio, mas bom (###valor### dB)
Graves 100 - 315Hz
(+) | bons graves - apenas 3.7% longe da mediana
(+) | o baixo é linear (5.5% delta para a frequência anterior)
Médios 400 - 2.000 Hz
(±) | médios mais altos - em média 7.1% maior que a mediana
(+) | médios são lineares (3.1% delta para frequência anterior)
Altos 2 - 16 kHz
(+) | agudos equilibrados - apenas 3.3% longe da mediana
(+) | os máximos são lineares (5.9% delta da frequência anterior)
Geral 100 - 16.000 Hz
(+) | o som geral é linear (12.2% diferença em relação à mediana)
Comparado com a mesma classe
» 13% de todos os dispositivos testados nesta classe foram melhores, 4% semelhantes, 83% piores
» O melhor teve um delta de 6%, a média foi 18%, o pior foi 132%
Comparado com todos os dispositivos testados
» 10% de todos os dispositivos testados foram melhores, 2% semelhantes, 88% piores
» O melhor teve um delta de 4%, a média foi 23%, o pior foi 134%
Apple MacBook Pro 16 2021 M1 Pro análise de áudio
(+) | os alto-falantes podem tocar relativamente alto (###valor### dB)
Graves 100 - 315Hz
(+) | bons graves - apenas 3.8% longe da mediana
(+) | o baixo é linear (5.2% delta para a frequência anterior)
Médios 400 - 2.000 Hz
(+) | médios equilibrados - apenas 1.3% longe da mediana
(+) | médios são lineares (2.1% delta para frequência anterior)
Altos 2 - 16 kHz
(+) | agudos equilibrados - apenas 1.9% longe da mediana
(+) | os máximos são lineares (2.7% delta da frequência anterior)
Geral 100 - 16.000 Hz
(+) | o som geral é linear (4.6% diferença em relação à mediana)
Comparado com a mesma classe
» 0% de todos os dispositivos testados nesta classe foram melhores, 0% semelhantes, 100% piores
» O melhor teve um delta de 5%, a média foi 17%, o pior foi 45%
Comparado com todos os dispositivos testados
» 0% de todos os dispositivos testados foram melhores, 0% semelhantes, 100% piores
» O melhor teve um delta de 4%, a média foi 23%, o pior foi 134%
Gestão de energia: O núcleo i9-12900H e o RTX 3070 Ti combinados podem ficar exigentes
Consumo de energia
A Asus fornece um adaptador de energia de 280 W com o Scar 15 deste ano, e vemos que o laptop é capaz de quase maximizar o consumo de energia sob carga máxima. O consumo geral de energia sob carga parece estar no lado mais alto, dadas as poderosas entranhas. O consumo de energia durante o modo de espera poderia ter sido menor
O Lâmina Razer 14 com um Ryzen 9 6900HX parece ser cerca de 20% menos econômico em geral, principalmente devido ao alto consumo de energia ociosa.
| desligado | |
| Ocioso | |
| Carga |
|
Key:
min: | |
| Asus ROG Strix Scar 15 G533ZW i9-12900H, GeForce RTX 3070 Ti Laptop GPU, Samsung PM9A1 MZVL22T0HBLB, IPS-level, 2560x1440, 15.6" | MSI Raider GE66 12UHS i9-12900HK, GeForce RTX 3080 Ti Laptop GPU, Samsung PM9A1 MZVL22T0HBLB, IPS, 3840x2160, 15.6" | Lenovo Legion 5 Pro 16 G7 i7 RTX 3070Ti i7-12700H, GeForce RTX 3070 Ti Laptop GPU, Samsung PM9A1 MZVL21T0HCLR, IPS, 2560x1600, 16" | Razer Blade 14 Ryzen 9 6900HX R9 6900HX, GeForce RTX 3070 Ti Laptop GPU, Samsung PM9A1 MZVL21T0HCLR, IPS, 2560x1440, 14" | Razer Blade 15 2022 i7-12800H, GeForce RTX 3080 Ti Laptop GPU, SSSTC CA6-8D1024, IPS, 2560x1440, 15.6" | Média NVIDIA GeForce RTX 3070 Ti Laptop GPU | Média da turma Gaming | |
|---|---|---|---|---|---|---|---|
| Power Consumption | -31% | -10% | -20% | -99% | -36% | -28% | |
| Idle Minimum * (Watt) | 7.56 | 16 -112% | 8.6 -14% | 10.2 -35% | 33.2 -339% | 14.2 ? -88% | 13 ? -72% |
| Idle Average * (Watt) | 13.5 | 19 -41% | 17.6 -30% | 26 -93% | 36.4 -170% | 19.9 ? -47% | 19 ? -41% |
| Idle Maximum * (Watt) | 16.87 | 26 -54% | 18.5 -10% | 26.7 -58% | 37.6 -123% | 26.2 ? -55% | 24.6 ? -46% |
| Load Average * (Watt) | 128.9 | 110 15% | 110 15% | 89.3 31% | 116.7 9% | 125.8 ? 2% | 110.7 ? 14% |
| Witcher 3 ultra * (Watt) | 196.2 | 202 -3% | 227 -16% | 158.7 19% | 172 12% | ||
| Load Maximum * (Watt) | 274.86 | 242 12% | 294.6 -7% | 227.5 17% | 228.6 17% | 248 ? 10% | 259 ? 6% |
* ... menor é melhor
Power Consumption - The Witcher 3 / Stress test
Power Consumption - External Monitor
Vida útil da bateria
O ROG Strix Scar 15 possui uma bateria de 90 Whr 4S1P. Os tempos de funcionamento são decentes, dados os poderosos internos. Asus reivindica um tempo de backup de reprodução de vídeo de até 10,5 horas - nós cronometrámos 8,5 horas com nosso loop de vídeo H.264 1080p.
Os tempos de navegação na Web com brilho reduzido com nosso roteiro padrão duram quase 8,5 horas. Curiosamente, tanto os computadores portáteis AMD Ryzen 9-powered na comparação - o Asus ROG Zephyrus G14 e a Razer Blade 14 - são capazes de suportar cerca de 70 minutos a mais de tempo de corrida neste teste, apesar de utilizarem baterias muito menores.
Os jogos com bateria resultam em apenas 70 minutos de backup, mesmo com brilho reduzido.
| Asus ROG Strix Scar 15 G533ZW i9-12900H, GeForce RTX 3070 Ti Laptop GPU, 90 Wh | MSI Raider GE66 12UHS i9-12900HK, GeForce RTX 3080 Ti Laptop GPU, 99 Wh | Lenovo Legion 5 Pro 16 G7 i7 RTX 3070Ti i7-12700H, GeForce RTX 3070 Ti Laptop GPU, 80 Wh | Asus ROG Zephyrus G14 GA402RK R9 6900HS, Radeon RX 6800S, 76 Wh | Razer Blade 14 Ryzen 9 6900HX R9 6900HX, GeForce RTX 3070 Ti Laptop GPU, 62 Wh | Razer Blade 15 2022 i7-12800H, GeForce RTX 3080 Ti Laptop GPU, 80 Wh | Média da turma Gaming | |
|---|---|---|---|---|---|---|---|
| Duração da bateria | 14% | -32% | 7% | 46% | -42% | 17% | |
| H.264 (h) | 8.5 | 7.1 -16% | 6.3 -26% | 8.32 ? -2% | |||
| WiFi v1.3 (h) | 8.4 | 5.7 -32% | 5.4 -36% | 9.5 13% | 9.5 13% | 4.9 -42% | 7.11 ? -15% |
| Witcher 3 ultra (h) | 1.2 | ||||||
| Load (h) | 0.9 | 1.7 89% | 0.6 -33% | 0.9 0% | 1.6 78% | 1.502 ? 67% | |
| Reader / Idle (h) | 18.1 | 12.2 | 8.27 ? |
Pro
Contra
Veredicto: máquina de jogos Brawny QHD que oferece na maioria das frentes
A Asus continua refinando a linha ROG Strix Scar com novas atualizações. A Asus ROG Strix Scar 15 G533 (2022) oferece quase tudo o que você esperaria de um laptop para jogos a este preço. A qualidade de construção é ótima, as opções de conectividade são decentes, e há espaço suficiente para atualizações internas também. Alguns SKUs em algumas regiões podem não ser enviados com a webcam externa ROG Eye, portanto, tenha isso em mente.
Asus reverte para interruptores de membrana para o teclado - embora não tão "clickety" quanto os opto-mecânicos que vimos com o modelo do ano passado, eles ainda fazem uma digitação decente e uma experiência de jogo. A falta de biometria em qualquer forma é um fator negativo.
As características da tela parecem boas para uso geral e jogos com resolução QHD, suporte Dolby Vision, calibração de cores decente, atualização de 240 Hz e tempos de resposta rápidos. Entretanto, os níveis de preto medidos parecem inadequados.
Com conectividade sem obstáculos, desempenho e muitas possibilidades de personalização, o Asus ROG Strix Scar 15 G533 definitivamente merece uma consideração máxima se você estiver em busca de um laptop QHD capaz para jogos, desde que você possa suportar maiores emissões de calor e ruído"
O Asus permite que tanto o Core i9-12900H quanto o RTX 3070 Ti flexionem totalmente sem muitos problemas. O desempenho adequado em movimento ainda pode ser obtido com perfis de desempenho inferiores, mas a bateria de 90 Whr poderia idealmente ter durado mais tempo.
O ROG Strix Scar 15 não está, no entanto, sem concorrência. O MSI Vector GP66 12UGS se apresenta como um concorrente capaz, e sua tela de 1080p 360 Hz pode chamar a atenção dos jogadores da concorrência. A Lenovo Legion 5i Pro 16 com seu Core i7-12700H consegue evocar surpresa com seu desempenho superlativo da CPU que supera até mesmo o Core i9-12900HK em alguns laptops
O desempenho do Core i9-12900H do Scar 15 também é superior ao dos concorrentes Ryzen 9 - oAsus ROG Zephyrus G14 e o Razer Blade 14- embora estes laptops Ryzen 6000 tenham uma vantagem em termos de consumo de energia e vida útil da bateria.
Em ₹2,64,990 (US$3.419), o preço pedido pelo ROG Strix Scar 15 é alto no mercado indiano, mas você está recebendo um dispositivo que confere quase todas as caixas necessárias e um que lhe permitirá jogar muitos jogos atuais e futuros no QHD Ultra sem quebrar um suor.
Preço e Disponibilidade
O Asus ROG Strix Scar 15 G533 está disponível em Amazon Indiabem como em Amazônia EUApor US$3.269. Você também pode obter um Scar 15 G533 mais barato com um display Core i9-12900H, RTX 3060 e FHD por US$1.736,99 em BestBuy.
Asus ROG Strix Scar 15 G533ZW-LN106WS
- 05/31/2022 v7 (old)
Vaidyanathan Subramaniam
Price comparison

