Revisão preliminar do XMG Neo 15 E22 com RTX 3080 Ti (Tongfang GM5AG8W): O resfriamento de água é uma solução provisória, mas viável para laptops de jogos?
Nota: Tanto o Neo 15 quanto o Oasis são dispositivos explicitamente de pré-produção. Muita coisa ainda pode mudar na corrida até o lançamento e falhas de produção ainda podem existir. Recomendamos aos leitores que anotem isto enquanto consideram os pontos de referência abaixo. Os sistemas acabados podem provavelmente ter um desempenho diferente.
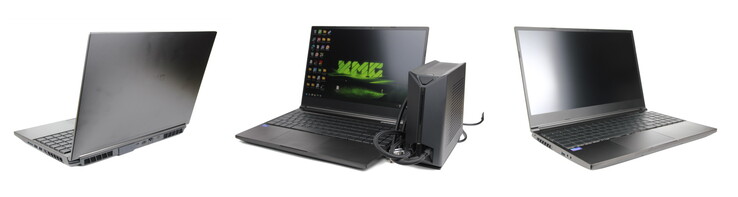
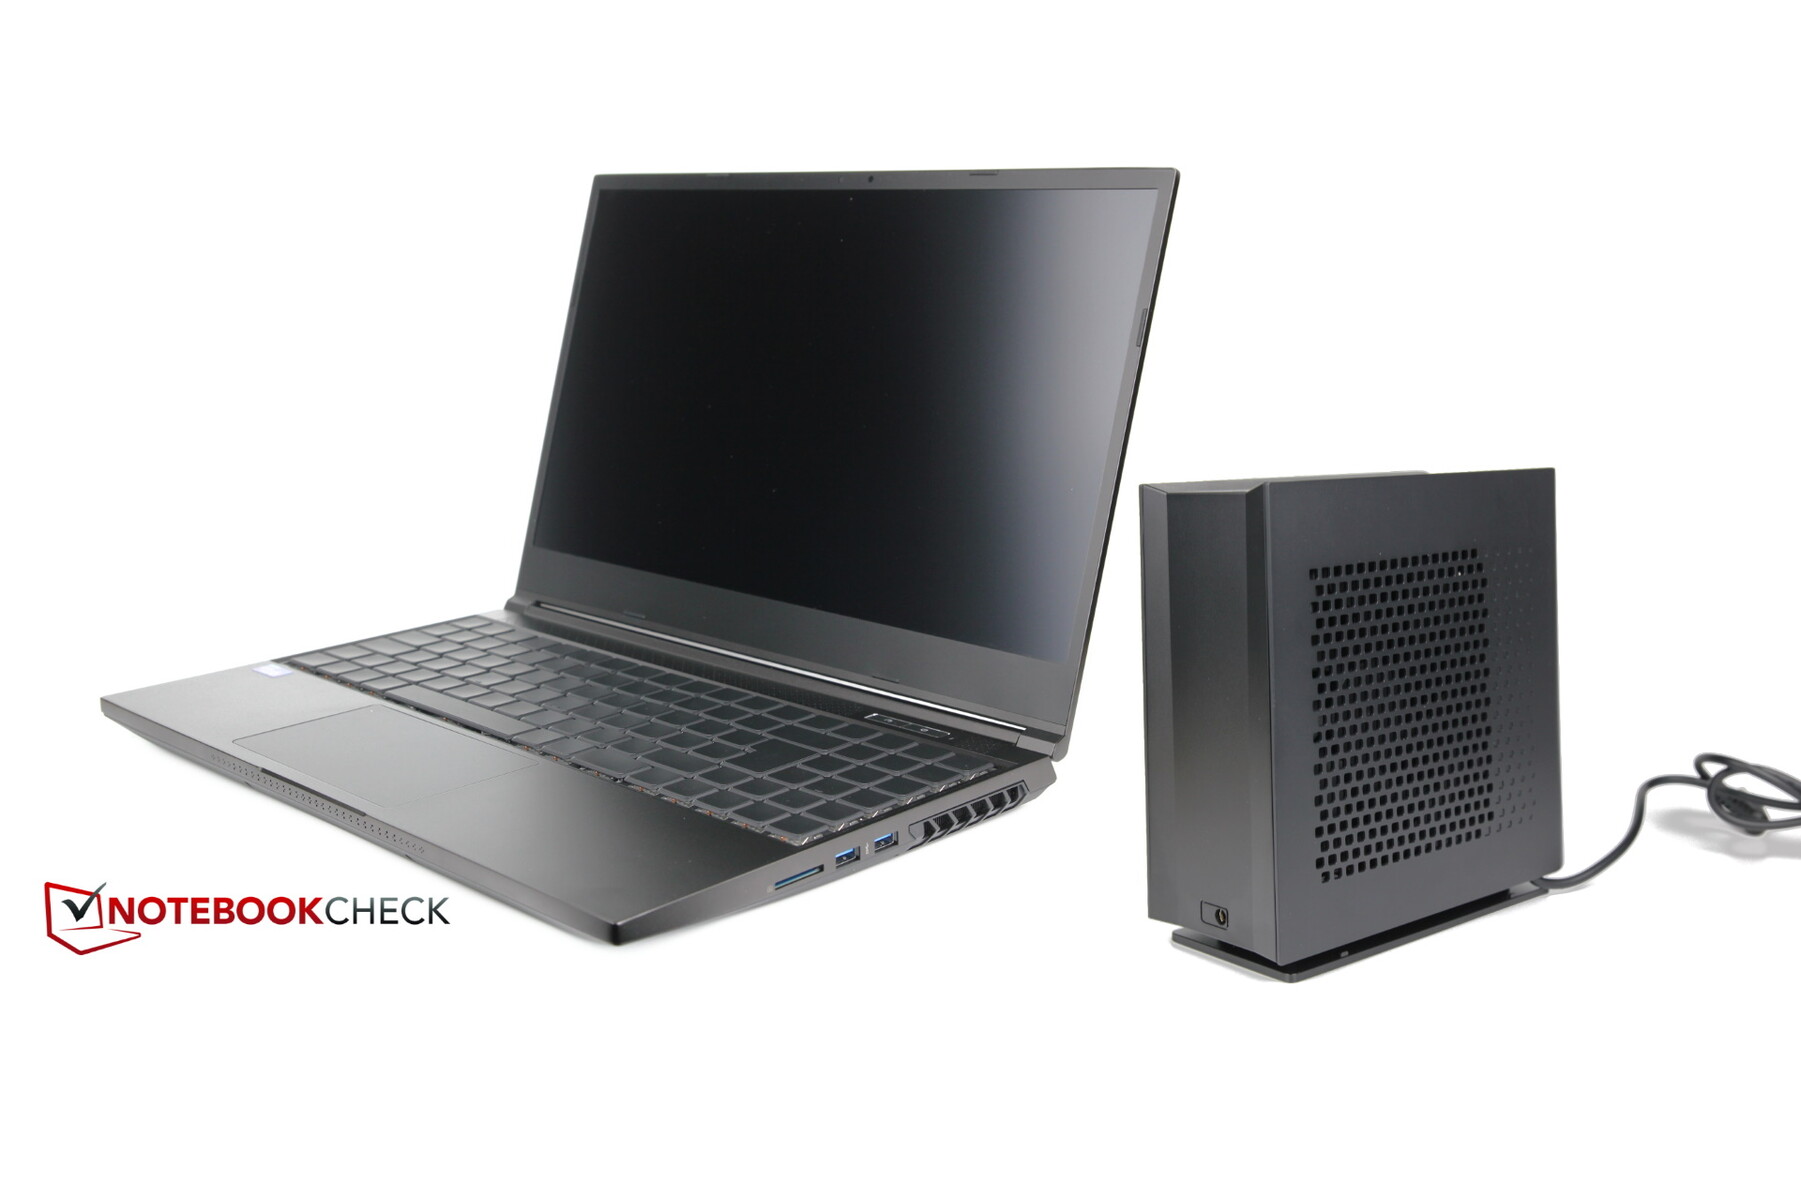
Schenker ousa entrar no desconhecido com o novo XMG Neo 15 E22. O fabricante agora equipou o laptop com uma nova porta para um sistema opcional de resfriamento de água. Você também pode encomendar o XMG Oasis por 199 euros ao comprar o Neo. Isto deve reduzir drasticamente as temperaturas e os níveis de ruído durante os jogos ou outro tipo de estresse. Mas será que os clientes aceitarão a compra e operação de um dispositivo adicional deste tipo? Como o XMG Neo com um hotspur RTX 3080 Ti funciona sem refrigeração a água? Nós examinamos estes aspectos em nosso teste.
A Schenker atualiza o XMG Neo em diversas áreas. O novíssimo GPU para laptop RTX 3080 Ti é usado ao invés de um RTX 3080, um CPU Alder Lake-H é usado ao invés de Tiger Lake, e depois há esta nova porta para resfriamento de água. Nossa configuração custa cerca de 3.442 euros sem o Oásis XMG (o resfriamento externo de água), optando por este valor, que acrescenta mais 199 euros.
Comparamos o novo Neo 15 E22 com seu predecessor igualmente forte do ano passado (classificação de 87%). Também criamos um elemento de comparação chamado "XMG Neo mais XMG Oasis" e o acrescentamos às comparações de referência. Além disso, também consideramos outros laptops para jogos de alta qualidade para comparação. Estes incluem o Asus ROG Strix Scar 15 G533QSoRazer Blade 15 Modelo avançadooAlienware m15 R6e também oMSI Raider GE76 de 17 polegadascom Alder Lake e RTX 3080 Ti devido à falta de uma comparação CPU/GPU da nova geração.
Possíveis concorrentes em comparação
Avaliação | Data | Modelo | Peso | Altura | Size | Resolução | Preço |
|---|---|---|---|---|---|---|---|
v (old) | 03/2022 | Schenker XMG Neo 15 E22 (Early 2022, RTX 3080 Ti) i7-12700H, GeForce RTX 3080 Ti Laptop GPU | 2.2 kg | 26.6 mm | 15.60" | 2560x1440 | |
| 87 % v7 (old) | 06/2021 | Schenker XMG Neo 15 Tiger Lake i7-11800H, GeForce RTX 3080 Laptop GPU | 2.2 kg | 26 mm | 15.60" | 2560x1440 | |
| 88.9 % v7 (old) | 07/2021 | Razer Blade 15 Advanced (Mid 2021) i7-11800H, GeForce RTX 3080 Laptop GPU | 2 kg | 16.99 mm | 15.60" | 1920x1080 | |
| 86.3 % v7 (old) | 07/2021 | Asus ROG Strix Scar 15 G533QS R9 5900HX, GeForce RTX 3080 Laptop GPU | 2.3 kg | 27.2 mm | 15.60" | 2560x1440 | |
| 86.1 % v7 (old) | 11/2021 | Alienware m15 R6, i7-11800H RTX 3080 i7-11800H, GeForce RTX 3080 Laptop GPU | 2.5 kg | 22.85 mm | 15.60" | 1920x1080 | |
| 87.5 % v7 (old) | 01/2022 | MSI GE76 Raider i9-12900HK, GeForce RTX 3080 Ti Laptop GPU | 3 kg | 26 mm | 17.30" | 1920x1080 |
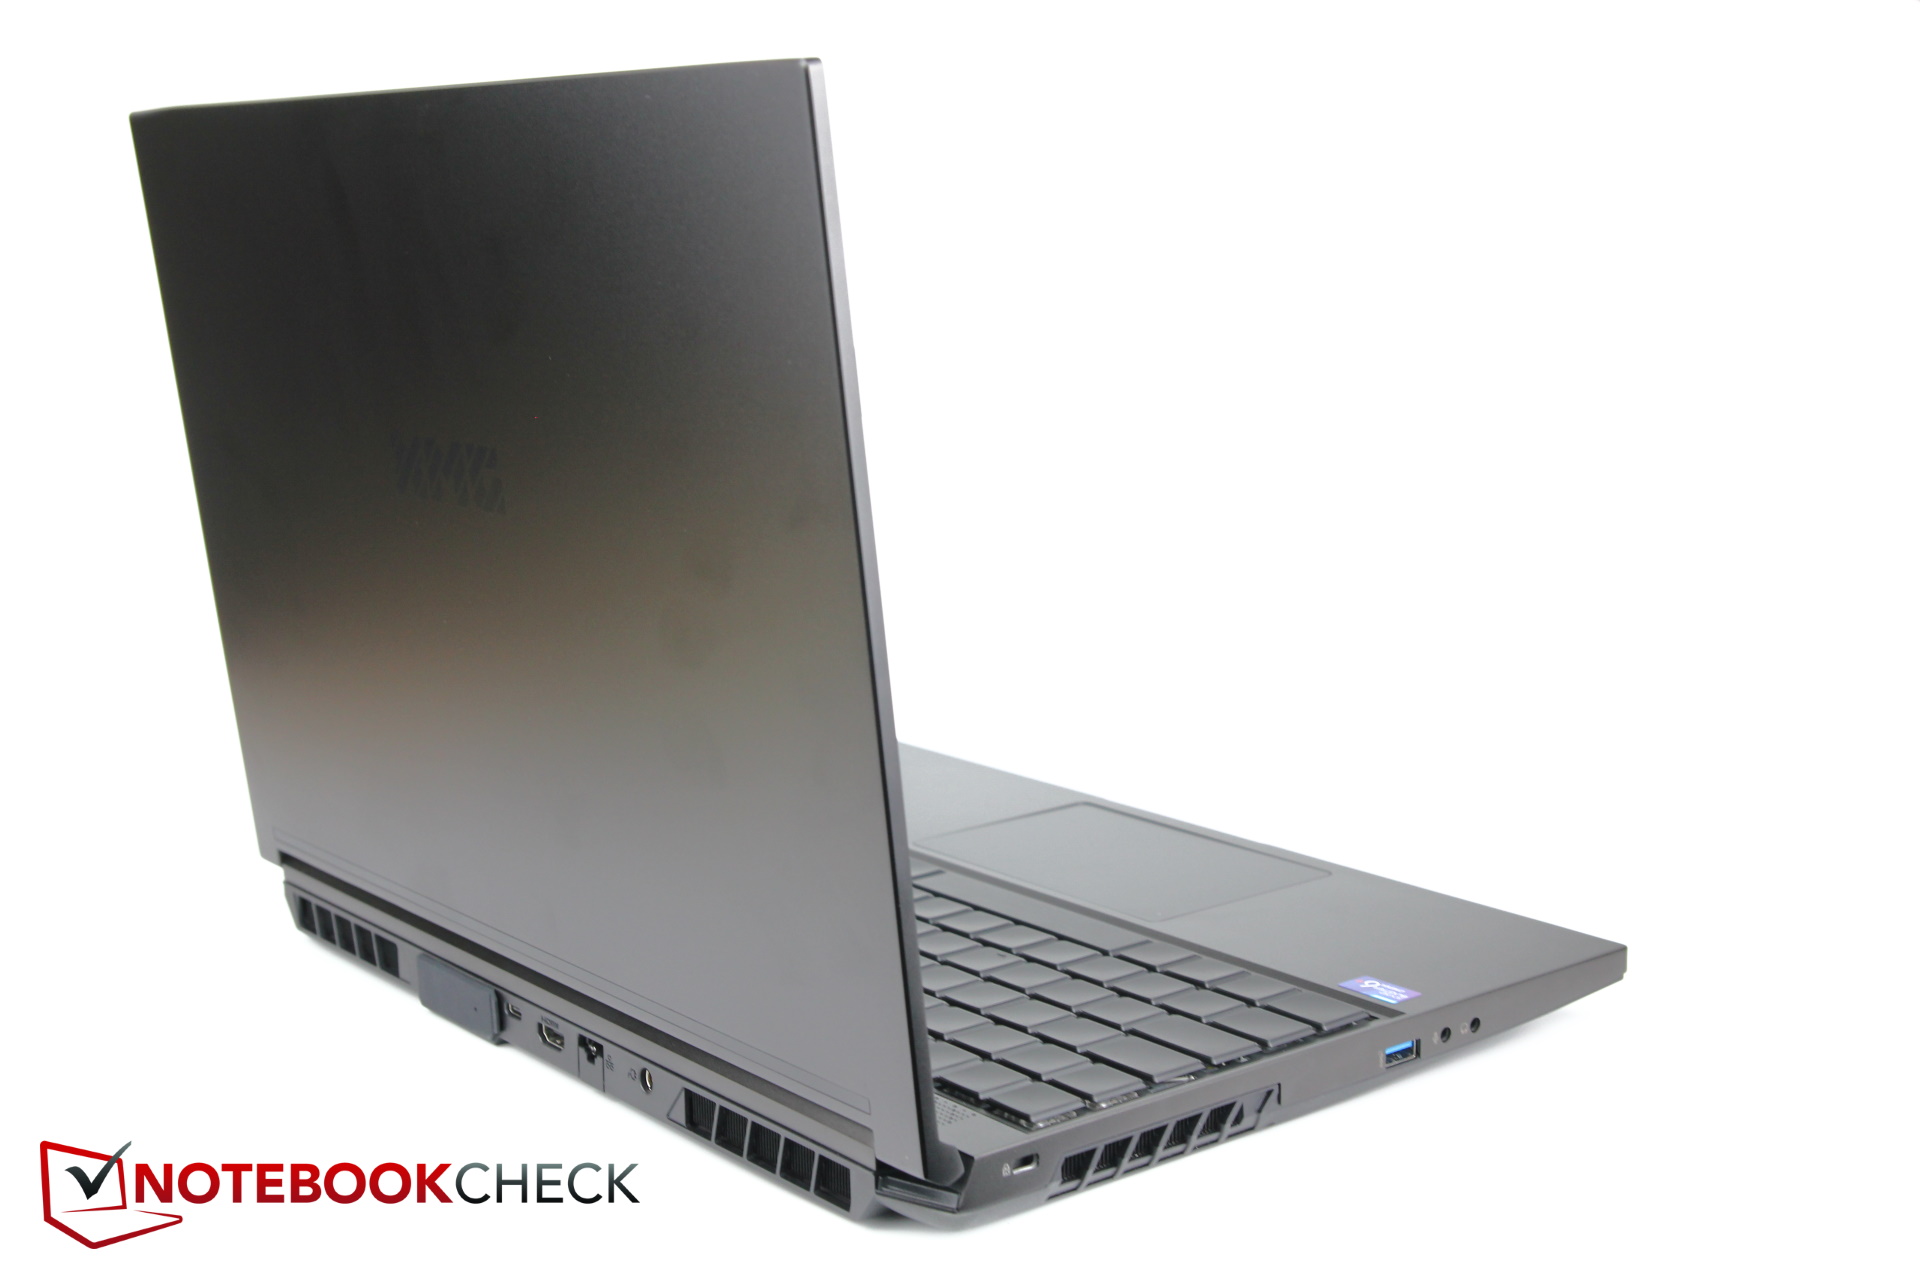
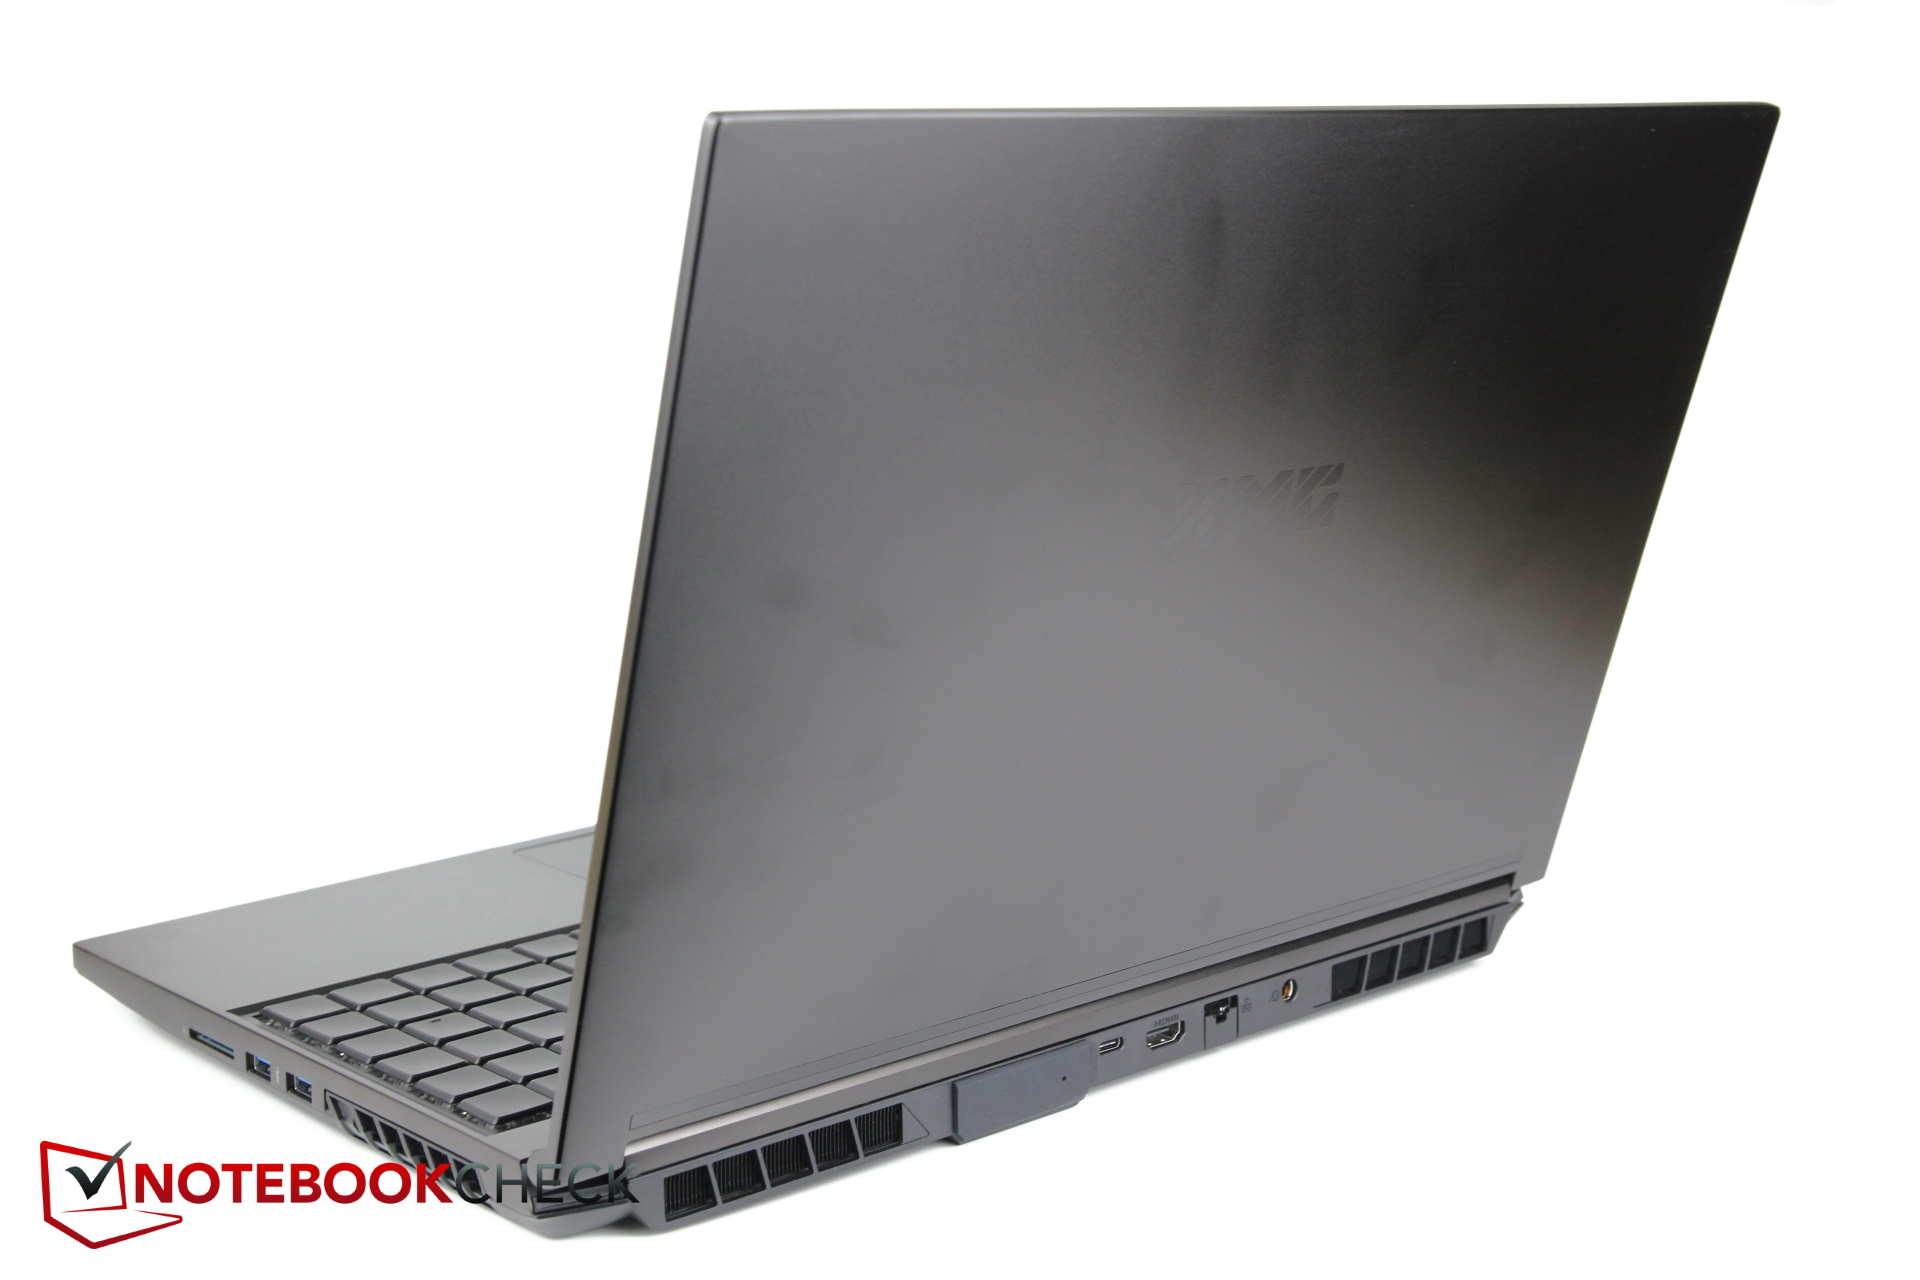
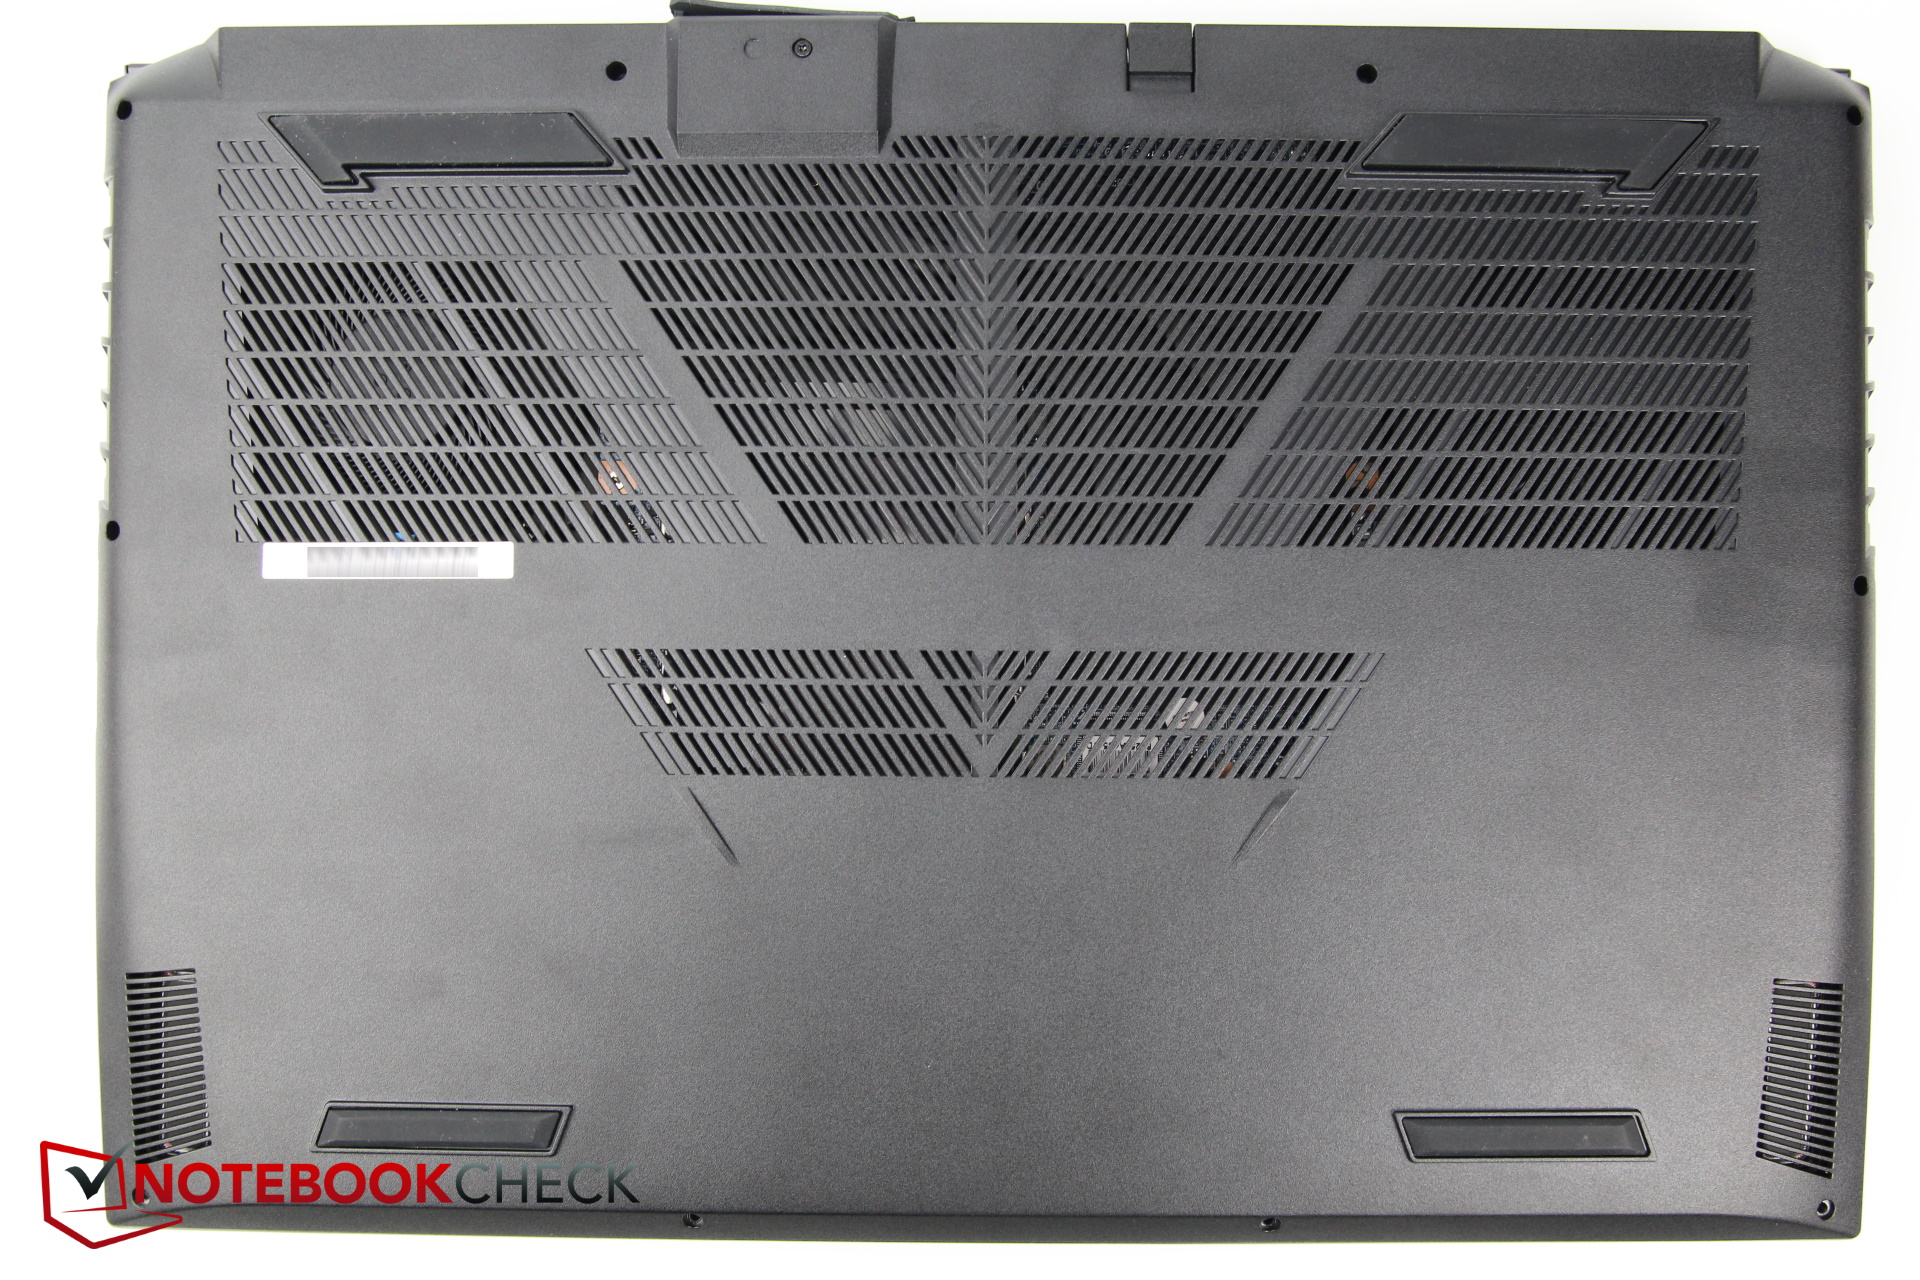
Estojo: Uma porta para resfriamento de água!
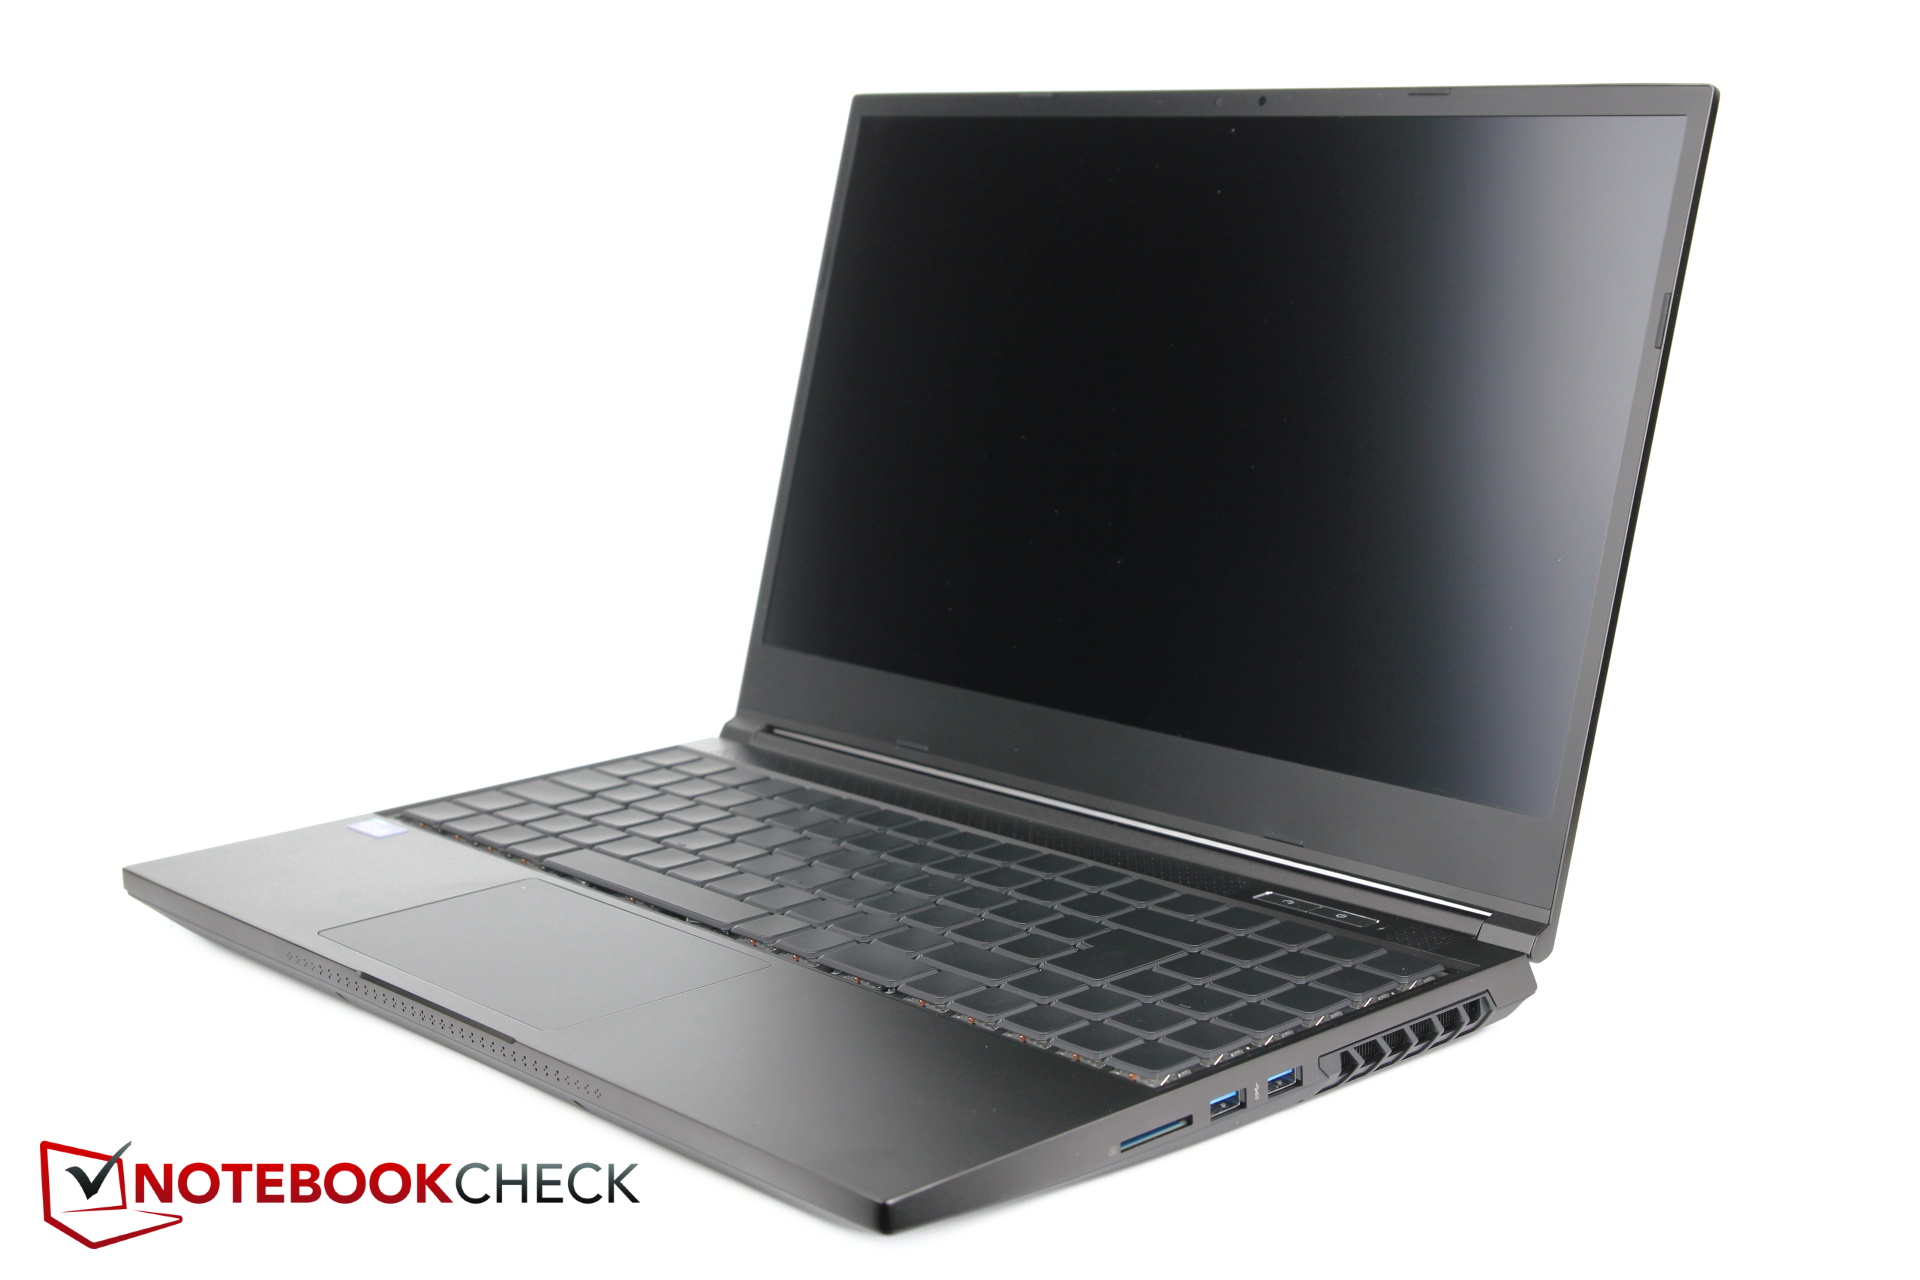
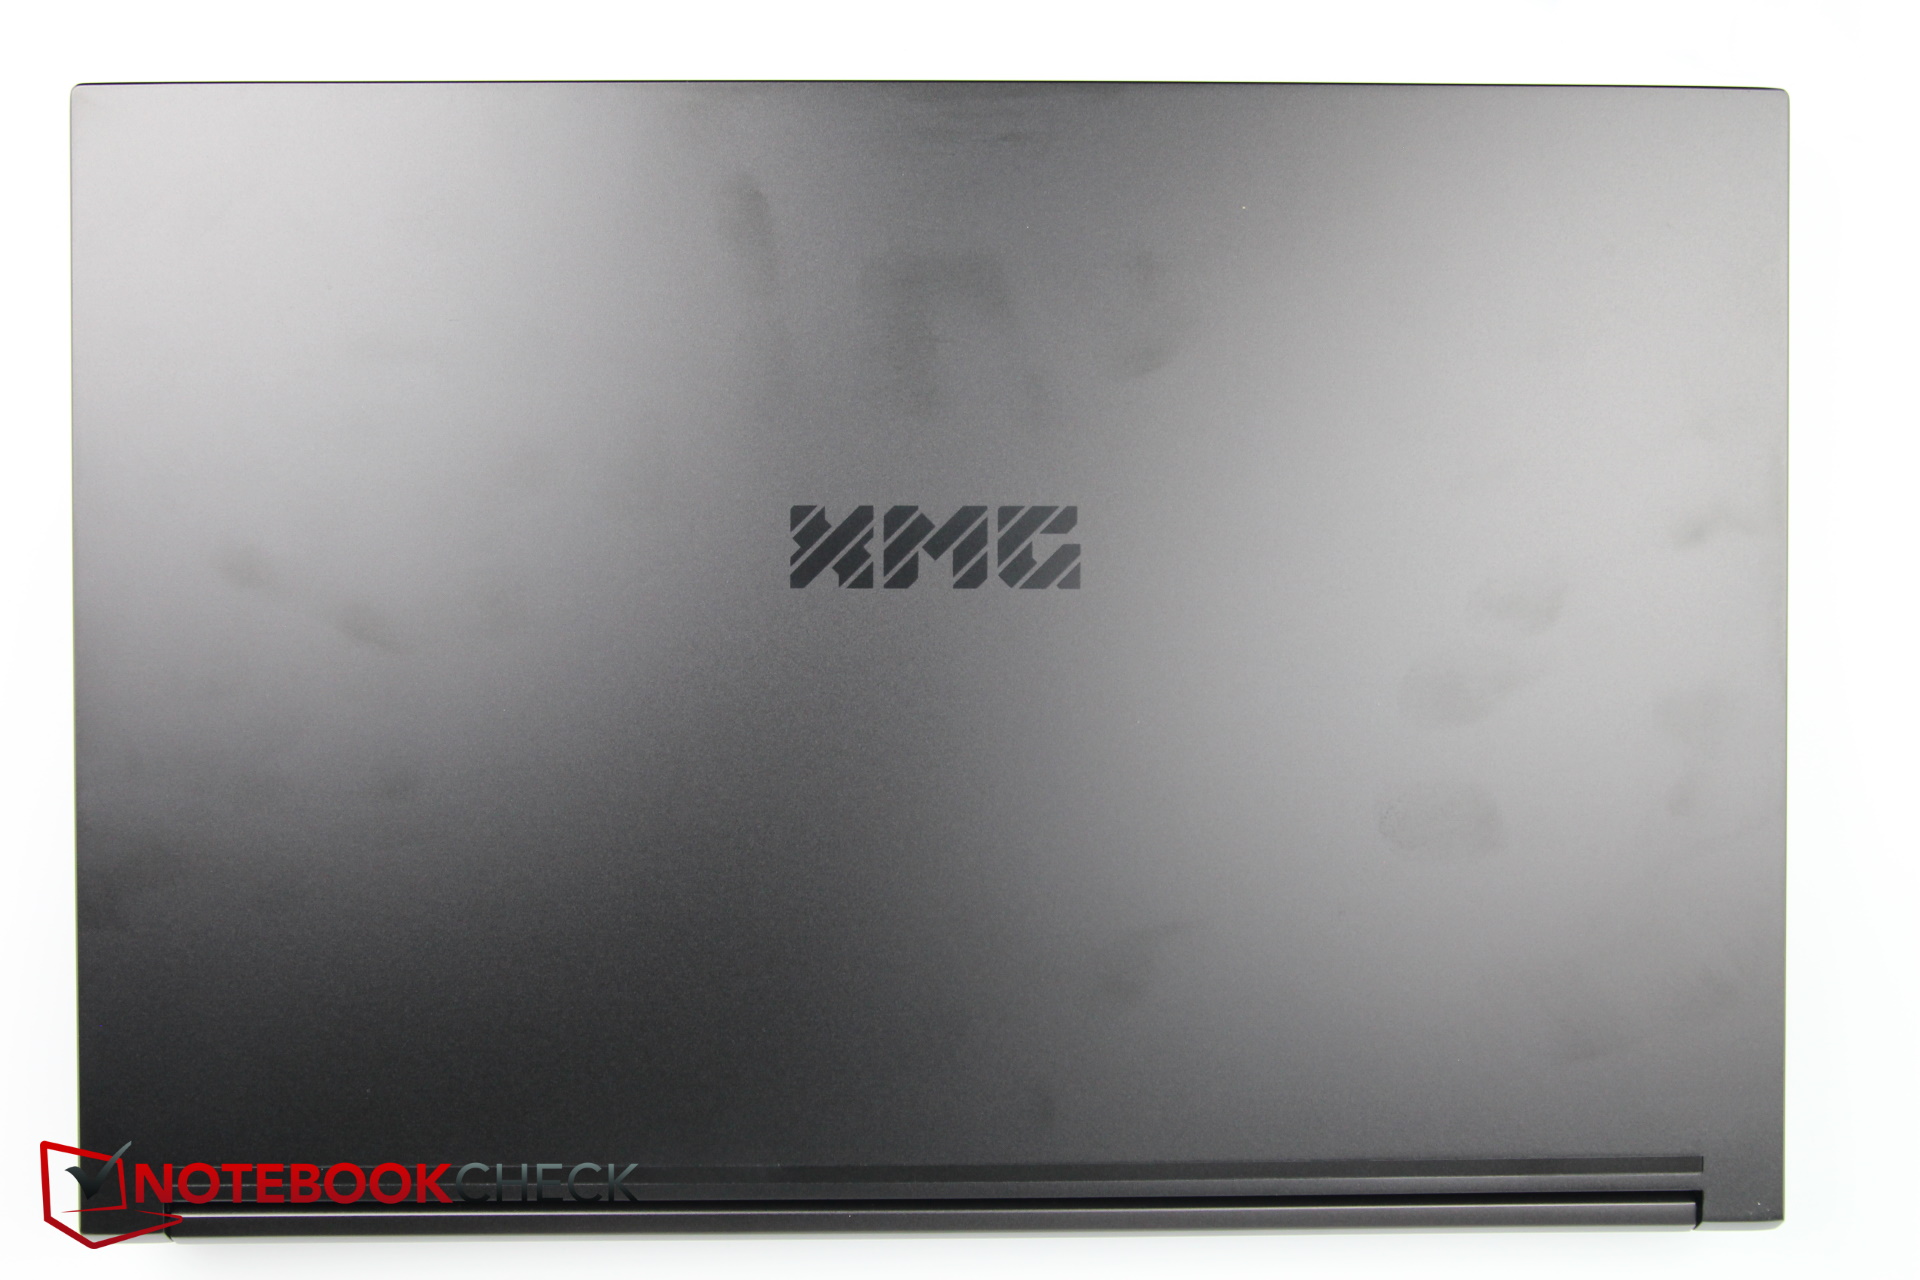
O invólucro é amplamente idêntico ao do predecessor - apenas a conexão de água na parte de trás é uma nova adição. Além disso, a tomada de energia se tornou mais robusta. O fundo é feito de plástico enquanto o restante do chassi, incluindo a tampa e até mesmo as bordas do mostrador são feitas de alumínio preto fosco. A base em particular parece muito robusta, mas a tampa do mostrador também é relativamente resistente à torção, embora sua superfície atraia fortemente as impressões digitais. A qualidade geral de construção é muito boa
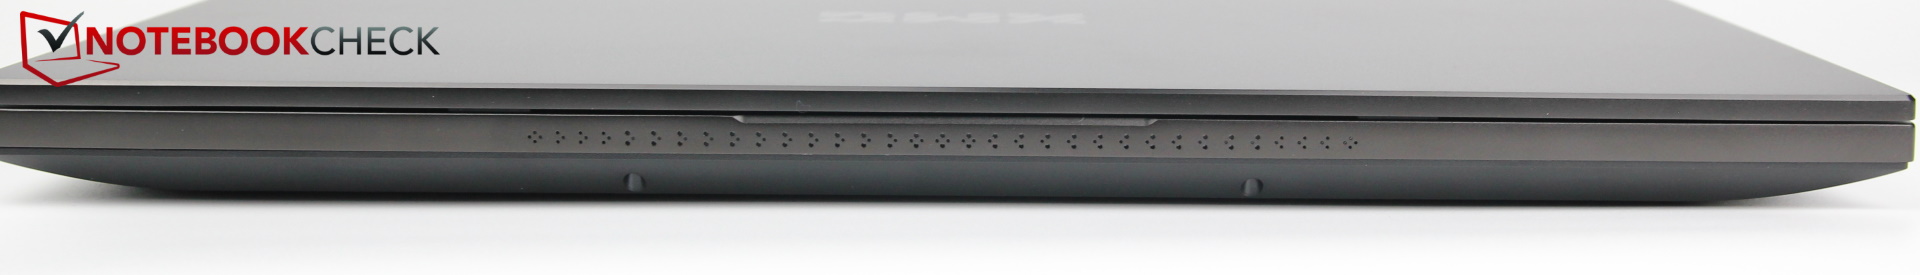
O design é bastante simples, de modo que o laptop não apenas parece apropriado na mesa para jogadores, mas também para usuários criativos e profissionais. Há uma faixa com pequenos furos na caixa na borda frontal, o que significa que a iluminação do teclado brilha levemente para a frente como uma "faixa de LED".
Apesar do circuito adicional de água, o laptop não se tornou mais grosso. Definitivamente não pertence à multidão magra, mas também não é particularmente grosso, tendo em vista o hardware extremamente potente. Entretanto, o Razer Blade e o Alienware M15 são visivelmente mais finos.
O peso de 2,2 kg também é moderado considerando as ferragens. A Lâmina Razer é 200 g mais leve, enquanto o Alienware é 300 g mais pesado.
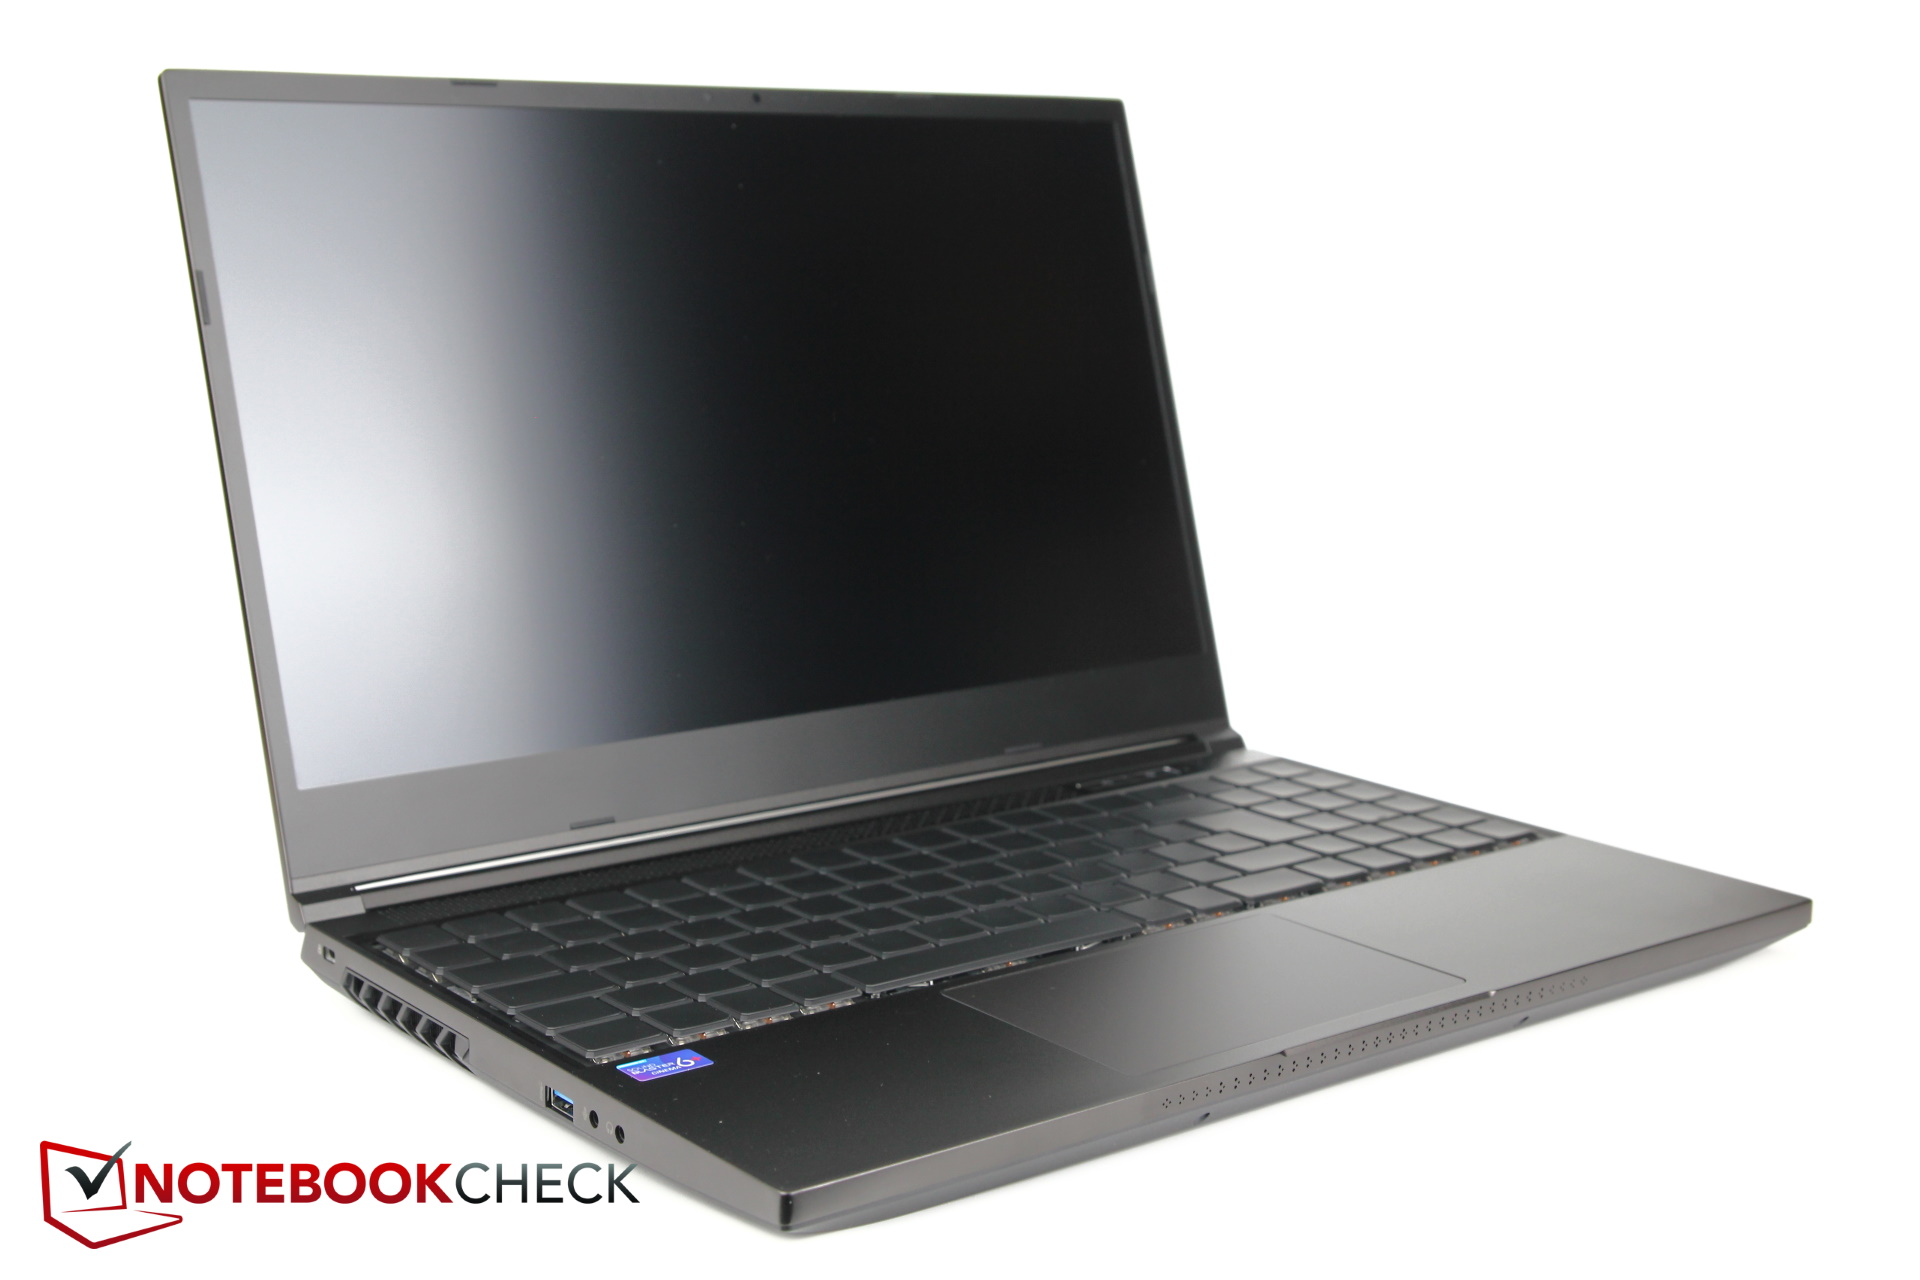
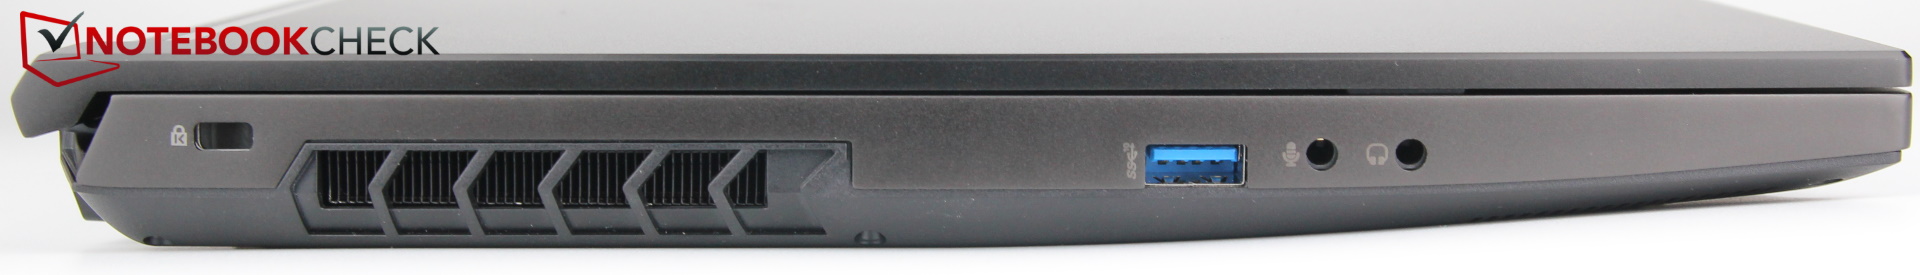
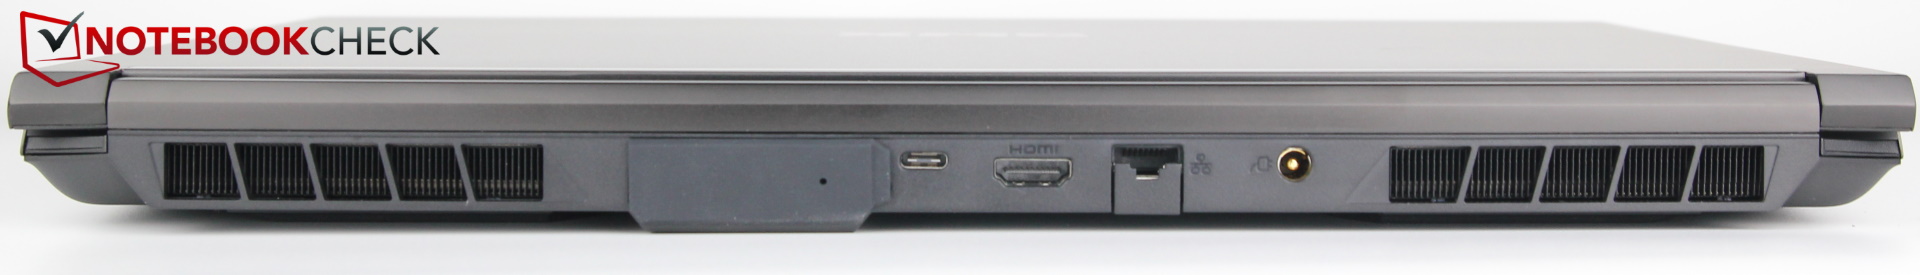
Equipamento: Thunderbolt 4 e conexão de água!
Enquanto o porto de água ocupa algum espaço, Schenker não renuncia aos outros portos. Desde leitores de cartões SD até USB-C com Thunderbolt 4 e duas tomadas de áudio, tudo está a bordo. O laptop não pode ser carregado via USB-C. Além disso, os laptops Alder Lake com Thunderbolt 4 não estão prontos para VR em si porque os sinais DisplayPort não são mais enviados diretamente para o dGPU, mas através do iGPU. Eles só estão prontos para VR quando há uma segunda porta USB-C com uma conexão com o dGPU ou um DisplayPort dedicado
As portas estão bastante próximas umas das outras, mas isso só é irritante em certas situações. As consideravelmente mais baratasMSI GP66 Leopardo 11UH mostra como a colocação dos portos pode ser melhor.
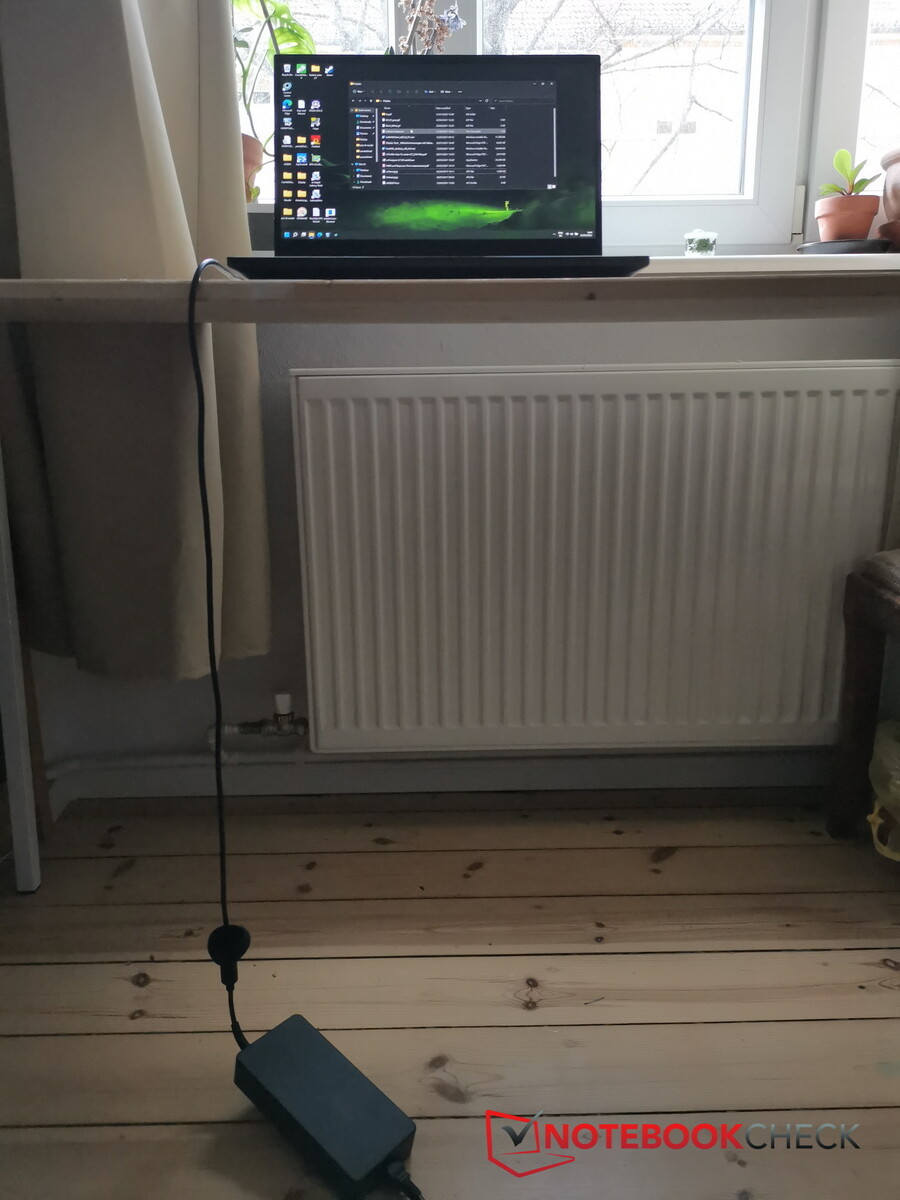
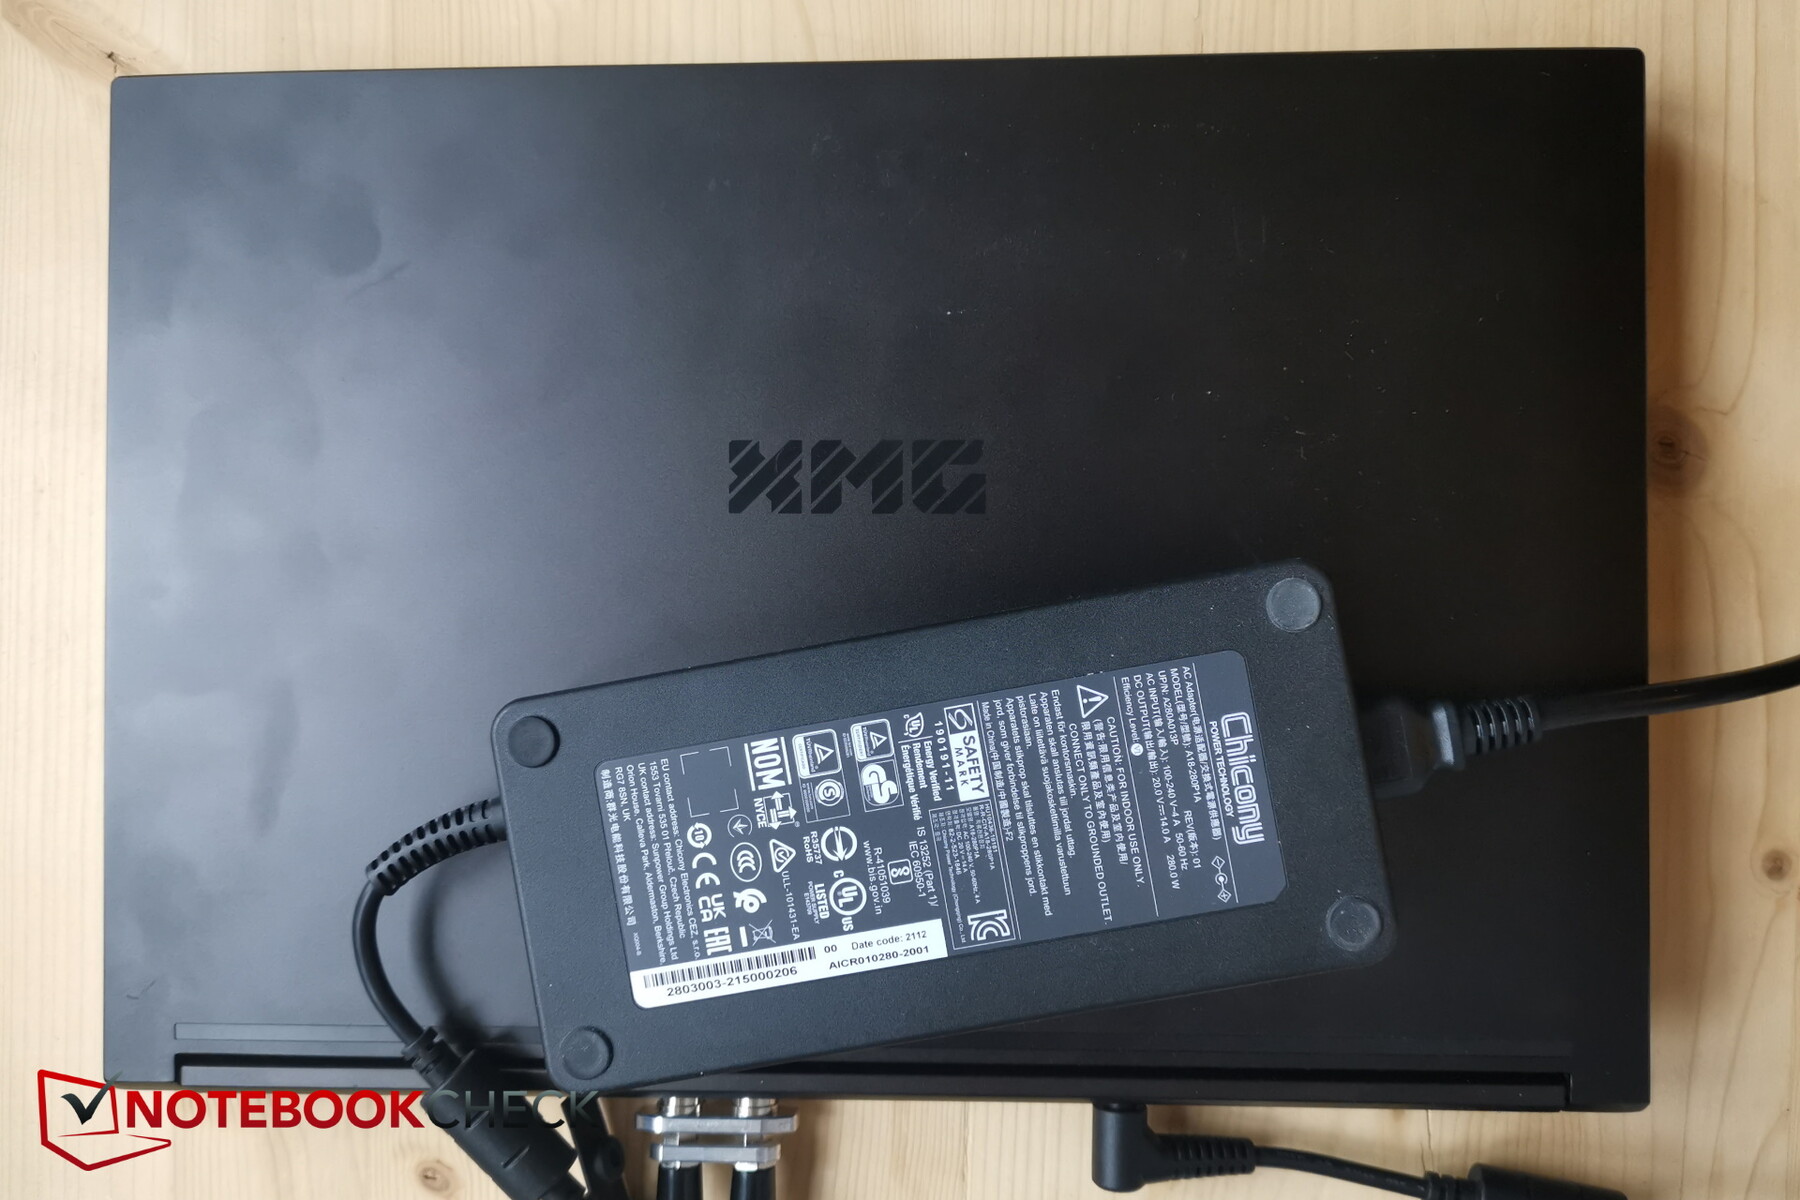
Uma palavra sobre o fornecimento de energia: O cabo que vai da fonte de alimentação ao laptop é muito curto e, portanto, irritante. Se você tiver uma mesa ligeiramente mais alta e tiver que puxar o cabo da frente da mesa para a parte de trás da porta do laptop, a fonte de alimentação fica pendurada no ar e se aperta muito irritantemente. Teria sido desejável um cabo um pouco mais longo.
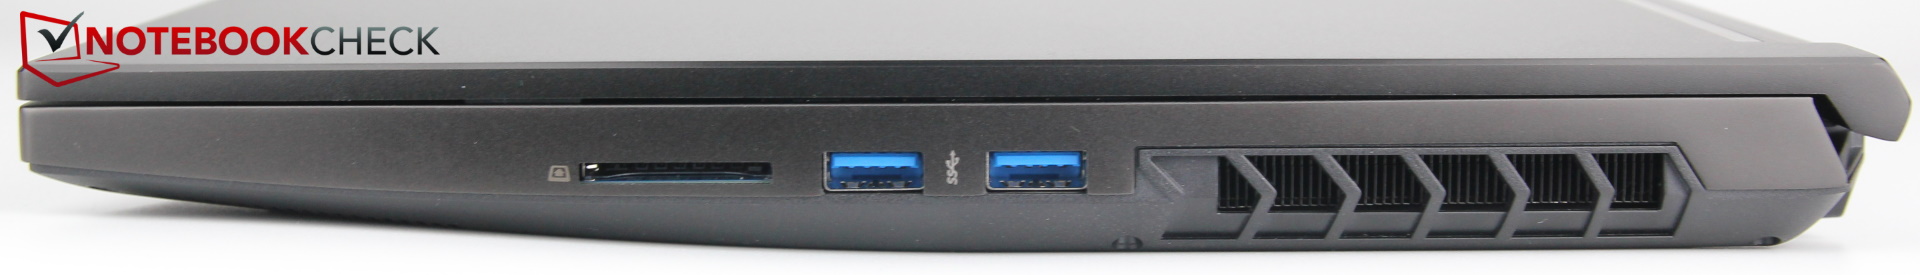
Leitor de cartões SD
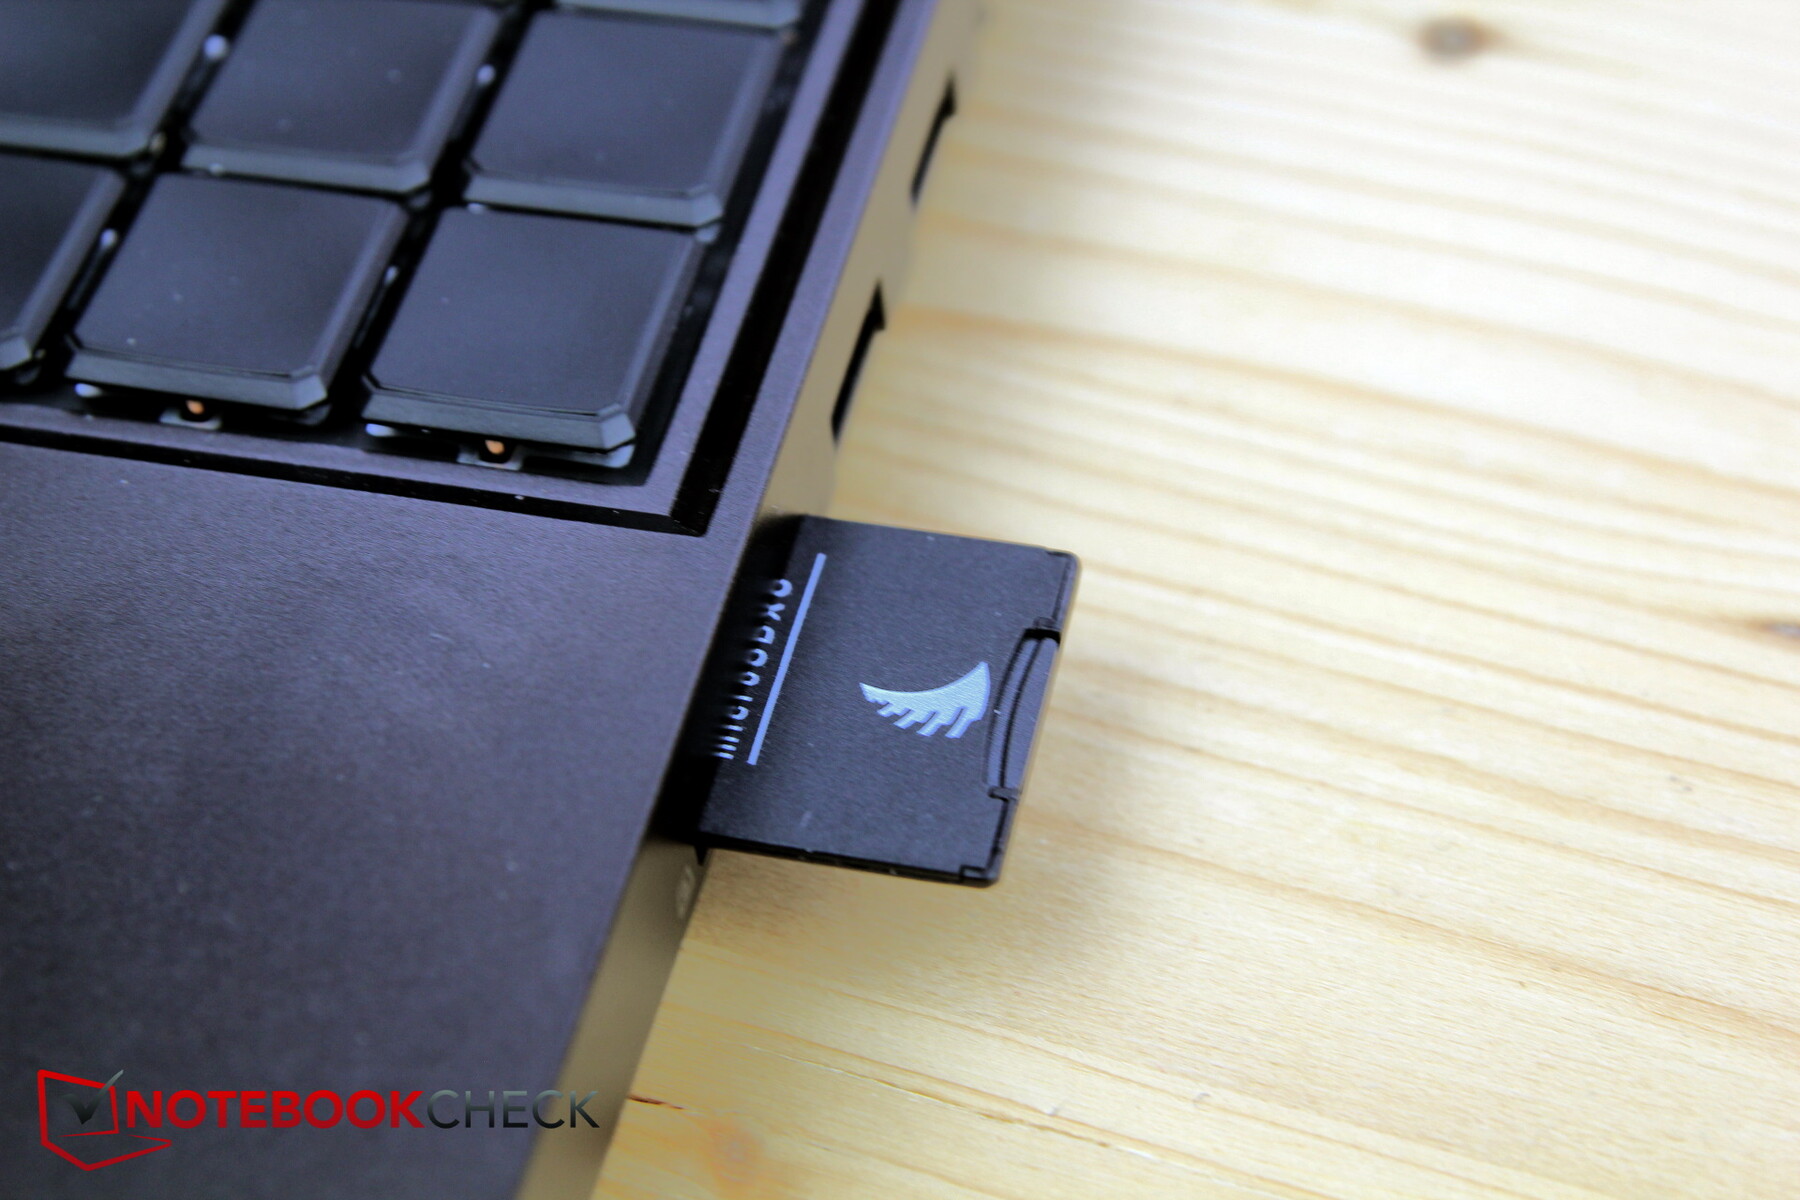
O leitor SD instalado tem sido um dos modelos mais lentos há pelo menos duas gerações. A média da classe é cerca de duas vezes mais rápida - se um for instalado, porque muitos dos fabricantes concorrentes não instalam mais nem mesmo um leitor de cartões SD.
Nossa placa de teste AV PRO microSD 128 GB V60 não se encaixa, mas é apenas inserida e com metade da placa saliente fora do slot.
| SD Card Reader | |
| average JPG Copy Test (av. of 3 runs) | |
| Média da turma Gaming (20.9 - 210, n=54, últimos 2 anos) | |
| MSI GE76 Raider (AV PRO microSD 128 GB V60) | |
| Schenker XMG Neo 15 Tiger Lake (AV PRO microSD 128 GB V60) | |
| Schenker XMG Neo 15 E22 (Early 2022, RTX 3080 Ti) | |
| maximum AS SSD Seq Read Test (1GB) | |
| Média da turma Gaming (25.5 - 261, n=51, últimos 2 anos) | |
| Schenker XMG Neo 15 Tiger Lake (AV PRO microSD 128 GB V60) | |
| Schenker XMG Neo 15 E22 (Early 2022, RTX 3080 Ti) | |
Comunicação
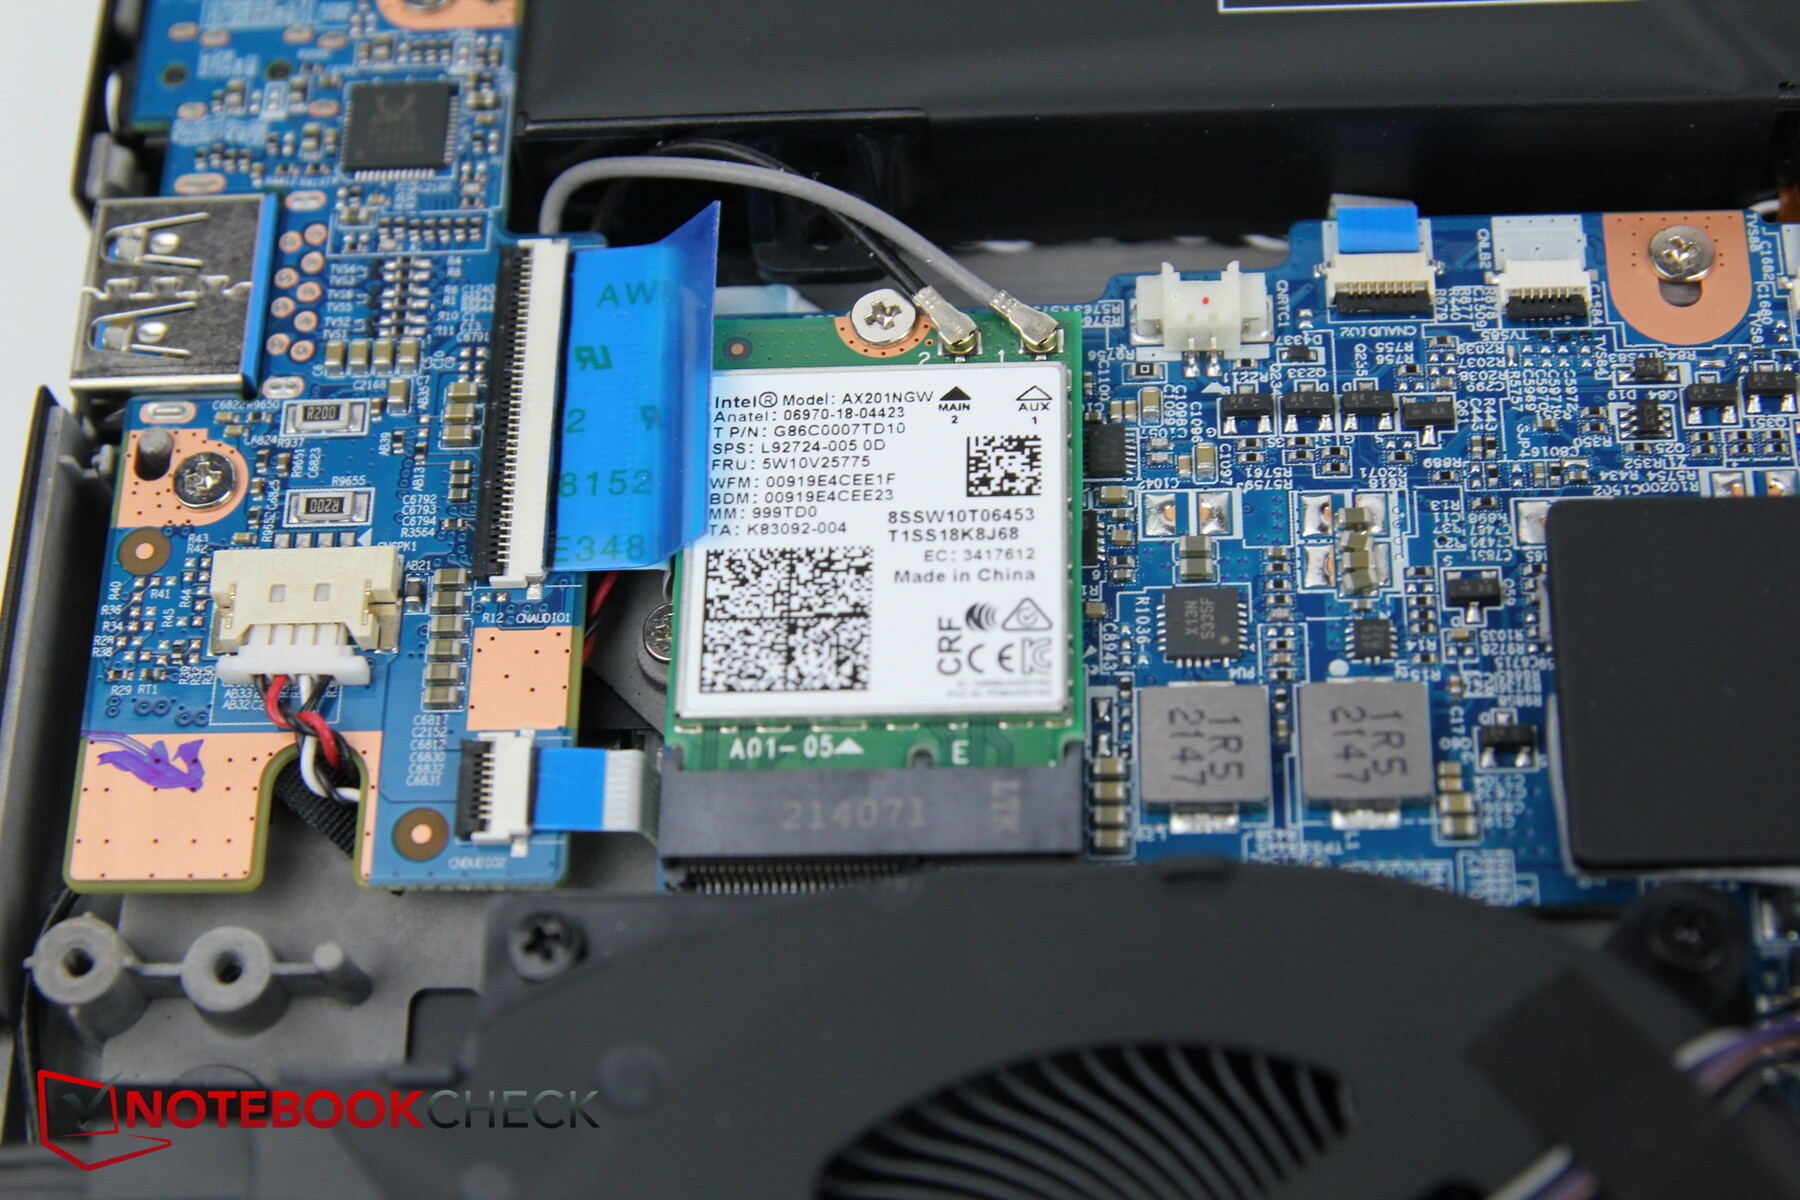
O Intel AX201 é o mesmo módulo WLAN do predecessor e pode ser trocado, se necessário.
Entretanto, medimos taxas de transferência de pouco menos de 1 GBit/s, enquanto o predecessor alcançou mais de 1,5 GBit/s. Resta saber se isto pode ser otimizado com atualizações de driver.
Webcam
A Schenker instala uma câmera Full HD. Os desvios de cor são bons, mas a imagem ainda é muito barulhenta mesmo em condições de luz média e com aspecto de lavagem.

 GeForce RTX 3080 Ti Laptop GPU, i7-12700H, Samsung SSD 980 Pro 250GB MZ-V8P250BW")
 GeForce RTX 3080 Ti Laptop GPU, i7-12700H, Samsung SSD 980 Pro 250GB MZ-V8P250BW")
Segurança
Uma porta de eclusa Kensington está disponível, assim como um chip TPM 2.0. No entanto, falta um sensor de impressão digital.
Acessórios
Como este é um modelo de pré-produção, ainda não é possível fazer declarações sobre os acessórios. Como é típico da Schenker, o CD do driver e a pen drive devem ser incluídos. O Oásis XMG, que é freqüentemente mencionado na revisão, pode ser adquirido por mais 199 euros (~$199).
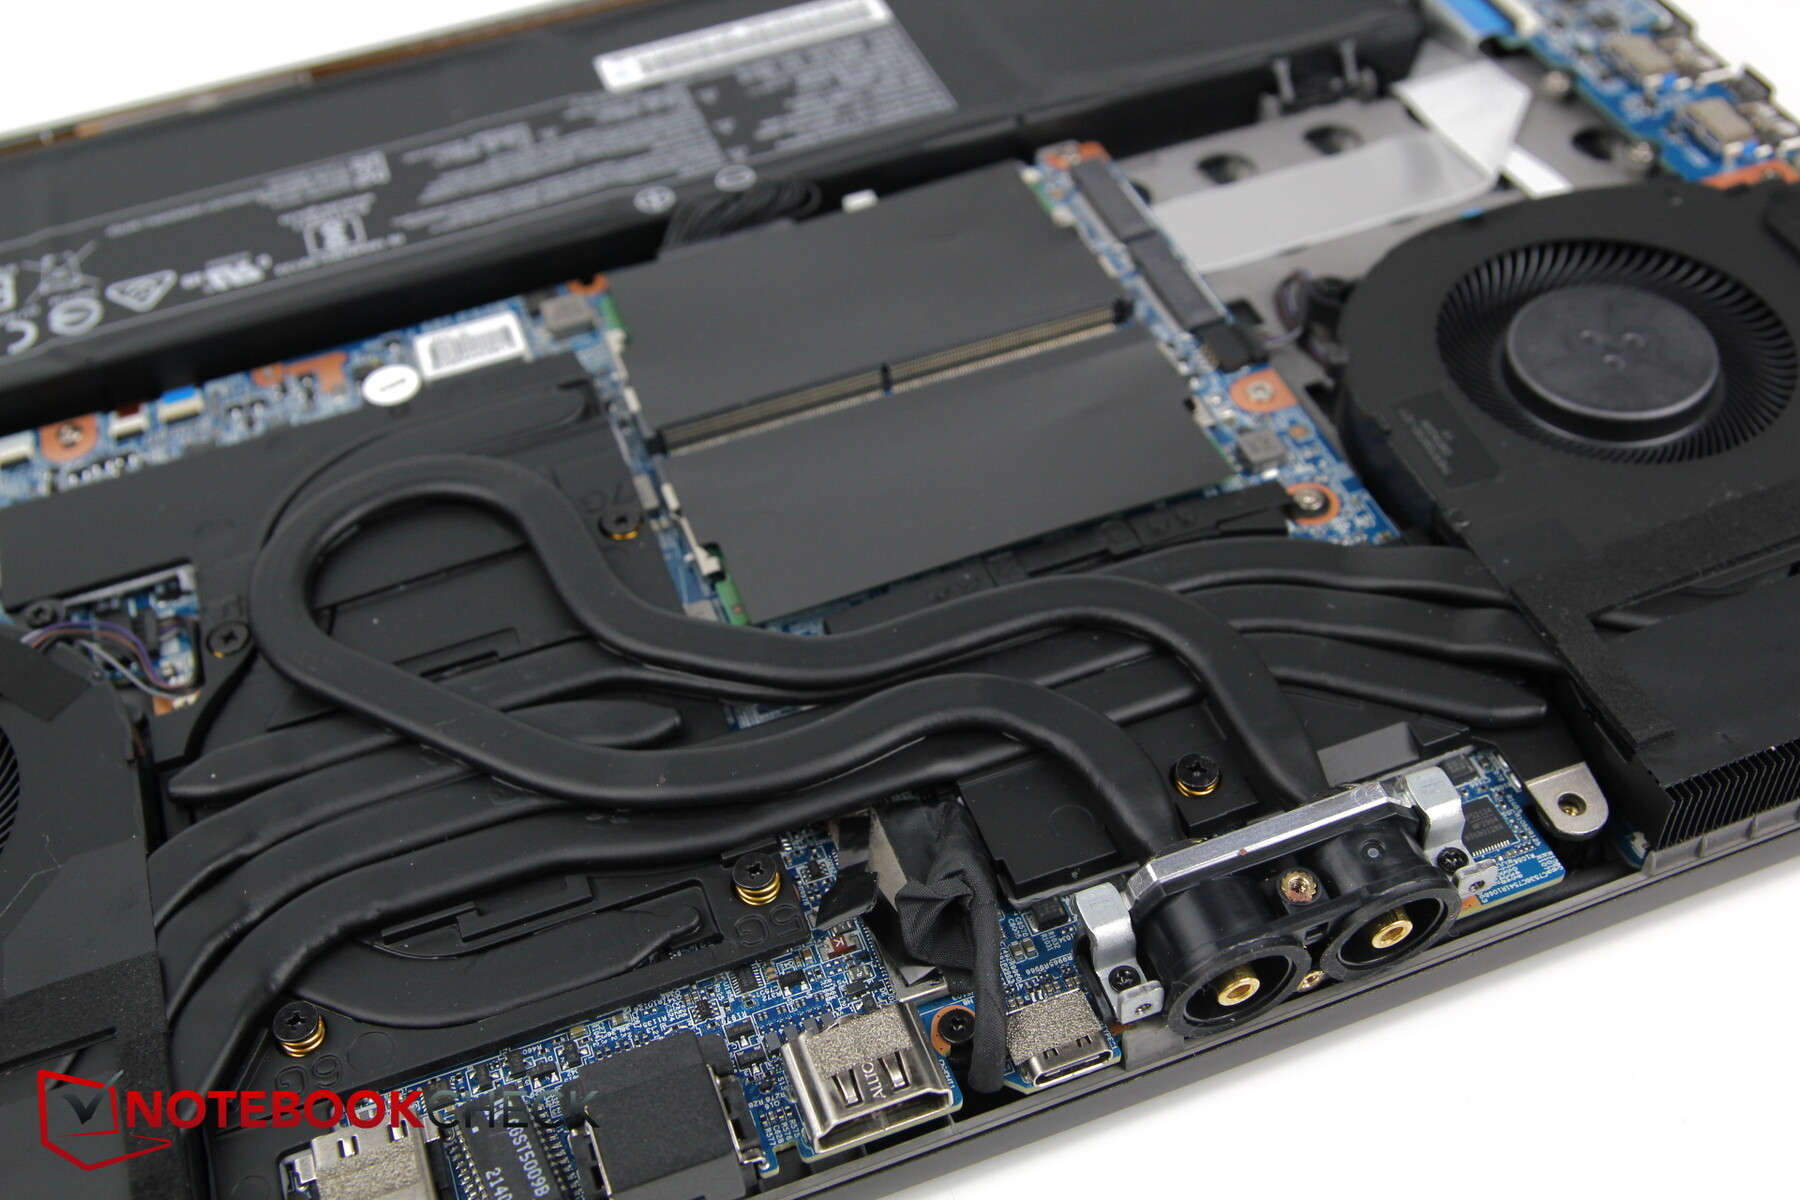
Manutenção
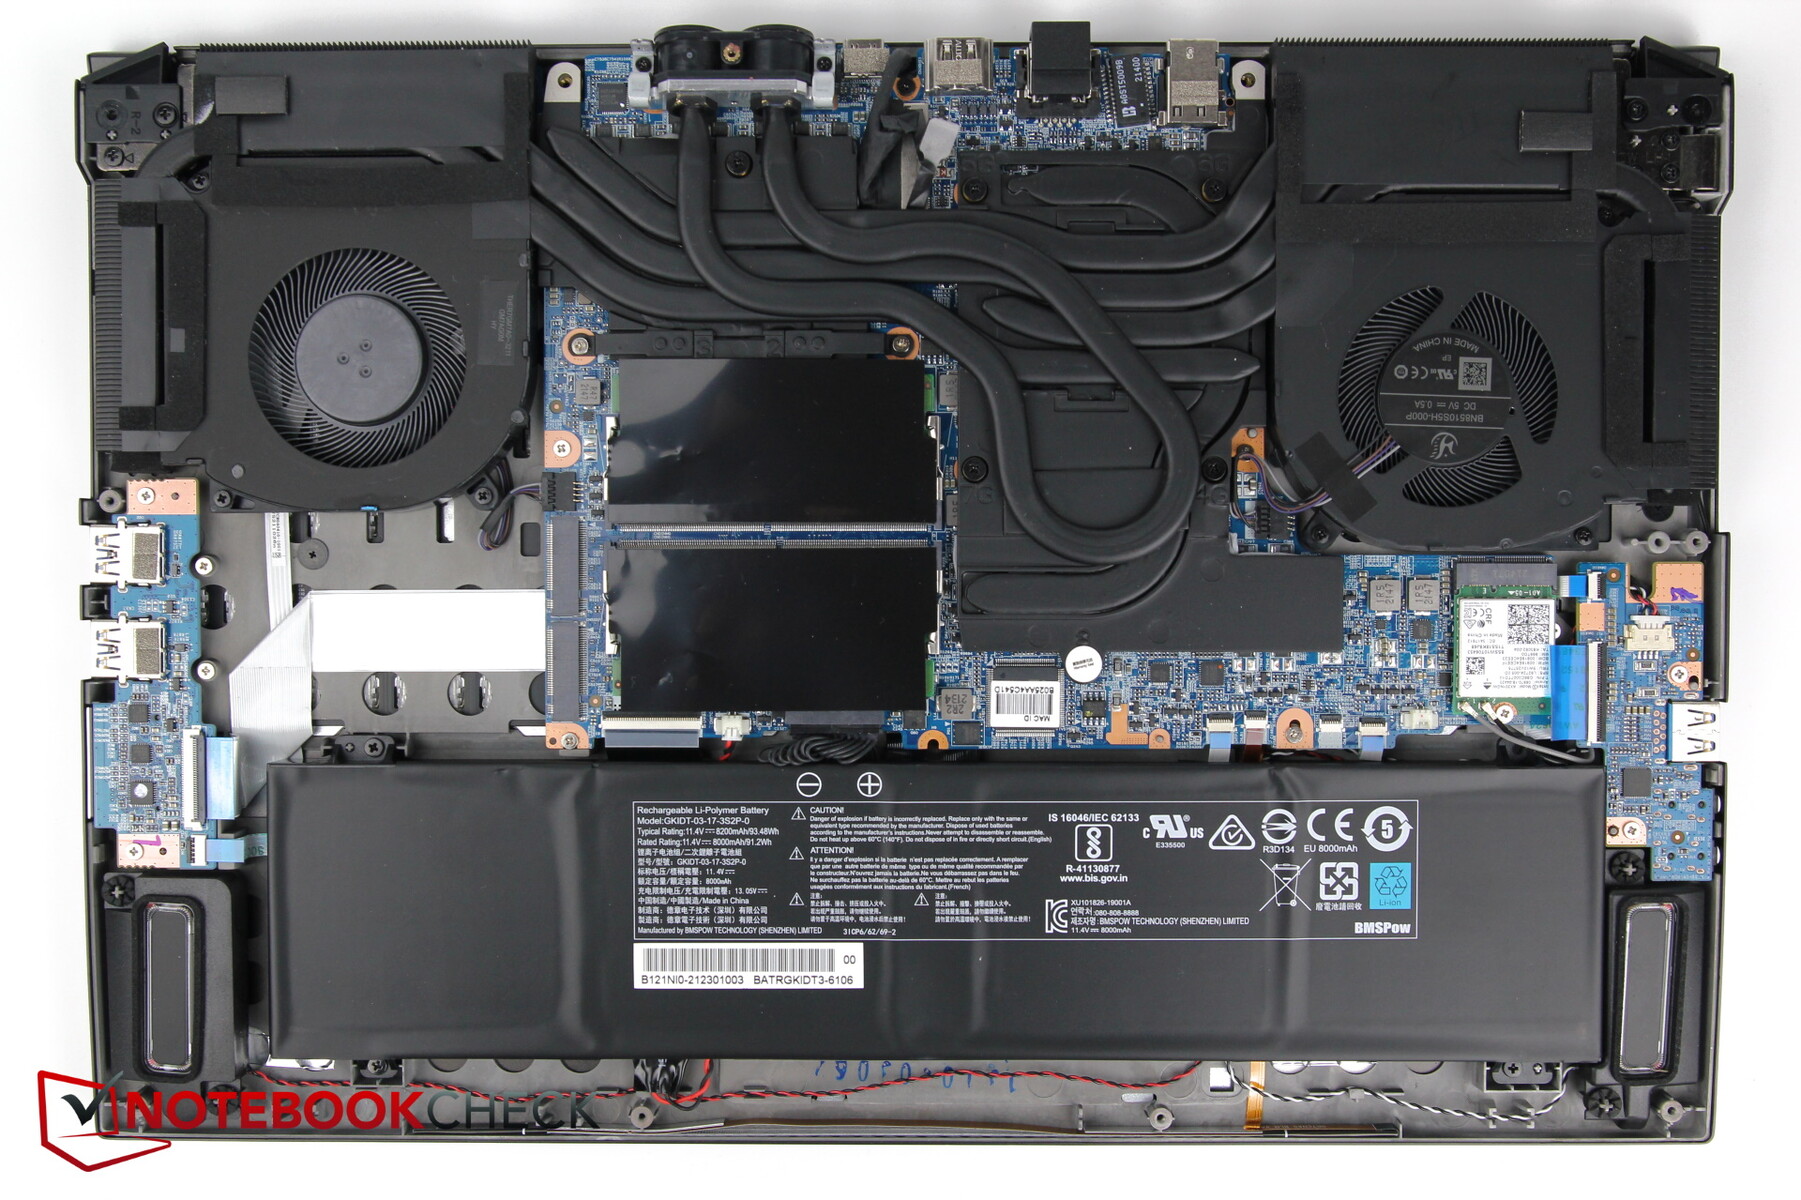
A manutenção geral é bastante simples. O sistema de resfriamento de água requer apenas quatro parafusos Phillips adicionais (14 no total) para ser removido. Depois disso, o estojo pode ser aberto com relativa facilidade.
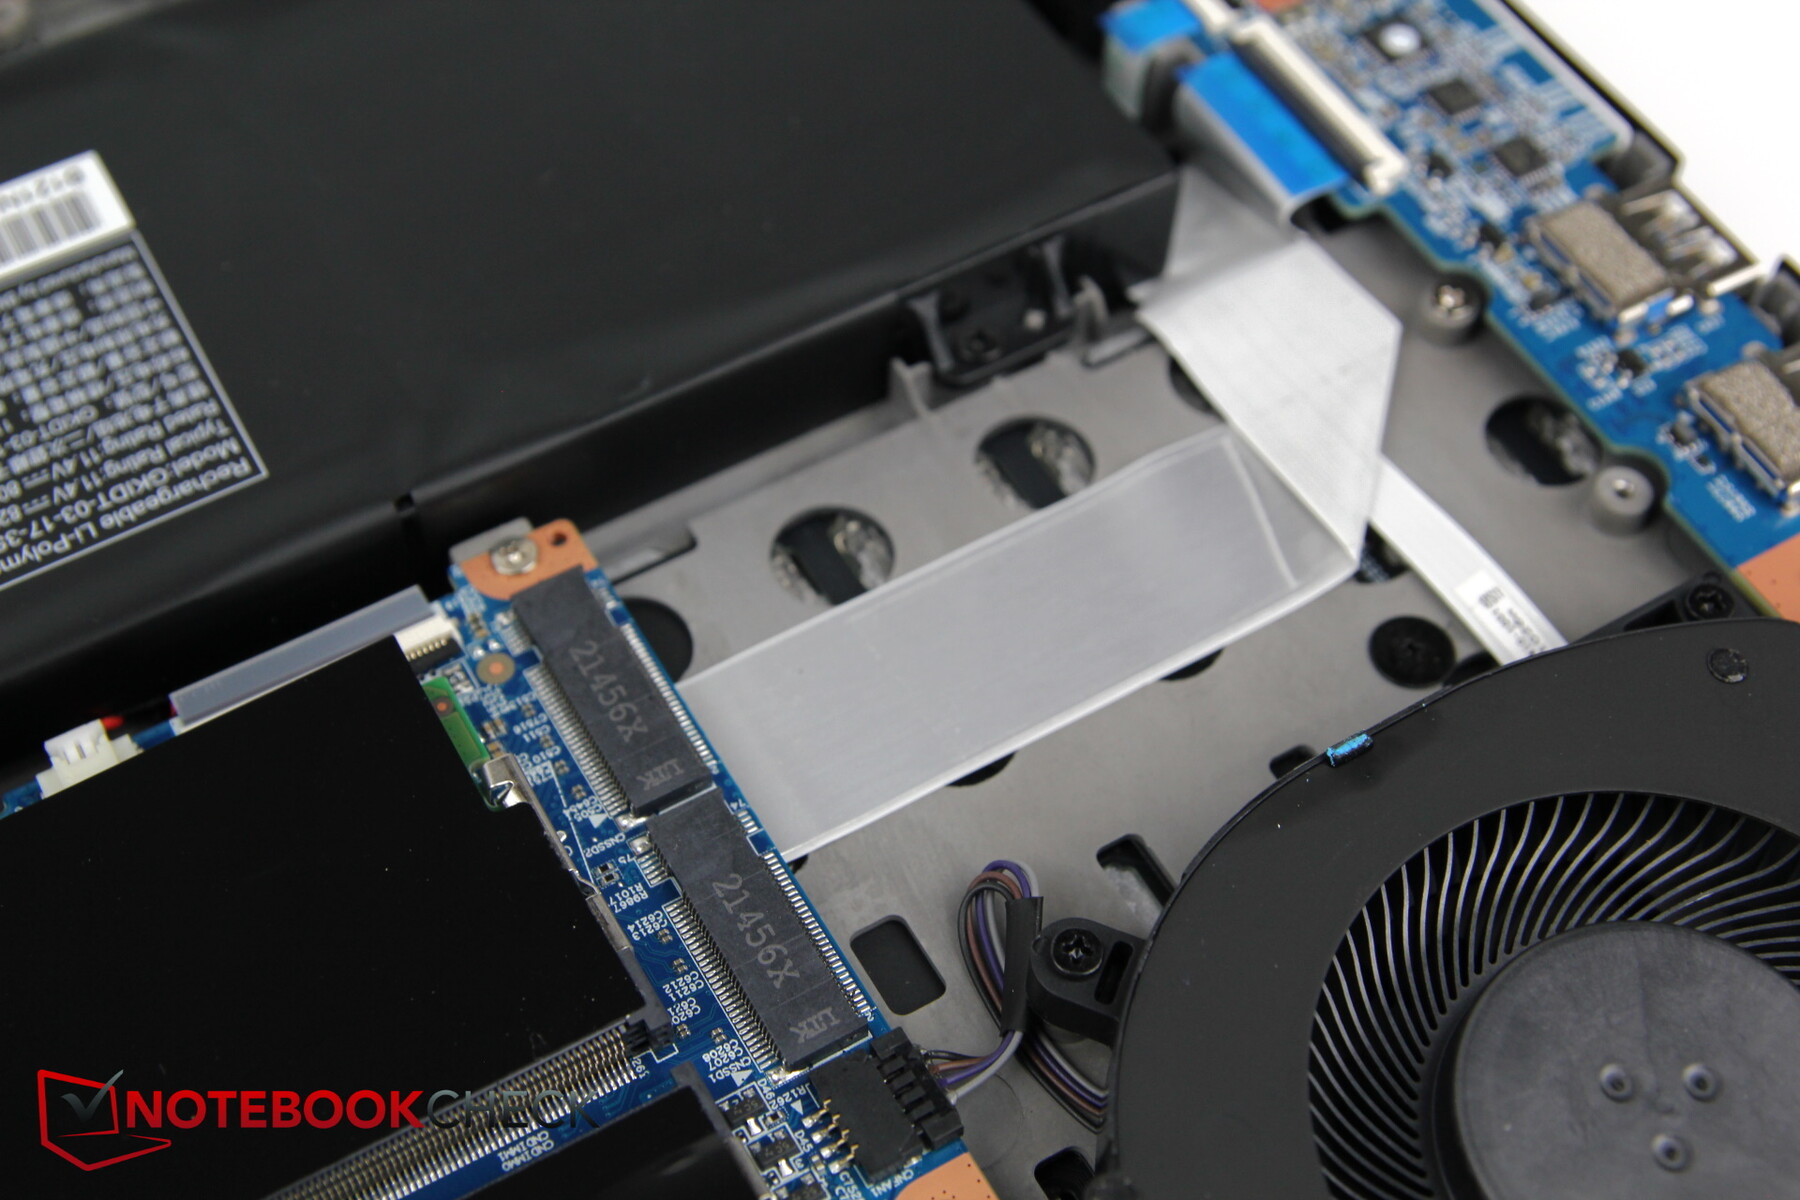
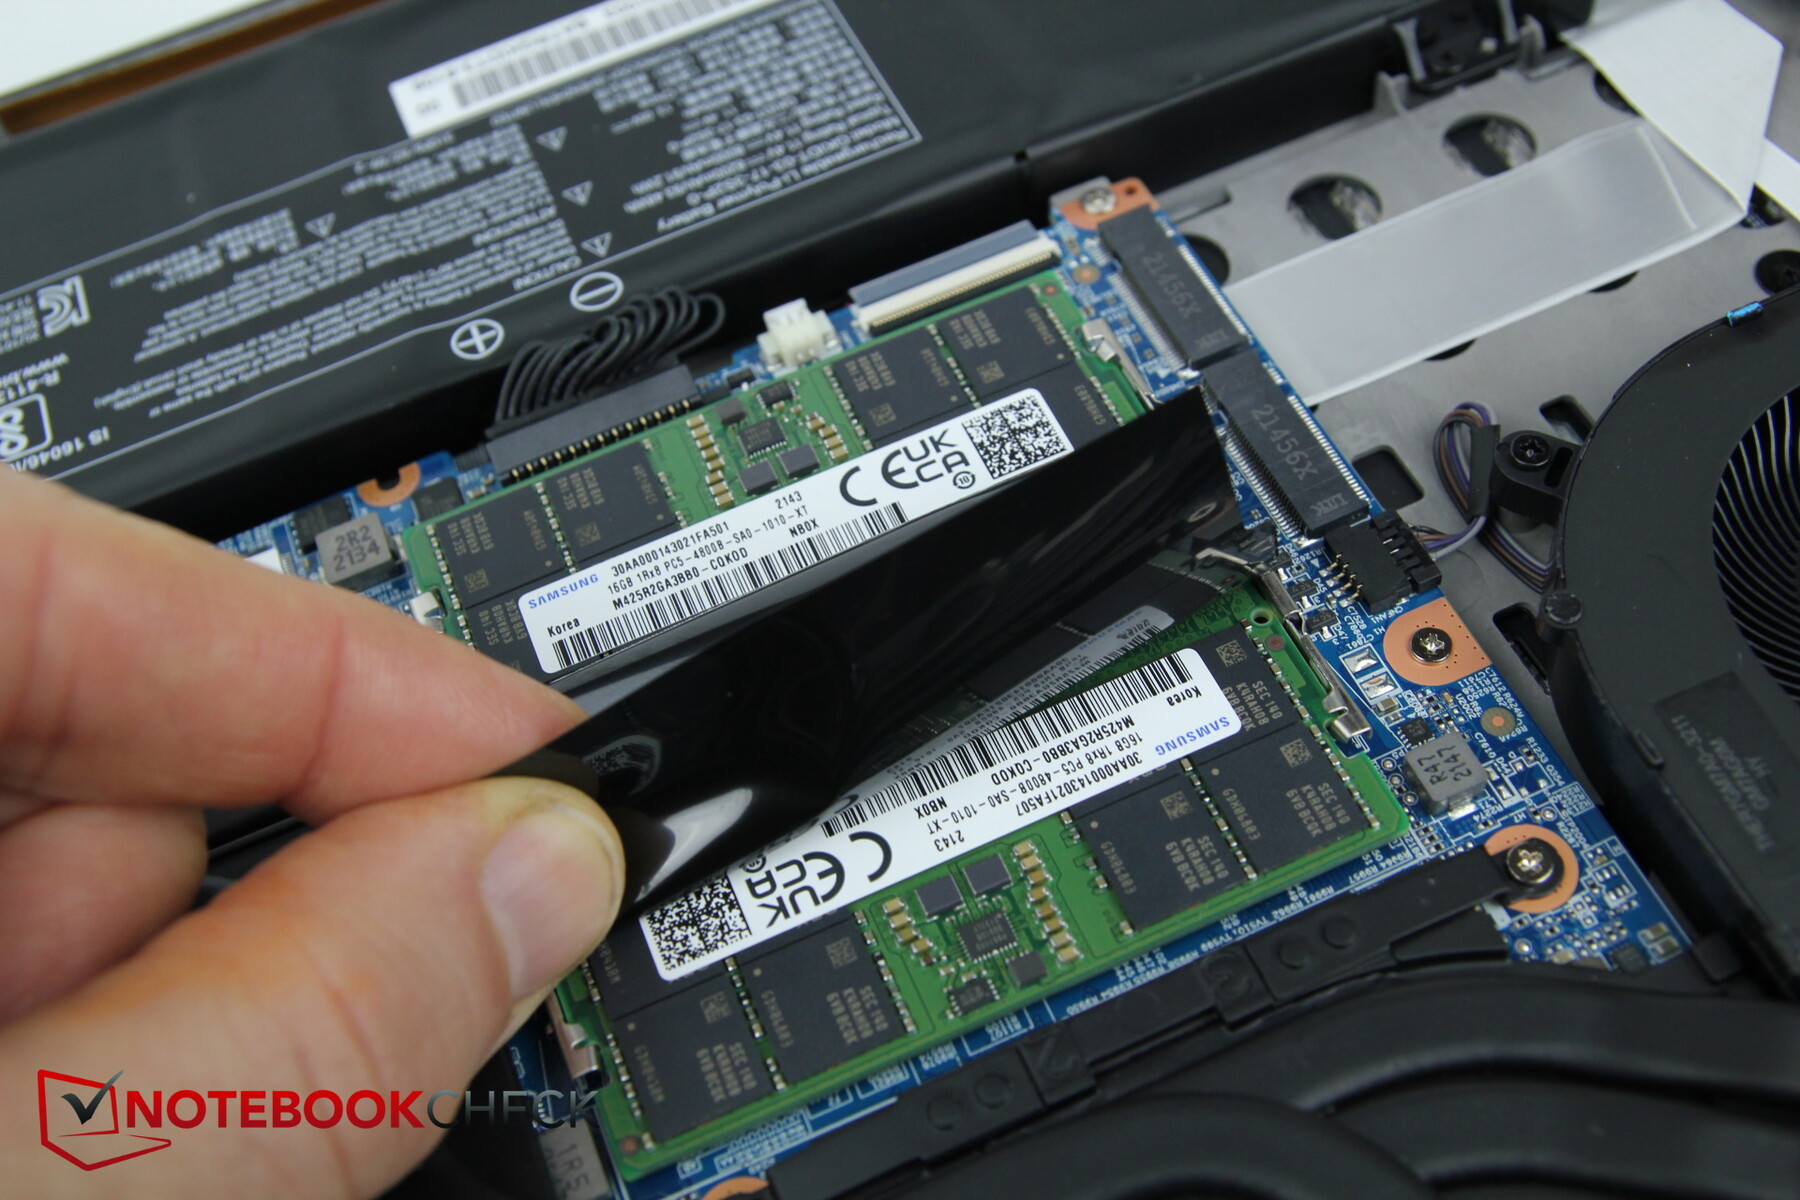
Os ventiladores, os tubos de calor incluindo o circuito de água, duas RAM e os slots SSD M.2, assim como o módulo Wi-Fi, são então acessíveis. Isto também mostra como seria fácil implementar um circuito de água adicional e eficaz para o fabricante caso o modelo se tornasse popular.
Garantia
A Schenker geralmente concede uma garantia de dois anos em seus laptops
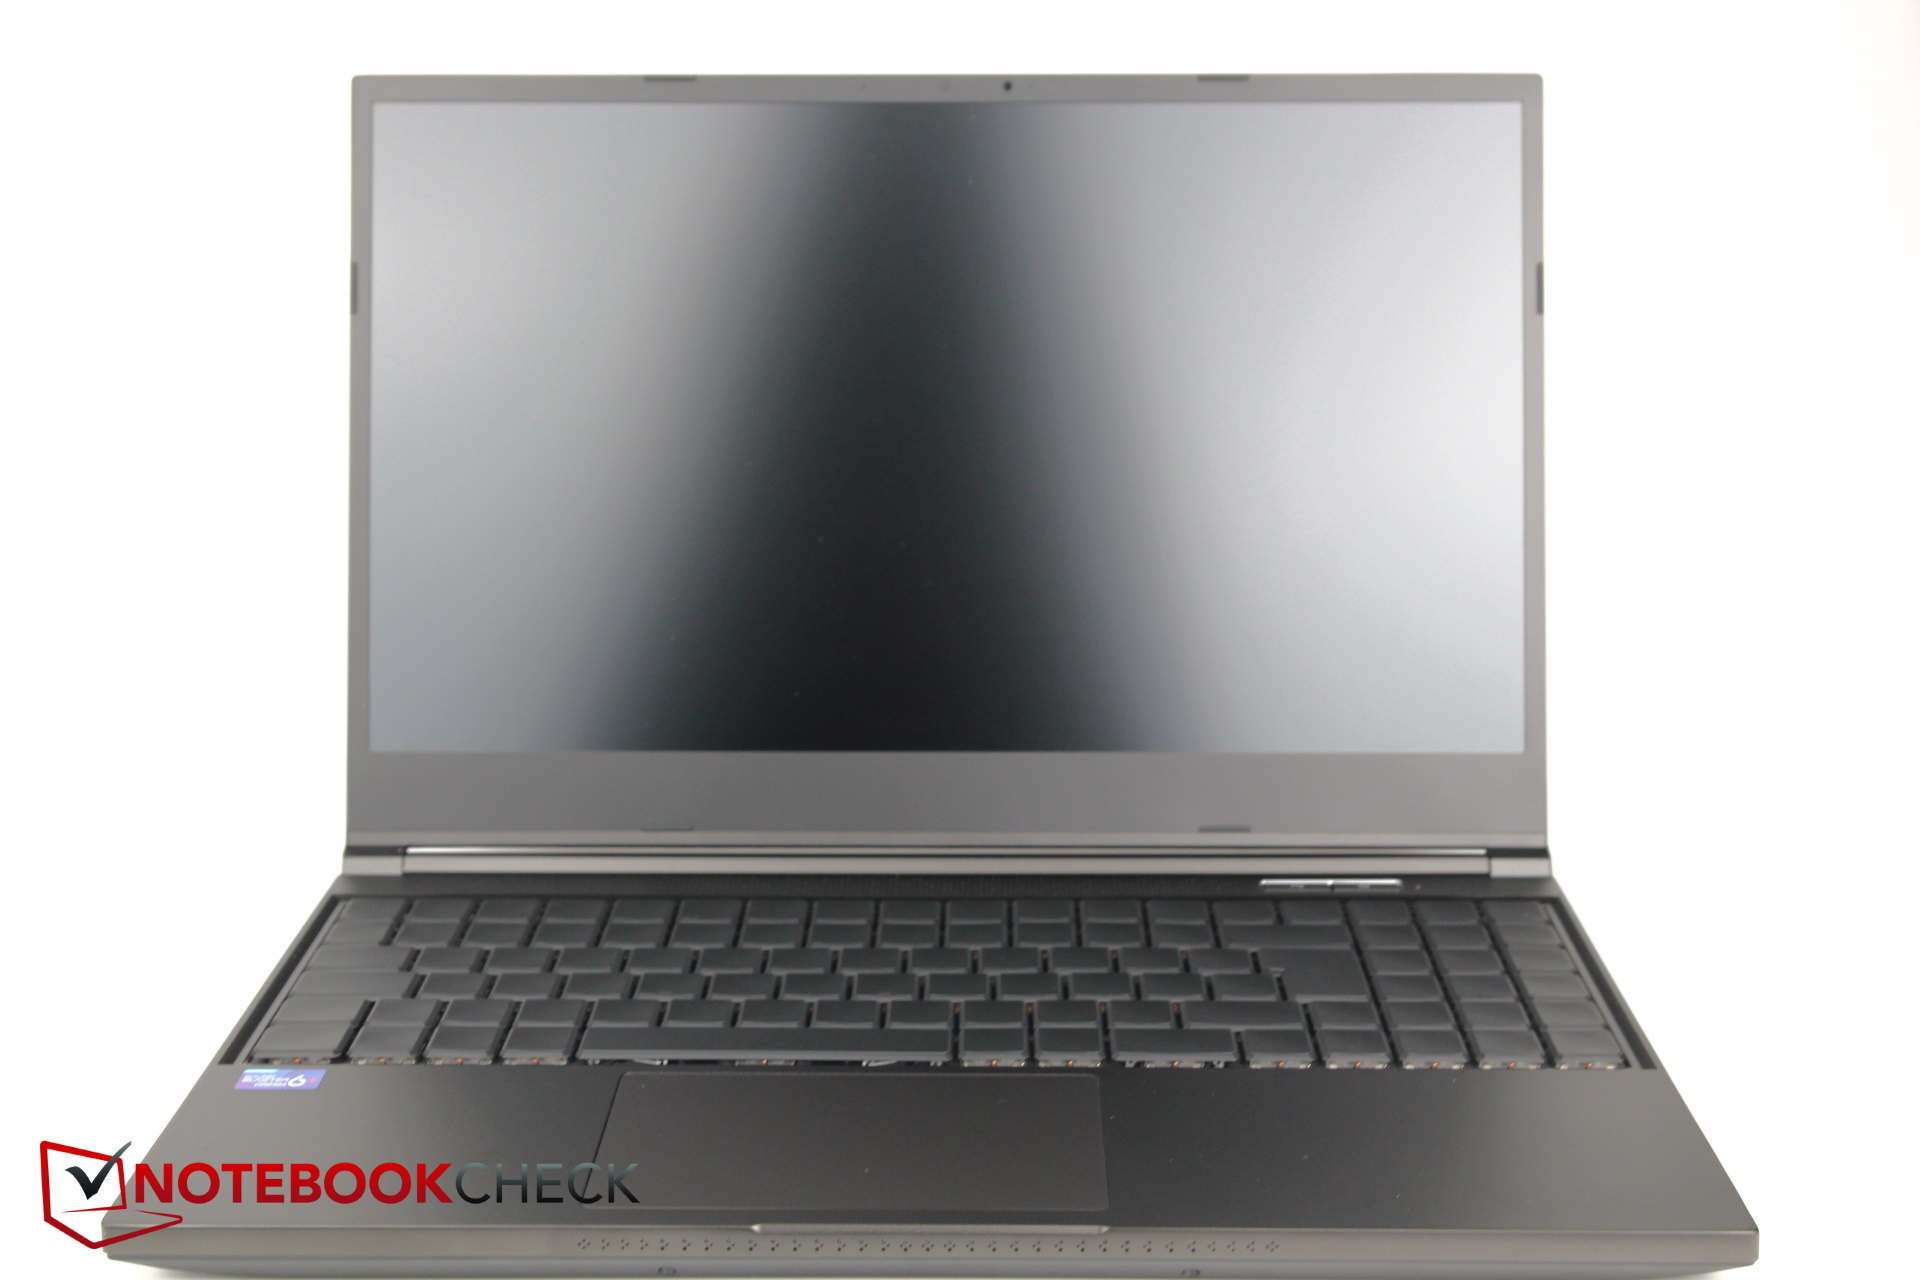
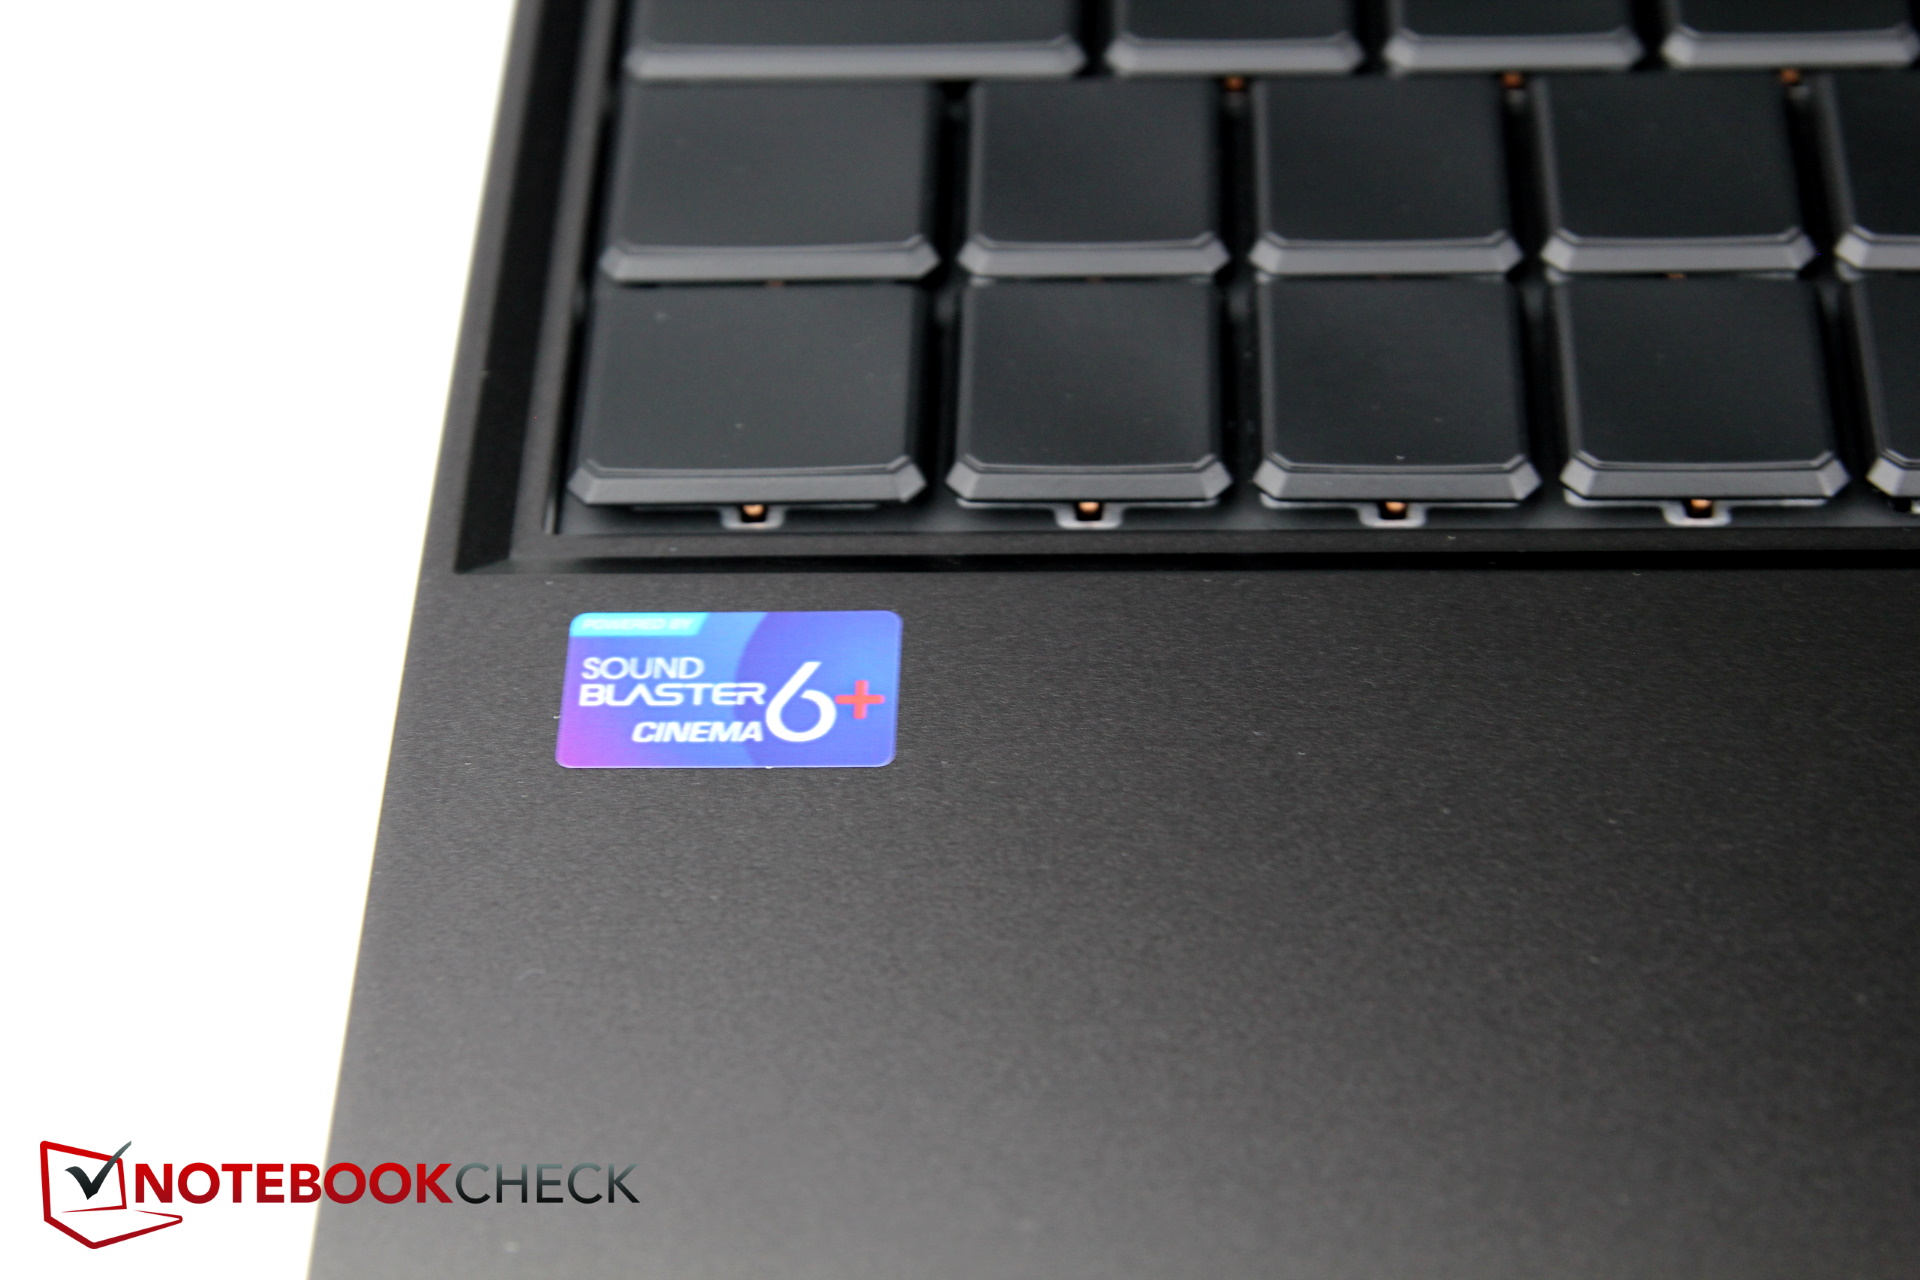
Dispositivos de entrada: Teclado optomecânico
Teclado
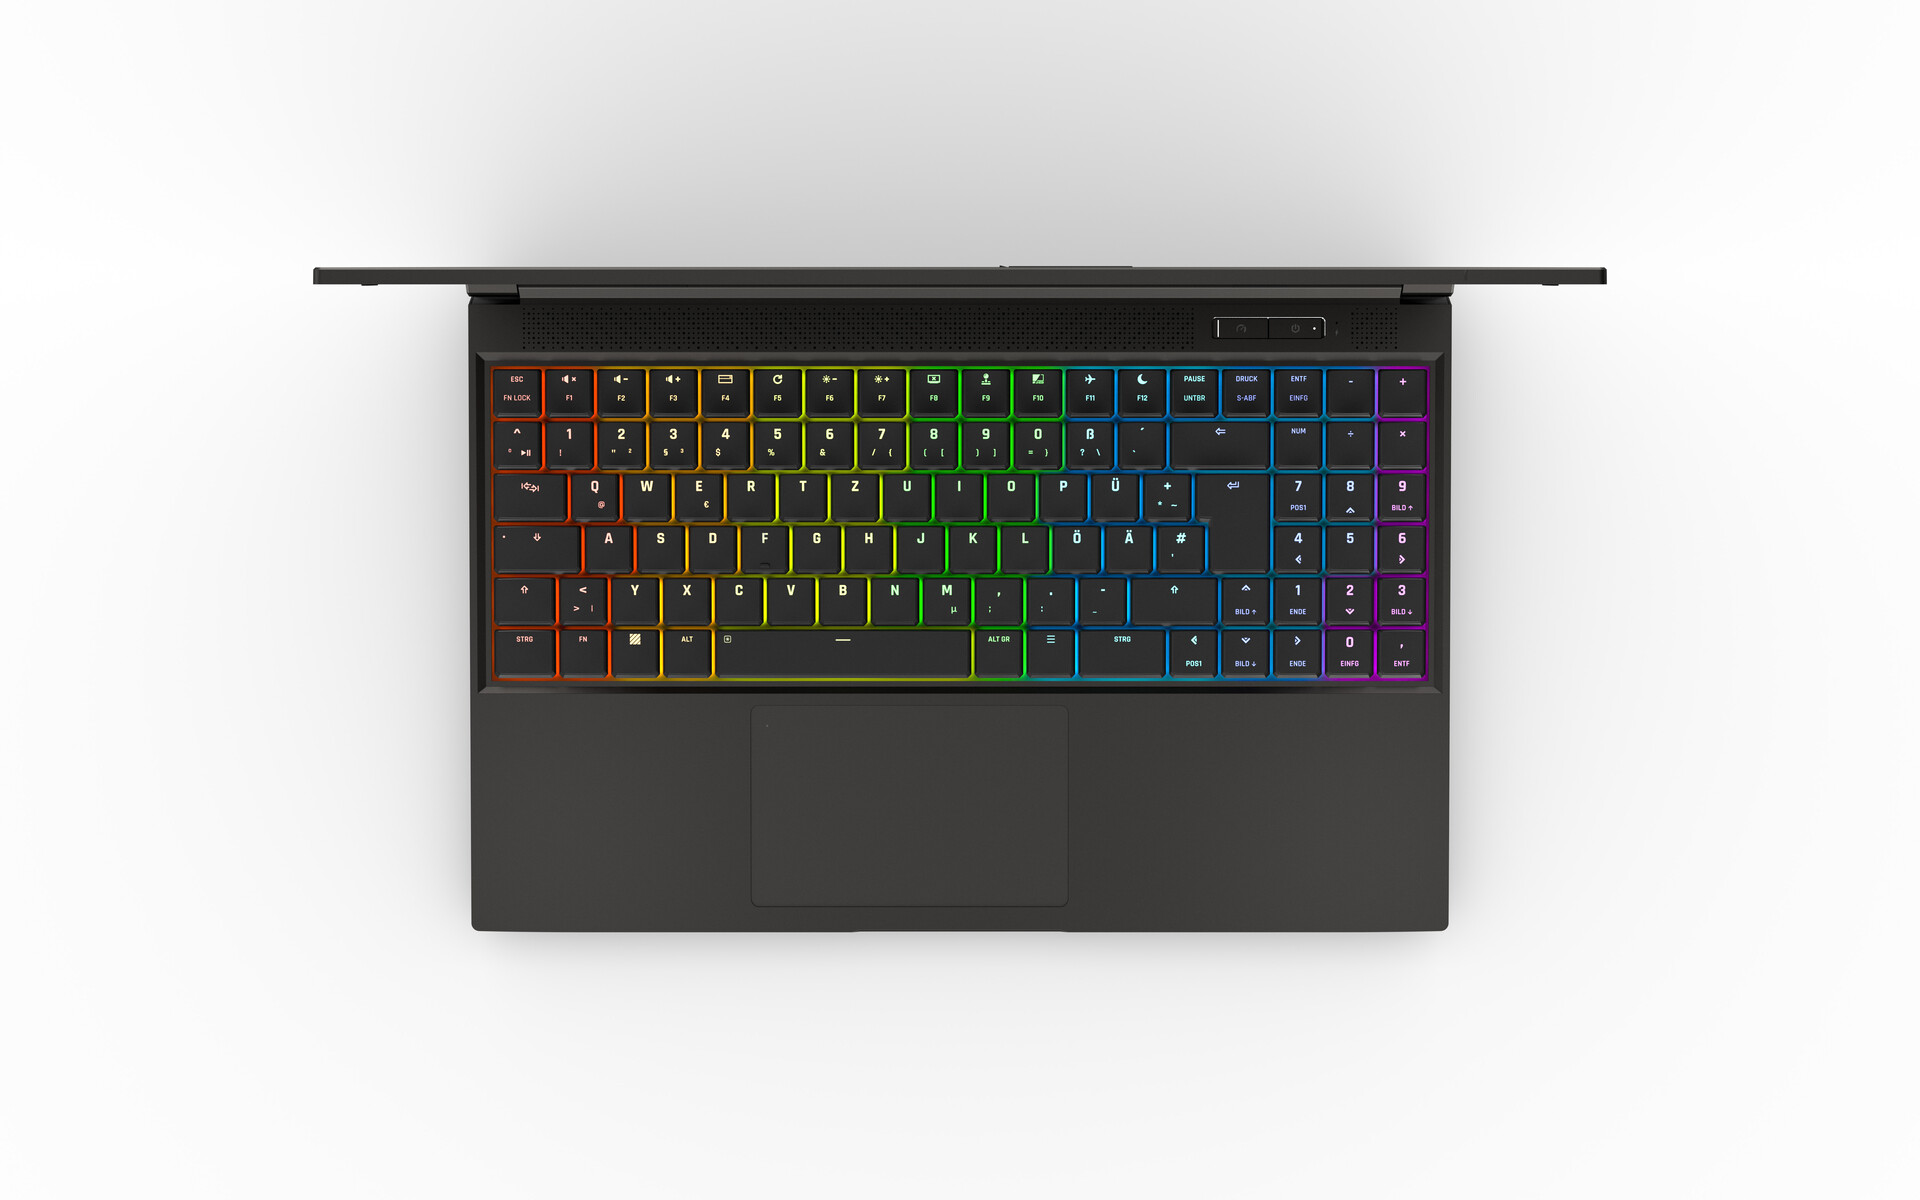
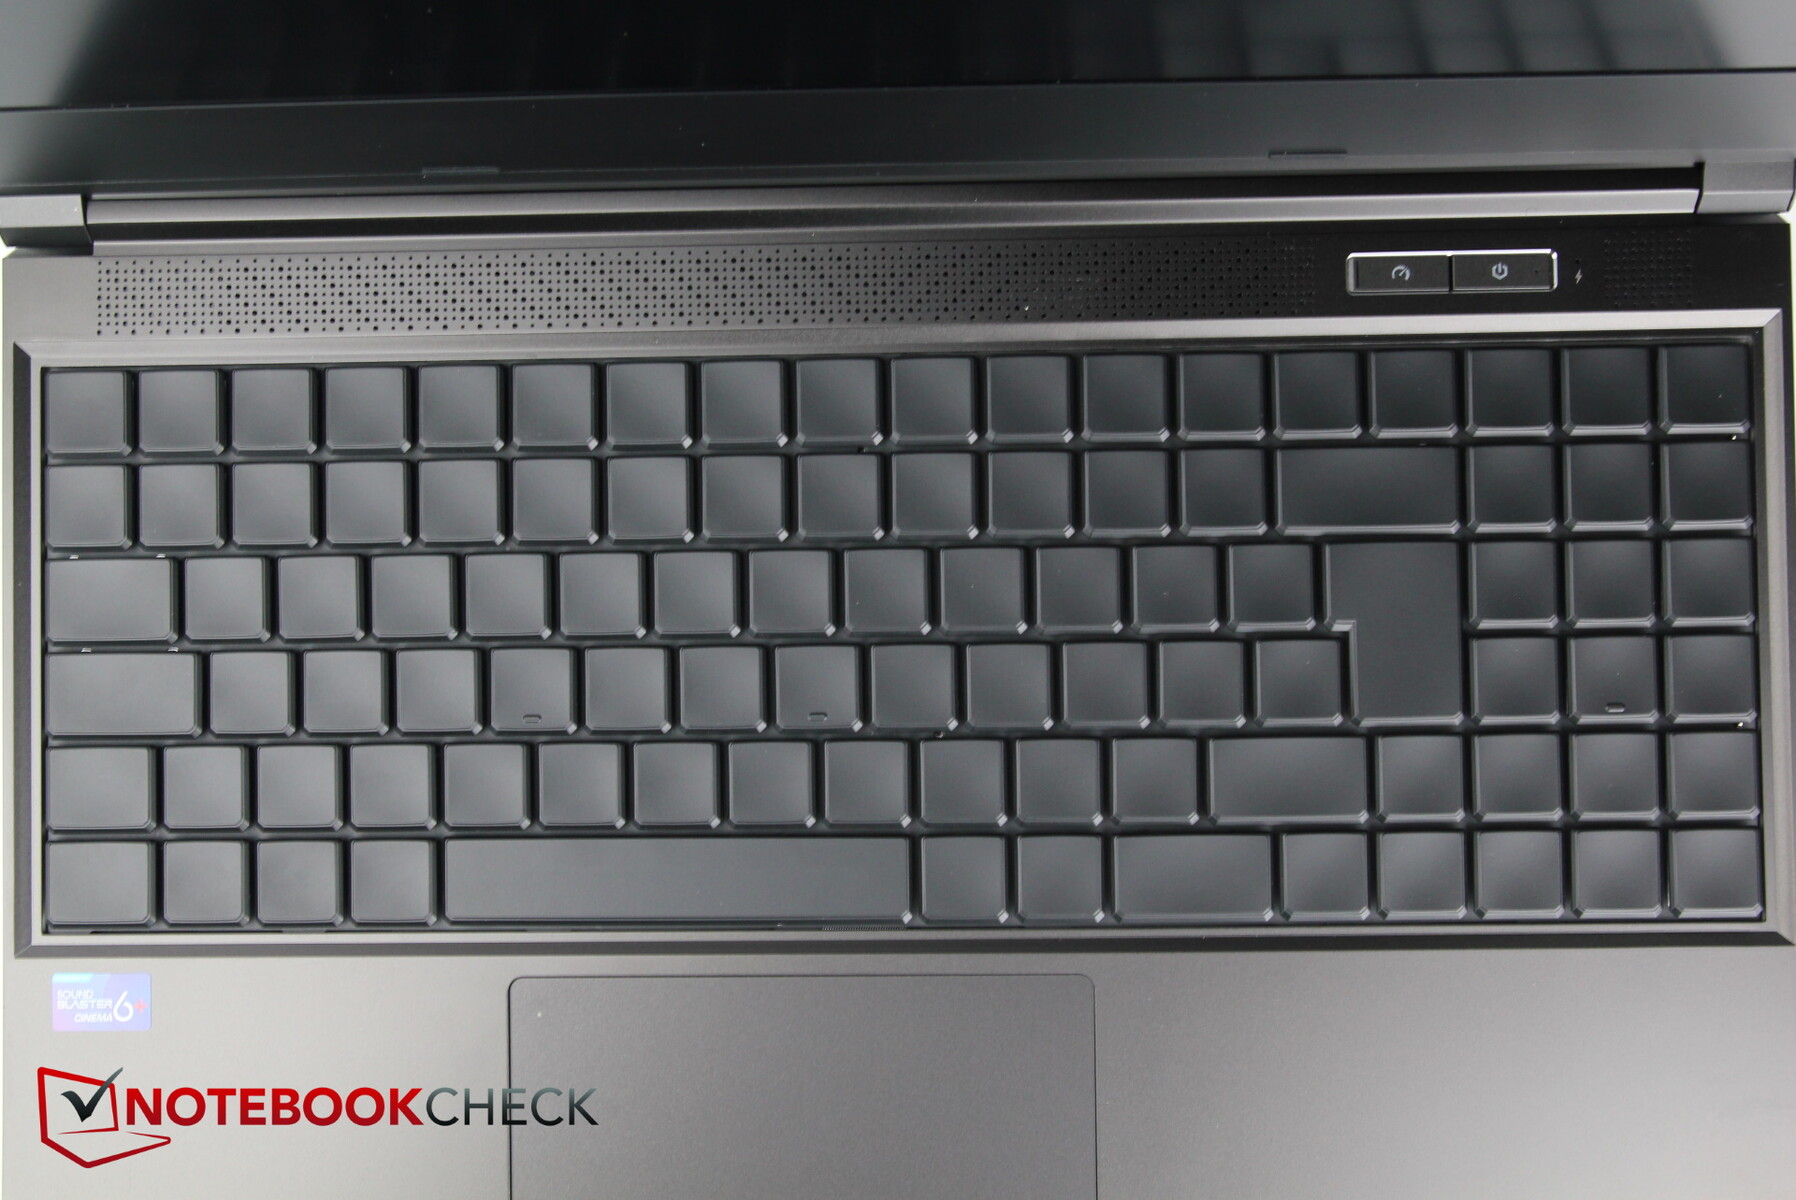
O fabricante utiliza um teclado optomecânico com iluminação RGB de uma tecla, teclado numérico, tecla N de rolagem e recursos anti-fantasma. Os interruptores tácteis silenciosos têm um curso de 2 mm e um curso de 1 mm.
As teclas acionam com um claro feedback no início do curso; a digitação é agradável e rápida.
Nosso modelo de pré-produção veio com chaves em branco, portanto, ainda não podemos dizer nada sobre as letras. O teclado numérico não rotulado parece muito lotado à direita, e não há espaço com o resto do teclado. No entanto, as teclas de seta são de tamanho normal, apesar de estarem um pouco apertadas entre o teclado e o numpad
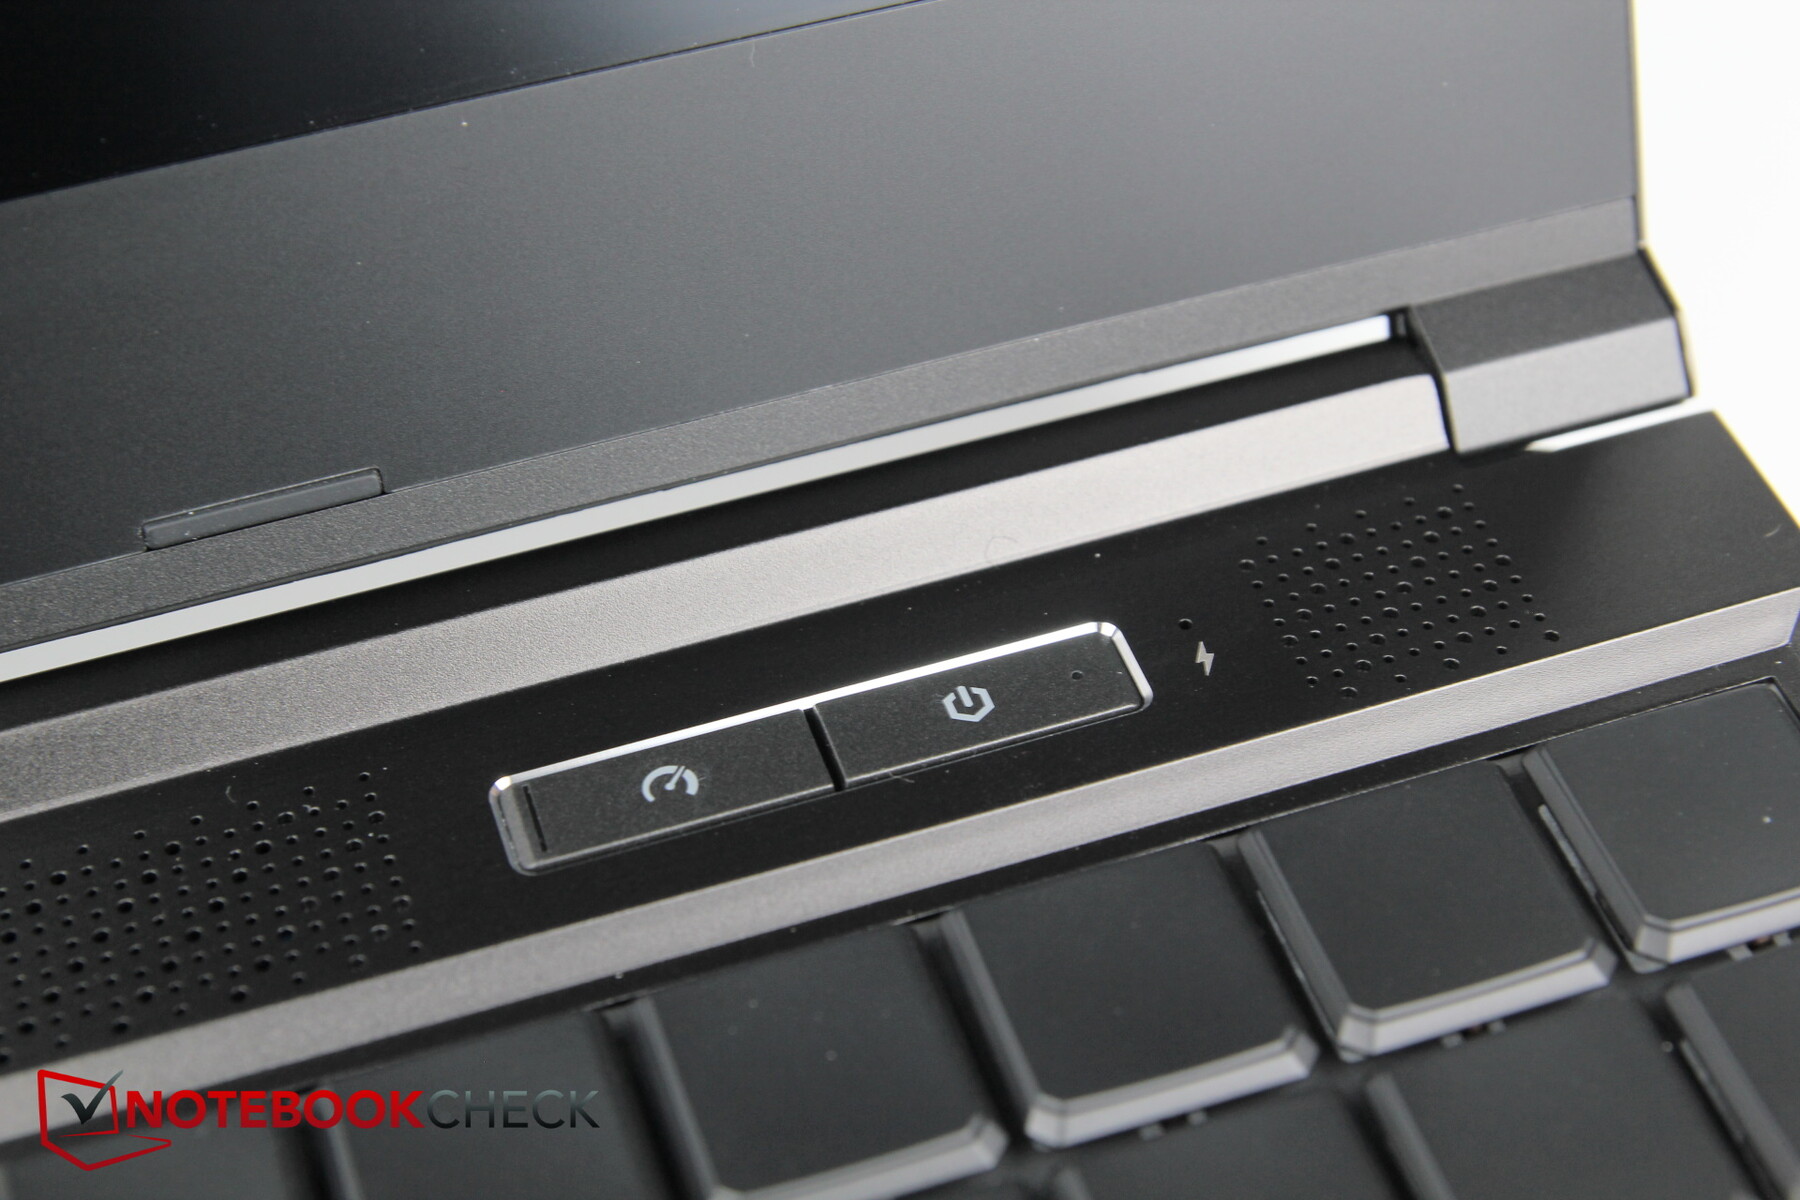
O interruptor de alimentação, bem como um interruptor dedicado para alternar através de vários modos de desempenho, estão incorporados acima da direita do teclado
O ruído é ligeiramente mais alto do que alguns dos teclados chiclet mais silenciosos devido aos interruptores optomecânicos. Entretanto, é significativamente mais silencioso do que os teclados mecânicos de tamanho normal.
Touchpad
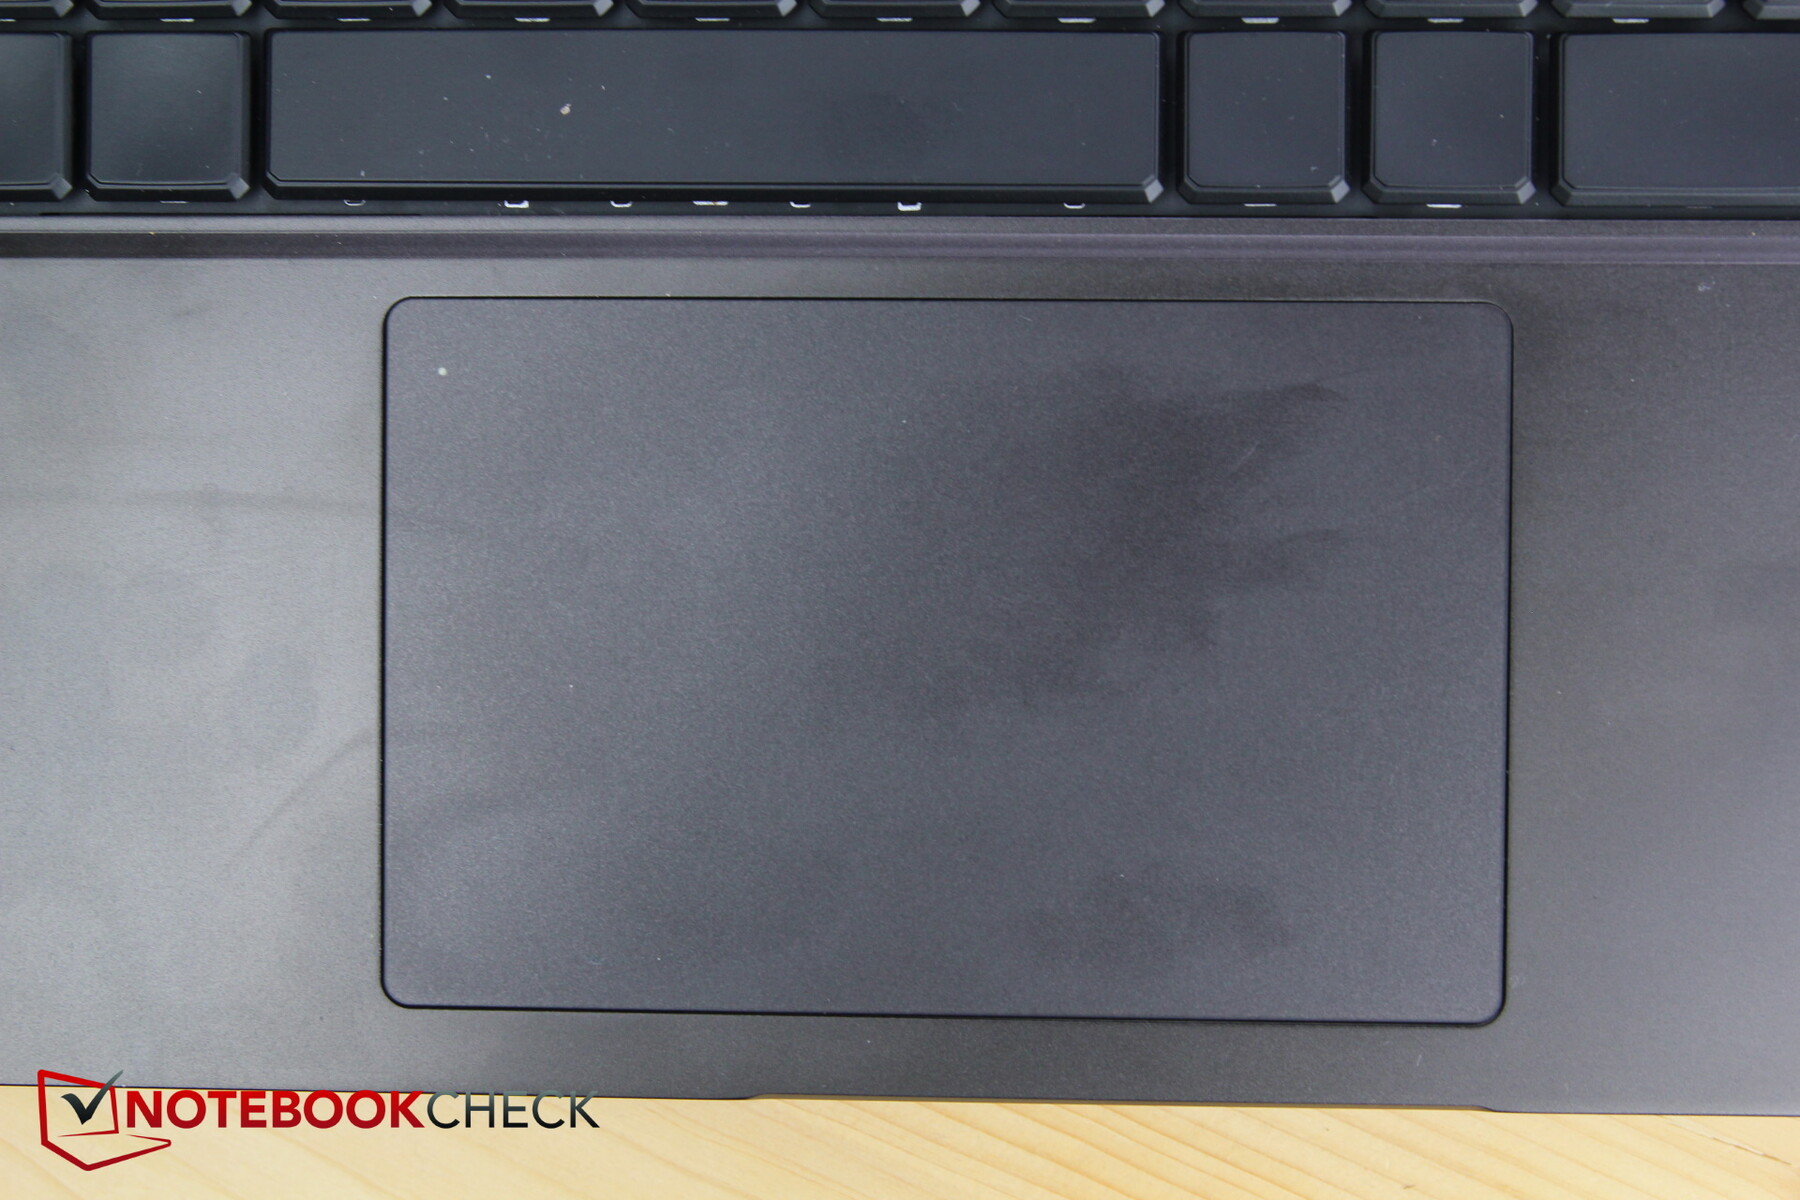
O touchpad bastante grande mede cerca de 11,6 cm x 7,4 cm e tem uma superfície muito lisa, que dificilmente vacila mesmo durante movimentos lentos.
Bater duas vezes no canto superior esquerdo desativa o touchpad e o aciona novamente da mesma forma, o que é conveniente.
Os botões integrados são bastante nítidos e deixam uma impressão confiável. Não encontramos nenhum problema ao utilizar o touchpad.
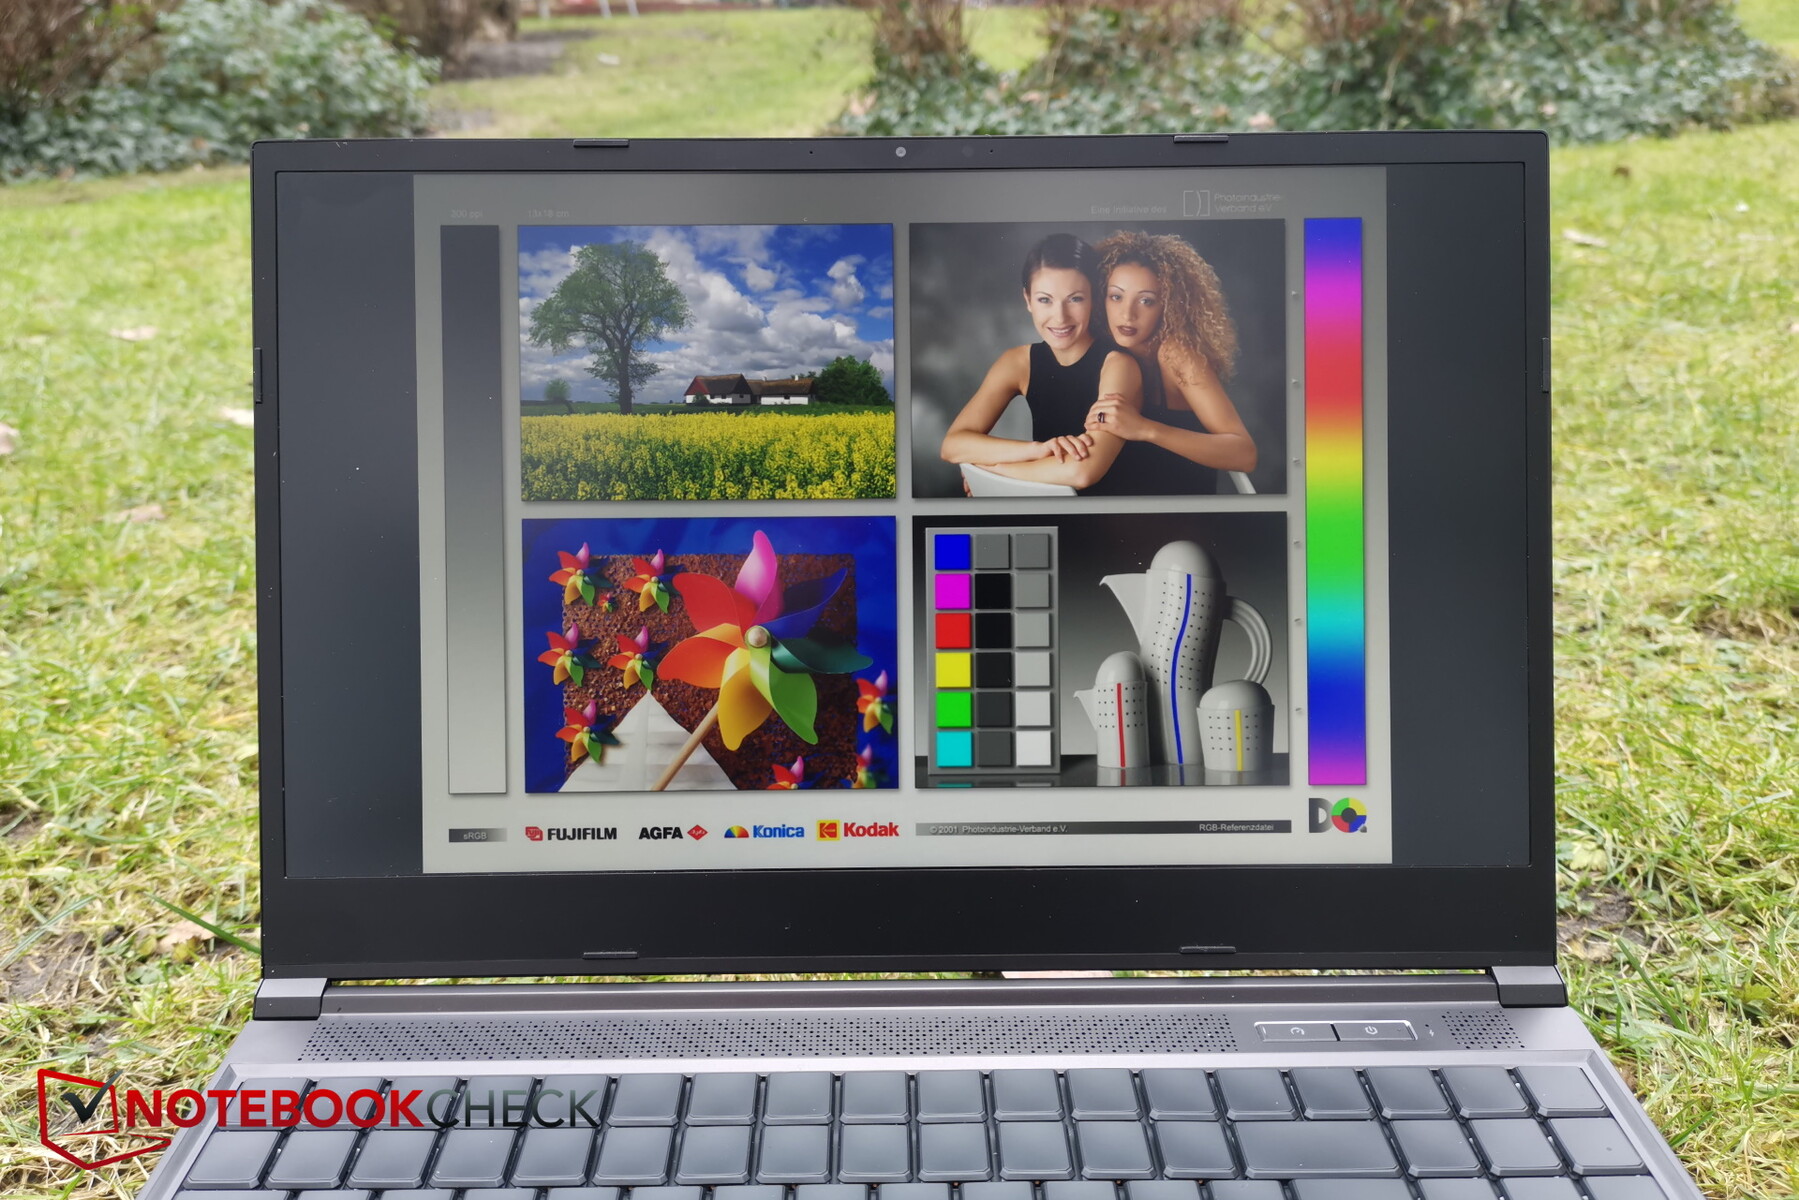
Mostrar: Um modelo de pré-produção para classificar
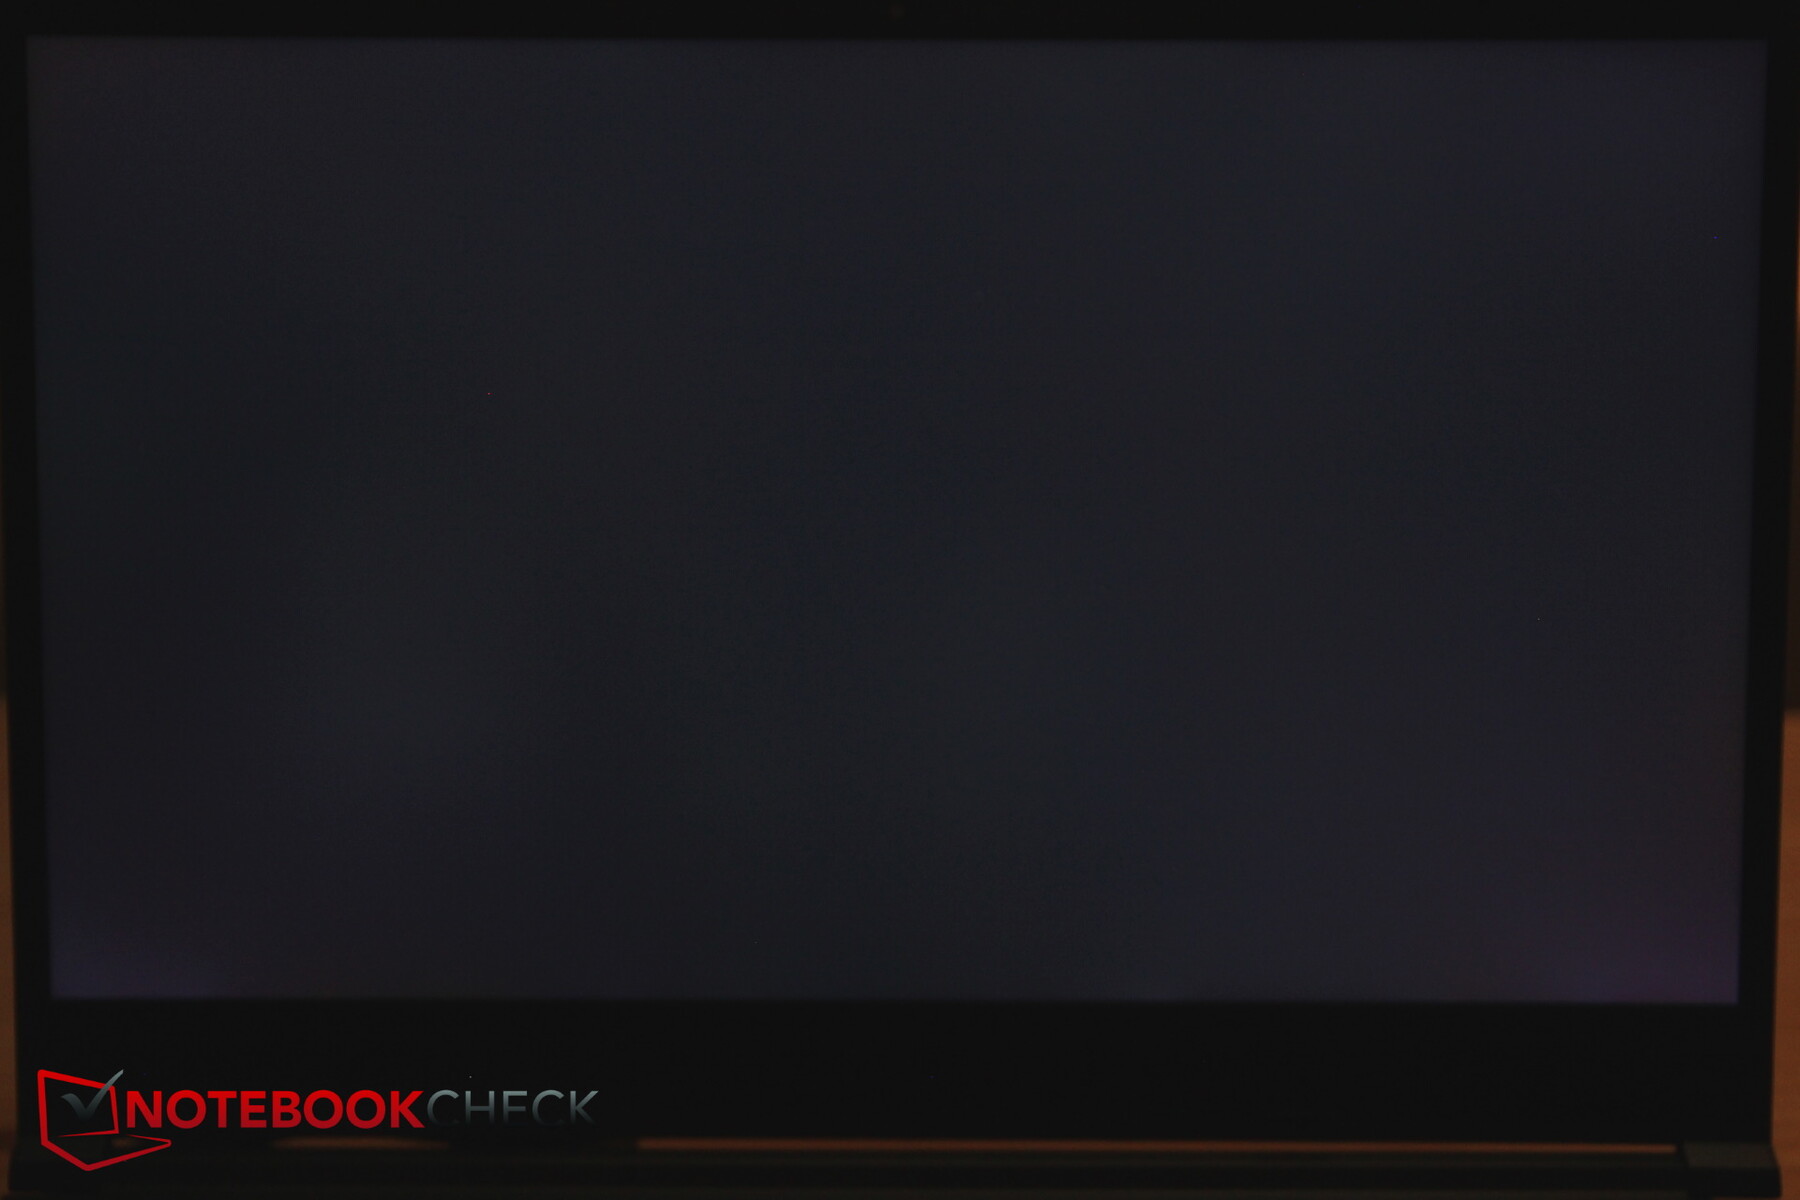
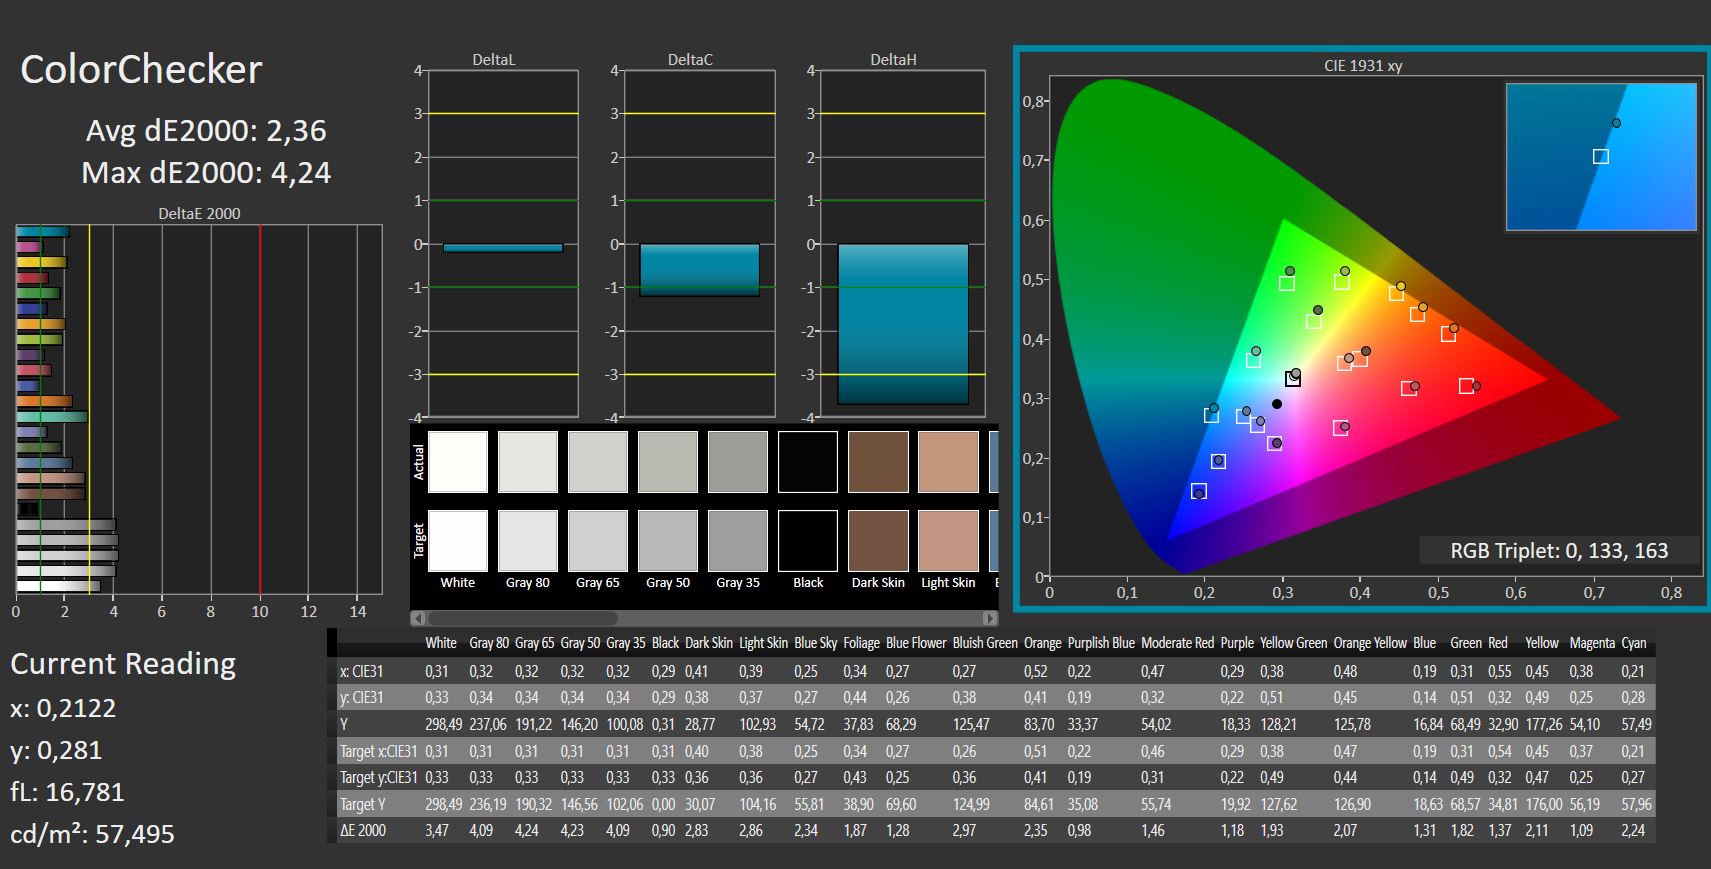
Como sua antecessora, a Schenker utiliza uma tela IPS mate da BOE com resolução WQHD (2.560 x 1.440 pixels). Entretanto, os modelos diferem ligeiramente. Em vez de 165 Hz, há agora um painel de 240 Hz. Entretanto, como no modelo anterior, o atual fica aquém das 350 lêndeas anunciadas pelo fabricante; medimos apenas 273 lêndeas, em média.
A distribuição de brilho do modelo de pré-produção também é tão ruim, com apenas 62%. A Schenker nos garantiu que tal painel não seria vendido. Assim, haverá ainda algumas mudanças até o lançamento. Portanto, não mediremos o espaço de cor por enquanto
| |||||||||||||||||||||||||
iluminação: 62 %
iluminação com acumulador: 293 cd/m²
Contraste: 1054:1 (Preto: 0.28 cd/m²)
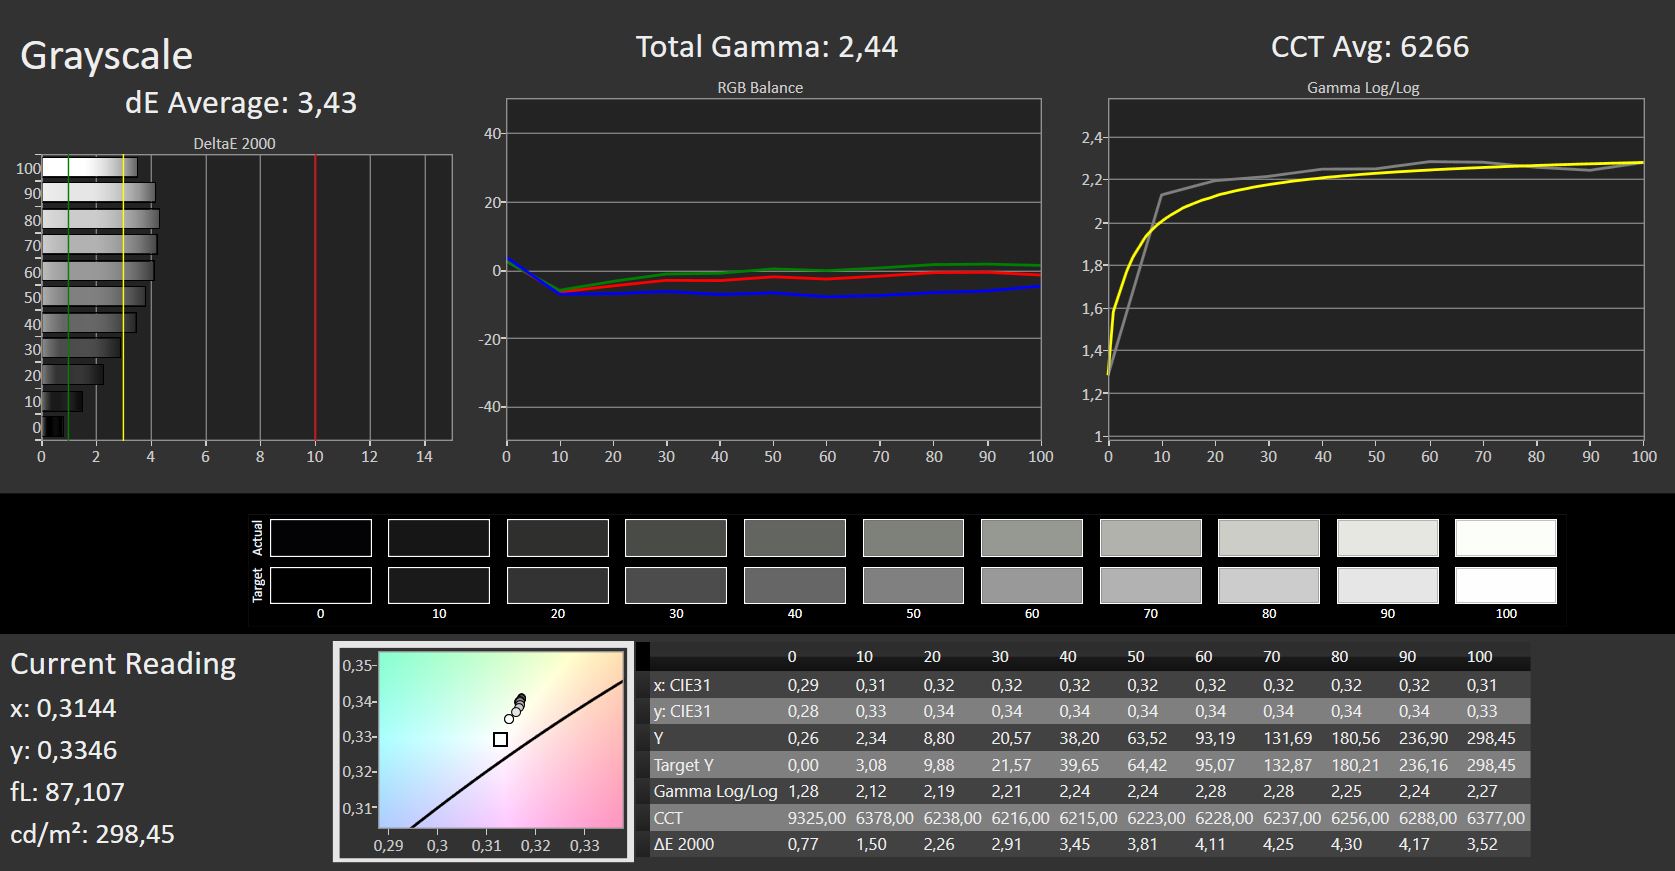
ΔE ColorChecker Calman: 2.36 | ∀{0.5-29.43 Ø4.71}
ΔE Greyscale Calman: 3.43 | ∀{0.09-98 Ø4.96}
Gamma: 2.44
CCT: 6266 K
| Schenker XMG Neo 15 E22 (Early 2022, RTX 3080 Ti) BOE0A67 (BOE CQ NE156QHM-NZ1), IPS, 2560x1440, 15.6" | Schenker XMG Neo 15 Tiger Lake BOE CQ NE156QHM-NY2, IPS, 2560x1440, 15.6" | Razer Blade 15 Advanced (Mid 2021) TL156VDXP02-0, IPS, 1920x1080, 15.6" | Asus ROG Strix Scar 15 G533QS BOE CQ NE156QHM-NY1, IPS, 2560x1440, 15.6" | Alienware m15 R6, i7-11800H RTX 3080 AU Optronics AUO9092 (B156HAN), IPS, 1920x1080, 15.6" | MSI GE76 Raider AU Optronics B173HAN05.4 (AUOE295), IPS-Level, 1920x1080, 17.3" | |
|---|---|---|---|---|---|---|
| Display | ||||||
| Display P3 Coverage (%) | 68.6 | 66.9 | 97.6 | 74.1 | 63.1 | |
| sRGB Coverage (%) | 98.6 | 97.1 | 99.9 | 99.5 | 94 | |
| AdobeRGB 1998 Coverage (%) | 69.3 | 69 | 85.3 | 75.7 | 65.2 | |
| Response Times | -11% | 39% | -6% | 65% | 36% | |
| Response Time Grey 50% / Grey 80% * (ms) | 14.4 ? | 16 ? -11% | 4.2 ? 71% | 14 ? 3% | 2.8 81% | 5.6 ? 61% |
| Response Time Black / White * (ms) | 10.8 ? | 12 ? -11% | 10 ? 7% | 12.4 ? -15% | 5.6 48% | 9.6 ? 11% |
| PWM Frequency (Hz) | ||||||
| Screen | -20% | 8% | -8% | -1% | 23% | |
| Brightness middle (cd/m²) | 295 | 324 10% | 353.4 20% | 304.3 3% | 359 22% | 290 -2% |
| Brightness (cd/m²) | 277 | 307 11% | 340 23% | 286 3% | 344 24% | 290 5% |
| Brightness Distribution (%) | 62 | 91 47% | 92 48% | 76 23% | 85 37% | 96 55% |
| Black Level * (cd/m²) | 0.28 | 0.27 4% | 0.31 -11% | 0.33 -18% | 0.35 -25% | 0.23 18% |
| Contrast (:1) | 1054 | 1200 14% | 1140 8% | 922 -13% | 1026 -3% | 1261 20% |
| Colorchecker dE 2000 * | 2.36 | 3.36 -42% | 2.17 8% | 2.76 -17% | 3.3 -40% | 1.59 33% |
| Colorchecker dE 2000 max. * | 4.24 | 9.87 -133% | 5.69 -34% | 5.57 -31% | 4.84 -14% | 3.17 25% |
| Greyscale dE 2000 * | 3.43 | 5.8 -69% | 3.4 1% | 4 -17% | 3.66 -7% | 2.5 27% |
| Gamma | 2.44 90% | 2.311 95% | 2.2 100% | 2.14 103% | 2.43 91% | 2.253 98% |
| CCT | 6266 104% | 7087 92% | 6830 95% | 6844 95% | 5896 110% | 6640 98% |
| Colorchecker dE 2000 calibrated * | 1.23 | 1.05 | 2.38 | 3.28 | 0.87 | |
| Color Space (Percent of AdobeRGB 1998) (%) | 69 | |||||
| Color Space (Percent of sRGB) (%) | 93 | |||||
| Média Total (Programa/Configurações) | -16% /
-18% | 24% /
14% | -7% /
-8% | 32% /
12% | 30% /
25% |
* ... menor é melhor
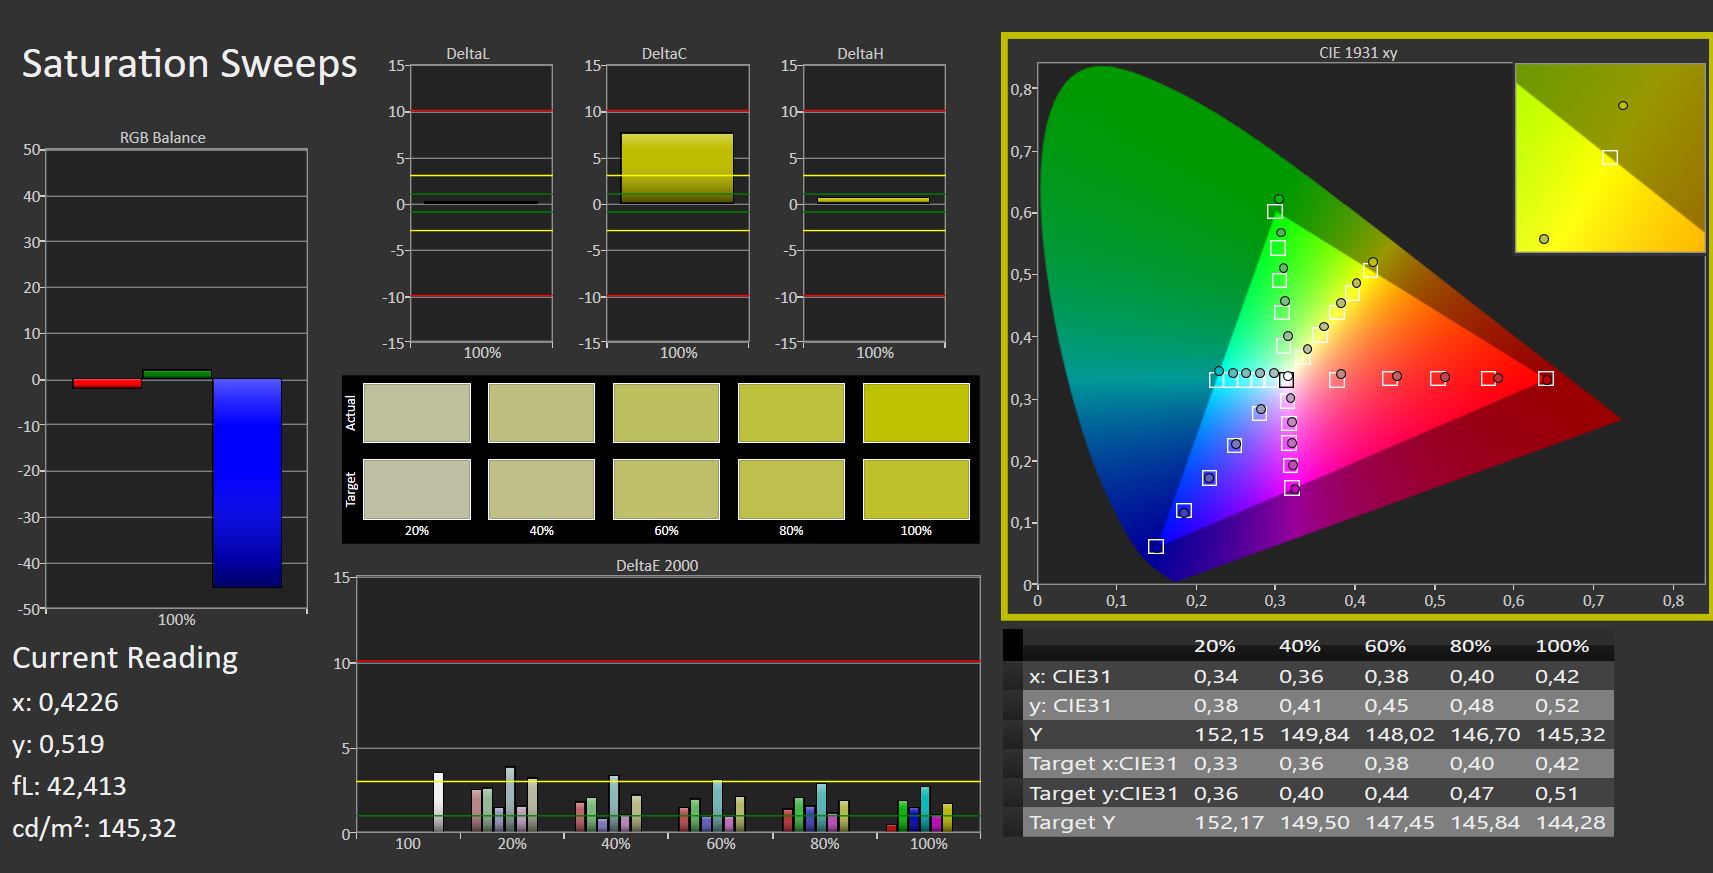
Dito isto, a exibição é bastante bem calibrada à saída da fábrica e os valores do Delta E são baixos. Os níveis de preto e contraste estão bem acima da média.
Exibir tempos de resposta
| ↔ Tempo de resposta preto para branco | ||
|---|---|---|
| 10.8 ms ... ascensão ↗ e queda ↘ combinadas | ↗ 5.4 ms ascensão | 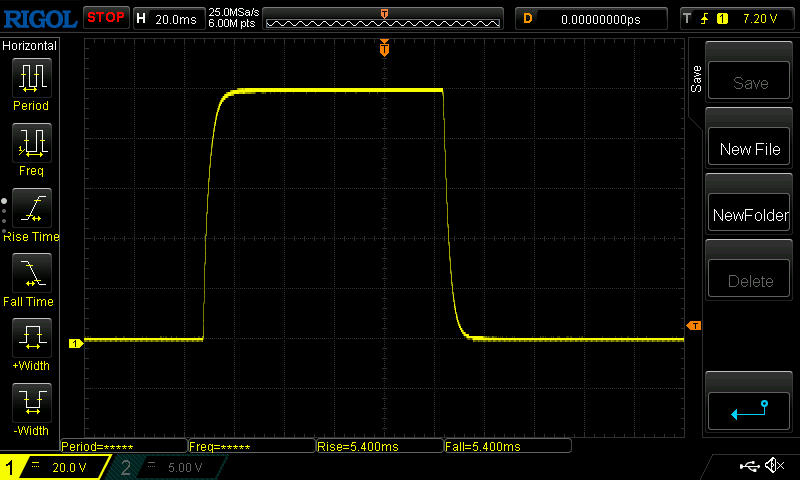 |
| ↘ 5.4 ms queda | ||
| A tela mostra boas taxas de resposta em nossos testes, mas pode ser muito lenta para jogadores competitivos. Em comparação, todos os dispositivos testados variam de 0.1 (mínimo) a 240 (máximo) ms. » 29 % de todos os dispositivos são melhores. Isso significa que o tempo de resposta medido é melhor que a média de todos os dispositivos testados (19.8 ms). | ||
| ↔ Tempo de resposta 50% cinza a 80% cinza | ||
| 14.4 ms ... ascensão ↗ e queda ↘ combinadas | ↗ 6.6 ms ascensão | 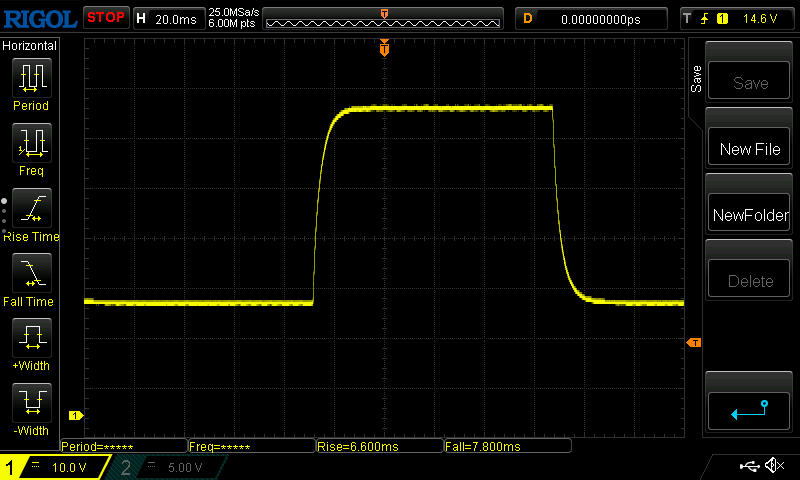 |
| ↘ 7.8 ms queda | ||
| A tela mostra boas taxas de resposta em nossos testes, mas pode ser muito lenta para jogadores competitivos. Em comparação, todos os dispositivos testados variam de 0.165 (mínimo) a 636 (máximo) ms. » 28 % de todos os dispositivos são melhores. Isso significa que o tempo de resposta medido é melhor que a média de todos os dispositivos testados (31 ms). | ||
Cintilação da tela / PWM (modulação por largura de pulso)
| Tela tremeluzindo / PWM não detectado | 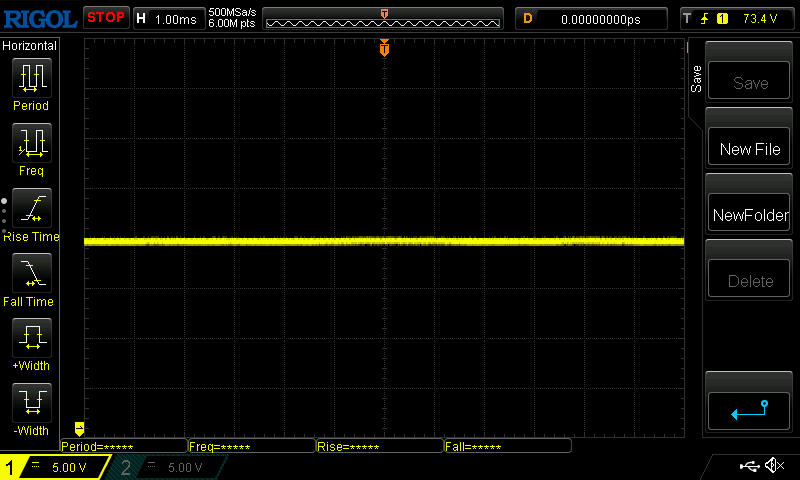 | ||
[pwm_comparison] Em comparação: 52 % de todos os dispositivos testados não usam PWM para escurecer a tela. Se PWM foi detectado, uma média de 7754 (mínimo: 5 - máximo: 343500) Hz foi medida. | |||
Os tempos de resposta são um pouco mais baixos para os jogos. O painel não usa PWM.
Ao ar livre, o revestimento fosco elimina a maioria dos reflexos. Os níveis de preto e contraste também são bons o suficiente para ainda ver bem o conteúdo da tela, pelo menos em dias nublados e na sombra.
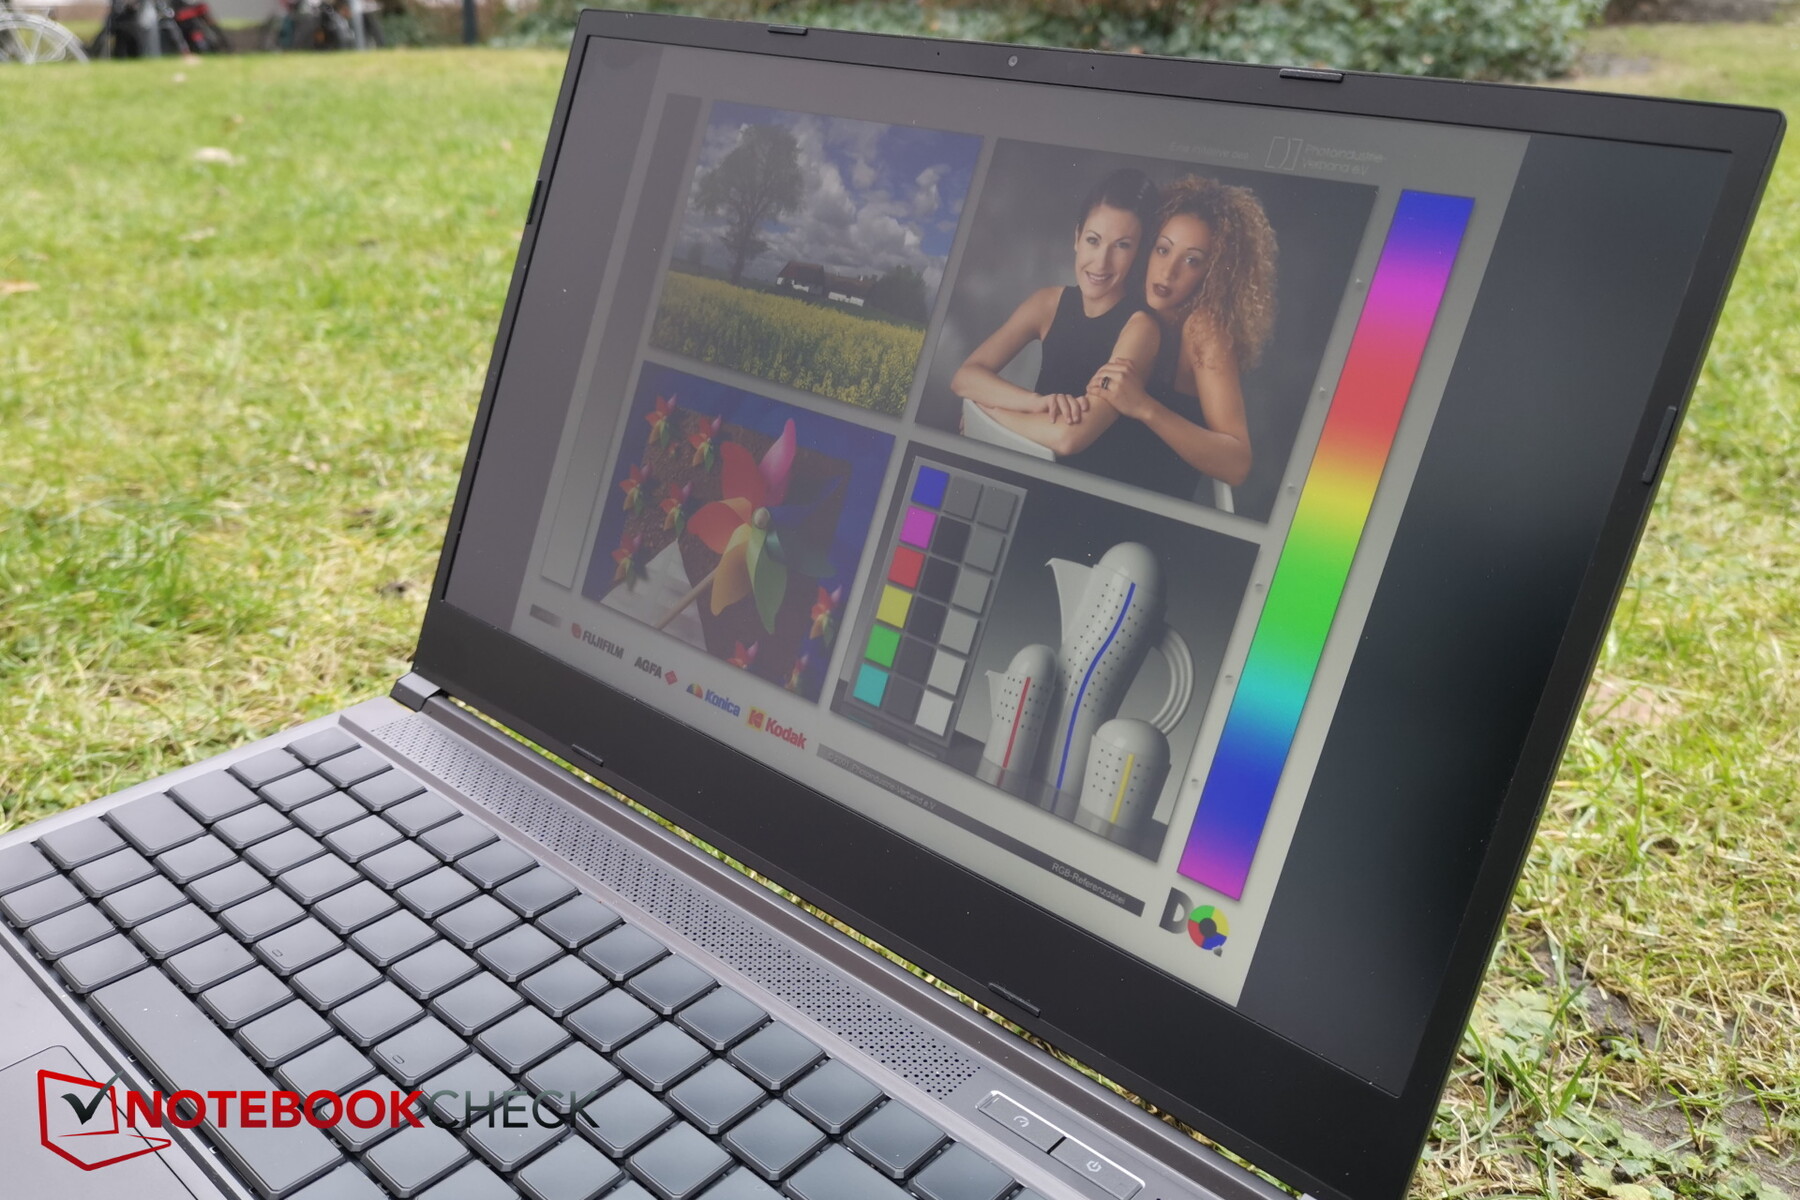
A estabilidade do ângulo de visão é boa. Mesmo em ângulos extremos, a diminuição da qualidade da imagem é bastante baixa

Desempenho: Alto!
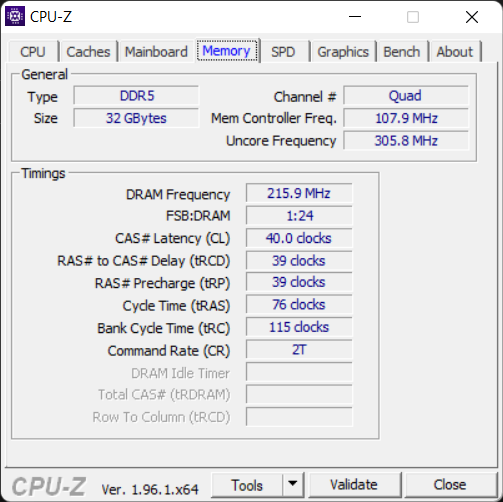
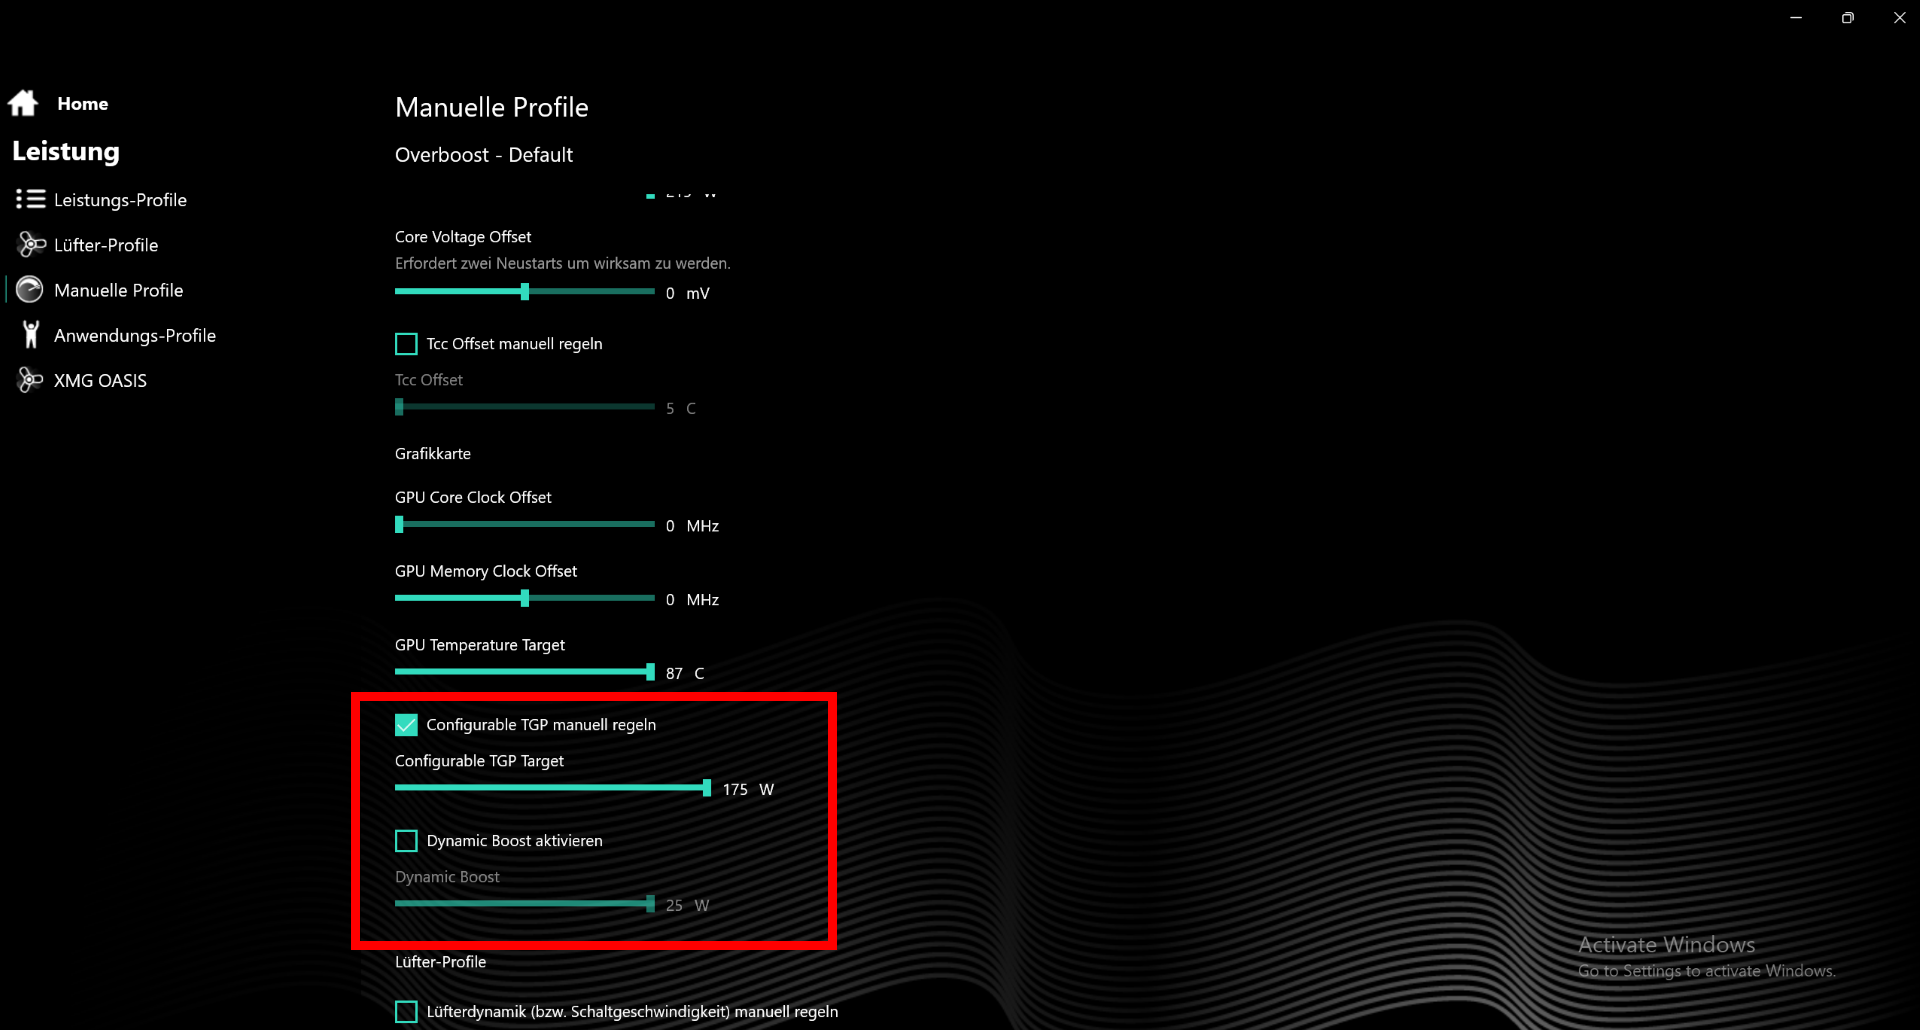
Estamos lidando aqui com hardware absolutamente high-end, especialmente o novo RTX 3080 Ti que pode rodar com um TGP máximo de 175 W através do Centro de Controle. O novo Alder Lake Intel Core i7-12700He, pela primeira vez, 32 GB de RAM DDR5 tornam o "novo Neo" um verdadeiro laptop de alto desempenho para jogos
Condições de teste
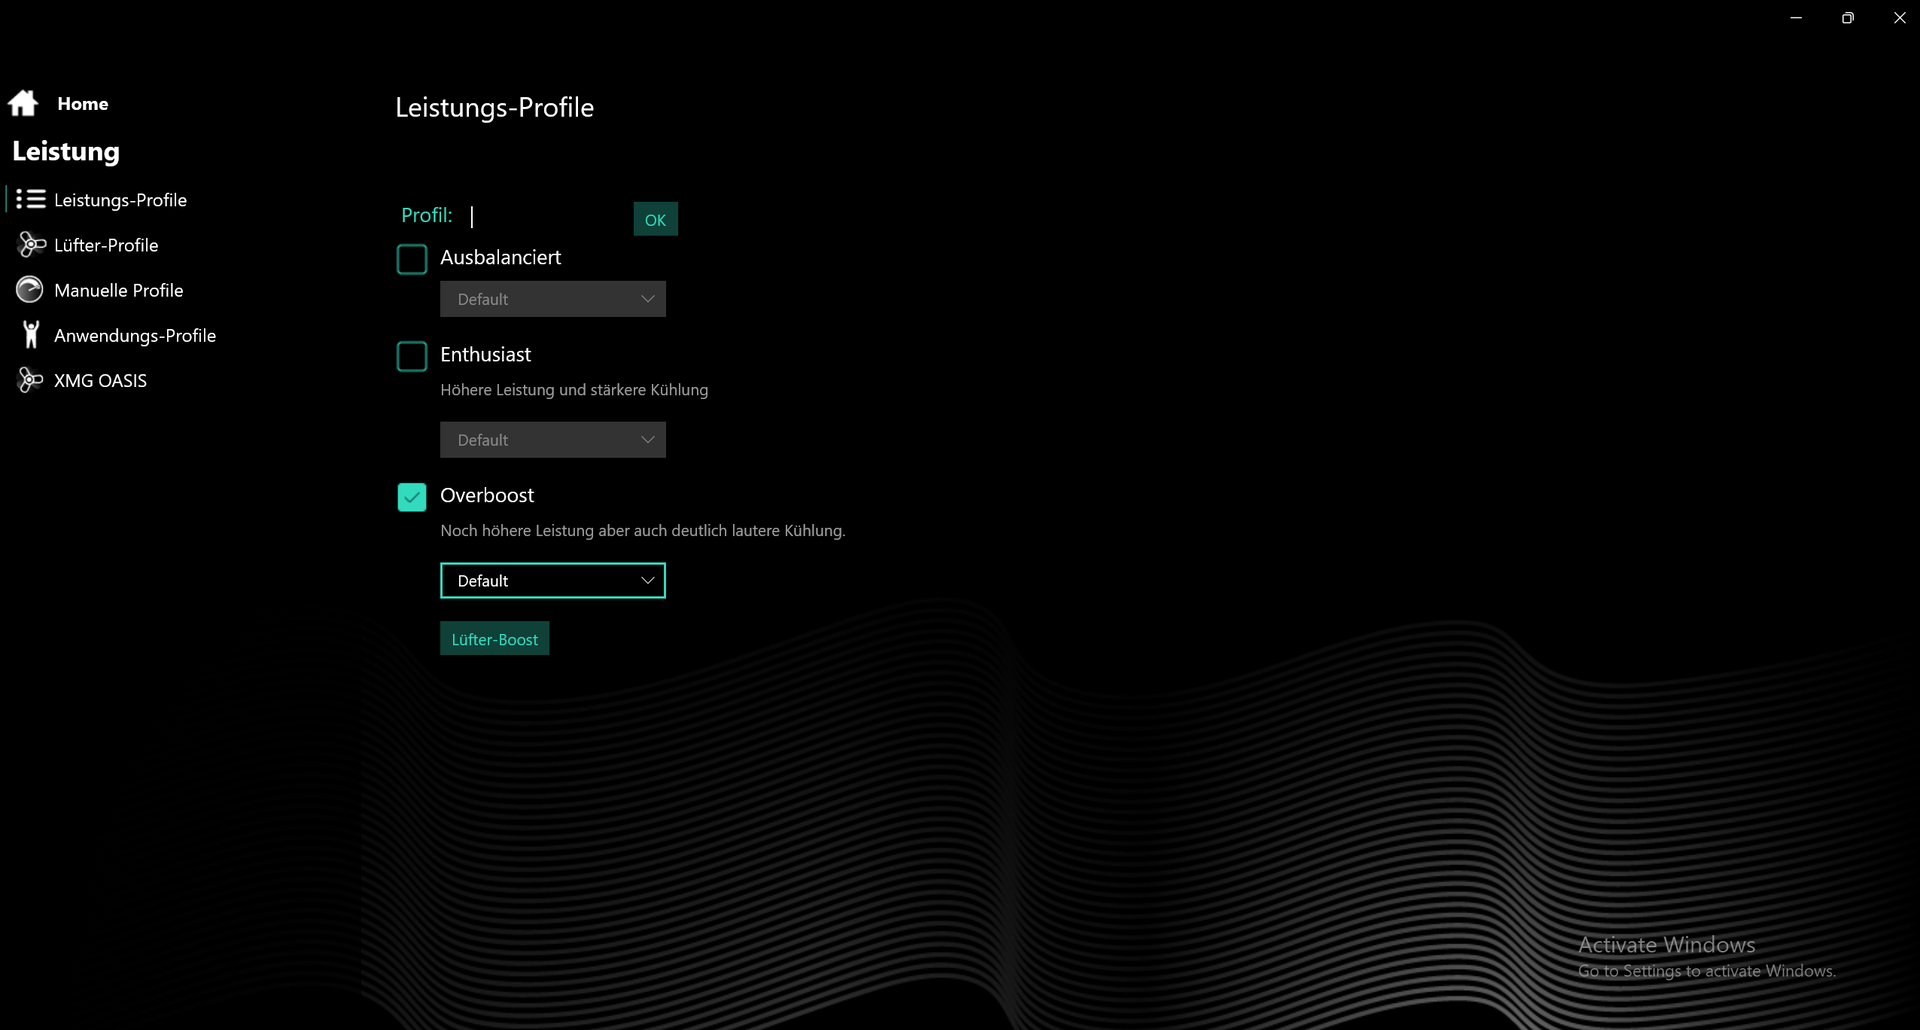
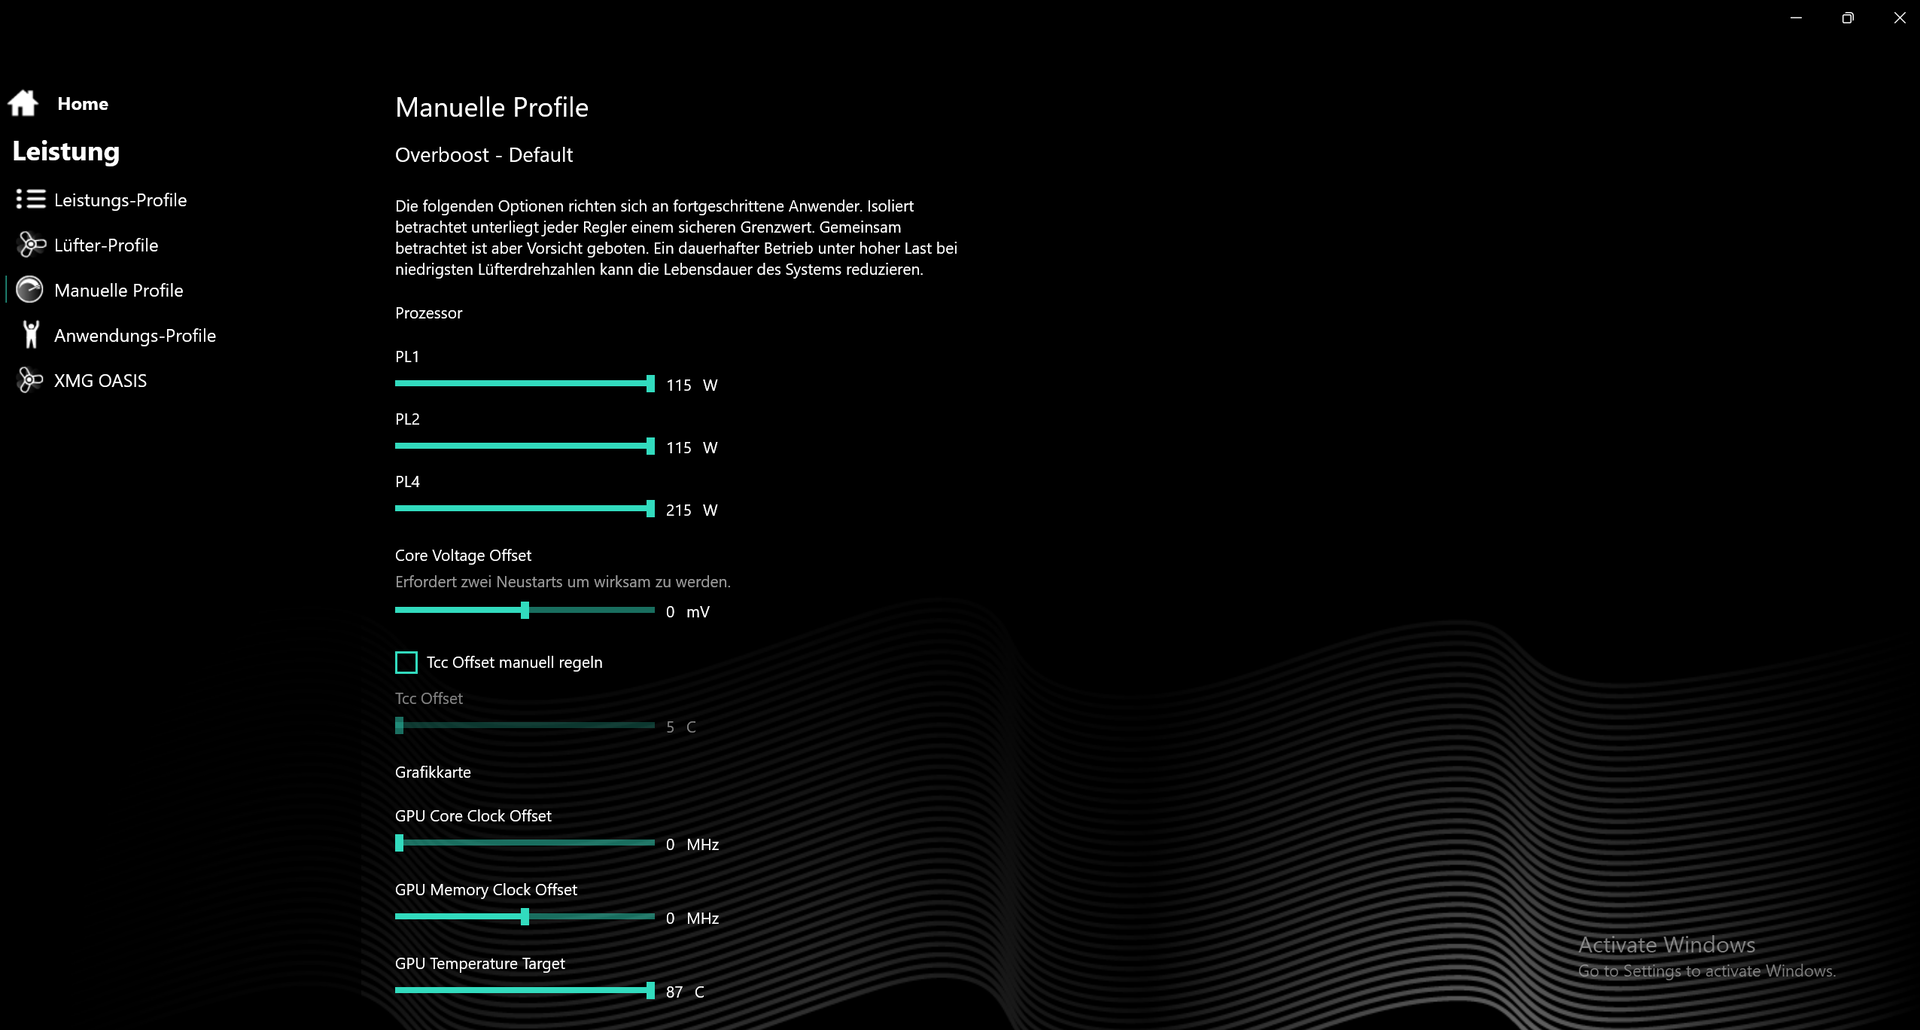
Para obter os melhores resultados de referência, ativamos o modo Overboost no Centro de Controle e também maximizamos os valores PL da CPU nas configurações de desempenho manual.
Para a GPU, ajustamos o Dynamic Boost para 25 W. Com o conjunto Dynamic Boost, você não pode mais ajustar o TGP da GPU você mesmo. A opção é cinzenta e é fixada em 150 W, de modo que o máximo de 175 W é máximo no total.
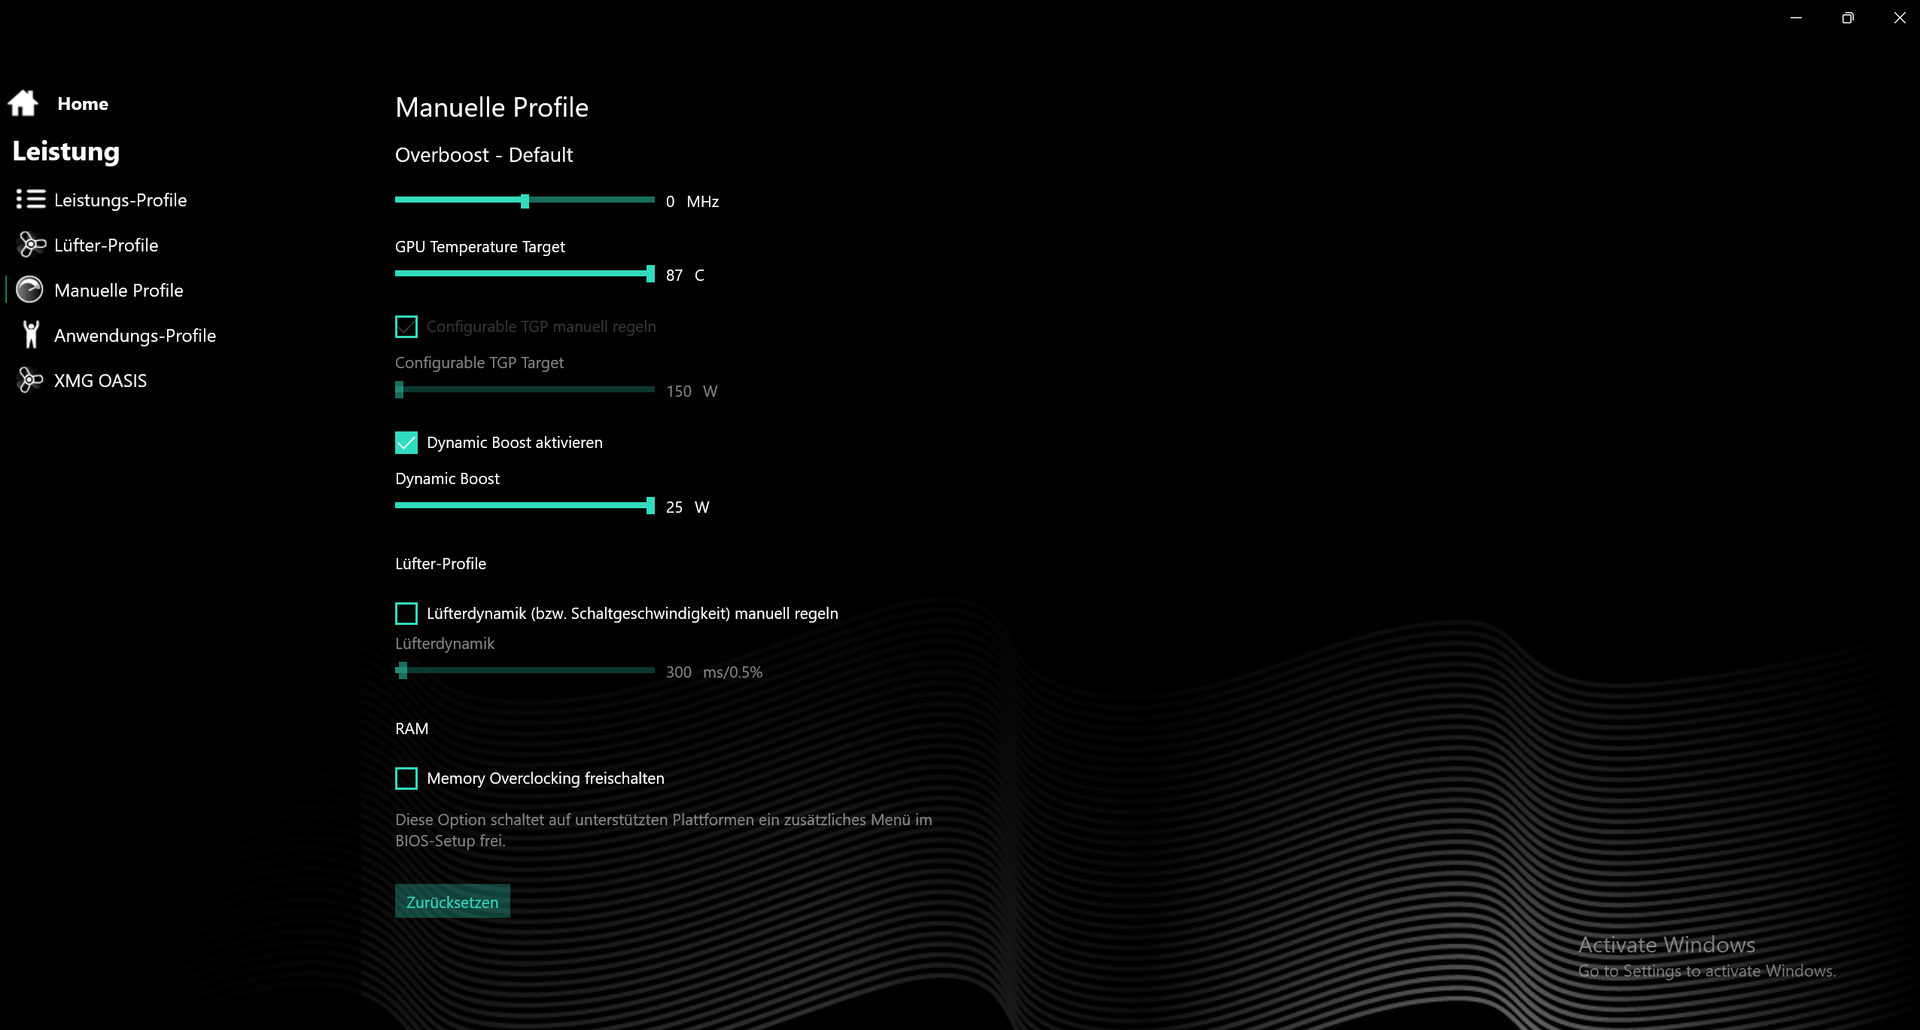
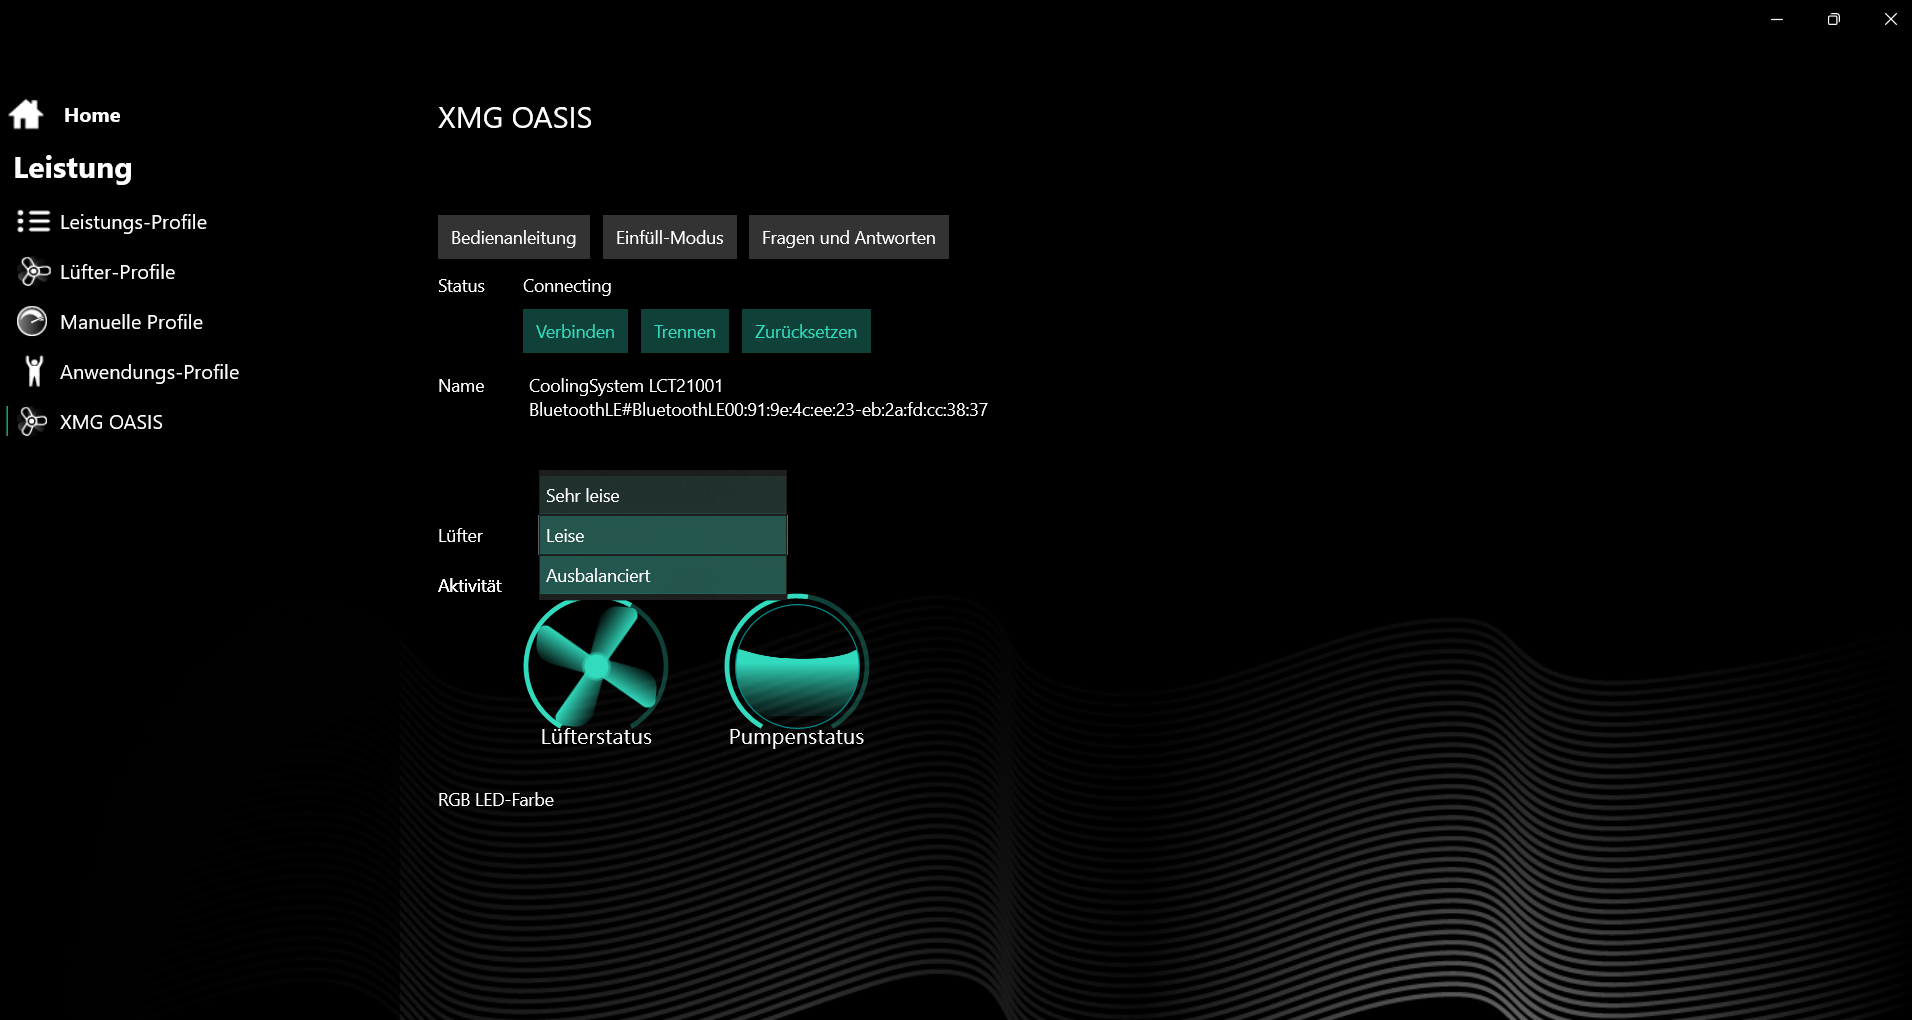
O XMG Oasis também oferece vários perfis de ventiladores (Muito Silencioso, Silencioso e Equilibrado). A menos que especificado, usamos o modo Equilibrado para o melhor desempenho de refrigeração.
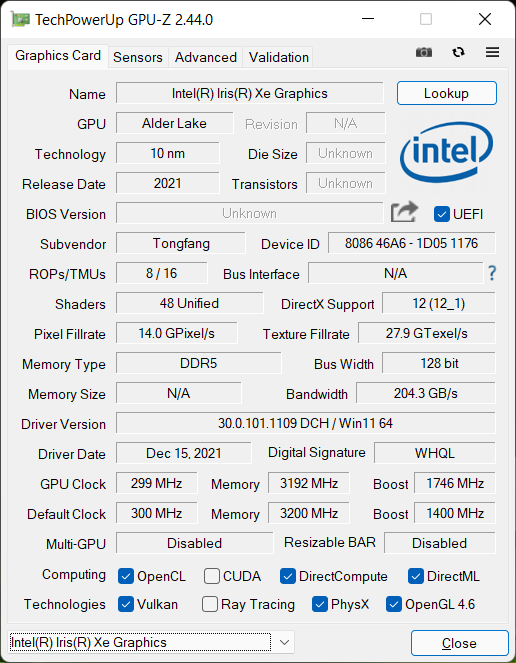
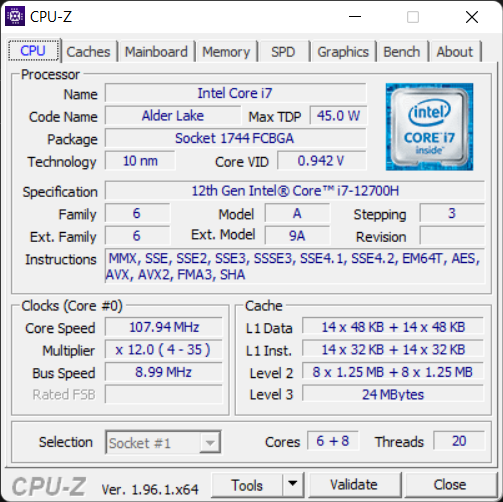
Processador
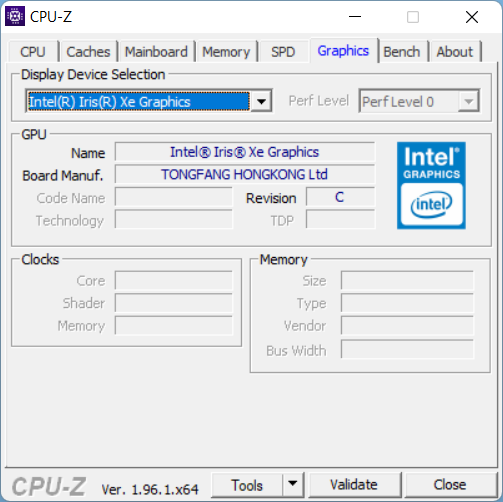
OIntel Core i7-12700H é uma CPU de alta tecnologia baseada na nova arquitetura do Lago Alder. Tem um total de 14 núcleos, que se dividem em núcleos de desempenho (6 P-cores) e de eficiência (8 E-cores) pela primeira vez, como nos processadores ARM. Somente os núcleos P suportam Hyperthreading, de modo que você obtém um total de 20 roscas. Uma unidade gráfica Intel Xe com 96 EUs e um relógio de até 1,4 GHz é integrada à CPU.
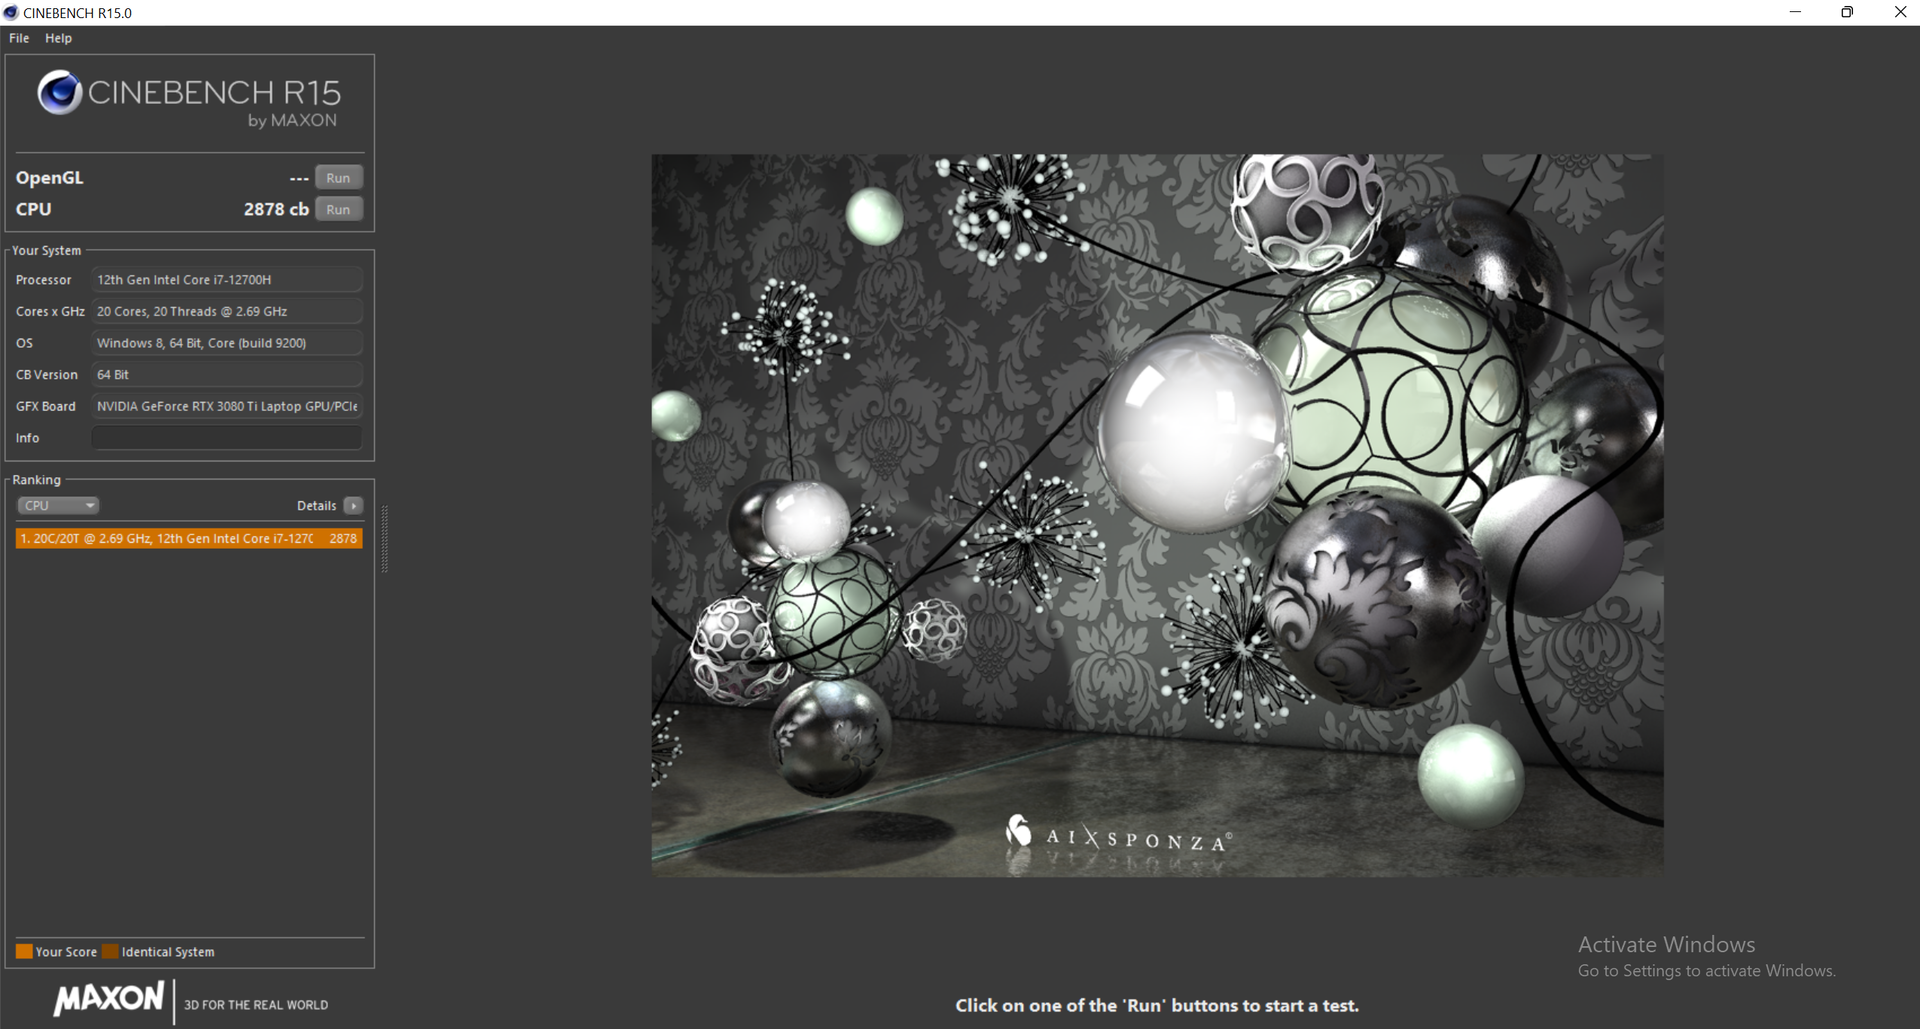
No loop Cinebench de uma hora, a CPU vai de cabeça em cabeça com seu modelo irmão com relógio ligeiramente mais alto Núcleo i9-12900HKe até ganha por uma margem estreita ao longo do tempo. Somente o Core i9-12900HK tem uma potência de saída maior
O desempenho é minimamente maior com Oasis do que sem, e a pequena queda de desempenho vista no início não acontece. Entretanto, não há diferença no desempenho a curto prazo.
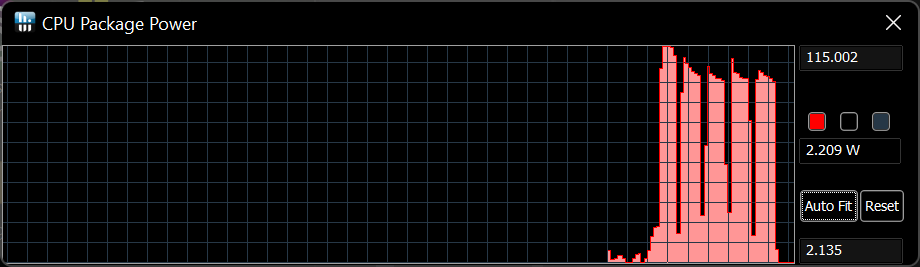
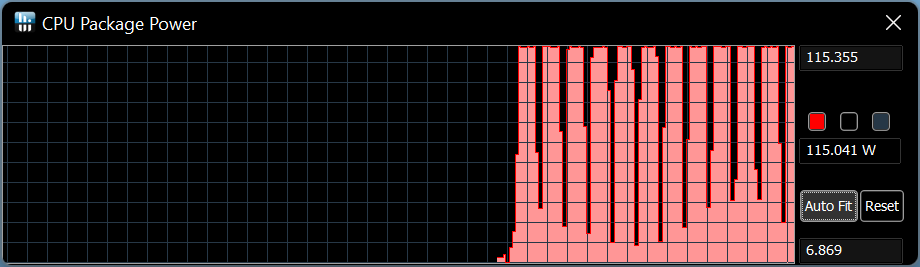
A potência do pacote é de no máximo 115 W na primeira corrida e apenas 100 W mais tarde. Com o Oasis, a potência da embalagem não cai para 100 W, mas permanece bastante estável a 115 W
O Core i7-12700H bate seu predecessor Tiger Lake por um total de 30% no teste multi-tarefa! O mesmo se aplica aoAMD Ryzen 9 5900HX no Asus ROG Strix Scar 15. As duas CPUs do Lago Alder também estão praticamente no mesmo nível das outras referências e lideram os gráficos
Mais de 50% do desempenho da CPU é perdido no modo de bateria. Apenas 1.214 pontos são alcançados no Cinebench R15 Multi em comparação com 2.824 pontos na alimentação DC.

Cinebench R15 Multi Dauertest
Cinebench R23: Multi Core | Single Core
Cinebench R20: CPU (Multi Core) | CPU (Single Core)
Cinebench R15: CPU Multi 64Bit | CPU Single 64Bit
Blender: v2.79 BMW27 CPU
7-Zip 18.03: 7z b 4 | 7z b 4 -mmt1
Geekbench 5.5: Multi-Core | Single-Core
HWBOT x265 Benchmark v2.2: 4k Preset
LibreOffice : 20 Documents To PDF
R Benchmark 2.5: Overall mean
| CPU Performance rating | |
| Média da turma Gaming | |
| MSI GE76 Raider | |
| Schenker XMG Neo 15 E22 (Early 2022, RTX 3080 Ti) | |
| Schenker XMG Oasis | |
| Média Intel Core i7-12700H | |
| Schenker XMG Neo 15 Tiger Lake | |
| Asus ROG Strix Scar 15 G533QS -2! | |
| Alienware m15 R6, i7-11800H RTX 3080 | |
| Razer Blade 15 Advanced (Mid 2021) -2! | |
| Cinebench R23 / Multi Core | |
| Média da turma Gaming (10488 - 42661, n=107, últimos 2 anos) | |
| Schenker XMG Neo 15 E22 (Early 2022, RTX 3080 Ti) | |
| Schenker XMG Oasis | |
| MSI GE76 Raider | |
| Média Intel Core i7-12700H (4032 - 19330, n=64) | |
| Schenker XMG Neo 15 Tiger Lake | |
| Asus ROG Strix Scar 15 G533QS | |
| Alienware m15 R6, i7-11800H RTX 3080 | |
| Razer Blade 15 Advanced (Mid 2021) | |
| Cinebench R23 / Single Core | |
| Média da turma Gaming (1166 - 2415, n=107, últimos 2 anos) | |
| MSI GE76 Raider | |
| Schenker XMG Oasis | |
| Schenker XMG Neo 15 E22 (Early 2022, RTX 3080 Ti) | |
| Média Intel Core i7-12700H (778 - 1826, n=63) | |
| Schenker XMG Neo 15 Tiger Lake | |
| Razer Blade 15 Advanced (Mid 2021) | |
| Alienware m15 R6, i7-11800H RTX 3080 | |
| Asus ROG Strix Scar 15 G533QS | |
| Cinebench R20 / CPU (Multi Core) | |
| Média da turma Gaming (4029 - 16433, n=106, últimos 2 anos) | |
| Schenker XMG Oasis | |
| Schenker XMG Neo 15 E22 (Early 2022, RTX 3080 Ti) | |
| MSI GE76 Raider | |
| Média Intel Core i7-12700H (1576 - 7407, n=64) | |
| Schenker XMG Neo 15 Tiger Lake | |
| Asus ROG Strix Scar 15 G533QS | |
| Razer Blade 15 Advanced (Mid 2021) | |
| Alienware m15 R6, i7-11800H RTX 3080 | |
| Cinebench R20 / CPU (Single Core) | |
| Média da turma Gaming (442 - 913, n=106, últimos 2 anos) | |
| MSI GE76 Raider | |
| Schenker XMG Neo 15 E22 (Early 2022, RTX 3080 Ti) | |
| Schenker XMG Oasis | |
| Média Intel Core i7-12700H (300 - 704, n=64) | |
| Razer Blade 15 Advanced (Mid 2021) | |
| Schenker XMG Neo 15 Tiger Lake | |
| Alienware m15 R6, i7-11800H RTX 3080 | |
| Asus ROG Strix Scar 15 G533QS | |
| Cinebench R15 / CPU Multi 64Bit | |
| Média da turma Gaming (1578 - 6330, n=105, últimos 2 anos) | |
| MSI GE76 Raider | |
| Schenker XMG Oasis | |
| Schenker XMG Neo 15 E22 (Early 2022, RTX 3080 Ti) | |
| Média Intel Core i7-12700H (1379 - 2916, n=70) | |
| Asus ROG Strix Scar 15 G533QS | |
| Schenker XMG Neo 15 Tiger Lake | |
| Alienware m15 R6, i7-11800H RTX 3080 | |
| Razer Blade 15 Advanced (Mid 2021) | |
| Cinebench R15 / CPU Single 64Bit | |
| Média da turma Gaming (188.8 - 350, n=106, últimos 2 anos) | |
| MSI GE76 Raider | |
| Schenker XMG Neo 15 E22 (Early 2022, RTX 3080 Ti) | |
| Schenker XMG Oasis | |
| Média Intel Core i7-12700H (113 - 263, n=65) | |
| Asus ROG Strix Scar 15 G533QS | |
| Schenker XMG Neo 15 Tiger Lake | |
| Razer Blade 15 Advanced (Mid 2021) | |
| Alienware m15 R6, i7-11800H RTX 3080 | |
| Blender / v2.79 BMW27 CPU | |
| Alienware m15 R6, i7-11800H RTX 3080 | |
| Razer Blade 15 Advanced (Mid 2021) | |
| Asus ROG Strix Scar 15 G533QS | |
| Média Intel Core i7-12700H (168 - 732, n=63) | |
| Schenker XMG Neo 15 Tiger Lake | |
| MSI GE76 Raider | |
| Schenker XMG Neo 15 E22 (Early 2022, RTX 3080 Ti) | |
| Schenker XMG Oasis | |
| Média da turma Gaming (79 - 330, n=104, últimos 2 anos) | |
| 7-Zip 18.03 / 7z b 4 | |
| Média da turma Gaming (33491 - 148086, n=105, últimos 2 anos) | |
| Schenker XMG Oasis | |
| Schenker XMG Neo 15 E22 (Early 2022, RTX 3080 Ti) | |
| MSI GE76 Raider | |
| Asus ROG Strix Scar 15 G533QS | |
| Média Intel Core i7-12700H (22844 - 73067, n=63) | |
| Schenker XMG Neo 15 Tiger Lake | |
| Razer Blade 15 Advanced (Mid 2021) | |
| Alienware m15 R6, i7-11800H RTX 3080 | |
| 7-Zip 18.03 / 7z b 4 -mmt1 | |
| Média da turma Gaming (4199 - 7436, n=105, últimos 2 anos) | |
| MSI GE76 Raider | |
| Schenker XMG Oasis | |
| Schenker XMG Neo 15 E22 (Early 2022, RTX 3080 Ti) | |
| Schenker XMG Neo 15 Tiger Lake | |
| Média Intel Core i7-12700H (2743 - 5972, n=63) | |
| Asus ROG Strix Scar 15 G533QS | |
| Razer Blade 15 Advanced (Mid 2021) | |
| Alienware m15 R6, i7-11800H RTX 3080 | |
| Geekbench 5.5 / Multi-Core | |
| Média da turma Gaming (6460 - 28263, n=105, últimos 2 anos) | |
| Schenker XMG Neo 15 E22 (Early 2022, RTX 3080 Ti) | |
| MSI GE76 Raider | |
| Schenker XMG Oasis | |
| Média Intel Core i7-12700H (5144 - 13745, n=64) | |
| Schenker XMG Neo 15 Tiger Lake | |
| Alienware m15 R6, i7-11800H RTX 3080 | |
| Geekbench 5.5 / Single-Core | |
| Média da turma Gaming (986 - 2474, n=105, últimos 2 anos) | |
| MSI GE76 Raider | |
| Schenker XMG Neo 15 E22 (Early 2022, RTX 3080 Ti) | |
| Schenker XMG Oasis | |
| Média Intel Core i7-12700H (803 - 1851, n=64) | |
| Schenker XMG Neo 15 Tiger Lake | |
| Alienware m15 R6, i7-11800H RTX 3080 | |
| HWBOT x265 Benchmark v2.2 / 4k Preset | |
| Média da turma Gaming (11.5 - 44.4, n=105, últimos 2 anos) | |
| Schenker XMG Oasis | |
| Schenker XMG Neo 15 E22 (Early 2022, RTX 3080 Ti) | |
| MSI GE76 Raider | |
| Schenker XMG Neo 15 Tiger Lake | |
| Média Intel Core i7-12700H (4.67 - 21.8, n=64) | |
| Asus ROG Strix Scar 15 G533QS | |
| Razer Blade 15 Advanced (Mid 2021) | |
| Alienware m15 R6, i7-11800H RTX 3080 | |
| LibreOffice / 20 Documents To PDF | |
| Asus ROG Strix Scar 15 G533QS | |
| Média da turma Gaming (33.2 - 88.8, n=105, últimos 2 anos) | |
| Schenker XMG Oasis | |
| Schenker XMG Neo 15 Tiger Lake | |
| Média Intel Core i7-12700H (34.2 - 95.3, n=63) | |
| Razer Blade 15 Advanced (Mid 2021) | |
| Alienware m15 R6, i7-11800H RTX 3080 | |
| Schenker XMG Neo 15 E22 (Early 2022, RTX 3080 Ti) | |
| MSI GE76 Raider | |
| R Benchmark 2.5 / Overall mean | |
| Alienware m15 R6, i7-11800H RTX 3080 | |
| Schenker XMG Neo 15 Tiger Lake | |
| Razer Blade 15 Advanced (Mid 2021) | |
| Asus ROG Strix Scar 15 G533QS | |
| Média Intel Core i7-12700H (0.4441 - 1.052, n=63) | |
| Schenker XMG Neo 15 E22 (Early 2022, RTX 3080 Ti) | |
| Schenker XMG Oasis | |
| Média da turma Gaming (0.3439 - 0.759, n=106, últimos 2 anos) | |
| MSI GE76 Raider | |
* ... menor é melhor
AIDA64: FP32 Ray-Trace | FPU Julia | CPU SHA3 | CPU Queen | FPU SinJulia | FPU Mandel | CPU AES | CPU ZLib | FP64 Ray-Trace | CPU PhotoWorxx
| Performance rating | |
| Média da turma Gaming | |
| Asus ROG Strix Scar 15 G533QS | |
| Alienware m15 R6, i7-11800H RTX 3080 | |
| MSI GE76 Raider | |
| Schenker XMG Oasis | |
| Schenker XMG Neo 15 E22 (Early 2022, RTX 3080 Ti) | |
| Média Intel Core i7-12700H | |
| AIDA64 / FP32 Ray-Trace | |
| Média da turma Gaming (10227 - 85542, n=105, últimos 2 anos) | |
| Alienware m15 R6, i7-11800H RTX 3080 | |
| Asus ROG Strix Scar 15 G533QS | |
| Média Intel Core i7-12700H (2585 - 17957, n=64) | |
| Schenker XMG Oasis | |
| Schenker XMG Neo 15 E22 (Early 2022, RTX 3080 Ti) | |
| MSI GE76 Raider | |
| AIDA64 / FPU Julia | |
| Média da turma Gaming (51376 - 238426, n=105, últimos 2 anos) | |
| Asus ROG Strix Scar 15 G533QS | |
| Alienware m15 R6, i7-11800H RTX 3080 | |
| Média Intel Core i7-12700H (12439 - 90760, n=64) | |
| Schenker XMG Neo 15 E22 (Early 2022, RTX 3080 Ti) | |
| Schenker XMG Oasis | |
| MSI GE76 Raider | |
| AIDA64 / CPU SHA3 | |
| Média da turma Gaming (2180 - 10115, n=105, últimos 2 anos) | |
| Alienware m15 R6, i7-11800H RTX 3080 | |
| Asus ROG Strix Scar 15 G533QS | |
| Schenker XMG Oasis | |
| Schenker XMG Neo 15 E22 (Early 2022, RTX 3080 Ti) | |
| MSI GE76 Raider | |
| Média Intel Core i7-12700H (833 - 4242, n=64) | |
| AIDA64 / CPU Queen | |
| Média da turma Gaming (49785 - 173351, n=90, últimos 2 anos) | |
| MSI GE76 Raider | |
| Asus ROG Strix Scar 15 G533QS | |
| Schenker XMG Oasis | |
| Schenker XMG Neo 15 E22 (Early 2022, RTX 3080 Ti) | |
| Média Intel Core i7-12700H (57923 - 103202, n=63) | |
| Alienware m15 R6, i7-11800H RTX 3080 | |
| AIDA64 / FPU SinJulia | |
| Média da turma Gaming (4424 - 33636, n=105, últimos 2 anos) | |
| Asus ROG Strix Scar 15 G533QS | |
| MSI GE76 Raider | |
| Schenker XMG Oasis | |
| Schenker XMG Neo 15 E22 (Early 2022, RTX 3080 Ti) | |
| Alienware m15 R6, i7-11800H RTX 3080 | |
| Média Intel Core i7-12700H (3249 - 9939, n=64) | |
| AIDA64 / FPU Mandel | |
| Média da turma Gaming (25115 - 128721, n=105, últimos 2 anos) | |
| Asus ROG Strix Scar 15 G533QS | |
| Alienware m15 R6, i7-11800H RTX 3080 | |
| Média Intel Core i7-12700H (7135 - 44760, n=64) | |
| Schenker XMG Oasis | |
| Schenker XMG Neo 15 E22 (Early 2022, RTX 3080 Ti) | |
| MSI GE76 Raider | |
| AIDA64 / CPU AES | |
| Alienware m15 R6, i7-11800H RTX 3080 | |
| Asus ROG Strix Scar 15 G533QS | |
| Média da turma Gaming (39258 - 247074, n=105, últimos 2 anos) | |
| MSI GE76 Raider | |
| Média Intel Core i7-12700H (31839 - 144360, n=64) | |
| Schenker XMG Neo 15 E22 (Early 2022, RTX 3080 Ti) | |
| Schenker XMG Oasis | |
| AIDA64 / CPU ZLib | |
| Média da turma Gaming (574 - 2531, n=105, últimos 2 anos) | |
| Schenker XMG Neo 15 E22 (Early 2022, RTX 3080 Ti) | |
| Schenker XMG Oasis | |
| MSI GE76 Raider | |
| Média Intel Core i7-12700H (305 - 1171, n=64) | |
| Asus ROG Strix Scar 15 G533QS | |
| Alienware m15 R6, i7-11800H RTX 3080 | |
| AIDA64 / FP64 Ray-Trace | |
| Média da turma Gaming (5509 - 45446, n=105, últimos 2 anos) | |
| Alienware m15 R6, i7-11800H RTX 3080 | |
| Asus ROG Strix Scar 15 G533QS | |
| Média Intel Core i7-12700H (1437 - 9692, n=64) | |
| Schenker XMG Oasis | |
| Schenker XMG Neo 15 E22 (Early 2022, RTX 3080 Ti) | |
| MSI GE76 Raider | |
| AIDA64 / CPU PhotoWorxx | |
| Média da turma Gaming (12271 - 89891, n=105, últimos 2 anos) | |
| Schenker XMG Oasis | |
| Schenker XMG Neo 15 E22 (Early 2022, RTX 3080 Ti) | |
| MSI GE76 Raider | |
| Média Intel Core i7-12700H (12863 - 52207, n=64) | |
| Asus ROG Strix Scar 15 G533QS | |
| Alienware m15 R6, i7-11800H RTX 3080 | |
Desempenho do sistema
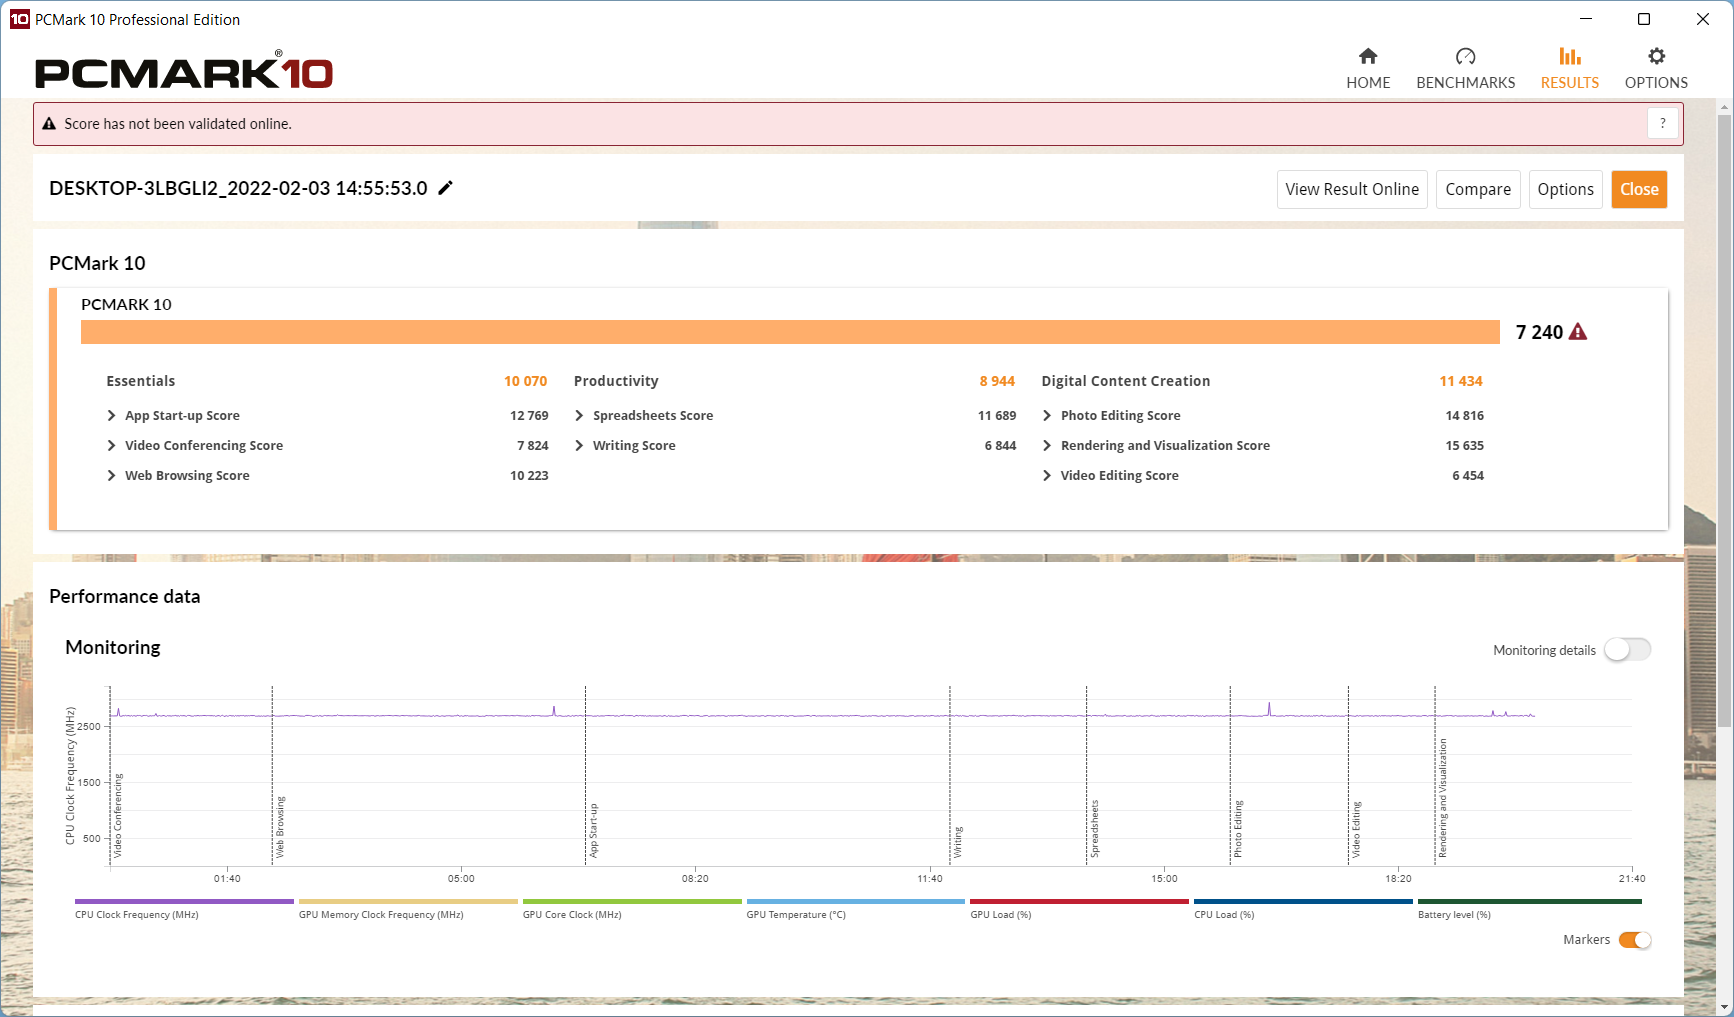
As notas no PCMark 10 não são convincentes em todos os aspectos. O Razer Blade 15 supera o Neo 15 na pontuação geral. Por outro lado, o Neo 15 está apenas atrás do MSI GE76 Raider com hardware similar no teste de Criação de Conteúdo Digital, mas o laptop fica um pouco atrás no Essentials and Productivity. Neste último, o Neo com o acessório Oasis tem um desempenho cerca de 10% melhor.
| PCMark 10 / Score | |
| Média da turma Gaming (5828 - 12414, n=93, últimos 2 anos) | |
| MSI GE76 Raider | |
| Schenker XMG Oasis | |
| Média Intel Core i7-12700H, NVIDIA GeForce RTX 3080 Ti Laptop GPU (6868 - 7638, n=7) | |
| Razer Blade 15 Advanced (Mid 2021) | |
| Schenker XMG Neo 15 E22 (Early 2022, RTX 3080 Ti) | |
| Asus ROG Strix Scar 15 G533QS | |
| Schenker XMG Neo 15 Tiger Lake | |
| Alienware m15 R6, i7-11800H RTX 3080 | |
| PCMark 10 / Essentials | |
| Razer Blade 15 Advanced (Mid 2021) | |
| MSI GE76 Raider | |
| Média da turma Gaming (8810 - 11935, n=97, últimos 2 anos) | |
| Média Intel Core i7-12700H, NVIDIA GeForce RTX 3080 Ti Laptop GPU (9987 - 11318, n=7) | |
| Schenker XMG Neo 15 Tiger Lake | |
| Asus ROG Strix Scar 15 G533QS | |
| Schenker XMG Neo 15 E22 (Early 2022, RTX 3080 Ti) | |
| Alienware m15 R6, i7-11800H RTX 3080 | |
| Schenker XMG Oasis | |
| PCMark 10 / Productivity | |
| Média da turma Gaming (6845 - 25323, n=95, últimos 2 anos) | |
| MSI GE76 Raider | |
| Asus ROG Strix Scar 15 G533QS | |
| Schenker XMG Oasis | |
| Média Intel Core i7-12700H, NVIDIA GeForce RTX 3080 Ti Laptop GPU (8944 - 10726, n=7) | |
| Alienware m15 R6, i7-11800H RTX 3080 | |
| Razer Blade 15 Advanced (Mid 2021) | |
| Schenker XMG Neo 15 Tiger Lake | |
| Schenker XMG Neo 15 E22 (Early 2022, RTX 3080 Ti) | |
| PCMark 10 / Digital Content Creation | |
| Média da turma Gaming (7602 - 19954, n=95, últimos 2 anos) | |
| MSI GE76 Raider | |
| Schenker XMG Oasis | |
| Schenker XMG Neo 15 E22 (Early 2022, RTX 3080 Ti) | |
| Média Intel Core i7-12700H, NVIDIA GeForce RTX 3080 Ti Laptop GPU (8956 - 12249, n=7) | |
| Schenker XMG Neo 15 Tiger Lake | |
| Razer Blade 15 Advanced (Mid 2021) | |
| Alienware m15 R6, i7-11800H RTX 3080 | |
| Asus ROG Strix Scar 15 G533QS | |
| PCMark 10 Score | 7240 pontos | |
Ajuda | ||
| AIDA64 / Memory Copy | |
| Média da turma Gaming (21750 - 129946, n=105, últimos 2 anos) | |
| Schenker XMG Neo 15 E22 (Early 2022, RTX 3080 Ti) | |
| MSI GE76 Raider | |
| Schenker XMG Oasis | |
| Média Intel Core i7-12700H (25615 - 80511, n=64) | |
| Alienware m15 R6, i7-11800H RTX 3080 | |
| Asus ROG Strix Scar 15 G533QS | |
| AIDA64 / Memory Read | |
| Média da turma Gaming (22956 - 118858, n=105, últimos 2 anos) | |
| Schenker XMG Oasis | |
| Schenker XMG Neo 15 E22 (Early 2022, RTX 3080 Ti) | |
| MSI GE76 Raider | |
| Média Intel Core i7-12700H (25586 - 79442, n=64) | |
| Alienware m15 R6, i7-11800H RTX 3080 | |
| Asus ROG Strix Scar 15 G533QS | |
| AIDA64 / Memory Write | |
| Média da turma Gaming (22297 - 135096, n=105, últimos 2 anos) | |
| Schenker XMG Oasis | |
| Schenker XMG Neo 15 E22 (Early 2022, RTX 3080 Ti) | |
| MSI GE76 Raider | |
| Média Intel Core i7-12700H (23679 - 88660, n=64) | |
| Asus ROG Strix Scar 15 G533QS | |
| Alienware m15 R6, i7-11800H RTX 3080 | |
| AIDA64 / Memory Latency | |
| Média da turma Gaming (75.3 - 259, n=105, últimos 2 anos) | |
| Alienware m15 R6, i7-11800H RTX 3080 | |
| MSI GE76 Raider | |
| Asus ROG Strix Scar 15 G533QS | |
| Média Intel Core i7-12700H (76.2 - 133.9, n=62) | |
| Schenker XMG Neo 15 Tiger Lake | |
| Razer Blade 15 Advanced (Mid 2021) | |
| Schenker XMG Neo 15 E22 (Early 2022, RTX 3080 Ti) | |
| Schenker XMG Oasis | |
* ... menor é melhor
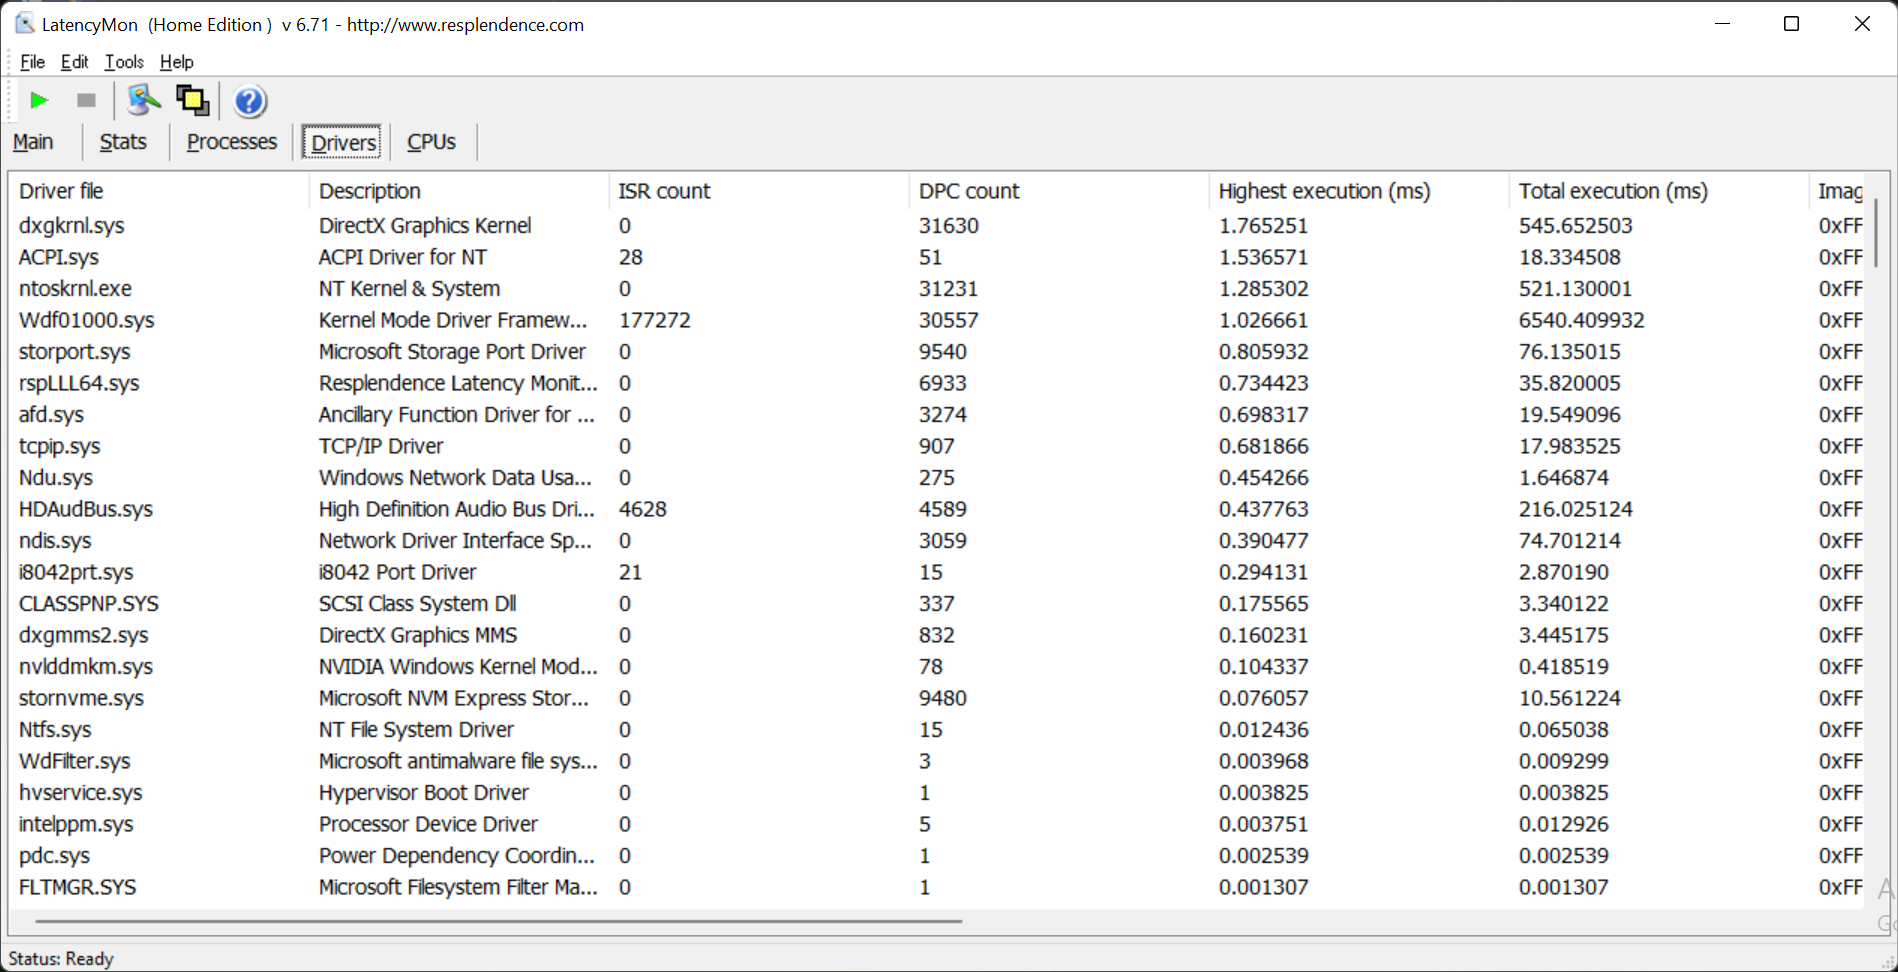
Latências DPC
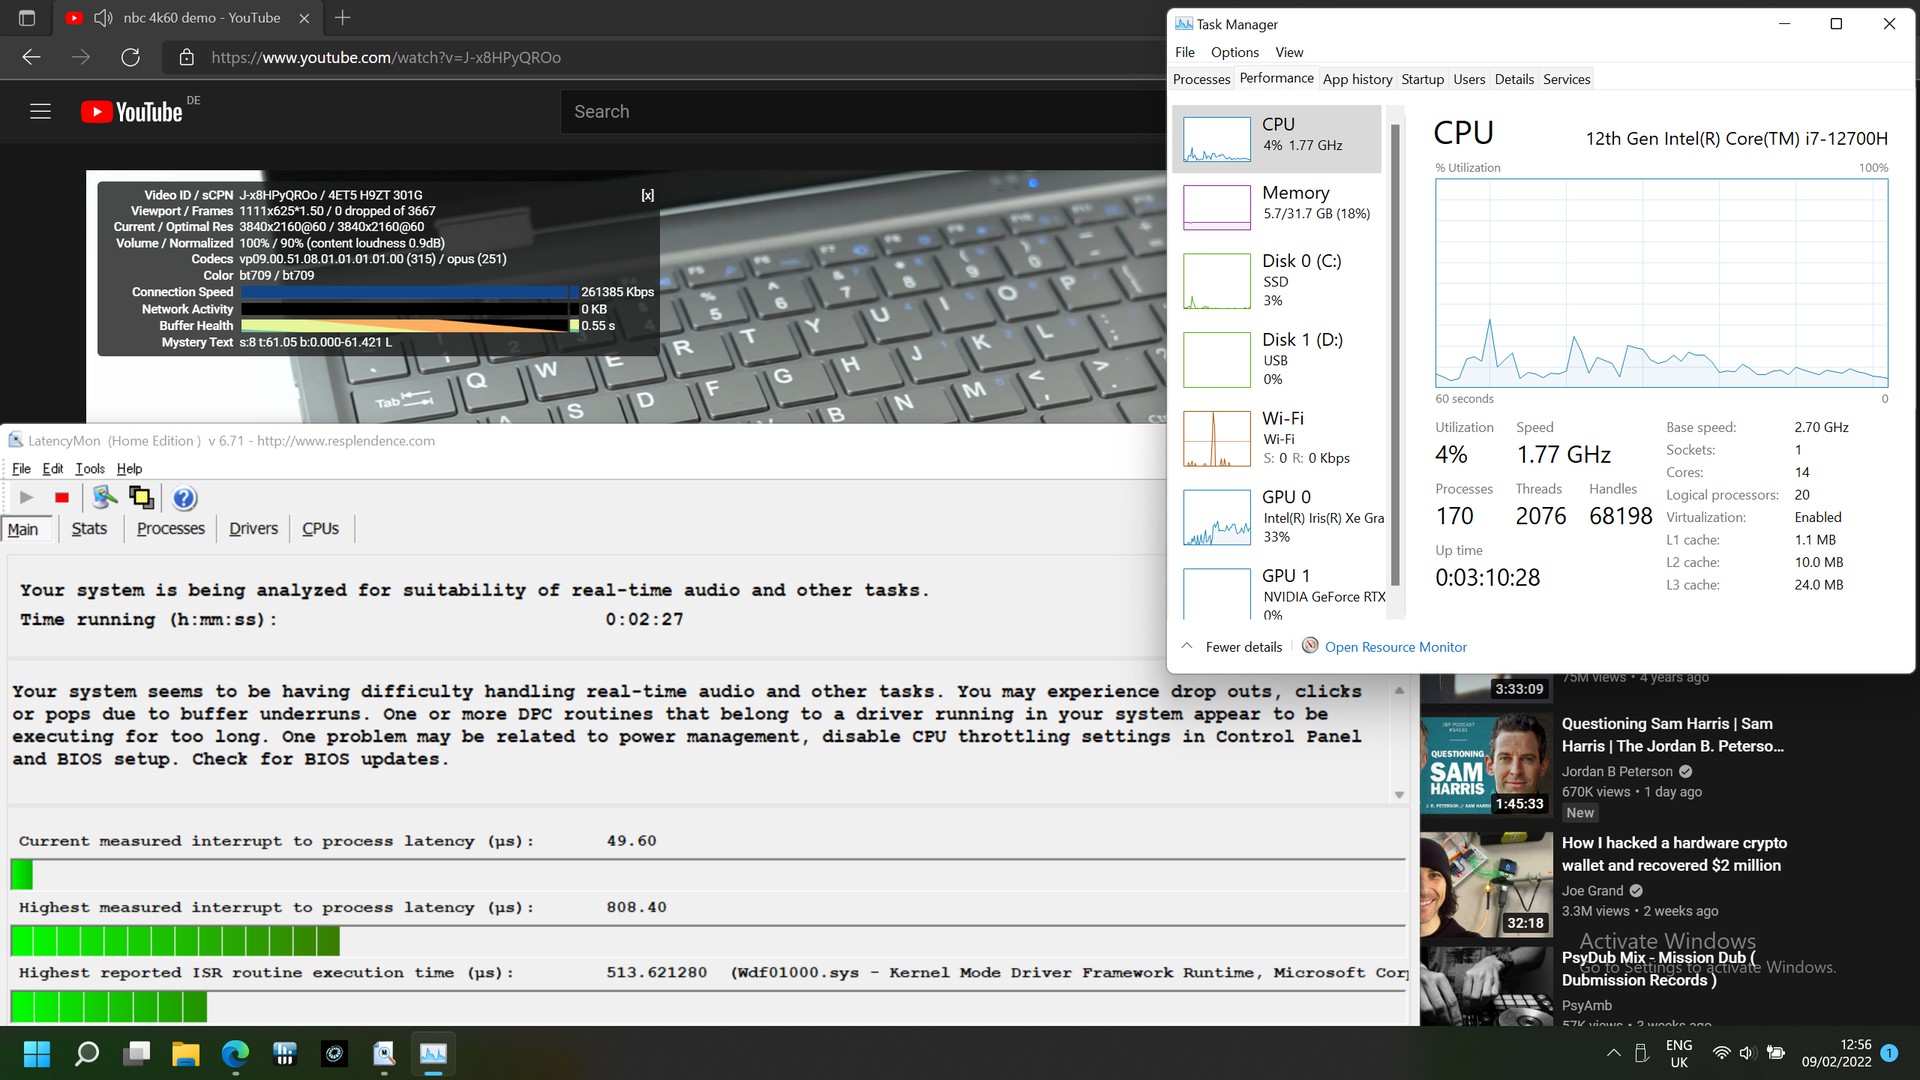
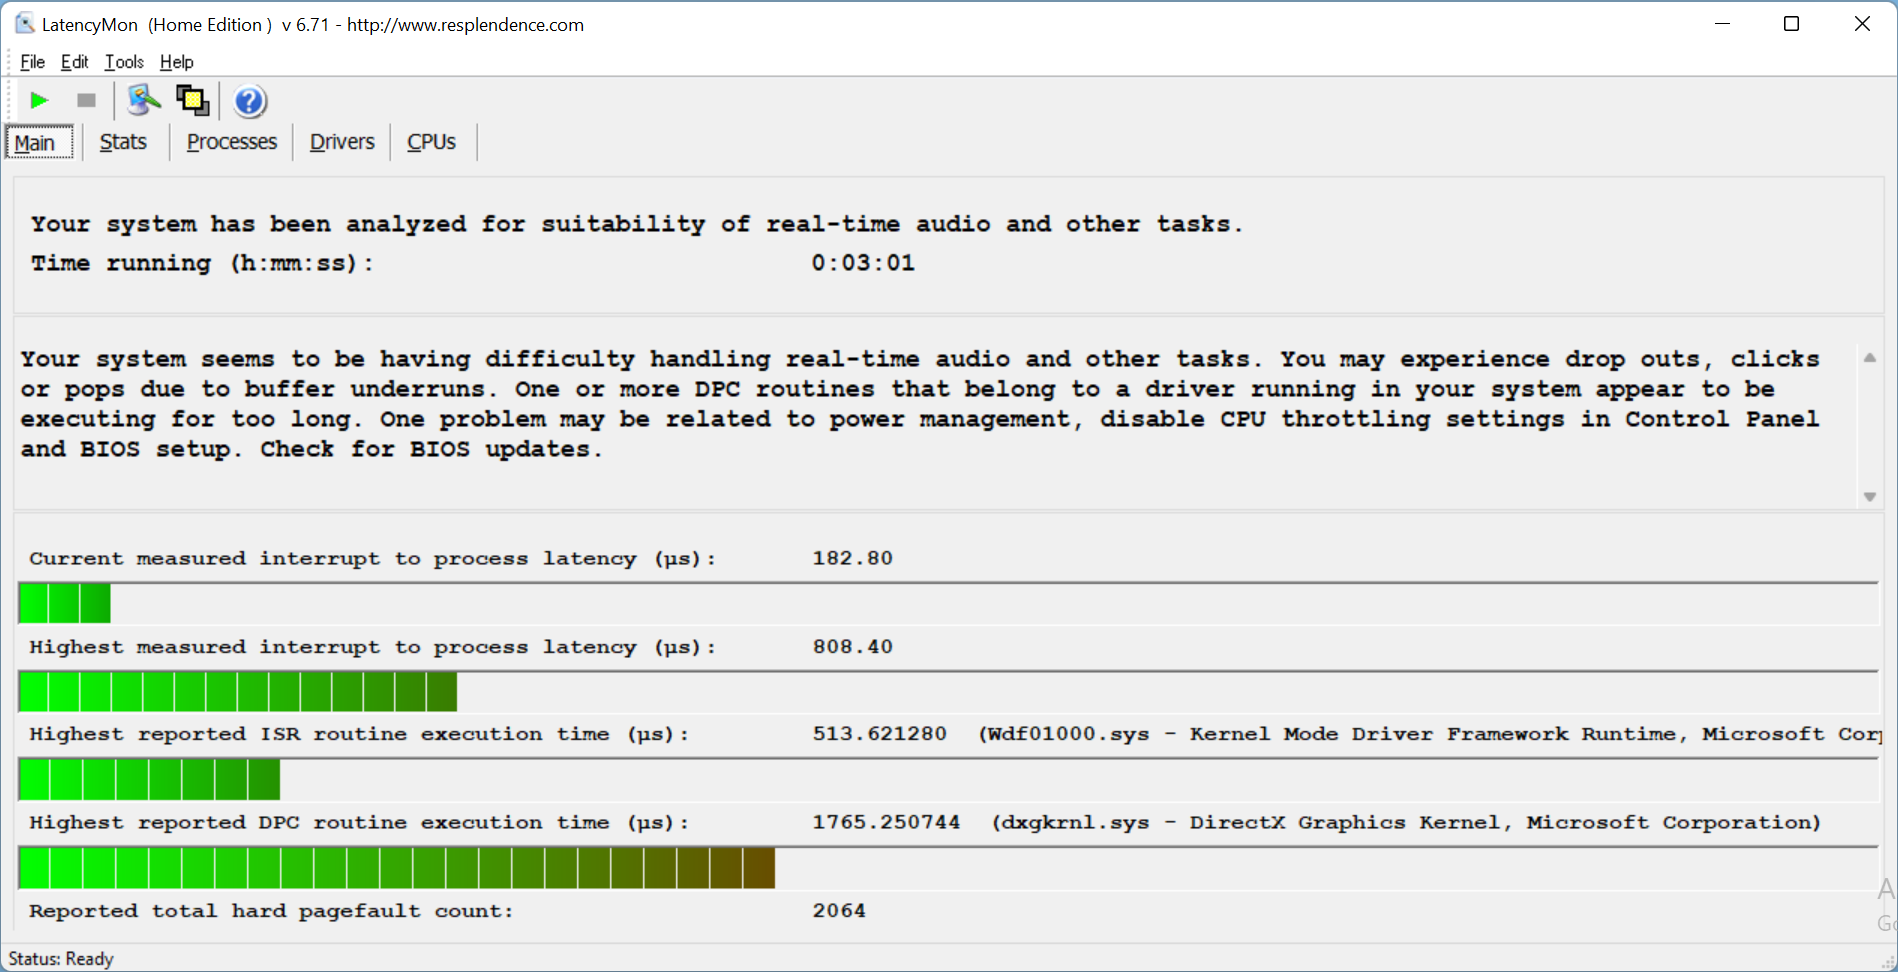
O LatencyMon já mostra maior latência ao abrir o navegador Edge. Fica um pouco pior ao abrir várias abas e ao reproduzir nosso vídeo 4K/60 fps no YouTube. No entanto, o vídeo é reproduzido sem deixar cair quadros.
| DPC Latencies / LatencyMon - interrupt to process latency (max), Web, Youtube, Prime95 | |
| Razer Blade 15 Advanced (Mid 2021) | |
| MSI GE76 Raider | |
| Asus ROG Strix Scar 15 G533QS | |
| Alienware m15 R6, i7-11800H RTX 3080 | |
| Schenker XMG Neo 15 E22 (Early 2022, RTX 3080 Ti) | |
| Schenker XMG Neo 15 Tiger Lake | |
* ... menor é melhor
Armazenamento em massa
Nosso modelo de pré-produção da China inicialmente não possuía um SSD. A Schenker nos enviou um rápido Samsung 980 Pro com apenas 250 GB para os testes, que quase nunca será instalado devido ao seu pequeno tamanho e nem sequer aparece em nossoA melhor lista de SSD até o momento.
Com o Windows 11 Home instalado, restaram apenas cerca de 60 a 80 GB para outros programas. O modelo de produção provavelmente terá pelo menos 512 GB.

* ... menor é melhor
Continuous load read: DiskSpd Read Loop, Queue Depth 8
Placa gráfica
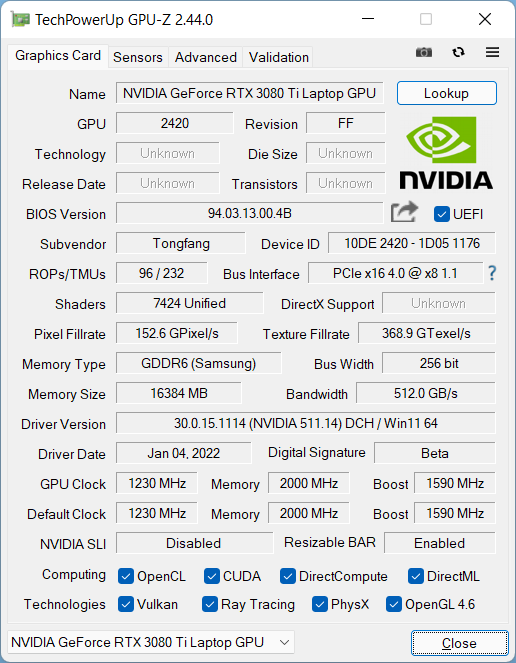
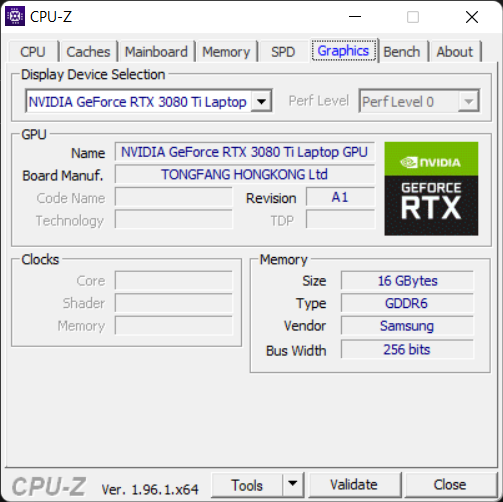
O novinho em folhaNvidia GeForce RTX 3080 Ti GPU Portátil é atualmente a placa gráfica mais rápida para notebooks. Max-Q e Whisper Mode estão disponíveis, mas não há nenhum Advanced Optimus no Neo 15. A placa tem uma memória de vídeo GDDR6 de 16 GB.
Mais uma vez, a Nvidia permite aos fabricantes decidir sobre o consumo de energia e, portanto, o desempenho. Schenker passa esta decisão para o cliente através do Centro de Controle
Nos testes 3DMark, o Neo 15 normalmente está logo atrás do MSI GE76 Raider que também executa o RTX 3080 Ti a 175 W. Entretanto, o predecessor do Neo 15 está apenas alguns pontos percentuais atrás em muitos testes 3DMark e cerca de 12% atrás na classificação de desempenho geral.
Quase não há diferenças notáveis com o Oasis, e a combinação está geralmente até mesmo atrás das taxas somente do Neo 15.
Longe da tomada elétrica, o desempenho 3D cai consideravelmente. No 3DMark 11, o laptop perde todo um desempenho de 87%. Em no Witcher 3 WQHD, a taxa de quadros cai de pouco menos de 100 fps para apenas cerca de 10 a 11 fps - uma perda de quase 90 por cento também! Infelizmente, isto é padrão tendo em vista o alto consumo de energia das atuais GPUs.
| 3DMark 11 Performance | 35910 pontos | |
| 3DMark Cloud Gate Standard Score | 63903 pontos | |
| 3DMark Fire Strike Score | 27983 pontos | |
| 3DMark Time Spy Score | 12480 pontos | |
Ajuda | ||
Desempenho do jogo
Com o RTX 3080 Ti em configuração completa, o Neo 15 joga todos os jogos atuais suavemente na resolução nativa WQHD. Também deve haver reservas suficientes para 4K na maior parte do tempo.
O Witcher 3 funciona a cerca de 95 fps em 2.560 x 1.440 pixels ultra e a 120 fps em full HD. Far Cry 5 também funciona a mais de 100 fps em resolução nativa
Portáteis com umRTX 3080em cerca de 10%, enquanto o MSI GE76 Raider é minimamente mais rápido. Não foi possível instalar o GTA Vpois a capacidade do SSD é muito pequena e o Windows 11 consome muito espaço. Esperamos poder compensar isso no modelo de produção.
Com o resfriamento Oasis, o Witcher 3 e o Far Cry 5 funcionam cerca de 3 a 5% mais rápido, o que normalmente não é perceptível na prática, mas resulta em maiores diferenças de temperatura.
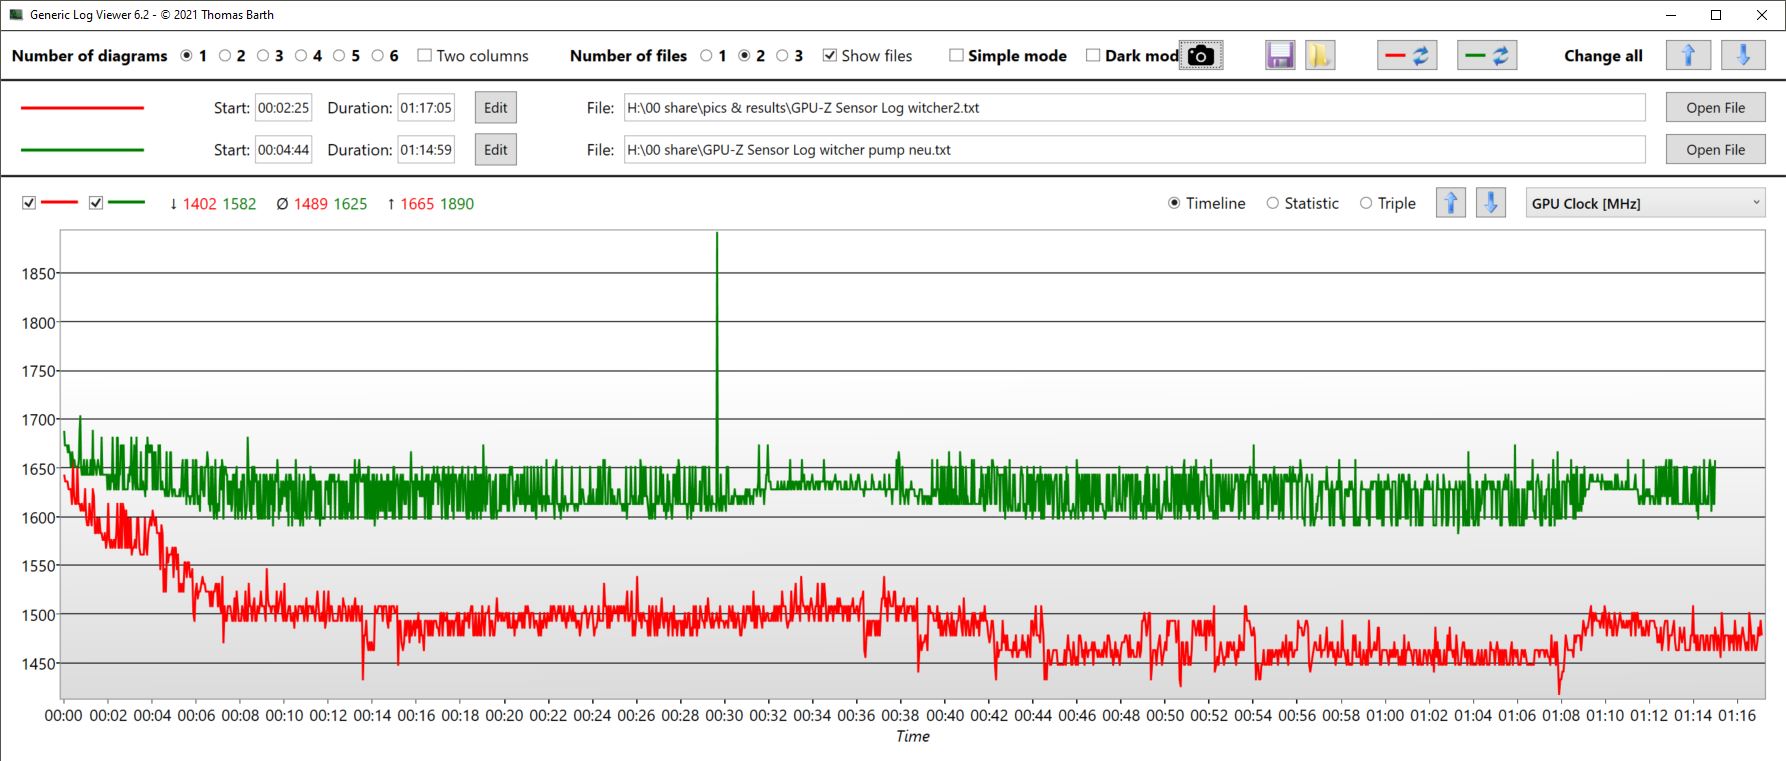
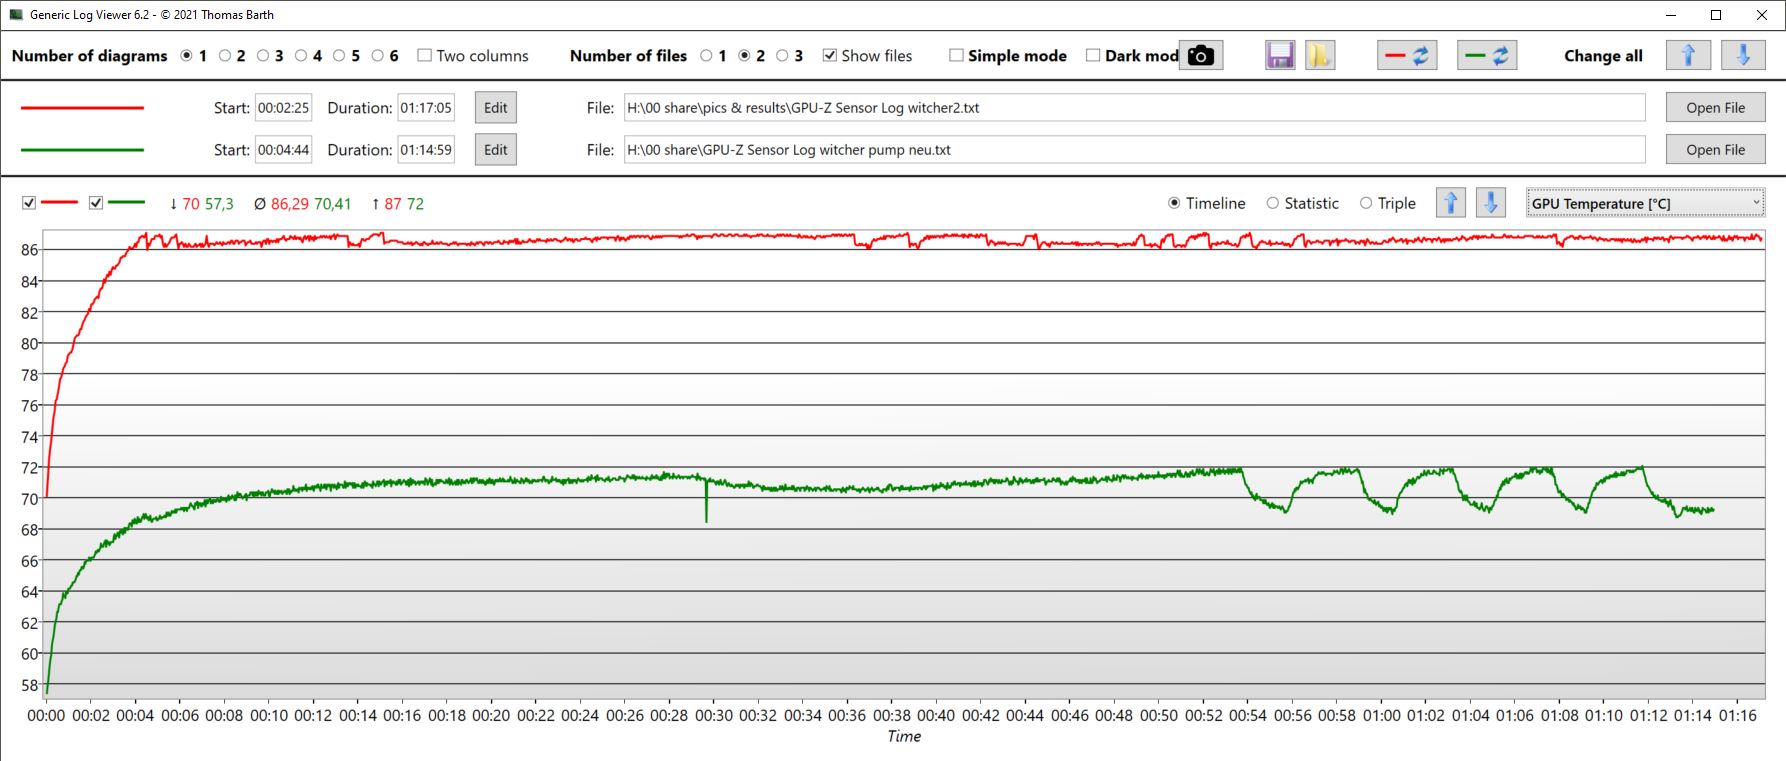
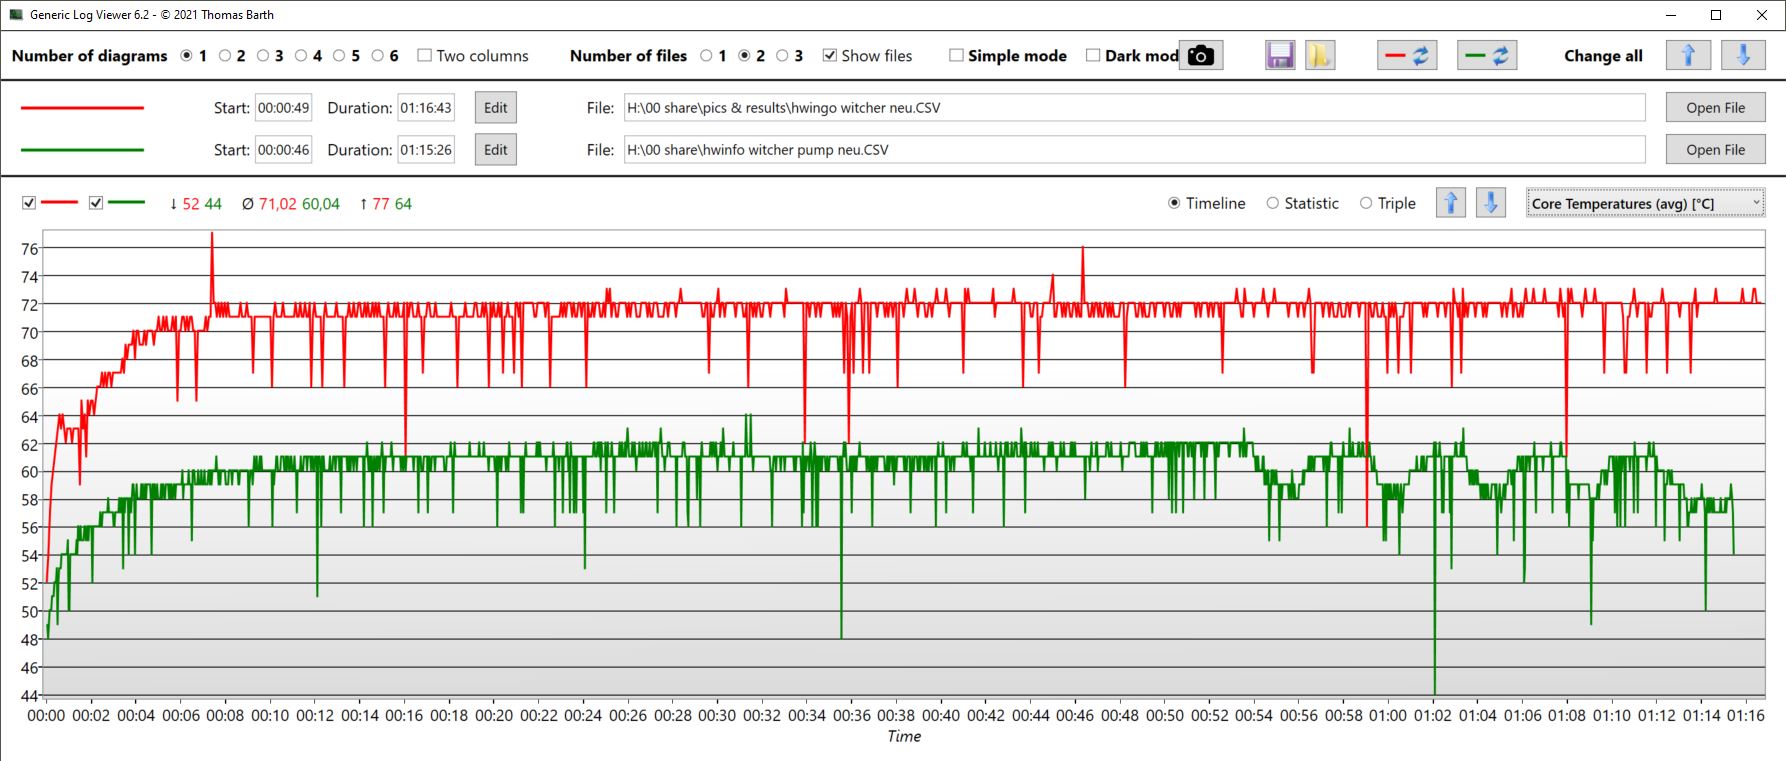
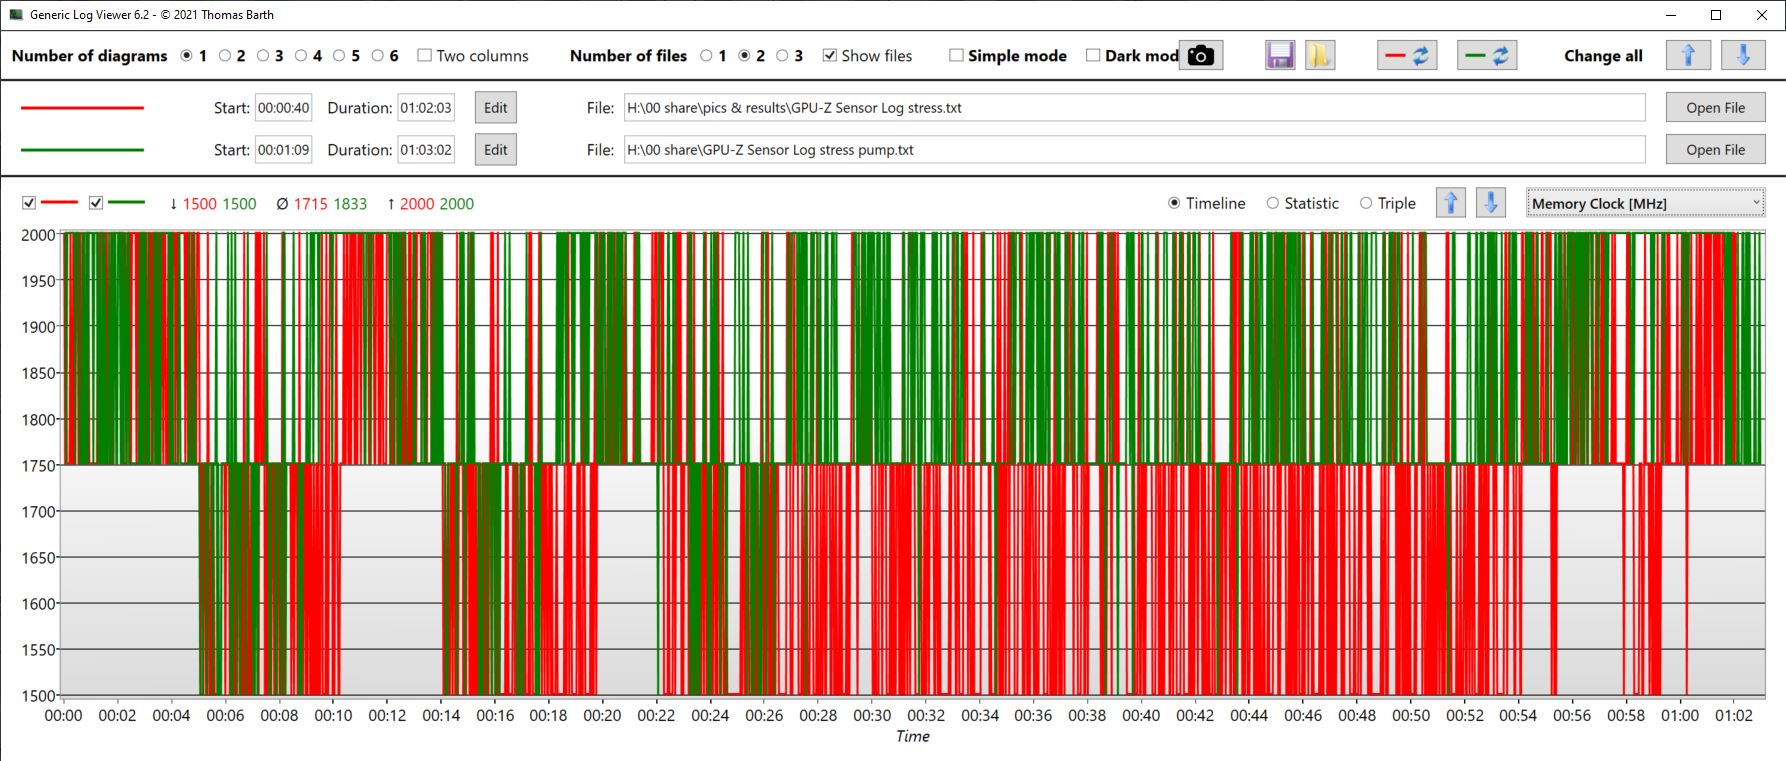
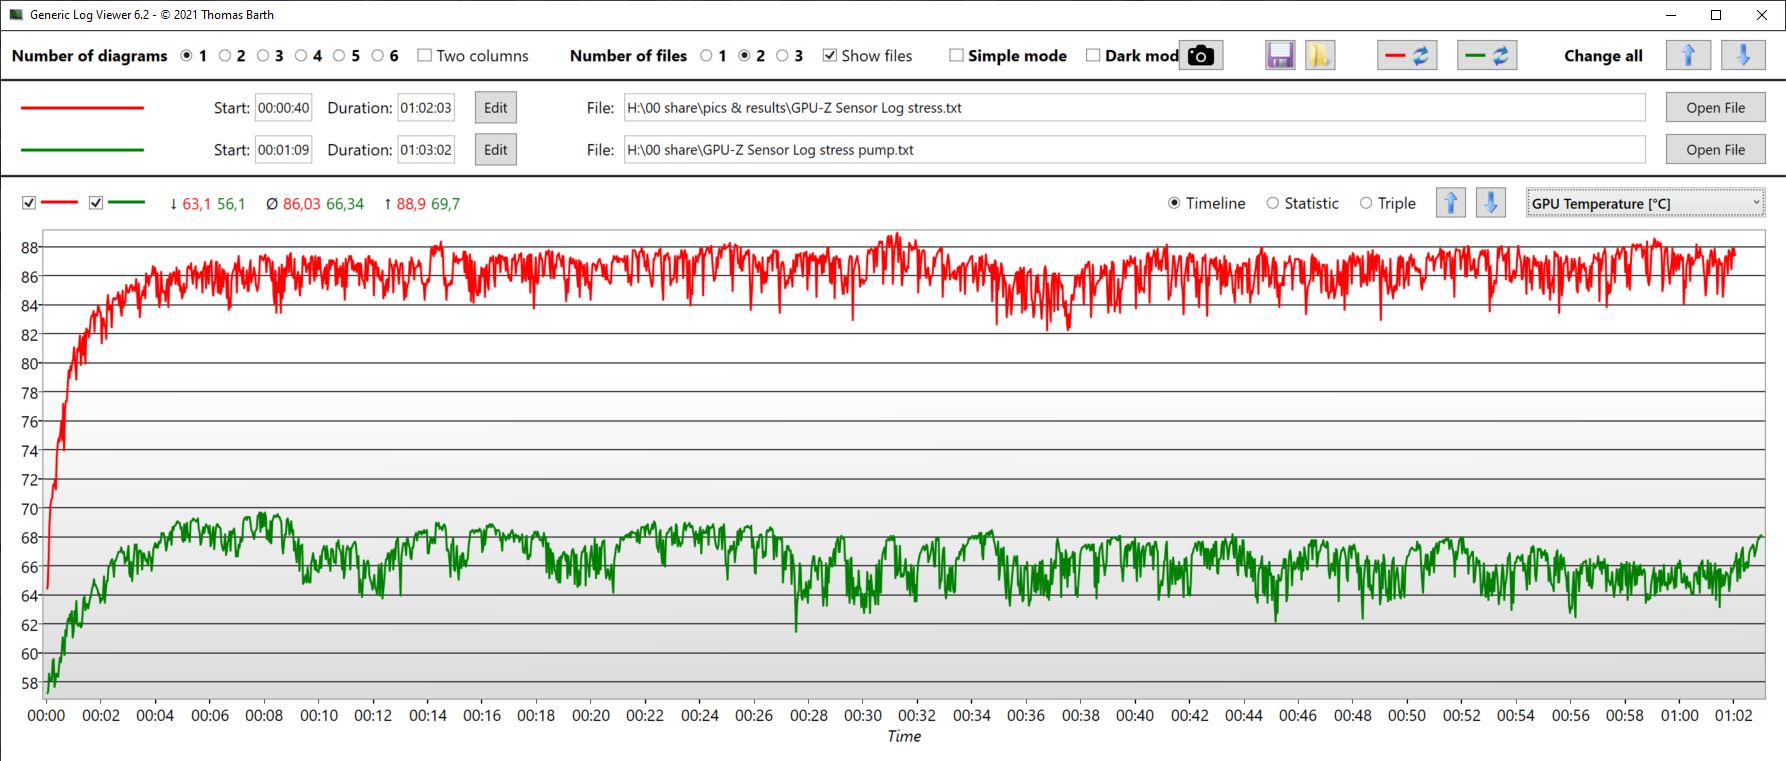
A avaliação de uma hora de estresse do Witcher 3mostra que a GPU do Neo 15 é capaz de registrar em média 150 MHz mais alto com o Oasis, permanece um refrigerador inteiro de 16 °C, consome mais energia e pode usar mais memória.
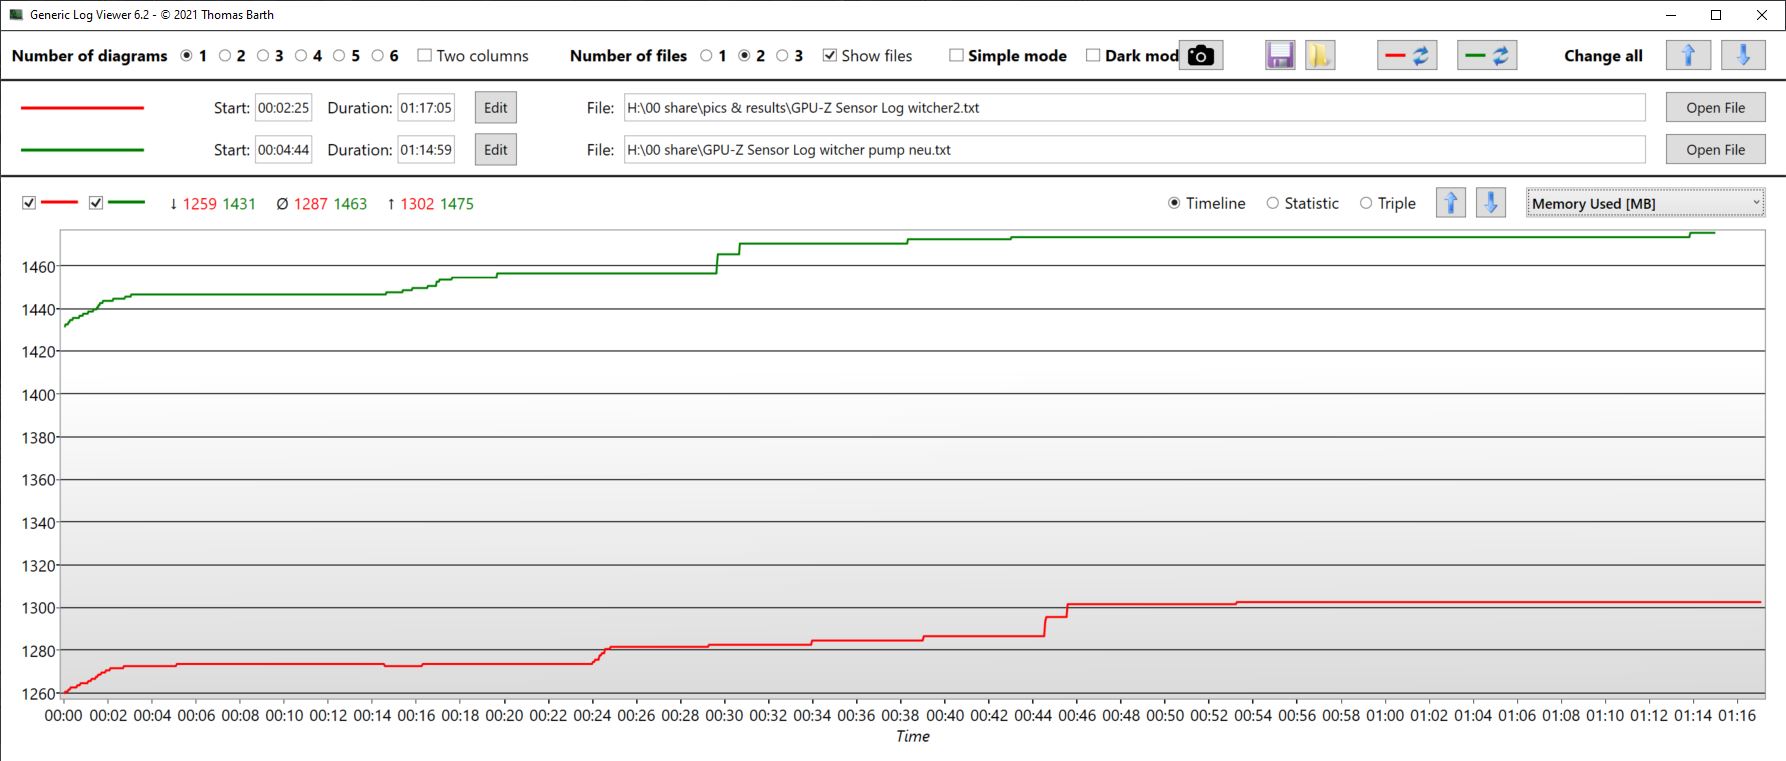
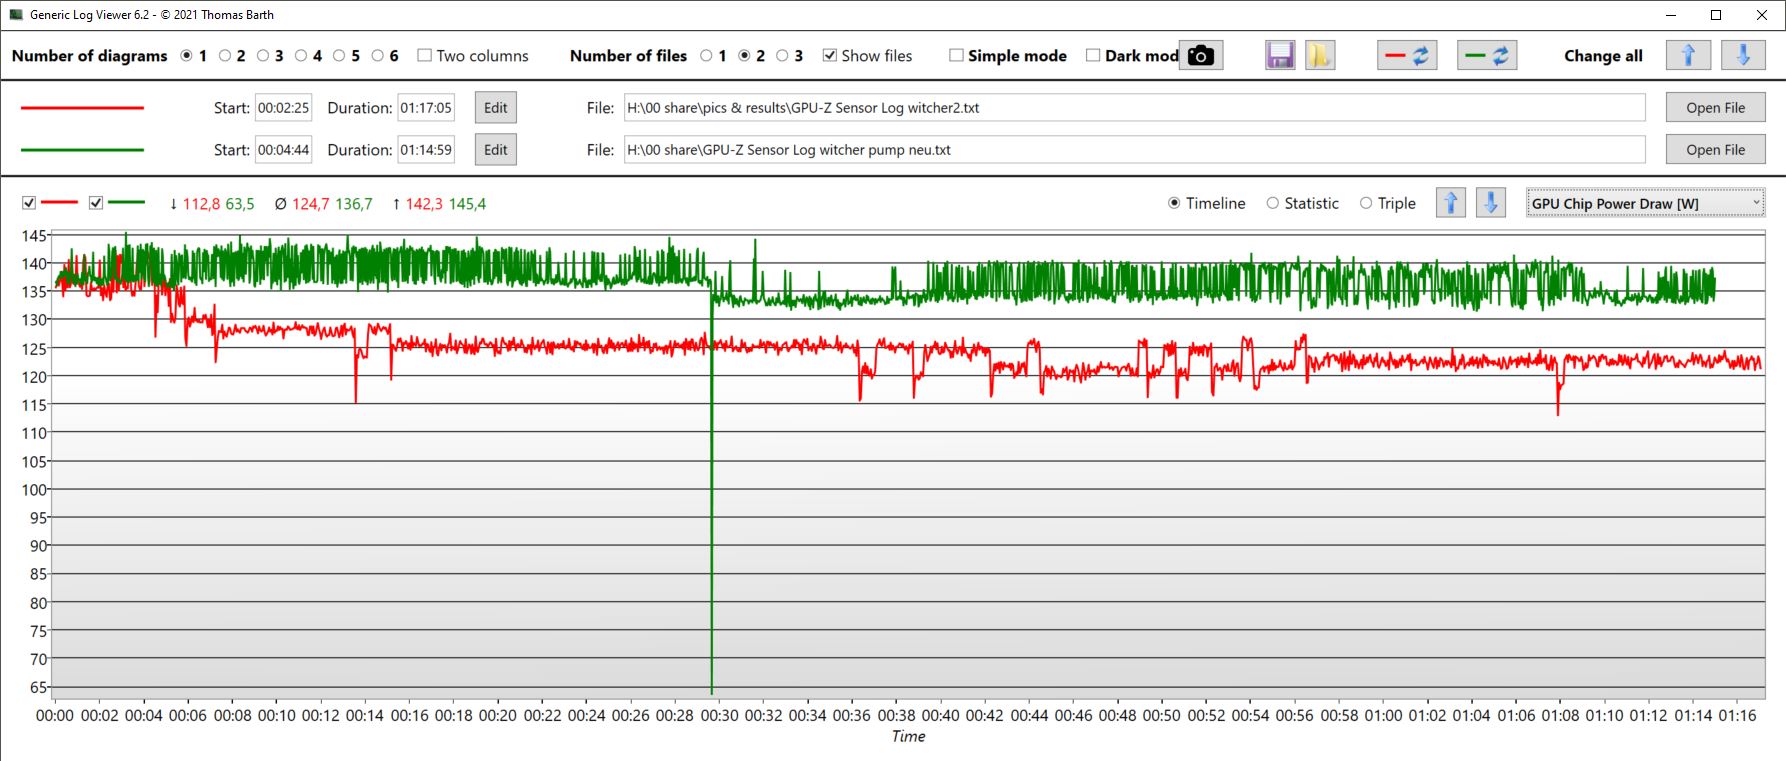
O efeito é um pouco menor sobre a CPU em The Witcher 3 stress. A velocidade do relógio é quase a mesma, e não há aparente estrangulamento térmico com a CPU mesmo sem Oásis. Entretanto, as temperaturas da CPU são cerca de 11 °C mais baixas com o Oasis acoplado.
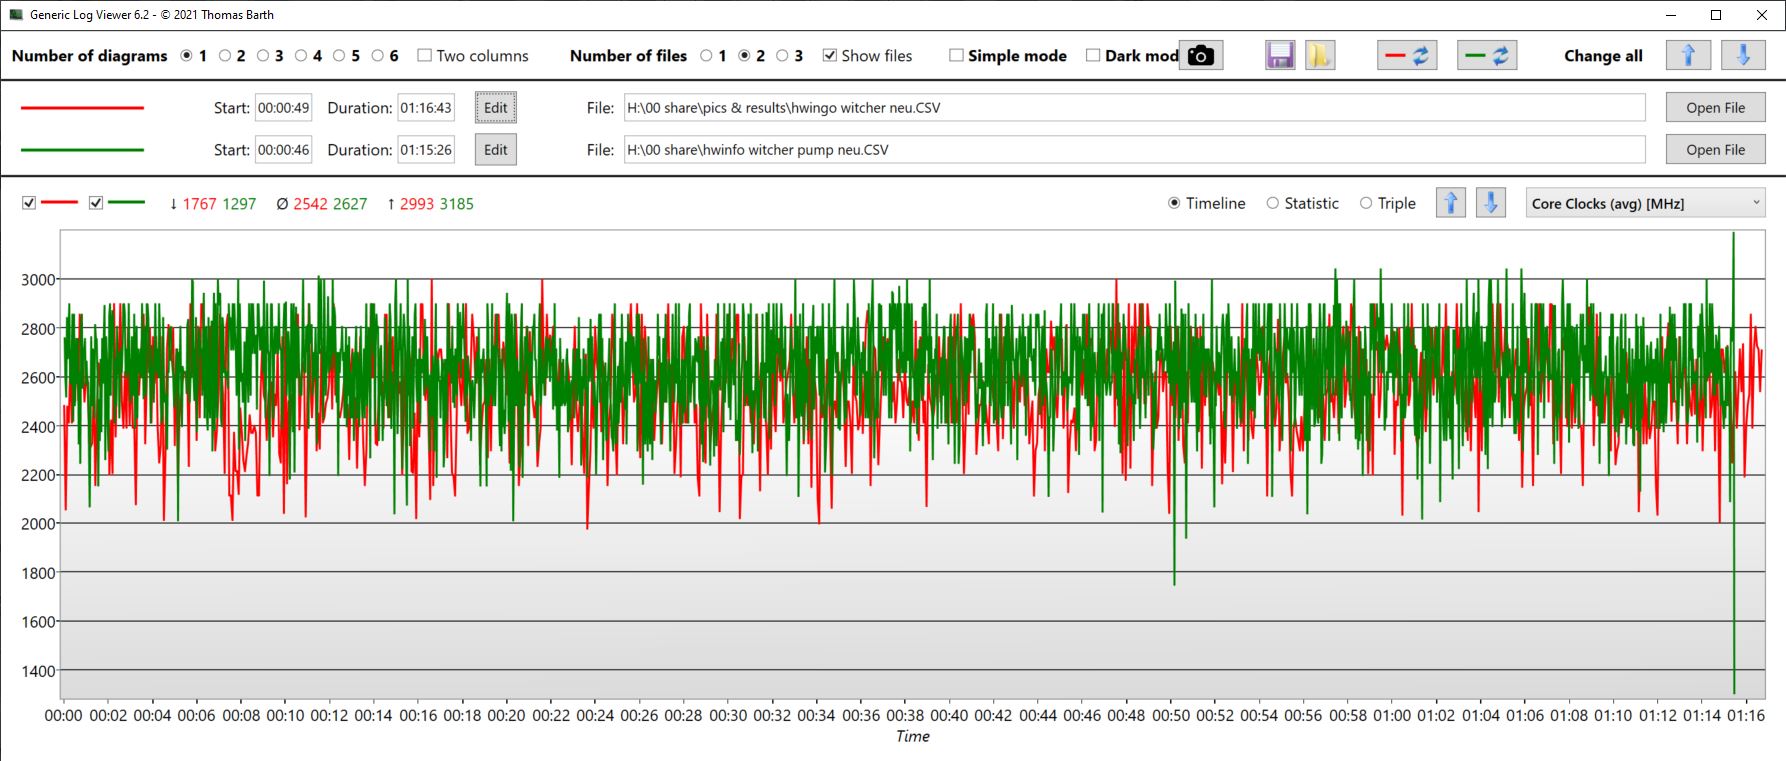
A taxa de quadros noThe Witcher 3 diminui apenas ligeiramente em uma hora, mas também não se comporta de forma bastante consistente. Com Oasis, a taxa de quadros é semelhante, mas está sempre cerca de 7% acima do que vimos sem o resfriamento da água. Assim, o desempenho a longo prazo é minimamente melhor.
The Witcher 3 - FPS Diagram
| baixo | média | alto | ultra | QHD | |
|---|---|---|---|---|---|
| The Witcher 3 (2015) | 388.4 | 325.6 | 212.4 | 121 | |
| Dota 2 Reborn (2015) | 175 | 162 | 153 | 147 | |
| Final Fantasy XV Benchmark (2018) | 151 | 115 | 87.4 | ||
| X-Plane 11.11 (2018) | 142 | 124 | 101 | ||
| Far Cry 5 (2018) | 164 | 145 | 140 | 131 | 116 |
Emissões: Mencionamos o resfriamento da água?
Emissões sonoras
O modo Overboost que usamos com valores de TDP/TGP maximizados manualmente não é certamente o caso de uso usual. O hardware oferece potência suficiente para ser operado também nos modos muito mais silencioso Enthusiast ou Balanced (com o modo Whisper)
Mesmo no modo Overboost, o dispositivo não é, pelo menos, mais alto do que o predecessor com um RTX 3080. Os dispositivos de comparação funcionam apenas um pouco mais silenciosos também.
Com o Oasis, a emissão de ruído infelizmente cai apenas marginalmente (Oasis Balanced) - de cerca de 54 a 53 dB no The Witcher 3. A queda do nível de ruído é igualmente baixa no teste de estresse. O ventilador não-silencioso do Oasis acrescenta seu volume ao do ventilador interno, que então gira a velocidades mais baixas. Em geral, a diferença é menor do que gostaríamos.
Entretanto, estes valores foram medidos após uma hora de jogo e teste de estresse. Durante cargas curtas, como um sub-teste 3DMark06, notamos que os ventiladores internos não ligaram de forma alguma devido ao Oasis. Deste ponto de vista, as emissões de ruído já são significativamente menores em teoria. Além disso, três perfis de ventiladores podem ser definidos para Oasis (Equilibrado, Silencioso, Muito Silencioso). Sob Quiet, o Witcher 3 produz apenas 49 dB ao invés de 53 ou 54 dB (medidos a uma distância de 15 - 20 cm).
Sob carga, ouvimos um zumbido do case Neo, mas ele se desvanece para o fundo devido ao som geral do ventilador.
Barulho
| Ocioso |
| 24 / 24 / 27.76 dB |
| Carga |
| 38.81 / 54.18 dB |
 | ||
30 dB silencioso 40 dB(A) audível 50 dB(A) ruidosamente alto |
||
min: | ||
| Schenker XMG Neo 15 E22 (Early 2022, RTX 3080 Ti) GeForce RTX 3080 Ti Laptop GPU, i7-12700H, Samsung SSD 980 Pro 250GB MZ-V8P250BW | Schenker XMG Neo 15 Tiger Lake GeForce RTX 3080 Laptop GPU, i7-11800H, Samsung SSD 980 Pro 1TB MZ-V8P1T0BW | Razer Blade 15 Advanced (Mid 2021) GeForce RTX 3080 Laptop GPU, i7-11800H, SSSTC CA6-8D1024 | Asus ROG Strix Scar 15 G533QS GeForce RTX 3080 Laptop GPU, R9 5900HX, ADATA Swordfish 2 TB | Alienware m15 R6, i7-11800H RTX 3080 GeForce RTX 3080 Laptop GPU, i7-11800H, Samsung PM9A1 MZVL21T0HCLR | MSI GE76 Raider GeForce RTX 3080 Ti Laptop GPU, i9-12900HK, Samsung PM9A1 MZVL22T0HBLB | |
|---|---|---|---|---|---|---|
| Noise | -11% | 1% | -6% | 0% | -14% | |
| desligado / ambiente * (dB) | 24 | 25 -4% | 25.1 -5% | 25.5 -6% | 23 4% | 26 -8% |
| Idle Minimum * (dB) | 24 | 27 -13% | 25.3 -5% | 25.5 -6% | 23 4% | 26 -8% |
| Idle Average * (dB) | 24 | 30 -25% | 25.3 -5% | 25.5 -6% | 23 4% | 27 -13% |
| Idle Maximum * (dB) | 27.76 | 32 -15% | 25.3 9% | 37.1 -34% | 30 -8% | 40 -44% |
| Load Average * (dB) | 38.81 | 46 -19% | 42 -8% | 39.2 -1% | 41.26 -6% | 50 -29% |
| Witcher 3 ultra * (dB) | 54.2 | 52 4% | 45.6 16% | 50.5 7% | 53.4 1% | 53 2% |
| Load Maximum * (dB) | 54.18 | 55 -2% | 51.6 5% | 51.8 4% | 53.37 1% | 53 2% |
* ... menor é melhor
Temperatura
O Oásis pode finalmente mostrar seus pontos fortes em emissões de temperatura. Vimos as temperaturas significativamente mais baixas do GPU e da CPU acima, e isso se estende pelo menos parcialmente às temperaturas de superfície.
Por causa do RTX 3080 Ti sem obstáculos, medimos até 68 °C na parte inferior após uma hora de testes de estresse. Entretanto, Schenker também suspeita aqui de um defeito do modelo de pré-lançamento. Com Oasis, este valor é reduzido a um valor muito mais tolerável de 51 °C.
(-) A temperatura máxima no lado superior é 52 °C / 126 F, em comparação com a média de 40.4 °C / 105 F , variando de 21.2 a 68.8 °C para a classe Gaming.
(-) A parte inferior aquece até um máximo de 68 °C / 154 F, em comparação com a média de 43.2 °C / 110 F
(+) Em uso inativo, a temperatura média para o lado superior é 29 °C / 84 F, em comparação com a média do dispositivo de 33.9 °C / ### class_avg_f### F.
(-) Jogando The Witcher 3, a temperatura média para o lado superior é 39 °C / 102 F, em comparação com a média do dispositivo de 33.9 °C / ## #class_avg_f### F.
(±) Os apoios para as mãos e o touchpad podem ficar muito quentes ao toque, com um máximo de 36 °C / 96.8 F.
(-) A temperatura média da área do apoio para as mãos de dispositivos semelhantes foi 28.8 °C / 83.8 F (-7.2 °C / -13 F).
| Schenker XMG Neo 15 E22 (Early 2022, RTX 3080 Ti) Intel Core i7-12700H, NVIDIA GeForce RTX 3080 Ti Laptop GPU | Schenker XMG Oasis | Schenker XMG Neo 15 Tiger Lake Intel Core i7-11800H, NVIDIA GeForce RTX 3080 Laptop GPU | Razer Blade 15 Advanced (Mid 2021) Intel Core i7-11800H, NVIDIA GeForce RTX 3080 Laptop GPU | Asus ROG Strix Scar 15 G533QS AMD Ryzen 9 5900HX, NVIDIA GeForce RTX 3080 Laptop GPU | Alienware m15 R6, i7-11800H RTX 3080 Intel Core i7-11800H, NVIDIA GeForce RTX 3080 Laptop GPU | MSI GE76 Raider Intel Core i9-12900HK, NVIDIA GeForce RTX 3080 Ti Laptop GPU | |
|---|---|---|---|---|---|---|---|
| Heat | 22% | 11% | 3% | 8% | -5% | 11% | |
| Maximum Upper Side * (°C) | 52 | 42 19% | 39 25% | 51 2% | 43.4 17% | 61 -17% | 43 17% |
| Maximum Bottom * (°C) | 68 | 51 25% | 50 26% | 52 24% | 48.2 29% | 58 15% | 47 31% |
| Idle Upper Side * (°C) | 32 | 34 -6% | 35.2 -10% | 35.2 -10% | 38 -19% | 33 -3% | |
| Idle Bottom * (°C) | 36 | 37 -3% | 37.8 -5% | 37 -3% | 36 -0% | 37 -3% |
* ... menor é melhor
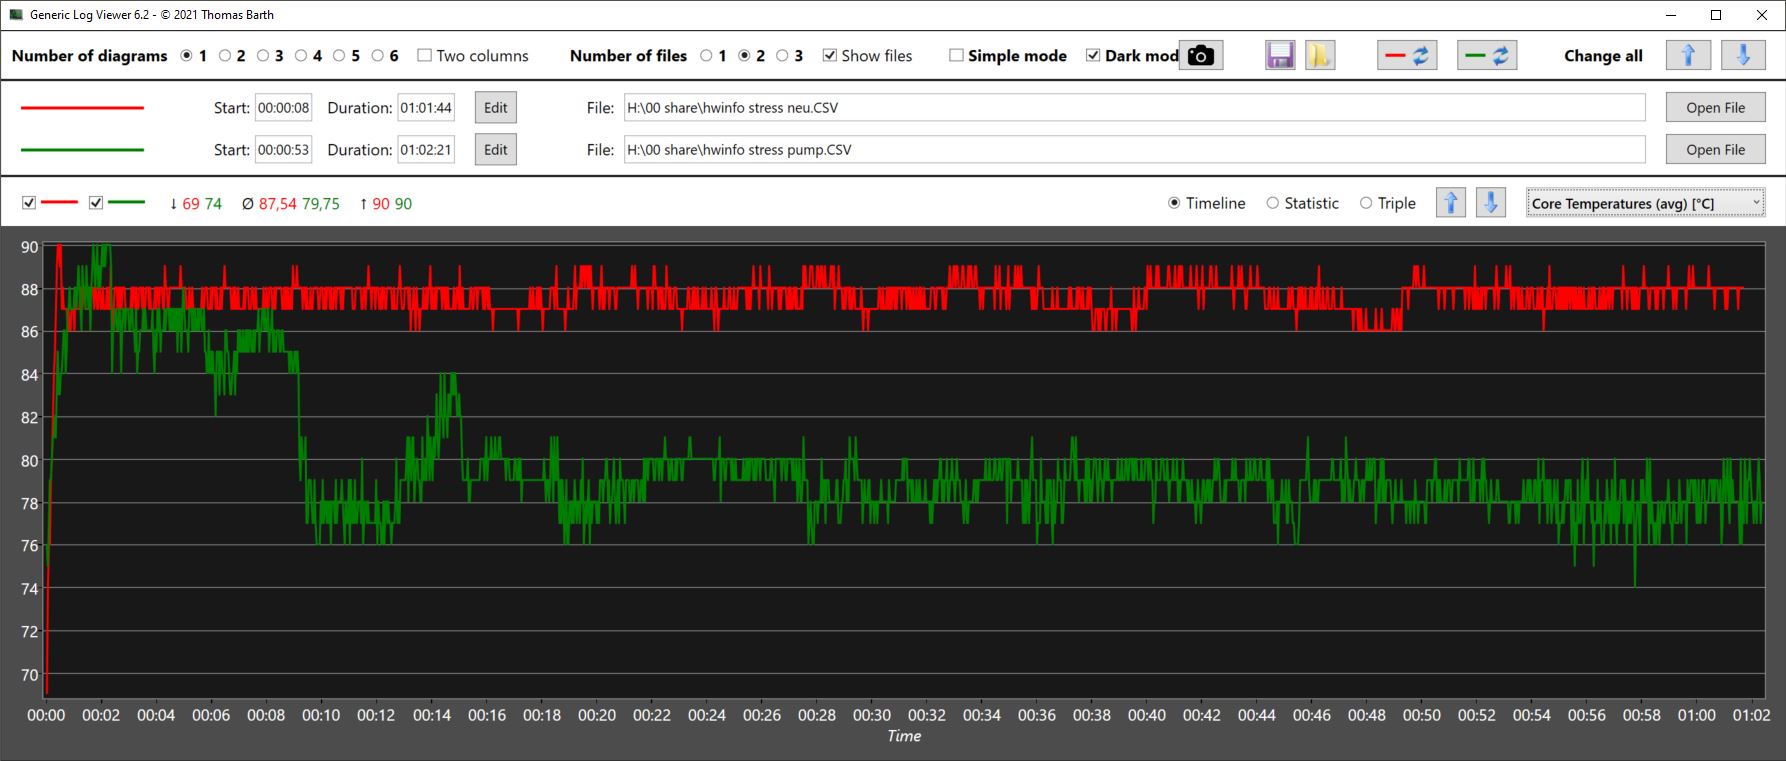
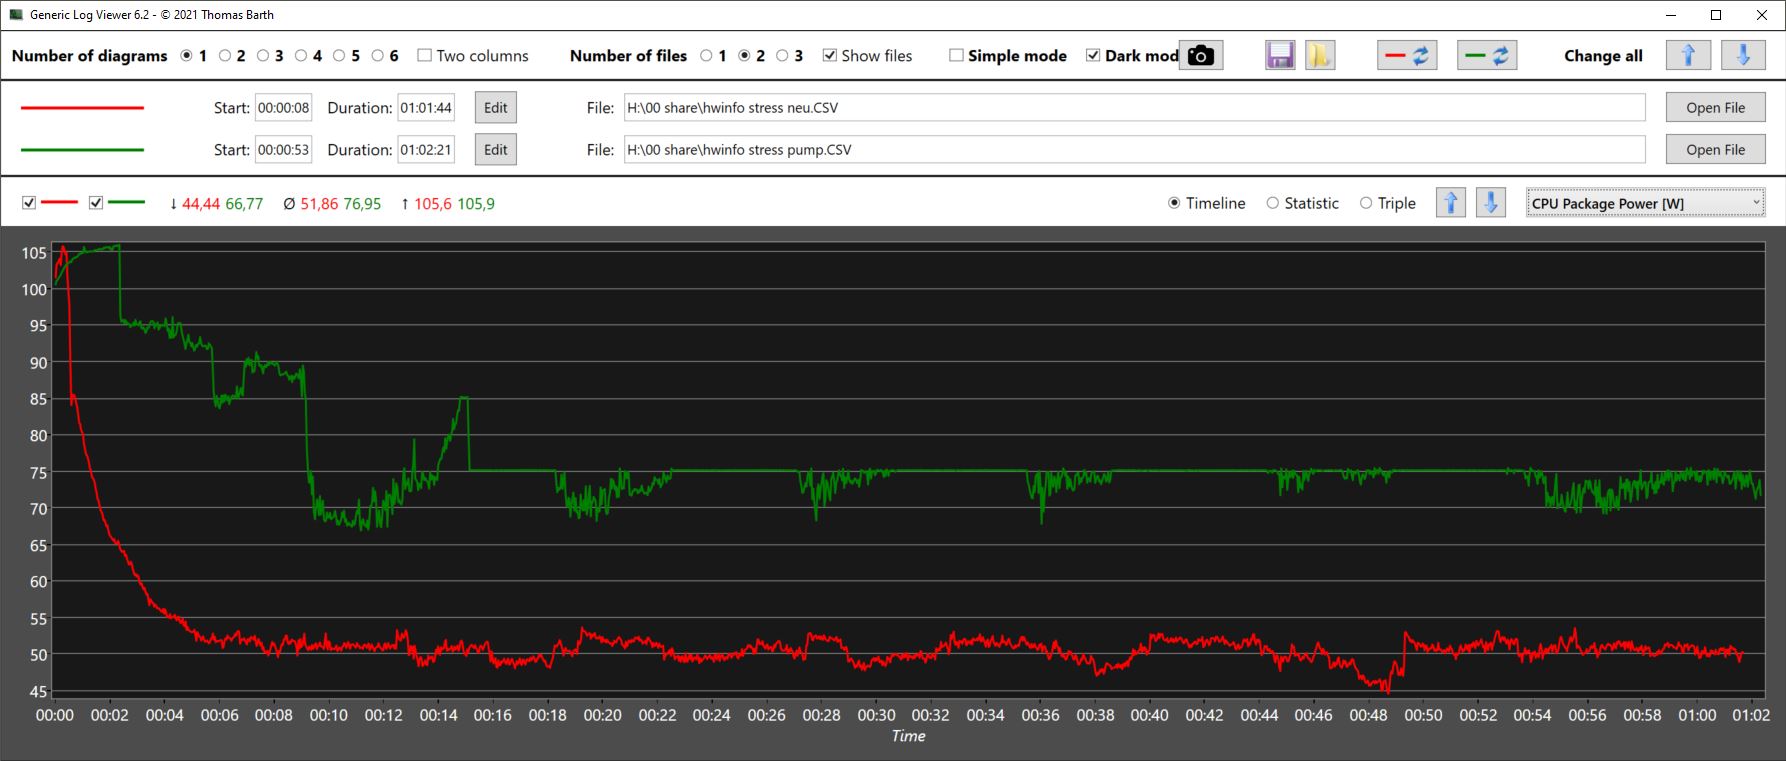
Teste de estresse
Os núcleos começam nosso teste de estresse em aproximadamente 3,6 GHz. Ao longo da hora, o relógio diminui e depois flutua entre 2,2 e 3 GHz. O relógio médio está em torno de 2,6 GHz. Com o Oasis, a média dos relógios está a 3,1 GHz muito mais alta com 8 °C de temperaturas centrais mais baixas ao mesmo tempo, enquanto a potência do pacote é aumentada em 25 W!
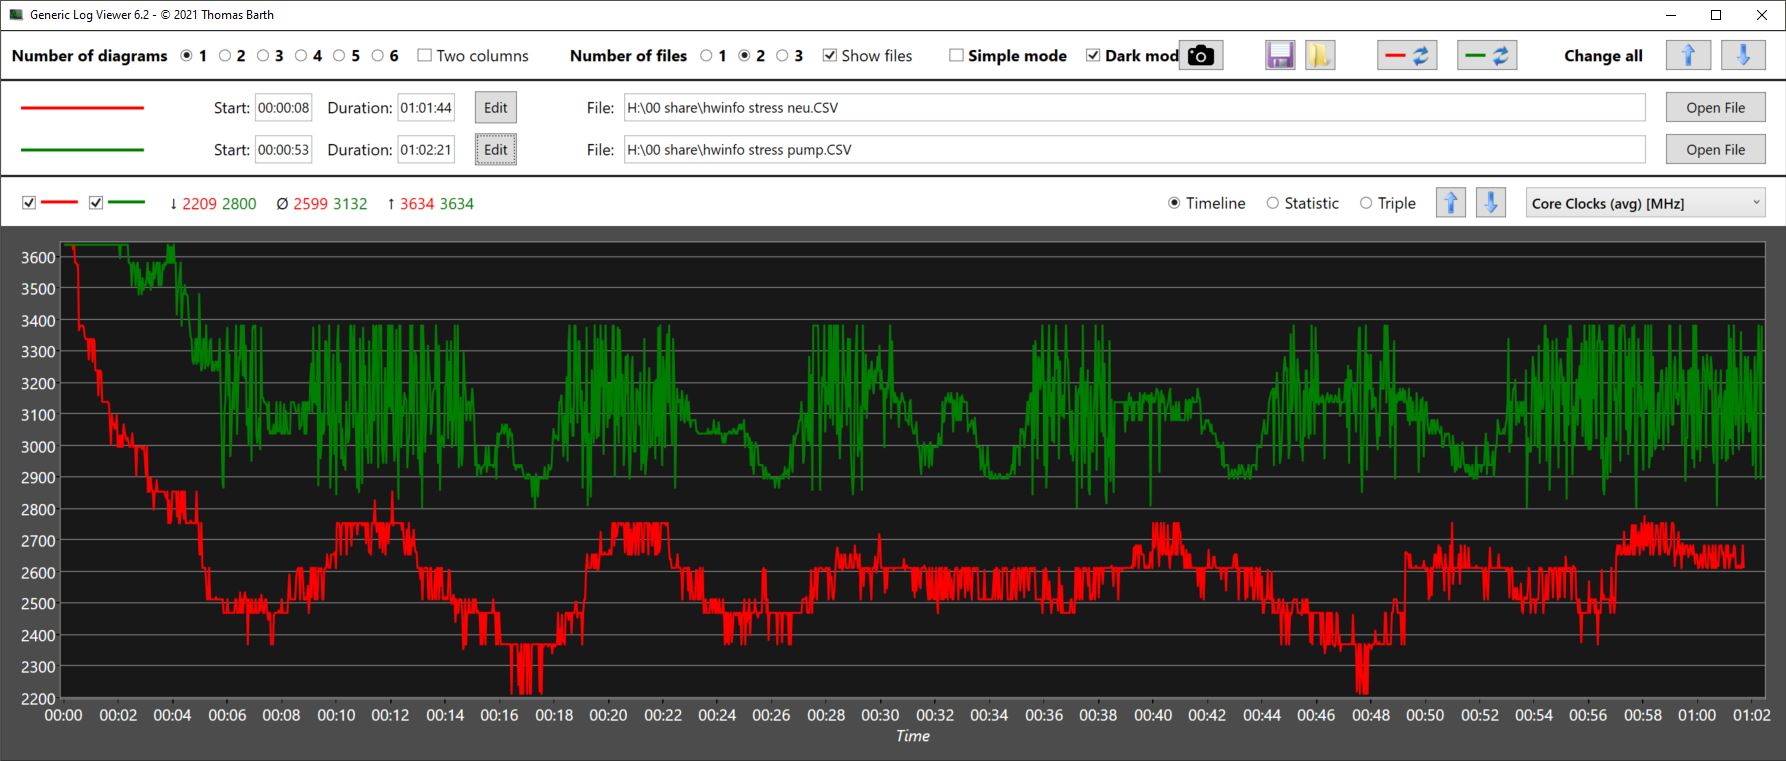
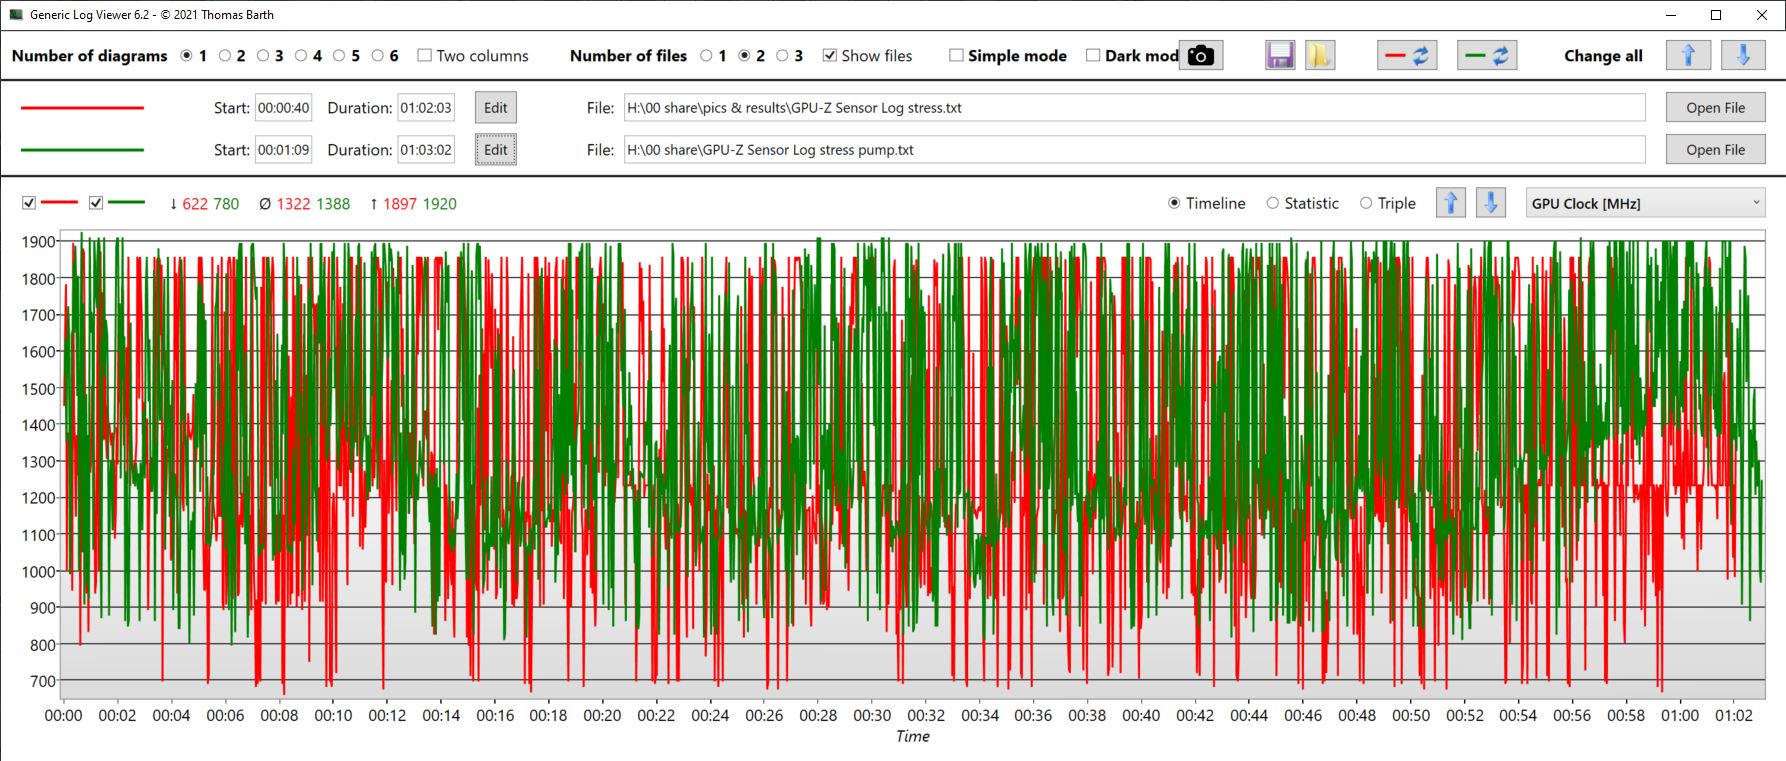
O relógio da GPU parece ser mais ou menos o mesmo, mas o relógio de memória aparentemente cai mais vezes sem Oásis. Ao mesmo tempo, o Oasis proporciona em média 20 °C de temperaturas mais baixas de GPU!
Um novo 3DMark 11 funciona diretamente após o estresse produziu a mesma pontuação que uma corrida sem estresse prévio.
| Resfriamento do ar/Oásis | |||
| Relógio de CPU (GHz) | Relógio GPU (MHz) | Temperatura média da CPU (°C) | Temperatura média da GPU (°C) |
| Prime95 + FurMark Stress | 2.6/3.1 | 1.3 | 88/80 |
| Witcher 3 Stress | 2.5/2.6 | 1.5/1.6 | 71/60 |
Alto-falante
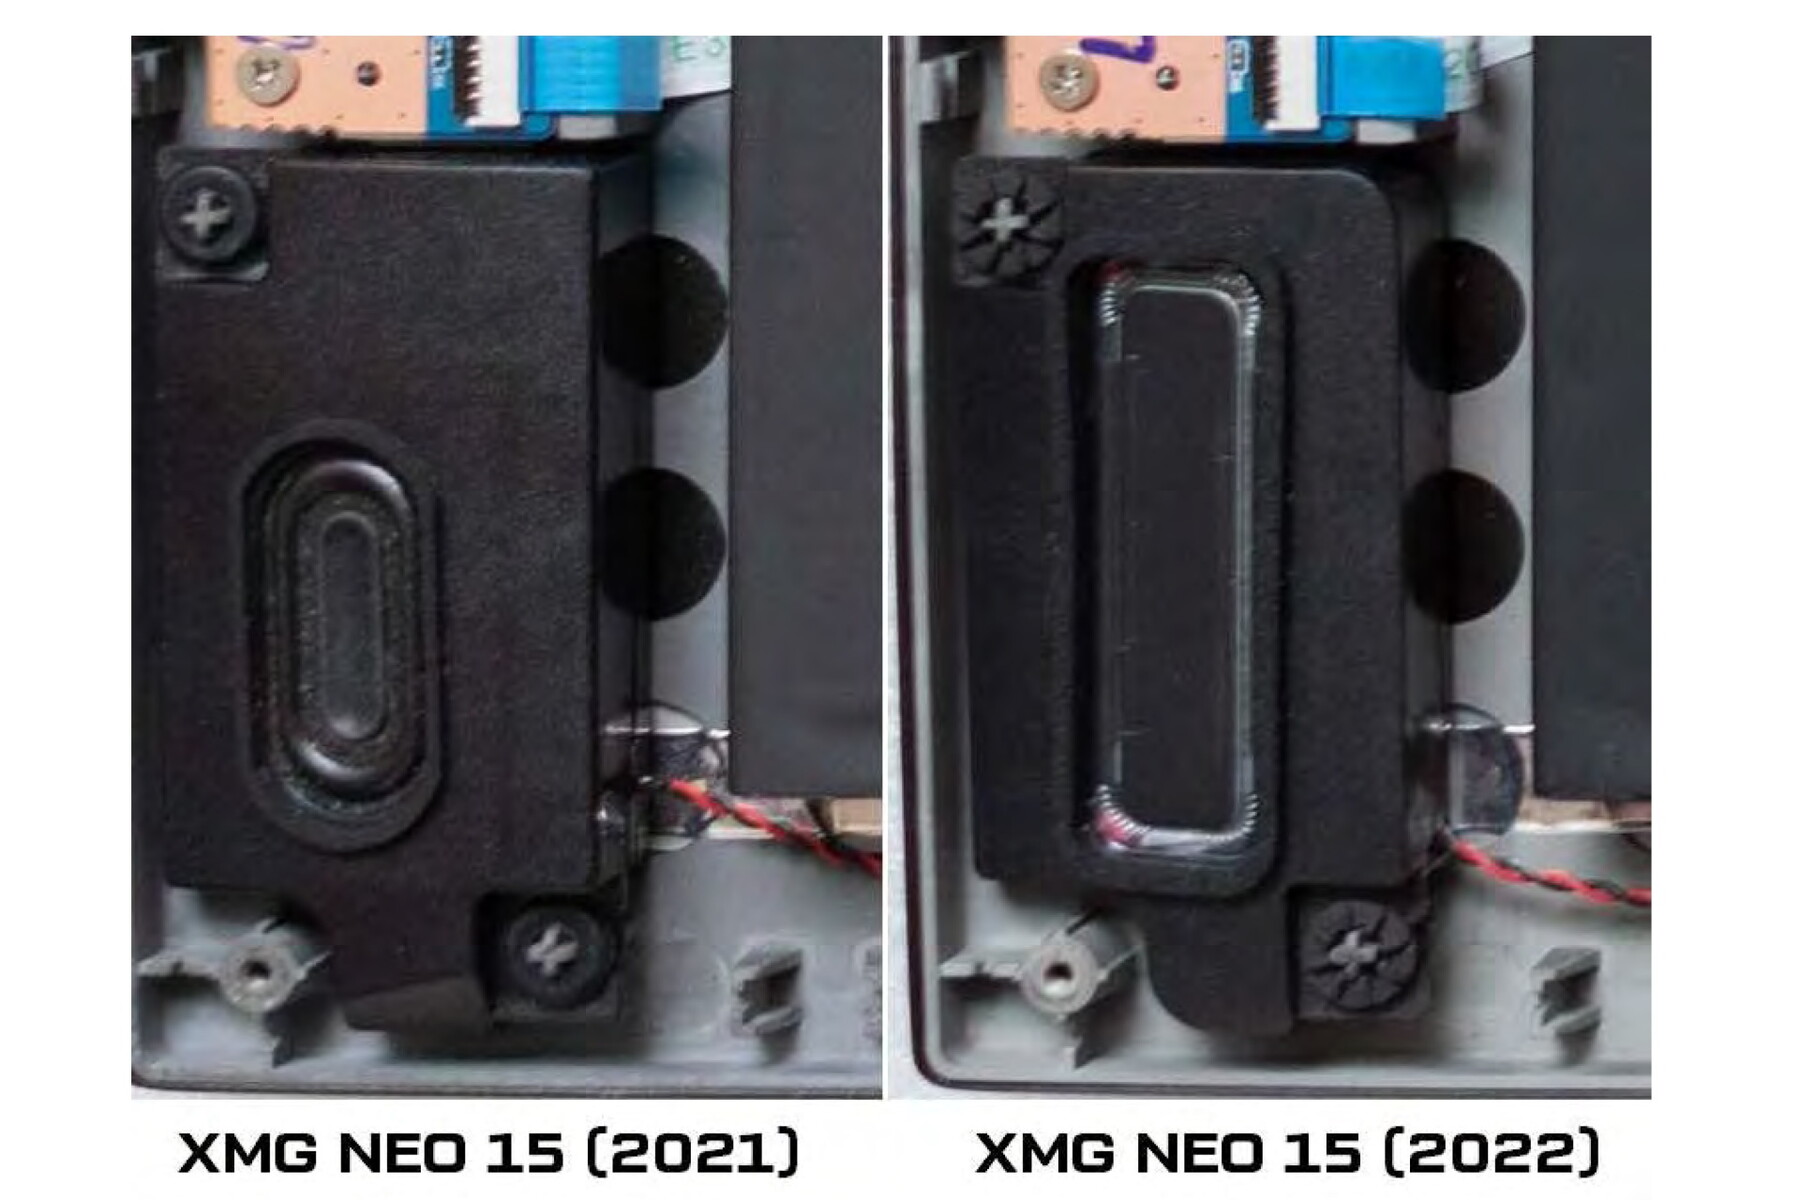
Schenker ampliou os alto-falantes do novo Neo. Eles agora são minimamente mais altos e oferecem minimamente mais graves, mas ainda é claramente muito baixo.
Um microfone/line-in e uma porta para fones de ouvido estão disponíveis para dispositivos analógicos de terceiros.
Schenker XMG Neo 15 E22 (Early 2022, RTX 3080 Ti) análise de áudio
(±) | o volume do alto-falante é médio, mas bom (###valor### dB)
Graves 100 - 315Hz
(-) | quase nenhum baixo - em média 16.5% menor que a mediana
(±) | a linearidade dos graves é média (7.6% delta para a frequência anterior)
Médios 400 - 2.000 Hz
(±) | médios mais altos - em média 6.7% maior que a mediana
(±) | a linearidade dos médios é média (7.5% delta para frequência anterior)
Altos 2 - 16 kHz
(+) | agudos equilibrados - apenas 2.8% longe da mediana
(+) | os máximos são lineares (5.2% delta da frequência anterior)
Geral 100 - 16.000 Hz
(±) | a linearidade do som geral é média (17% diferença em relação à mediana)
Comparado com a mesma classe
» 45% de todos os dispositivos testados nesta classe foram melhores, 12% semelhantes, 43% piores
» O melhor teve um delta de 6%, a média foi 18%, o pior foi 132%
Comparado com todos os dispositivos testados
» 31% de todos os dispositivos testados foram melhores, 8% semelhantes, 61% piores
» O melhor teve um delta de 4%, a média foi 23%, o pior foi 134%
Schenker XMG Neo 15 Tiger Lake análise de áudio
(±) | o volume do alto-falante é médio, mas bom (###valor### dB)
Graves 100 - 315Hz
(-) | quase nenhum baixo - em média 22.6% menor que a mediana
(±) | a linearidade dos graves é média (9.5% delta para a frequência anterior)
Médios 400 - 2.000 Hz
(+) | médios equilibrados - apenas 4.7% longe da mediana
(±) | a linearidade dos médios é média (9.1% delta para frequência anterior)
Altos 2 - 16 kHz
(+) | agudos equilibrados - apenas 4.1% longe da mediana
(+) | os máximos são lineares (5.3% delta da frequência anterior)
Geral 100 - 16.000 Hz
(±) | a linearidade do som geral é média (19.4% diferença em relação à mediana)
Comparado com a mesma classe
» 67% de todos os dispositivos testados nesta classe foram melhores, 7% semelhantes, 26% piores
» O melhor teve um delta de 6%, a média foi 18%, o pior foi 132%
Comparado com todos os dispositivos testados
» 48% de todos os dispositivos testados foram melhores, 7% semelhantes, 45% piores
» O melhor teve um delta de 4%, a média foi 23%, o pior foi 134%
Gestão de energia: Alto consumo, bom desempenho da bateria
Consumo de energia
O RTX 3080 Ti naturalmente coloca certas exigências sobre o fornecimento de energia. O sistema extrai uma média de 228 W da tomada no The Witcher 3,
que aumenta em cerca de 10 W com o XMG Oasis. Entretanto, o consumo também pode disparar até 280 W, especialmente no início.Ainda mais energia é consumida durante o teste de estresse. Medimos uma média de 242 W e picos de carga de até 330 W, além de um consumo flutuante que sempre salta para cerca de 280 W a longo prazo. Em geral, o consumo de energia é tão alto quanto o desempenho.
A fonte de alimentação grande, de conexão curta (~18 x 8,5 x 3,4 cm) é projetada para 280 W de potência de saída e deve realmente ser capaz de acomodar os valores medidos no início, mas uma carga confiável em todas as situações pode não ser uma possibilidade. Existem planos para uma fonte de alimentação de 330 W.
| Ocioso | |
| Carga |
|
Key:
min: | |
| Schenker XMG Neo 15 E22 (Early 2022, RTX 3080 Ti) i7-12700H, GeForce RTX 3080 Ti Laptop GPU, Samsung SSD 980 Pro 250GB MZ-V8P250BW, IPS, 2560x1440, 15.6" | Schenker XMG Neo 15 Tiger Lake i7-11800H, GeForce RTX 3080 Laptop GPU, Samsung SSD 980 Pro 1TB MZ-V8P1T0BW, IPS, 2560x1440, 15.6" | Razer Blade 15 Advanced (Mid 2021) i7-11800H, GeForce RTX 3080 Laptop GPU, SSSTC CA6-8D1024, IPS, 1920x1080, 15.6" | Asus ROG Strix Scar 15 G533QS R9 5900HX, GeForce RTX 3080 Laptop GPU, ADATA Swordfish 2 TB, IPS, 2560x1440, 15.6" | Alienware m15 R6, i7-11800H RTX 3080 i7-11800H, GeForce RTX 3080 Laptop GPU, Samsung PM9A1 MZVL21T0HCLR, IPS, 1920x1080, 15.6" | MSI GE76 Raider i9-12900HK, GeForce RTX 3080 Ti Laptop GPU, Samsung PM9A1 MZVL22T0HBLB, IPS-Level, 1920x1080, 17.3" | Média NVIDIA GeForce RTX 3080 Ti Laptop GPU | Média da turma Gaming | |
|---|---|---|---|---|---|---|---|---|
| Power Consumption | 6% | -19% | 5% | 3% | -5% | -22% | -2% | |
| Idle Minimum * (Watt) | 14 | 15 -7% | 19.5 -39% | 11.2 20% | 14 -0% | 12 14% | 17.2 ? -23% | 13 ? 7% |
| Idle Average * (Watt) | 18 | 17 6% | 23.3 -29% | 16.4 9% | 18 -0% | 17 6% | 23.3 ? -29% | 19 ? -6% |
| Idle Maximum * (Watt) | 19 | 22 -16% | 40.1 -111% | 29.4 -55% | 29 -53% | 28 -47% | 30.8 ? -62% | 24.6 ? -29% |
| Load Average * (Watt) | 115 | 101 12% | 98.9 14% | 106.2 8% | 93 19% | 118 -3% | 121.2 ? -5% | 110.7 ? 4% |
| Witcher 3 ultra * (Watt) | 228 | 195 14% | 174 24% | 189 17% | 190 17% | 252 -11% | ||
| Load Maximum * (Watt) | 307 | 230 25% | 214 30% | 213.6 30% | 203 34% | 272 11% | 276 ? 10% | 259 ? 16% |
* ... menor é melhor
Power consumption - The Witcher 3 / Stress test
Power consumption with external monitor
Duração da bateria
A bateria de 93-Wh faz bem. Aparentemente, algumas melhorias nos mecanismos de economia de energia podem ser feitas através dos perfis de desempenho oferecidos. O predecessor dura menos com uma bateria do mesmo tamanho. Medimos cerca de 6 a 7 horas em nosso teste de Wi-Fi e vídeo.
| Schenker XMG Neo 15 E22 (Early 2022, RTX 3080 Ti) i7-12700H, GeForce RTX 3080 Ti Laptop GPU, 93 Wh | Schenker XMG Neo 15 Tiger Lake i7-11800H, GeForce RTX 3080 Laptop GPU, 93 Wh | Razer Blade 15 Advanced (Mid 2021) i7-11800H, GeForce RTX 3080 Laptop GPU, 80 Wh | Asus ROG Strix Scar 15 G533QS R9 5900HX, GeForce RTX 3080 Laptop GPU, 90 Wh | Alienware m15 R6, i7-11800H RTX 3080 i7-11800H, GeForce RTX 3080 Laptop GPU, 84 Wh | MSI GE76 Raider i9-12900HK, GeForce RTX 3080 Ti Laptop GPU, 99.99 Wh | Média da turma Gaming | |
|---|---|---|---|---|---|---|---|
| Duração da bateria | -20% | -12% | -27% | -34% | -24% | -11% | |
| H.264 (h) | 6.9 | 5.9 -14% | 5.6 -19% | 8.32 ? 21% | |||
| WiFi v1.3 (h) | 6.7 | 5.6 -16% | 5.9 -12% | 7.3 9% | 5 -25% | 5.1 -24% | 7.11 ? 6% |
| Load (h) | 3.8 | 2.7 -29% | 1.4 -63% | 1.6 -58% | 1.502 ? -60% | ||
| Reader / Idle (h) | 11.1 | 8.27 ? |
Veredicto: Valor agregado real através do Oásis
O XMG Neo 15 é um ótimo laptop para jogos com um ponto de venda de valor agregado único - o porto de água. O estrangulamento térmico não interfere excessivamente mesmo quando resfriado a ar, o que resulta não apenas em um desempenho de jogo muito alto, mas também em temperaturas de superfície muito altas.
Com o sistema de resfriamento externo de água de 200 euros, o XMG Oasis, as temperaturas caem visivelmente. Conseqüentemente, o ruído também diminui e o desempenho também pode ser maior dependendo da aplicação, desde que a estrangulamento térmico seja evitado devido à queda de temperatura. Em geral, a paisagem sonora do Oasis ainda poderia ser otimizada, talvez na bomba ou no arrebatamento que ocorre apesar da ventilação. Dito isto, de modo geral, as vantagens nos convenceram. A combinação pode definitivamente compensar os jogadores com altas exigências de desempenho e também em termos da longevidade do sistema.
Detalhes, como a exibição, terão primeiro que ser esclarecidos em nosso teste de um modelo de produção. Mas o modelo de pré-produção já faz muitas coisas certas.
O XMG Neo 15 tem um desempenho extremamente alto e tem um verdadeiro ponto de venda de valor agregado único na forma do XMG Oasis, que, no entanto, custa mais 199 Euros. Sem refrigeração por água, o modelo de pré-produção fica muito quente.
Preço e disponibilidade
O modelo de pré-produção ainda não está disponível no momento. Entretanto, já pode ser pré-encomendado em bestwarecom entrega prevista para começar no início de abril. Nossa configuração de teste, mas com um SSD de 512 GB em vez de 250 GB, custa ali 3.427,00 euros.
Price comparison
