Razer Blade 15 Advanced Model Early 2022 review - Laptop compacto para jogos com visor rápido
Embalado com os últimos chips Intel e Nvidia, o modelo de mola Razer Blade 15 2022 promete melhorias iterativas para a popular linha de laptops para jogos de 15 polegadas. A principal diferença entre o modelo analisado aqui e o lâmina 15 2022, anteriormente revista é o painel 1080p 360 Hz, de modo que os leitores podem se ater a esta revisão para obter detalhes sobre as especificações físicas em grande parte idênticas. Os concorrentes diretos da Blade 15 incluem outros laptops de 15,6 polegadas de alto desempenho, tais como o Schenker XMG Neo 15 E22o Asus ROG Strix Scar 15o MSI Stealth GS66 12UGS e o MSI Vetor GP66 12UGS.
Outras revisões da Razer:
Possíveis concorrentes em comparação
Avaliação | Data | Modelo | Peso | Altura | Size | Resolução | Preço |
|---|---|---|---|---|---|---|---|
| 88.3 % v7 (old) | 05/2022 | Razer Blade 15 Advanced Model Early 2022 i7-12800H, GeForce RTX 3080 Ti Laptop GPU | 2.1 kg | 16.99 mm | 15.60" | 1920x1080 | |
| 89.1 % v7 (old) | 03/2022 | Razer Blade 15 2022 i7-12800H, GeForce RTX 3080 Ti Laptop GPU | 2.1 kg | 16.99 mm | 15.60" | 2560x1440 | |
v (old) | 03/2022 | Schenker XMG Neo 15 E22 (Early 2022, RTX 3080 Ti) i7-12700H, GeForce RTX 3080 Ti Laptop GPU | 2.2 kg | 26.6 mm | 15.60" | 2560x1440 | |
| 86.3 % v7 (old) | 07/2021 | Asus ROG Strix Scar 15 G533QS R9 5900HX, GeForce RTX 3080 Laptop GPU | 2.3 kg | 27.2 mm | 15.60" | 2560x1440 | |
| 84.5 % v7 (old) | 02/2022 | MSI Stealth GS66 12UGS i7-12700H, GeForce RTX 3070 Ti Laptop GPU | 2.2 kg | 19.8 mm | 15.60" | 2560x1440 | |
| 86.9 % v7 (old) | 03/2022 | MSI Vector GP66 12UGS i9-12900H, GeForce RTX 3070 Ti Laptop GPU | 2.3 kg | 23.4 mm | 15.60" | 1920x1080 |
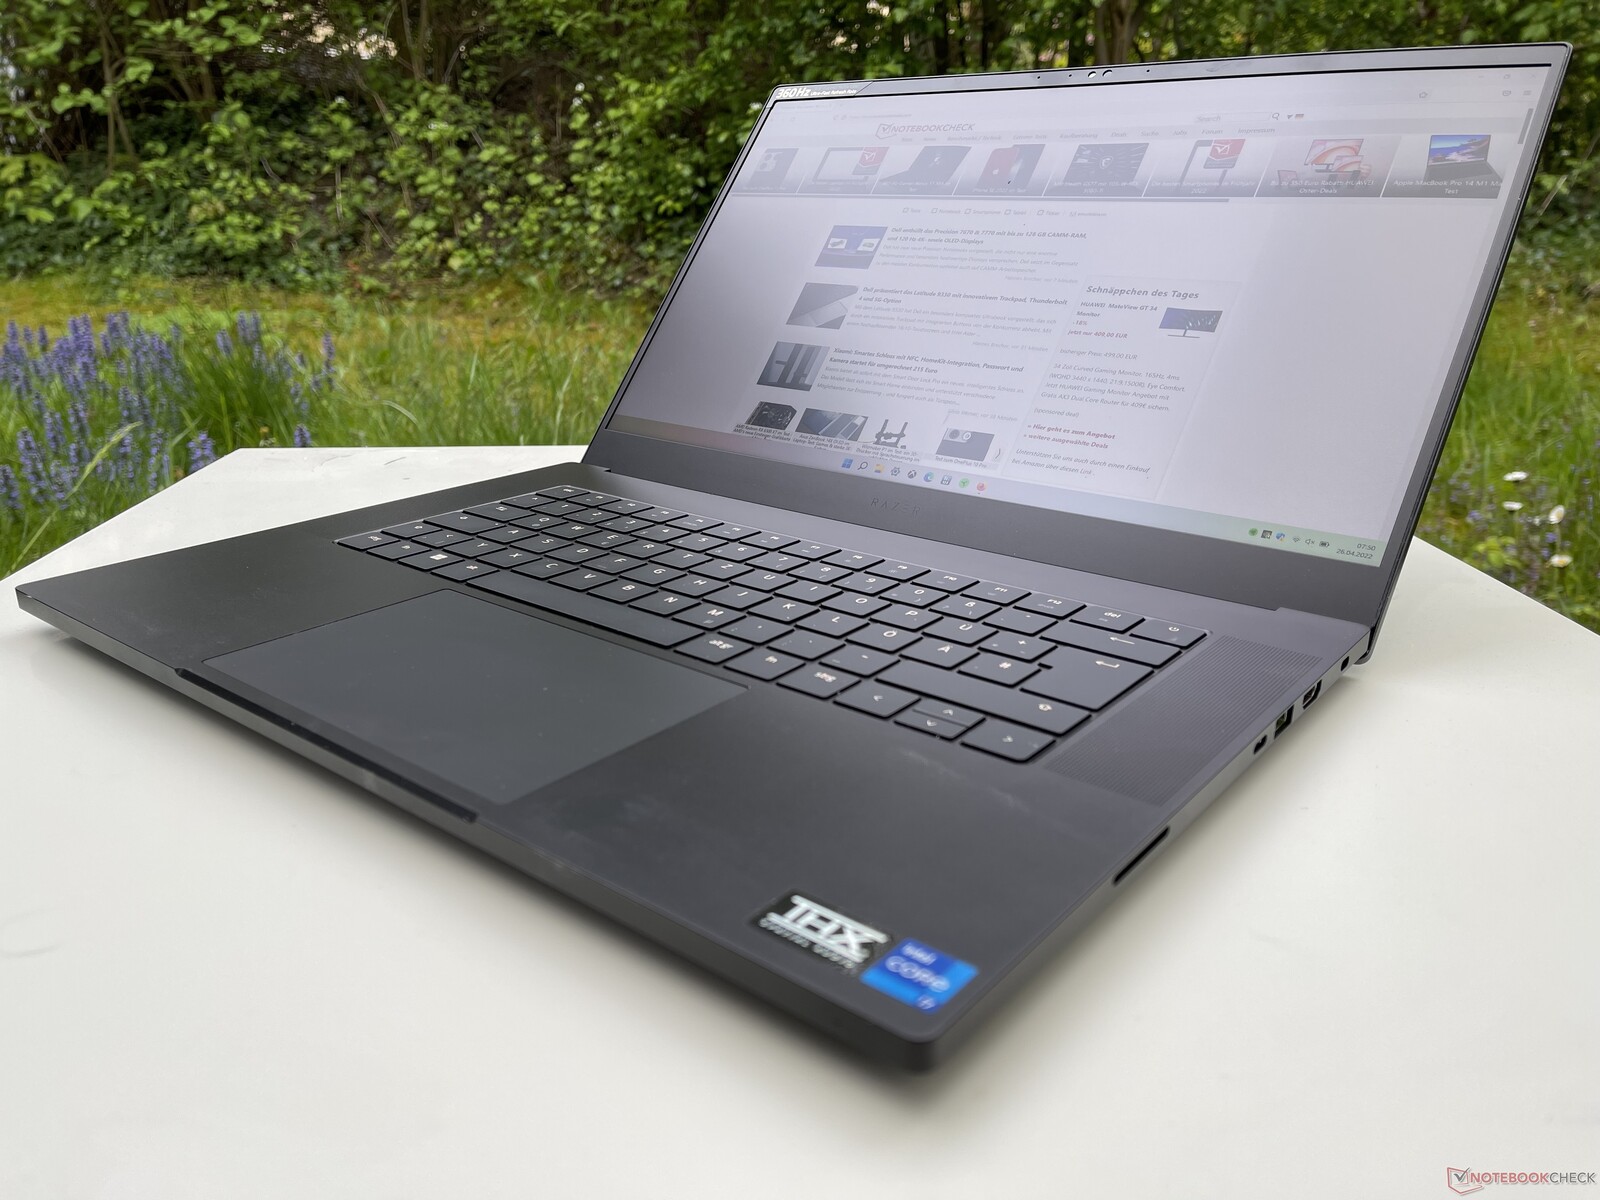
Estojo - Compacto e adequado para viagens
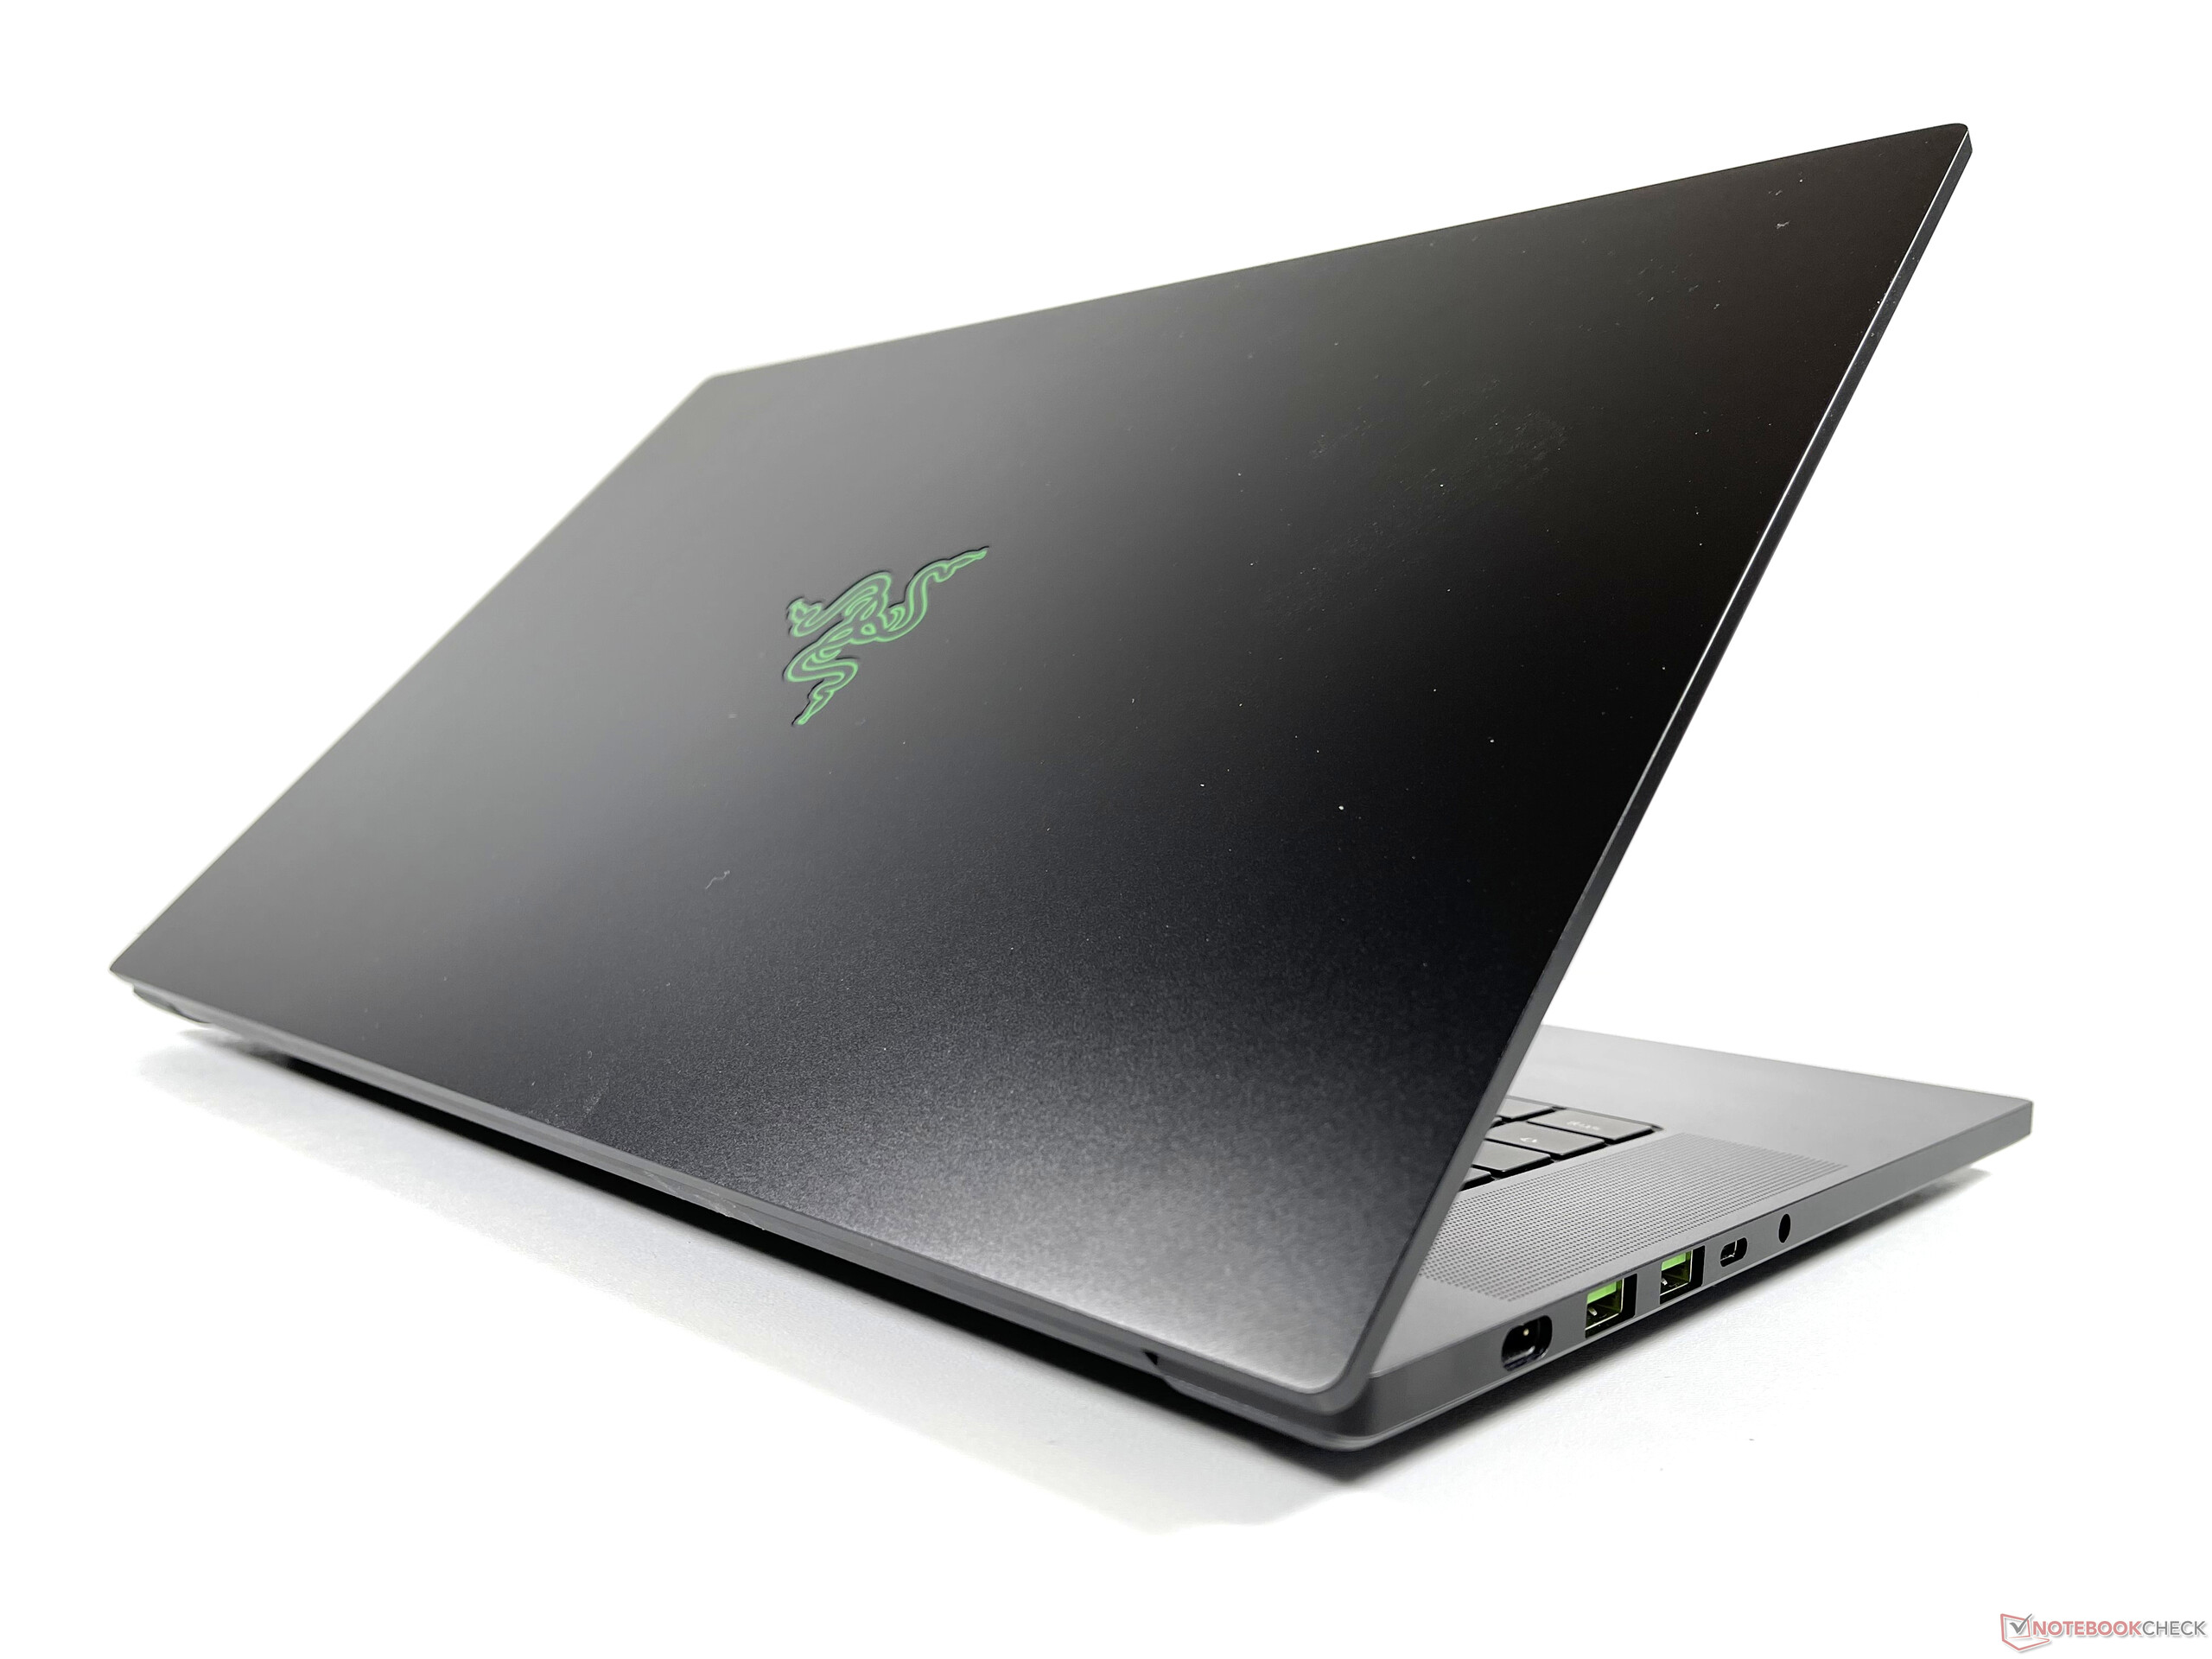
Para o caso, vemos mais uma vez a familiar e manhosa construção metálica com a qual a série Blade fez originalmente um nome para si mesma. A estabilidade, o acabamento e a resistência à torção permanecem, portanto, excelentes. A inversão é a alta suscetibilidade a impressões digitais
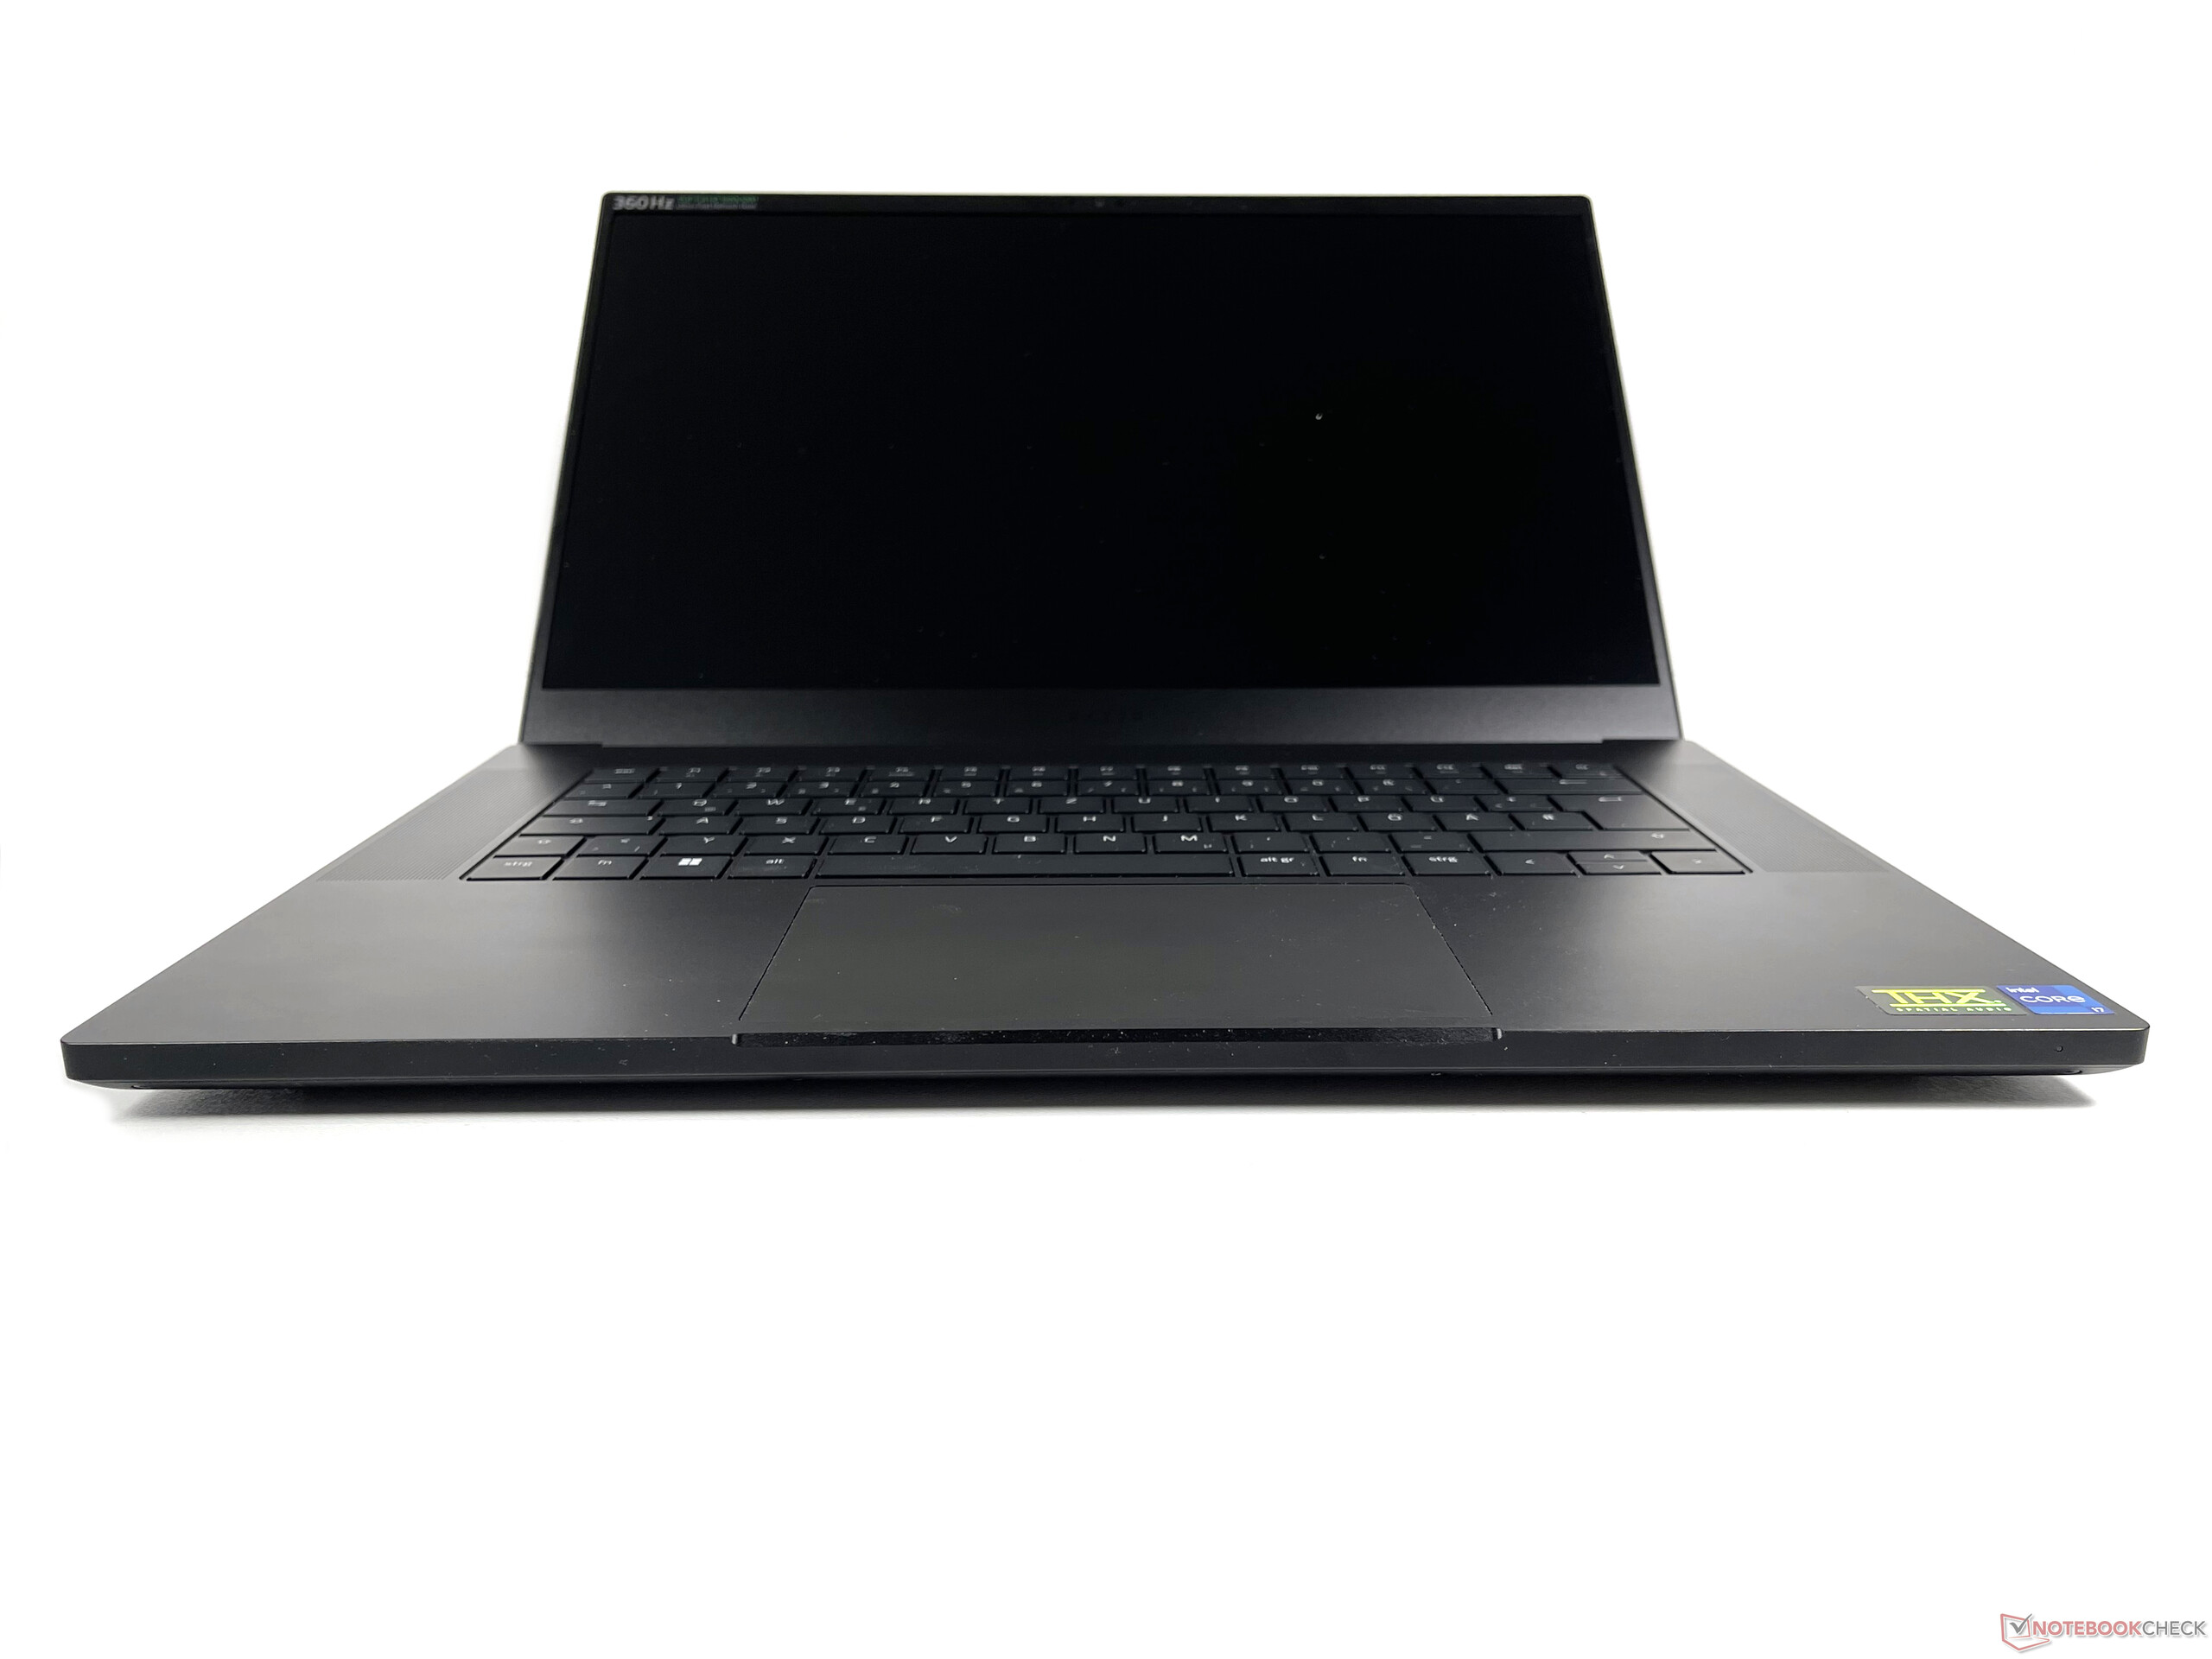
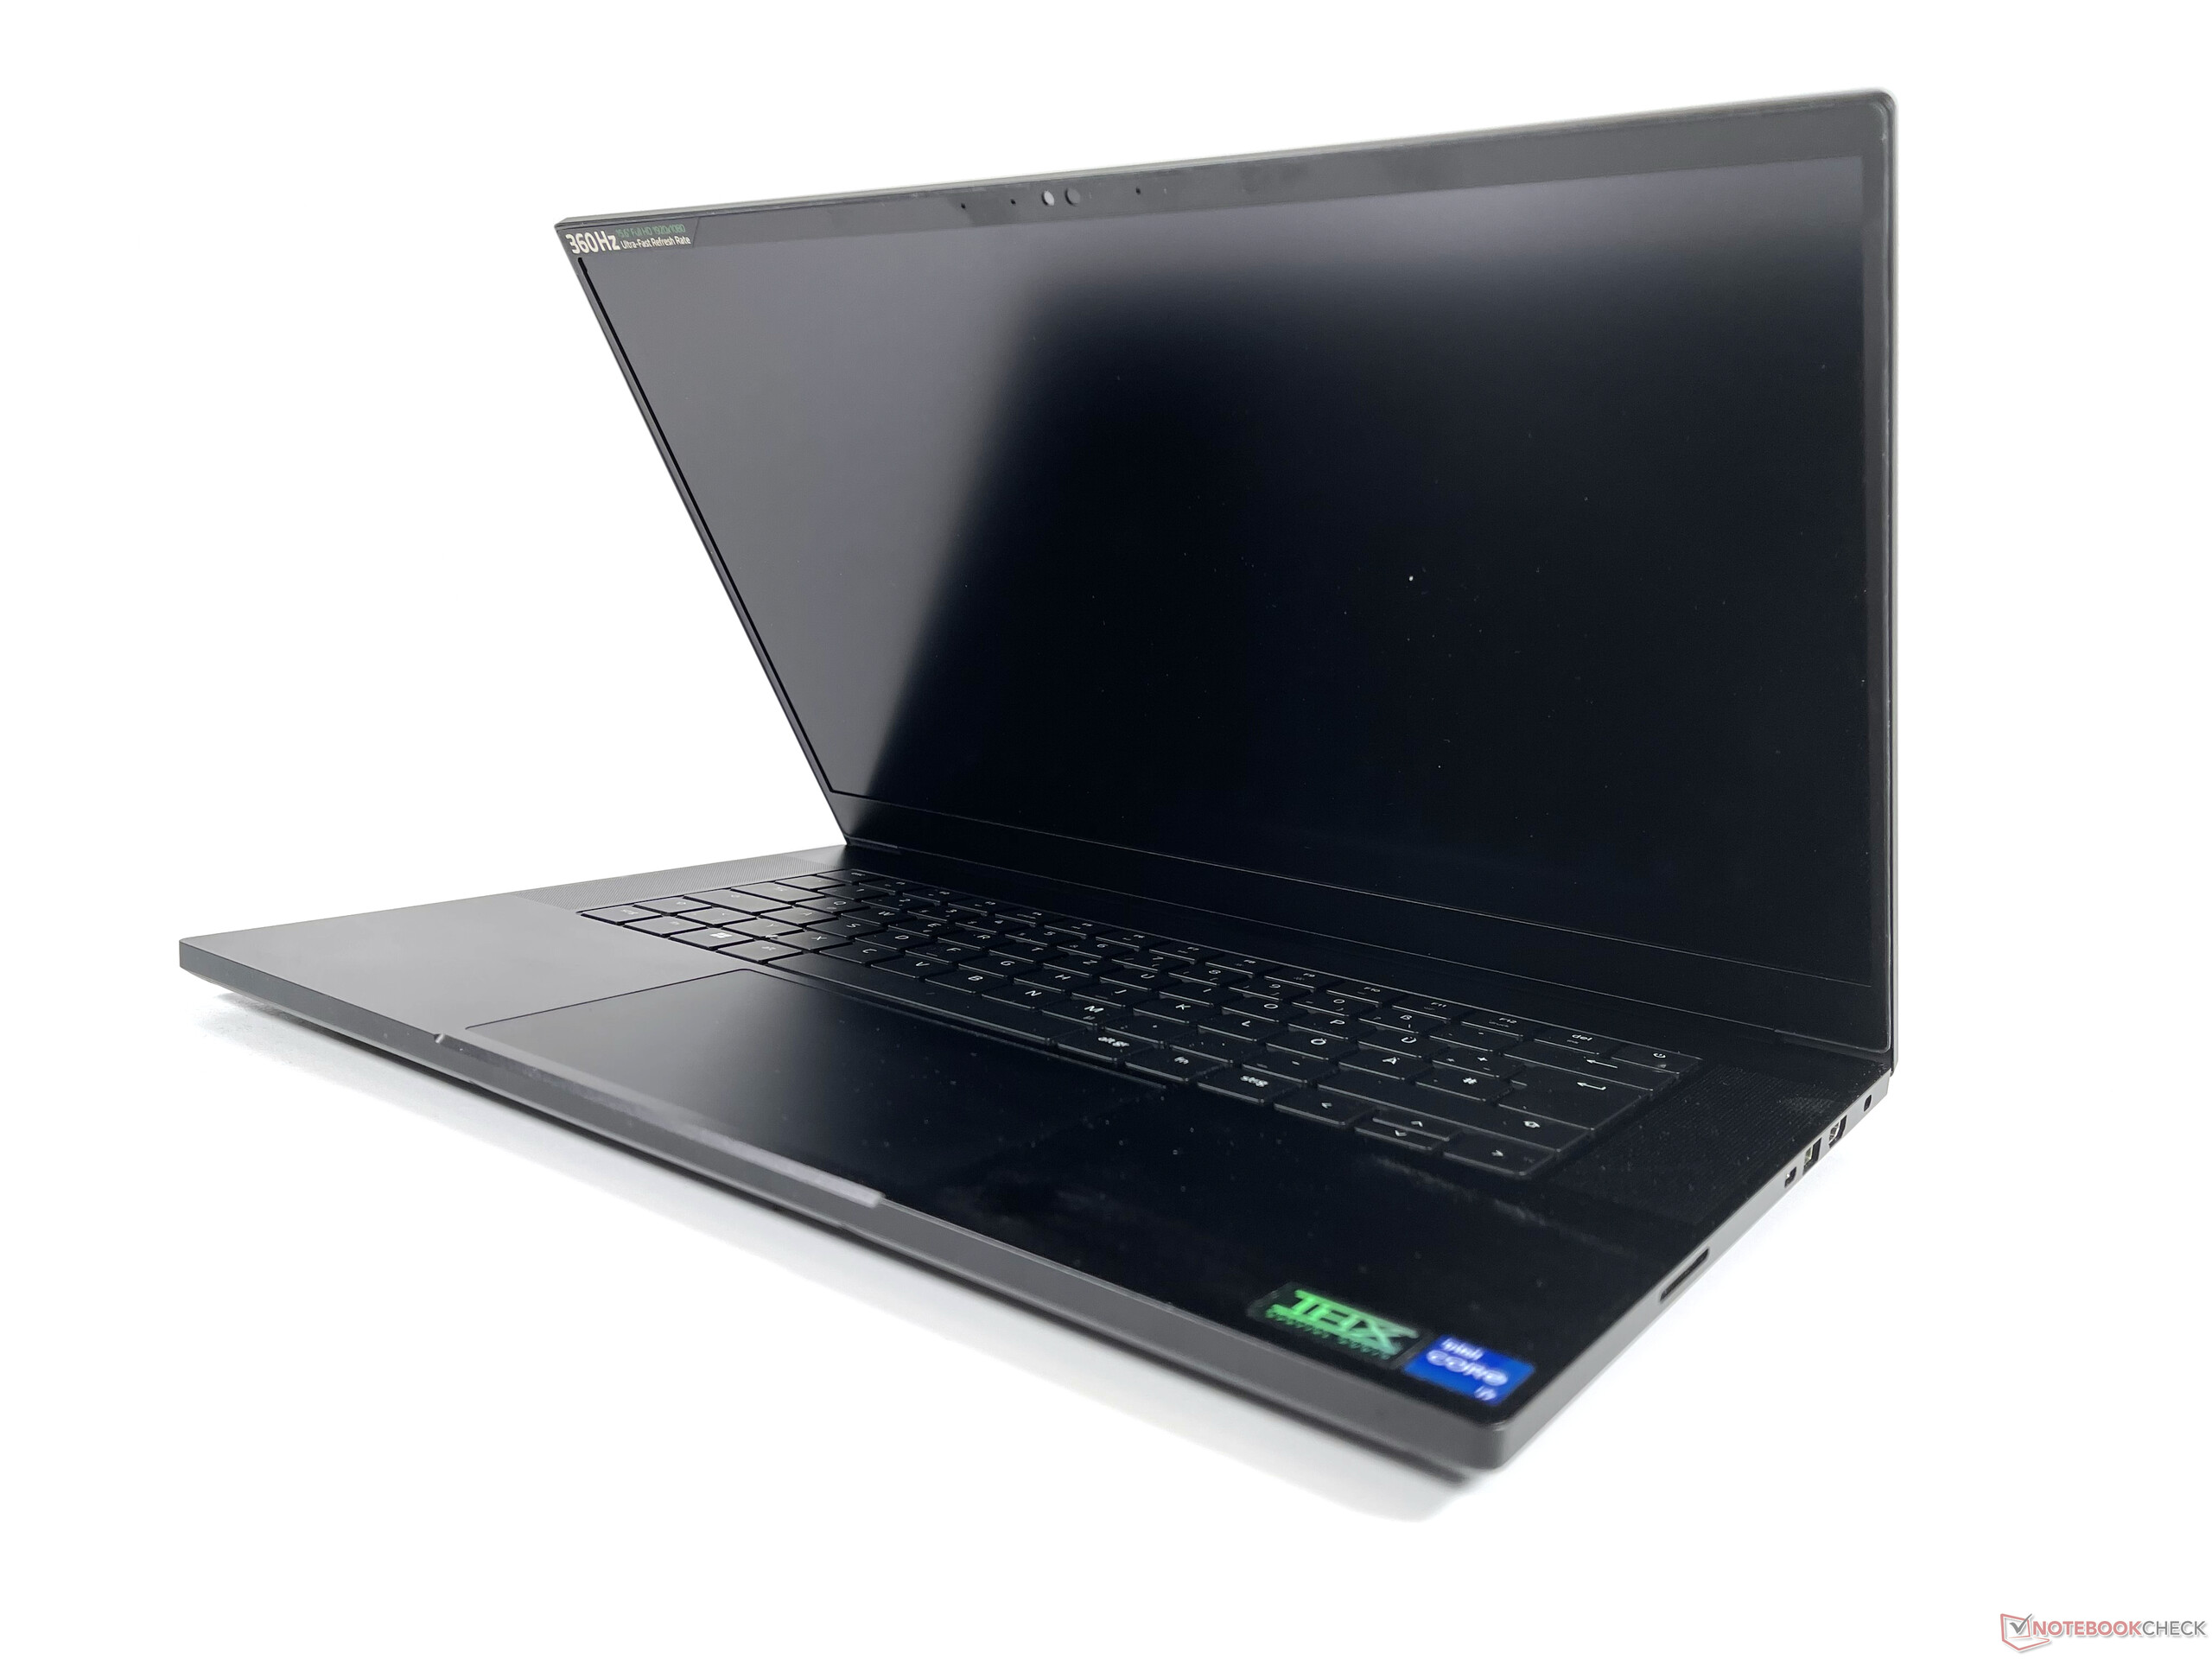
O Razer Blade 15 é um laptop muito compacto de 15,6 polegadas e é tanto menor quanto mais fino do que a maioria de seus concorrentes. Em particular, o ROG Strix Scar 15 e o XMG Neo 15 E22 são significativamente mais espessos e cerca de 100-200 g mais pesados que nosso dispositivo de revisão de 2,1 kg.
Hardware - Lâmina 15 com conectividade moderna
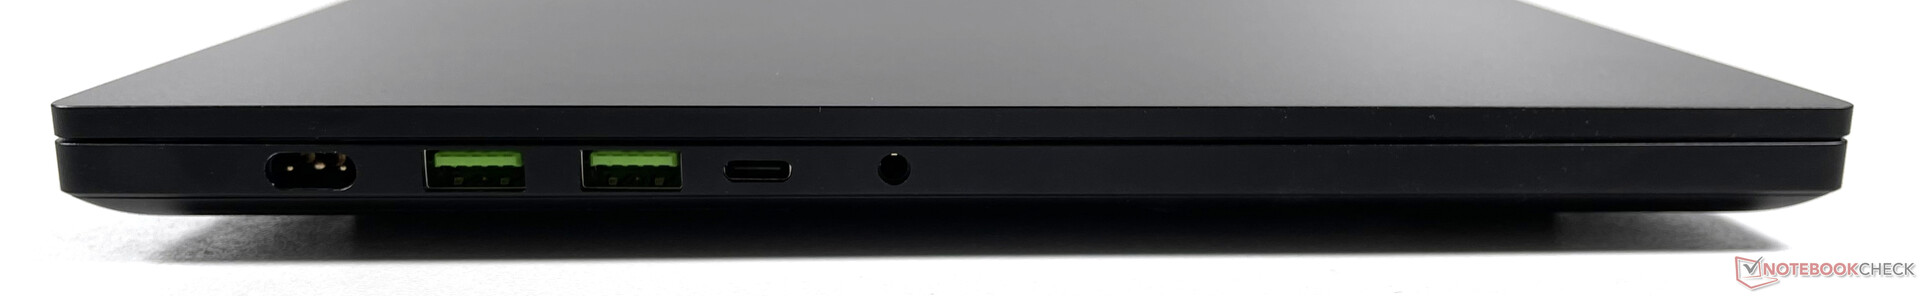
Não há grandes surpresas em termos de conectividade. Vale a pena mencionar o leitor de cartões SD completo e a porta HDMI, que suporta a versão 2.1. Ao contrário de muitos concorrentes, tais como o XMG Neo 15 E22não há aqui nenhum porto LAN dedicado. Mas isto pode ser retificado através de uma doca Thunderbolt, se necessário.
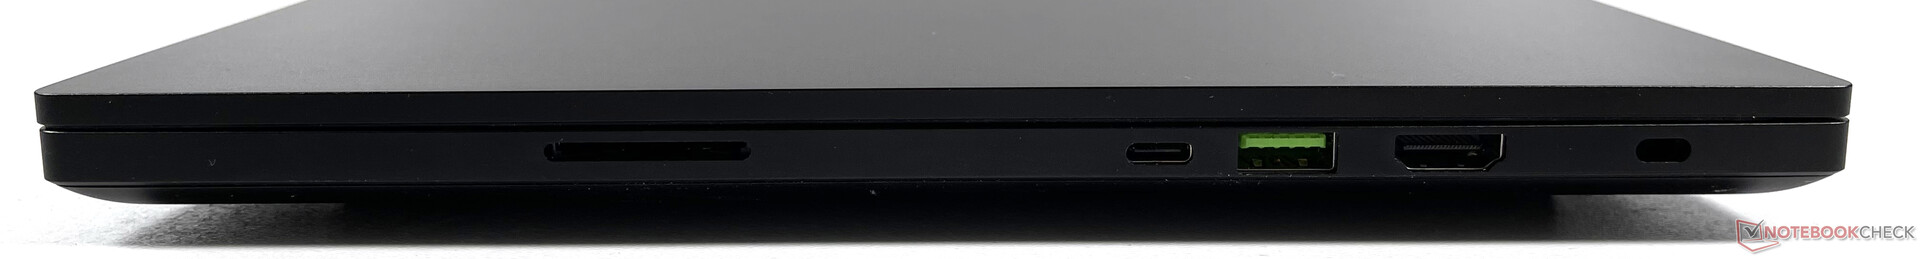
Leitor de cartões SD
O desempenho do leitor de cartões SD está em um nível elevado. No teste seqüencial de leitura AS-SSD com nosso cartão microSD AV PRO 128GB V60, ocorreu um erro em nosso dispositivo de revisão
| SD Card Reader - average JPG Copy Test (av. of 3 runs) | |
| Razer Blade 15 2022 (Toshiba Exceria Pro SDXC 64 GB UHS-II) | |
| Razer Blade 15 Advanced Model Early 2022 (AV PRO microSD 128 GB V60) | |
| Média da turma Gaming (20.9 - 210, n=54, últimos 2 anos) | |
| Schenker XMG Neo 15 E22 (Early 2022, RTX 3080 Ti) | |
Comunicação
O módulo Killer Wi-Fi 6E 1690i integrado ofereceu taxas de transferência muito rápidas quando conectado ao nosso roteador de teste Asus GT-AXE11000. O suporte a Bluetooth 5.2 também é fornecido
| Networking | |
| iperf3 transmit AXE11000 | |
| Razer Blade 15 Advanced Model Early 2022 | |
| Média da turma Gaming (560 - 1862, n=88, últimos 2 anos) | |
| iperf3 receive AXE11000 | |
| Razer Blade 15 Advanced Model Early 2022 | |
| MSI Stealth GS66 12UGS | |
| Média da turma Gaming (680 - 1745, n=88, últimos 2 anos) | |
Webcam


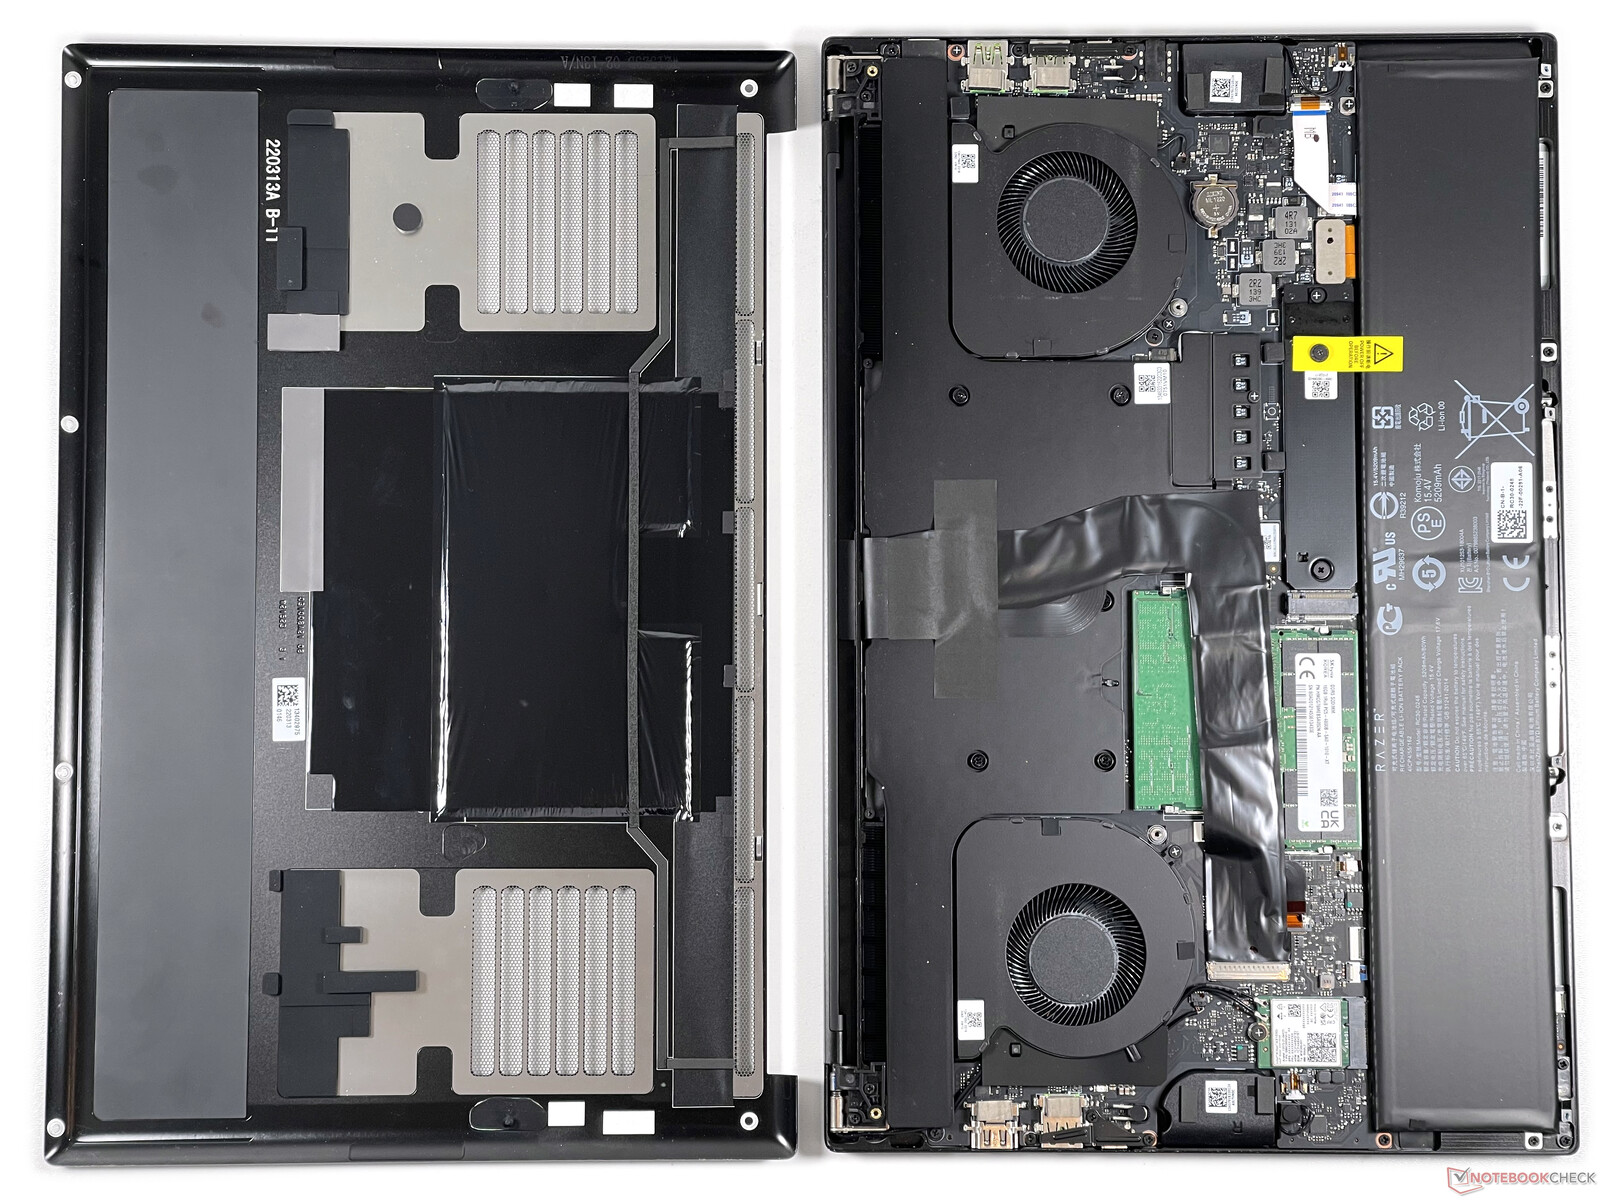
Manutenção
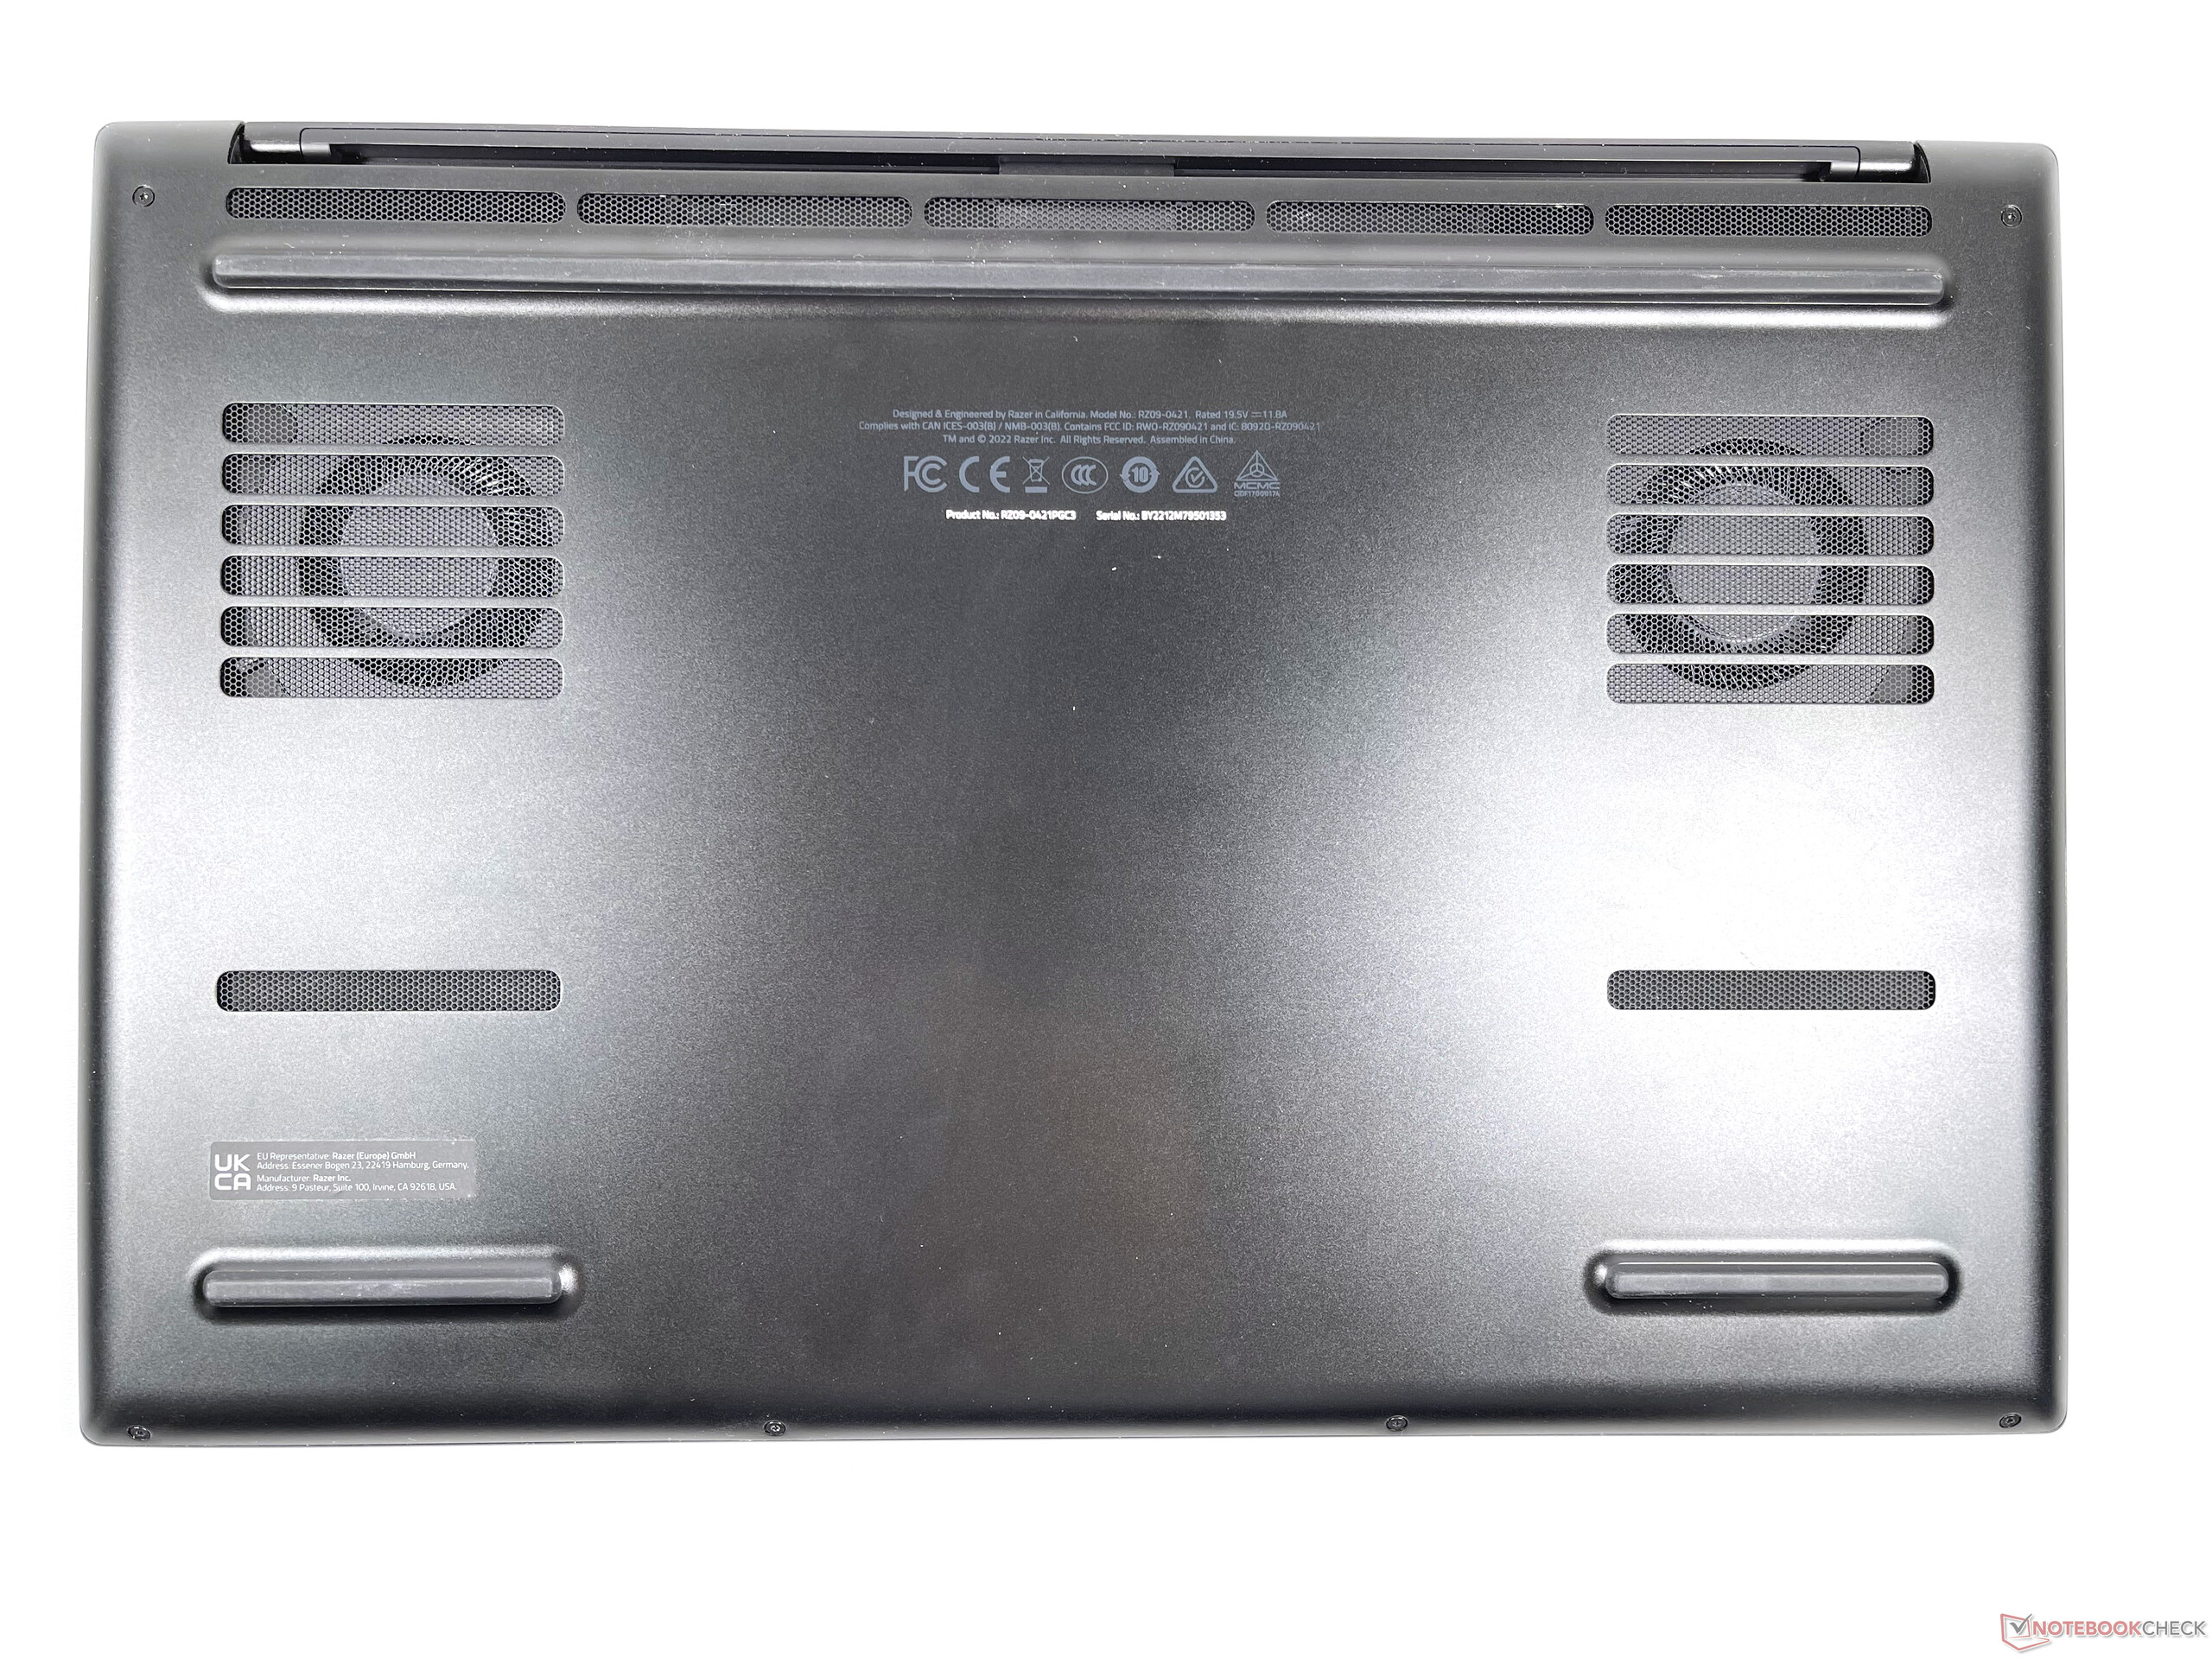
Após remover seis parafusos Torx (T5), tem-se acesso aos dois módulos RAM, a bateria, o módulo WLAN e (após remover uma tampa adicional) o M.2 SSD
Dispositivos de entrada - Clickpad grande e teclado arrumado
Teclado
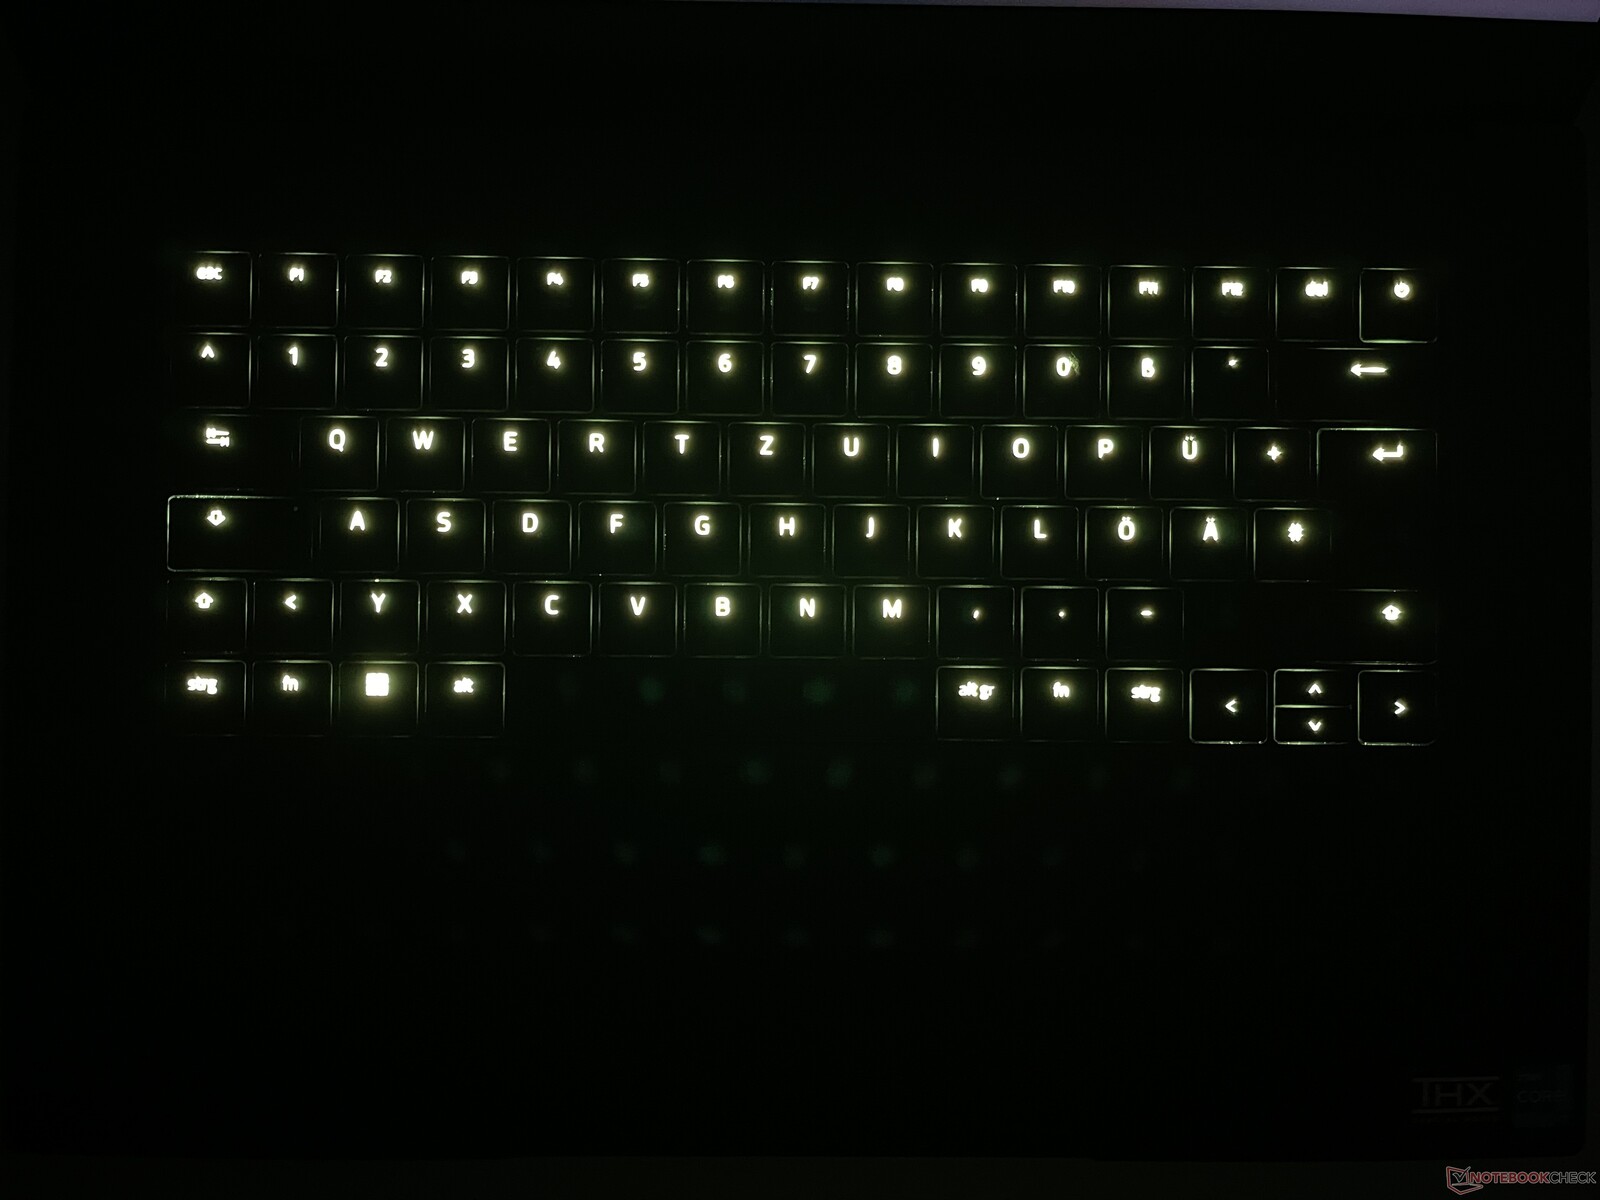
O teclado possui iluminação de teclas RGB com 16 níveis de brilho (incluindo "off") e setas de meia altura para cima e para baixo, o que permite que a Razer coloque todo o teclado em uma área retangular centrada entre as aberturas do alto-falante. As teclas oferecem um deslocamento plano da tecla e sons de digitação silenciosos e abafados. A resistência das teclas é moderada e o centro do teclado dificilmente cede quando se digita.
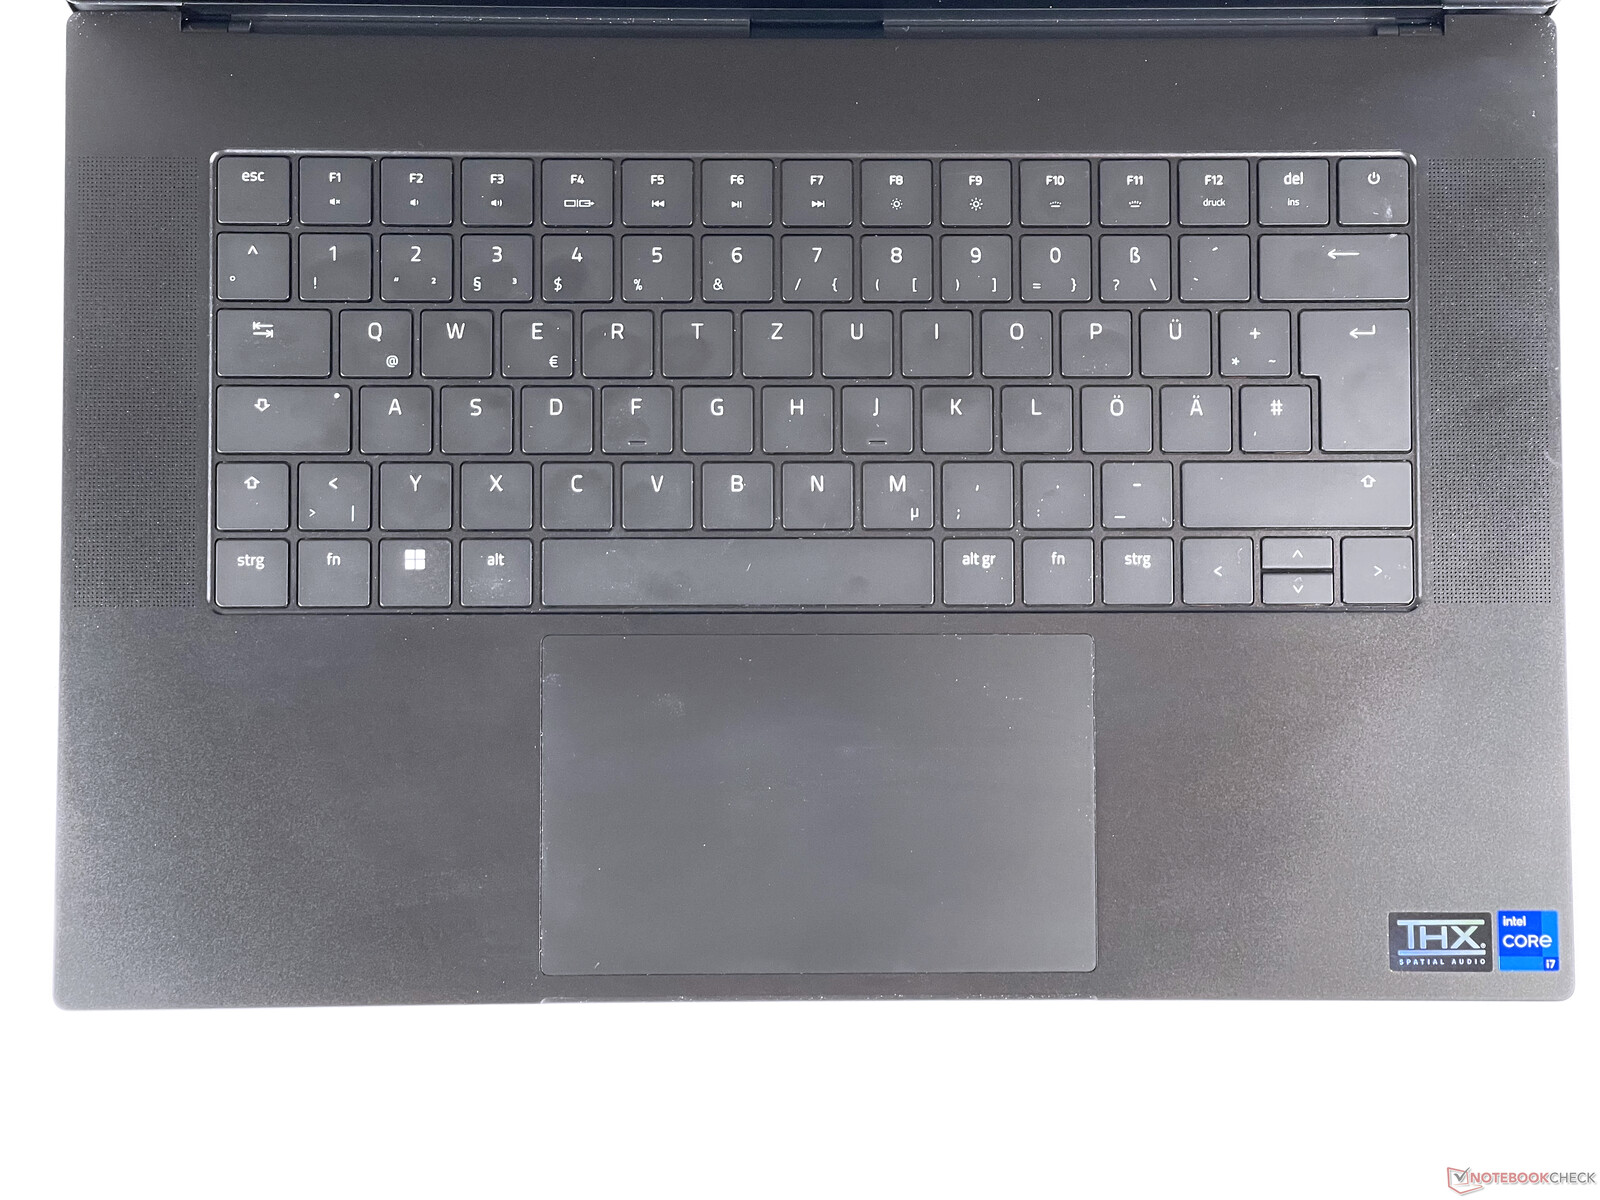
Touchpad
O touchpad compreende uma área de cerca de 13x8 cm e permite um excelente deslizamento dos dedos. Os cliques são caracterizados por uma curta viagem com teclas e um claro feedback táctil
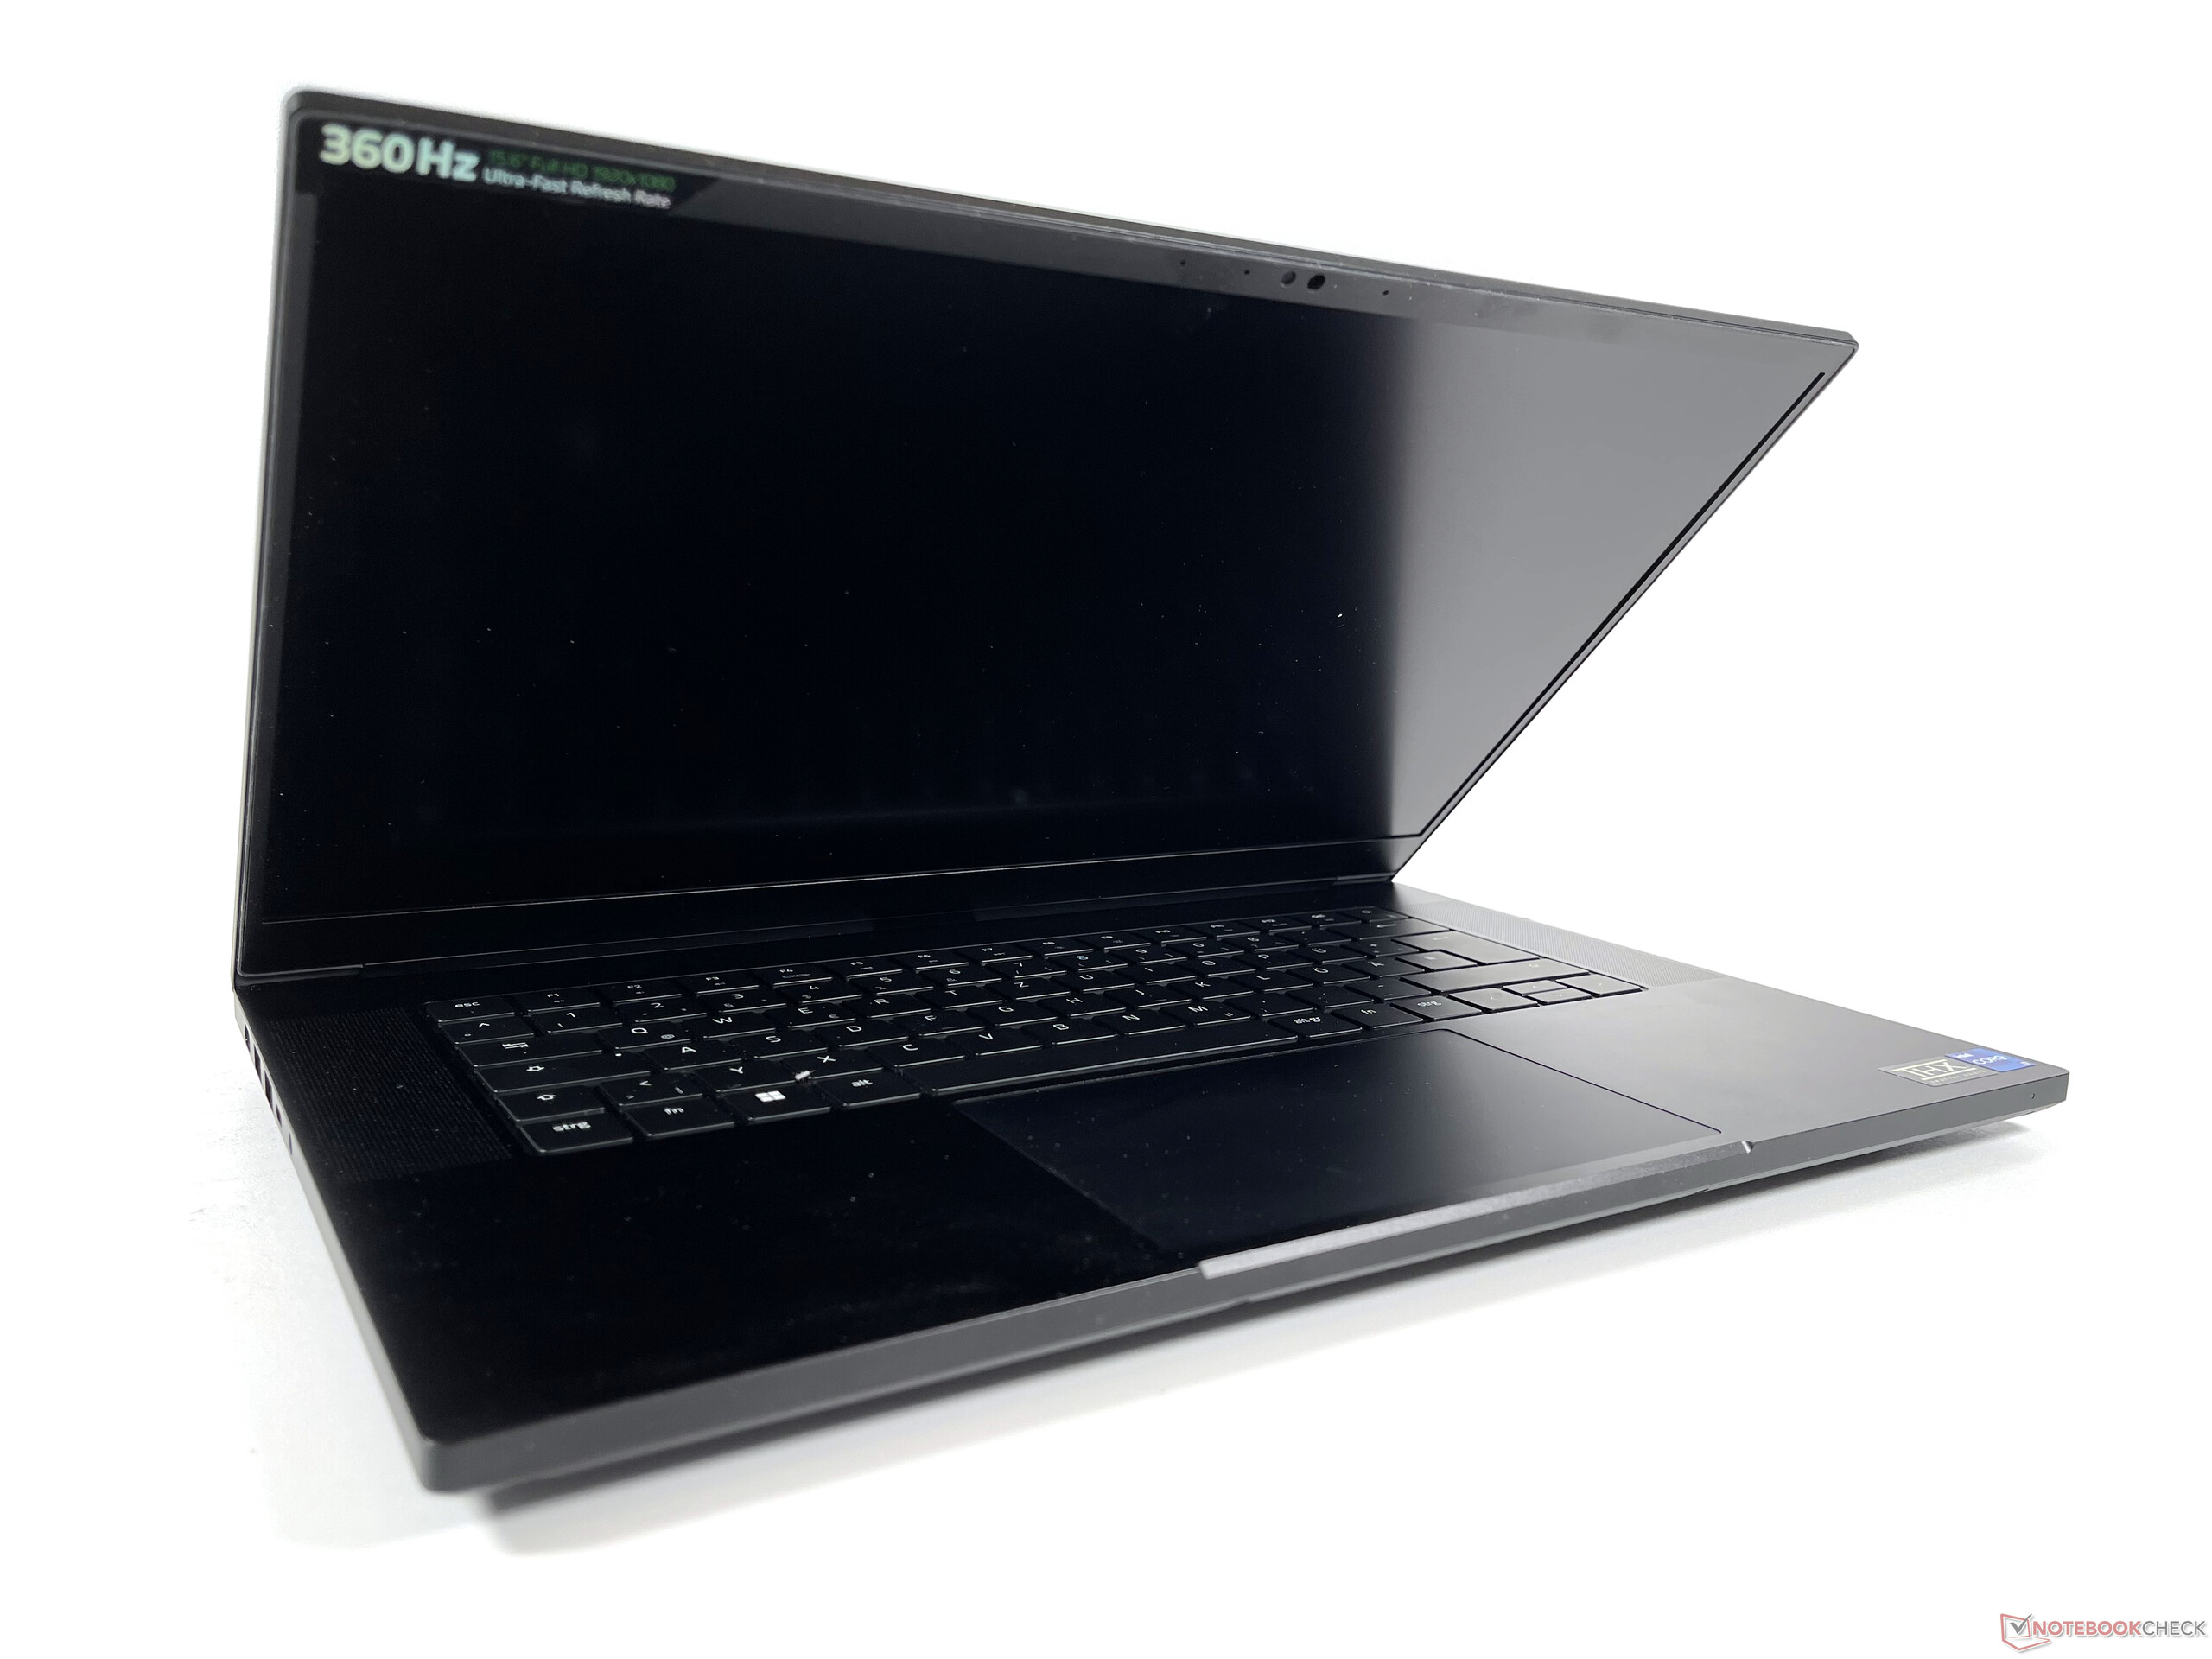
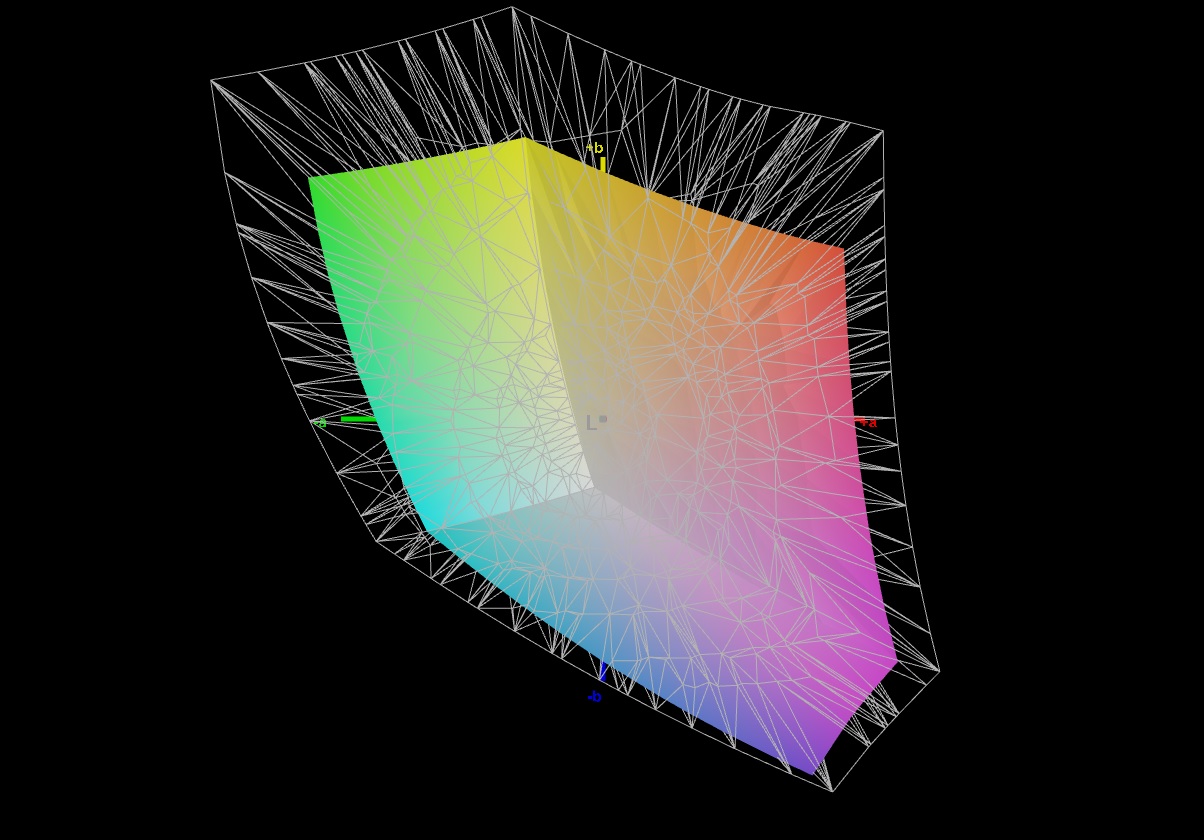
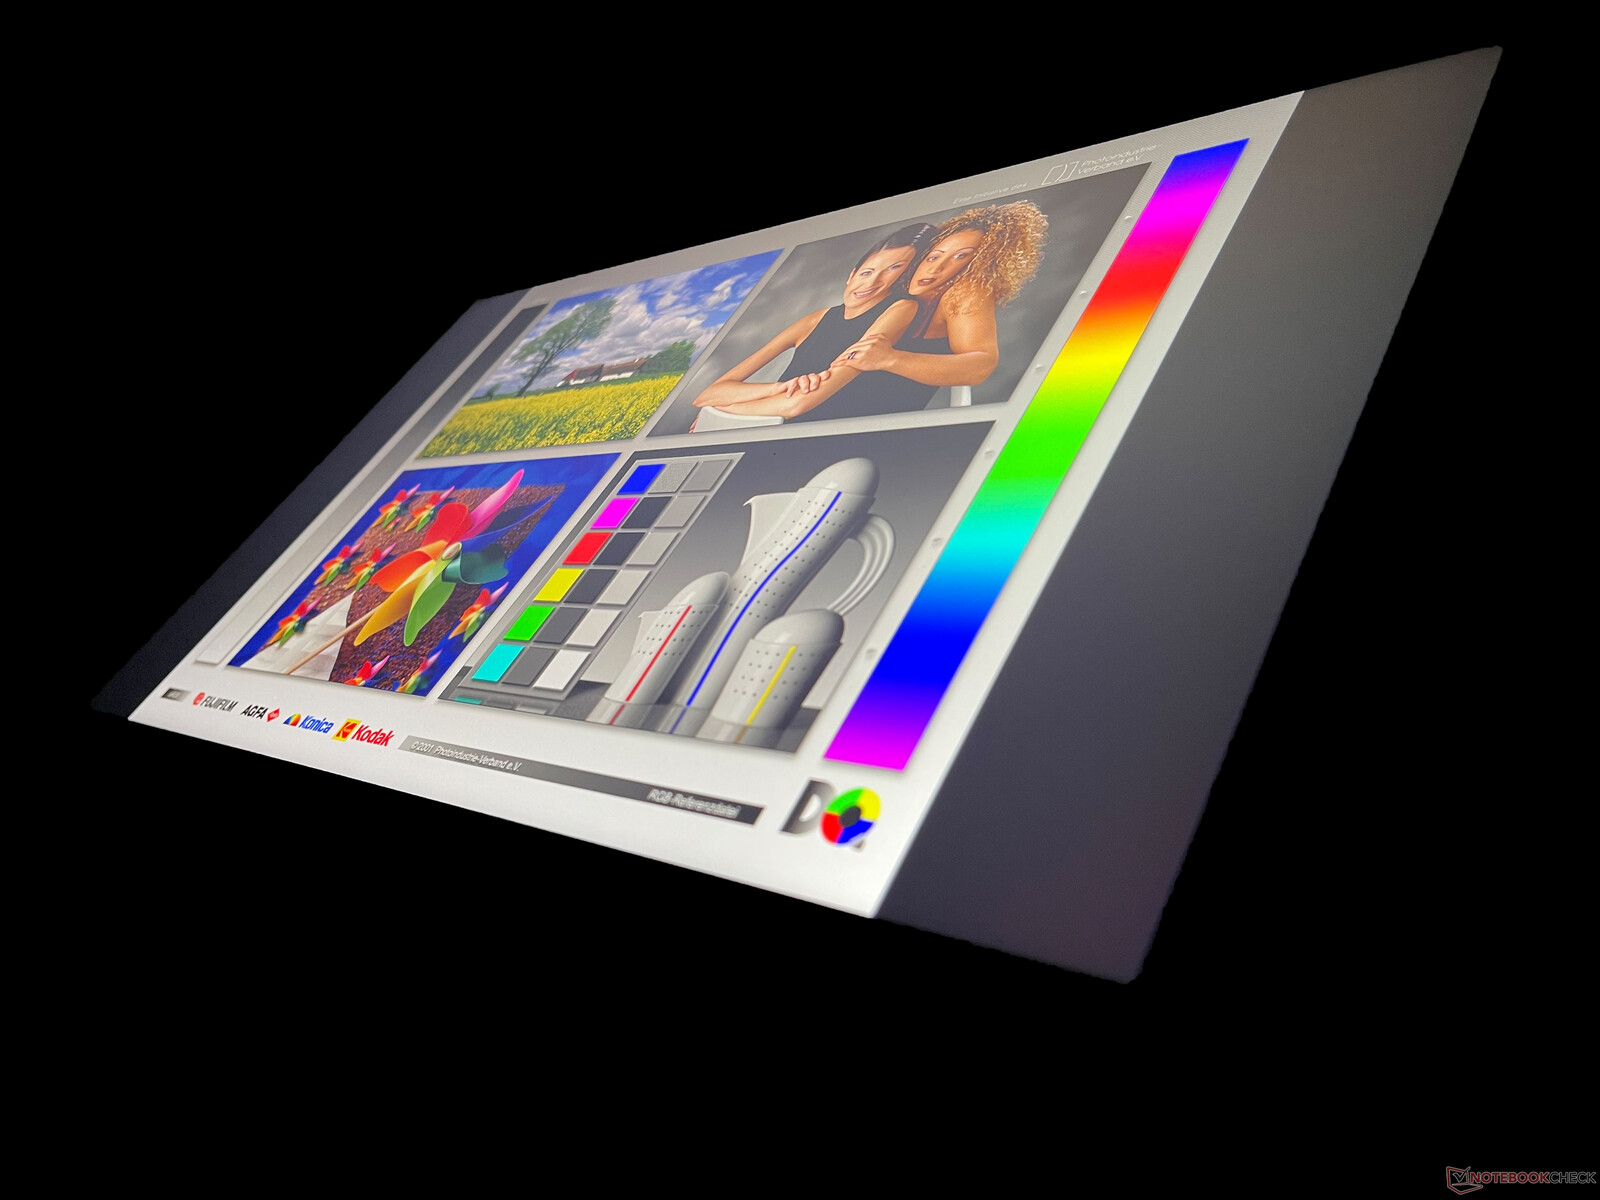
Display - Painel rápido com espectro de cores limitado
Um painel IPS mate de alta definição com uma resolução nativa de 1920x1080 pixels e uma taxa de atualização de 360 Hz é instalado em nosso dispositivo de revisão. Alternativamente, um QHD 240 Hz e um display de 4K 144 Hz estão disponíveis, cada um dos quais deve cobrir o espaço de cor DCI-P3. O modelo QHD também suporta Nvidia G-Sync e Advanced Optimus.
O brilho de 315 cd/m² em média é mais do que suficiente para a maioria dos cenários de aplicação e, juntamente com um valor decente de 0,24, resulta em um contraste acima da média de 1.375:1 na comparação de classes. Os tempos de resposta cinza a cinza são particularmente curtos e não pudemos detectar nenhum PWM.
| |||||||||||||||||||||||||
iluminação: 89 %
iluminação com acumulador: 330 cd/m²
Contraste: 1375:1 (Preto: 0.24 cd/m²)
ΔE ColorChecker Calman: 1.47 | ∀{0.5-29.43 Ø4.71}
calibrated: 0.63
ΔE Greyscale Calman: 1.8 | ∀{0.09-98 Ø4.96}
67.4% AdobeRGB 1998 (Argyll 3D)
85.1% sRGB (Argyll 3D)
65.3% Display P3 (Argyll 3D)
Gamma: 2.282
CCT: 6499 K
| Razer Blade 15 Advanced Model Early 2022 TL156VDXP02-0, IPS, 1920x1080, 15.6" | Razer Blade 15 2022 Sharp LQ156T1JW03, IPS, 2560x1440, 15.6" | Schenker XMG Neo 15 E22 (Early 2022, RTX 3080 Ti) BOE0A67 (BOE CQ NE156QHM-NZ1), IPS, 2560x1440, 15.6" | Asus ROG Strix Scar 15 G533QS BOE CQ NE156QHM-NY1, IPS, 2560x1440, 15.6" | MSI Stealth GS66 12UGS Sharp LQ156T1JW04 (SHP153C), IPS-Level, 2560x1440, 15.6" | MSI Vector GP66 12UGS BOE NE156FHM-NZ3, IPS, 1920x1080, 15.6" | |
|---|---|---|---|---|---|---|
| Display | 33% | 31% | 31% | 10% | ||
| Display P3 Coverage (%) | 65.3 | 99.1 52% | 97.6 49% | 96.4 48% | 70.1 7% | |
| sRGB Coverage (%) | 85.1 | 99.9 17% | 99.9 17% | 99.7 17% | 99.5 17% | |
| AdobeRGB 1998 Coverage (%) | 67.4 | 86.8 29% | 85.3 27% | 85.6 27% | 72.1 7% | |
| Response Times | -123% | -119% | -122% | -10% | -13% | |
| Response Time Grey 50% / Grey 80% * (ms) | 4.3 ? | 14.4 ? -235% | 14.4 ? -235% | 14 ? -226% | 6 ? -40% | 5.8 ? -35% |
| Response Time Black / White * (ms) | 10.5 ? | 11.6 ? -10% | 10.8 ? -3% | 12.4 ? -18% | 8.4 ? 20% | 9.6 ? 9% |
| PWM Frequency (Hz) | ||||||
| Screen | -54% | -38% | -77% | -87% | -45% | |
| Brightness middle (cd/m²) | 330 | 286 -13% | 295 -11% | 304.3 -8% | 272 -18% | 353.1 7% |
| Brightness (cd/m²) | 315 | 271 -14% | 277 -12% | 286 -9% | 253 -20% | 325 3% |
| Brightness Distribution (%) | 89 | 89 0% | 62 -30% | 76 -15% | 87 -2% | 85 -4% |
| Black Level * (cd/m²) | 0.24 | 0.25 -4% | 0.28 -17% | 0.33 -38% | 0.25 -4% | 0.38 -58% |
| Contrast (:1) | 1375 | 1144 -17% | 1054 -23% | 922 -33% | 1088 -21% | 929 -32% |
| Colorchecker dE 2000 * | 1.47 | 2.74 -86% | 2.36 -61% | 2.76 -88% | 3.73 -154% | 2.24 -52% |
| Colorchecker dE 2000 max. * | 2.73 | 5.21 -91% | 4.24 -55% | 5.57 -104% | 9.43 -245% | 5 -83% |
| Colorchecker dE 2000 calibrated * | 0.63 | 2.52 -300% | 2.38 -278% | 0.98 -56% | 1.02 -62% | |
| Greyscale dE 2000 * | 1.8 | 1.1 39% | 3.43 -91% | 4 -122% | 6.5 -261% | 4 -122% |
| Gamma | 2.282 96% | 2.2 100% | 2.44 90% | 2.14 103% | 2.172 101% | 2.24 98% |
| CCT | 6499 100% | 6408 101% | 6266 104% | 6844 95% | 6485 100% | 6864 95% |
| Média Total (Programa/Configurações) | -48% /
-45% | -79% /
-54% | -56% /
-60% | -22% /
-51% | -16% /
-28% |
* ... menor é melhor
Em nossa configuração, a Razer Blade 15 cobre apenas 85% do espaço de cor sRGB. Considerando a reivindicação do fabricante de "até 100%", esperávamos mais aqui.
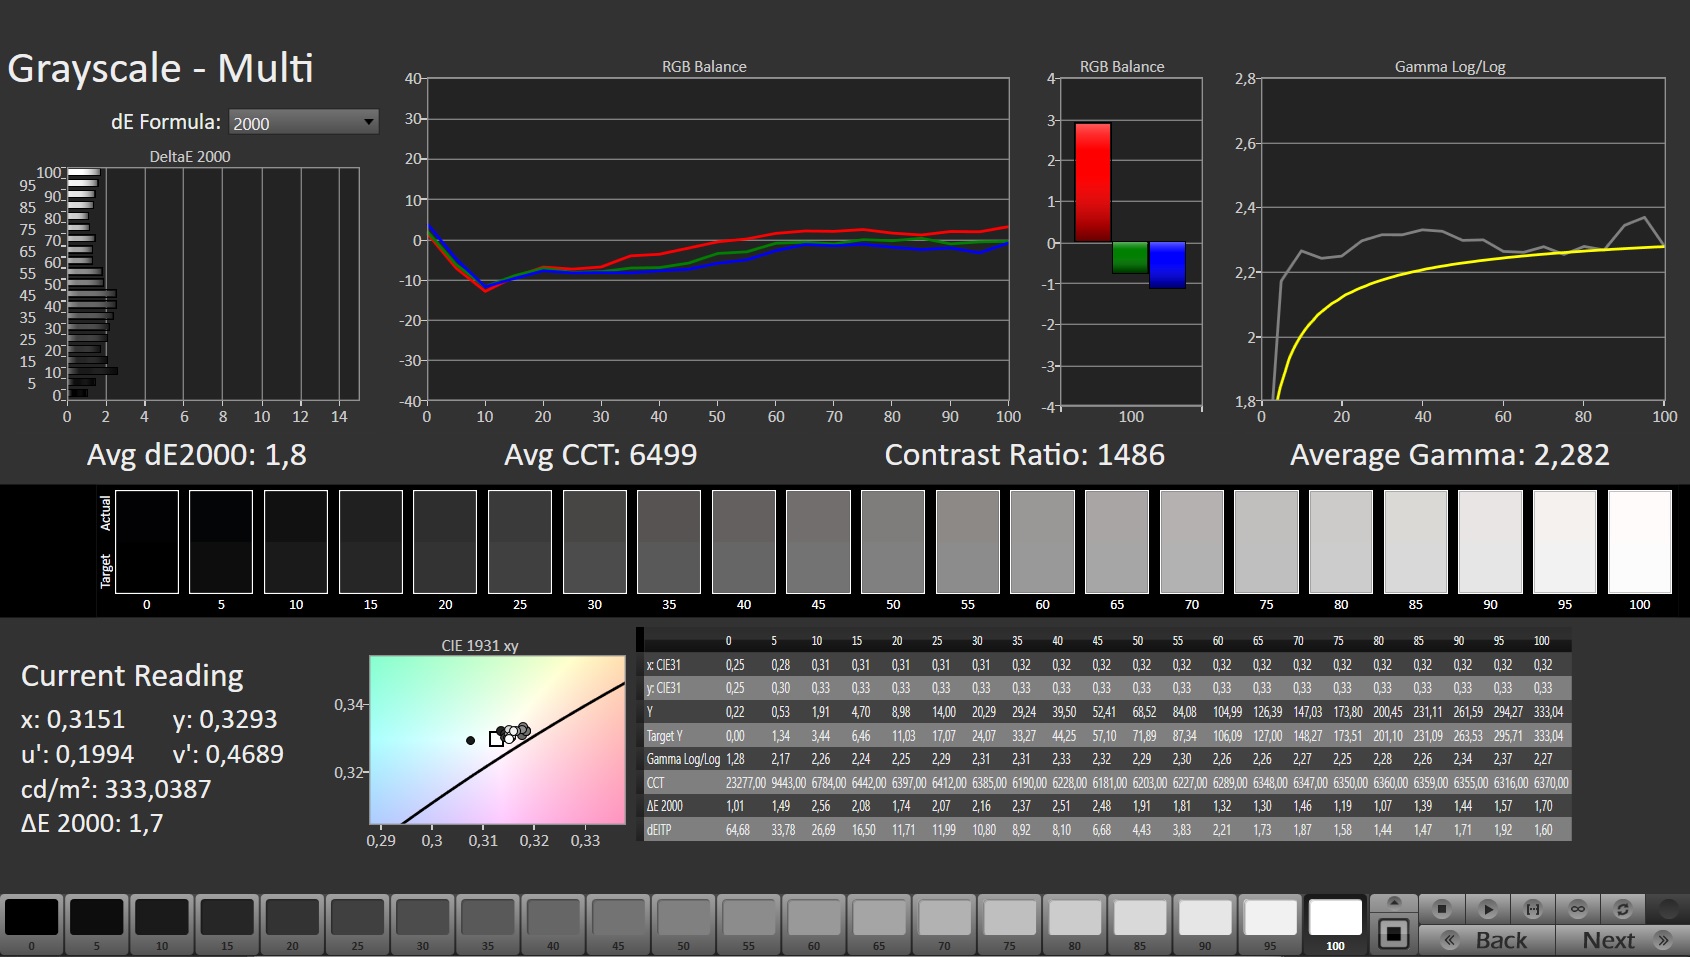
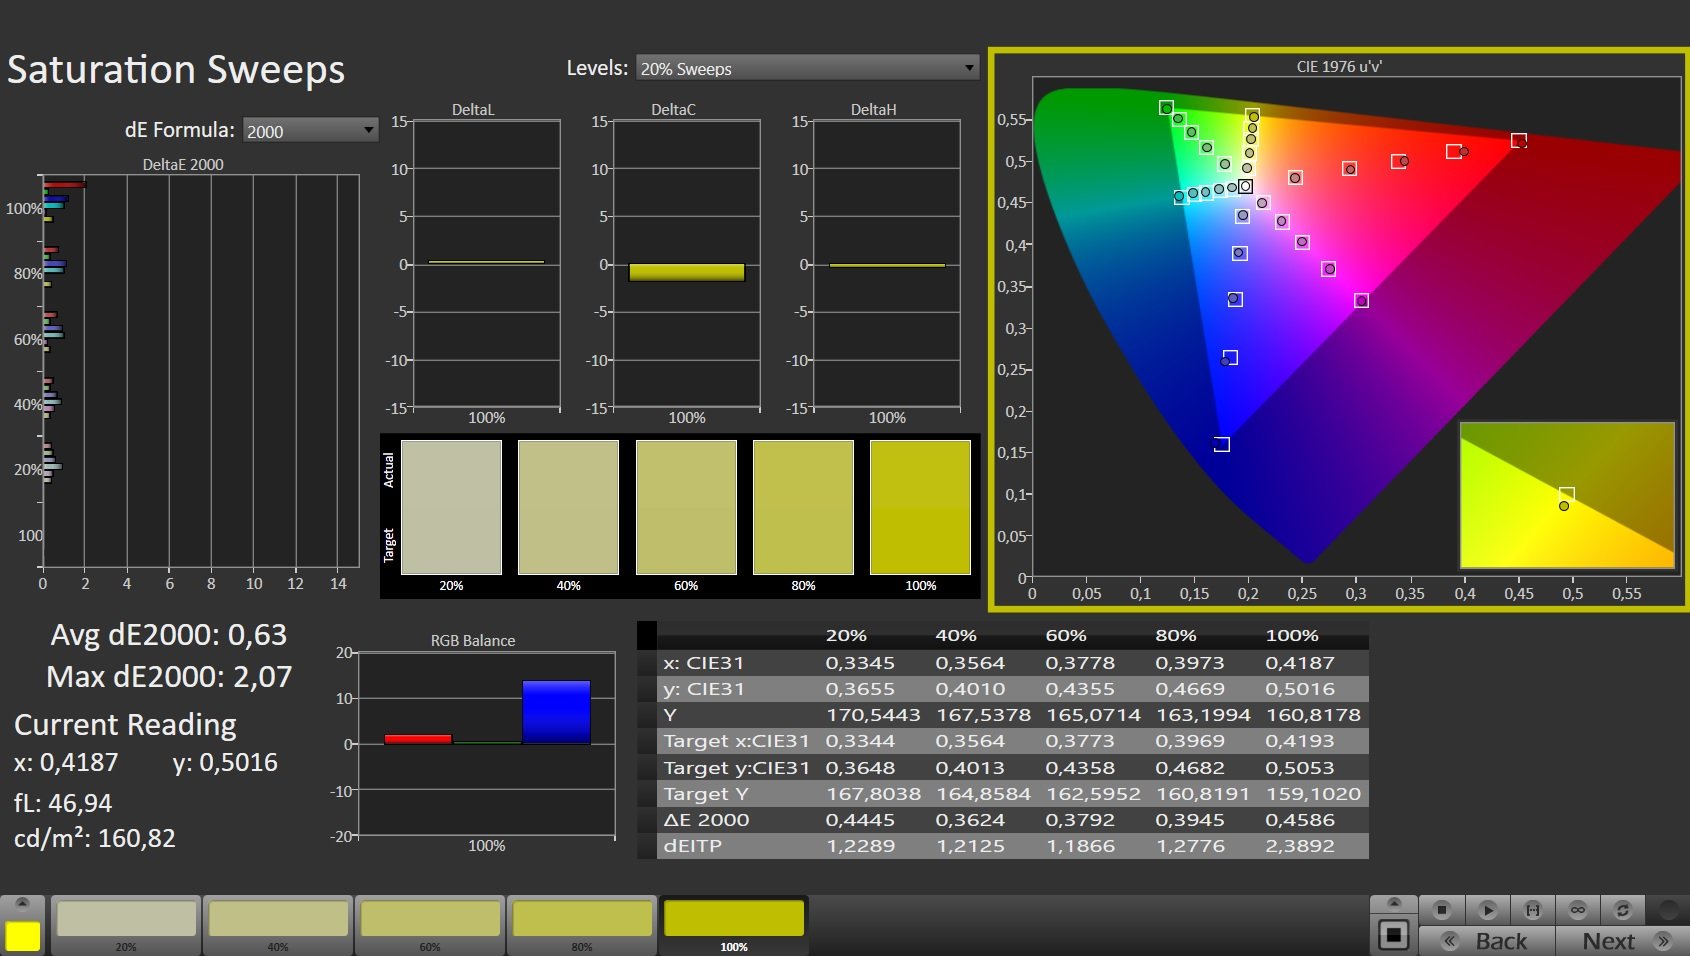
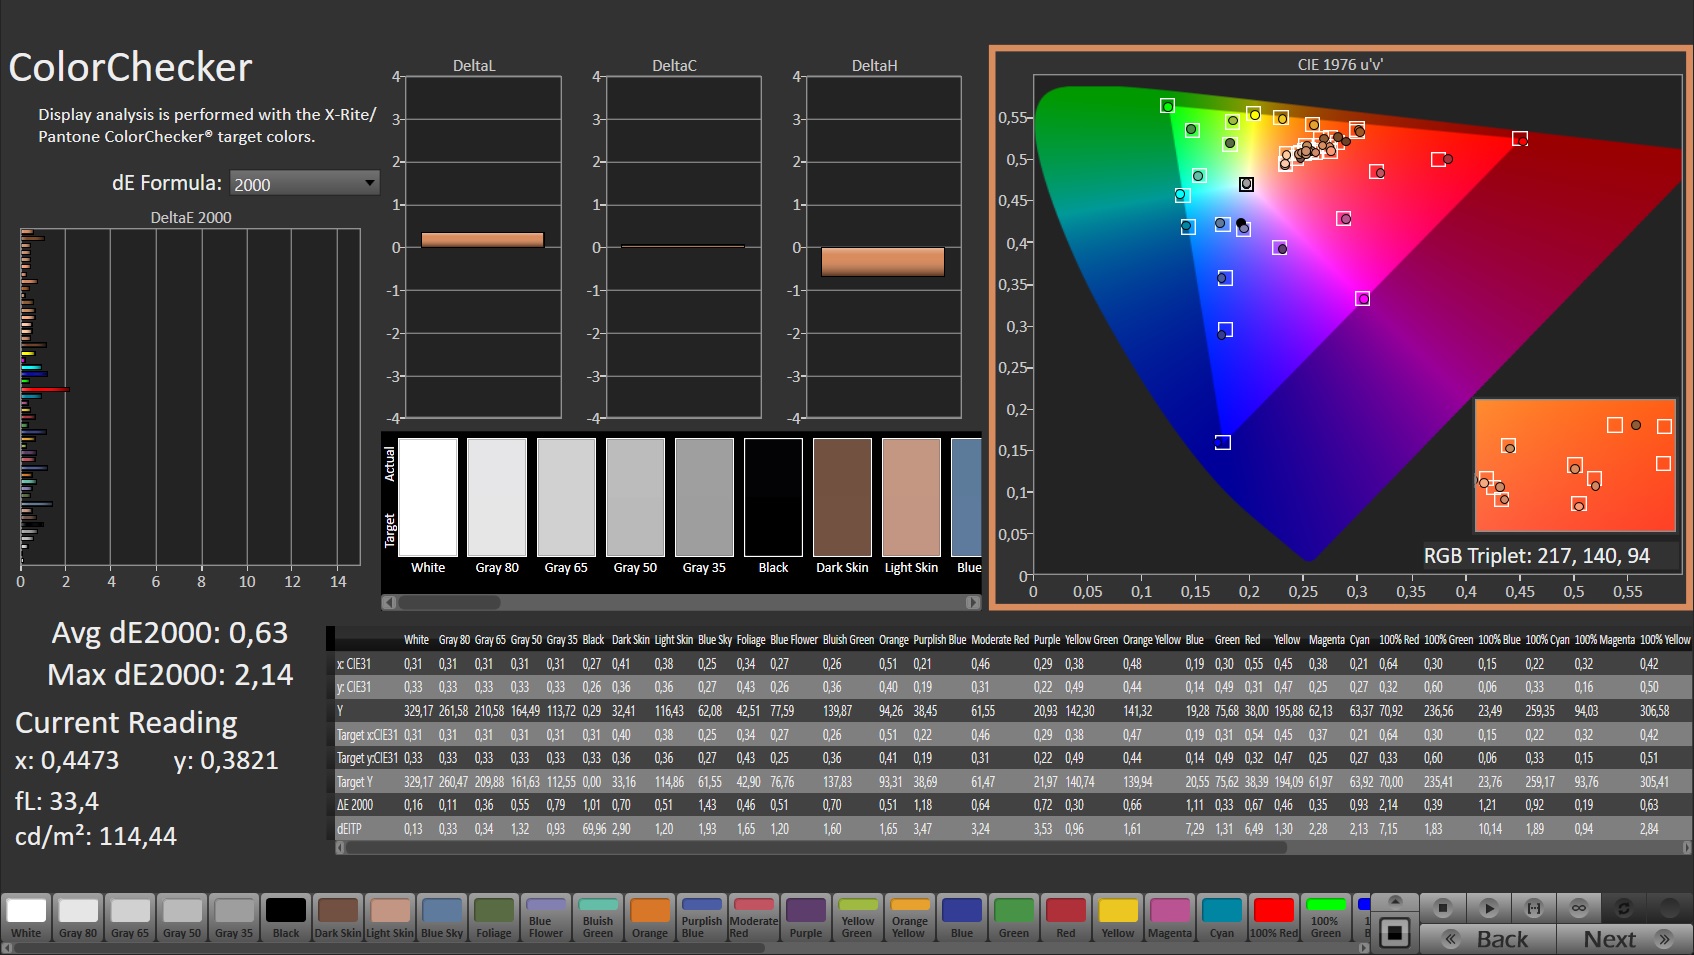
Na entrega, os desvios do espaço de cor DeltaE das escalas de cinza e cores já estão na faixa ideal (menos de 3) e podem ser melhorados para um sólido 0,63 e 0,8, respectivamente, através de calibragem posterior
Exibir tempos de resposta
| ↔ Tempo de resposta preto para branco | ||
|---|---|---|
| 10.5 ms ... ascensão ↗ e queda ↘ combinadas | ↗ 5.7 ms ascensão | 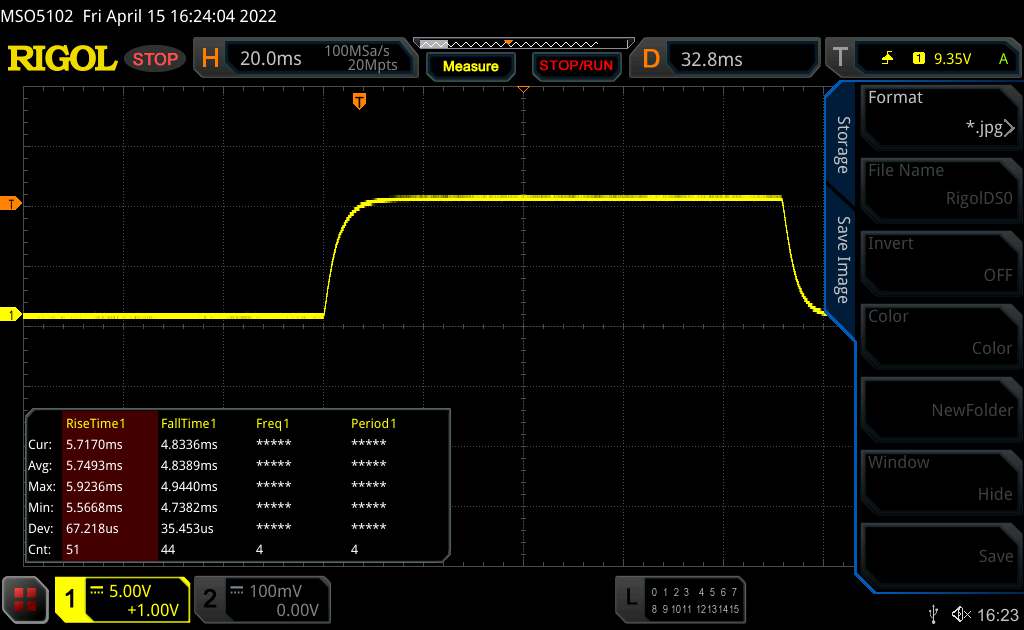 |
| ↘ 4.8 ms queda | ||
| A tela mostra boas taxas de resposta em nossos testes, mas pode ser muito lenta para jogadores competitivos. Em comparação, todos os dispositivos testados variam de 0.1 (mínimo) a 240 (máximo) ms. » 29 % de todos os dispositivos são melhores. Isso significa que o tempo de resposta medido é melhor que a média de todos os dispositivos testados (19.8 ms). | ||
| ↔ Tempo de resposta 50% cinza a 80% cinza | ||
| 4.3 ms ... ascensão ↗ e queda ↘ combinadas | ↗ 2.4 ms ascensão | 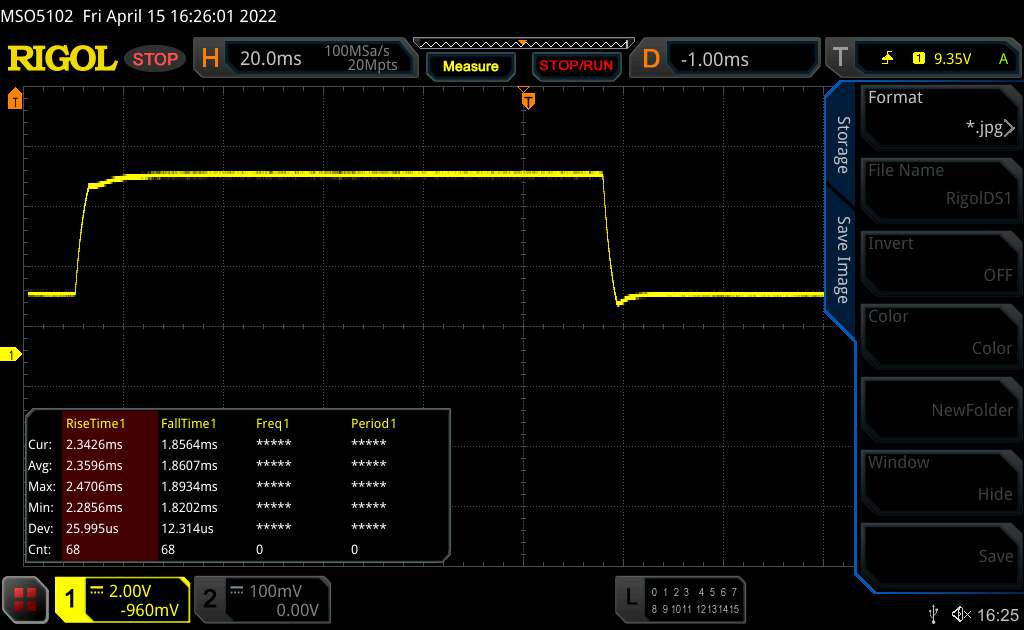 |
| ↘ 1.9 ms queda | ||
| A tela mostra taxas de resposta muito rápidas em nossos testes e deve ser muito adequada para jogos em ritmo acelerado. Em comparação, todos os dispositivos testados variam de 0.165 (mínimo) a 636 (máximo) ms. » 16 % de todos os dispositivos são melhores. Isso significa que o tempo de resposta medido é melhor que a média de todos os dispositivos testados (31 ms). | ||
Cintilação da tela / PWM (modulação por largura de pulso)
| Tela tremeluzindo / PWM não detectado |  | ||
[pwm_comparison] Em comparação: 52 % de todos os dispositivos testados não usam PWM para escurecer a tela. Se PWM foi detectado, uma média de 7754 (mínimo: 5 - máximo: 343500) Hz foi medida. | |||
Graças a um brilho de mais de 300 cd/m², a tela também está equipada para uso ao ar livre, desde que você permaneça na sombra
Os ângulos de visão são soberbos. Mesmo em ângulos íngremes, as cores e os contrastes da tela IPS são dificilmente distorcidos
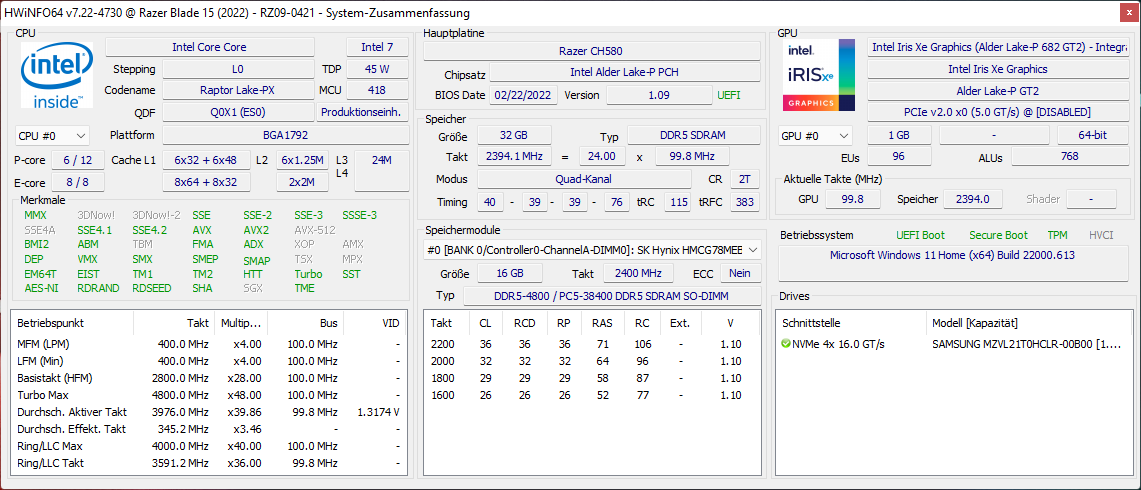
Desempenho - Laptop de jogos Razer com hardware de ponta
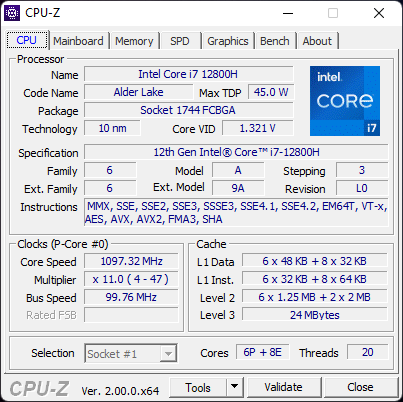
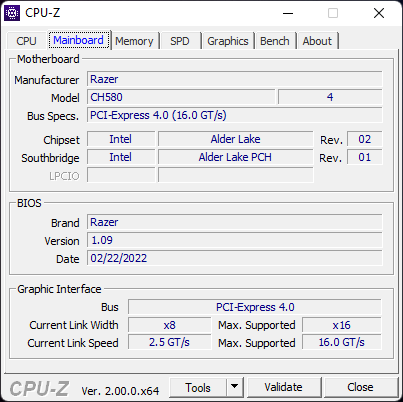
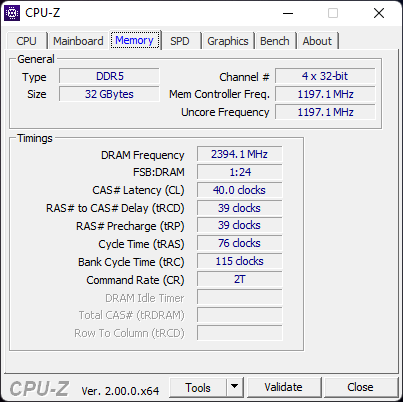
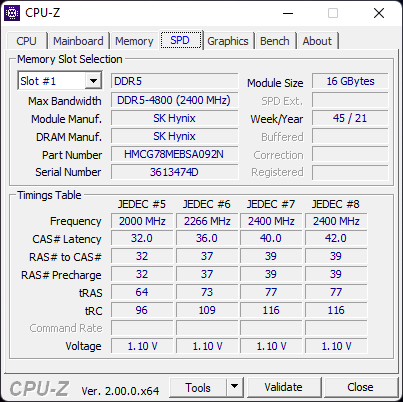
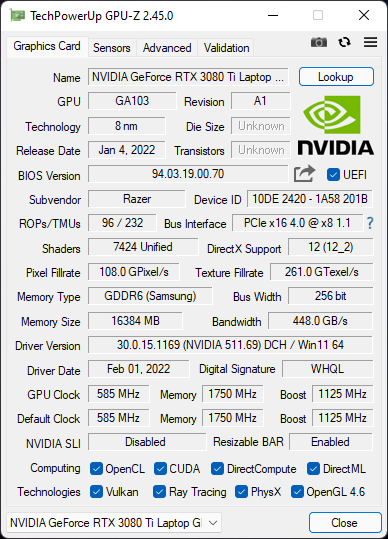
Nossa Razer Blade 15 está equipada com um Intel Core i7-12800H e um Nvidia GeForce RTX 3080 Ti. Há também 32 GB de RAM DDR5 em modo quad-canal e um SSD de 1 TB PCIe 4.0. Em combinação com o painel de 4K, o laptop está alternativamente disponível com o Núcleo i9-12900H.
Condições de teste
A fim de obter novos conhecimentos durante os testes, realizamos todas as medições com o perfil "equilibrado" Synapse. Isto faz com que a GPU trabalhe com um TGP máximo de cerca de 95 W e também limita a CPU. Você pode encontrar a pontuação máxima atingível em nossa outras revisões.
Processador
O Intel Core i7-12800H é um novíssimo processador Intel de 12ª geração com suporte de RAM DDR5. A funcionalidade DDR5 permite que os dois módulos de RAM operem em modo quad-canal.
O Razer Blade 15 é menos capaz de acompanhar a concorrência em termos de desempenho da CPU em modo "balanceado" do que sem limitações de desempenho. Mesmo os nominalmente mais fracos Núcleo i7-12700H no XMG Neo 15 E22 bate nosso dispositivo de revisão em ambos os cenários no teste Cinebench R15 multi-loop. O fato de alguns benchmarks de linha única serem melhores é provavelmente devido ao fato de que os limites de temperatura são atingidos antes dos limites do TDP. O turboalimentação permanece ativo apenas por um curto período.
O teste Cinebench R15 multi-tarefa fornece a mesma pontuação em modo de bateria sob o perfil que selecionamos.
Cinebench R15 Multi Sustained Load
* ... menor é melhor
AIDA64: FP32 Ray-Trace | FPU Julia | CPU SHA3 | CPU Queen | FPU SinJulia | FPU Mandel | CPU AES | CPU ZLib | FP64 Ray-Trace | CPU PhotoWorxx
| Performance rating | |
| Média da turma Gaming | |
| Asus ROG Strix Scar 15 G533QS | |
| MSI Stealth GS66 12UGS | |
| Schenker XMG Neo 15 E22 (Early 2022, RTX 3080 Ti) | |
| MSI Vector GP66 12UGS | |
| Média Intel Core i7-12800H | |
| Razer Blade 15 2022 | |
| Razer Blade 15 Advanced Model Early 2022 | |
| AIDA64 / FP32 Ray-Trace | |
| Média da turma Gaming (10227 - 85542, n=105, últimos 2 anos) | |
| Asus ROG Strix Scar 15 G533QS | |
| Schenker XMG Neo 15 E22 (Early 2022, RTX 3080 Ti) | |
| MSI Stealth GS66 12UGS | |
| Média Intel Core i7-12800H (5839 - 15206, n=5) | |
| MSI Vector GP66 12UGS | |
| Razer Blade 15 2022 | |
| Razer Blade 15 Advanced Model Early 2022 | |
| AIDA64 / FPU Julia | |
| Média da turma Gaming (51376 - 238426, n=105, últimos 2 anos) | |
| Asus ROG Strix Scar 15 G533QS | |
| Média Intel Core i7-12800H (27801 - 80002, n=5) | |
| Schenker XMG Neo 15 E22 (Early 2022, RTX 3080 Ti) | |
| MSI Stealth GS66 12UGS | |
| MSI Vector GP66 12UGS | |
| Razer Blade 15 2022 | |
| Razer Blade 15 Advanced Model Early 2022 | |
| AIDA64 / CPU SHA3 | |
| Média da turma Gaming (2180 - 10115, n=105, últimos 2 anos) | |
| Asus ROG Strix Scar 15 G533QS | |
| Schenker XMG Neo 15 E22 (Early 2022, RTX 3080 Ti) | |
| MSI Stealth GS66 12UGS | |
| MSI Vector GP66 12UGS | |
| Média Intel Core i7-12800H (2013 - 3684, n=5) | |
| Razer Blade 15 2022 | |
| Razer Blade 15 Advanced Model Early 2022 | |
| AIDA64 / CPU Queen | |
| Média da turma Gaming (49785 - 173351, n=90, últimos 2 anos) | |
| MSI Vector GP66 12UGS | |
| Asus ROG Strix Scar 15 G533QS | |
| MSI Stealth GS66 12UGS | |
| Schenker XMG Neo 15 E22 (Early 2022, RTX 3080 Ti) | |
| Média Intel Core i7-12800H (85965 - 108084, n=5) | |
| Razer Blade 15 2022 | |
| Razer Blade 15 Advanced Model Early 2022 | |
| AIDA64 / FPU SinJulia | |
| Média da turma Gaming (4424 - 33636, n=105, últimos 2 anos) | |
| Asus ROG Strix Scar 15 G533QS | |
| Schenker XMG Neo 15 E22 (Early 2022, RTX 3080 Ti) | |
| MSI Stealth GS66 12UGS | |
| MSI Vector GP66 12UGS | |
| Razer Blade 15 2022 | |
| Média Intel Core i7-12800H (7027 - 9658, n=5) | |
| Razer Blade 15 Advanced Model Early 2022 | |
| AIDA64 / FPU Mandel | |
| Média da turma Gaming (25115 - 128721, n=105, últimos 2 anos) | |
| Asus ROG Strix Scar 15 G533QS | |
| Schenker XMG Neo 15 E22 (Early 2022, RTX 3080 Ti) | |
| MSI Stealth GS66 12UGS | |
| Média Intel Core i7-12800H (15765 - 38179, n=5) | |
| MSI Vector GP66 12UGS | |
| Razer Blade 15 2022 | |
| Razer Blade 15 Advanced Model Early 2022 | |
| AIDA64 / CPU AES | |
| Asus ROG Strix Scar 15 G533QS | |
| Média da turma Gaming (39258 - 247074, n=105, últimos 2 anos) | |
| MSI Stealth GS66 12UGS | |
| MSI Vector GP66 12UGS | |
| Schenker XMG Neo 15 E22 (Early 2022, RTX 3080 Ti) | |
| Razer Blade 15 Advanced Model Early 2022 | |
| Média Intel Core i7-12800H (55371 - 73928, n=5) | |
| Razer Blade 15 2022 | |
| AIDA64 / CPU ZLib | |
| Média da turma Gaming (574 - 2531, n=105, últimos 2 anos) | |
| Schenker XMG Neo 15 E22 (Early 2022, RTX 3080 Ti) | |
| MSI Vector GP66 12UGS | |
| MSI Stealth GS66 12UGS | |
| Razer Blade 15 2022 | |
| Média Intel Core i7-12800H (701 - 1047, n=5) | |
| Asus ROG Strix Scar 15 G533QS | |
| Razer Blade 15 Advanced Model Early 2022 | |
| AIDA64 / FP64 Ray-Trace | |
| Média da turma Gaming (5509 - 45446, n=105, últimos 2 anos) | |
| Asus ROG Strix Scar 15 G533QS | |
| Schenker XMG Neo 15 E22 (Early 2022, RTX 3080 Ti) | |
| MSI Stealth GS66 12UGS | |
| Média Intel Core i7-12800H (3257 - 8559, n=5) | |
| MSI Vector GP66 12UGS | |
| Razer Blade 15 2022 | |
| Razer Blade 15 Advanced Model Early 2022 | |
| AIDA64 / CPU PhotoWorxx | |
| Média da turma Gaming (12271 - 89891, n=105, últimos 2 anos) | |
| Razer Blade 15 2022 | |
| Schenker XMG Neo 15 E22 (Early 2022, RTX 3080 Ti) | |
| MSI Stealth GS66 12UGS | |
| Razer Blade 15 Advanced Model Early 2022 | |
| Média Intel Core i7-12800H (31329 - 40992, n=5) | |
| MSI Vector GP66 12UGS | |
| Asus ROG Strix Scar 15 G533QS | |
Desempenho do sistema
O desempenho do sistema é sólido, de acordo com os testes PCMark 10. No uso diário, a velocidade de operação é suave e não há atrasos perceptíveis, razão pela qual você pode usar o modo "Equilibrado" livre de preocupações.
CrossMark: Overall | Productivity | Creativity | Responsiveness
| PCMark 10 / Score | |
| Média da turma Gaming (5828 - 12414, n=93, últimos 2 anos) | |
| MSI Vector GP66 12UGS | |
| Razer Blade 15 2022 | |
| Média Intel Core i7-12800H, NVIDIA GeForce RTX 3080 Ti Laptop GPU (7313 - 7744, n=3) | |
| MSI Stealth GS66 12UGS | |
| Razer Blade 15 Advanced Model Early 2022 | |
| Schenker XMG Neo 15 E22 (Early 2022, RTX 3080 Ti) | |
| Asus ROG Strix Scar 15 G533QS | |
| PCMark 10 / Essentials | |
| MSI Vector GP66 12UGS | |
| MSI Stealth GS66 12UGS | |
| Razer Blade 15 2022 | |
| Média Intel Core i7-12800H, NVIDIA GeForce RTX 3080 Ti Laptop GPU (10597 - 10814, n=3) | |
| Média da turma Gaming (8810 - 11935, n=97, últimos 2 anos) | |
| Razer Blade 15 Advanced Model Early 2022 | |
| Asus ROG Strix Scar 15 G533QS | |
| Schenker XMG Neo 15 E22 (Early 2022, RTX 3080 Ti) | |
| PCMark 10 / Productivity | |
| Média da turma Gaming (6845 - 25323, n=95, últimos 2 anos) | |
| MSI Vector GP66 12UGS | |
| Asus ROG Strix Scar 15 G533QS | |
| Razer Blade 15 Advanced Model Early 2022 | |
| Razer Blade 15 2022 | |
| Média Intel Core i7-12800H, NVIDIA GeForce RTX 3080 Ti Laptop GPU (9470 - 9675, n=3) | |
| MSI Stealth GS66 12UGS | |
| Schenker XMG Neo 15 E22 (Early 2022, RTX 3080 Ti) | |
| PCMark 10 / Digital Content Creation | |
| Média da turma Gaming (7602 - 19954, n=95, últimos 2 anos) | |
| MSI Vector GP66 12UGS | |
| Razer Blade 15 2022 | |
| Média Intel Core i7-12800H, NVIDIA GeForce RTX 3080 Ti Laptop GPU (10351 - 12306, n=3) | |
| MSI Stealth GS66 12UGS | |
| Schenker XMG Neo 15 E22 (Early 2022, RTX 3080 Ti) | |
| Razer Blade 15 Advanced Model Early 2022 | |
| Asus ROG Strix Scar 15 G533QS | |
| CrossMark / Overall | |
| Média da turma Gaming (1366 - 2409, n=94, últimos 2 anos) | |
| Razer Blade 15 Advanced Model Early 2022 | |
| Média Intel Core i7-12800H, NVIDIA GeForce RTX 3080 Ti Laptop GPU (n=1) | |
| CrossMark / Productivity | |
| Média da turma Gaming (1386 - 2254, n=94, últimos 2 anos) | |
| Razer Blade 15 Advanced Model Early 2022 | |
| Média Intel Core i7-12800H, NVIDIA GeForce RTX 3080 Ti Laptop GPU (n=1) | |
| CrossMark / Creativity | |
| Média da turma Gaming (1343 - 2786, n=94, últimos 2 anos) | |
| Razer Blade 15 Advanced Model Early 2022 | |
| Média Intel Core i7-12800H, NVIDIA GeForce RTX 3080 Ti Laptop GPU (n=1) | |
| CrossMark / Responsiveness | |
| Média da turma Gaming (1226 - 2334, n=94, últimos 2 anos) | |
| Razer Blade 15 Advanced Model Early 2022 | |
| Média Intel Core i7-12800H, NVIDIA GeForce RTX 3080 Ti Laptop GPU (n=1) | |
| PCMark 8 Home Score Accelerated v2 | 6657 pontos | |
| PCMark 8 Work Score Accelerated v2 | 7009 pontos | |
| PCMark 10 Score | 7313 pontos | |
Ajuda | ||
| AIDA64 / Memory Copy | |
| Média da turma Gaming (21750 - 129946, n=105, últimos 2 anos) | |
| Schenker XMG Neo 15 E22 (Early 2022, RTX 3080 Ti) | |
| Razer Blade 15 2022 | |
| MSI Stealth GS66 12UGS | |
| Razer Blade 15 Advanced Model Early 2022 | |
| Média Intel Core i7-12800H (48643 - 62522, n=5) | |
| MSI Vector GP66 12UGS | |
| Asus ROG Strix Scar 15 G533QS | |
| AIDA64 / Memory Read | |
| Média da turma Gaming (22956 - 118858, n=105, últimos 2 anos) | |
| Schenker XMG Neo 15 E22 (Early 2022, RTX 3080 Ti) | |
| Razer Blade 15 2022 | |
| MSI Stealth GS66 12UGS | |
| Razer Blade 15 Advanced Model Early 2022 | |
| Média Intel Core i7-12800H (56629 - 66199, n=5) | |
| MSI Vector GP66 12UGS | |
| Asus ROG Strix Scar 15 G533QS | |
| AIDA64 / Memory Write | |
| Média da turma Gaming (22297 - 135096, n=105, últimos 2 anos) | |
| MSI Stealth GS66 12UGS | |
| Razer Blade 15 2022 | |
| Razer Blade 15 Advanced Model Early 2022 | |
| Schenker XMG Neo 15 E22 (Early 2022, RTX 3080 Ti) | |
| Média Intel Core i7-12800H (50923 - 66074, n=5) | |
| MSI Vector GP66 12UGS | |
| Asus ROG Strix Scar 15 G533QS | |
| AIDA64 / Memory Latency | |
| Média da turma Gaming (75.3 - 259, n=105, últimos 2 anos) | |
| Razer Blade 15 Advanced Model Early 2022 | |
| MSI Stealth GS66 12UGS | |
| MSI Vector GP66 12UGS | |
| Asus ROG Strix Scar 15 G533QS | |
| Média Intel Core i7-12800H (89.3 - 95.2, n=5) | |
| Schenker XMG Neo 15 E22 (Early 2022, RTX 3080 Ti) | |
| Razer Blade 15 2022 | |
* ... menor é melhor
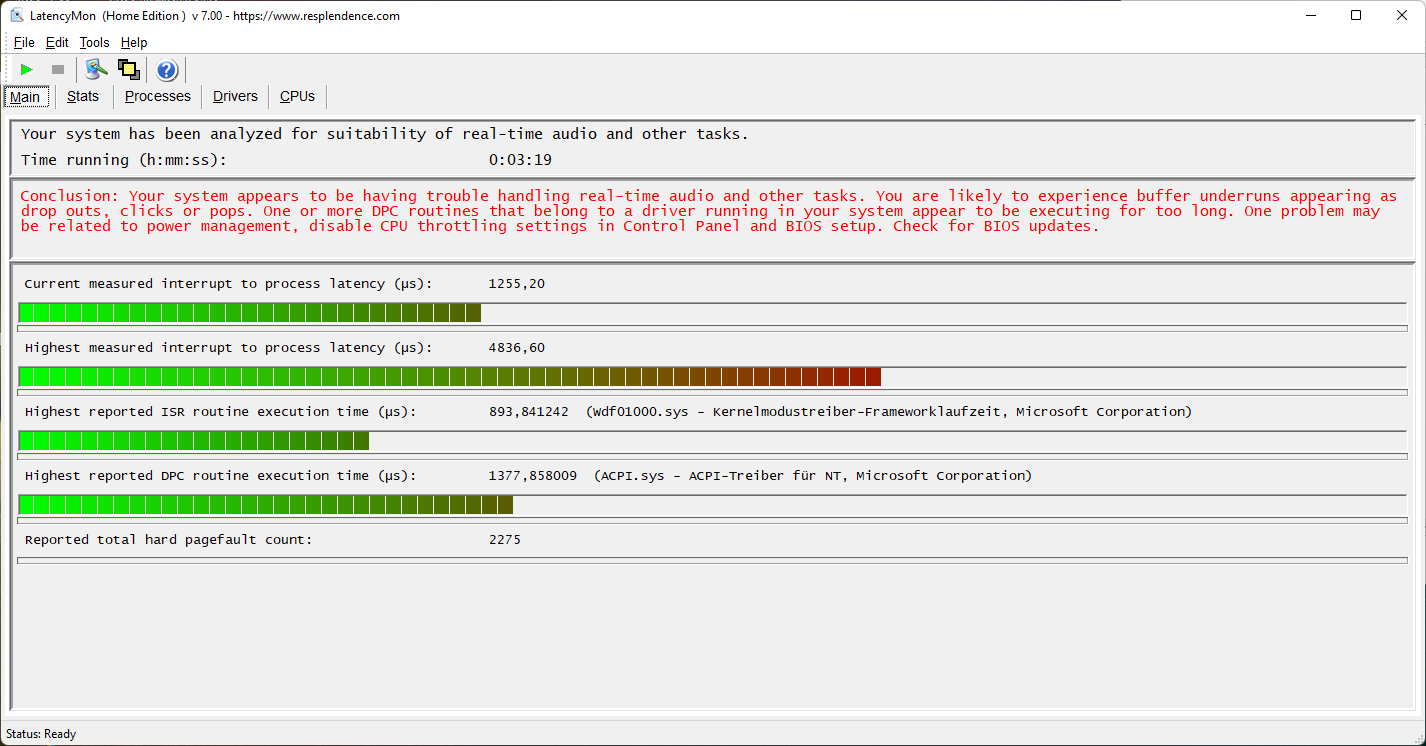
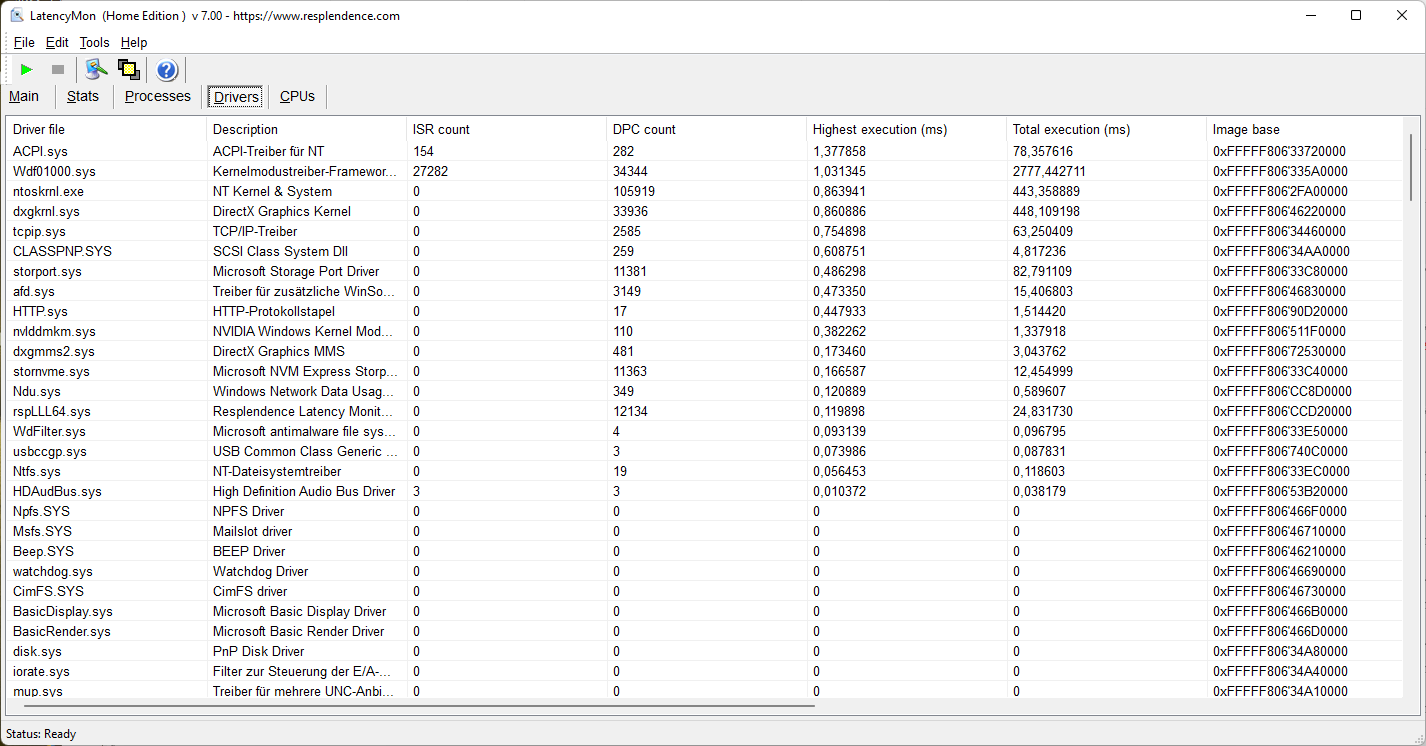
Latências DPC
De acordo com LatencyMon, as latências DPC podem ser muito altas para edição de áudio e vídeo em tempo real na configuração que testamos
| DPC Latencies / LatencyMon - interrupt to process latency (max), Web, Youtube, Prime95 | |
| Razer Blade 15 Advanced Model Early 2022 | |
| MSI Vector GP66 12UGS | |
| MSI Stealth GS66 12UGS | |
| Asus ROG Strix Scar 15 G533QS | |
| Razer Blade 15 2022 | |
| Schenker XMG Neo 15 E22 (Early 2022, RTX 3080 Ti) | |
* ... menor é melhor
Dispositivos de armazenamento
Um 1TB Samsung PM9A1 M.2 SDD com PCIe 4.0 está instalado em nosso dispositivo de revisão, o que resulta em taxas de transferência de dados muito altas. Desde que o SSD PCIe 4.0 "CA6-8D1024" do SSSTC foi instalado em nosso primeiro dispositivo de revisão Blade 15os modelos de acionamento e as taxas de transferência podem ser diferentes.

* ... menor é melhor
Sustained Read Performance: DiskSpd Read Loop, Queue Depth 8
GPU
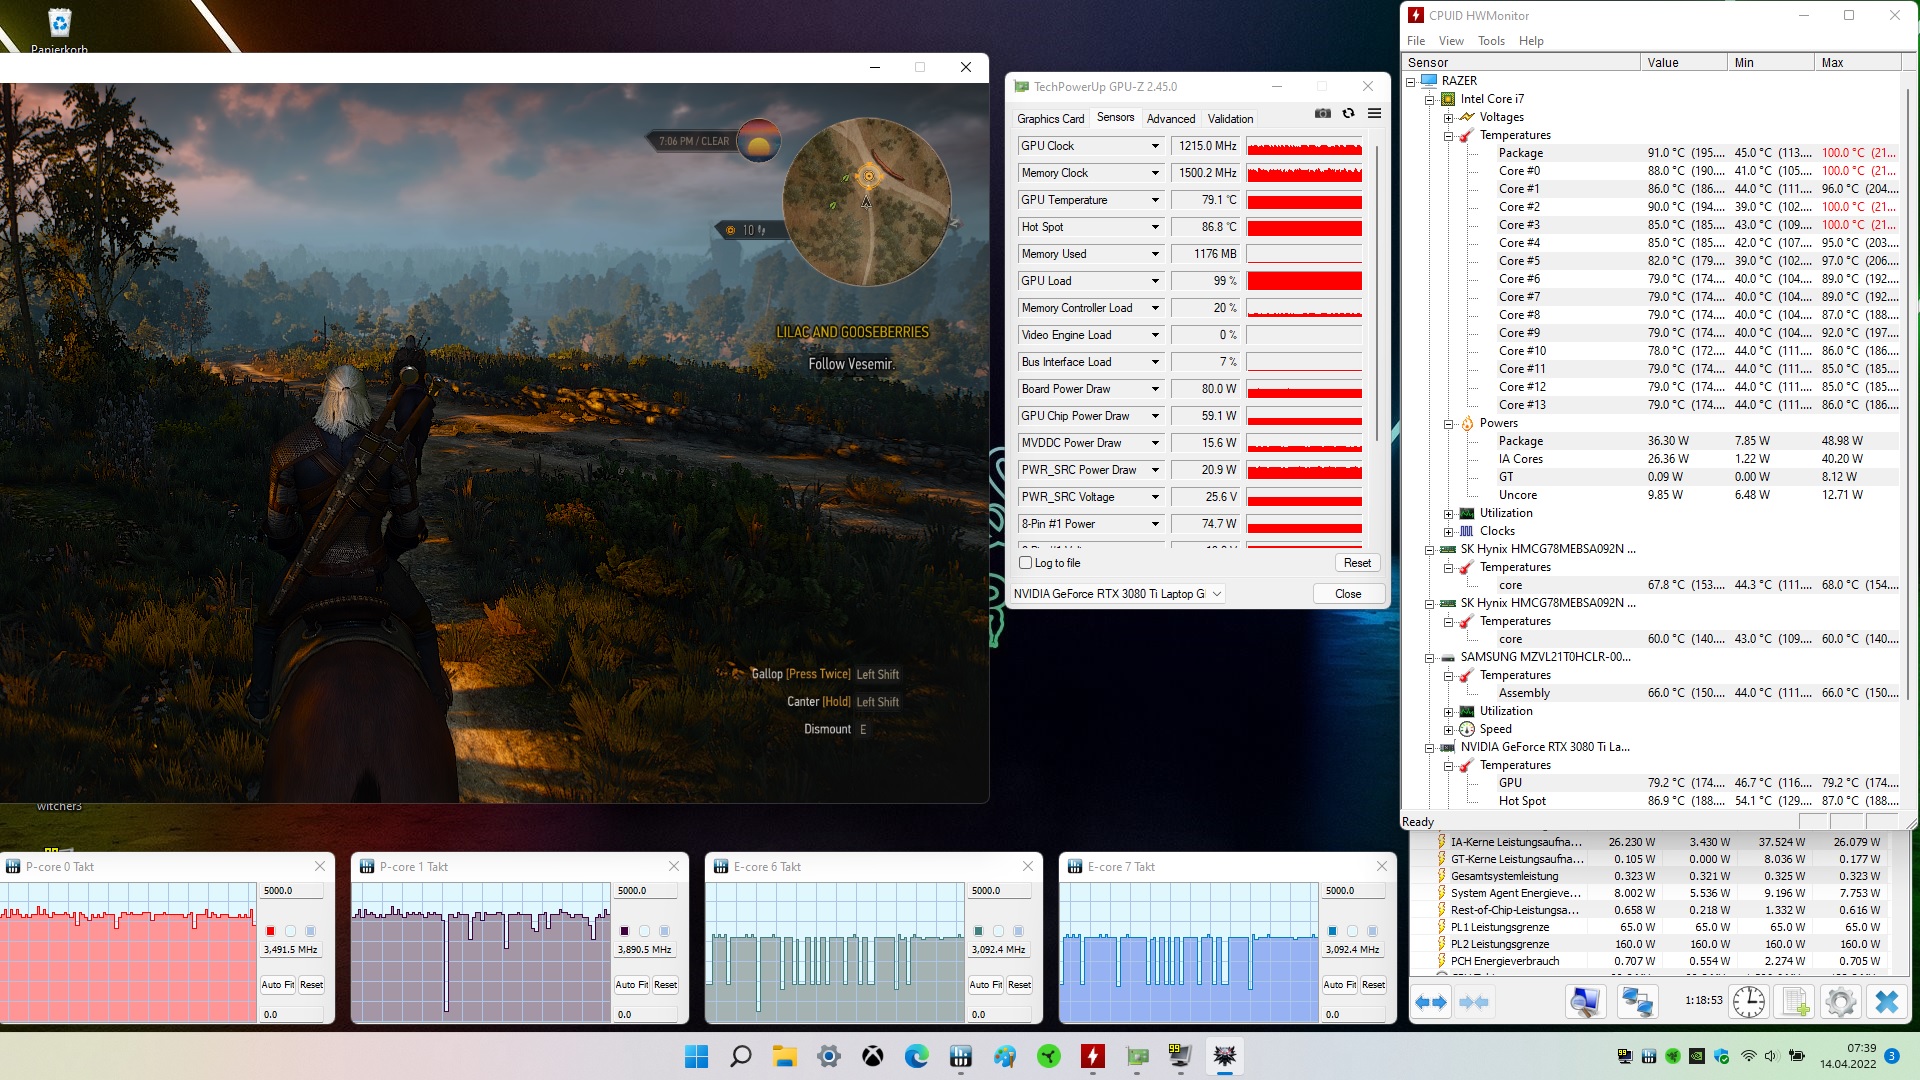
O móvel Nvidia GeForce RTX 3080 Ti com 16 GB de VRAM pertence à geração Ampere Refresh. Com base nos 3DMark benchmarks, o uso do modo "Equilibrado" resulta em um déficit de desempenho de cerca de 10-20%. Pequenas quedas podem ser vistas na progressão da taxa de quadros do The Witcher 3, mas isto teve um impacto subjetivamente mínimo na experiência do jogo.
O desempenho é limitado no modo de bateria. Um Fire Strike run forneceu resultados físicos e gráficos de 12.888 e 10.344 respectivamente no modo de bateria, em comparação com 21866 e 25240 no modo de rede.
| 3DMark 11 Performance | 25091 pontos | |
| 3DMark Ice Storm Standard Score | 158195 pontos | |
| 3DMark Cloud Gate Standard Score | 43351 pontos | |
| 3DMark Fire Strike Score | 21106 pontos | |
| 3DMark Time Spy Score | 9596 pontos | |
Ajuda | ||
Desempenho nos jogos
Os benchmarks de Gming são naturalmente mais fracos no modo de desempenho equilibrado. No entanto, as taxas de quadros absolutos ainda são altas o suficiente para uma experiência de jogo suave, de modo que você não precisa necessariamente rodar a Lâmina 15 no modo de alto desempenho.
Witcher 3 FPS Diagram
| baixo | média | alto | ultra | |
|---|---|---|---|---|
| GTA V (2015) | 178.7 | 170.7 | 153.4 | 92.4 |
| The Witcher 3 (2015) | 316 | 200 | 155.5 | 89.3 |
| Dota 2 Reborn (2015) | 59.9 | 59.9 | 59.9 | 59.9 |
| Final Fantasy XV Benchmark (2018) | 148.3 | 119.4 | 90.4 | |
| X-Plane 11.11 (2018) | 124.3 | 109.5 | 93.4 | |
| Strange Brigade (2018) | 361 | 212 | 167.6 | 149.8 |
Emissões - carcaça condutora de calor
Ruído
Os ventiladores são lentos e permitem que os componentes se tornem um pouco quentes antes de fazer efeito. Em particular, o nível médio de ruído sob carga é sensivelmente mais baixo no modo balanceado. O nível de ruído de nossos primeira Lâmina 15 (modo: desempenho máximo) estava dentro da faixa habitual. Não foi detectada nenhuma lamúria de bobina em nosso dispositivo de revisão.
Barulho
| Ocioso |
| 26 / 27 / 29 dB |
| Carga |
| 37 / 45 dB |
 | ||
30 dB silencioso 40 dB(A) audível 50 dB(A) ruidosamente alto |
||
min: | ||
| Razer Blade 15 Advanced Model Early 2022 i7-12800H, GeForce RTX 3080 Ti Laptop GPU | Razer Blade 15 2022 i7-12800H, GeForce RTX 3080 Ti Laptop GPU | Schenker XMG Neo 15 E22 (Early 2022, RTX 3080 Ti) i7-12700H, GeForce RTX 3080 Ti Laptop GPU | Asus ROG Strix Scar 15 G533QS R9 5900HX, GeForce RTX 3080 Laptop GPU | MSI Stealth GS66 12UGS i7-12700H, GeForce RTX 3070 Ti Laptop GPU | MSI Vector GP66 12UGS i9-12900H, GeForce RTX 3070 Ti Laptop GPU | |
|---|---|---|---|---|---|---|
| Noise | -5% | -2% | -8% | -12% | -2% | |
| desligado / ambiente * (dB) | 26 | 25.4 2% | 24 8% | 25.5 2% | 24 8% | 22.9 12% |
| Idle Minimum * (dB) | 26 | 26.2 -1% | 24 8% | 25.5 2% | 31 -19% | 23.4 10% |
| Idle Average * (dB) | 27 | 26.2 3% | 24 11% | 25.5 6% | 32 -19% | 23.4 13% |
| Idle Maximum * (dB) | 29 | 28.4 2% | 27.76 4% | 37.1 -28% | 35 -21% | 27.4 6% |
| Load Average * (dB) | 37 | 44.7 -21% | 38.81 -5% | 39.2 -6% | 48 -30% | 36 3% |
| Witcher 3 ultra * (dB) | 44 | 44.7 -2% | 54.2 -23% | 50.5 -15% | 43 2% | 58.2 -32% |
| Load Maximum * (dB) | 45 | 51.9 -15% | 54.18 -20% | 51.8 -15% | 48 -7% | 58 -29% |
* ... menor é melhor
Temperatura
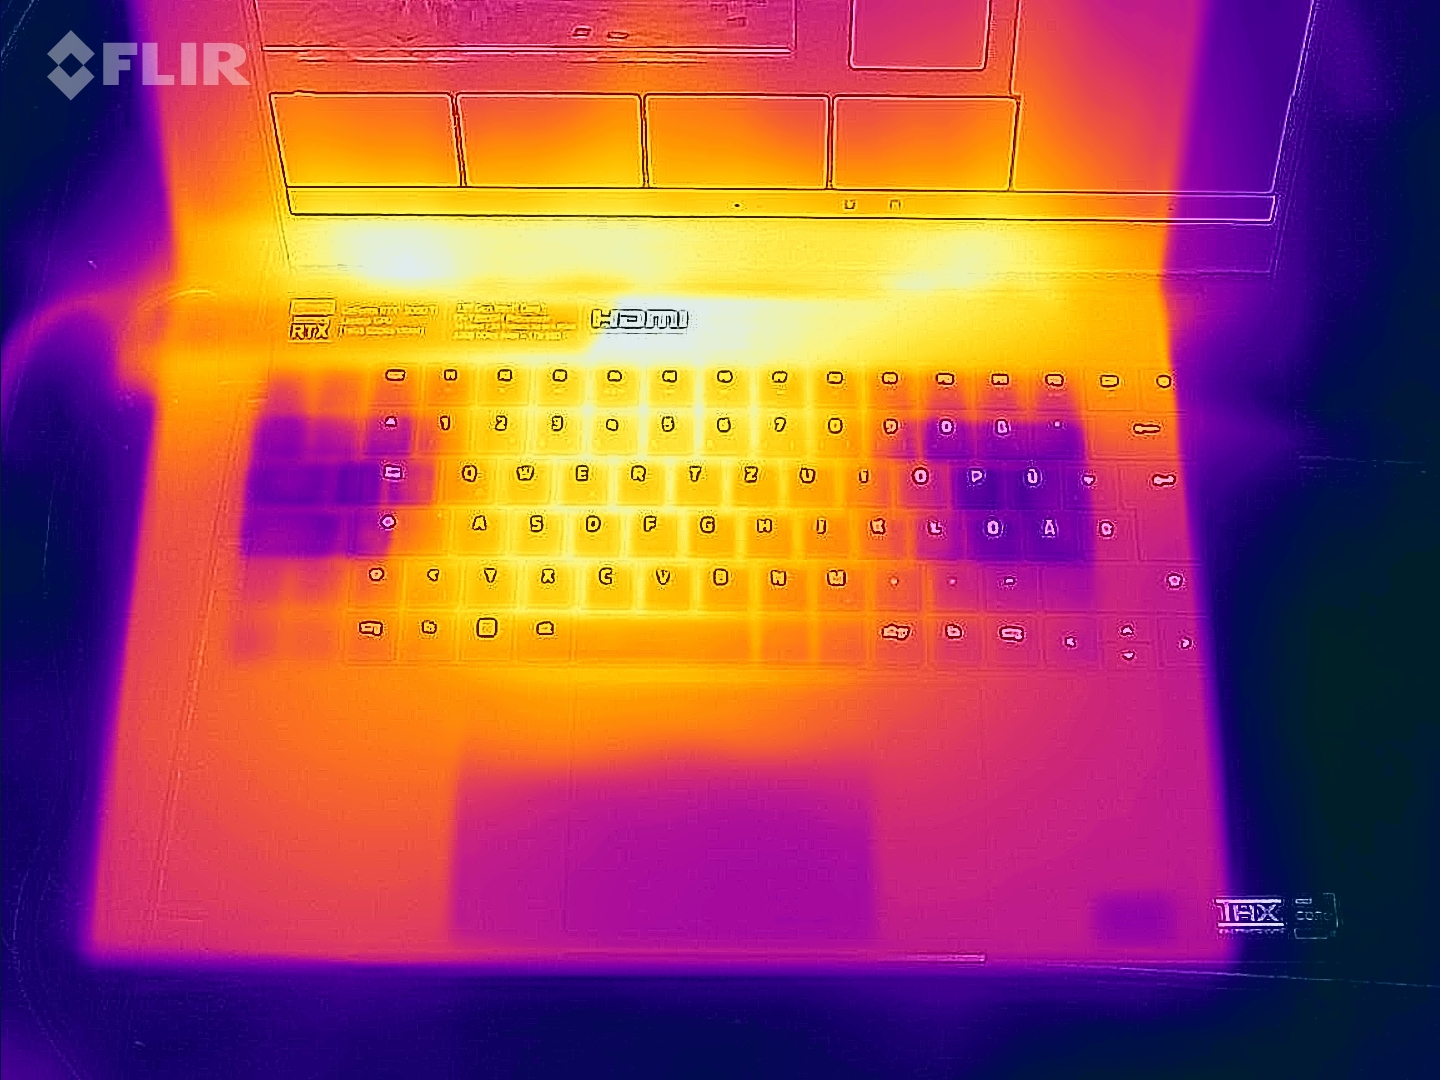
Devido à construção metálica e aos componentes potentes, o case se torna relativamente quente sob carga moderada. O laptop também aquece fortemente através das superfícies de controle quando se joga The Witcher 3, por exemplo.
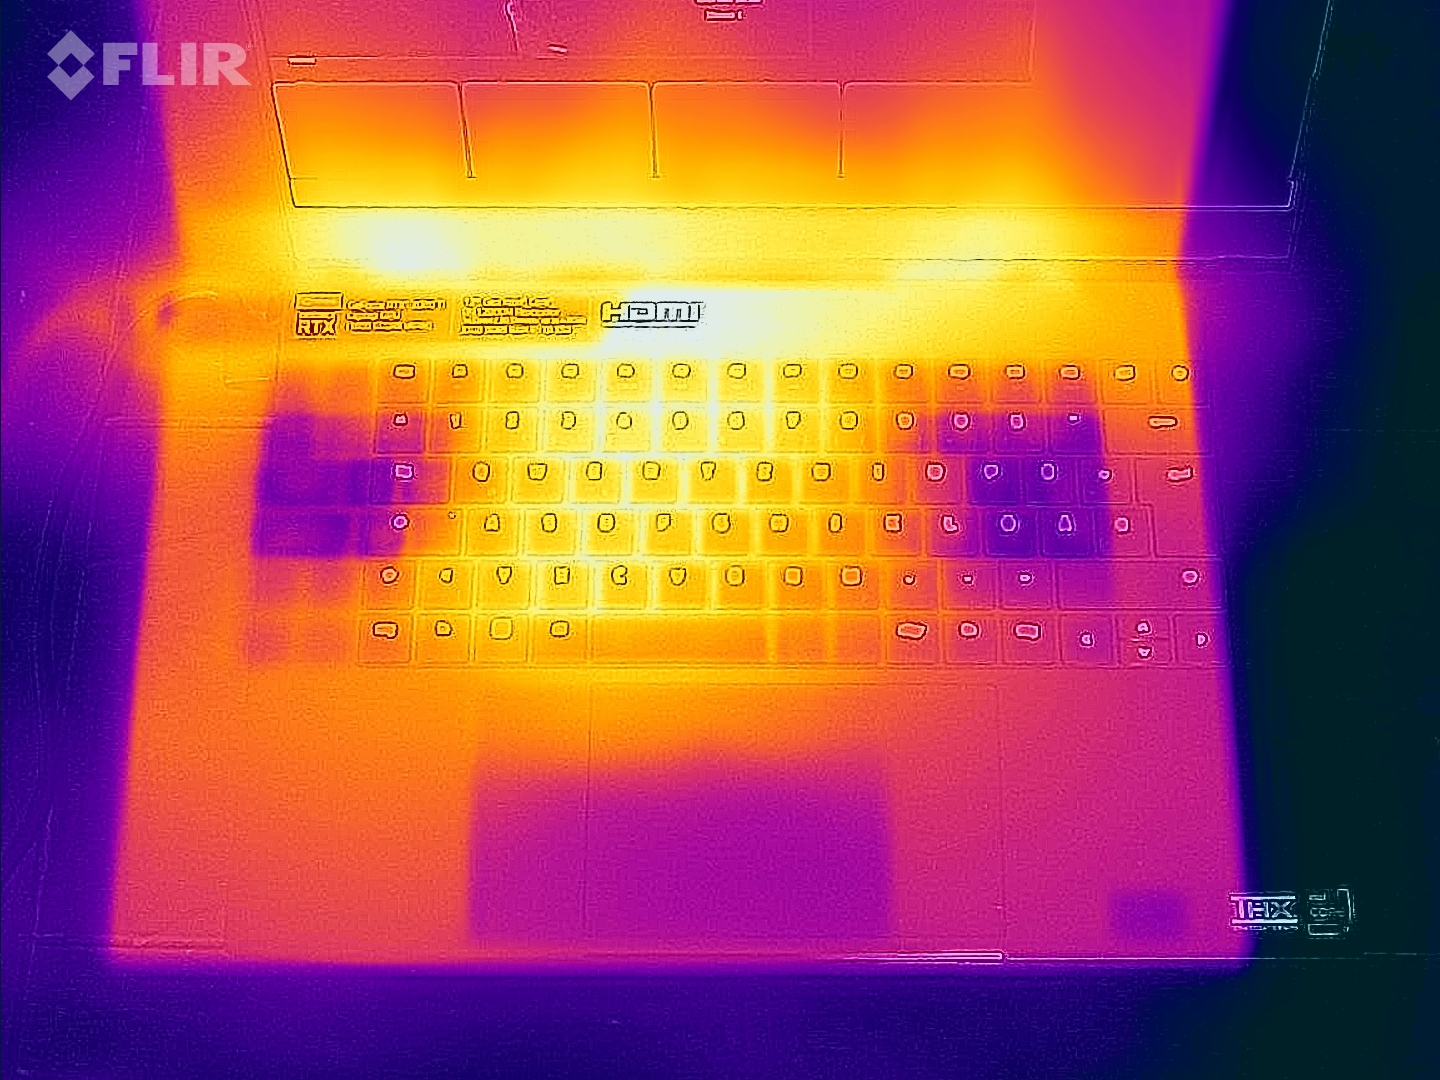
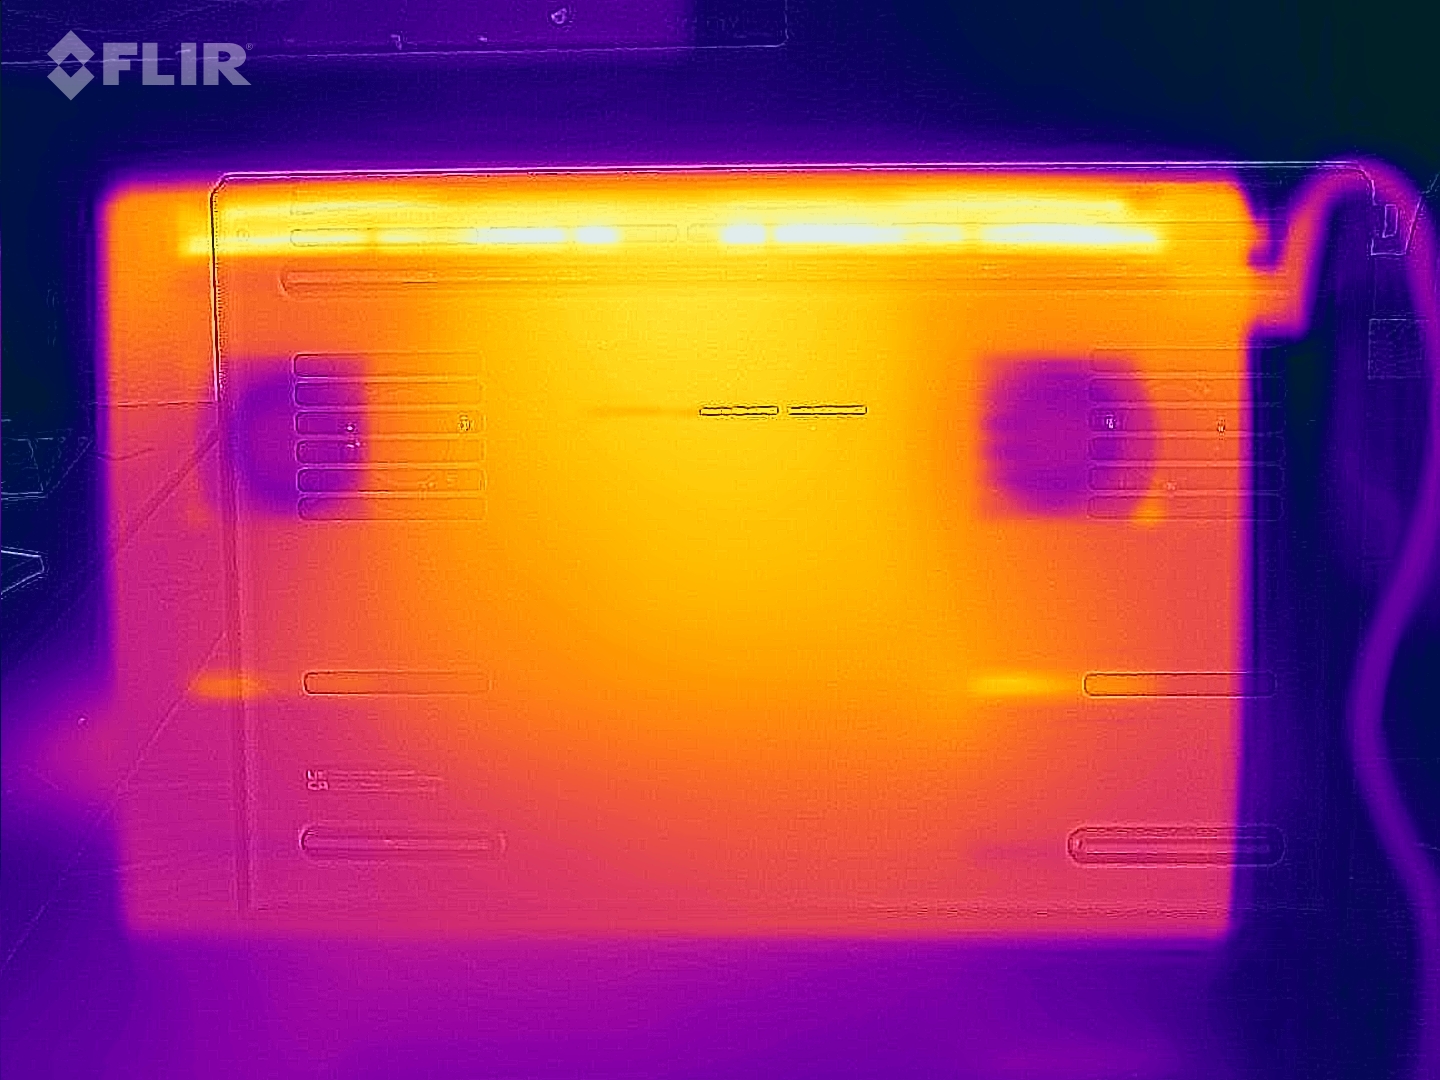
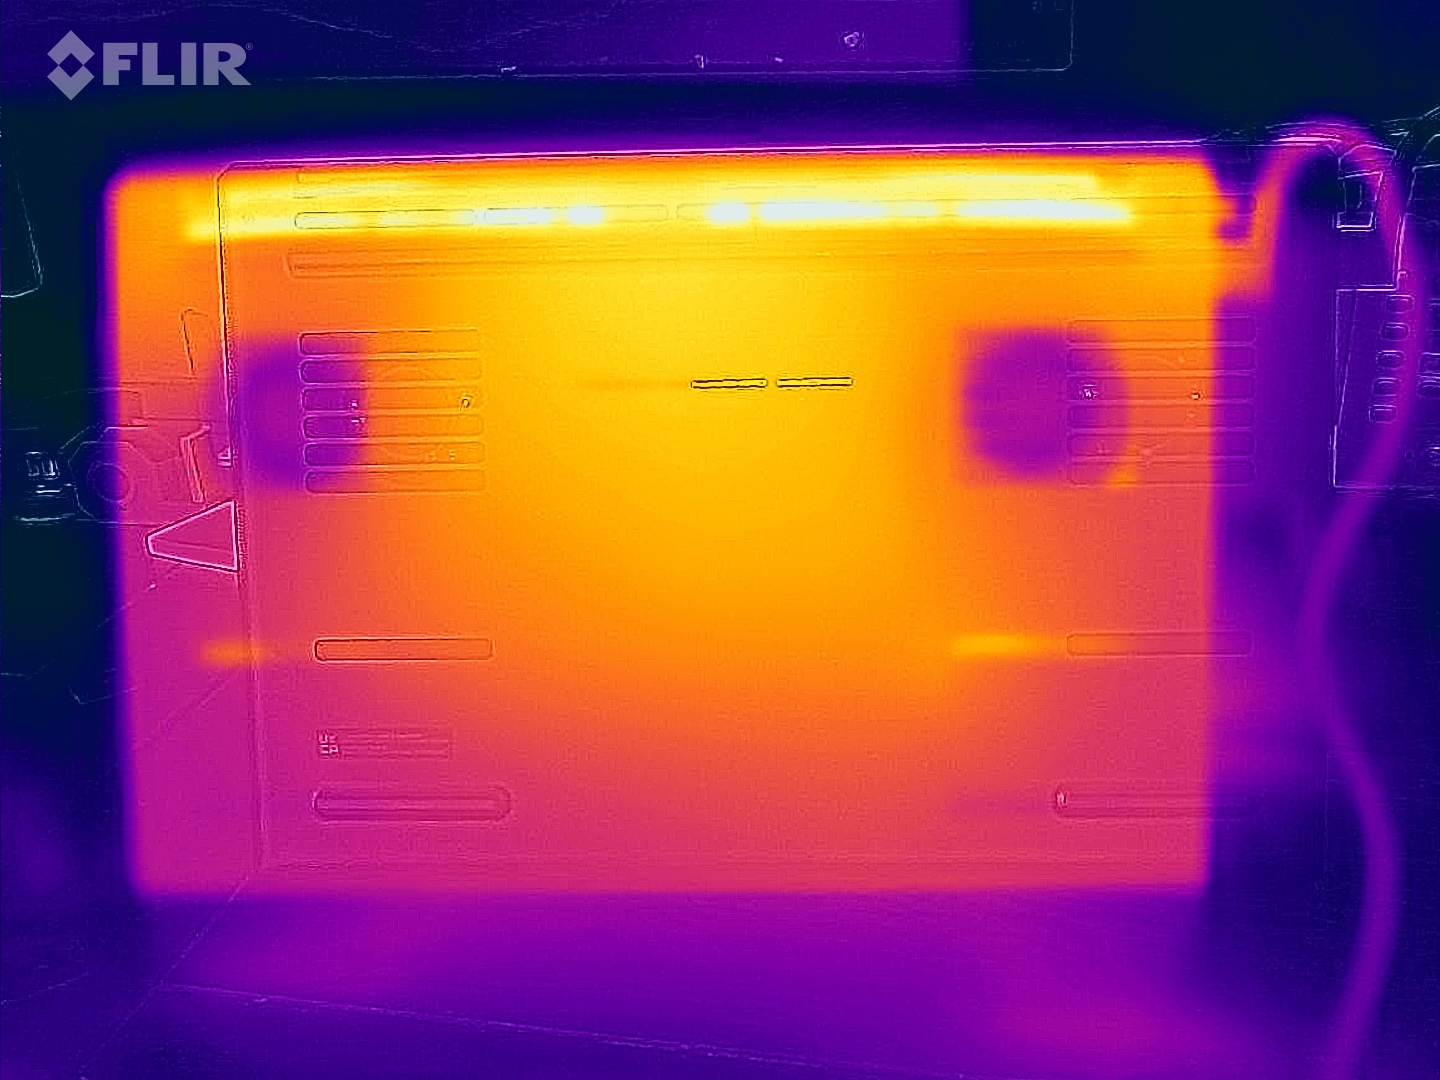
(-) A temperatura máxima no lado superior é 53 °C / 127 F, em comparação com a média de 40.4 °C / 105 F , variando de 21.2 a 68.8 °C para a classe Gaming.
(-) A parte inferior aquece até um máximo de 53 °C / 127 F, em comparação com a média de 43.2 °C / 110 F
(±) Em uso inativo, a temperatura média para o lado superior é 33.2 °C / 92 F, em comparação com a média do dispositivo de 33.9 °C / ### class_avg_f### F.
(-) Jogando The Witcher 3, a temperatura média para o lado superior é 45.2 °C / 113 F, em comparação com a média do dispositivo de 33.9 °C / ## #class_avg_f### F.
(-) Os apoios para as mãos e o touchpad podem ficar muito quentes ao toque, com um máximo de 43 °C / 109.4 F.
(-) A temperatura média da área do apoio para as mãos de dispositivos semelhantes foi 28.8 °C / 83.8 F (-14.2 °C / -25.6 F).
| Razer Blade 15 Advanced Model Early 2022 Intel Core i7-12800H, NVIDIA GeForce RTX 3080 Ti Laptop GPU | Razer Blade 15 2022 Intel Core i7-12800H, NVIDIA GeForce RTX 3080 Ti Laptop GPU | Schenker XMG Neo 15 E22 (Early 2022, RTX 3080 Ti) Intel Core i7-12700H, NVIDIA GeForce RTX 3080 Ti Laptop GPU | Asus ROG Strix Scar 15 G533QS AMD Ryzen 9 5900HX, NVIDIA GeForce RTX 3080 Laptop GPU | MSI Stealth GS66 12UGS Intel Core i7-12700H, NVIDIA GeForce RTX 3070 Ti Laptop GPU | MSI Vector GP66 12UGS Intel Core i9-12900H, NVIDIA GeForce RTX 3070 Ti Laptop GPU | |
|---|---|---|---|---|---|---|
| Heat | 3% | -3% | 8% | 11% | 12% | |
| Maximum Upper Side * (°C) | 53 | 50 6% | 52 2% | 43.4 18% | 54 -2% | 40.2 24% |
| Maximum Bottom * (°C) | 53 | 47 11% | 68 -28% | 48.2 9% | 59 -11% | 43.8 17% |
| Idle Upper Side * (°C) | 36 | 37.4 -4% | 32 11% | 35.2 2% | 26 28% | 34.8 3% |
| Idle Bottom * (°C) | 38 | 38.4 -1% | 36 5% | 37 3% | 27 29% | 37 3% |
* ... menor é melhor
Teste de estresse
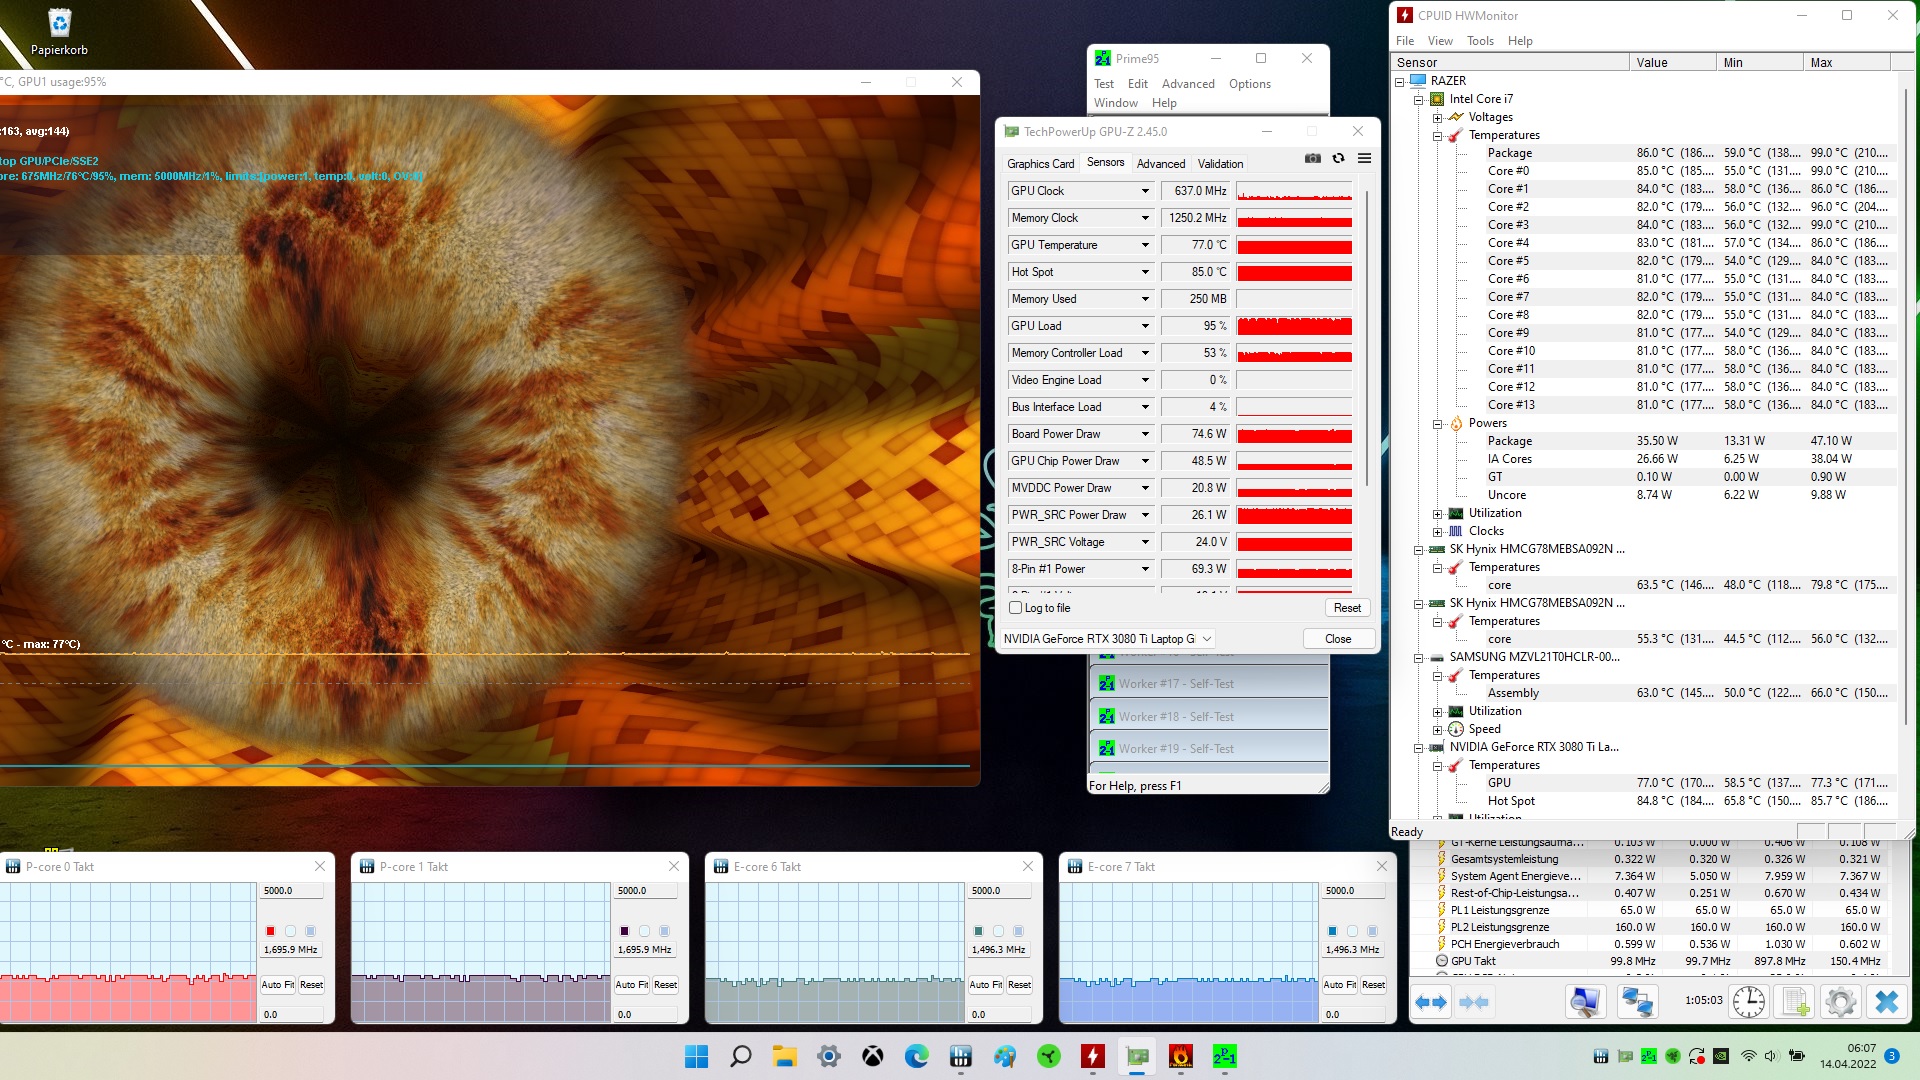
Em nosso teste de estresse, carregamos o sistema simultaneamente com Prime95 e FurMark. A CPU começou o teste com velocidades de relógio P e E-core de cerca de 2 e 1,9 GHz, respectivamente, e estabilizou em 1,7 e 1,5 GHz, respectivamente, e em torno de 85°C durante períodos de tempo mais longos. A GPU começou em torno de 1.100 MHz e eventualmente nivelou-se em 640 MHz e a uma temperatura central de 77°C
Oradores
Os alto-falantes estão sintonizados de forma desigual. O diagrama de ruído rosa mostra a queda de freqüência significativamente mais plana do MacBook Pro 16, que é um dos melhores laptops desta disciplina. Os dispositivos de áudio externos podem ser conectados via Bluetooth, USB ou pela porta de 3,5mm
Razer Blade 15 Advanced Model Early 2022 análise de áudio
(+) | os alto-falantes podem tocar relativamente alto (###valor### dB)
Graves 100 - 315Hz
(-) | quase nenhum baixo - em média 21.8% menor que a mediana
(±) | a linearidade dos graves é média (9.2% delta para a frequência anterior)
Médios 400 - 2.000 Hz
(+) | médios equilibrados - apenas 4.1% longe da mediana
(+) | médios são lineares (3.4% delta para frequência anterior)
Altos 2 - 16 kHz
(+) | agudos equilibrados - apenas 3.3% longe da mediana
(+) | os máximos são lineares (6.8% delta da frequência anterior)
Geral 100 - 16.000 Hz
(±) | a linearidade do som geral é média (15% diferença em relação à mediana)
Comparado com a mesma classe
» 32% de todos os dispositivos testados nesta classe foram melhores, 6% semelhantes, 62% piores
» O melhor teve um delta de 6%, a média foi 18%, o pior foi 132%
Comparado com todos os dispositivos testados
» 21% de todos os dispositivos testados foram melhores, 4% semelhantes, 75% piores
» O melhor teve um delta de 4%, a média foi 23%, o pior foi 134%
Apple MacBook Pro 16 2021 M1 Pro análise de áudio
(+) | os alto-falantes podem tocar relativamente alto (###valor### dB)
Graves 100 - 315Hz
(+) | bons graves - apenas 3.8% longe da mediana
(+) | o baixo é linear (5.2% delta para a frequência anterior)
Médios 400 - 2.000 Hz
(+) | médios equilibrados - apenas 1.3% longe da mediana
(+) | médios são lineares (2.1% delta para frequência anterior)
Altos 2 - 16 kHz
(+) | agudos equilibrados - apenas 1.9% longe da mediana
(+) | os máximos são lineares (2.7% delta da frequência anterior)
Geral 100 - 16.000 Hz
(+) | o som geral é linear (4.6% diferença em relação à mediana)
Comparado com a mesma classe
» 0% de todos os dispositivos testados nesta classe foram melhores, 0% semelhantes, 100% piores
» O melhor teve um delta de 5%, a média foi 17%, o pior foi 45%
Comparado com todos os dispositivos testados
» 0% de todos os dispositivos testados foram melhores, 0% semelhantes, 100% piores
» O melhor teve um delta de 4%, a média foi 23%, o pior foi 134%
Gerenciamento de energia - Sem registros de tempo de execução
Consumo de energia
Os valores de consumo ocioso de 19 W em média são significativamente mais baixos do que os dos valores anteriormente revisados Lâmina Razer 15 (36.4 W). Isto é provavelmente devido ao perfil de desempenho mais econômico e à menor resolução de exibição. Na tela Witcher 3o consumo total é cerca de 13% menor.
O consumo máximo da fonte de alimentação de 230 W durante a execução simultânea de Prime95 e FurMark foi de 179 W. A fonte de alimentação de 230 W é suficientemente grande.
| desligado | |
| Ocioso | |
| Carga |
|
Key:
min: | |
| Razer Blade 15 Advanced Model Early 2022 i7-12800H, GeForce RTX 3080 Ti Laptop GPU | Razer Blade 15 2022 i7-12800H, GeForce RTX 3080 Ti Laptop GPU | Schenker XMG Neo 15 E22 (Early 2022, RTX 3080 Ti) i7-12700H, GeForce RTX 3080 Ti Laptop GPU | Asus ROG Strix Scar 15 G533QS R9 5900HX, GeForce RTX 3080 Laptop GPU | MSI Stealth GS66 12UGS i7-12700H, GeForce RTX 3070 Ti Laptop GPU | MSI Vector GP66 12UGS i9-12900H, GeForce RTX 3070 Ti Laptop GPU | Média da turma Gaming | |
|---|---|---|---|---|---|---|---|
| Power Consumption | -48% | -14% | -2% | 5% | -34% | -4% | |
| Idle Minimum * (Watt) | 17 | 33.2 -95% | 14 18% | 11.2 34% | 11 35% | 17.5 -3% | 13 ? 24% |
| Idle Average * (Watt) | 19 | 36.4 -92% | 18 5% | 16.4 14% | 16 16% | 20.1 -6% | 19 ? -0% |
| Idle Maximum * (Watt) | 25 | 37.6 -50% | 19 24% | 29.4 -18% | 23 8% | 47.3 -89% | 24.6 ? 2% |
| Load Average * (Watt) | 108 | 116.7 -8% | 115 -6% | 106.2 2% | 110 -2% | 107.3 1% | 110.7 ? -3% |
| Witcher 3 ultra * (Watt) | 150 | 172 -15% | 228 -52% | 189 -26% | 151 -1% | 225 -50% | |
| Load Maximum * (Watt) | 179 | 228.6 -28% | 307 -72% | 213.6 -19% | 230 -28% | 277.7 -55% | 259 ? -45% |
* ... menor é melhor
Power Consumption Witcher 3 / Stress test
{
Vida útil da bateria
Em nosso teste WLAN do mundo real, a Lâmina 15 atinge um tempo de execução de 4:53 h. Quase nenhum concorrente consegue acompanhar as 7:20 h do Asus ROG Strix Scar 15enquanto o MSI Vetor GP66 também oferece um tempo de funcionamento mais longo, apesar de uma bateria menor (65 Wh vs. 80 Wh).
| Razer Blade 15 Advanced Model Early 2022 i7-12800H, GeForce RTX 3080 Ti Laptop GPU, 80 Wh | Razer Blade 15 2022 i7-12800H, GeForce RTX 3080 Ti Laptop GPU, 80 Wh | Schenker XMG Neo 15 E22 (Early 2022, RTX 3080 Ti) i7-12700H, GeForce RTX 3080 Ti Laptop GPU, 93 Wh | Asus ROG Strix Scar 15 G533QS R9 5900HX, GeForce RTX 3080 Laptop GPU, 90 Wh | MSI Stealth GS66 12UGS i7-12700H, GeForce RTX 3070 Ti Laptop GPU, 99.9 Wh | MSI Vector GP66 12UGS i9-12900H, GeForce RTX 3070 Ti Laptop GPU, 65 Wh | Média da turma Gaming | |
|---|---|---|---|---|---|---|---|
| Duração da bateria | 0% | 48% | 19% | -5% | -12% | 16% | |
| Reader / Idle (h) | 8.1 | 11.1 37% | 7.8 -4% | 7.9 -2% | 8.27 ? 2% | ||
| H.264 (h) | 5.9 | 6.9 17% | 8.32 ? 41% | ||||
| WiFi v1.3 (h) | 4.9 | 4.9 0% | 6.7 37% | 7.3 49% | 5.4 10% | 5.7 16% | 7.11 ? 45% |
| Load (h) | 2 | 3.8 90% | 1.4 -30% | 1.6 -20% | 1 -50% | 1.502 ? -25% |
Pro
Contra
Veredicto
O Blade 15 é um laptop muito compacto e bem feito. A conectividade é tão moderna quanto os novos chips da Intel e Nvidia e é bem completada por um rápido leitor de cartões SD. A tela oferece uma representação visual incrivelmente suave e um brilho máximo decente, mas, ao contrário do modelo QHD, falta o Advanced Optimus e a cobertura do espaço de cores poderia ser um pouco melhor. Considerando o grupo alvo, no entanto, este último é aceitável
As referências no modo "Equilibrado" dão uma imagem interessante. Na prática, o desempenho é frequentemente mais do que suficiente e o nível de ruído é significativamente menor. Entretanto, as superfícies do case ainda aquecem muito fortemente.
Se você está procurando um laptop elegante e compacto com um display excepcionalmente rápido, não procure mais. Entretanto, os usuários sensíveis à temperatura devem ser cautelosos aqui
Outro ponto de crítica são os alto-falantes: Muitos laptops mais baratos oferecem melhor som
Cicatriz ROG Strix Scar 15 da Asus é uma alternativa menos compacta, baseada em AMD para o Razer Blade 15, com tempos de funcionamento da bateria muito mais longos. Para usuários que estão frequentemente em movimento e precisam de muito desempenho, o Razer Blade 15 ainda pode ser a escolha certa.
Preço e Disponibilidade
Nossa configuração da Razer Blade 15 está atualmente disponível em B&H Photo Video por US$ 3.699,99 ou através do site oficial Razer pelo mesmo preço.
Razer Blade 15 Advanced Model Early 2022
- 05/04/2022 v7 (old)
Marius Schell
Price comparison

