MSI Raider GE77 HX 12UHS em revisão: 4K caderno de jogos com desempenho superior

O MSI Raider GE77 HX 12UHS é voltado para jogadores e usuários criativos. Assim, nossa configuração está equipada com o mais moderno e poderoso hardware Core i9-12900HX CPU, GeForce Laptop RTX 3080 Ti GPU, 64 GB de RAM, e uma tela de 4K (17,3 polegadas). Nosso modelo custa cerca de 5.200 USD. Com o MSI Raider GE66 12UHSrecentemente, revisamos a versão de 15,6 polegadas. A concorrência consiste em laptops igualmente potentes (e caros), como o Alienware x17 R2 P48E, Medion Erazer Beast X30e o Lâmina Razer 17 (Início de 2022).
Possíveis concorrentes em comparação
Avaliação | Data | Modelo | Peso | Altura | Size | Resolução | Preço |
|---|---|---|---|---|---|---|---|
| 86.8 % v7 (old) | 07/2022 | MSI Raider GE77 HX 12UHS i9-12900HX, GeForce RTX 3080 Ti Laptop GPU | 3.1 kg | 25.9 mm | 17.30" | 3840x2160 | |
| 89.9 % v7 (old) | 07/2022 | Razer Blade 17 Early 2022 i9-12900H, GeForce RTX 3080 Ti Laptop GPU | 2.8 kg | 19.9 mm | 17.30" | 3840x2160 | |
| 89.2 % v7 (old) | 05/2022 | Alienware x17 R2 P48E i9-12900HK, GeForce RTX 3080 Ti Laptop GPU | 3.1 kg | 20.9 mm | 17.30" | 1920x1080 | |
| 86.7 % v7 (old) | 05/2022 | Medion Erazer Beast X30 i9-12900HK, GeForce RTX 3080 Ti Laptop GPU | 2.2 kg | 23 mm | 17.30" | 2560x1440 |
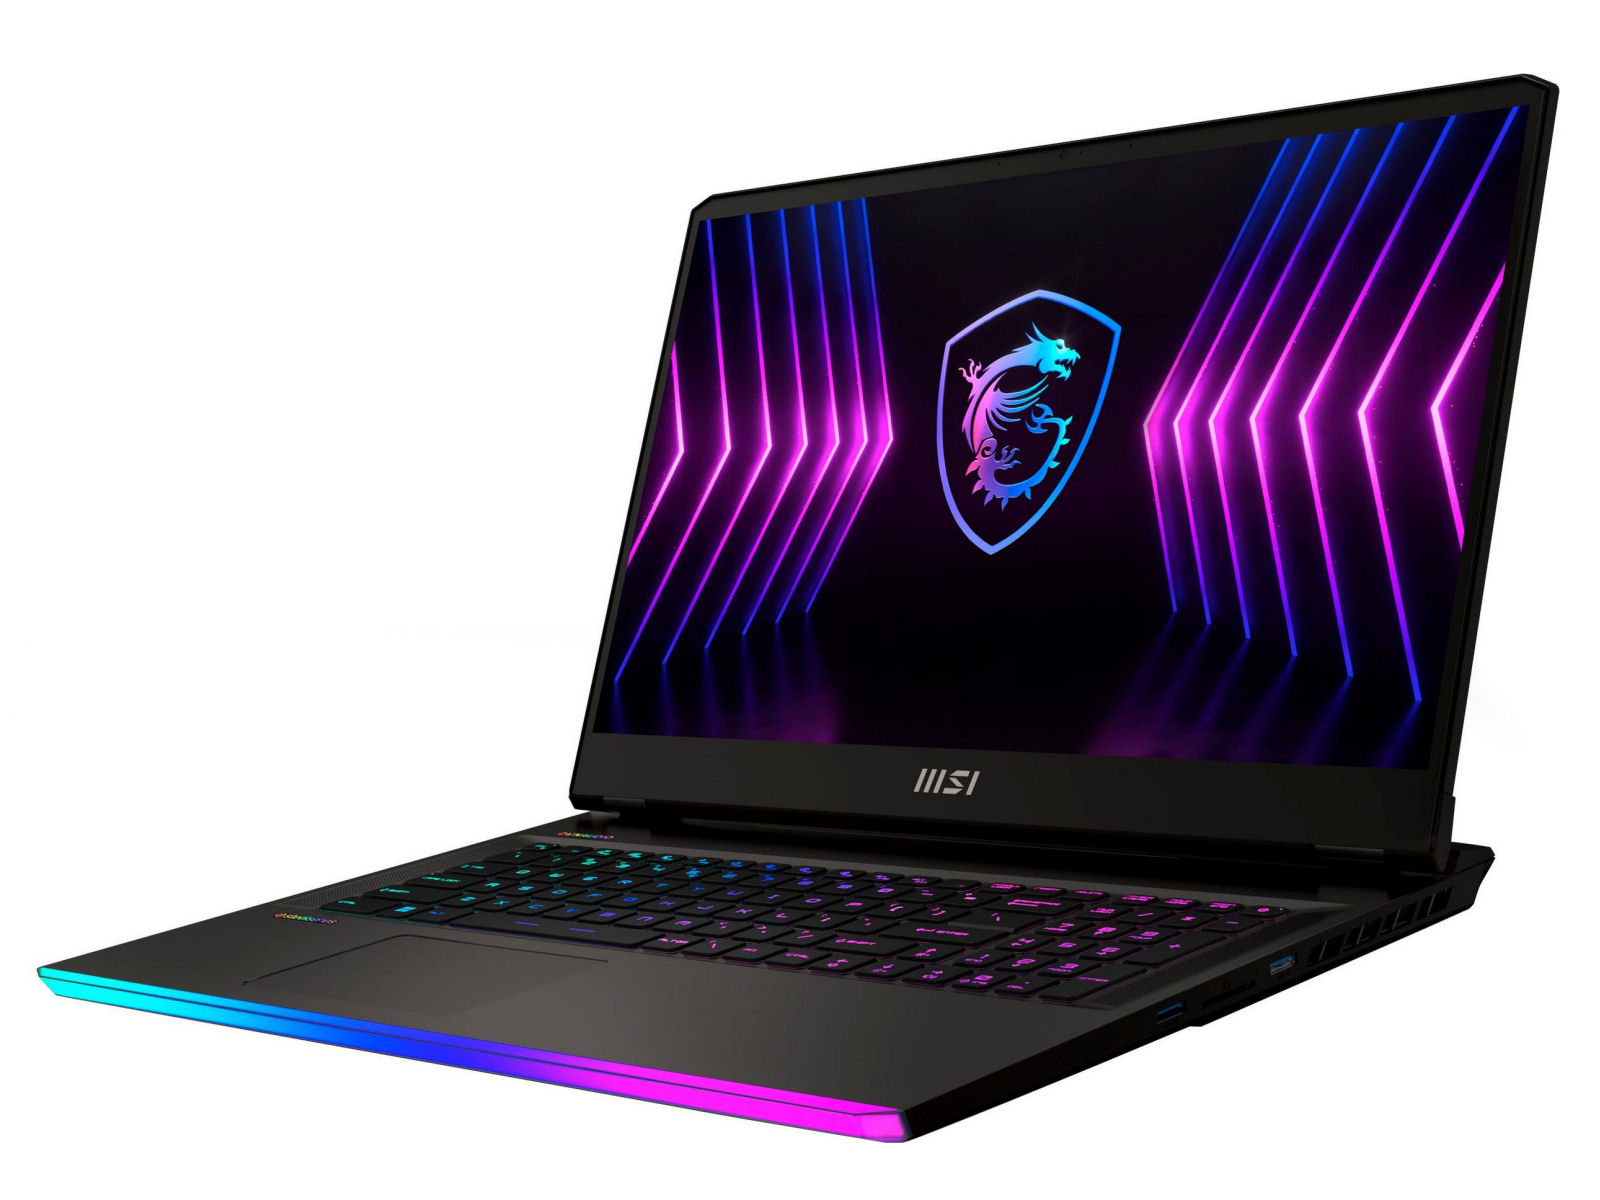
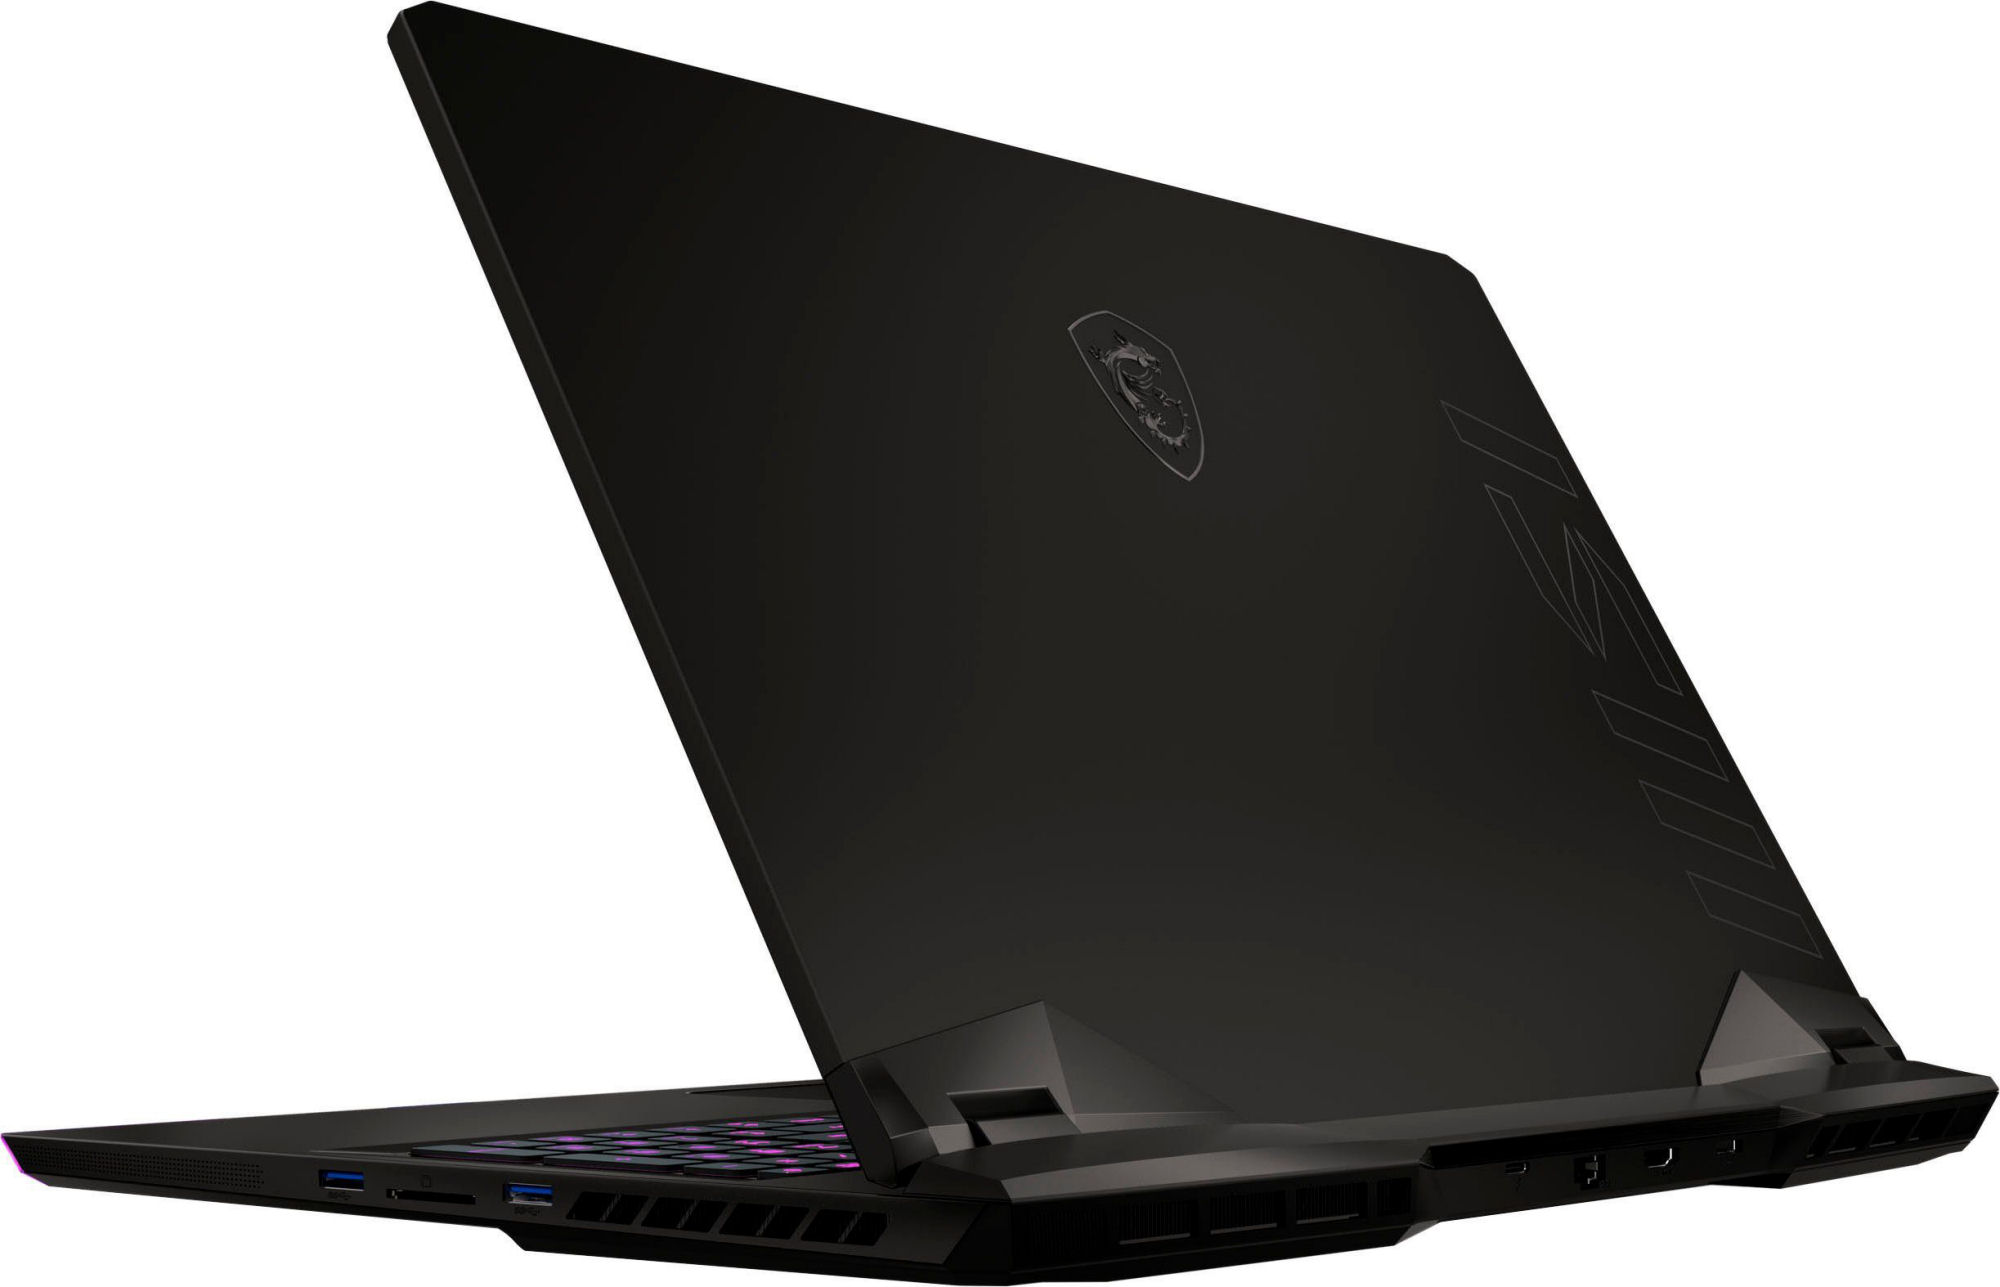
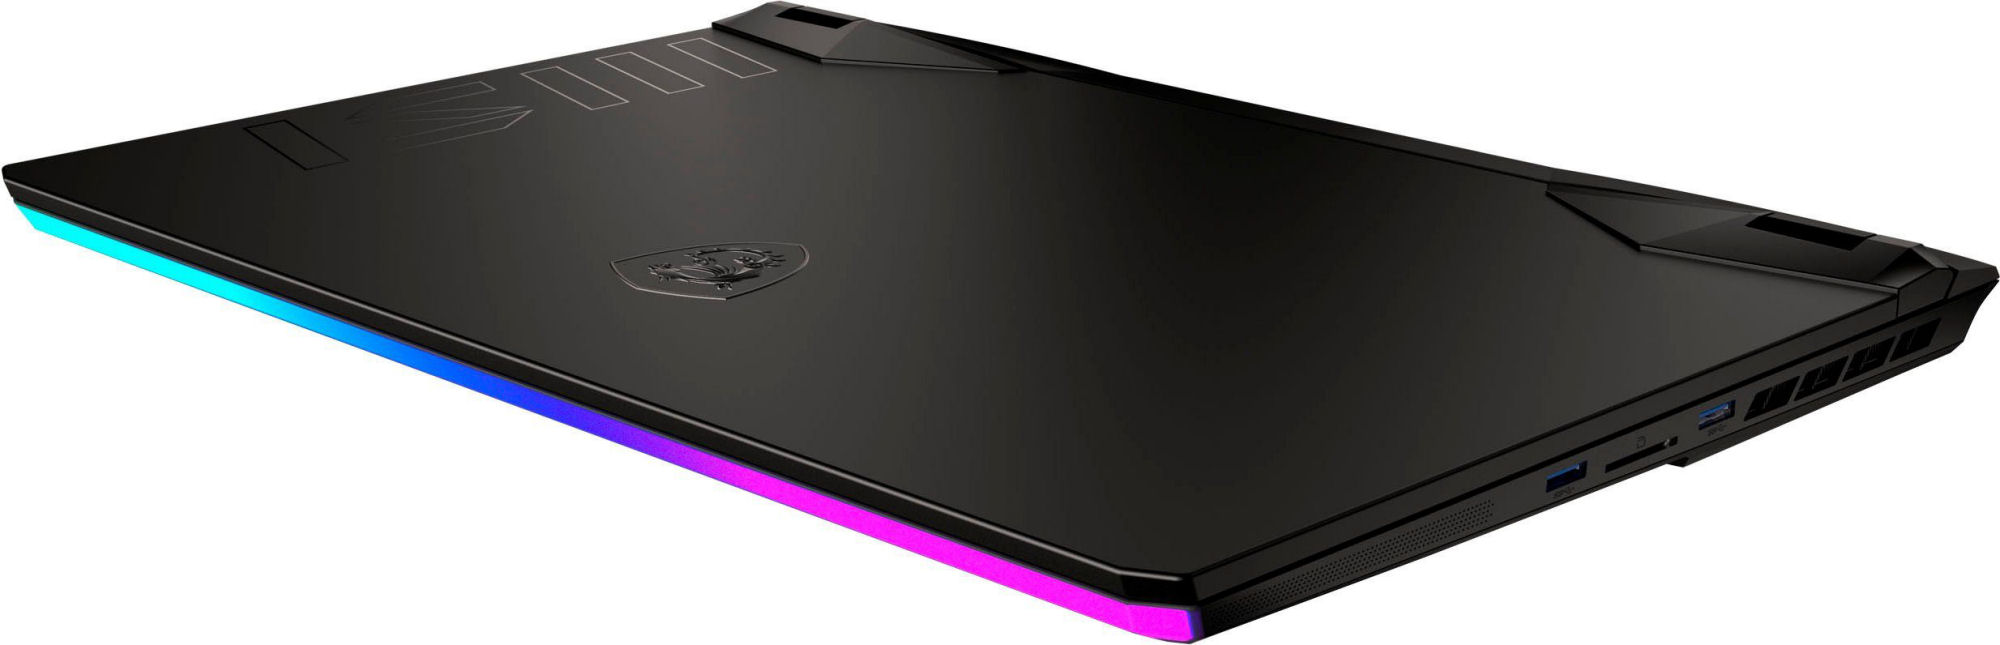
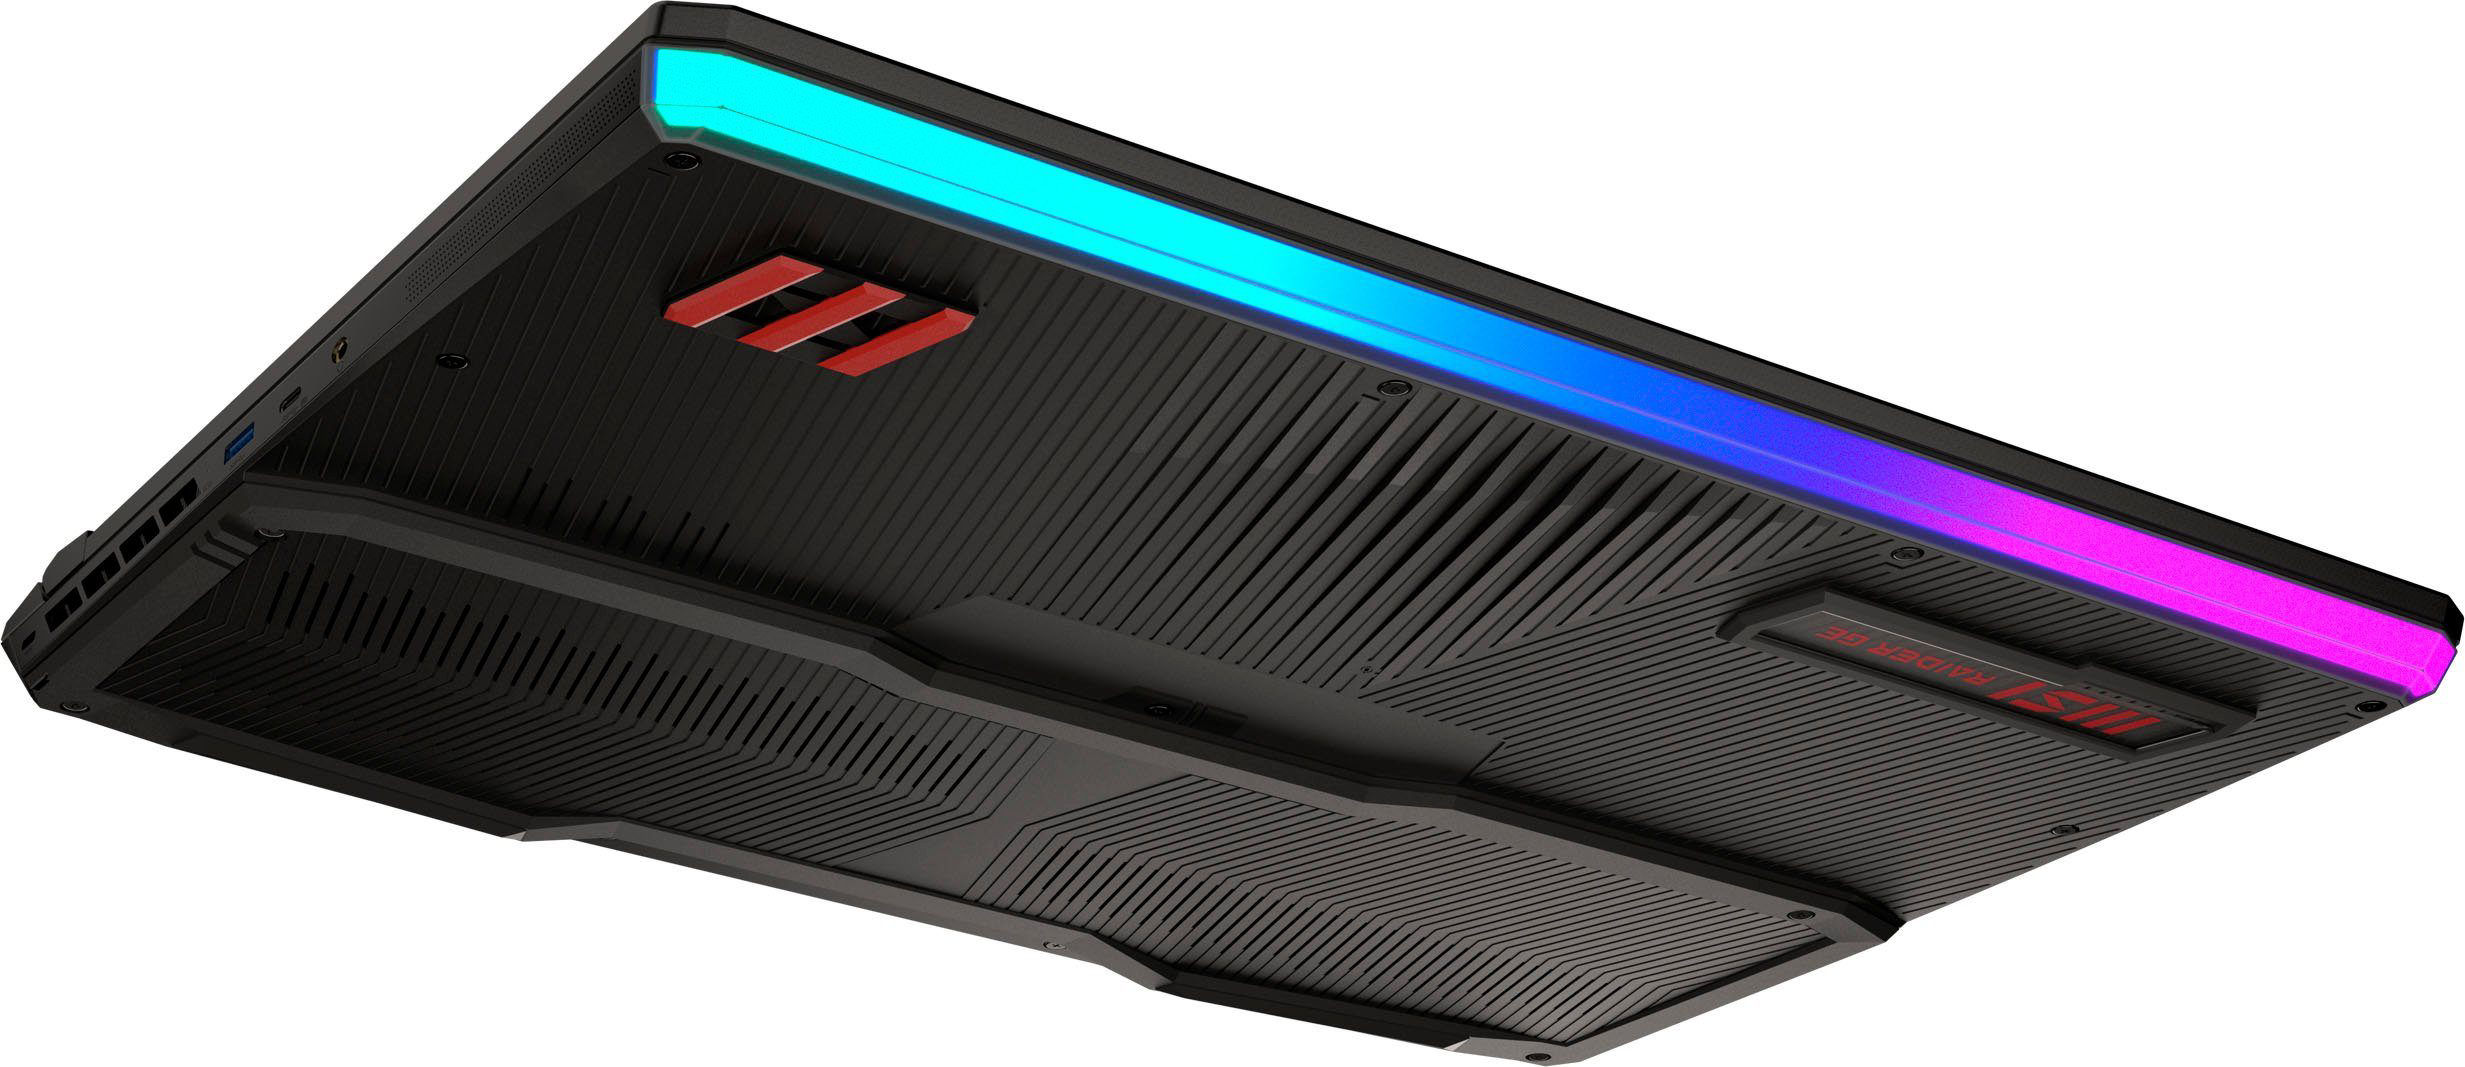
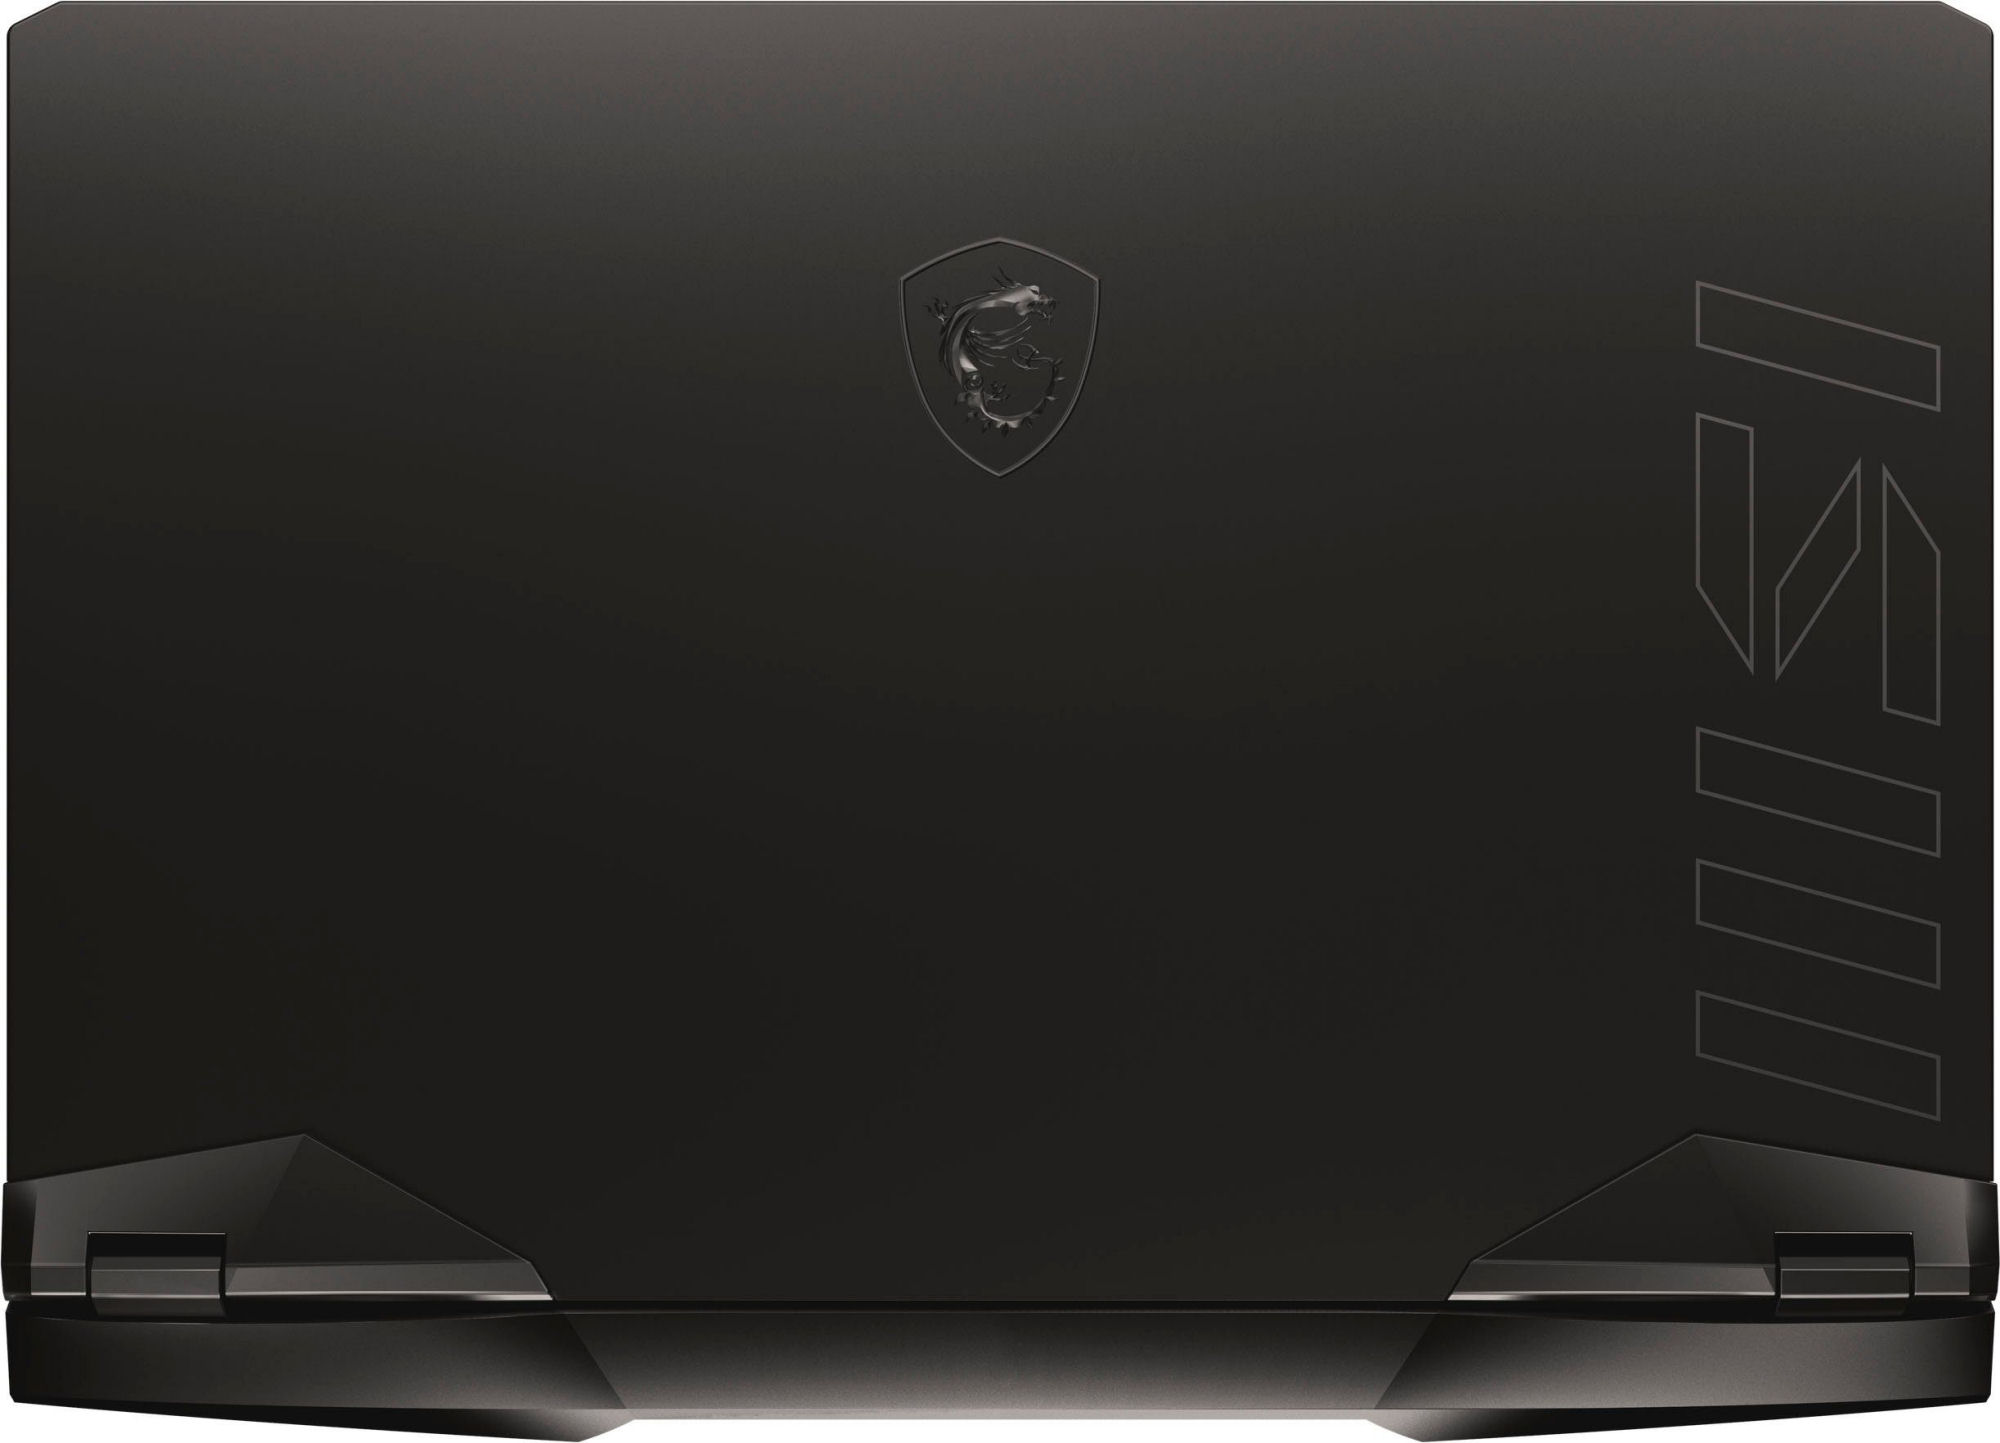
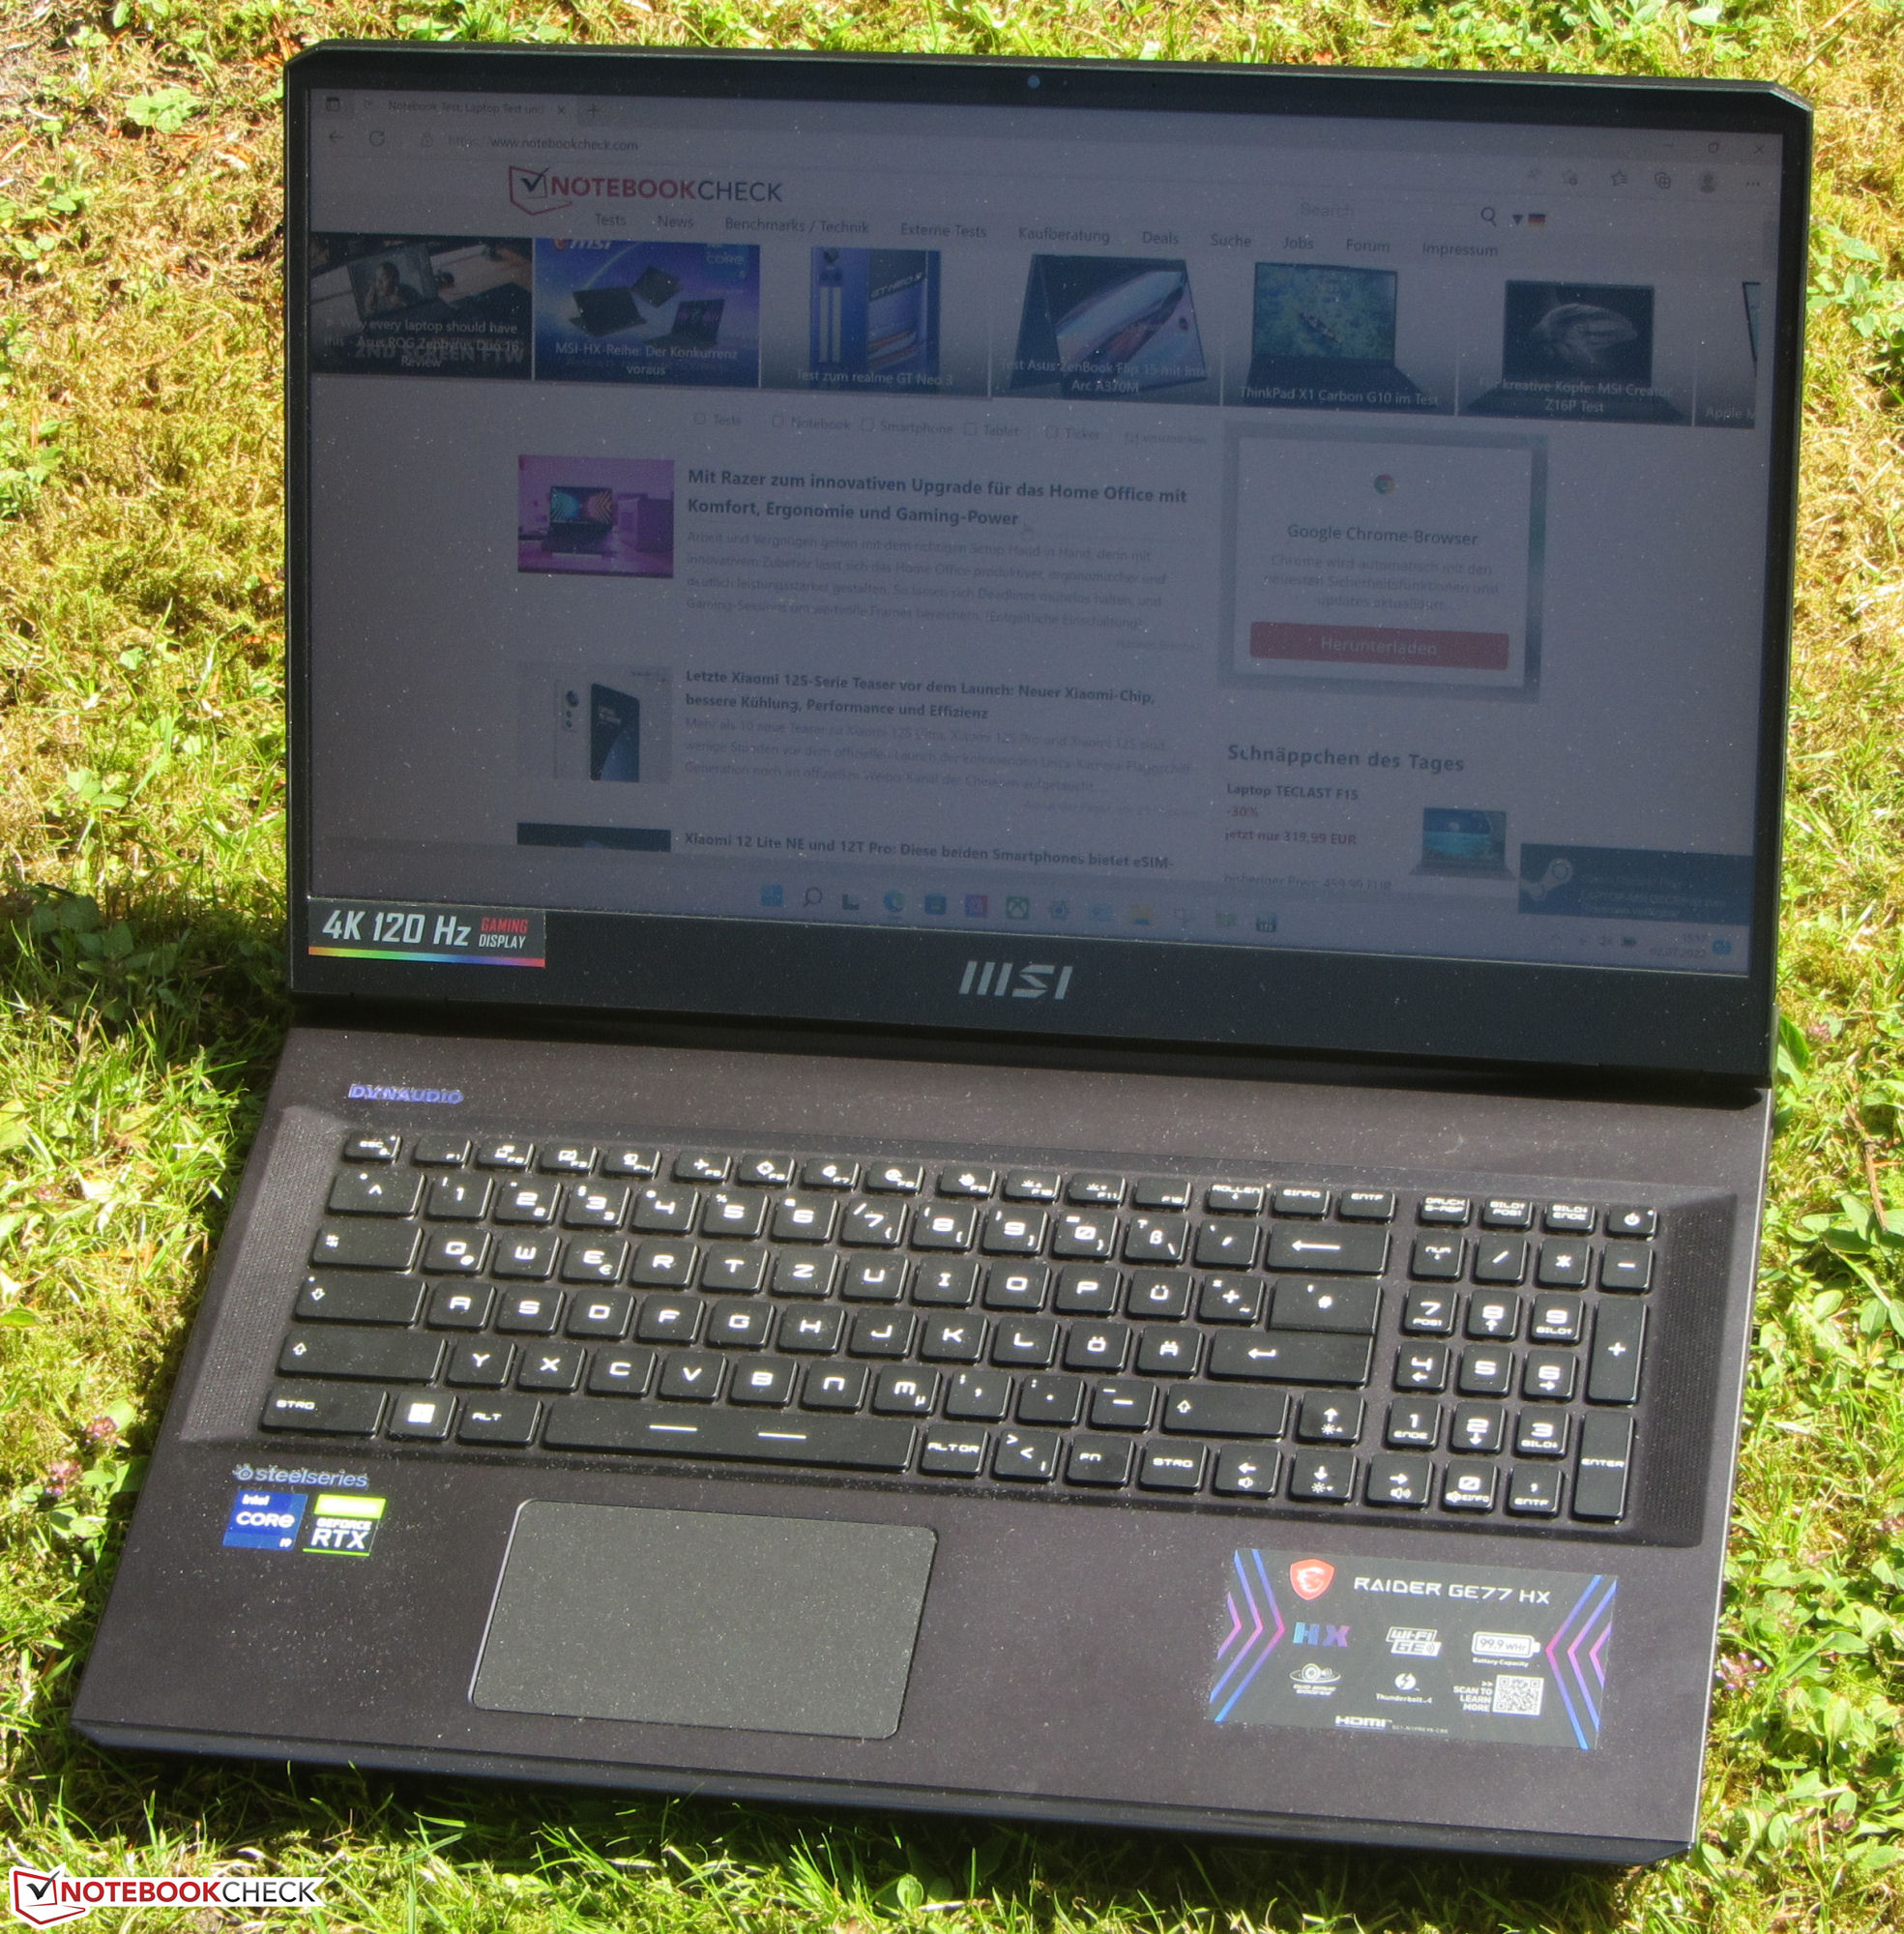
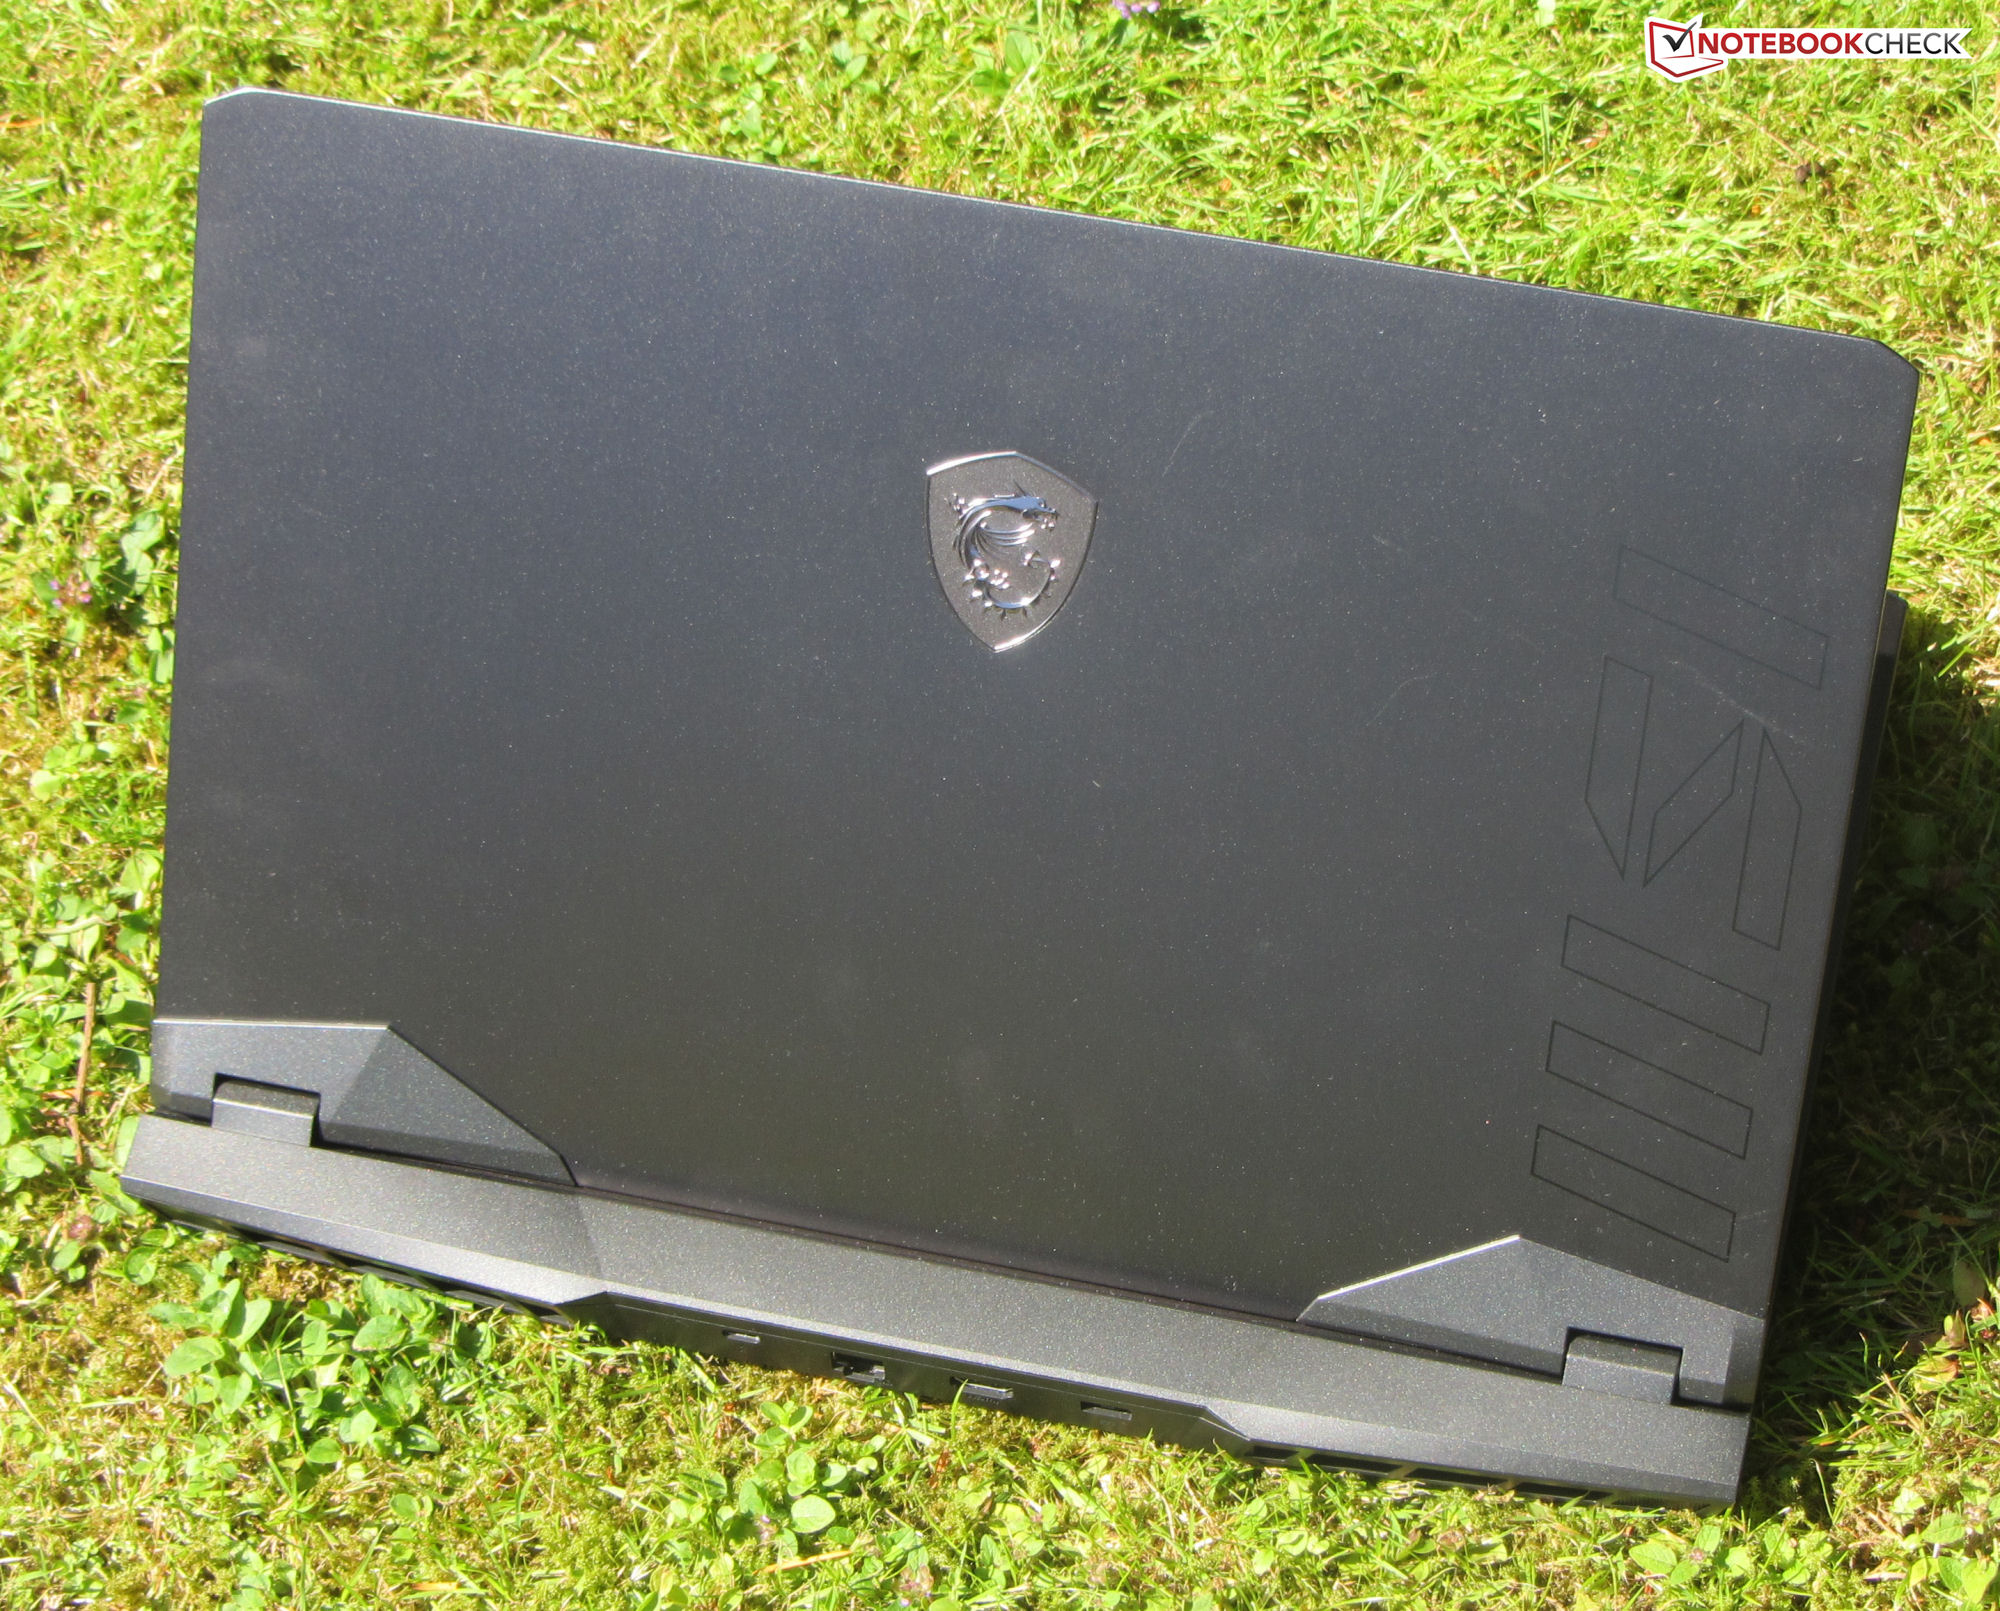
Estojo - GE77 com um sutil chassi metálico
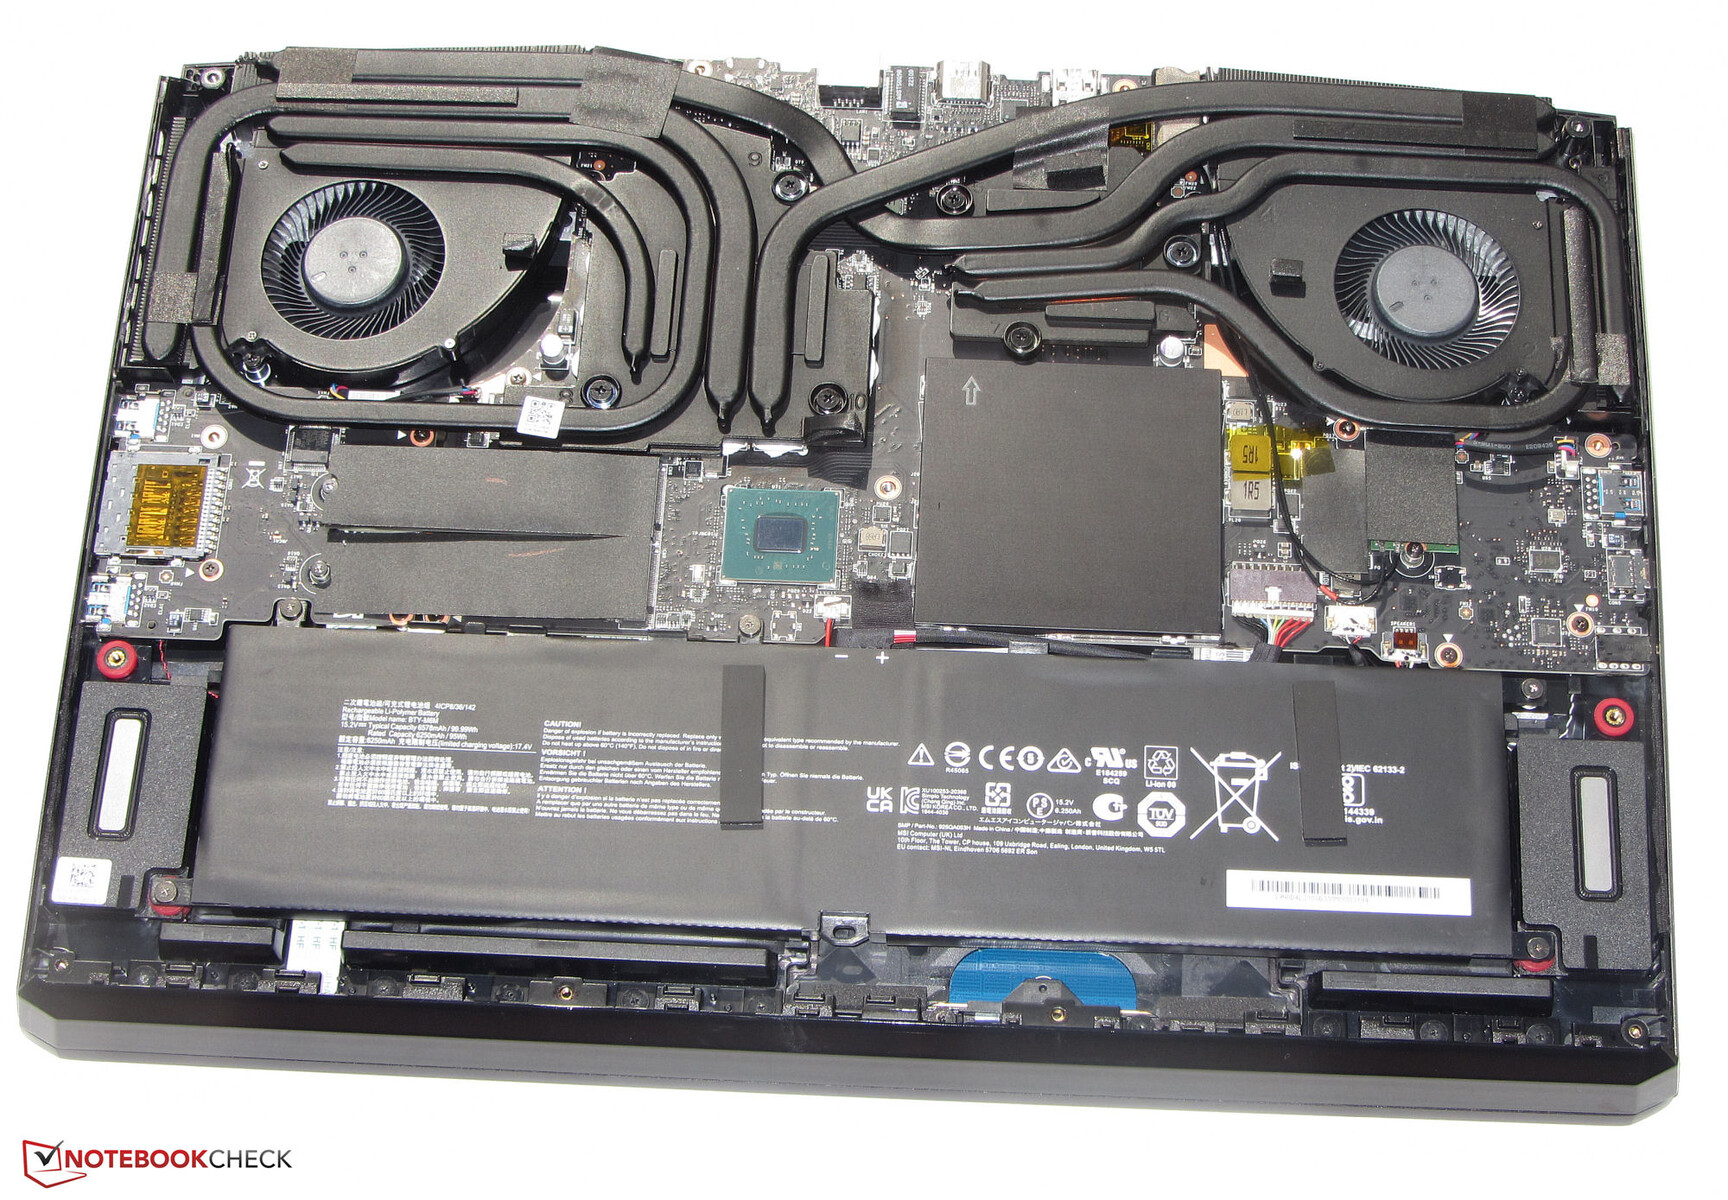
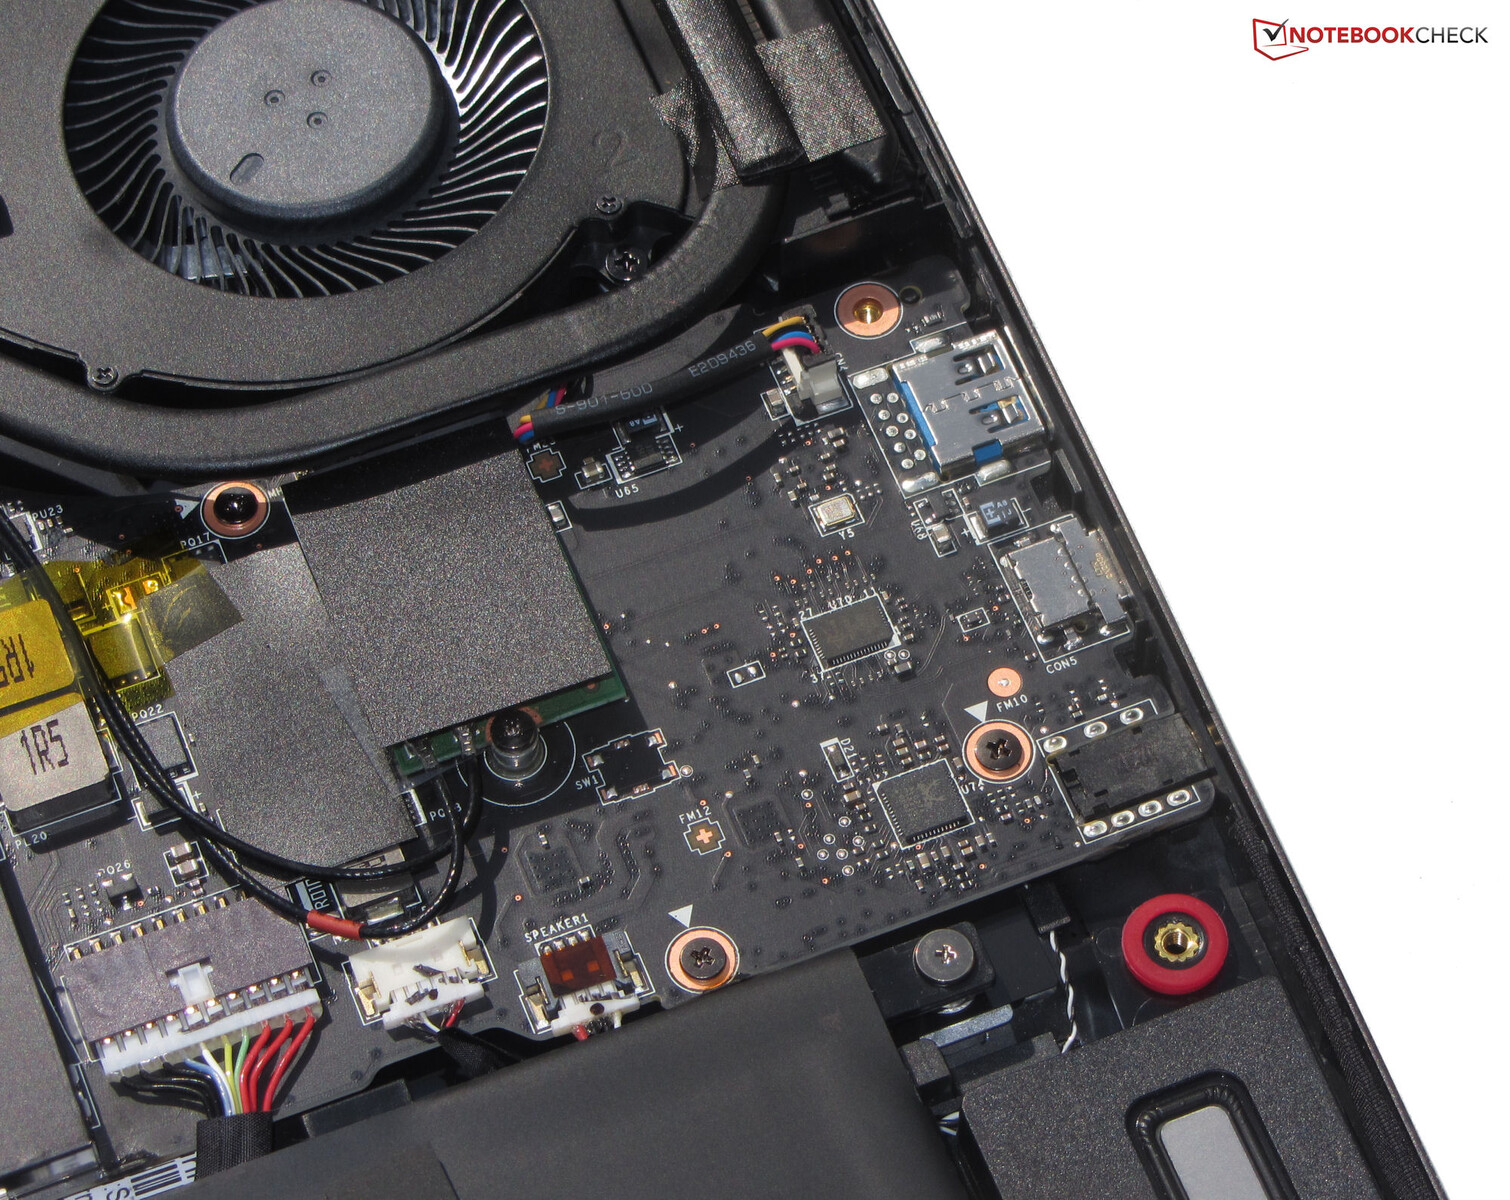
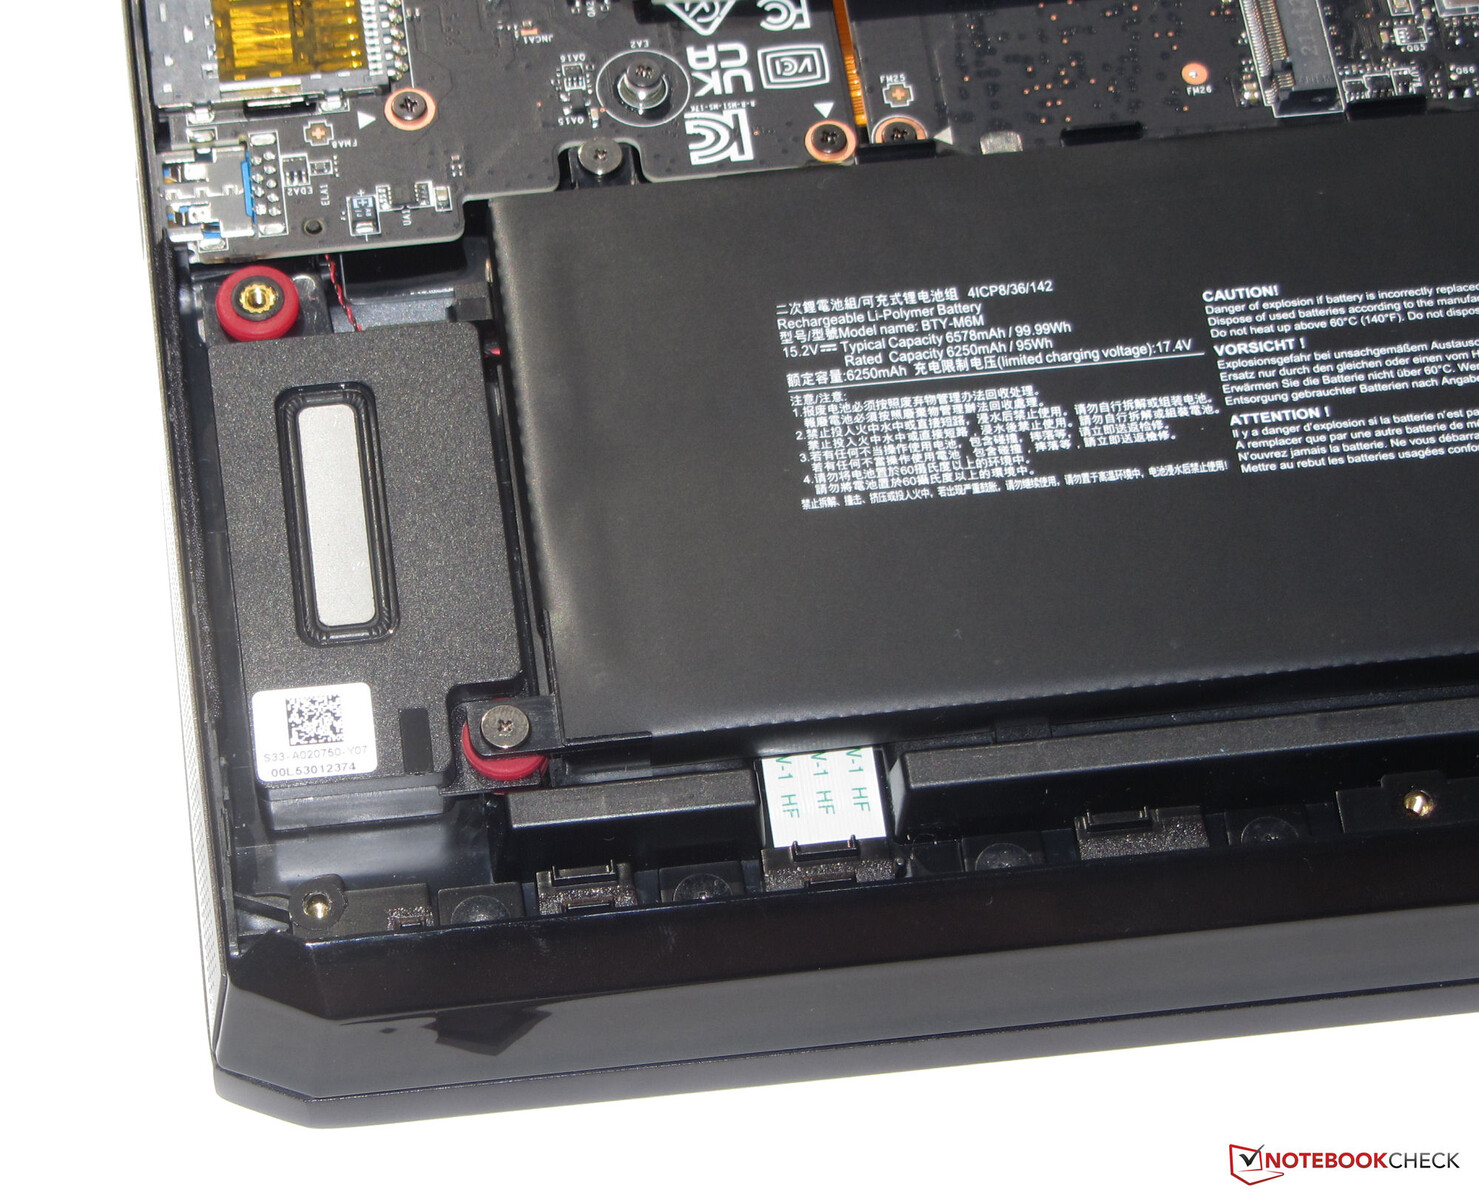
Os componentes do Raider ocupam um chassi metálico com superfícies lisas e negras mate. Há uma faixa LED voltada para o usuário que pode ser desligada na unidade base, o que permite efeitos de luz coloridos no case que, de outra forma, careceria de acentos coloridos. Portanto, nada impede que os usuários utilizem o dispositivo em ambientes profissionais. A aparência do laptop MSI é ainda mais realçada pelas moldura bastante finas. A bateria interna (aparafusada, não colada), bem como o restante do hardware são todos acessíveis após a remoção da placa inferior.
Não notamos nenhuma falha de fabricação no dispositivo de 17,3 polegadas. As folgas são uniformes e não há excesso de protuberâncias de material. A unidade base é muito resistente à torção dos cantos, enquanto a tampa pode ser ligeiramente torcida. Ambas estão dentro das faixas normais. As dobradiças seguram a tampa firmemente no lugar, mas permitem um pouco de teetering. A tampa pode ser aberta até um ângulo máximo de cerca de 140 graus. Ela também pode ser aberta com uma mão.

Dentro de nossa comparação, o laptop MSI e o Alienware x17 R2 são os dispositivos mais pesados. Em termos de dimensões, o GE77 se enquadra na faixa média - não tão compacto quanto o Lâmina e o X30mas significativamente mais compacto do que o x17.
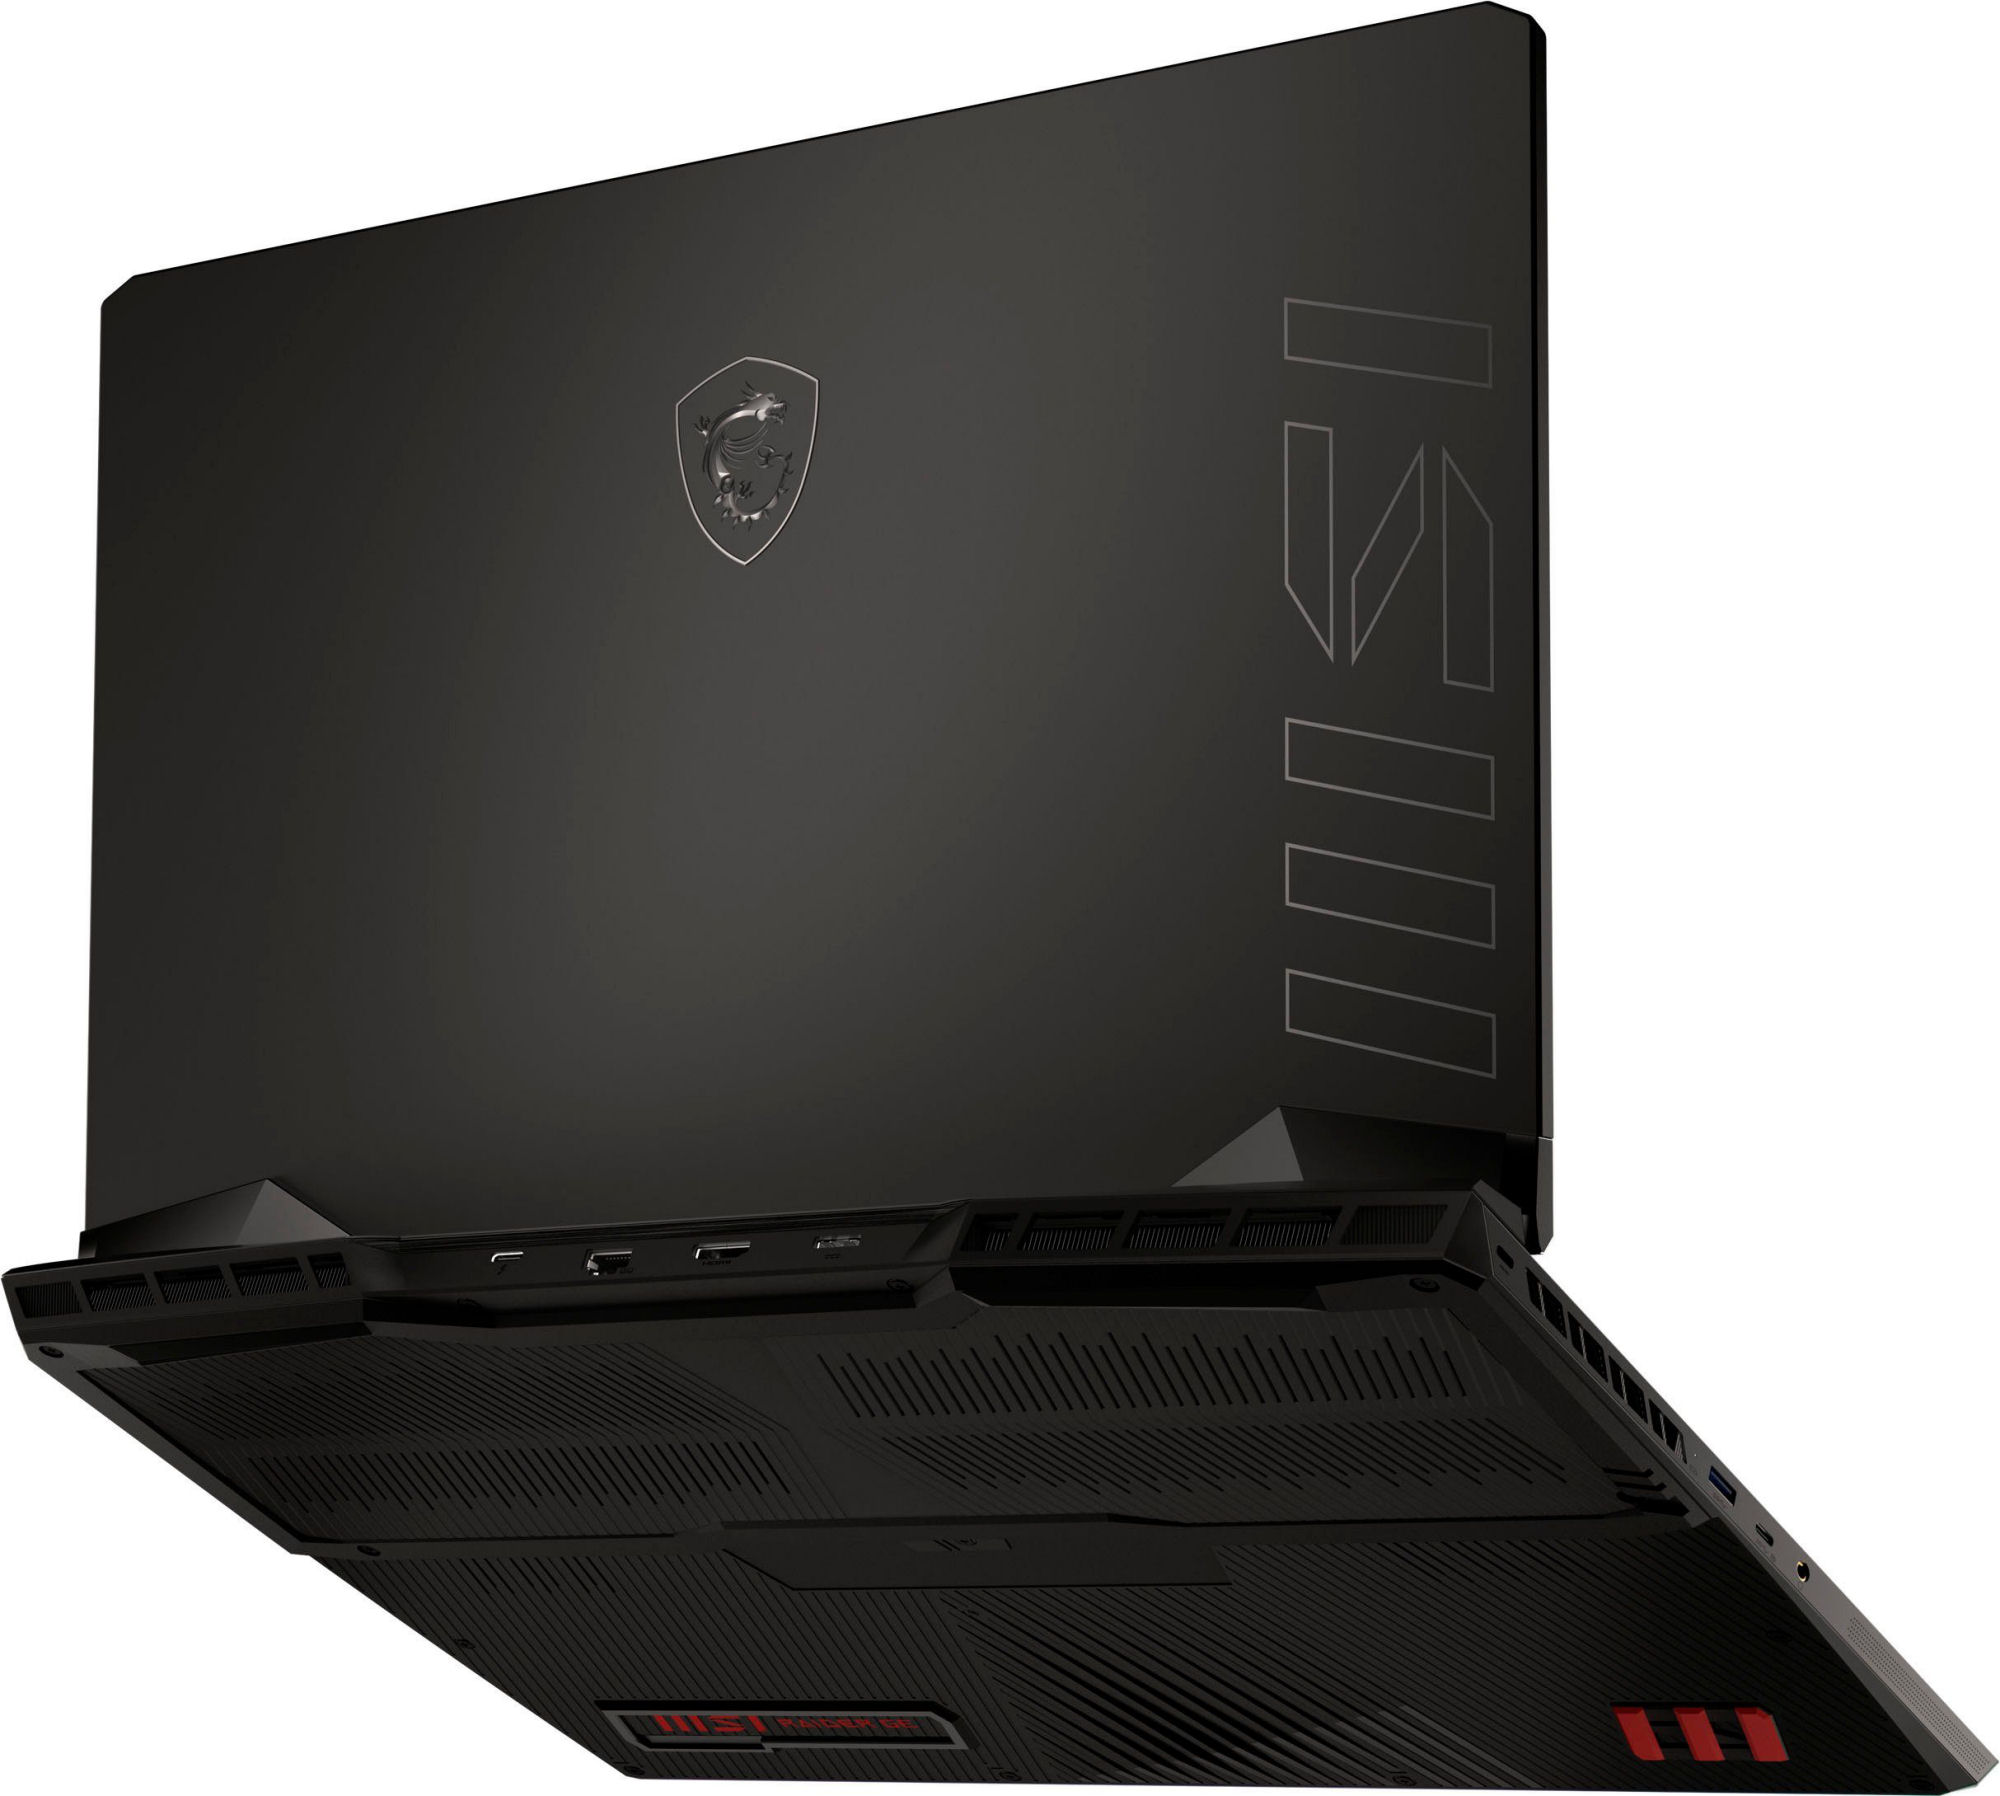
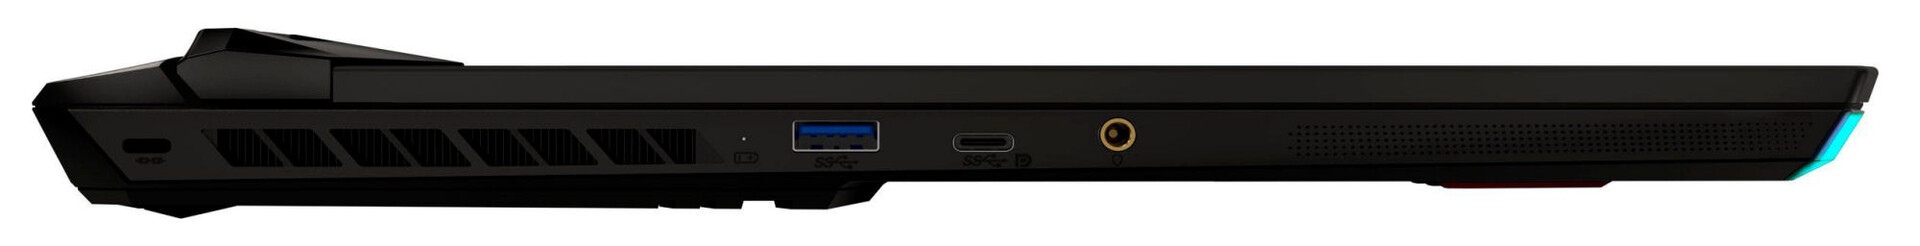
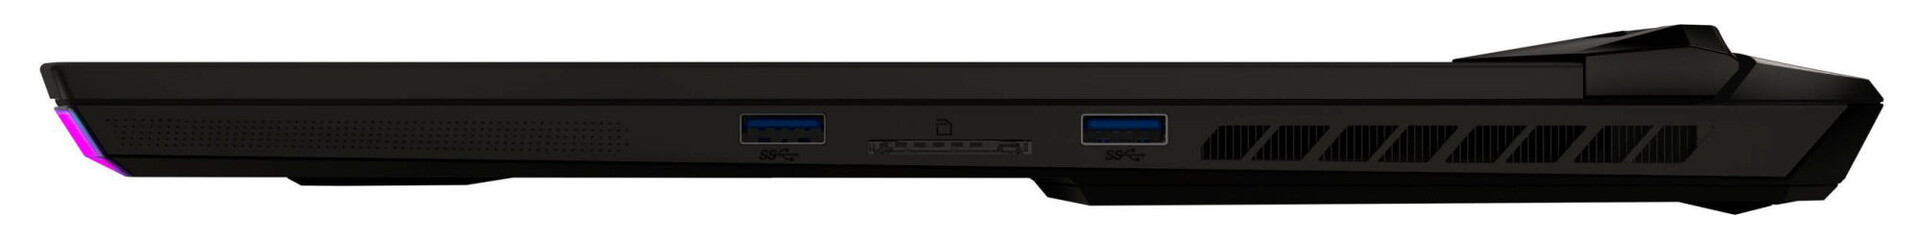
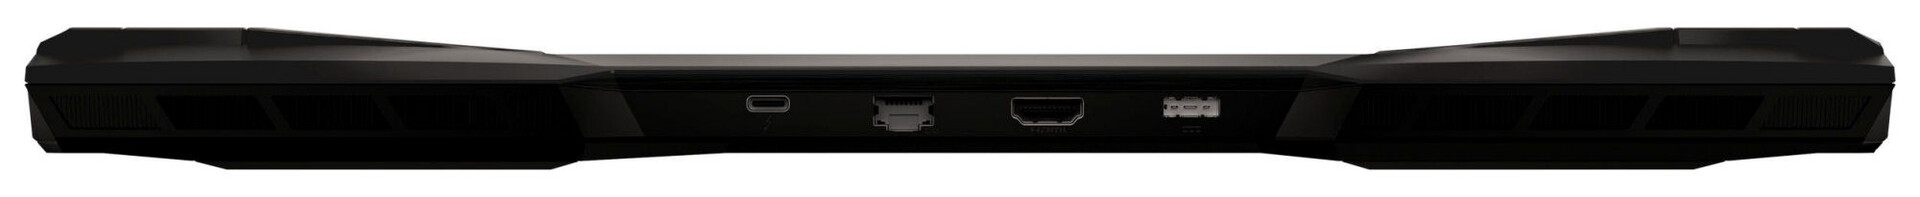
Conectividade - Sistema MSI com Thunderbolt 4
O GE77 vem com três portas USB-A (1x USB 3.2 Gen 2, 2x USB 3.2 Gen 1) e duas portas USB-C (1x Thunderbolt 4, 1x USB 3.2 Gen 2). Esta última suporta DisplayPort via USB-C, mas não o fornecimento de energia. No total, o sistema tem três saídas de vídeo (2x DP, 1x HDMI). Além disso, há uma tomada de áudio combinada, uma porta Ethernet de 2,5 Gb/s e uma porta de travamento de cabo.
Há portas em três lados da caixa. Duas saídas de vídeo, a porta Ethernet e a porta do adaptador AC estão na parte de trás da caixa. Isto simplifica o gerenciamento de cabos, tornando os cabos menos susceptíveis de atrapalhar o caminho.
Leitor de cartões SD
| SD Card Reader - average JPG Copy Test (av. of 3 runs) | |
| Alienware x17 R2 P48E (AV Pro V60) | |
| Razer Blade 17 Early 2022 (AV PRO microSD 128 GB V60) | |
| Média da turma Gaming (20.9 - 210, n=54, últimos 2 anos) | |
| Medion Erazer Beast X30 (AV PRO microSD 128 GB V60) | |
| MSI Raider GE77 HX 12UHS (AV PRO microSD 128 GB V60) | |
Comunicação
Registramos excelentes taxas de transferência Wi-Fi sob condições ideais (nenhum outro dispositivo Wi-Fi nas proximidades, baixa distância entre o laptop e o servidor) e esgotamos as capacidades dos chips Wi-Fi (Killer AX1675i = Intel AX211; 802.11 eixos).
Há também um chip Ethernet (Killer E3100G, 2,5 Gb/s) para comunicações com fio.
| Networking - iperf3 receive AXE11000 6GHz | |
| MSI Raider GE77 HX 12UHS | |
| Média da turma Gaming (975 - 1775, n=35, últimos 2 anos) | |
| Média Killer Wi-Fi 6E AX1675i 160MHz Wireless Network Adapter (1327 - 1788, n=20) | |
Webcam
A webcam captura imagens com uma resolução máxima de 1920 x 1080. A precisão das cores é pouco nítida. As cores se desviam de seus valores ideais. Não há cobertura mecânica da webcam.


Acessórios
O laptop vem com os documentos habituais (guia de início rápido, informações sobre garantia).
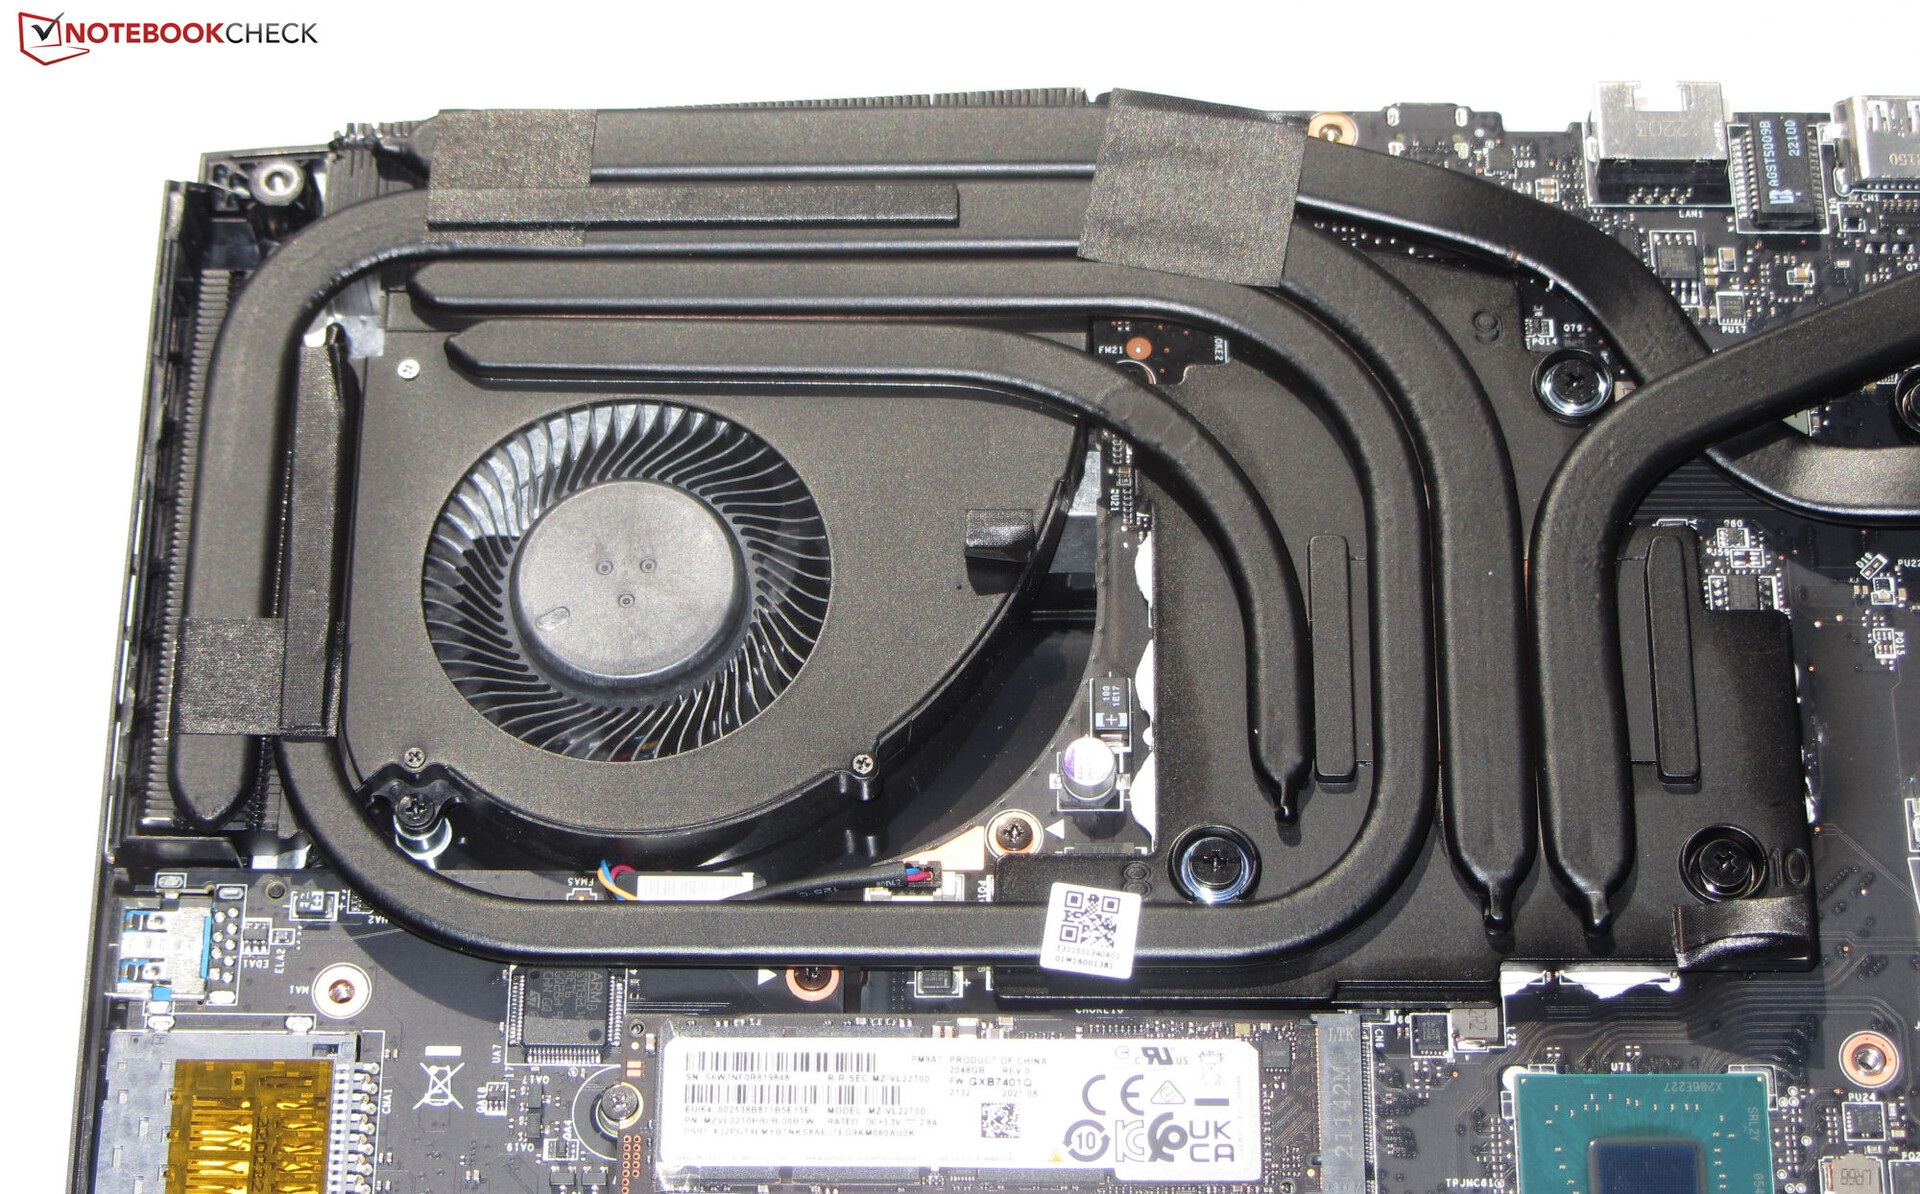
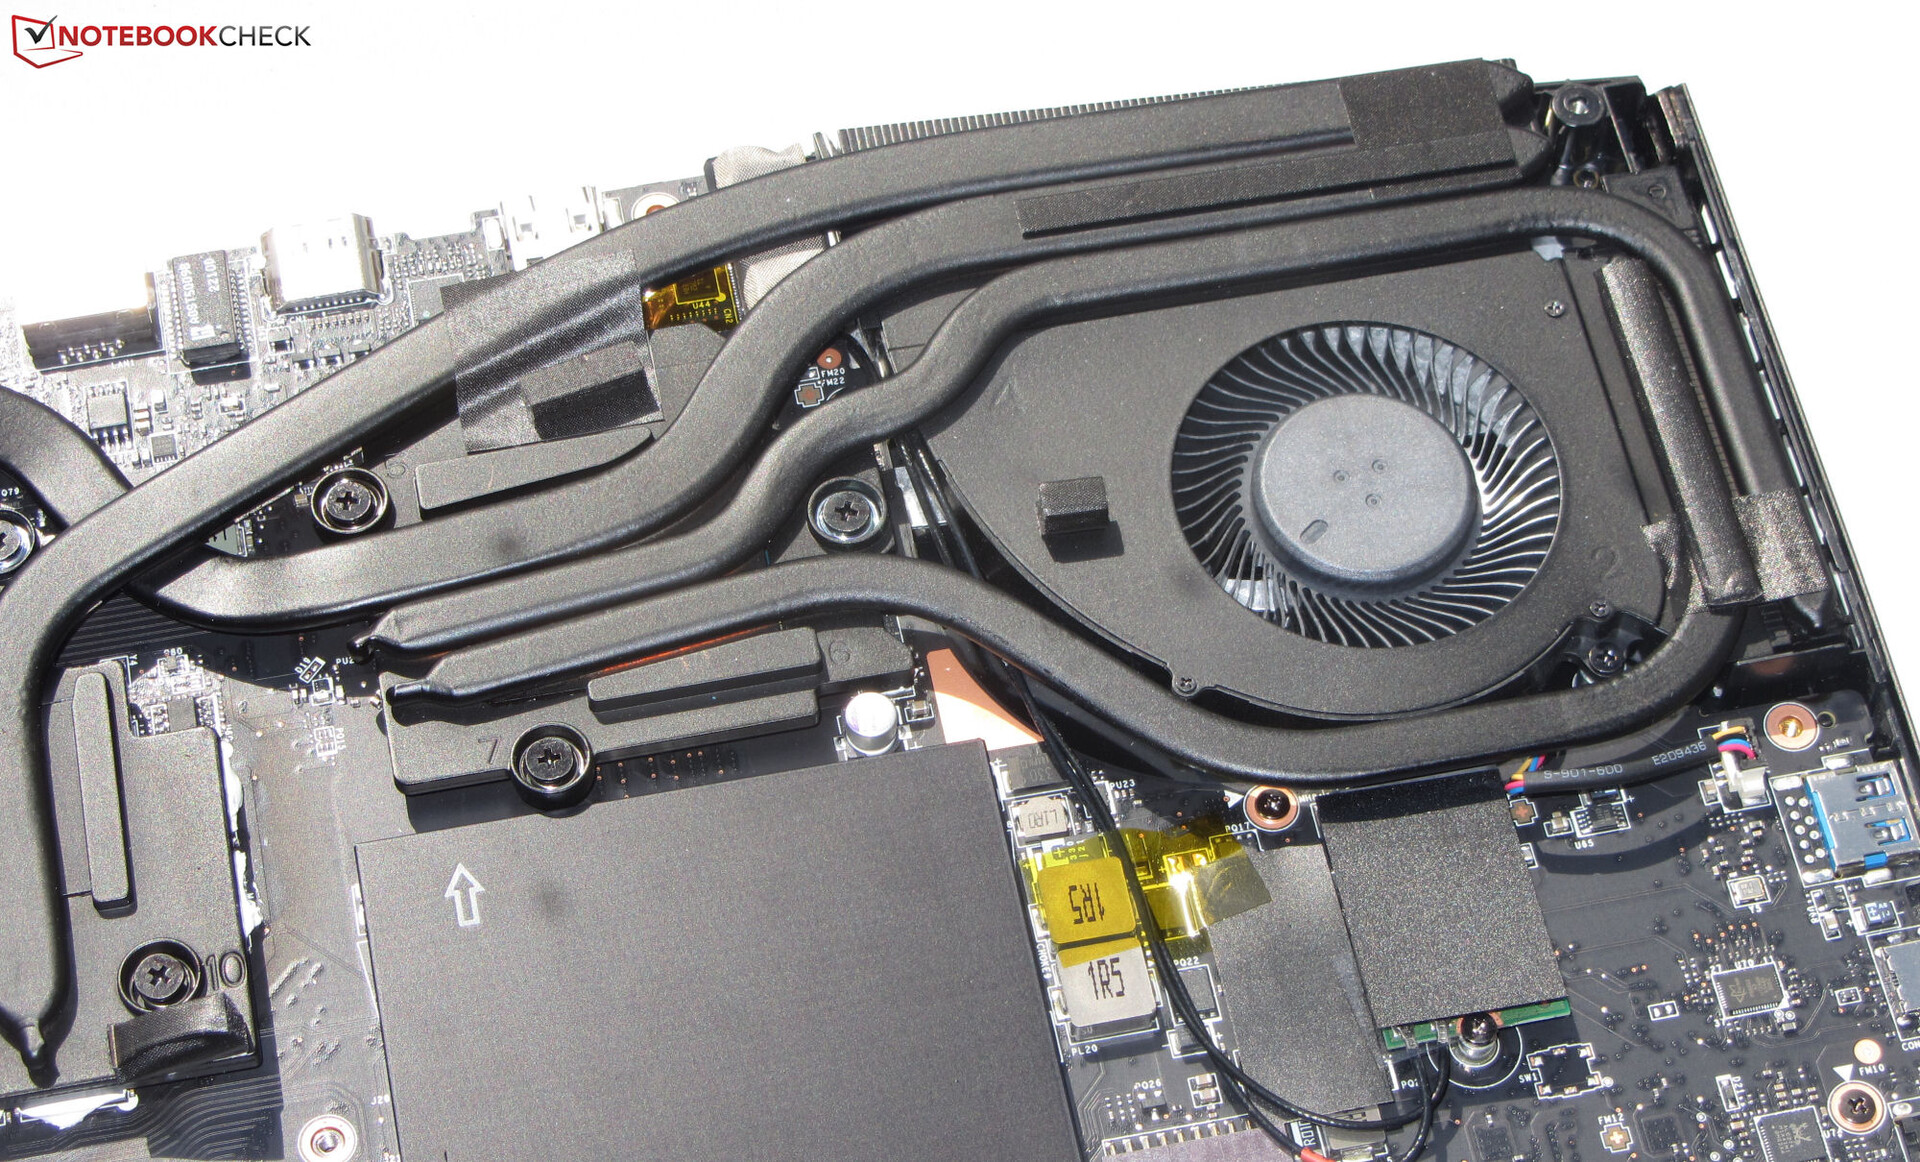
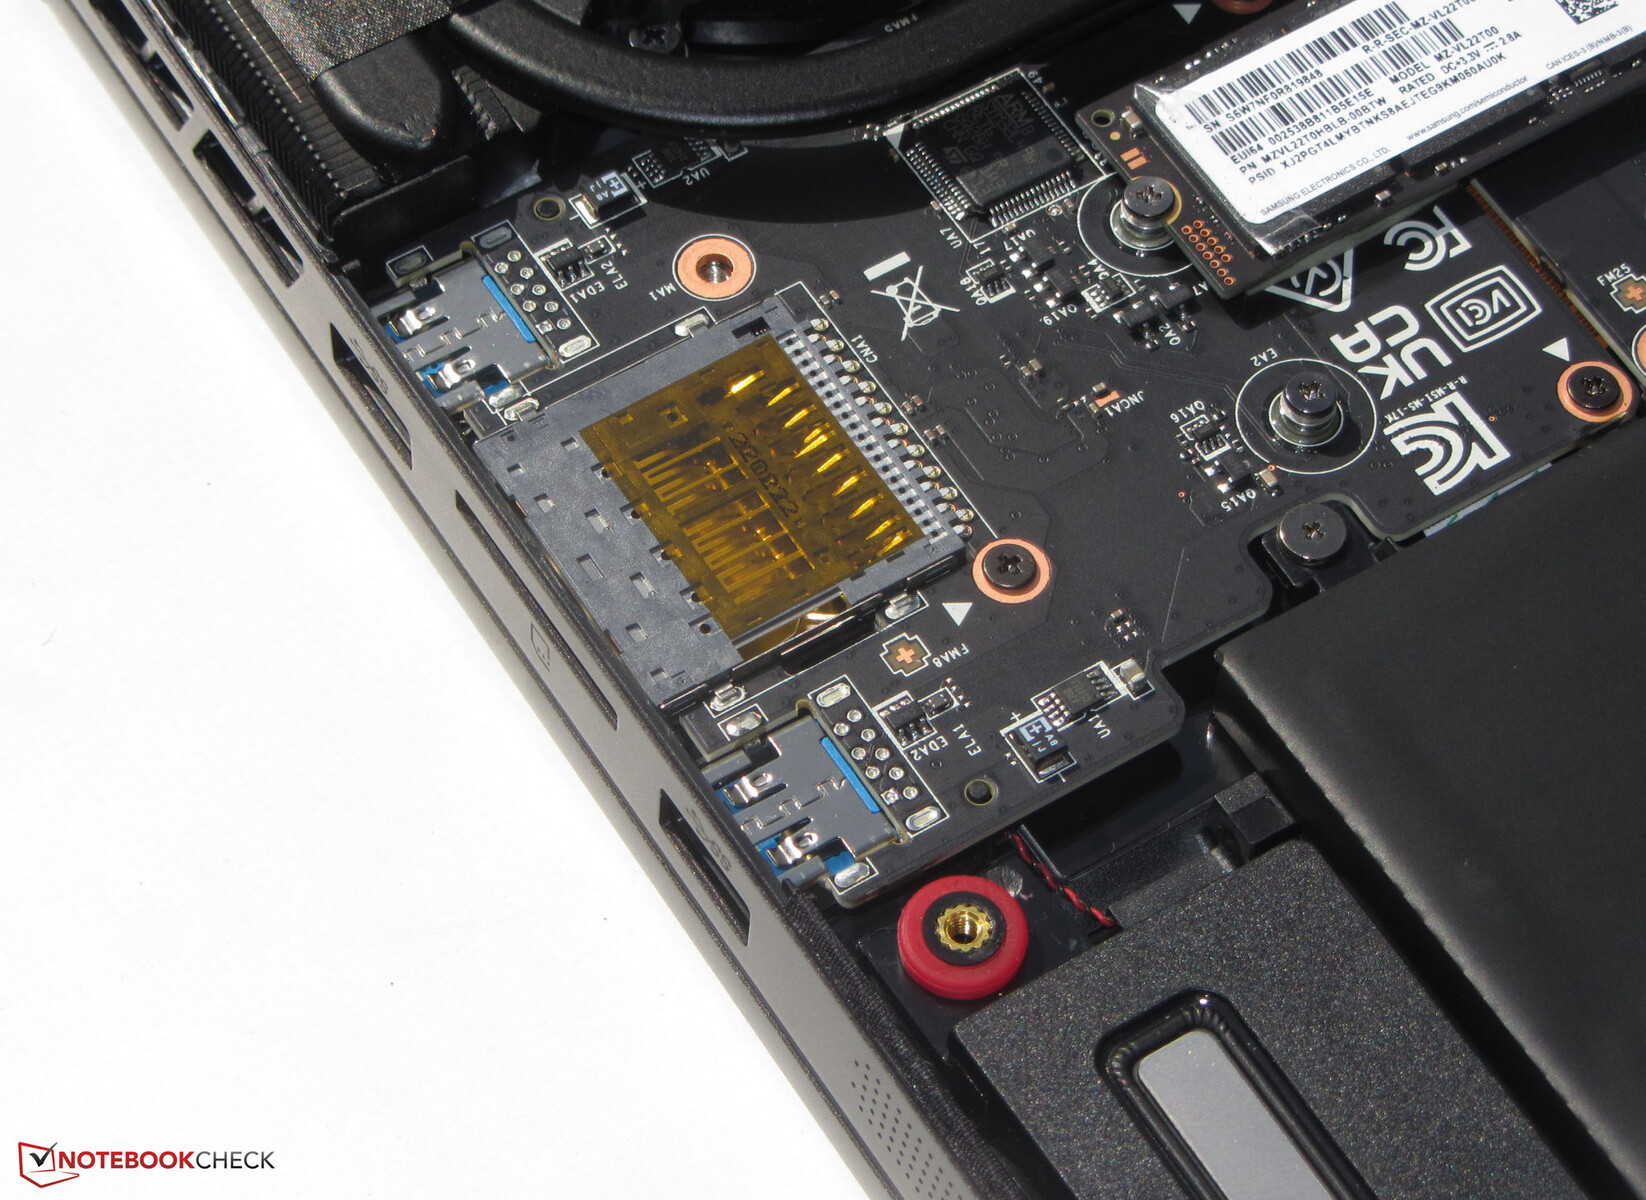
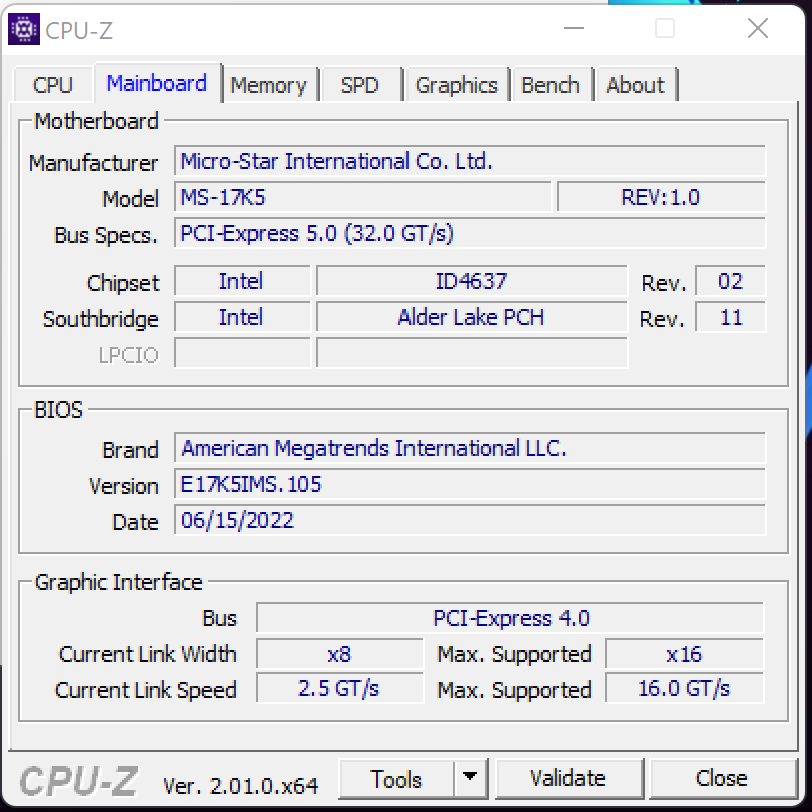
Manutenção
A manutenção e as atualizações podem ser realizadas sem qualquer inconveniente. Após soltar todos os parafusos no fundo, a placa inferior pode ser removida com bastante facilidade - um objeto com uma aresta afiada pode ser útil aqui. Então, os usuários têm acesso ao SSD (PCIe4, M.2-2280), ao slot secundário do SSD (PCIe4, M.2-2280), ao módulo Wi-Fi, à bateria, à RAM (escondida sob uma tampa adicional, firmemente presa), aos alto-falantes e aos ventiladores.
Garantia
A MSI oferece uma garantia padrão limitada de um ano. Extensões de garantia para dois e três anos custam 80 e 140 USD, respectivamente.
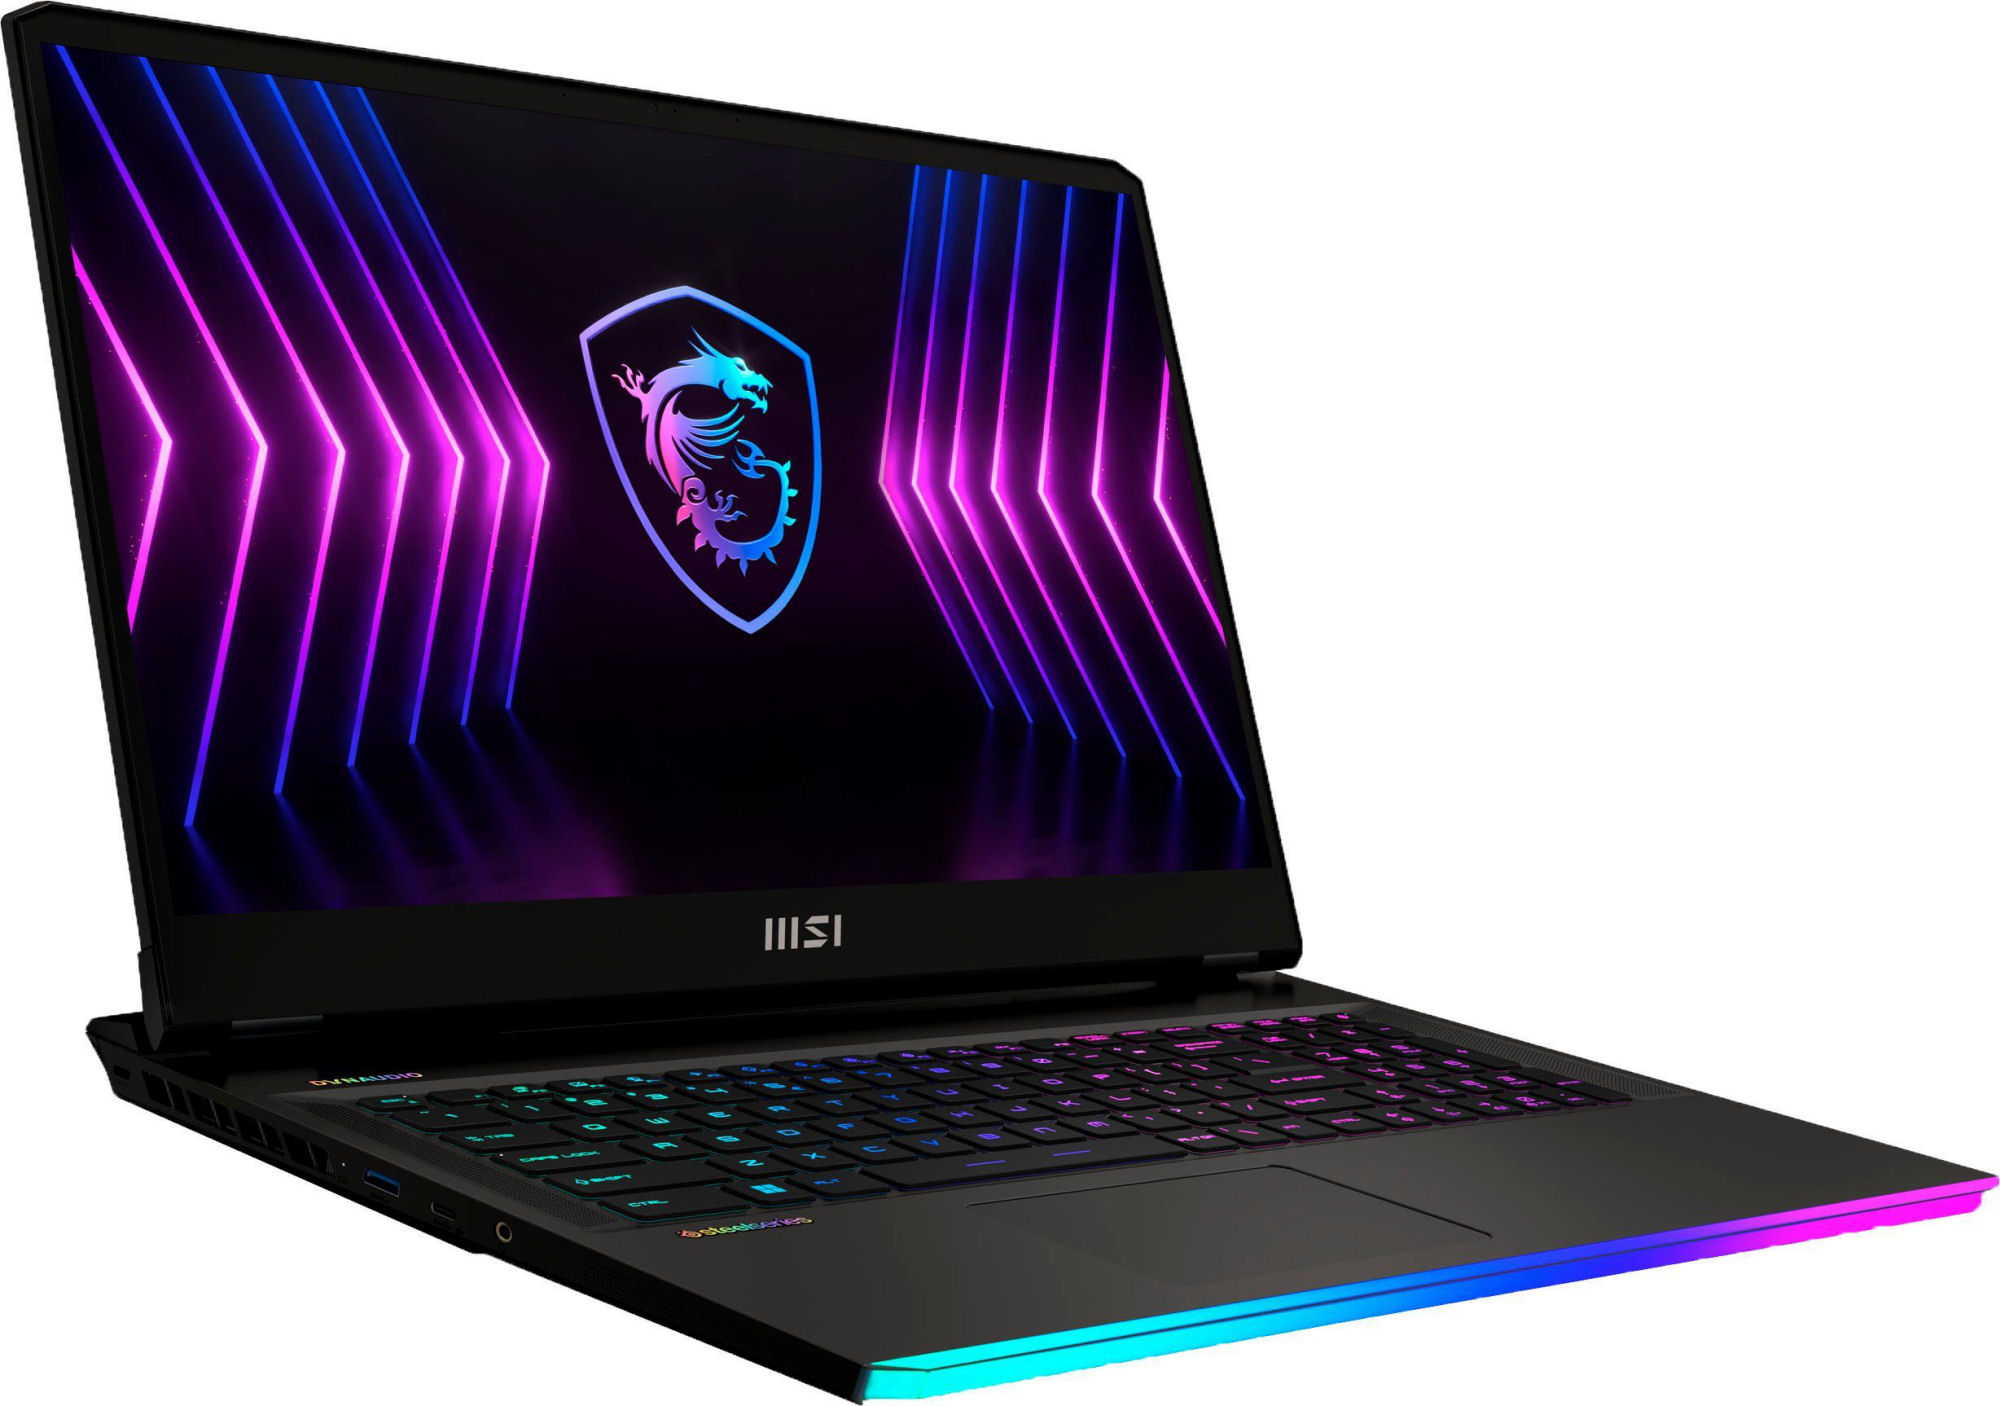
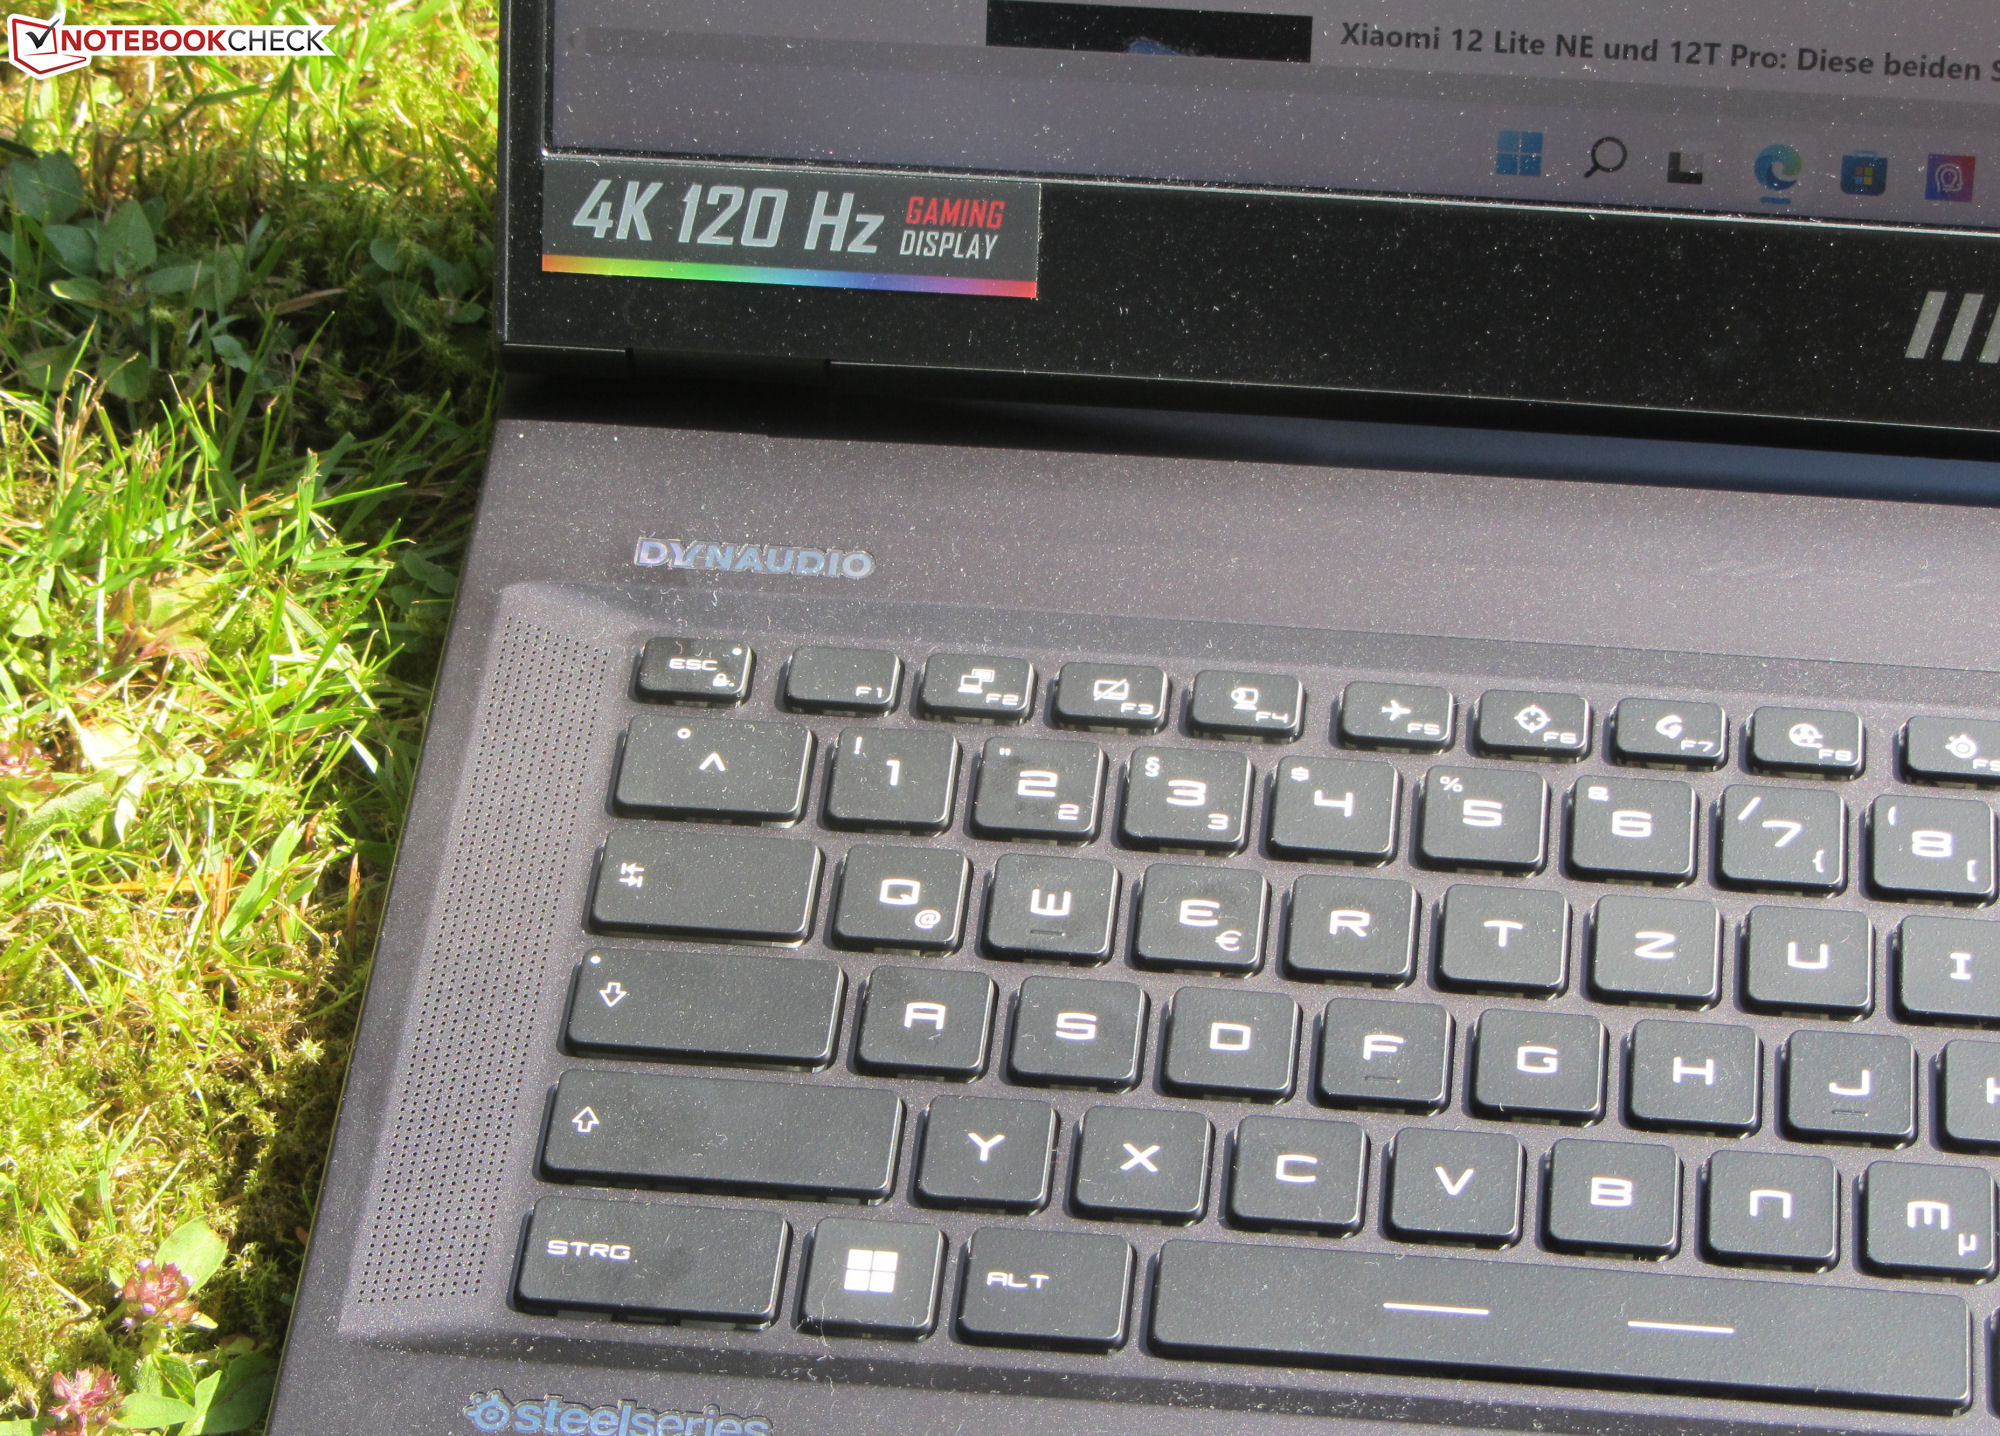
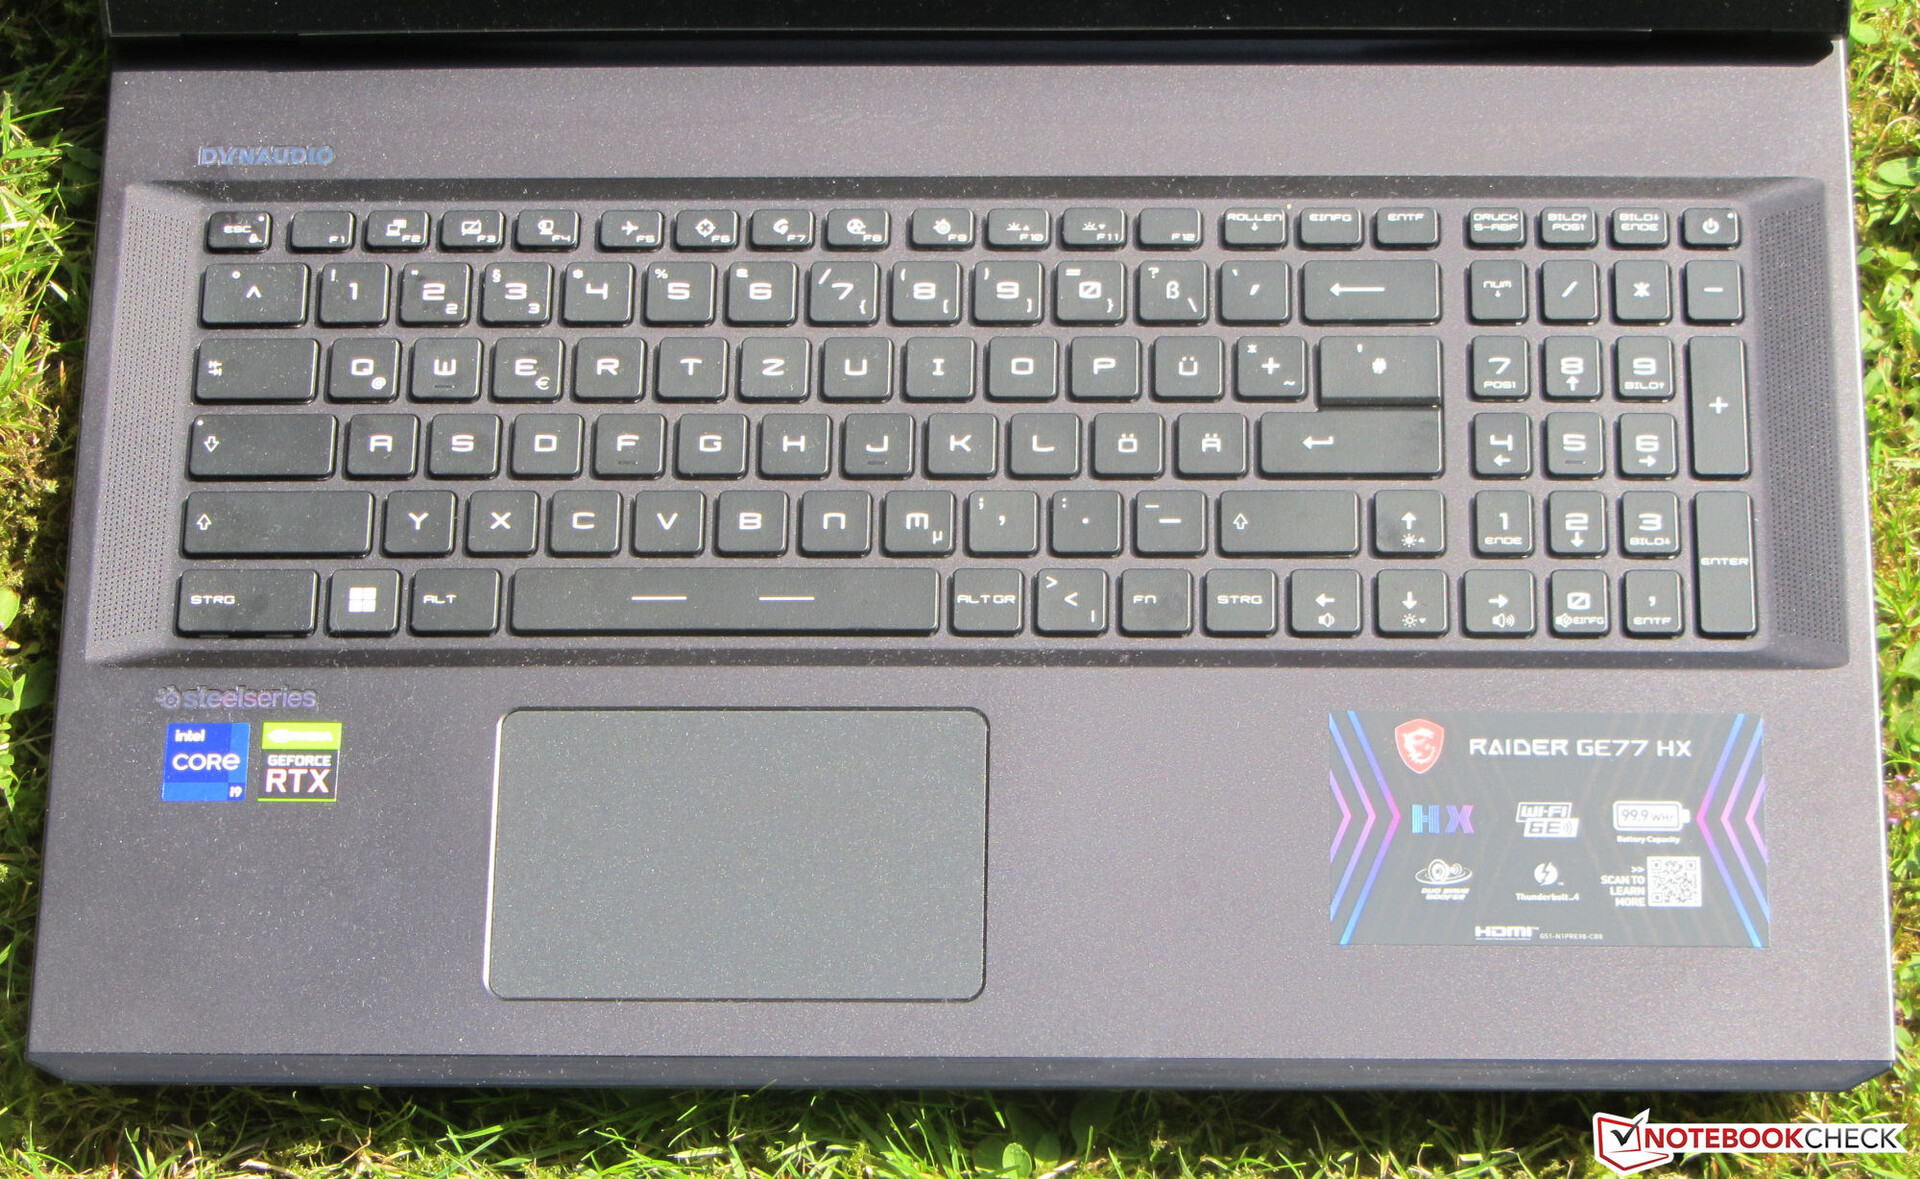
Dispositivos de entrada - Teclado com luz de fundo RGB
Teclado
As teclas planas e ligeiramente ásperas do teclado chiclet retroiluminado oferecem um deslocamento moderado e um ponto de atuação distinto. O feedback do teclado é decente. Enquanto digita, o teclado mal rende. De acordo com o design usual da MSI, a tecla "Fn" não está localizada onde se esperaria que estivesse de outros laptops. A retroiluminação do teclado tem três configurações de brilho, que podem ser controladas através de duas teclas de função. Em geral, a MSI fornece com um teclado que é adequado para o uso diário.
Touchpad
A superfície lisa do ClickPad multi-toque habilitado (aprox. 10,5 x 6,5 cm ou 4,13 x 2,56 pol.) tem boas propriedades de deslizamento. A almofada responde bem em todos os cantos. Oferece um curso curto e um ponto de atuação distinto.
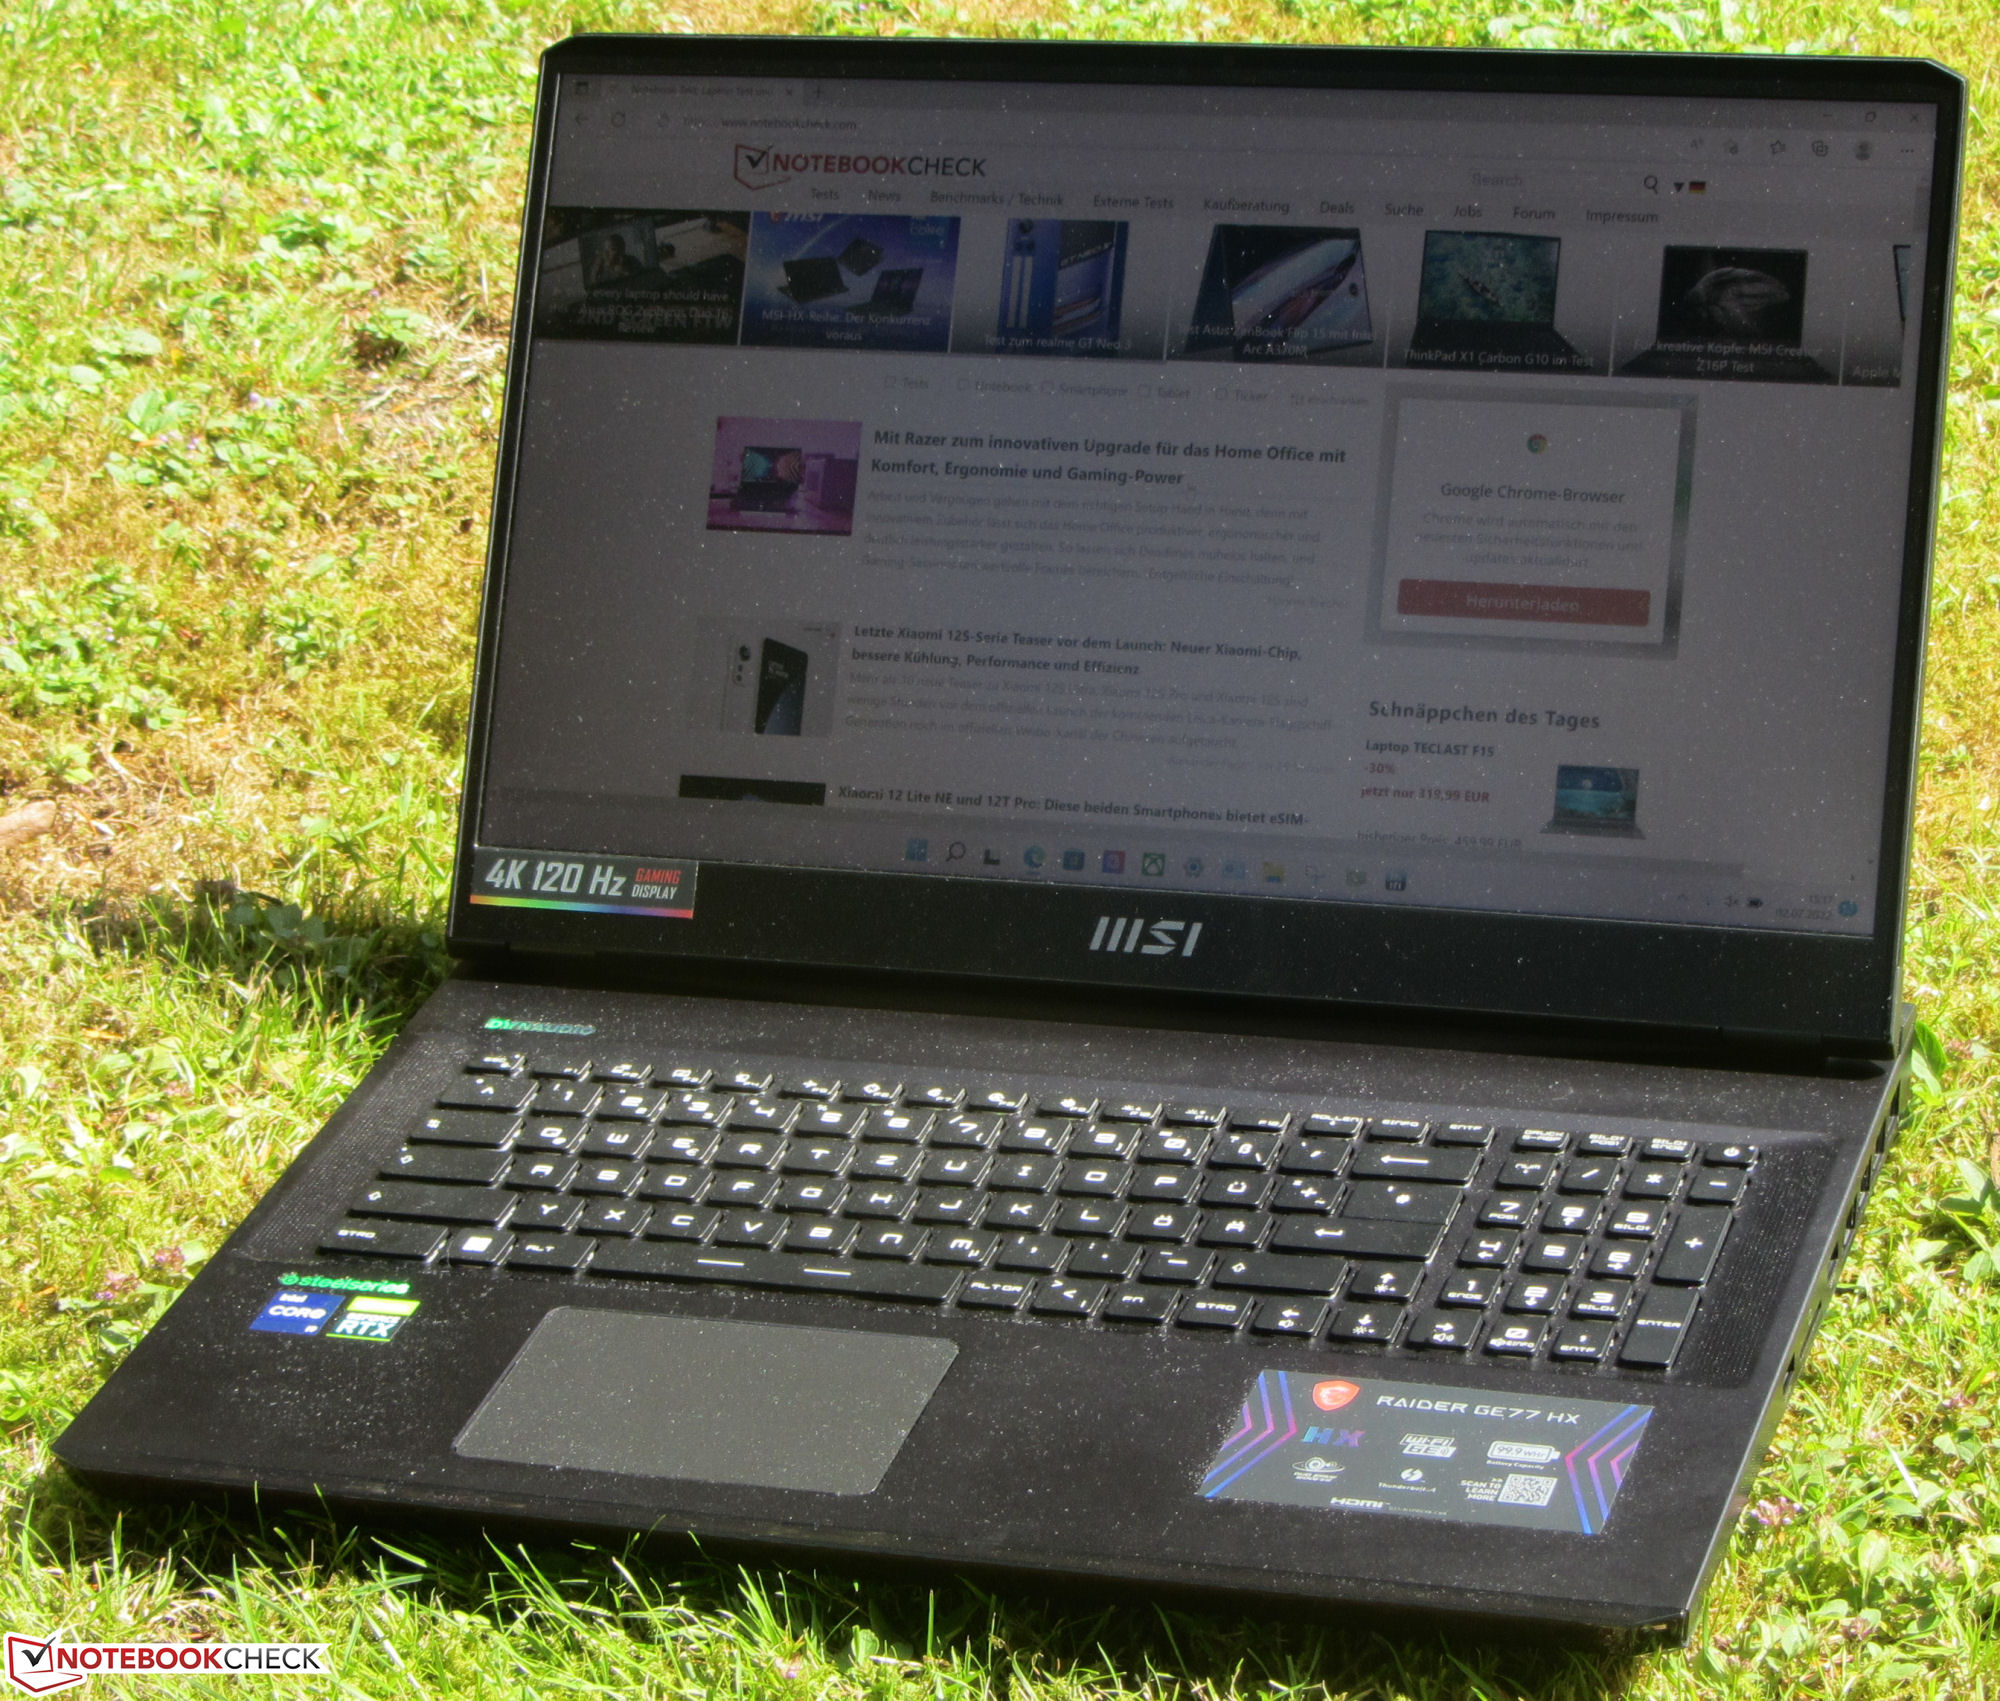
Display - Painel IPS
Enquanto o brilho (371,2 lêndeas) do display mate de 17,3 polegadas (3840 x 2160 pixels) excede o mínimo desejado (> 300 lêndeas), o contraste é pouco brilhante (733:1) - esperamos mais de um laptop que custa 5.200 euros. Para referência, consideramos valores de 1000:1 e bem superior. O painel de 120-Hz vem com tempos de resposta curtos. Também não detectamos nenhuma cintilação de PWM.
| |||||||||||||||||||||||||
iluminação: 84 %
iluminação com acumulador: 381 cd/m²
Contraste: 733:1 (Preto: 0.52 cd/m²)
calibrated: 2.53
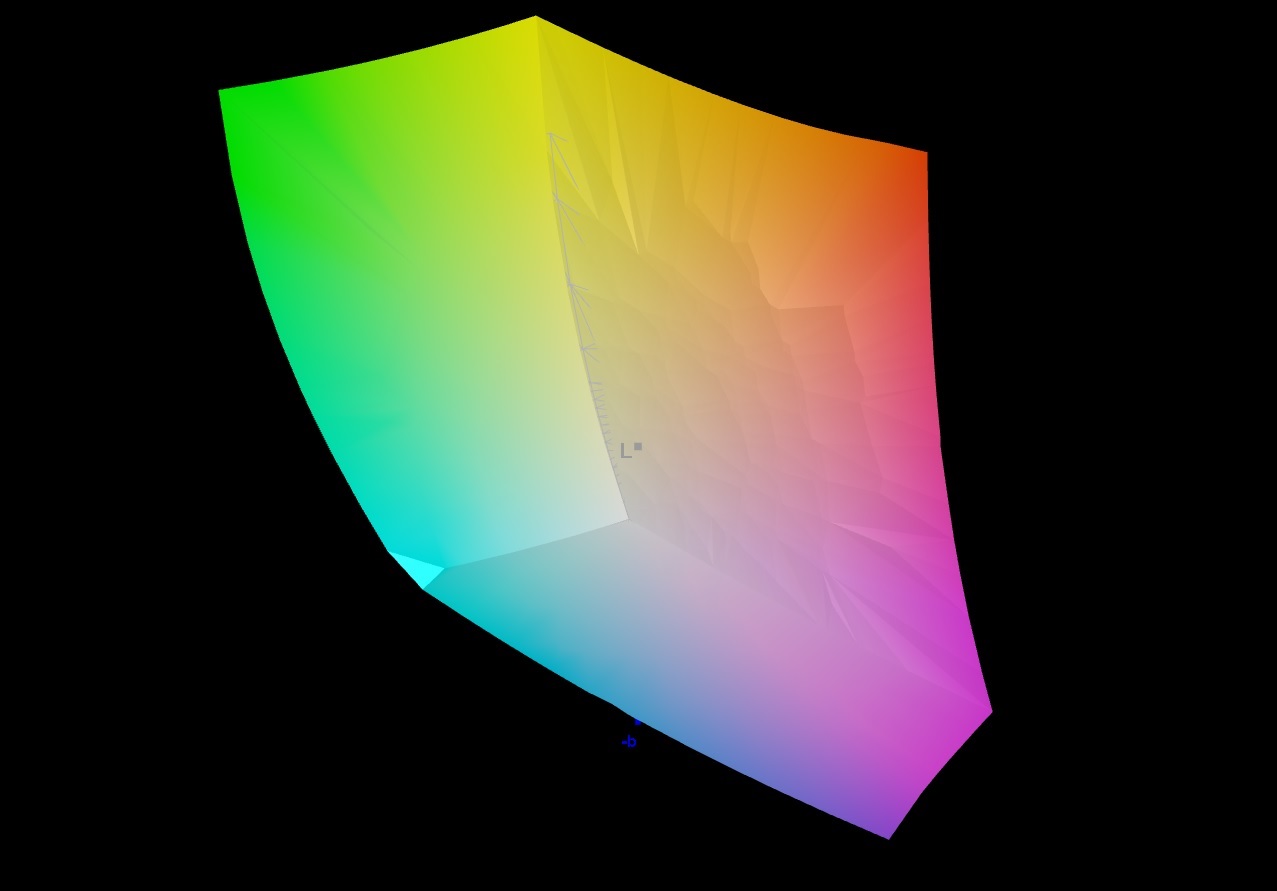
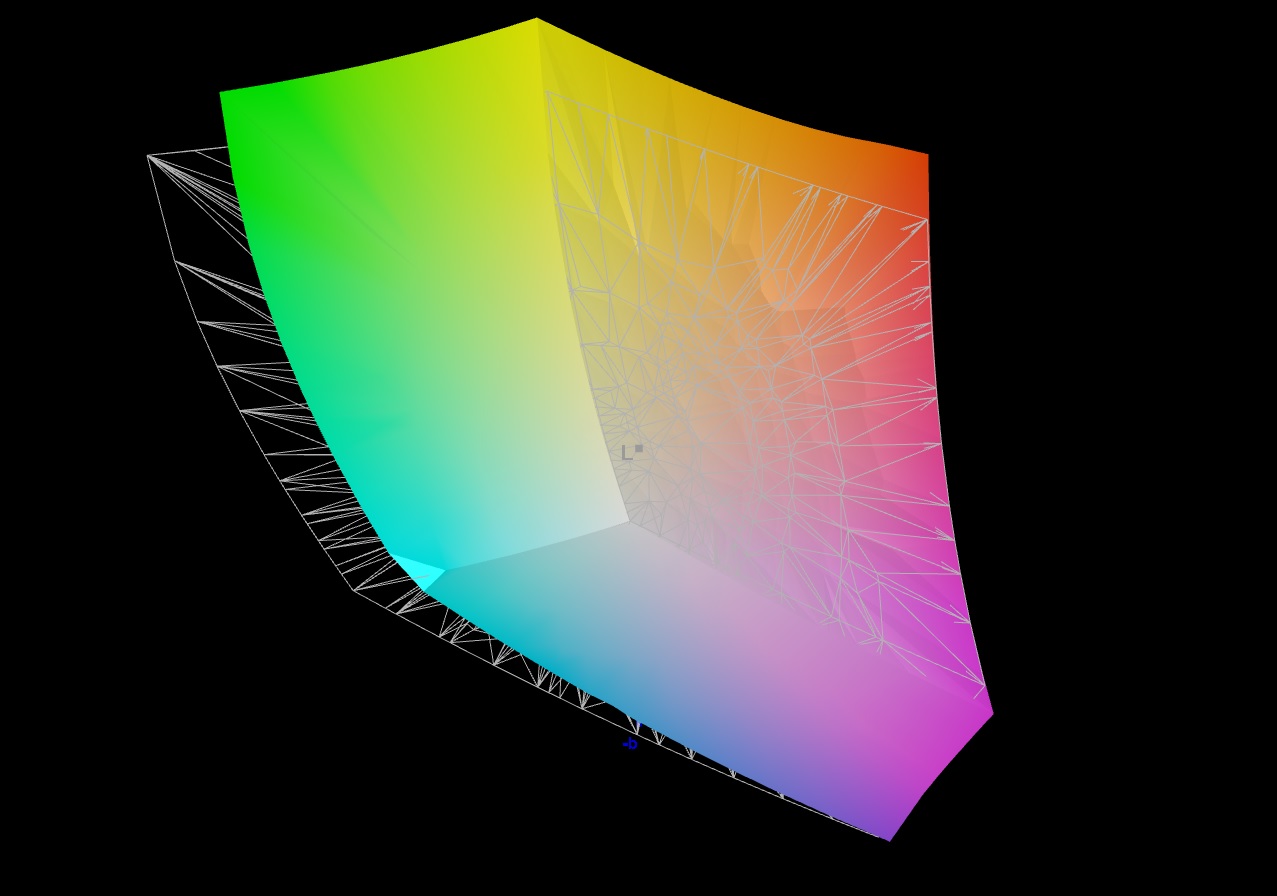
85.8% AdobeRGB 1998 (Argyll 3D)
99.8% sRGB (Argyll 3D)
96.6% Display P3 (Argyll 3D)
| MSI Raider GE77 HX 12UHS AU Optronics B173ZAN06.1, IPS, 3840x2160, 17.3" | Razer Blade 17 Early 2022 AU Optronics B173ZAN06.9, IPS, 3840x2160, 17.3" | Alienware x17 R2 P48E AU Optronics B173HAN, IPS, 1920x1080, 17.3" | Medion Erazer Beast X30 BOE CQ NE173QHM-NZ3, IPS, 2560x1440, 17.3" | |
|---|---|---|---|---|
| Display | 2% | -8% | -17% | |
| Display P3 Coverage (%) | 96.6 | 99.4 3% | 79.2 -18% | 67.7 -30% |
| sRGB Coverage (%) | 99.8 | 100 0% | 99.8 0% | 97.6 -2% |
| AdobeRGB 1998 Coverage (%) | 85.8 | 87.3 2% | 79.6 -7% | 69.2 -19% |
| Response Times | -15% | -89% | -102% | |
| Response Time Grey 50% / Grey 80% * (ms) | 5.8 ? | 7.5 ? -29% | 12.4 ? -114% | 14.7 ? -153% |
| Response Time Black / White * (ms) | 5.6 ? | 5.6 ? -0% | 9.2 ? -64% | 8.4 ? -50% |
| PWM Frequency (Hz) | ||||
| Screen | 35% | 31% | 24% | |
| Brightness middle (cd/m²) | 381 | 503 32% | 365.4 -4% | 377 -1% |
| Brightness (cd/m²) | 371 | 486 31% | 344 -7% | 352 -5% |
| Brightness Distribution (%) | 84 | 84 0% | 85 1% | 86 2% |
| Black Level * (cd/m²) | 0.52 | 0.44 15% | 0.29 44% | 0.32 38% |
| Contrast (:1) | 733 | 1143 56% | 1260 72% | 1178 61% |
| Colorchecker dE 2000 calibrated * | 2.53 | 0.6 76% | 0.51 80% | 1.3 49% |
| Colorchecker dE 2000 * | 1.08 | 3.17 | 2.91 | |
| Colorchecker dE 2000 max. * | 4.54 | 7.69 | 6.78 | |
| Greyscale dE 2000 * | 1.3 | 5.3 | 3.4 | |
| Gamma | 2.151 102% | 2.18 101% | 2.109 104% | |
| CCT | 6541 99% | 5879 111% | 7273 89% | |
| Média Total (Programa/Configurações) | 7% /
17% | -22% /
-2% | -32% /
-10% |
* ... menor é melhor
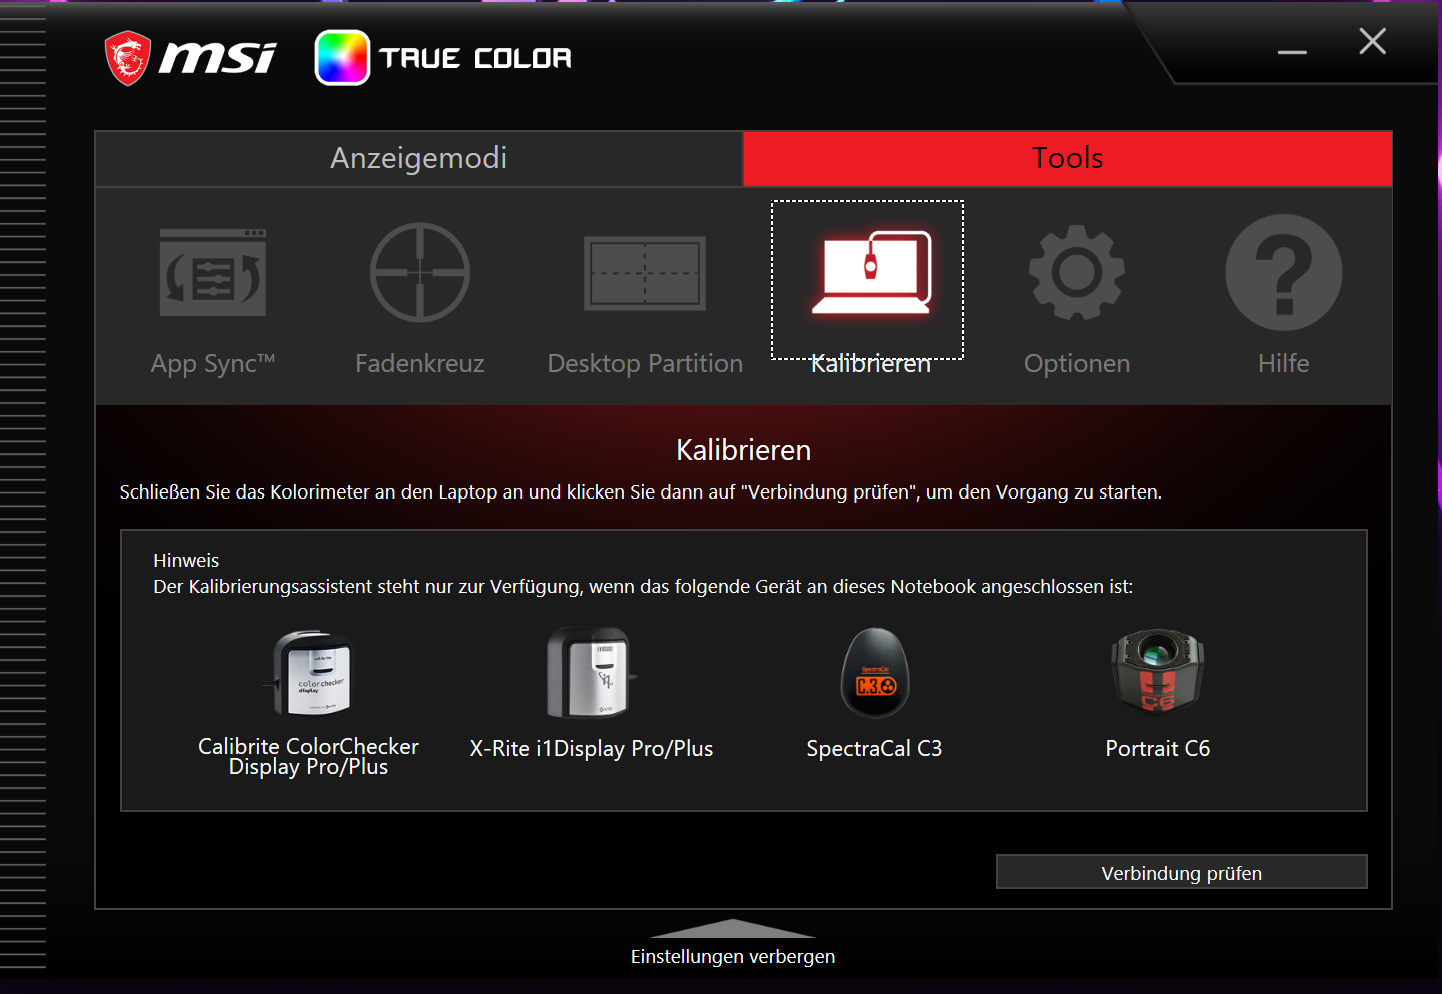
O software MSI True Color pré-instalado permite aos usuários ajustar as cores para um determinado espaço de cor ou caso de uso. Utilizamos o "Display P3" pré-definido. No entanto: A precisão da cor é bastante pobre à saída da fábrica - independentemente da seleção pré-definida. Todas as cores parecem exageradas e leitosas, com medidas que estão completamente apagadas. Isto não pode ser o que a MSI pretendia.
Suspeitamos que o software True Color, o perfil de cor pré-instalado e/ou o iGPU ou seus drivers interferem uns com os outros. Por quê? Assim que o modo dGPU (= o laptop usa exclusivamente o GPU GeForce ) é ativado, a tela fica fantástica e as cores se tornam precisas. A diferença é imediatamente perceptível.
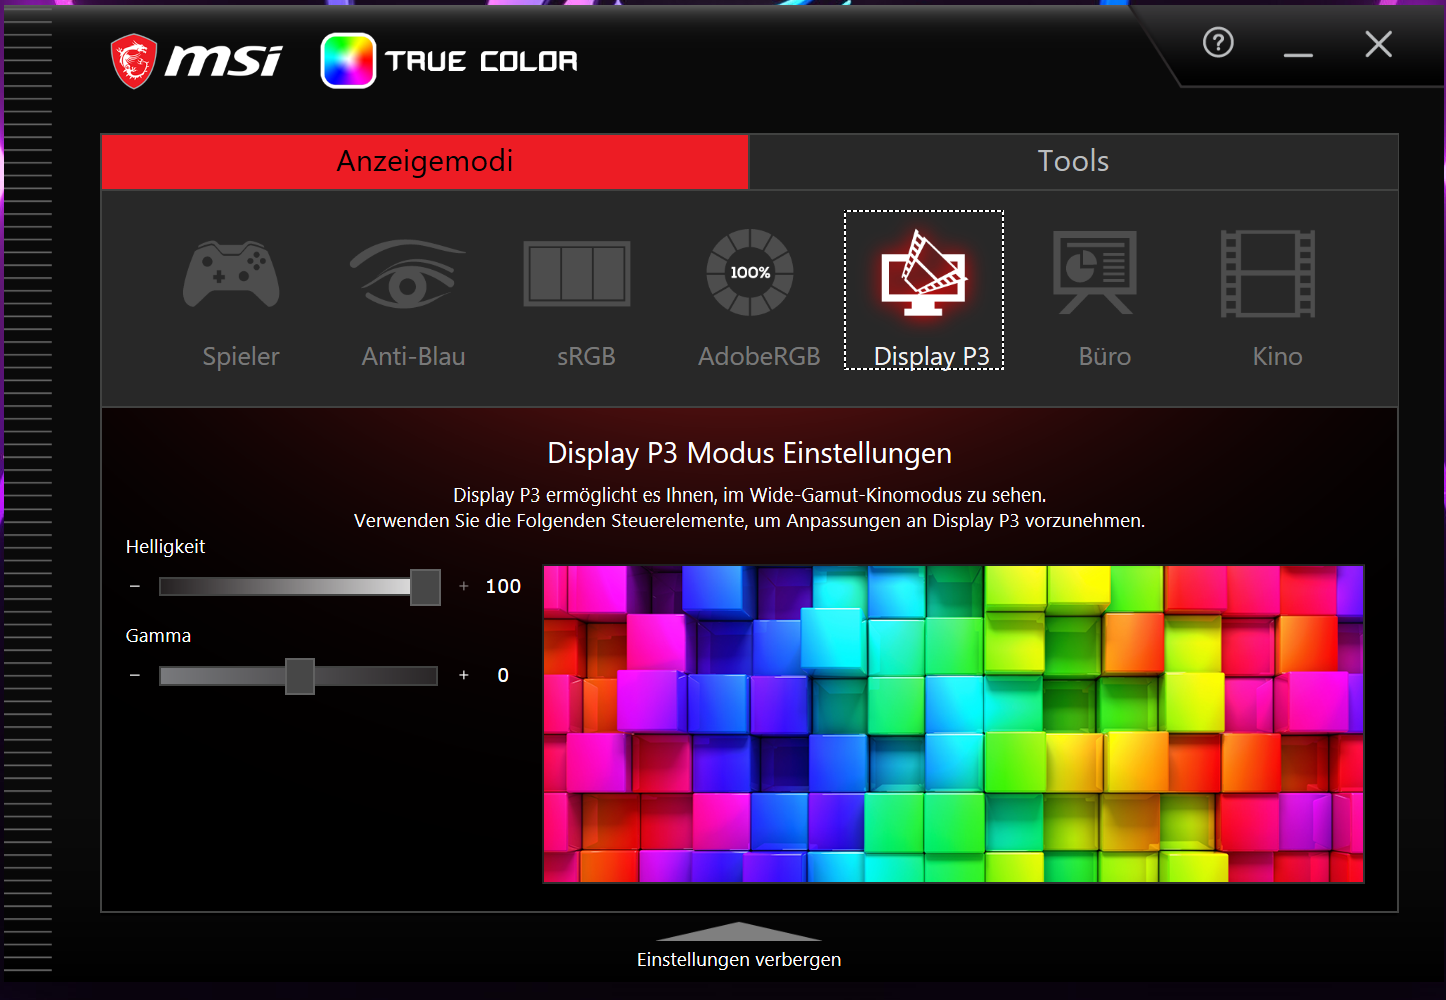
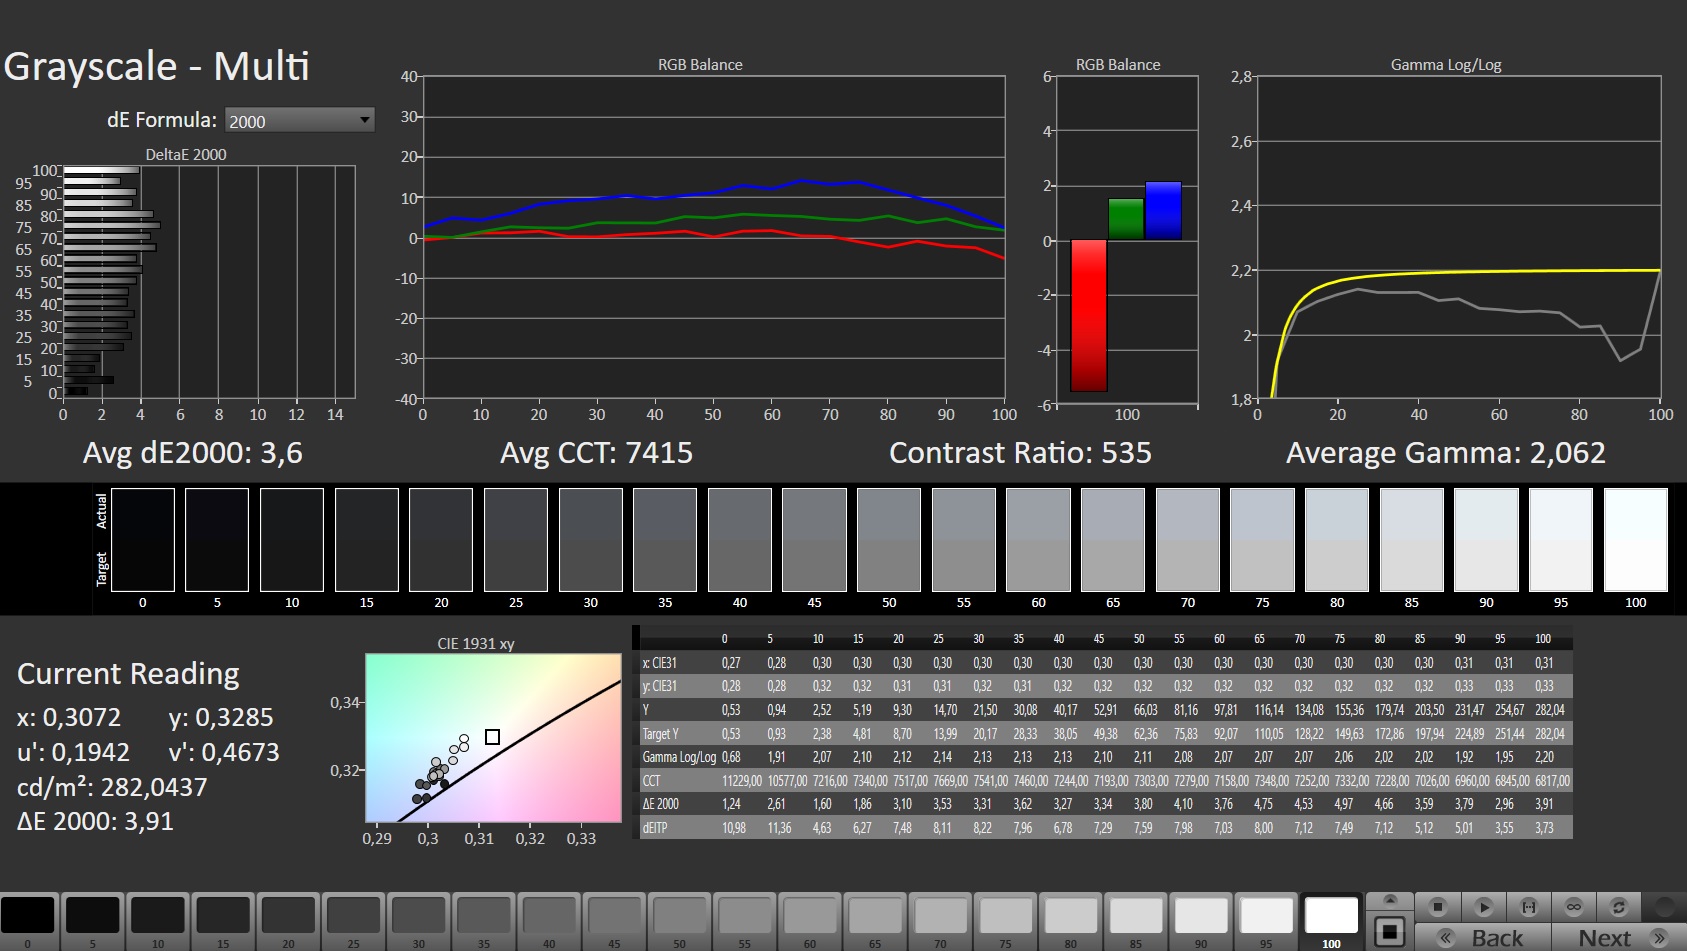
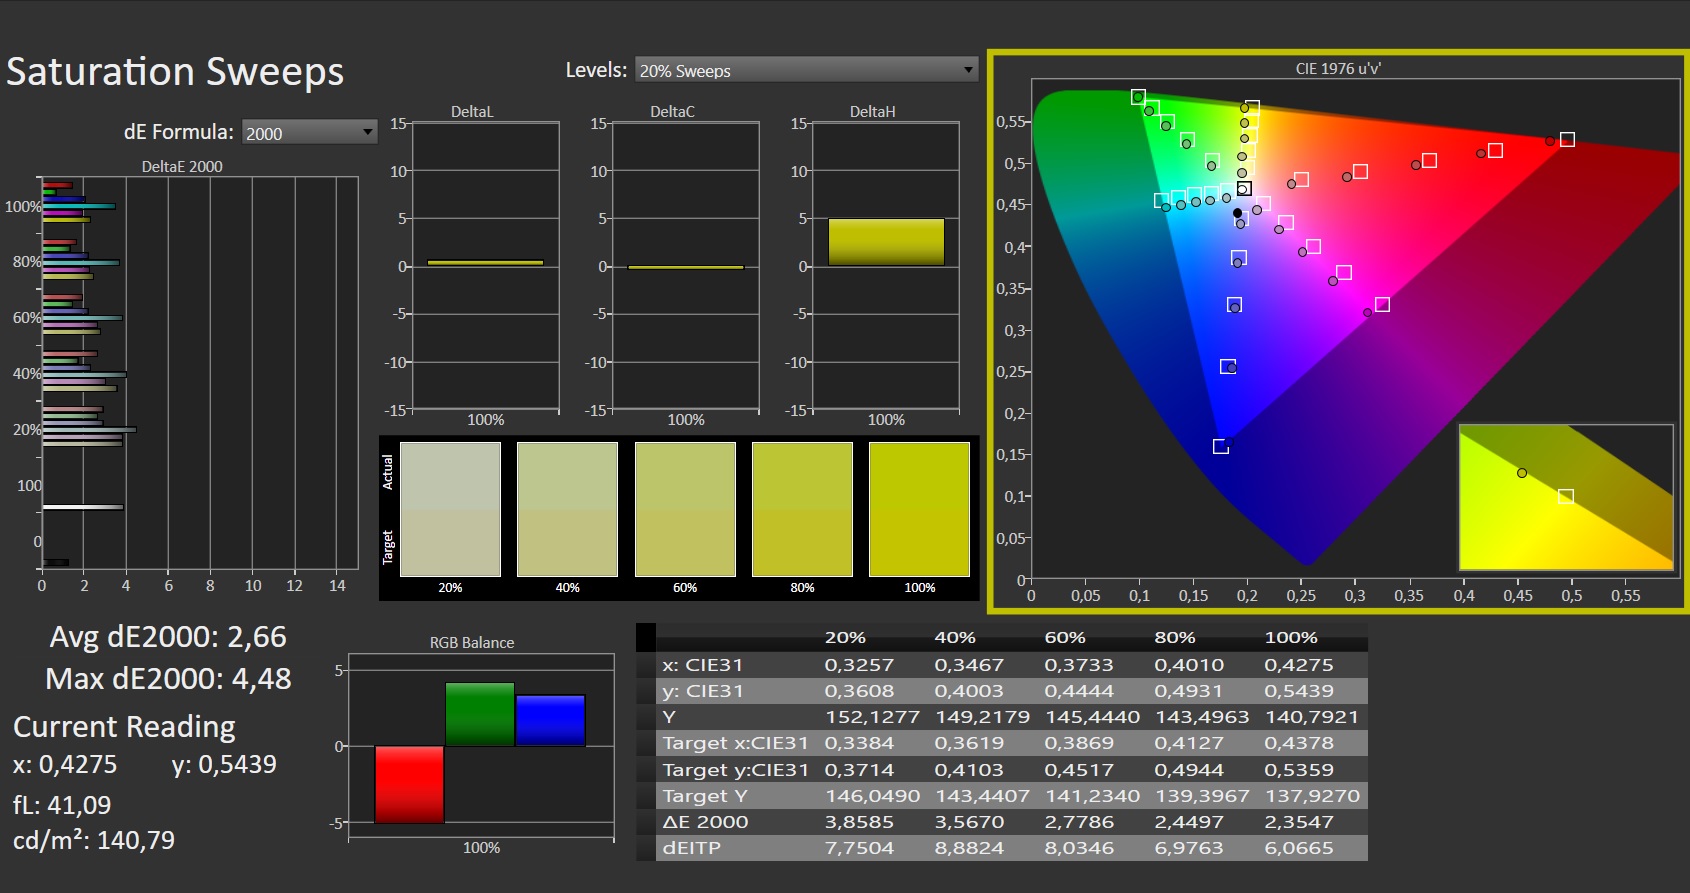
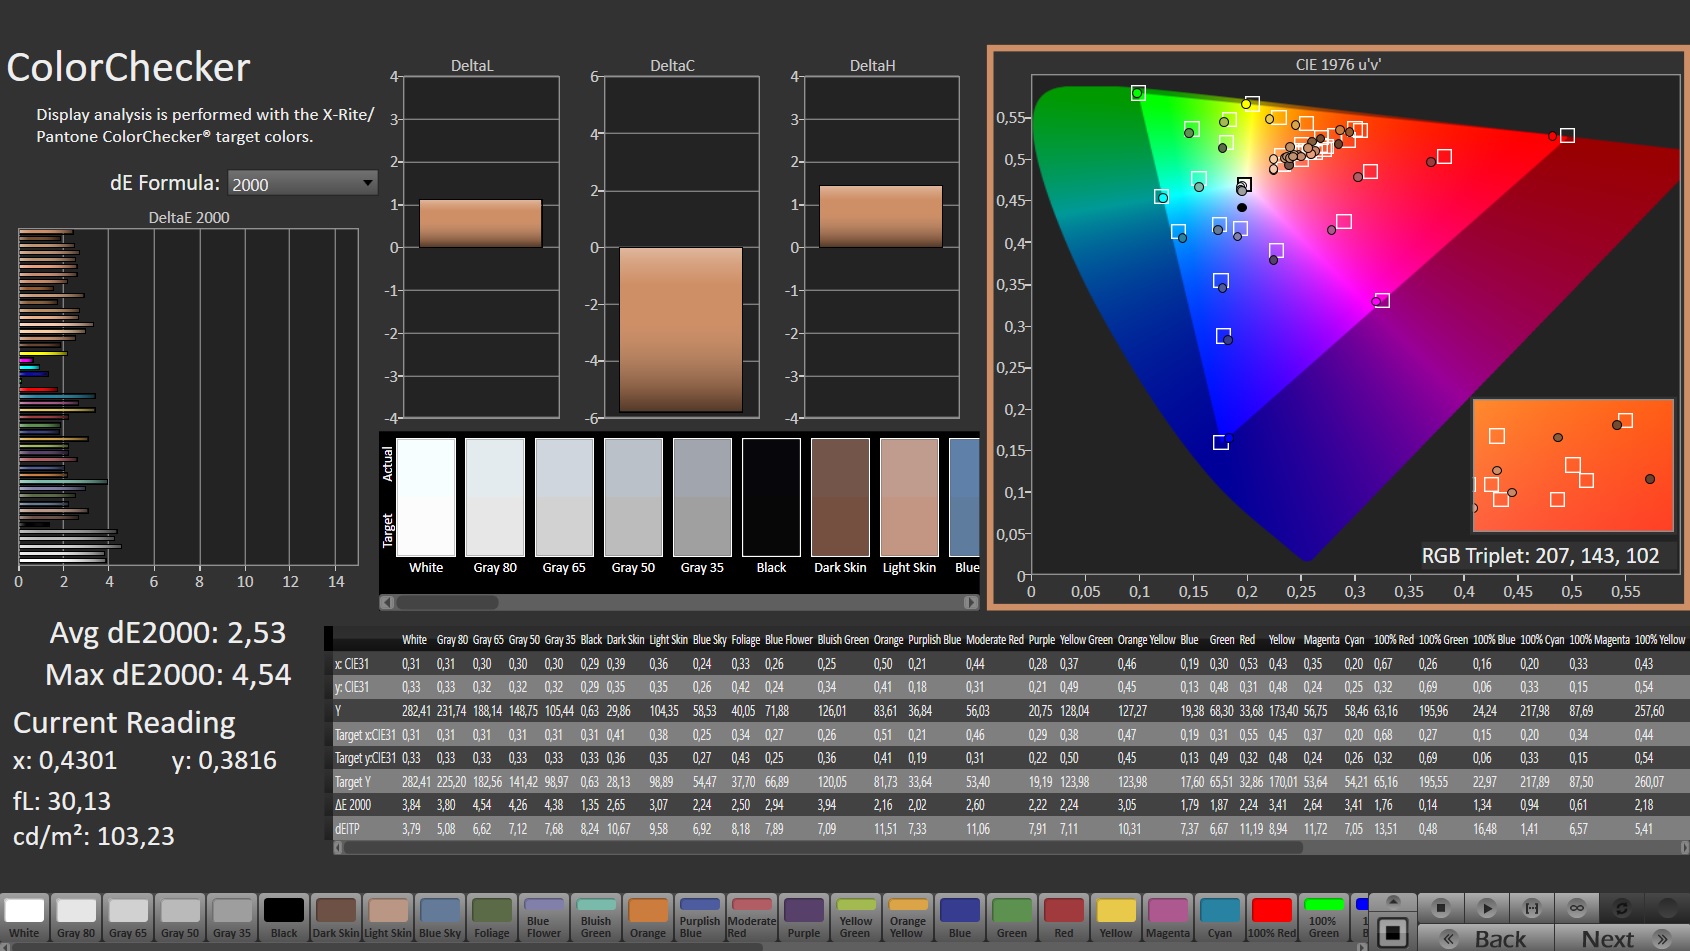
Uma calibração da tela (modo Optimus) resulta em melhorias significativas. O desvio de cor está dentro da faixa desejada (deltaE < 3) e a escala de cinza parece mais uniforme. A tela é capaz de exibir os espaços de cor sRGB (100%) e DCI-P3 (97%) inteiramente, e quase inteiramente, respectivamente, assim como 86% do espaço de cor AdobeRGB.
Nota: O perfil de cor vinculado muda as cores de acordo com nossa calibração.

Exibir tempos de resposta
| ↔ Tempo de resposta preto para branco | ||
|---|---|---|
| 5.6 ms ... ascensão ↗ e queda ↘ combinadas | ↗ 1.9 ms ascensão | 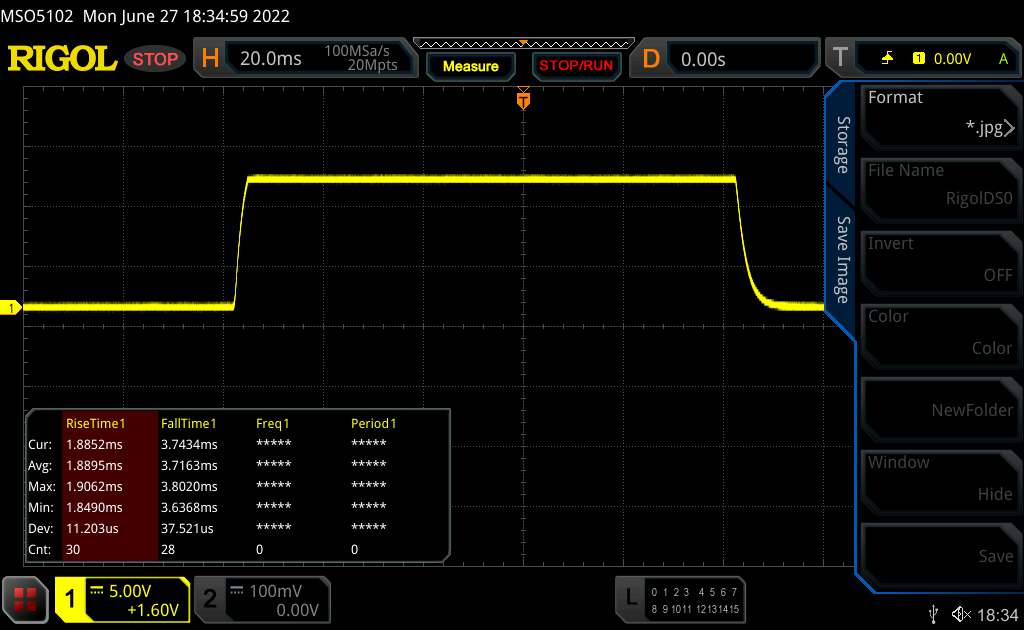 |
| ↘ 3.7 ms queda | ||
| A tela mostra taxas de resposta muito rápidas em nossos testes e deve ser muito adequada para jogos em ritmo acelerado. Em comparação, todos os dispositivos testados variam de 0.1 (mínimo) a 240 (máximo) ms. » 18 % de todos os dispositivos são melhores. Isso significa que o tempo de resposta medido é melhor que a média de todos os dispositivos testados (19.8 ms). | ||
| ↔ Tempo de resposta 50% cinza a 80% cinza | ||
| 5.8 ms ... ascensão ↗ e queda ↘ combinadas | ↗ 1.6 ms ascensão | 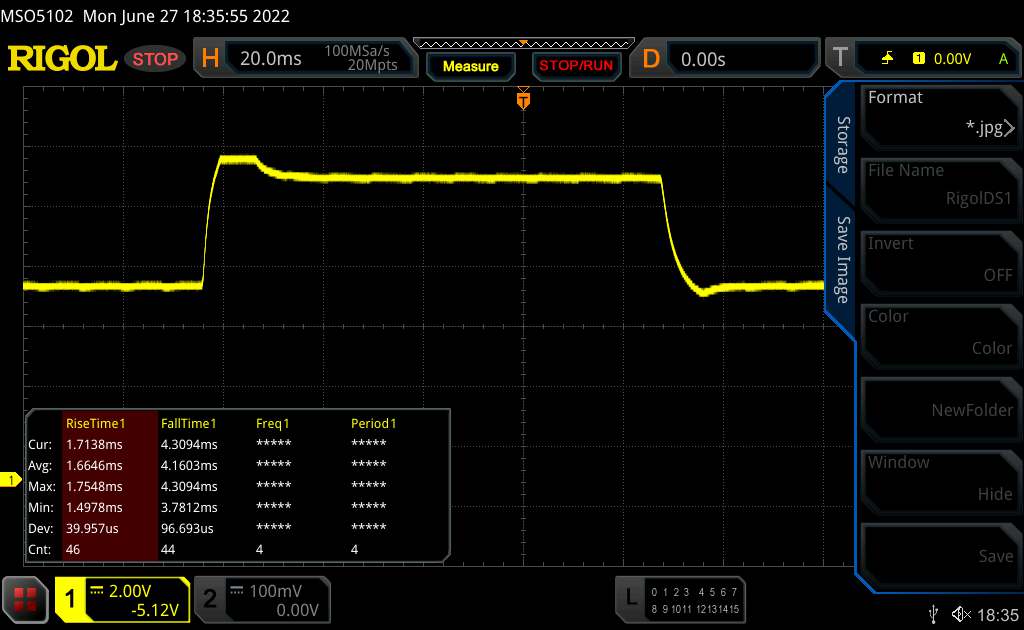 |
| ↘ 4.2 ms queda | ||
| A tela mostra taxas de resposta muito rápidas em nossos testes e deve ser muito adequada para jogos em ritmo acelerado. Em comparação, todos os dispositivos testados variam de 0.165 (mínimo) a 636 (máximo) ms. » 19 % de todos os dispositivos são melhores. Isso significa que o tempo de resposta medido é melhor que a média de todos os dispositivos testados (31 ms). | ||
Cintilação da tela / PWM (modulação por largura de pulso)
| Tela tremeluzindo / PWM não detectado |  | ||
[pwm_comparison] Em comparação: 52 % de todos os dispositivos testados não usam PWM para escurecer a tela. Se PWM foi detectado, uma média de 7757 (mínimo: 5 - máximo: 343500) Hz foi medida. | |||
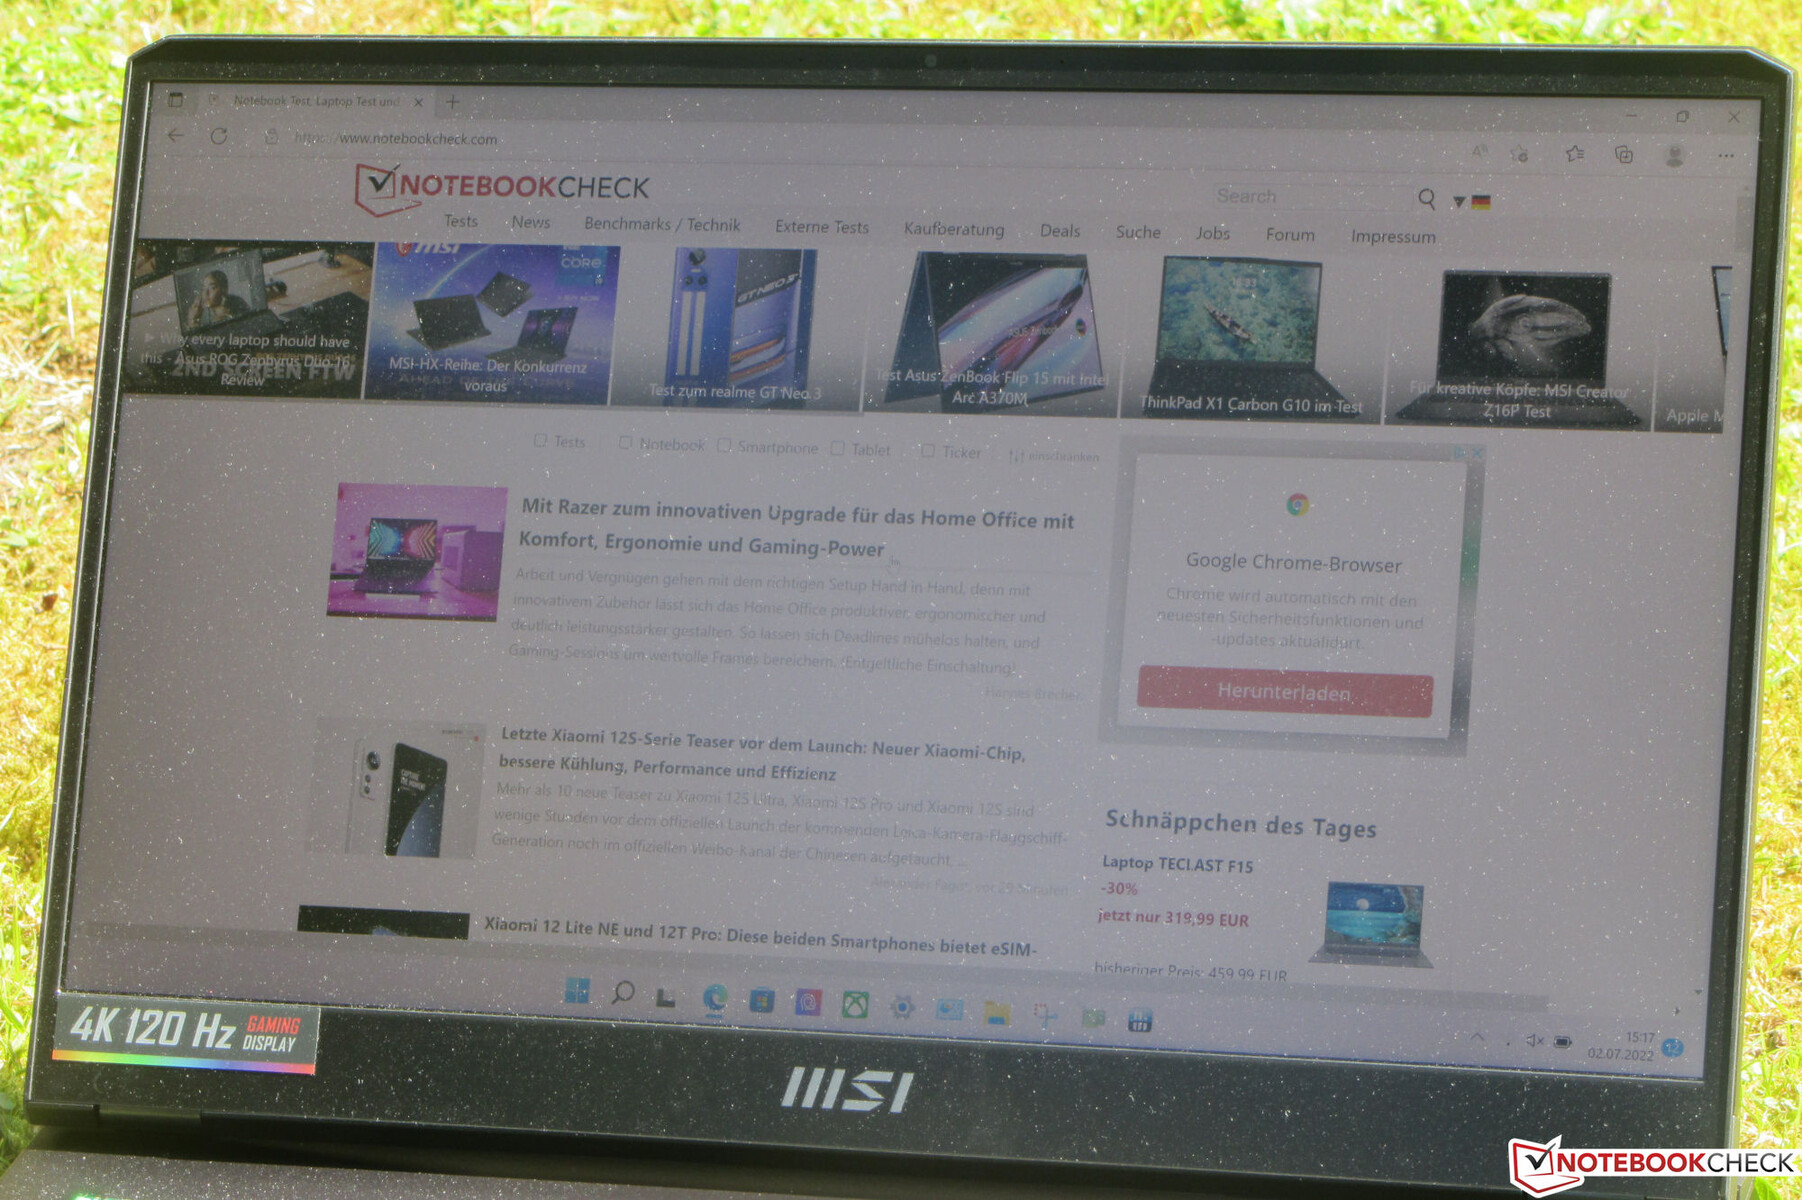
O painel IPS tem bons ângulos de visão e permanece legível a partir de qualquer posição. Ao ar livre, o conteúdo da tela pode ser lido desde que o sol não brilhe muito.

Desempenho - Ampere e Alder Lake brilham
Com o Raider GE77 HX 12UHS, a MSI tem um laptop de 17,3 polegadas de alto desempenho em oferta que verifica todas as caixas para cenários exigentes.
Condições de teste
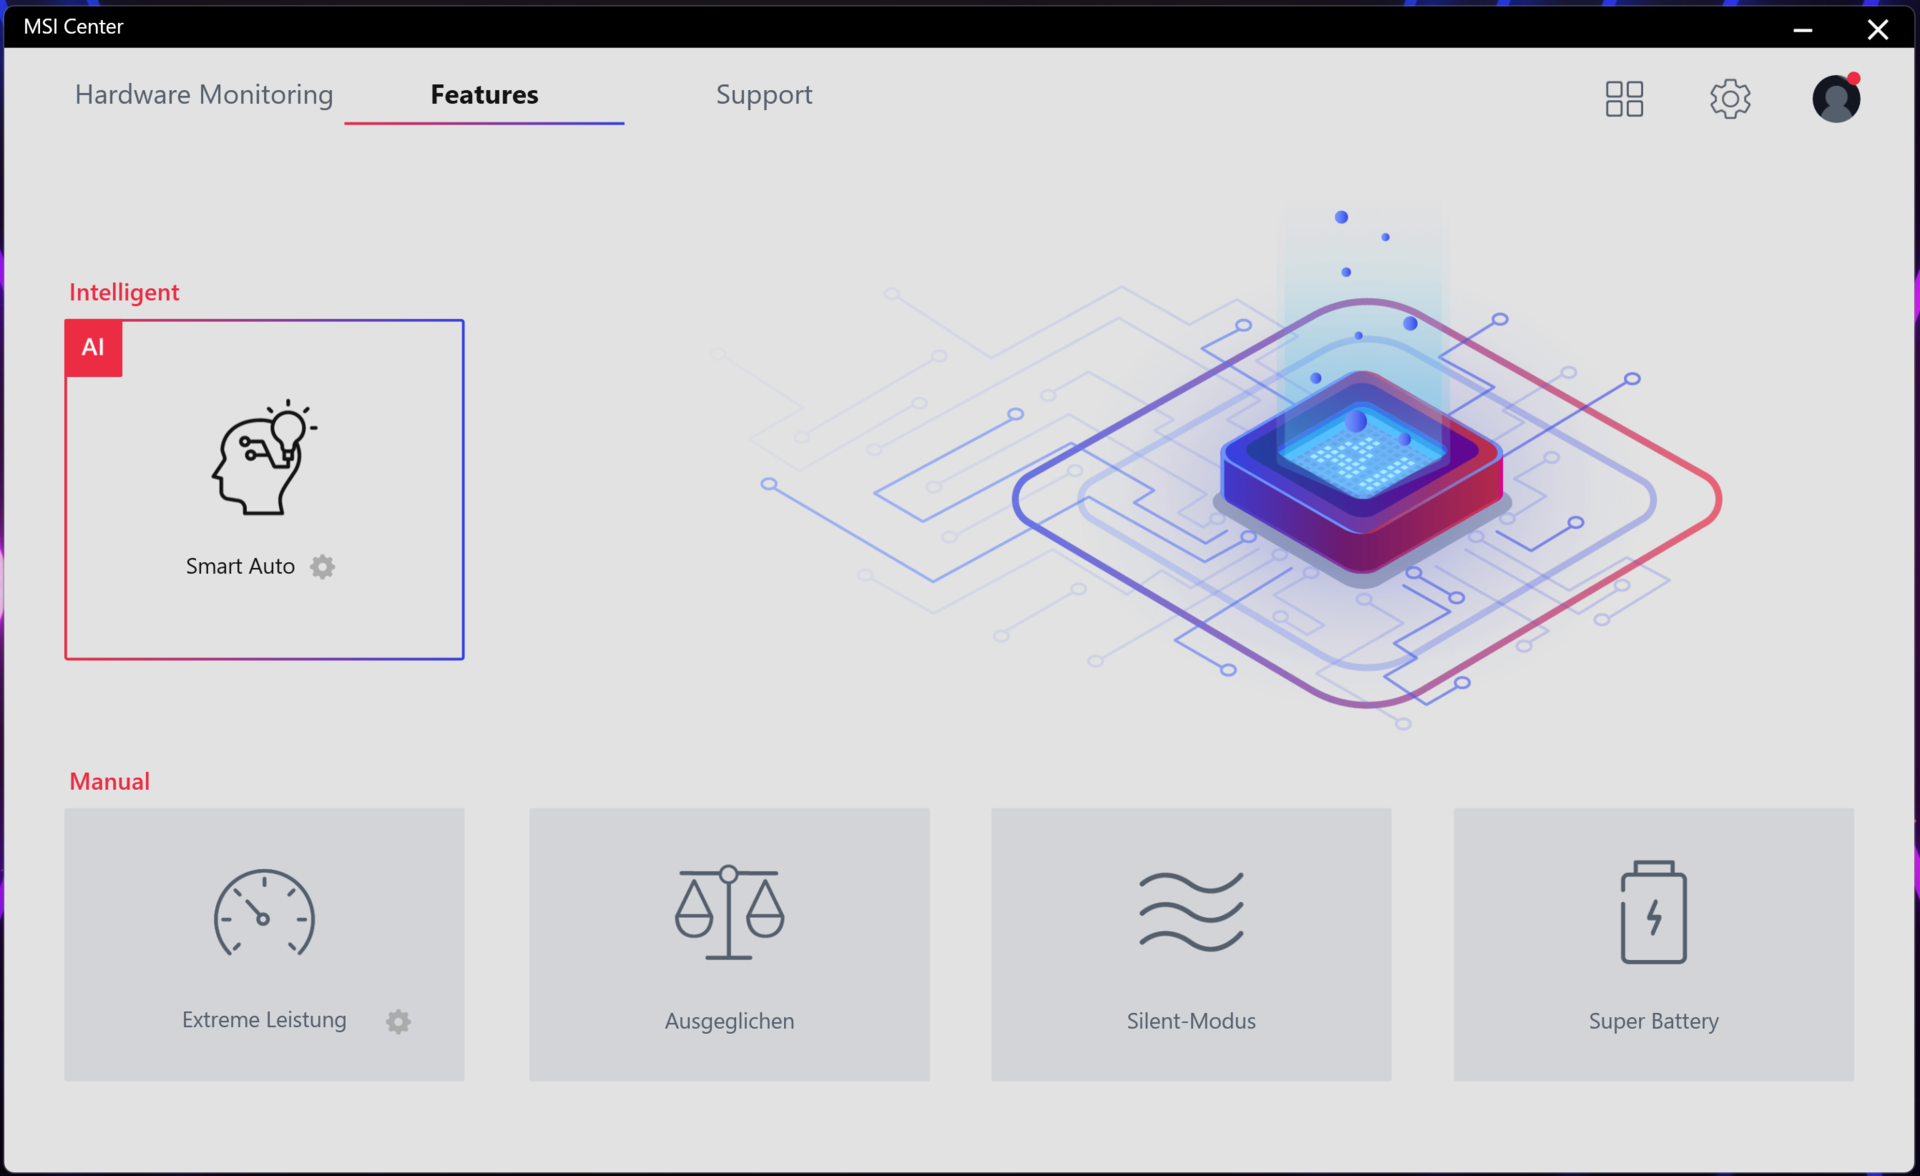
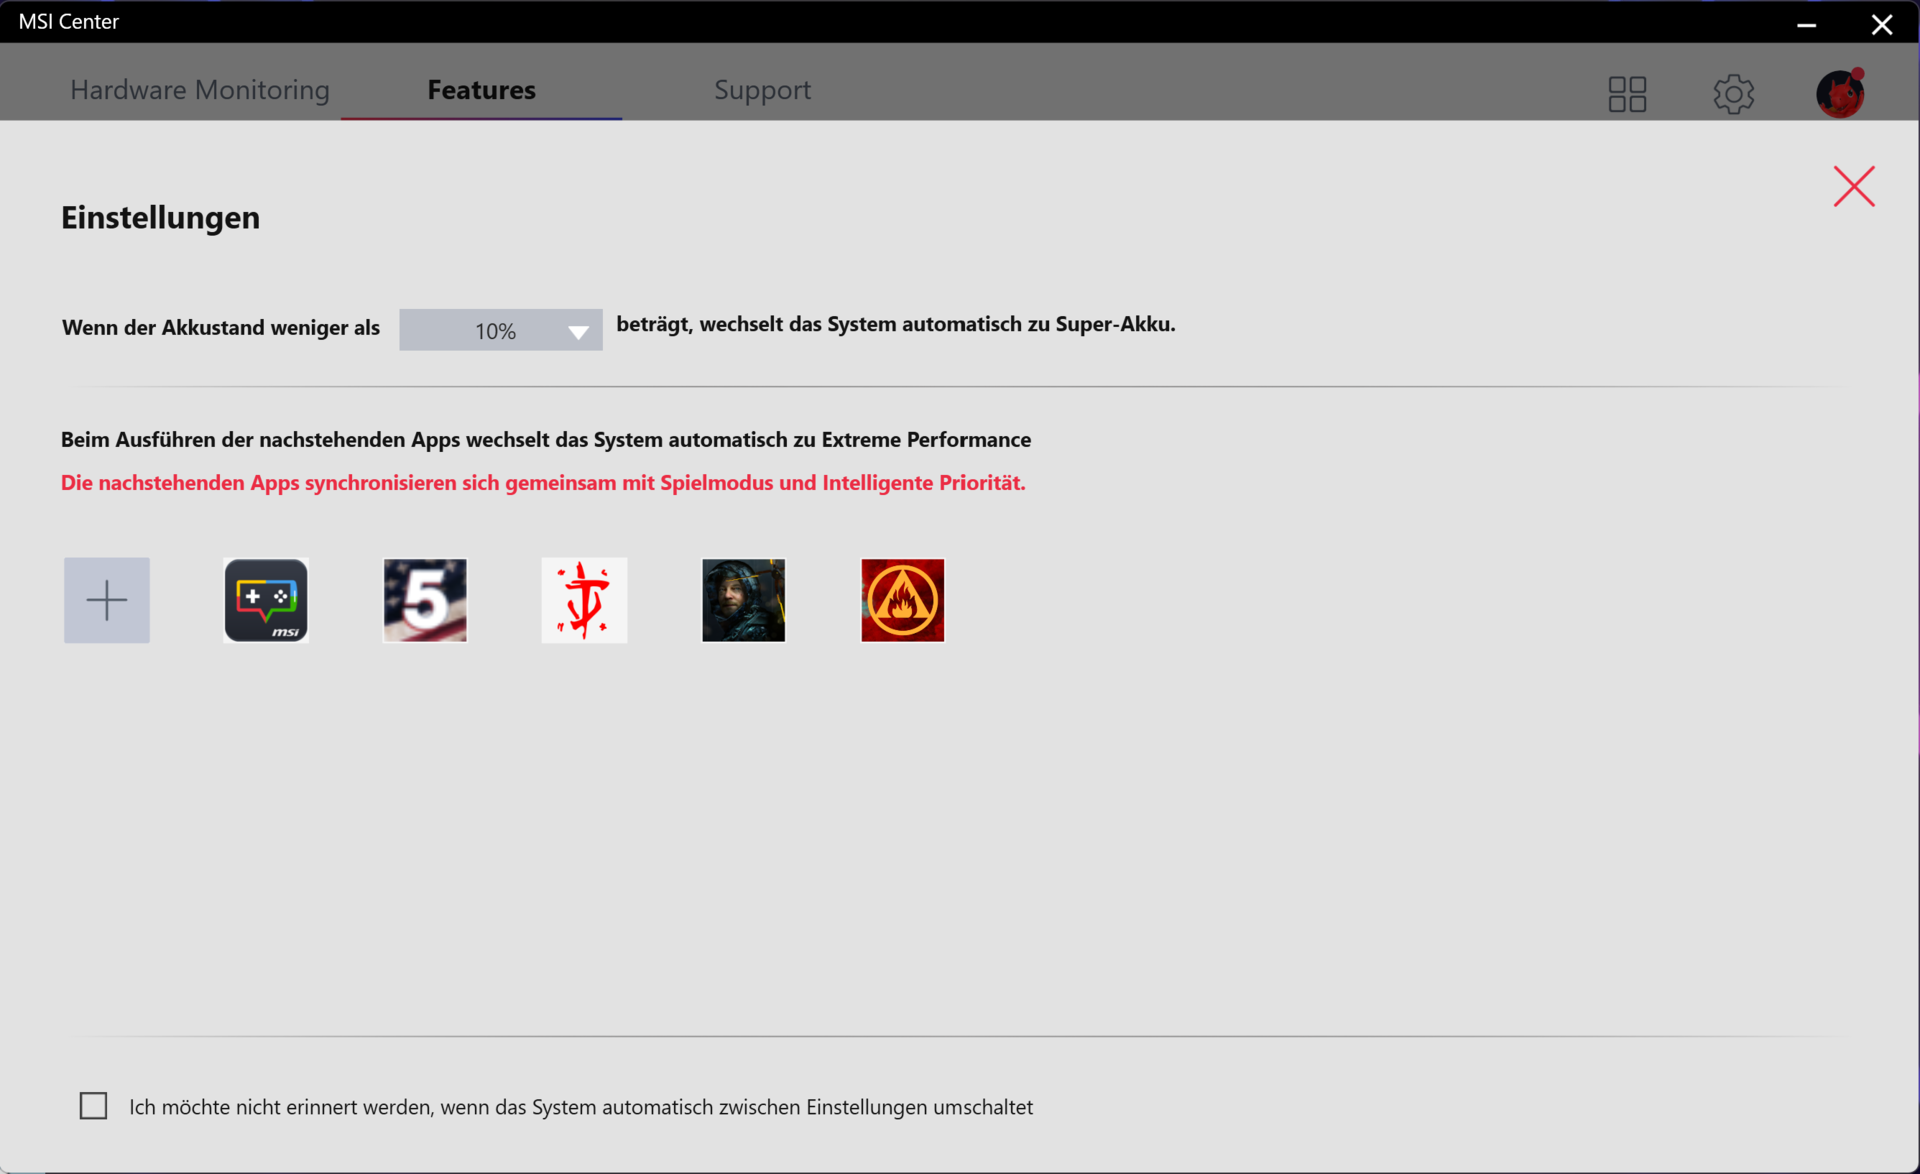
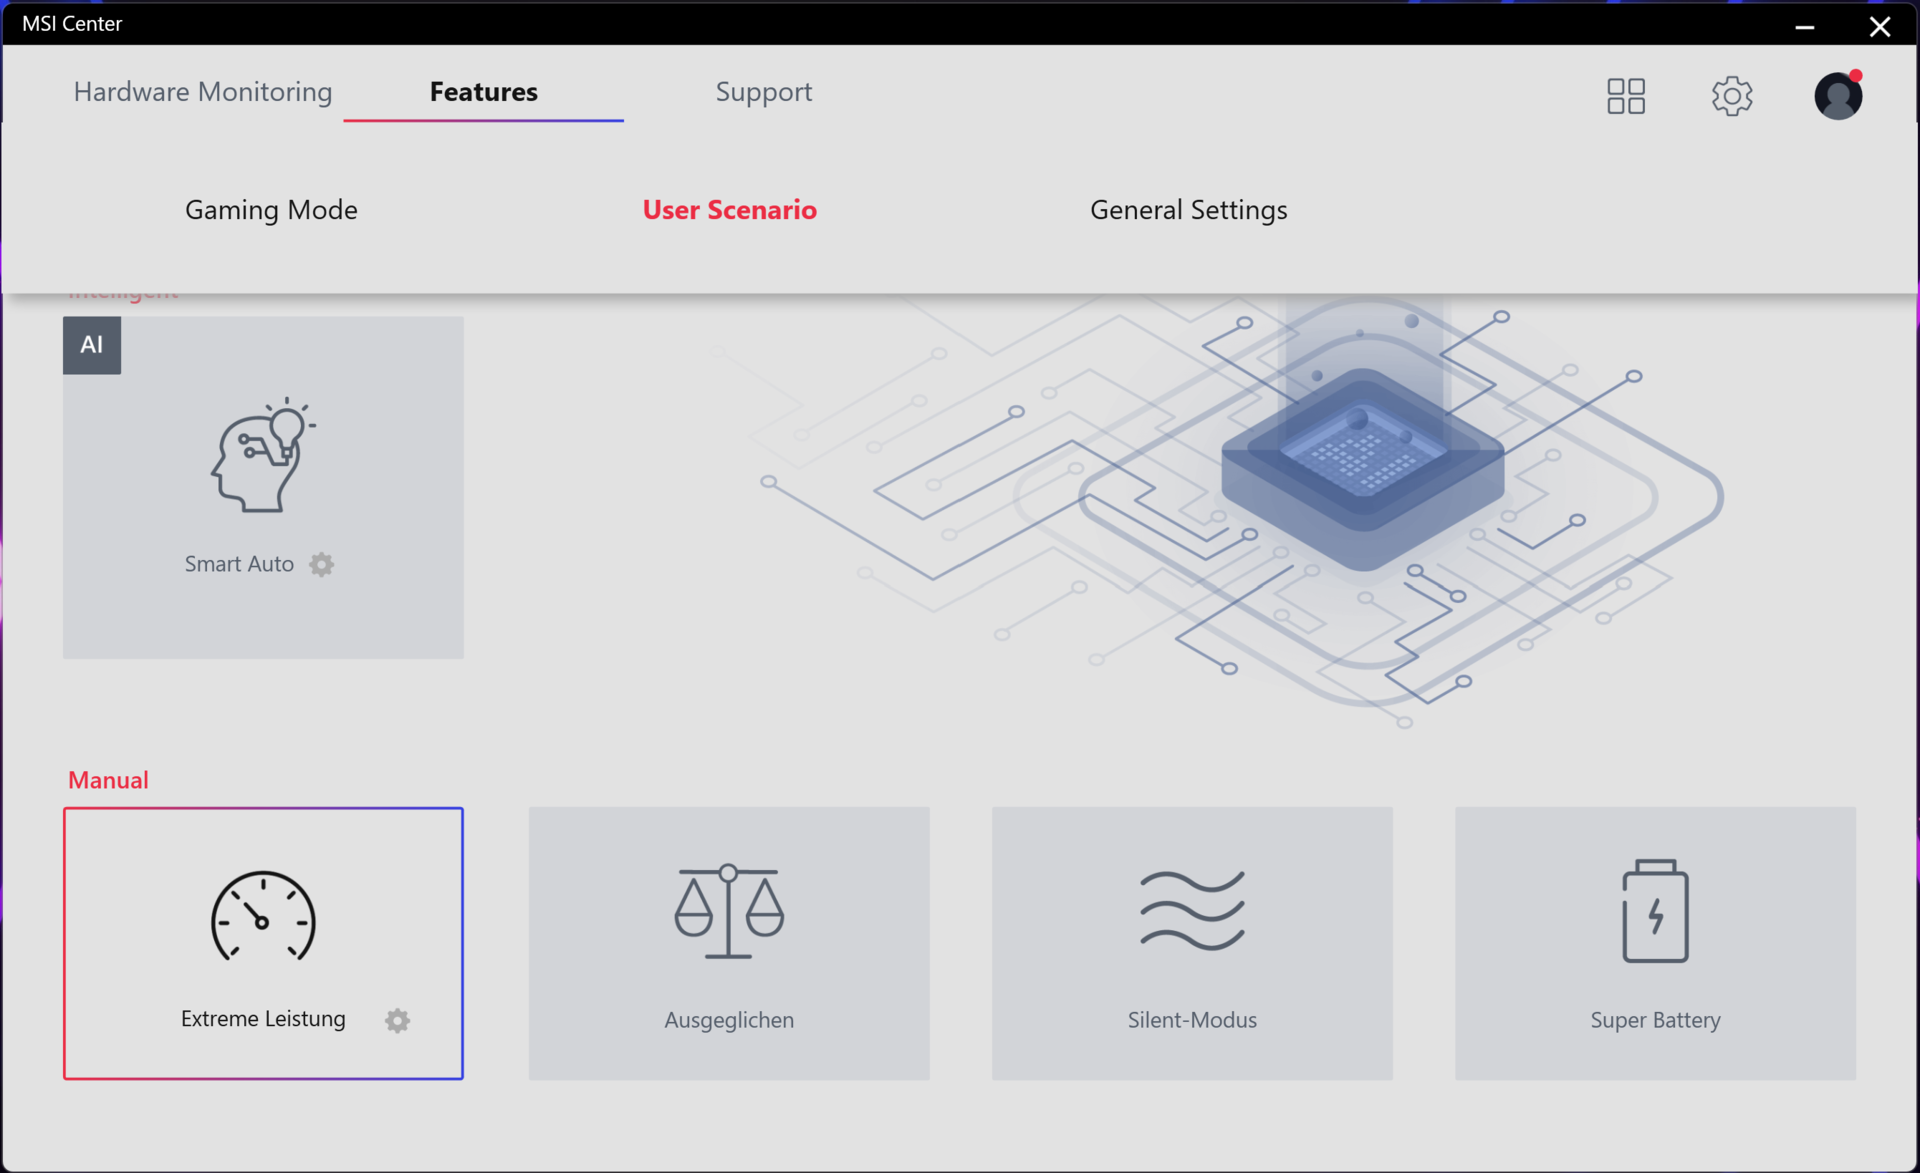
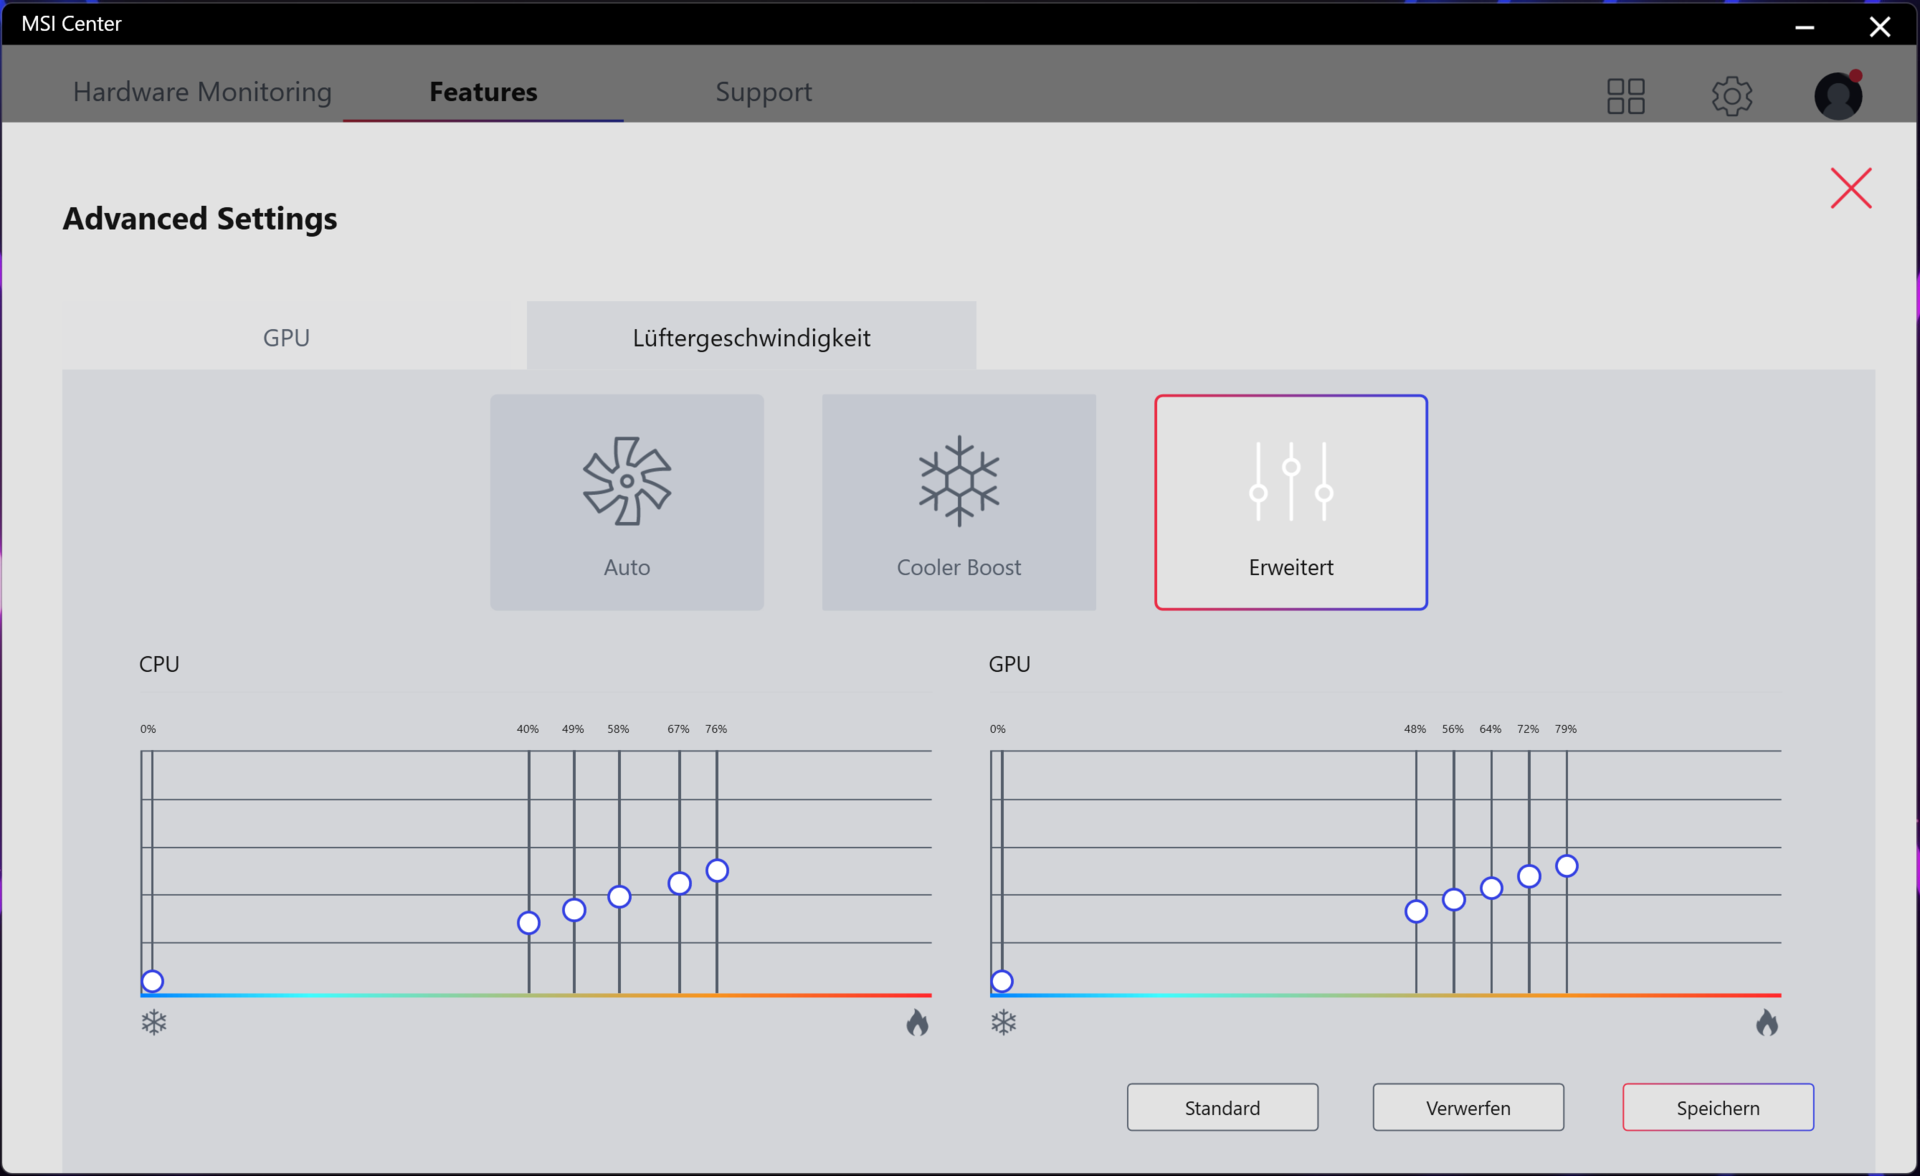
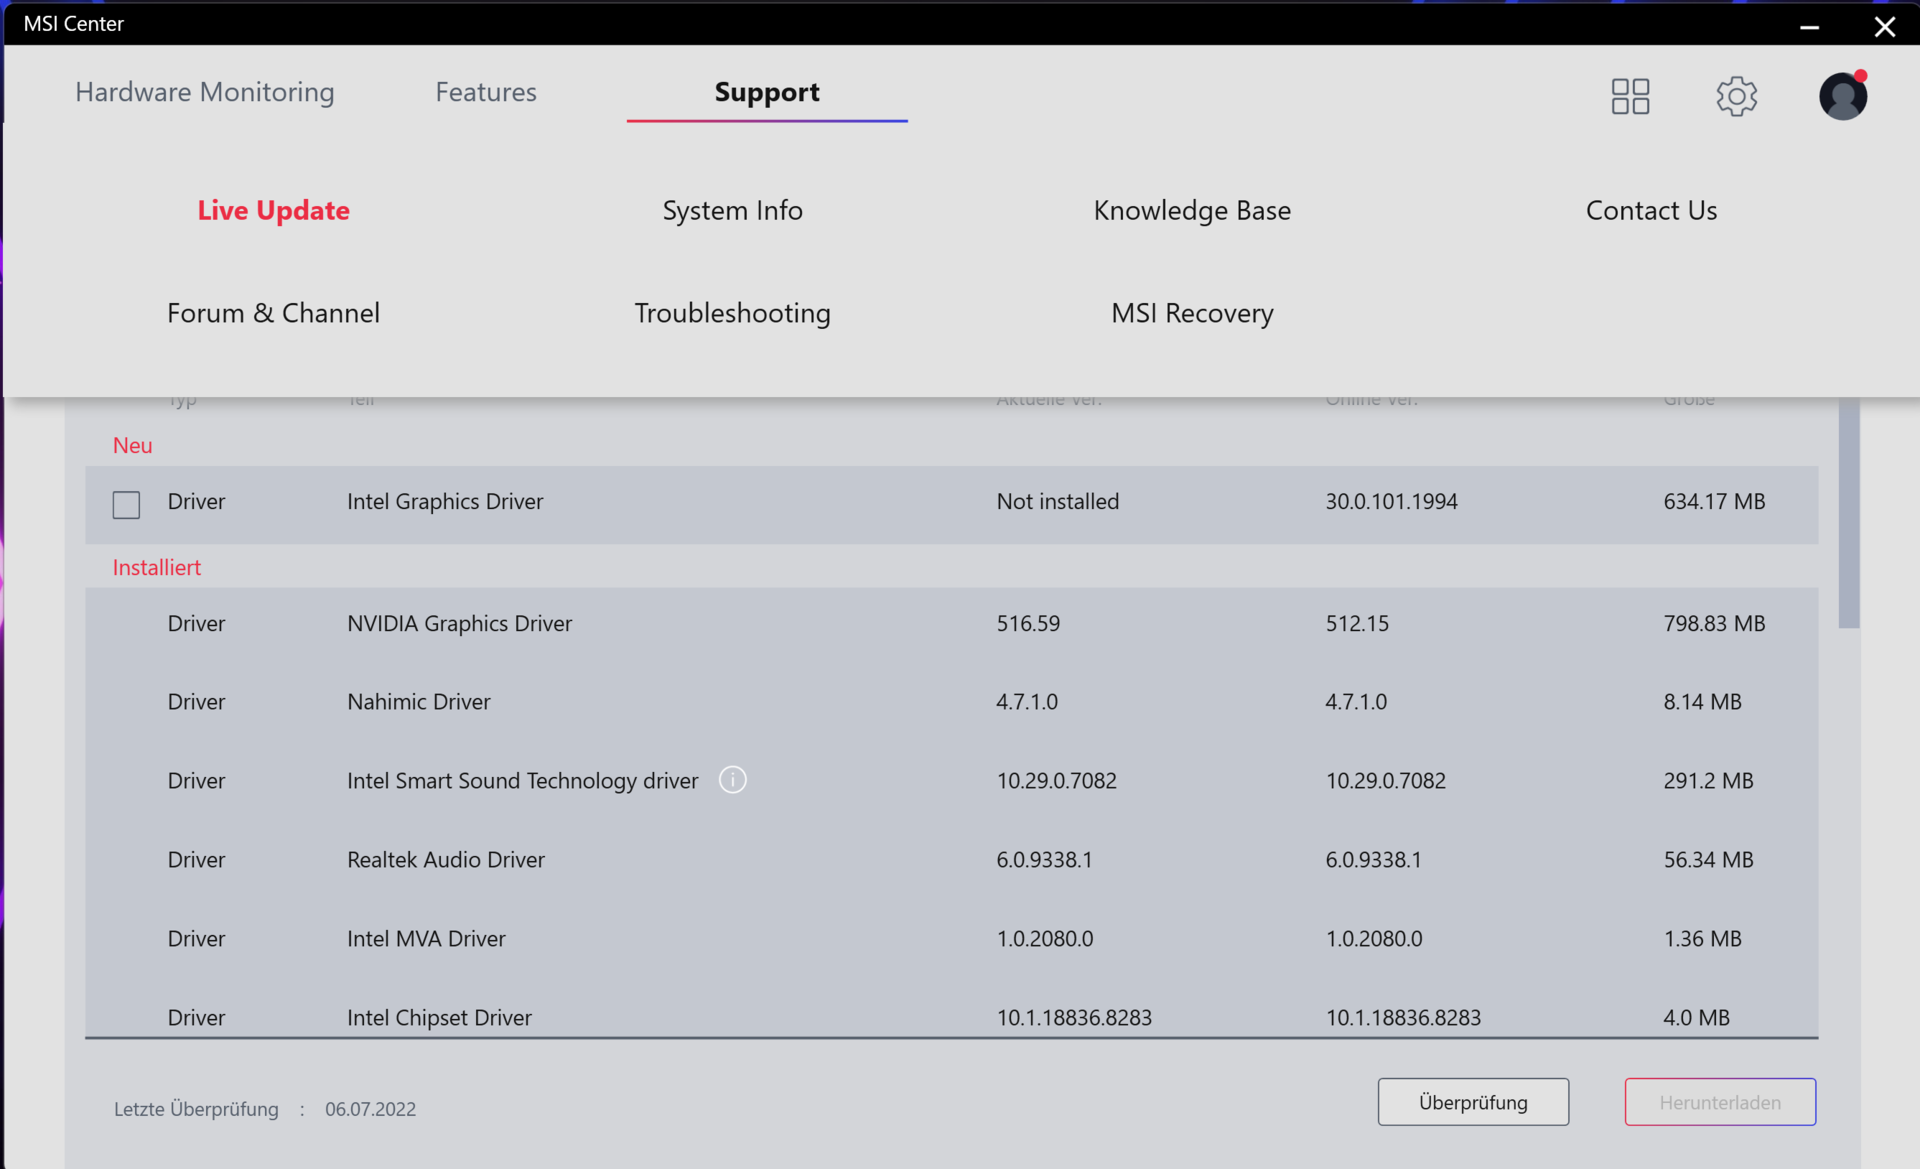
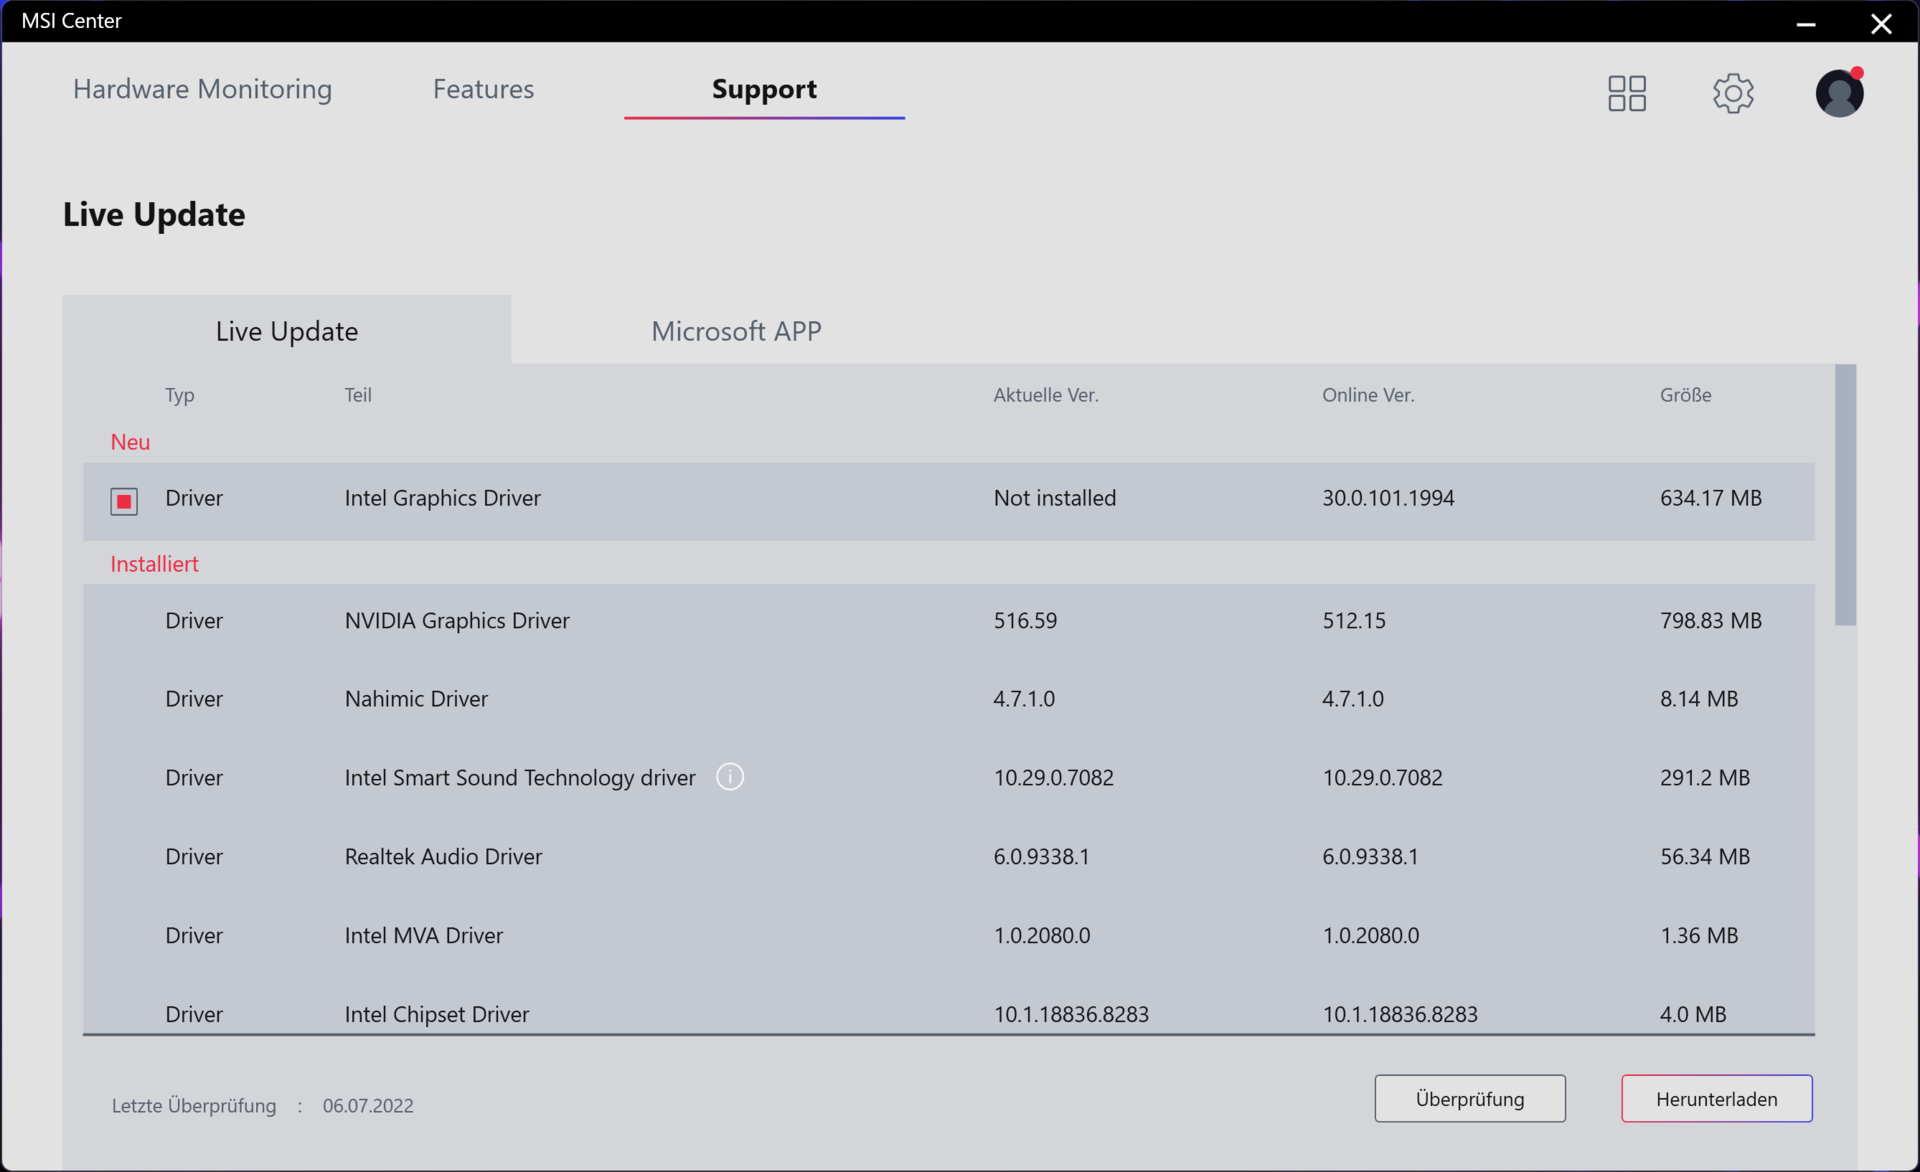
Os usuários podem alternar manualmente entre quatro perfis de potência através do software MSI Center pré-instalado. Ao ativar - como nós fizemos - a função universal, baseada na IA "Smart Auto", o MSI Center escolhe automaticamente o perfil de acordo com o cenário atual. Este recurso também permite que os usuários criem uma lista de aplicações, que habilitam o perfil "Desempenho extremo" quando lançado.
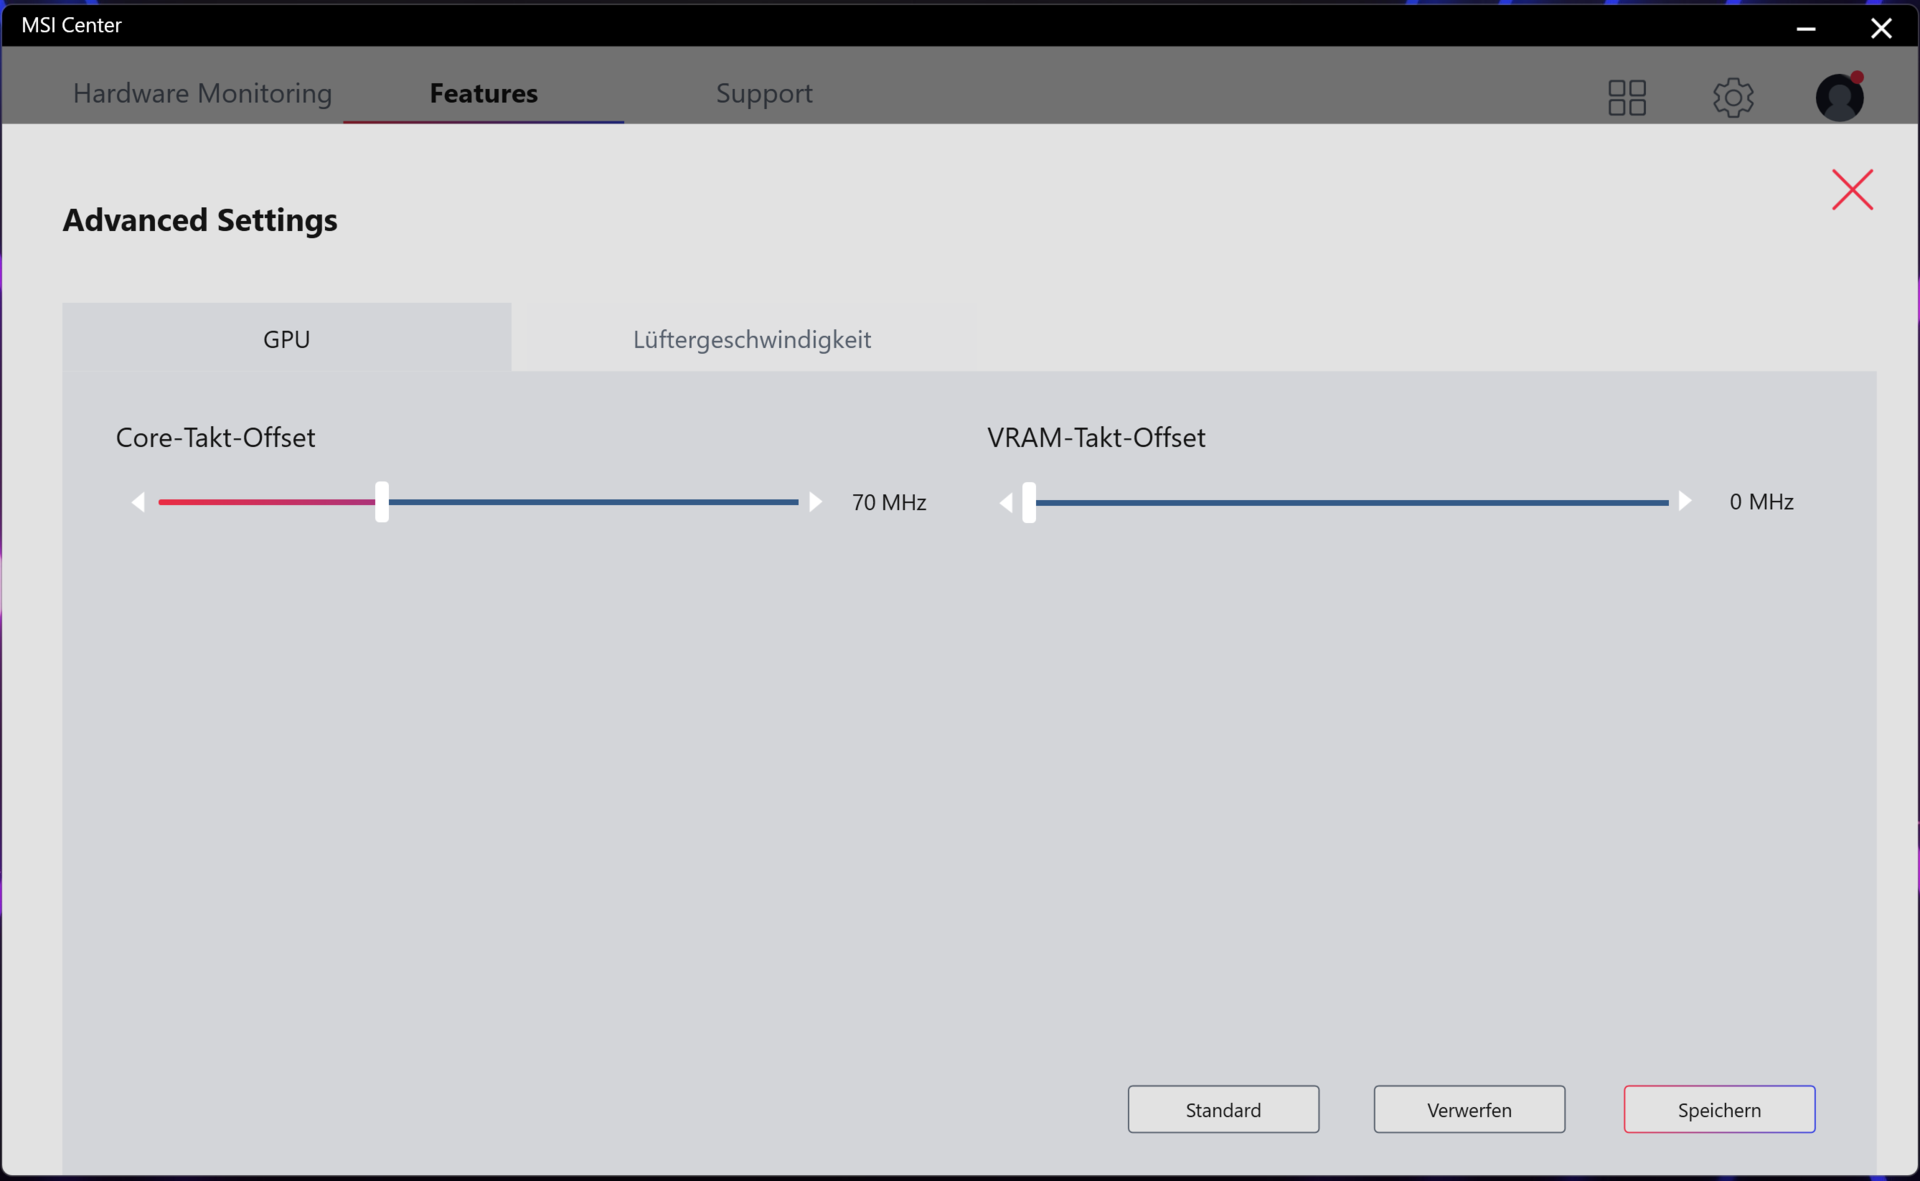
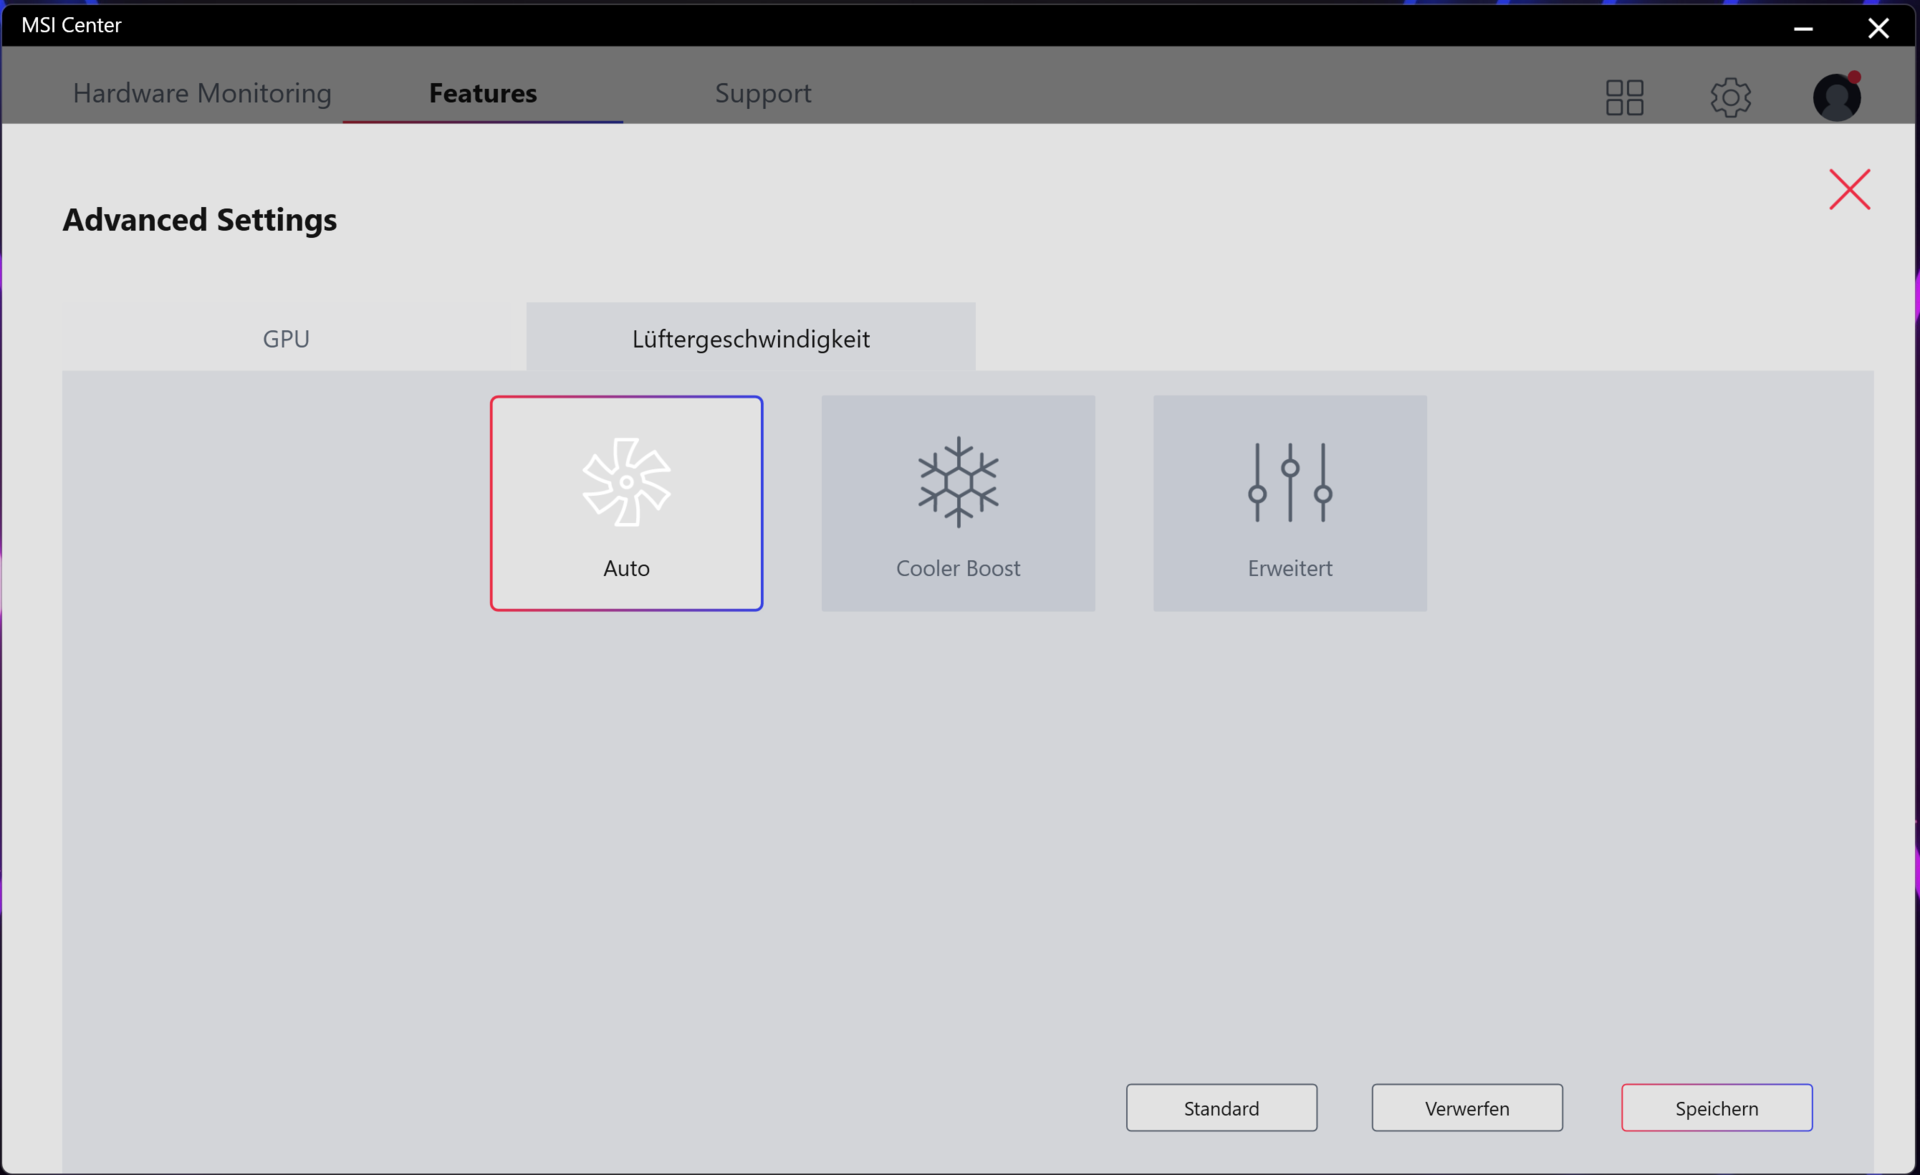
O perfil "Perfil Extremo" oferece várias opções de ajuste. É possível fazer overclock da GPU e da VRAM, por exemplo. Além disso, os usuários têm acesso aos controles do ventilador. Aqui, as opções são "Auto", "Cooler Boost" (ventiladores funcionam em velocidades máximas), e "Advanced" (curvas de ventiladores ajustáveis).
Bug, benchmark de otimização, ou recurso útil? A execução de nosso conjunto de referência produz resultados um pouco curiosos ao usar o "Modo Silencioso": O lançamento de determinados benchmarks faz com que o MSI Center mude automaticamente para o perfil "Extreme performance". Este foi o caso dos benchmarks do Cinebench e dos benchmarks do AIDA64.
| Desempenho extremo | Equilibrado | Modo silencioso | Super bateria | |
|---|---|---|---|---|
| Limite de potência 1 | 115 watts | 110 watts | 30 watts | 15 watts |
| Limite de potência 2 | 180 watts | 150 watts | 30 watts | 15 watts |
Processador
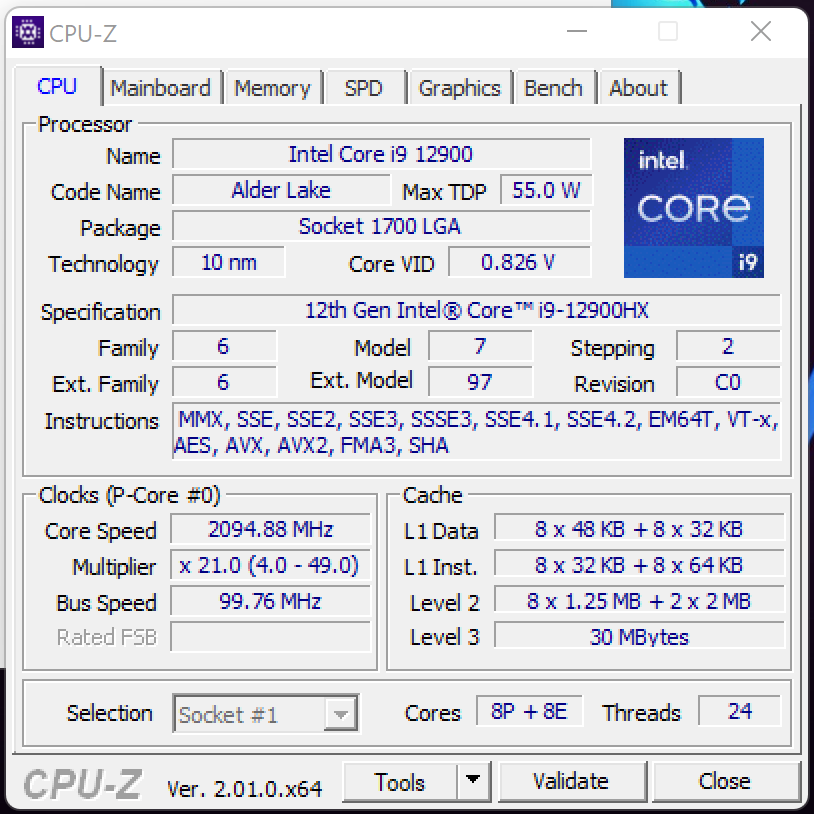
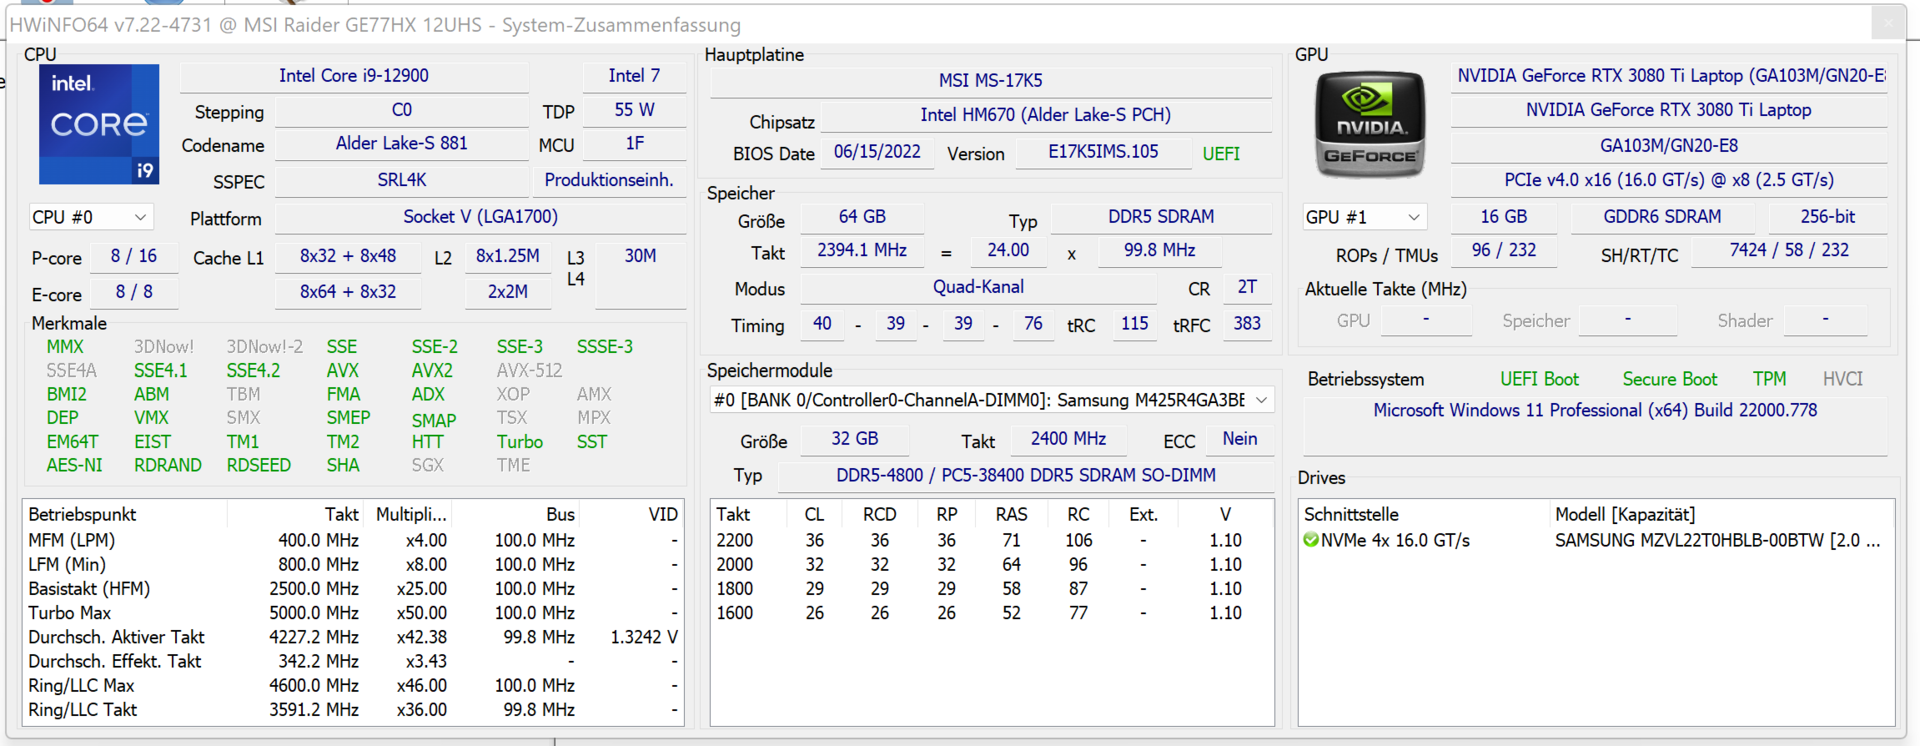
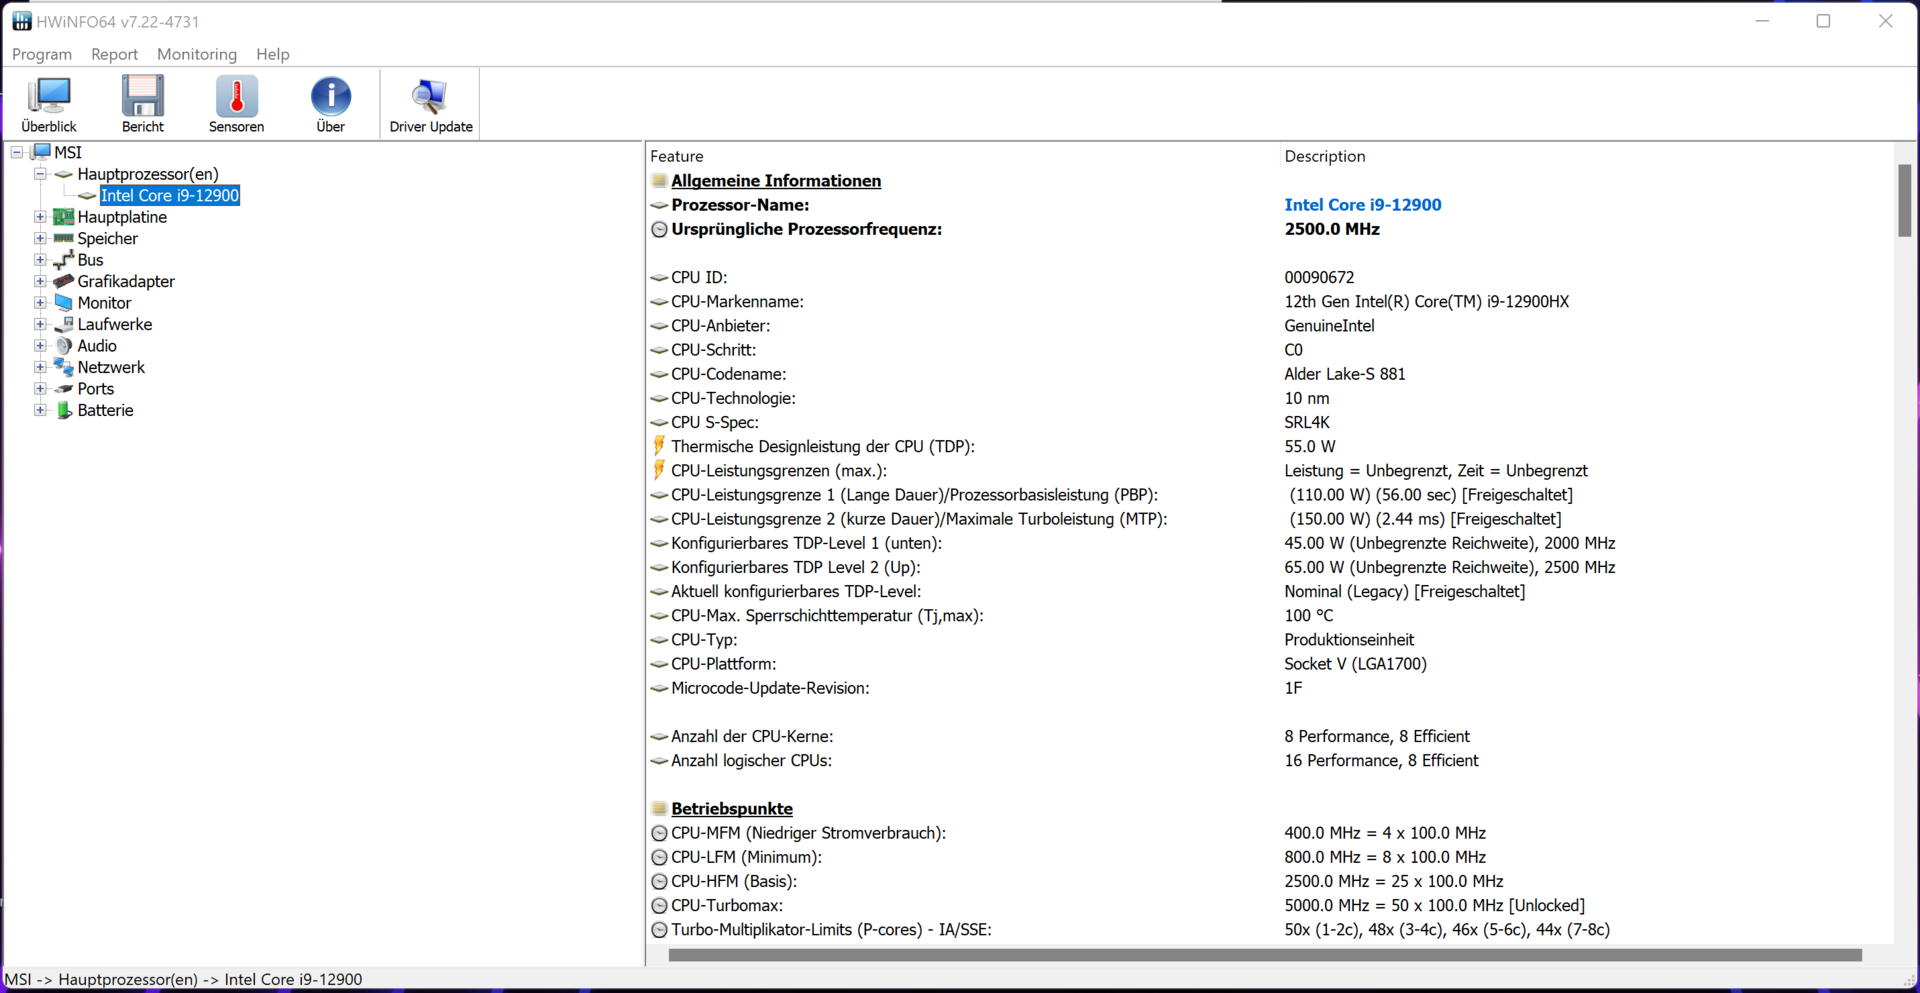
O Núcleo i7-12900HX (Alder Lake) consiste em oito núcleos de desempenho (Hyper-threading, 2,3 a 5 GHz) e oito núcleos de eficiência (sem Hyper-threading, 1,7 a 3,6 GHz). No total, há 24 núcleos lógicos de CPU.
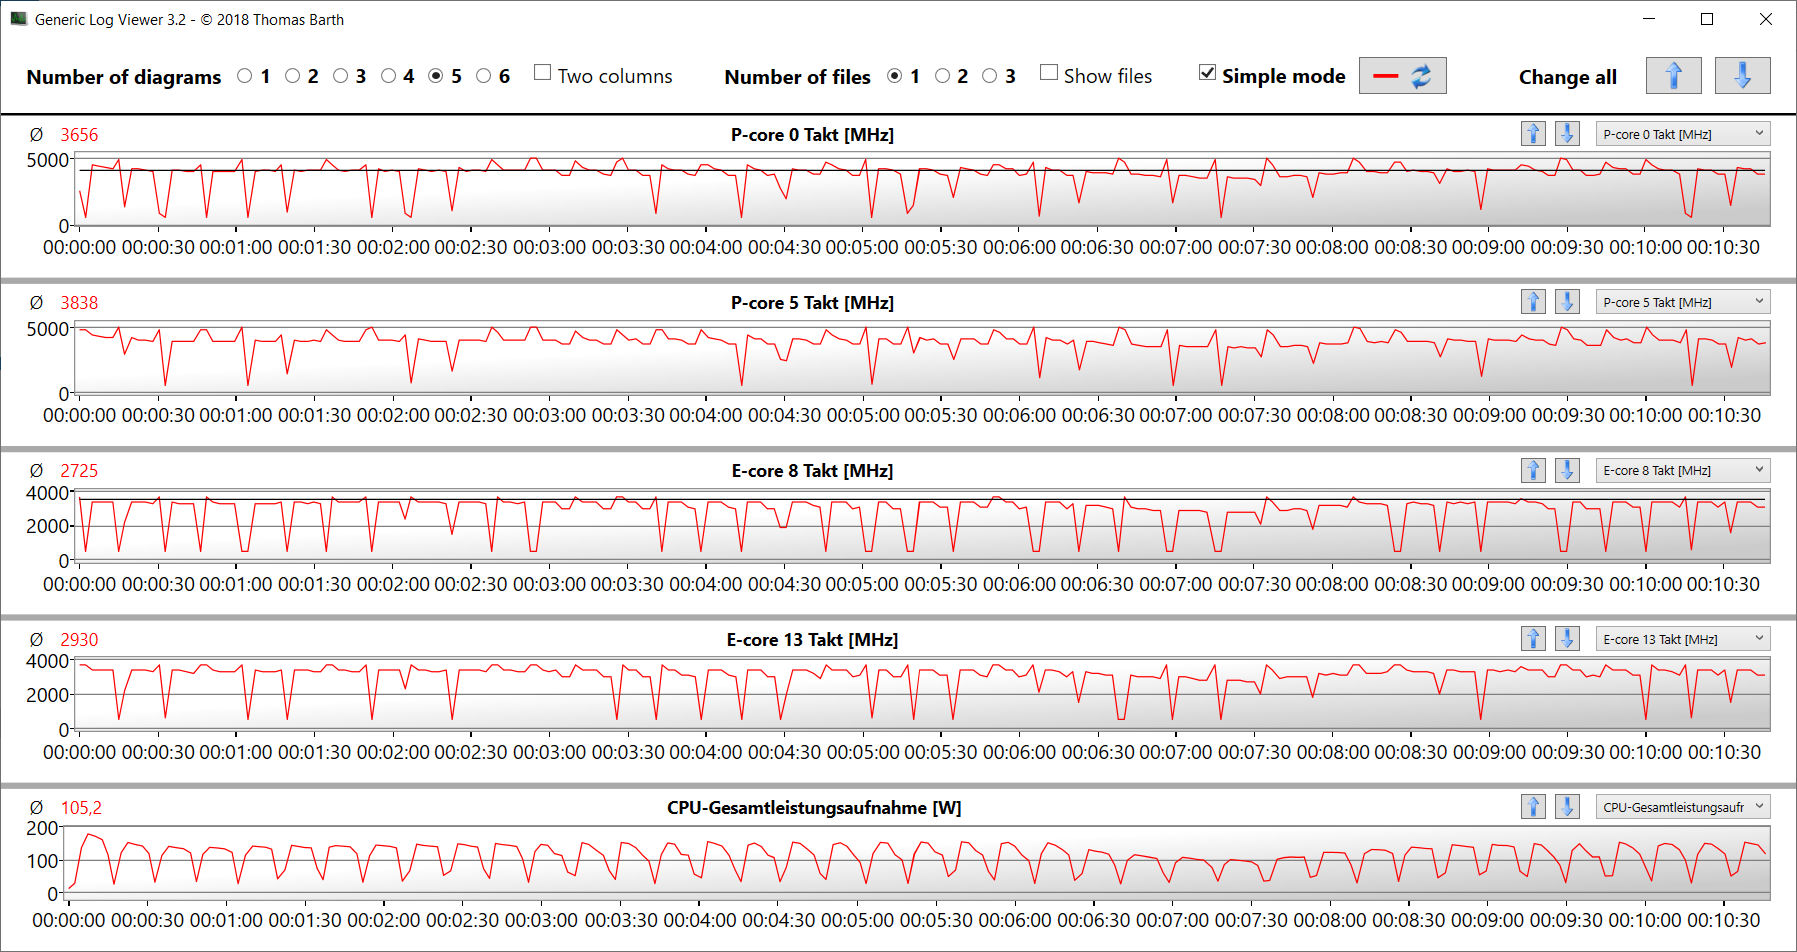
As velocidades do relógio permanecem altas em toda a Cinebench R15 Multi benchmark (núcleos P: 4,4 a 4,5 GHz, núcleos E: 3,3 a 3,4 GHz) e o teste de rosca única (núcleos P: 500 MHz a 5 GHz, núcleos E: 400 MHz a 3,6 GHz). No modo de bateria, as velocidades de relógio de rosca única são similares (núcleos P: 400 MHz a 4,8 GHz, núcleos E: 400 MHz a 3,6 GHz), enquanto as velocidades de relógio de rosca múltipla (núcleos P: 1,7 a 2,6 GHz, núcleos E: 1,4 a 2 GHz) não são similares.
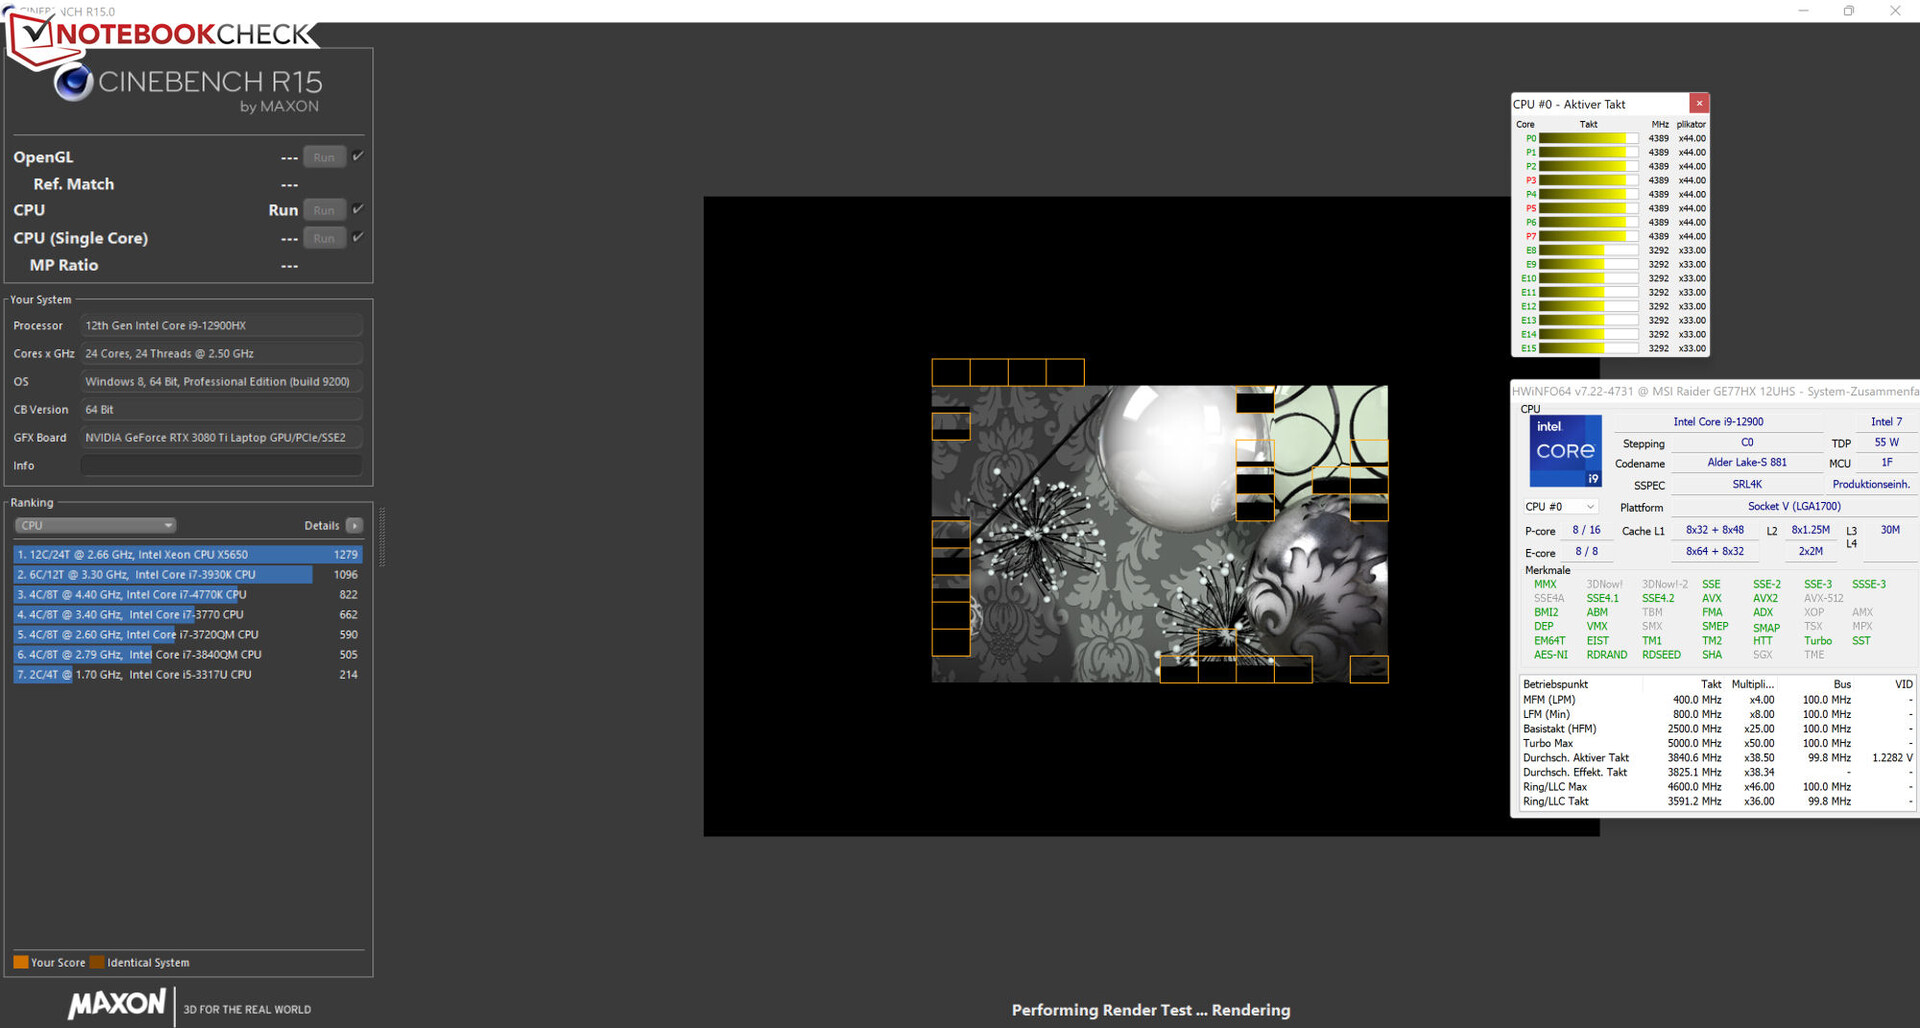
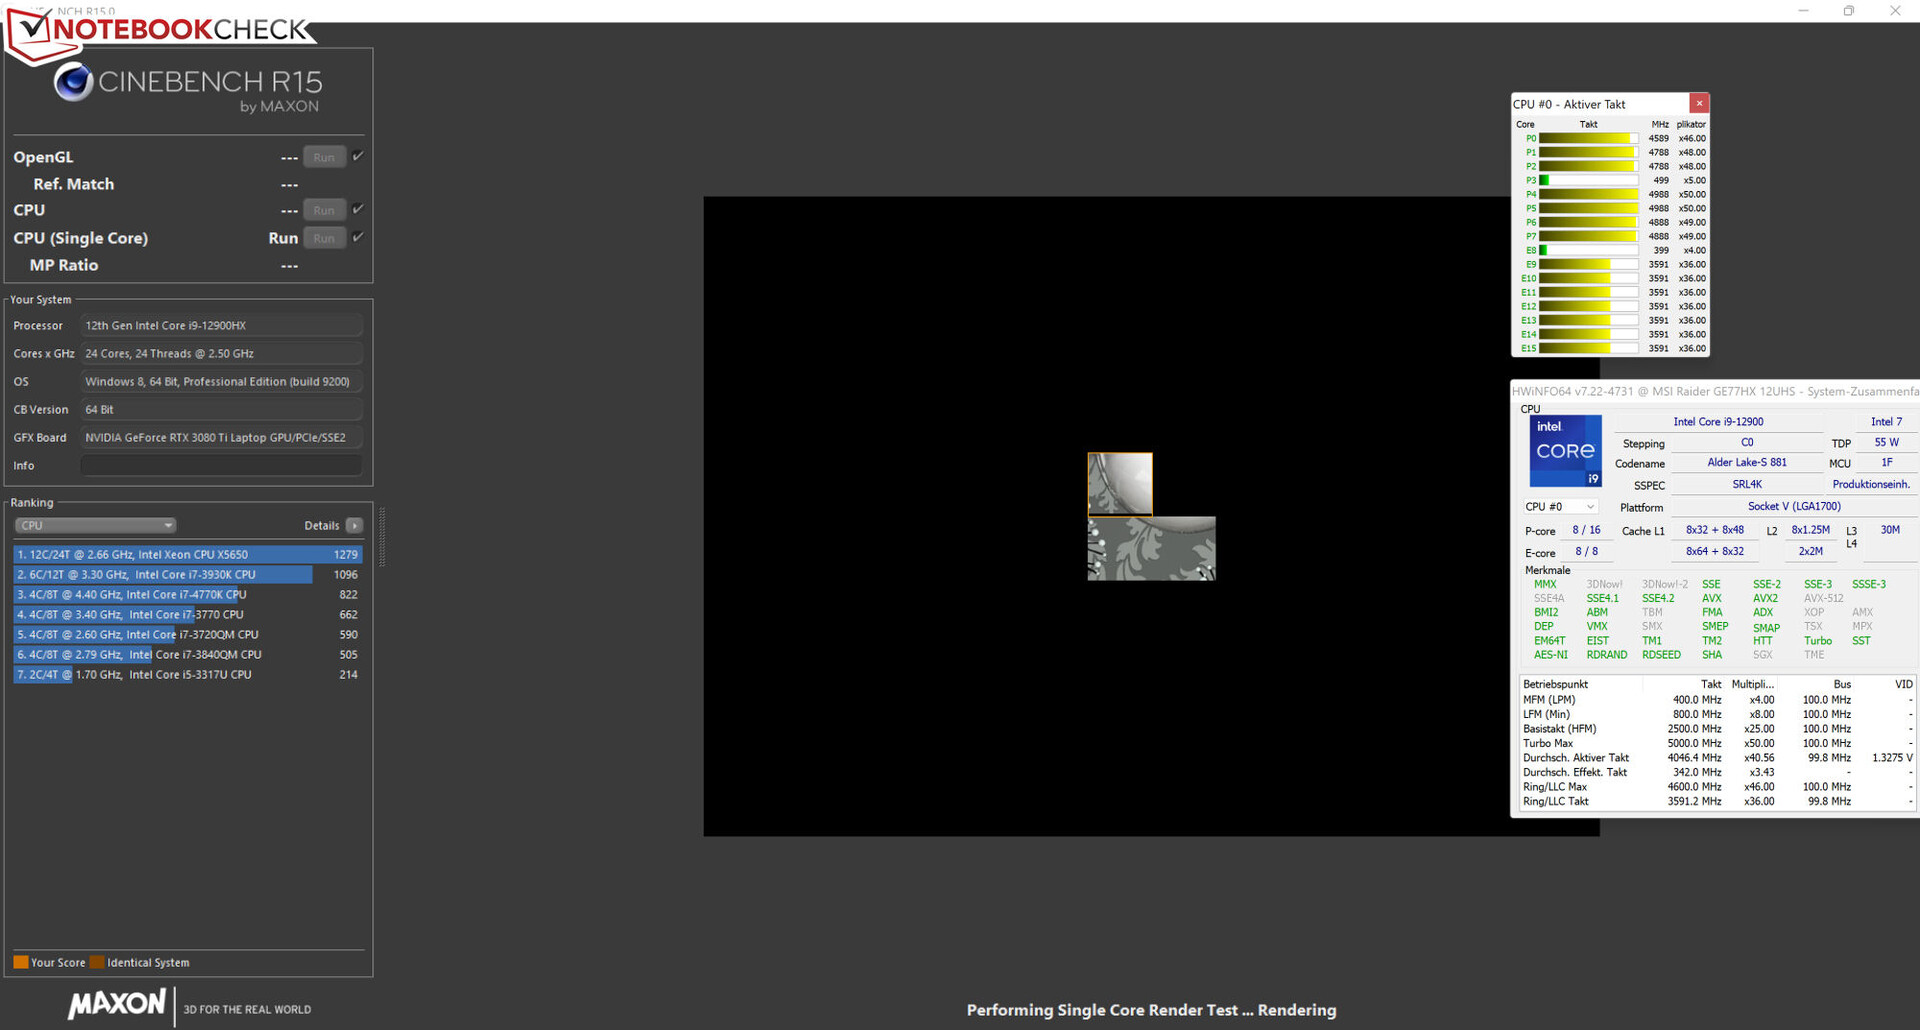
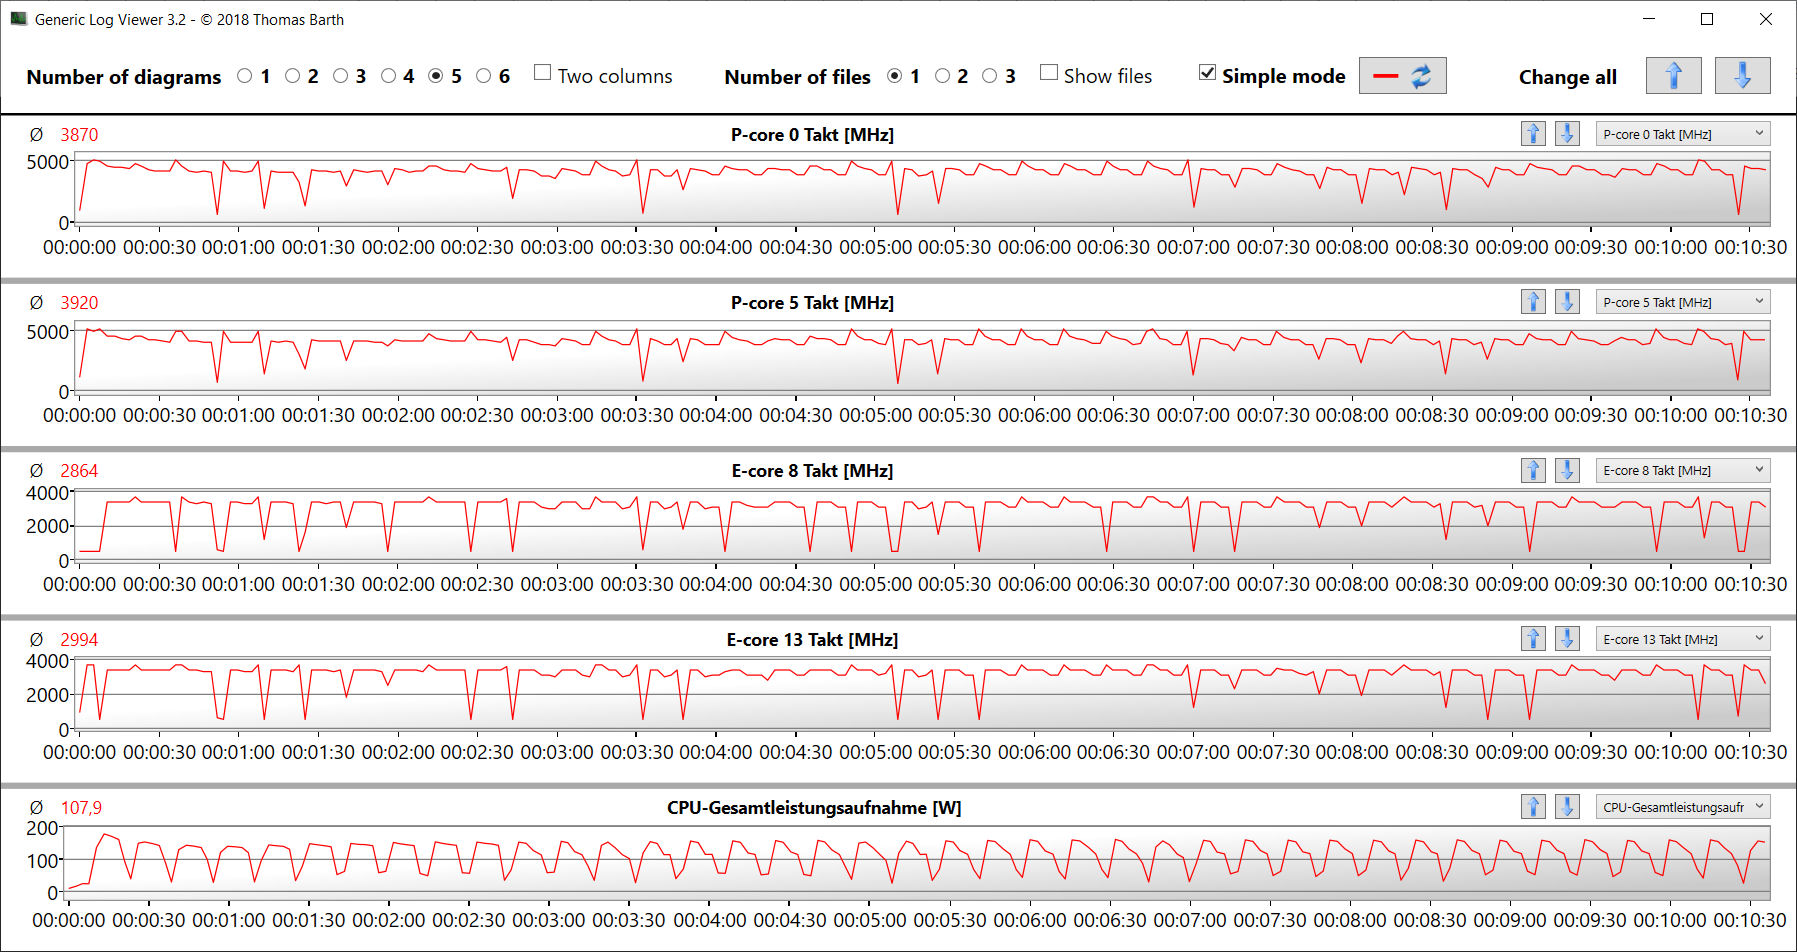
Determinamos se o turbo da CPU está permanentemente ativo enquanto está na rede elétrica, executando o benchmark Cinebench R15 Multi em um loop. Aqui, observamos consistentemente altas velocidades de relógio. O perfil "Desempenho extremo" resulta em um nível de desempenho mais uniforme.
Cinebench R15 Multi Loop
| CPU Performance rating - Percent | |
| Média da turma Gaming | |
| MSI Raider GE77 HX 12UHS | |
| MSI Raider GE77 HX 12UHS | |
| Média Intel Core i9-12900HX | |
| Alienware x17 R2 P48E | |
| Medion Erazer Beast X30 | |
| Razer Blade 17 Early 2022 | |
| Cinebench R23 | |
| Multi Core | |
| Média da turma Gaming (10488 - 42661, n=107, últimos 2 anos) | |
| MSI Raider GE77 HX 12UHS (Extreme Leistung) | |
| MSI Raider GE77 HX 12UHS | |
| Média Intel Core i9-12900HX (18337 - 23482, n=8) | |
| Medion Erazer Beast X30 | |
| Alienware x17 R2 P48E | |
| Razer Blade 17 Early 2022 | |
| Single Core | |
| Média da turma Gaming (1166 - 2415, n=107, últimos 2 anos) | |
| Média Intel Core i9-12900HX (1897 - 1936, n=8) | |
| Razer Blade 17 Early 2022 | |
| MSI Raider GE77 HX 12UHS | |
| Alienware x17 R2 P48E | |
| MSI Raider GE77 HX 12UHS (Extreme Leistung) | |
| Medion Erazer Beast X30 | |
| Cinebench R20 | |
| CPU (Multi Core) | |
| Média da turma Gaming (4029 - 16433, n=106, últimos 2 anos) | |
| MSI Raider GE77 HX 12UHS (Extreme Leistung) | |
| MSI Raider GE77 HX 12UHS | |
| Média Intel Core i9-12900HX (7037 - 9042, n=8) | |
| Medion Erazer Beast X30 | |
| Alienware x17 R2 P48E | |
| Razer Blade 17 Early 2022 | |
| CPU (Single Core) | |
| Média da turma Gaming (442 - 913, n=106, últimos 2 anos) | |
| MSI Raider GE77 HX 12UHS | |
| Média Intel Core i9-12900HX (728 - 745, n=8) | |
| MSI Raider GE77 HX 12UHS (Extreme Leistung) | |
| Alienware x17 R2 P48E | |
| Razer Blade 17 Early 2022 | |
| Medion Erazer Beast X30 | |
| Cinebench R15 | |
| CPU Multi 64Bit | |
| Média da turma Gaming (1578 - 6330, n=105, últimos 2 anos) | |
| MSI Raider GE77 HX 12UHS | |
| MSI Raider GE77 HX 12UHS (Extreme Leistung) | |
| Média Intel Core i9-12900HX (2830 - 3652, n=8) | |
| Alienware x17 R2 P48E | |
| Medion Erazer Beast X30 | |
| Razer Blade 17 Early 2022 | |
| CPU Single 64Bit | |
| Média da turma Gaming (188.8 - 350, n=106, últimos 2 anos) | |
| MSI Raider GE77 HX 12UHS | |
| Média Intel Core i9-12900HX (274 - 282, n=8) | |
| MSI Raider GE77 HX 12UHS (Extreme Leistung) | |
| Alienware x17 R2 P48E | |
| Razer Blade 17 Early 2022 | |
| Medion Erazer Beast X30 | |
| Blender - v2.79 BMW27 CPU | |
| Razer Blade 17 Early 2022 | |
| Medion Erazer Beast X30 | |
| Alienware x17 R2 P48E | |
| Média Intel Core i9-12900HX (144 - 201, n=8) | |
| MSI Raider GE77 HX 12UHS | |
| Média da turma Gaming (79 - 330, n=104, últimos 2 anos) | |
| MSI Raider GE77 HX 12UHS (Extreme Leistung) | |
| 7-Zip 18.03 | |
| 7z b 4 | |
| Média da turma Gaming (33491 - 148086, n=105, últimos 2 anos) | |
| MSI Raider GE77 HX 12UHS (Extreme Leistung) | |
| MSI Raider GE77 HX 12UHS | |
| Média Intel Core i9-12900HX (69778 - 88128, n=7) | |
| Medion Erazer Beast X30 | |
| Alienware x17 R2 P48E | |
| Razer Blade 17 Early 2022 | |
| 7z b 4 -mmt1 | |
| Média da turma Gaming (4199 - 7436, n=105, últimos 2 anos) | |
| MSI Raider GE77 HX 12UHS | |
| Média Intel Core i9-12900HX (6165 - 6358, n=7) | |
| MSI Raider GE77 HX 12UHS (Extreme Leistung) | |
| Razer Blade 17 Early 2022 | |
| Alienware x17 R2 P48E | |
| Medion Erazer Beast X30 | |
| Geekbench 5.5 | |
| Multi-Core | |
| Média da turma Gaming (6460 - 28263, n=105, últimos 2 anos) | |
| MSI Raider GE77 HX 12UHS (Extreme Leistung) | |
| MSI Raider GE77 HX 12UHS | |
| Média Intel Core i9-12900HX (15116 - 16925, n=8) | |
| Alienware x17 R2 P48E | |
| Medion Erazer Beast X30 | |
| Razer Blade 17 Early 2022 | |
| Single-Core | |
| Média da turma Gaming (986 - 2474, n=105, últimos 2 anos) | |
| MSI Raider GE77 HX 12UHS | |
| Média Intel Core i9-12900HX (1874 - 1949, n=8) | |
| MSI Raider GE77 HX 12UHS (Extreme Leistung) | |
| Alienware x17 R2 P48E | |
| Razer Blade 17 Early 2022 | |
| Medion Erazer Beast X30 | |
| HWBOT x265 Benchmark v2.2 - 4k Preset | |
| Média da turma Gaming (11.5 - 44.4, n=105, últimos 2 anos) | |
| MSI Raider GE77 HX 12UHS (Extreme Leistung) | |
| MSI Raider GE77 HX 12UHS | |
| Média Intel Core i9-12900HX (19.6 - 26.6, n=7) | |
| Alienware x17 R2 P48E | |
| Medion Erazer Beast X30 | |
| Razer Blade 17 Early 2022 | |
| LibreOffice - 20 Documents To PDF | |
| Média da turma Gaming (33.2 - 88.8, n=105, últimos 2 anos) | |
| Medion Erazer Beast X30 | |
| MSI Raider GE77 HX 12UHS | |
| Alienware x17 R2 P48E | |
| Razer Blade 17 Early 2022 | |
| Média Intel Core i9-12900HX (33.6 - 42.4, n=7) | |
| MSI Raider GE77 HX 12UHS (Extreme Leistung) | |
| R Benchmark 2.5 - Overall mean | |
| Medion Erazer Beast X30 | |
| Razer Blade 17 Early 2022 | |
| Alienware x17 R2 P48E | |
| Média da turma Gaming (0.3439 - 0.759, n=106, últimos 2 anos) | |
| MSI Raider GE77 HX 12UHS | |
| MSI Raider GE77 HX 12UHS (Extreme Leistung) | |
| Média Intel Core i9-12900HX (0.4159 - 0.4242, n=7) | |
* ... menor é melhor
AIDA64: FP32 Ray-Trace | FPU Julia | CPU SHA3 | CPU Queen | FPU SinJulia | FPU Mandel | CPU AES | CPU ZLib | FP64 Ray-Trace | CPU PhotoWorxx
| Performance rating | |
| Média da turma Gaming | |
| MSI Raider GE77 HX 12UHS | |
| MSI Raider GE77 HX 12UHS | |
| Média Intel Core i9-12900HX | |
| Alienware x17 R2 P48E | |
| Medion Erazer Beast X30 | |
| Razer Blade 17 Early 2022 | |
| AIDA64 / FP32 Ray-Trace | |
| Média da turma Gaming (10227 - 85542, n=105, últimos 2 anos) | |
| MSI Raider GE77 HX 12UHS (v6.70.6000, Extreme Leistung) | |
| MSI Raider GE77 HX 12UHS (v6.70.6000) | |
| Média Intel Core i9-12900HX (11535 - 22183, n=7) | |
| Alienware x17 R2 P48E (v6.50.5800) | |
| Medion Erazer Beast X30 (v6.50.5800) | |
| Razer Blade 17 Early 2022 (v6.50.5800) | |
| AIDA64 / FPU Julia | |
| Média da turma Gaming (51376 - 238426, n=105, últimos 2 anos) | |
| MSI Raider GE77 HX 12UHS (v6.70.6000) | |
| MSI Raider GE77 HX 12UHS (v6.70.6000, Extreme Leistung) | |
| Média Intel Core i9-12900HX (52916 - 110093, n=7) | |
| Alienware x17 R2 P48E (v6.50.5800) | |
| Medion Erazer Beast X30 (v6.50.5800) | |
| Razer Blade 17 Early 2022 (v6.50.5800) | |
| AIDA64 / CPU SHA3 | |
| Média da turma Gaming (2180 - 10115, n=105, últimos 2 anos) | |
| MSI Raider GE77 HX 12UHS (v6.70.6000) | |
| MSI Raider GE77 HX 12UHS (v6.70.6000, Extreme Leistung) | |
| Média Intel Core i9-12900HX (3559 - 5123, n=7) | |
| Alienware x17 R2 P48E (v6.50.5800) | |
| Medion Erazer Beast X30 (v6.50.5800) | |
| Razer Blade 17 Early 2022 (v6.50.5800) | |
| AIDA64 / CPU Queen | |
| Média da turma Gaming (49785 - 173351, n=90, últimos 2 anos) | |
| Alienware x17 R2 P48E (v6.50.5800) | |
| Medion Erazer Beast X30 (v6.50.5800) | |
| Média Intel Core i9-12900HX (101029 - 104457, n=7) | |
| MSI Raider GE77 HX 12UHS (v6.70.6000) | |
| MSI Raider GE77 HX 12UHS (v6.70.6000, Extreme Leistung) | |
| Razer Blade 17 Early 2022 (v6.50.5800) | |
| AIDA64 / FPU SinJulia | |
| Média da turma Gaming (4424 - 33636, n=105, últimos 2 anos) | |
| MSI Raider GE77 HX 12UHS (v6.70.6000, Extreme Leistung) | |
| MSI Raider GE77 HX 12UHS (v6.70.6000) | |
| Média Intel Core i9-12900HX (10475 - 13062, n=7) | |
| Alienware x17 R2 P48E (v6.50.5800) | |
| Medion Erazer Beast X30 (v6.50.5800) | |
| Razer Blade 17 Early 2022 (v6.50.5800) | |
| AIDA64 / FPU Mandel | |
| Média da turma Gaming (25115 - 128721, n=105, últimos 2 anos) | |
| MSI Raider GE77 HX 12UHS (v6.70.6000, Extreme Leistung) | |
| MSI Raider GE77 HX 12UHS (v6.70.6000) | |
| Média Intel Core i9-12900HX (31779 - 53628, n=7) | |
| Alienware x17 R2 P48E (v6.50.5800) | |
| Medion Erazer Beast X30 (v6.50.5800) | |
| Razer Blade 17 Early 2022 (v6.50.5800) | |
| AIDA64 / CPU AES | |
| MSI Raider GE77 HX 12UHS (v6.70.6000) | |
| MSI Raider GE77 HX 12UHS (v6.70.6000, Extreme Leistung) | |
| Média Intel Core i9-12900HX (125268 - 183146, n=7) | |
| Média da turma Gaming (39258 - 247074, n=105, últimos 2 anos) | |
| Alienware x17 R2 P48E (v6.50.5800) | |
| Medion Erazer Beast X30 (v6.50.5800) | |
| Razer Blade 17 Early 2022 (v6.50.5800) | |
| AIDA64 / CPU ZLib | |
| Média da turma Gaming (574 - 2531, n=105, últimos 2 anos) | |
| MSI Raider GE77 HX 12UHS (v6.70.6000) | |
| MSI Raider GE77 HX 12UHS (v6.70.6000, Extreme Leistung) | |
| Média Intel Core i9-12900HX (990 - 1408, n=7) | |
| Alienware x17 R2 P48E (v6.50.5800) | |
| Medion Erazer Beast X30 (v6.50.5800) | |
| Razer Blade 17 Early 2022 (v6.50.5800) | |
| AIDA64 / FP64 Ray-Trace | |
| Média da turma Gaming (5509 - 45446, n=105, últimos 2 anos) | |
| MSI Raider GE77 HX 12UHS (v6.70.6000, Extreme Leistung) | |
| MSI Raider GE77 HX 12UHS (v6.70.6000) | |
| Média Intel Core i9-12900HX (6663 - 11913, n=7) | |
| Alienware x17 R2 P48E (v6.50.5800) | |
| Medion Erazer Beast X30 (v6.50.5800) | |
| Razer Blade 17 Early 2022 (v6.50.5800) | |
| AIDA64 / CPU PhotoWorxx | |
| MSI Raider GE77 HX 12UHS (v6.70.6000) | |
| MSI Raider GE77 HX 12UHS (v6.70.6000, Extreme Leistung) | |
| Média da turma Gaming (12271 - 89891, n=105, últimos 2 anos) | |
| Média Intel Core i9-12900HX (40239 - 47710, n=7) | |
| Medion Erazer Beast X30 (v6.50.5800) | |
| Razer Blade 17 Early 2022 (v6.50.5800) | |
| Alienware x17 R2 P48E (v6.50.5800) | |
Desempenho do sistema
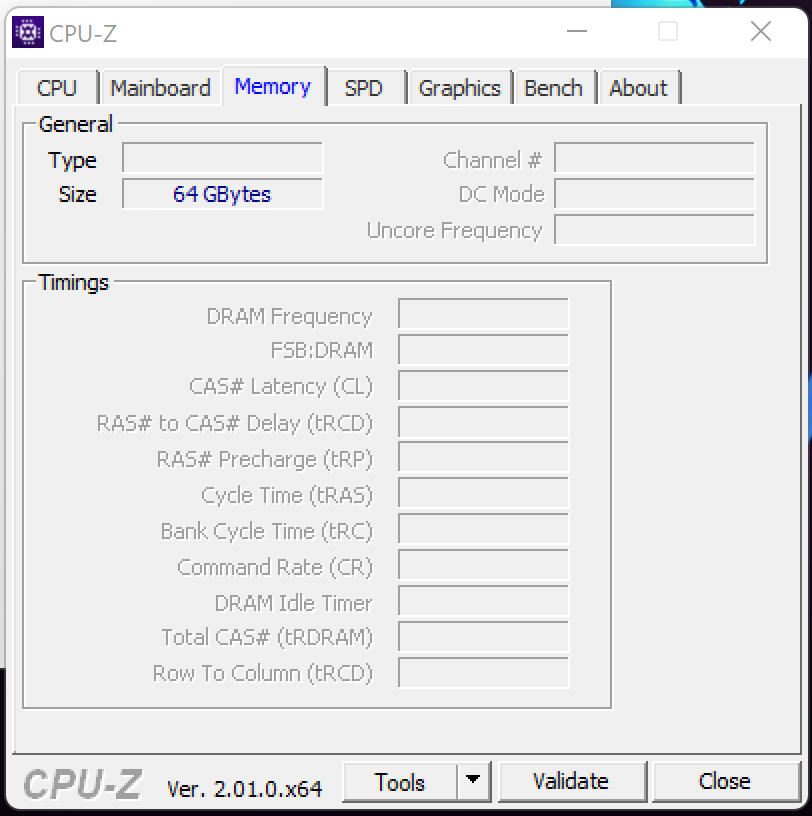
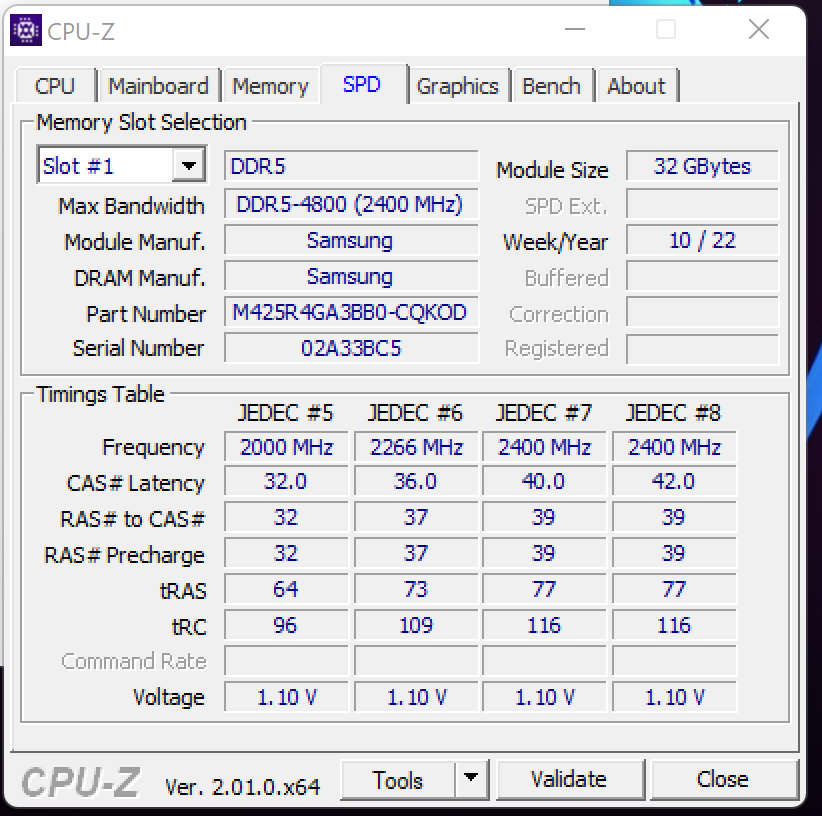
O GE77 é atualmente um dos laptops mais rápidos do mercado. A combinação de 24 núcleos de CPU lógica e uma GPU RTX 3080 Ti com um TGP máximo torna o sistema adequado para qualquer caso de uso exigente - seja edição de vídeo, jogos ou renderização. As taxas de transferência da memória DDR4-4800 estão acima da média. Isto pode ter origem no cache da CPU, que é maior neste modelo específico em comparação com outros processadores Intel. Além disso, o sistema atinge bons resultados nos benchmarks da PCMark.
CrossMark: Overall | Productivity | Creativity | Responsiveness
| PCMark 10 / Score | |
| Média da turma Gaming (5828 - 12414, n=93, últimos 2 anos) | |
| MSI Raider GE77 HX 12UHS (dGPU, Extreme Leistung) | |
| Alienware x17 R2 P48E | |
| Média Intel Core i9-12900HX, NVIDIA GeForce RTX 3080 Ti Laptop GPU (6812 - 8636, n=6) | |
| Medion Erazer Beast X30 | |
| Razer Blade 17 Early 2022 | |
| MSI Raider GE77 HX 12UHS | |
| PCMark 10 / Essentials | |
| Alienware x17 R2 P48E | |
| MSI Raider GE77 HX 12UHS (dGPU, Extreme Leistung) | |
| Média da turma Gaming (8810 - 11935, n=97, últimos 2 anos) | |
| Média Intel Core i9-12900HX, NVIDIA GeForce RTX 3080 Ti Laptop GPU (9598 - 11192, n=6) | |
| Razer Blade 17 Early 2022 | |
| Medion Erazer Beast X30 | |
| MSI Raider GE77 HX 12UHS | |
| PCMark 10 / Productivity | |
| Média da turma Gaming (6845 - 25323, n=95, últimos 2 anos) | |
| MSI Raider GE77 HX 12UHS (dGPU, Extreme Leistung) | |
| Média Intel Core i9-12900HX, NVIDIA GeForce RTX 3080 Ti Laptop GPU (9365 - 10932, n=6) | |
| Alienware x17 R2 P48E | |
| MSI Raider GE77 HX 12UHS | |
| Medion Erazer Beast X30 | |
| Razer Blade 17 Early 2022 | |
| PCMark 10 / Digital Content Creation | |
| Média da turma Gaming (7602 - 19954, n=95, últimos 2 anos) | |
| MSI Raider GE77 HX 12UHS (dGPU, Extreme Leistung) | |
| Alienware x17 R2 P48E | |
| Média Intel Core i9-12900HX, NVIDIA GeForce RTX 3080 Ti Laptop GPU (9543 - 14291, n=6) | |
| Medion Erazer Beast X30 | |
| Razer Blade 17 Early 2022 | |
| MSI Raider GE77 HX 12UHS | |
| CrossMark / Overall | |
| MSI Raider GE77 HX 12UHS | |
| MSI Raider GE77 HX 12UHS (dGPU, Extreme Leistung) | |
| Média Intel Core i9-12900HX, NVIDIA GeForce RTX 3080 Ti Laptop GPU (2108 - 2170, n=5) | |
| Média da turma Gaming (1366 - 2409, n=94, últimos 2 anos) | |
| Alienware x17 R2 P48E | |
| Razer Blade 17 Early 2022 | |
| Medion Erazer Beast X30 | |
| CrossMark / Productivity | |
| MSI Raider GE77 HX 12UHS | |
| MSI Raider GE77 HX 12UHS (dGPU, Extreme Leistung) | |
| Média Intel Core i9-12900HX, NVIDIA GeForce RTX 3080 Ti Laptop GPU (1978 - 2047, n=5) | |
| Média da turma Gaming (1386 - 2254, n=94, últimos 2 anos) | |
| Alienware x17 R2 P48E | |
| Razer Blade 17 Early 2022 | |
| Medion Erazer Beast X30 | |
| CrossMark / Creativity | |
| MSI Raider GE77 HX 12UHS | |
| Média Intel Core i9-12900HX, NVIDIA GeForce RTX 3080 Ti Laptop GPU (2288 - 2366, n=5) | |
| MSI Raider GE77 HX 12UHS (dGPU, Extreme Leistung) | |
| Média da turma Gaming (1343 - 2786, n=94, últimos 2 anos) | |
| Alienware x17 R2 P48E | |
| Medion Erazer Beast X30 | |
| Razer Blade 17 Early 2022 | |
| CrossMark / Responsiveness | |
| MSI Raider GE77 HX 12UHS | |
| Média Intel Core i9-12900HX, NVIDIA GeForce RTX 3080 Ti Laptop GPU (1991 - 2090, n=5) | |
| MSI Raider GE77 HX 12UHS (dGPU, Extreme Leistung) | |
| Média da turma Gaming (1226 - 2334, n=94, últimos 2 anos) | |
| Alienware x17 R2 P48E | |
| Razer Blade 17 Early 2022 | |
| Medion Erazer Beast X30 | |
| PCMark 8 Home Score Accelerated v2 | 4209 pontos | |
| PCMark 8 Creative Score Accelerated v2 | 6879 pontos | |
| PCMark 8 Work Score Accelerated v2 | 5259 pontos | |
| PCMark 10 Score | 6993 pontos | |
Ajuda | ||
| AIDA64 / Memory Copy | |
| Média da turma Gaming (21750 - 129946, n=105, últimos 2 anos) | |
| MSI Raider GE77 HX 12UHS | |
| MSI Raider GE77 HX 12UHS (v6.70.6000, Extreme Leistung) | |
| Média Intel Core i9-12900HX (62852 - 70863, n=7) | |
| Medion Erazer Beast X30 (v6.50.5800) | |
| Razer Blade 17 Early 2022 (v6.50.5800) | |
| Alienware x17 R2 P48E (v6.50.5800) | |
| AIDA64 / Memory Read | |
| Média da turma Gaming (22956 - 118858, n=105, últimos 2 anos) | |
| MSI Raider GE77 HX 12UHS | |
| MSI Raider GE77 HX 12UHS (v6.70.6000, Extreme Leistung) | |
| Média Intel Core i9-12900HX (62140 - 72930, n=7) | |
| Medion Erazer Beast X30 (v6.50.5800) | |
| Razer Blade 17 Early 2022 (v6.50.5800) | |
| Alienware x17 R2 P48E (v6.50.5800) | |
| AIDA64 / Memory Write | |
| Média da turma Gaming (22297 - 135096, n=105, últimos 2 anos) | |
| MSI Raider GE77 HX 12UHS (v6.70.6000, Extreme Leistung) | |
| MSI Raider GE77 HX 12UHS (v6.70.6000) | |
| Medion Erazer Beast X30 (v6.50.5800) | |
| Média Intel Core i9-12900HX (60001 - 68782, n=7) | |
| Razer Blade 17 Early 2022 (v6.50.5800) | |
| Alienware x17 R2 P48E (v6.50.5800) | |
| AIDA64 / Memory Latency | |
| Média da turma Gaming (75.3 - 259, n=105, últimos 2 anos) | |
| Alienware x17 R2 P48E (v6.50.5800) | |
| Média Intel Core i9-12900HX (83.9 - 93.4, n=7) | |
| MSI Raider GE77 HX 12UHS (v6.70.6000, Extreme Leistung) | |
| MSI Raider GE77 HX 12UHS (v6.70.6000) | |
| Medion Erazer Beast X30 (v6.50.5800) | |
* ... menor é melhor
Latências DPC
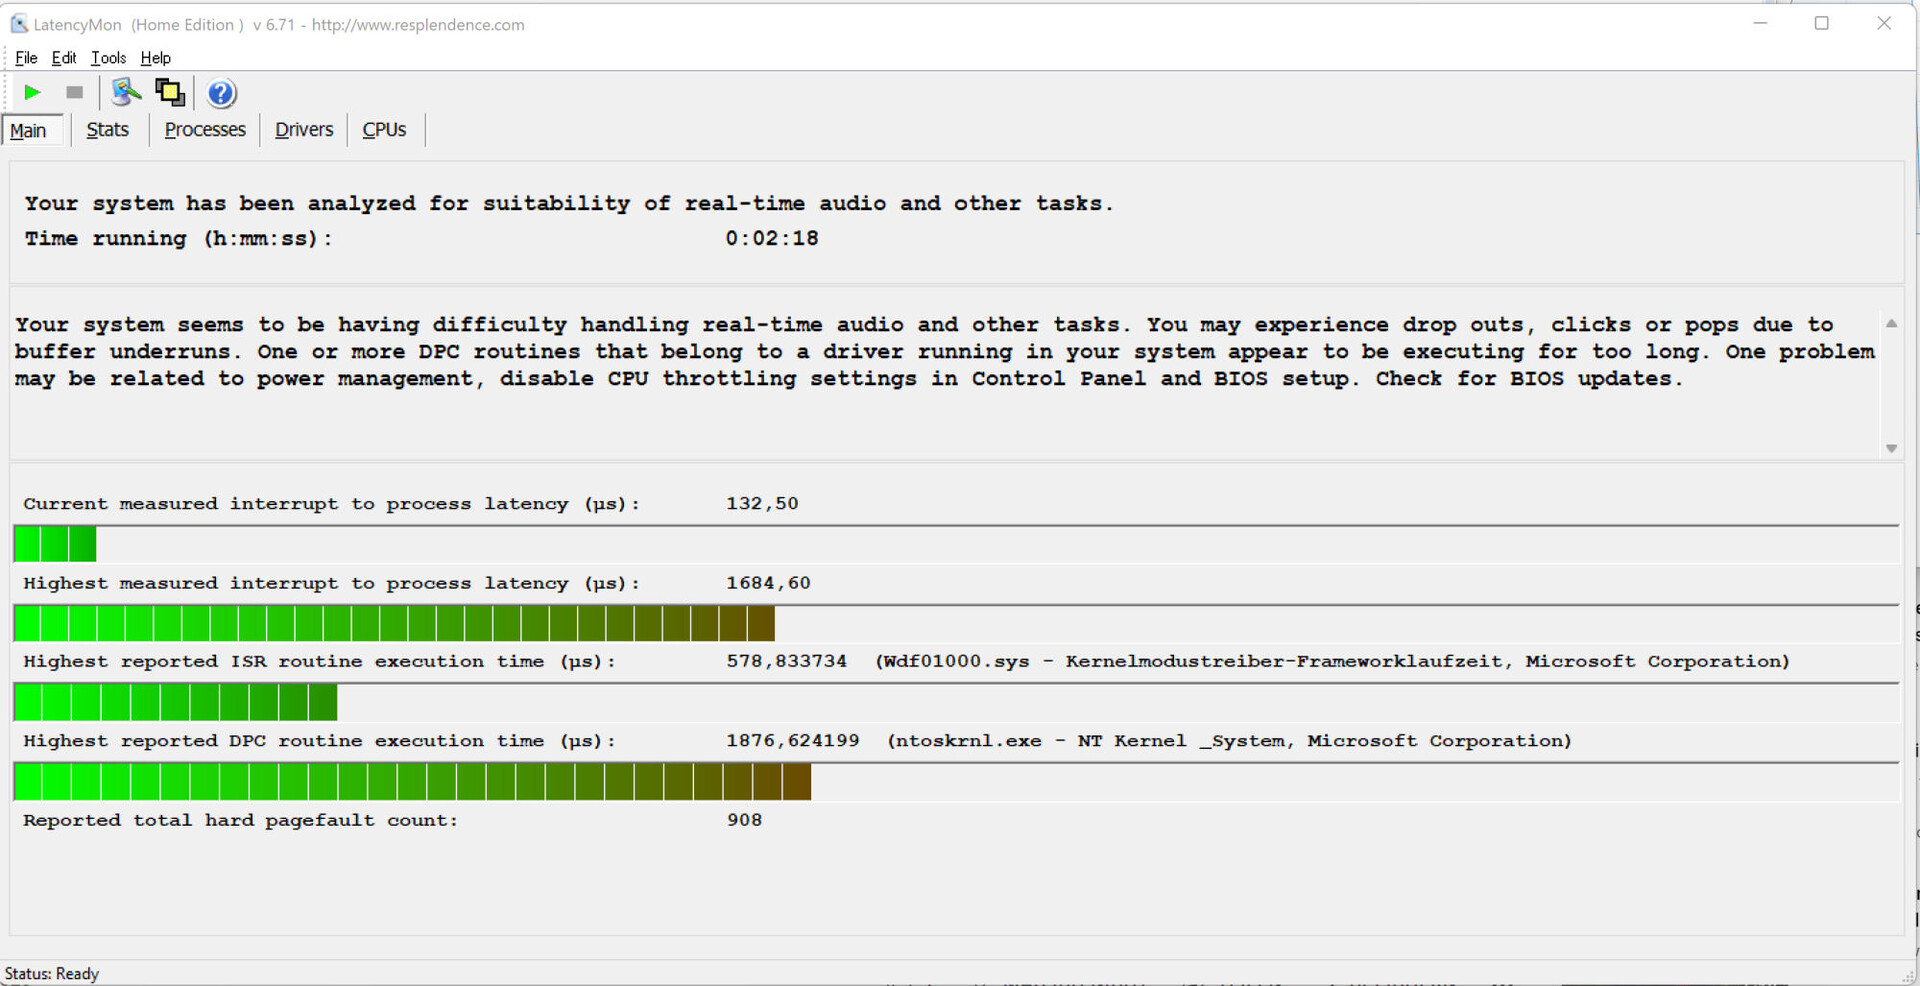
O teste padronizado do Monitor de Latência (navegação na web, reprodução de vídeo 4K, carga alta Prime95) mostra latências DPC um pouco problemáticas. O sistema não parece ser adequado para edição de vídeo e áudio em tempo real. As futuras atualizações de software podem melhorar ou exacerbar a situação.
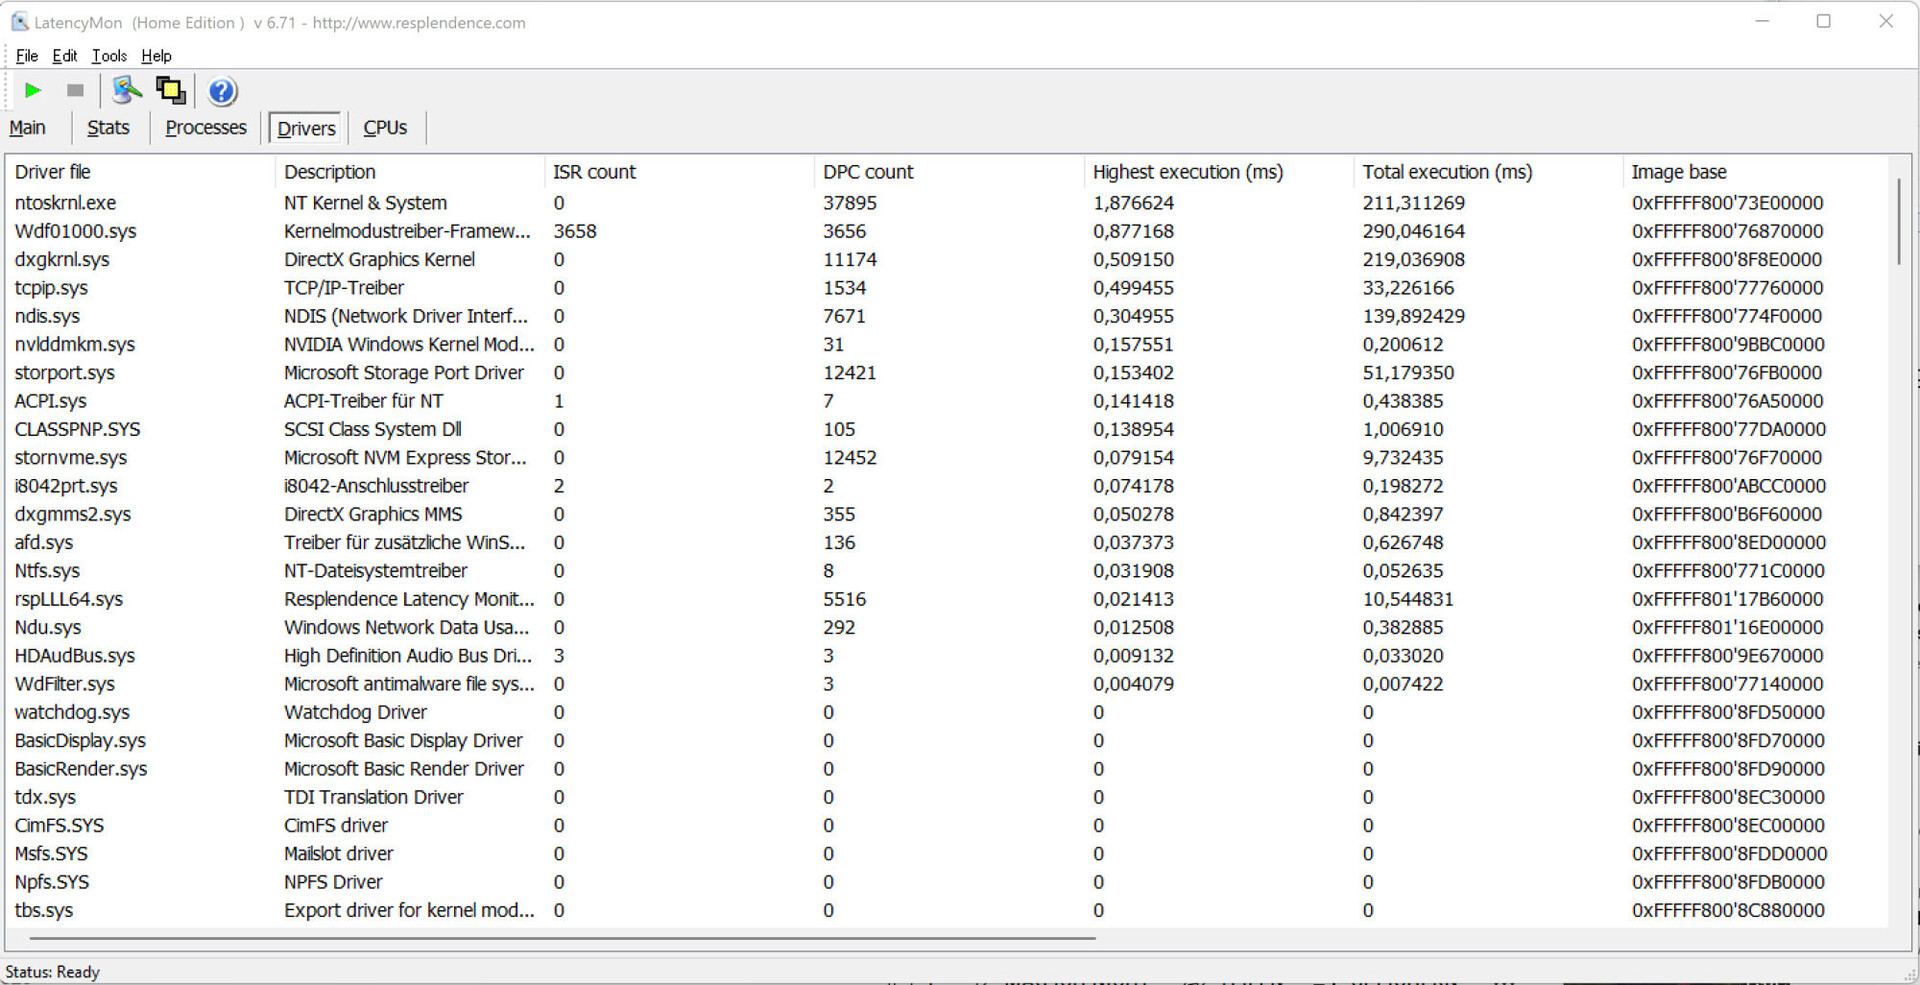
| DPC Latencies / LatencyMon - interrupt to process latency (max), Web, Youtube, Prime95 | |
| MSI Raider GE77 HX 12UHS | |
| Alienware x17 R2 P48E | |
| Medion Erazer Beast X30 | |
| Razer Blade 17 Early 2022 | |
* ... menor é melhor
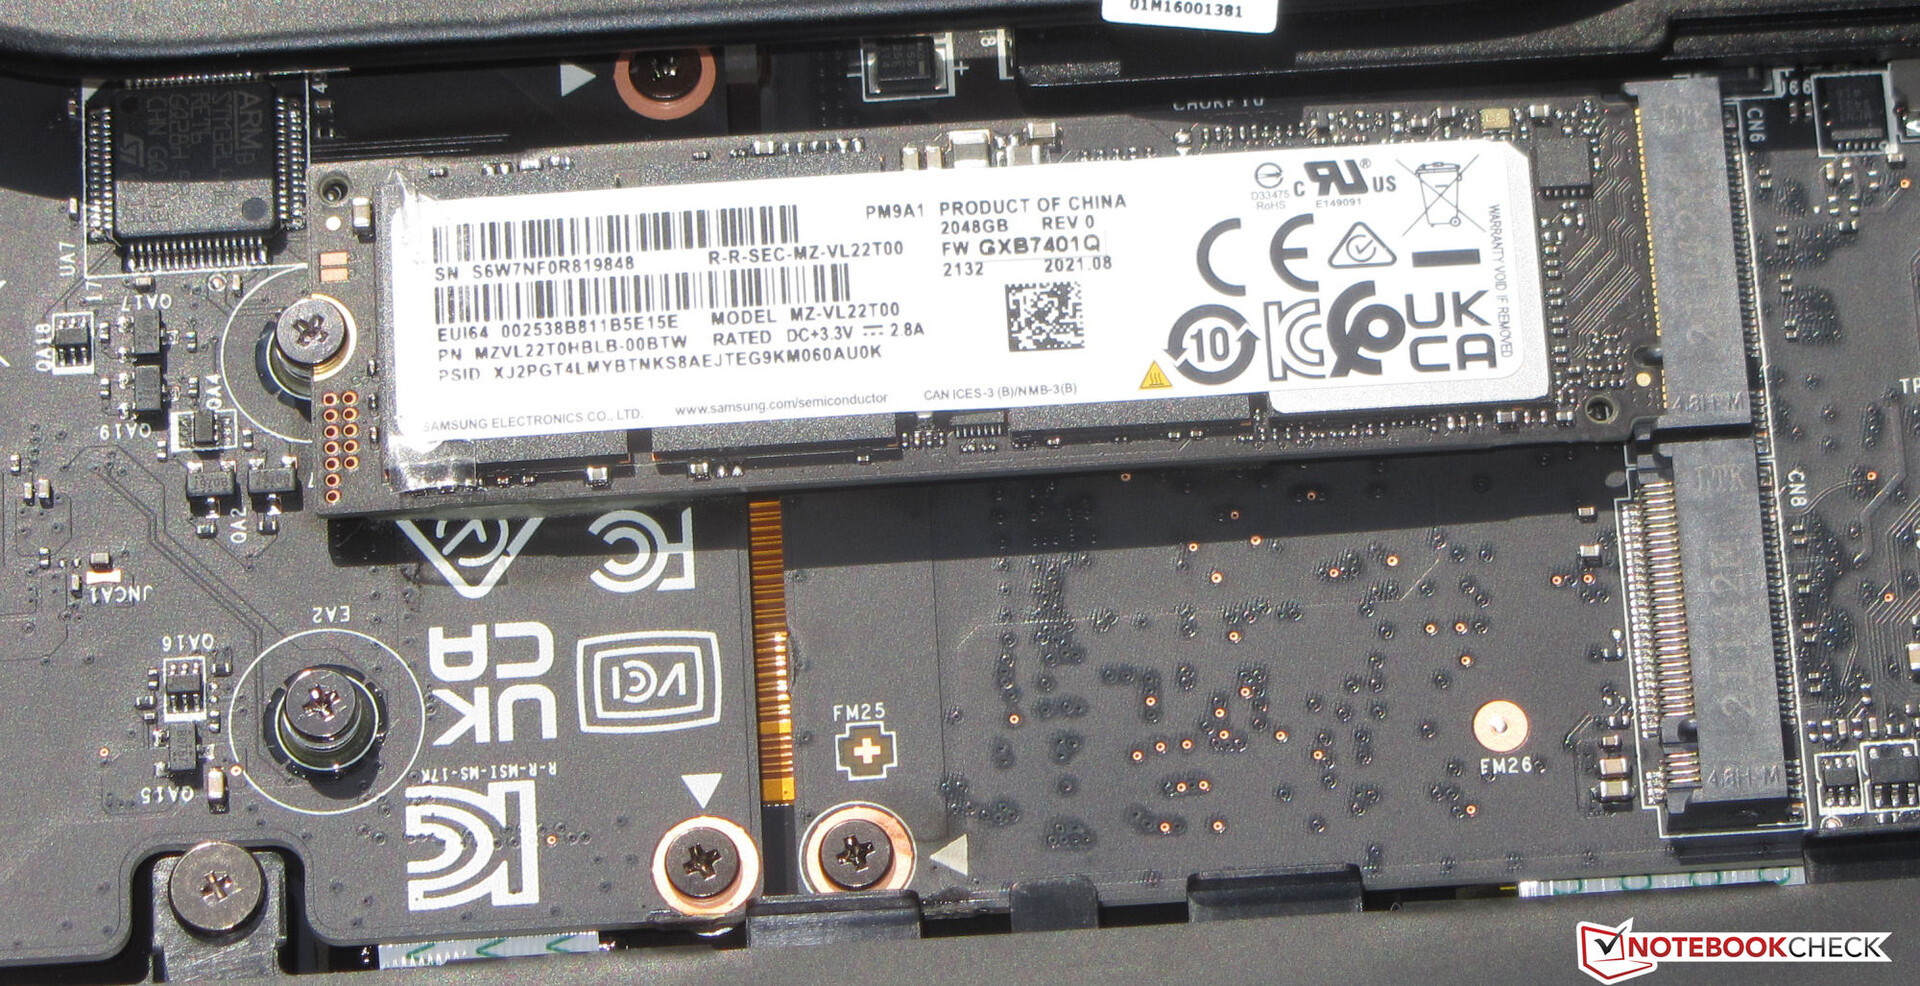
Solução de armazenamento
A MSI equipa o Raider com um SSD de 2-TB (PCIe4, M.2-2280) da Samsung com excelentes velocidades de transferência. Há espaço para um SSD PCIe4 secundário.

| Drive Performance rating - Percent | |
| MSI Raider GE77 HX 12UHS | |
| Medion Erazer Beast X30 | |
| Razer Blade 17 Early 2022 | |
| Média Samsung PM9A1 MZVL22T0HBLB | |
| Média da turma Gaming | |
| Alienware x17 R2 P48E | |
* ... menor é melhor
Disk Throttling: DiskSpd Read Loop, Queue Depth 8
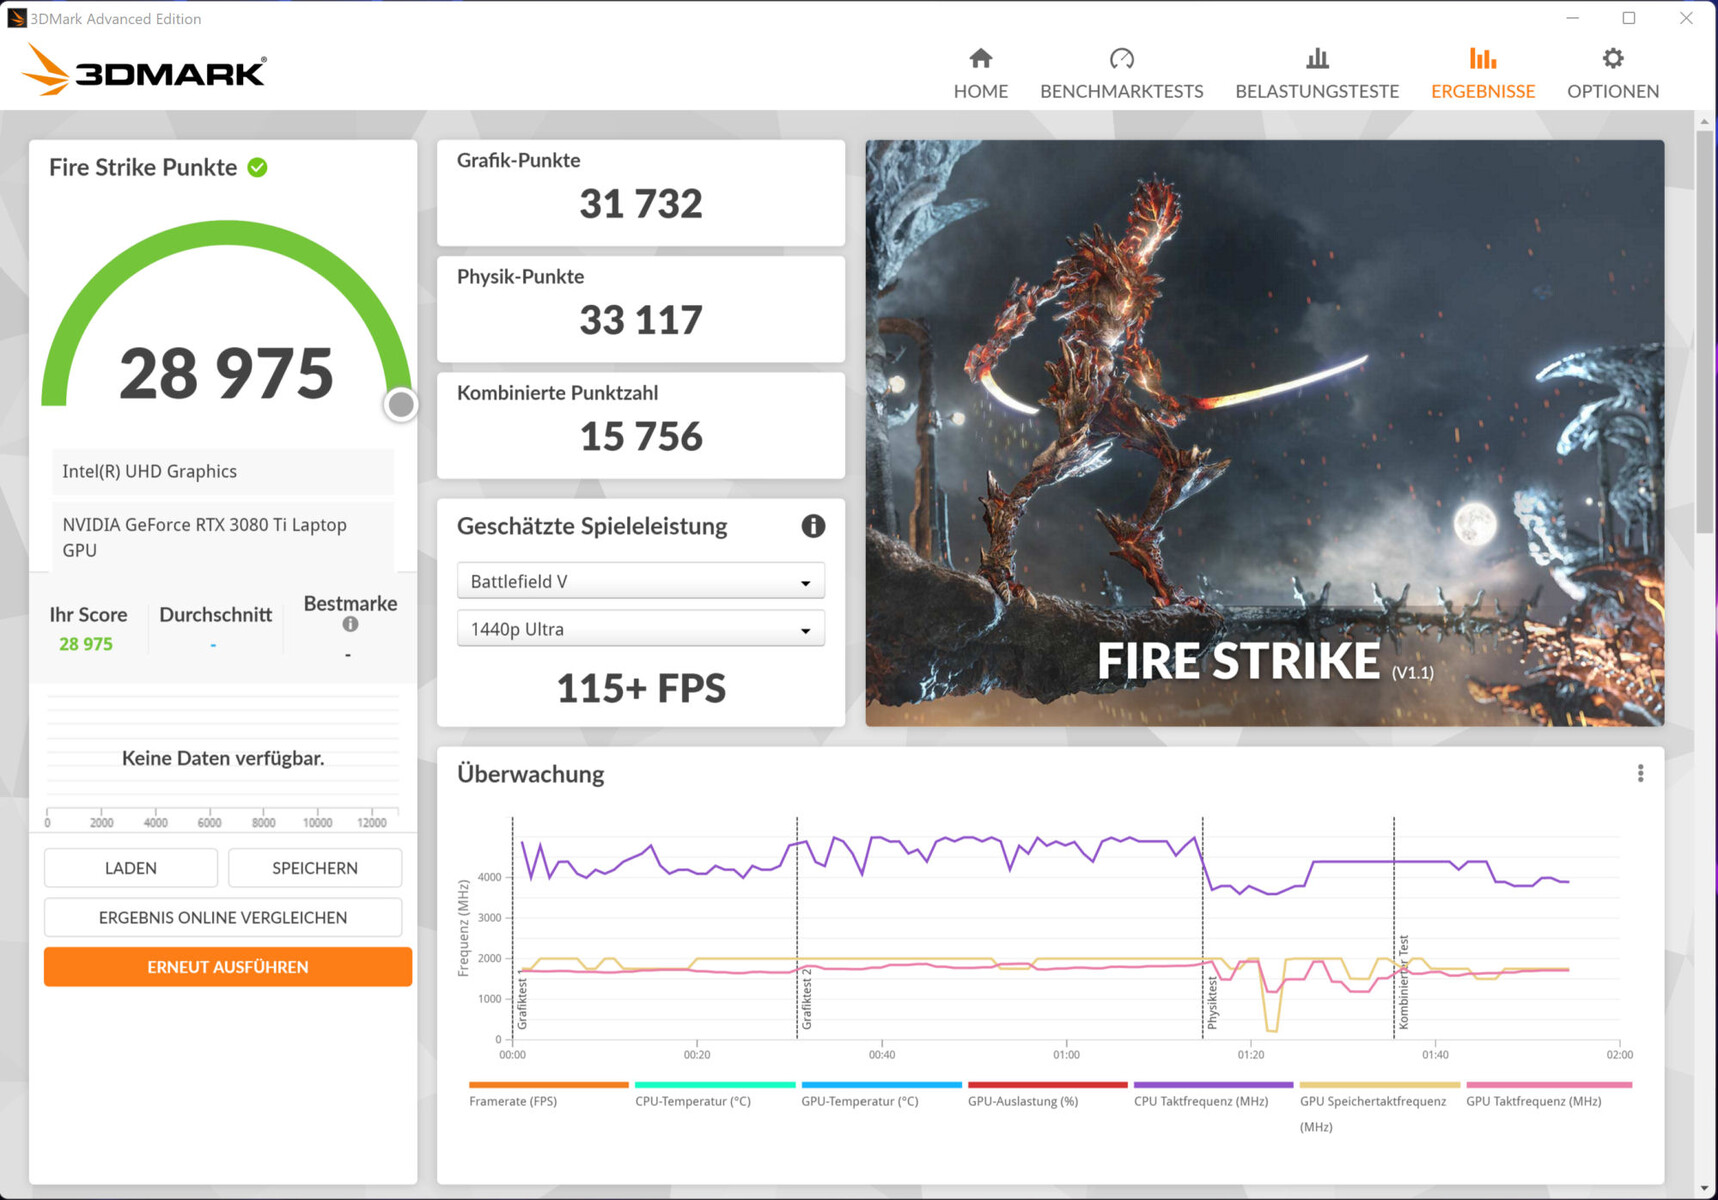
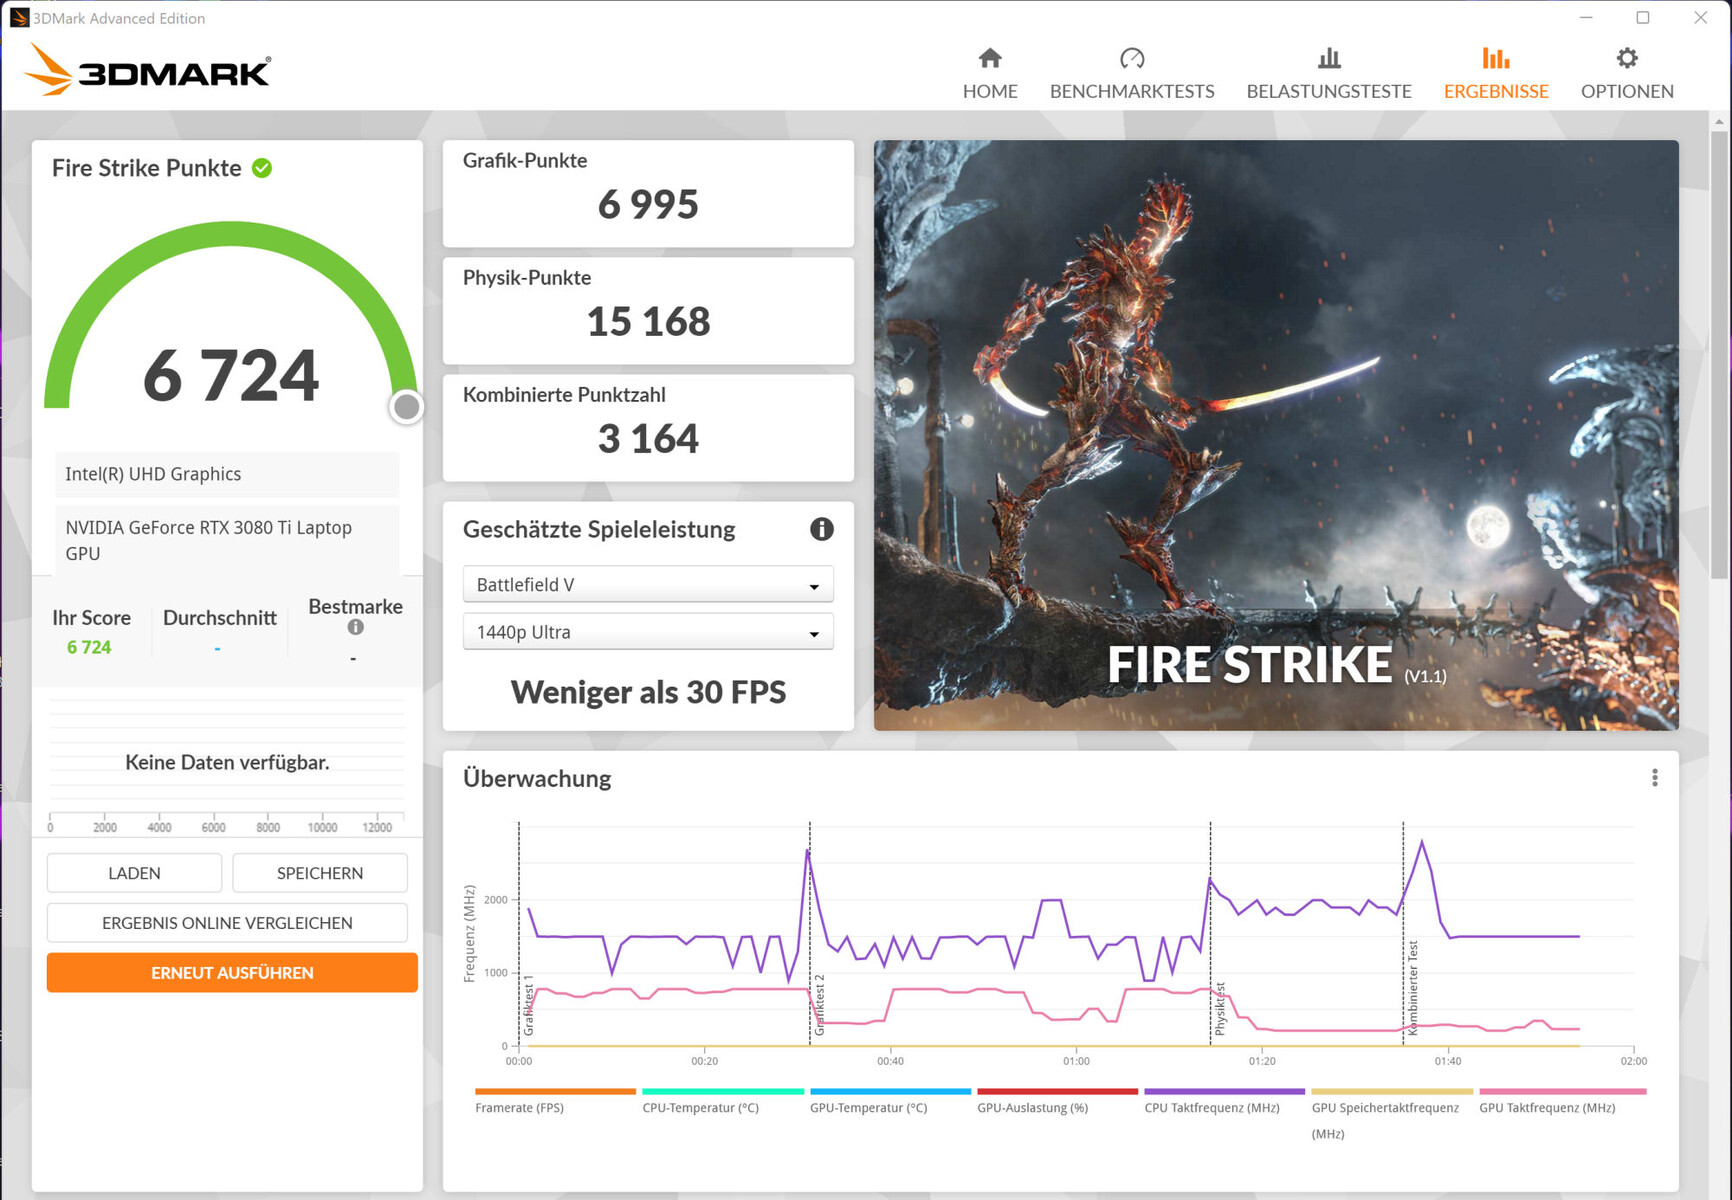
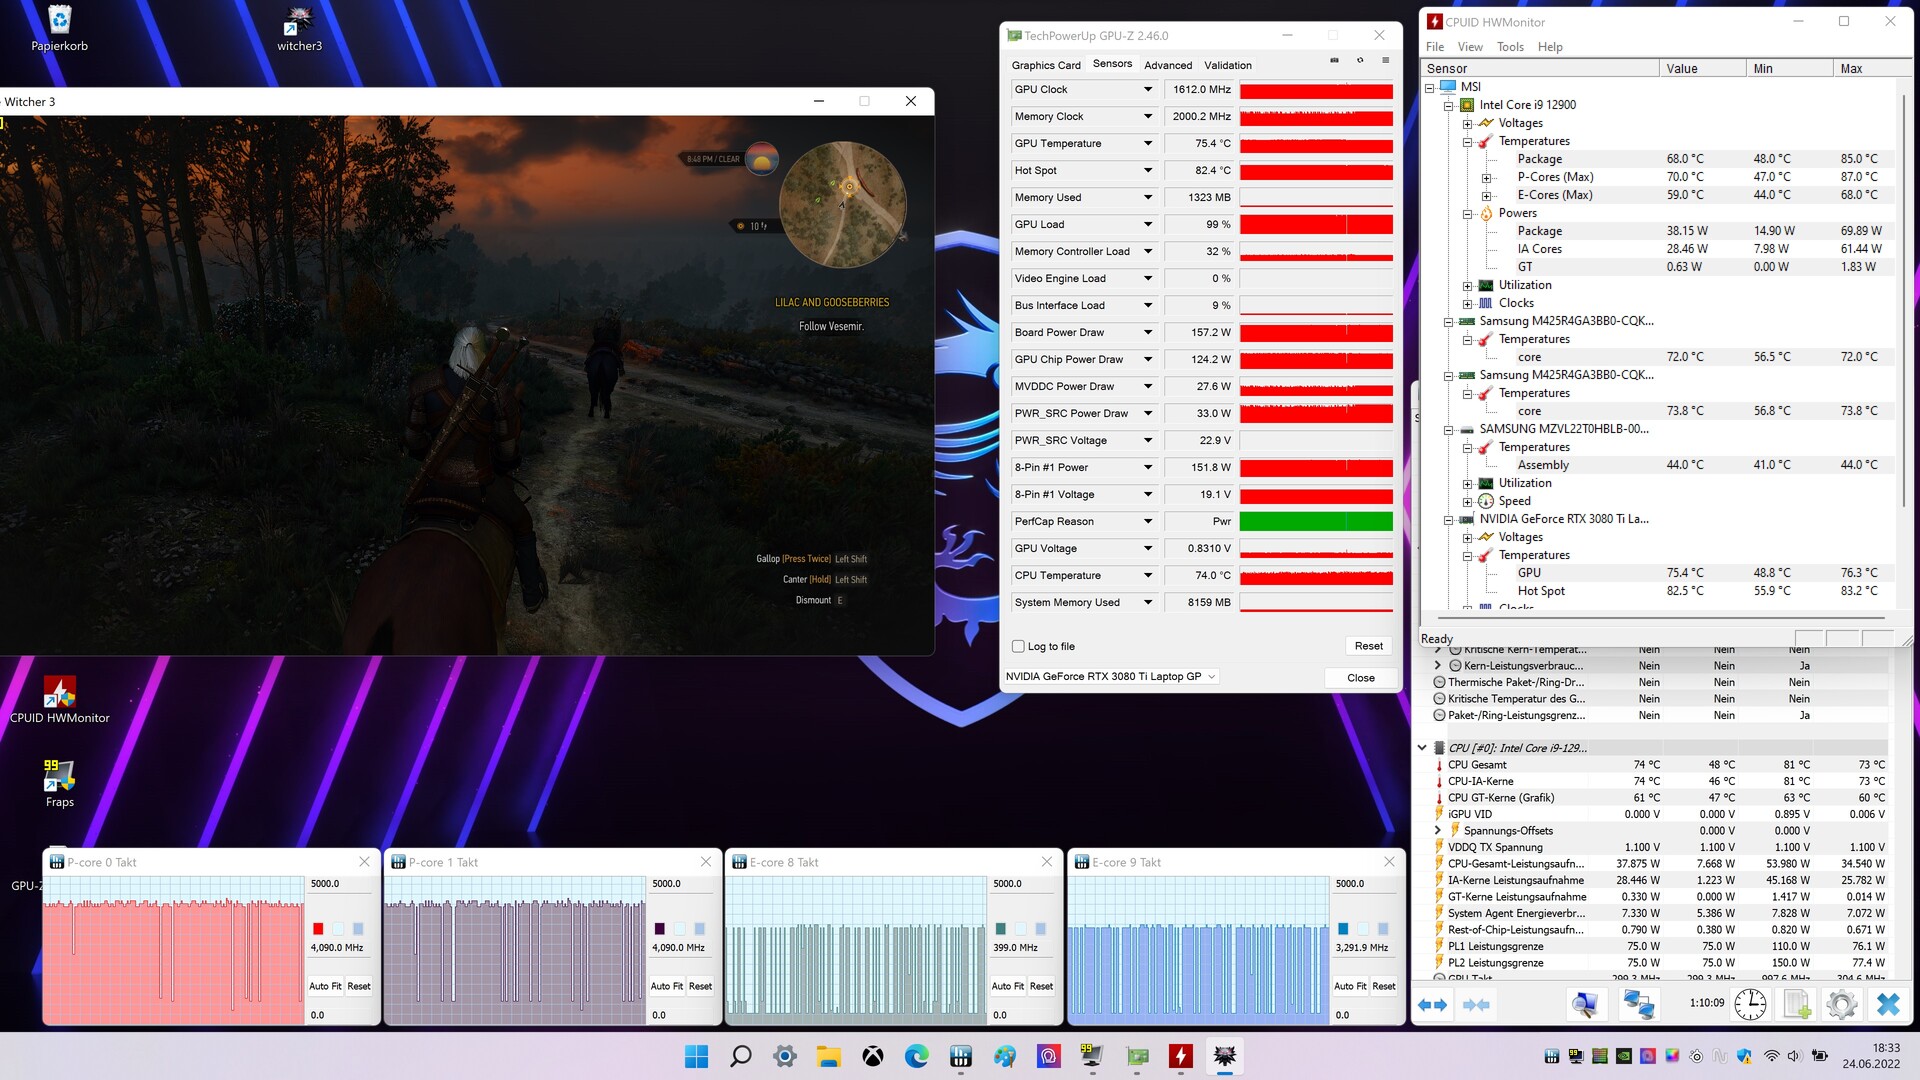
Desempenho da GPU
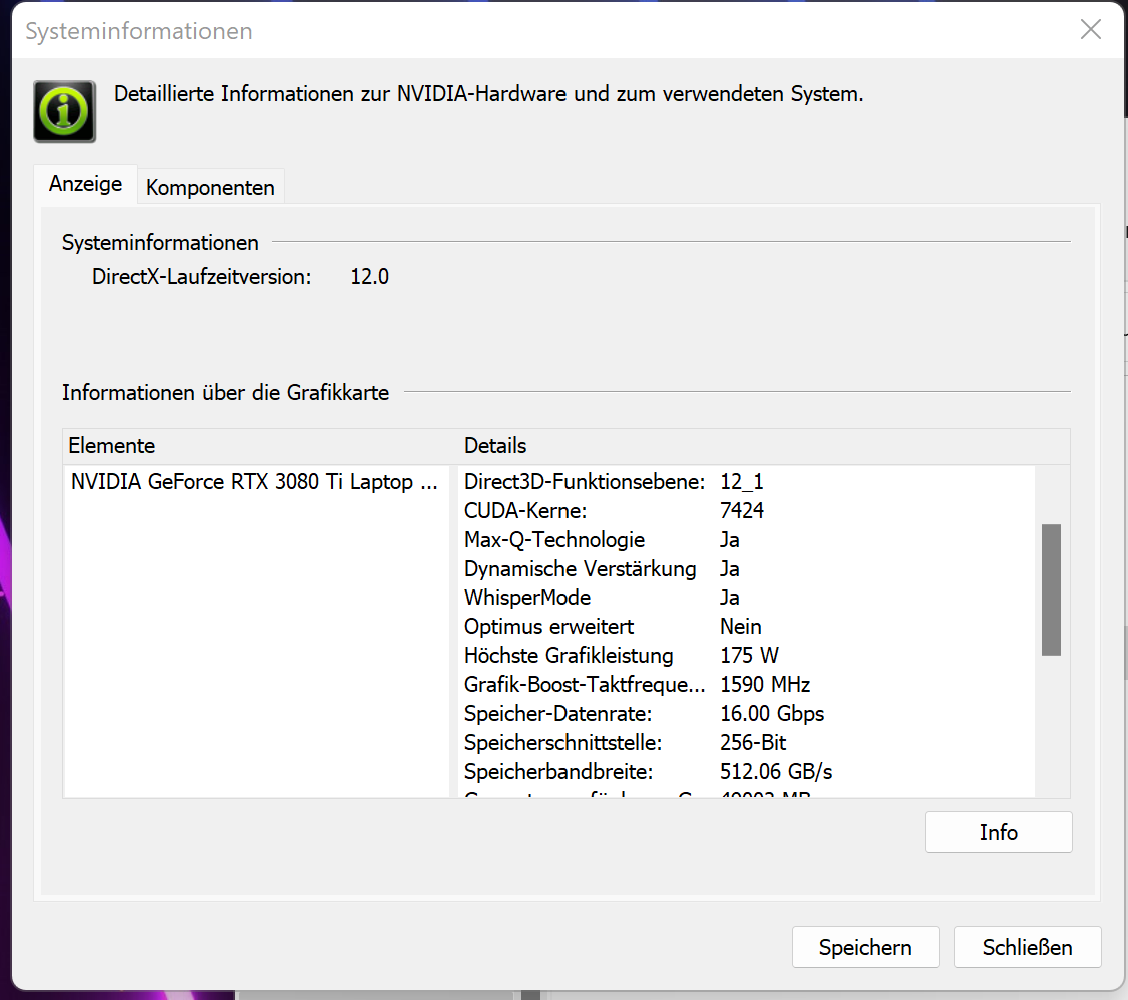
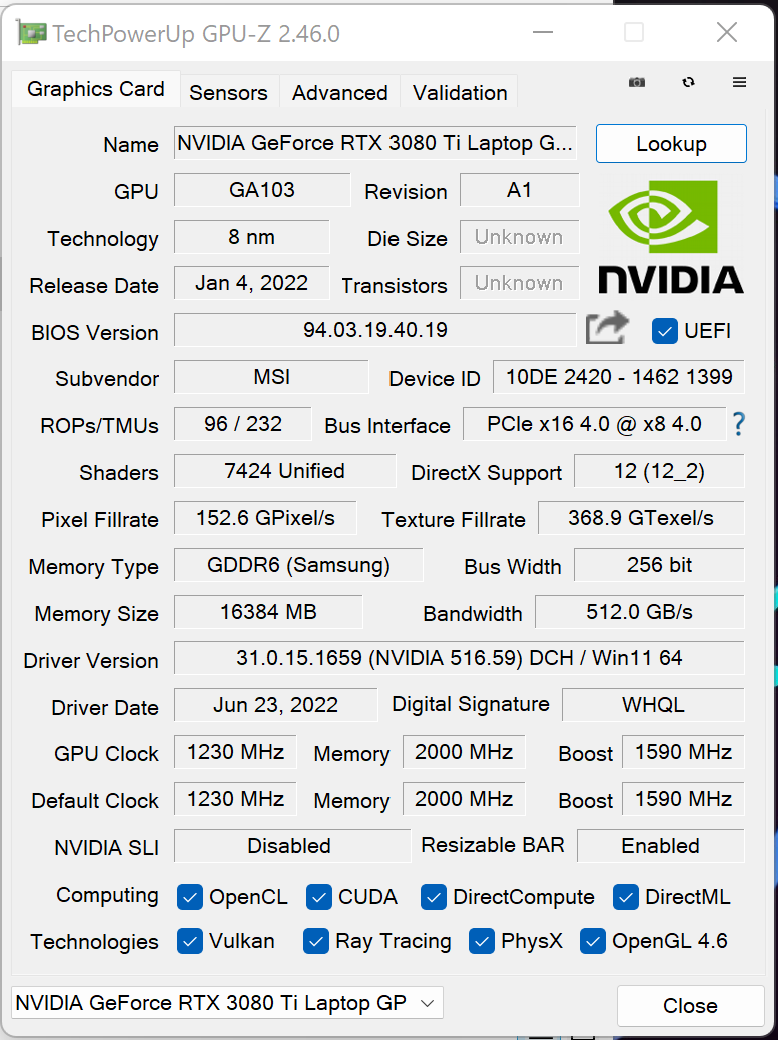
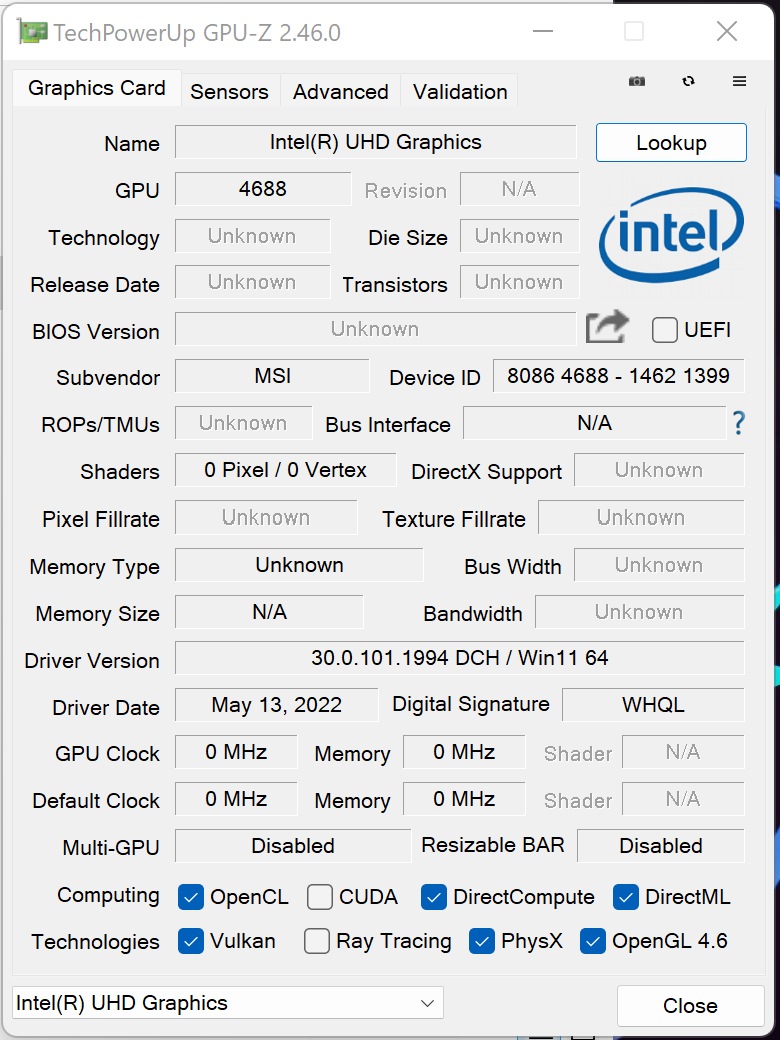
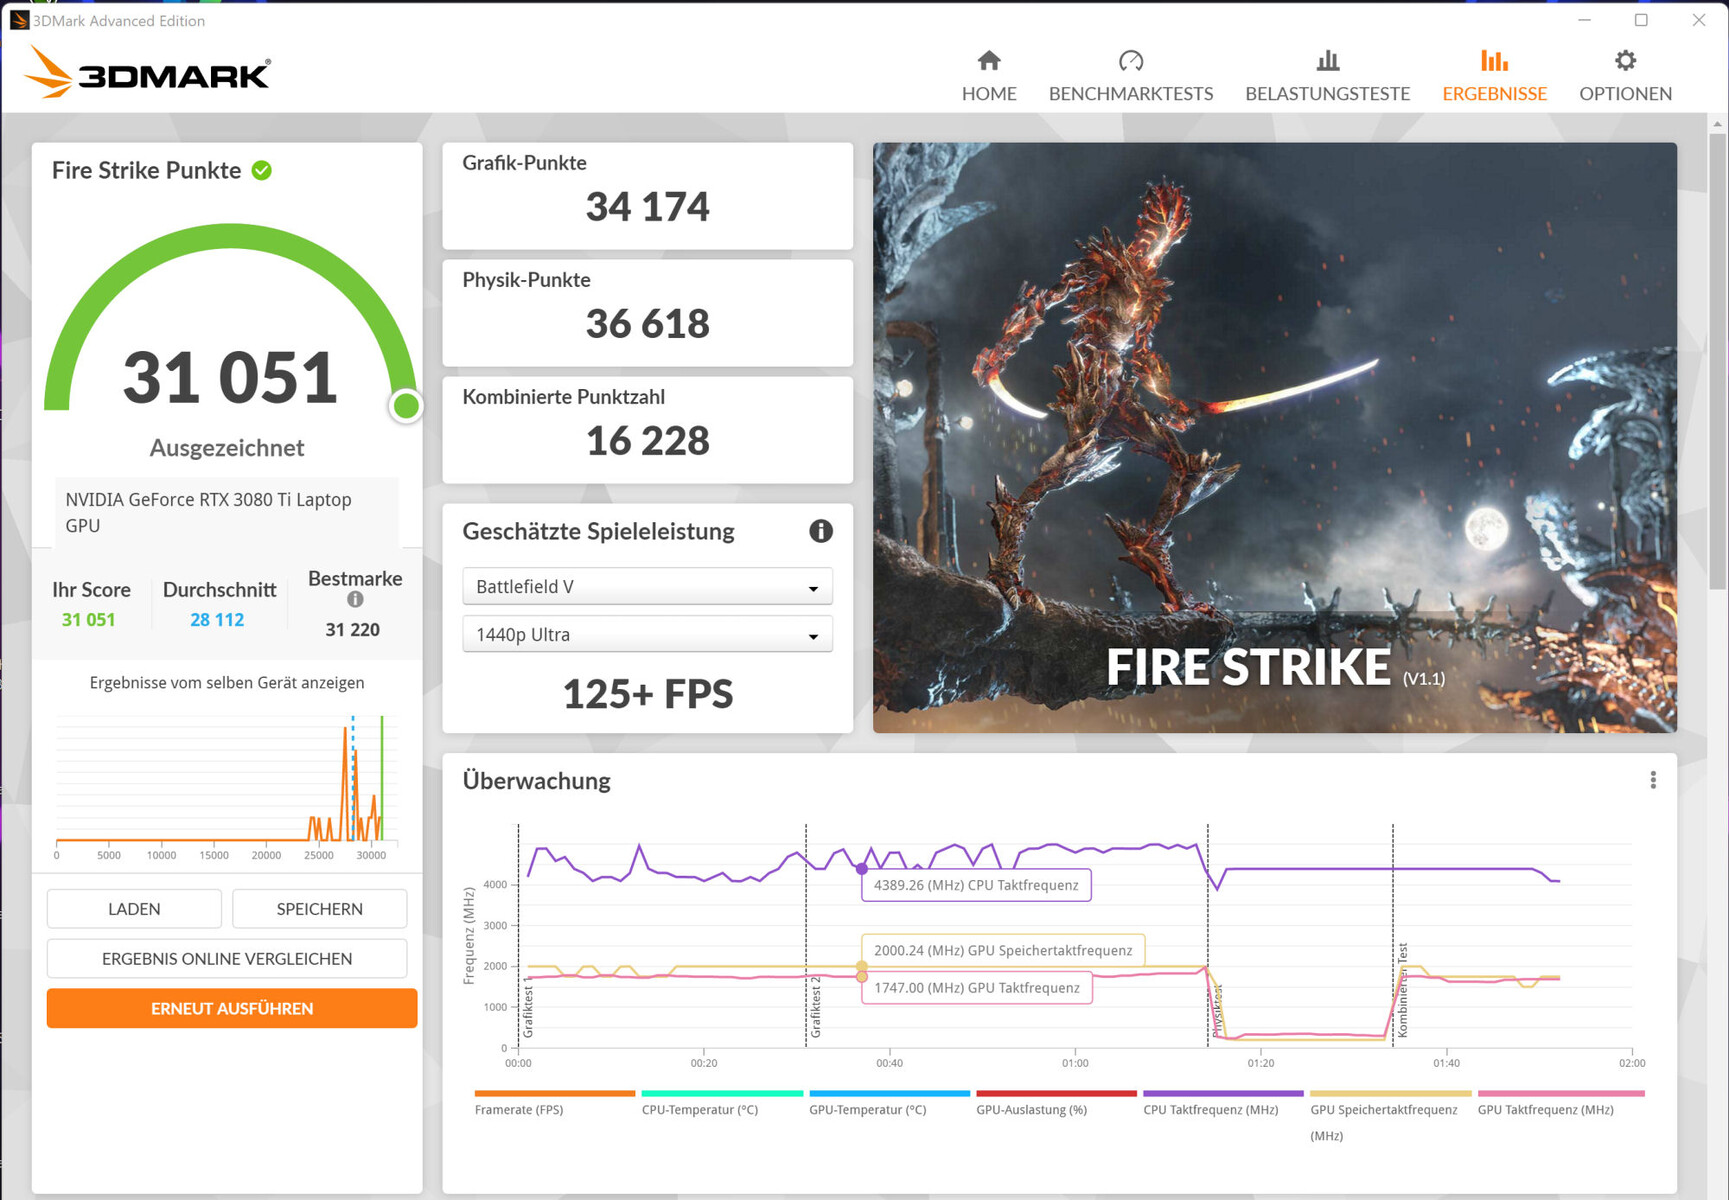
O desempenho real de uma GPU RTX 3000 depende de vários fatores: A solução de resfriamento, configuração de memória e o TGP máximo selecionado pelo fabricante dentro dos limites especificados pela Nvidia. Para a GPU instalada GeForce RTX 3080 Ti laptop GPU, MSI define um TGP máximo de 175 watts. A GPU tem acesso à rápida memória gráfica GDDR6 (16384 MB).
Os resultados de referência excedem a média de nossas medições RTX 3080 Ti anteriores. Ao combinar o perfil de potência "Performance extrema" com a saída direta de vídeo através da GPU GeForce, medimos algumas das mais altas pontuações que vimos a partir desta GPU. Como nosso teste Witcher 3 mostra, porém, a faixa TGP não está sendo totalmente esgotada. O Advanced Optimus não é suportado. Assim, a troca entre o dGPU e o Optimus requer uma reinicialização.
No entanto, isso não termina aí: O software MSI Center oferece configurações de overclocking para a GPU e a VRAM. Naturalmente, os usuários que optam por fazer overclock, o fazem por sua própria conta e risco. Os recursos de overclocking podem ser encontrados sob o perfil de potência "Performance extrema" (Selecione o perfil, depois clique na roda dentada).
| 3DMark Performance rating - Percent | |
| Média da turma Gaming | |
| MSI Raider GE77 HX 12UHS | |
| Alienware x17 R2 P48E | |
| MSI Raider GE77 HX 12UHS | |
| Razer Blade 17 Early 2022 | |
| Medion Erazer Beast X30 | |
| Média NVIDIA GeForce RTX 3080 Ti Laptop GPU | |
| 3DMark 11 - 1280x720 Performance GPU | |
| Média da turma Gaming (21841 - 80022, n=104, últimos 2 anos) | |
| MSI Raider GE77 HX 12UHS | |
| Alienware x17 R2 P48E | |
| MSI Raider GE77 HX 12UHS (dGPU, Extreme Leistung) | |
| Razer Blade 17 Early 2022 | |
| Medion Erazer Beast X30 | |
| Média NVIDIA GeForce RTX 3080 Ti Laptop GPU (13920 - 45841, n=45) | |
| 3DMark | |
| 1920x1080 Fire Strike Graphics | |
| Média da turma Gaming (12242 - 62849, n=115, últimos 2 anos) | |
| MSI Raider GE77 HX 12UHS (dGPU, Extreme Leistung) | |
| Alienware x17 R2 P48E | |
| MSI Raider GE77 HX 12UHS | |
| Medion Erazer Beast X30 | |
| Razer Blade 17 Early 2022 | |
| Média NVIDIA GeForce RTX 3080 Ti Laptop GPU (6928 - 34439, n=43) | |
| 2560x1440 Time Spy Graphics | |
| Média da turma Gaming (5012 - 26212, n=115, últimos 2 anos) | |
| Alienware x17 R2 P48E | |
| MSI Raider GE77 HX 12UHS (dGPU, Extreme Leistung) | |
| MSI Raider GE77 HX 12UHS | |
| Razer Blade 17 Early 2022 | |
| Medion Erazer Beast X30 | |
| Média NVIDIA GeForce RTX 3080 Ti Laptop GPU (4921 - 13835, n=43) | |
| 2560x1440 Port Royal Graphics | |
| Média da turma Gaming (4395 - 17286, n=71, últimos 2 anos) | |
| MSI Raider GE77 HX 12UHS (dGPU, Extreme Leistung) | |
| Alienware x17 R2 P48E | |
| MSI Raider GE77 HX 12UHS | |
| Razer Blade 17 Early 2022 | |
| Média NVIDIA GeForce RTX 3080 Ti Laptop GPU (6423 - 8462, n=28) | |
| Medion Erazer Beast X30 | |
V-Ray Benchmark Next 4.10: GPU | CPU
Geekbench 5.5: OpenCL Score
SPECviewperf 13: Solidworks (sw-04) | Siemens NX (snx-03) | Showcase (showcase-02) | Medical (medical-02) | Maya (maya-05) | Energy (energy-02) | Creo (creo-02) | Catia (catia-05) | 3ds Max (3dsmax-06)
| V-Ray 5 Benchmark / GPU RTX | |
| Média da turma Gaming (1146 - 4363, n=33, últimos 2 anos) | |
| MSI Raider GE77 HX 12UHS (5.0.1, Extreme Leistung) | |
| MSI Raider GE77 HX 12UHS (5.0.1) | |
| Razer Blade 17 Early 2022 (5.0.1) | |
| MSI Raider GE77 HX 12UHS (5.0.1, dGPU, Extreme Leistung) | |
| Medion Erazer Beast X30 (5.0.1) | |
| Média NVIDIA GeForce RTX 3080 Ti Laptop GPU (1225 - 1915, n=19) | |
| V-Ray 5 Benchmark / GPU CUDA | |
| Média da turma Gaming (887 - 3288, n=33, últimos 2 anos) | |
| MSI Raider GE77 HX 12UHS (5.0.1, Extreme Leistung) | |
| Razer Blade 17 Early 2022 (5.0.1) | |
| MSI Raider GE77 HX 12UHS (5.0.1) | |
| MSI Raider GE77 HX 12UHS (5.0.1, dGPU, Extreme Leistung) | |
| Medion Erazer Beast X30 (5.0.1) | |
| Média NVIDIA GeForce RTX 3080 Ti Laptop GPU (846 - 1384, n=20) | |
| V-Ray 5 Benchmark / CPU | |
| Média da turma Gaming (5864 - 30302, n=32, últimos 2 anos) | |
| MSI Raider GE77 HX 12UHS (5.0.1, dGPU, Extreme Leistung) | |
| MSI Raider GE77 HX 12UHS (5.0.1) | |
| MSI Raider GE77 HX 12UHS (5.0.1, Extreme Leistung) | |
| Alienware x17 R2 P48E (5.0.1) | |
| Média NVIDIA GeForce RTX 3080 Ti Laptop GPU (3692 - 15811, n=25) | |
| Medion Erazer Beast X30 (5.0.1) | |
| Razer Blade 17 Early 2022 (5.0.1) | |
| V-Ray Benchmark Next 4.10 / GPU | |
| Média da turma Gaming (427 - 1627, n=99, últimos 2 anos) | |
| MSI Raider GE77 HX 12UHS (v4.10.07 ) | |
| Medion Erazer Beast X30 (v4.10.07 ) | |
| MSI Raider GE77 HX 12UHS (v4.10.07, Extreme Leistung) | |
| MSI Raider GE77 HX 12UHS (v4.10.07, dGPU, Extreme Leistung) | |
| Média NVIDIA GeForce RTX 3080 Ti Laptop GPU (311 - 552, n=35) | |
| Razer Blade 17 Early 2022 (v4.10.07 ) | |
| V-Ray Benchmark Next 4.10 / CPU | |
| Média da turma Gaming (10048 - 45327, n=97, últimos 2 anos) | |
| MSI Raider GE77 HX 12UHS (v4.10.07, Extreme Leistung) | |
| MSI Raider GE77 HX 12UHS (v4.10.07, dGPU, Extreme Leistung) | |
| MSI Raider GE77 HX 12UHS (v4.10.07 ) | |
| Medion Erazer Beast X30 (v4.10.07 ) | |
| Média NVIDIA GeForce RTX 3080 Ti Laptop GPU (5564 - 23947, n=35) | |
| Razer Blade 17 Early 2022 (v4.10.07 ) | |
| Geekbench 5.5 / OpenCL Score | |
| Média da turma Gaming (80702 - 277970, n=101, últimos 2 anos) | |
| MSI Raider GE77 HX 12UHS | |
| MSI Raider GE77 HX 12UHS (Extreme Leistung) | |
| Alienware x17 R2 P48E | |
| Medion Erazer Beast X30 | |
| Média NVIDIA GeForce RTX 3080 Ti Laptop GPU (88580 - 151633, n=41) | |
| Razer Blade 17 Early 2022 | |
| SPECviewperf 13 / Solidworks (sw-04) | |
| Razer Blade 17 Early 2022 (dGPU, 175W) | |
| MSI Raider GE77 HX 12UHS | |
| Média NVIDIA GeForce RTX 3080 Ti Laptop GPU (62.9 - 133.4, n=8) | |
| Média da turma Gaming (n=1últimos 2 anos) | |
| SPECviewperf 13 / Siemens NX (snx-03) | |
| MSI Raider GE77 HX 12UHS | |
| Razer Blade 17 Early 2022 (dGPU, 175W) | |
| Média NVIDIA GeForce RTX 3080 Ti Laptop GPU (18.3 - 25.3, n=8) | |
| Média da turma Gaming (n=1últimos 2 anos) | |
| SPECviewperf 13 / Showcase (showcase-02) | |
| Razer Blade 17 Early 2022 (dGPU, 175W) | |
| MSI Raider GE77 HX 12UHS | |
| Média NVIDIA GeForce RTX 3080 Ti Laptop GPU (110 - 175, n=8) | |
| Média da turma Gaming (n=1últimos 2 anos) | |
| SPECviewperf 13 / Medical (medical-02) | |
| Razer Blade 17 Early 2022 (dGPU, 175W) | |
| MSI Raider GE77 HX 12UHS | |
| Média NVIDIA GeForce RTX 3080 Ti Laptop GPU (65.3 - 79.1, n=8) | |
| Média da turma Gaming (n=1últimos 2 anos) | |
| SPECviewperf 13 / Maya (maya-05) | |
| Razer Blade 17 Early 2022 (dGPU, 175W) | |
| Média NVIDIA GeForce RTX 3080 Ti Laptop GPU (212 - 430, n=8) | |
| MSI Raider GE77 HX 12UHS | |
| Média da turma Gaming (n=1últimos 2 anos) | |
| SPECviewperf 13 / Energy (energy-02) | |
| MSI Raider GE77 HX 12UHS | |
| Razer Blade 17 Early 2022 (dGPU, 175W) | |
| Média NVIDIA GeForce RTX 3080 Ti Laptop GPU (19.3 - 27.3, n=8) | |
| Média da turma Gaming (n=1últimos 2 anos) | |
| SPECviewperf 13 / Creo (creo-02) | |
| Razer Blade 17 Early 2022 (dGPU, 175W) | |
| MSI Raider GE77 HX 12UHS | |
| Média NVIDIA GeForce RTX 3080 Ti Laptop GPU (177.4 - 311, n=8) | |
| Média da turma Gaming (n=1últimos 2 anos) | |
| SPECviewperf 13 / Catia (catia-05) | |
| Razer Blade 17 Early 2022 (dGPU, 175W) | |
| MSI Raider GE77 HX 12UHS | |
| Média NVIDIA GeForce RTX 3080 Ti Laptop GPU (130.4 - 190.3, n=8) | |
| Média da turma Gaming (n=1últimos 2 anos) | |
| SPECviewperf 13 / 3ds Max (3dsmax-06) | |
| Razer Blade 17 Early 2022 (dGPU, 175W) | |
| MSI Raider GE77 HX 12UHS | |
| Média NVIDIA GeForce RTX 3080 Ti Laptop GPU (161 - 260, n=8) | |
| Média da turma Gaming (n=1últimos 2 anos) | |
| 3DMark 06 Standard Score | 58305 pontos | |
| 3DMark 11 Performance | 36734 pontos | |
| 3DMark Cloud Gate Standard Score | 61721 pontos | |
| 3DMark Fire Strike Score | 28975 pontos | |
| 3DMark Time Spy Score | 13320 pontos | |
Ajuda | ||
Desempenho nos jogos
O hardware permite jogos de 4K em configurações de alto a máximo. As taxas de quadros variam acima da média para um RTX 3080 Ti. A mudança para a saída direta de vídeo através da GPU GeForce resulta em um aumento dos valores. Muitas vezes, o GE77 produz então algumas das taxas de quadros mais altas que temos visto com esta GPU.
| The Witcher 3 - 1920x1080 Ultra Graphics & Postprocessing (HBAO+) | |
| Média da turma Gaming (104.7 - 240, n=7, últimos 2 anos) | |
| MSI Raider GE77 HX 12UHS (dGPU, Extreme Leistung) | |
| Alienware x17 R2 P48E | |
| MSI Raider GE77 HX 12UHS | |
| Razer Blade 17 Early 2022 | |
| Medion Erazer Beast X30 | |
| Média NVIDIA GeForce RTX 3080 Ti Laptop GPU (30 - 130.6, n=43) | |
| Dota 2 Reborn | |
| 3840x2160 ultra (3/3) best looking | |
| Média da turma Gaming (114.9 - 199.2, n=32, últimos 2 anos) | |
| MSI Raider GE77 HX 12UHS (dGPU, Extreme Leistung) | |
| MSI Raider GE77 HX 12UHS (Extreme Leistung) | |
| MSI Raider GE77 HX 12UHS | |
| Média NVIDIA GeForce RTX 3080 Ti Laptop GPU (70.8 - 155.6, n=19) | |
| Razer Blade 17 Early 2022 | |
| 1920x1080 ultra (3/3) best looking | |
| MSI Raider GE77 HX 12UHS (Extreme Leistung) | |
| MSI Raider GE77 HX 12UHS (dGPU, Extreme Leistung) | |
| MSI Raider GE77 HX 12UHS | |
| Alienware x17 R2 P48E | |
| Média da turma Gaming (84.8 - 248, n=107, últimos 2 anos) | |
| Medion Erazer Beast X30 | |
| Média NVIDIA GeForce RTX 3080 Ti Laptop GPU (29.9 - 170.5, n=45) | |
| Razer Blade 17 Early 2022 | |
| X-Plane 11.11 | |
| 3840x2160 high (fps_test=3) | |
| MSI Raider GE77 HX 12UHS (dGPU, Extreme Leistung) | |
| MSI Raider GE77 HX 12UHS | |
| MSI Raider GE77 HX 12UHS (Extreme Leistung) | |
| Média da turma Gaming (60 - 124.1, n=32, últimos 2 anos) | |
| Média NVIDIA GeForce RTX 3080 Ti Laptop GPU (32.9 - 109.5, n=20) | |
| Razer Blade 17 Early 2022 | |
| 1920x1080 high (fps_test=3) | |
| MSI Raider GE77 HX 12UHS (dGPU, Extreme Leistung) | |
| MSI Raider GE77 HX 12UHS | |
| MSI Raider GE77 HX 12UHS (Extreme Leistung) | |
| Alienware x17 R2 P48E | |
| Média NVIDIA GeForce RTX 3080 Ti Laptop GPU (32.6 - 127, n=45) | |
| Medion Erazer Beast X30 | |
| Média da turma Gaming (55.5 - 143.5, n=109, últimos 2 anos) | |
| Razer Blade 17 Early 2022 | |
| Final Fantasy XV Benchmark | |
| 3840x2160 High Quality | |
| Média da turma Gaming (49.1 - 111.8, n=33, últimos 2 anos) | |
| MSI Raider GE77 HX 12UHS (1.3, dGPU, Extreme Leistung) | |
| MSI Raider GE77 HX 12UHS (1.3, Extreme Leistung) | |
| MSI Raider GE77 HX 12UHS (1.3) | |
| Razer Blade 17 Early 2022 (1.3) | |
| Média NVIDIA GeForce RTX 3080 Ti Laptop GPU (35.1 - 61.2, n=18) | |
| 1920x1080 High Quality | |
| Média da turma Gaming (41 - 215, n=95, últimos 2 anos) | |
| MSI Raider GE77 HX 12UHS (1.3, dGPU, Extreme Leistung) | |
| MSI Raider GE77 HX 12UHS (1.3, Extreme Leistung) | |
| MSI Raider GE77 HX 12UHS (1.3) | |
| Alienware x17 R2 P48E (1.3) | |
| Média NVIDIA GeForce RTX 3080 Ti Laptop GPU (30.7 - 140.6, n=42) | |
| Razer Blade 17 Early 2022 (1.3) | |
| Medion Erazer Beast X30 (1.3) | |
| GTA V | |
| 1920x1080 Highest AA:4xMSAA + FX AF:16x | |
| MSI Raider GE77 HX 12UHS (Extreme Leistung) | |
| MSI Raider GE77 HX 12UHS (dGPU, Extreme Leistung) | |
| MSI Raider GE77 HX 12UHS | |
| Média da turma Gaming (48.3 - 186.9, n=94, últimos 2 anos) | |
| Alienware x17 R2 P48E | |
| Média NVIDIA GeForce RTX 3080 Ti Laptop GPU (30 - 139.2, n=42) | |
| Medion Erazer Beast X30 | |
| Razer Blade 17 Early 2022 | |
| 3840x2160 Highest AA:4xMSAA + FX AF:16x | |
| Média da turma Gaming (53.9 - 123.2, n=25, últimos 2 anos) | |
| MSI Raider GE77 HX 12UHS (Extreme Leistung) | |
| MSI Raider GE77 HX 12UHS (dGPU, Extreme Leistung) | |
| MSI Raider GE77 HX 12UHS | |
| Razer Blade 17 Early 2022 | |
| Média NVIDIA GeForce RTX 3080 Ti Laptop GPU (37.7 - 67.2, n=14) | |
| Strange Brigade | |
| 3840x2160 ultra AA:ultra AF:16 | |
| Média da turma Gaming (83 - 187.2, n=34, últimos 2 anos) | |
| MSI Raider GE77 HX 12UHS (1.47.22.14 D3D12, dGPU, Extreme Leistung) | |
| MSI Raider GE77 HX 12UHS (1.47.22.14 D3D12, Extreme Leistung) | |
| MSI Raider GE77 HX 12UHS (1.47.22.14 D3D12) | |
| Razer Blade 17 Early 2022 (1.47.22.14 D3D12) | |
| Média NVIDIA GeForce RTX 3080 Ti Laptop GPU (61.7 - 100.7, n=15) | |
| 1920x1080 ultra AA:ultra AF:16 | |
| Média da turma Gaming (76.3 - 458, n=87, últimos 2 anos) | |
| MSI Raider GE77 HX 12UHS (1.47.22.14 D3D12, dGPU, Extreme Leistung) | |
| Alienware x17 R2 P48E (1.47.22.14 D3D12) | |
| MSI Raider GE77 HX 12UHS (1.47.22.14 D3D12, Extreme Leistung) | |
| MSI Raider GE77 HX 12UHS (1.47.22.14 D3D12) | |
| Razer Blade 17 Early 2022 (1.47.22.14 D3D12) | |
| Medion Erazer Beast X30 (1.47.22.14 D3D12) | |
| Média NVIDIA GeForce RTX 3080 Ti Laptop GPU (42.3 - 224, n=41) | |
| F1 2021 | |
| 1920x1080 Ultra High Preset + Raytracing AA:T AF:16x | |
| MSI Raider GE77 HX 12UHS (874931, dGPU, Extreme Leistung) | |
| MSI Raider GE77 HX 12UHS (874931) | |
| MSI Raider GE77 HX 12UHS (874931, Extreme Leistung) | |
| Razer Blade 17 Early 2022 (874931) | |
| Medion Erazer Beast X30 (874931) | |
| Média NVIDIA GeForce RTX 3080 Ti Laptop GPU (30.2 - 160.6, n=30) | |
| 3840x2160 Ultra High Preset + Raytracing AA:T AF:16x | |
| MSI Raider GE77 HX 12UHS (874931, dGPU, Extreme Leistung) | |
| MSI Raider GE77 HX 12UHS (874931, Extreme Leistung) | |
| MSI Raider GE77 HX 12UHS (874931) | |
| Razer Blade 17 Early 2022 (874931) | |
| Média NVIDIA GeForce RTX 3080 Ti Laptop GPU (41.1 - 70.2, n=18) | |
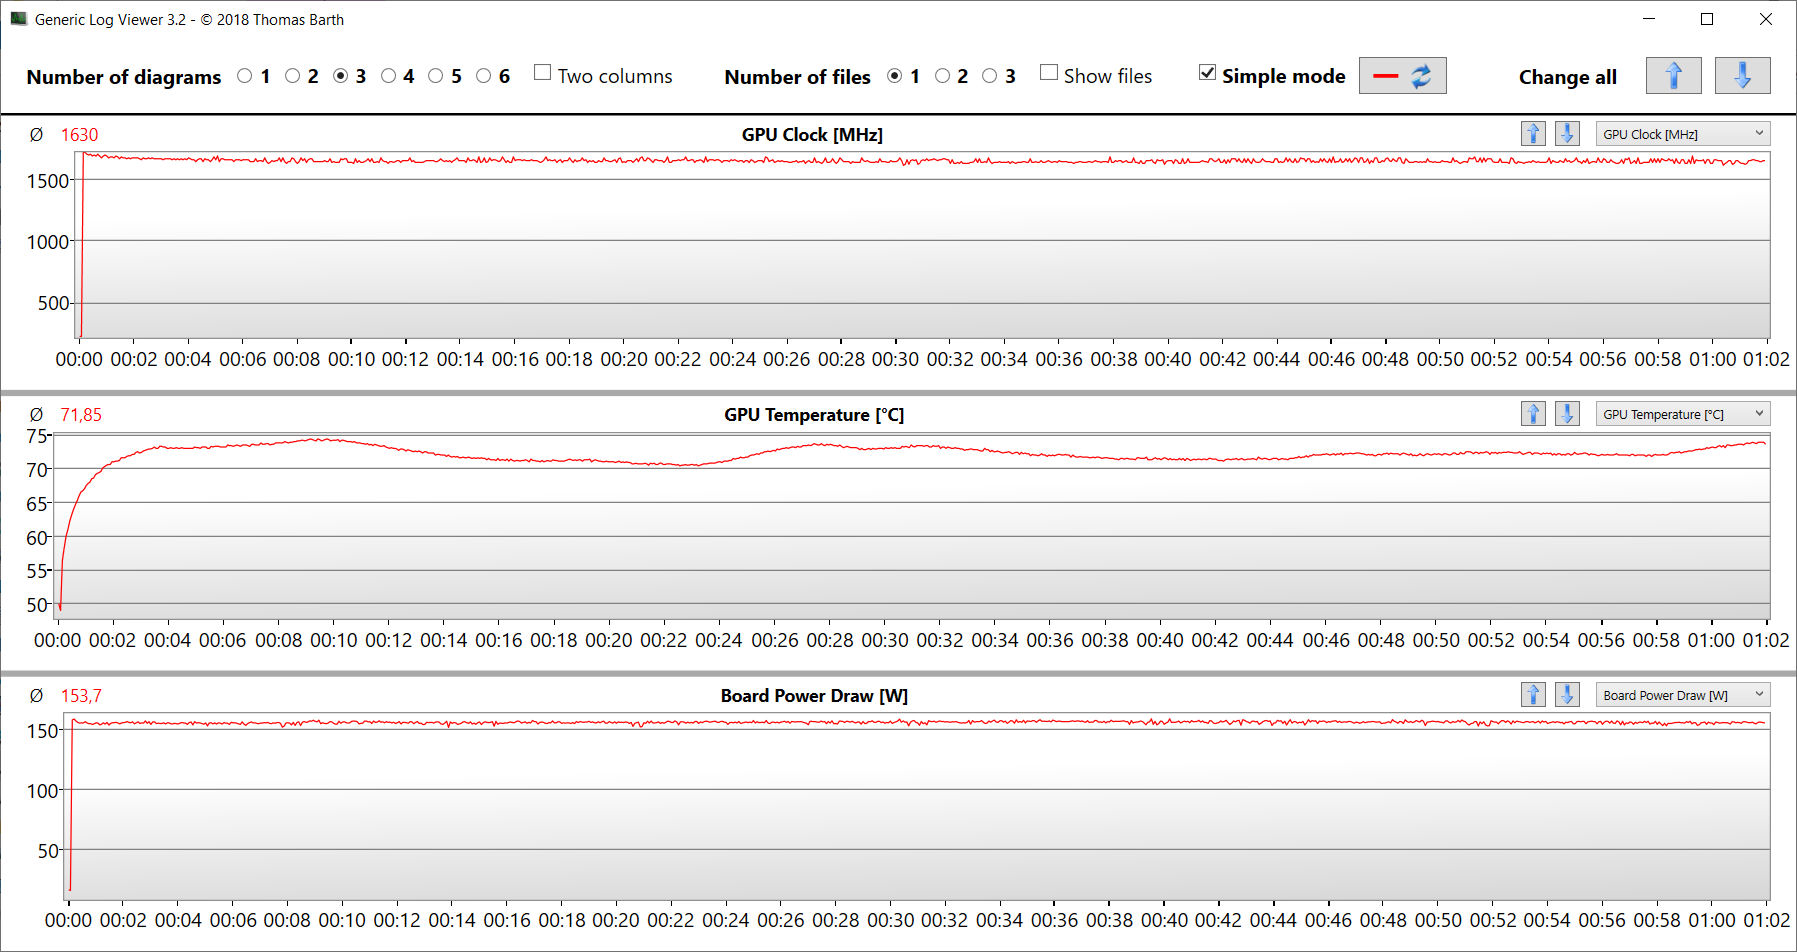
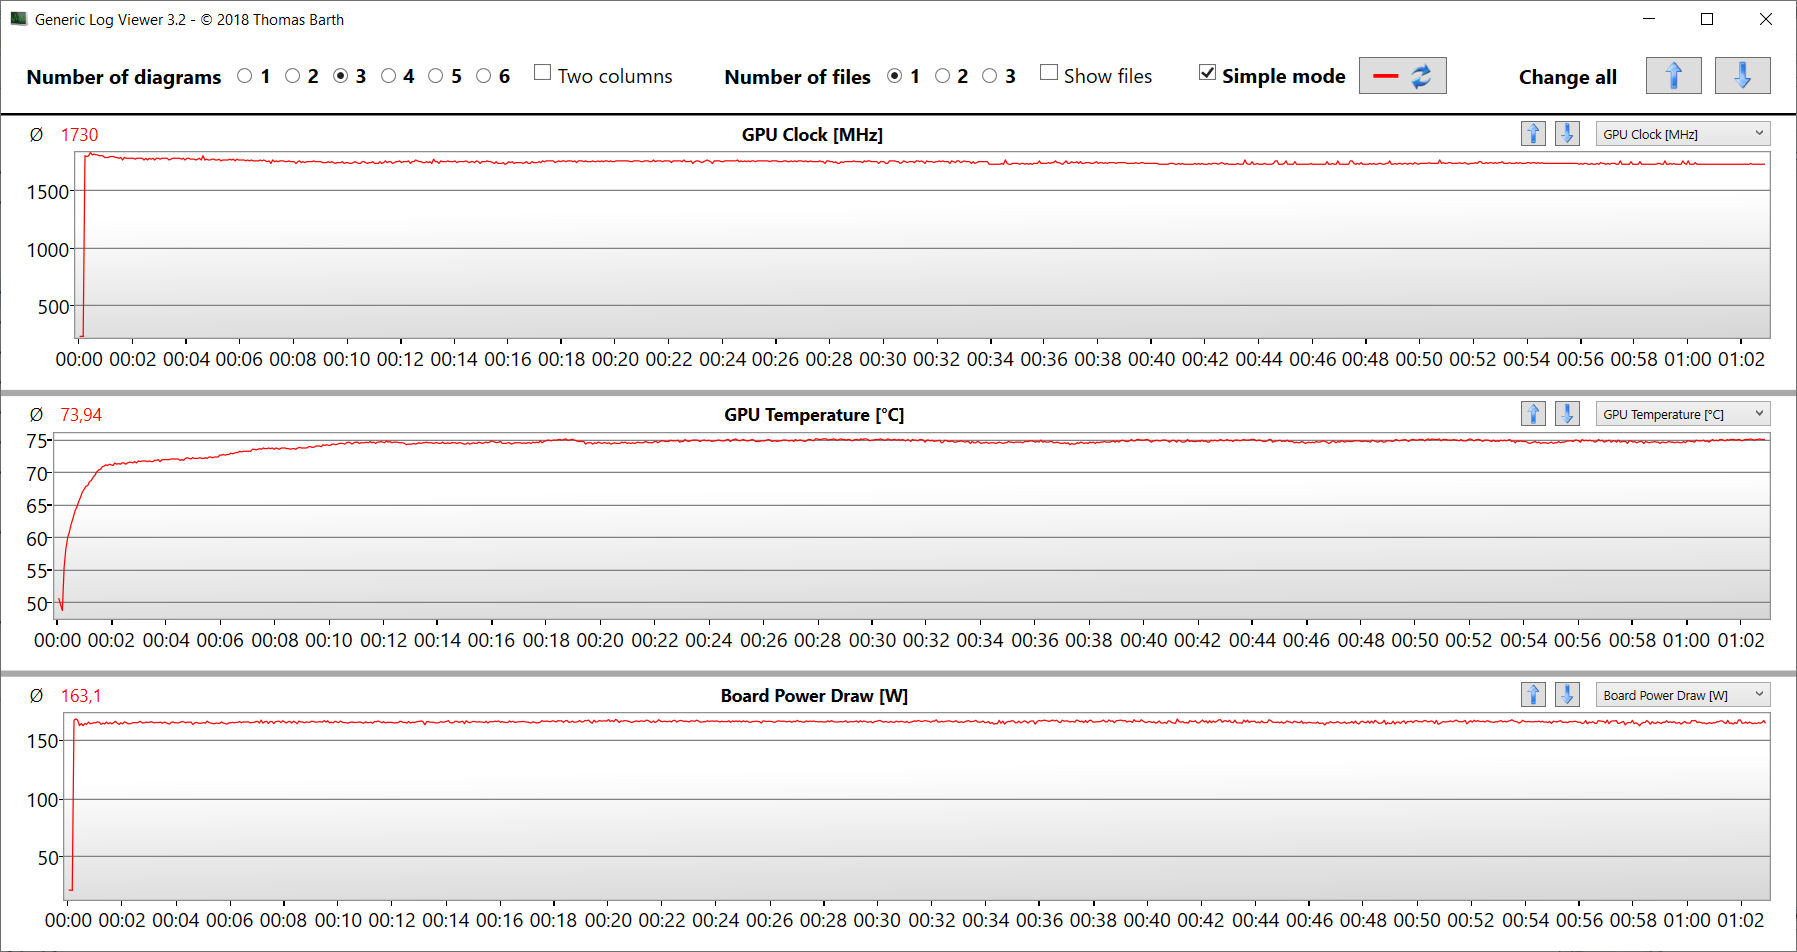
A fim de determinar se as taxas de quadros permanecem consistentes durante um longo período de tempo, executamos o jogo "The Witcher 3" durante 60 minutos com resolução Full HD e ajustes de qualidade máxima. O personagem não é movido durante todo o teste. Não notamos nenhum frame rate dips.
Witcher 3 FPS Chart
| baixo | média | alto | ultra | QHD | 4K | |
|---|---|---|---|---|---|---|
| GTA V (2015) | 186.8 | 187 | 184.3 | 136 | 121.1 | 122 |
| The Witcher 3 (2015) | 498 | 392 | 249 | 126.7 | 62.1 | |
| Dota 2 Reborn (2015) | 203 | 184 | 174.8 | 165.7 | 144.7 | |
| Final Fantasy XV Benchmark (2018) | 217 | 175.6 | 132 | 98.6 | 57.9 | |
| X-Plane 11.11 (2018) | 172.8 | 152.3 | 121.1 | 103 | ||
| Far Cry 5 (2018) | 214 | 176 | 167 | 156 | 131 | 73 |
| Strange Brigade (2018) | 505 | 291 | 234 | 209 | 159.9 | 96.6 |
| F1 2021 (2021) | 354 | 243 | 207 | 133.8 | 104.3 | 64 |
Emissões - O sistema MSI fica barulhento sob carga
Ruído do sistema
Mesmo durante ocioso e sob cargas baixas, o controle do ventilador não funciona totalmente sem problemas. Por exemplo, os ventiladores ficam parados às vezes para uma experiência completamente silenciosa; outras vezes, eles se tornam muito perceptíveis (até 46 dB(A)). Sob carga, o portátil MSI produz níveis máximos de ruído muito altos de até 55 dB(A) (Witcher 3 teste) ou 57 dB(A) (teste de estresse).
Para operação silenciosa, é recomendado o uso do "Modo silencioso". O sistema é então mais silencioso, mas não totalmente silencioso - ao mesmo tempo, o desempenho é significativamente reduzido.
Barulho
| Ocioso |
| 26 / 34 / 46 dB |
| Carga |
| 50 / 57 dB |
 | ||
30 dB silencioso 40 dB(A) audível 50 dB(A) ruidosamente alto |
||
min: | ||
| MSI Raider GE77 HX 12UHS Intel Core i9-12900HX, NVIDIA GeForce RTX 3080 Ti Laptop GPU | Razer Blade 17 Early 2022 Intel Core i9-12900H, NVIDIA GeForce RTX 3080 Ti Laptop GPU | Alienware x17 R2 P48E Intel Core i9-12900HK, NVIDIA GeForce RTX 3080 Ti Laptop GPU | Medion Erazer Beast X30 Intel Core i9-12900HK, NVIDIA GeForce RTX 3080 Ti Laptop GPU | |
|---|---|---|---|---|
| Noise | 10% | 22% | 8% | |
| desligado / ambiente * (dB) | 26 | 26 -0% | 22.7 13% | 26 -0% |
| Idle Minimum * (dB) | 26 | 26 -0% | 23.1 11% | 27 -4% |
| Idle Average * (dB) | 34 | 27 21% | 23.1 32% | 29 15% |
| Idle Maximum * (dB) | 46 | 32 30% | 23.1 50% | 34 26% |
| Load Average * (dB) | 50 | 50 -0% | 31.9 36% | 48 4% |
| Witcher 3 ultra * (dB) | 55 | 51 7% | 52.5 5% | 51 7% |
| Load Maximum * (dB) | 57 | 51 11% | 52.5 8% | 53 7% |
* ... menor é melhor
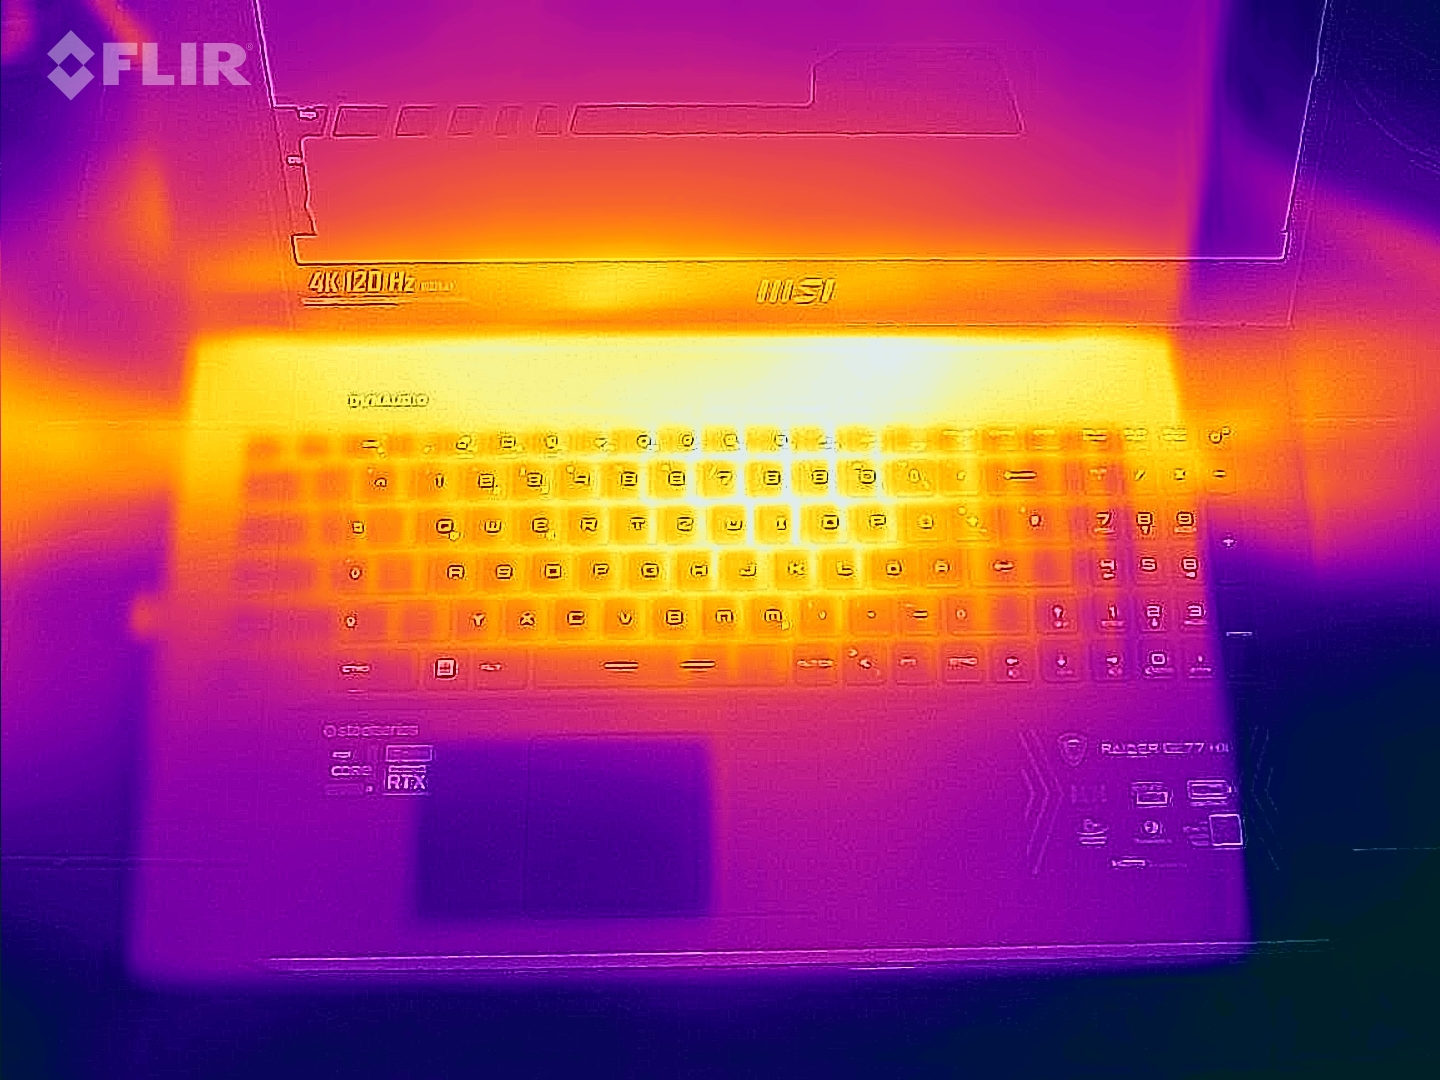
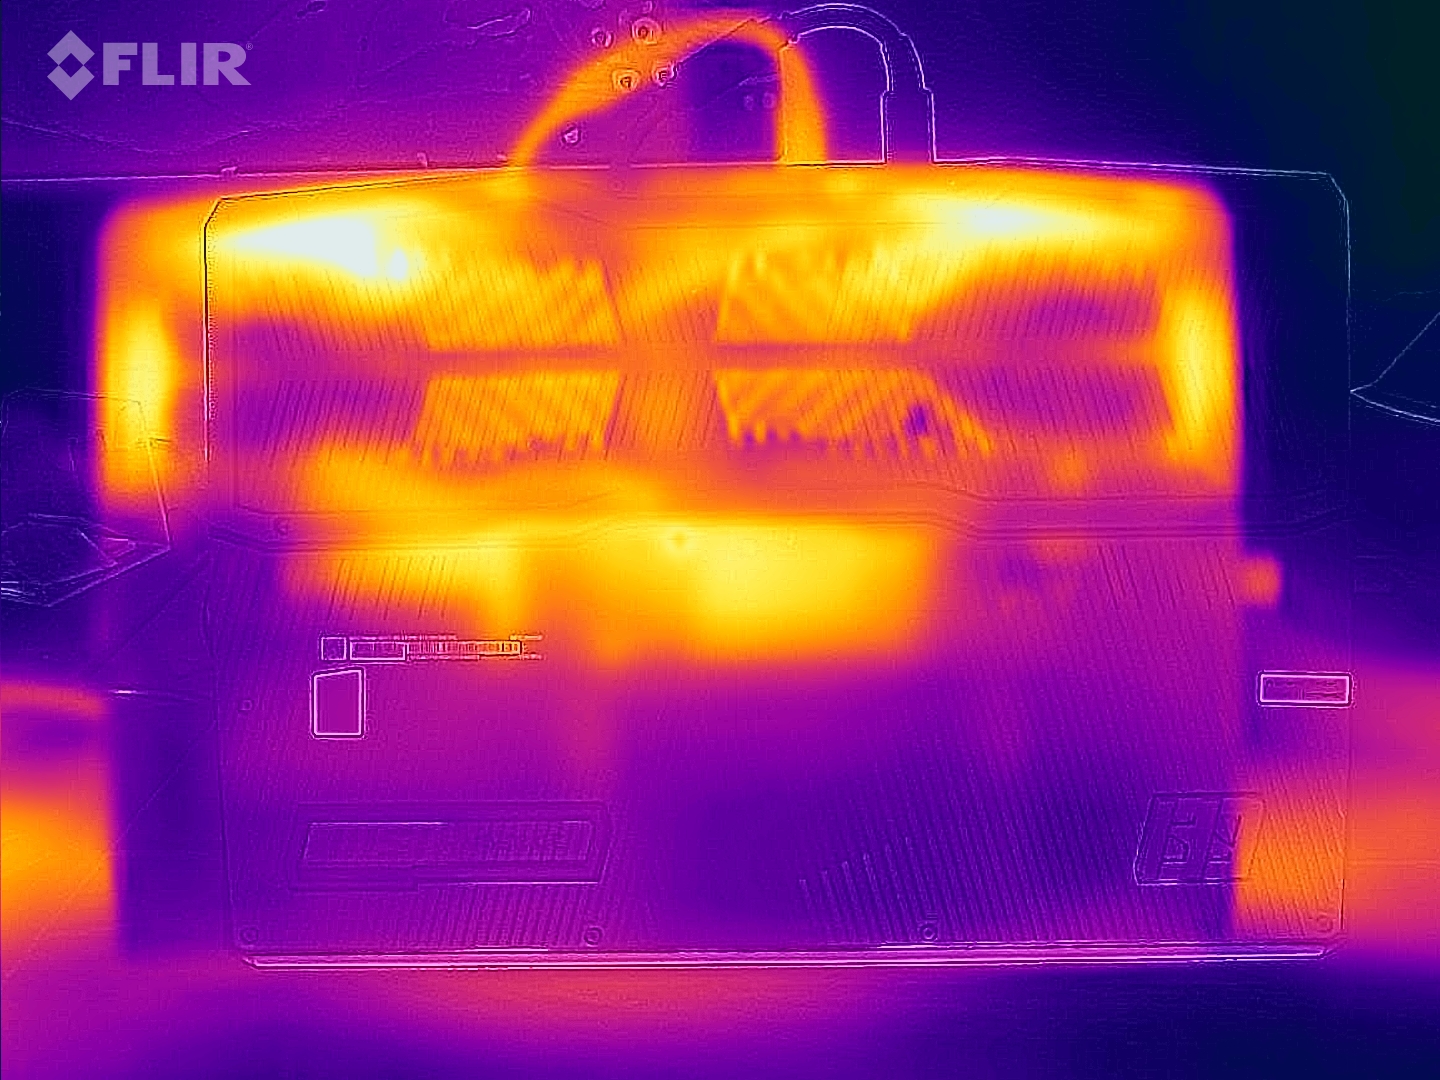
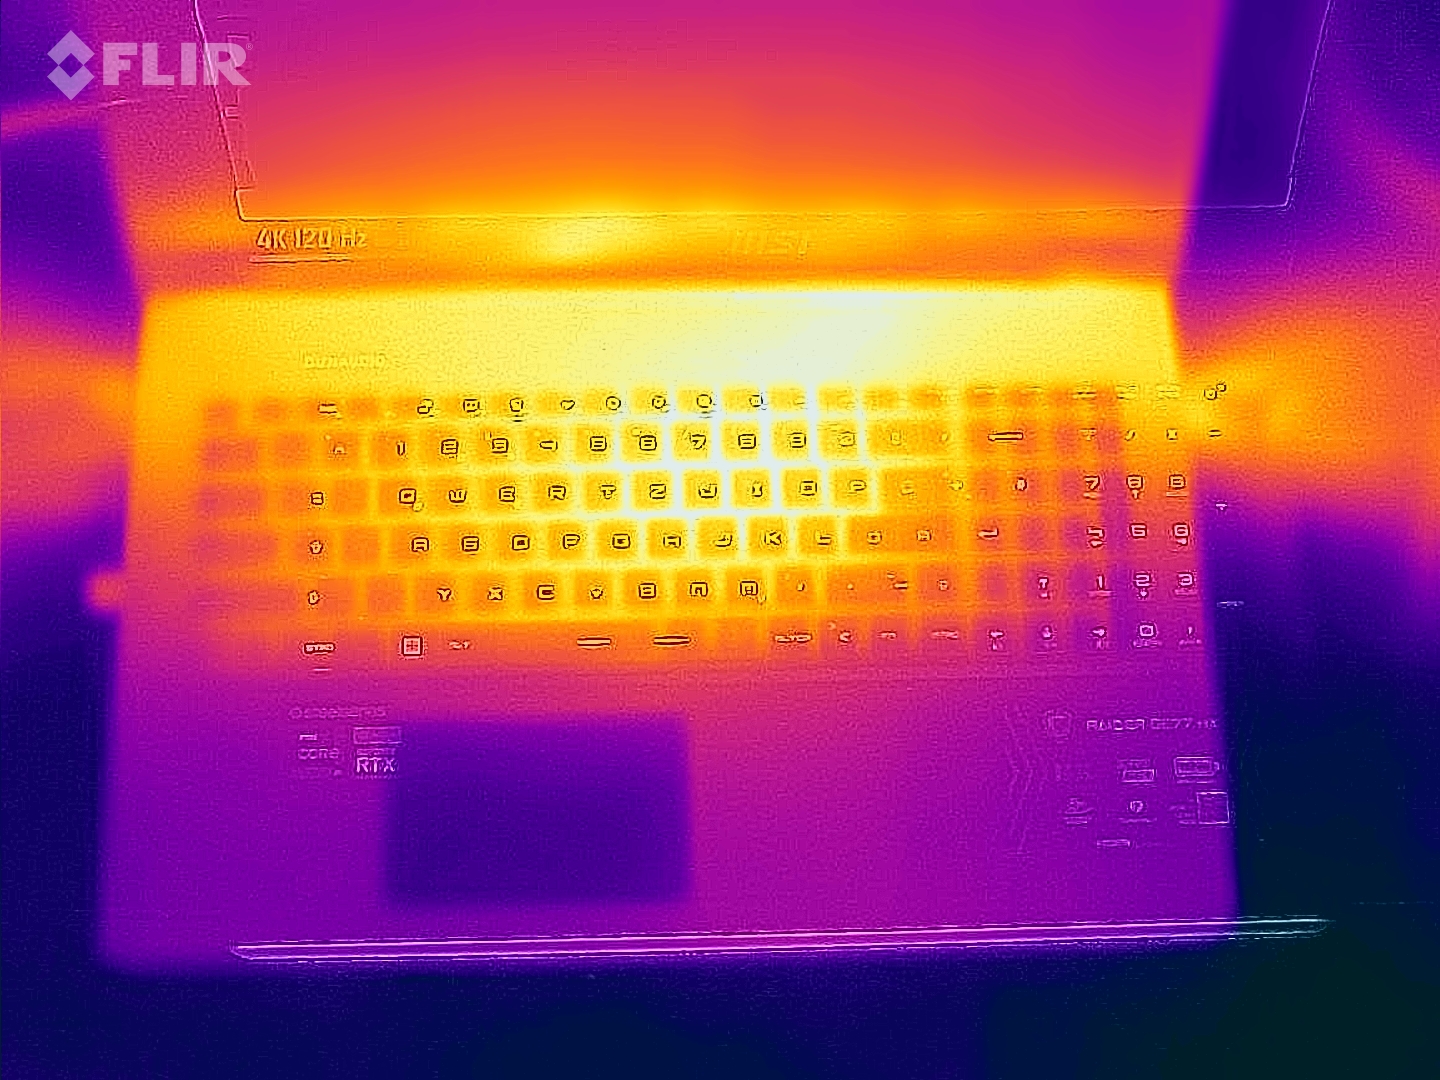
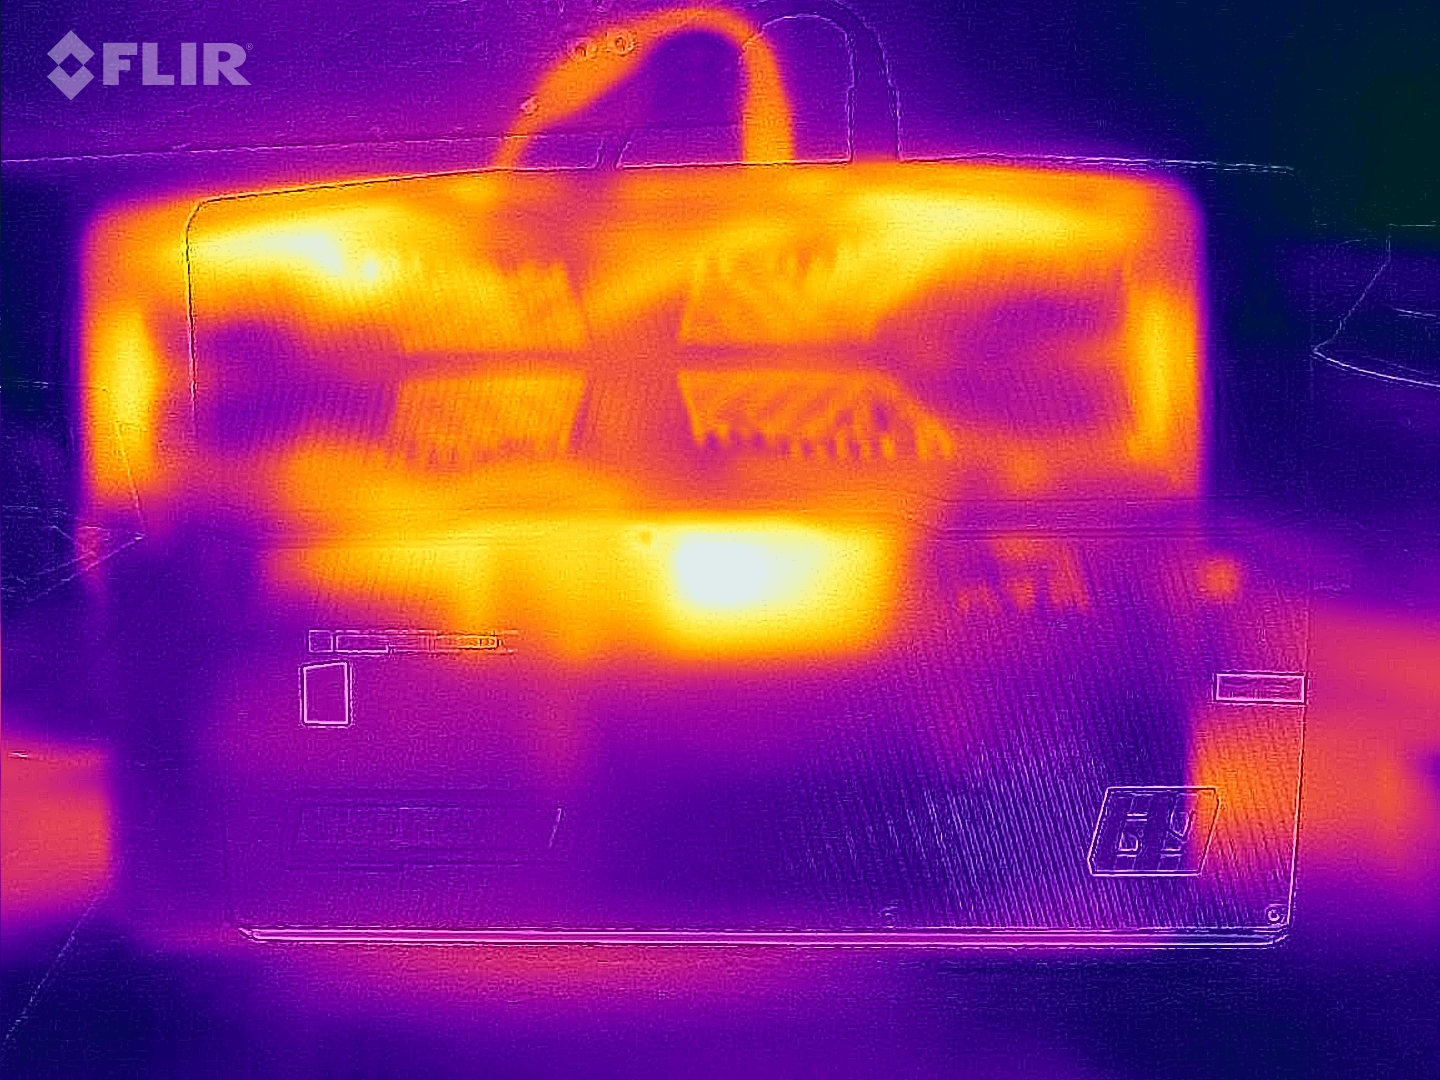
Temperatura
Durante o uso diário (escritório, web) as temperaturas de superfície permanecem dentro de uma faixa aceitável. Sob carga (teste de estresse, Witcher 3 teste), o laptop aquece significativamente, mas não excessivamente. Os usuários também não terão que se preocupar com as temperaturas da CPU.
(-) A temperatura máxima no lado superior é 53 °C / 127 F, em comparação com a média de 40.4 °C / 105 F , variando de 21.2 a 68.8 °C para a classe Gaming.
(-) A parte inferior aquece até um máximo de 58 °C / 136 F, em comparação com a média de 43.2 °C / 110 F
(±) Em uso inativo, a temperatura média para o lado superior é 34.8 °C / 95 F, em comparação com a média do dispositivo de 33.9 °C / ### class_avg_f### F.
(-) Jogando The Witcher 3, a temperatura média para o lado superior é 44.1 °C / 111 F, em comparação com a média do dispositivo de 33.9 °C / ## #class_avg_f### F.
(+) Os apoios para as mãos e o touchpad estão atingindo a temperatura máxima da pele (35 °C / 95 F) e, portanto, não estão quentes.
(-) A temperatura média da área do apoio para as mãos de dispositivos semelhantes foi 28.8 °C / 83.8 F (-6.2 °C / -11.2 F).
| MSI Raider GE77 HX 12UHS Intel Core i9-12900HX, NVIDIA GeForce RTX 3080 Ti Laptop GPU | Razer Blade 17 Early 2022 Intel Core i9-12900H, NVIDIA GeForce RTX 3080 Ti Laptop GPU | Alienware x17 R2 P48E Intel Core i9-12900HK, NVIDIA GeForce RTX 3080 Ti Laptop GPU | Medion Erazer Beast X30 Intel Core i9-12900HK, NVIDIA GeForce RTX 3080 Ti Laptop GPU | |
|---|---|---|---|---|
| Heat | 7% | 21% | 5% | |
| Maximum Upper Side * (°C) | 53 | 50 6% | 49.6 6% | 55 -4% |
| Maximum Bottom * (°C) | 58 | 56 3% | 42.4 27% | 62 -7% |
| Idle Upper Side * (°C) | 38 | 36 5% | 29.2 23% | 32 16% |
| Idle Bottom * (°C) | 43 | 38 12% | 32 26% | 36 16% |
* ... menor é melhor
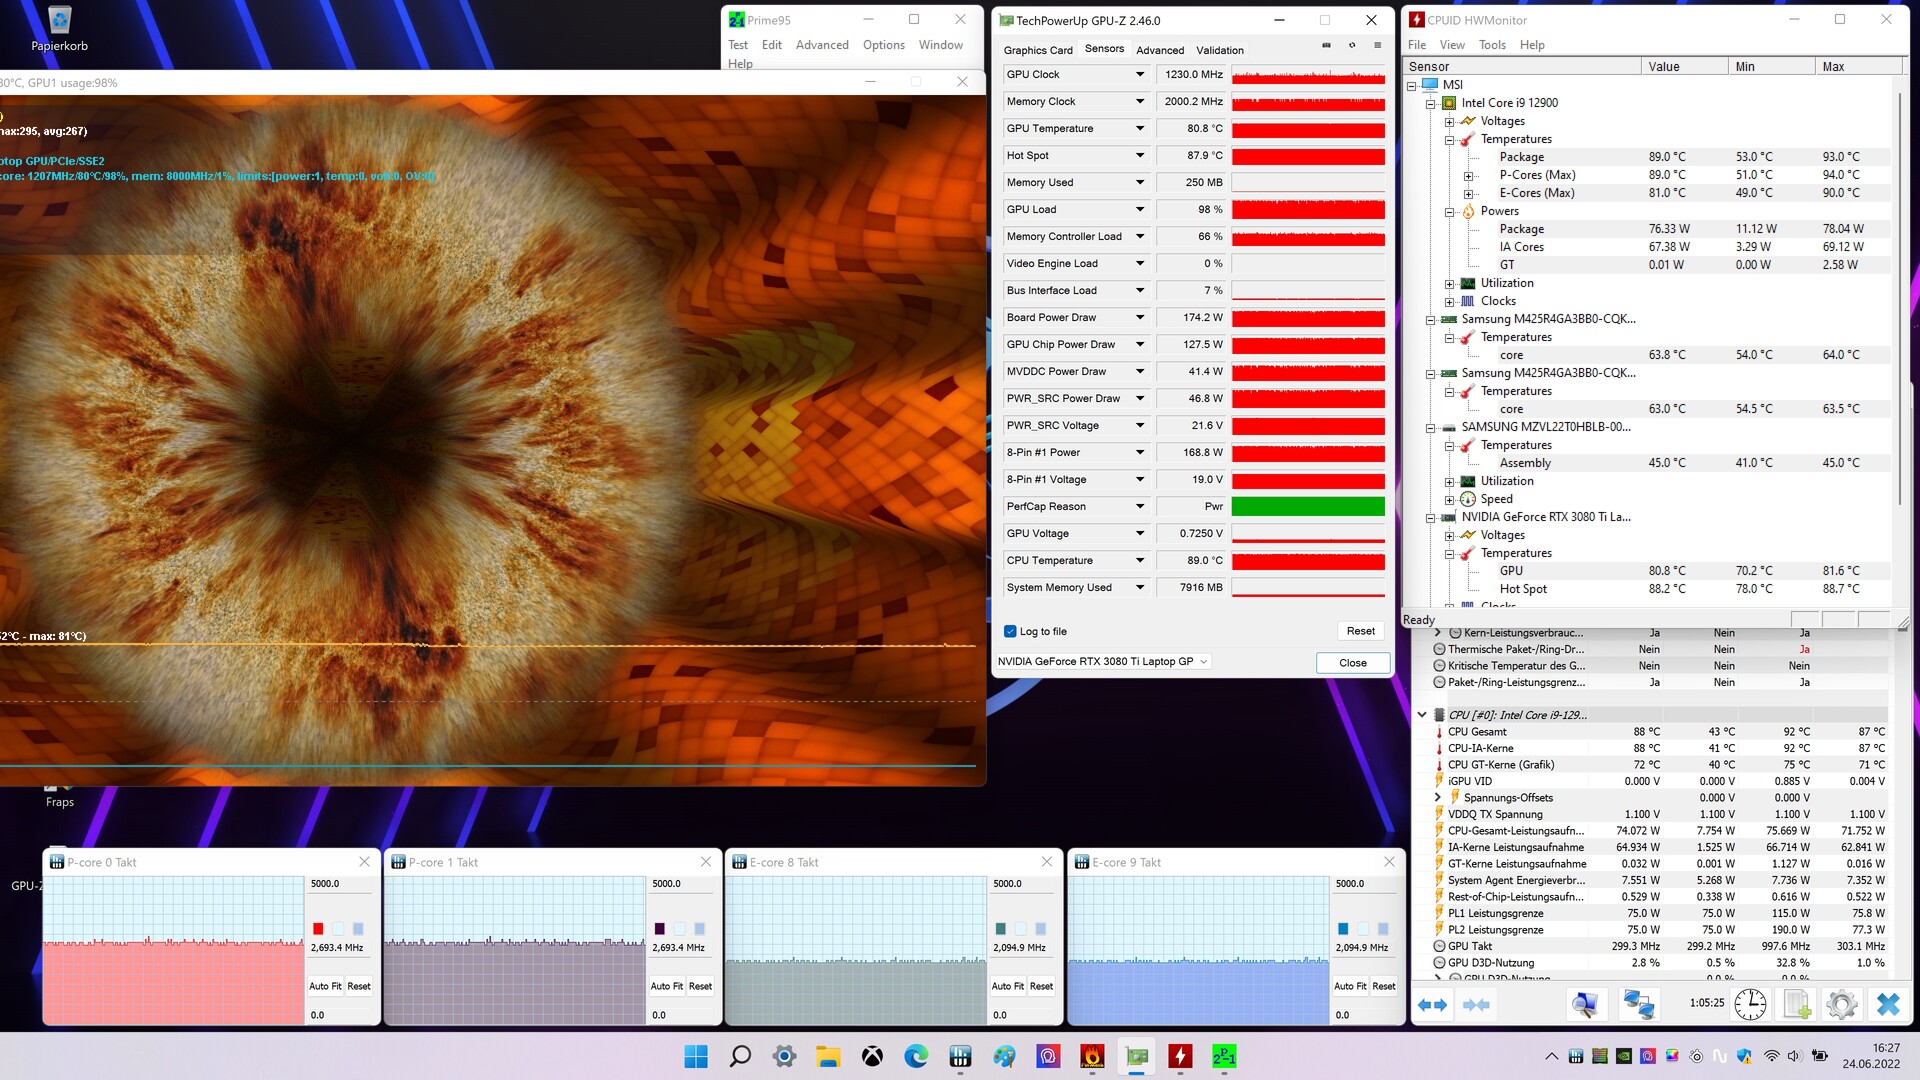
Teste de estresse
No início do teste de estresse (rodando Prime95 e FurMark por pelo menos uma hora), tanto a CPU quanto a GPU rodam em alta velocidade. Em seguida, a velocidade do relógio cai para 1,3 (CPU) e 1100 MHz (GPU). O teste de estresse representa um cenário extremo. Utilizamos este teste para determinar se o sistema permanece estável sob carga total.
Oradores
O laptop vem com dois alto-falantes e dois woofers, que juntos produzem um som decente - embora um pouco mais de graves não faria mal. Para uma melhor experiência sonora, são recomendados fones de ouvido ou alto-falantes externos.
MSI Raider GE77 HX 12UHS análise de áudio
(+) | os alto-falantes podem tocar relativamente alto (###valor### dB)
Graves 100 - 315Hz
(±) | graves reduzidos - em média 11% menor que a mediana
(±) | a linearidade dos graves é média (11.3% delta para a frequência anterior)
Médios 400 - 2.000 Hz
(+) | médios equilibrados - apenas 4.3% longe da mediana
(+) | médios são lineares (3.2% delta para frequência anterior)
Altos 2 - 16 kHz
(+) | agudos equilibrados - apenas 2.3% longe da mediana
(+) | os máximos são lineares (5% delta da frequência anterior)
Geral 100 - 16.000 Hz
(+) | o som geral é linear (11% diferença em relação à mediana)
Comparado com a mesma classe
» 7% de todos os dispositivos testados nesta classe foram melhores, 3% semelhantes, 89% piores
» O melhor teve um delta de 6%, a média foi 18%, o pior foi 132%
Comparado com todos os dispositivos testados
» 6% de todos os dispositivos testados foram melhores, 2% semelhantes, 92% piores
» O melhor teve um delta de 4%, a média foi 23%, o pior foi 134%
Razer Blade 17 Early 2022 análise de áudio
(+) | os alto-falantes podem tocar relativamente alto (###valor### dB)
Graves 100 - 315Hz
(±) | graves reduzidos - em média 7.4% menor que a mediana
(±) | a linearidade dos graves é média (9.7% delta para a frequência anterior)
Médios 400 - 2.000 Hz
(+) | médios equilibrados - apenas 3% longe da mediana
(+) | médios são lineares (3.7% delta para frequência anterior)
Altos 2 - 16 kHz
(+) | agudos equilibrados - apenas 2.5% longe da mediana
(+) | os máximos são lineares (6.1% delta da frequência anterior)
Geral 100 - 16.000 Hz
(+) | o som geral é linear (9.2% diferença em relação à mediana)
Comparado com a mesma classe
» 3% de todos os dispositivos testados nesta classe foram melhores, 1% semelhantes, 96% piores
» O melhor teve um delta de 6%, a média foi 18%, o pior foi 132%
Comparado com todos os dispositivos testados
» 3% de todos os dispositivos testados foram melhores, 1% semelhantes, 96% piores
» O melhor teve um delta de 4%, a média foi 23%, o pior foi 134%
Gerenciamento de energia - Laptop de jogos com vida útil decente da bateria
Consumo de energia
O consumo de energia durante o ociosidade corresponde às nossas expectativas para o hardware instalado. Durante o Witcher 3 e testes de estresse, o consumo de energia sobe para uma média de 247 watts e 352 watts, respectivamente - este último valor representa um pico temporário. Enquanto o consumo de energia permanece estável durante todo o período de Witcher 3 teste, ele flutua durante o teste de estresse. O adaptador AC de 330 watts incluído é suficientemente dimensionado.
| desligado | |
| Ocioso | |
| Carga |
|
Key:
min: | |
| MSI Raider GE77 HX 12UHS Intel Core i9-12900HX, NVIDIA GeForce RTX 3080 Ti Laptop GPU | Razer Blade 17 Early 2022 Intel Core i9-12900H, NVIDIA GeForce RTX 3080 Ti Laptop GPU | Alienware x17 R2 P48E Intel Core i9-12900HK, NVIDIA GeForce RTX 3080 Ti Laptop GPU | Medion Erazer Beast X30 Intel Core i9-12900HK, NVIDIA GeForce RTX 3080 Ti Laptop GPU | Média NVIDIA GeForce RTX 3080 Ti Laptop GPU | Média da turma Gaming | |
|---|---|---|---|---|---|---|
| Power Consumption | -3% | -38% | 16% | -5% | 13% | |
| Idle Minimum * (Watt) | 13 | 17 -31% | 24.1 -85% | 12 8% | 17.2 ? -32% | 13 ? -0% |
| Idle Average * (Watt) | 19 | 23 -21% | 28.5 -50% | 16 16% | 23.3 ? -23% | 19 ? -0% |
| Idle Maximum * (Watt) | 29 | 34 -17% | 60 -107% | 22 24% | 30.8 ? -6% | 24.6 ? 15% |
| Load Average * (Watt) | 143 | 120 16% | 128.7 10% | 118 17% | 121.2 ? 15% | 110.7 ? 23% |
| Witcher 3 ultra * (Watt) | 247 | 229 7% | 254 -3% | 223 10% | ||
| Load Maximum * (Watt) | 352 | 243 31% | 323 8% | 290 18% | 276 ? 22% | 259 ? 26% |
* ... menor é melhor
Consumption Witcher 3 / Stress Test
Consumption external Monitor
Vida útil da bateria
O laptop de 17,3 polegadas atinge um tempo de execução de 5:24 h e 6:29 h em nosso teste Wi-Fi (acesso periódico a websites através de um roteiro) e vídeo (curta-metragem Big Buck Bunny (codec H.264, FHD)). Os recursos de economia de energia do laptop são desativados para ambos os testes e o brilho da tela é ajustado para 150 nits. Para o teste de vídeo, os módulos sem fio também foram desabilitados.
| MSI Raider GE77 HX 12UHS i9-12900HX, GeForce RTX 3080 Ti Laptop GPU, 99.99 Wh | Razer Blade 17 Early 2022 i9-12900H, GeForce RTX 3080 Ti Laptop GPU, 82 Wh | Alienware x17 R2 P48E i9-12900HK, GeForce RTX 3080 Ti Laptop GPU, 87 Wh | Medion Erazer Beast X30 i9-12900HK, GeForce RTX 3080 Ti Laptop GPU, 91.2 Wh | Média da turma Gaming | |
|---|---|---|---|---|---|
| Duração da bateria | -25% | -61% | 1% | 5% | |
| Reader / Idle (h) | 9.8 | 7.1 -28% | 3.9 -60% | 7.7 -21% | 8.27 ? -16% |
| H.264 (h) | 6.5 | 4.8 -26% | 6.4 -2% | 8.32 ? 28% | |
| WiFi v1.3 (h) | 5.4 | 3.8 -30% | 2 -63% | 5.7 6% | 7.11 ? 32% |
| Load (h) | 2 | 1.7 -15% | 0.8 -60% | 2.4 20% | 1.502 ? -25% |
Pro
Contra
Veredicto - Muito poder por muito dinheiro
Para nossa configuração do Raider GE77, a MSI exige cerca de 5.200 USD. Pelo preço, os compradores recebem um laptop muito poderoso para aplicações exigentes como edição de vídeo, renderização e jogos 4K.
O MSI Raider GE77 HX 12 UHS é um dos laptops mais potentes atualmente disponíveis.
Os principais componentes consistem em um Núcleo i9-12900HX CPU, uma GeForce Laptop RTX 3080 Ti GPU (175 watts TGP, 16 GB de VRAM), e 64 GB de RAM, o que resulta em um alto nível de desempenho geral. A GPU GeForce em particular pontua algumas das mais altas pontuações que temos visto deste chip.
Tanto a CPU quanto a GPU são capazes de funcionar a velocidades de relógio continuamente altas. As emissões relativamente altas de calor e ruído correspondem às nossas expectativas para esta classe de dispositivos. Com aproximadamente 5,5 a 6,5 horas, a vida útil da bateria é boa para um potente laptop de 4K. A porta Thunderbolt 4 permite a expansão adicional através de uma GPU externa ou uma solução de acoplamento.
A tela mate 4K (IPS, 120 Hz) oferece brilho máximo suficiente, tempos de resposta curtos e uma boa cobertura de espaço de cor. Falta, no entanto, em termos de contraste. Embora a precisão da cor estivesse fora da fábrica, isto pode ser corrigido com uma calibração. Suspeitamos de um conflito entre o software MSI True Color, o perfil de cor pré-instalado e/ou o iGPU ou seus drivers. Isto é inaceitável para um laptop nesta categoria de preço.
O é uma das mais altas pontuações.Lâmina Razer 17 (Início de 2022) é uma alternativa potencial para o GE77. Embora ofereça um nível de desempenho geral inferior ao sistema MSI, ele é mais compacto e mais leve. Em termos de duração da bateria, ele não pode competir com o Raider.
Preço e Disponibilidade
Várias configurações do MSI Raider GE77 HX 12UHS estão disponíveis no site MSI's official store (Core i9-12800HX, RTX 3080 Ti, FHD 360 Hz, 1 TB SSD) e varejistas on-line, como Xotic PC (Core i9-12900HX, RTX 3080 Ti, QHD 240 Hz, 1 TB SSD) por cerca de 3.000 USD e 3700 USD, respectivamente.
MSI Raider GE77 HX 12UHS
- 07/12/2022 v7 (old)
Sascha Mölck
Price comparison

