Revisão do laptop Alienware x17 R2: Pico 175 W GeForce RTX 3080 Ti performance
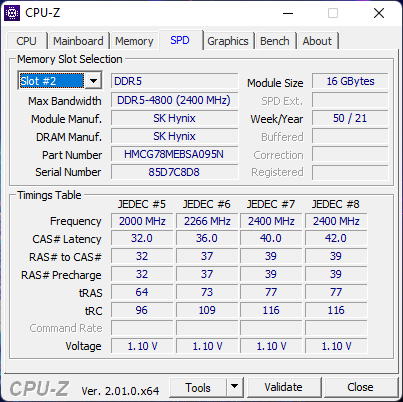
A Dell apresentou sua série Alienware x17 no final do ano passado com um projeto de chassis completamente novo para distingui-la da série Alienware m17 existente. Para este ano, o fabricante atualizou a linha com o lançamento do Alienware x17 R2 completo com CPUs Intel Alder Lake-P da 12ª geração e GeForce RTX 3070/3080 Ti gráficos para substituir as opções da 11ª geração do ano passado Tiger Lake-H e RTX 3070/3080, respectivamente. Outras atualizações também estão presentes, incluindo a RAM mais rápida (DDR4-3466 a DDR5-4800), novas opções de exibição, e suporte para MUX e Advanced Optimus.
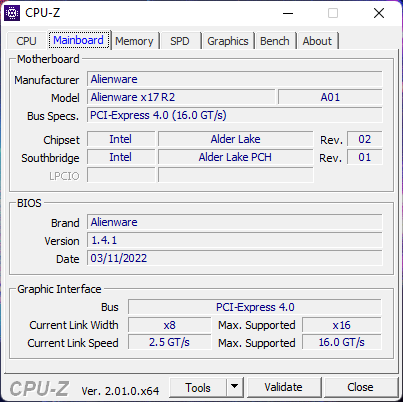
Além das atualizações internas mencionadas acima, o Alienware x17 R2 usa o mesmo chassi que o Alienware x17 R1. Recomendamos verificar nossa revisão sobre o x17 R1 já que nossos comentários existentes sobre o chassi, teclado mecânico Cherry e portas também são relevantes sobre o x17 R2.
Veja as especificações técnicas oficiais abaixo para todas as opções configuráveis. Nossa unidade de teste específica é um SKU de alta qualidade com o display Core i9-12900HK, 360 Hz 1080p, e 175 W GeForce RTX 3080 Ti gráficos por pouco menos de $4000 USD. Os concorrentes neste espaço incluem outros laptops ultra-finos de 17,3 polegadas para jogos como o MSI GS77, Lâmina Razer 17e Asus Zephyrus S17.
Mais revisões de Alienware:
Possíveis concorrentes em comparação
Avaliação | Data | Modelo | Peso | Altura | Size | Resolução | Preço |
|---|---|---|---|---|---|---|---|
| 89.2 % v7 (old) | 05/2022 | Alienware x17 R2 P48E i9-12900HK, GeForce RTX 3080 Ti Laptop GPU | 3.1 kg | 20.9 mm | 17.30" | 1920x1080 | |
| 89 % v7 (old) | 09/2021 | Alienware x17 RTX 3080 P48E i7-11800H, GeForce RTX 3080 Laptop GPU | 3.2 kg | 21.4 mm | 17.30" | 3840x2160 | |
| 90.1 % v7 (old) | 07/2021 | Asus ROG Zephyrus S17 GX703HSD i9-11900H, GeForce RTX 3080 Laptop GPU | 2.8 kg | 19.9 mm | 17.30" | 2560x1440 | |
| 87.2 % v7 (old) | 04/2022 | MSI Stealth GS77 12UHS-083US i7-12700H, GeForce RTX 3080 Ti Laptop GPU | 2.9 kg | 20.8 mm | 17.30" | 2560x1440 | |
| 87.4 % v7 (old) | 10/2020 | MSI GT76 Titan DT 10SGS i9-10900K, GeForce RTX 2080 Super Mobile | 4.2 kg | 42 mm | 17.30" | 3840x2160 | |
| 83.2 % v7 (old) | 10/2021 | Gigabyte A7 X1 R9 5900HX, GeForce RTX 3070 Laptop GPU | 2.5 kg | 34 mm | 17.30" | 1920x1080 |
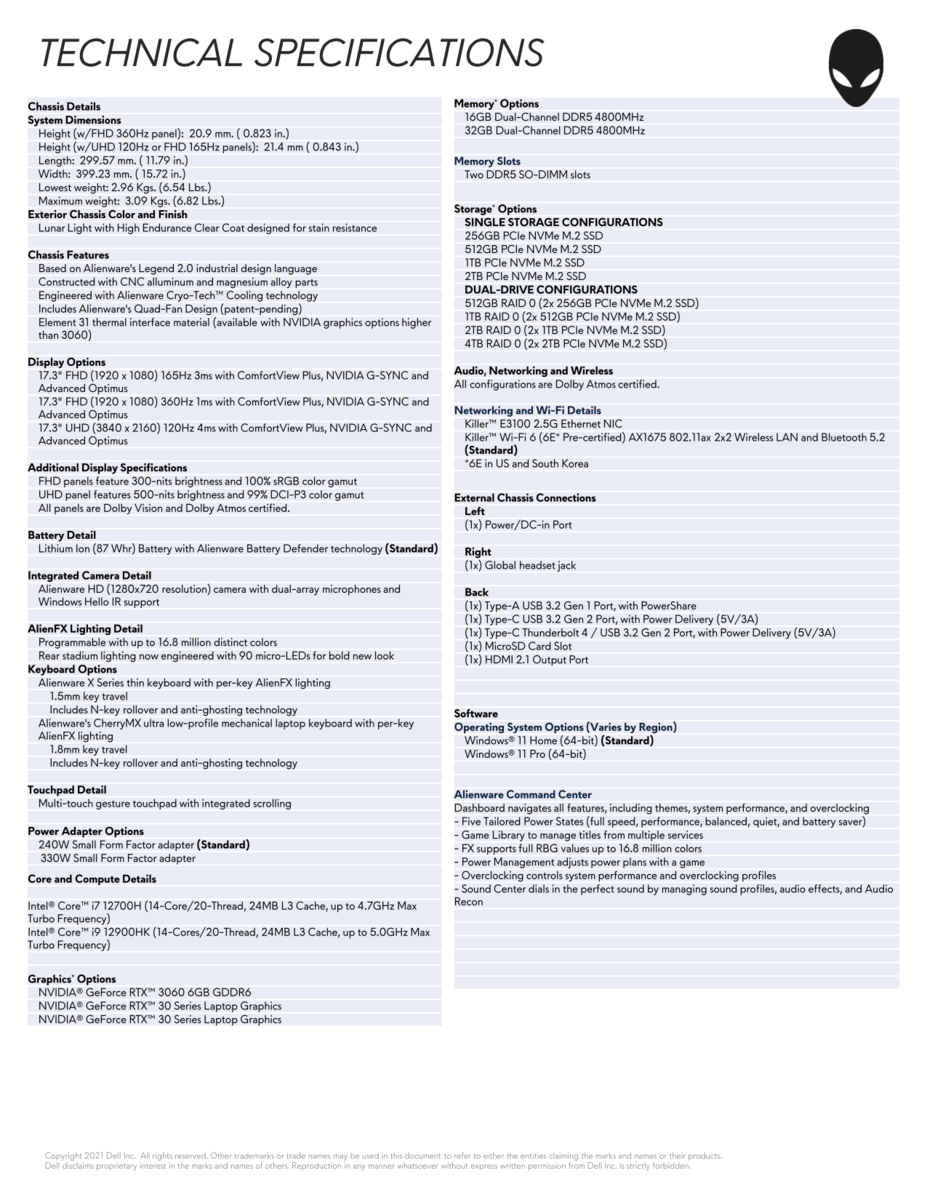
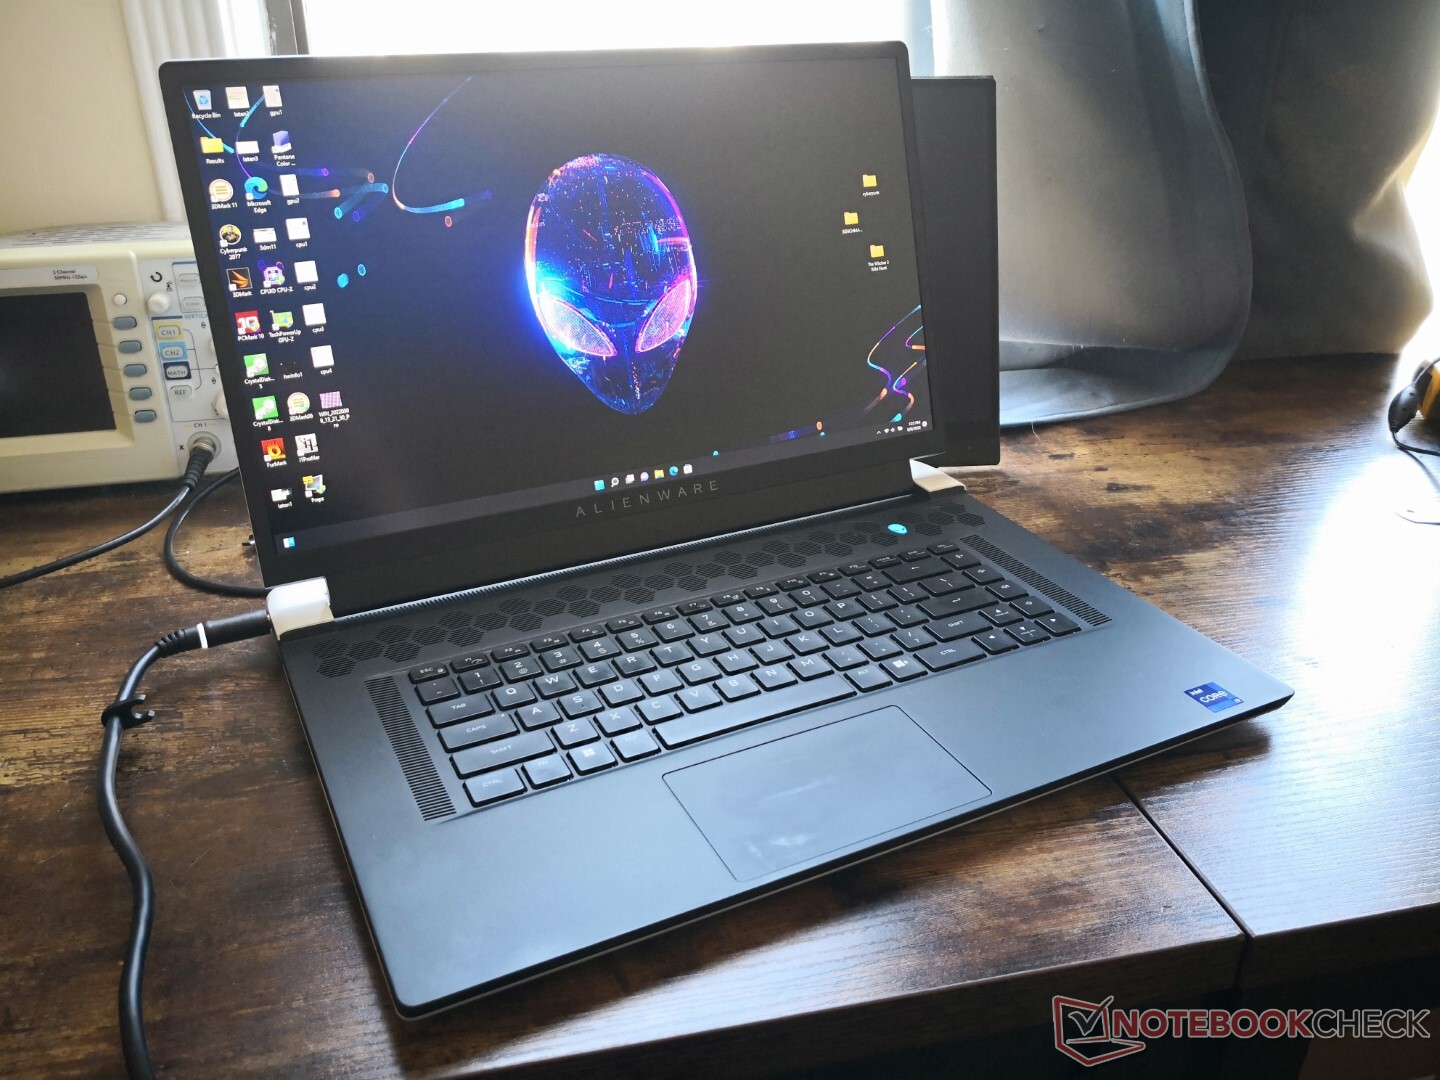
Caso
Embora seja comercializado como um laptop para jogos ultramarino, o chassi Alienware x17 R2 ainda é visivelmente mais pesado e maior que alternativas como o Asus Zephyrus S17, MSI GS77, ou Razer Blade 17. Em troca, o sistema Alienware é capaz de carregar uma GPU de 175 W mais potente, enquanto a maioria dos outros laptops ultramodernos para jogos são limitados a 140 W ou menos.
Leitor de cartões SD
| SD Card Reader | |
| average JPG Copy Test (av. of 3 runs) | |
| MSI GT76 Titan DT 10SGS (Toshiba Exceria Pro M501 UHS-II) | |
| Asus ROG Zephyrus S17 GX703HSD | |
| Alienware x17 R2 P48E (AV Pro V60) | |
| Alienware x17 RTX 3080 P48E (AV Pro V60) | |
| MSI Stealth GS77 12UHS-083US (AV Pro V60) | |
| maximum AS SSD Seq Read Test (1GB) | |
| Asus ROG Zephyrus S17 GX703HSD | |
| Alienware x17 RTX 3080 P48E (AV Pro V60) | |
| Alienware x17 R2 P48E (AV Pro V60) | |
| MSI GT76 Titan DT 10SGS (Toshiba Exceria Pro M501 UHS-II) | |
| MSI Stealth GS77 12UHS-083US (AV Pro V60) | |
Comunicação
Webcam
A webcam permanece 720p sem obturador de privacidade física em comparação com 1080p no último Razer Blade 17. Windows Olá é suportado.

")
")
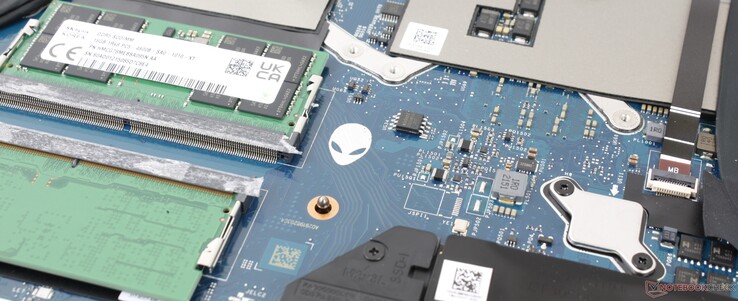
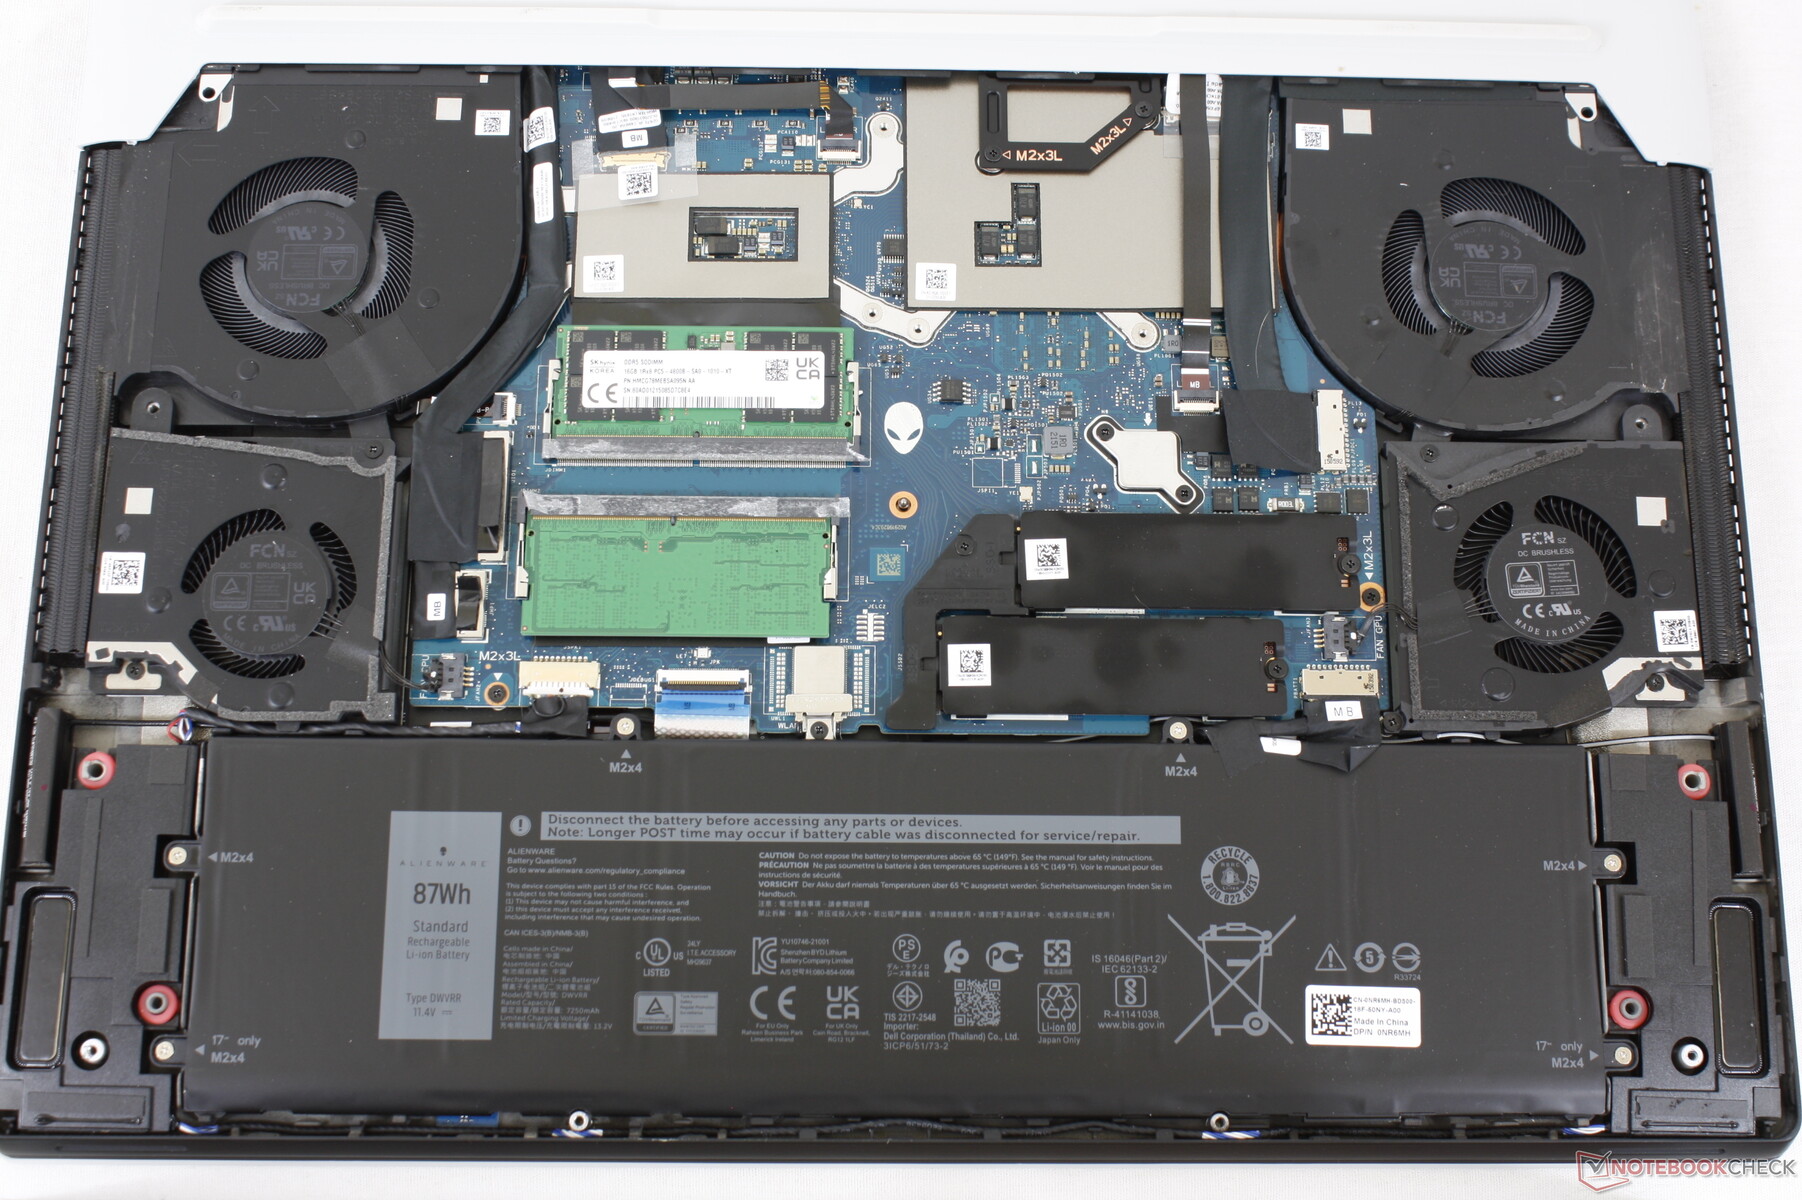
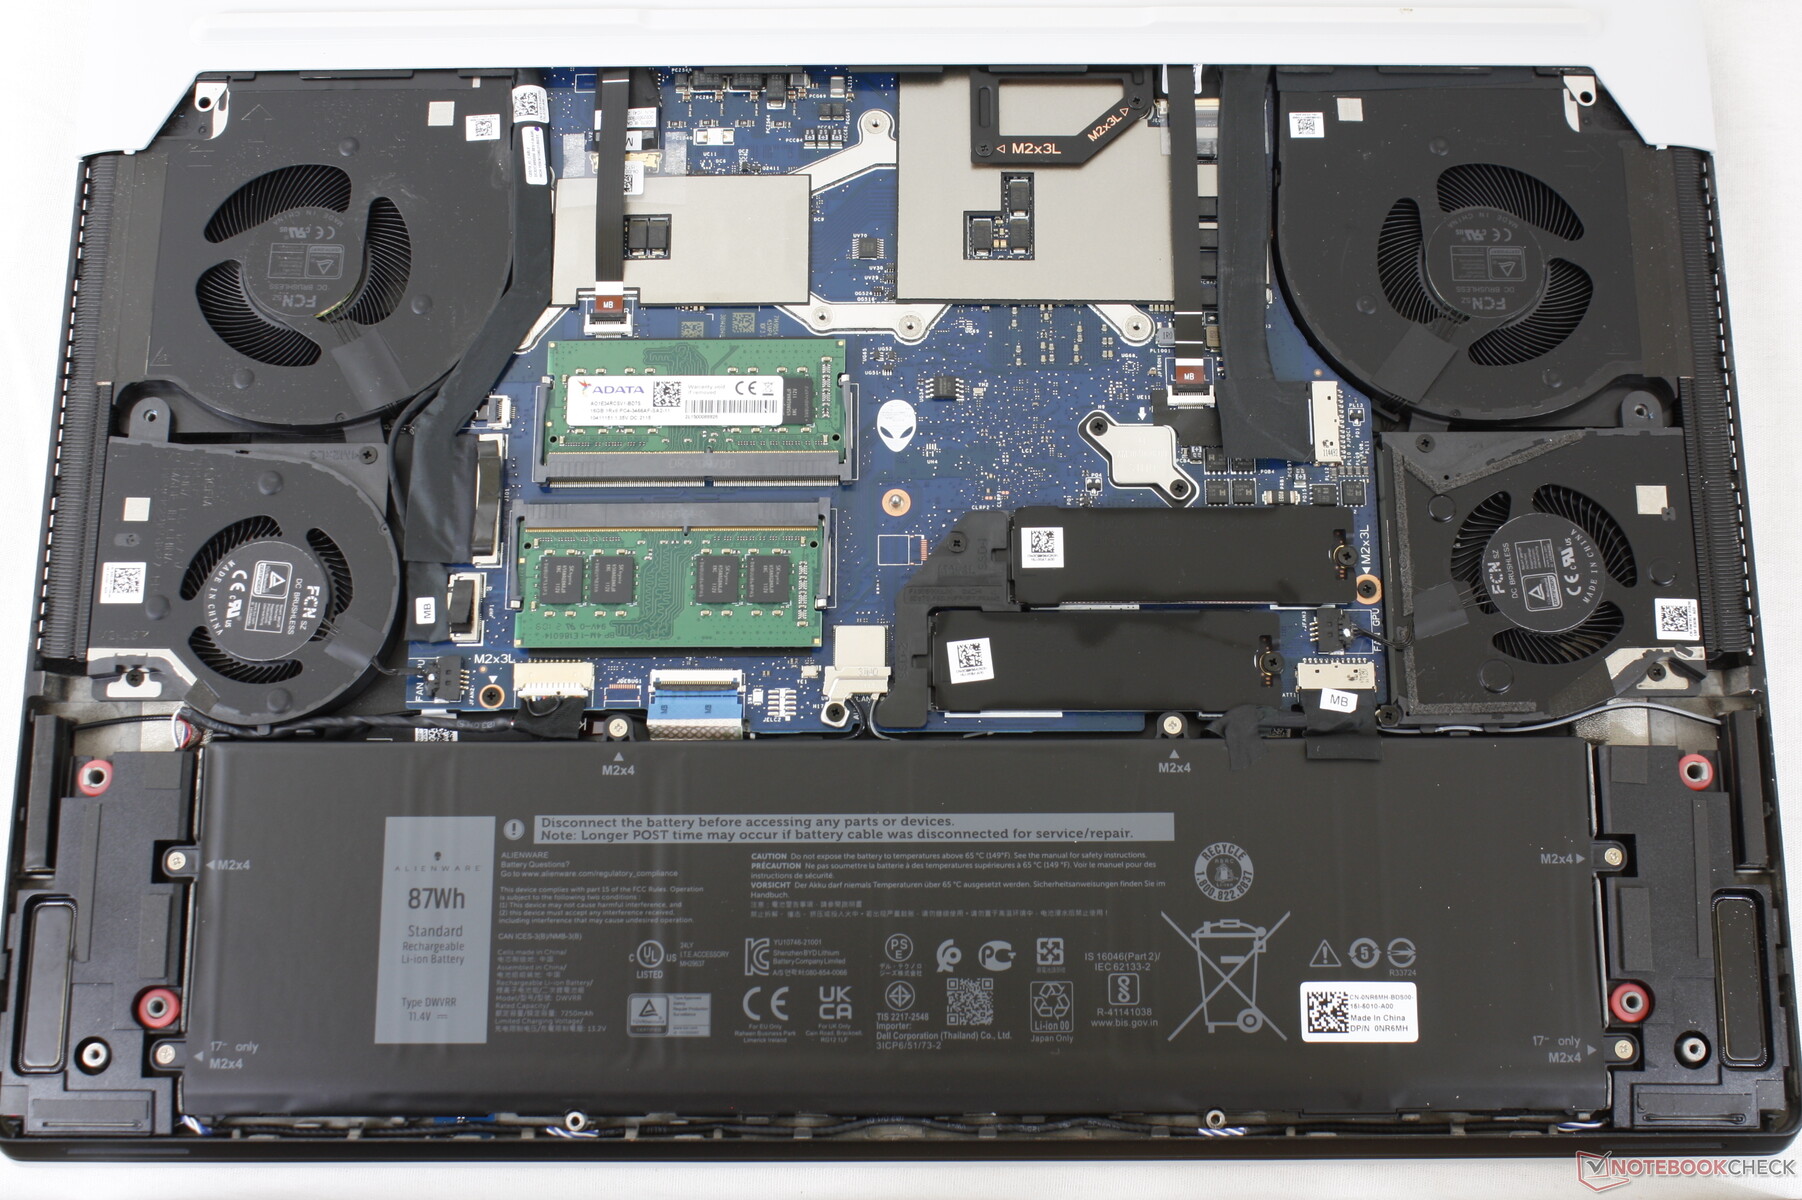
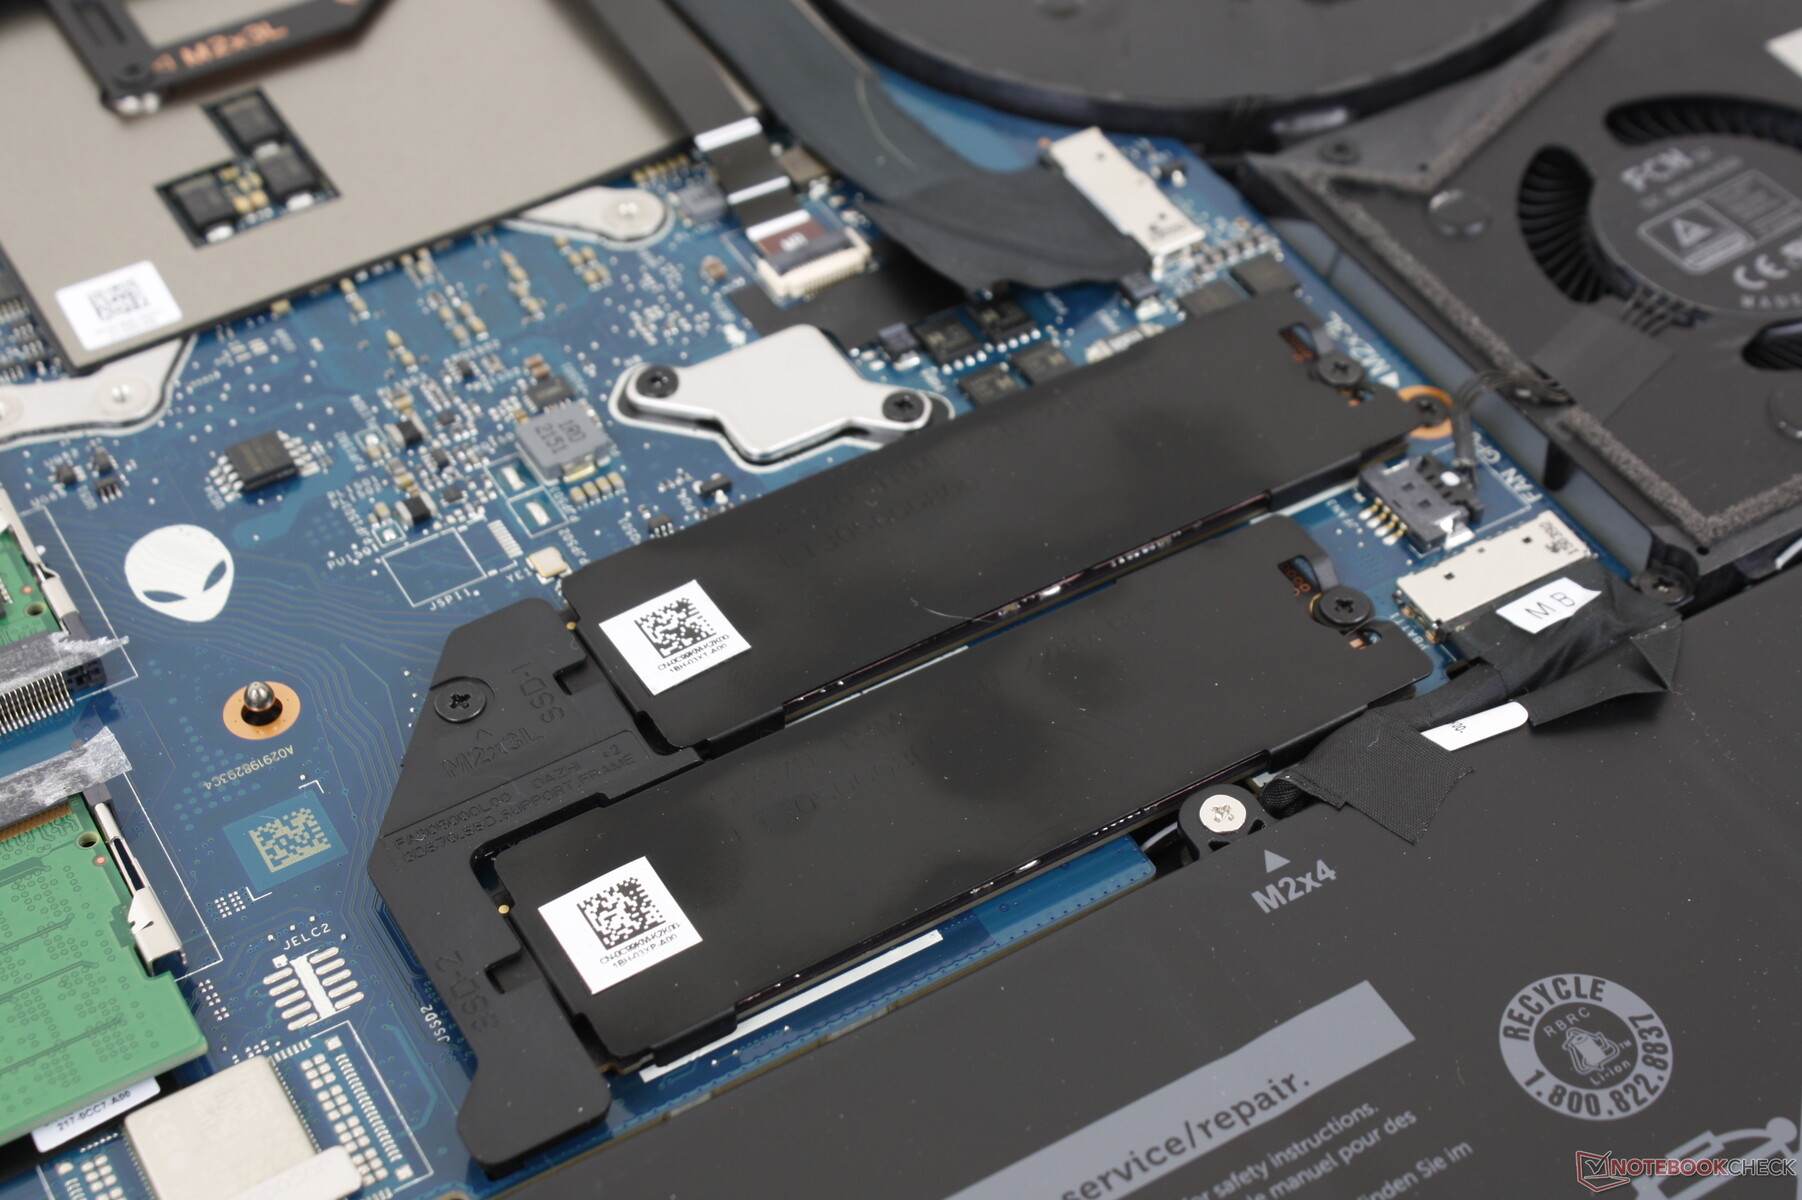
Manutenção
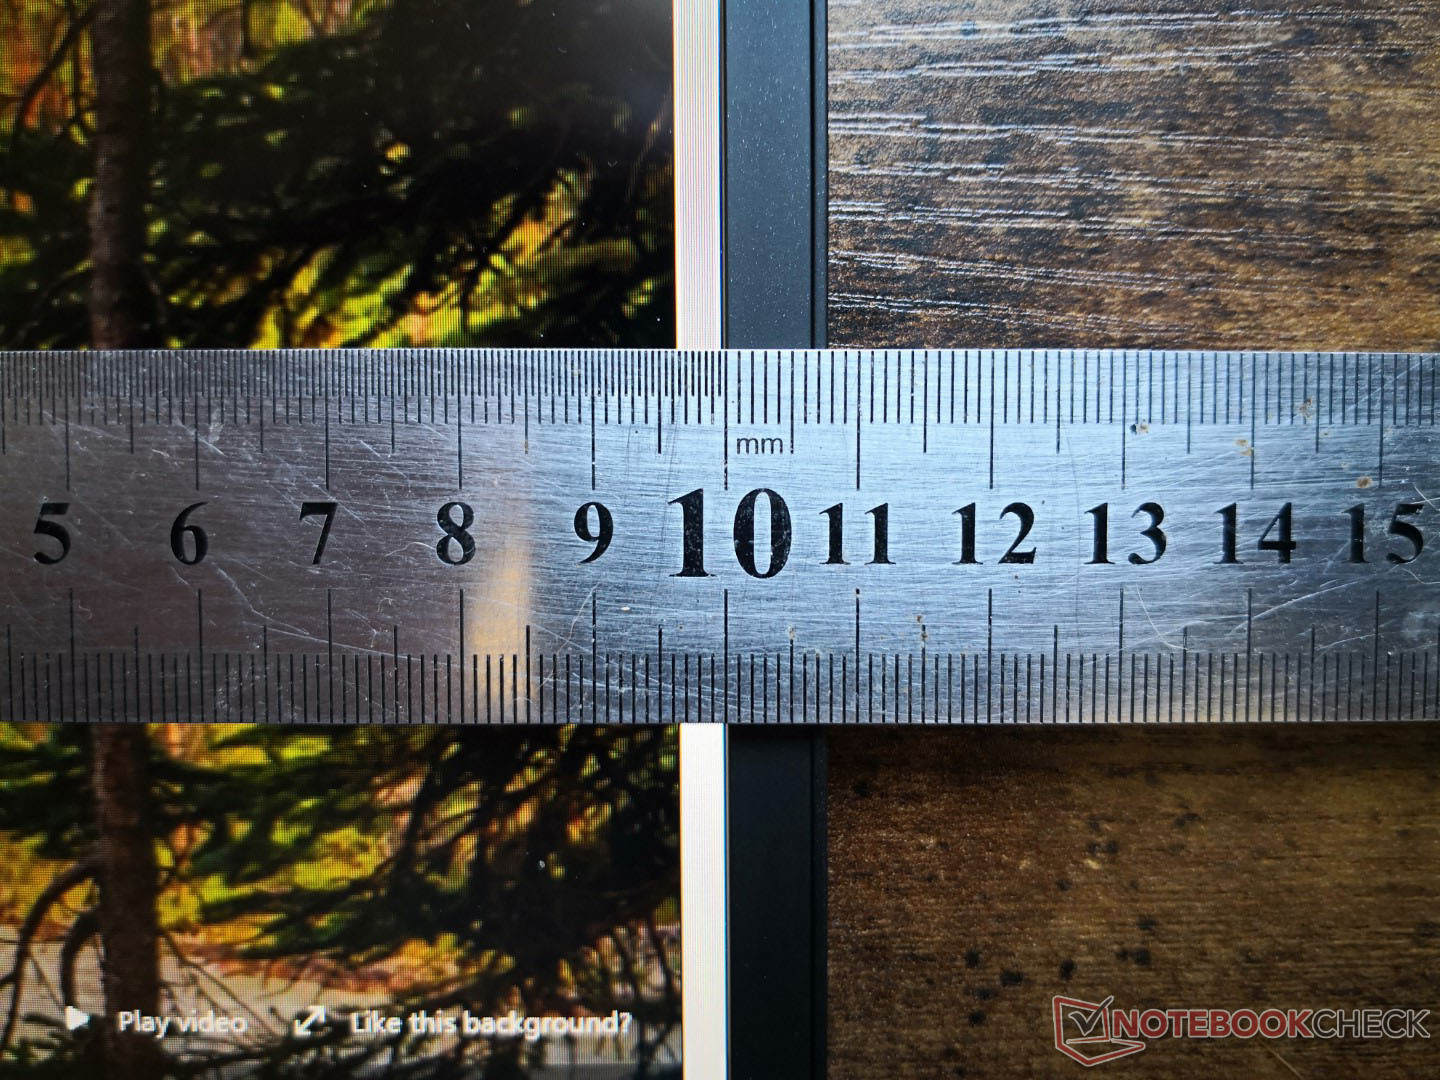
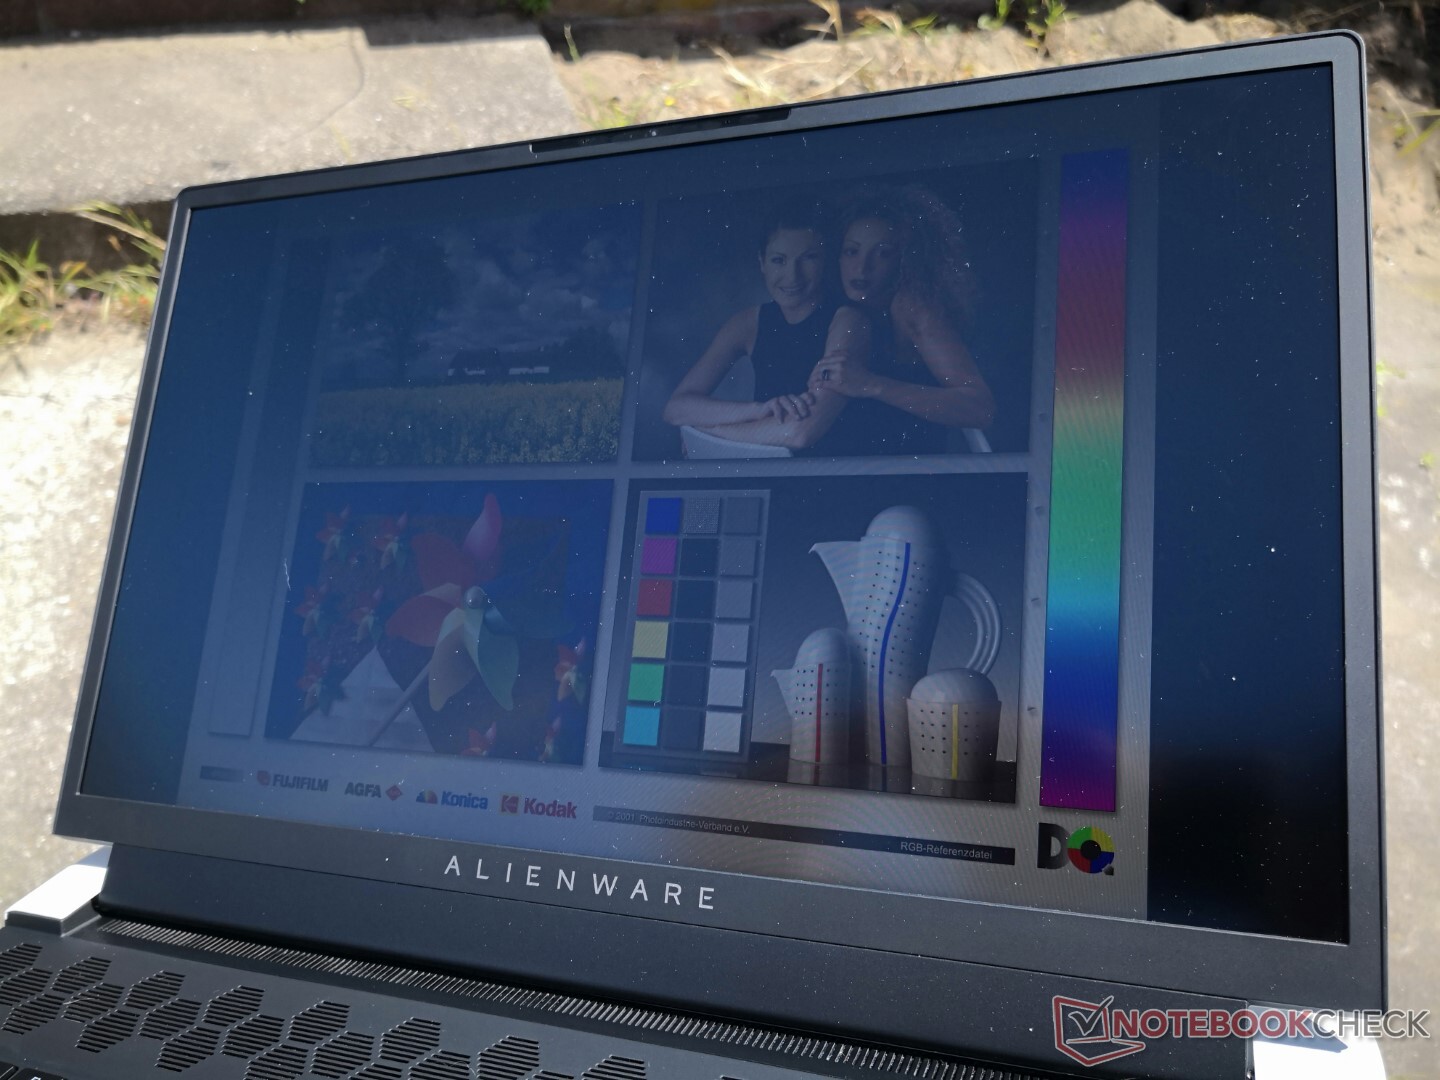
Mostrar
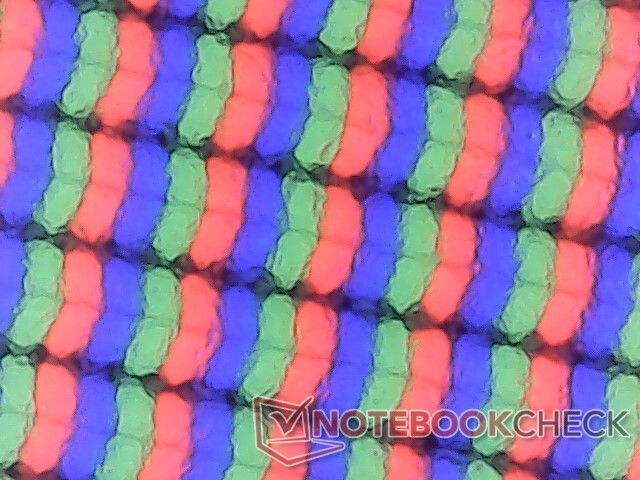
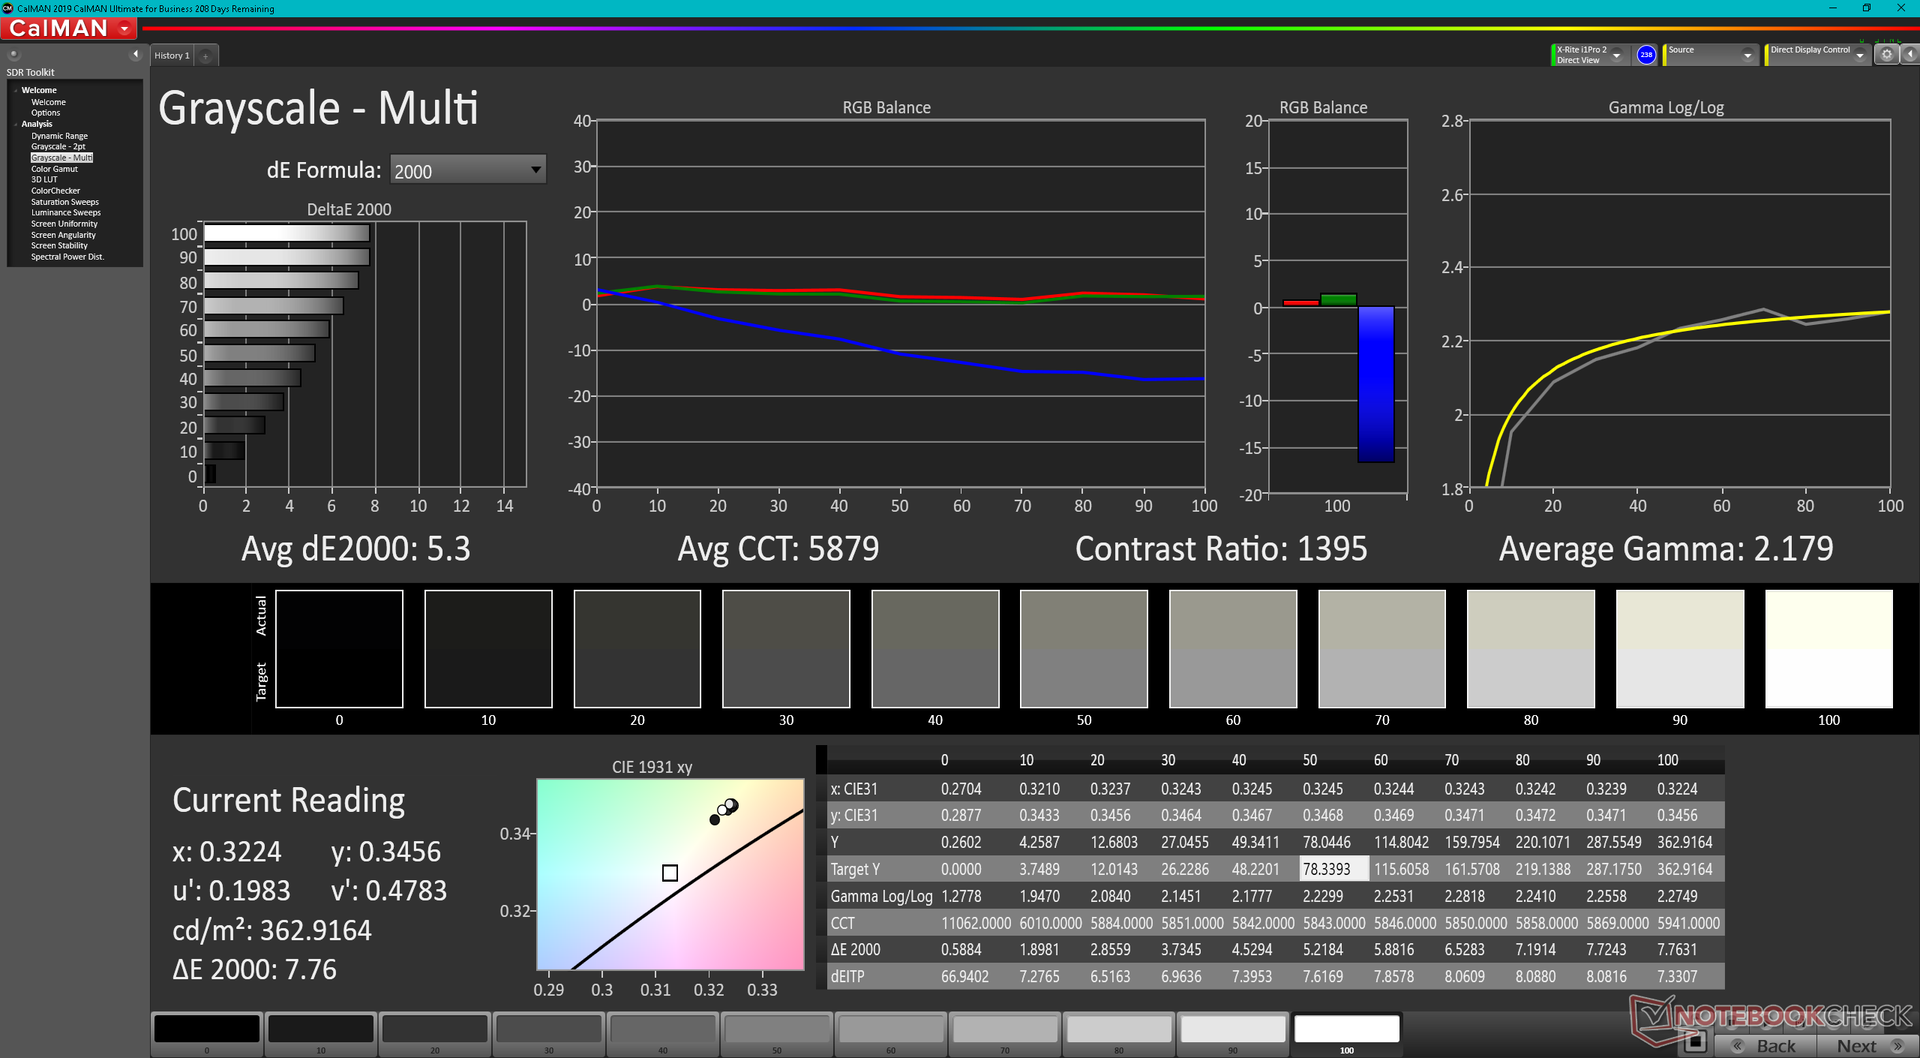
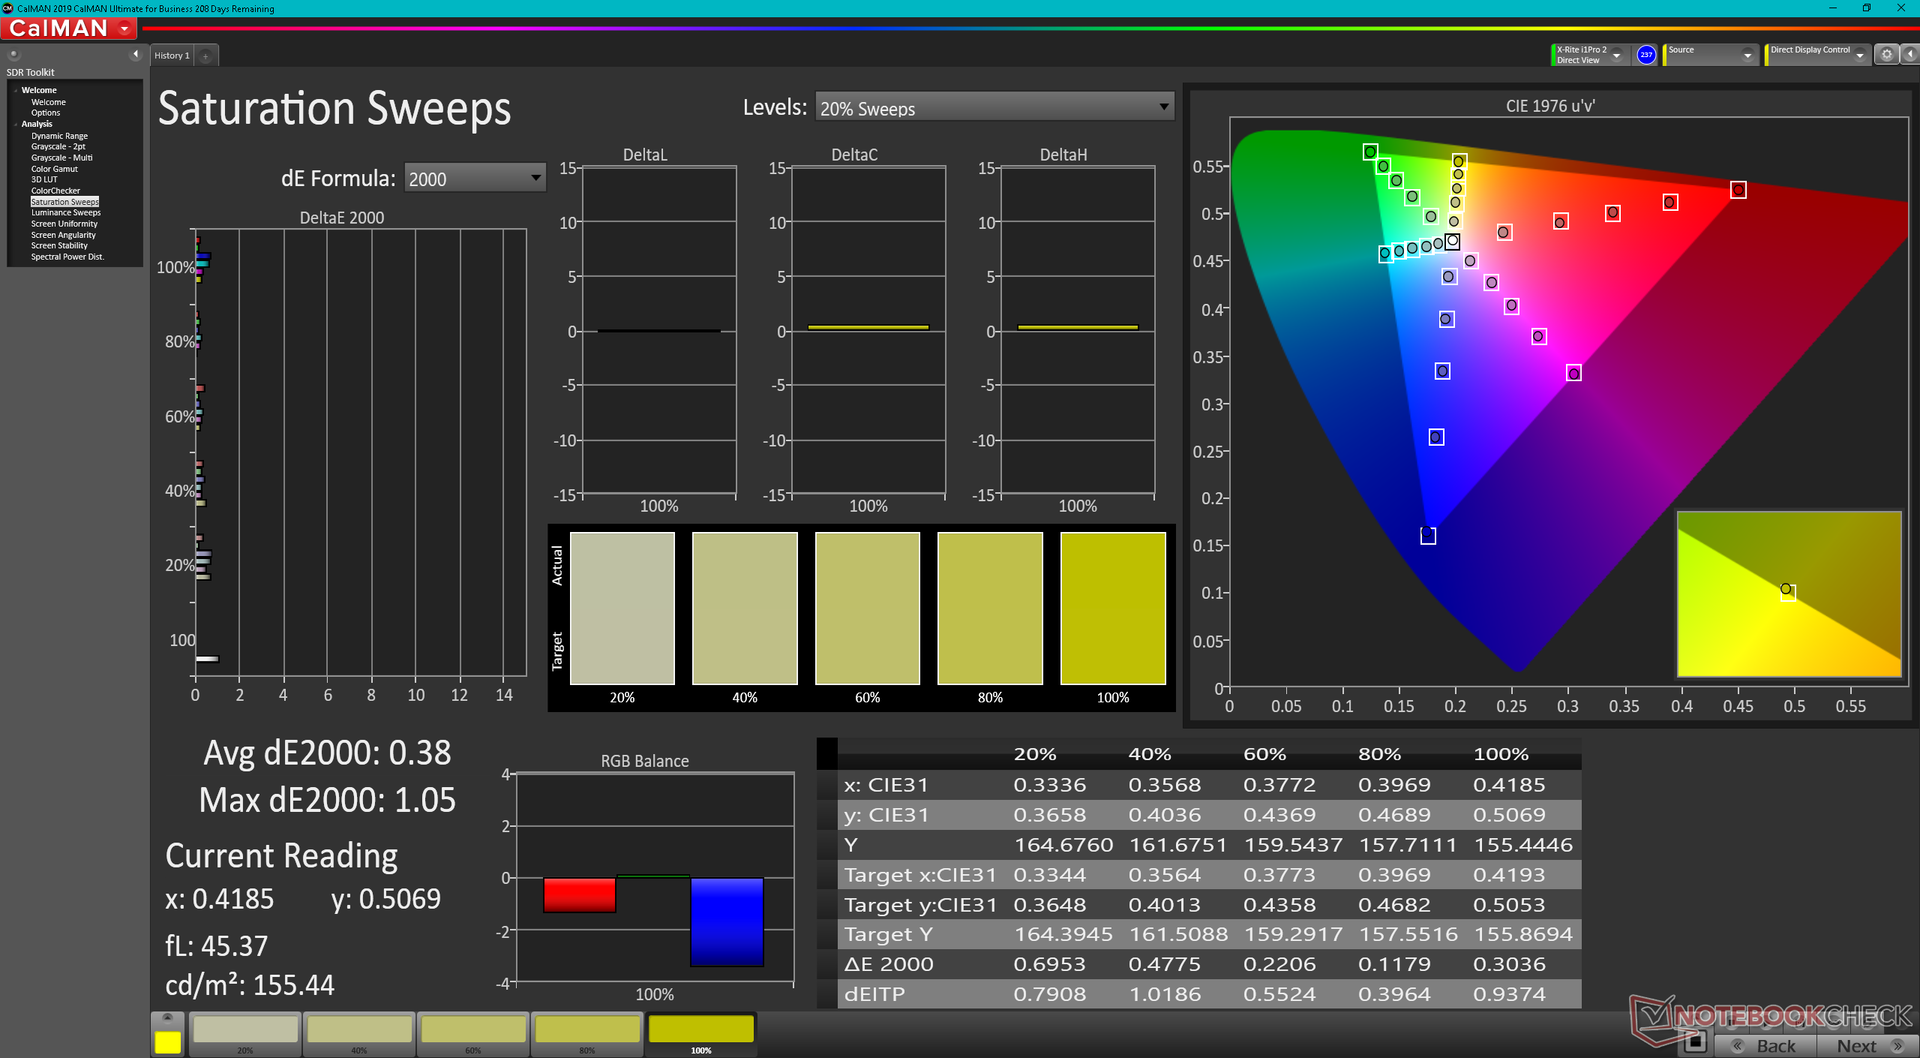
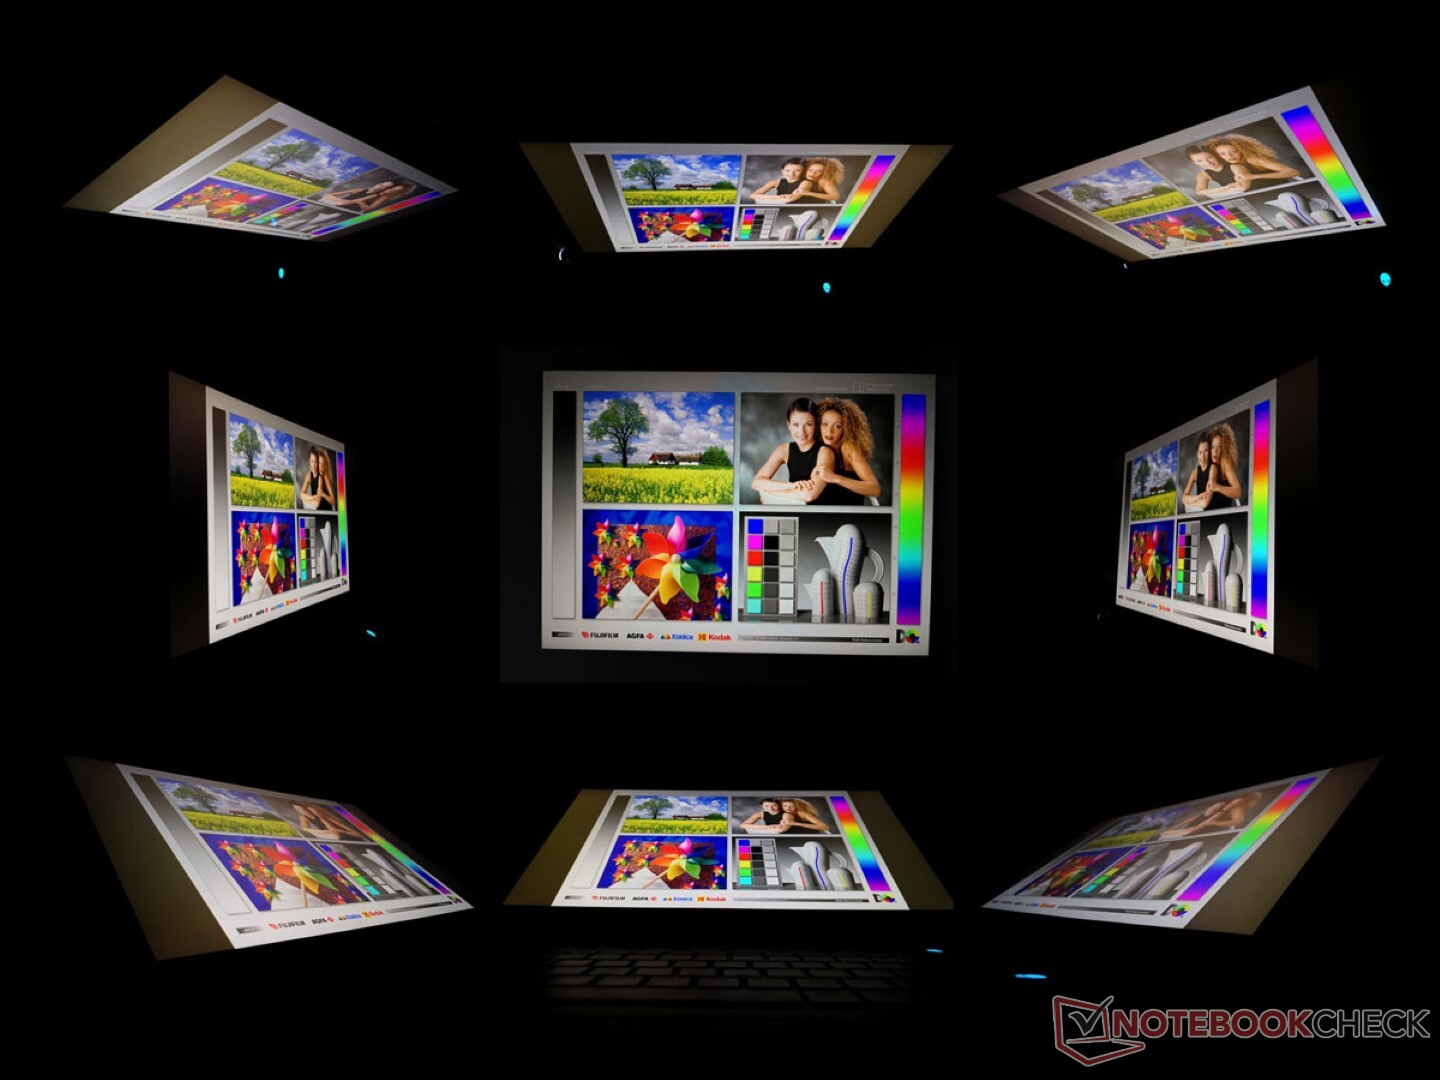
Nosso painel IPS AU Optronics B173HAN verifica quase todas as caixas típicas, incluindo uma rápida taxa de atualização de 360 Hz, rápidos tempos de resposta preto-branco e cinza cinza, e cobertura completa de sRGB para ser adequada tanto para jogos quanto para a maioria da edição gráfica. Outros fabricantes de laptops com opções de exibição de 1080p 360 Hz de 17,3 polegadas provavelmente usarão o mesmo painel AU Optronics que encontramos em nosso Alienware. Uma opção mais alta de 4K 120 Hz também está disponível, com suporte G-Sync.
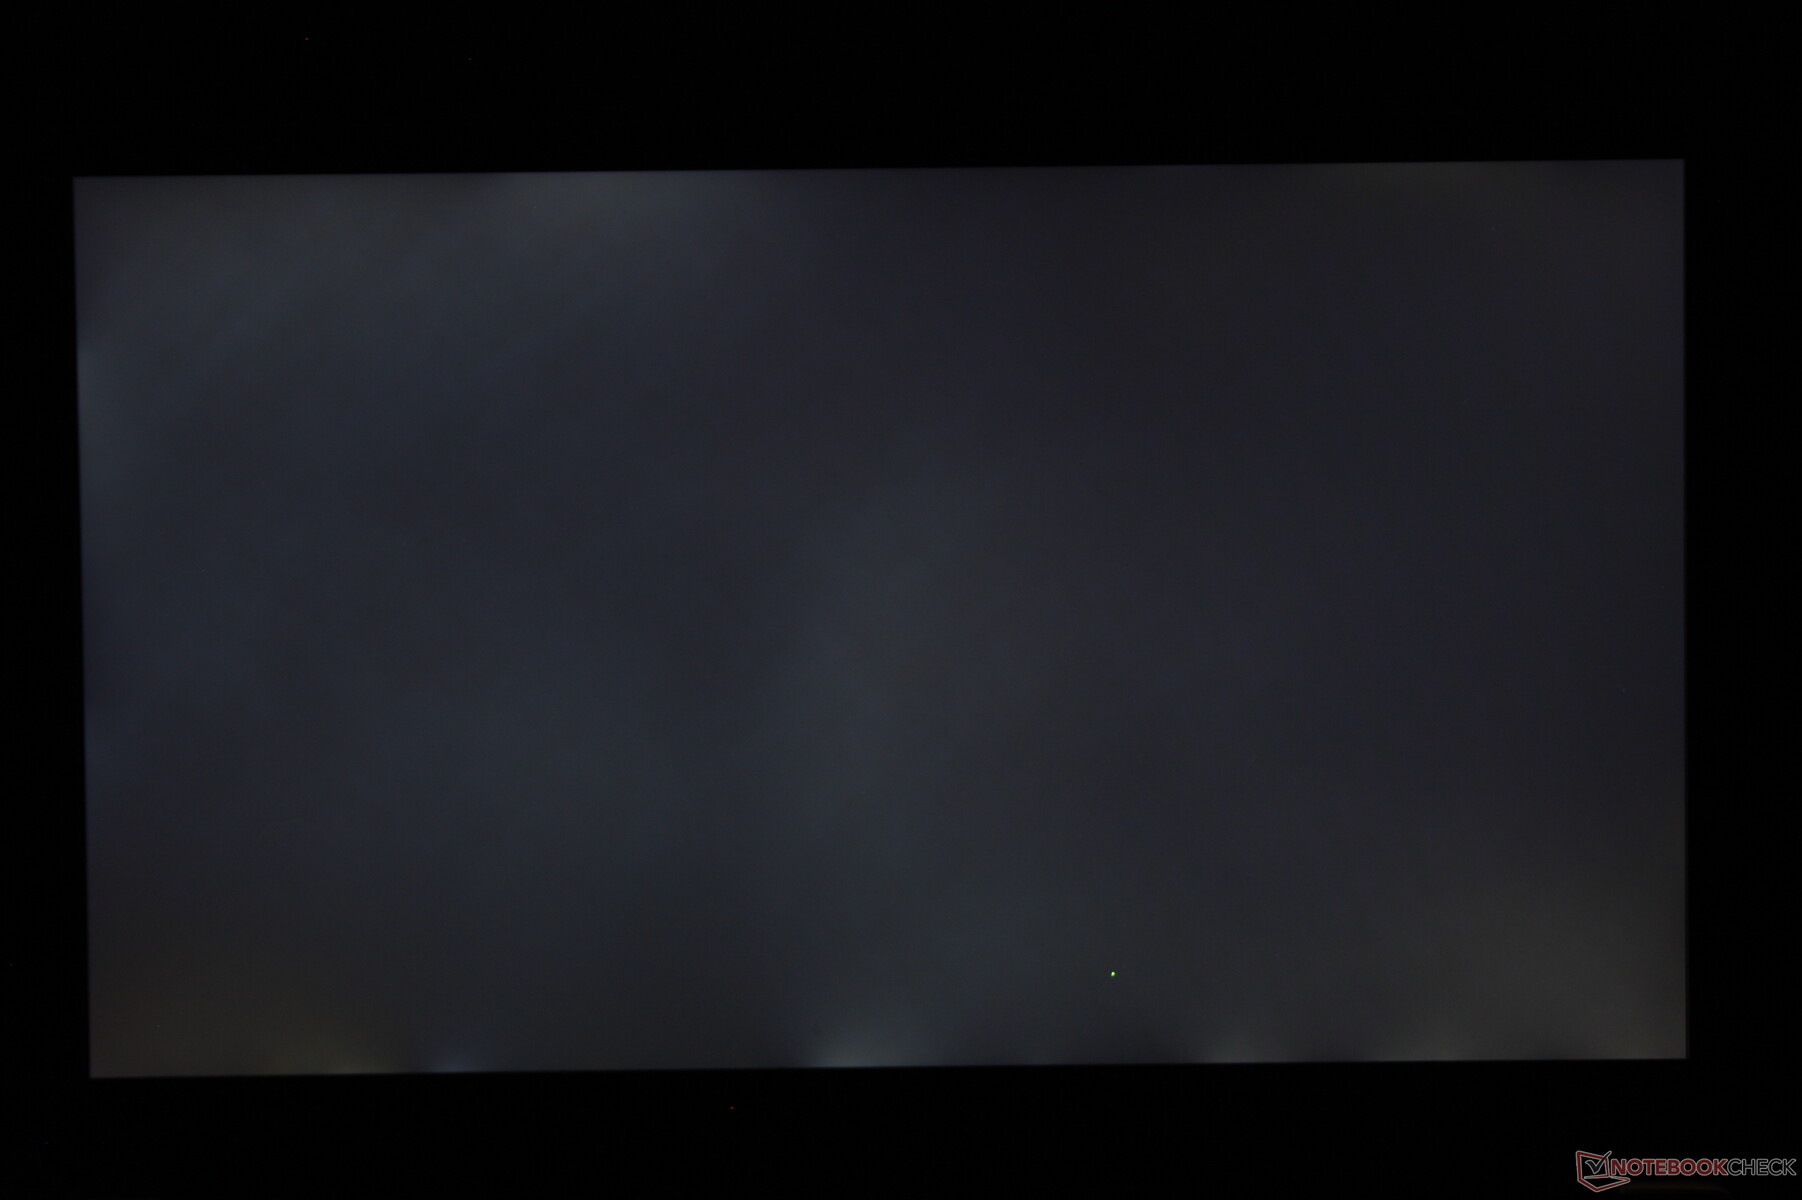
Atualmente não há opções OLED que teriam oferecido uma cobertura de cores DCI-P3 mais ampla e níveis de preto mais profundos do que a solução IPS usual.
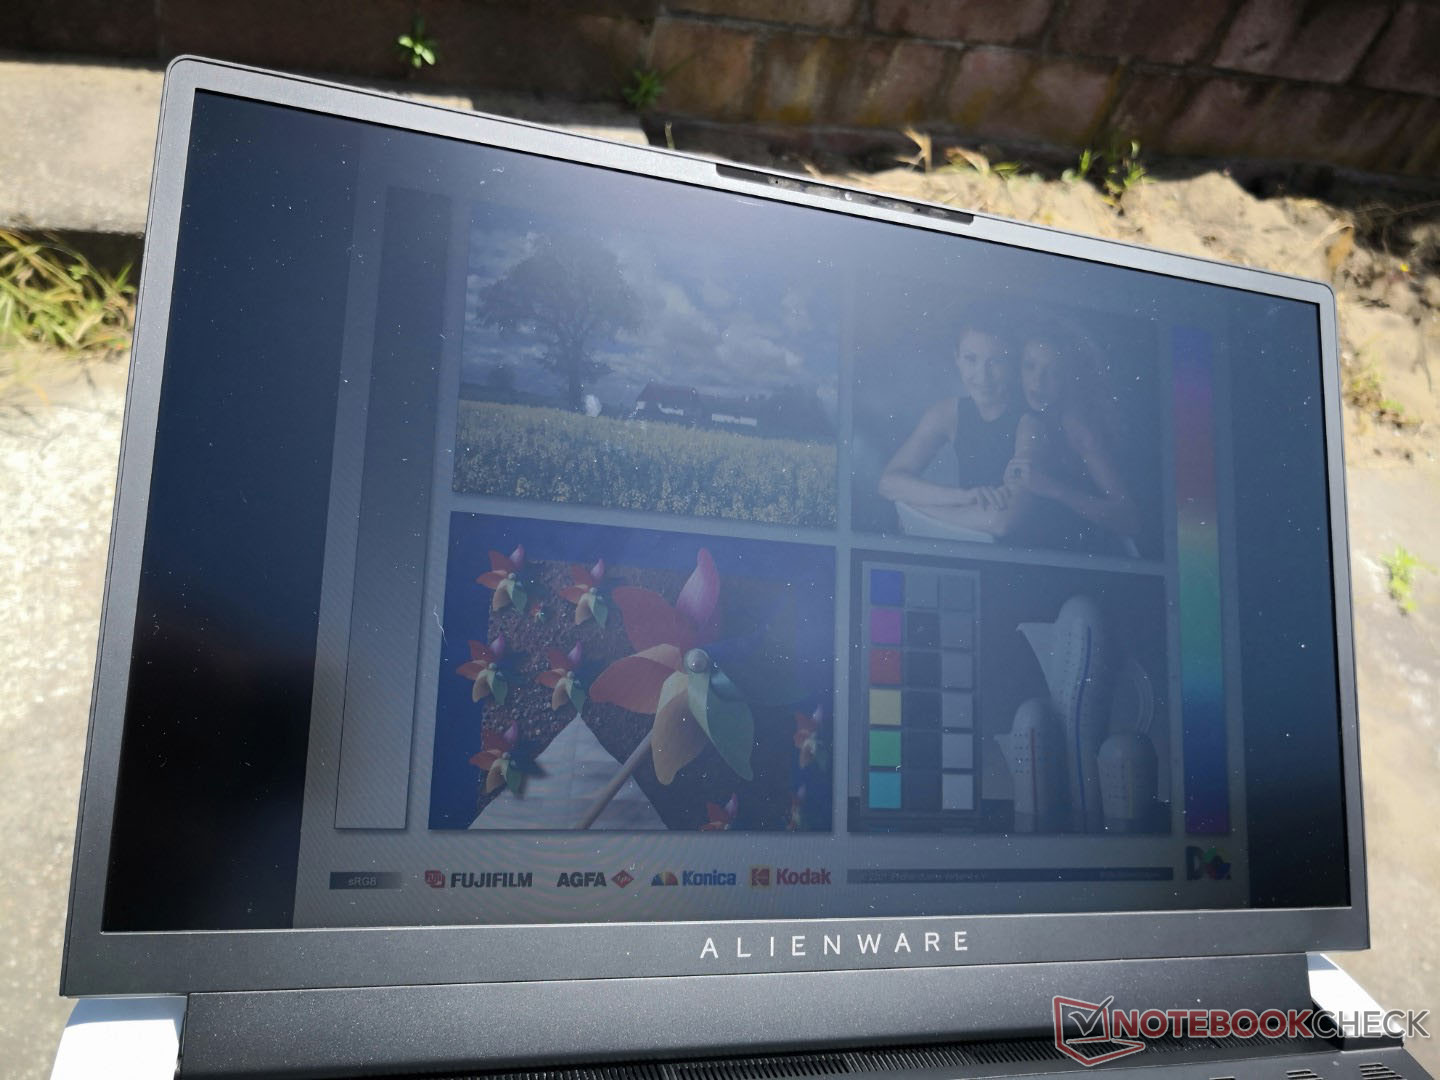
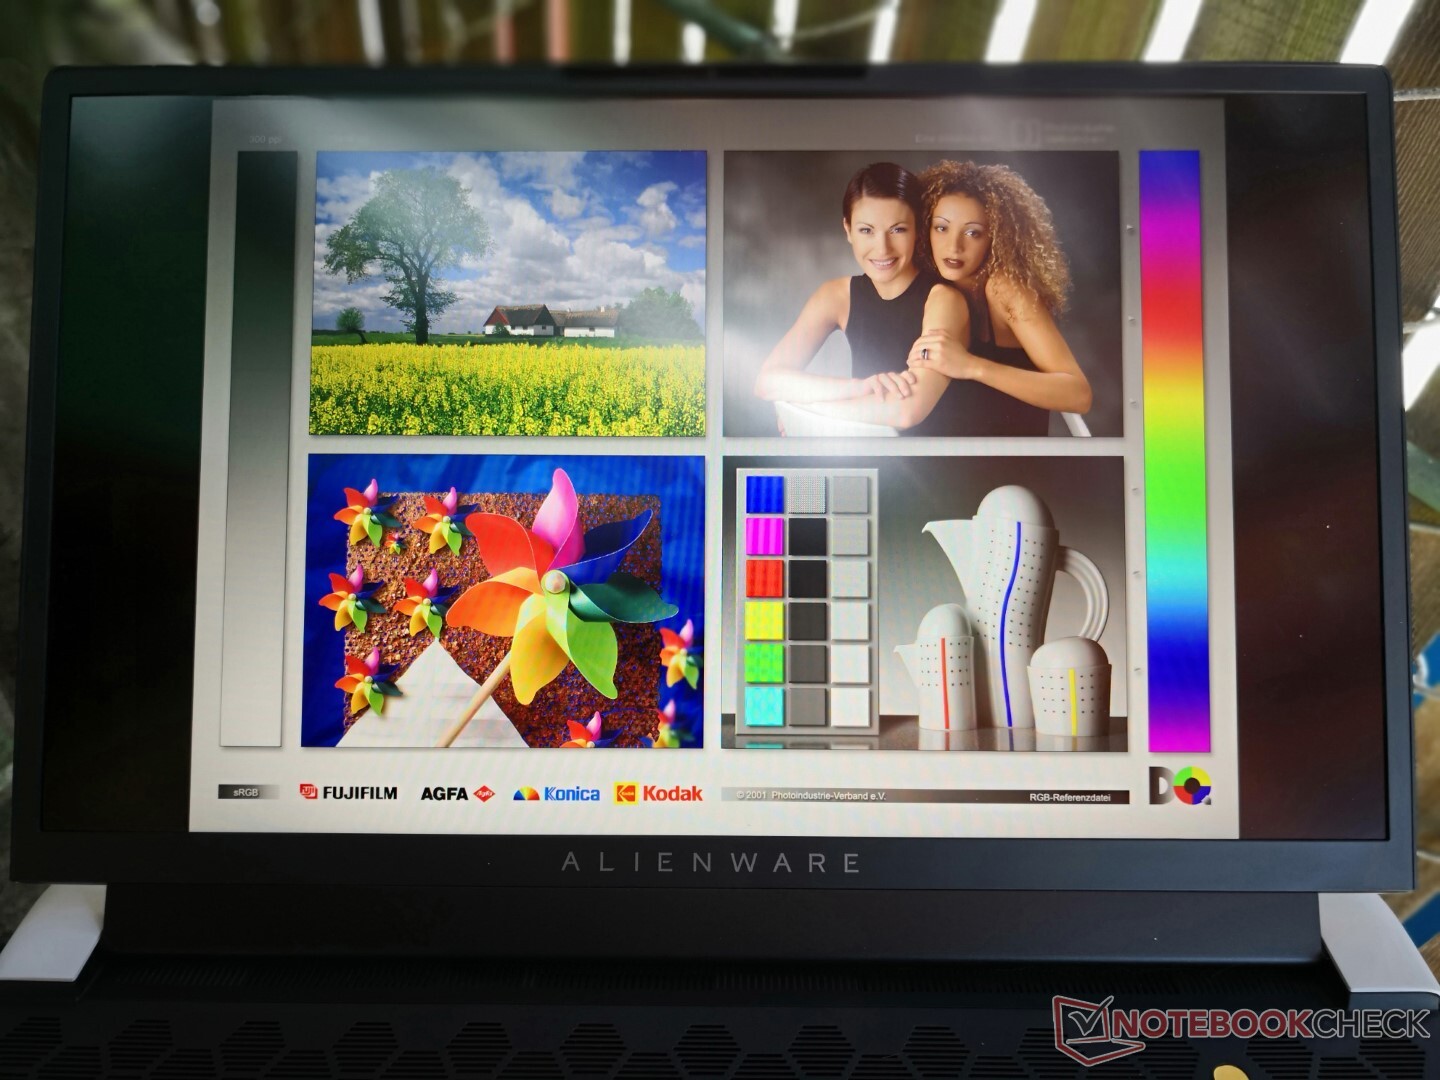
Curiosamente, nosso painel FHD não é tão brilhante quanto o painel 4K UHD no x17 R1 original. Somos capazes de medir um brilho máximo de 365 lêndeas aqui em comparação com 439 lêndeas no painel 4K x17 R1.
| |||||||||||||||||||||||||
iluminação: 85 %
iluminação com acumulador: 365.4 cd/m²
Contraste: 1260:1 (Preto: 0.29 cd/m²)
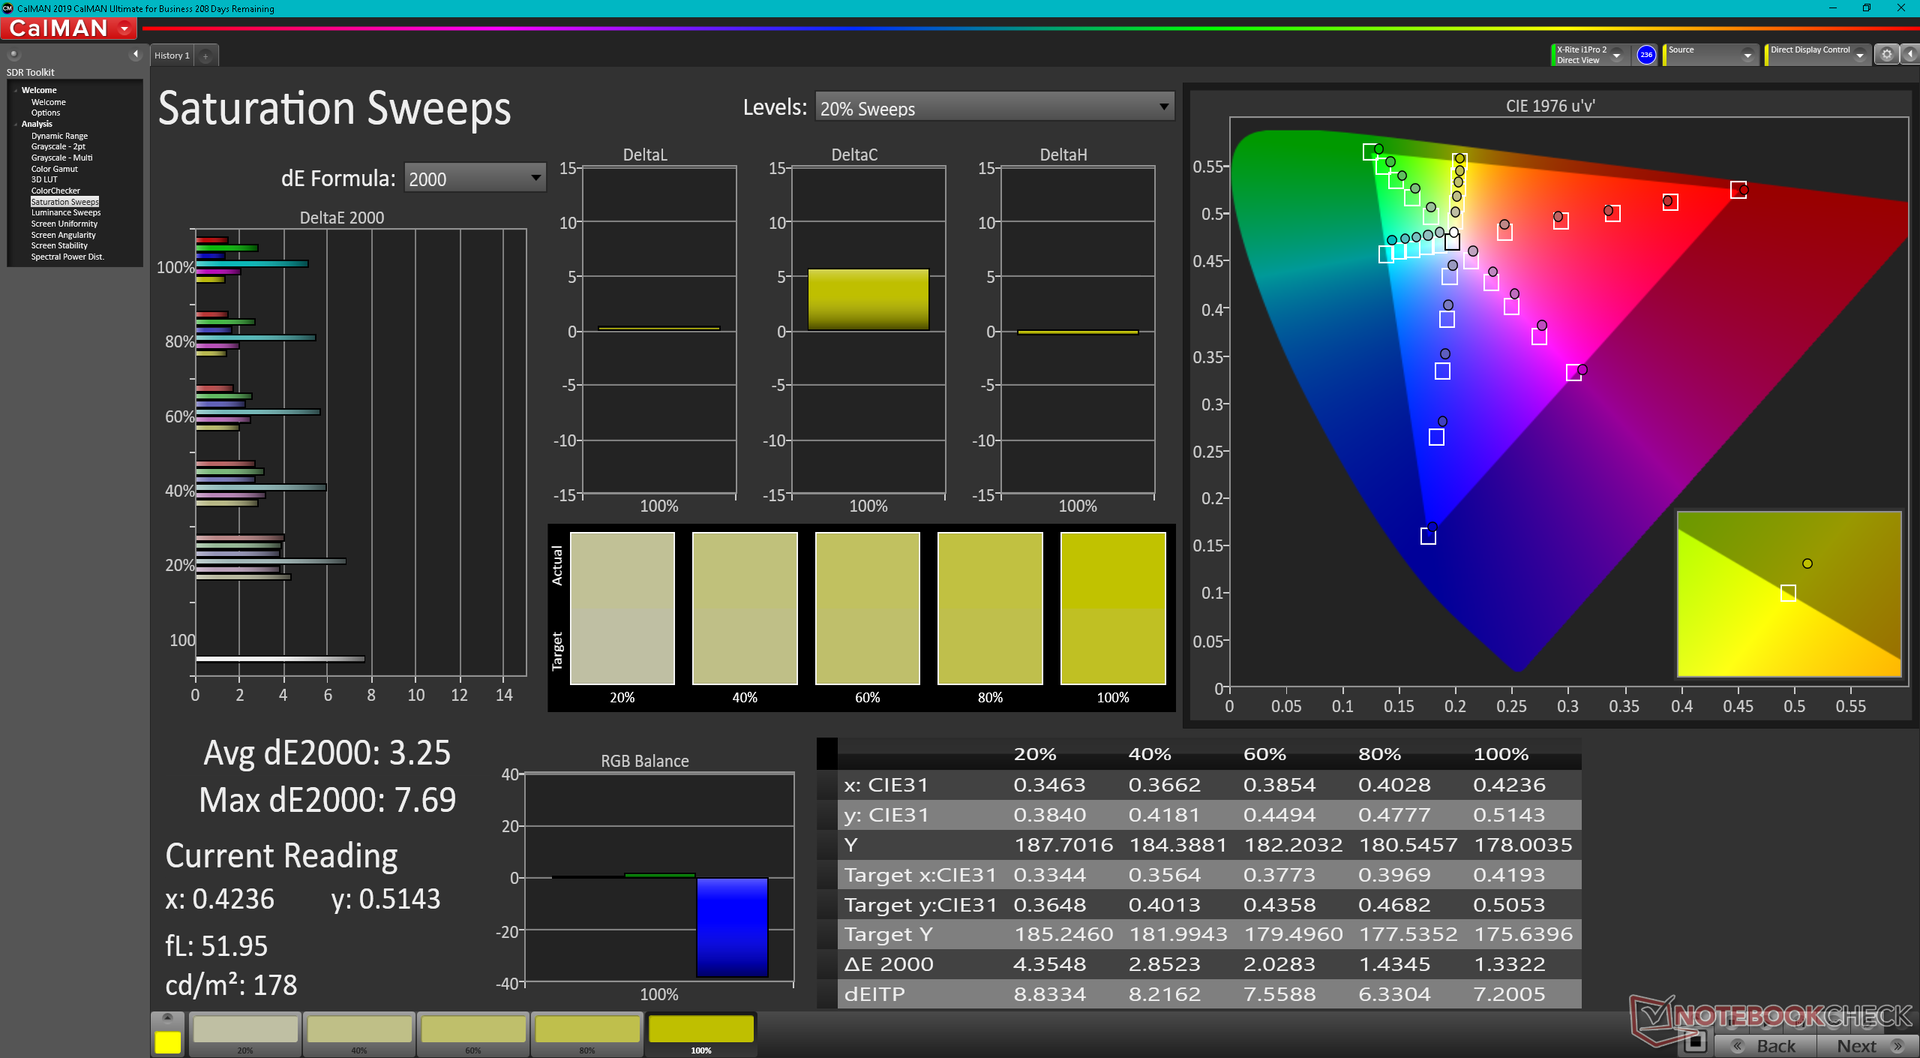
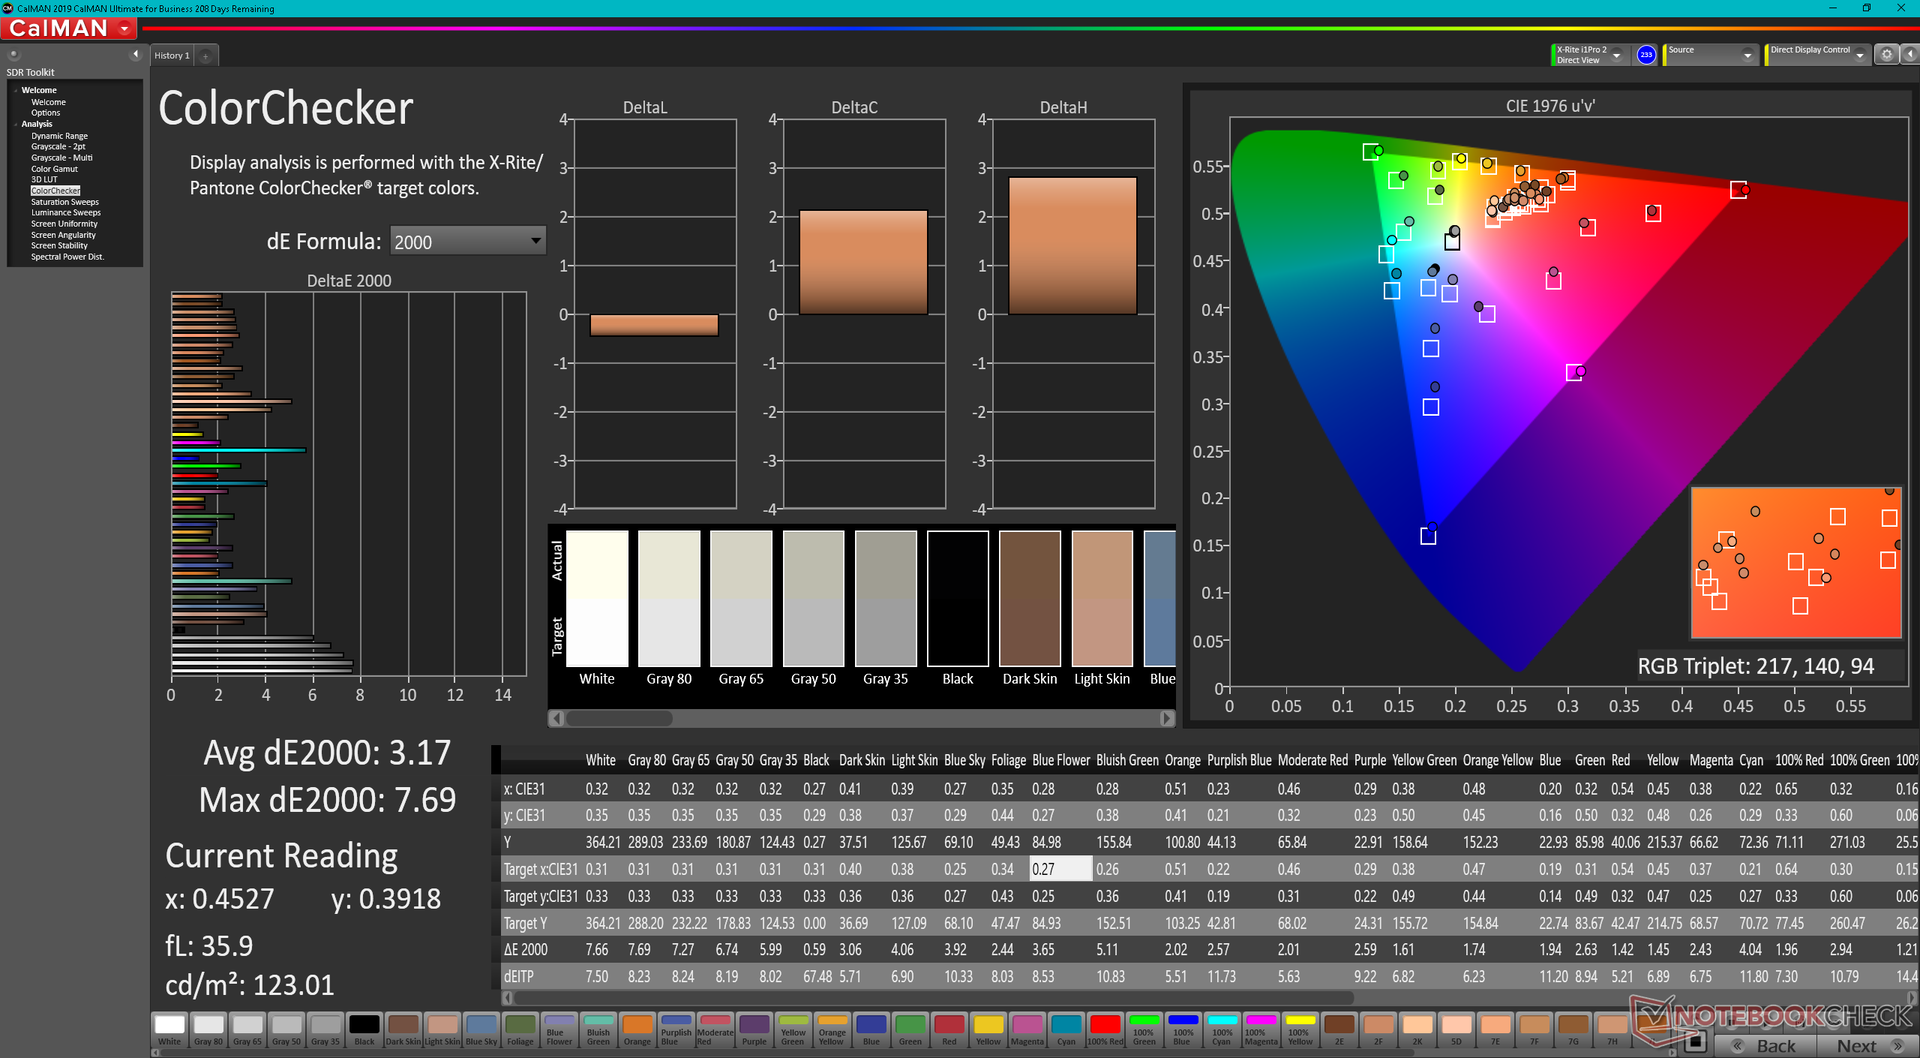
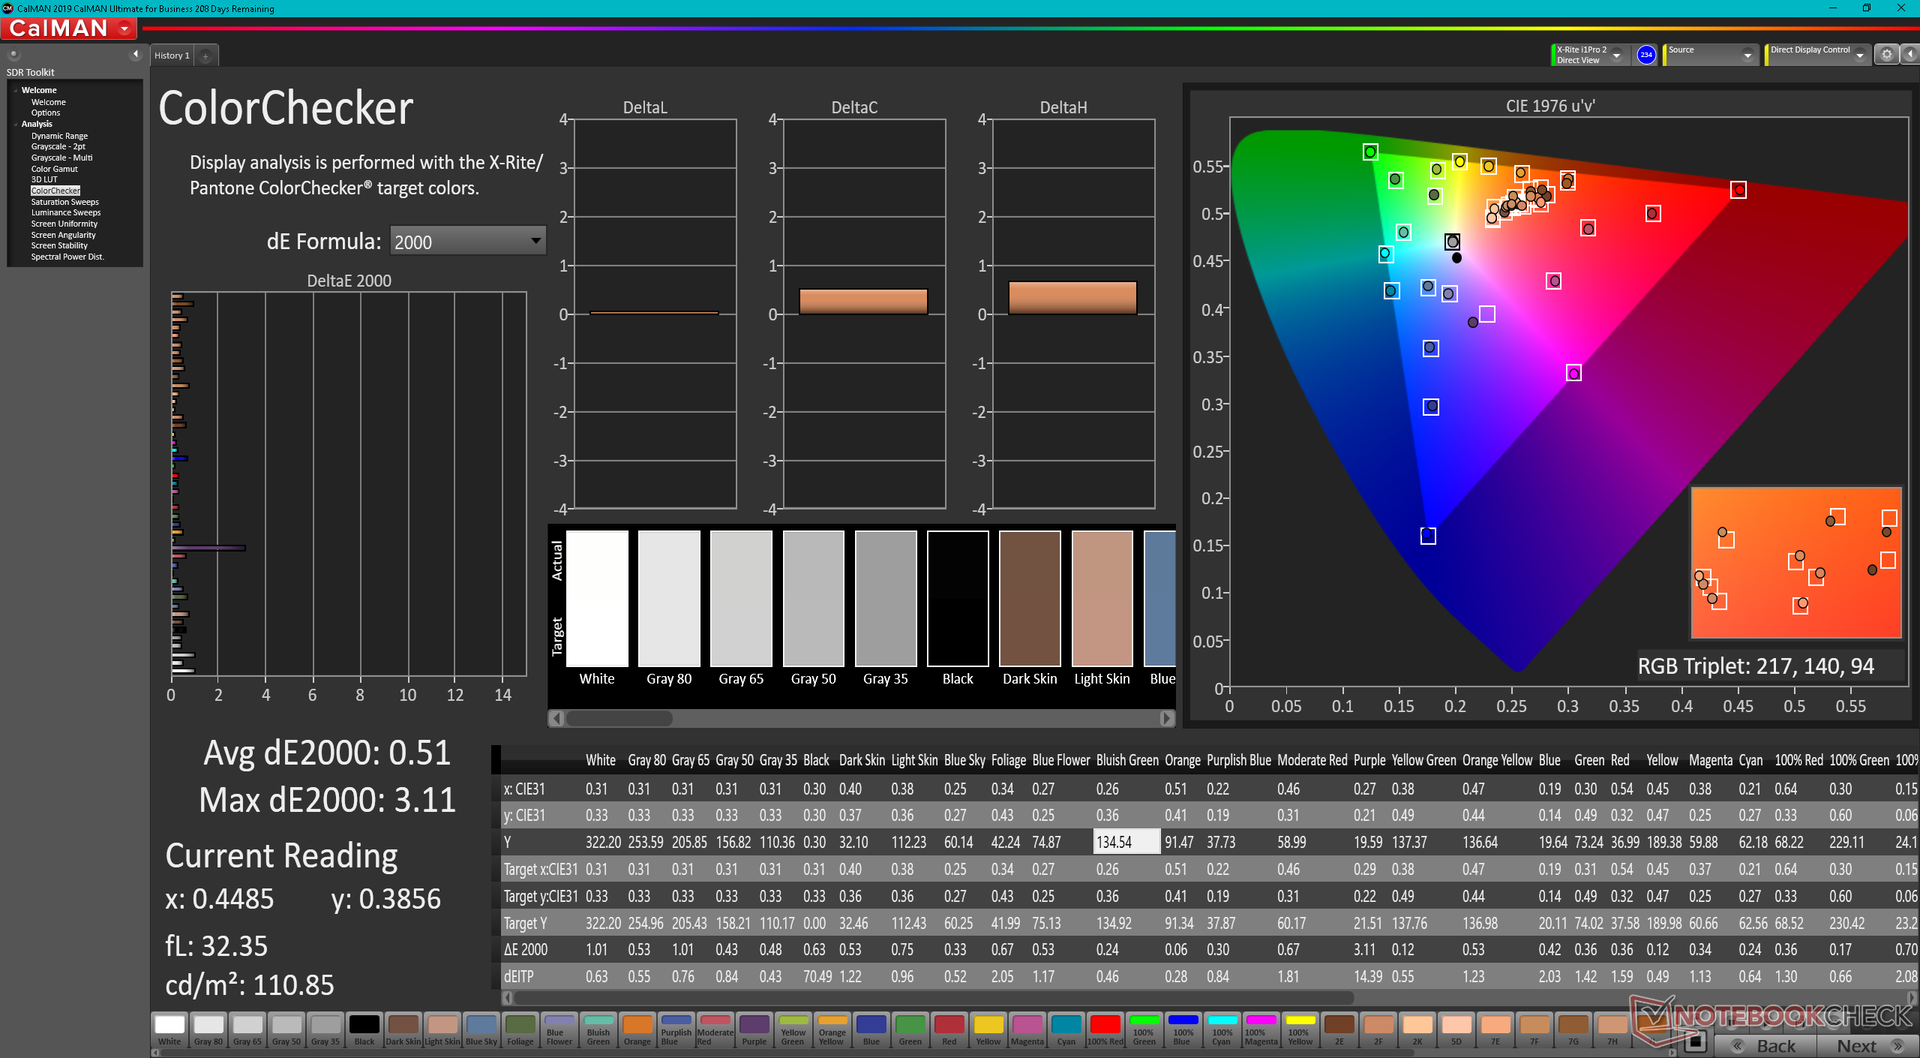
ΔE ColorChecker Calman: 3.17 | ∀{0.5-29.43 Ø4.71}
calibrated: 0.51
ΔE Greyscale Calman: 5.3 | ∀{0.09-98 Ø4.96}
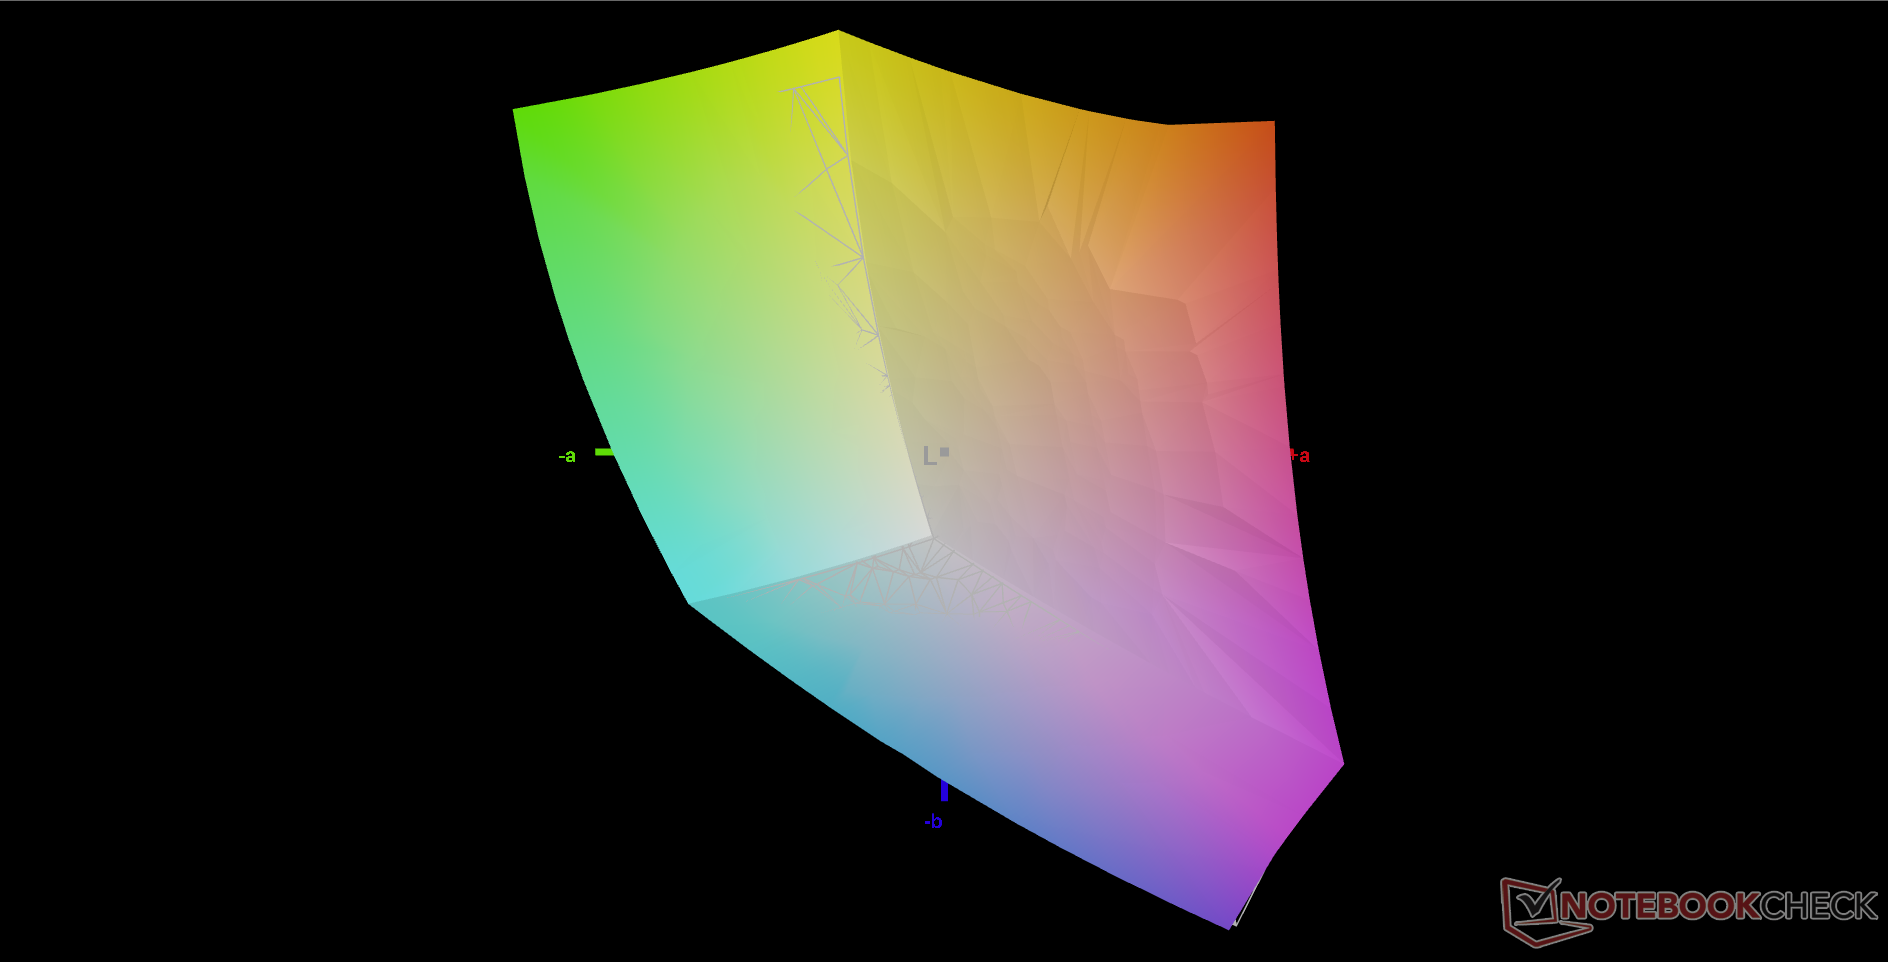
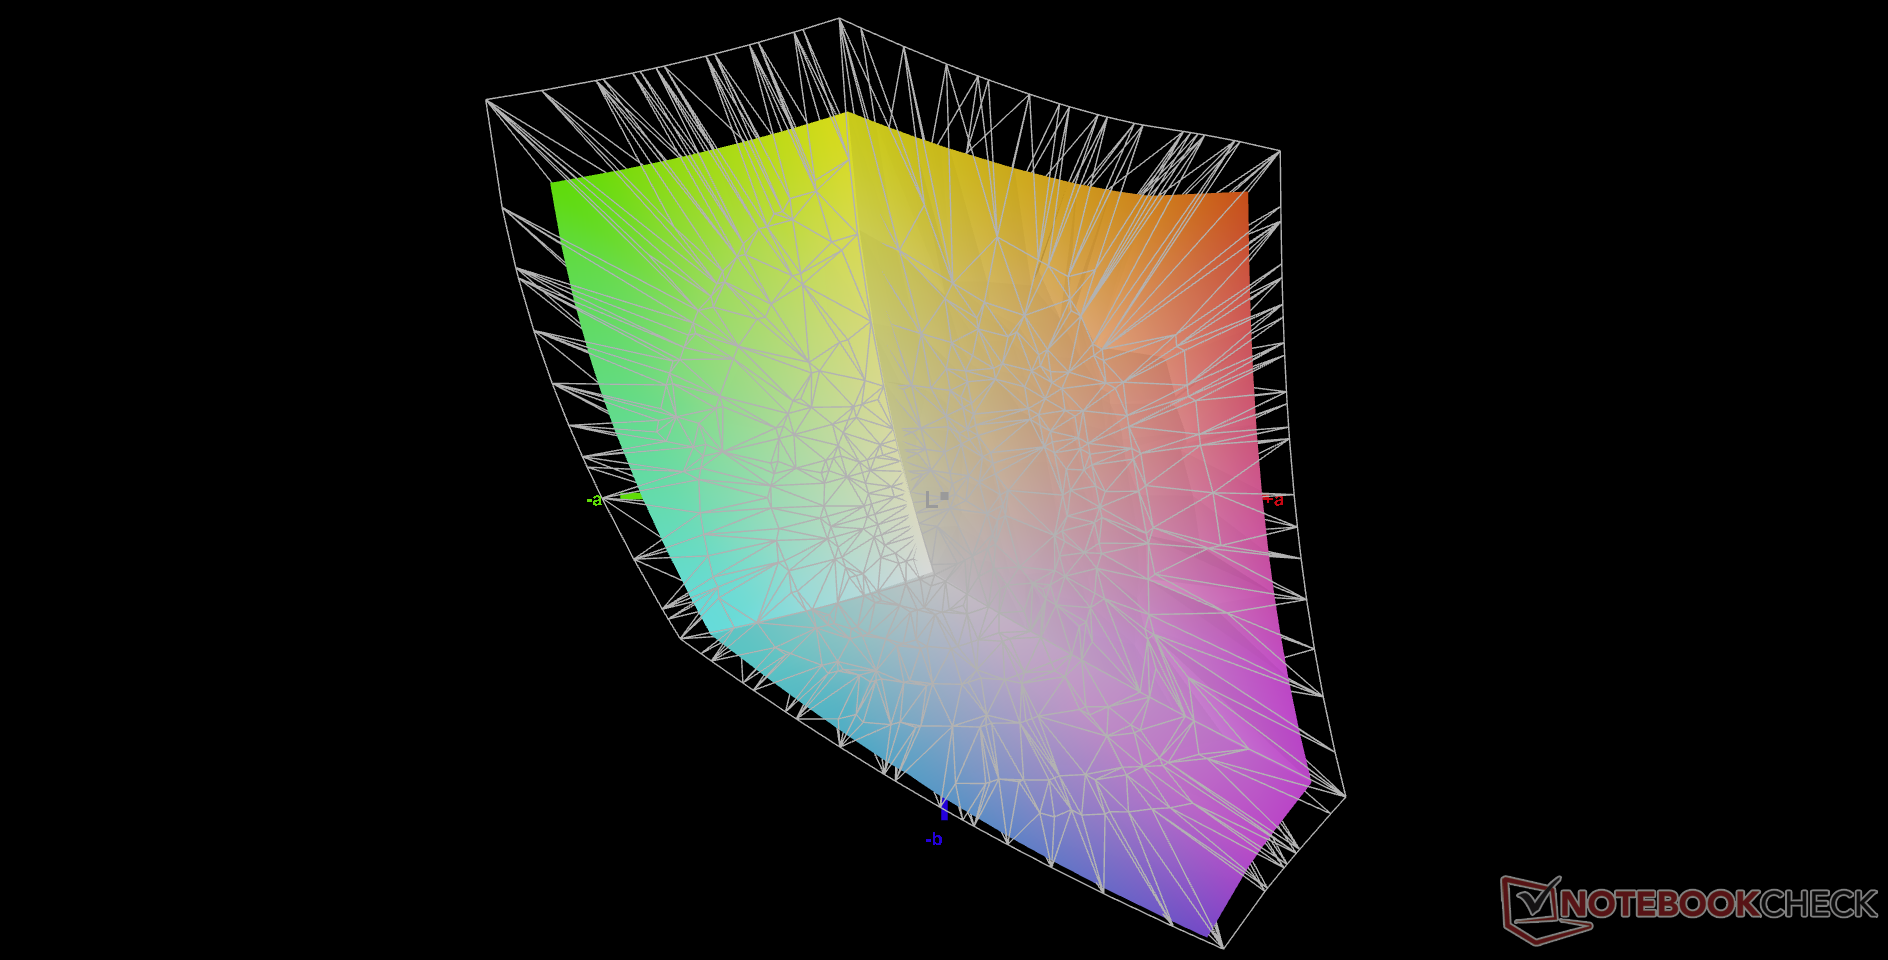
79.6% AdobeRGB 1998 (Argyll 3D)
99.8% sRGB (Argyll 3D)
79.2% Display P3 (Argyll 3D)
Gamma: 2.18
CCT: 5879 K
| Alienware x17 R2 P48E AU Optronics B173HAN, IPS, 1920x1080, 17.3" | Alienware x17 RTX 3080 P48E AU Optronics B173ZAN, IPS, 3840x2160, 17.3" | Asus ROG Zephyrus S17 GX703HSD BOE099D (BOE CQ NE173QHM-NY3), IPS, 2560x1440, 17.3" | MSI Stealth GS77 12UHS-083US BOE NE173QHM-NZ1, IPS, 2560x1440, 17.3" | MSI GT76 Titan DT 10SGS AU Optronics B173ZAN03.3, IPS, 3840x2160, 17.3" | Gigabyte A7 X1 AU Optronics AUO8E8D, IPS, 1920x1080, 17.3" | |
|---|---|---|---|---|---|---|
| Display | 12% | 8% | 10% | 8% | -17% | |
| Display P3 Coverage (%) | 79.2 | 88.3 11% | 94.2 19% | 96.2 21% | 82.5 4% | 61.5 -22% |
| sRGB Coverage (%) | 99.8 | 100 0% | 98.7 -1% | 99.7 0% | 98 -2% | 90.9 -9% |
| AdobeRGB 1998 Coverage (%) | 79.6 | 100 26% | 84.4 6% | 85.8 8% | 96.6 21% | 63.2 -21% |
| Response Times | -15% | 37% | -41% | -57% | -23% | |
| Response Time Grey 50% / Grey 80% * (ms) | 12.4 ? | 14.4 ? -16% | 4.8 61% | 17.6 ? -42% | 23.2 ? -87% | 16 ? -29% |
| Response Time Black / White * (ms) | 9.2 ? | 10.4 ? -13% | 8 13% | 12.8 ? -39% | 11.6 ? -26% | 10.8 ? -17% |
| PWM Frequency (Hz) | ||||||
| Screen | -6% | -29% | -12% | -55% | -39% | |
| Brightness middle (cd/m²) | 365.4 | 438.7 20% | 322 -12% | 334.8 -8% | 419.5 15% | 325 -11% |
| Brightness (cd/m²) | 344 | 435 26% | 288 -16% | 305 -11% | 413 20% | 318 -8% |
| Brightness Distribution (%) | 85 | 91 7% | 72 -15% | 79 -7% | 93 9% | 95 12% |
| Black Level * (cd/m²) | 0.29 | 0.48 -66% | 0.3 -3% | 0.34 -17% | 0.4 -38% | 0.29 -0% |
| Contrast (:1) | 1260 | 914 -27% | 1073 -15% | 985 -22% | 1049 -17% | 1121 -11% |
| Colorchecker dE 2000 * | 3.17 | 4.34 -37% | 3.05 4% | 4.1 -29% | 3.4 -7% | 4.33 -37% |
| Colorchecker dE 2000 max. * | 7.69 | 7.3 5% | 5.23 32% | 7.28 5% | 7.4 4% | 8.6 -12% |
| Colorchecker dE 2000 calibrated * | 0.51 | 0.72 -41% | 1.92 -276% | 3.28 -543% | 1.95 -282% | |
| Greyscale dE 2000 * | 5.3 | 2.4 55% | 3.11 41% | 5.6 -6% | 2 62% | 5.5 -4% |
| Gamma | 2.18 101% | 2.09 105% | 2.13 103% | 2.16 102% | 2.14 103% | 2.142 103% |
| CCT | 5879 111% | 6413 101% | 6553 99% | 6314 103% | 6858 95% | 7893 82% |
| Color Space (Percent of AdobeRGB 1998) (%) | 84 | 84.6 | ||||
| Color Space (Percent of sRGB) (%) | 99 | 97.9 | ||||
| Média Total (Programa/Configurações) | -3% /
-4% | 5% /
-12% | -14% /
-11% | -35% /
-42% | -26% /
-32% |
* ... menor é melhor
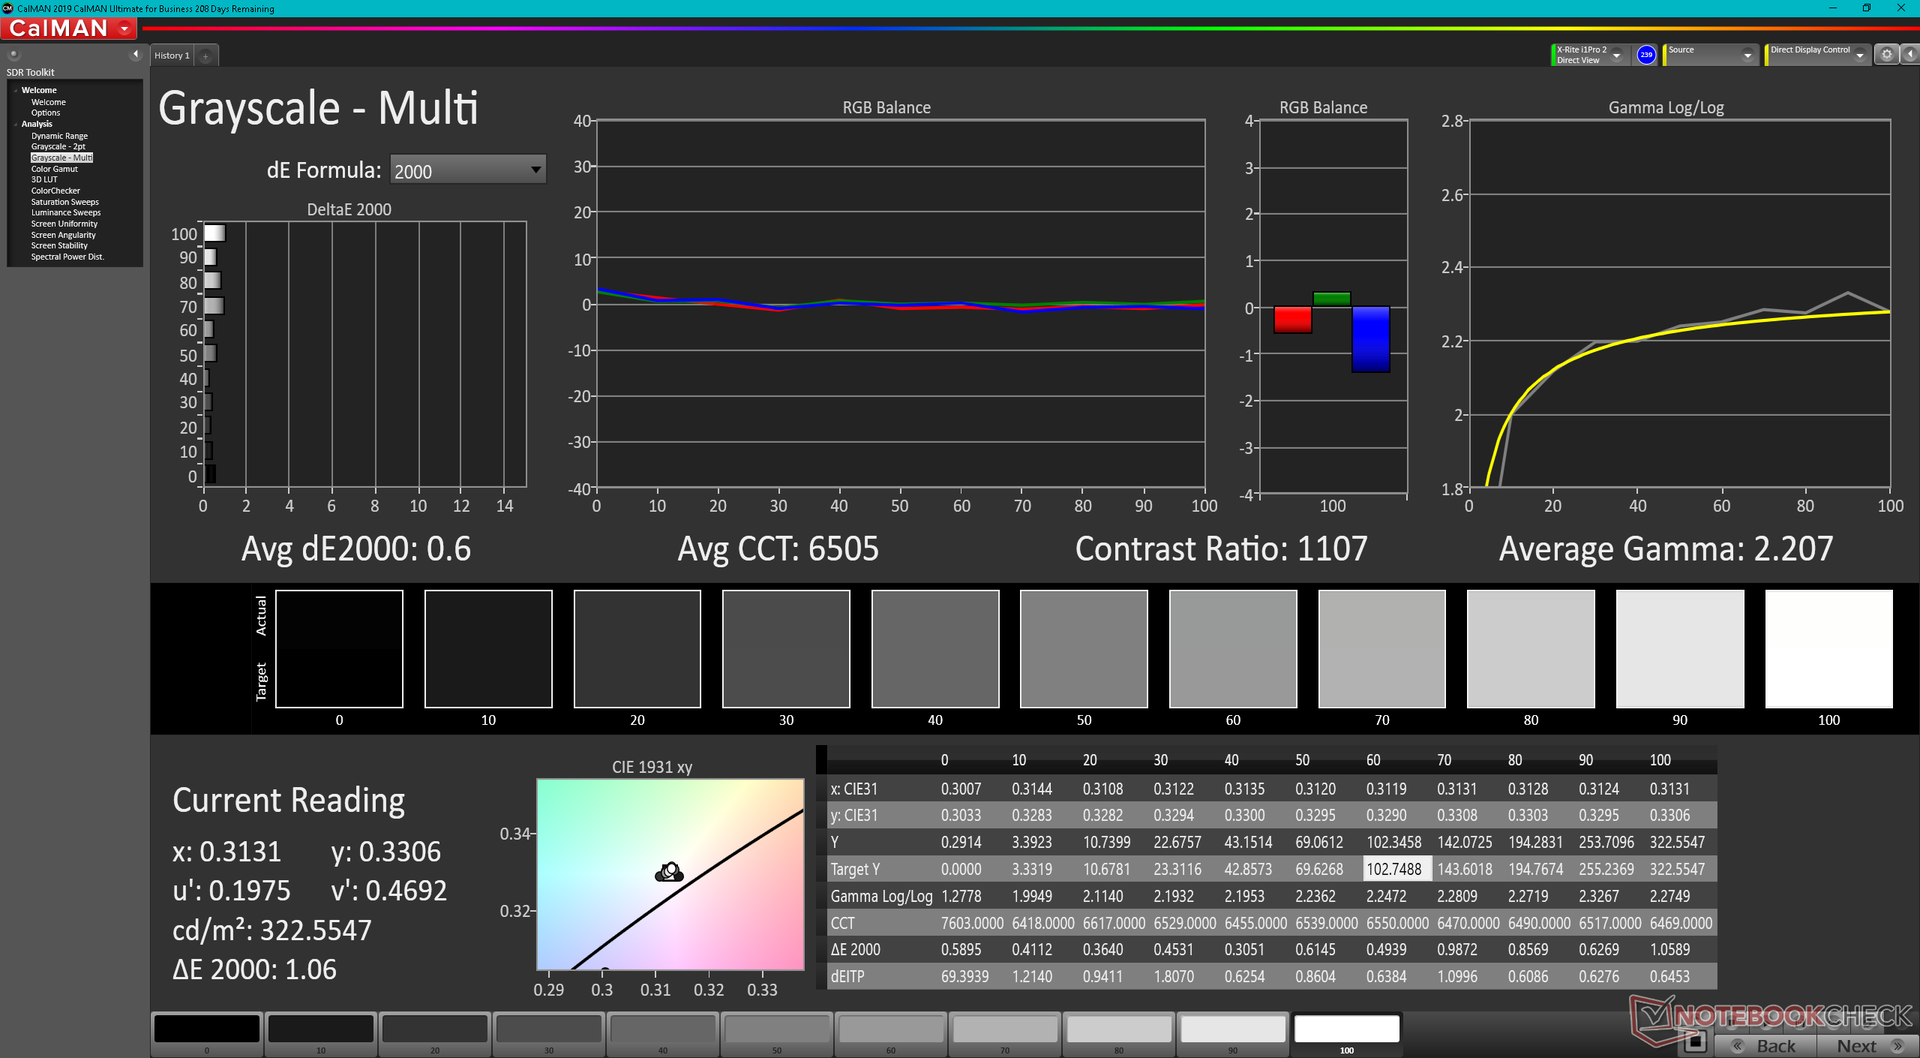
O display não está muito bem calibrado fora da caixa, especialmente porque a temperatura da cor é excessivamente quente. Uma vez devidamente calibrado contra sRGB, no entanto, somos capazes de atingir valores médios de escala de cinza e deltaE de cor de apenas 0,6 e 0,51, respectivamente.
Exibir tempos de resposta
| ↔ Tempo de resposta preto para branco | ||
|---|---|---|
| 9.2 ms ... ascensão ↗ e queda ↘ combinadas | ↗ 5.2 ms ascensão | 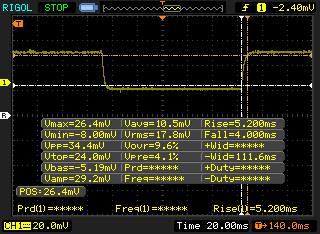 |
| ↘ 4 ms queda | ||
| A tela mostra taxas de resposta rápidas em nossos testes e deve ser adequada para jogos. Em comparação, todos os dispositivos testados variam de 0.1 (mínimo) a 240 (máximo) ms. » 26 % de todos os dispositivos são melhores. Isso significa que o tempo de resposta medido é melhor que a média de todos os dispositivos testados (19.8 ms). | ||
| ↔ Tempo de resposta 50% cinza a 80% cinza | ||
| 12.4 ms ... ascensão ↗ e queda ↘ combinadas | ↗ 6.4 ms ascensão | 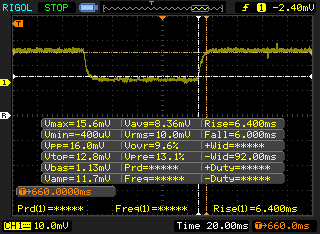 |
| ↘ 6 ms queda | ||
| A tela mostra boas taxas de resposta em nossos testes, mas pode ser muito lenta para jogadores competitivos. Em comparação, todos os dispositivos testados variam de 0.165 (mínimo) a 636 (máximo) ms. » 26 % de todos os dispositivos são melhores. Isso significa que o tempo de resposta medido é melhor que a média de todos os dispositivos testados (31 ms). | ||
Cintilação da tela / PWM (modulação por largura de pulso)
| Tela tremeluzindo / PWM não detectado | 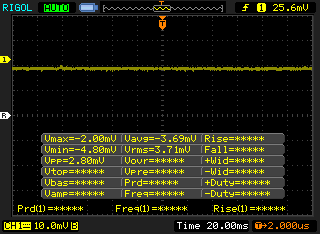 | ||
[pwm_comparison] Em comparação: 52 % de todos os dispositivos testados não usam PWM para escurecer a tela. Se PWM foi detectado, uma média de 7754 (mínimo: 5 - máximo: 343500) Hz foi medida. | |||
Desempenho
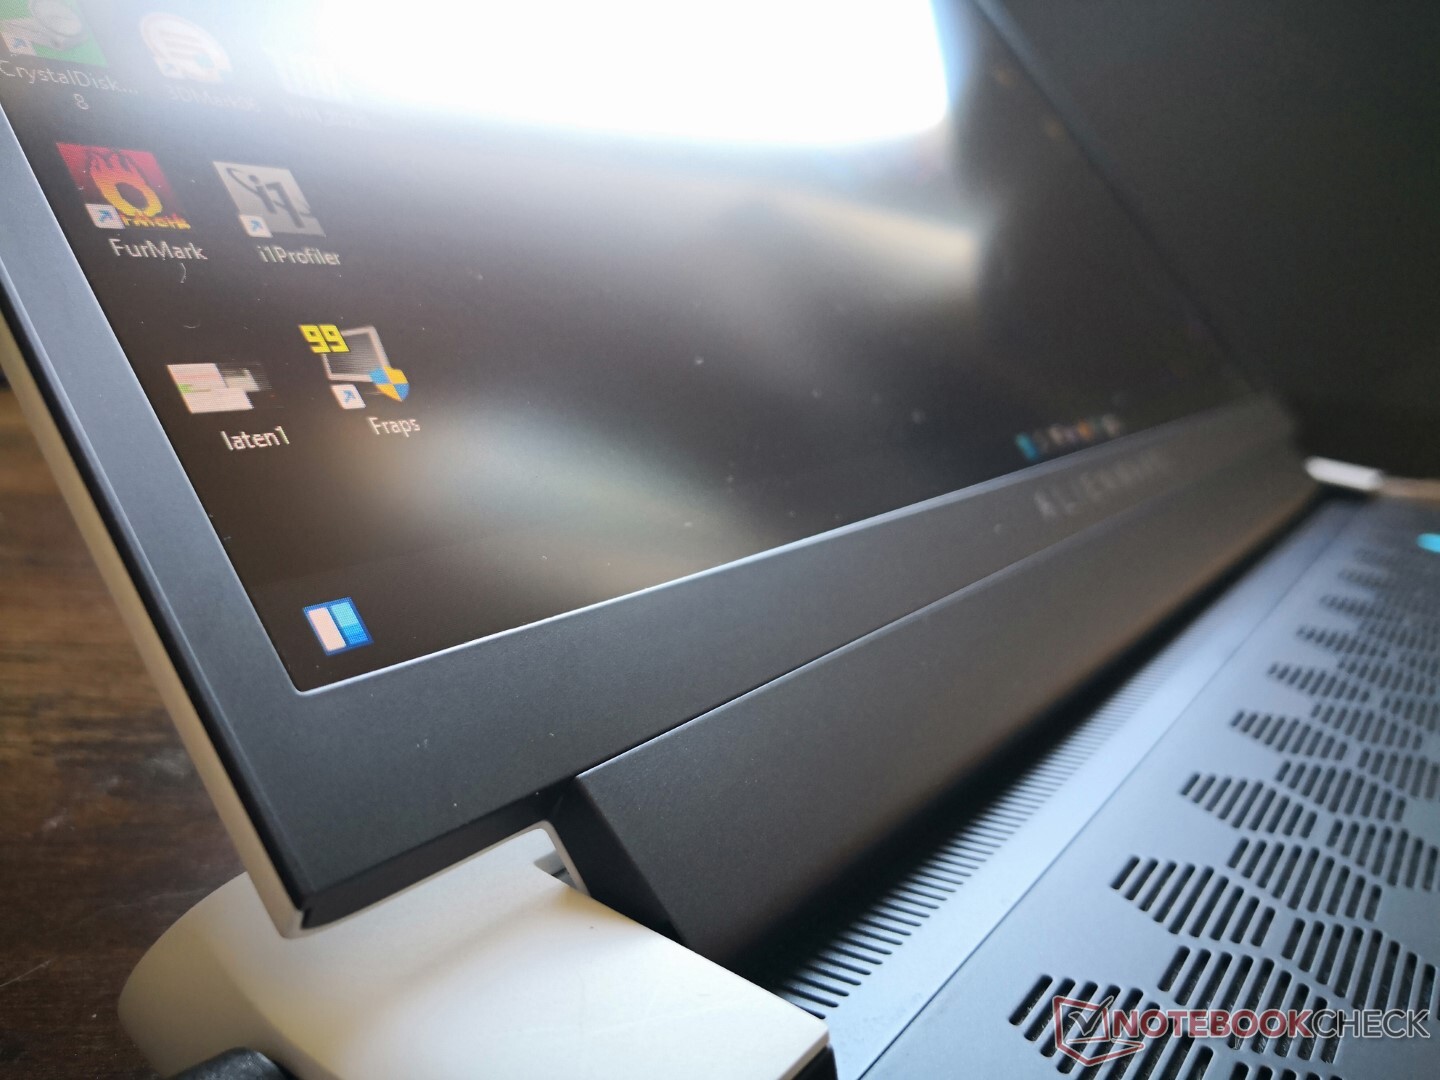
Condições de teste
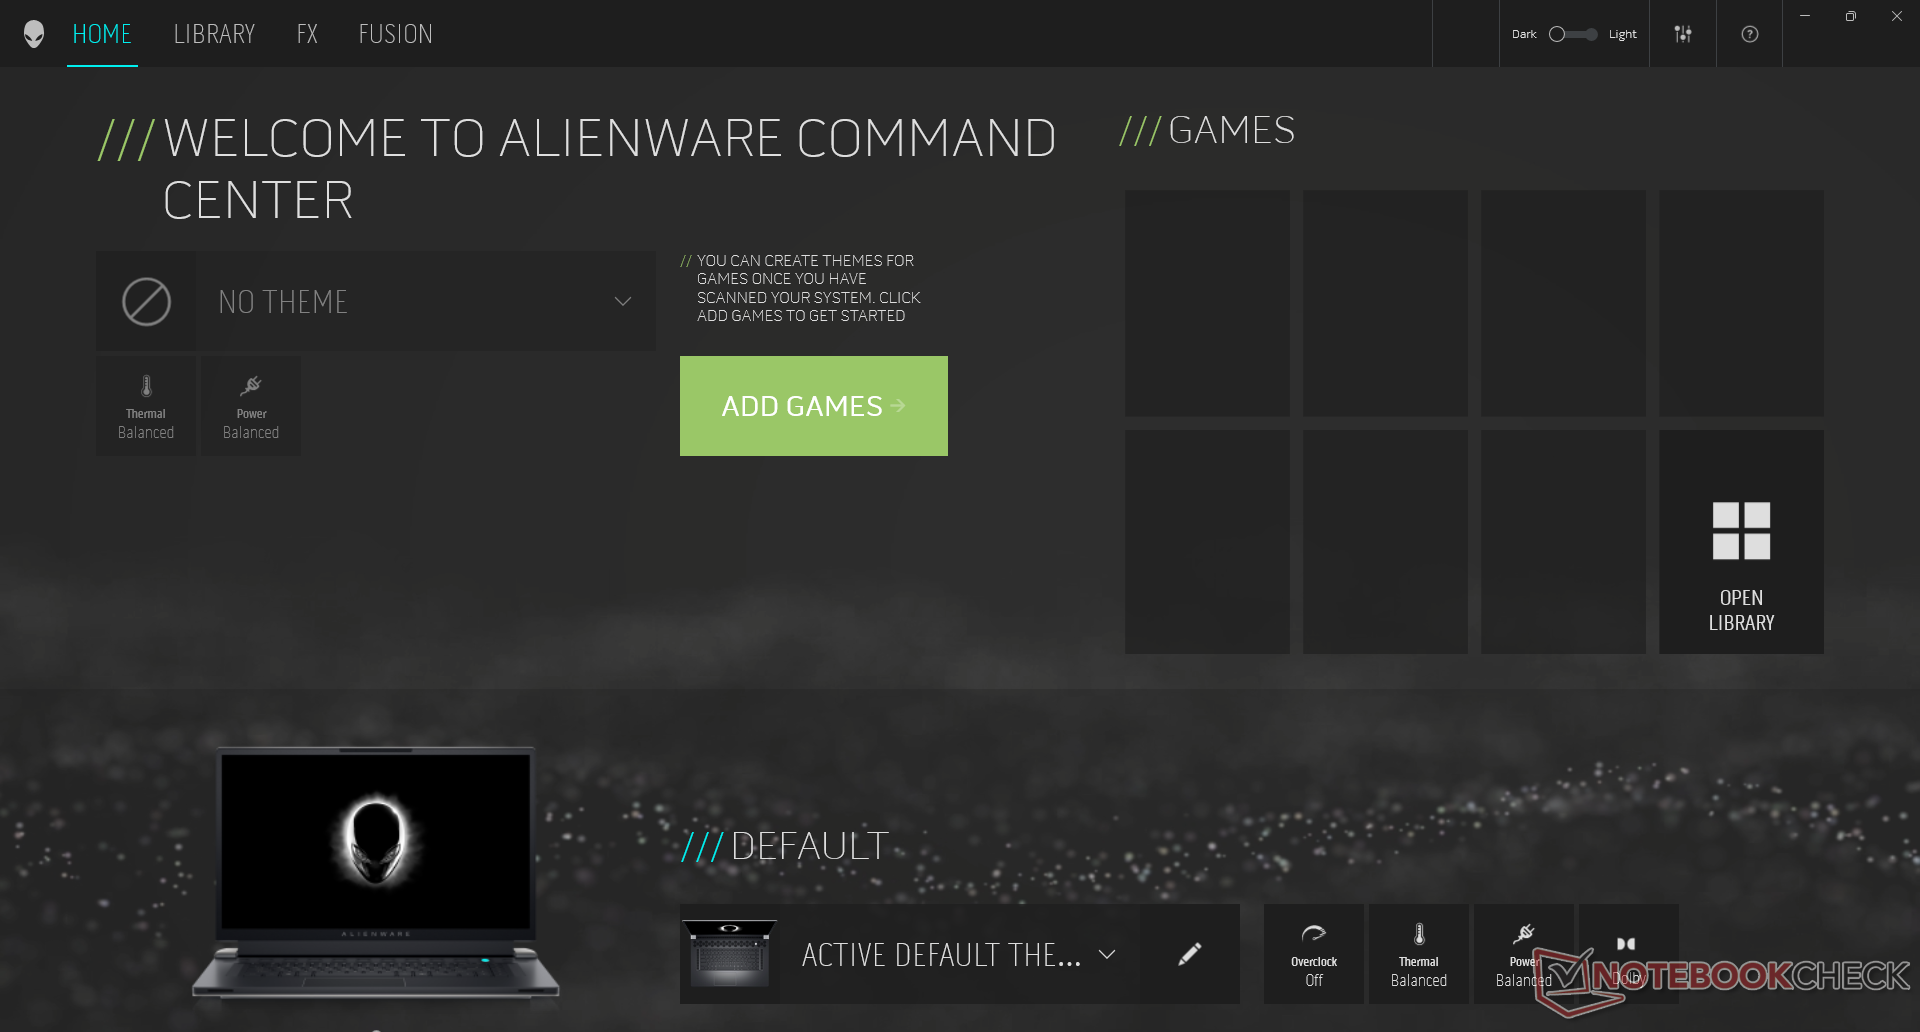
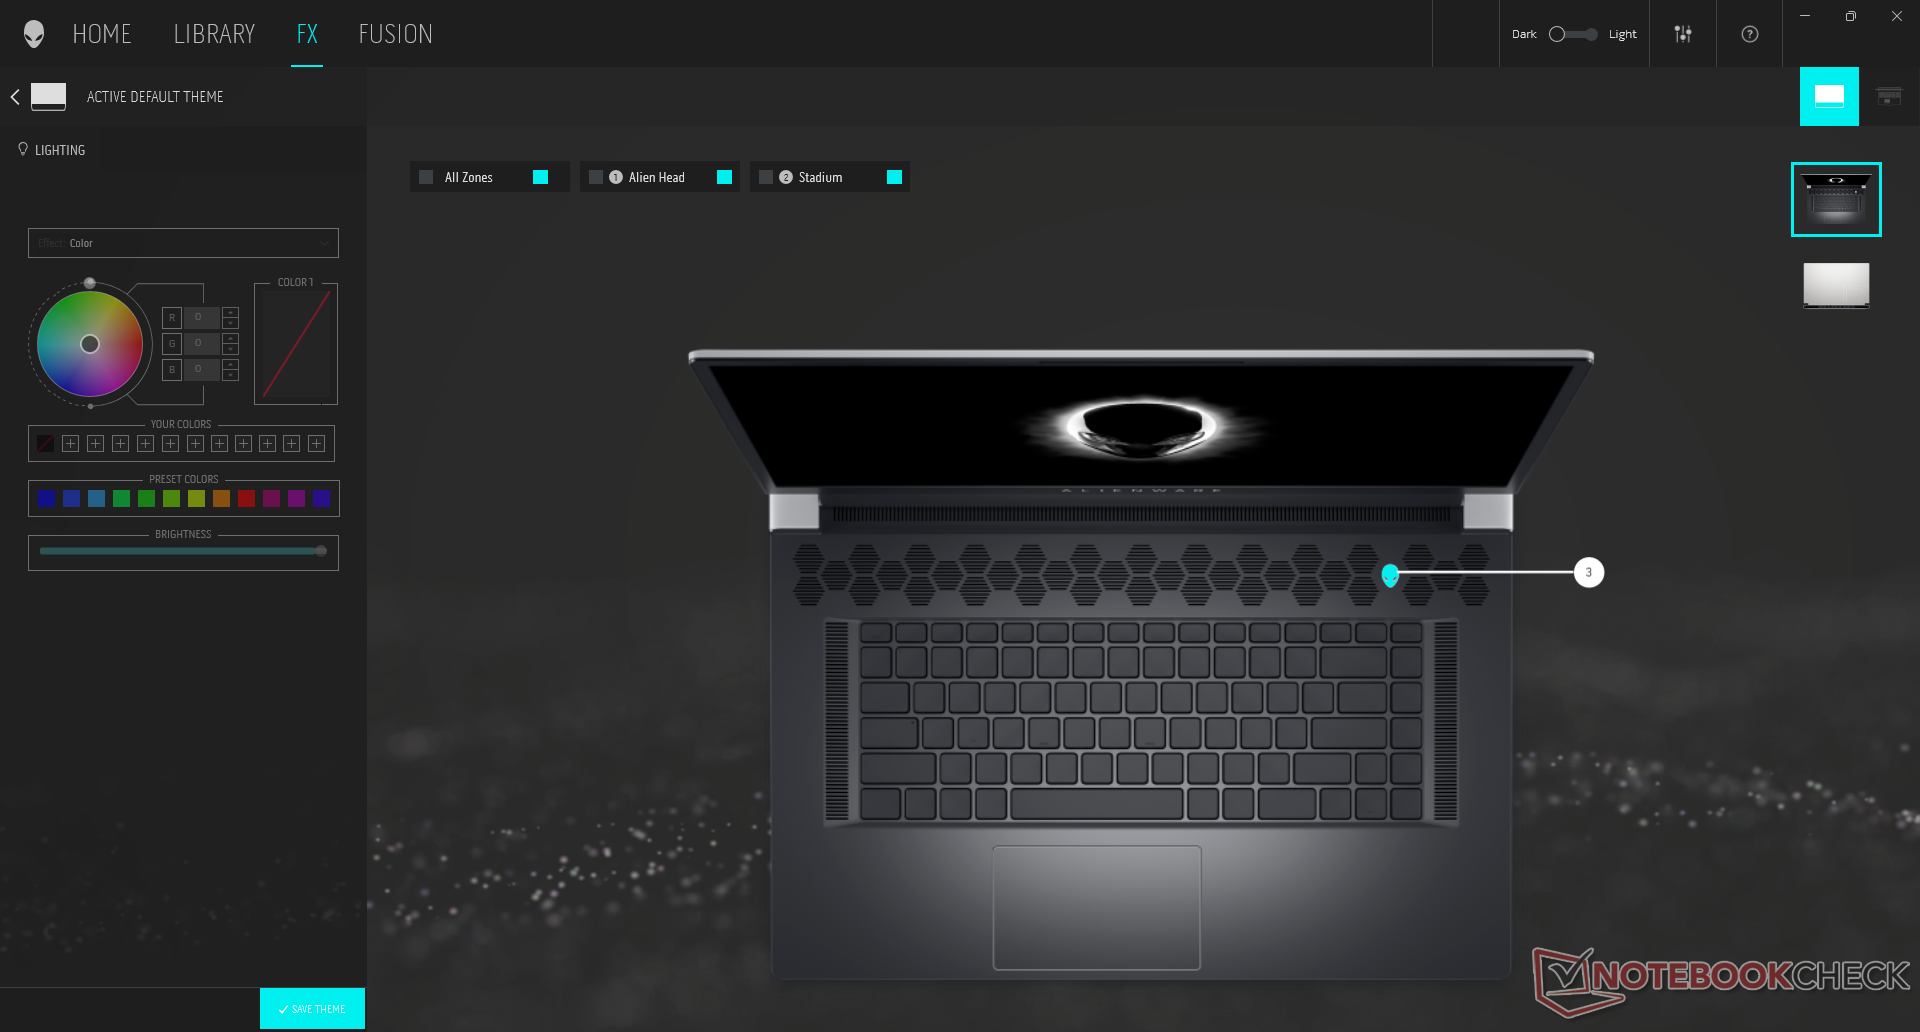
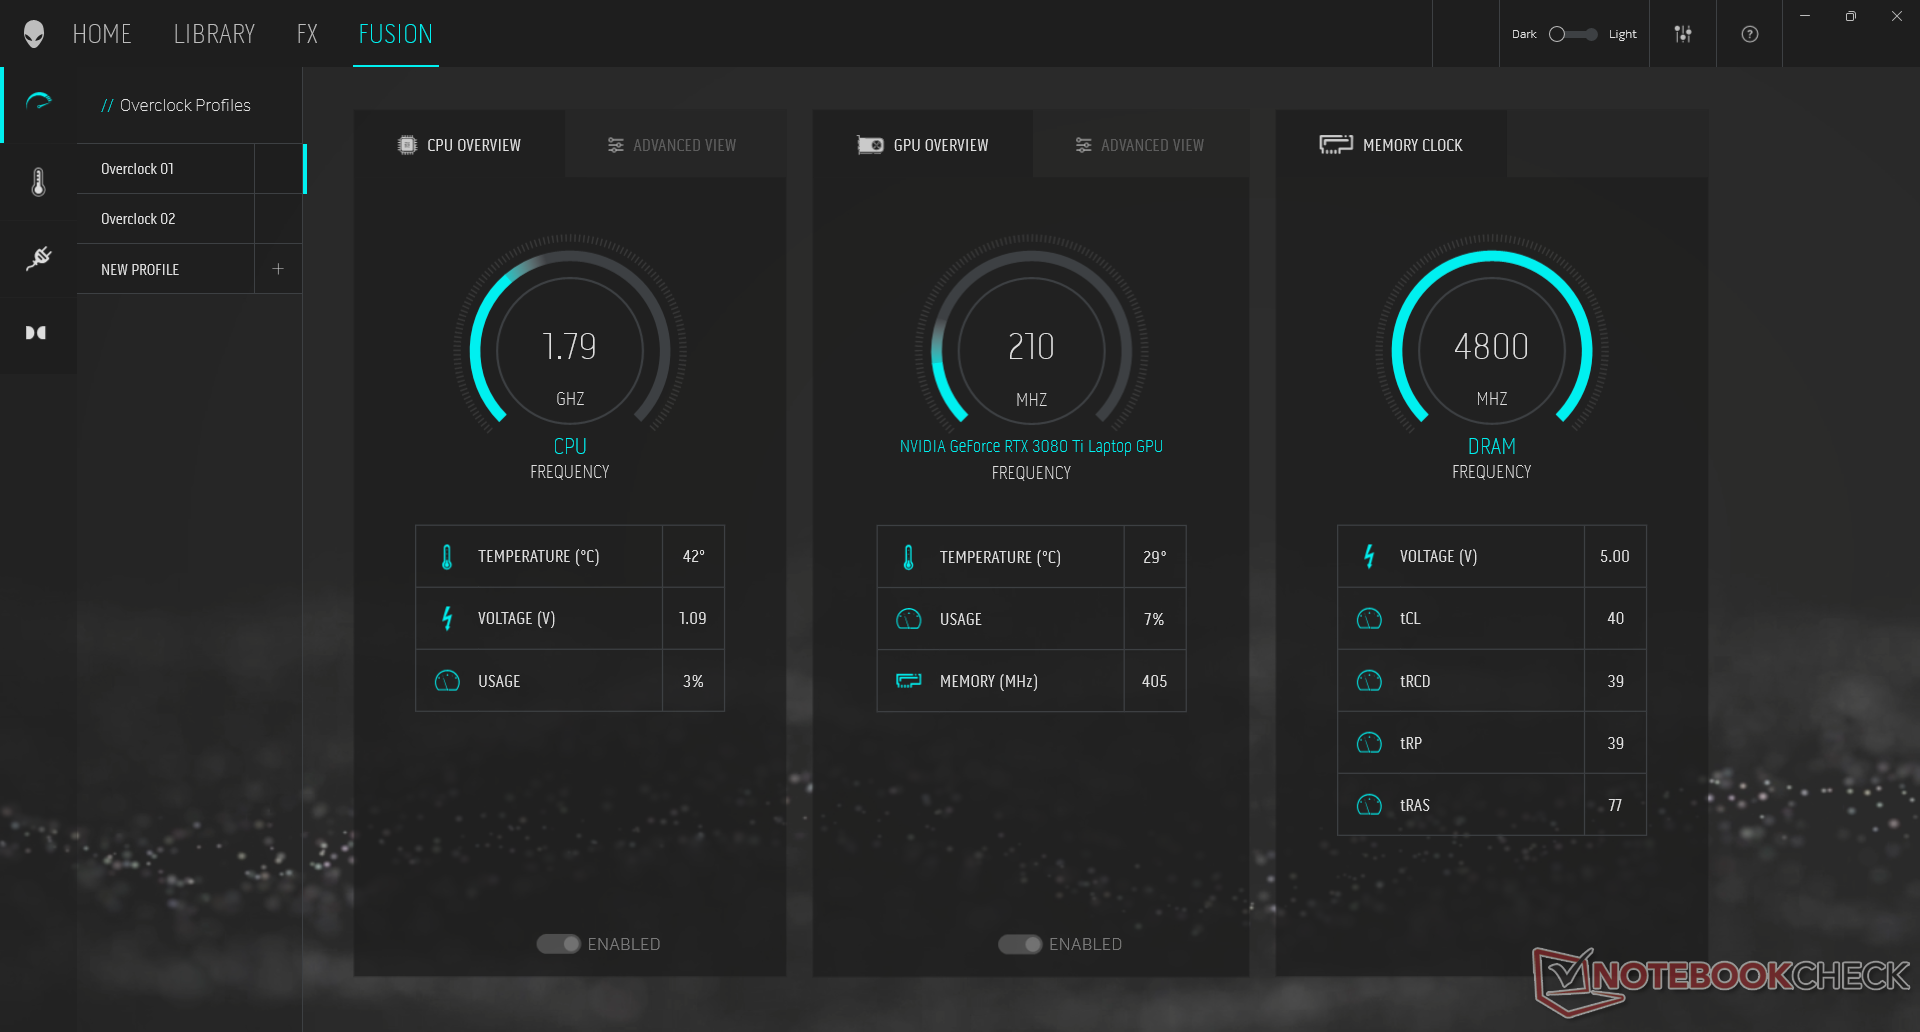
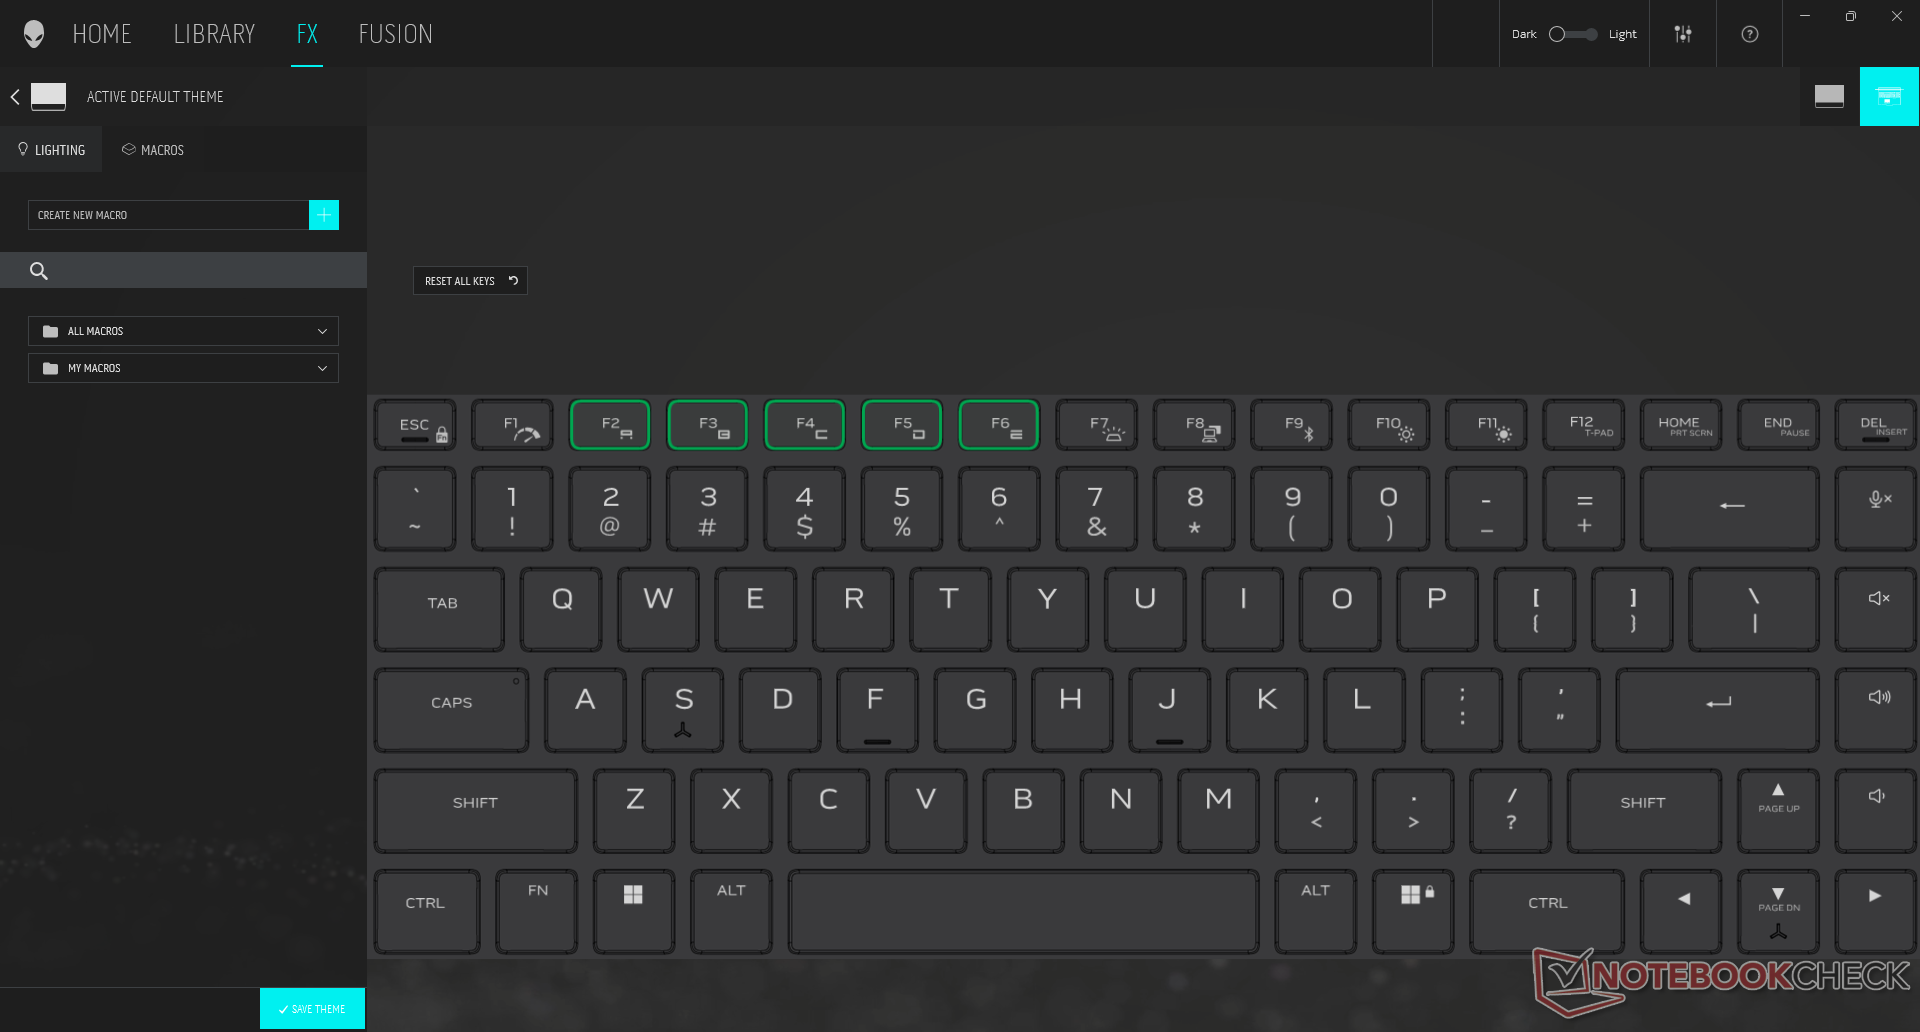
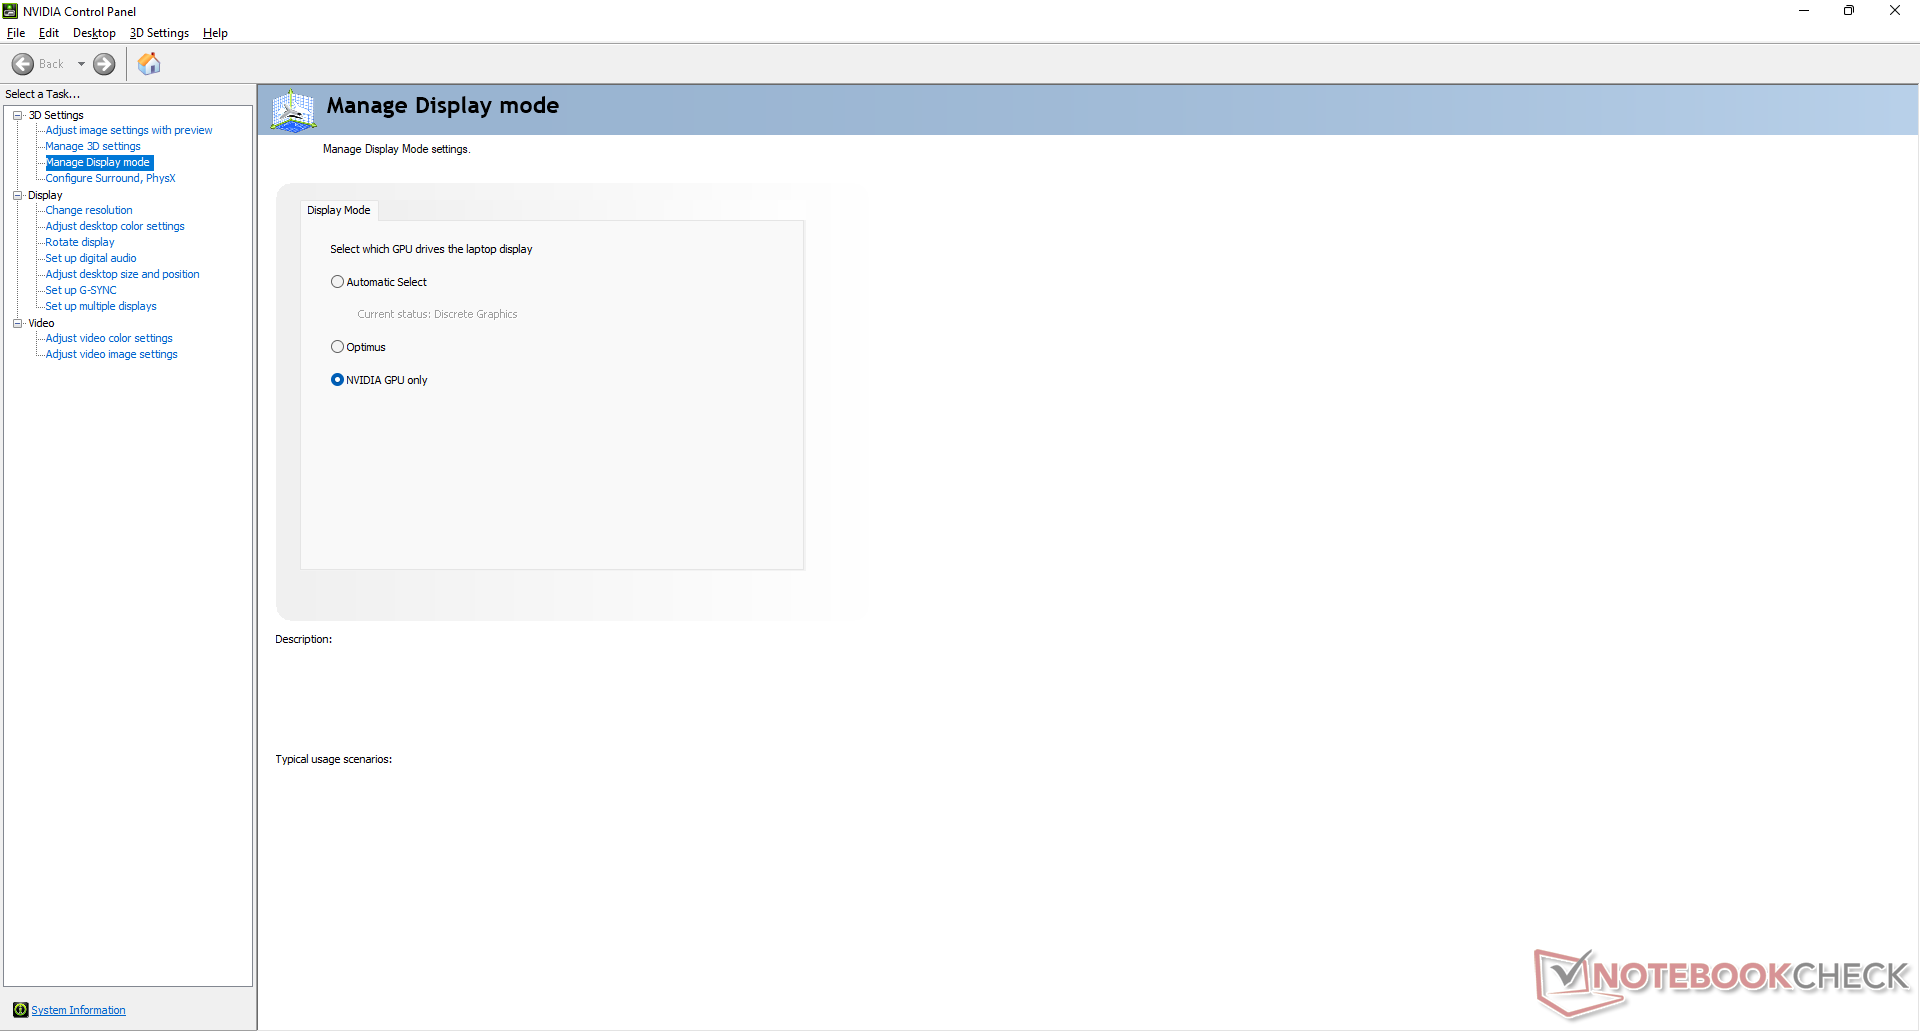
Configuramos nossa unidade para o modo High Performance e com a GPU discreta ativa antes de executar qualquer benchmark de desempenho abaixo para obter as mais altas pontuações possíveis. O modo High Performance pode ser facilmente comutado via Fn+F1 enquanto a chave MUX pode ser acessada através do Painel de Controle Nvidia. É altamente recomendável que os usuários se familiarizem com o software Alienware Command Center, pois os perfis de potência, configurações RGB, monitoramento em tempo real e outros recursos são encontrados aqui.
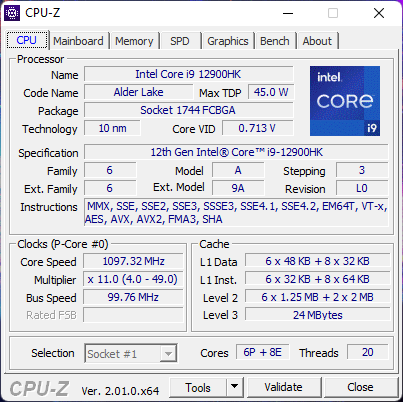
Processador
O desempenho bruto da CPU é cerca de 10 a 15% mais rápido do que a média dos portáteis em nosso banco de dados com o mesmo Núcleo i9-12900HK. É um impulso decente sobre a Núcleo i7-12800H ou de última geração Núcleo i7-11800H em até 30% cada um em cargas de trabalho multi-tarefas. A mais recente CPU Zen 3+ da AMD, a Ryzen 9 6900HXo Core i9-12900HK, também é consistentemente mais lento nos benchmarks do CineBench, mas superará o Core i9-12900HK em certos benchmarks do AIDA64.
Cinebench R15 Multi Loop
Cinebench R23: Multi Core | Single Core
Cinebench R15: CPU Multi 64Bit | CPU Single 64Bit
Blender: v2.79 BMW27 CPU
7-Zip 18.03: 7z b 4 | 7z b 4 -mmt1
Geekbench 5.5: Multi-Core | Single-Core
HWBOT x265 Benchmark v2.2: 4k Preset
LibreOffice : 20 Documents To PDF
R Benchmark 2.5: Overall mean
| Cinebench R20 / CPU (Multi Core) | |
| AMD Radeon RX 6800 XT | |
| Corsair One i300 | |
| Alienware x17 R2 P48E | |
| Média Intel Core i9-12900HK (1828 - 7366, n=14) | |
| Razer Blade 14 Ryzen 9 6900HX | |
| Alienware x17 RTX 3080 P48E | |
| Razer Blade 17 (i7-12800H, RTX 3070 Ti) | |
| Gigabyte A7 X1 | |
| Razer Blade Pro 17 2021 (QHD Touch) | |
| Lenovo Legion Y740-17IRHg-81UJ001VGE | |
| Cinebench R20 / CPU (Single Core) | |
| Corsair One i300 | |
| Alienware x17 R2 P48E | |
| Razer Blade 17 (i7-12800H, RTX 3070 Ti) | |
| Média Intel Core i9-12900HK (316 - 739, n=14) | |
| AMD Radeon RX 6800 XT | |
| Razer Blade 14 Ryzen 9 6900HX | |
| Alienware x17 RTX 3080 P48E | |
| Gigabyte A7 X1 | |
| Razer Blade Pro 17 2021 (QHD Touch) | |
| Lenovo Legion Y740-17IRHg-81UJ001VGE | |
| Cinebench R23 / Multi Core | |
| Corsair One i300 | |
| AMD Radeon RX 6800 XT | |
| Alienware x17 R2 P48E | |
| Média Intel Core i9-12900HK (4796 - 19282, n=14) | |
| Razer Blade 17 (i7-12800H, RTX 3070 Ti) | |
| Razer Blade 14 Ryzen 9 6900HX | |
| Alienware x17 RTX 3080 P48E | |
| Gigabyte A7 X1 | |
| Razer Blade Pro 17 2021 (QHD Touch) | |
| Cinebench R23 / Single Core | |
| Corsair One i300 | |
| Alienware x17 R2 P48E | |
| Razer Blade 17 (i7-12800H, RTX 3070 Ti) | |
| Média Intel Core i9-12900HK (819 - 1940, n=15) | |
| AMD Radeon RX 6800 XT | |
| Razer Blade 14 Ryzen 9 6900HX | |
| Alienware x17 RTX 3080 P48E | |
| Gigabyte A7 X1 | |
| Razer Blade Pro 17 2021 (QHD Touch) | |
| Cinebench R15 / CPU Multi 64Bit | |
| AMD Radeon RX 6800 XT | |
| Corsair One i300 | |
| Alienware x17 R2 P48E | |
| Razer Blade 17 (i7-12800H, RTX 3070 Ti) | |
| Média Intel Core i9-12900HK (965 - 2944, n=14) | |
| Razer Blade 14 Ryzen 9 6900HX | |
| Alienware x17 RTX 3080 P48E | |
| Gigabyte A7 X1 | |
| Razer Blade Pro 17 2021 (QHD Touch) | |
| Lenovo Legion Y740-17IRHg-81UJ001VGE | |
| Cinebench R15 / CPU Single 64Bit | |
| Corsair One i300 | |
| Alienware x17 R2 P48E | |
| Razer Blade 17 (i7-12800H, RTX 3070 Ti) | |
| AMD Radeon RX 6800 XT | |
| Razer Blade 14 Ryzen 9 6900HX | |
| Gigabyte A7 X1 | |
| Média Intel Core i9-12900HK (119 - 279, n=14) | |
| Alienware x17 RTX 3080 P48E | |
| Razer Blade Pro 17 2021 (QHD Touch) | |
| Lenovo Legion Y740-17IRHg-81UJ001VGE | |
| Blender / v2.79 BMW27 CPU | |
| Lenovo Legion Y740-17IRHg-81UJ001VGE | |
| Razer Blade Pro 17 2021 (QHD Touch) | |
| Gigabyte A7 X1 | |
| Média Intel Core i9-12900HK (172.5 - 483, n=13) | |
| Razer Blade 14 Ryzen 9 6900HX | |
| Razer Blade 17 (i7-12800H, RTX 3070 Ti) | |
| Alienware x17 RTX 3080 P48E | |
| Alienware x17 R2 P48E | |
| Corsair One i300 | |
| AMD Radeon RX 6800 XT | |
| 7-Zip 18.03 / 7z b 4 | |
| AMD Radeon RX 6800 XT | |
| Corsair One i300 | |
| Alienware x17 R2 P48E | |
| Razer Blade 17 (i7-12800H, RTX 3070 Ti) | |
| Razer Blade 14 Ryzen 9 6900HX | |
| Média Intel Core i9-12900HK (25736 - 75564, n=14) | |
| Gigabyte A7 X1 | |
| Alienware x17 RTX 3080 P48E | |
| Razer Blade Pro 17 2021 (QHD Touch) | |
| Lenovo Legion Y740-17IRHg-81UJ001VGE | |
| 7-Zip 18.03 / 7z b 4 -mmt1 | |
| AMD Radeon RX 6800 XT | |
| Corsair One i300 | |
| Razer Blade 14 Ryzen 9 6900HX | |
| Alienware x17 R2 P48E | |
| Razer Blade 17 (i7-12800H, RTX 3070 Ti) | |
| Gigabyte A7 X1 | |
| Média Intel Core i9-12900HK (2898 - 6186, n=14) | |
| Alienware x17 RTX 3080 P48E | |
| Razer Blade Pro 17 2021 (QHD Touch) | |
| Lenovo Legion Y740-17IRHg-81UJ001VGE | |
| Geekbench 5.5 / Multi-Core | |
| Corsair One i300 | |
| AMD Radeon RX 6800 XT | |
| Alienware x17 R2 P48E | |
| Razer Blade 17 (i7-12800H, RTX 3070 Ti) | |
| Média Intel Core i9-12900HK (5869 - 14294, n=13) | |
| Razer Blade 14 Ryzen 9 6900HX | |
| Razer Blade Pro 17 2021 (QHD Touch) | |
| Gigabyte A7 X1 | |
| Lenovo Legion Y740-17IRHg-81UJ001VGE | |
| Geekbench 5.5 / Single-Core | |
| Corsair One i300 | |
| Alienware x17 R2 P48E | |
| Razer Blade 17 (i7-12800H, RTX 3070 Ti) | |
| Média Intel Core i9-12900HK (843 - 1918, n=13) | |
| AMD Radeon RX 6800 XT | |
| Razer Blade 14 Ryzen 9 6900HX | |
| Gigabyte A7 X1 | |
| Razer Blade Pro 17 2021 (QHD Touch) | |
| Lenovo Legion Y740-17IRHg-81UJ001VGE | |
| HWBOT x265 Benchmark v2.2 / 4k Preset | |
| AMD Radeon RX 6800 XT | |
| Corsair One i300 | |
| Alienware x17 R2 P48E | |
| Razer Blade 14 Ryzen 9 6900HX | |
| Alienware x17 RTX 3080 P48E | |
| Média Intel Core i9-12900HK (5.33 - 21.6, n=14) | |
| Razer Blade 17 (i7-12800H, RTX 3070 Ti) | |
| Gigabyte A7 X1 | |
| Razer Blade Pro 17 2021 (QHD Touch) | |
| Lenovo Legion Y740-17IRHg-81UJ001VGE | |
| LibreOffice / 20 Documents To PDF | |
| Gigabyte A7 X1 | |
| AMD Radeon RX 6800 XT | |
| Razer Blade 14 Ryzen 9 6900HX | |
| Média Intel Core i9-12900HK (34.8 - 89.1, n=14) | |
| Alienware x17 RTX 3080 P48E | |
| Razer Blade Pro 17 2021 (QHD Touch) | |
| Razer Blade 17 (i7-12800H, RTX 3070 Ti) | |
| Alienware x17 R2 P48E | |
| Corsair One i300 | |
| R Benchmark 2.5 / Overall mean | |
| Lenovo Legion Y740-17IRHg-81UJ001VGE | |
| Razer Blade Pro 17 2021 (QHD Touch) | |
| Alienware x17 RTX 3080 P48E | |
| Média Intel Core i9-12900HK (0.4155 - 0.994, n=14) | |
| Gigabyte A7 X1 | |
| Razer Blade 14 Ryzen 9 6900HX | |
| AMD Radeon RX 6800 XT | |
| Razer Blade 17 (i7-12800H, RTX 3070 Ti) | |
| Alienware x17 R2 P48E | |
| Corsair One i300 | |
* ... menor é melhor
AIDA64: FP32 Ray-Trace | FPU Julia | CPU SHA3 | CPU Queen | FPU SinJulia | FPU Mandel | CPU AES | CPU ZLib | FP64 Ray-Trace | CPU PhotoWorxx
| Performance rating | |
| Razer Blade 14 Ryzen 9 6900HX | |
| Gigabyte A7 X1 | |
| Alienware x17 R2 P48E | |
| MSI Stealth GS77 12UHS-083US | |
| Média Intel Core i9-12900HK | |
| AIDA64 / FP32 Ray-Trace | |
| Razer Blade 14 Ryzen 9 6900HX | |
| Gigabyte A7 X1 | |
| Alienware x17 R2 P48E | |
| Média Intel Core i9-12900HK (2677 - 13948, n=15) | |
| MSI Stealth GS77 12UHS-083US | |
| AIDA64 / FPU Julia | |
| Razer Blade 14 Ryzen 9 6900HX | |
| Gigabyte A7 X1 | |
| Média Intel Core i9-12900HK (12762 - 70764, n=15) | |
| Alienware x17 R2 P48E | |
| MSI Stealth GS77 12UHS-083US | |
| AIDA64 / CPU SHA3 | |
| Alienware x17 R2 P48E | |
| Razer Blade 14 Ryzen 9 6900HX | |
| Gigabyte A7 X1 | |
| MSI Stealth GS77 12UHS-083US | |
| Média Intel Core i9-12900HK (841 - 3504, n=15) | |
| AIDA64 / CPU Queen | |
| Alienware x17 R2 P48E | |
| Razer Blade 14 Ryzen 9 6900HX | |
| Gigabyte A7 X1 | |
| MSI Stealth GS77 12UHS-083US | |
| Média Intel Core i9-12900HK (60202 - 107161, n=15) | |
| AIDA64 / FPU SinJulia | |
| Razer Blade 14 Ryzen 9 6900HX | |
| Gigabyte A7 X1 | |
| Alienware x17 R2 P48E | |
| MSI Stealth GS77 12UHS-083US | |
| Média Intel Core i9-12900HK (3225 - 10402, n=15) | |
| AIDA64 / FPU Mandel | |
| Razer Blade 14 Ryzen 9 6900HX | |
| Gigabyte A7 X1 | |
| Alienware x17 R2 P48E | |
| Média Intel Core i9-12900HK (7417 - 34233, n=15) | |
| MSI Stealth GS77 12UHS-083US | |
| AIDA64 / CPU AES | |
| Razer Blade 14 Ryzen 9 6900HX | |
| Gigabyte A7 X1 | |
| Alienware x17 R2 P48E | |
| MSI Stealth GS77 12UHS-083US | |
| Média Intel Core i9-12900HK (32382 - 112498, n=15) | |
| AIDA64 / CPU ZLib | |
| Alienware x17 R2 P48E | |
| MSI Stealth GS77 12UHS-083US | |
| Média Intel Core i9-12900HK (314 - 1209, n=15) | |
| Razer Blade 14 Ryzen 9 6900HX | |
| Gigabyte A7 X1 | |
| AIDA64 / FP64 Ray-Trace | |
| Razer Blade 14 Ryzen 9 6900HX | |
| Gigabyte A7 X1 | |
| Alienware x17 R2 P48E | |
| Média Intel Core i9-12900HK (1501 - 7616, n=15) | |
| MSI Stealth GS77 12UHS-083US | |
| AIDA64 / CPU PhotoWorxx | |
| MSI Stealth GS77 12UHS-083US | |
| Média Intel Core i9-12900HK (24446 - 42462, n=15) | |
| Alienware x17 R2 P48E | |
| Razer Blade 14 Ryzen 9 6900HX | |
| Gigabyte A7 X1 | |
Desempenho do sistema
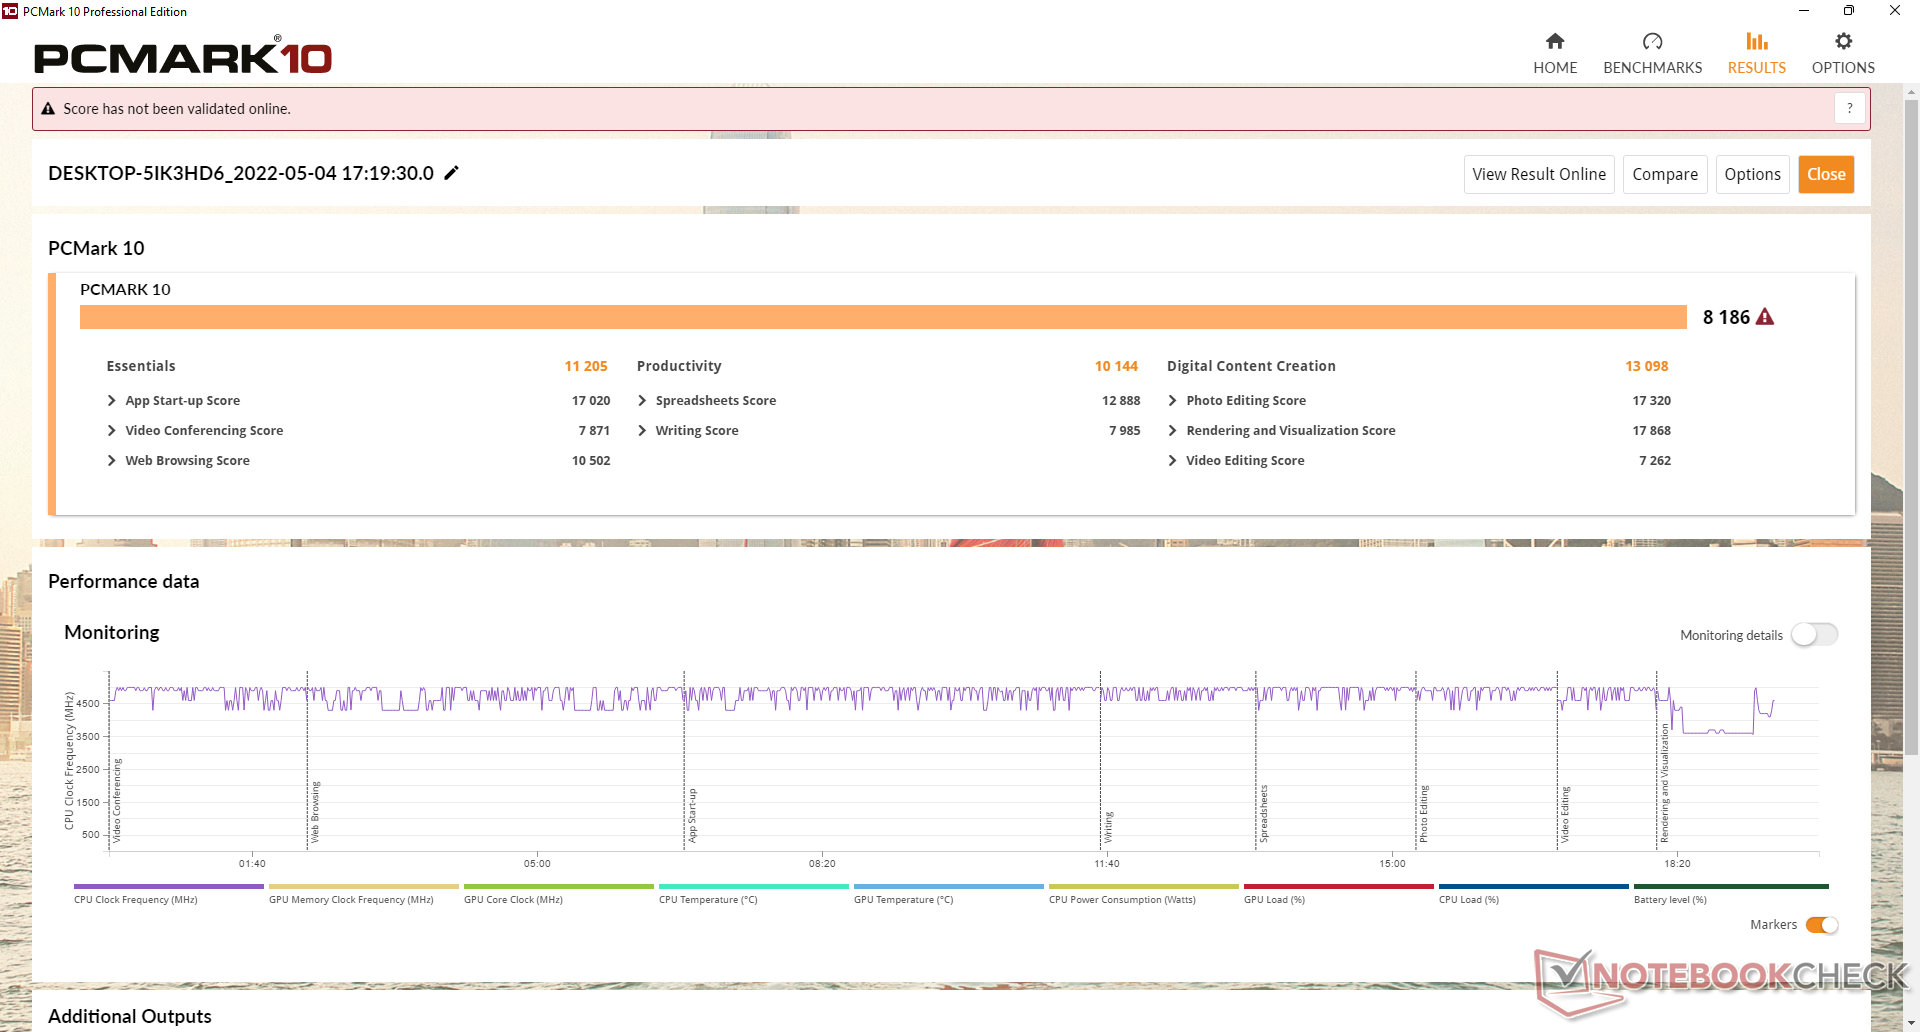
Os resultados da PCMark são consistentemente superiores ao que registramos no ano passado no x17 R1 por margens relativamente pequenas.
Vale notar que o laptop consome muita energia, mesmo quando em modo standby ou sleep mode. Somos capazes de registrar um consumo de quase 12 W quando em modo de espera em comparação com <2 W na maioria dos outros laptops. Além disso, os ventiladores em nossa unidade de teste às vezes estariam ativos mesmo quando em modo de espera e a unidade às vezes também teria problemas para acordar corretamente.
CrossMark: Overall | Productivity | Creativity | Responsiveness
| PCMark 10 / Score | |
| Alienware x17 R2 P48E | |
| Média Intel Core i9-12900HK, NVIDIA GeForce RTX 3080 Ti Laptop GPU (7149 - 8186, n=5) | |
| Alienware x17 RTX 3080 P48E | |
| MSI Stealth GS77 12UHS-083US | |
| MSI GT76 Titan DT 10SGS | |
| Asus ROG Zephyrus S17 GX703HSD | |
| Gigabyte A7 X1 | |
| PCMark 10 / Essentials | |
| Alienware x17 R2 P48E | |
| Média Intel Core i9-12900HK, NVIDIA GeForce RTX 3080 Ti Laptop GPU (9870 - 11205, n=5) | |
| Asus ROG Zephyrus S17 GX703HSD | |
| MSI GT76 Titan DT 10SGS | |
| MSI Stealth GS77 12UHS-083US | |
| Alienware x17 RTX 3080 P48E | |
| Gigabyte A7 X1 | |
| PCMark 10 / Productivity | |
| Alienware x17 R2 P48E | |
| Média Intel Core i9-12900HK, NVIDIA GeForce RTX 3080 Ti Laptop GPU (9173 - 10422, n=5) | |
| Alienware x17 RTX 3080 P48E | |
| MSI Stealth GS77 12UHS-083US | |
| Gigabyte A7 X1 | |
| Asus ROG Zephyrus S17 GX703HSD | |
| MSI GT76 Titan DT 10SGS | |
| PCMark 10 / Digital Content Creation | |
| Alienware x17 R2 P48E | |
| Média Intel Core i9-12900HK, NVIDIA GeForce RTX 3080 Ti Laptop GPU (10951 - 13098, n=5) | |
| MSI GT76 Titan DT 10SGS | |
| Alienware x17 RTX 3080 P48E | |
| MSI Stealth GS77 12UHS-083US | |
| Asus ROG Zephyrus S17 GX703HSD | |
| Gigabyte A7 X1 | |
| CrossMark / Overall | |
| Alienware x17 R2 P48E | |
| Média Intel Core i9-12900HK, NVIDIA GeForce RTX 3080 Ti Laptop GPU (970 - 2138, n=5) | |
| CrossMark / Productivity | |
| Alienware x17 R2 P48E | |
| Média Intel Core i9-12900HK, NVIDIA GeForce RTX 3080 Ti Laptop GPU (921 - 2038, n=5) | |
| CrossMark / Creativity | |
| Alienware x17 R2 P48E | |
| Média Intel Core i9-12900HK, NVIDIA GeForce RTX 3080 Ti Laptop GPU (1007 - 2210, n=5) | |
| CrossMark / Responsiveness | |
| Média Intel Core i9-12900HK, NVIDIA GeForce RTX 3080 Ti Laptop GPU (1012 - 2234, n=5) | |
| Alienware x17 R2 P48E | |
| PCMark 10 Score | 8186 pontos | |
Ajuda | ||
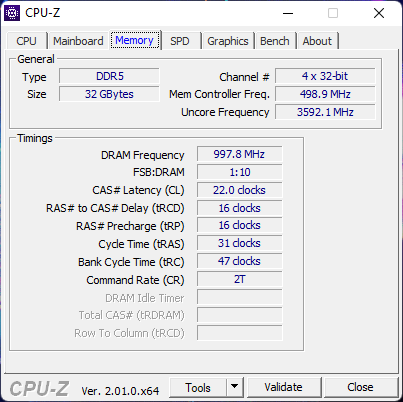
| AIDA64 / Memory Copy | |
| MSI Stealth GS77 12UHS-083US | |
| Média Intel Core i9-12900HK (42967 - 62959, n=15) | |
| Alienware x17 R2 P48E | |
| Gigabyte A7 X1 | |
| AIDA64 / Memory Read | |
| MSI Stealth GS77 12UHS-083US | |
| Média Intel Core i9-12900HK (44419 - 66989, n=15) | |
| Alienware x17 R2 P48E | |
| Gigabyte A7 X1 | |
| AIDA64 / Memory Write | |
| MSI Stealth GS77 12UHS-083US | |
| Média Intel Core i9-12900HK (42144 - 65268, n=15) | |
| Alienware x17 R2 P48E | |
| Gigabyte A7 X1 | |
| AIDA64 / Memory Latency | |
| Alienware x17 R2 P48E | |
| MSI Stealth GS77 12UHS-083US | |
| Gigabyte A7 X1 | |
| Média Intel Core i9-12900HK (79.9 - 109, n=15) | |
| Asus ROG Zephyrus S17 GX703HSD | |
| Alienware x17 RTX 3080 P48E | |
* ... menor é melhor
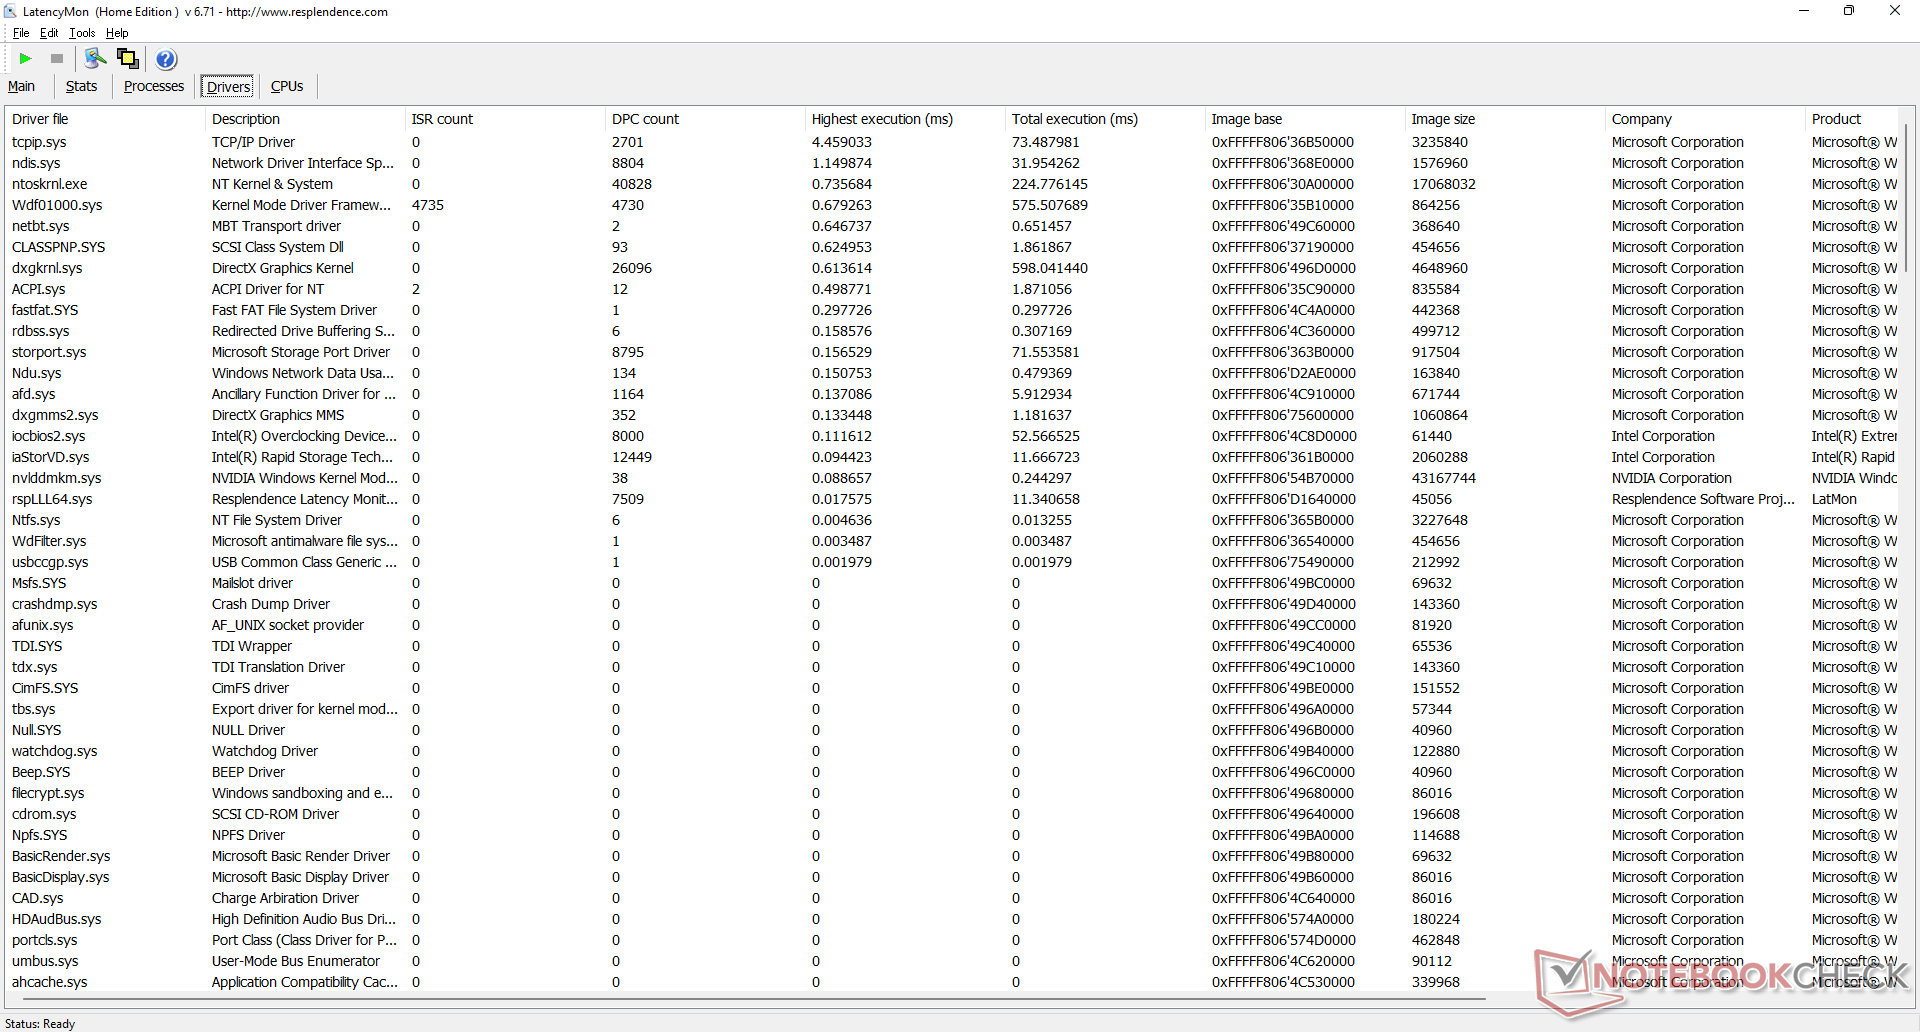
Latência do DPC
LatencyMon revela problemas de DPC ao abrir várias abas do navegador na página inicial. a reprodução de vídeo de 4K a 60 FPS é, de outra forma, suave e sem qualquer queda de quadros.

| DPC Latencies / LatencyMon - interrupt to process latency (max), Web, Youtube, Prime95 | |
| MSI GT76 Titan DT 10SGS | |
| Alienware x17 RTX 3080 P48E | |
| MSI Stealth GS77 12UHS-083US | |
| Asus ROG Zephyrus S17 GX703HSD | |
| Alienware x17 R2 P48E | |
| Gigabyte A7 X1 | |
* ... menor é melhor
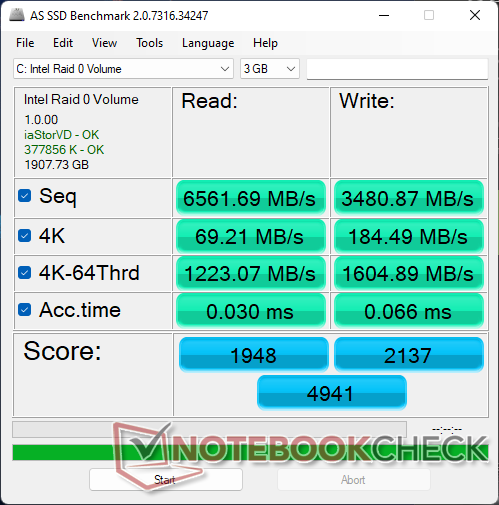
Dispositivos de armazenamento
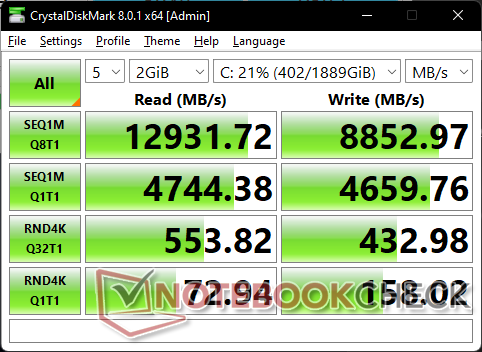

* ... menor é melhor
Disk Throttling: DiskSpd Read Loop, Queue Depth 8
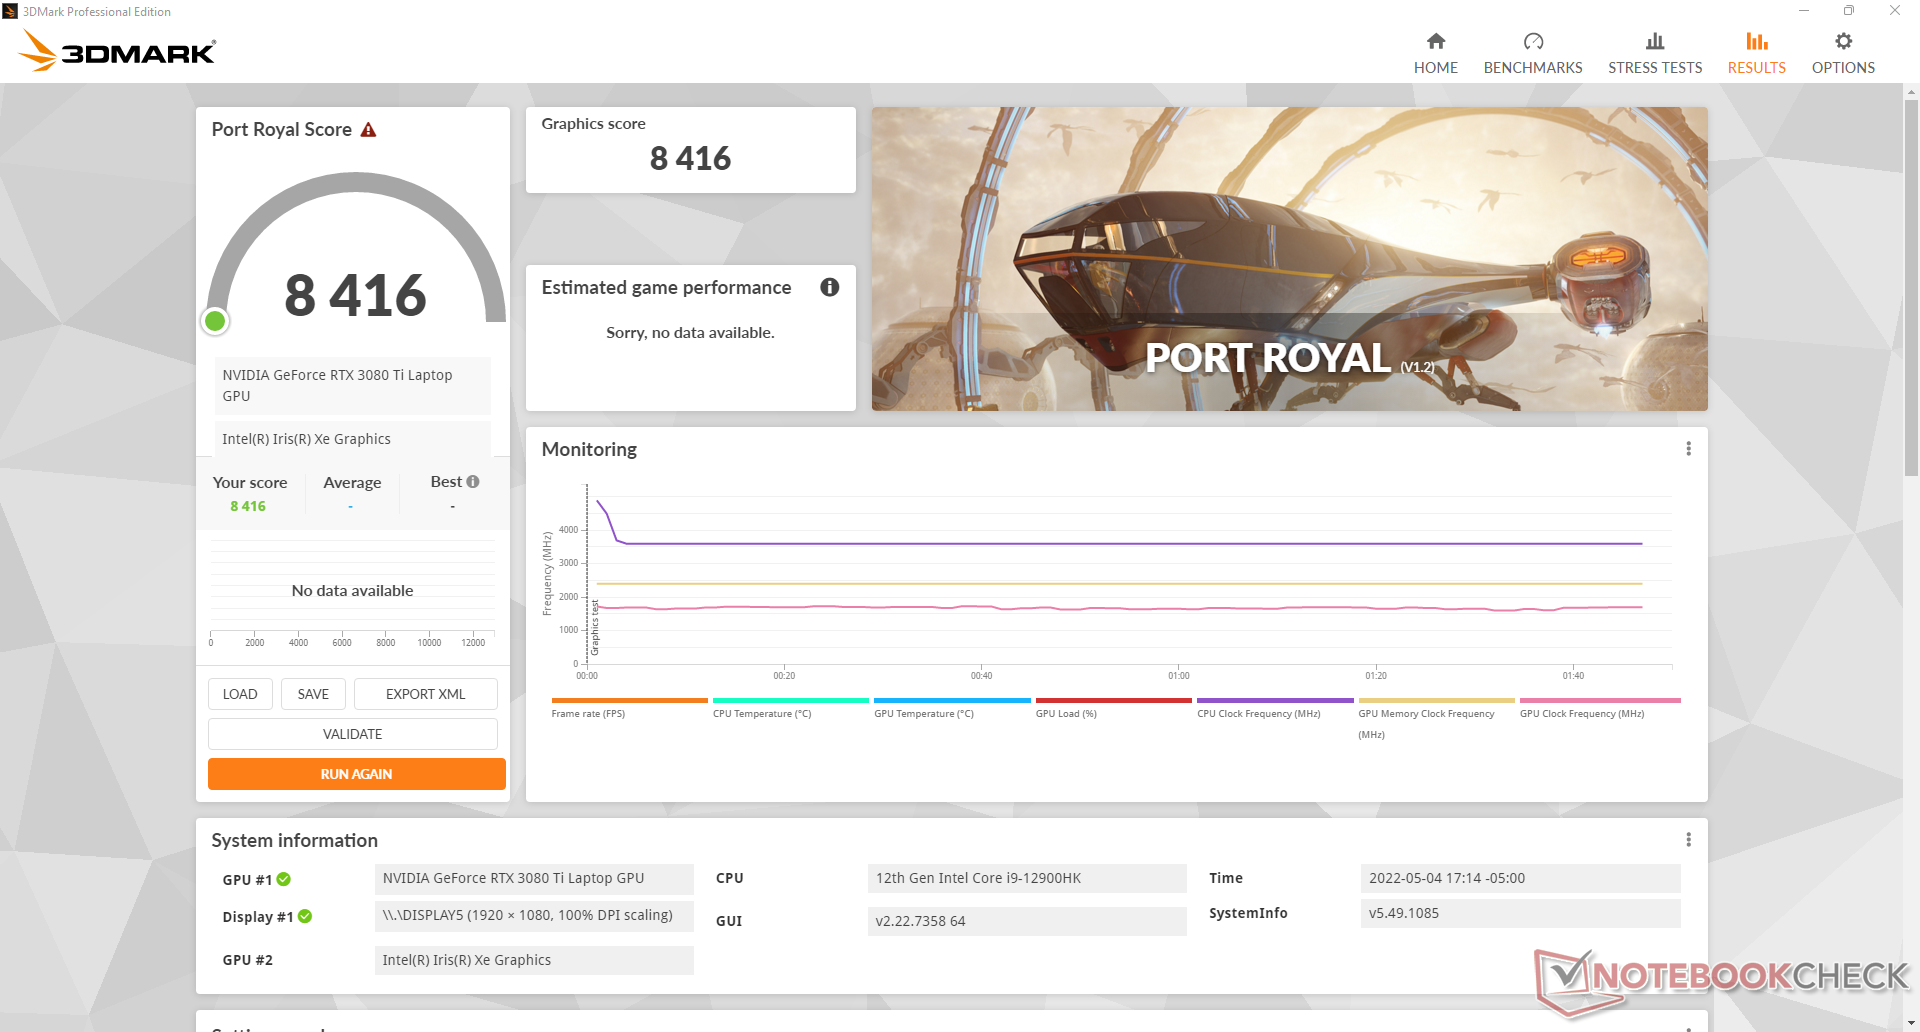
Desempenho da GPU
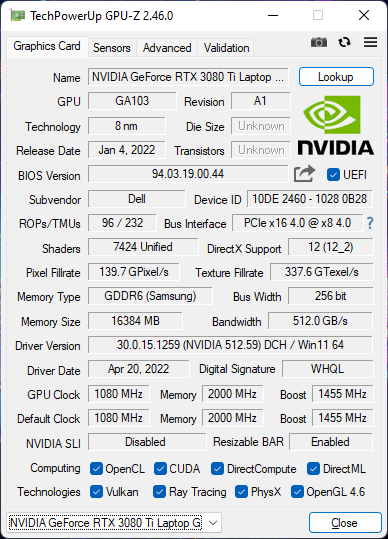
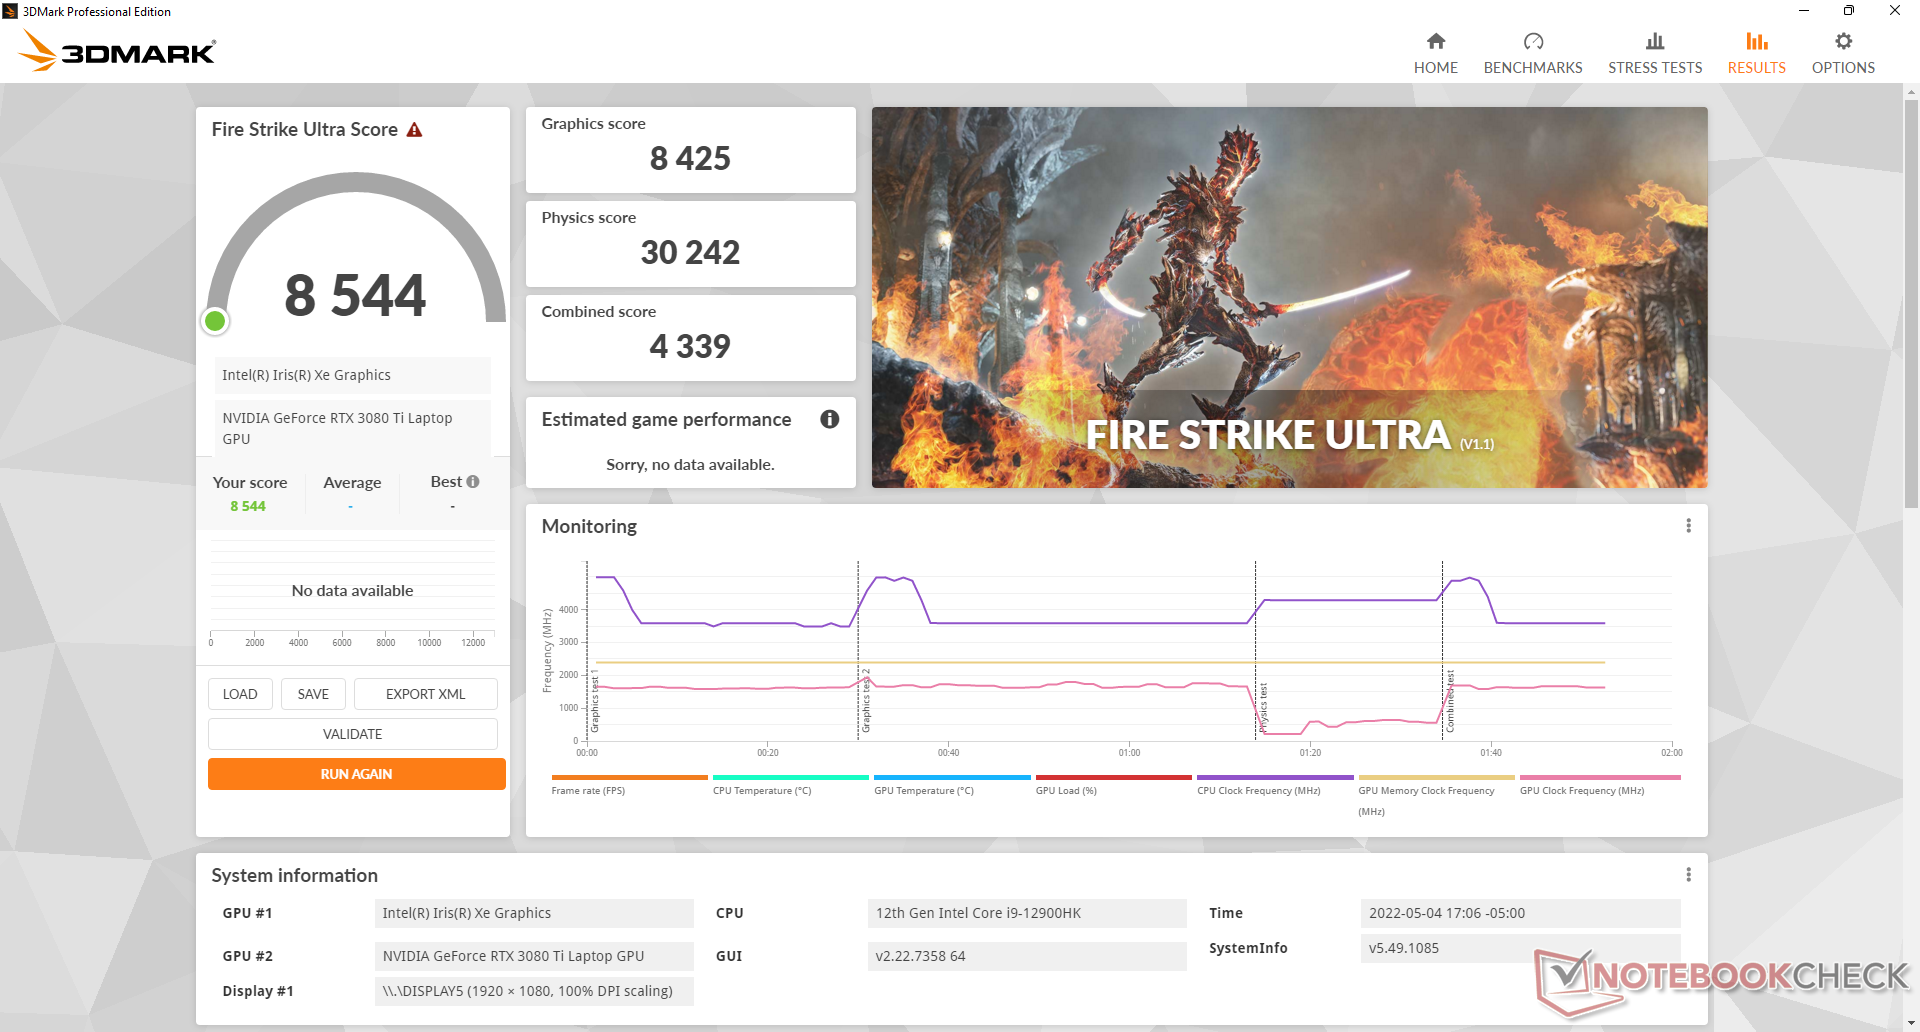
Com sua altíssima meta TGP de 175 W, o desempenho gráfico é um dos mais rápidos em qualquer laptop para jogos. O é um dos mais rápidos em qualquer laptop para jogos 2022 Lâmina Razer 15por exemplo, vem com o mesmo GeForce RTX 3080 Ti GPU, embora com uma meta inferior de 110 W TGP para um desempenho 25 a 30 por cento mais lento. Déficits similares podem ser observados ao comparar a GPU no Alienware com a mesma GPU no MSI GS77 também. Quando combinado com a CPU mais rápida que a média, os usuários podem esperar que as taxas de quadros sejam ligeiramente mais altas que a maioria dos outros laptops para jogos equipados com GeForce RTX 3080 gráficos.
O móvel RTX 3080 Ti em nosso Alienware x17 R2 é mais parecido com o desktop GeForce RTX 3070. A desktop RTX 3080 Ti ainda pode oferecer um desempenho quase 50% mais rápido do que nossa versão móvel Alienware.
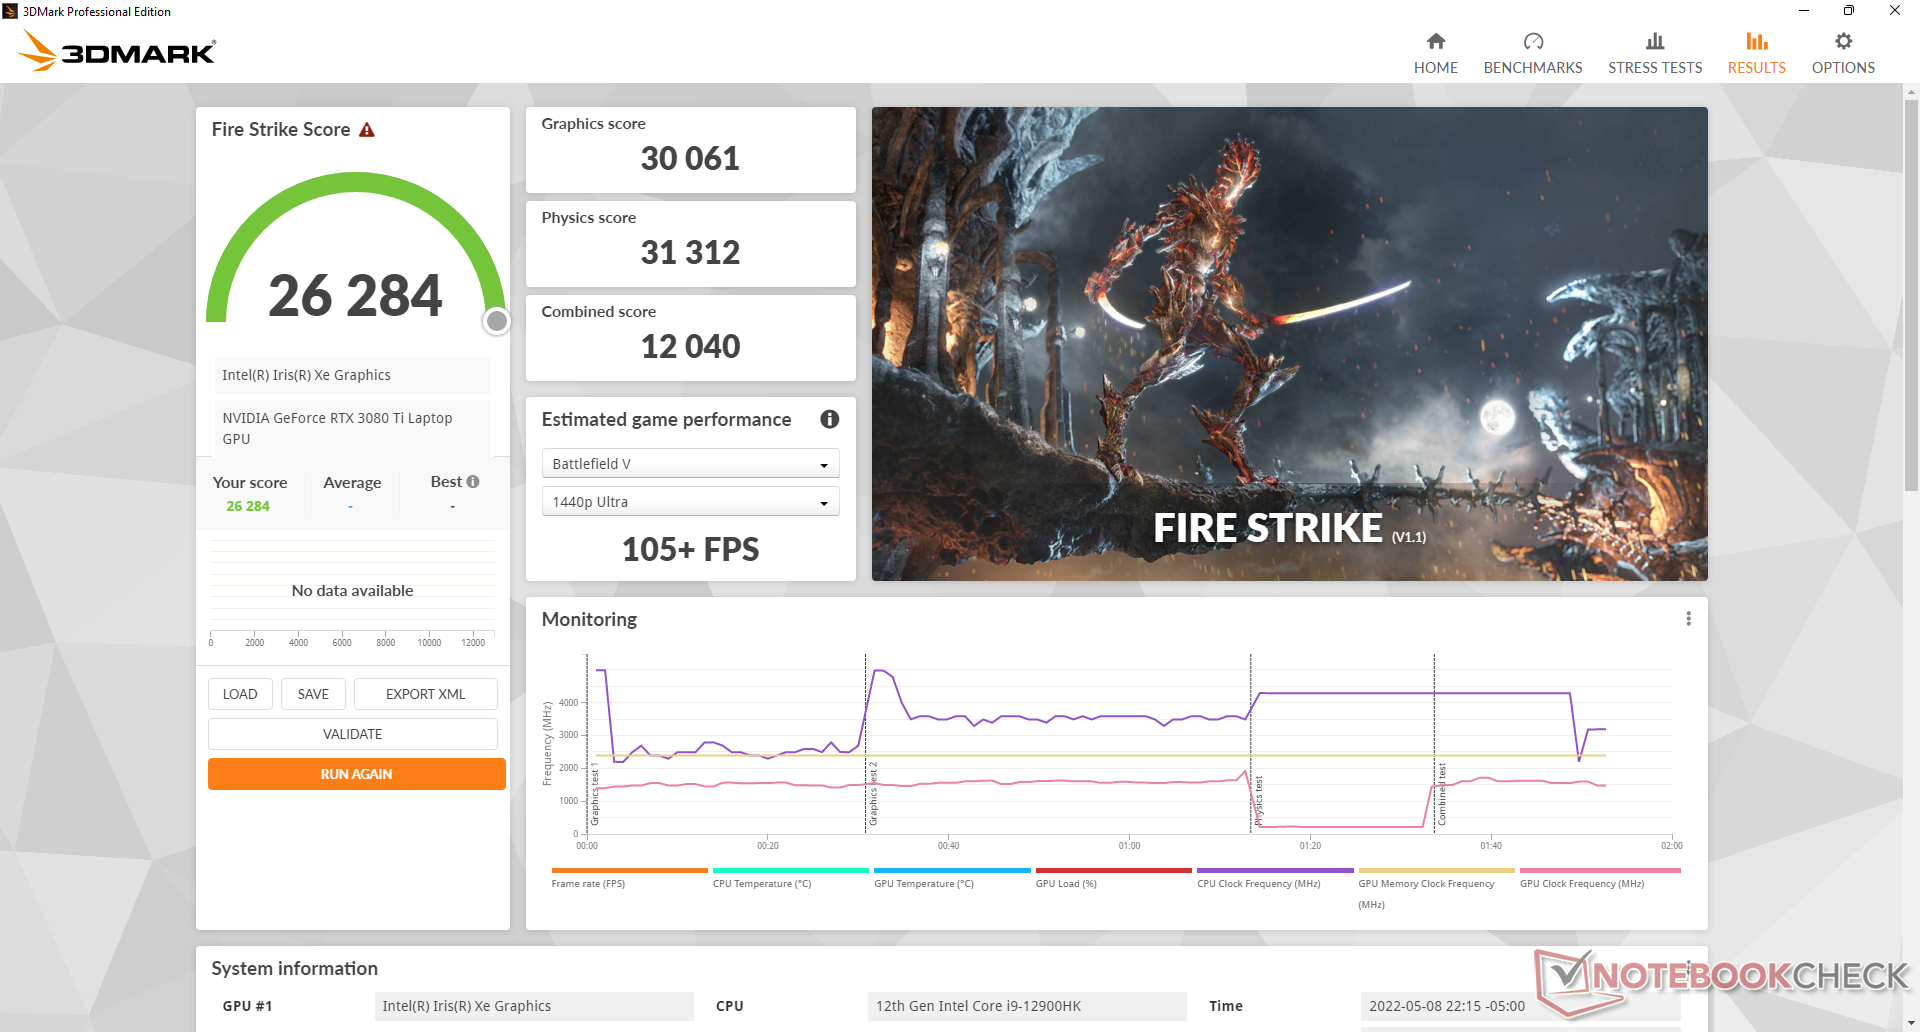
Tenha em mente que o desempenho gráfico é mais lento se for executado no modo balanceado ao invés do modo ventilador máximo. Fire Strike A pontuação gráfica seria cerca de 8% a 9% menor quando no perfil de potência Equilibrado.
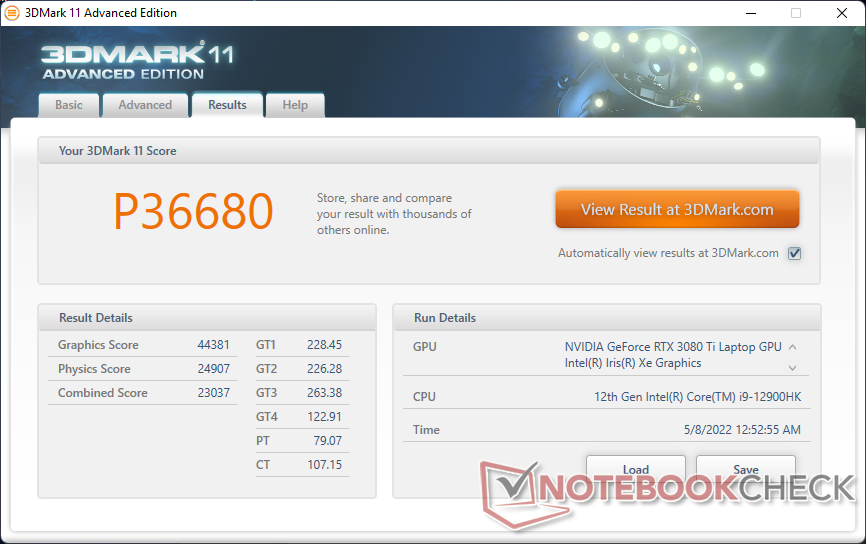
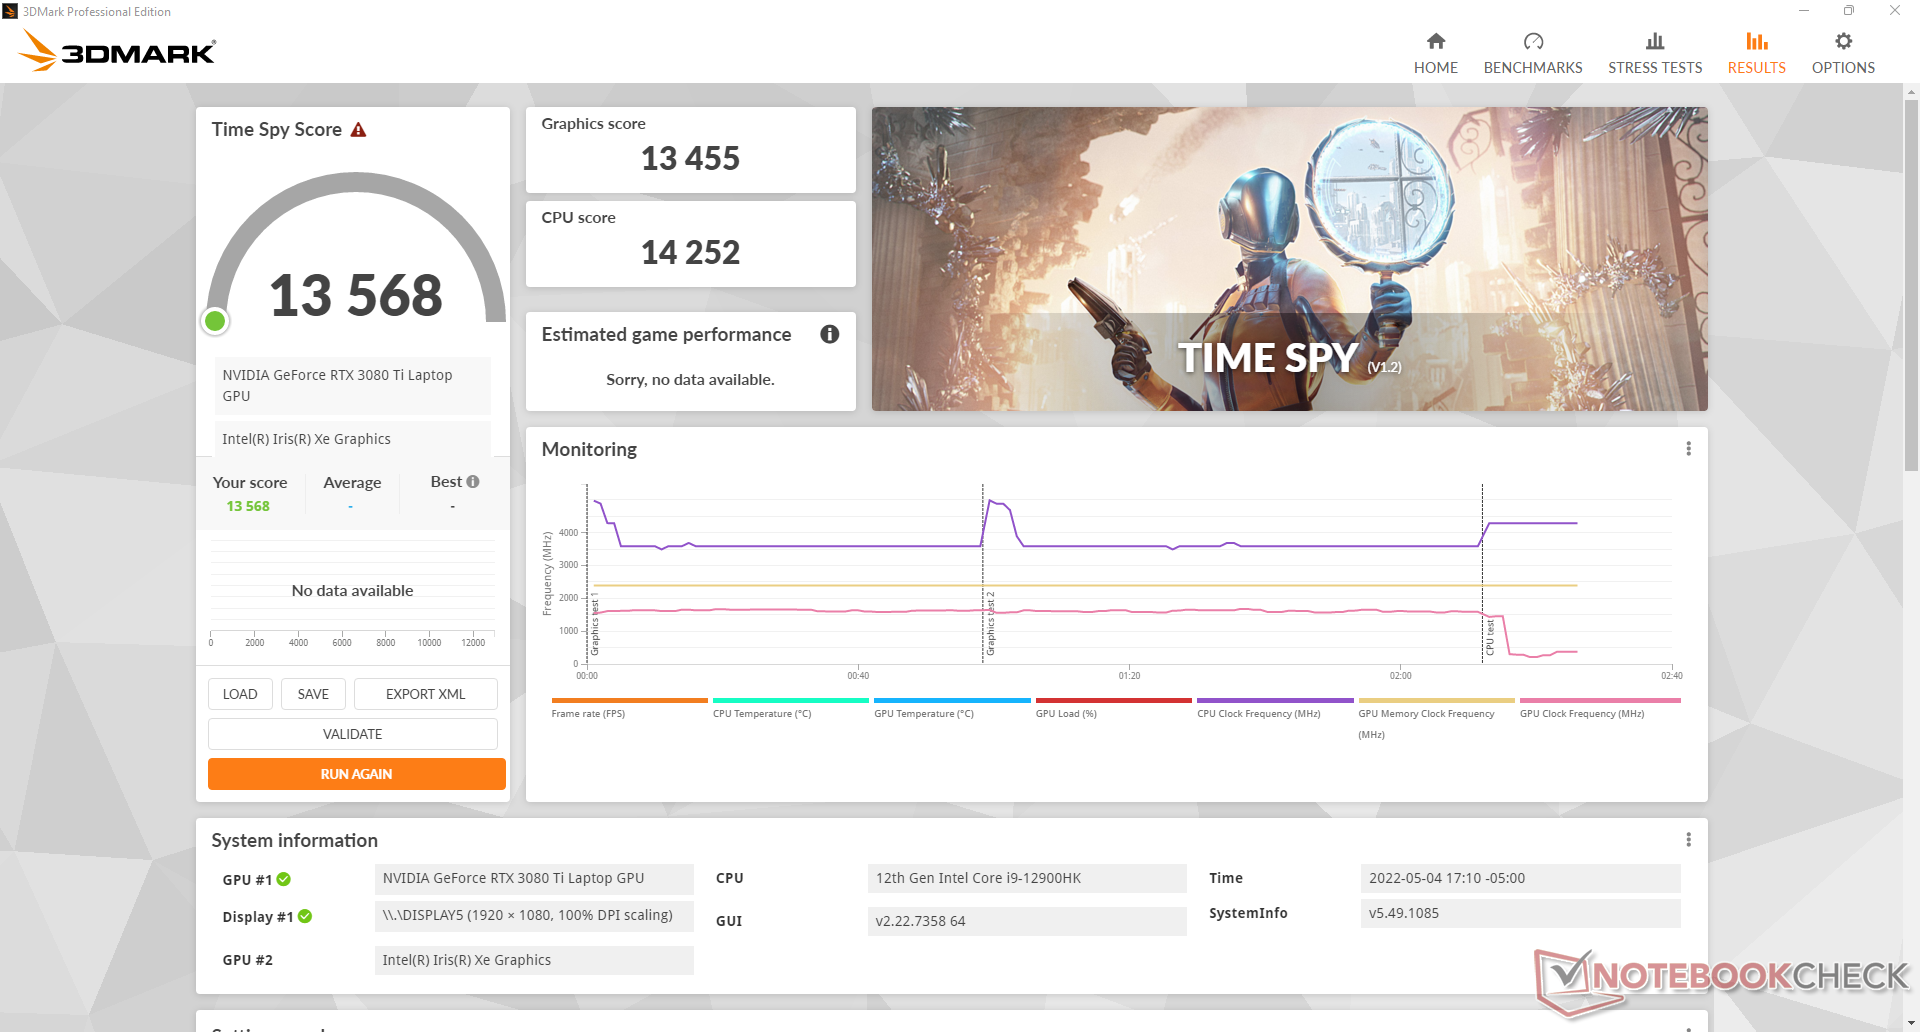
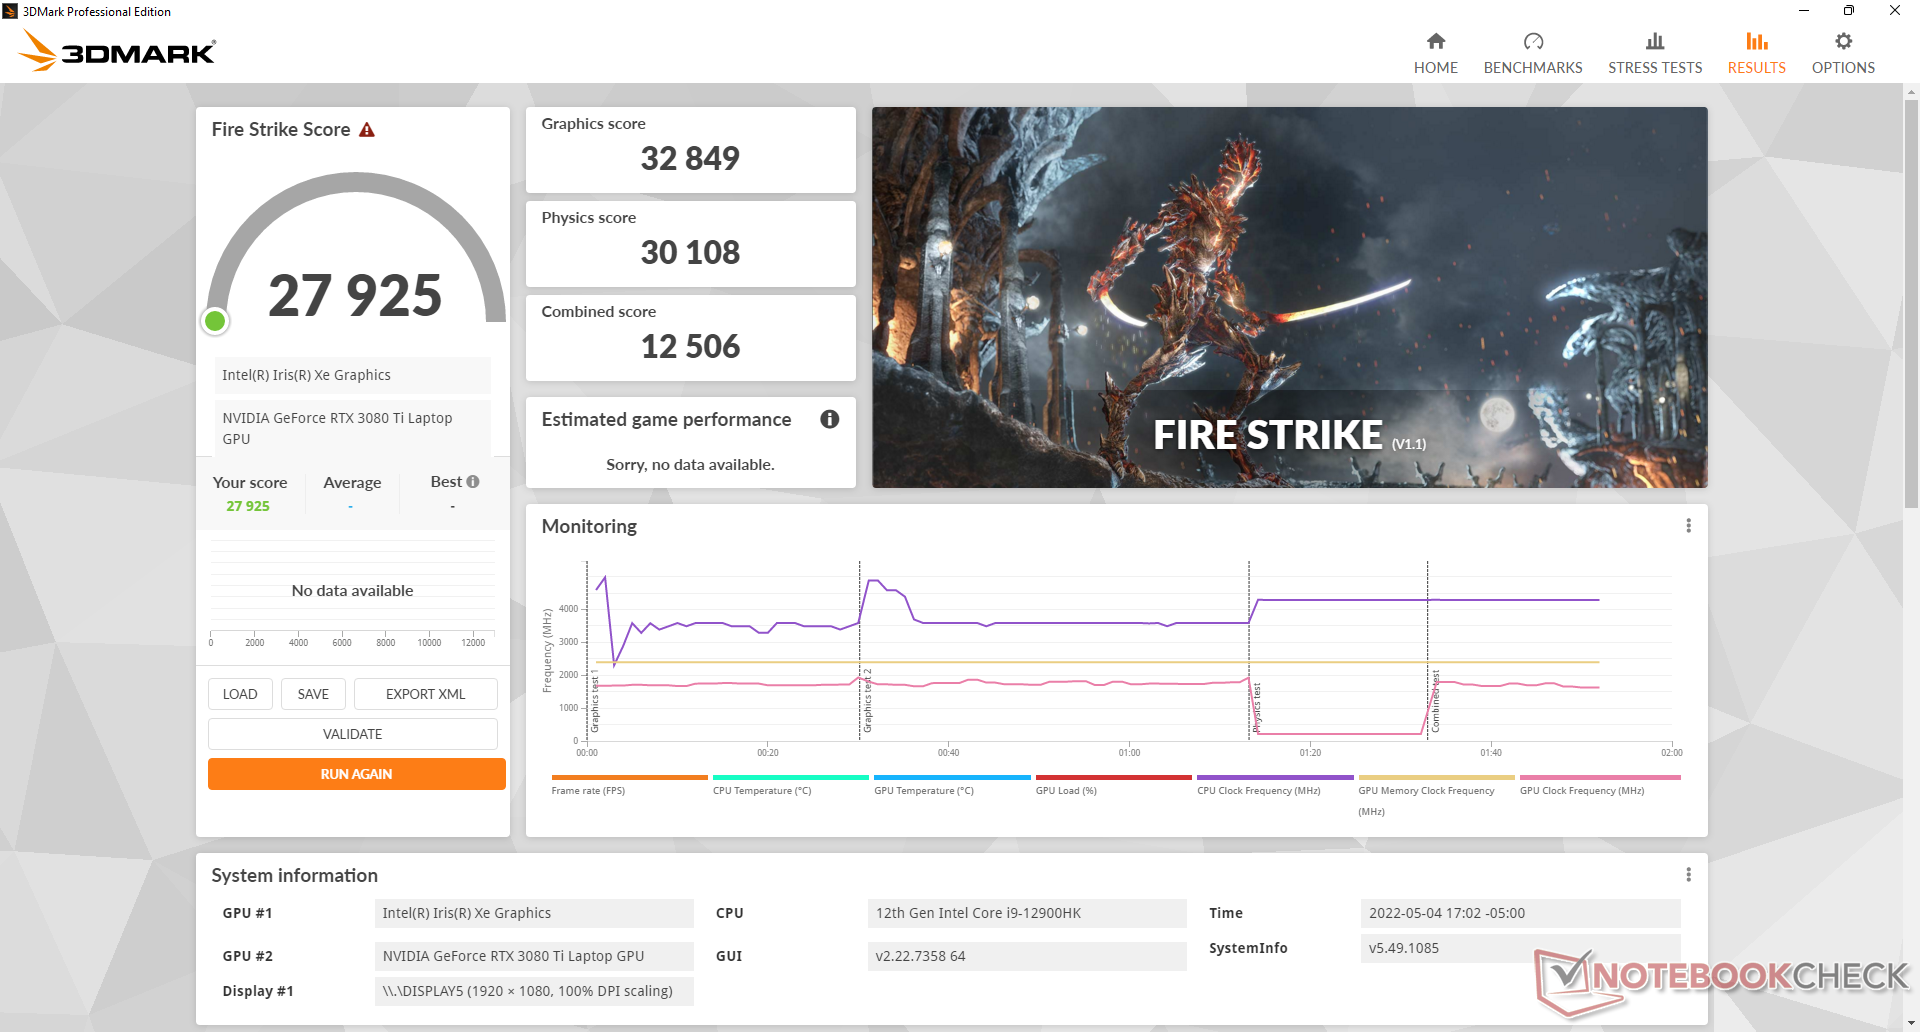
| 3DMark 11 Performance | 36680 pontos | |
| 3DMark Cloud Gate Standard Score | 63911 pontos | |
| 3DMark Fire Strike Score | 27925 pontos | |
| 3DMark Time Spy Score | 13568 pontos | |
Ajuda | ||
Witcher 3 FPS Chart
| baixo | média | alto | ultra | |
|---|---|---|---|---|
| GTA V (2015) | 187 | 185.1 | 180.8 | 126.3 |
| The Witcher 3 (2015) | 500.9 | 388.5 | 267.7 | 128 |
| Dota 2 Reborn (2015) | 186.1 | 172.3 | 166.6 | 158.9 |
| Final Fantasy XV Benchmark (2018) | 215 | 167.8 | 127.8 | |
| X-Plane 11.11 (2018) | 161 | 143.9 | 112.9 | |
| Strange Brigade (2018) | 474 | 300 | 243 | 213 |
| Cyberpunk 2077 1.6 (2022) | 167.7 | 142 | 116.2 | 115.7 |
Emissões
Ruído do sistema
O ruído dos ventiladores depende das configurações do Centro de Comando de Alienígenas. Os ventiladores do Alienware tendem a pulsar freqüentemente quando em modo Balanceado ou superior e, portanto, o modo Silencioso é recomendado ao navegar, enviar por e-mail ou streaming. Nossa unidade raramente ultrapassaria 32 dB(A) quando executando cargas tão pouco exigentes para ser notada, mas não incomodativa.
Ao jogar no modo Balanceado, o ruído do ventilador estabilizaria em torno de 43,3 dB(A) contra 52,5 dB(A) se no modo Ventilador máximo. Os usuários podem querer jogar no modo Equilibrado para o ruído do ventilador significativamente mais silencioso, apesar do supracitado déficit de desempenho que isso implica.
Barulho
| Ocioso |
| 23.1 / 23.1 / 23.1 dB |
| Carga |
| 31.9 / 52.5 dB |
 | ||
30 dB silencioso 40 dB(A) audível 50 dB(A) ruidosamente alto |
||
min: | ||
| Alienware x17 R2 P48E GeForce RTX 3080 Ti Laptop GPU, i9-12900HK, 2x Samsung PM9A1 1TB (RAID 0) | Alienware x17 RTX 3080 P48E GeForce RTX 3080 Laptop GPU, i7-11800H, 2x WDC PC SN730 SDBPNTY-1T00 (RAID 0) | Asus ROG Zephyrus S17 GX703HSD GeForce RTX 3080 Laptop GPU, i9-11900H, Samsung PM9A1 MZVL22T0HBLB | MSI Stealth GS77 12UHS-083US GeForce RTX 3080 Ti Laptop GPU, i7-12700H, Micron 3400 1TB MTFDKBA1T0TFH | MSI GT76 Titan DT 10SGS GeForce RTX 2080 Super Mobile, i9-10900K, 2x WDC PC SN730 SDBPNTY-1T00 (RAID 0) | Gigabyte A7 X1 GeForce RTX 3070 Laptop GPU, R9 5900HX, ESR512GTLCG-EAC-4 | |
|---|---|---|---|---|---|---|
| Noise | -7% | -2% | -8% | -18% | -28% | |
| desligado / ambiente * (dB) | 22.7 | 24.9 -10% | 23 -1% | 24.5 -8% | 26.4 -16% | 24 -6% |
| Idle Minimum * (dB) | 23.1 | 24.9 -8% | 23 -0% | 24.5 -6% | 27.5 -19% | 25 -8% |
| Idle Average * (dB) | 23.1 | 24.9 -8% | 23 -0% | 24.5 -6% | 27.5 -19% | 29 -26% |
| Idle Maximum * (dB) | 23.1 | 29.6 -28% | 23 -0% | 30.8 -33% | 29.8 -29% | 35 -52% |
| Load Average * (dB) | 31.9 | 31.1 3% | 41 -29% | 34.6 -8% | 30.9 3% | 58 -82% |
| Witcher 3 ultra * (dB) | 52.5 | 49.7 5% | 45 14% | 46.2 12% | 60.7 -16% | 57 -9% |
| Load Maximum * (dB) | 52.5 | 54.8 -4% | 52 1% | 56.8 -8% | 66.6 -27% | 59 -12% |
* ... menor é melhor
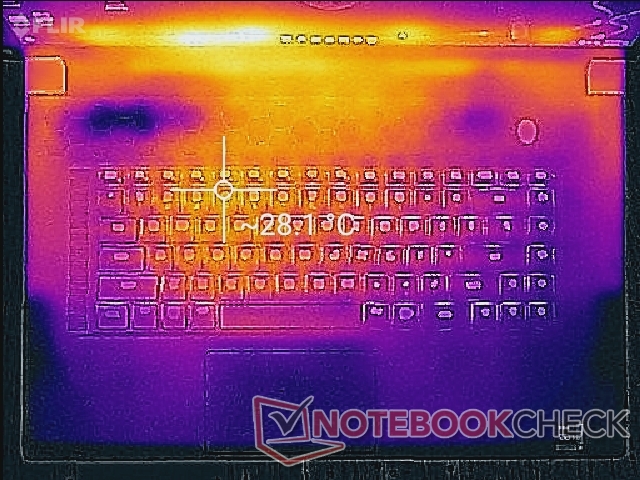
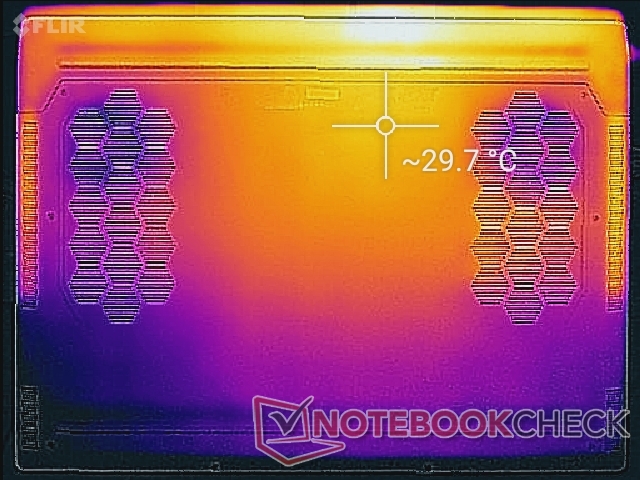
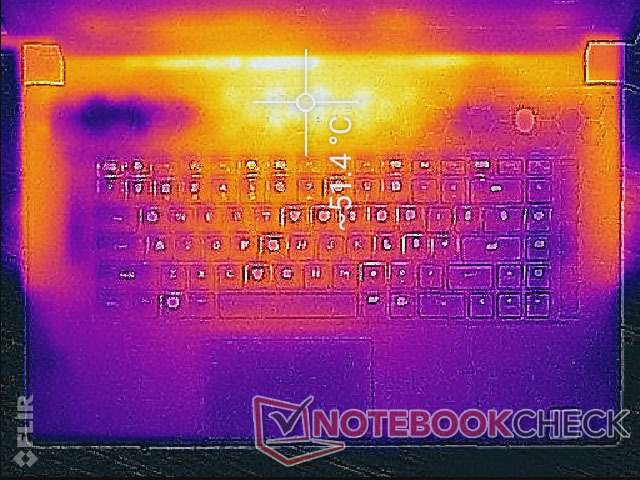
Temperatura
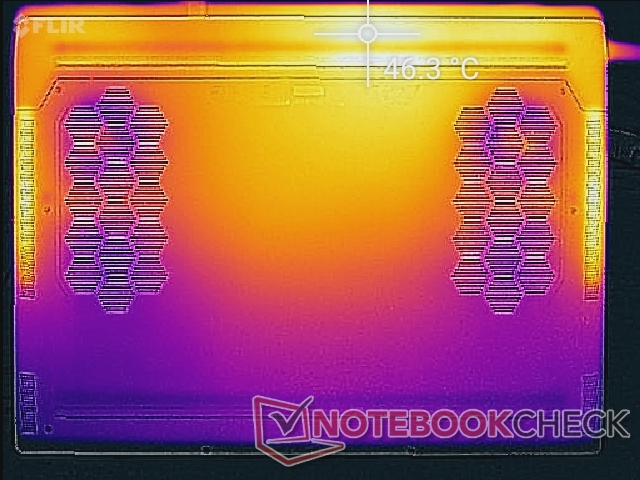
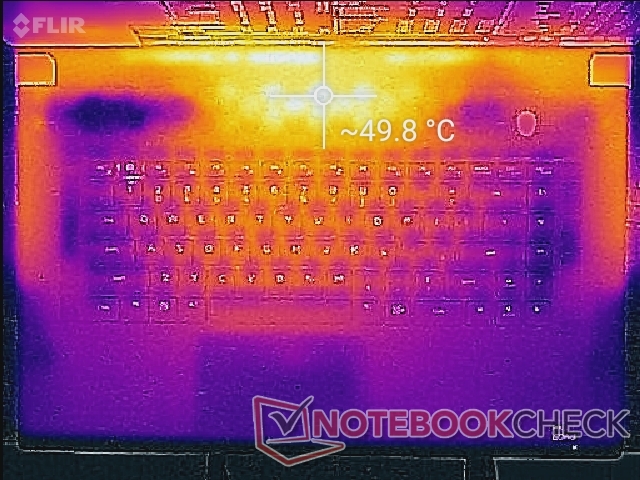
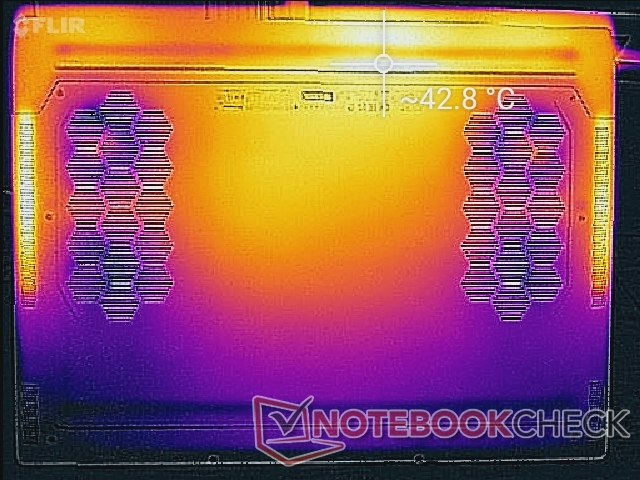
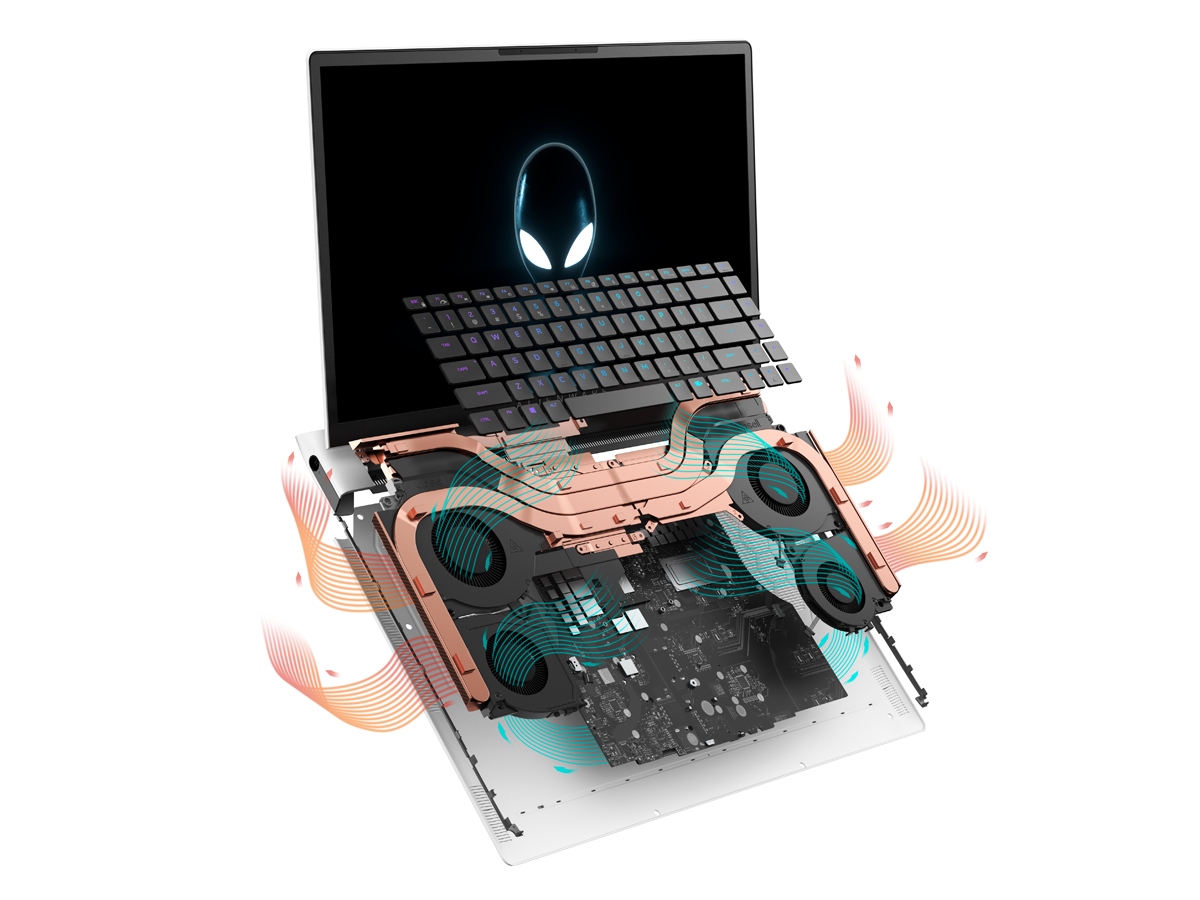
As temperaturas de superfície são geralmente mais frias do que esperávamos, dados os níveis extremos de desempenho que a Dell está visando com um design tão fino. Os pontos quentes podem atingir mais de 45 C ou 50 C quando a carga é alta, mas estas áreas estão na parte traseira do chassi e longe das teclas do teclado e dos apoios das palmas. O sistema é quente, mas nunca desconfortável, quando se joga.
Tenha em mente que há muitas grades de ventilação em quase todos os lados do sistema. Com as temperaturas da CPU chegando tão altas quanto quando sob carga, será importante não bloquear nenhuma abertura sempre que possível.
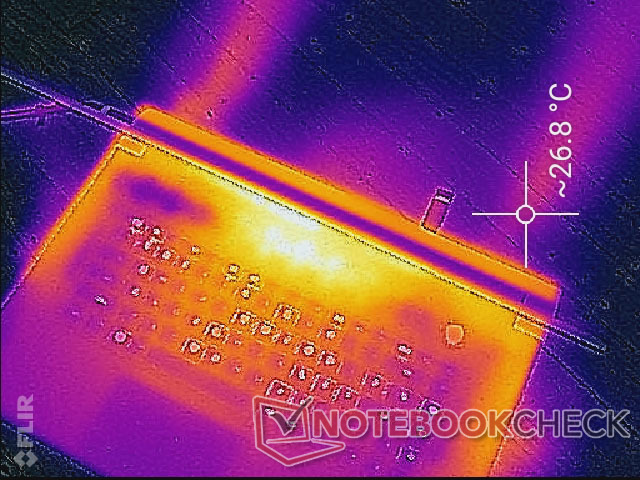
(-) A temperatura máxima no lado superior é 49.6 °C / 121 F, em comparação com a média de 40.4 °C / 105 F , variando de 21.2 a 68.8 °C para a classe Gaming.
(±) A parte inferior aquece até um máximo de 42.4 °C / 108 F, em comparação com a média de 43.2 °C / 110 F
(+) Em uso inativo, a temperatura média para o lado superior é 26.1 °C / 79 F, em comparação com a média do dispositivo de 33.9 °C / ### class_avg_f### F.
(±) Jogando The Witcher 3, a temperatura média para o lado superior é 34.7 °C / 94 F, em comparação com a média do dispositivo de 33.9 °C / ## #class_avg_f### F.
(+) Os apoios para as mãos e o touchpad são mais frios que a temperatura da pele, com um máximo de 29.2 °C / 84.6 F e, portanto, são frios ao toque.
(±) A temperatura média da área do apoio para as mãos de dispositivos semelhantes foi 28.8 °C / 83.8 F (-0.4 °C / -0.8 F).
| Alienware x17 R2 P48E Intel Core i9-12900HK, NVIDIA GeForce RTX 3080 Ti Laptop GPU | Alienware x17 RTX 3080 P48E Intel Core i7-11800H, NVIDIA GeForce RTX 3080 Laptop GPU | Asus ROG Zephyrus S17 GX703HSD Intel Core i9-11900H, NVIDIA GeForce RTX 3080 Laptop GPU | MSI Stealth GS77 12UHS-083US Intel Core i7-12700H, NVIDIA GeForce RTX 3080 Ti Laptop GPU | MSI GT76 Titan DT 10SGS Intel Core i9-10900K, NVIDIA GeForce RTX 2080 Super Mobile | Gigabyte A7 X1 AMD Ryzen 9 5900HX, NVIDIA GeForce RTX 3070 Laptop GPU | |
|---|---|---|---|---|---|---|
| Heat | -14% | -18% | -16% | 7% | 2% | |
| Maximum Upper Side * (°C) | 49.6 | 58.4 -18% | 59 -19% | 50.6 -2% | 36.4 27% | 44 11% |
| Maximum Bottom * (°C) | 42.4 | 49 -16% | 53 -25% | 59.6 -41% | 43 -1% | 49 -16% |
| Idle Upper Side * (°C) | 29.2 | 33.6 -15% | 35 -20% | 30 -3% | 28 4% | 27 8% |
| Idle Bottom * (°C) | 32 | 34.6 -8% | 35 -9% | 37.4 -17% | 33.4 -4% | 30 6% |
* ... menor é melhor
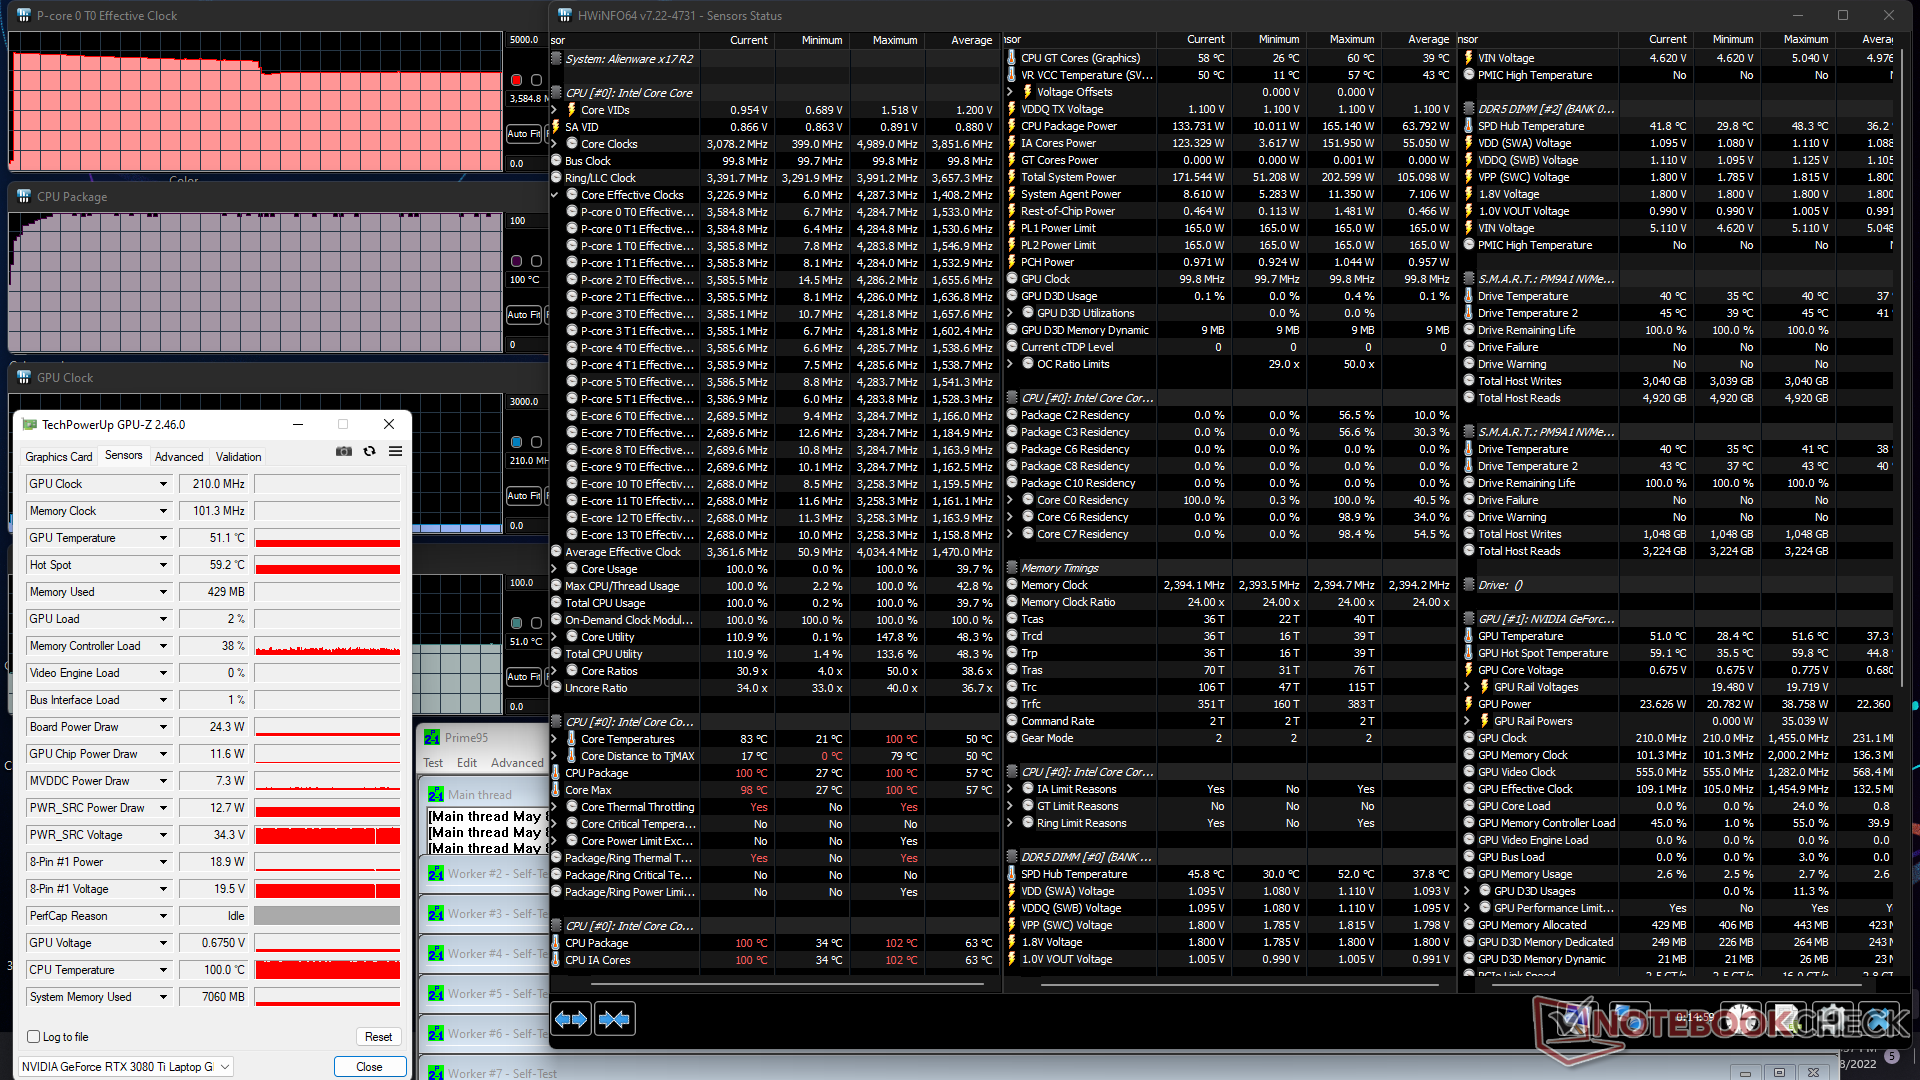
Teste de estresse
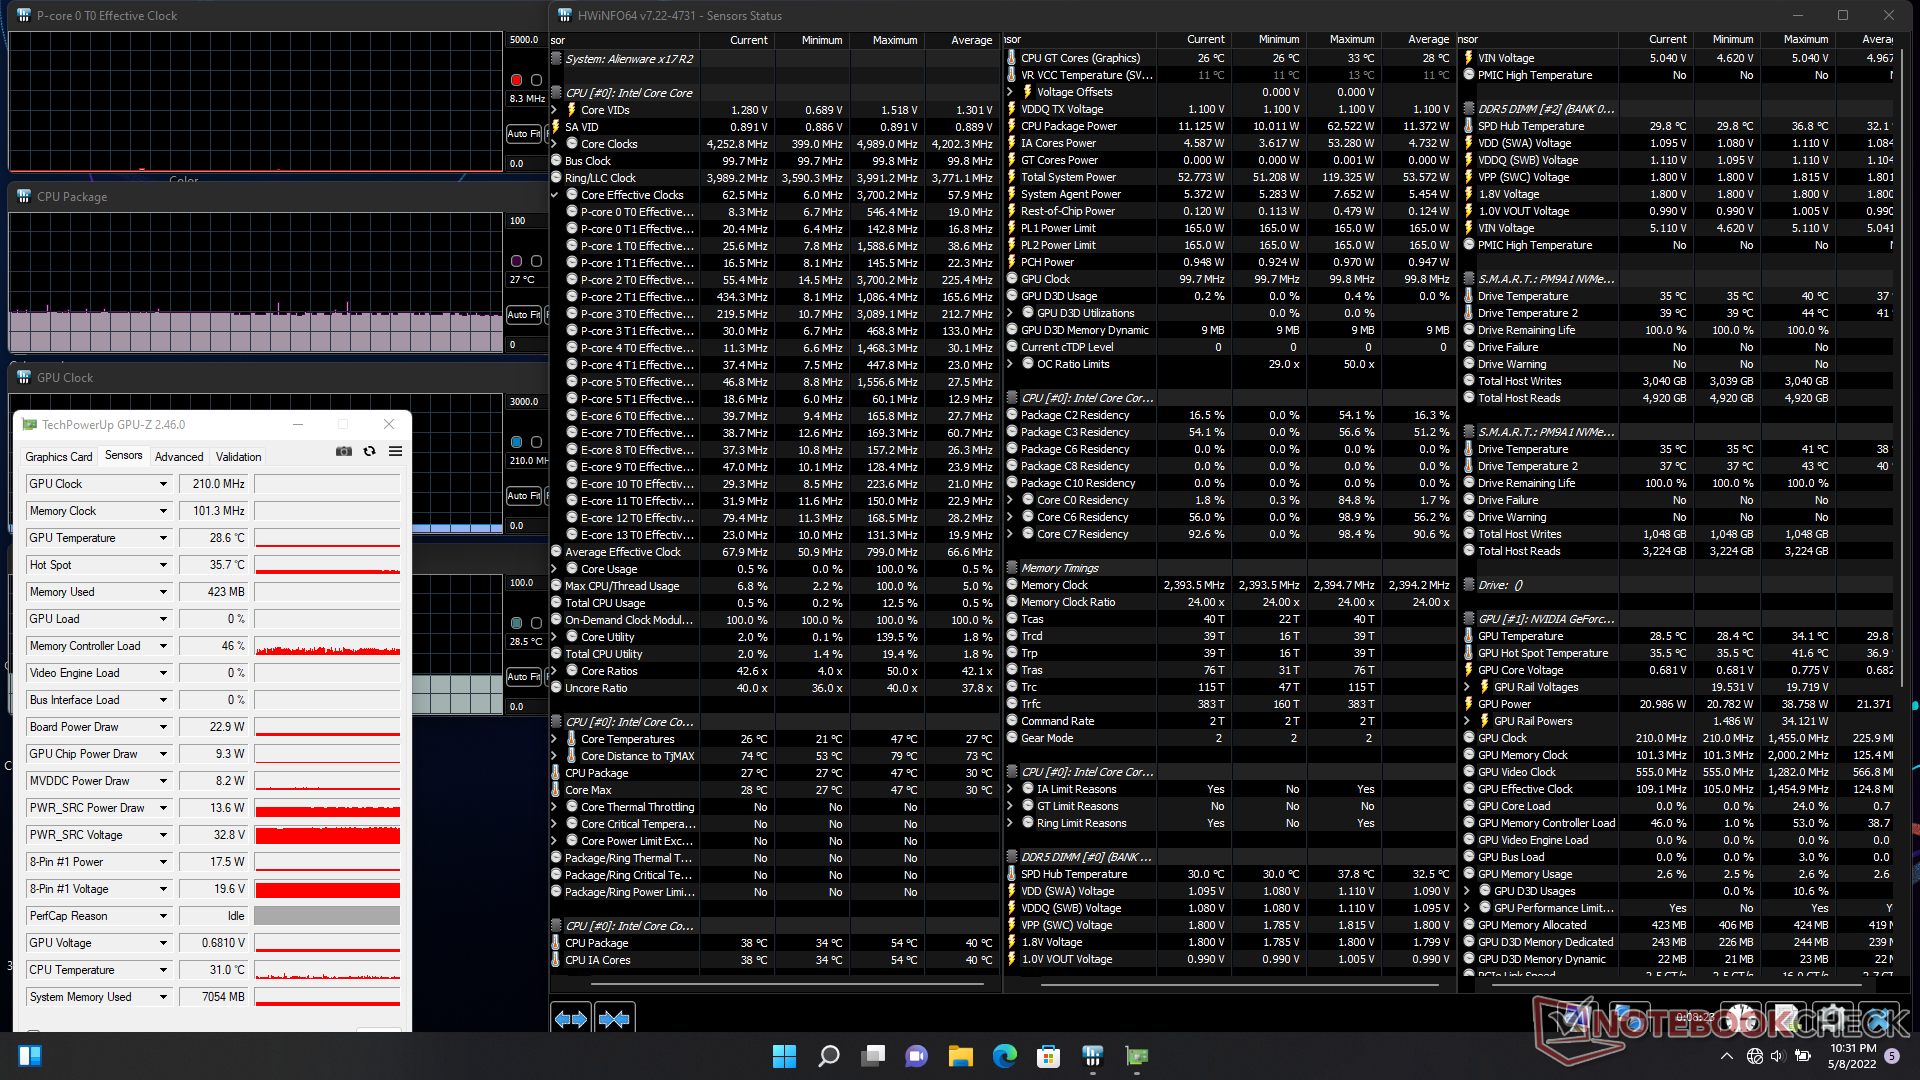
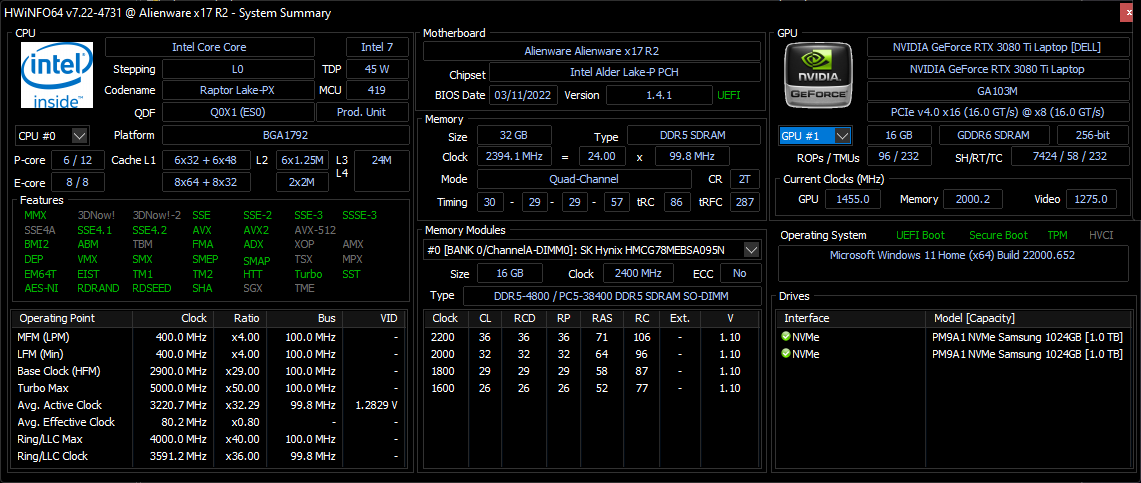
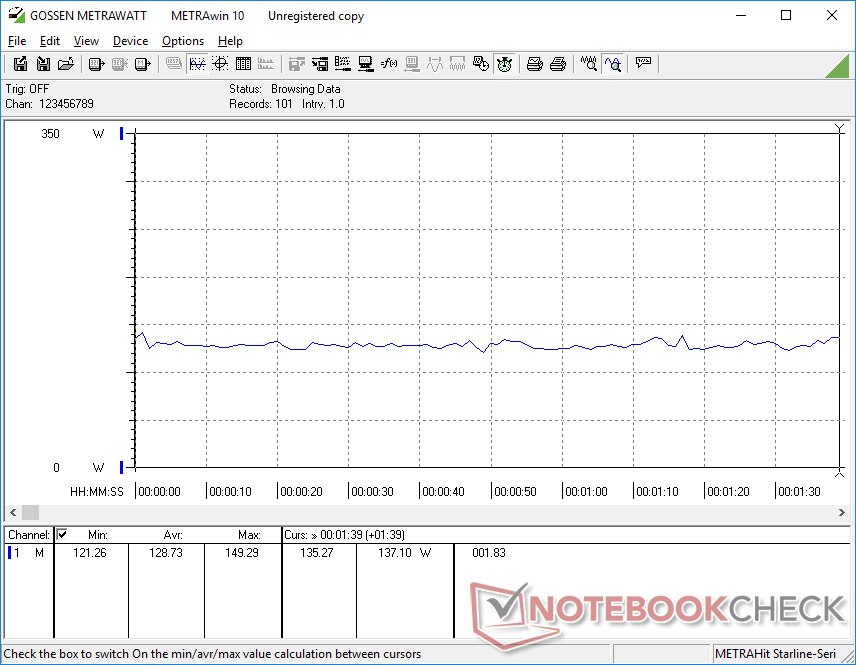
Ao rodar Prime95, as taxas de relógio da CPU aumentariam para 4,3 GHz por apenas alguns segundos antes de atingir uma temperatura central de 100 C. As taxas de relógio eventualmente se estabilizariam em 3,6 GHz, mantendo uma temperatura central logo abaixo de 100 C. Enquanto isso, o consumo de energia do pacote da CPU chegaria a 165 W durante o início do teste antes de se estabilizar em 134 W devido a limitações térmicas. É claro que a CPU está funcionando o mais rápido possível e como ela pode dar os limites da solução de resfriamento Alienware. Em comparação, o Core i7-12700H no MSI GS77 se estabilizaria a uma faixa mais lenta de 2,7 a 3 GHz quando sob condições similares.
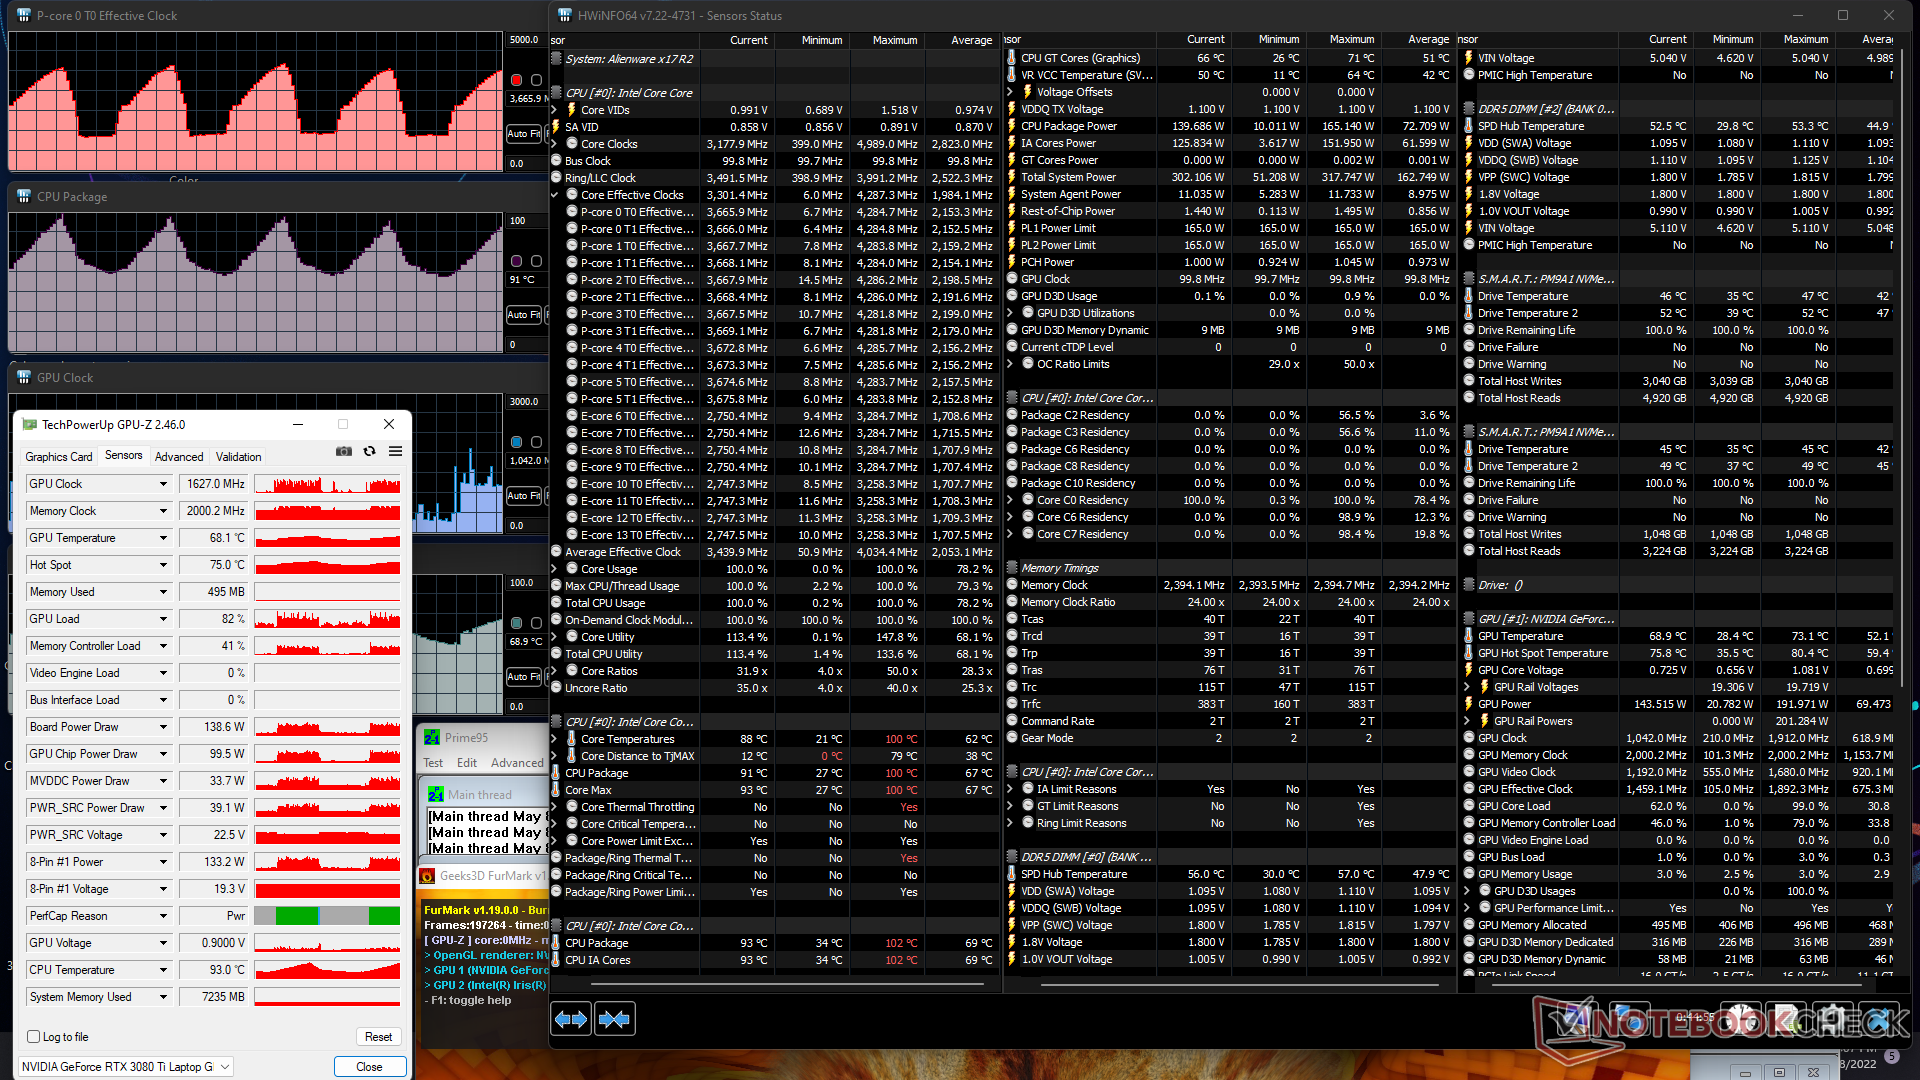
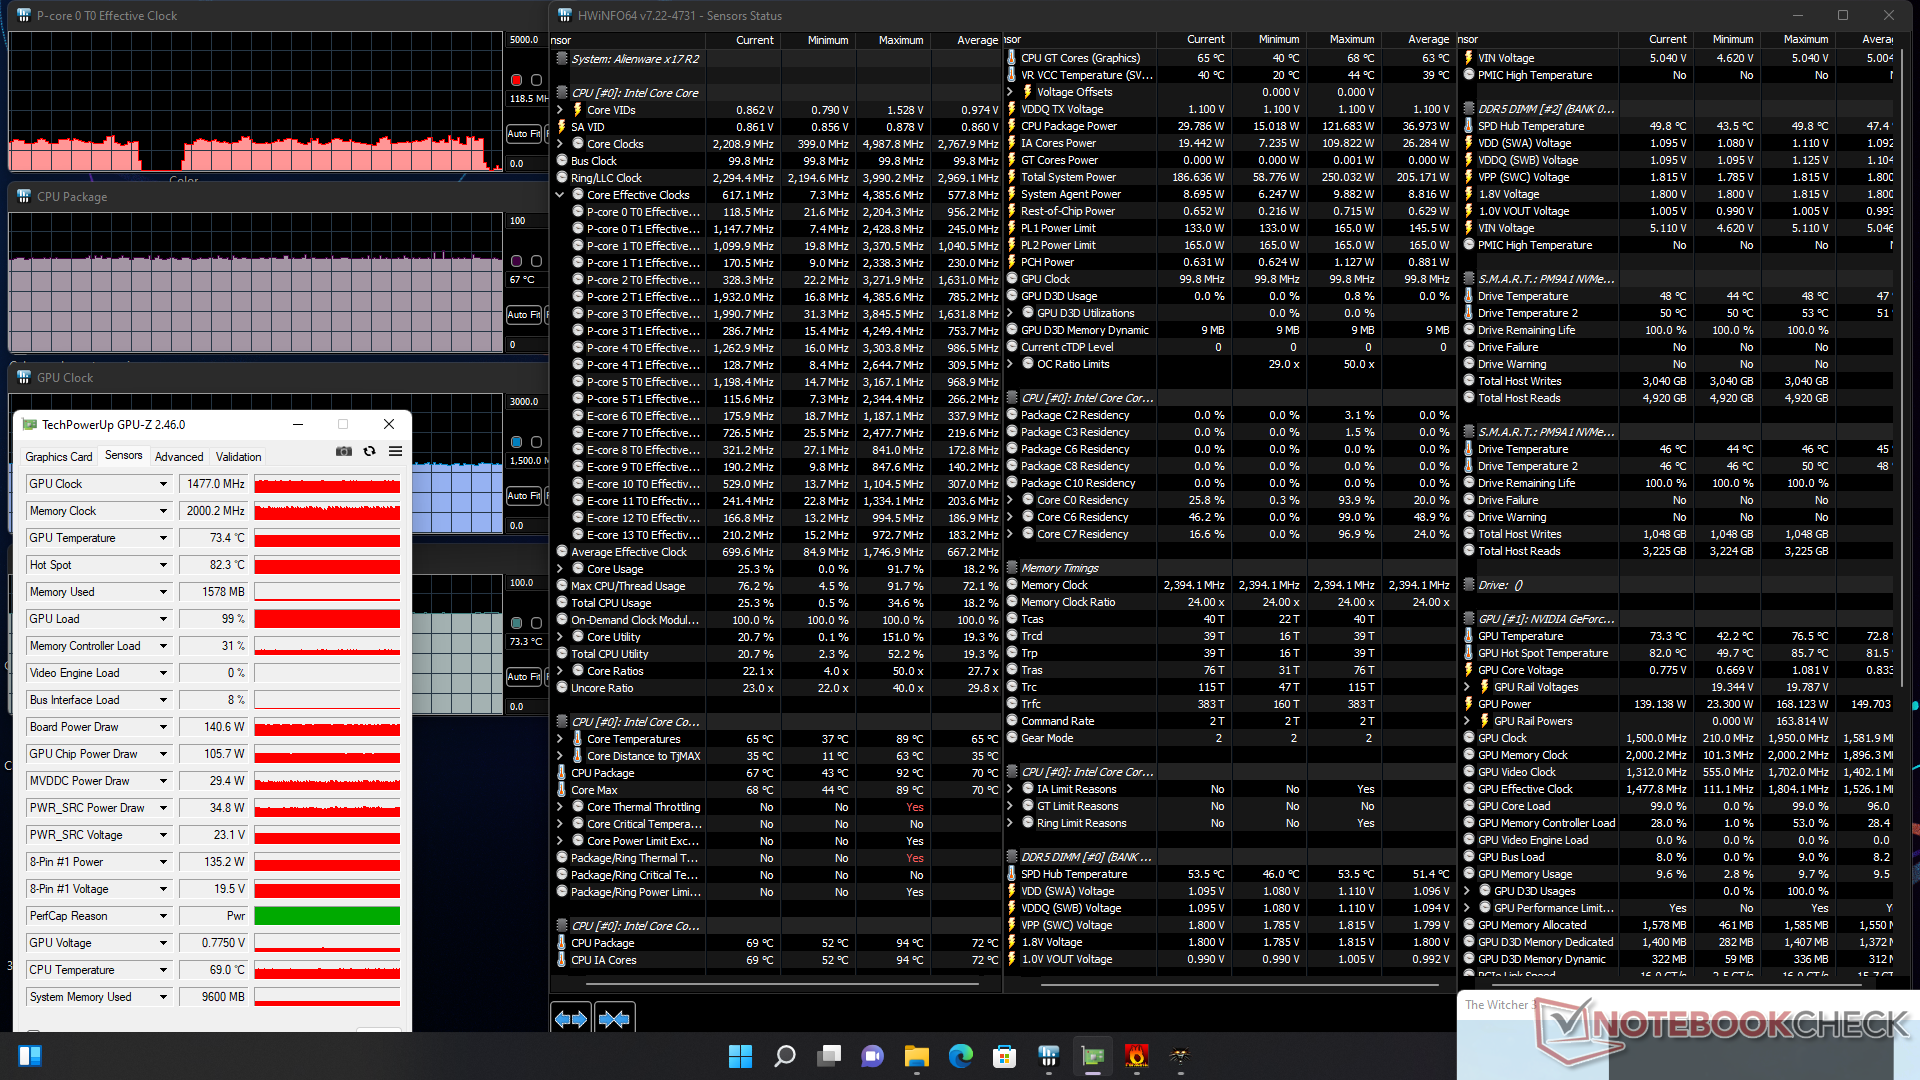
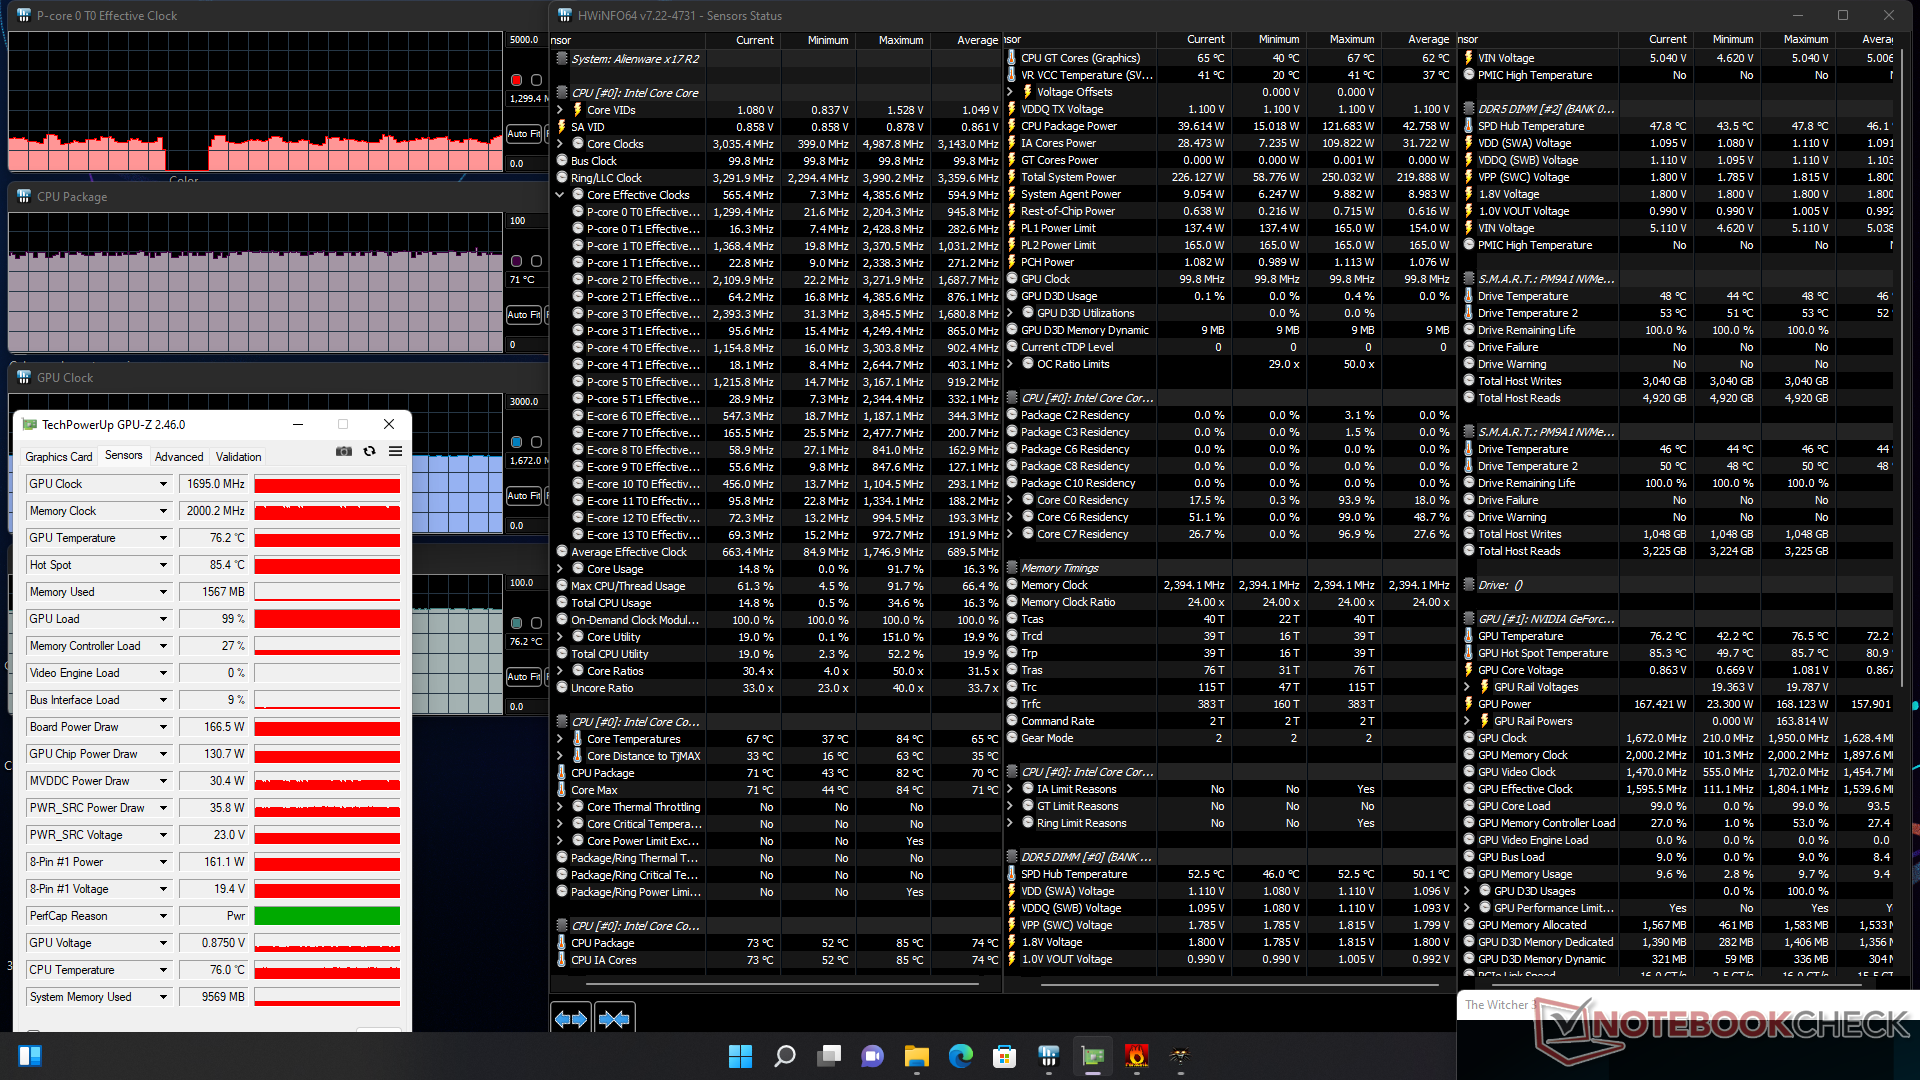
A taxa de clock GPU, relógio de memória e consumo de energia da placa se estabilizariam em 1695 MHz, 2000 MHz e 167 W, respectivamente, quando em funcionamento Witcher 3 no modo ventilador máximo. Se no modo balanceado, o relógio da GPU e o consumo de energia da placa cairiam para 1477 MHz e 141 W, respectivamente. Assim, os usuários devem suportar o modo de máximo ruído do ventilador se quiserem o potencial de desempenho total do x17 R2. A execução deste mesmo teste no MSI GS77 resultaria em um clock GPU mais lento e um relógio de memória de 1432 MHz e 1750 MHz, respectivamente.
Funcionando com a energia da bateria limitará significativamente o desempenho. Um teste Fire Strike nas baterias retornaria pontuações de Física e Gráfica de 27369 e 12095 pontos, respectivamente, em comparação com 30108 e 32849 pontos quando em rede elétrica.
| Relógio CPU (GHz) | Relógio GPU (MHz) | Temperatura média da CPU (°C) | Temperatura média da GPU (°C) | |
| Sistema ocioso (modo ventilador máximo) | -- | -- | 27 | 29 |
| Prime95 Stress (Modo ventilador máximo) | 3.6 | -- | -- | 100 |
| Prime95 + FurMark Stress (modo ventilador máximo) | 1.4 - 3.7 | 337 - 1770 | 53 - 100 | 49 - 71 |
| Witcher 3 Stress (modo equilibrado) | ~0.6 | 1477 | 67 | 73 |
| Witcher 3 Estresse (modo de ventilação máxima) | ~1.3 | 1695 | 71 | 76 |
Oradores
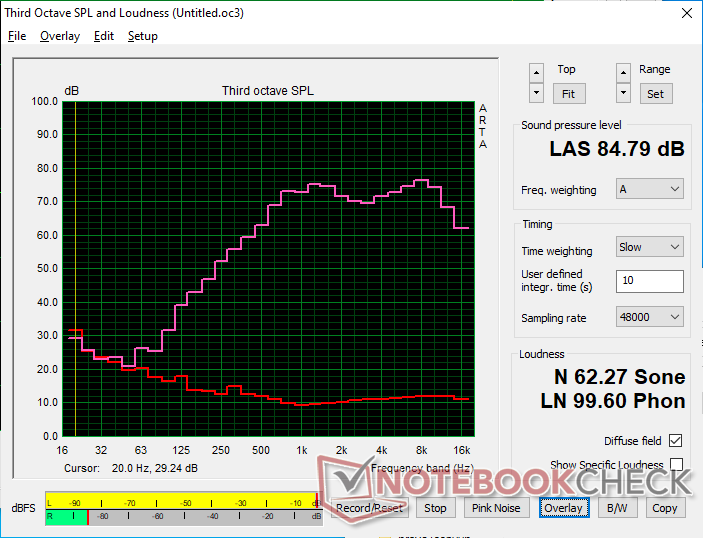
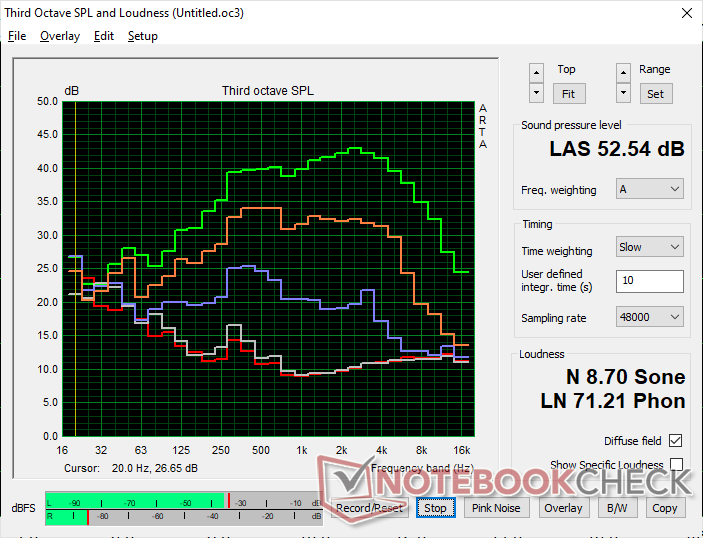
Alienware x17 R2 P48E análise de áudio
(+) | os alto-falantes podem tocar relativamente alto (###valor### dB)
Graves 100 - 315Hz
(±) | graves reduzidos - em média 9.7% menor que a mediana
(+) | o baixo é linear (5.5% delta para a frequência anterior)
Médios 400 - 2.000 Hz
(+) | médios equilibrados - apenas 1.6% longe da mediana
(+) | médios são lineares (3% delta para frequência anterior)
Altos 2 - 16 kHz
(±) | máximos mais altos - em média 5% maior que a mediana
(±) | a linearidade dos máximos é média (7.6% delta para frequência anterior)
Geral 100 - 16.000 Hz
(+) | o som geral é linear (9.3% diferença em relação à mediana)
Comparado com a mesma classe
» 3% de todos os dispositivos testados nesta classe foram melhores, 2% semelhantes, 95% piores
» O melhor teve um delta de 6%, a média foi 18%, o pior foi 132%
Comparado com todos os dispositivos testados
» 3% de todos os dispositivos testados foram melhores, 1% semelhantes, 96% piores
» O melhor teve um delta de 4%, a média foi 23%, o pior foi 134%
Apple MacBook Pro 16 2021 M1 Pro análise de áudio
(+) | os alto-falantes podem tocar relativamente alto (###valor### dB)
Graves 100 - 315Hz
(+) | bons graves - apenas 3.8% longe da mediana
(+) | o baixo é linear (5.2% delta para a frequência anterior)
Médios 400 - 2.000 Hz
(+) | médios equilibrados - apenas 1.3% longe da mediana
(+) | médios são lineares (2.1% delta para frequência anterior)
Altos 2 - 16 kHz
(+) | agudos equilibrados - apenas 1.9% longe da mediana
(+) | os máximos são lineares (2.7% delta da frequência anterior)
Geral 100 - 16.000 Hz
(+) | o som geral é linear (4.6% diferença em relação à mediana)
Comparado com a mesma classe
» 0% de todos os dispositivos testados nesta classe foram melhores, 0% semelhantes, 100% piores
» O melhor teve um delta de 5%, a média foi 17%, o pior foi 45%
Comparado com todos os dispositivos testados
» 0% de todos os dispositivos testados foram melhores, 0% semelhantes, 100% piores
» O melhor teve um delta de 4%, a média foi 23%, o pior foi 134%
Gestão de energia
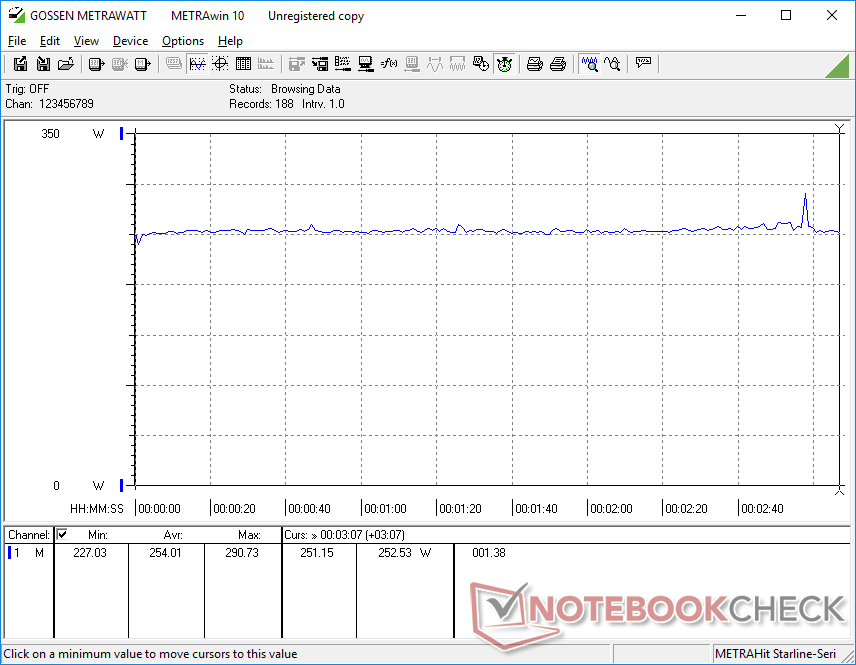
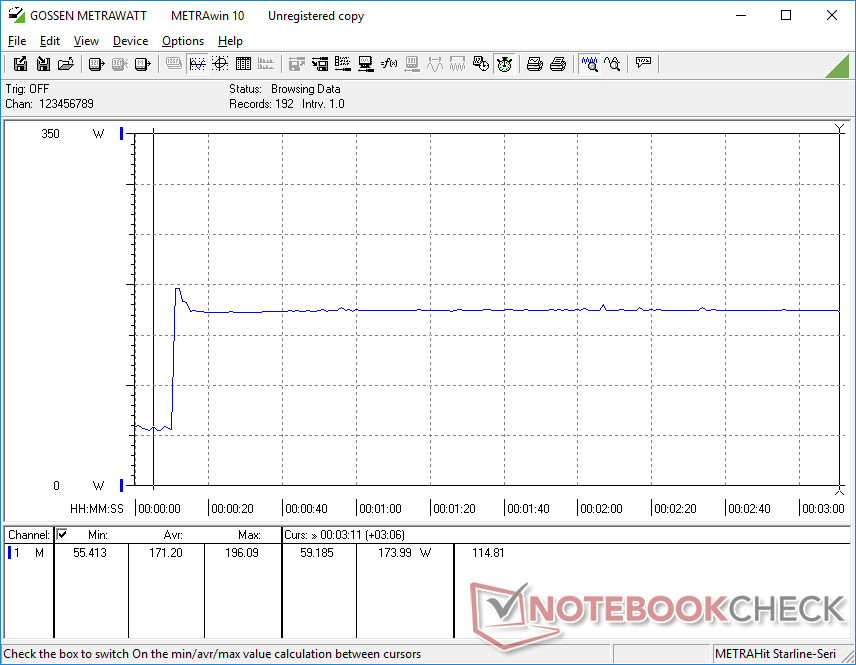
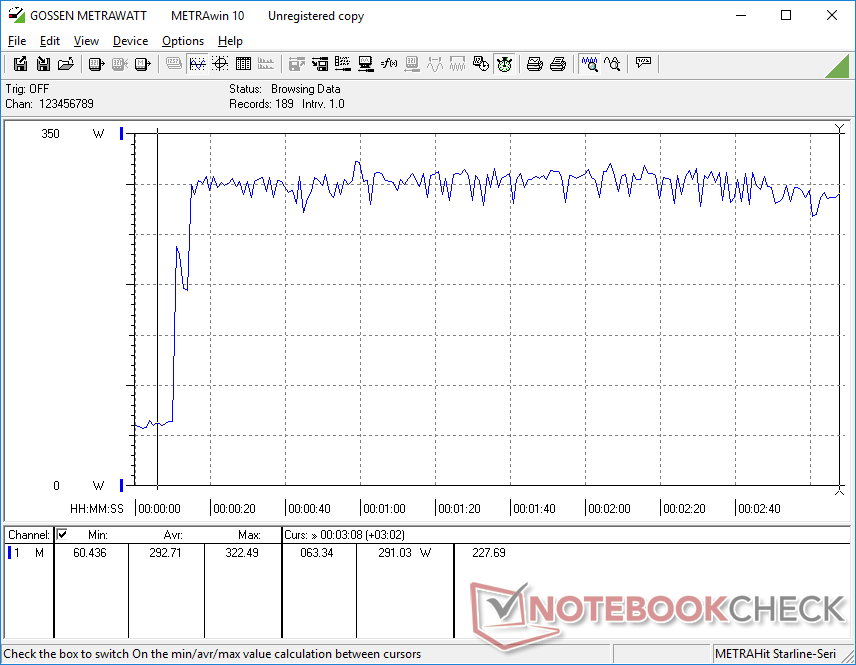
Consumo de energia
Os laptops alienígenas sempre foram mais ávidos por energia do que as alternativas concorrentes e o x17 R2 não é diferente. Simplesmente ocioso no desktop pode exigir até 60 W quando configurado para o modo High Performance, que é mais do que a maioria dos Ultrabooks da série U quando sob carga. O consumo muito alto é provavelmente responsável pela fraca duração da bateria registrada na próxima seção.
Rodando Witcher 3 consome 54% mais energia do que no MSI GS77, embora ambos estejam equipados com CPUs Core-H do 12º gênero e o mesmo GeForce RTX 3080 Ti GPU. Em troca, o sistema Alienware é capaz de oferecer até 15% e 25% mais rápido de desempenho da CPU e desempenho gráfico, respectivamente, do que o concorrente MSI.
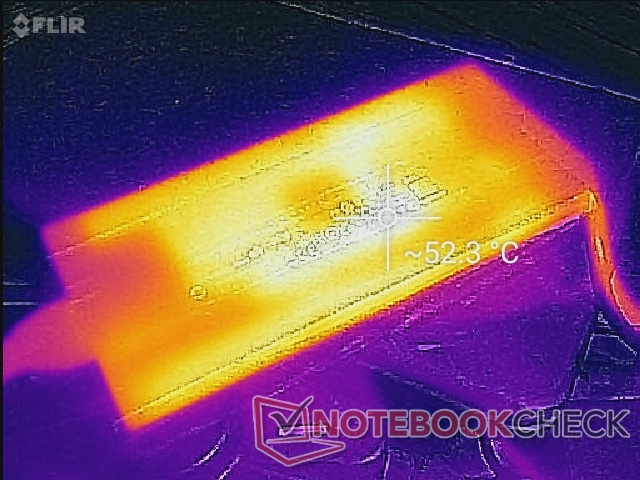
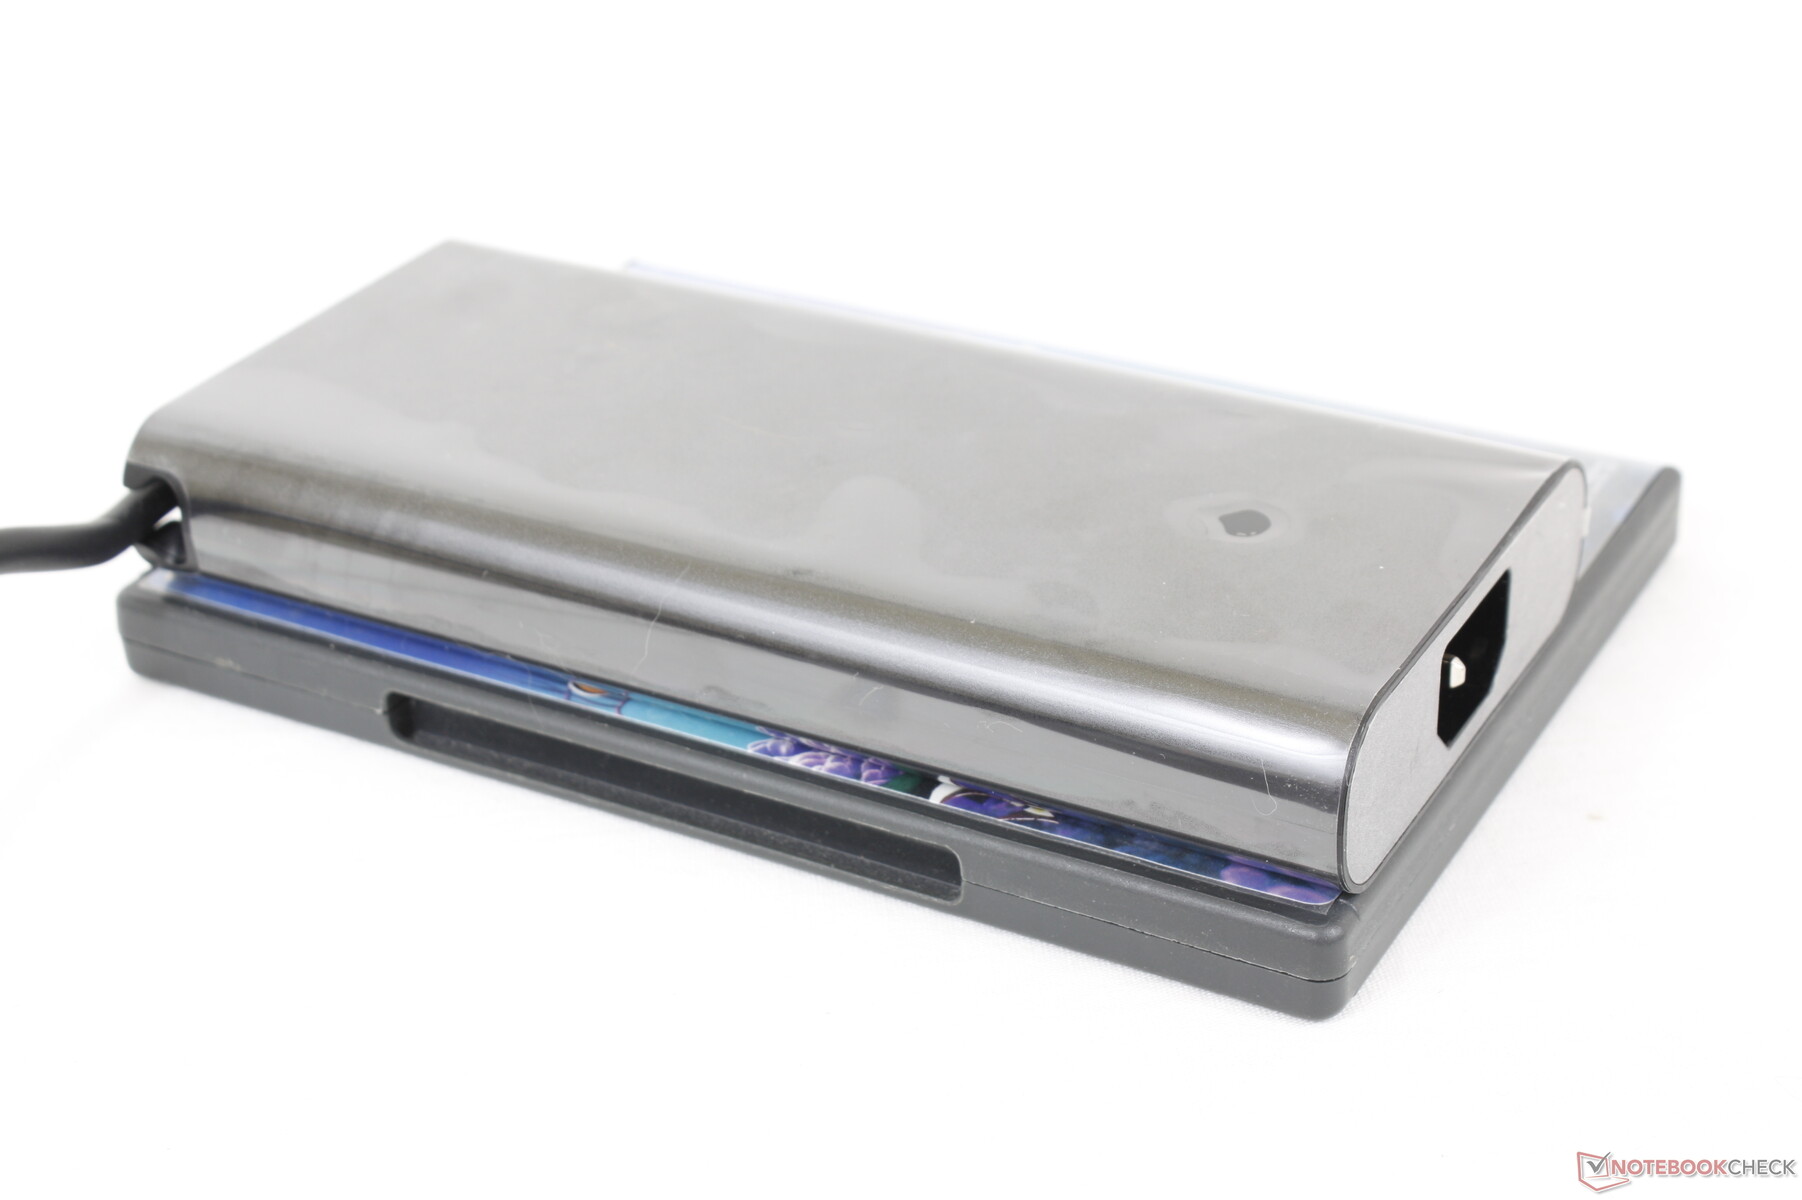
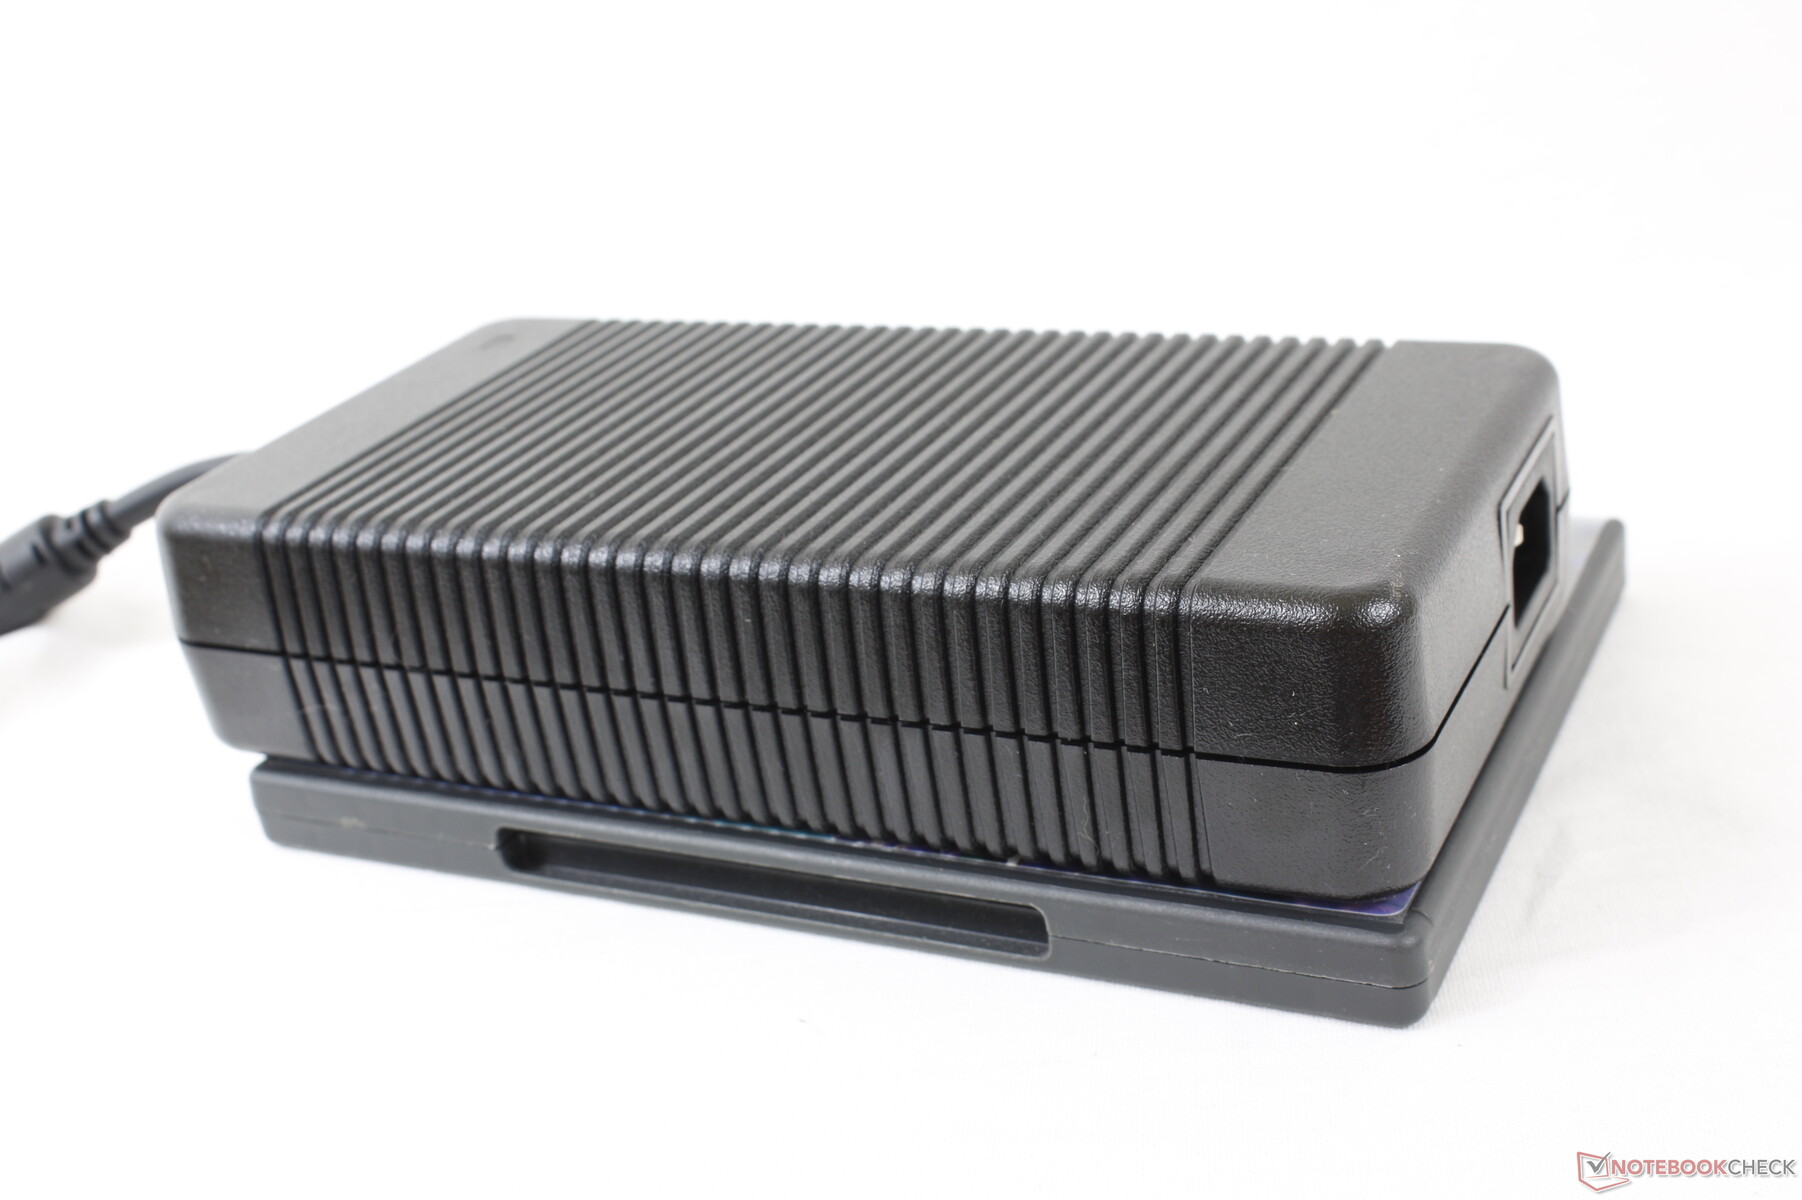
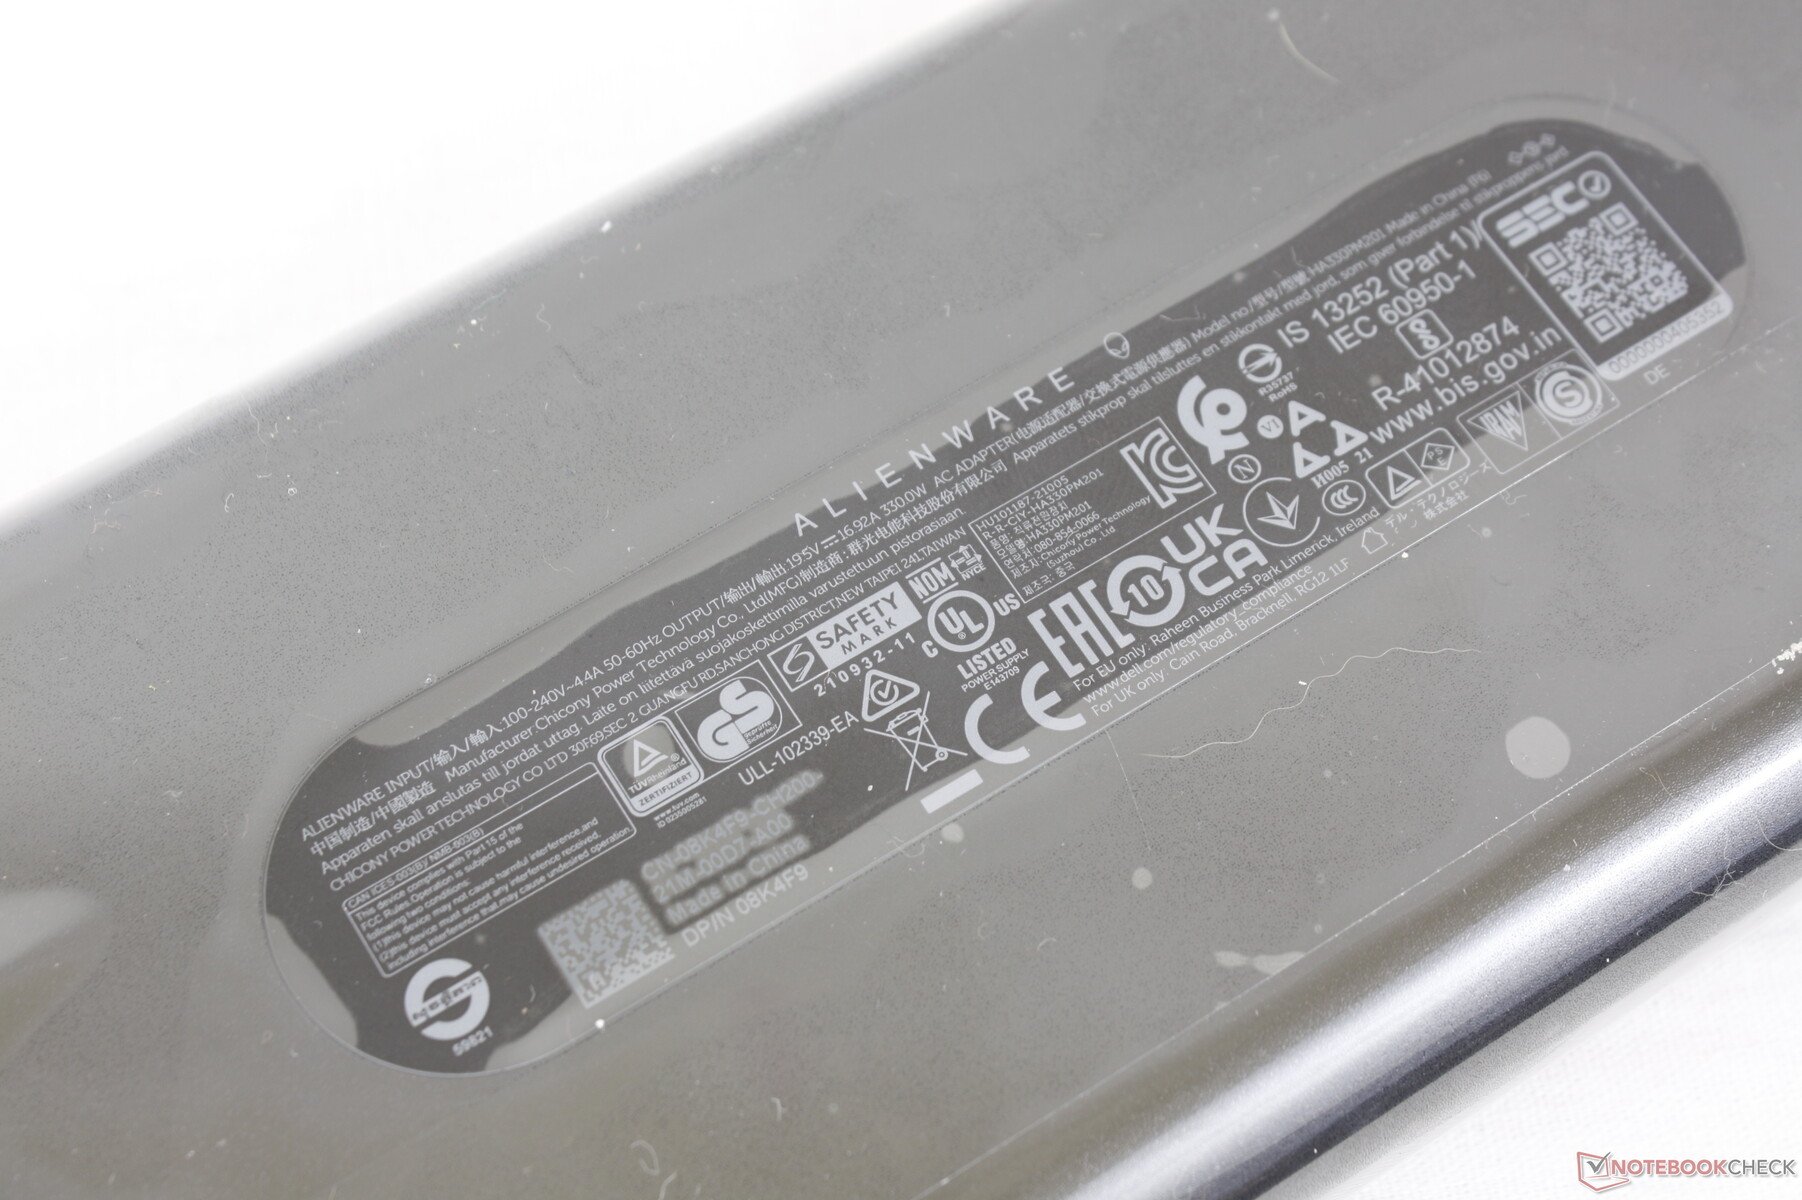
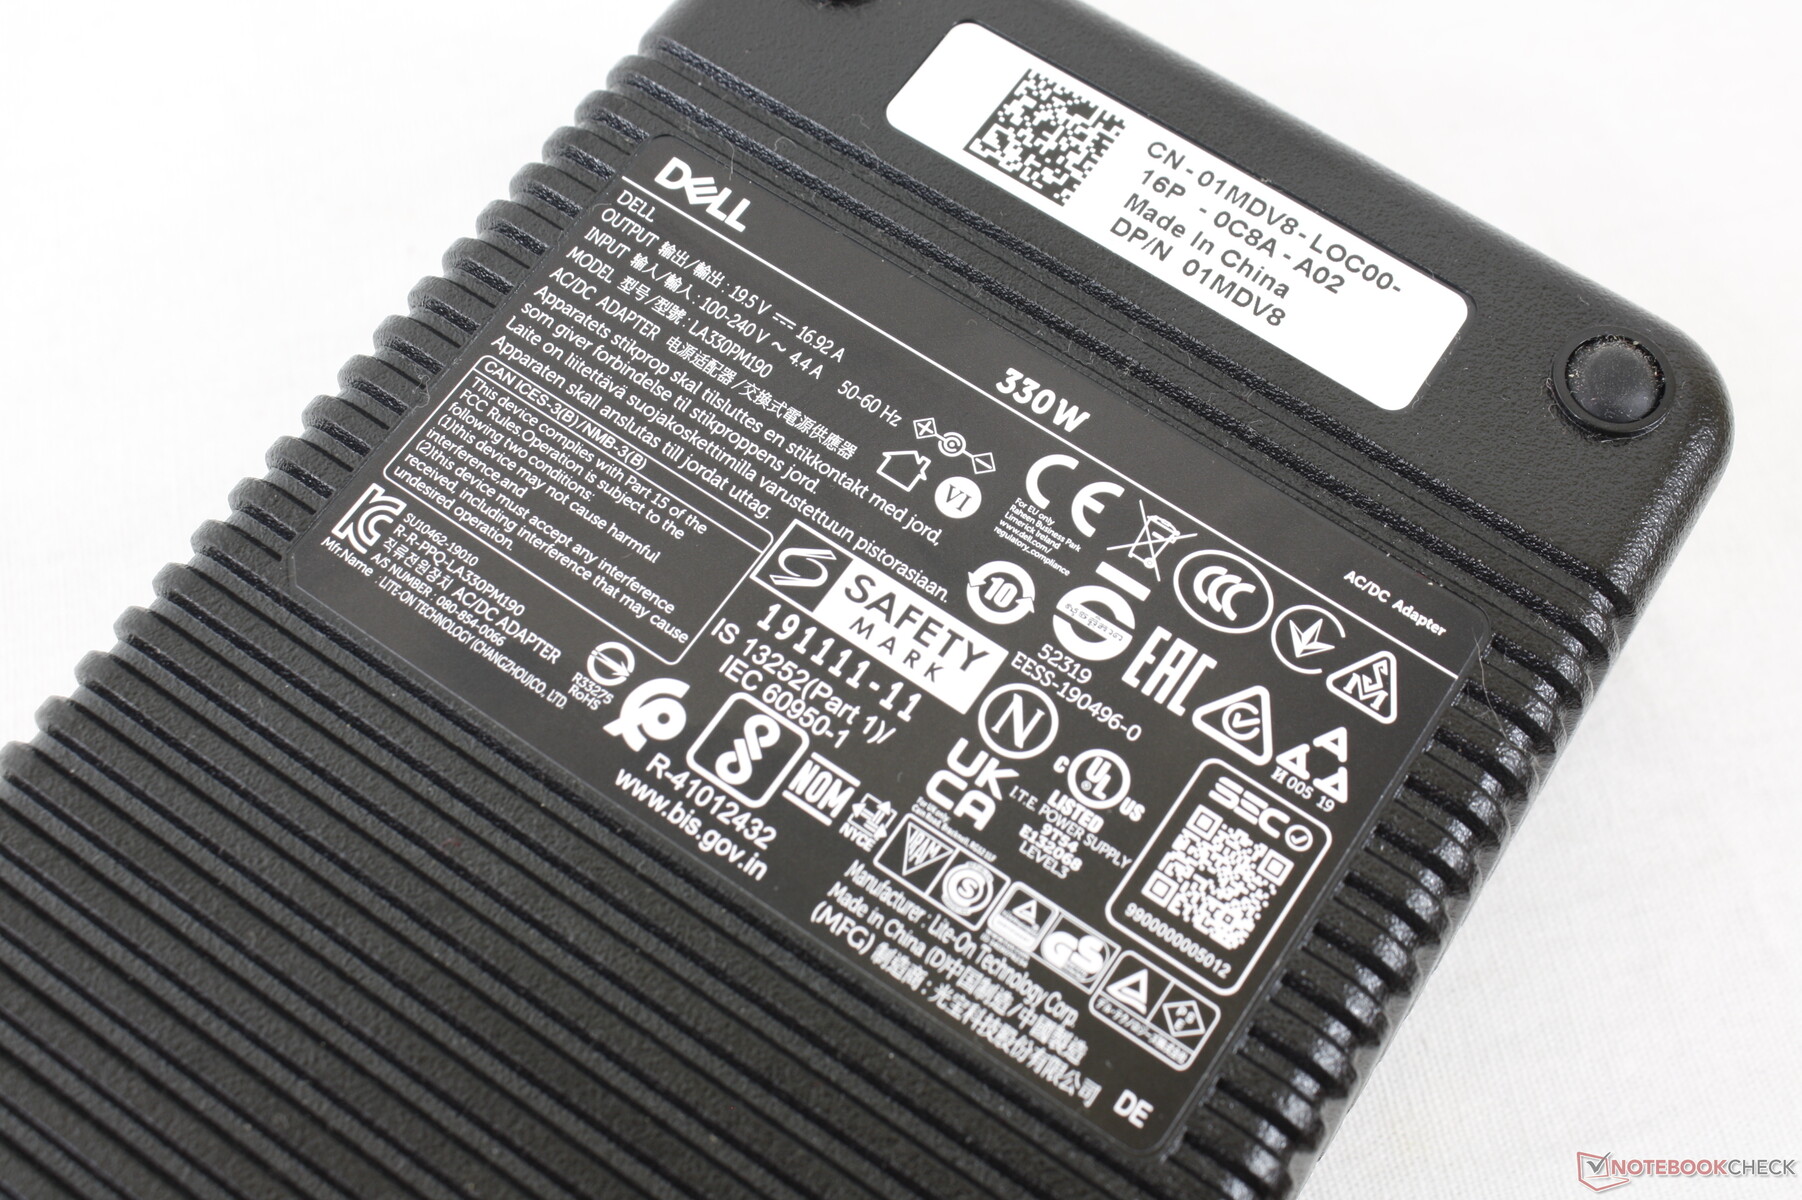
Somos capazes de registrar um consumo máximo de 323 W do adaptador AC de 330 W quando tanto a CPU quanto a GPU estão em 100% de utilização. O adaptador AC é menor desta vez quando comparado com o que foi enviado com o x17 R1 do ano passado (~18,3 x 8,7 x 2,5 cm vs. ~20 x 9,9 x 4,3 cm). Note que a maioria dos outros laptops para jogos são fornecidos com adaptadores CA menores de menos de 280 W. As configurações do menor Alienware x17 R2 podem vir com adaptadores CA ainda menores.
| desligado | |
| Ocioso | |
| Carga |
|
Key:
min: | |
| Alienware x17 R2 P48E i9-12900HK, GeForce RTX 3080 Ti Laptop GPU, 2x Samsung PM9A1 1TB (RAID 0), IPS, 1920x1080, 17.3" | Alienware x17 RTX 3080 P48E i7-11800H, GeForce RTX 3080 Laptop GPU, 2x WDC PC SN730 SDBPNTY-1T00 (RAID 0), IPS, 3840x2160, 17.3" | Asus ROG Zephyrus S17 GX703HSD i9-11900H, GeForce RTX 3080 Laptop GPU, Samsung PM9A1 MZVL22T0HBLB, IPS, 2560x1440, 17.3" | MSI Stealth GS77 12UHS-083US i7-12700H, GeForce RTX 3080 Ti Laptop GPU, Micron 3400 1TB MTFDKBA1T0TFH, IPS, 2560x1440, 17.3" | MSI GT76 Titan DT 10SGS i9-10900K, GeForce RTX 2080 Super Mobile, 2x WDC PC SN730 SDBPNTY-1T00 (RAID 0), IPS, 3840x2160, 17.3" | Gigabyte A7 X1 R9 5900HX, GeForce RTX 3070 Laptop GPU, ESR512GTLCG-EAC-4, IPS, 1920x1080, 17.3" | |
|---|---|---|---|---|---|---|
| Power Consumption | 22% | 22% | 30% | -15% | 38% | |
| Idle Minimum * (Watt) | 24.1 | 10.2 58% | 21.7 10% | 20 17% | 25.9 -7% | 12 50% |
| Idle Average * (Watt) | 28.5 | 21.2 26% | 27 5% | 21.4 25% | 38 -33% | 14 51% |
| Idle Maximum * (Watt) | 60 | 48.4 19% | 33 45% | 27 55% | 53.2 11% | 19 68% |
| Load Average * (Watt) | 128.7 | 118.7 8% | 108 16% | 100.5 22% | 123.8 4% | 118 8% |
| Witcher 3 ultra * (Watt) | 254 | 249 2% | 195 23% | 165 35% | 312.5 -23% | 205 19% |
| Load Maximum * (Watt) | 323 | 262 19% | 210 35% | 247.1 23% | 459.8 -42% | 229 29% |
* ... menor é melhor
Power Consumption Witcher 3 / Stresstest
Power Consumption external Monitor
Vida útil da bateria
Os tempos de funcionamento da bateria são alguns dos piores que já vimos em qualquer laptop para jogos. Mesmo ociosos na área de trabalho com a configuração de brilho mais baixa, perfil de potência mais baixo e gráficos ativos da Optimus durarão apenas 4 horas. Espere apenas 2 horas de navegação WLAN no mundo real em comparação com mais de 7 horas do Asus ROG Zephyrus S17.
O carregamento da capacidade vazia para a capacidade total leva cerca de 100 minutos. Os usuários também podem recarregar com adaptadores USB-C de terceiros.
| Alienware x17 R2 P48E i9-12900HK, GeForce RTX 3080 Ti Laptop GPU, 87 Wh | Alienware x17 RTX 3080 P48E i7-11800H, GeForce RTX 3080 Laptop GPU, 87 Wh | Asus ROG Zephyrus S17 GX703HSD i9-11900H, GeForce RTX 3080 Laptop GPU, 90 Wh | MSI Stealth GS77 12UHS-083US i7-12700H, GeForce RTX 3080 Ti Laptop GPU, 99 Wh | MSI GT76 Titan DT 10SGS i9-10900K, GeForce RTX 2080 Super Mobile, 90 Wh | Gigabyte A7 X1 R9 5900HX, GeForce RTX 3070 Laptop GPU, 48.96 Wh | |
|---|---|---|---|---|---|---|
| Duração da bateria | 91% | 257% | 154% | 20% | 93% | |
| Reader / Idle (h) | 3.9 | 7 79% | 10.8 177% | |||
| WiFi v1.3 (h) | 2 | 5.9 195% | 7.5 275% | 6.2 210% | 2.4 20% | 4.7 135% |
| Load (h) | 0.8 | 0.8 0% | 2.7 238% | 1.4 75% | 1.2 50% | |
| H.264 (h) | 7.2 | |||||
| Witcher 3 ultra (h) | 1 |
Pro
Contra
Veredicto - TGP superior significa maior desempenho
Quando a Nvidia anunciou o GeForce RTX 3080 Ti para laptops, ficamos desapontados ao descobrir que alguns modelos estariam visando classificações TGP muito baixas de apenas cerca de 100 W. Embora tal abordagem permitisse designs super-finos, também sacrificou o desempenho ao longo do caminho, já que a GPU estaria efetivamente sub-crítica. O Alienware x17 R2 reconhece esta troca e, em vez disso, visa um TGP significativamente maior de 175 W para um aumento de desempenho de cerca de 30% em relação aos laptops rodando na faixa de ~100 W GeForce RTX 3080 Ti como o Lâmina Razer 15 ou Gigabyte Aero YE5. Resultados similares também podem ser encontrados através da CPU. Este aspecto único do Alienware é talvez o maior fator de diferenciação entre ele e outros laptops de jogos ultramodernos.
Naturalmente, a abordagem de "desempenho a qualquer custo" vem com desvantagens. O consumo de energia em particular é através do teto e a vida útil da bateria sofre por causa disso, mesmo quando nos ambientes de menor desempenho. O sistema também é visivelmente mais pesado e maior, respectivamente, do que outros laptops de jogos ultraleves, embora o chassi ainda seja considerado um ultramaterial. O posicionamento das portas também leva alguns a se acostumar.
se você quiser maximizar o desempenho sem se contentar com grandes laptops para jogos como o Série MSI GT, Série Asus ROG Chimeraou o Area-51m de alienígenas série, então o Alienware x17 R2 e seu teclado mecânico surpreendentemente satisfatório são dignos de consideração.
Preço e Disponibilidade
O Alienware x17 R2 está agora sendo enviado na Amazon em várias SKUs, embora nenhuma seja nossa configuração exata. Alternativamente, os usuários podem adquirir diretamente da Dell.
Alienware x17 R2 P48E
- 05/11/2022 v7 (old)
Allen Ngo
Price comparison

