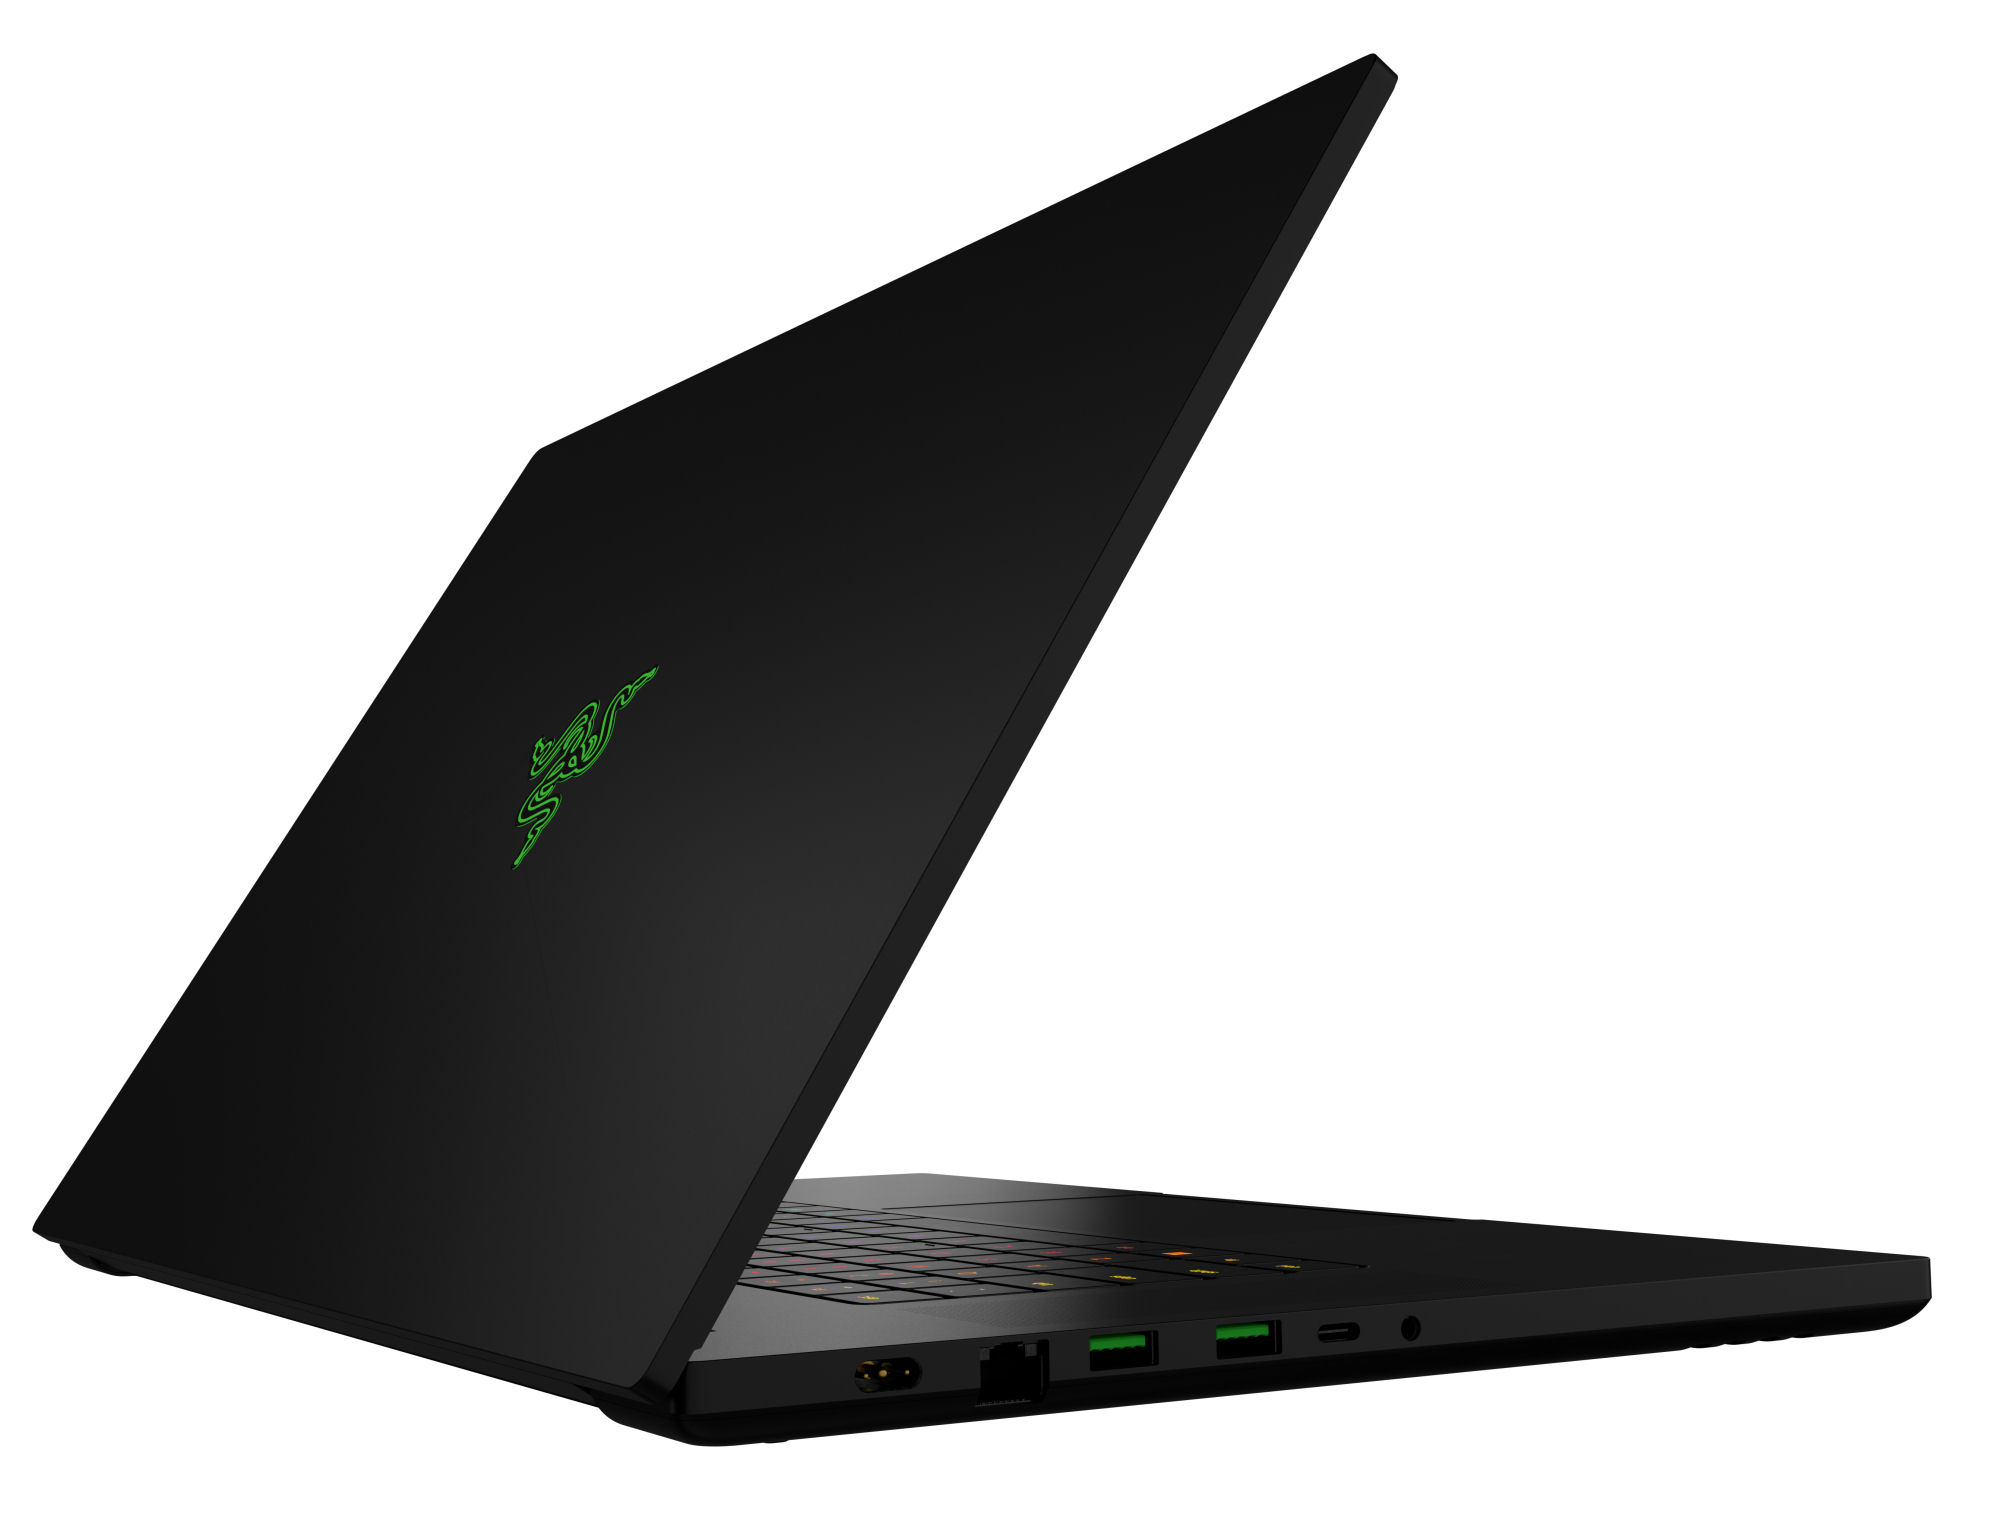
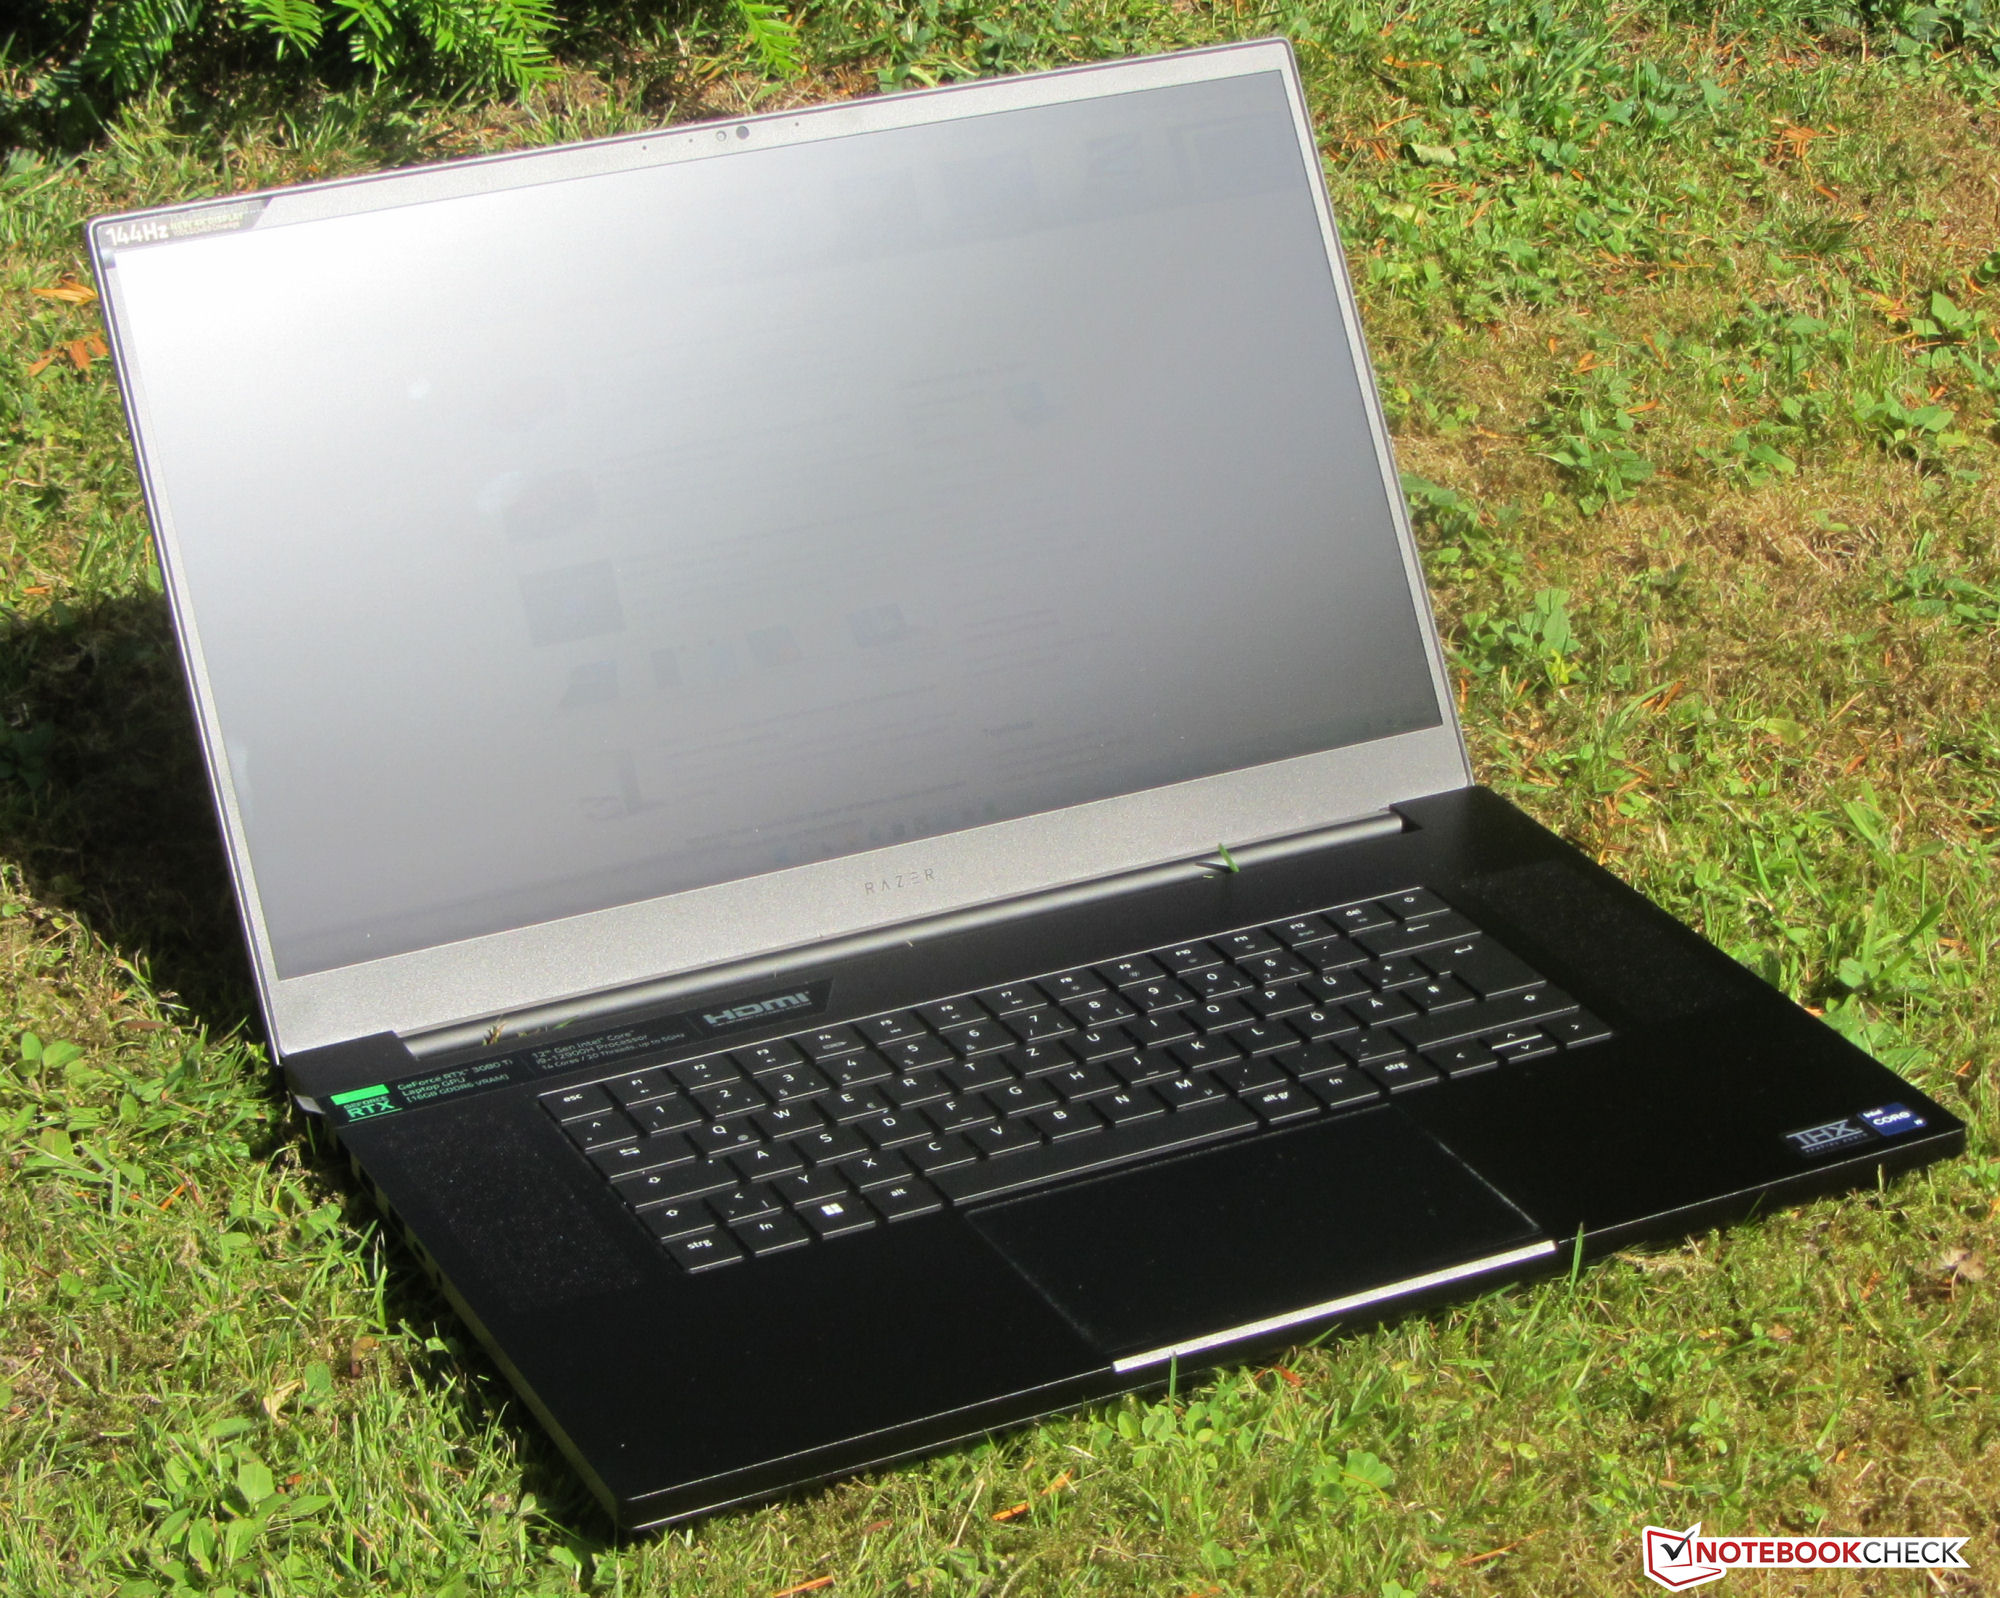
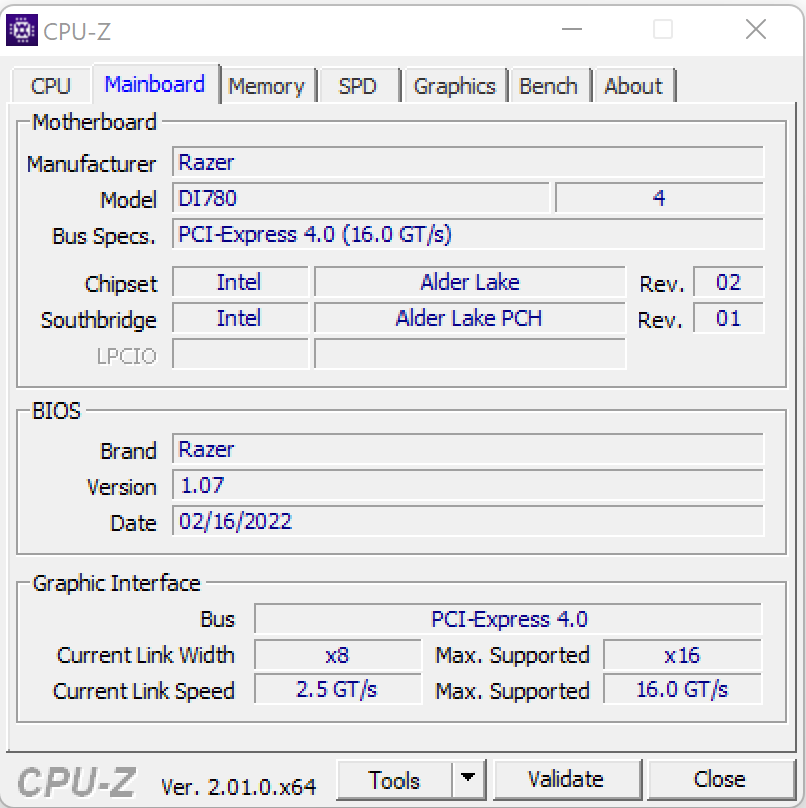
Revisão da Razer Blade 17 (início de 2022): Elegante laptop 4k para jogos com tela brilhante
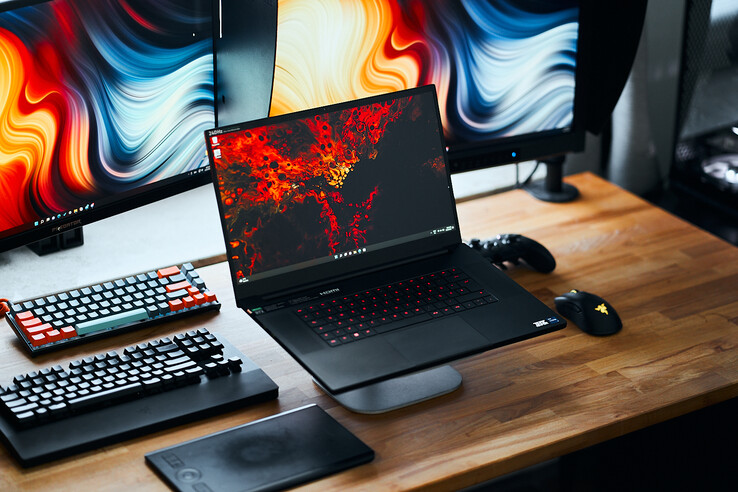
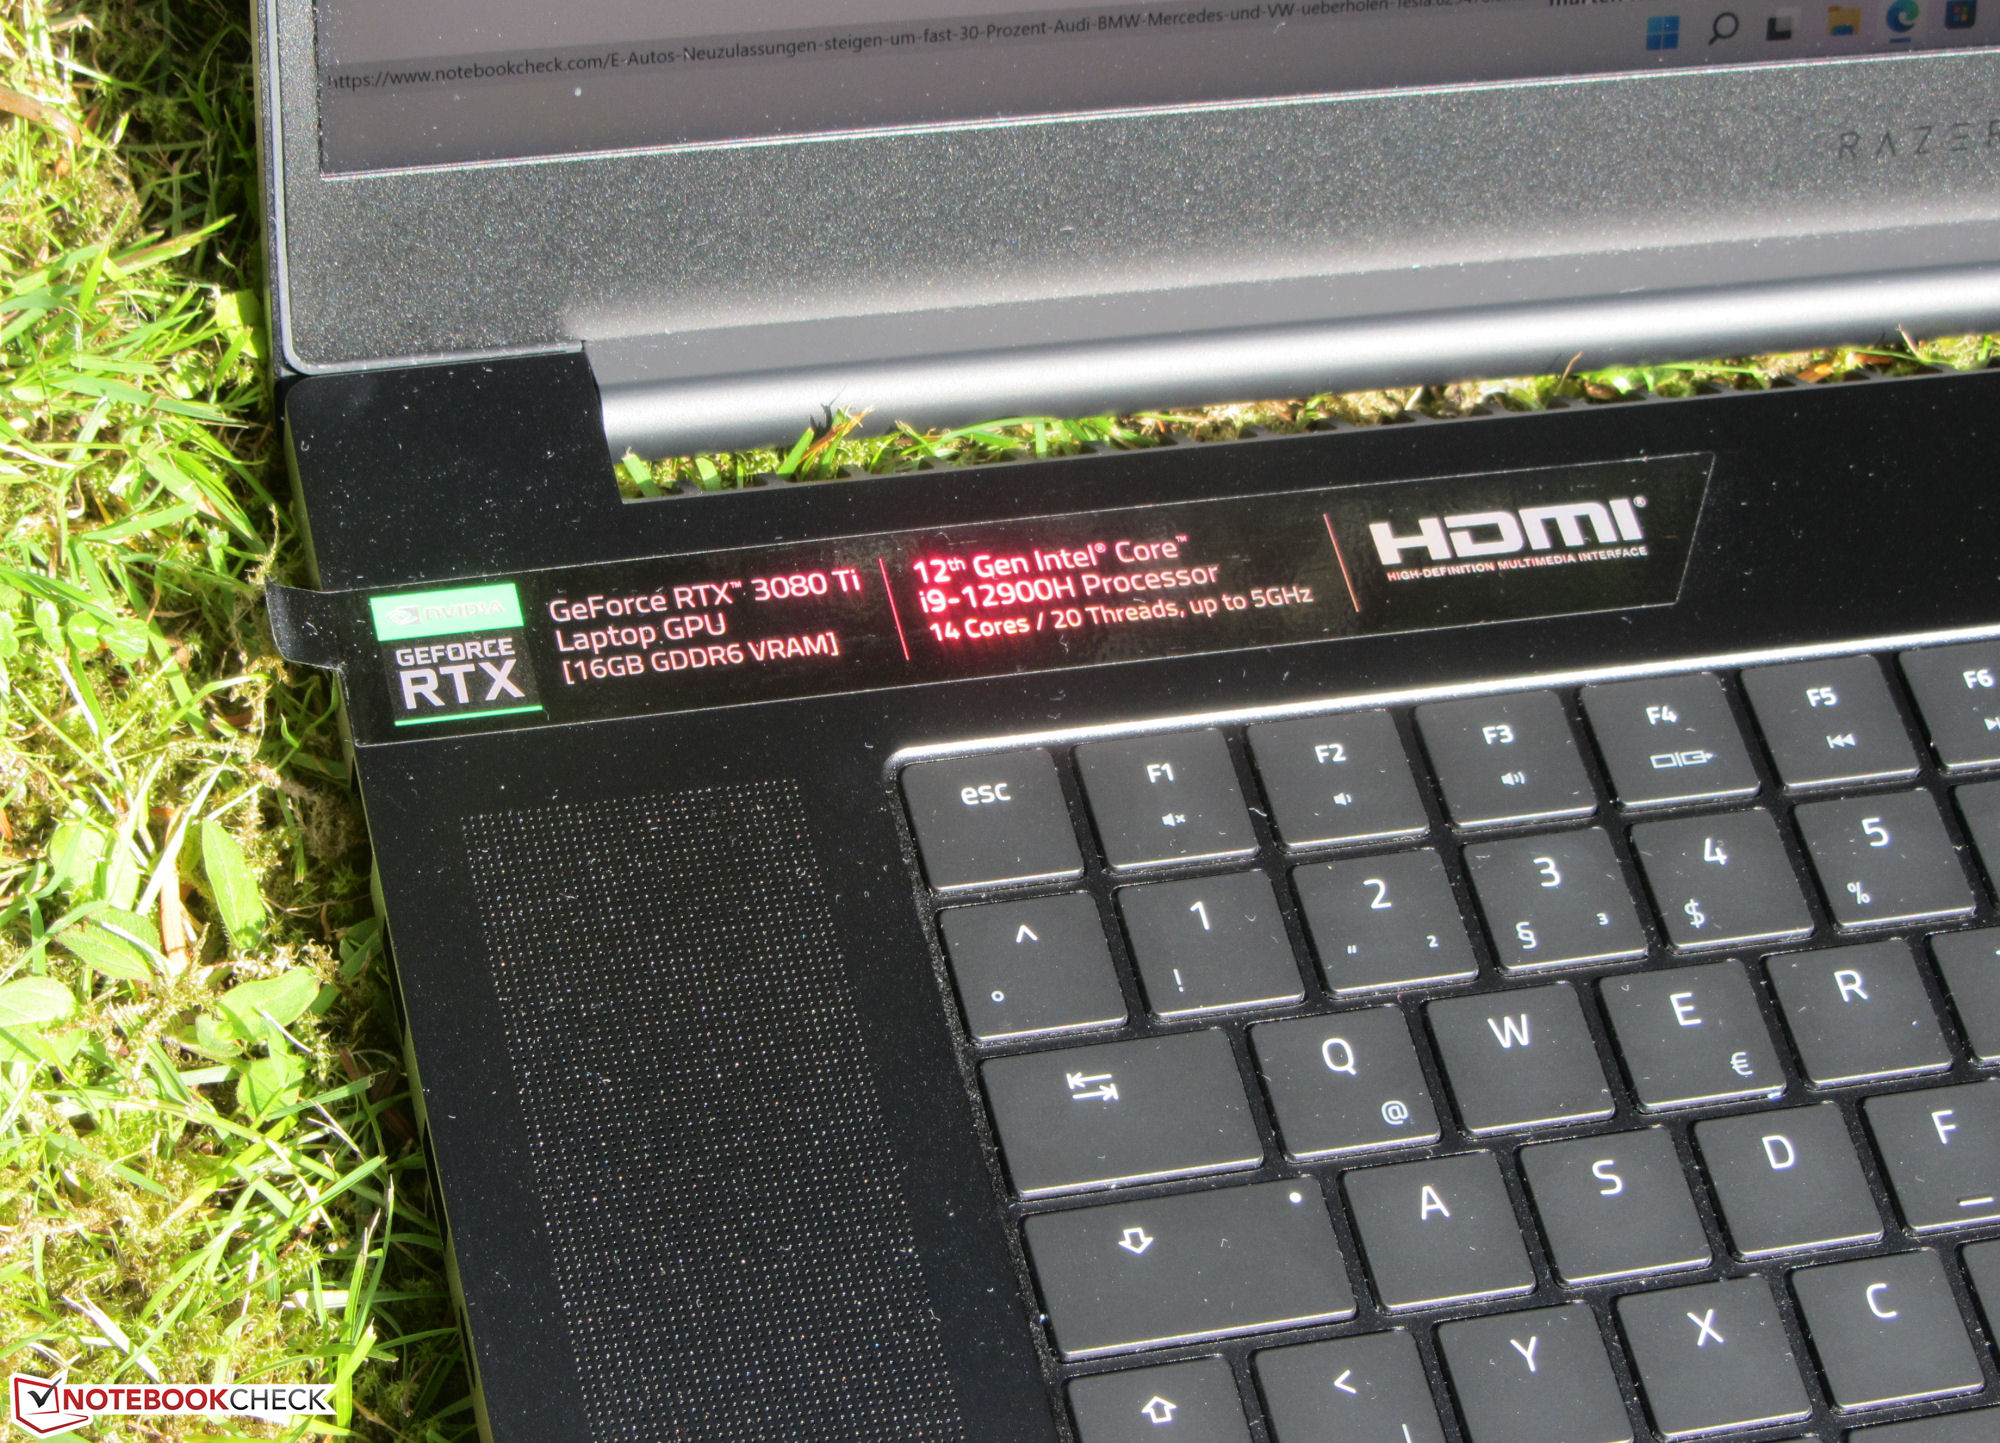
A Razer Blade 17 é voltada para jogadores e profissionais criativos - particularmente em nossa configuração testada de alta qualidade com um CPU Core i9-12900H, GeForce RTX 3080 Ti Laptop GPU, e display de 17,3 polegadas de 4k com cores precisas. O ponto de preço está em torno de 4.700 Euros (~$4.900). Além do RTX 3080 Ti, seu Irmão americanoque já testamos tinha uma CPU Core i7-12800H e um QHD-Panel (240 Hz). Os concorrentes incluem laptops extremamente potentes, como o Alienware x17 R2 P48EoMedion Erazer Beast X30e oMSI Stealth GS77 12UHS.
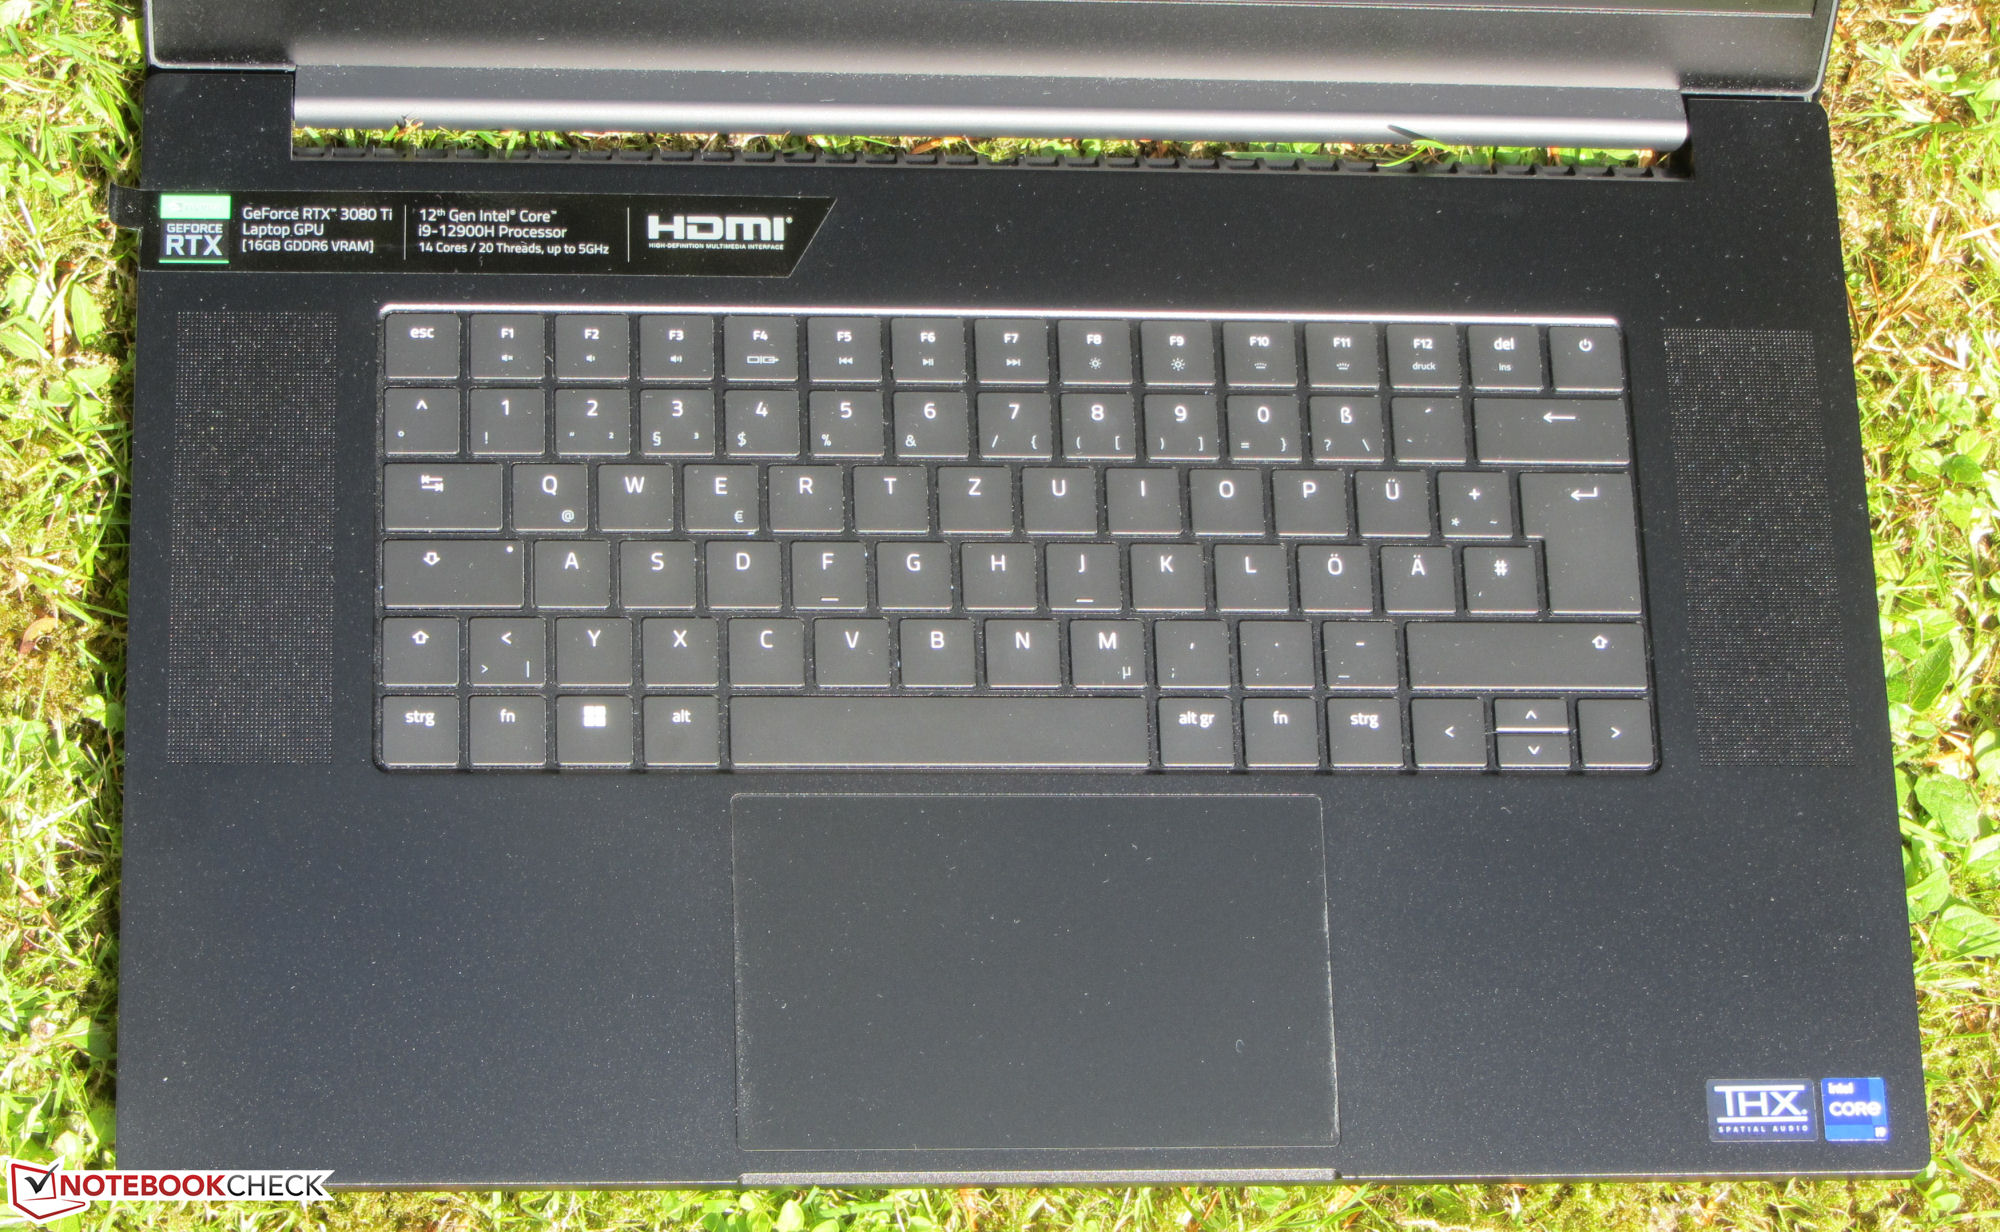
Você pode encontrar informações sobre a caixa, equipamentos de conexão, dispositivos de entrada e alto-falantes em nosso revisão da Lâmina 17 2022 (Core i7, QHD) de construção idêntica.
Possíveis concorrentes em comparação
Avaliação | Data | Modelo | Peso | Altura | Size | Resolução | Preço |
|---|---|---|---|---|---|---|---|
| 89.9 % v7 (old) | 07/2022 | Razer Blade 17 Early 2022 i9-12900H, GeForce RTX 3080 Ti Laptop GPU | 2.8 kg | 19.9 mm | 17.30" | 3840x2160 | |
| 89.2 % v7 (old) | 05/2022 | Alienware x17 R2 P48E i9-12900HK, GeForce RTX 3080 Ti Laptop GPU | 3.1 kg | 20.9 mm | 17.30" | 1920x1080 | |
| 86.7 % v7 (old) | 05/2022 | Medion Erazer Beast X30 i9-12900HK, GeForce RTX 3080 Ti Laptop GPU | 2.2 kg | 23 mm | 17.30" | 2560x1440 | |
| 87.2 % v7 (old) | 04/2022 | MSI Stealth GS77 12UHS-083US i7-12700H, GeForce RTX 3080 Ti Laptop GPU | 2.9 kg | 20.8 mm | 17.30" | 2560x1440 |
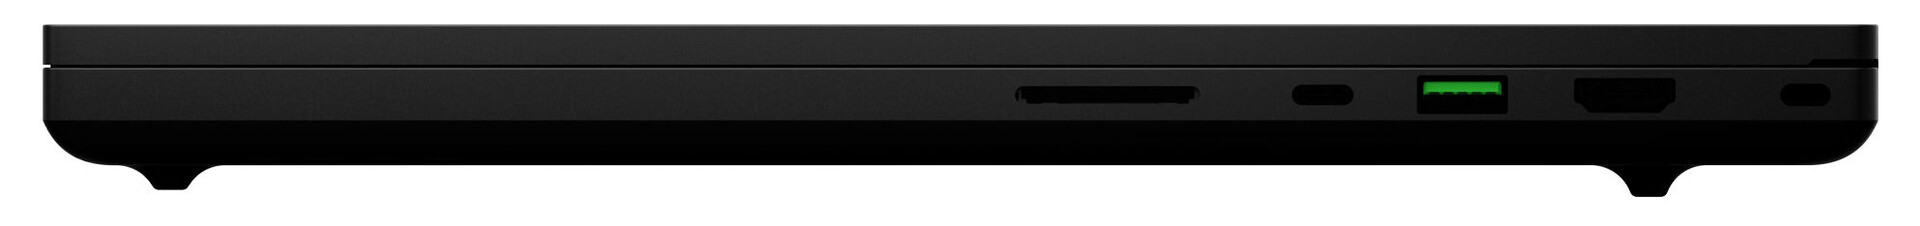
| SD Card Reader | |
| average JPG Copy Test (av. of 3 runs) | |
| Alienware x17 R2 P48E (AV Pro V60) | |
| Razer Blade 17 Early 2022 (AV PRO microSD 128 GB V60) | |
| Razer Blade 17 RTX 3080 Ti (AV Pro V60) | |
| Média da turma Gaming (20.9 - 210, n=54, últimos 2 anos) | |
| MSI Stealth GS77 12UHS-083US (AV Pro V60) | |
| Medion Erazer Beast X30 (AV PRO microSD 128 GB V60) | |
| maximum AS SSD Seq Read Test (1GB) | |
| Alienware x17 R2 P48E (AV Pro V60) | |
| Razer Blade 17 RTX 3080 Ti (AV Pro V60) | |
| Média da turma Gaming (25.5 - 261, n=51, últimos 2 anos) | |
| Medion Erazer Beast X30 (AV PRO microSD 128 GB V60) | |
| MSI Stealth GS77 12UHS-083US (AV Pro V60) | |
| Networking - iperf3 receive AXE11000 | |
| Medion Erazer Beast X30 | |
| Razer Blade 17 Early 2022 | |
| Média da turma Gaming (680 - 1745, n=88, últimos 2 anos) | |
| Média Killer Wi-Fi 6E AX1690i 160MHz (917 - 1727, n=9) | |


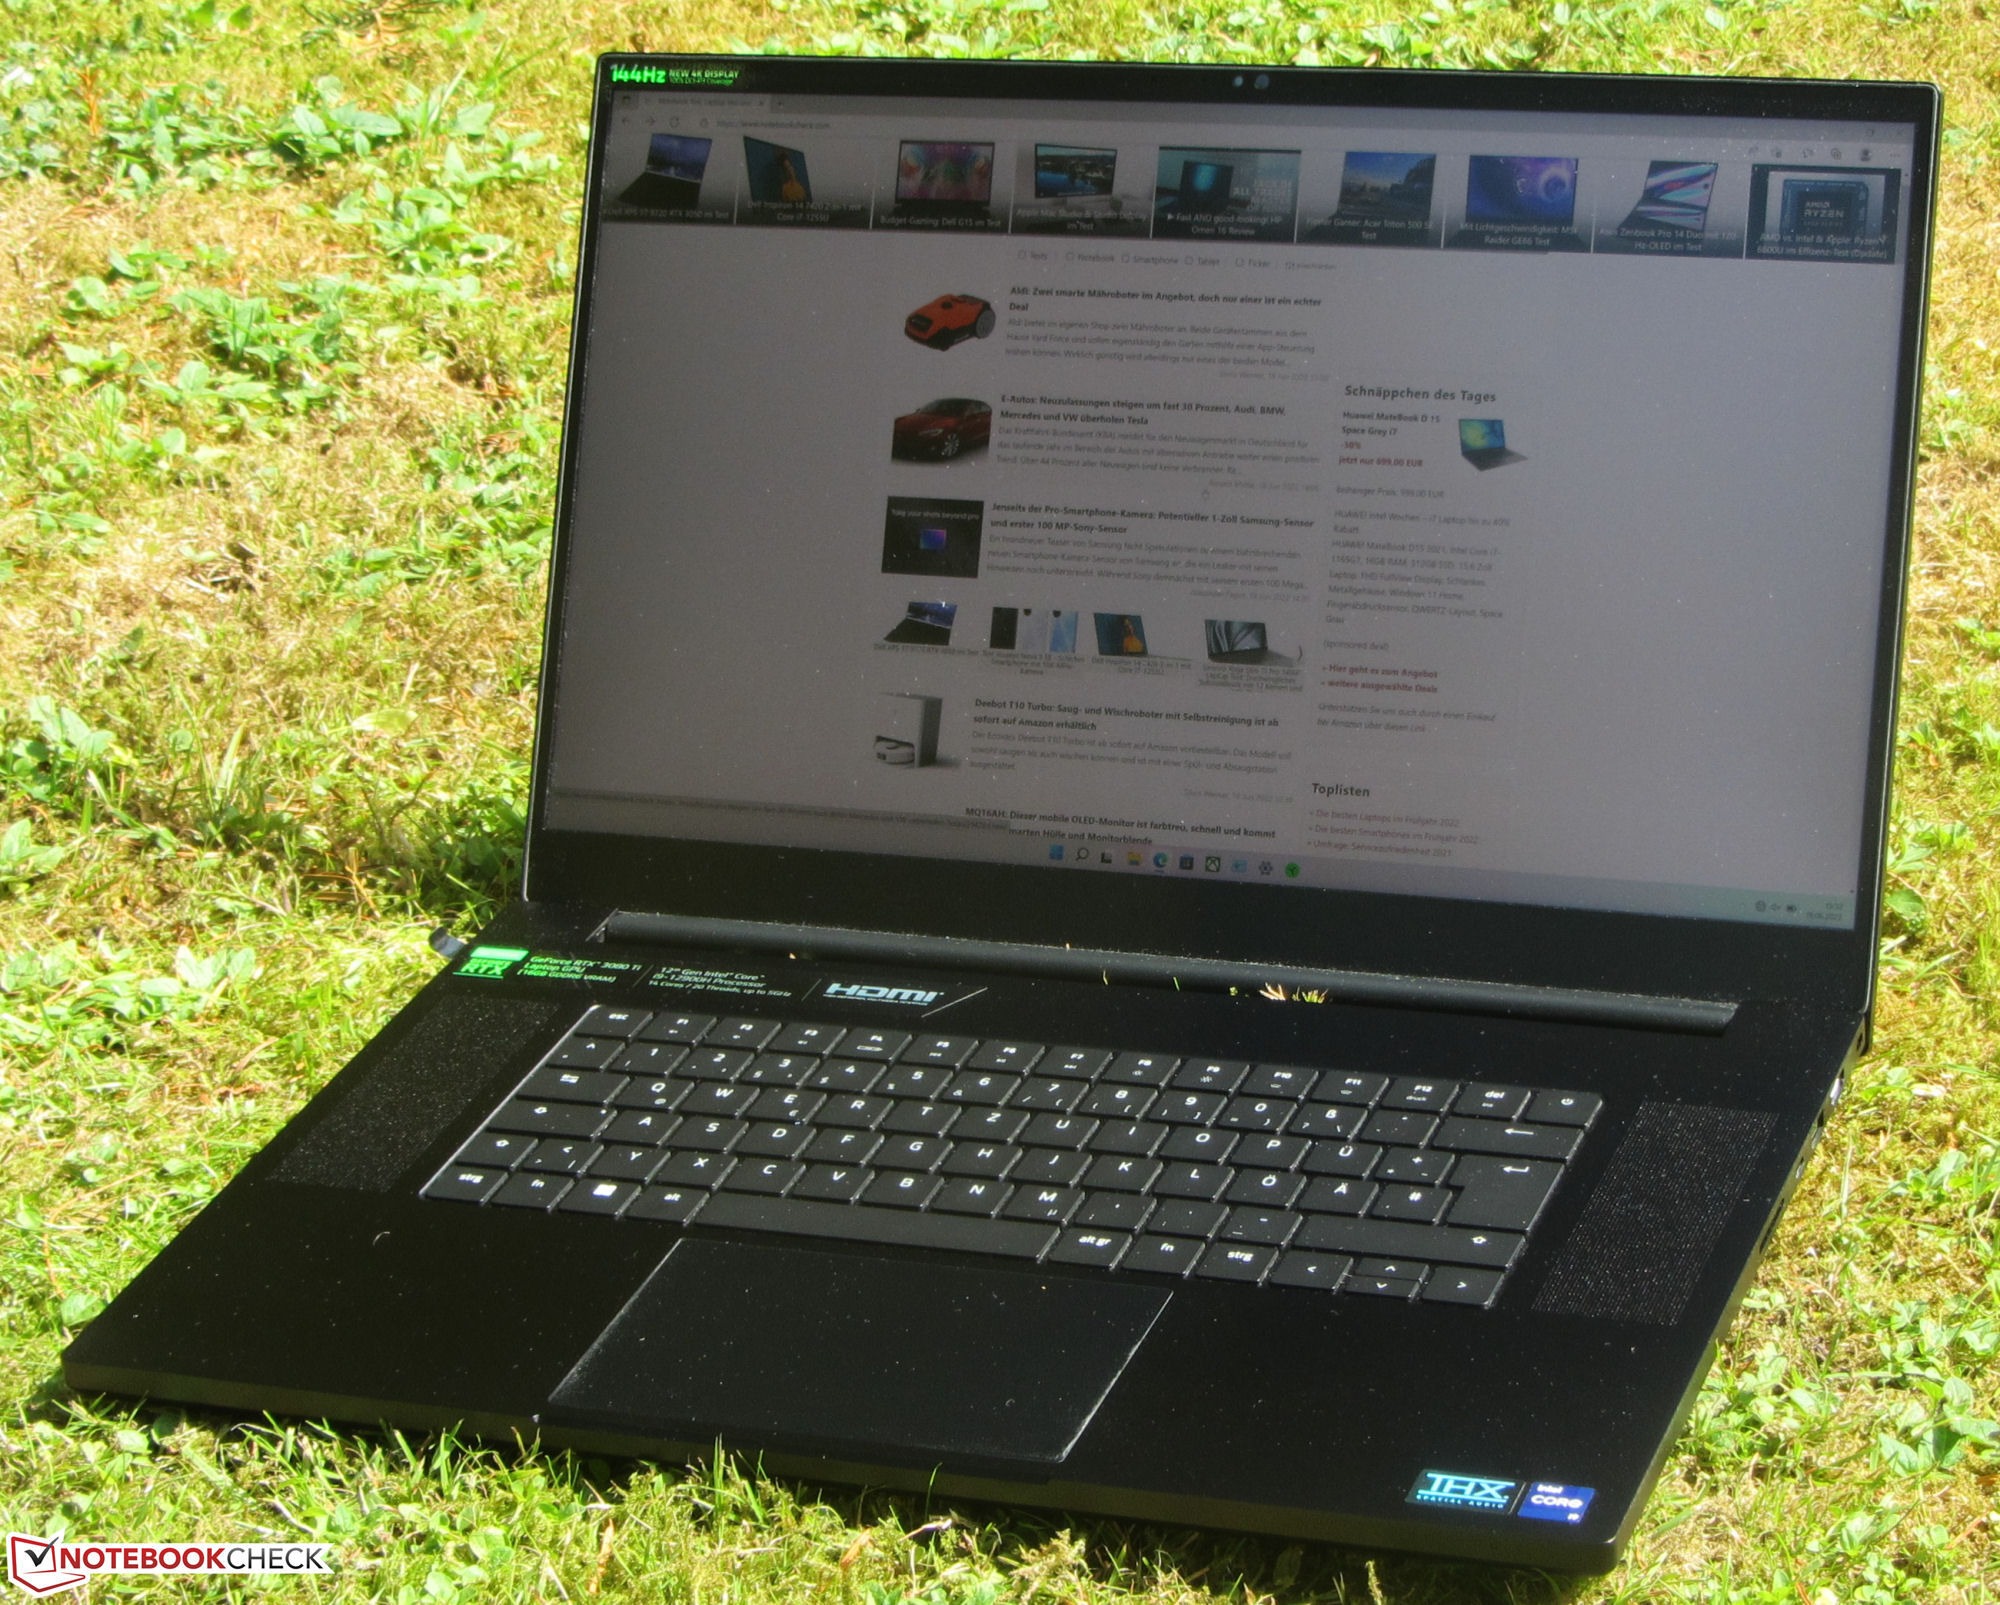
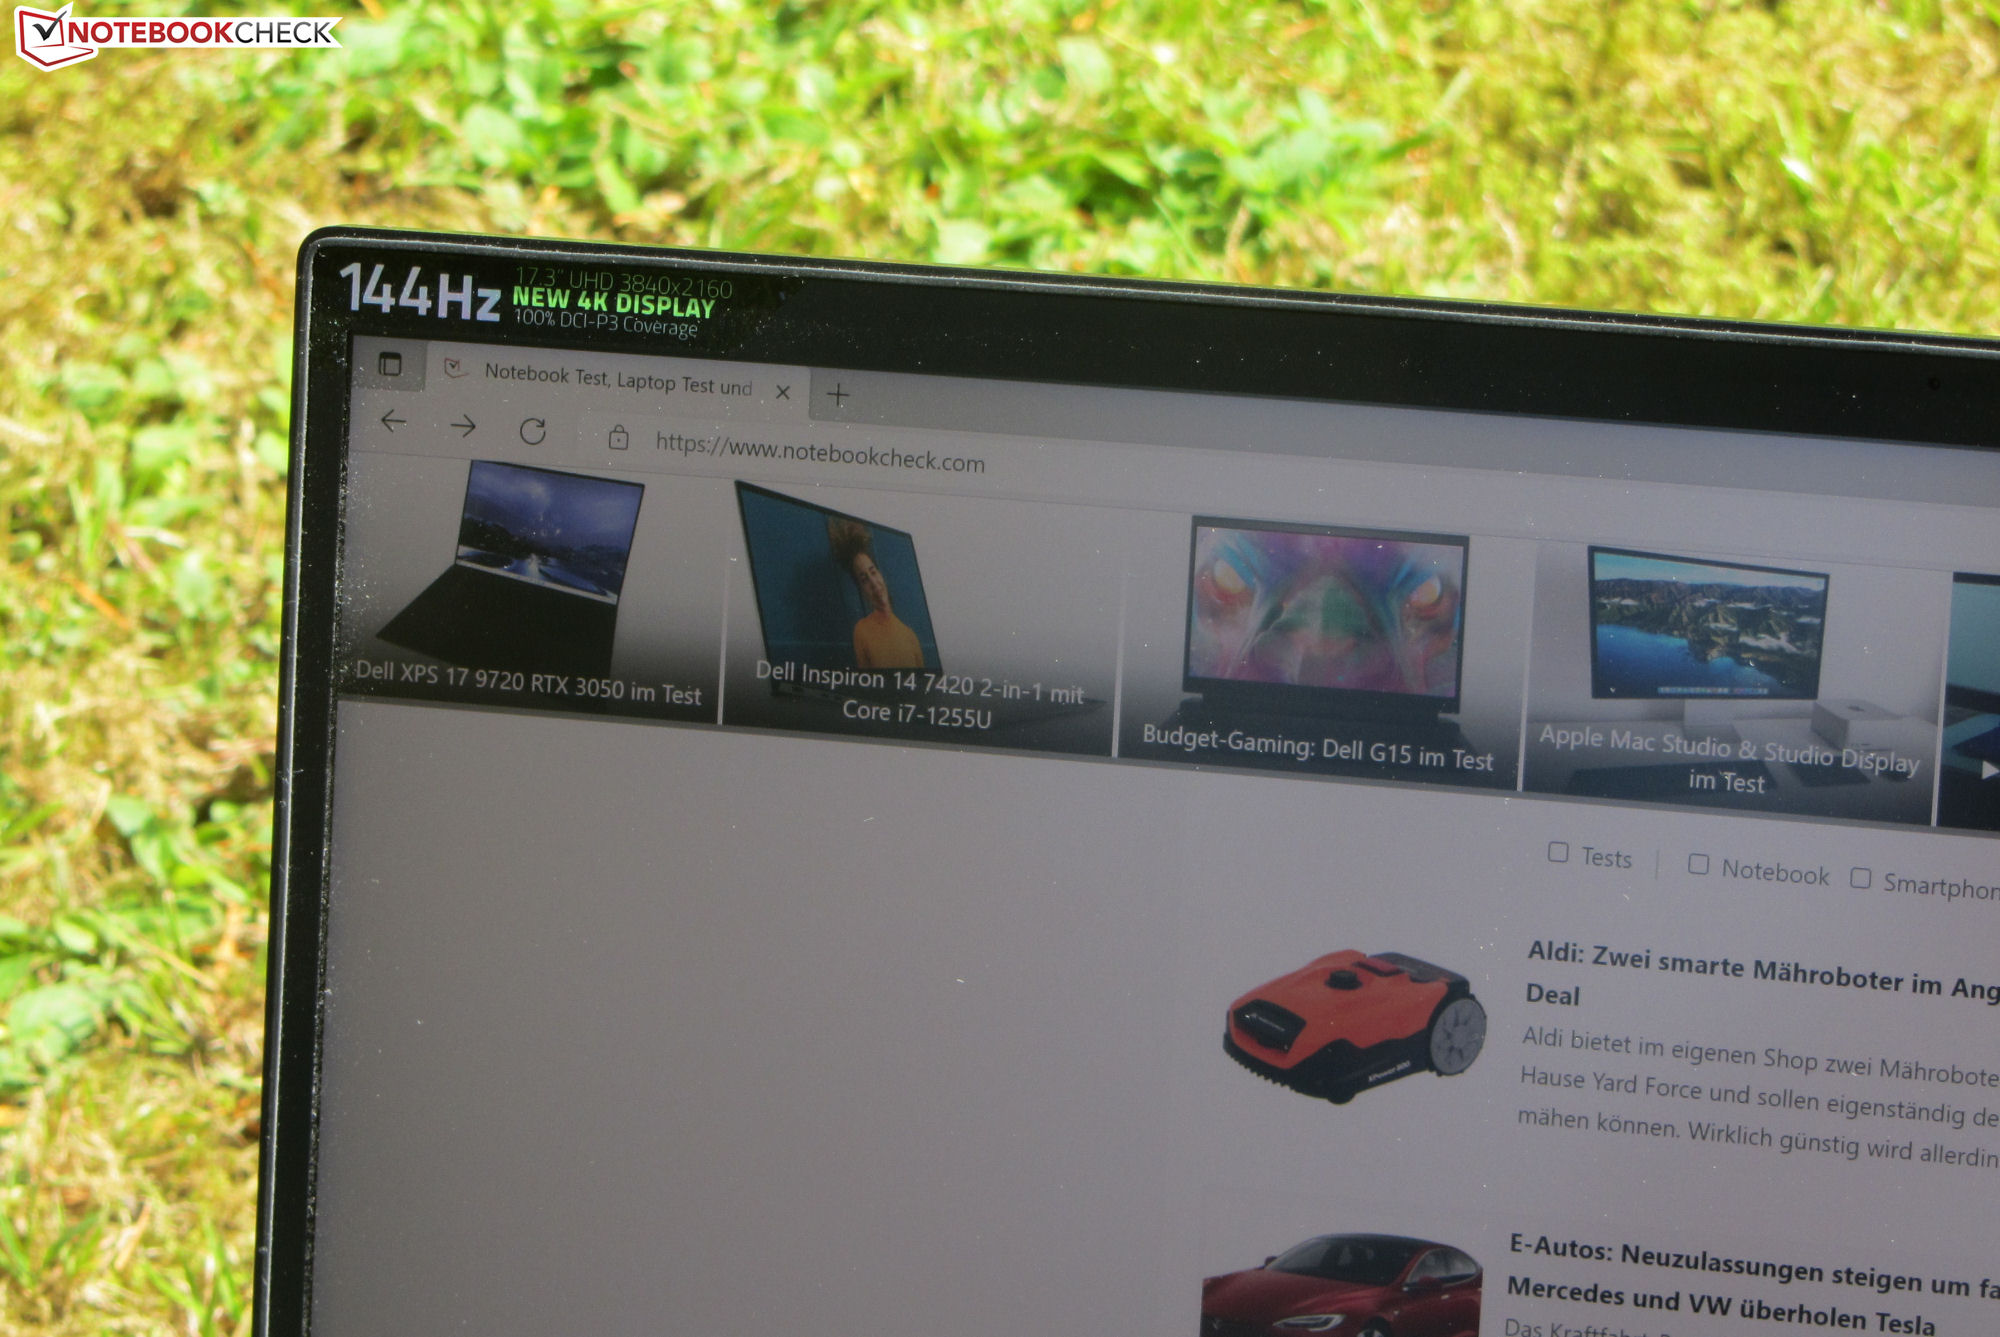
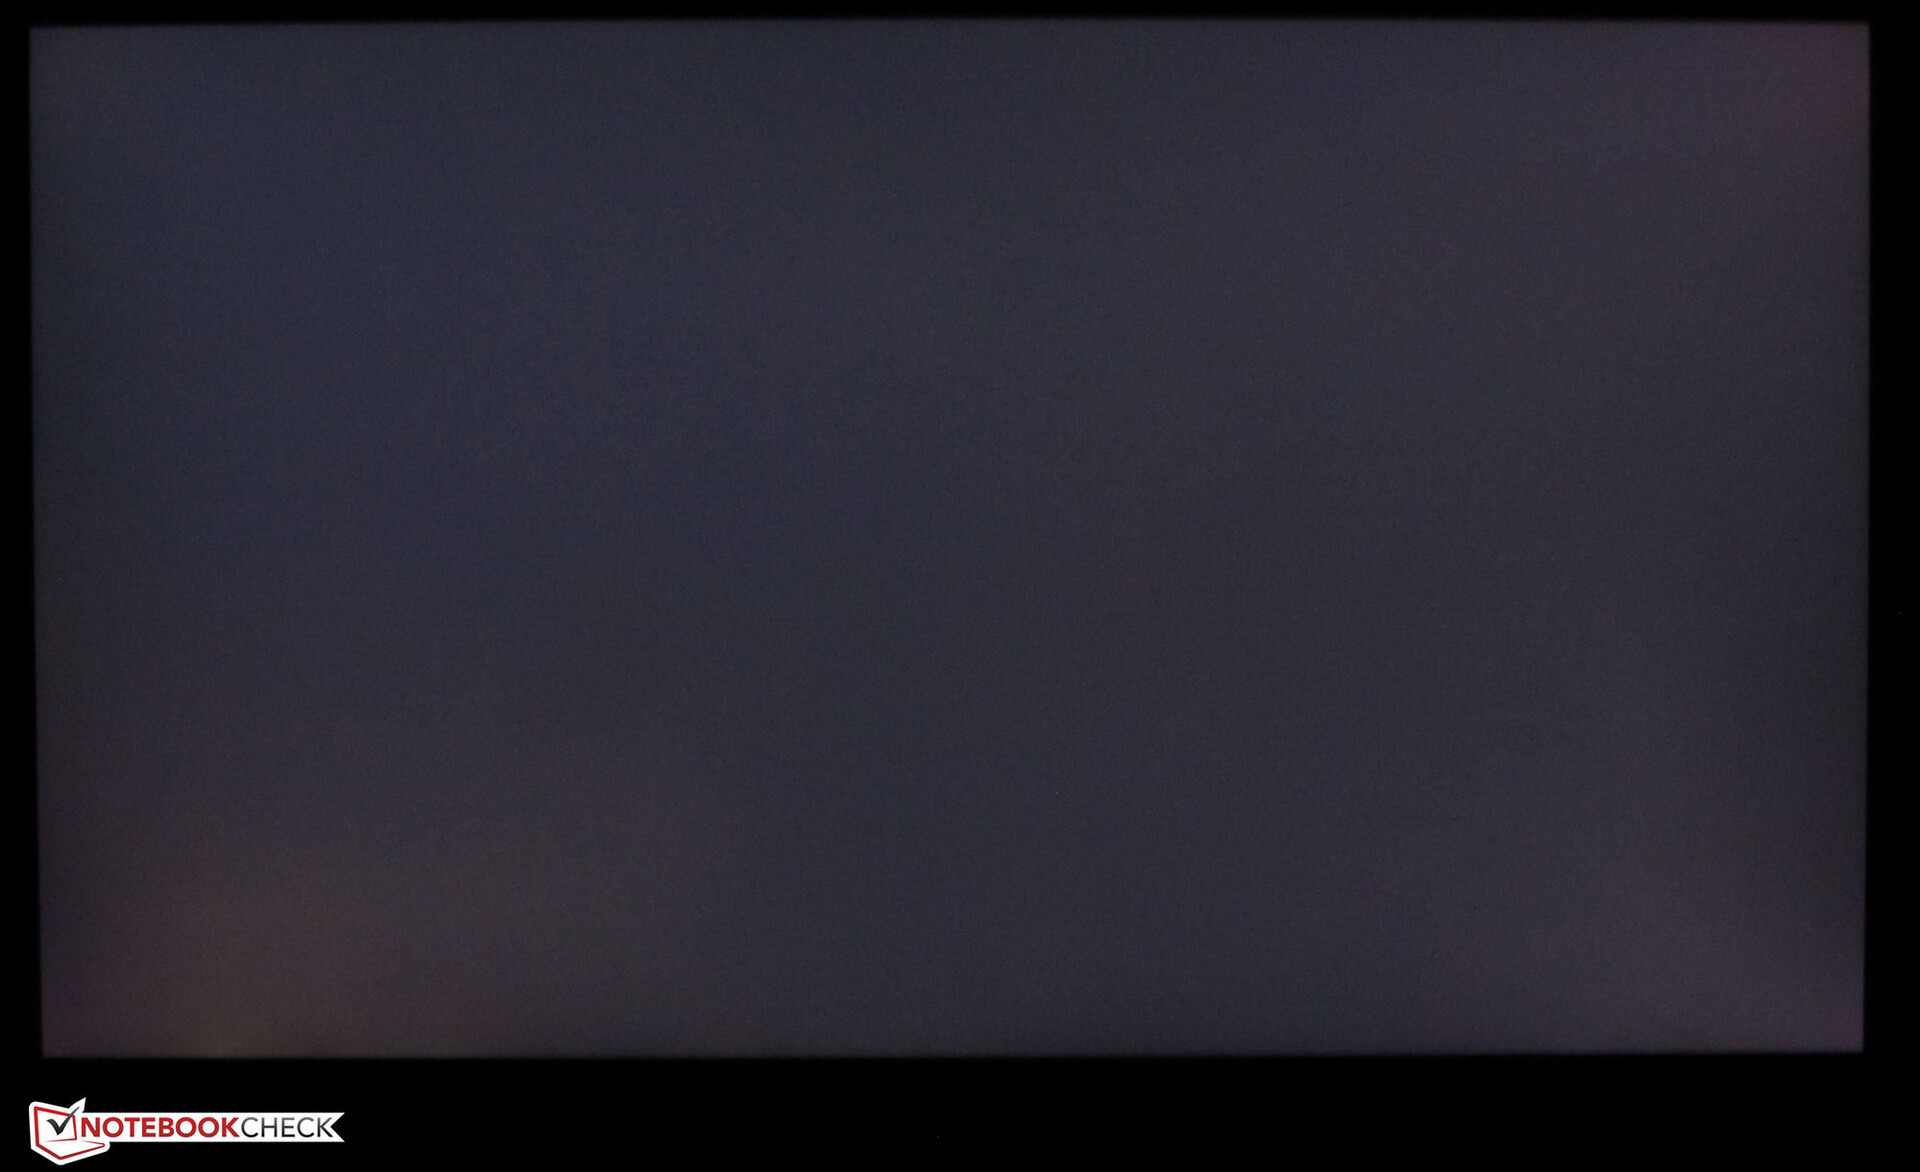
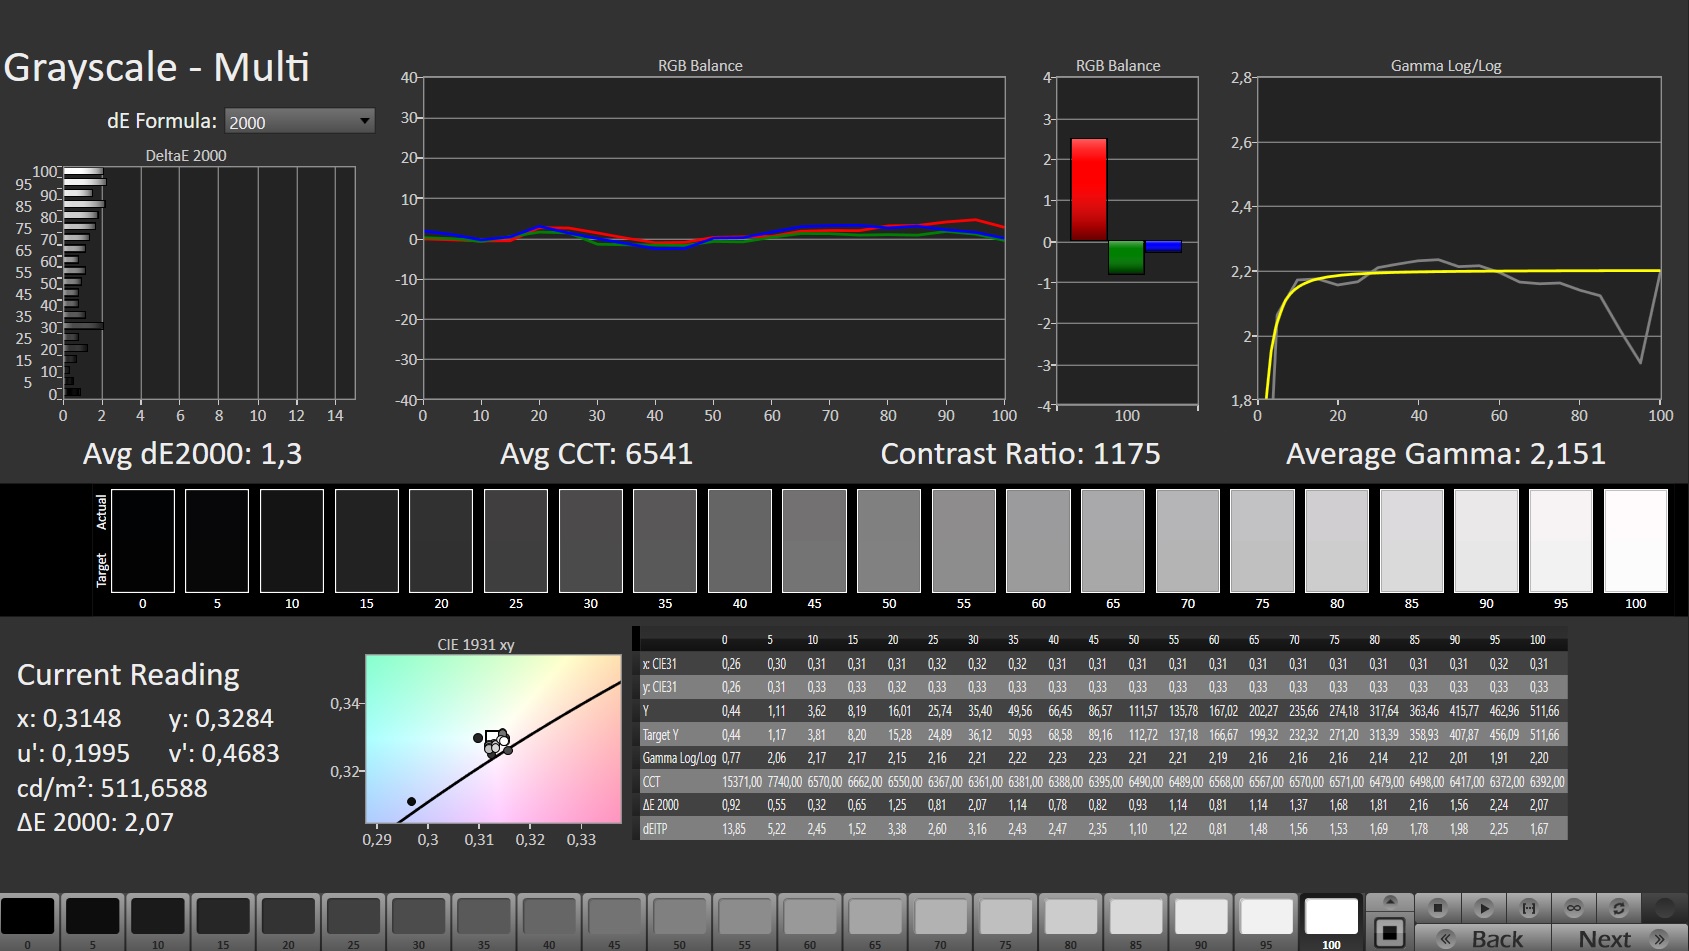
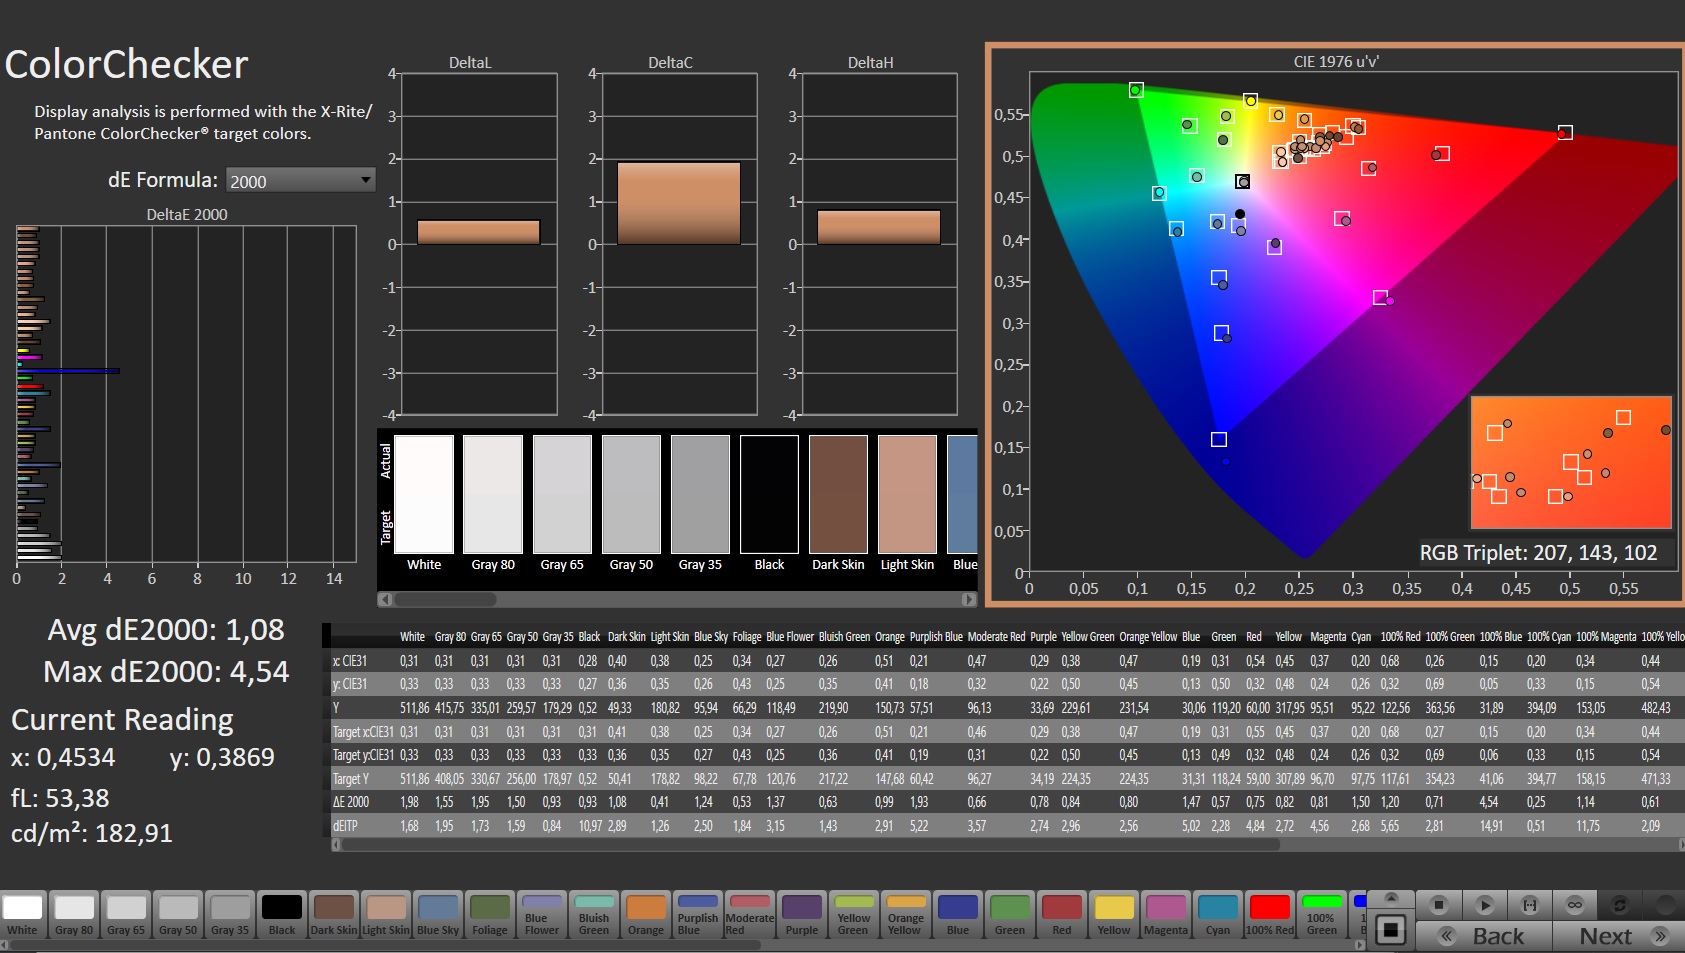
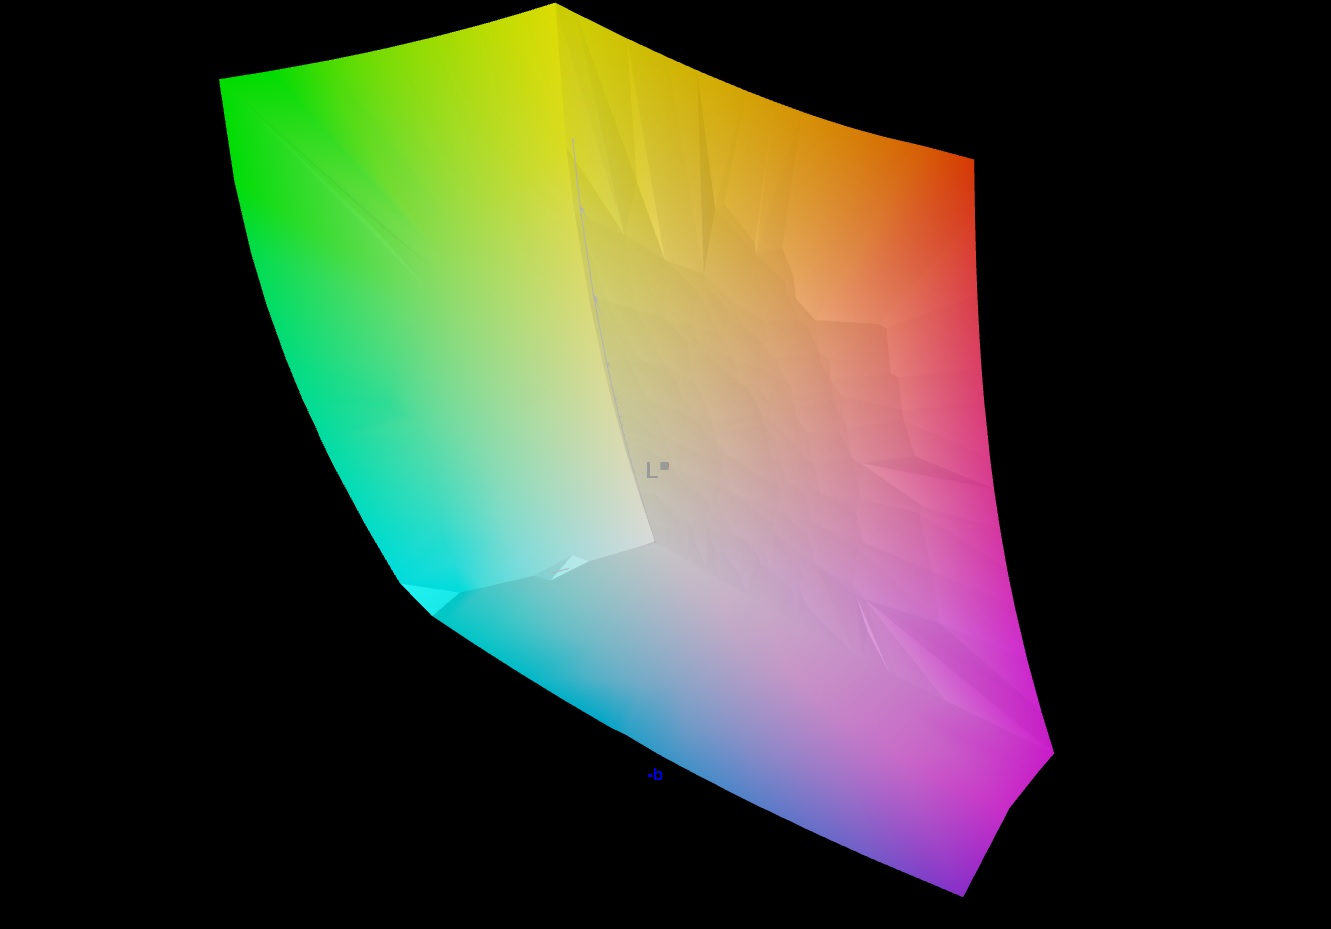
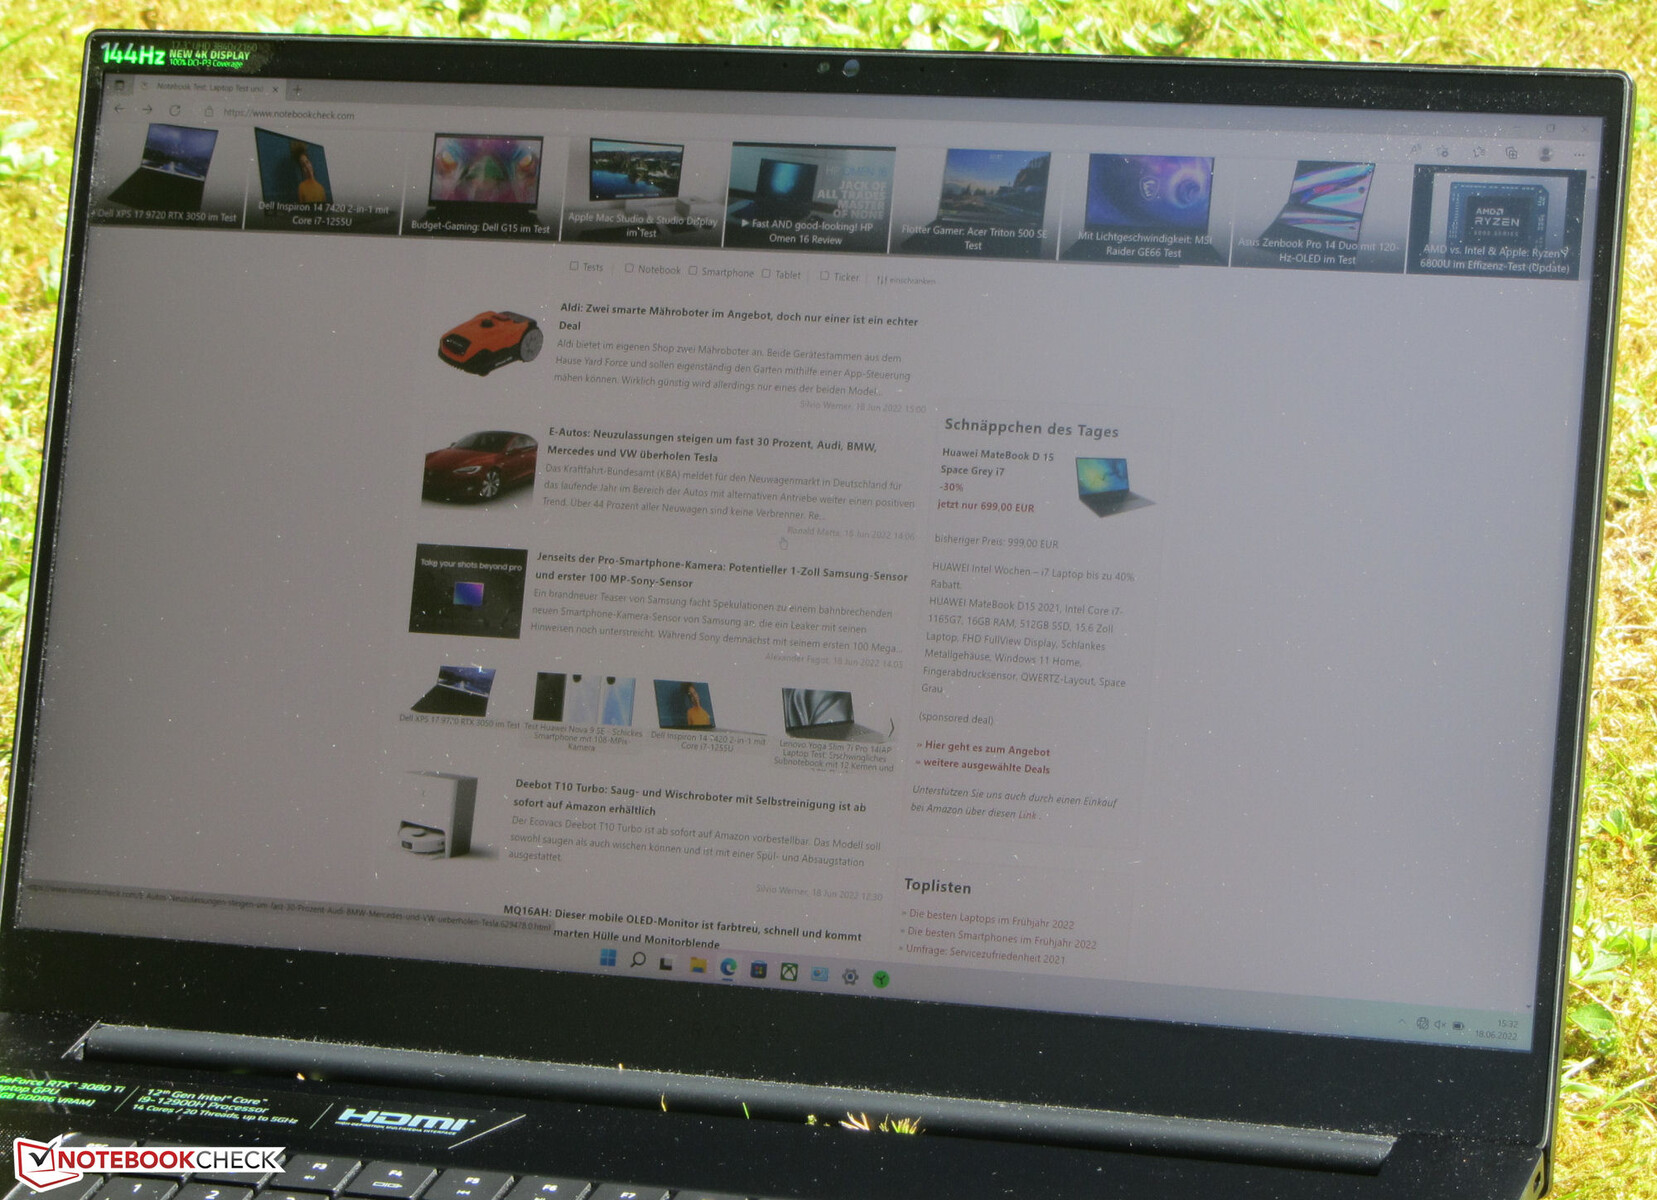
Display - Brilhante e com cores precisas
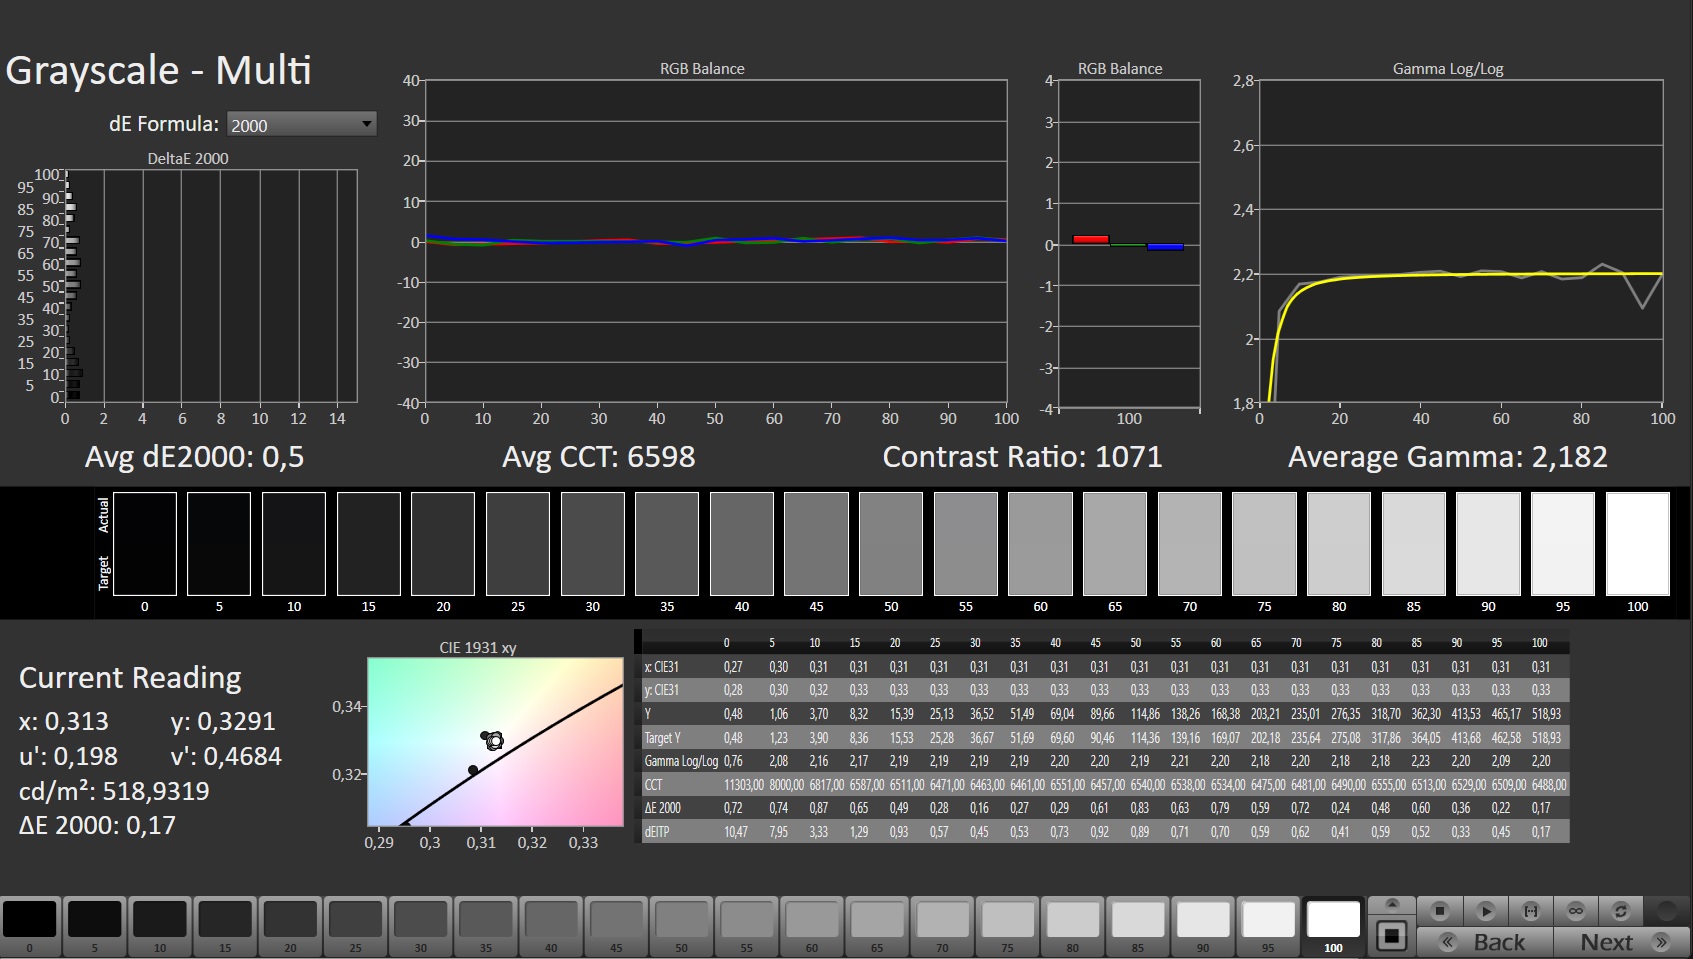
Em nossa unidade de teste, a Razer utiliza um visor impressionante de 17,3 polegadas com uma resolução de 4K (3840 x 2160 pixels) e uma taxa de atualização de 144 Hz que oferece um brilho superior (486,3 cd/m²) e tempos de resposta mais curtos do que os visores dos concorrentes. Isto também é válido para a comparação com o painel QHD do Modelo de irmão americano que já testamos. O contraste de 1.143:1 também está em um nível alto, e não observamos nenhum PWM tremeluzindo durante nossas medições.
| |||||||||||||||||||||||||
iluminação: 84 %
iluminação com acumulador: 503 cd/m²
Contraste: 1143:1 (Preto: 0.44 cd/m²)
ΔE ColorChecker Calman: 1.08 | ∀{0.5-29.43 Ø4.71}
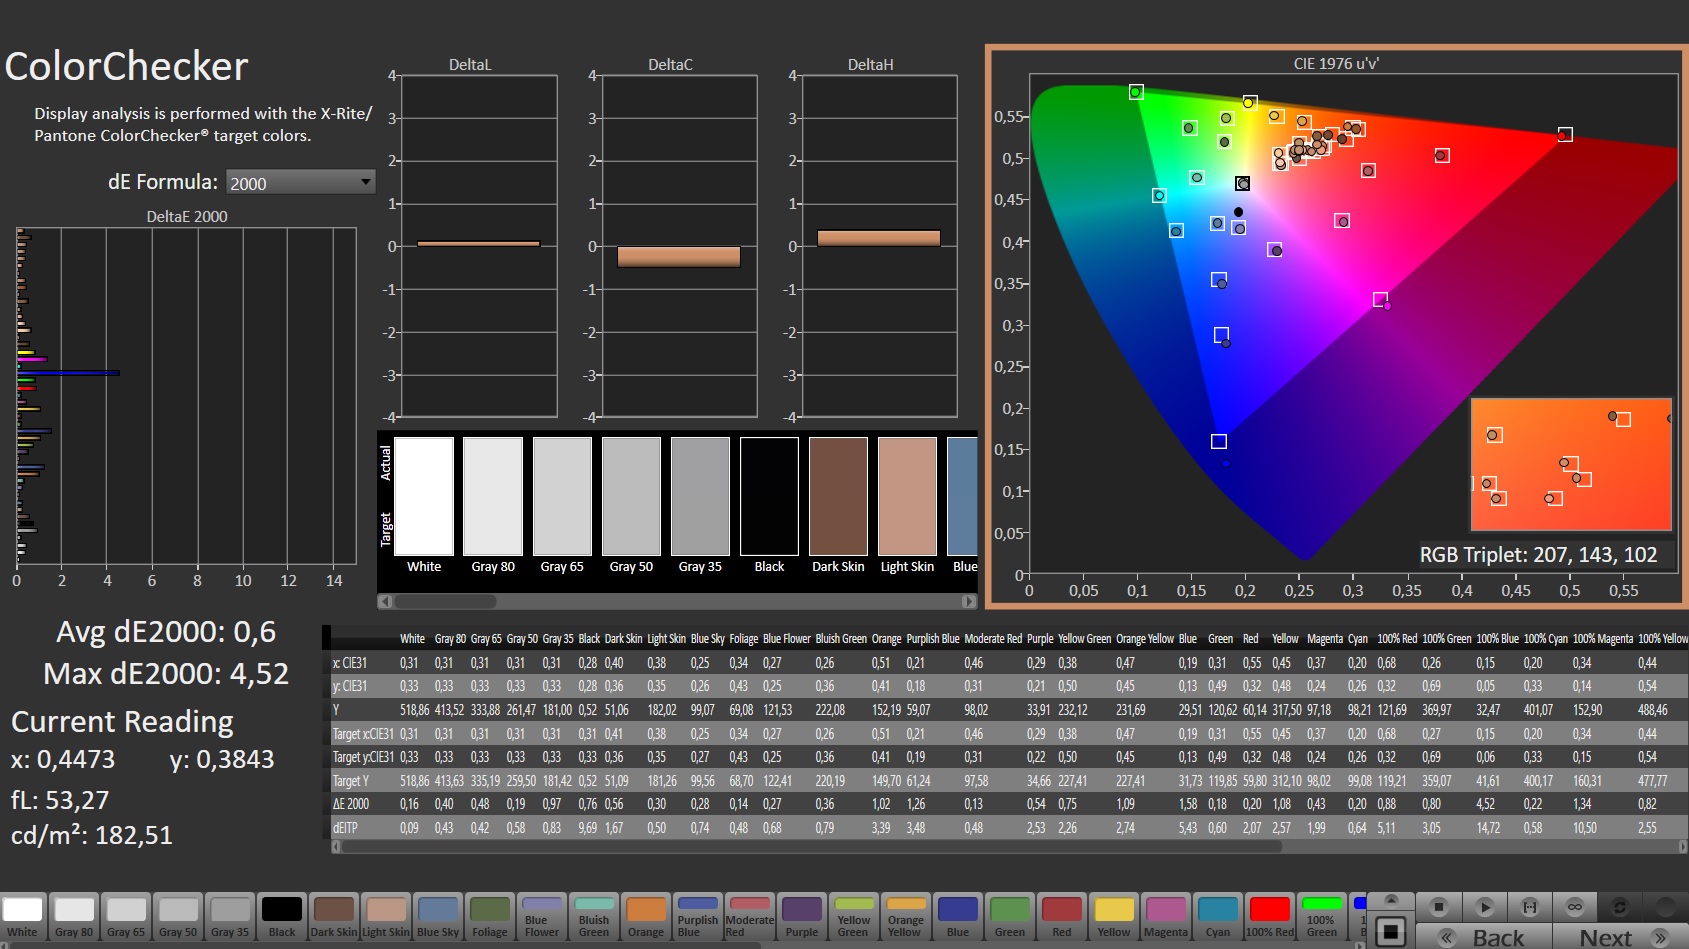
calibrated: 0.6
ΔE Greyscale Calman: 1.3 | ∀{0.09-98 Ø4.96}
87.3% AdobeRGB 1998 (Argyll 3D)
100% sRGB (Argyll 3D)
99.4% Display P3 (Argyll 3D)
Gamma: 2.151
CCT: 6541 K
| Razer Blade 17 Early 2022 AU Optronics B173ZAN06.9, IPS, 3840x2160, 17.3" | Alienware x17 R2 P48E AU Optronics B173HAN, IPS, 1920x1080, 17.3" | Medion Erazer Beast X30 BOE CQ NE173QHM-NZ3, IPS, 2560x1440, 17.3" | MSI Stealth GS77 12UHS-083US BOE NE173QHM-NZ1, IPS, 2560x1440, 17.3" | Razer Blade 17 RTX 3080 Ti BOE NE173QHM-NZ1, IPS, 2560x1440, 17.3" | |
|---|---|---|---|---|---|
| Display | -10% | -18% | -2% | -1% | |
| Display P3 Coverage (%) | 99.4 | 79.2 -20% | 67.7 -32% | 96.2 -3% | 98.7 -1% |
| sRGB Coverage (%) | 100 | 99.8 0% | 97.6 -2% | 99.7 0% | 99.9 0% |
| AdobeRGB 1998 Coverage (%) | 87.3 | 79.6 -9% | 69.2 -21% | 85.8 -2% | 86.2 -1% |
| Response Times | -65% | -73% | -132% | -120% | |
| Response Time Grey 50% / Grey 80% * (ms) | 7.5 ? | 12.4 ? -65% | 14.7 ? -96% | 17.6 ? -135% | 17.6 ? -135% |
| Response Time Black / White * (ms) | 5.6 ? | 9.2 ? -64% | 8.4 ? -50% | 12.8 ? -129% | 11.4 ? -104% |
| PWM Frequency (Hz) | |||||
| Screen | -63% | -58% | -92% | -37% | |
| Brightness middle (cd/m²) | 503 | 365.4 -27% | 377 -25% | 334.8 -33% | 335.9 -33% |
| Brightness (cd/m²) | 486 | 344 -29% | 352 -28% | 305 -37% | 294 -40% |
| Brightness Distribution (%) | 84 | 85 1% | 86 2% | 79 -6% | 75 -11% |
| Black Level * (cd/m²) | 0.44 | 0.29 34% | 0.32 27% | 0.34 23% | 0.38 14% |
| Contrast (:1) | 1143 | 1260 10% | 1178 3% | 985 -14% | 884 -23% |
| Colorchecker dE 2000 * | 1.08 | 3.17 -194% | 2.91 -169% | 4.1 -280% | 2.82 -161% |
| Colorchecker dE 2000 max. * | 4.54 | 7.69 -69% | 6.78 -49% | 7.28 -60% | 5.04 -11% |
| Colorchecker dE 2000 calibrated * | 0.6 | 0.51 15% | 1.3 -117% | ||
| Greyscale dE 2000 * | 1.3 | 5.3 -308% | 3.4 -162% | 5.6 -331% | 1.7 -31% |
| Gamma | 2.151 102% | 2.18 101% | 2.109 104% | 2.16 102% | 2.14 103% |
| CCT | 6541 99% | 5879 111% | 7273 89% | 6314 103% | 6382 102% |
| Média Total (Programa/Configurações) | -46% /
-52% | -50% /
-51% | -75% /
-77% | -53% /
-41% |
* ... menor é melhor
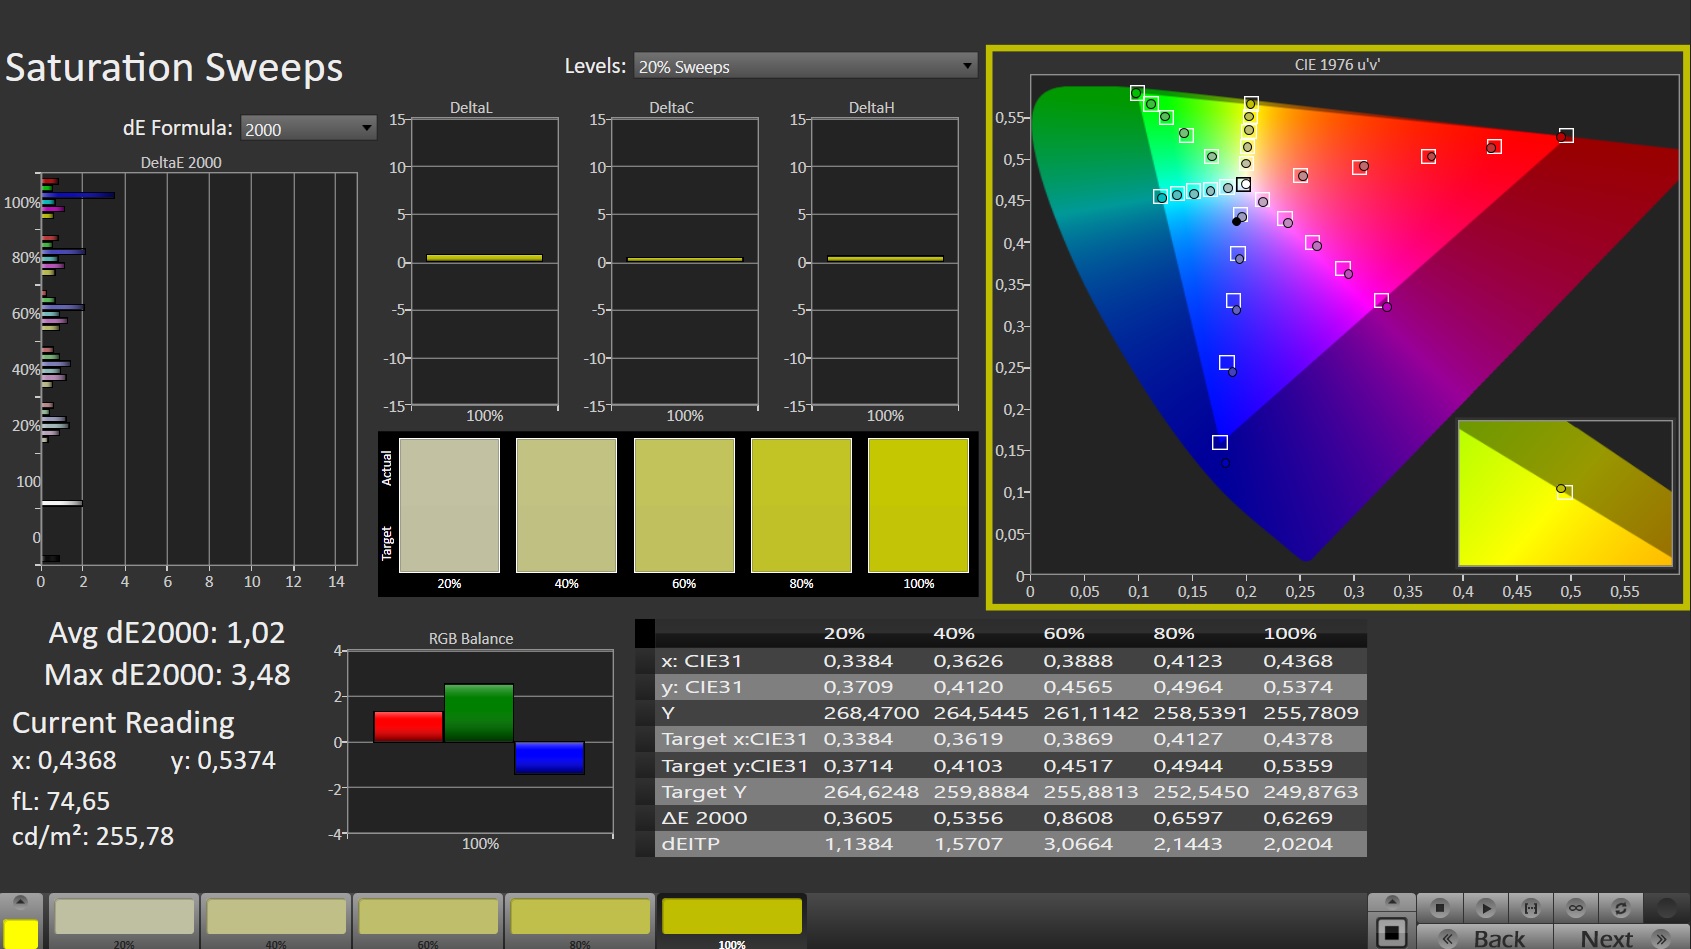
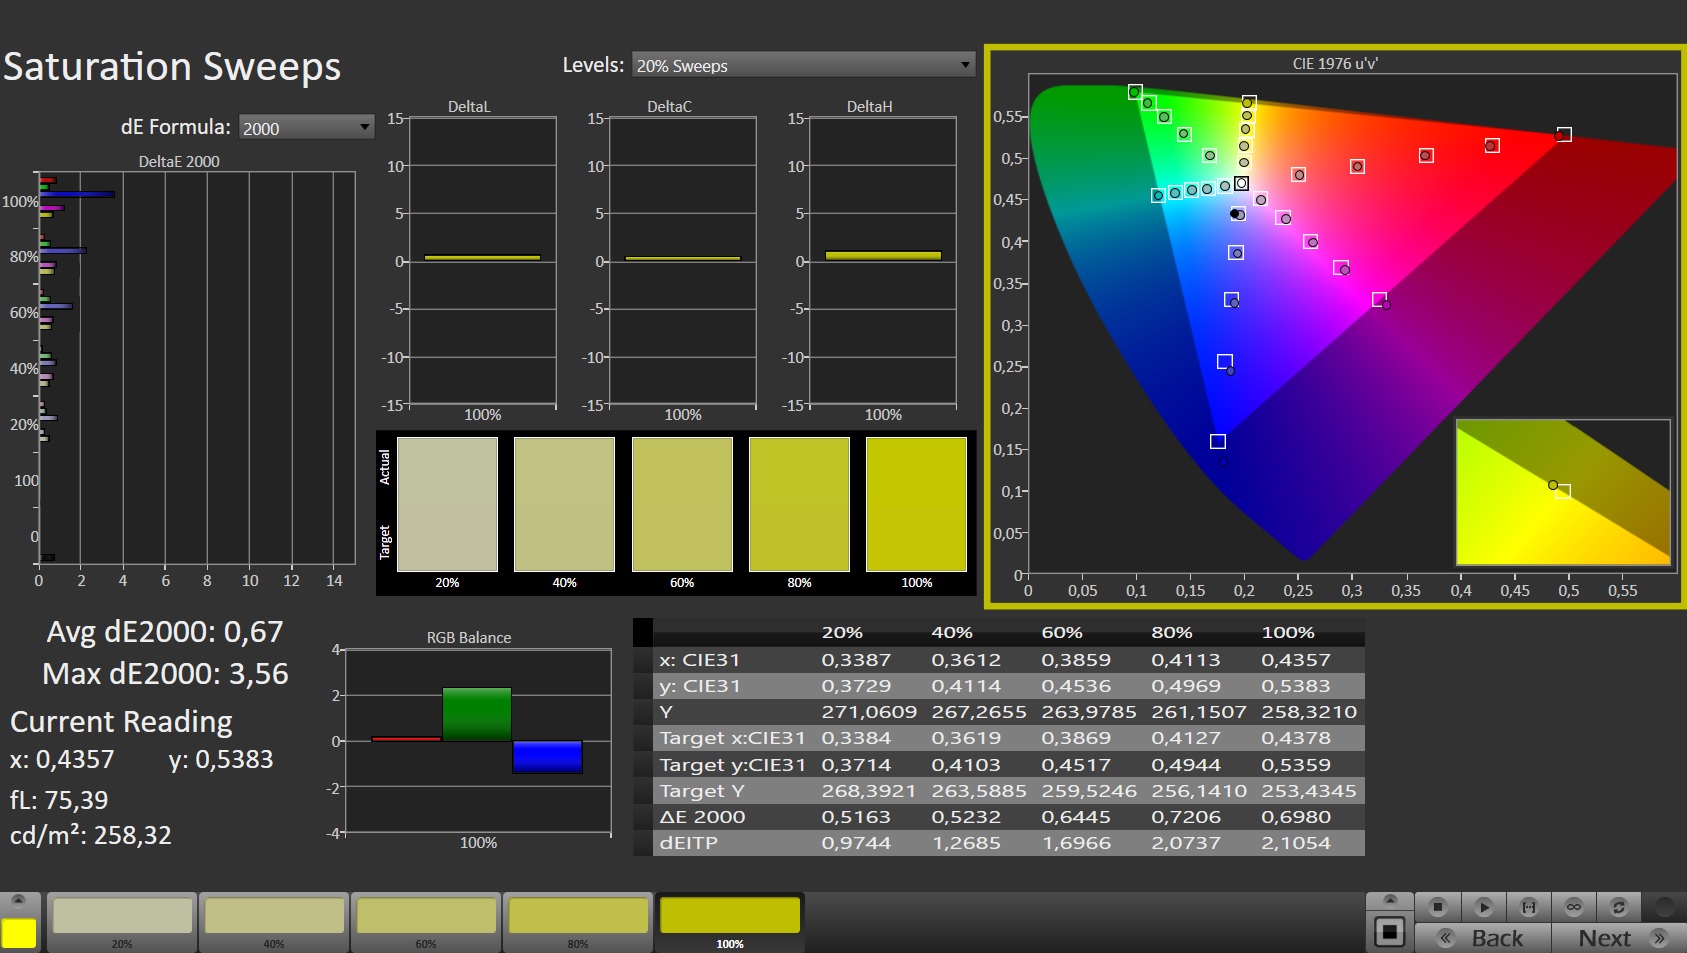
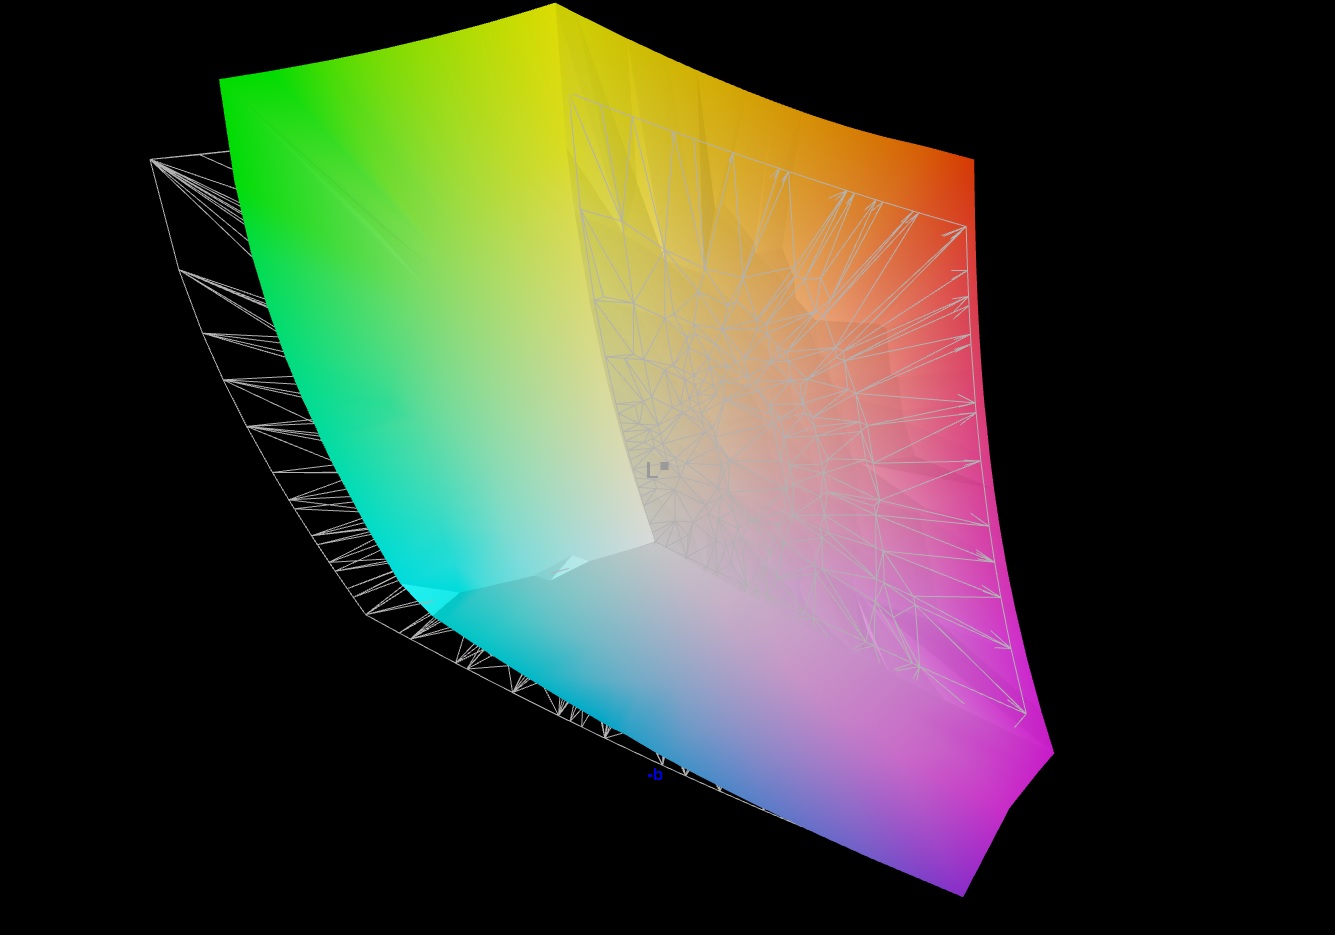
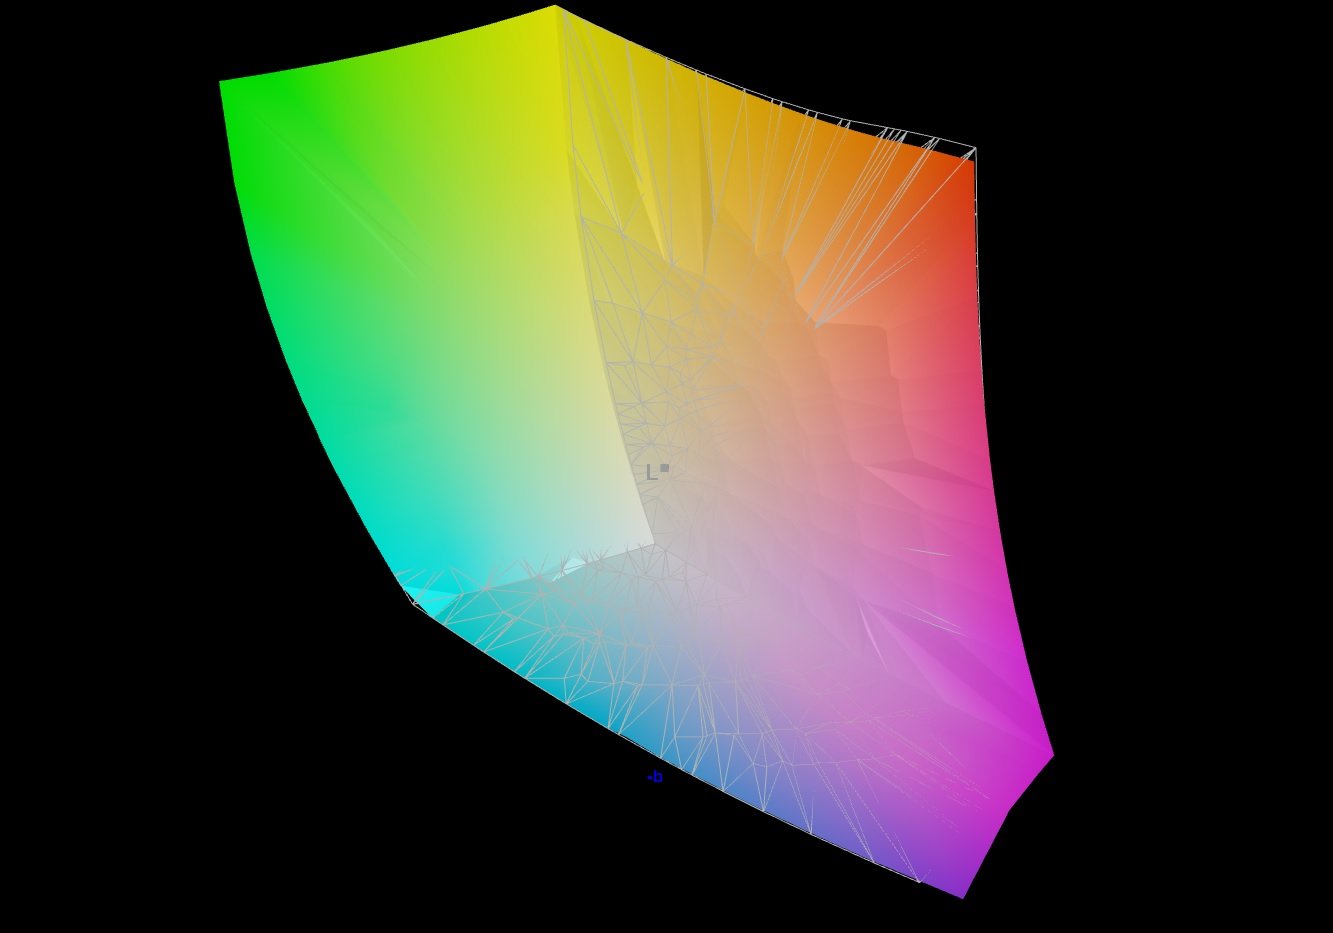
Em termos de reprodução de cores e cobertura do espaço de cores, o painel 4K e o painel QHD do modelo irmão são similares, com ambos os modelos fornecendo bons valores de níveis quase idênticos já no estado de entrega. Os desvios médios de cor permanecem dentro da faixa alvo do DeltaE < 3. Uma calibração traz mais melhorias, e nosso arquivo de perfil está vinculado na janela de informações no display acima para seu download gratuito. Entretanto, o painel 4K mostra alguma ligeira fraqueza nos tons azuis mesmo após a calibração. Ambos os displays são capazes de cobrir completamente os espaços de cor sRGB e DCI-P3, e o espaço de cor AdobeRGB é coberto pelo menos a 86 e 87% respectivamente.
Exibir tempos de resposta
| ↔ Tempo de resposta preto para branco | ||
|---|---|---|
| 5.6 ms ... ascensão ↗ e queda ↘ combinadas | ↗ 1.6 ms ascensão | 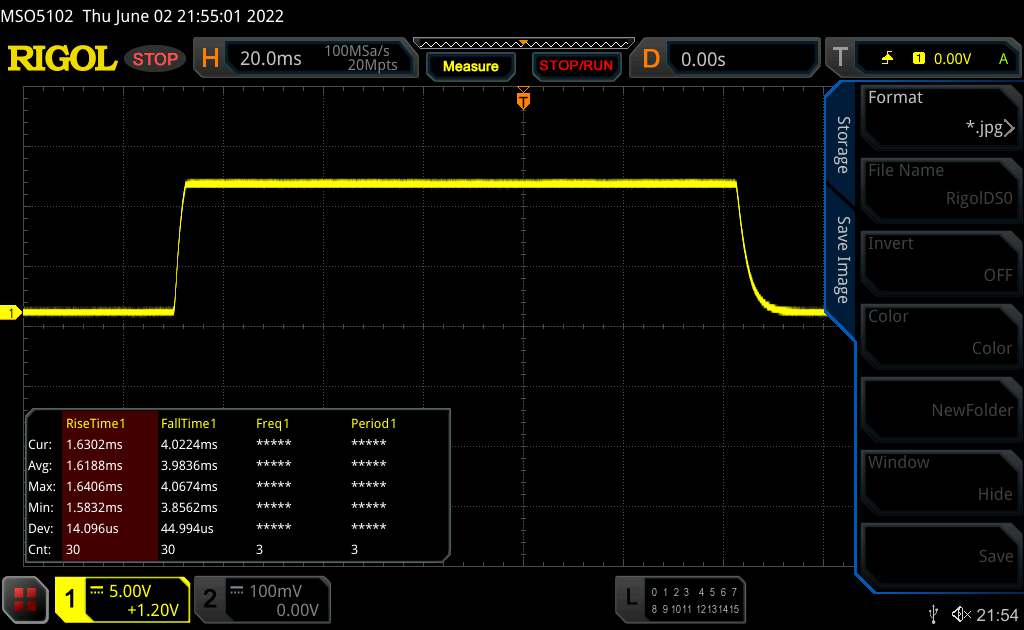 |
| ↘ 4 ms queda | ||
| A tela mostra taxas de resposta muito rápidas em nossos testes e deve ser muito adequada para jogos em ritmo acelerado. Em comparação, todos os dispositivos testados variam de 0.1 (mínimo) a 240 (máximo) ms. » 18 % de todos os dispositivos são melhores. Isso significa que o tempo de resposta medido é melhor que a média de todos os dispositivos testados (19.8 ms). | ||
| ↔ Tempo de resposta 50% cinza a 80% cinza | ||
| 7.5 ms ... ascensão ↗ e queda ↘ combinadas | ↗ 2.1 ms ascensão | 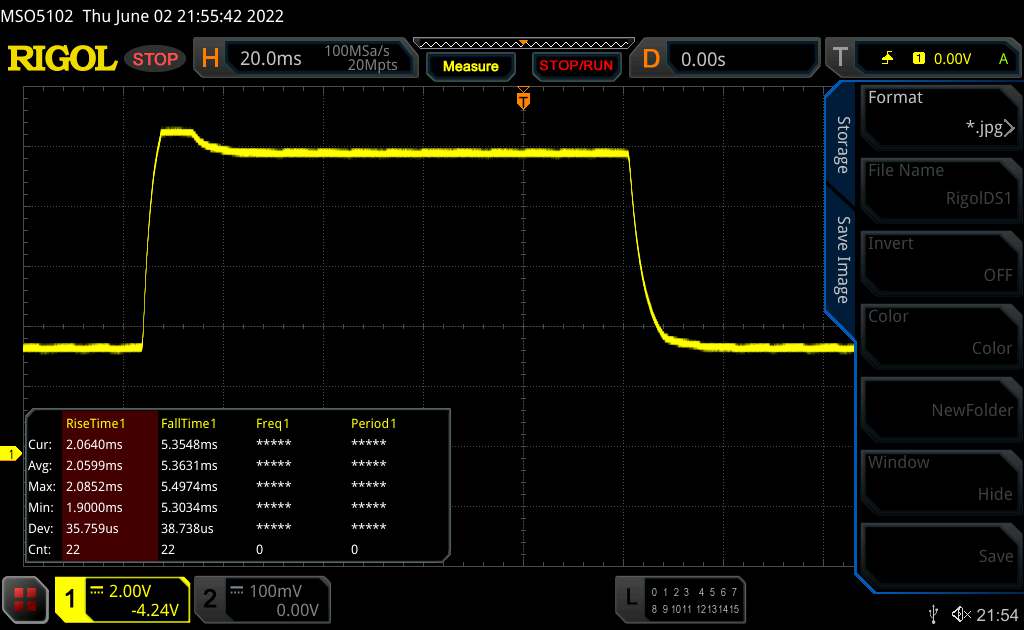 |
| ↘ 5.4 ms queda | ||
| A tela mostra taxas de resposta muito rápidas em nossos testes e deve ser muito adequada para jogos em ritmo acelerado. Em comparação, todos os dispositivos testados variam de 0.165 (mínimo) a 636 (máximo) ms. » 20 % de todos os dispositivos são melhores. Isso significa que o tempo de resposta medido é melhor que a média de todos os dispositivos testados (31 ms). | ||
Cintilação da tela / PWM (modulação por largura de pulso)
| Tela tremeluzindo / PWM não detectado |  | ||
[pwm_comparison] Em comparação: 52 % de todos os dispositivos testados não usam PWM para escurecer a tela. Se PWM foi detectado, uma média de 7757 (mínimo: 5 - máximo: 343500) Hz foi medida. | |||
O painel IPS oferece ângulos de visão estáveis e pode ser lido de qualquer ângulo. Graças ao brilho bastante alto do visor, você também pode ler seu conteúdo facilmente ao ar livre.

Desempenho - O laptop Razer usa Alder Lake e Ampere
Com o Blade 17, a Razer oferece um laptop para jogos de 17,3 polegadas que é capaz de trazer todos os jogos atuais para a tela com suavidade.
Condições de teste
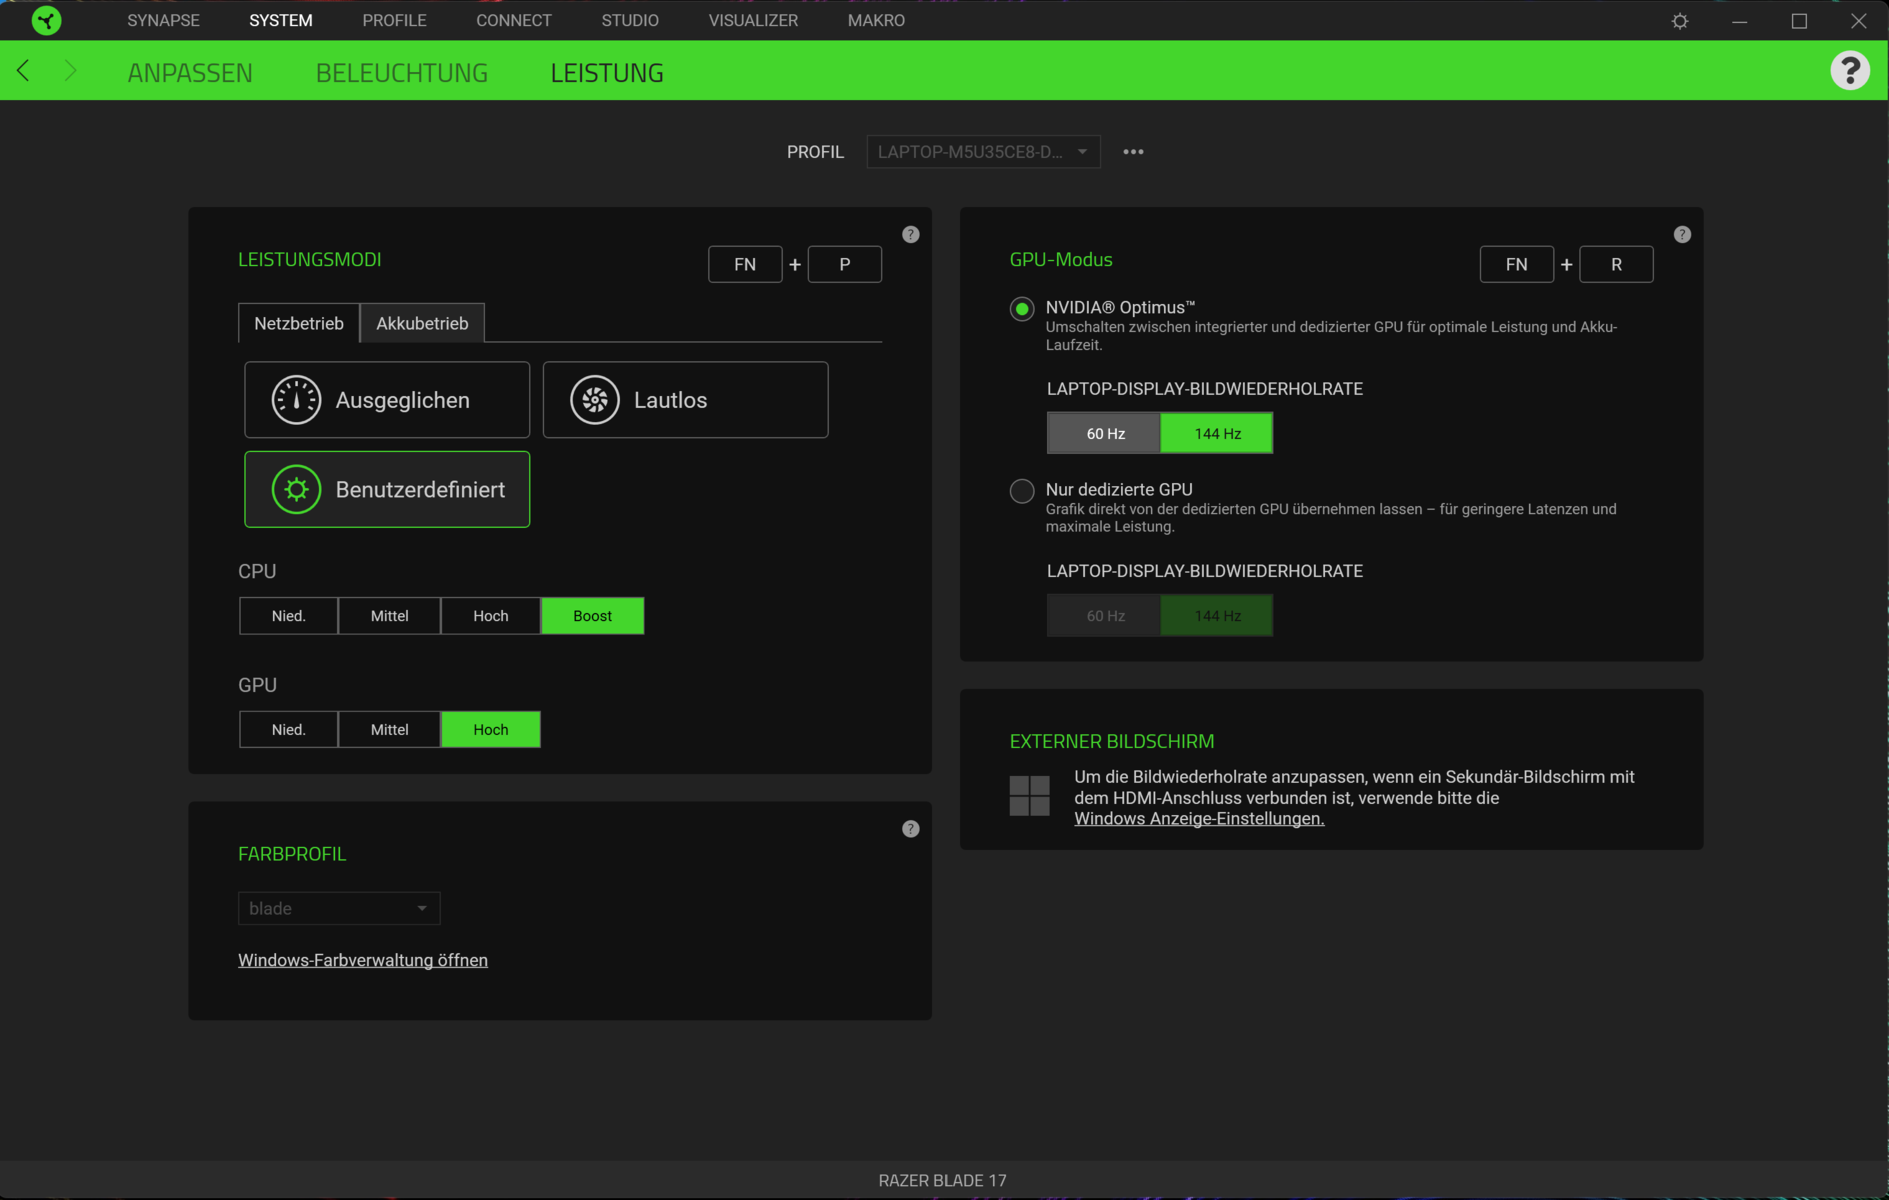
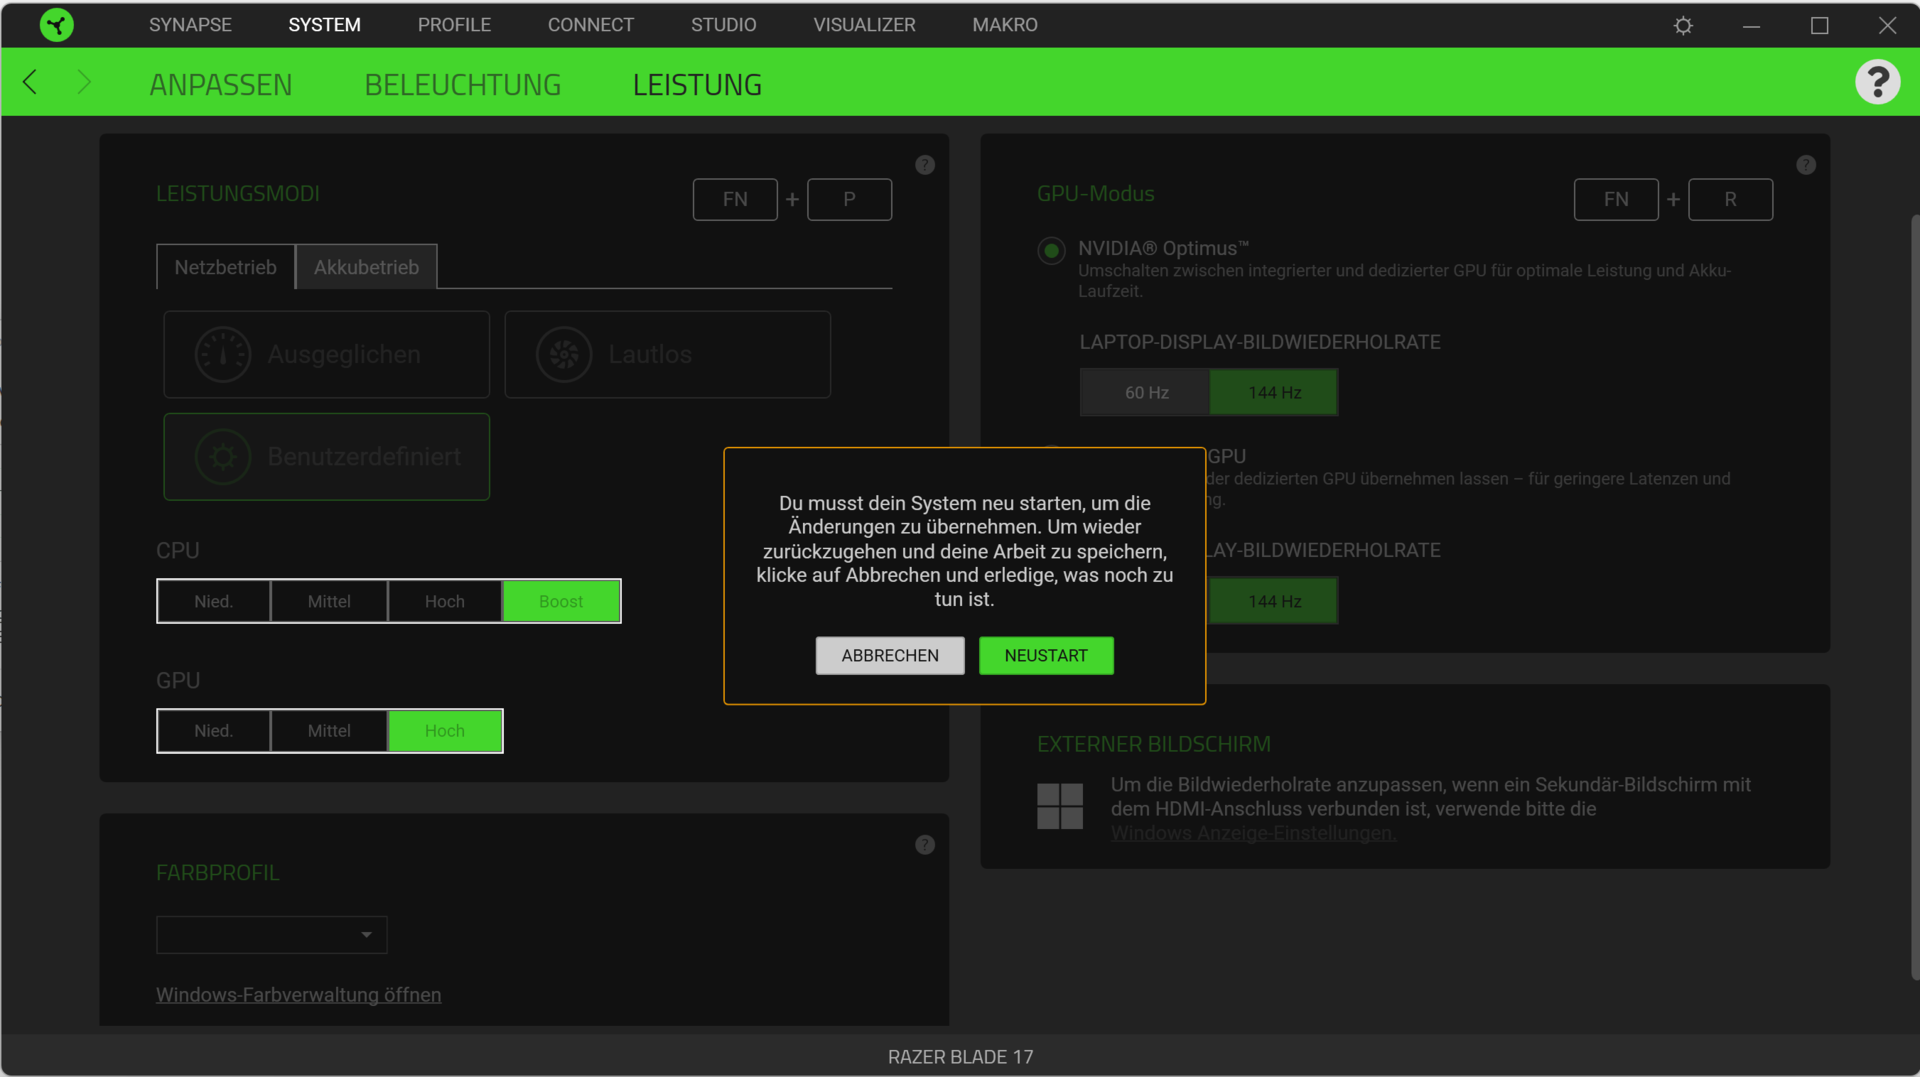
Você pode alternar entre os três perfis de desempenho disponíveis ("Balanceado", "Silencioso" e "Definido pelo usuário") usando a combinação de teclas "Fn" + "P". O perfil "User defined" permite definir os subpresets para a CPU ("Low", "Medium", "High", e "Boost") e GPU ("Low", "Medium", e "High") através do software Razer Synapse. Na operação com bateria, o único perfil disponível é "Equilibrado"
Durante nosso teste, usamos o perfil "Usuário definido" com os subpresets "Médio" (CPU) e "Alto" (GPU), que é a configuração padrão no estado de entrega. Além disso, executamos vários benchmarks usando o perfil "Silencioso", no desempenho máximo (CPU: "Boost", GPU: "Alta"), e no modo dGPU. Você pode encontrar os resultados nos gráficos abaixo.
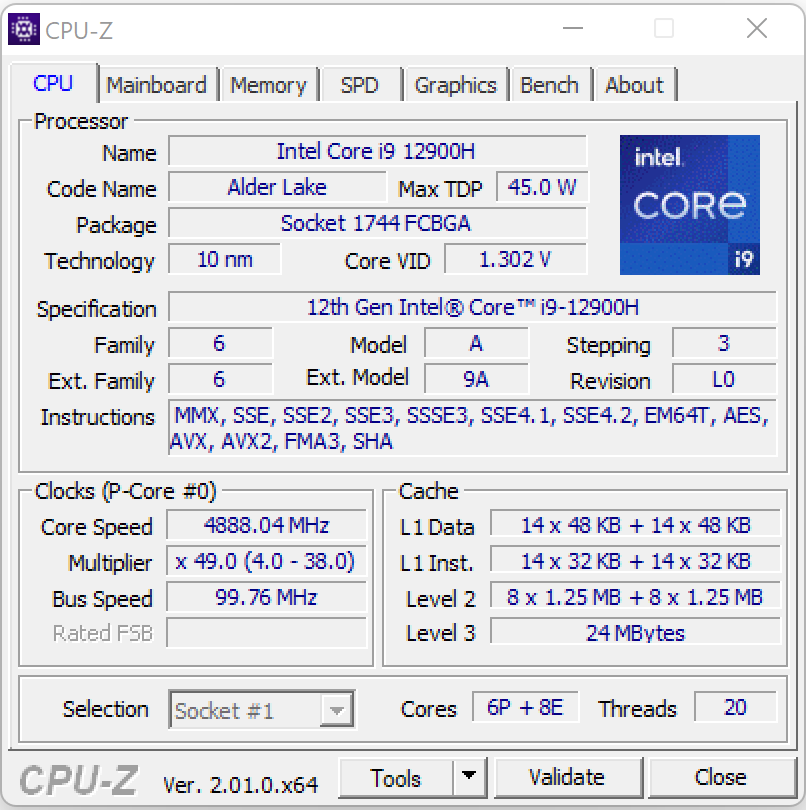
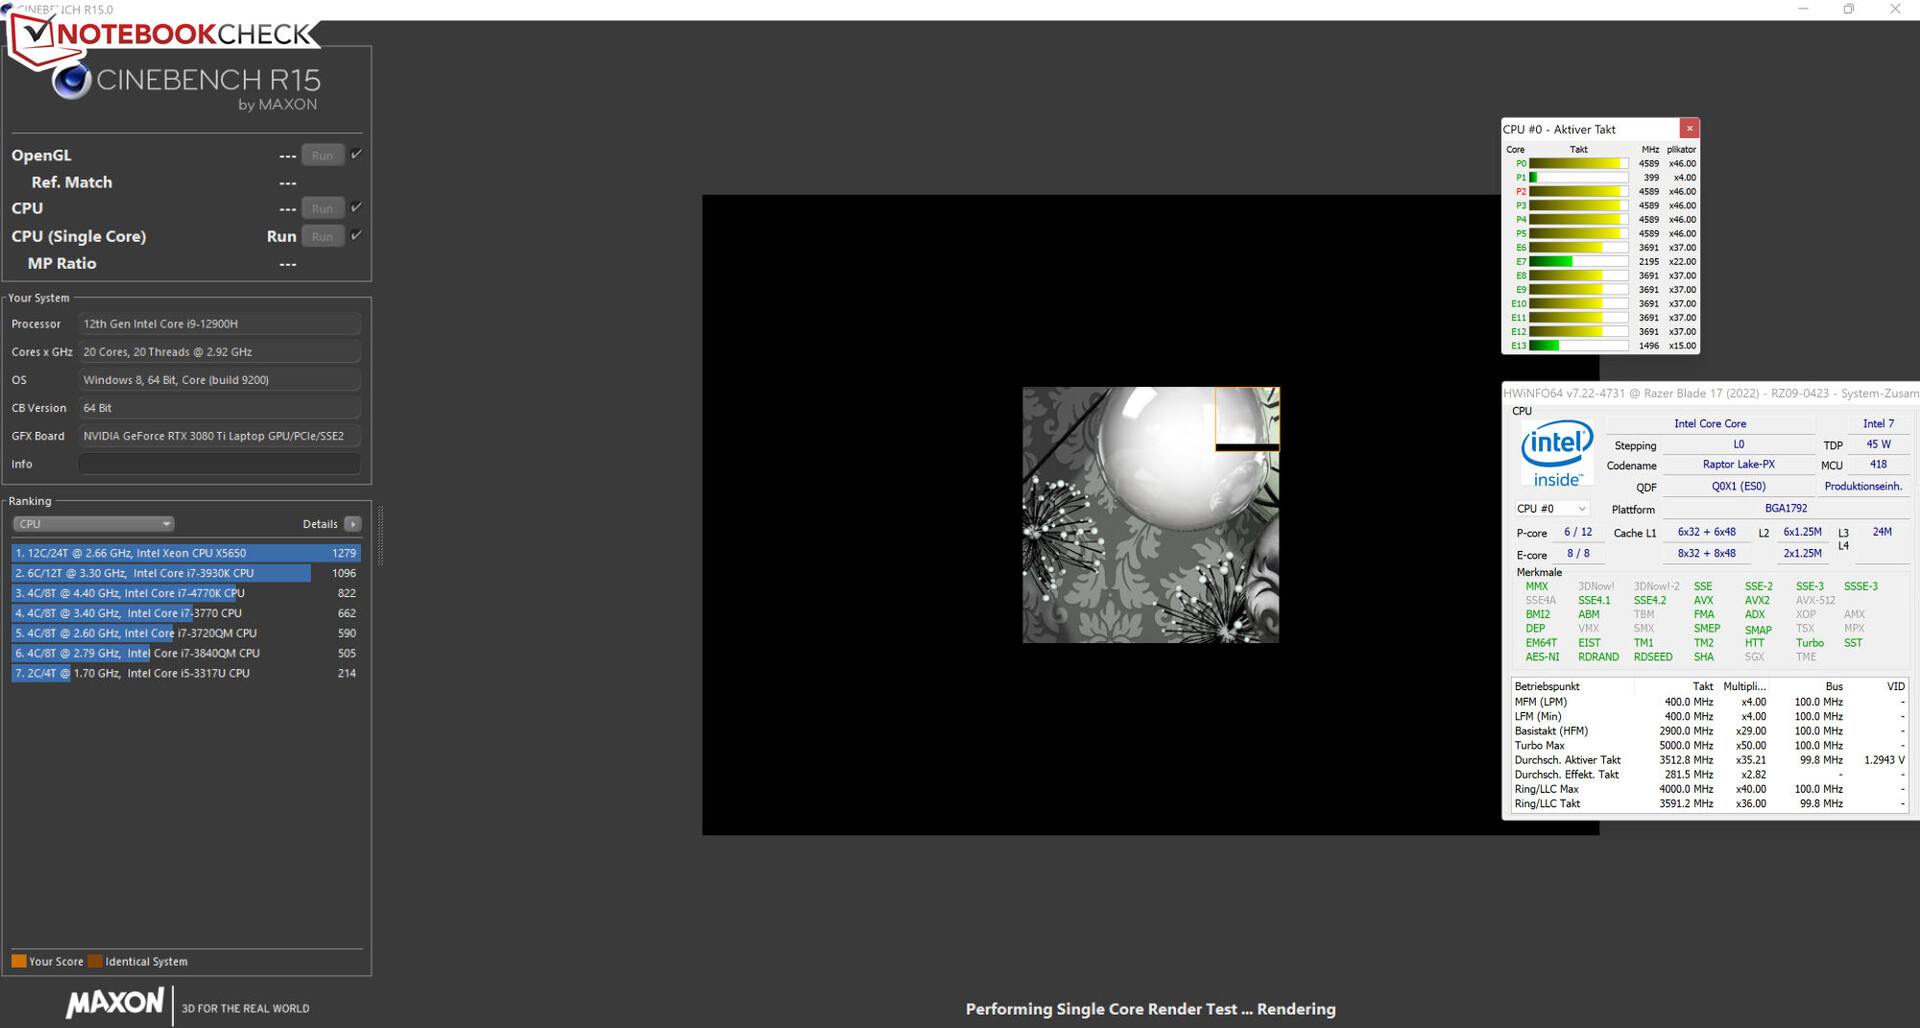
Processador
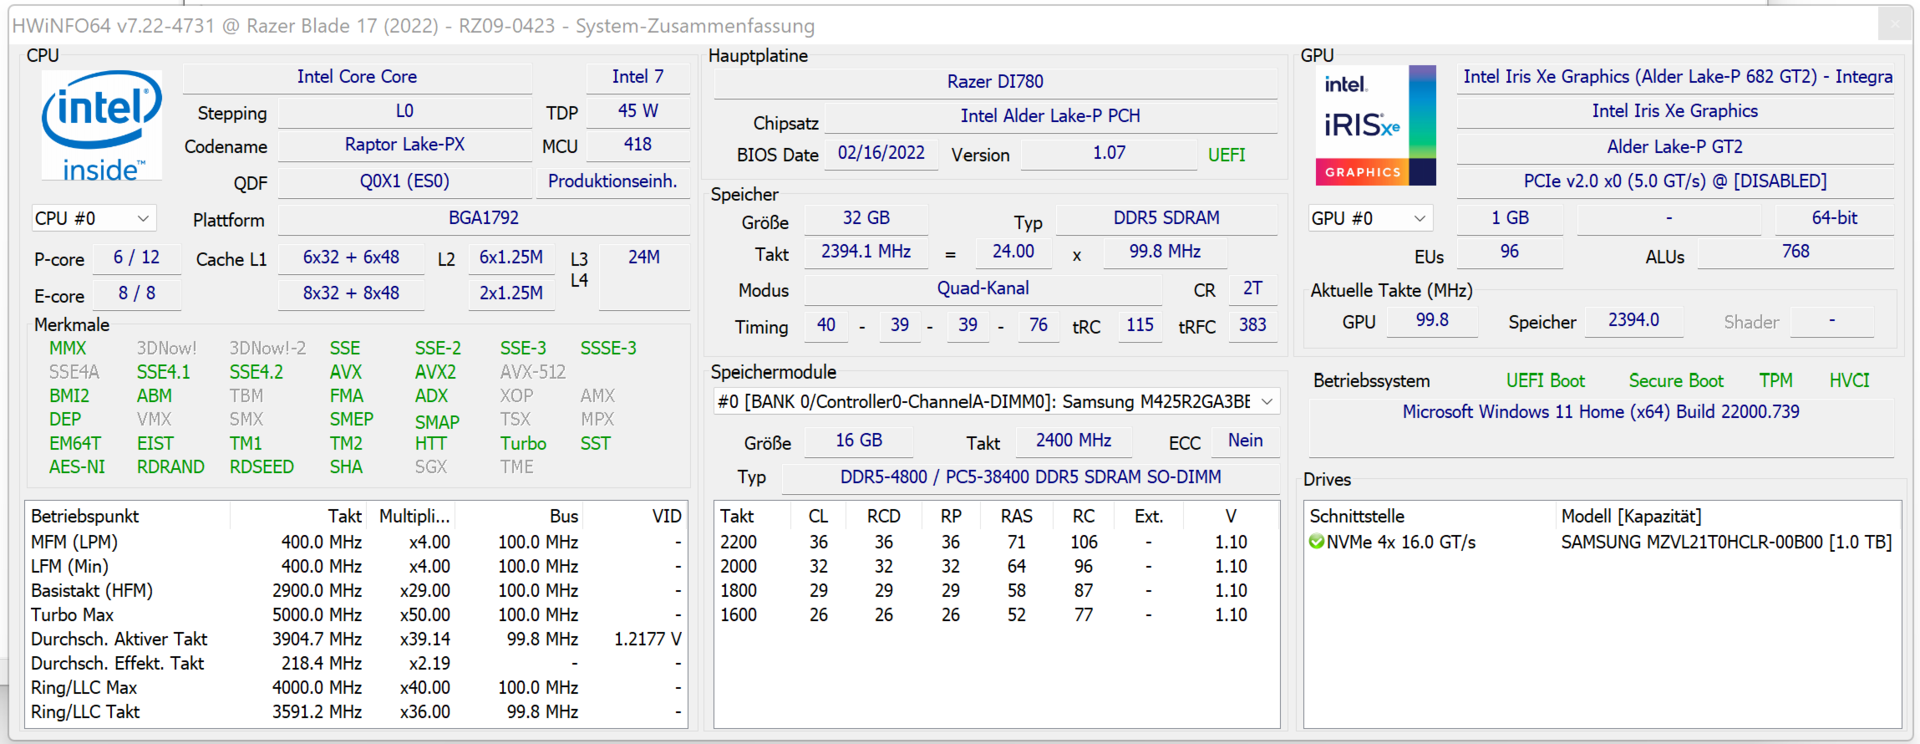
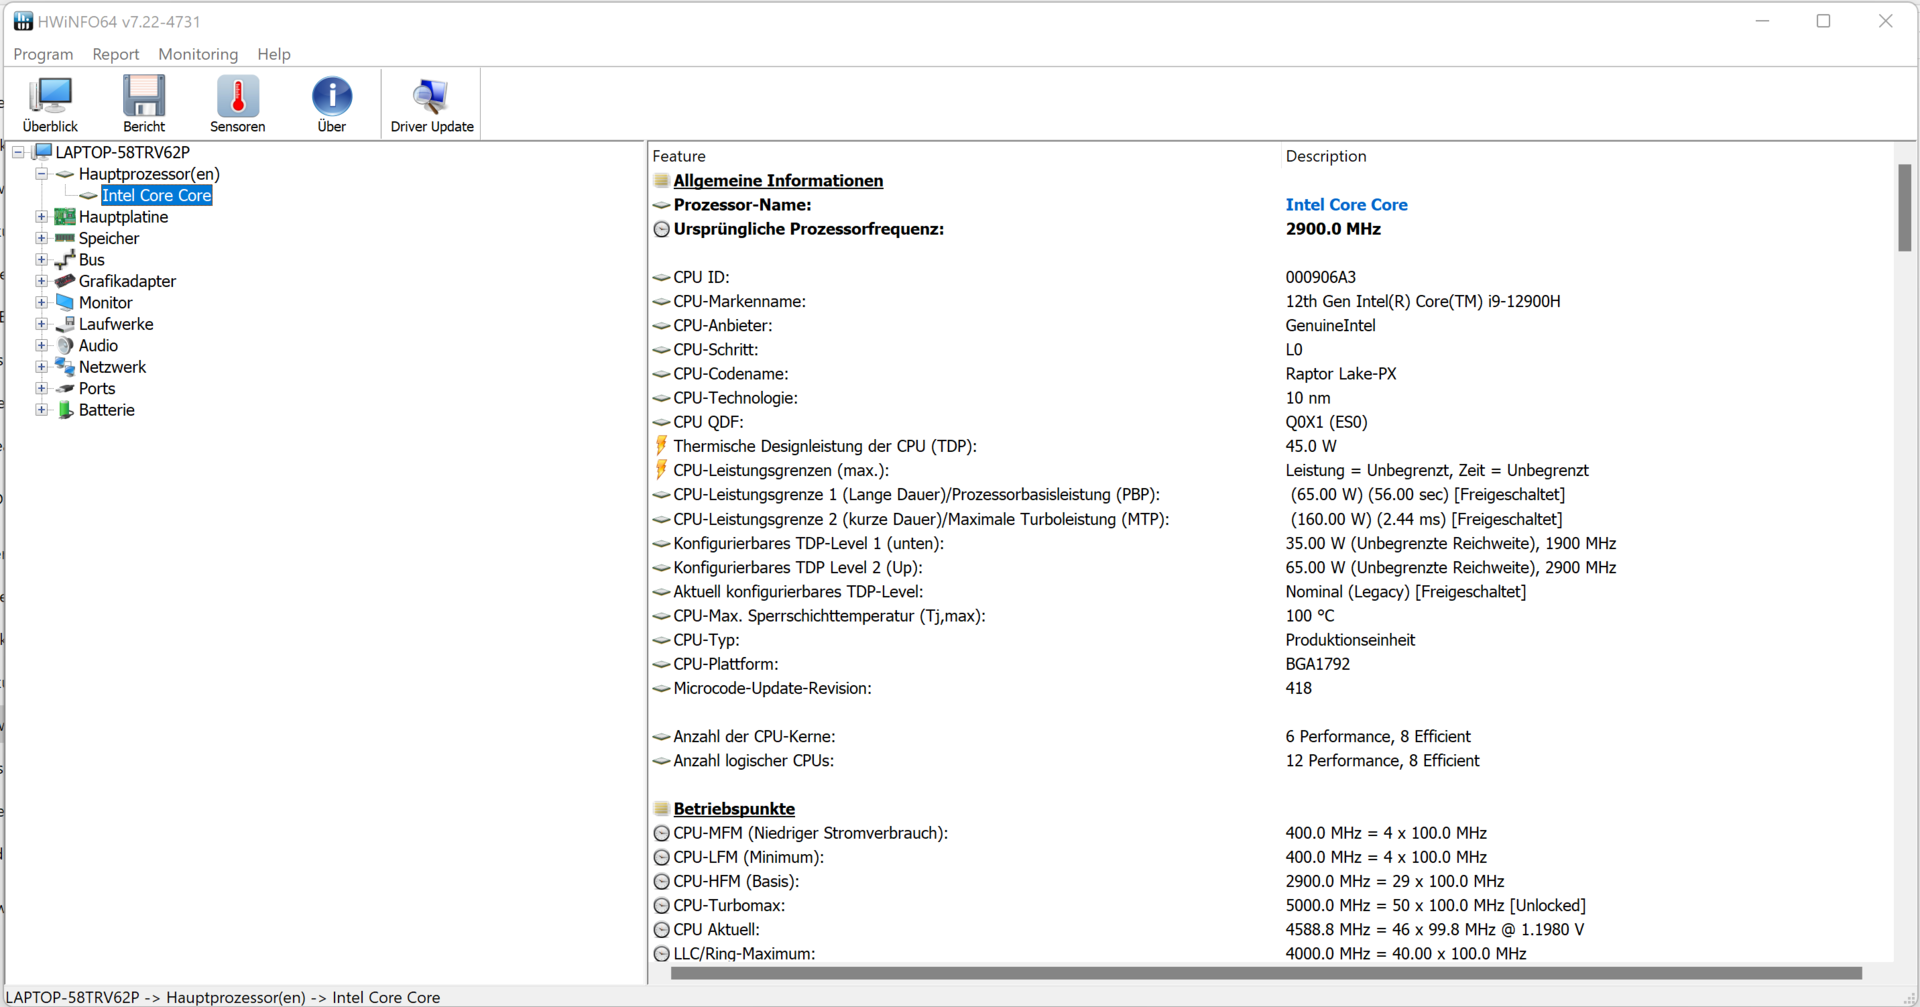
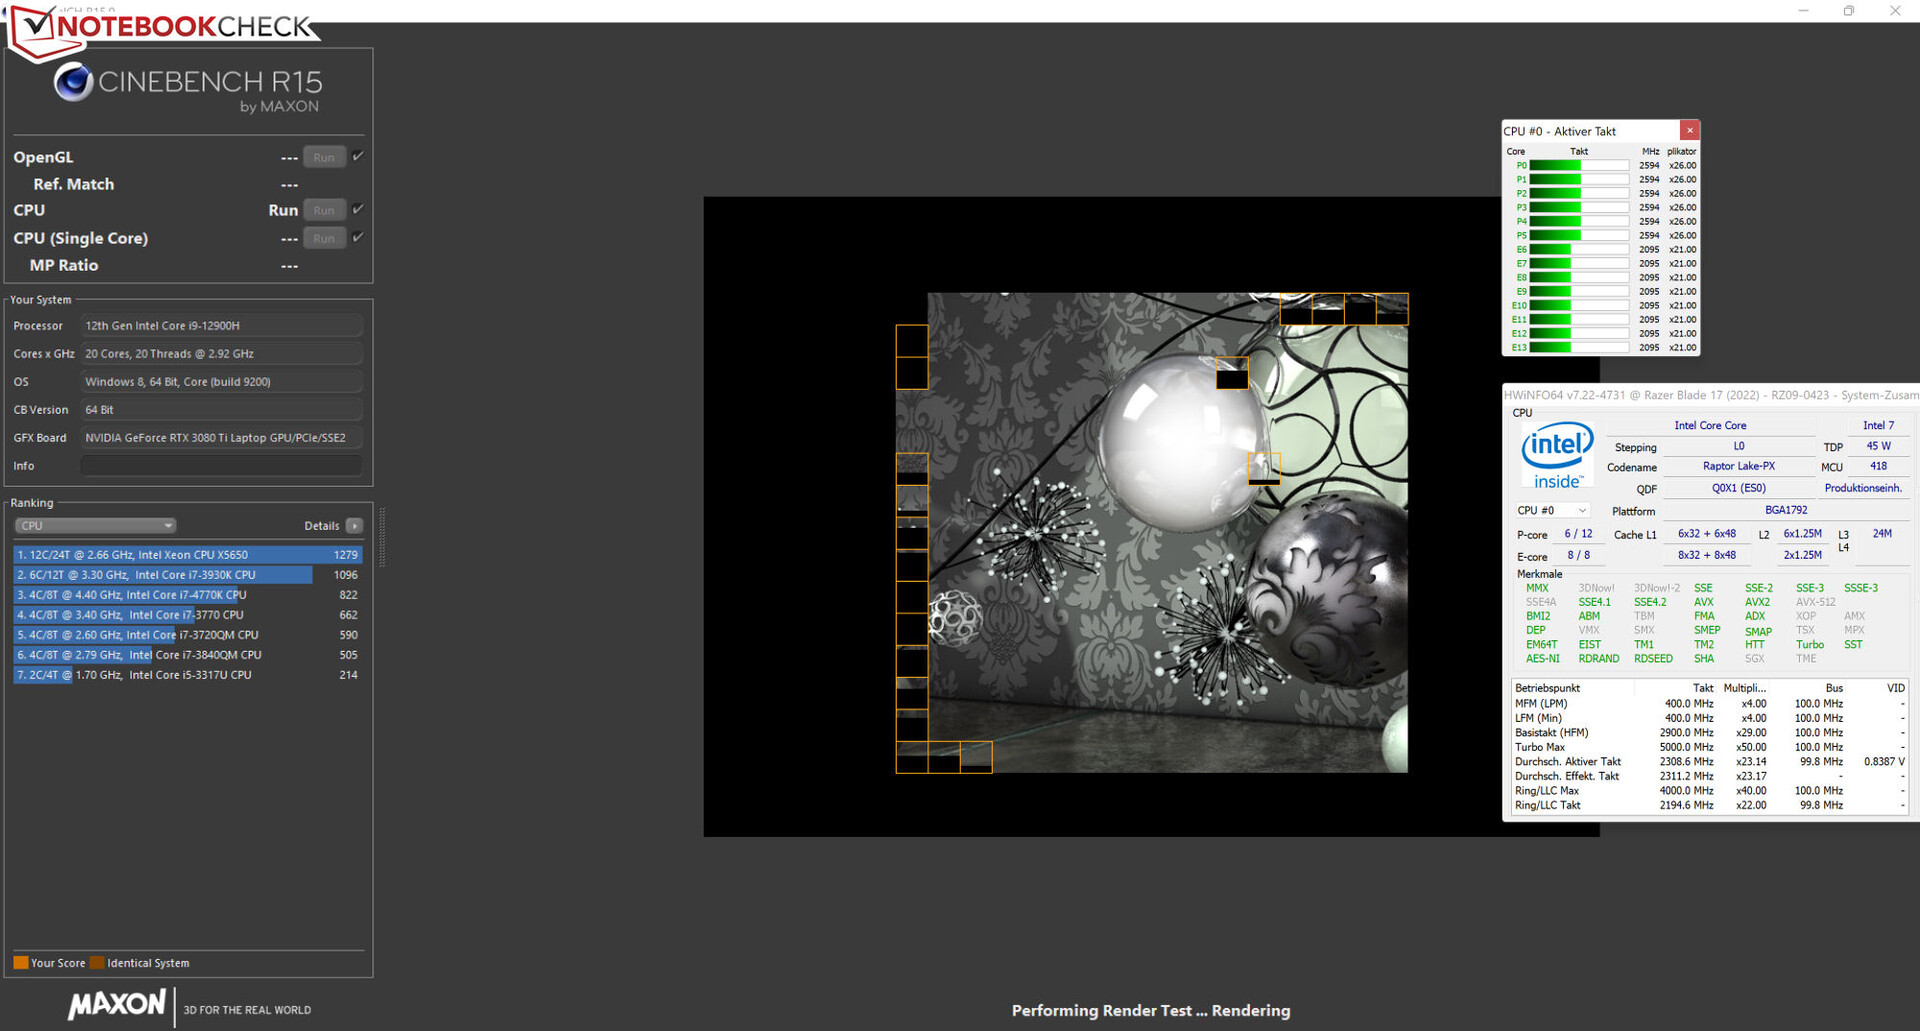
ONúcleo i9-12900H(Alder Lake) consiste em seis núcleos de desempenho (Hyperthreading, 2,5 a 5 GHz) e oito núcleos de eficiência (sem Hyperthreading, 1,8 a 3,8 GHz). No total, isto resulta em 20 núcleos lógicos de CPU.
Durante o teste de multi-rosca CB15, o subpreço "Médio" da CPU garante velocidades (núcleos P: 2,6 a 2,7 GHz, núcleos E: 2,1 GHz) logo acima da velocidade básica do relógio. O teste de rosca única completa-se com altas velocidades de relógio (núcleos P: 4 a 4,6 GHz, núcleos E: 2,1 a 3,7 GHz). Em funcionamento por bateria, os valores são significativamente mais baixos.
Utilizando as mesmas predefinições de CPU, o Core i9 oferece apenas uma ligeira vantagem de desempenho nos picos, em comparação com o Núcleo i7-12800Hprocessador do modelo irmão. Isto não é surpreendente, já que ambas CPUs oferecem a mesma quantidade de núcleos e o Core i9 oferece uma velocidade máxima ligeiramente maior (5 GHz vs. 4,8 GHz)
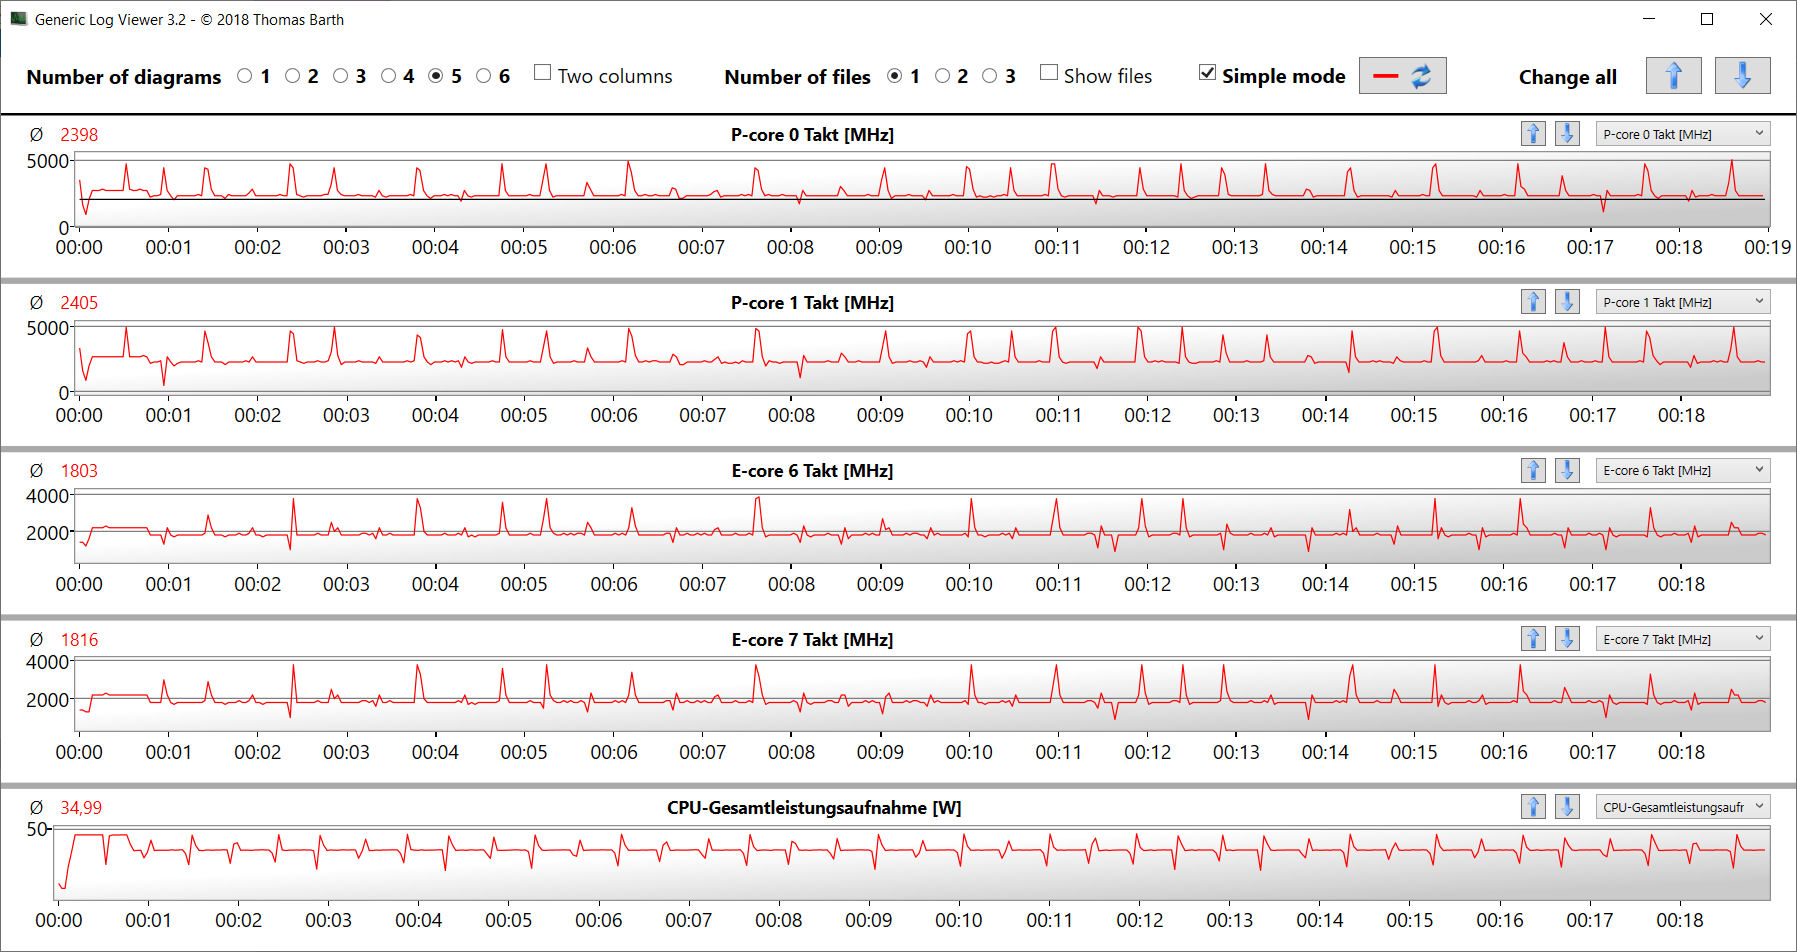
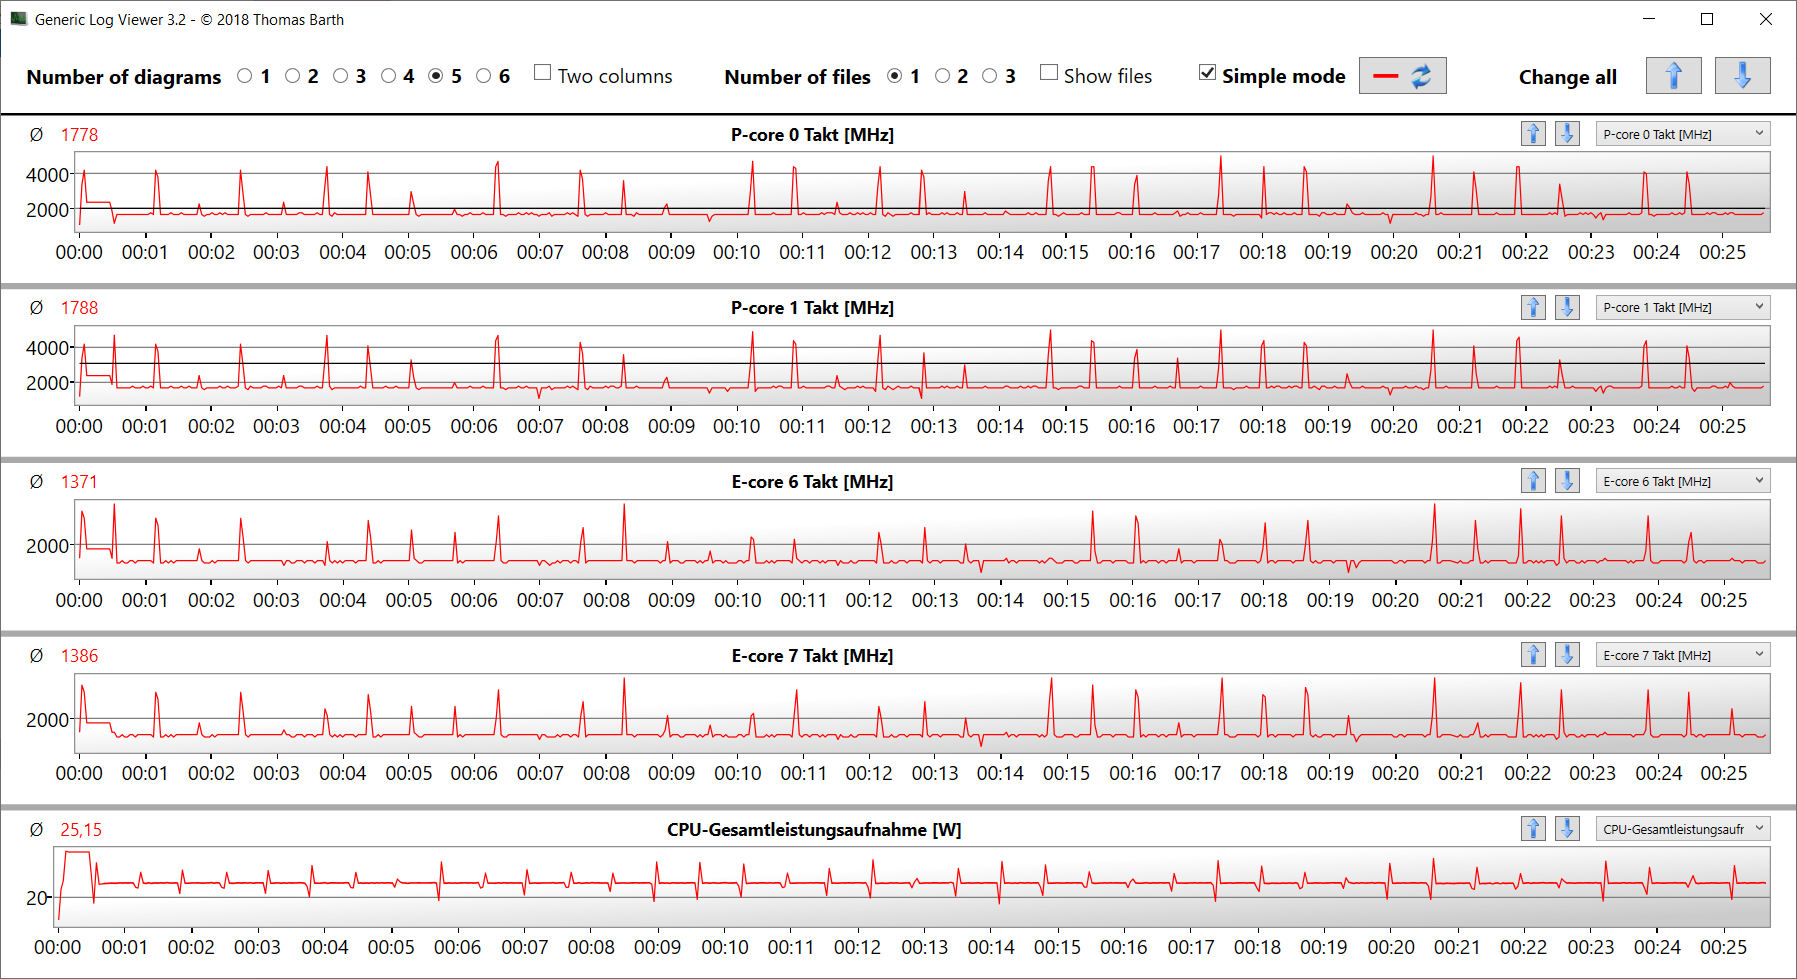
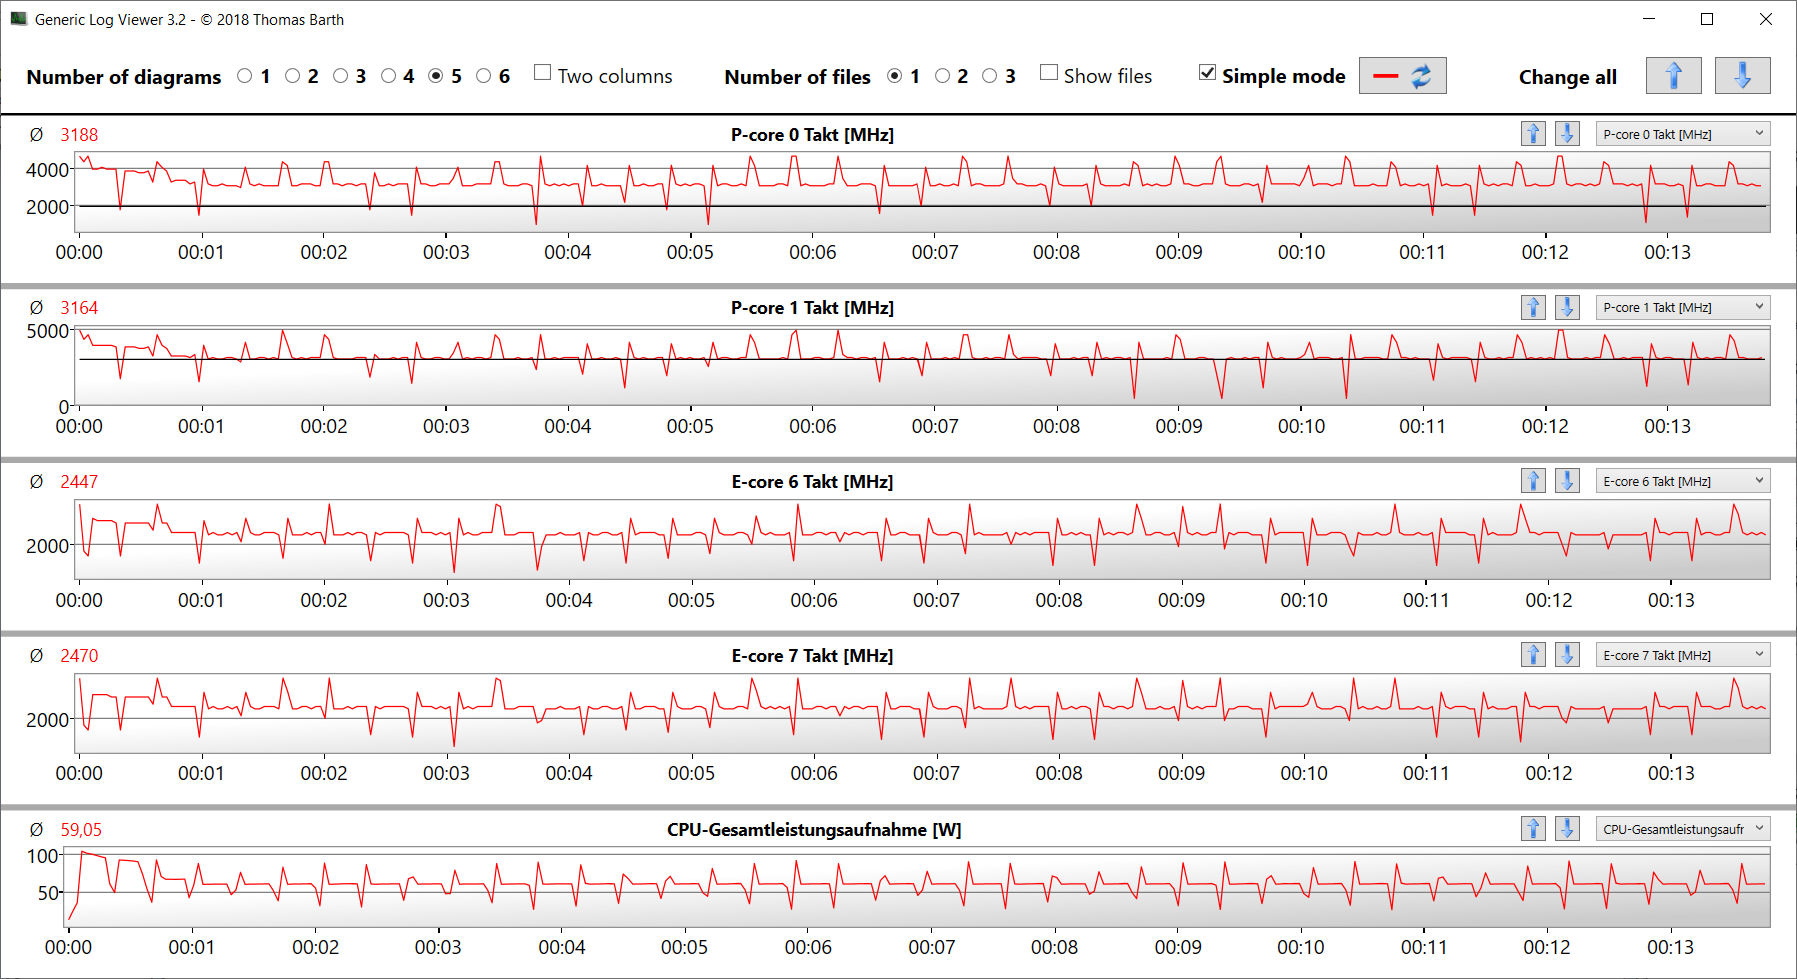
Em operação com várias roscas, a intensidade do uso do Turbo depende muito do subprejeto de CPU selecionado. Em todos os casos, a CPU é capaz de funcionar constantemente a uma velocidade de relógio uniforme, o que é mostrado pelo teste de loop CB15. É perceptível que a velocidade do relógio da CPU cai ligeiramente da primeira para a segunda/terceira corrida, independentemente da pré-configuração selecionada. A CPU i9 só trará uma vantagem notável para o usuário em comparação com a CPU i7 em alguns breves picos de carga. Sob cargas mais longas, a diferença de desempenho entre os dois processadores está diminuindo e eles acabam ficando muito próximos um do outro.
Cinebench R15 Multi Constant Load Test
| CPU Performance rating - Percent | |
| Média da turma Gaming | |
| Alienware x17 R2 P48E | |
| MSI Stealth GS77 12UHS-083US | |
| Razer Blade 17 Early 2022 | |
| Medion Erazer Beast X30 | |
| Média Intel Core i9-12900H | |
| Razer Blade 17 RTX 3080 Ti | |
| Razer Blade 17 Early 2022 | |
| Razer Blade 17 Early 2022 | |
| Cinebench R23 | |
| Multi Core | |
| Média da turma Gaming (10488 - 42661, n=107, últimos 2 anos) | |
| Medion Erazer Beast X30 | |
| Alienware x17 R2 P48E | |
| MSI Stealth GS77 12UHS-083US | |
| Razer Blade 17 Early 2022 (Max.) | |
| Razer Blade 17 RTX 3080 Ti | |
| Média Intel Core i9-12900H (7359 - 19648, n=28) | |
| Razer Blade 17 Early 2022 | |
| Razer Blade 17 Early 2022 (Lautlos) | |
| Single Core | |
| Média da turma Gaming (1166 - 2415, n=107, últimos 2 anos) | |
| Razer Blade 17 Early 2022 | |
| Alienware x17 R2 P48E | |
| Razer Blade 17 Early 2022 (Max.) | |
| Razer Blade 17 RTX 3080 Ti | |
| Média Intel Core i9-12900H (1634 - 1930, n=28) | |
| MSI Stealth GS77 12UHS-083US | |
| Razer Blade 17 Early 2022 (Lautlos) | |
| Medion Erazer Beast X30 | |
| Cinebench R20 | |
| CPU (Multi Core) | |
| Média da turma Gaming (4029 - 16433, n=106, últimos 2 anos) | |
| Medion Erazer Beast X30 | |
| Alienware x17 R2 P48E | |
| MSI Stealth GS77 12UHS-083US | |
| Razer Blade 17 Early 2022 (Max.) | |
| Razer Blade 17 RTX 3080 Ti | |
| Média Intel Core i9-12900H (2681 - 7471, n=28) | |
| Razer Blade 17 Early 2022 | |
| Razer Blade 17 Early 2022 (Lautlos) | |
| CPU (Single Core) | |
| Média da turma Gaming (442 - 913, n=106, últimos 2 anos) | |
| Alienware x17 R2 P48E | |
| Razer Blade 17 Early 2022 (Max.) | |
| Razer Blade 17 RTX 3080 Ti | |
| Média Intel Core i9-12900H (624 - 738, n=28) | |
| Razer Blade 17 Early 2022 | |
| MSI Stealth GS77 12UHS-083US | |
| Razer Blade 17 Early 2022 (Lautlos) | |
| Medion Erazer Beast X30 | |
| Cinebench R15 | |
| CPU Multi 64Bit | |
| Média da turma Gaming (1578 - 6330, n=105, últimos 2 anos) | |
| Alienware x17 R2 P48E | |
| Medion Erazer Beast X30 | |
| Razer Blade 17 Early 2022 (Max.) | |
| MSI Stealth GS77 12UHS-083US | |
| Média Intel Core i9-12900H (1395 - 3077, n=28) | |
| Razer Blade 17 RTX 3080 Ti | |
| Razer Blade 17 Early 2022 | |
| Razer Blade 17 Early 2022 (Lautlos) | |
| CPU Single 64Bit | |
| Média da turma Gaming (188.8 - 350, n=106, últimos 2 anos) | |
| Alienware x17 R2 P48E | |
| Razer Blade 17 Early 2022 (Max.) | |
| Razer Blade 17 RTX 3080 Ti | |
| Média Intel Core i9-12900H (235 - 277, n=29) | |
| MSI Stealth GS77 12UHS-083US | |
| Razer Blade 17 Early 2022 | |
| Razer Blade 17 Early 2022 (Lautlos) | |
| Medion Erazer Beast X30 | |
| Blender - v2.79 BMW27 CPU | |
| Razer Blade 17 Early 2022 (Lautlos) | |
| Razer Blade 17 Early 2022 | |
| Média Intel Core i9-12900H (160 - 451, n=28) | |
| Razer Blade 17 RTX 3080 Ti | |
| Razer Blade 17 Early 2022 (Max.) | |
| MSI Stealth GS77 12UHS-083US | |
| Medion Erazer Beast X30 | |
| Alienware x17 R2 P48E | |
| Média da turma Gaming (79 - 330, n=104, últimos 2 anos) | |
| 7-Zip 18.03 | |
| 7z b 4 | |
| Média da turma Gaming (33491 - 148086, n=105, últimos 2 anos) | |
| Medion Erazer Beast X30 | |
| Alienware x17 R2 P48E | |
| MSI Stealth GS77 12UHS-083US | |
| Razer Blade 17 Early 2022 (Max.) | |
| Razer Blade 17 RTX 3080 Ti | |
| Média Intel Core i9-12900H (34684 - 76677, n=28) | |
| Razer Blade 17 Early 2022 | |
| Razer Blade 17 Early 2022 (Lautlos) | |
| 7z b 4 -mmt1 | |
| Média da turma Gaming (4199 - 7436, n=105, últimos 2 anos) | |
| Razer Blade 17 Early 2022 | |
| Média Intel Core i9-12900H (5302 - 6289, n=28) | |
| Razer Blade 17 RTX 3080 Ti | |
| Alienware x17 R2 P48E | |
| Razer Blade 17 Early 2022 (Max.) | |
| MSI Stealth GS77 12UHS-083US | |
| Razer Blade 17 Early 2022 (Lautlos) | |
| Medion Erazer Beast X30 | |
| Geekbench 5.5 | |
| Multi-Core | |
| Média da turma Gaming (6460 - 28263, n=105, últimos 2 anos) | |
| Alienware x17 R2 P48E | |
| Razer Blade 17 Early 2022 (Max.) | |
| MSI Stealth GS77 12UHS-083US | |
| Razer Blade 17 RTX 3080 Ti | |
| Medion Erazer Beast X30 | |
| Média Intel Core i9-12900H (8519 - 14376, n=31) | |
| Razer Blade 17 Early 2022 | |
| Razer Blade 17 Early 2022 (Lautlos) | |
| Single-Core | |
| Média da turma Gaming (986 - 2474, n=105, últimos 2 anos) | |
| Alienware x17 R2 P48E | |
| Média Intel Core i9-12900H (1631 - 1897, n=31) | |
| Razer Blade 17 Early 2022 | |
| Razer Blade 17 Early 2022 (Max.) | |
| Razer Blade 17 Early 2022 (Lautlos) | |
| Razer Blade 17 RTX 3080 Ti | |
| MSI Stealth GS77 12UHS-083US | |
| Medion Erazer Beast X30 | |
| HWBOT x265 Benchmark v2.2 - 4k Preset | |
| Média da turma Gaming (11.5 - 44.4, n=105, últimos 2 anos) | |
| Alienware x17 R2 P48E | |
| Medion Erazer Beast X30 | |
| MSI Stealth GS77 12UHS-083US | |
| Razer Blade 17 Early 2022 (Max.) | |
| Média Intel Core i9-12900H (8.05 - 22.5, n=28) | |
| Razer Blade 17 RTX 3080 Ti | |
| Razer Blade 17 Early 2022 | |
| Razer Blade 17 Early 2022 (Lautlos) | |
| LibreOffice - 20 Documents To PDF | |
| Média da turma Gaming (33.2 - 88.8, n=105, últimos 2 anos) | |
| Medion Erazer Beast X30 | |
| Razer Blade 17 Early 2022 (Lautlos) | |
| Razer Blade 17 RTX 3080 Ti | |
| Razer Blade 17 Early 2022 (Max.) | |
| MSI Stealth GS77 12UHS-083US | |
| Média Intel Core i9-12900H (36.8 - 59.8, n=28) | |
| Alienware x17 R2 P48E | |
| Razer Blade 17 Early 2022 | |
| R Benchmark 2.5 - Overall mean | |
| Medion Erazer Beast X30 | |
| Razer Blade 17 Early 2022 (Lautlos) | |
| MSI Stealth GS77 12UHS-083US | |
| Razer Blade 17 RTX 3080 Ti | |
| Média Intel Core i9-12900H (0.4218 - 0.506, n=28) | |
| Razer Blade 17 Early 2022 (Max.) | |
| Razer Blade 17 Early 2022 | |
| Alienware x17 R2 P48E | |
| Média da turma Gaming (0.3439 - 0.759, n=106, últimos 2 anos) | |
* ... menor é melhor
AIDA64: FP32 Ray-Trace | FPU Julia | CPU SHA3 | CPU Queen | FPU SinJulia | FPU Mandel | CPU AES | CPU ZLib | FP64 Ray-Trace | CPU PhotoWorxx
| Performance rating | |
| Média da turma Gaming | |
| Alienware x17 R2 P48E | |
| Medion Erazer Beast X30 | |
| Média Intel Core i9-12900H | |
| MSI Stealth GS77 12UHS-083US | |
| Razer Blade 17 Early 2022 | |
| Razer Blade 17 RTX 3080 Ti | |
| Razer Blade 17 Early 2022 | |
| Razer Blade 17 Early 2022 | |
| AIDA64 / FP32 Ray-Trace | |
| Média da turma Gaming (10227 - 85542, n=105, últimos 2 anos) | |
| Média Intel Core i9-12900H (4074 - 18289, n=29) | |
| Alienware x17 R2 P48E (v6.50.5800) | |
| Medion Erazer Beast X30 (v6.50.5800) | |
| MSI Stealth GS77 12UHS-083US (v6.50.5800) | |
| Razer Blade 17 Early 2022 (v6.50.5800, Max.) | |
| Razer Blade 17 RTX 3080 Ti (v6.50.5800) | |
| Razer Blade 17 Early 2022 (v6.50.5800) | |
| Razer Blade 17 Early 2022 (v6.50.5800, Lautlos) | |
| AIDA64 / FPU Julia | |
| Média da turma Gaming (51376 - 238426, n=105, últimos 2 anos) | |
| Média Intel Core i9-12900H (22307 - 93236, n=29) | |
| Alienware x17 R2 P48E (v6.50.5800) | |
| Medion Erazer Beast X30 (v6.50.5800) | |
| MSI Stealth GS77 12UHS-083US (v6.50.5800) | |
| Razer Blade 17 Early 2022 (v6.50.5800, Max.) | |
| Razer Blade 17 RTX 3080 Ti (v6.50.5800) | |
| Razer Blade 17 Early 2022 (v6.50.5800) | |
| Razer Blade 17 Early 2022 (v6.50.5800, Lautlos) | |
| AIDA64 / CPU SHA3 | |
| Média da turma Gaming (2180 - 10115, n=105, últimos 2 anos) | |
| Alienware x17 R2 P48E (v6.50.5800) | |
| Medion Erazer Beast X30 (v6.50.5800) | |
| MSI Stealth GS77 12UHS-083US (v6.50.5800) | |
| Média Intel Core i9-12900H (1378 - 4215, n=29) | |
| Razer Blade 17 Early 2022 (v6.50.5800, Max.) | |
| Razer Blade 17 RTX 3080 Ti (v6.50.5800) | |
| Razer Blade 17 Early 2022 (v6.50.5800) | |
| Razer Blade 17 Early 2022 (v6.50.5800, Lautlos) | |
| AIDA64 / CPU Queen | |
| Média da turma Gaming (49785 - 173351, n=90, últimos 2 anos) | |
| Alienware x17 R2 P48E (v6.50.5800) | |
| Razer Blade 17 Early 2022 (v6.50.5800, Max.) | |
| Medion Erazer Beast X30 (v6.50.5800) | |
| Razer Blade 17 RTX 3080 Ti (v6.50.5800) | |
| Média Intel Core i9-12900H (78172 - 111241, n=28) | |
| MSI Stealth GS77 12UHS-083US (v6.50.5800) | |
| Razer Blade 17 Early 2022 (v6.50.5800) | |
| Razer Blade 17 Early 2022 (v6.50.5800, Lautlos) | |
| AIDA64 / FPU SinJulia | |
| Média da turma Gaming (4424 - 33636, n=105, últimos 2 anos) | |
| Alienware x17 R2 P48E (v6.50.5800) | |
| Medion Erazer Beast X30 (v6.50.5800) | |
| MSI Stealth GS77 12UHS-083US (v6.50.5800) | |
| Razer Blade 17 Early 2022 (v6.50.5800, Max.) | |
| Razer Blade 17 RTX 3080 Ti (v6.50.5800) | |
| Média Intel Core i9-12900H (5709 - 10410, n=29) | |
| Razer Blade 17 Early 2022 (v6.50.5800) | |
| Razer Blade 17 Early 2022 (v6.50.5800, Lautlos) | |
| AIDA64 / FPU Mandel | |
| Média da turma Gaming (25115 - 128721, n=105, últimos 2 anos) | |
| Média Intel Core i9-12900H (11257 - 45581, n=29) | |
| Alienware x17 R2 P48E (v6.50.5800) | |
| Medion Erazer Beast X30 (v6.50.5800) | |
| MSI Stealth GS77 12UHS-083US (v6.50.5800) | |
| Razer Blade 17 Early 2022 (v6.50.5800, Max.) | |
| Razer Blade 17 RTX 3080 Ti (v6.50.5800) | |
| Razer Blade 17 Early 2022 (v6.50.5800) | |
| Razer Blade 17 Early 2022 (v6.50.5800, Lautlos) | |
| AIDA64 / CPU AES | |
| Média da turma Gaming (39258 - 247074, n=105, últimos 2 anos) | |
| Alienware x17 R2 P48E (v6.50.5800) | |
| MSI Stealth GS77 12UHS-083US (v6.50.5800) | |
| Média Intel Core i9-12900H (31935 - 151546, n=29) | |
| Medion Erazer Beast X30 (v6.50.5800) | |
| Razer Blade 17 Early 2022 (v6.50.5800, Max.) | |
| Razer Blade 17 RTX 3080 Ti (v6.50.5800) | |
| Razer Blade 17 Early 2022 (v6.50.5800) | |
| Razer Blade 17 Early 2022 (v6.50.5800, Lautlos) | |
| AIDA64 / CPU ZLib | |
| Média da turma Gaming (574 - 2531, n=105, últimos 2 anos) | |
| Alienware x17 R2 P48E (v6.50.5800) | |
| Medion Erazer Beast X30 (v6.50.5800) | |
| MSI Stealth GS77 12UHS-083US (v6.50.5800) | |
| Razer Blade 17 Early 2022 (v6.50.5800, Max.) | |
| Média Intel Core i9-12900H (449 - 1193, n=29) | |
| Razer Blade 17 RTX 3080 Ti (v6.50.5800) | |
| Razer Blade 17 Early 2022 (v6.50.5800) | |
| Razer Blade 17 Early 2022 (v6.50.5800, Lautlos) | |
| AIDA64 / FP64 Ray-Trace | |
| Média da turma Gaming (5509 - 45446, n=105, últimos 2 anos) | |
| Média Intel Core i9-12900H (2235 - 10511, n=29) | |
| Alienware x17 R2 P48E (v6.50.5800) | |
| Medion Erazer Beast X30 (v6.50.5800) | |
| MSI Stealth GS77 12UHS-083US (v6.50.5800) | |
| Razer Blade 17 Early 2022 (v6.50.5800, Max.) | |
| Razer Blade 17 RTX 3080 Ti (v6.50.5800) | |
| Razer Blade 17 Early 2022 (v6.50.5800) | |
| Razer Blade 17 Early 2022 (v6.50.5800, Lautlos) | |
| AIDA64 / CPU PhotoWorxx | |
| Média da turma Gaming (12271 - 89891, n=105, últimos 2 anos) | |
| Razer Blade 17 RTX 3080 Ti (v6.50.5800) | |
| Razer Blade 17 Early 2022 (v6.50.5800, Max.) | |
| Medion Erazer Beast X30 (v6.50.5800) | |
| MSI Stealth GS77 12UHS-083US (v6.50.5800) | |
| Razer Blade 17 Early 2022 (v6.50.5800) | |
| Média Intel Core i9-12900H (20960 - 48269, n=30) | |
| Razer Blade 17 Early 2022 (v6.50.5800, Lautlos) | |
| Alienware x17 R2 P48E (v6.50.5800) | |
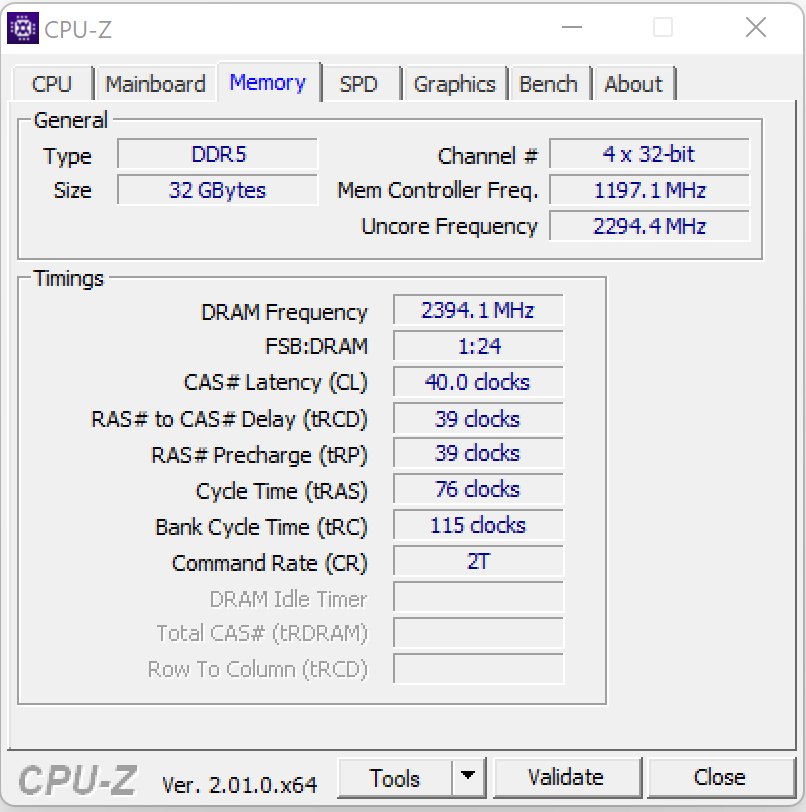
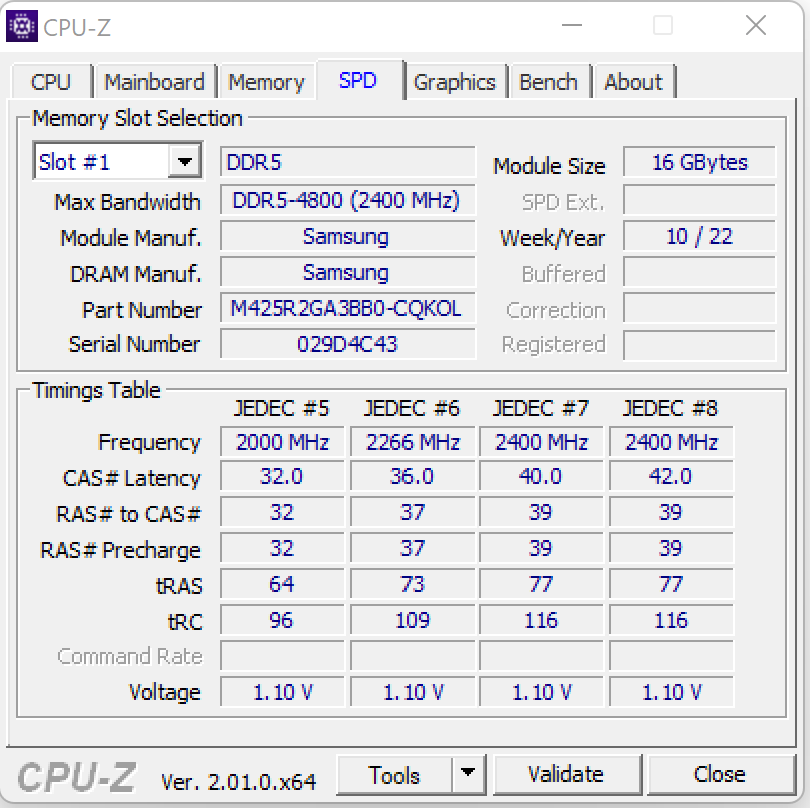
Desempenho do sistema
O hardware do sistema em bom funcionamento oferece desempenho computacional mais do que suficiente para jogos, corte de vídeo e renderização. As taxas de transferência da faixa de memória de trabalho em níveis normais para o armazenamento DDR5-4800. Elas são acompanhadas de bons resultados de PC Mark.
CrossMark: Overall | Productivity | Creativity | Responsiveness
| PCMark 10 / Score | |
| Média da turma Gaming (5828 - 12414, n=93, últimos 2 anos) | |
| Alienware x17 R2 P48E | |
| Razer Blade 17 RTX 3080 Ti | |
| Média Intel Core i9-12900H, NVIDIA GeForce RTX 3080 Ti Laptop GPU (7139 - 8083, n=6) | |
| MSI Stealth GS77 12UHS-083US | |
| Medion Erazer Beast X30 | |
| Razer Blade 17 Early 2022 | |
| PCMark 10 / Essentials | |
| Alienware x17 R2 P48E | |
| Razer Blade 17 RTX 3080 Ti | |
| Média Intel Core i9-12900H, NVIDIA GeForce RTX 3080 Ti Laptop GPU (10254 - 11178, n=6) | |
| Média da turma Gaming (8810 - 11935, n=97, últimos 2 anos) | |
| MSI Stealth GS77 12UHS-083US | |
| Razer Blade 17 Early 2022 | |
| Medion Erazer Beast X30 | |
| PCMark 10 / Productivity | |
| Média da turma Gaming (6845 - 25323, n=95, últimos 2 anos) | |
| Alienware x17 R2 P48E | |
| Média Intel Core i9-12900H, NVIDIA GeForce RTX 3080 Ti Laptop GPU (9102 - 11186, n=6) | |
| MSI Stealth GS77 12UHS-083US | |
| Razer Blade 17 RTX 3080 Ti | |
| Medion Erazer Beast X30 | |
| Razer Blade 17 Early 2022 | |
| PCMark 10 / Digital Content Creation | |
| Média da turma Gaming (7602 - 19954, n=95, últimos 2 anos) | |
| Alienware x17 R2 P48E | |
| Razer Blade 17 RTX 3080 Ti | |
| Média Intel Core i9-12900H, NVIDIA GeForce RTX 3080 Ti Laptop GPU (9847 - 12627, n=6) | |
| MSI Stealth GS77 12UHS-083US | |
| Medion Erazer Beast X30 | |
| Razer Blade 17 Early 2022 | |
| CrossMark / Overall | |
| Média da turma Gaming (1366 - 2409, n=94, últimos 2 anos) | |
| Alienware x17 R2 P48E | |
| Média Intel Core i9-12900H, NVIDIA GeForce RTX 3080 Ti Laptop GPU (1696 - 1965, n=3) | |
| Razer Blade 17 Early 2022 | |
| Medion Erazer Beast X30 | |
| CrossMark / Productivity | |
| Média da turma Gaming (1386 - 2254, n=94, últimos 2 anos) | |
| Alienware x17 R2 P48E | |
| Média Intel Core i9-12900H, NVIDIA GeForce RTX 3080 Ti Laptop GPU (1622 - 1870, n=3) | |
| Razer Blade 17 Early 2022 | |
| Medion Erazer Beast X30 | |
| CrossMark / Creativity | |
| Média da turma Gaming (1343 - 2786, n=94, últimos 2 anos) | |
| Alienware x17 R2 P48E | |
| Medion Erazer Beast X30 | |
| Média Intel Core i9-12900H, NVIDIA GeForce RTX 3080 Ti Laptop GPU (1855 - 2135, n=3) | |
| Razer Blade 17 Early 2022 | |
| CrossMark / Responsiveness | |
| Média da turma Gaming (1226 - 2334, n=94, últimos 2 anos) | |
| Alienware x17 R2 P48E | |
| Razer Blade 17 Early 2022 | |
| Média Intel Core i9-12900H, NVIDIA GeForce RTX 3080 Ti Laptop GPU (1483 - 1777, n=3) | |
| Medion Erazer Beast X30 | |
| PCMark 8 Home Score Accelerated v2 | 4671 pontos | |
| PCMark 8 Creative Score Accelerated v2 | 6358 pontos | |
| PCMark 8 Work Score Accelerated v2 | 5464 pontos | |
| PCMark 10 Score | 7139 pontos | |
Ajuda | ||
| AIDA64 / Memory Copy | |
| Média da turma Gaming (21750 - 129946, n=105, últimos 2 anos) | |
| Razer Blade 17 RTX 3080 Ti (v6.50.5800) | |
| MSI Stealth GS77 12UHS-083US (v6.50.5800) | |
| Medion Erazer Beast X30 (v6.50.5800) | |
| Razer Blade 17 Early 2022 (v6.50.5800, Max.) | |
| Razer Blade 17 Early 2022 (v6.50.5800, Lautlos) | |
| Razer Blade 17 Early 2022 (v6.50.5800) | |
| Média Intel Core i9-12900H (34438 - 74264, n=29) | |
| Alienware x17 R2 P48E (v6.50.5800) | |
| AIDA64 / Memory Read | |
| Média da turma Gaming (22956 - 118858, n=105, últimos 2 anos) | |
| Razer Blade 17 RTX 3080 Ti (v6.50.5800) | |
| Medion Erazer Beast X30 (v6.50.5800) | |
| Razer Blade 17 Early 2022 (v6.50.5800, Max.) | |
| MSI Stealth GS77 12UHS-083US (v6.50.5800) | |
| Razer Blade 17 Early 2022 (v6.50.5800, Lautlos) | |
| Razer Blade 17 Early 2022 (v6.50.5800) | |
| Média Intel Core i9-12900H (36365 - 74642, n=29) | |
| Alienware x17 R2 P48E (v6.50.5800) | |
| AIDA64 / Memory Write | |
| Média da turma Gaming (22297 - 135096, n=105, últimos 2 anos) | |
| Razer Blade 17 RTX 3080 Ti (v6.50.5800) | |
| MSI Stealth GS77 12UHS-083US (v6.50.5800) | |
| Razer Blade 17 Early 2022 (v6.50.5800, Max.) | |
| Medion Erazer Beast X30 (v6.50.5800) | |
| Razer Blade 17 Early 2022 (v6.50.5800, Lautlos) | |
| Média Intel Core i9-12900H (32276 - 67858, n=29) | |
| Razer Blade 17 Early 2022 (v6.50.5800) | |
| Alienware x17 R2 P48E (v6.50.5800) | |
| AIDA64 / Memory Latency | |
| Média da turma Gaming (75.3 - 259, n=105, últimos 2 anos) | |
| Alienware x17 R2 P48E (v6.50.5800) | |
| MSI Stealth GS77 12UHS-083US (v6.50.5800) | |
| Média Intel Core i9-12900H (74.7 - 118.1, n=28) | |
| Razer Blade 17 RTX 3080 Ti (v6.50.5800) | |
| Medion Erazer Beast X30 (v6.50.5800) | |
| Razer Blade 17 Early 2022 (v6.50.5800, Max.) | |
| Razer Blade 17 Early 2022 (v6.50.5800, Lautlos) | |
* ... menor é melhor
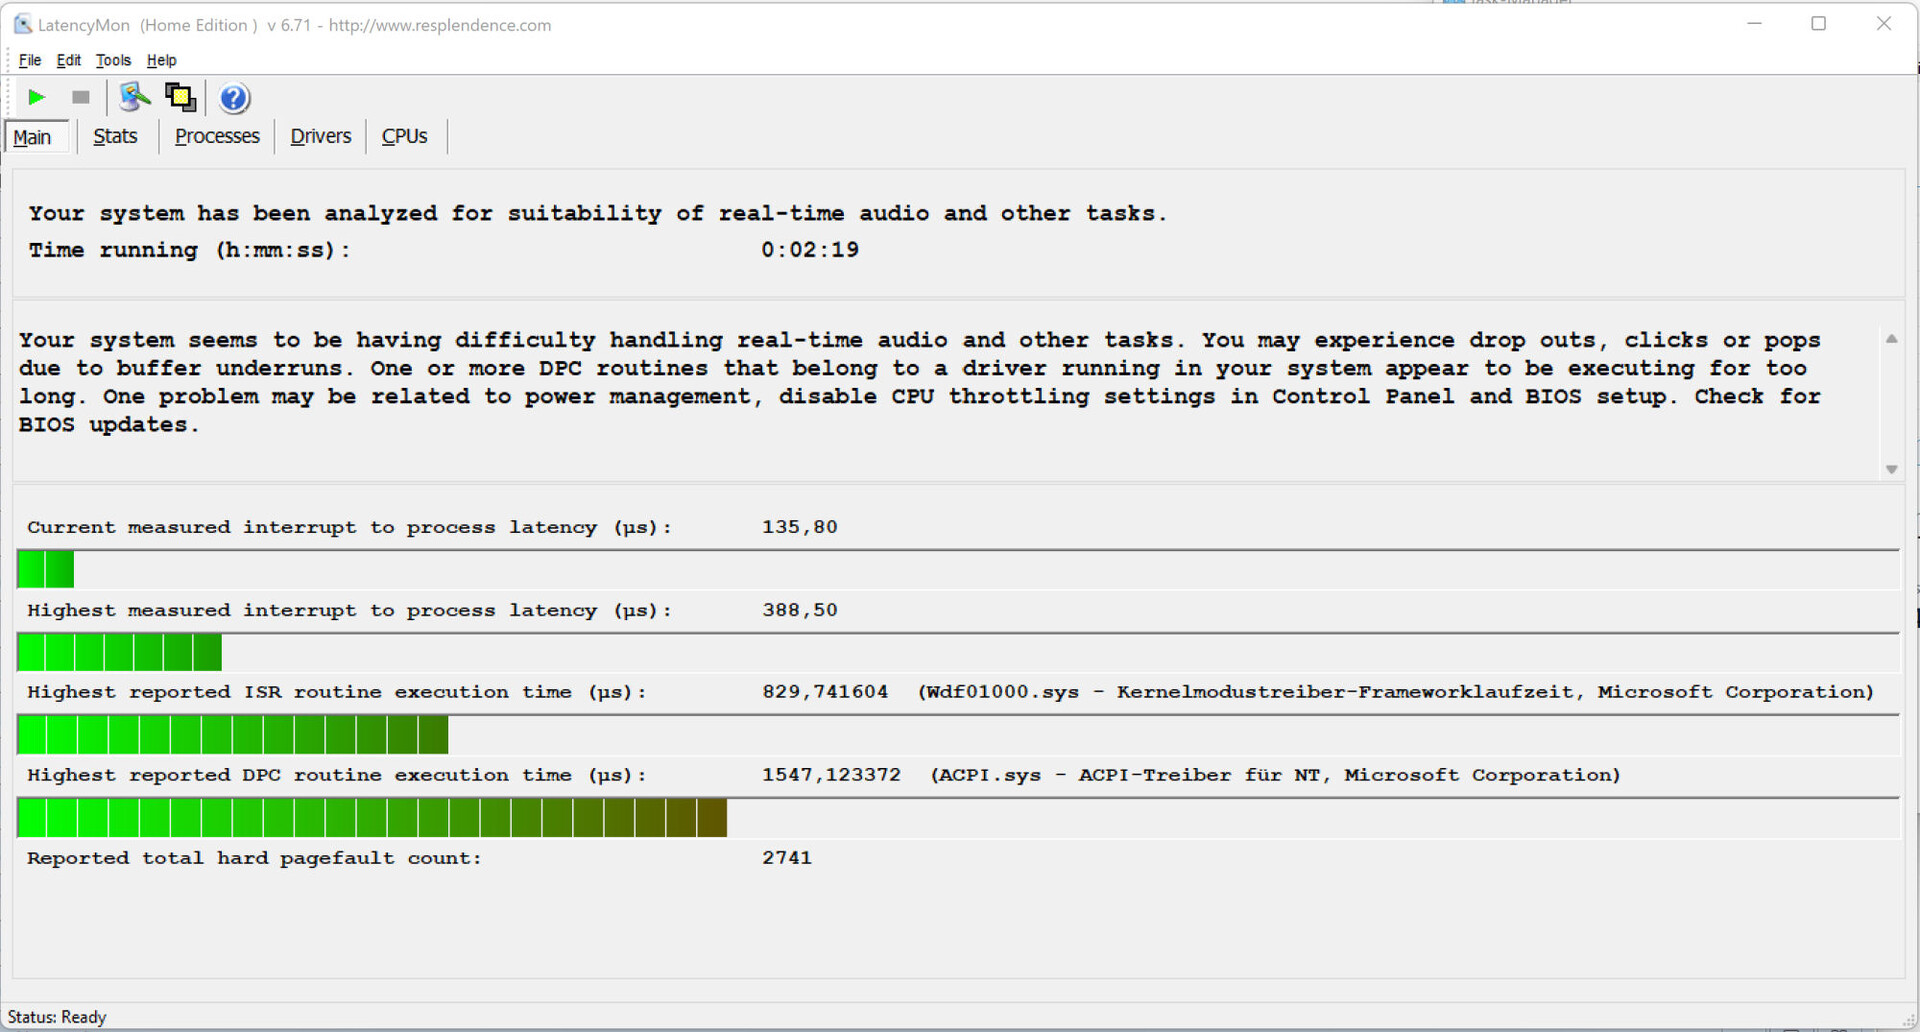
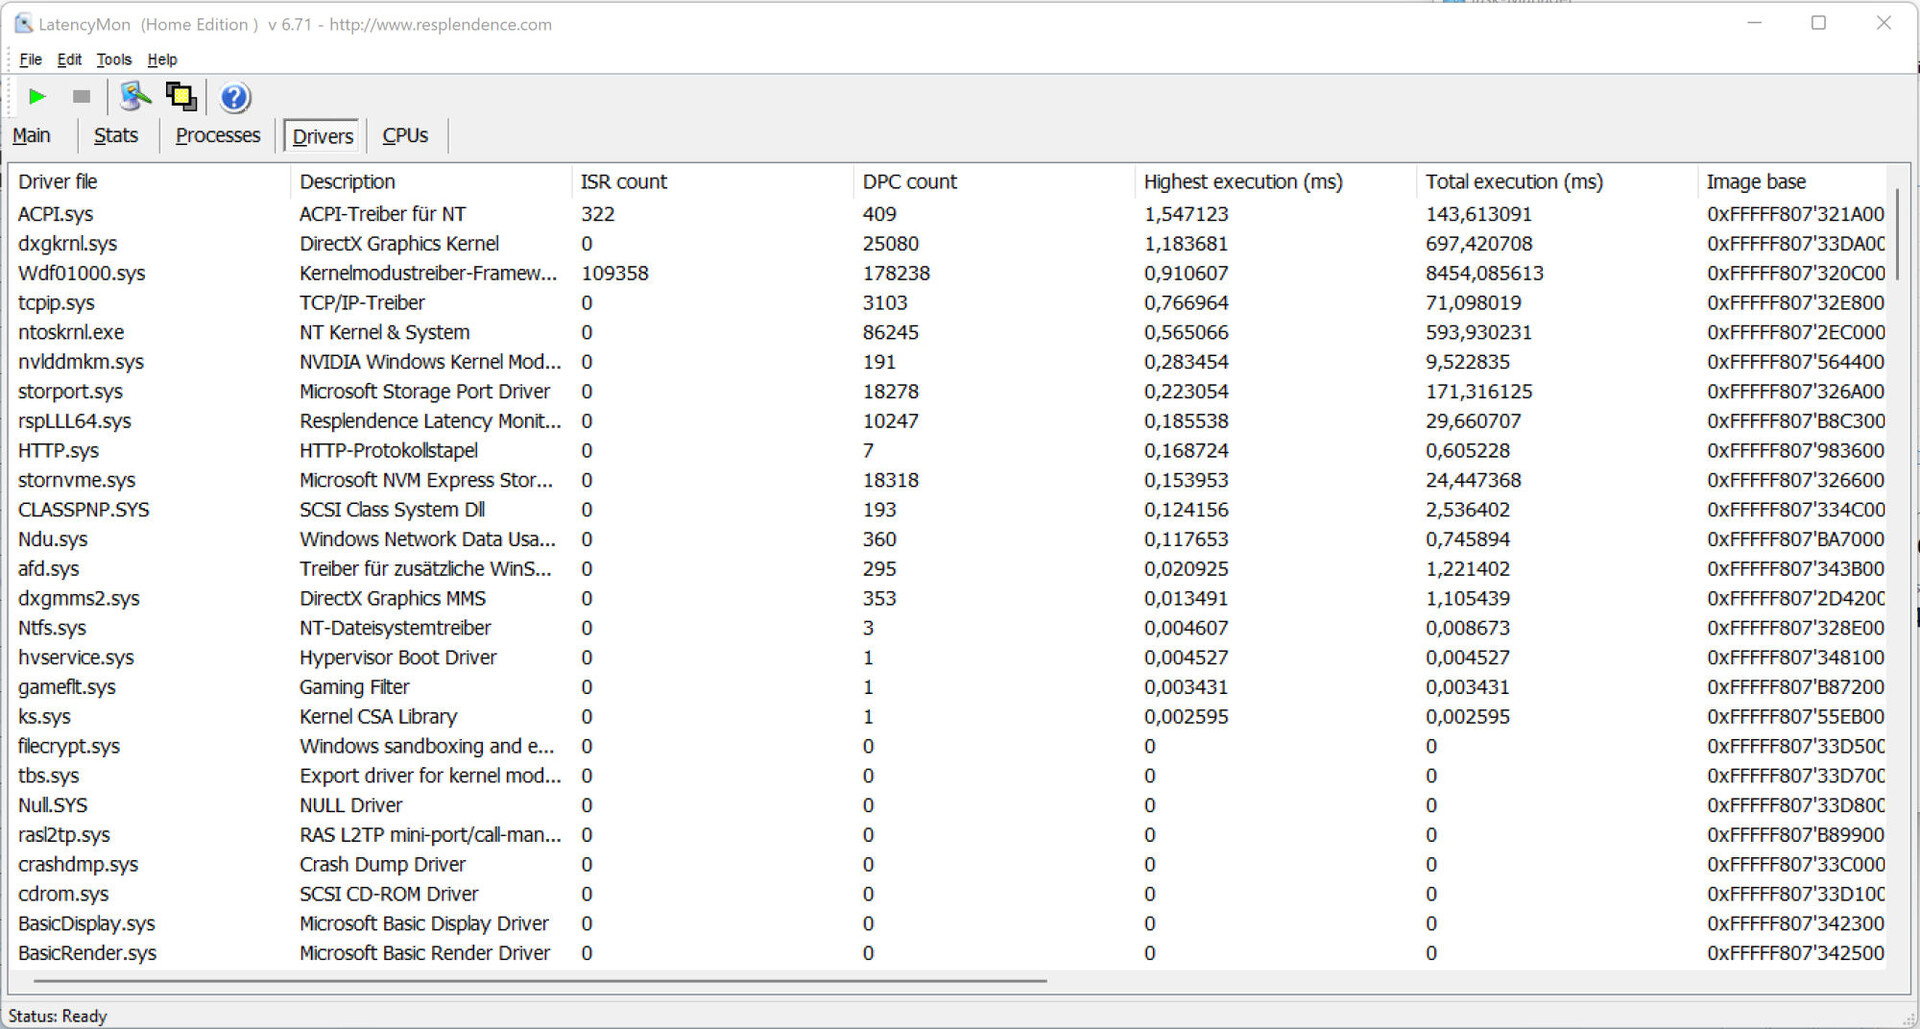
Latências DPC
O teste padronizado do Monitor de Latência (navegação na web, reprodução de vídeo 4k, Prime95 High Load) revelou algum comportamento conspícuo nas latências DPC. O sistema não parece ser adequado para o processamento de vídeo e áudio em tempo real. Futuras atualizações de software podem levar a melhorias ou mesmo piorar as coisas.
| DPC Latencies / LatencyMon - interrupt to process latency (max), Web, Youtube, Prime95 | |
| MSI Stealth GS77 12UHS-083US | |
| Alienware x17 R2 P48E | |
| Razer Blade 17 RTX 3080 Ti | |
| Medion Erazer Beast X30 | |
| Razer Blade 17 Early 2022 | |
* ... menor é melhor
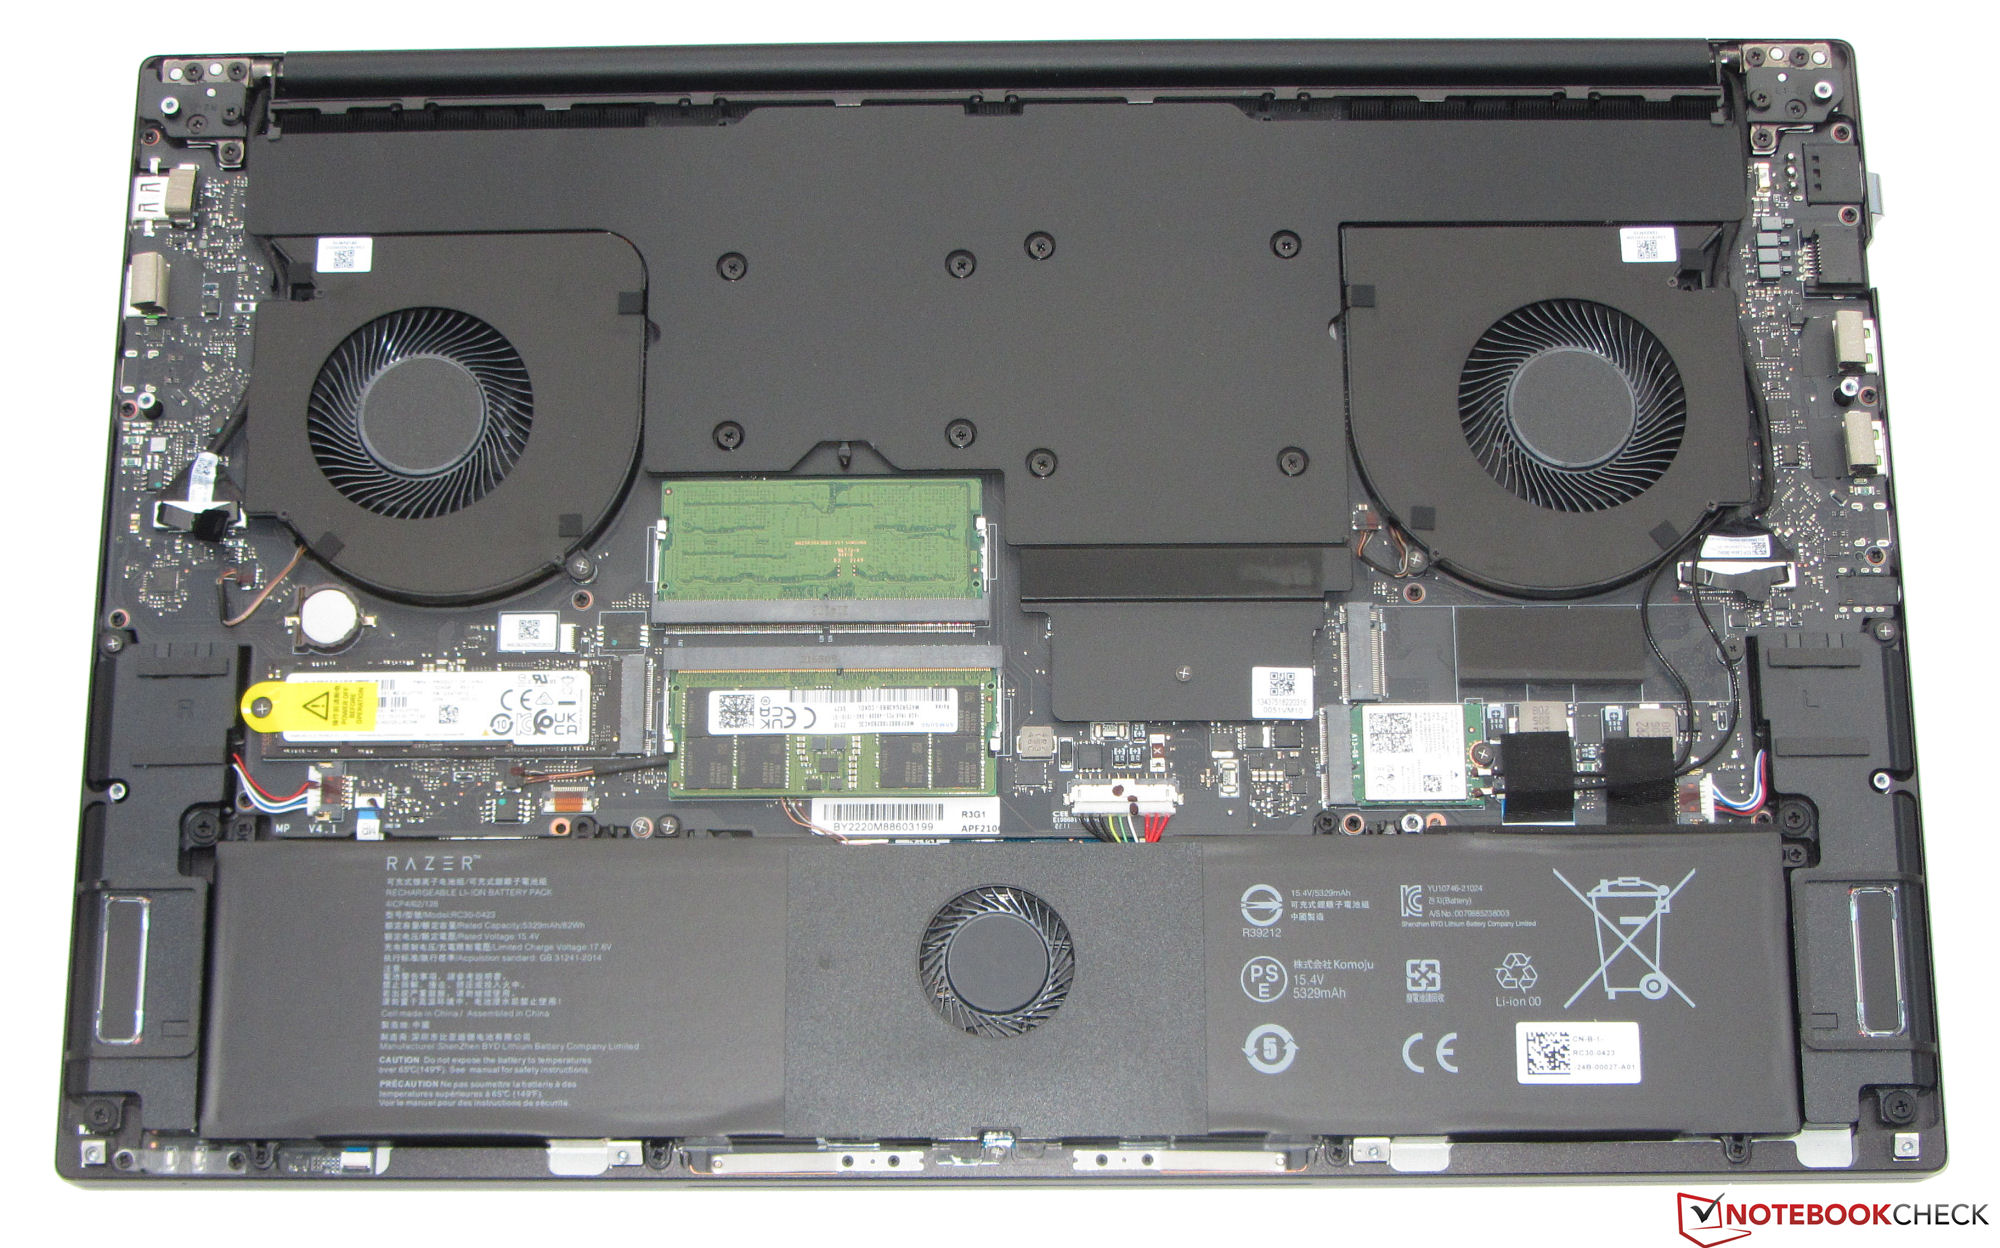
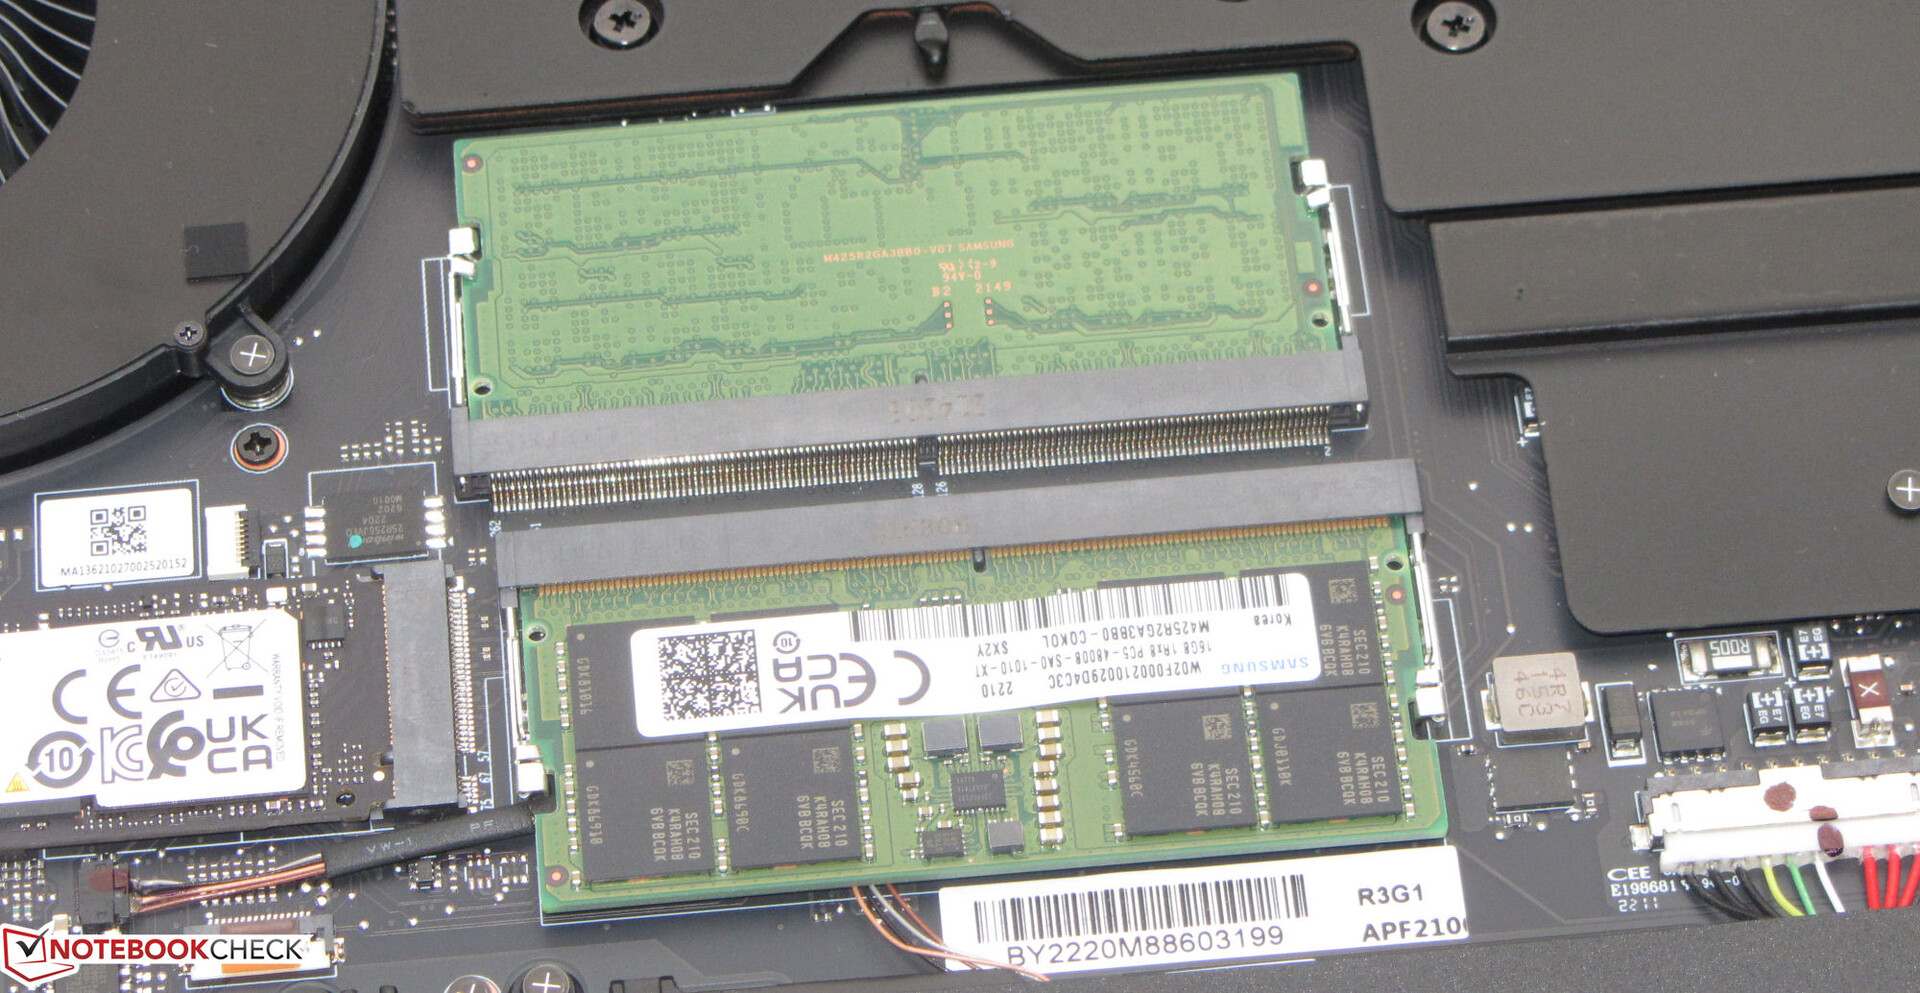
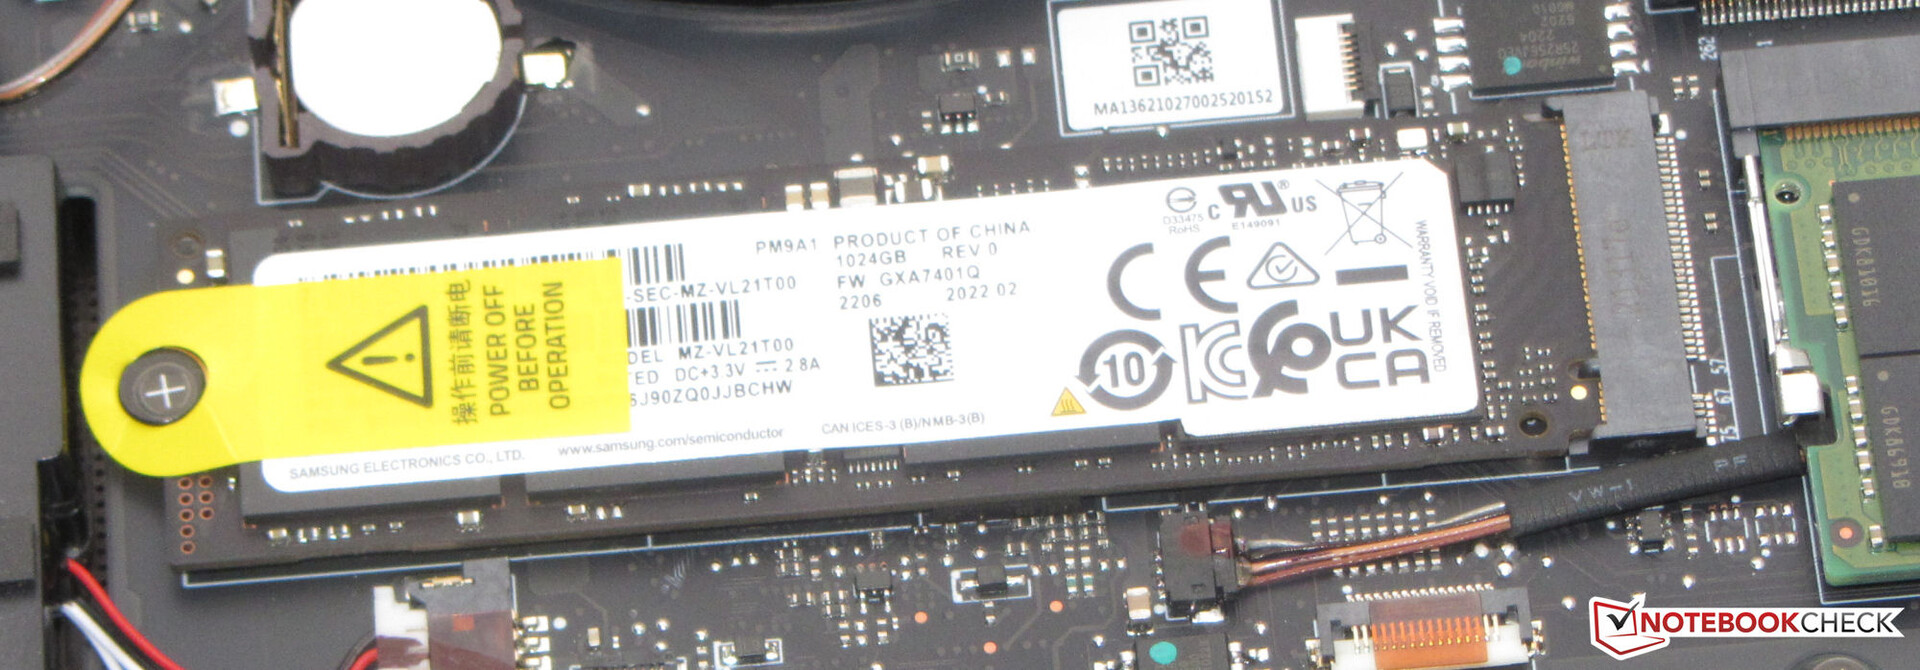
Solução de armazenamento
A Razer equipou o Blade com um SSD de 1 TB (PCIe 4, M.2-2280) da Samsung que oferece taxas de transferência muito boas. Além disso, o laptop oferece espaço para um segundo SSD (PCIe 4, M.2-2280).

* ... menor é melhor
Constant Performance Reading: DiskSpd Read Loop, Queue Depth 8
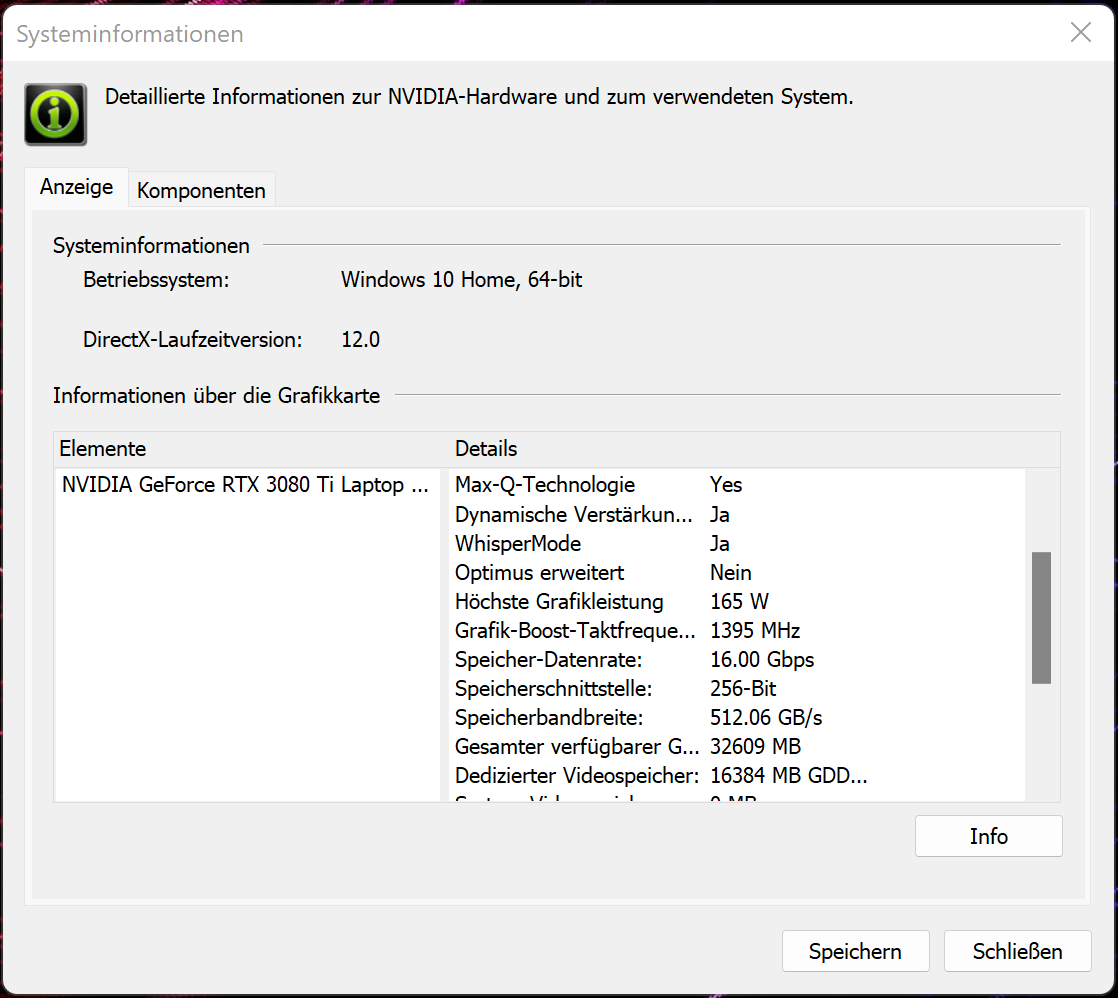
Placa Gráfica
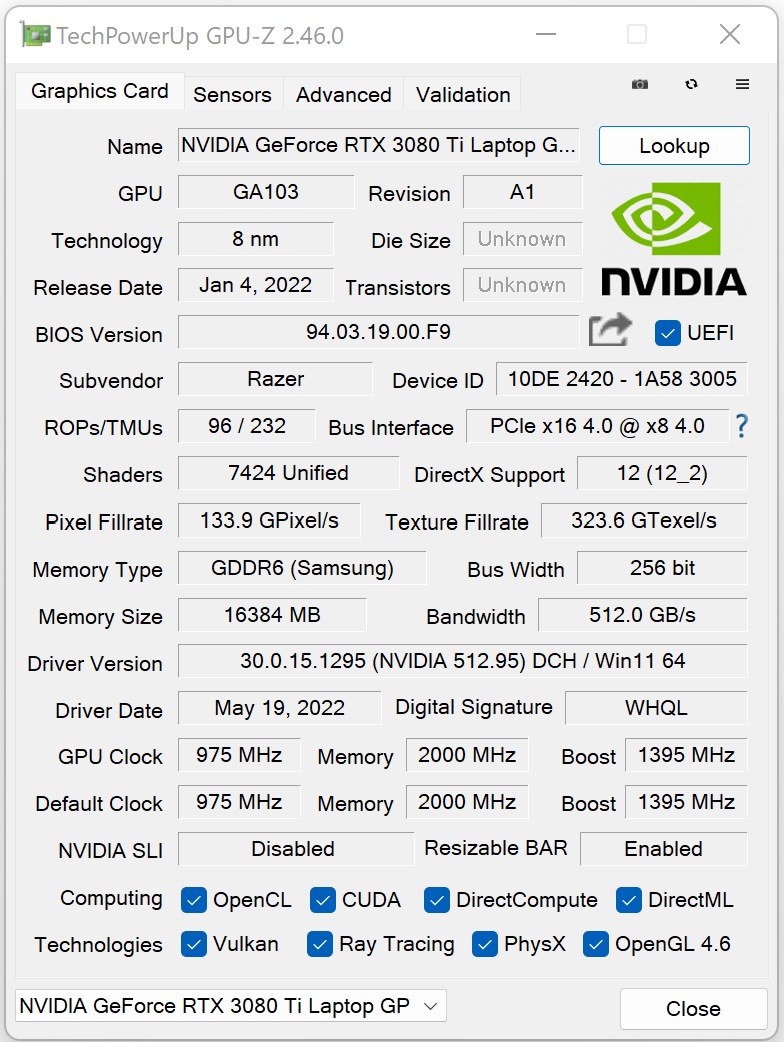
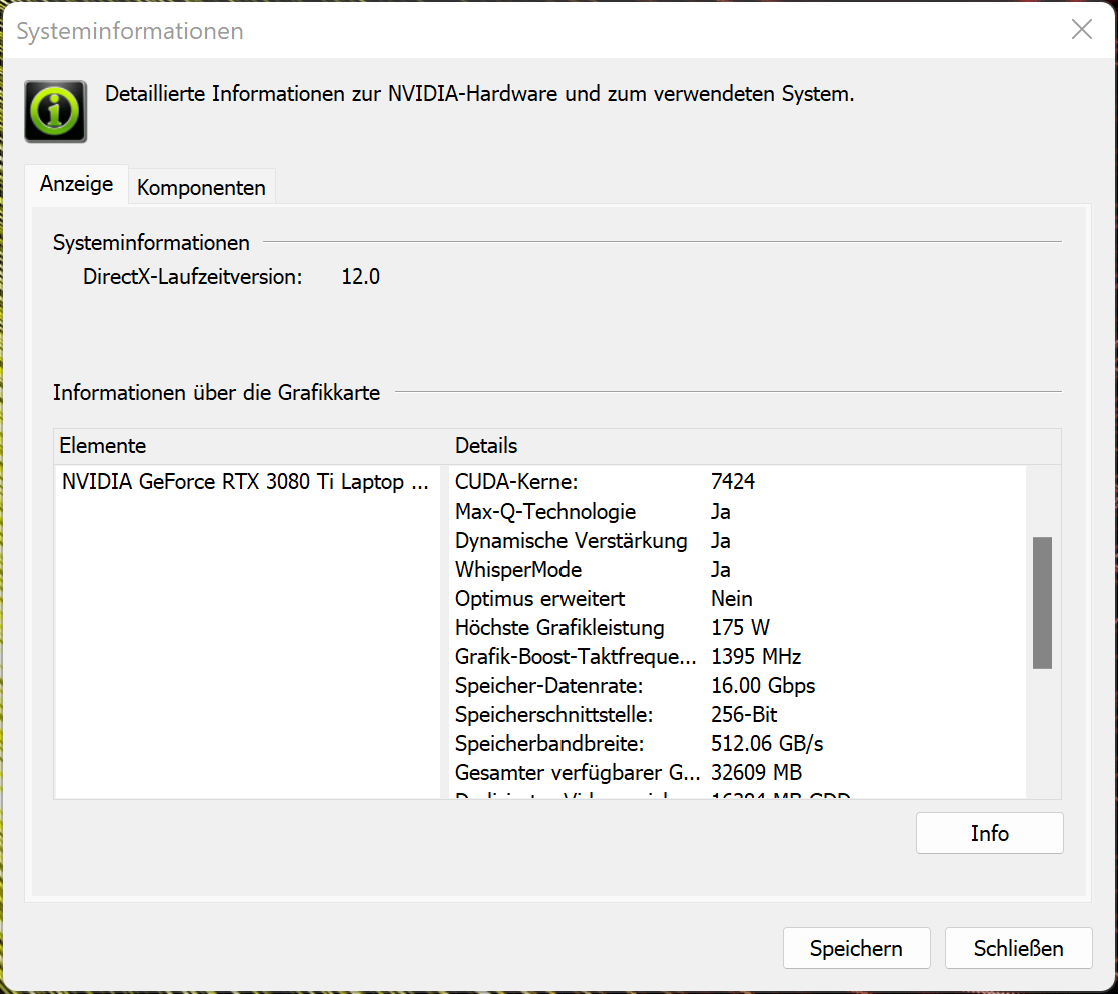
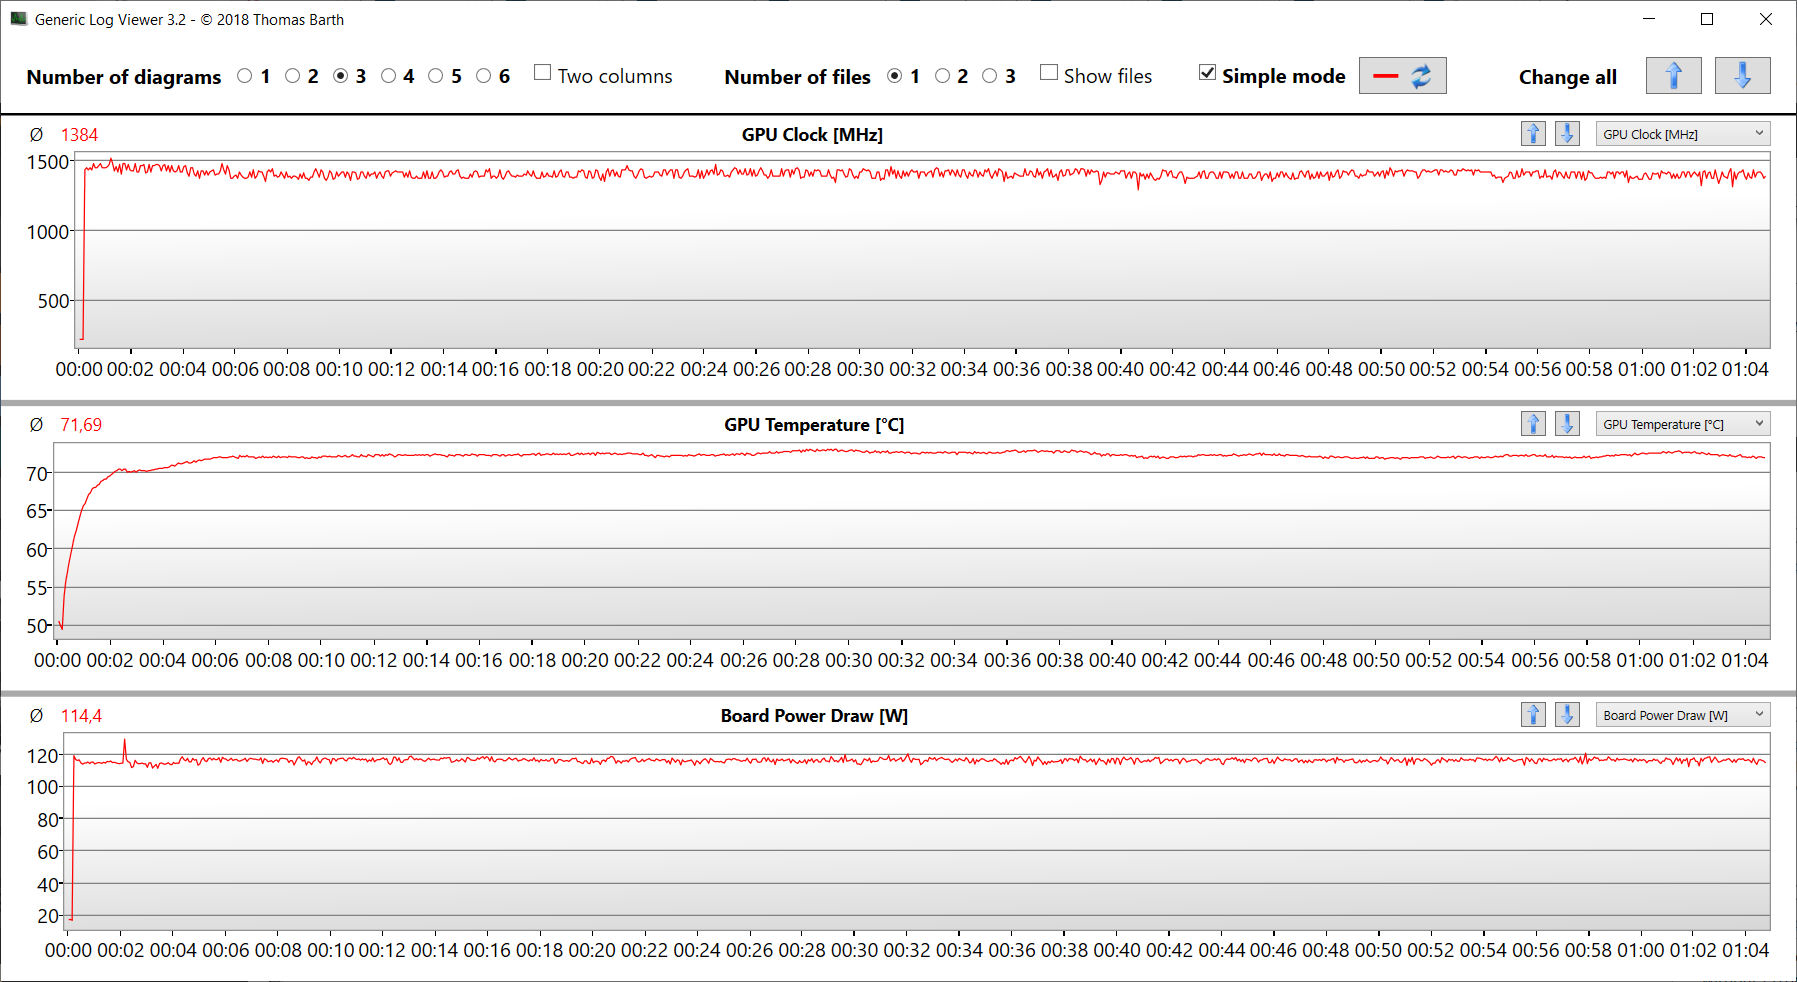
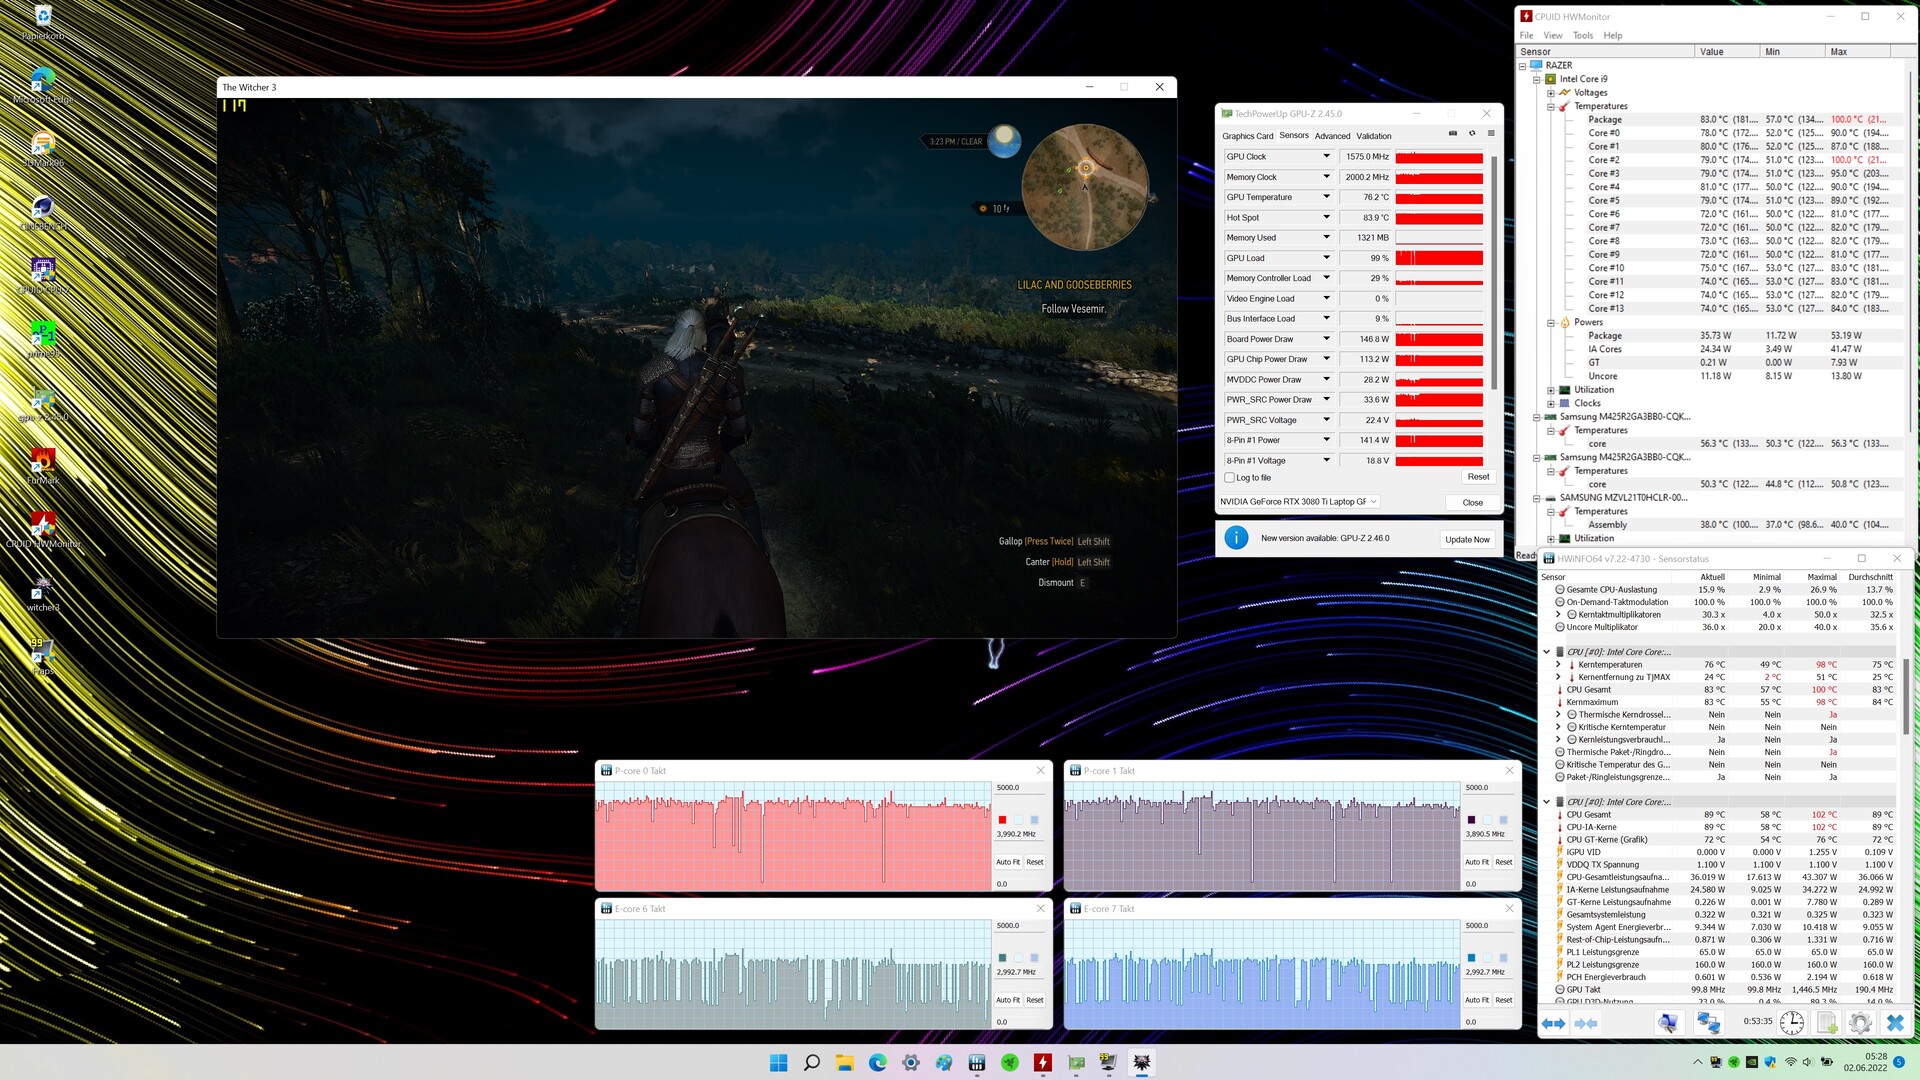
Uma atualização da BIOS a partir de junho de 2022 aumenta o TGP do GeForce Laptop RTX 3080 TigPU (VRAM: 16.384 MB GDDR6) de 165 a 175 watts - sem mostrar qualquer efeito sobre os resultados do benchmark. Entretanto, em todos os casos, os resultados ainda variam acima da média do RTX 3080 Ti médio que determinamos anteriormente. O TGP não é totalmente utilizado, o que é mostrado pelo nosso teste The Witcher 3. O desempenho gráfico pode ser aumentado sem uma atualização da BIOS, uma vez que o laptop oferece a opção de saída direta de imagem via GeForce GPU.
| 3DMark Performance rating - Percent | |
| Média da turma Gaming -2! | |
| Alienware x17 R2 P48E -25! | |
| Razer Blade 17 RTX 3080 Ti -25! | |
| Razer Blade 17 Early 2022 -2! | |
| Razer Blade 17 Early 2022 -25! | |
| Razer Blade 17 Early 2022 -25! | |
| Medion Erazer Beast X30 -25! | |
| Média NVIDIA GeForce RTX 3080 Ti Laptop GPU | |
| Asus ROG Zephyrus Duo 16 GX650RX -2! | |
| Razer Blade 17 Early 2022 -25! | |
| MSI Stealth GS77 12UHS-083US -25! | |
| Gigabyte Aero 16 YE5 -1! | |
| 3DMark 11 - 1280x720 Performance GPU | |
| Média da turma Gaming (21841 - 80022, n=104, últimos 2 anos) | |
| Alienware x17 R2 P48E | |
| Razer Blade 17 Early 2022 (Max.) | |
| Razer Blade 17 Early 2022 | |
| Razer Blade 17 RTX 3080 Ti | |
| Medion Erazer Beast X30 | |
| Razer Blade 17 Early 2022 (dGPU, 175W) | |
| Asus ROG Zephyrus Duo 16 GX650RX | |
| Média NVIDIA GeForce RTX 3080 Ti Laptop GPU (13920 - 45841, n=45) | |
| Razer Blade 17 Early 2022 (Lautlos) | |
| MSI Stealth GS77 12UHS-083US | |
| Gigabyte Aero 16 YE5 | |
| 3DMark 11 Performance | 30538 pontos | |
| 3DMark Cloud Gate Standard Score | 42346 pontos | |
| 3DMark Fire Strike Score | 24291 pontos | |
| 3DMark Time Spy Score | 11457 pontos | |
| 3DMark Steel Nomad Score | 3076 pontos | |
Ajuda | ||
Desempenho nos jogos
O hardware permite jogos de 4k em configurações altas ao máximo. Normalmente, as taxas de quadros variam acima da média para o RTX 3080 Ti. A saída direta da imagem via GeForce GPU leva a um aumento às vezes significativo dos valores. Com configurações de desempenho similares, o modelo irmão produz valores em um nível idêntico. As taxas de quadros permanecem em um nível constante mesmo durante um período de tempo mais longo, o que é mostrado pelo nosso teste Witcher 3 (FHD, configurações máximas, 60 min. de tempo de execução).
| The Witcher 3 - 1920x1080 Ultra Graphics & Postprocessing (HBAO+) | |
| Média da turma Gaming (104.7 - 240, n=7, últimos 2 anos) | |
| Alienware x17 R2 P48E | |
| Razer Blade 17 RTX 3080 Ti | |
| Razer Blade 17 Early 2022 (dGPU, 175W) | |
| Razer Blade 17 Early 2022 (Max.) | |
| Razer Blade 17 Early 2022 | |
| Medion Erazer Beast X30 | |
| Razer Blade 17 Early 2022 (Lautlos) | |
| Média NVIDIA GeForce RTX 3080 Ti Laptop GPU (30 - 130.6, n=43) | |
| MSI Stealth GS77 12UHS-083US | |
| Dota 2 Reborn | |
| 1920x1080 ultra (3/3) best looking | |
| Alienware x17 R2 P48E | |
| Razer Blade 17 RTX 3080 Ti | |
| MSI Stealth GS77 12UHS-083US | |
| Média da turma Gaming (84.8 - 248, n=107, últimos 2 anos) | |
| Razer Blade 17 Early 2022 (Max.) | |
| Razer Blade 17 Early 2022 (dGPU, 175W) | |
| Medion Erazer Beast X30 | |
| Média NVIDIA GeForce RTX 3080 Ti Laptop GPU (29.9 - 170.5, n=45) | |
| Razer Blade 17 Early 2022 | |
| Razer Blade 17 Early 2022 (Lautlos) | |
| 3840x2160 ultra (3/3) best looking | |
| Média da turma Gaming (114.9 - 199.2, n=32, últimos 2 anos) | |
| Razer Blade 17 Early 2022 (dGPU, 175W) | |
| Razer Blade 17 Early 2022 (Max.) | |
| Média NVIDIA GeForce RTX 3080 Ti Laptop GPU (70.8 - 155.6, n=19) | |
| Razer Blade 17 Early 2022 | |
| Razer Blade 17 Early 2022 (Lautlos) | |
| X-Plane 11.11 | |
| 3840x2160 high (fps_test=3) | |
| Razer Blade 17 Early 2022 (dGPU, 175W) | |
| Média da turma Gaming (60 - 124.1, n=32, últimos 2 anos) | |
| Razer Blade 17 Early 2022 (Max.) | |
| Média NVIDIA GeForce RTX 3080 Ti Laptop GPU (32.9 - 109.5, n=20) | |
| Razer Blade 17 Early 2022 | |
| Razer Blade 17 Early 2022 (Lautlos) | |
| 1920x1080 high (fps_test=3) | |
| Alienware x17 R2 P48E | |
| Razer Blade 17 Early 2022 (dGPU, 175W) | |
| Razer Blade 17 RTX 3080 Ti | |
| Razer Blade 17 Early 2022 (Max.) | |
| MSI Stealth GS77 12UHS-083US | |
| Média NVIDIA GeForce RTX 3080 Ti Laptop GPU (32.6 - 127, n=45) | |
| Medion Erazer Beast X30 | |
| Média da turma Gaming (55.5 - 143.5, n=109, últimos 2 anos) | |
| Razer Blade 17 Early 2022 | |
| Razer Blade 17 Early 2022 (Lautlos) | |
| Final Fantasy XV Benchmark | |
| 3840x2160 High Quality | |
| Média da turma Gaming (49.1 - 111.8, n=33, últimos 2 anos) | |
| Razer Blade 17 Early 2022 (1.3, dGPU, 175W) | |
| Razer Blade 17 Early 2022 (1.3, Max.) | |
| Razer Blade 17 Early 2022 (1.3) | |
| Média NVIDIA GeForce RTX 3080 Ti Laptop GPU (35.1 - 61.2, n=18) | |
| Razer Blade 17 Early 2022 (1.3, Lautlos) | |
| 1920x1080 High Quality | |
| Média da turma Gaming (41 - 215, n=95, últimos 2 anos) | |
| Alienware x17 R2 P48E (1.3) | |
| Razer Blade 17 Early 2022 (1.3, dGPU, 175W) | |
| Razer Blade 17 RTX 3080 Ti (1.3) | |
| Razer Blade 17 Early 2022 (1.3, Max.) | |
| Média NVIDIA GeForce RTX 3080 Ti Laptop GPU (30.7 - 140.6, n=42) | |
| Razer Blade 17 Early 2022 (1.3) | |
| MSI Stealth GS77 12UHS-083US (1.3) | |
| Medion Erazer Beast X30 (1.3) | |
| Razer Blade 17 Early 2022 (1.3, Lautlos) | |
| GTA V | |
| 1920x1080 Highest AA:4xMSAA + FX AF:16x | |
| Média da turma Gaming (48.3 - 186.9, n=94, últimos 2 anos) | |
| Alienware x17 R2 P48E | |
| Razer Blade 17 Early 2022 (Max.) | |
| Razer Blade 17 Early 2022 (dGPU, 175W) | |
| Razer Blade 17 RTX 3080 Ti | |
| MSI Stealth GS77 12UHS-083US | |
| Média NVIDIA GeForce RTX 3080 Ti Laptop GPU (30 - 139.2, n=42) | |
| Medion Erazer Beast X30 | |
| Razer Blade 17 Early 2022 | |
| Razer Blade 17 Early 2022 (Lautlos) | |
| 3840x2160 Highest AA:4xMSAA + FX AF:16x | |
| Média da turma Gaming (53.9 - 123.2, n=25, últimos 2 anos) | |
| Razer Blade 17 Early 2022 (Max.) | |
| Razer Blade 17 Early 2022 | |
| Razer Blade 17 Early 2022 (dGPU, 175W) | |
| Média NVIDIA GeForce RTX 3080 Ti Laptop GPU (37.7 - 67.2, n=14) | |
| Razer Blade 17 Early 2022 (Lautlos) | |
| Strange Brigade | |
| 3840x2160 ultra AA:ultra AF:16 | |
| Média da turma Gaming (83 - 187.2, n=34, últimos 2 anos) | |
| Razer Blade 17 Early 2022 (1.47.22.14 D3D12, dGPU, 175W) | |
| Razer Blade 17 Early 2022 (1.47.22.14 D3D12) | |
| Média NVIDIA GeForce RTX 3080 Ti Laptop GPU (61.7 - 100.7, n=15) | |
| Razer Blade 17 Early 2022 (1.47.22.14 D3D12, Lautlos) | |
| 1920x1080 ultra AA:ultra AF:16 | |
| Média da turma Gaming (76.3 - 458, n=87, últimos 2 anos) | |
| Razer Blade 17 RTX 3080 Ti (1.47.22.14 D3D12) | |
| Razer Blade 17 Early 2022 (1.47.22.14 D3D12, dGPU, 175W) | |
| Alienware x17 R2 P48E (1.47.22.14 D3D12) | |
| Razer Blade 17 Early 2022 (1.47.22.14 D3D12) | |
| Medion Erazer Beast X30 (1.47.22.14 D3D12) | |
| Média NVIDIA GeForce RTX 3080 Ti Laptop GPU (42.3 - 224, n=41) | |
| Razer Blade 17 Early 2022 (1.47.22.14 D3D12, Lautlos) | |
| MSI Stealth GS77 12UHS-083US (1.47.22.14 D3D12) | |
| F1 2021 | |
| 3840x2160 Ultra High Preset + Raytracing AA:T AF:16x | |
| Razer Blade 17 Early 2022 (874931, dGPU, 175W) | |
| Razer Blade 17 Early 2022 (874931, Max.) | |
| Razer Blade 17 Early 2022 (874931) | |
| Média NVIDIA GeForce RTX 3080 Ti Laptop GPU (41.1 - 70.2, n=18) | |
| Razer Blade 17 Early 2022 (874931, Lautlos) | |
| 1920x1080 Ultra High Preset + Raytracing AA:T AF:16x | |
| Razer Blade 17 Early 2022 (874931, dGPU, 175W) | |
| Razer Blade 17 Early 2022 (874931, Max.) | |
| Razer Blade 17 Early 2022 (874931) | |
| Medion Erazer Beast X30 (874931) | |
| Média NVIDIA GeForce RTX 3080 Ti Laptop GPU (30.2 - 160.6, n=30) | |
| Razer Blade 17 Early 2022 (874931, Lautlos) | |
| Far Cry 5 | |
| 3840x2160 Ultra Preset AA:T | |
| Média da turma Gaming (n=1últimos 2 anos) | |
| Razer Blade 17 Early 2022 | |
| Razer Blade 17 Early 2022 (dGPU, 175W) | |
| Média NVIDIA GeForce RTX 3080 Ti Laptop GPU (45 - 76, n=9) | |
| 1920x1080 Ultra Preset AA:T | |
| Média NVIDIA GeForce RTX 3080 Ti Laptop GPU (111 - 162, n=24) | |
| Medion Erazer Beast X30 | |
| MSI Stealth GS77 12UHS-083US | |
| Razer Blade 17 RTX 3080 Ti | |
| Razer Blade 17 Early 2022 (dGPU, 175W) | |
| Razer Blade 17 Early 2022 | |
| Média da turma Gaming (70 - 151, n=6, últimos 2 anos) | |
The Witcher 3 FPS Chart
| baixo | média | alto | ultra | QHD | 4K | |
|---|---|---|---|---|---|---|
| GTA V (2015) | 179.4 | 175.2 | 166 | 106 | 102.7 | 118 |
| The Witcher 3 (2015) | 328 | 289 | 218 | 119.6 | 89.6 | |
| Dota 2 Reborn (2015) | 176.1 | 149.2 | 140 | 131.9 | 117.3 | |
| Final Fantasy XV Benchmark (2018) | 155.9 | 139.3 | 112.2 | 90.8 | 55.2 | |
| X-Plane 11.11 (2018) | 127.9 | 115.5 | 95.6 | 82.1 | ||
| Far Cry 5 (2018) | 148 | 127 | 122 | 116 | 110 | 70 |
| Strange Brigade (2018) | 382 | 272 | 229 | 204 | 152.7 | 91.1 |
| F1 2021 (2021) | 295 | 255 | 219 | 132.8 | 104.3 | 62.5 |
| Baldur's Gate 3 (2023) | 117.7 | 84.4 | 46 | |||
| Cyberpunk 2077 (2023) | 91.43 | 57.12 | 25.46 |
Emissões - A Lâmina 17 não esquenta excessivamente
Emissões sonoras
No funcionamento diário (escritório, Internet), o laptop não produz ruído excessivo. Ocasionalmente, os ventiladores permanecem até mesmo completamente desligados e há silêncio. Sob carga, ele pode ficar alto com um nível máximo de ruído de até 51 dB(A) (teste de estresse, o teste Witcher 3 ).
O perfil de desempenho "Silencioso" se oferece para a operação diária. Embora o laptop então não funcione silenciosamente, ele ainda produz menos ruído e calor. O desempenho reduzido da computação também é suficiente para jogos.
Barulho
| Ocioso |
| 26 / 27 / 32 dB |
| Carga |
| 50 / 51 dB |
 | ||
30 dB silencioso 40 dB(A) audível 50 dB(A) ruidosamente alto |
||
min: | ||
| Razer Blade 17 Early 2022 GeForce RTX 3080 Ti Laptop GPU, i9-12900H, Samsung PM9A1 MZVL21T0HCLR | Alienware x17 R2 P48E GeForce RTX 3080 Ti Laptop GPU, i9-12900HK, 2x Samsung PM9A1 1TB (RAID 0) | Medion Erazer Beast X30 GeForce RTX 3080 Ti Laptop GPU, i9-12900HK, Samsung PM9A1 MZVL21T0HCLR | MSI Stealth GS77 12UHS-083US GeForce RTX 3080 Ti Laptop GPU, i7-12700H, Micron 3400 1TB MTFDKBA1T0TFH | Razer Blade 17 RTX 3080 Ti GeForce RTX 3080 Ti Laptop GPU, i7-12800H, Samsung PM9A1 MZVL21T0HCLR | |
|---|---|---|---|---|---|
| Noise | 14% | -2% | 8% | 11% | |
| desligado / ambiente * (dB) | 26 | 22.7 13% | 26 -0% | 24.5 6% | 23.3 10% |
| Idle Minimum * (dB) | 26 | 23.1 11% | 27 -4% | 24.5 6% | 23.3 10% |
| Idle Average * (dB) | 27 | 23.1 14% | 29 -7% | 24.5 9% | 23.3 14% |
| Idle Maximum * (dB) | 32 | 23.1 28% | 34 -6% | 30.8 4% | 26.3 18% |
| Load Average * (dB) | 50 | 31.9 36% | 48 4% | 34.6 31% | 38.2 24% |
| Witcher 3 ultra * (dB) | 51 | 52.5 -3% | 51 -0% | 46.2 9% | 50.9 -0% |
| Load Maximum * (dB) | 51 | 52.5 -3% | 53 -4% | 56.8 -11% | 49.1 4% |
* ... menor é melhor
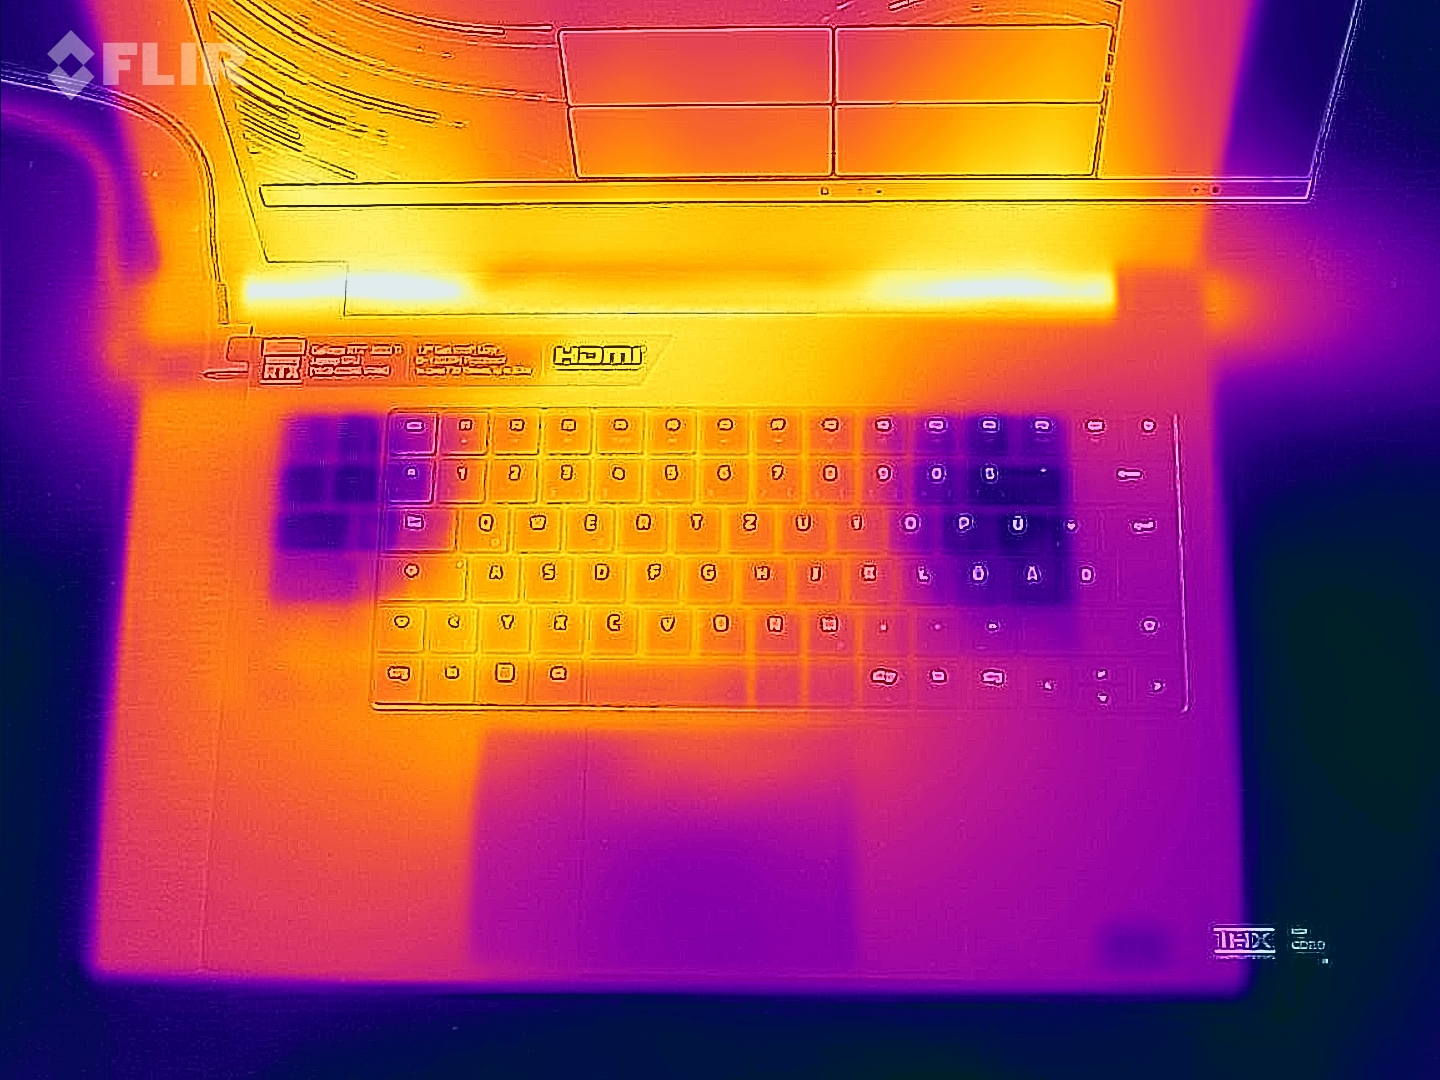
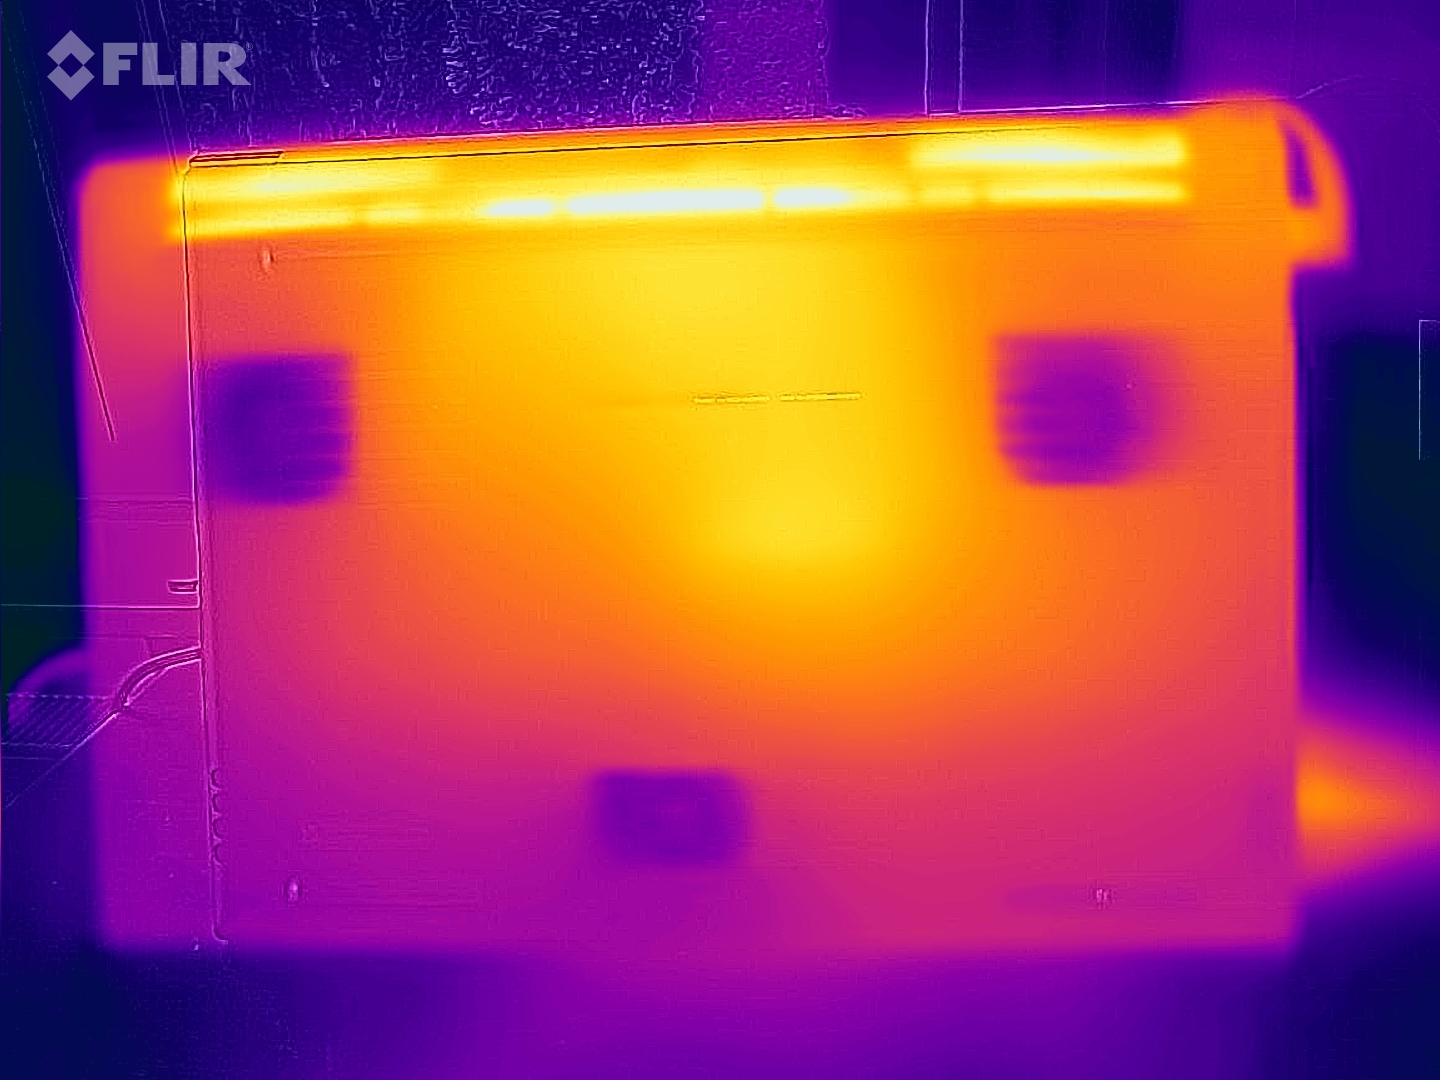
Temperaturas
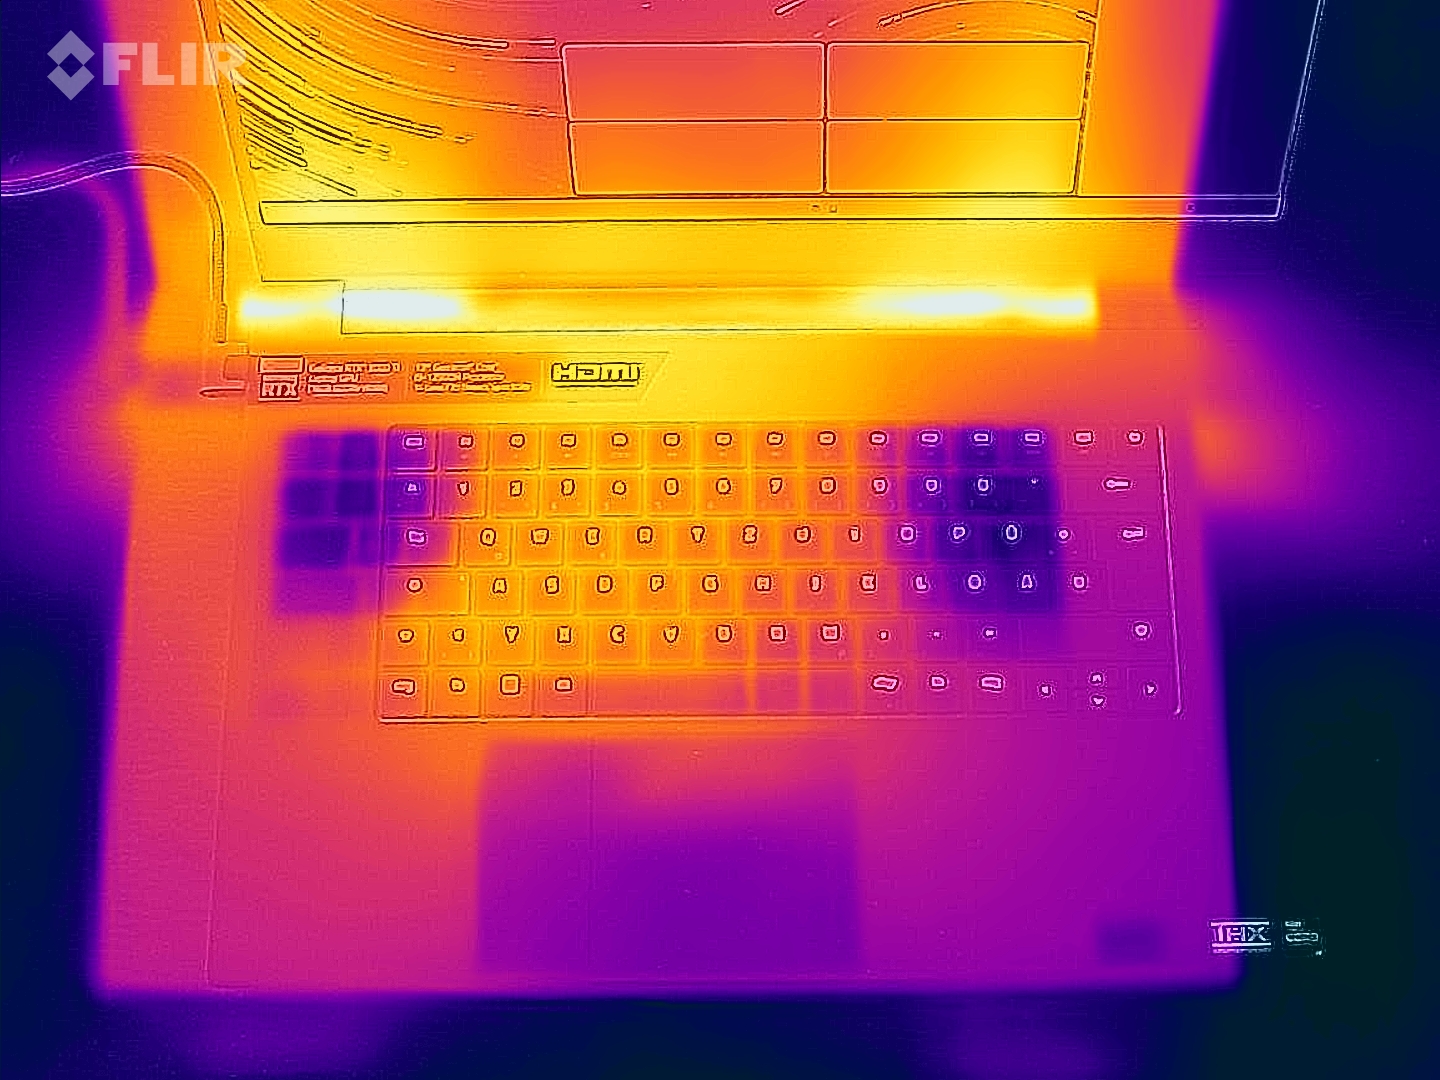
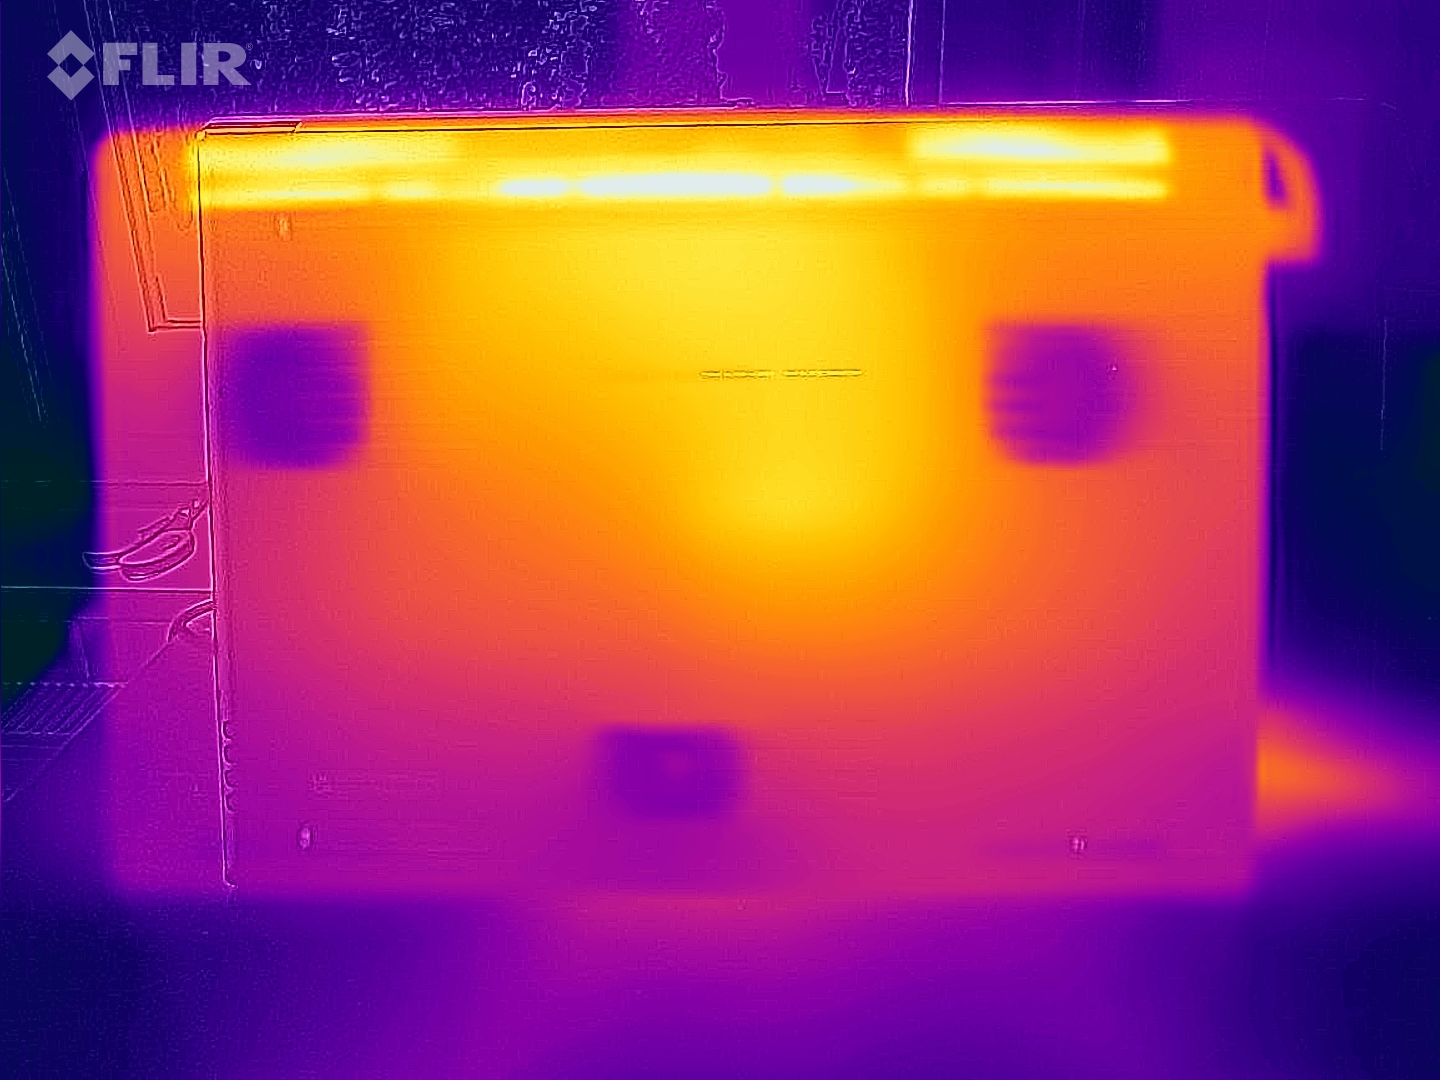
No funcionamento diário (escritório, Internet), as temperaturas do estojo permanecem dentro de uma faixa verde. Enquanto o laptop aquece visivelmente sob carga (teste de estresse, o teste Witcher 3 ), o desenvolvimento do calor ainda permanece dentro de limites aceitáveis. No entanto, as temperaturas da CPU podem, às vezes, chegar até a faixa vermelha.
(-) A temperatura máxima no lado superior é 50 °C / 122 F, em comparação com a média de 40.4 °C / 105 F , variando de 21.2 a 68.8 °C para a classe Gaming.
(-) A parte inferior aquece até um máximo de 56 °C / 133 F, em comparação com a média de 43.2 °C / 110 F
(±) Em uso inativo, a temperatura média para o lado superior é 33 °C / 91 F, em comparação com a média do dispositivo de 33.9 °C / ### class_avg_f### F.
(-) Jogando The Witcher 3, a temperatura média para o lado superior é 42.7 °C / 109 F, em comparação com a média do dispositivo de 33.9 °C / ## #class_avg_f### F.
(-) Os apoios para as mãos e o touchpad podem ficar muito quentes ao toque, com um máximo de 42 °C / 107.6 F.
(-) A temperatura média da área do apoio para as mãos de dispositivos semelhantes foi 28.8 °C / 83.8 F (-13.2 °C / -23.8 F).
| Razer Blade 17 Early 2022 Intel Core i9-12900H, NVIDIA GeForce RTX 3080 Ti Laptop GPU | Alienware x17 R2 P48E Intel Core i9-12900HK, NVIDIA GeForce RTX 3080 Ti Laptop GPU | Medion Erazer Beast X30 Intel Core i9-12900HK, NVIDIA GeForce RTX 3080 Ti Laptop GPU | MSI Stealth GS77 12UHS-083US Intel Core i7-12700H, NVIDIA GeForce RTX 3080 Ti Laptop GPU | Razer Blade 17 RTX 3080 Ti Intel Core i7-12800H, NVIDIA GeForce RTX 3080 Ti Laptop GPU | |
|---|---|---|---|---|---|
| Heat | 15% | -1% | 3% | 5% | |
| Maximum Upper Side * (°C) | 50 | 49.6 1% | 55 -10% | 50.6 -1% | 46 8% |
| Maximum Bottom * (°C) | 56 | 42.4 24% | 62 -11% | 59.6 -6% | 46.8 16% |
| Idle Upper Side * (°C) | 36 | 29.2 19% | 32 11% | 30 17% | 36.2 -1% |
| Idle Bottom * (°C) | 38 | 32 16% | 36 5% | 37.4 2% | 38.6 -2% |
* ... menor é melhor
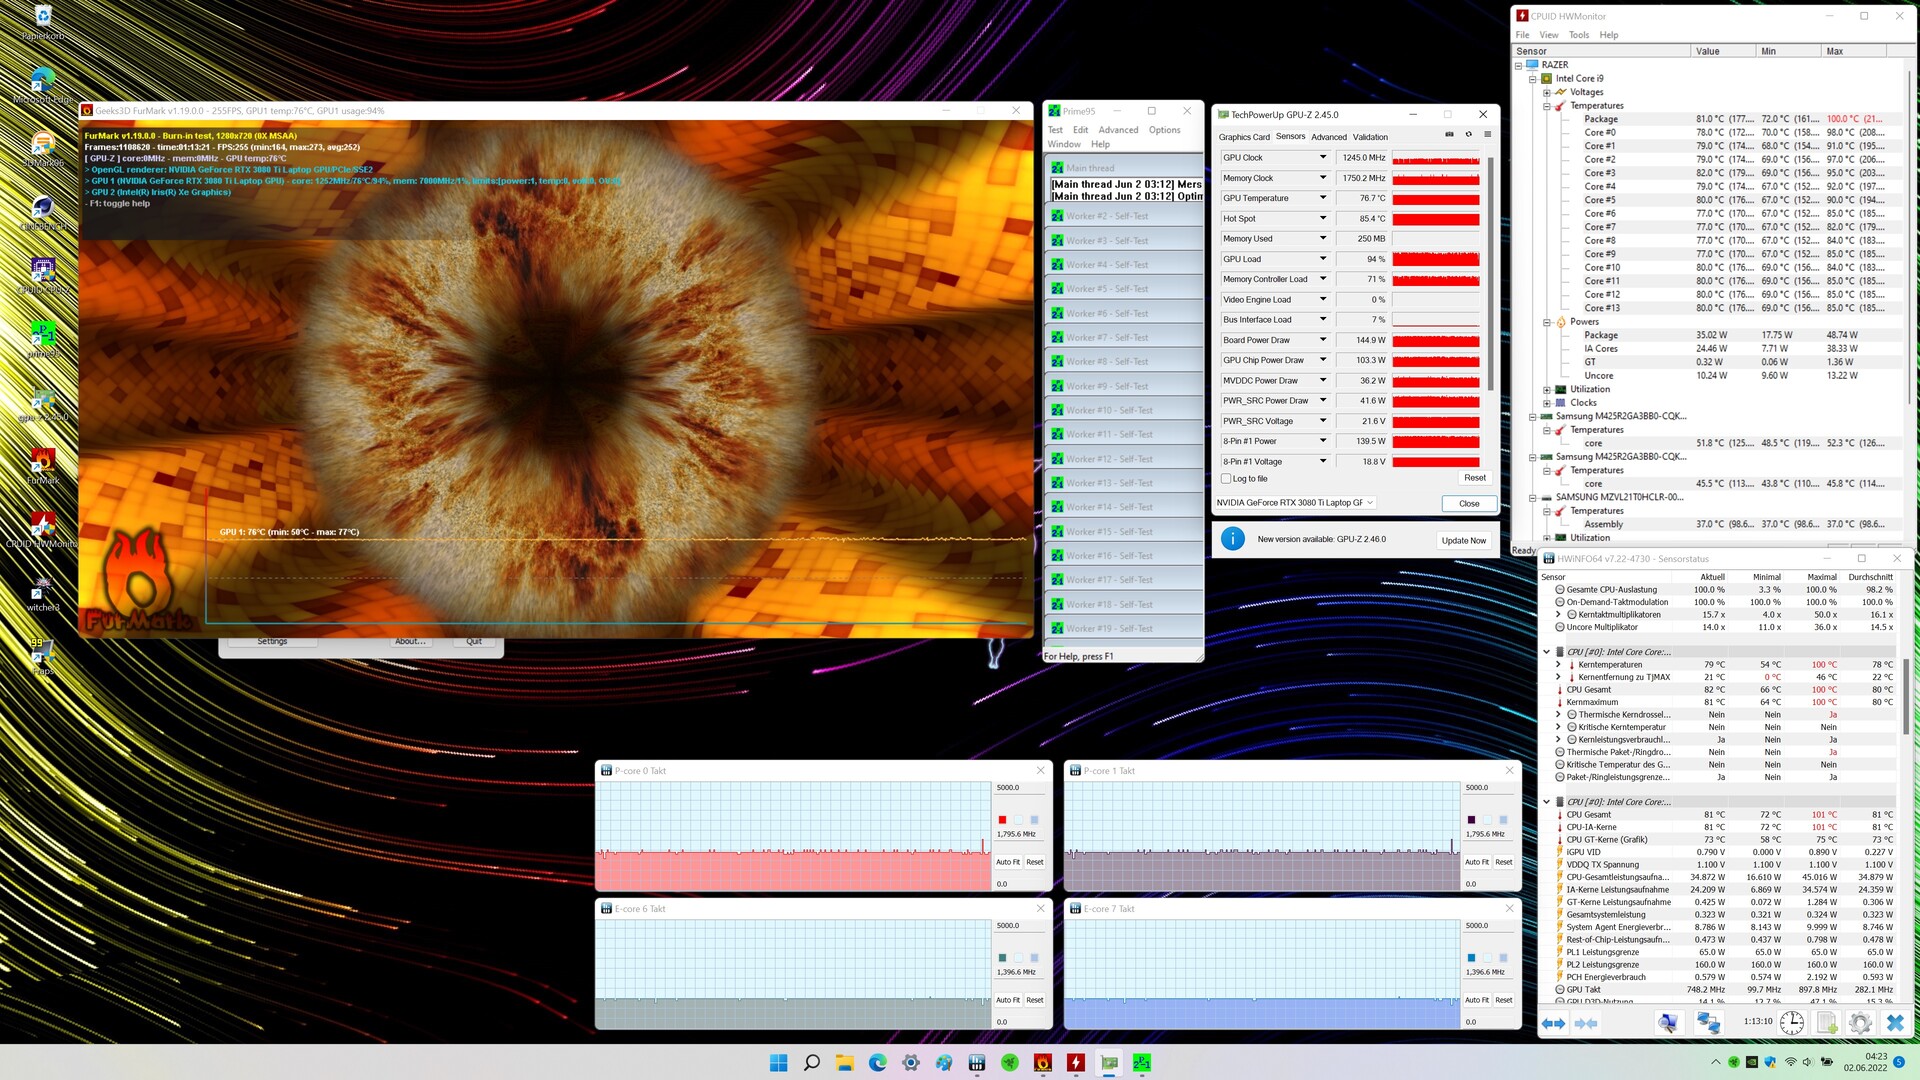
Teste de estresse
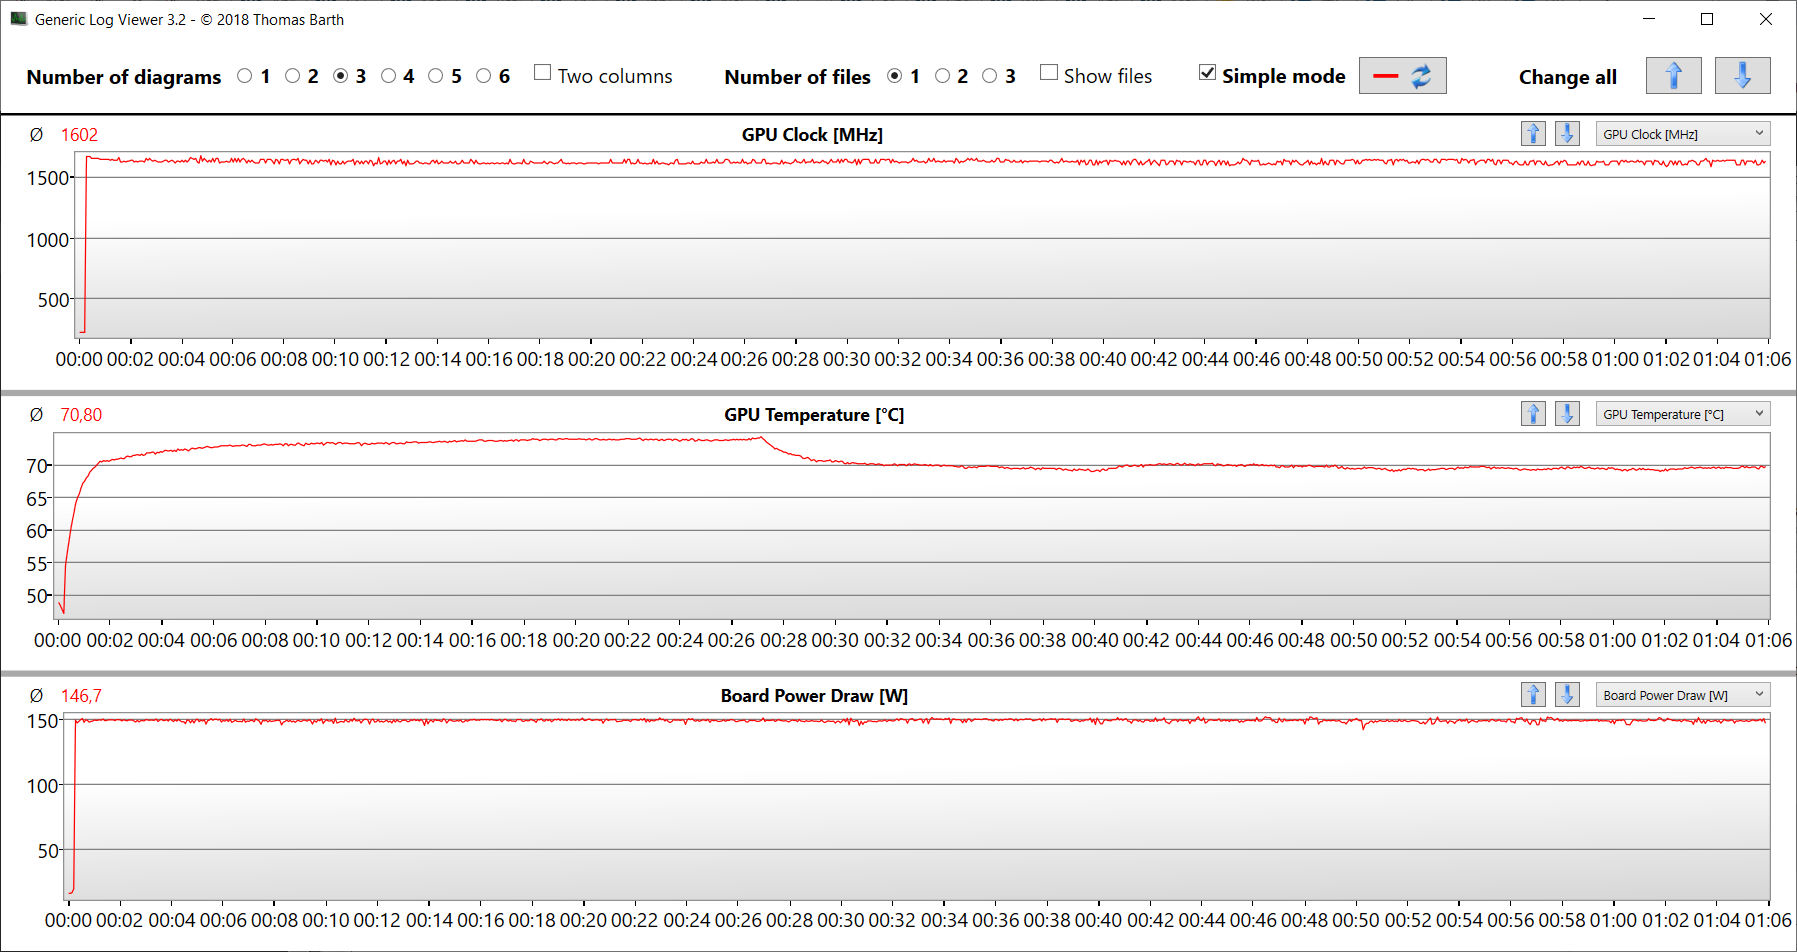
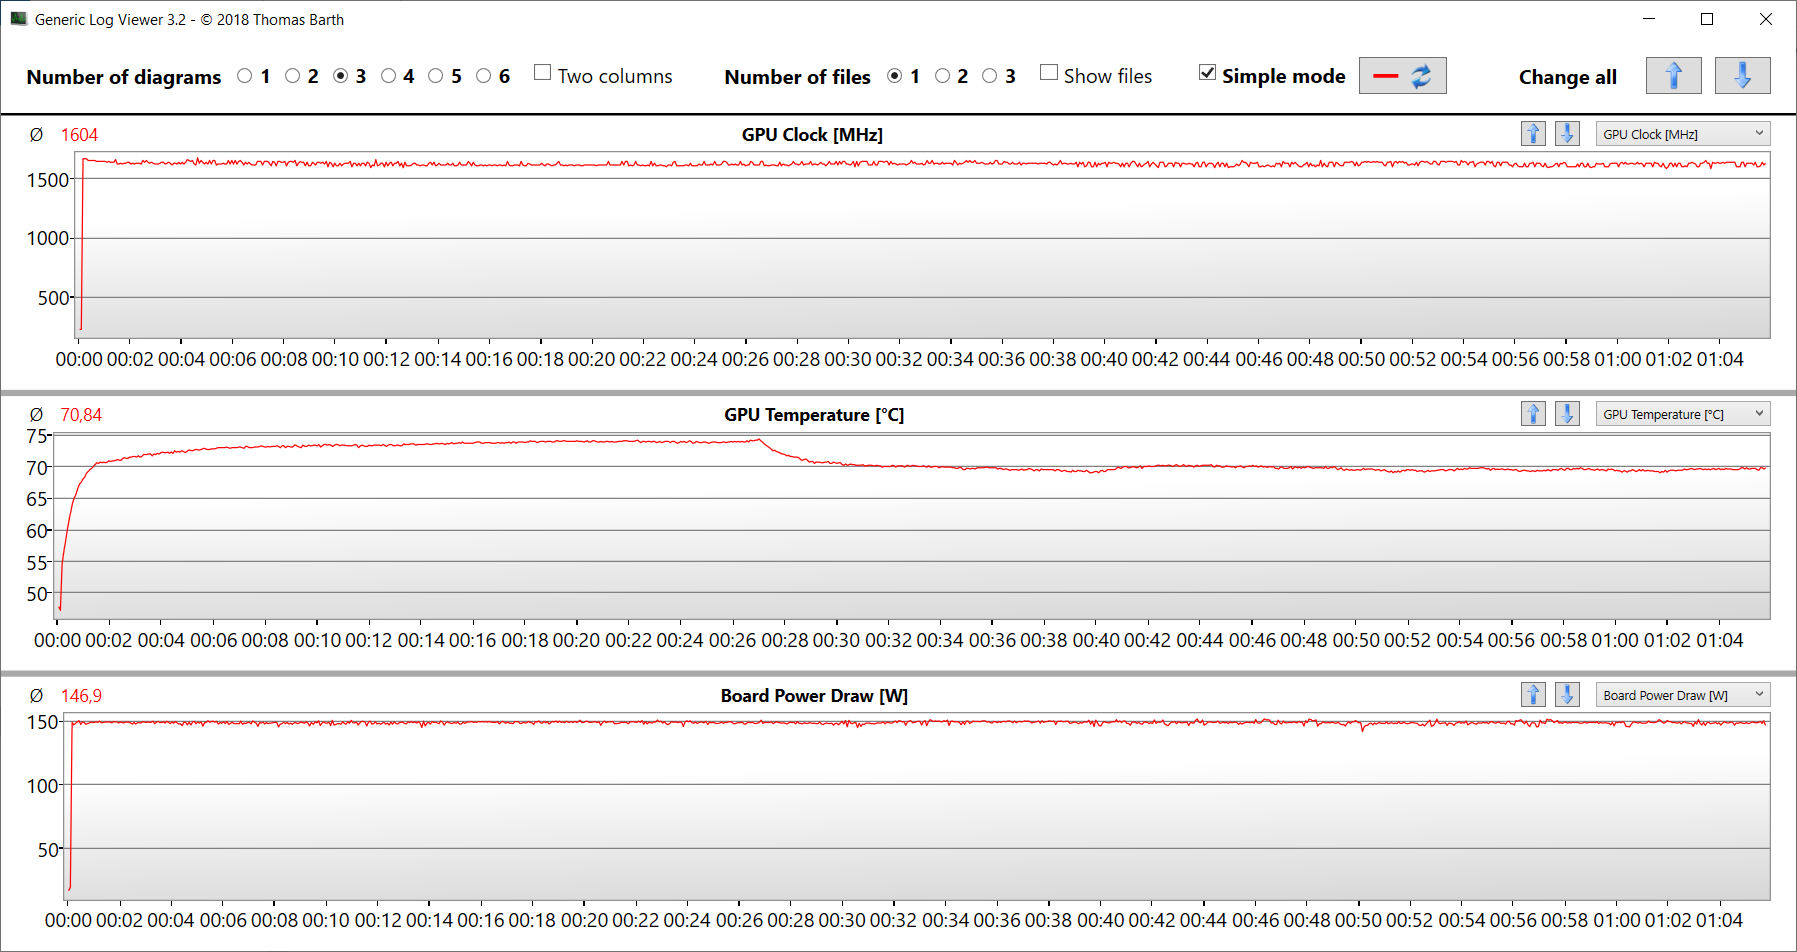
Já no início do teste de estresse (com Prime95 e Furmark funcionando por pelo menos uma hora), a CPU funciona em baixas velocidades de clock (núcleos P: 2,1 a 2,2 GHz; núcleos E: 1,6 a 1,7 GHz). Continuando, os valores caem para 1,8 GHz para os núcleos P e 1,4 GHz para os núcleos E. A velocidade do relógio GPU cai de cerca de 1500 MHz para cerca de 1250 MHz. O teste de estresse representa um cenário extremo, e nós o usamos para avaliar se o sistema permanece estável em carga máxima.
Oradores
Razer Blade 17 Early 2022 análise de áudio
(+) | os alto-falantes podem tocar relativamente alto (###valor### dB)
Graves 100 - 315Hz
(±) | graves reduzidos - em média 7.4% menor que a mediana
(±) | a linearidade dos graves é média (9.7% delta para a frequência anterior)
Médios 400 - 2.000 Hz
(+) | médios equilibrados - apenas 3% longe da mediana
(+) | médios são lineares (3.7% delta para frequência anterior)
Altos 2 - 16 kHz
(+) | agudos equilibrados - apenas 2.5% longe da mediana
(+) | os máximos são lineares (6.1% delta da frequência anterior)
Geral 100 - 16.000 Hz
(+) | o som geral é linear (9.2% diferença em relação à mediana)
Comparado com a mesma classe
» 3% de todos os dispositivos testados nesta classe foram melhores, 1% semelhantes, 96% piores
» O melhor teve um delta de 6%, a média foi 18%, o pior foi 132%
Comparado com todos os dispositivos testados
» 3% de todos os dispositivos testados foram melhores, 1% semelhantes, 96% piores
» O melhor teve um delta de 4%, a média foi 23%, o pior foi 134%
MSI Stealth GS77 12UHS-083US análise de áudio
(+) | os alto-falantes podem tocar relativamente alto (###valor### dB)
Graves 100 - 315Hz
(±) | graves reduzidos - em média 9.4% menor que a mediana
(±) | a linearidade dos graves é média (9.8% delta para a frequência anterior)
Médios 400 - 2.000 Hz
(±) | médios mais altos - em média 7% maior que a mediana
(+) | médios são lineares (4.9% delta para frequência anterior)
Altos 2 - 16 kHz
(±) | máximos mais altos - em média 5.8% maior que a mediana
(±) | a linearidade dos máximos é média (7.9% delta para frequência anterior)
Geral 100 - 16.000 Hz
(±) | a linearidade do som geral é média (15.9% diferença em relação à mediana)
Comparado com a mesma classe
» 38% de todos os dispositivos testados nesta classe foram melhores, 7% semelhantes, 56% piores
» O melhor teve um delta de 6%, a média foi 18%, o pior foi 132%
Comparado com todos os dispositivos testados
» 25% de todos os dispositivos testados foram melhores, 5% semelhantes, 70% piores
» O melhor teve um delta de 4%, a média foi 23%, o pior foi 134%
Gerenciamento de energia - O laptop Razer oferece uma bateria com pouca duração
Consumo de energia
Durante a operação ociosa, o consumo de energia se torna relativamente alto em até 34 watts, e alguns dos concorrentes são mais eficientes aqui. Sob carga alta, o consumo da lâmina está em um nível semelhante ao dos concorrentes, e às vezes até mais baixo. O Alienware x17 R2 P48Erepresenta um outlier em direção ao topo. Embora consome significativamente mais energia, geralmente também produz os melhores resultados de referência. A fonte de alimentação de 280 watts incluída é suficientemente grande.
Nota: O modelo irmão QHD foi testado com o modo "Boost" CPU preset e dGPU ativado. Isto explica seu maior consumo durante a operação ociosa e sob cargas baixas
| desligado | |
| Ocioso | |
| Carga |
|
Key:
min: | |
| Razer Blade 17 Early 2022 i9-12900H, GeForce RTX 3080 Ti Laptop GPU, Samsung PM9A1 MZVL21T0HCLR, IPS, 3840x2160, 17.3" | Alienware x17 R2 P48E i9-12900HK, GeForce RTX 3080 Ti Laptop GPU, 2x Samsung PM9A1 1TB (RAID 0), IPS, 1920x1080, 17.3" | Medion Erazer Beast X30 i9-12900HK, GeForce RTX 3080 Ti Laptop GPU, Samsung PM9A1 MZVL21T0HCLR, IPS, 2560x1440, 17.3" | MSI Stealth GS77 12UHS-083US i7-12700H, GeForce RTX 3080 Ti Laptop GPU, Micron 3400 1TB MTFDKBA1T0TFH, IPS, 2560x1440, 17.3" | Razer Blade 17 RTX 3080 Ti i7-12800H, GeForce RTX 3080 Ti Laptop GPU, Samsung PM9A1 MZVL21T0HCLR, IPS, 2560x1440, 17.3" | Média NVIDIA GeForce RTX 3080 Ti Laptop GPU | Média da turma Gaming | |
|---|---|---|---|---|---|---|---|
| Power Consumption | -32% | 13% | 9% | -41% | -2% | 14% | |
| Idle Minimum * (Watt) | 17 | 24.1 -42% | 12 29% | 20 -18% | 29.8 -75% | 17.2 ? -1% | 13 ? 24% |
| Idle Average * (Watt) | 23 | 28.5 -24% | 16 30% | 21.4 7% | 37.1 -61% | 23.3 ? -1% | 19 ? 17% |
| Idle Maximum * (Watt) | 34 | 60 -76% | 22 35% | 27 21% | 60.8 -79% | 30.8 ? 9% | 24.6 ? 28% |
| Load Average * (Watt) | 120 | 128.7 -7% | 118 2% | 100.5 16% | 135.3 -13% | 121.2 ? -1% | 110.7 ? 8% |
| Witcher 3 ultra * (Watt) | 229 | 254 -11% | 223 3% | 165 28% | 243 -6% | ||
| Load Maximum * (Watt) | 243 | 323 -33% | 290 -19% | 247.1 -2% | 273.1 -12% | 276 ? -14% | 259 ? -7% |
* ... menor é melhor
Power Consumption The Witcher 3 / Stress Test
Power Consumption With External Monitor
Vida útil da bateria
No teste WLAN (carregamento de websites via roteiro) e no teste de vídeo (reprodução do curta-metragem Big Buck Bunny (codificação H.264, FHD) em loop constante), o laptop de 17,3 polegadas atinge tempos de execução de 3:49 h e 4:50 h, respectivamente. Devido à menor resolução de exibição do Lâmina de QHDnão é de se estranhar que ela possa alcançar uma vida útil mais longa da bateria usando a mesma bateria de 82-Wh.
| Razer Blade 17 Early 2022 i9-12900H, GeForce RTX 3080 Ti Laptop GPU, 82 Wh | Alienware x17 R2 P48E i9-12900HK, GeForce RTX 3080 Ti Laptop GPU, 87 Wh | Medion Erazer Beast X30 i9-12900HK, GeForce RTX 3080 Ti Laptop GPU, 91.2 Wh | MSI Stealth GS77 12UHS-083US i7-12700H, GeForce RTX 3080 Ti Laptop GPU, 99 Wh | Razer Blade 17 RTX 3080 Ti i7-12800H, GeForce RTX 3080 Ti Laptop GPU, 82 Wh | Média da turma Gaming | |
|---|---|---|---|---|---|---|
| Duração da bateria | -48% | 33% | 32% | 8% | 41% | |
| Reader / Idle (h) | 7.1 | 3.9 -45% | 7.7 8% | 10.8 52% | 8 13% | 8.27 ? 16% |
| H.264 (h) | 4.8 | 6.4 33% | 8.32 ? 73% | |||
| WiFi v1.3 (h) | 3.8 | 2 -47% | 5.7 50% | 6.2 63% | 5.5 45% | 7.11 ? 87% |
| Load (h) | 1.7 | 0.8 -53% | 2.4 41% | 1.4 -18% | 1.1 -35% | 1.502 ? -12% |
Pro
Contra
Veredicto - Muito desempenho em um estojo compacto
Nossa configuração de teste da Lâmina 17 visa jogadores e profissionais criativos. Um processador Core i9-12900H, GeForce RTX 3080 Ti GPU Laptop (175 watts TGP após a atualização da BIOS, 16 GB de VRAM), e 32 GB de memória de trabalho equipam o laptop para processamento de vídeo, rending, e 4k jogos ao mais alto nível. Além disso, um rápido SSD PCIe-4 (1 TB) garante curtos tempos de carga e armazenamento.
Com a Lâmina 17 (início de 2022), a Razer fornece um dispositivo de trabalho poderoso e bem-sucedido para profissionais criativos. Mas isto também tem seu preço.
A CPU e a GPU são capazes de funcionar constantemente em altas velocidades de relógio. Como de costume para esta classe de dispositivos, o desenvolvimento de ruído e calor está em um nível elevado. Uma duração realista da bateria entre 4 e 5 horas ainda é suficiente para um potente laptop de 4K. O destaque é a tela brilhante e responsiva de 17,3 polegadas (4K, IPS, 144 Hz) com uma reprodução de cores precisa (DCI-P3: 100%).
A Lâmina custa cerca de 4.650 Euros (~$4847), que é cerca de 400 Euros (~$417) a mais do que o Modelo QHD. Vale a pena? O Core i9 não fornece quase nenhuma potência adicional em comparação com o Core i7 do modelo irmão, particularmente sob carga constante. E o irmão oferece uma melhor duração da bateria. Outro ponto para o modelo QHD que testamos anteriormente é o suporte do Advanced Optimus. A lâmina de 4k não oferece isto.
O display 4K oferece um brilho significativamente maior e tempos de resposta mais curtos do que o painel QHD. Se além da resolução mais alta, estes critérios não são os fatores decisivos, você pode escolher com segurança uma Lâmina QHD. O painel QHD e 4K são igualmente bons em termos de reprodução de cores e cobertura de espaço de cor.
Como alternativa à Lâmina 17, você também poderia obter o Medion Erazer Beast X30. Tem quase as mesmas dimensões, mas traz menos peso para a balança. Em termos de desempenho gráfico, ele permanece ligeiramente atrás do laptop Razer.
Preço e Disponibilidade
O Razer Blade 17 em configuração similar (Core i9-12900H, GeForce RTX 3080 Ti Laptop, 32 GB RAM, 1 TB SSD, 4k display) está disponível por $4.300 da Amazone também de Razer diretamente pelo mesmo preço.
Razer Blade 17 Early 2022
- 07/05/2022 v7 (old)
Sascha Mölck
Price comparison

