Medion Erazer Major X10 revisão de laptop: Estreia do Intel Arc A730M
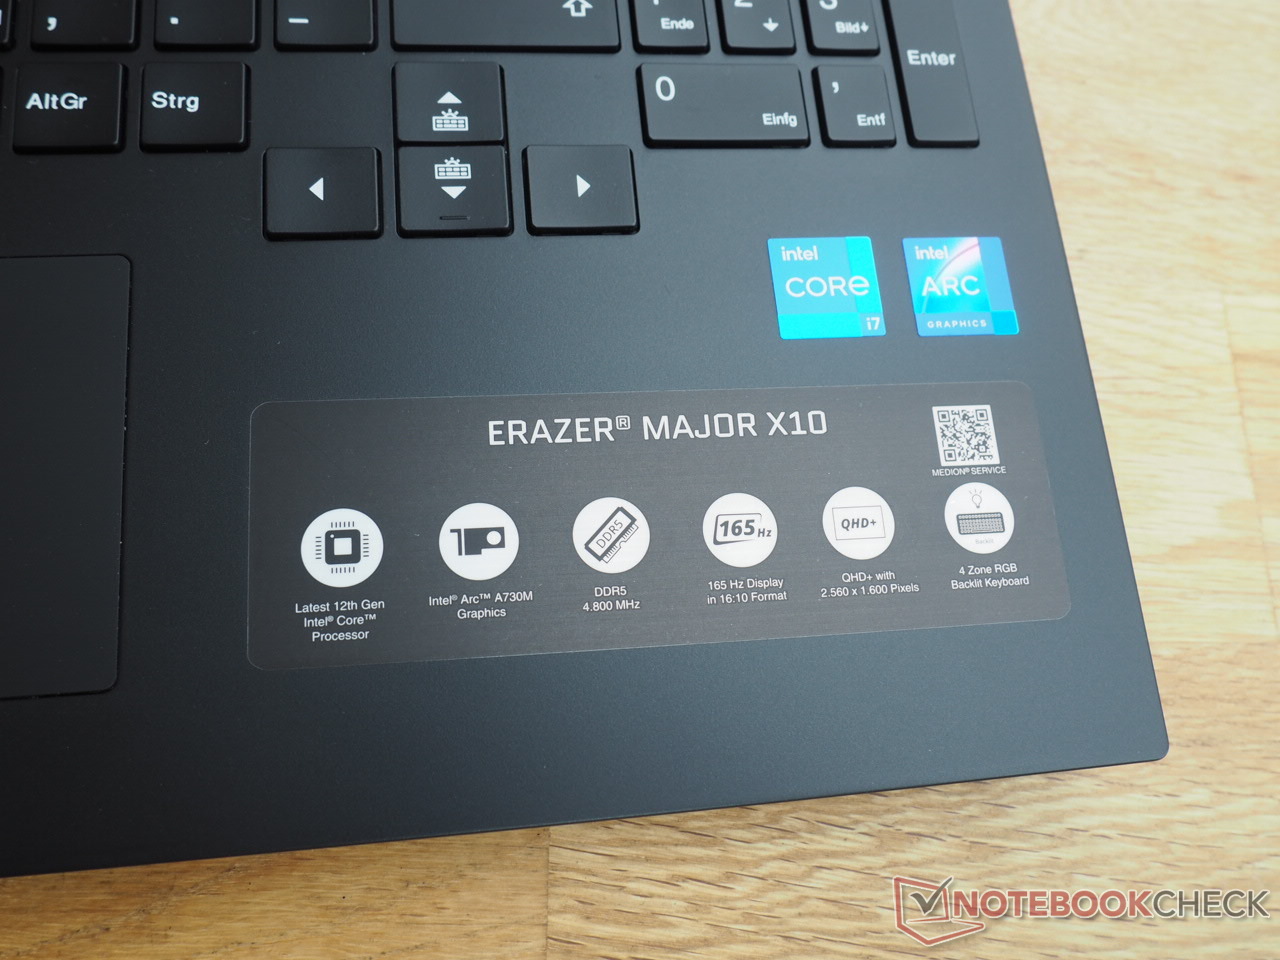
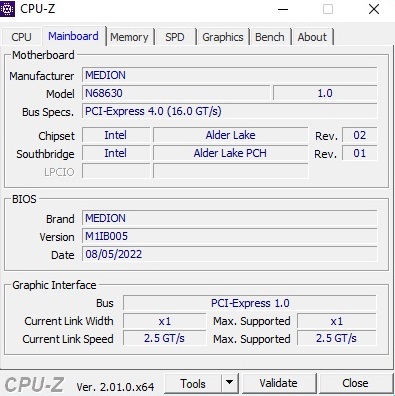
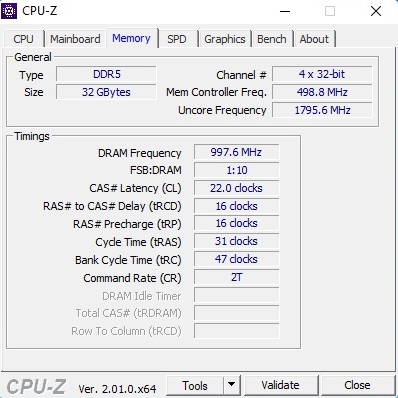
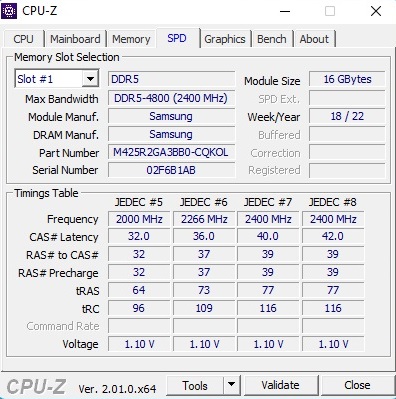
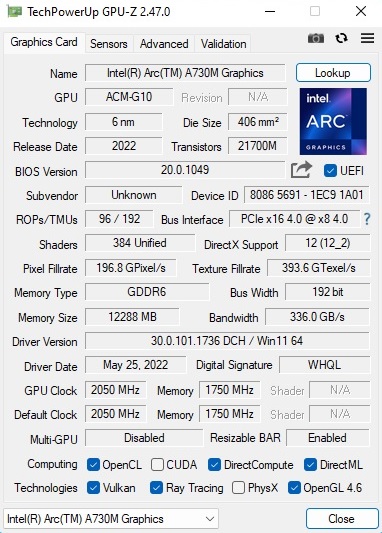
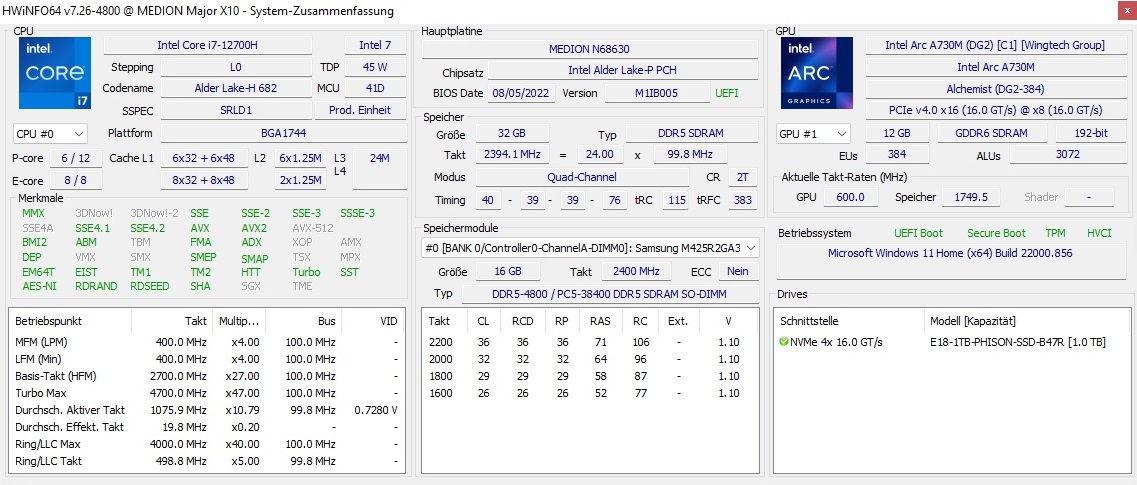
O Erazer Major X10 custa cerca de 1.700 euros (US$ 1.728) e está disponível na loja online da Medion https://www.medion.com/de/shop/p/core-gaming-notebooks-medion-erazer-major-x10-intel-core-i7-12700h-windows-11-home-40-6-cm-16-0--qhd-display-100-srgb-mit-165-hz-intel-arc-a730m-1-tb-pcie-ssd-32-gb-ram-high-end-gaming-notebook-30034414A1. Pelo preço, você receberá não apenas 32 GB de RAM de canal duplo (2 x 16 GB DDR5-4800), mas também 1 TB de armazenamento NVMe. O laptop apresenta o Core i7-12700H, um processador de 14 núcleos que é muito popular em laptops para jogos. Como mencionado no início, o processamento gráfico exigente é tratado pelo Arc A730M da Intel - uma GPU de gama média que é projetada principalmente para competir com o GeForce RTX 3060 e o Radeon RX 6600M. O laptop também apresenta um display mate de 165Hz com uma relação de aspecto 16:10 e uma resolução de 2.560 x 1.600. O Windows 11 Home completa o pacote geral.
O Major X10 está competindo com outros laptops de gama média, tais como o Asus TUF F17 FX707Z-HX011Wo Acer Nitro 5 AN517-55-738R (ambos com RTX 3060; um com um TGP superior e o outro com um TGP médio) e o HP Omen 16-c0077ng (RX 6600M). O supostamente mais lento Dell Inspiron 16 Plus 7620 com GeForce RTX 3050 Ti está igualmente incluído nas tabelas de comparação. Explicaremos o motivo mais tarde na revisão.
Possíveis concorrentes em comparação
Avaliação | Data | Modelo | Peso | Altura | Size | Resolução | Preço |
|---|---|---|---|---|---|---|---|
| 85 % v7 (old) | 09/2022 | Medion Erazer Major X10 i7-12700H, A730M | 2.5 kg | 31 mm | 16.00" | 2560x1600 | |
| 84.1 % v7 (old) | 04/2022 | Asus TUF Gaming F17 FX707Z-HX011W i7-12700H, GeForce RTX 3060 Laptop GPU | 2.5 kg | 25 mm | 17.30" | 1920x1080 | |
| 83.9 % v7 (old) | 08/2022 | Acer Nitro 5 AN517-55-738R i7-12700H, GeForce RTX 3060 Laptop GPU | 3.1 kg | 28.6 mm | 17.30" | 1920x1080 | |
| 87.4 % v7 (old) | 08/2022 | Dell Inspiron 16 Plus 7620 i7-12700H, GeForce RTX 3050 Ti Laptop GPU | 2.1 kg | 18.99 mm | 16.00" | 3072x1920 | |
| 86 % v7 (old) | 04/2022 | HP Omen 16-c0077ng R7 5800H, Radeon RX 6600M | 2.3 kg | 26 mm | 16.10" | 2560x1440 |
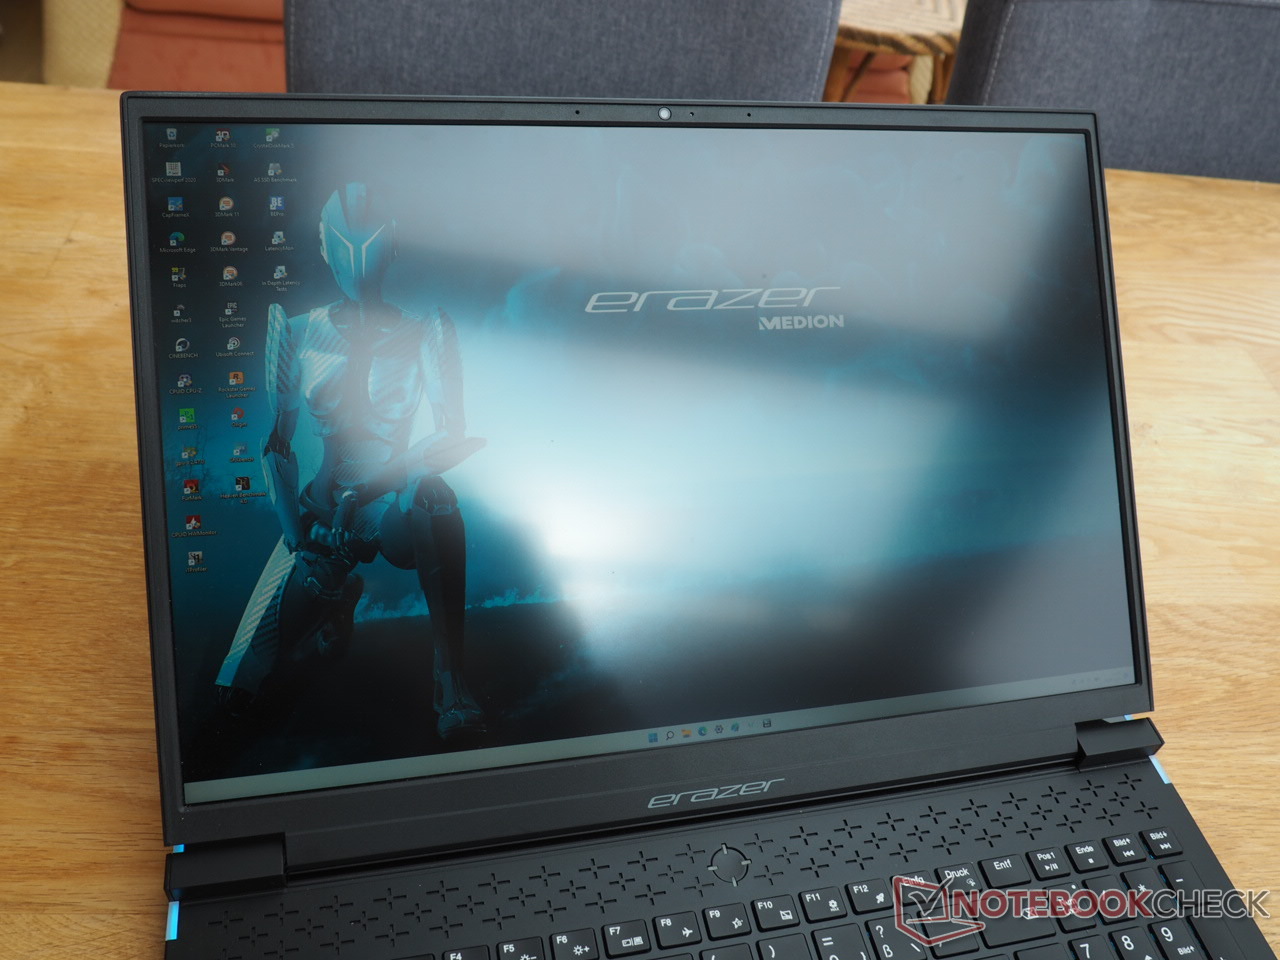
Chassi
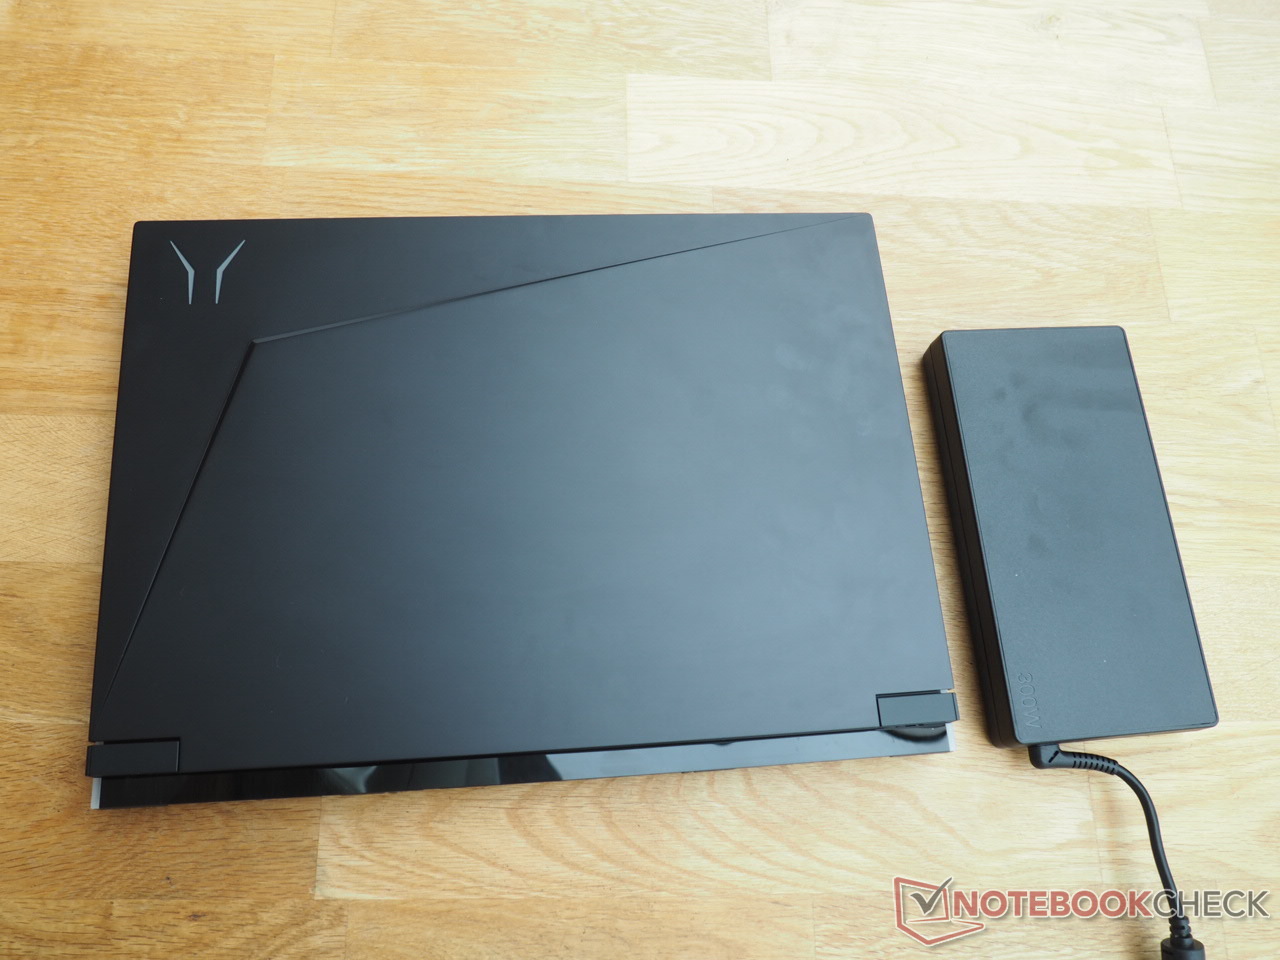
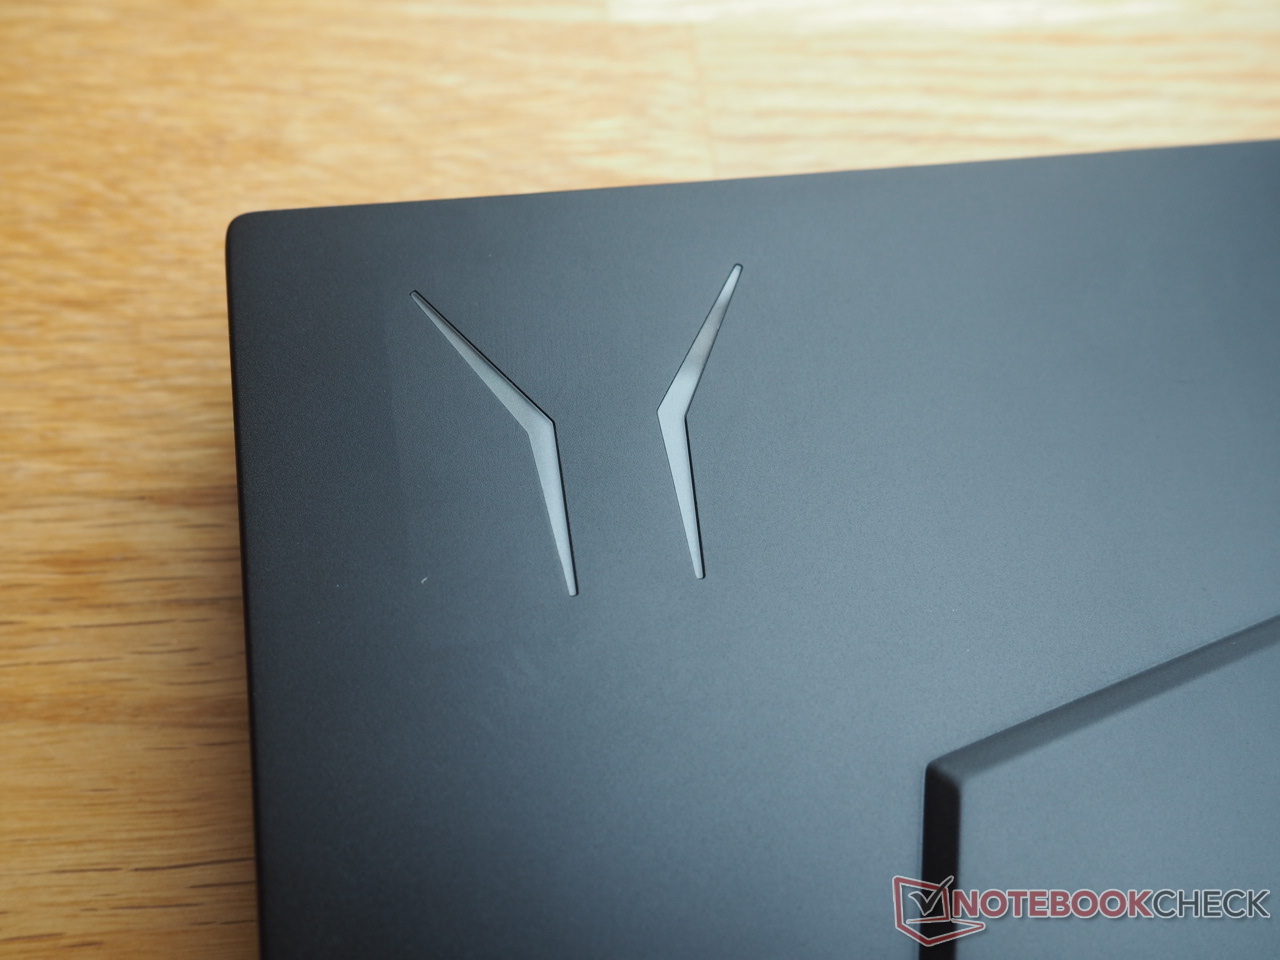
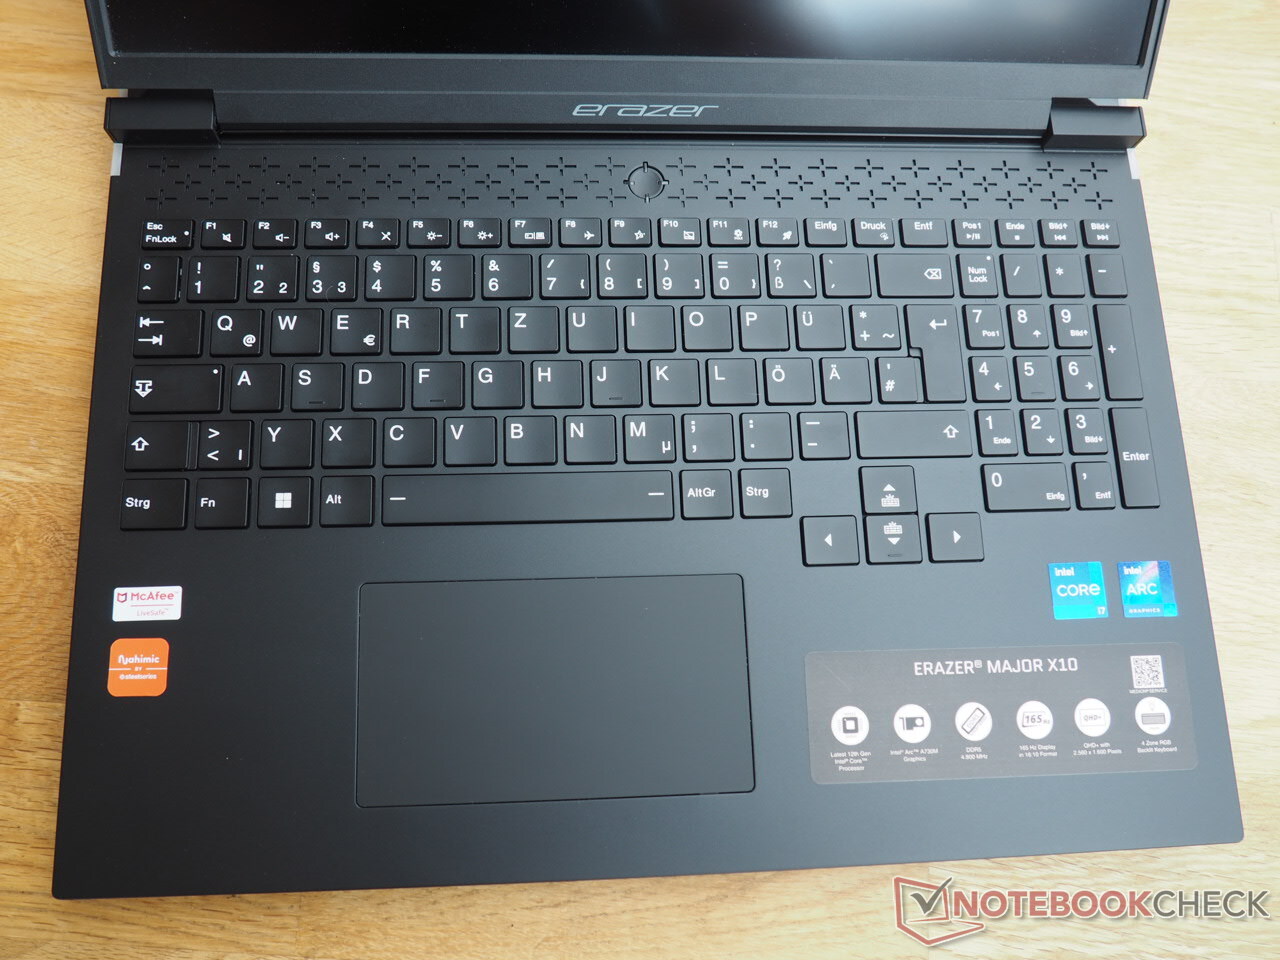
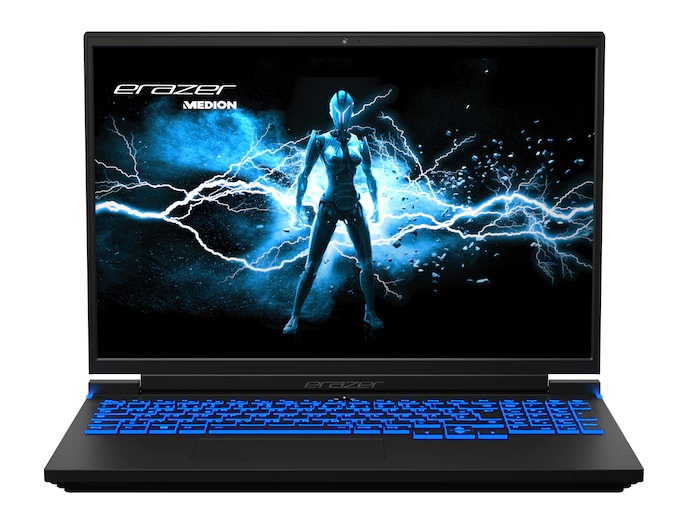
Em termos de aparência, o Major X10 nos faz lembrar a série Legion da Lenovo. A Medion optou por usar um chassi preto mate com tampa de alumínio. O chassi parece sólido em nossa opinião, embora a seção de base possa definitivamente flexionar em alguns pontos quando se aplica mais força e a tampa poderia ser um pouco mais firme (como é o caso da maioria dos laptops). A tela pode ser aberta até 180°, o que é bastante incomum para um laptop. E as dobradiças fazem seu trabalho sem nenhum problema. Por exemplo, o dispositivo pode ser facilmente aberto com uma mão. A Medion equipou o laptop com numerosos elementos de iluminação para torná-lo atraente para os gamers. Além do teclado, o logotipo na tampa e a mira na parte de trás das laterais também se destacam visualmente. As aberturas de ar acima do teclado apresentam um design de mira para complementar a estética geral.
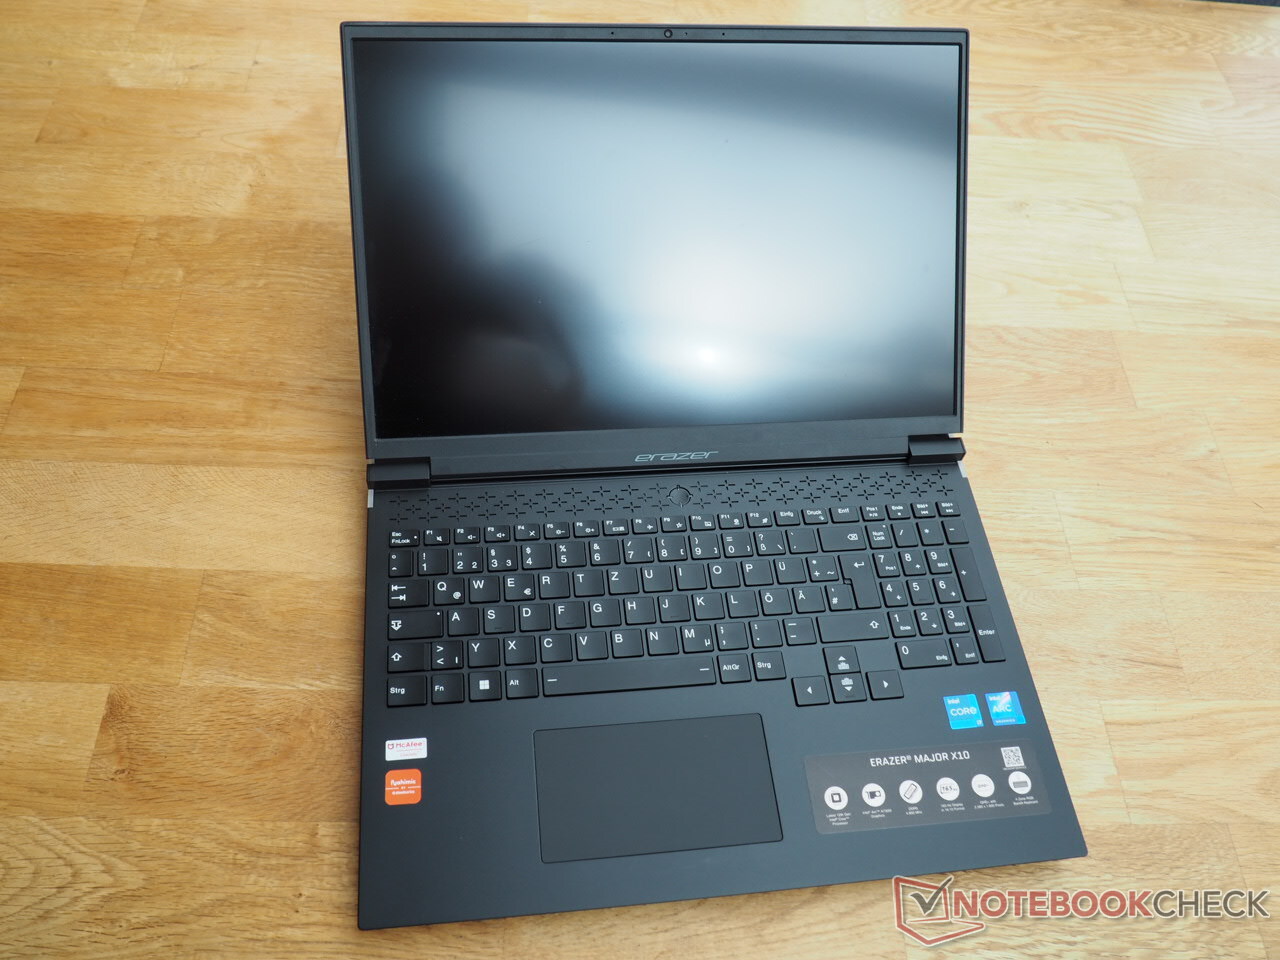
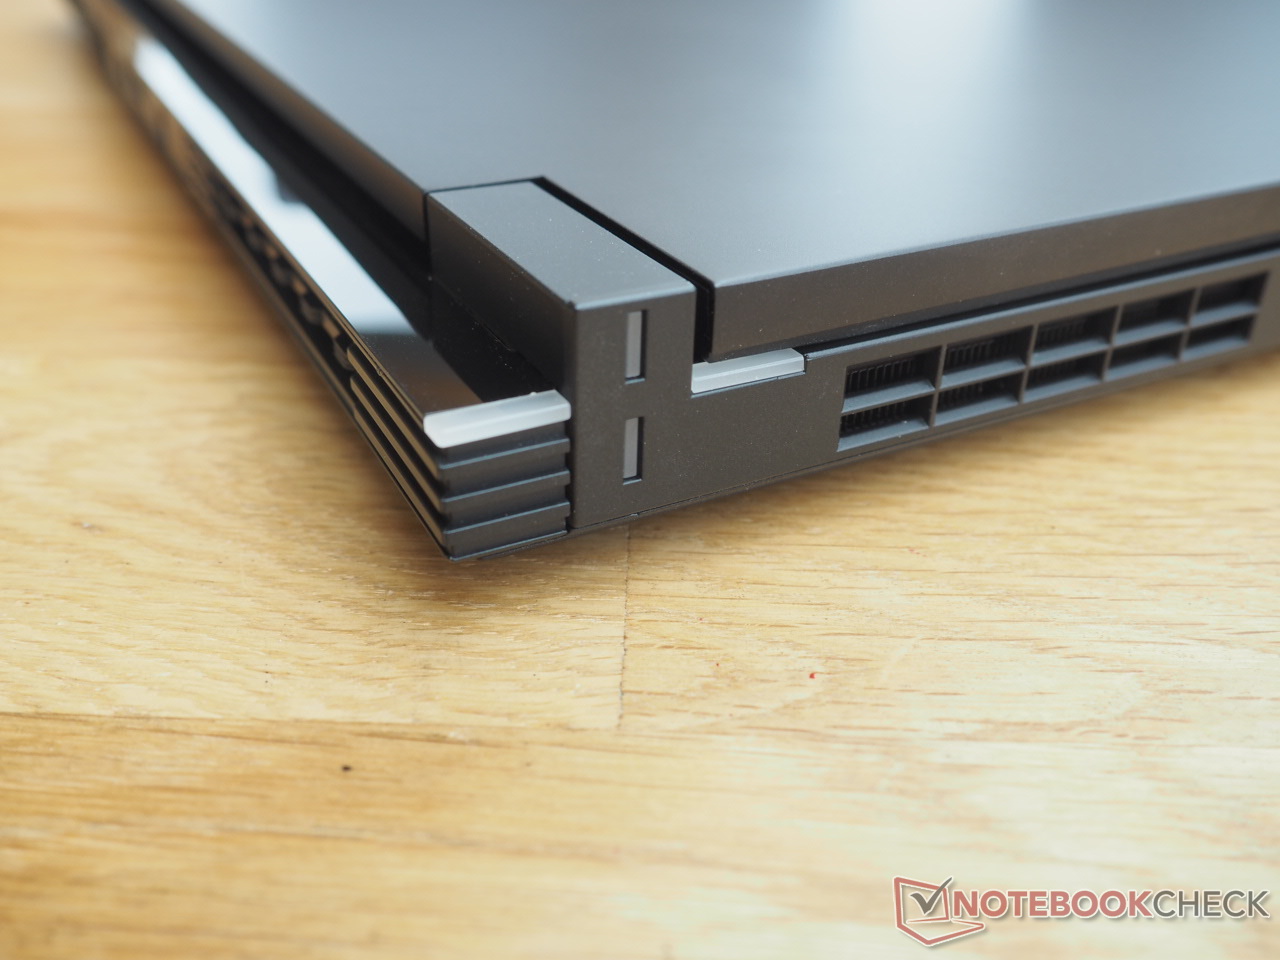
O Major X10 tem um ajuste e acabamento muito bons. Em nossa unidade de revisão, todas as superfícies estão bem unidas. Com 2,5 kg (5,5 lb), o dispositivo de 16 polegadas não é nem leve nem especialmente pesado para um laptop de jogos. Para comparação, o Asus TUF F17 ligeiramente maior e o Acer Nitro 5 AN517 pesam 2,5 kg (5,5 lb) e 3,1 kg (6,8 lb) respectivamente, enquanto os concorrentes de 16 polegadas Omen 16 e Inspiron 16 Plus são marginalmente mais leves a 2,3 kg (5,1 lb) e 2,1 kg (4,6 lb) respectivamente. Segundo o fabricante, o Major X10 tem uma espessura de 2,7 cm (1,06") sem seus pés e 3,1 cm (1,22") com eles.
Características
Interfaces
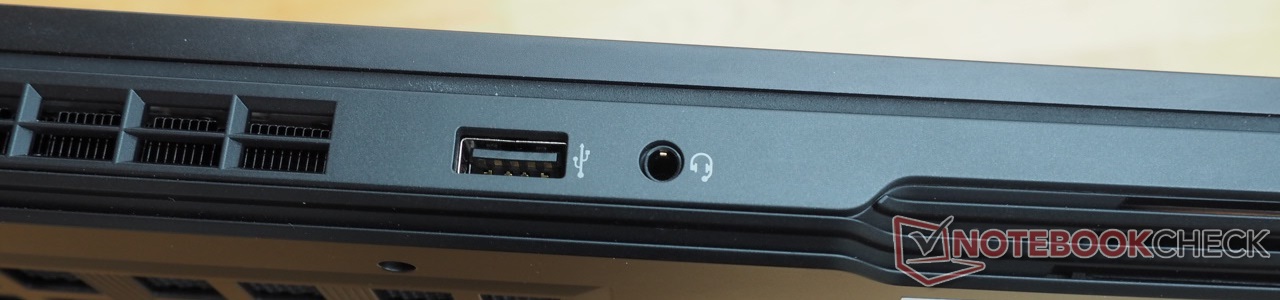
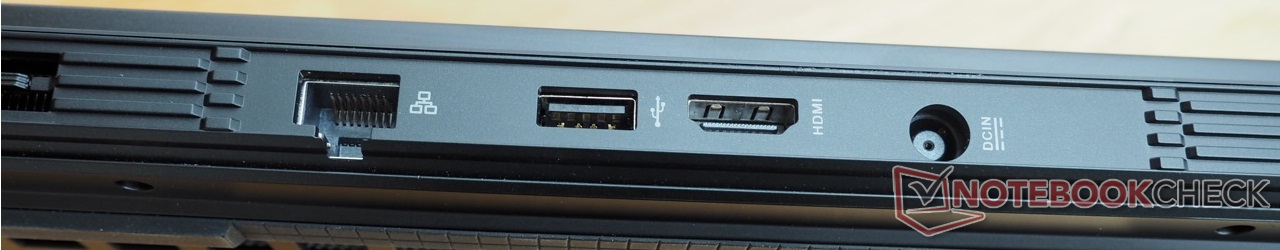
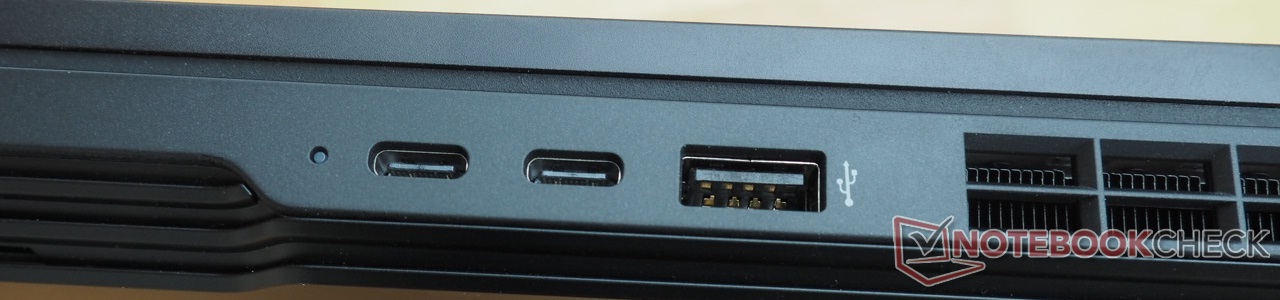
Se você não se importa de não ter uma porta Thunderbolt e um leitor de cartões, você ficaria satisfeito com a seleção da porta do laptop. Existem três portas USB tipo A e duas tipo C (compatíveis com DisplayPort), e todas, exceto uma delas, suportam o padrão 3.2 Gen 2. O laptop também é equipado com uma tomada de áudio combinada (fones de ouvido e microfone), uma porta Ethernet RJ45 e uma saída HDMI 2.0. Como as portas mais importantes estão localizadas na parte de trás do laptop, você não terá que se preocupar com o fato de seu movimento ser muito restrito enquanto estiver jogando com um mouse externo.
Conectividade
Não houve surpresas durante nosso teste Wi-Fi (laptop a 1 m do nosso roteador de referência Asus AXE11000). O módulo Intel Wi-Fi 6 AX201 dentro do dispositivo oferece alta velocidade de transferência, de acordo com as expectativas.
| Networking | |
| iperf3 receive AXE11000 | |
| Medion Erazer Major X10 | |
| Média da turma Gaming (680 - 1745, n=88, últimos 2 anos) | |
| Média Intel Wi-Fi 6 AX201 (390 - 1734, n=79) | |
| iperf3 transmit AXE11000 | |
| Medion Erazer Major X10 | |
| Média Intel Wi-Fi 6 AX201 (438 - 1715, n=74) | |
| Média da turma Gaming (560 - 1862, n=88, últimos 2 anos) | |
Webcam
A Medion poderia fazer com uma webcam melhor. Embora a webcam seja um pouco mais nítida e rápida do que muitos de seus concorrentes, ela é pouco precisa em cores, muito parecida com muitas webcams embutidas em laptops.


Acessórios
Nossa unidade de revisão só veio com uma fonte de alimentação de 300 watts que mede aproximadamente 20 x 9 x 2 cm (7,9 x 3,5 x 0,8").
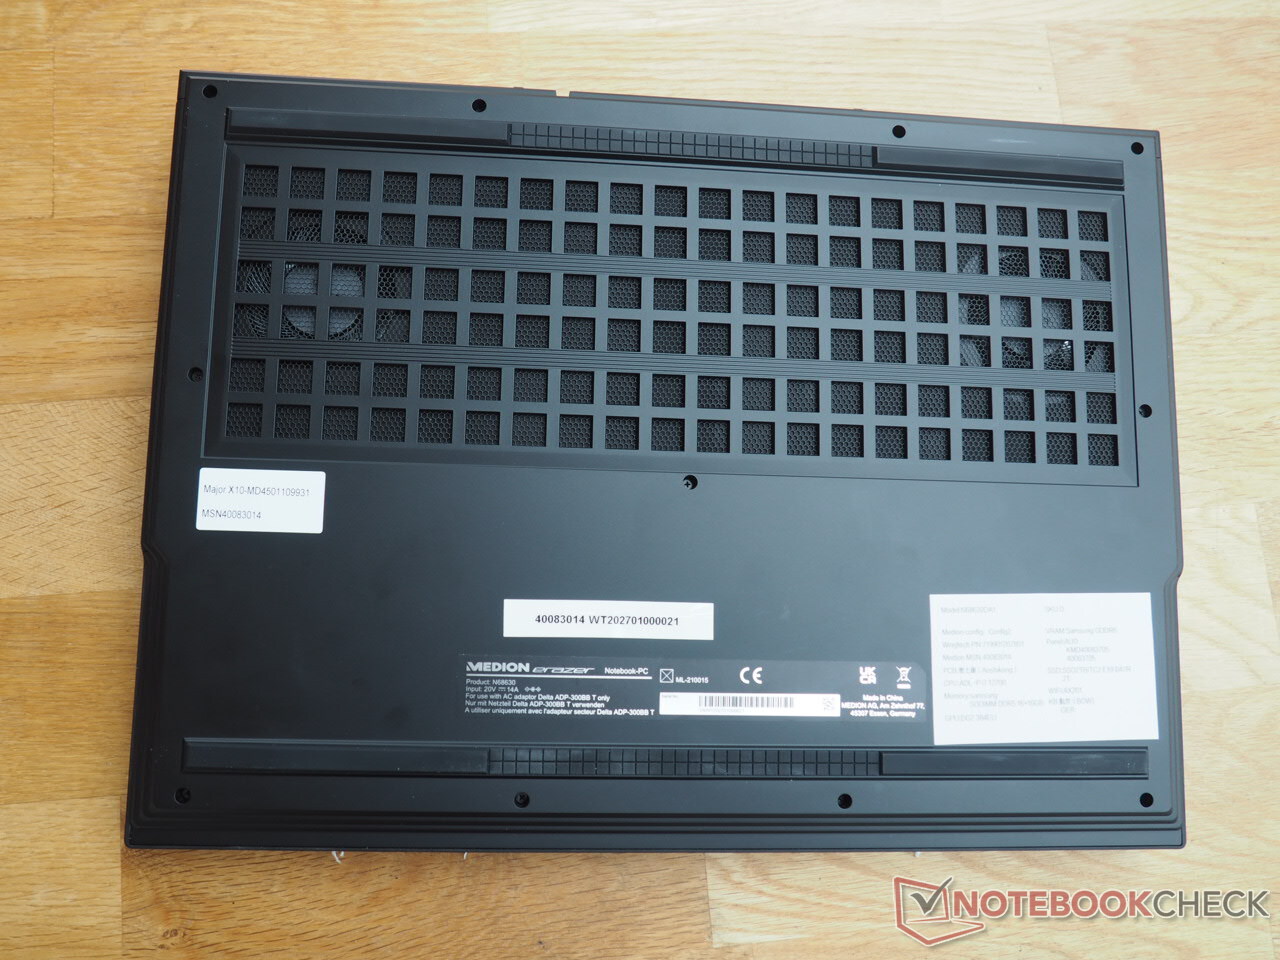
Manutenção
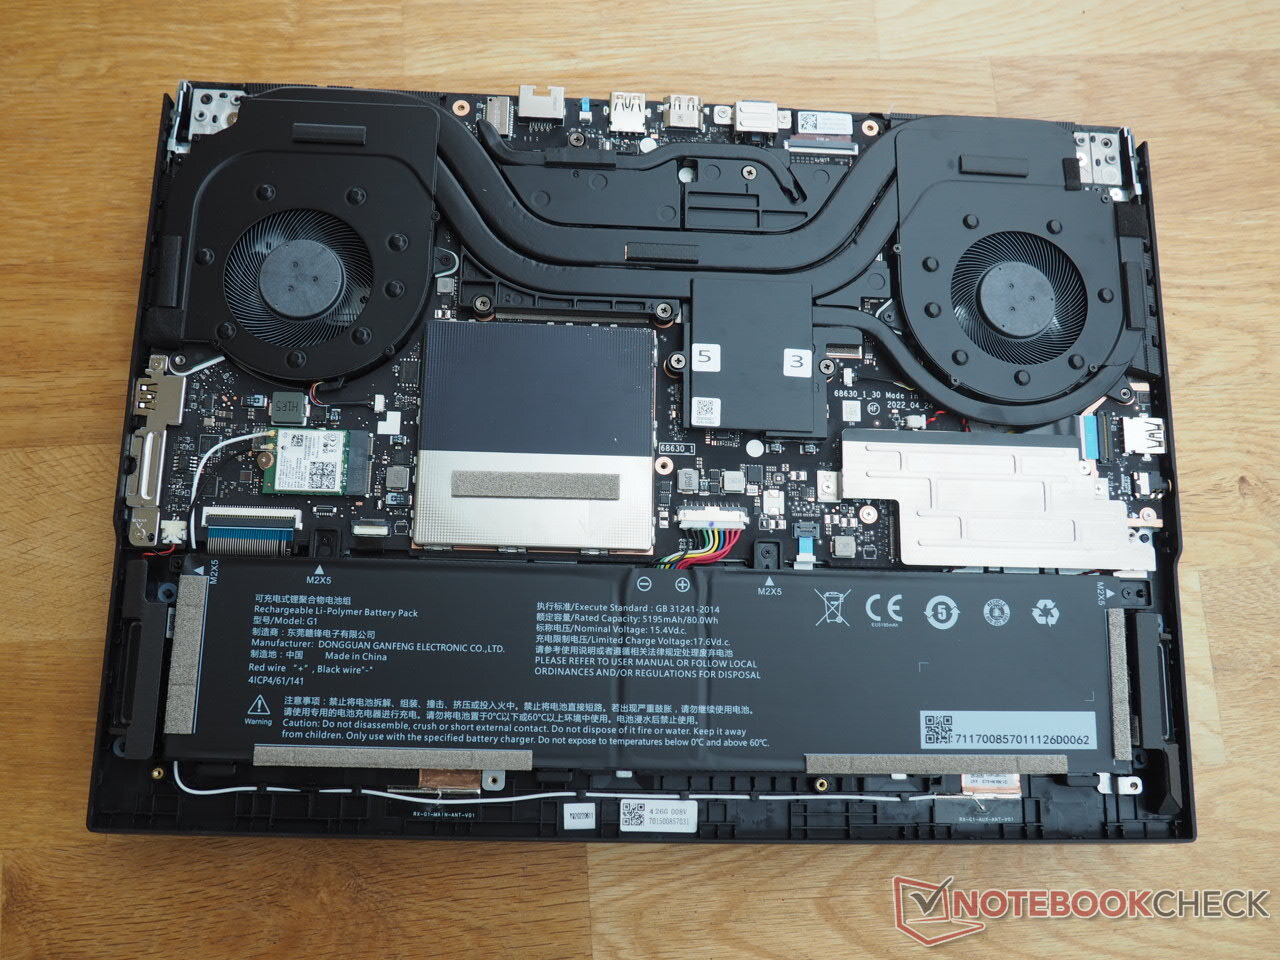
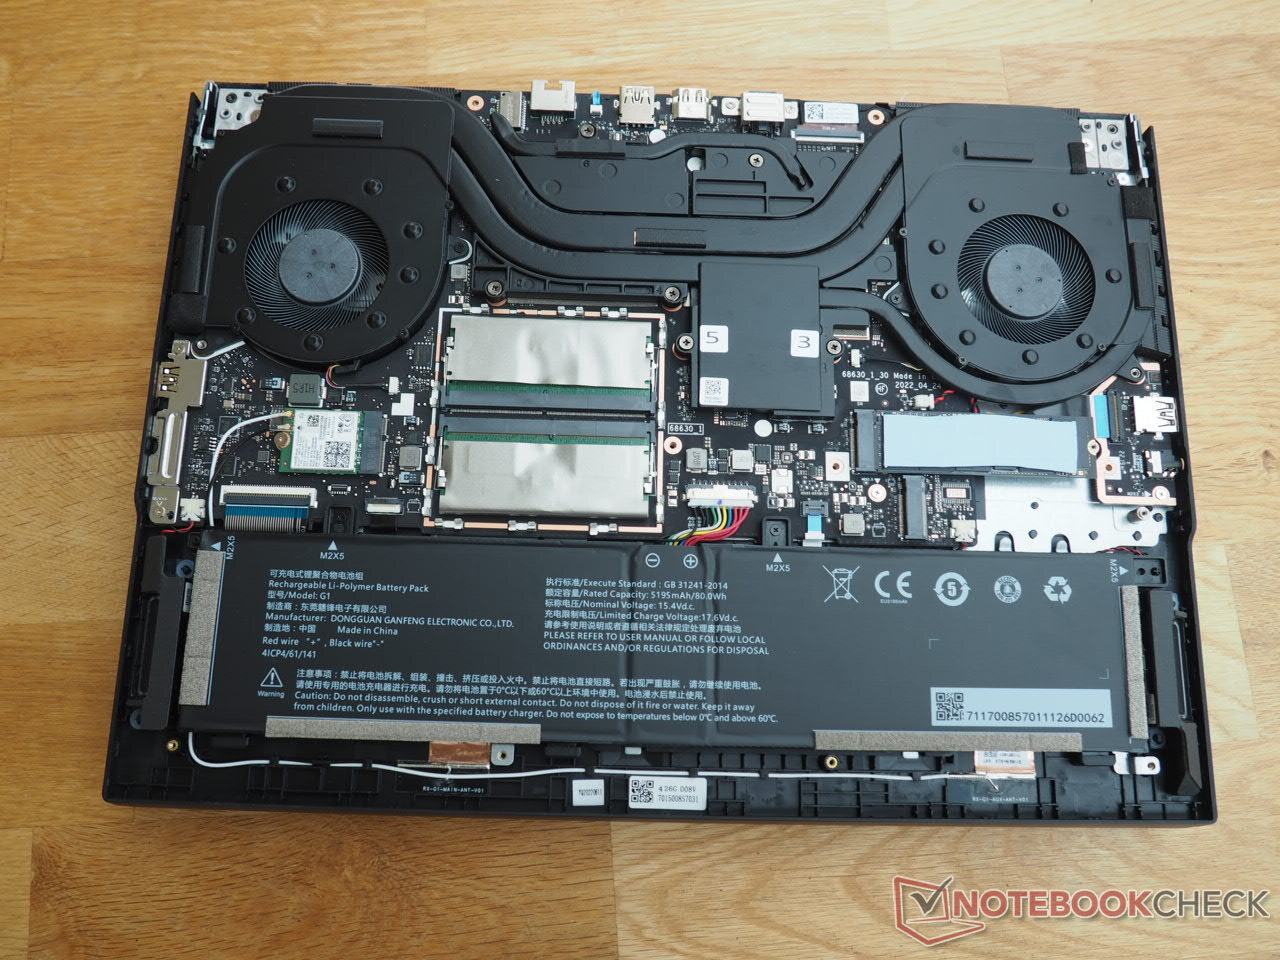
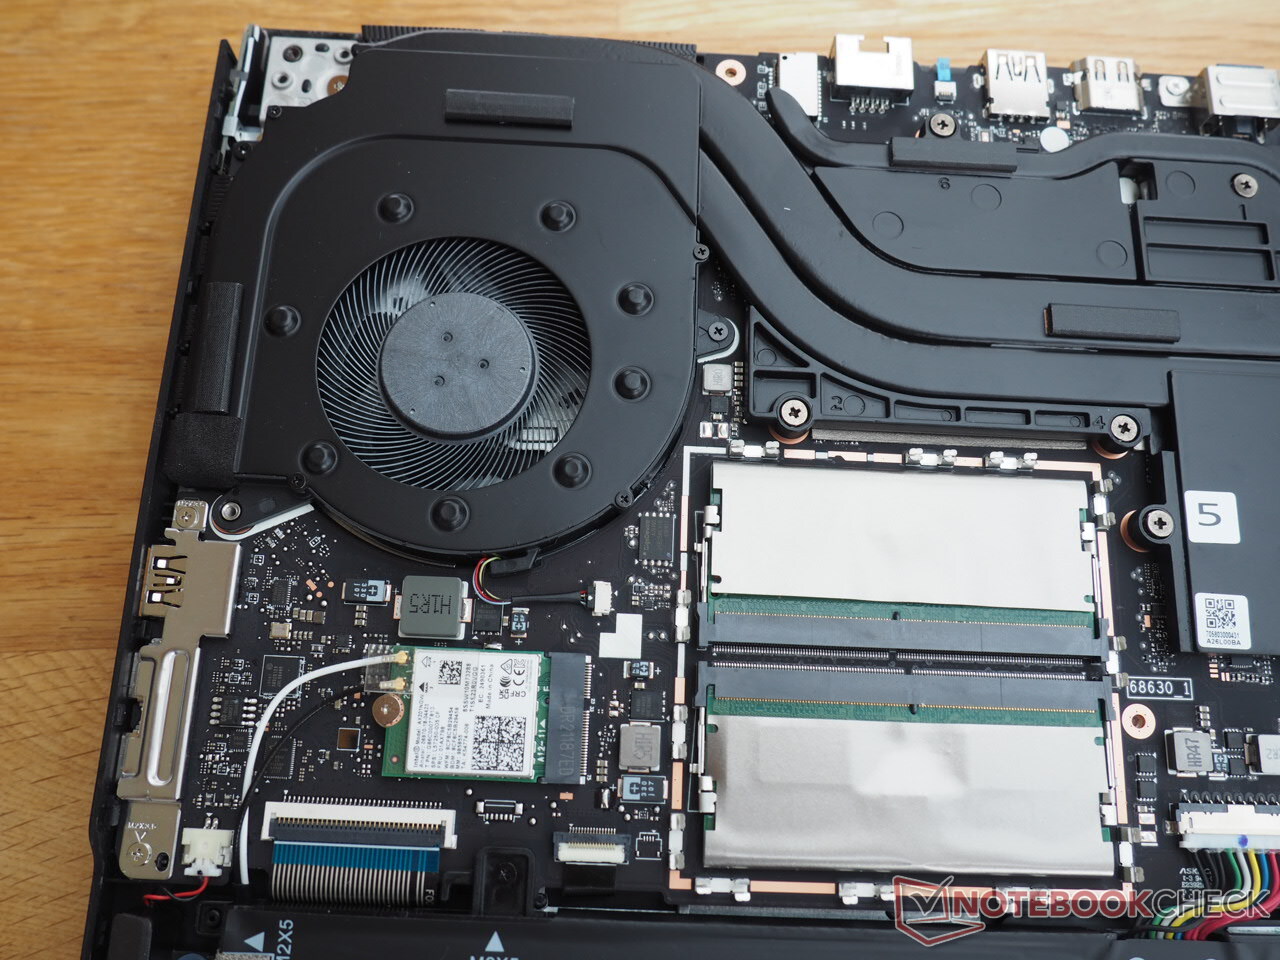
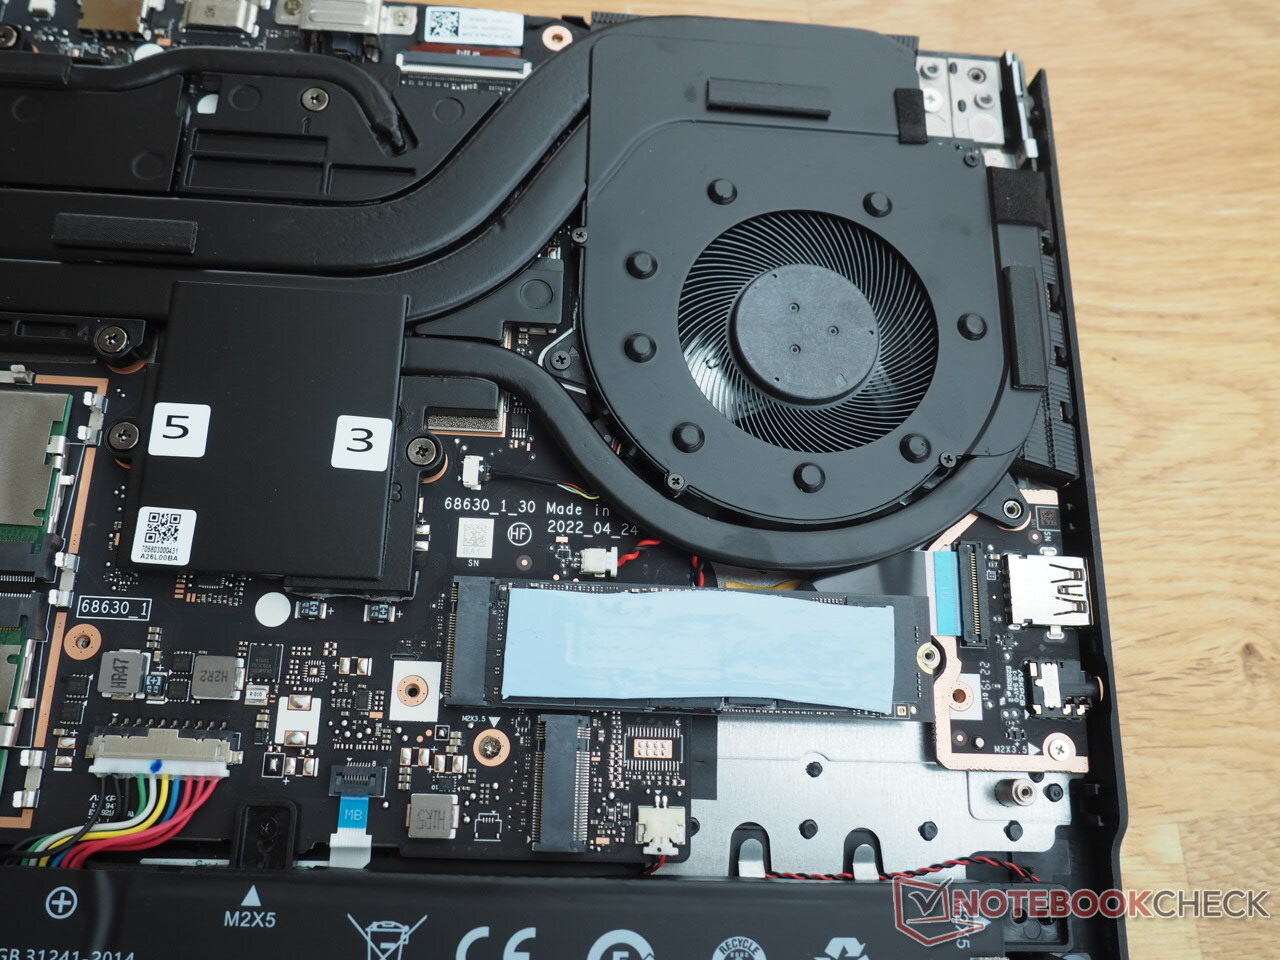
O interior do dispositivo pode ser acessado para manutenção da mesma forma que na maioria dos laptops de jogos. Depois de remover 11 parafusos Phillips do fundo, você pode levantar a tampa inferior do laptop. Como há clipes segurando a tampa no lugar, você precisará aplicar uma boa quantidade de força usando uma ferramenta plana para fazê-lo. Dentro do chassi, você encontrará dois slots SODIMM, dois slots M.2 (ambos localizados embaixo de uma tampa), o módulo sem fio e a bateria. O sistema de resfriamento consiste em dois ventiladores que compartilham vários tubos de calor.
Garantia
O Erazer Major X10 vem com uma garantia de 24 meses.
Dispositivos de entrada
Teclado
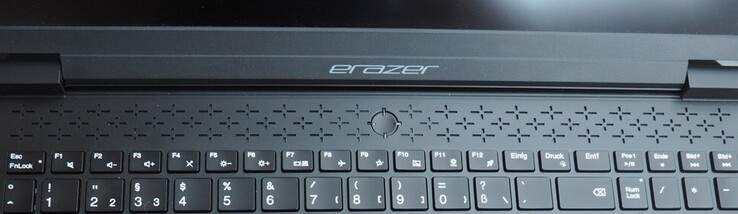
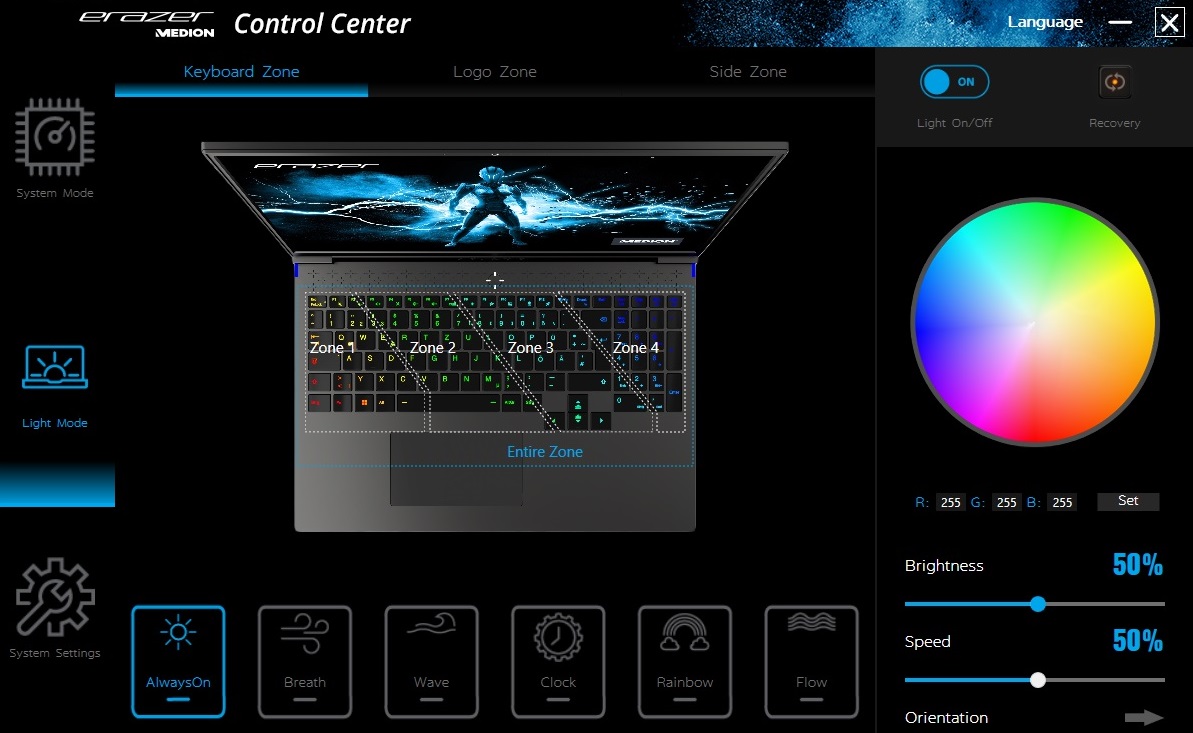
O laptop de 16 polegadas possui um teclado chiclet com um teclado numérico completo cujas teclas são um pouco mais estreitas do que as demais. Ao contrário de muitos outros fabricantes, a Medion decidiu usar teclas de seta de tamanho decente em vez daquelas minúsculas - alguns gamers vão ficar felizes com isso. Também gostamos do layout do teclado, que em sua maioria adere ao design padrão QWERTZ. Um dos destaques é a iluminação RGB de quatro zonas com níveis de luminosidade ajustáveis. Vários modos estão disponíveis para permitir que você personalize a iluminação. O teclado parece decente para digitar em um laptop para jogos, ou seja, ele lhe dá retorno suficiente.
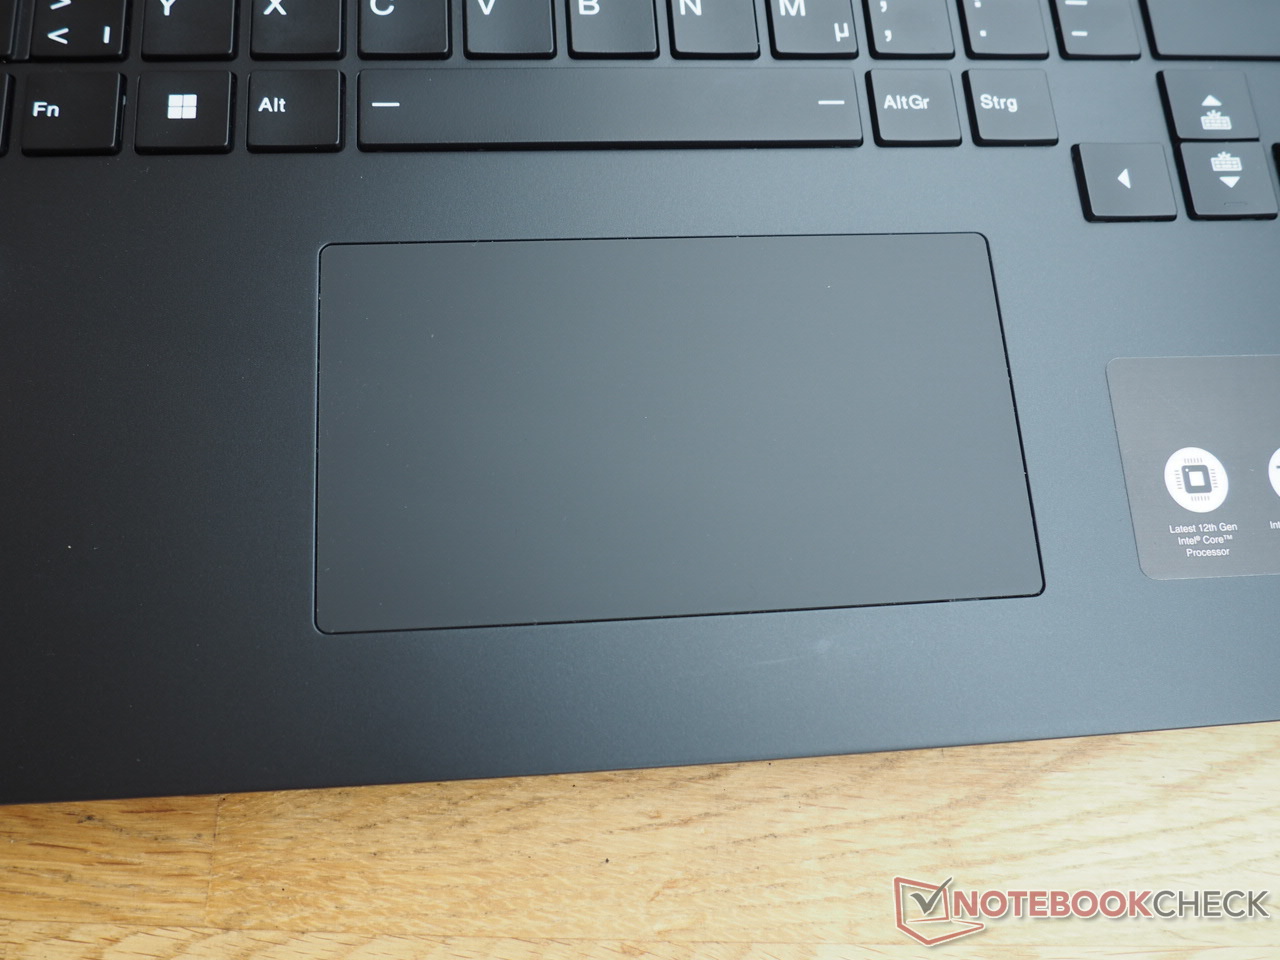
Touchpad
Também não há muito a reclamar sobre o touchpad. Medindo cerca de 12 x 6,5 cm (4,7 x 2,6"), permite que os dedos deslizem sobre ele sem esforço, graças a sua superfície bastante lisa e também não exibe nenhum problema (por exemplo, com precisão, gestos). Apenas as áreas para clicar no fundo eram um pouco frágeis demais para nosso gosto, apesar de serem robustas o suficiente.
Mostrar
O visor de alto nível é uma característica marcante do dispositivo. Neste momento, os painéis 16:10 estão se tornando cada vez mais populares também nos laptops de jogos. E a Medion está seguindo esta tendência.
| |||||||||||||||||||||||||
iluminação: 82 %
iluminação com acumulador: 489 cd/m²
Contraste: 1223:1 (Preto: 0.4 cd/m²)
ΔE ColorChecker Calman: 2.08 | ∀{0.5-29.43 Ø4.71}
calibrated: 1.27
ΔE Greyscale Calman: 2.6 | ∀{0.09-98 Ø4.96}
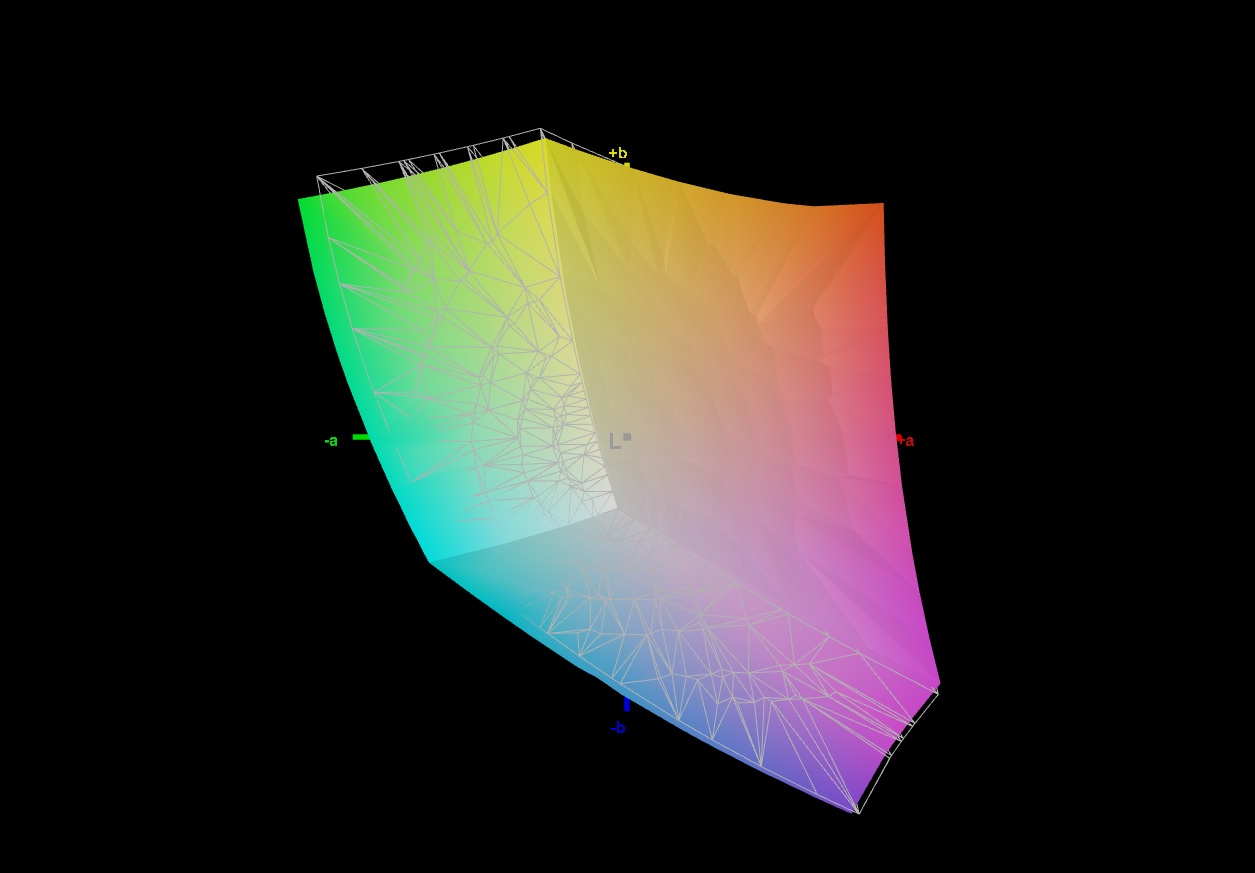
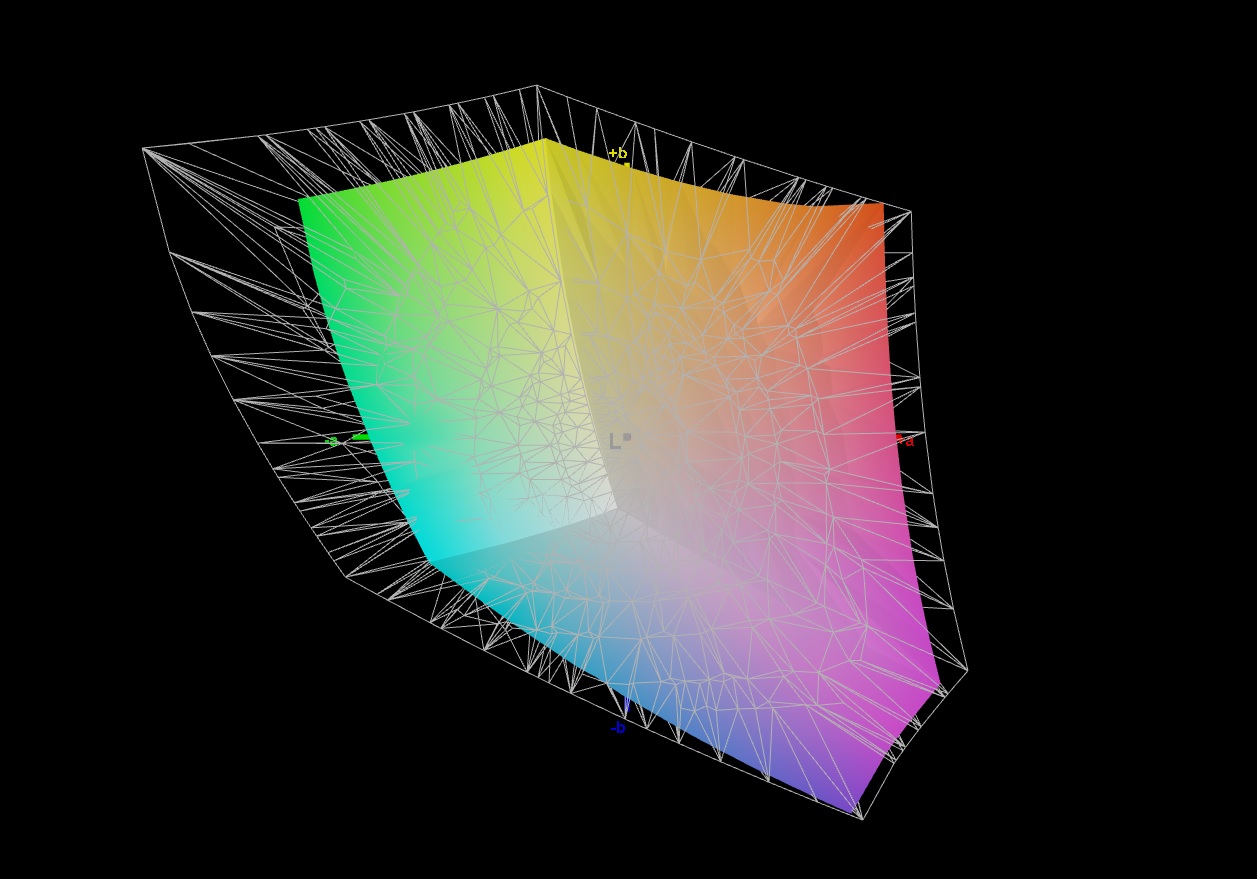
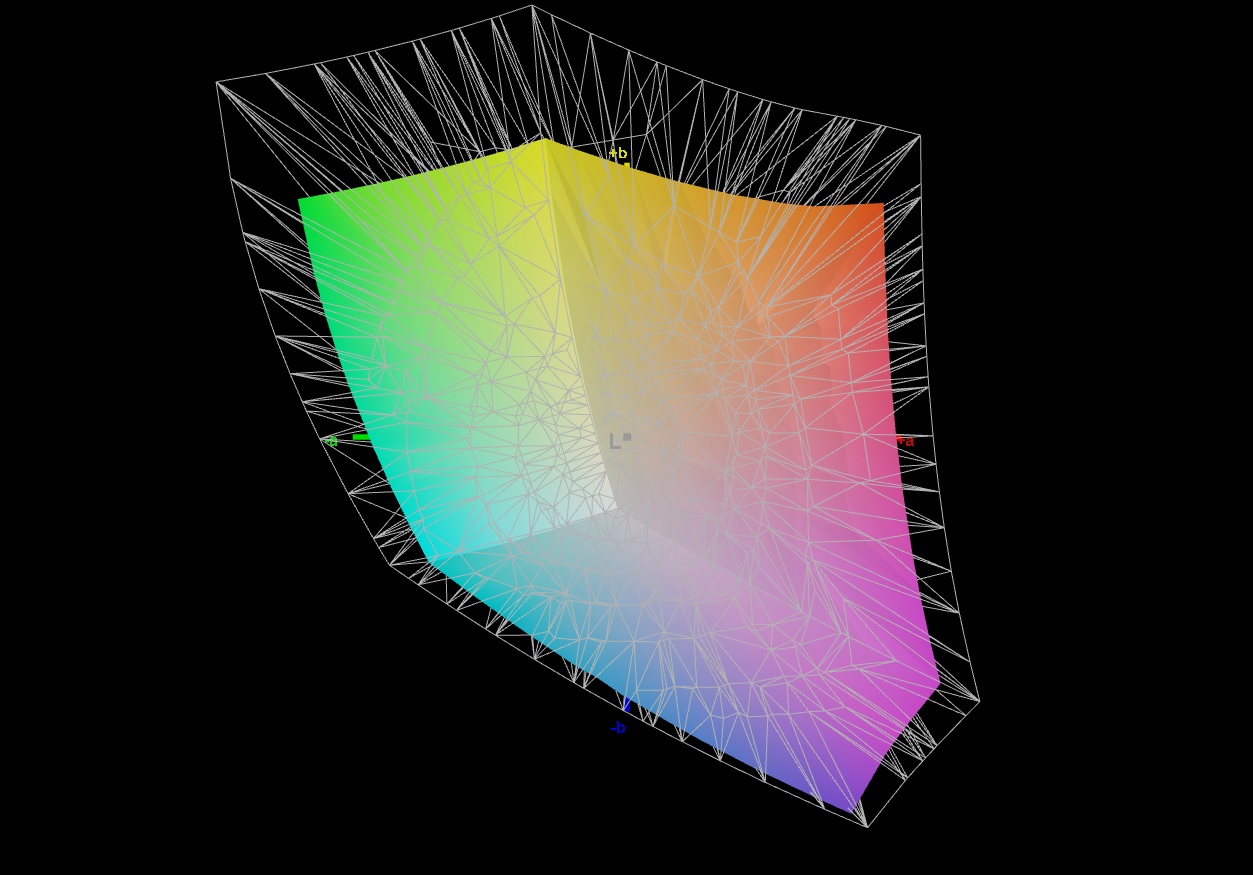
72.5% AdobeRGB 1998 (Argyll 3D)
98% sRGB (Argyll 3D)
70.4% Display P3 (Argyll 3D)
Gamma: 2.205
CCT: 6797 K
| Medion Erazer Major X10 AUO B160QAN03.H, IPS, 2560x1600, 16" | Asus TUF Gaming F17 FX707Z-HX011W AU Optronics B173HAN04.9 (AUO4B9D), IPS, 1920x1080, 17.3" | Acer Nitro 5 AN517-55-738R B173HAN04.0, IPS, 1920x1080, 17.3" | Dell Inspiron 16 Plus 7620 BOE NE16N41, IPS, 3072x1920, 16" | HP Omen 16-c0077ng BOE09E5, IPS, 2560x1440, 16.1" | |
|---|---|---|---|---|---|
| Display | -42% | -15% | 1% | -2% | |
| Display P3 Coverage (%) | 70.4 | 40.2 -43% | 58.9 -16% | 70.8 1% | 68.8 -2% |
| sRGB Coverage (%) | 98 | 59.7 -39% | 86.4 -12% | 99.5 2% | 96.9 -1% |
| AdobeRGB 1998 Coverage (%) | 72.5 | 41.5 -43% | 60.5 -17% | 73.2 1% | 71.1 -2% |
| Response Times | -273% | 16% | -256% | -25% | |
| Response Time Grey 50% / Grey 80% * (ms) | 13.9 ? | 39.2 ? -182% | 6 ? 57% | 38 ? -173% | 13 ? 6% |
| Response Time Black / White * (ms) | 6.4 ? | 29.6 ? -363% | 8 ? -25% | 28 ? -338% | 10 ? -56% |
| PWM Frequency (Hz) | |||||
| Screen | -66% | -36% | 9% | -30% | |
| Brightness middle (cd/m²) | 489 | 287 -41% | 286 -42% | 288.9 -41% | 297 -39% |
| Brightness (cd/m²) | 436 | 268 -39% | 278 -36% | 276 -37% | 283 -35% |
| Brightness Distribution (%) | 82 | 89 9% | 89 9% | 92 12% | 91 11% |
| Black Level * (cd/m²) | 0.4 | 0.17 57% | 0.32 20% | 0.26 35% | 0.22 45% |
| Contrast (:1) | 1223 | 1688 38% | 894 -27% | 1111 -9% | 1350 10% |
| Colorchecker dE 2000 * | 2.08 | 5.1 -145% | 3.05 -47% | 1.88 10% | 3.25 -56% |
| Colorchecker dE 2000 max. * | 4.27 | 8.72 -104% | 5.83 -37% | 4.37 -2% | 6.33 -48% |
| Colorchecker dE 2000 calibrated * | 1.27 | 5.1 -302% | 3.13 -146% | 0.42 67% | 1.11 13% |
| Greyscale dE 2000 * | 2.6 | 4.24 -63% | 3.17 -22% | 1.4 46% | 6.97 -168% |
| Gamma | 2.205 100% | 2.44 90% | 2.29 96% | 2.3 96% | 2.3 96% |
| CCT | 6797 96% | 6008 108% | 6916 94% | 6634 98% | 6050 107% |
| Média Total (Programa/Configurações) | -127% /
-90% | -12% /
-24% | -82% /
-30% | -19% /
-23% |
* ... menor é melhor
A tela de 165Hz feita pela AUO (modelo B160QAN03.H) é excepcional em quase todos os aspectos. Em primeiro lugar, ele supera a concorrência quando se trata de brilho de pico. O painel tem um bom brilho médio de pico de 436 cd/m², tornando assim o Major X10 bastante adequado para uso externo. Para comparação, os concorrentes não podem sequer atingir 300 cd/m².
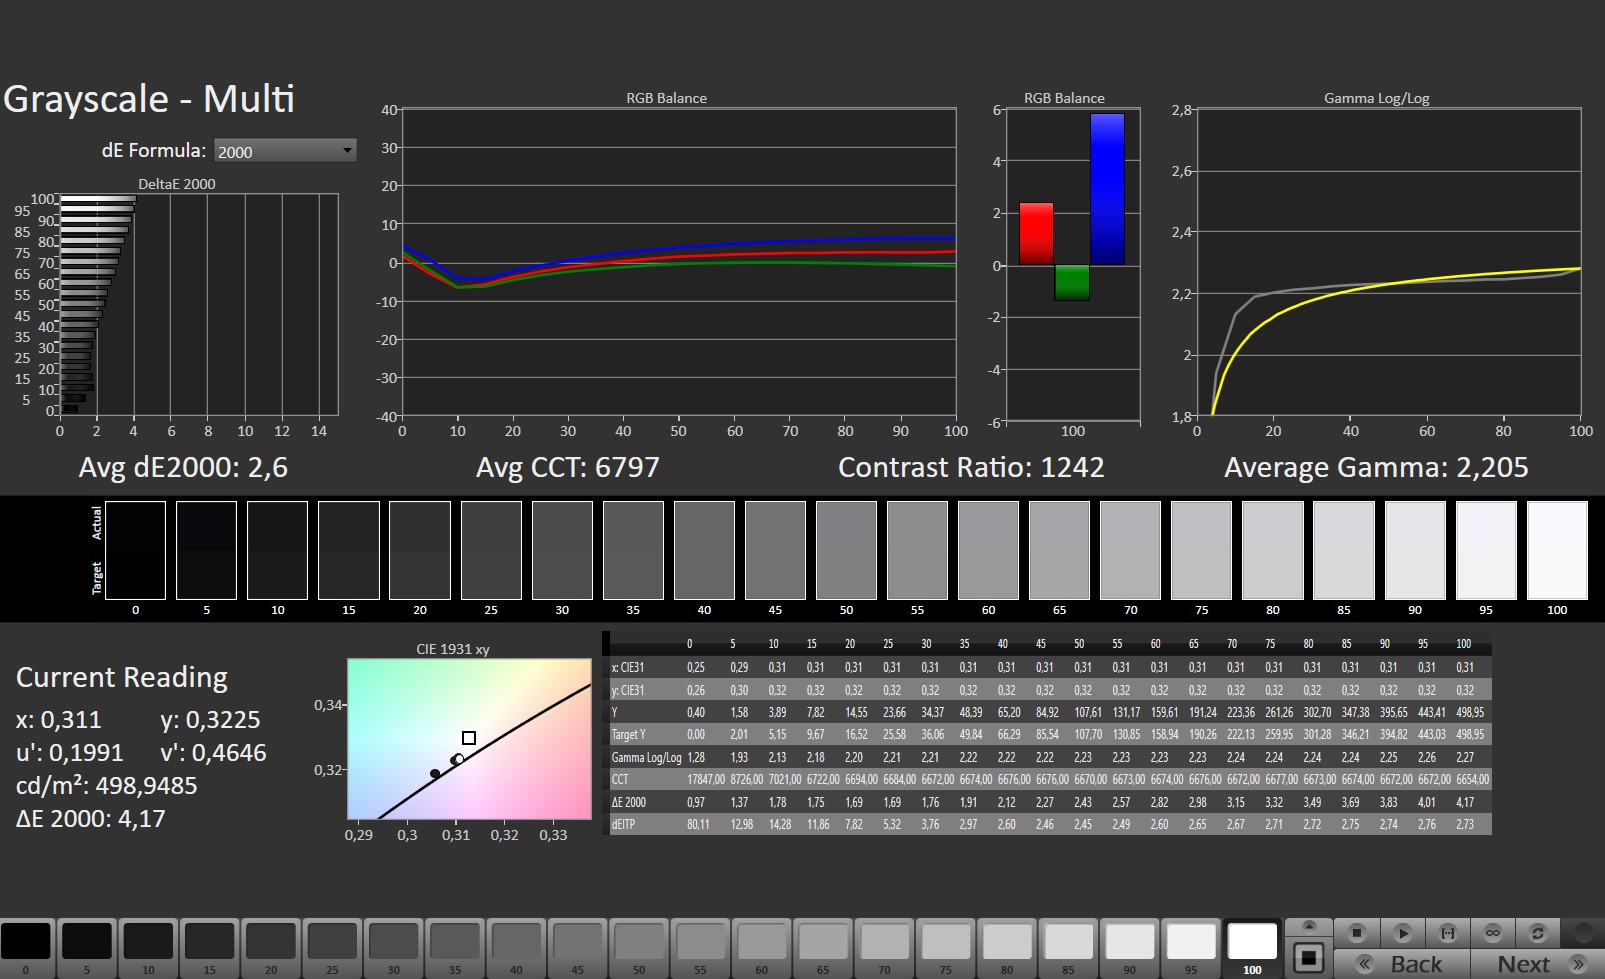
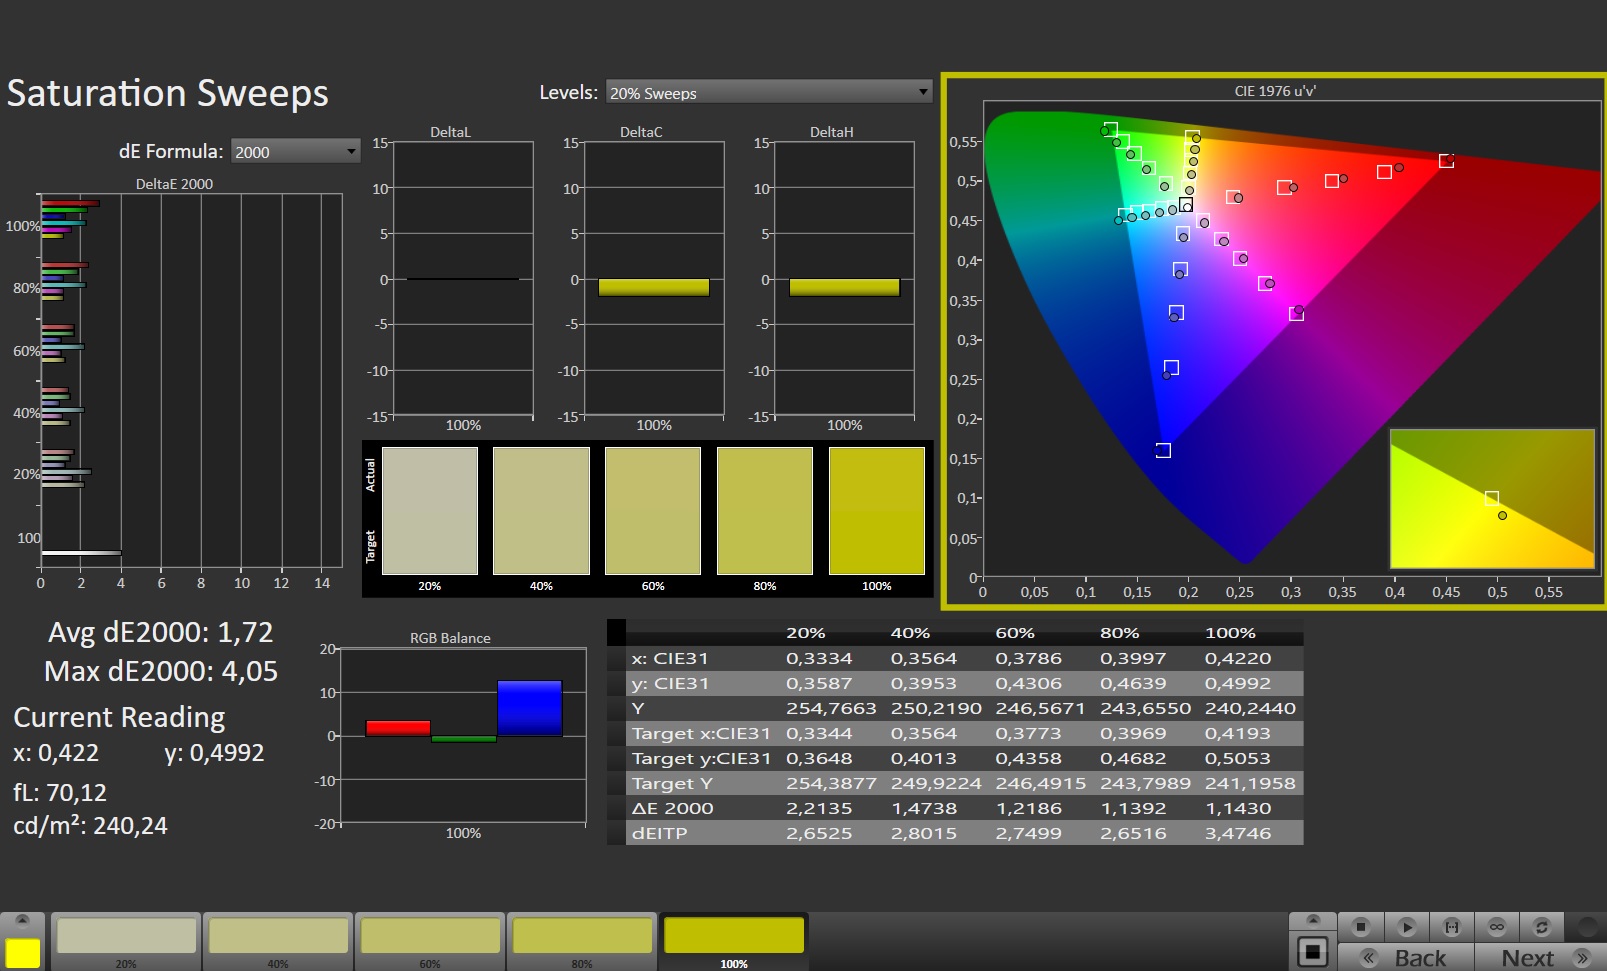
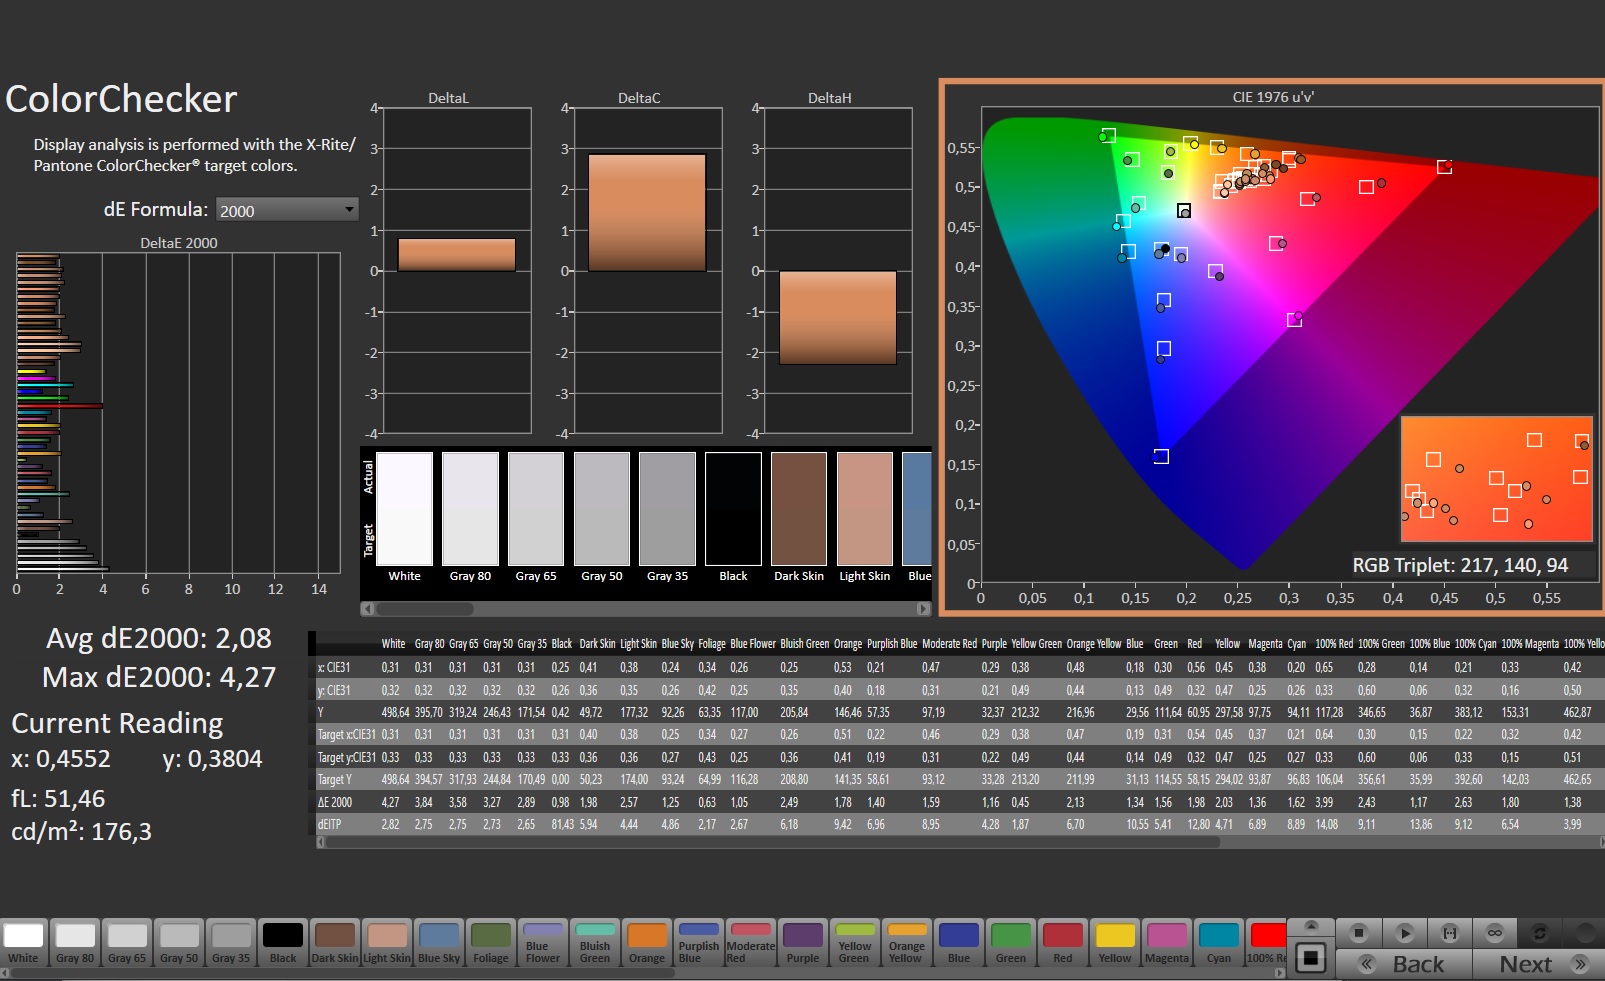
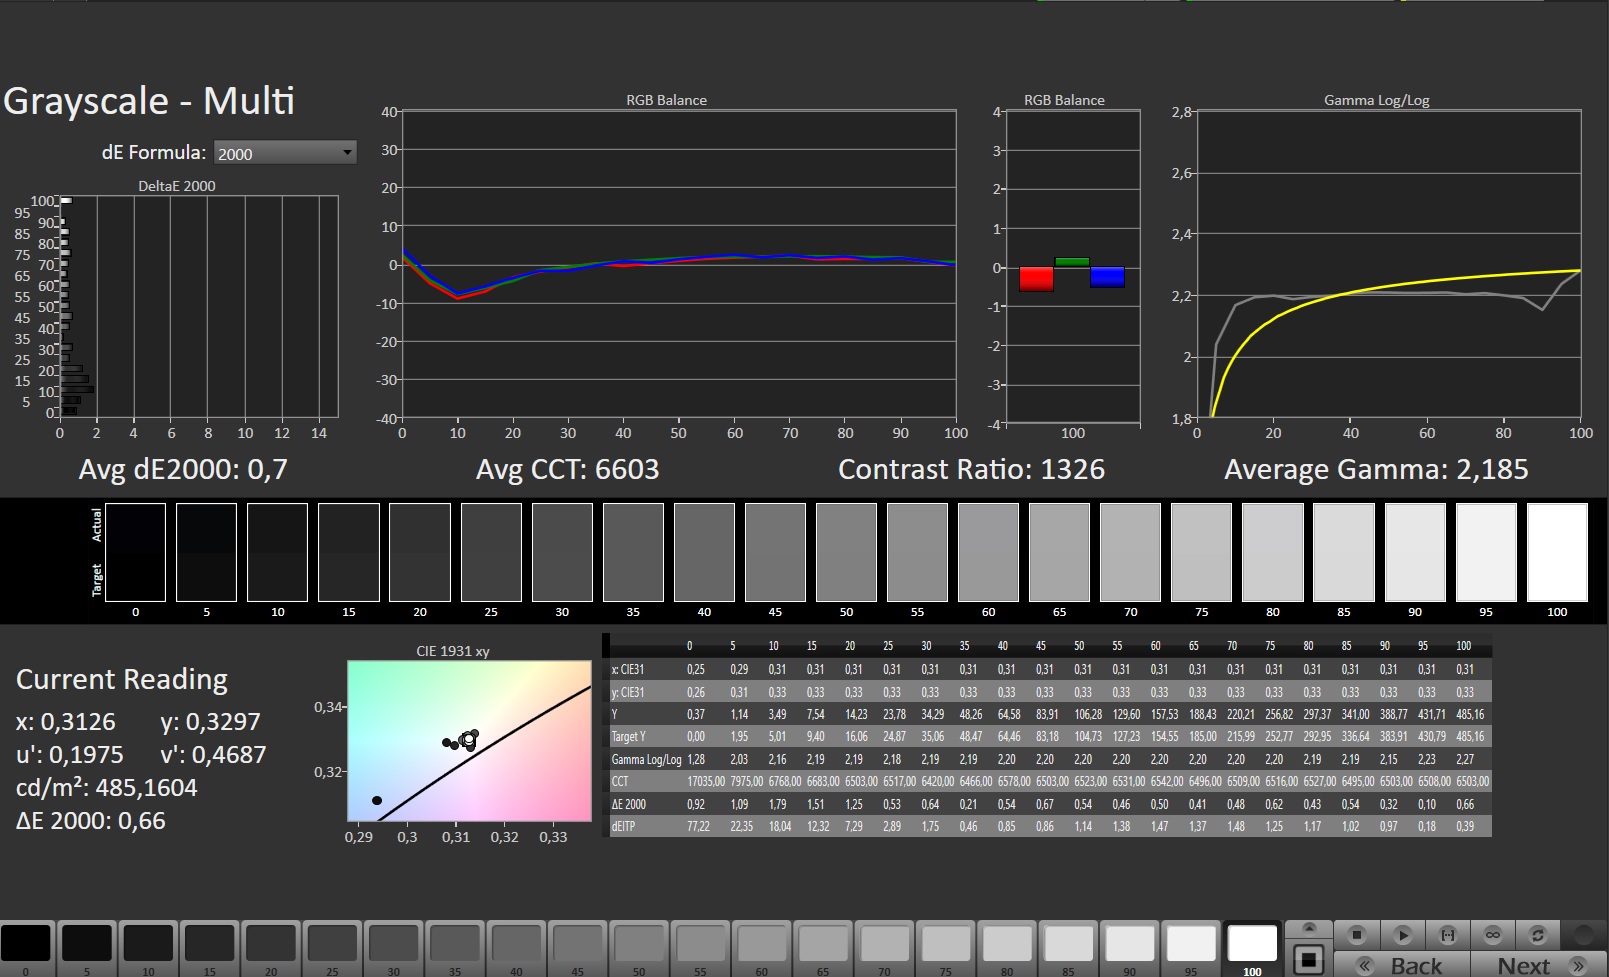
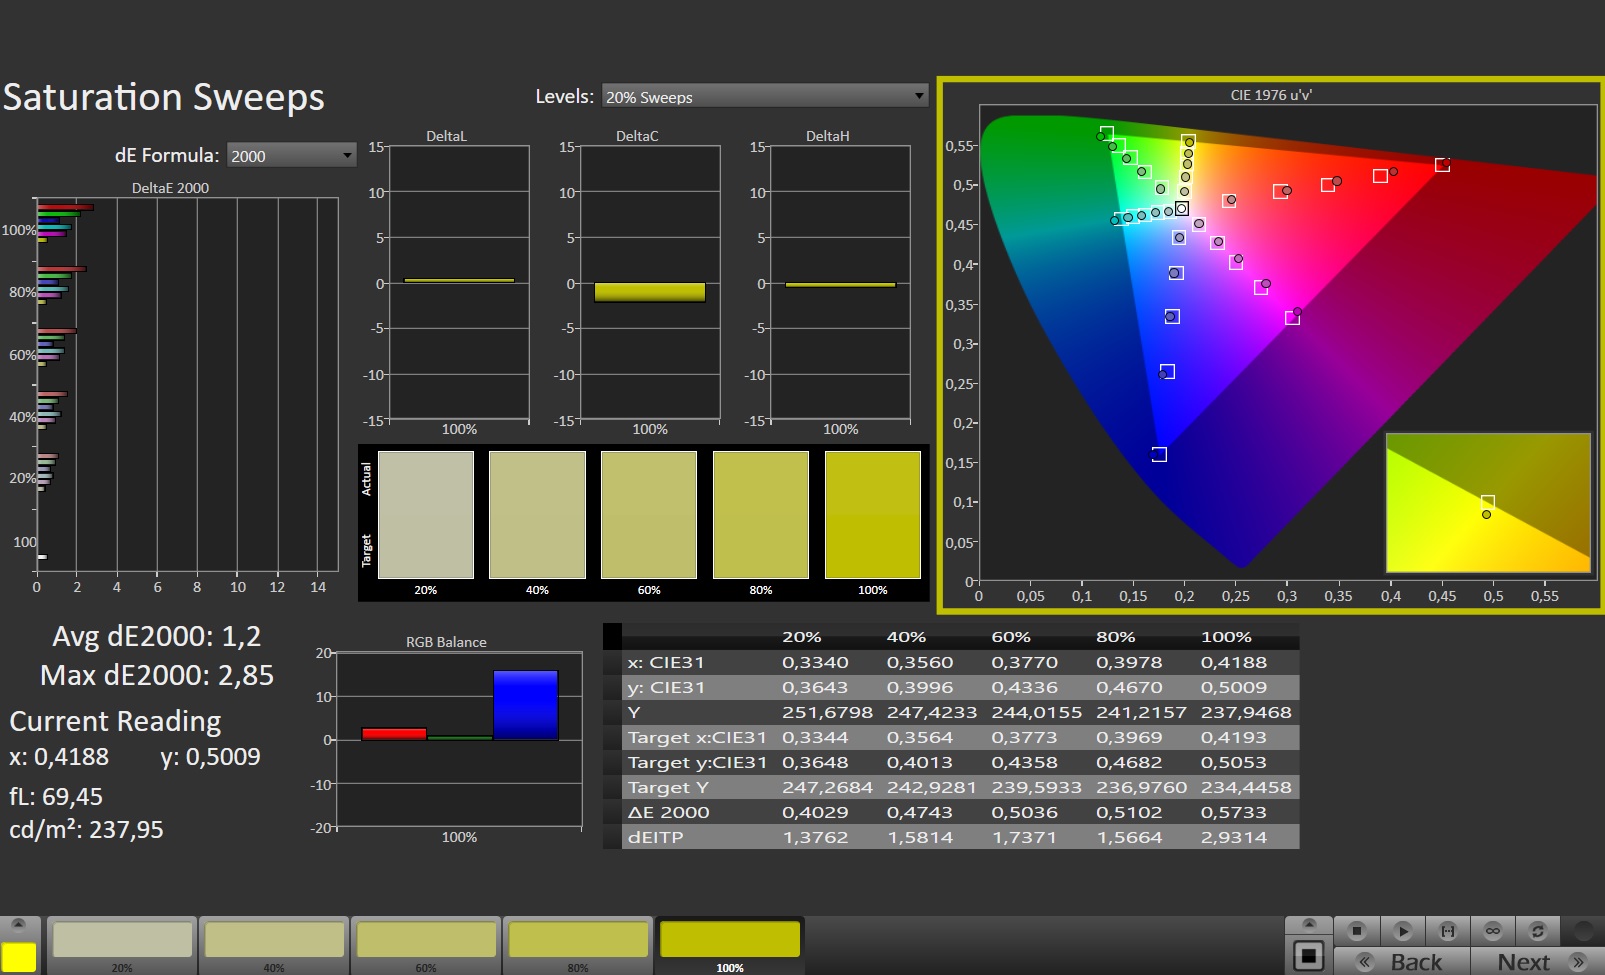
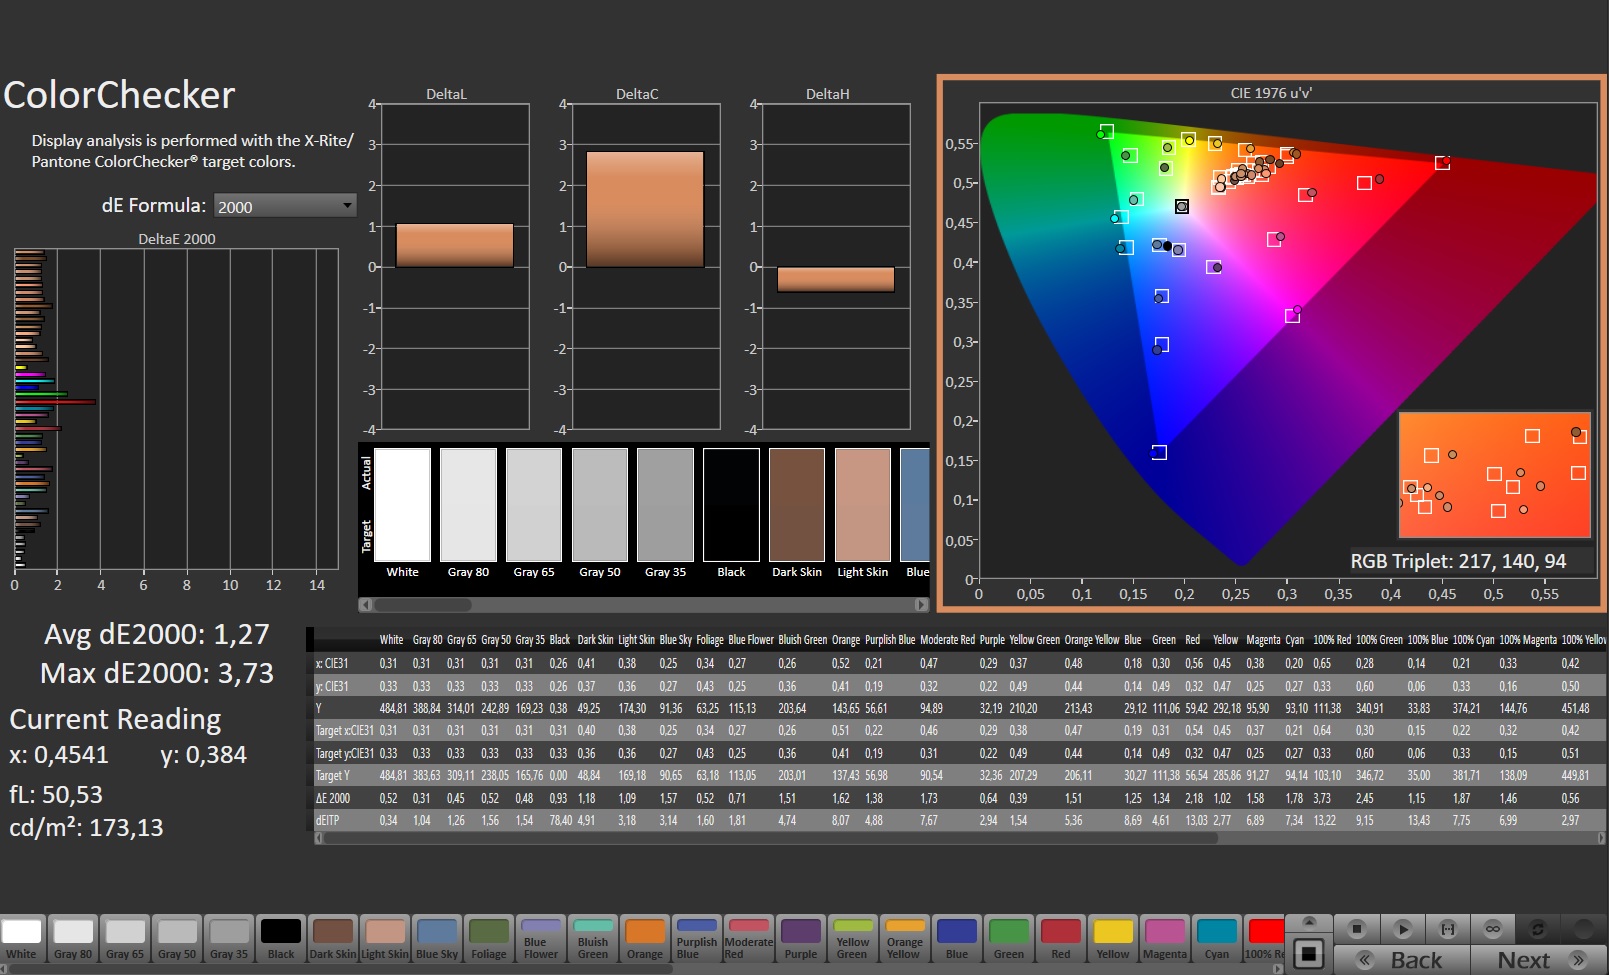
Em segundo lugar, a relação de contraste de 1.233:1 é excelente para um painel IPS. Entretanto, isto só é suficiente para colocar o laptop no meio do nosso grupo de comparação. Dito isto, a tela já está bastante colorida, como mostram as medidas que tomamos usando CalMan (veja screenshots). Sua cobertura colorida deve ser capaz de satisfazer a maioria dos consumidores - a cobertura de 98% sRGB é mais do que adequada para um notebook de jogos. E a tela é capaz de cobrir até 73% do AdobeRGB e 70% do espaço de cor P3.
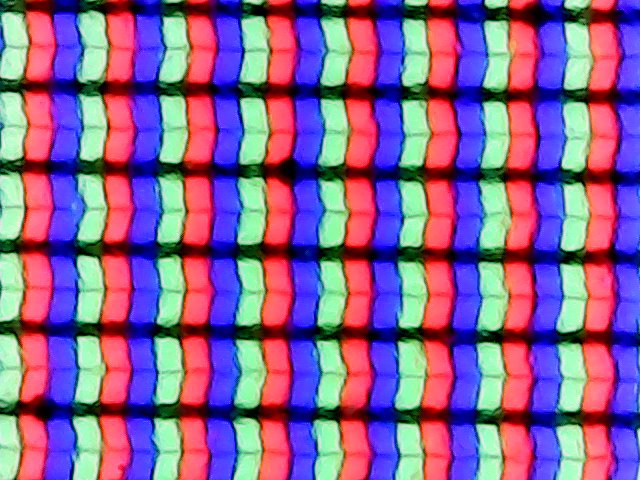
O ângulo de visão é típico de um painel IPS. Nosso dispositivo de medição relatou tempos de resposta de 6 ms (preto para branco) e 14 ms (cinza para cinza), o que também não é ruim em relação aos outros laptops em nossa comparação. No entanto, é um pouco lamentável que haja algum brilho perceptível de IPS em torno das bordas. Nossa unidade de revisão tinha uma distribuição de brilho de apenas 82%.

Exibir tempos de resposta
| ↔ Tempo de resposta preto para branco | ||
|---|---|---|
| 6.4 ms ... ascensão ↗ e queda ↘ combinadas | ↗ 2 ms ascensão | 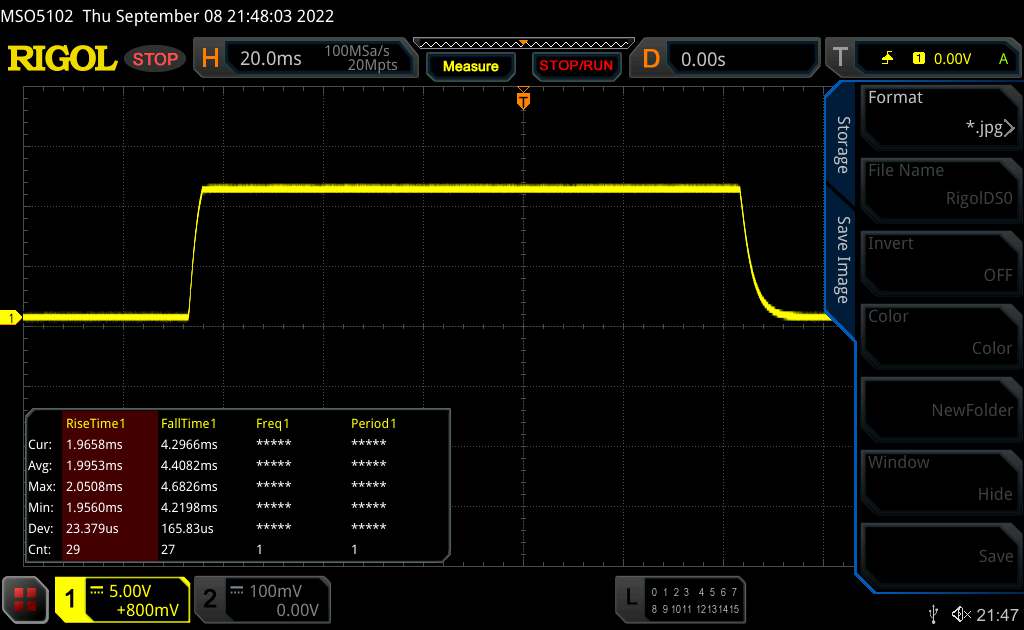 |
| ↘ 4.4 ms queda | ||
| A tela mostra taxas de resposta muito rápidas em nossos testes e deve ser muito adequada para jogos em ritmo acelerado. Em comparação, todos os dispositivos testados variam de 0.1 (mínimo) a 240 (máximo) ms. » 20 % de todos os dispositivos são melhores. Isso significa que o tempo de resposta medido é melhor que a média de todos os dispositivos testados (19.8 ms). | ||
| ↔ Tempo de resposta 50% cinza a 80% cinza | ||
| 13.9 ms ... ascensão ↗ e queda ↘ combinadas | ↗ 6.5 ms ascensão | 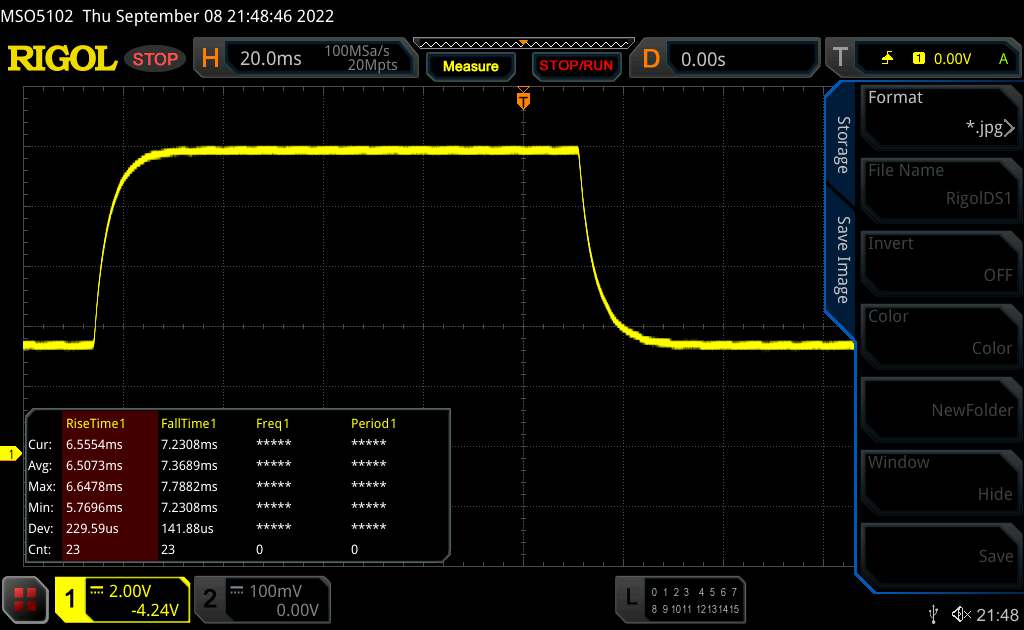 |
| ↘ 7.4 ms queda | ||
| A tela mostra boas taxas de resposta em nossos testes, mas pode ser muito lenta para jogadores competitivos. Em comparação, todos os dispositivos testados variam de 0.165 (mínimo) a 636 (máximo) ms. » 28 % de todos os dispositivos são melhores. Isso significa que o tempo de resposta medido é melhor que a média de todos os dispositivos testados (31 ms). | ||
Cintilação da tela / PWM (modulação por largura de pulso)
| Tela tremeluzindo / PWM não detectado | 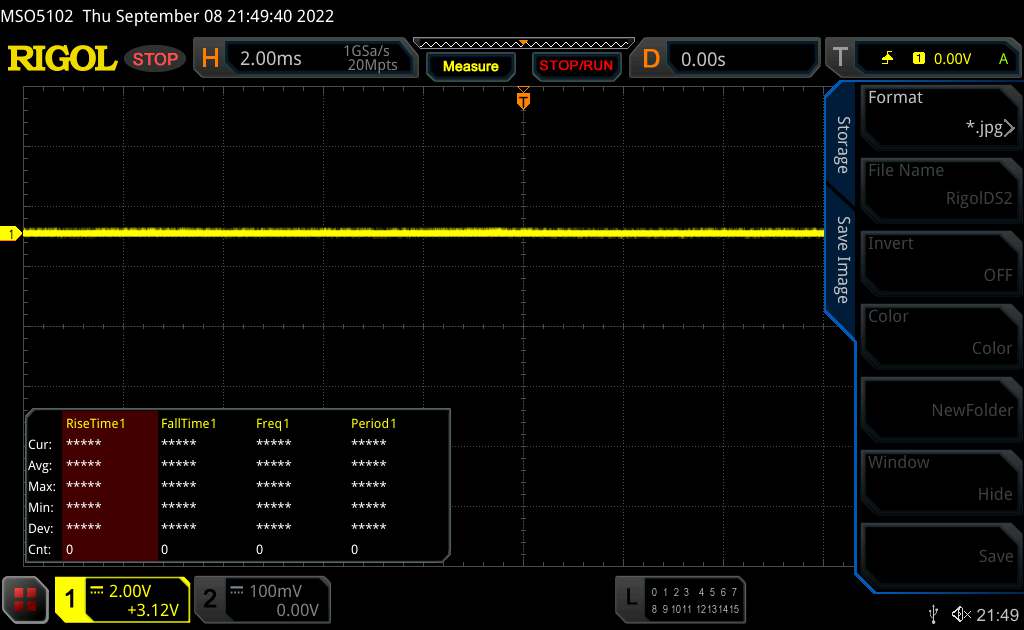 | ||
[pwm_comparison] Em comparação: 52 % de todos os dispositivos testados não usam PWM para escurecer a tela. Se PWM foi detectado, uma média de 7757 (mínimo: 5 - máximo: 343500) Hz foi medida. | |||
Desempenho
Embora tenhamos 32 GB de RAM e 12 GB de VRAM grita high-end, classificaríamos o Major X10 apenas como uma máquina de médio porte devido a seu desempenho gráfico menos que estelar (análise mais aprofundada mais adiante). Com 1.700 euros (US$ 1.728), o pacote geral não pode ser considerado um grande negócio.
Condições de teste
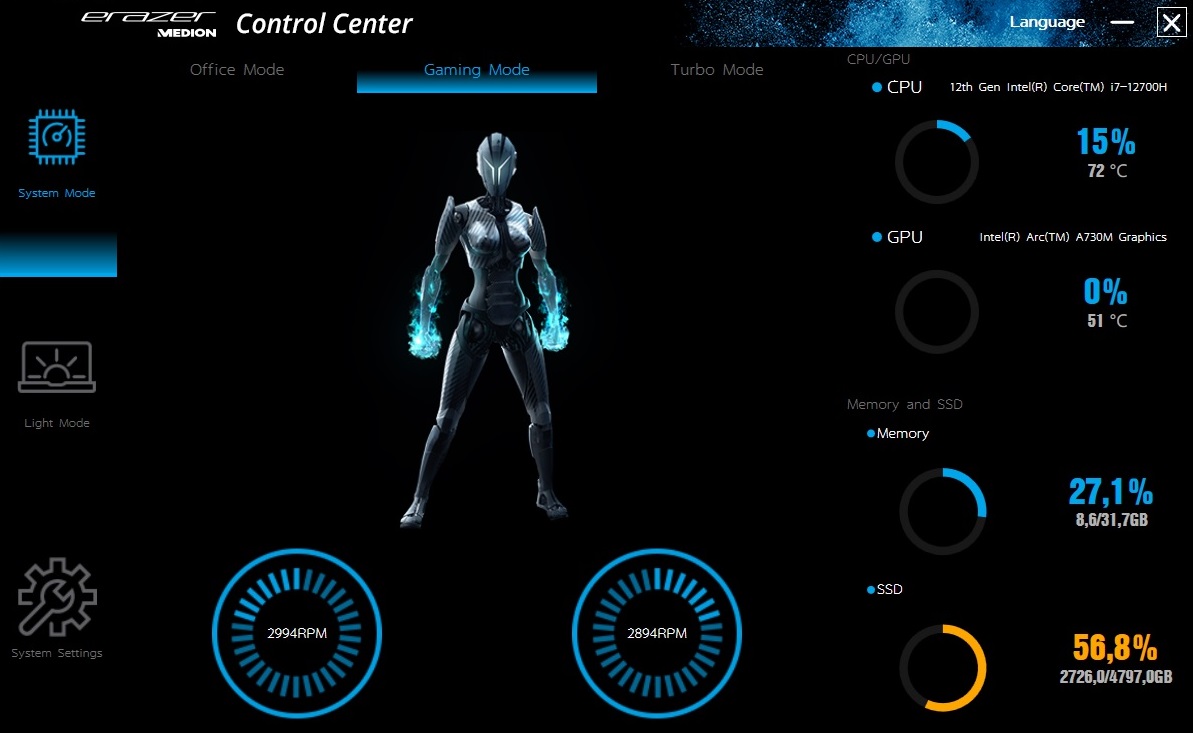
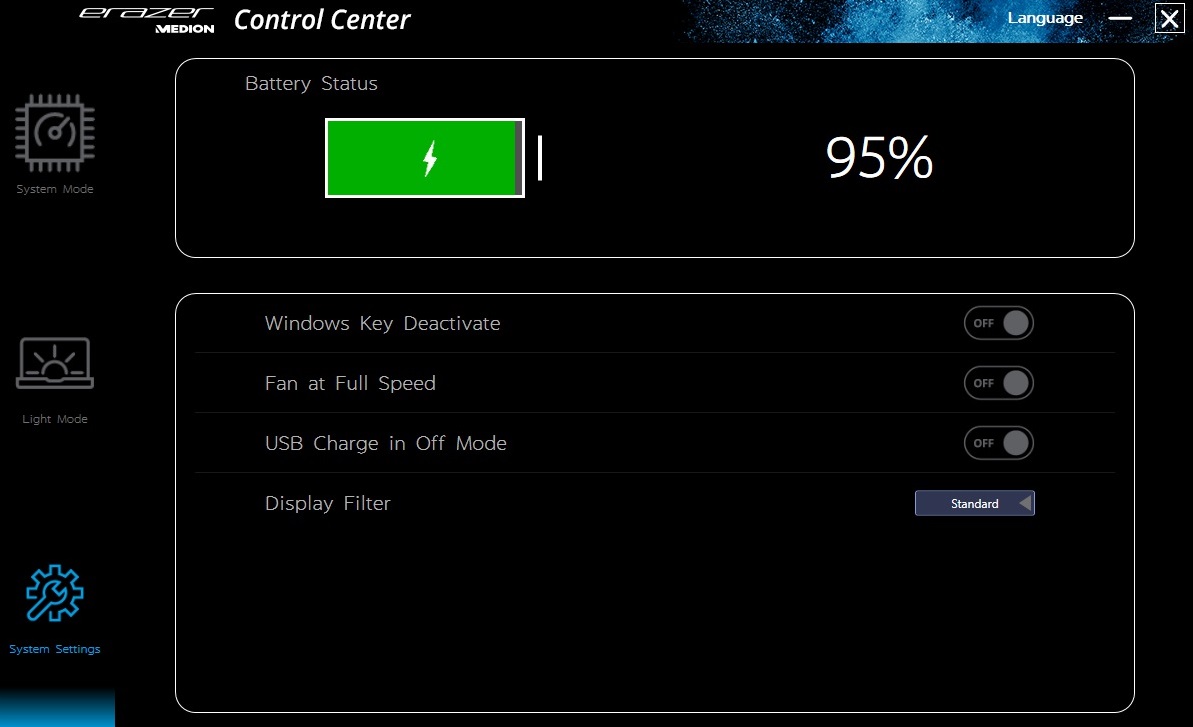
Você pode escolher entre três perfis no software do Centro de Controle pré-instalado. A menos que de outra forma indicado, as medidas foram tomadas com o Major X10 no modo de jogo, que deve ser semelhante ao modo de desempenho em outros laptops. Você pode encontrar as configurações PL1 e PL2 dos vários perfis na tabela abaixo.
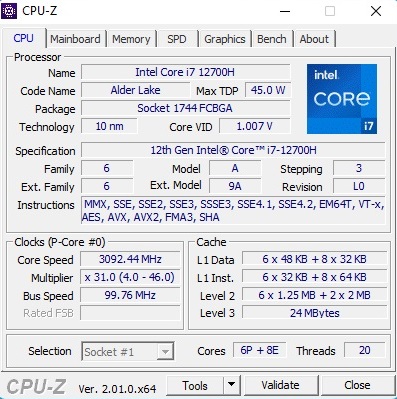
Processador
O Core i7-12700H encontrado neste laptop Medion é um processador atual de 10 nm da linha Alder Lake da Intel. A opção high-end oferece 6 núcleos de desempenho e 8 núcleos de eficiência e pode manusear até 20 roscas em paralelo usando Hyper-Threading. Em nossa série de testes de CPU, o Major X10 teve um bom desempenho mesmo sem o modo Turbo ativado. Durante o loop Cinebench R15, seu desempenho se estabeleceu a um nível bastante consistente que é ligeiramente superior ao que os rivais do 12700H são capazes de fazer. Mesmo o Ryzen 7 5800H no HP Omen 16 não pode igualar este nível de desempenho.
Cinebench R15 Multi Sustained Load
* ... menor é melhor
AIDA64: FP32 Ray-Trace | FPU Julia | CPU SHA3 | CPU Queen | FPU SinJulia | FPU Mandel | CPU AES | CPU ZLib | FP64 Ray-Trace | CPU PhotoWorxx
| Performance rating | |
| Média da turma Gaming | |
| HP Omen 16-c0077ng | |
| Dell Inspiron 16 Plus 7620 | |
| Média Intel Core i7-12700H | |
| Medion Erazer Major X10 | |
| Acer Nitro 5 AN517-55-738R | |
| Asus TUF Gaming F17 FX707Z-HX011W | |
| AIDA64 / FP32 Ray-Trace | |
| Média da turma Gaming (10227 - 85542, n=105, últimos 2 anos) | |
| HP Omen 16-c0077ng | |
| Dell Inspiron 16 Plus 7620 | |
| Média Intel Core i7-12700H (2585 - 17957, n=64) | |
| Acer Nitro 5 AN517-55-738R | |
| Medion Erazer Major X10 | |
| Asus TUF Gaming F17 FX707Z-HX011W | |
| AIDA64 / FPU Julia | |
| Média da turma Gaming (51376 - 238426, n=105, últimos 2 anos) | |
| HP Omen 16-c0077ng | |
| Dell Inspiron 16 Plus 7620 | |
| Média Intel Core i7-12700H (12439 - 90760, n=64) | |
| Acer Nitro 5 AN517-55-738R | |
| Medion Erazer Major X10 | |
| Asus TUF Gaming F17 FX707Z-HX011W | |
| AIDA64 / CPU SHA3 | |
| Média da turma Gaming (2180 - 10115, n=105, últimos 2 anos) | |
| HP Omen 16-c0077ng | |
| Média Intel Core i7-12700H (833 - 4242, n=64) | |
| Dell Inspiron 16 Plus 7620 | |
| Acer Nitro 5 AN517-55-738R | |
| Medion Erazer Major X10 | |
| Asus TUF Gaming F17 FX707Z-HX011W | |
| AIDA64 / CPU Queen | |
| Média da turma Gaming (49785 - 173351, n=90, últimos 2 anos) | |
| Asus TUF Gaming F17 FX707Z-HX011W | |
| HP Omen 16-c0077ng | |
| Acer Nitro 5 AN517-55-738R | |
| Medion Erazer Major X10 | |
| Média Intel Core i7-12700H (57923 - 103202, n=63) | |
| Dell Inspiron 16 Plus 7620 | |
| AIDA64 / FPU SinJulia | |
| Média da turma Gaming (4424 - 33636, n=105, últimos 2 anos) | |
| HP Omen 16-c0077ng | |
| Medion Erazer Major X10 | |
| Acer Nitro 5 AN517-55-738R | |
| Média Intel Core i7-12700H (3249 - 9939, n=64) | |
| Dell Inspiron 16 Plus 7620 | |
| Asus TUF Gaming F17 FX707Z-HX011W | |
| AIDA64 / FPU Mandel | |
| Média da turma Gaming (25115 - 128721, n=105, últimos 2 anos) | |
| HP Omen 16-c0077ng | |
| Dell Inspiron 16 Plus 7620 | |
| Média Intel Core i7-12700H (7135 - 44760, n=64) | |
| Acer Nitro 5 AN517-55-738R | |
| Medion Erazer Major X10 | |
| Asus TUF Gaming F17 FX707Z-HX011W | |
| AIDA64 / CPU AES | |
| HP Omen 16-c0077ng | |
| Média da turma Gaming (39258 - 247074, n=105, últimos 2 anos) | |
| Média Intel Core i7-12700H (31839 - 144360, n=64) | |
| Dell Inspiron 16 Plus 7620 | |
| Acer Nitro 5 AN517-55-738R | |
| Medion Erazer Major X10 | |
| Asus TUF Gaming F17 FX707Z-HX011W | |
| AIDA64 / CPU ZLib | |
| Média da turma Gaming (574 - 2531, n=105, últimos 2 anos) | |
| Dell Inspiron 16 Plus 7620 | |
| Média Intel Core i7-12700H (305 - 1171, n=64) | |
| Medion Erazer Major X10 | |
| Acer Nitro 5 AN517-55-738R | |
| HP Omen 16-c0077ng | |
| Asus TUF Gaming F17 FX707Z-HX011W | |
| AIDA64 / FP64 Ray-Trace | |
| Média da turma Gaming (5509 - 45446, n=105, últimos 2 anos) | |
| HP Omen 16-c0077ng | |
| Dell Inspiron 16 Plus 7620 | |
| Média Intel Core i7-12700H (1437 - 9692, n=64) | |
| Acer Nitro 5 AN517-55-738R | |
| Medion Erazer Major X10 | |
| Asus TUF Gaming F17 FX707Z-HX011W | |
| AIDA64 / CPU PhotoWorxx | |
| Média da turma Gaming (12271 - 89891, n=105, últimos 2 anos) | |
| Medion Erazer Major X10 | |
| Dell Inspiron 16 Plus 7620 | |
| Média Intel Core i7-12700H (12863 - 52207, n=64) | |
| Asus TUF Gaming F17 FX707Z-HX011W | |
| HP Omen 16-c0077ng | |
| Acer Nitro 5 AN517-55-738R | |
Desempenho do sistema
Em termos de desempenho do sistema, o laptop de 16 polegadas ficou em terceiro lugar em nossa comparação com uma excelente pontuação de 6.830 no PCMark. Com base em nossa impressão subjetiva, o sistema operacional é responsivo e suave.
CrossMark: Overall | Productivity | Creativity | Responsiveness
| PCMark 10 / Score | |
| Média da turma Gaming (5828 - 12414, n=93, últimos 2 anos) | |
| HP Omen 16-c0077ng | |
| Dell Inspiron 16 Plus 7620 | |
| Média Intel Core i7-12700H, Intel Arc A730M (6830 - 6845, n=2) | |
| Medion Erazer Major X10 | |
| Acer Nitro 5 AN517-55-738R | |
| Asus TUF Gaming F17 FX707Z-HX011W | |
| PCMark 10 / Essentials | |
| Medion Erazer Major X10 | |
| Média Intel Core i7-12700H, Intel Arc A730M (10529 - 11116, n=2) | |
| Média da turma Gaming (8810 - 11935, n=97, últimos 2 anos) | |
| HP Omen 16-c0077ng | |
| Dell Inspiron 16 Plus 7620 | |
| Acer Nitro 5 AN517-55-738R | |
| Asus TUF Gaming F17 FX707Z-HX011W | |
| PCMark 10 / Productivity | |
| Média da turma Gaming (6845 - 25323, n=95, últimos 2 anos) | |
| HP Omen 16-c0077ng | |
| Acer Nitro 5 AN517-55-738R | |
| Dell Inspiron 16 Plus 7620 | |
| Medion Erazer Major X10 | |
| Média Intel Core i7-12700H, Intel Arc A730M (7070 - 7260, n=2) | |
| Asus TUF Gaming F17 FX707Z-HX011W | |
| PCMark 10 / Digital Content Creation | |
| Média da turma Gaming (7602 - 19954, n=95, últimos 2 anos) | |
| Média Intel Core i7-12700H, Intel Arc A730M (10714 - 11691, n=2) | |
| Medion Erazer Major X10 | |
| HP Omen 16-c0077ng | |
| Asus TUF Gaming F17 FX707Z-HX011W | |
| Dell Inspiron 16 Plus 7620 | |
| Acer Nitro 5 AN517-55-738R | |
| CrossMark / Overall | |
| Média da turma Gaming (1366 - 2409, n=94, últimos 2 anos) | |
| Média Intel Core i7-12700H, Intel Arc A730M (n=1) | |
| Acer Nitro 5 AN517-55-738R | |
| Dell Inspiron 16 Plus 7620 | |
| Asus TUF Gaming F17 FX707Z-HX011W | |
| CrossMark / Productivity | |
| Média da turma Gaming (1386 - 2254, n=94, últimos 2 anos) | |
| Média Intel Core i7-12700H, Intel Arc A730M (n=1) | |
| Acer Nitro 5 AN517-55-738R | |
| Dell Inspiron 16 Plus 7620 | |
| Asus TUF Gaming F17 FX707Z-HX011W | |
| CrossMark / Creativity | |
| Média da turma Gaming (1343 - 2786, n=94, últimos 2 anos) | |
| Asus TUF Gaming F17 FX707Z-HX011W | |
| Média Intel Core i7-12700H, Intel Arc A730M (n=1) | |
| Dell Inspiron 16 Plus 7620 | |
| Acer Nitro 5 AN517-55-738R | |
| CrossMark / Responsiveness | |
| Média Intel Core i7-12700H, Intel Arc A730M (n=1) | |
| Acer Nitro 5 AN517-55-738R | |
| Média da turma Gaming (1226 - 2334, n=94, últimos 2 anos) | |
| Dell Inspiron 16 Plus 7620 | |
| Asus TUF Gaming F17 FX707Z-HX011W | |
| PCMark 10 Score | 6830 pontos | |
Ajuda | ||
| AIDA64 / Memory Copy | |
| Média da turma Gaming (21750 - 129946, n=105, últimos 2 anos) | |
| Medion Erazer Major X10 | |
| Dell Inspiron 16 Plus 7620 | |
| Média Intel Core i7-12700H (25615 - 80511, n=64) | |
| Asus TUF Gaming F17 FX707Z-HX011W | |
| Acer Nitro 5 AN517-55-738R | |
| HP Omen 16-c0077ng | |
| AIDA64 / Memory Read | |
| Média da turma Gaming (22956 - 118858, n=105, últimos 2 anos) | |
| Medion Erazer Major X10 | |
| Asus TUF Gaming F17 FX707Z-HX011W | |
| Dell Inspiron 16 Plus 7620 | |
| Média Intel Core i7-12700H (25586 - 79442, n=64) | |
| HP Omen 16-c0077ng | |
| Acer Nitro 5 AN517-55-738R | |
| AIDA64 / Memory Write | |
| Média da turma Gaming (22297 - 135096, n=105, últimos 2 anos) | |
| Medion Erazer Major X10 | |
| Asus TUF Gaming F17 FX707Z-HX011W | |
| Dell Inspiron 16 Plus 7620 | |
| Média Intel Core i7-12700H (23679 - 88660, n=64) | |
| Acer Nitro 5 AN517-55-738R | |
| HP Omen 16-c0077ng | |
| AIDA64 / Memory Latency | |
| Média da turma Gaming (75.3 - 259, n=105, últimos 2 anos) | |
| Dell Inspiron 16 Plus 7620 | |
| HP Omen 16-c0077ng | |
| Média Intel Core i7-12700H (76.2 - 133.9, n=62) | |
| Asus TUF Gaming F17 FX707Z-HX011W | |
| Acer Nitro 5 AN517-55-738R | |
* ... menor é melhor
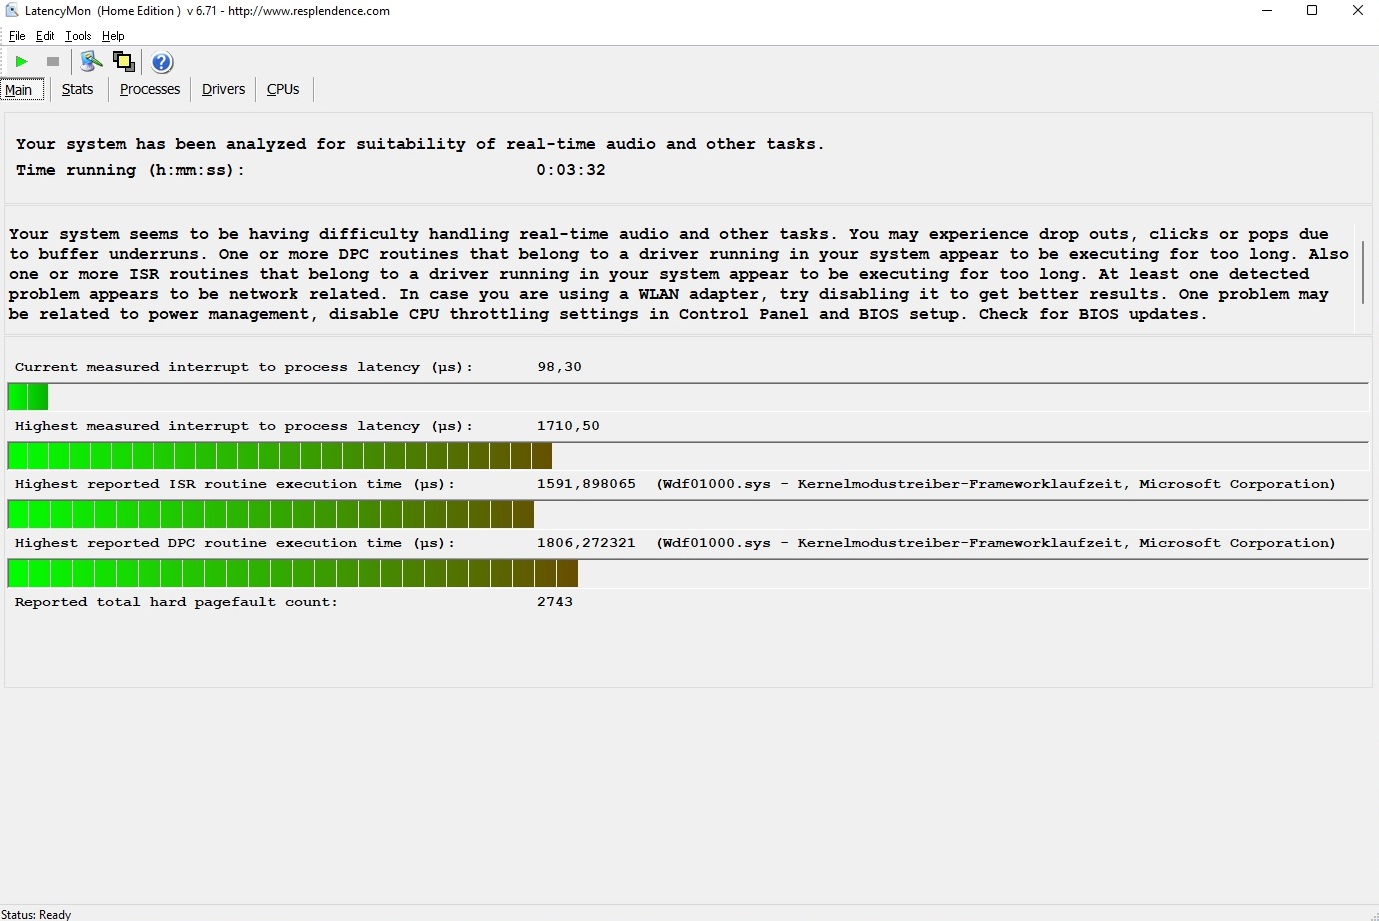
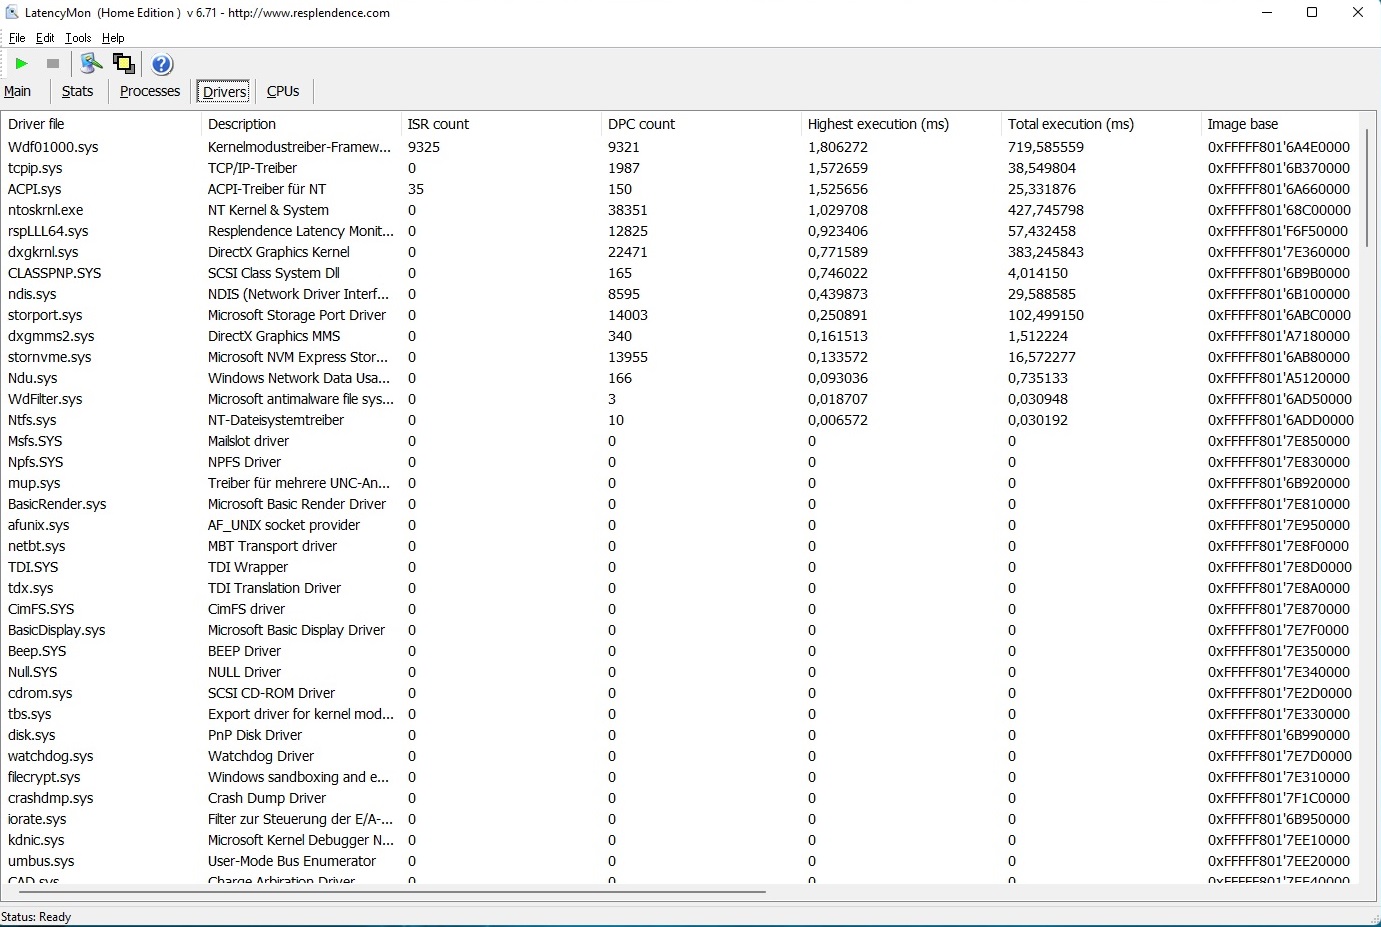
Latência do DPC
Como acontece frequentemente com os laptops, o Major X10 tem alguns problemas com a latência. Segundo o LatencyMon, o laptop só é adequado para o processamento de áudio e vídeo em tempo real em uma extensão limitada.
| DPC Latencies / LatencyMon - interrupt to process latency (max), Web, Youtube, Prime95 | |
| Asus TUF Gaming F17 FX707Z-HX011W | |
| HP Omen 16-c0077ng | |
| Medion Erazer Major X10 | |
| Acer Nitro 5 AN517-55-738R | |
| Dell Inspiron 16 Plus 7620 | |
* ... menor é melhor
Armazenamento em massa
O Major X10 abriga um SSD NVMe com velocidade acima da média que deixará os concorrentes nervosos. Tem excelente velocidade de leitura e escrita sequencial de mais de 5.000 MB/s e 4.000 MB/s respectivamente (obtida usando AS SSD Benchmark). Há também um segundo slot PCIe M.2 para que você possa expandir convenientemente o armazenamento, se necessário no futuro.

| Drive Performance rating - Percent | |
| Medion Erazer Major X10 | |
| Média da turma Gaming | |
| Acer Nitro 5 AN517-55-738R | |
| HP Omen 16-c0077ng | |
| Asus TUF Gaming F17 FX707Z-HX011W | |
| Dell Inspiron 16 Plus 7620 | |
* ... menor é melhor
Sustained Performance Read: DiskSpd Read Loop, Queue Depth 8
Placa gráfica
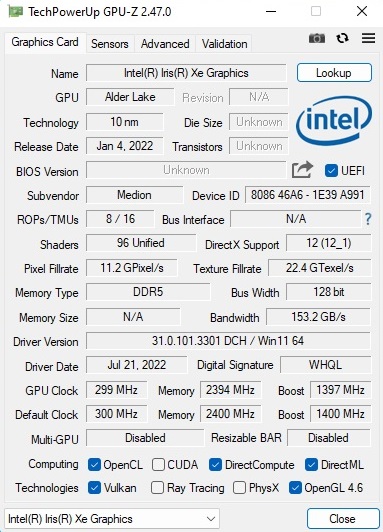
Chegamos à parte mais interessante sobre o Major X10: sua placa gráfica. Esta é a primeira vez que um Intel Arc A730M (24 núcleos Xe e 24 Ray Tracing Units) pousou em nossa bancada de testes. A GPU Intel é uma grande performance quando se trata de benchmarks gráficos sintéticos. Nos testes 3DMark, ela supera significativamente o GeForce RTX 3050 Ti e está no mesmo nível do GeForce RTX 3060 e Radeon RX 6600M. Com o modo Turbo ativado, o laptop Medion foi capaz de obter quase 20% a mais de desempenho da GPU e velocidade além dos outros dispositivos em nossa comparação. Mais resultados de referência podem ser encontrados em nossa página sobre o Arco A730M.
| 3DMark Performance rating - Percent | |
| Média da turma Gaming | |
| Medion Erazer Major X10 Turbo Mode | |
| HP Omen 16-c0077ng -1! | |
| Asus TUF Gaming F17 FX707Z-HX011W -1! | |
| Média Intel Arc A730M | |
| Acer Nitro 5 AN517-55-738R | |
| Medion Erazer Major X10 | |
| Dell Inspiron 16 Plus 7620 -1! | |
| 3DMark 11 - 1280x720 Performance GPU | |
| Média da turma Gaming (21841 - 80022, n=104, últimos 2 anos) | |
| HP Omen 16-c0077ng | |
| Medion Erazer Major X10 Turbo Mode | |
| Asus TUF Gaming F17 FX707Z-HX011W | |
| Média Intel Arc A730M (24928 - 31551, n=4) | |
| Acer Nitro 5 AN517-55-738R | |
| Medion Erazer Major X10 | |
| Dell Inspiron 16 Plus 7620 | |
| 3DMark | |
| 1920x1080 Fire Strike Graphics | |
| Média da turma Gaming (12242 - 62849, n=115, últimos 2 anos) | |
| HP Omen 16-c0077ng | |
| Asus TUF Gaming F17 FX707Z-HX011W | |
| Medion Erazer Major X10 Turbo Mode | |
| Acer Nitro 5 AN517-55-738R | |
| Média Intel Arc A730M (19850 - 22620, n=4) | |
| Medion Erazer Major X10 | |
| Dell Inspiron 16 Plus 7620 | |
| 2560x1440 Time Spy Graphics | |
| Média da turma Gaming (5012 - 26212, n=115, últimos 2 anos) | |
| Medion Erazer Major X10 Turbo Mode | |
| Asus TUF Gaming F17 FX707Z-HX011W | |
| Média Intel Arc A730M (7212 - 10352, n=4) | |
| Medion Erazer Major X10 | |
| Acer Nitro 5 AN517-55-738R | |
| HP Omen 16-c0077ng | |
| Dell Inspiron 16 Plus 7620 | |
| 2560x1440 Port Royal Graphics | |
| Média da turma Gaming (4395 - 17286, n=71, últimos 2 anos) | |
| Medion Erazer Major X10 Turbo Mode | |
| Acer Nitro 5 AN517-55-738R | |
| Média Intel Arc A730M (3758 - 5678, n=3) | |
| Medion Erazer Major X10 | |
| 3DMark 06 Standard Score | 46579 pontos | |
| 3DMark Vantage P Result | 63844 pontos | |
| 3DMark 11 Performance | 24223 pontos | |
| 3DMark Ice Storm Standard Score | 119799 pontos | |
| 3DMark Cloud Gate Standard Score | 44757 pontos | |
| 3DMark Fire Strike Score | 18543 pontos | |
| 3DMark Time Spy Score | 9041 pontos | |
Ajuda | ||
Desempenho do jogo
Em contraste, a GPU pintou um quadro muito misto em benchmarks de jogos. Mesmo que o Arc A730M seja às vezes capaz de desafiar o RTX 3060 e o RX 6600M, ele freqüentemente paira em torno do nível de desempenho do GeForce RTX 3050 Ti, que normalmente é encontrado em laptops para jogos muito mais baratos. No pior caso, o Arco A730M é ainda mais lento do que o RTX 3050 Ti. Isto é bastante decepcionante considerando o preço e as especificações da GPU (12 GB vs 4 GB de VRAM). A Intel deve realmente continuar a melhorar o suporte ao motorista. Similar ao que vimos em iGPUs, alguns jogos foram executados com artefatos visuais ou outros problemas diversos. Tivemos também que lidar com falhas ocasionais. Dito isto, a troca de gráficos parece funcionar bem. Todos os jogos usados em nossos testes foram diretamente atribuídos ao dGPU. Fundamentalmente, o Arco A730M é mais ou menos projetado para monitores Full HD. Com uma resolução de 1.920 x 1.080, quase todos os jogos funcionaram suavemente com detalhes definidos para alto ou muito alto. Enquanto isso, resoluções mais altas (como as 2.560 x 1.600 nativas) levam a GPU Intel aos seus limites. Para mais comparações de GPU, você pode conferir nossa lista de jogos https://www.notebookcheck.net/Computer-Games-on-Laptop-Graphics-Cards.13849.0.html.
| The Witcher 3 | |
| 1920x1080 High Graphics & Postprocessing (Nvidia HairWorks Off) | |
| Média da turma Gaming (341 - 404, n=2, últimos 2 anos) | |
| Asus TUF Gaming F17 FX707Z-HX011W | |
| Acer Nitro 5 AN517-55-738R | |
| HP Omen 16-c0077ng | |
| Medion Erazer Major X10 | |
| Dell Inspiron 16 Plus 7620 | |
| 1920x1080 Ultra Graphics & Postprocessing (HBAO+) | |
| Média da turma Gaming (104.7 - 240, n=7, últimos 2 anos) | |
| Asus TUF Gaming F17 FX707Z-HX011W | |
| HP Omen 16-c0077ng | |
| Acer Nitro 5 AN517-55-738R | |
| Dell Inspiron 16 Plus 7620 | |
| Medion Erazer Major X10 | |
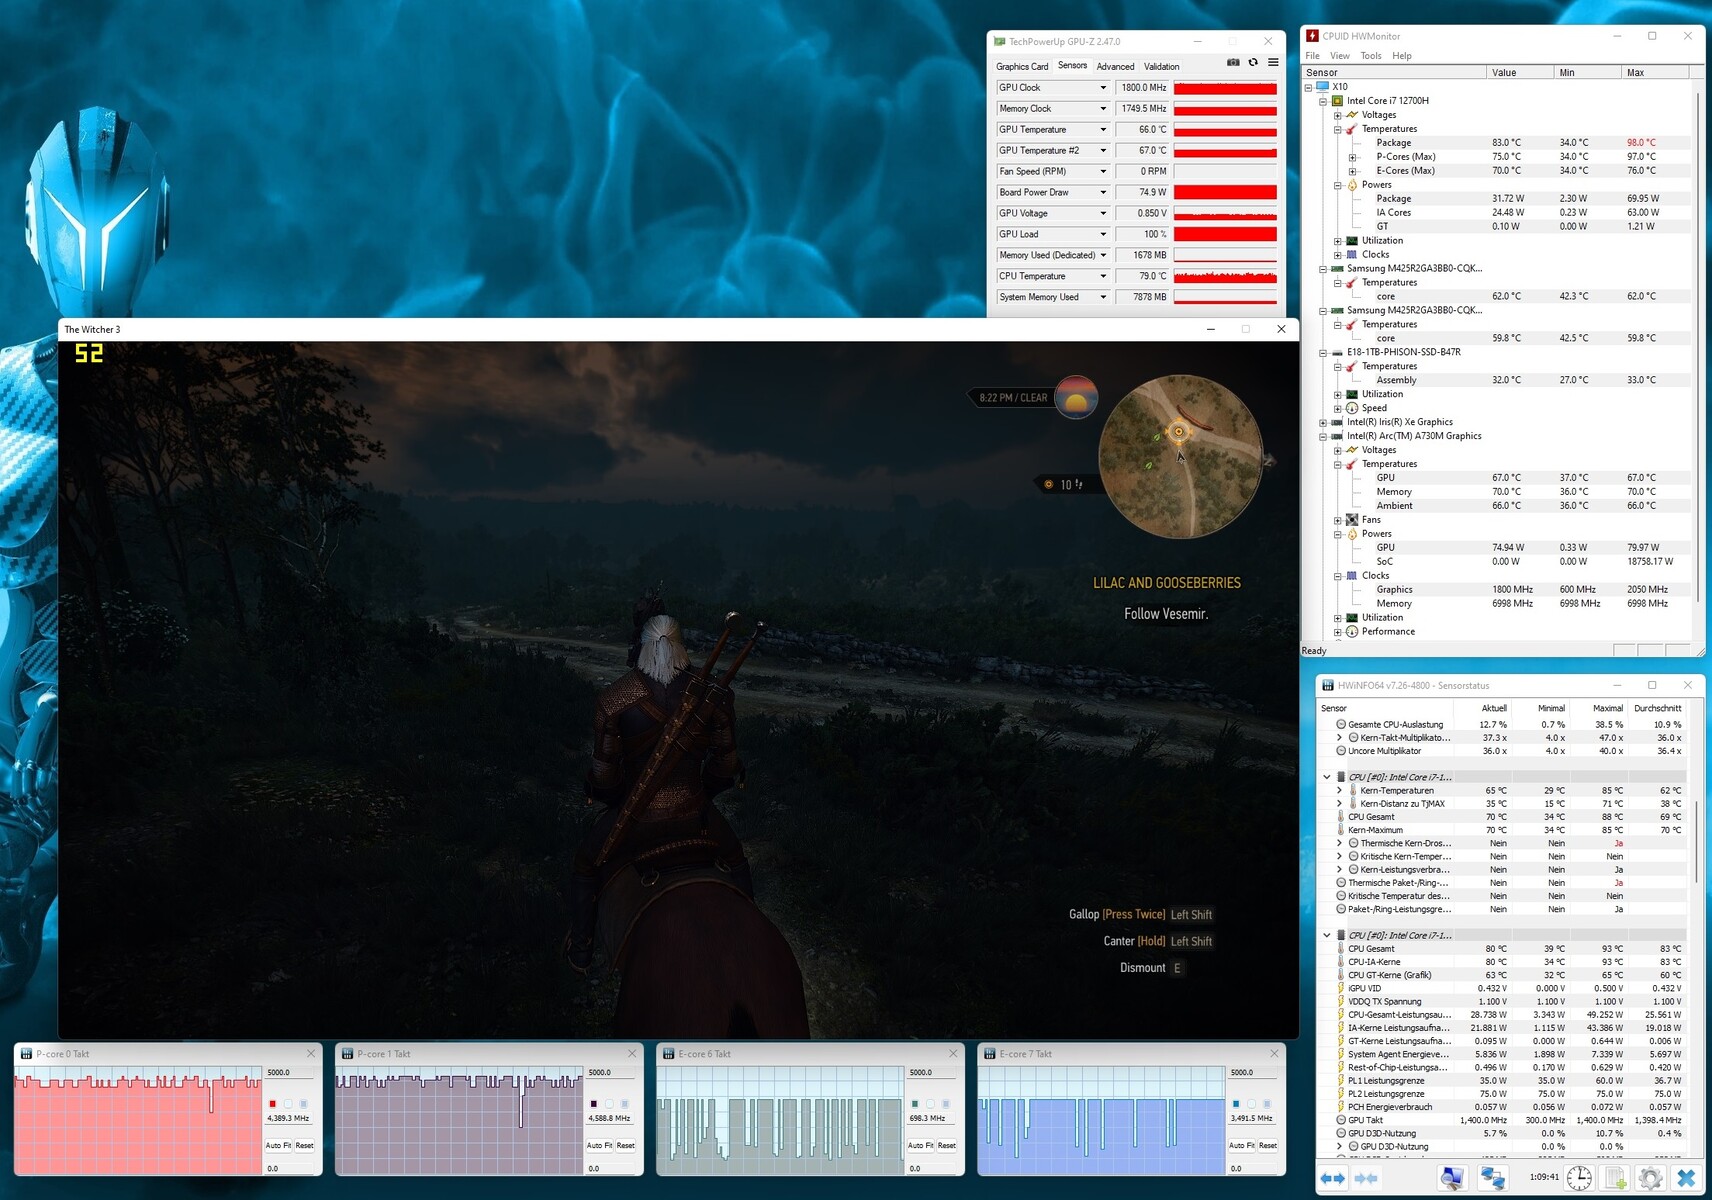
Nós corremos O Witcher 3no laptop por uma hora para verificar quão bem o desempenho 3D se mantém durante um período mais longo. O resultado: não houve queda de desempenho ou qualquer problema semelhante.
Witcher 3 FPS graph
| baixo | média | alto | ultra | QHD | |
|---|---|---|---|---|---|
| GTA V (2015) | 165.9 | 100.3 | 42.8 | ||
| The Witcher 3 (2015) | 212 | 114 | 49.4 | ||
| Dota 2 Reborn (2015) | 109.3 | 94.2 | 90.4 | 80.4 | |
| Final Fantasy XV Benchmark (2018) | 71 | 49.7 | |||
| X-Plane 11.11 (2018) | 57.3 | 47.1 | 38.6 | ||
| Far Cry 5 (2018) | 92 | 83 | 78 | ||
| Strange Brigade (2018) | 178.2 | 148.8 | 124.1 | ||
| Hunt Showdown (2020) | 88.2 | 72.3 | 50.1 | ||
| Doom Eternal (2020) | 112.4 | 104.2 | 101.7 | 70.9 | |
| Gears Tactics (2020) | 147 | 99.2 | 79.7 | 52 | |
| Death Stranding (2020) | 89.8 | 82.9 | 81.9 | 60 | |
| Crysis Remastered (2020) | 125.4 | 60.7 | 50.1 | 34.8 | |
| Serious Sam 4 (2020) | 72.7 | 54.8 | 42.5 | 34.7 | |
| Mafia Definitive Edition (2020) | 55.4 | 52.7 | 36.9 | ||
| Star Wars Squadrons (2020) | 167.1 | 149.4 | 140.6 | 97.4 | |
| Watch Dogs Legion (2020) | 85 | 75 | 48 | 35 | |
| Dirt 5 (2020) | 80.6 | 64.5 | 54 | 44.2 | |
| Assassin´s Creed Valhalla (2020) | 64 | 54 | 48 | 37 | |
| Yakuza Like a Dragon (2020) | 51.3 | 47.3 | 46.1 | 39.4 | |
| Hitman 3 (2021) | 123 | 109 | 102 | 65 | |
| Outriders (2021) | 90 | 76.1 | 69 | 43.9 | |
| Resident Evil Village (2021) | 119.9 | 107.8 | 93.3 | 61.1 | |
| Mass Effect Legendary Edition (2021) | 88.5 | 81.9 | |||
| Days Gone (2021) | 80.2 | 76 | 58.2 | 42 | |
| Deathloop (2021) | 76.2 | 65.5 | 54.6 | 37 | |
| Alan Wake Remastered (2021) | 116.7 | 98.6 | 67.5 | ||
| Far Cry 6 (2021) | 87 | 75 | 65 | 47 | |
| Back 4 Blood (2021) | 132.9 | 115.4 | 105.9 | 68.3 | |
| Guardians of the Galaxy (2021) | 81 | 76 | 73 | 52 | |
| Riders Republic (2021) | 60 | 51 | 47 | 34 | |
| Forza Horizon 5 (2021) | 86 | 80 | 50 | 41 | |
| Farming Simulator 22 (2021) | 136.6 | 110.8 | 107.2 | 80.5 | |
| Halo Infinite (2021) | 67.2 | 59.8 | 56.2 | 42.3 | |
| God of War (2022) | 53.1 | 44.9 | 36.9 | 30.7 | |
| Rainbow Six Extraction (2022) | 103 | 99 | 83 | 55 | |
| Dying Light 2 (2022) | 60.9 | 51.2 | 35.6 | ||
| GRID Legends (2022) | 109 | 91 | 71 | 56.9 | |
| Elden Ring (2022) | 59.9 | 59.7 | 56.9 | 46.2 | |
| Cyberpunk 2077 1.6 (2022) | 71 | 57.5 | 57.4 | 30.9 | |
| Elex 2 (2022) | 49.7 | 48.8 | 43.3 | 36.5 | |
| Ghostwire Tokyo (2022) | 85.4 | 83.6 | 83.3 | 52.3 | |
| Tiny Tina's Wonderlands (2022) | 86.6 | 64.6 | 52 | 35.5 | |
| Vampire Bloodhunt (2022) | 135.8 | 121.5 | 111.9 | 71.4 | |
| F1 22 (2022) | 124 | 104 | 35 | 23.4 | |
| The Quarry (2022) | 58.9 | 47.5 | 38.1 | 24.8 |
Emissões
Emissões sonoras
O Major X10 é claramente audível quando executado no modo de jogo. Os níveis de ruído podem atingir 49 a 51 dB(A) sob carga, o que muitos usuários provavelmente considerarão irritante. Dito isto, outros laptops para jogos podem ser tão barulhentos ou até mais barulhentos que o Major X10. Nós definitivamente recomendaríamos o uso de fones de ouvido. Ao ocioso, pode-se esperar que o dispositivo produza 30 a 31 dB(A) de ruído, o que é bastante perceptível, mas não particularmente silencioso. O notebook de 16 polegadas raramente é completamente silencioso, uma vez que os ventiladores normalmente estão funcionando.
Barulho
| Ocioso |
| 25 / 30 / 31 dB |
| Carga |
| 49 / 51 dB |
 | ||
30 dB silencioso 40 dB(A) audível 50 dB(A) ruidosamente alto |
||
min: | ||
| Medion Erazer Major X10 i7-12700H, A730M | Asus TUF Gaming F17 FX707Z-HX011W i7-12700H, GeForce RTX 3060 Laptop GPU | Acer Nitro 5 AN517-55-738R i7-12700H, GeForce RTX 3060 Laptop GPU | Dell Inspiron 16 Plus 7620 i7-12700H, GeForce RTX 3050 Ti Laptop GPU | HP Omen 16-c0077ng R7 5800H, Radeon RX 6600M | |
|---|---|---|---|---|---|
| Noise | 11% | -3% | 4% | -6% | |
| desligado / ambiente * (dB) | 25 | 24 4% | 25.5 -2% | 23.3 7% | 25 -0% |
| Idle Minimum * (dB) | 25 | 24 4% | 25.5 -2% | 25.7 -3% | 25 -0% |
| Idle Average * (dB) | 30 | 24 20% | 25.5 15% | 26.1 13% | 31.2 -4% |
| Idle Maximum * (dB) | 31 | 24 23% | 27 13% | 30.6 1% | 33.8 -9% |
| Load Average * (dB) | 49 | 42.6 13% | 52.6 -7% | 46.2 6% | 55.4 -13% |
| Witcher 3 ultra * (dB) | 50 | 46.84 6% | 49.2 2% | ||
| Load Maximum * (dB) | 51 | 46.84 8% | 68.2 -34% | 49.4 3% | 56 -10% |
* ... menor é melhor
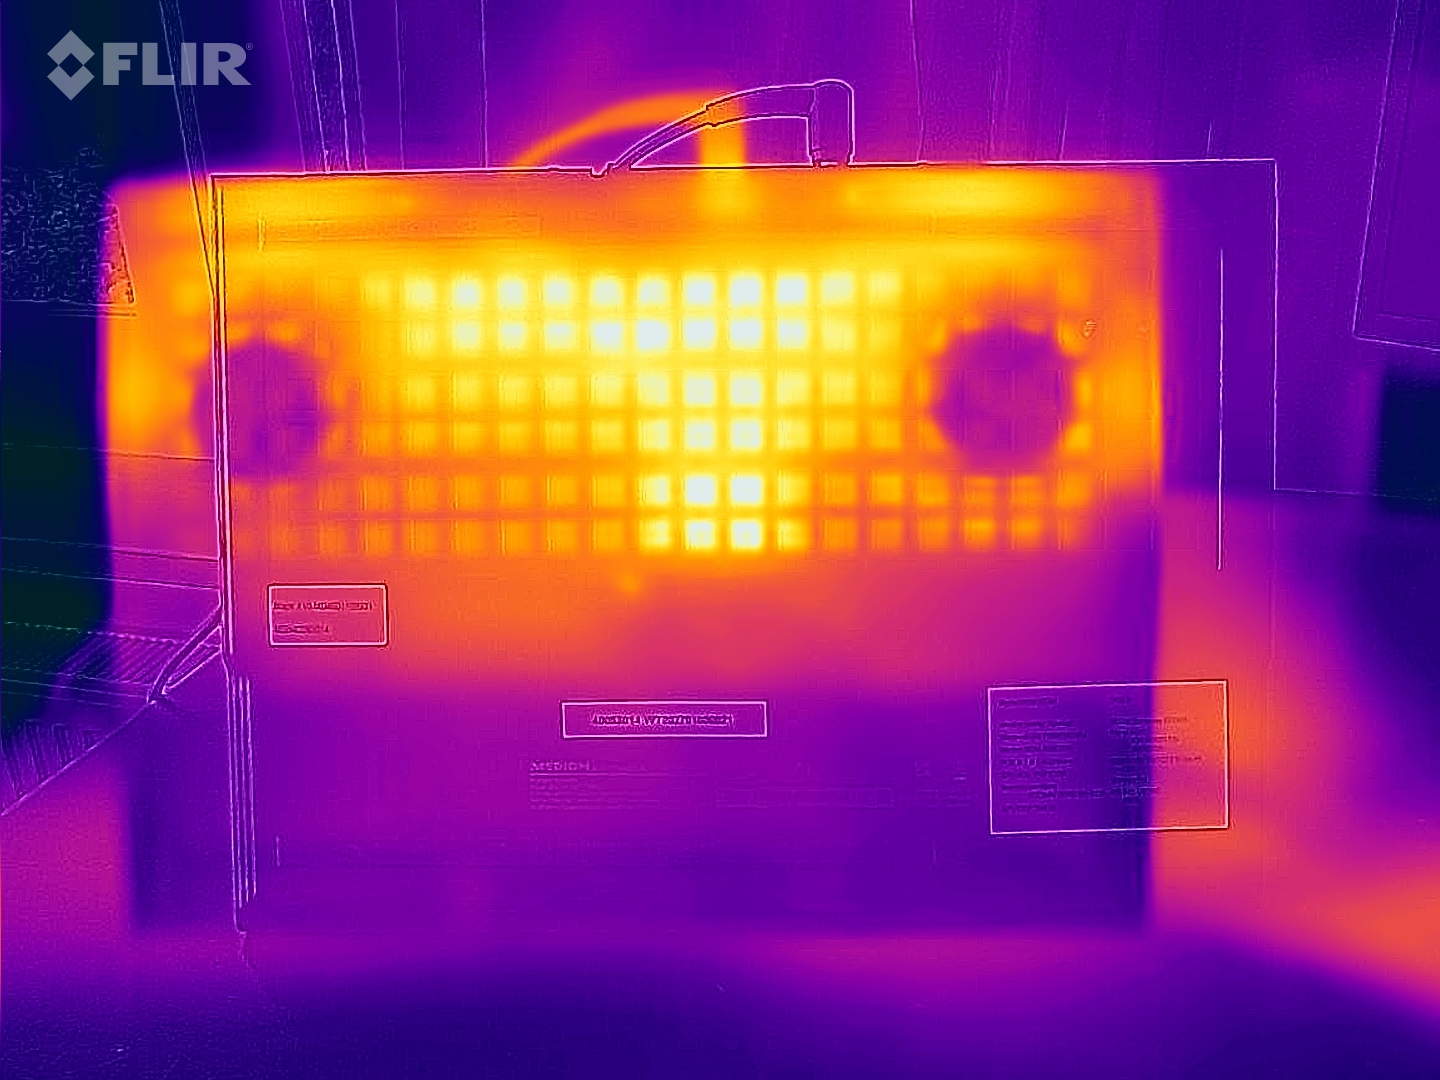
Temperatura
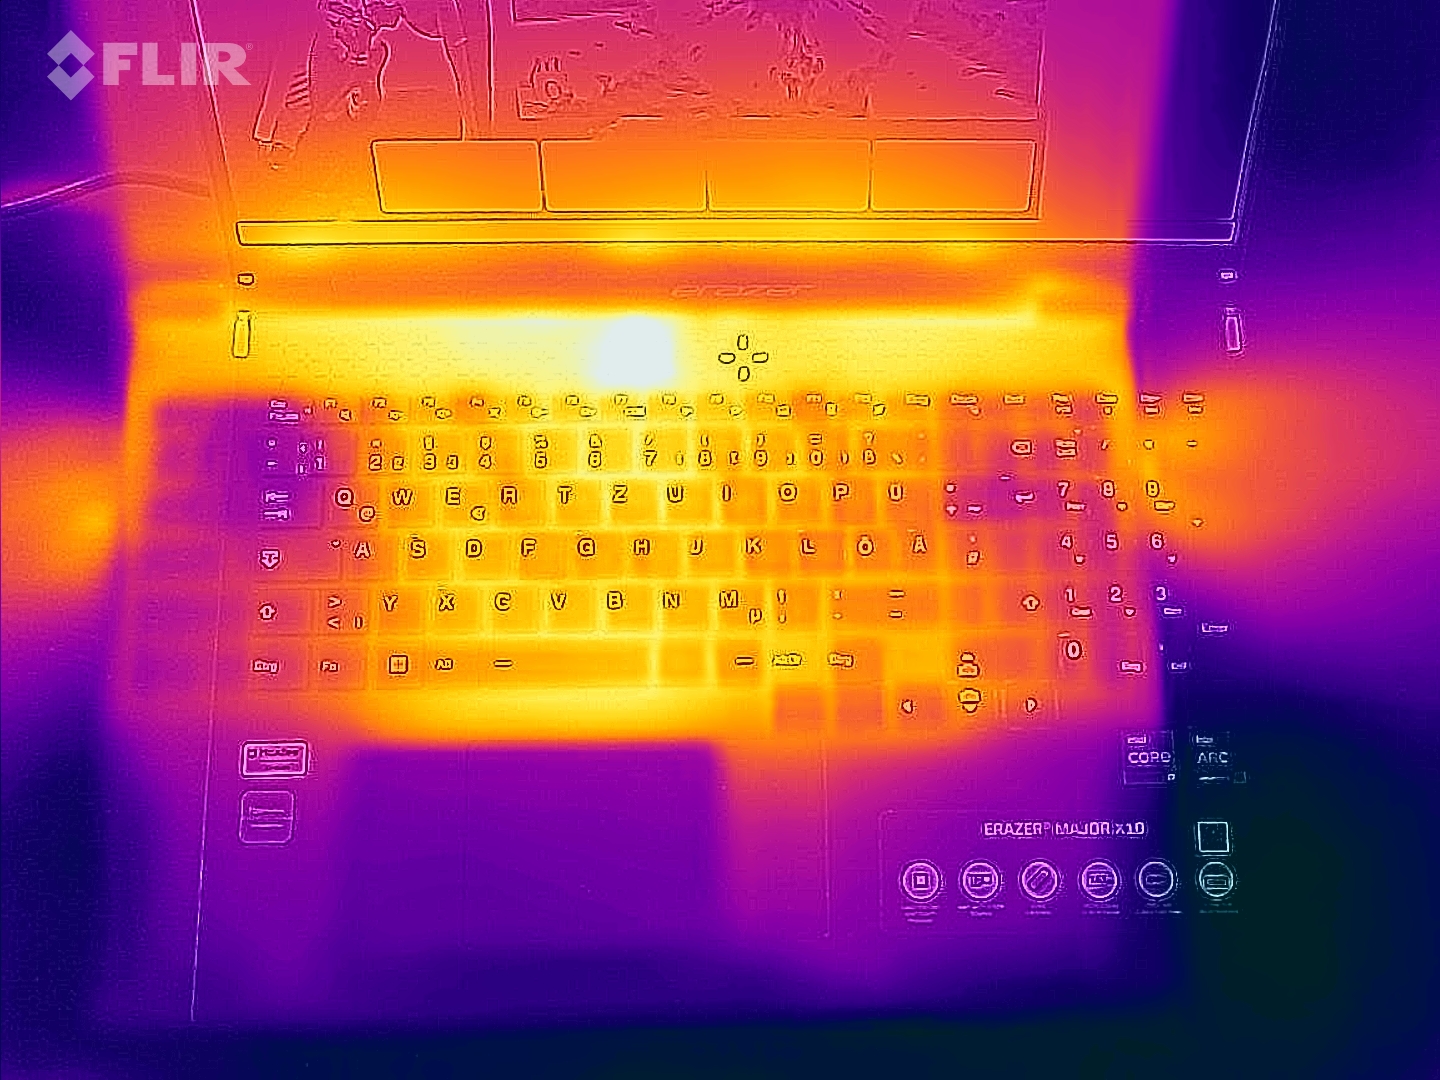
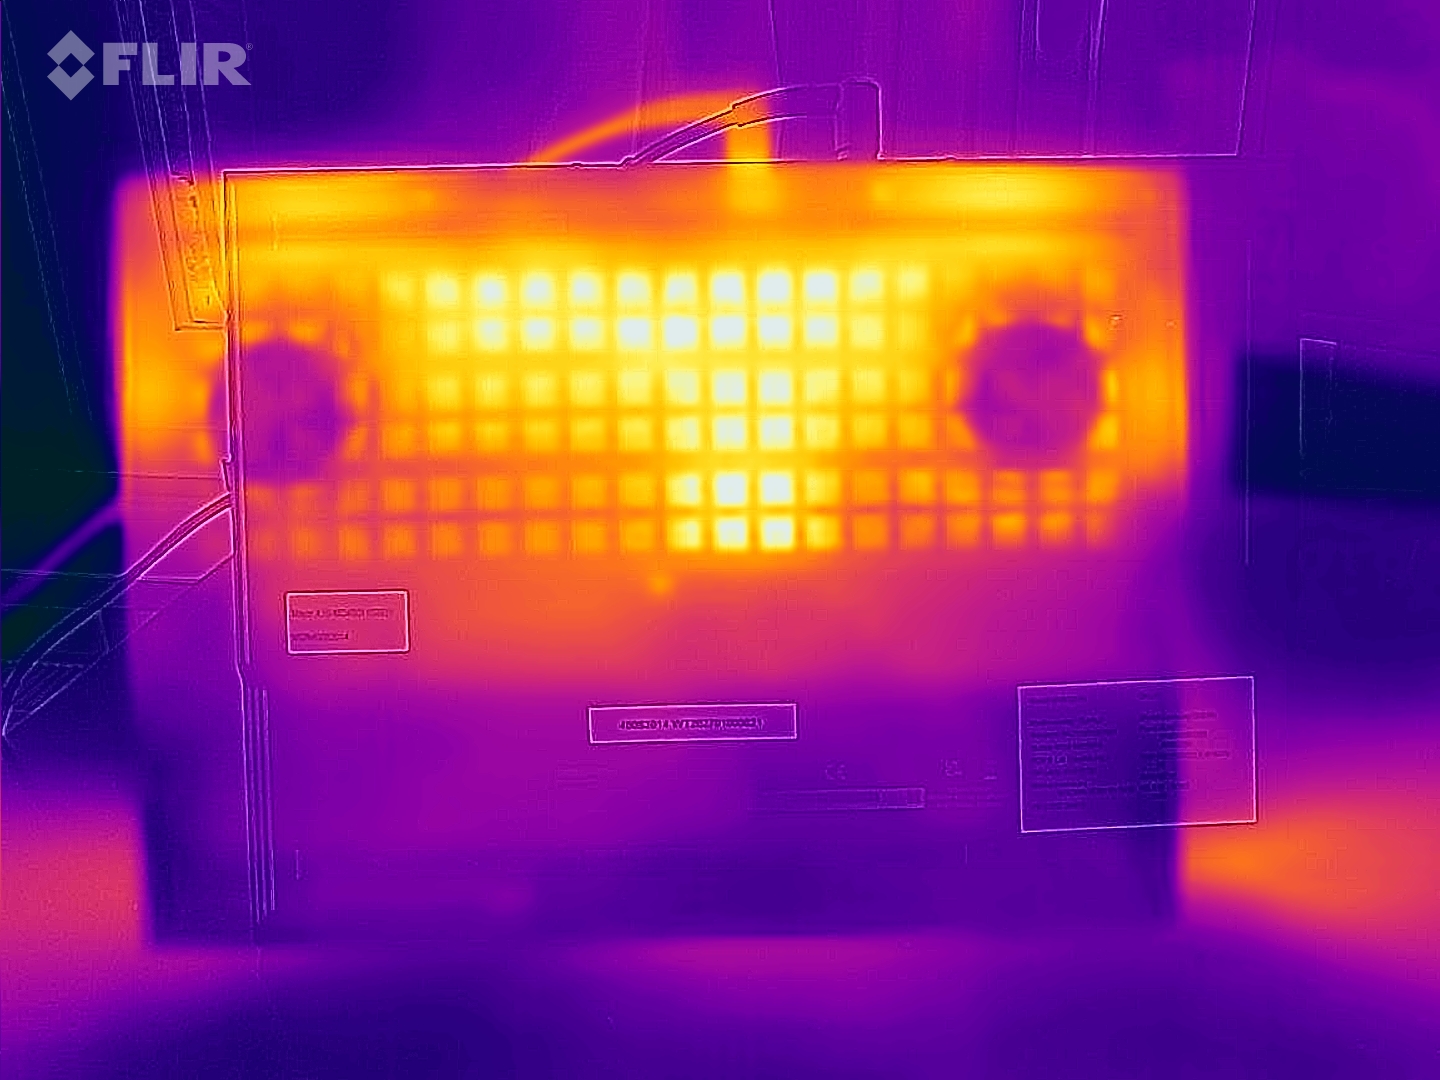
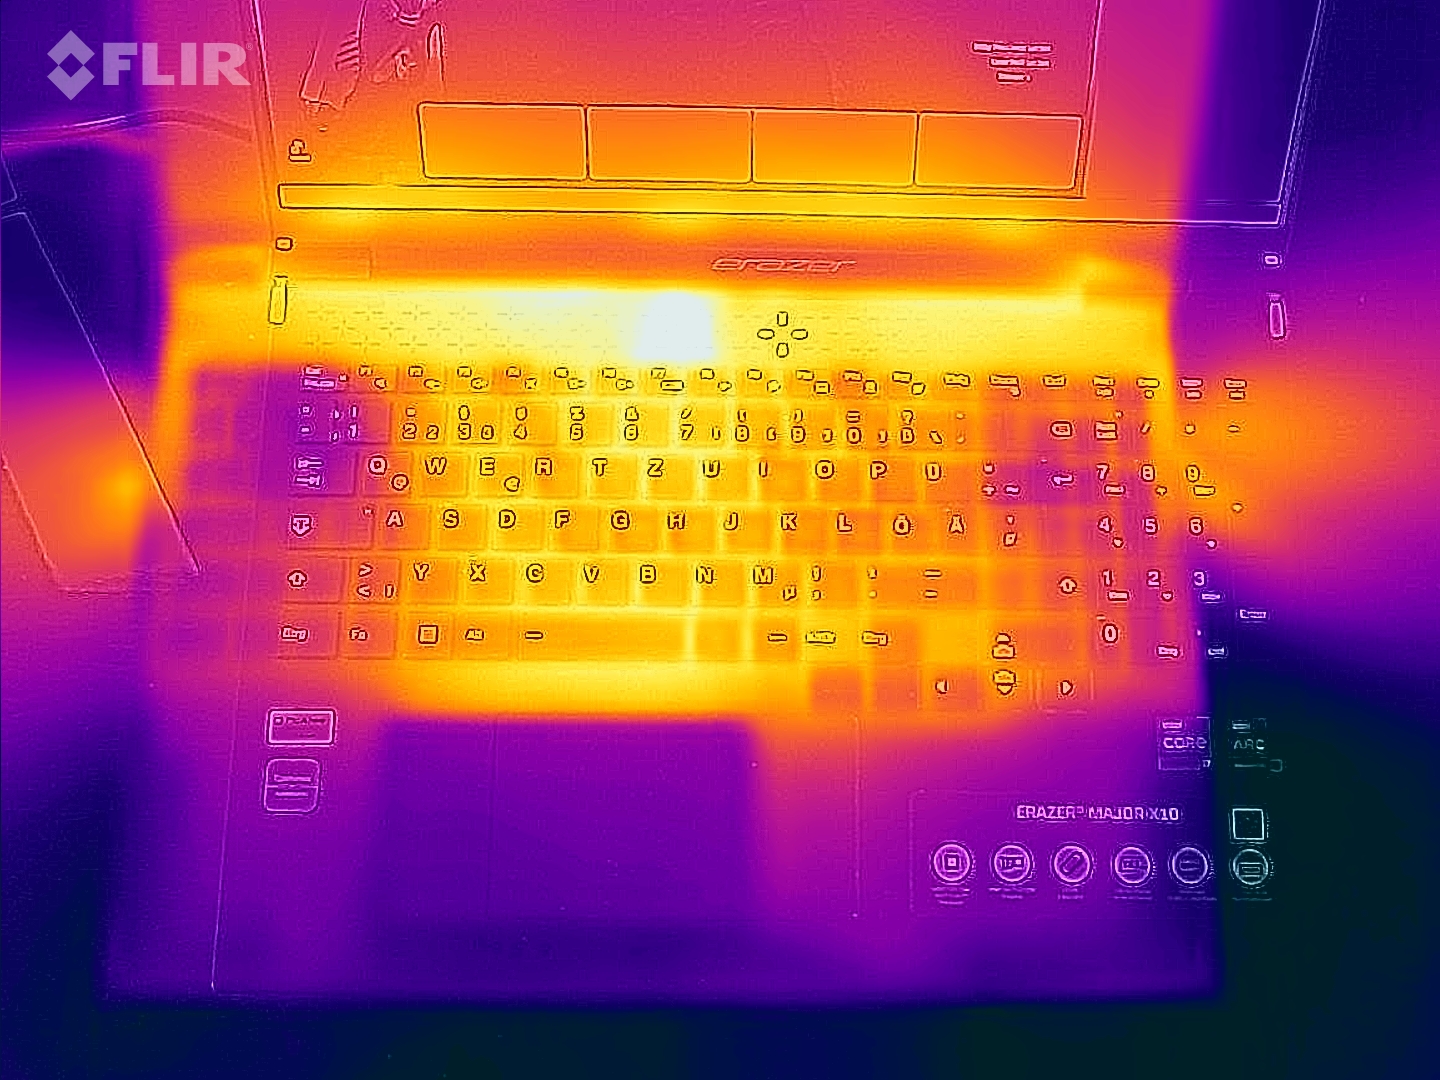
A temperatura do chassi nos deixou com sentimentos mistos. Por um lado, o chassi é mais quente do que seus concorrentes ao ralenti, atingindo até 45°C (113°F) no topo e 48°C (118°F) na parte inferior. Por outro lado, não fica muito mais quente enquanto o dispositivo está funcionando com carga máxima. No entanto, provavelmente você ainda não deve colocar o dispositivo em seu colo durante as sessões de jogo.
(±) A temperatura máxima no lado superior é 45 °C / 113 F, em comparação com a média de 40.4 °C / 105 F , variando de 21.2 a 68.8 °C para a classe Gaming.
(-) A parte inferior aquece até um máximo de 48 °C / 118 F, em comparação com a média de 43.2 °C / 110 F
(±) Em uso inativo, a temperatura média para o lado superior é 32.7 °C / 91 F, em comparação com a média do dispositivo de 33.9 °C / ### class_avg_f### F.
(-) Jogando The Witcher 3, a temperatura média para o lado superior é 40.9 °C / 106 F, em comparação com a média do dispositivo de 33.9 °C / ## #class_avg_f### F.
(±) Os apoios para as mãos e o touchpad podem ficar muito quentes ao toque, com um máximo de 38 °C / 100.4 F.
(-) A temperatura média da área do apoio para as mãos de dispositivos semelhantes foi 28.8 °C / 83.8 F (-9.2 °C / -16.6 F).
| Medion Erazer Major X10 i7-12700H, A730M | Asus TUF Gaming F17 FX707Z-HX011W i7-12700H, GeForce RTX 3060 Laptop GPU | Acer Nitro 5 AN517-55-738R i7-12700H, GeForce RTX 3060 Laptop GPU | Dell Inspiron 16 Plus 7620 i7-12700H, GeForce RTX 3050 Ti Laptop GPU | HP Omen 16-c0077ng R7 5800H, Radeon RX 6600M | |
|---|---|---|---|---|---|
| Heat | 6% | 1% | 12% | 15% | |
| Maximum Upper Side * (°C) | 45 | 52 -16% | 48.3 -7% | 46 -2% | 40.6 10% |
| Maximum Bottom * (°C) | 48 | 47 2% | 52 -8% | 45.8 5% | 36 25% |
| Idle Upper Side * (°C) | 38 | 31 18% | 34.5 9% | 29.2 23% | 31.3 18% |
| Idle Bottom * (°C) | 39 | 31 21% | 35.8 8% | 31 21% | 36 8% |
* ... menor é melhor
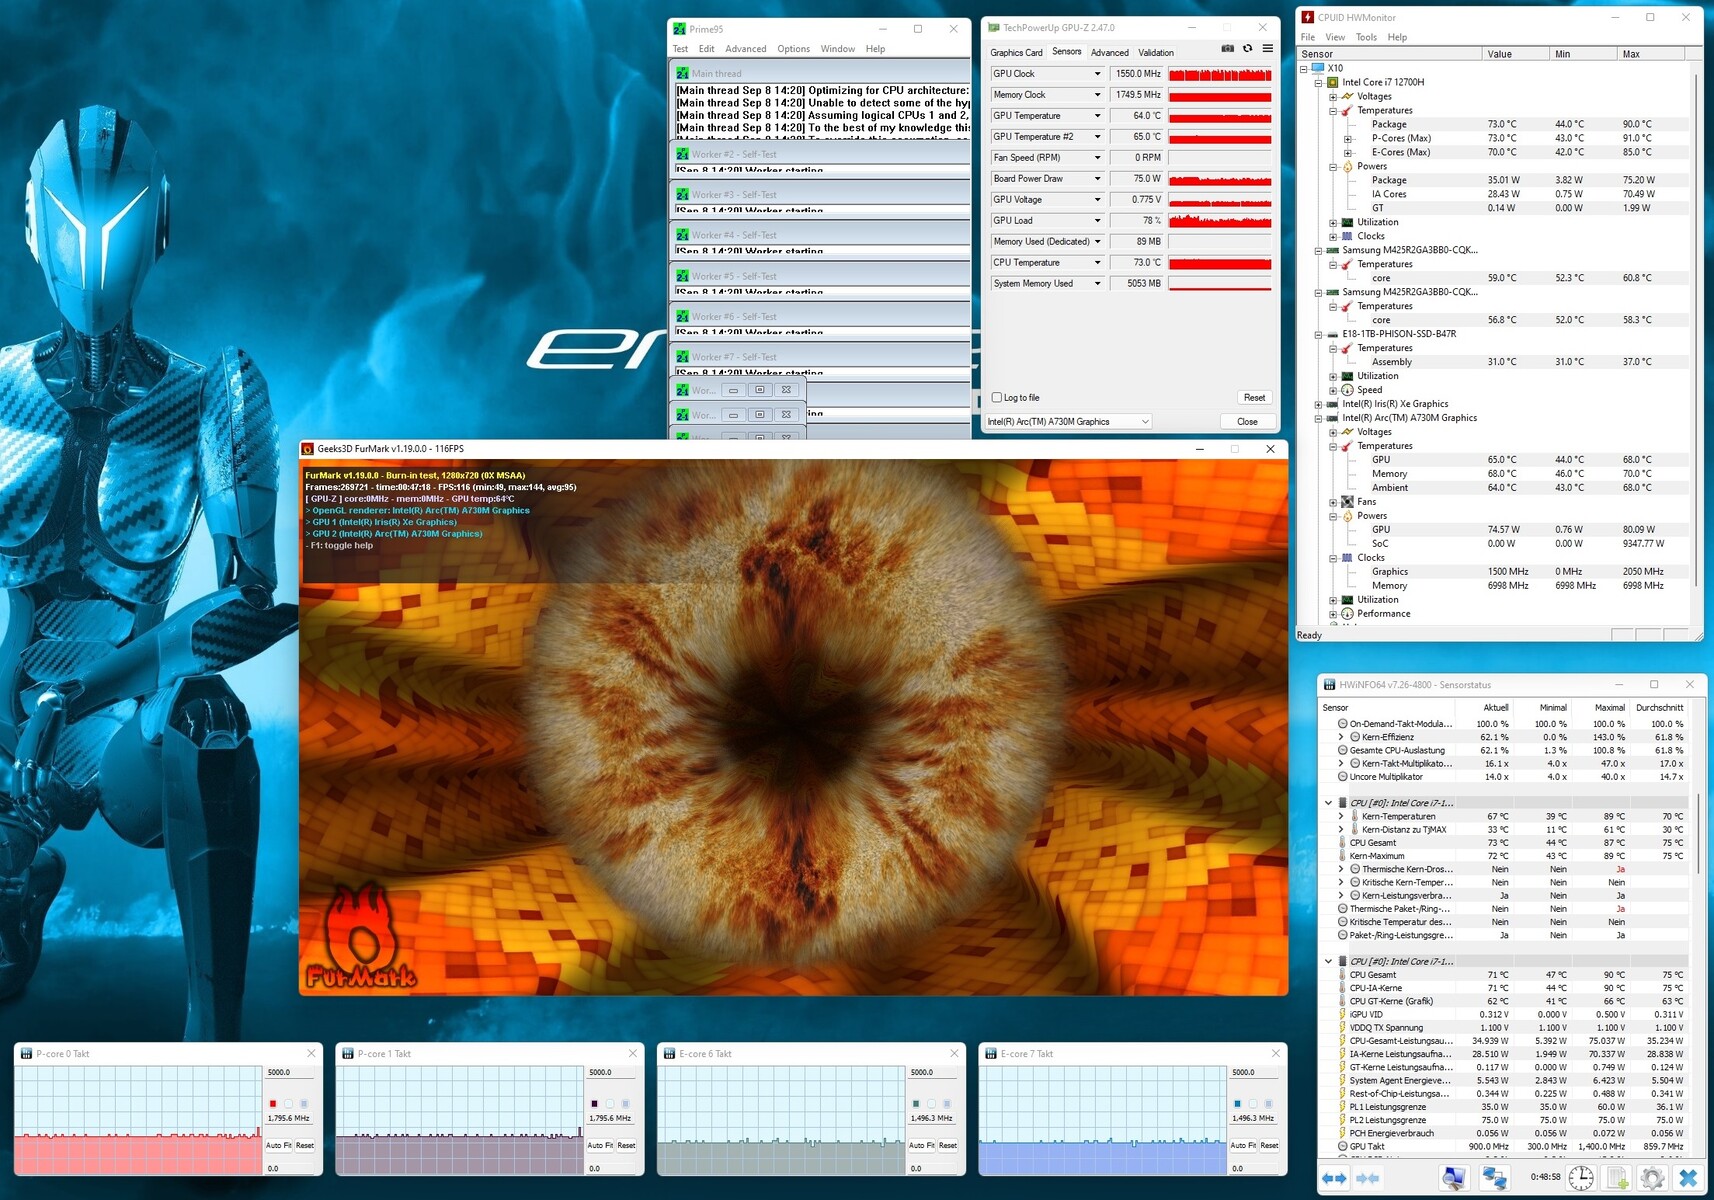
Teste de estresse
Similar ao teste Witcher 3, o Arco A730M completou o teste de estresse de uma hora (rodando FurMark e Prime95) com uma temperatura média de cerca de 65°C (149°F). Enquanto isso, o Core i7-12700H passou pelo teste e funcionou a pouco mais de 70°C (158°F), o que também é absolutamente seguro para a CPU.
Medion Erazer Major X10 análise de áudio
(+) | os alto-falantes podem tocar relativamente alto (###valor### dB)
Graves 100 - 315Hz
(-) | quase nenhum baixo - em média 16.1% menor que a mediana
(±) | a linearidade dos graves é média (12.9% delta para a frequência anterior)
Médios 400 - 2.000 Hz
(±) | médios mais altos - em média 6.9% maior que a mediana
(+) | médios são lineares (4.3% delta para frequência anterior)
Altos 2 - 16 kHz
(+) | agudos equilibrados - apenas 3.2% longe da mediana
(+) | os máximos são lineares (6.7% delta da frequência anterior)
Geral 100 - 16.000 Hz
(±) | a linearidade do som geral é média (17.5% diferença em relação à mediana)
Comparado com a mesma classe
» 49% de todos os dispositivos testados nesta classe foram melhores, 12% semelhantes, 39% piores
» O melhor teve um delta de 6%, a média foi 18%, o pior foi 132%
Comparado com todos os dispositivos testados
» 34% de todos os dispositivos testados foram melhores, 8% semelhantes, 58% piores
» O melhor teve um delta de 4%, a média foi 23%, o pior foi 134%
Asus TUF Gaming F17 FX707Z-HX011W análise de áudio
(±) | o volume do alto-falante é médio, mas bom (###valor### dB)
Graves 100 - 315Hz
(±) | graves reduzidos - em média 13.1% menor que a mediana
(±) | a linearidade dos graves é média (9% delta para a frequência anterior)
Médios 400 - 2.000 Hz
(±) | médios mais altos - em média 9.1% maior que a mediana
(±) | a linearidade dos médios é média (7.8% delta para frequência anterior)
Altos 2 - 16 kHz
(+) | agudos equilibrados - apenas 3.9% longe da mediana
(±) | a linearidade dos máximos é média (9.1% delta para frequência anterior)
Geral 100 - 16.000 Hz
(±) | a linearidade do som geral é média (20.4% diferença em relação à mediana)
Comparado com a mesma classe
» 72% de todos os dispositivos testados nesta classe foram melhores, 6% semelhantes, 22% piores
» O melhor teve um delta de 6%, a média foi 18%, o pior foi 132%
Comparado com todos os dispositivos testados
» 54% de todos os dispositivos testados foram melhores, 8% semelhantes, 38% piores
» O melhor teve um delta de 4%, a média foi 23%, o pior foi 134%
Oradores
A qualidade sonora do Major X10 é média entre os laptops de jogos. Como muitas vezes acontece, os alto-falantes carecem principalmente de graves. Portanto, você deve pegar um par de fones de ouvido sempre que possível se quiser realmente curtir música e vídeos no laptop.
Gerenciamento de energia
Consumo de energia
É difícil entender porque a Medion incluiu uma fonte de alimentação volumosa de 300 watts com o laptop. O Major X10 não utilizou mais de 220 watts durante nosso teste de estresse, sugerindo que um carregador mais compacto de 230 watts teria feito mais sentido. Sob carga, o dispositivo consome de 122 a 220 watts de potência, o que é semelhante aos laptops equipados com um RTX 3060. No entanto, seu alto consumo de energia ociosa de 24 a 36 watts o coloca firmemente na parte inferior do grupo de comparação.
| desligado | |
| Ocioso | |
| Carga |
|
Key:
min: | |
| Medion Erazer Major X10 i7-12700H, A730M | Asus TUF Gaming F17 FX707Z-HX011W i7-12700H, GeForce RTX 3060 Laptop GPU | Acer Nitro 5 AN517-55-738R i7-12700H, GeForce RTX 3060 Laptop GPU | Dell Inspiron 16 Plus 7620 i7-12700H, GeForce RTX 3050 Ti Laptop GPU | HP Omen 16-c0077ng R7 5800H, Radeon RX 6600M | Média da turma Gaming | |
|---|---|---|---|---|---|---|
| Power Consumption | 33% | 23% | 43% | 13% | 19% | |
| Idle Minimum * (Watt) | 24 | 6.6 73% | 9.7 60% | 6.8 72% | 12 50% | 13 ? 46% |
| Idle Average * (Watt) | 26 | 8.3 68% | 14.6 44% | 9.6 63% | 12.8 51% | 19 ? 27% |
| Idle Maximum * (Watt) | 36 | 11.8 67% | 16.7 54% | 17 53% | 18.5 49% | 24.6 ? 32% |
| Load Average * (Watt) | 122 | 119 2% | 166 -36% | 117.5 4% | 190 -56% | 110.7 ? 9% |
| Witcher 3 ultra * (Watt) | 155.6 | 169 -9% | 113.1 27% | 194 -25% | ||
| Load Maximum * (Watt) | 220 | 222 -1% | 235 -7% | 137.4 38% | 200 9% | 259 ? -18% |
* ... menor é melhor
Power consumption Witcher 3 / Stress test
Power consumption with external monitor
Duração da bateria
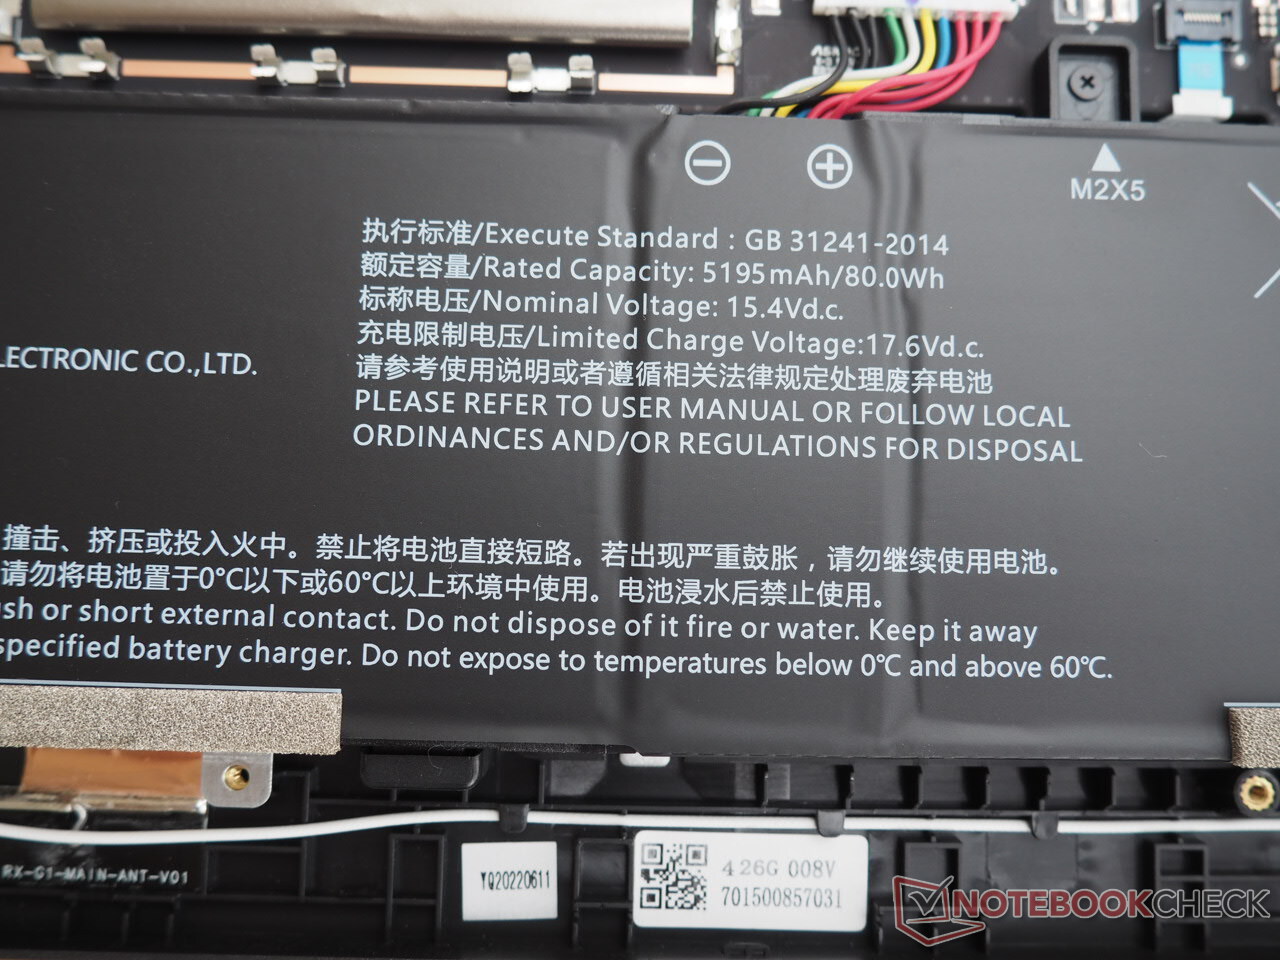
Apesar de sua capacidade de bateria decente (80 Wh), o Major X10 não tem exatamente grande resistência e muitas vezes fica atrás da concorrência neste aspecto. No entanto, ele durou 6,5 horas quando o utilizamos para navegar na Internet via Wi-Fi com brilho médio da tela.
| Medion Erazer Major X10 i7-12700H, A730M, 80 Wh | Asus TUF Gaming F17 FX707Z-HX011W i7-12700H, GeForce RTX 3060 Laptop GPU, 90 Wh | Acer Nitro 5 AN517-55-738R i7-12700H, GeForce RTX 3060 Laptop GPU, 90.61 Wh | Dell Inspiron 16 Plus 7620 i7-12700H, GeForce RTX 3050 Ti Laptop GPU, 86 Wh | HP Omen 16-c0077ng R7 5800H, Radeon RX 6600M, 70 Wh | Média da turma Gaming | |
|---|---|---|---|---|---|---|
| Duração da bateria | 109% | 59% | 73% | -9% | 32% | |
| Reader / Idle (h) | 8.2 | 11.7 43% | 18.6 127% | 8.27 ? 1% | ||
| WiFi v1.3 (h) | 6.7 | 8.7 30% | 6.5 -3% | 9.6 43% | 6.1 -9% | 7.11 ? 6% |
| Load (h) | 0.8 | 2.3 187% | 1.9 137% | 1.2 50% | 1.502 ? 88% | |
| H.264 (h) | 7.7 | 5.3 | 7 | 8.32 ? | ||
| Witcher 3 ultra (h) | 1.4 |
Pro
Contra
Veredicto
Demasiado caro para o desempenho do jogo que oferece: é assim que o Medion Erazer Major X10 poderia ser resumido em poucas palavras
Enquanto o Intel Arc A730M tem um desempenho relativamente bom em benchmarks sintéticos e coloca uma boa luta contra o GeForce RTX 3060 e Radeon RX 6600M, suas várias fraquezas e outliers de desempenho se tornam aparentes nos jogos reais, com níveis de desempenho equivalentes ou ainda piores que um GeForce RTX 3050 Ti. Portanto, é difícil recomendar o Arco A730M em termos de relação custo-benefício, especialmente considerando sua eficiência de poder ainda deixa algo a desejar
Caso contrário, o Major X10 é bastante impressionante em sua maior parte. Em particular, a tela de 16 polegadas fornece uma razão convincente para a compra do laptop devido a sua relação de aspecto 16:10, alta resolução (2.560 x 1.600), alto brilho de pico e ótima reprodução de cores.
Em geral, só recomendamos o Major X10 aos fãs hardcore da Intel ou àqueles que são extremamente particulares em relação às telas. Todos os outros jogadores que precisam ou querem ver seu orçamento deveriam provavelmente dar uma olhada em um laptop com um RTX 3060 ou uma GPU que tenha desempenho semelhante. A Medion oferece atualmente alguns dispositivos com tais especificações (sem mencionar que eles são muitas vezes mais baratos).
Preço e disponibilidade
O Erazer Major X10 com um Core i7-12700H, Arc A730M, 32 GB de RAM e 1 TB de armazenamento SSD custa cerca de 1.700 Euros (US$1.728) e pode ser adquirido na loja online alemã da Medion https://www.medion.com/de/shop/p/core-gaming-notebooks-medion-erazer-major-x10-intel-core-i7-12700h-windows-11-home-40-6-cm-16-0--qhd-display-100-srgb-mit-165-hz-intel-arc-a730m-1-tb-pcie-ssd-32-gb-ram-high-end-gaming-notebook-30034414A1. O laptop ainda não está disponível em outras regiões no momento desta revisão.
Medion Erazer Major X10
- 09/12/2022 v7 (old)
Florian Glaser
Price comparison

