Revisão do Medion Erazer Beast X40: Caderno de jogos com RTX 4090

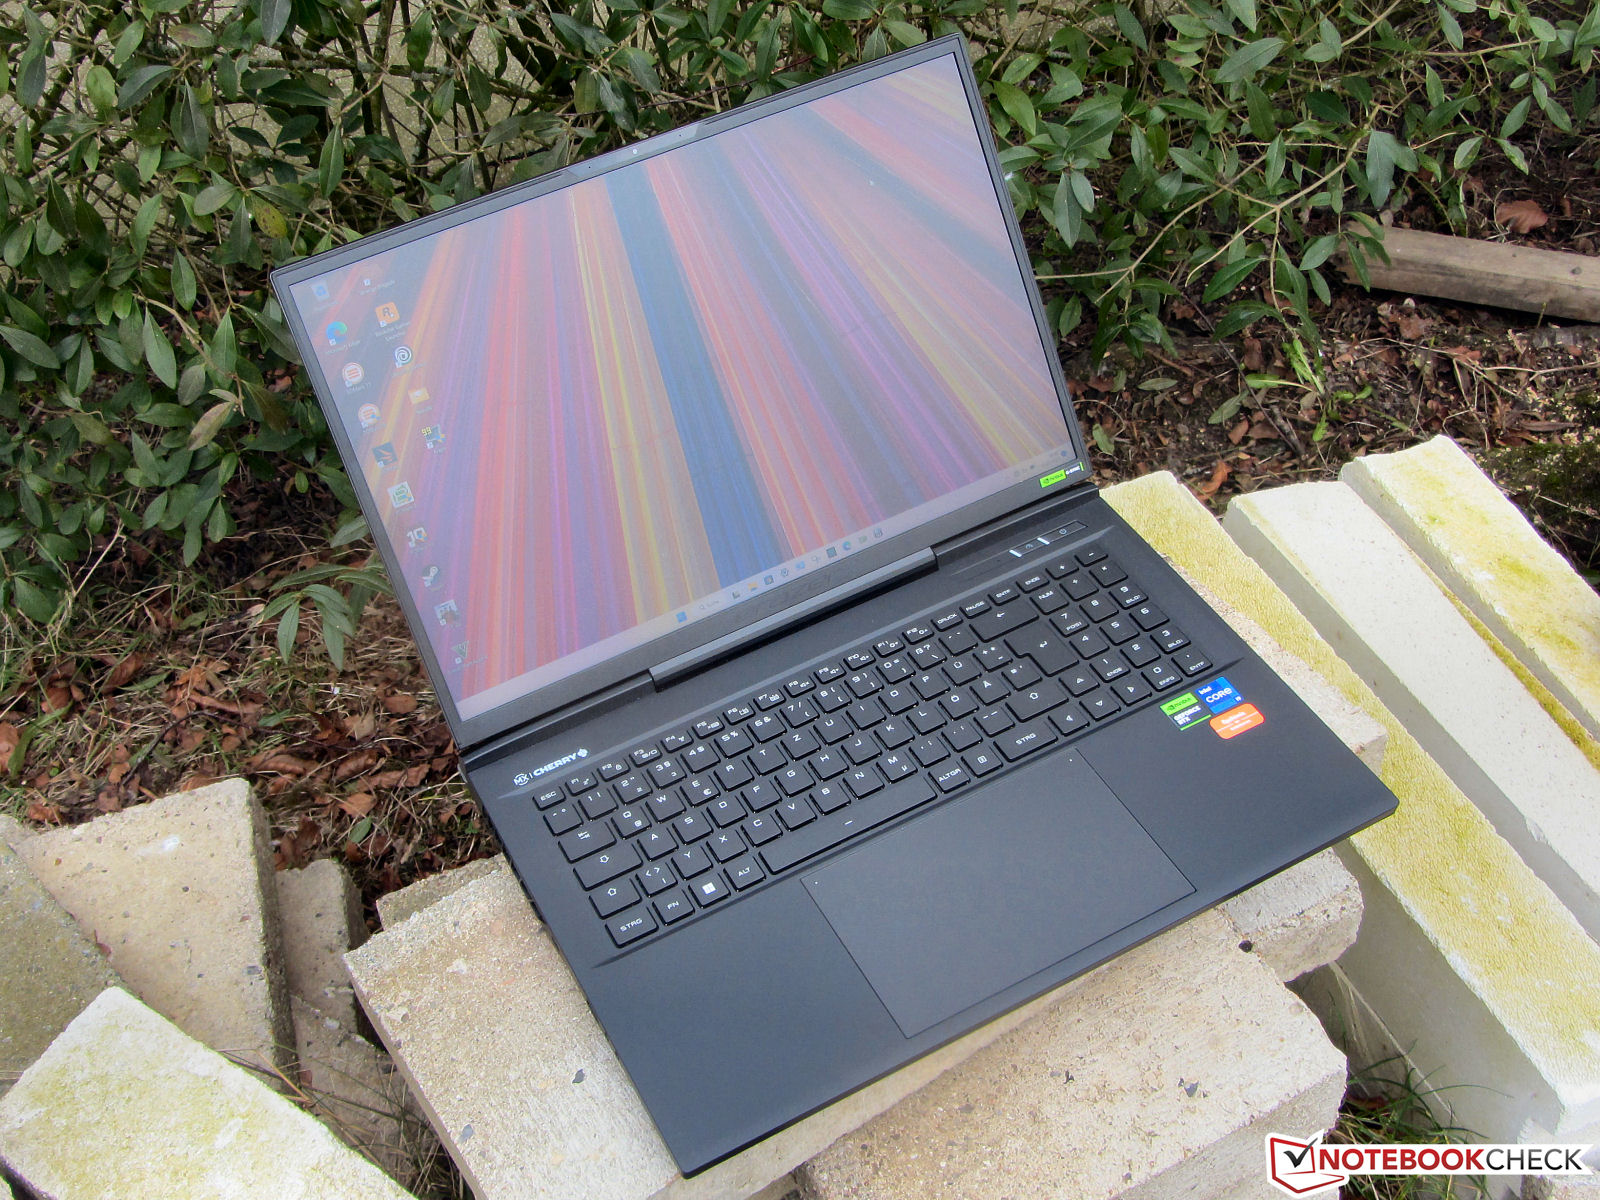
Embora se enquadre na categoria de laptops para jogos, o Erazer Beast X40 também é concebido para outros cenários de uso muito exigentes. A performance computacional necessária é fornecida por uma CPU Raptor Lake e uma GPU Ada Lovelace. Em comparação com seus predecessores Revisão do Medion Erazer Beast X30: Caderno de jogos QHD magro e poderoso , o laptop recebeu uma grande reforma: Medion lhe deu uma nova relação de aspecto de tela (16:10 em vez de 16:9), um sistema de resfriamento com resfriamento de água opcional e um teclado mecânico.
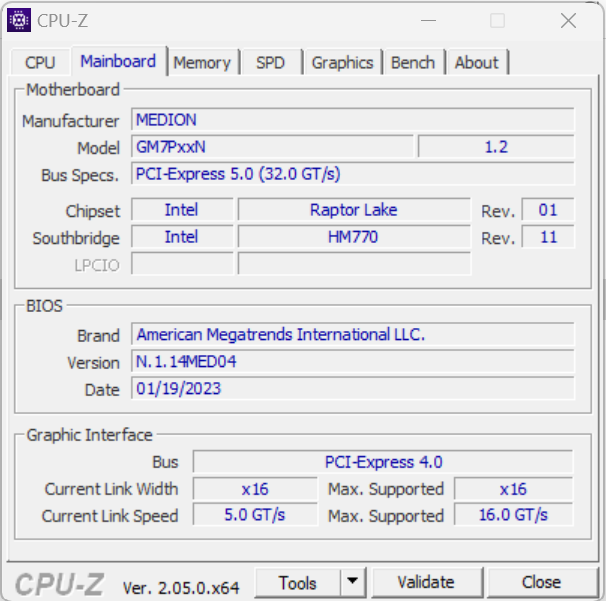
O X40 é baseado em um barebone Tongfang (GM7PX9N) que é em sua maioria idêntico ao utilizado para o XMG Neo 17. Ele está competindo com os MSI Titan GT77 HX 13VI, Alienware x17 R2 P48E, Lâmina Razer 16 (início de 2023)e Asus ROG Strix Scar 18 2023 G834JY.
Possíveis concorrentes em comparação
Avaliação | Data | Modelo | Peso | Altura | Size | Resolução | Preço |
|---|---|---|---|---|---|---|---|
| 88.4 % v7 (old) | 03/2023 | Medion Erazer Beast X40 i9-13900HX, GeForce RTX 4090 Laptop GPU | 2.9 kg | 33 mm | 17.00" | 2560x1600 | |
| 89 % v7 (old) | 02/2023 | MSI Titan GT77 HX 13VI i9-13950HX, GeForce RTX 4090 Laptop GPU | 3.5 kg | 23 mm | 17.30" | 3840x2160 | |
| 91.2 % v7 (old) | 02/2023 | Razer Blade 16 Early 2023 i9-13950HX, GeForce RTX 4080 Laptop GPU | 2.4 kg | 21.99 mm | 16.00" | 2560x1600 | |
| 87.6 % v7 (old) | 09/2022 | Schenker XMG Neo 17 M22 R9 6900HX, GeForce RTX 3080 Ti Laptop GPU | 2.8 kg | 27 mm | 17.00" | 2560x1600 | |
| 89.2 % v7 (old) | 05/2022 | Alienware x17 R2 P48E i9-12900HK, GeForce RTX 3080 Ti Laptop GPU | 3.1 kg | 20.9 mm | 17.30" | 1920x1080 | |
| 86.6 % v7 (old) | 02/2023 | Asus ROG Strix Scar 18 2023 G834JY-N6005W i9-13980HX, GeForce RTX 4090 Laptop GPU | 3.1 kg | 30.8 mm | 18.00" | 2560x1600 |
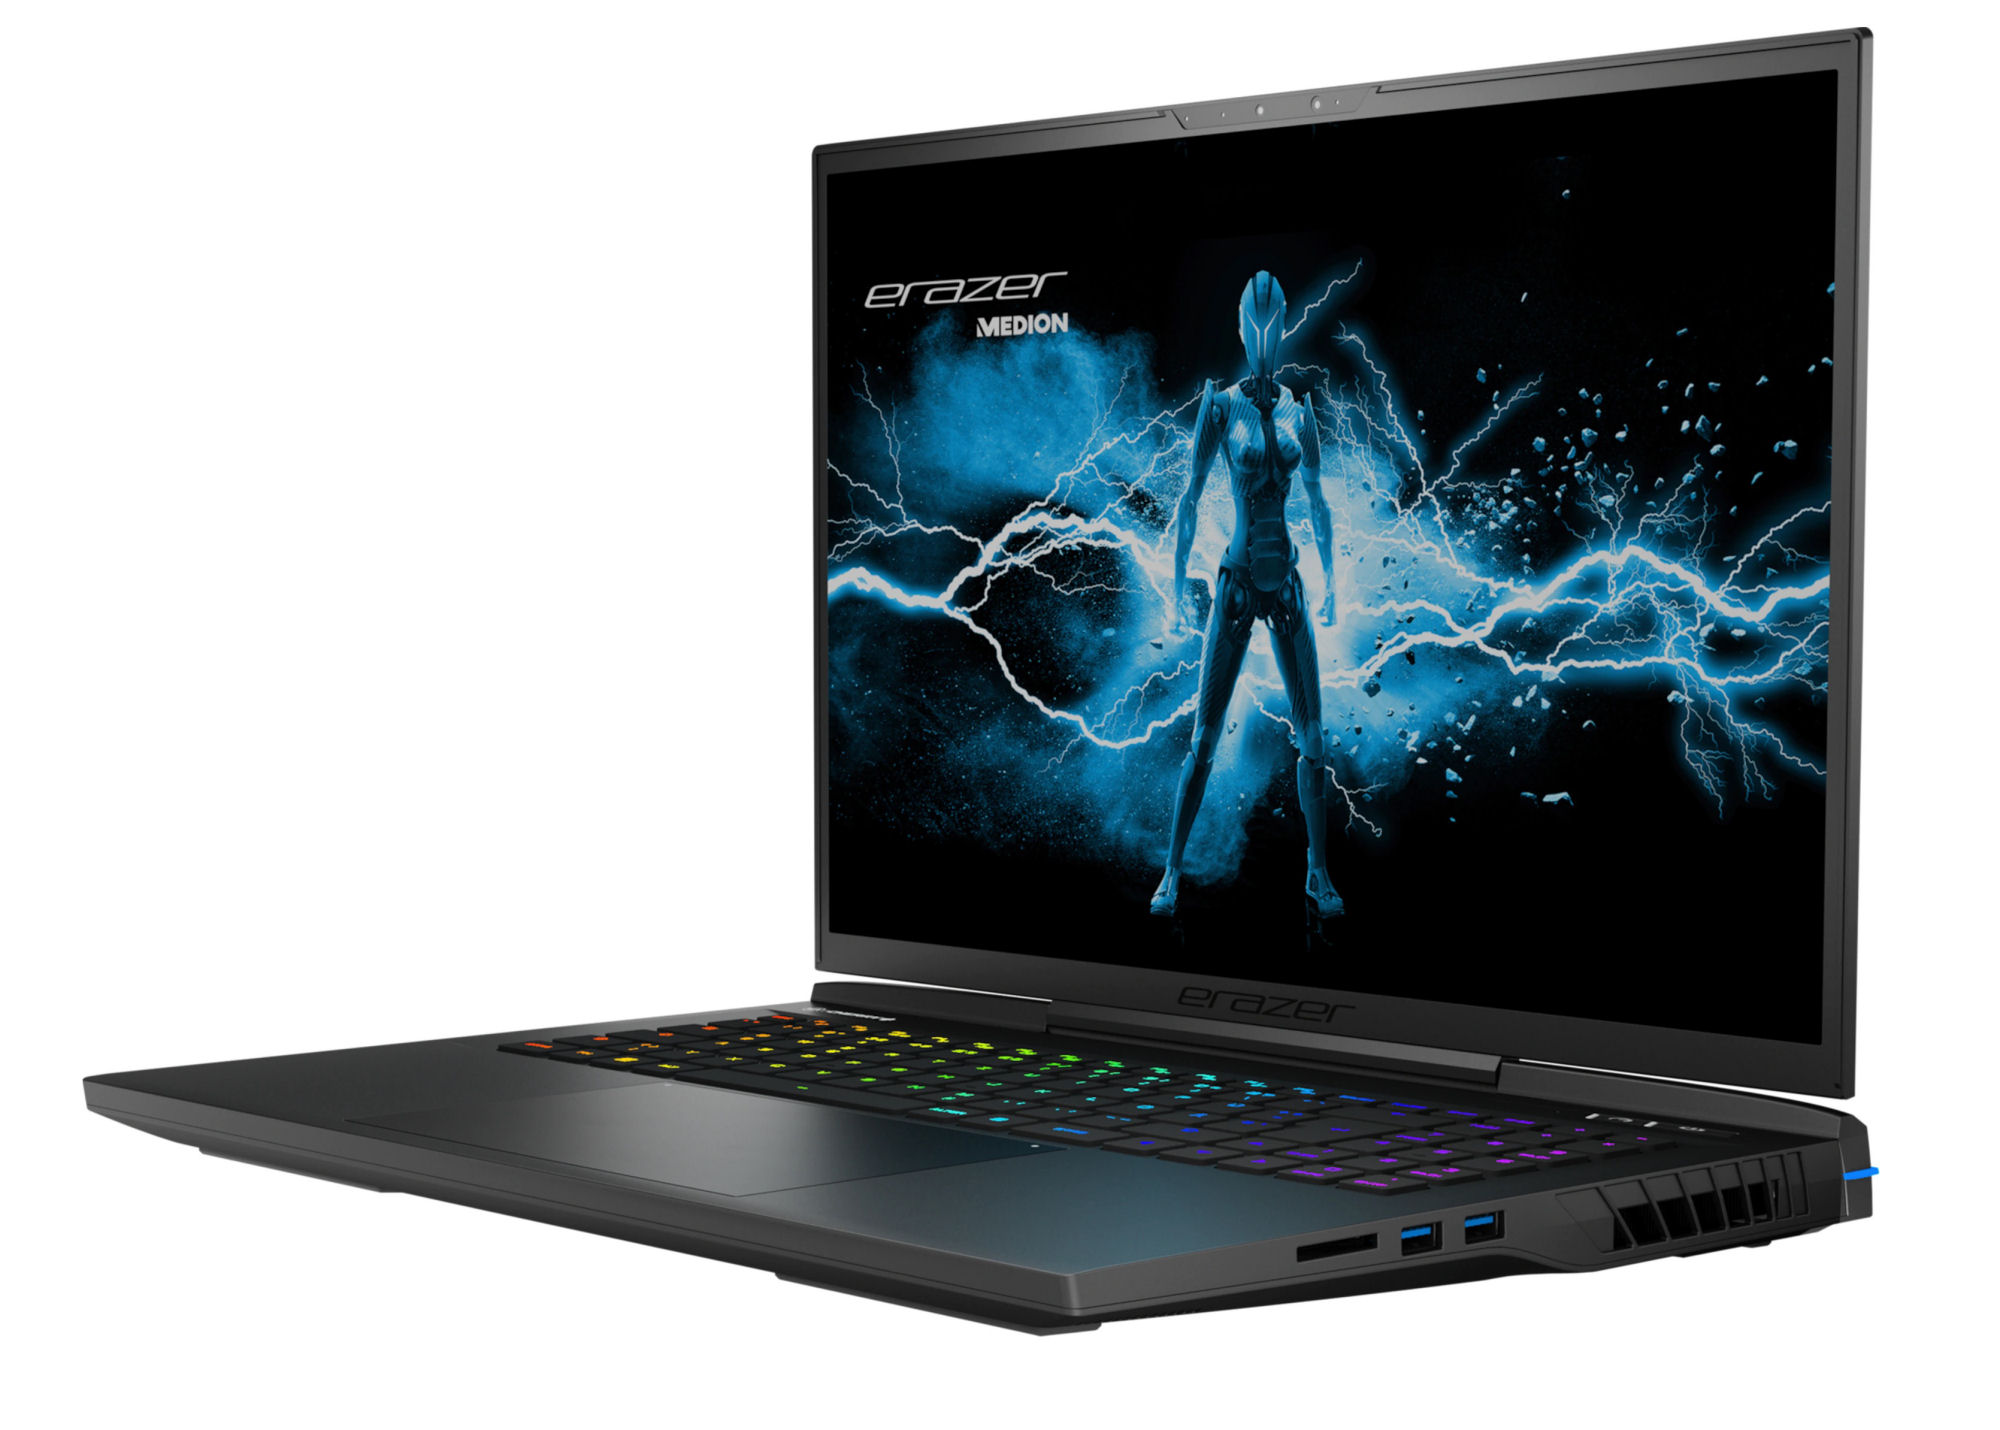
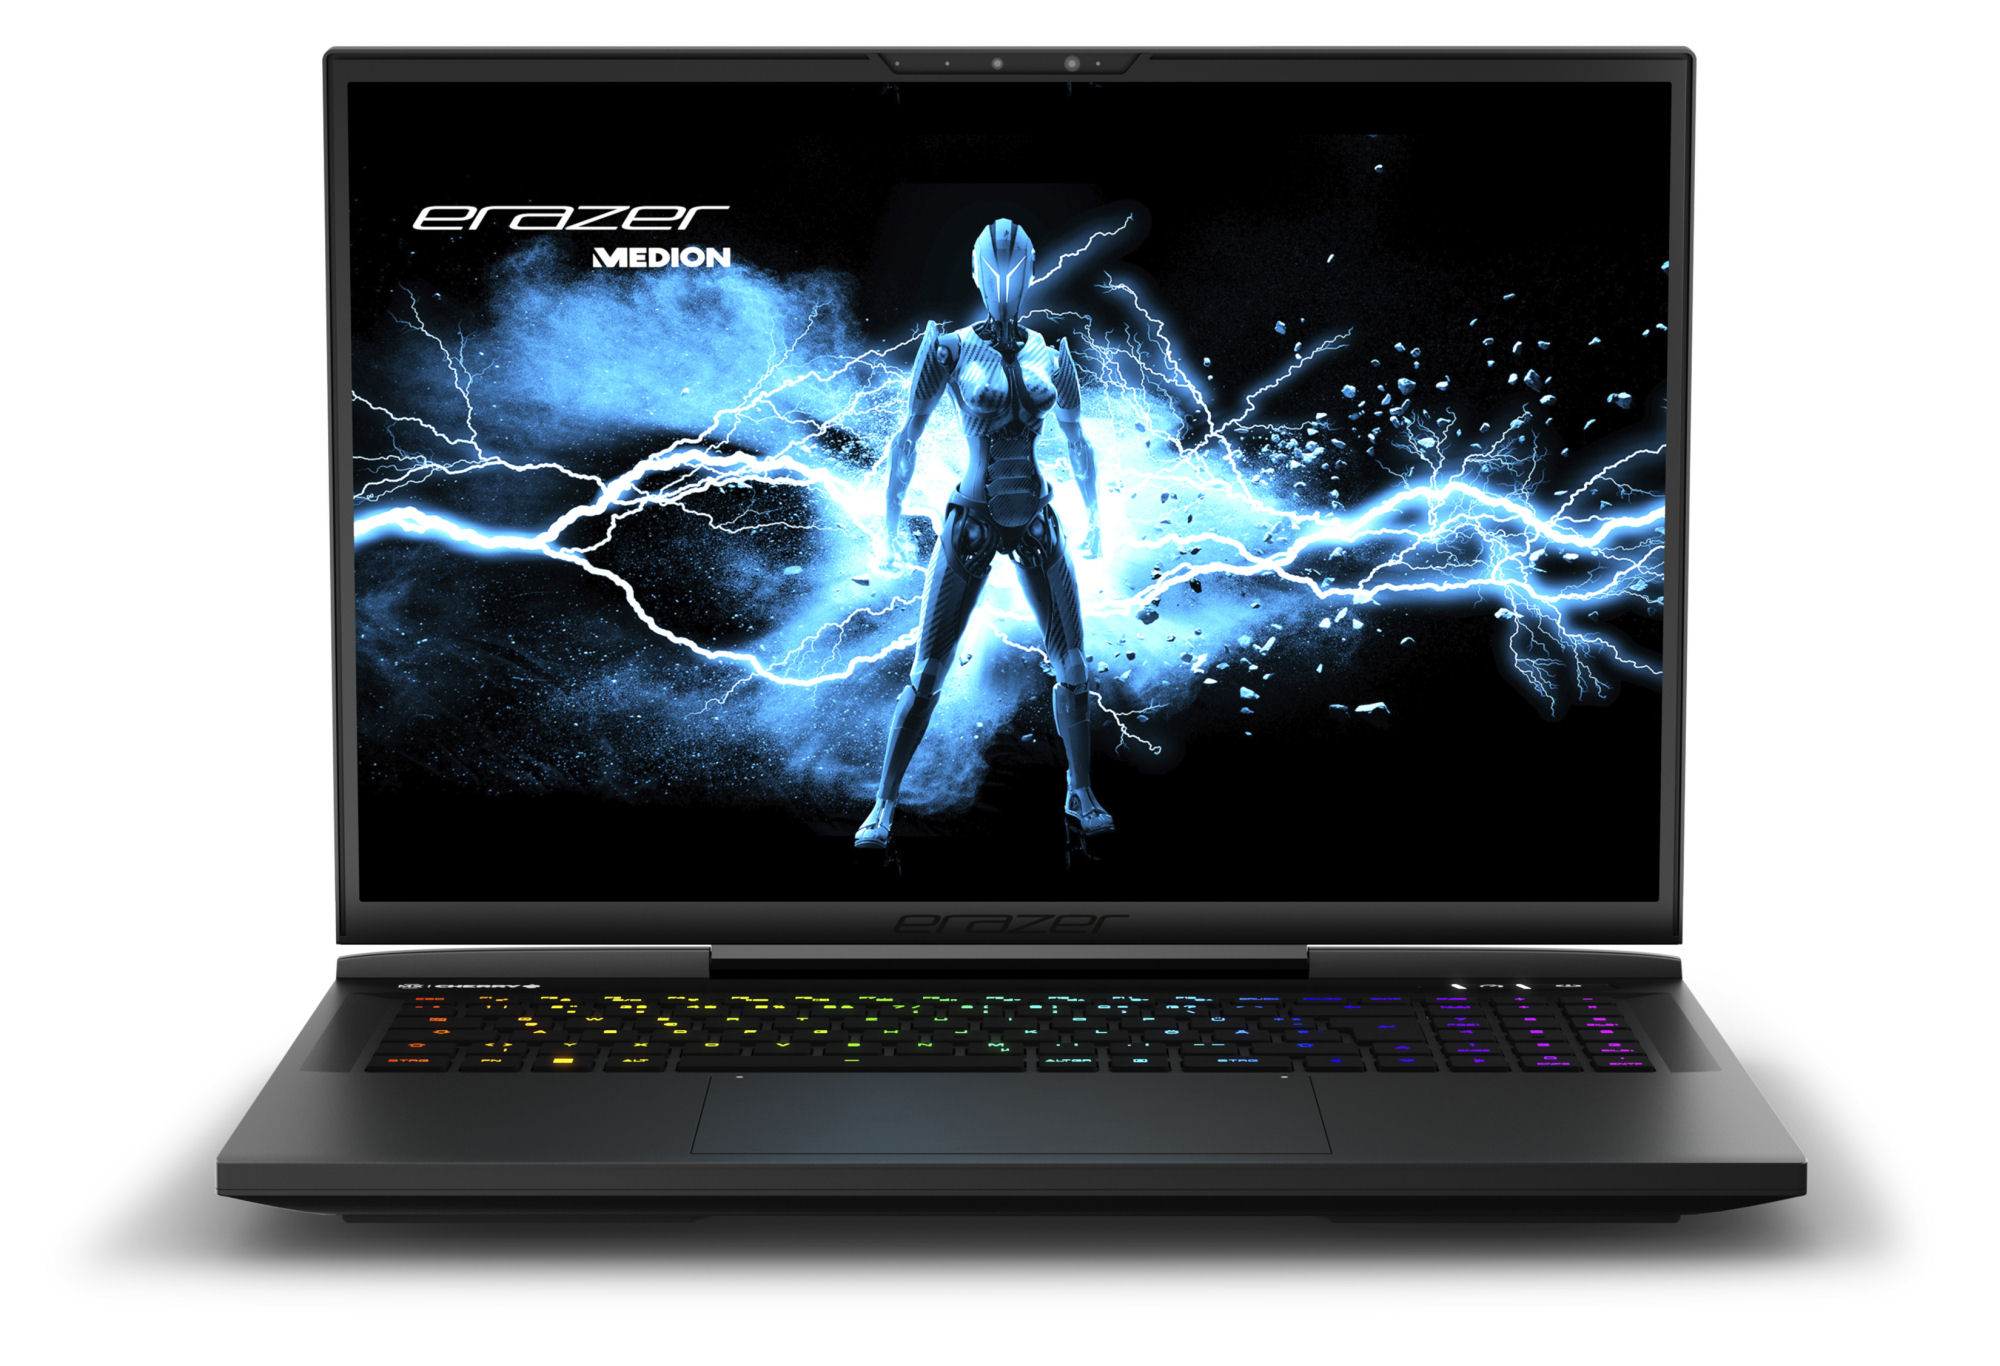
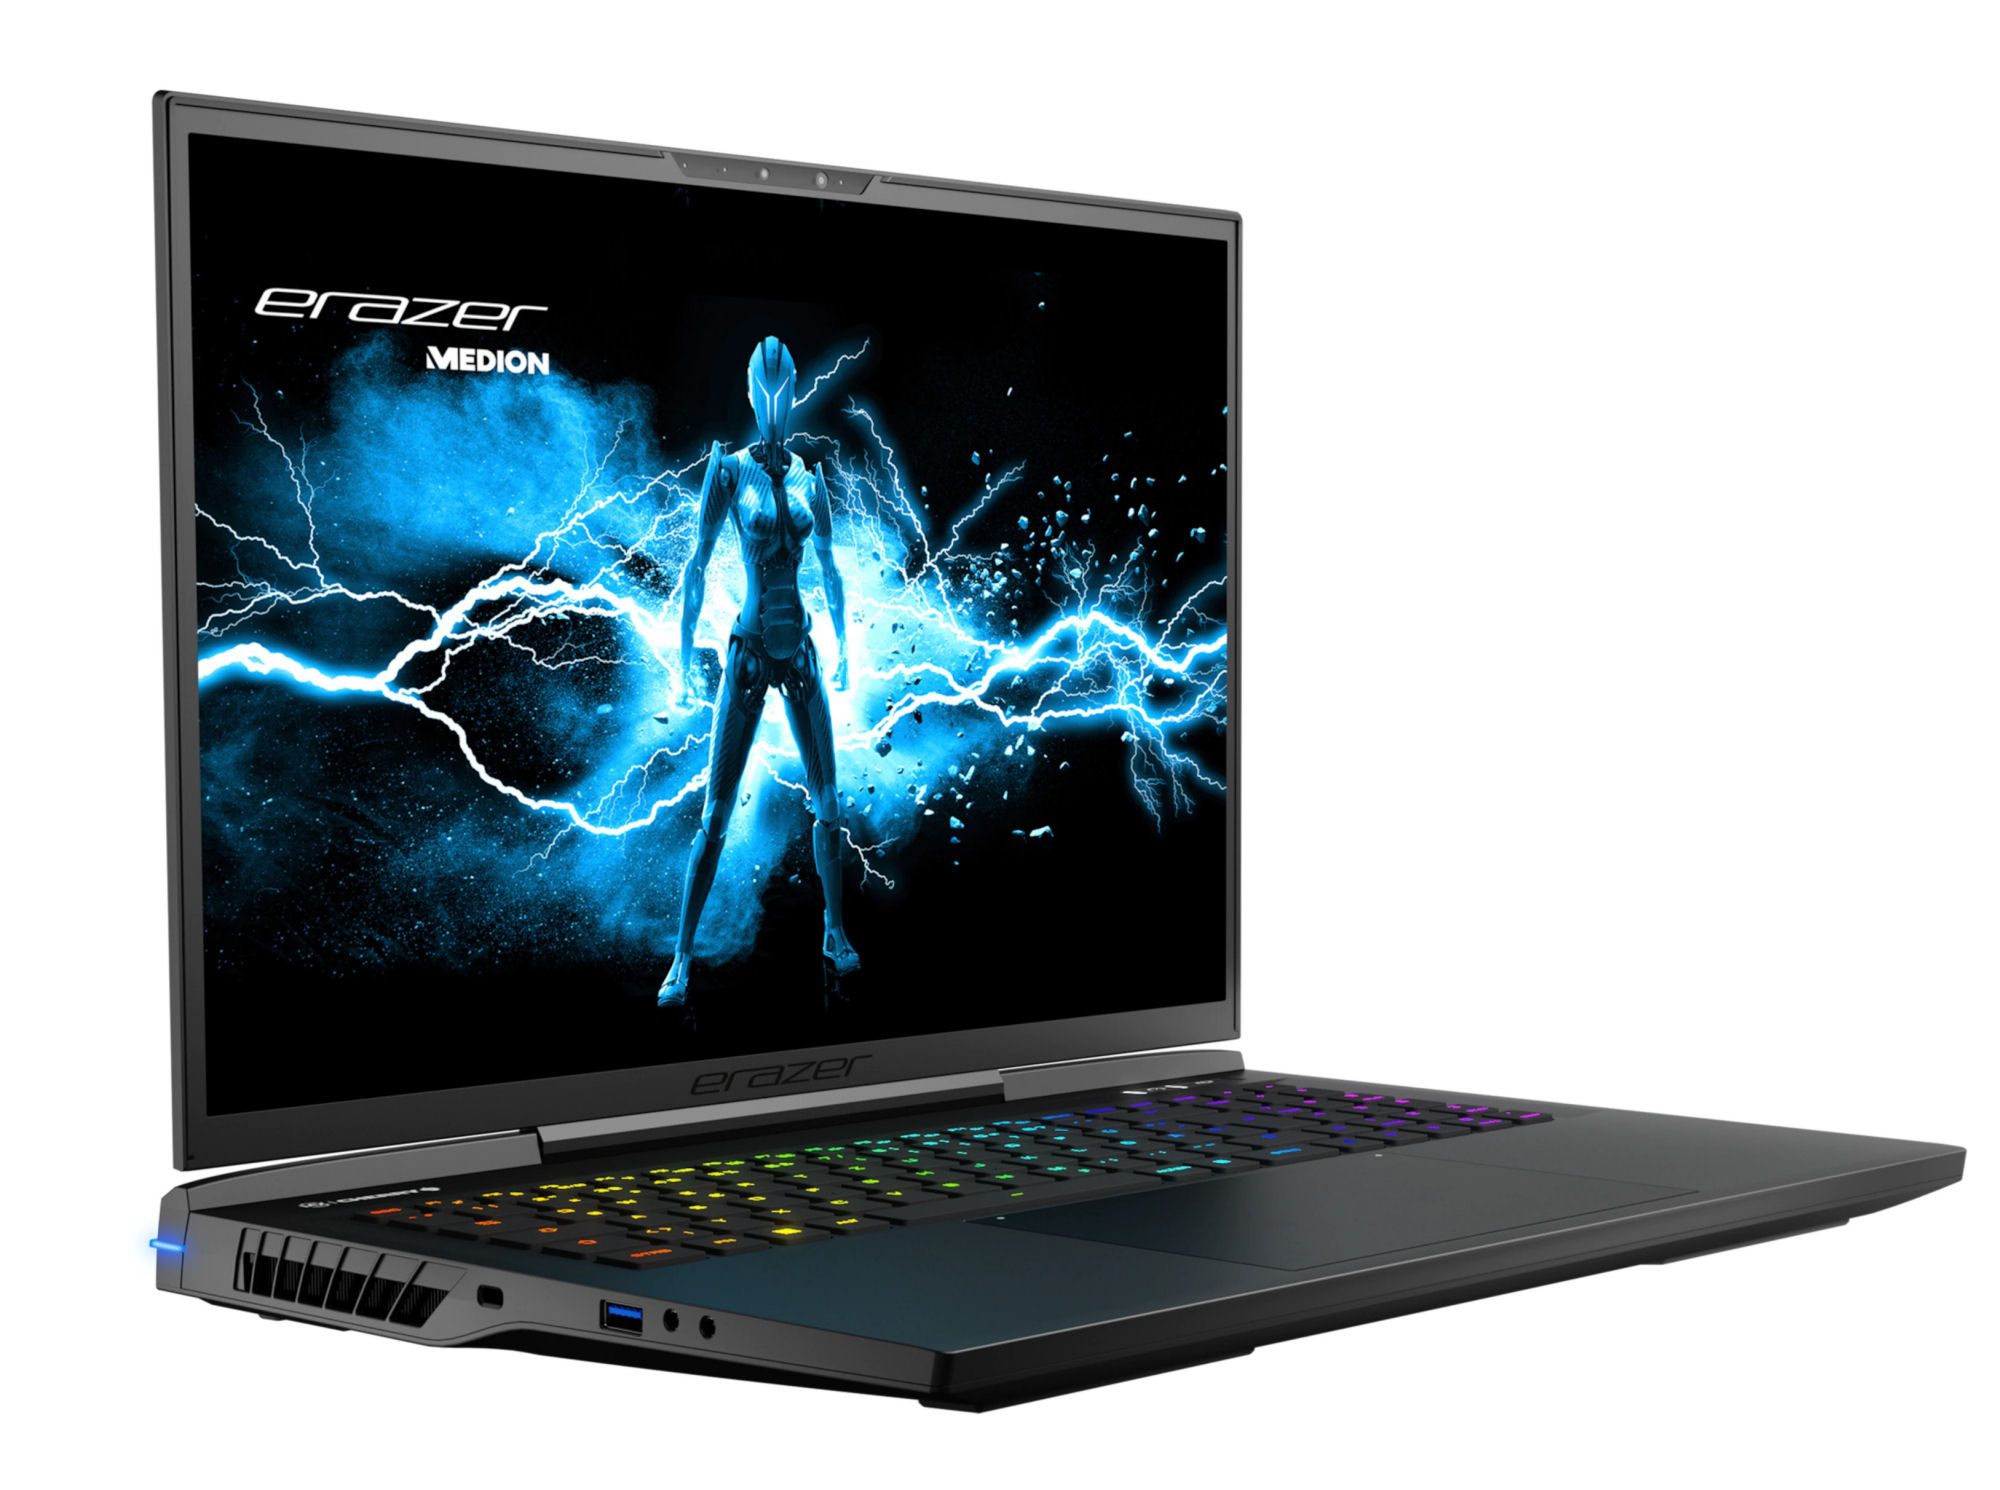
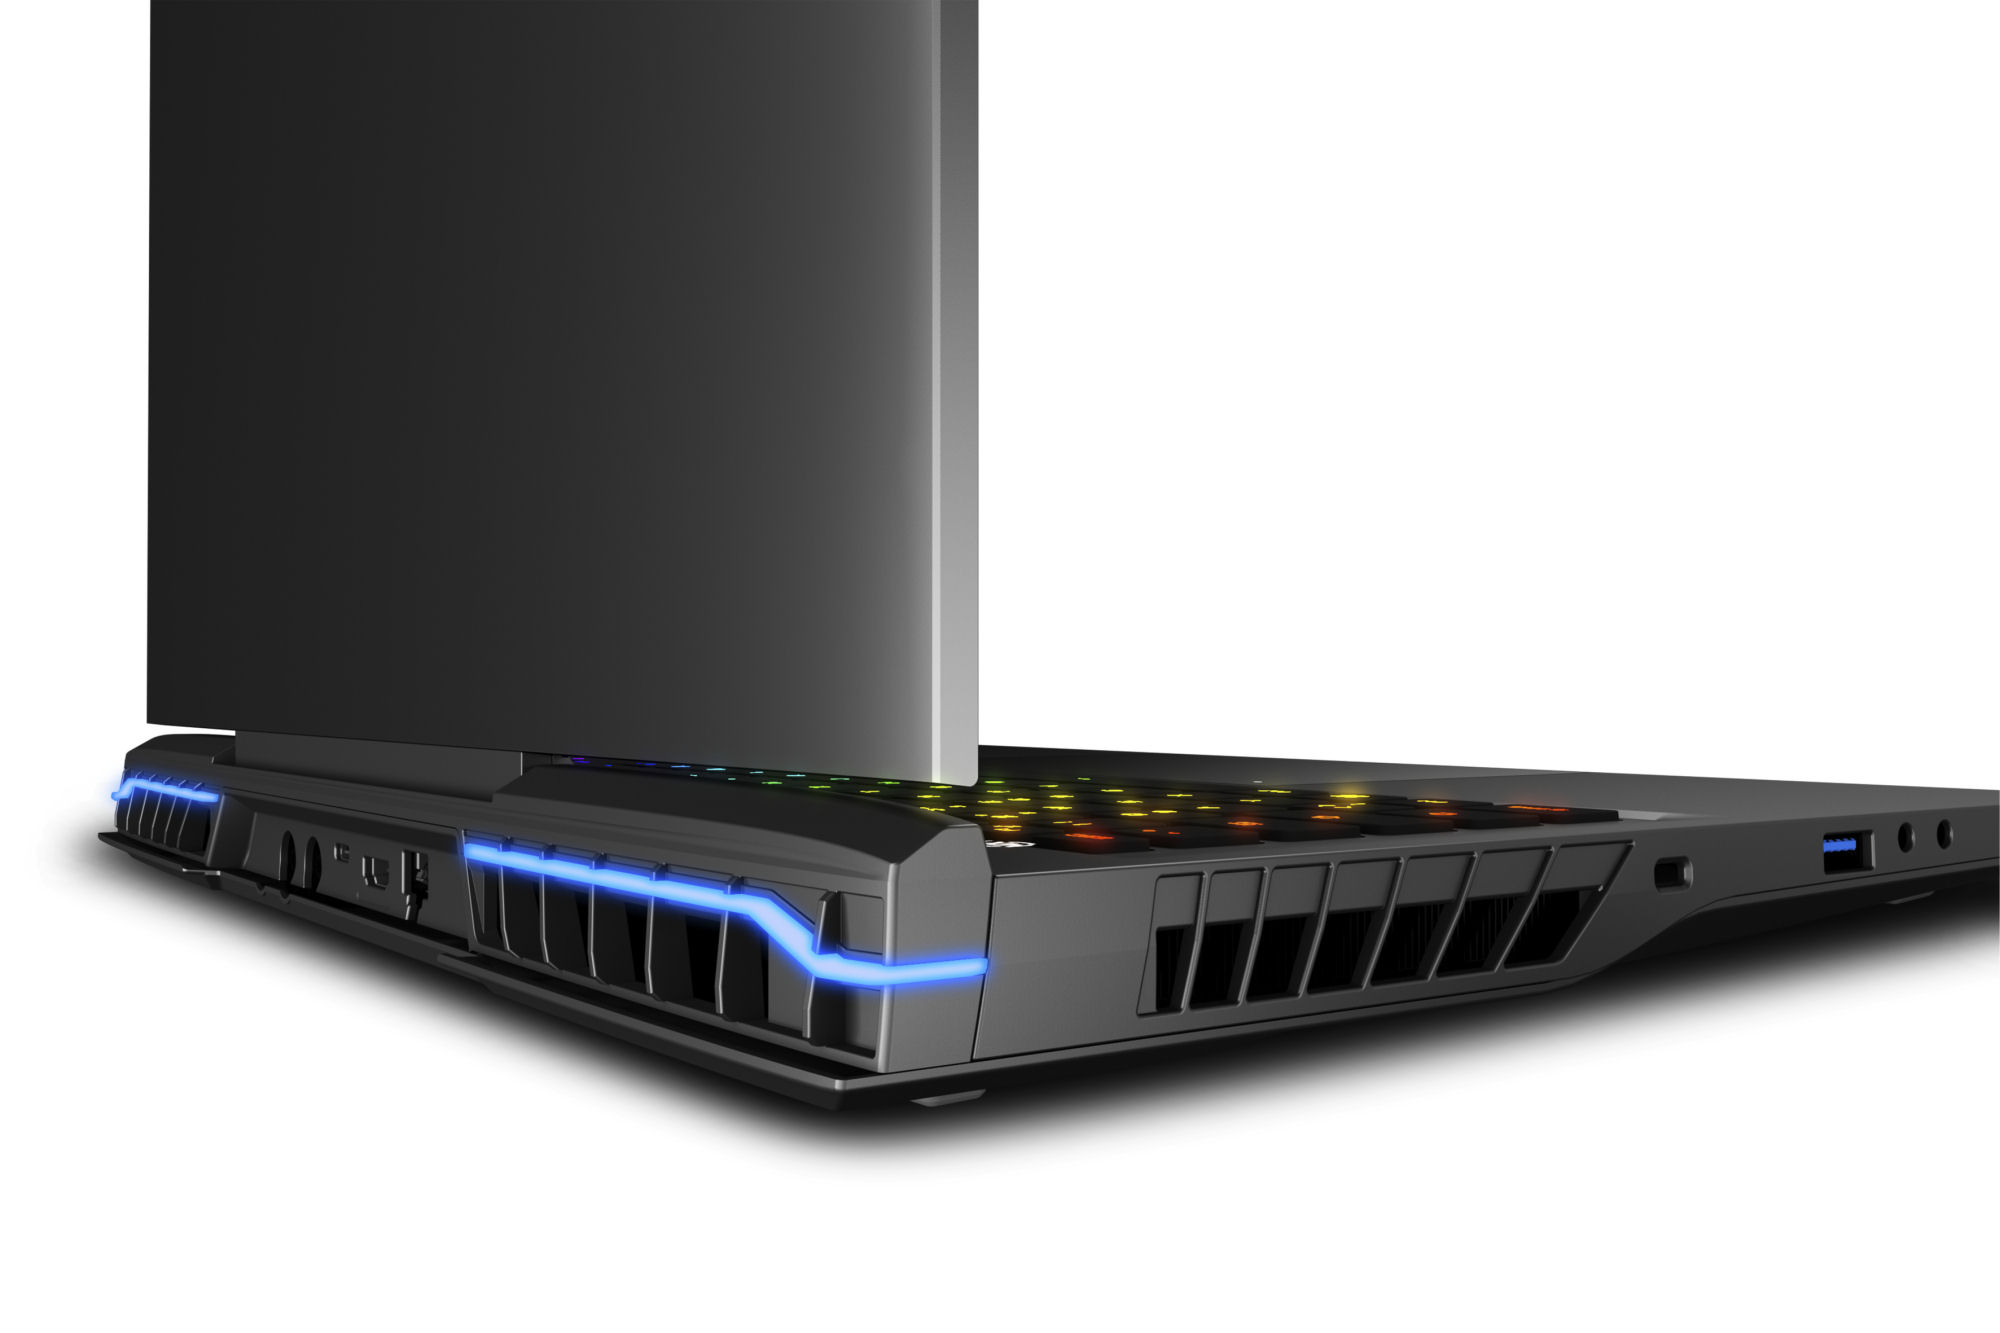
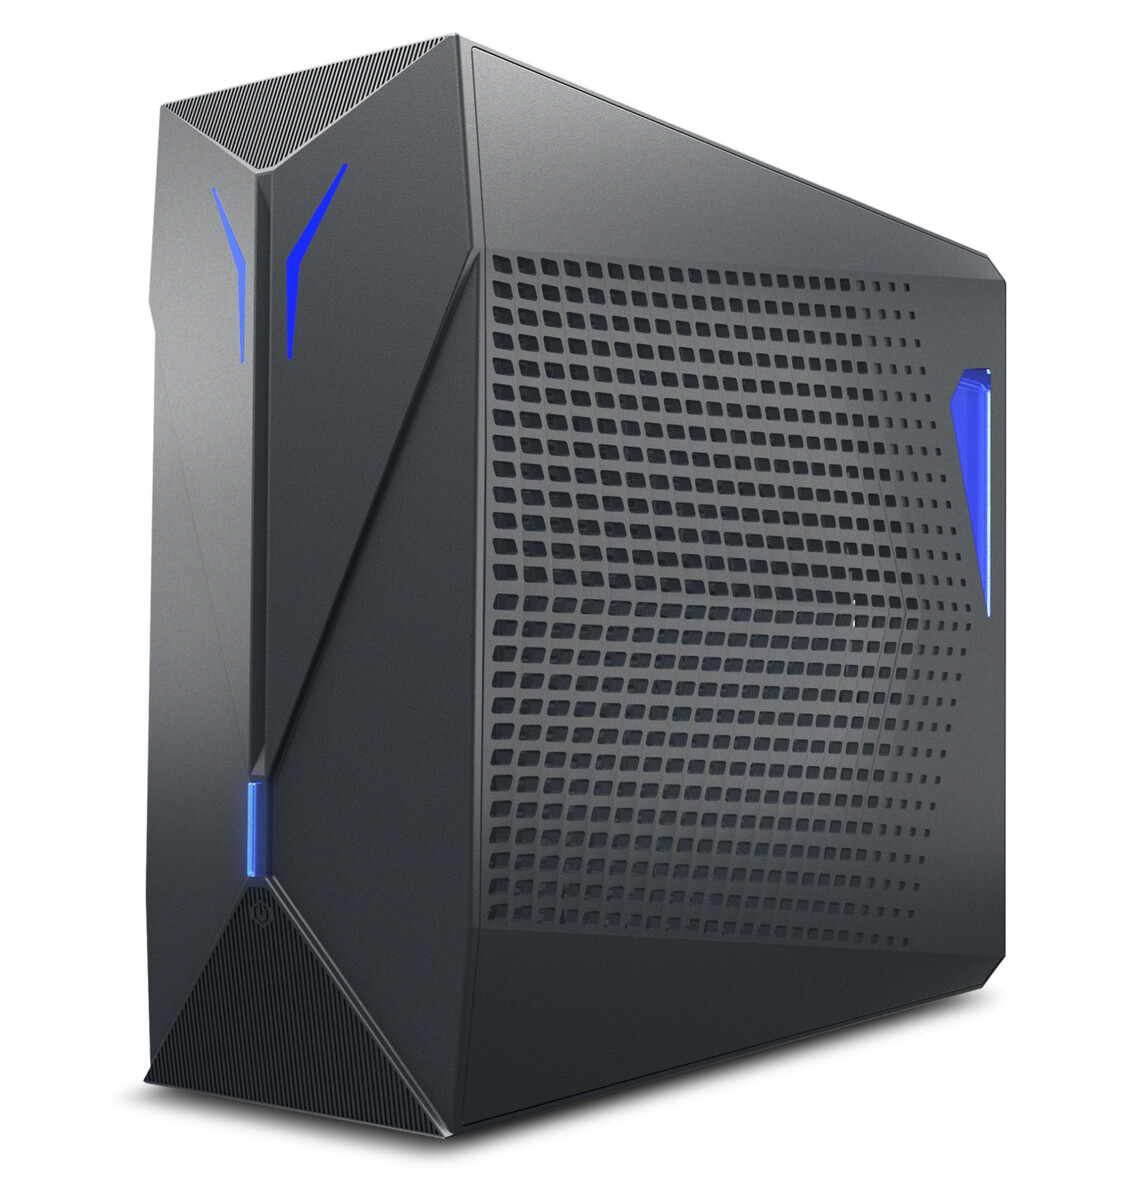
Estojo - O Erazer tem um chassi metálico
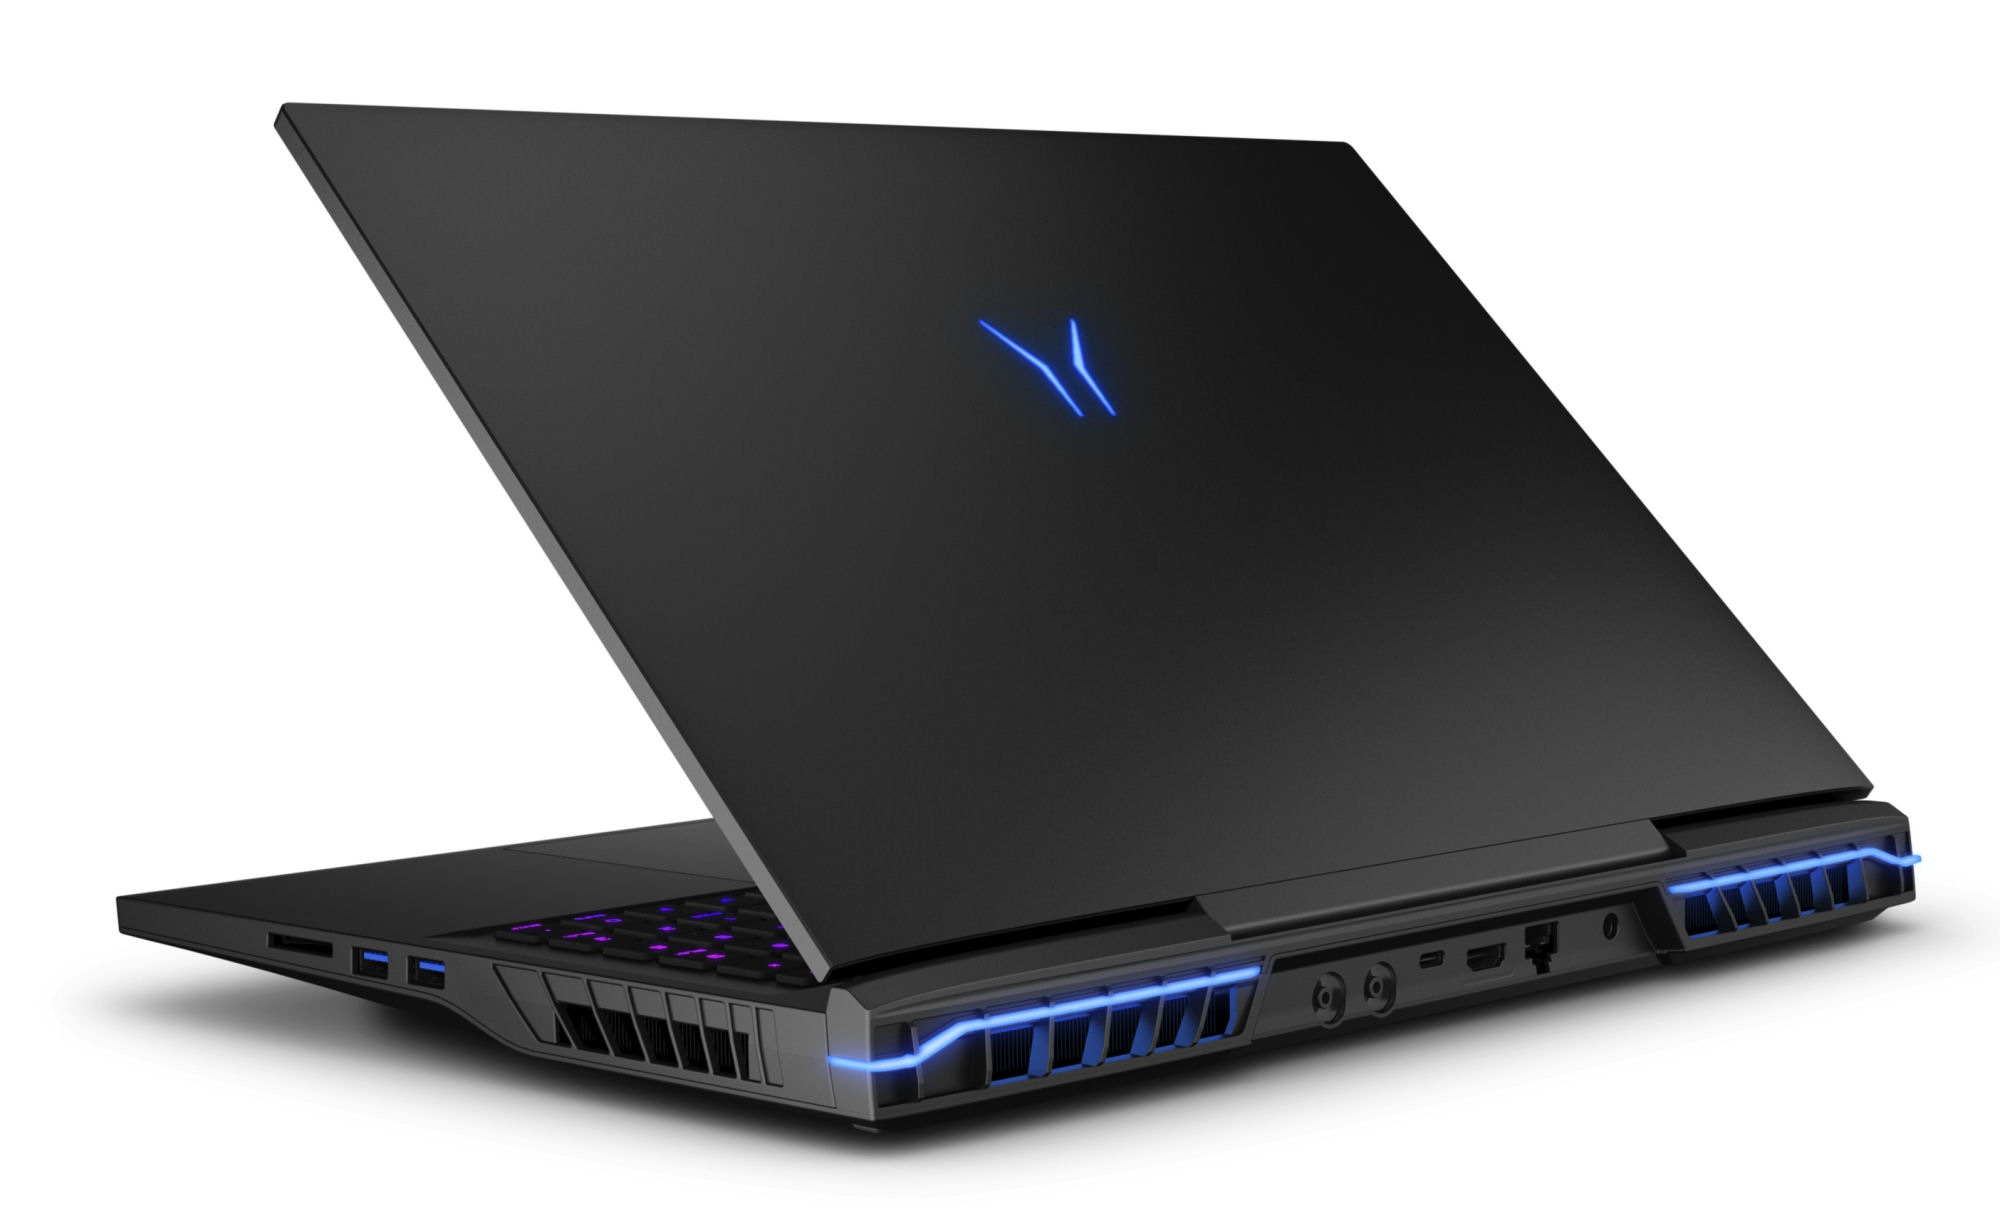
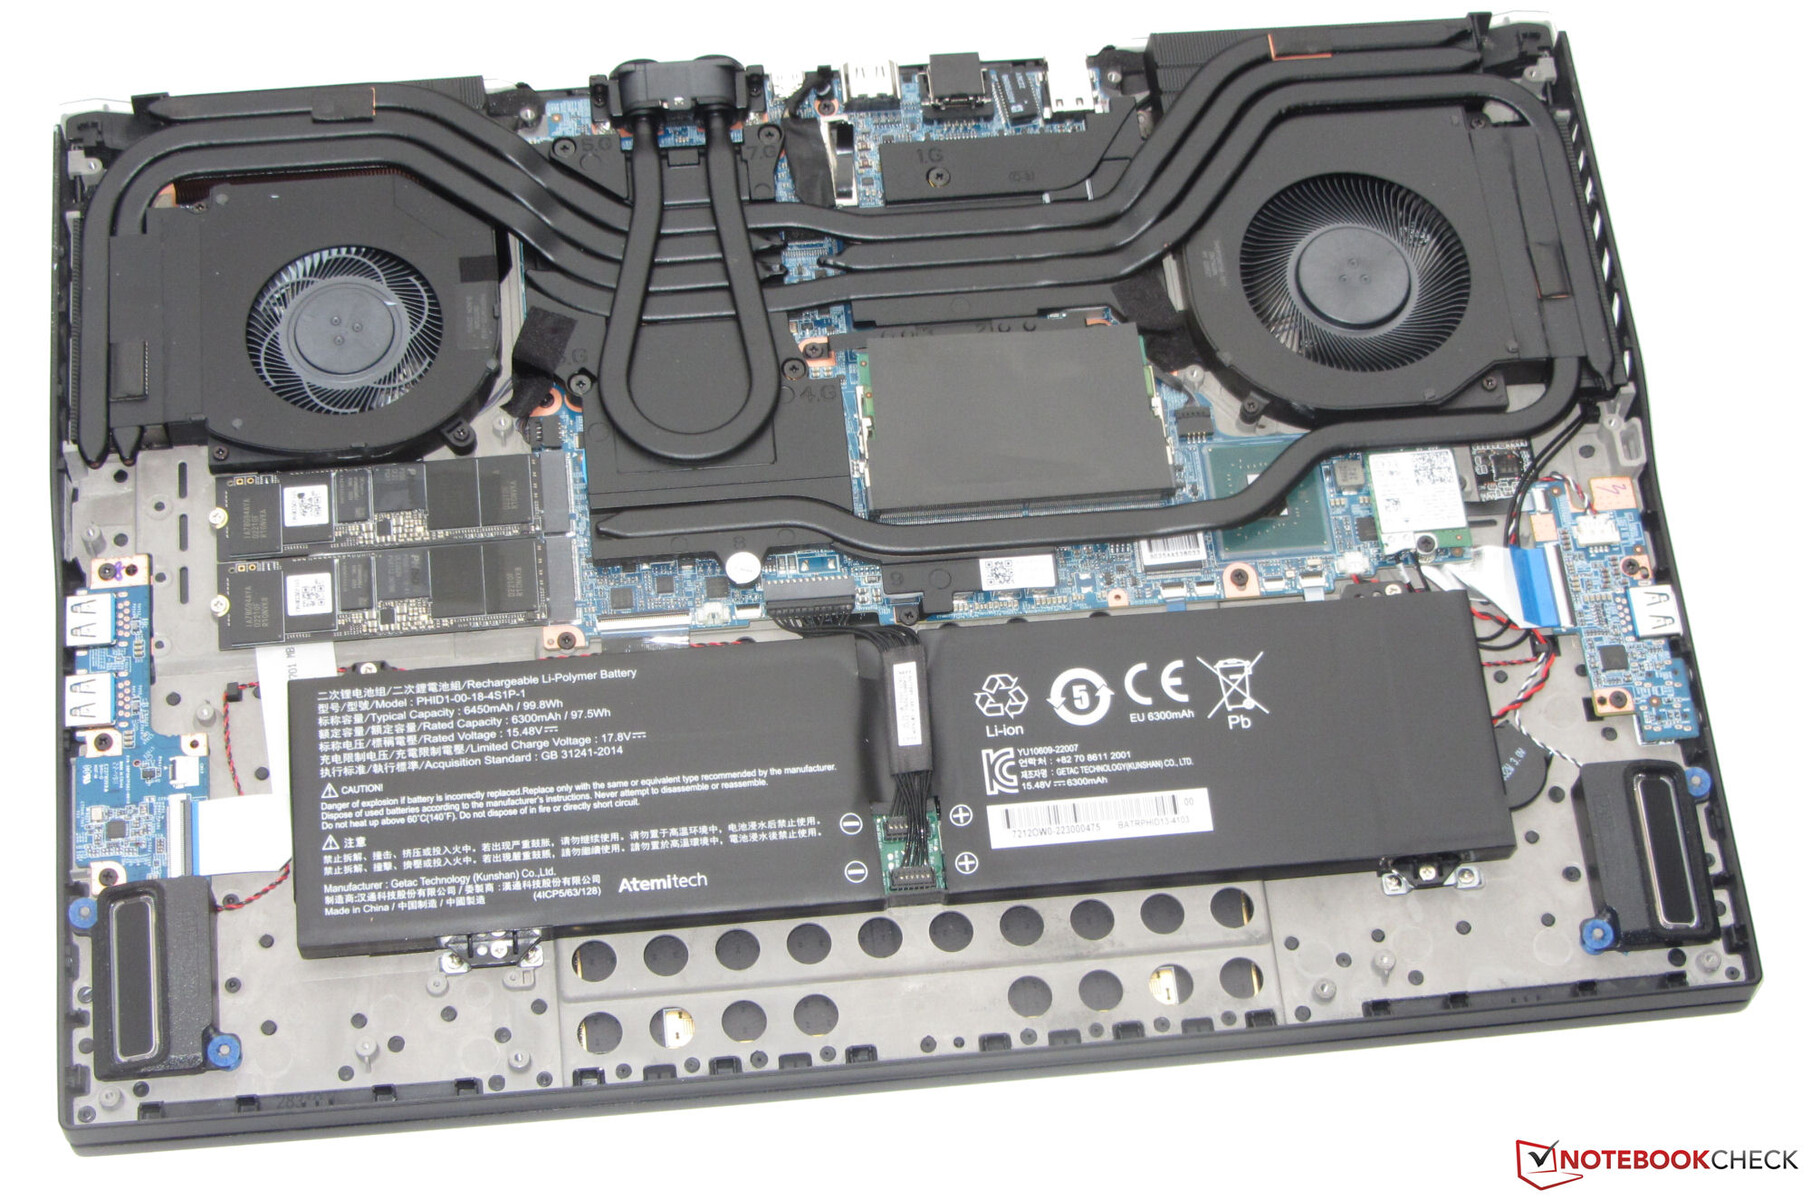
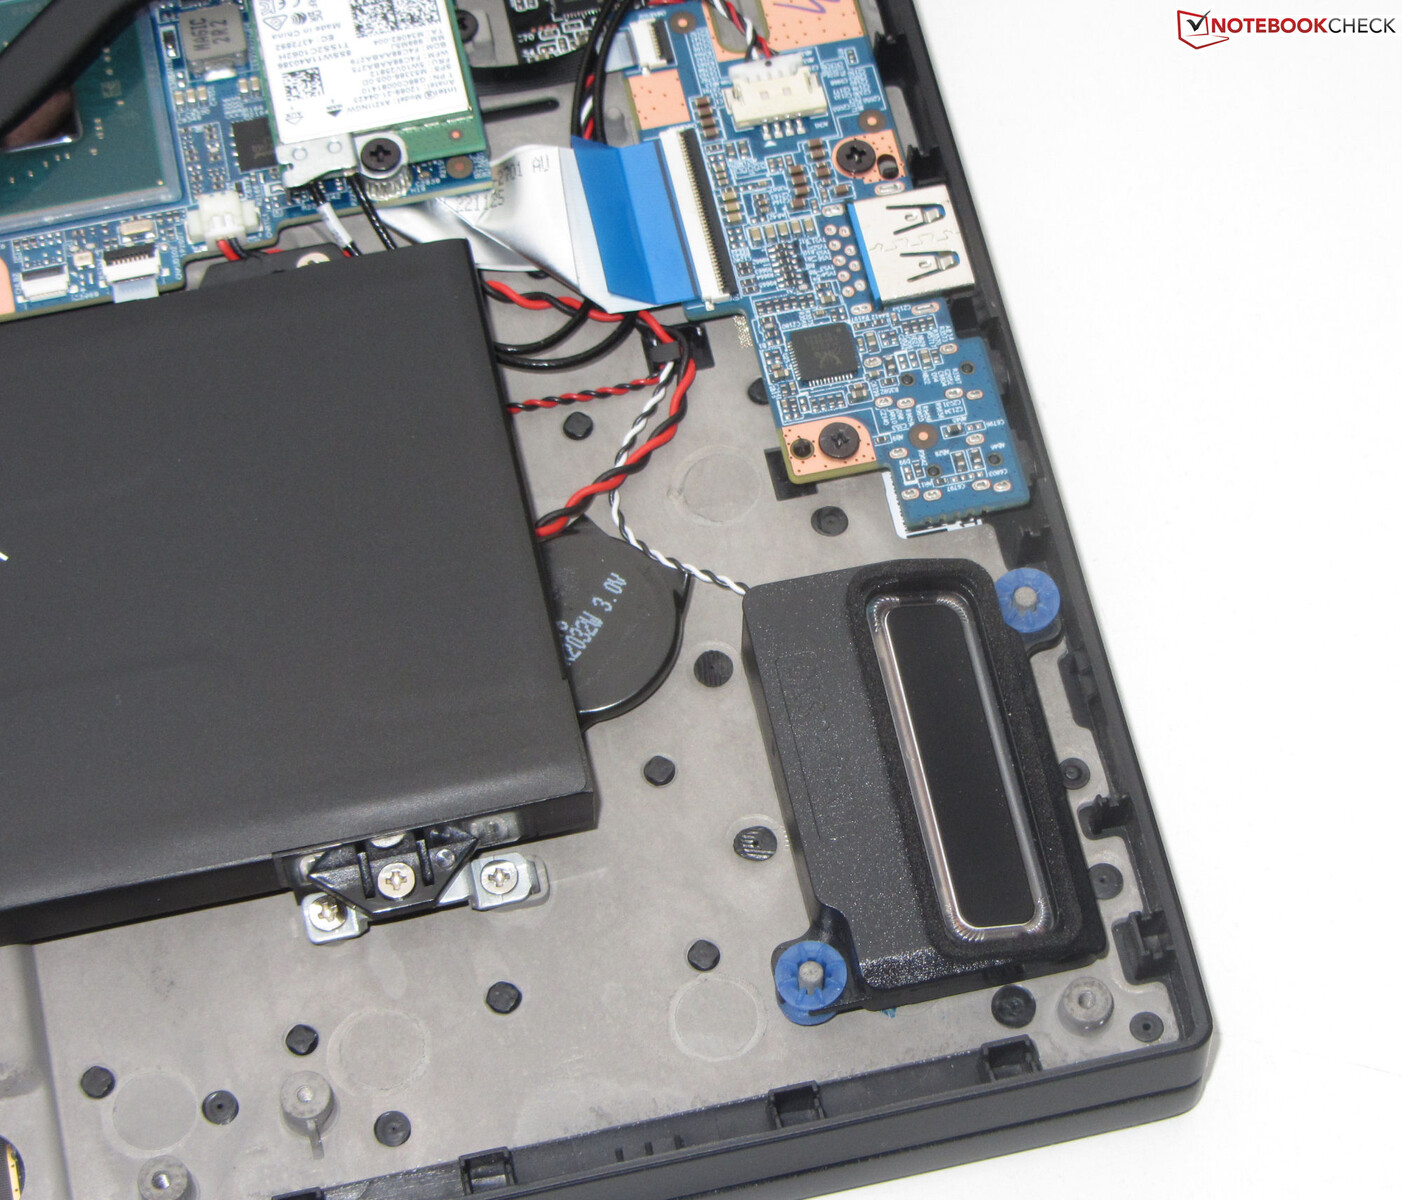
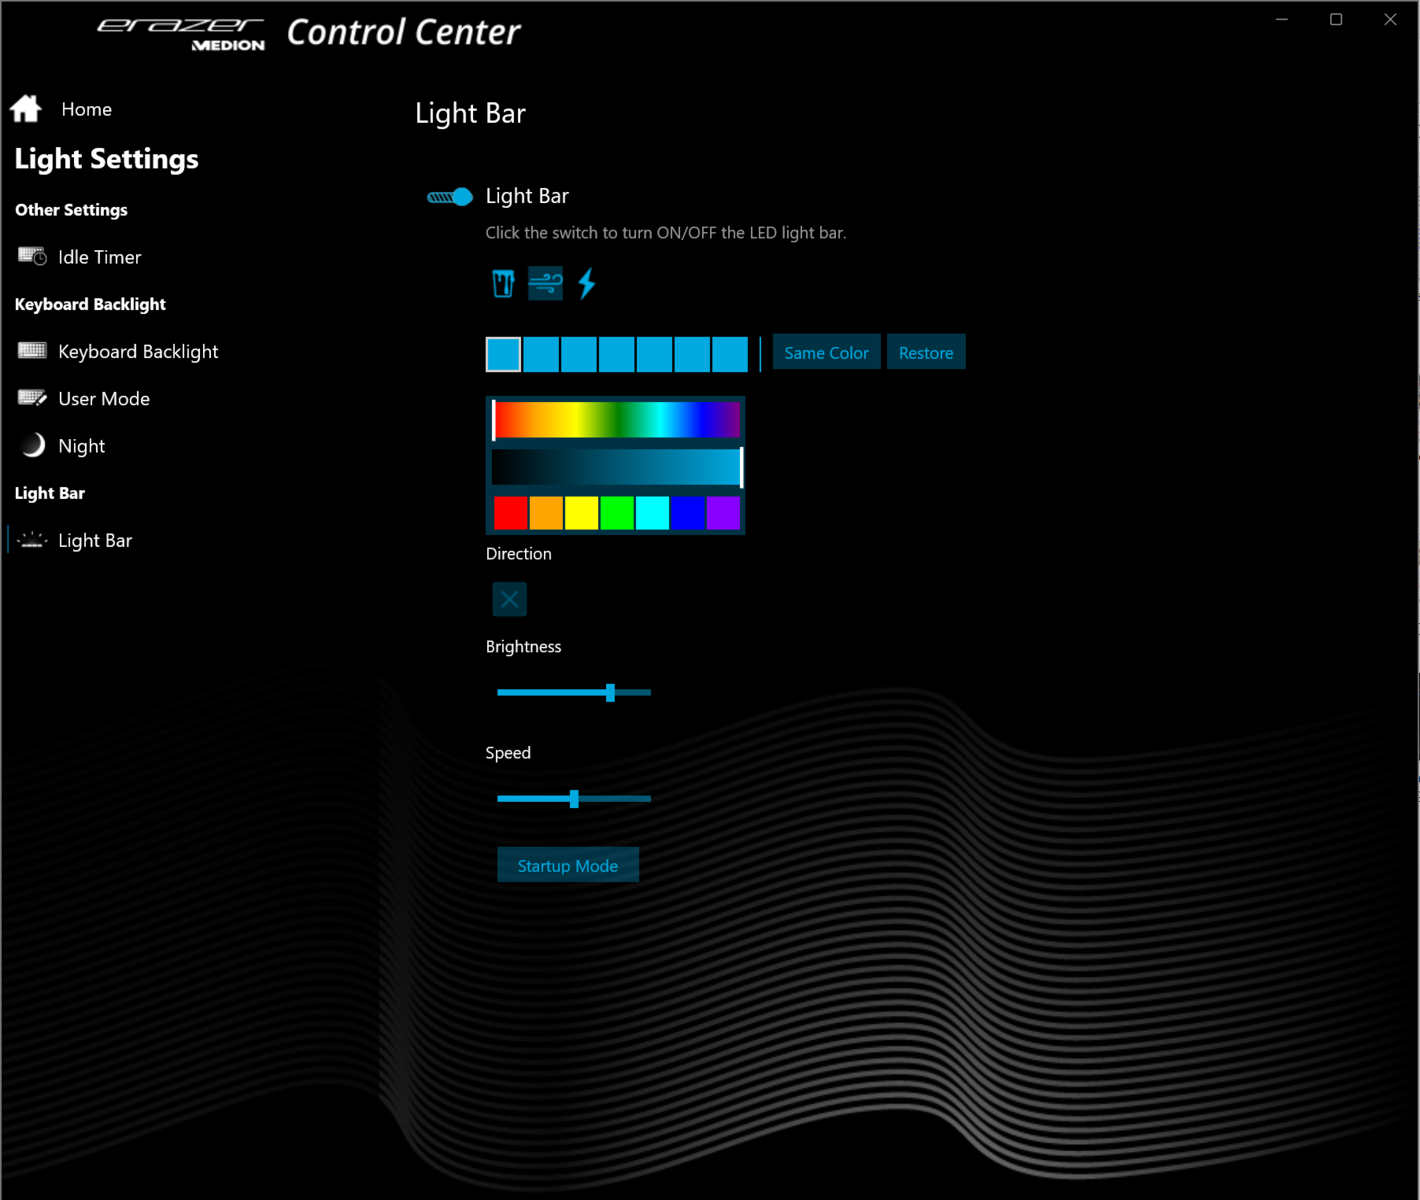
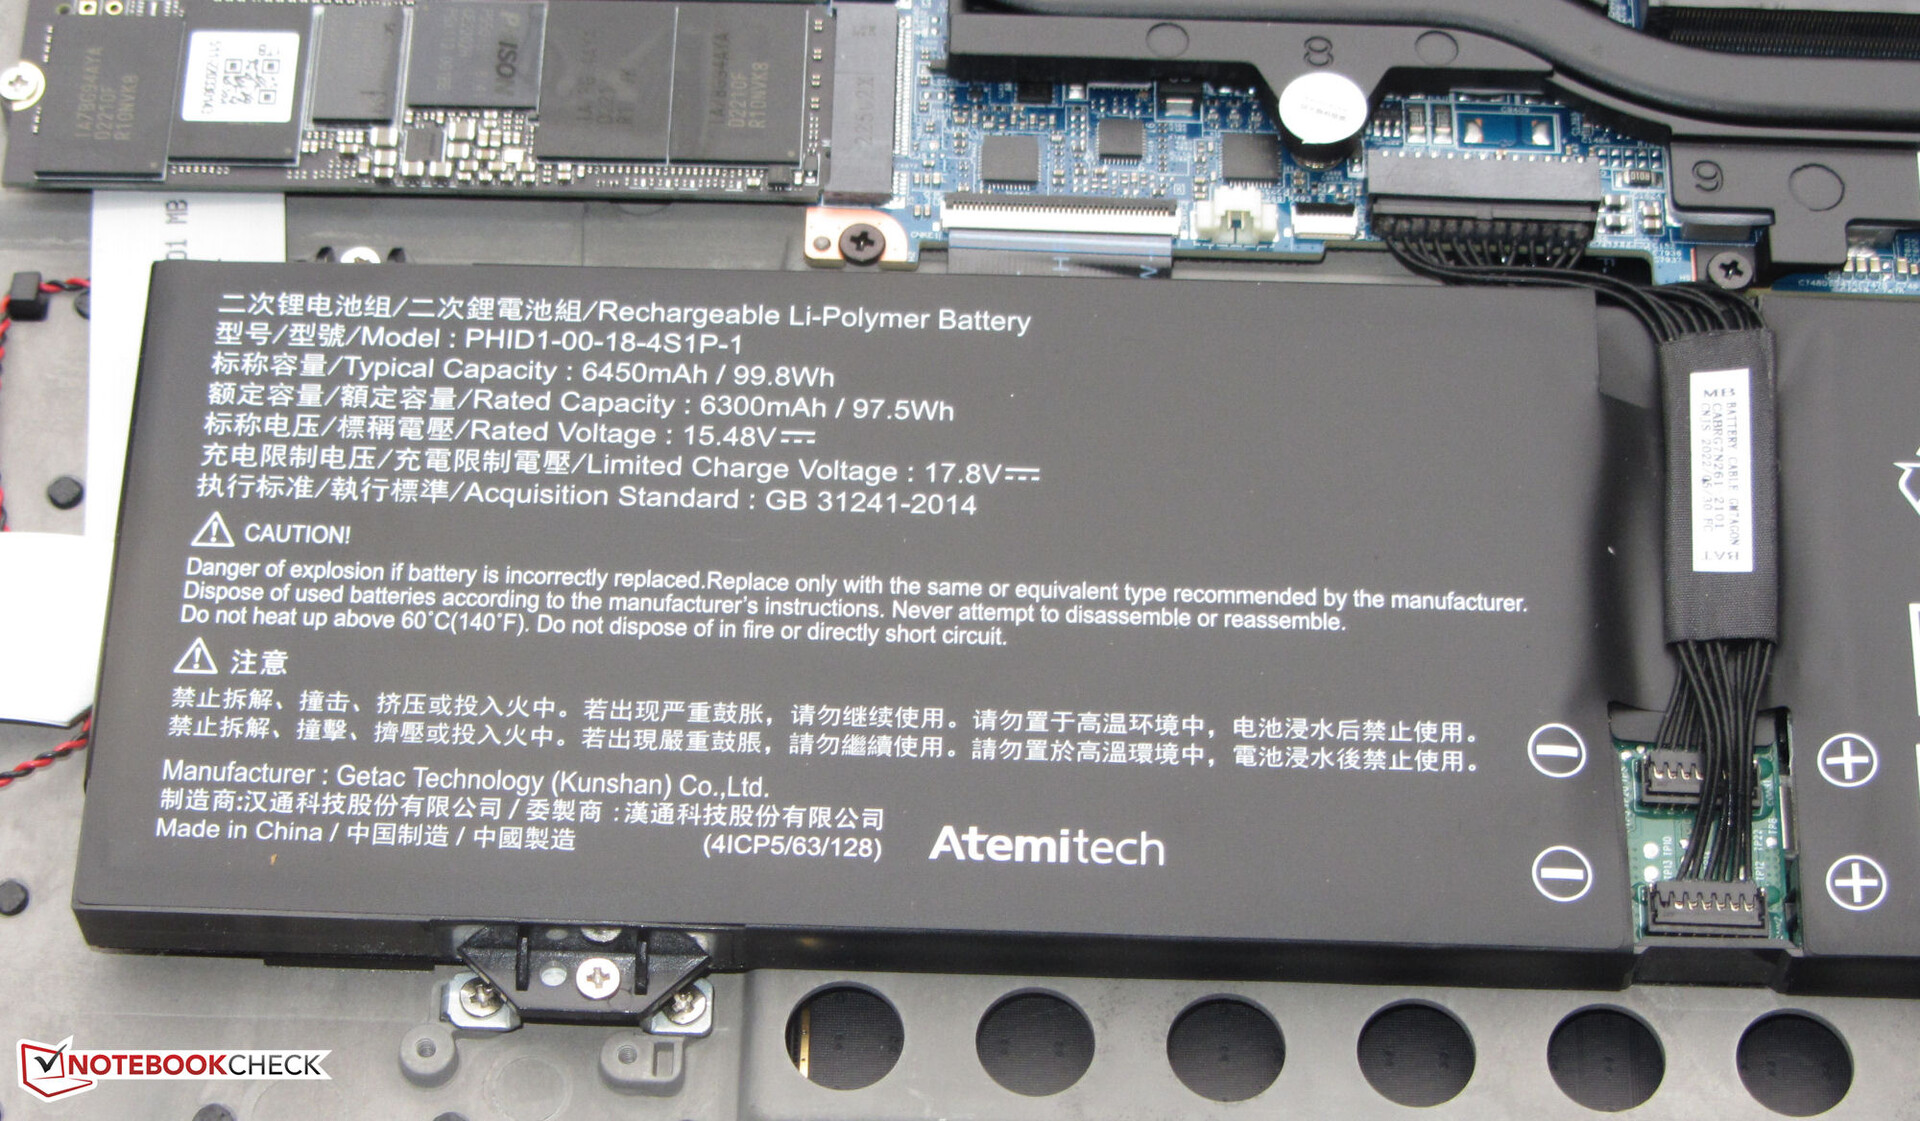
A Besta Erazer X40 escapa de um olhar sonoro e cintilante em favor de um design moderado que não se destacaria em um ambiente profissional. Como com seus predecessores, o X40 usa um chassi de metal preto com acabamento fosco. A seção de base é revestida com um revestimento de borracha grippy. A retroiluminação do teclado (RGB), bem como duas tiras de LED (RGB) totalmente configuráveis acima das aberturas de exaustão traseiras, proporcionam ao laptop um traço de cor. A bateria, que é aparafusada em vez de colada, e o restante das internas são acessíveis uma vez que a tampa inferior é removida.
Não notamos nenhum problema de mão-de-obra em nossa unidade de revisão. As lacunas no chassi são boas e apertadas, e não sobram materiais em excesso do processo de fabricação. É praticamente impossível torcer a seção de base. A tampa pode ser levemente flexionada, mas a quantidade de dar é totalmente aceitável. As dobradiças mantêm a tela firmemente no lugar e permitem que a tela seja dobrada de volta até cerca de 140 graus. A tampa do laptop não pode ser aberta com uma mão.
O Medion Erazer Beast X40 é um dos dispositivos mais compactos em nossa comparação e fica em algum lugar no meio quando se trata de peso.
Especificações - Thunderbolt 4 para a Besta
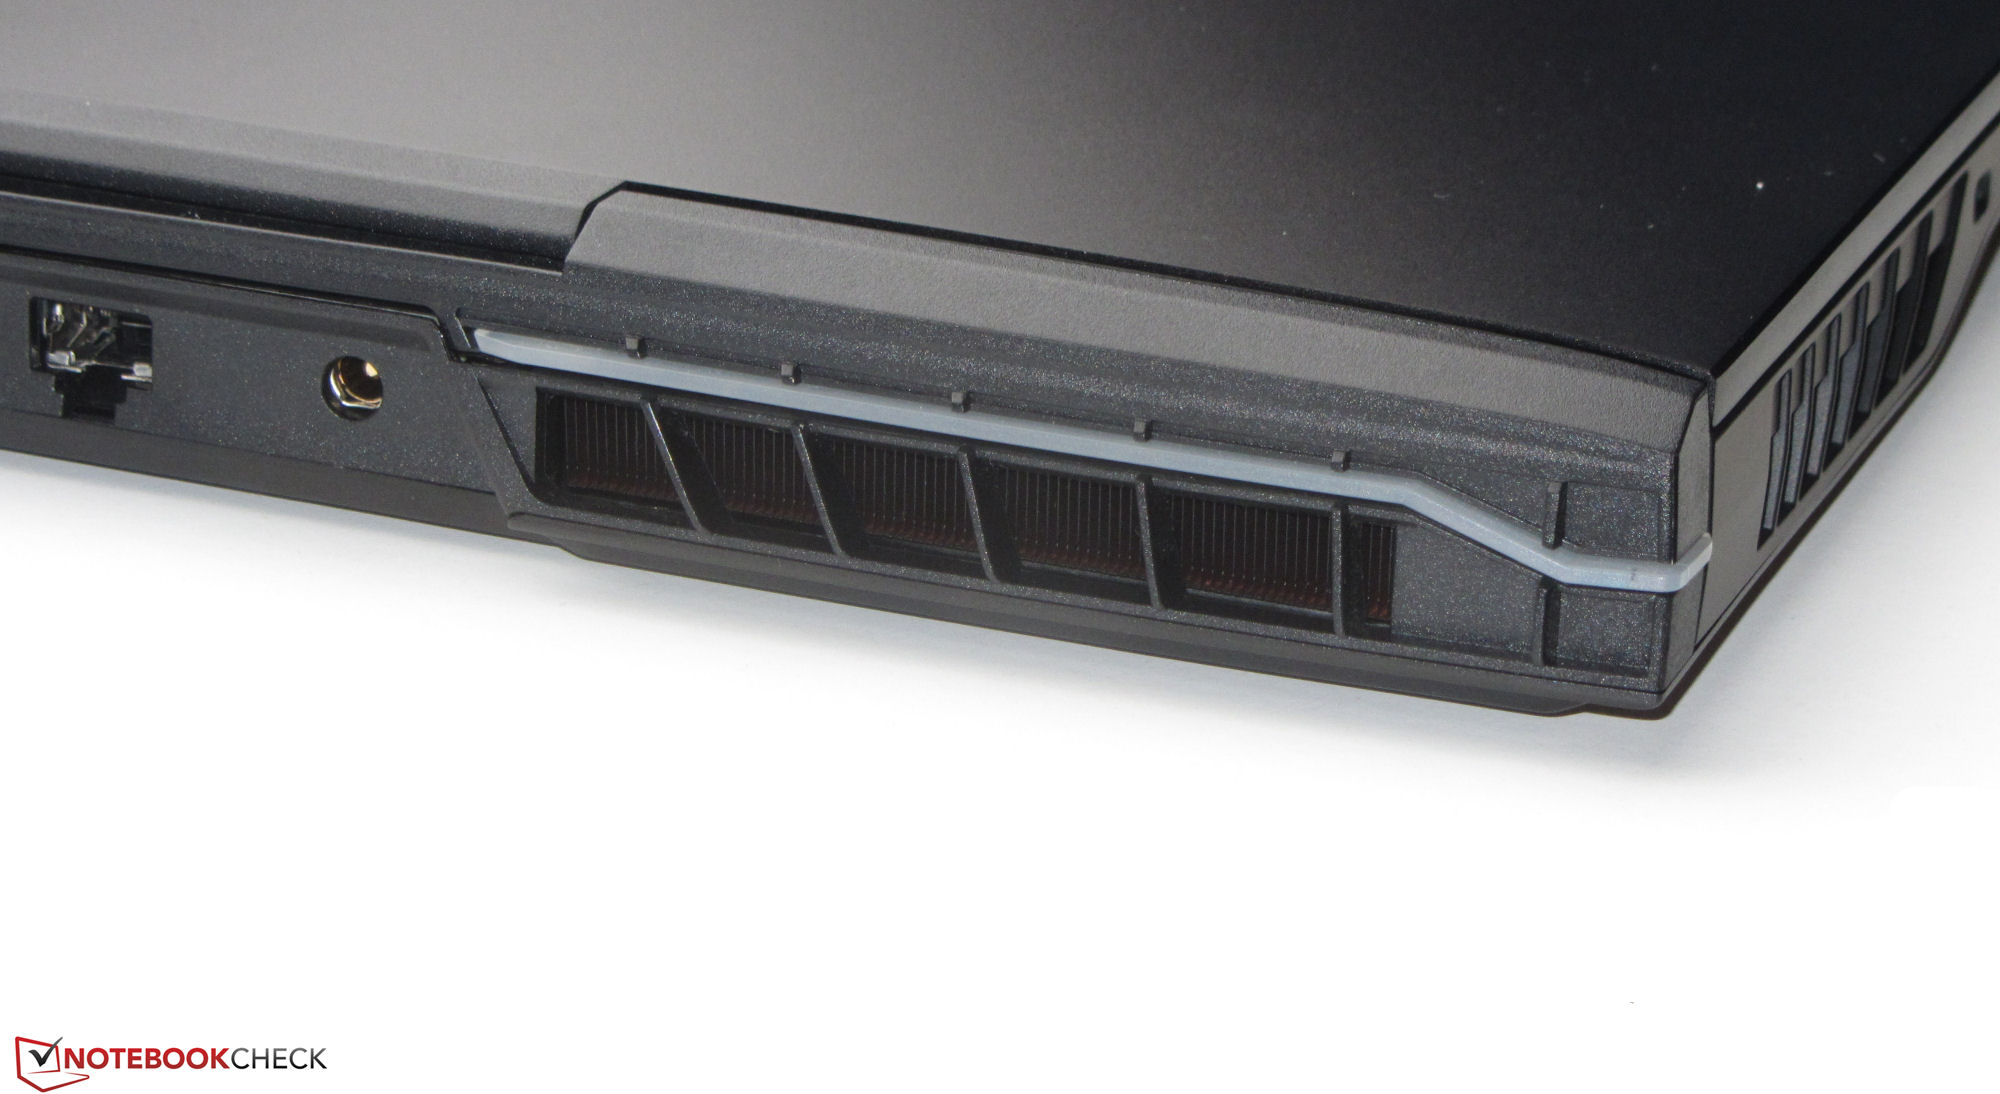
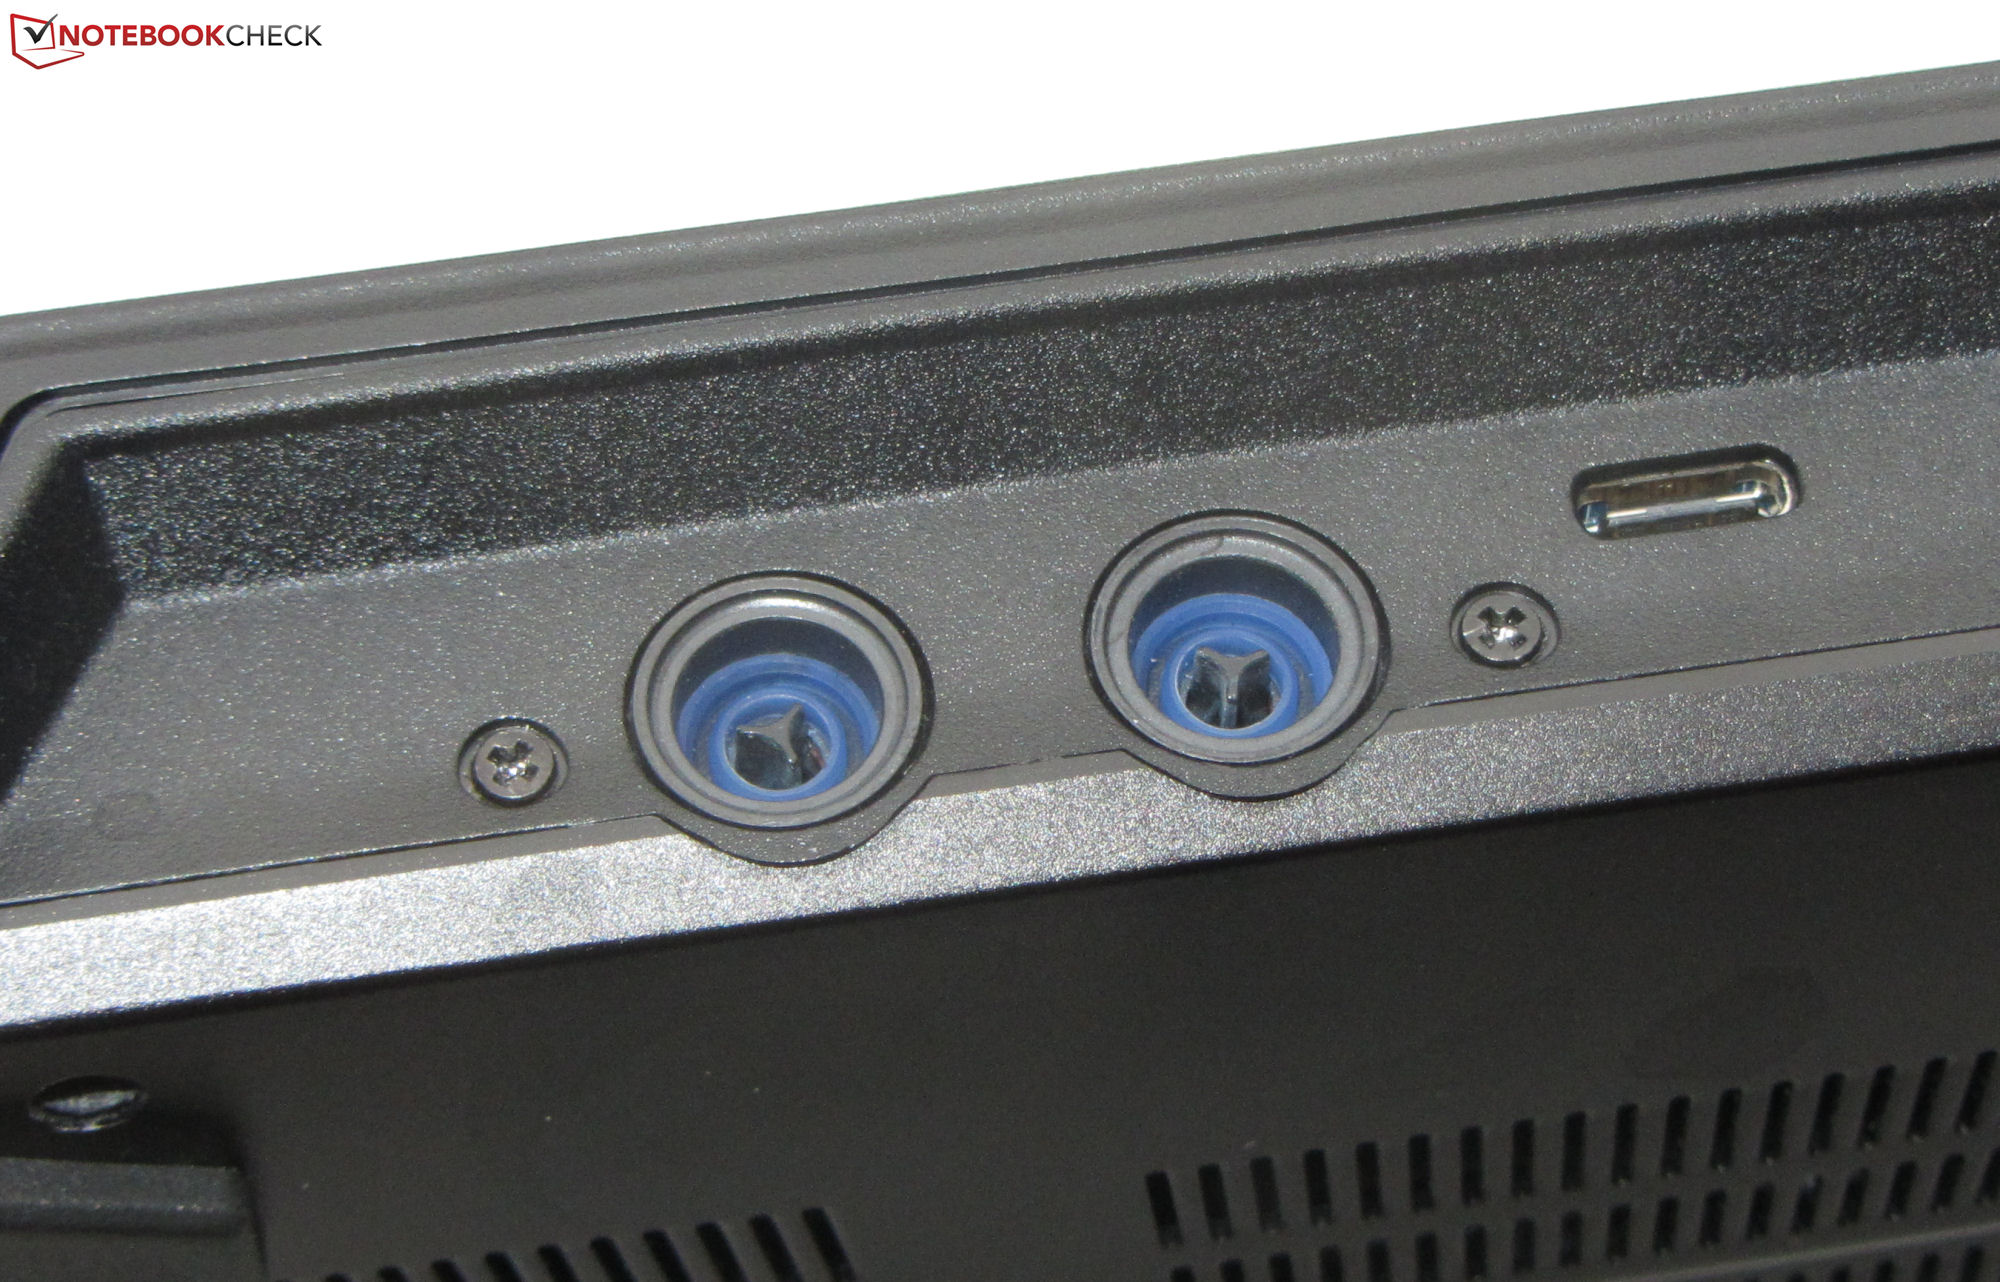
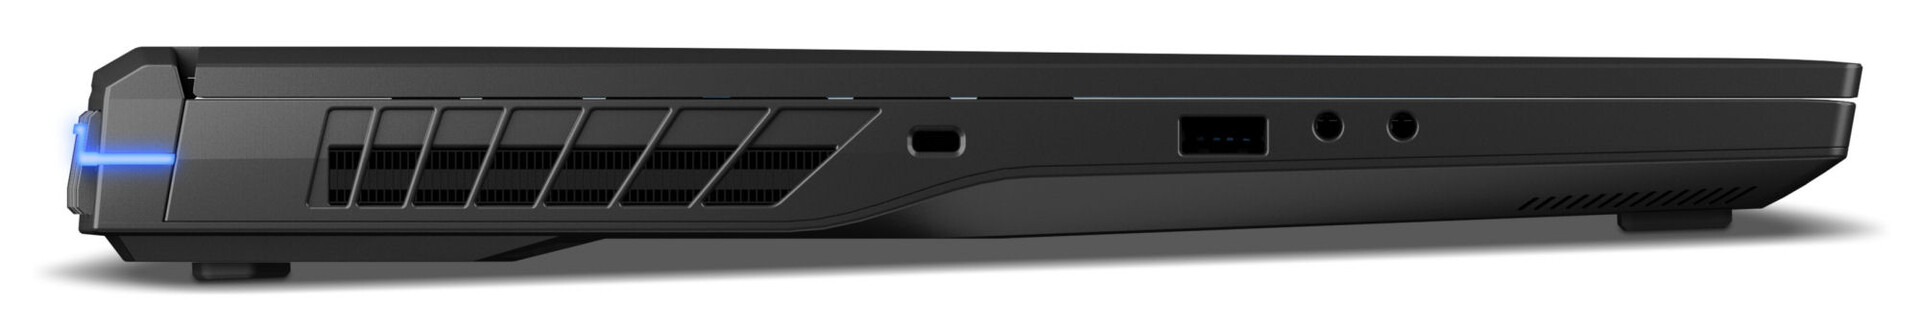
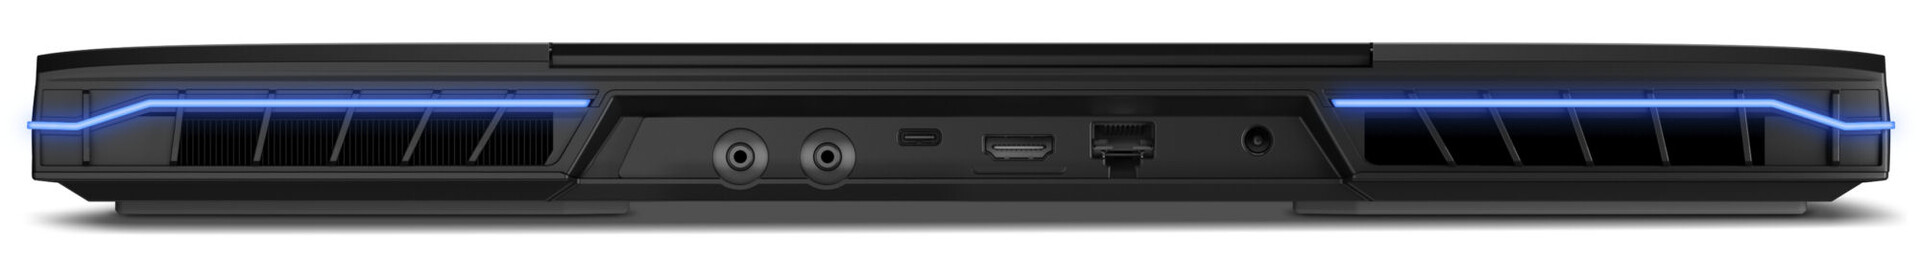
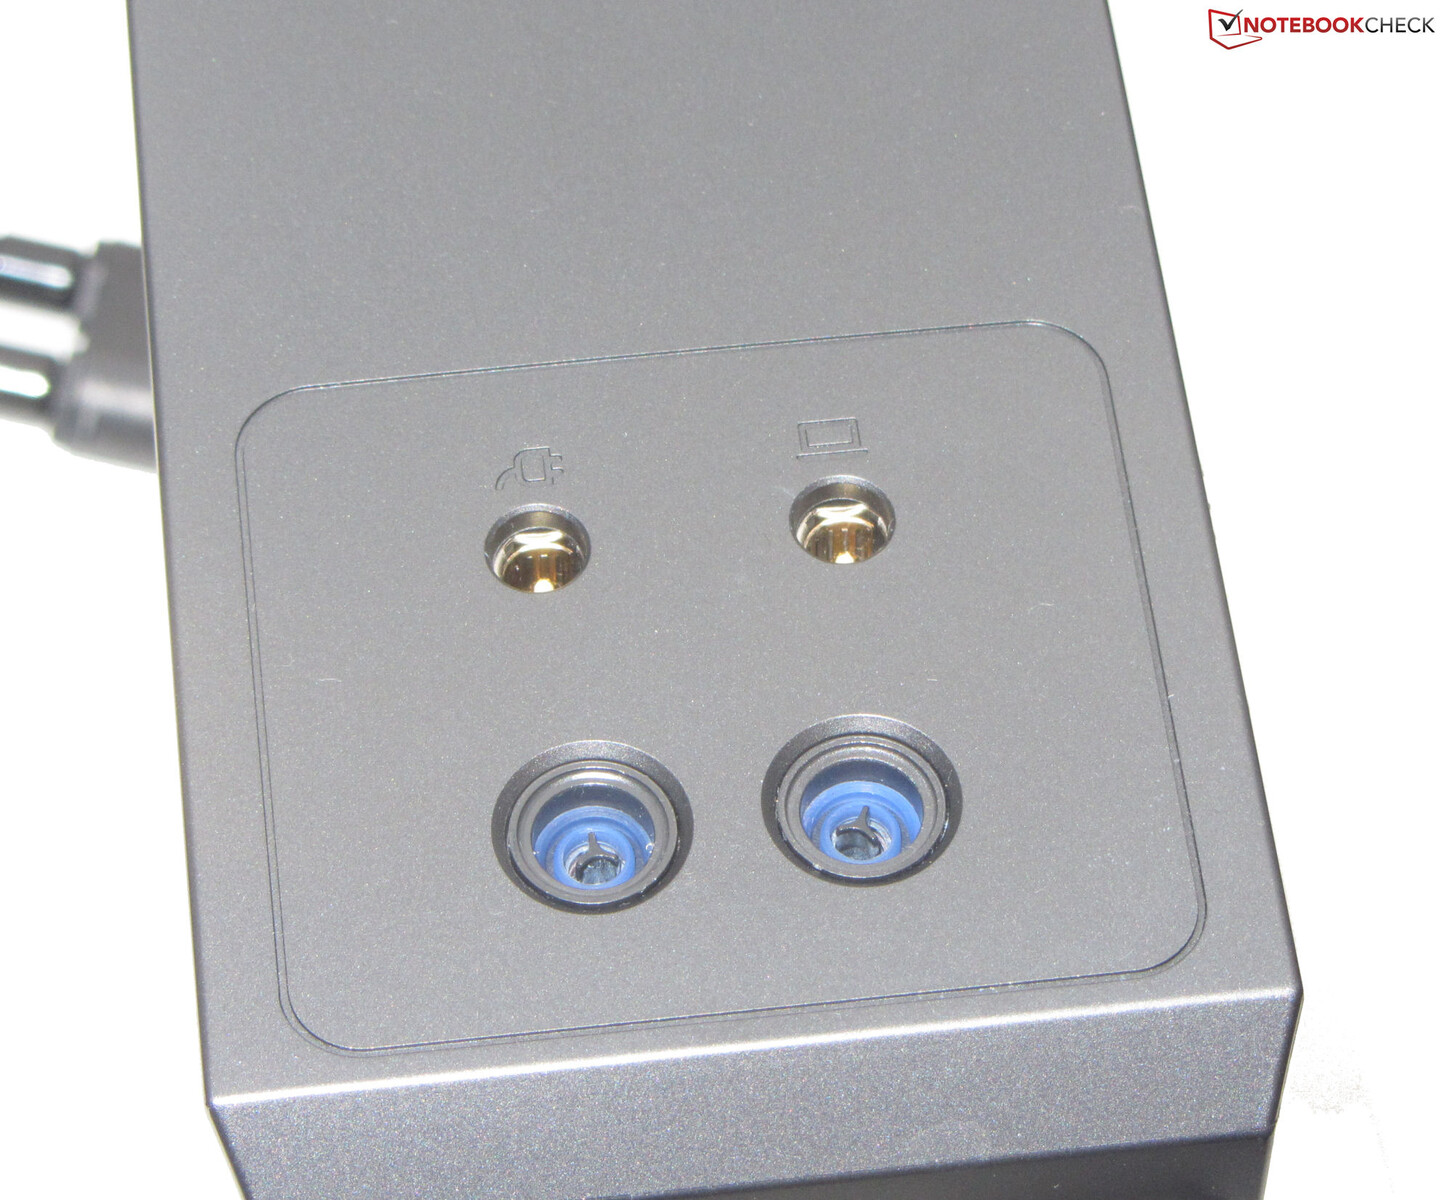
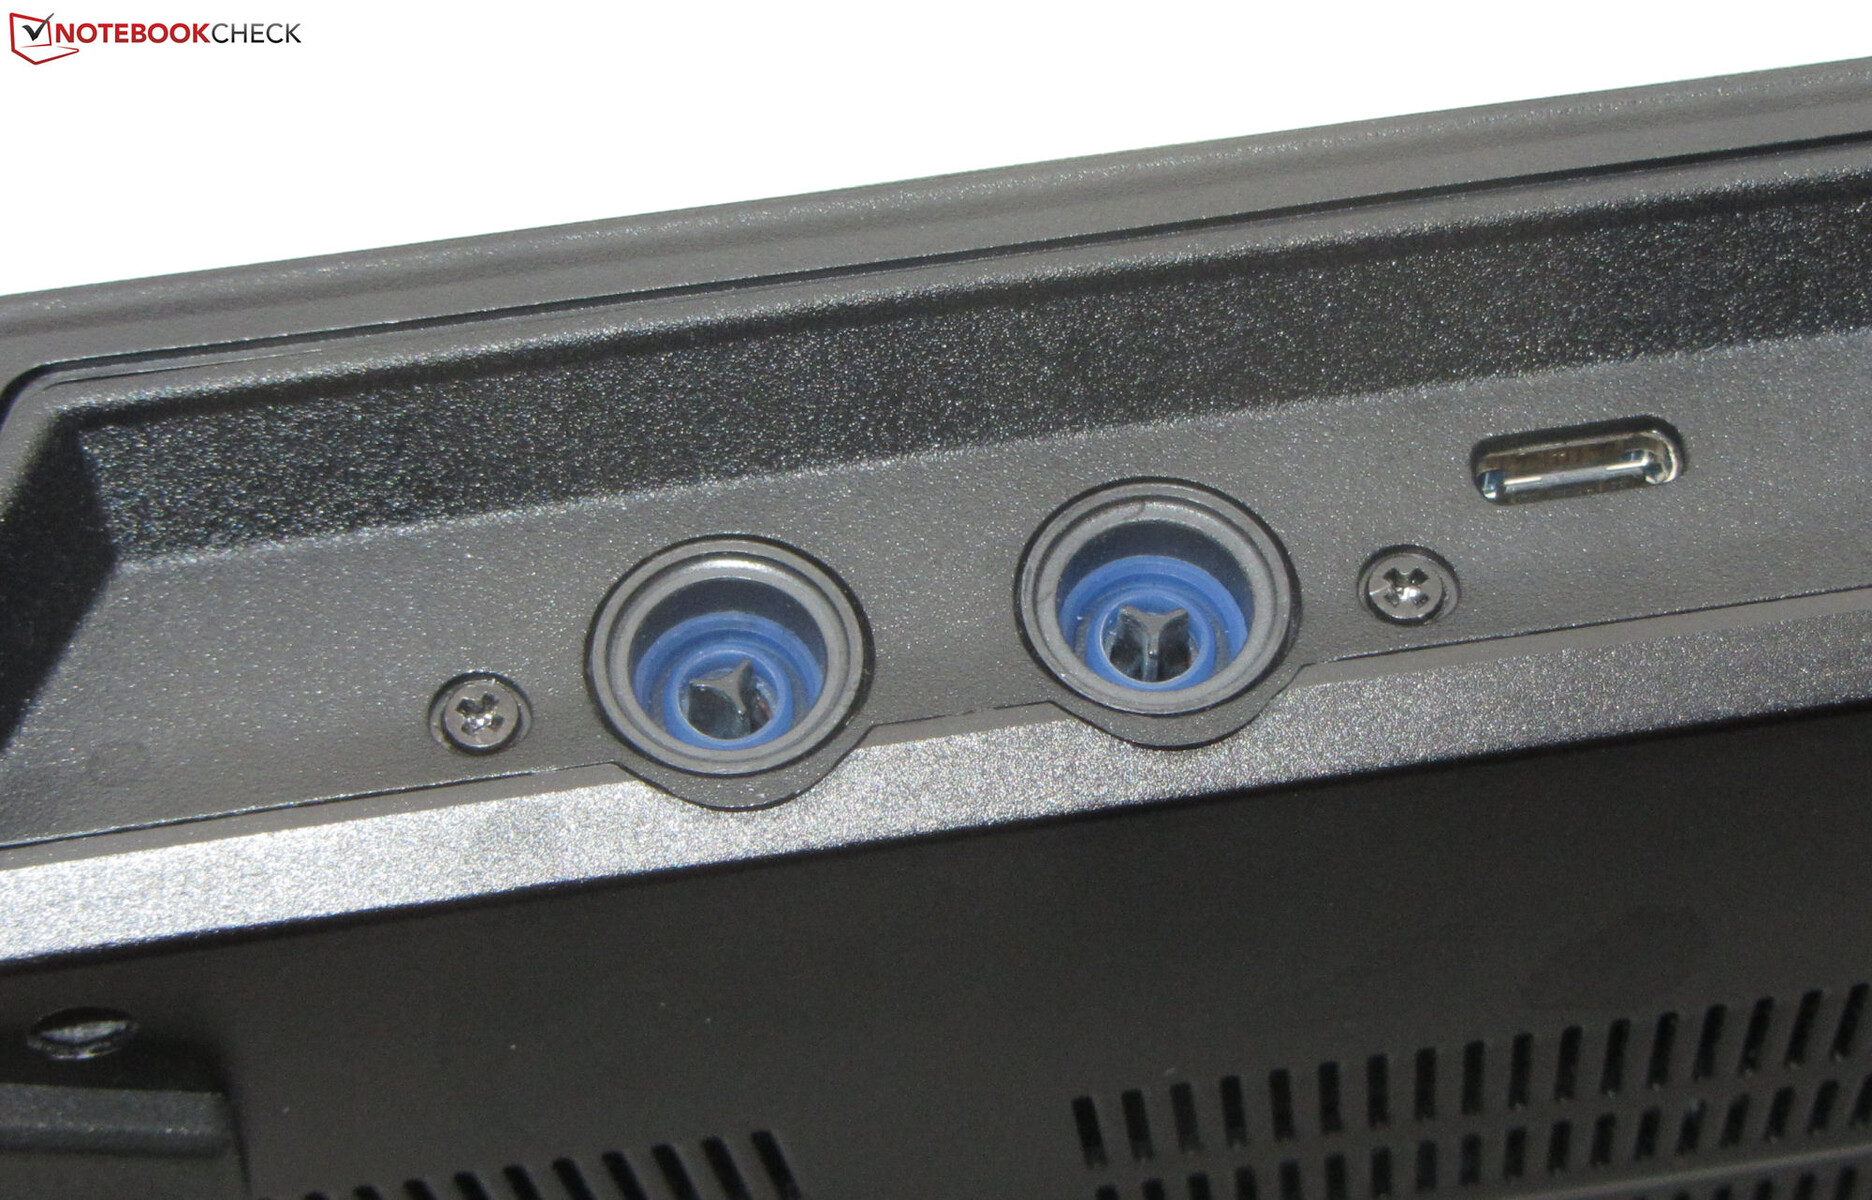
O Erazer tem três portas USB-A (2x USB 3.2 Gen 1, 1x USB 3.2 Gen 2) e uma porta USB-C (Thunderbolt 4) a bordo. Esta última não suporta Power Delivery, mas é capaz de emitir sinais DisplayPort. O laptop tem um total de duas saídas de vídeo (HDMI 2.1, DP), dois conectores de áudio (fones de ouvido e microfone), uma porta Gigabit Ethernet e um slot Kensington. Na parte traseira, você também encontrará conectores para a solução opcional de resfriamento de água.
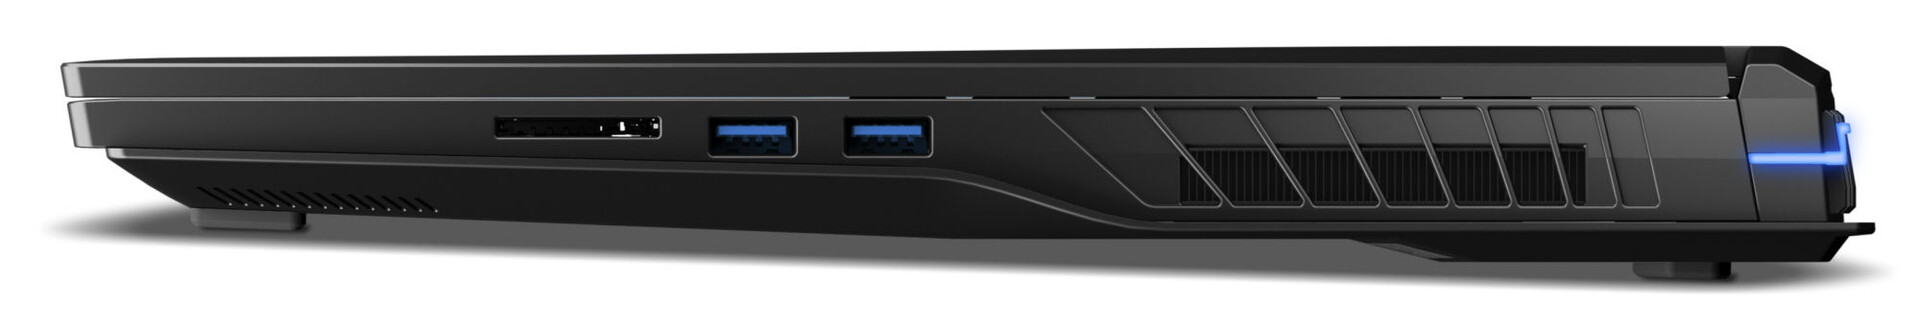
Leitor de cartões SD
O leitor de cartões SD é um modelo de velocidade média que, em conjunto com nosso cartão de referência AV Pro microSD 128 GB V60, conseguiu atingir velocidades de até 77 MB/s ao transferir 250 imagens JPEG de cerca de 5 MB cada e 86 MB/s ao copiar grandes pedaços de dados.
| SD Card Reader | |
| average JPG Copy Test (av. of 3 runs) | |
| Alienware x17 R2 P48E (AV Pro V60) | |
| Média da turma Gaming (20.9 - 210, n=54, últimos 2 anos) | |
| Razer Blade 16 Early 2023 (AV PRO microSD 128 GB V60) | |
| MSI Titan GT77 HX 13VI (Angelibird AV Pro V60) | |
| Medion Erazer Beast X40 (AV PRO microSD 128 GB V60) | |
| Schenker XMG Neo 17 M22 (AV PRO microSD 128 GB V60) | |
| maximum AS SSD Seq Read Test (1GB) | |
| Alienware x17 R2 P48E (AV Pro V60) | |
| Razer Blade 16 Early 2023 (AV PRO microSD 128 GB V60) | |
| Média da turma Gaming (25.5 - 261, n=51, últimos 2 anos) | |
| MSI Titan GT77 HX 13VI (Angelibird AV Pro V60) | |
| Medion Erazer Beast X40 (AV PRO microSD 128 GB V60) | |
Conectividade
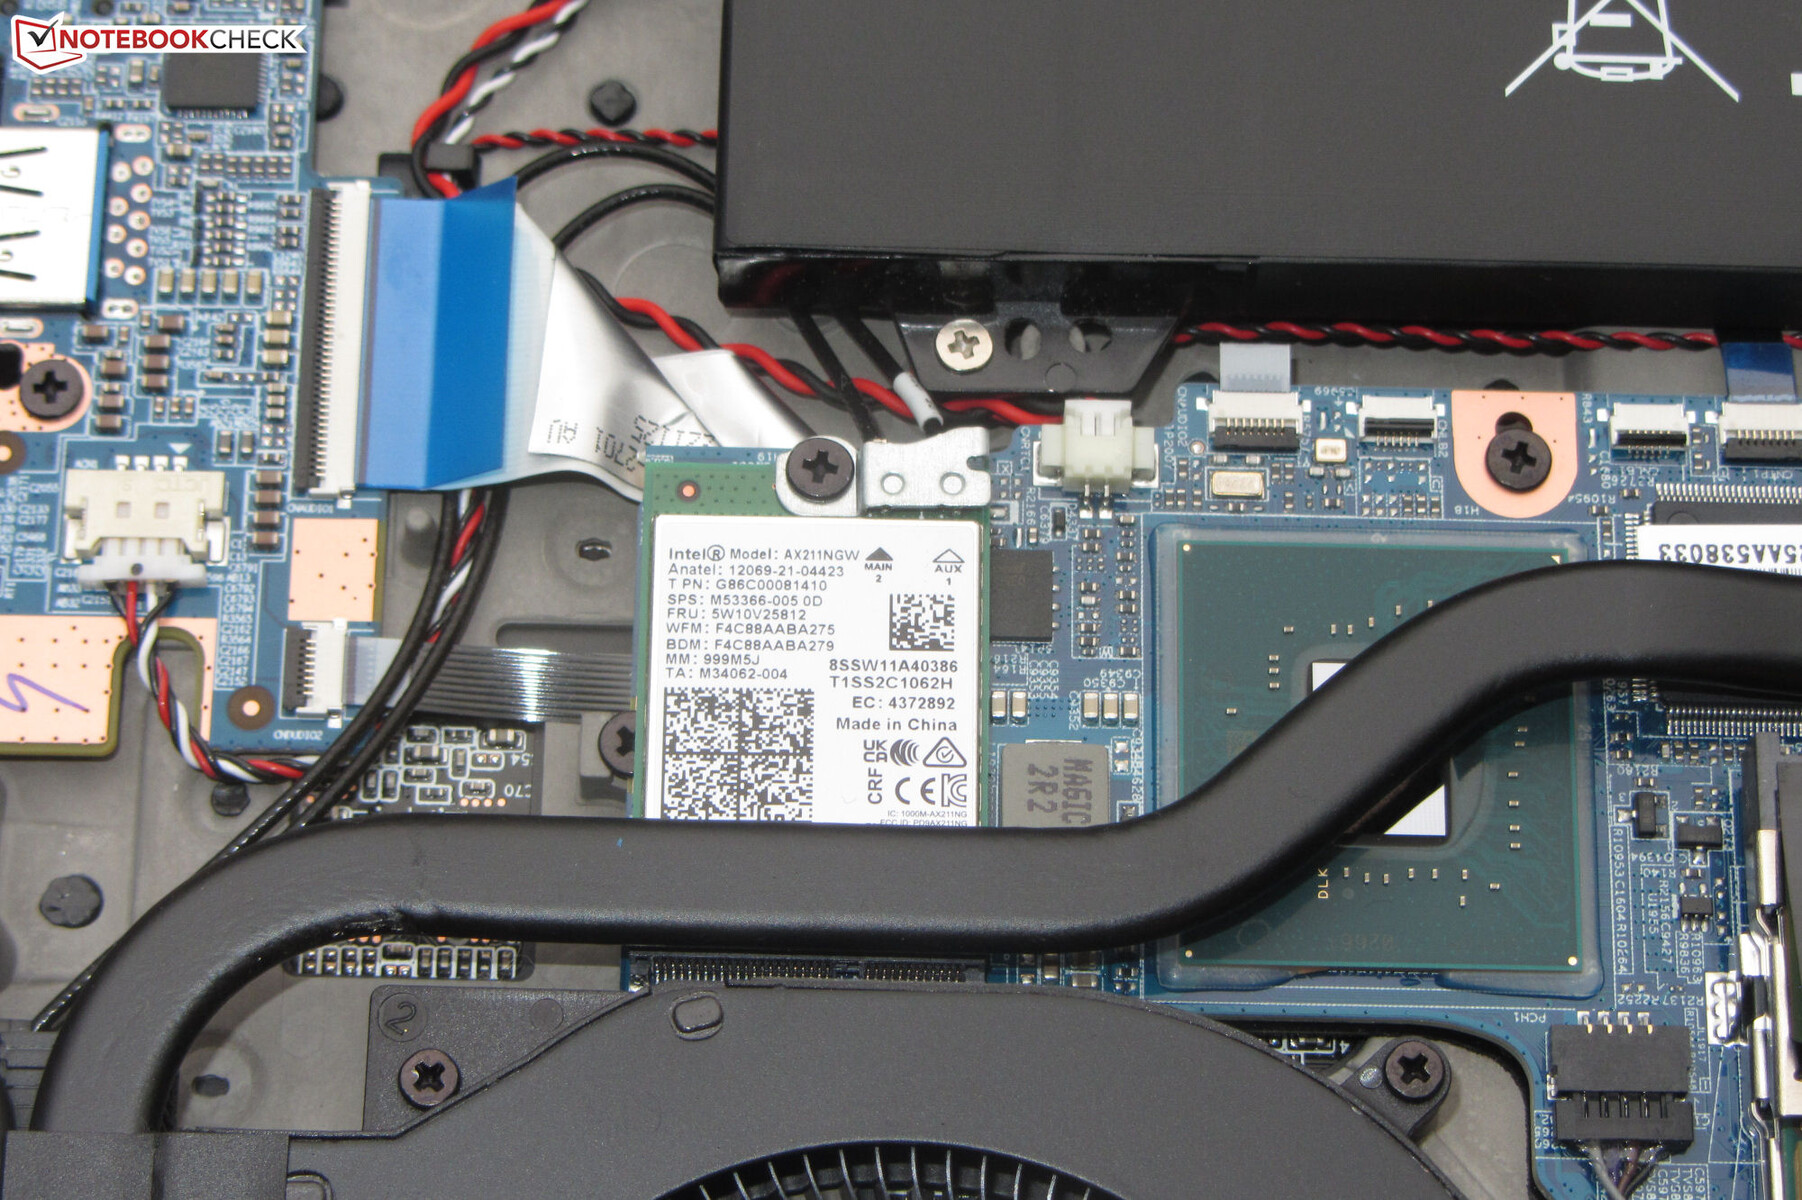
Sob condições ideais (nenhum outro dispositivo Wi-Fi no entorno imediato, distância curta entre o laptop e o PC servidor), a Erazer forneceu excelentes taxas de transferência sobre Wi-Fi porque a Medion decidiu optar por um módulo Intel AX211 Wi-Fi 6E. As conexões de rede com fio são tratadas pelo chip Ethernet Gigabit RTL8125 da Realtek, que é capaz de velocidades de até 2,5 Gbit/s.
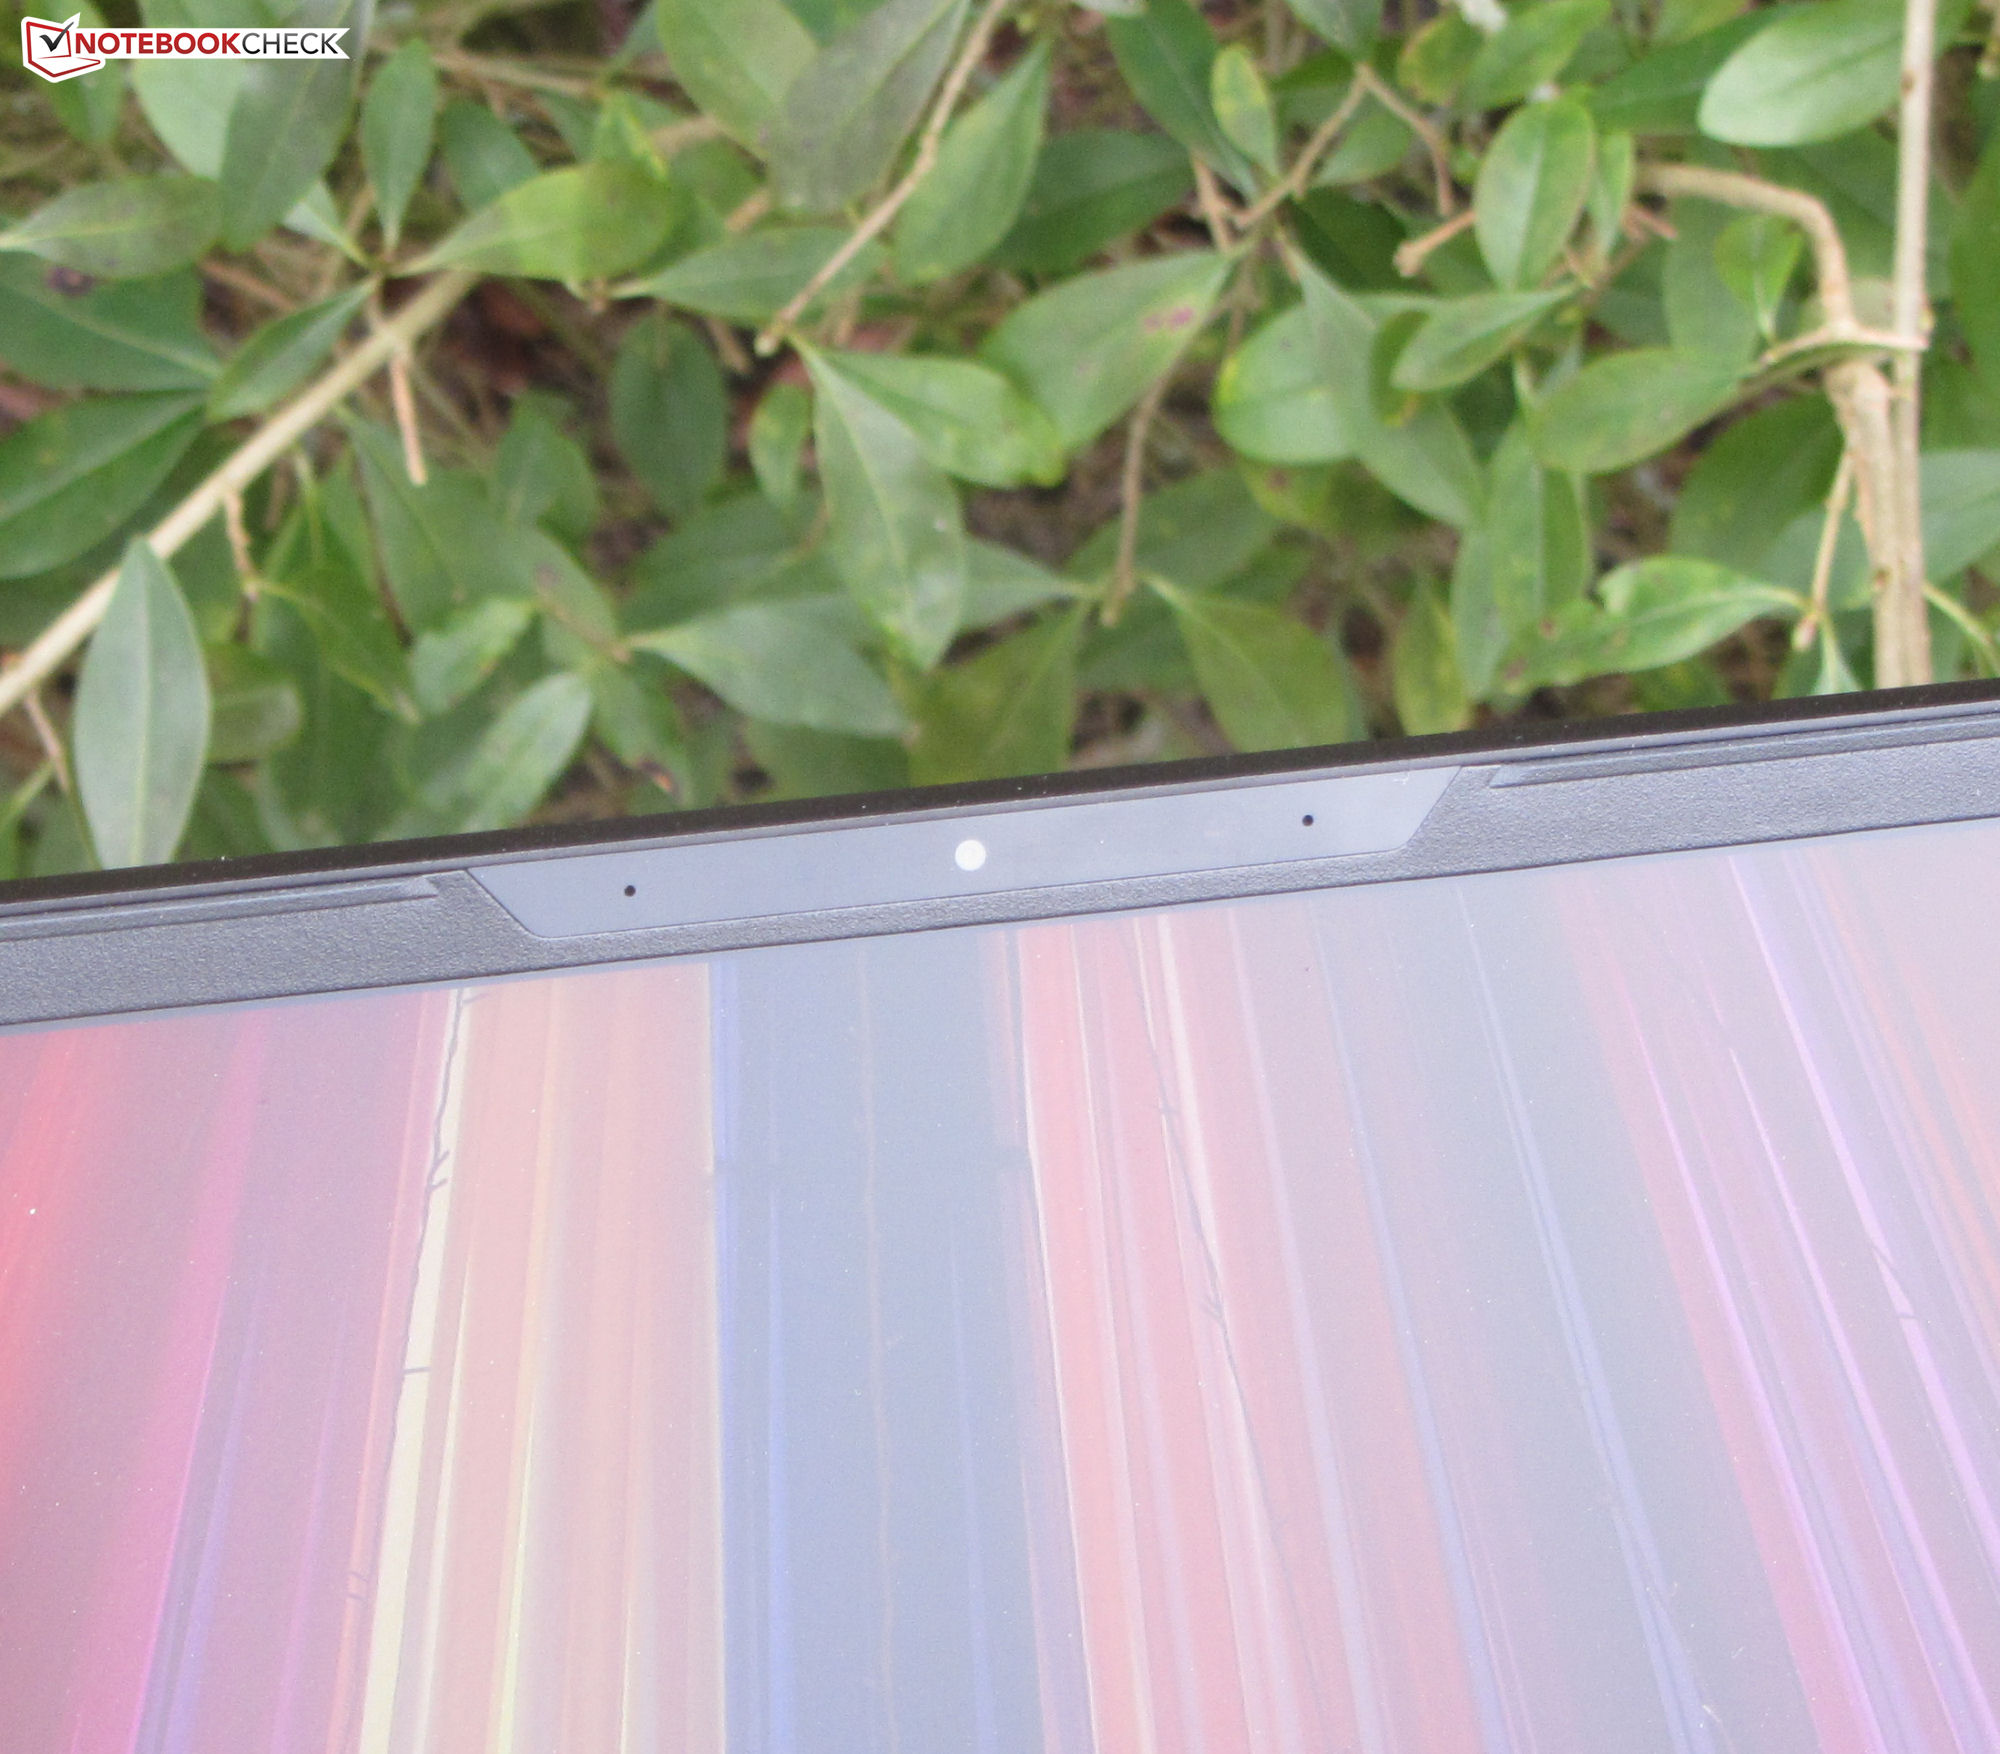
Webcam
A webcam de 2.1MP captura imagens com resolução máxima de 1.920 x 1.080. Falta precisão nas cores: as cores produzidas pela câmera se desviam significativamente das cores de referência. Não há nenhum obturador mecânico de privacidade na webcam.


Acessórios
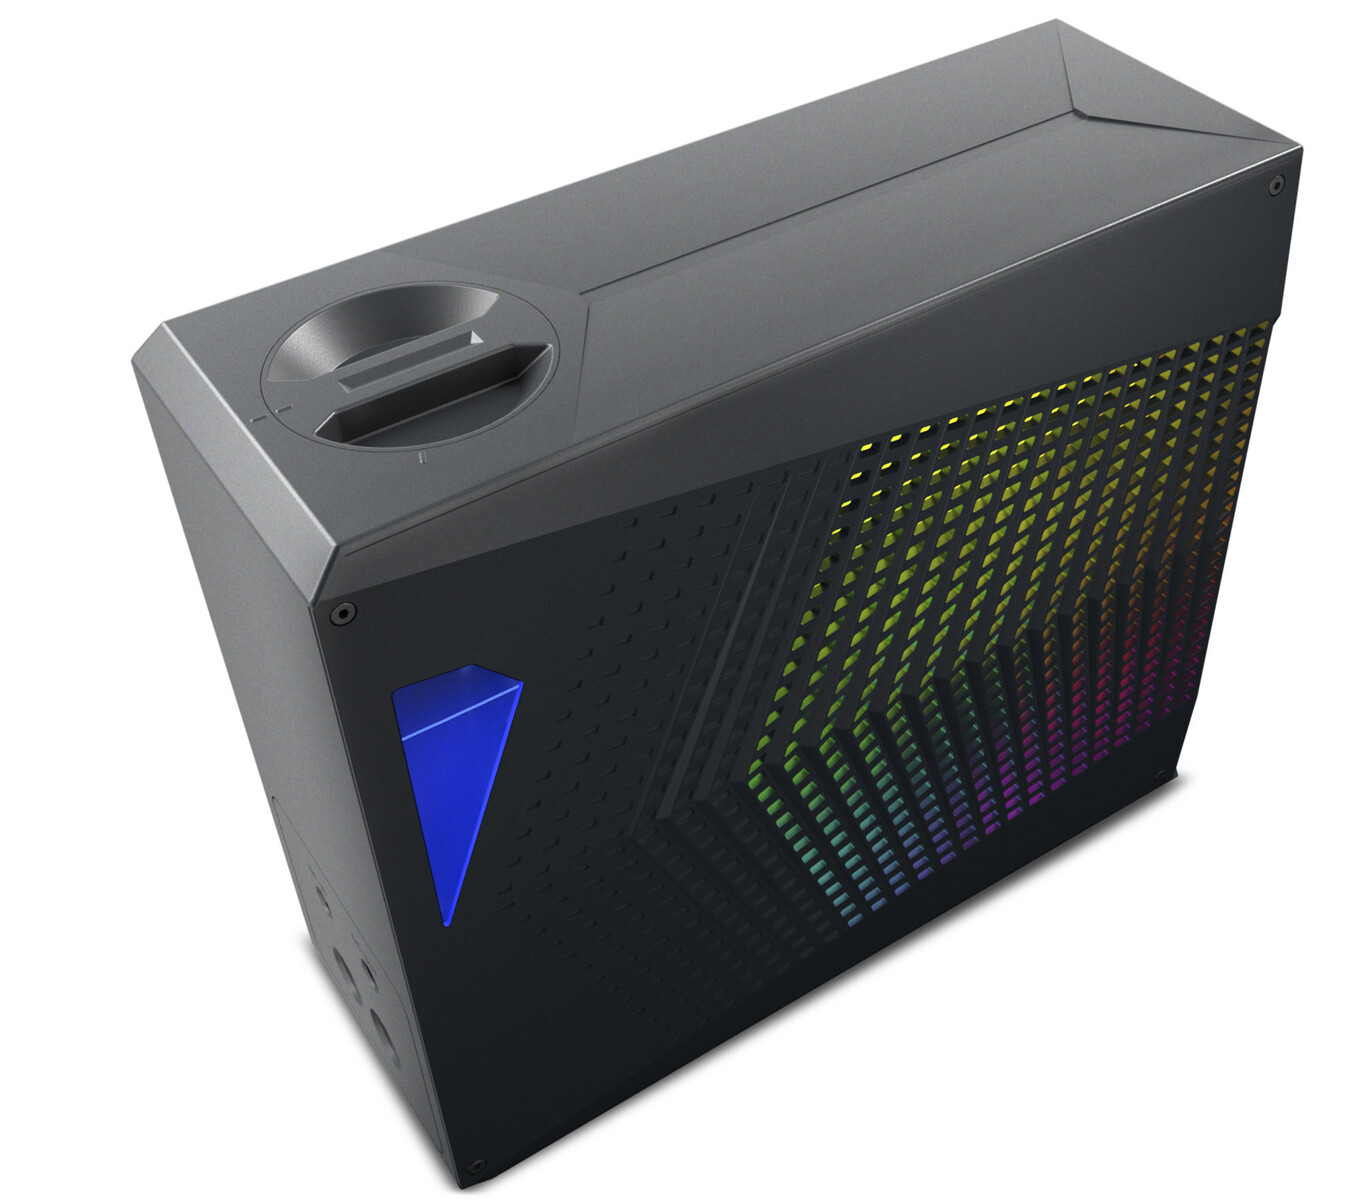
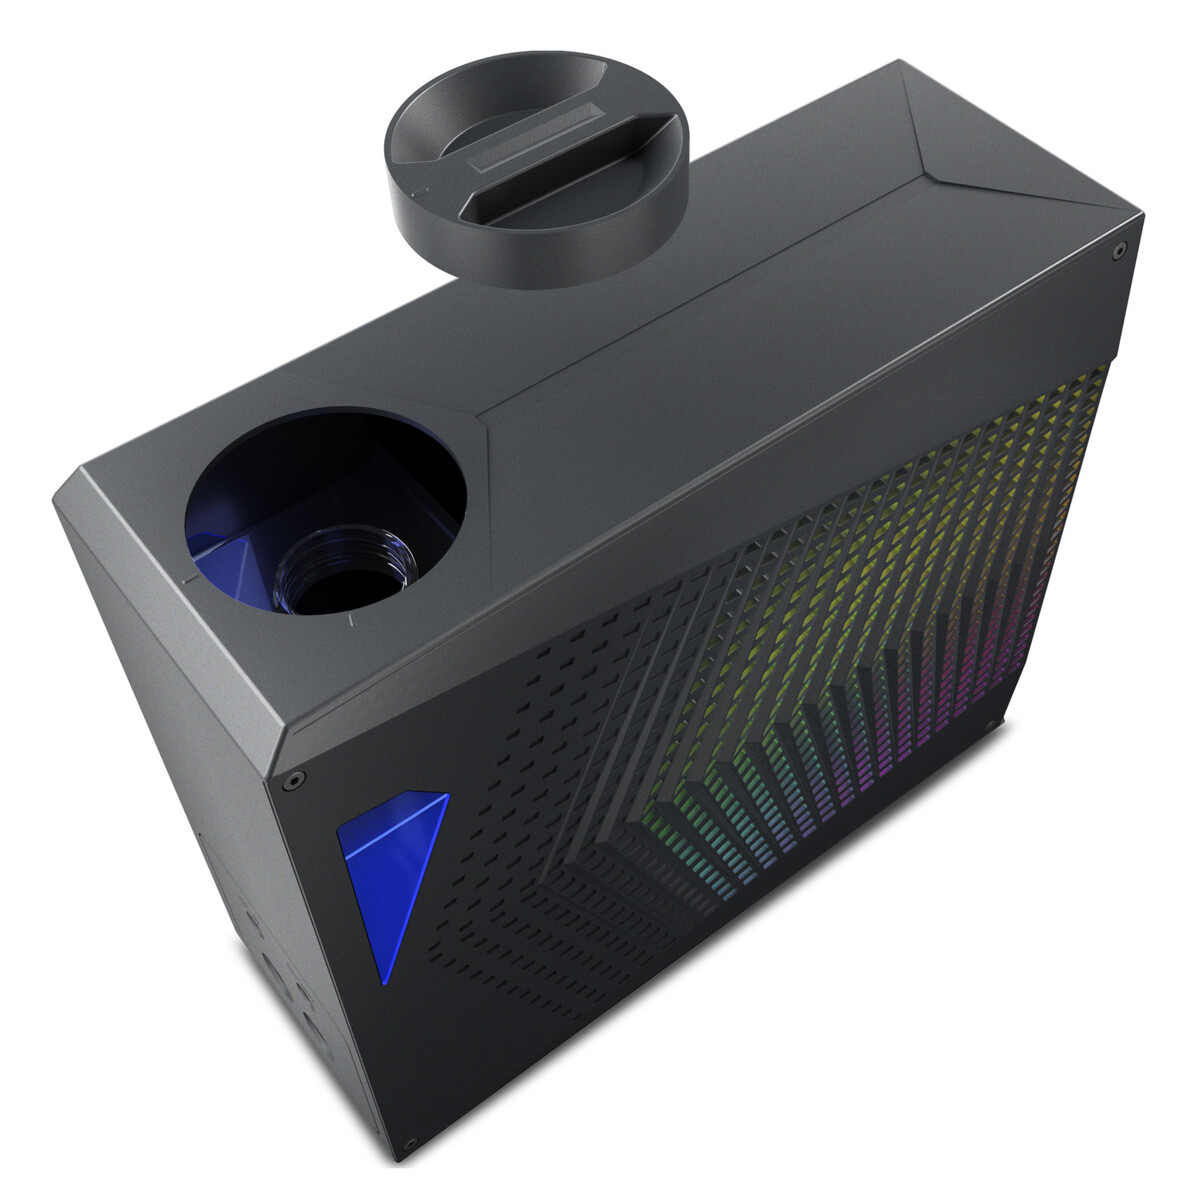
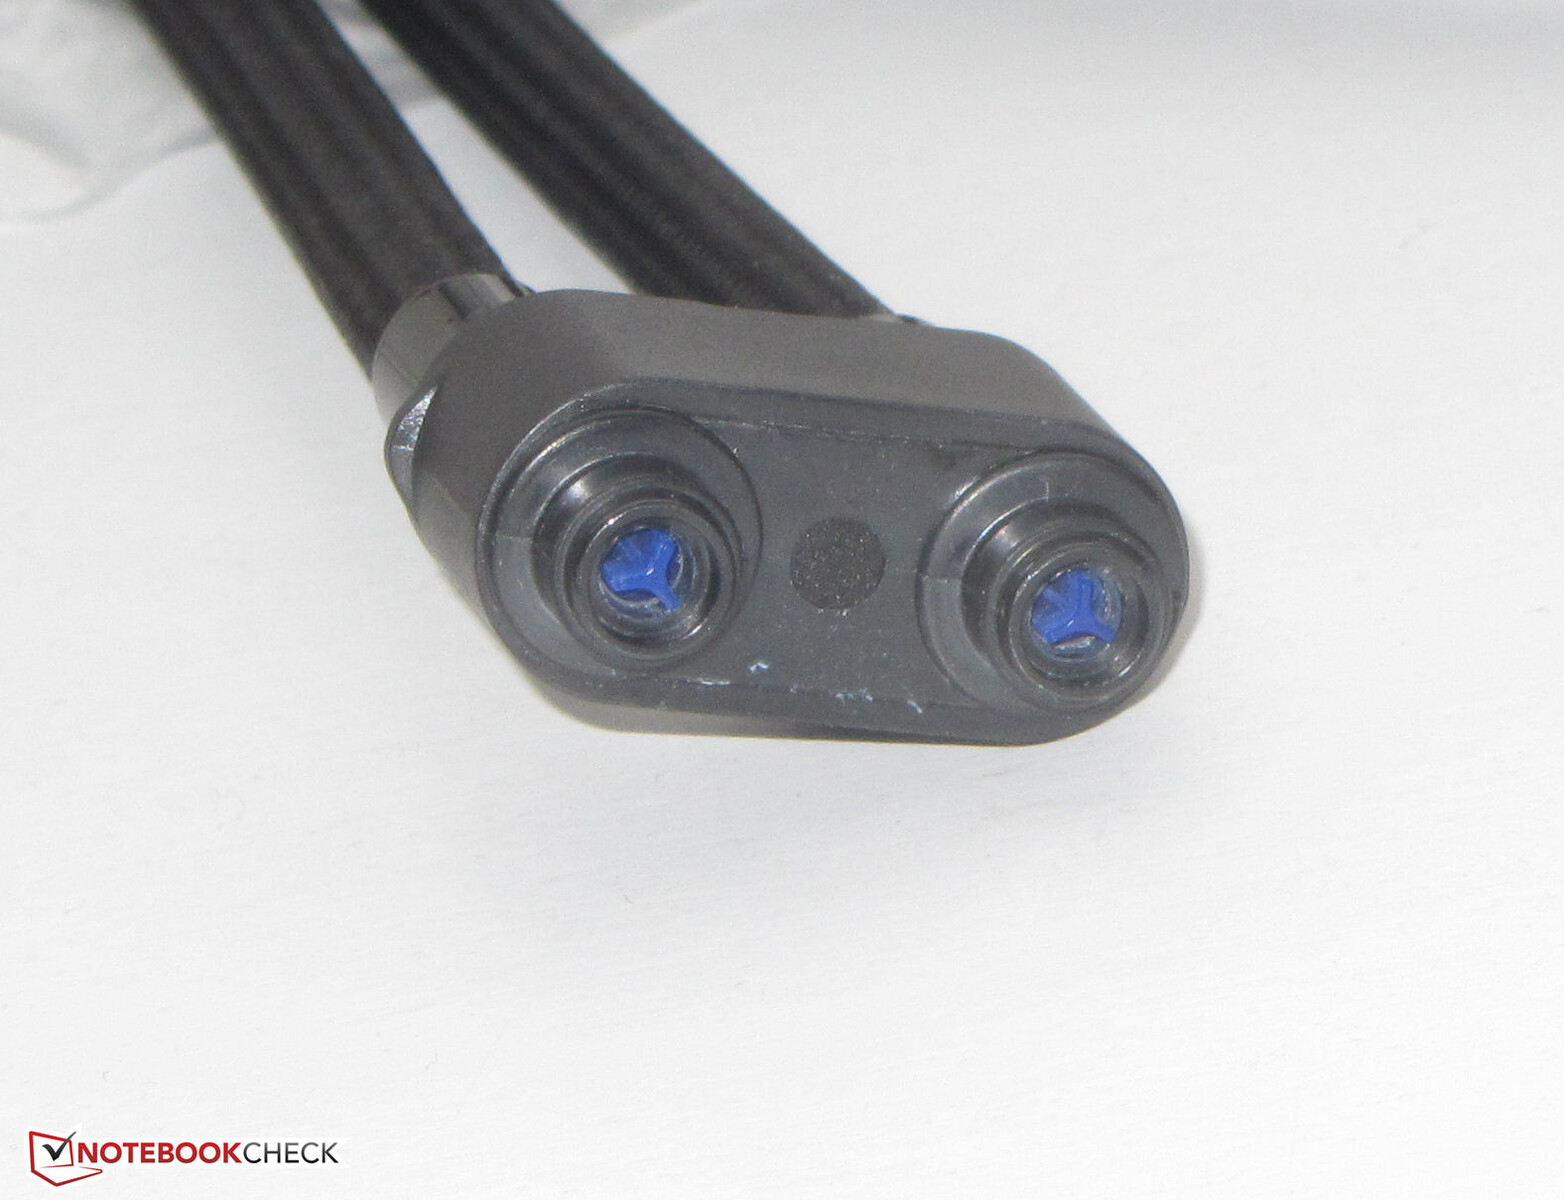
O laptop é fornecido sem outros acessórios além da documentação usual e um adaptador de energia. A Medion está oferecendo uma solução opcional de resfriamento externo de água a um preço de cerca de 250 euros (US$ 270), que a empresa também nos forneceu para testes.
A pequena unidade de resfriamento é bastante fácil de usar: basta enchê-la com água destilada, conectar os cabos e tubos, e ligá-la. O laptop e a unidade de refrigeração externa comunicam-se entre si via Bluetooth, e a conexão é estabelecida automaticamente. O carregador do laptop fornece energia tanto para o X40 quanto para a unidade de resfriamento. Os tubos de água são mantidos no lugar magneticamente - não é necessário apertar os parafusos. Entretanto, algumas gotas de água podem vazar quando você estiver desconectando os tubos.
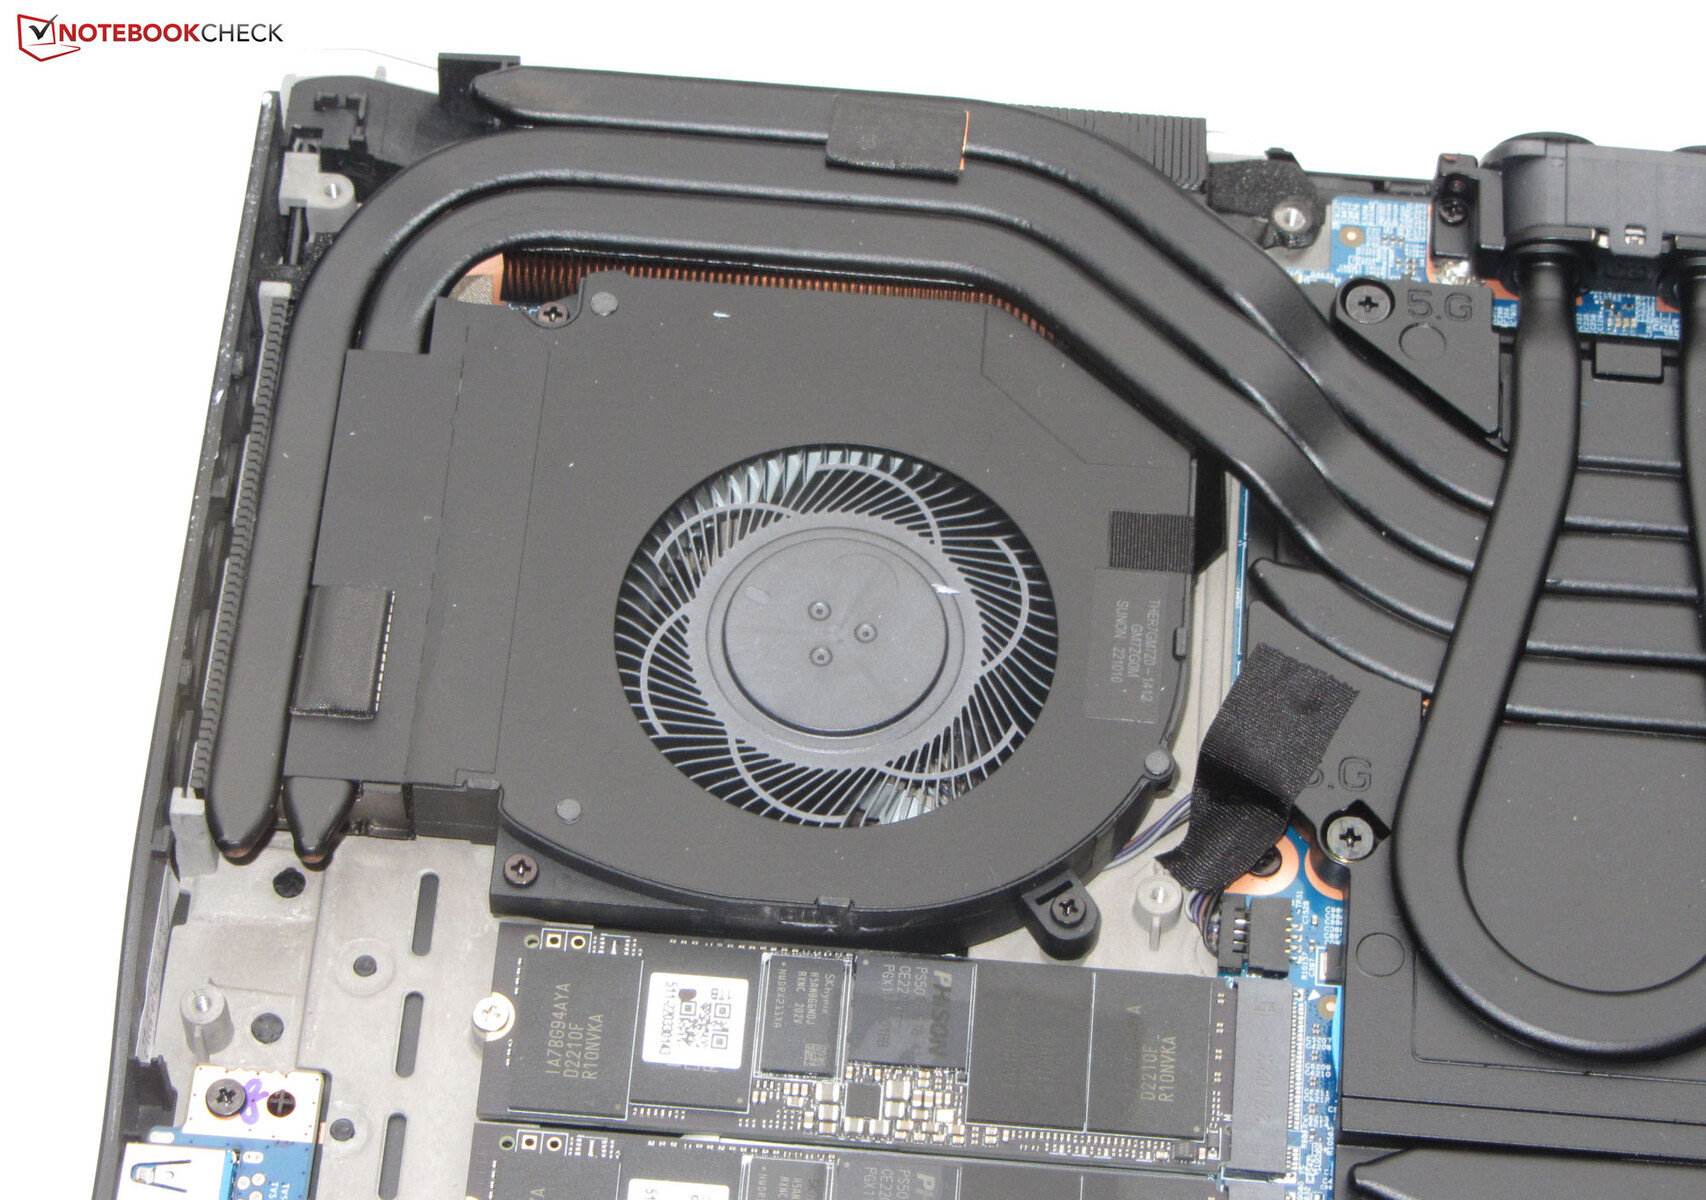
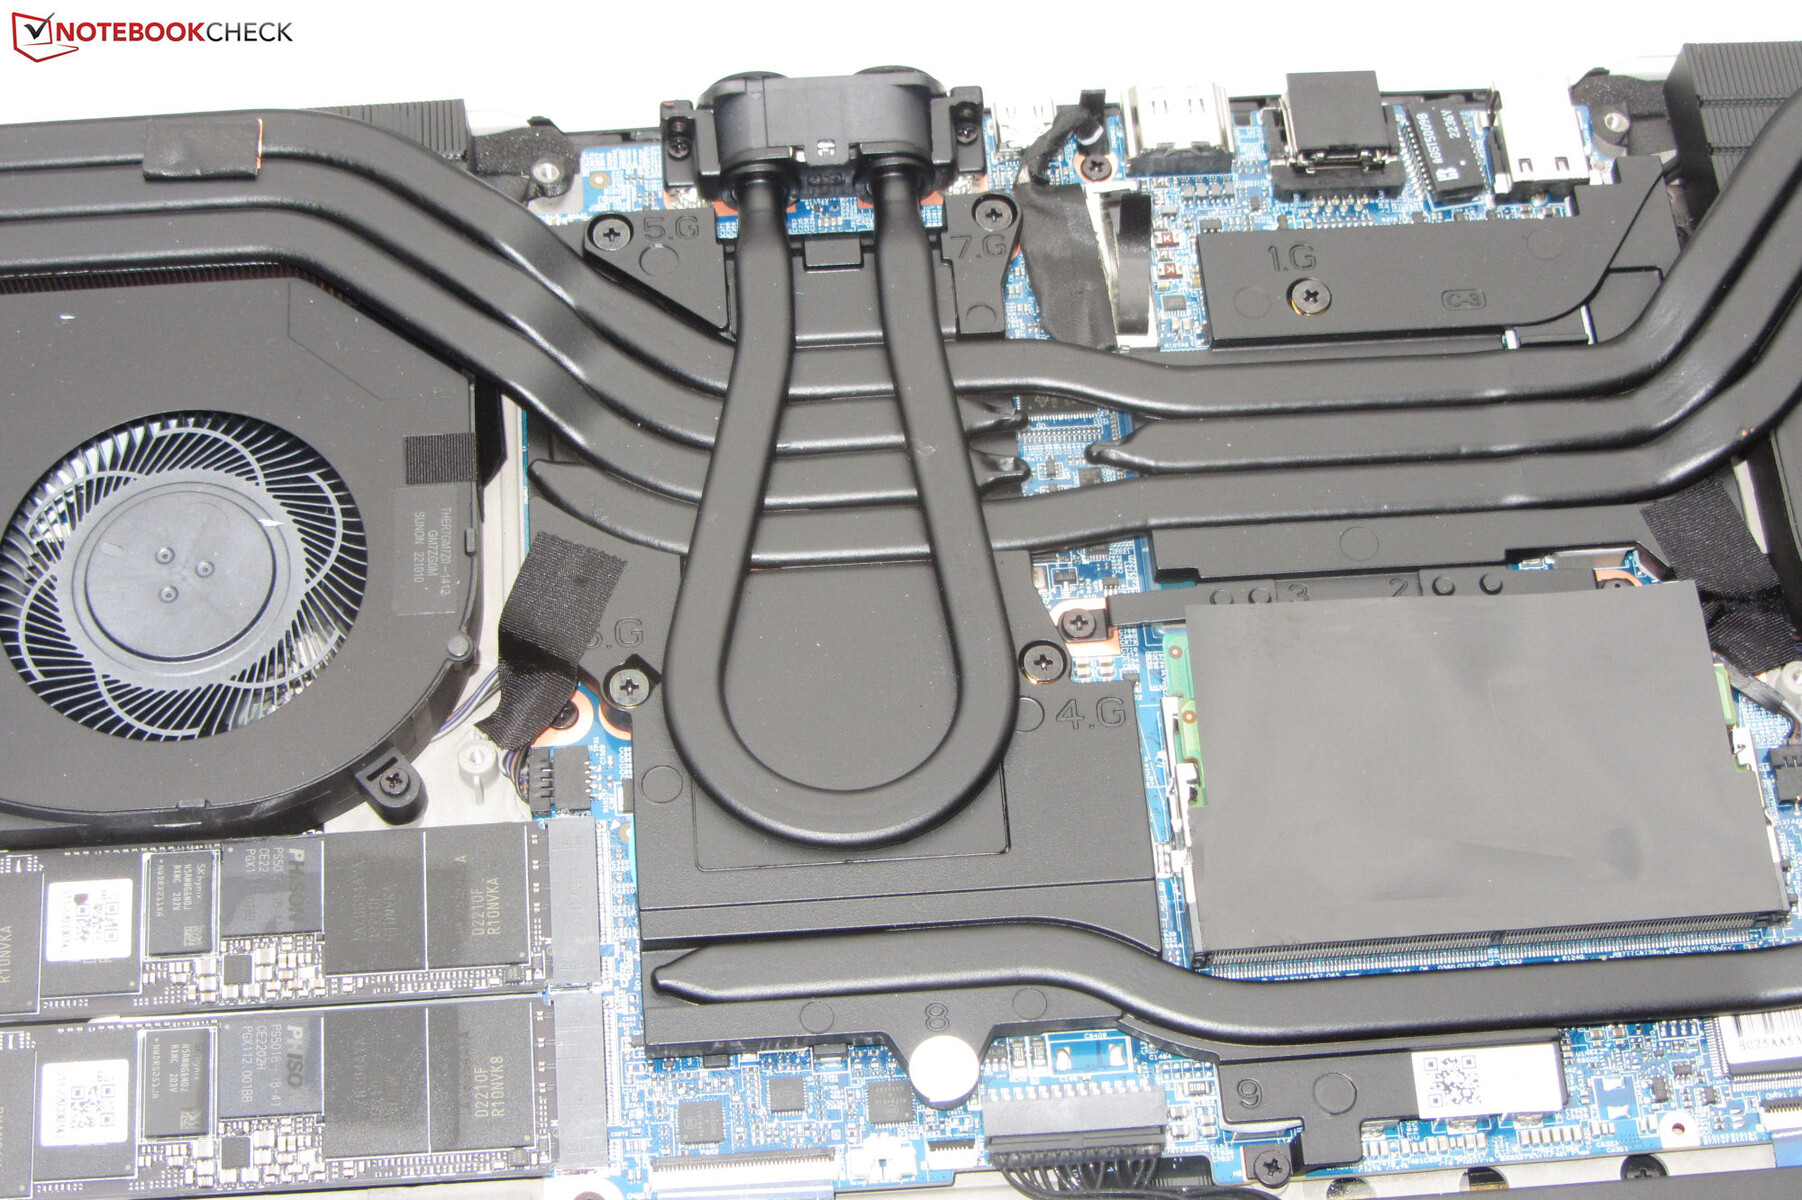
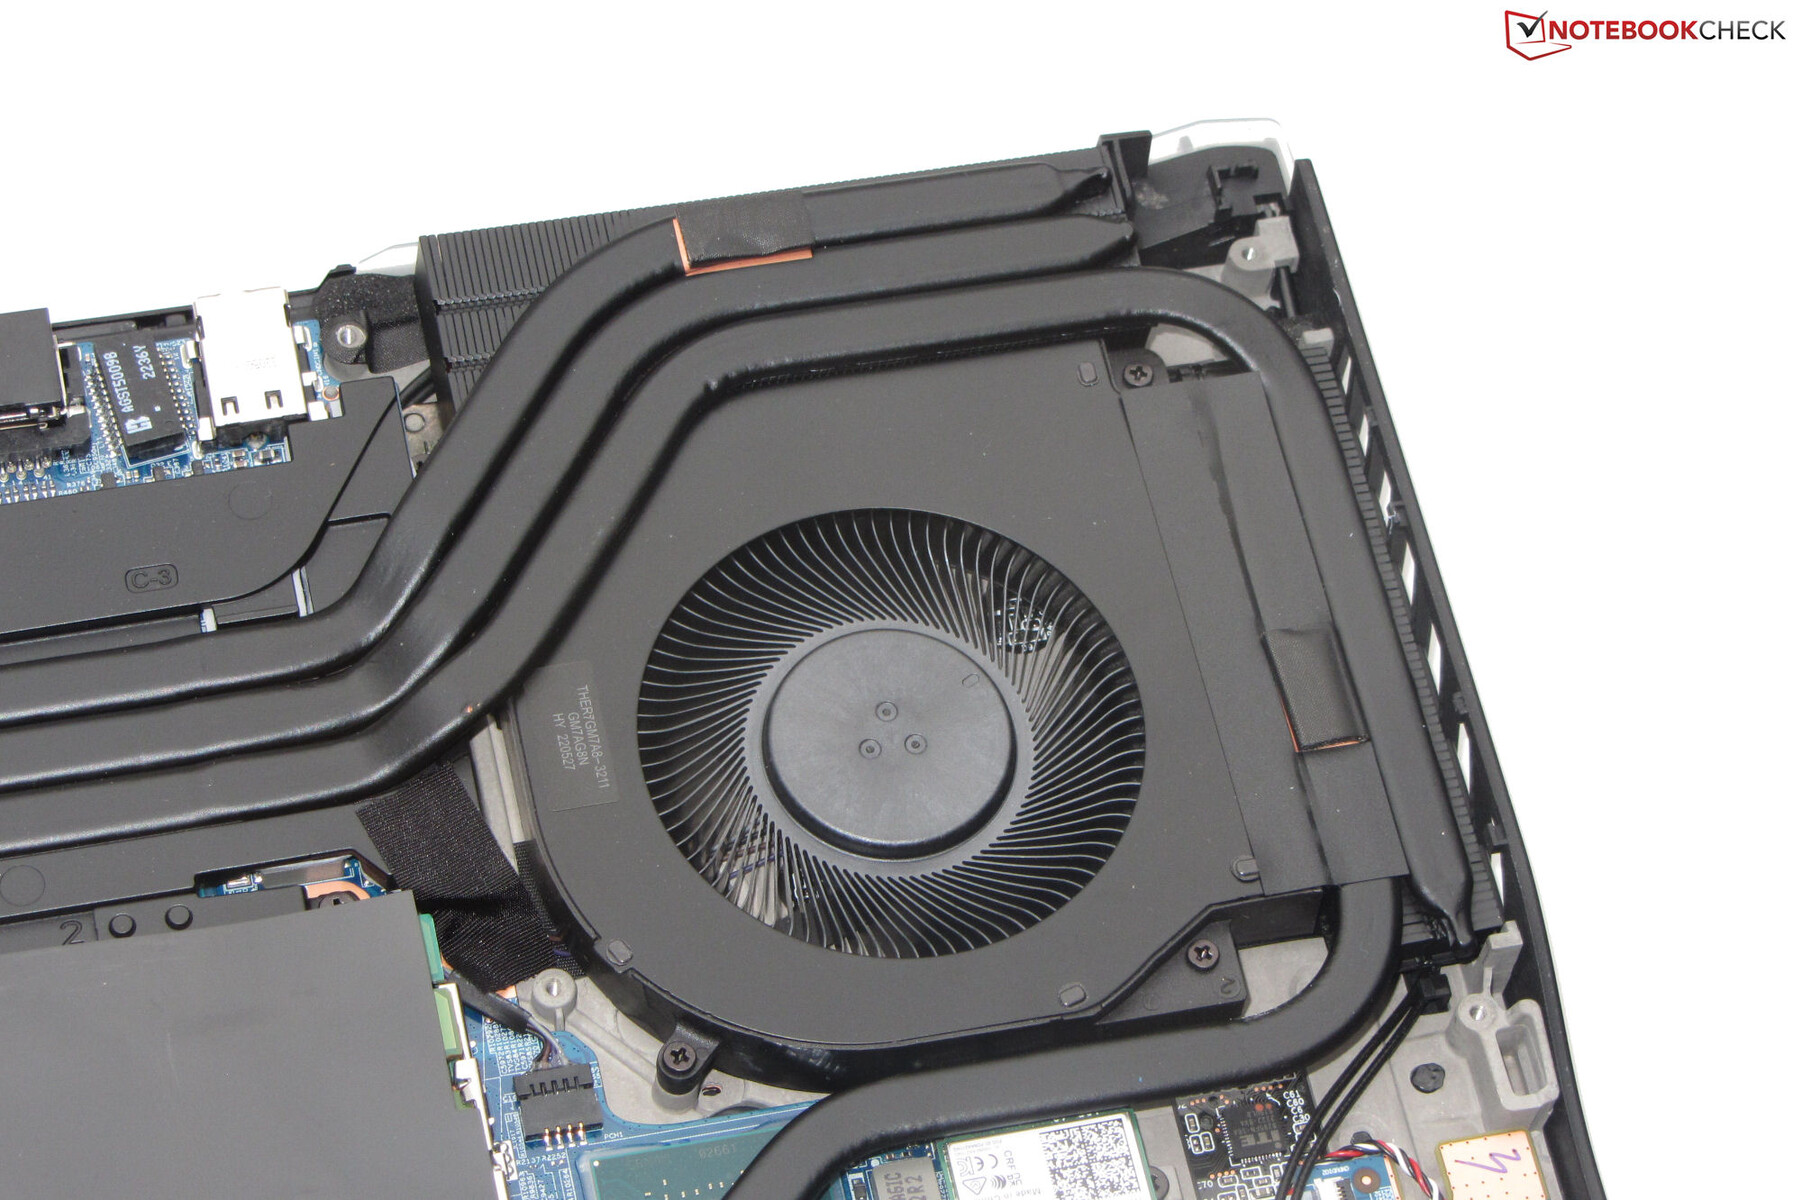
Manutenção
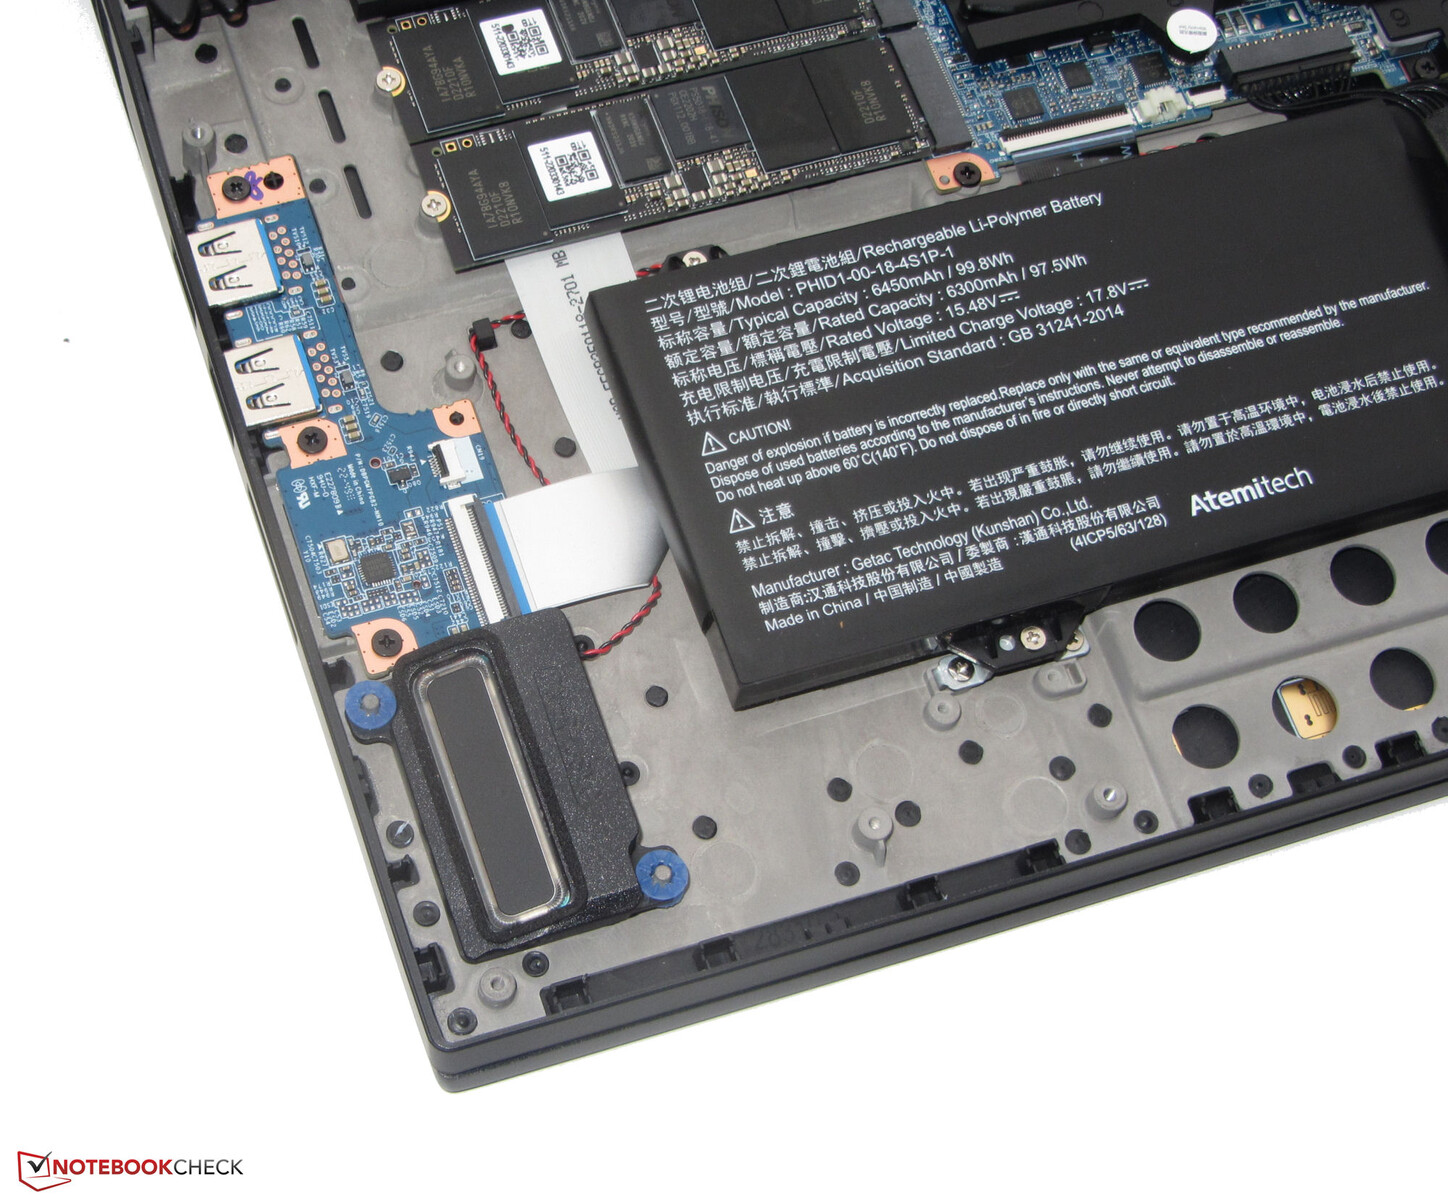
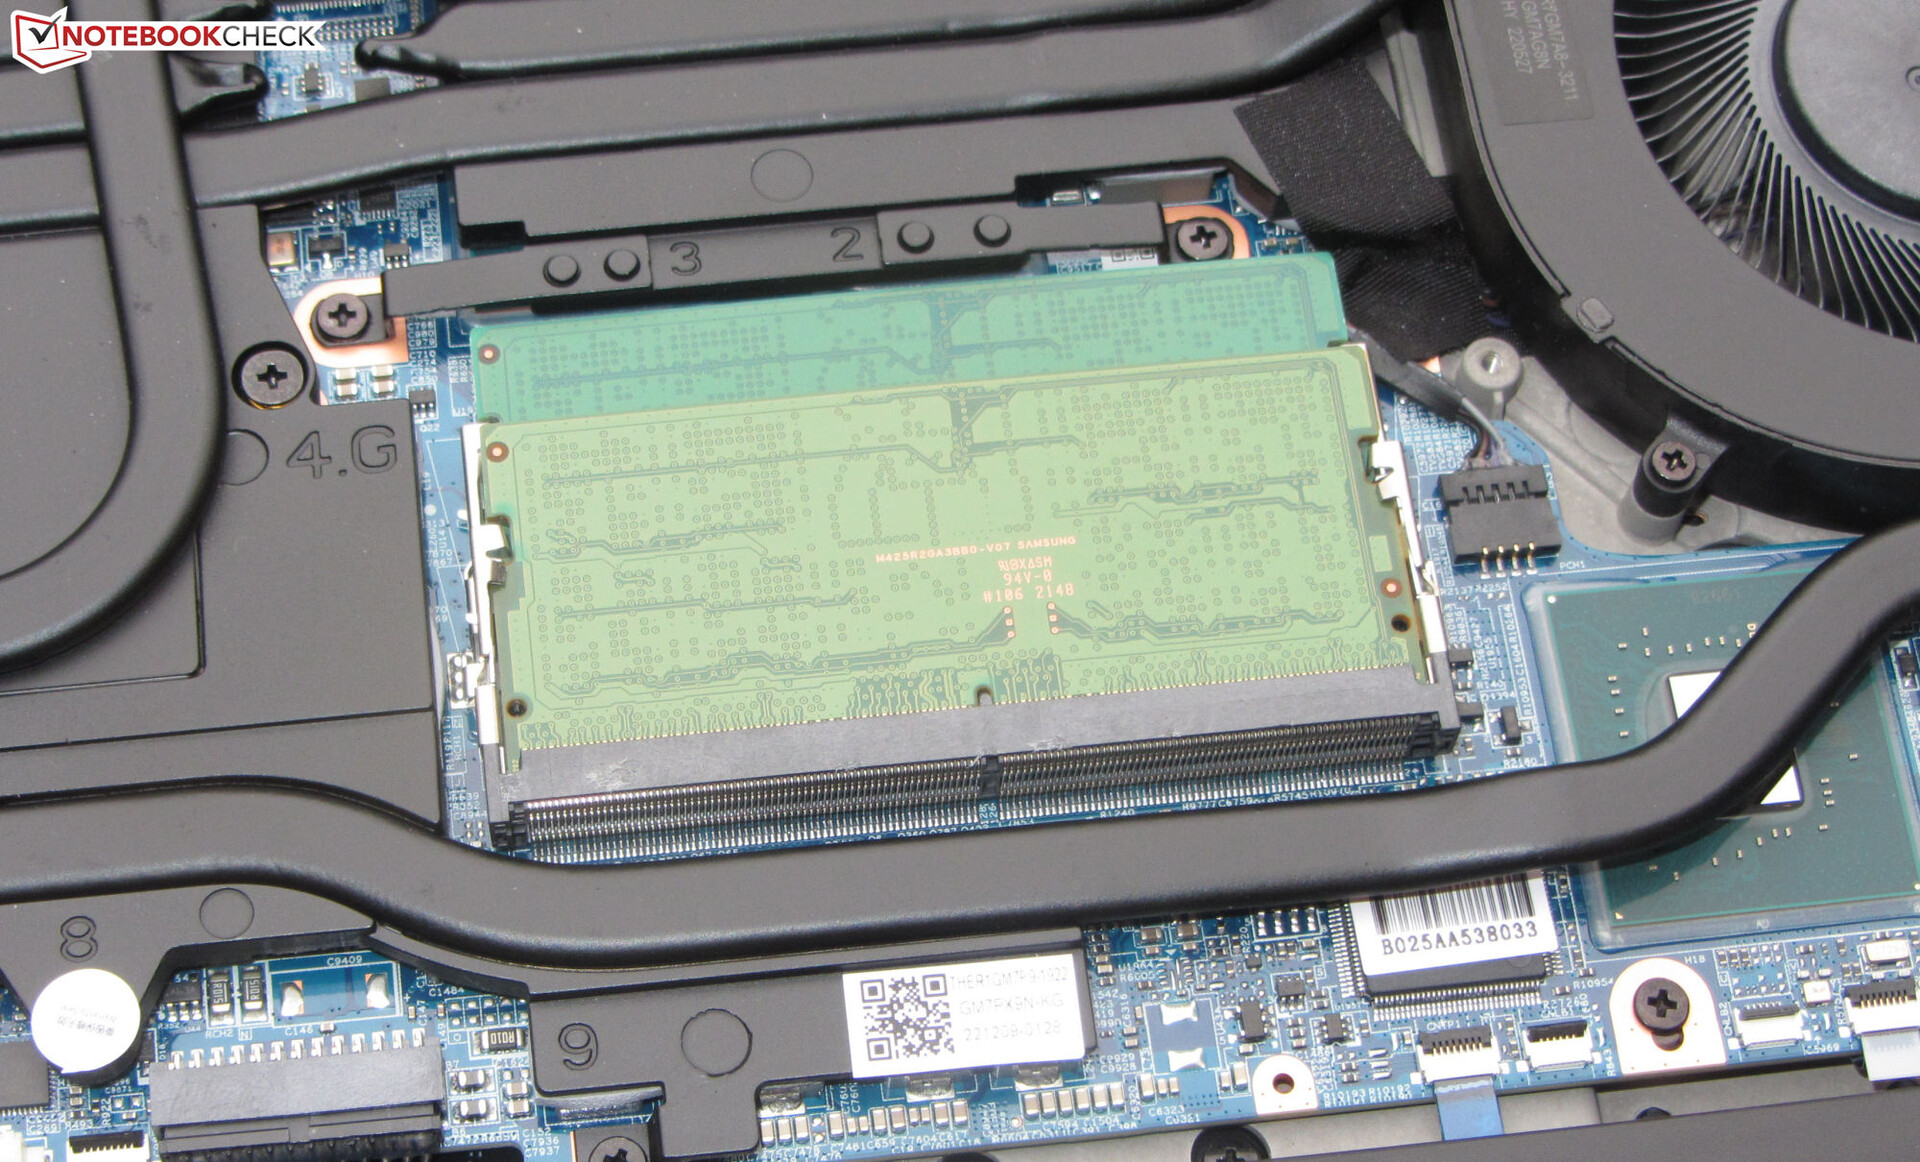
Para remover a tampa inferior, é necessário desfazer todos os parafusos na parte inferior, bem como mais dois parafusos na parte traseira ao lado dos conectores de resfriamento de água. Depois disso, a tampa inferior pode ser arrancada em um movimento brusco pelas aberturas de escape. A remoção da tampa permite o acesso aos slots de memória (ambos em uso), dois SSDs PCIe 4.0, módulo Wi-Fi, ventiladores, bateria BIOS e bateria recarregável.
Garantia
A Medion fornece uma garantia de dois anos sobre o Erazer. Estão disponíveis opções de atualização, mas elas têm de ser compradas junto com o laptop na loja on-line da Medion. Você não pode atualizar ou estender a garantia após a compra do laptop. Custa quase 200 euros (US$216) para estender a garantia por um ano.
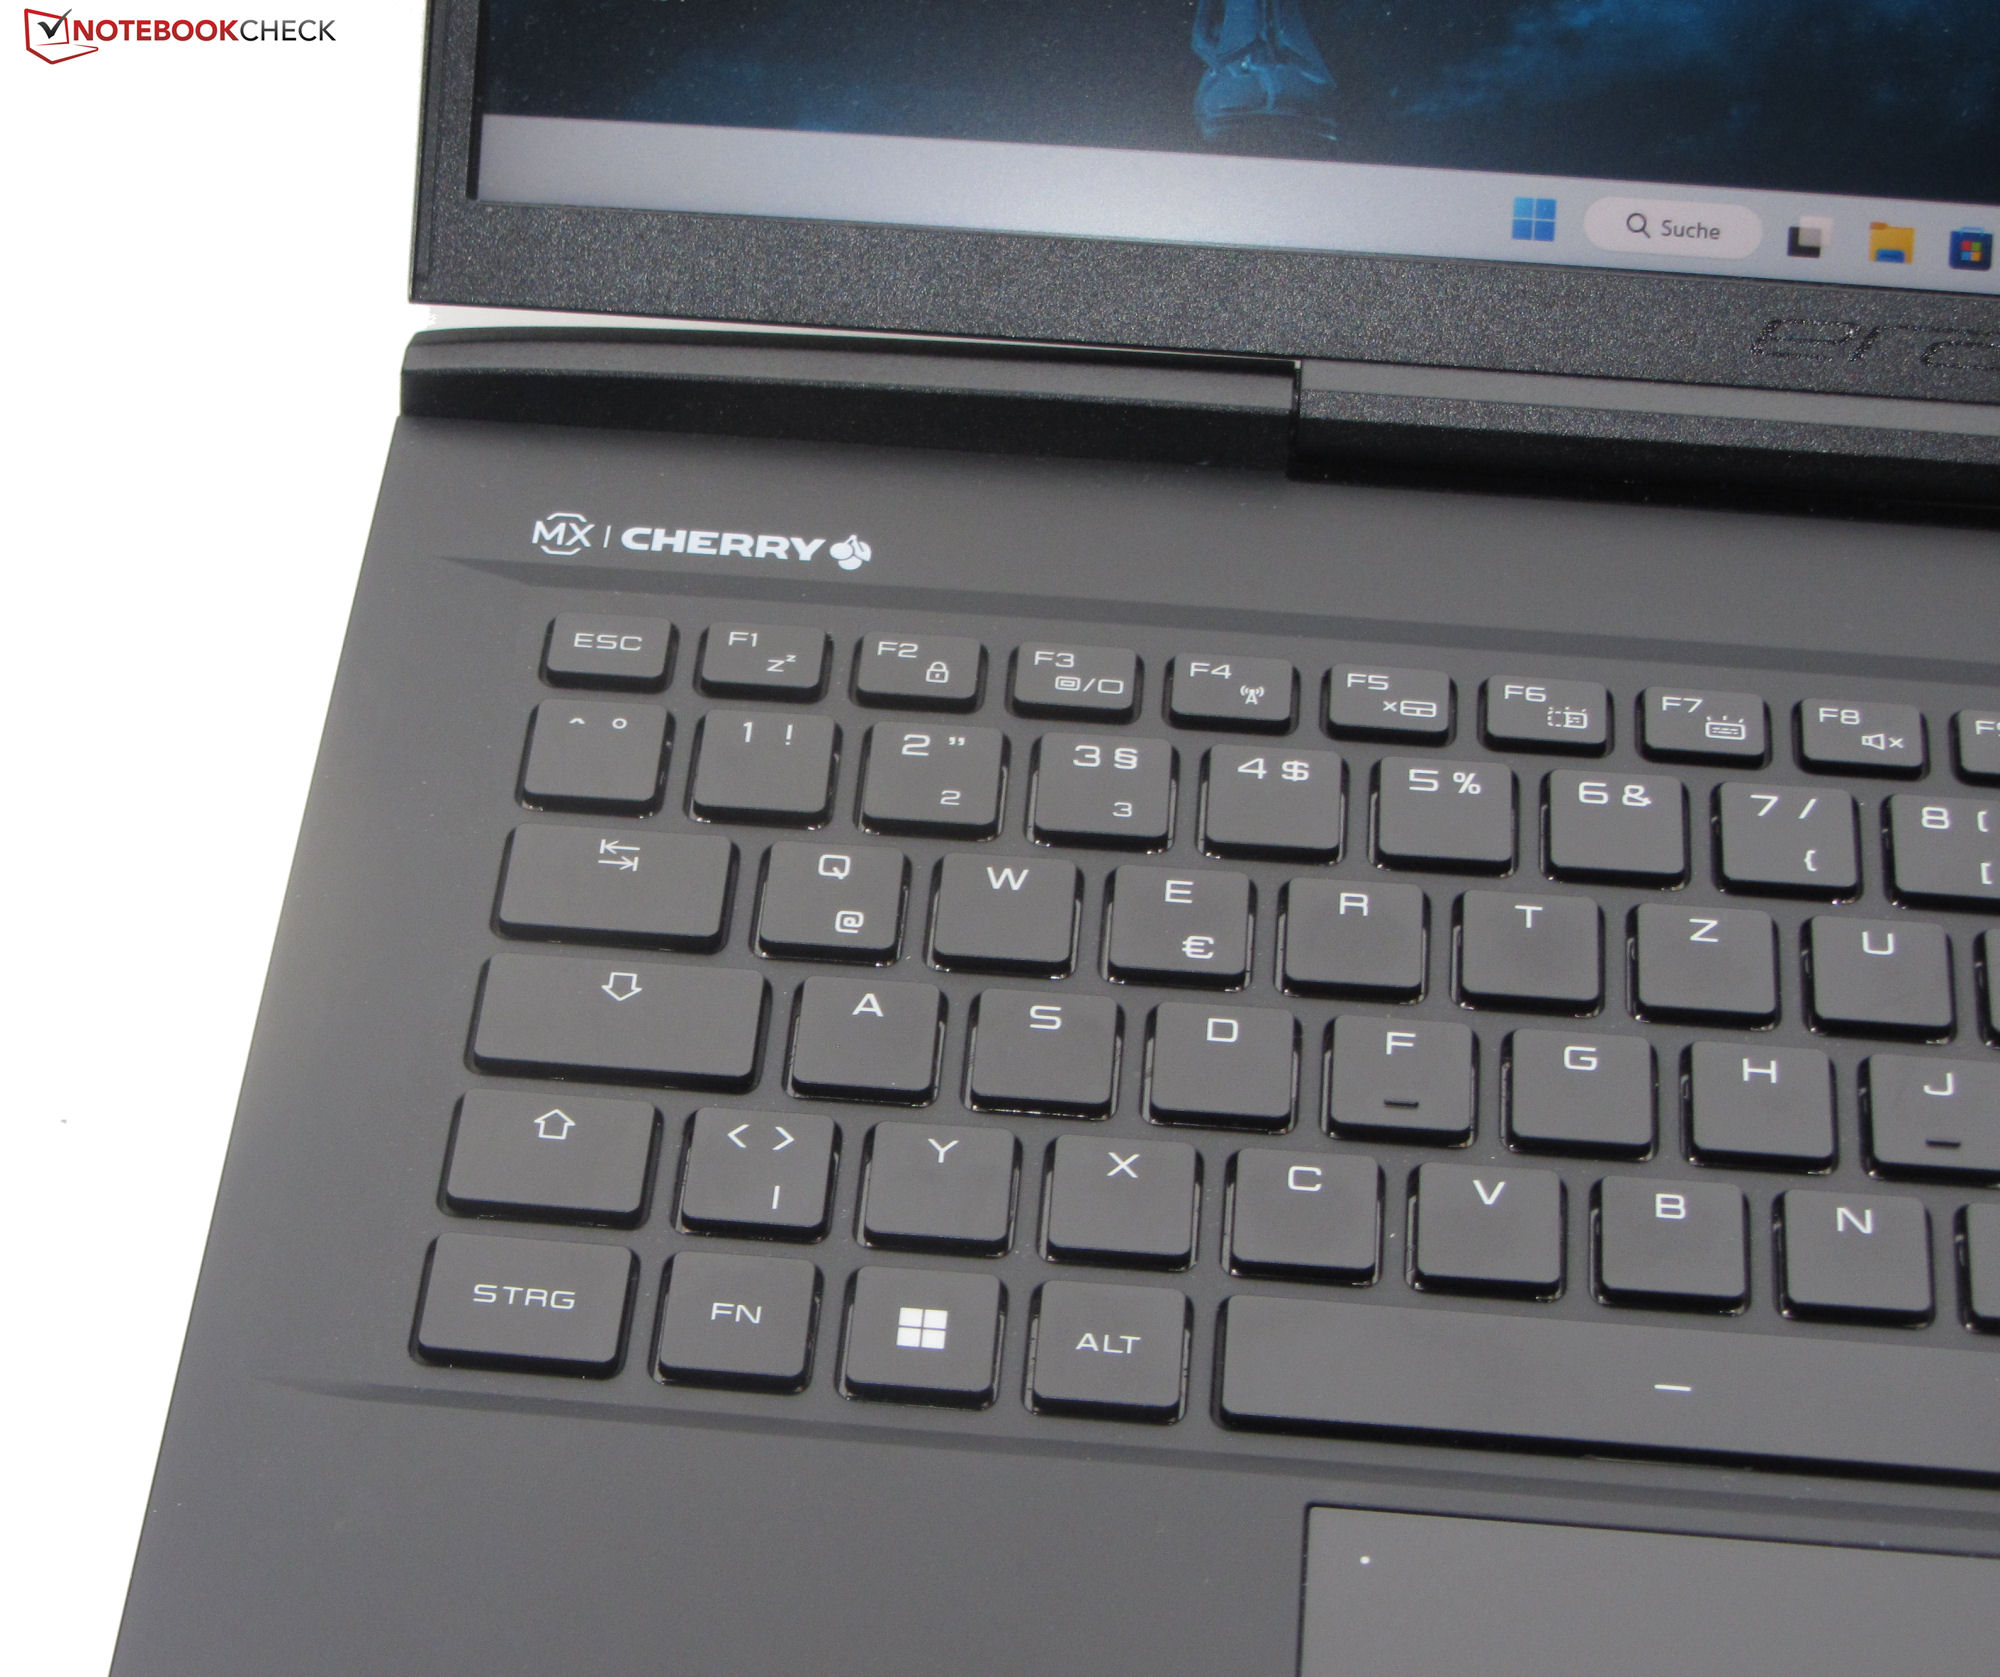
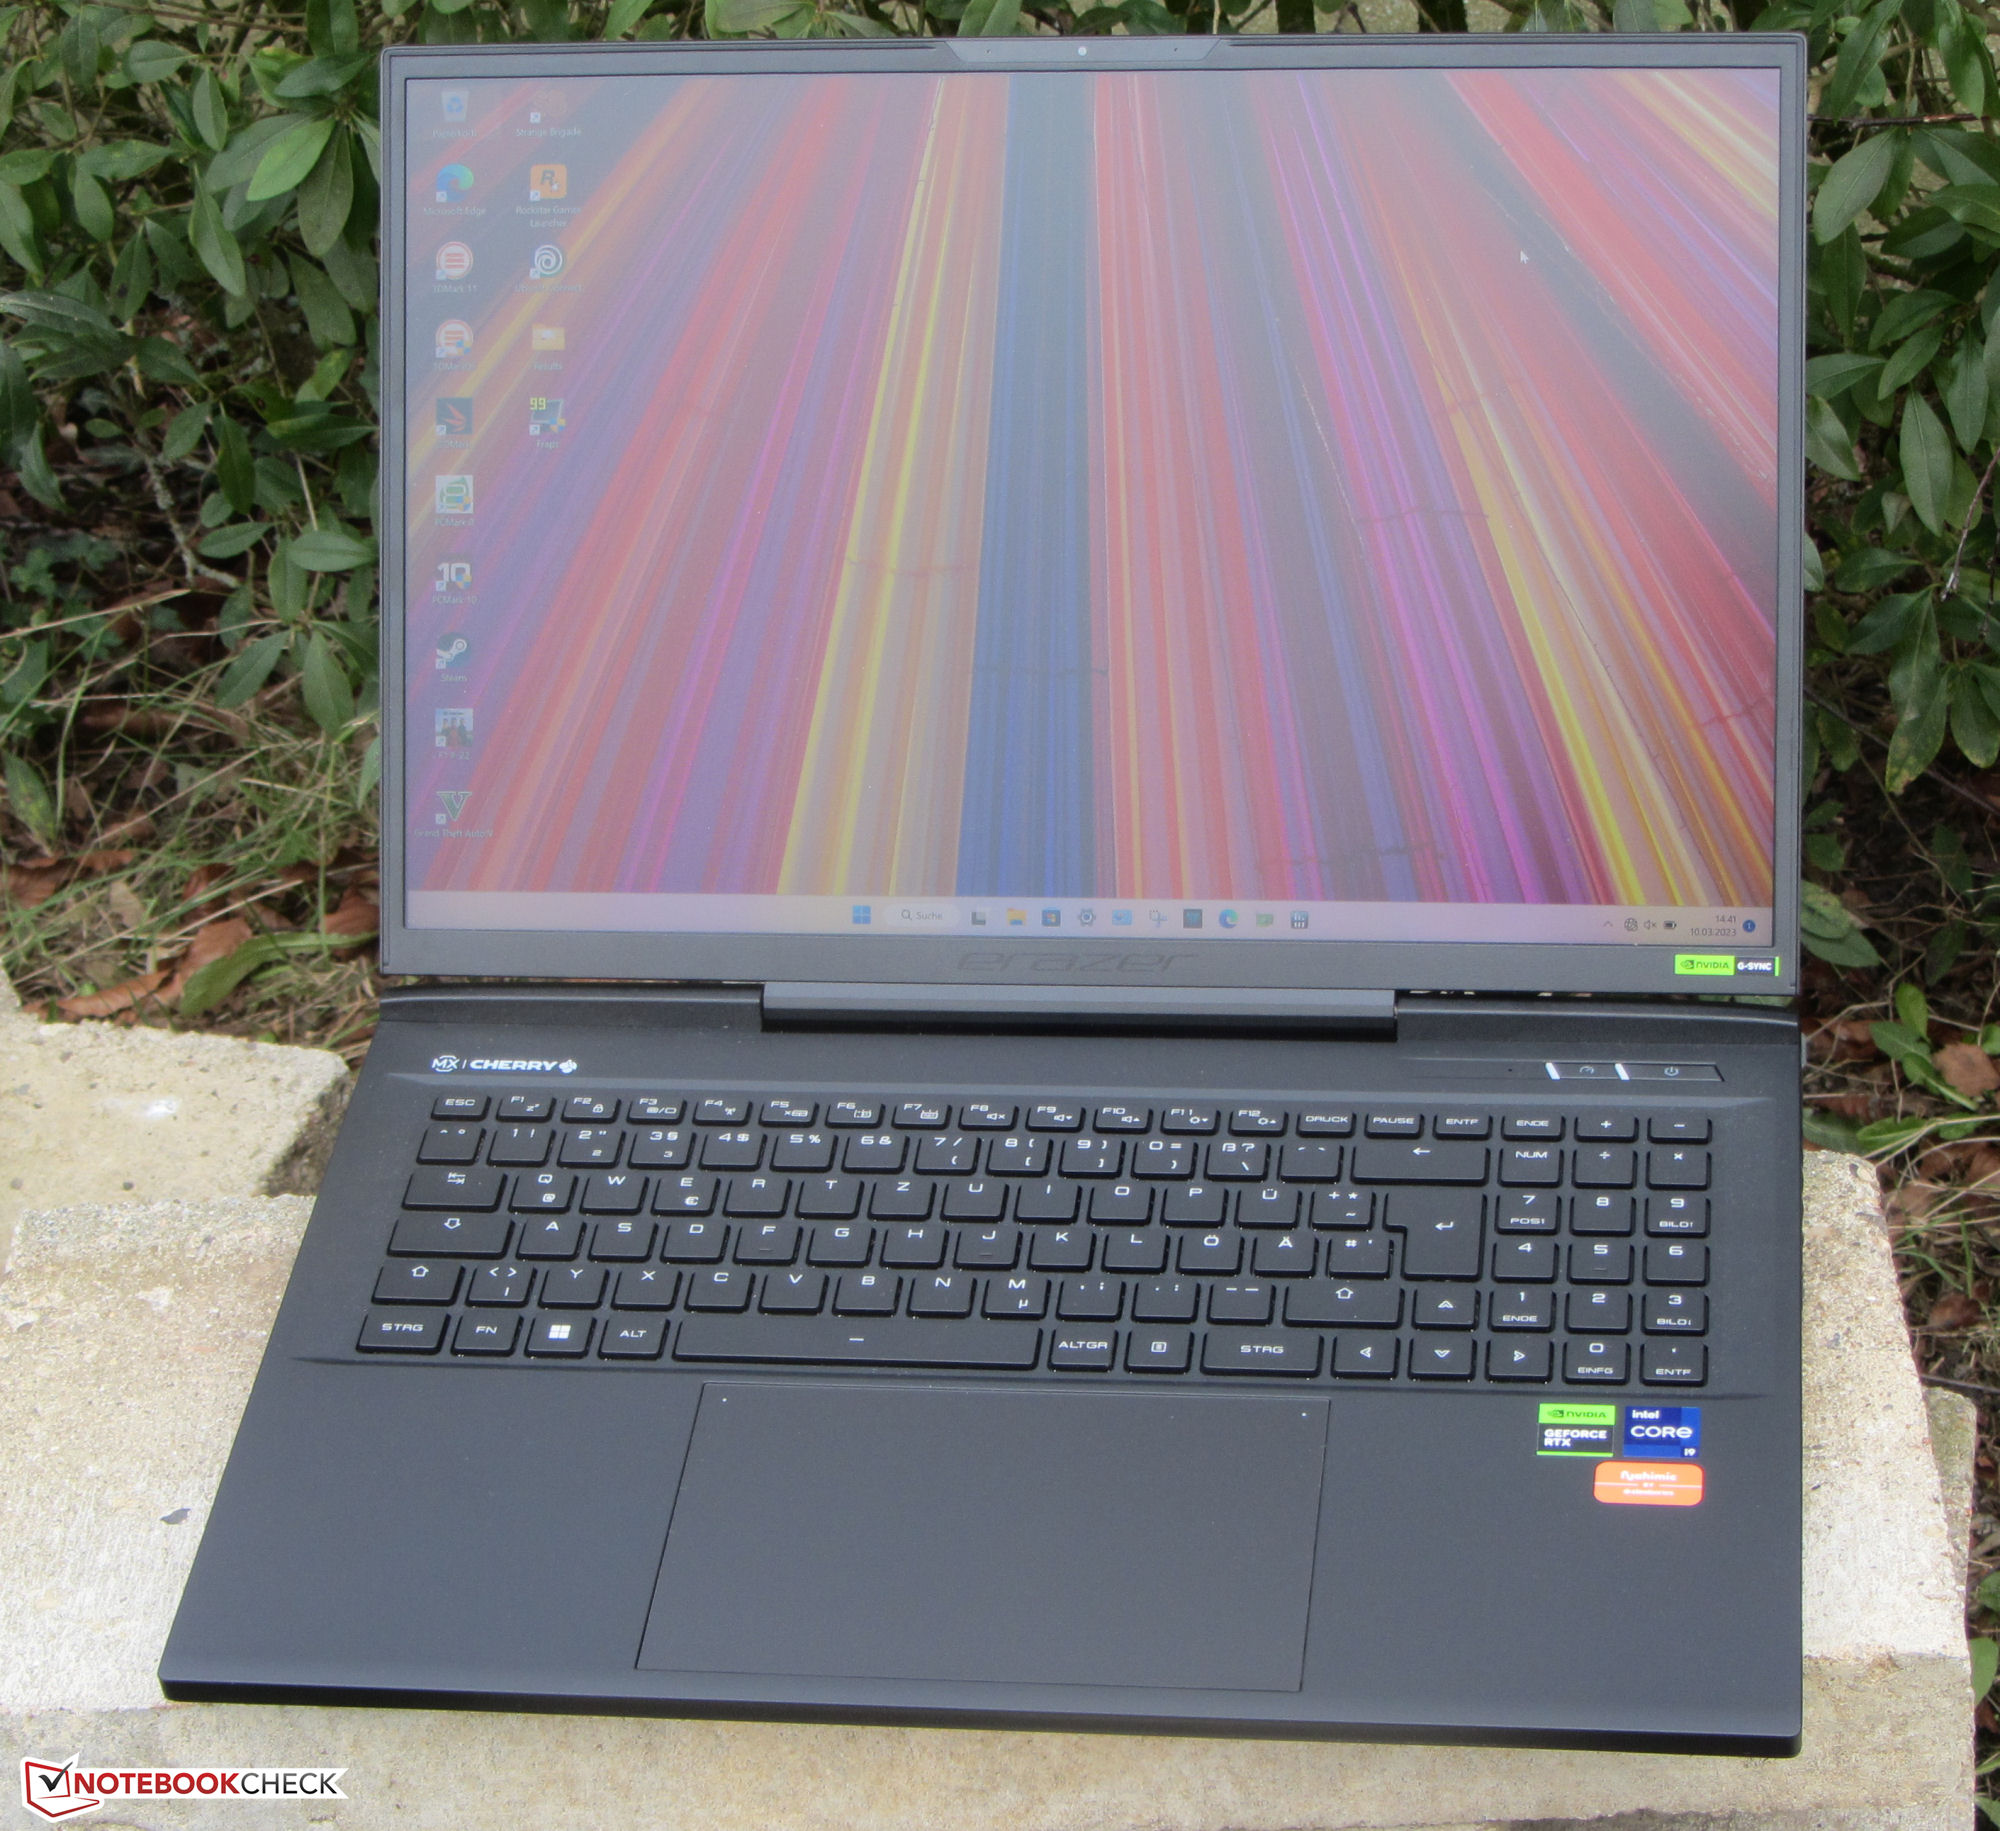
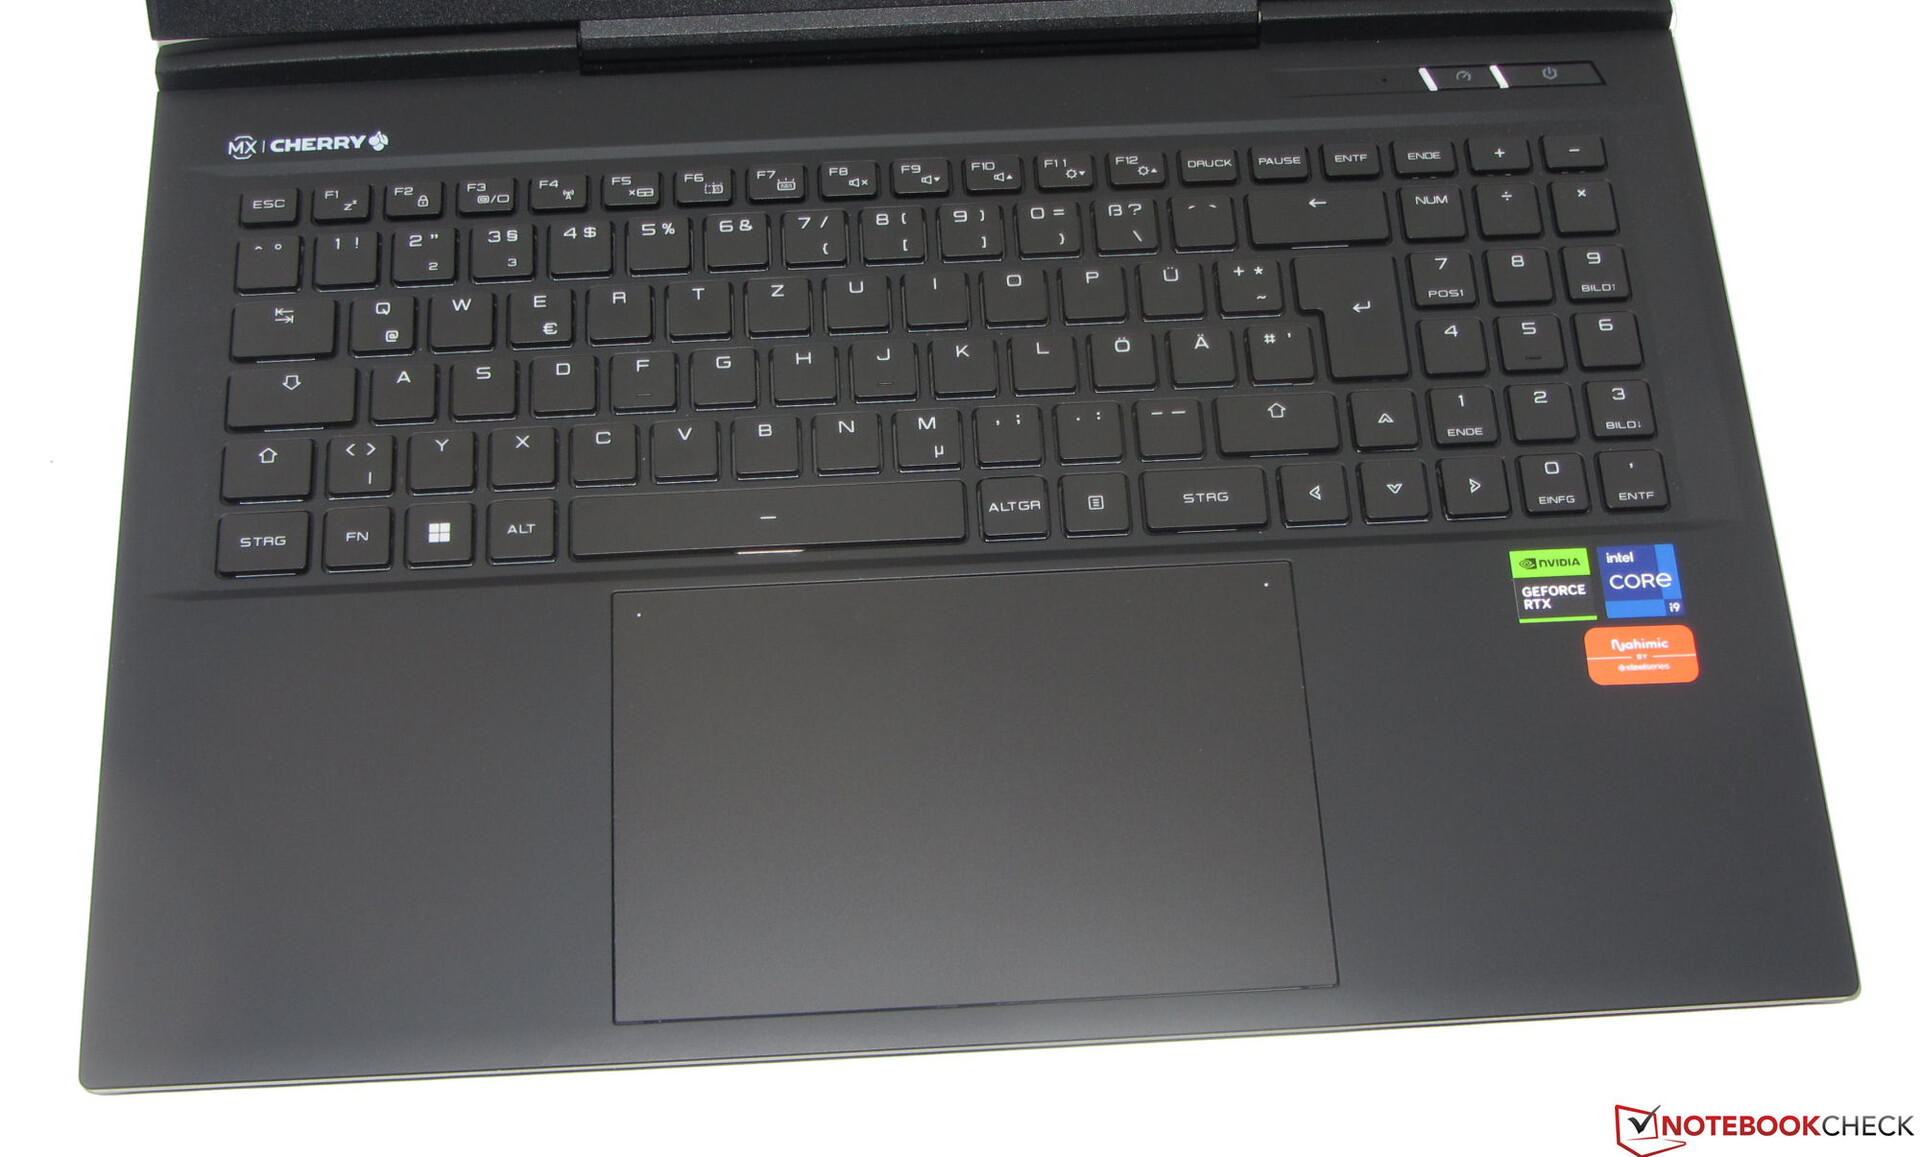
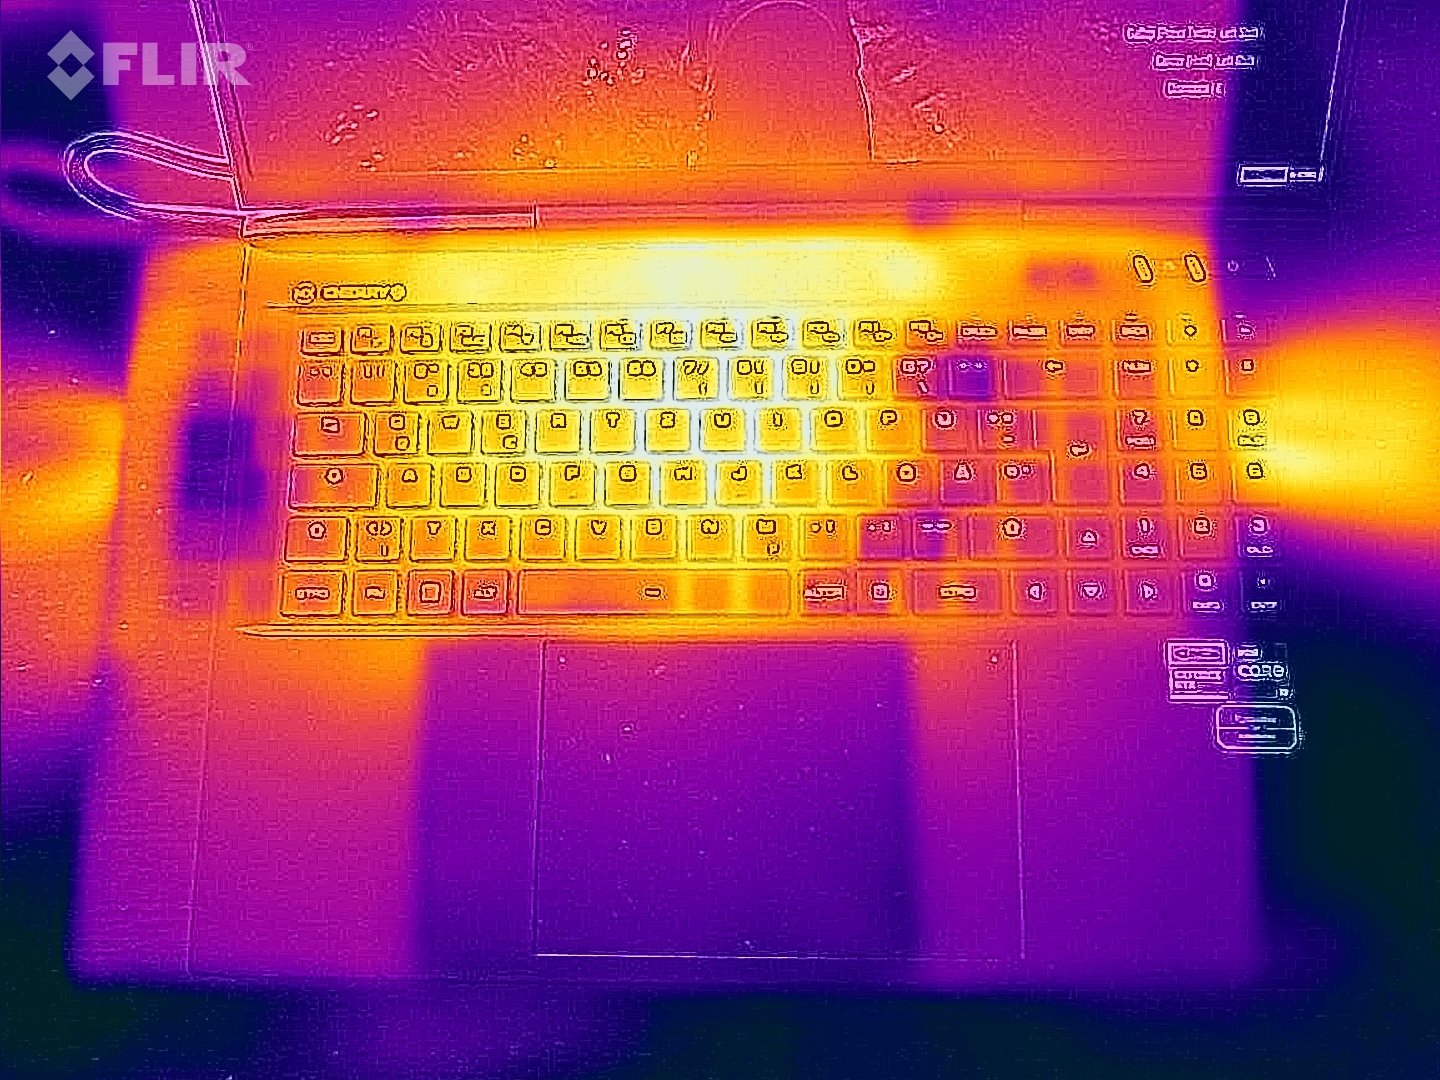
Dispositivos de entrada - Teclado mecânico com interruptores Cherry MX
Teclado
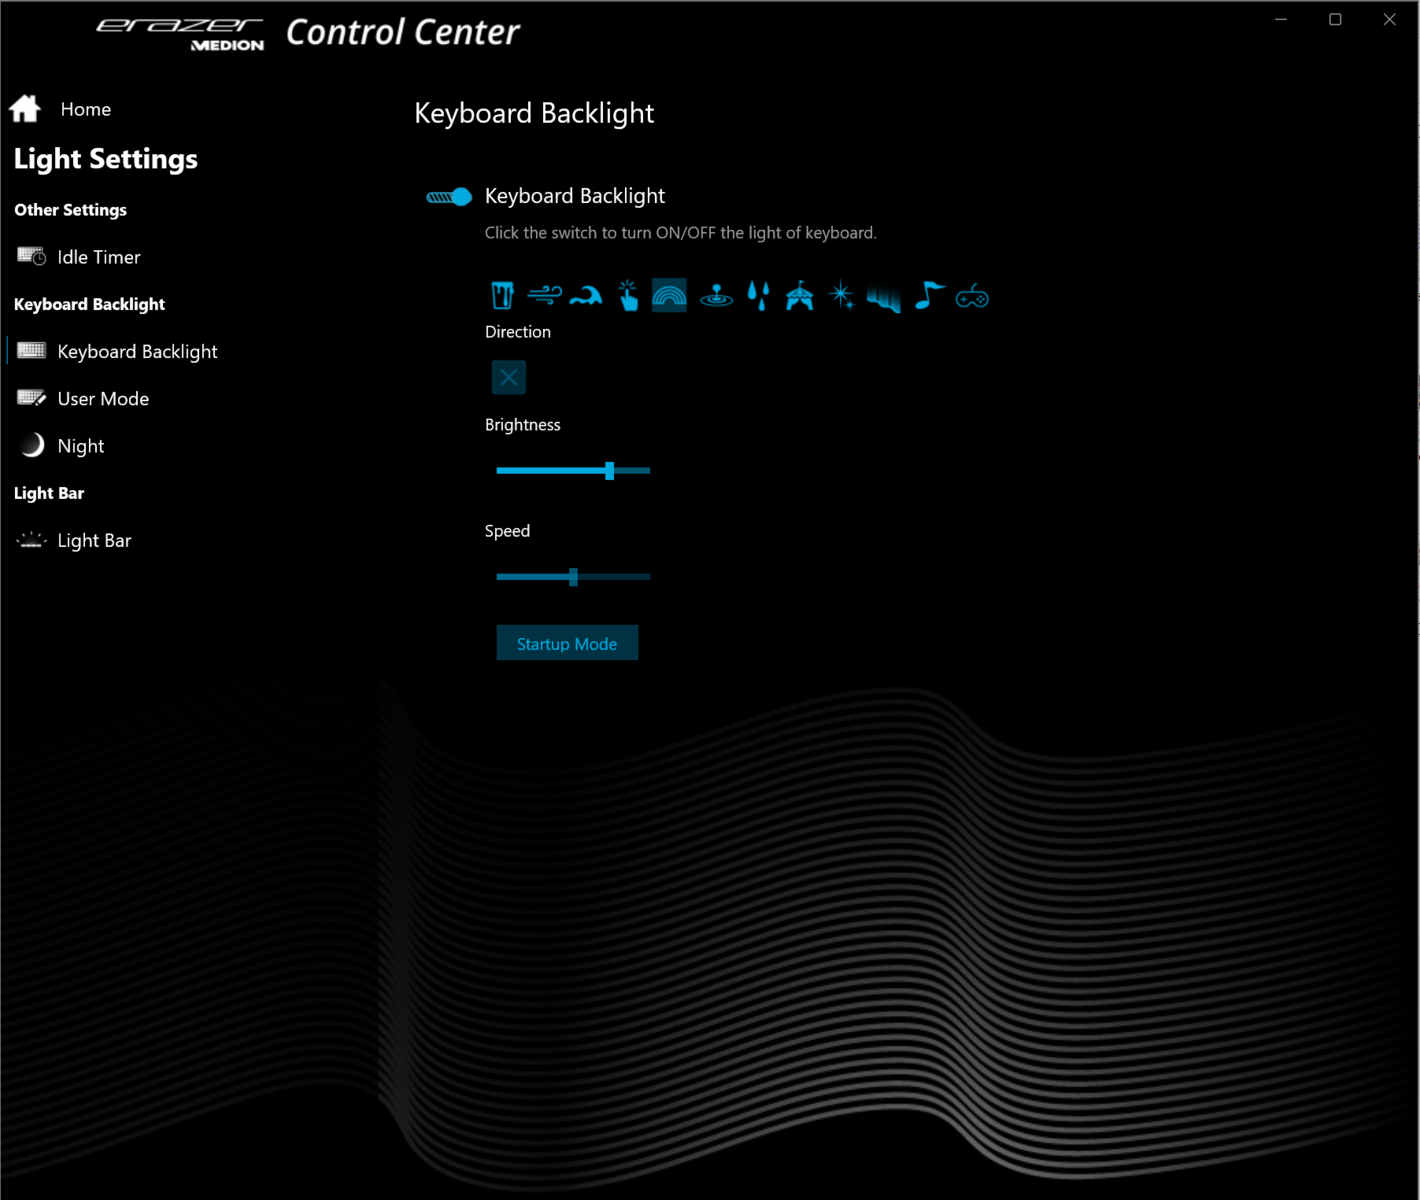
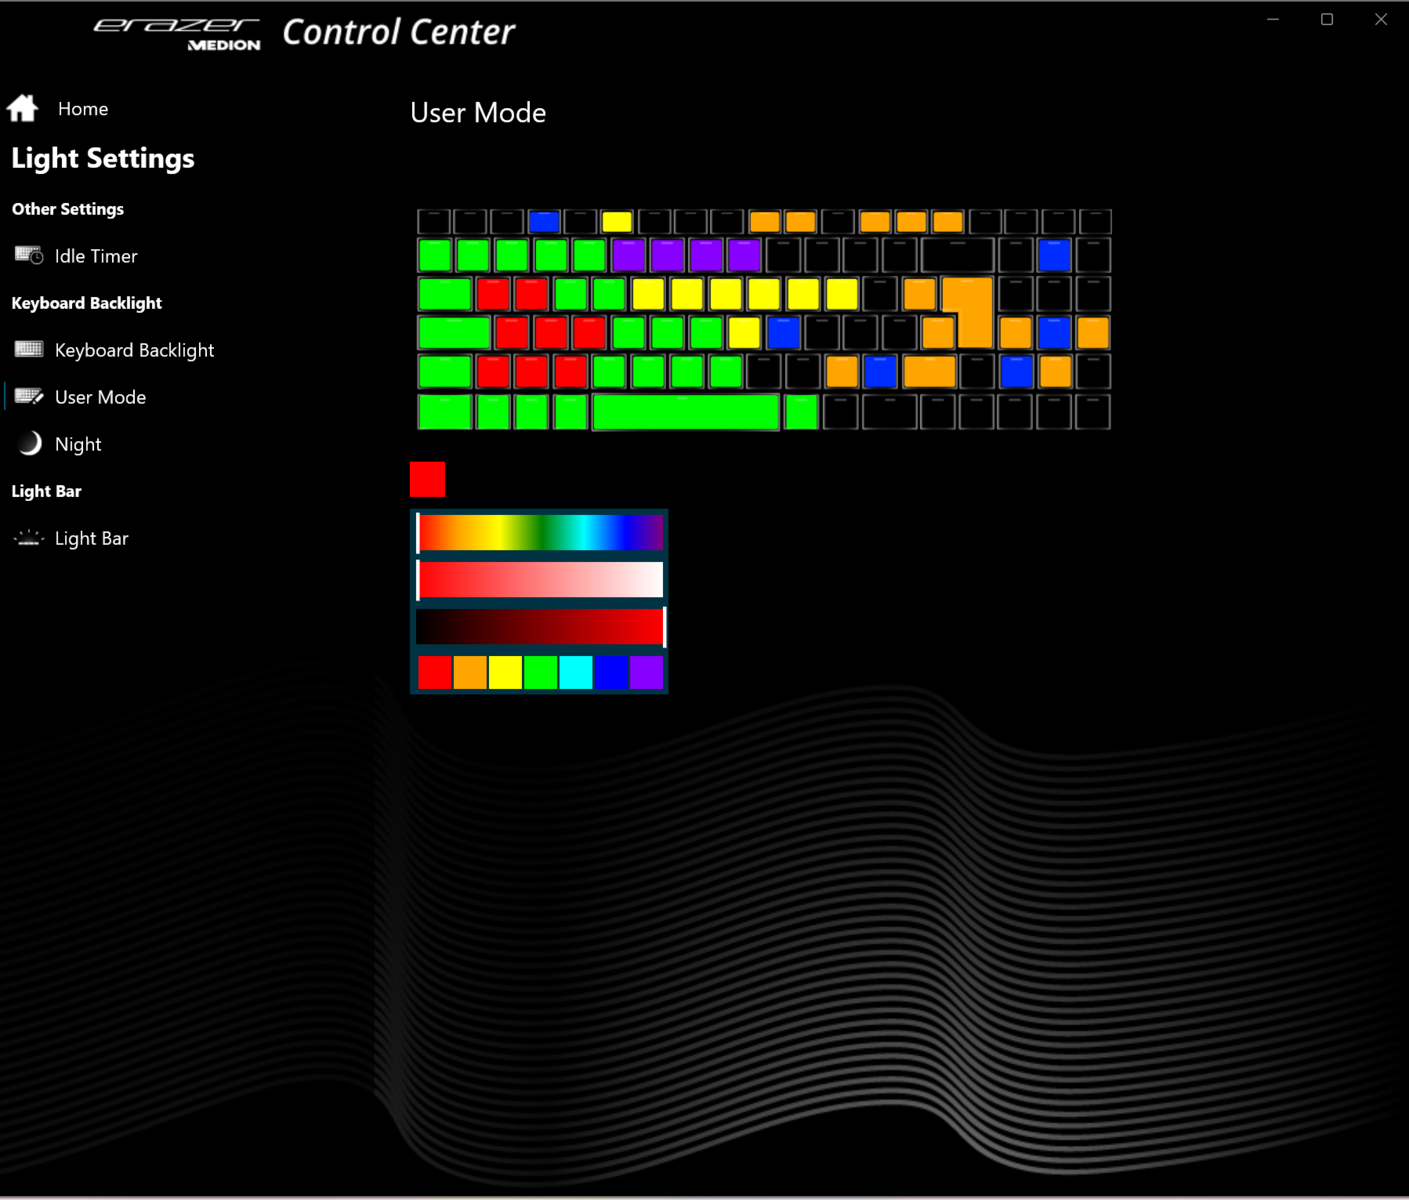
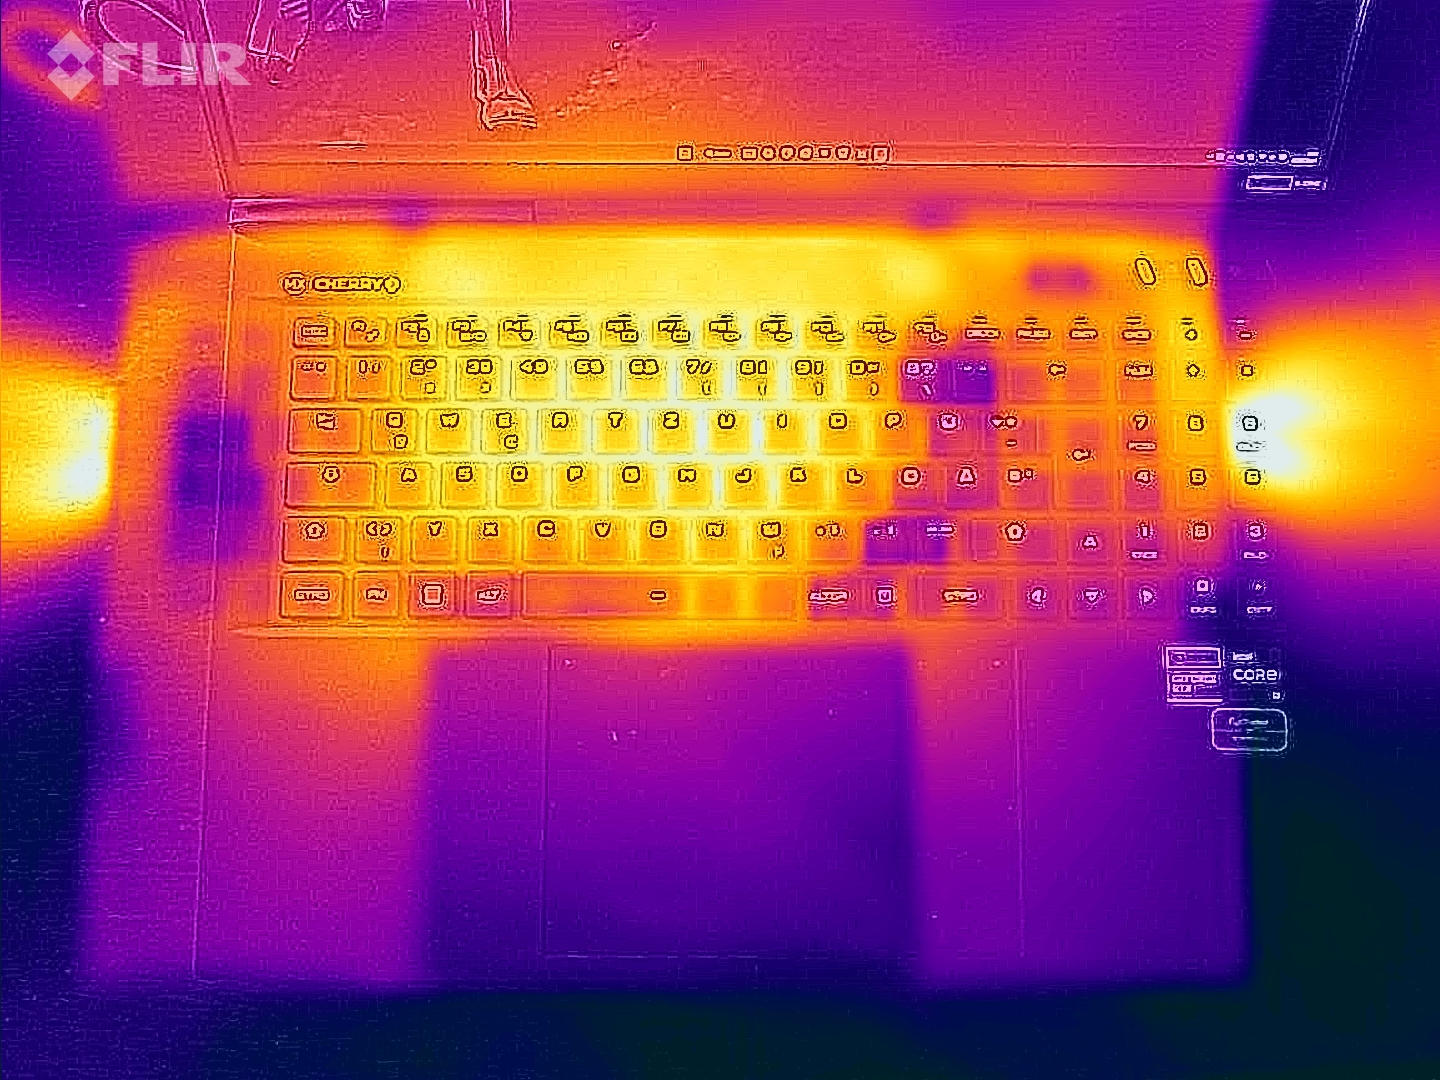
Os teclados mecânicos são geralmente conhecidos por suas entradas e feedback precisos, bem como pela sensação de digitação premium - isto não é diferente com o teclado do X40. Seus interruptores Cherry MX oferecem um deslocamento moderado e um ponto de acionamento audível e tátil. O teclado não flexiona quando você está digitando. Há duas teclas de função que permitem ajustar a iluminação RGB por tecla para um dos quatro níveis de luminosidade. No geral, o Erazer Beast X40 tem um teclado fantástico e completo.
Touchpad
Medindo aproximadamente 15,5 x 10 cm (6,1 x 3,9"), o clickpad multitouch tem uma superfície lisa que permite deslizar os dedos com facilidade. Ele oferece uma viagem curta e um ponto de clique distinto. Há LEDs de status nos cantos superiores do tapete. Bater no LED esquerdo habilitará ou desabilitará o touchpad inteiro, enquanto o LED direito é usado para ligar ou desligar somente a metade direita do pad.
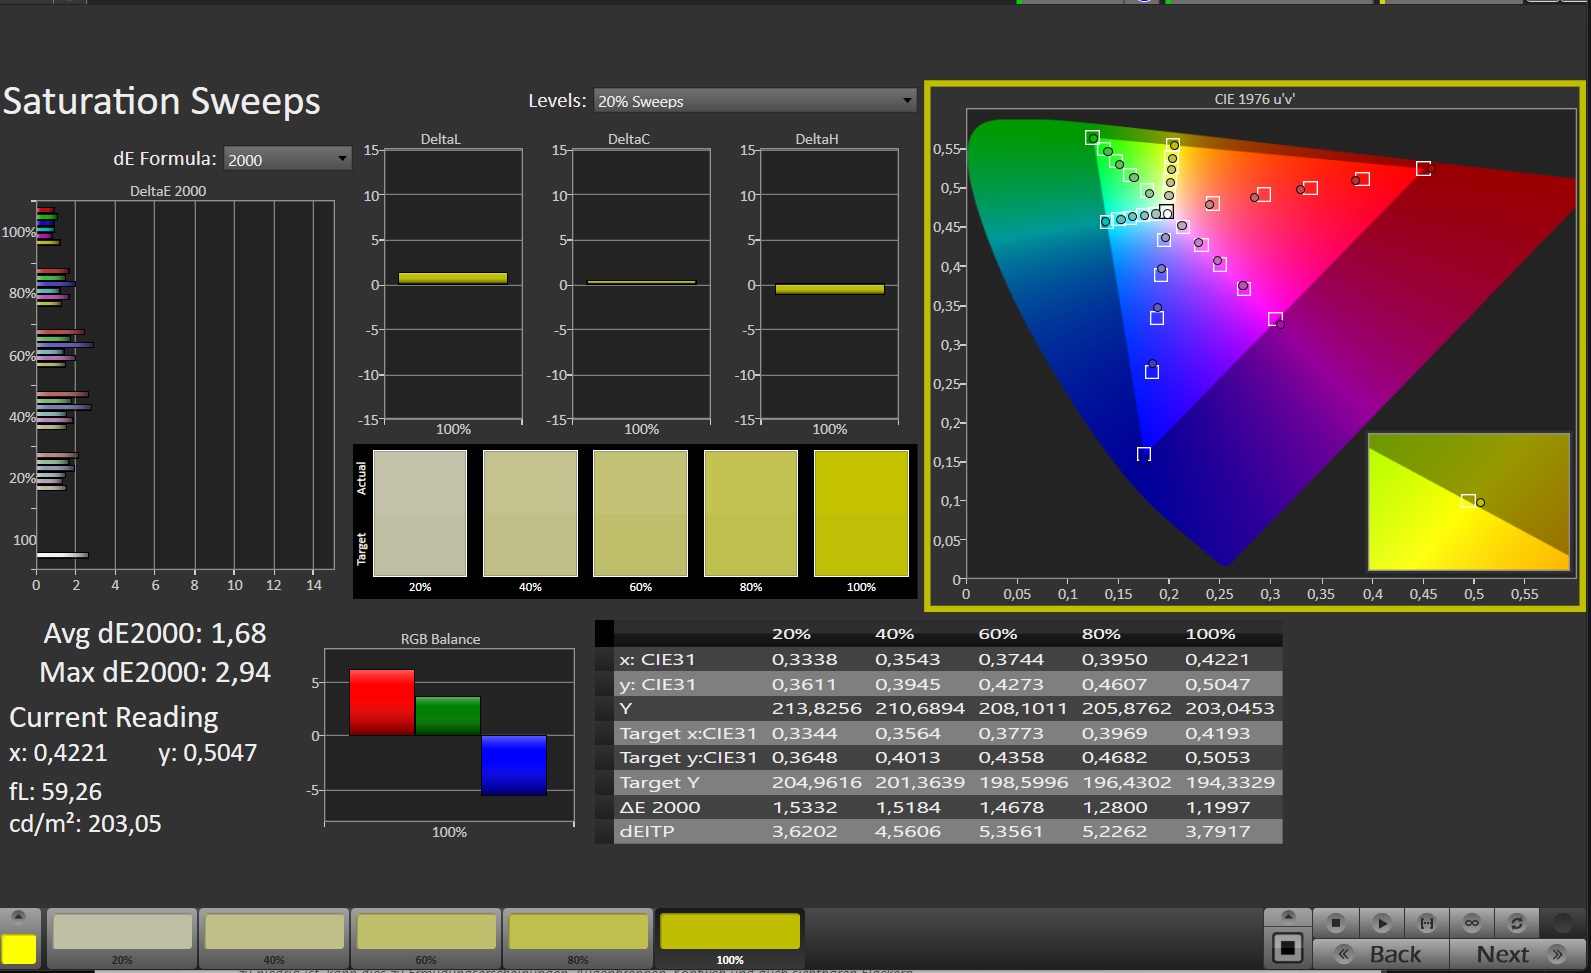
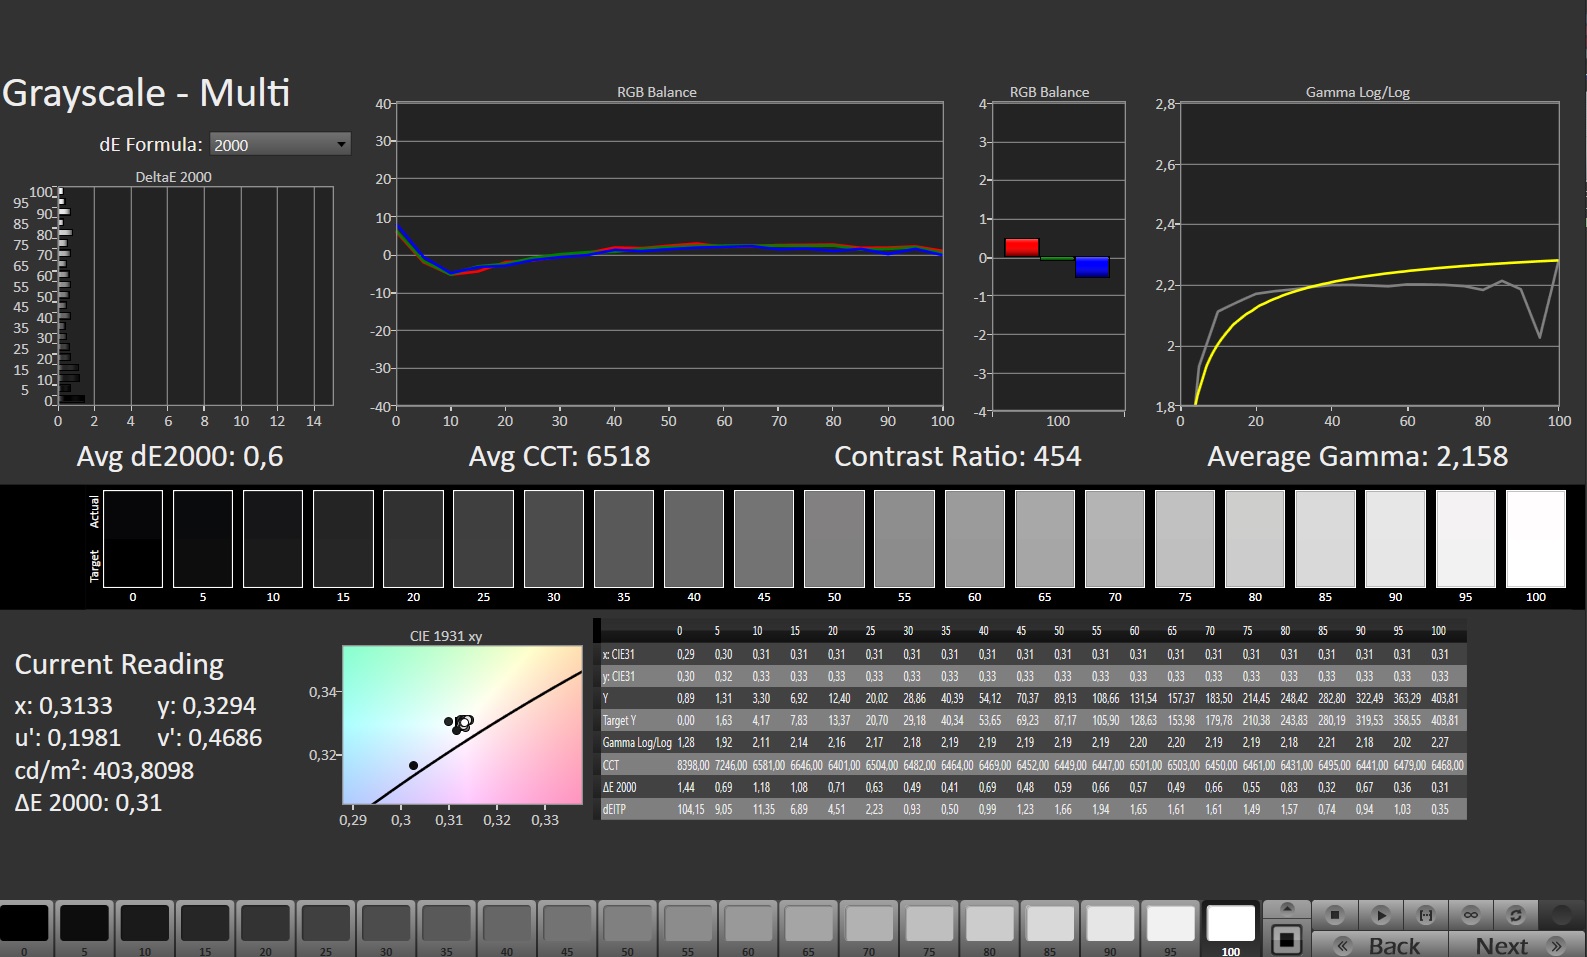
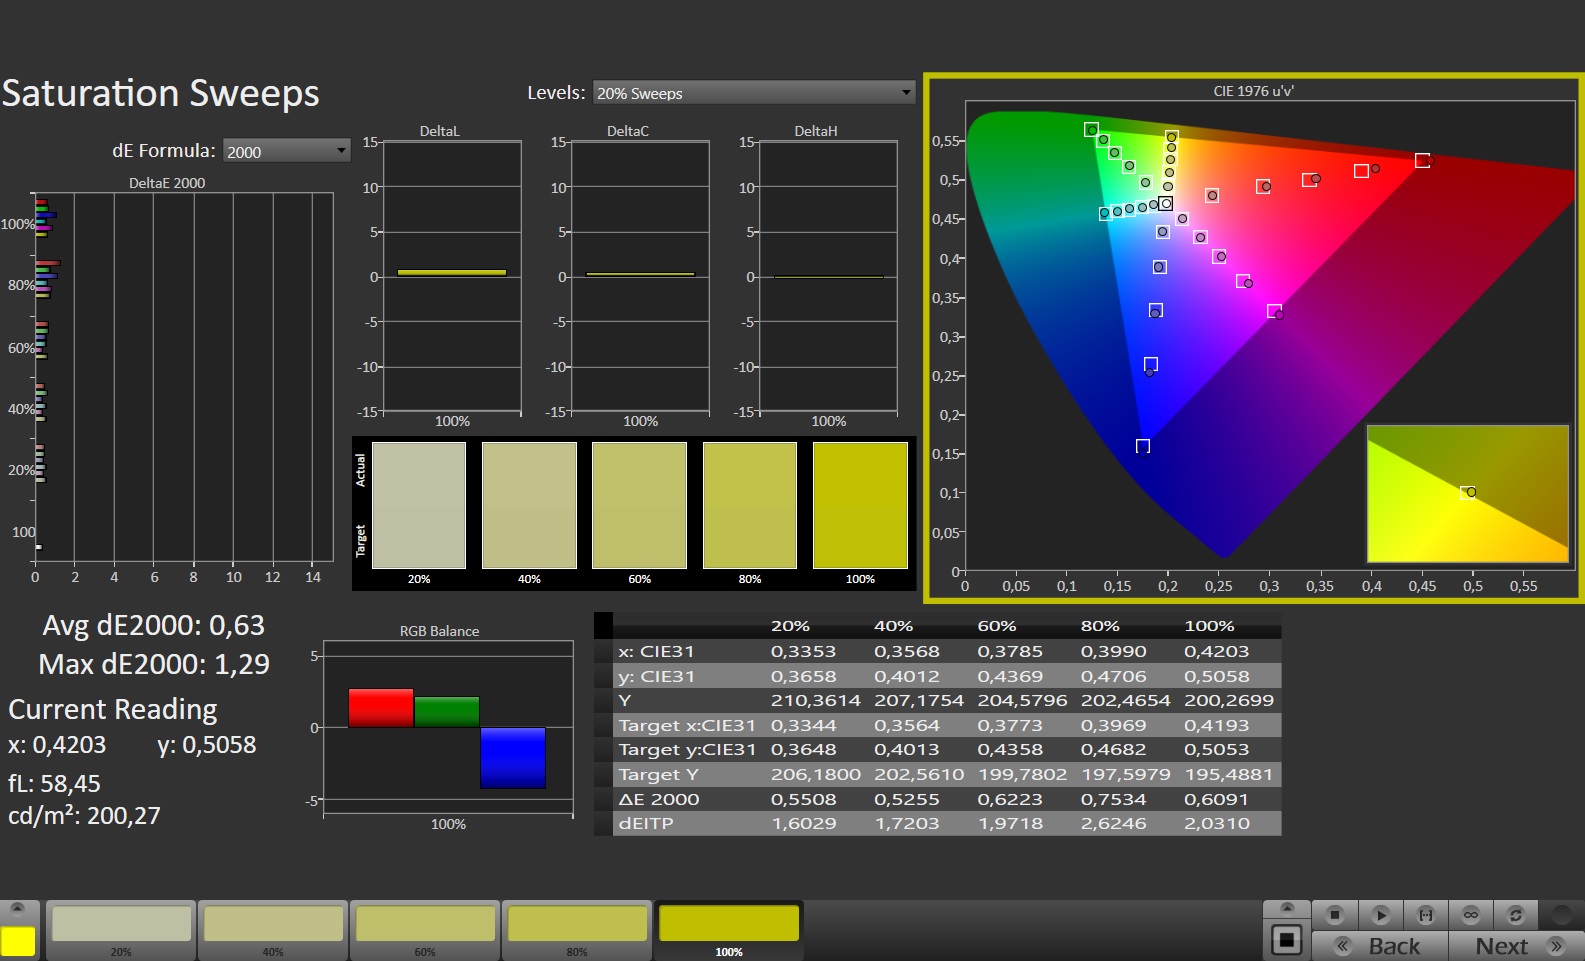
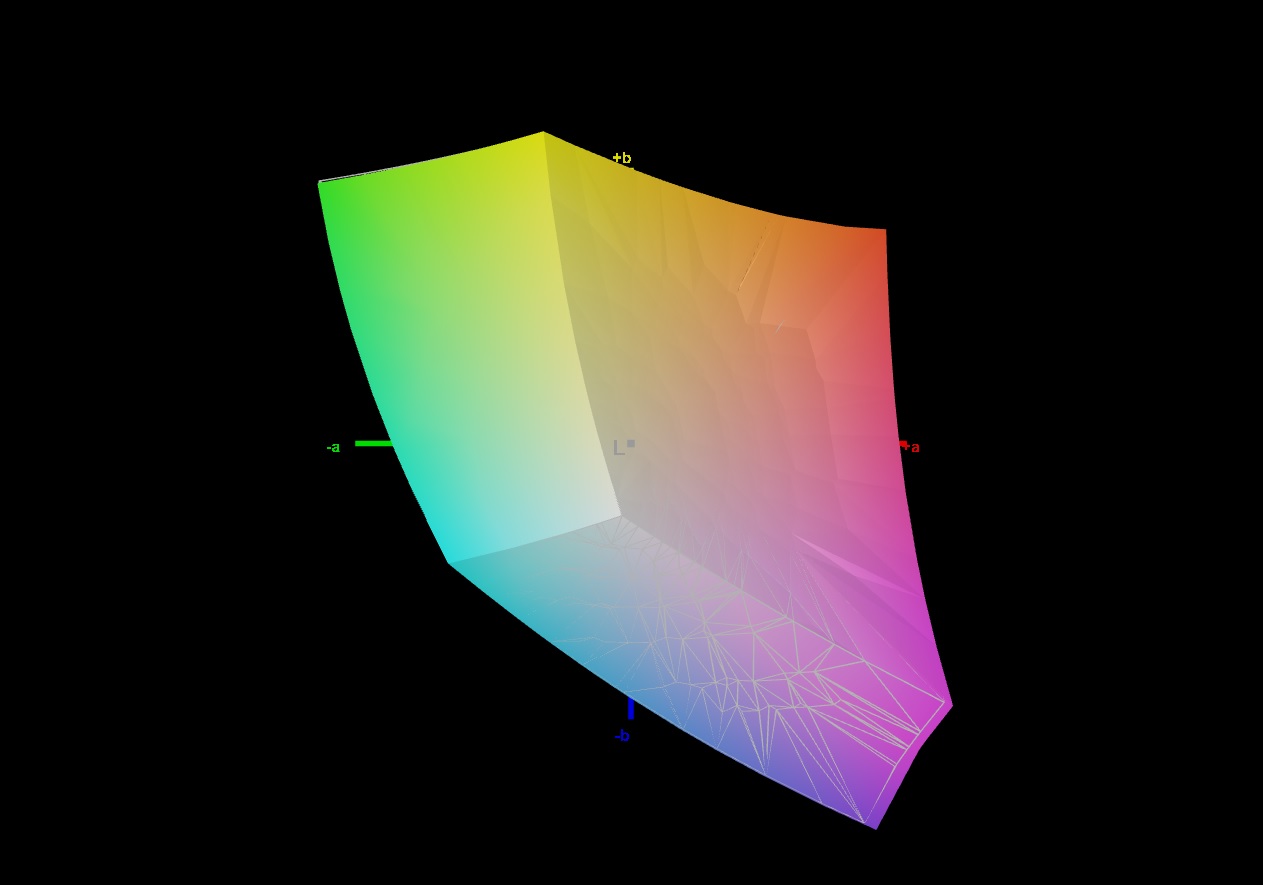
Display - QHD+ com relação de aspecto 16:10
A tela IPS mate de 17 polegadas (2.560 x 1.440) tem uma relação de aspecto 16:10 e se destaca com brilho adequado, tempos de resposta rápidos, alta taxa de atualização (240Hz) e a ausência de cintilação PWM. Mas sua relação de contraste fica aquém do que é considerado bom (>1.000:1).
O painel suporta G-Sync, uma tecnologia que ajuda a taxa de atualização do display a se adaptar dinamicamente à taxa de quadros que está sendo emitida pela GPU. Isto é projetado para proporcionar uma experiência de visualização mais suave, particularmente quando se trata de jogos.
| |||||||||||||||||||||||||
iluminação: 90 %
iluminação com acumulador: 384 cd/m²
Contraste: 853:1 (Preto: 0.45 cd/m²)
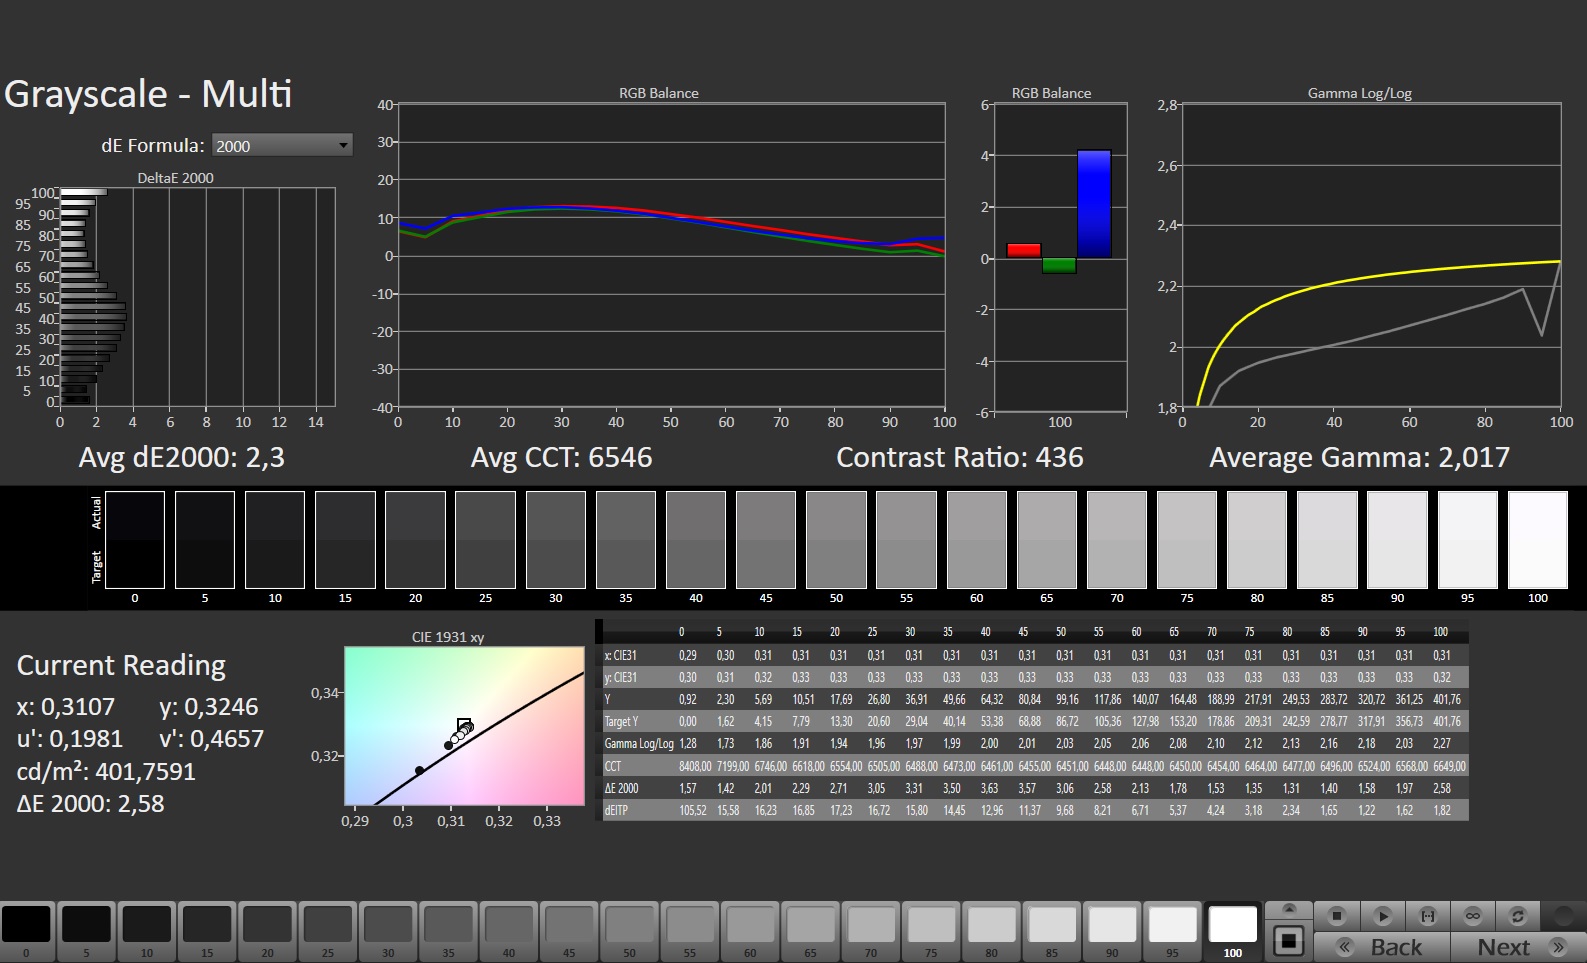
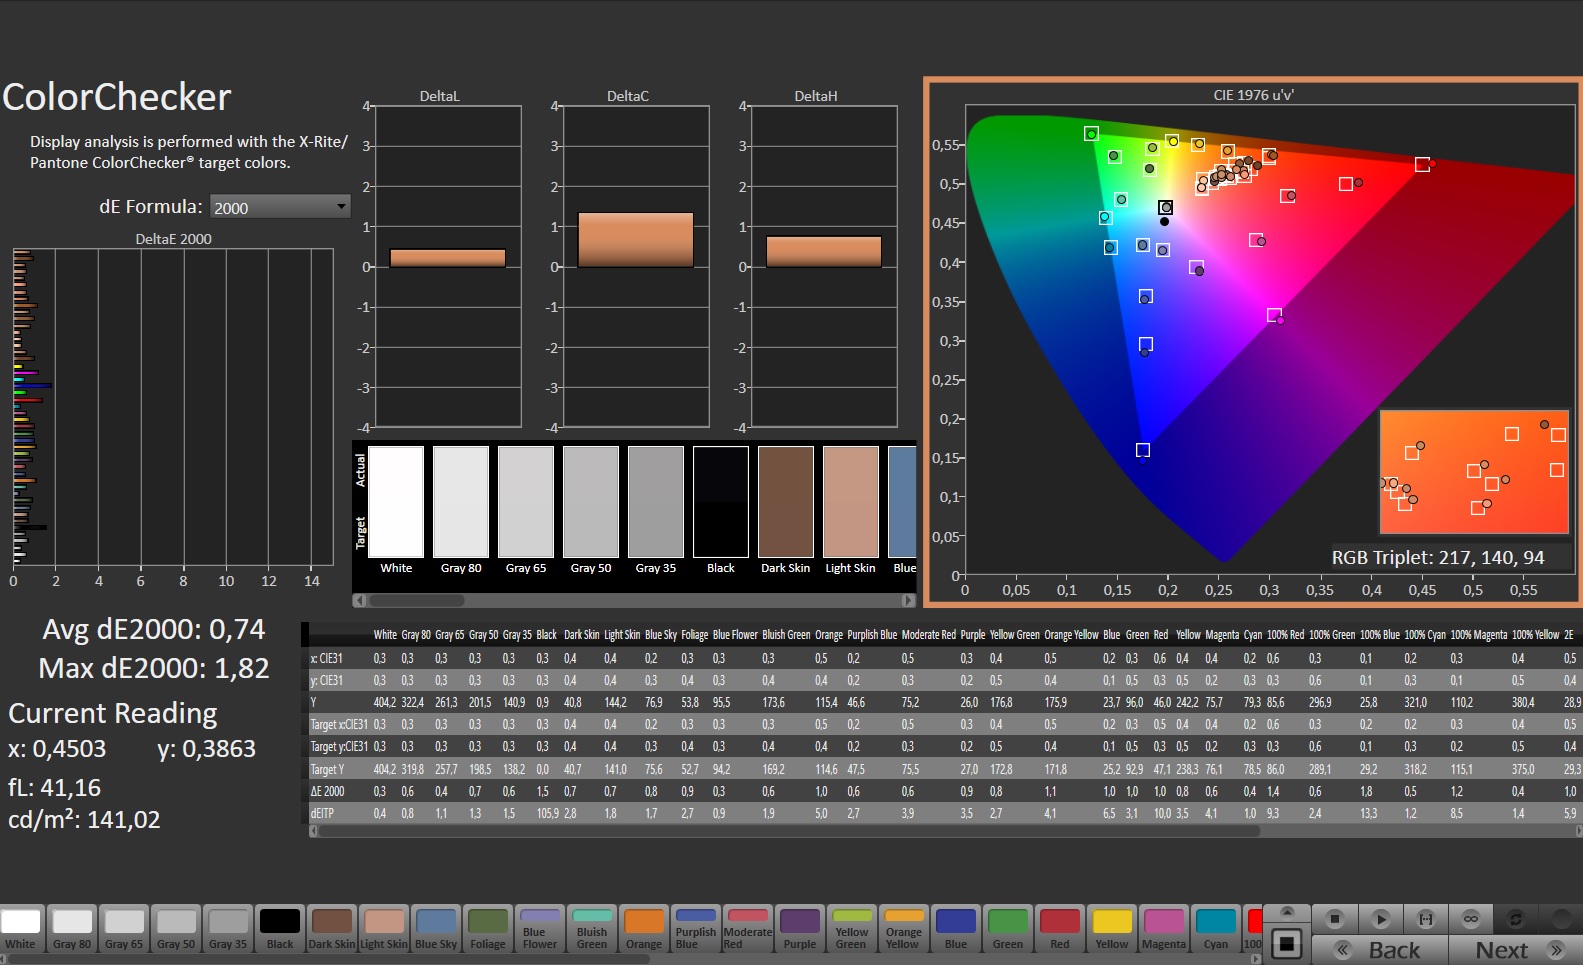
ΔE ColorChecker Calman: 2.05 | ∀{0.5-29.43 Ø4.71}
calibrated: 0.74
ΔE Greyscale Calman: 2.3 | ∀{0.09-98 Ø4.96}
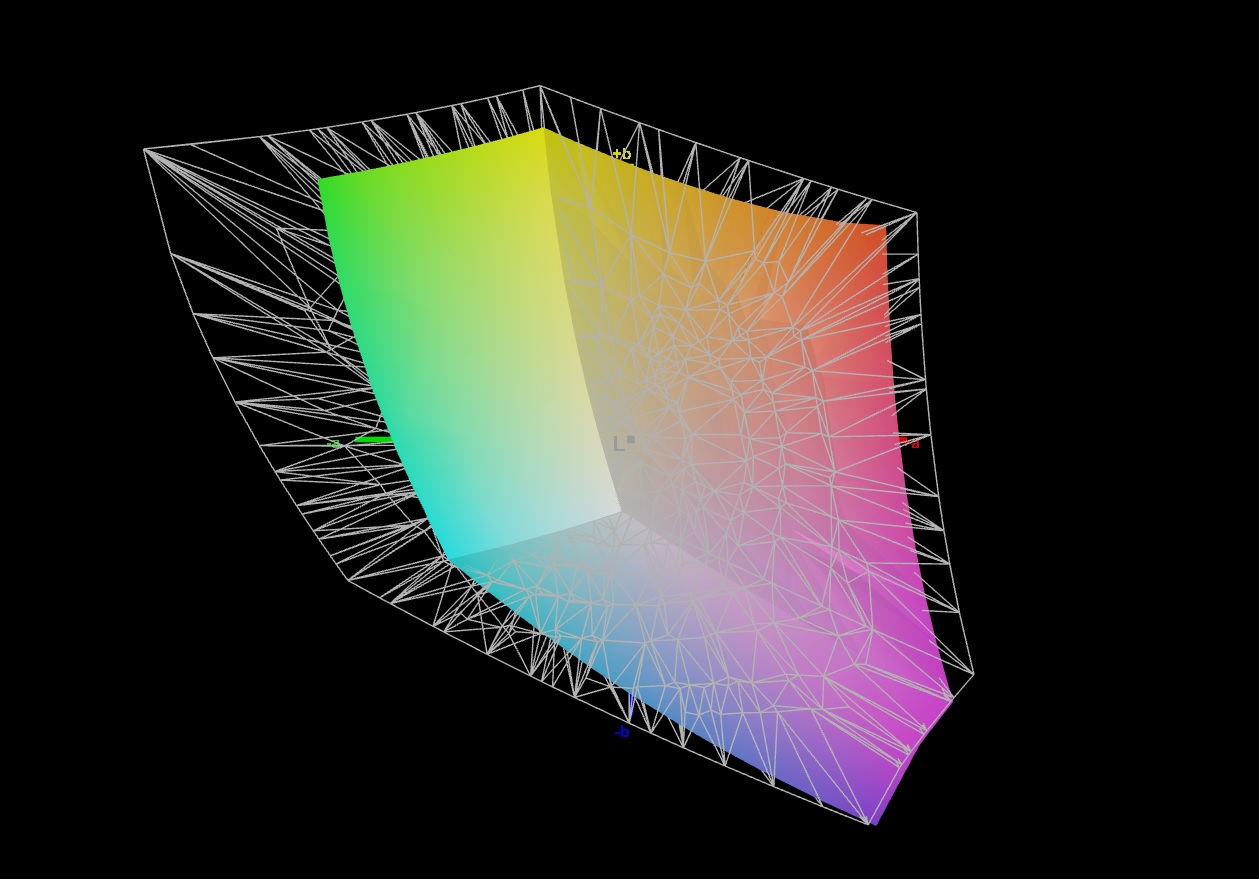
69.4% AdobeRGB 1998 (Argyll 3D)
99.8% sRGB (Argyll 3D)
68.6% Display P3 (Argyll 3D)
Gamma: 2.017
CCT: 6546 K
| Medion Erazer Beast X40 BOE NE170QDM-NZ1, IPS, 2560x1600, 17" | MSI Titan GT77 HX 13VI B173ZAN06.C, Mini-LED, 3840x2160, 17.3" | Razer Blade 16 Early 2023 CSOT T3 MNG007DA4-1, IPS, 2560x1600, 16" | Schenker XMG Neo 17 M22 BOE0A99, IPS, 2560x1600, 17" | Alienware x17 R2 P48E AU Optronics B173HAN, IPS, 1920x1080, 17.3" | Asus ROG Strix Scar 18 2023 G834JY-N6005W NE180QDM-NZ2, IPS, 2560x1600, 18" | |
|---|---|---|---|---|---|---|
| Display | 24% | 24% | 0% | 10% | 21% | |
| Display P3 Coverage (%) | 68.6 | 94.9 38% | 98.5 44% | 69 1% | 79.2 15% | 97.2 42% |
| sRGB Coverage (%) | 99.8 | 99.9 0% | 100 0% | 99.8 0% | 99.8 0% | 99.9 0% |
| AdobeRGB 1998 Coverage (%) | 69.4 | 92.4 33% | 89.7 29% | 69.6 0% | 79.6 15% | 84.9 22% |
| Response Times | -248% | -9% | 12% | -17% | 19% | |
| Response Time Grey 50% / Grey 80% * (ms) | 11.3 ? | 38.4 ? -240% | 6.6 ? 42% | 10.8 ? 4% | 12.4 ? -10% | 5.41 ? 52% |
| Response Time Black / White * (ms) | 7.5 ? | 26.6 ? -255% | 12 ? -60% | 6.1 ? 19% | 9.2 ? -23% | 8.62 ? -15% |
| PWM Frequency (Hz) | 2380 ? | |||||
| Screen | 78886% | -6% | 11% | -22% | -92% | |
| Brightness middle (cd/m²) | 384 | 606 58% | 456.8 19% | 415 8% | 365.4 -5% | 490 28% |
| Brightness (cd/m²) | 377 | 602 60% | 437 16% | 399 6% | 344 -9% | 468 24% |
| Brightness Distribution (%) | 90 | 93 3% | 83 -8% | 90 0% | 85 -6% | 86 -4% |
| Black Level * (cd/m²) | 0.45 | 0.0001 100% | 0.35 22% | 0.43 4% | 0.29 36% | 0.54 -20% |
| Contrast (:1) | 853 | 6060000 710334% | 1305 53% | 965 13% | 1260 48% | 907 6% |
| Colorchecker dE 2000 * | 2.05 | 4.8 -134% | 3.7 -80% | 1.44 30% | 3.17 -55% | 4.97 -142% |
| Colorchecker dE 2000 max. * | 3.64 | 8.2 -125% | 6.42 -76% | 2.33 36% | 7.69 -111% | 11.02 -203% |
| Colorchecker dE 2000 calibrated * | 0.74 | 1.8 -143% | 0.66 11% | 0.89 -20% | 0.51 31% | 2.97 -301% |
| Greyscale dE 2000 * | 2.3 | 6.5 -183% | 2.6 -13% | 1.8 22% | 5.3 -130% | 7.2 -213% |
| Gamma | 2.017 109% | 2.63 84% | 2.3 96% | 2.132 103% | 2.18 101% | 2.161 102% |
| CCT | 6546 99% | 6596 99% | 6108 106% | 6327 103% | 5879 111% | 6515 100% |
| Média Total (Programa/Configurações) | 26221% /
50682% | 3% /
-0% | 8% /
9% | -10% /
-15% | -17% /
-52% |
* ... menor é melhor
O display já tem uma ótima reprodução de cores logo de saída. Sua diferença de cor média de aproximadamente 2 é significativamente menor do que a debulha do que é considerado bom (Delta E < 3). A calibração do visor reduziu a diferença média de cores para 0,74 e tornou a escala de cinzas mais equilibrada. O painel é capaz de cobrir todo o espaço de cor sRGB, mas não o AdobeRGB e o DCI-P3. Os displays em alguns dos laptops concorrentes têm melhor desempenho em termos de cobertura de cores.

Exibir tempos de resposta
| ↔ Tempo de resposta preto para branco | ||
|---|---|---|
| 7.5 ms ... ascensão ↗ e queda ↘ combinadas | ↗ 3.3 ms ascensão | 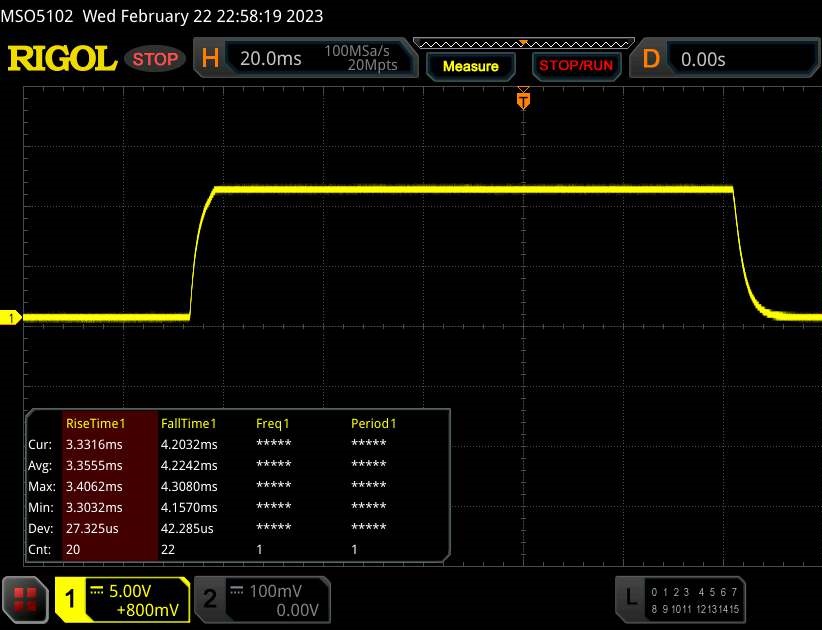 |
| ↘ 4.2 ms queda | ||
| A tela mostra taxas de resposta muito rápidas em nossos testes e deve ser muito adequada para jogos em ritmo acelerado. Em comparação, todos os dispositivos testados variam de 0.1 (mínimo) a 240 (máximo) ms. » 22 % de todos os dispositivos são melhores. Isso significa que o tempo de resposta medido é melhor que a média de todos os dispositivos testados (19.8 ms). | ||
| ↔ Tempo de resposta 50% cinza a 80% cinza | ||
| 11.3 ms ... ascensão ↗ e queda ↘ combinadas | ↗ 5.4 ms ascensão | 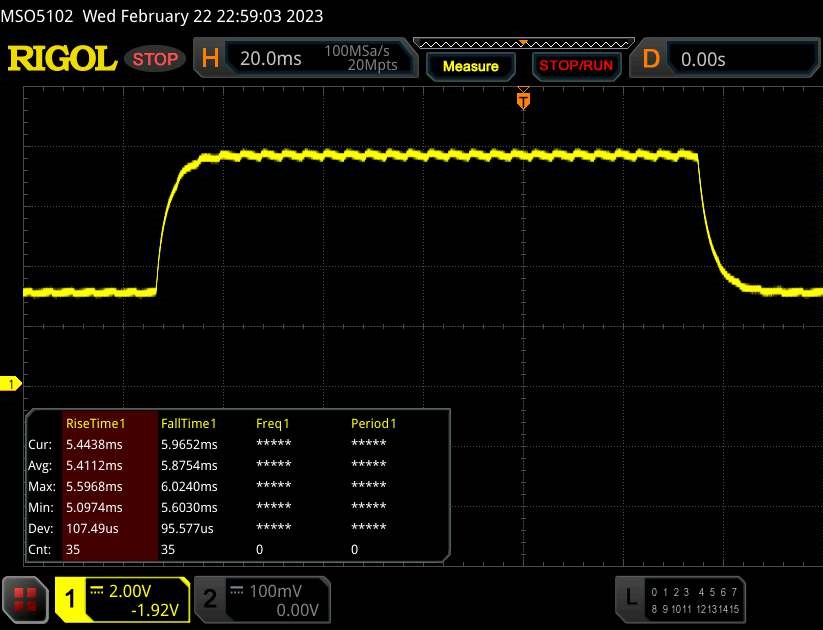 |
| ↘ 5.9 ms queda | ||
| A tela mostra boas taxas de resposta em nossos testes, mas pode ser muito lenta para jogadores competitivos. Em comparação, todos os dispositivos testados variam de 0.165 (mínimo) a 636 (máximo) ms. » 25 % de todos os dispositivos são melhores. Isso significa que o tempo de resposta medido é melhor que a média de todos os dispositivos testados (31 ms). | ||
Cintilação da tela / PWM (modulação por largura de pulso)
| Tela tremeluzindo / PWM não detectado | 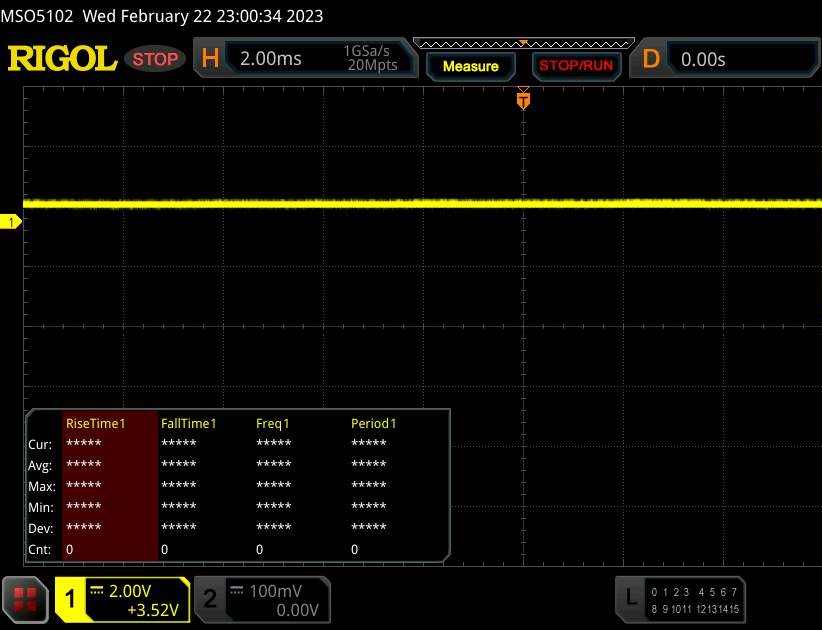 | ||
[pwm_comparison] Em comparação: 52 % de todos os dispositivos testados não usam PWM para escurecer a tela. Se PWM foi detectado, uma média de 7754 (mínimo: 5 - máximo: 343500) Hz foi medida. | |||
O painel IPS tem um amplo ângulo de visão e é facilmente legível a partir de qualquer posição. O display é definitivamente utilizável ao ar livre, desde que o sol não seja muito brilhante.

Desempenho - Raptor Lake encontra Ada Lovelace
Embora tenha sido projetado principalmente com o QHD+ em mente, o Erazer Beast X40 também corta uma boa figura em aplicações como edição e renderização de vídeo. O músculo de computação necessário é fornecido por Raptor Lake e Ada Lovelace. O modelo X40 nesta revisão pode ser obtido por cerca de 4.500 euros (US$ 4.856). Mas a Medion também oferece uma configuração ligeiramente inferior (RTX 4080 e 1 TB SSD; caso contrário, idêntica) a 3.500 euros (US$ 3.777).
Condições de teste
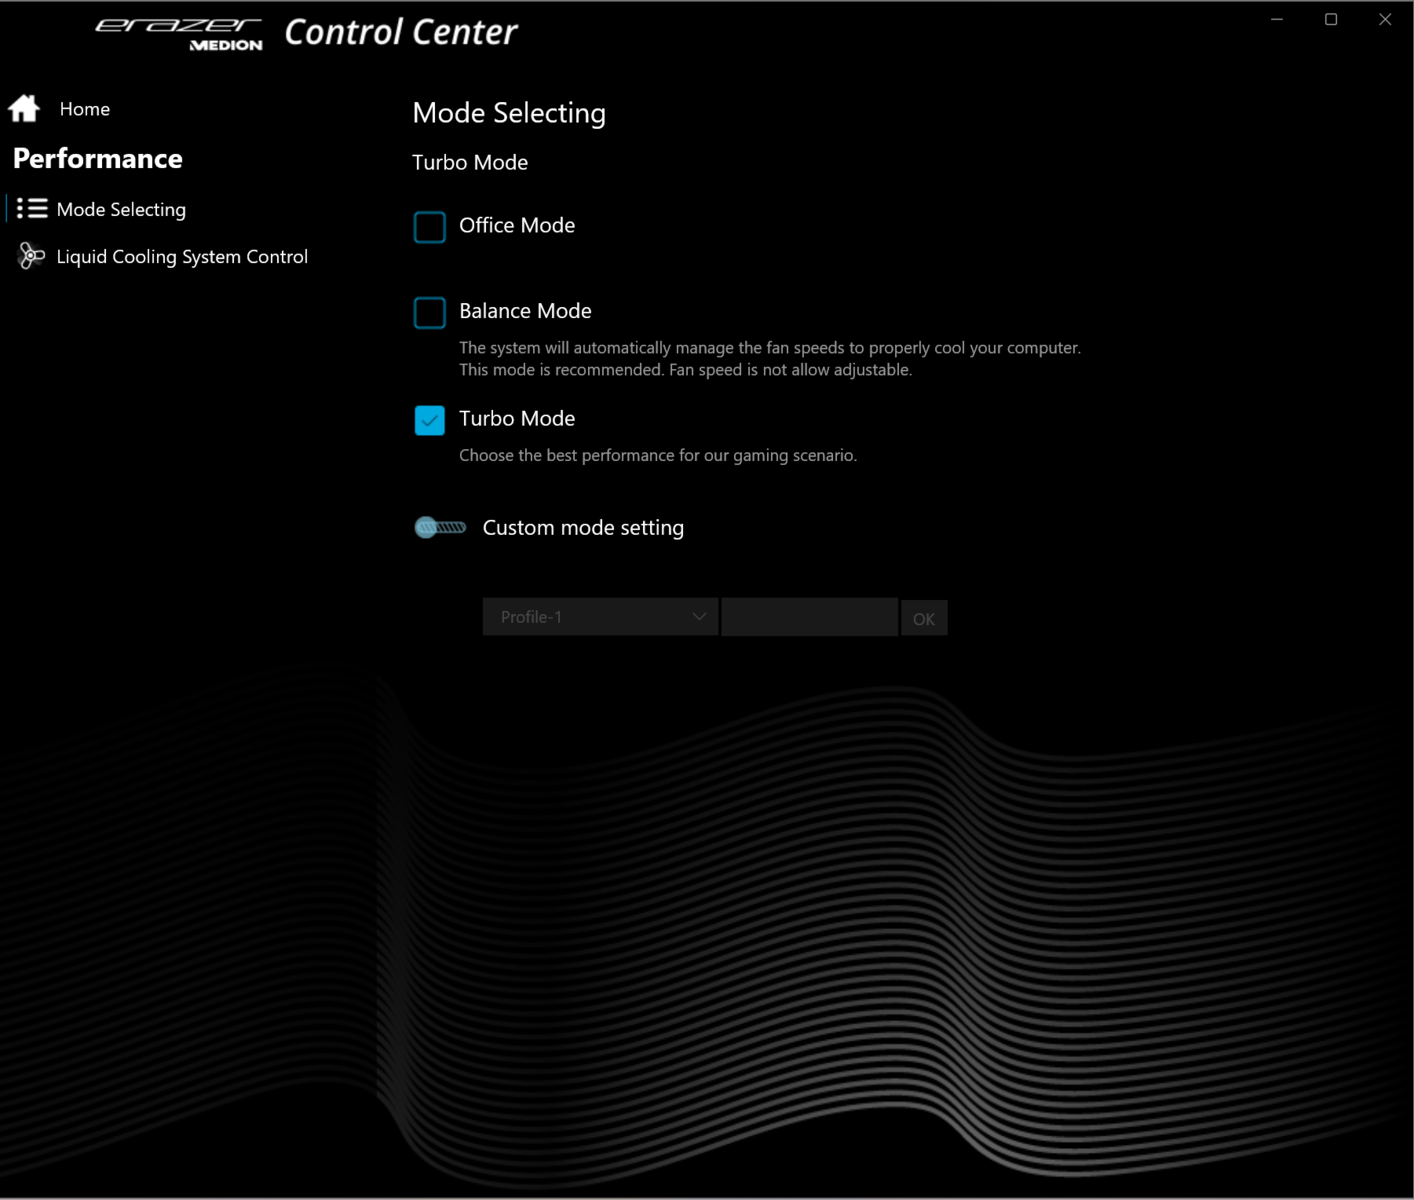
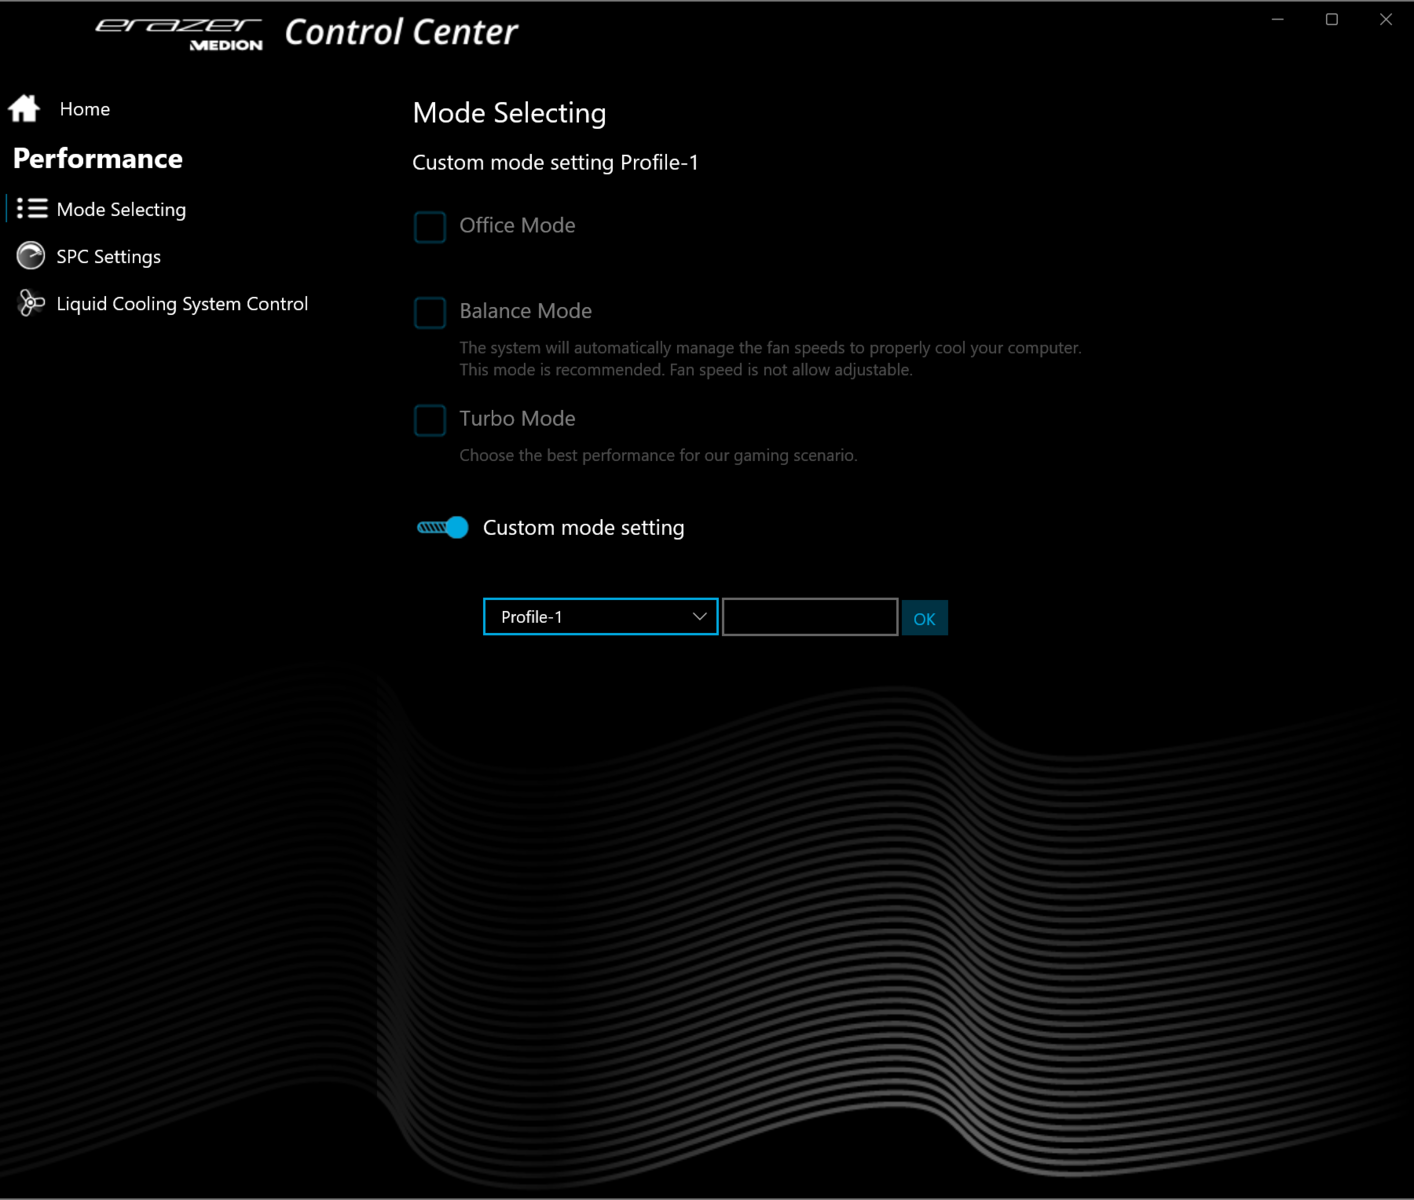
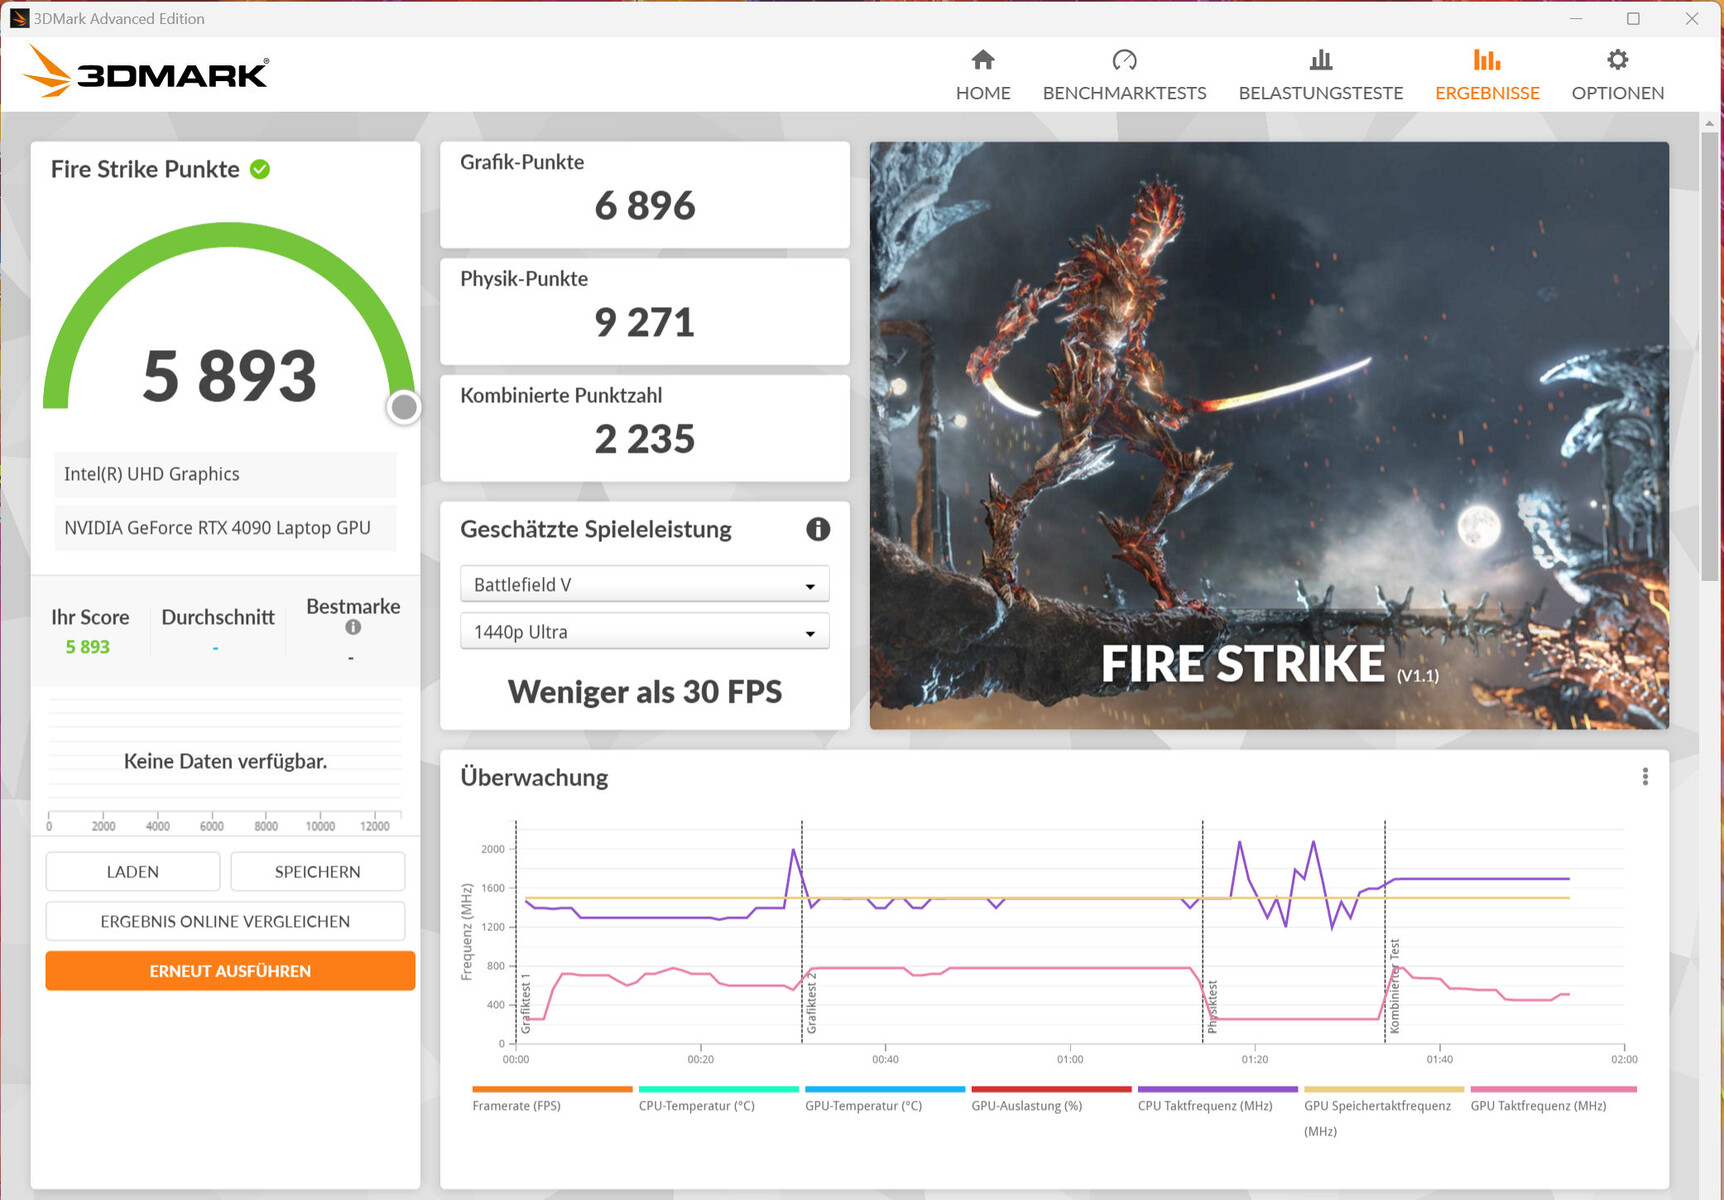
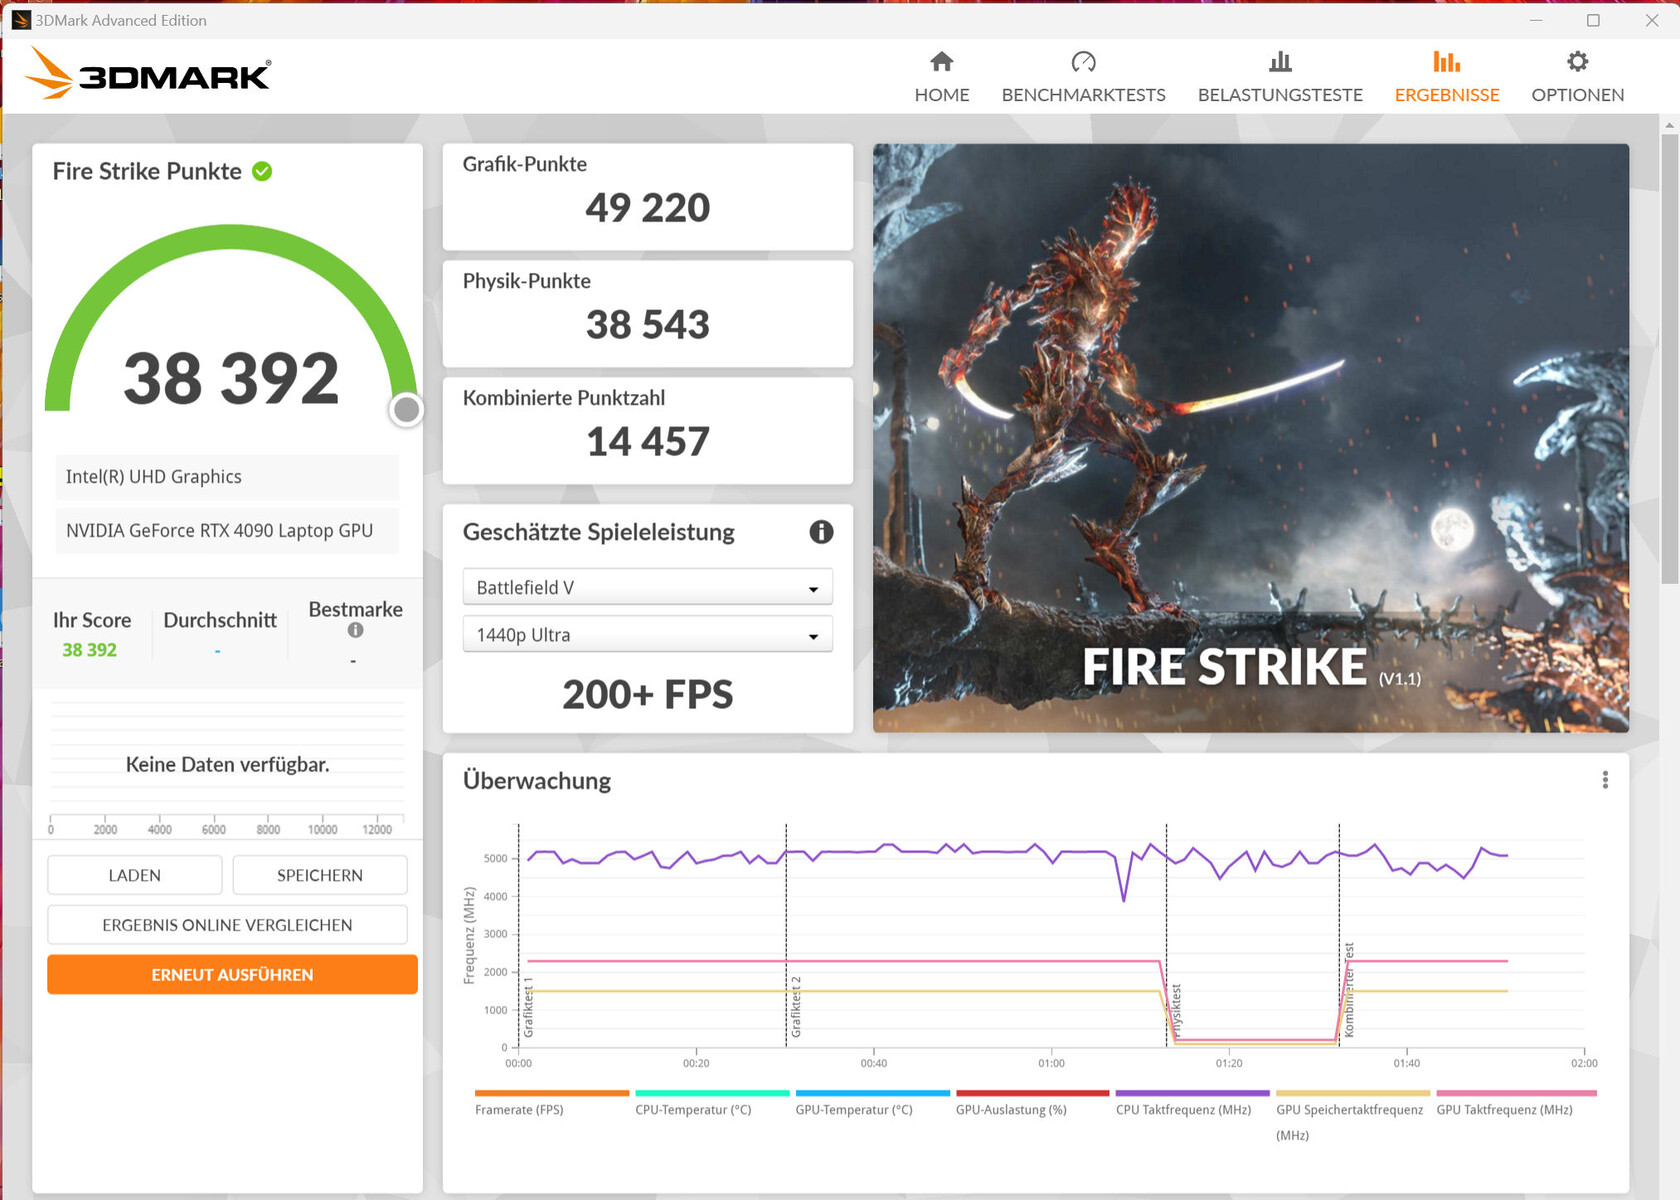
Há três modos de desempenho especificados pelo fabricante: Office, Balance e Turbo. Utilizamos o modo Turbo para benchmarking e o modo Office para nossos testes de vida útil da bateria e ativamos o Nvidia Optimus em ambos os casos. Após completar estes testes, executamos mais benchmarks com o modo dGPU ativado e a unidade externa de resfriamento de água conectada. Você pode encontrar os resultados destes testes adicionais na tabela de comparação, mas eles não são levados em consideração para a classificação.
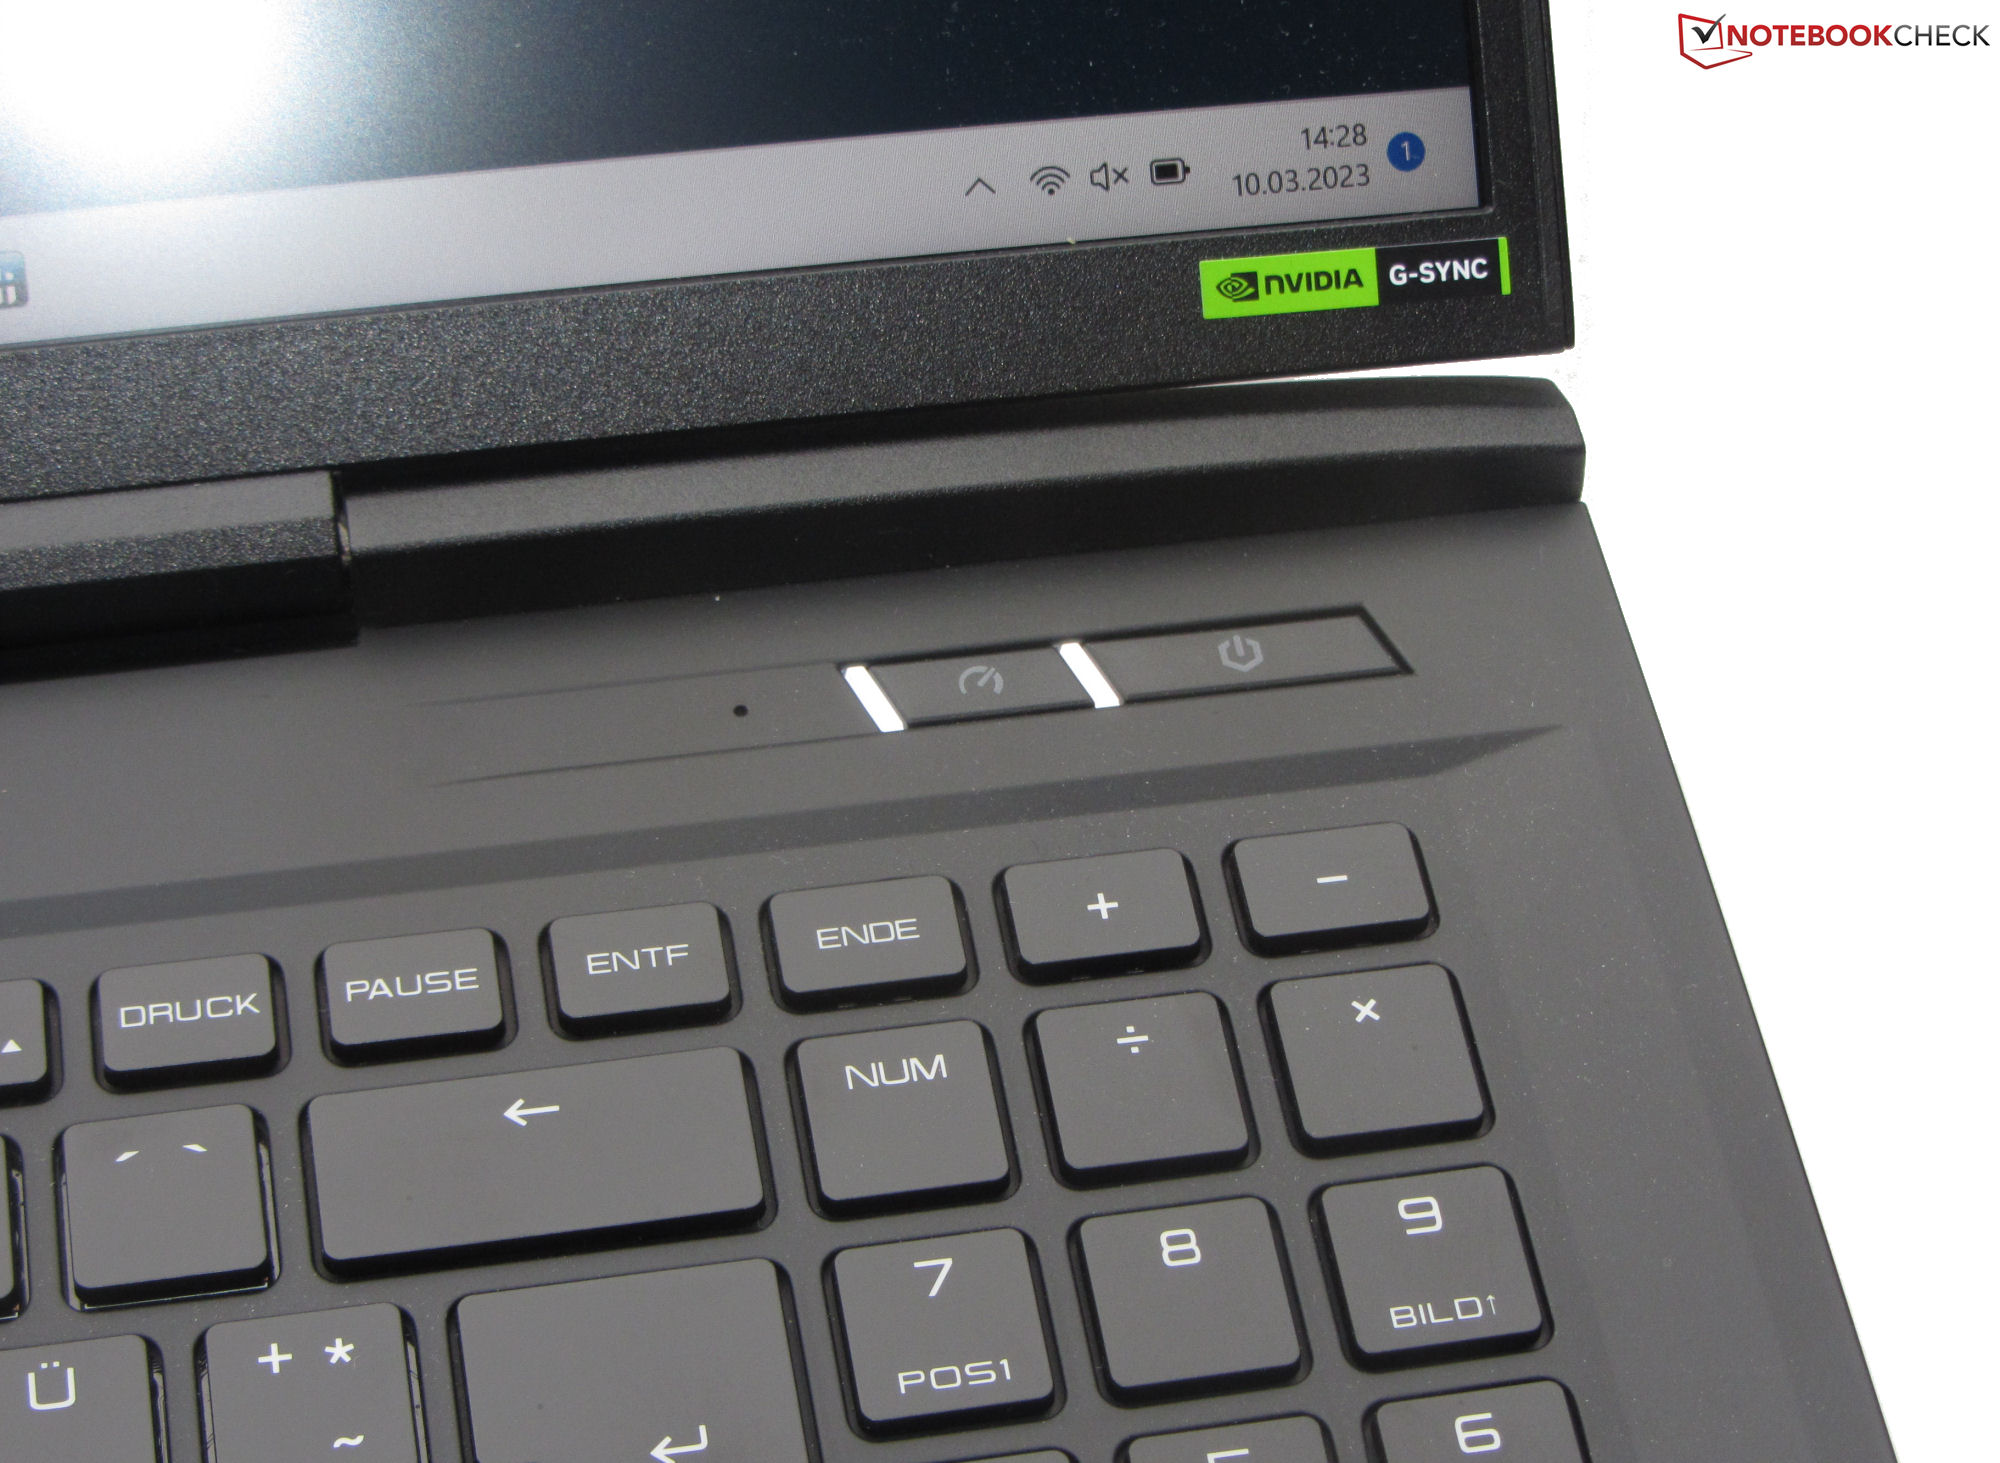
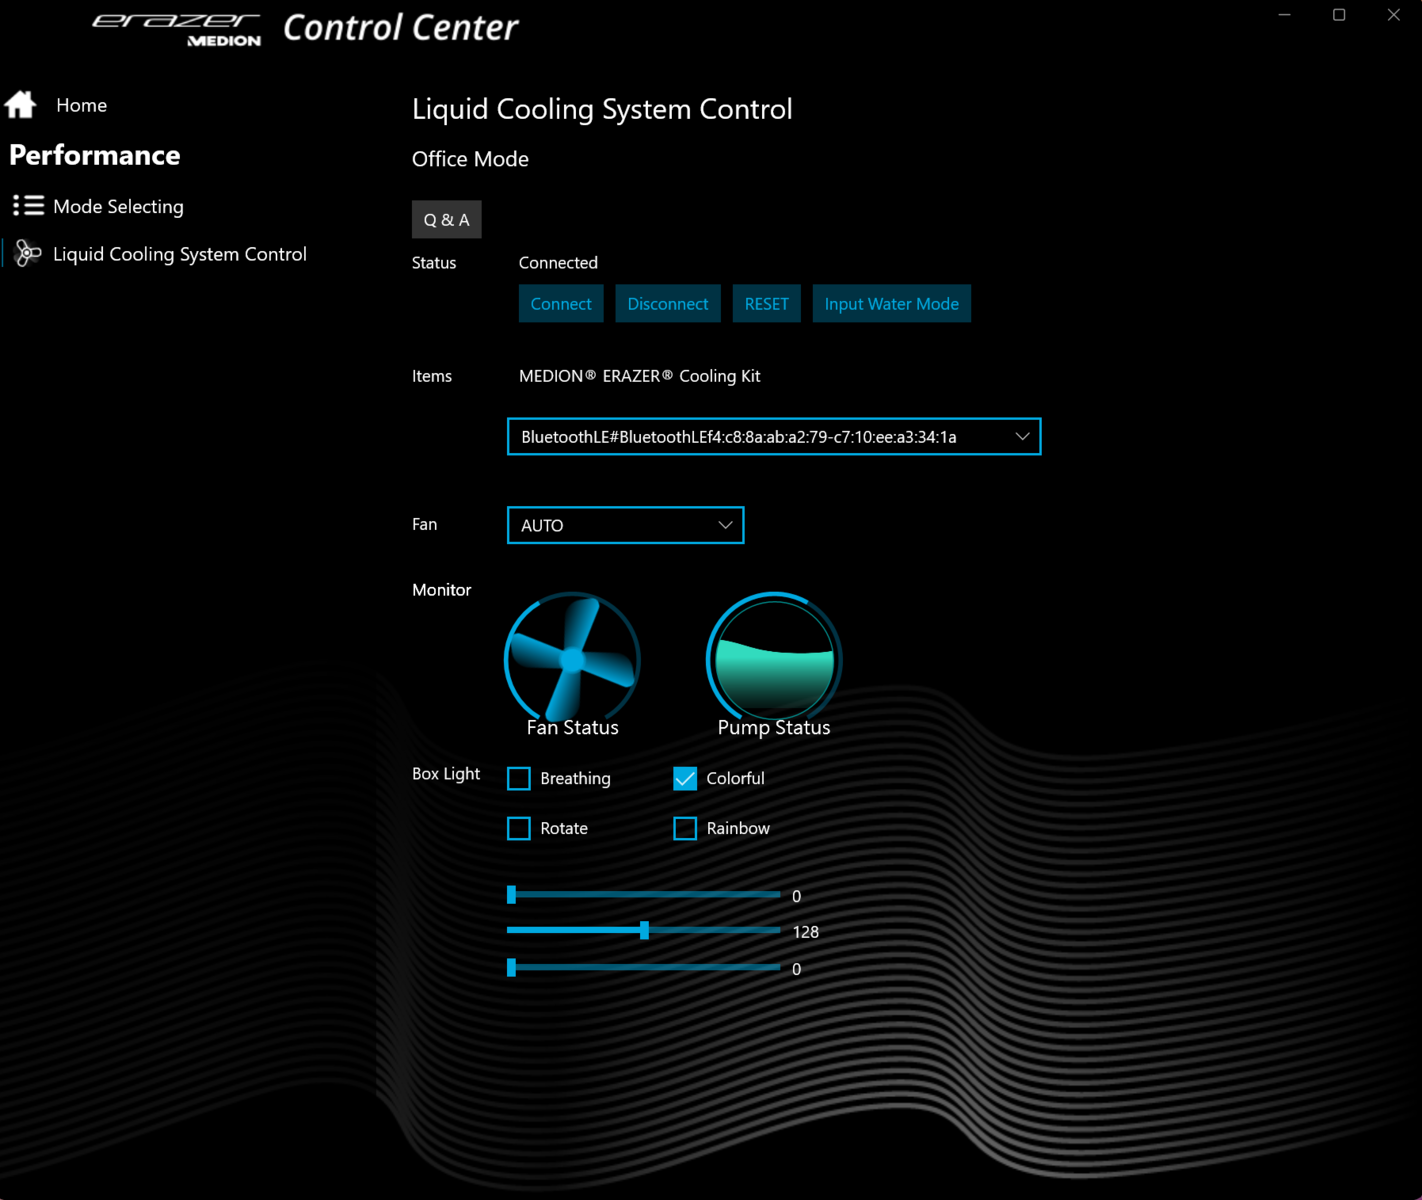
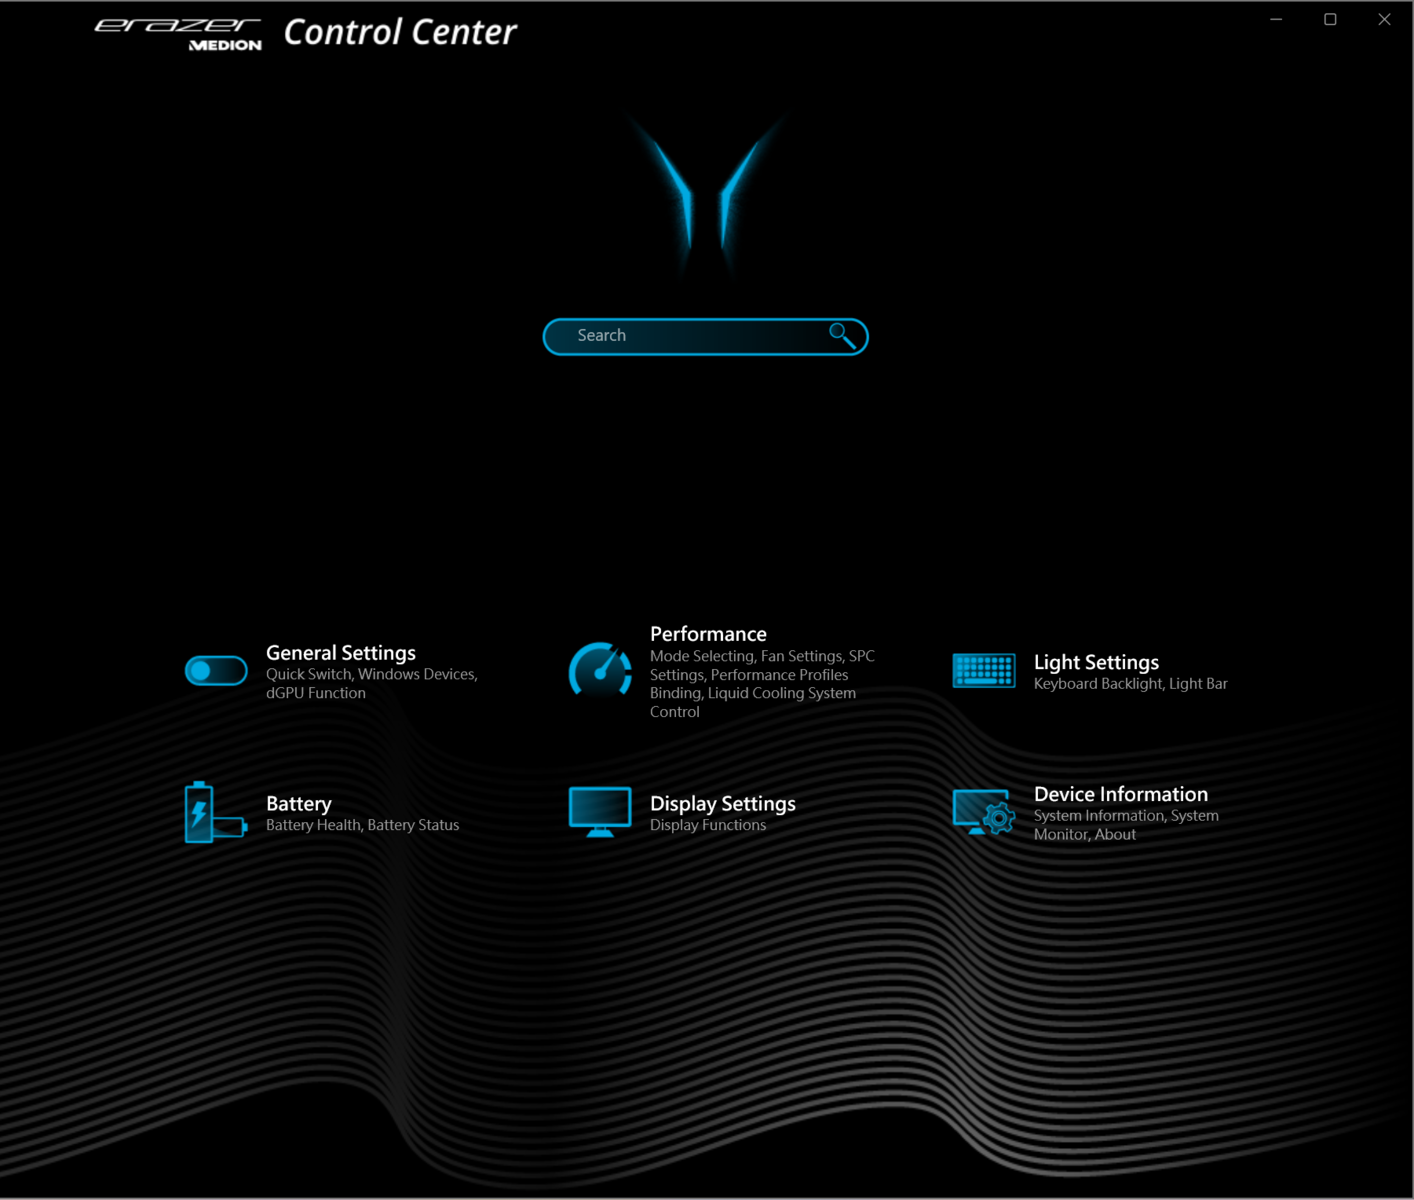
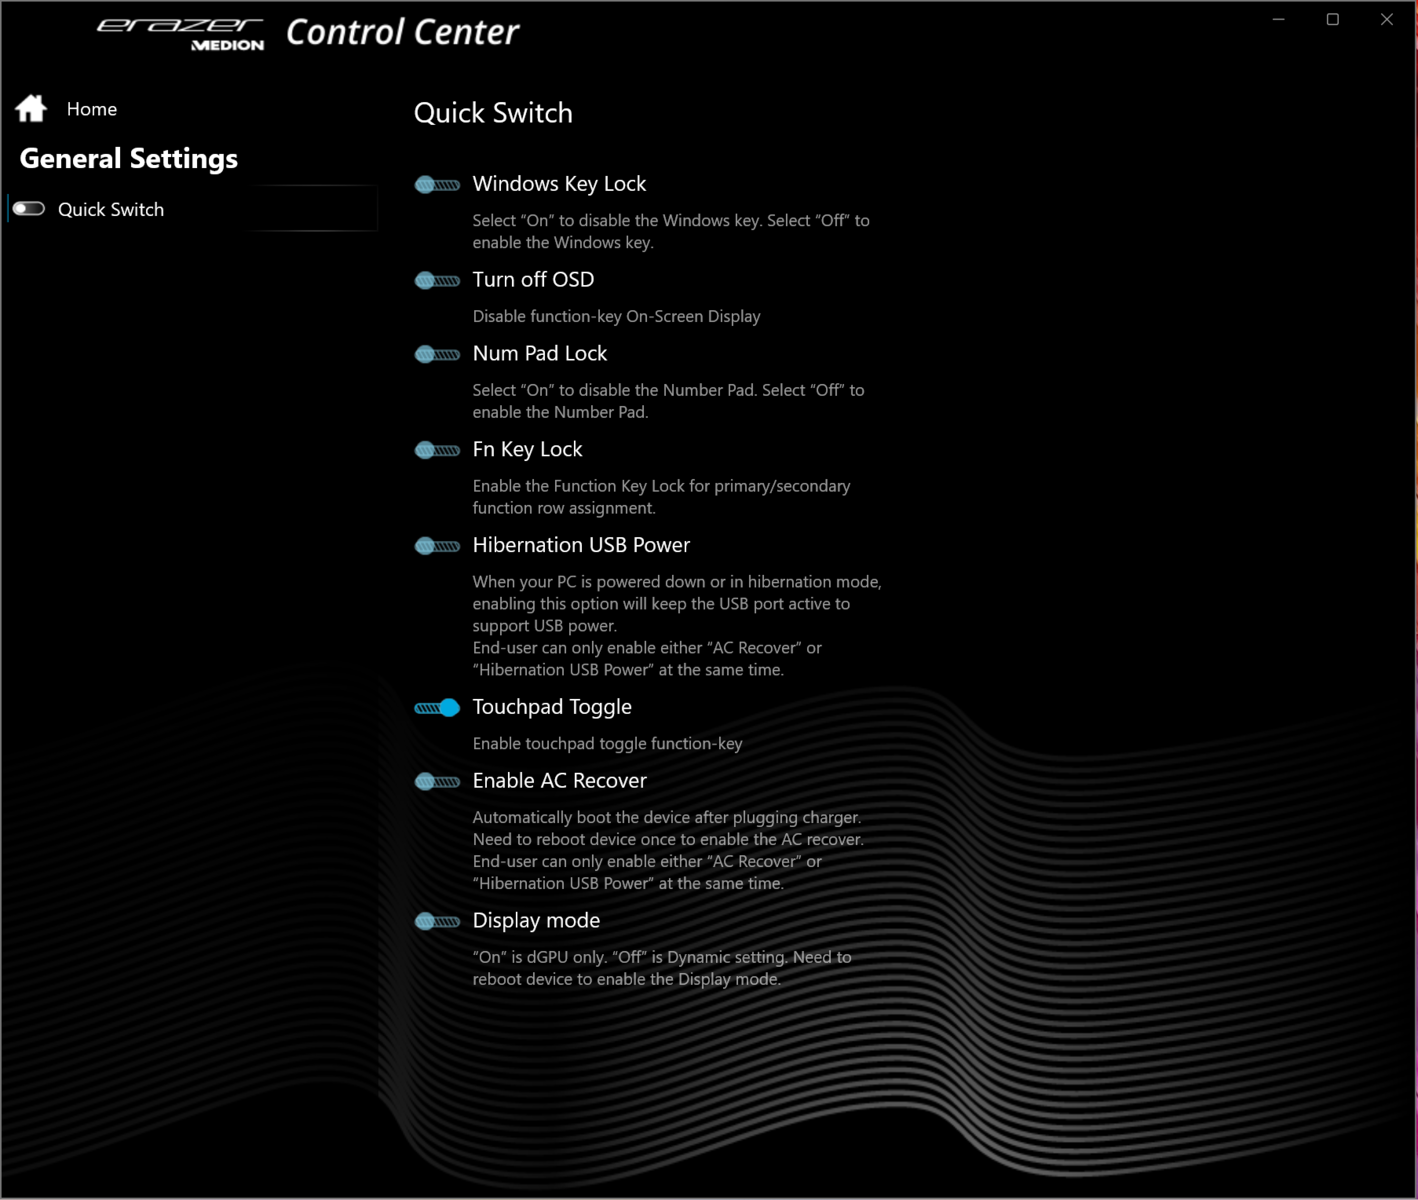
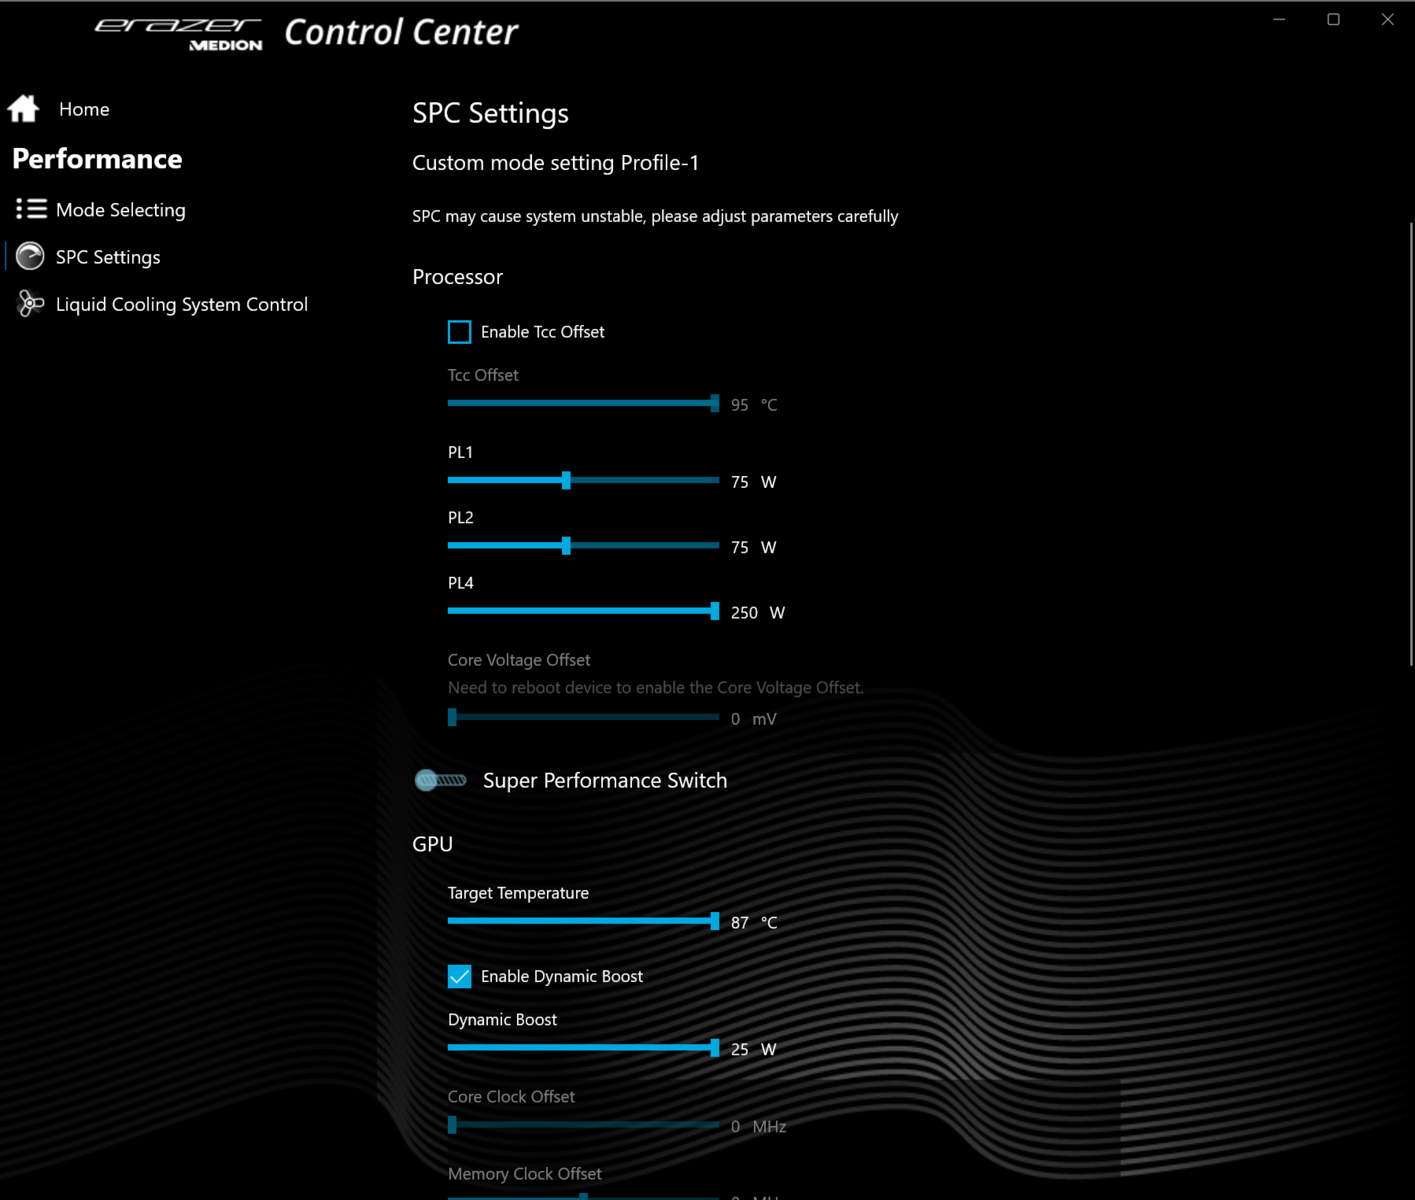
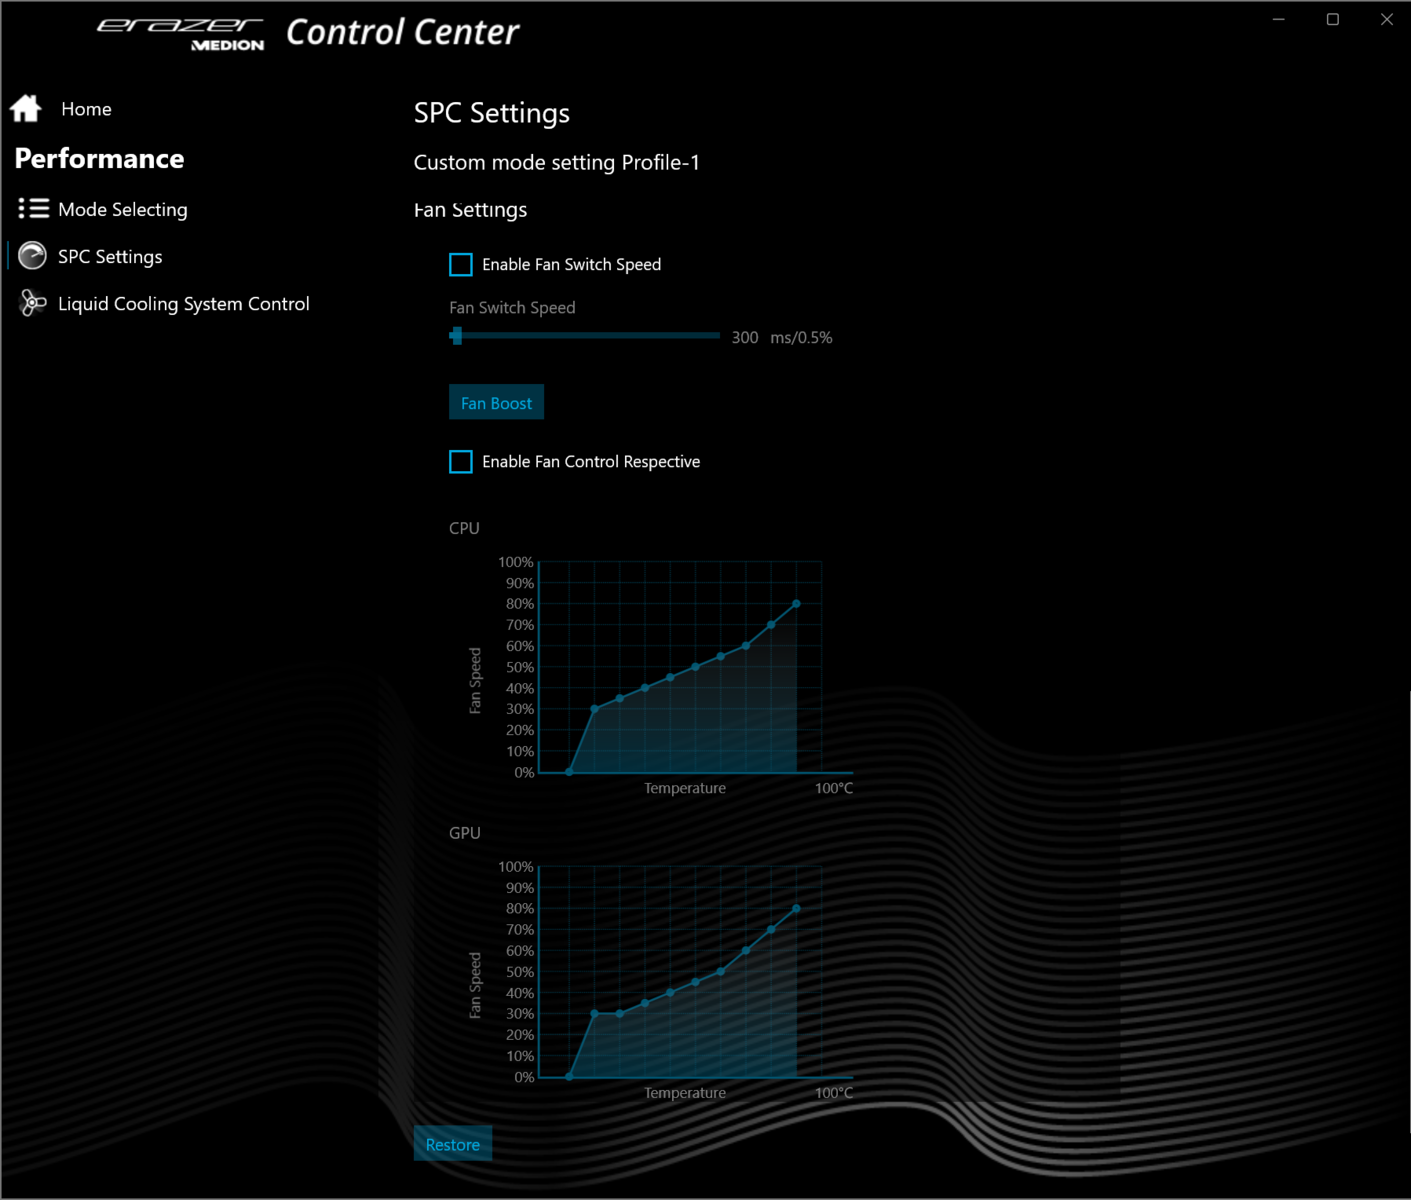
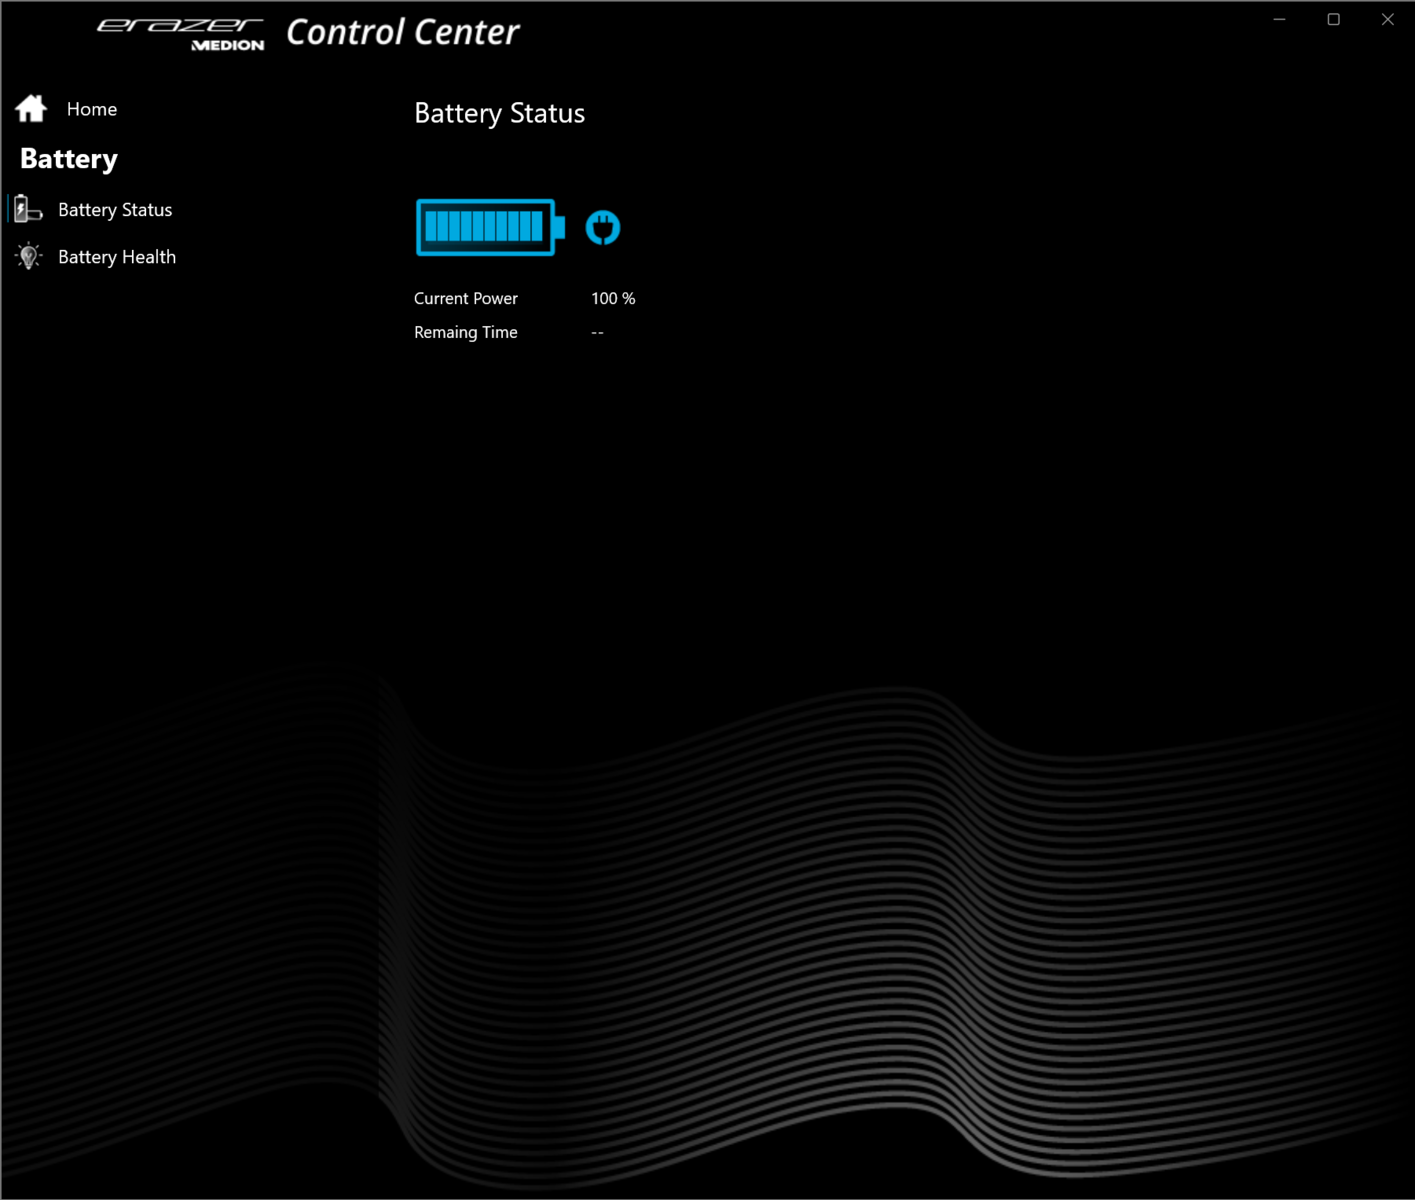
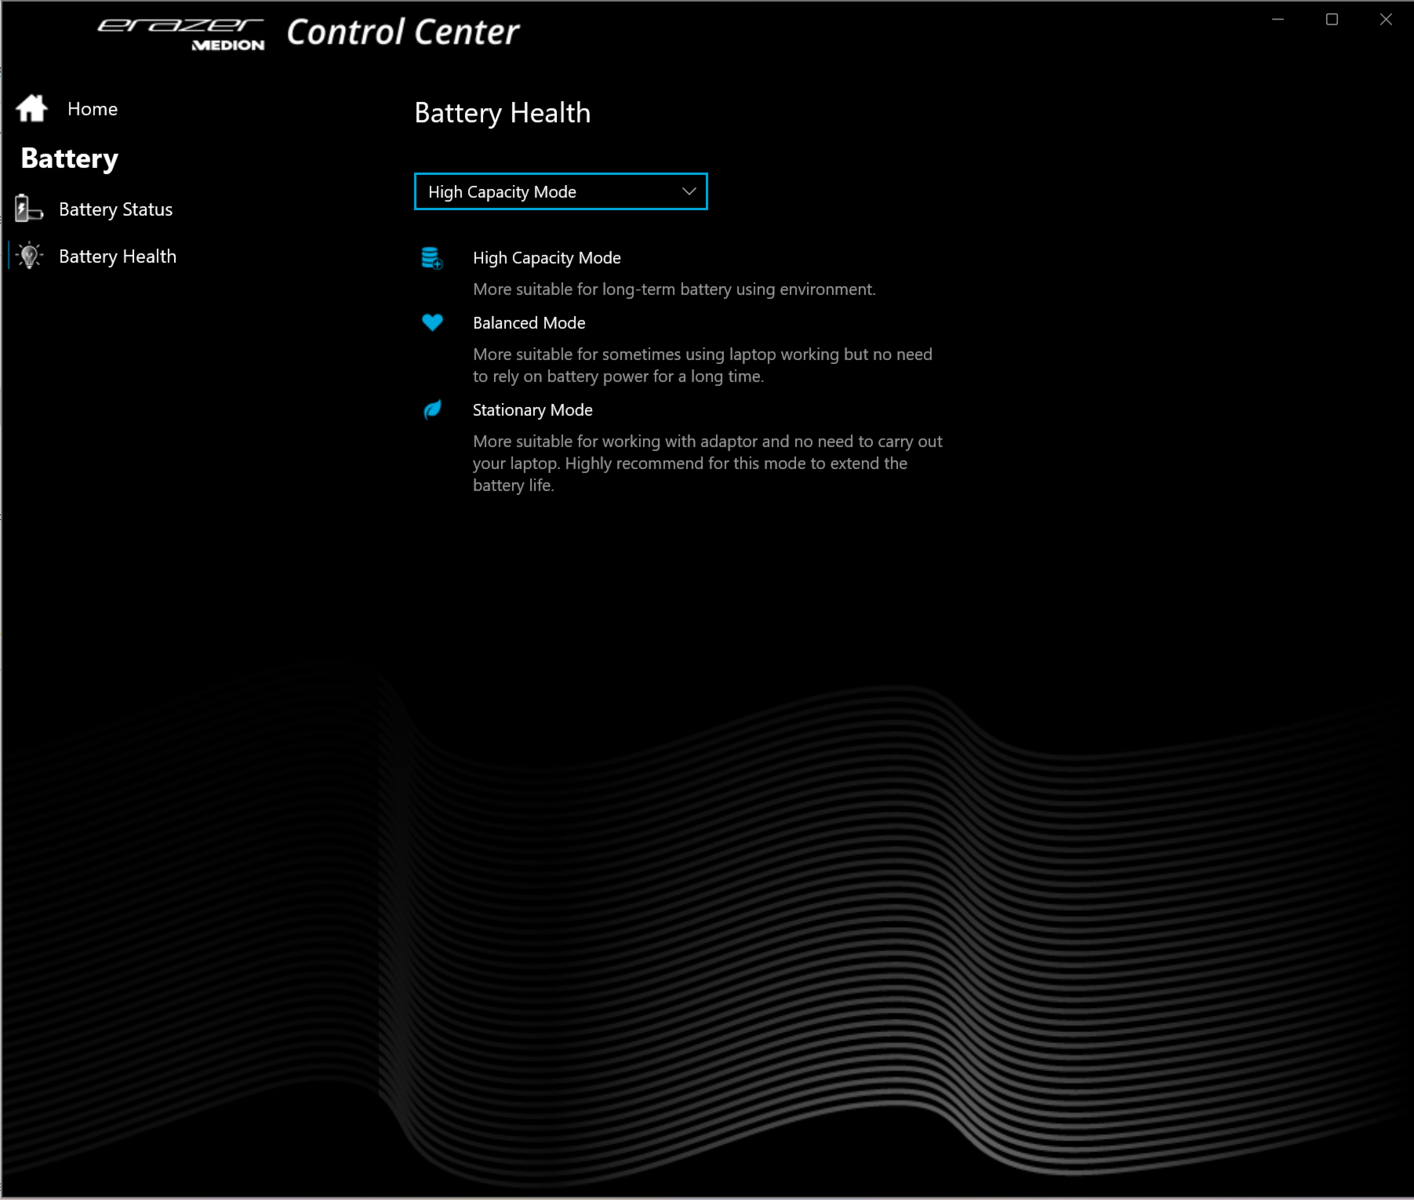
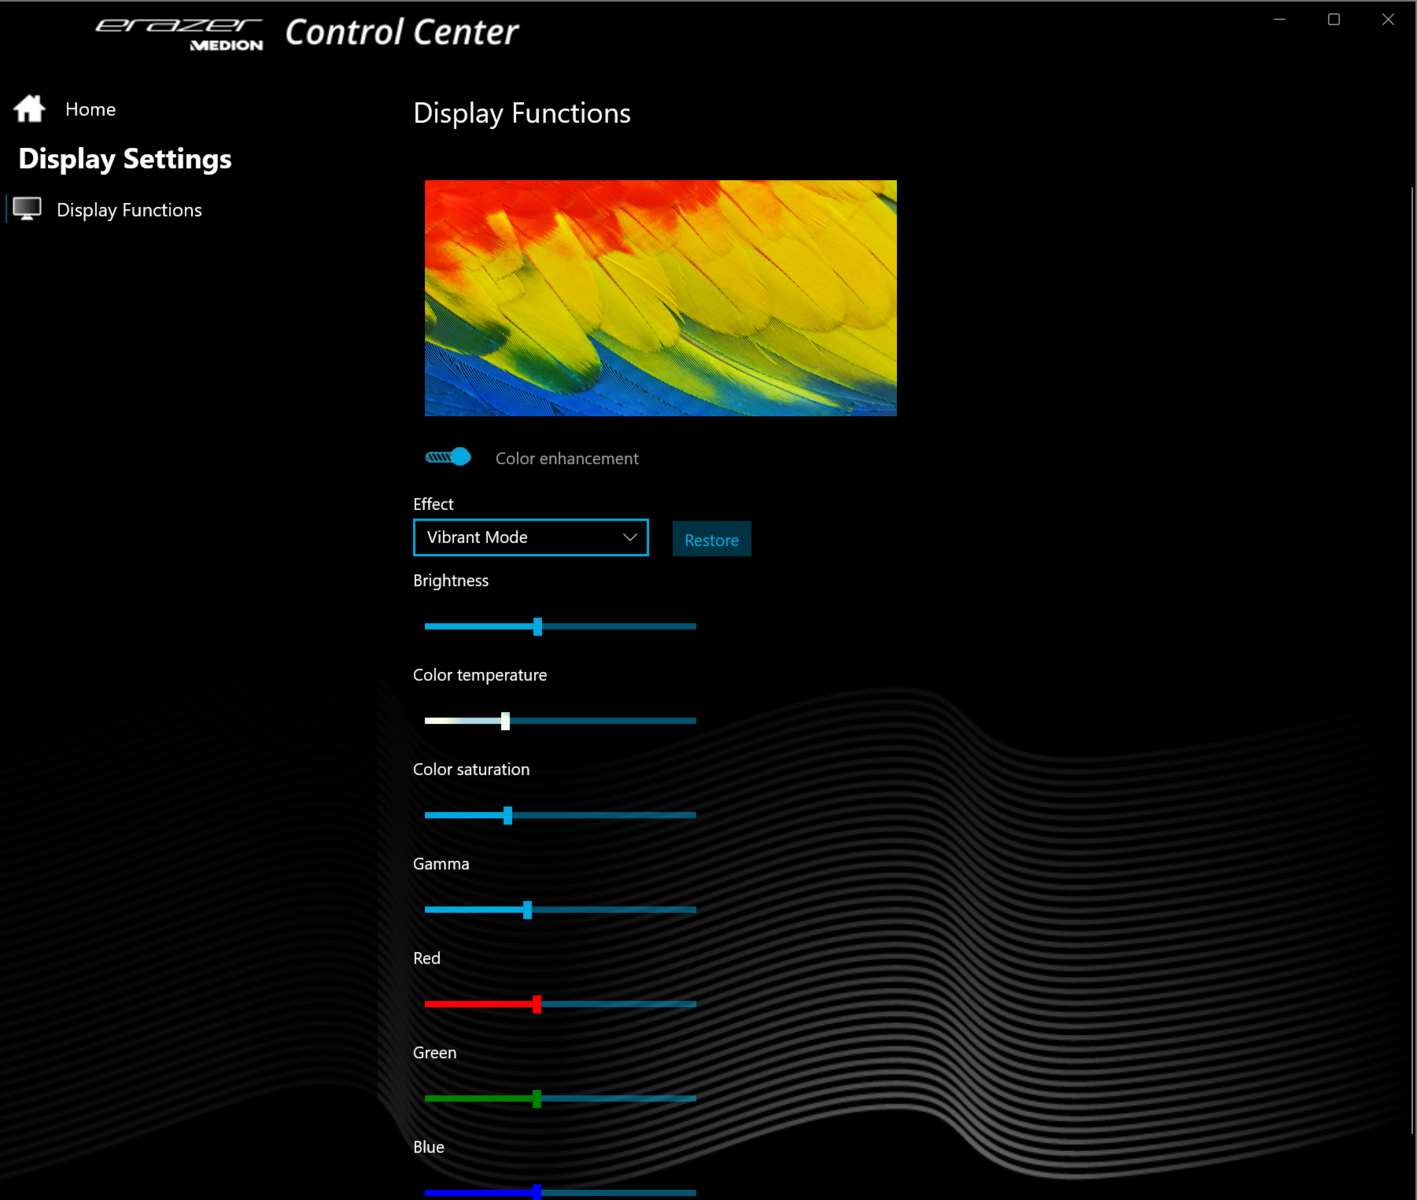
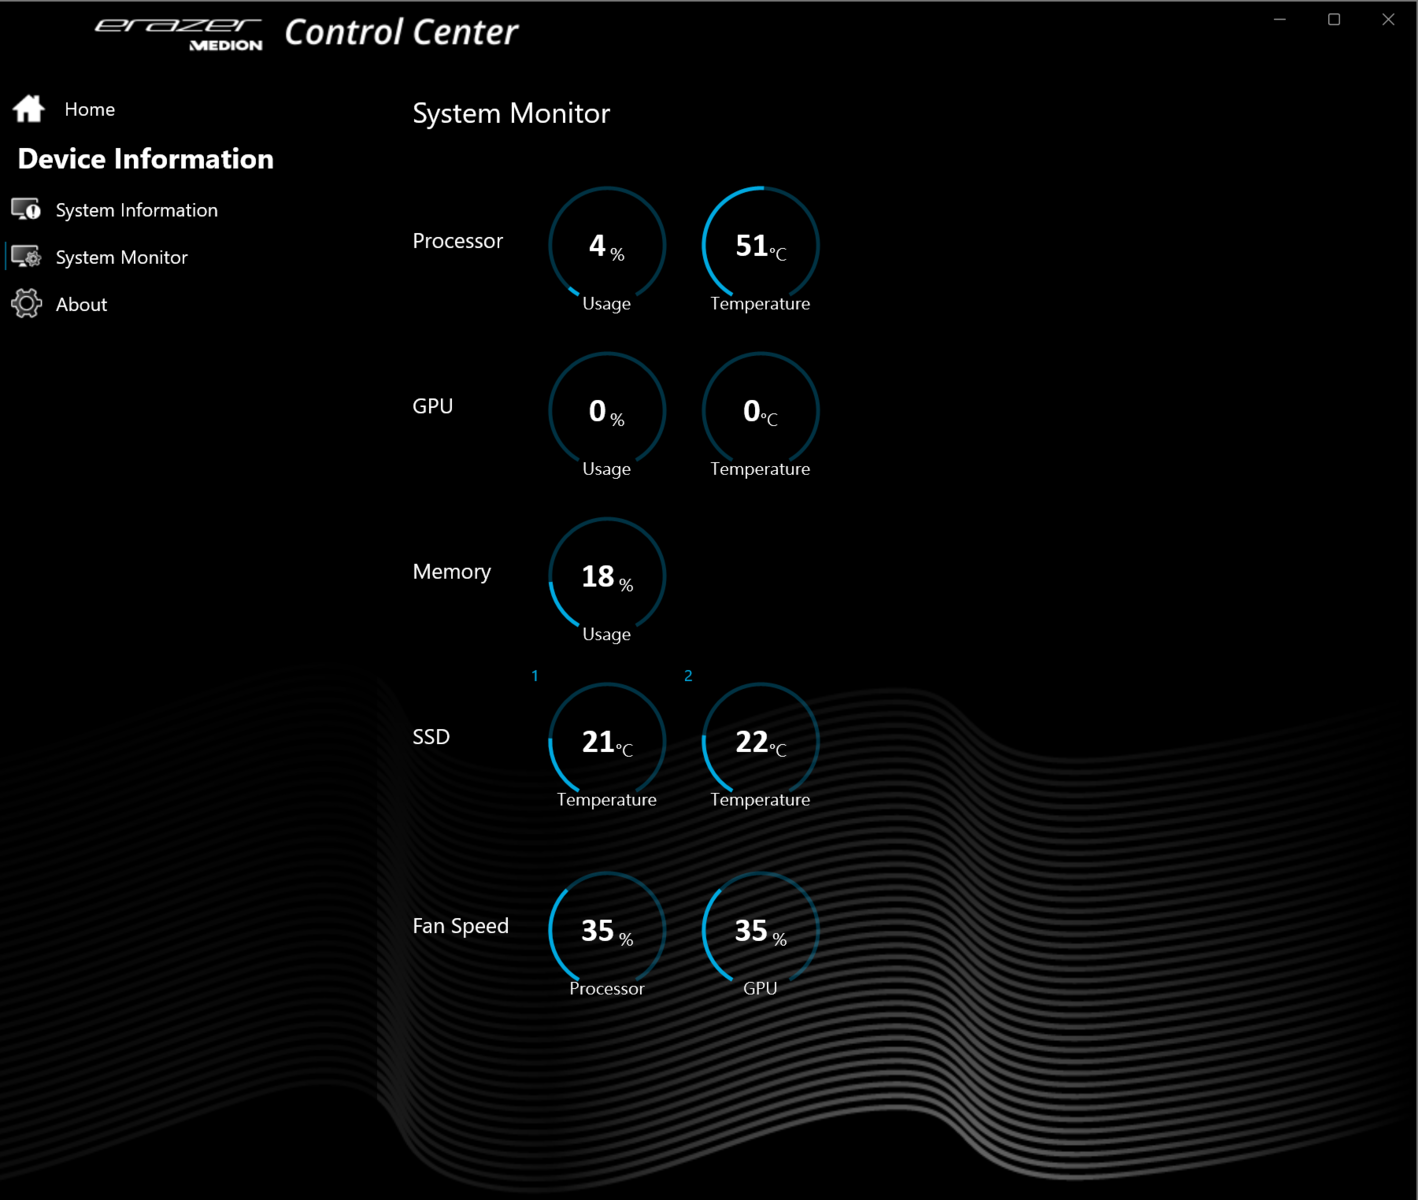
Os usuários podem alternar entre os três modos usando um botão dedicado bem ao lado do botão de alimentação. Um LED de status indica qual modo está atualmente habilitado. Os perfis personalizados também podem ser criados usando o software pré-instalado do Centro de Controle. Por exemplo, é possível especificar os limites de potência da CPU, o TGP da GPU, os limites de temperatura e assim por diante.
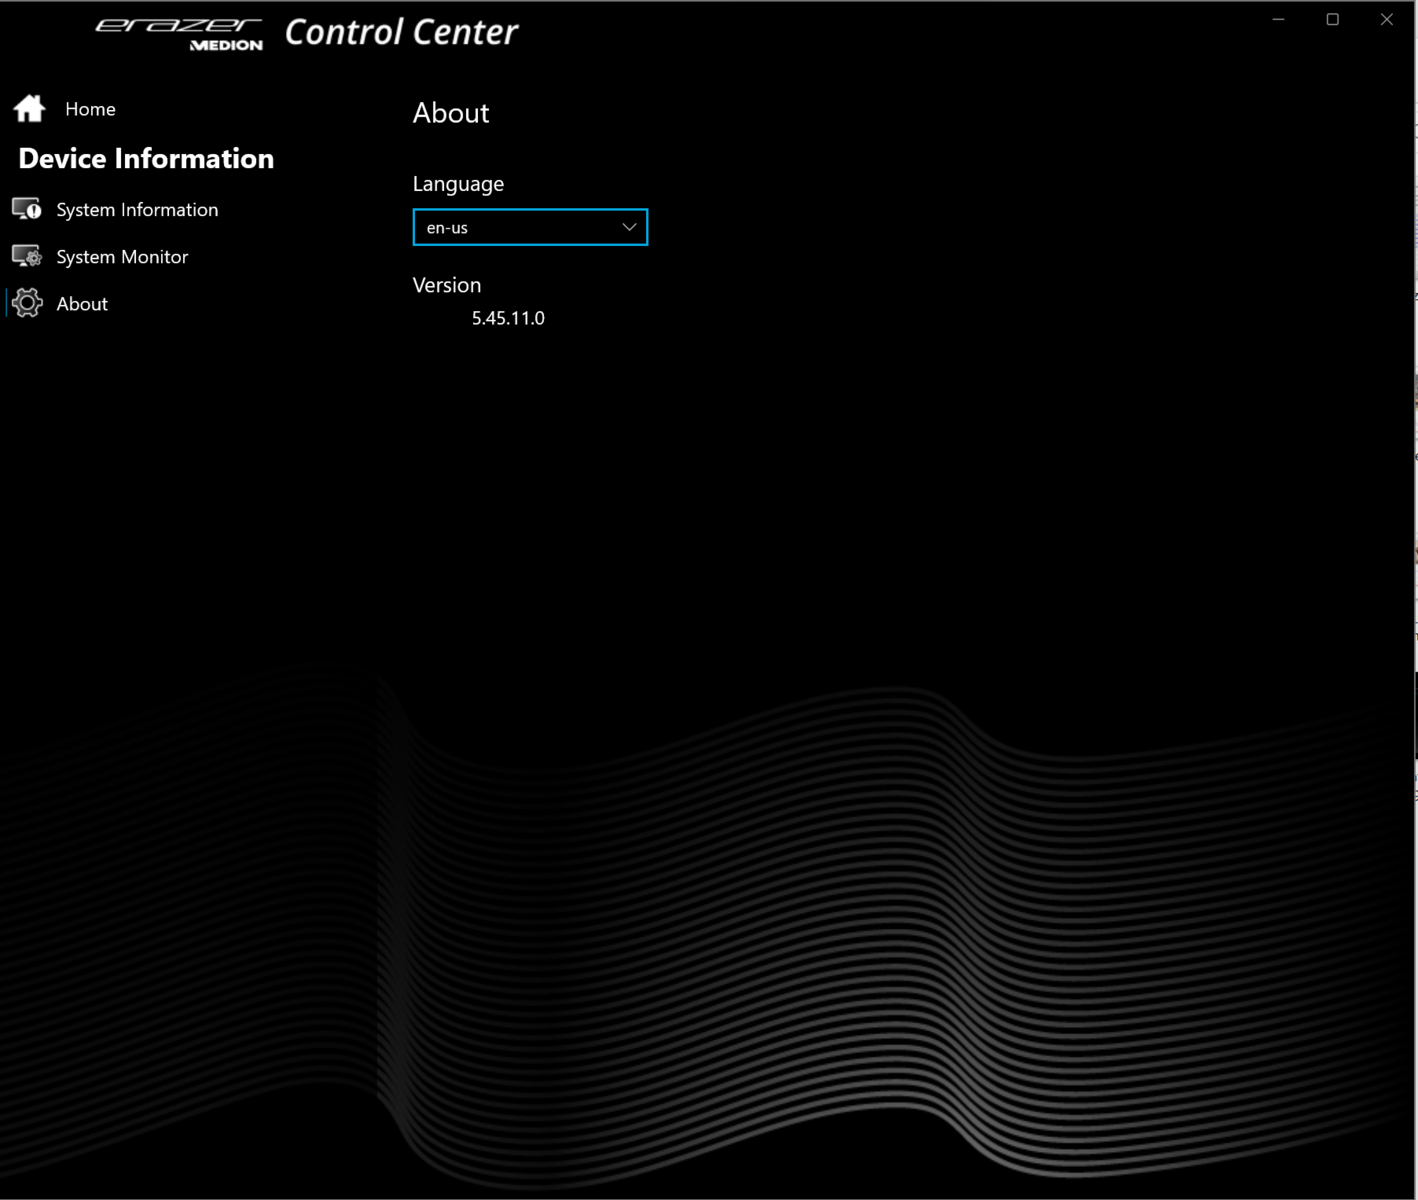
Nota: Utilizamos a interface do usuário em inglês no software do Centro de Controle porque há alguns problemas com a tradução para o alemão. O software permite que você troque entre os dois idiomas.
| Modo Turbo | Modo Balanço | Modo Escritório | |
|---|---|---|---|
| Limite de potência 1 | 160 Watt | 160 Watt | 160 Watt |
| Limite de potência 2 | 160 Watt | 160 Watt | 160 Watt |
Processador
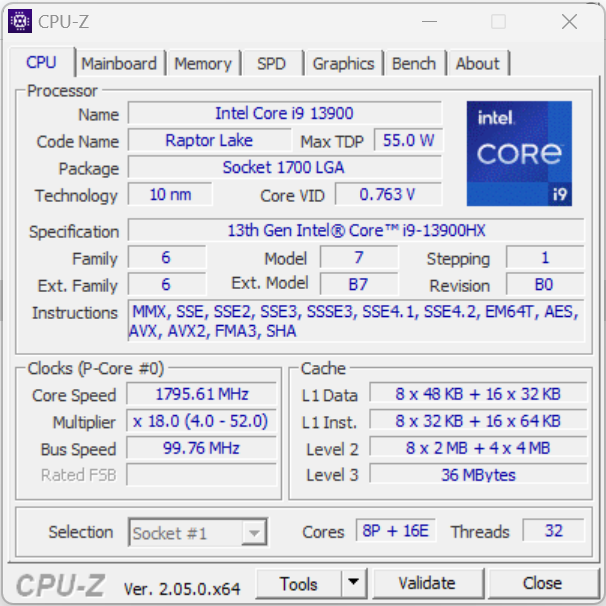
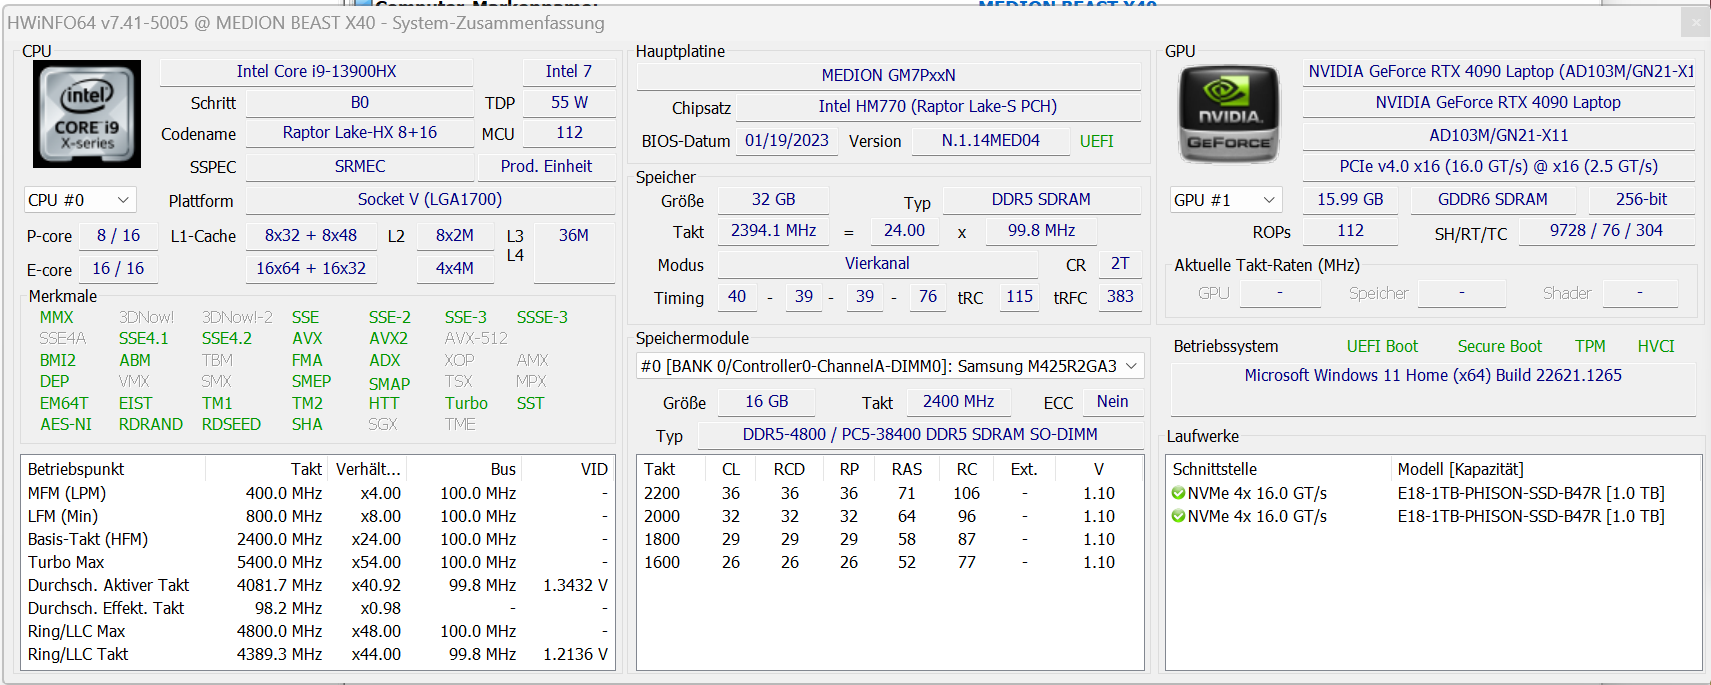
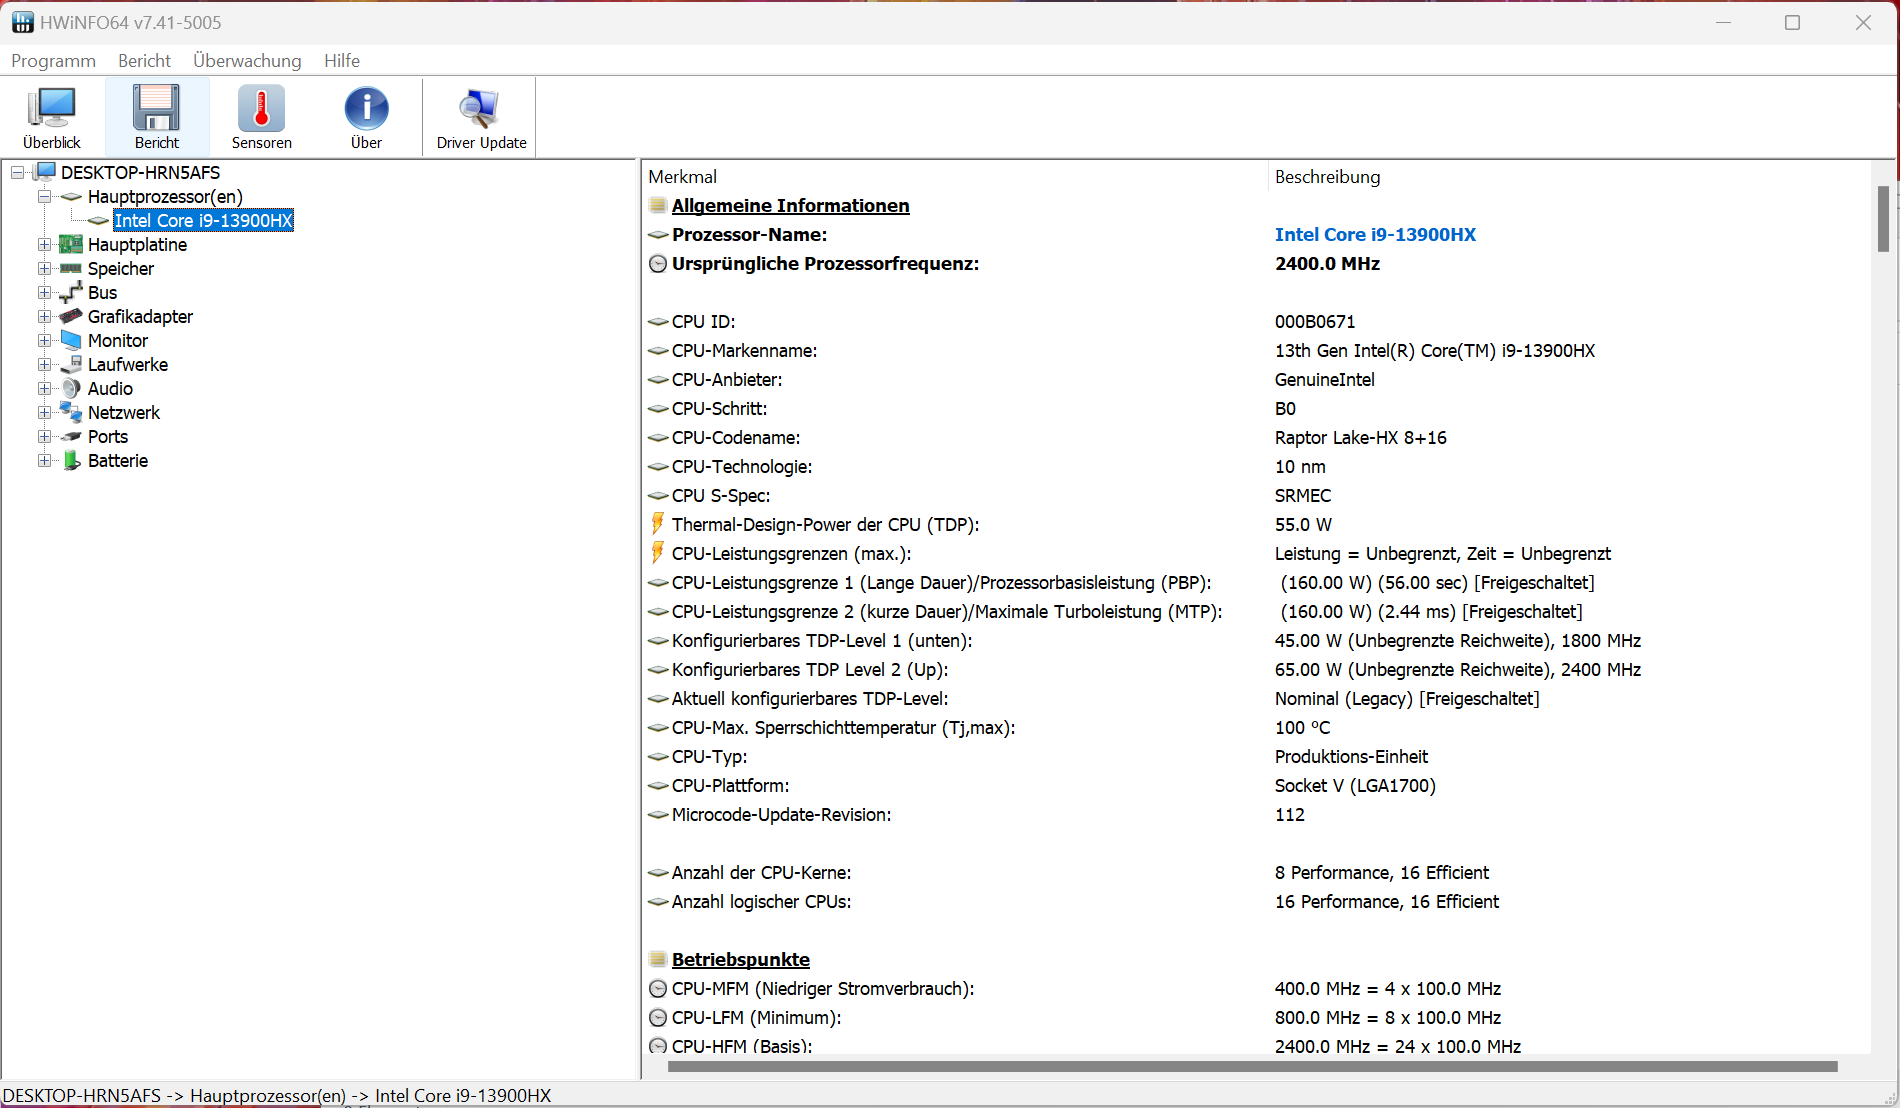
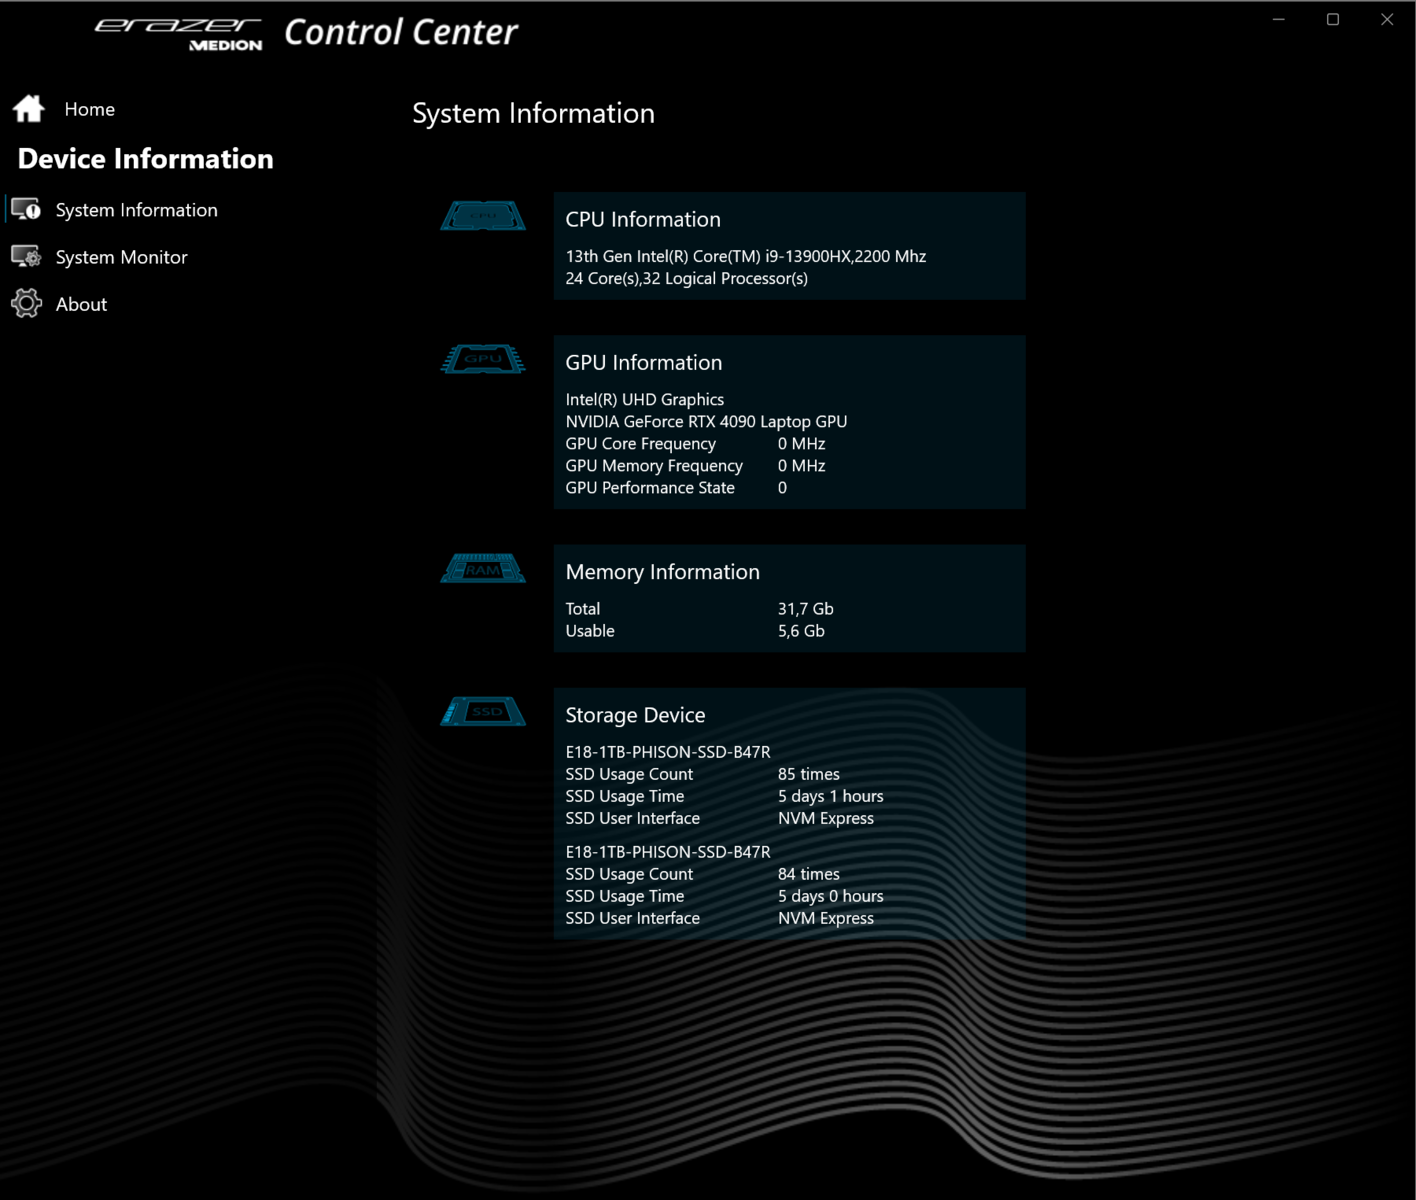
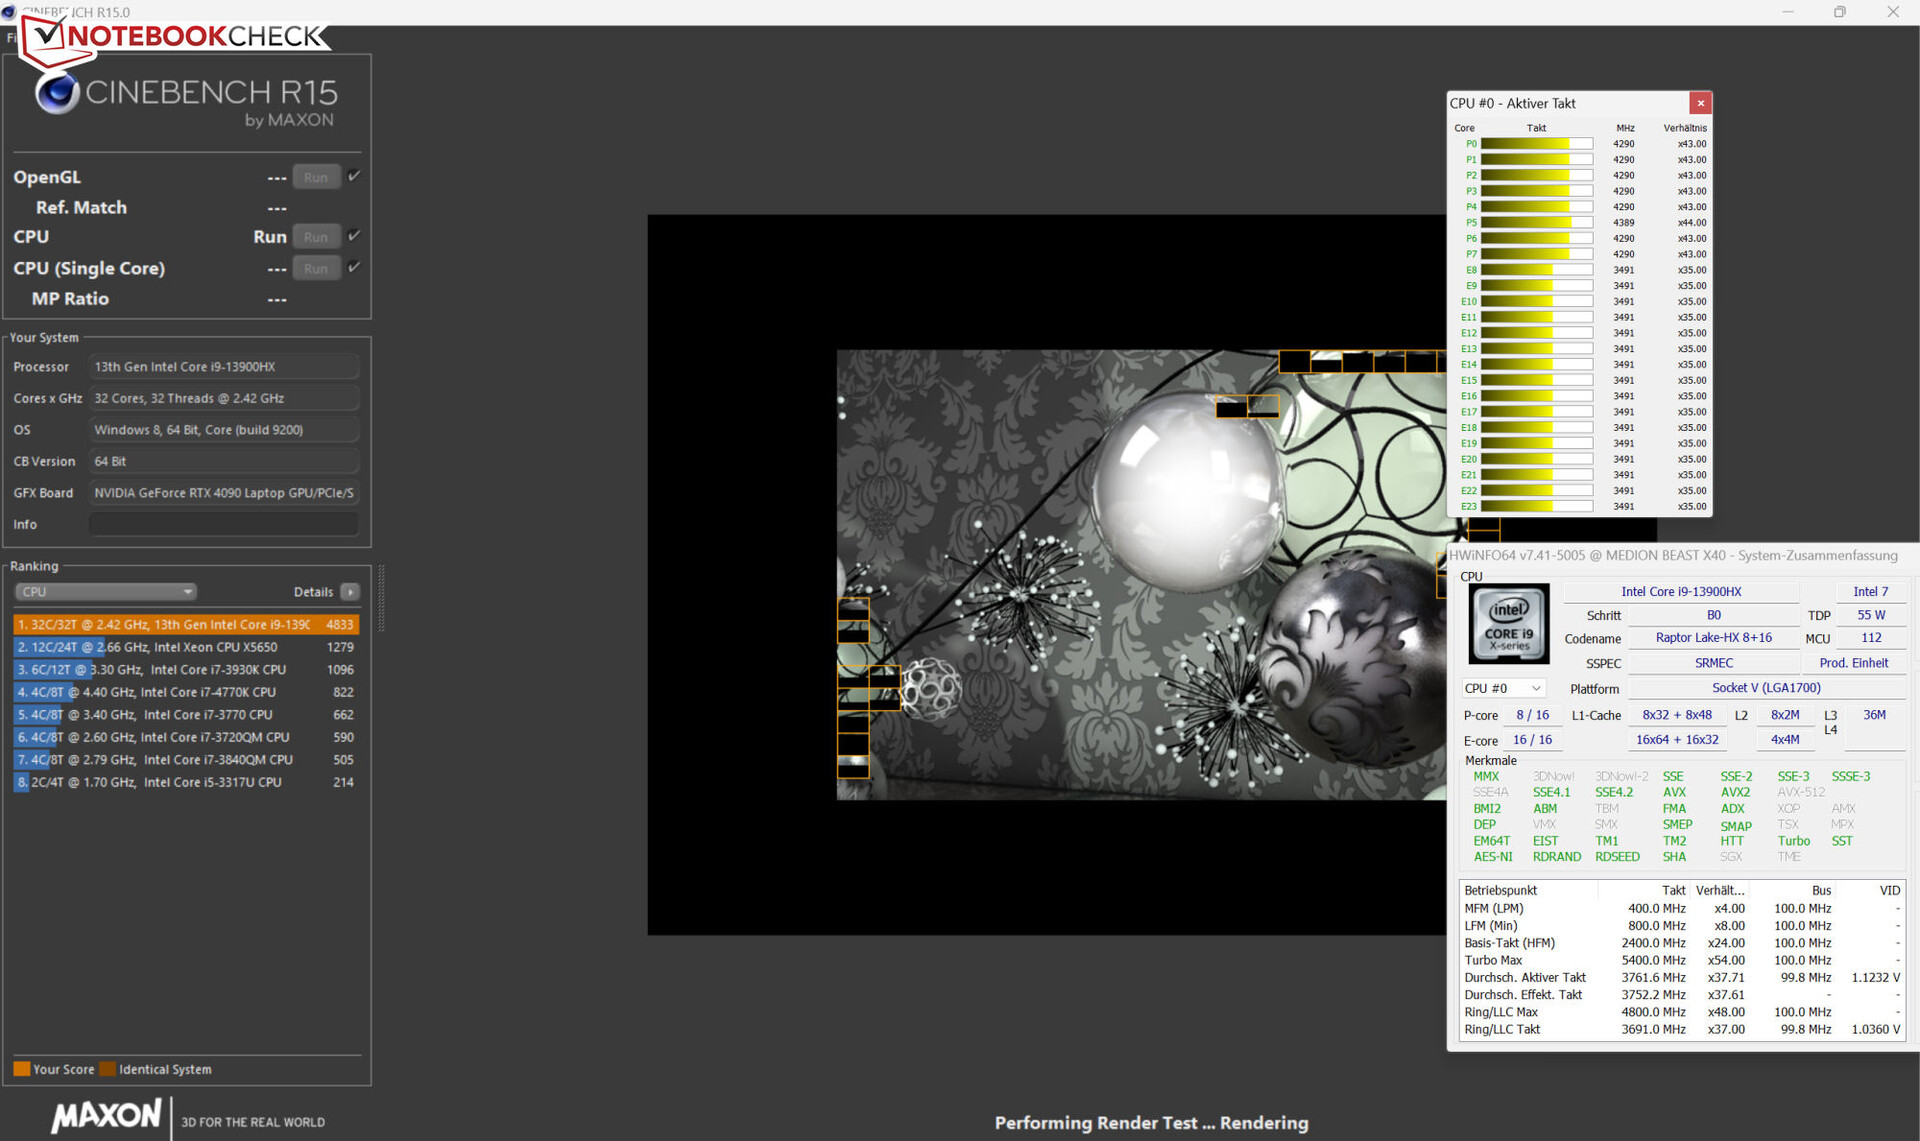
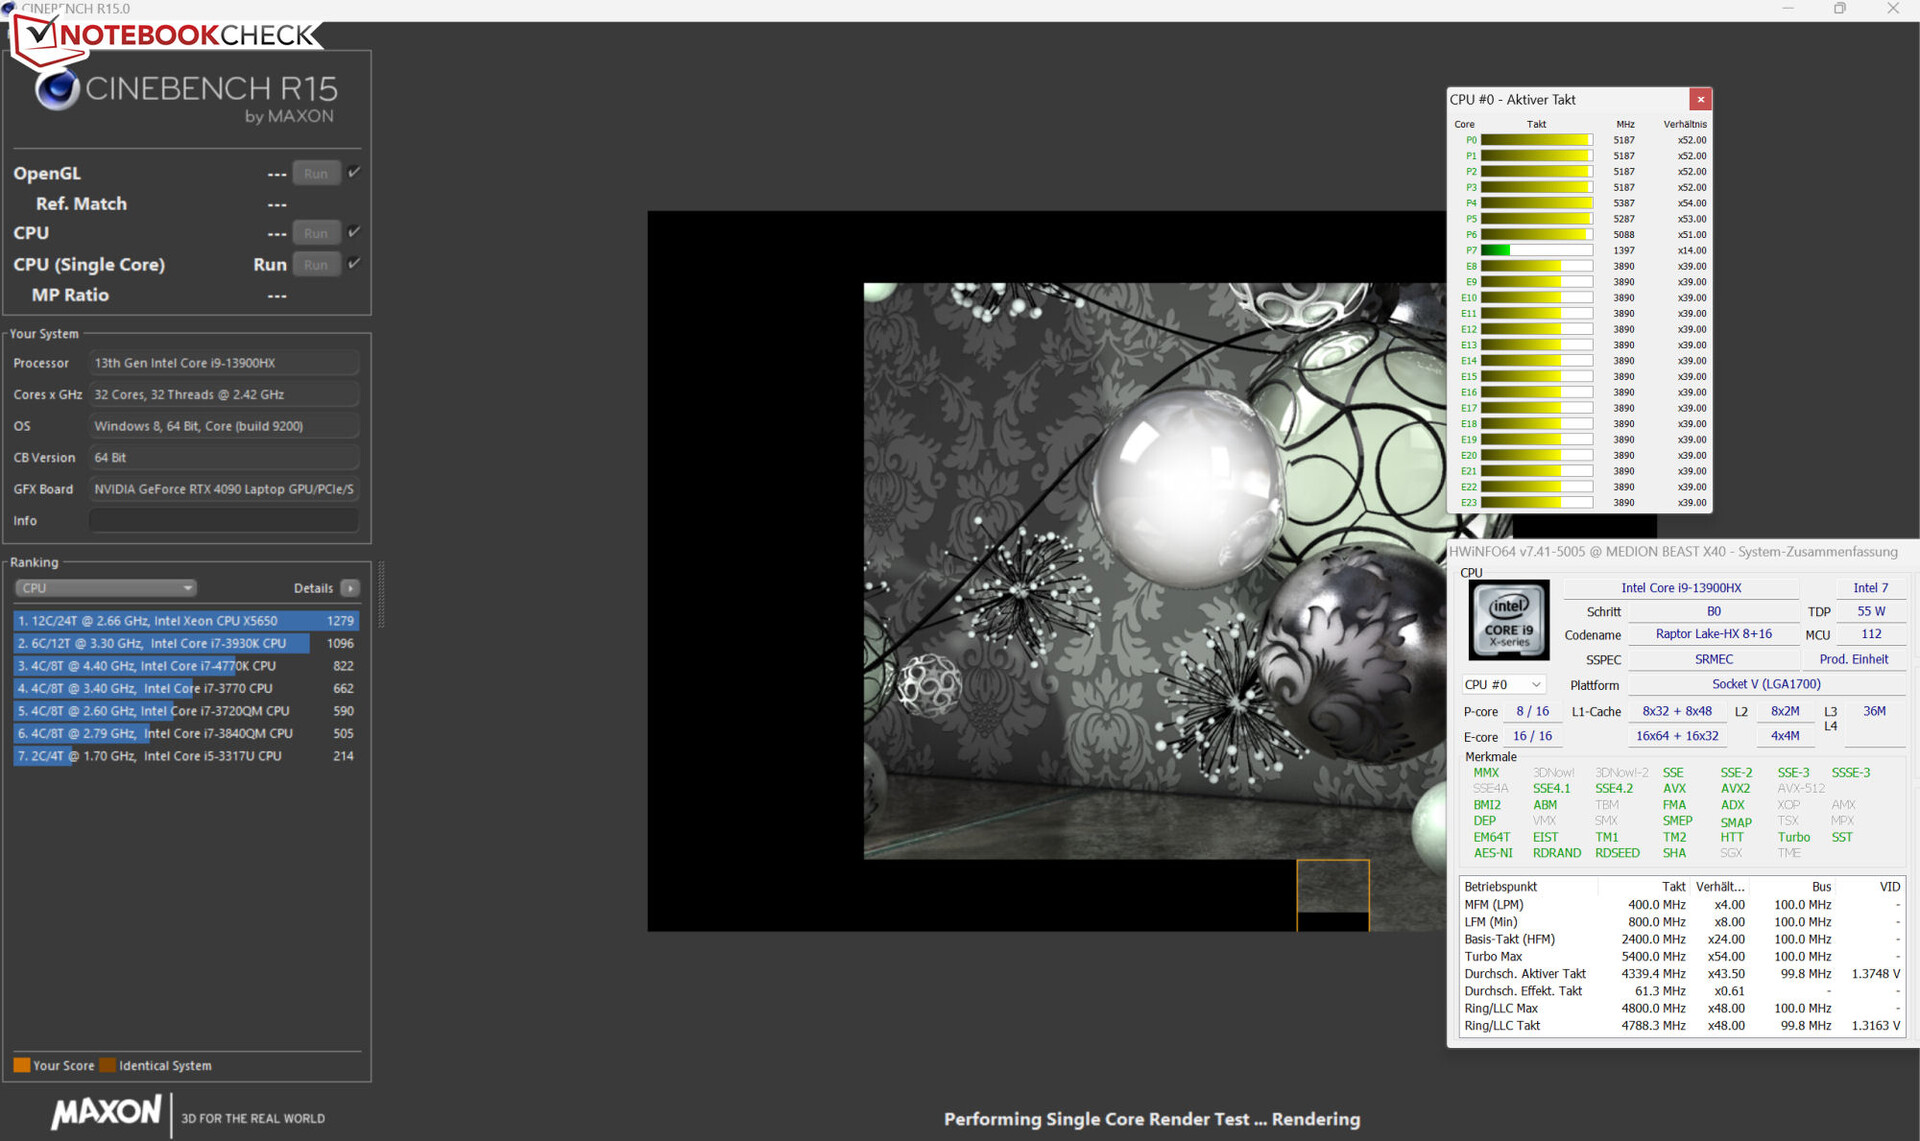
O Core i9-13900HX (Raptor Lake) consiste em oito núcleos de desempenho (Hyper-Threading, 2,2 a 5,4 GHz) e dezesseis núcleos de eficiência (sem Hyper-Threading, 1,6 a 3,9 GHz), resultando em um total de 40 núcleos lógicos. Os resultados de referência obtidos estão ligeiramente acima do que a CPU pode produzir em média.
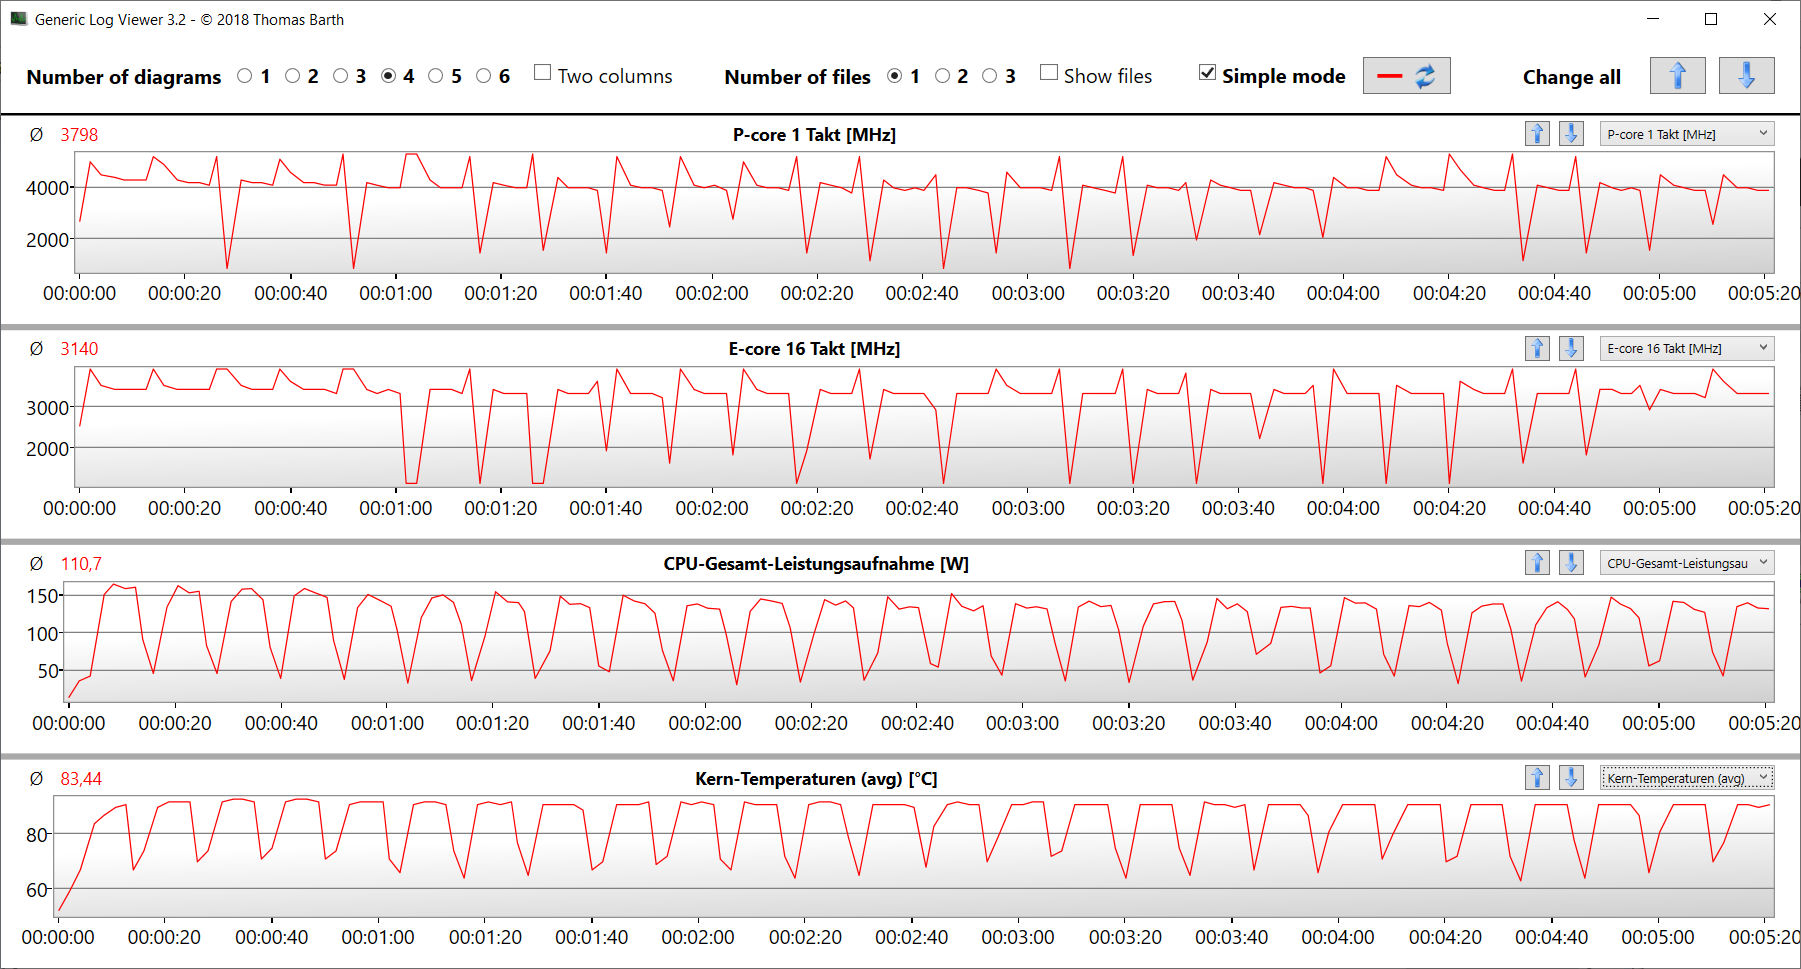
Com a Besta Erazer X40 conectada, sua CPU rodou Cinebench R15 em velocidades de relógio altas a máximas. Com a energia da bateria, o desempenho com uma única linha foi apenas marginalmente menor (pontuação: 228), enquanto o desempenho com várias linhas levou um golpe considerável (pontuação: 1.154). O funcionamento do Cinebench 15 em um loop demonstrou que a CPU é capaz de funcionar constantemente em altas velocidades de impulso quando está na rede elétrica.
A utilização da unidade de resfriamento de água não trouxe nenhum aumento dramático no desempenho. No entanto, o desempenho da CPU foi mais estável sob carga multi-tarefa sustentada (loop CB15), e a temperatura média da CPU caiu cerca de 5°C (9°F).
Cinebench R15 Multi Sustained Load
| CPU Performance rating - Percent | |
| Asus ROG Strix Scar 18 2023 G834JY-N6005W | |
| MSI Titan GT77 HX 13VI | |
| Medion Erazer Beast X40 | |
| Medion Erazer Beast X40 | |
| Média Intel Core i9-13900HX | |
| Razer Blade 16 Early 2023 | |
| Média da turma Gaming | |
| Alienware x17 R2 P48E | |
| Schenker XMG Neo 17 M22 | |
| Cinebench R20 | |
| CPU (Multi Core) | |
| MSI Titan GT77 HX 13VI | |
| Asus ROG Strix Scar 18 2023 G834JY-N6005W | |
| Medion Erazer Beast X40 (dGPU, Cooling) | |
| Medion Erazer Beast X40 | |
| Média Intel Core i9-13900HX (9152 - 12541, n=21) | |
| Média da turma Gaming (4029 - 16433, n=106, últimos 2 anos) | |
| Razer Blade 16 Early 2023 | |
| Alienware x17 R2 P48E | |
| Schenker XMG Neo 17 M22 | |
| CPU (Single Core) | |
| Asus ROG Strix Scar 18 2023 G834JY-N6005W | |
| MSI Titan GT77 HX 13VI | |
| Medion Erazer Beast X40 (dGPU, Cooling) | |
| Média Intel Core i9-13900HX (722 - 810, n=21) | |
| Medion Erazer Beast X40 | |
| Média da turma Gaming (442 - 913, n=106, últimos 2 anos) | |
| Razer Blade 16 Early 2023 | |
| Alienware x17 R2 P48E | |
| Schenker XMG Neo 17 M22 | |
| Cinebench R15 | |
| CPU Multi 64Bit | |
| MSI Titan GT77 HX 13VI | |
| Medion Erazer Beast X40 | |
| Medion Erazer Beast X40 (dGPU, Cooling) | |
| Medion Erazer Beast X40 (dGPU, Cooling) | |
| Asus ROG Strix Scar 18 2023 G834JY-N6005W | |
| Razer Blade 16 Early 2023 | |
| Média Intel Core i9-13900HX (3913 - 4970, n=22) | |
| Média da turma Gaming (1578 - 6330, n=105, últimos 2 anos) | |
| Alienware x17 R2 P48E | |
| Schenker XMG Neo 17 M22 | |
| CPU Single 64Bit | |
| Asus ROG Strix Scar 18 2023 G834JY-N6005W | |
| MSI Titan GT77 HX 13VI | |
| Medion Erazer Beast X40 | |
| Média da turma Gaming (188.8 - 350, n=106, últimos 2 anos) | |
| Medion Erazer Beast X40 (dGPU, Cooling) | |
| Medion Erazer Beast X40 (dGPU, Cooling) | |
| Média Intel Core i9-13900HX (247 - 304, n=22) | |
| Razer Blade 16 Early 2023 | |
| Alienware x17 R2 P48E | |
| Schenker XMG Neo 17 M22 | |
| Blender - v2.79 BMW27 CPU | |
| Schenker XMG Neo 17 M22 | |
| Alienware x17 R2 P48E | |
| Média da turma Gaming (79 - 330, n=104, últimos 2 anos) | |
| Média Intel Core i9-13900HX (101 - 153, n=22) | |
| Razer Blade 16 Early 2023 | |
| Medion Erazer Beast X40 | |
| Asus ROG Strix Scar 18 2023 G834JY-N6005W | |
| Medion Erazer Beast X40 (dGPU, Cooling) | |
| MSI Titan GT77 HX 13VI | |
| HWBOT x265 Benchmark v2.2 - 4k Preset | |
| Asus ROG Strix Scar 18 2023 G834JY-N6005W | |
| MSI Titan GT77 HX 13VI | |
| Medion Erazer Beast X40 (dGPU, Cooling) | |
| Medion Erazer Beast X40 | |
| Média Intel Core i9-13900HX (23.5 - 34.4, n=22) | |
| Média da turma Gaming (11.5 - 44.4, n=105, últimos 2 anos) | |
| Razer Blade 16 Early 2023 | |
| Alienware x17 R2 P48E | |
| Schenker XMG Neo 17 M22 | |
| LibreOffice - 20 Documents To PDF | |
| Schenker XMG Neo 17 M22 | |
| Média da turma Gaming (33.2 - 88.8, n=105, últimos 2 anos) | |
| Razer Blade 16 Early 2023 | |
| MSI Titan GT77 HX 13VI | |
| Medion Erazer Beast X40 | |
| Média Intel Core i9-13900HX (32.8 - 51.1, n=21) | |
| Alienware x17 R2 P48E | |
| Medion Erazer Beast X40 (dGPU, Cooling) | |
| Asus ROG Strix Scar 18 2023 G834JY-N6005W | |
| R Benchmark 2.5 - Overall mean | |
| Schenker XMG Neo 17 M22 | |
| Alienware x17 R2 P48E | |
| Média da turma Gaming (0.3439 - 0.759, n=106, últimos 2 anos) | |
| Razer Blade 16 Early 2023 | |
| MSI Titan GT77 HX 13VI | |
| Média Intel Core i9-13900HX (0.375 - 0.4564, n=22) | |
| Medion Erazer Beast X40 | |
| Medion Erazer Beast X40 (dGPU, Cooling) | |
| Asus ROG Strix Scar 18 2023 G834JY-N6005W | |
* ... menor é melhor
AIDA64: FP32 Ray-Trace | FPU Julia | CPU SHA3 | CPU Queen | FPU SinJulia | FPU Mandel | CPU AES | CPU ZLib | FP64 Ray-Trace | CPU PhotoWorxx
| Performance rating | |
| MSI Titan GT77 HX 13VI | |
| Asus ROG Strix Scar 18 2023 G834JY-N6005W | |
| Medion Erazer Beast X40 | |
| Medion Erazer Beast X40 | |
| Média da turma Gaming | |
| Média Intel Core i9-13900HX | |
| Razer Blade 16 Early 2023 | |
| Schenker XMG Neo 17 M22 | |
| Alienware x17 R2 P48E | |
| AIDA64 / FP32 Ray-Trace | |
| Média da turma Gaming (10227 - 85542, n=105, últimos 2 anos) | |
| MSI Titan GT77 HX 13VI (v6.85.6300) | |
| Asus ROG Strix Scar 18 2023 G834JY-N6005W (v6.85.6300) | |
| Medion Erazer Beast X40 (v6.75.6100, dGPU, Cooling) | |
| Medion Erazer Beast X40 (v6.75.6100) | |
| Razer Blade 16 Early 2023 (v6.85.6300) | |
| Razer Blade 16 Early 2023 (v8.20.8100) | |
| Razer Blade 16 Early 2023 (v6.92.6600) | |
| Média Intel Core i9-13900HX (17589 - 27615, n=22) | |
| Schenker XMG Neo 17 M22 (v6.70.6000) | |
| Alienware x17 R2 P48E (v6.50.5800) | |
| AIDA64 / FPU Julia | |
| MSI Titan GT77 HX 13VI (v6.85.6300) | |
| Média da turma Gaming (51376 - 238426, n=105, últimos 2 anos) | |
| Asus ROG Strix Scar 18 2023 G834JY-N6005W (v6.85.6300) | |
| Medion Erazer Beast X40 (v6.75.6100, dGPU, Cooling) | |
| Medion Erazer Beast X40 (v6.75.6100) | |
| Razer Blade 16 Early 2023 (v6.85.6300) | |
| Razer Blade 16 Early 2023 (v8.20.8100) | |
| Razer Blade 16 Early 2023 (v6.92.6600) | |
| Média Intel Core i9-13900HX (88686 - 137015, n=22) | |
| Schenker XMG Neo 17 M22 (v6.70.6000) | |
| Alienware x17 R2 P48E (v6.50.5800) | |
| AIDA64 / CPU SHA3 | |
| MSI Titan GT77 HX 13VI (v6.85.6300) | |
| Asus ROG Strix Scar 18 2023 G834JY-N6005W (v6.85.6300) | |
| Medion Erazer Beast X40 (v6.75.6100, dGPU, Cooling) | |
| Medion Erazer Beast X40 (v6.75.6100) | |
| Média da turma Gaming (2180 - 10115, n=105, últimos 2 anos) | |
| Razer Blade 16 Early 2023 (v6.85.6300) | |
| Razer Blade 16 Early 2023 (v6.92.6600) | |
| Razer Blade 16 Early 2023 (v8.20.8100) | |
| Média Intel Core i9-13900HX (4362 - 7029, n=22) | |
| Alienware x17 R2 P48E (v6.50.5800) | |
| Schenker XMG Neo 17 M22 (v6.70.6000) | |
| AIDA64 / CPU Queen | |
| Asus ROG Strix Scar 18 2023 G834JY-N6005W (v6.85.6300) | |
| MSI Titan GT77 HX 13VI (v6.85.6300) | |
| Razer Blade 16 Early 2023 (v6.92.6600) | |
| Razer Blade 16 Early 2023 (v6.85.6300) | |
| Medion Erazer Beast X40 (v6.75.6100, dGPU, Cooling) | |
| Média Intel Core i9-13900HX (125644 - 141385, n=22) | |
| Medion Erazer Beast X40 (v6.75.6100) | |
| Média da turma Gaming (49785 - 173351, n=90, últimos 2 anos) | |
| Alienware x17 R2 P48E (v6.50.5800) | |
| Schenker XMG Neo 17 M22 (v6.70.6000) | |
| AIDA64 / FPU SinJulia | |
| Asus ROG Strix Scar 18 2023 G834JY-N6005W (v6.85.6300) | |
| MSI Titan GT77 HX 13VI (v6.85.6300) | |
| Medion Erazer Beast X40 (v6.75.6100, dGPU, Cooling) | |
| Medion Erazer Beast X40 (v6.75.6100) | |
| Razer Blade 16 Early 2023 (v6.85.6300) | |
| Razer Blade 16 Early 2023 (v8.20.8100) | |
| Razer Blade 16 Early 2023 (v6.92.6600) | |
| Média Intel Core i9-13900HX (12334 - 17179, n=22) | |
| Média da turma Gaming (4424 - 33636, n=105, últimos 2 anos) | |
| Schenker XMG Neo 17 M22 (v6.70.6000) | |
| Alienware x17 R2 P48E (v6.50.5800) | |
| AIDA64 / FPU Mandel | |
| Média da turma Gaming (25115 - 128721, n=105, últimos 2 anos) | |
| MSI Titan GT77 HX 13VI (v6.85.6300) | |
| Asus ROG Strix Scar 18 2023 G834JY-N6005W (v6.85.6300) | |
| Medion Erazer Beast X40 (v6.75.6100, dGPU, Cooling) | |
| Medion Erazer Beast X40 (v6.75.6100) | |
| Razer Blade 16 Early 2023 (v6.85.6300) | |
| Razer Blade 16 Early 2023 (v8.20.8100) | |
| Razer Blade 16 Early 2023 (v6.92.6600) | |
| Média Intel Core i9-13900HX (43850 - 69202, n=22) | |
| Schenker XMG Neo 17 M22 (v6.70.6000) | |
| Alienware x17 R2 P48E (v6.50.5800) | |
| AIDA64 / CPU AES | |
| Razer Blade 16 Early 2023 (v6.92.6600) | |
| Razer Blade 16 Early 2023 (v8.20.8100) | |
| Razer Blade 16 Early 2023 (v6.85.6300) | |
| Média Intel Core i9-13900HX (89413 - 237881, n=22) | |
| MSI Titan GT77 HX 13VI (v6.85.6300) | |
| Schenker XMG Neo 17 M22 (v6.70.6000) | |
| Asus ROG Strix Scar 18 2023 G834JY-N6005W (v6.85.6300) | |
| Medion Erazer Beast X40 (v6.75.6100, dGPU, Cooling) | |
| Medion Erazer Beast X40 (v6.75.6100) | |
| Média da turma Gaming (39258 - 247074, n=105, últimos 2 anos) | |
| Alienware x17 R2 P48E (v6.50.5800) | |
| AIDA64 / CPU ZLib | |
| MSI Titan GT77 HX 13VI (v6.85.6300) | |
| Asus ROG Strix Scar 18 2023 G834JY-N6005W (v6.85.6300) | |
| Medion Erazer Beast X40 (v6.75.6100, dGPU, Cooling) | |
| Medion Erazer Beast X40 (v6.75.6100) | |
| Razer Blade 16 Early 2023 (v6.85.6300) | |
| Razer Blade 16 Early 2023 (v6.92.6600) | |
| Razer Blade 16 Early 2023 (v8.20.8100) | |
| Média Intel Core i9-13900HX (1284 - 1958, n=22) | |
| Média da turma Gaming (574 - 2531, n=105, últimos 2 anos) | |
| Alienware x17 R2 P48E (v6.50.5800) | |
| Schenker XMG Neo 17 M22 (v6.70.6000) | |
| AIDA64 / FP64 Ray-Trace | |
| Média da turma Gaming (5509 - 45446, n=105, últimos 2 anos) | |
| MSI Titan GT77 HX 13VI (v6.85.6300) | |
| Asus ROG Strix Scar 18 2023 G834JY-N6005W (v6.85.6300) | |
| Medion Erazer Beast X40 (v6.75.6100, dGPU, Cooling) | |
| Medion Erazer Beast X40 (v6.75.6100) | |
| Razer Blade 16 Early 2023 (v6.85.6300) | |
| Razer Blade 16 Early 2023 (v6.92.6600) | |
| Razer Blade 16 Early 2023 (v8.20.8100) | |
| Média Intel Core i9-13900HX (9481 - 15279, n=22) | |
| Schenker XMG Neo 17 M22 (v6.70.6000) | |
| Alienware x17 R2 P48E (v6.50.5800) | |
| AIDA64 / CPU PhotoWorxx | |
| Razer Blade 16 Early 2023 (v6.85.6300) | |
| Razer Blade 16 Early 2023 (v6.92.6600) | |
| Razer Blade 16 Early 2023 (v8.20.8100) | |
| Média Intel Core i9-13900HX (42994 - 51994, n=22) | |
| Média da turma Gaming (12271 - 89891, n=105, últimos 2 anos) | |
| Medion Erazer Beast X40 (v6.75.6100, dGPU, Cooling) | |
| Asus ROG Strix Scar 18 2023 G834JY-N6005W (v6.85.6300) | |
| Medion Erazer Beast X40 (v6.75.6100) | |
| MSI Titan GT77 HX 13VI (v6.85.6300) | |
| Alienware x17 R2 P48E (v6.50.5800) | |
| Schenker XMG Neo 17 M22 (v6.70.6000) | |
Desempenho do sistema
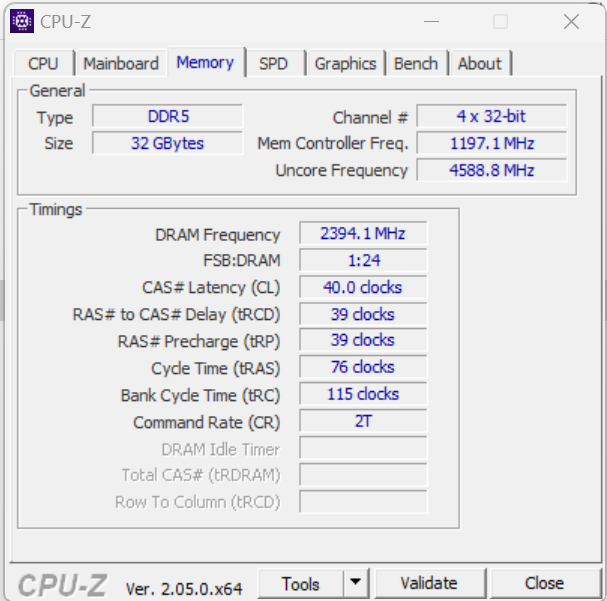
O hardware dentro deste sistema rápido oferece desempenho mais do que suficiente para tarefas como jogos e renderização. O laptop vem com 32 GB de memória rodando em modo de canal duplo. E as taxas de transferência de memória são típicas para DDR5-4800 RAM. Além do mais, o sistema também forneceu excelentes resultados PCMark em nossos testes.
CrossMark: Overall | Productivity | Creativity | Responsiveness
| PCMark 10 / Score | |
| Medion Erazer Beast X40 (dGPU, Cooling) | |
| MSI Titan GT77 HX 13VI | |
| Asus ROG Strix Scar 18 2023 G834JY-N6005W | |
| Média Intel Core i9-13900HX, NVIDIA GeForce RTX 4090 Laptop GPU (7690 - 9331, n=8) | |
| Média da turma Gaming (5828 - 12414, n=93, últimos 2 anos) | |
| Alienware x17 R2 P48E | |
| Medion Erazer Beast X40 | |
| Razer Blade 16 Early 2023 | |
| Schenker XMG Neo 17 M22 | |
| PCMark 10 / Essentials | |
| MSI Titan GT77 HX 13VI | |
| Medion Erazer Beast X40 (dGPU, Cooling) | |
| Média Intel Core i9-13900HX, NVIDIA GeForce RTX 4090 Laptop GPU (10972 - 11983, n=8) | |
| Medion Erazer Beast X40 | |
| Alienware x17 R2 P48E | |
| Razer Blade 16 Early 2023 | |
| Média da turma Gaming (8810 - 11935, n=97, últimos 2 anos) | |
| Schenker XMG Neo 17 M22 | |
| PCMark 10 / Productivity | |
| Medion Erazer Beast X40 (dGPU, Cooling) | |
| Medion Erazer Beast X40 | |
| Média da turma Gaming (6845 - 25323, n=95, últimos 2 anos) | |
| Média Intel Core i9-13900HX, NVIDIA GeForce RTX 4090 Laptop GPU (9038 - 11680, n=8) | |
| Alienware x17 R2 P48E | |
| MSI Titan GT77 HX 13VI | |
| Schenker XMG Neo 17 M22 | |
| Razer Blade 16 Early 2023 | |
| PCMark 10 / Digital Content Creation | |
| MSI Titan GT77 HX 13VI | |
| Medion Erazer Beast X40 (dGPU, Cooling) | |
| Razer Blade 16 Early 2023 | |
| Média da turma Gaming (7602 - 19954, n=95, últimos 2 anos) | |
| Média Intel Core i9-13900HX, NVIDIA GeForce RTX 4090 Laptop GPU (10605 - 16395, n=8) | |
| Alienware x17 R2 P48E | |
| Medion Erazer Beast X40 | |
| Schenker XMG Neo 17 M22 | |
| CrossMark / Overall | |
| Medion Erazer Beast X40 (dGPU, Cooling) | |
| MSI Titan GT77 HX 13VI | |
| Medion Erazer Beast X40 | |
| Média Intel Core i9-13900HX, NVIDIA GeForce RTX 4090 Laptop GPU (1825 - 2295, n=8) | |
| Asus ROG Strix Scar 18 2023 G834JY-N6005W | |
| Média da turma Gaming (1366 - 2409, n=94, últimos 2 anos) | |
| Alienware x17 R2 P48E | |
| Schenker XMG Neo 17 M22 | |
| Razer Blade 16 Early 2023 | |
| CrossMark / Productivity | |
| Medion Erazer Beast X40 (dGPU, Cooling) | |
| Medion Erazer Beast X40 | |
| MSI Titan GT77 HX 13VI | |
| Média Intel Core i9-13900HX, NVIDIA GeForce RTX 4090 Laptop GPU (1666 - 2166, n=8) | |
| Asus ROG Strix Scar 18 2023 G834JY-N6005W | |
| Média da turma Gaming (1386 - 2254, n=94, últimos 2 anos) | |
| Alienware x17 R2 P48E | |
| Schenker XMG Neo 17 M22 | |
| Razer Blade 16 Early 2023 | |
| CrossMark / Creativity | |
| Asus ROG Strix Scar 18 2023 G834JY-N6005W | |
| MSI Titan GT77 HX 13VI | |
| Medion Erazer Beast X40 (dGPU, Cooling) | |
| Medion Erazer Beast X40 | |
| Média Intel Core i9-13900HX, NVIDIA GeForce RTX 4090 Laptop GPU (2162 - 2514, n=8) | |
| Média da turma Gaming (1343 - 2786, n=94, últimos 2 anos) | |
| Alienware x17 R2 P48E | |
| Schenker XMG Neo 17 M22 | |
| Razer Blade 16 Early 2023 | |
| CrossMark / Responsiveness | |
| Medion Erazer Beast X40 (dGPU, Cooling) | |
| MSI Titan GT77 HX 13VI | |
| Medion Erazer Beast X40 | |
| Média Intel Core i9-13900HX, NVIDIA GeForce RTX 4090 Laptop GPU (1441 - 2275, n=8) | |
| Média da turma Gaming (1226 - 2334, n=94, últimos 2 anos) | |
| Alienware x17 R2 P48E | |
| Asus ROG Strix Scar 18 2023 G834JY-N6005W | |
| Schenker XMG Neo 17 M22 | |
| Razer Blade 16 Early 2023 | |
| PCMark 8 Home Score Accelerated v2 | 4936 pontos | |
| PCMark 8 Work Score Accelerated v2 | 6075 pontos | |
| PCMark 10 Score | 7932 pontos | |
Ajuda | ||
| AIDA64 / Memory Copy | |
| Razer Blade 16 Early 2023 | |
| Razer Blade 16 Early 2023 | |
| Razer Blade 16 Early 2023 | |
| Média Intel Core i9-13900HX (67716 - 79193, n=22) | |
| Média da turma Gaming (21750 - 129946, n=105, últimos 2 anos) | |
| Medion Erazer Beast X40 | |
| Asus ROG Strix Scar 18 2023 G834JY-N6005W | |
| MSI Titan GT77 HX 13VI | |
| Alienware x17 R2 P48E | |
| Schenker XMG Neo 17 M22 | |
| AIDA64 / Memory Read | |
| Razer Blade 16 Early 2023 | |
| Razer Blade 16 Early 2023 | |
| Razer Blade 16 Early 2023 | |
| Média Intel Core i9-13900HX (73998 - 88462, n=22) | |
| Asus ROG Strix Scar 18 2023 G834JY-N6005W | |
| Medion Erazer Beast X40 | |
| Média da turma Gaming (22956 - 118858, n=105, últimos 2 anos) | |
| MSI Titan GT77 HX 13VI | |
| Alienware x17 R2 P48E | |
| Schenker XMG Neo 17 M22 | |
| AIDA64 / Memory Write | |
| Razer Blade 16 Early 2023 | |
| Razer Blade 16 Early 2023 | |
| Razer Blade 16 Early 2023 | |
| Média da turma Gaming (22297 - 135096, n=105, últimos 2 anos) | |
| Média Intel Core i9-13900HX (65472 - 77045, n=22) | |
| Asus ROG Strix Scar 18 2023 G834JY-N6005W | |
| Medion Erazer Beast X40 | |
| MSI Titan GT77 HX 13VI | |
| Schenker XMG Neo 17 M22 | |
| Alienware x17 R2 P48E | |
| AIDA64 / Memory Latency | |
| Média da turma Gaming (75.3 - 259, n=105, últimos 2 anos) | |
| Razer Blade 16 Early 2023 | |
| Razer Blade 16 Early 2023 | |
| Razer Blade 16 Early 2023 | |
| Alienware x17 R2 P48E | |
| MSI Titan GT77 HX 13VI | |
| Schenker XMG Neo 17 M22 | |
| Asus ROG Strix Scar 18 2023 G834JY-N6005W | |
| Medion Erazer Beast X40 | |
| Média Intel Core i9-13900HX (75.3 - 91.1, n=22) | |
* ... menor é melhor
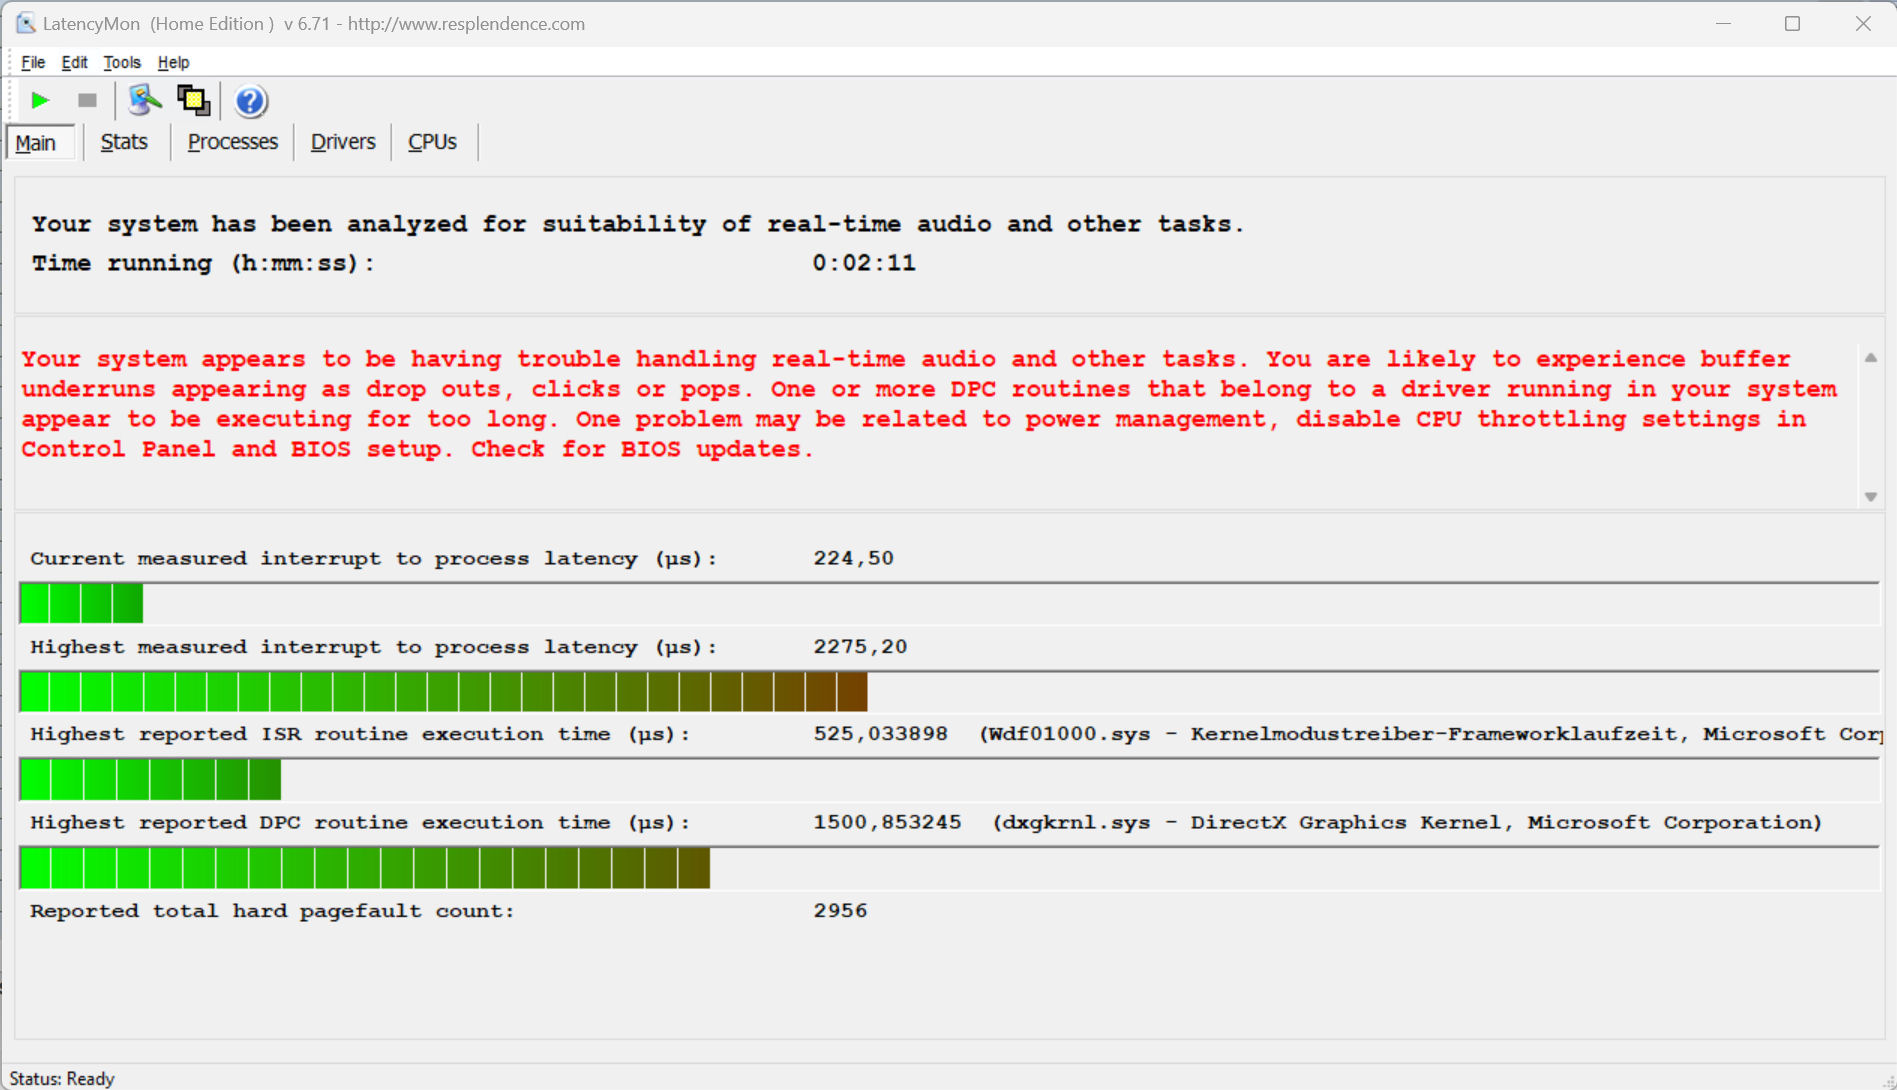
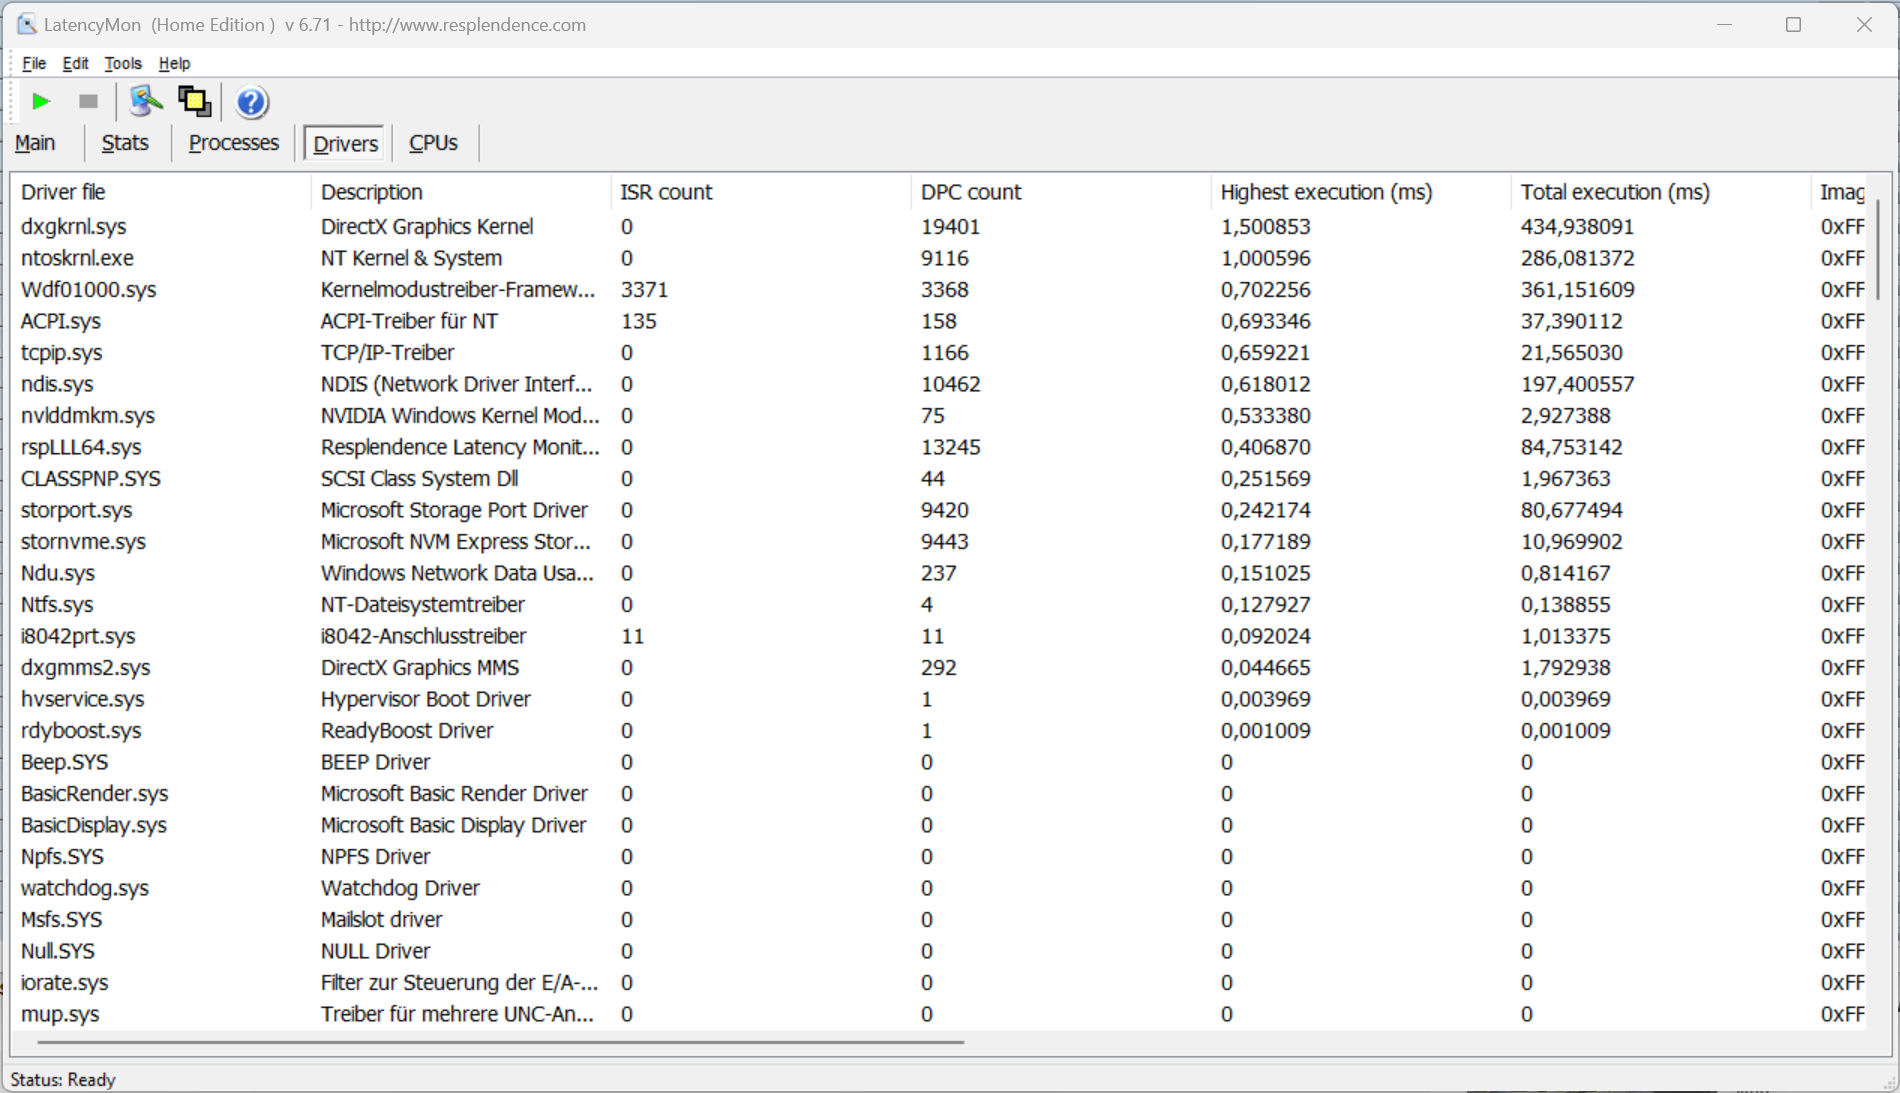
Latência do DPC
Nosso teste de monitor de latência padronizado, que envolve navegação na web, reprodução de vídeo 4K e Prime95 de alta carga, revelou alguns problemas. O sistema parece ser inadequado para o processamento de vídeo e áudio em tempo real. Esperamos que futuras atualizações de software ajudem a retificar estes problemas.
| DPC Latencies / LatencyMon - interrupt to process latency (max), Web, Youtube, Prime95 | |
| MSI Titan GT77 HX 13VI | |
| Schenker XMG Neo 17 M22 | |
| Razer Blade 16 Early 2023 | |
| Medion Erazer Beast X40 | |
| Alienware x17 R2 P48E | |
| Asus ROG Strix Scar 18 2023 G834JY-N6005W | |
* ... menor é melhor
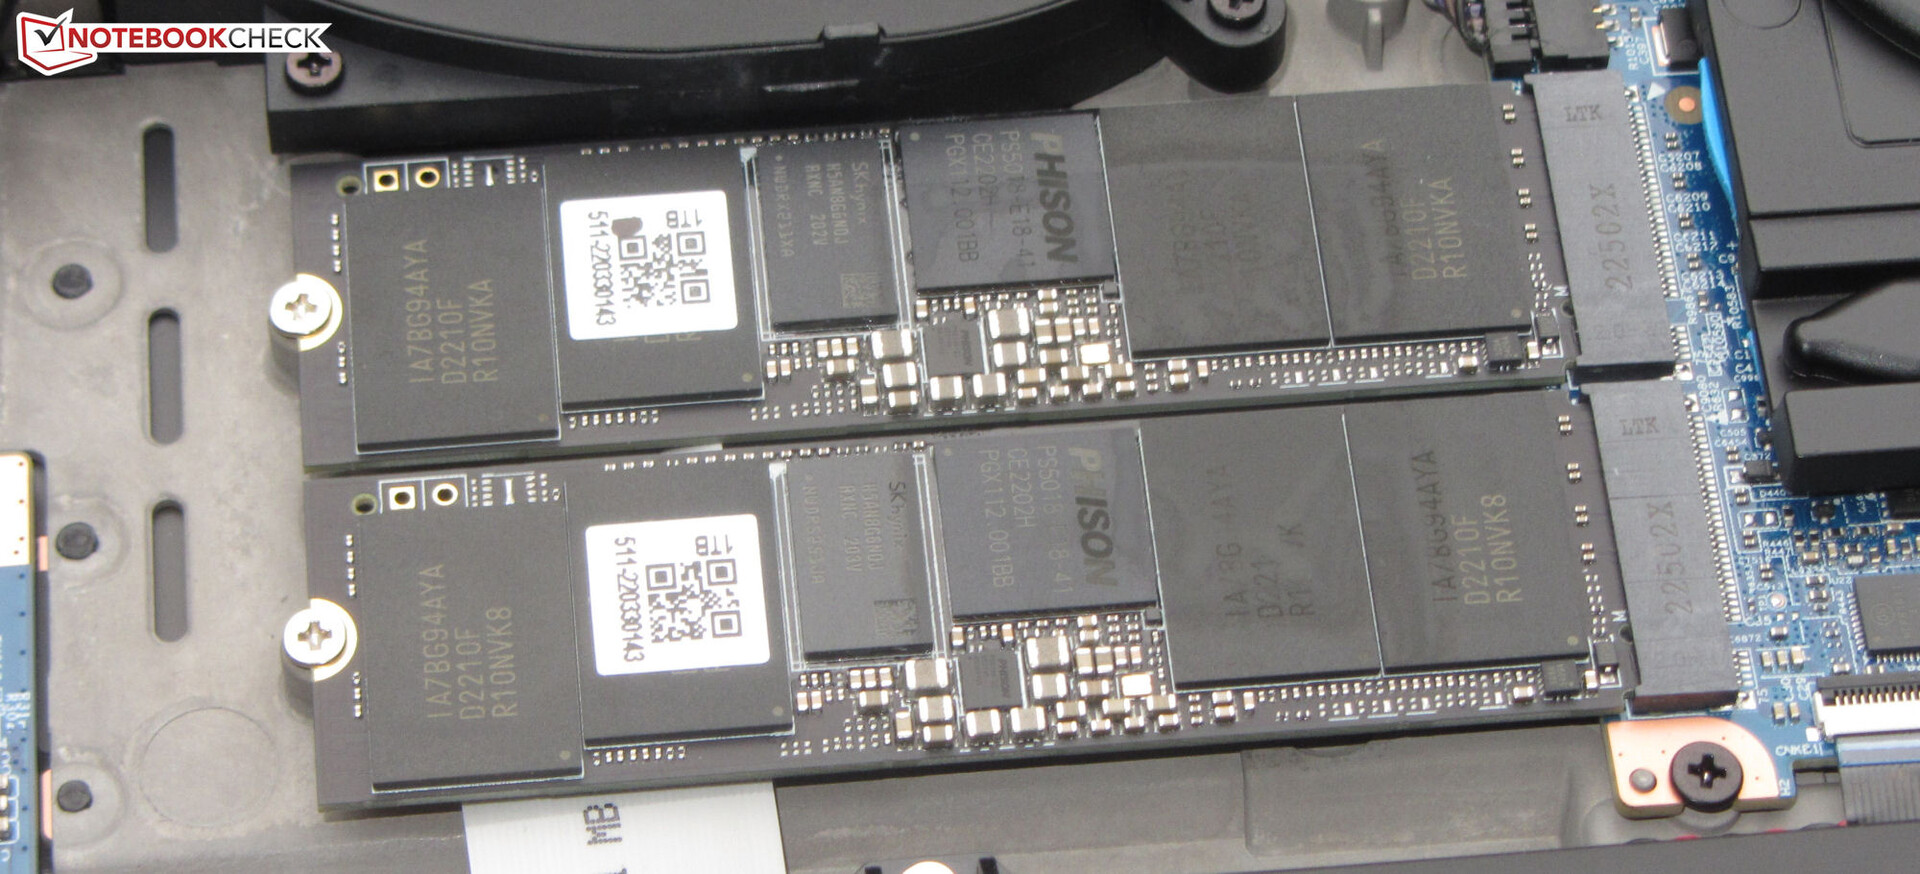
Armazenamento em massa
A Medion equipou nossa unidade de revisão X40 com dois SSDs de 1 TB (PCIe 4.0, M.2-2280) fabricados pela Phison. Um deles serve como unidade do sistema, e o outro é usado para armazenamento de dados. Não apenas os SSDs não formam uma configuração RAID, mas o próprio laptop não suporta RAID. As unidades incluídas não estão entre as melhores SSDs do mercado. Mesmo assim, elas ainda oferecem um ótimo desempenho. Outro ponto positivo a mencionar é que não notamos nenhuma queda de desempenho causada por estrangulamento térmico.

* ... menor é melhor
Sustained Load Read: DiskSpd Read Loop, Queue Depth 8
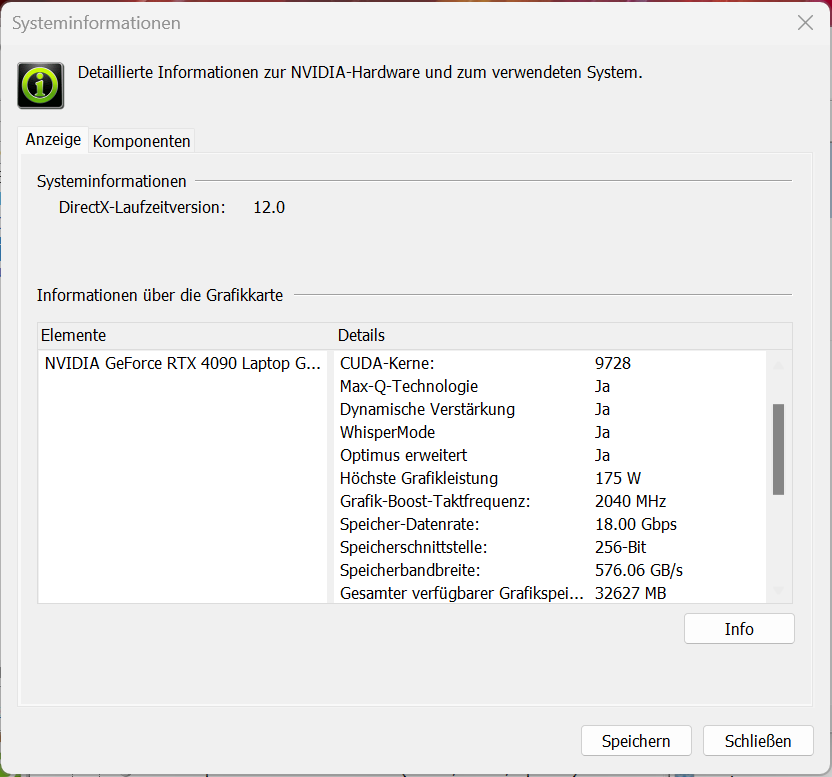
Placa gráfica
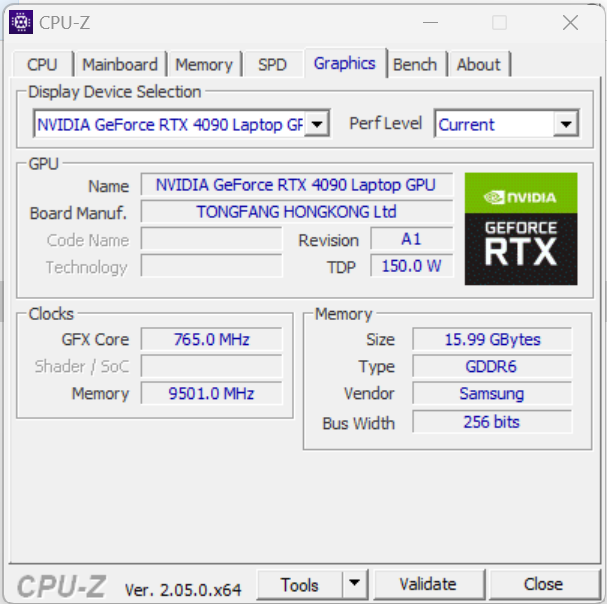
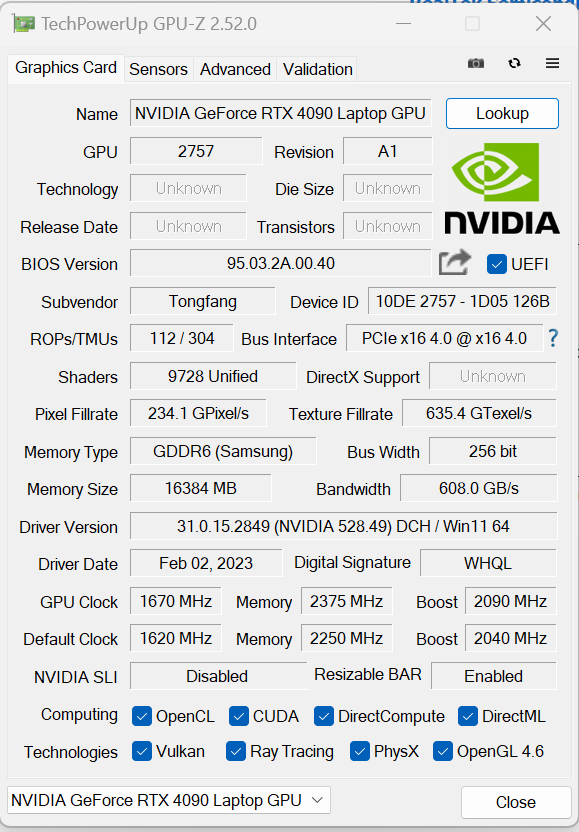
O GeForce RTX 4090 Laptop é o atual GPU móvel da Nvidia. Ele possui 9.728 unidades de sombreamento, um barramento de memória de 256 bits e 16.384 MB de memória GDDR6 de alta velocidade. O RTX 4090 tem à sua disposição até 175 watts de TGP (150 watts + 25 watts de Dynamic Boost) - isto é o mais alto que se pode obter. Mas o TGP não foi totalmente utilizado durante nosso teste Witcher 3
.
Os resultados de referência estão ao mesmo nível (modo Optimus) ou ligeiramente melhor do que (modo dGPU) o que vimos até agora do laptop RTX 4090, em média. O laptop também suporta o Advanced Optimus. A troca entre o modo dGPU e o modo Optimus não requer reiniciar o computador.
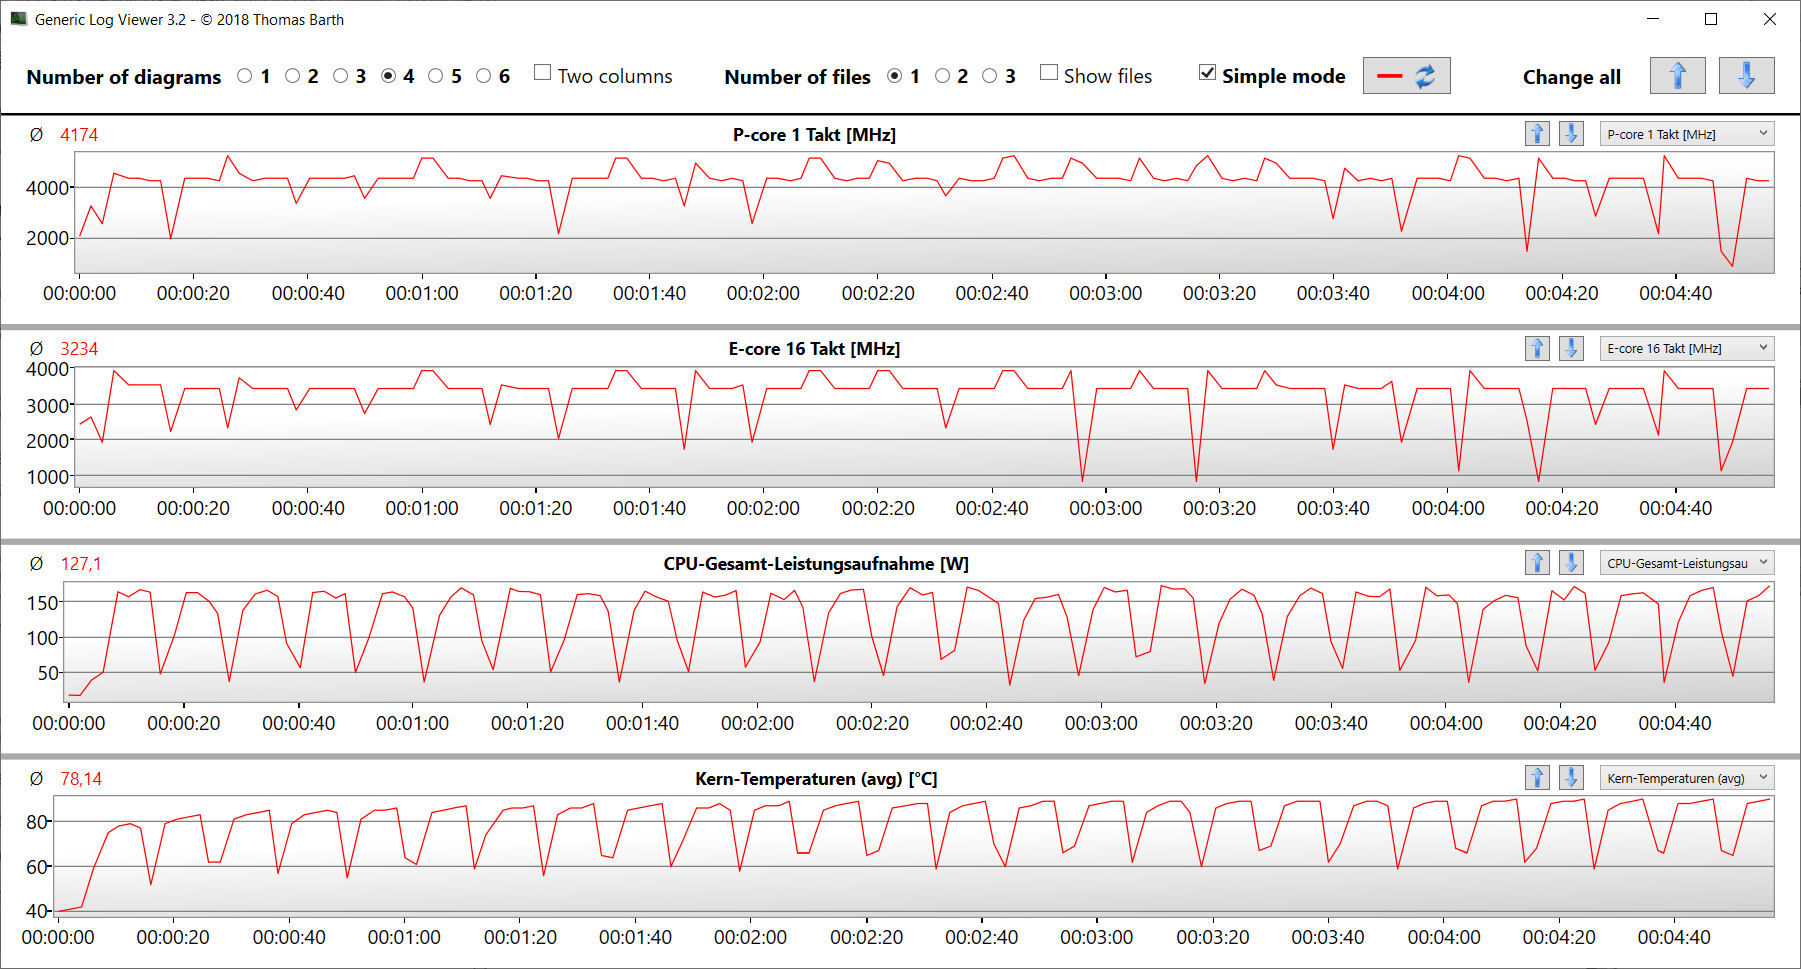
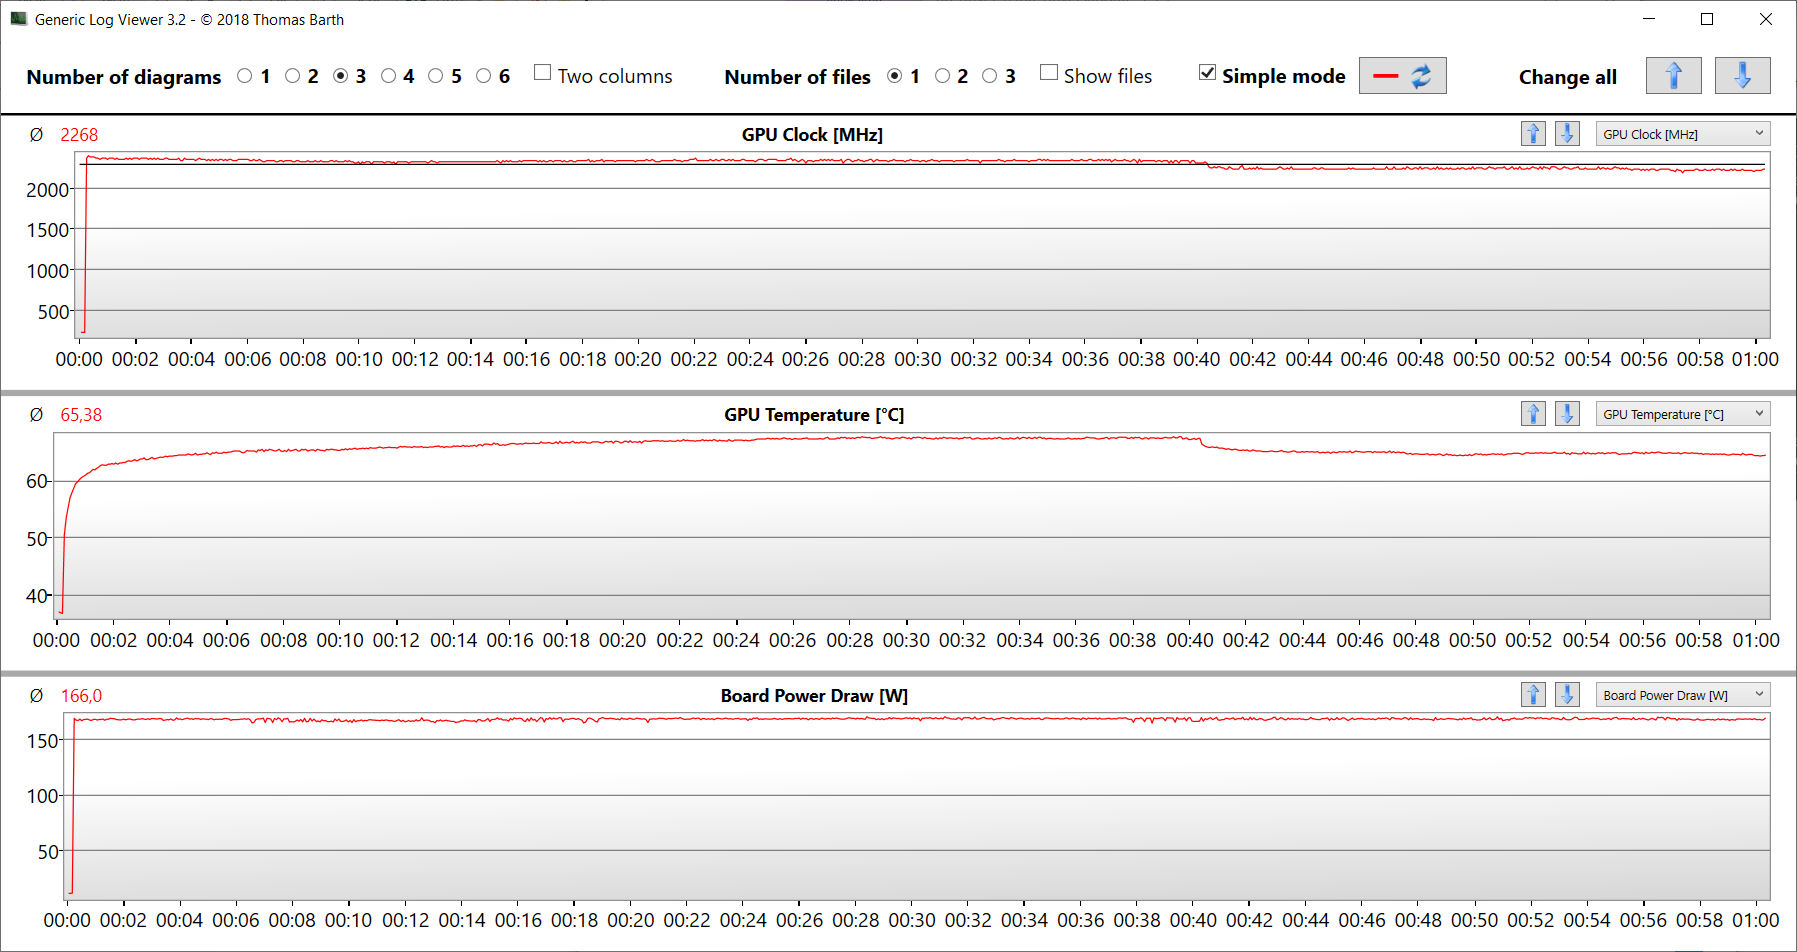
O resfriamento de água opcional pode proporcionar um leve ganho de desempenho em alguns benchmarks e jogos. Witcher 3 por exemplo, funcionou com taxas de quadros mais altas durante nossos testes. A temperatura média da GPU também foi mais baixa do que quando se usava apenas o resfriamento a ar.
| 3DMark Performance rating - Percent | |
| MSI Titan GT77 HX 13VI -1! | |
| Medion Erazer Beast X40 | |
| Medion Erazer Beast X40 | |
| Asus ROG Strix Scar 18 2023 G834JY-N6005W | |
| Medion Erazer Beast X40 | |
| Média NVIDIA GeForce RTX 4090 Laptop GPU | |
| Razer Blade 16 Early 2023 -1! | |
| Média da turma Gaming | |
| Alienware x17 R2 P48E | |
| Schenker XMG Neo 17 M22 -1! | |
| 3DMark 11 - 1280x720 Performance GPU | |
| Medion Erazer Beast X40 (dGPU, Cooling) | |
| MSI Titan GT77 HX 13VI | |
| Medion Erazer Beast X40 | |
| Medion Erazer Beast X40 (dGPU) | |
| Média NVIDIA GeForce RTX 4090 Laptop GPU (54073 - 73027, n=42) | |
| Asus ROG Strix Scar 18 2023 G834JY-N6005W | |
| Razer Blade 16 Early 2023 | |
| Média da turma Gaming (21841 - 80022, n=104, últimos 2 anos) | |
| Alienware x17 R2 P48E | |
| Schenker XMG Neo 17 M22 | |
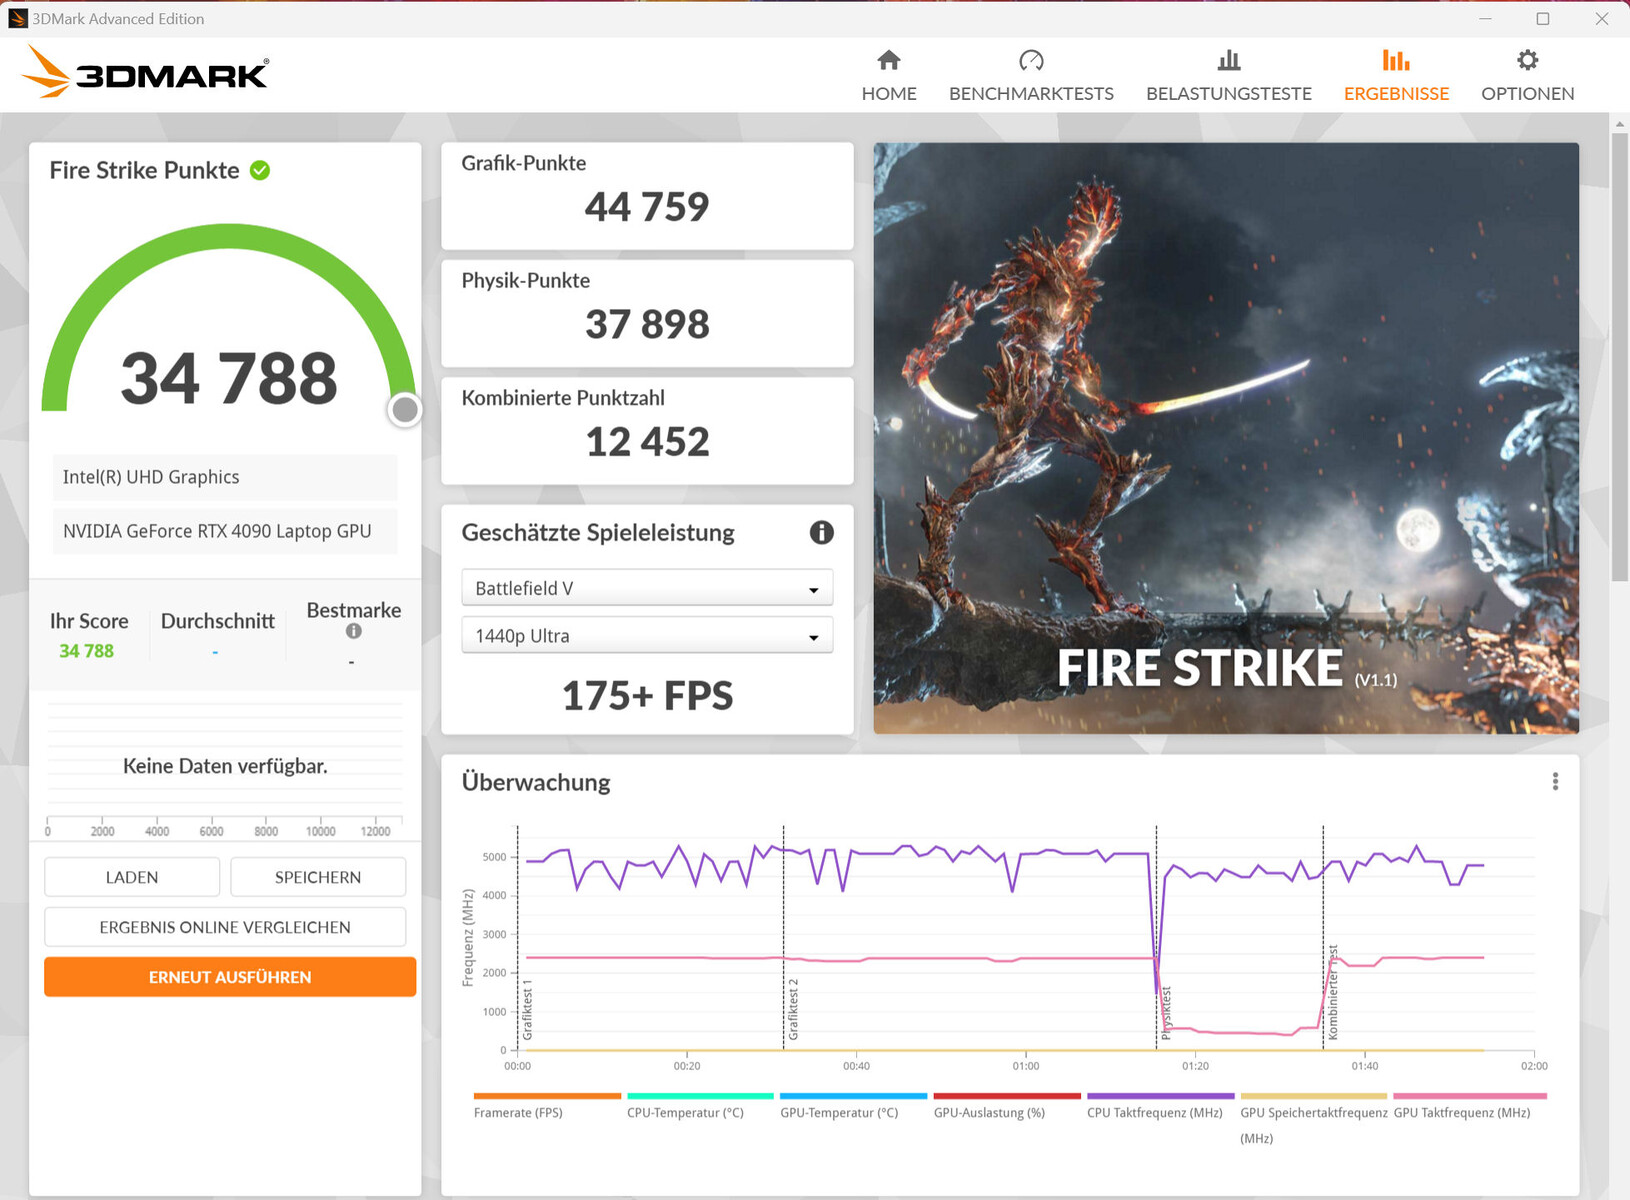
| 3DMark 06 Standard Score | 60717 pontos | |
| 3DMark 11 Performance | 47487 pontos | |
| 3DMark Cloud Gate Standard Score | 66757 pontos | |
| 3DMark Fire Strike Score | 34788 pontos | |
| 3DMark Time Spy Score | 19708 pontos | |
Ajuda | ||
| Blender | |
| v3.3 Classroom OPTIX/RTX | |
| Média da turma Gaming (9 - 32, n=106, últimos 2 anos) | |
| Razer Blade 16 Early 2023 (3.3.3) | |
| Medion Erazer Beast X40 (3.3.3) | |
| Média NVIDIA GeForce RTX 4090 Laptop GPU (9 - 19, n=39) | |
| Medion Erazer Beast X40 (3.3.3, dGPU, Cooling) | |
| MSI Titan GT77 HX 13VI (3.3.3) | |
| Asus ROG Strix Scar 18 2023 G834JY-N6005W (3.3.3) | |
| Medion Erazer Beast X40 (3.3.3, dGPU) | |
| v3.3 Classroom CUDA | |
| Média da turma Gaming (15 - 228, n=106, últimos 2 anos) | |
| Razer Blade 16 Early 2023 (3.3.3) | |
| Medion Erazer Beast X40 (3.3.3) | |
| Medion Erazer Beast X40 (3.3.3, dGPU, Cooling) | |
| Média NVIDIA GeForce RTX 4090 Laptop GPU (16 - 24, n=39) | |
| Asus ROG Strix Scar 18 2023 G834JY-N6005W (3.3.3) | |
| Asus ROG Strix Scar 18 2023 G834JY-N6005W (3.3.3) | |
| Medion Erazer Beast X40 (3.3.3, dGPU) | |
| MSI Titan GT77 HX 13VI (3.3.3) | |
| Geekbench 5.5 | |
| OpenCL Score | |
| Medion Erazer Beast X40 (dGPU) | |
| MSI Titan GT77 HX 13VI | |
| Asus ROG Strix Scar 18 2023 G834JY-N6005W | |
| Média NVIDIA GeForce RTX 4090 Laptop GPU (6841 - 237138, n=39) | |
| Medion Erazer Beast X40 | |
| Medion Erazer Beast X40 (dGPU, Cooling) | |
| Razer Blade 16 Early 2023 | |
| Média da turma Gaming (80702 - 277970, n=101, últimos 2 anos) | |
| Alienware x17 R2 P48E | |
| Schenker XMG Neo 17 M22 | |
| Vulkan Score 5.5 | |
| Medion Erazer Beast X40 (dGPU, Cooling) | |
| Média da turma Gaming (18857 - 246759, n=76, últimos 2 anos) | |
| Média NVIDIA GeForce RTX 4090 Laptop GPU (49663 - 163089, n=28) | |
| MSI Titan GT77 HX 13VI | |
| Alienware x17 R2 P48E | |
| Medion Erazer Beast X40 (dGPU) | |
| Razer Blade 16 Early 2023 | |
| Asus ROG Strix Scar 18 2023 G834JY-N6005W | |
| V-Ray Benchmark Next 4.10 | |
| GPU | |
| Asus ROG Strix Scar 18 2023 G834JY-N6005W (v4.10.07 ) | |
| MSI Titan GT77 HX 13VI (v4.10.07 ) | |
| Medion Erazer Beast X40 (v4.10.07 ) | |
| Medion Erazer Beast X40 (v4.10.07, dGPU) | |
| Média NVIDIA GeForce RTX 4090 Laptop GPU (873 - 1334, n=30) | |
| Medion Erazer Beast X40 (v4.10.07, dGPU, Cooling ) | |
| Média da turma Gaming (427 - 1627, n=99, últimos 2 anos) | |
| Schenker XMG Neo 17 M22 (v4.10.07 ) | |
| CPU | |
| MSI Titan GT77 HX 13VI (v4.10.07 ) | |
| Medion Erazer Beast X40 (v4.10.07, dGPU, Cooling) | |
| Asus ROG Strix Scar 18 2023 G834JY-N6005W (v4.10.07 ) | |
| Medion Erazer Beast X40 (v4.10.07 ) | |
| Medion Erazer Beast X40 (v4.10.07, dGPU) | |
| Média NVIDIA GeForce RTX 4090 Laptop GPU (18206 - 37629, n=30) | |
| Média da turma Gaming (10048 - 45327, n=97, últimos 2 anos) | |
| Schenker XMG Neo 17 M22 (v4.10.07 ) | |
* ... menor é melhor
Desempenho do jogo
O X40 permite que os usuários joguem em QHD+ e max settings. É possível usar uma resolução mais alta se você conectar o laptop a um monitor apropriado. Os jogos que testamos geralmente funcionavam a taxas de quadros similares às que vimos do RTX 4090 até agora. Dependendo do jogo, você poderá obter taxas de quadros mais altas dirigindo a tela diretamente da GPU GeForce.
| Performance rating - Percent | |
| Medion Erazer Beast X40 | |
| Medion Erazer Beast X40 | |
| Asus ROG Strix Scar 18 2023 G834JY-N6005W -1! | |
| MSI Titan GT77 HX 13VI | |
| Medion Erazer Beast X40 | |
| Média NVIDIA GeForce RTX 4090 Laptop GPU | |
| Razer Blade 16 Early 2023 | |
| Média da turma Gaming | |
| Alienware x17 R2 P48E | |
| Schenker XMG Neo 17 M22 | |
| The Witcher 3 - 1920x1080 Ultra Graphics & Postprocessing (HBAO+) | |
| Medion Erazer Beast X40 (dGPU) | |
| Medion Erazer Beast X40 (dGPU, Cooling) | |
| MSI Titan GT77 HX 13VI | |
| Média NVIDIA GeForce RTX 4090 Laptop GPU (139.2 - 216, n=35) | |
| Média da turma Gaming (104.7 - 240, n=7, últimos 2 anos) | |
| Medion Erazer Beast X40 | |
| Razer Blade 16 Early 2023 | |
| Alienware x17 R2 P48E | |
| Schenker XMG Neo 17 M22 | |
| GTA V - 1920x1080 Highest AA:4xMSAA + FX AF:16x | |
| Medion Erazer Beast X40 (dGPU) | |
| Medion Erazer Beast X40 | |
| Medion Erazer Beast X40 (dGPU, Cooling) | |
| Asus ROG Strix Scar 18 2023 G834JY-N6005W | |
| MSI Titan GT77 HX 13VI | |
| Razer Blade 16 Early 2023 | |
| Média NVIDIA GeForce RTX 4090 Laptop GPU (91.1 - 167.7, n=40) | |
| Média da turma Gaming (48.3 - 186.9, n=94, últimos 2 anos) | |
| Alienware x17 R2 P48E | |
| Schenker XMG Neo 17 M22 | |
| Final Fantasy XV Benchmark - 1920x1080 High Quality | |
| MSI Titan GT77 HX 13VI (1.3) | |
| Medion Erazer Beast X40 (1.3, dGPU) | |
| Medion Erazer Beast X40 (1.3, dGPU, Cooling) | |
| Asus ROG Strix Scar 18 2023 G834JY-N6005W (1.3) | |
| Medion Erazer Beast X40 (1.3) | |
| Média NVIDIA GeForce RTX 4090 Laptop GPU (122.2 - 201, n=40) | |
| Razer Blade 16 Early 2023 (1.3) | |
| Média da turma Gaming (41 - 215, n=95, últimos 2 anos) | |
| Alienware x17 R2 P48E (1.3) | |
| Schenker XMG Neo 17 M22 (1.3) | |
| Strange Brigade - 1920x1080 ultra AA:ultra AF:16 | |
| Medion Erazer Beast X40 (1.47.22.14 D3D12, dGPU, Cooling) | |
| Medion Erazer Beast X40 (1.47.22.14 D3D12, dGPU) | |
| MSI Titan GT77 HX 13VI (1.47.22.14 D3D12) | |
| Asus ROG Strix Scar 18 2023 G834JY-N6005W (1.47.22.14 D3D12) | |
| Medion Erazer Beast X40 (1.47.22.14 D3D12) | |
| Média NVIDIA GeForce RTX 4090 Laptop GPU (233 - 421, n=39) | |
| Razer Blade 16 Early 2023 (1.47.22.14 D3D12) | |
| Média da turma Gaming (76.3 - 458, n=87, últimos 2 anos) | |
| Alienware x17 R2 P48E (1.47.22.14 D3D12) | |
| Schenker XMG Neo 17 M22 (1.47.22.14 D3D12) | |
| Dota 2 Reborn - 1920x1080 ultra (3/3) best looking | |
| Razer Blade 16 Early 2023 | |
| Asus ROG Strix Scar 18 2023 G834JY-N6005W | |
| MSI Titan GT77 HX 13VI | |
| Medion Erazer Beast X40 (dGPU, Cooling) | |
| Medion Erazer Beast X40 (dGPU) | |
| Média NVIDIA GeForce RTX 4090 Laptop GPU (115.7 - 220, n=42) | |
| Medion Erazer Beast X40 | |
| Alienware x17 R2 P48E | |
| Média da turma Gaming (84.8 - 248, n=107, últimos 2 anos) | |
| Schenker XMG Neo 17 M22 | |
| X-Plane 11.11 - 1920x1080 high (fps_test=3) | |
| Asus ROG Strix Scar 18 2023 G834JY-N6005W | |
| Razer Blade 16 Early 2023 | |
| Medion Erazer Beast X40 (dGPU) | |
| Medion Erazer Beast X40 (dGPU, Cooling) | |
| MSI Titan GT77 HX 13VI | |
| MSI Titan GT77 HX 13VI | |
| Média NVIDIA GeForce RTX 4090 Laptop GPU (77.8 - 166.2, n=46) | |
| Medion Erazer Beast X40 | |
| Alienware x17 R2 P48E | |
| Média da turma Gaming (55.5 - 143.5, n=109, últimos 2 anos) | |
| Schenker XMG Neo 17 M22 | |
| Returnal | |
| 1920x1080 Epic Preset | |
| Média NVIDIA GeForce RTX 4090 Laptop GPU (141 - 155, n=3) | |
| Medion Erazer Beast X40 | |
| 2560x1440 Epic Preset | |
| Média NVIDIA GeForce RTX 4090 Laptop GPU (113 - 119, n=3) | |
| Medion Erazer Beast X40 | |
| 1920x1080 Epic Preset + Epic Ray-Tracing | |
| Média NVIDIA GeForce RTX 4090 Laptop GPU (126 - 128, n=2) | |
| Medion Erazer Beast X40 | |
| Atomic Heart | |
| 1920x1080 Atomic Preset | |
| Média NVIDIA GeForce RTX 4090 Laptop GPU (128.6 - 166, n=3) | |
| Medion Erazer Beast X40 | |
| 2560x1440 Atomic Preset | |
| Média NVIDIA GeForce RTX 4090 Laptop GPU (93.8 - 135, n=3) | |
| Medion Erazer Beast X40 | |
| Hogwarts Legacy | |
| 1920x1080 Ultra Preset AA:High T | |
| Medion Erazer Beast X40 | |
| Média da turma Gaming (n=1últimos 2 anos) | |
| Média NVIDIA GeForce RTX 4090 Laptop GPU (41.2 - 166.1, n=4) | |
| 2560x1440 Ultra Preset AA:High T | |
| Medion Erazer Beast X40 | |
| Média da turma Gaming (n=1últimos 2 anos) | |
| Média NVIDIA GeForce RTX 4090 Laptop GPU (40.6 - 125.9, n=4) | |
| 1920x1080 Ultra Preset + Full Ray Tracing AA:High T | |
| Medion Erazer Beast X40 | |
| Média NVIDIA GeForce RTX 4090 Laptop GPU (52.2 - 67, n=3) | |
| Company of Heroes 3 | |
| 1920x1080 Maximum Settings | |
| Média NVIDIA GeForce RTX 4090 Laptop GPU (215 - 235, n=2) | |
| Medion Erazer Beast X40 | |
| 2560x1440 Maximum Settings | |
| Média NVIDIA GeForce RTX 4090 Laptop GPU (176.4 - 194.8, n=2) | |
| Medion Erazer Beast X40 | |
| Sons of the Forest | |
| 1920x1080 Ultra Preset AA:T | |
| Média NVIDIA GeForce RTX 4090 Laptop GPU (85.7 - 93.9, n=2) | |
| Medion Erazer Beast X40 | |
| 2560x1440 Ultra Preset AA:T | |
| Média NVIDIA GeForce RTX 4090 Laptop GPU (85.2 - 89.6, n=2) | |
| Medion Erazer Beast X40 | |
Para testar se o laptop pode rodar jogos com taxas de quadros mais estáveis durante um período prolongado, rodamos o The Witcher 3 por cerca de 60 minutos em Full HD e configurações de qualidade máxima sem mover o personagem do jogador. Não observamos nenhuma queda nas taxas de quadros.
Witcher 3 FPS graph
| baixo | média | alto | ultra | QHD | |
|---|---|---|---|---|---|
| GTA V (2015) | 187.5 | 187.1 | 186 | 151.3 | 145.3 |
| The Witcher 3 (2015) | 586.4 | 511.4 | 363.8 | 195.1 | |
| Dota 2 Reborn (2015) | 215 | 193.5 | 182.6 | 171.5 | |
| Final Fantasy XV Benchmark (2018) | 232 | 207 | 176.2 | 146.7 | |
| X-Plane 11.11 (2018) | 187.1 | 162.9 | 128.3 | ||
| Far Cry 5 (2018) | 199 | 172 | 167 | 158 | 151 |
| Strange Brigade (2018) | 515 | 387 | 369 | 365 | 292 |
| Hunt Showdown (2020) | 367 | 285 | 262 | 168 | |
| Death Stranding (2020) | 179 | 171.4 | 166.6 | 163 | 162.1 |
| Yakuza Like a Dragon (2020) | 179.7 | 167.7 | 166.6 | 152.3 | 138.1 |
| Back 4 Blood (2021) | 403 | 309 | 309 | 327 | |
| Guardians of the Galaxy (2021) | 163 | 160 | 158 | 152 | 141 |
| Riders Republic (2021) | 209 | 200 | 185 | 179 | 146 |
| Elex 2 (2022) | 118.2 | 117.1 | 116.2 | 116.2 | 116.7 |
| F1 22 (2022) | 301 | 290 | 268 | 118.2 | 79.9 |
| The Quarry (2022) | 278 | 211 | 177.3 | 146.1 | 100.2 |
| Hogwarts Legacy (2023) | 242 | 204 | 186.5 | 166.1 | 125.9 |
| Returnal (2023) | 178 | 171 | 164 | 146 | 113 |
| Atomic Heart (2023) | 205 | 161.8 | 144.2 | 128.6 | 93.8 |
| Company of Heroes 3 (2023) | 285.3 | 262.9 | 235.2 | 215.2 | 176.4 |
| Sons of the Forest (2023) | 96.1 | 90 | 87.9 | 85.7 | 85.2 |
Emissões - O laptop Erazer pode ficar bastante barulhento
Emissões sonoras
O laptop é relativamente silencioso no uso diário (por exemplo, aplicações de escritório, navegação na web). Os ventiladores podem até parar de girar de vez em quando. Sem surpresas, o X40 pode ficar bem alto sob carga pesada, produzindo até 53 dB(A) de ruído durante o teste de estresse e Witcher 3 teste. Apesar dos níveis de ruído relativamente altos, o som produzido pelos dois ventiladores é tolerável como um todo: um barulho de whooshing é acompanhado por um zumbido sonoro que gradualmente se transforma em um leve assobio com o aumento da velocidade do ventilador.
Os ventiladores do laptop se desligam facilmente quando a unidade externa de resfriamento de água é conectada. Entretanto, a própria unidade também aumenta o ruído geral: embora a bomba seja relativamente silenciosa no uso, o ventilador dentro do refrigerador faz mais barulho. Tudo considerado, pensamos que o ruído geral é mais agradável quando a unidade de resfriamento de água é usada.
Barulho
| Ocioso |
| 25 / 29 / 35 dB |
| Carga |
| 51 / 53 dB |
 | ||
30 dB silencioso 40 dB(A) audível 50 dB(A) ruidosamente alto |
||
min: | ||
| Medion Erazer Beast X40 GeForce RTX 4090 Laptop GPU, i9-13900HX | MSI Titan GT77 HX 13VI GeForce RTX 4090 Laptop GPU, i9-13950HX | Razer Blade 16 Early 2023 GeForce RTX 4080 Laptop GPU, i9-13950HX | Schenker XMG Neo 17 M22 GeForce RTX 3080 Ti Laptop GPU, R9 6900HX | Alienware x17 R2 P48E GeForce RTX 3080 Ti Laptop GPU, i9-12900HK | Asus ROG Strix Scar 18 2023 G834JY-N6005W GeForce RTX 4090 Laptop GPU, i9-13980HX | |
|---|---|---|---|---|---|---|
| Noise | -3% | 13% | -3% | 15% | 4% | |
| desligado / ambiente * (dB) | 24 | 24.6 -3% | 23 4% | 26 -8% | 22.7 5% | 23.9 -0% |
| Idle Minimum * (dB) | 25 | 29.2 -17% | 23 8% | 26 -4% | 23.1 8% | 23.9 4% |
| Idle Average * (dB) | 29 | 29.2 -1% | 23 21% | 29 -0% | 23.1 20% | 32.6 -12% |
| Idle Maximum * (dB) | 35 | 29.2 17% | 23.6 33% | 40 -14% | 23.1 34% | 32.6 7% |
| Load Average * (dB) | 51 | 50.7 1% | 39 24% | 47 8% | 31.9 37% | 35.9 30% |
| Witcher 3 ultra * (dB) | 51 | 53.3 -5% | 51.6 -1% | 52 -2% | 52.5 -3% | |
| Load Maximum * (dB) | 53 | 61 -15% | 51.3 3% | 54 -2% | 52.5 1% | 55.8 -5% |
* ... menor é melhor
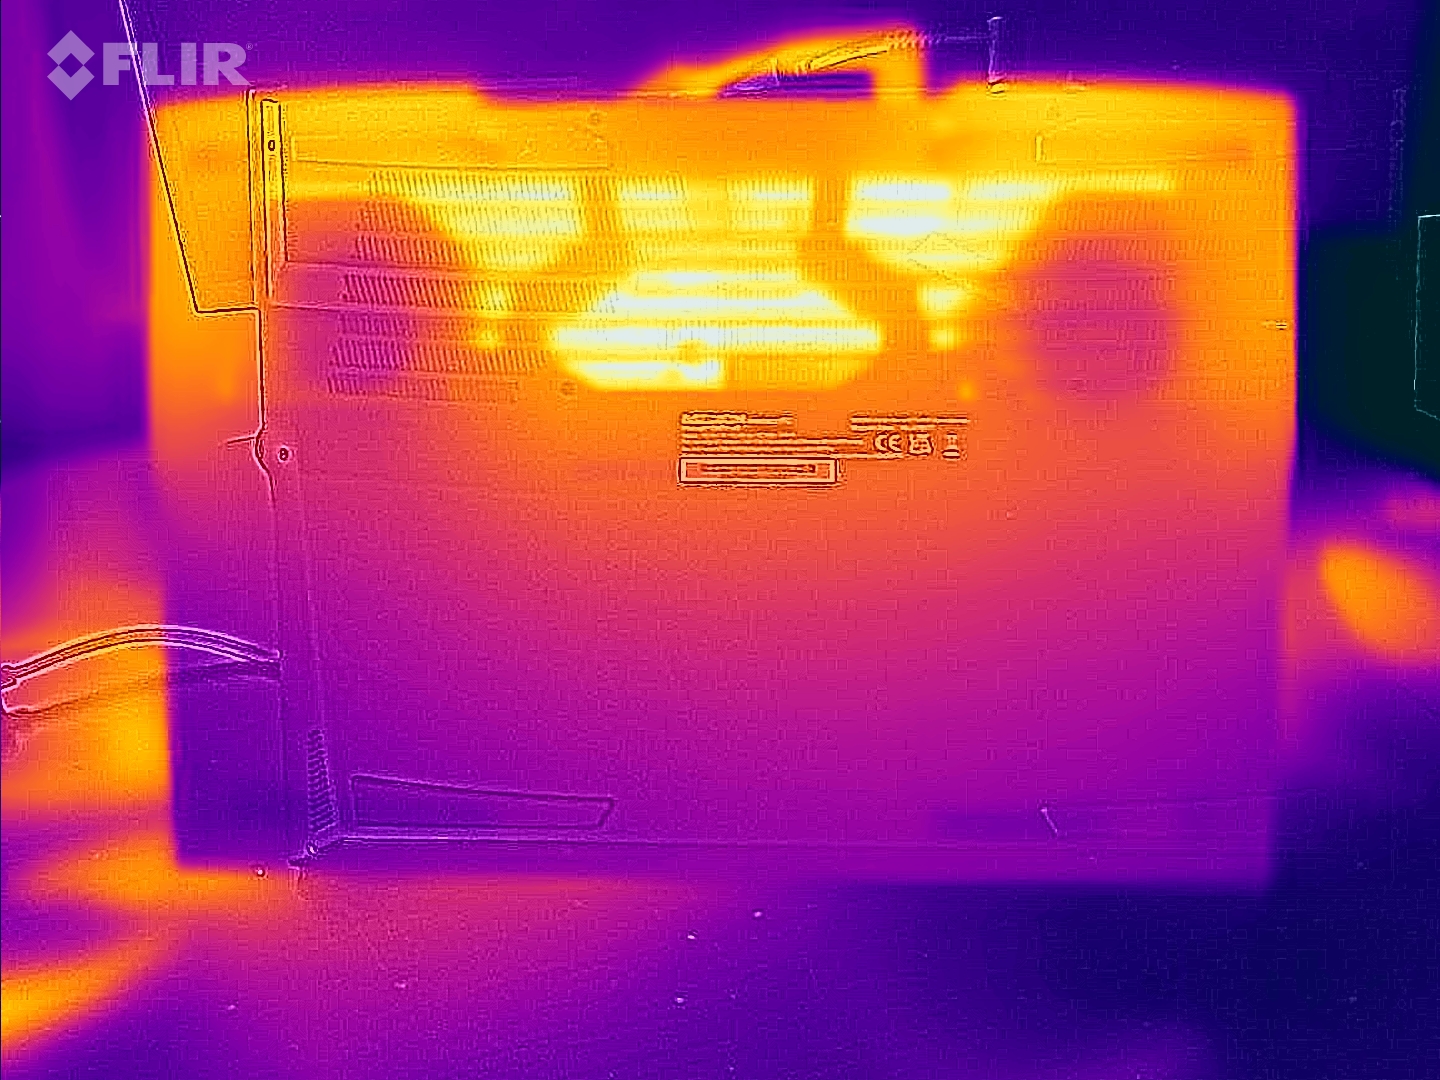
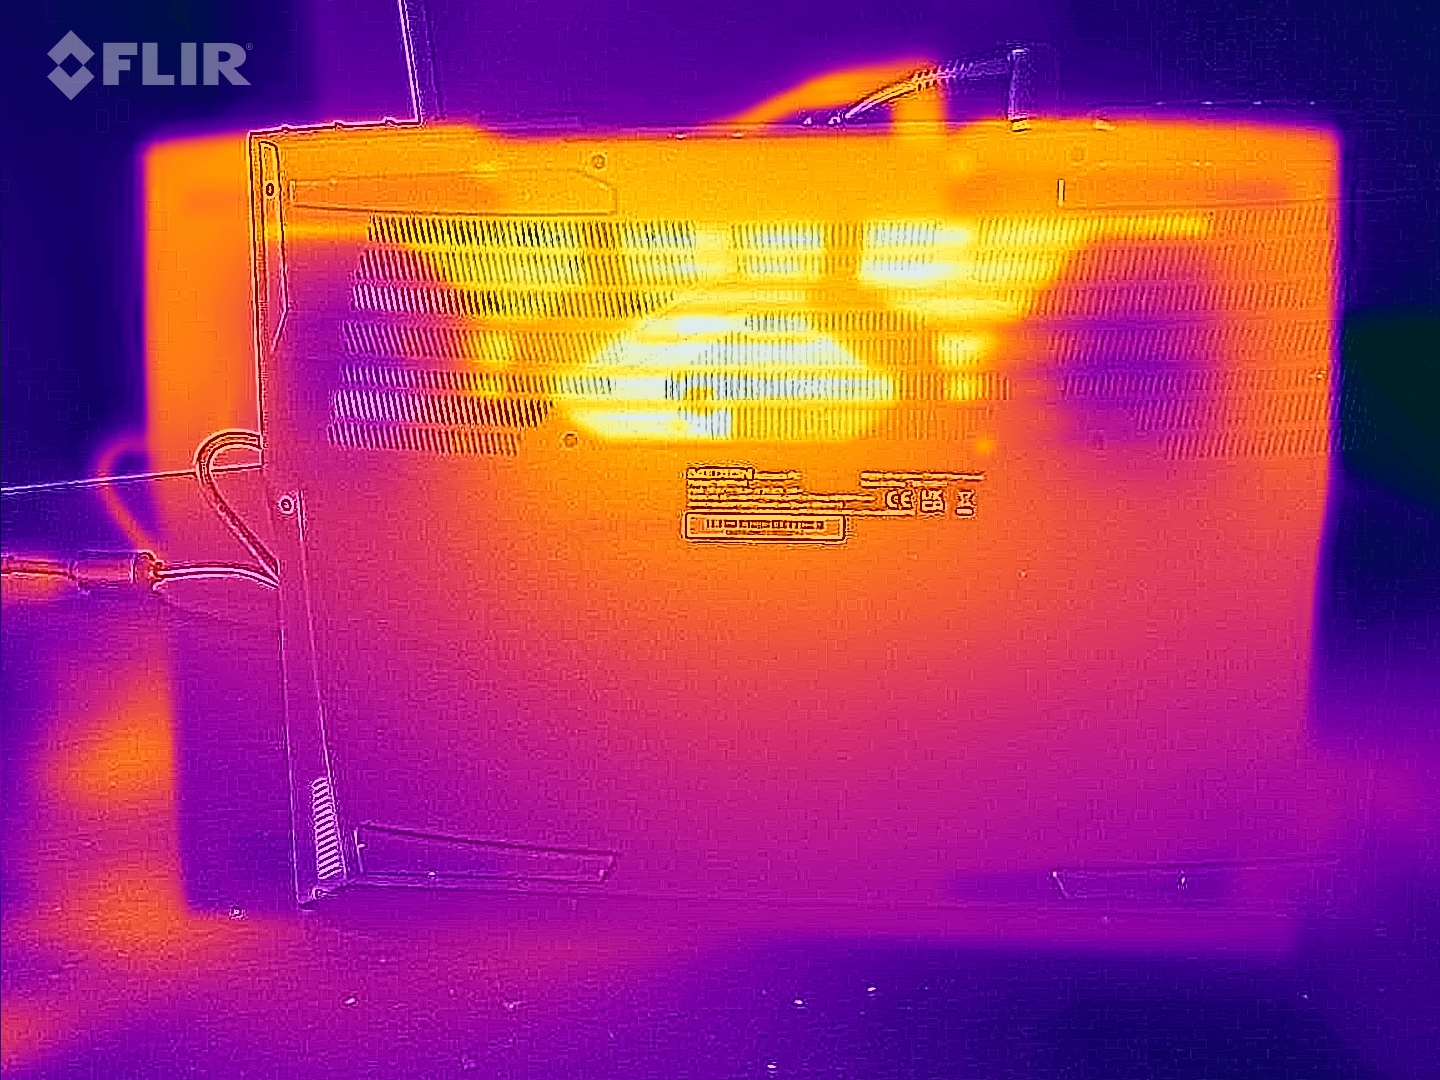
Temperatura
As temperaturas dos chassi ficam dentro de uma faixa aceitável em casos de uso diário, como a execução de software de escritório e navegadores de Internet. O laptop fica visivelmente quente, mas não excessivamente quente sob carga, como notamos durante o teste de estresse e o teste Witcher 3. As temperaturas da CPU também não nos deram nenhum motivo de preocupação.
(-) A temperatura máxima no lado superior é 48 °C / 118 F, em comparação com a média de 40.4 °C / 105 F , variando de 21.2 a 68.8 °C para a classe Gaming.
(-) A parte inferior aquece até um máximo de 52 °C / 126 F, em comparação com a média de 43.2 °C / 110 F
(+) Em uso inativo, a temperatura média para o lado superior é 28.2 °C / 83 F, em comparação com a média do dispositivo de 33.9 °C / ### class_avg_f### F.
(-) Jogando The Witcher 3, a temperatura média para o lado superior é 40.7 °C / 105 F, em comparação com a média do dispositivo de 33.9 °C / ## #class_avg_f### F.
(+) Os apoios para as mãos e o touchpad estão atingindo a temperatura máxima da pele (34 °C / 93.2 F) e, portanto, não estão quentes.
(-) A temperatura média da área do apoio para as mãos de dispositivos semelhantes foi 28.8 °C / 83.8 F (-5.2 °C / -9.4 F).
| Medion Erazer Beast X40 Intel Core i9-13900HX, NVIDIA GeForce RTX 4090 Laptop GPU | MSI Titan GT77 HX 13VI Intel Core i9-13950HX, NVIDIA GeForce RTX 4090 Laptop GPU | Razer Blade 16 Early 2023 Intel Core i9-13950HX, NVIDIA GeForce RTX 4080 Laptop GPU | Schenker XMG Neo 17 M22 AMD Ryzen 9 6900HX, NVIDIA GeForce RTX 3080 Ti Laptop GPU | Alienware x17 R2 P48E Intel Core i9-12900HK, NVIDIA GeForce RTX 3080 Ti Laptop GPU | Asus ROG Strix Scar 18 2023 G834JY-N6005W Intel Core i9-13980HX, NVIDIA GeForce RTX 4090 Laptop GPU | |
|---|---|---|---|---|---|---|
| Heat | 13% | 9% | -2% | 4% | -0% | |
| Maximum Upper Side * (°C) | 48 | 40.6 15% | 40 17% | 49 -2% | 49.6 -3% | 54 -13% |
| Maximum Bottom * (°C) | 52 | 41.1 21% | 37.6 28% | 52 -0% | 42.4 18% | 46 12% |
| Idle Upper Side * (°C) | 30 | 26.2 13% | 32.4 -8% | 30 -0% | 29.2 3% | 30 -0% |
| Idle Bottom * (°C) | 31 | 30.3 2% | 31.4 -1% | 33 -6% | 32 -3% | 31 -0% |
* ... menor é melhor
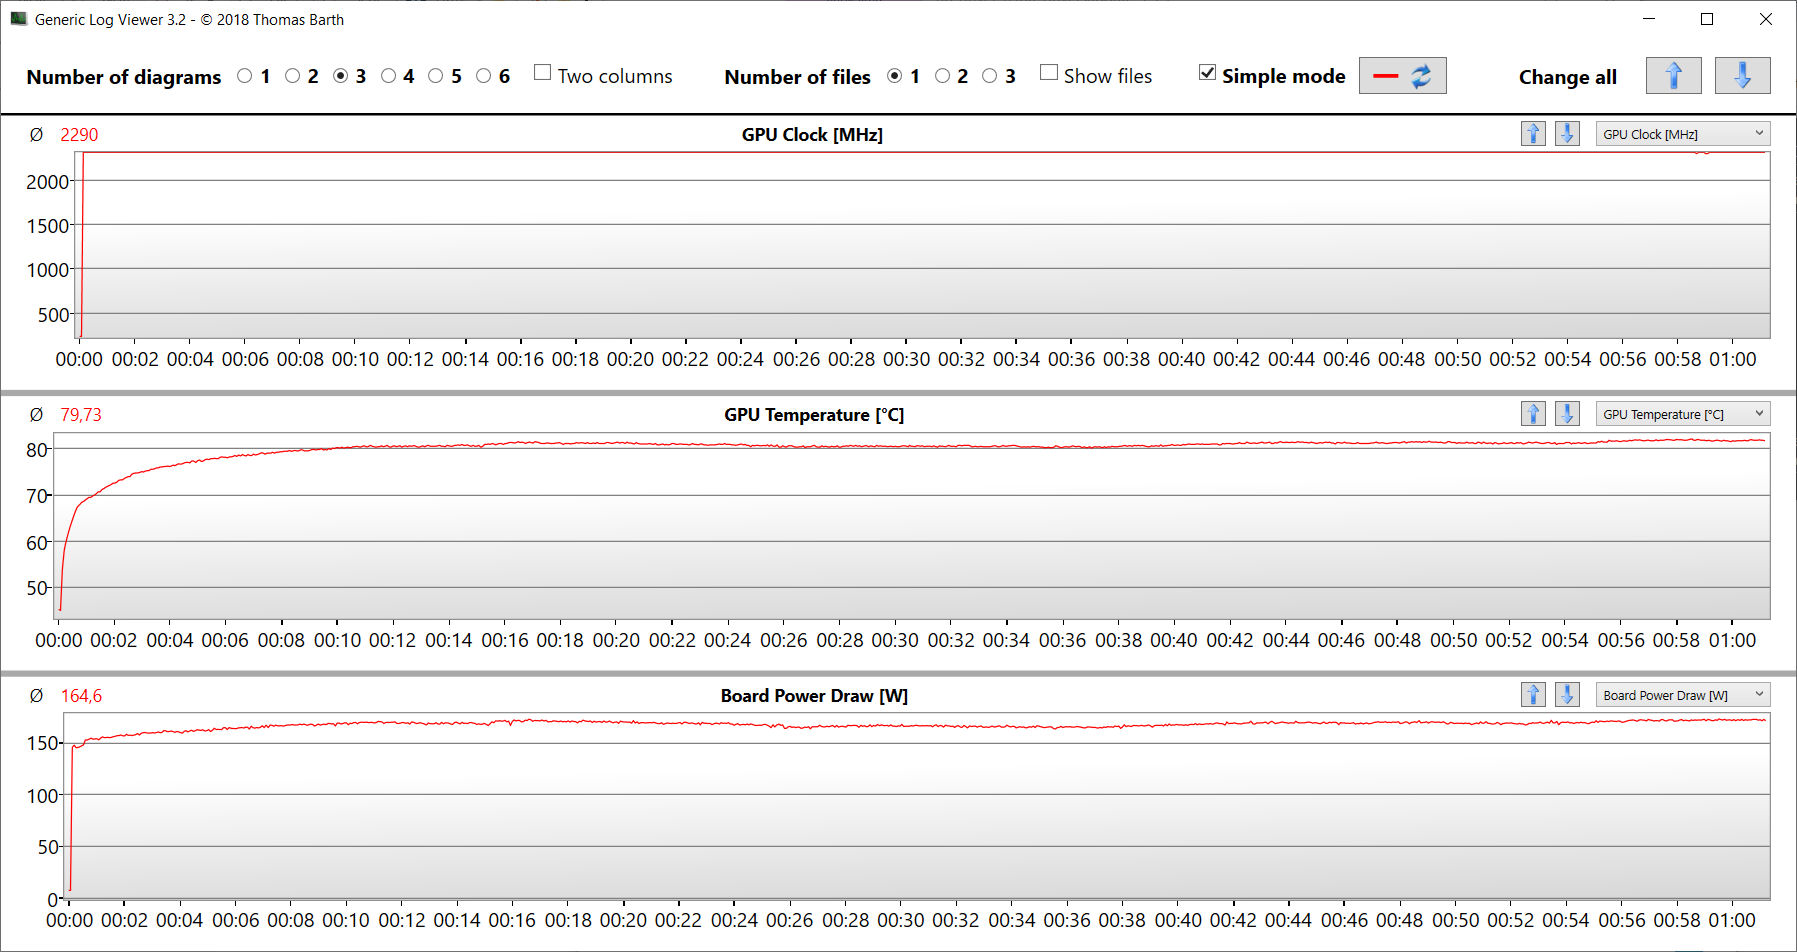
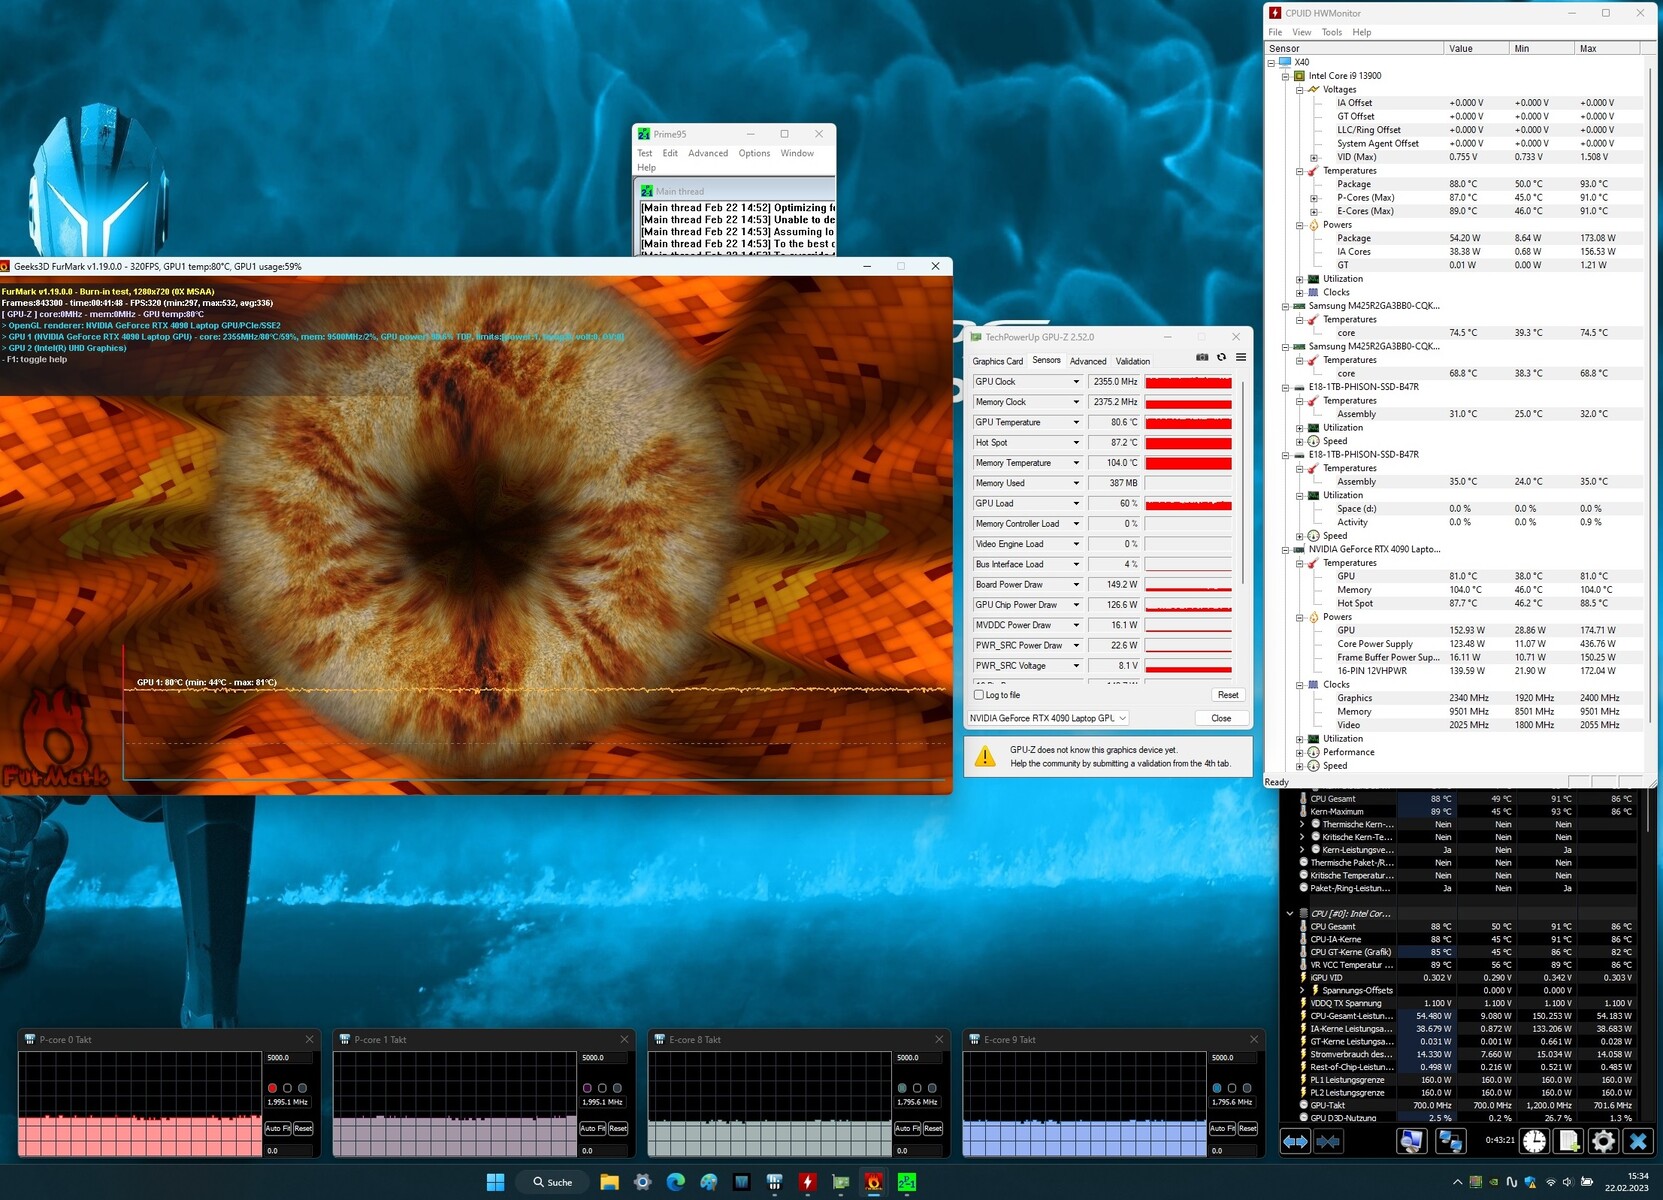
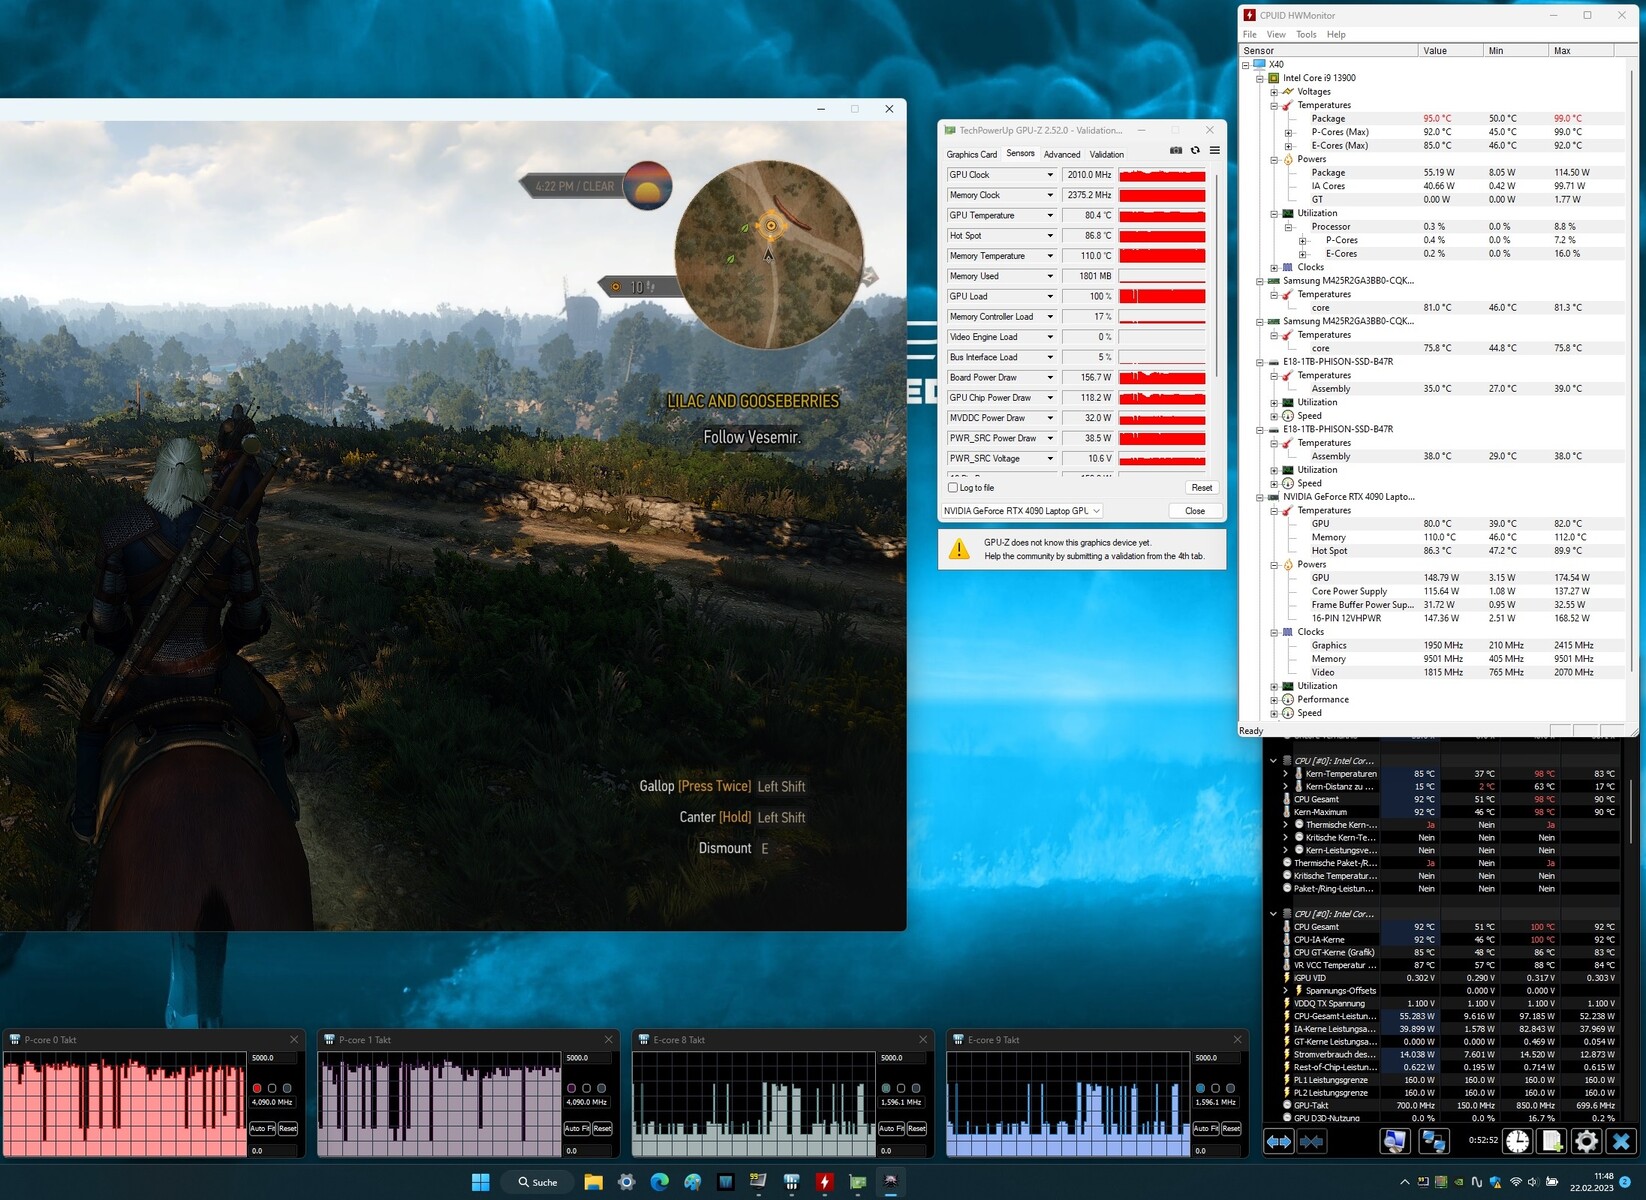
Teste de estresse
Para o teste de estresse, deixamos Prime95 e FurMark funcionar por um período prolongado. Ele representa um cenário extremo projetado para avaliar quão estável o sistema está sob carga total. A CPU começou em altas velocidades de clock (P-cores: 4 GHz, E-cores: 3,3 GHz) enquanto a GPU flutuou entre 1 e 1,5 GHz. Após cerca de cinco minutos, os núcleos P e E da CPU caíram gradualmente para 2 GHz e 1,8 GHz respectivamente, mas o relógio da GPU subiu para cerca de 2,3 a 2,4 GHz
Oradores
Os alto-falantes estéreo soam decentemente, mas produzem quase nenhum baixo. Recomendamos usar um par de fones de ouvido ou alto-falantes externos para uma melhor experiência de áudio.
Medion Erazer Beast X40 análise de áudio
(+) | os alto-falantes podem tocar relativamente alto (###valor### dB)
Graves 100 - 315Hz
(-) | quase nenhum baixo - em média 20.2% menor que a mediana
(±) | a linearidade dos graves é média (8.4% delta para a frequência anterior)
Médios 400 - 2.000 Hz
(±) | médios mais altos - em média 5.5% maior que a mediana
(+) | médios são lineares (6.5% delta para frequência anterior)
Altos 2 - 16 kHz
(+) | agudos equilibrados - apenas 3.1% longe da mediana
(+) | os máximos são lineares (5.8% delta da frequência anterior)
Geral 100 - 16.000 Hz
(±) | a linearidade do som geral é média (16.1% diferença em relação à mediana)
Comparado com a mesma classe
» 39% de todos os dispositivos testados nesta classe foram melhores, 7% semelhantes, 54% piores
» O melhor teve um delta de 6%, a média foi 18%, o pior foi 132%
Comparado com todos os dispositivos testados
» 26% de todos os dispositivos testados foram melhores, 5% semelhantes, 69% piores
» O melhor teve um delta de 4%, a média foi 23%, o pior foi 134%
MSI Titan GT77 HX 13VI análise de áudio
(+) | os alto-falantes podem tocar relativamente alto (###valor### dB)
Graves 100 - 315Hz
(±) | graves reduzidos - em média 14.3% menor que a mediana
(±) | a linearidade dos graves é média (7.5% delta para a frequência anterior)
Médios 400 - 2.000 Hz
(+) | médios equilibrados - apenas 3.5% longe da mediana
(+) | médios são lineares (3.2% delta para frequência anterior)
Altos 2 - 16 kHz
(+) | agudos equilibrados - apenas 1.9% longe da mediana
(+) | os máximos são lineares (3.8% delta da frequência anterior)
Geral 100 - 16.000 Hz
(+) | o som geral é linear (11.1% diferença em relação à mediana)
Comparado com a mesma classe
» 8% de todos os dispositivos testados nesta classe foram melhores, 3% semelhantes, 89% piores
» O melhor teve um delta de 6%, a média foi 18%, o pior foi 132%
Comparado com todos os dispositivos testados
» 7% de todos os dispositivos testados foram melhores, 2% semelhantes, 91% piores
» O melhor teve um delta de 4%, a média foi 23%, o pior foi 134%
Gerenciamento de energia - O X40 oferece uma resistência bastante boa
Consumo de energia
O consumo de energia do X40 foi em média de 280 watts no teste Witcher 3 e atingiu brevemente um pico de 363 watts no teste de estresse. Enquanto o consumo de energia caiu ligeiramente durante o teste Witcher 3, ele flutuou durante todo o teste de estresse. Ao ocioso, o laptop consome uma quantidade de energia bastante normal para o hardware interno. O carregador incluído é avaliado em 330 watts e assim pode fornecer energia suficiente para o laptop.
| desligado | |
| Ocioso | |
| Carga |
|
Key:
min: | |
| Medion Erazer Beast X40 i9-13900HX, GeForce RTX 4090 Laptop GPU | MSI Titan GT77 HX 13VI i9-13950HX, GeForce RTX 4090 Laptop GPU | Razer Blade 16 Early 2023 i9-13950HX, GeForce RTX 4080 Laptop GPU | Schenker XMG Neo 17 M22 R9 6900HX, GeForce RTX 3080 Ti Laptop GPU | Alienware x17 R2 P48E i9-12900HK, GeForce RTX 3080 Ti Laptop GPU | Asus ROG Strix Scar 18 2023 G834JY-N6005W i9-13980HX, GeForce RTX 4090 Laptop GPU | Média NVIDIA GeForce RTX 4090 Laptop GPU | Média da turma Gaming | |
|---|---|---|---|---|---|---|---|---|
| Power Consumption | -5% | -14% | 31% | -42% | -30% | -15% | 8% | |
| Idle Minimum * (Watt) | 11 | 14 -27% | 15.2 -38% | 7 36% | 24.1 -119% | 17.3 -57% | 16.2 ? -47% | 13 ? -18% |
| Idle Average * (Watt) | 18 | 21.6 -20% | 22.8 -27% | 11 39% | 28.5 -58% | 27 -50% | 23.1 ? -28% | 19 ? -6% |
| Idle Maximum * (Watt) | 30 | 24.8 17% | 49.8 -66% | 17 43% | 60 -100% | 46 -53% | 34.2 ? -14% | 24.6 ? 18% |
| Load Average * (Watt) | 136 | 122.5 10% | 121.2 11% | 92 32% | 128.7 5% | 133 2% | 130.5 ? 4% | 110.7 ? 19% |
| Witcher 3 ultra * (Watt) | 280 | 265 5% | 242 14% | 221 21% | 254 9% | |||
| Load Maximum * (Watt) | 363 | 418 -15% | 273.7 25% | 306 16% | 323 11% | 329 9% | 324 ? 11% | 259 ? 29% |
* ... menor é melhor
Power consumption Witcher 3 / Stress test
Power consumption with external monitor
Duração da bateria
O laptop de 17 polegadas durou 6h 22m e 6h 56m respectivamente no teste Wi-Fi (acessando websites automaticamente usando um roteiro) e teste de vídeo (looping do curta-metragem Big Buck Bunny, codificado em H.264, em Full HD). Para ambos os testes, todos os recursos de economia de energia foram desativados no laptop, e o brilho da tela foi ajustado para cerca de 150 cd/m². O adaptador sem fio também foi desativado quando estávamos realizando o teste de vídeo.
De modo geral, o Erazer oferece uma grande autonomia de bateria para um laptop de tão alto desempenho. Ele pode durar mais do que a maioria dos concorrentes, mesmo aqueles com capacidade de bateria idêntica.
| Medion Erazer Beast X40 i9-13900HX, GeForce RTX 4090 Laptop GPU, 99.8 Wh | MSI Titan GT77 HX 13VI i9-13950HX, GeForce RTX 4090 Laptop GPU, 99.9 Wh | Razer Blade 16 Early 2023 i9-13950HX, GeForce RTX 4080 Laptop GPU, 95.2 Wh | Schenker XMG Neo 17 M22 R9 6900HX, GeForce RTX 3080 Ti Laptop GPU, 99 Wh | Alienware x17 R2 P48E i9-12900HK, GeForce RTX 3080 Ti Laptop GPU, 87 Wh | Asus ROG Strix Scar 18 2023 G834JY-N6005W i9-13980HX, GeForce RTX 4090 Laptop GPU, 90 Wh | Média da turma Gaming | |
|---|---|---|---|---|---|---|---|
| Duração da bateria | -19% | -12% | 15% | -62% | -14% | -0% | |
| Reader / Idle (h) | 9.4 | 8.9 -5% | 12 28% | 3.9 -59% | 8.27 ? -12% | ||
| H.264 (h) | 6.9 | 6 -13% | 6.6 -4% | 7 1% | 8.32 ? 21% | ||
| WiFi v1.3 (h) | 6.4 | 5.3 -17% | 6.1 -5% | 9 41% | 2 -69% | 7.1 11% | 7.11 ? 11% |
| Load (h) | 1.9 | 1.4 -26% | 1.4 -26% | 1.8 -5% | 0.8 -58% | 0.9 -53% | 1.502 ? -21% |
| Witcher 3 ultra (h) | 0.9 |
Pro
Contra
Veredicto - Caderno para jogos de alto nível excepcional
O Medion Erazer Beast X40 é um laptop projetado para cenários de uso altamente exigentes, tais como edição de vídeo, renderização e jogos. O músculo computacional necessário para estas aplicações é fornecido por uma das mais poderosas combinações CPU-GPU no momento: um Core i9-13900HX emparelhado com um GeForce RTX 4090.
O processador e a placa gráfica são capazes de funcionar consistentemente em altas velocidades de relógio, e o X40 produz uma quantidade bastante normal de calor e ruído para esta classe de dispositivo.
Em suma, o Erazer Beast X40 é um portátil atraente para jogos e outras aplicações exigentes.
O visor mate de 17 polegadas 16:10 (QHD, IPS, 240Hz, G-Sync, sRGB) parece ótimo para a maioria das aplicações. A única desvantagem é que seu contraste é um pouco baixo demais. O excelente teclado mecânico (com iluminação RGB) faz com que o laptop pareça ainda mais atraente. Aqueles que nunca usaram um teclado mecânico antes, estão prontos para uma nova experiência de digitação. A porta Thunderbolt 4 no laptop abre opções de expansão (por exemplo, GPU externo, solução de docking), mas não suporta Power Delivery.
Uma alternativa possível à Besta Erazer X40 é o Asus ROG Strix Scar 18 2023 G834JY. O Asus ROG se destaca com seu painel de 18 polegadas de 16:10 QHD+, mais RAM (64 GB) e suporte RAID. Com cerca de 4.800 euros (US$ 5.177), está na mesma faixa de preço que a Besta. Se o dinheiro não é objeto, você pode dar uma olhada noMSI Titan GT77 HX 13V como outra alternativa. Ela oferece um pouco mais de desempenho da CPU, três slots SSD, suporte RAID e quatro soquetes de RAM. O display mini-LED excepcionalmente brilhante, com excelente contraste, é um destaque no dispositivo. Mas o pacote geral lhe dará um retorno de cerca de 6.600 euros (US$ 7.120).
Veredicto sobre o resfriamento da água
A unidade opcional de resfriamento de água faz fundamentalmente o que é suposto: melhorar o desempenho (Medion promete um aumento de até 10%) e reduzir o calor e o ruído. No uso real, porém, o ganho de desempenho é bastante modesto, e o laptop está confinado a um ponto estacionário. As únicas vantagens que restam são temperaturas e níveis de ruído mais baixos. Cabe a cada proprietário de X40 decidir se estes benefícios valem os 250 euros extras (US$ 270).
Preço e disponibilidade
Na Alemanha, a configuração de revisão do Medion Erazer Beast X40 está disponível em Saturn.de e tem uma etiqueta de preço de 4.499 euros (US$ 4.856).
Medion Erazer Beast X40
- 03/20/2023 v7 (old)
Sascha Mölck
Transparência
A seleção dos dispositivos a serem analisados é feita pela nossa equipe editorial. A amostra de teste foi fornecida ao autor como empréstimo pelo fabricante ou varejista para fins desta revisão. O credor não teve influência nesta revisão, nem o fabricante recebeu uma cópia desta revisão antes da publicação. Não houve obrigação de publicar esta revisão. Como empresa de mídia independente, a Notebookcheck não está sujeita à autoridade de fabricantes, varejistas ou editores.
É assim que o Notebookcheck está testando
Todos os anos, o Notebookcheck analisa de forma independente centenas de laptops e smartphones usando procedimentos padronizados para garantir que todos os resultados sejam comparáveis. Desenvolvemos continuamente nossos métodos de teste há cerca de 20 anos e definimos padrões da indústria no processo. Em nossos laboratórios de teste, equipamentos de medição de alta qualidade são utilizados por técnicos e editores experientes. Esses testes envolvem um processo de validação em vários estágios. Nosso complexo sistema de classificação é baseado em centenas de medições e benchmarks bem fundamentados, o que mantém a objetividade.Price comparison

