Breve Análise do Conversível Dell Inspiron 15 7000 2-em-1 Black Edition (i7-8565U, MX150)


| SD Card Reader | |
| average JPG Copy Test (av. of 3 runs) | |
| HP Spectre x360 15-ch011nr (Toshiba Exceria Pro SDXC 64 GB UHS-II) | |
| Média da turma Multimedia (23 - 531, n=44, últimos 2 anos) | |
| Samsung Notebook 9 NP900X5T-X01US (Toshiba Exceria Pro M501 UHS-II) | |
| Acer Aspire 5 A515-52G-53PU (Toshiba Exceria Pro SDXC 64 GB UHS-II) | |
| Dell Inspiron 15 7000 2-in-1 Black Edition (Toshiba Exceria Pro SDXC 64 GB UHS-II) | |
| MSI PL62 MX150 7300HQ (Toshiba Exceria Pro SDXC 64 GB UHS-II) | |
| maximum AS SSD Seq Read Test (1GB) | |
| HP Spectre x360 15-ch011nr (Toshiba Exceria Pro SDXC 64 GB UHS-II) | |
| Média da turma Multimedia (27.9 - 1455, n=43, últimos 2 anos) | |
| Samsung Notebook 9 NP900X5T-X01US (Toshiba Exceria Pro M501 UHS-II) | |
| Acer Aspire 5 A515-52G-53PU (Toshiba Exceria Pro SDXC 64 GB UHS-II) | |
| Dell Inspiron 15 7000 2-in-1 Black Edition (Toshiba Exceria Pro SDXC 64 GB UHS-II) | |
| MSI PL62 MX150 7300HQ (Toshiba Exceria Pro SDXC 64 GB UHS-II) | |
| Networking | |
| iperf3 transmit AX12 | |
| Acer Aspire 5 A515-52G-53PU | |
| Dell Inspiron 15 7000 2-in-1 Black Edition | |
| Samsung Notebook 9 NP900X5T-X01US | |
| HP Spectre x360 15-ch011nr | |
| MSI PL62 MX150 7300HQ | |
| iperf3 receive AX12 | |
| Samsung Notebook 9 NP900X5T-X01US | |
| HP Spectre x360 15-ch011nr | |
| Dell Inspiron 15 7000 2-in-1 Black Edition | |
| Acer Aspire 5 A515-52G-53PU | |
| MSI PL62 MX150 7300HQ | |
| |||||||||||||||||||||||||
iluminação: 95 %
iluminação com acumulador: 321.1 cd/m²
Contraste: 892:1 (Preto: 0.36 cd/m²)
ΔE ColorChecker Calman: 5.45 | ∀{0.5-29.43 Ø4.72}
calibrated: 2.08
ΔE Greyscale Calman: 8.1 | ∀{0.09-98 Ø4.97}
99.3% sRGB (Argyll 1.6.3 3D)
67.3% AdobeRGB 1998 (Argyll 1.6.3 3D)
75.7% AdobeRGB 1998 (Argyll 3D)
99.3% sRGB (Argyll 3D)
75.7% Display P3 (Argyll 3D)
Gamma: 2.207
CCT: 6845 K
| Dell Inspiron 15 7000 2-in-1 Black Edition AUO34EB, IPS, 15.6", 3840x2160 | Acer Aspire 5 A515-52G-53PU BOE CQ NV156FHM-N48, IPS, 15.6", 1920x1080 | HP Spectre x360 15-ch011nr BOE0730, IPS, 15.6", 3840x2160 | Samsung Notebook 9 NP900X5T-X01US ID: BOE06E8, Name: BOE HF NV150FHB-N31, IPS, 15", 1920x1080 | MSI PL62 MX150 7300HQ Chi Mei CMN15D6, TN LED, 15.6", 1920x1080 | |
|---|---|---|---|---|---|
| Display | -45% | -10% | -9% | 8% | |
| Display P3 Coverage (%) | 75.7 | 39.85 -47% | 68.5 -10% | 65.2 -14% | 85.4 13% |
| sRGB Coverage (%) | 99.3 | 58.7 -41% | 90.7 -9% | 97.4 -2% | 99.6 0% |
| AdobeRGB 1998 Coverage (%) | 75.7 | 41.17 -46% | 66.3 -12% | 66.8 -12% | 82.9 10% |
| Response Times | -9% | 12% | 0% | 30% | |
| Response Time Grey 50% / Grey 80% * (ms) | 48 ? | 45 ? 6% | 38 ? 21% | 46 ? 4% | 44 ? 8% |
| Response Time Black / White * (ms) | 28.4 ? | 35 ? -23% | 27.6 ? 3% | 29.6 ? -4% | 14 ? 51% |
| PWM Frequency (Hz) | 20000 ? | 943 ? | 2976 ? | 250 ? | |
| Screen | -4% | -4% | 19% | -38% | |
| Brightness middle (cd/m²) | 321.1 | 296 -8% | 329.3 3% | 558.2 74% | 227 -29% |
| Brightness (cd/m²) | 315 | 268 -15% | 316 0% | 528 68% | 200 -37% |
| Brightness Distribution (%) | 95 | 81 -15% | 84 -12% | 92 -3% | 82 -14% |
| Black Level * (cd/m²) | 0.36 | 0.3 17% | 0.31 14% | 0.46 -28% | 0.46 -28% |
| Contrast (:1) | 892 | 987 11% | 1062 19% | 1213 36% | 493 -45% |
| Colorchecker dE 2000 * | 5.45 | 4.01 26% | 4.78 12% | 4.41 19% | 10.88 -100% |
| Colorchecker dE 2000 max. * | 12.6 | 8.7 31% | 11.75 7% | 10.91 13% | 18.36 -46% |
| Colorchecker dE 2000 calibrated * | 2.08 | 4 -92% | 3.51 -69% | ||
| Greyscale dE 2000 * | 8.1 | 0.98 88% | 7.9 2% | 6.6 19% | 12.18 -50% |
| Gamma | 2.207 100% | 2.35 94% | 2.24 98% | 2.19 100% | 2.58 85% |
| CCT | 6845 95% | 6408 101% | 8323 78% | 7615 85% | 14446 45% |
| Color Space (Percent of AdobeRGB 1998) (%) | 67.3 | 38 -44% | 58.8 -13% | 61.3 -9% | 74 10% |
| Color Space (Percent of sRGB) (%) | 99.3 | 58 -42% | 90.4 -9% | 97.2 -2% | 63 -37% |
| Média Total (Programa/Configurações) | -19% /
-12% | -1% /
-3% | 3% /
11% | 0% /
-20% |
* ... menor é melhor
Exibir tempos de resposta
| ↔ Tempo de resposta preto para branco | ||
|---|---|---|
| 28.4 ms ... ascensão ↗ e queda ↘ combinadas | ↗ 12.8 ms ascensão | 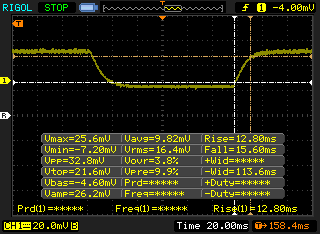 |
| ↘ 15.6 ms queda | ||
| A tela mostra taxas de resposta relativamente lentas em nossos testes e pode ser muito lenta para os jogadores. Em comparação, todos os dispositivos testados variam de 0.1 (mínimo) a 240 (máximo) ms. » 75 % de todos os dispositivos são melhores. Isso significa que o tempo de resposta medido é pior que a média de todos os dispositivos testados (19.8 ms). | ||
| ↔ Tempo de resposta 50% cinza a 80% cinza | ||
| 48 ms ... ascensão ↗ e queda ↘ combinadas | ↗ 25.2 ms ascensão | 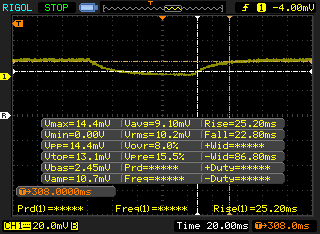 |
| ↘ 22.8 ms queda | ||
| A tela mostra taxas de resposta lentas em nossos testes e será insatisfatória para os jogadores. Em comparação, todos os dispositivos testados variam de 0.165 (mínimo) a 636 (máximo) ms. » 82 % de todos os dispositivos são melhores. Isso significa que o tempo de resposta medido é pior que a média de todos os dispositivos testados (31 ms). | ||
Cintilação da tela / PWM (modulação por largura de pulso)
| Tela tremeluzindo / PWM não detectado | 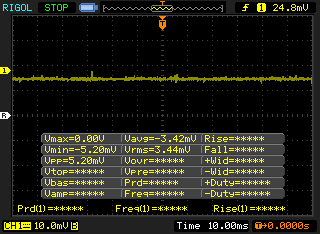 | ||
[pwm_comparison] Em comparação: 52 % de todos os dispositivos testados não usam PWM para escurecer a tela. Se PWM foi detectado, uma média de 7772 (mínimo: 5 - máximo: 343500) Hz foi medida. | |||
| wPrime 2.10 - 1024m | |
| Acer Aspire 5 A515-52G-53PU | |
| Média Intel Core i7-8565U (263 - 420, n=7) | |
| Média da turma Multimedia (227 - 340, n=6, últimos 2 anos) | |
| Samsung Notebook 9 NP900X5T-X01US | |
* ... menor é melhor
| PCMark 8 Home Score Accelerated v2 | 3141 pontos | |
| PCMark 8 Work Score Accelerated v2 | 4240 pontos | |
| PCMark 10 Score | 3719 pontos | |
Ajuda | ||
| Dell Inspiron 15 7000 2-in-1 Black Edition Toshiba BG3 KBG30ZMS256G | Acer Aspire 5 A515-52G-53PU Micron 1100 MTFDDAV256TBN | HP Spectre x360 15-ch011nr SK hynix PC401 NVMe 500 GB | Samsung Notebook 9 NP900X5T-X01US Samsung PM961 MZVLW256HEHP | Dell XPS 15 9570 Core i9 UHD Samsung SSD PM981 MZVLB1T0HALR | |
|---|---|---|---|---|---|
| AS SSD | |||||
| Seq Read (MB/s) | 1123 | 490.6 -56% | 1739 55% | 2337 108% | 1320 18% |
| Seq Write (MB/s) | 208.9 | 390.2 87% | 1189 469% | 1206 477% | 1500 618% |
| 4K Read (MB/s) | 27.36 | 19.47 -29% | 38.76 42% | 48.71 78% | 30.73 12% |
| 4K Write (MB/s) | 65 | 72.2 11% | 93.2 43% | 115 77% | 94.4 45% |
| 4K-64 Read (MB/s) | 313.2 | 236.2 -25% | 646 106% | 1085 246% | 1453 364% |
| 4K-64 Write (MB/s) | 111.2 | 276.7 149% | 545 390% | 392.6 253% | 1815 1532% |
| Access Time Read * (ms) | 0.684 | 0.054 92% | 0.054 92% | 0.061 91% | |
| Access Time Write * (ms) | 0.344 | 0.063 82% | 0.051 85% | 0.032 91% | 0.044 87% |
| Score Read (Points) | 453 | 305 -33% | 859 90% | 1367 202% | 1616 257% |
| Score Write (Points) | 197 | 388 97% | 757 284% | 628 219% | 2059 945% |
| Score Total (Points) | 844 | 850 1% | 2037 141% | 2646 214% | 4507 434% |
| Copy ISO MB/s (MB/s) | 927 | 321.3 -65% | 1668 80% | 1751 89% | 2577 178% |
| Copy Program MB/s (MB/s) | 206.4 | 141.7 -31% | 486.8 136% | 479.5 132% | 515 150% |
| Copy Game MB/s (MB/s) | 360.4 | 239.4 -34% | 1042 189% | 1058 194% | 1120 211% |
| CrystalDiskMark 5.2 / 6 | |||||
| Write 4K (MB/s) | 83.4 | 78.4 -6% | 108.5 30% | 162.7 95% | 103 24% |
| Read 4K (MB/s) | 32.22 | 25.99 -19% | 37.67 17% | 47.06 46% | 52.6 63% |
| Write Seq (MB/s) | 171.7 | 390.9 128% | 1120 552% | 1075 526% | 2216 1191% |
| Read Seq (MB/s) | 924 | 482.6 -48% | 1300 41% | 1023 11% | 1599 73% |
| Write 4K Q32T1 (MB/s) | 161.5 | 205.5 27% | 243.9 51% | 435.4 170% | 603 273% |
| Read 4K Q32T1 (MB/s) | 301.1 | 227.9 -24% | 311.6 3% | 517 72% | 321.4 7% |
| Write Seq Q32T1 (MB/s) | 222.3 | 502 126% | 1395 528% | 1276 474% | 2395 977% |
| Read Seq Q32T1 (MB/s) | 1300 | 526 -60% | 2667 105% | 3418 163% | 2251 73% |
* ... menor é melhor

| 3DMark 11 Performance | 4567 pontos | |
| 3DMark Cloud Gate Standard Score | 13170 pontos | |
| 3DMark Fire Strike Score | 3102 pontos | |
Ajuda | ||
| Thief | |
| 1920x1080 Very High Preset AA:FXAA & High SS AF:8x | |
| Dell Inspiron 15 7000 2-in-1 Black Edition | |
| Samsung Notebook 9 NP900X5T-X01US | |
| Média NVIDIA GeForce MX150 (16 - 23.2, n=6) | |
| 1366x768 High Preset AA:FXAA & Low SS AF:4x | |
| Média NVIDIA GeForce MX150 (30.2 - 44.1, n=6) | |
| Dell Inspiron 15 7000 2-in-1 Black Edition | |
| Samsung Notebook 9 NP900X5T-X01US | |
| 1366x768 Normal Preset AA:FX | |
| Média NVIDIA GeForce MX150 (32.5 - 51.9, n=6) | |
| Dell Inspiron 15 7000 2-in-1 Black Edition | |
| Samsung Notebook 9 NP900X5T-X01US | |
| 1024x768 Very Low Preset | |
| Média NVIDIA GeForce MX150 (41.5 - 79.2, n=6) | |
| Samsung Notebook 9 NP900X5T-X01US | |
| Dell Inspiron 15 7000 2-in-1 Black Edition | |
| Batman: Arkham Knight | |
| 3840x2160 High / On (Interactive Smoke & Paper Debris Off) AA:SM AF:8x | |
| Dell Inspiron 15 7000 2-in-1 Black Edition | |
| Média NVIDIA GeForce MX150 (n=1) | |
| 1920x1080 High / On AA:SM AF:16x | |
| Dell Inspiron 15 7000 2-in-1 Black Edition | |
| Média NVIDIA GeForce MX150 (8 - 23, n=3) | |
| 1920x1080 High / On (Interactive Smoke & Paper Debris Off) AA:SM AF:8x | |
| Dell Inspiron 15 7000 2-in-1 Black Edition | |
| Média NVIDIA GeForce MX150 (16 - 23, n=7) | |
| Samsung Notebook 9 NP900X5T-X01US | |
| HP Spectre x360 15-ch011nr | |
| 1366x768 Normal / Off AF:4x | |
| HP Spectre x360 15-ch011nr | |
| Dell Inspiron 15 7000 2-in-1 Black Edition | |
| Média NVIDIA GeForce MX150 (36 - 51, n=7) | |
| Samsung Notebook 9 NP900X5T-X01US | |
| 1280x720 Low / Off AF:Trilinear | |
| HP Spectre x360 15-ch011nr | |
| Média NVIDIA GeForce MX150 (41 - 60, n=7) | |
| Dell Inspiron 15 7000 2-in-1 Black Edition | |
| Samsung Notebook 9 NP900X5T-X01US | |
| baixo | média | alto | ultra | 4K | |
|---|---|---|---|---|---|
| BioShock Infinite (2013) | 175 | 109 | 93 | 34 | |
| Metro: Last Light (2013) | 86 | ||||
| Thief (2014) | 41.5 | 38 | 33.6 | 19.4 | |
| The Witcher 3 (2015) | 12 | ||||
| Batman: Arkham Knight (2015) | 48 | 45 | 23 | 23 | 5 |
| Dell Inspiron 15 7000 2-in-1 Black Edition GeForce MX150, i7-8565U, Toshiba BG3 KBG30ZMS256G | Acer Aspire 5 A515-52G-53PU GeForce MX150, i5-8265U, Micron 1100 MTFDDAV256TBN | HP Spectre x360 15-ch011nr GeForce MX150, i5-8550U, SK hynix PC401 NVMe 500 GB | Samsung Notebook 9 NP900X5T-X01US GeForce MX150, i5-8550U, Samsung PM961 MZVLW256HEHP | MSI PL62 MX150 7300HQ GeForce MX150, i5-7300HQ | Dell XPS 15 9570 Core i9 UHD GeForce GTX 1050 Ti Max-Q, i9-8950HK, Samsung SSD PM981 MZVLB1T0HALR | |
|---|---|---|---|---|---|---|
| Noise | -1% | 8% | 4% | -5% | 3% | |
| desligado / ambiente * (dB) | 28 | 30.5 -9% | 28.6 -2% | 29.6 -6% | 30.4 -9% | 28.2 -1% |
| Idle Minimum * (dB) | 28 | 30.5 -9% | 29.2 -4% | 29.6 -6% | 32 -14% | 28.5 -2% |
| Idle Average * (dB) | 28 | 30.5 -9% | 29.2 -4% | 29.6 -6% | 32 -14% | 28.6 -2% |
| Idle Maximum * (dB) | 28.4 | 30.9 -9% | 29.2 -3% | 30.3 -7% | 32 -13% | 28.8 -1% |
| Load Average * (dB) | 48.6 | 41.2 15% | 29.2 40% | 40 18% | 38.7 20% | 36.2 26% |
| Witcher 3 ultra * (dB) | 47.9 | 38.4 20% | 40 16% | 47.6 1% | ||
| Load Maximum * (dB) | 49.2 | 41.9 15% | 45.7 7% | 40 19% | 48.7 1% | 47.6 3% |
* ... menor é melhor
Barulho
| Ocioso |
| 28 / 28 / 28.4 dB |
| Carga |
| 48.6 / 49.2 dB |
 | ||
30 dB silencioso 40 dB(A) audível 50 dB(A) ruidosamente alto |
||
min: | ||
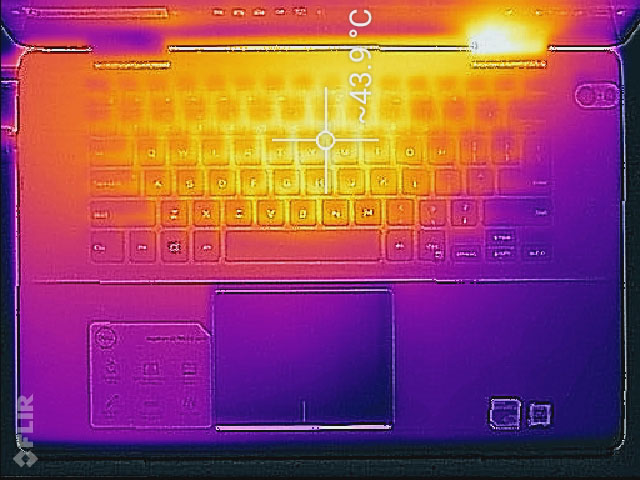
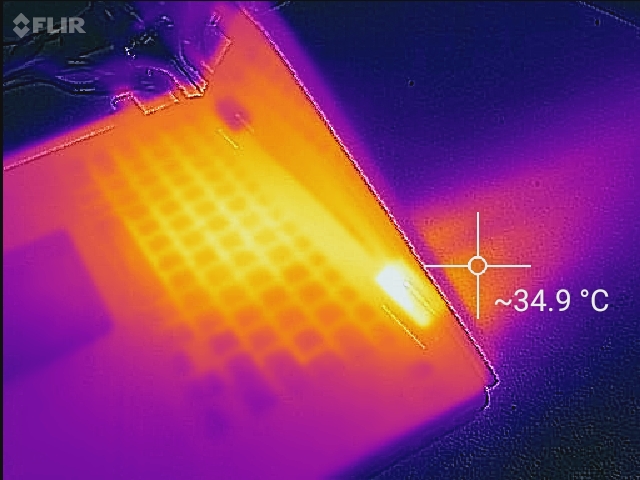
(±) A temperatura máxima no lado superior é 43.4 °C / 110 F, em comparação com a média de 36.8 °C / 98 F , variando de 21 a 71 °C para a classe Multimedia.
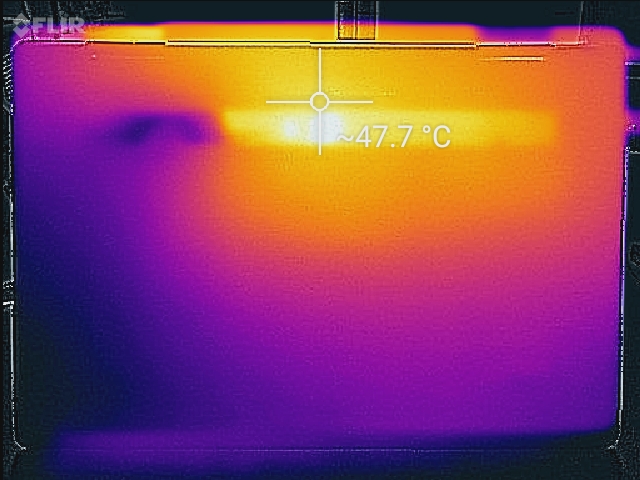
(-) A parte inferior aquece até um máximo de 47.4 °C / 117 F, em comparação com a média de 39.1 °C / 102 F
(+) Em uso inativo, a temperatura média para o lado superior é 20.1 °C / 68 F, em comparação com a média do dispositivo de 31.3 °C / ### class_avg_f### F.
(+) Jogando The Witcher 3, a temperatura média para o lado superior é 31.4 °C / 89 F, em comparação com a média do dispositivo de 31.3 °C / ## #class_avg_f### F.
(+) Os apoios para as mãos e o touchpad são mais frios que a temperatura da pele, com um máximo de 27 °C / 80.6 F e, portanto, são frios ao toque.
(±) A temperatura média da área do apoio para as mãos de dispositivos semelhantes foi 28.7 °C / 83.7 F (+1.7 °C / 3.1 F).
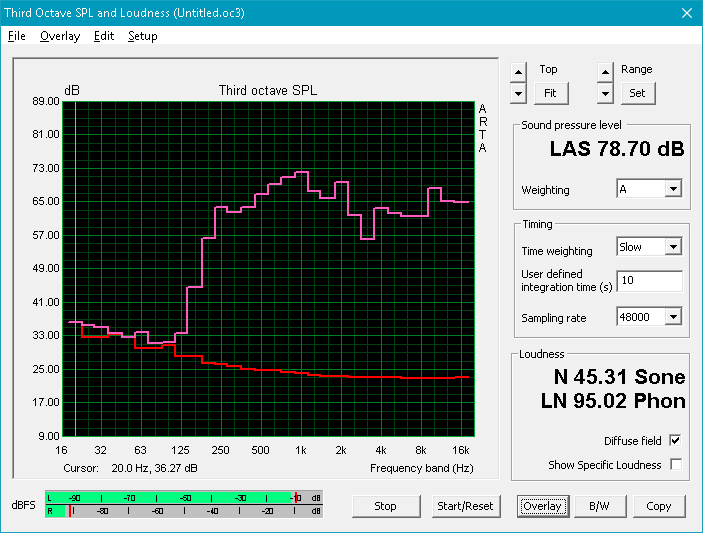
Dell Inspiron 15 7000 2-in-1 Black Edition análise de áudio
(±) | o volume do alto-falante é médio, mas bom (###valor### dB)
Graves 100 - 315Hz
(-) | quase nenhum baixo - em média 15% menor que a mediana
(±) | a linearidade dos graves é média (14% delta para a frequência anterior)
Médios 400 - 2.000 Hz
(+) | médios equilibrados - apenas 4.5% longe da mediana
(+) | médios são lineares (6% delta para frequência anterior)
Altos 2 - 16 kHz
(+) | agudos equilibrados - apenas 2.9% longe da mediana
(±) | a linearidade dos máximos é média (10.6% delta para frequência anterior)
Geral 100 - 16.000 Hz
(±) | a linearidade do som geral é média (18.1% diferença em relação à mediana)
Comparado com a mesma classe
» 54% de todos os dispositivos testados nesta classe foram melhores, 8% semelhantes, 38% piores
» O melhor teve um delta de 5%, a média foi 17%, o pior foi 45%
Comparado com todos os dispositivos testados
» 38% de todos os dispositivos testados foram melhores, 8% semelhantes, 54% piores
» O melhor teve um delta de 4%, a média foi 24%, o pior foi 134%
HP Spectre x360 15-ch011nr análise de áudio
(±) | o volume do alto-falante é médio, mas bom (###valor### dB)
Graves 100 - 315Hz
(-) | quase nenhum baixo - em média 22.3% menor que a mediana
(±) | a linearidade dos graves é média (11.5% delta para a frequência anterior)
Médios 400 - 2.000 Hz
(+) | médios equilibrados - apenas 2.4% longe da mediana
(±) | a linearidade dos médios é média (7.5% delta para frequência anterior)
Altos 2 - 16 kHz
(+) | agudos equilibrados - apenas 4% longe da mediana
(+) | os máximos são lineares (6.2% delta da frequência anterior)
Geral 100 - 16.000 Hz
(±) | a linearidade do som geral é média (17.7% diferença em relação à mediana)
Comparado com a mesma classe
» 51% de todos os dispositivos testados nesta classe foram melhores, 7% semelhantes, 42% piores
» O melhor teve um delta de 5%, a média foi 17%, o pior foi 45%
Comparado com todos os dispositivos testados
» 35% de todos os dispositivos testados foram melhores, 8% semelhantes, 57% piores
» O melhor teve um delta de 4%, a média foi 24%, o pior foi 134%
| desligado | |
| Ocioso | |
| Carga |
|
Key:
min: | |
| Dell Inspiron 15 7000 2-in-1 Black Edition i7-8565U, GeForce MX150, Toshiba BG3 KBG30ZMS256G, IPS, 3840x2160, 15.6" | Acer Aspire 5 A515-52G-53PU i5-8265U, GeForce MX150, Micron 1100 MTFDDAV256TBN, IPS, 1920x1080, 15.6" | HP Spectre x360 15-ch011nr i5-8550U, GeForce MX150, SK hynix PC401 NVMe 500 GB, IPS, 3840x2160, 15.6" | Samsung Notebook 9 NP900X5T-X01US i5-8550U, GeForce MX150, Samsung PM961 MZVLW256HEHP, IPS, 1920x1080, 15" | MSI PL62 MX150 7300HQ i5-7300HQ, GeForce MX150, , TN LED, 1920x1080, 15.6" | Dell XPS 15 9570 Core i9 UHD i9-8950HK, GeForce GTX 1050 Ti Max-Q, Samsung SSD PM981 MZVLB1T0HALR, IPS, 3840x2160, 15.6" | |
|---|---|---|---|---|---|---|
| Power Consumption | 3% | -27% | -10% | -62% | -77% | |
| Idle Minimum * (Watt) | 4.2 | 3.8 10% | 5.3 -26% | 3.5 17% | 9.2 -119% | 7.1 -69% |
| Idle Average * (Watt) | 7.8 | 6.3 19% | 9.8 -26% | 11.3 -45% | 13.6 -74% | 13.6 -74% |
| Idle Maximum * (Watt) | 8.5 | 9.6 -13% | 12.6 -48% | 14.2 -67% | 14.7 -73% | 14.1 -66% |
| Load Average * (Watt) | 57 | 59.5 -4% | 73 -28% | 53.3 6% | 64 -12% | 103.9 -82% |
| Witcher 3 ultra * (Watt) | 57.3 | 67.6 -18% | 50.6 12% | 103 -80% | ||
| Load Maximum * (Watt) | 68 | 64.4 5% | 80 -18% | 56.2 17% | 89.2 -31% | 130.9 -93% |
* ... menor é melhor
| Dell Inspiron 15 7000 2-in-1 Black Edition i7-8565U, GeForce MX150, 56 Wh | Acer Aspire 5 A515-52G-53PU i5-8265U, GeForce MX150, 48 Wh | HP Spectre x360 15-ch011nr i5-8550U, GeForce MX150, 84 Wh | Samsung Notebook 9 NP900X5T-X01US i5-8550U, GeForce MX150, 75 Wh | MSI PL62 MX150 7300HQ i5-7300HQ, GeForce MX150, 41.4 Wh | Dell XPS 15 9570 Core i9 UHD i9-8950HK, GeForce GTX 1050 Ti Max-Q, 97 Wh | |
|---|---|---|---|---|---|---|
| Duração da bateria | 14% | 58% | 61% | -33% | 30% | |
| WiFi v1.3 (h) | 6.6 | 7.5 14% | 10.4 58% | 10.6 61% | 4.4 -33% | 8.6 30% |
| Reader / Idle (h) | 14.1 | 15.5 | 30.2 | 15 | ||
| Load (h) | 1.7 | 2.3 | 2.1 | 1 |
Pro
Contra
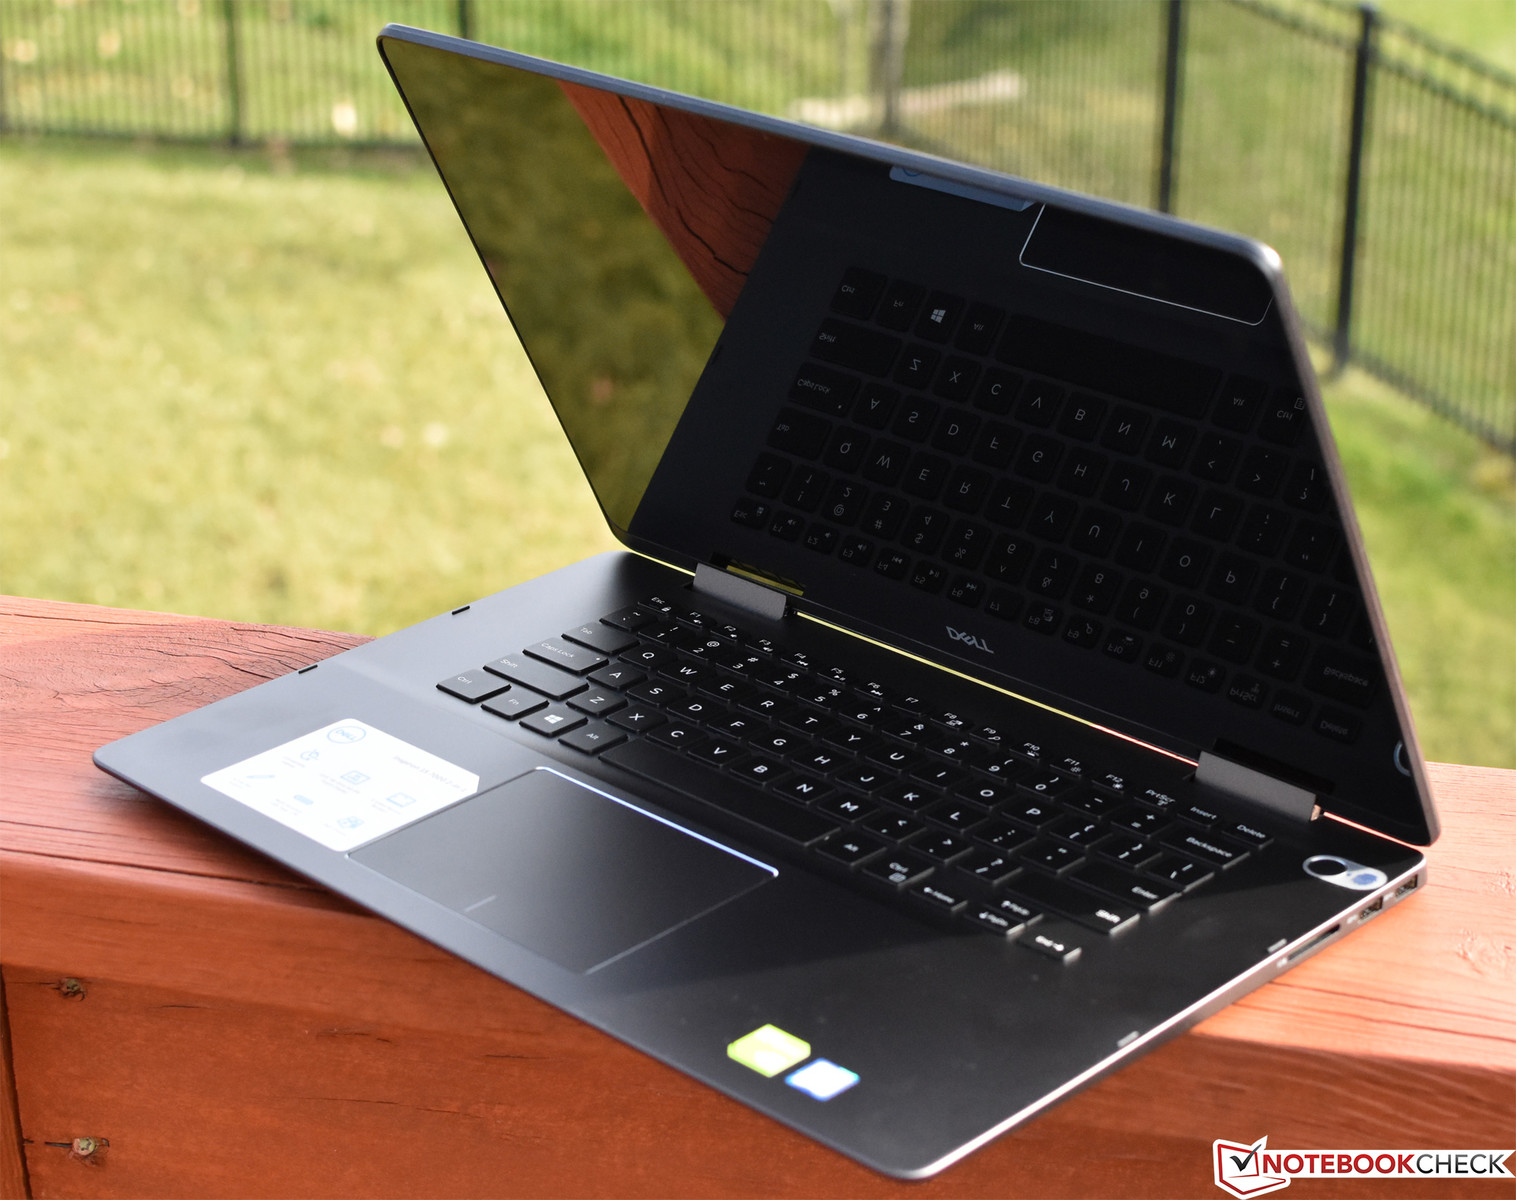
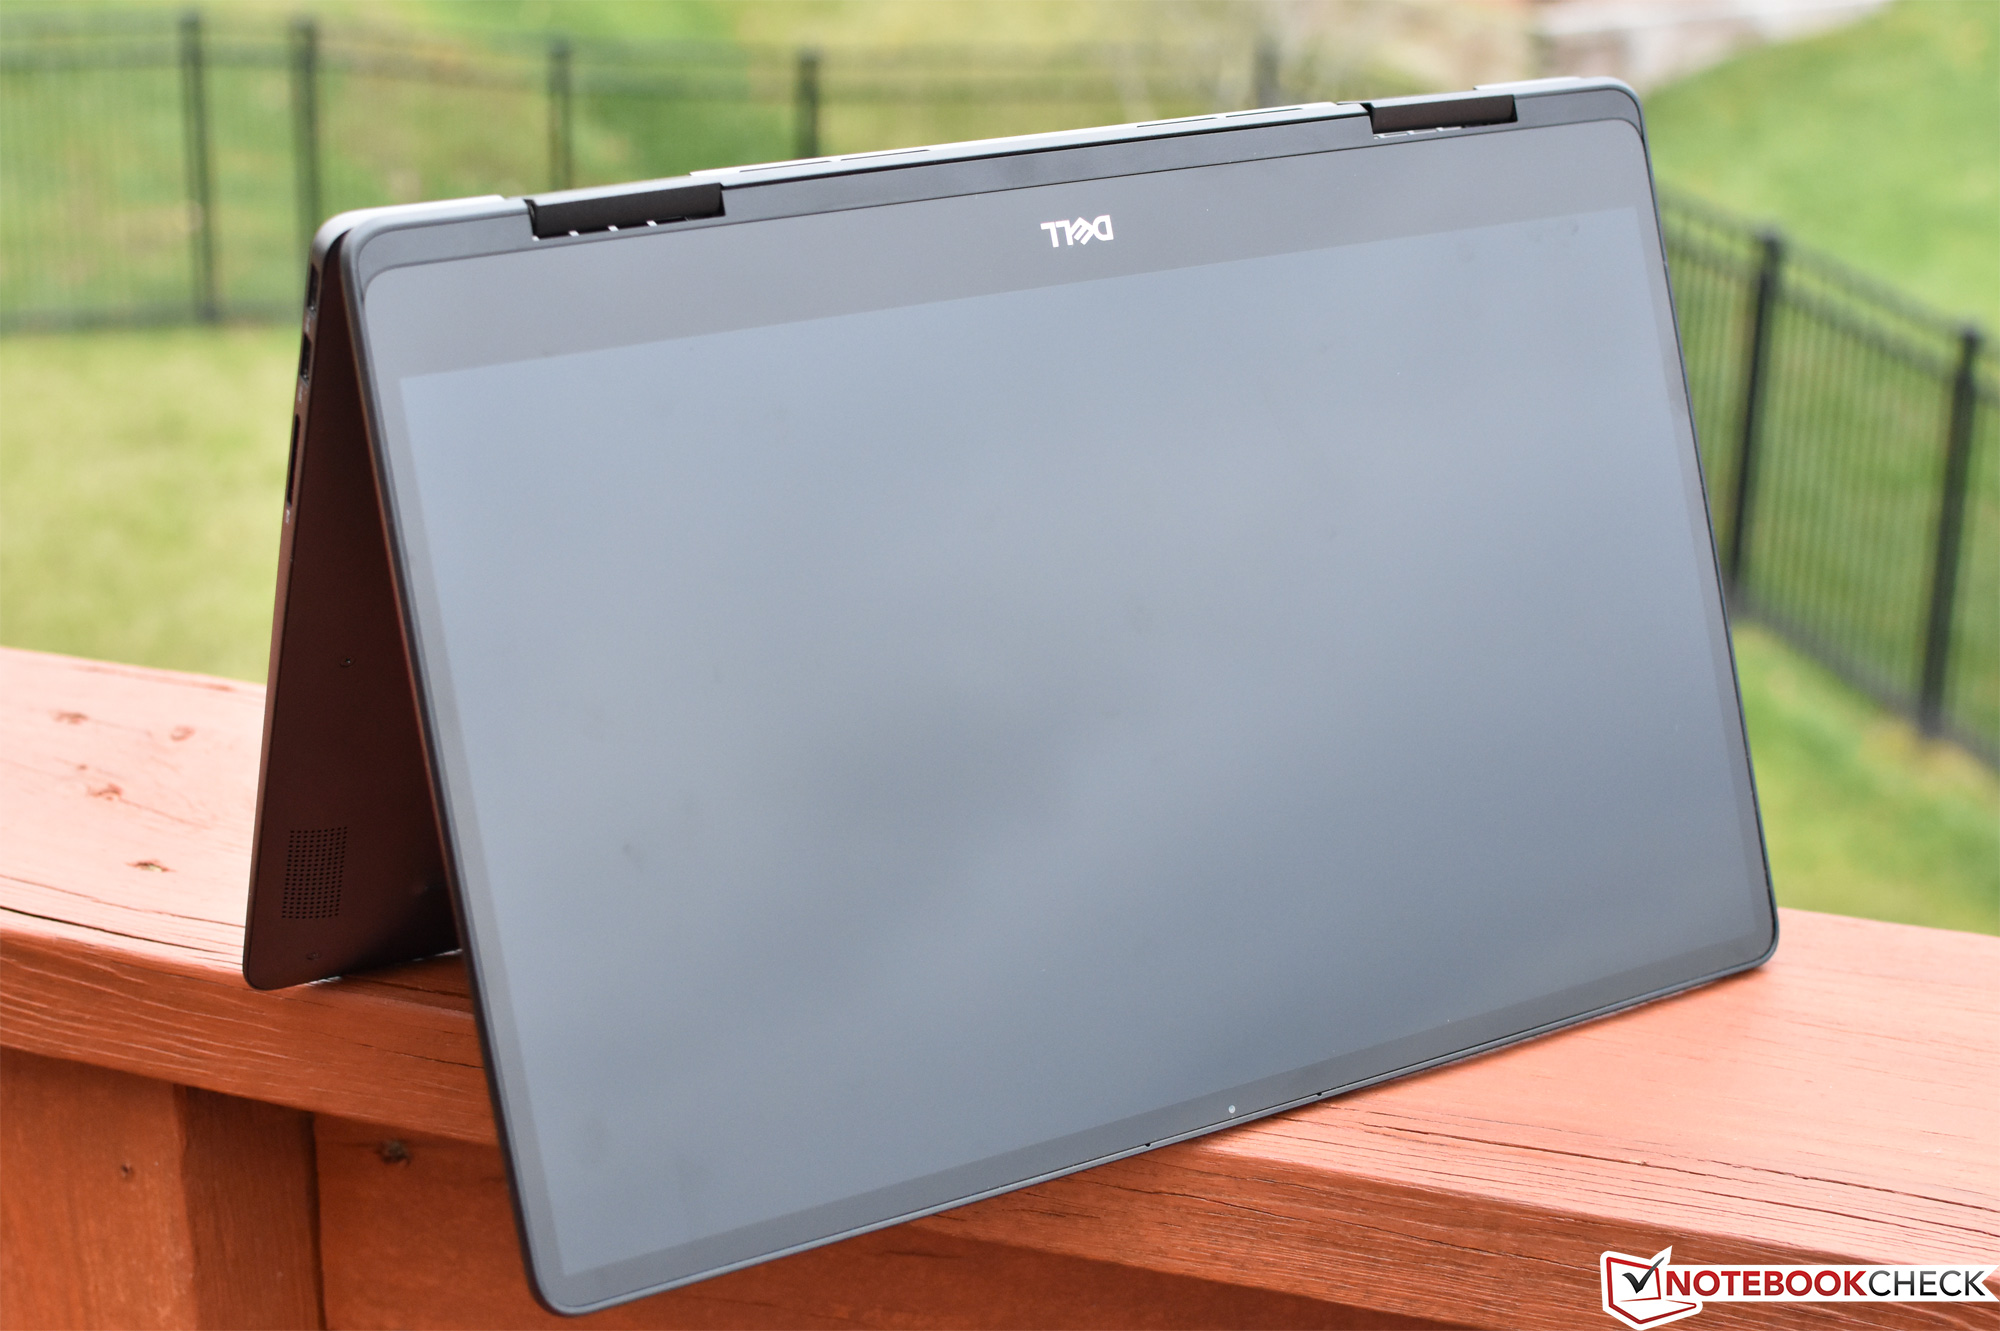
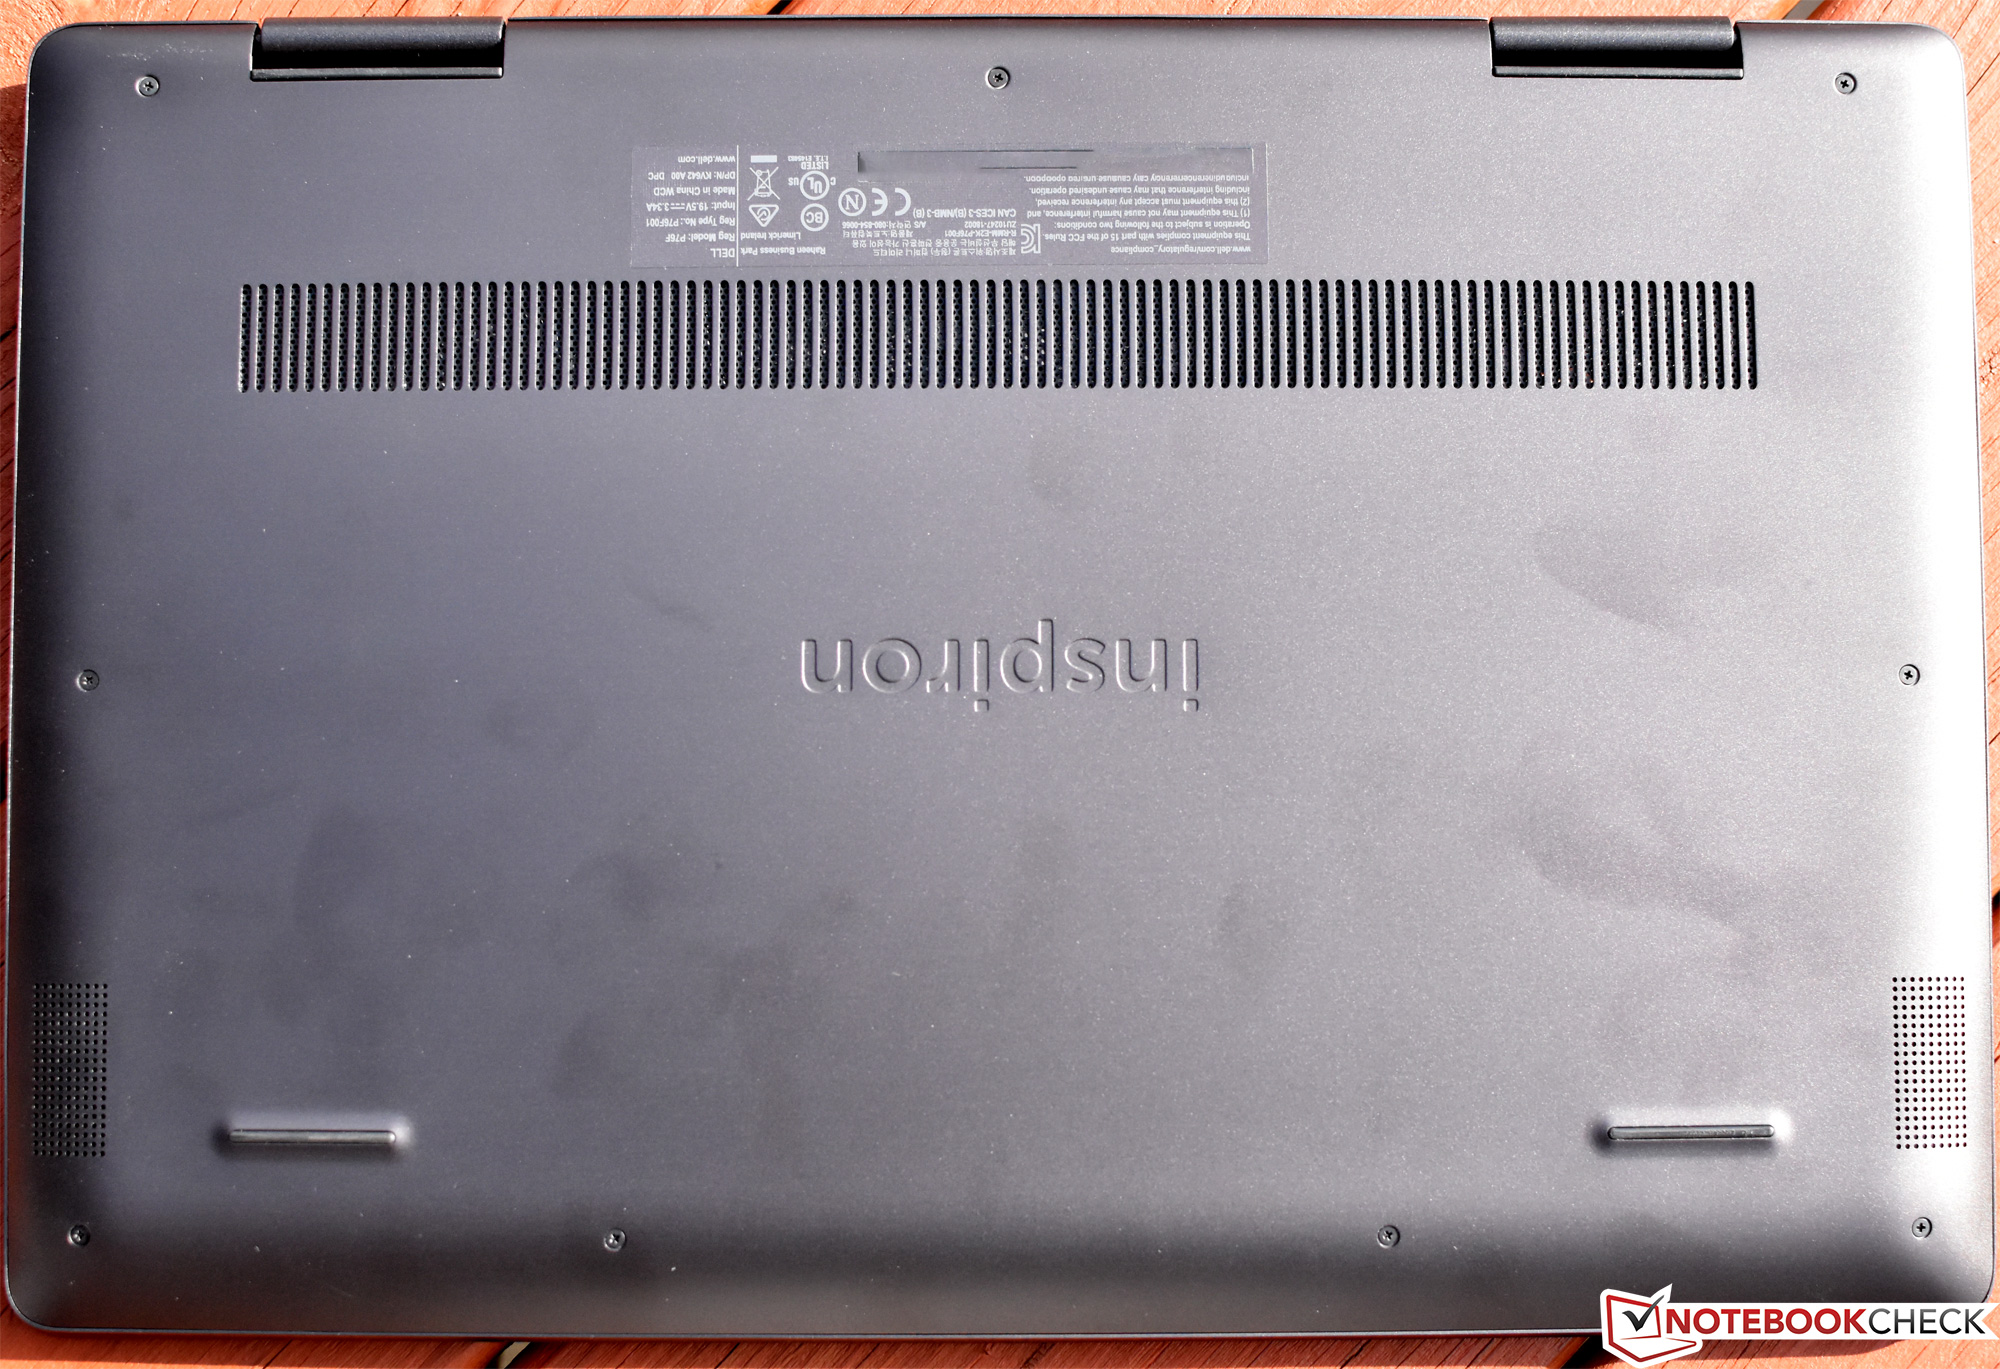
Um pouco Inspiron, um pouco XPS, o Inspiron 15 7000 2-em-1 Black Edition está um pouco mais próximo de seus pares mais avançados do que normalmente esperaríamos da marca. Isso é em grande parte um triunfo: em termos de design geral, estética e praticamente, a carcaça de alumínio toda em metal atualizada - embora não na mesma liga que o XPS - realmente faz a diferença. O portátil também possui um conjunto bastante bom de especificações, impulsionado por uma CPU Core i7-8565U de gama alta, GPU dedicada NVIDIA GeForce MX150 de gama baixa, 16 GB de RAM DDR4, e um SSD. É um pouco grande para um conversível que se destina a uso ocasional de tablet, mas funciona bem como um portátil padrão, por isso nunca é demais ter a opção. É fácil manter e atualizar também.
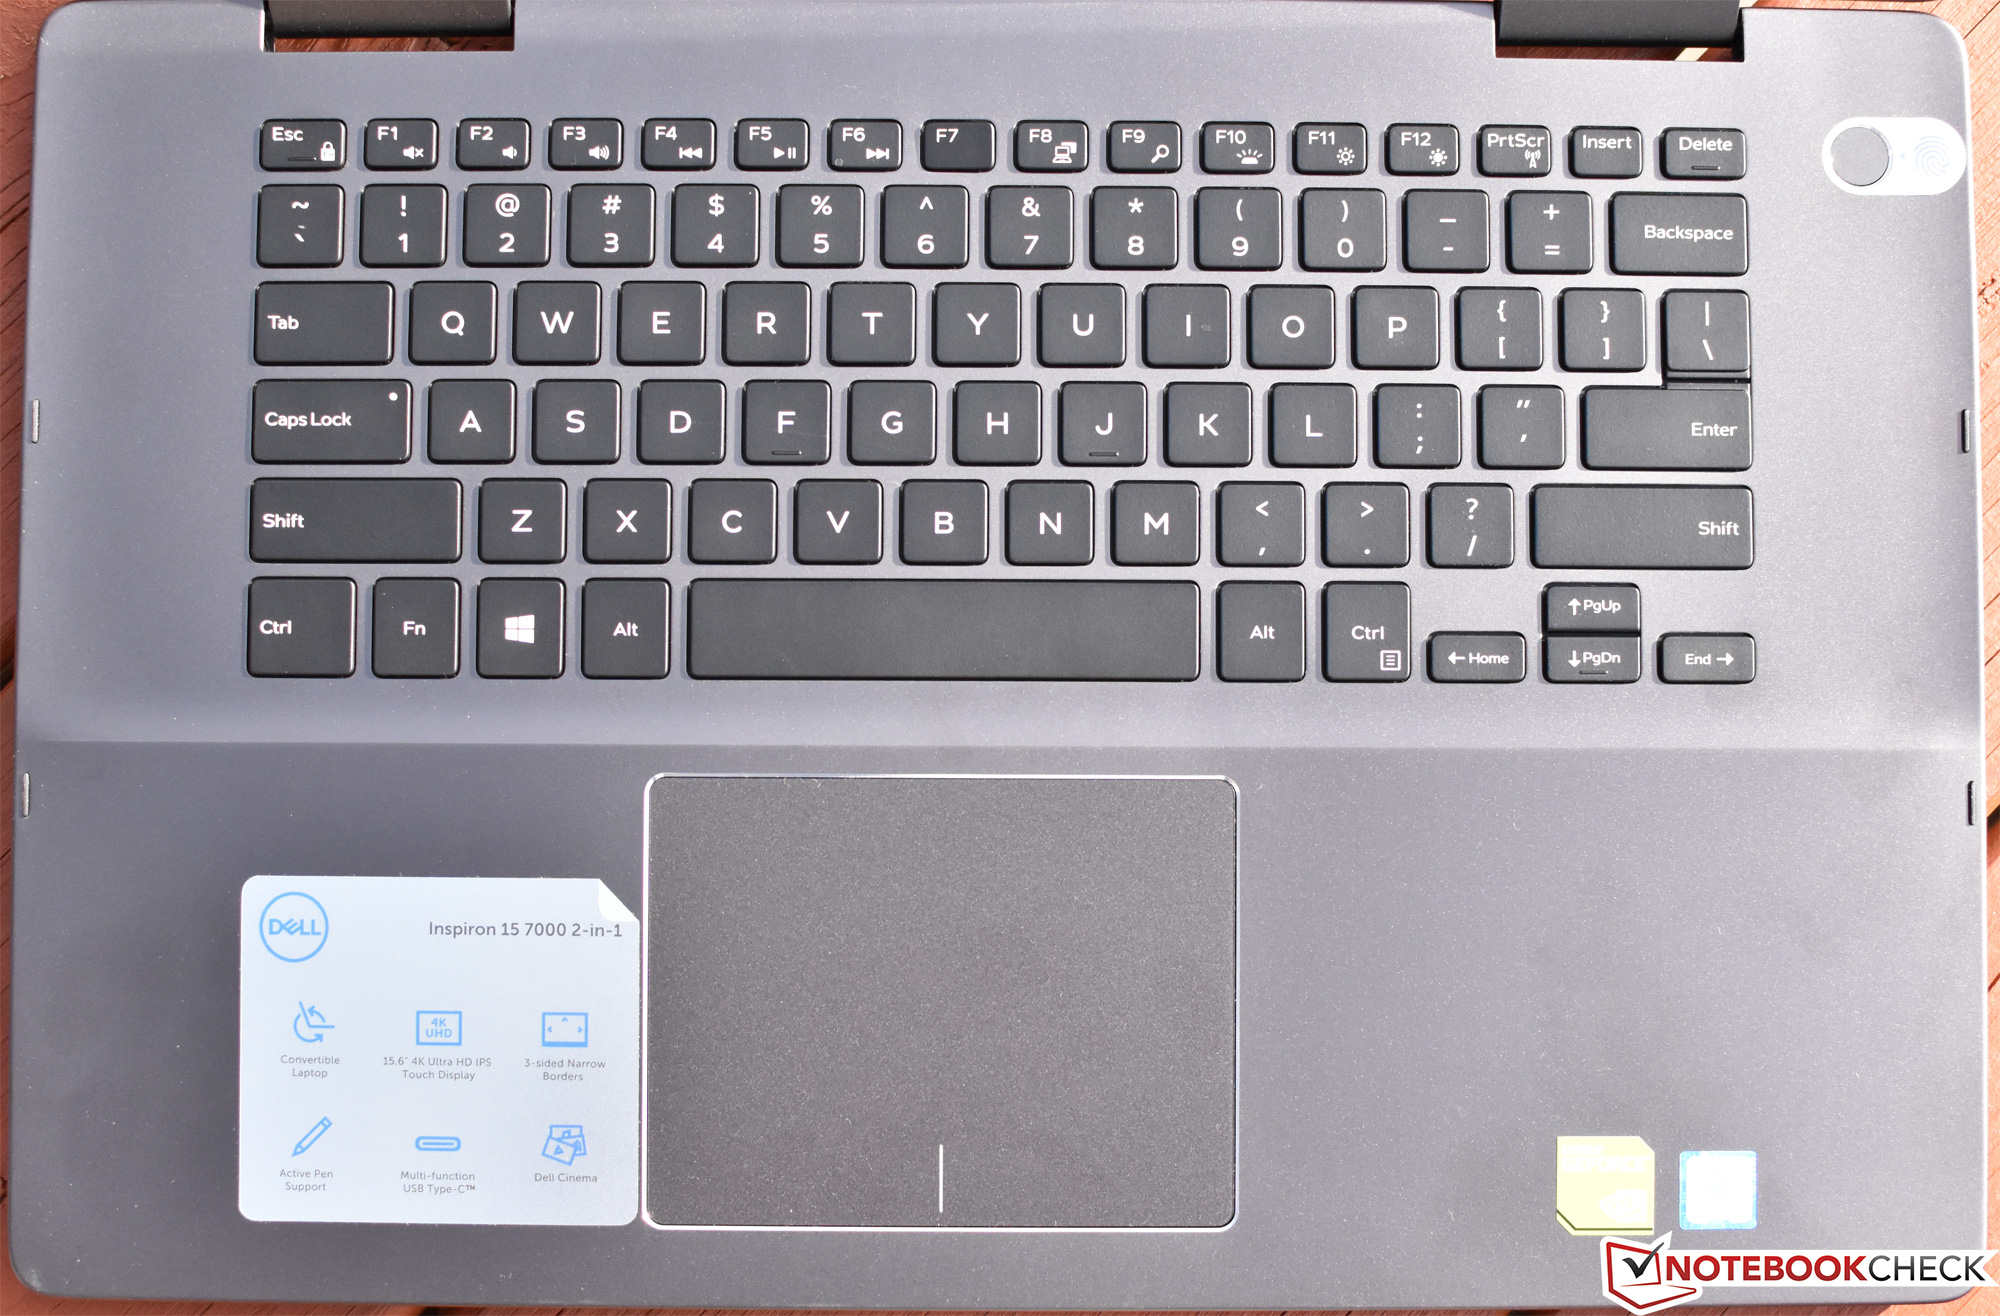
Por mais luxuoso que pareça ser, no entanto, cavar um pouco mais e passar um pouco mais de tempo com a máquina revela algumas divergências óbvias de seus irmãos mais sofisticados. Para começar, os dispositivos de entrada não podem ser comparados aos do Dell XPS 15 ou HP Spectre x360; o teclado é meramente aceitável e o touchpad - embora confortável para apontar - é prejudicado por botões integrados um tanto irritantes. O desempenho da CPU é bom para uso geral, mas sob cargas sustentadas, o Core i7-8565U na unidade de análise atual cai para níveis de desempenho abaixo mesmo dos chips mais baratos. O desempenho da GPU está um pouco acima da média para o MX150, mas é claro, não se compara com outros como digamos o XPS 15, que traz um GTX 1050 Ti Max-Q muito mais capaz. O SSD NVMe realmente não está na mesma liga da maioria das outras unidades NVMe, prejudicado principalmente pela velocidade de gravação fraca. A duração da bateria é relativamente curta, graças principalmente a uma bateria subdimensionada. E, finalmente, embora certamente não seja limitado aos Inspirons, o ruído elétrico é definitivamente perceptível em uma sala silenciosa.
Sim, a $1.333,00, o Inspiron 7000 2-em-1 Black Edition é um pouco caro para um PC de entretenimento convencional - mas, embora o preço tenha subido, o nível de qualidade também aumentou, indiscutível e tangivelmente.
Em outros lugares, a máquina é razoavelmente equilibrada. O consumo de energia é surpreendentemente baixo para um portátil com esses componentes, as temperaturas são na maioria das vezes gerenciáveis, os alto-falantes são bastante decentes e a tela - apesar de seu brilho e contraste serem meramente medianos - é colorida e atraente. A esse preço, também pode valer a pena considerar o Dell XPS 15 ou HP Spectre x360—então dê uma olhada em ambos os modelos antes de se comprometer. Mas na maior parte, perdoando algumas arestas em relação aos dispositivos de entrada, duração da bateria e expectativas de desempenho ideal, o Inspiron é uma boa escolha para um PC doméstico cotidiano.
Dell Inspiron 15 7000 2-in-1 Black Edition
- 12/05/2018 v6 (old)
Steve Schardein
Price comparison
