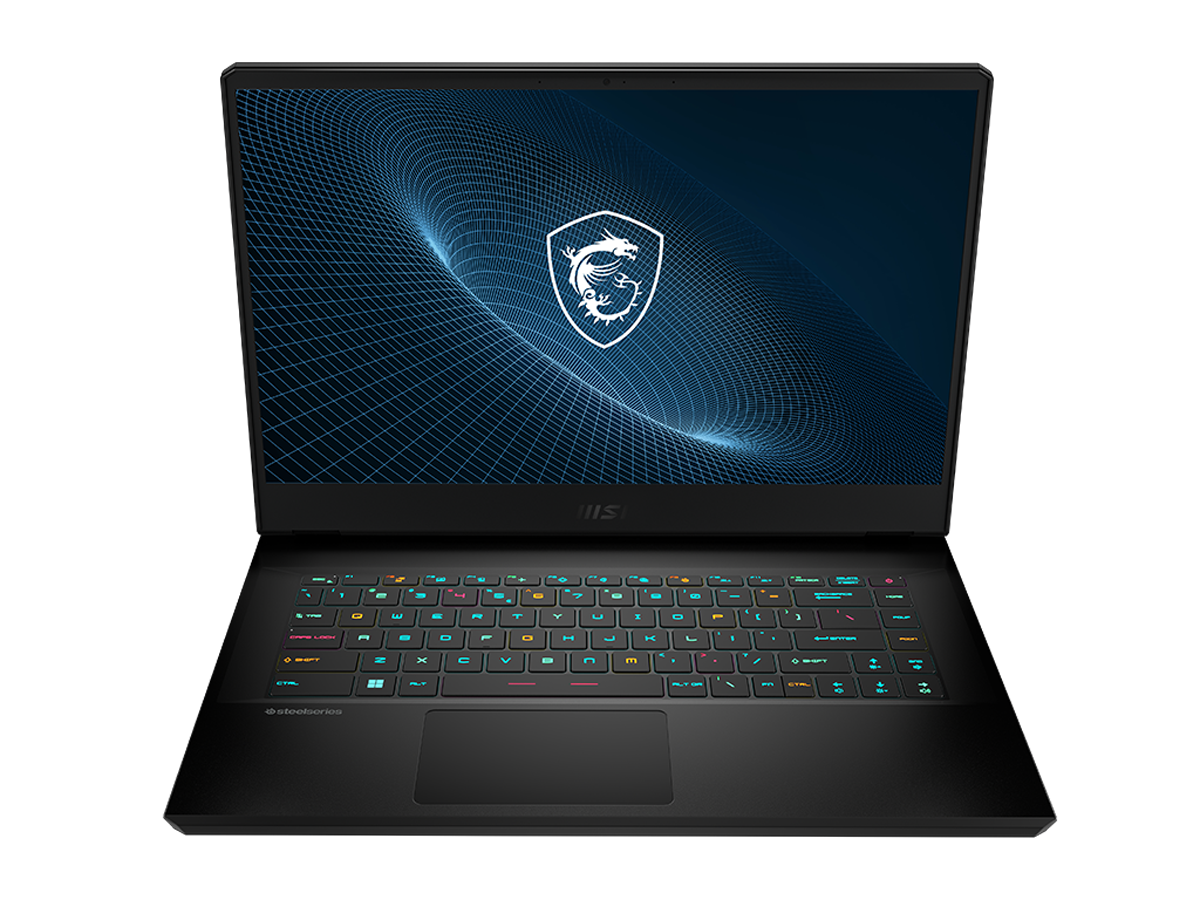
MSI Vector GP66 12UGS revisão de laptop: 150 W TGP GeForce RTX 3070 Ti sweet spot
A MSI foi um dos primeiros grandes jogadores a disponibilizar laptops para jogos do 12º gênero Alder Lake-H no início do mês passado. Embora os novos modelos MSI sejam quase visualmente idênticos aos modelos do 11º gênero do ano passado, eles trazem consigo CPUs e GPUs mais rápidos, assim como novas opções de exibição que os entusiastas podem apreciar.
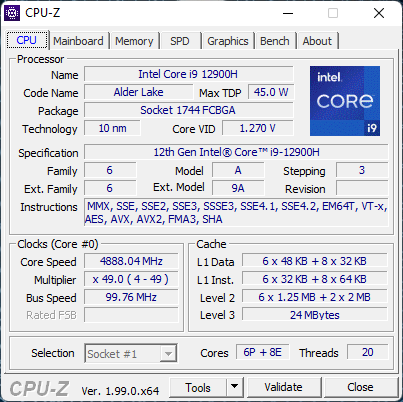
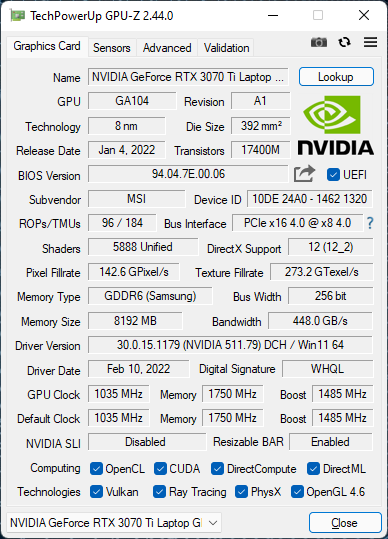
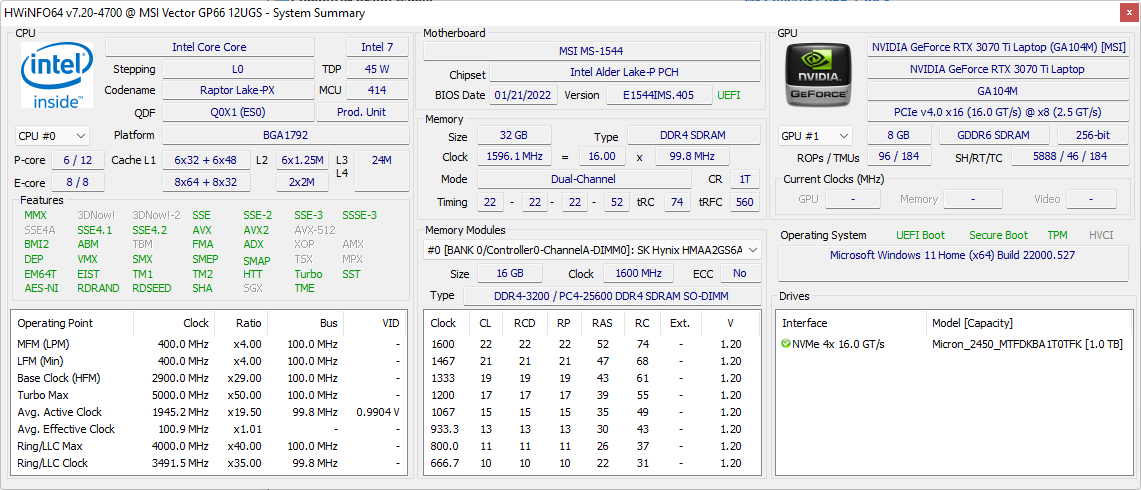
A unidade em revisão hoje é o Vector GP66, que teve sucesso no ano passado GP66 Leopardo. Nossa configuração específica com a CPU Core i9-12900H, 150 W GeForce RTX 3070 Ti GPU, 32 GB RAM, 360 Hz 1080p IPS display, e 1 TB NVMe SSD pode ser encontrada online por cerca de US$2400 USD. Outras SKUs estão disponíveis com o display RTX 3060, RTX 3080, QHD 165 Hz ou FHD 144 Hz, ou Core i7-12700H em seu lugar.
As alternativas para o MSI Vector incluem outros laptops de 15,6 polegadas de alcance médio superior como o Série Asus ROG Strix, Razer Blade 15 Modelo Base, Série Dell G15ou o Lenovo Legion Série S7. O MSI Vector não deve ser confundido com o Vetor Maingear.
Mais revisões da MSI:
Possíveis concorrentes em comparação
Avaliação | Data | Modelo | Peso | Altura | Size | Resolução | Preço |
|---|---|---|---|---|---|---|---|
| 86.9 % v7 (old) | 03/2022 | MSI Vector GP66 12UGS i9-12900H, GeForce RTX 3070 Ti Laptop GPU | 2.3 kg | 23.4 mm | 15.60" | 1920x1080 | |
| 85.4 % v7 (old) | 12/2021 | MSI GP66 Leopard 11UH-028 i7-11800H, GeForce RTX 3080 Laptop GPU | 2.3 kg | 23.4 mm | 15.60" | 1920x1080 | |
| 79.2 % v7 (old) | 09/2021 | MSI Katana GF66 11UG-220 i7-11800H, GeForce RTX 3070 Laptop GPU | 2.3 kg | 25 mm | 15.60" | 1920x1080 | |
| 85.9 % v7 (old) | 06/2021 | Asus TUF Gaming F15 FX506HM i7-11800H, GeForce RTX 3060 Laptop GPU | 2.3 kg | 24.9 mm | 15.60" | 1920x1080 | |
| 85.5 % v7 (old) | 03/2021 | Razer Blade 15 Base Edition 2021, i7-10750H RTX 3060 i7-10750H, GeForce RTX 3060 Laptop GPU | 2.1 kg | 19.9 mm | 15.60" | 1920x1080 | |
| 84.7 % v7 (old) | 06/2021 | Alienware m15 R5 Ryzen Edition R7 5800H, GeForce RTX 3060 Laptop GPU | 2.5 kg | 22.85 mm | 15.60" | 1920x1080 |
Caso
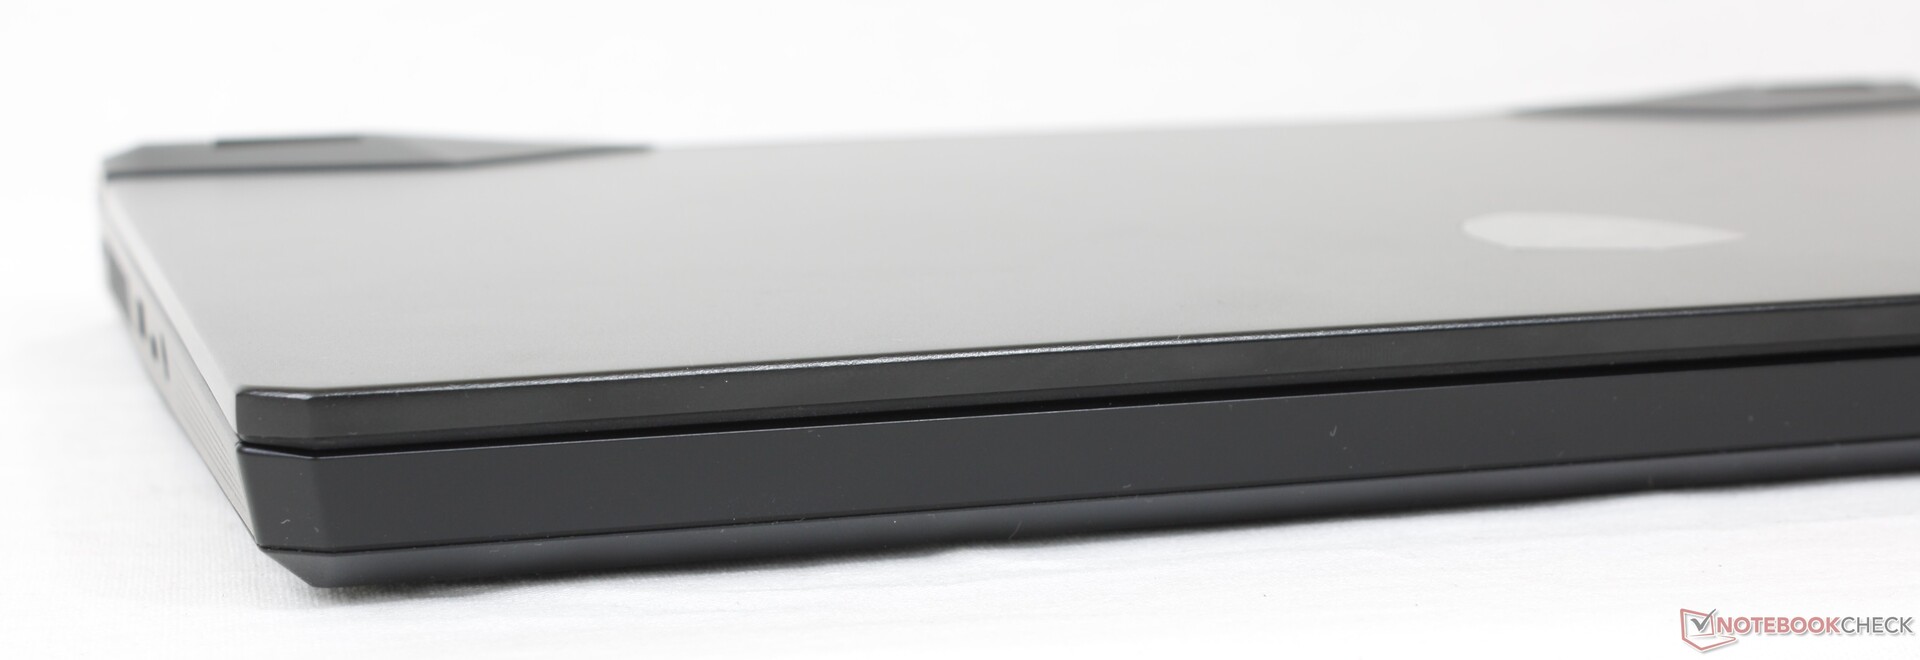
A MSI redesenhou seu GP66 no início do ano passado e, portanto, ainda é muito cedo para outra atualização visual. Assim, recomendamos verificar nossas revisões existentes sobre o GP66 com Intel da 10ª geração e GP66 com a 11ª geração Intel já que a maioria de nossos comentários sobre o chassi ainda se aplica ao nosso modelo Intel GP66 12th gen aqui. Há ainda algumas pequenas diferenças em relação aos portos, no entanto, as quais iremos revisar na próxima seção.
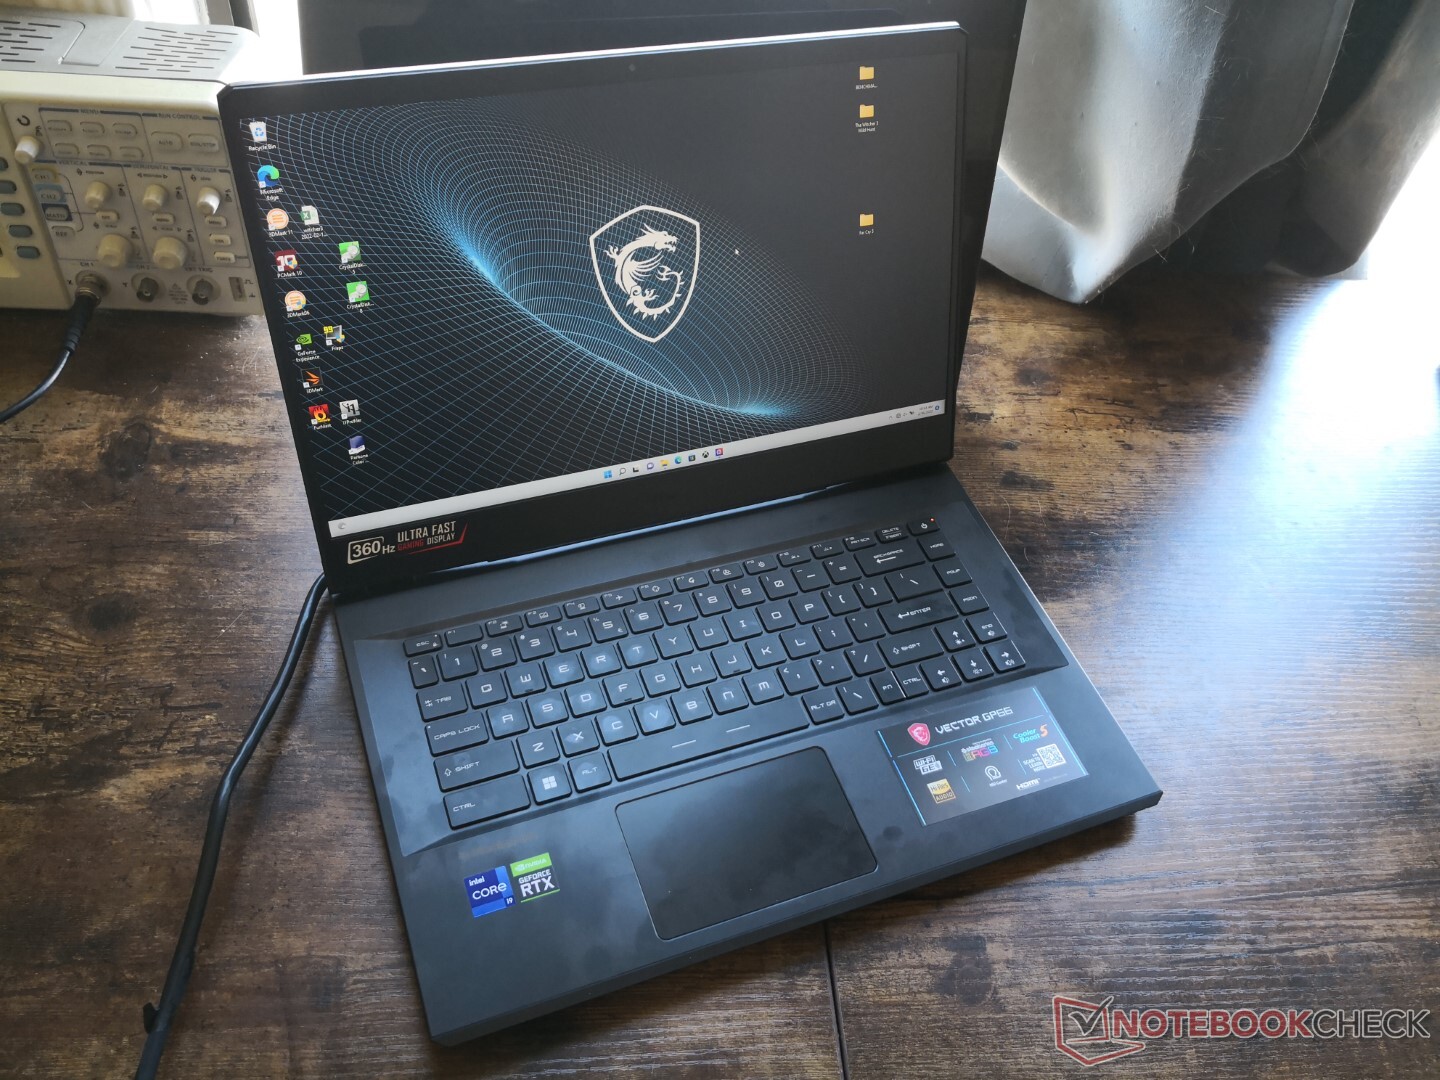
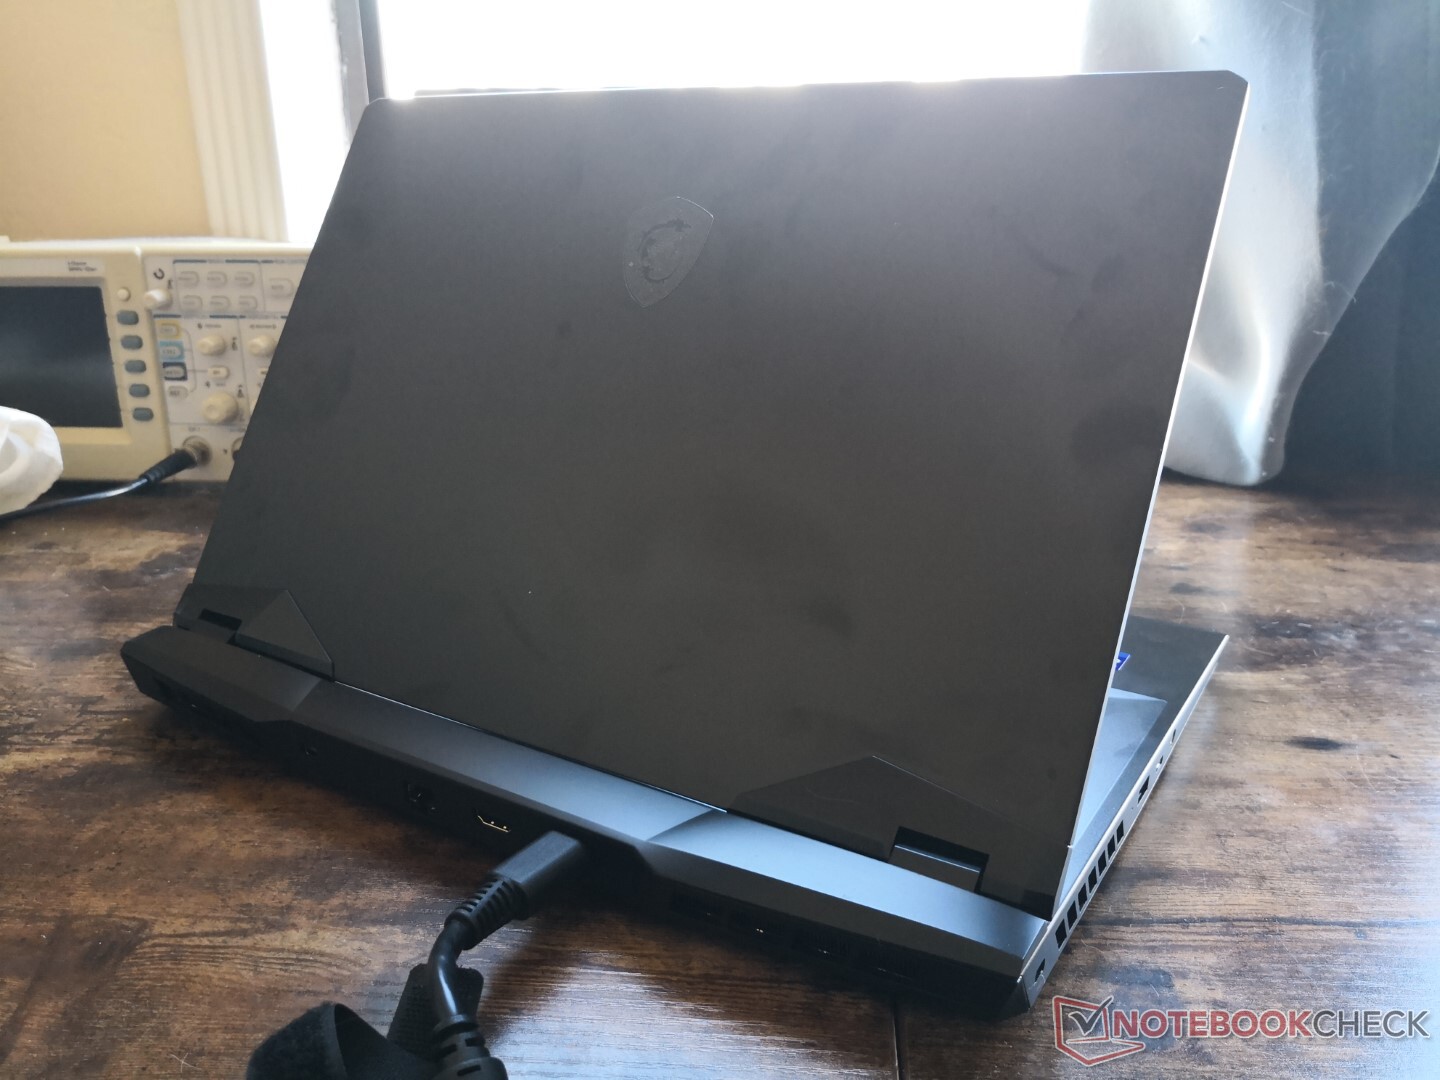
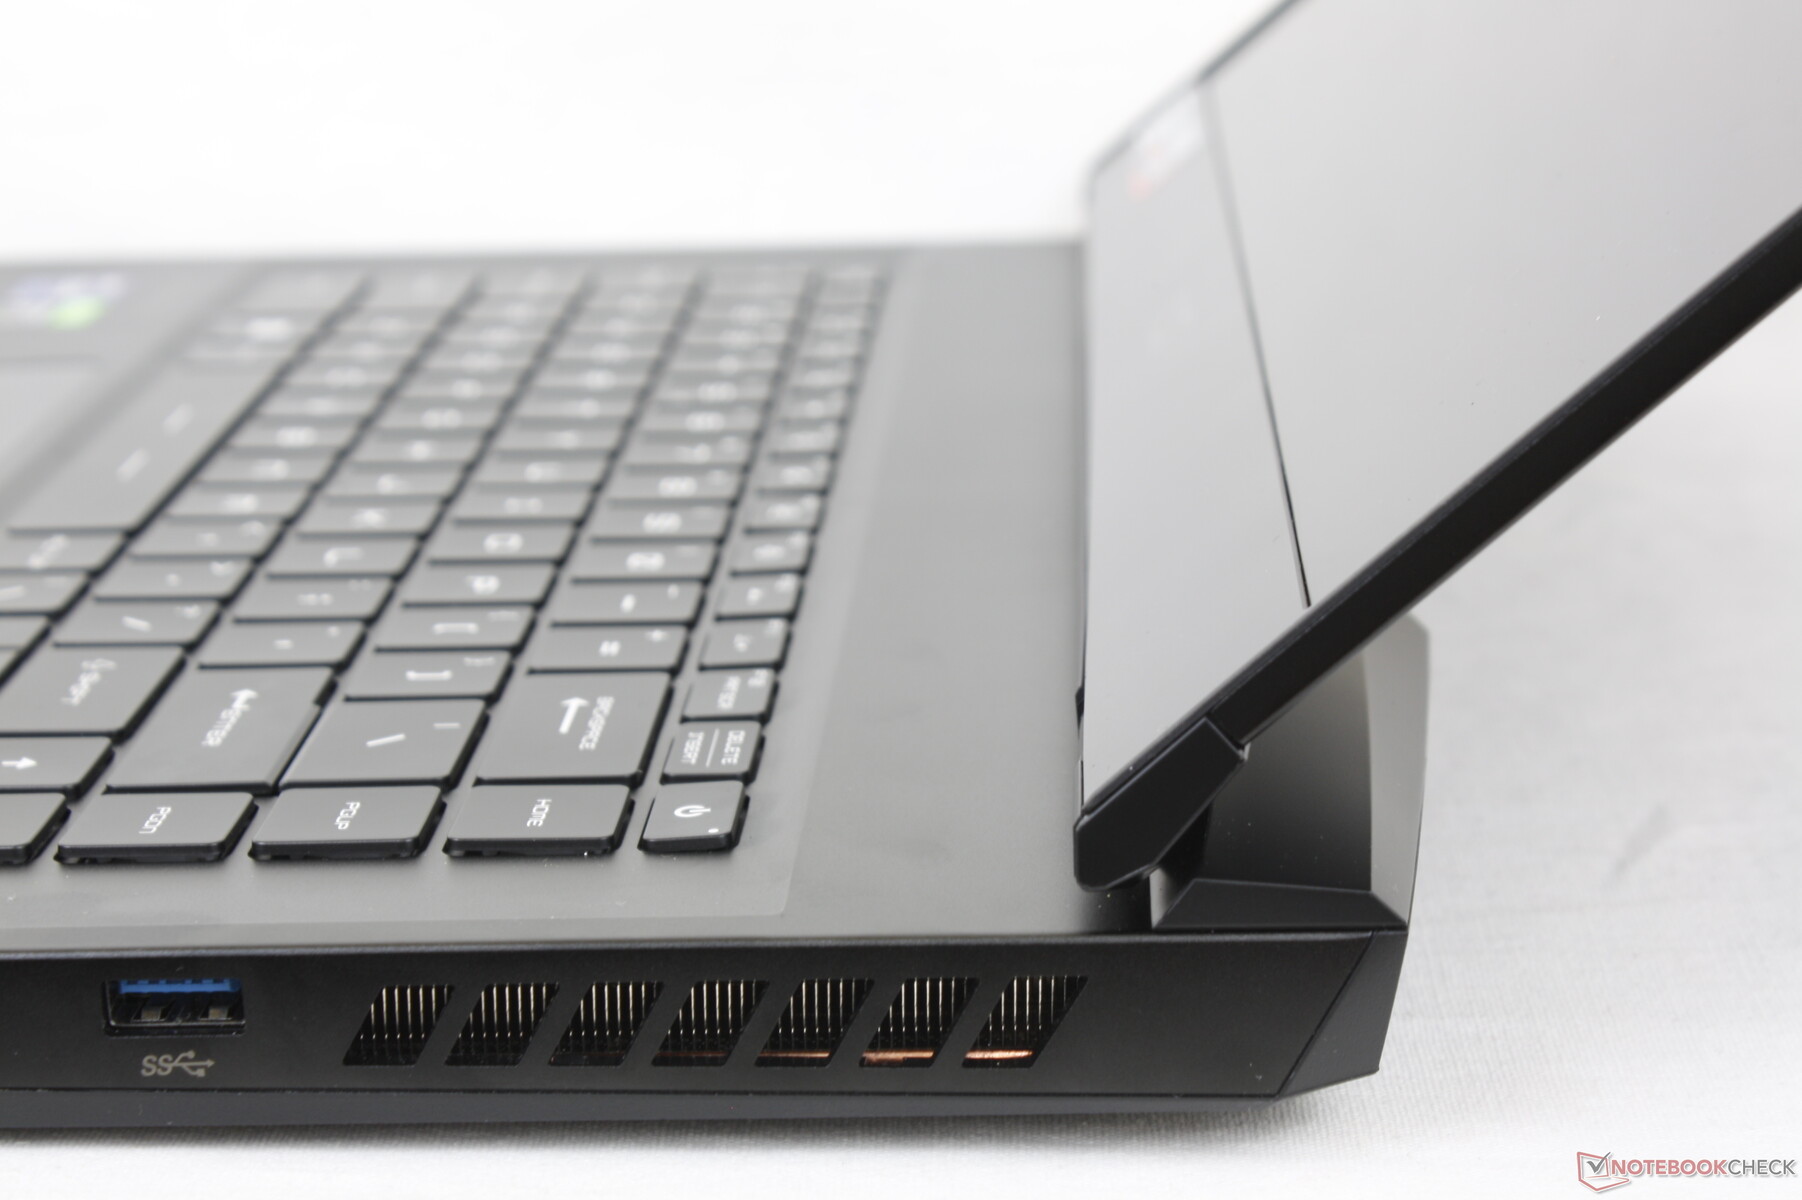
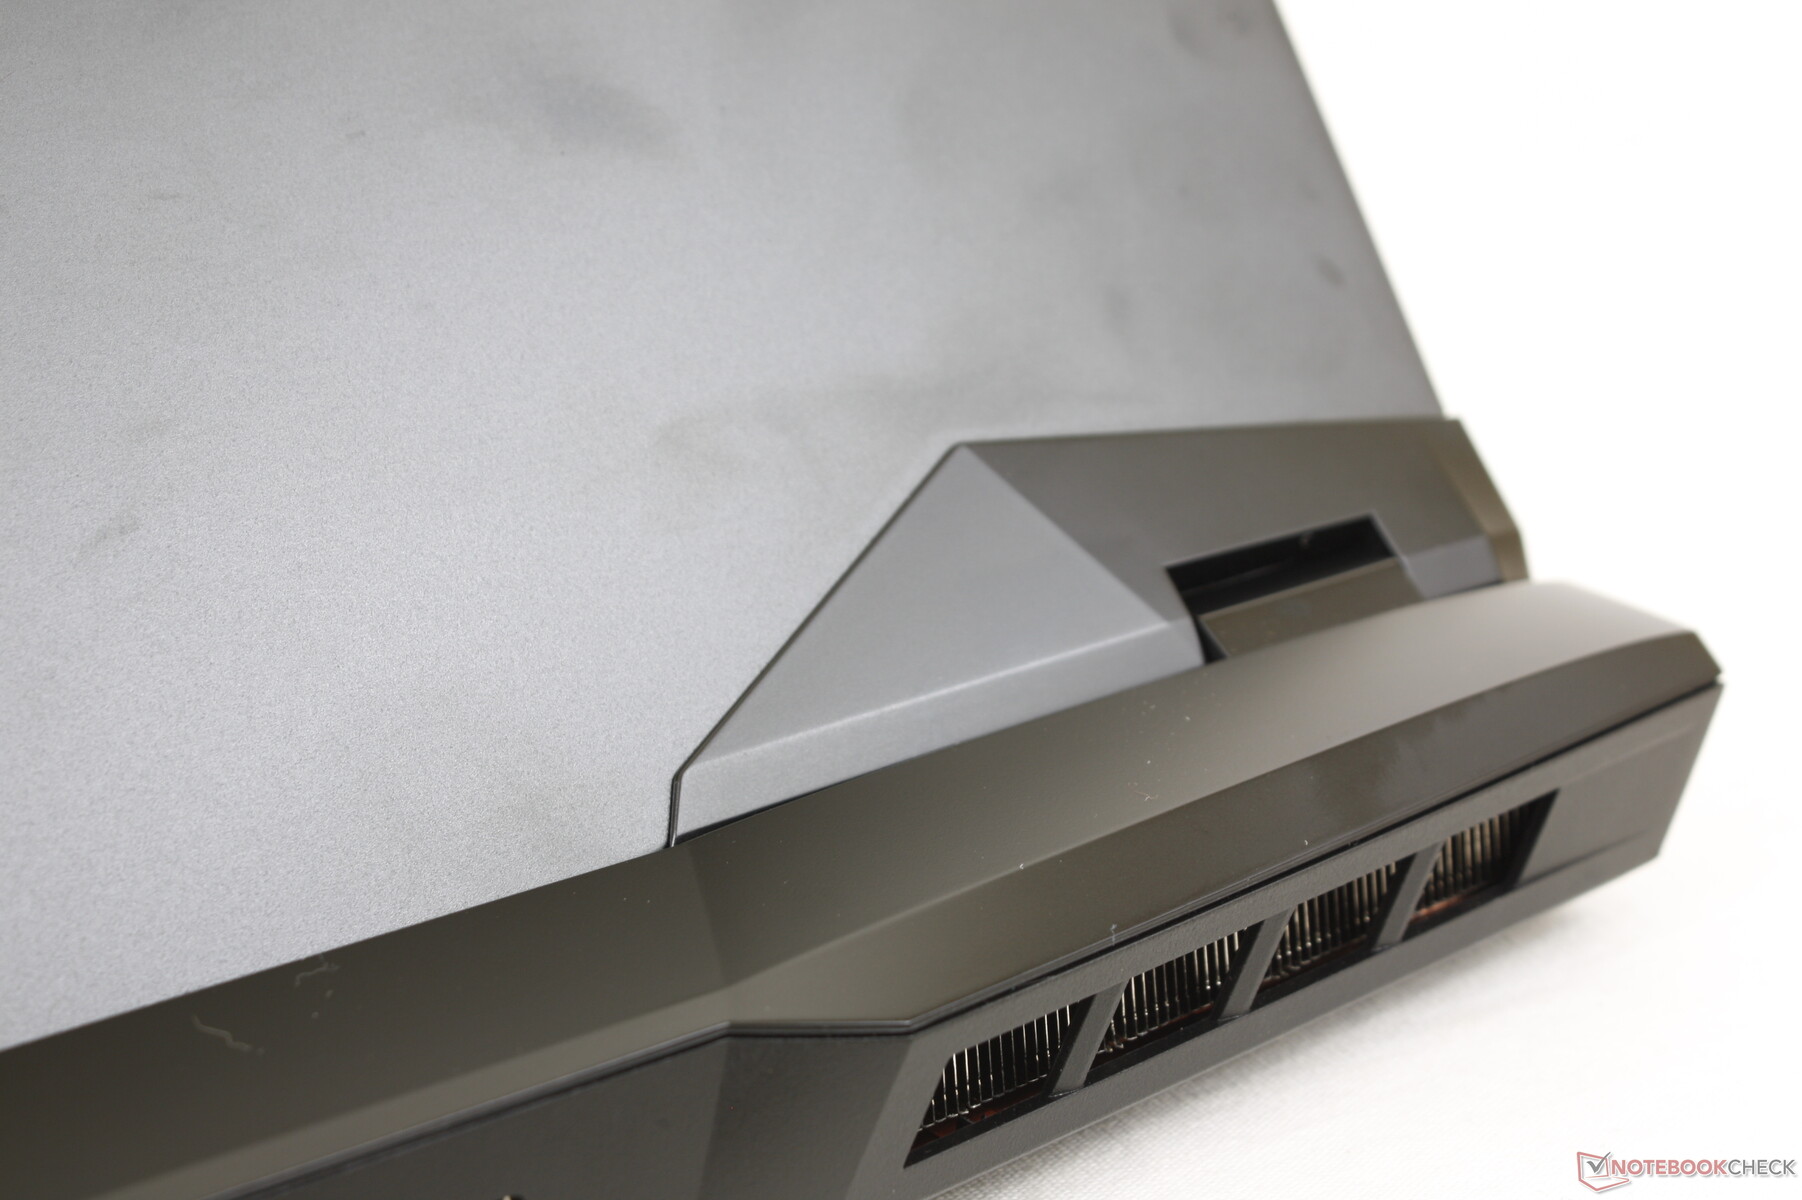
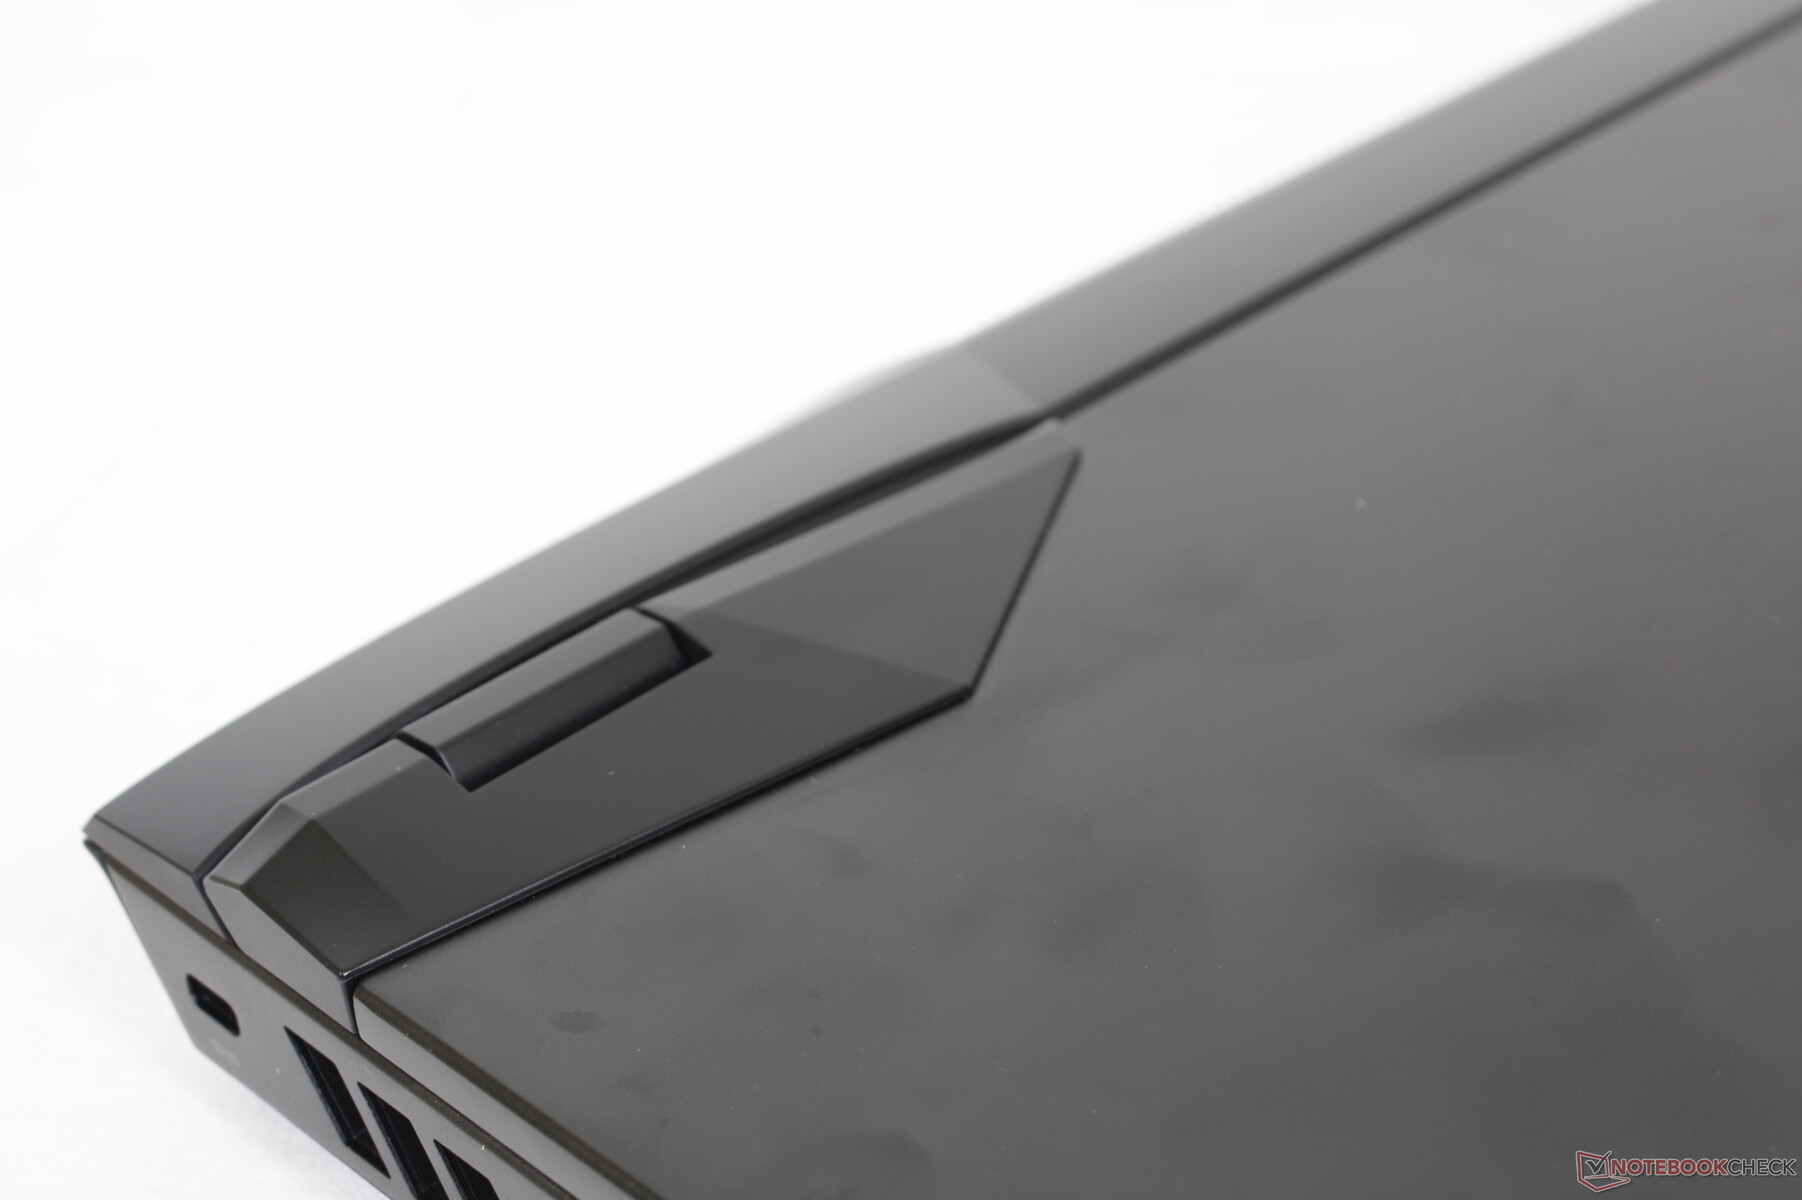
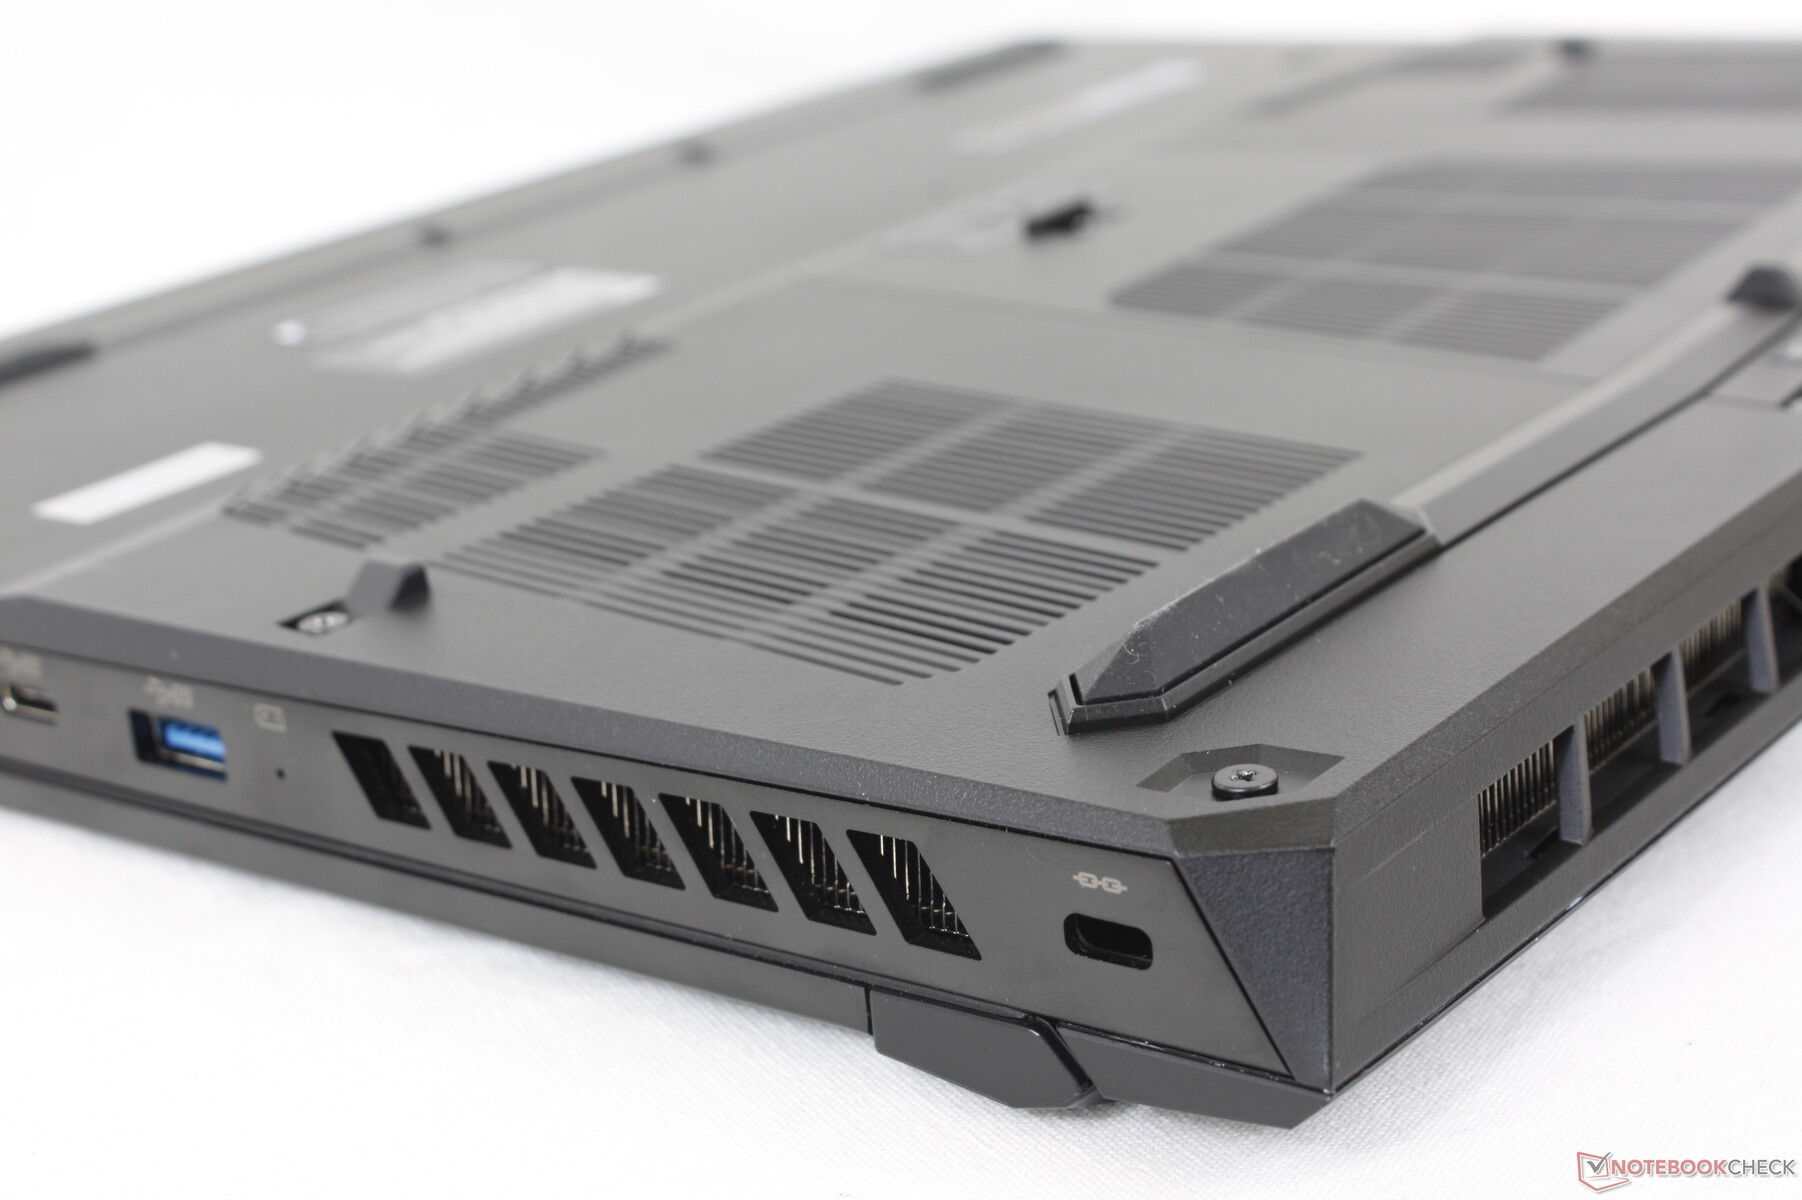
A falta de grandes mudanças significa que o Vector GP66 2022 ainda sofre das mesmas falhas que encontramos em nosso Leopardo GP66 2021. Em particular, a parte frontal de nossa unidade às vezes ficava solta para deixar primeiras impressões menos que positivas. O design visual é, de outra forma, um derivado mais elegante e sutil da grande série GE ou GT.
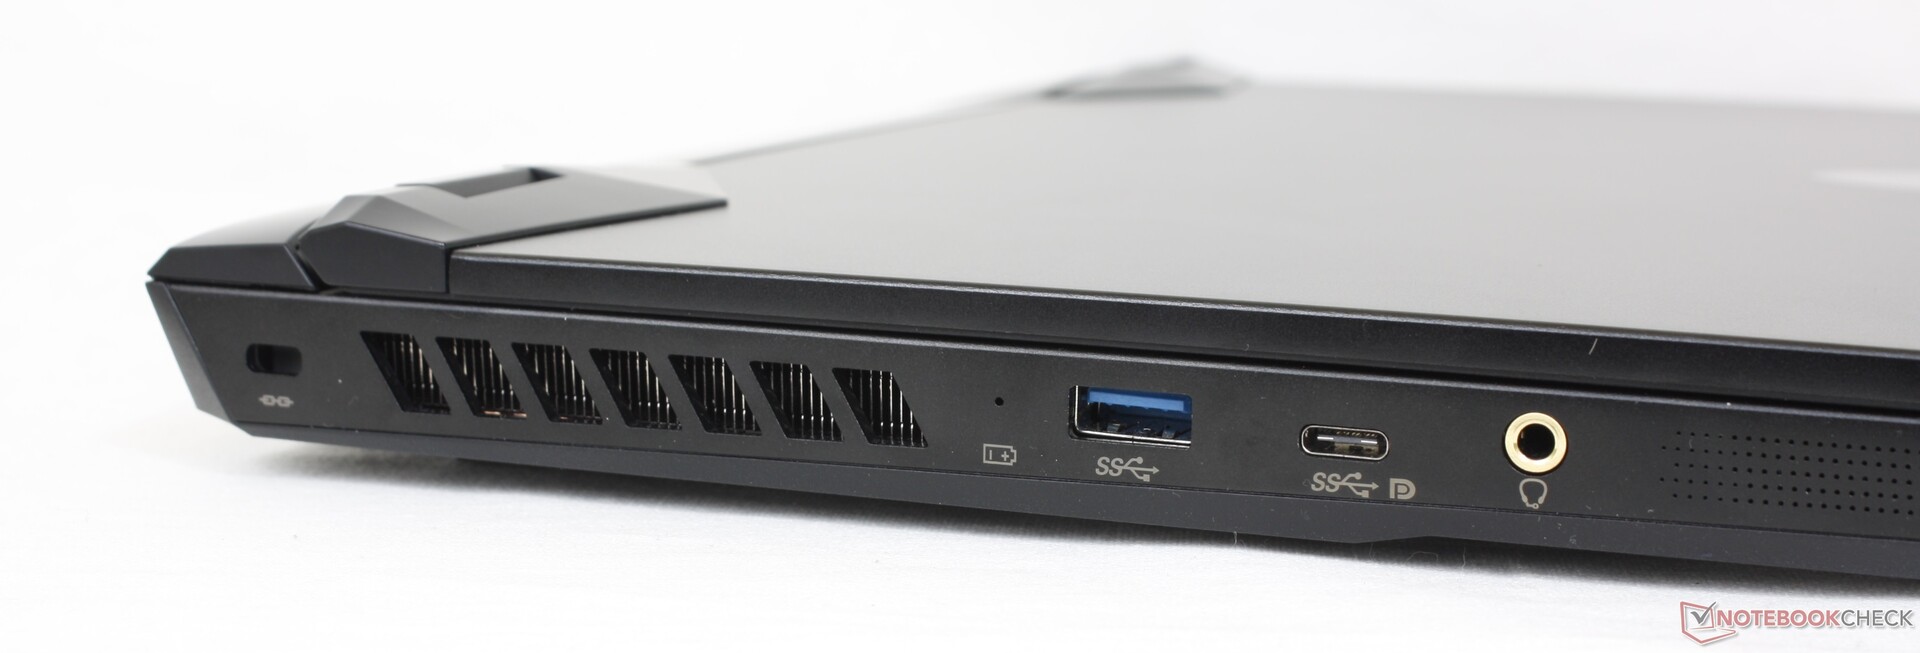
Conectividade
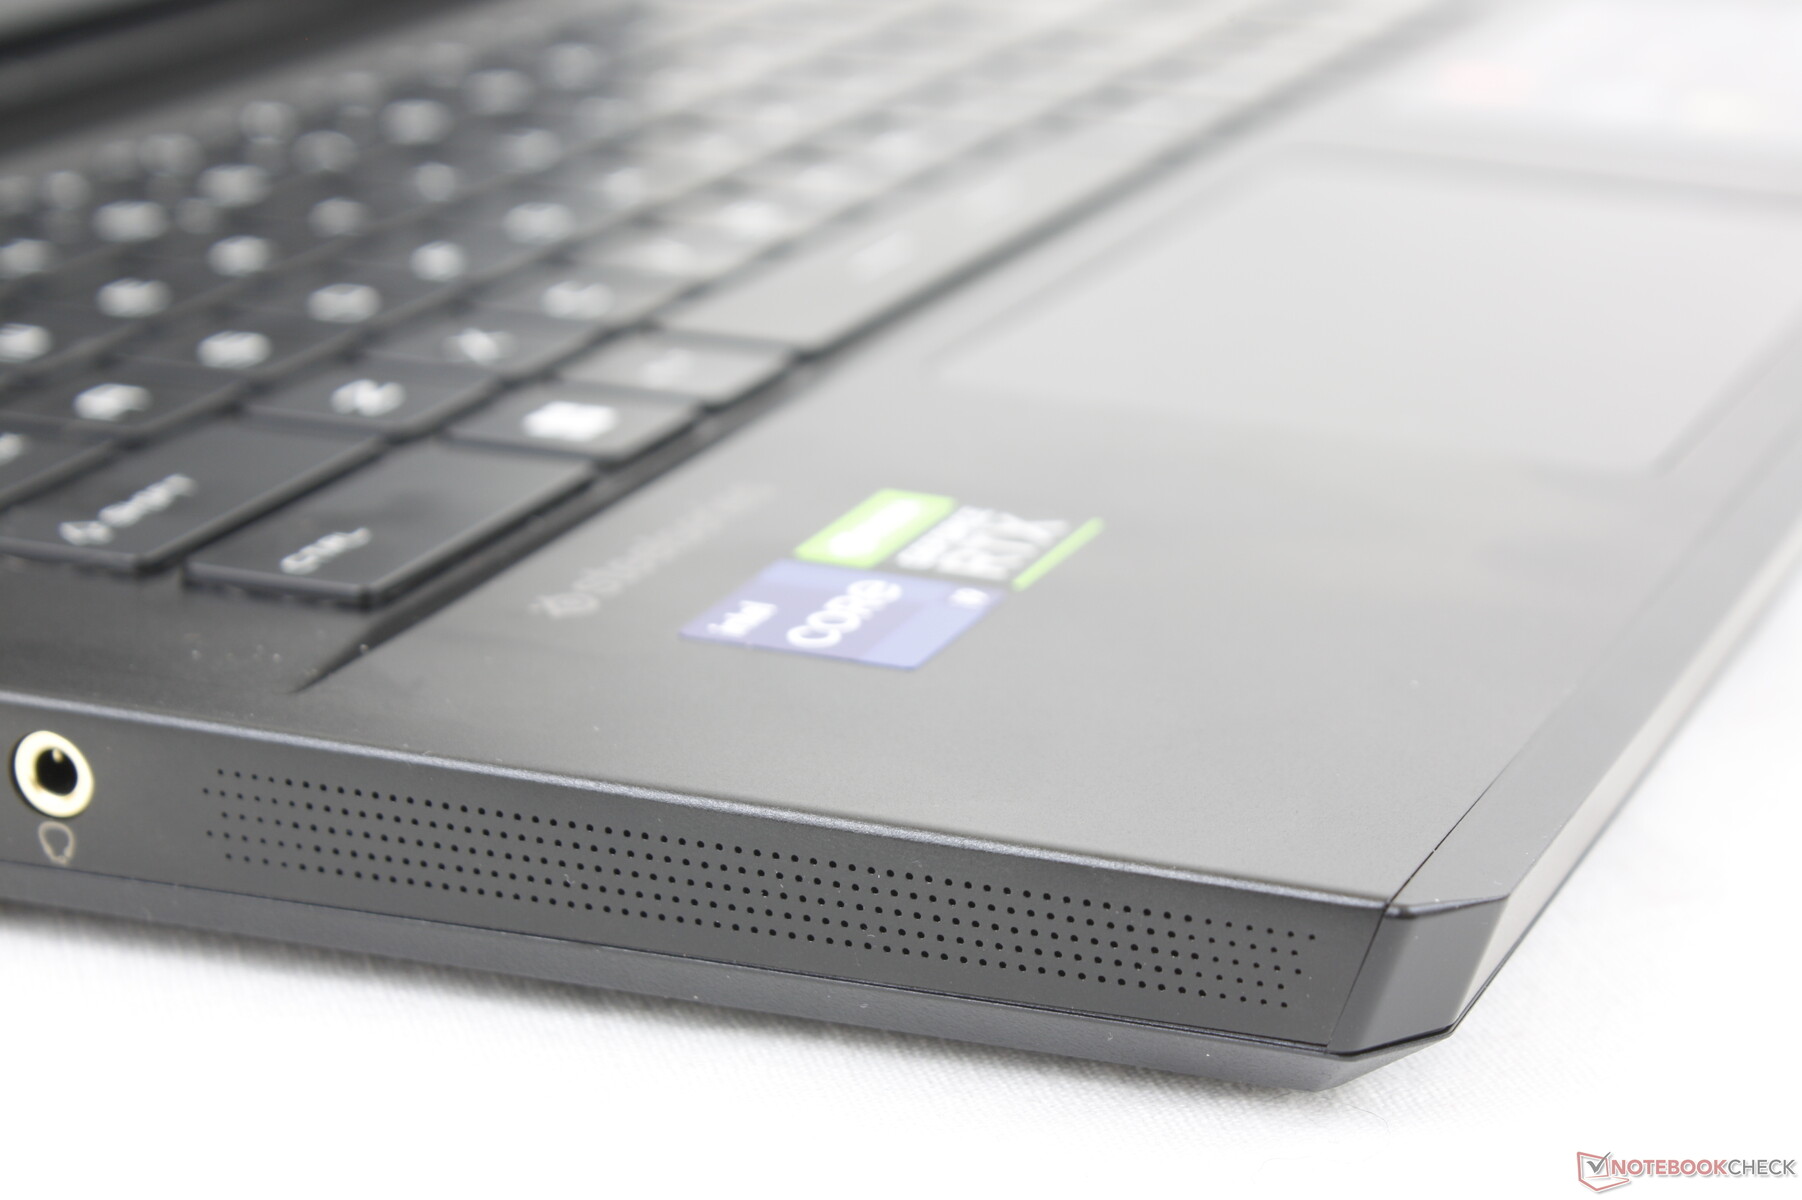
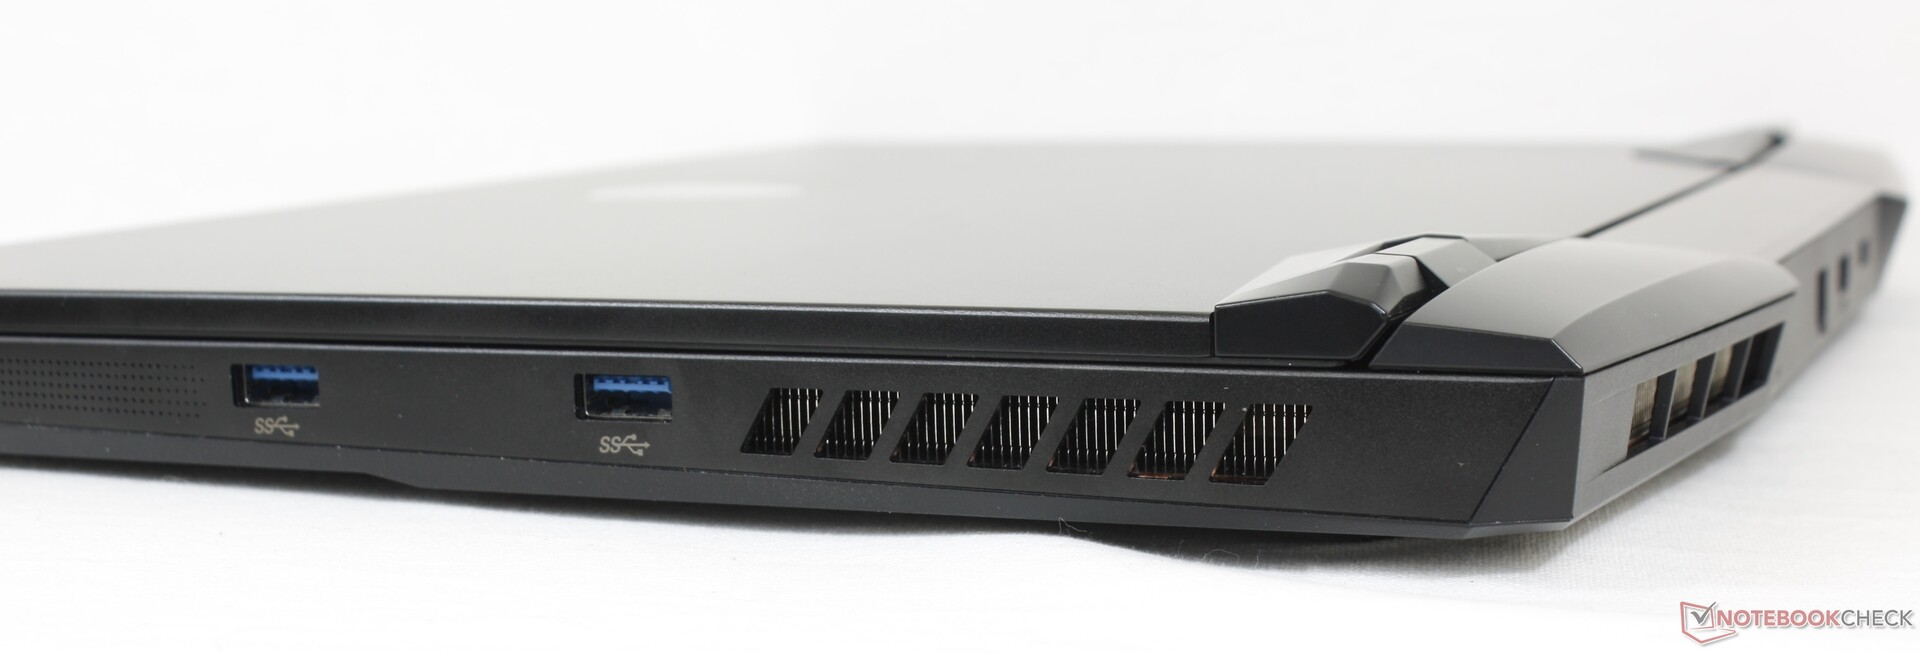
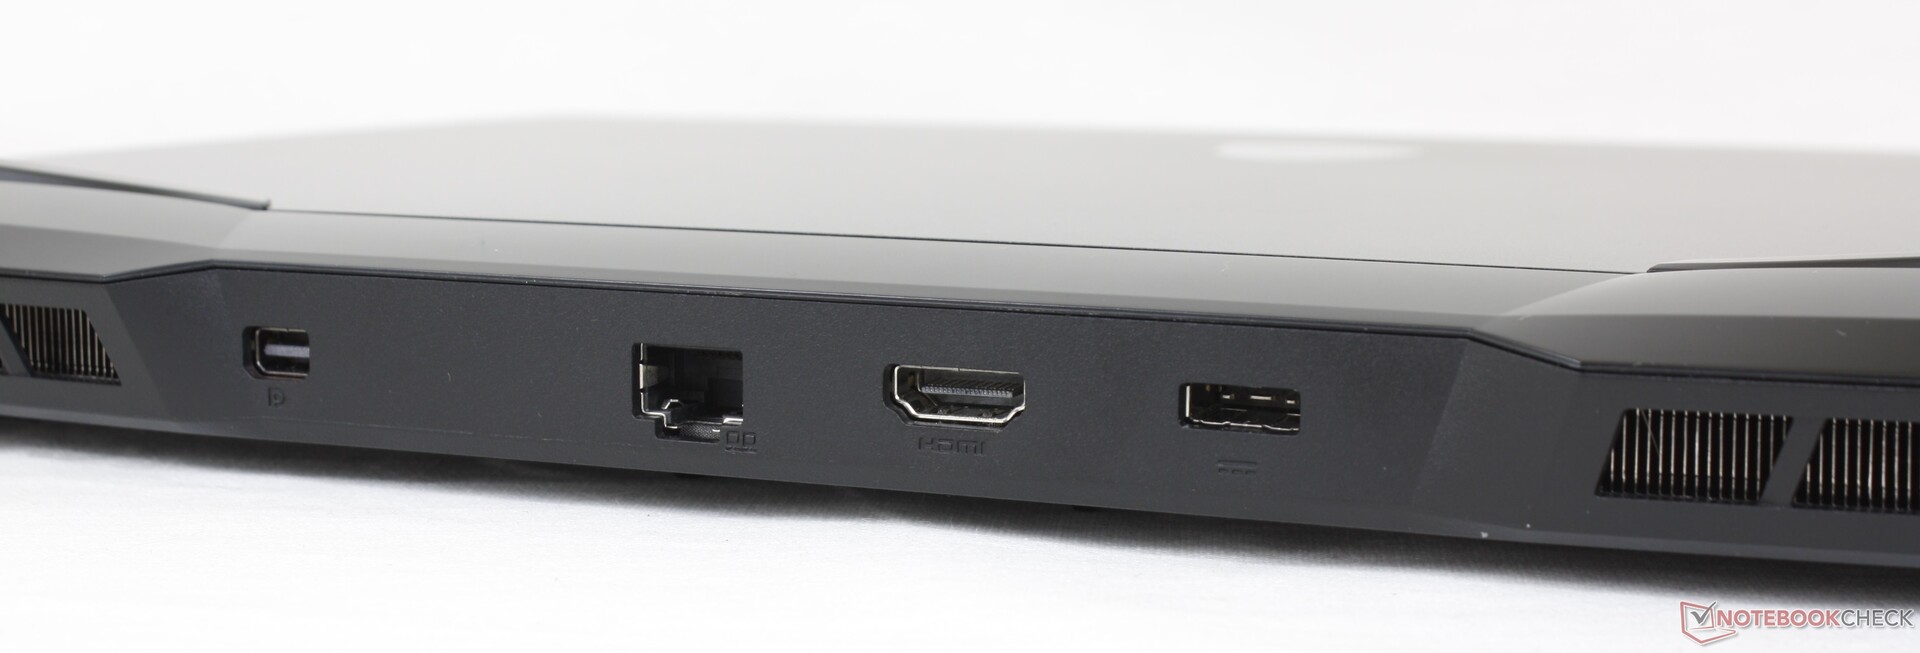
As opções de porto são ligeiramente diferentes do que foi oferecido no GP66 Leopard. Para um, a porta USB-C que estava ao longo da parte traseira do GP66 Leopard está agora ao longo da borda esquerda para facilitar o acesso. Além disso, foi adicionado um mini-DisplayPort para maior compatibilidade com monitores externos que suportam a sincronização adaptativa
Note que a porta USB-C continua a não suportar Thunderbolt. Os usuários terão que atualizar para a série MSI GS, GE, ou GT para tal recurso.
Comunicação
Webcam
A câmera permanece 720p e sem suporte para IR ou Windows Olá. Os laptops MSI continuam a usar um obturador eletrônico ao invés de um obturador físico, ao contrário da maioria dos Ultrabooks ou laptops comerciais.


Manutenção
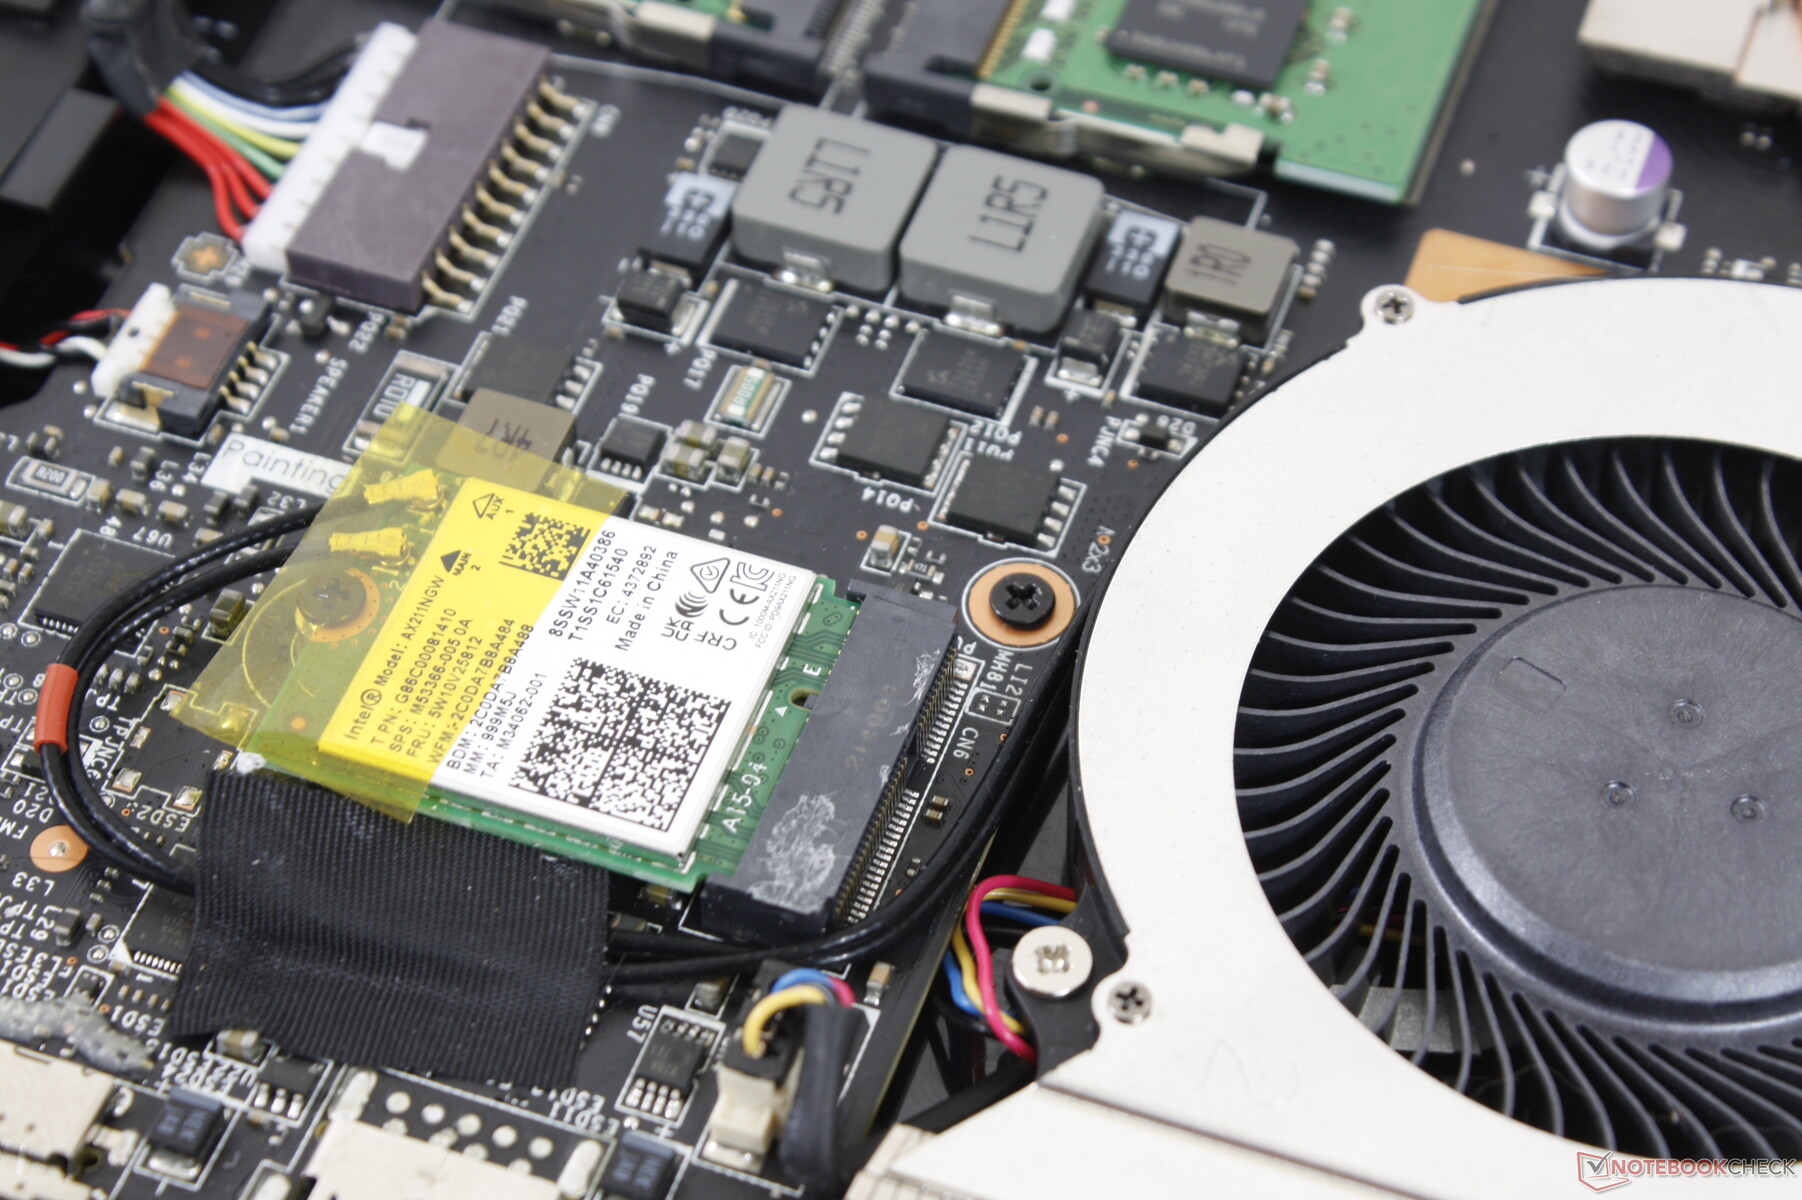
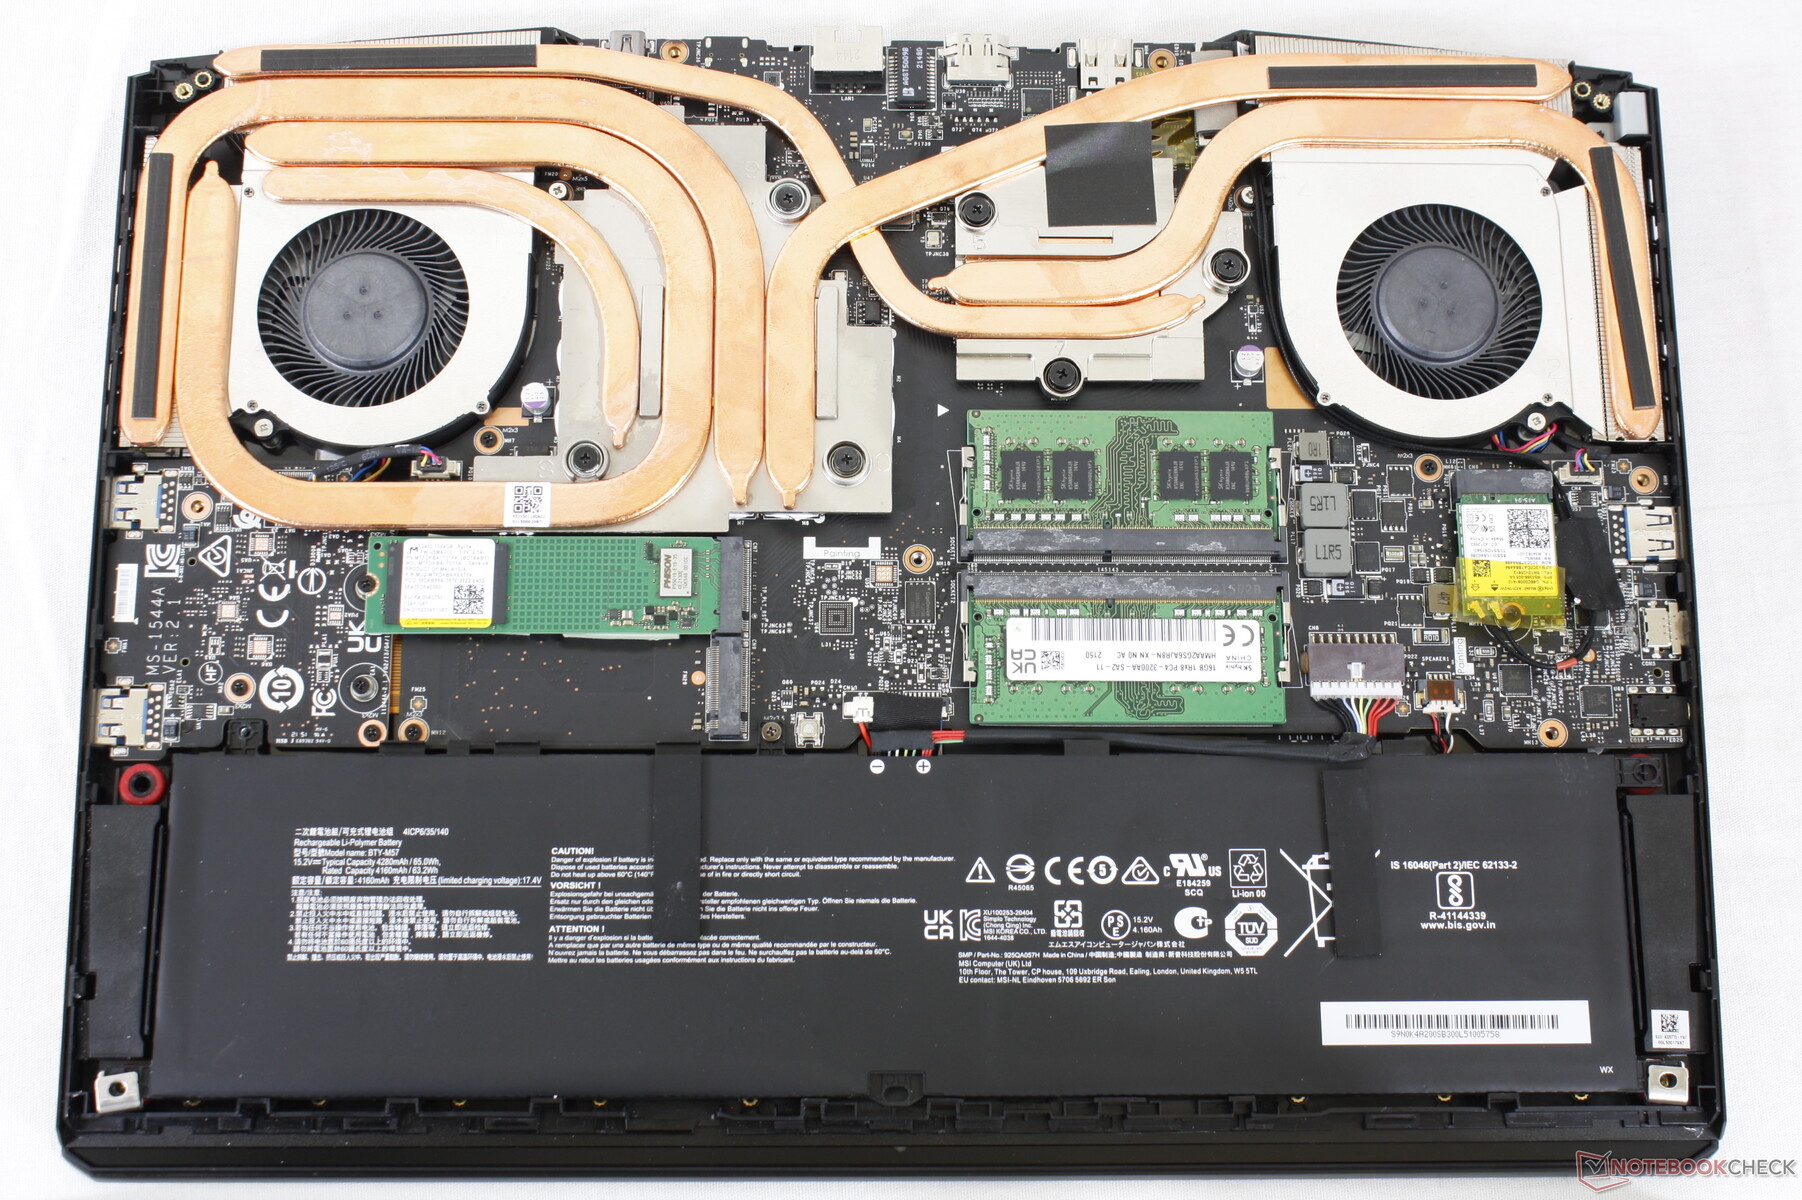
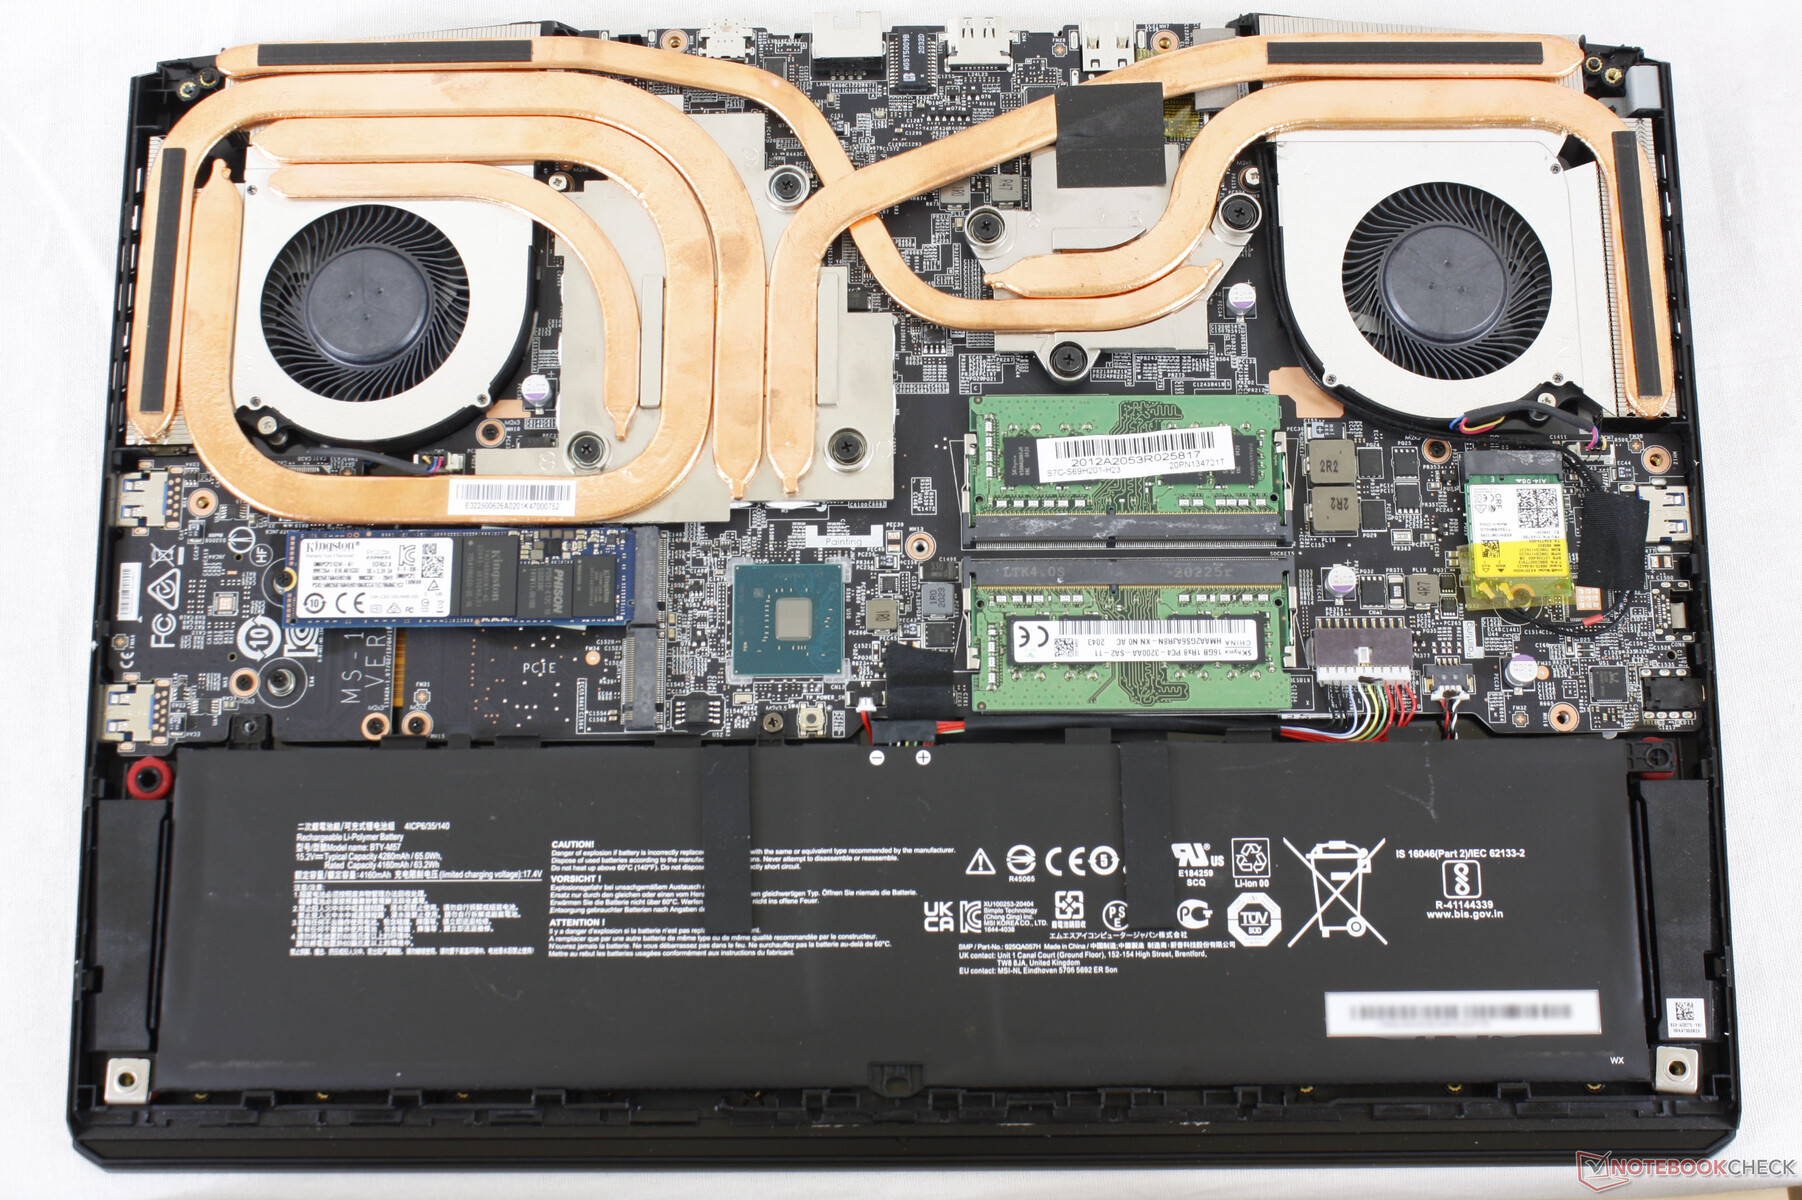
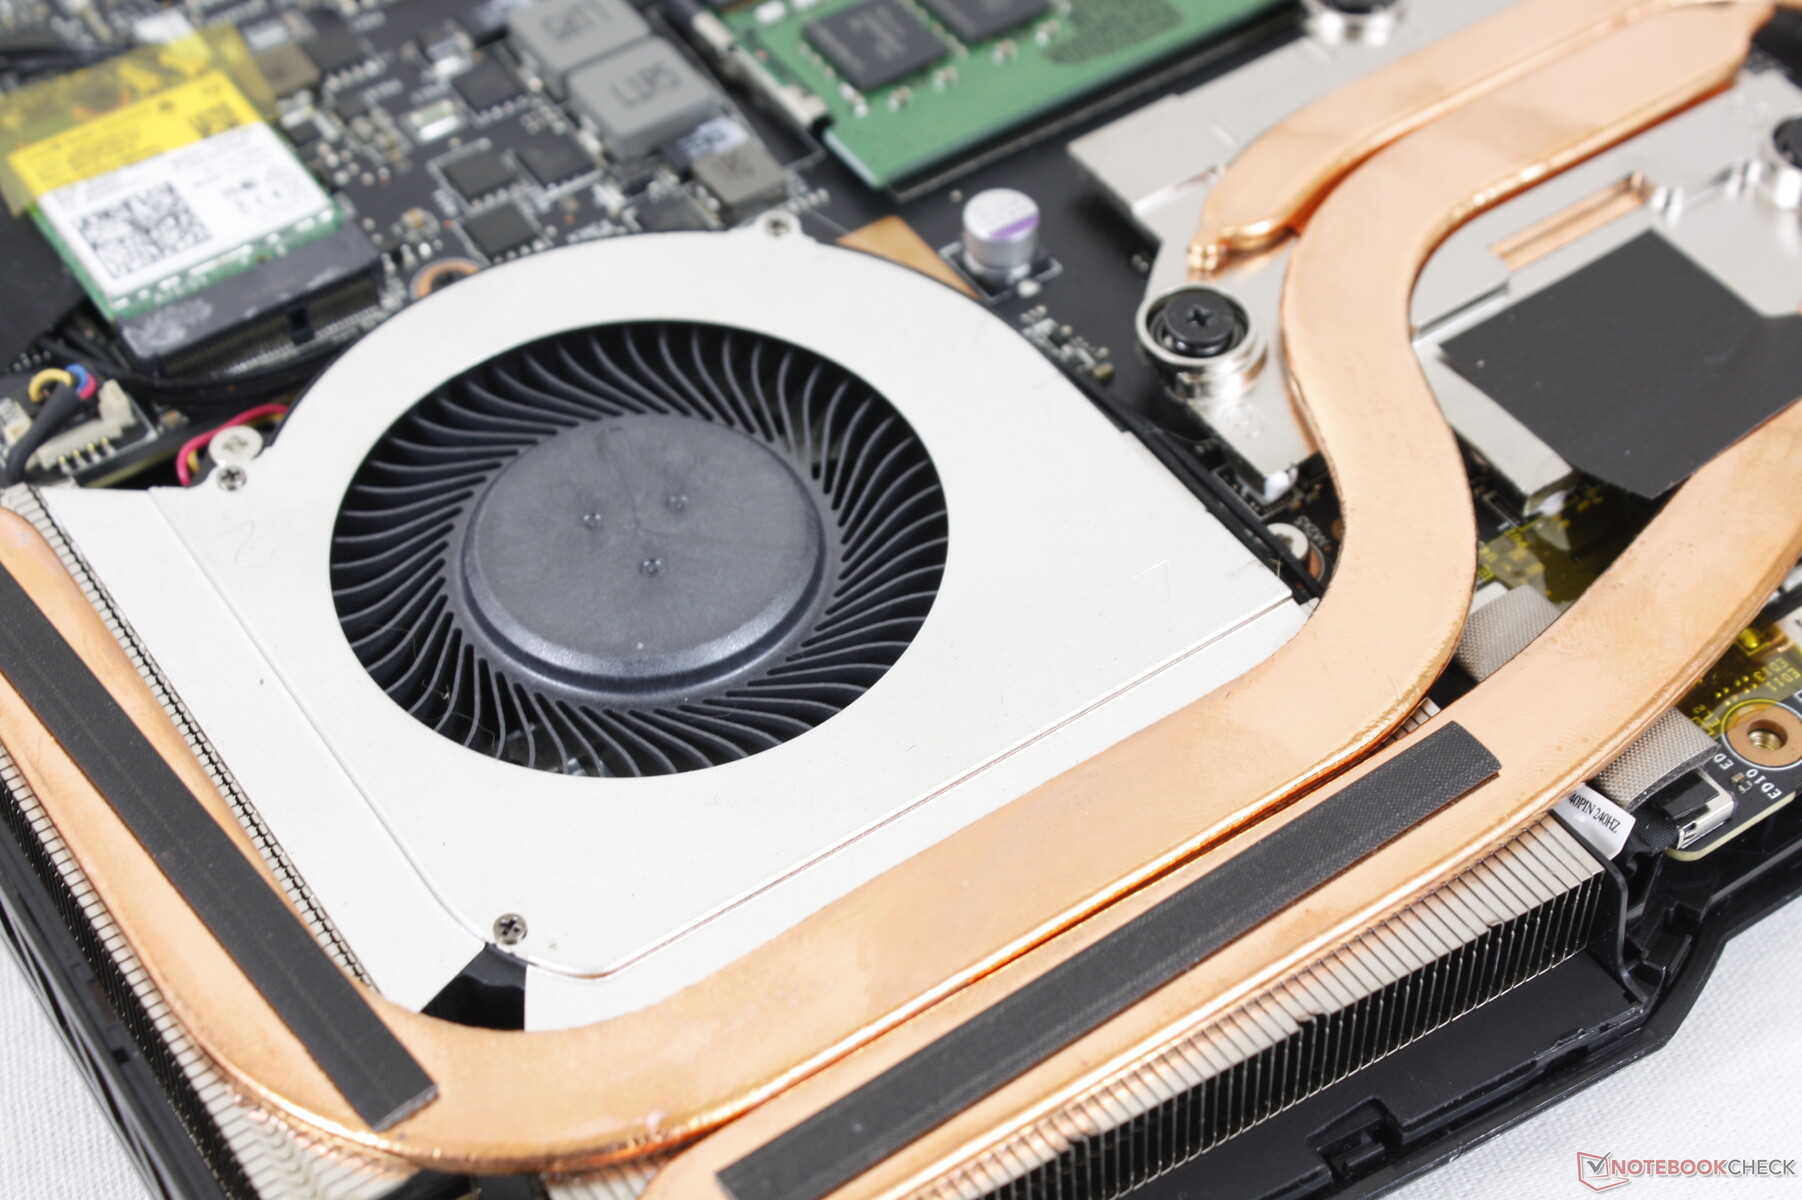
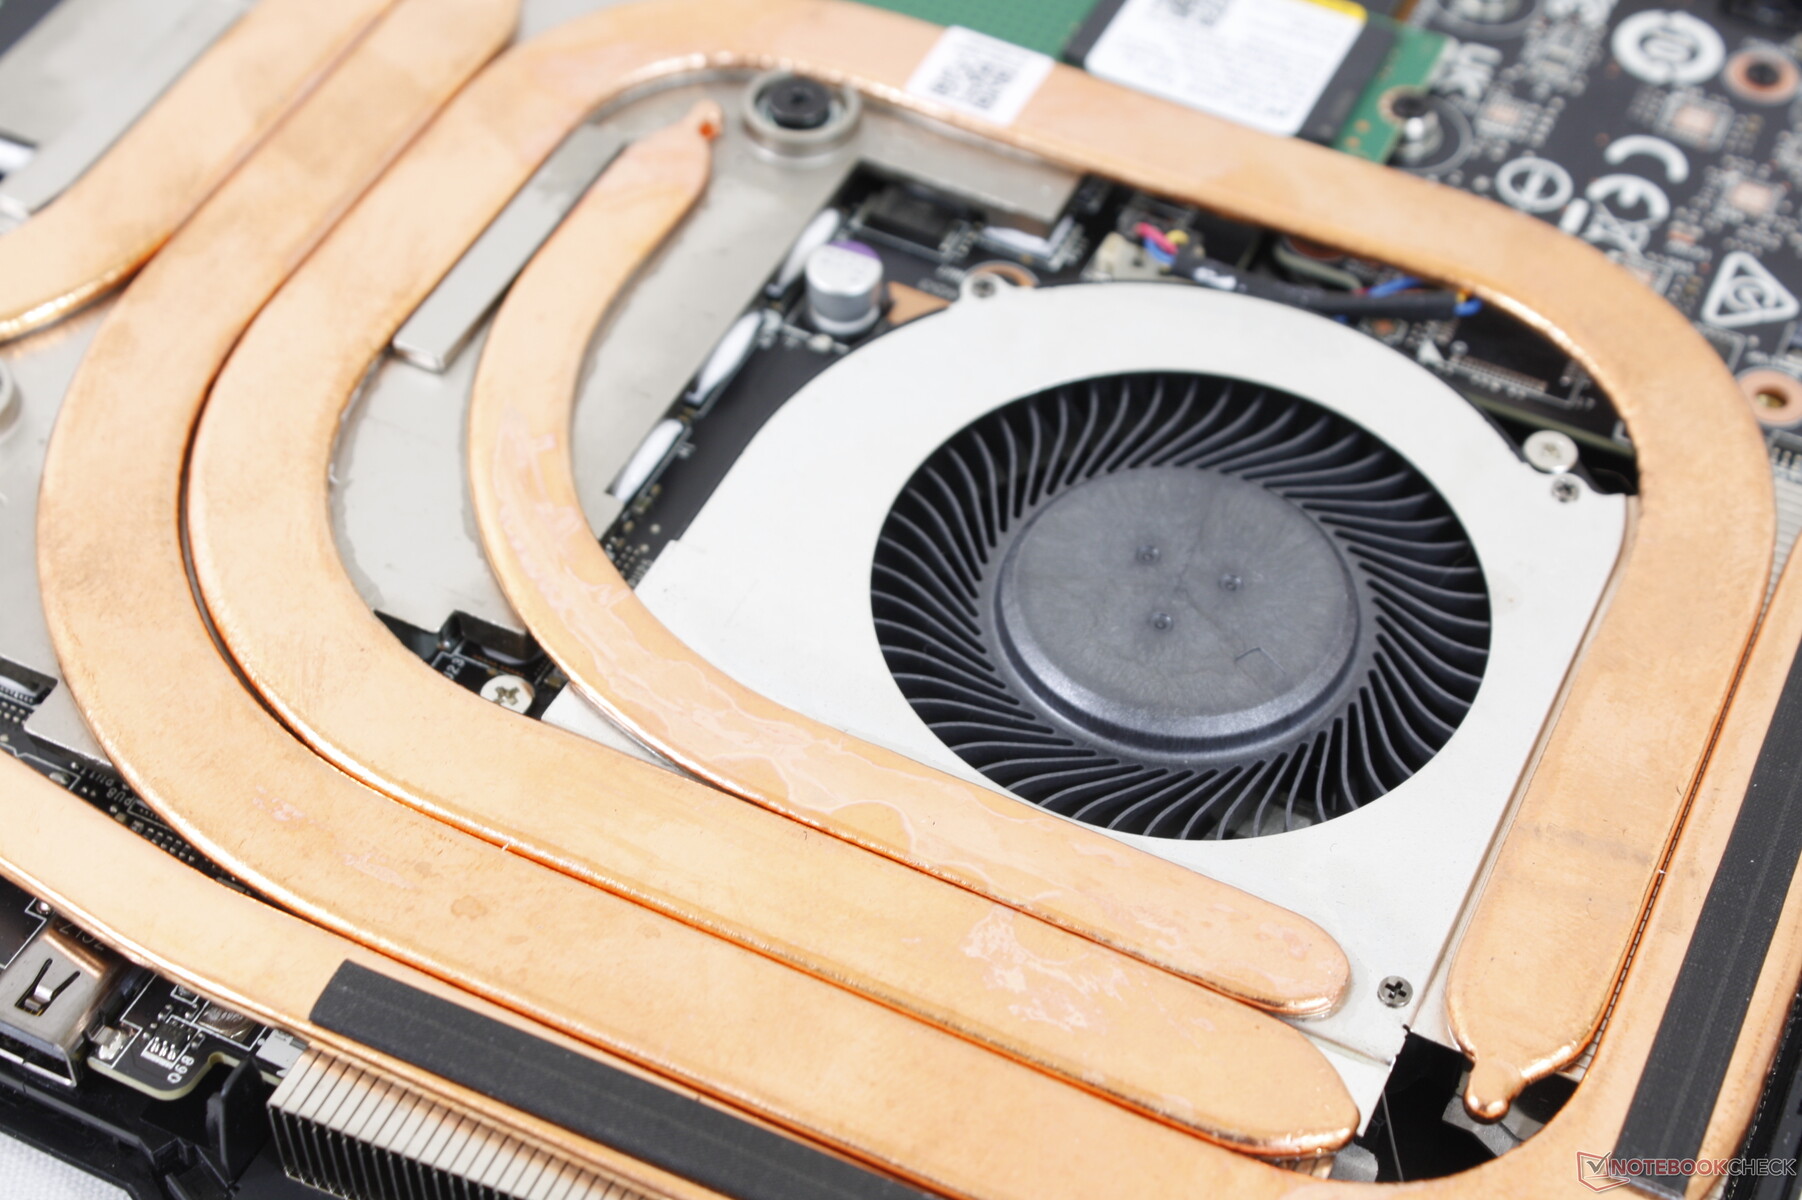
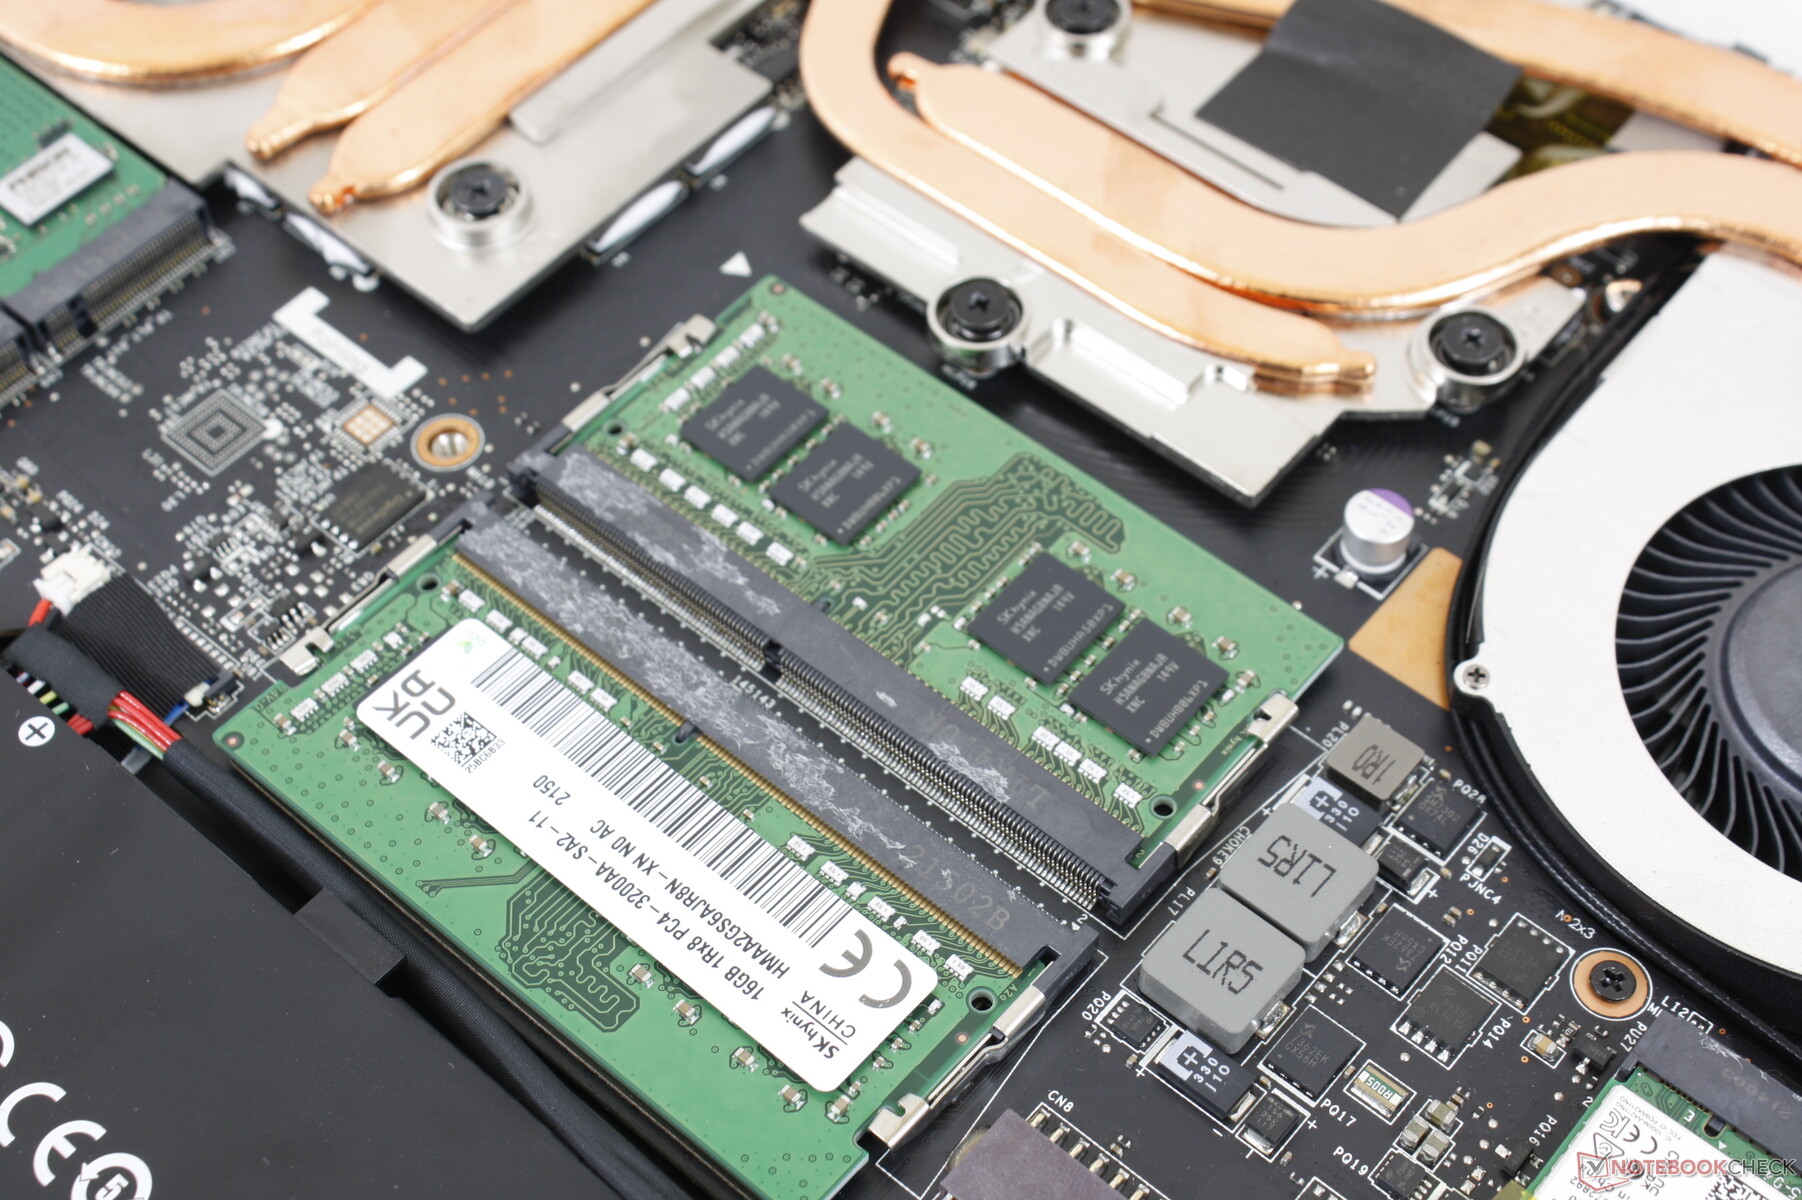
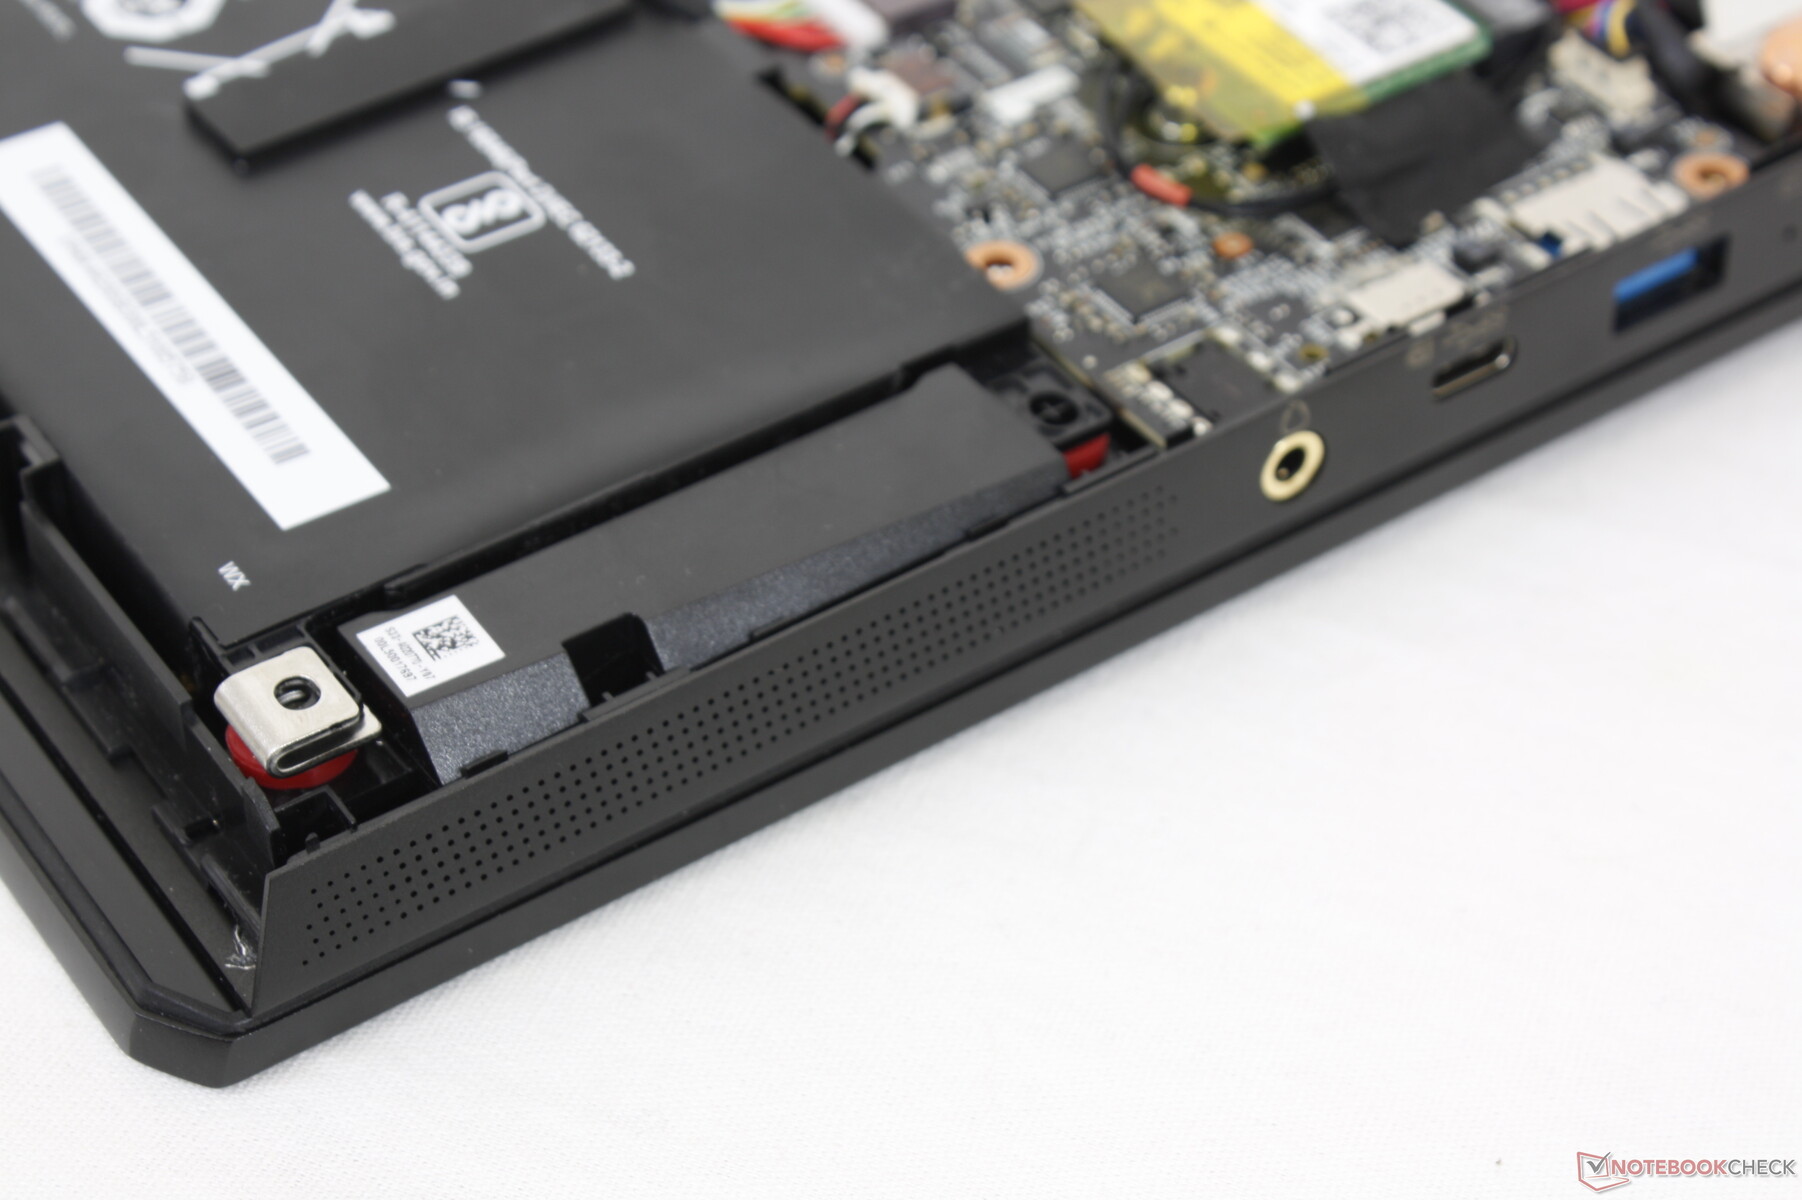
O painel inferior é fixado por 11 parafusos Philips sem nenhum por baixo de qualquer base de borracha para facilitar a manutenção. Observe que um adesivo de "vedação de fábrica" deve ser quebrado, no entanto.
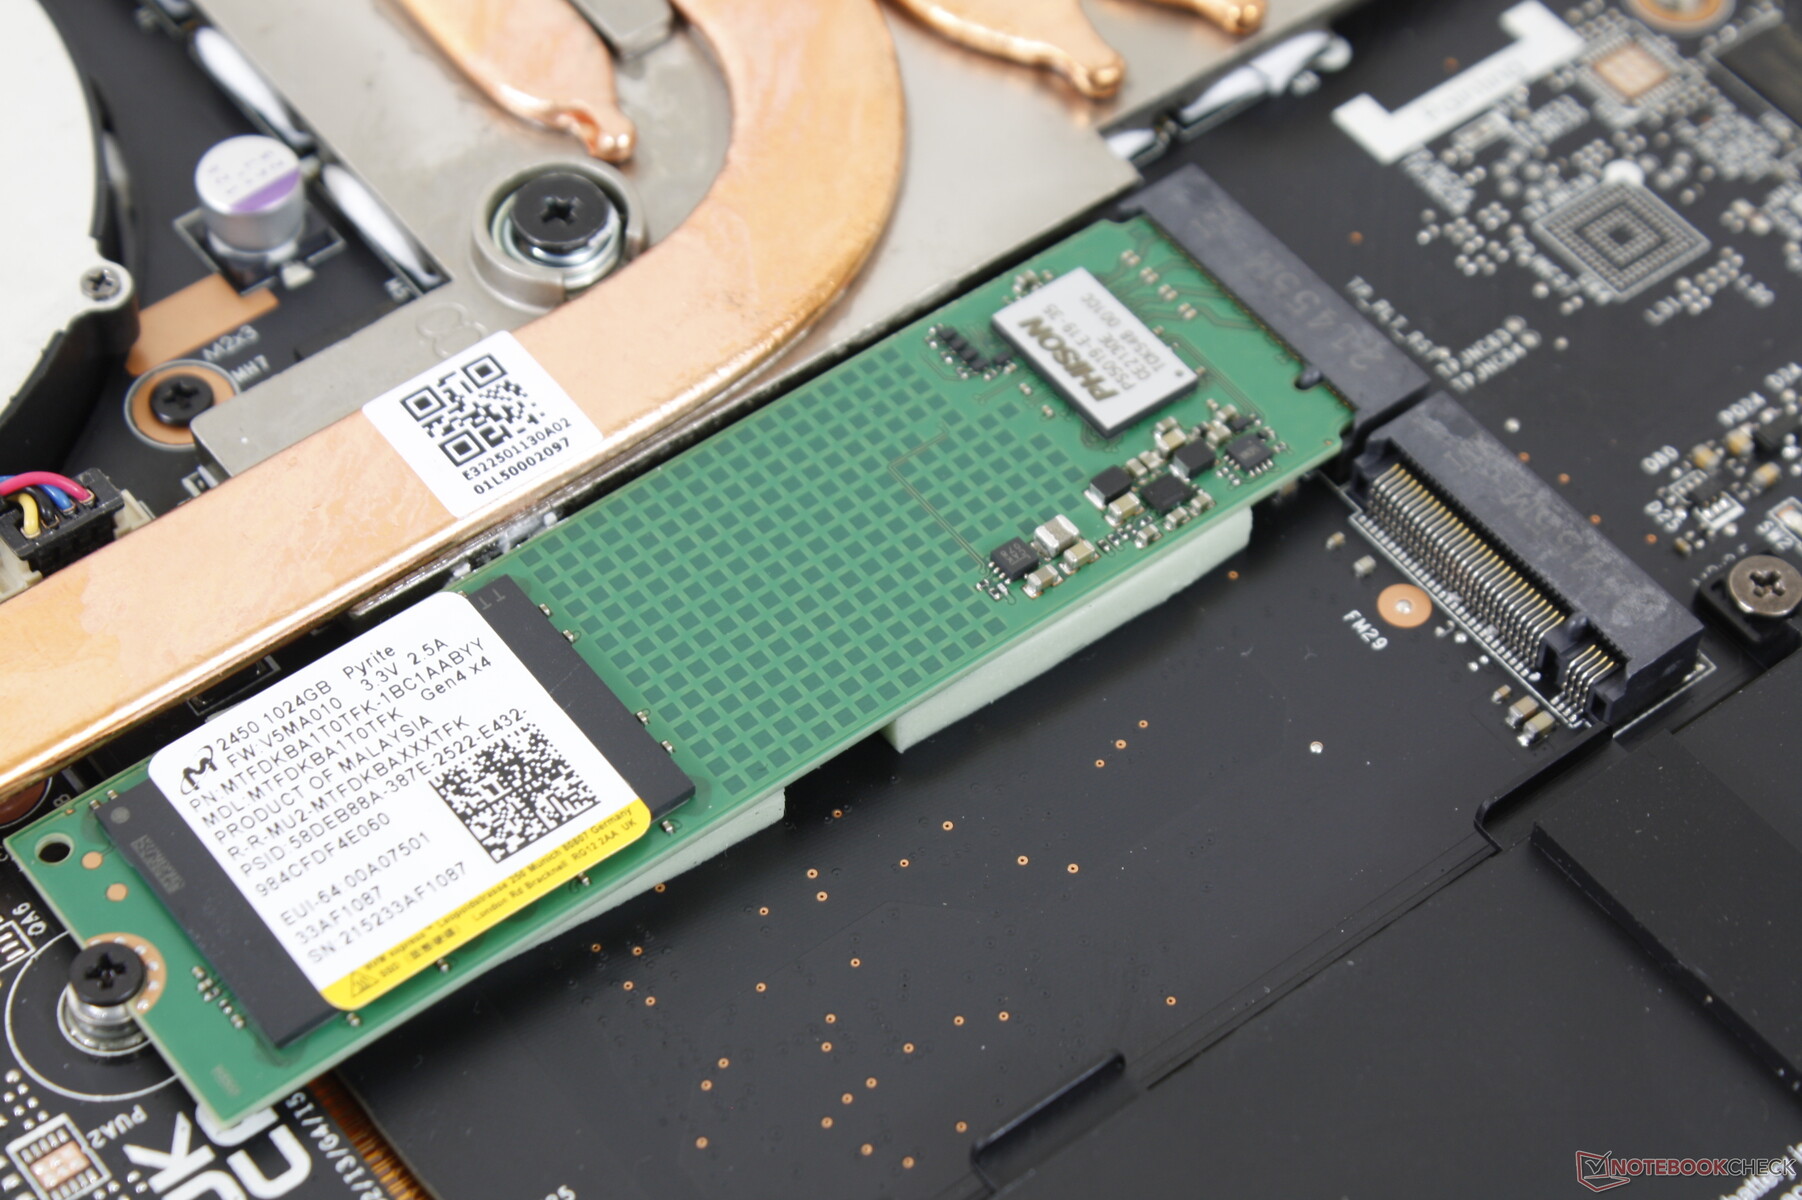
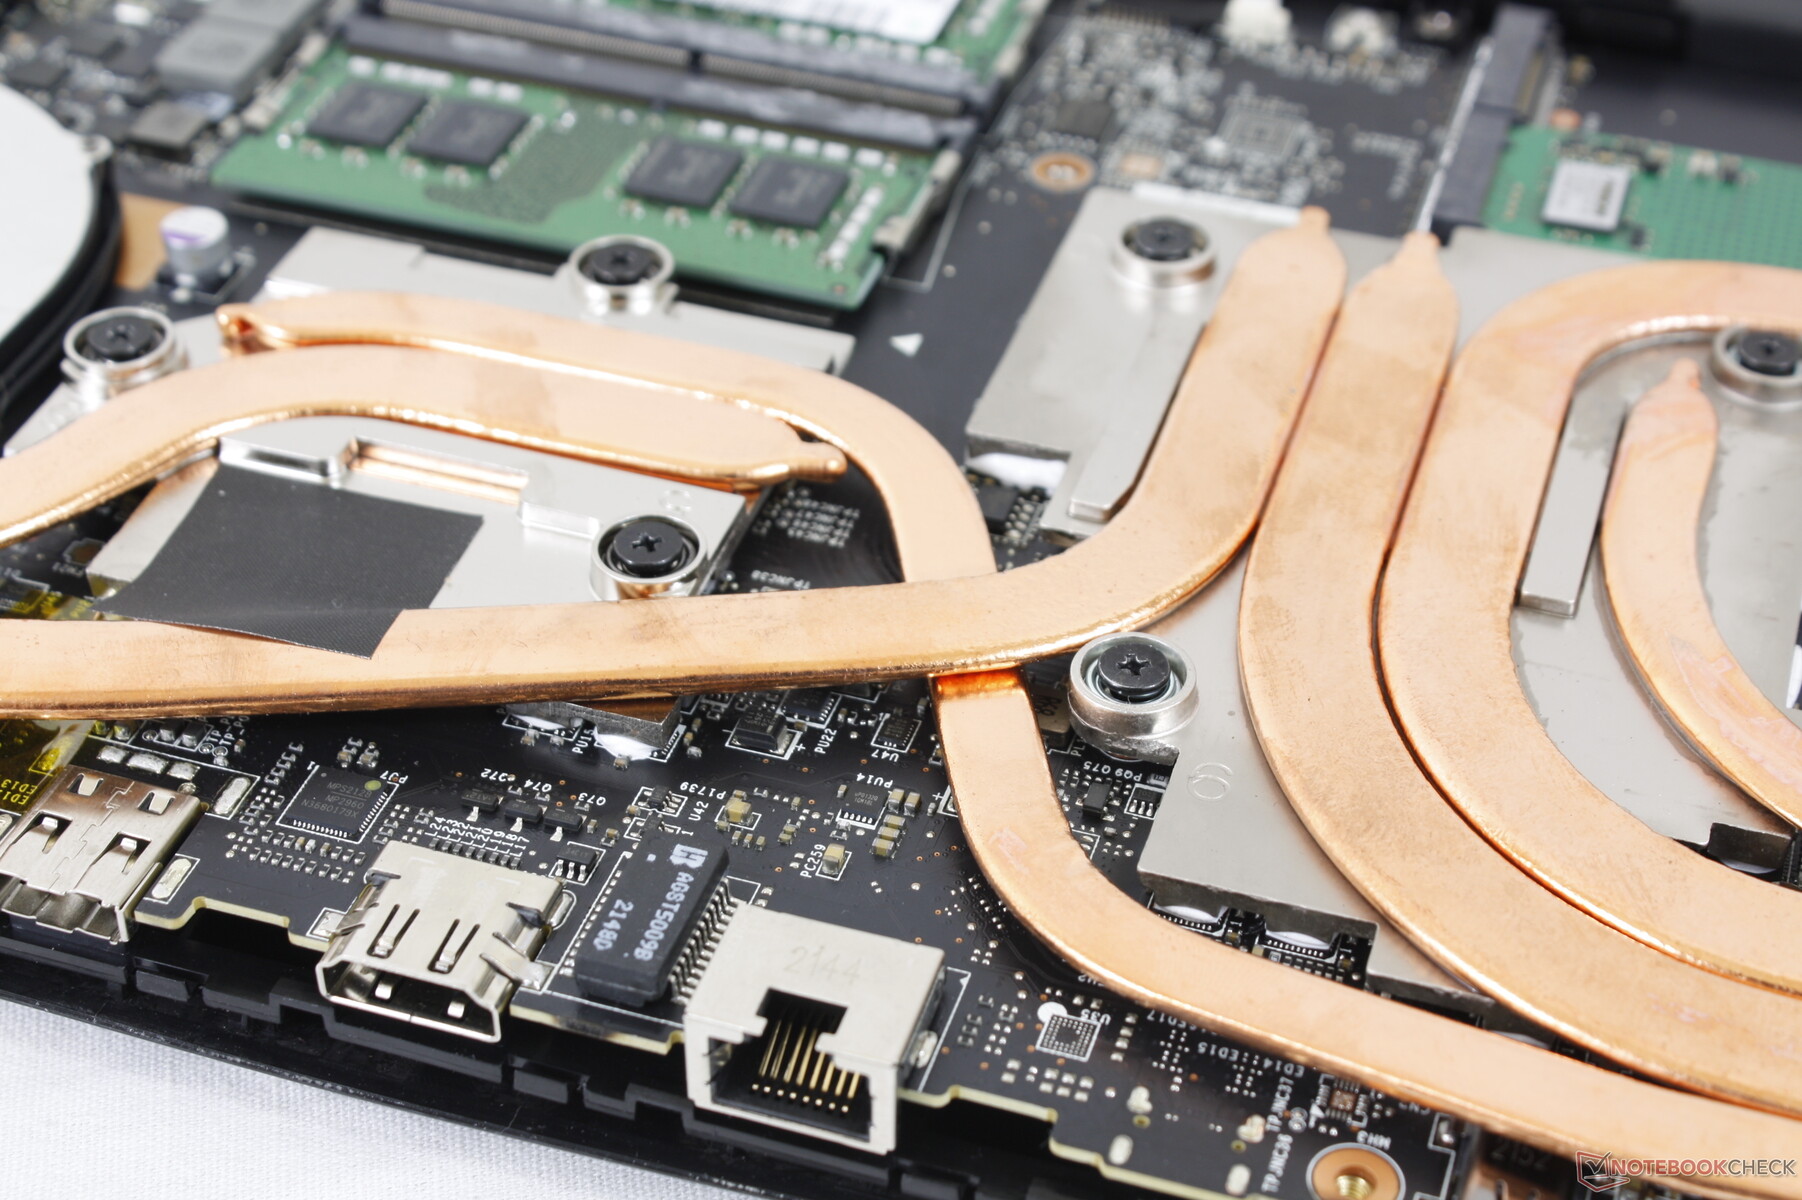
O layout interno é essencialmente idêntico ao do Leopardo GP66, como mostrado abaixo. Os usuários têm acesso direto aos dois slots SODIMM e aos dois slots M.2 2280 PCIe4 x4. Portáteis de alta tecnologia como oGM7AG8P pode vir com suporte para uma RAM DDR5 mais rápida.
Acessórios e Garantia
Não há extras na caixa a não ser o adaptador AC ou a papelada. A habitual garantia limitada de um ano aplica-se nos Estados Unidos
Dispositivos de entrada
Teclado e Touchpad
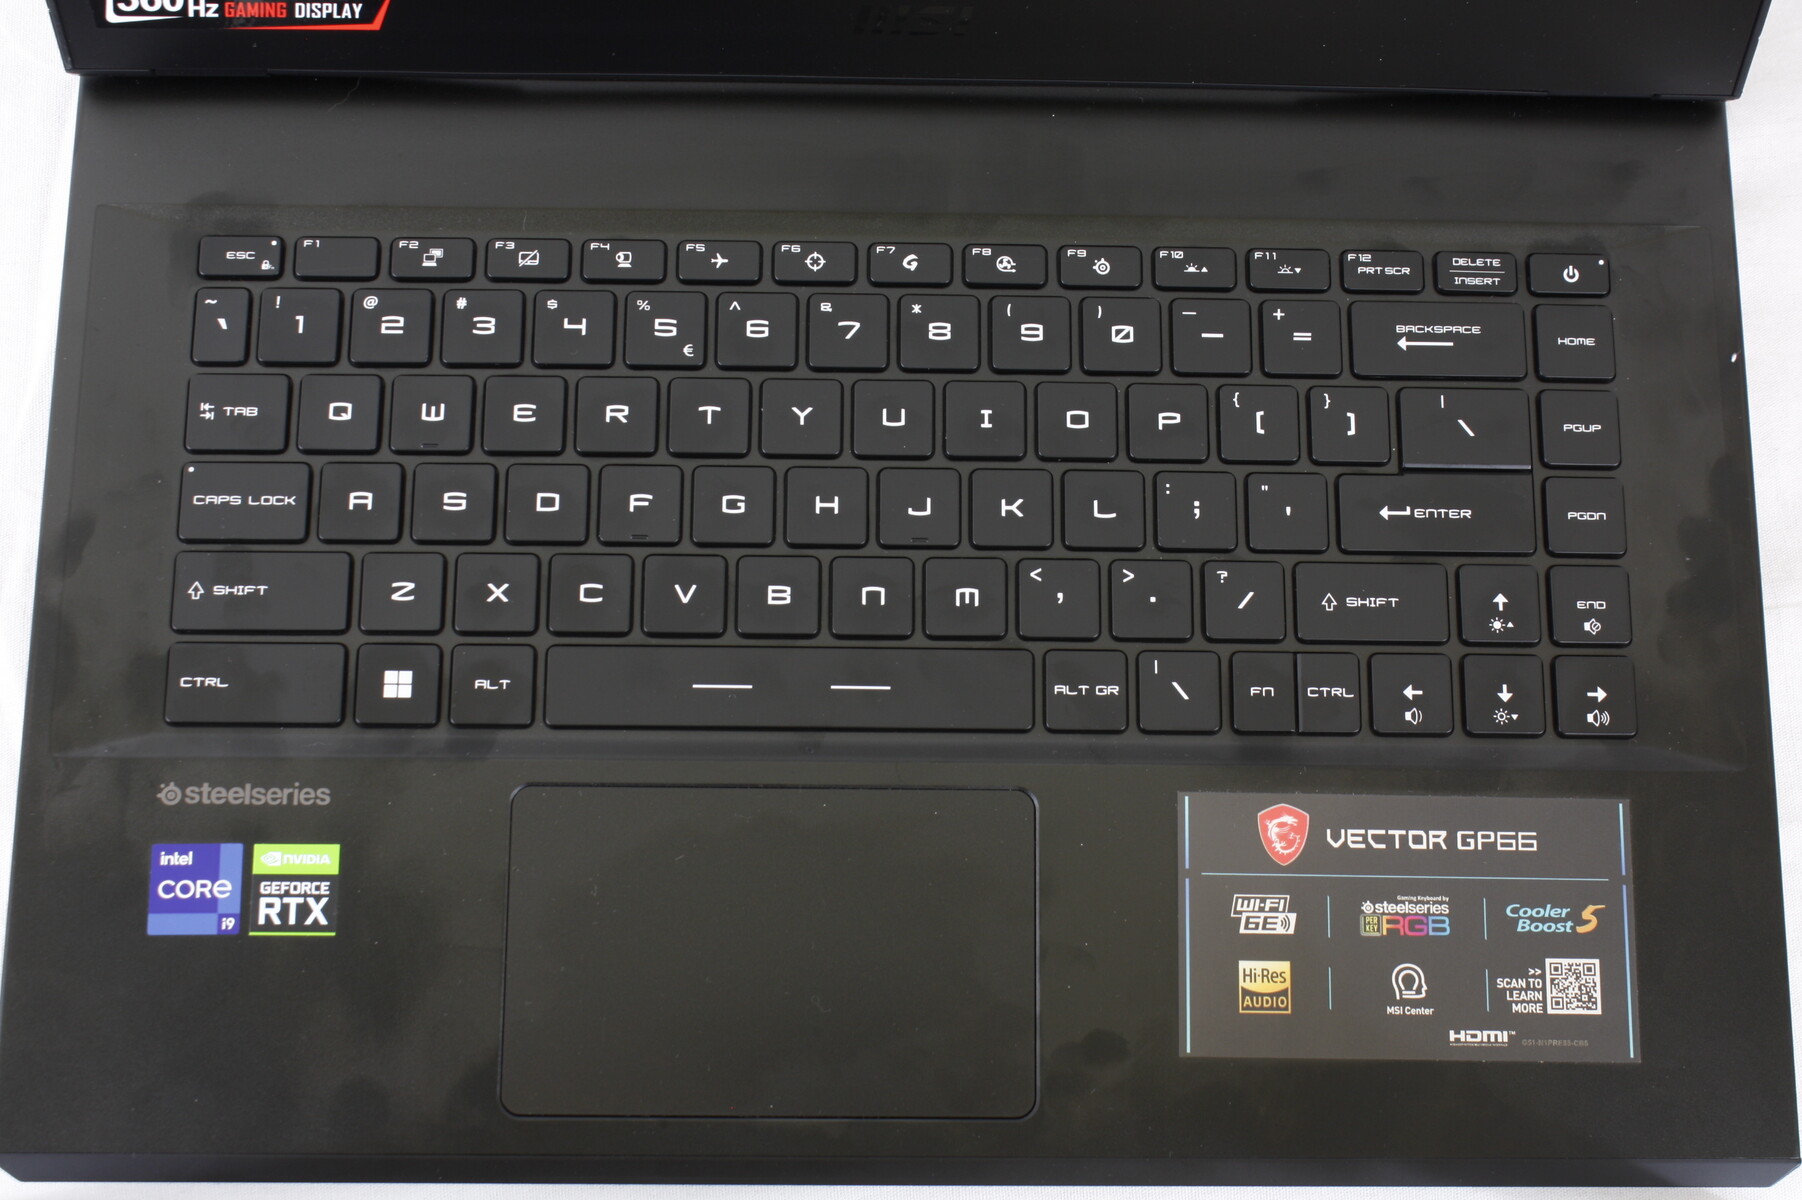
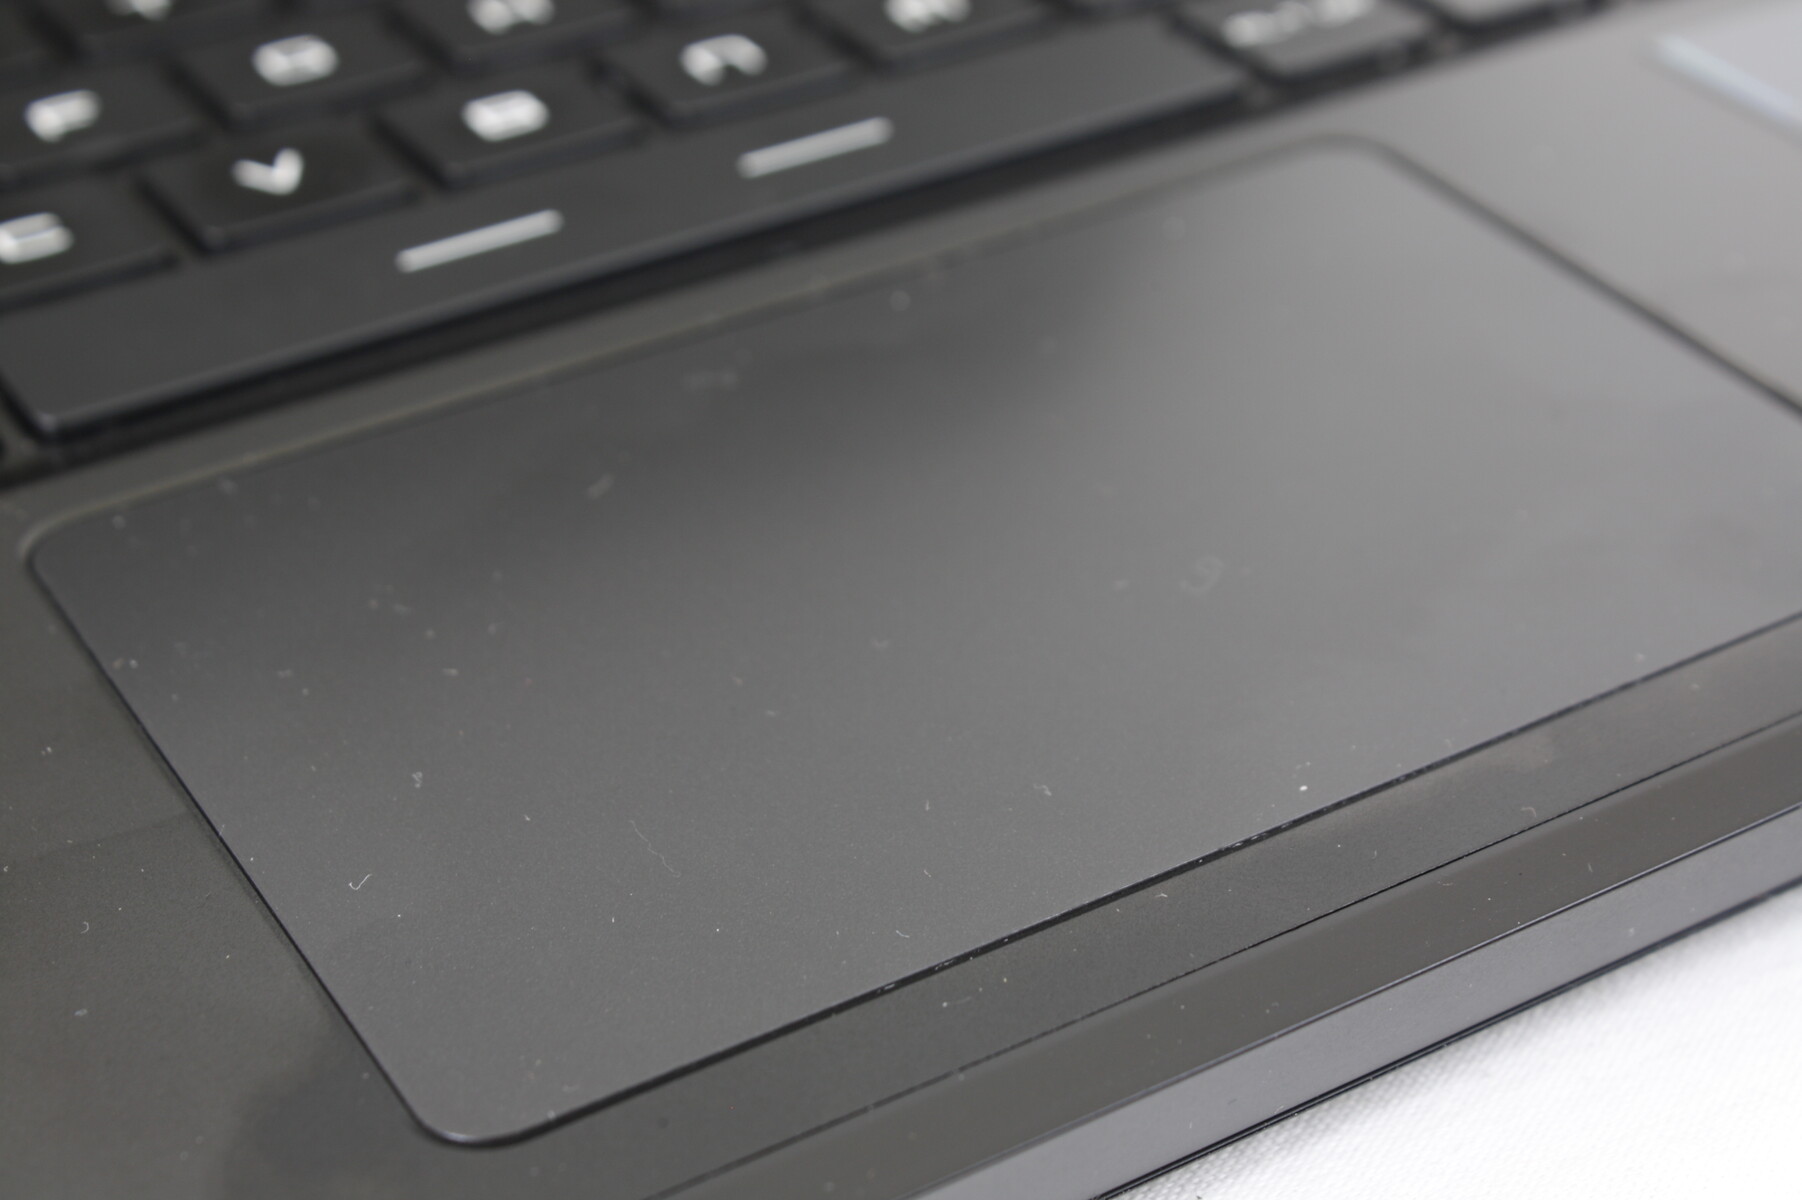
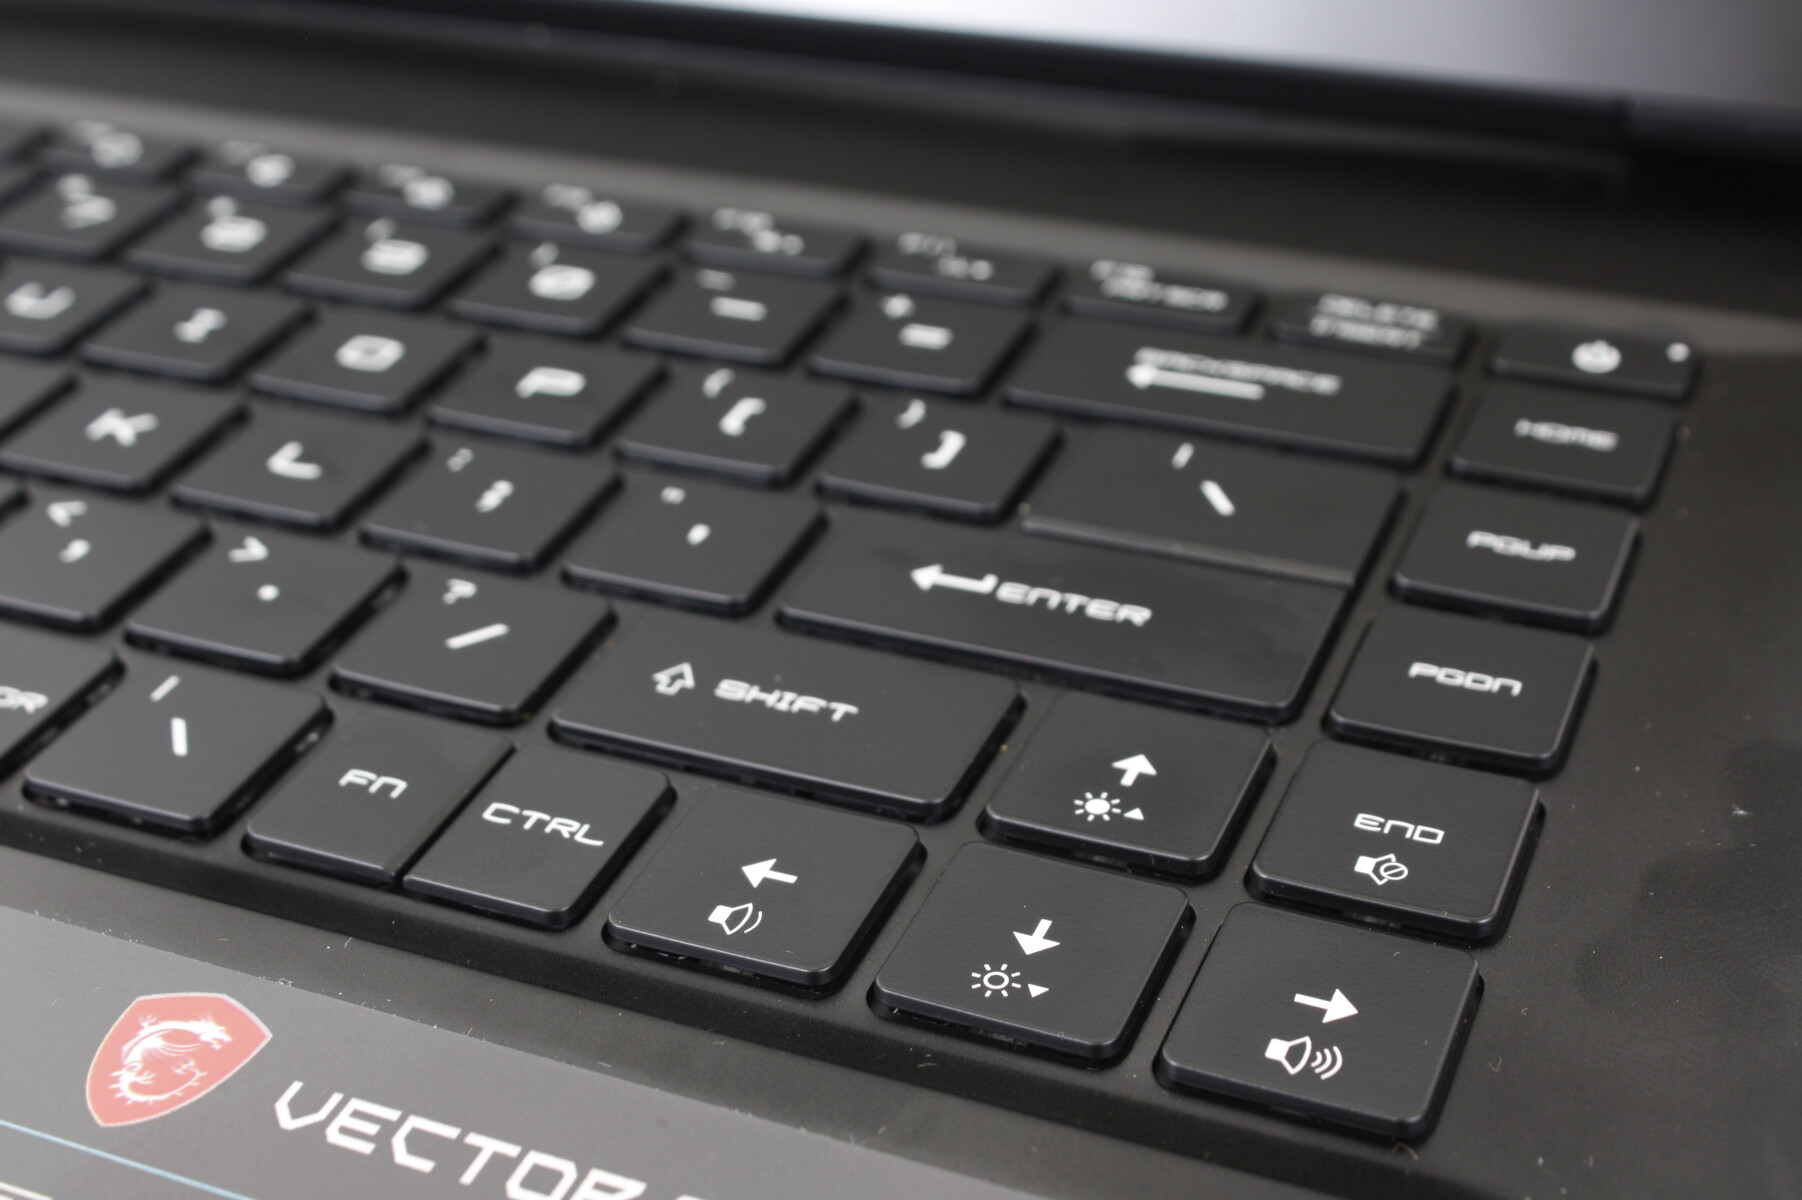
O teclado de iluminação por tecla RGB e o clickpad (10,5 x 6,5 cm) permanecem inalterados em relação ao Leopardo GP66 original de 2020. Embora a experiência de digitação seja satisfatória se não um pouco no lado macio, clicar no clickpad continua a ser muito esponjoso. O controle do cursor era mais fácil para os mais velhos GP65 pois integrou botões físicos do mouse que foram soltos ao fazer a transição para o projeto GP66.

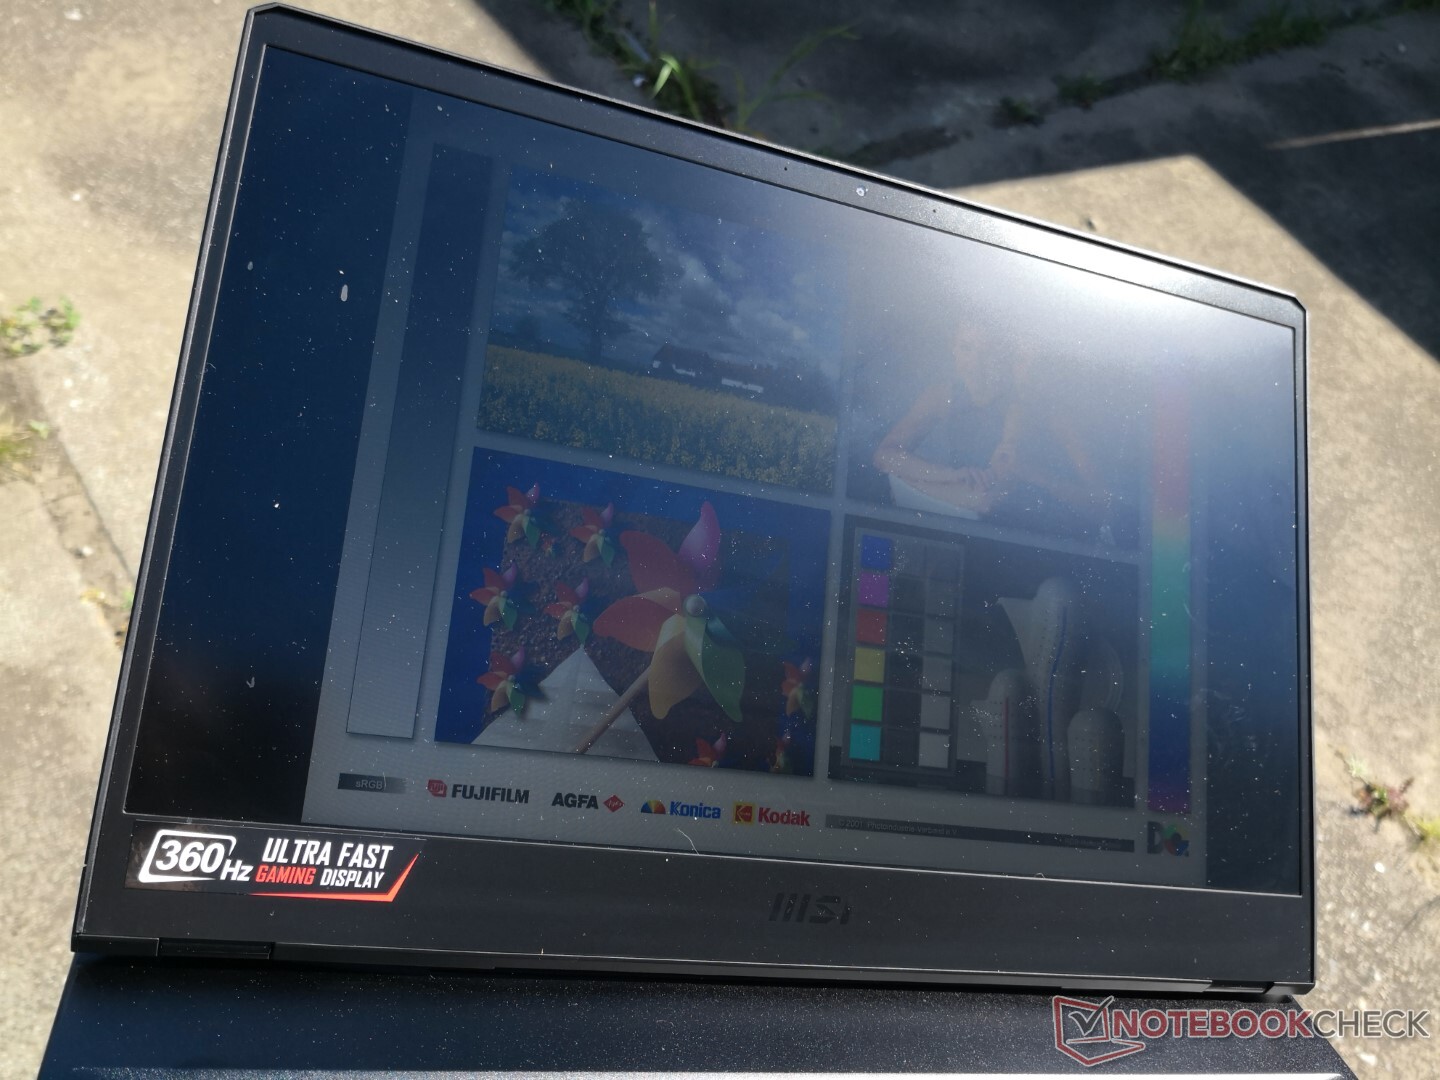
Mostrar
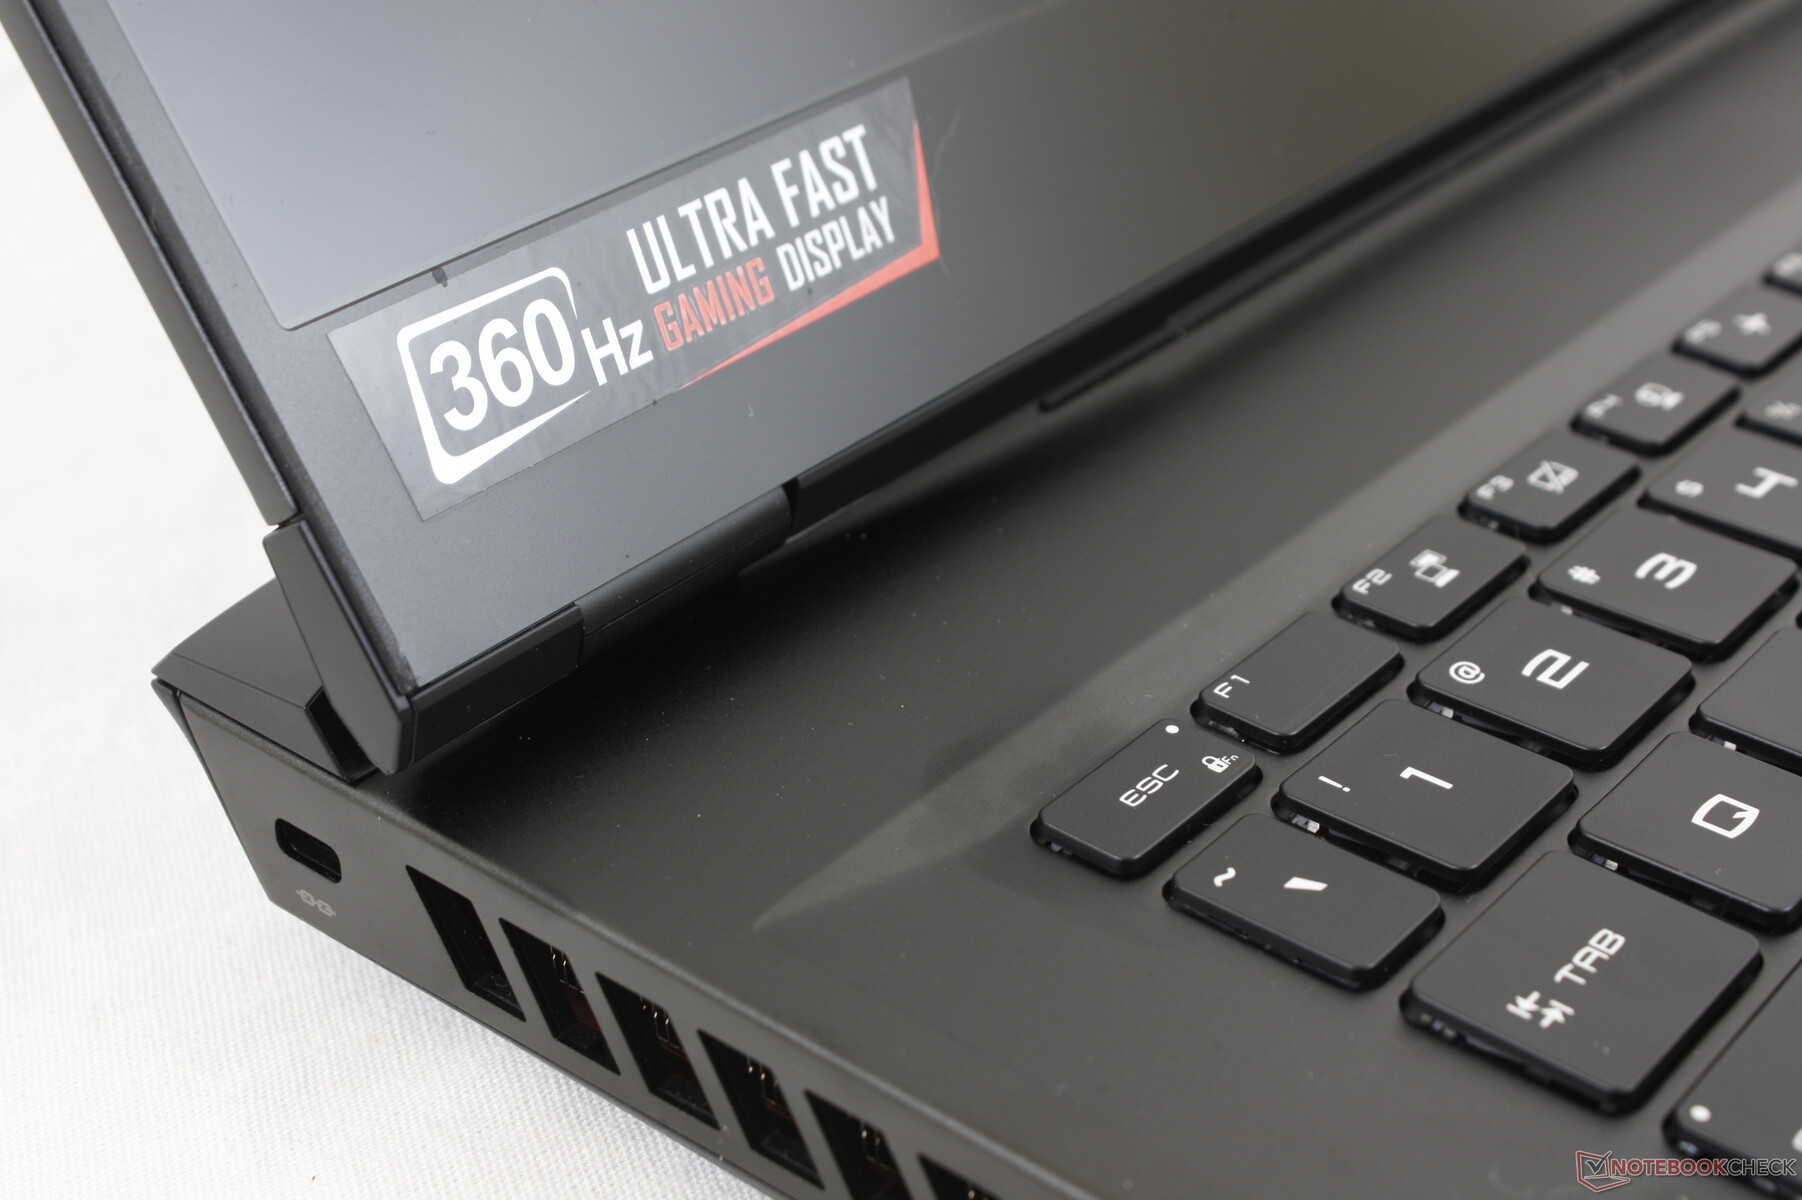
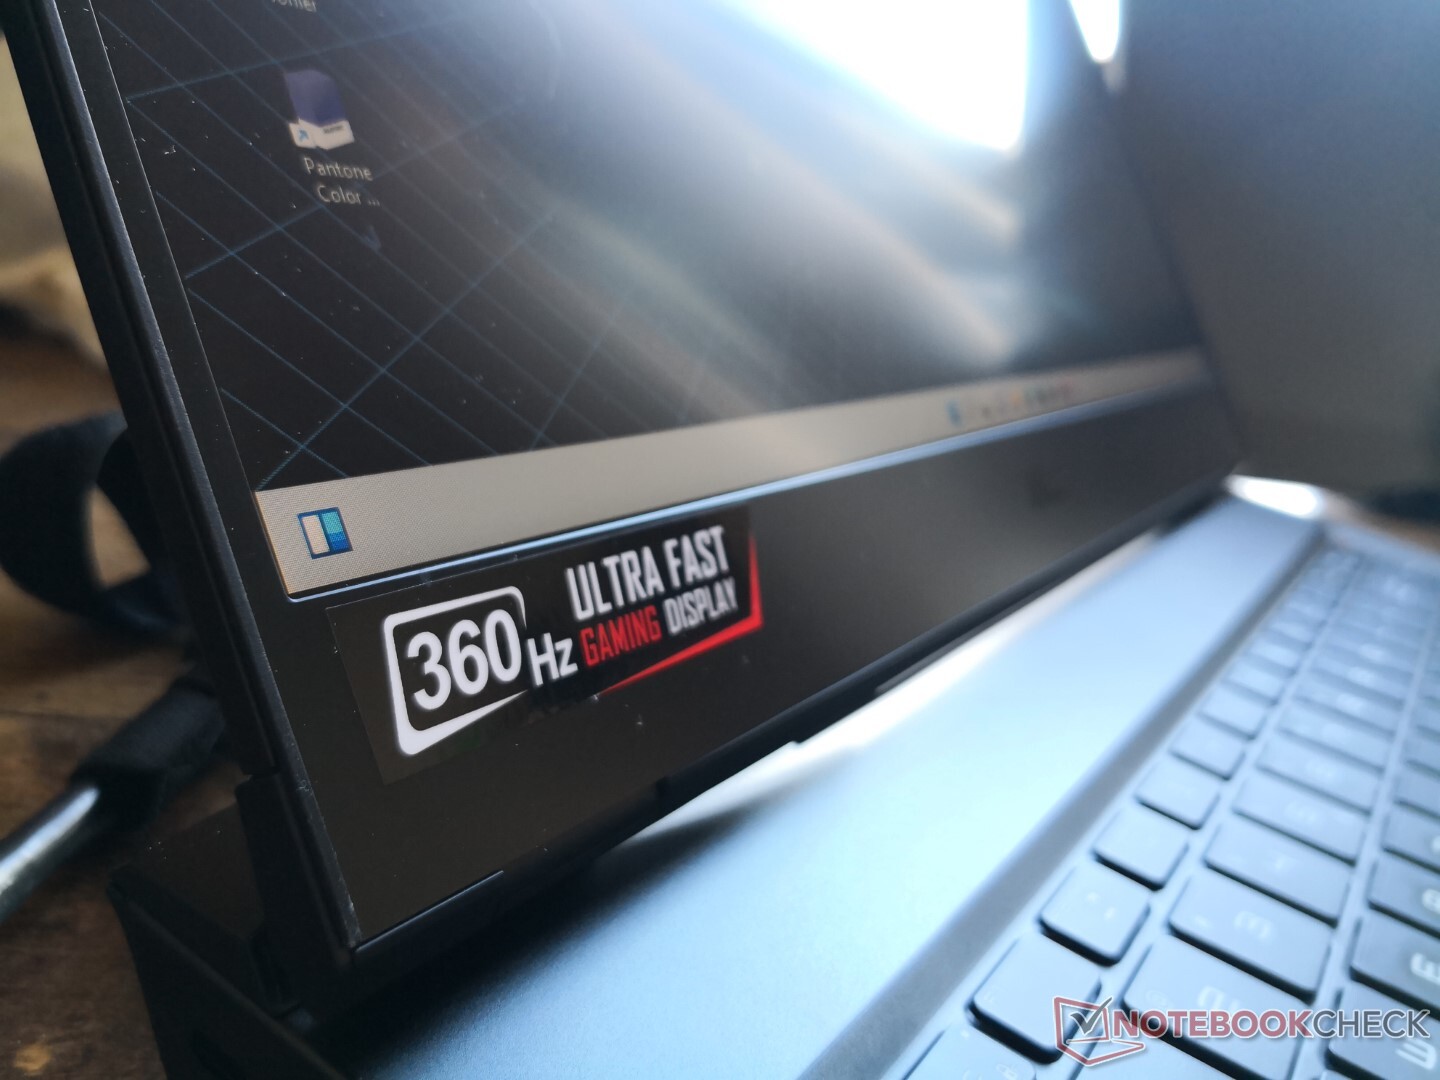
O Vector GP66 é o primeiro laptop em nosso banco de dados a vir com o painel IPS 360 Hz BOE NE156FHM-NZ3 em contraste com o painel IPS 144 Hz LG LP156WFG-SPB3 em nosso Leopardo GP66 mais antigo. O painel BOE oferece tanto taxas de atualização mais rápidas quanto tempos de resposta cinza a cinza, mantendo a mesma cobertura total de sRGB e relação de contraste que o painel LG acima mencionado. O brilho máximo é ligeiramente menor, mas não por margens perceptíveis. É um painel high-end adequado para um PC de gama média superior de jogos.
Tenha em mente que a MSI também está oferecendo uma opção mais lenta de 144 Hz em SKUs mais baratas do Vector GP66. As cores neste painel de 144 Hz são significativamente piores em apenas ~60 por cento do sRGB e por isso pode ser sábio evitar estes SKUs se a qualidade de exibição for uma prioridade.

| |||||||||||||||||||||||||
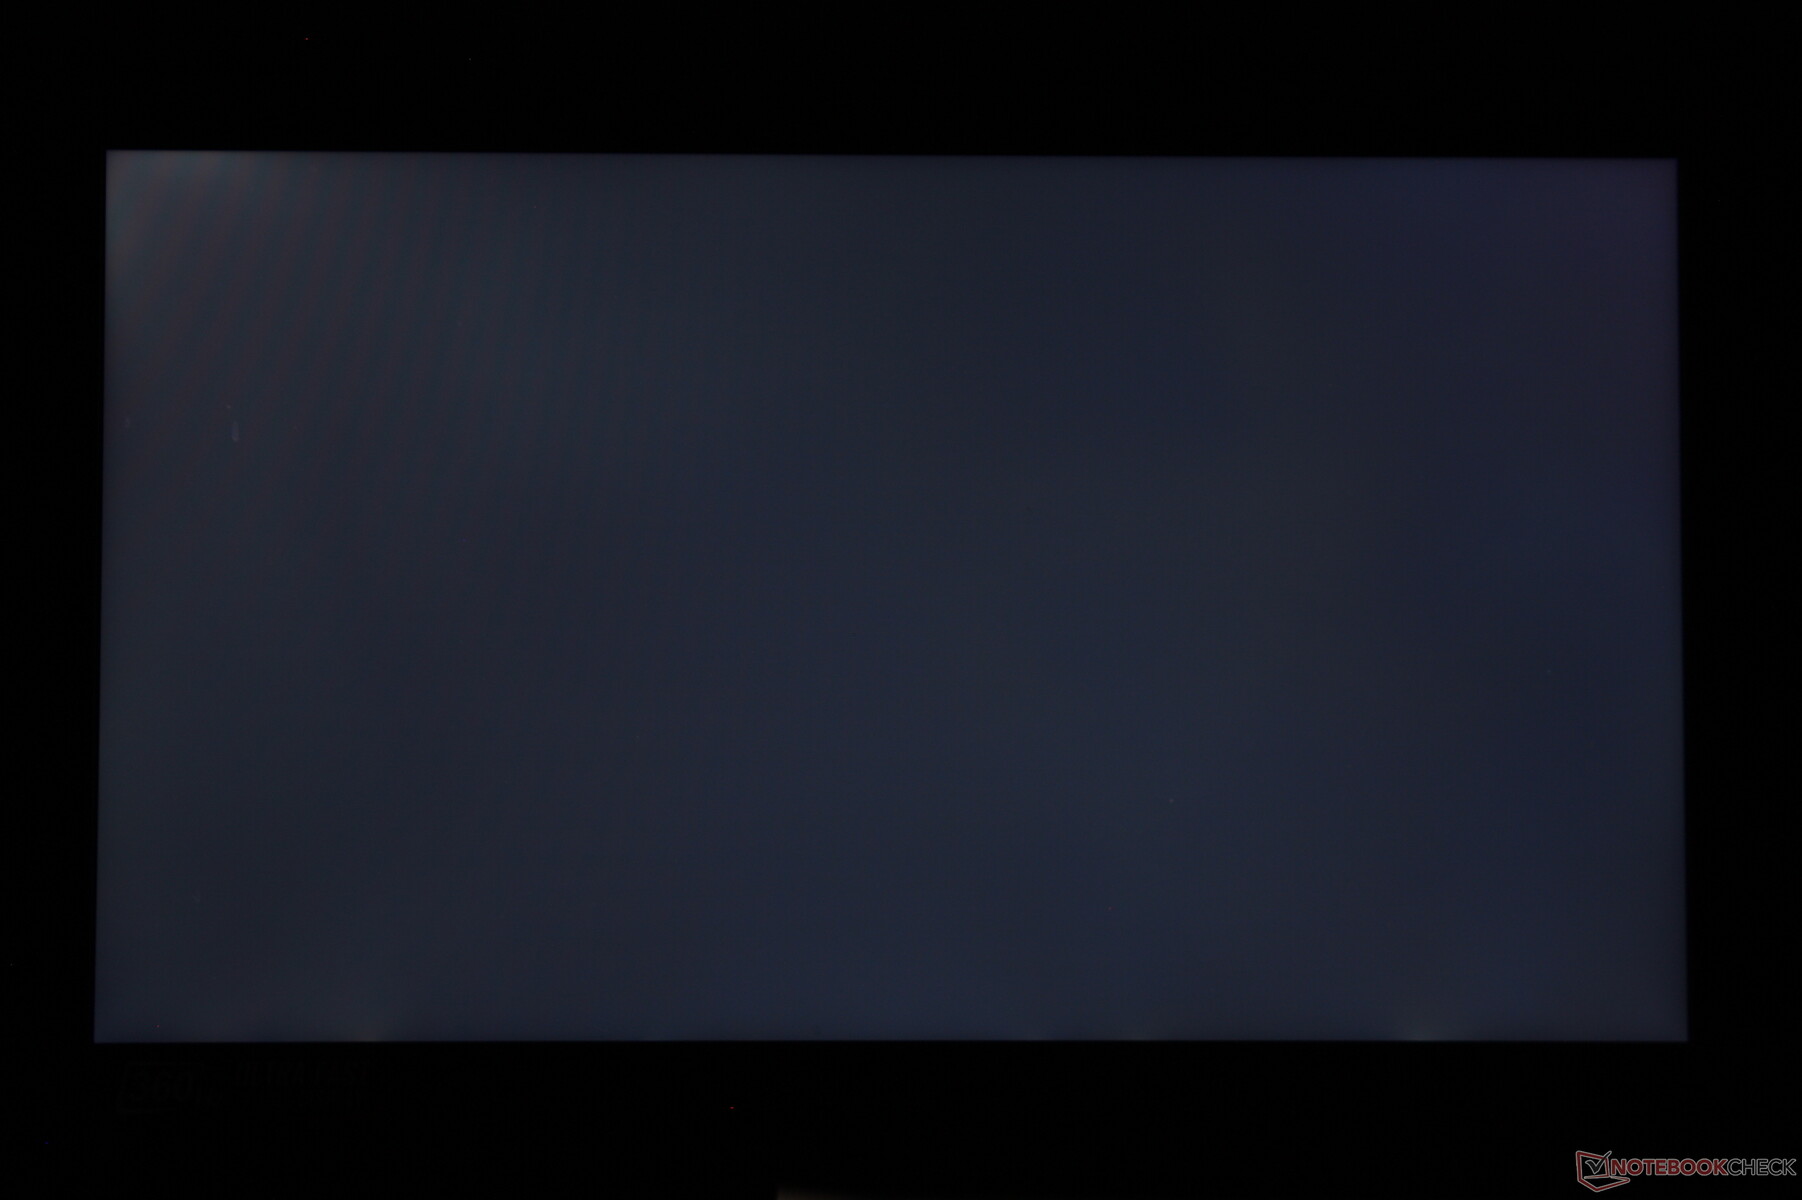
iluminação: 85 %
iluminação com acumulador: 353.1 cd/m²
Contraste: 929:1 (Preto: 0.38 cd/m²)
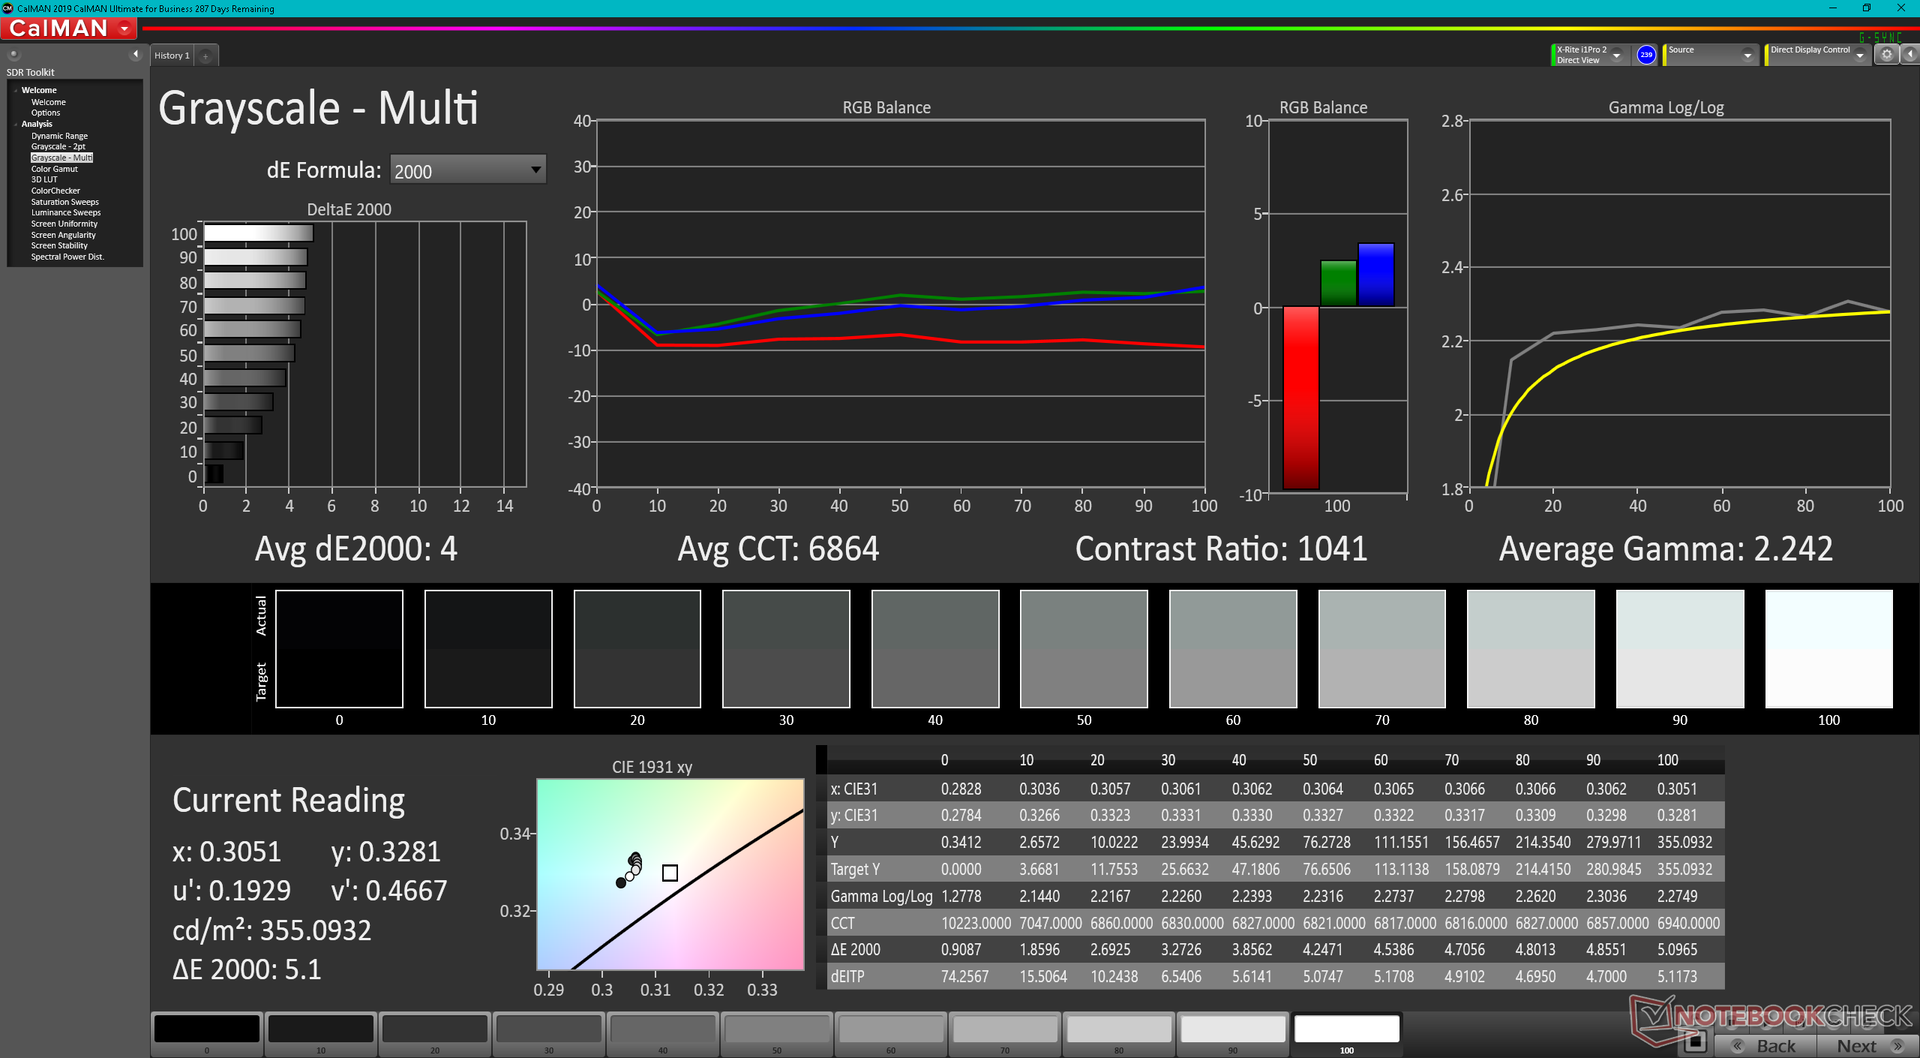
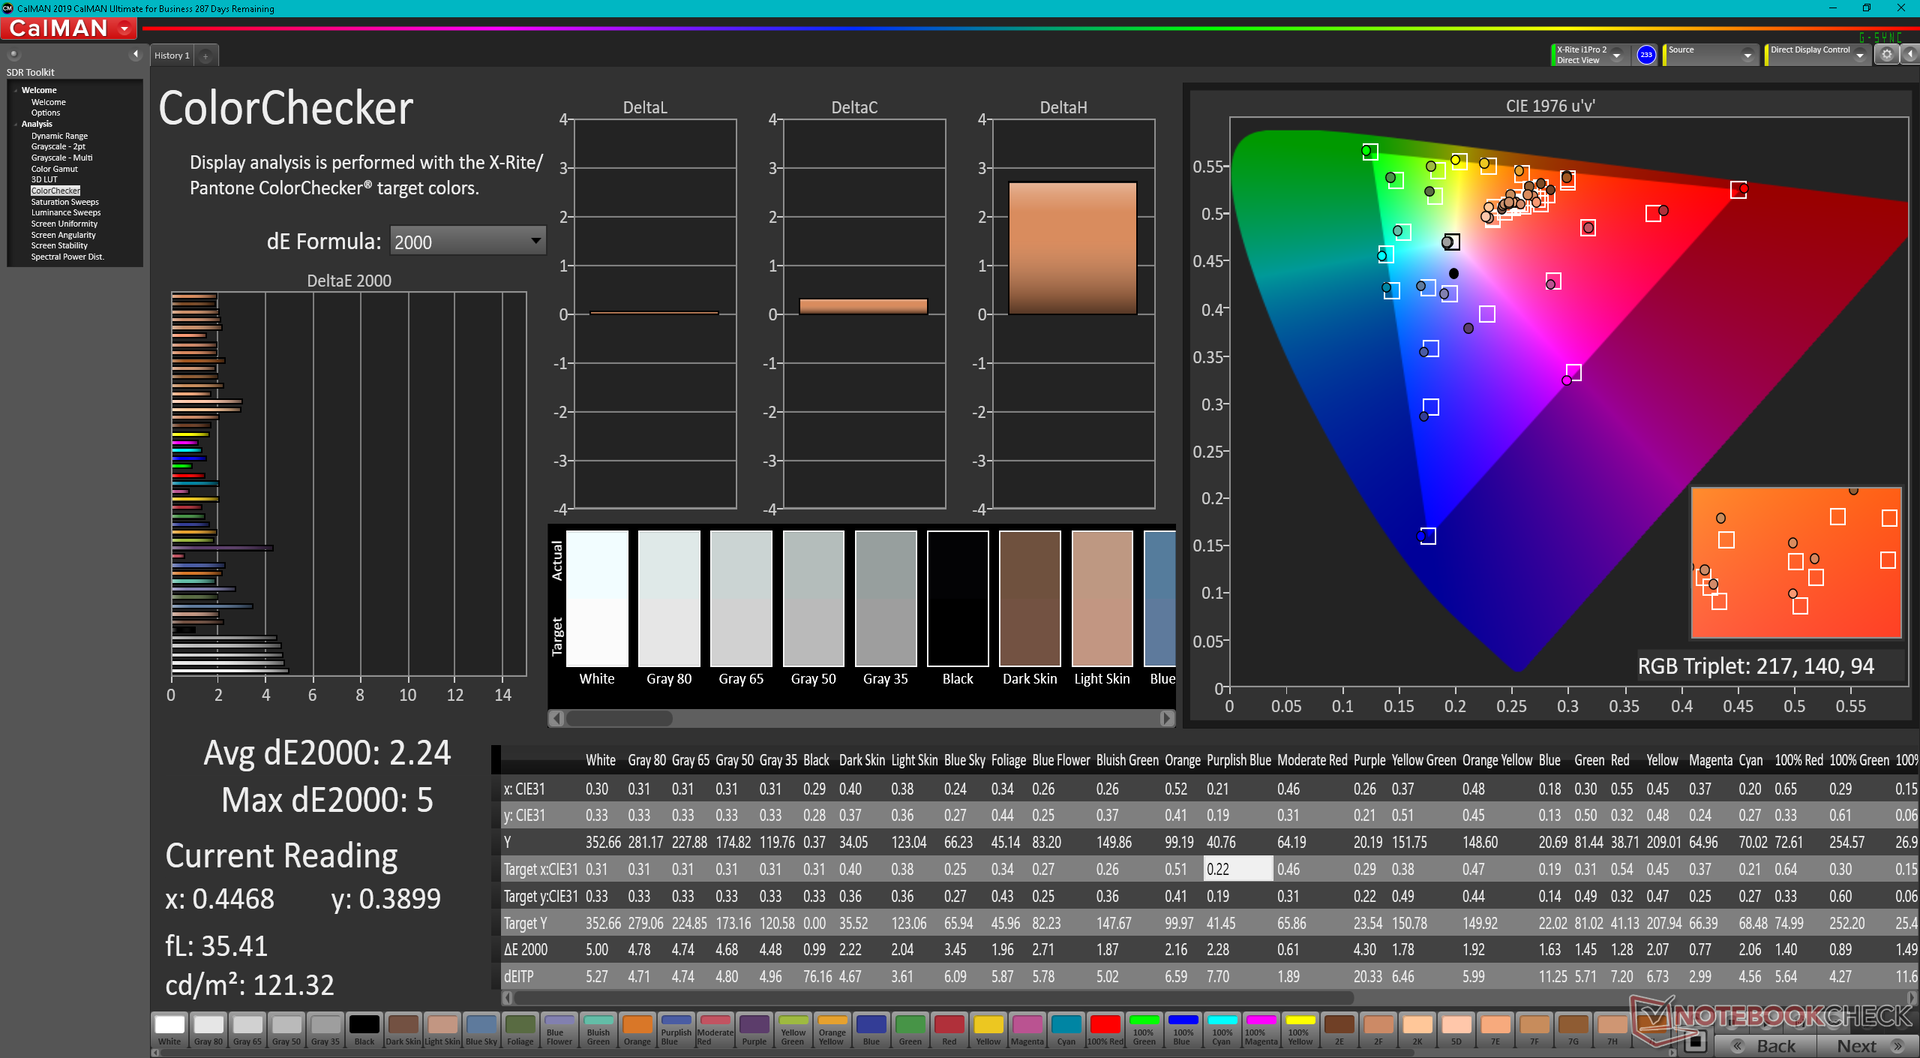
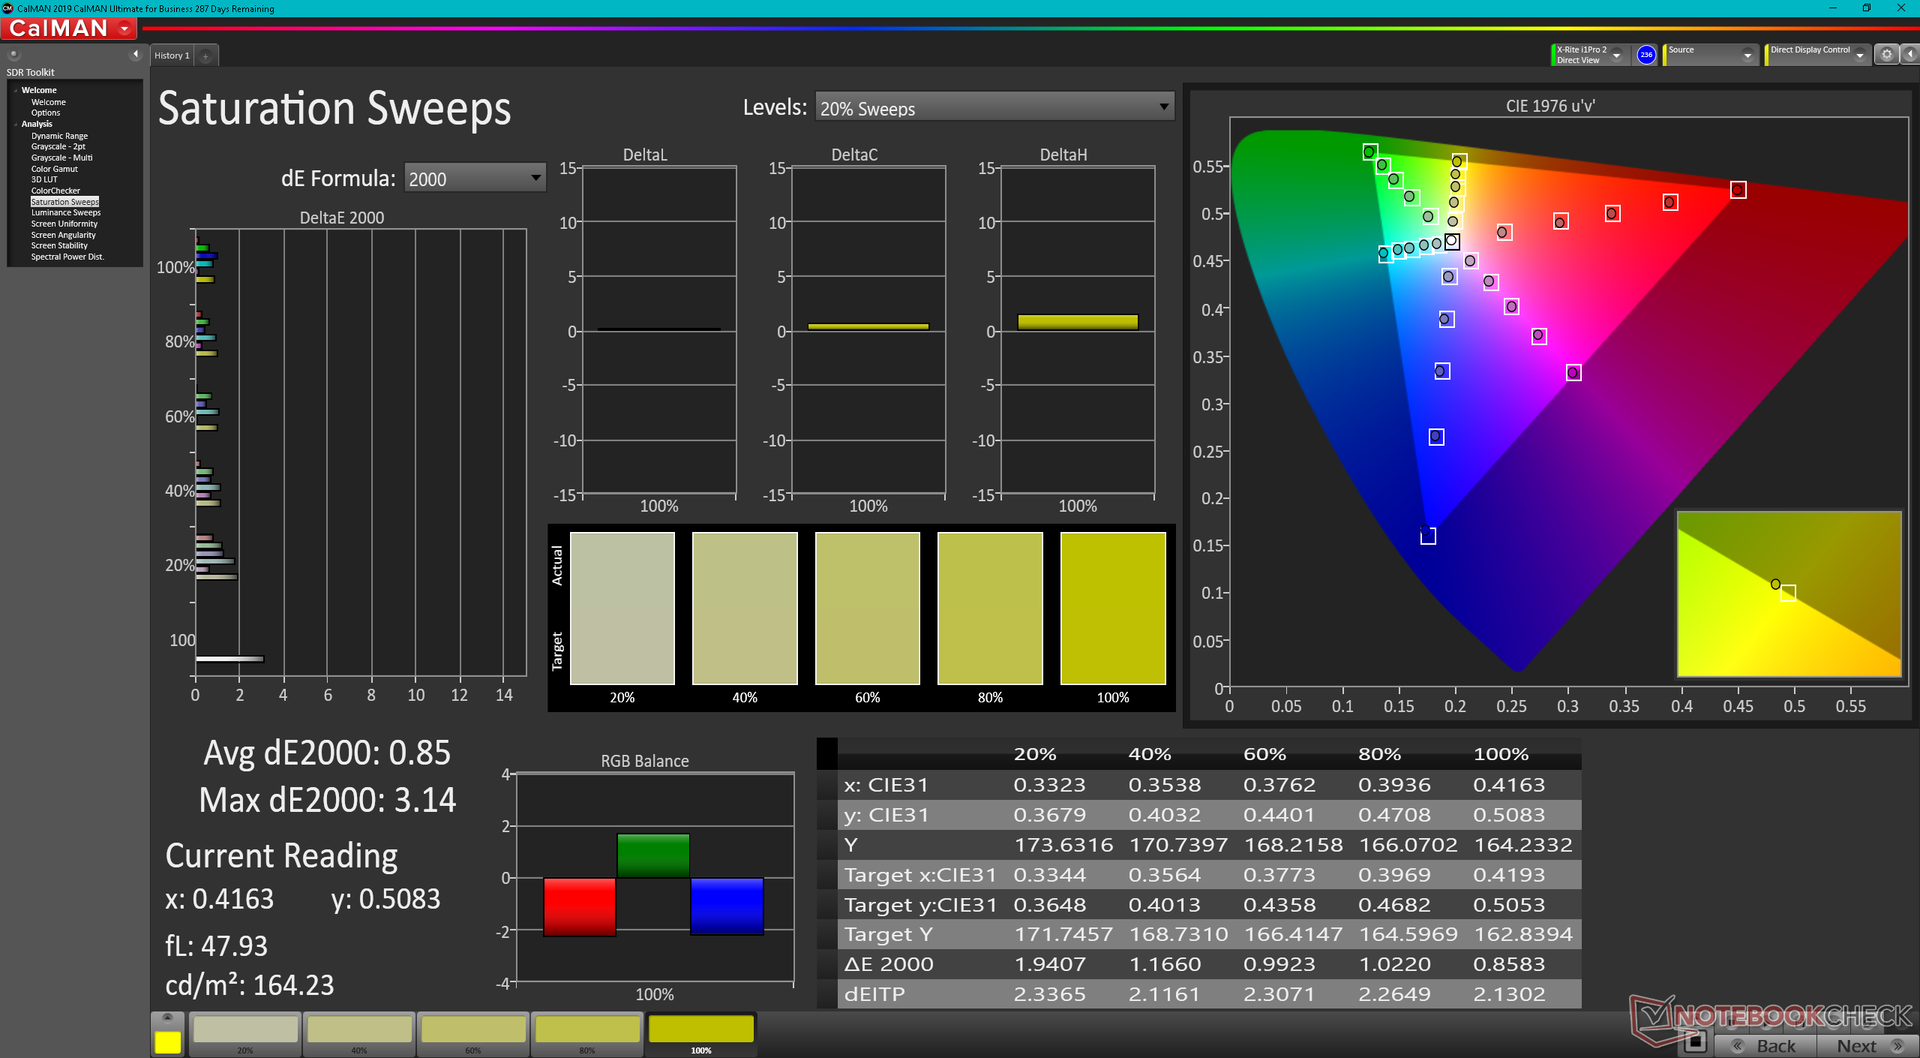
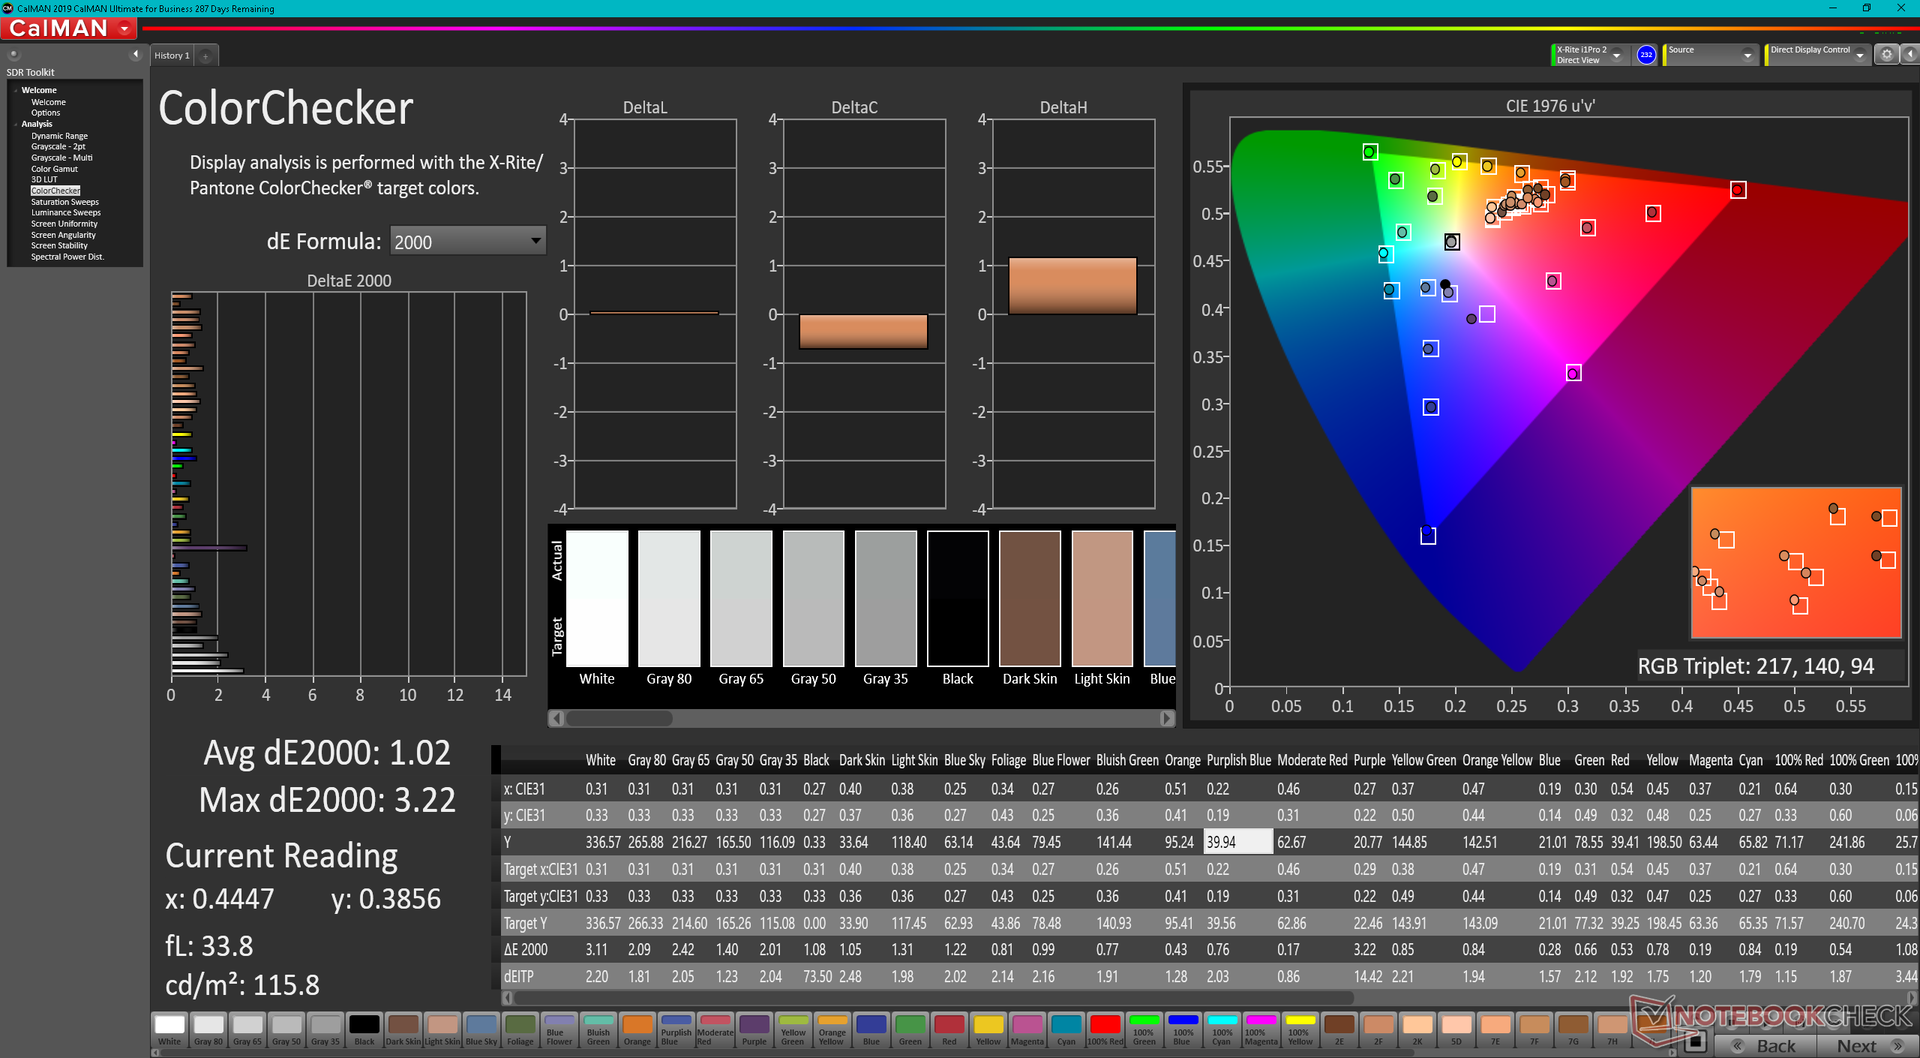
ΔE ColorChecker Calman: 2.24 | ∀{0.5-29.43 Ø4.71}
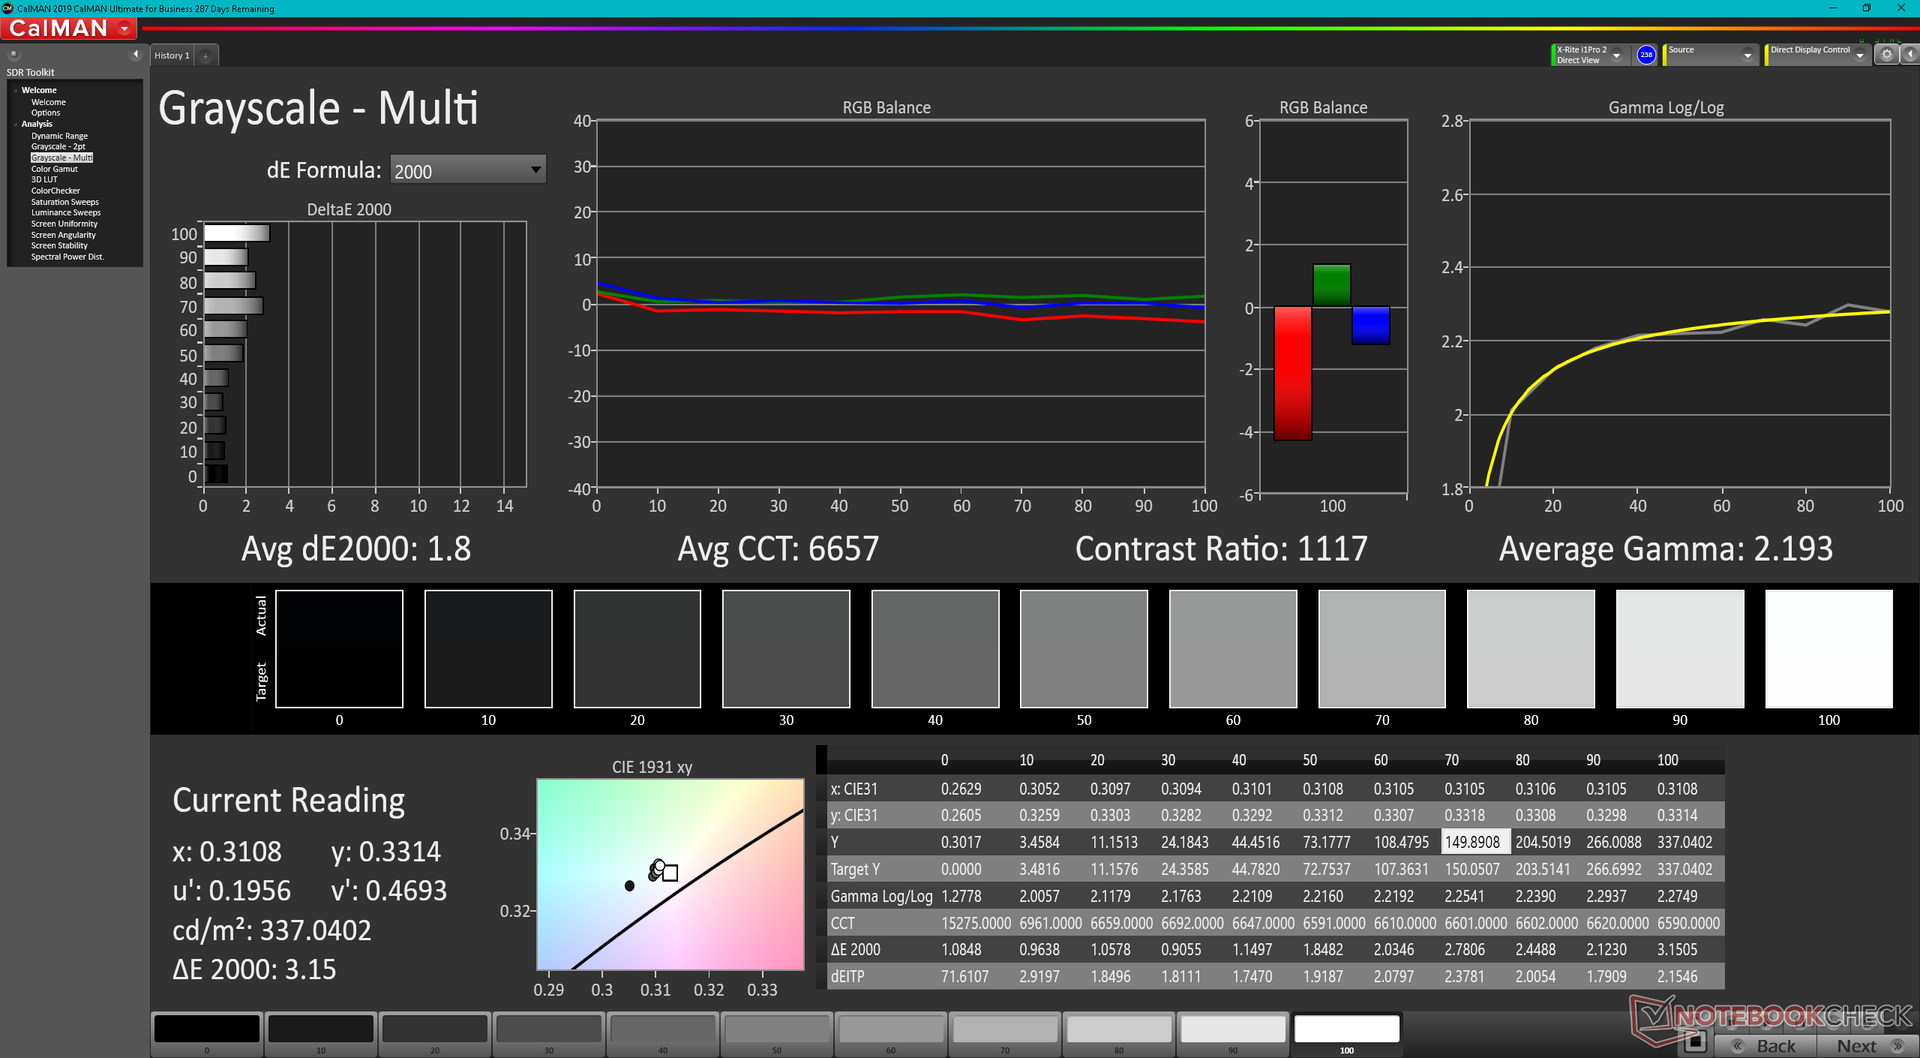
calibrated: 1.02
ΔE Greyscale Calman: 4 | ∀{0.09-98 Ø4.96}
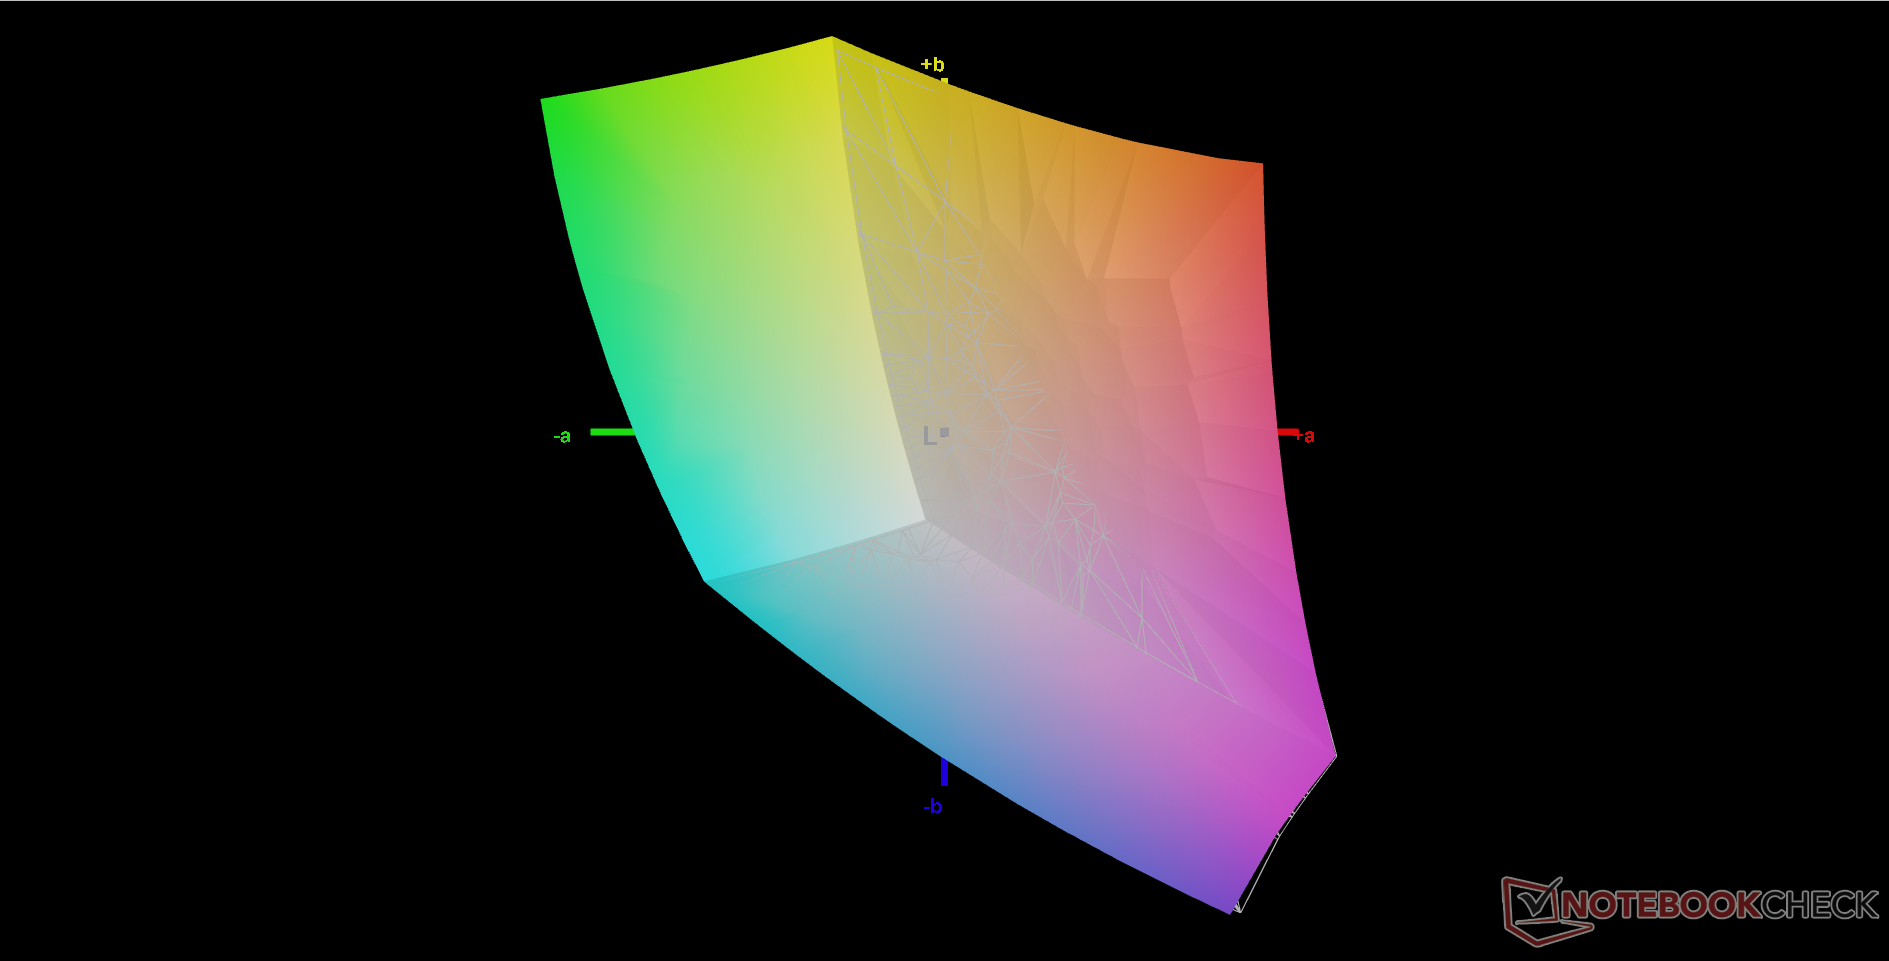
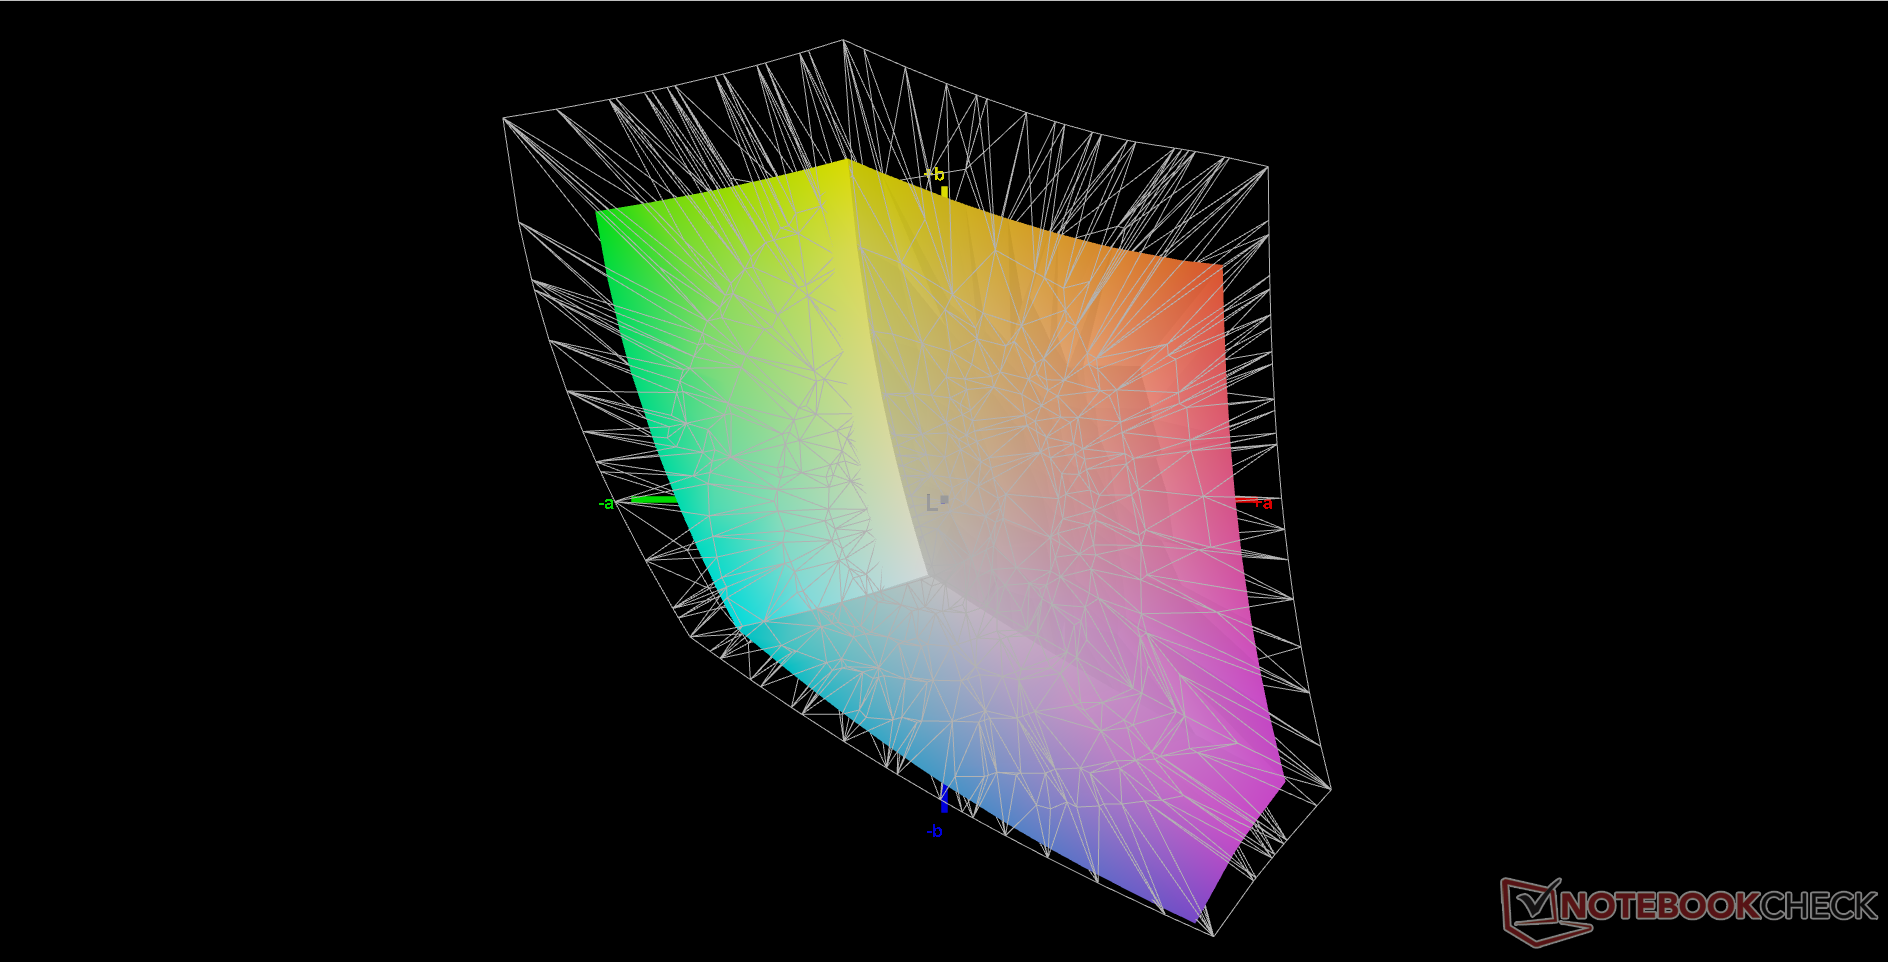
72.1% AdobeRGB 1998 (Argyll 3D)
99.5% sRGB (Argyll 3D)
70.1% Display P3 (Argyll 3D)
Gamma: 2.24
CCT: 6864 K
| MSI Vector GP66 12UGS BOE NE156FHM-NZ3, IPS, 1920x1080, 15.6" | MSI GP66 Leopard 11UH-028 LGD0625 (LP156WFG-SPB3), IPS, 1920x1080, 15.6" | MSI Katana GF66 11UG-220 AU Optronics B156HAN08.0, IPS, 1920x1080, 15.6" | Asus TUF Gaming F15 FX506HM Chi Mei N156HRA-EA1, IPS, 1920x1080, 15.6" | Razer Blade 15 Base Edition 2021, i7-10750H RTX 3060 BOE NV156FHM-N4K, IPS, 1920x1080, 15.6" | Alienware m15 R5 Ryzen Edition B156HAN, IPS, 1920x1080, 15.6" | |
|---|---|---|---|---|---|---|
| Display | -6% | -7% | -39% | -8% | ||
| Display P3 Coverage (%) | 70.1 | 65.2 -7% | 65.4 -7% | 41.9 -40% | 64.3 -8% | |
| sRGB Coverage (%) | 99.5 | 95.8 -4% | 91.3 -8% | 62.9 -37% | 91.8 -8% | |
| AdobeRGB 1998 Coverage (%) | 72.1 | 66 -8% | 66.7 -7% | 43.3 -40% | 65.5 -9% | |
| Response Times | -77% | -23% | -258% | -28% | 22% | |
| Response Time Grey 50% / Grey 80% * (ms) | 5.8 ? | 14 ? -141% | 7.4 ? -28% | 28.4 ? -390% | 8.8 ? -52% | 4 ? 31% |
| Response Time Black / White * (ms) | 9.6 ? | 10.8 ? -13% | 11.2 ? -17% | 21.6 ? -125% | 10 ? -4% | 8.4 ? 12% |
| PWM Frequency (Hz) | 1000 ? | |||||
| Screen | -21% | -30% | -71% | -32% | 2% | |
| Brightness middle (cd/m²) | 353.1 | 390 10% | 307 -13% | 268.3 -24% | 317.2 -10% | 329 -7% |
| Brightness (cd/m²) | 325 | 362 11% | 321 -1% | 257 -21% | 306 -6% | 321 -1% |
| Brightness Distribution (%) | 85 | 87 2% | 83 -2% | 84 -1% | 89 5% | 92 8% |
| Black Level * (cd/m²) | 0.38 | 0.41 -8% | 0.27 29% | 0.34 11% | 0.31 18% | 0.27 29% |
| Contrast (:1) | 929 | 951 2% | 1137 22% | 789 -15% | 1023 10% | 1219 31% |
| Colorchecker dE 2000 * | 2.24 | 2.66 -19% | 4.67 -108% | 5.05 -125% | 4.37 -95% | 2.78 -24% |
| Colorchecker dE 2000 max. * | 5 | 7.14 -43% | 7.53 -51% | 15.43 -209% | 6.62 -32% | 4.88 2% |
| Colorchecker dE 2000 calibrated * | 1.02 | 2.56 -151% | 2.41 -136% | 3.21 -215% | 2.67 -162% | 1.63 -60% |
| Greyscale dE 2000 * | 4 | 3.63 9% | 4.5 -13% | 5.5 -38% | 4.5 -13% | 2.5 37% |
| Gamma | 2.24 98% | 2.57 86% | 2.276 97% | 2.35 94% | 2.4 92% | 2.106 104% |
| CCT | 6864 95% | 6894 94% | 6824 95% | 7392 88% | 7418 88% | 6201 105% |
| Color Space (Percent of AdobeRGB 1998) (%) | 59.2 | 76 | ||||
| Color Space (Percent of sRGB) (%) | 91.4 | 99 | ||||
| Média Total (Programa/Configurações) | -35% /
-26% | -20% /
-24% | -123% /
-91% | -23% /
-26% | 12% /
5% |
* ... menor é melhor
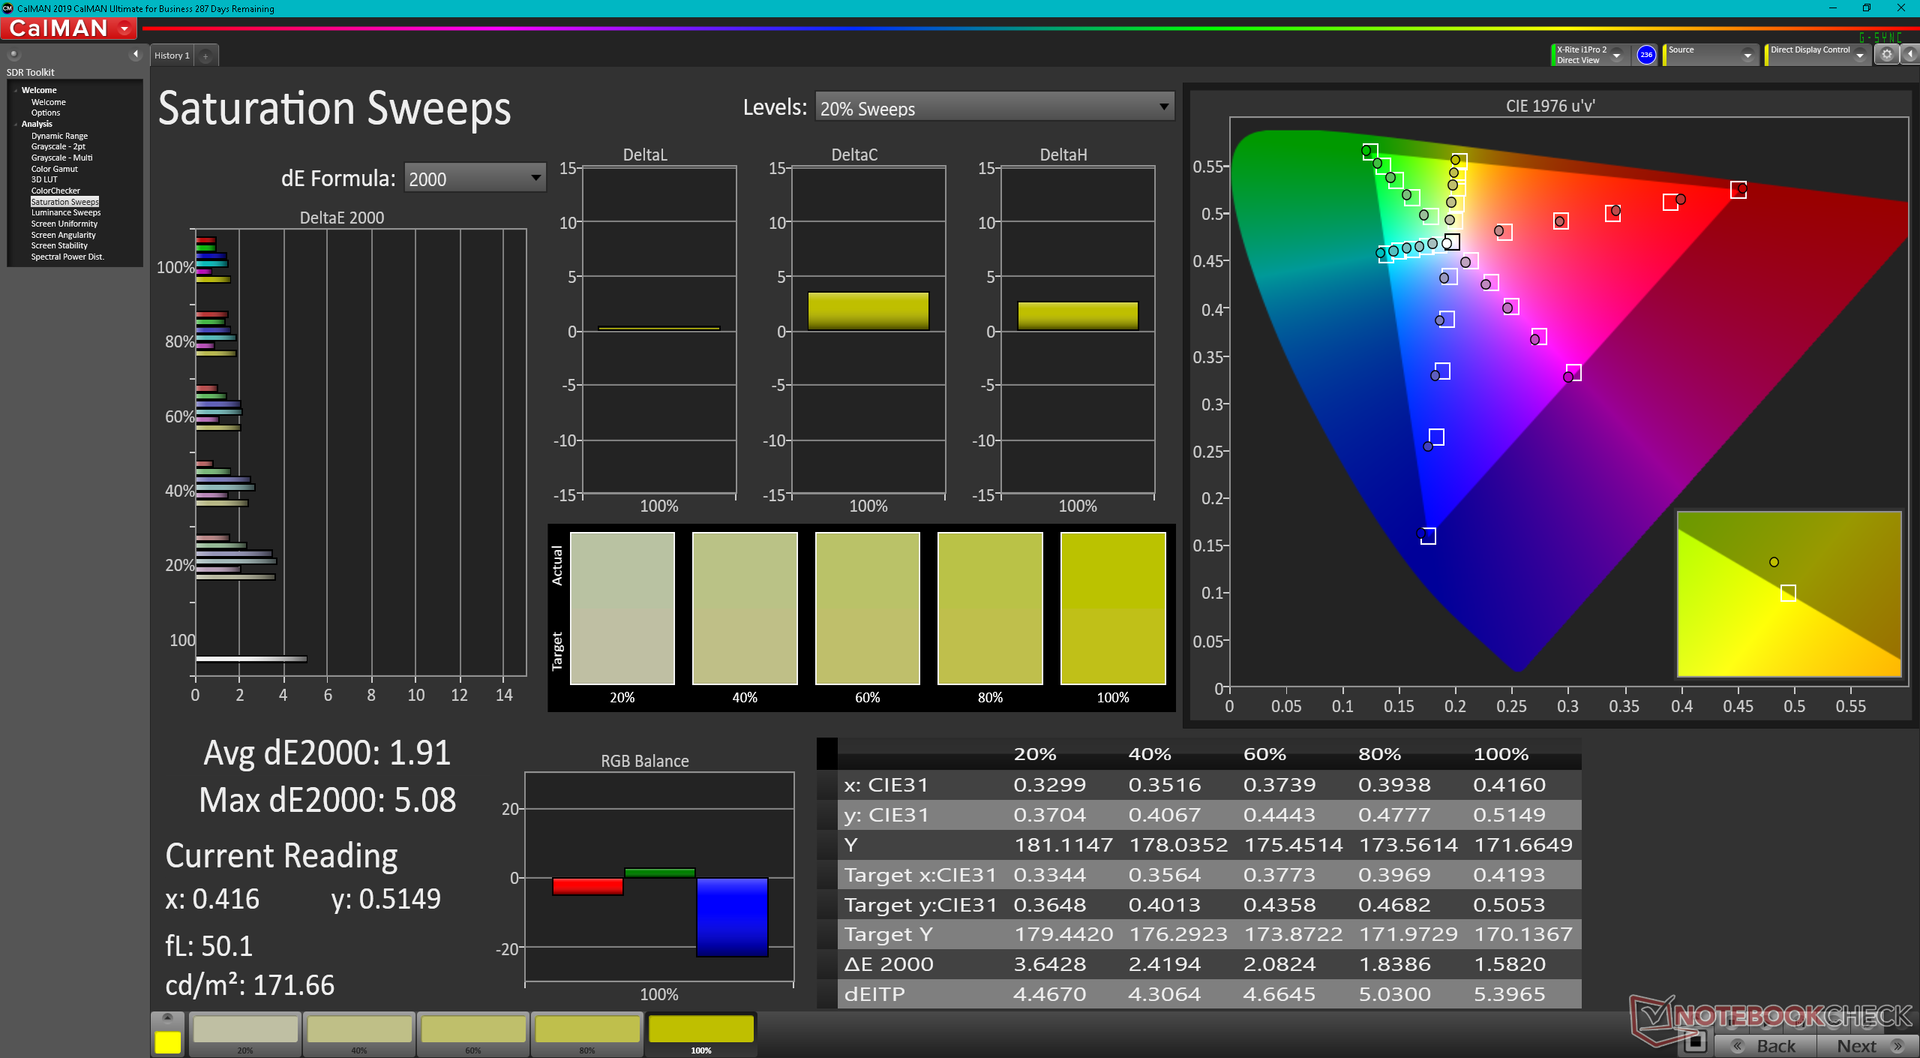
O painel cobre todo o sRGB e até mesmo um pouco mais de AdobeRGB quando comparado aos painéis do GF66 Katana ou GP66 Leopard. Estamos felizes em ver aqui um painel de alta qualidade, ao contrário do Chi Mei no Asus TUF Gaming F15 que cobre uma gama significativamente mais estreita
O display é decentemente calibrado fora da caixa, embora sua temperatura de cor possa ser ligeiramente mais quente. Uma calibragem do colorímetro X-Rite trata disso para melhorar os valores médios de escala de cinza e DeltaE de cor de 4 e 2,24 para apenas 1,8 e 1,02, respectivamente
Exibir tempos de resposta
| ↔ Tempo de resposta preto para branco | ||
|---|---|---|
| 9.6 ms ... ascensão ↗ e queda ↘ combinadas | ↗ 5.2 ms ascensão | 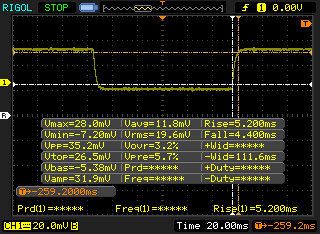 |
| ↘ 4.4 ms queda | ||
| A tela mostra taxas de resposta rápidas em nossos testes e deve ser adequada para jogos. Em comparação, todos os dispositivos testados variam de 0.1 (mínimo) a 240 (máximo) ms. » 26 % de todos os dispositivos são melhores. Isso significa que o tempo de resposta medido é melhor que a média de todos os dispositivos testados (19.8 ms). | ||
| ↔ Tempo de resposta 50% cinza a 80% cinza | ||
| 5.8 ms ... ascensão ↗ e queda ↘ combinadas | ↗ 3.4 ms ascensão | 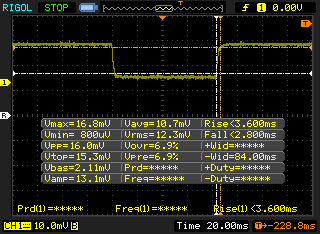 |
| ↘ 2.4 ms queda | ||
| A tela mostra taxas de resposta muito rápidas em nossos testes e deve ser muito adequada para jogos em ritmo acelerado. Em comparação, todos os dispositivos testados variam de 0.165 (mínimo) a 636 (máximo) ms. » 19 % de todos os dispositivos são melhores. Isso significa que o tempo de resposta medido é melhor que a média de todos os dispositivos testados (31 ms). | ||
Cintilação da tela / PWM (modulação por largura de pulso)
| Tela tremeluzindo / PWM não detectado | 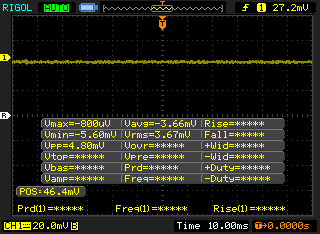 | ||
[pwm_comparison] Em comparação: 52 % de todos os dispositivos testados não usam PWM para escurecer a tela. Se PWM foi detectado, uma média de 7757 (mínimo: 5 - máximo: 343500) Hz foi medida. | |||

Desempenho
Condições de teste
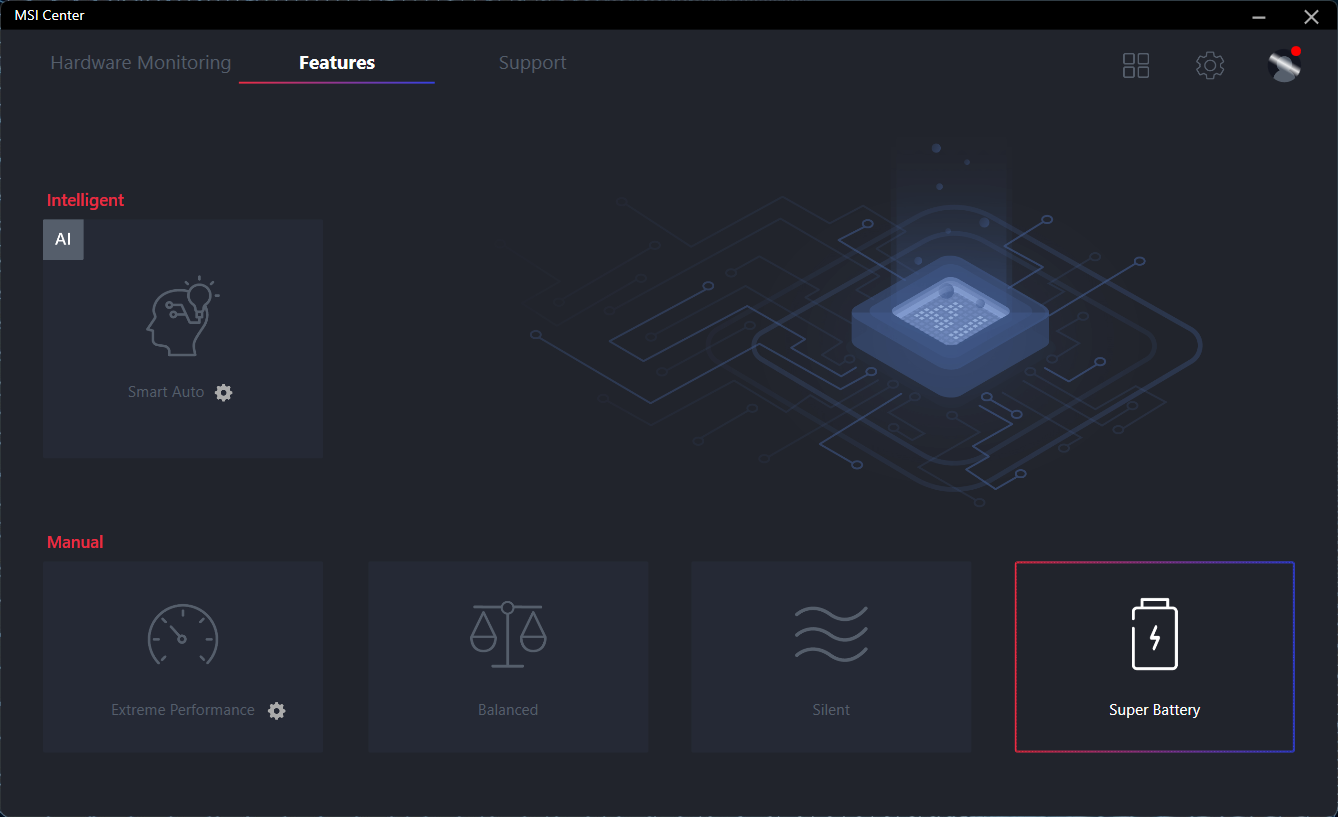
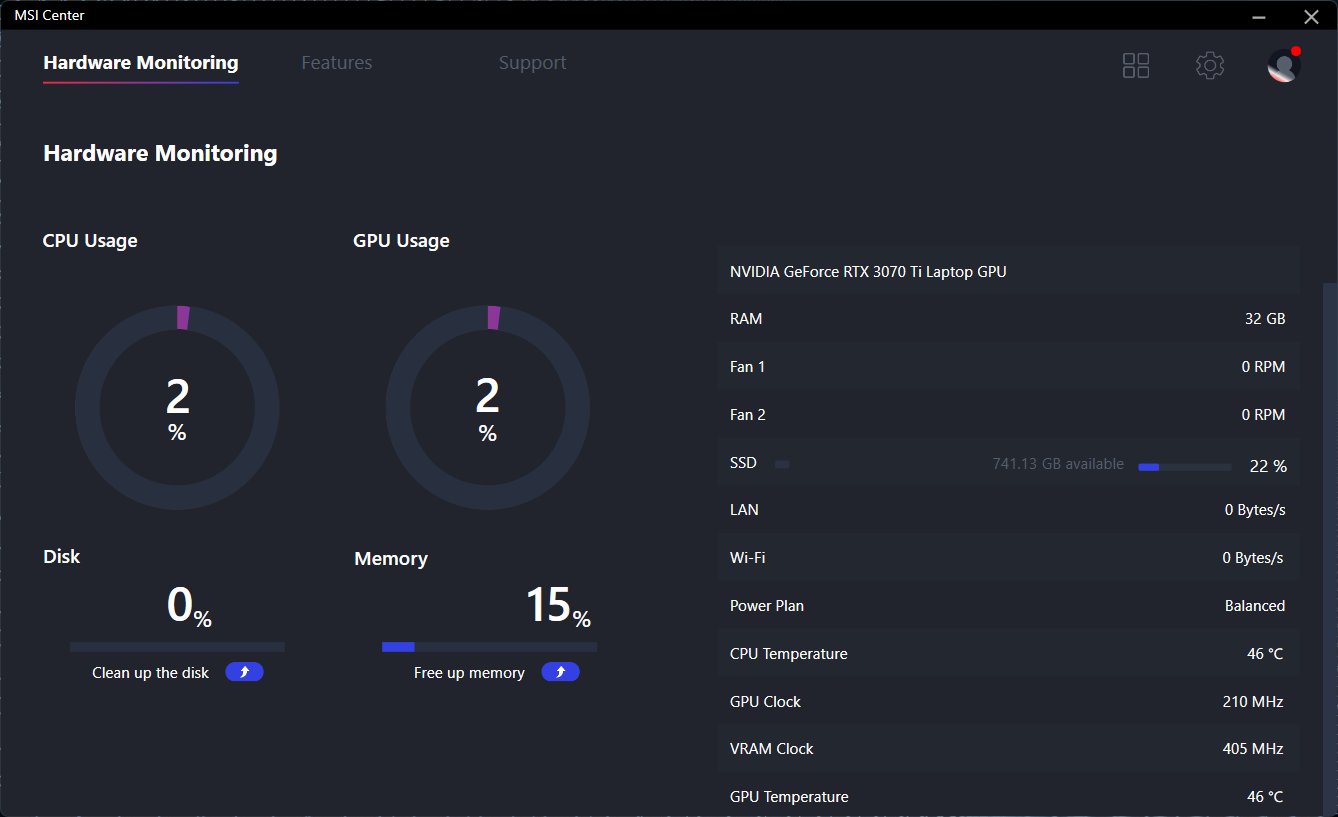
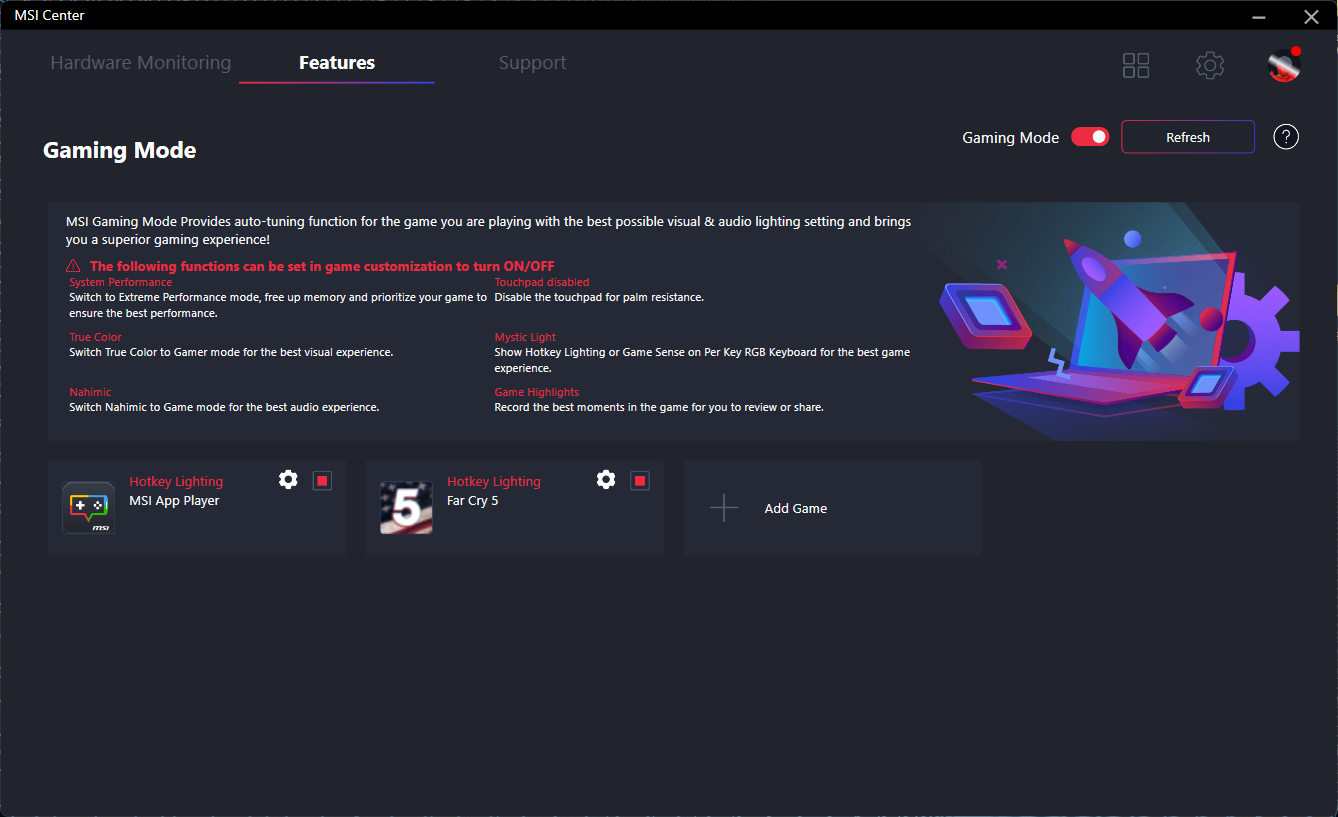
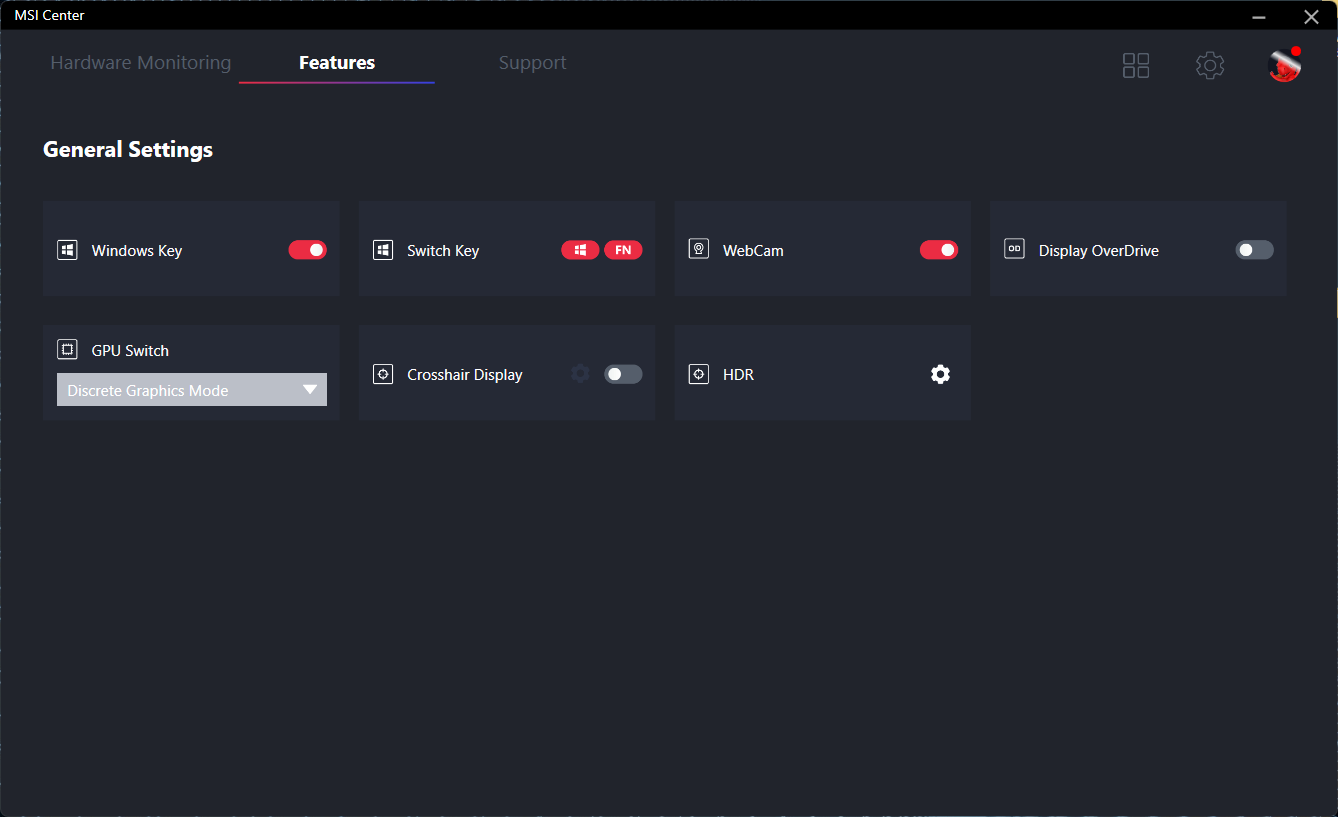
Nossa unidade foi configurada para o modo Extreme Performance com a GPU discreta ativa através do software MSI Center para as mais altas pontuações possíveis. Recomendamos aos usuários que se familiarizem com este software, pois muitas características importantes são combinadas aqui, incluindo MSHybrid, monitoramento de hardware, HDR e outras configurações de QoL. Para efeitos de iluminação do teclado, os usuários devem confiar no software SteelSeries GG pré-instalado
Uma reinicialização é necessária se alternar entre os modos MSHybrid e GPU discreto.
Processador
O Núcleo i9-12900H é cerca de 25% e 35% mais rápido em aplicações com rosca única e rosca múltipla, respectivamente, quando comparado com a última geração Núcleo i7-11800H como encontrado no GP66 Leopard. O desempenho geral pode até superar o desktop mais ávido de energiaNúcleo i9-11900K. A série AMD Zen 3 H anteriormente detinha a coroa de desempenho antes do lançamento da série Alder Lake-H da Intel.
Mais informações sobre o Alder Lake podem ser encontradas em nossa visão geral da plataforma aqui.
Cinebench R15 Multi Loop
Cinebench R23: Multi Core | Single Core
Cinebench R15: CPU Multi 64Bit | CPU Single 64Bit
Blender: v2.79 BMW27 CPU
7-Zip 18.03: 7z b 4 | 7z b 4 -mmt1
Geekbench 5.5: Multi-Core | Single-Core
HWBOT x265 Benchmark v2.2: 4k Preset
LibreOffice : 20 Documents To PDF
R Benchmark 2.5: Overall mean
| Cinebench R20 / CPU (Multi Core) | |
| Intel Core i9-12900K | |
| MSI Vector GP66 12UGS | |
| MSI MEG Z590 ACE | |
| Média Intel Core i9-12900H (2681 - 7471, n=28) | |
| Eurocom Nightsky ARX315 | |
| MSI GP66 Leopard 11UH-028 | |
| HP ZBook Fury 15 G8 | |
| MSI Alpha 15 B5EEK-008 | |
| MSI Delta 15 A5EFK | |
| Alienware m15 R4 | |
| MSI GE65 Raider 9SF-049US | |
| Razer Blade 15 Advanced Model Early 2021 | |
| Cinebench R20 / CPU (Single Core) | |
| Intel Core i9-12900K | |
| MSI Vector GP66 12UGS | |
| Média Intel Core i9-12900H (624 - 738, n=28) | |
| MSI MEG Z590 ACE | |
| HP ZBook Fury 15 G8 | |
| Eurocom Nightsky ARX315 | |
| MSI GP66 Leopard 11UH-028 | |
| MSI Delta 15 A5EFK | |
| MSI Alpha 15 B5EEK-008 | |
| Alienware m15 R4 | |
| Razer Blade 15 Advanced Model Early 2021 | |
| MSI GE65 Raider 9SF-049US | |
| Cinebench R23 / Multi Core | |
| Intel Core i9-12900K | |
| MSI Vector GP66 12UGS | |
| MSI MEG Z590 ACE | |
| Média Intel Core i9-12900H (7359 - 19648, n=28) | |
| Eurocom Nightsky ARX315 | |
| MSI GP66 Leopard 11UH-028 | |
| HP ZBook Fury 15 G8 | |
| MSI Alpha 15 B5EEK-008 | |
| MSI Delta 15 A5EFK | |
| Razer Blade 15 Advanced Model Early 2021 | |
| Cinebench R23 / Single Core | |
| Intel Core i9-12900K | |
| MSI Vector GP66 12UGS | |
| Média Intel Core i9-12900H (1634 - 1930, n=28) | |
| MSI MEG Z590 ACE | |
| HP ZBook Fury 15 G8 | |
| Eurocom Nightsky ARX315 | |
| MSI GP66 Leopard 11UH-028 | |
| MSI Delta 15 A5EFK | |
| MSI Alpha 15 B5EEK-008 | |
| Razer Blade 15 Advanced Model Early 2021 | |
| Cinebench R15 / CPU Multi 64Bit | |
| Intel Core i9-12900K | |
| Média Intel Core i9-12900H (1395 - 3077, n=28) | |
| MSI Vector GP66 12UGS | |
| MSI MEG Z590 ACE | |
| Eurocom Nightsky ARX315 | |
| MSI Delta 15 A5EFK | |
| MSI GP66 Leopard 11UH-028 | |
| MSI Alpha 15 B5EEK-008 | |
| HP ZBook Fury 15 G8 | |
| MSI GE65 Raider 9SF-049US | |
| Alienware m15 R4 | |
| Razer Blade 15 Advanced Model Early 2021 | |
| Cinebench R15 / CPU Single 64Bit | |
| Intel Core i9-12900K | |
| MSI Vector GP66 12UGS | |
| Média Intel Core i9-12900H (235 - 277, n=29) | |
| MSI MEG Z590 ACE | |
| Eurocom Nightsky ARX315 | |
| HP ZBook Fury 15 G8 | |
| MSI Delta 15 A5EFK | |
| MSI Alpha 15 B5EEK-008 | |
| MSI GP66 Leopard 11UH-028 | |
| Alienware m15 R4 | |
| Razer Blade 15 Advanced Model Early 2021 | |
| MSI GE65 Raider 9SF-049US | |
| Blender / v2.79 BMW27 CPU | |
| Razer Blade 15 Advanced Model Early 2021 | |
| Alienware m15 R4 | |
| HP ZBook Fury 15 G8 | |
| MSI Alpha 15 B5EEK-008 | |
| MSI GP66 Leopard 11UH-028 | |
| MSI Delta 15 A5EFK | |
| Média Intel Core i9-12900H (160 - 451, n=28) | |
| Eurocom Nightsky ARX315 | |
| MSI Vector GP66 12UGS | |
| MSI MEG Z590 ACE | |
| Intel Core i9-12900K | |
| 7-Zip 18.03 / 7z b 4 | |
| Intel Core i9-12900K | |
| Eurocom Nightsky ARX315 | |
| MSI Vector GP66 12UGS | |
| MSI MEG Z590 ACE | |
| Média Intel Core i9-12900H (34684 - 76677, n=28) | |
| MSI Delta 15 A5EFK | |
| MSI Alpha 15 B5EEK-008 | |
| MSI GP66 Leopard 11UH-028 | |
| HP ZBook Fury 15 G8 | |
| Alienware m15 R4 | |
| Razer Blade 15 Advanced Model Early 2021 | |
| 7-Zip 18.03 / 7z b 4 -mmt1 | |
| Intel Core i9-12900K | |
| Eurocom Nightsky ARX315 | |
| MSI MEG Z590 ACE | |
| MSI Vector GP66 12UGS | |
| Média Intel Core i9-12900H (5302 - 6289, n=28) | |
| HP ZBook Fury 15 G8 | |
| MSI Delta 15 A5EFK | |
| MSI GP66 Leopard 11UH-028 | |
| MSI Alpha 15 B5EEK-008 | |
| Alienware m15 R4 | |
| Razer Blade 15 Advanced Model Early 2021 | |
| Geekbench 5.5 / Multi-Core | |
| Intel Core i9-12900K | |
| MSI Vector GP66 12UGS | |
| Média Intel Core i9-12900H (8519 - 14376, n=31) | |
| MSI MEG Z590 ACE | |
| Eurocom Nightsky ARX315 | |
| MSI GP66 Leopard 11UH-028 | |
| MSI Delta 15 A5EFK | |
| MSI Alpha 15 B5EEK-008 | |
| Alienware m15 R4 | |
| Razer Blade 15 Advanced Model Early 2021 | |
| Geekbench 5.5 / Single-Core | |
| Intel Core i9-12900K | |
| MSI Vector GP66 12UGS | |
| Média Intel Core i9-12900H (1631 - 1897, n=31) | |
| MSI MEG Z590 ACE | |
| Eurocom Nightsky ARX315 | |
| MSI GP66 Leopard 11UH-028 | |
| MSI Delta 15 A5EFK | |
| MSI Alpha 15 B5EEK-008 | |
| Alienware m15 R4 | |
| Razer Blade 15 Advanced Model Early 2021 | |
| HWBOT x265 Benchmark v2.2 / 4k Preset | |
| Intel Core i9-12900K | |
| MSI Vector GP66 12UGS | |
| MSI MEG Z590 ACE | |
| Eurocom Nightsky ARX315 | |
| Média Intel Core i9-12900H (8.05 - 22.5, n=28) | |
| MSI Delta 15 A5EFK | |
| MSI GP66 Leopard 11UH-028 | |
| MSI Alpha 15 B5EEK-008 | |
| HP ZBook Fury 15 G8 | |
| Alienware m15 R4 | |
| Razer Blade 15 Advanced Model Early 2021 | |
| LibreOffice / 20 Documents To PDF | |
| MSI Alpha 15 B5EEK-008 | |
| Razer Blade 15 Advanced Model Early 2021 | |
| MSI Delta 15 A5EFK | |
| HP ZBook Fury 15 G8 | |
| Alienware m15 R4 | |
| MSI GP66 Leopard 11UH-028 | |
| Eurocom Nightsky ARX315 | |
| Média Intel Core i9-12900H (36.8 - 59.8, n=28) | |
| MSI MEG Z590 ACE | |
| Intel Core i9-12900K | |
| MSI Vector GP66 12UGS | |
| R Benchmark 2.5 / Overall mean | |
| Razer Blade 15 Advanced Model Early 2021 | |
| Alienware m15 R4 | |
| MSI GP66 Leopard 11UH-028 | |
| HP ZBook Fury 15 G8 | |
| MSI Alpha 15 B5EEK-008 | |
| MSI Delta 15 A5EFK | |
| Eurocom Nightsky ARX315 | |
| MSI MEG Z590 ACE | |
| Média Intel Core i9-12900H (0.4218 - 0.506, n=28) | |
| MSI Vector GP66 12UGS | |
| Intel Core i9-12900K | |
* ... menor é melhor
AIDA64: FP32 Ray-Trace | FPU Julia | CPU SHA3 | CPU Queen | FPU SinJulia | FPU Mandel | CPU AES | CPU ZLib | FP64 Ray-Trace | CPU PhotoWorxx
| Performance rating | |
| MSI GP66 Leopard 11UH-028 | |
| Alienware m15 R5 Ryzen Edition | |
| Média Intel Core i9-12900H | |
| MSI Vector GP66 12UGS | |
| MSI Katana GF66 11UG-220 -9! | |
| Asus TUF Gaming F15 FX506HM -9! | |
| AIDA64 / FP32 Ray-Trace | |
| MSI GP66 Leopard 11UH-028 | |
| Alienware m15 R5 Ryzen Edition | |
| Média Intel Core i9-12900H (4074 - 18289, n=29) | |
| MSI Vector GP66 12UGS | |
| AIDA64 / FPU Julia | |
| Alienware m15 R5 Ryzen Edition | |
| MSI GP66 Leopard 11UH-028 | |
| Média Intel Core i9-12900H (22307 - 93236, n=29) | |
| MSI Vector GP66 12UGS | |
| AIDA64 / CPU SHA3 | |
| MSI GP66 Leopard 11UH-028 | |
| Alienware m15 R5 Ryzen Edition | |
| Média Intel Core i9-12900H (1378 - 4215, n=29) | |
| MSI Vector GP66 12UGS | |
| AIDA64 / CPU Queen | |
| MSI Vector GP66 12UGS | |
| Média Intel Core i9-12900H (78172 - 111241, n=28) | |
| Alienware m15 R5 Ryzen Edition | |
| MSI GP66 Leopard 11UH-028 | |
| AIDA64 / FPU SinJulia | |
| Alienware m15 R5 Ryzen Edition | |
| MSI GP66 Leopard 11UH-028 | |
| MSI Vector GP66 12UGS | |
| Média Intel Core i9-12900H (5709 - 10410, n=29) | |
| AIDA64 / FPU Mandel | |
| Alienware m15 R5 Ryzen Edition | |
| MSI GP66 Leopard 11UH-028 | |
| Média Intel Core i9-12900H (11257 - 45581, n=29) | |
| MSI Vector GP66 12UGS | |
| AIDA64 / CPU AES | |
| MSI GP66 Leopard 11UH-028 | |
| Alienware m15 R5 Ryzen Edition | |
| MSI Vector GP66 12UGS | |
| Média Intel Core i9-12900H (31935 - 151546, n=29) | |
| AIDA64 / CPU ZLib | |
| MSI Vector GP66 12UGS | |
| Média Intel Core i9-12900H (449 - 1193, n=29) | |
| MSI GP66 Leopard 11UH-028 | |
| Alienware m15 R5 Ryzen Edition | |
| Asus TUF Gaming F15 FX506HM | |
| MSI Katana GF66 11UG-220 | |
| AIDA64 / FP64 Ray-Trace | |
| MSI GP66 Leopard 11UH-028 | |
| Alienware m15 R5 Ryzen Edition | |
| Média Intel Core i9-12900H (2235 - 10511, n=29) | |
| MSI Vector GP66 12UGS | |
| AIDA64 / CPU PhotoWorxx | |
| Média Intel Core i9-12900H (20960 - 48269, n=30) | |
| MSI Vector GP66 12UGS | |
| MSI GP66 Leopard 11UH-028 | |
| Alienware m15 R5 Ryzen Edition | |
Desempenho do sistema
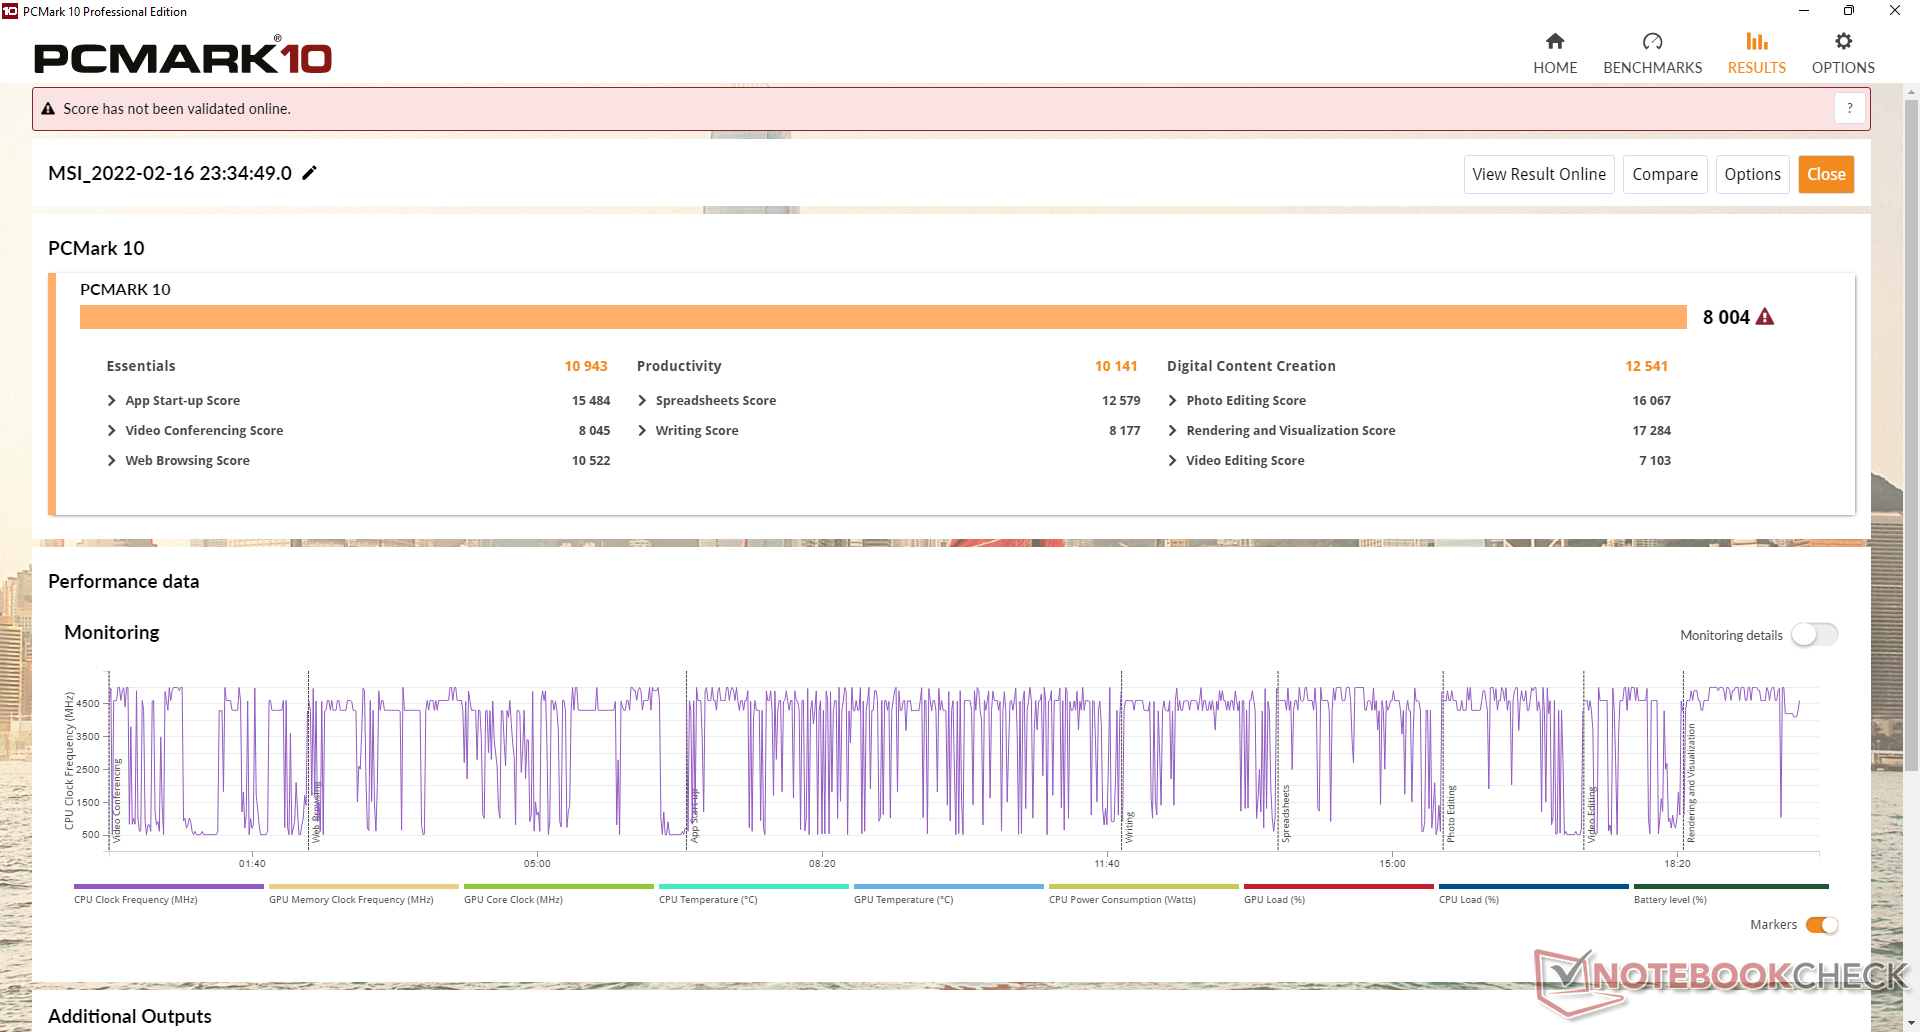
Os resultados da PCMark são alguns dos mais altos em nosso banco de dados em pouco mais de 8000 pontos. OMSI Raider GE76 equipado com o Core i9-12900HK desbloqueado e mais rápido GeForce RTX 3080 Ti retornaria pontuações essencialmente idênticas às nossas GP66
Vale notar que tivemos problemas de despertar e dormir com nossa unidade de teste onde a tela às vezes permaneceria preta ao alternar entre os modos GPU ou ao entrar no modo de sono. Uma reinicialização dura seria então necessária.
| PCMark 10 / Score | |
| MSI Vector GP66 12UGS | |
| Média Intel Core i9-12900H, NVIDIA GeForce RTX 3070 Ti Laptop GPU (7087 - 8072, n=6) | |
| MSI GP66 Leopard 11UH-028 | |
| Asus TUF Gaming F15 FX506HM | |
| MSI Katana GF66 11UG-220 | |
| Alienware m15 R5 Ryzen Edition | |
| Razer Blade 15 Base Edition 2021, i7-10750H RTX 3060 | |
| PCMark 10 / Essentials | |
| MSI Vector GP66 12UGS | |
| Média Intel Core i9-12900H, NVIDIA GeForce RTX 3070 Ti Laptop GPU (10266 - 11663, n=6) | |
| Asus TUF Gaming F15 FX506HM | |
| MSI GP66 Leopard 11UH-028 | |
| Razer Blade 15 Base Edition 2021, i7-10750H RTX 3060 | |
| Alienware m15 R5 Ryzen Edition | |
| MSI Katana GF66 11UG-220 | |
| PCMark 10 / Productivity | |
| Média Intel Core i9-12900H, NVIDIA GeForce RTX 3070 Ti Laptop GPU (9402 - 10742, n=6) | |
| MSI Vector GP66 12UGS | |
| MSI Katana GF66 11UG-220 | |
| Alienware m15 R5 Ryzen Edition | |
| Asus TUF Gaming F15 FX506HM | |
| MSI GP66 Leopard 11UH-028 | |
| Razer Blade 15 Base Edition 2021, i7-10750H RTX 3060 | |
| PCMark 10 / Digital Content Creation | |
| MSI Vector GP66 12UGS | |
| Média Intel Core i9-12900H, NVIDIA GeForce RTX 3070 Ti Laptop GPU (10009 - 12541, n=6) | |
| MSI GP66 Leopard 11UH-028 | |
| MSI Katana GF66 11UG-220 | |
| Asus TUF Gaming F15 FX506HM | |
| Alienware m15 R5 Ryzen Edition | |
| Razer Blade 15 Base Edition 2021, i7-10750H RTX 3060 | |
| PCMark 10 Score | 8004 pontos | |
Ajuda | ||
| AIDA64 / Memory Copy | |
| Média Intel Core i9-12900H (34438 - 74264, n=29) | |
| MSI Vector GP66 12UGS | |
| MSI GP66 Leopard 11UH-028 | |
| Alienware m15 R5 Ryzen Edition | |
| AIDA64 / Memory Read | |
| Média Intel Core i9-12900H (36365 - 74642, n=29) | |
| MSI GP66 Leopard 11UH-028 | |
| MSI Vector GP66 12UGS | |
| Alienware m15 R5 Ryzen Edition | |
| AIDA64 / Memory Write | |
| Média Intel Core i9-12900H (32276 - 67858, n=29) | |
| MSI Vector GP66 12UGS | |
| MSI GP66 Leopard 11UH-028 | |
| Alienware m15 R5 Ryzen Edition | |
| AIDA64 / Memory Latency | |
| MSI GP66 Leopard 11UH-028 | |
| MSI Vector GP66 12UGS | |
| Média Intel Core i9-12900H (74.7 - 118.1, n=28) | |
| Alienware m15 R5 Ryzen Edition | |
| Asus TUF Gaming F15 FX506HM | |
| MSI Katana GF66 11UG-220 | |
| MSI Katana GF66 11UG-220 | |
* ... menor é melhor
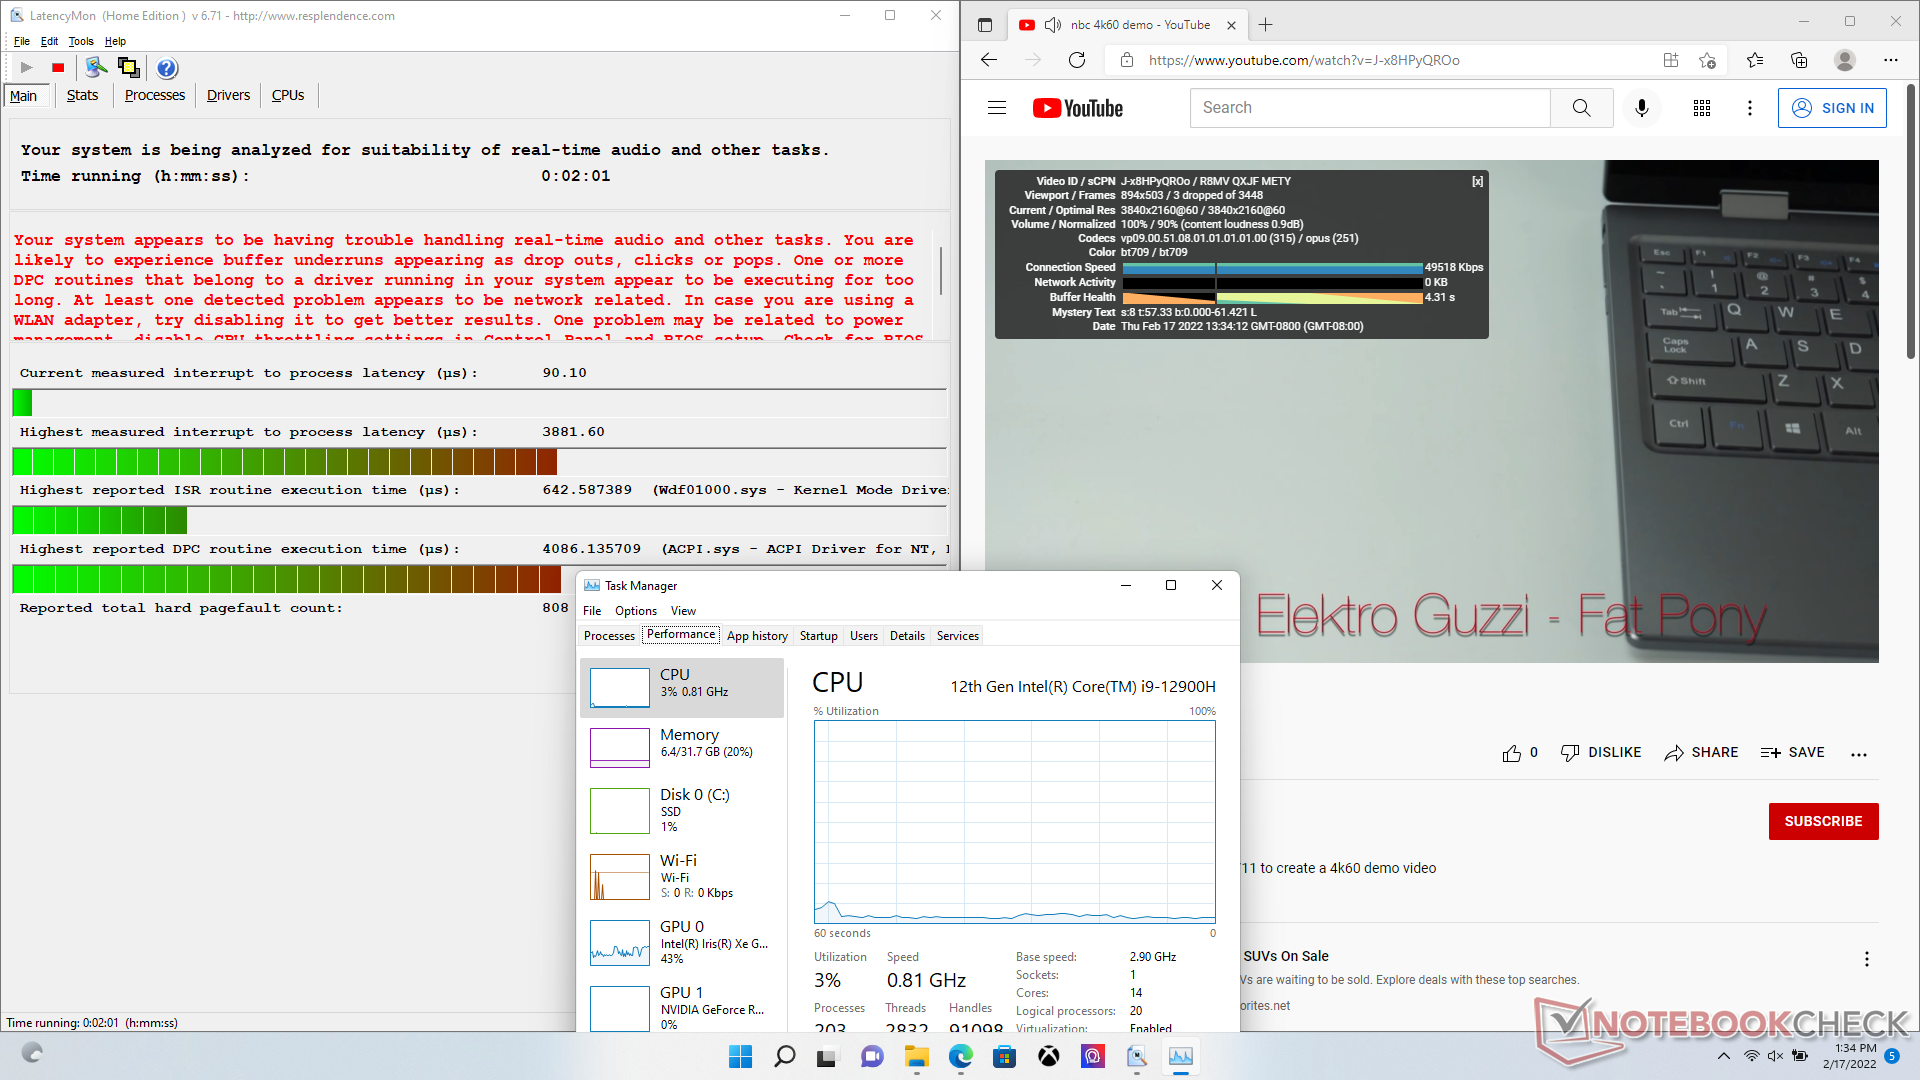
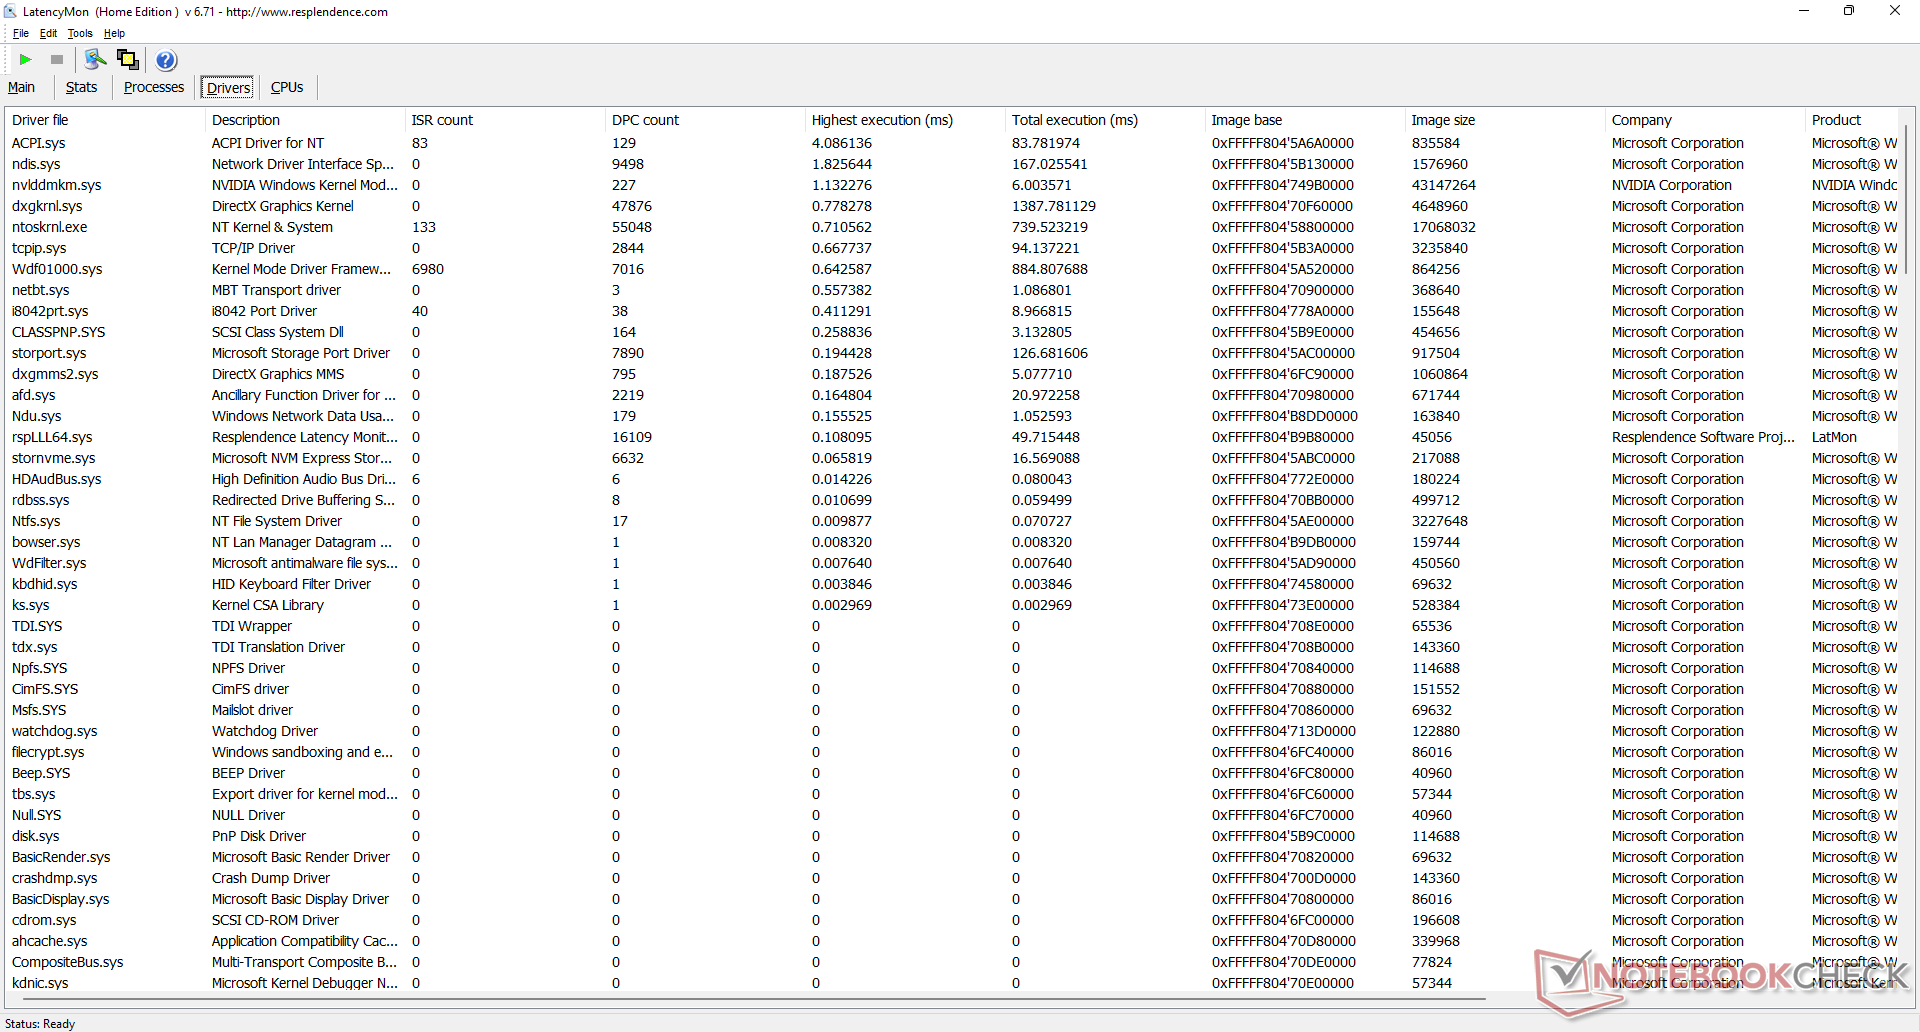
Latência do DPC
LatencyMon revela problemas de DPC ao abrir várias abas do navegador em nossa página inicial. a reprodução de vídeo de 4K a 60 FPS é, de outra forma, suave com apenas 3 quadros descartados durante nosso teste de vídeo de minutos.
| DPC Latencies / LatencyMon - interrupt to process latency (max), Web, Youtube, Prime95 | |
| MSI Vector GP66 12UGS | |
| Asus TUF Gaming F15 FX506HM | |
| MSI Katana GF66 11UG-220 | |
| MSI GP66 Leopard 11UH-028 | |
| Razer Blade 15 Base Edition 2021, i7-10750H RTX 3060 | |
| Alienware m15 R5 Ryzen Edition | |
* ... menor é melhor
Dispositivos de armazenamento
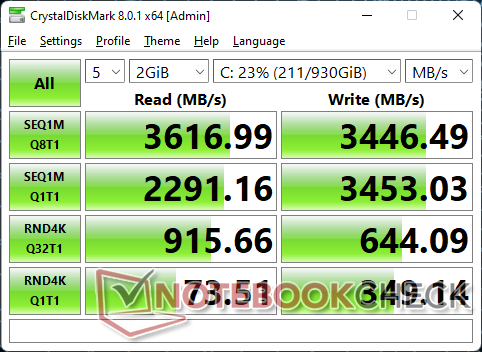
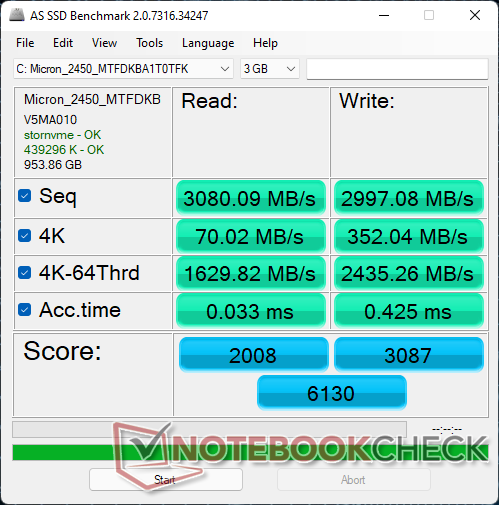
Nossa unidade de teste vem equipada com o orçamento 1 TB Micron 2450 MTFDKBA1T0TFK PCIe4 x4 NVMe SSD. Ao contrário de muitos outros SSDs PCIe4 x4 que podem alcançar taxas de transferência ao norte de 7000 MB/s, o Micron 2450 de 1 TB só promete até 3500 MB/s de leitura e 3000 MB/s de gravação para ser comparável à maioria dos SSDs PCIe3 x4. Naturalmente, os usuários ainda podem trocar ou instalar um drive PCIe4 x4 mais rápido se desejarem, muito parecido com o que foi incluído em nosso GP66 Leopard. Os modelos MSI mais avançados como as séries GT ou GS são mais propensos a virem com unidades PCIe4 mais rápidas da Samsung
A unidade em nossa amostra não apresentaria problemas mantendo sua taxa máxima de leitura de 3500 MB/s por longos períodos.

* ... menor é melhor
Disk Throttling: DiskSpd Read Loop, Queue Depth 8
Desempenho da GPU
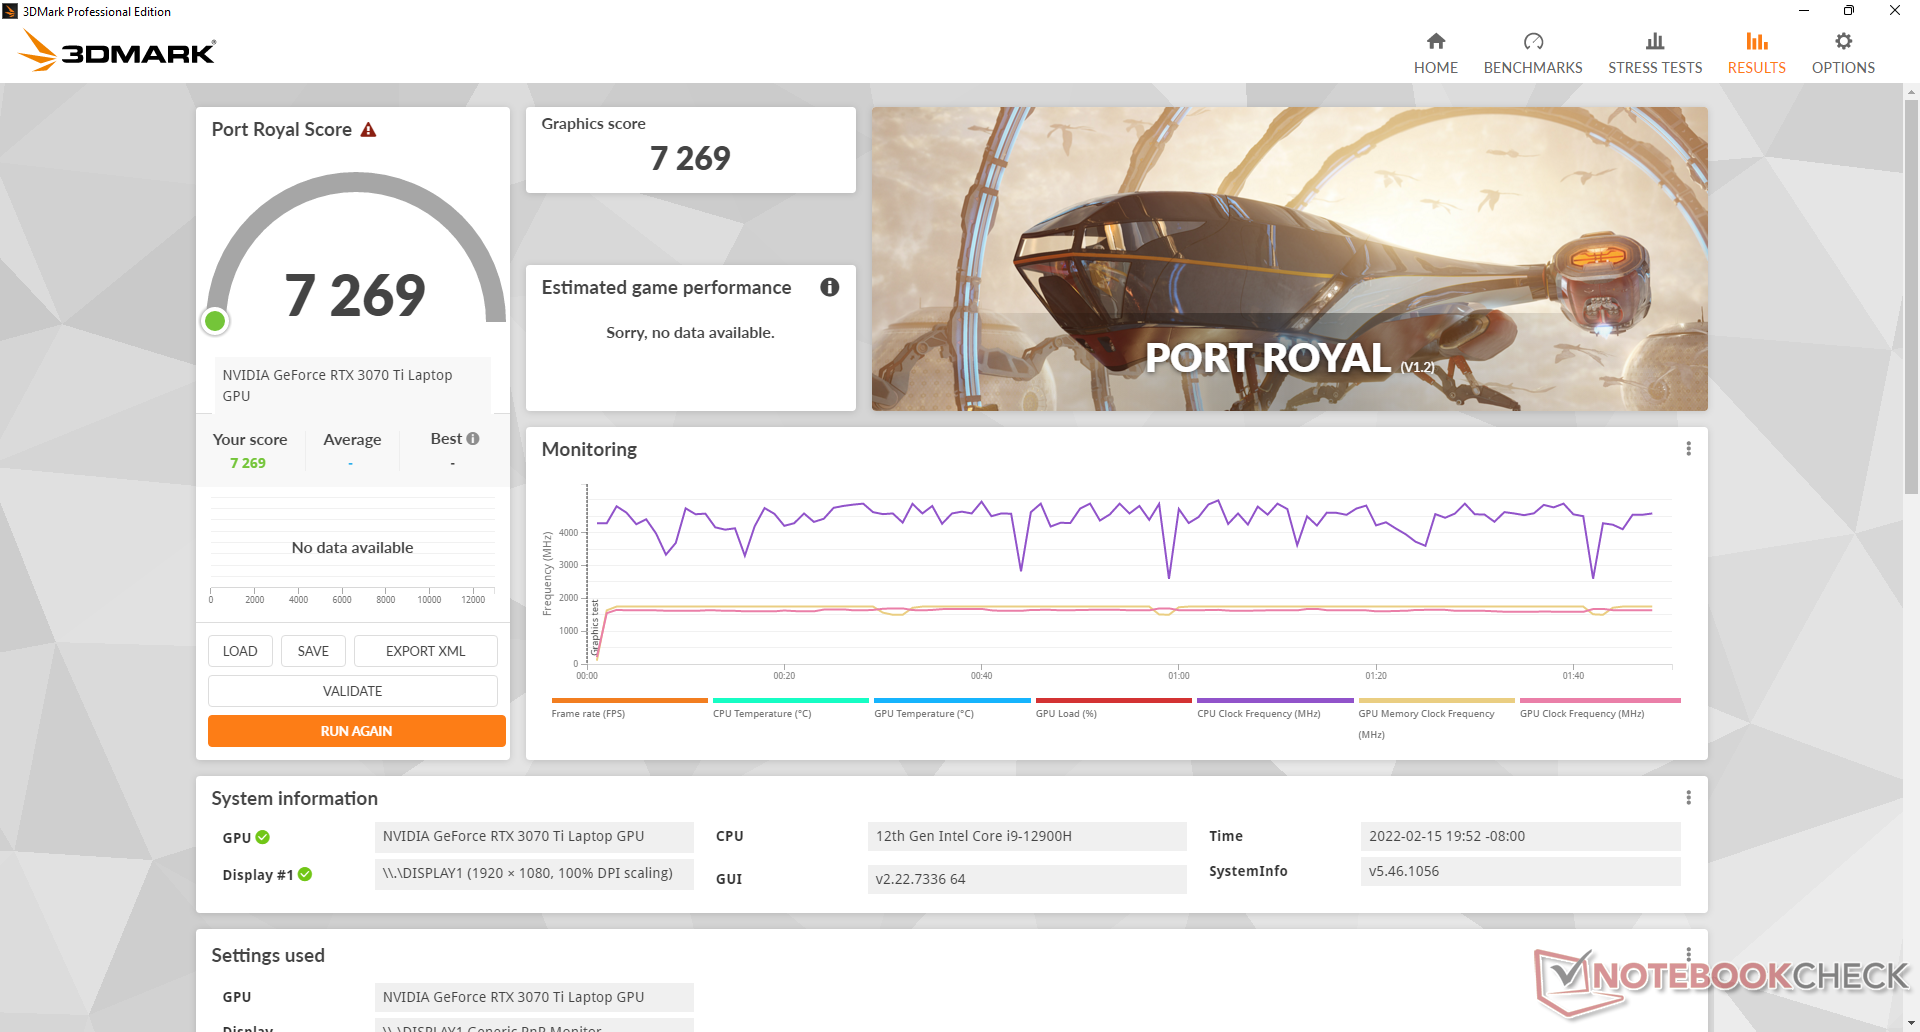
O desempenho gráfico é apenas cerca de 5 a 10% mais lento do que o móvel GeForce RTX 3080 Ti ou cerca de 15 a 20 por cento mais rápido que o móvel GeForce RTX 3070 como encontrado no ADATA XPG Xenia 15. Estes resultados colocam nosso celular GeForce RTX 3070 Ti dentro de 5 a 15 por cento do desktop GeForce RTX 3070.
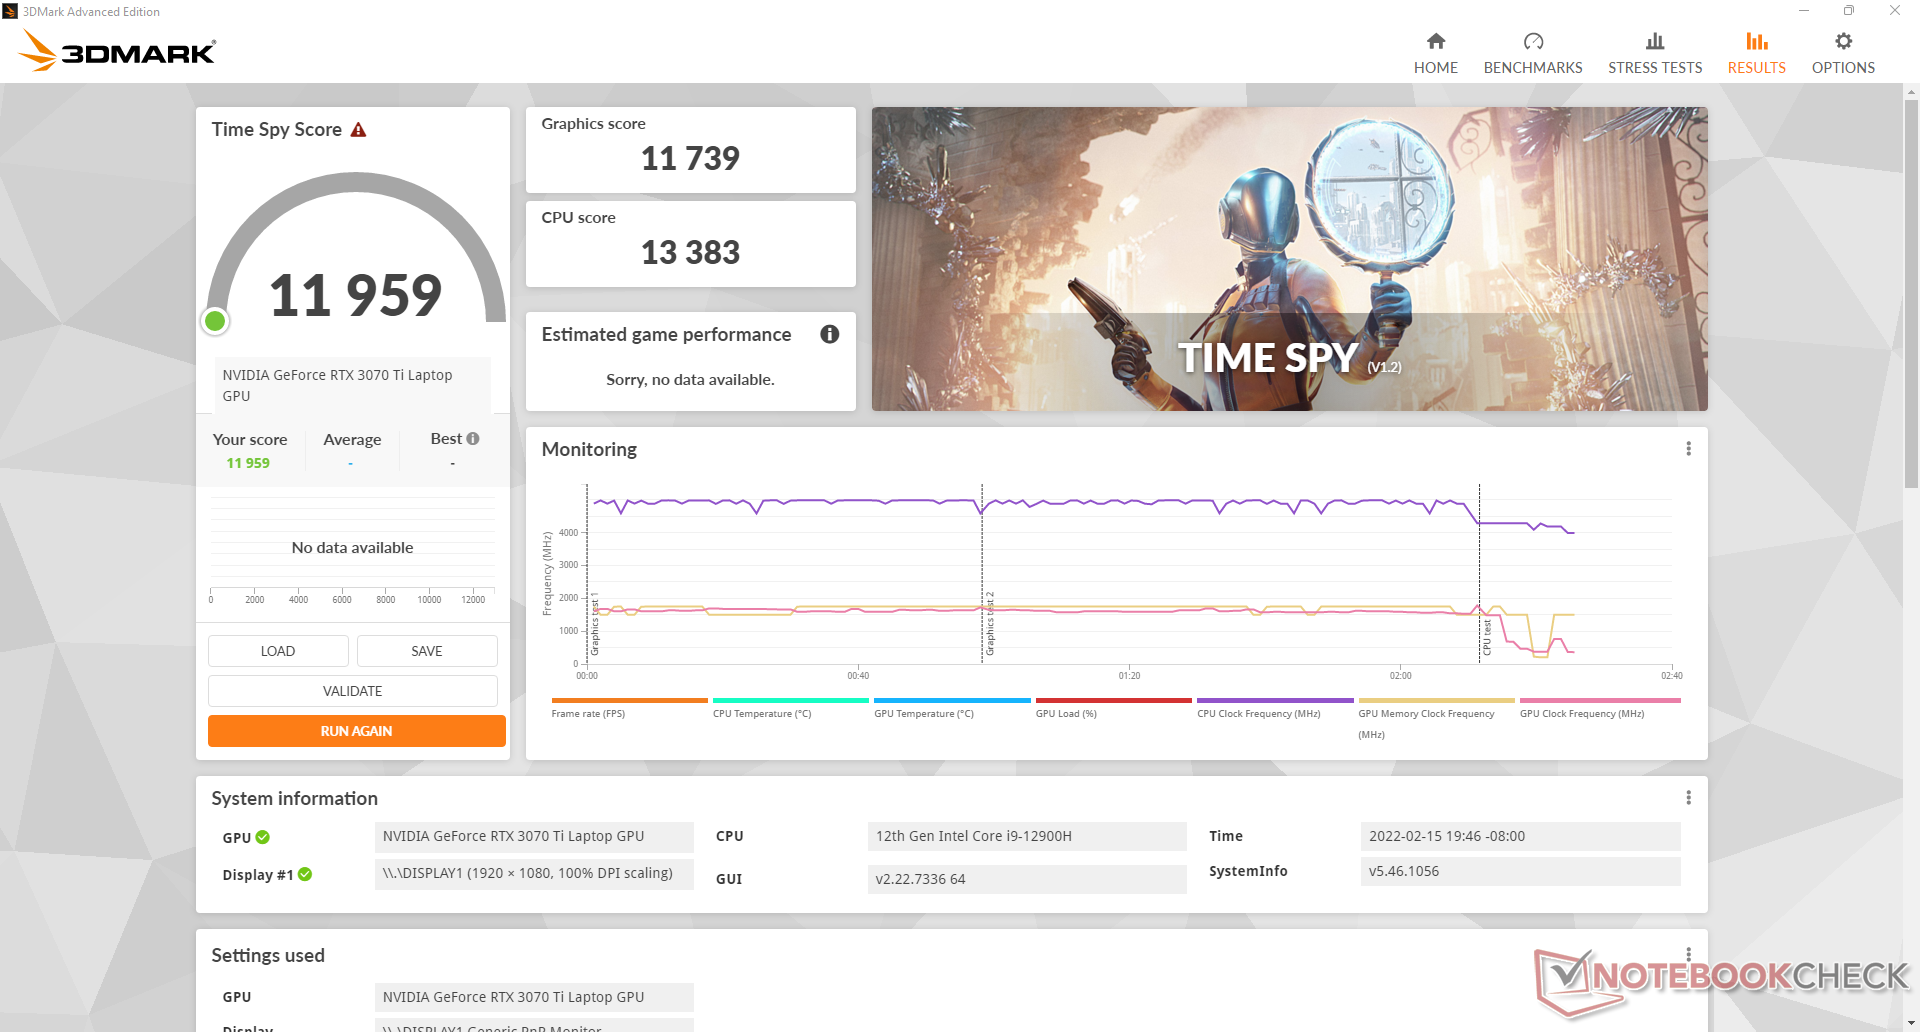
A execução no modo MSHybrid em vez do modo dGPU não transmitirá um déficit de desempenho. A pontuação no modo MSHybrid Time Spy é essencialmente a mesma que a pontuação no modo dGPU (11880 pontos vs. 11739 pontos).
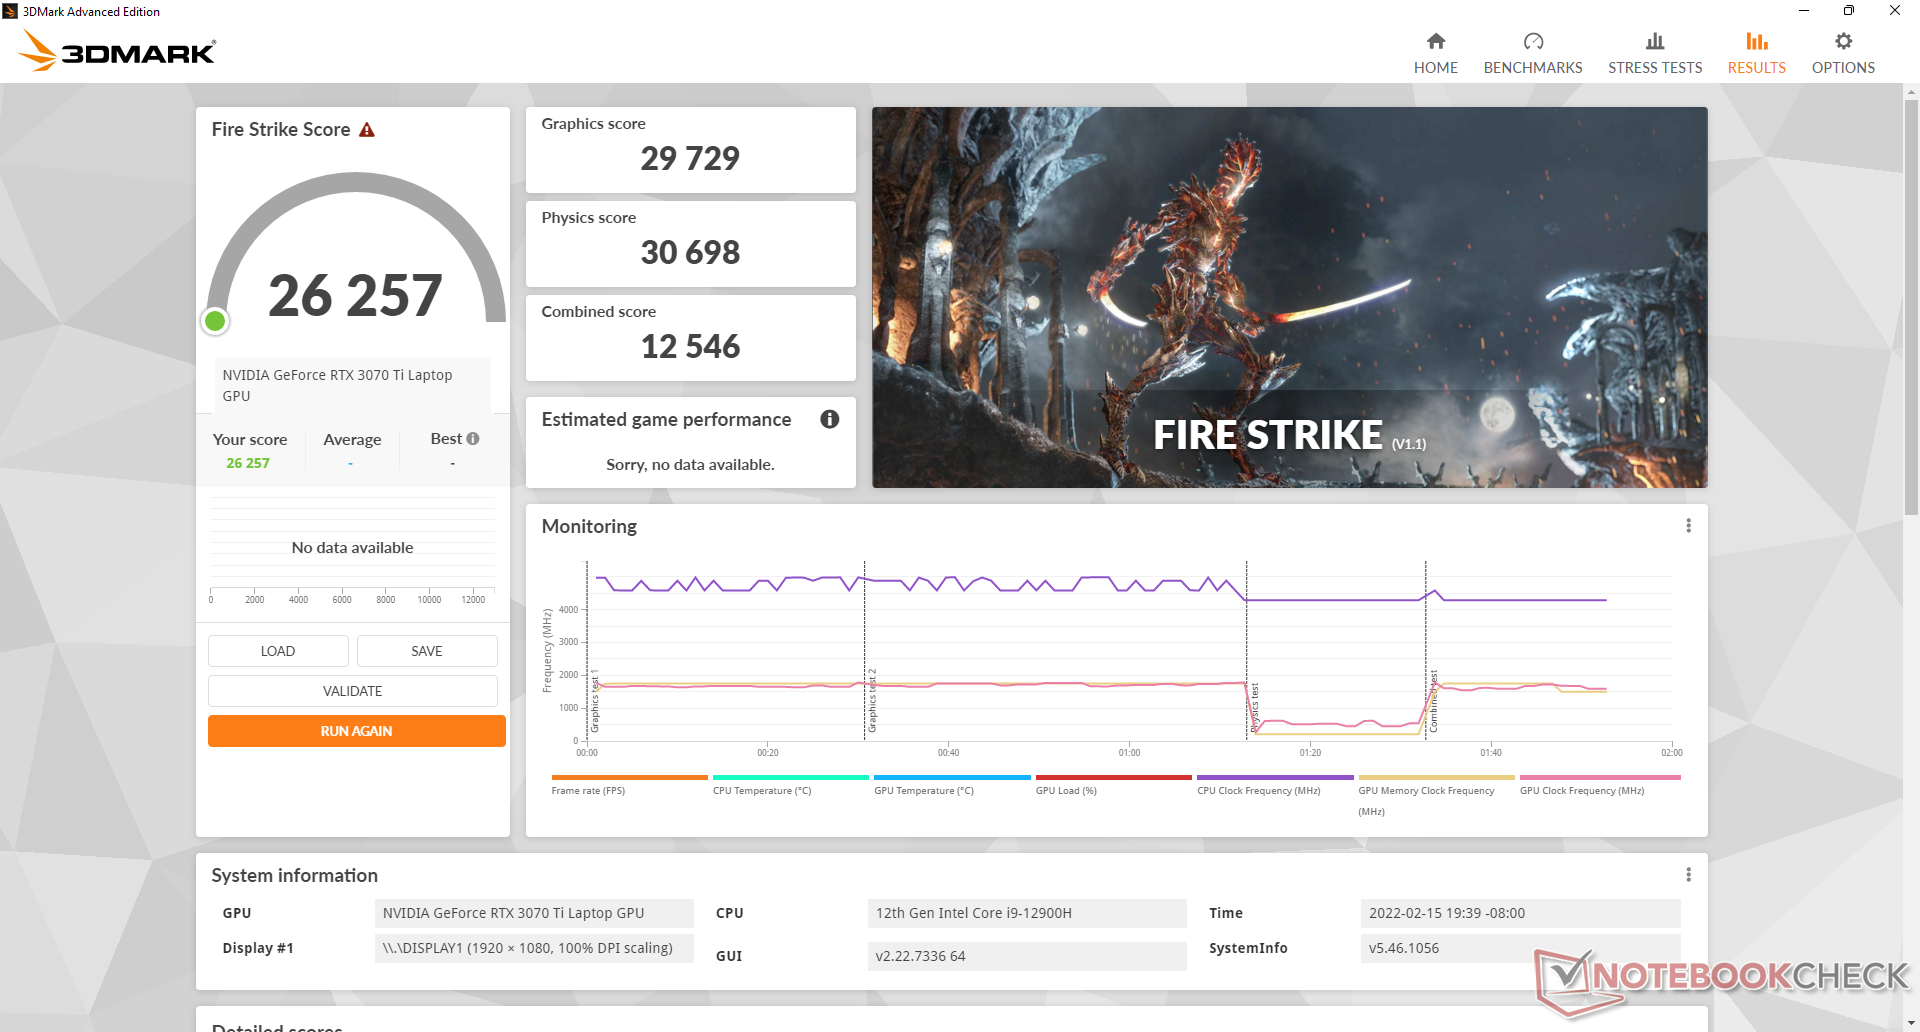
O desempenho gráfico no modo balanceado é reduzido em apenas 4% a 5%, sendo as compensações muito mais silenciosas para os ventiladores e processadores e superfícies mais quentes. Nossa Fire Strike pontuação nos gráficos cairia para 28508 pontos, de 29729 pontos quando em funcionamento no modo Equilibrado.
Note que a pontuação do 3DMark é até 20% mais rápida do que no MSI GS66 equipado com o mesmo GeForce RTX 3070 Ti devido à meta TGP mais alta de nosso GP66 (150 W vs. 105 W).
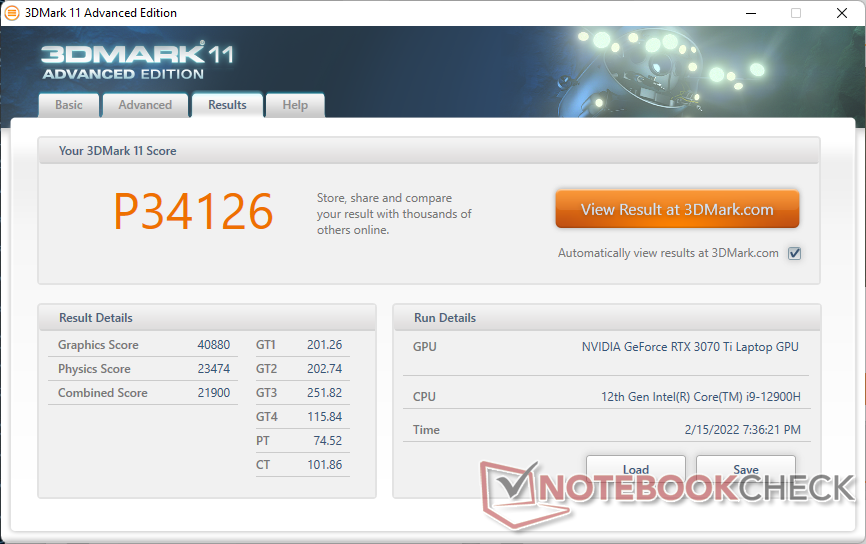
| 3DMark 11 Performance | 34126 pontos | |
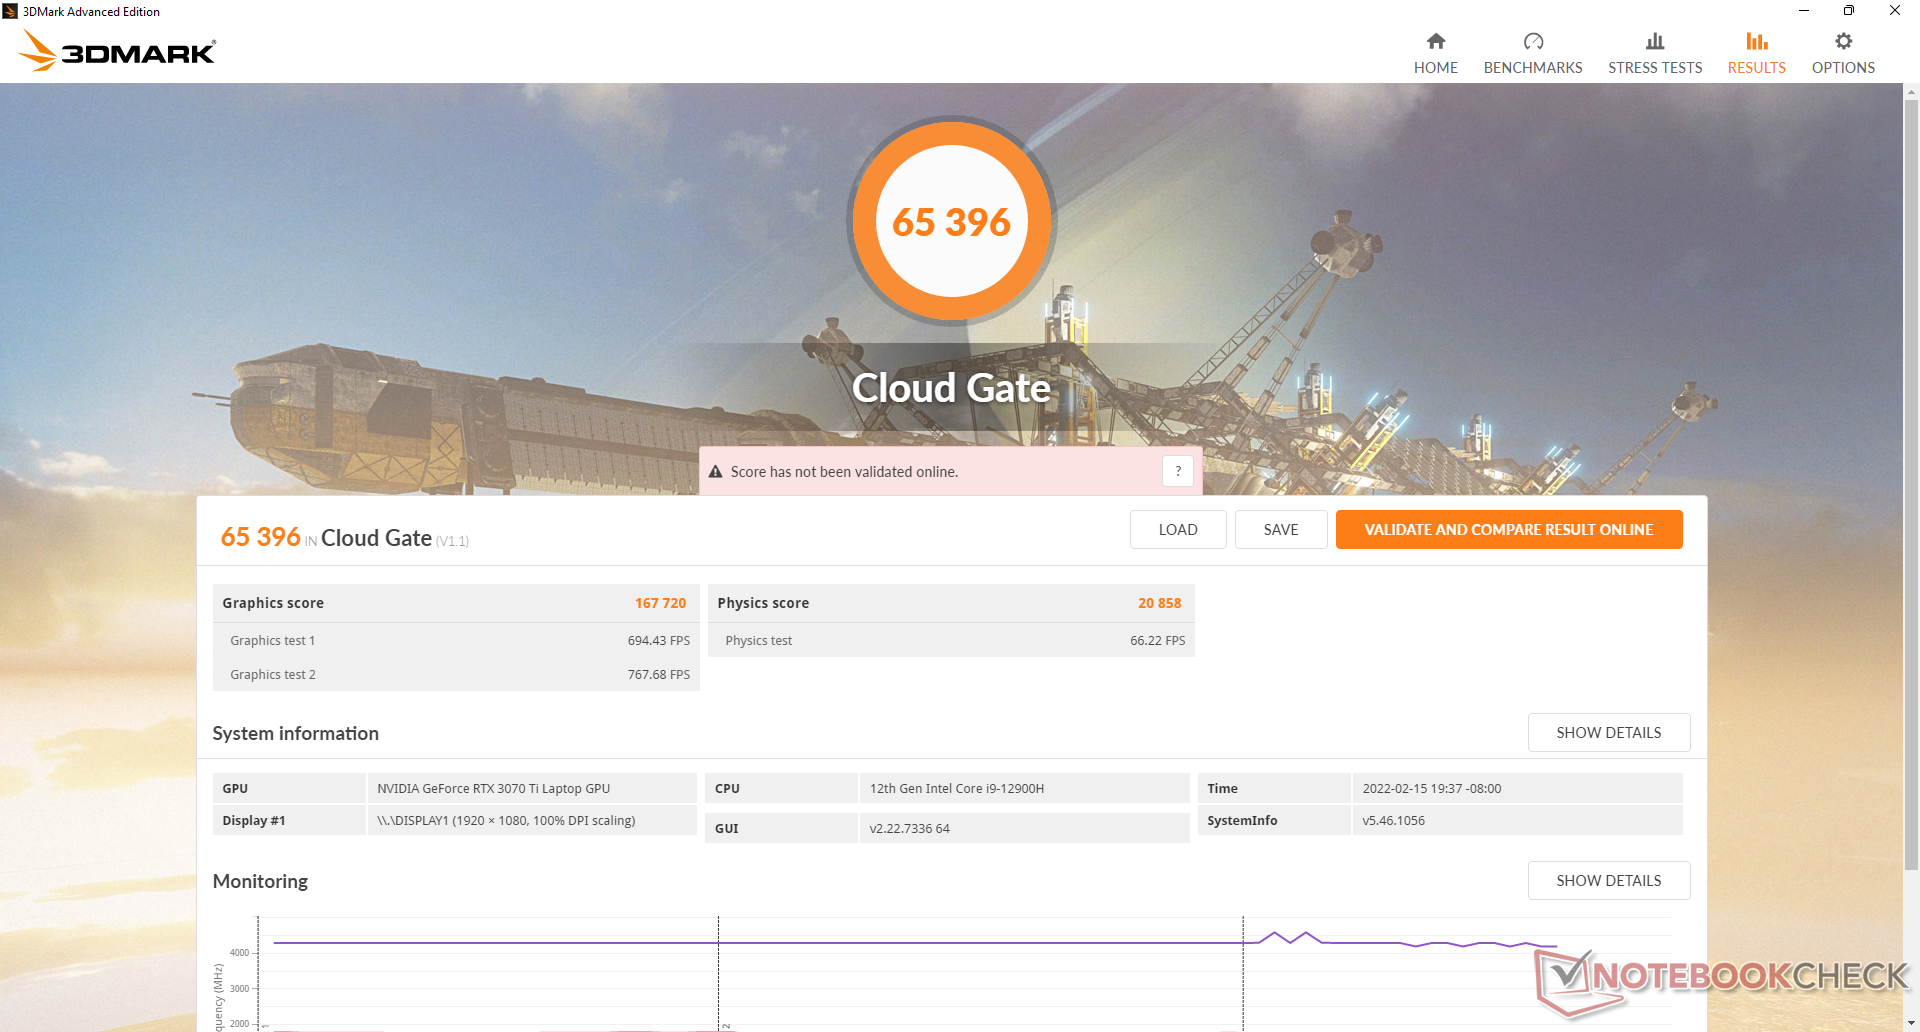
| 3DMark Cloud Gate Standard Score | 65396 pontos | |
| 3DMark Fire Strike Score | 26257 pontos | |
| 3DMark Time Spy Score | 11959 pontos | |
Ajuda | ||
Witcher 3 FPS Chart
| baixo | média | alto | ultra | |
|---|---|---|---|---|
| GTA V (2015) | 185 | 184 | 179 | 123 |
| The Witcher 3 (2015) | 492.3 | 360 | 223.9 | 114.6 |
| Dota 2 Reborn (2015) | 185 | 169 | 164 | 155 |
| Final Fantasy XV Benchmark (2018) | 207 | 152 | 115 | |
| X-Plane 11.11 (2018) | 161 | 143 | 112 | |
| Far Cry 5 (2018) | 180 | 152 | 145 | 136 |
| Strange Brigade (2018) | 471 | 298 | 244 | 213 |
Emissões
Ruído do sistema
O ruído do ventilador é altamente dependente dos quatro perfis de potência do MSI Center: Super Bateria, Silencioso, Equilibrado e Desempenho Extremo. Sempre haverá algum ruído do ventilador em torno de 26,8 dB(A) contra um fundo silencioso de 24,7 dB(A) mesmo quando ajustado para o modo Silencioso, mas este nível é baixo o suficiente para ser difícil de ser notado durante o uso diário. Recomendamos este modo se simplesmente a navegação na web ou a transmissão de vídeo, pois os ventiladores pulsariam com muito menos freqüência quando comparados com os outros dois modos mais rápidos
Os jogos no modo Equilibrado resultariam em um ruído do ventilador de pouco menos de 40 dB(A) em comparação com 58 dB(A) se no modo de Desempenho Extremo. O desempenho da GPU será um pouco mais lento no modo Equilibrado, mas a economia de ruído é significativa. A faixa superior de 50 dB(A) é geralmente mais alta do que a maioria dos outros laptops de jogos que testamos.
Barulho
| Ocioso |
| 23.4 / 23.4 / 27.4 dB |
| Carga |
| 36 / 58 dB |
 | ||
30 dB silencioso 40 dB(A) audível 50 dB(A) ruidosamente alto |
||
min: | ||
| MSI Vector GP66 12UGS GeForce RTX 3070 Ti Laptop GPU, i9-12900H | MSI GP66 Leopard 11UH-028 GeForce RTX 3080 Laptop GPU, i7-11800H, Samsung PM9A1 MZVL21T0HCLR | MSI Katana GF66 11UG-220 GeForce RTX 3070 Laptop GPU, i7-11800H, Kingston OM8PDP3512B-AI1 | Asus TUF Gaming F15 FX506HM GeForce RTX 3060 Laptop GPU, i7-11800H, SK Hynix HFM001TD3JX013N | Razer Blade 15 Base Edition 2021, i7-10750H RTX 3060 GeForce RTX 3060 Laptop GPU, i7-10750H, Samsung SSD PM981a MZVLB512HBJQ | Alienware m15 R5 Ryzen Edition GeForce RTX 3060 Laptop GPU, R7 5800H, Toshiba KBG40ZNS512G NVMe | |
|---|---|---|---|---|---|---|
| Noise | 1% | -19% | 7% | -0% | -5% | |
| desligado / ambiente * (dB) | 22.9 | 23 -0% | 25 -9% | 24.8 -8% | 25.3 -10% | 24 -5% |
| Idle Minimum * (dB) | 23.4 | 23 2% | 34 -45% | 24.6 -5% | 25.4 -9% | 24 -3% |
| Idle Average * (dB) | 23.4 | 23 2% | 35 -50% | 24.9 -6% | 25.4 -9% | 25 -7% |
| Idle Maximum * (dB) | 27.4 | 30.11 -10% | 36 -31% | 24.9 9% | 25.4 7% | 35 -28% |
| Load Average * (dB) | 36 | 41.86 -16% | 48 -33% | 27.1 25% | 42.5 -18% | 44 -22% |
| Witcher 3 ultra * (dB) | 58.2 | 47.79 18% | 46 21% | 46.4 20% | 42 28% | 48 18% |
| Load Maximum * (dB) | 58 | 53 9% | 49 16% | 49 16% | 52.2 10% | 50 14% |
* ... menor é melhor
Temperatura
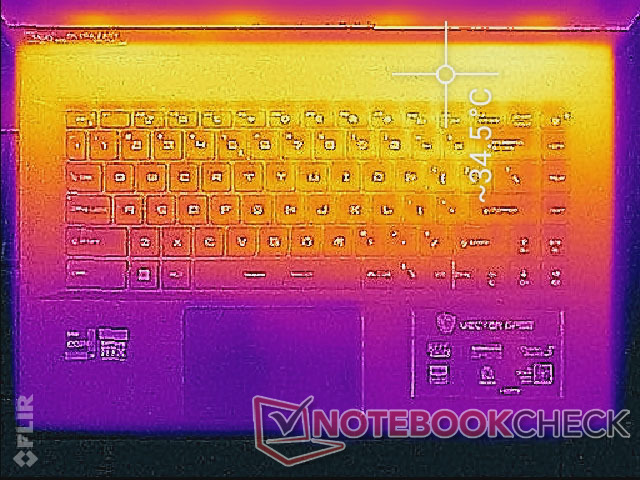
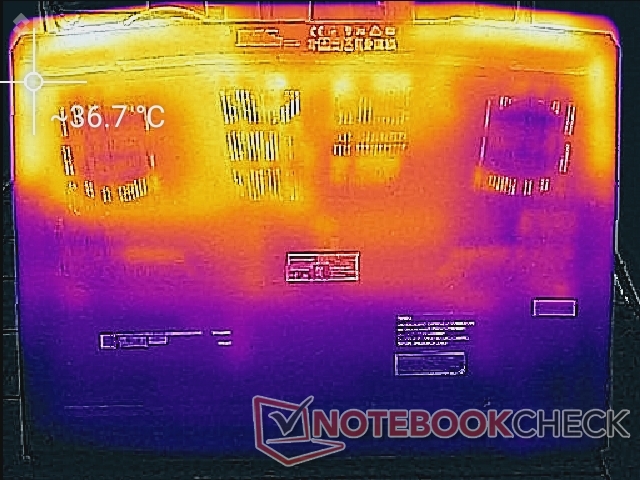
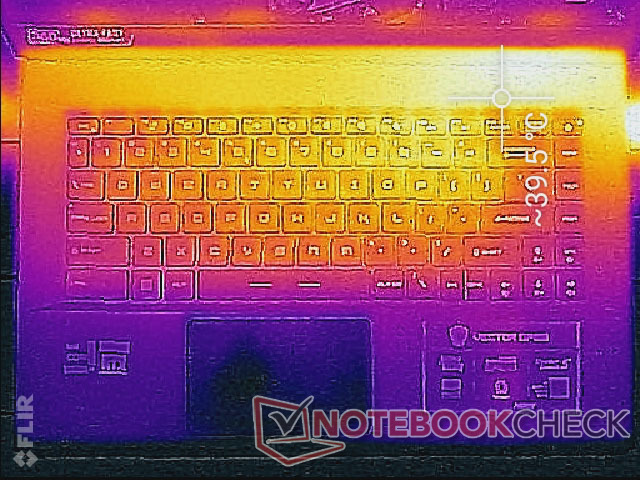
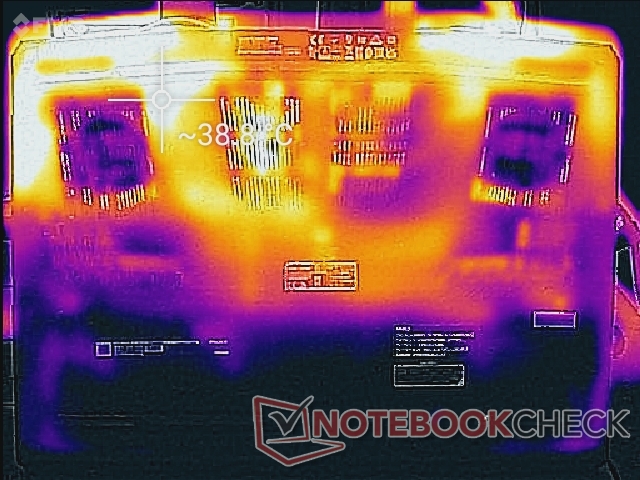
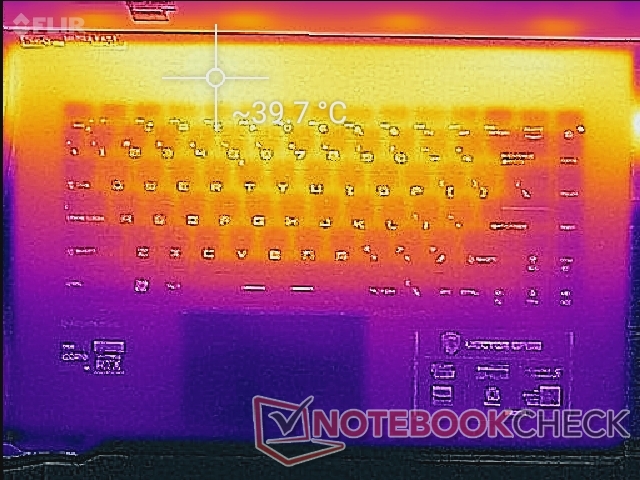
As temperaturas de superfície dependem muito da configuração do perfil de potência do MSI Center. Quando no modo Balanceado, os pontos quentes podem ser tão quentes quanto 49 C em comparação com apenas 42 C se no ajuste de Desempenho Extremo, uma vez que um teto de RPM mais alto do ventilador está ligado ao modo de Desempenho Extremo
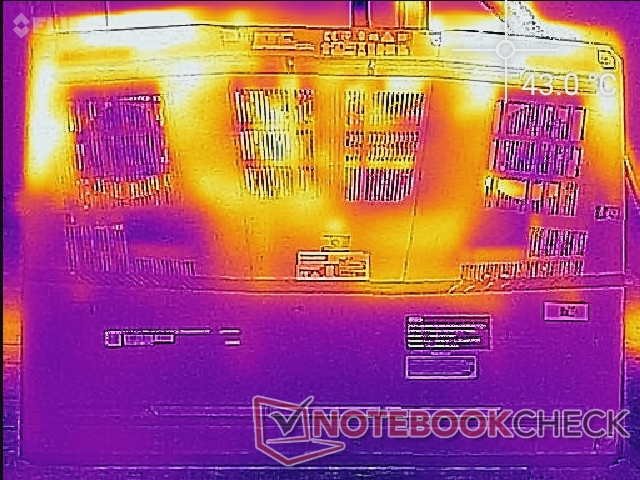
Os pontos quentes são concentrados ao longo dos quadrantes traseiros do chassi, como mostram nossos mapas de temperatura abaixo. As teclas do teclado e os apoios das mãos podem ser quentes, mas nunca incomodativos ou desconfortáveis. O mais fino GS66 ou Lâmina Razer 15 têm descansos de palma e teclados mais quentes em comparação com alguns graus cada um em média.
(±) A temperatura máxima no lado superior é 40.2 °C / 104 F, em comparação com a média de 40.4 °C / 105 F , variando de 21.2 a 68.8 °C para a classe Gaming.
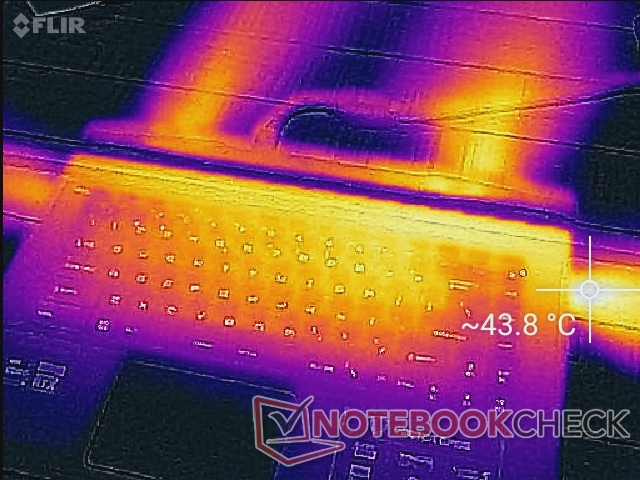
(±) A parte inferior aquece até um máximo de 43.8 °C / 111 F, em comparação com a média de 43.2 °C / 110 F
(+) Em uso inativo, a temperatura média para o lado superior é 29.6 °C / 85 F, em comparação com a média do dispositivo de 33.9 °C / ### class_avg_f### F.
(+) Jogando The Witcher 3, a temperatura média para o lado superior é 30.7 °C / 87 F, em comparação com a média do dispositivo de 33.9 °C / ## #class_avg_f### F.
(+) Os apoios para as mãos e o touchpad são mais frios que a temperatura da pele, com um máximo de 24.8 °C / 76.6 F e, portanto, são frios ao toque.
(+) A temperatura média da área do apoio para as mãos de dispositivos semelhantes foi 28.8 °C / 83.8 F (+4 °C / 7.2 F).
| MSI Vector GP66 12UGS Intel Core i9-12900H, NVIDIA GeForce RTX 3070 Ti Laptop GPU | MSI GP66 Leopard 11UH-028 Intel Core i7-11800H, NVIDIA GeForce RTX 3080 Laptop GPU | MSI Katana GF66 11UG-220 Intel Core i7-11800H, NVIDIA GeForce RTX 3070 Laptop GPU | Asus TUF Gaming F15 FX506HM Intel Core i7-11800H, NVIDIA GeForce RTX 3060 Laptop GPU | Razer Blade 15 Base Edition 2021, i7-10750H RTX 3060 Intel Core i7-10750H, NVIDIA GeForce RTX 3060 Laptop GPU | Alienware m15 R5 Ryzen Edition AMD Ryzen 7 5800H, NVIDIA GeForce RTX 3060 Laptop GPU | |
|---|---|---|---|---|---|---|
| Heat | -2% | -8% | 8% | -6% | -21% | |
| Maximum Upper Side * (°C) | 40.2 | 49 -22% | 56 -39% | 46.4 -15% | 45.2 -12% | 62 -54% |
| Maximum Bottom * (°C) | 43.8 | 47 -7% | 49 -12% | 45.4 -4% | 48 -10% | 61 -39% |
| Idle Upper Side * (°C) | 34.8 | 31 11% | 36 -3% | 26 25% | 34.4 1% | 36 -3% |
| Idle Bottom * (°C) | 37 | 33 11% | 28 24% | 27.4 26% | 37.2 -1% | 33 11% |
* ... menor é melhor
Teste de estresse
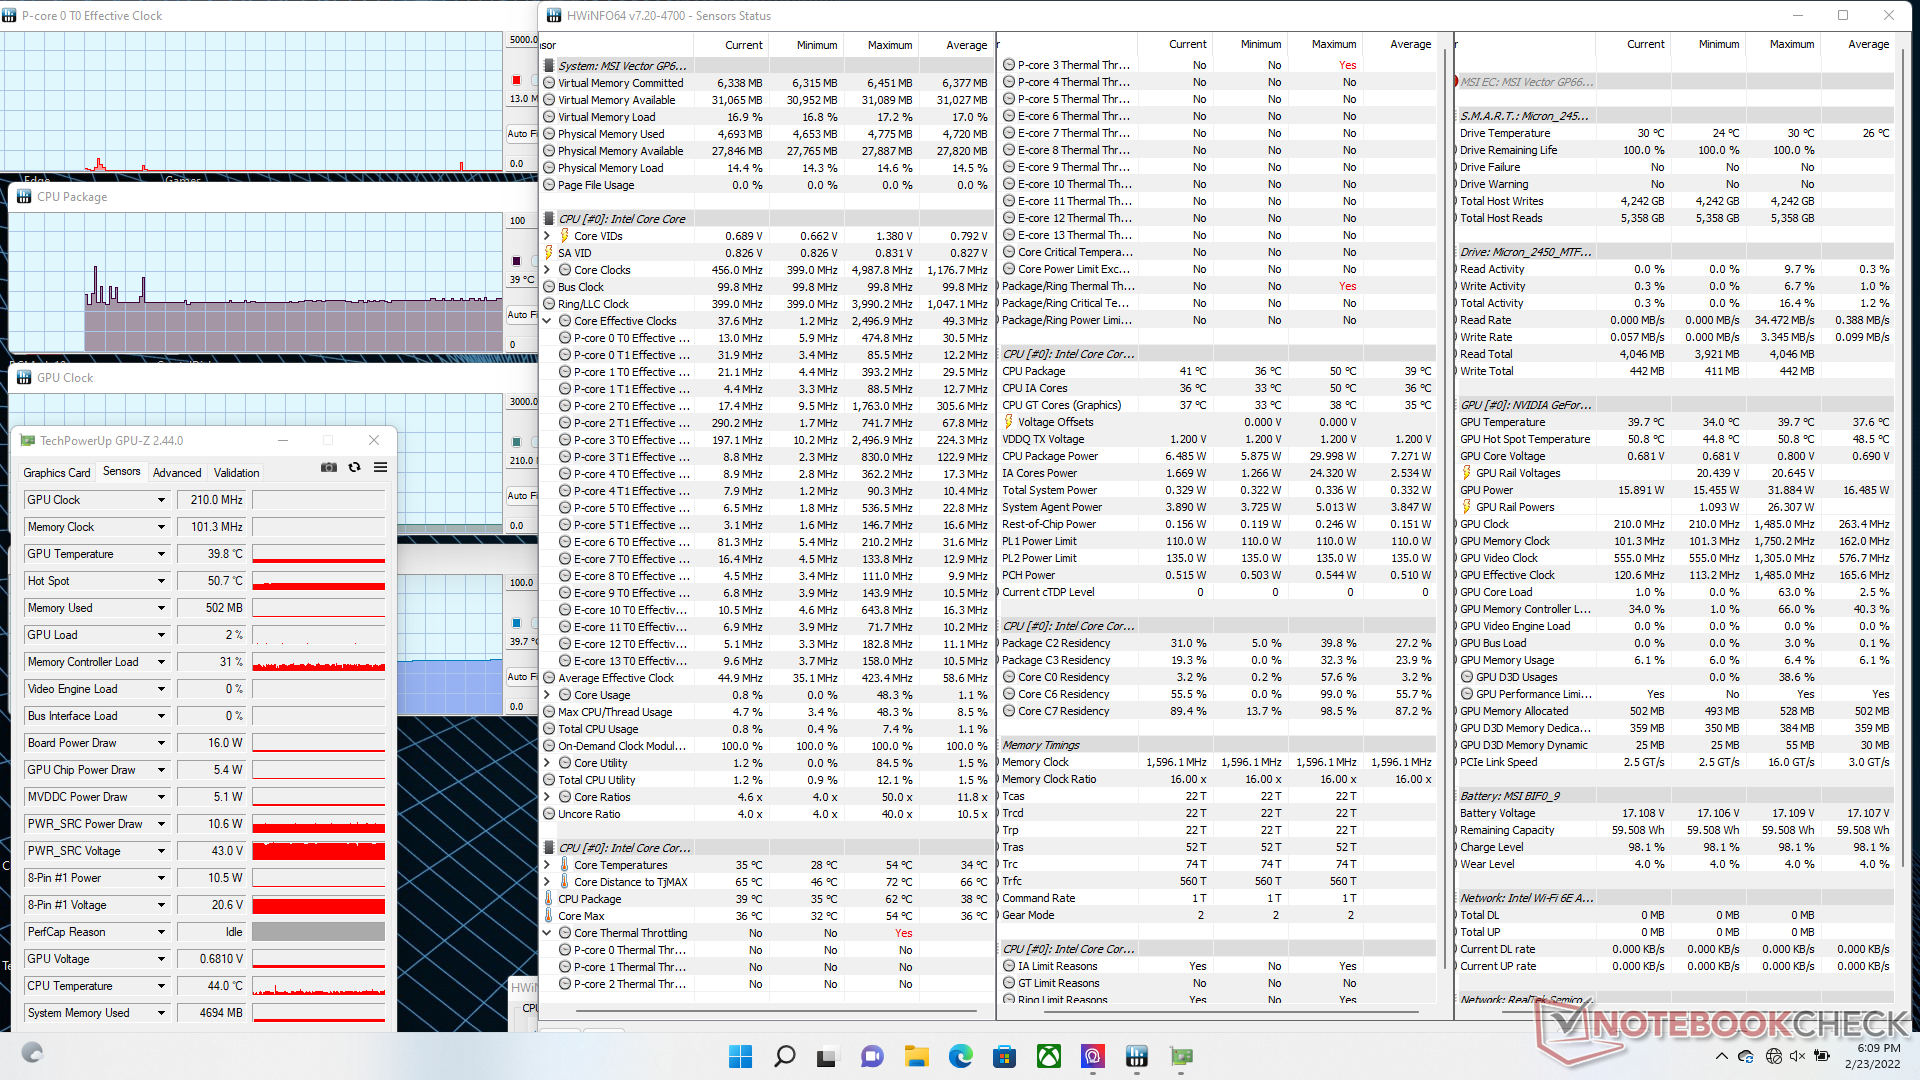
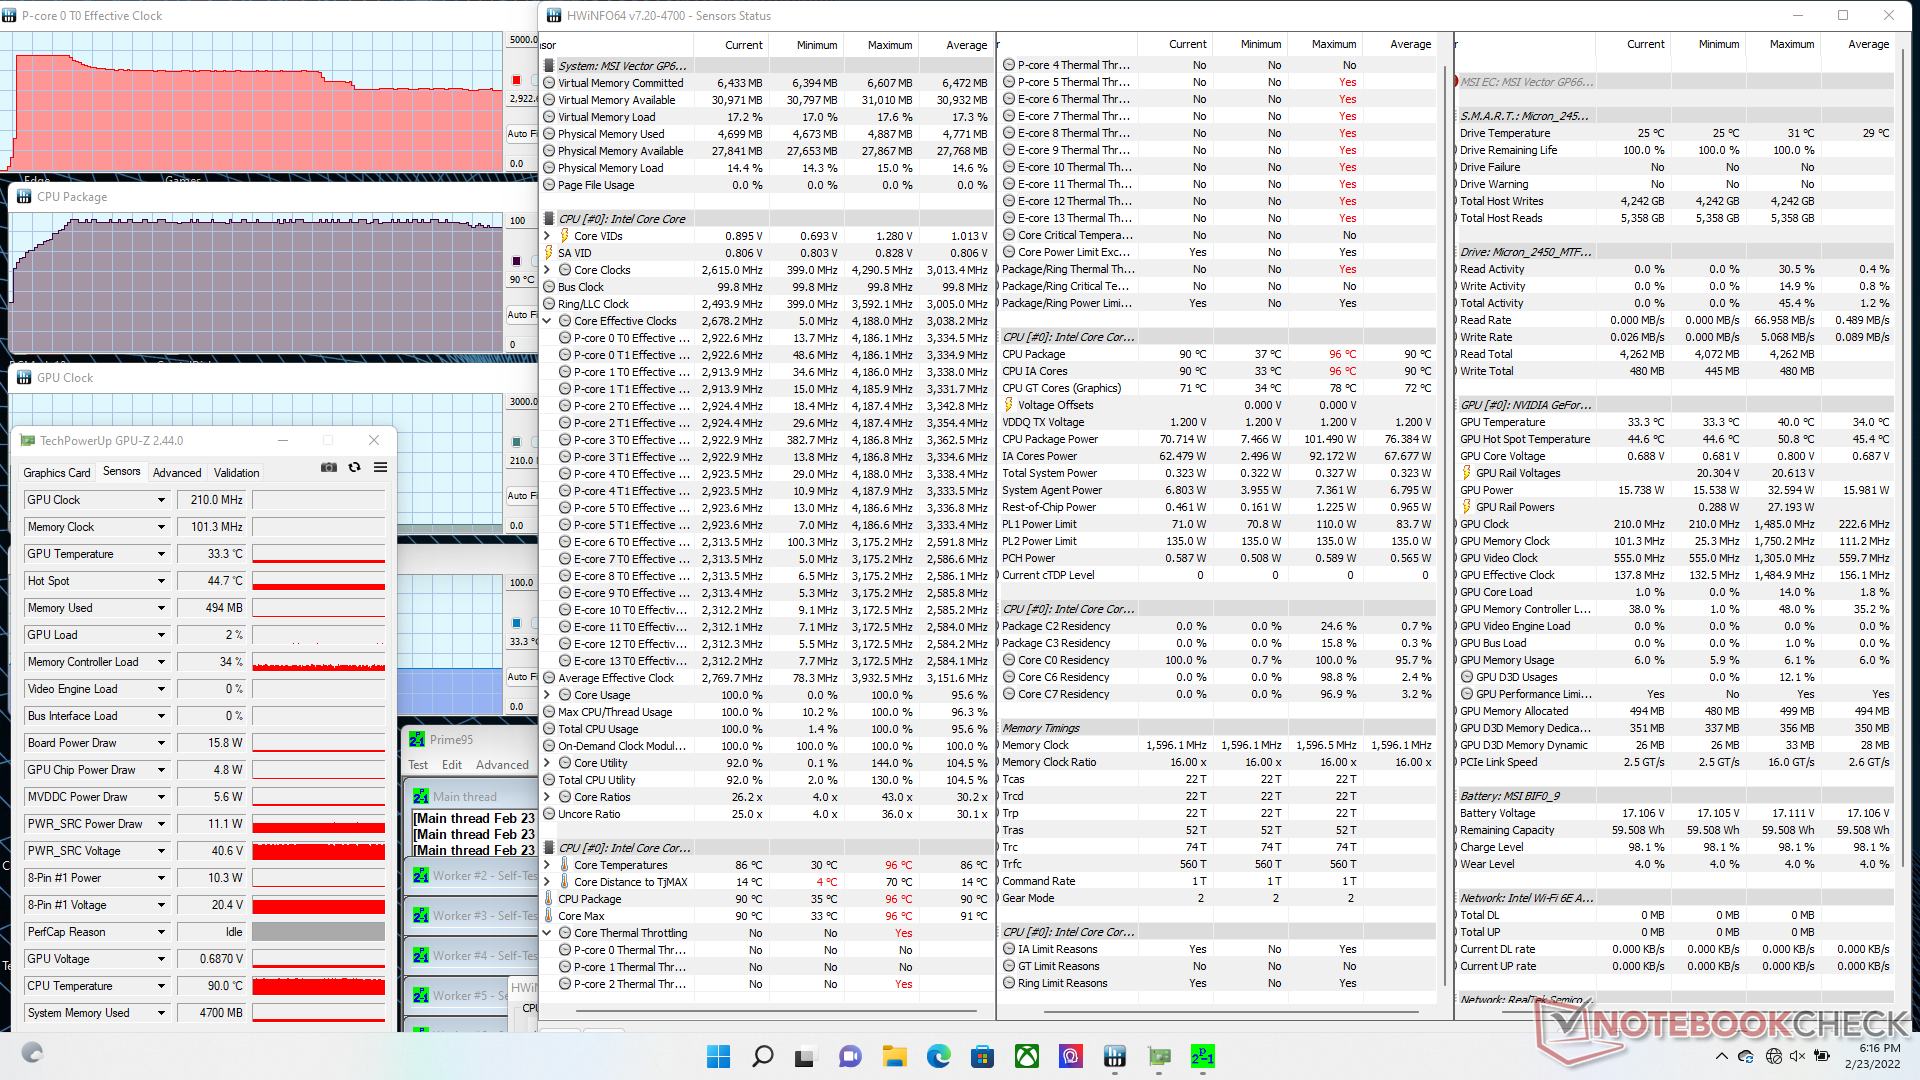
Quando enfatizado com Prime95 no perfil de desempenho extremo, as taxas de relógio da CPU aumentariam para 4,2 GHz por apenas um segundo ou dois antes de cair rapidamente para 3,7 GHz. Após mais ou menos um minuto, as taxas de relógio cairiam ainda mais para apenas 3 GHz a fim de manter uma temperatura central de 90 C. A potência do pacote da CPU aumentaria inicialmente para 100 W ao iniciar Prime95 antes de cair e se estabilizar em 70 W. A mesma CPU Core i9-12900H na maior Tecnologia Uniwill GM7AG8P funcionaria tanto mais rápido (3,2 GHz vs. 3,0 GHz) quanto mais frio (80 C vs. 90 C), respectivamente, e com um TDP estável mais alto (75 W vs. 70 W) do que o que registramos em nosso Vector GP66.
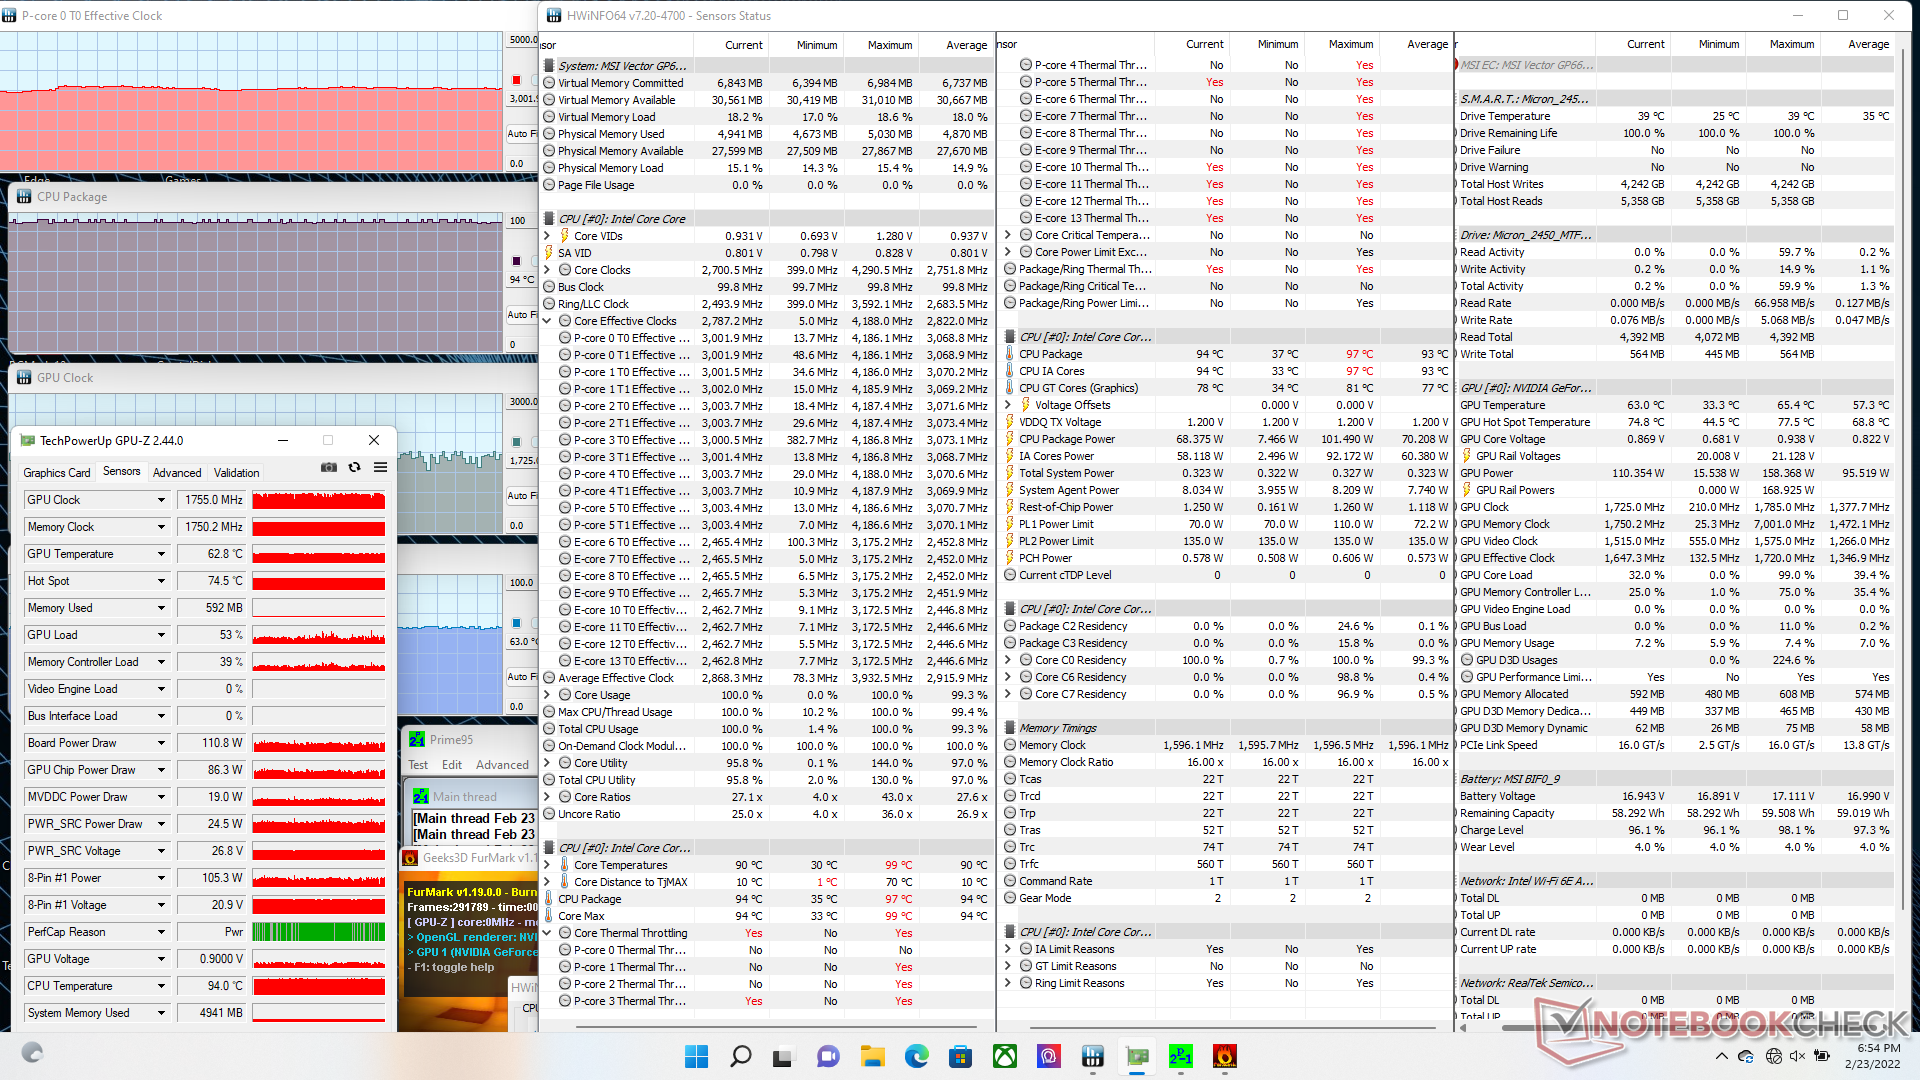
As temperaturas de CPU e GPU se estabilizariam em 71 C e 70 C, respectivamente, quando no perfil de Performance Extrema. A queda para o perfil Equilibrado resultaria em temperaturas mais altas de CPU e GPU de 85 C e 78 C, respectivamente, e uma taxa de relógio da GPU ligeiramente mais lenta (1650 MHz vs. 1755 MHz) também. As taxas de relógio são, no entanto, significativamente mais rápidas do que as observadas no MSI GS66 (1155 MHz) que vem com a mesma GPU GeForce RTX 3070 Ti, embora com uma TGP mais baixa (105 W vs. 150 W).
Funcionando com energia da bateria limitará significativamente o desempenho. Um teste Fire Strike em baterias retornaria Física e Gráficos de 10913 pontos e 6061 pontos, respectivamente, em comparação com 30698 e 29729 pontos quando em rede elétrica.
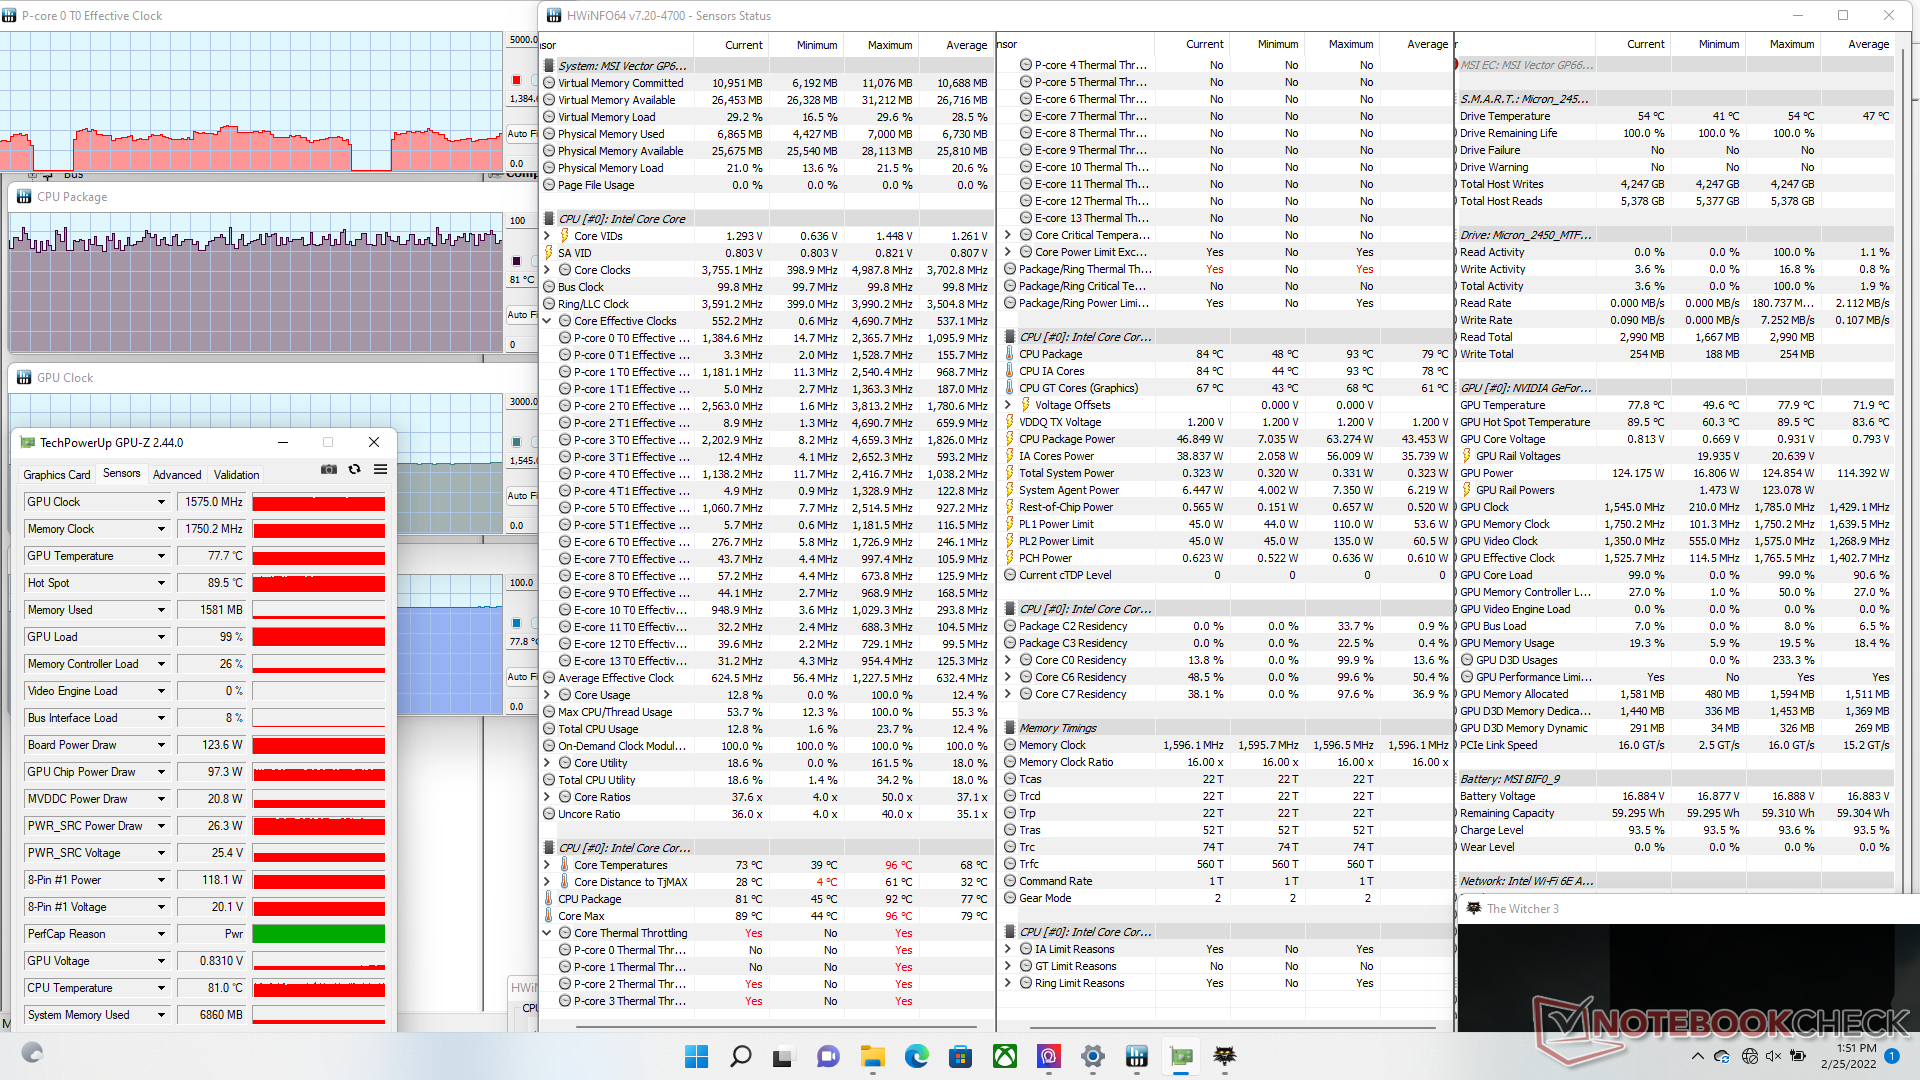
| Relógio CPU (GHz) | Relógio GPU (MHz) | Temperatura média da CPU (°C) | Temperatura média da GPU (°C) | |
| Sistema ocioso (modo balanceado) | -- | -- | 39 | 40 |
| Prime95 Stress (Modo Extreme Performance) | 3.0 | -- | 90 | 33 |
| Prime95 + FurMark Stress (Modo de Extrema Performance) | 3.0 | 1755 | 94 | 63 |
| Witcher 3 Stress (Modo de desempenho extremo) | ~1.0 | 1650 | 71 | 70 |
| Witcher 3 Stress (modo equilibrado) | ~1.0 | 1515 | 85 | 78 |
Oradores
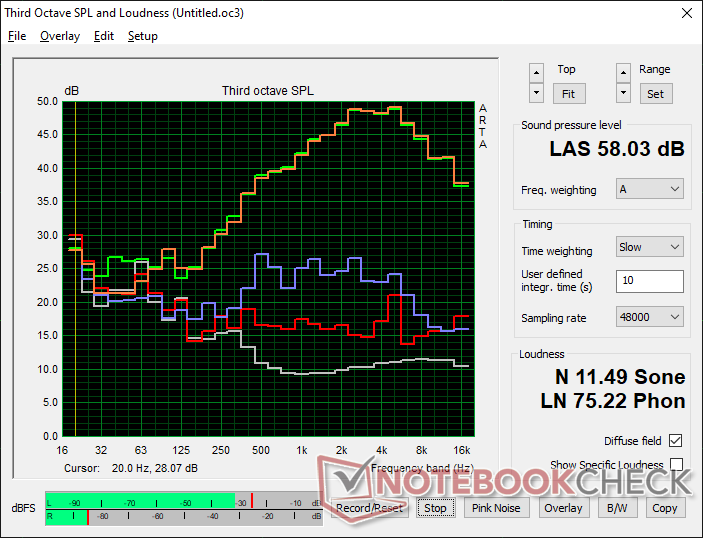
MSI Vector GP66 12UGS análise de áudio
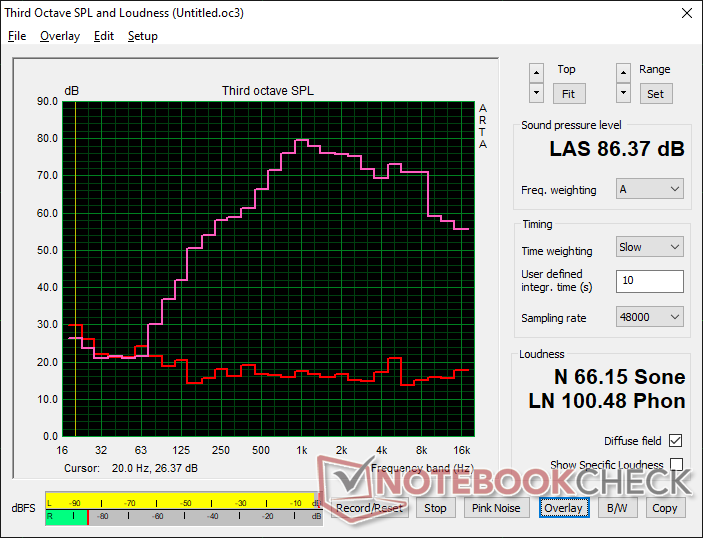
(+) | os alto-falantes podem tocar relativamente alto (###valor### dB)
Graves 100 - 315Hz
(-) | quase nenhum baixo - em média 19.2% menor que a mediana
(±) | a linearidade dos graves é média (9.1% delta para a frequência anterior)
Médios 400 - 2.000 Hz
(±) | médios mais altos - em média 6.5% maior que a mediana
(+) | médios são lineares (5.8% delta para frequência anterior)
Altos 2 - 16 kHz
(+) | agudos equilibrados - apenas 3.7% longe da mediana
(+) | os máximos são lineares (6.5% delta da frequência anterior)
Geral 100 - 16.000 Hz
(±) | a linearidade do som geral é média (18.1% diferença em relação à mediana)
Comparado com a mesma classe
» 57% de todos os dispositivos testados nesta classe foram melhores, 8% semelhantes, 35% piores
» O melhor teve um delta de 6%, a média foi 18%, o pior foi 132%
Comparado com todos os dispositivos testados
» 39% de todos os dispositivos testados foram melhores, 8% semelhantes, 54% piores
» O melhor teve um delta de 4%, a média foi 23%, o pior foi 134%
Apple MacBook Pro 16 2021 M1 Pro análise de áudio
(+) | os alto-falantes podem tocar relativamente alto (###valor### dB)
Graves 100 - 315Hz
(+) | bons graves - apenas 3.8% longe da mediana
(+) | o baixo é linear (5.2% delta para a frequência anterior)
Médios 400 - 2.000 Hz
(+) | médios equilibrados - apenas 1.3% longe da mediana
(+) | médios são lineares (2.1% delta para frequência anterior)
Altos 2 - 16 kHz
(+) | agudos equilibrados - apenas 1.9% longe da mediana
(+) | os máximos são lineares (2.7% delta da frequência anterior)
Geral 100 - 16.000 Hz
(+) | o som geral é linear (4.6% diferença em relação à mediana)
Comparado com a mesma classe
» 0% de todos os dispositivos testados nesta classe foram melhores, 0% semelhantes, 100% piores
» O melhor teve um delta de 5%, a média foi 17%, o pior foi 45%
Comparado com todos os dispositivos testados
» 0% de todos os dispositivos testados foram melhores, 0% semelhantes, 100% piores
» O melhor teve um delta de 4%, a média foi 23%, o pior foi 134%
Gestão de energia
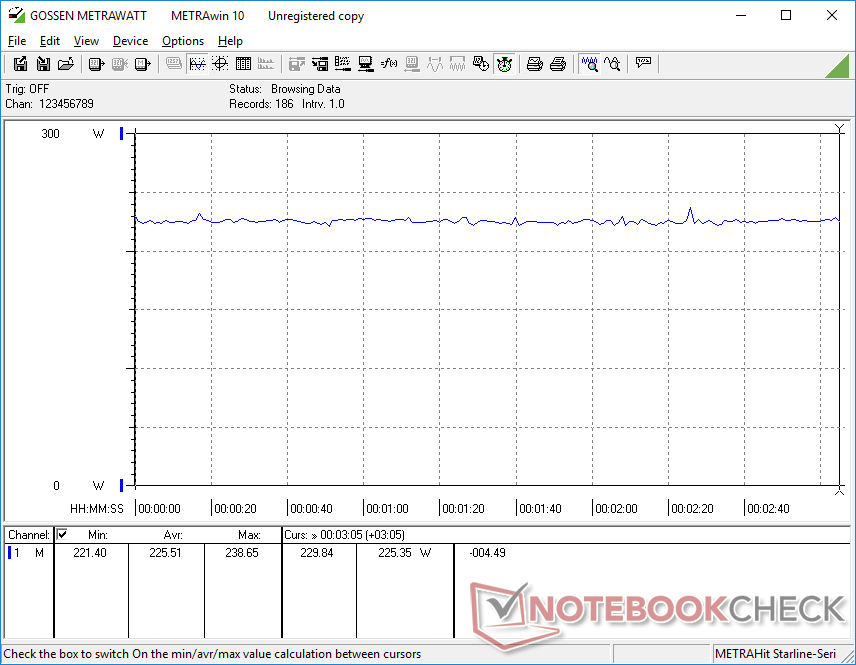
Consumo de energia
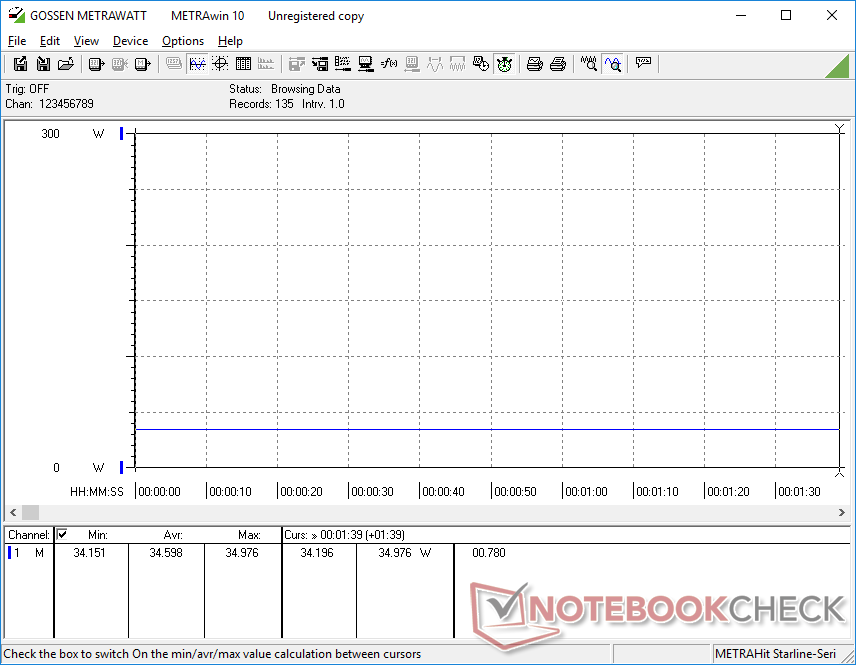
Esperar um maior consumo de energia em geral no Vector GP66 quando comparado ao GP66 Leopard do ano passado, devido a sua maior taxa de atualização do display nativo (360 Hz vs. 144 Hz), metas mais altas de CPU PL (70 W vs. 45 W), e TGP mais alto (150 W vs. 140 W). Os jogos em execução atrairão cerca de 20 W a mais da tomada para serem mais exigentes do que muitos outros laptops de jogo de 17 polegadas equipados com GeForce RTX 3080 gráficos. Embora os usuários estejam obtendo maior desempenho ano após ano, especialmente em termos de CPU, o desempenho por watt pode não ser muito melhor.
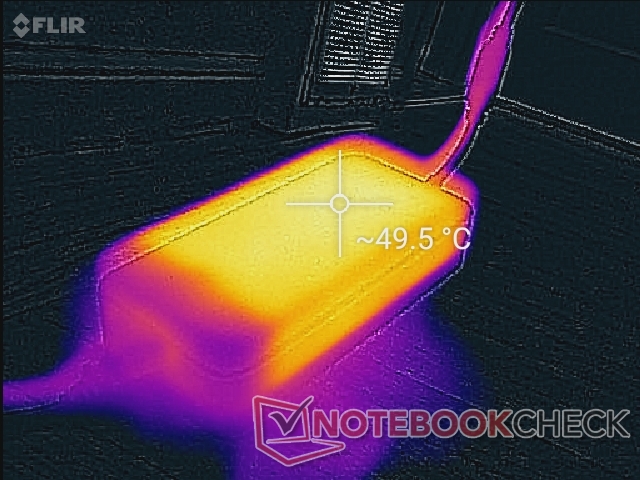
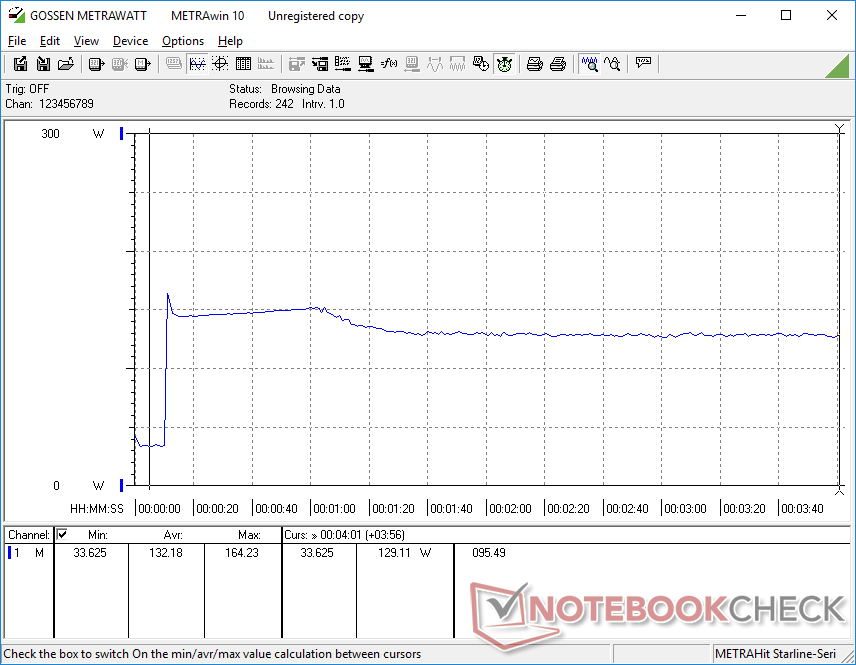
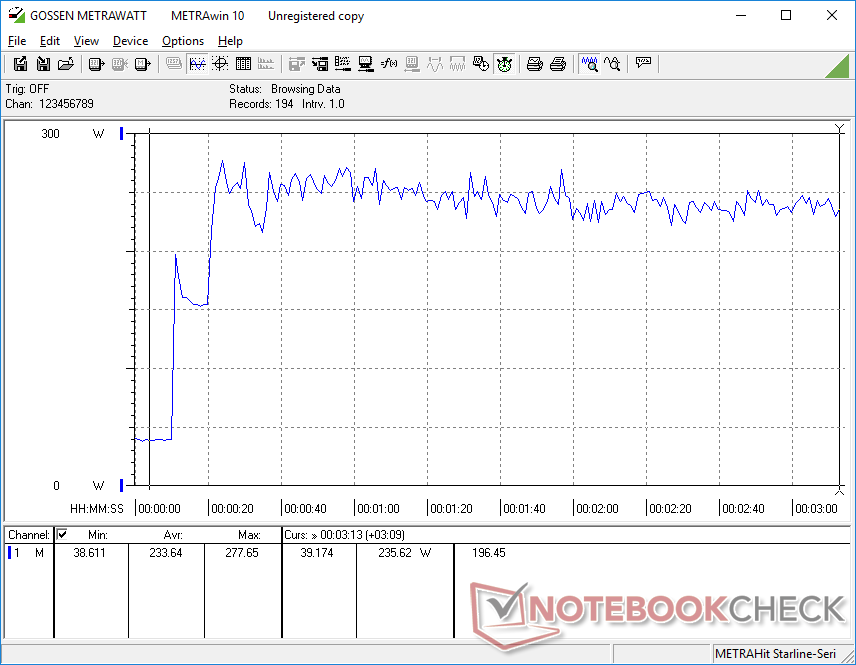
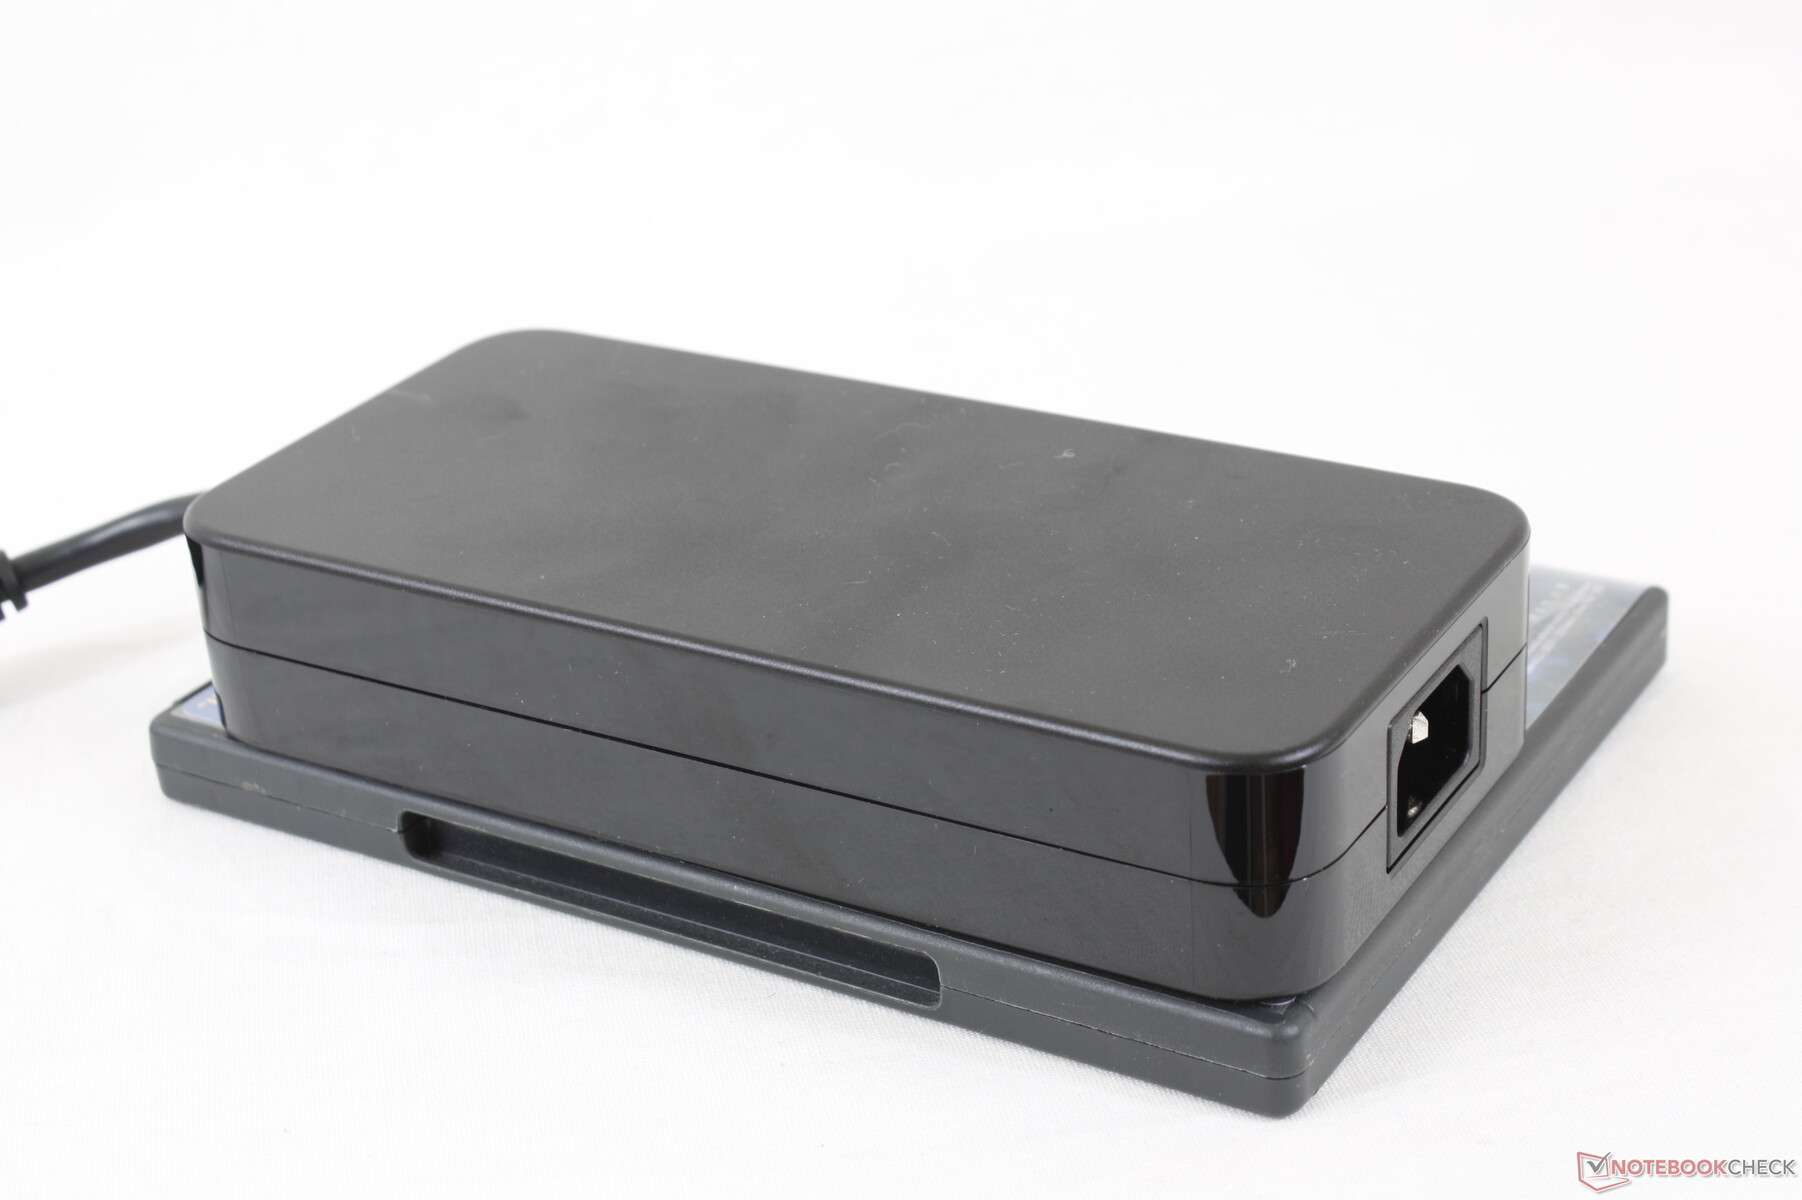
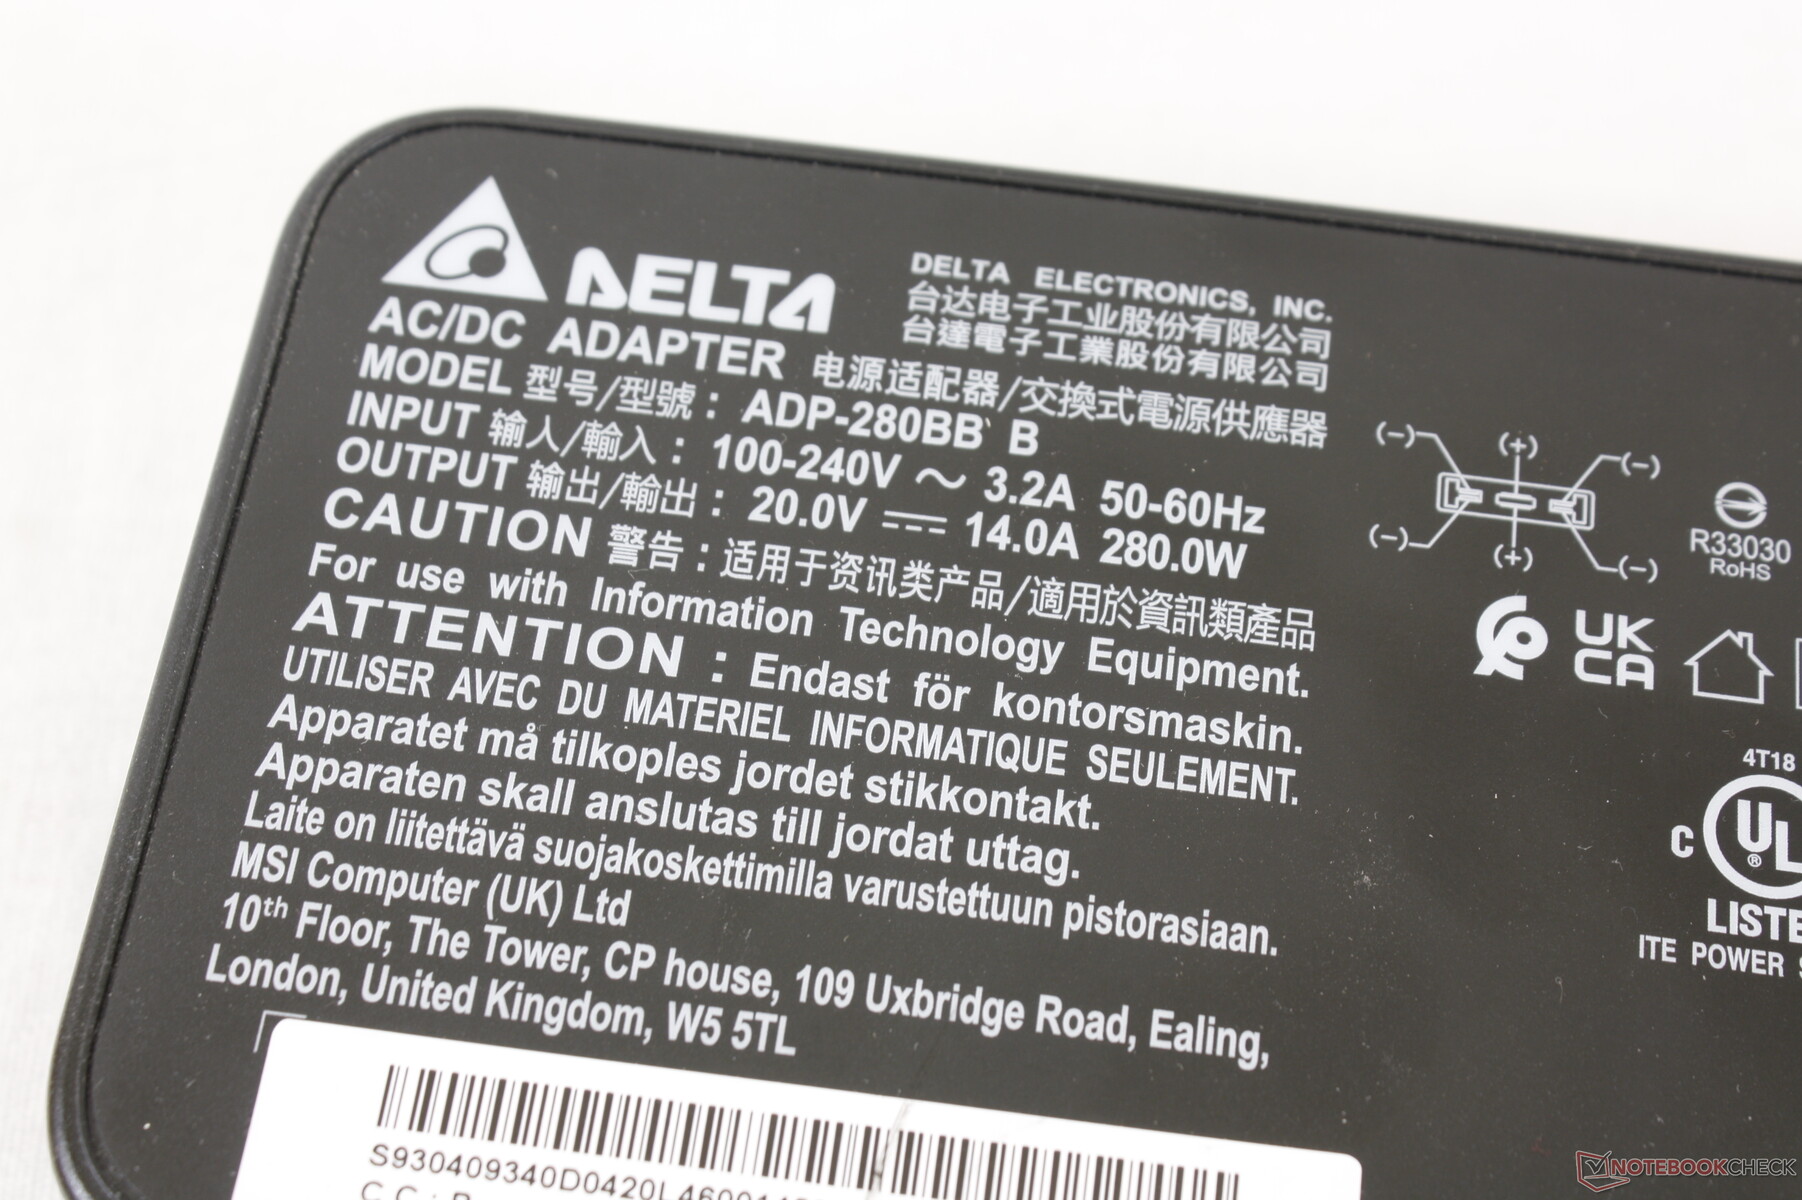
Somos capazes de registrar um draw temporário máximo de 278 W do grande adaptador AC de 280 W (~18 x 8,5 x 3,5 cm) ao rodar simultaneamente o Prime95 e o FurMark. A bateria ainda será recarregada a uma taxa decente quando estiver jogando.

| desligado | |
| Ocioso | |
| Carga |
|
Key:
min: | |
| MSI Vector GP66 12UGS i9-12900H, GeForce RTX 3070 Ti Laptop GPU, , IPS, 1920x1080, 15.6" | MSI GP66 Leopard 11UH-028 i7-11800H, GeForce RTX 3080 Laptop GPU, Samsung PM9A1 MZVL21T0HCLR, IPS, 1920x1080, 15.6" | MSI Katana GF66 11UG-220 i7-11800H, GeForce RTX 3070 Laptop GPU, Kingston OM8PDP3512B-AI1, IPS, 1920x1080, 15.6" | Asus TUF Gaming F15 FX506HM i7-11800H, GeForce RTX 3060 Laptop GPU, SK Hynix HFM001TD3JX013N, IPS, 1920x1080, 15.6" | Razer Blade 15 Base Edition 2021, i7-10750H RTX 3060 i7-10750H, GeForce RTX 3060 Laptop GPU, Samsung SSD PM981a MZVLB512HBJQ, IPS, 1920x1080, 15.6" | Alienware m15 R5 Ryzen Edition R7 5800H, GeForce RTX 3060 Laptop GPU, Toshiba KBG40ZNS512G NVMe, IPS, 1920x1080, 15.6" | |
|---|---|---|---|---|---|---|
| Power Consumption | 24% | 38% | 36% | 28% | 23% | |
| Idle Minimum * (Watt) | 17.5 | 13 26% | 8 54% | 9.5 46% | 11.7 33% | 11 37% |
| Idle Average * (Watt) | 20.1 | 17 15% | 12 40% | 12.1 40% | 16 20% | 14 30% |
| Idle Maximum * (Watt) | 47.3 | 18 62% | 22 53% | 22.5 52% | 29.3 38% | 25 47% |
| Load Average * (Watt) | 107.3 | 96 11% | 98 9% | 99.5 7% | 95.6 11% | 123 -15% |
| Witcher 3 ultra * (Watt) | 225 | 207 8% | 152 32% | 157 30% | 141.3 37% | 176 22% |
| Load Maximum * (Watt) | 277.7 | 223 20% | 162 42% | 173.5 38% | 197 29% | 226 19% |
* ... menor é melhor
Power Consumption Witcher 3 / Stresstest
Power Consumption external Monitor
Vida útil da bateria
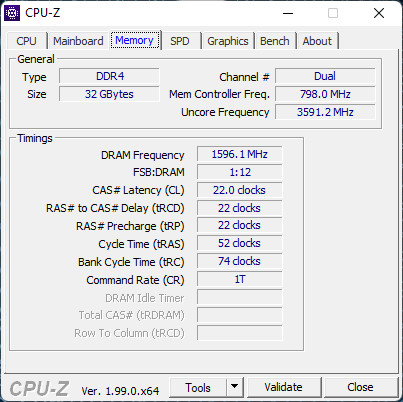
A capacidade da bateria é a mesma entre o GP66 Vector e o GP66 Leopard do ano passado, com 65 Wh. No entanto, somos capazes de registrar tempos de execução WLAN mais longos no modelo mais recente em pouco mais de duas horas adicionais. Recomendamos rodar o sistema no modo MSHybrid para aumentar a vida útil da bateria se o modo dGPU não for uma prioridade.
O carregamento da capacidade vazia à plena capacidade com o adaptador AC incluído leva cerca de 2,5 horas em comparação com 2 horas ou mais rápido na maioria dos outros laptops. O carregamento com adaptadores USB-C não é suportado, ao contrário de muitas alternativas da Asus ou da Razer.
| MSI Vector GP66 12UGS i9-12900H, GeForce RTX 3070 Ti Laptop GPU, 65 Wh | MSI GP66 Leopard 11UH-028 i7-11800H, GeForce RTX 3080 Laptop GPU, 65 Wh | MSI Katana GF66 11UG-220 i7-11800H, GeForce RTX 3070 Laptop GPU, 90 Wh | Asus TUF Gaming F15 FX506HM i7-11800H, GeForce RTX 3060 Laptop GPU, 90 Wh | Razer Blade 15 Base Edition 2021, i7-10750H RTX 3060 i7-10750H, GeForce RTX 3060 Laptop GPU, 65 Wh | Alienware m15 R5 Ryzen Edition R7 5800H, GeForce RTX 3060 Laptop GPU, 86 Wh | |
|---|---|---|---|---|---|---|
| Duração da bateria | -9% | 9% | 59% | 11% | 22% | |
| Reader / Idle (h) | 7.9 | 9.1 15% | 11 39% | 7.8 -1% | 14.7 86% | |
| WiFi v1.3 (h) | 5.7 | 3.6 -37% | 5.3 -7% | 7.9 39% | 4.8 -16% | 5.1 -11% |
| Load (h) | 1 | 1.2 20% | 1.2 20% | 2 100% | 1.5 50% | 0.9 -10% |
| H.264 (h) | 3.5 | 8.8 | ||||
| Witcher 3 ultra (h) | 0.8 | 1.6 |
Pro
Contra
Veredicto
As melhores térmicas do GP66 sobre o GP65 permitiram suportar gráficos TGP mais potentes de 150 W em comparação com apenas ~100 W no Lâmina Razer 15 ou MSI GS66 série. Em outras palavras, você está recebendo uma das melhores versões da móvel GeForce RTX 3070 Ti em qualquer laptop de 15,6 polegadas no momento, devido ao teto TGP mais alto do GP66. O GS66 pode ser mais fino e portátil, mas seu GeForce RTX 3070 Ti também é visivelmente mais lento como conseqüência direta. Para uma experiência mais equilibrada, o GP66 seria a melhor opção.
O modo de desempenho extremo é necessário se você quiser tirar o máximo de desempenho possível da GPU. Este modo também é o mais alto em termos de ruído do ventilador, o que significa que os ventiladores mais altos do que a média são inevitáveis se o desempenho máximo for desejado. Ao invés disso, os jogos no modo balanceado limitariam significativamente o ruído do ventilador para apenas um pequeno ~5 por cento de queda na performance gráfica. Achamos este modo ideal para jogadores que não gostam de usar fones de ouvido ou que são incomodados por laptops de jogo extra alto.
O Vector GP66 equilibra melhor a portabilidade e a performance do que a maioria dos outros laptops ultra-finos para jogos com suas opções de GPU de 150 W de potência superior.
Para futuras revisões, gostaríamos de ver melhorias tanto no clickpad esponjoso quanto na sustentabilidade da performance do SSD PCIe4 x4. O clickpad é uma redução do GP65 mais antigo, enquanto que a falta de um espalhador de calor para o SSD NVMe significa que as taxas de transferência serão aceleradas após um curto período de uso intensivo.
Preço e Disponibilidade
Nossa configuração exata, conforme revista, está disponível atualmente em Best Buy por $2400 USD.
MSI Vector GP66 12UGS
- 03/03/2022 v7 (old)
Allen Ngo
Price comparison

