MSI GS66 Stealth 10UG Revisão de Laptop: Quão rápido é um 95 W GeForce RTX 3070?
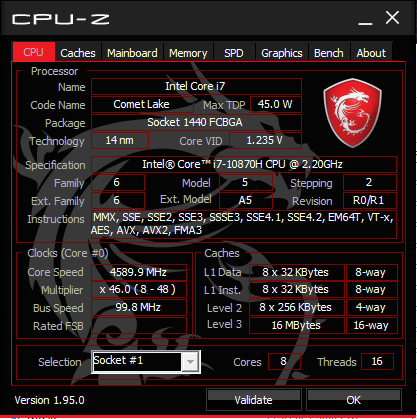
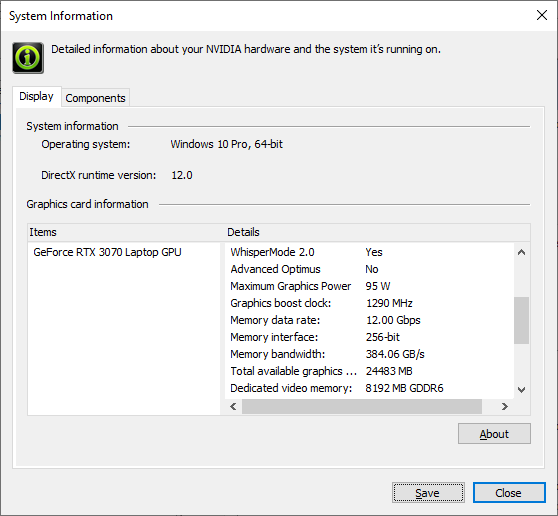
A MSI tem sido rápida em entrar no celular GeForce RTX 30 bandwagon com muitos modelos atualizados para escolher. O GS66, GE76 e GE66 estão agora todos disponíveis com as últimas GPUs Nvidia Ampere para substituir as opções Turing do ano passado. Nossa configuração do GS66 10UG vem com um GeForce RTX 3070 que a MSI confirmou conosco que tem como alvo um TGP de 95 W. Há também uma nova CPU Core i7-10870H para complementar o Core i7-10875H existente.
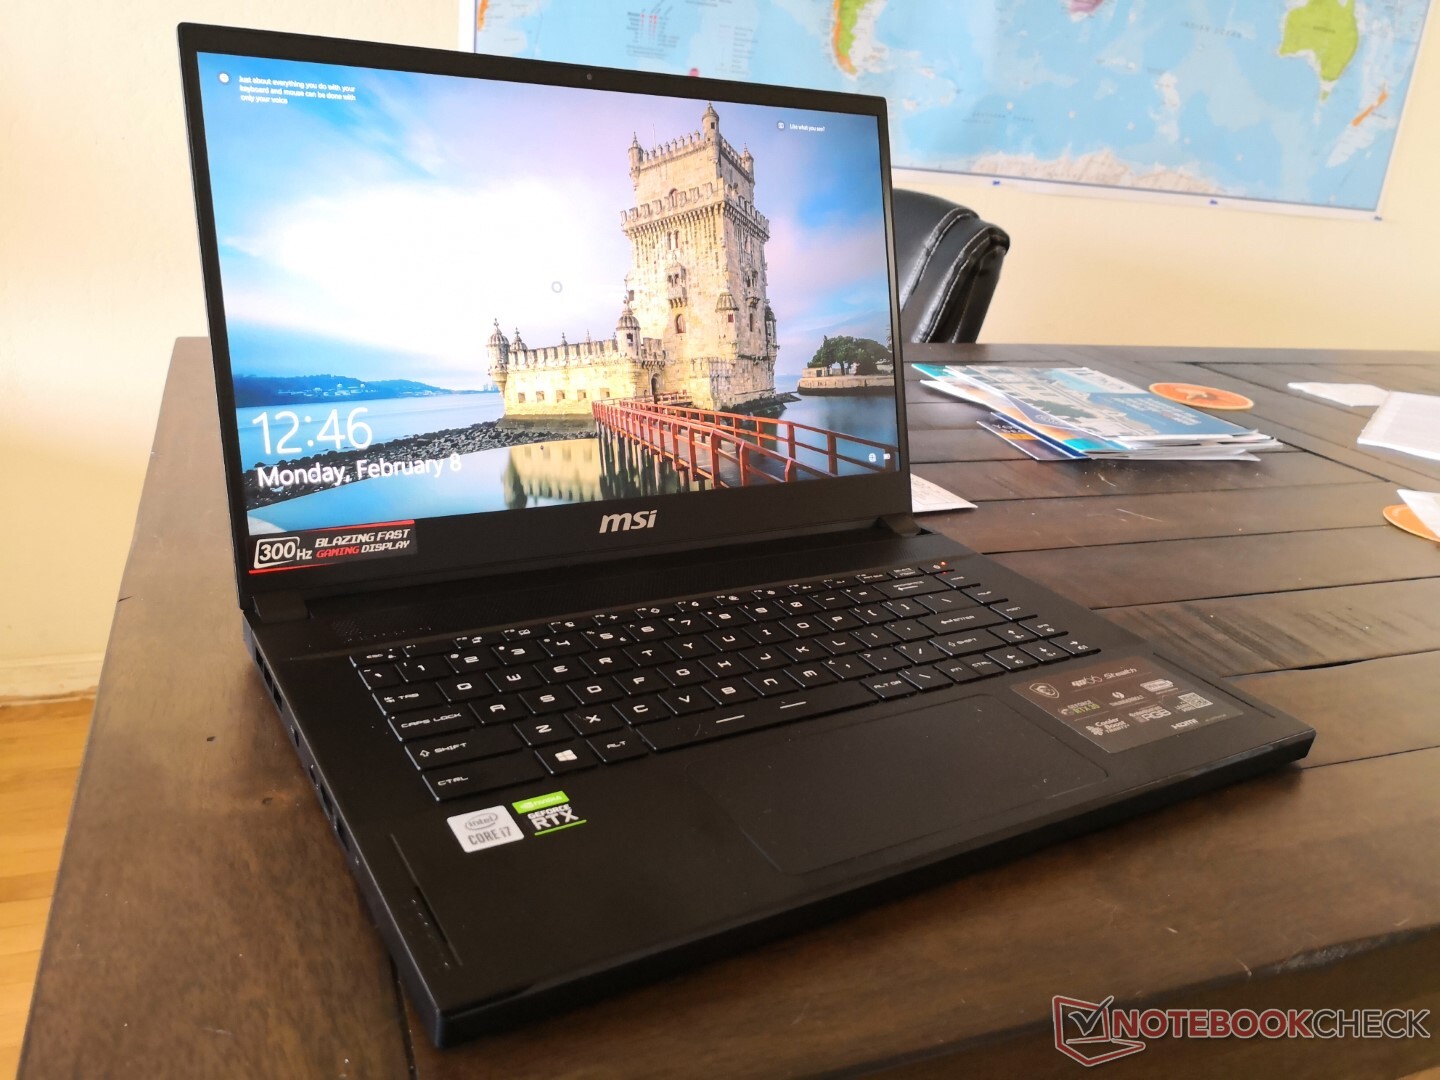
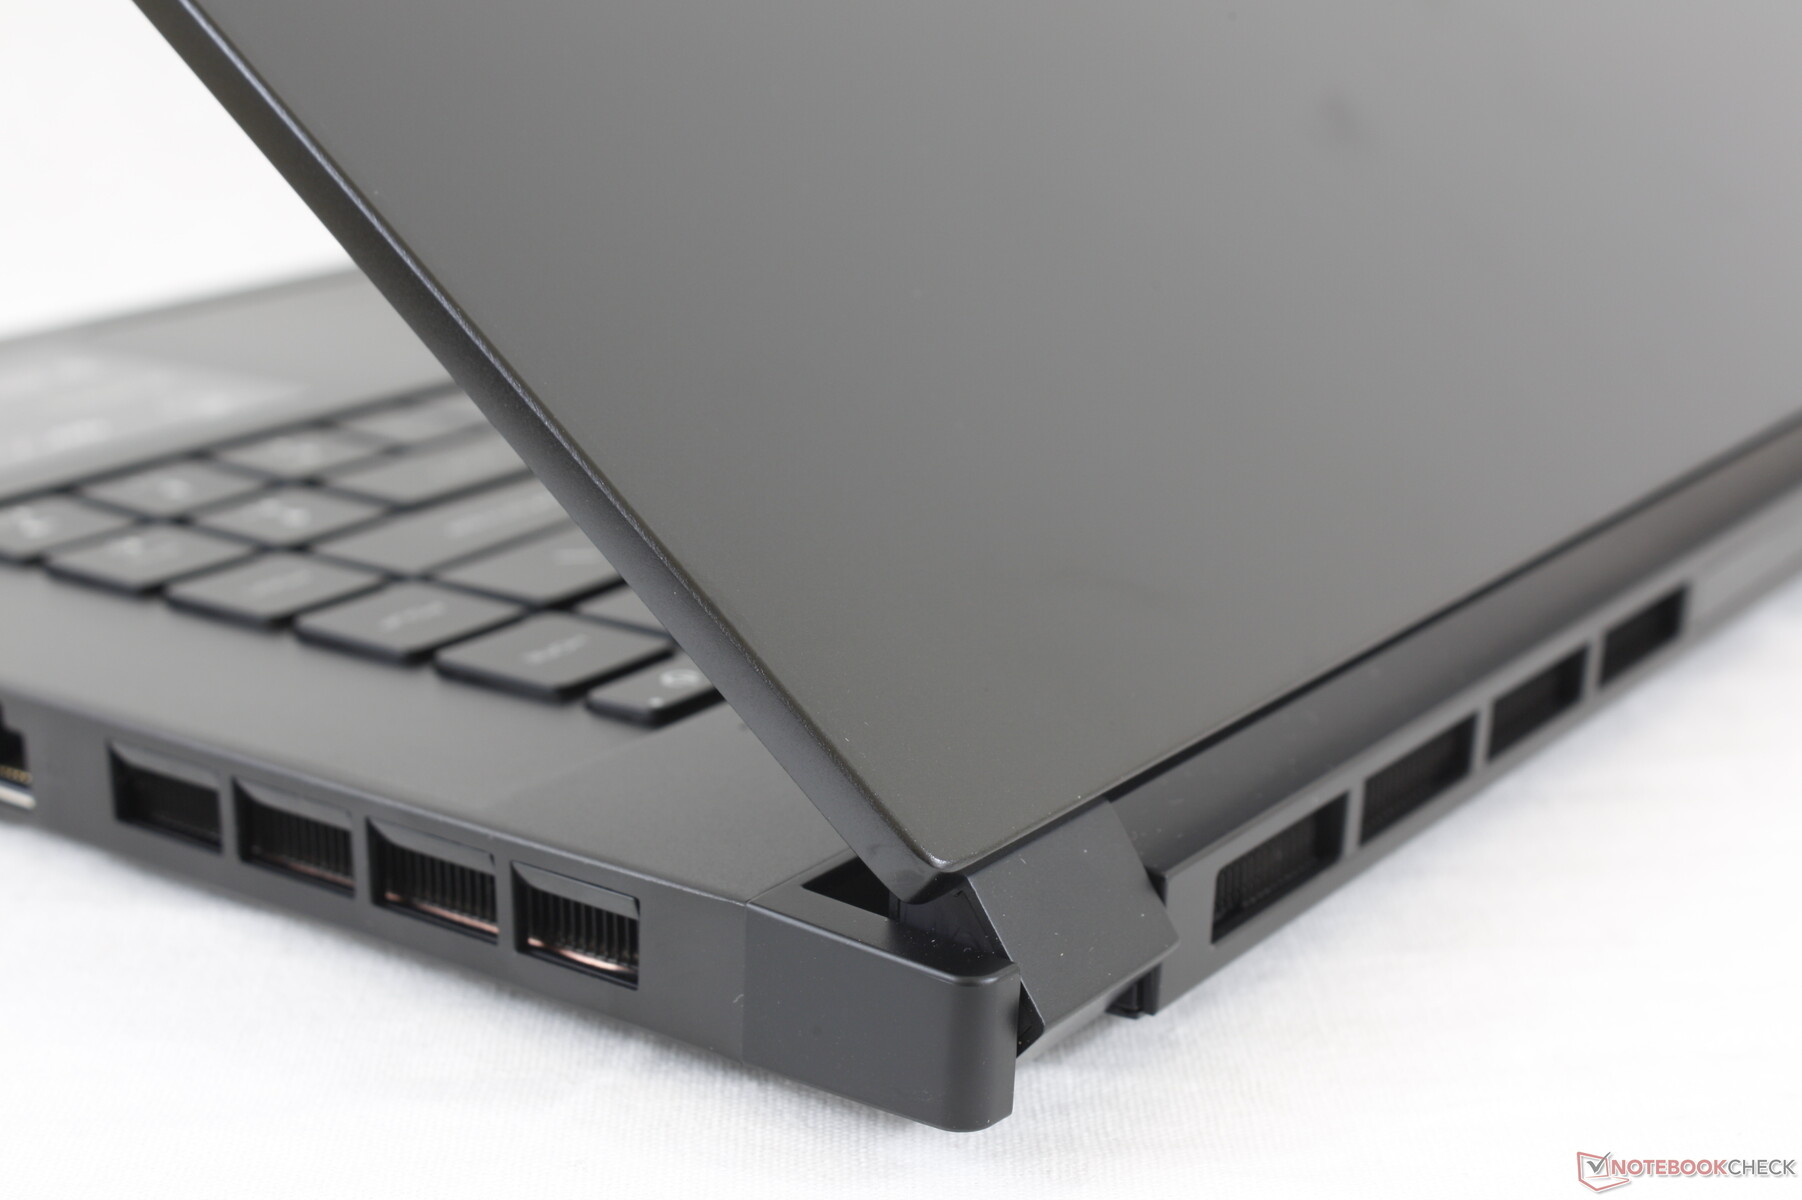
Além da nova CPU e GPU, o chassi permanece visualmente idêntico aos modelos anteriores GS66. Recomendamos verificar nossas revisões existentes sobre o GS66 para saber mais sobre as características físicas do laptop, já que todas elas também se aplicam aqui. O GS66 compete diretamente com outros laptops ultrafinos de 15,6 polegadas de alto desempenho como o Razer Blade 15, Lenovo Legion 7, Gigabyte Aero 15, e a série Asus Zephyrus.
Mais análises da MSI:
potential competitors in comparison
Avaliação | Data | Modelo | Peso | Altura | Size | Resolução | Preço |
|---|---|---|---|---|---|---|---|
| 84 % v7 (old) | 02/2021 | MSI GS66 Stealth 10UG i7-10870H, GeForce RTX 3070 Laptop GPU | 2.1 kg | 19.8 mm | 15.60" | 1920x1080 | |
| 84 % v7 (old) | 05/2020 | MSI GS66 10SGS i7-10750H, GeForce RTX 2080 Super Max-Q | 2.2 kg | 20 mm | 15.60" | 1920x1080 | |
| 82.4 % v7 (old) | 02/2021 | Asus TUF Dash F15 FX516PR i7-11370H, GeForce RTX 3070 Laptop GPU | 2 kg | 20 mm | 15.60" | 1920x1080 | |
| 86.9 % v7 (old) | 08/2020 | Razer Blade 15 RTX 2070 Super Max-Q i7-10875H, GeForce RTX 2070 Super Max-Q | 2.1 kg | 17.8 mm | 15.60" | 1920x1080 | |
| 84.5 % v7 (old) | 01/2021 | Aorus 15P WB i7-10750H, GeForce RTX 2070 Max-Q | 2.1 kg | 23 mm | 15.60" | 1920x1080 | |
| 84.8 % v7 (old) | 08/2020 | Alienware m15 R3 P87F i7-10750H, GeForce RTX 2070 Mobile | 2.3 kg | 19.9 mm | 15.60" | 1920x1080 |
Caso
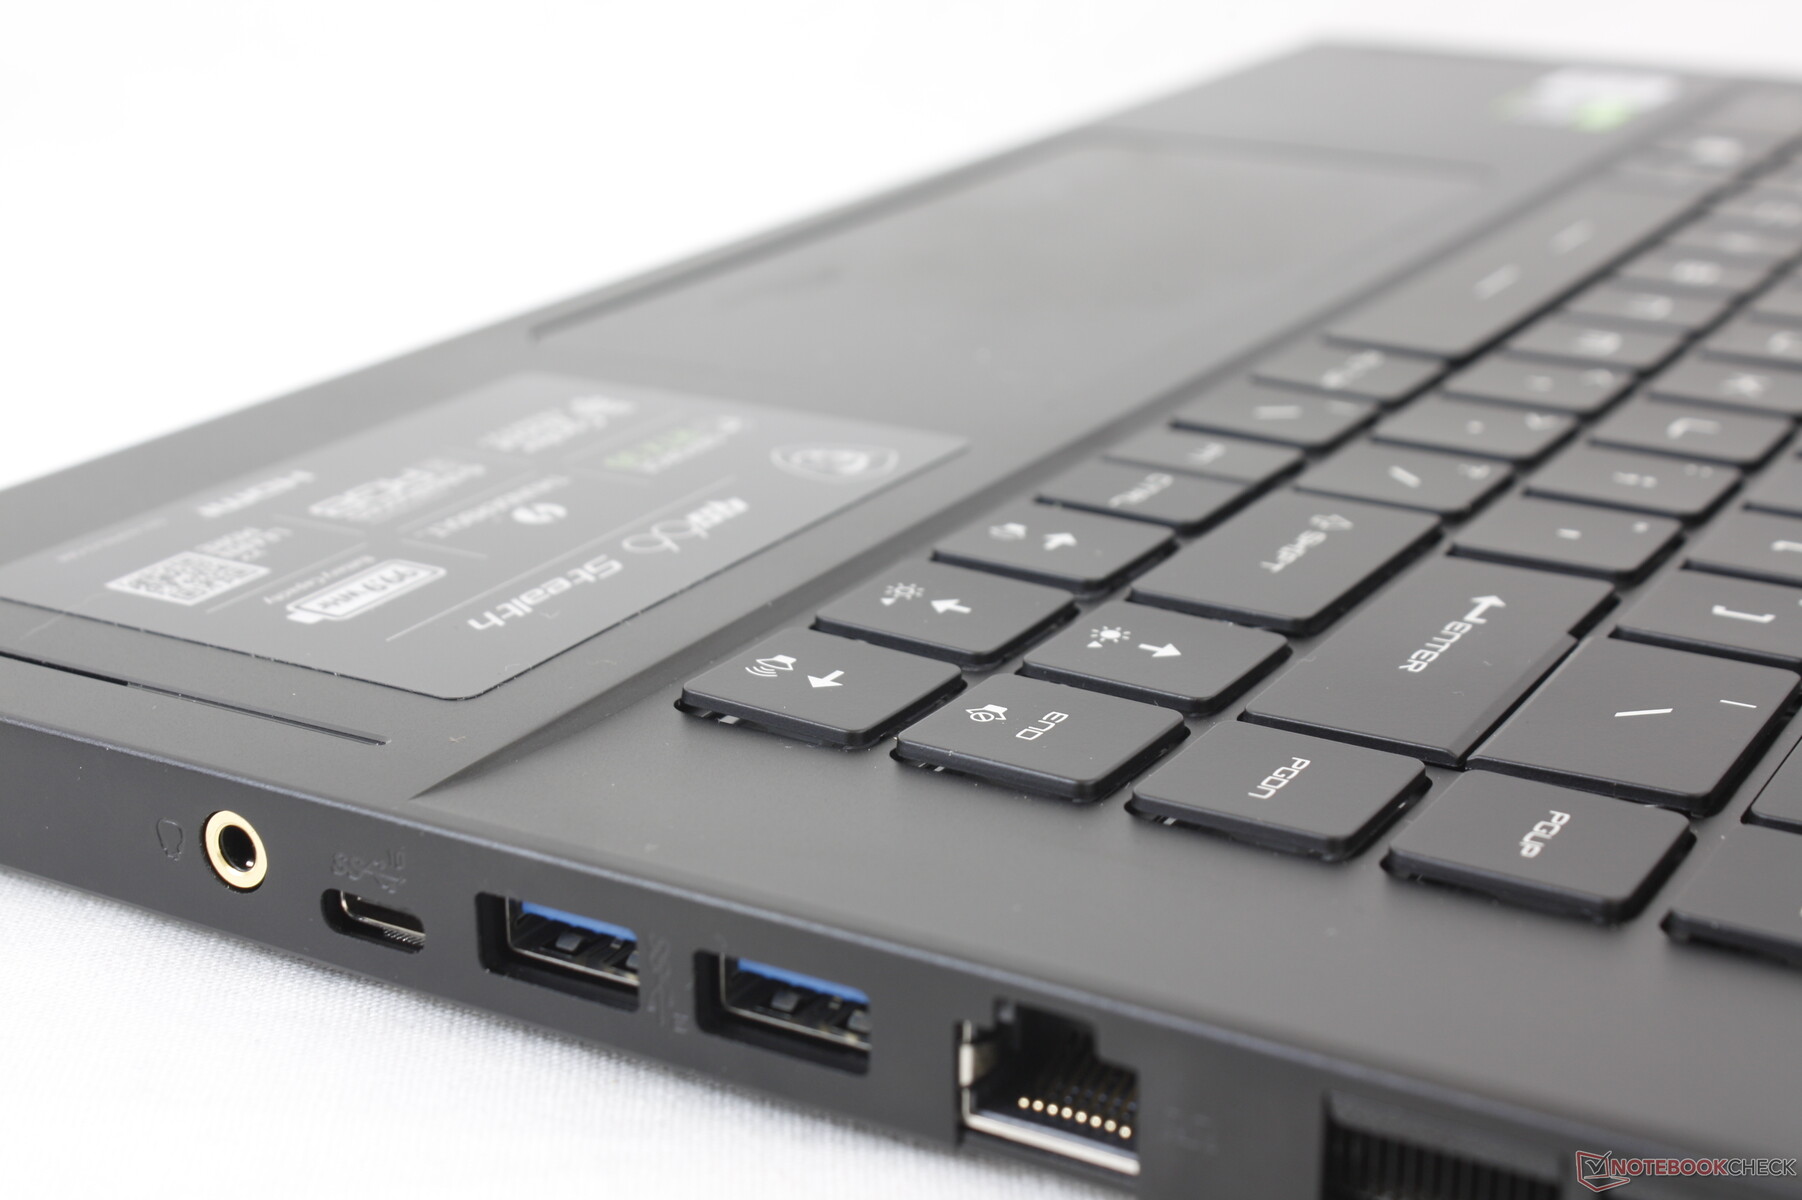
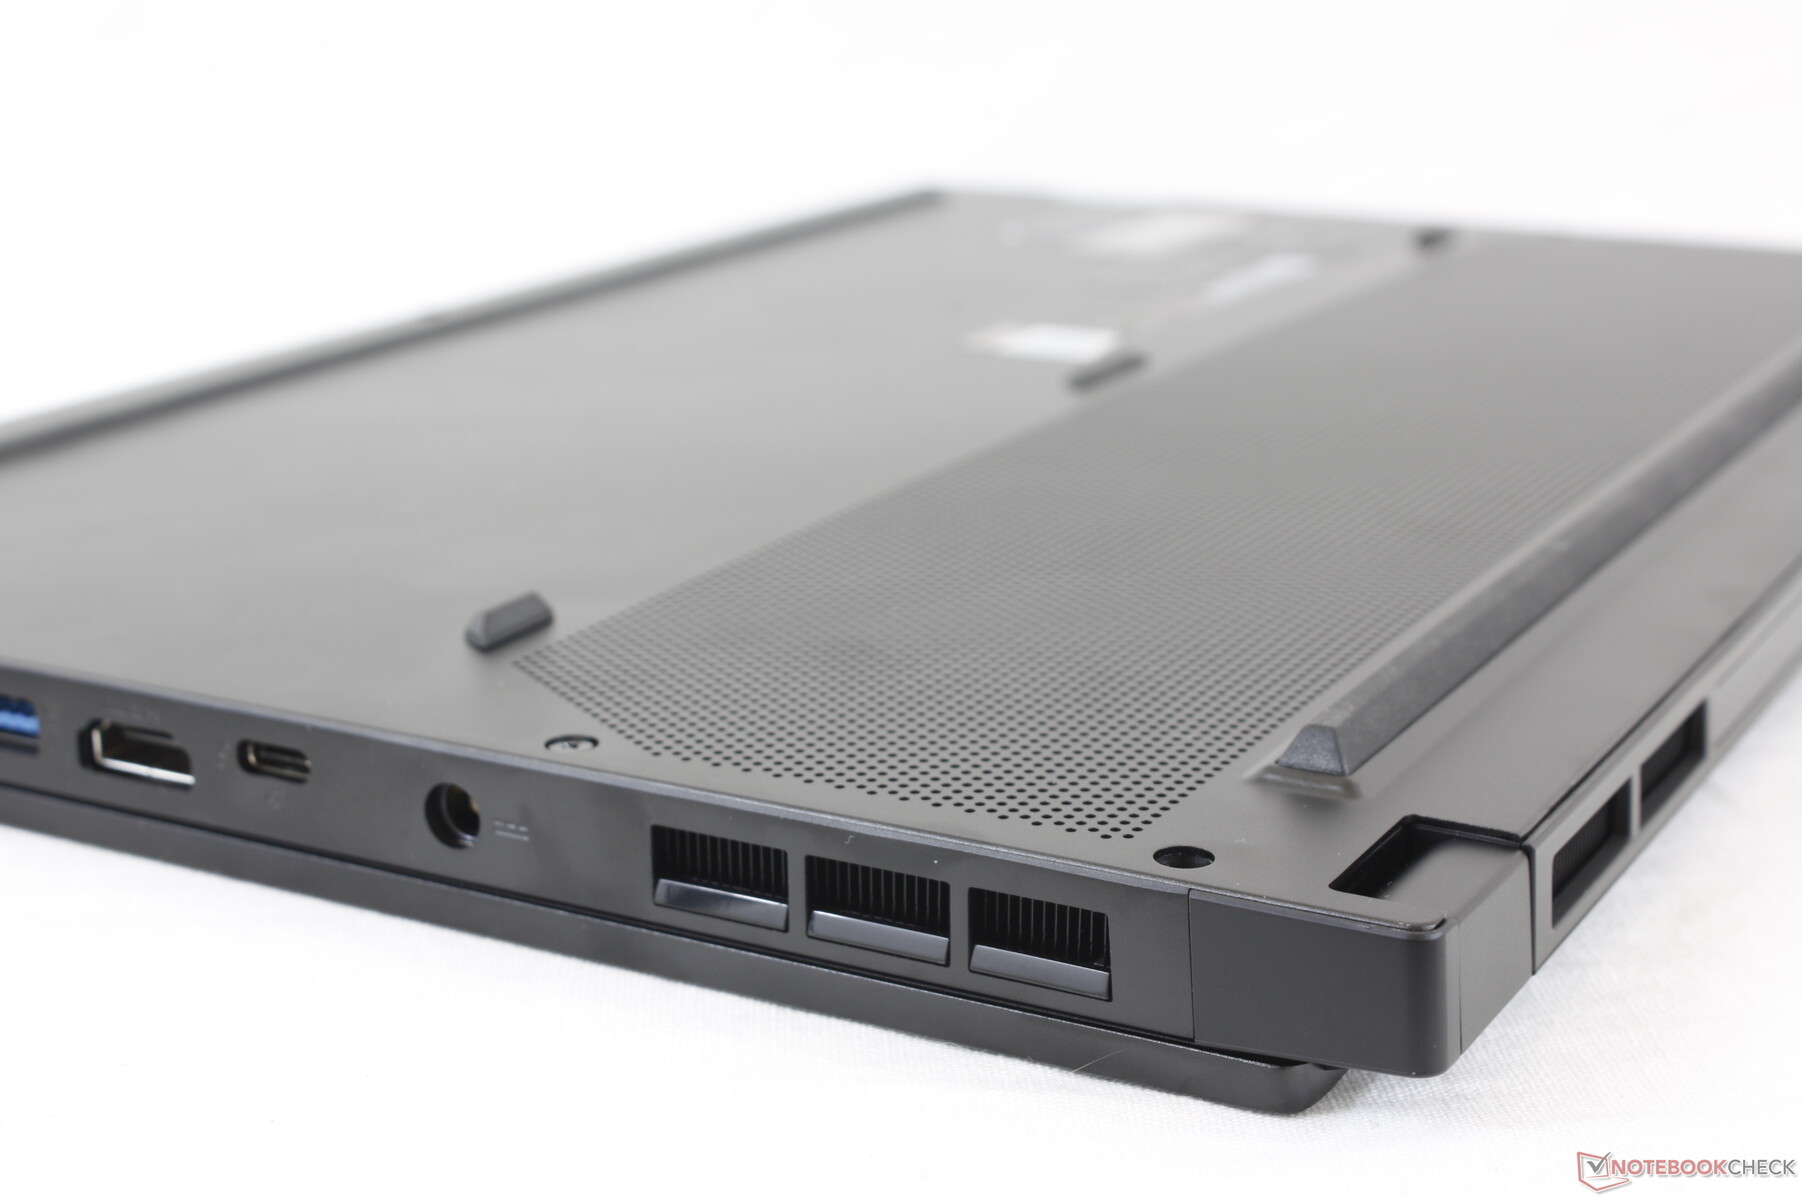
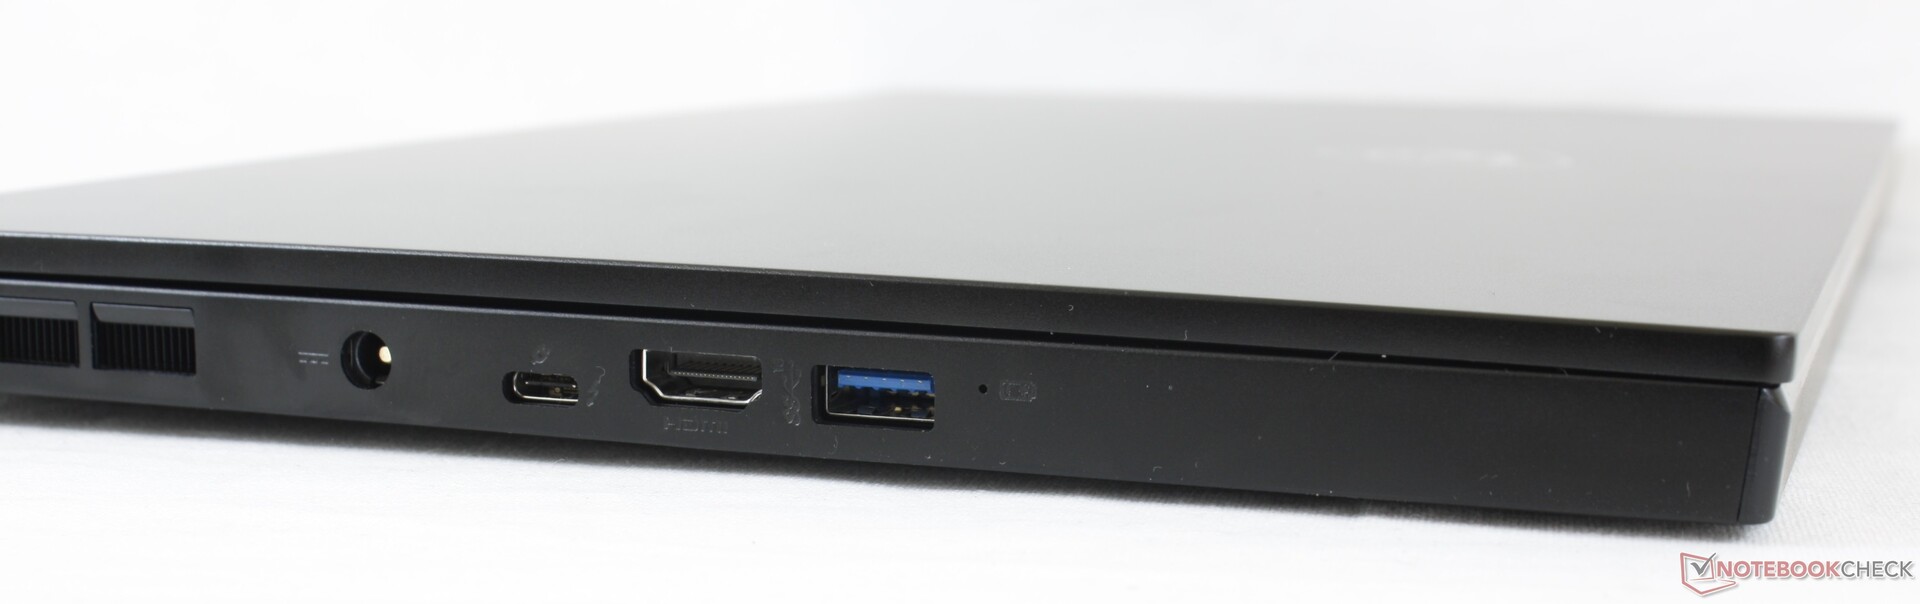
Conectividade
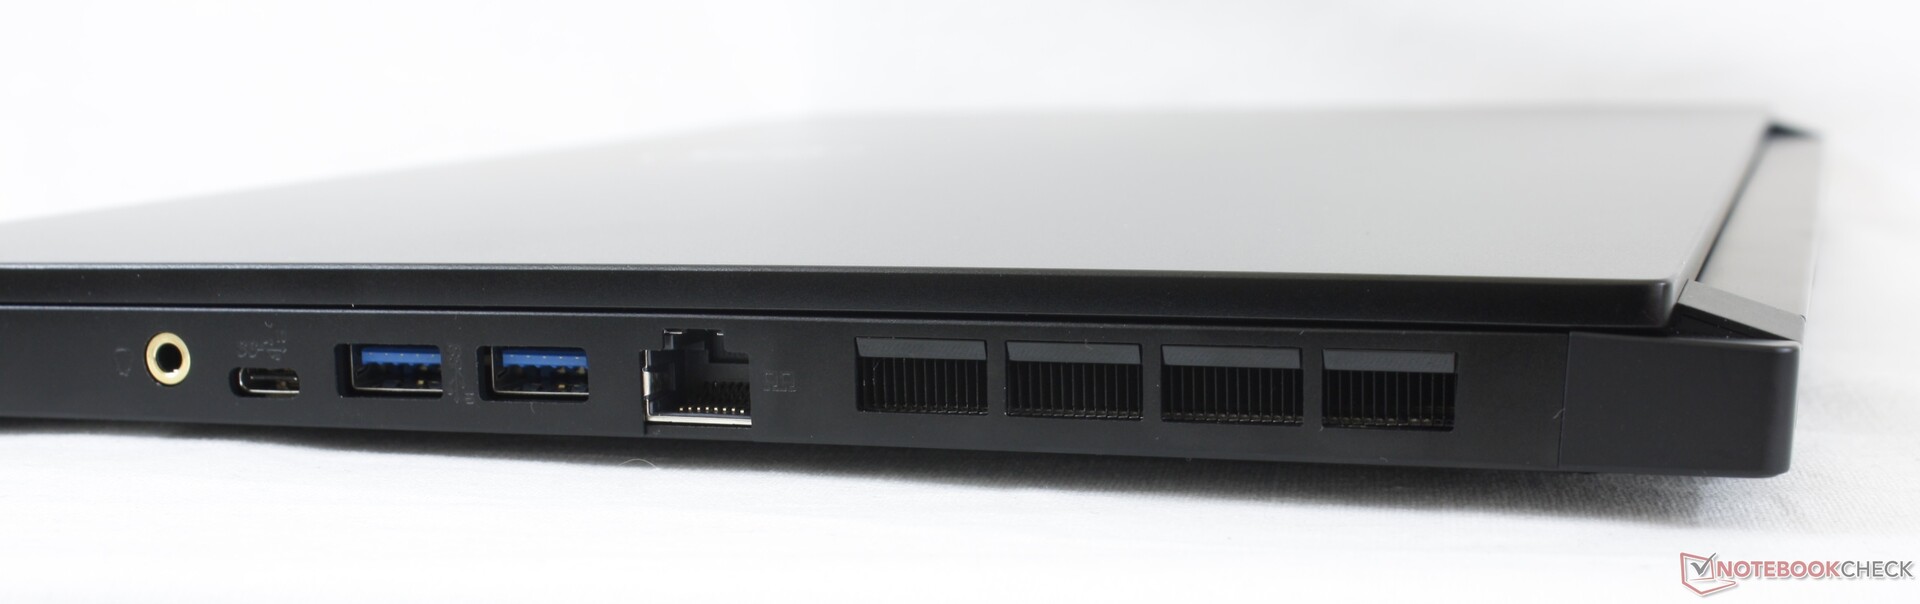
Comunicação
Webcam


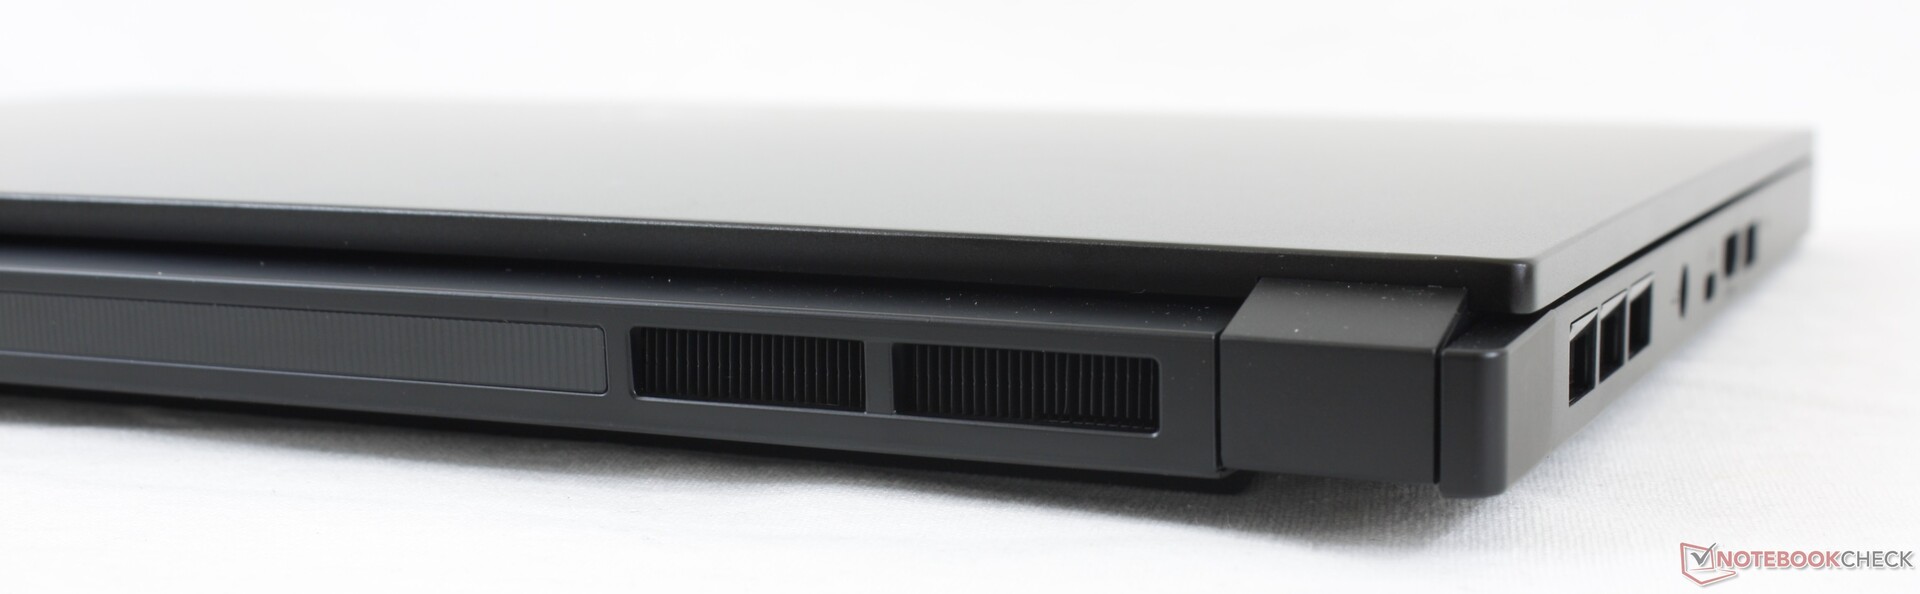
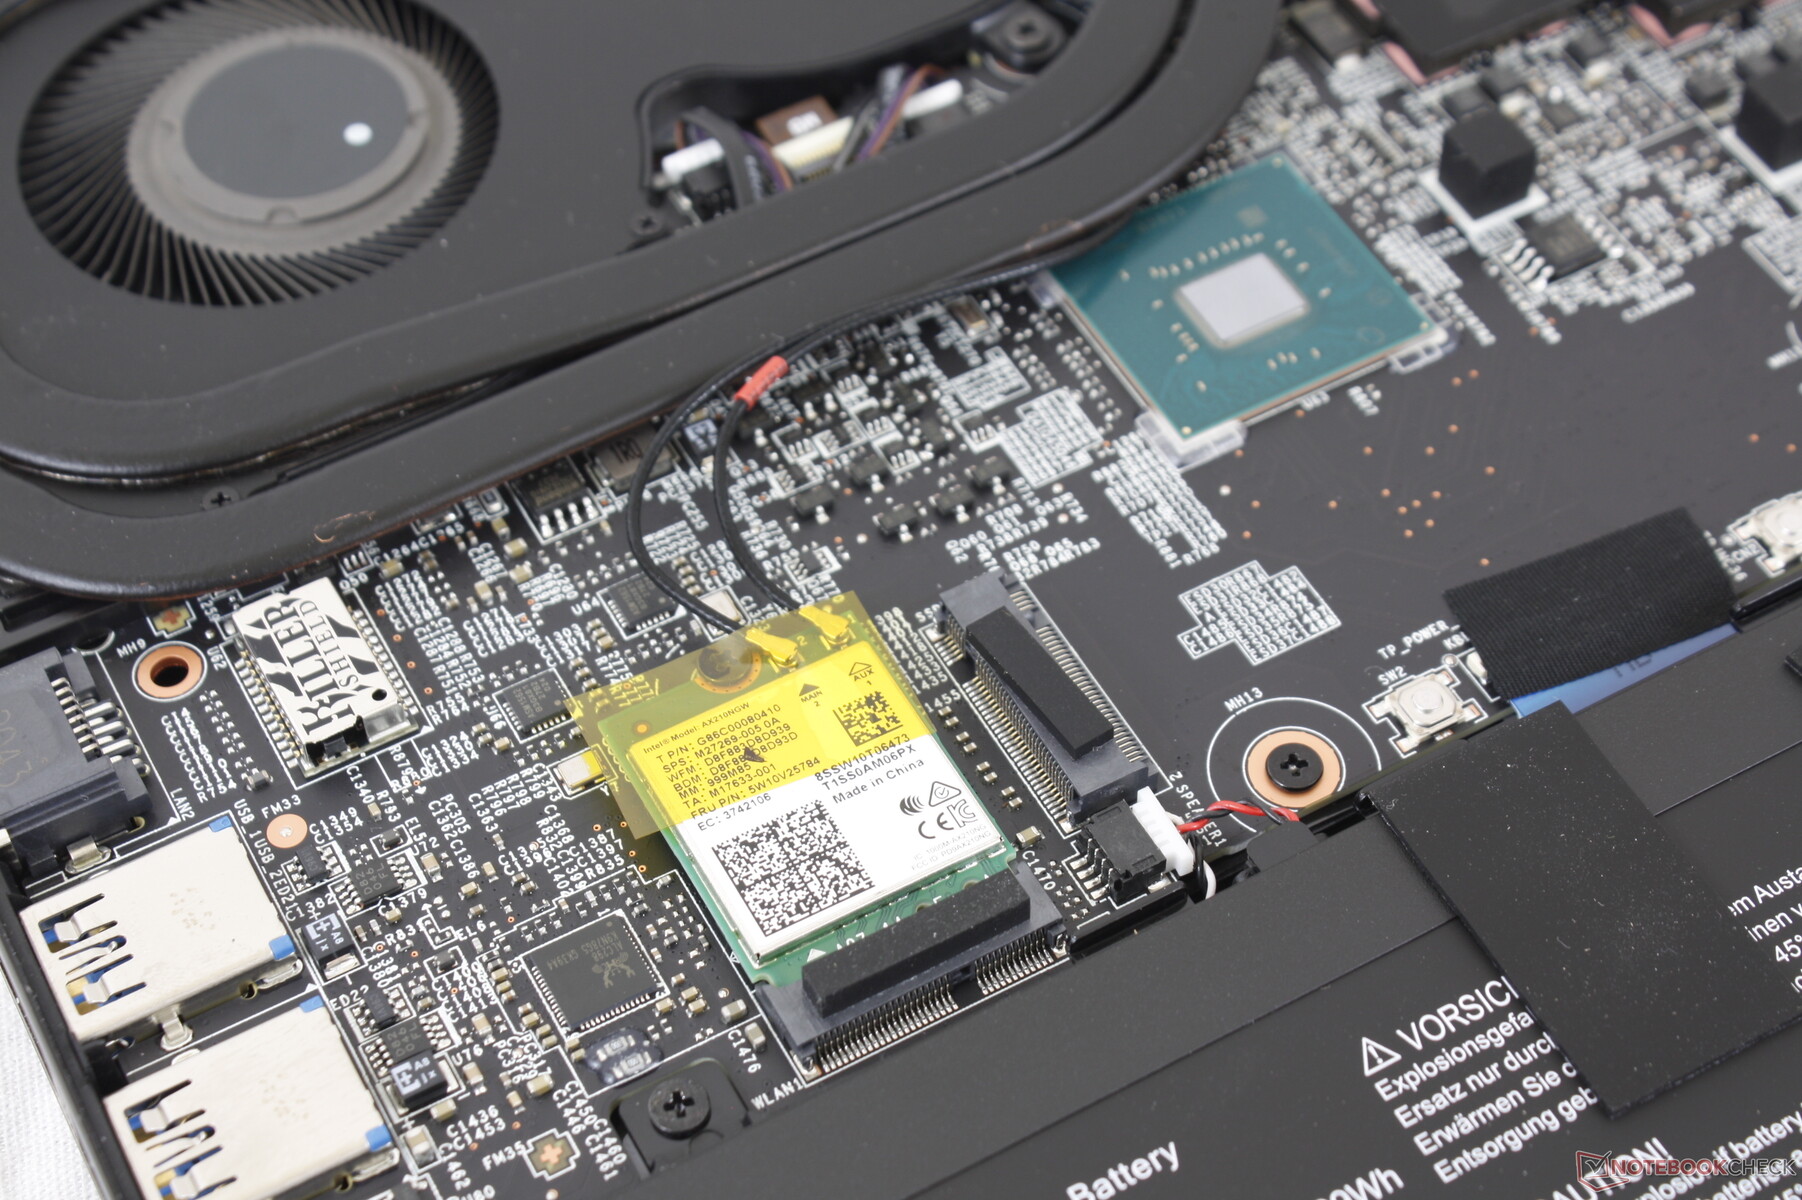
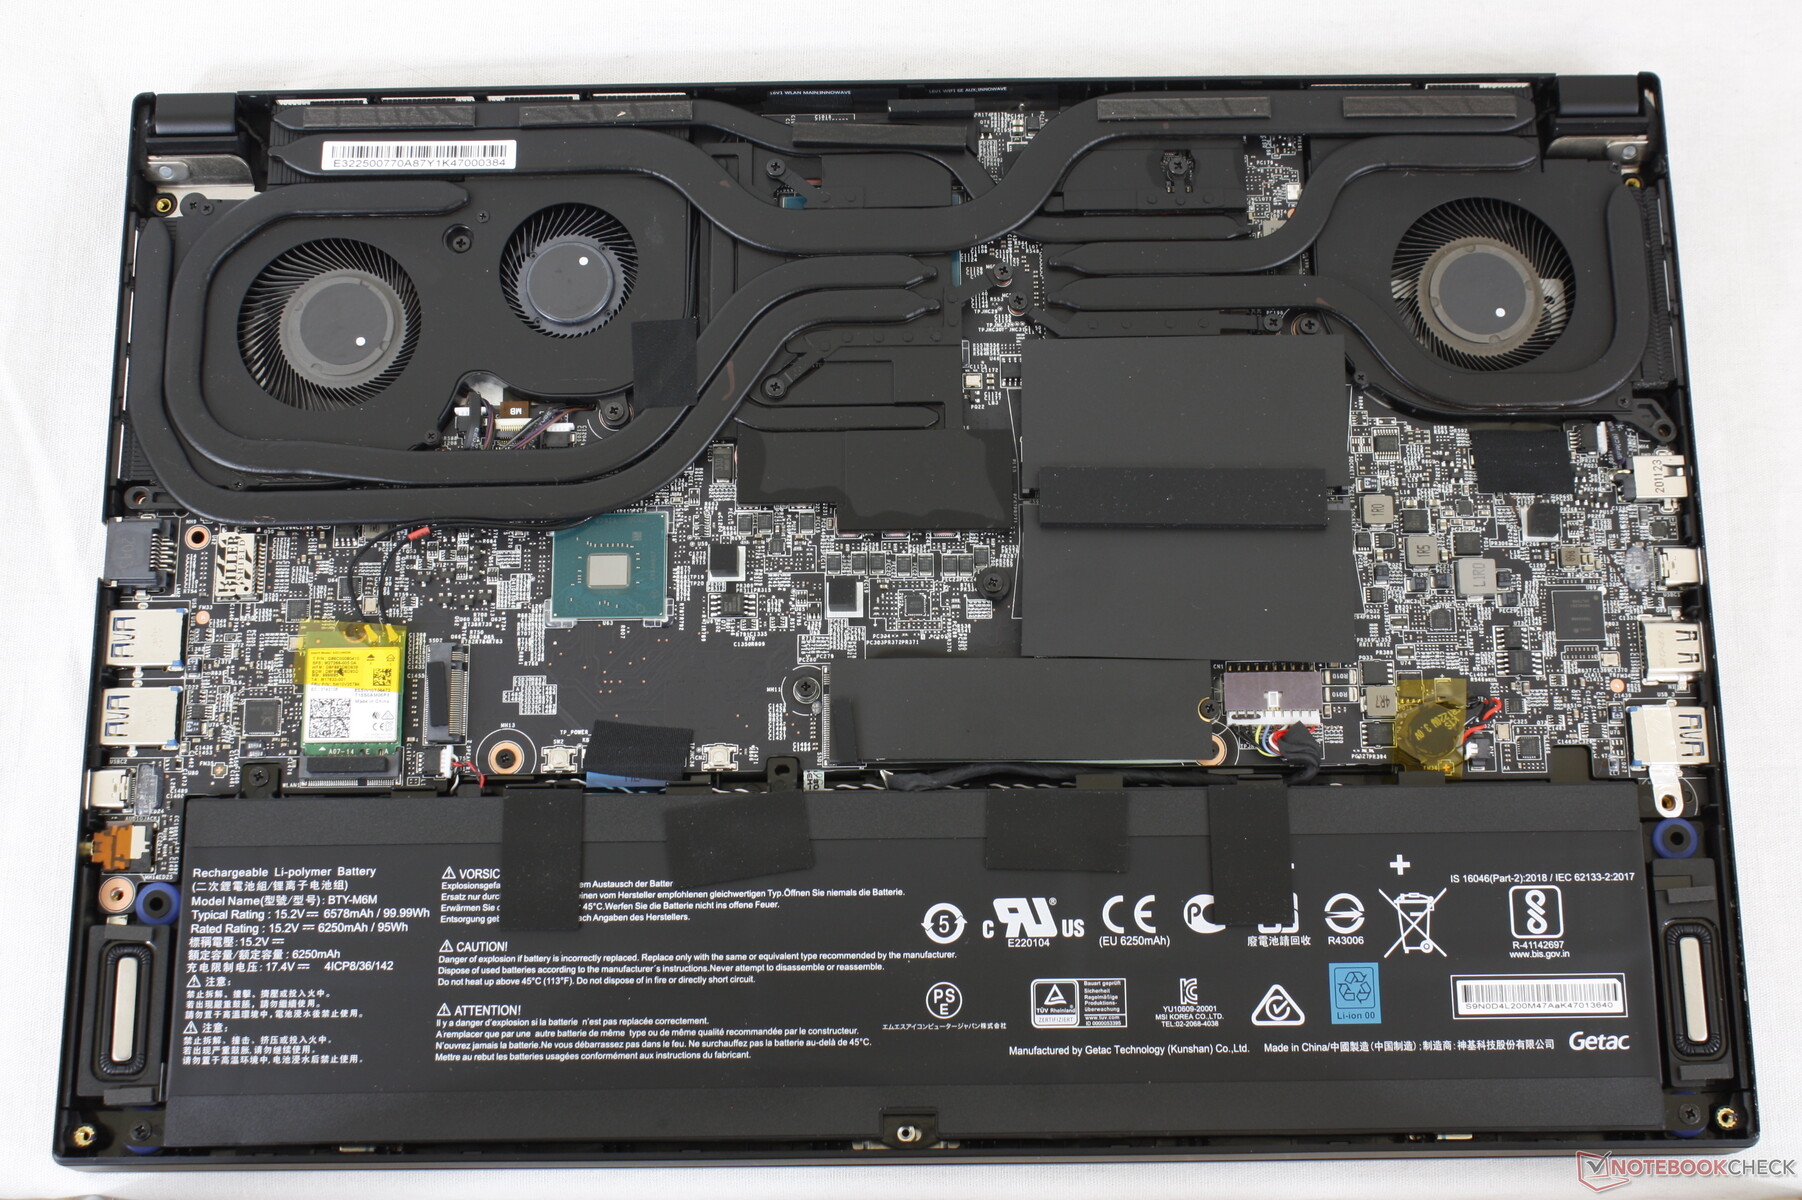
Manutenção
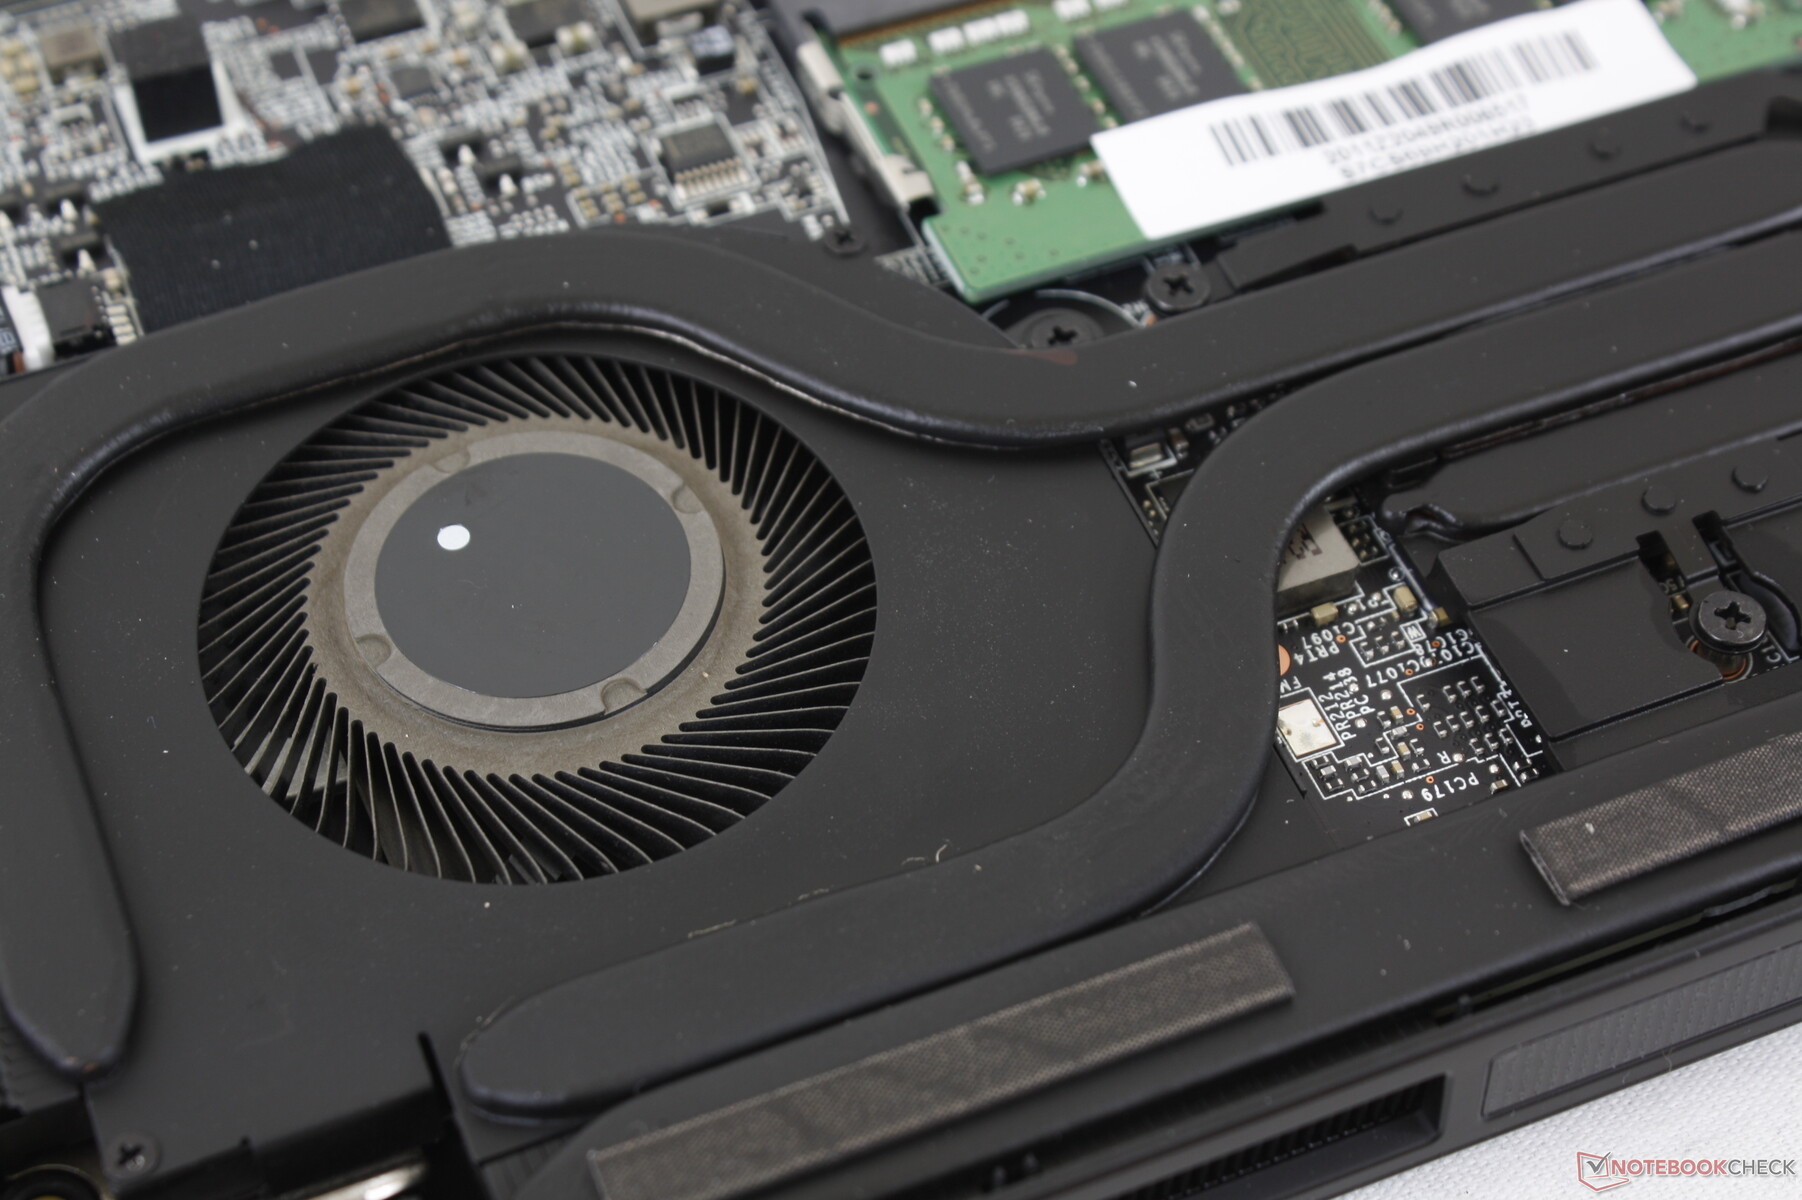
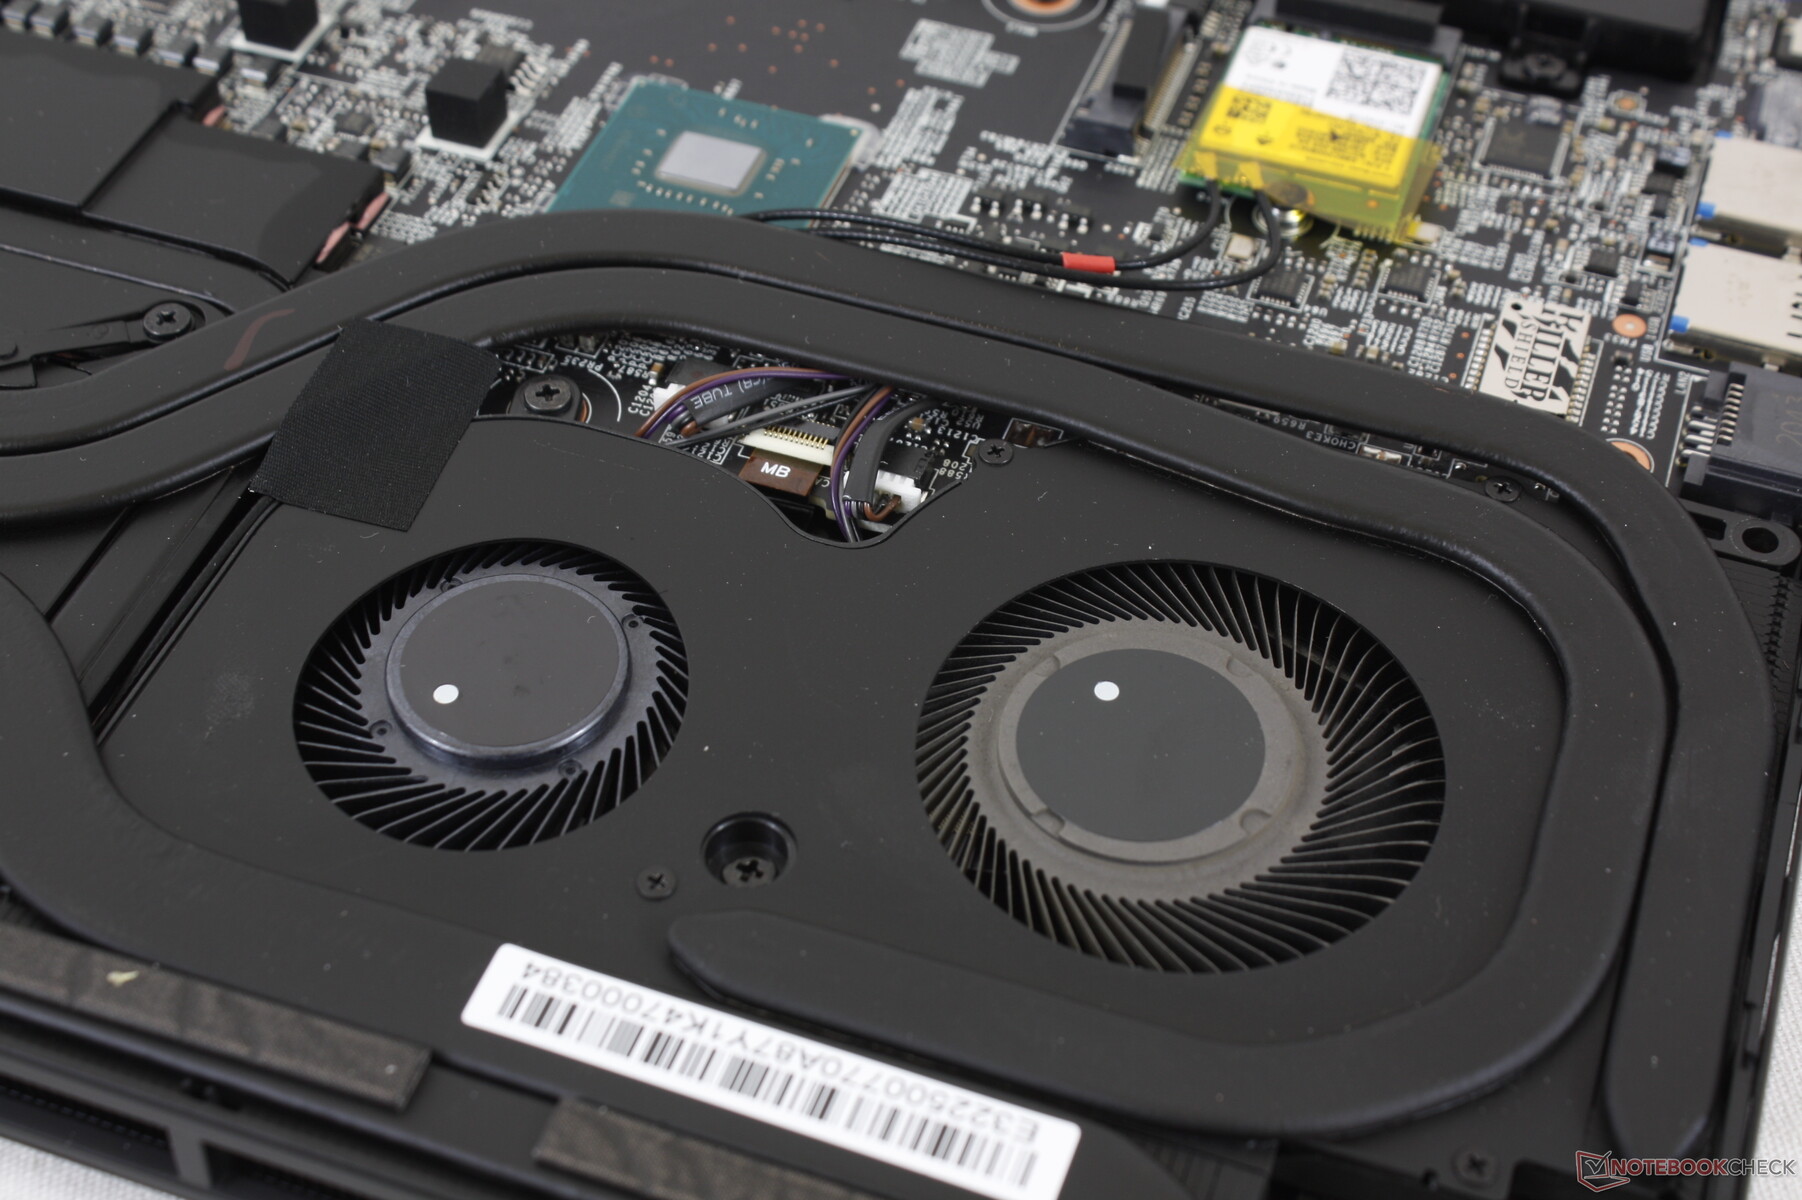
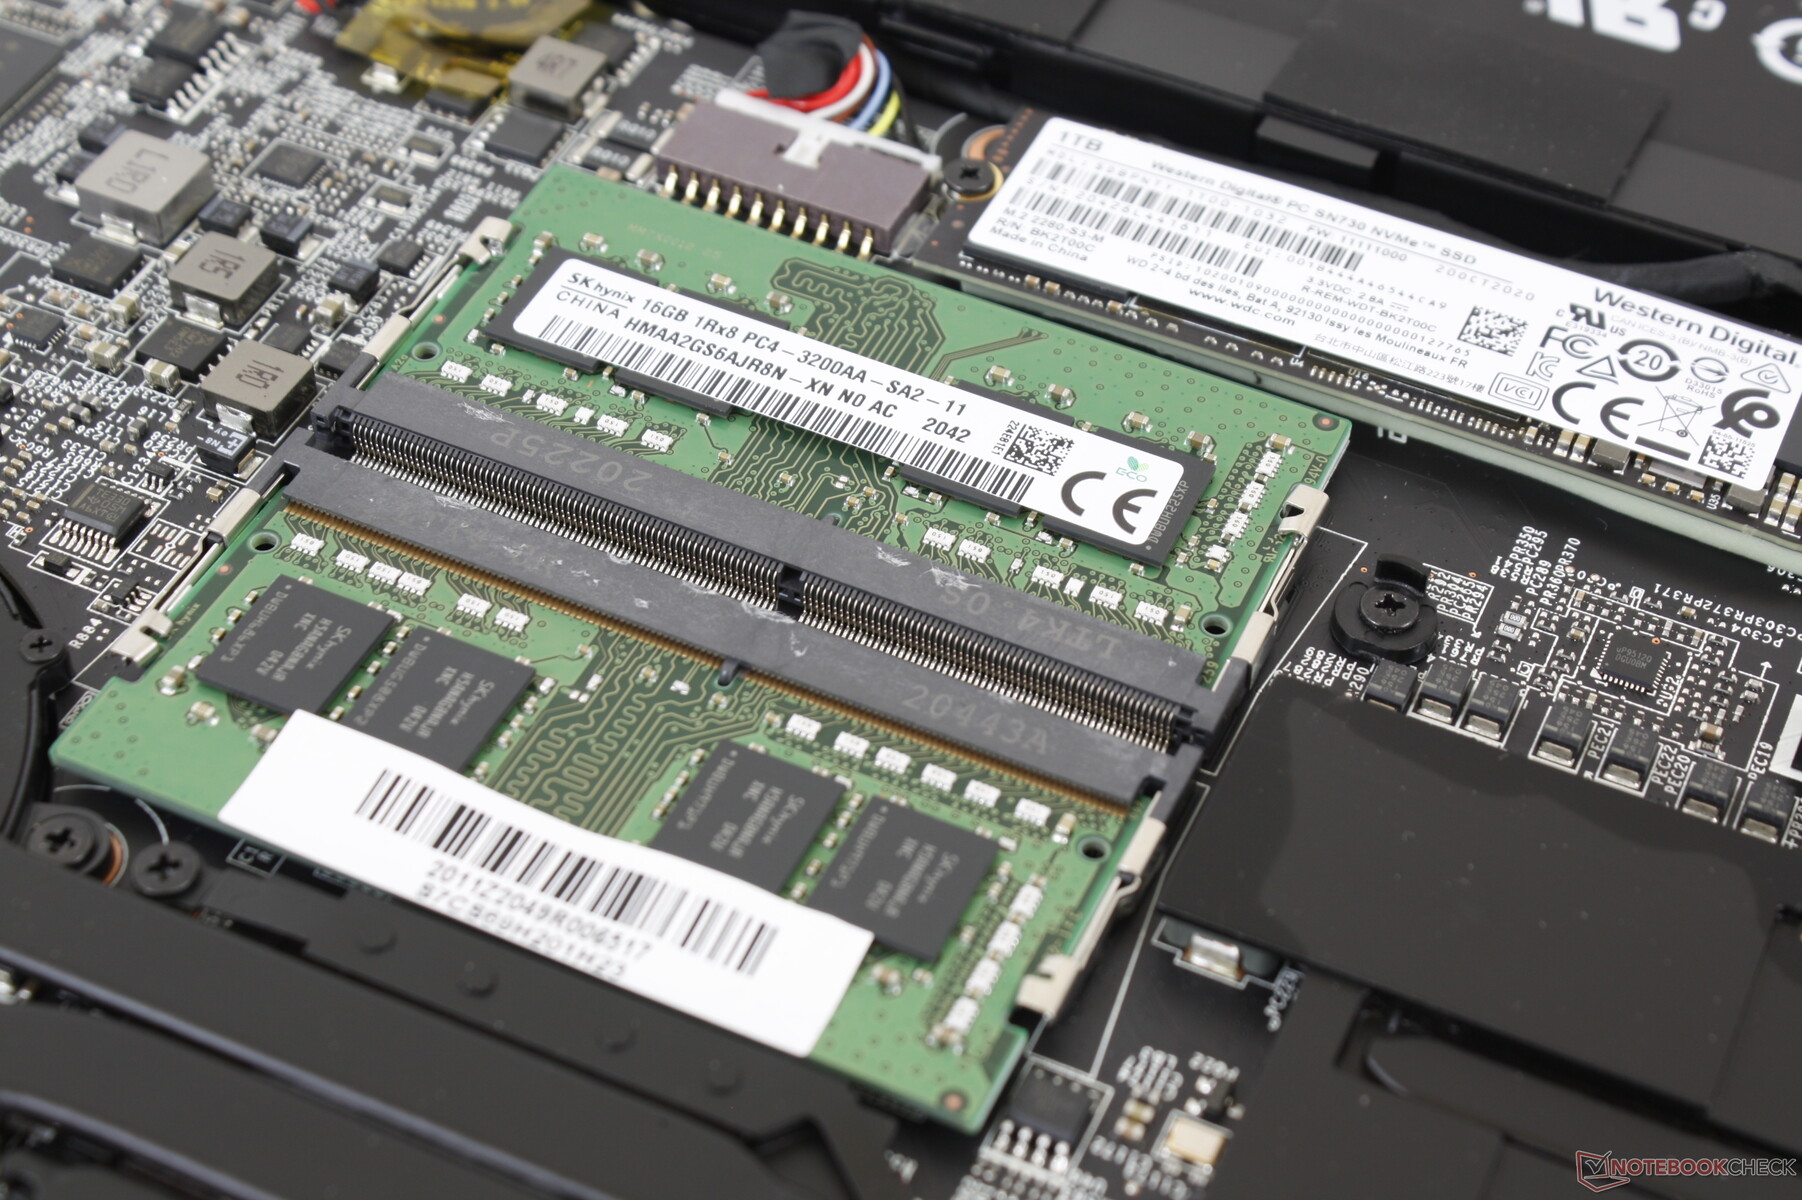
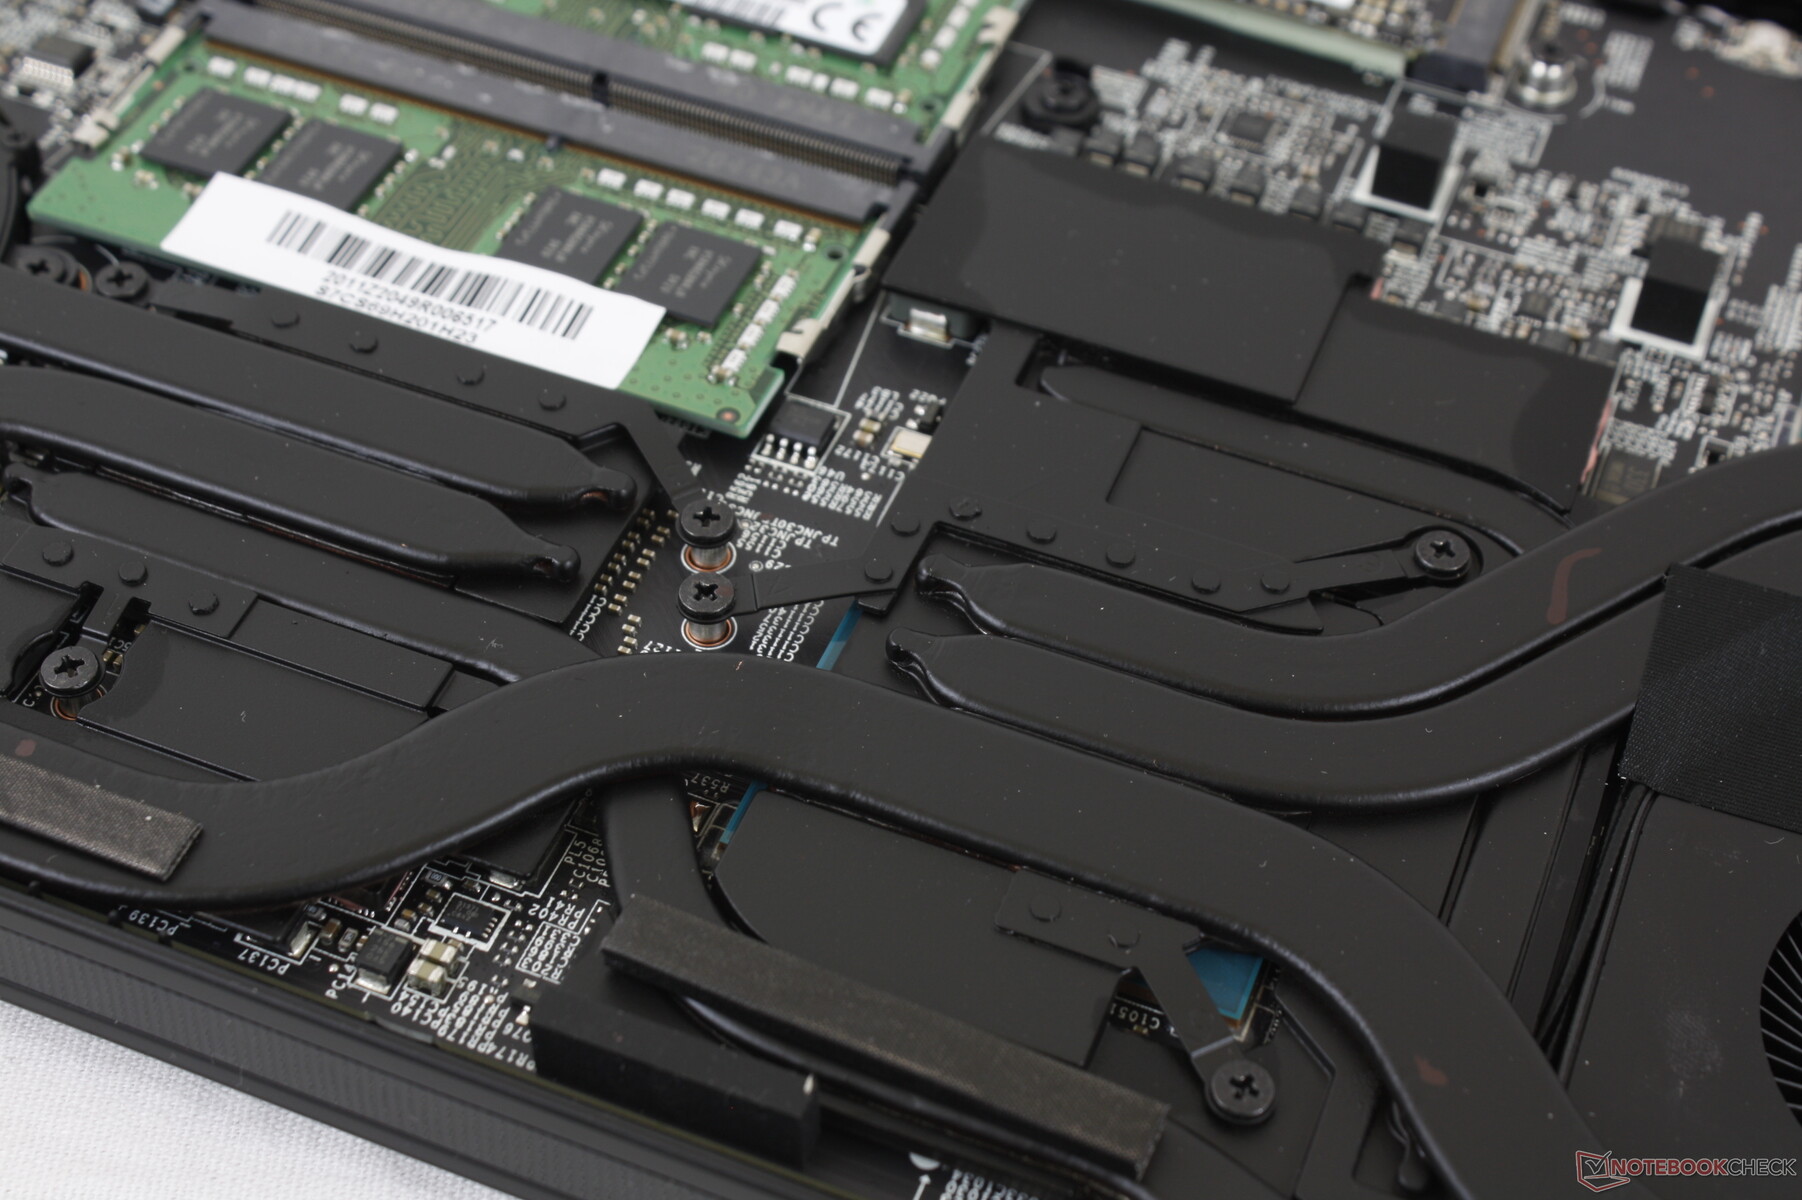
A MSI não fez grandes mudanças internas fora da troca de CPU e GPU. A solução de resfriamento e os componentes parecem idênticos ao que observamos no GS66 do ano passado, alimentado por Turing.
Acessórios e Garantia
A caixa de varejo inclui um grande pano de veludo, além do habitual adaptador AC e manuais. A garantia padrão limitada de um ano se aplica com opções adicionais se comprada no PC Xotic.
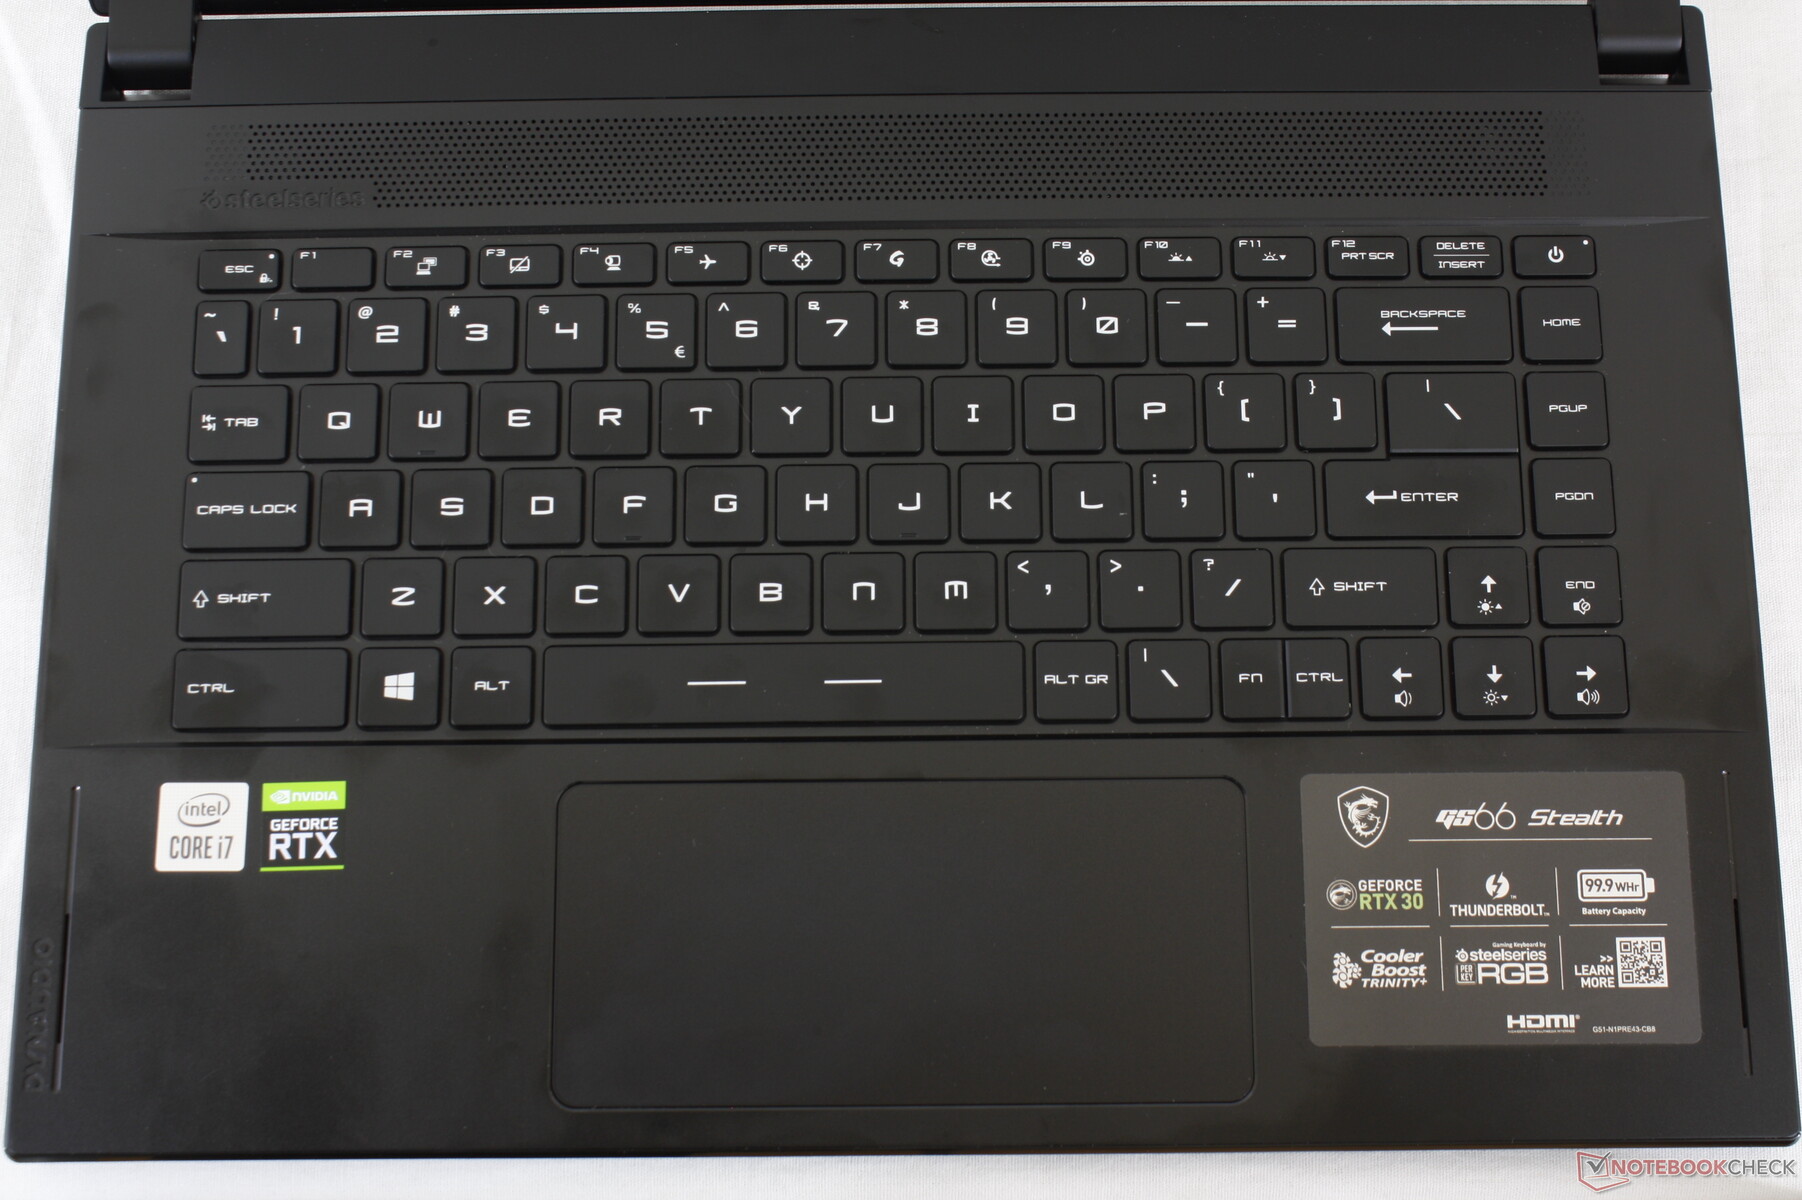
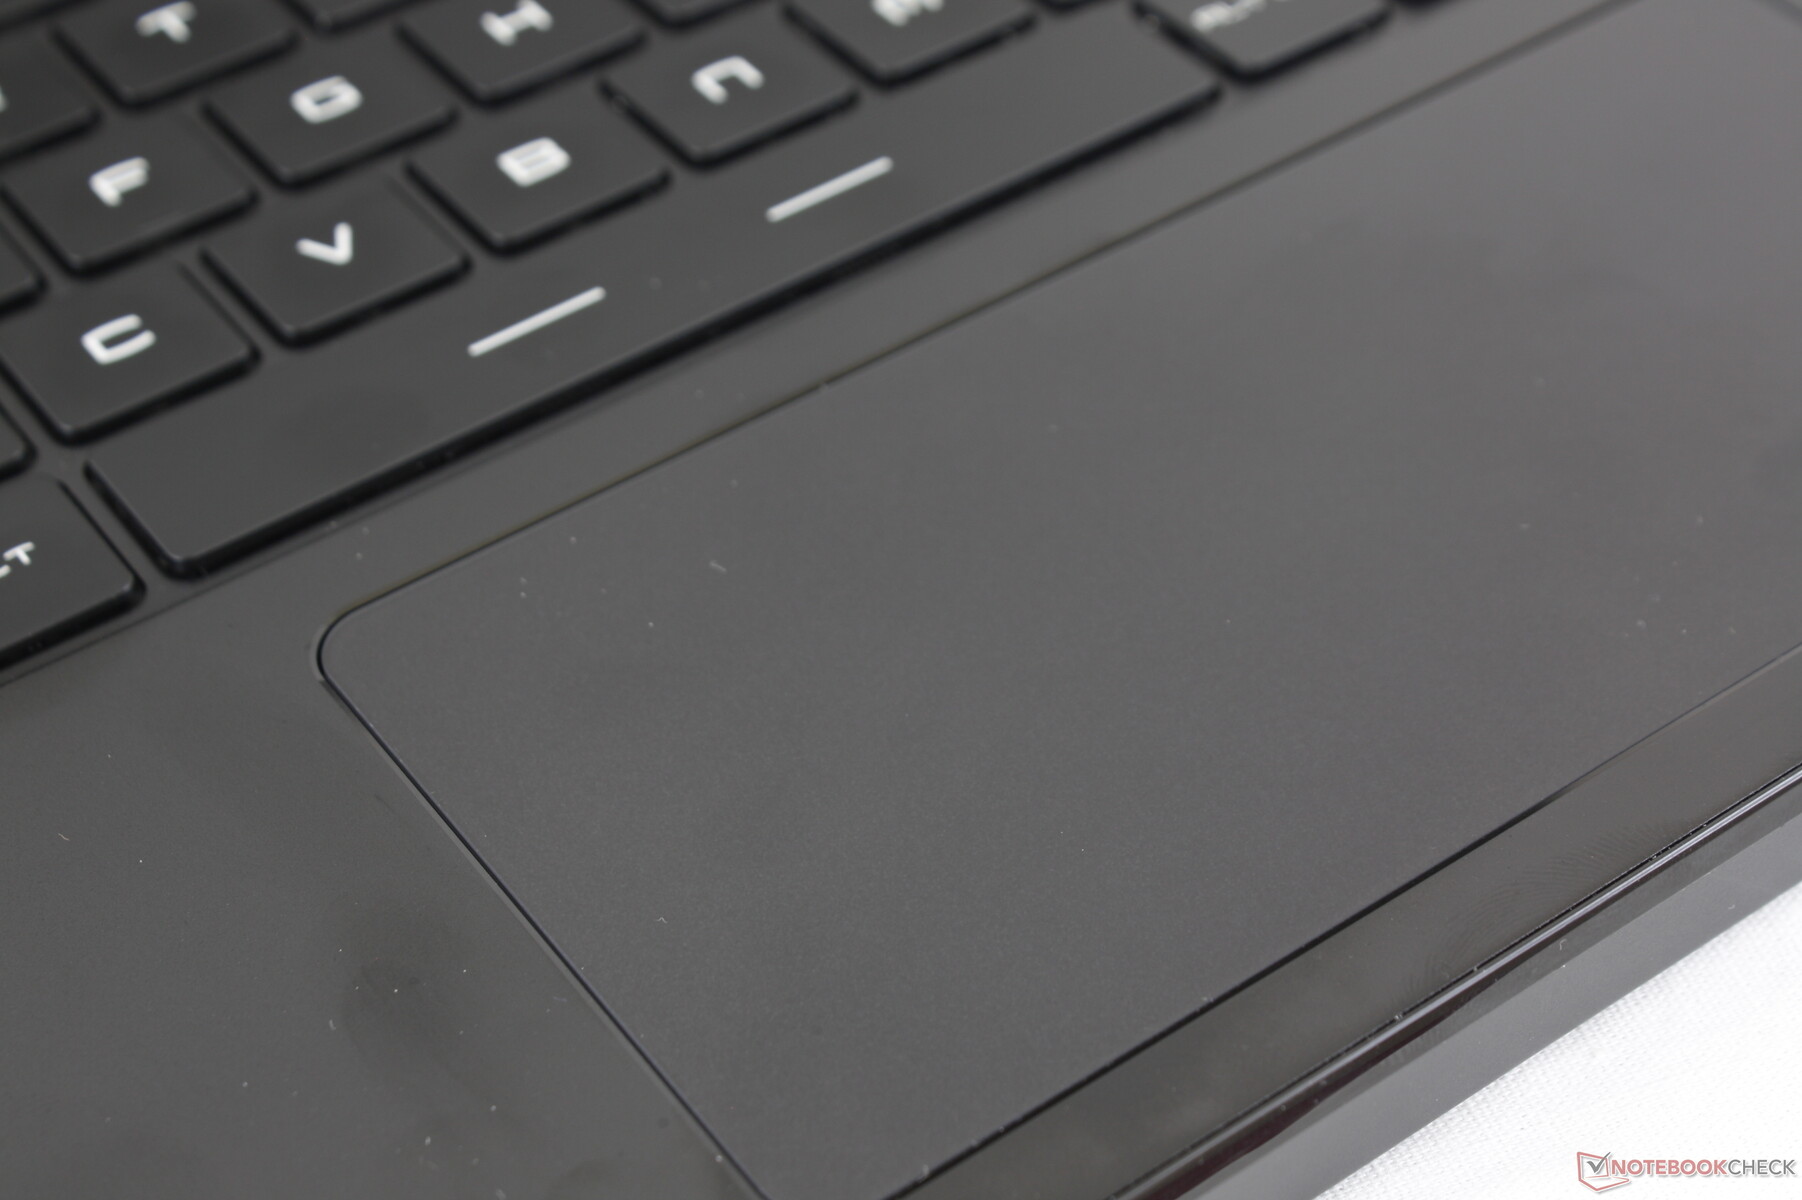
Dispositivos de entrada


Mostrar
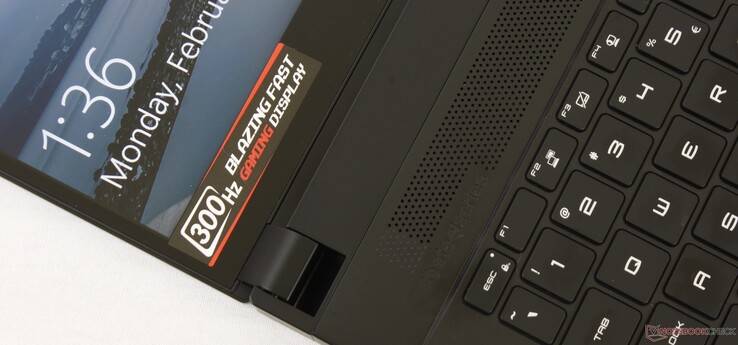
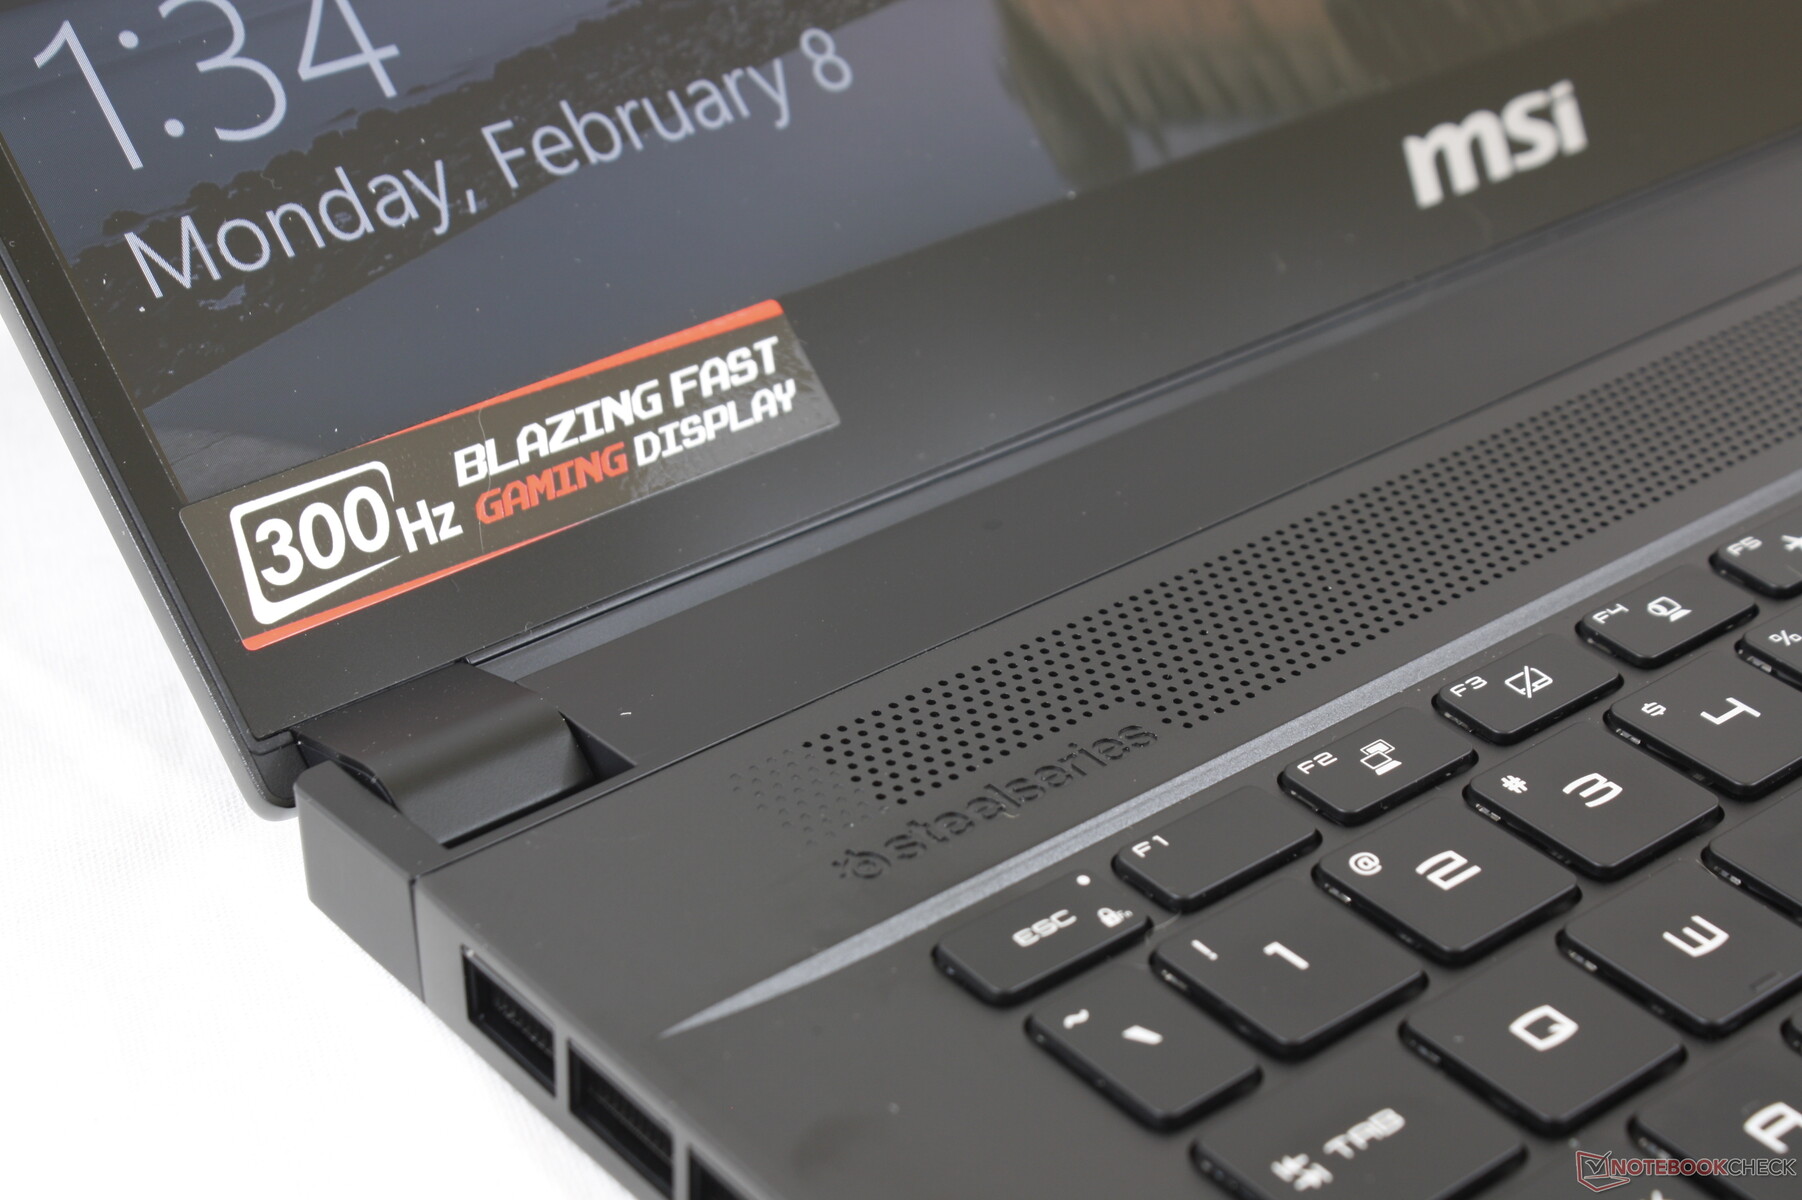
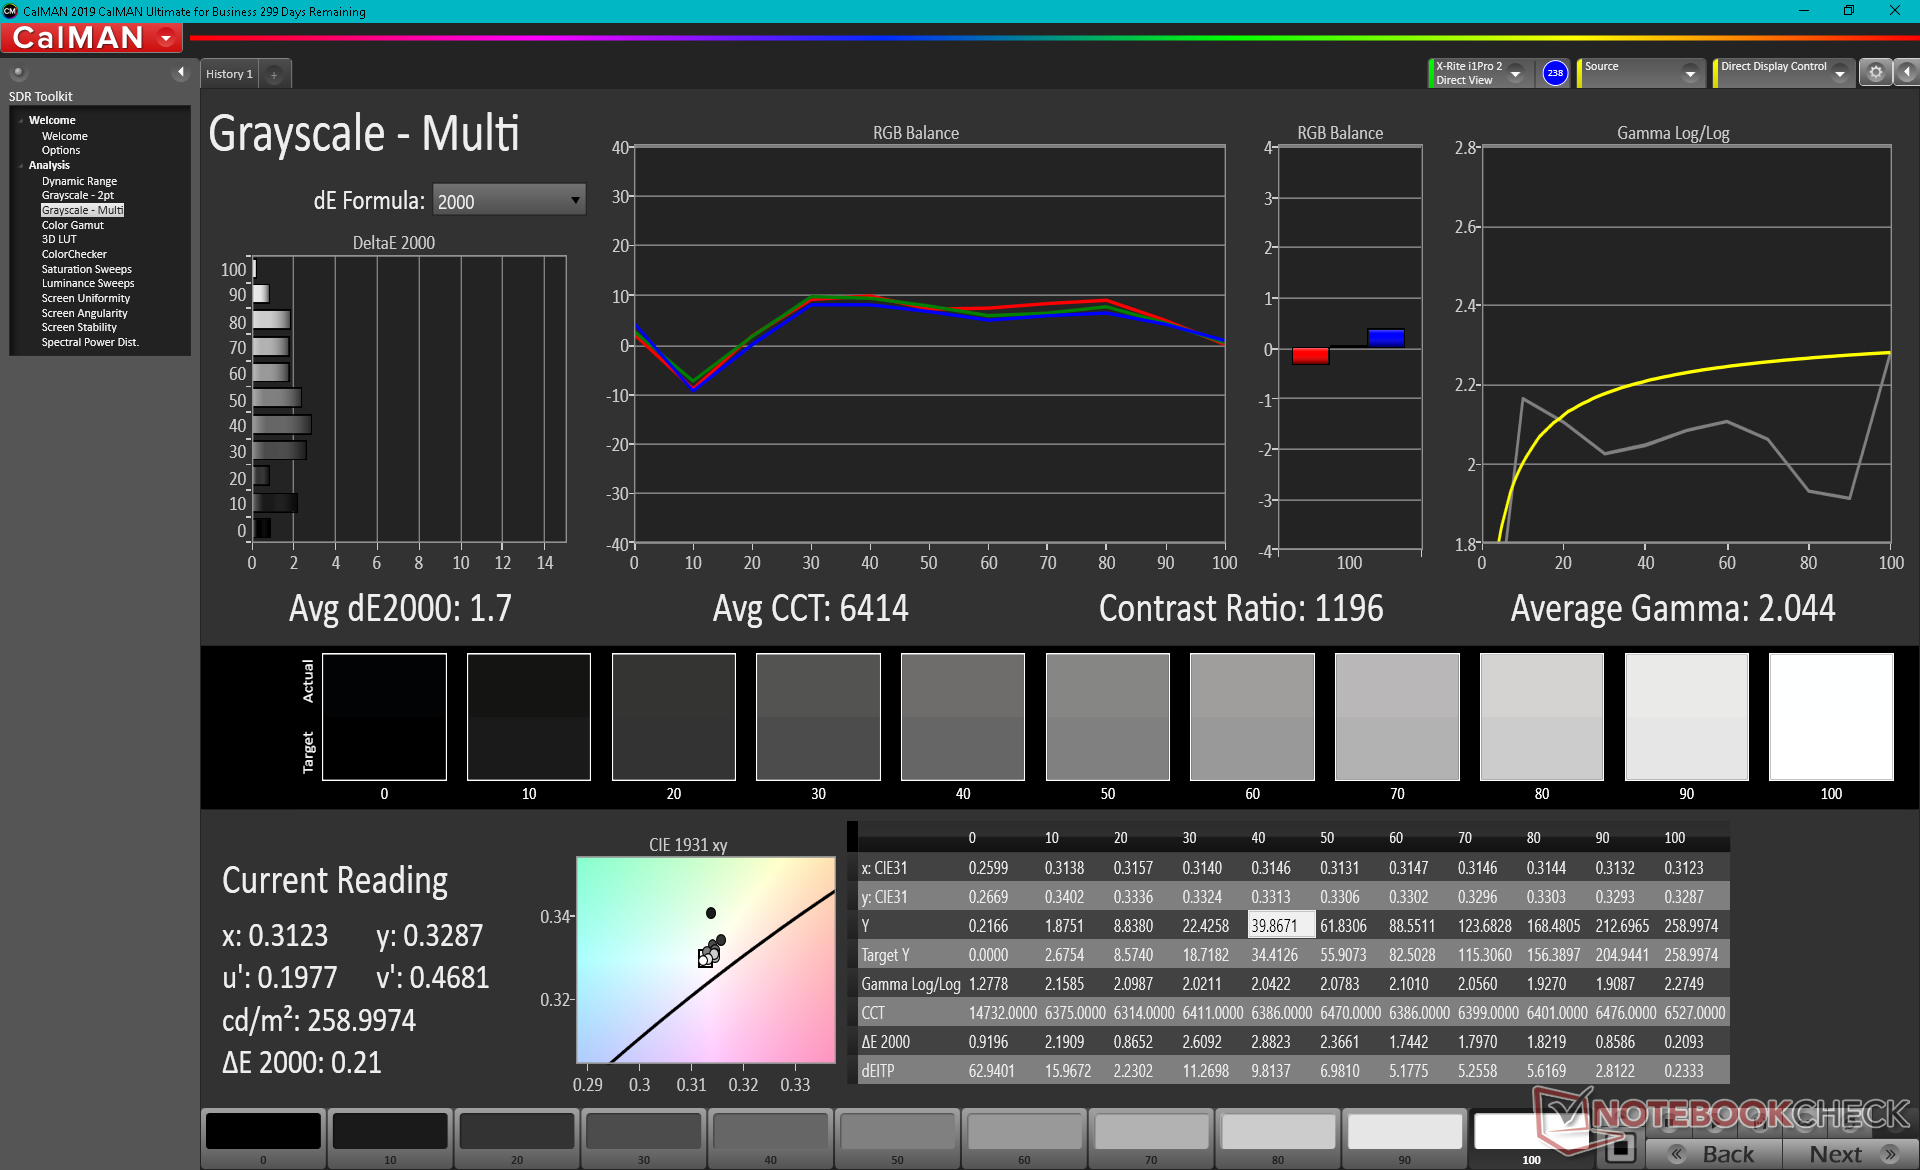
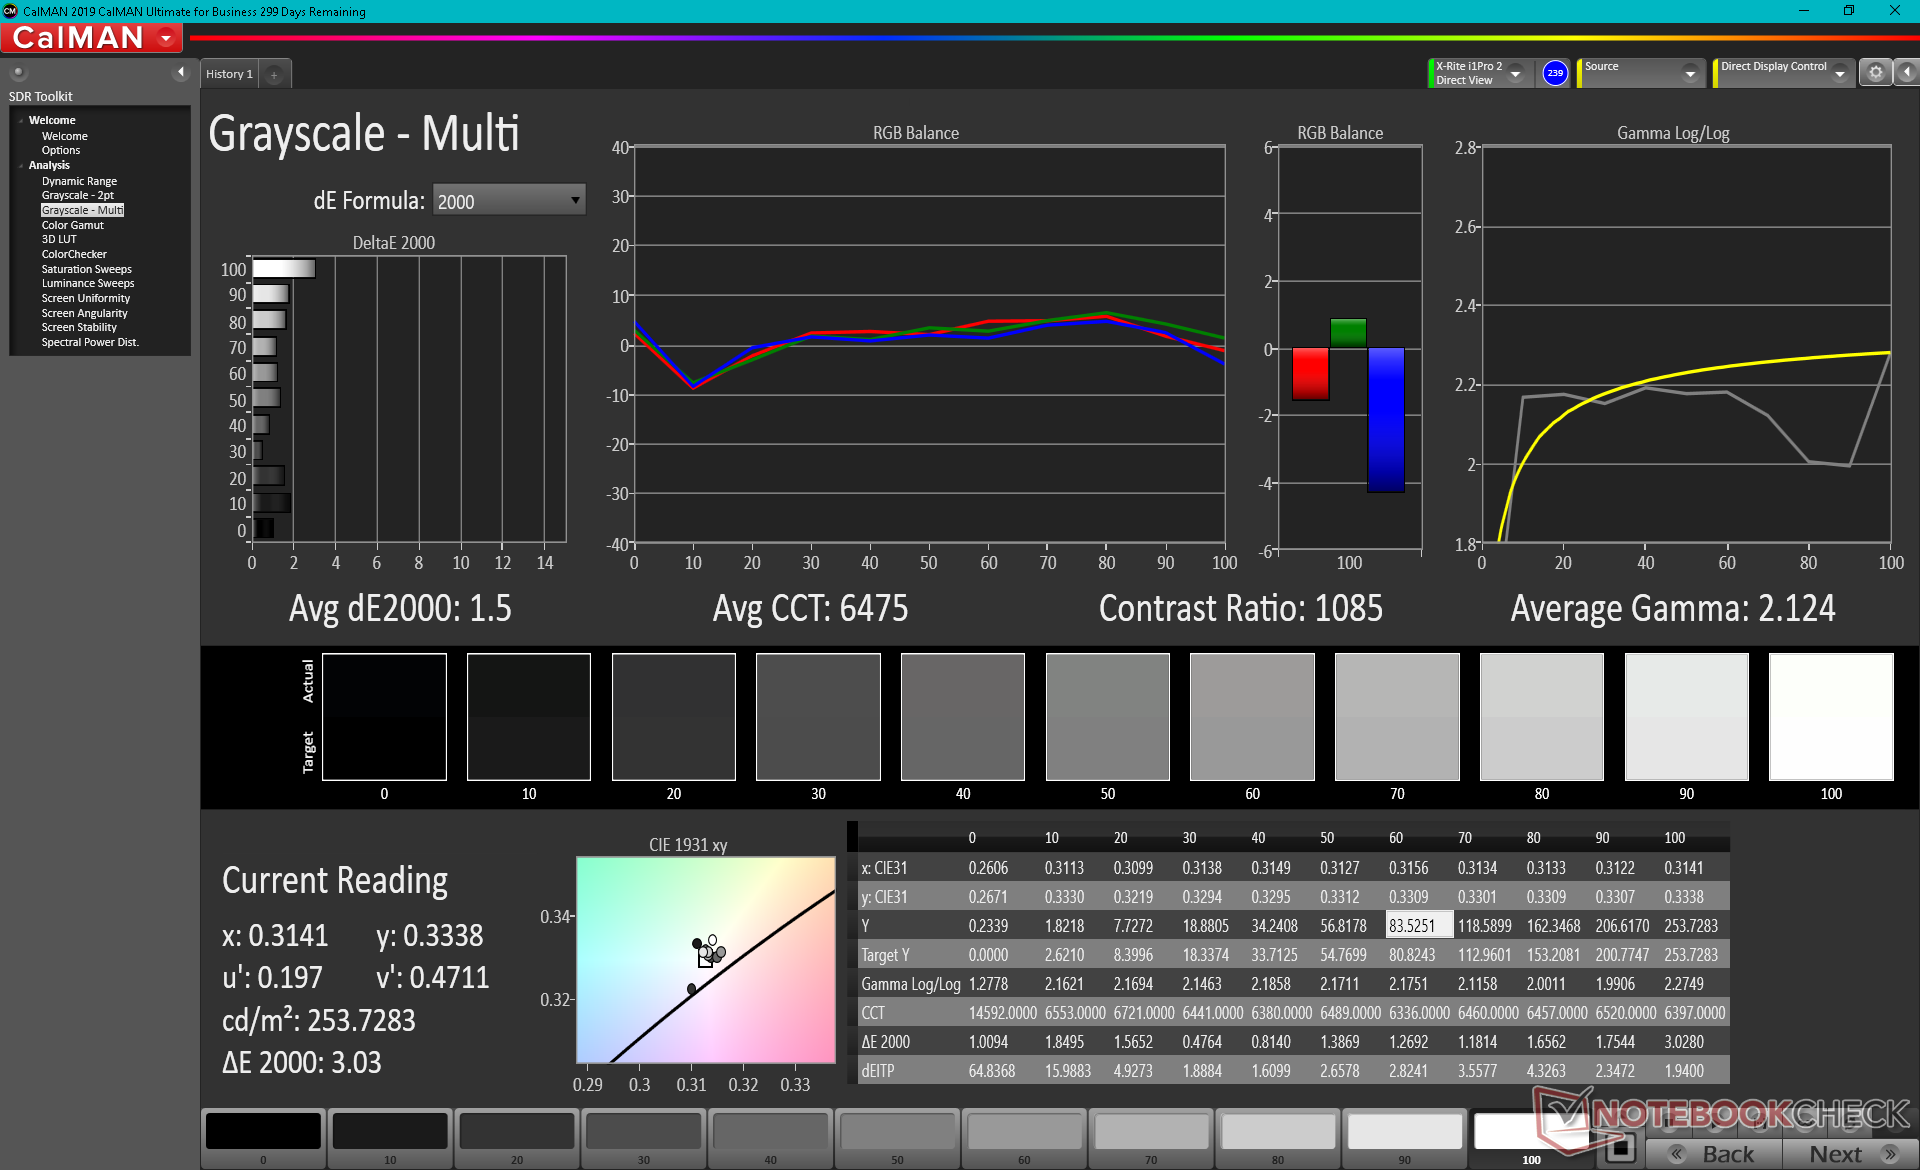
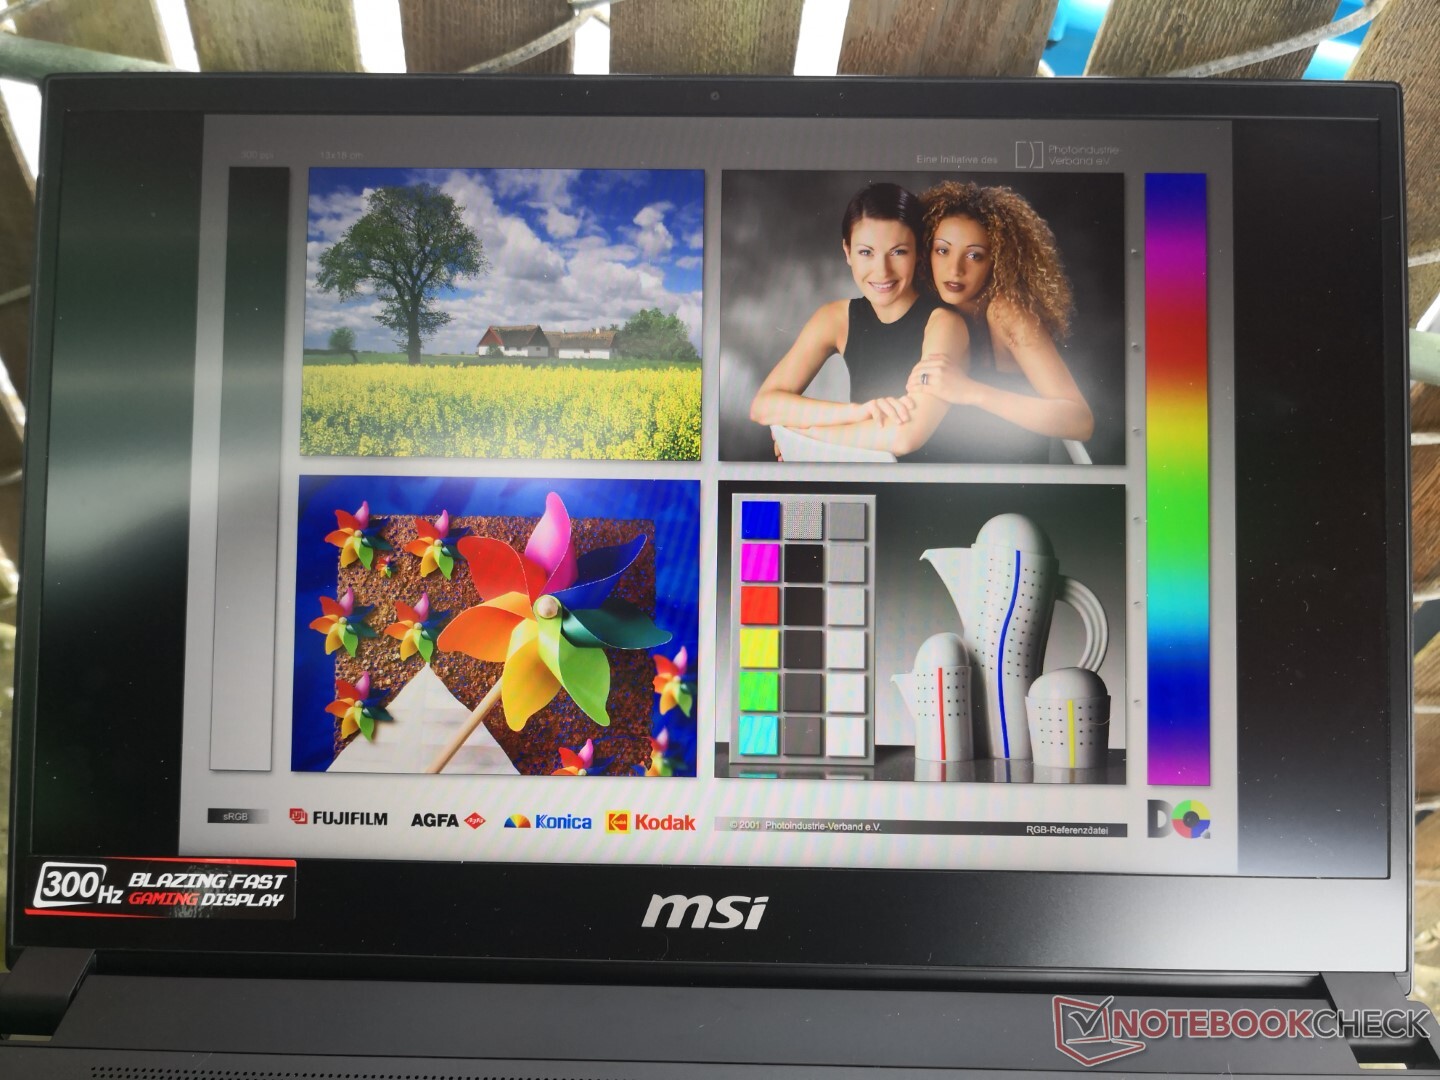
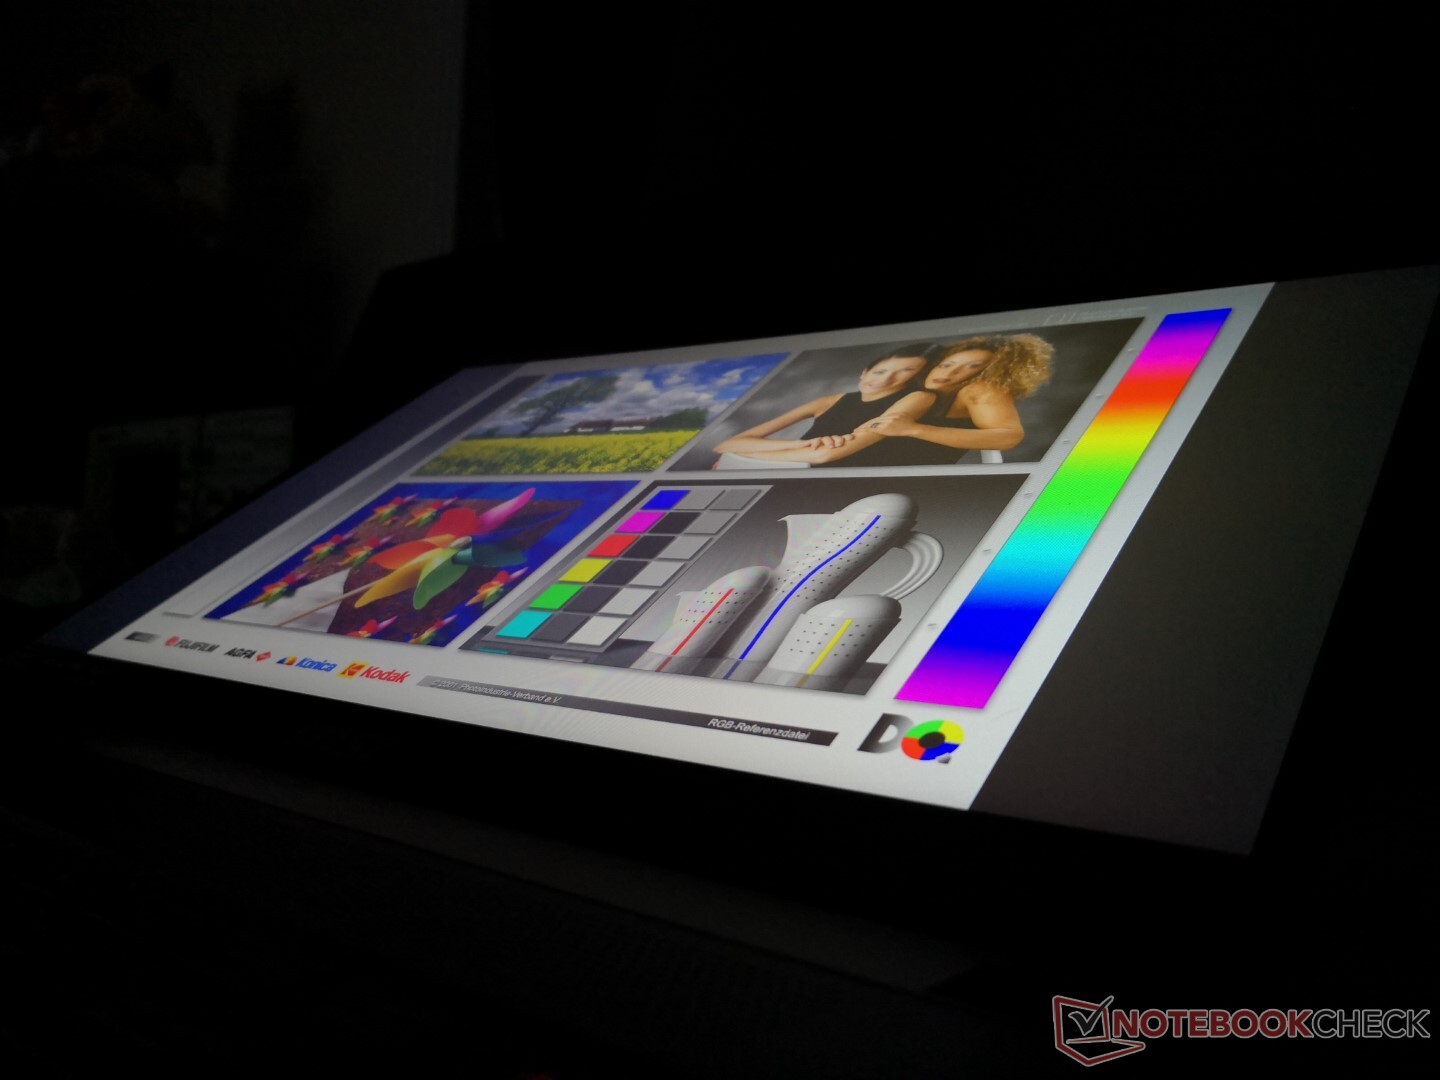
O painel IPS 300 Hz AU Optronics B156HAN12.0 em nosso GS66 10UG é o mesmo que no GS66 10SGS do ano passado. Estranhamente, porém, o brilho máximo é visivelmente menor desta vez em apenas 264 lêndeas em comparação com 331 lêndeas no modelo mais antigo, mesmo após dupla checagem. Também não sabemos ao certo por que isto está acontecendo, pois não podemos identificar nenhum controle automático de brilho ou limitadores.
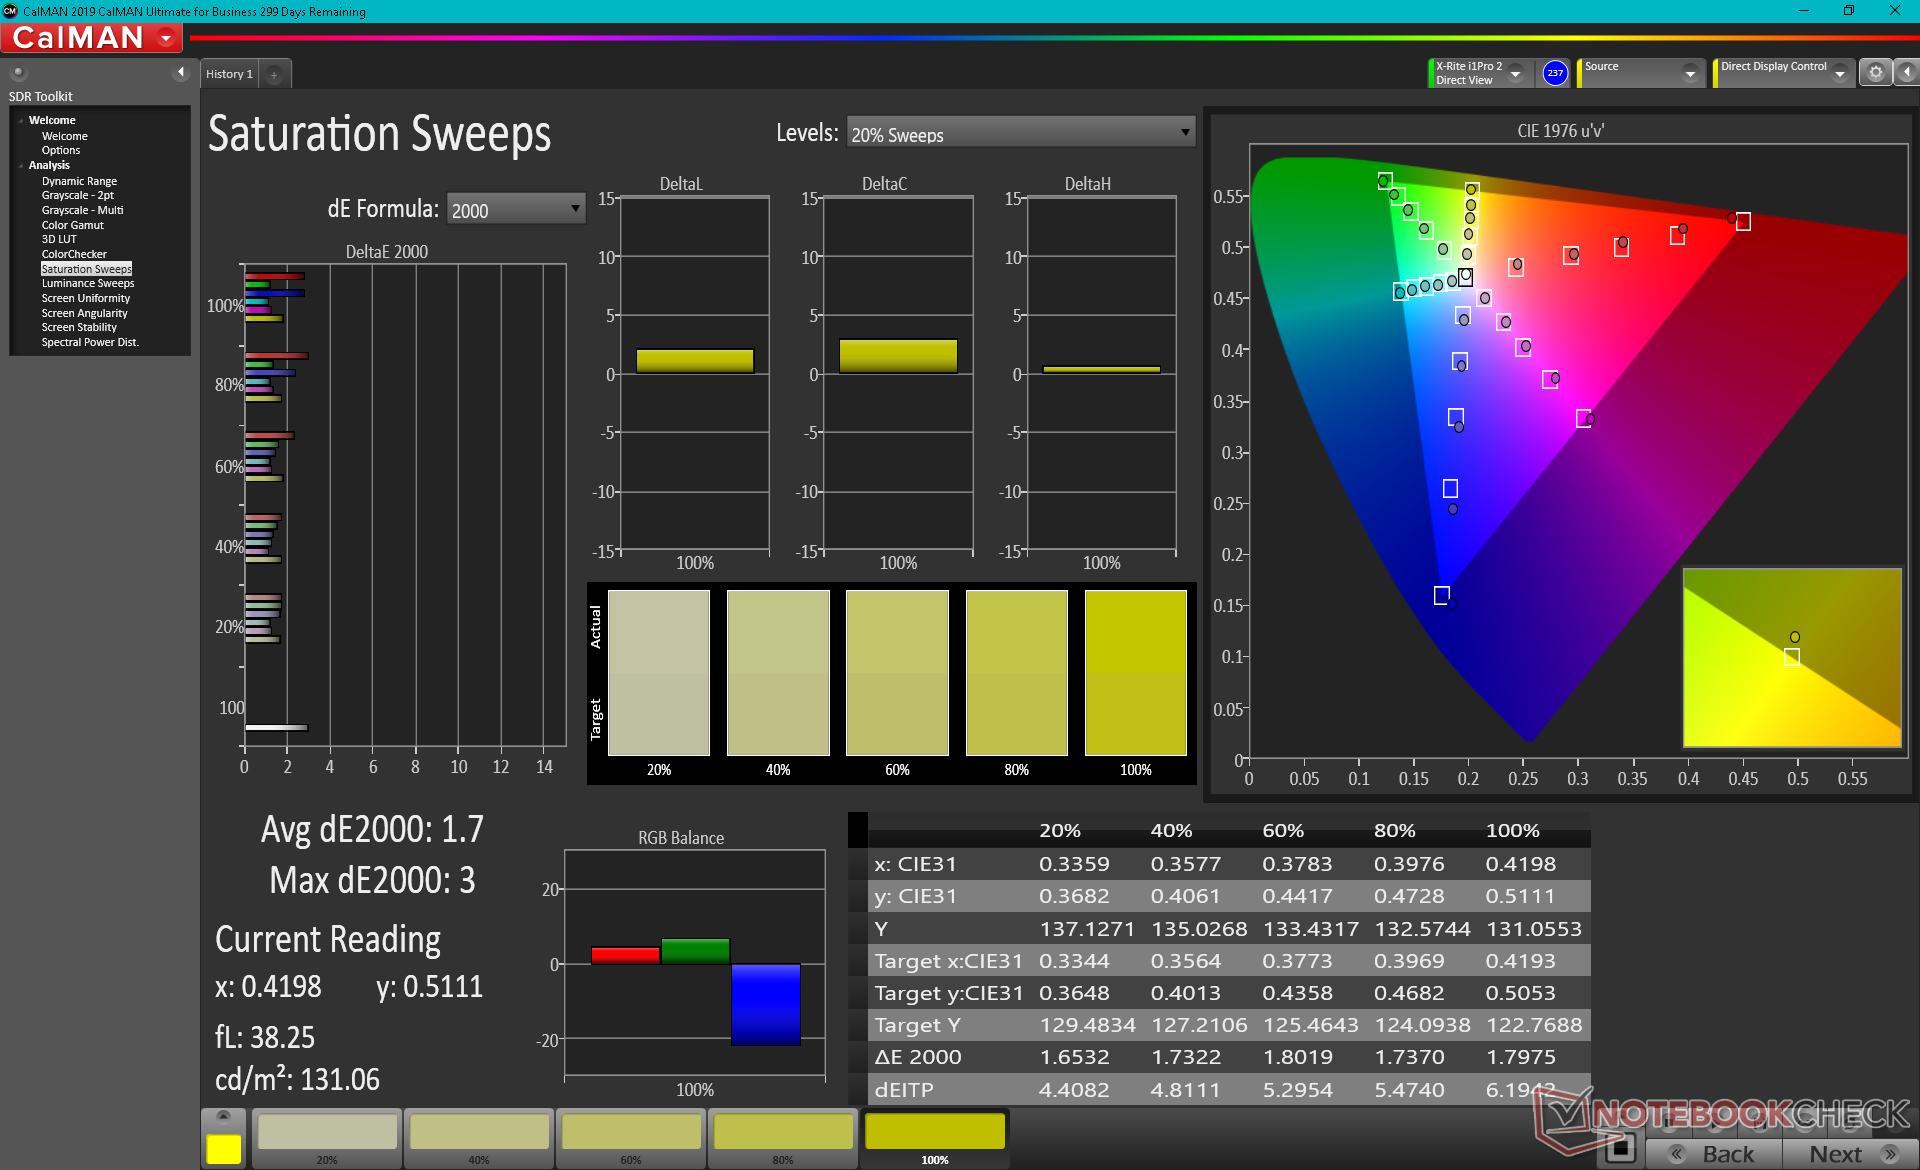
Além da discrepância de brilho, outras características do painel permanecem intactas, incluindo os tempos de resposta muito rápidos, relação de contraste >1000:1, e amplo espaço de cor. Os usuários devem ter em mente que a taxa de atualização de 300 Hz é útil mesmo que seja improvável que você alcance taxas de quadros tão altas quando estiver jogando.


| |||||||||||||||||||||||||
iluminação: 90 %
iluminação com acumulador: 259.5 cd/m²
Contraste: 1038:1 (Preto: 0.25 cd/m²)
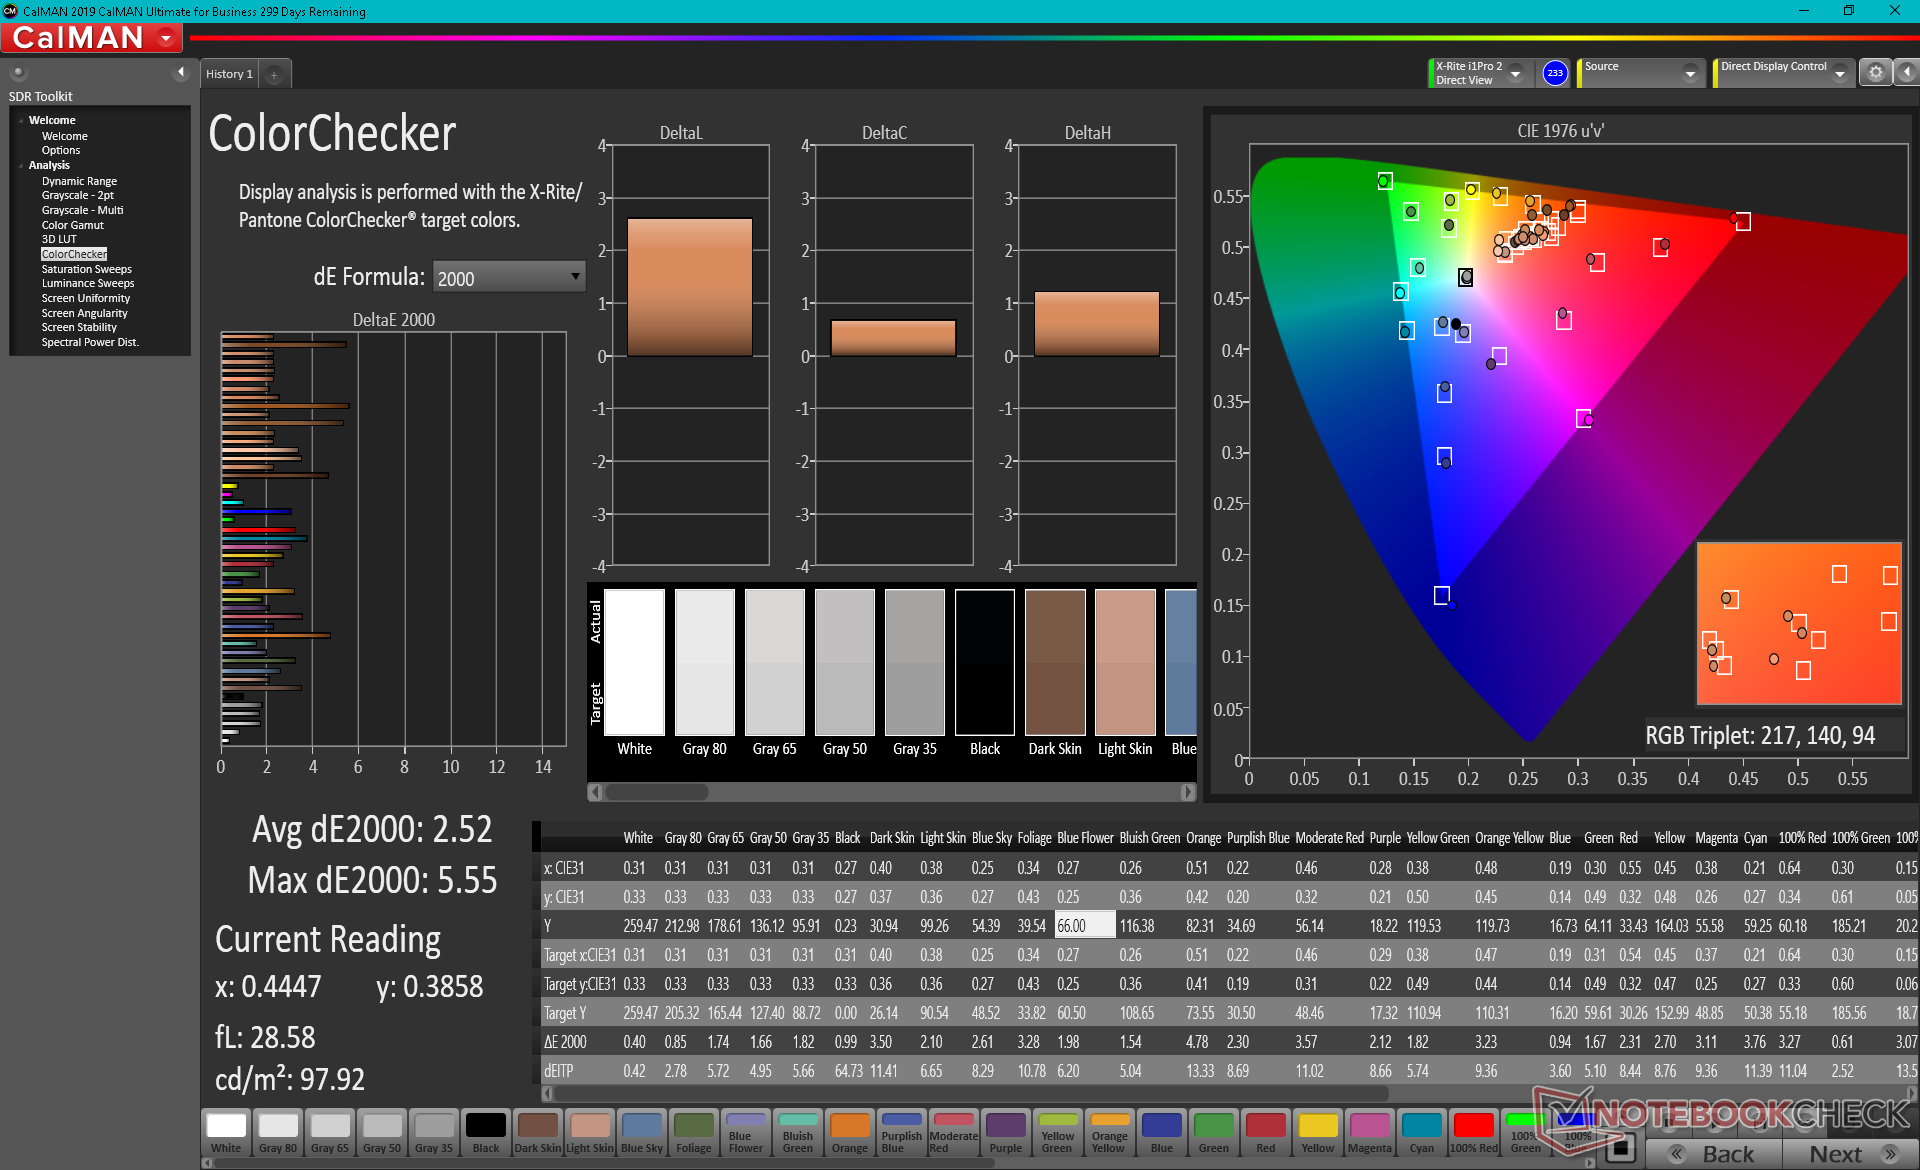
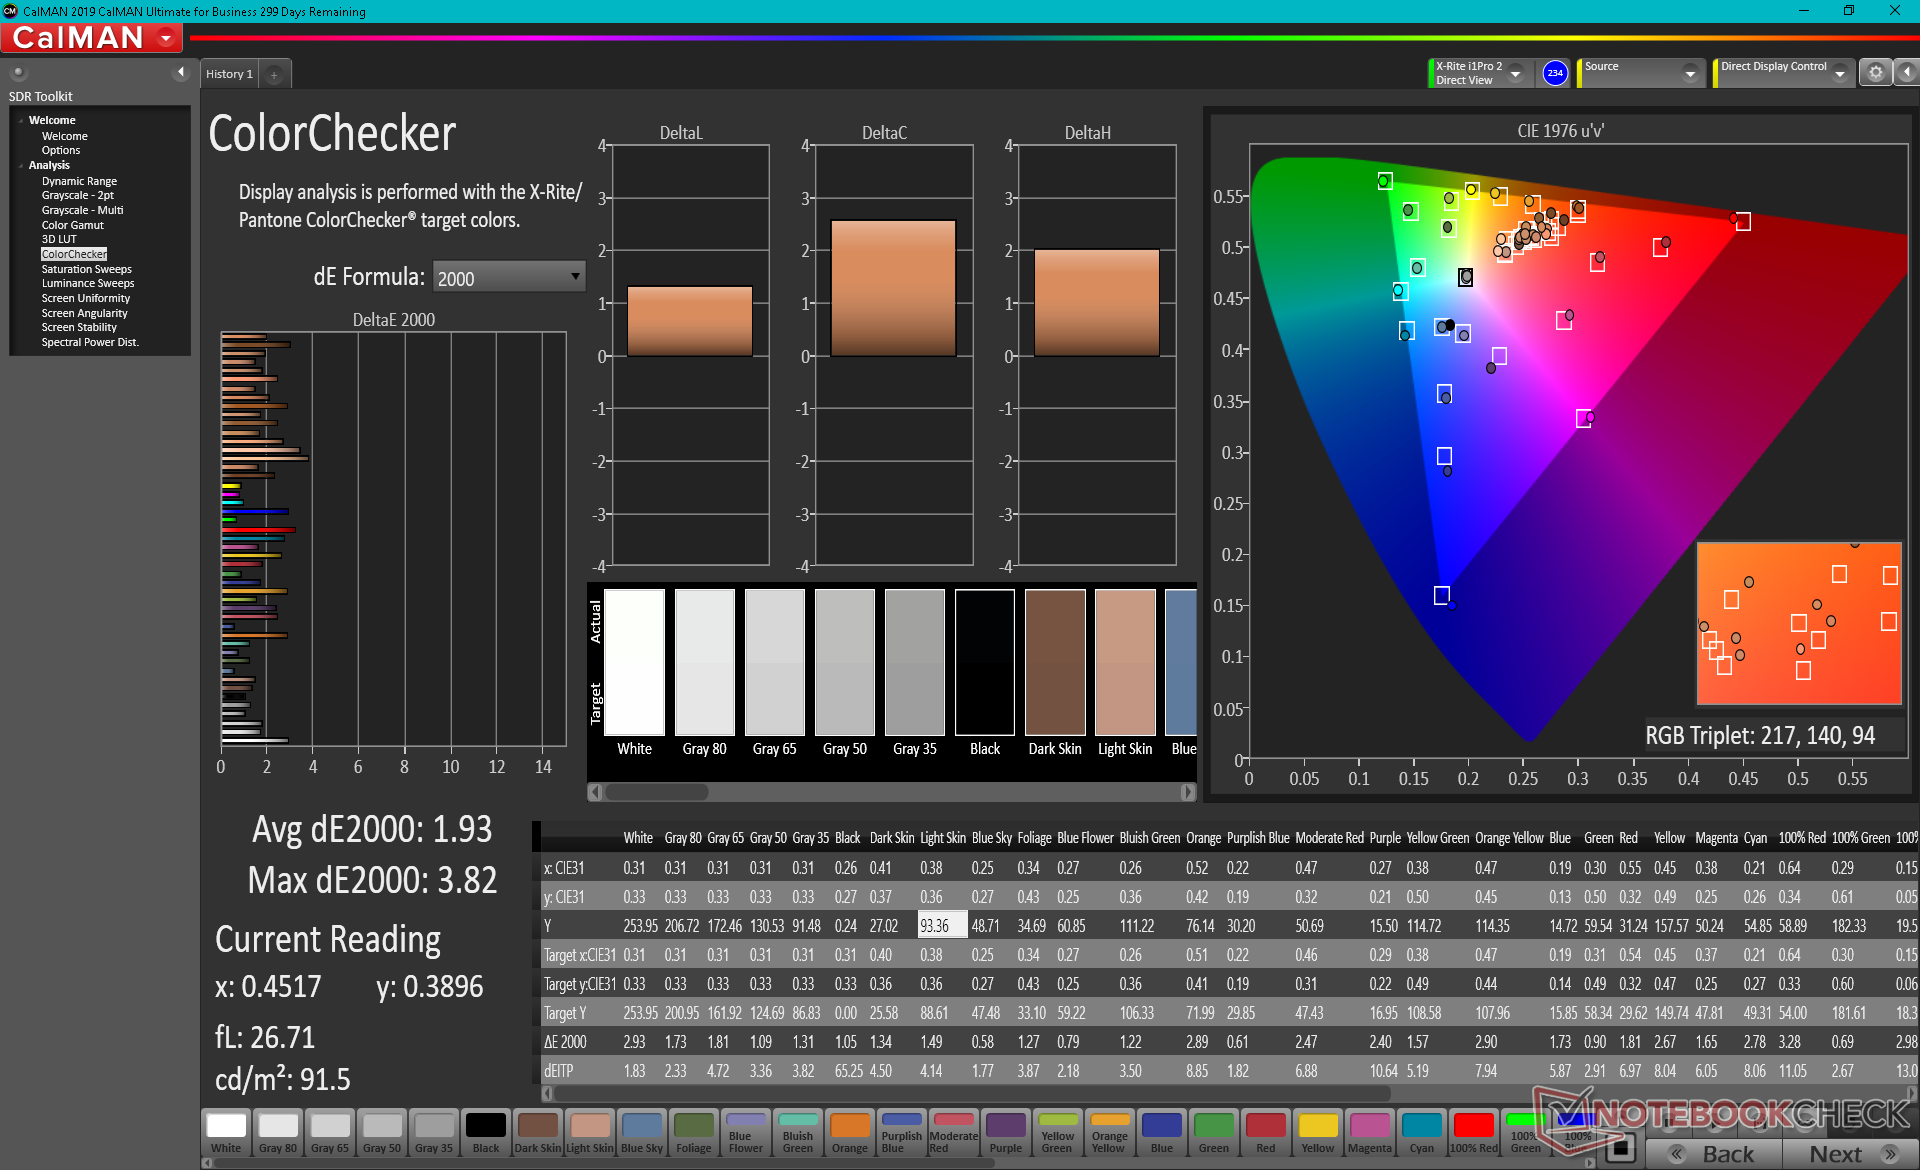
ΔE ColorChecker Calman: 2.52 | ∀{0.5-29.43 Ø4.71}
calibrated: 1.93
ΔE Greyscale Calman: 1.7 | ∀{0.09-98 Ø4.96}
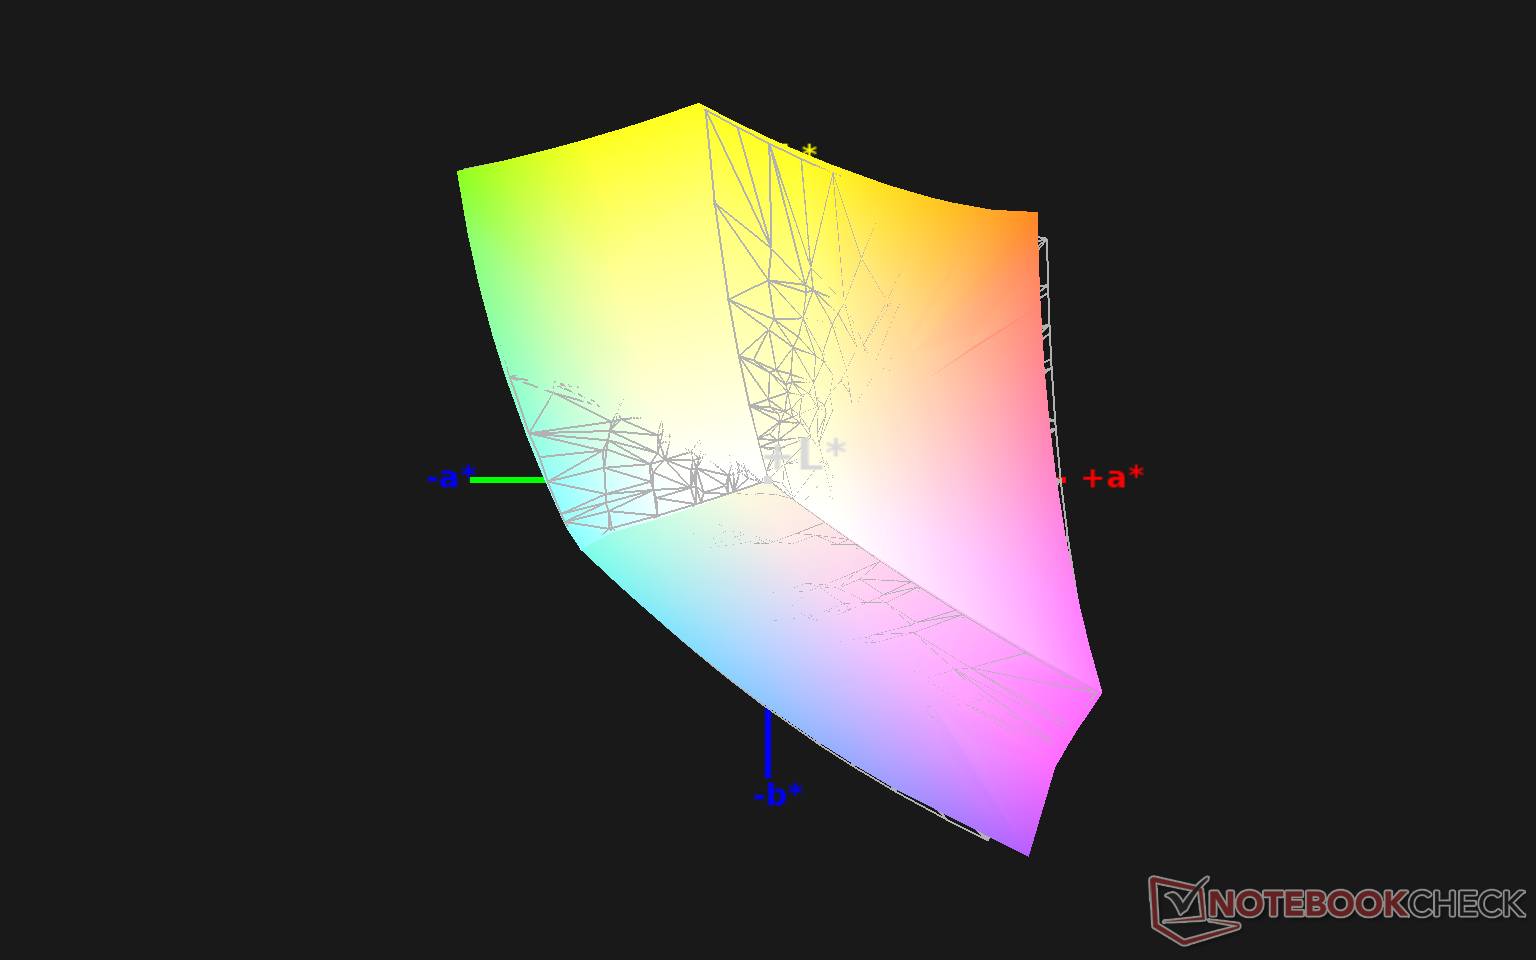
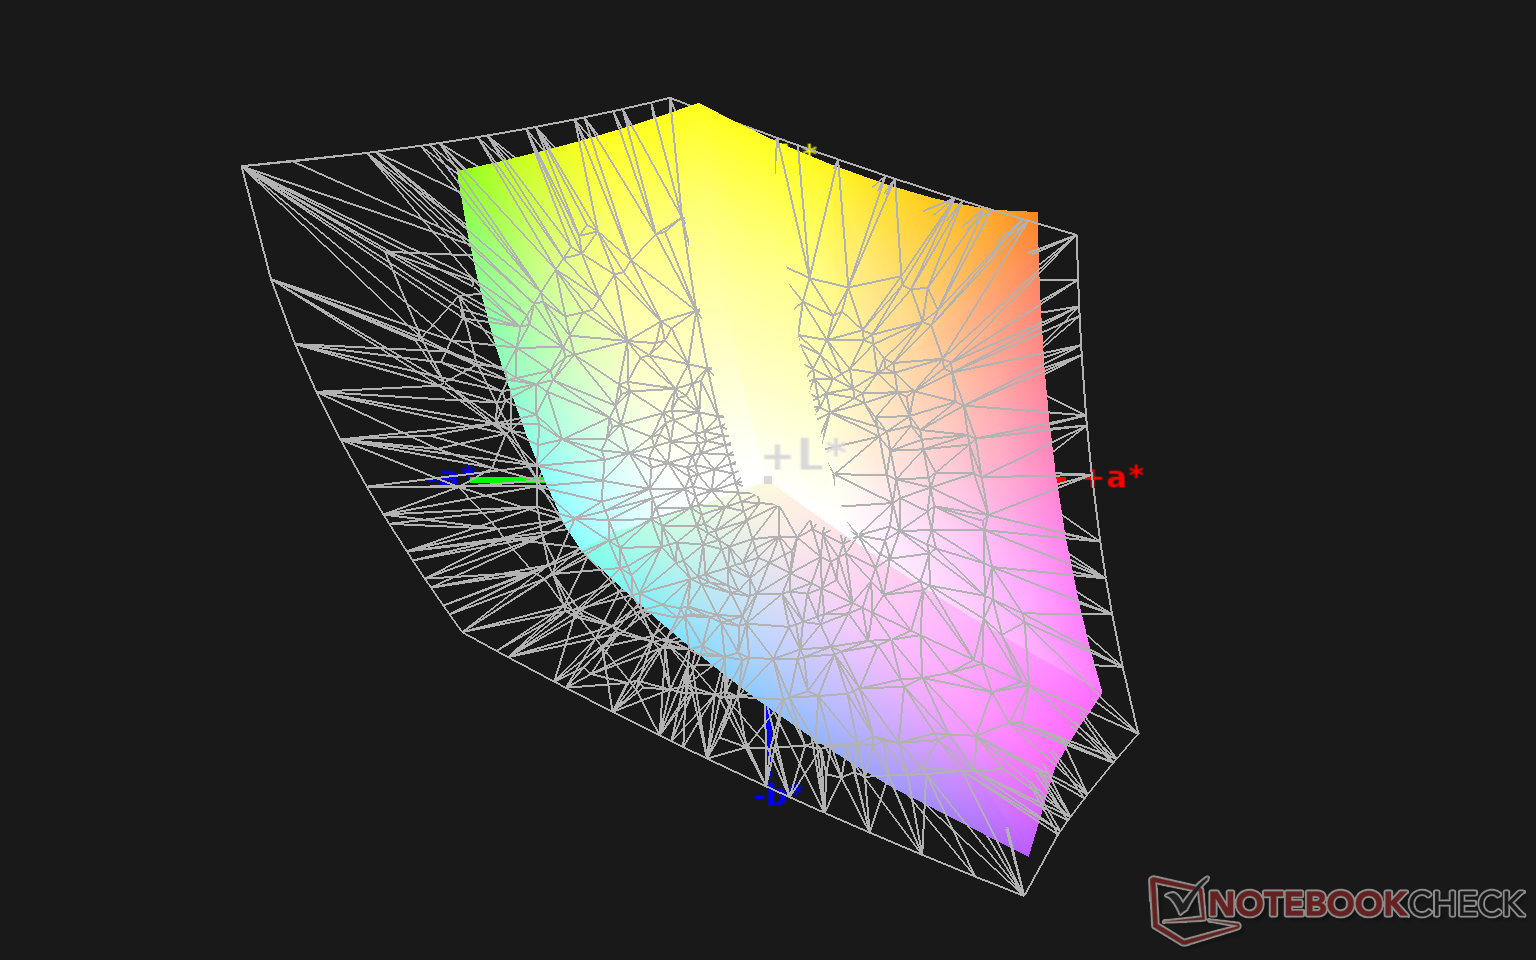
98.8% sRGB (Argyll 1.6.3 3D)
63.3% AdobeRGB 1998 (Argyll 1.6.3 3D)
69.1% AdobeRGB 1998 (Argyll 3D)
98.4% sRGB (Argyll 3D)
67.7% Display P3 (Argyll 3D)
Gamma: 2.04
CCT: 6414 K
| MSI GS66 Stealth 10UG AU Optronics B156HAN12.0, IPS, 15.6", 1920x1080 | MSI GS66 10SGS AU Optronics B156HAN12.0, IPS, 15.6", 1920x1080 | Asus TUF Dash F15 FX516PR LQ156M1JW26 (SHP1532), IPS, 15.6", 1920x1080 | Razer Blade 15 RTX 2070 Super Max-Q AU Optronics B156HAN12.0, IPS, 15.6", 1920x1080 | Aorus 15P WB BOE HF NV156FHM-N4G, IPS, 15.6", 1920x1080 | Alienware m15 R3 P87F AU Optronics B156HAN, IPS, 15.6", 1920x1080 | |
|---|---|---|---|---|---|---|
| Display | 2% | -1% | 2% | -7% | 1% | |
| Display P3 Coverage (%) | 67.7 | 69.9 3% | 66.9 -1% | 69.4 3% | 63 -7% | 68.6 1% |
| sRGB Coverage (%) | 98.4 | 99.1 1% | 98.1 0% | 98.8 0% | 91.3 -7% | 98.9 1% |
| AdobeRGB 1998 Coverage (%) | 69.1 | 71.1 3% | 67.9 -2% | 70.5 2% | 64.6 -7% | 69.8 1% |
| Response Times | 18% | 16% | 55% | 30% | 40% | |
| Response Time Grey 50% / Grey 80% * (ms) | 14.4 ? | 11.2 ? 22% | 12 ? 17% | 3.2 ? 78% | 8.8 ? 39% | 4 ? 72% |
| Response Time Black / White * (ms) | 11.6 ? | 10 ? 14% | 10 ? 14% | 8 ? 31% | 9.2 ? 21% | 10.8 ? 7% |
| PWM Frequency (Hz) | 23580 ? | |||||
| Screen | 14% | -3% | -12% | -7% | -6% | |
| Brightness middle (cd/m²) | 259.5 | 339.4 31% | 286 10% | 345.4 33% | 275 6% | 326.7 26% |
| Brightness (cd/m²) | 264 | 331 25% | 275 4% | 342 30% | 268 2% | 316 20% |
| Brightness Distribution (%) | 90 | 92 2% | 91 1% | 90 0% | 91 1% | 87 -3% |
| Black Level * (cd/m²) | 0.25 | 0.24 4% | 0.25 -0% | 0.34 -36% | 0.33 -32% | 0.33 -32% |
| Contrast (:1) | 1038 | 1414 36% | 1144 10% | 1016 -2% | 833 -20% | 990 -5% |
| Colorchecker dE 2000 * | 2.52 | 1.58 37% | 2.43 4% | 3.18 -26% | 2.72 -8% | 2.4 5% |
| Colorchecker dE 2000 max. * | 5.55 | 3.8 32% | 6.33 -14% | 6.57 -18% | 4.45 20% | 6.06 -9% |
| Colorchecker dE 2000 calibrated * | 1.93 | 1.47 24% | 0.83 57% | 1.77 8% | 2.09 -8% | 1.51 22% |
| Greyscale dE 2000 * | 1.7 | 2.3 -35% | 3.5 -106% | 3.8 -124% | 2.3 -35% | 3.2 -88% |
| Gamma | 2.04 108% | 2.24 98% | 2.32 95% | 2.15 102% | 2.266 97% | 2.13 103% |
| CCT | 6414 101% | 6952 93% | 7145 91% | 7109 91% | 6933 94% | 7129 91% |
| Color Space (Percent of AdobeRGB 1998) (%) | 63.3 | 64.8 2% | 68 7% | 64.3 2% | 65 3% | 63.7 1% |
| Color Space (Percent of sRGB) (%) | 98.8 | 99.4 1% | 91 -8% | 99 0% | 90 -9% | 99.2 0% |
| Média Total (Programa/Configurações) | 11% /
13% | 4% /
-0% | 15% /
-1% | 5% /
-3% | 12% /
1% |
* ... menor é melhor
O espaço de cores é idêntico à alta taxa de atualização dos painéis 1080p do ano passado, com aproximadamente 63% de AdobeRGB e 99% de sRGB. A MSI não está oferecendo nenhuma opção 4K no momento para sua atualização em GeForce RTX 30 GS66.
O display é bem calibrado em relação ao padrão sRGB fora da caixa com valores médios de escala de cinza e deltaE ColorChcker de apenas 1,7 e 2,52, respectivamente. Estes valores melhorariam apenas marginalmente depois de calibrarmos o painel ainda mais nós mesmos.

Exibir tempos de resposta
| ↔ Tempo de resposta preto para branco | ||
|---|---|---|
| 11.6 ms ... ascensão ↗ e queda ↘ combinadas | ↗ 7.6 ms ascensão | 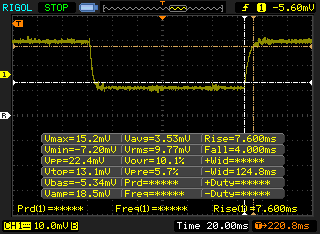 |
| ↘ 4 ms queda | ||
| A tela mostra boas taxas de resposta em nossos testes, mas pode ser muito lenta para jogadores competitivos. Em comparação, todos os dispositivos testados variam de 0.1 (mínimo) a 240 (máximo) ms. » 31 % de todos os dispositivos são melhores. Isso significa que o tempo de resposta medido é melhor que a média de todos os dispositivos testados (19.8 ms). | ||
| ↔ Tempo de resposta 50% cinza a 80% cinza | ||
| 14.4 ms ... ascensão ↗ e queda ↘ combinadas | ↗ 6.8 ms ascensão | 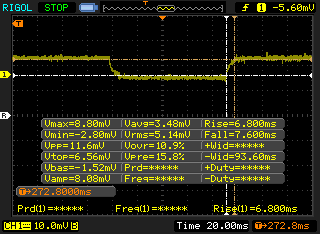 |
| ↘ 7.6 ms queda | ||
| A tela mostra boas taxas de resposta em nossos testes, mas pode ser muito lenta para jogadores competitivos. Em comparação, todos os dispositivos testados variam de 0.165 (mínimo) a 636 (máximo) ms. » 28 % de todos os dispositivos são melhores. Isso significa que o tempo de resposta medido é melhor que a média de todos os dispositivos testados (31 ms). | ||
Cintilação da tela / PWM (modulação por largura de pulso)
| Tela tremeluzindo / PWM não detectado | 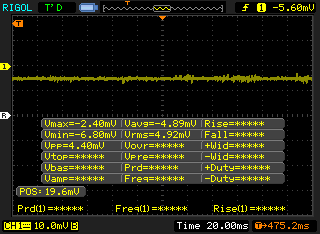 | ||
[pwm_comparison] Em comparação: 52 % de todos os dispositivos testados não usam PWM para escurecer a tela. Se PWM foi detectado, uma média de 7757 (mínimo: 5 - máximo: 343500) Hz foi medida. | |||
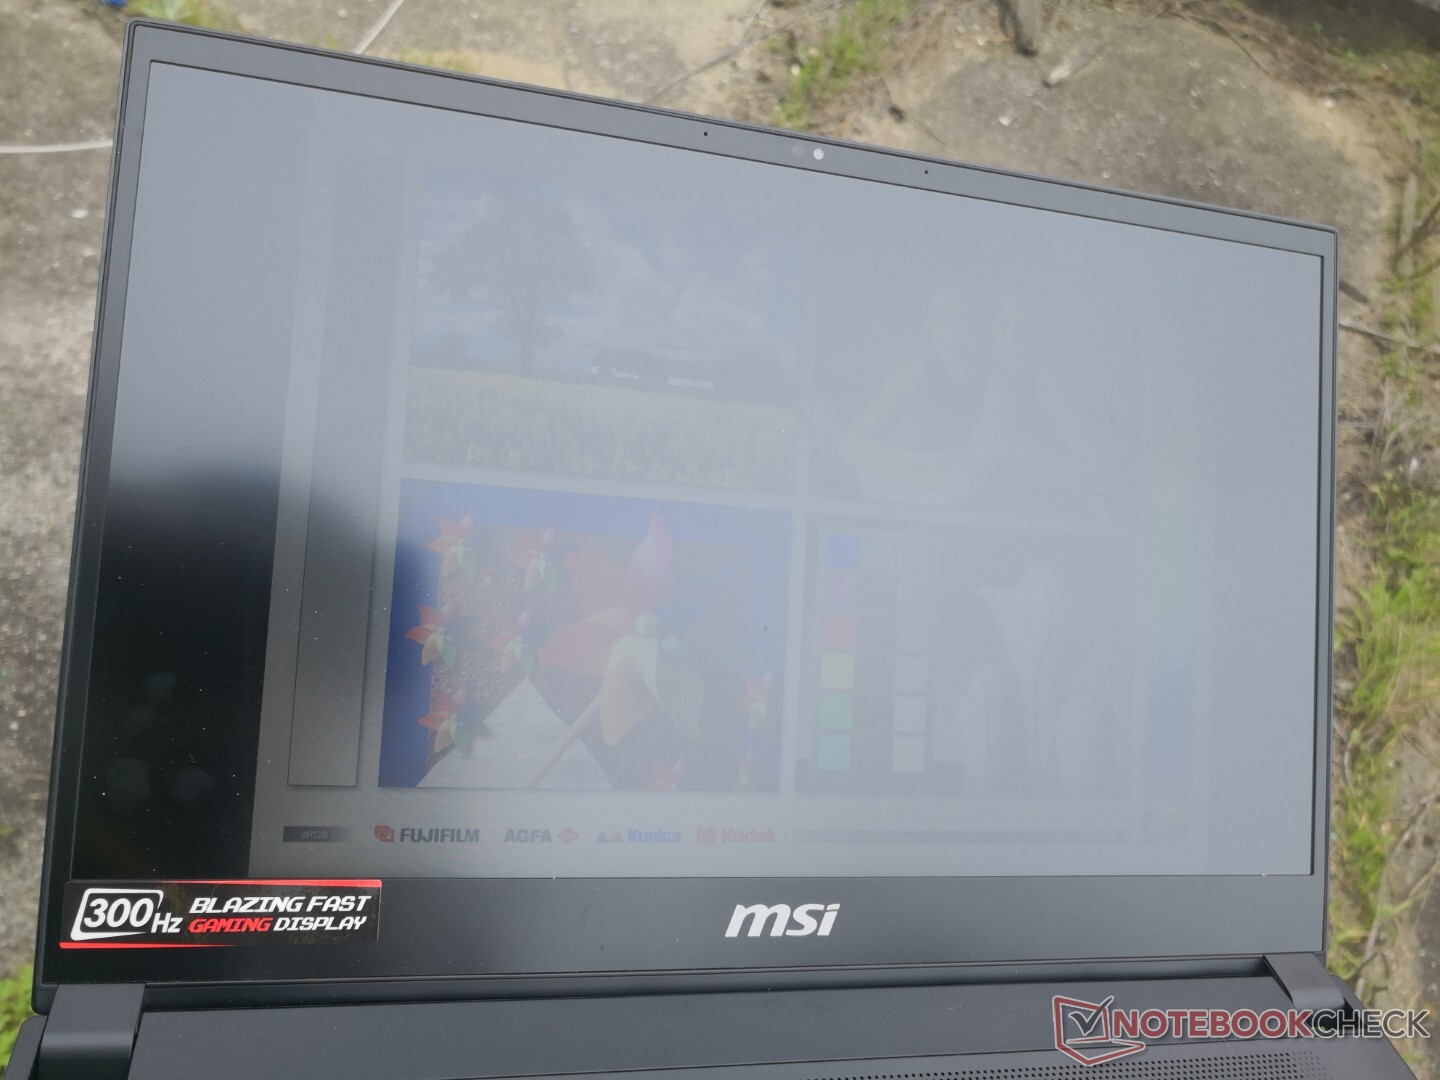
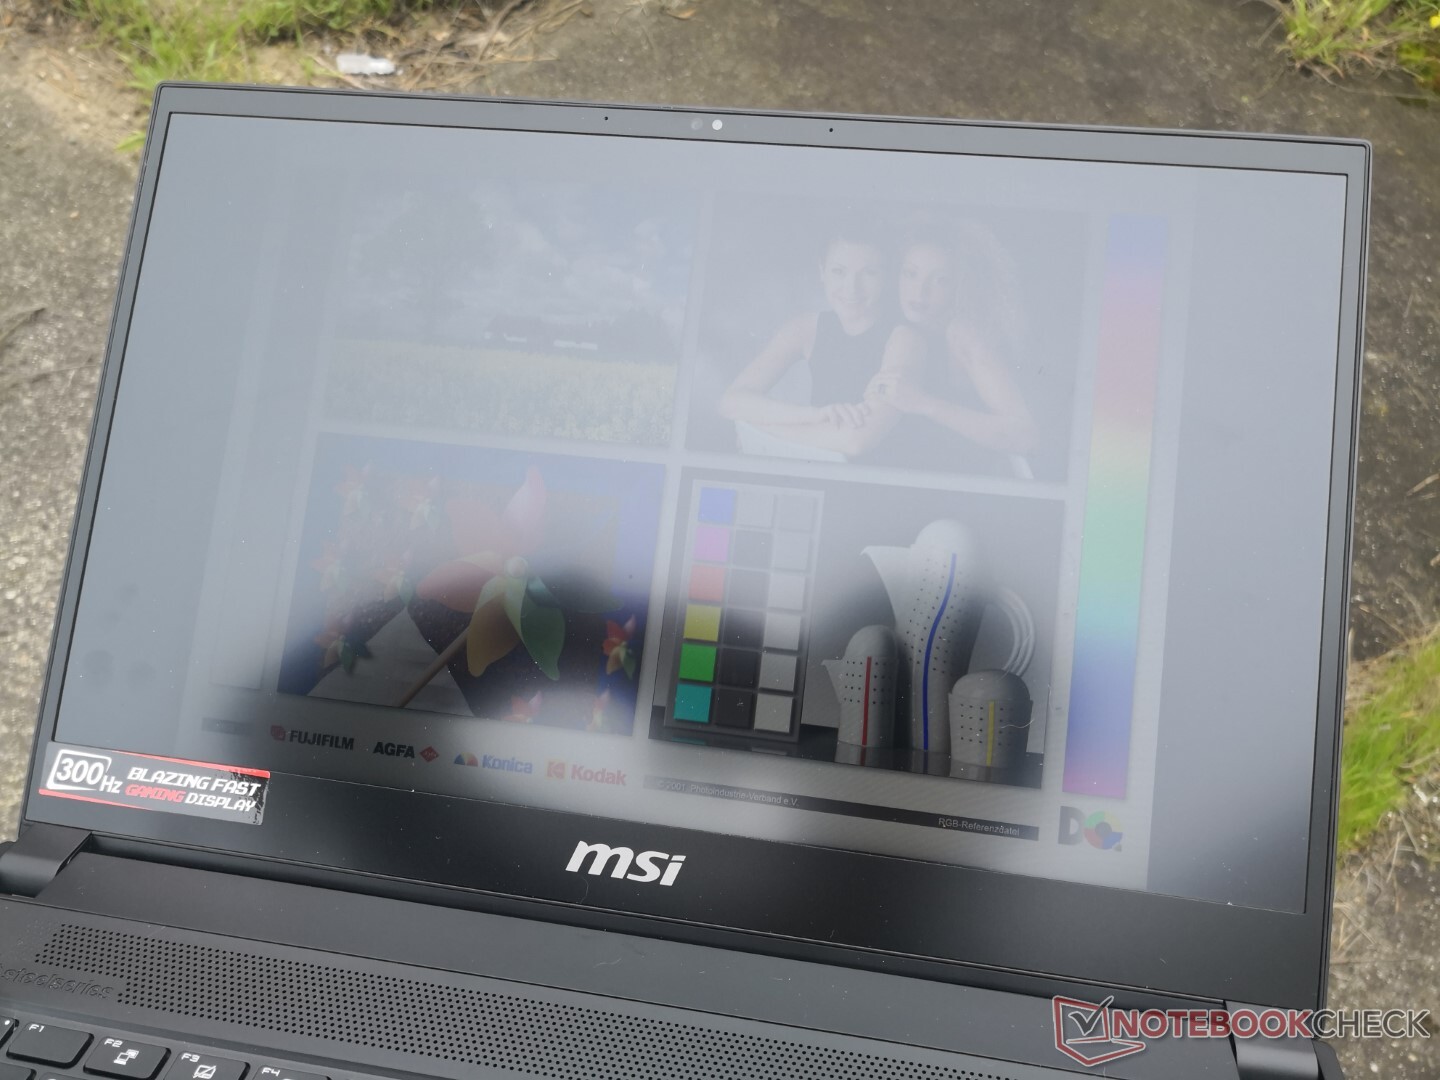
A visibilidade ao ar livre é pior do que a maioria dos Ultrabooks, pois o display simplesmente não é tão brilhante. O mais recente Dell XPS 15, por exemplo, é mais de duas vezes mais brilhante do que nosso MSI. Para um laptop de jogos tão fino e leve, esperávamos uma tela mais vibrante quando viajando e trabalhando fora do escritório.
Desempenho
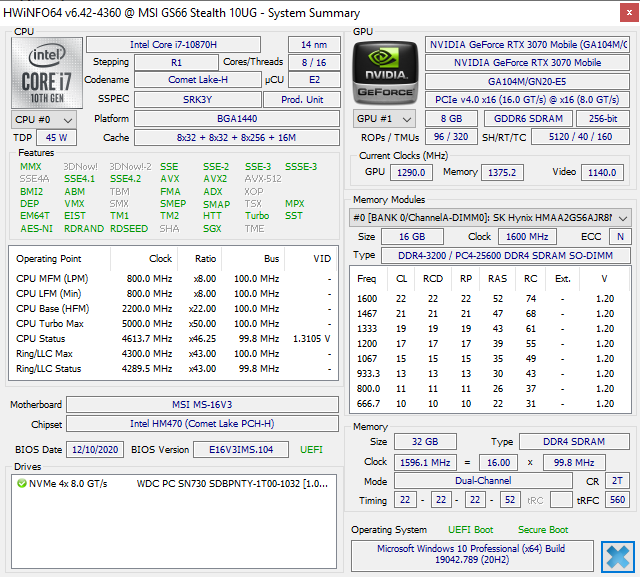
O Core i7-10870H é exatamente o mesmo que o Core i7-10875H com apenas algumas pequenas diferenças. Em primeiro lugar, as taxas de relógio base e máximas são cada uma 100 MHz mais lentas que o Core i7-10875H em 2,2 GHz vs. 2,3 GHz e 5 GHz vs. 5,1 GHz, respectivamente. Em segundo lugar, a CPU não é compatível com certos recursos de segurança da Intel, incluindo vPro e Trusted Execution que laptops dedicados a jogos provavelmente nunca utilizariam, de qualquer forma. Corriam rumores de que a Intel introduziu o Core i7-10870H para aliviar os problemas de fornecimento que alguns fabricantes de laptops estavam enfrentando com o Core i7-10875H no final do ano passado.
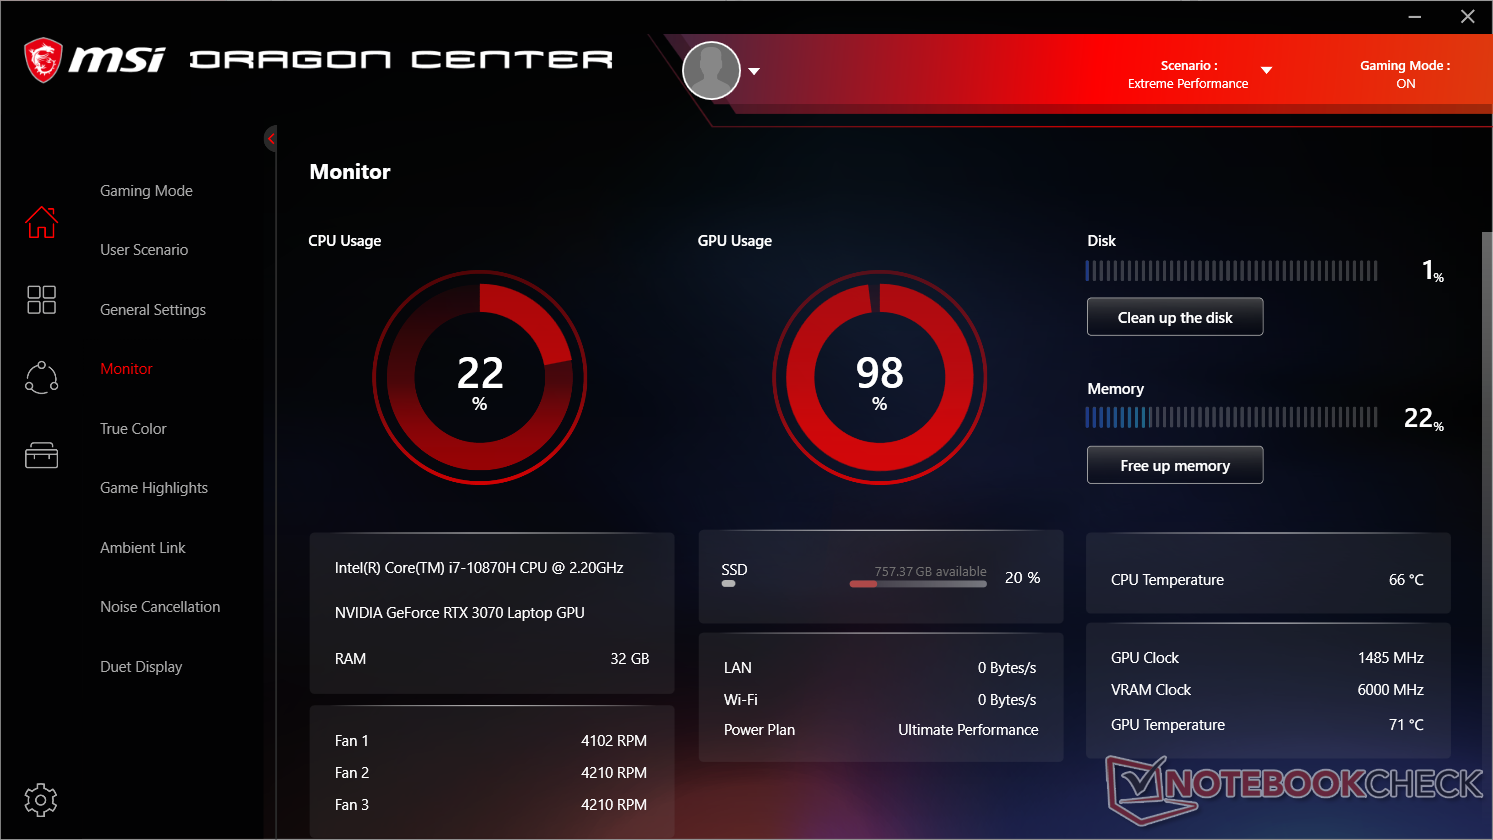
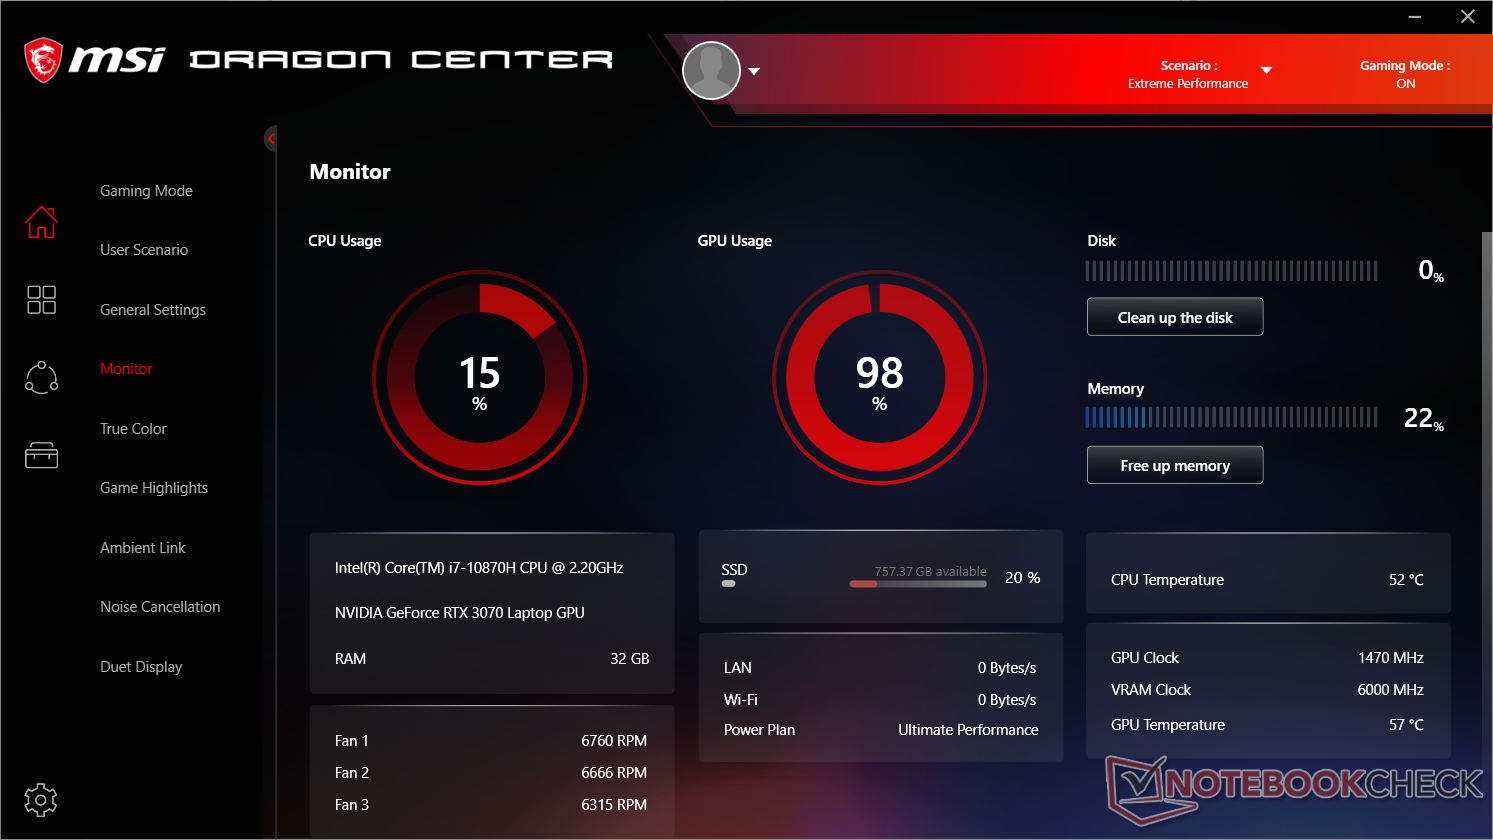
A menos que de outra forma observado, nossos benchmarks abaixo foram realizados no modo de Desempenho Extremo. Recomendamos aos usuários que se familiarizem com o software MSI Dragon Center, já que o desempenho importante e os controles de ventiladores podem ser encontrados aqui. Observe que a ferramenta de monitoramento em tempo real do Dragon Center é propensa a congelar sempre que a CPU estiver 100% utilizada e, portanto, nem sempre é confiável.
Processador
O desempenho bruto da CPU é onde esperamos que esteja de acordo com os benchmarks do CineBench com pontuações que estão apenas alguns pontos percentuais atrás do Core i7-10875H. Entretanto, o Turbo Boost máximo não é sustentável por longos períodos, como exemplificado pelo nosso teste de loop do CineBench R15 xT. O desempenho começaria forte em quase 1650 pontos antes de cair para 1480 pontos e diminuiria com o tempo. Os resultados não mudariam mesmo após um novo teste. Note que tínhamos ajustado nosso sistema para o modo Cooler Boost Turbo antes de iniciar o teste do loop e, portanto, o GS66 deveria estar com o melhor desempenho sob estas condições.
Apesar da queda nas taxas de relógio, o Core i7-10870H ainda pode oferecer um desempenho multi-linha 30 a 35 por cento mais rápido que o Core i7-10750H no GS66 do ano passado para estar aproximadamente entre os concorrentes AMD Ryzen 5 4600H e Ryzen 7 4800H.
Cinebench R15: CPU Multi 64Bit | CPU Single 64Bit
Blender: v2.79 BMW27 CPU
7-Zip 18.03: 7z b 4 -mmt1 | 7z b 4
Geekbench 5.5: Single-Core | Multi-Core
HWBOT x265 Benchmark v2.2: 4k Preset
LibreOffice : 20 Documents To PDF
R Benchmark 2.5: Overall mean
Cinebench R15: CPU Multi 64Bit | CPU Single 64Bit
Blender: v2.79 BMW27 CPU
7-Zip 18.03: 7z b 4 -mmt1 | 7z b 4
Geekbench 5.5: Single-Core | Multi-Core
HWBOT x265 Benchmark v2.2: 4k Preset
LibreOffice : 20 Documents To PDF
R Benchmark 2.5: Overall mean
* ... menor é melhor
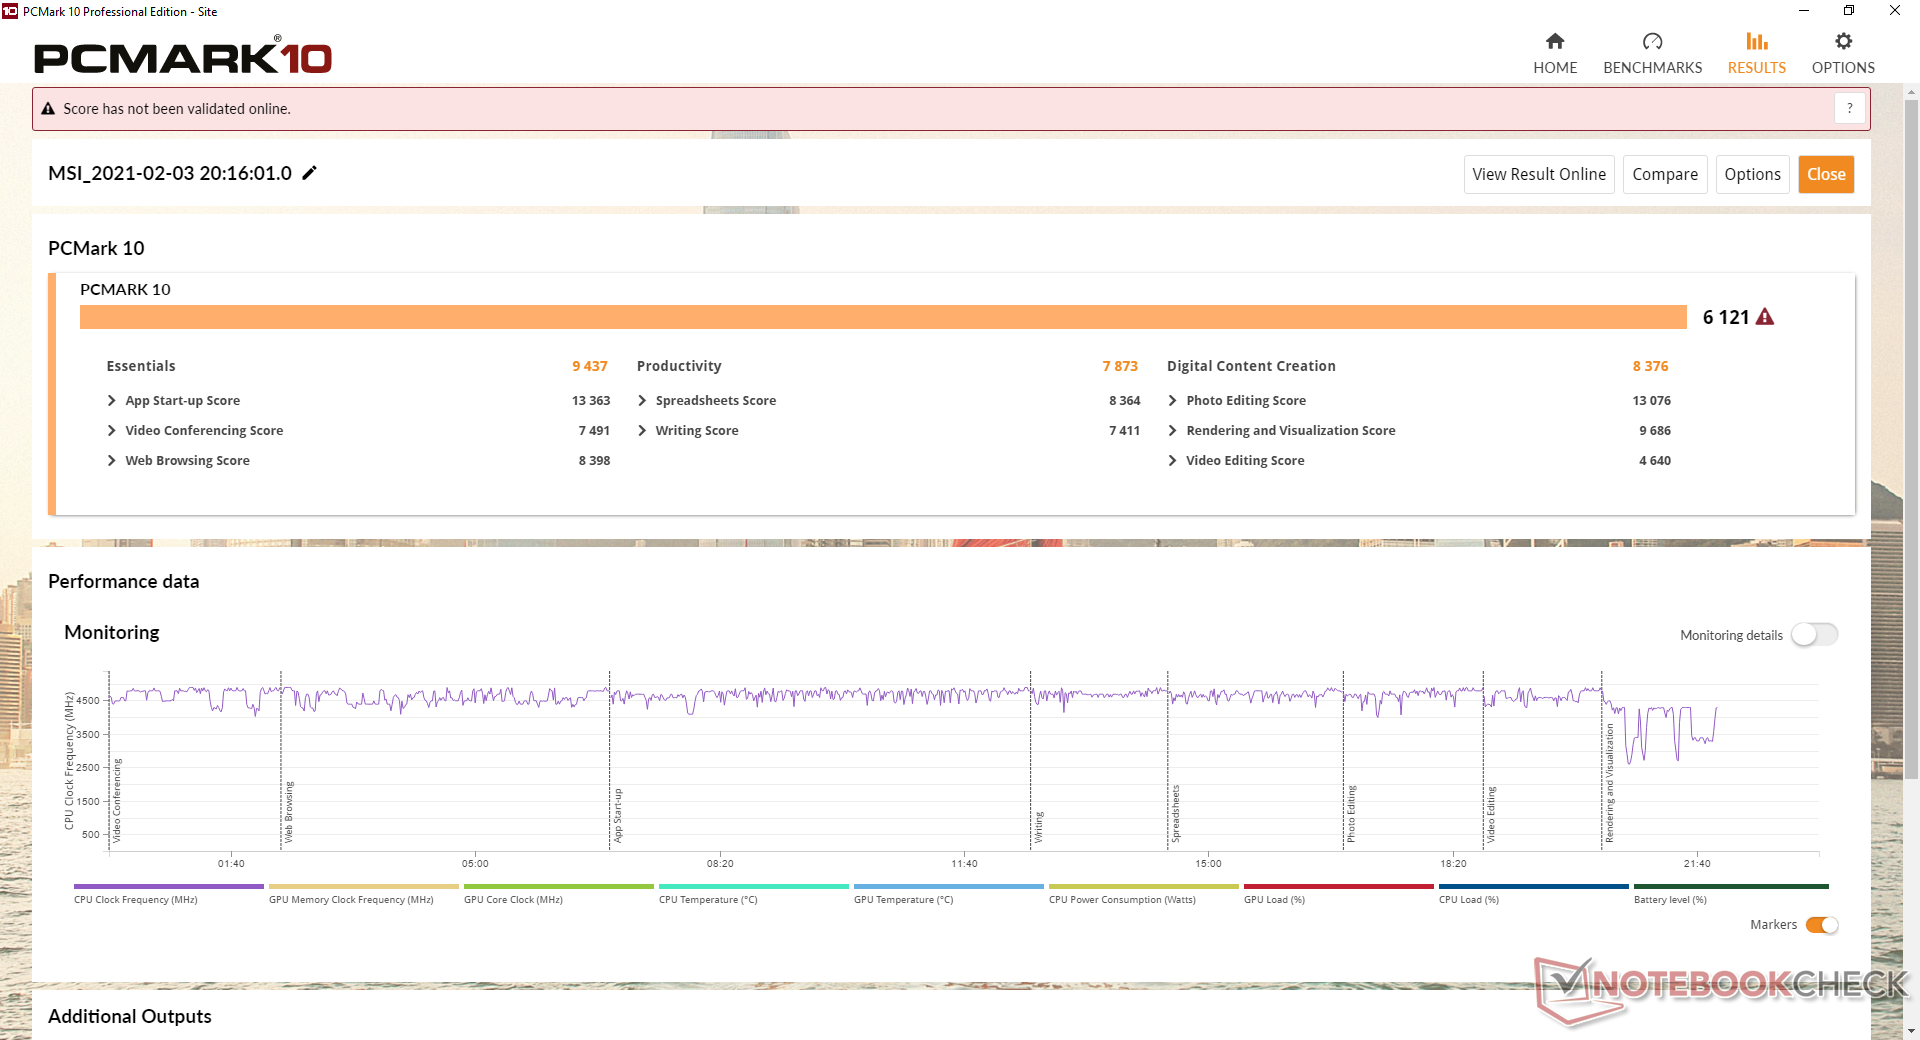
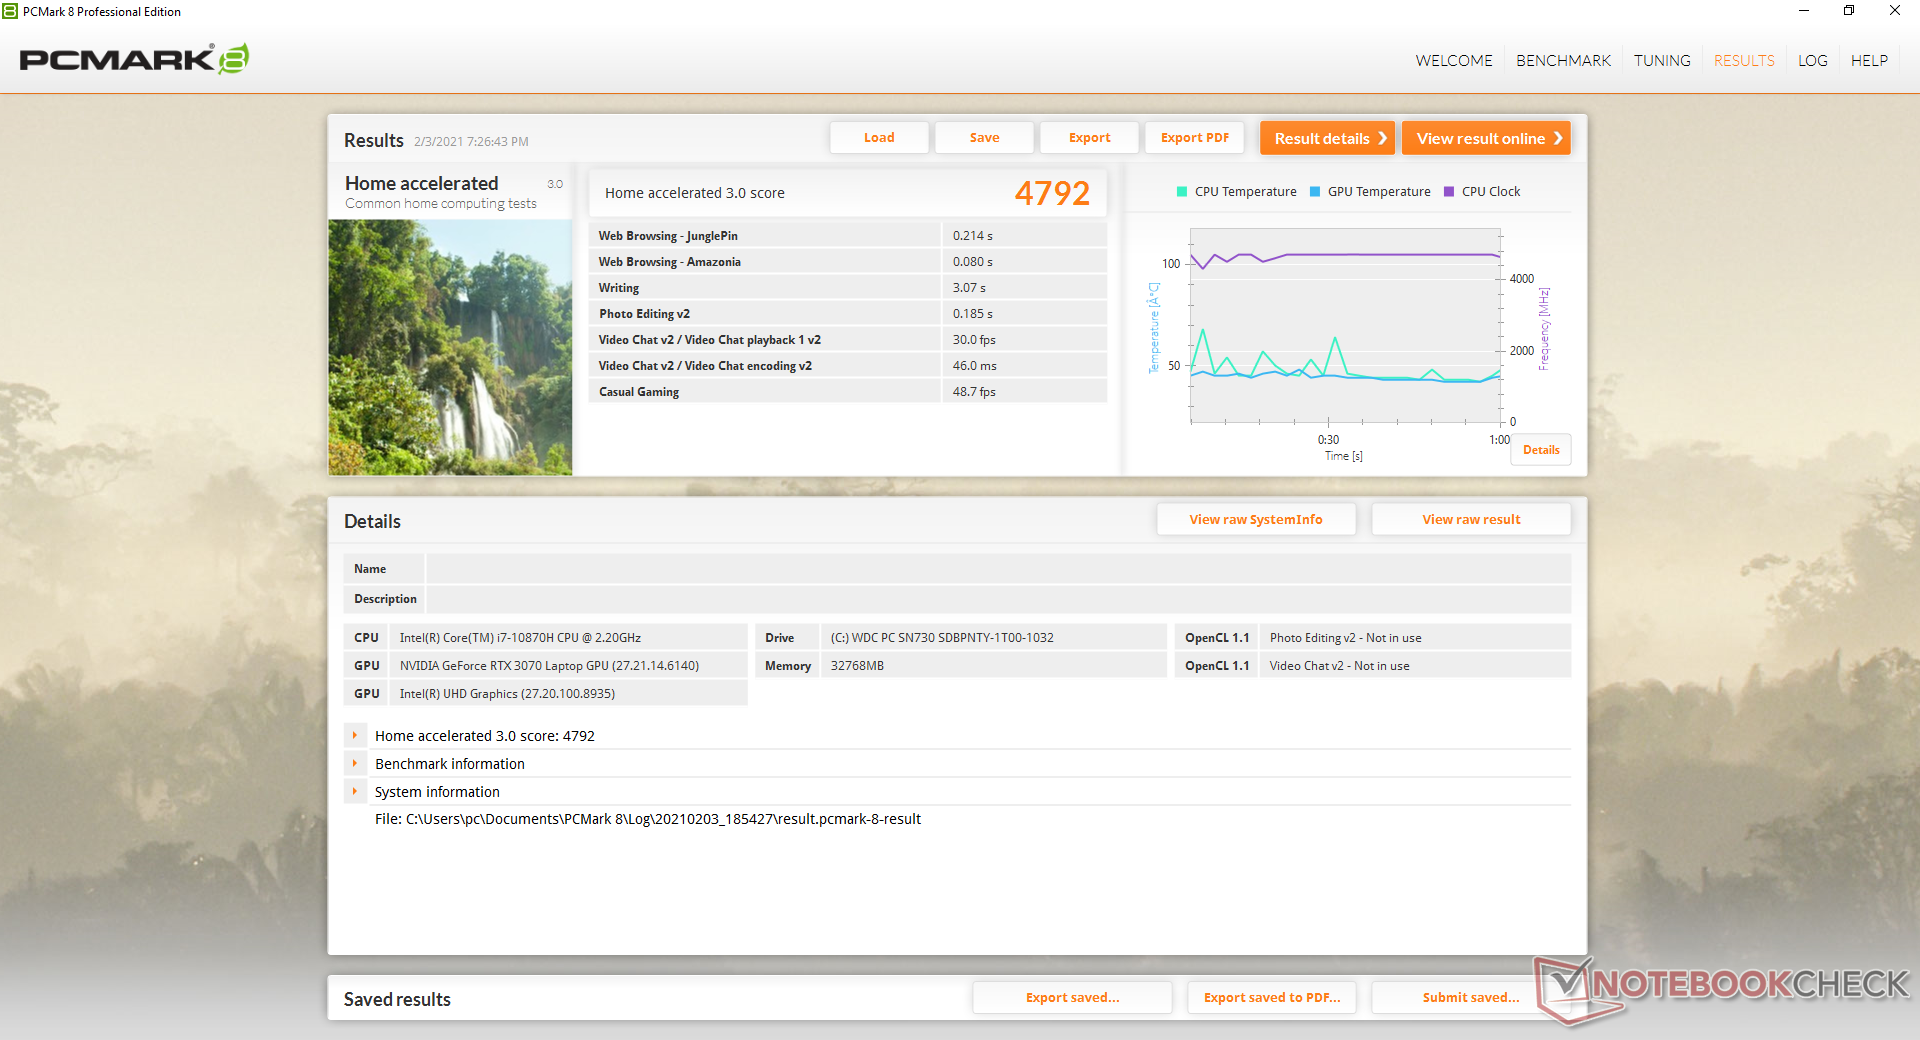
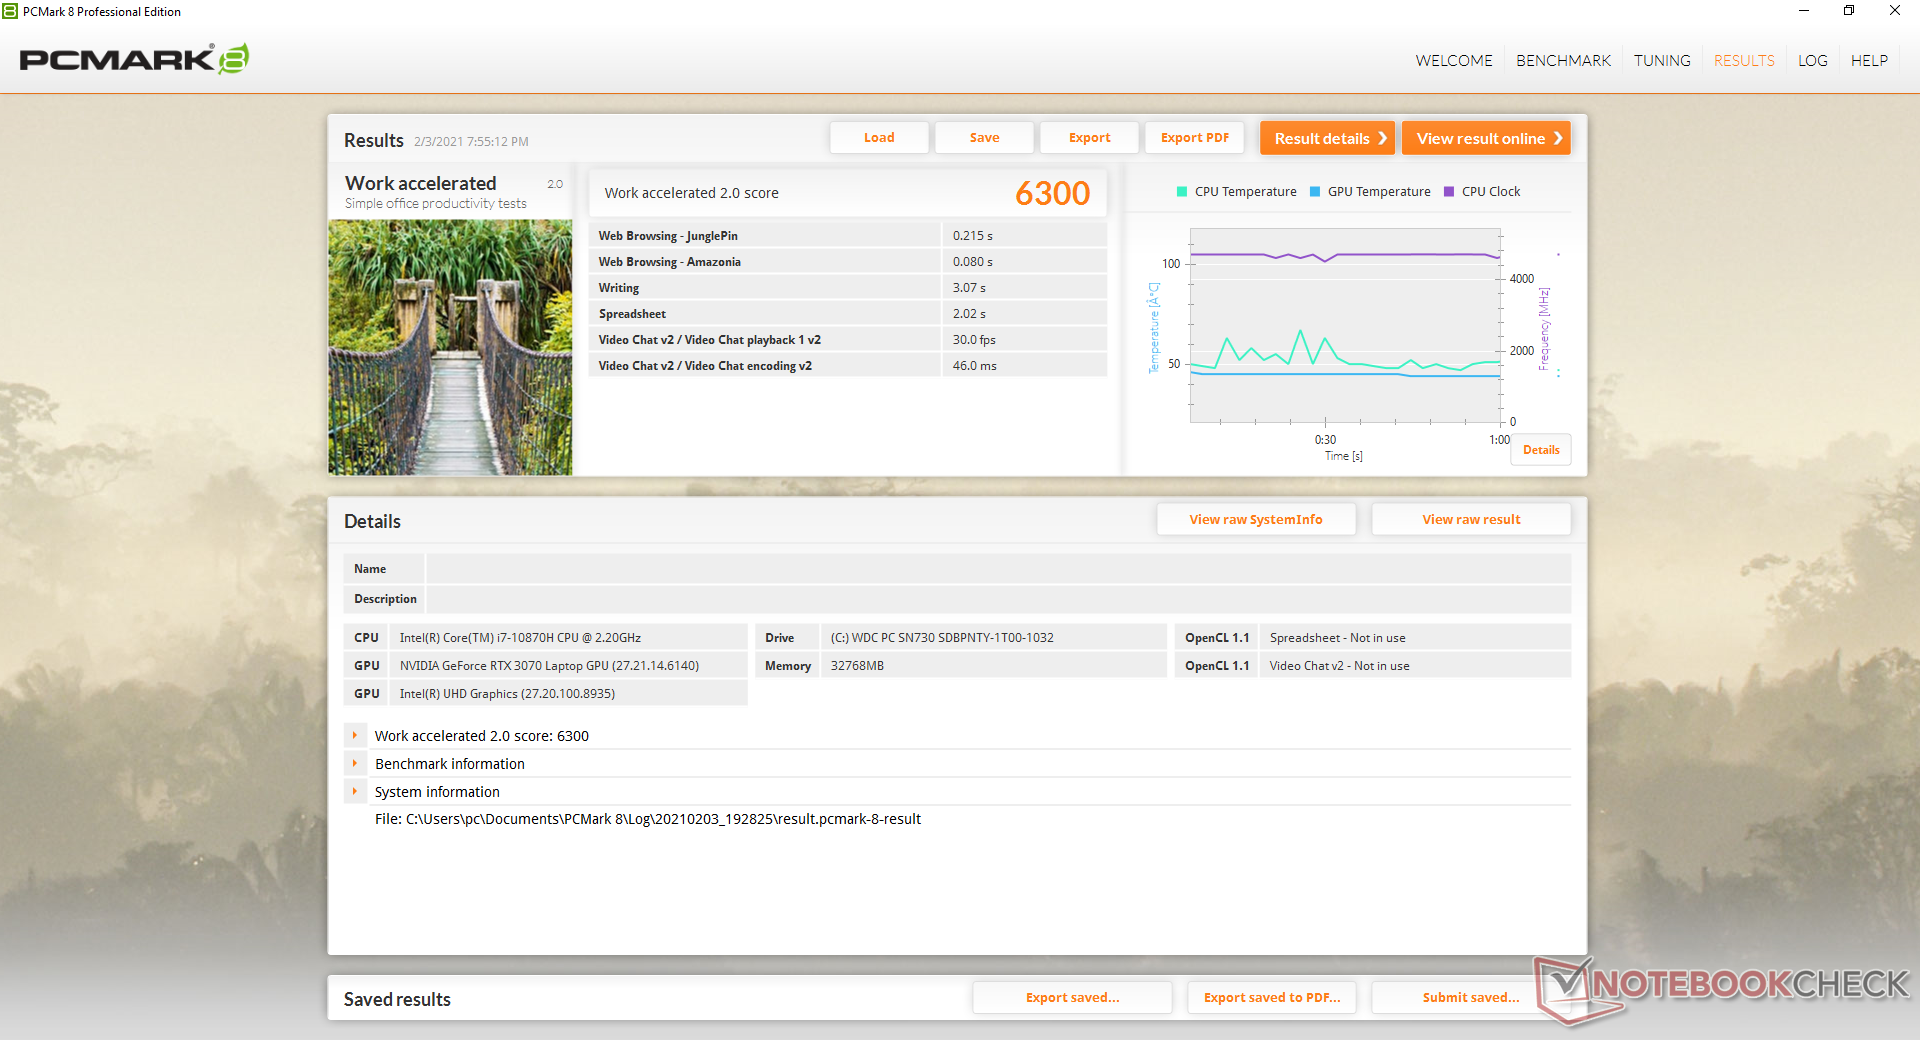
Desempenho do sistema
Os resultados da PCMark estão dentro dos pontos percentuais de um dígito de outros GeForce laptops alimentados por RTX, incluindo os da série Turing mais antiga. Em outras palavras, não parece que a vantagem de desempenho de GPU gen-to-gen do Ampere móvel seja suficientemente ampla para realmente impactar a pontuação PCMark.
| PCMark 8 | |
| Home Score Accelerated v2 | |
| Razer Blade 15 RTX 2070 Super Max-Q | |
| Alienware m15 R3 P87F | |
| MSI GS66 Stealth 10UG | |
| MSI GS66 10SGS | |
| Aorus 15P WB | |
| Work Score Accelerated v2 | |
| Razer Blade 15 RTX 2070 Super Max-Q | |
| MSI GS66 Stealth 10UG | |
| Alienware m15 R3 P87F | |
| MSI GS66 10SGS | |
| Aorus 15P WB | |
| PCMark 8 Home Score Accelerated v2 | 4792 pontos | |
| PCMark 8 Work Score Accelerated v2 | 6300 pontos | |
| PCMark 10 Score | 6121 pontos | |
Ajuda | ||
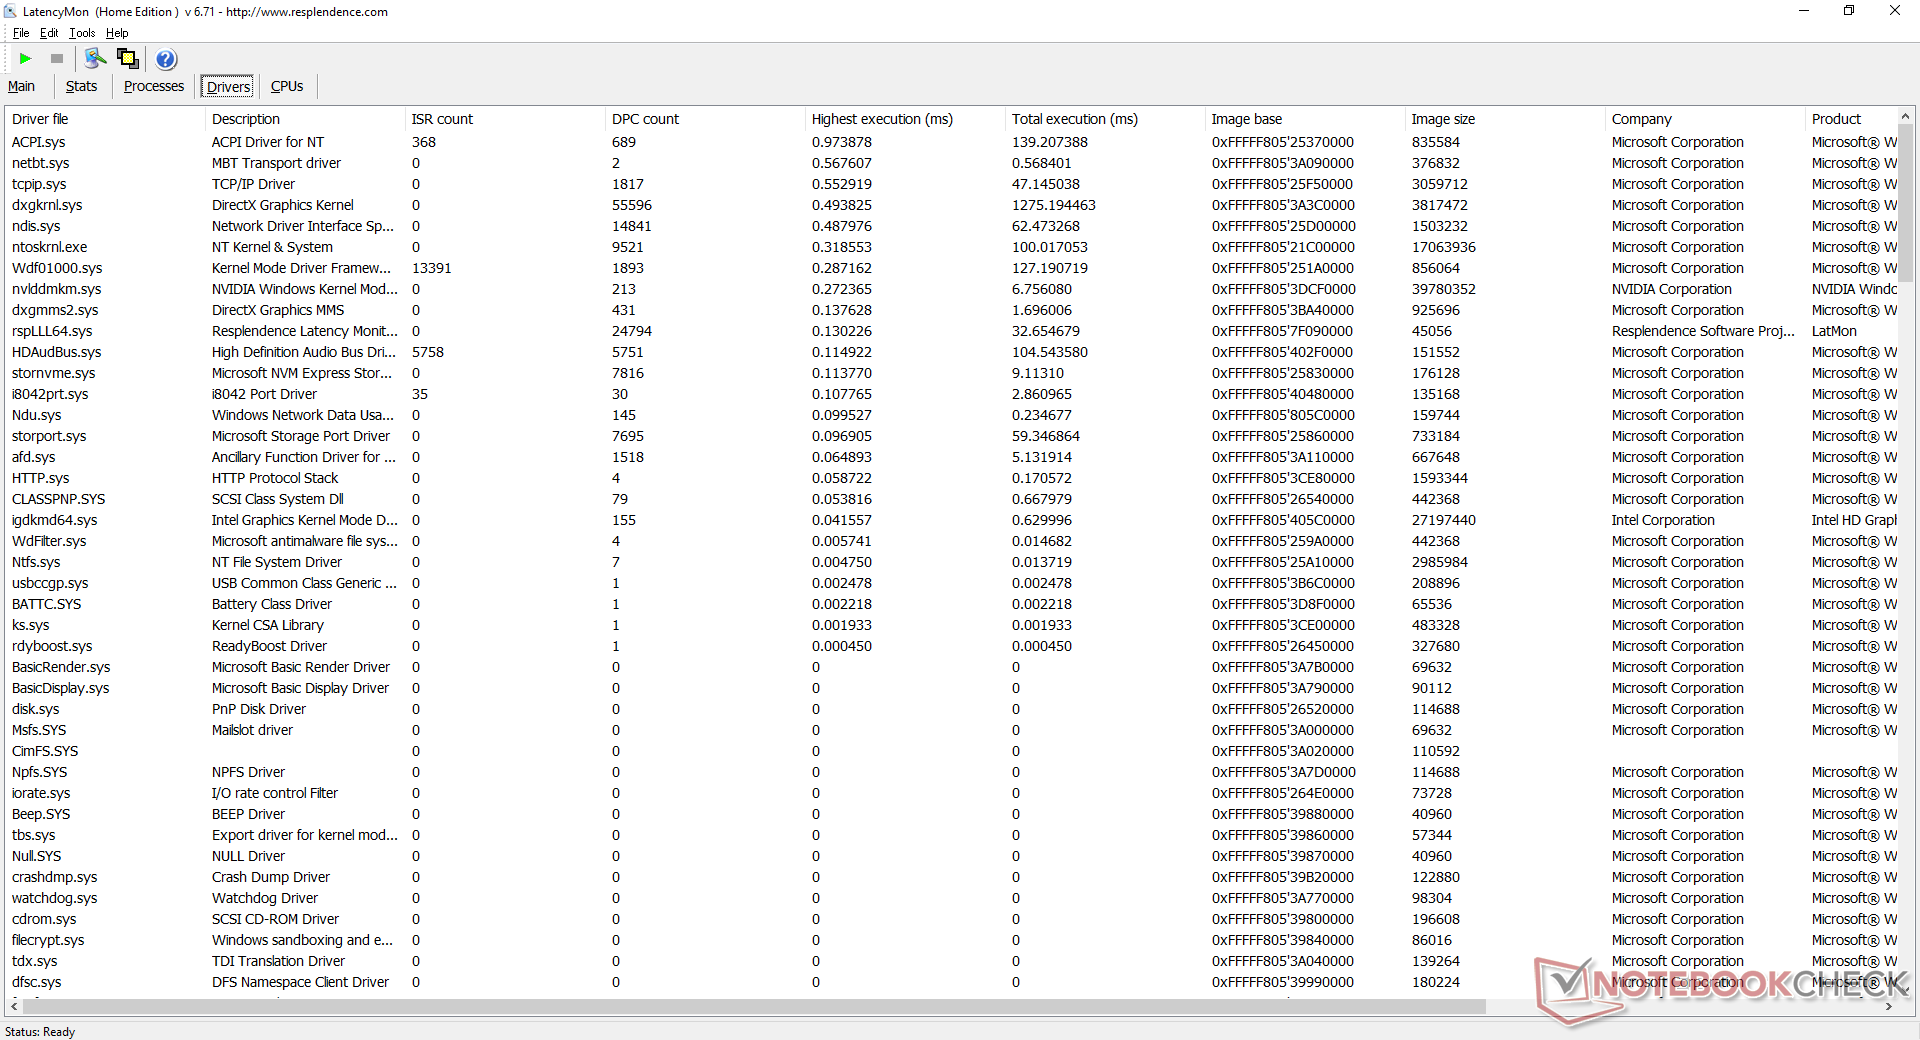
Latência do DPC
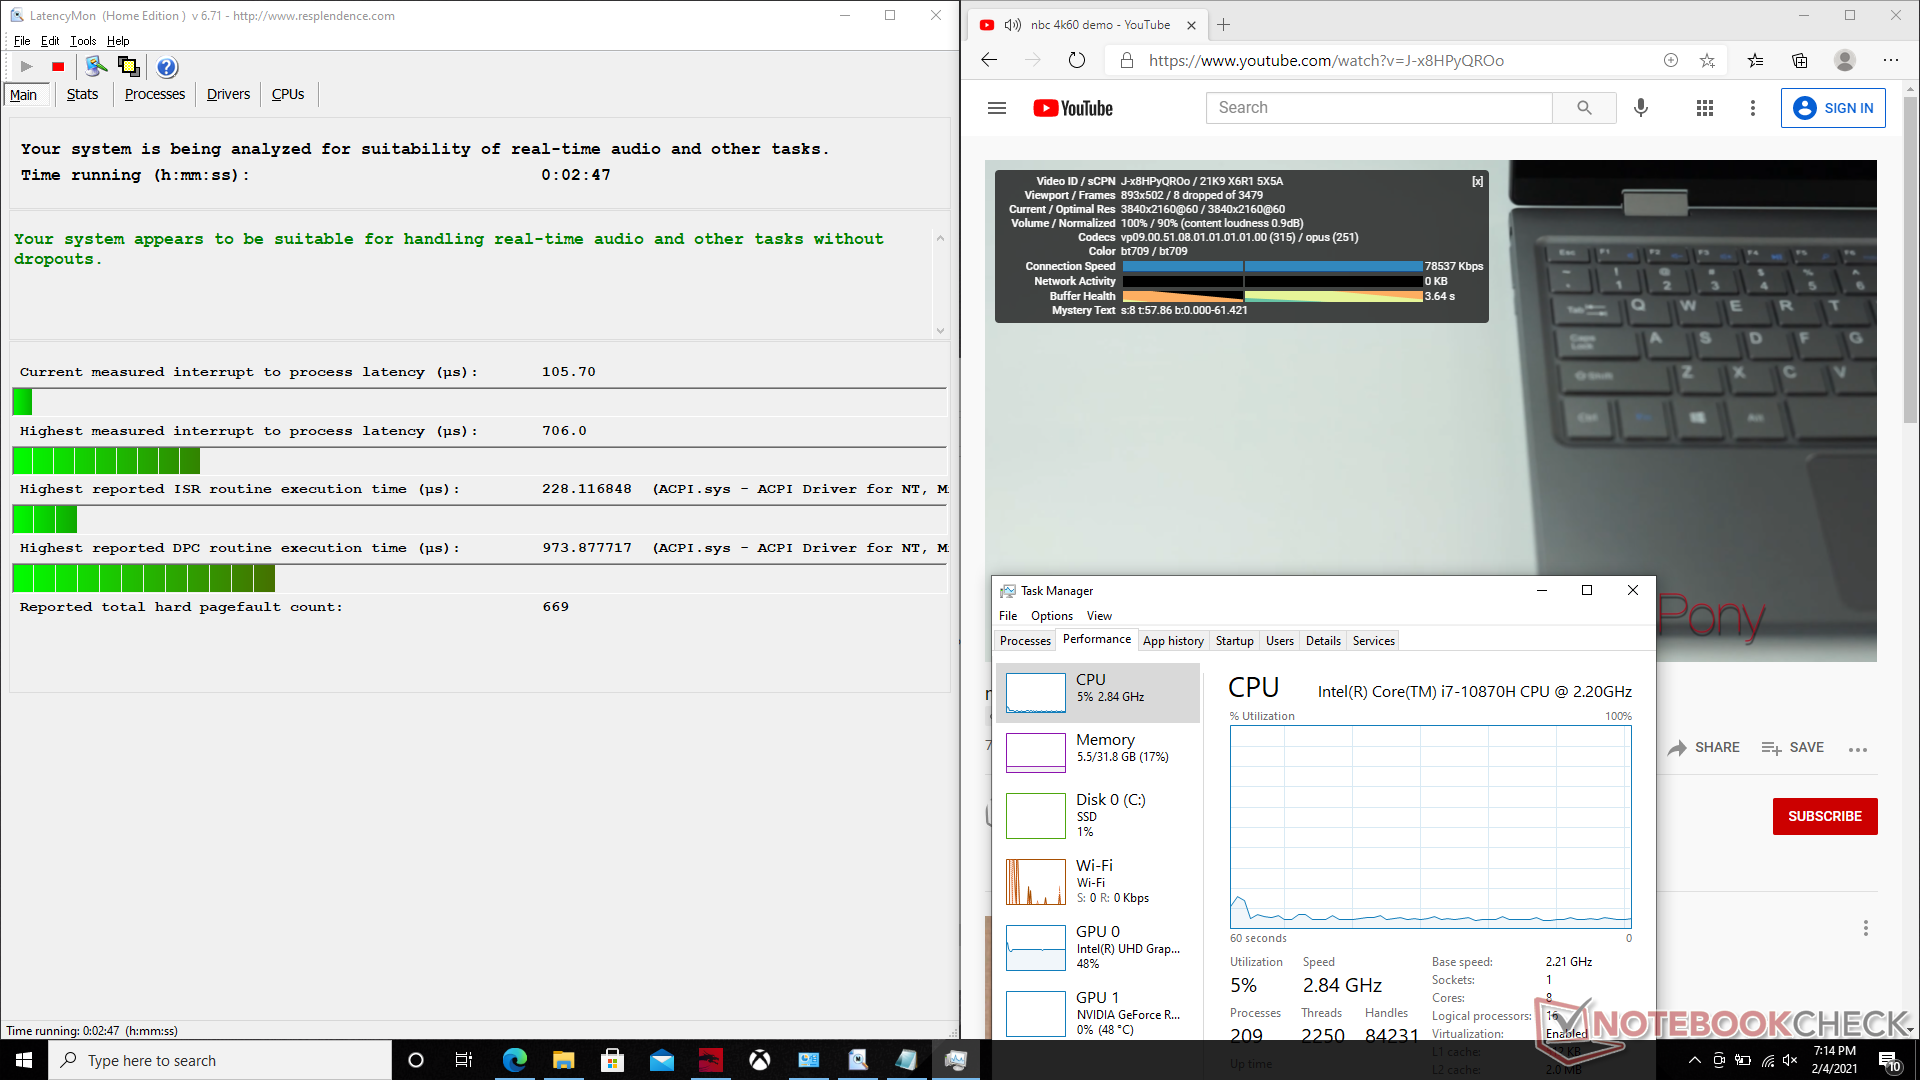
LatencyMon não apresenta problemas de latência ao abrir várias abas do navegador em nossa página inicial. A reprodução de vídeo de 4K a 60 FPS é suave, mas não perfeita, com 8 quadros descartados durante nosso teste de vídeo de minutos.
| DPC Latencies / LatencyMon - interrupt to process latency (max), Web, Youtube, Prime95 | |
| Razer Blade 15 RTX 2070 Super Max-Q | |
| MSI GS66 10SGS | |
| Alienware m15 R3 P87F | |
| Asus TUF Dash F15 FX516PR | |
| Aorus 15P WB | |
| MSI GS66 Stealth 10UG | |
* ... menor é melhor
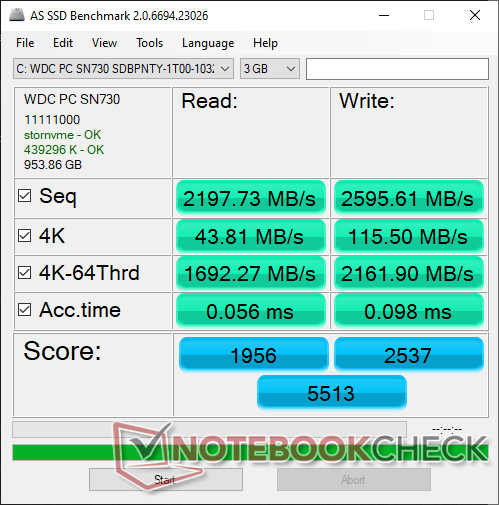
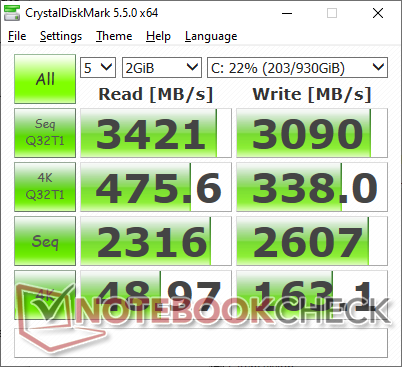
Dispositivos de armazenamento
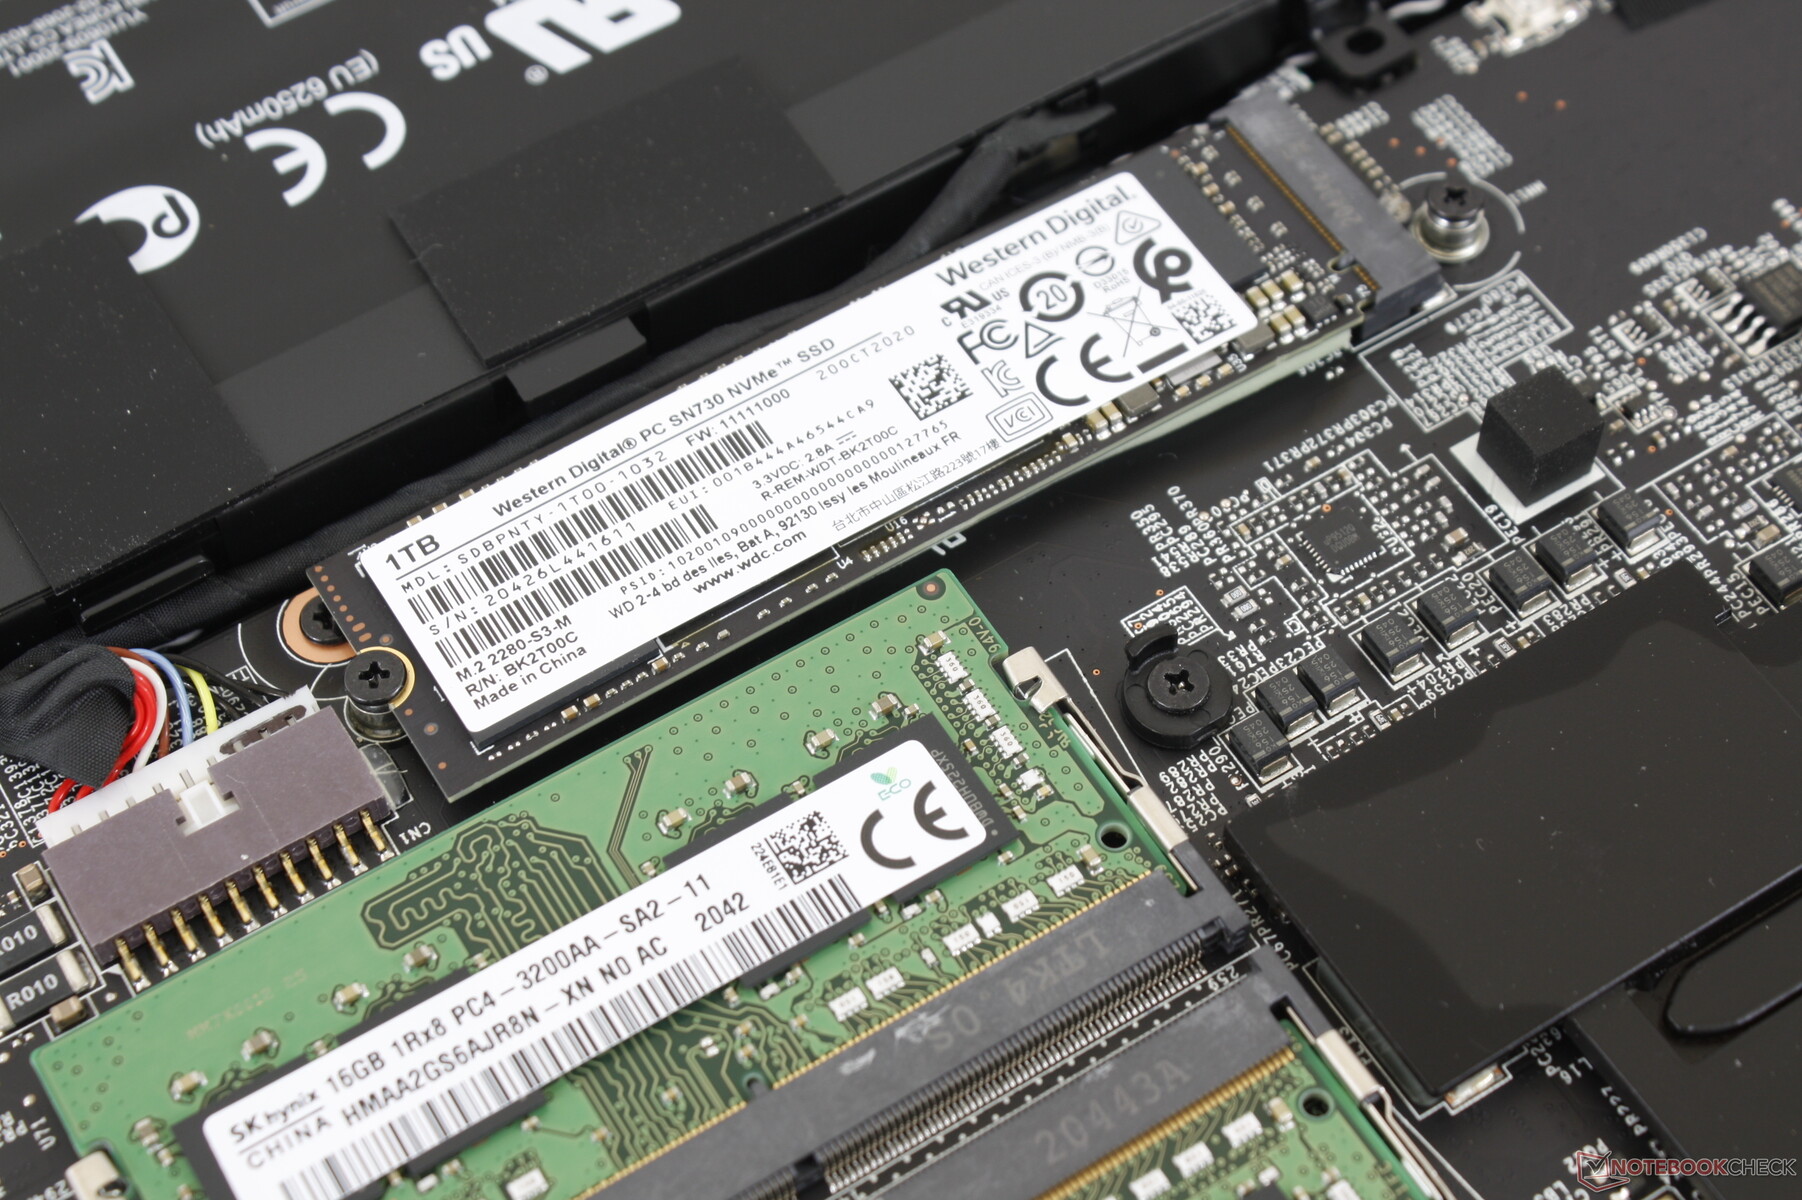
| MSI GS66 Stealth 10UG WDC PC SN730 SDBPNTY-1T00 | MSI GS66 10SGS Samsung SSD PM981 MZVLB512HAJQ | Asus TUF Dash F15 FX516PR SK Hynix HFM001TD3JX013N | Razer Blade 15 RTX 2070 Super Max-Q Samsung SSD PM981a MZVLB512HBJQ | Aorus 15P WB ADATA XPG SX8200 Pro (ASX8200PNP-512GT) | Alienware m15 R3 P87F 2x Micron 2200S 512 GB (RAID 0) | |
|---|---|---|---|---|---|---|
| AS SSD | -11% | -20% | -9% | -18% | -40% | |
| Seq Read (MB/s) | 2198 | 1086 -51% | 2671 22% | 1957 -11% | 2241 2% | 2058 -6% |
| Seq Write (MB/s) | 2596 | 1901 -27% | 1501 -42% | 2092 -19% | 2121 -18% | 2316 -11% |
| 4K Read (MB/s) | 43.81 | 51 16% | 39.65 -9% | 50.2 15% | 52.3 19% | 39.72 -9% |
| 4K Write (MB/s) | 115.5 | 117.3 2% | 69 -40% | 96.5 -16% | 116.2 1% | 62.9 -46% |
| 4K-64 Read (MB/s) | 1692 | 1503 -11% | 1209 -29% | 1594 -6% | 713 -58% | 1334 -21% |
| 4K-64 Write (MB/s) | 2162 | 1721 -20% | 1650 -24% | 2005 -7% | 827 -62% | 1271 -41% |
| Access Time Read * (ms) | 0.056 | 0.059 -5% | 0.093 -66% | 0.057 -2% | 0.054 4% | 0.062 -11% |
| Access Time Write * (ms) | 0.098 | 0.1 -2% | 0.055 44% | 0.112 -14% | 0.031 68% | 0.388 -296% |
| Score Read (Points) | 1956 | 1662 -15% | 1516 -22% | 1840 -6% | 989 -49% | 1580 -19% |
| Score Write (Points) | 2537 | 2029 -20% | 1869 -26% | 2310 -9% | 1155 -54% | 1565 -38% |
| Score Total (Points) | 5513 | 4588 -17% | 4105 -26% | 5103 -7% | 2659 -52% | 3968 -28% |
| Copy ISO MB/s (MB/s) | 2236 | 2155 -4% | 1793 -20% | 2192 -2% | 1685 -25% | |
| Copy Program MB/s (MB/s) | 690 | 715 4% | 573 -17% | 576 -17% | 669 -3% | |
| Copy Game MB/s (MB/s) | 1546 | 1506 -3% | 1418 -8% | 1062 -31% | 1493 -3% | |
| CrystalDiskMark 5.2 / 6 | -10% | -13% | 3% | 3% | -7% | |
| Write 4K (MB/s) | 163.1 | 132.5 -19% | 129.6 -21% | 139.8 -14% | 131.7 -19% | 67.3 -59% |
| Read 4K (MB/s) | 48.97 | 45.03 -8% | 44.71 -9% | 48.62 -1% | 55.7 14% | 41.47 -15% |
| Write Seq (MB/s) | 2607 | 1987 -24% | 1929 -26% | 2260 -13% | 2273 -13% | 2239 -14% |
| Read Seq (MB/s) | 2316 | 1434 -38% | 2035 -12% | 2135 -8% | 2533 9% | 2112 -9% |
| Write 4K Q32T1 (MB/s) | 338 | 467.5 38% | 425.9 26% | 499.3 48% | 475.1 41% | 488.9 45% |
| Read 4K Q32T1 (MB/s) | 475.6 | 536 13% | 433.4 -9% | 552 16% | 590 24% | 557 17% |
| Write Seq Q32T1 (MB/s) | 3090 | 2003 -35% | 1390 -55% | 2960 -4% | 2373 -23% | 2654 -14% |
| Read Seq Q32T1 (MB/s) | 3421 | 3306 -3% | 3505 2% | 3269 -4% | 3068 -10% | 3137 -8% |
| Média Total (Programa/Configurações) | -11% /
-10% | -17% /
-17% | -3% /
-5% | -8% /
-10% | -24% /
-28% |
* ... menor é melhor

Disk Throttling: DiskSpd Read Loop, Queue Depth 8
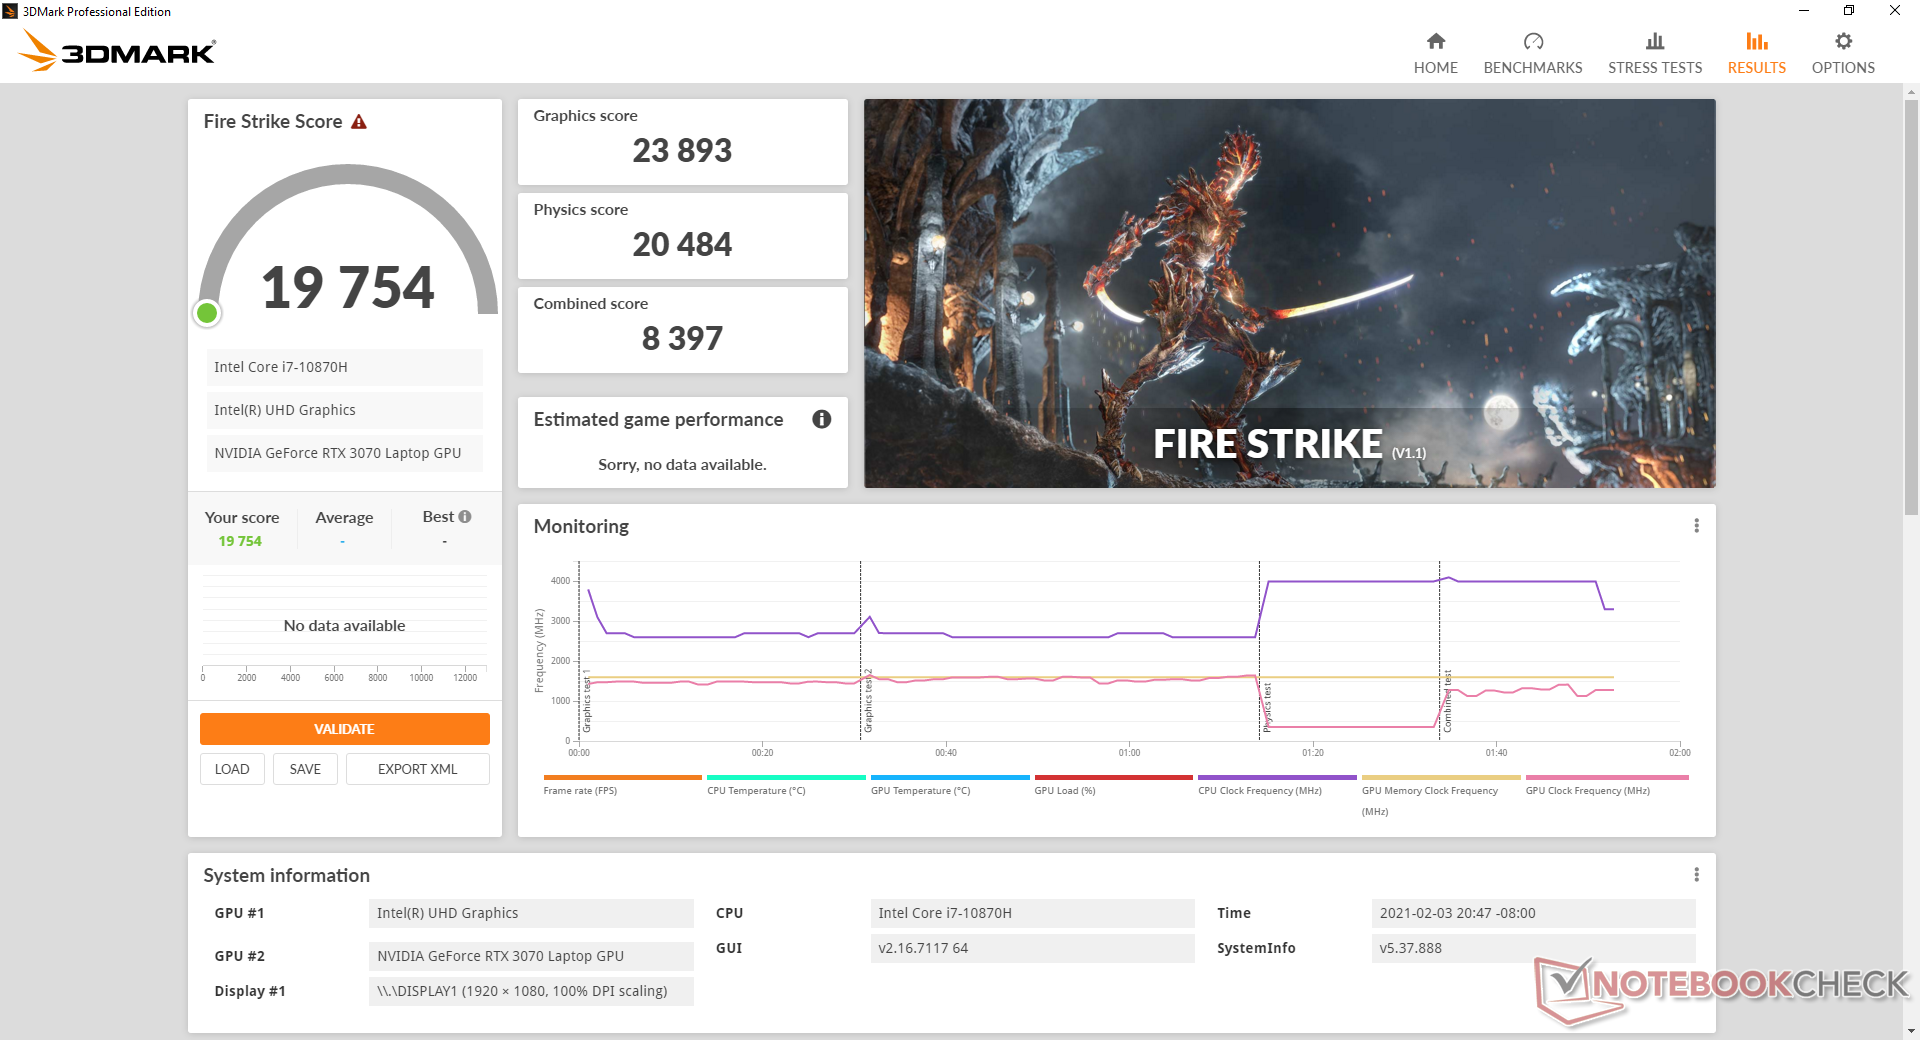
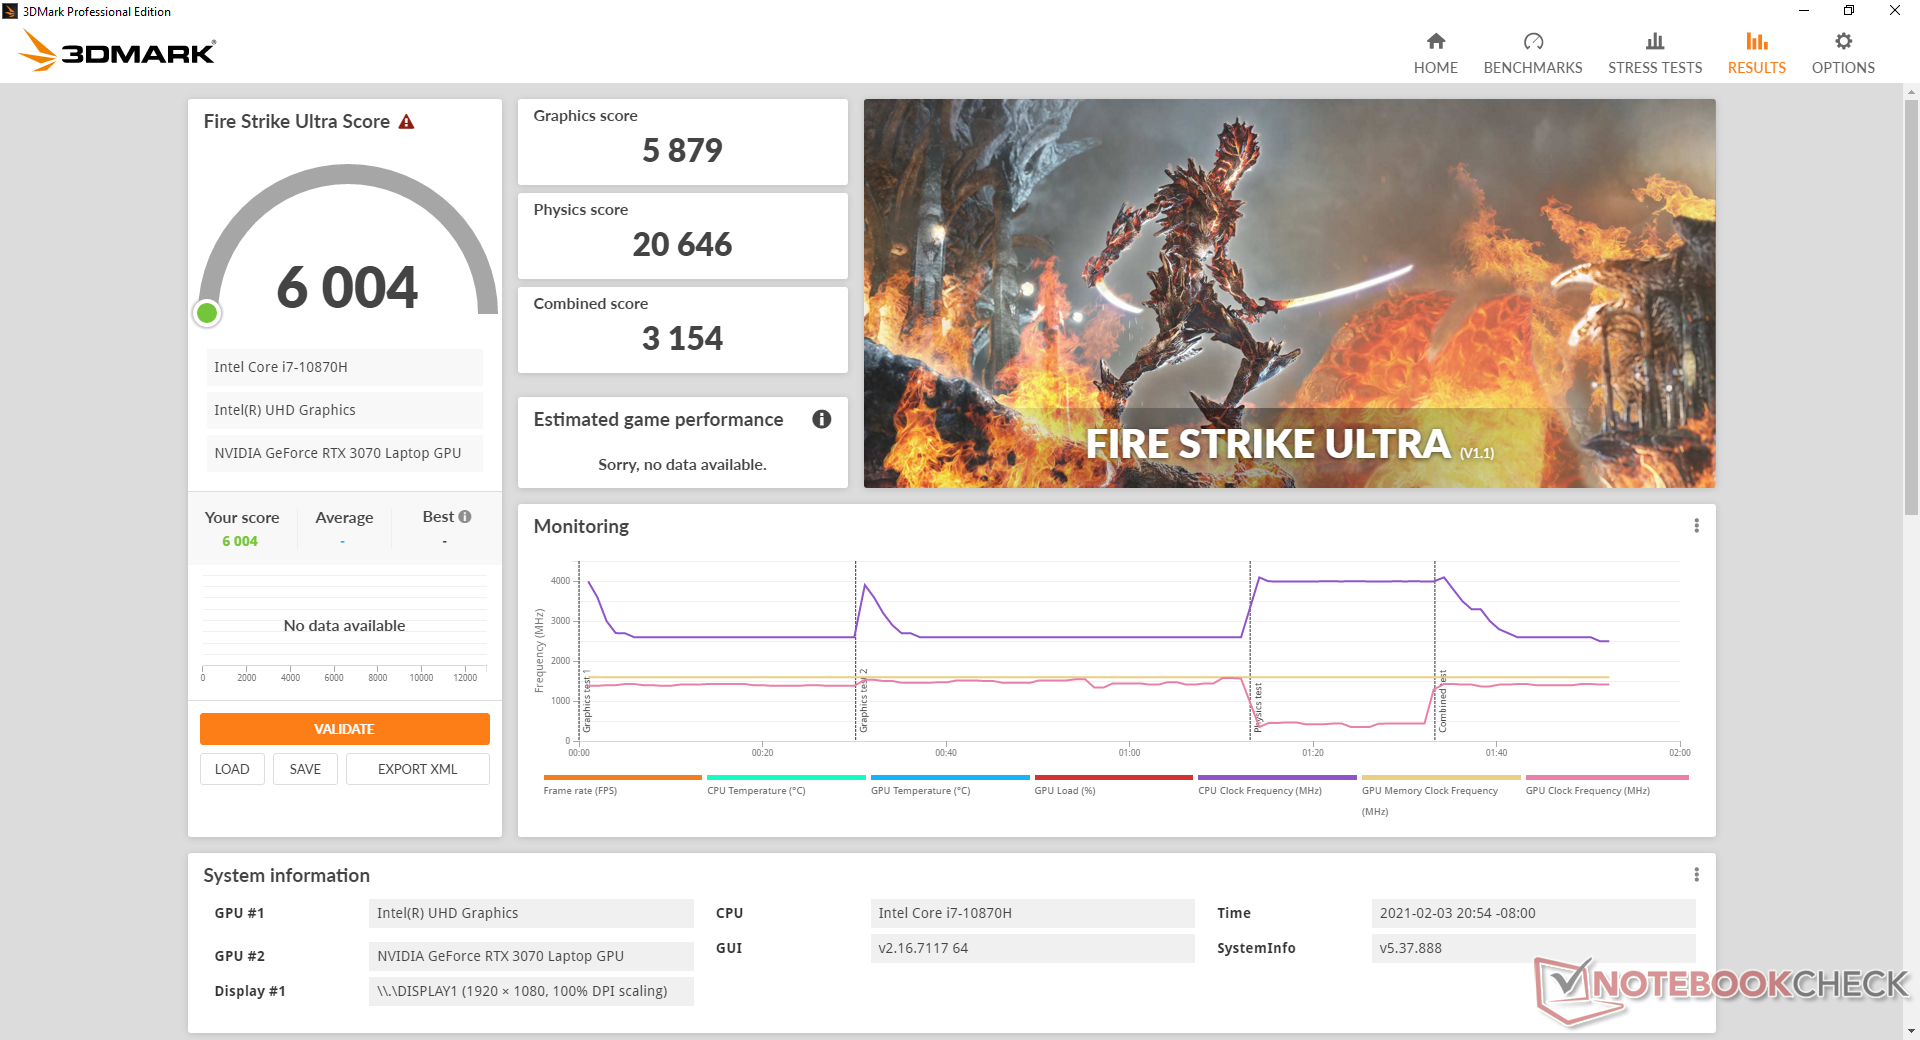
Desempenho da GPU
O móvel GeForce RTX 3070 aqui é cerca de 20% mais rápido que o GeForce RTX 2080 Max-Q no GS66 10SGS do ano passado ou 30% mais rápido que o 2070 Super Max-Q no GS66 10SFS. Os ganhos de gênero a gênero não estão nem perto da versão desktop RTX 3070, pois a versão desktop oferece cerca de 50% mais rápida do que nossa versão móvel. O desempenho geral dos jogos é do pescoço ao pescoço com o desktop RTX 2070.
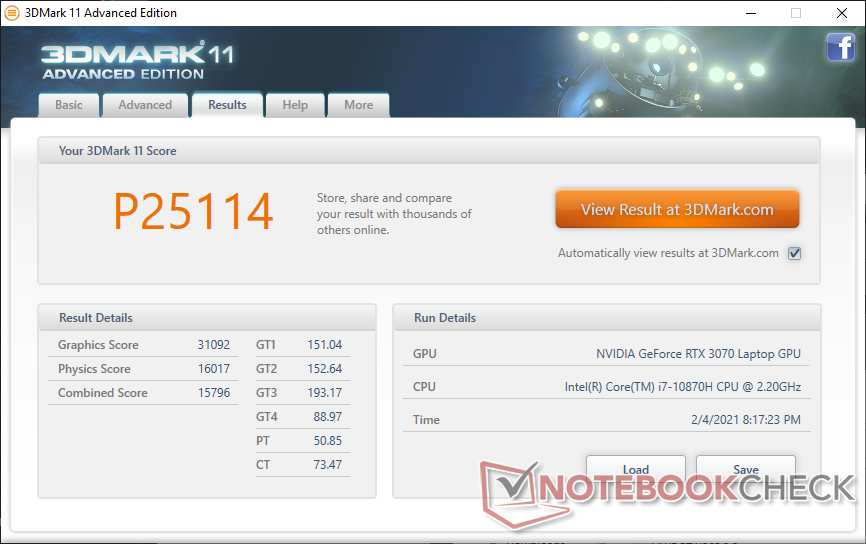
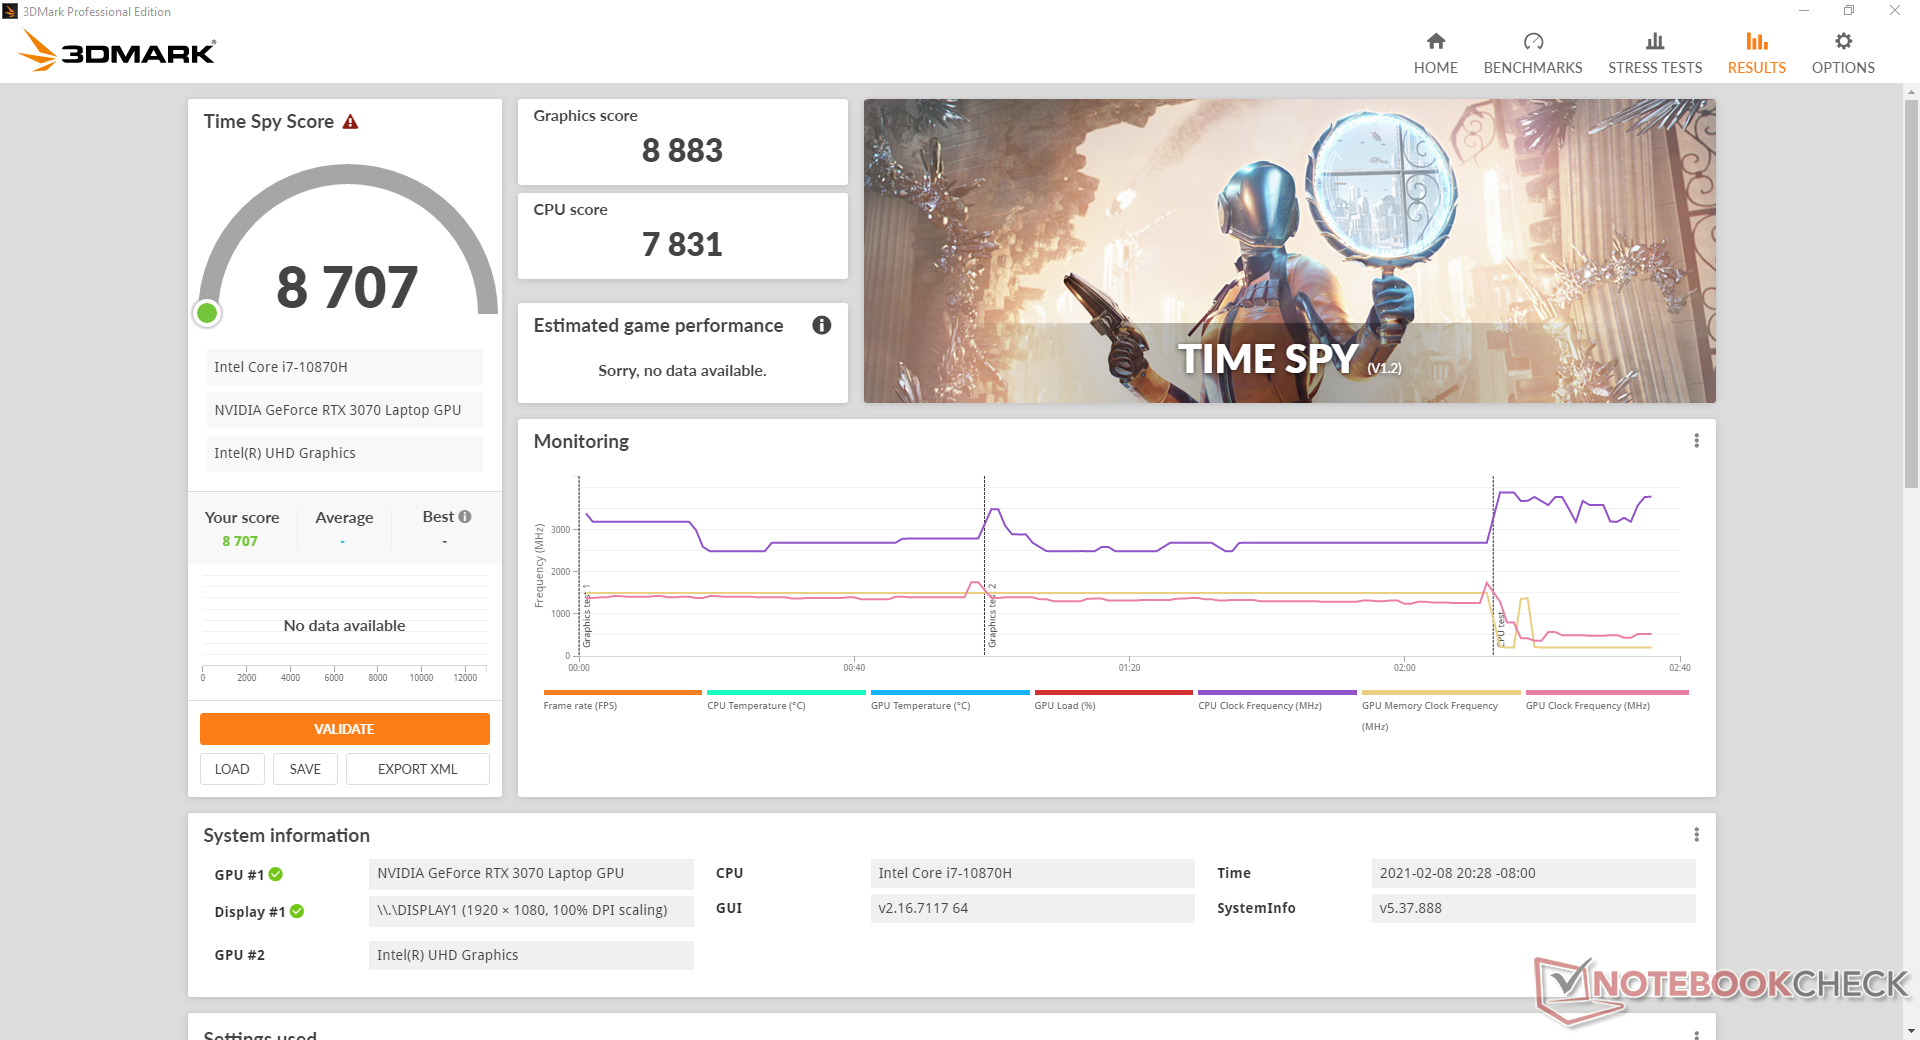
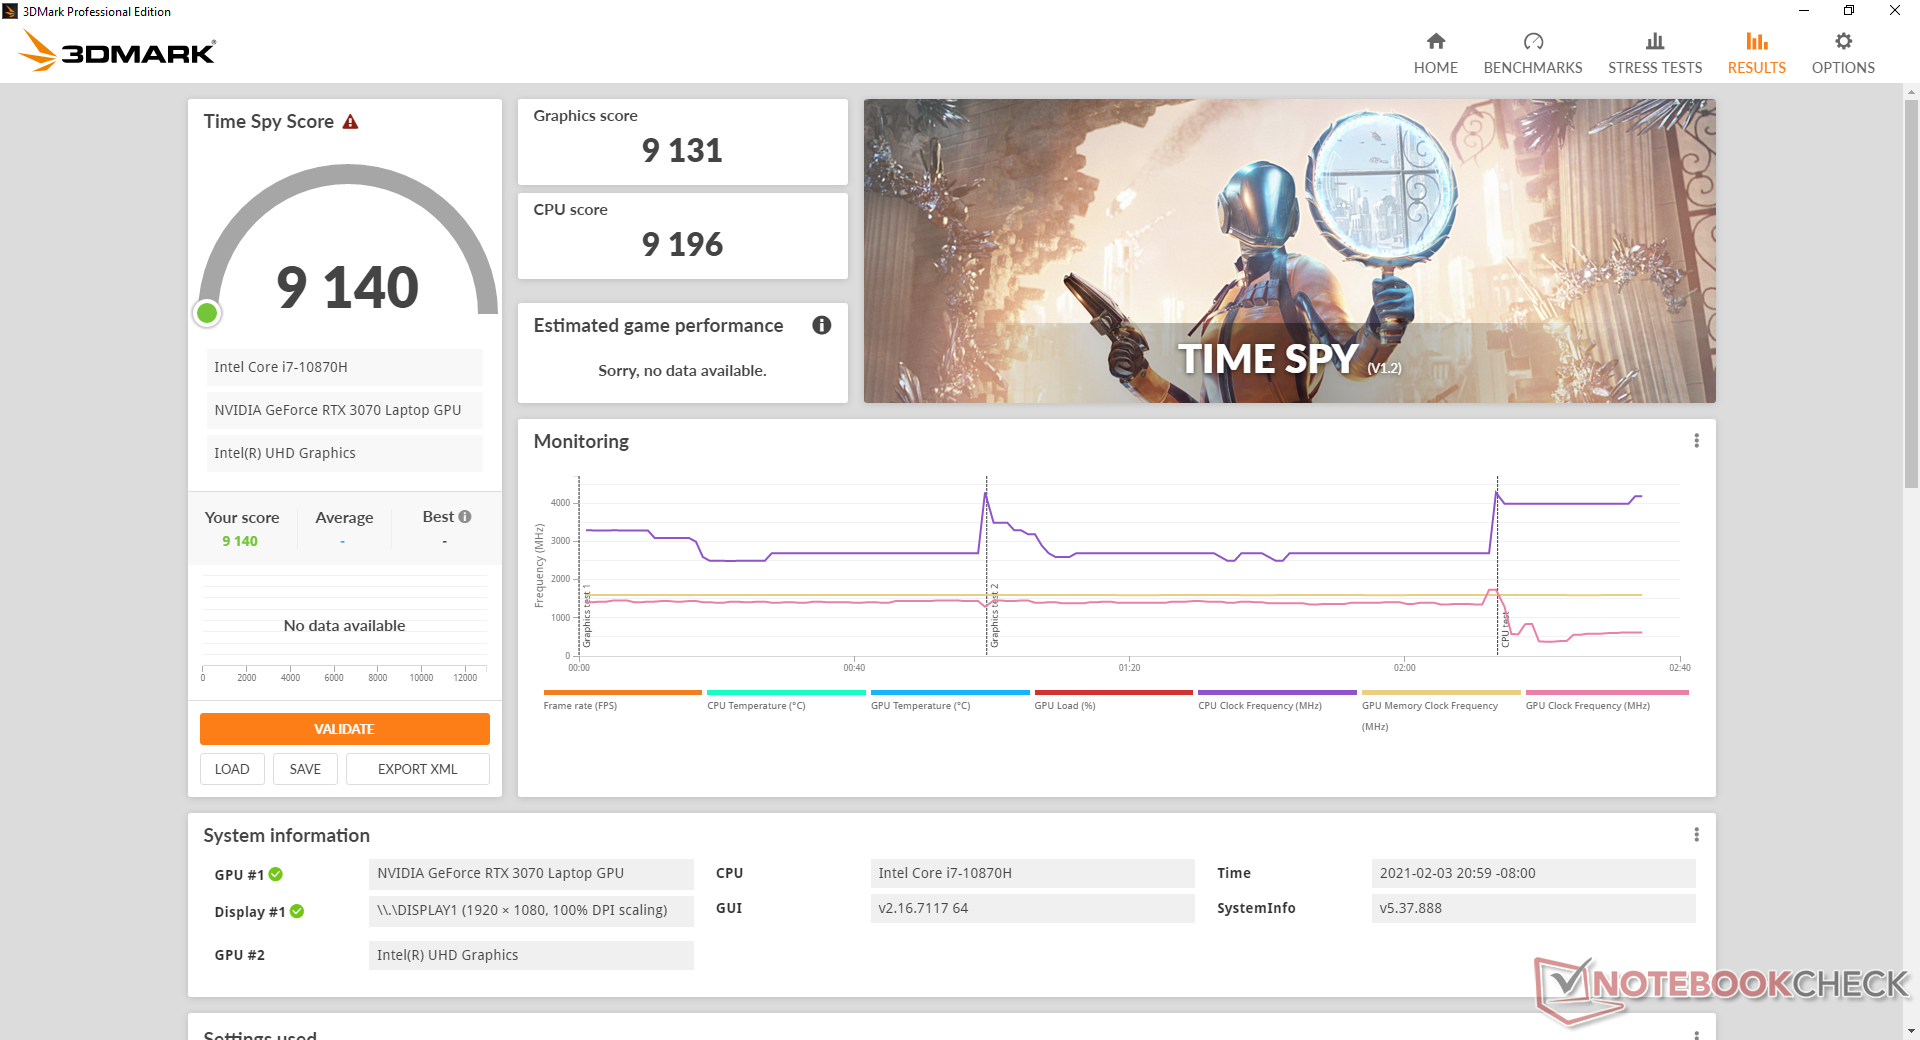
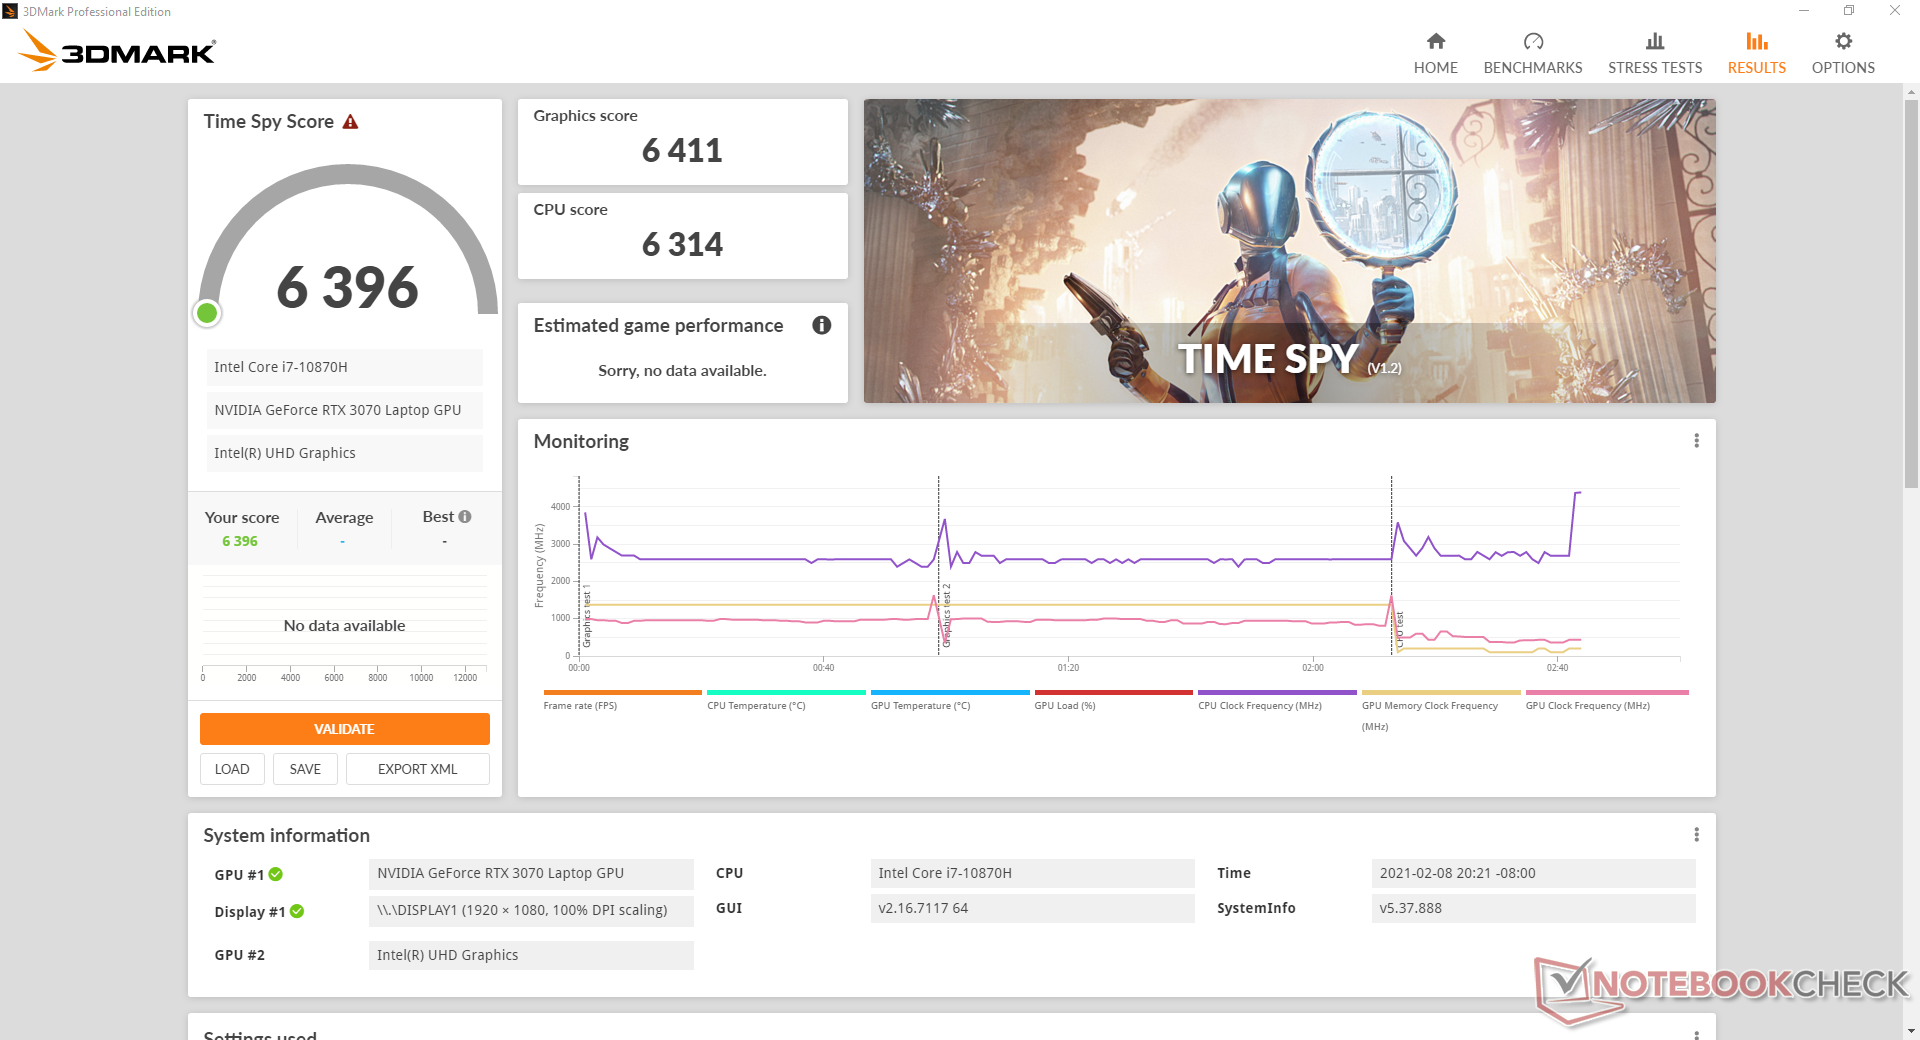
| 3DMark 11 Performance | 25114 pontos | |
| 3DMark Cloud Gate Standard Score | 49338 pontos | |
| 3DMark Fire Strike Score | 19754 pontos | |
| 3DMark Time Spy Score | 9140 pontos | |
Ajuda | ||
| baixo | média | alto | ultra | |
|---|---|---|---|---|
| GTA V (2015) | 178 | 169 | 152 | 90.4 |
| The Witcher 3 (2015) | 335.9 | 246.7 | 152.6 | 89.7 |
| Dota 2 Reborn (2015) | 137 | 120 | 120 | 107 |
| Final Fantasy XV Benchmark (2018) | 151 | 111 | 87.5 | |
| X-Plane 11.11 (2018) | 107 | 90.5 | 76.4 | |
| Strange Brigade (2018) | 347 | 213 | 175 | 155 |
Emissions
Ruído do sistema
O ruído do ventilador é quase o mesmo do modelo do ano passado, apesar da atualização da GPU, o que não é surpreendente porque a solução de resfriamento e as metas TGP não mudaram. Embora isto signifique que os proprietários estão obtendo mais desempenho no mesmo nível de ruído do ventilador, também significa que a MSI não melhorou o comportamento do ruído do ventilador sem recorrer ao Nvidia Whisper Mode 2.0, que limita as taxas de quadros. Nós reclamamos do constante ruído do ventilador no GS66 do ano passado, mesmo quando simplesmente ociosos no modo "Silent" e isto permanece verdadeiro para o modelo 2021. Os ventiladores também tenderiam a pulsar entre 40,8 dB(A) a 46,3 dB(A) durante nosso Witcher 3 correr.
Ativando o modo Cooler Boost, que é a versão da MSI do modo "Turbo", o ruído do ventilador atinge 58 dB(A), não importando a carga na tela. Observe que este aumento é muito significativo em relação aos pequenos benefícios de desempenho obtidos, como mostrado em nossa seção Teste de Estresse. Os jogadores podem querer pensar duas vezes sobre o uso deste recurso, pois seus benefícios podem não valer a pena.

| MSI GS66 Stealth 10UG GeForce RTX 3070 Laptop GPU, i7-10870H, WDC PC SN730 SDBPNTY-1T00 | MSI GS66 10SGS GeForce RTX 2080 Super Max-Q, i7-10750H, Samsung SSD PM981 MZVLB512HAJQ | Asus TUF Dash F15 FX516PR GeForce RTX 3070 Laptop GPU, i7-11370H, SK Hynix HFM001TD3JX013N | Razer Blade 15 RTX 2070 Super Max-Q GeForce RTX 2070 Super Max-Q, i7-10875H, Samsung SSD PM981a MZVLB512HBJQ | Alienware m15 R3 P87F GeForce RTX 2070 Mobile, i7-10750H, 2x Micron 2200S 512 GB (RAID 0) | |
|---|---|---|---|---|---|
| Noise | 5% | 5% | 9% | 8% | |
| desligado / ambiente * (dB) | 26.2 | 28.5 -9% | 24 8% | 27 -3% | 26.3 -0% |
| Idle Minimum * (dB) | 34 | 30 12% | 25 26% | 27 21% | 26.7 21% |
| Idle Average * (dB) | 34 | 30 12% | 30 12% | 27 21% | 26.7 21% |
| Idle Maximum * (dB) | 34 | 30.9 9% | 35 -3% | 27 21% | 30.7 10% |
| Load Average * (dB) | 47.2 | 39.5 16% | 53 -12% | 44.7 5% | 40.2 15% |
| Witcher 3 ultra * (dB) | 46.3 | 48 -4% | 48 -4% | 51.2 -11% | 51 -10% |
| Load Maximum * (dB) | 58.2 | 59.4 -2% | 54 7% | 54 7% | 59.7 -3% |
* ... menor é melhor
Barulho
| Ocioso |
| 34 / 34 / 34 dB |
| Carga |
| 47.2 / 58.2 dB |
 | ||
30 dB silencioso 40 dB(A) audível 50 dB(A) ruidosamente alto |
||
min: | ||
Temperatura
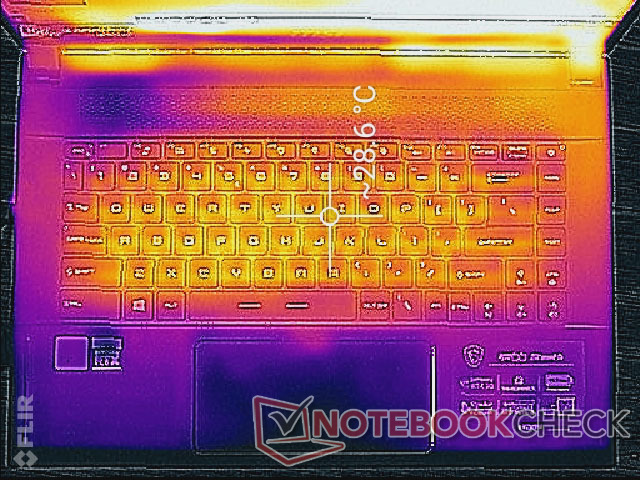
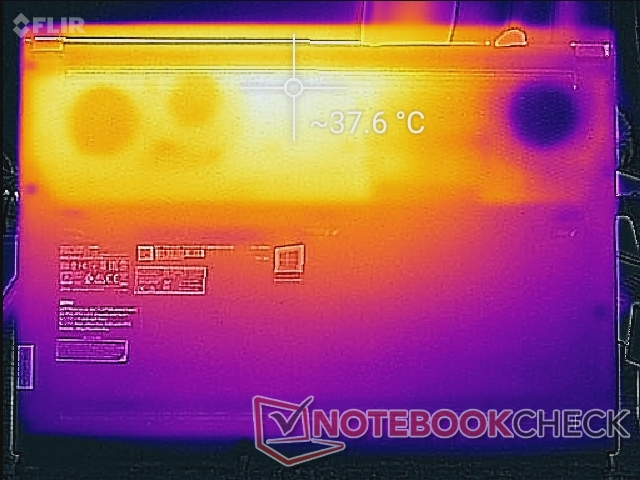
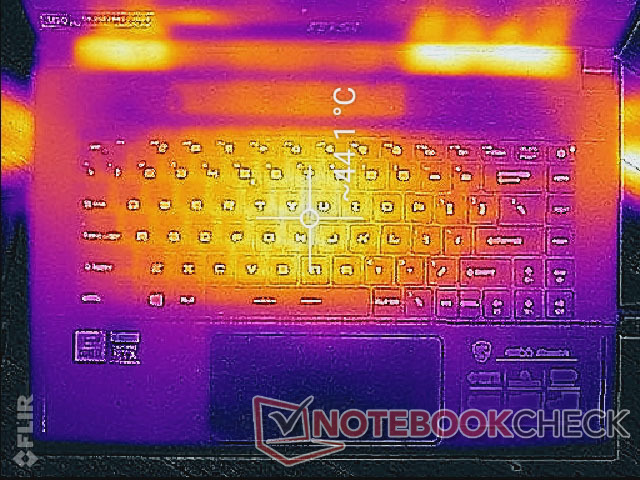
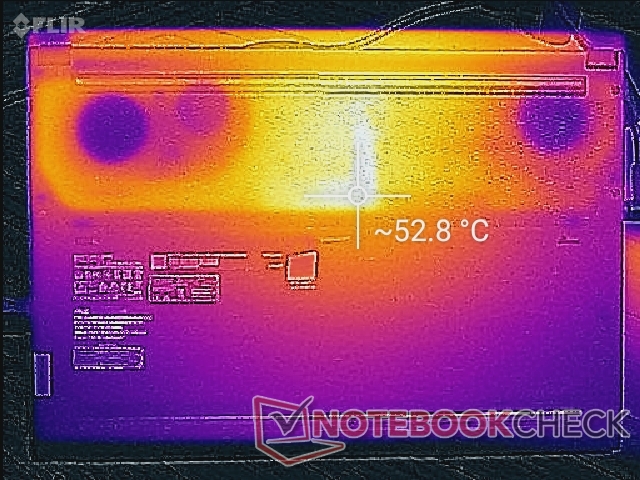
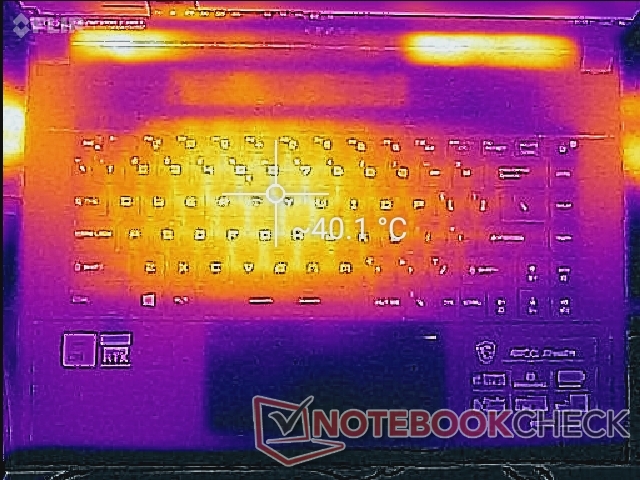
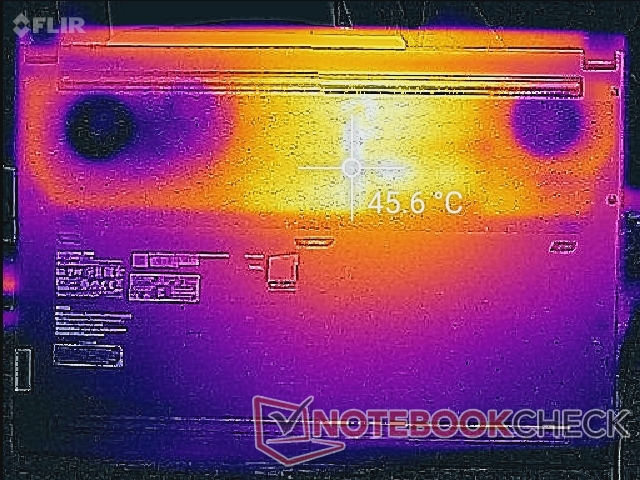
As temperaturas de superfície não são muito diferentes das dos SKUs GS66 Turing-powered, uma vez que a MSI tem como objetivo térmico semelhante de gênero a gênero. O centro do teclado pode ser tão quente quanto 44 C quando se joga enquanto a palma da mão descansa, as teclas WASD e as teclas de seta permanecem muito mais frias para jogos mais confortáveis. O concorrente Razer Blade 15 funciona mais quente especialmente nos descansos de palma devido ao seu design unibody mais resistente e ao menor número de grelhas de ventilação.
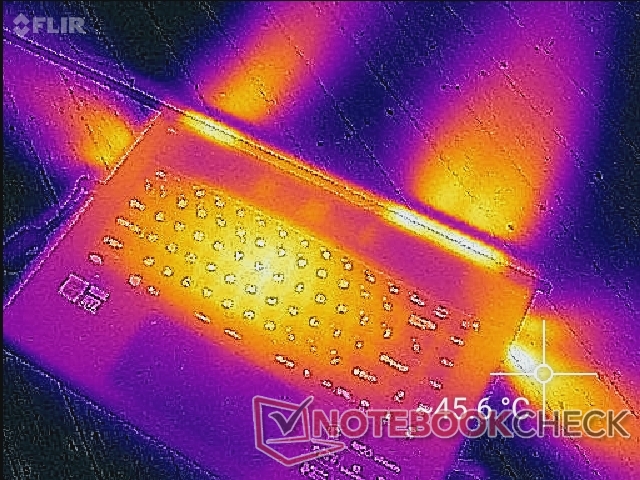
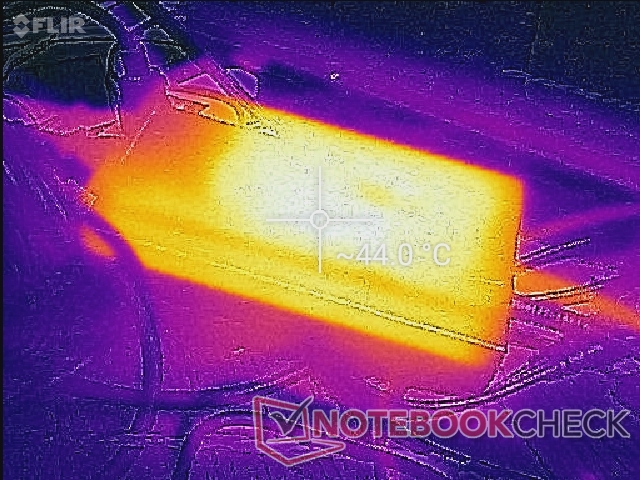
(±) A temperatura máxima no lado superior é 40.2 °C / 104 F, em comparação com a média de 40.4 °C / 105 F , variando de 21.2 a 68.8 °C para a classe Gaming.
(-) A parte inferior aquece até um máximo de 45.6 °C / 114 F, em comparação com a média de 43.2 °C / 110 F
(+) Em uso inativo, a temperatura média para o lado superior é 27 °C / 81 F, em comparação com a média do dispositivo de 33.9 °C / ### class_avg_f### F.
(+) Jogando The Witcher 3, a temperatura média para o lado superior é 31.3 °C / 88 F, em comparação com a média do dispositivo de 33.9 °C / ## #class_avg_f### F.
(+) Os apoios para as mãos e o touchpad são mais frios que a temperatura da pele, com um máximo de 26.2 °C / 79.2 F e, portanto, são frios ao toque.
(+) A temperatura média da área do apoio para as mãos de dispositivos semelhantes foi 28.8 °C / 83.8 F (+2.6 °C / 4.6 F).
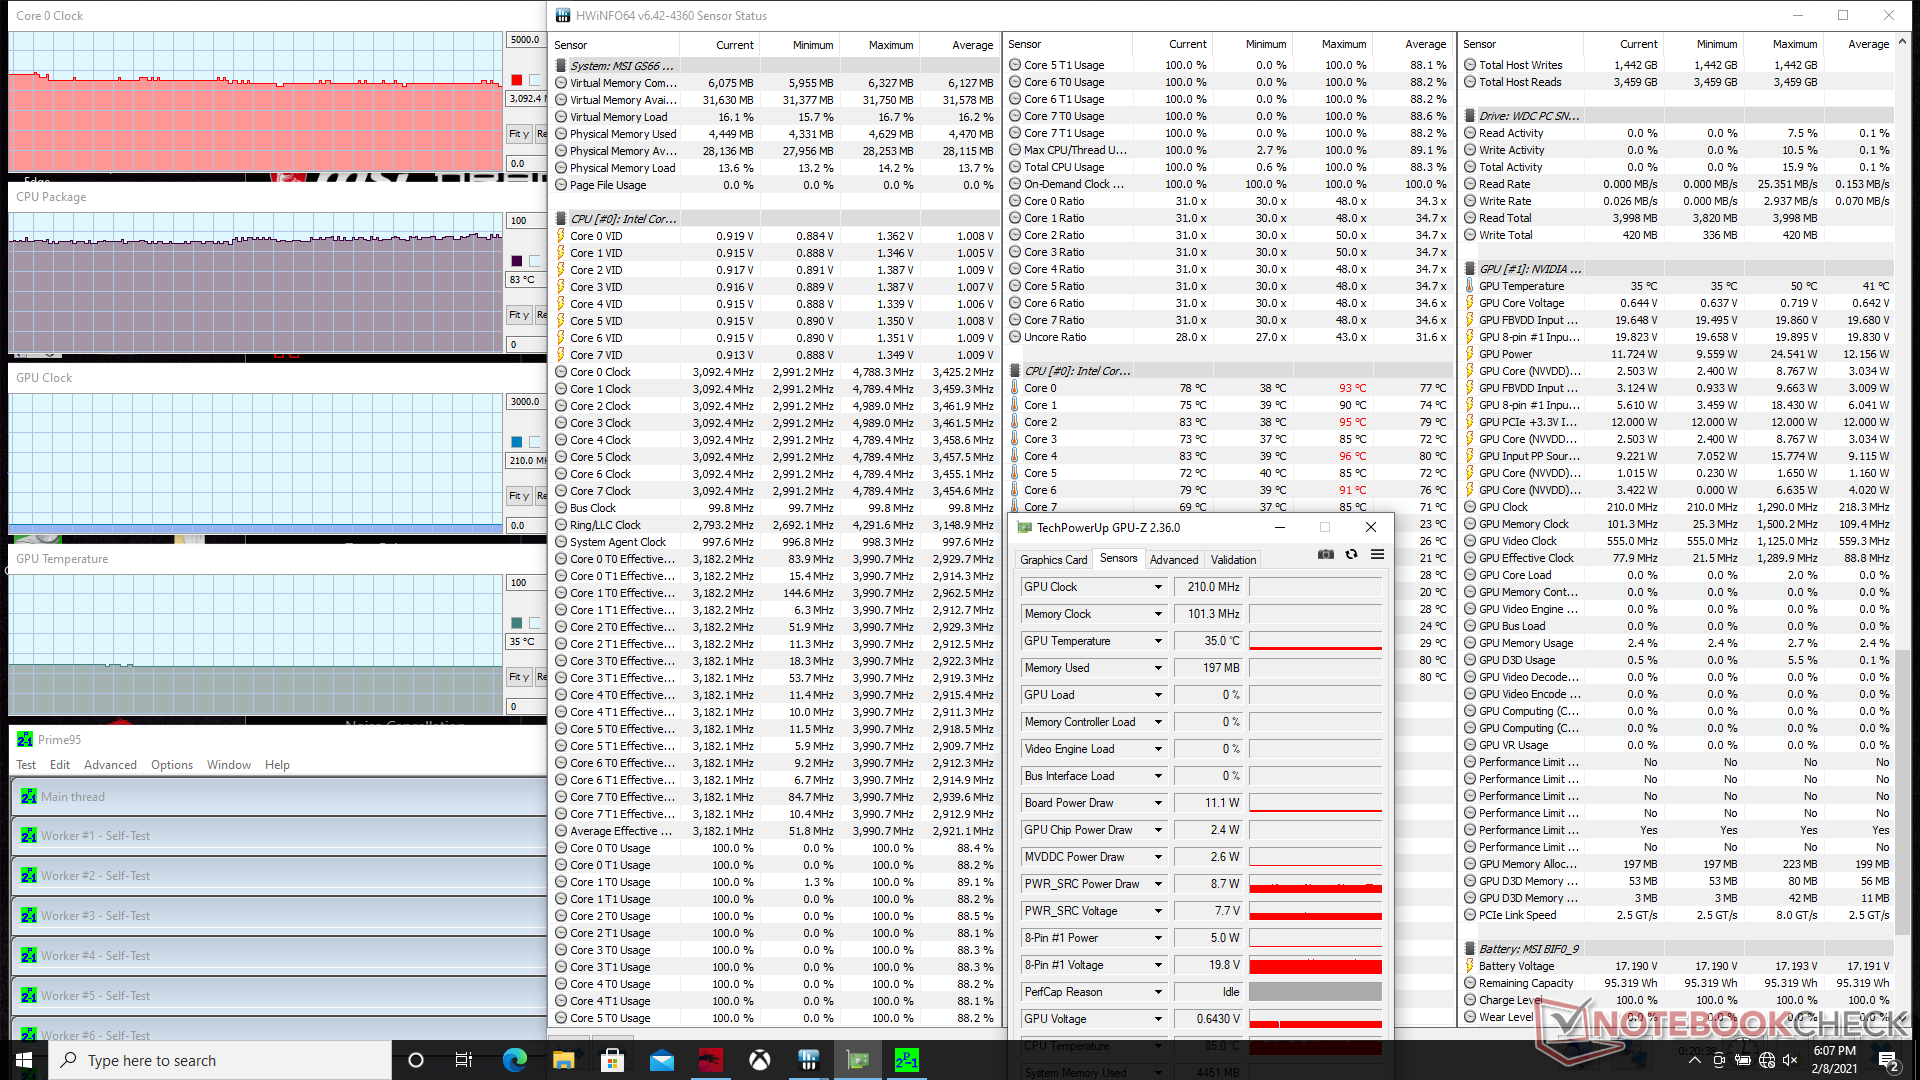
Teste de estresse
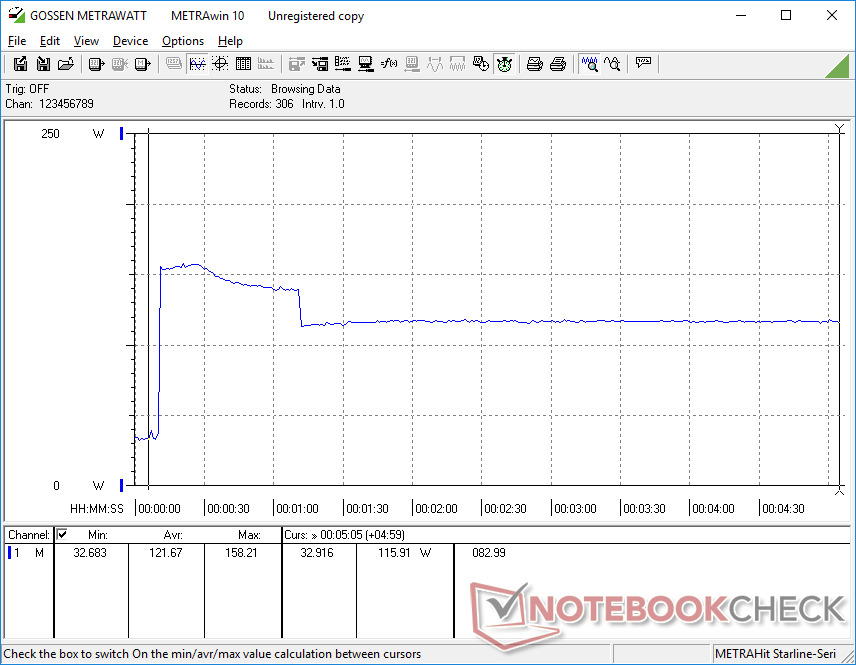
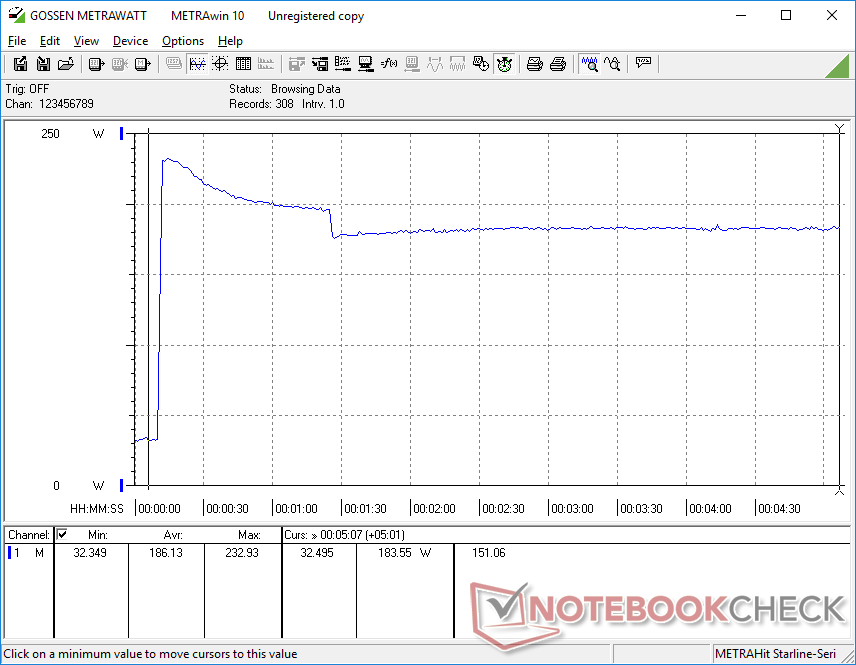
Enfatizamos o laptop com cargas sintéticas para identificar qualquer problema potencial de estrangulamento ou estabilidade tanto no modo Cooler Boost quanto no modo não Cooler Boost. Ao executar Prime95 com Cooler Boost desligado, a CPU aumentaria para 4 GHz e 95 C durante os primeiros segundos antes de eventualmente cair e estabilizar em 3,0 GHz e 90 C. Se o Cooler Boost estiver ativado, a temperatura central cairia para 83 C enquanto as taxas de relógio permaneceriam as mesmas.
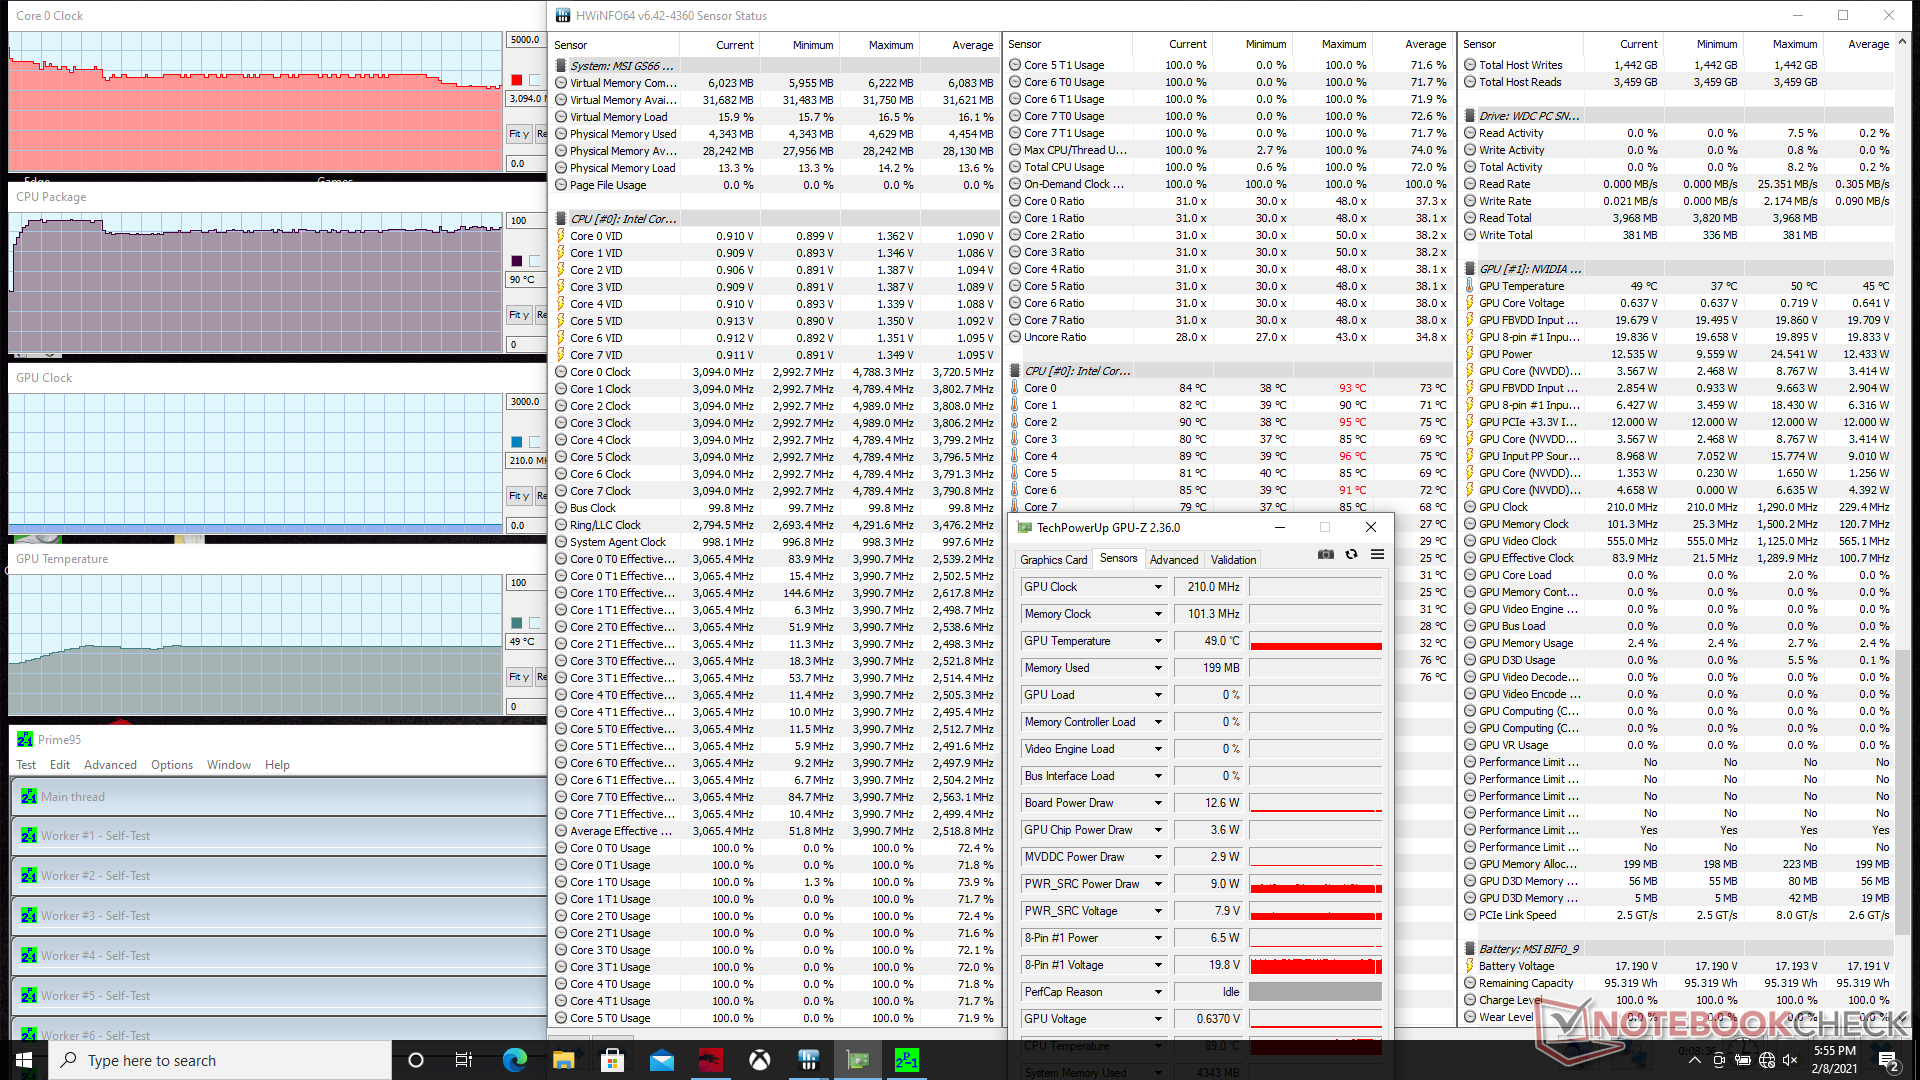
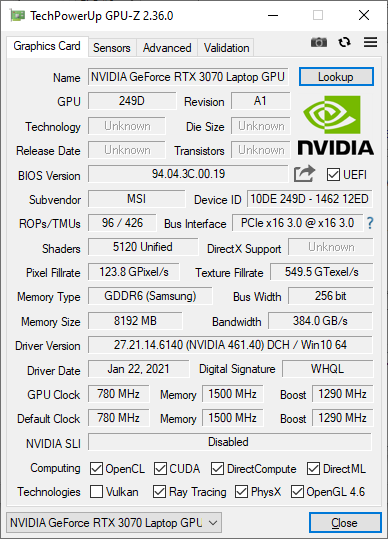
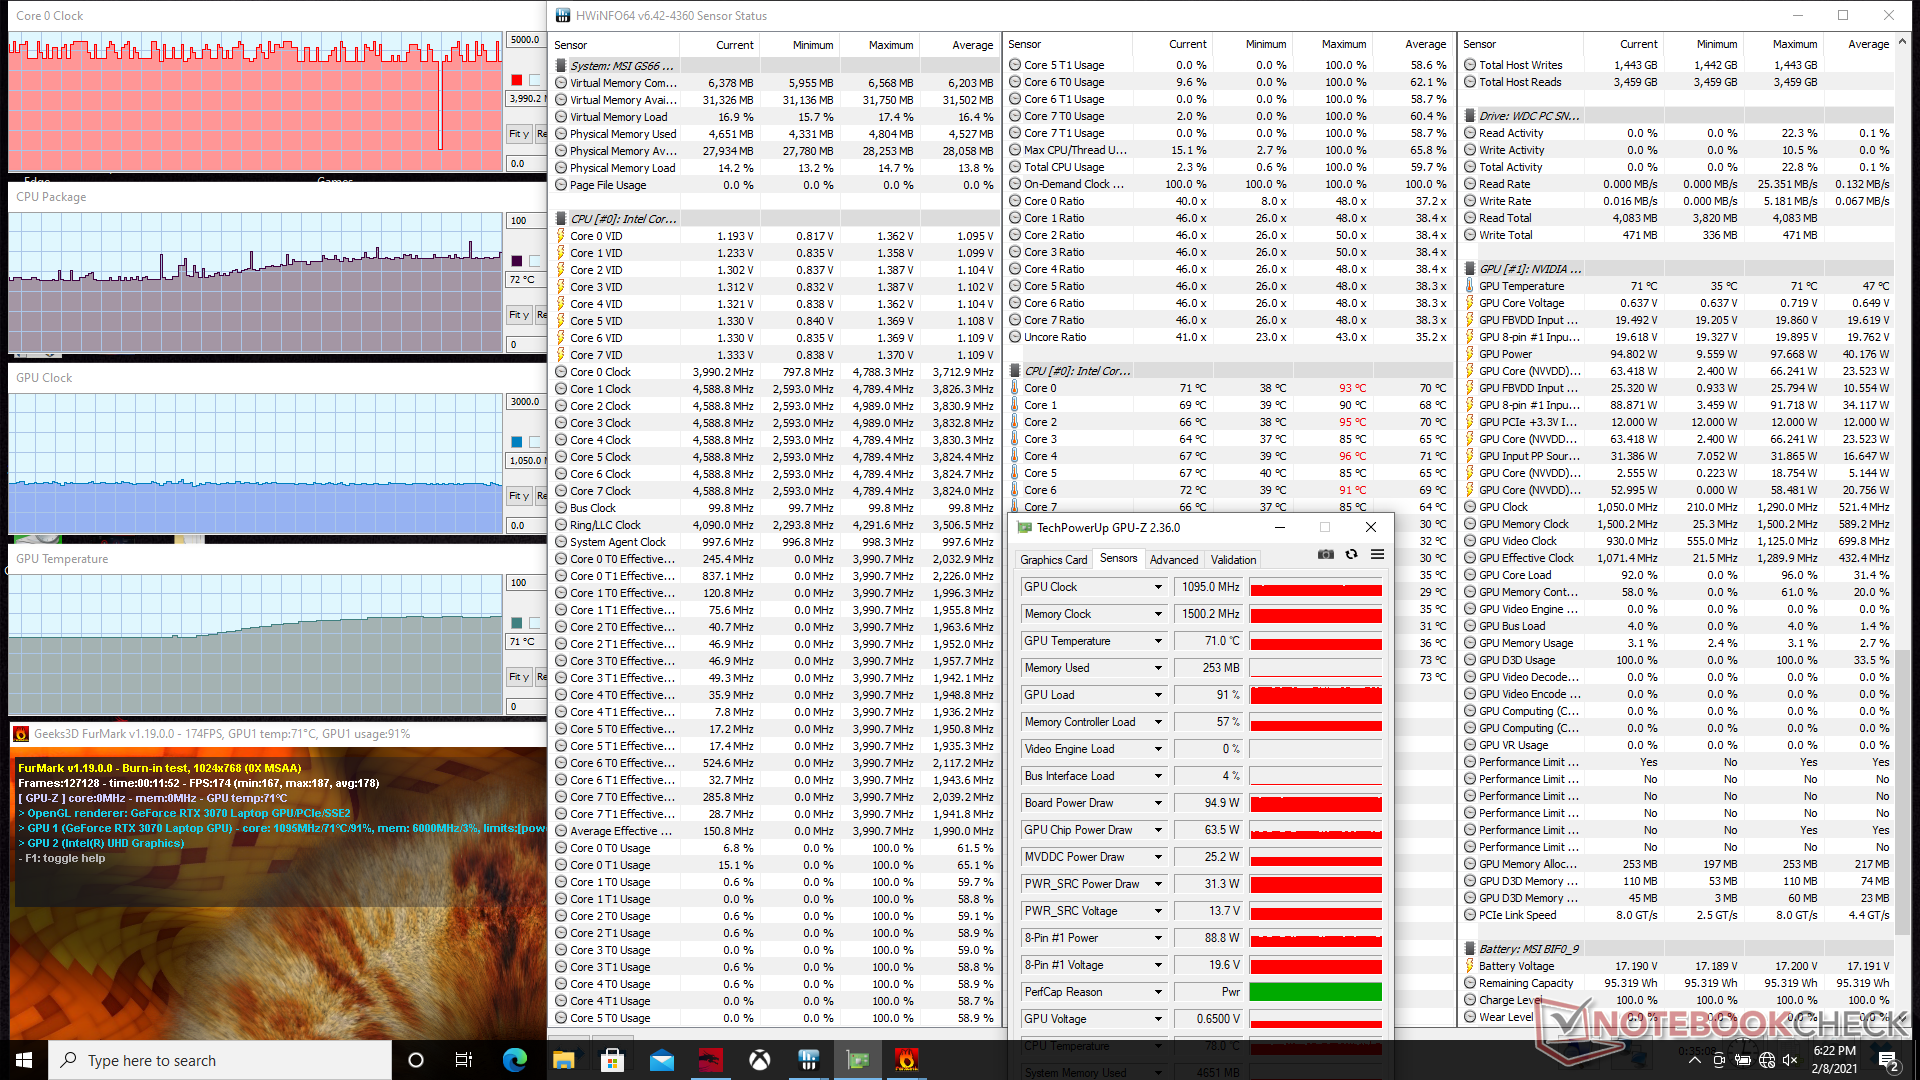
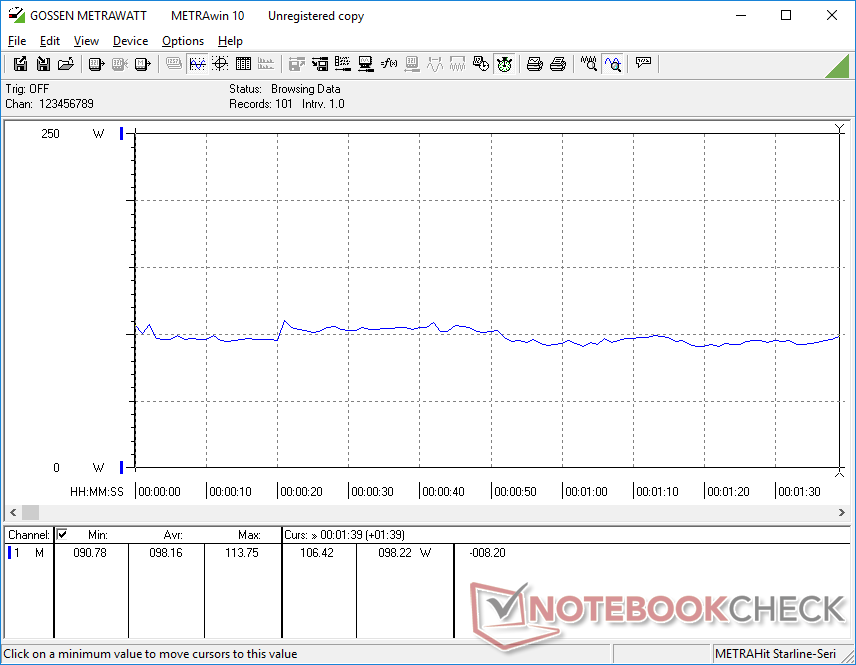
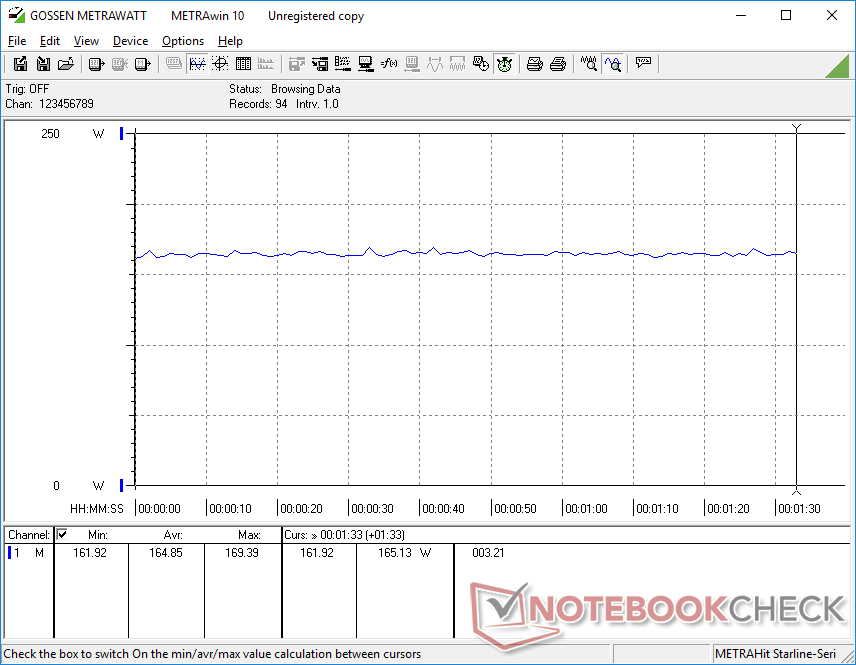
A execução do FurMark com Cooler Boost on resultaria em uma temperatura de GPU significativamente mais fria de 56 C em comparação com 71 C se o recurso fosse desativado. A taxa de relógio GPU também funcionaria ligeiramente mais alta em cerca de 50 a 60 MHz. GPU-Z mostra um consumo de 95,4 W na placa para igualar a reivindicação da MSI de um TGP de 95 W.

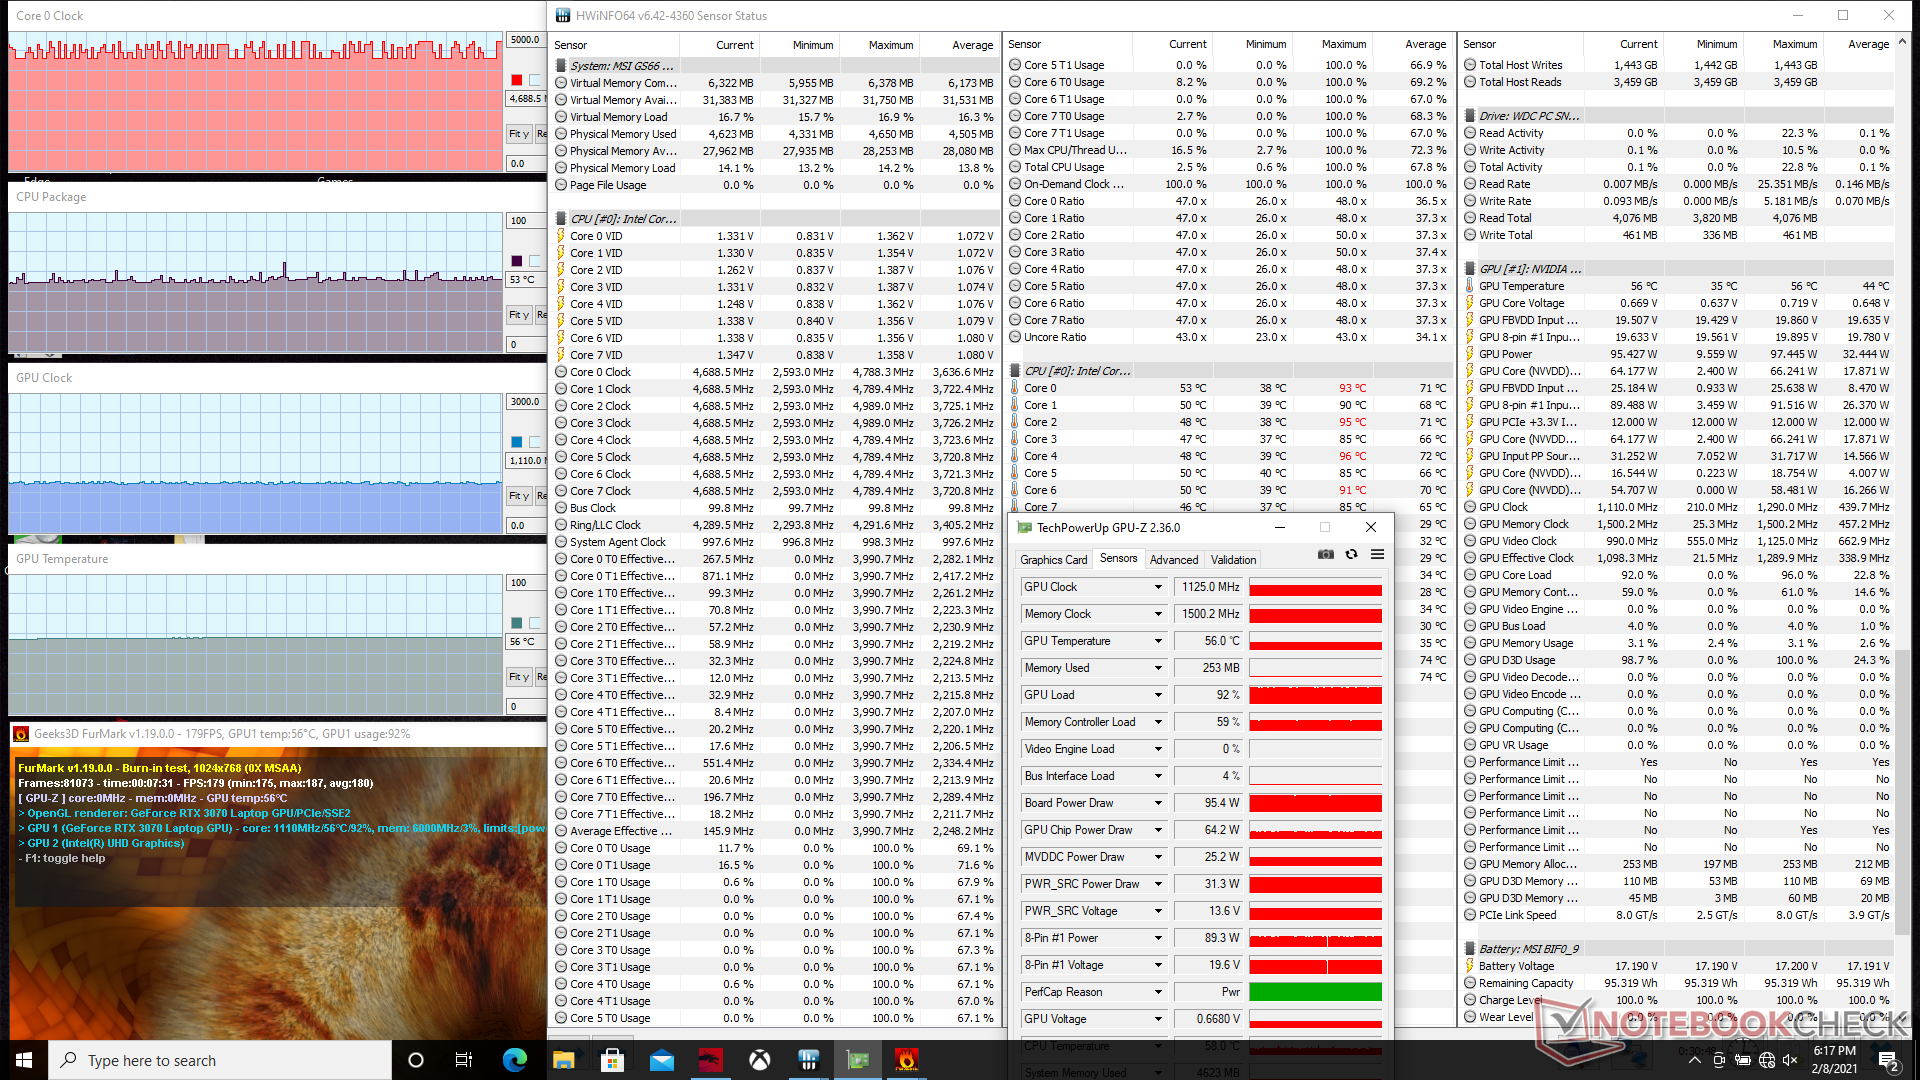

Em funcionamento Witcher 3 é mais representativa das cargas de jogos do mundo real do que Prime95 ou FurMark. A CPU e GPU estabilizariam a temperaturas relativamente frias de 66 C e 71 C, respectivamente, mesmo sem permitir o Cooler Boost. A ativação deste recurso faria com que as temperaturas da CPU e da GPU caíssem para apenas 50 C e 57 C, respectivamente. As taxas de relógio nem são tão altas com o Cooler Boost, apesar do extremo aumento do ruído do ventilador. Assim, o modo Cooler Boost tem mais a ver com a melhoria das temperaturas do que com a maximização das taxas de quadros quando se joga.

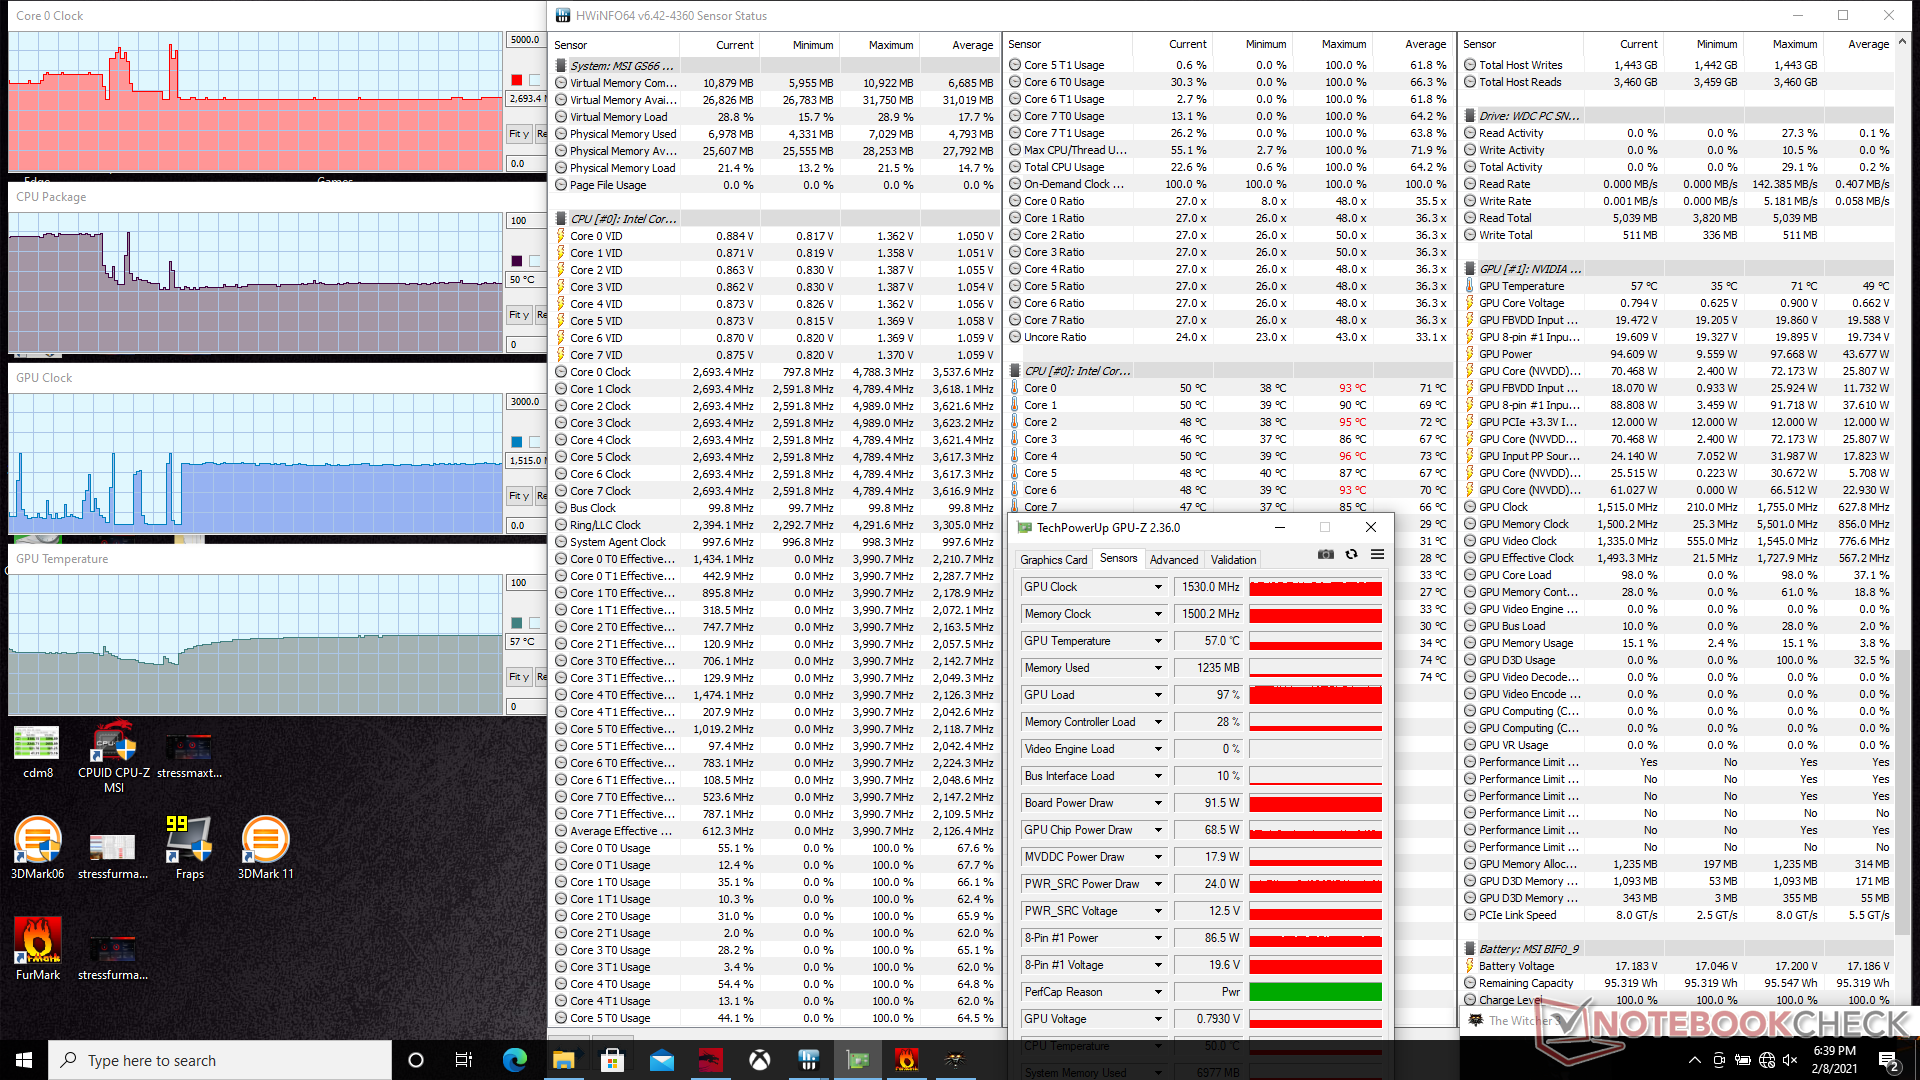
O funcionamento simultâneo do Prime95 e do FurMark aciona a GPU com bastante força até cerca de 375 MHz e 31 W, independentemente do ajuste do Cooler Boost. A CPU, no entanto, permanece quase inalterada, pois ainda funcionará a mais de 3 GHz.
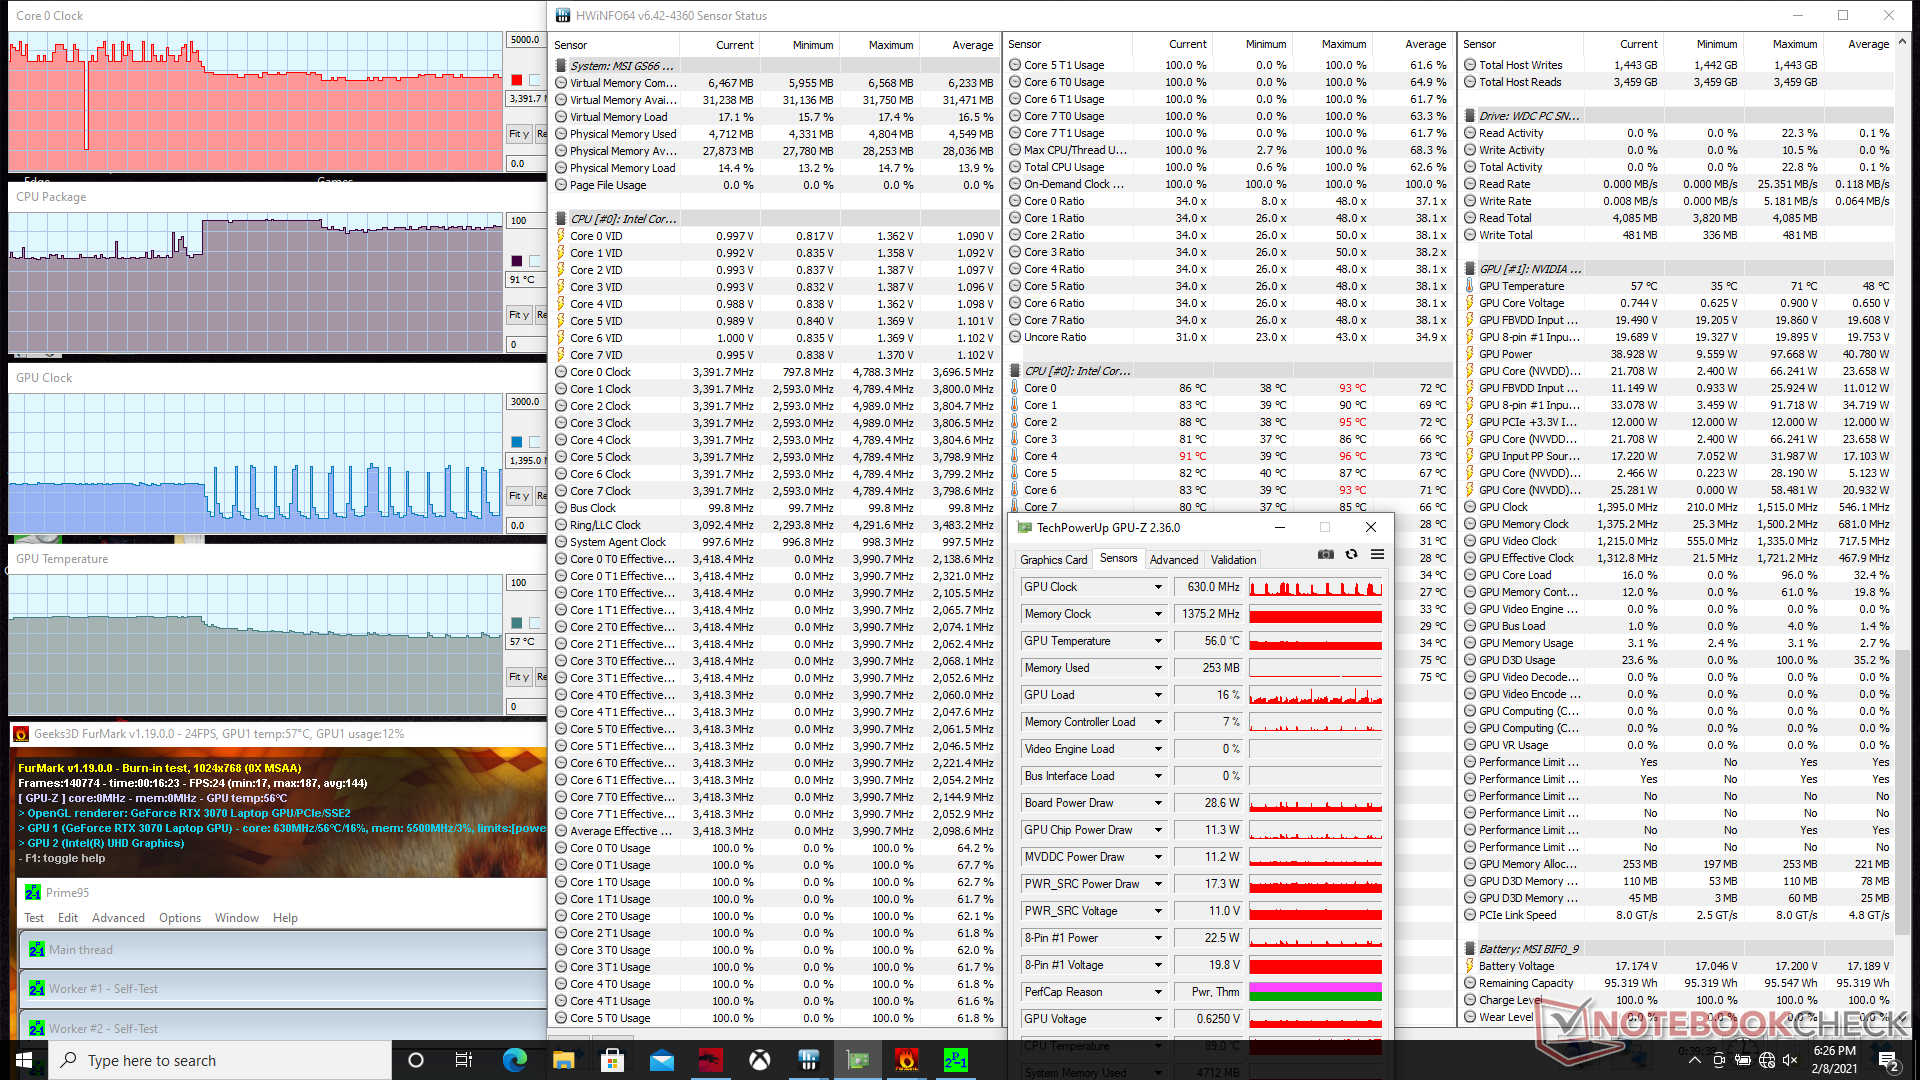
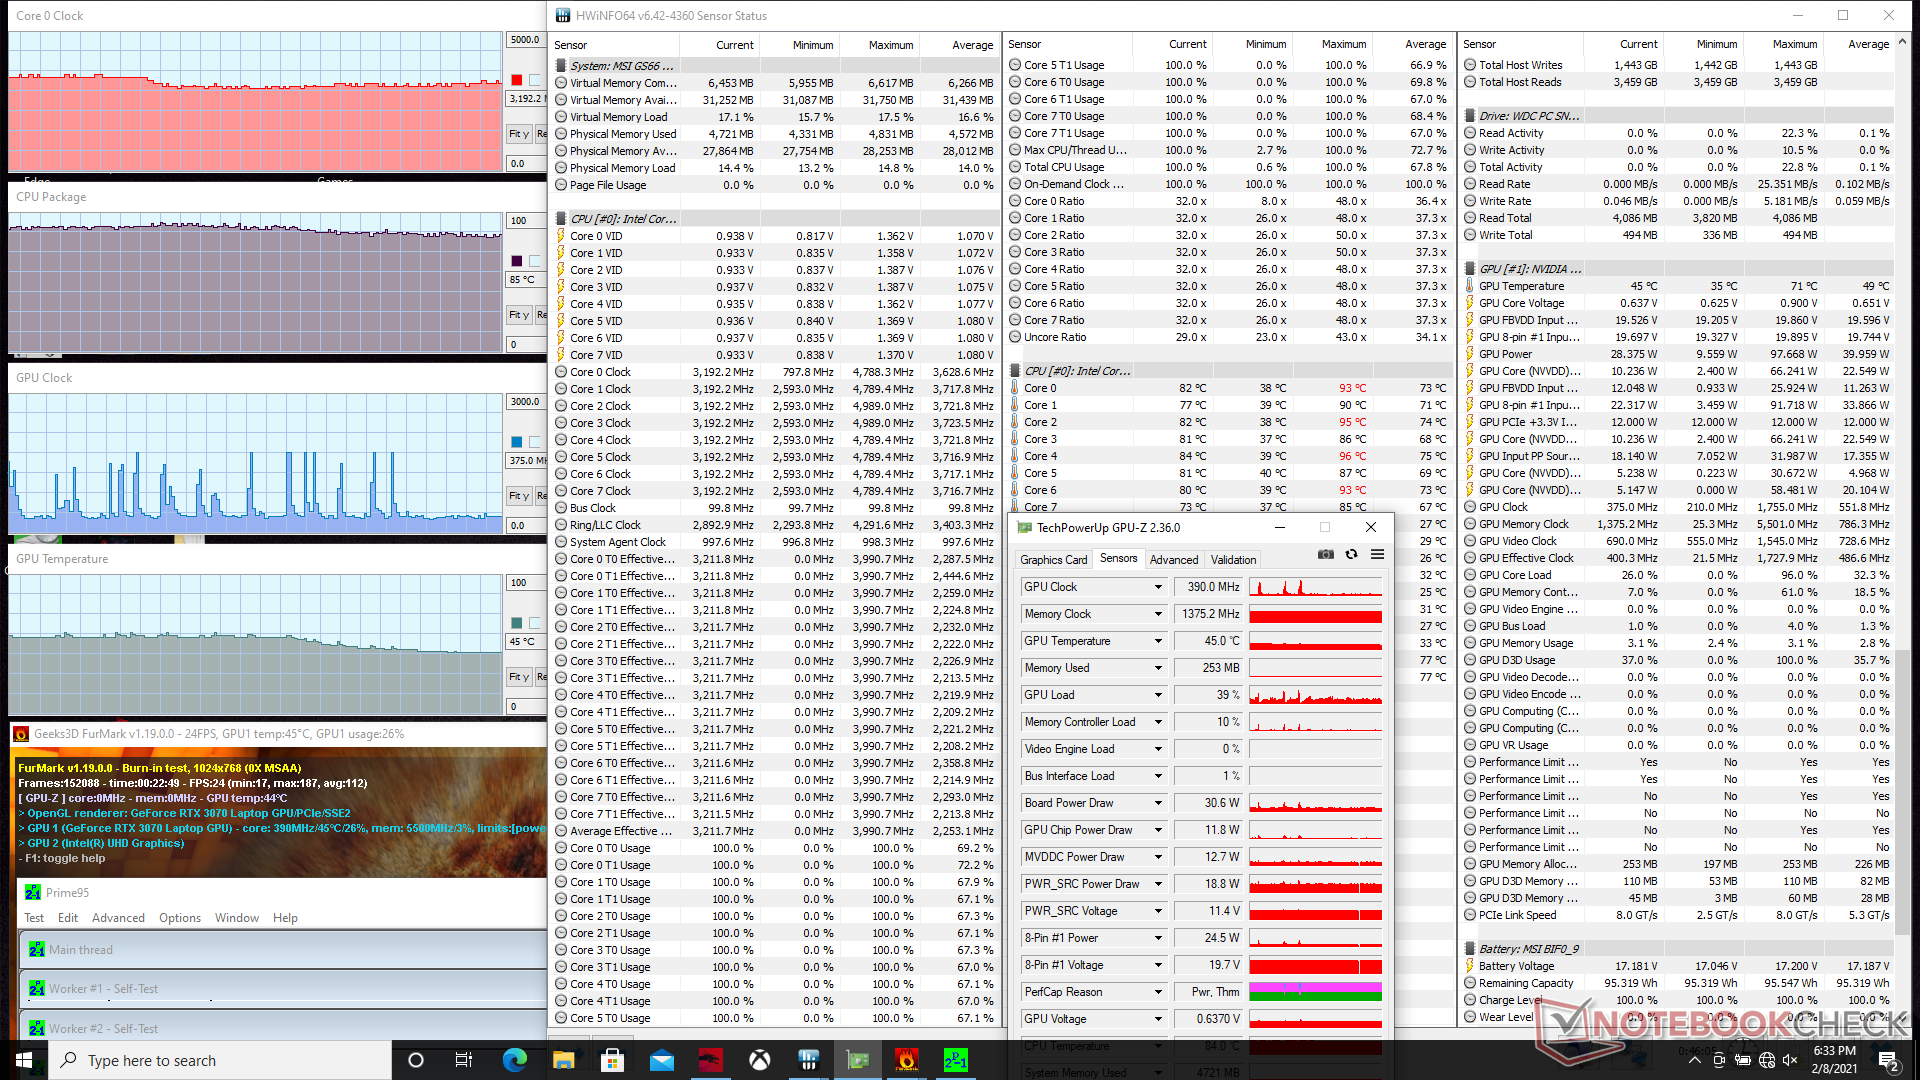
| RelógioCPU (GHz) | RelógioGPU (MHz) | Temperaturamédiada CPU (°C) | Temperaturamédiada GPU (°C) | |
| Sistema ocioso (Cooler Boost off) | -- | --41 | 37 | |
| Prime95 Stress (Cooler Boost off) | 3.0 - 3.1 | -90 | 49 | |
| Prime95 Stress (Cooler Boost on) | 3.0 - 3.1 | -83 | 35 | |
| FurMark Stress (Cooler Boost off) | -- | 1050 | 72 | 71 |
| FurMark Stress (Cooler Boost on) | -- | 1110 | 53 | 56 |
| Witcher 3 Stress (Cooler Boost off) | 2.7 | 1440 | 66 | 71 |
| Witcher 3 Stress (Cooler Boost on) | 2.7 | 1515 | 50 | 57 |
| Prime95 + FurMark Stress (Cooler Boost off) | 3.3 - 3.4 | 375 - 1440 | 91 | 57 |
| Prime95 + FurMark Stress (Cooler Boost on) | 3.1 - 3.2 | 375 | 85 | 45 |
Oradores


MSI GS66 Stealth 10UG análise de áudio
(±) | o volume do alto-falante é médio, mas bom (###valor### dB)
Graves 100 - 315Hz
(-) | quase nenhum baixo - em média 18.9% menor que a mediana
(±) | a linearidade dos graves é média (13.6% delta para a frequência anterior)
Médios 400 - 2.000 Hz
(±) | médios mais altos - em média 6.1% maior que a mediana
(+) | médios são lineares (5.7% delta para frequência anterior)
Altos 2 - 16 kHz
(+) | agudos equilibrados - apenas 2.4% longe da mediana
(±) | a linearidade dos máximos é média (8% delta para frequência anterior)
Geral 100 - 16.000 Hz
(±) | a linearidade do som geral é média (20.3% diferença em relação à mediana)
Comparado com a mesma classe
» 72% de todos os dispositivos testados nesta classe foram melhores, 6% semelhantes, 23% piores
» O melhor teve um delta de 6%, a média foi 18%, o pior foi 132%
Comparado com todos os dispositivos testados
» 53% de todos os dispositivos testados foram melhores, 8% semelhantes, 39% piores
» O melhor teve um delta de 4%, a média foi 23%, o pior foi 134%
Apple MacBook 12 (Early 2016) 1.1 GHz análise de áudio
(+) | os alto-falantes podem tocar relativamente alto (###valor### dB)
Graves 100 - 315Hz
(±) | graves reduzidos - em média 11.3% menor que a mediana
(±) | a linearidade dos graves é média (14.2% delta para a frequência anterior)
Médios 400 - 2.000 Hz
(+) | médios equilibrados - apenas 2.4% longe da mediana
(+) | médios são lineares (5.5% delta para frequência anterior)
Altos 2 - 16 kHz
(+) | agudos equilibrados - apenas 2% longe da mediana
(+) | os máximos são lineares (4.5% delta da frequência anterior)
Geral 100 - 16.000 Hz
(+) | o som geral é linear (10.2% diferença em relação à mediana)
Comparado com a mesma classe
» 7% de todos os dispositivos testados nesta classe foram melhores, 2% semelhantes, 90% piores
» O melhor teve um delta de 5%, a média foi 18%, o pior foi 53%
Comparado com todos os dispositivos testados
» 5% de todos os dispositivos testados foram melhores, 1% semelhantes, 94% piores
» O melhor teve um delta de 4%, a média foi 23%, o pior foi 134%
Energy Management
Consumo de energia
O consumo geral de energia é semelhante ao que registramos no GS66 10SFS com o antigo GeForce RTX 2070 Super Max-Q. Mais notadamente, o consumo de energia em nosso GS66 10UG é apenas cerca de 6% maior quando se joga, apesar de o sistema oferecer um desempenho gráfico aproximadamente 30% mais rápido para mostrar um desempenho superior por watt em relação à GPU Turing do ano passado.
Somos capazes de registrar um draw máximo temporário de 233 W a partir do médio-grande (~15,3 x 7,3 x 3 cm) adaptador de 230 W AC ao rodar simultaneamente Prime95 e FurMark. A taxa sustentada está mais próxima de 184 W devido a limitações térmicas
| desligado | |
| Ocioso | |
| Carga |
|
Key:
min: | |
| MSI GS66 Stealth 10UG i7-10870H, GeForce RTX 3070 Laptop GPU, WDC PC SN730 SDBPNTY-1T00, IPS, 1920x1080, 15.6" | MSI GS66 10SGS i7-10750H, GeForce RTX 2080 Super Max-Q, Samsung SSD PM981 MZVLB512HAJQ, IPS, 1920x1080, 15.6" | Asus TUF Dash F15 FX516PR i7-11370H, GeForce RTX 3070 Laptop GPU, SK Hynix HFM001TD3JX013N, IPS, 1920x1080, 15.6" | Alienware m15 R3 P87F i7-10750H, GeForce RTX 2070 Mobile, 2x Micron 2200S 512 GB (RAID 0), IPS, 1920x1080, 15.6" | MSI GS66 Stealth 10SFS i9-10980HK, GeForce RTX 2070 Super Max-Q, Samsung SSD PM981 MZVLB1T0HALR, IPS, 1920x1080, 15.6" | |
|---|---|---|---|---|---|
| Power Consumption | -3% | 25% | -95% | -2% | |
| Idle Minimum * (Watt) | 12.9 | 14.9 -16% | 9 30% | 34 -164% | 13 -1% |
| Idle Average * (Watt) | 15.4 | 17.5 -14% | 11 29% | 48.6 -216% | 16 -4% |
| Idle Maximum * (Watt) | 27.1 | 29.5 -9% | 16 41% | 58.2 -115% | 27 -0% |
| Load Average * (Watt) | 98.2 | 94.8 3% | 107 -9% | 129.4 -32% | 109 -11% |
| Witcher 3 ultra * (Watt) | 164.9 | 146.1 11% | 121 27% | 214.5 -30% | 155 6% |
| Load Maximum * (Watt) | 232.9 | 210.9 9% | 162 30% | 257.3 -10% | 236 -1% |
* ... menor é melhor
Vida útil da bateria
Os tempos de funcionamento são quase idênticos aos que registramos no GS66 10SGS mais antigo, alimentado pela Turing, com cerca de 7 horas de uso da WLAN no mundo real, quando no perfil de potência Balanceado. O sistema também pode ser recarregado via USB-C, embora a um ritmo mais lento.
Experimentamos um estranho comportamento de recarga com o adaptador AC incluído em nossa unidade de teste. Ao carregar do vazio, a taxa de carga seria extremamente lenta, a ponto de uma hora cheia carregar apenas 10%. Então, a taxa de recarga seria inexplicavelmente retomada até sua taxa "normal" para recarregar totalmente o laptop 1,5 a 2 horas mais tarde. Este mesmo fenômeno ocorreria mesmo após os testes novamente. Recomendamos aos novos proprietários que verifiquem novamente suas taxas de carga para ter certeza de que não está demorando mais do que o normal para recarregar a bateria.
| MSI GS66 Stealth 10UG i7-10870H, GeForce RTX 3070 Laptop GPU, 99.9 Wh | MSI GS66 10SGS i7-10750H, GeForce RTX 2080 Super Max-Q, 99.99 Wh | Asus TUF Dash F15 FX516PR i7-11370H, GeForce RTX 3070 Laptop GPU, 76 Wh | Razer Blade 15 RTX 2070 Super Max-Q i7-10875H, GeForce RTX 2070 Super Max-Q, 80 Wh | Aorus 15P WB i7-10750H, GeForce RTX 2070 Max-Q, 94.24 Wh | Alienware m15 R3 P87F i7-10750H, GeForce RTX 2070 Mobile, 86 Wh | |
|---|---|---|---|---|---|---|
| Duração da bateria | -12% | 38% | -11% | 3% | -61% | |
| Reader / Idle (h) | 10.8 | 10.2 -6% | 16 48% | 11.3 5% | 5 -54% | |
| WiFi v1.3 (h) | 7.1 | 6.9 -3% | 9.1 28% | 6.3 -11% | 7.1 0% | 2.8 -61% |
| Load (h) | 2.2 | 1.6 -27% | 2.3 5% | 0.7 -68% |
Pro
Contra
Veredicto

A atualização da área de trabalho GeForce RTX 2070 para a área de trabalho RTX 3070 irá proporcionar um ganho líquido de 40 a 45 por cento no desempenho gráfico bruto. Enquanto isso, a atualização do móvel GeForce RTX 2070 para o móvel RTX 3070 terá um ganho líquido de 25 a 30 por cento. O GS66 2021 pode vir equipado com uma nova GPU sofisticada, mas as limitações de potência permanecem semelhantes para ganhos menores de gen para gen em geral. É mais rápido, com certeza - mas não tanto assim. Os gamers no mercado para um novo GS66 ainda podem considerar os SKUs RTX 20 ligeiramente mais antigos sem sentir que estão perdendo algo enorme.
O GS66 com GeForce RTX 30 oferece um desempenho gráfico mais rápido do que as opções do ano passado sem a necessidade de rodar mais quente, mais alto ou mais curto. Entretanto, os ganhos são leves a moderados na melhor das hipóteses.
É recomendado evitar a opção Core i9-10980HK, pois não oferece benefícios significativos sobre o Core i7-10875H ou i7-10870H. Gastar esses dólares extras em mais RAM, armazenamento ou uma opção mais rápida de GPU seria uma abordagem mais equilibrada.
Preço e disponibilidade
MSI GS66 Stealth 10UG
- 02/11/2021 v7 (old)
Allen Ngo
Price comparison

