Razer Blade Pro 17 Early 2021 Laptop Review: A diferença GeForce RTX 30

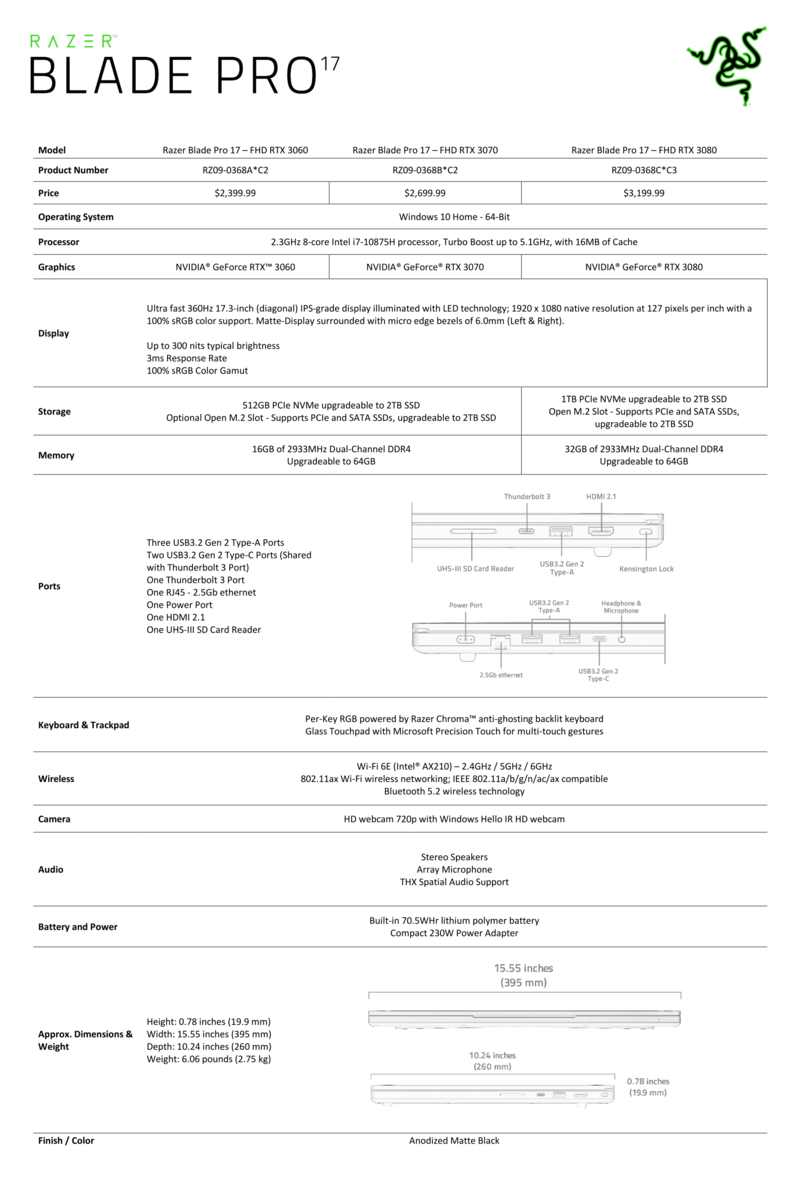
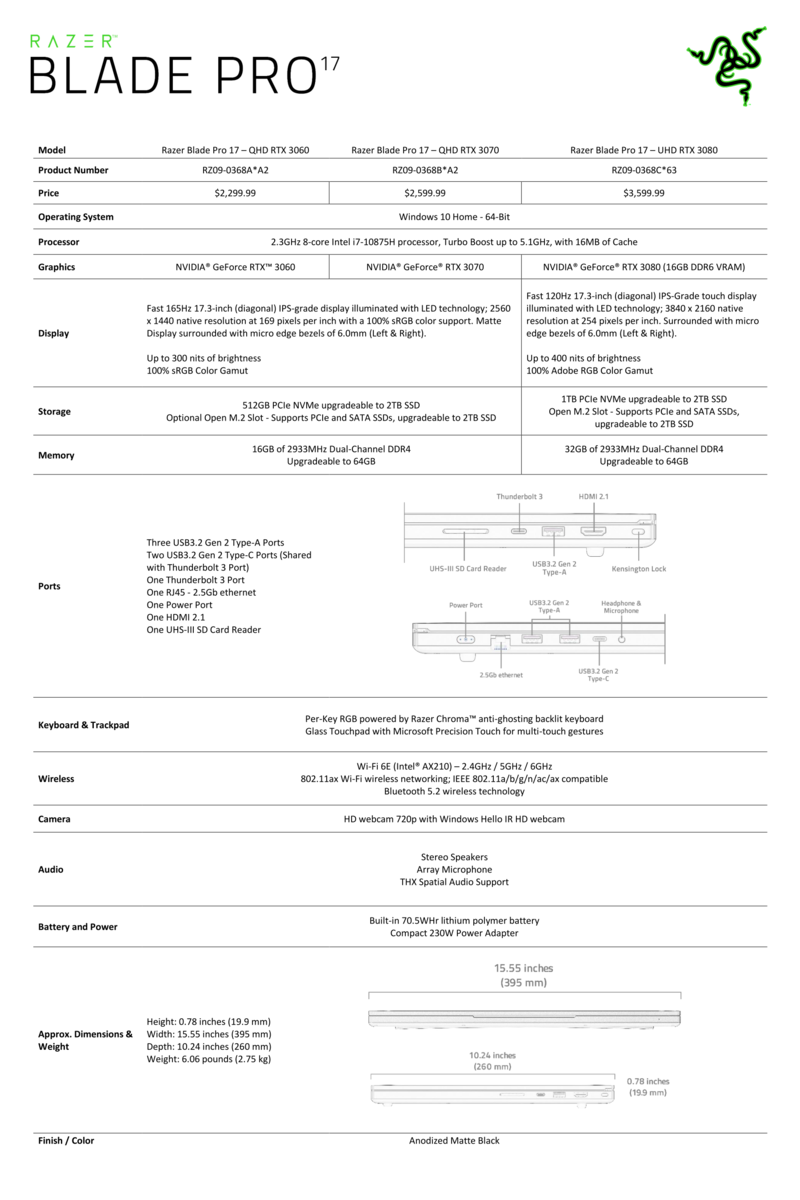
A Razer atualizou sua série Blade Pro de 17,3 polegadas com o novo GeForce RTX 30 Ampere GPUs para suplantar as opções de Turing RTX 20 do ano passado. O novo modelo também introduz uma opção de display QHD 1440p de 165 Hz para complementar os painéis existentes de 300 Hz FHD e 120 Hz 4K. Caso contrário, tudo mais sobre o laptop permanece idêntico ano após ano.
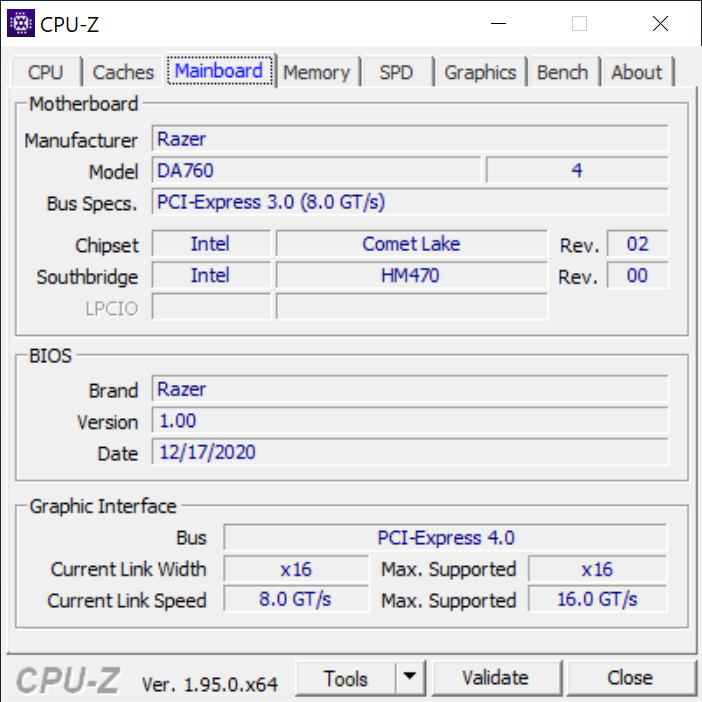
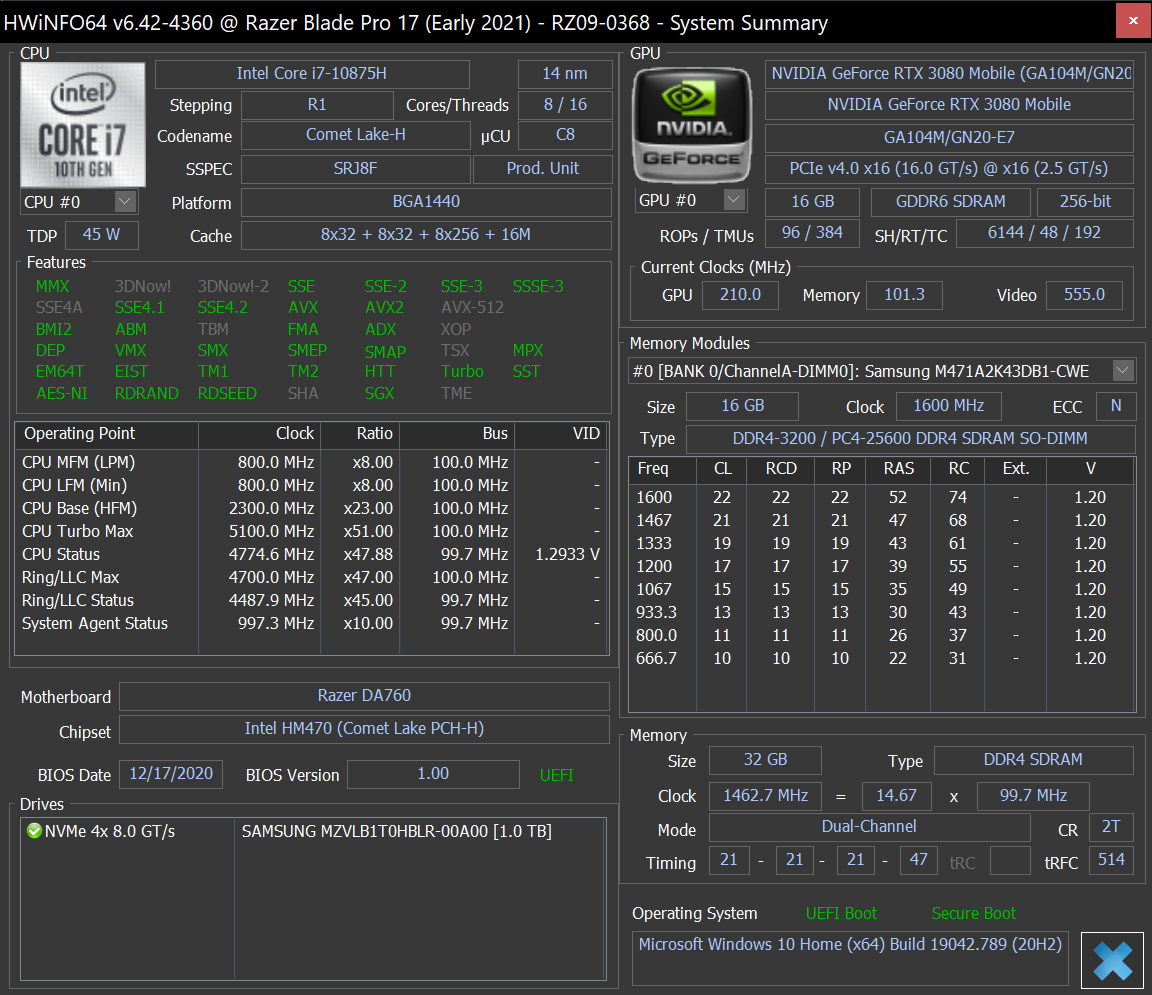
A configuração de teste que temos para esta revisão é a SKU de ponta mais alta com o GeForce RTX 3080 e 120 Hz 4K UHD touchscreen por cerca de US$3600. Recomendamos verificar nossas revisões existentes nos modelos Blade Pro 2020 e 2019 para mais informações sobre o chassi e suas características físicas. O RTX 3080 no Razer tem como alvo um TGP de 100 W em comparação com 135 W no Asus Zephyrus Duo 15 SE.
Mais análises da Razer:
potential competitors in comparison
Avaliação | Data | Modelo | Peso | Altura | Size | Resolução | Preço |
|---|---|---|---|---|---|---|---|
| 87.8 % v7 (old) | 02/2021 | Razer Blade Pro 17 2021 (QHD Touch) i7-10875H, GeForce RTX 3080 Laptop GPU | 3 kg | 19.9 mm | 17.30" | 3840x2160 | |
| 87.4 % v7 (old) | 06/2020 | Razer Blade Pro 17 RTX 2070 Max-Q 300 Hz i7-10875H, GeForce RTX 2070 Max-Q | 2.7 kg | 19.9 mm | 17.30" | 1920x1080 | |
| 85.1 % v7 (old) | 01/2021 | Schenker XMG Neo 17 (Early 2021, RTX 3070, 5800H) R7 5800H, GeForce RTX 3070 Laptop GPU | 2.5 kg | 27 mm | 17.30" | 2560x1440 | |
| 87.4 % v7 (old) | 10/2020 | MSI GT76 Titan DT 10SGS i9-10900K, GeForce RTX 2080 Super Mobile | 4.2 kg | 42 mm | 17.30" | 3840x2160 | |
| 83.1 % v7 (old) | 10/2020 | Asus Strix G17 G712LWS i7-10750H, GeForce RTX 2070 Super Mobile | 2.8 kg | 26.5 mm | 17.30" | 1920x1080 | |
| 83.7 % v7 (old) | 08/2020 | MSI GS75 10SF-609US i7-10875H, GeForce RTX 2070 Max-Q | 2.3 kg | 18.9 mm | 17.30" | 1920x1080 |
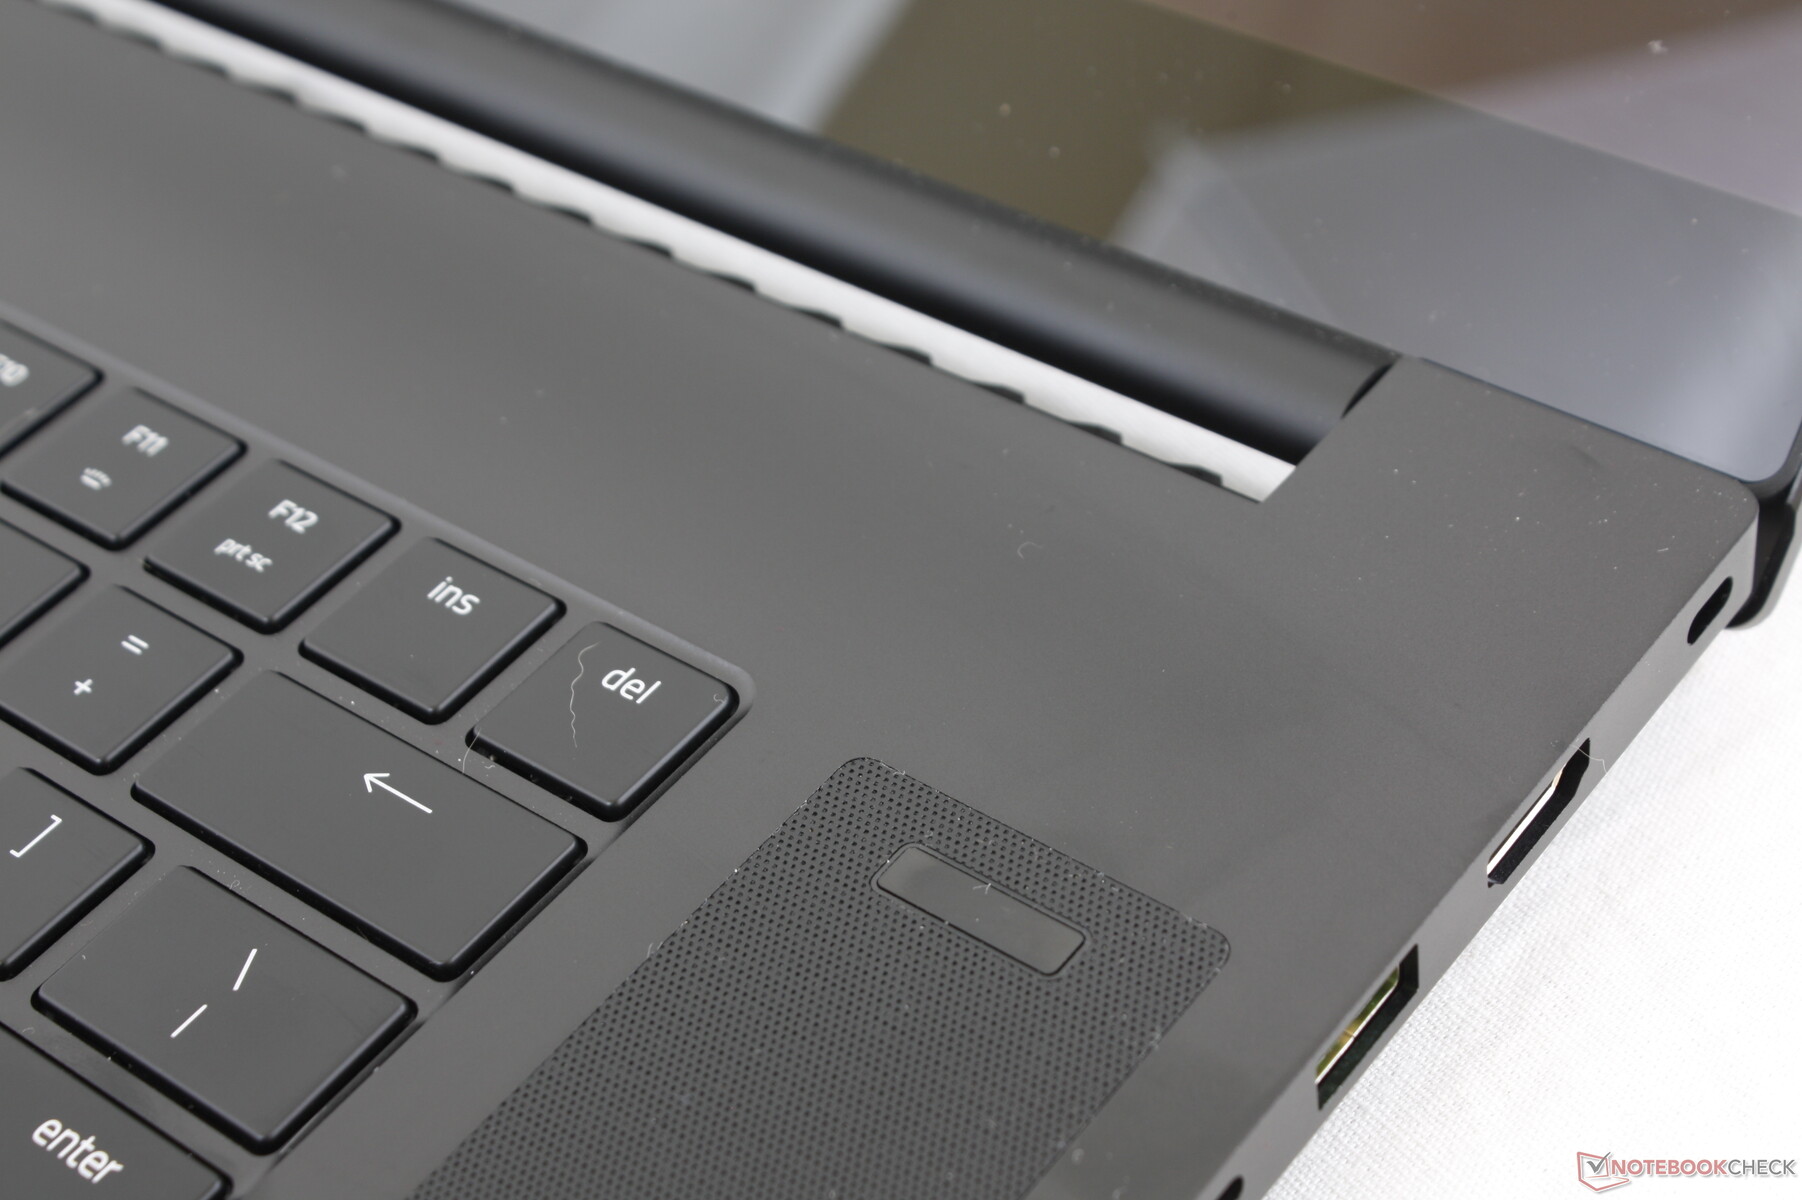
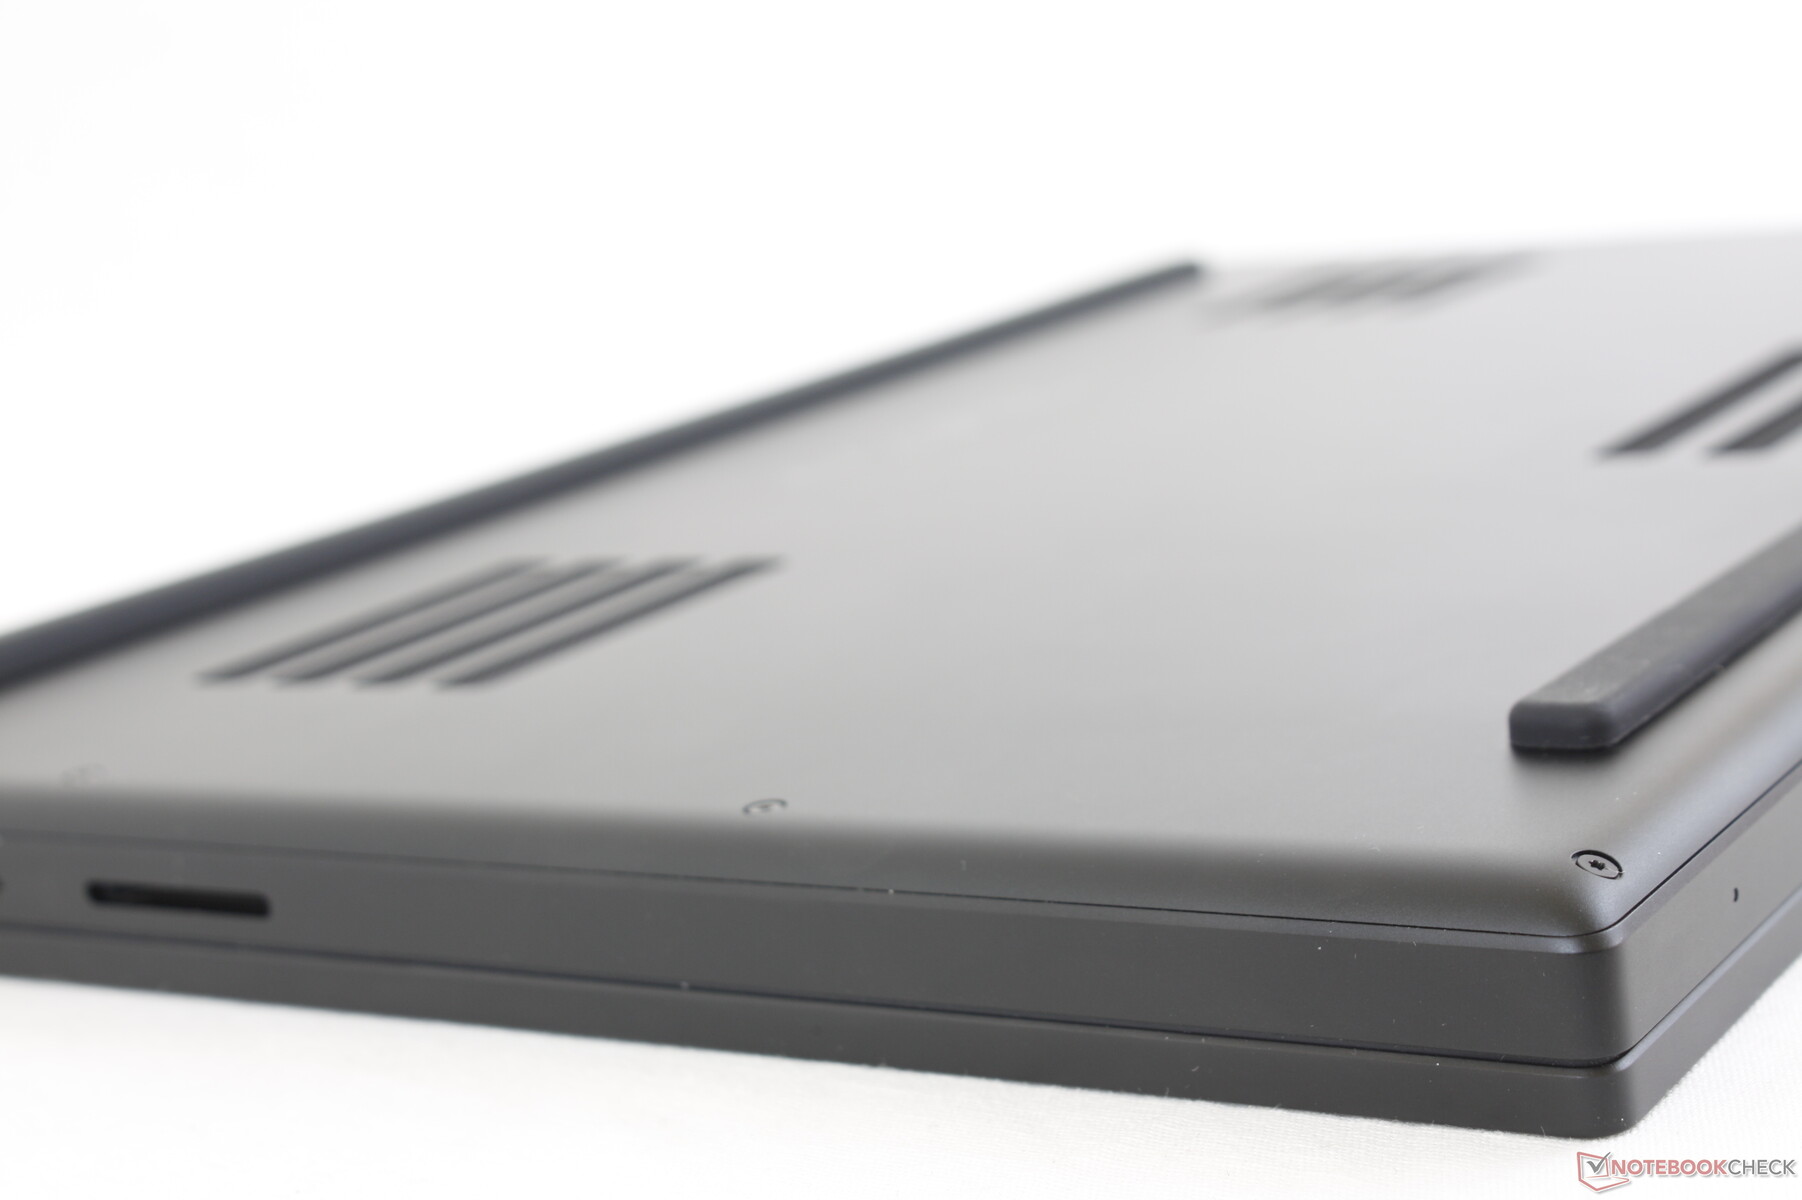
Caso


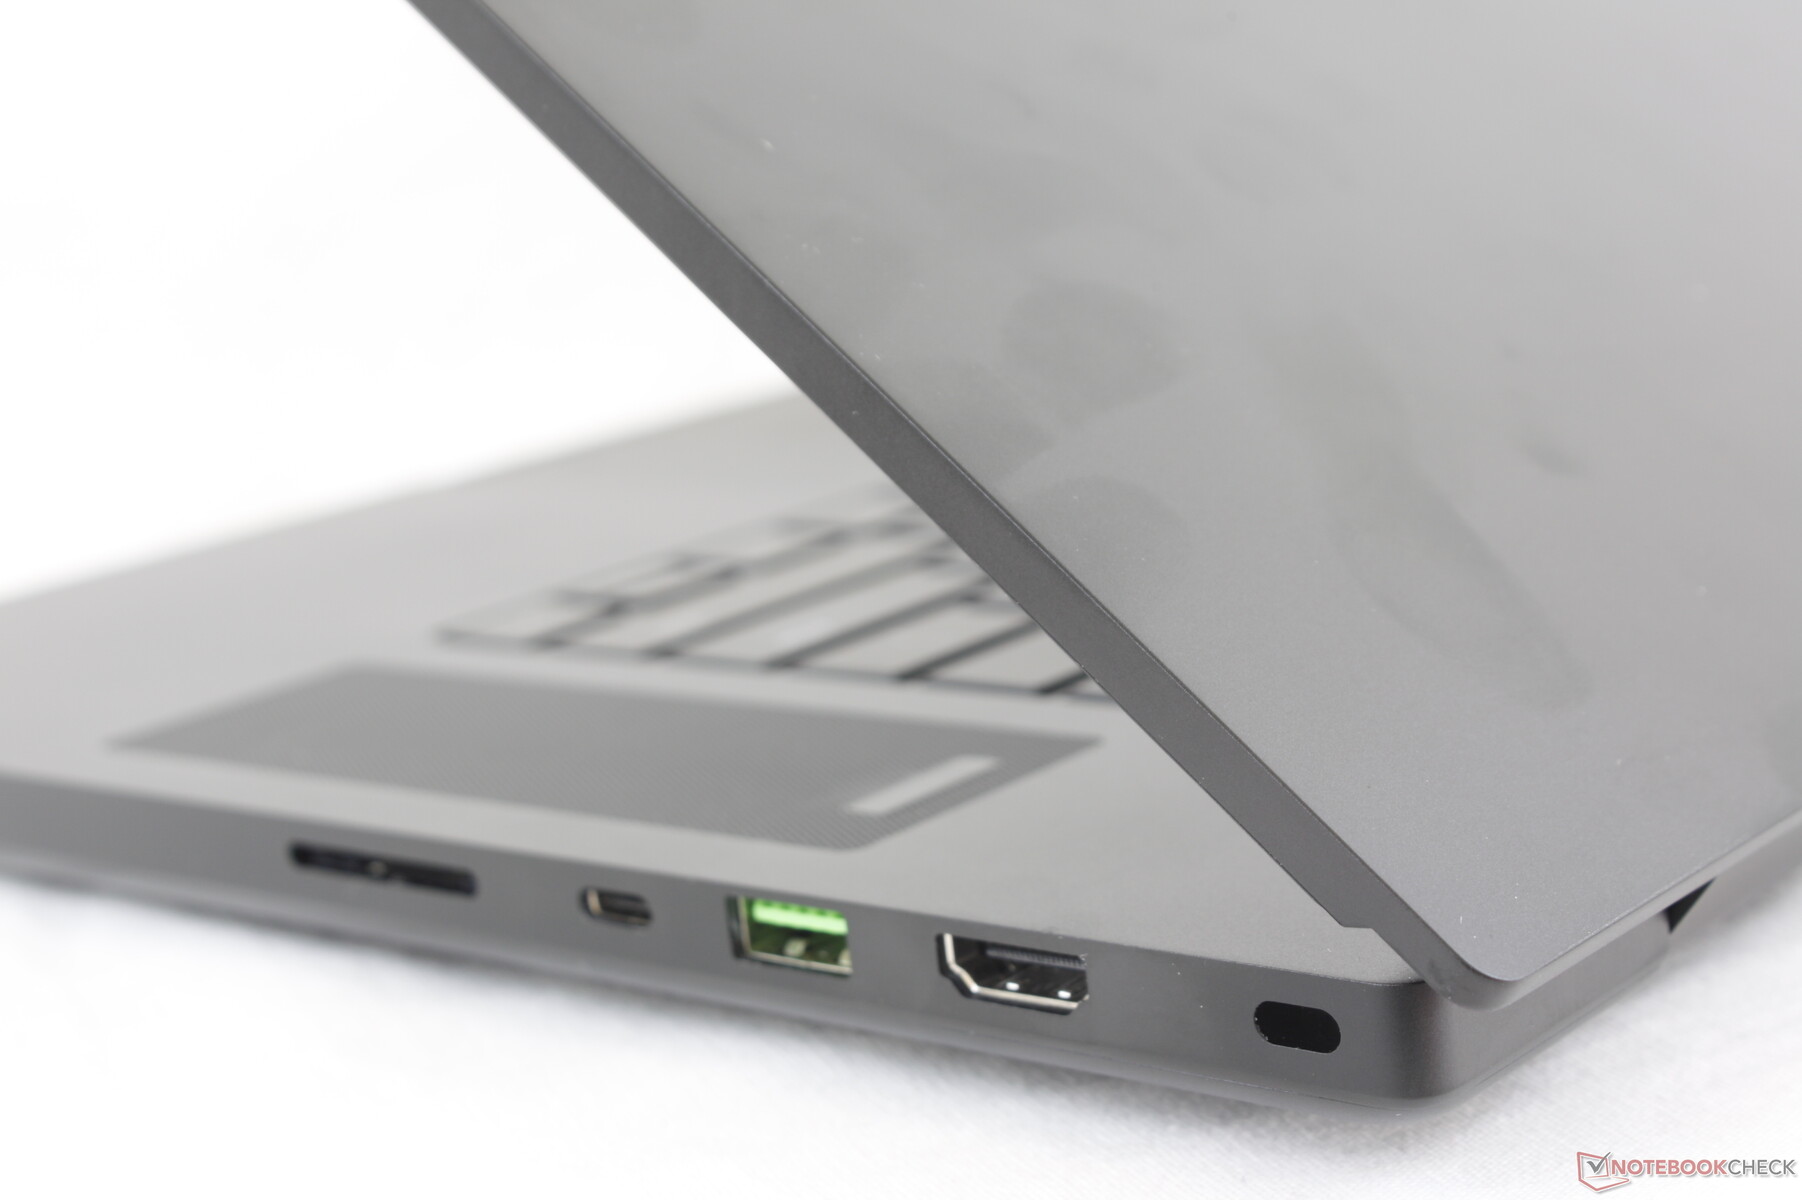
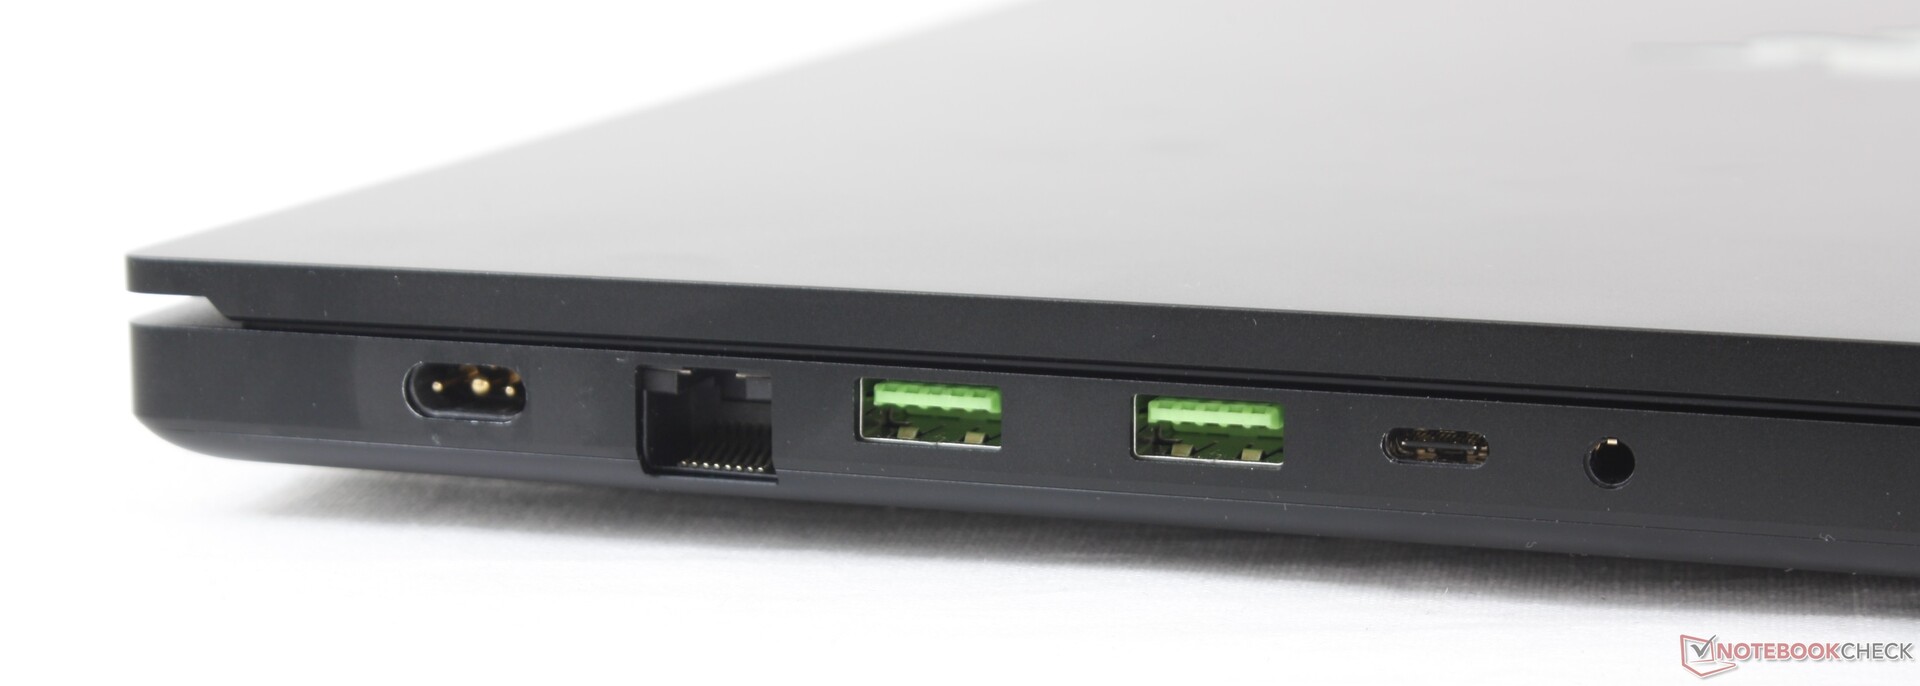
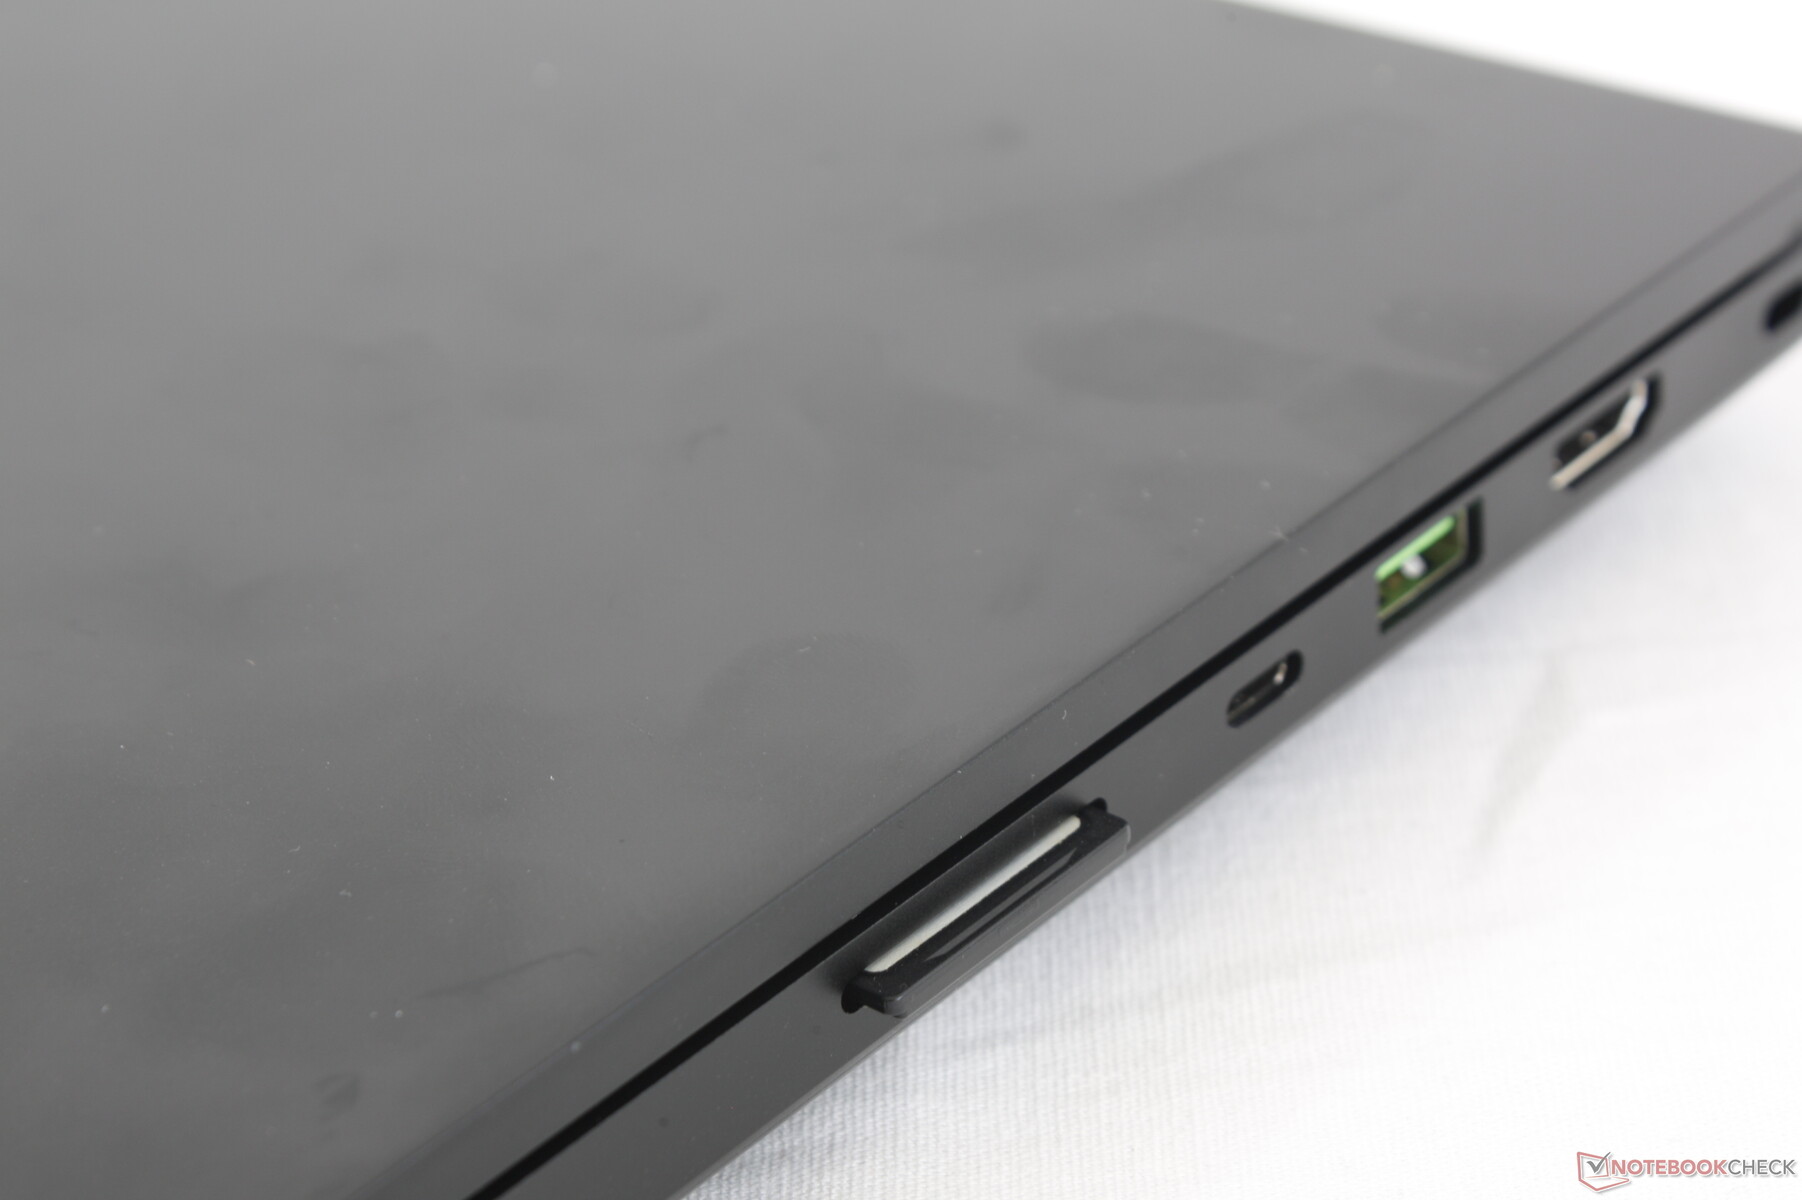
Conectividade
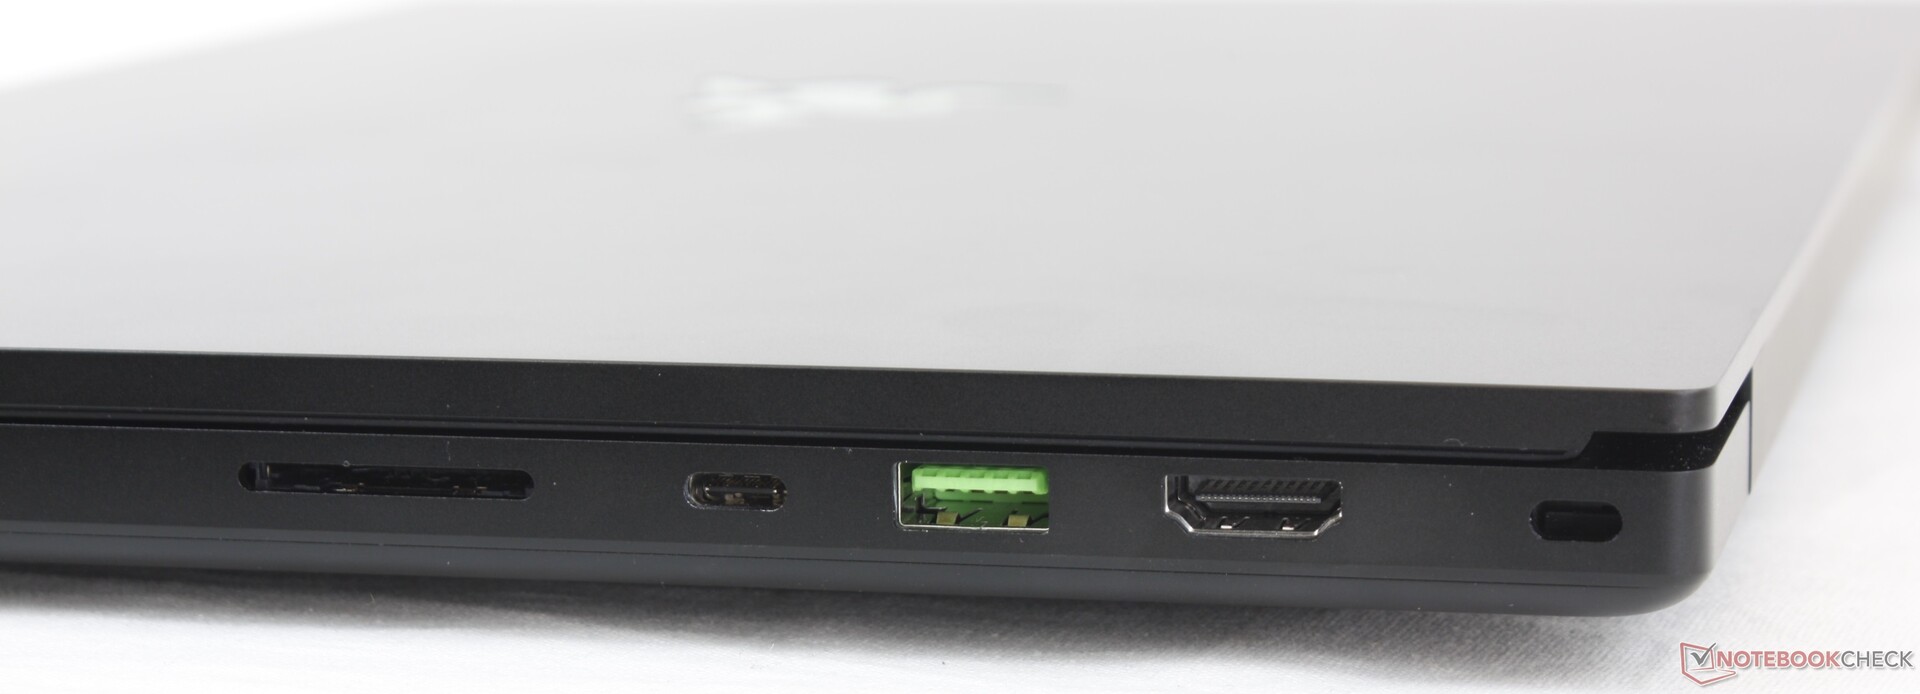
Leitor de cartões SD
| SD Card Reader | |
| average JPG Copy Test (av. of 3 runs) | |
| Razer Blade Pro 17 RTX 2070 Max-Q 300 Hz (Toshiba Exceria Pro SDXC 64 GB UHS-II) | |
| MSI GS75 10SF-609US (Toshiba Exceria Pro M501 UHS-II) | |
| Razer Blade Pro 17 2021 (QHD Touch) (Toshiba Exceria Pro SDXC 64 GB UHS-II) | |
| MSI GT76 Titan DT 10SGS (Toshiba Exceria Pro M501 UHS-II) | |
| Schenker XMG Neo 17 (Early 2021, RTX 3070, 5800H) (Toshiba Exceria Pro SDXC 64 GB UHS-II) | |
| maximum AS SSD Seq Read Test (1GB) | |
| MSI GS75 10SF-609US (Toshiba Exceria Pro M501 UHS-II) | |
| Razer Blade Pro 17 RTX 2070 Max-Q 300 Hz (Toshiba Exceria Pro SDXC 64 GB UHS-II) | |
| MSI GT76 Titan DT 10SGS (Toshiba Exceria Pro M501 UHS-II) | |
| Razer Blade Pro 17 2021 (QHD Touch) (Toshiba Exceria Pro SDXC 64 GB UHS-II) | |
| Schenker XMG Neo 17 (Early 2021, RTX 3070, 5800H) (Toshiba Exceria Pro SDXC 64 GB UHS-II) | |
Comunicação
Webcam

 GeForce RTX 3080 Laptop GPU, i7-10875H, Samsung PM981a MZVLB1T0HBLR")
 GeForce RTX 3080 Laptop GPU, i7-10875H, Samsung PM981a MZVLB1T0HBLR")
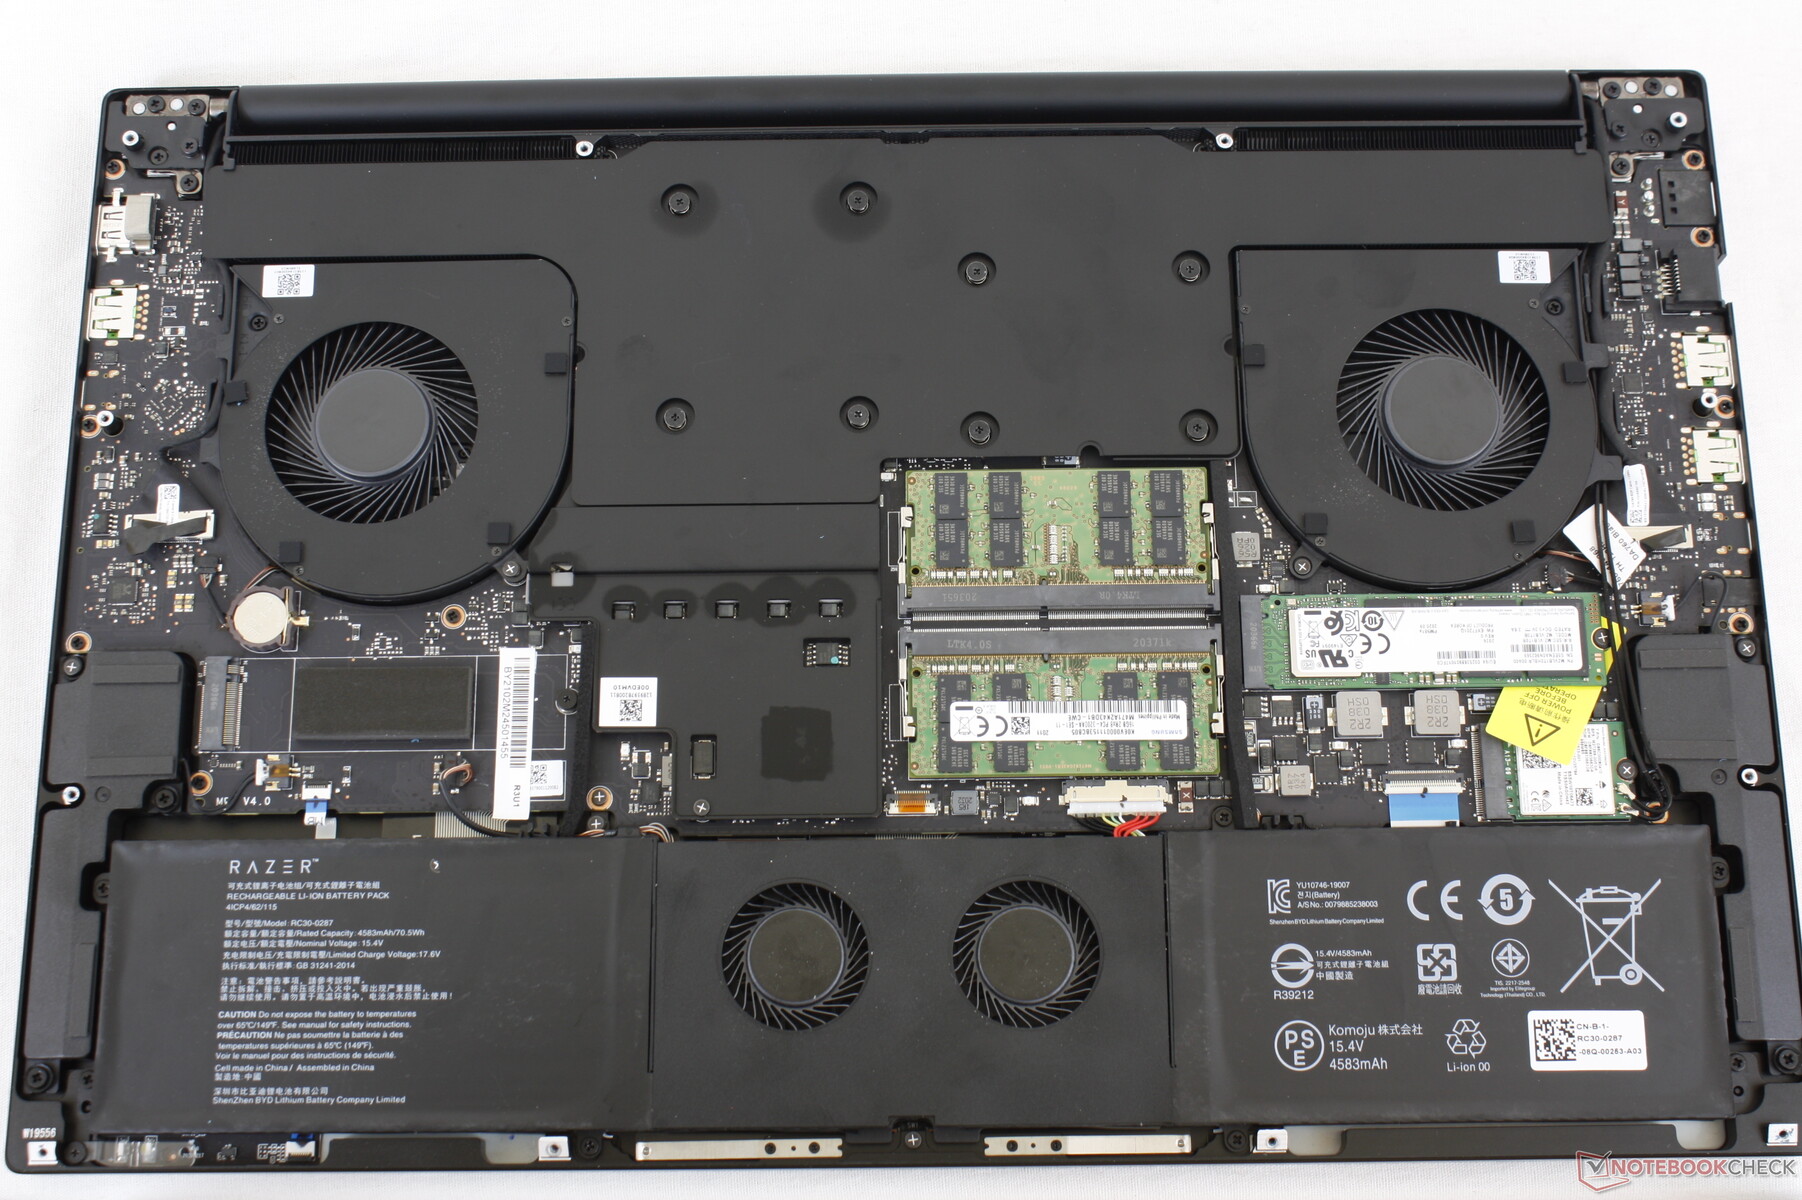
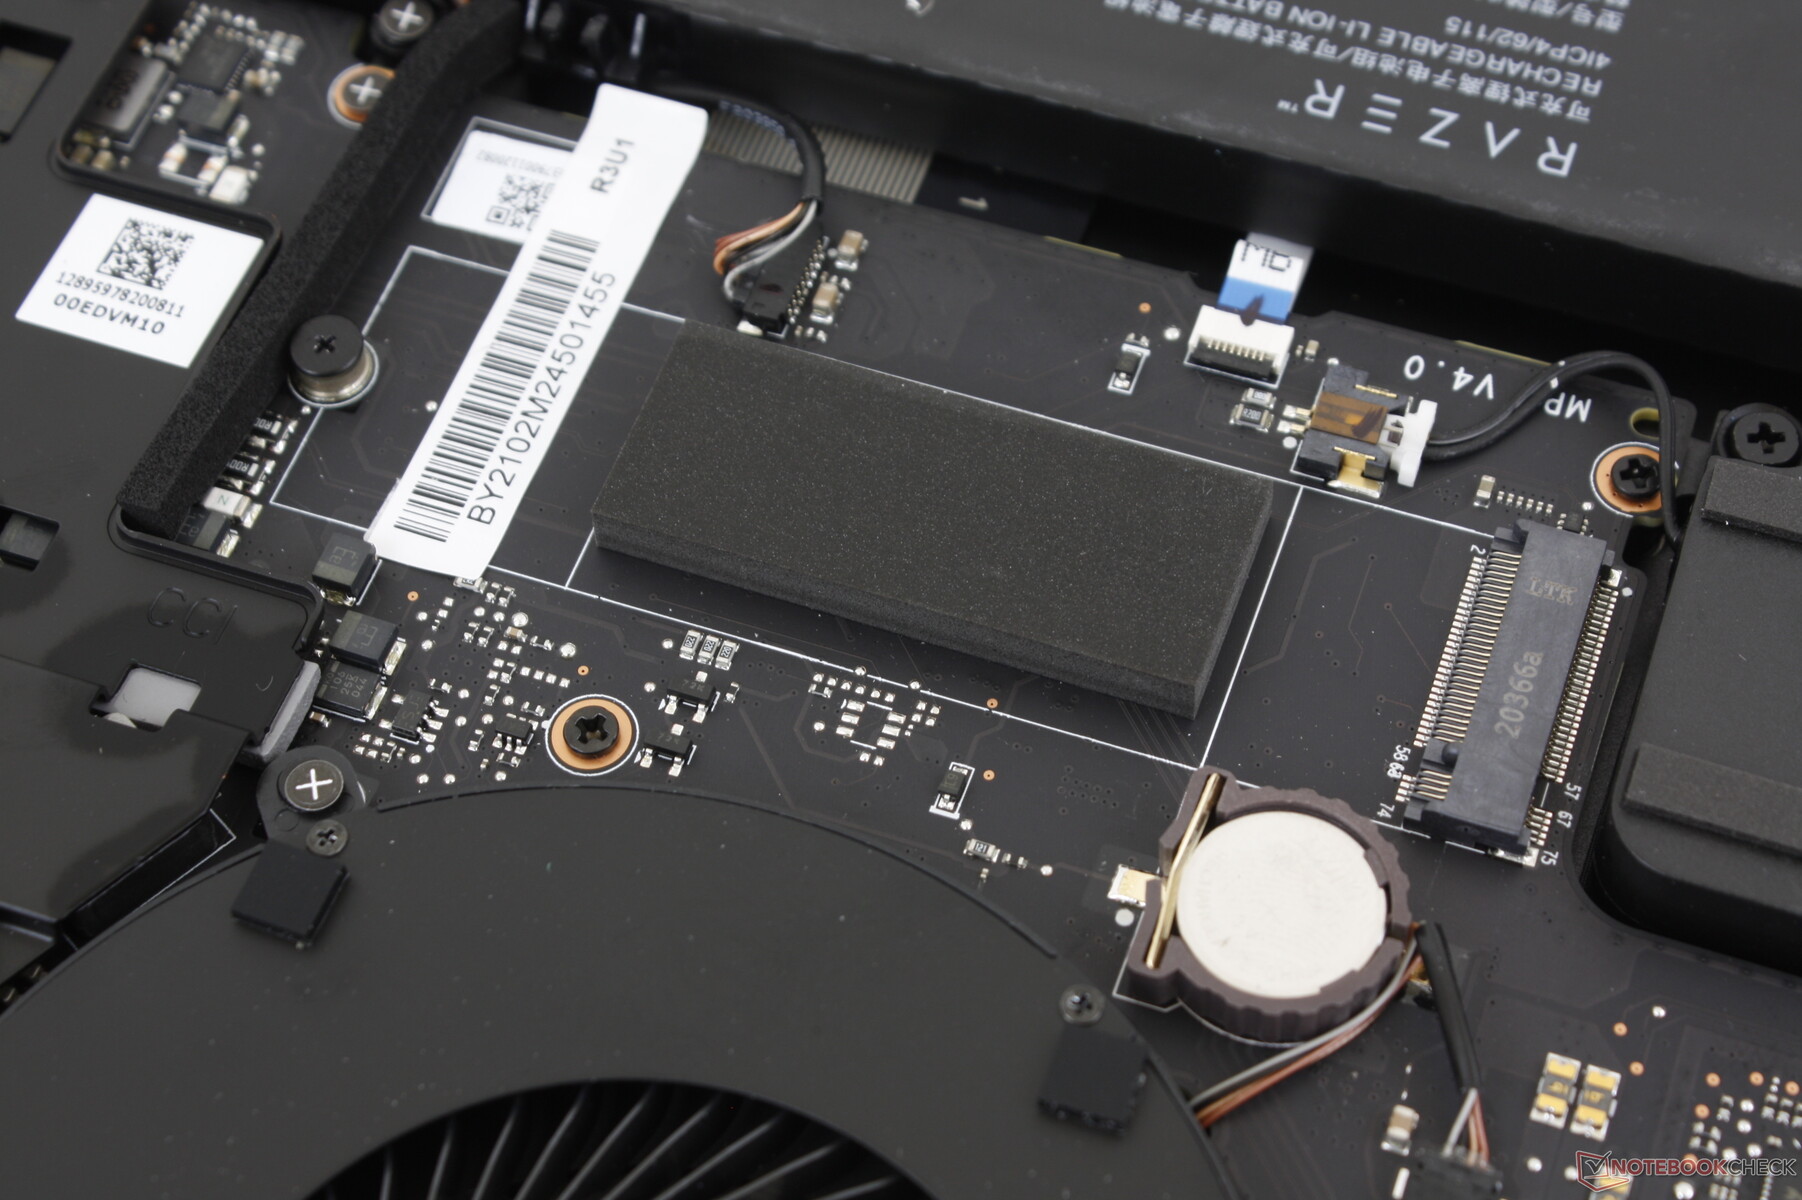
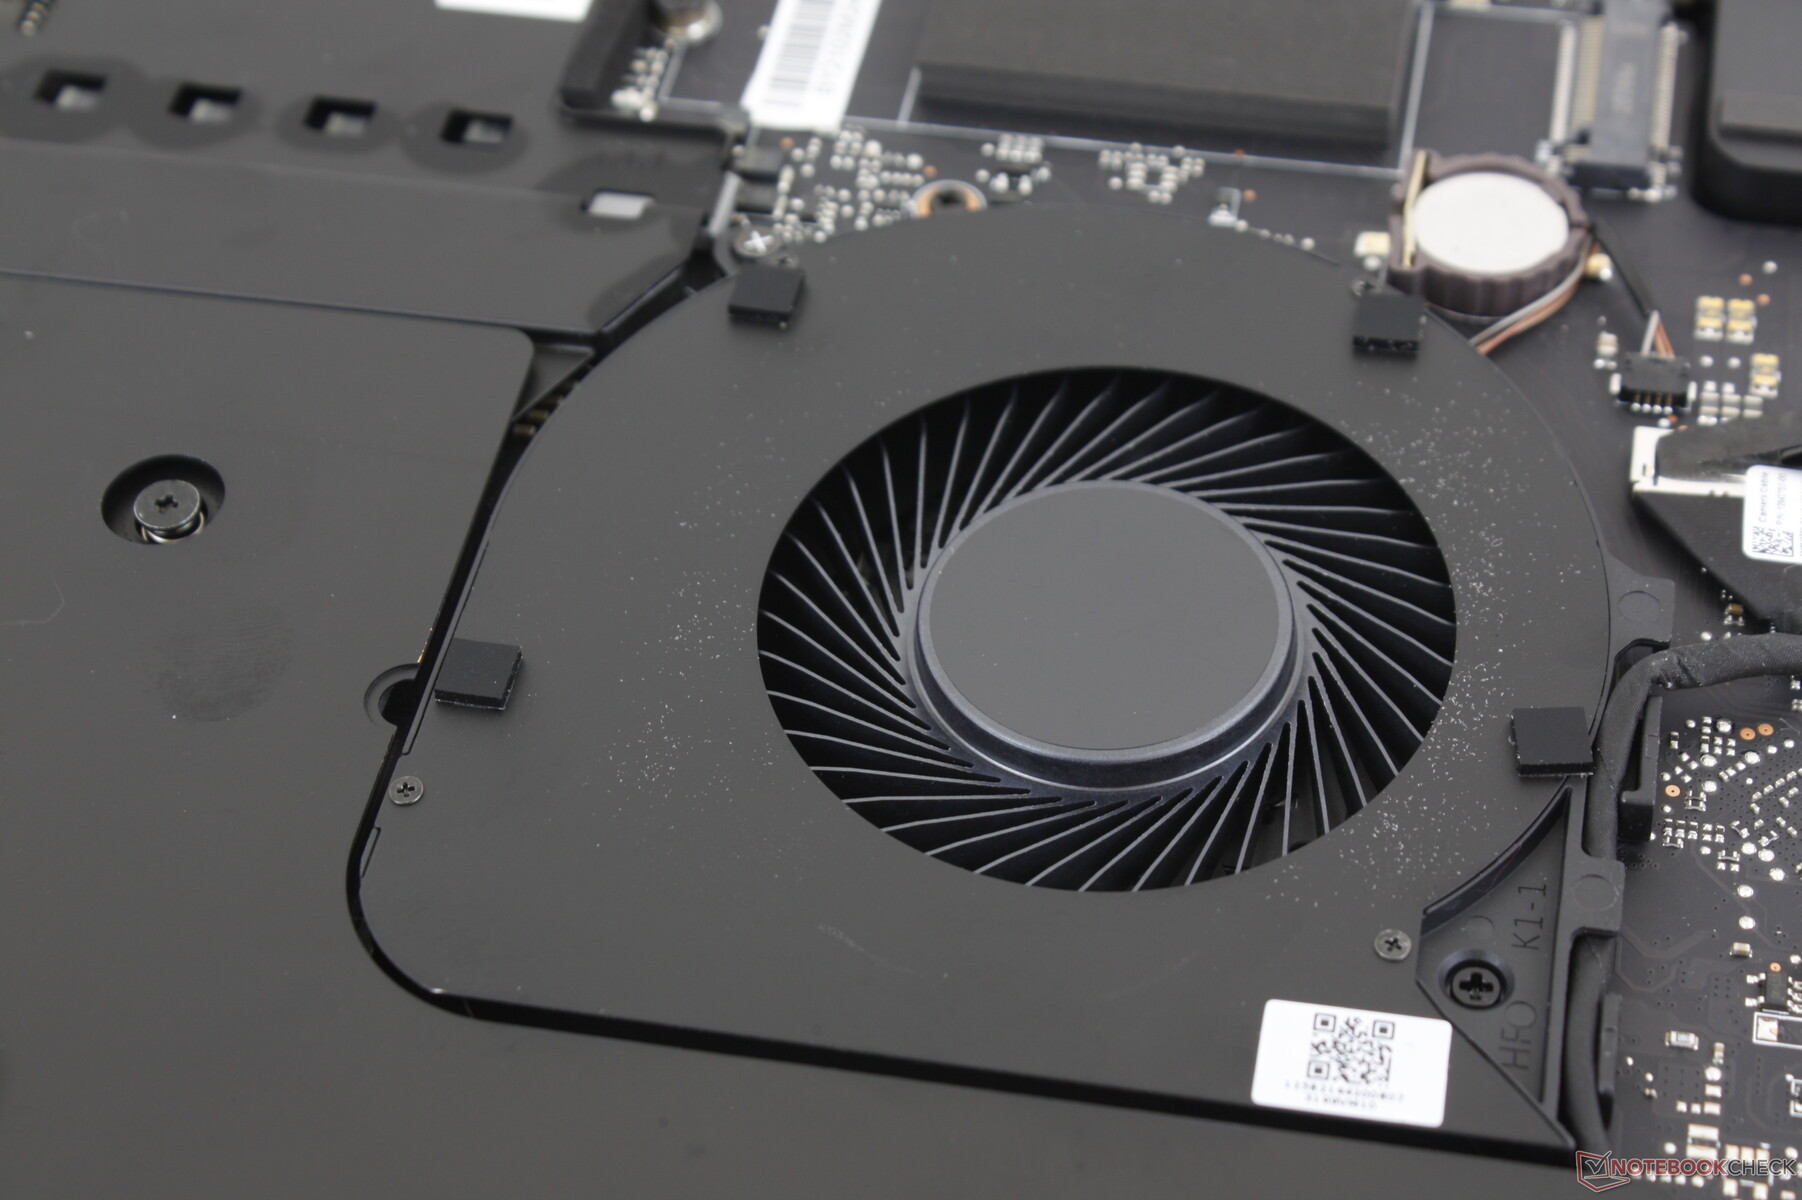
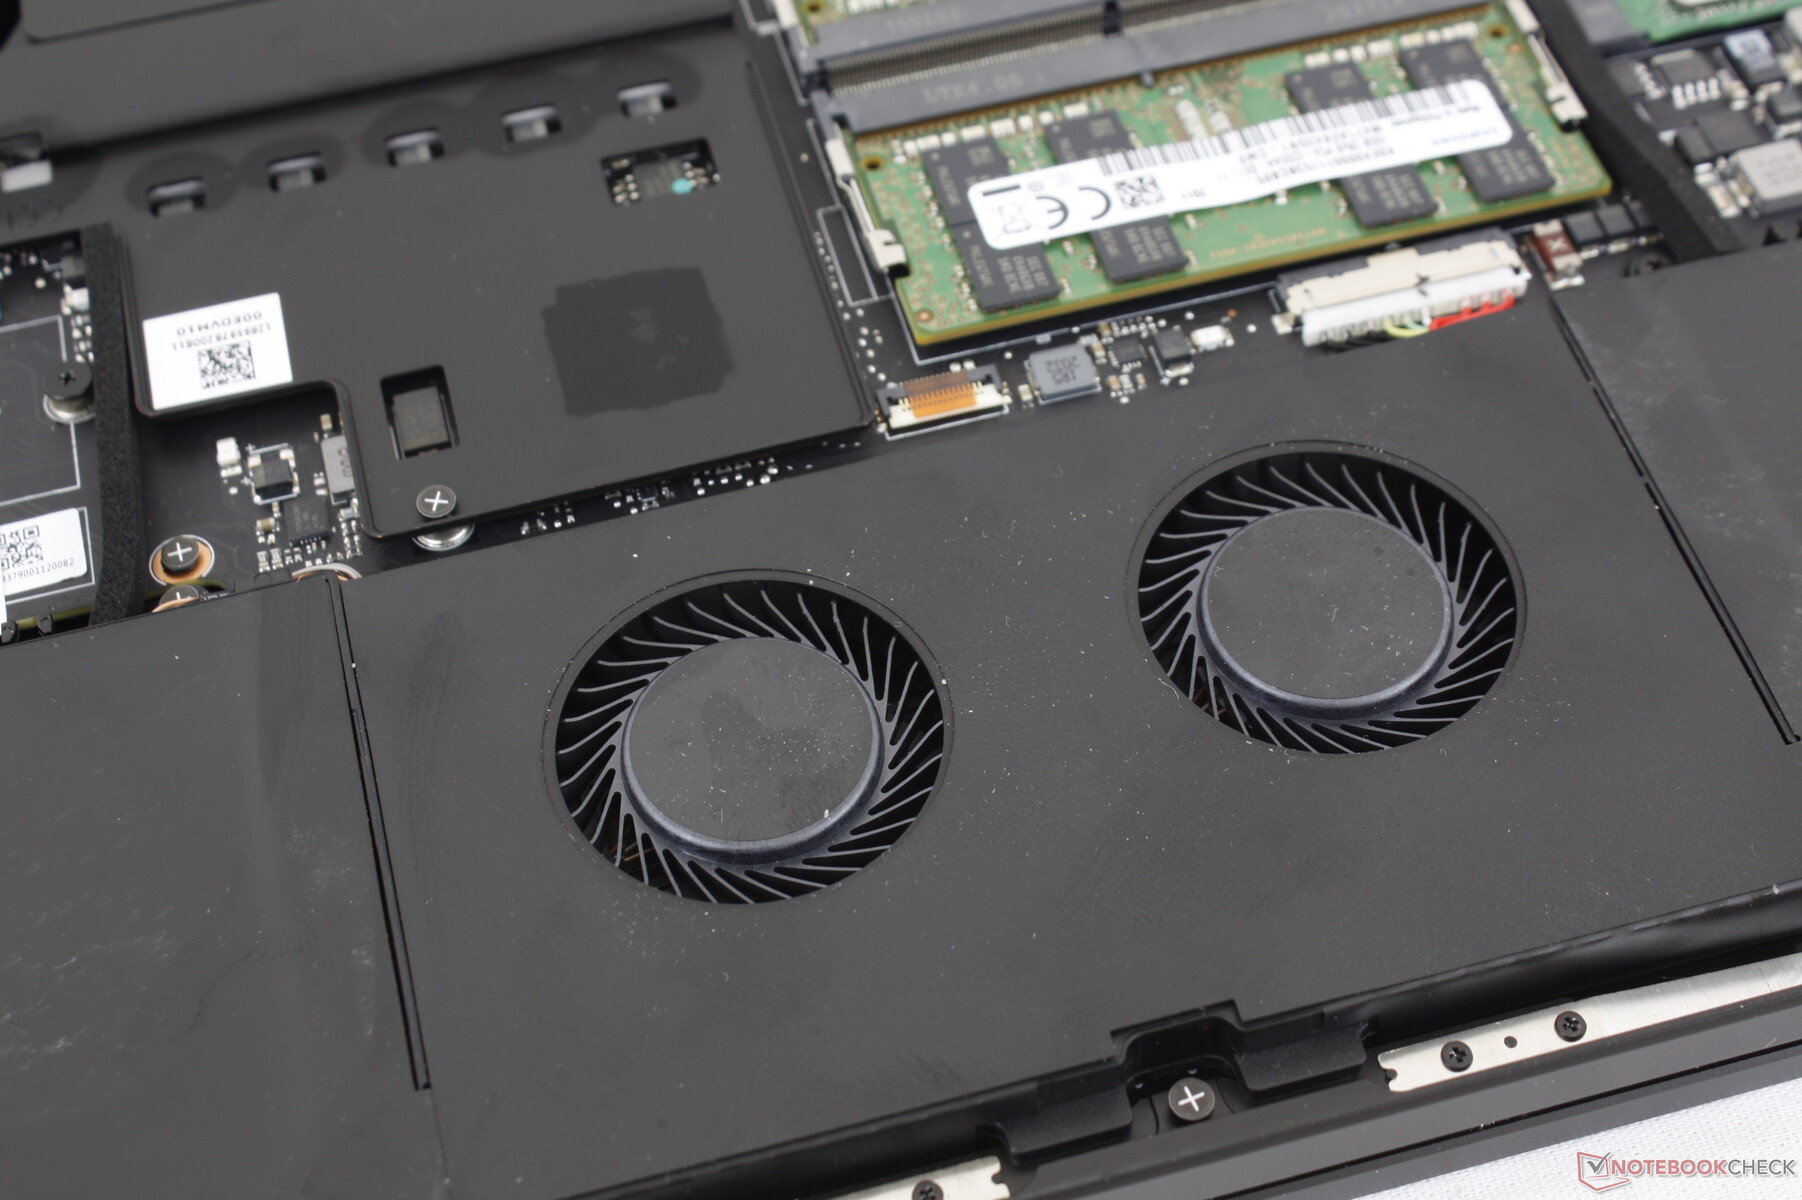
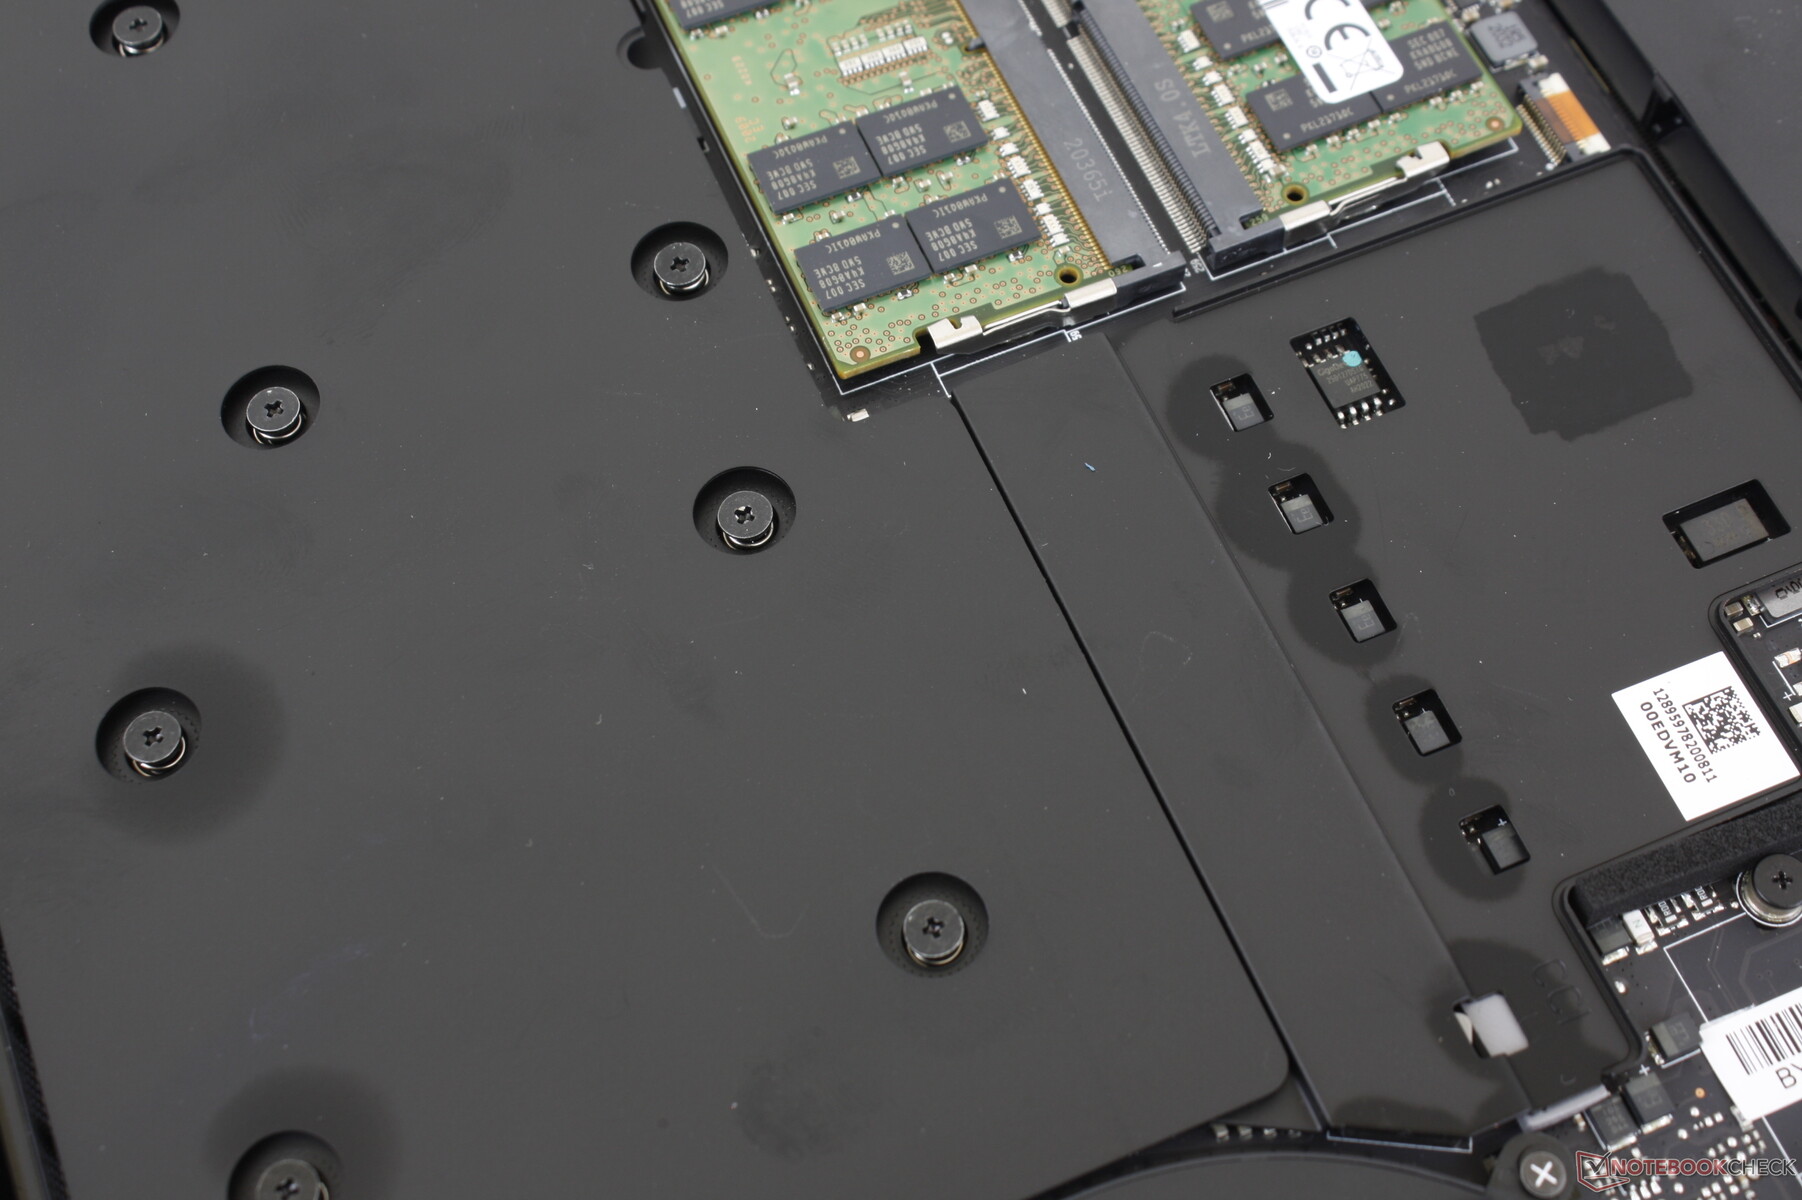
Manutenção
Acessórios e Garantia
A caixa de varejo inclui um pequeno pano de veludo e alguns adesivos Razer, além dos habituais manuais de papel. Aplica-se a garantia padrão limitada de um ano do fabricante.
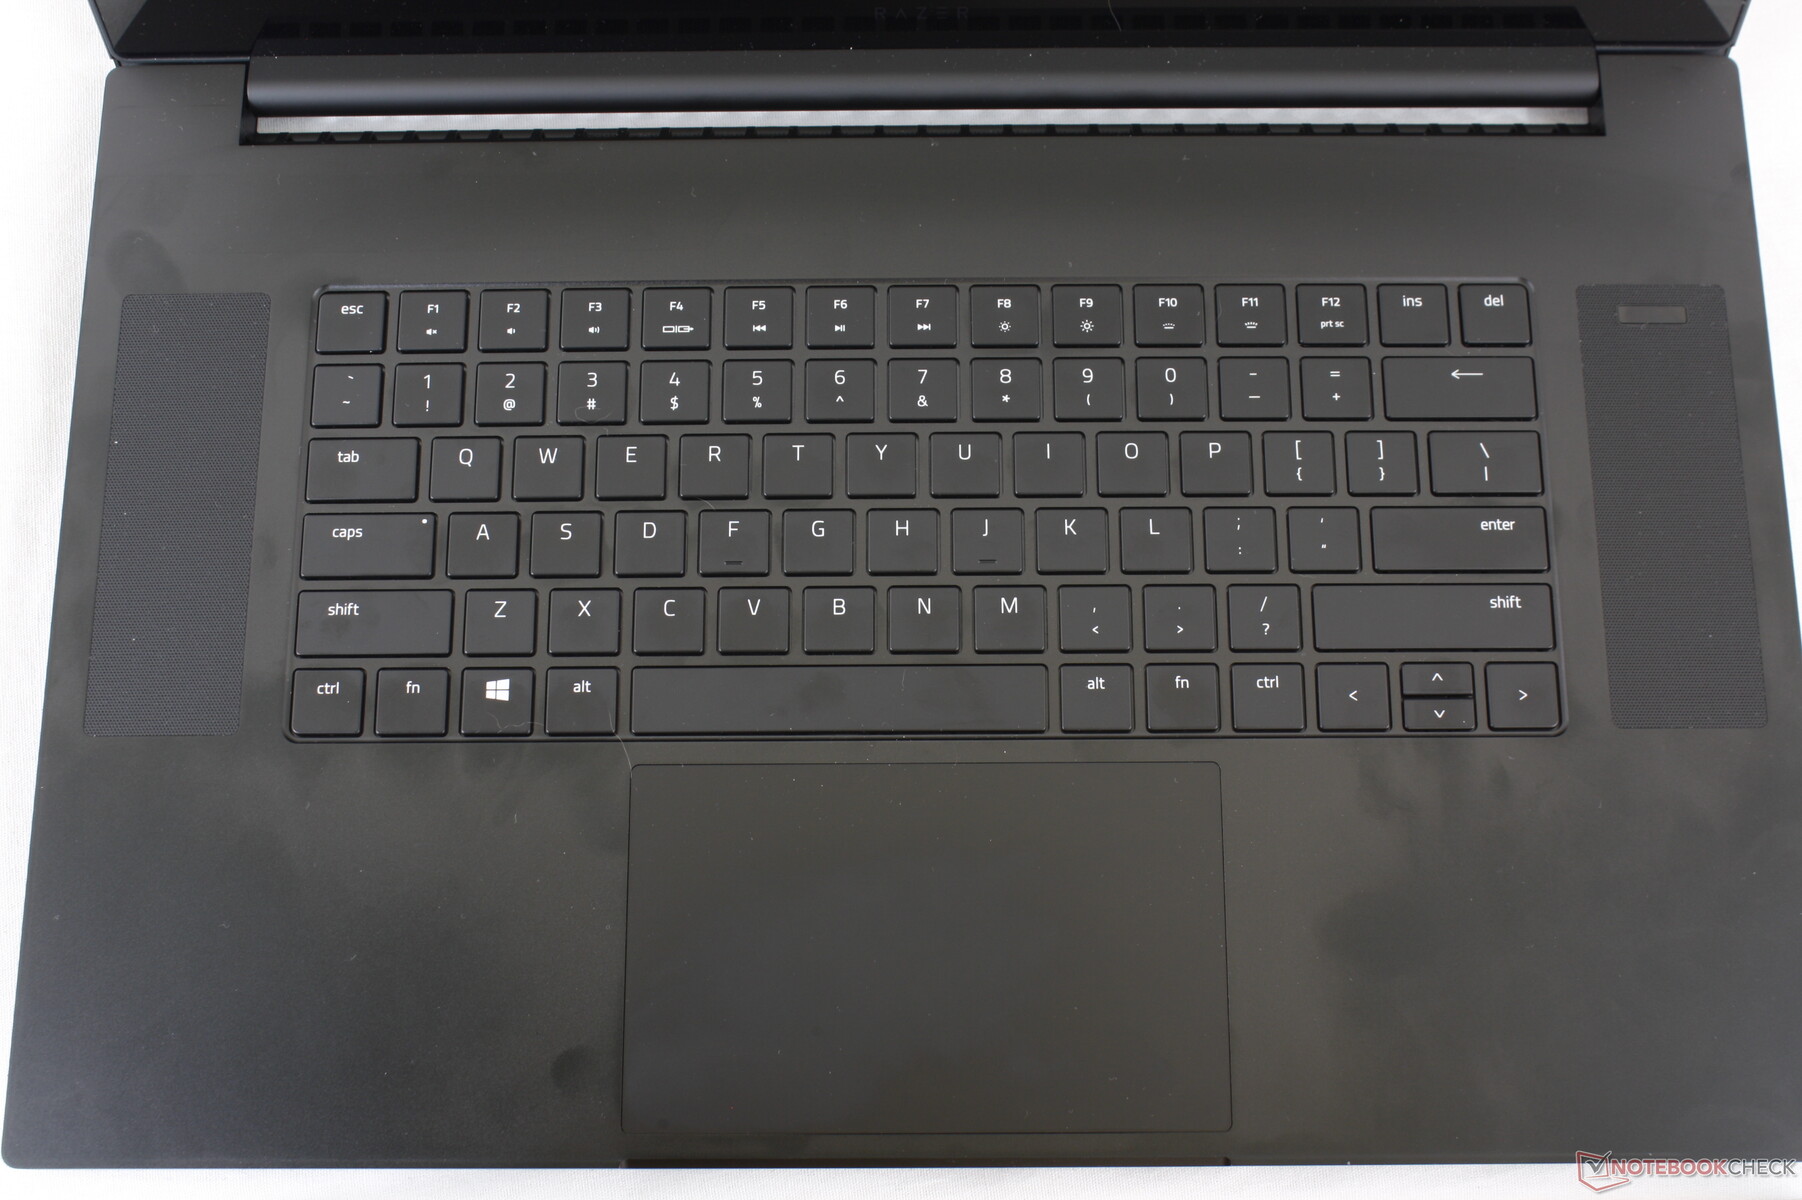
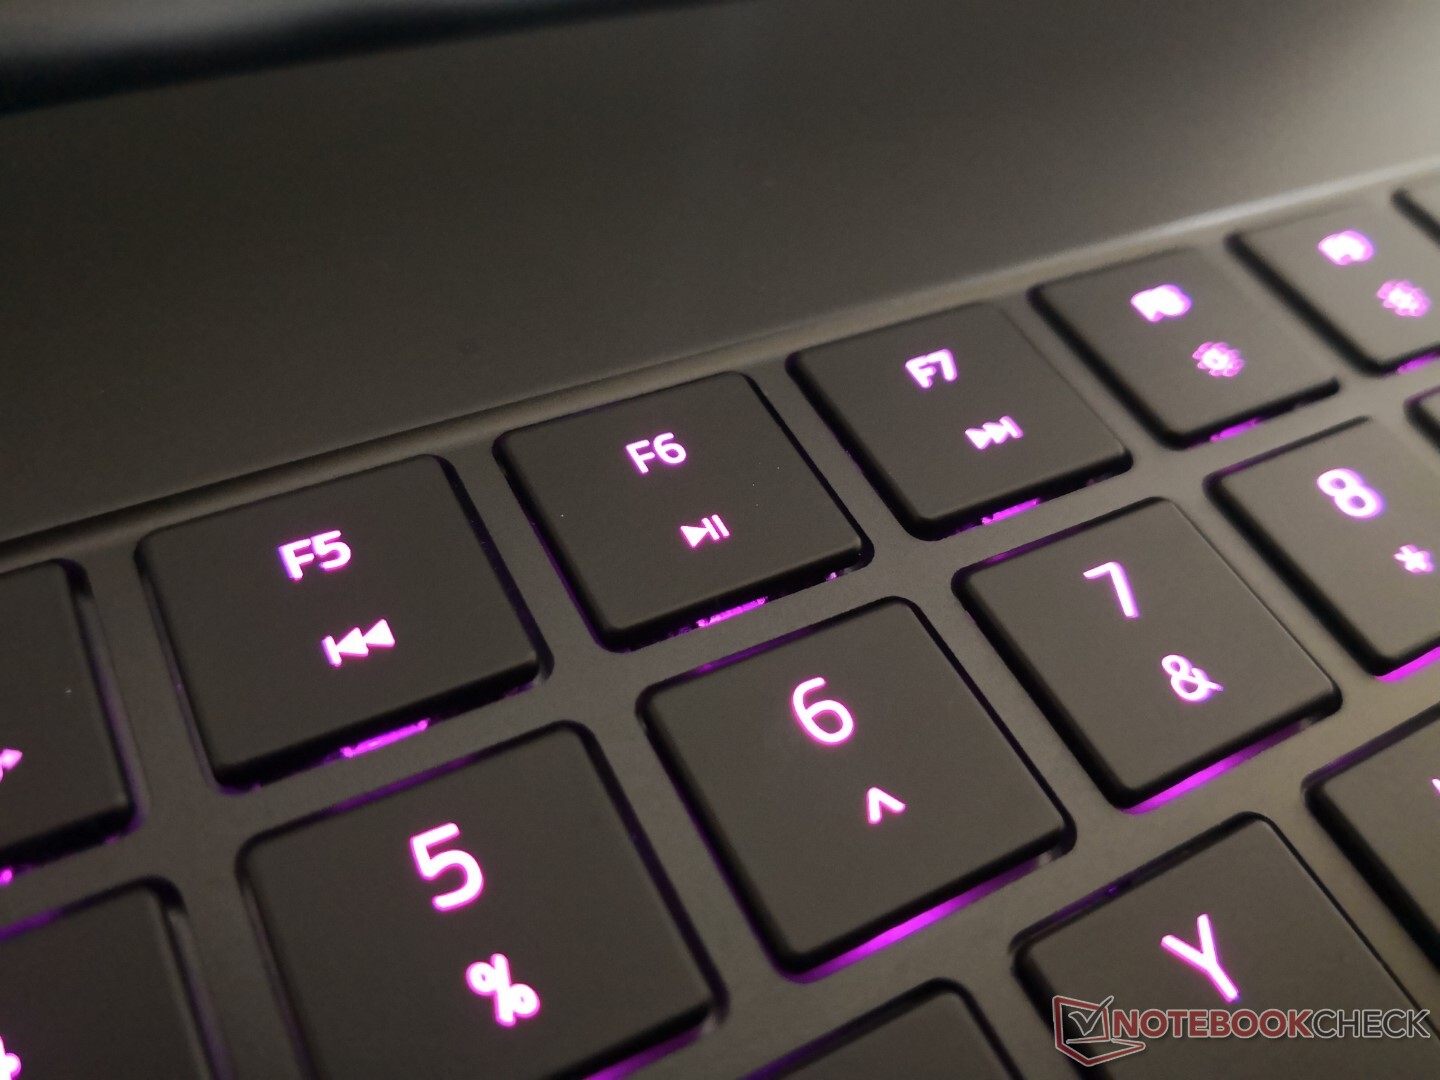
Dispositivos de entrada
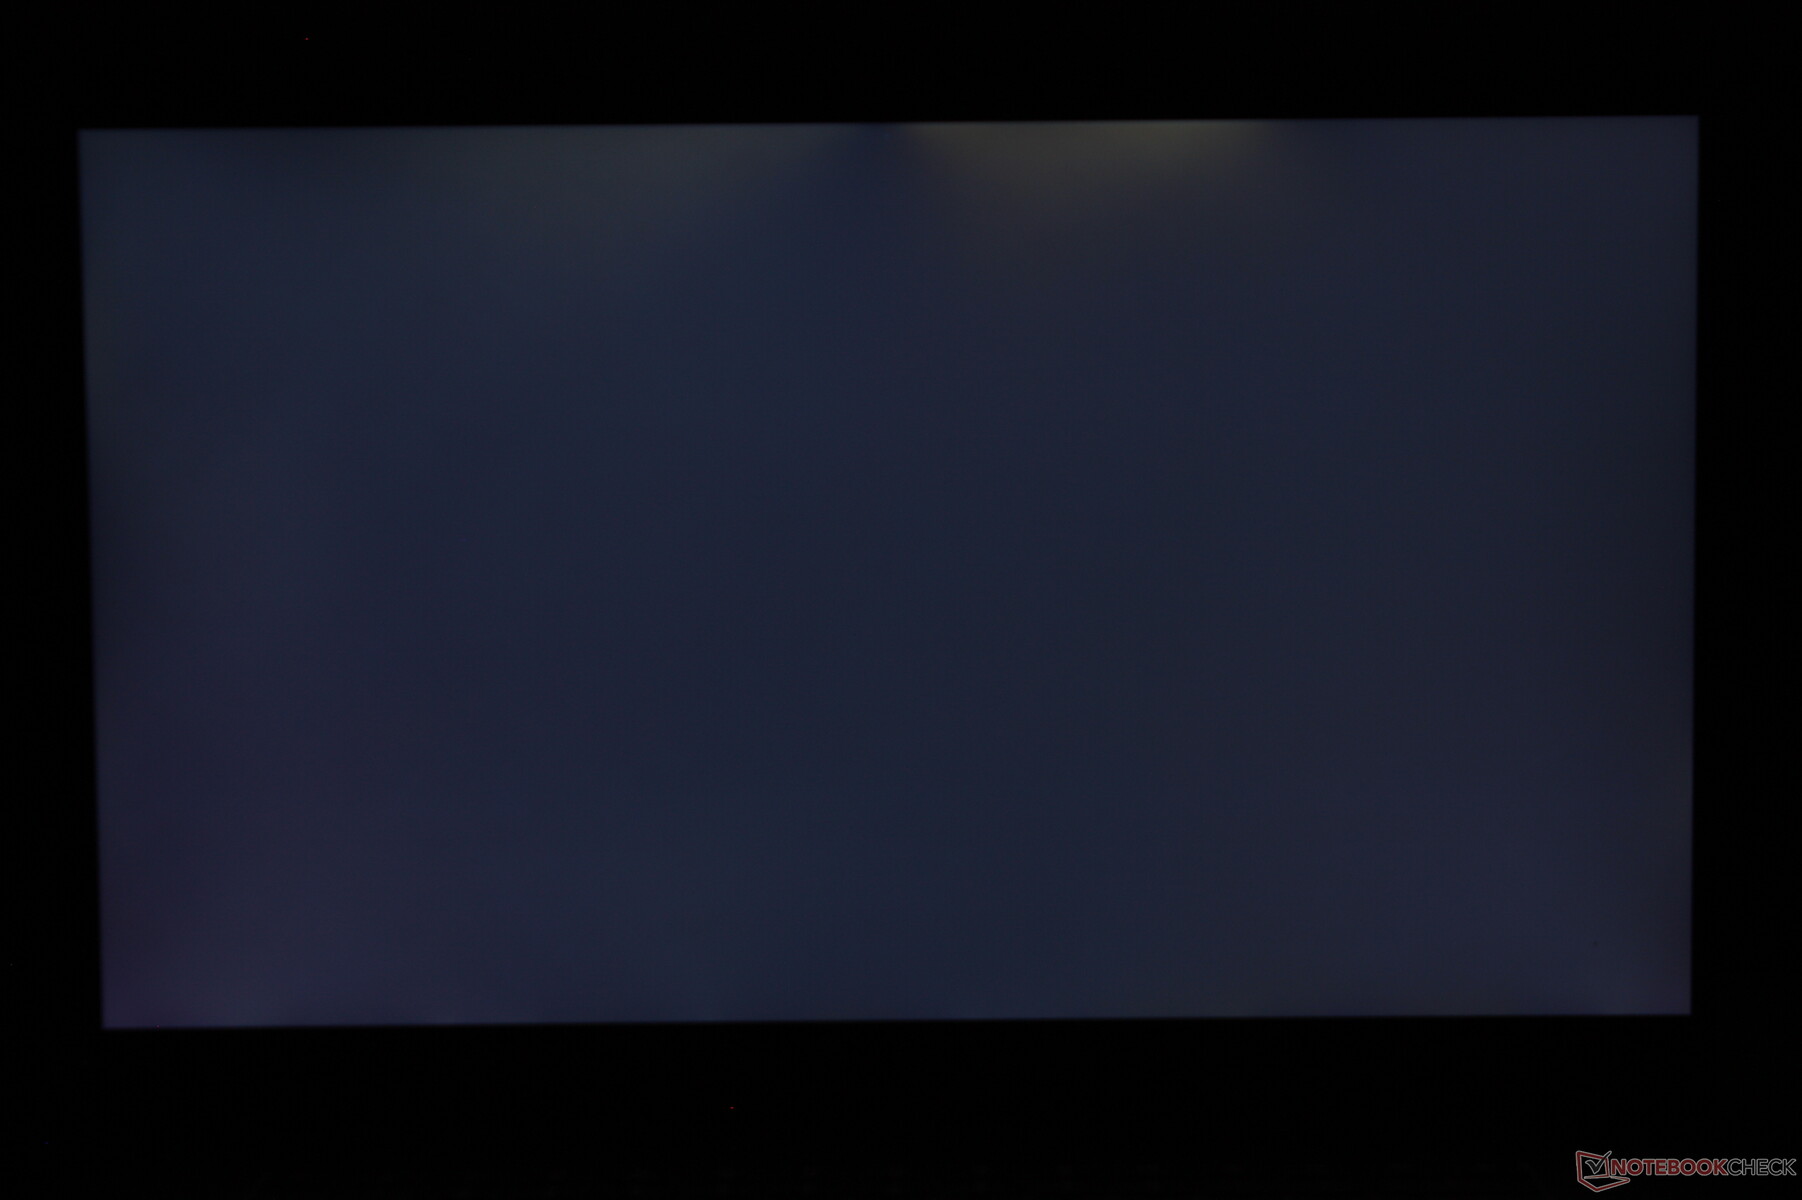
Mostrar
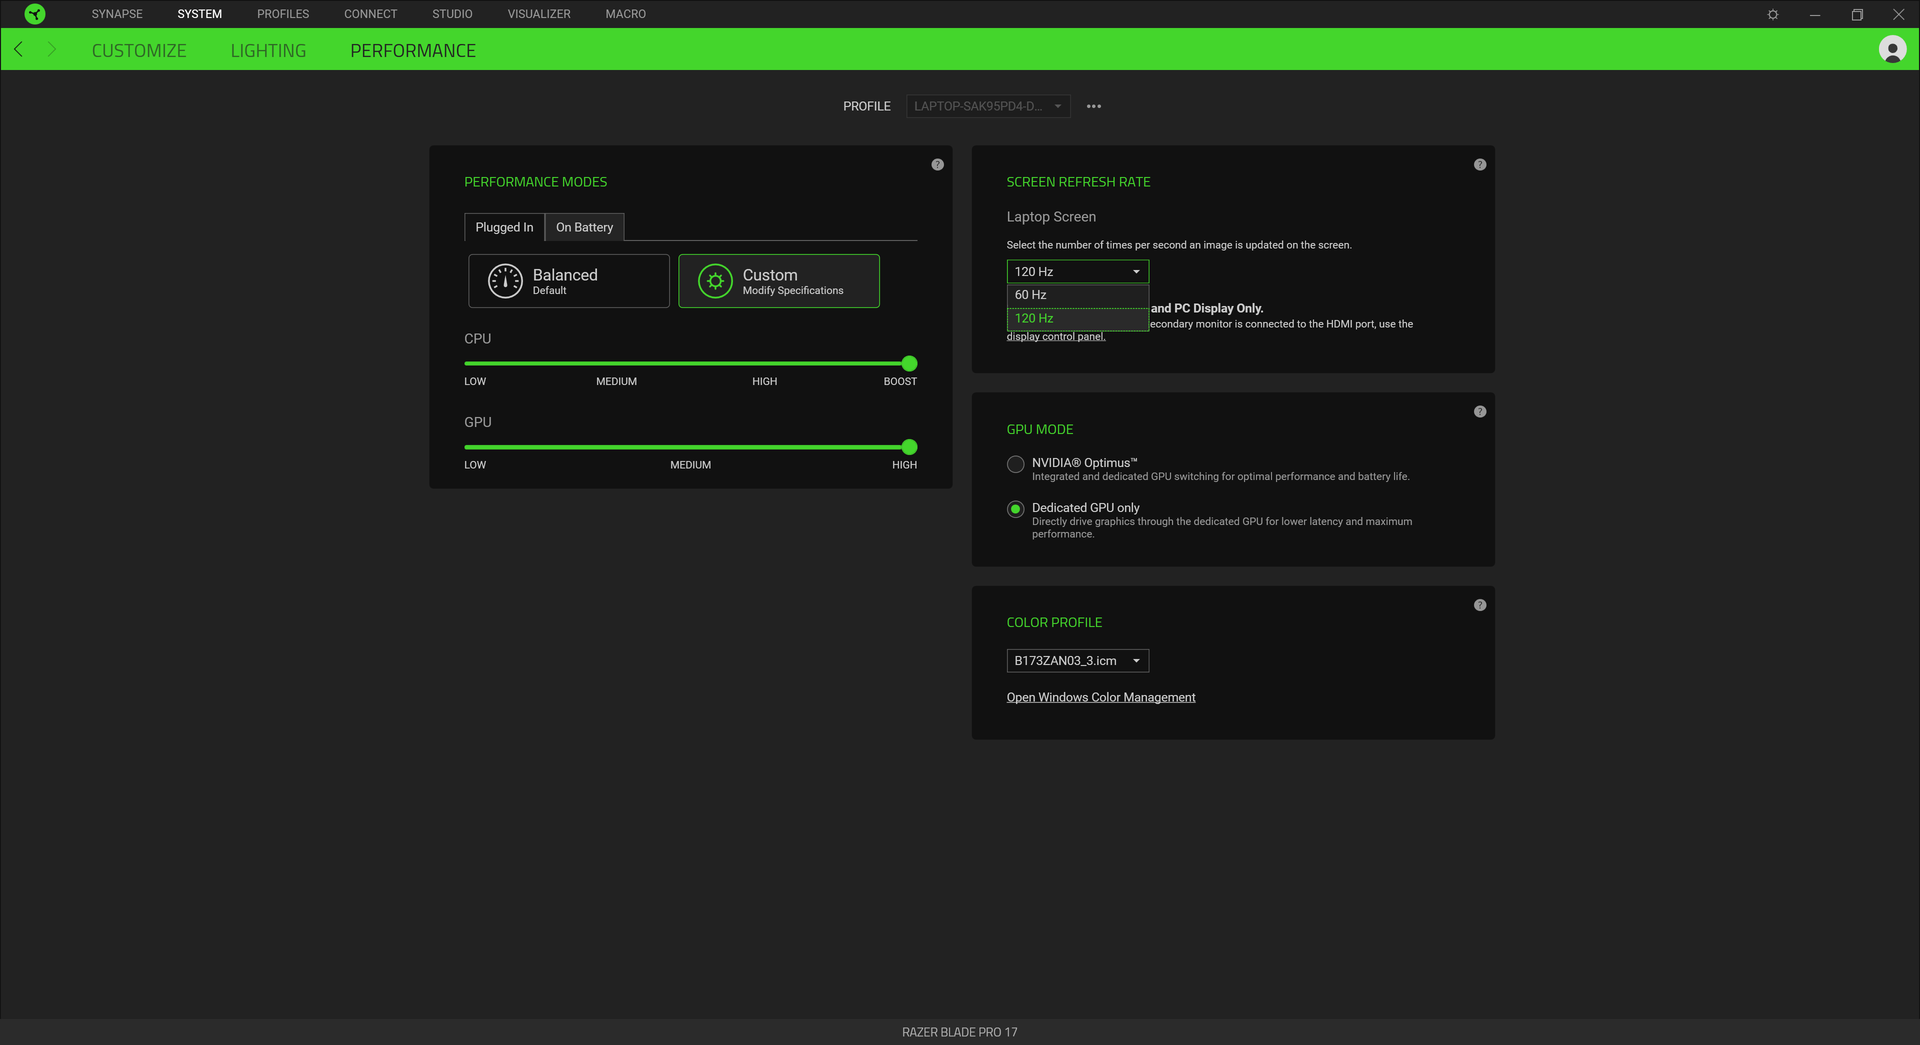
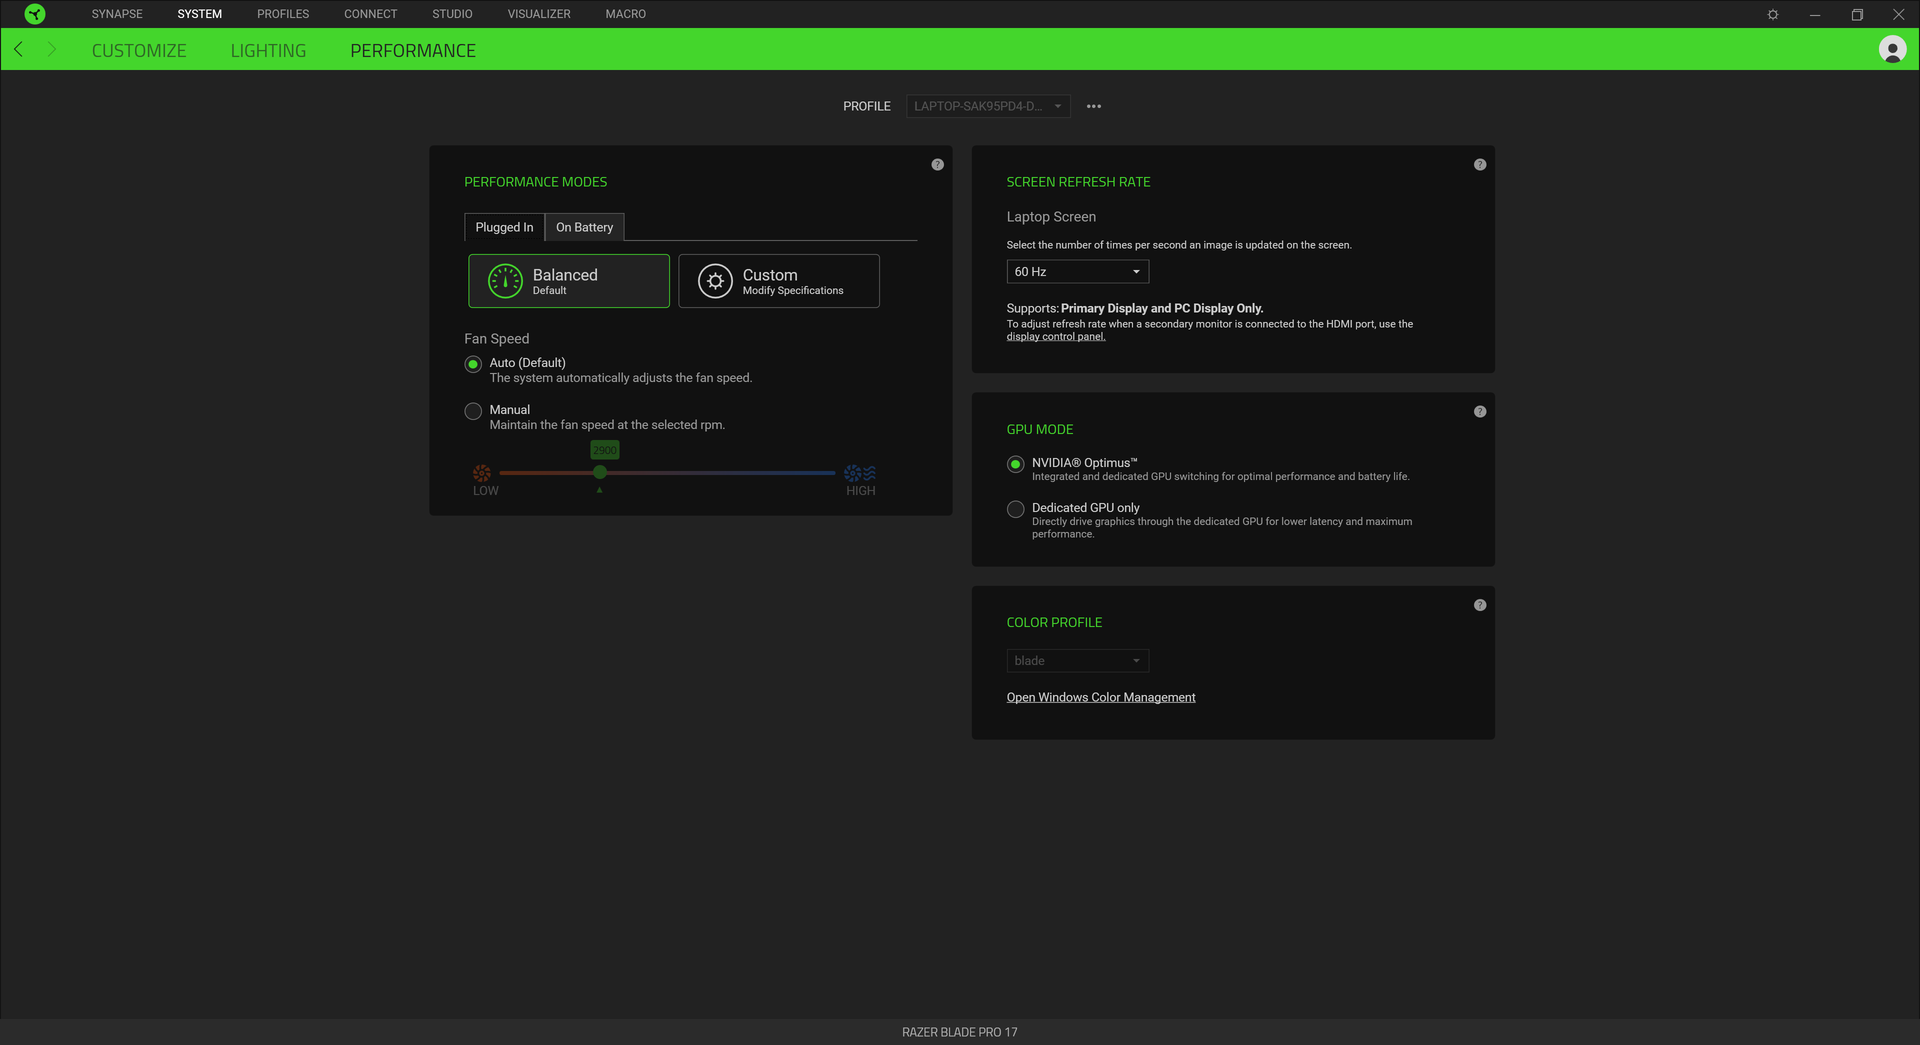
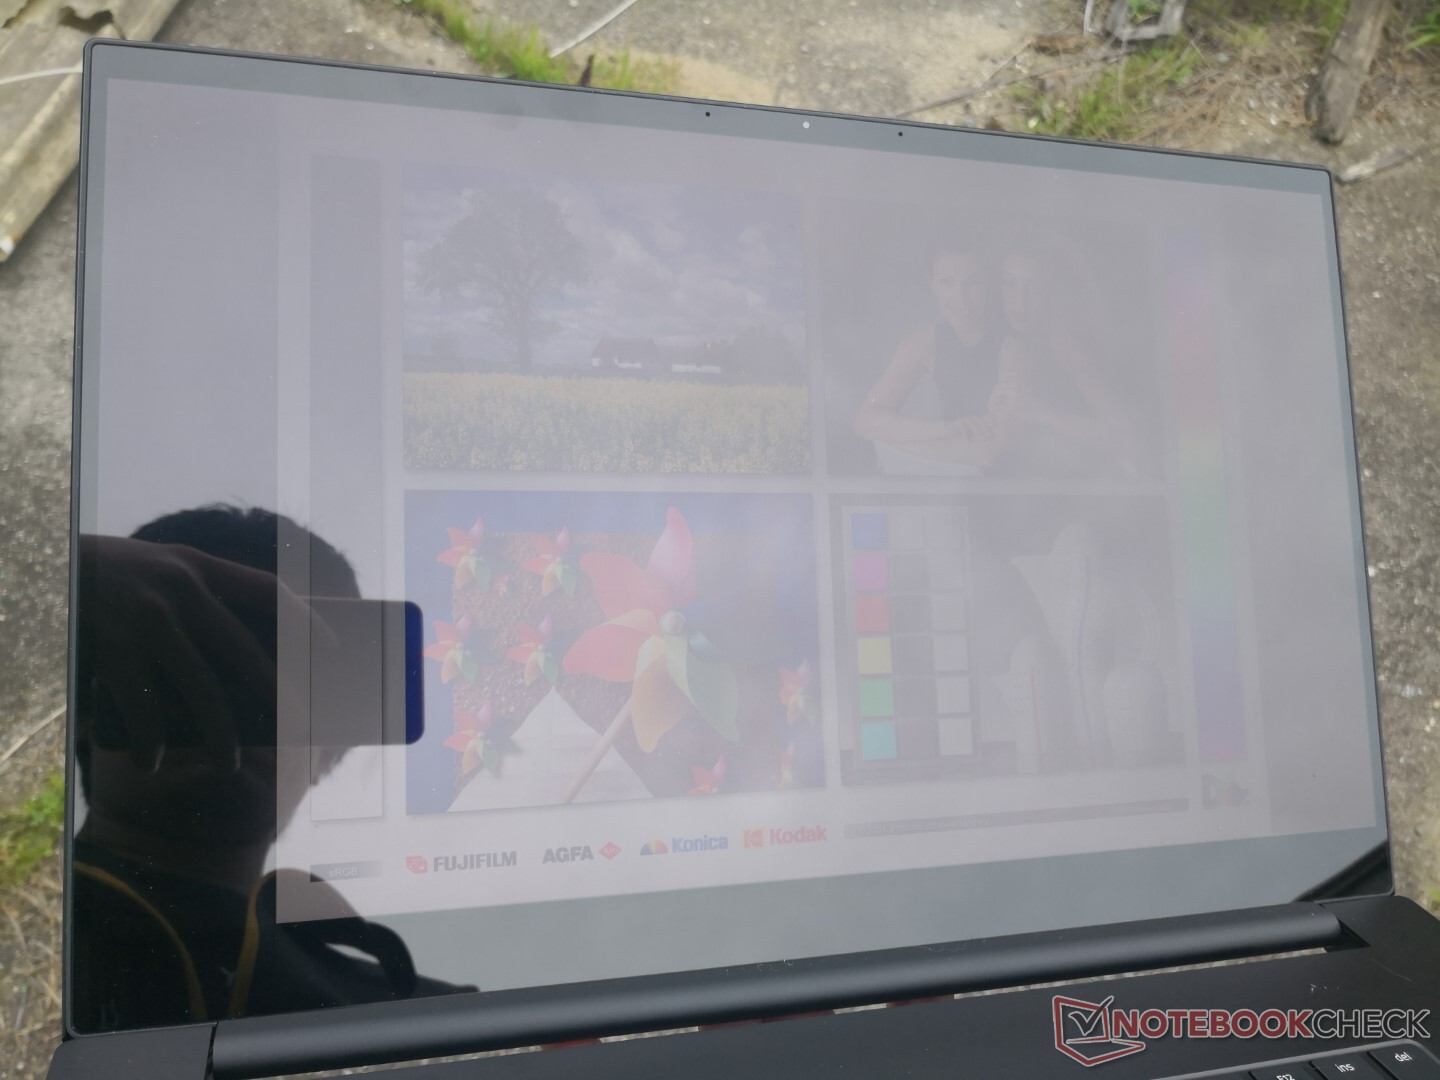
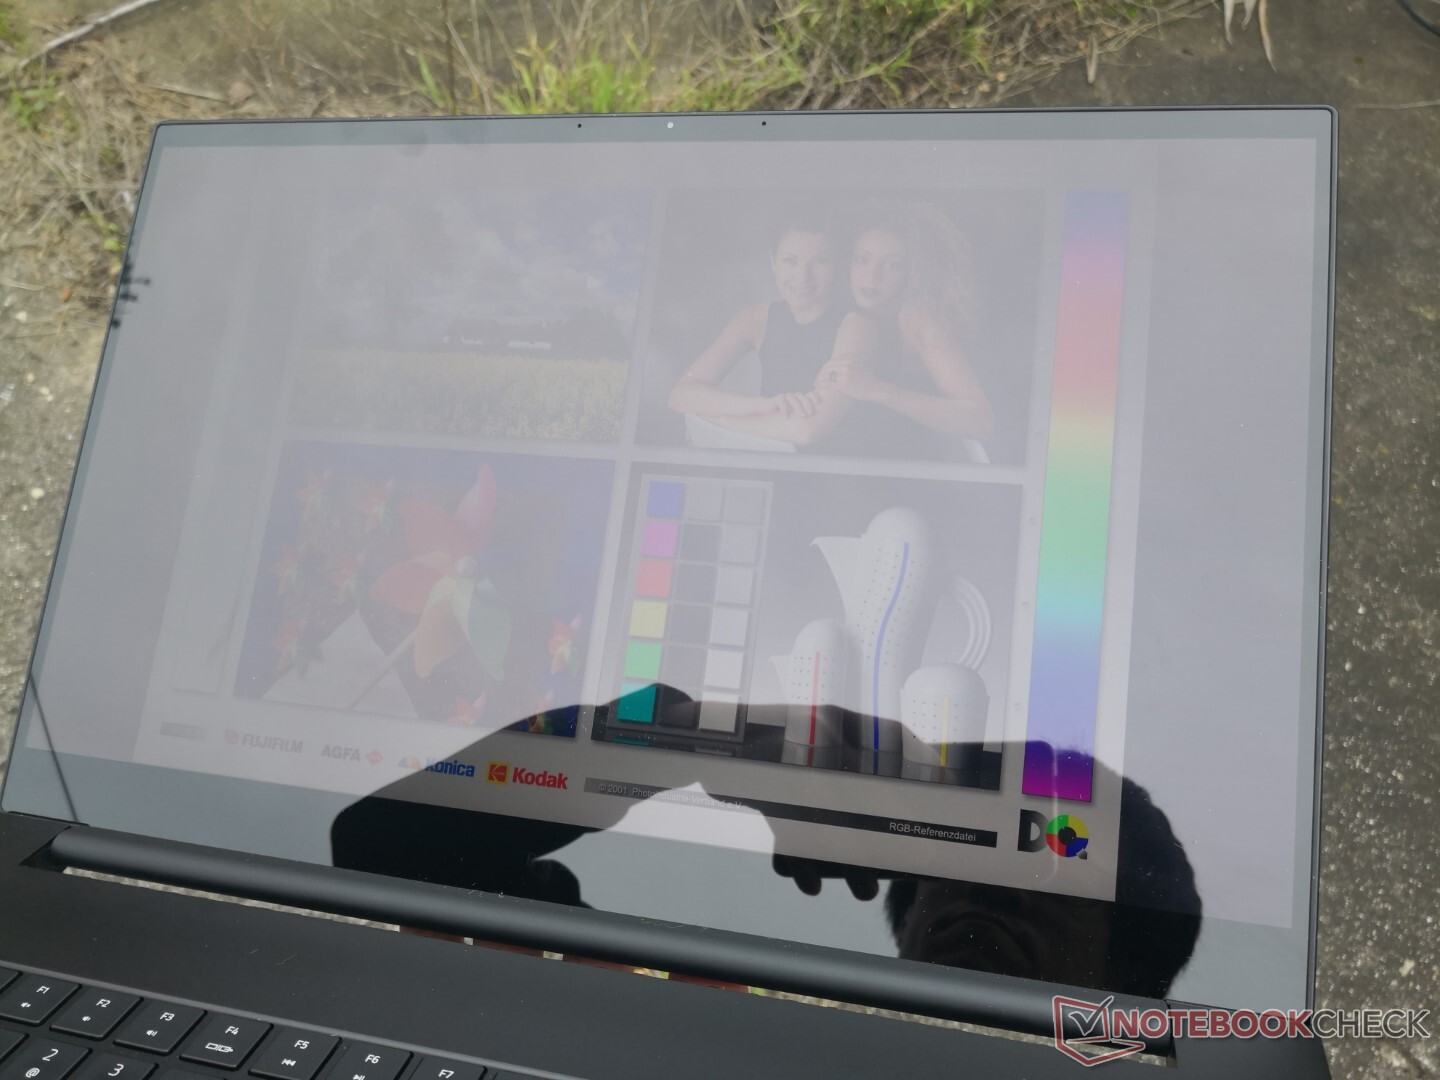
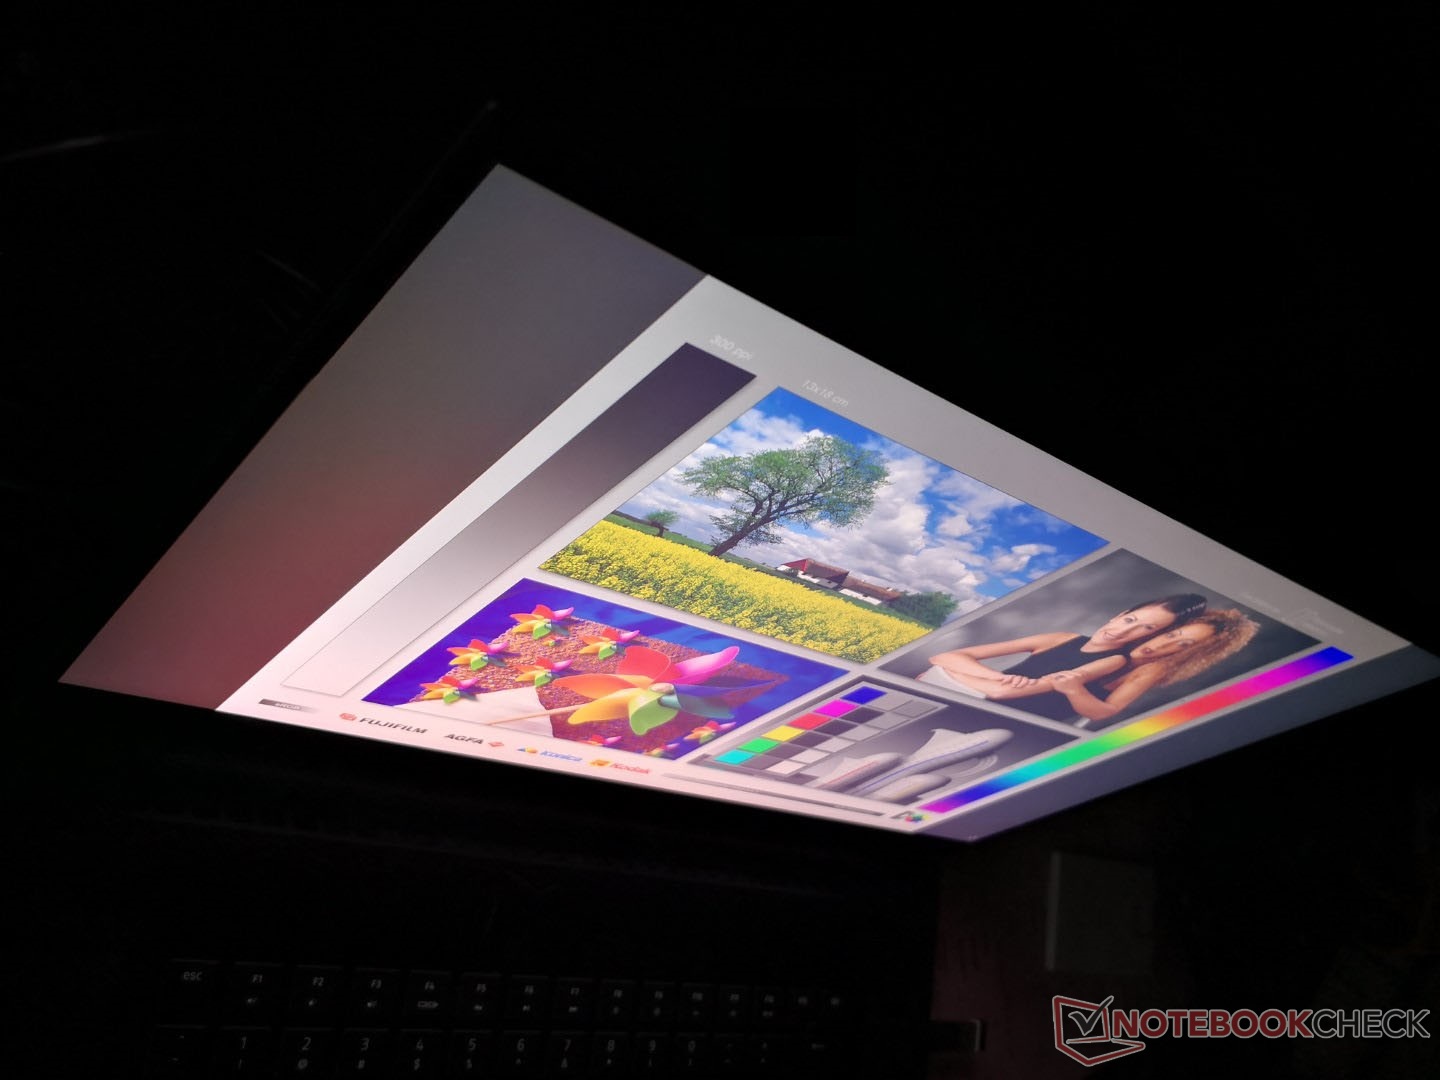
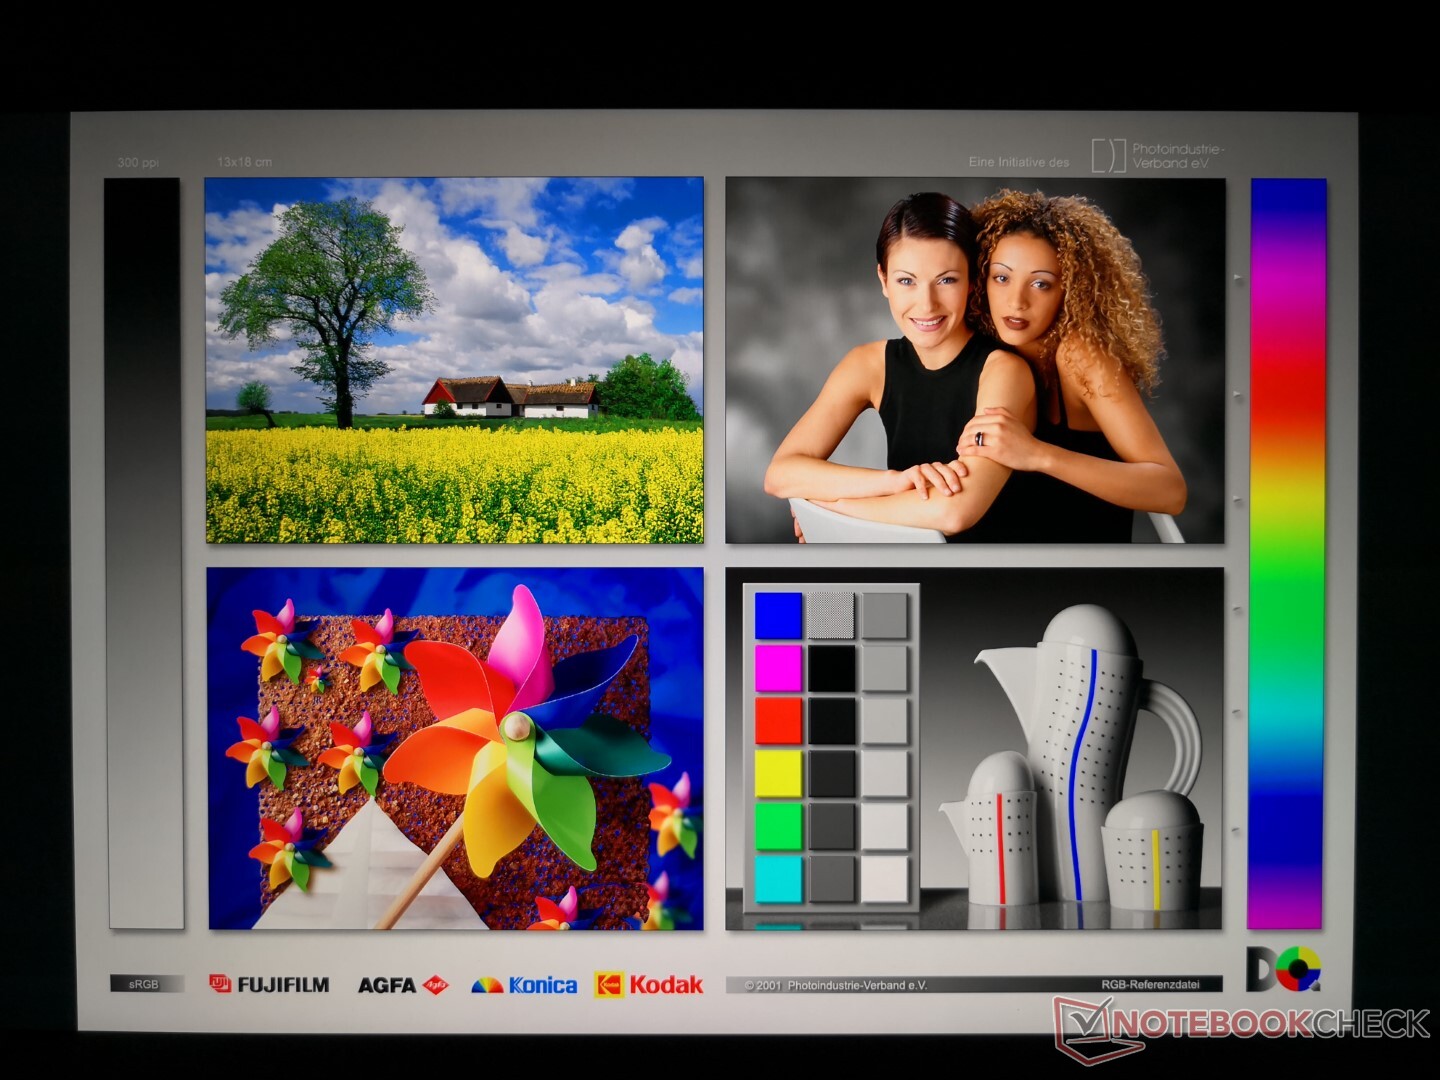
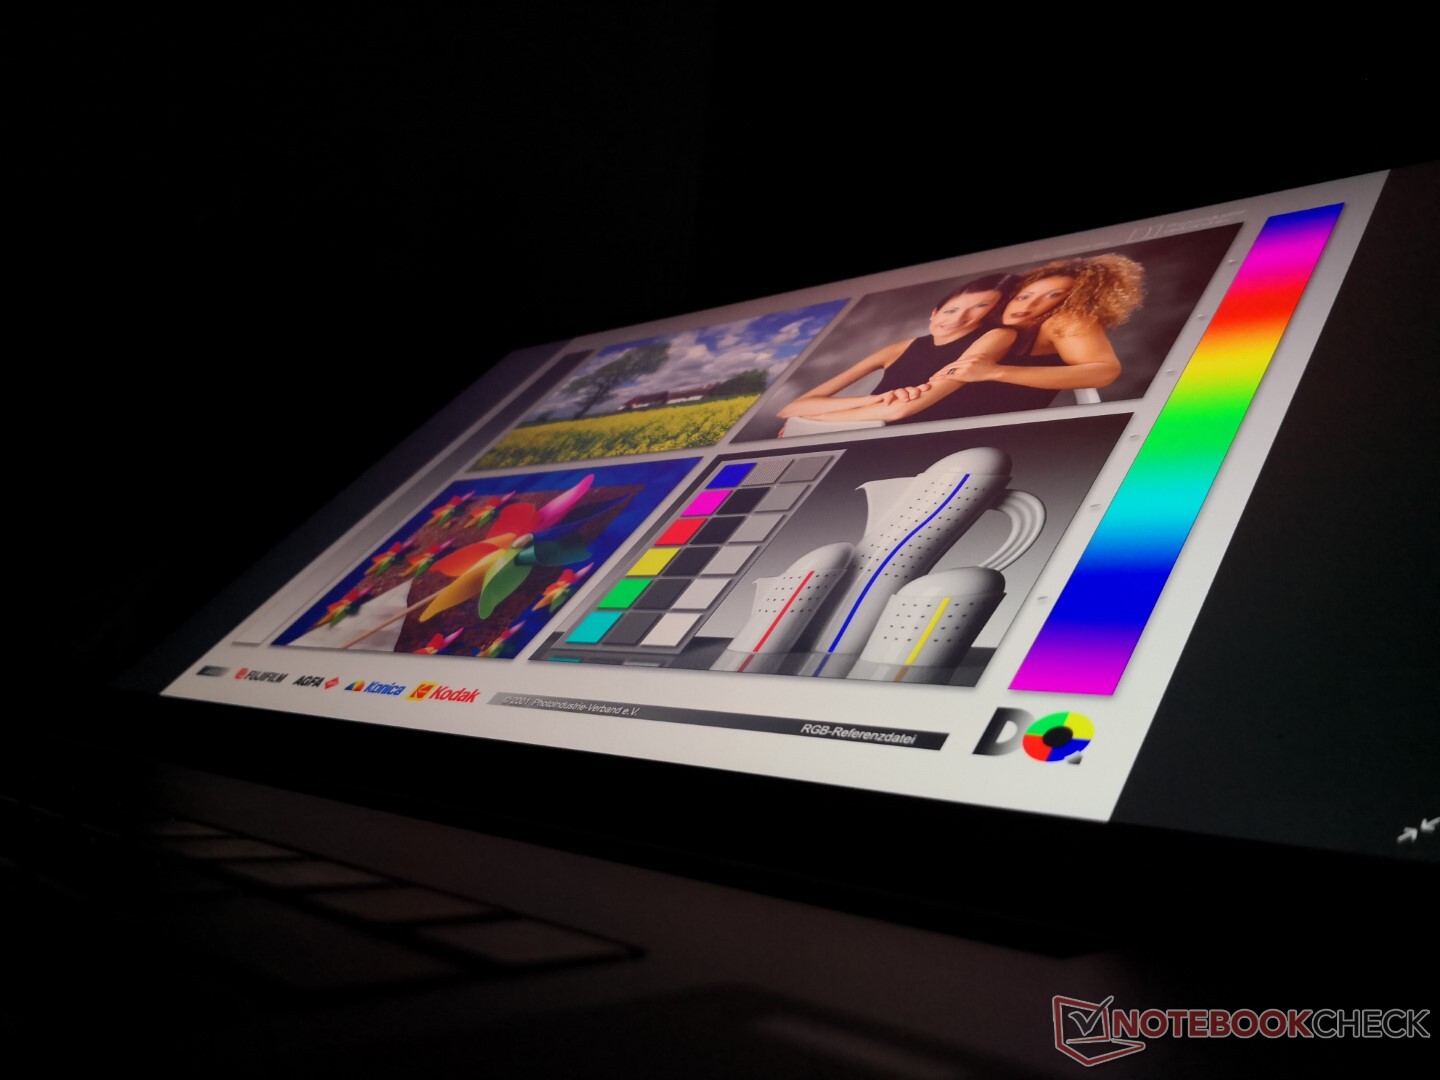
A tela tátil 4K 120 Hz da série 2021 Blade Pro é idêntica à opção 4K 120 Hz da série 2020, pois ambos são painéis IPS B173ZAN03.3 da AU Optronics. Teremos que esperar por outra configuração da Razer para testar o novo painel de 165 Hz 1440p, que inevitavelmente exibirá atributos diferentes dos que registramos aqui no painel 4K.
Tenha em mente que o modo 120 Hz só está disponível se a GPU discreta estiver ativa. A taxa de atualização nativa será limitada a 60 Hz se a comutação para a GPU integrada. Uma reinicialização do sistema é necessária se os usuários quiserem ativar as configurações Optimus

| |||||||||||||||||||||||||
iluminação: 90 %
iluminação com acumulador: 407.2 cd/m²
Contraste: 970:1 (Preto: 0.42 cd/m²)
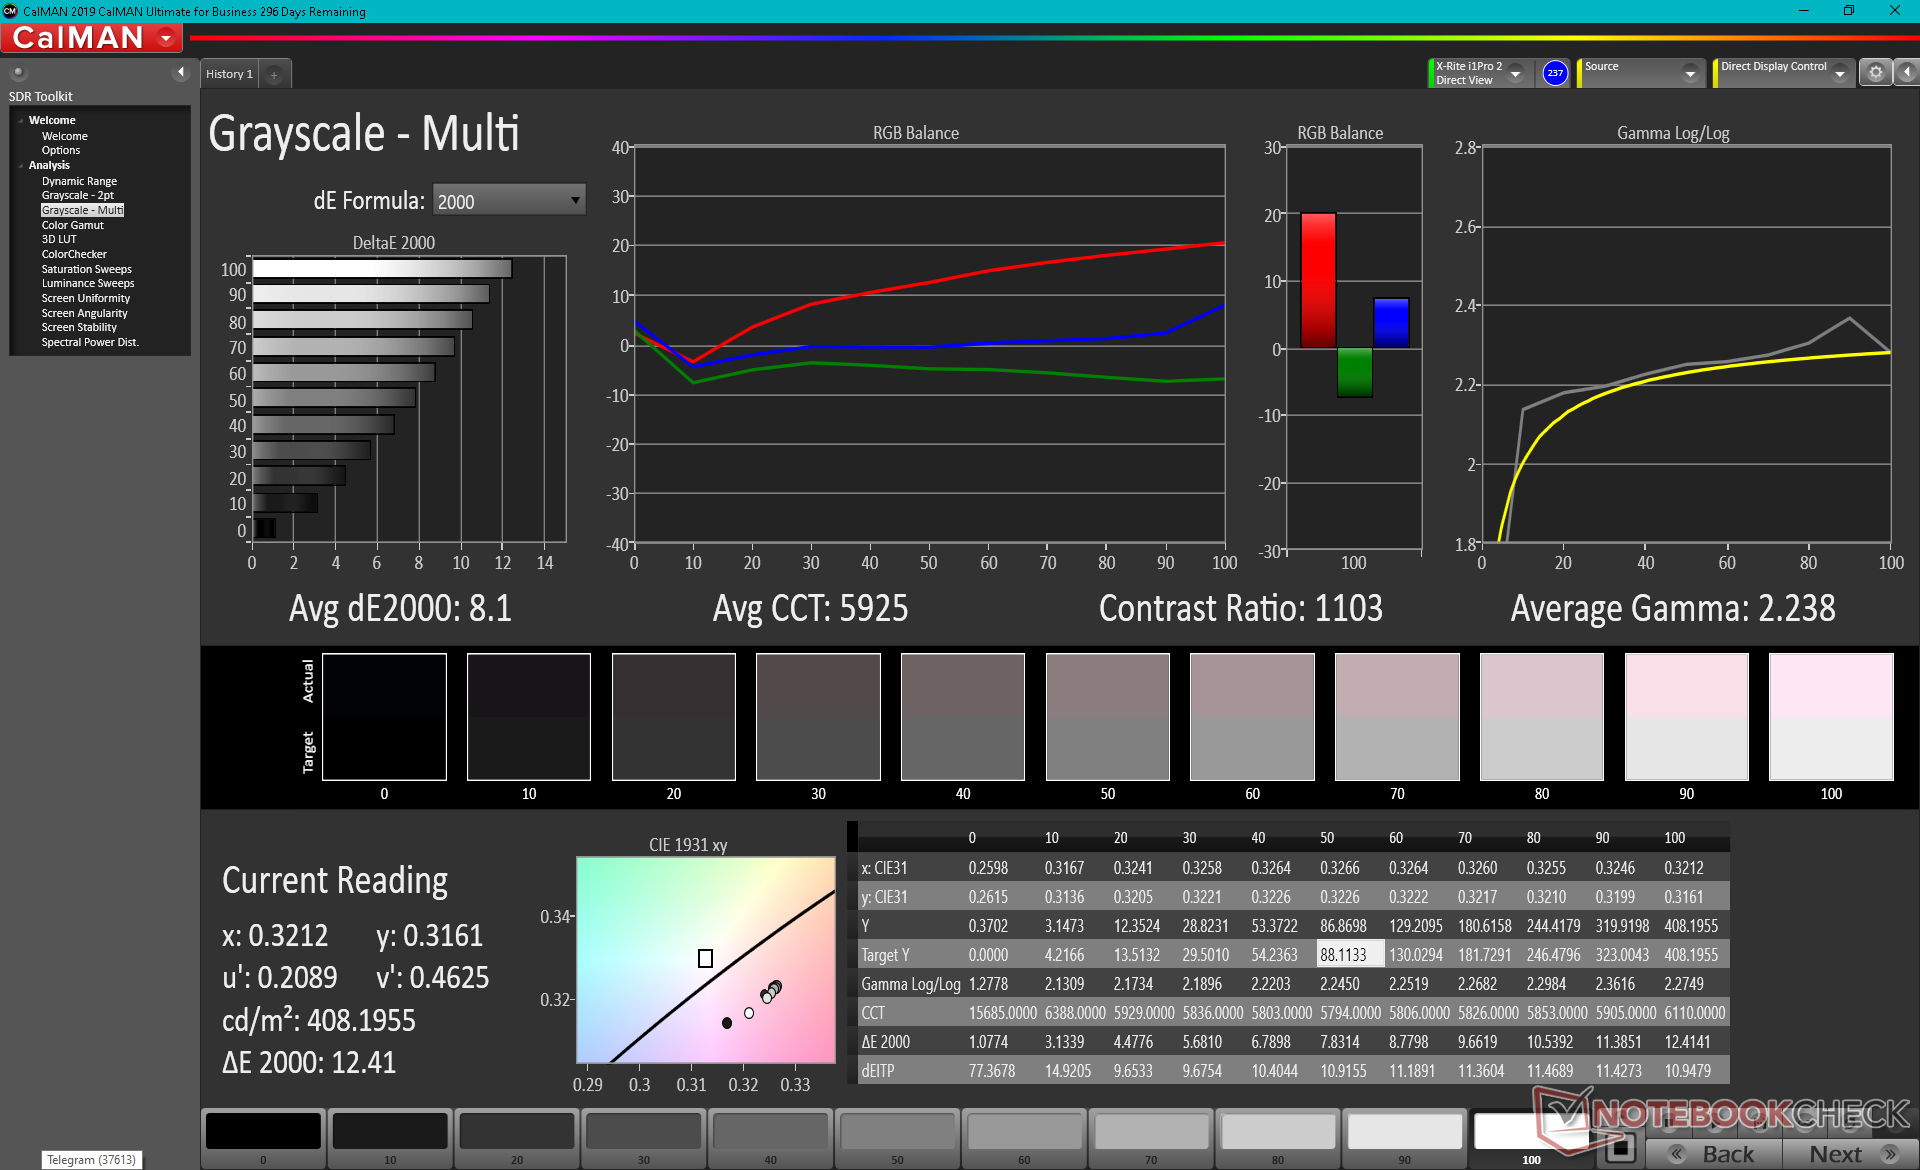
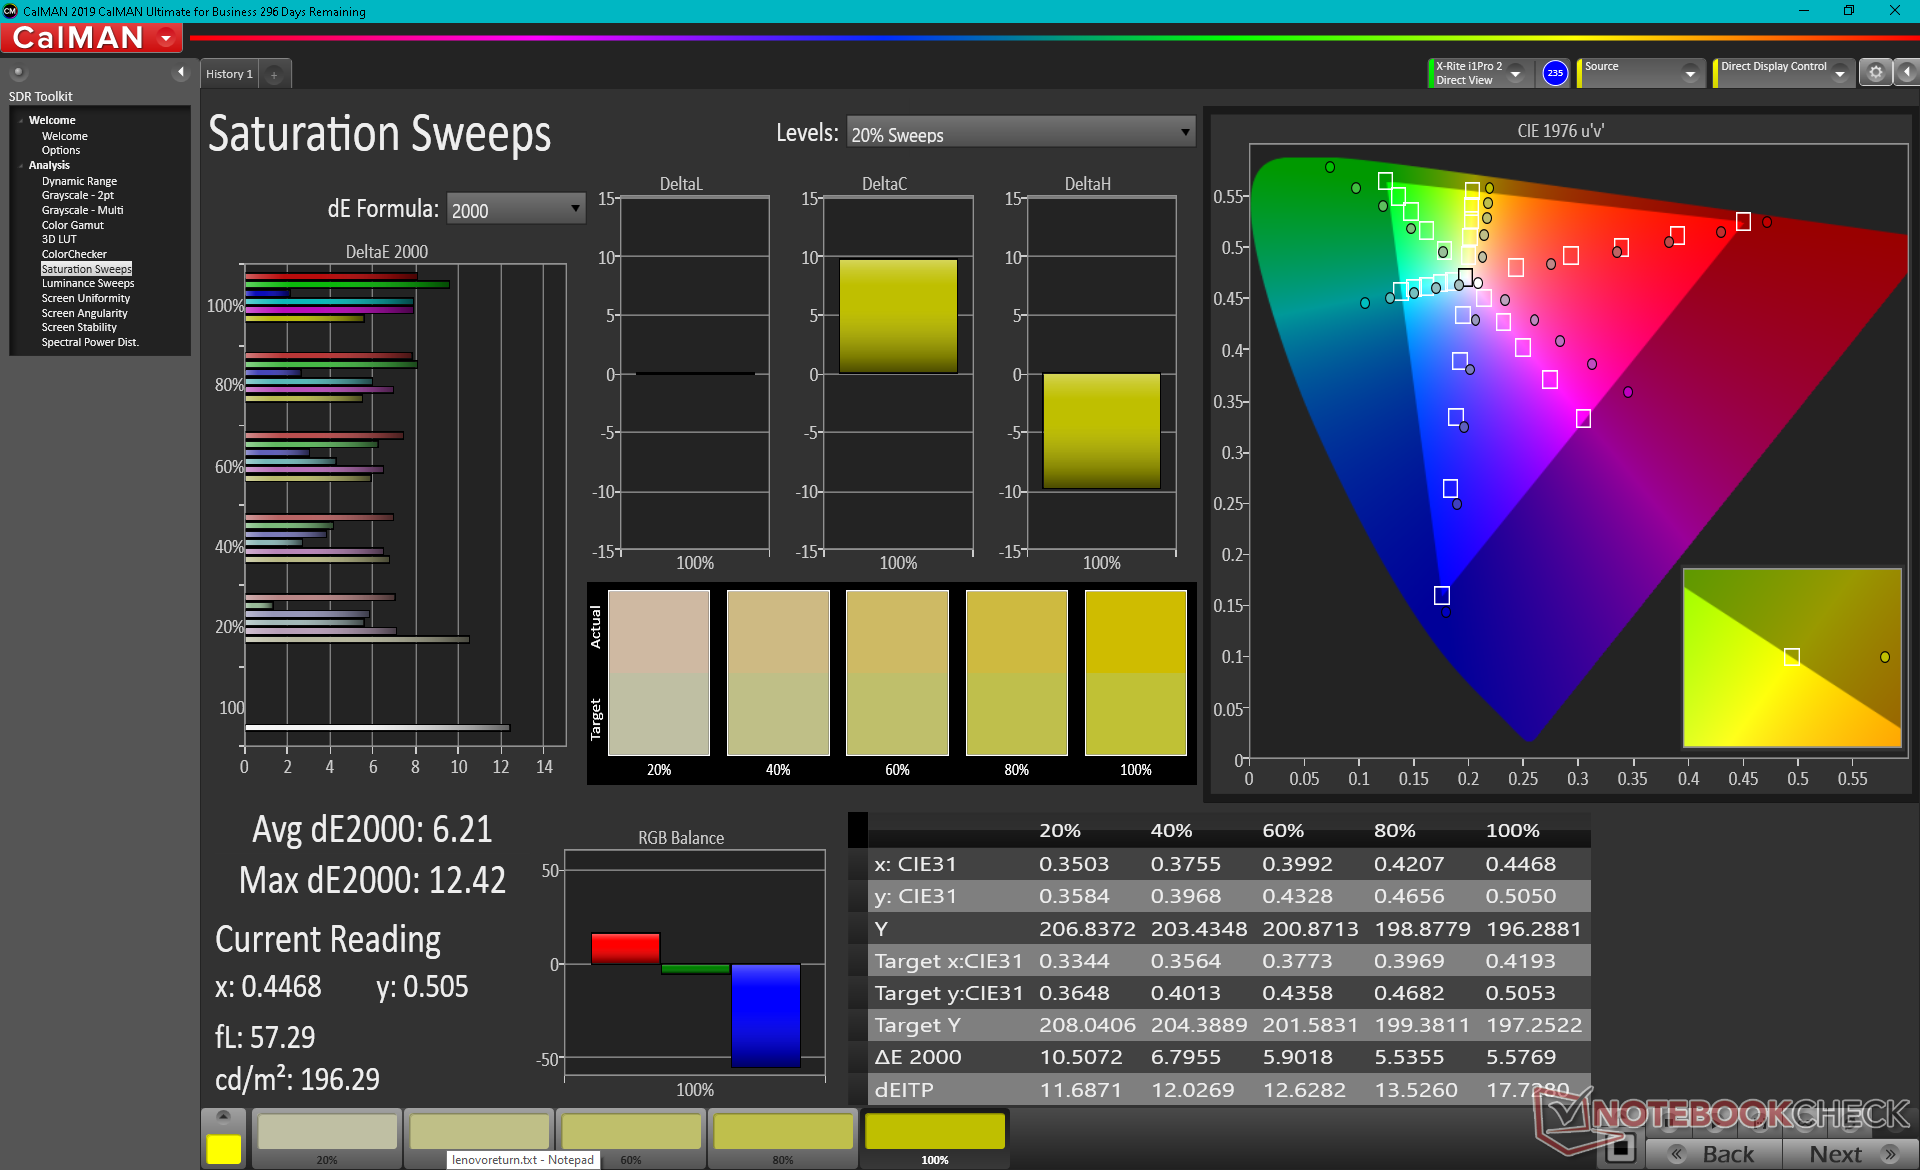
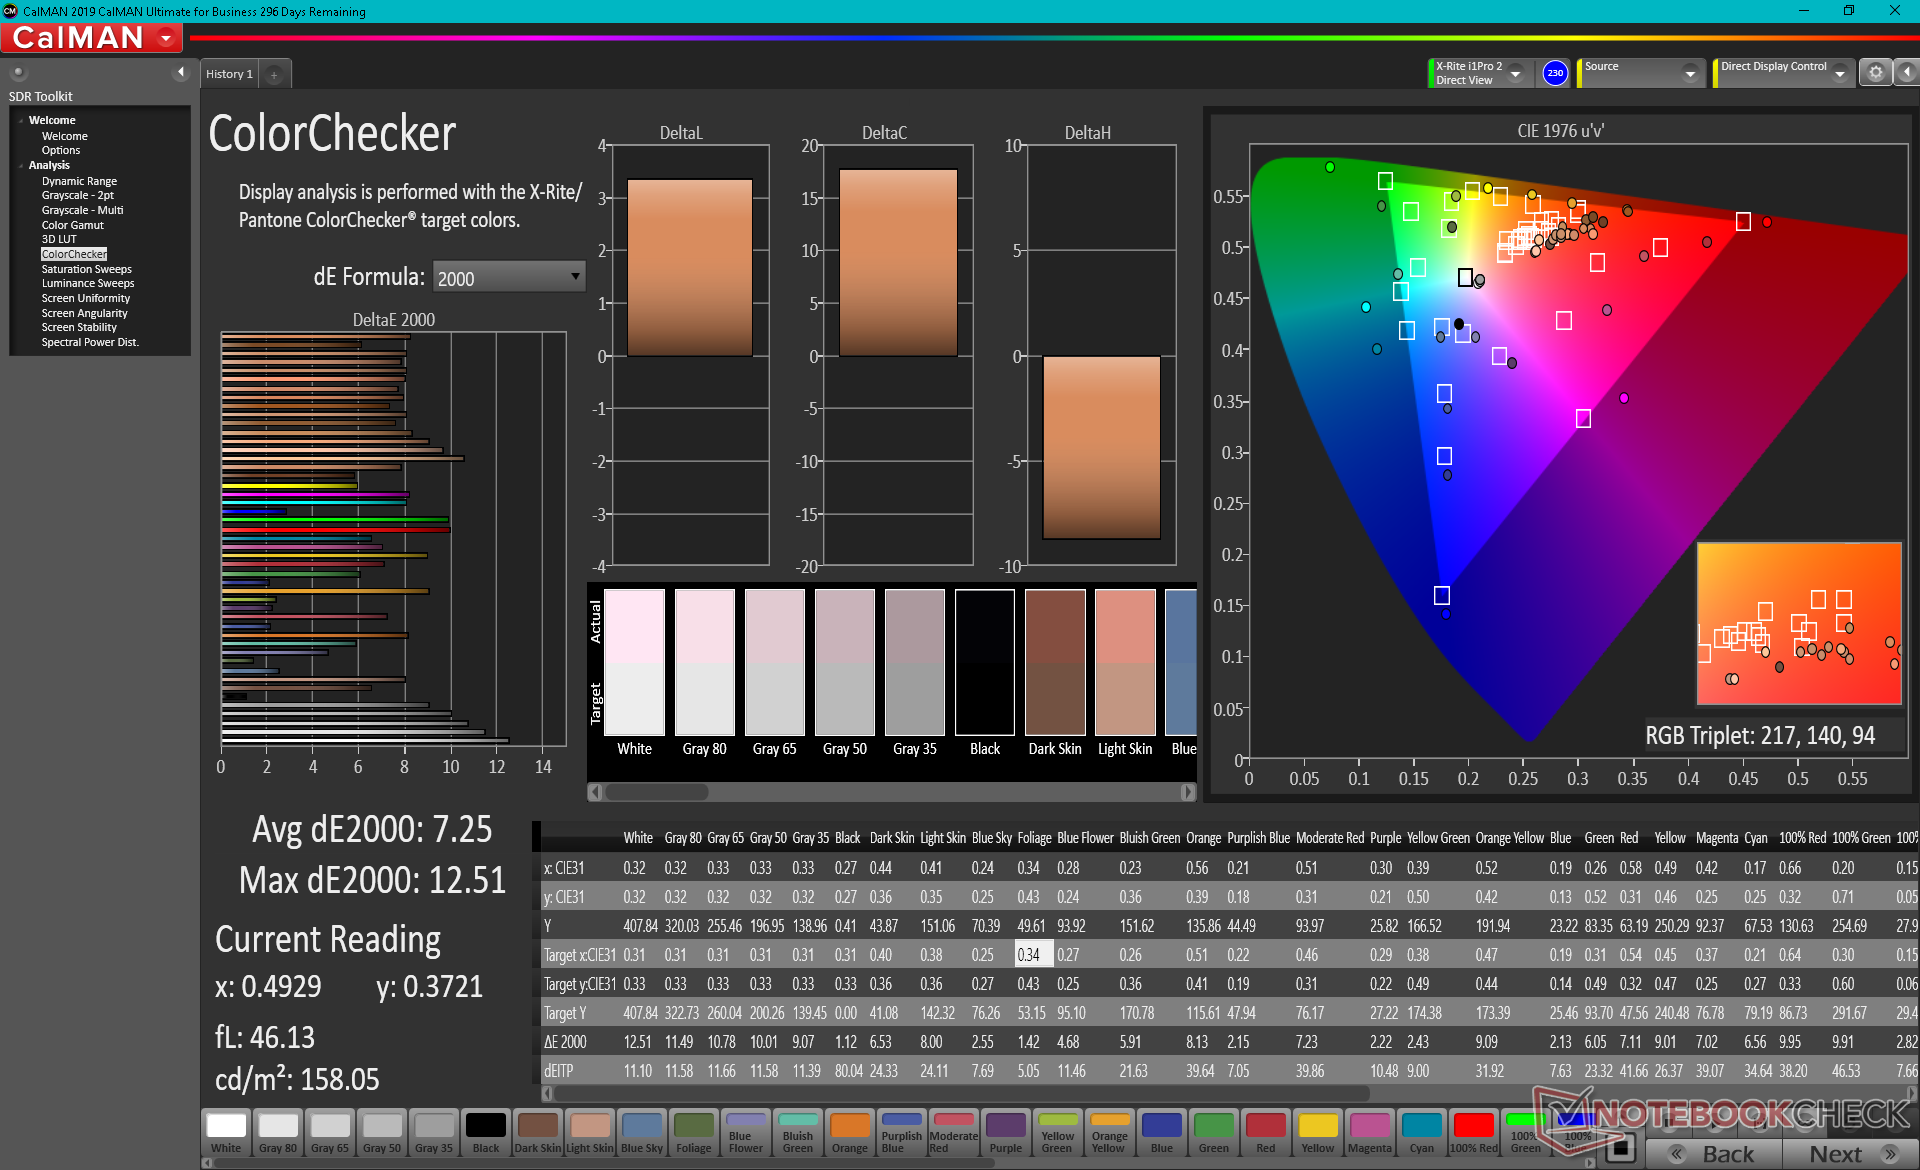
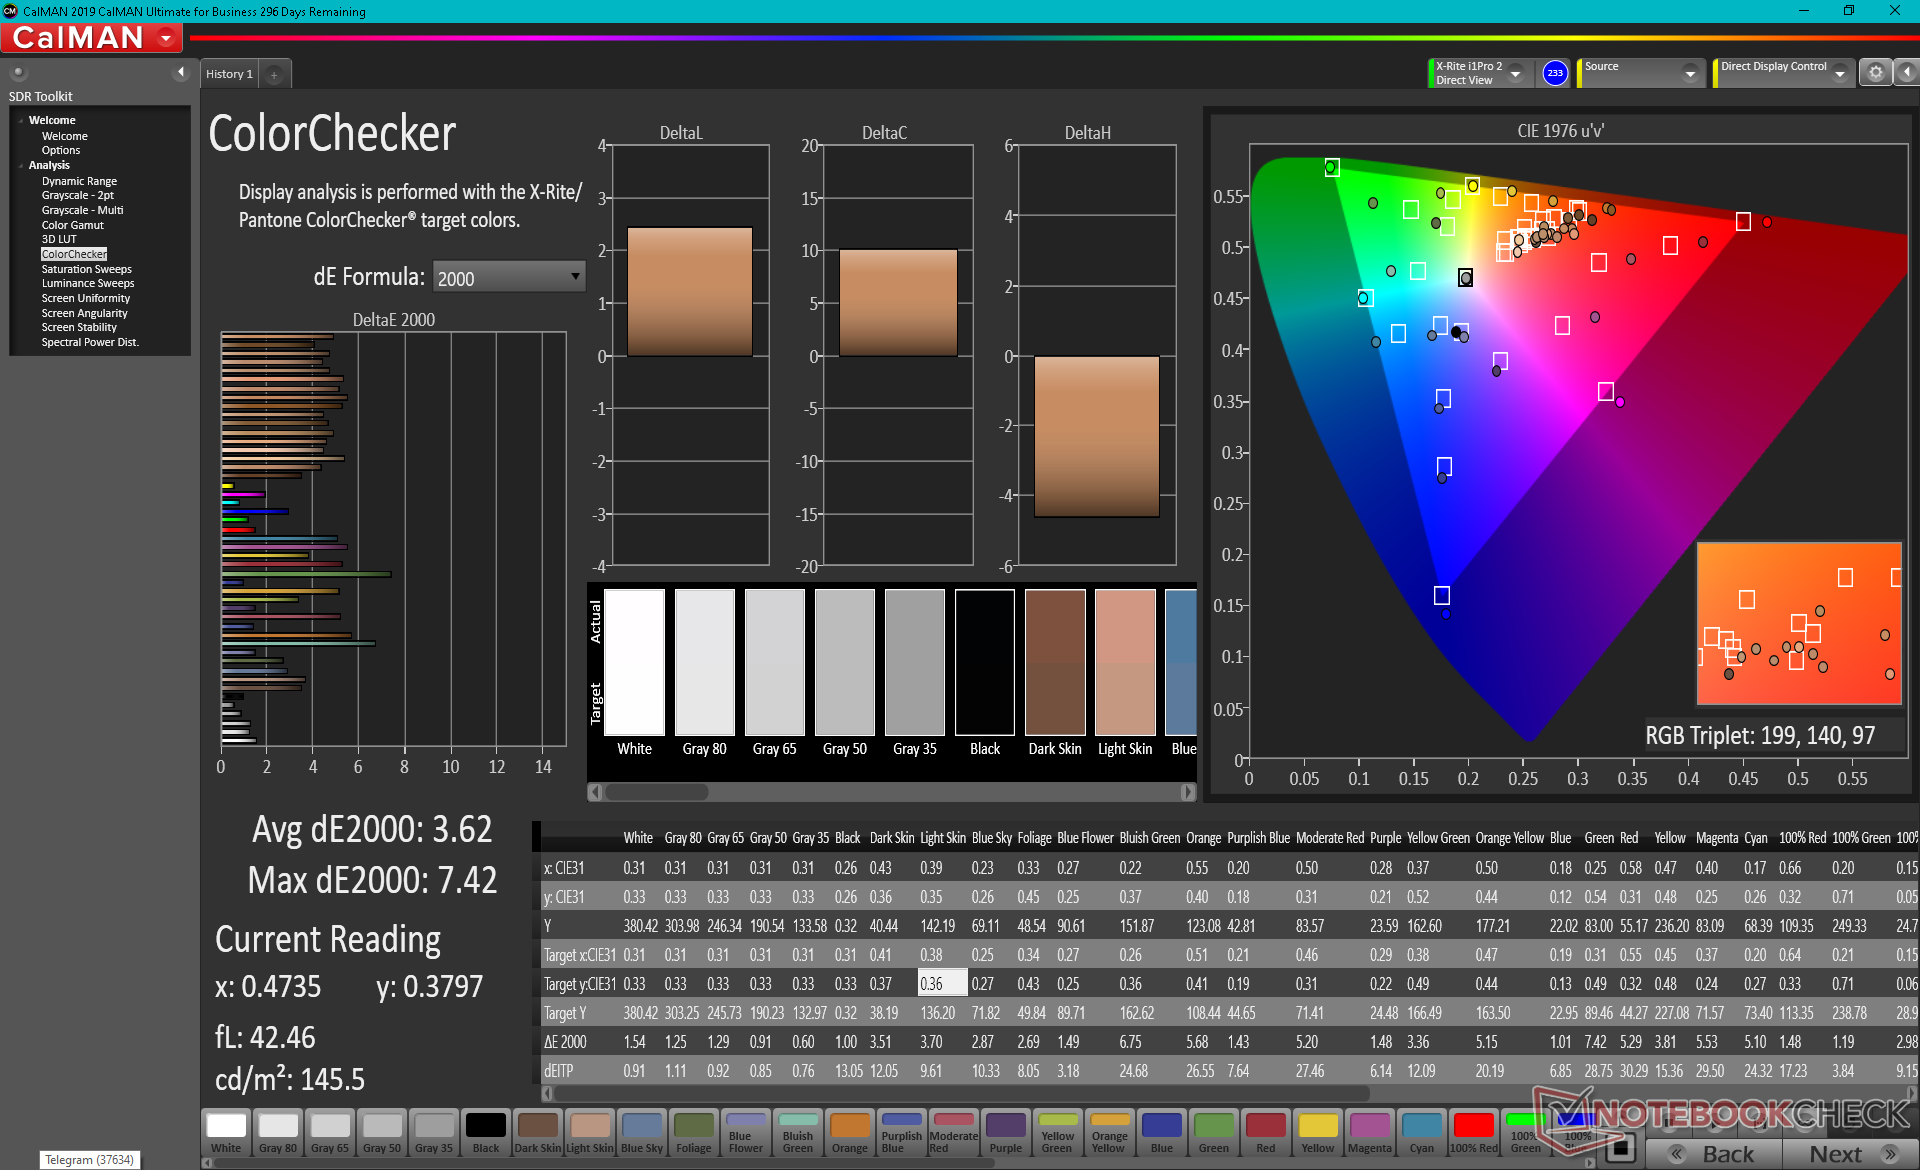
ΔE ColorChecker Calman: 7.25 | ∀{0.5-29.43 Ø4.71}
calibrated: 3.62
ΔE Greyscale Calman: 8.1 | ∀{0.09-98 Ø4.96}
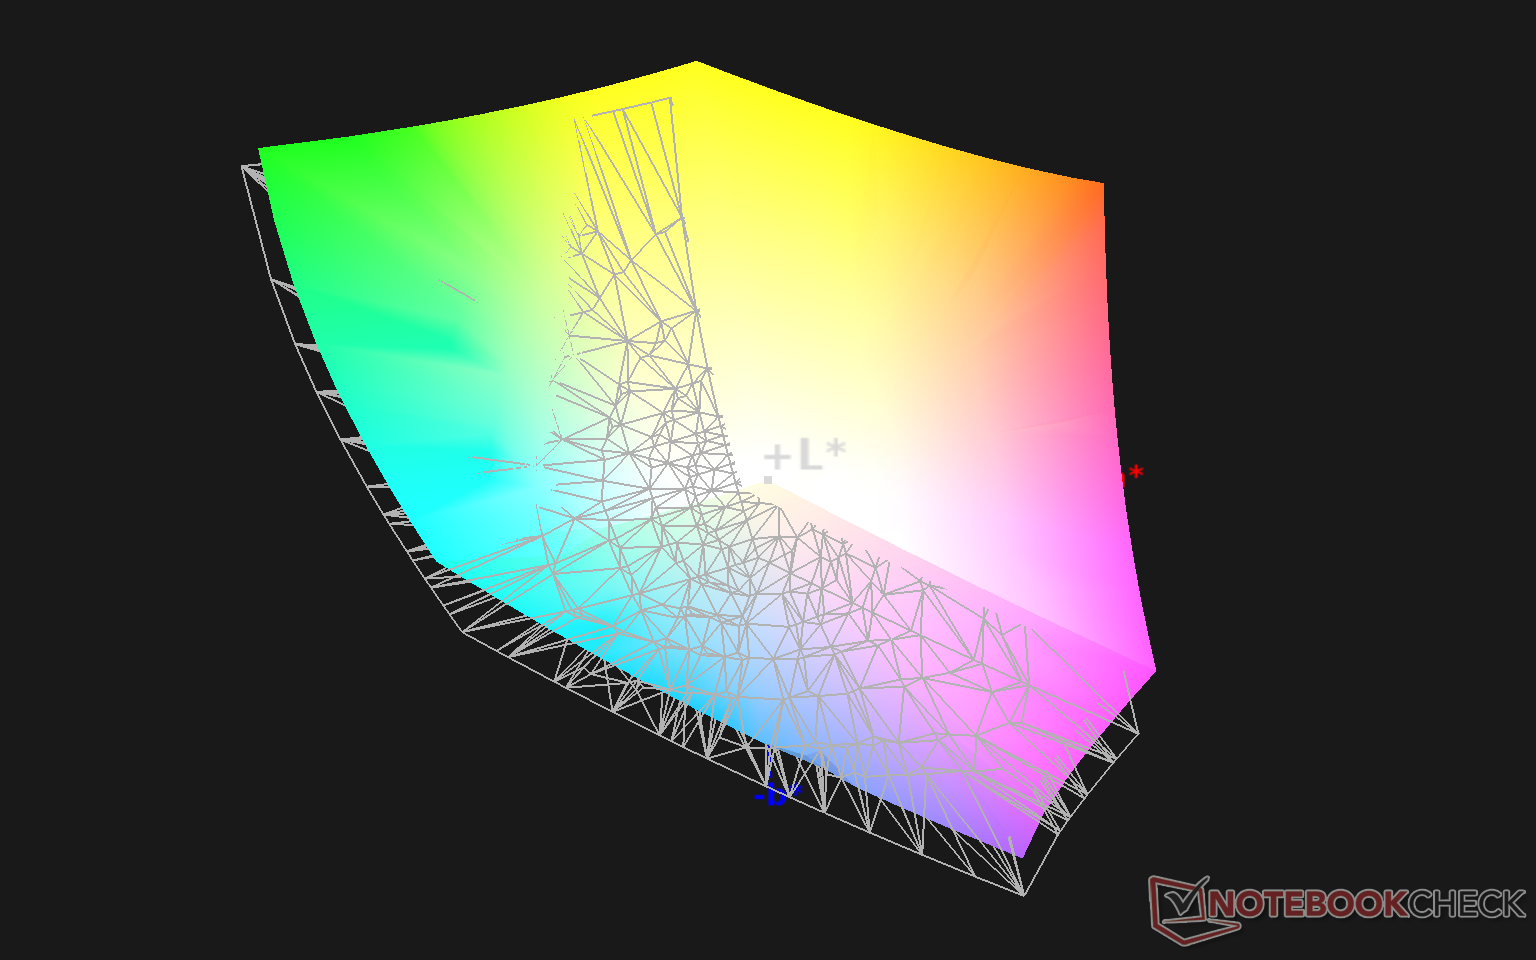
100% sRGB (Argyll 1.6.3 3D)
88.1% AdobeRGB 1998 (Argyll 1.6.3 3D)
99.9% AdobeRGB 1998 (Argyll 3D)
100% sRGB (Argyll 3D)
88.6% Display P3 (Argyll 3D)
Gamma: 2.24
CCT: 5925 K
| Razer Blade Pro 17 2021 (QHD Touch) AU Optronics B173ZAN03.3, IPS, 17.3", 3840x2160 | Razer Blade Pro 17 RTX 2070 Max-Q 300 Hz Sharp LQ173M1JW02, IPS, 17.3", 1920x1080 | Schenker XMG Neo 17 (Early 2021, RTX 3070, 5800H) BOE NE173QHM-NY2 (BOE0977), IPS, 17.3", 2560x1440 | MSI GT76 Titan DT 10SGS AU Optronics B173ZAN03.3, IPS, 17.3", 3840x2160 | Asus Strix G17 G712LWS LG Philips LP173WFG-SPB3, IPS, 17.3", 1920x1080 | MSI GS75 10SF-609US Sharp LQ173M1JW05, IPS, 17.3", 1920x1080 | |
|---|---|---|---|---|---|---|
| Display | -16% | -16% | -4% | -21% | -13% | |
| Display P3 Coverage (%) | 88.6 | 72.2 -19% | 70.5 -20% | 82.5 -7% | 65.2 -26% | 75.6 -15% |
| sRGB Coverage (%) | 100 | 98.5 -1% | 99.5 0% | 98 -2% | 96.8 -3% | 99.8 0% |
| AdobeRGB 1998 Coverage (%) | 99.9 | 73 -27% | 71.8 -28% | 96.6 -3% | 66.4 -34% | 75.1 -25% |
| Response Times | 42% | 3% | -25% | 9% | 56% | |
| Response Time Grey 50% / Grey 80% * (ms) | 15.2 ? | 5.6 ? 63% | 16.8 ? -11% | 23.2 ? -53% | 14.4 ? 5% | 5 ? 67% |
| Response Time Black / White * (ms) | 12 ? | 9.6 ? 20% | 10 ? 17% | 11.6 ? 3% | 10.4 ? 13% | 6.6 ? 45% |
| PWM Frequency (Hz) | ||||||
| Screen | 5% | 23% | 18% | 16% | 19% | |
| Brightness middle (cd/m²) | 407.2 | 328 -19% | 410 1% | 419.5 3% | 323 -21% | 299.4 -26% |
| Brightness (cd/m²) | 403 | 329 -18% | 381 -5% | 413 2% | 300 -26% | 299 -26% |
| Brightness Distribution (%) | 90 | 78 -13% | 88 -2% | 93 3% | 89 -1% | 84 -7% |
| Black Level * (cd/m²) | 0.42 | 0.35 17% | 0.37 12% | 0.4 5% | 0.31 26% | 0.31 26% |
| Contrast (:1) | 970 | 937 -3% | 1108 14% | 1049 8% | 1042 7% | 966 0% |
| Colorchecker dE 2000 * | 7.25 | 4.74 35% | 2.55 65% | 3.4 53% | 3.01 58% | 1.82 75% |
| Colorchecker dE 2000 max. * | 12.51 | 8.99 28% | 4.33 65% | 7.4 41% | 7.65 39% | 3.91 69% |
| Colorchecker dE 2000 calibrated * | 3.62 | 2.12 41% | 1.28 65% | 3.28 9% | 1 72% | 1.59 56% |
| Greyscale dE 2000 * | 8.1 | 6.8 16% | 3.4 58% | 2 75% | 3.8 53% | 2.7 67% |
| Gamma | 2.24 98% | 2.2 100% | 2.275 97% | 2.14 103% | 2.154 102% | 2.18 101% |
| CCT | 5925 110% | 6446 101% | 6637 98% | 6858 95% | 7507 87% | 6837 95% |
| Color Space (Percent of AdobeRGB 1998) (%) | 88.1 | 64.8 -26% | 72 -18% | 84.6 -4% | 66 -25% | 67.1 -24% |
| Color Space (Percent of sRGB) (%) | 100 | 98.6 -1% | 95 -5% | 97.9 -2% | 90 -10% | 99.8 0% |
| Média Total (Programa/Configurações) | 10% /
6% | 3% /
13% | -4% /
8% | 1% /
8% | 21% /
18% |
* ... menor é melhor
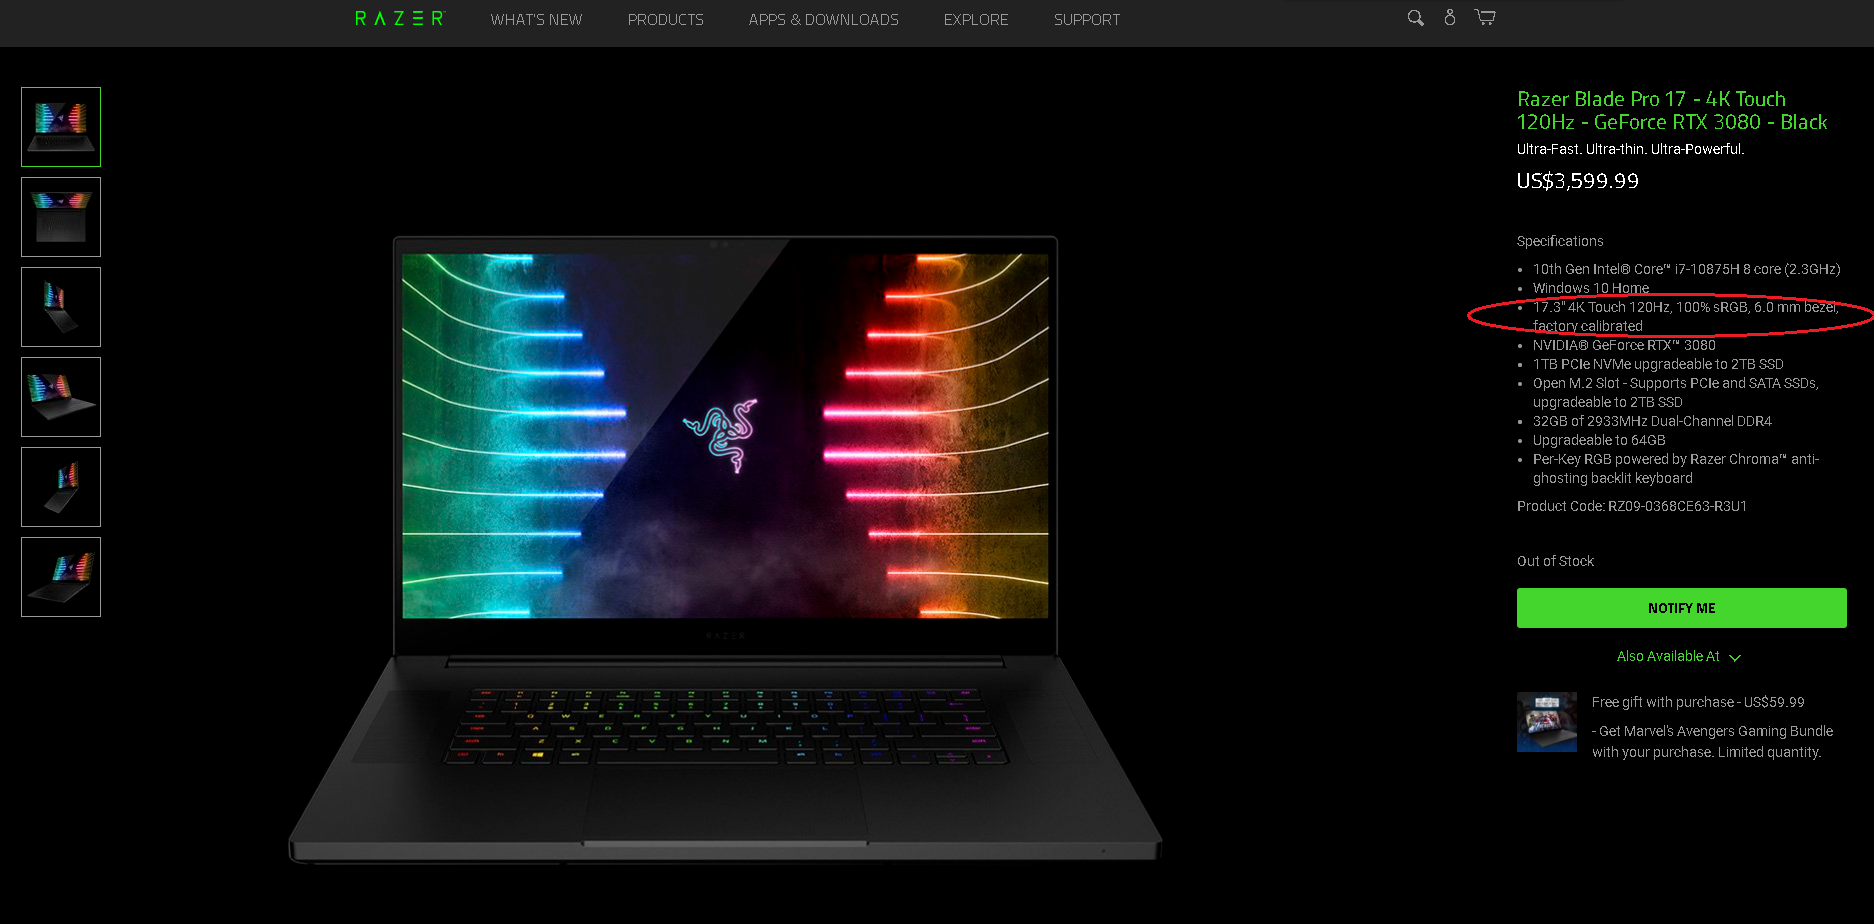
O espaço de cores cobre todo o sRGB e AdobeRGB. A Razer confirmou conosco que a listagem "100% sRGB" na página do produto de configuração 4K é um erro, pois deveria ler "100% AdobeRGB" em seu lugar. Este é um dos poucos laptops com um painel de 4K capaz tanto de taxas de atualização rápida quanto de cores profundas para jogos e edição gráfica.

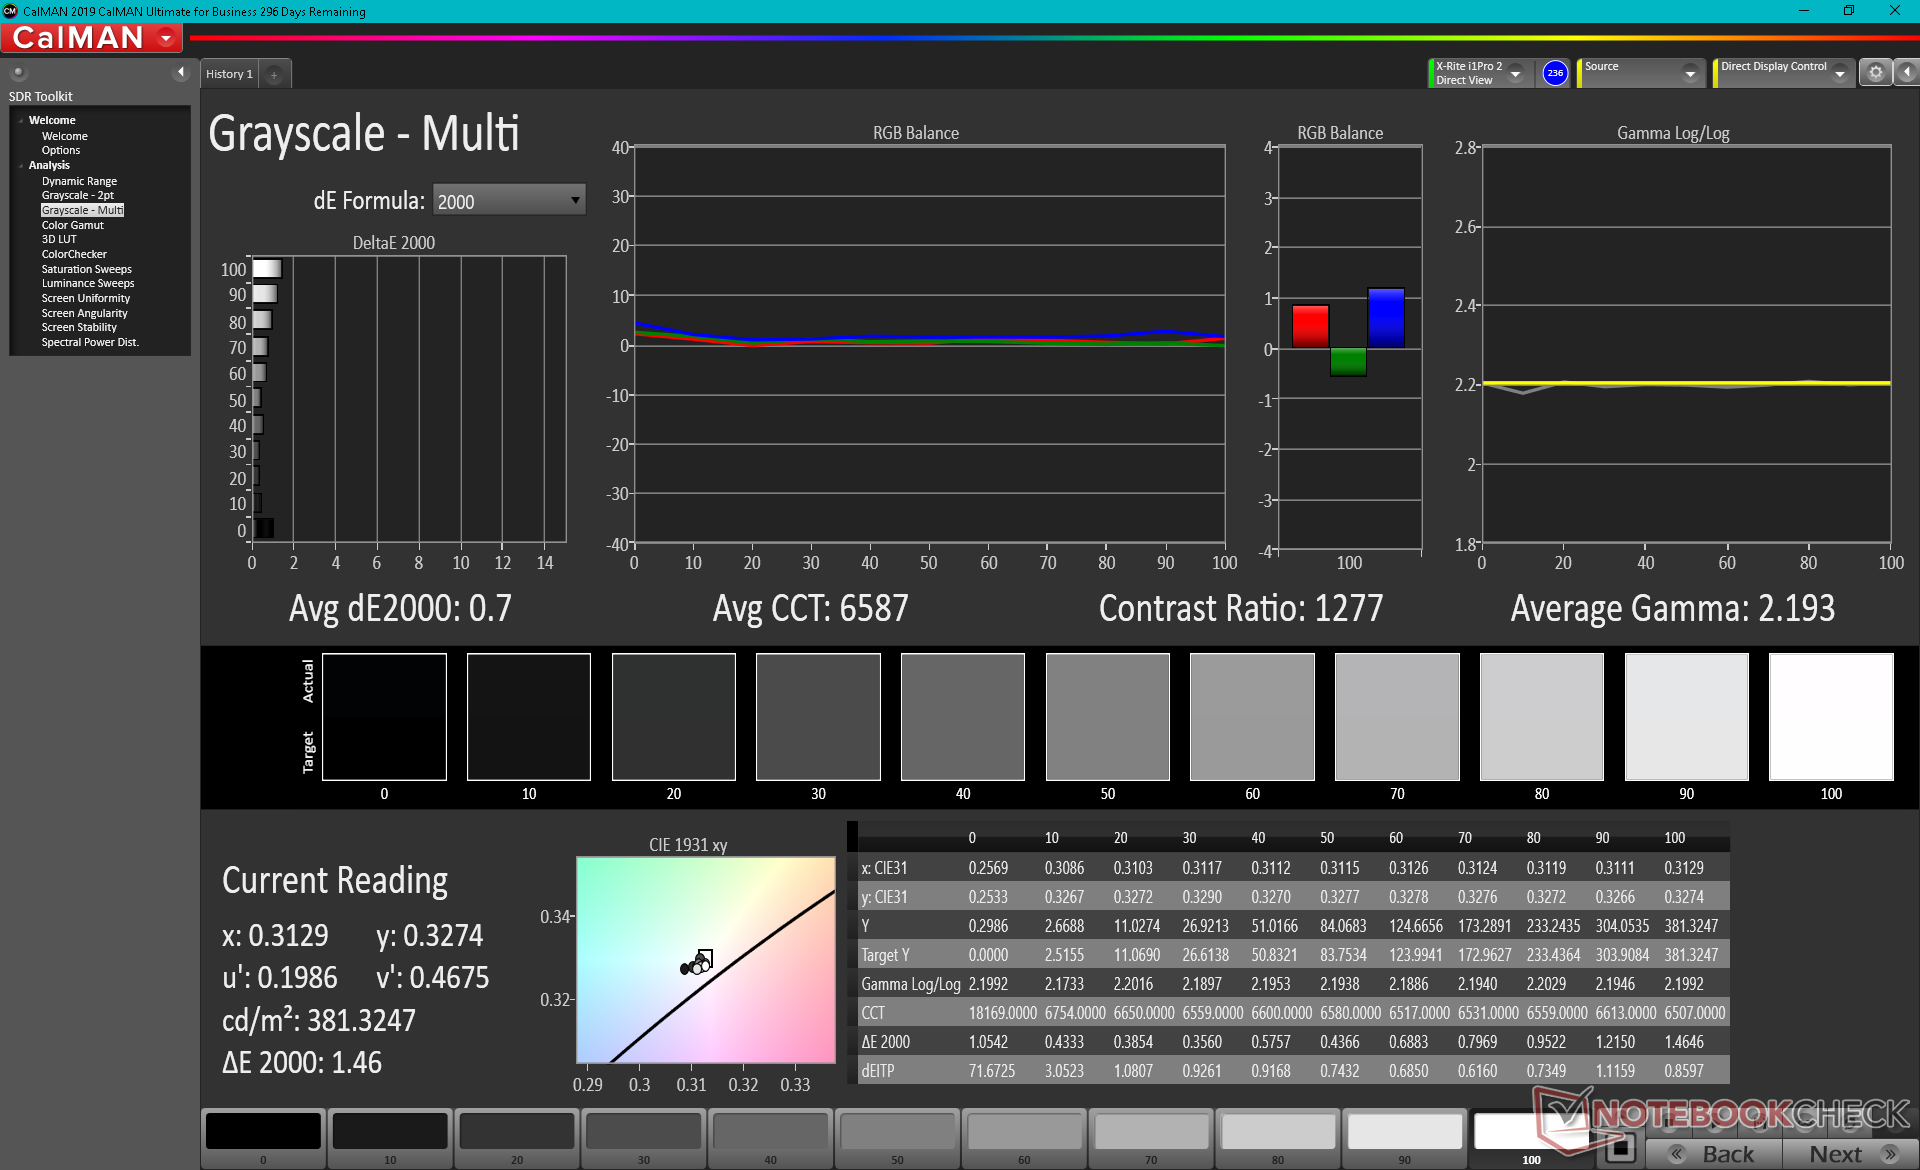
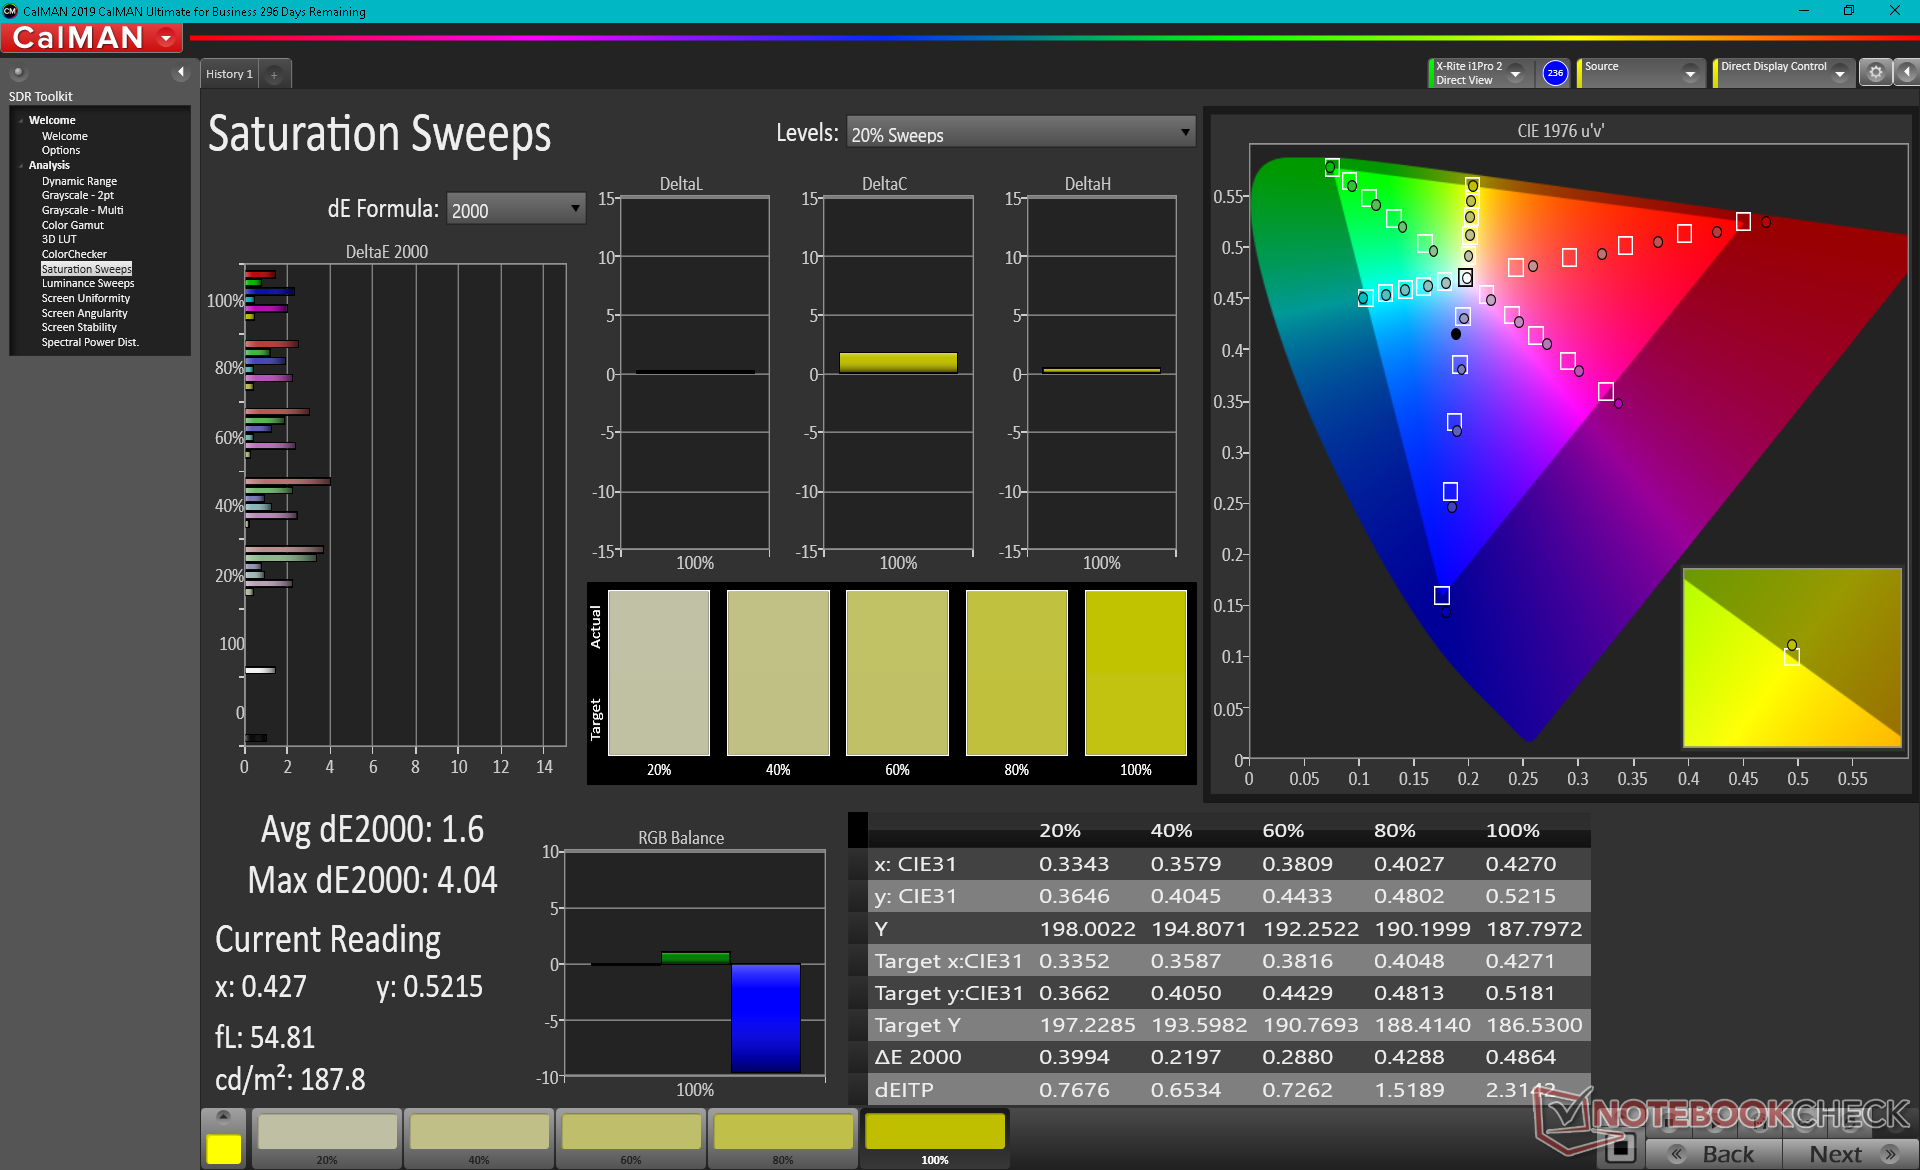
As medições do colorímetro X-Rite mostram uma temperatura de cor excessivamente quente, resultando em uma escala de cinza e um equilíbrio RGB pobre. Uma calibração aborda este aspecto para melhorar o valor médio do deltaE de escala de cinza para apenas 0,7. Alguns ajustes são recomendados para novos proprietários se as cores parecerem muito quentes.
Exibir tempos de resposta
| ↔ Tempo de resposta preto para branco | ||
|---|---|---|
| 12 ms ... ascensão ↗ e queda ↘ combinadas | ↗ 6 ms ascensão | 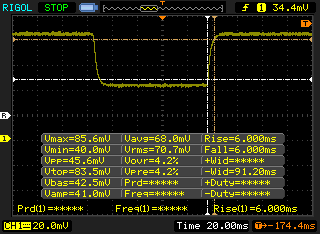 |
| ↘ 6 ms queda | ||
| A tela mostra boas taxas de resposta em nossos testes, mas pode ser muito lenta para jogadores competitivos. Em comparação, todos os dispositivos testados variam de 0.1 (mínimo) a 240 (máximo) ms. » 32 % de todos os dispositivos são melhores. Isso significa que o tempo de resposta medido é melhor que a média de todos os dispositivos testados (19.8 ms). | ||
| ↔ Tempo de resposta 50% cinza a 80% cinza | ||
| 15.2 ms ... ascensão ↗ e queda ↘ combinadas | ↗ 7.6 ms ascensão | 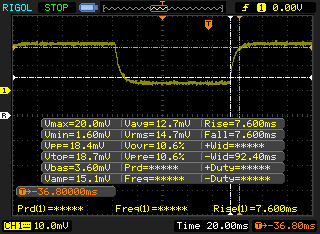 |
| ↘ 7.6 ms queda | ||
| A tela mostra boas taxas de resposta em nossos testes, mas pode ser muito lenta para jogadores competitivos. Em comparação, todos os dispositivos testados variam de 0.165 (mínimo) a 636 (máximo) ms. » 29 % de todos os dispositivos são melhores. Isso significa que o tempo de resposta medido é melhor que a média de todos os dispositivos testados (31 ms). | ||
Cintilação da tela / PWM (modulação por largura de pulso)
| Tela tremeluzindo / PWM não detectado | 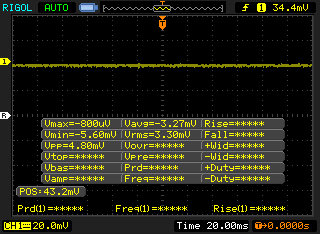 | ||
[pwm_comparison] Em comparação: 52 % de todos os dispositivos testados não usam PWM para escurecer a tela. Se PWM foi detectado, uma média de 7757 (mínimo: 5 - máximo: 343500) Hz foi medida. | |||

Desempenho
O Core i7-10875H retornou para todas as SKUs sem opções Core i5, Core i7-10870H, ou Core i9. Razer diz que o Core i9-10980HK não oferece grandes vantagens aos jogos, o que podemos concordar com base em nossas experiências com os SKUs Core i7 e Core i9 MSI GS66.
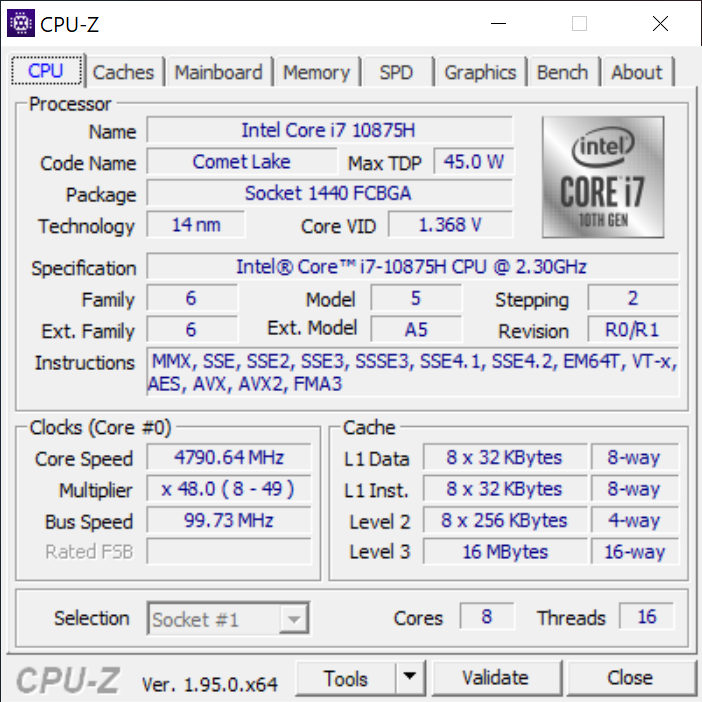
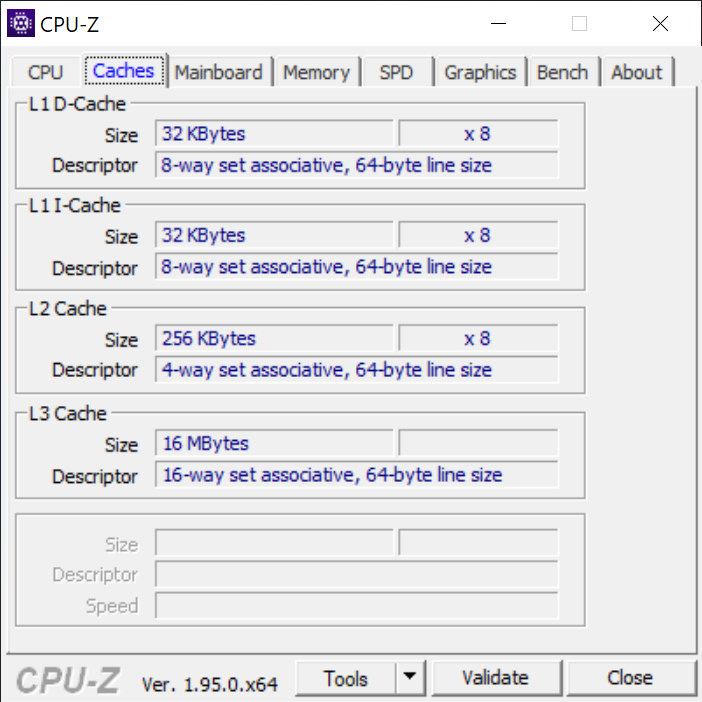
Processador
O desempenho da CPU está dentro de alguns pontos percentuais da média da CPU Core i7-10875H em nosso banco de dados, com base em pelo menos 30 outros laptops. Isto é bom no sentido de que o Blade Pro 17 não é de baixo desempenho, mas também significa que a CPU poderia ter sido mais rápida se houvesse uma altura térmica adicional. O mesmo processador no SchenkerXMG Neo 15, por exemplo, é cerca de 10 a 20 por cento mais rápido do que nosso Blade Pro 17.
A sustentabilidade do Turbo Boost é média. Os menores 15,6 polegadas MSI GS66 Stealth e Schenker XMG Neo 15 são capazes de manter taxas de relógio mais altas por mais tempo para retornar números iniciais mais altos do CineBench R15 xT, como mostra nosso gráfico de comparação abaixo.
Os laptops para jogos com o Ryzen 7 4800H ou Ryzen 7 5800H são capazes de oferecer um desempenho ainda mais rápido do processador do que o Core i7-10875H.
Cinebench R15: CPU Multi 64Bit | CPU Single 64Bit
Blender: v2.79 BMW27 CPU
7-Zip 18.03: 7z b 4 -mmt1 | 7z b 4
Geekbench 5.5: Single-Core | Multi-Core
HWBOT x265 Benchmark v2.2: 4k Preset
LibreOffice : 20 Documents To PDF
R Benchmark 2.5: Overall mean
| Cinebench R20 / CPU (Multi Core) | |
| Schenker XMG Ultra 17 Comet Lake | |
| Schenker XMG Core 17 (Early 2021, RTX 3060, 5800H) | |
| MSI Alpha 17 A4DEK | |
| Alienware m17 R3 P45E | |
| Razer Blade Pro 17 2021 (QHD Touch) | |
| Média Intel Core i7-10875H (1986 - 4176, n=32) | |
| MSI GF75 Thin 10SDR | |
| Razer Blade Pro 17 4K UHD 120 Hz | |
| MSI GF75 Thin 10SCXR | |
| Lenovo Legion Y540-17IRH | |
| Asus TUF FX705DT-AU068T | |
| Cinebench R20 / CPU (Single Core) | |
| Schenker XMG Core 17 (Early 2021, RTX 3060, 5800H) | |
| Schenker XMG Ultra 17 Comet Lake | |
| Razer Blade Pro 17 2021 (QHD Touch) | |
| Média Intel Core i7-10875H (430 - 524, n=32) | |
| MSI Alpha 17 A4DEK | |
| MSI GF75 Thin 10SDR | |
| Alienware m17 R3 P45E | |
| MSI GF75 Thin 10SCXR | |
| Razer Blade Pro 17 4K UHD 120 Hz | |
| Lenovo Legion Y540-17IRH | |
| Asus TUF FX705DT-AU068T | |
| Cinebench R15 / CPU Multi 64Bit | |
| Schenker XMG Ultra 17 Comet Lake | |
| Schenker XMG Core 17 (Early 2021, RTX 3060, 5800H) | |
| MSI Alpha 17 A4DEK | |
| Alienware m17 R3 P45E | |
| Média Intel Core i7-10875H (1003 - 1833, n=38) | |
| Razer Blade Pro 17 2021 (QHD Touch) | |
| MSI GF75 Thin 10SDR | |
| Razer Blade Pro 17 4K UHD 120 Hz | |
| Lenovo Legion Y540-17IRH | |
| MSI GF75 Thin 10SCXR | |
| Asus TUF FX705DT-AU068T | |
| Cinebench R15 / CPU Single 64Bit | |
| Schenker XMG Core 17 (Early 2021, RTX 3060, 5800H) | |
| Schenker XMG Ultra 17 Comet Lake | |
| Alienware m17 R3 P45E | |
| Média Intel Core i7-10875H (190 - 220, n=37) | |
| Razer Blade Pro 17 2021 (QHD Touch) | |
| MSI GF75 Thin 10SDR | |
| MSI Alpha 17 A4DEK | |
| MSI GF75 Thin 10SCXR | |
| Razer Blade Pro 17 4K UHD 120 Hz | |
| Lenovo Legion Y540-17IRH | |
| Asus TUF FX705DT-AU068T | |
| Blender / v2.79 BMW27 CPU | |
| MSI GF75 Thin 10SCXR | |
| MSI GF75 Thin 10SDR | |
| Média Intel Core i7-10875H (259 - 535, n=30) | |
| Razer Blade Pro 17 2021 (QHD Touch) | |
| Schenker XMG Core 17 (Early 2021, RTX 3060, 5800H) | |
| MSI Alpha 17 A4DEK | |
| Alienware m17 R3 P45E | |
| Schenker XMG Ultra 17 Comet Lake | |
| 7-Zip 18.03 / 7z b 4 -mmt1 | |
| Schenker XMG Ultra 17 Comet Lake | |
| Alienware m17 R3 P45E | |
| Média Intel Core i7-10875H (5071 - 5780, n=31) | |
| Razer Blade Pro 17 2021 (QHD Touch) | |
| Schenker XMG Core 17 (Early 2021, RTX 3060, 5800H) | |
| MSI GF75 Thin 10SDR | |
| MSI Alpha 17 A4DEK | |
| MSI GF75 Thin 10SCXR | |
| 7-Zip 18.03 / 7z b 4 | |
| Schenker XMG Ultra 17 Comet Lake | |
| Schenker XMG Core 17 (Early 2021, RTX 3060, 5800H) | |
| MSI Alpha 17 A4DEK | |
| Alienware m17 R3 P45E | |
| Razer Blade Pro 17 2021 (QHD Touch) | |
| Média Intel Core i7-10875H (29844 - 49562, n=31) | |
| MSI GF75 Thin 10SDR | |
| MSI GF75 Thin 10SCXR | |
| Geekbench 5.5 / Single-Core | |
| Schenker XMG Core 17 (Early 2021, RTX 3060, 5800H) | |
| Schenker XMG Ultra 17 Comet Lake | |
| Alienware m17 R3 P45E | |
| Razer Blade Pro 17 2021 (QHD Touch) | |
| Média Intel Core i7-10875H (1233 - 1371, n=29) | |
| MSI GF75 Thin 10SDR | |
| MSI Alpha 17 A4DEK | |
| MSI GF75 Thin 10SCXR | |
| Geekbench 5.5 / Multi-Core | |
| Schenker XMG Ultra 17 Comet Lake | |
| Razer Blade Pro 17 2021 (QHD Touch) | |
| MSI Alpha 17 A4DEK | |
| Alienware m17 R3 P45E | |
| Schenker XMG Core 17 (Early 2021, RTX 3060, 5800H) | |
| Média Intel Core i7-10875H (5715 - 8620, n=29) | |
| MSI GF75 Thin 10SDR | |
| MSI GF75 Thin 10SCXR | |
| HWBOT x265 Benchmark v2.2 / 4k Preset | |
| Schenker XMG Ultra 17 Comet Lake | |
| Schenker XMG Core 17 (Early 2021, RTX 3060, 5800H) | |
| Alienware m17 R3 P45E | |
| MSI Alpha 17 A4DEK | |
| Razer Blade Pro 17 2021 (QHD Touch) | |
| Média Intel Core i7-10875H (7.27 - 14.1, n=27) | |
| MSI GF75 Thin 10SDR | |
| MSI GF75 Thin 10SCXR | |
| LibreOffice / 20 Documents To PDF | |
| MSI Alpha 17 A4DEK | |
| MSI GF75 Thin 10SCXR | |
| MSI GF75 Thin 10SDR | |
| Schenker XMG Core 17 (Early 2021, RTX 3060, 5800H) | |
| Média Intel Core i7-10875H (30.2 - 84.3, n=30) | |
| Alienware m17 R3 P45E | |
| Schenker XMG Ultra 17 Comet Lake | |
| Razer Blade Pro 17 2021 (QHD Touch) | |
| R Benchmark 2.5 / Overall mean | |
| MSI GF75 Thin 10SCXR | |
| MSI GF75 Thin 10SDR | |
| Razer Blade Pro 17 2021 (QHD Touch) | |
| Média Intel Core i7-10875H (0.546 - 0.662, n=29) | |
| MSI Alpha 17 A4DEK | |
| Alienware m17 R3 P45E | |
| Schenker XMG Core 17 (Early 2021, RTX 3060, 5800H) | |
| Schenker XMG Ultra 17 Comet Lake | |
* ... menor é melhor
Desempenho do sistema
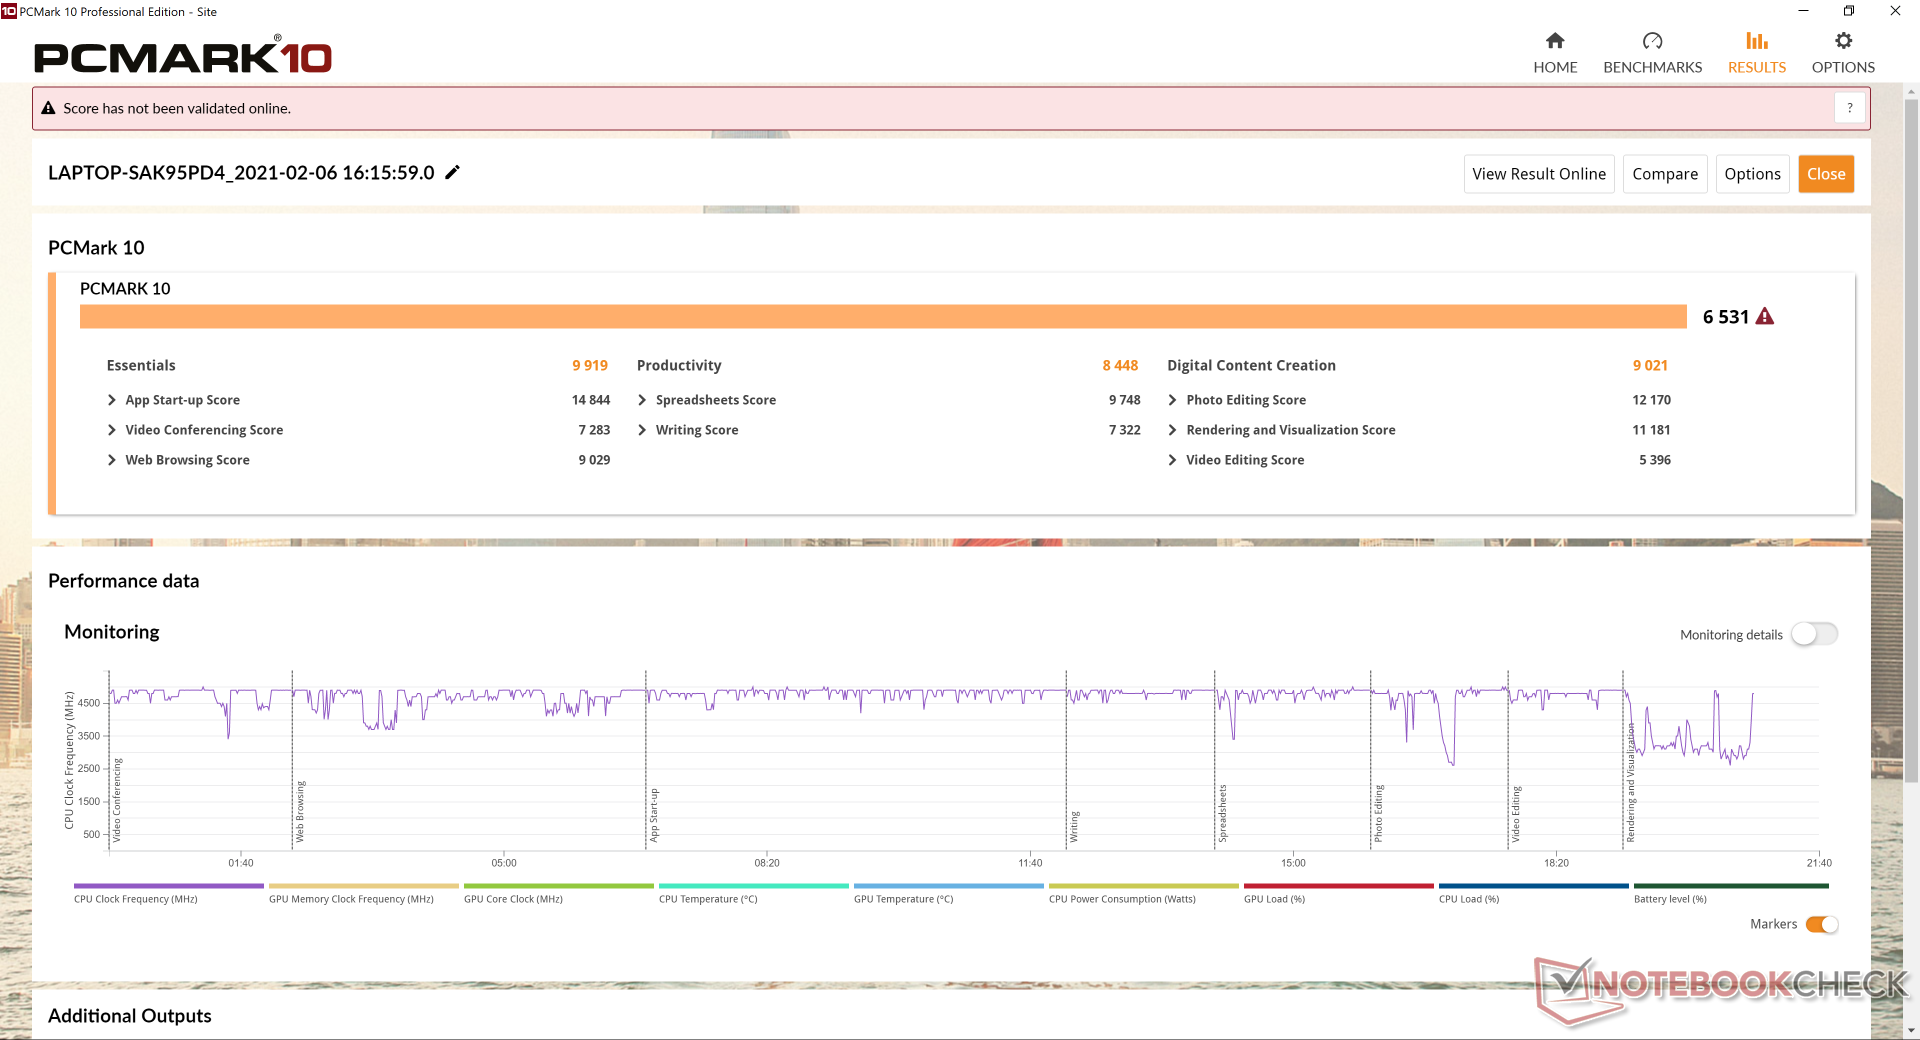
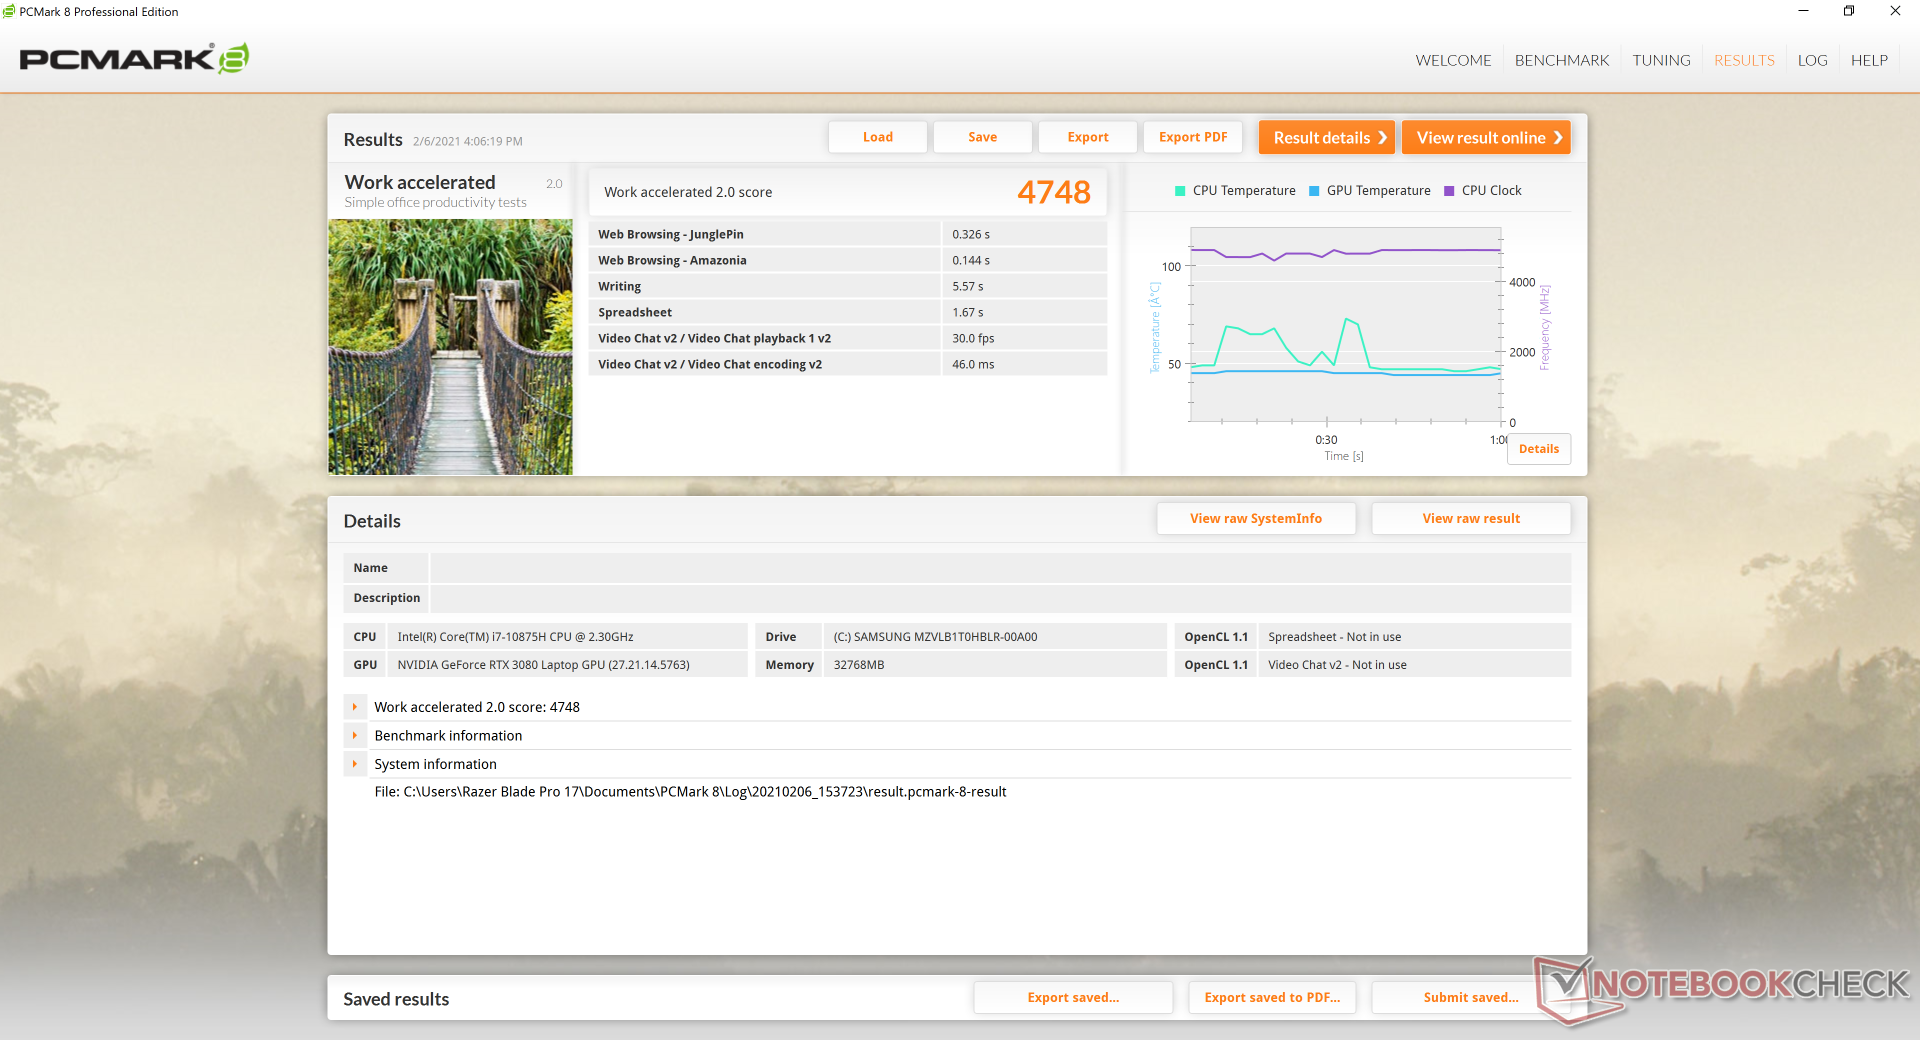
Os benchmarks PCMark são quase idênticos ao GeForce RTX 2070 Max-Q configuração, o que significa que as cargas de trabalho do dia-a-dia não vão se sentir muito mais rápidas só por causa da mais nova GeForce RTX 30 GPU.
O software Razer Synapse às vezes falhará no lançamento se não estiver conectado à Internet. A inicialização a frio ou o despertar do sono, por exemplo, pode fazer com que o Synapse não se lance ou se auto-logue corretamente. Terminar o software via Task Manager seria a maneira mais rápida de reiniciá-lo caso o problema ocorresse. Este tem sido um problema irritante durante anos e é decepcionante ainda vê-lo não resolvido.
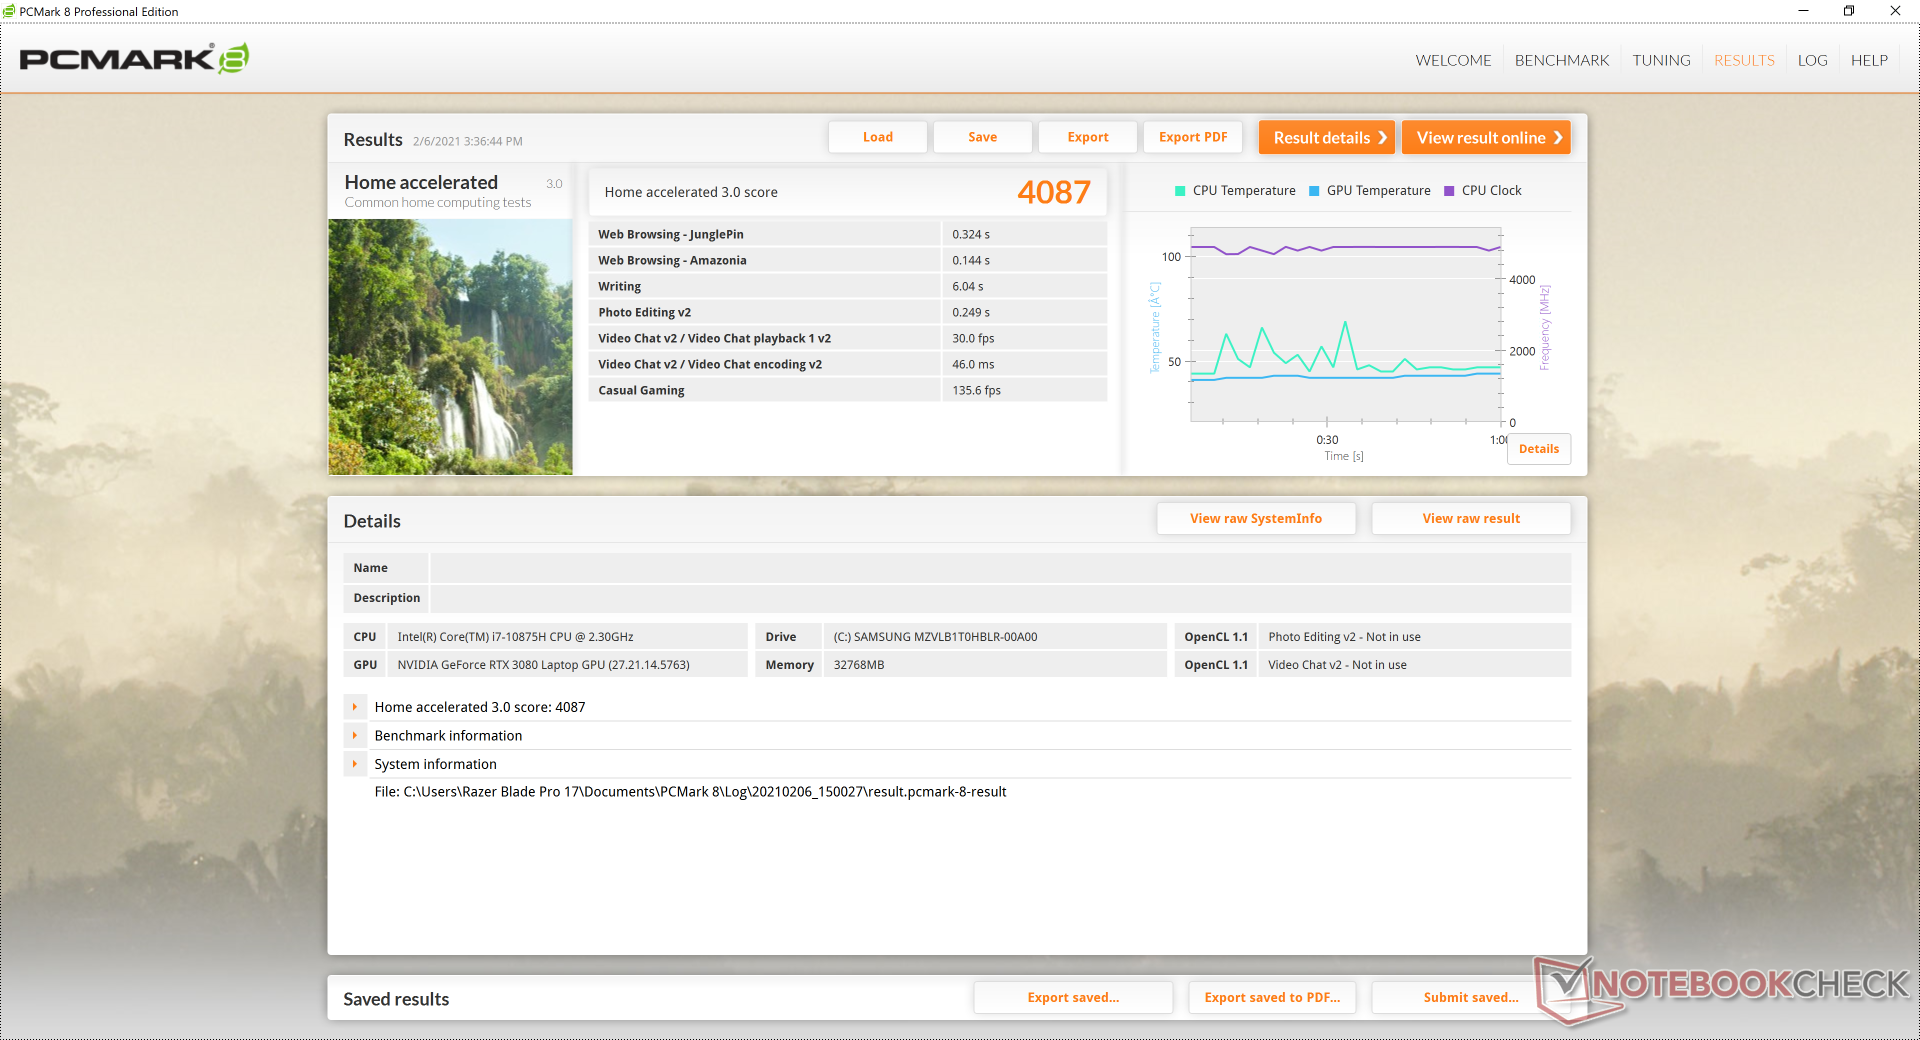
| PCMark 8 Home Score Accelerated v2 | 4087 pontos | |
| PCMark 8 Work Score Accelerated v2 | 4748 pontos | |
| PCMark 10 Score | 6531 pontos | |
Ajuda | ||
Latência do DPC
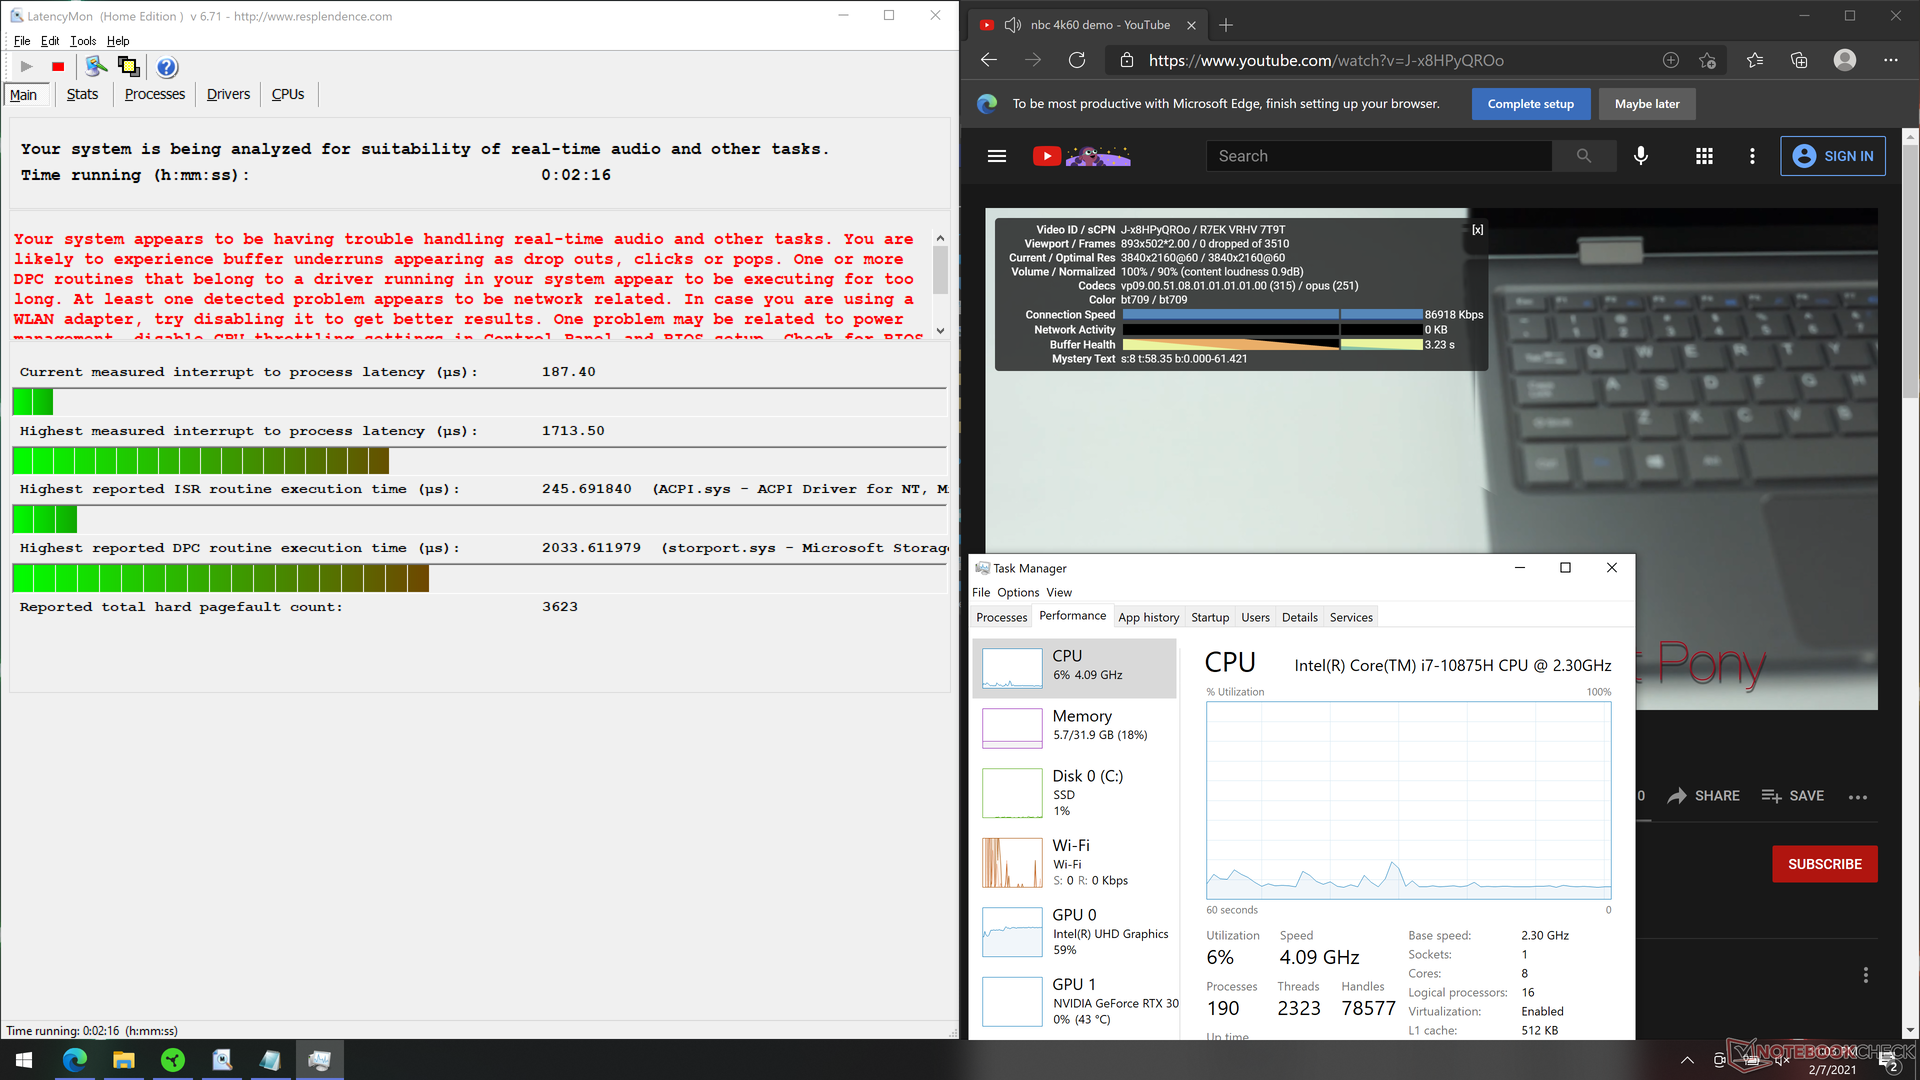
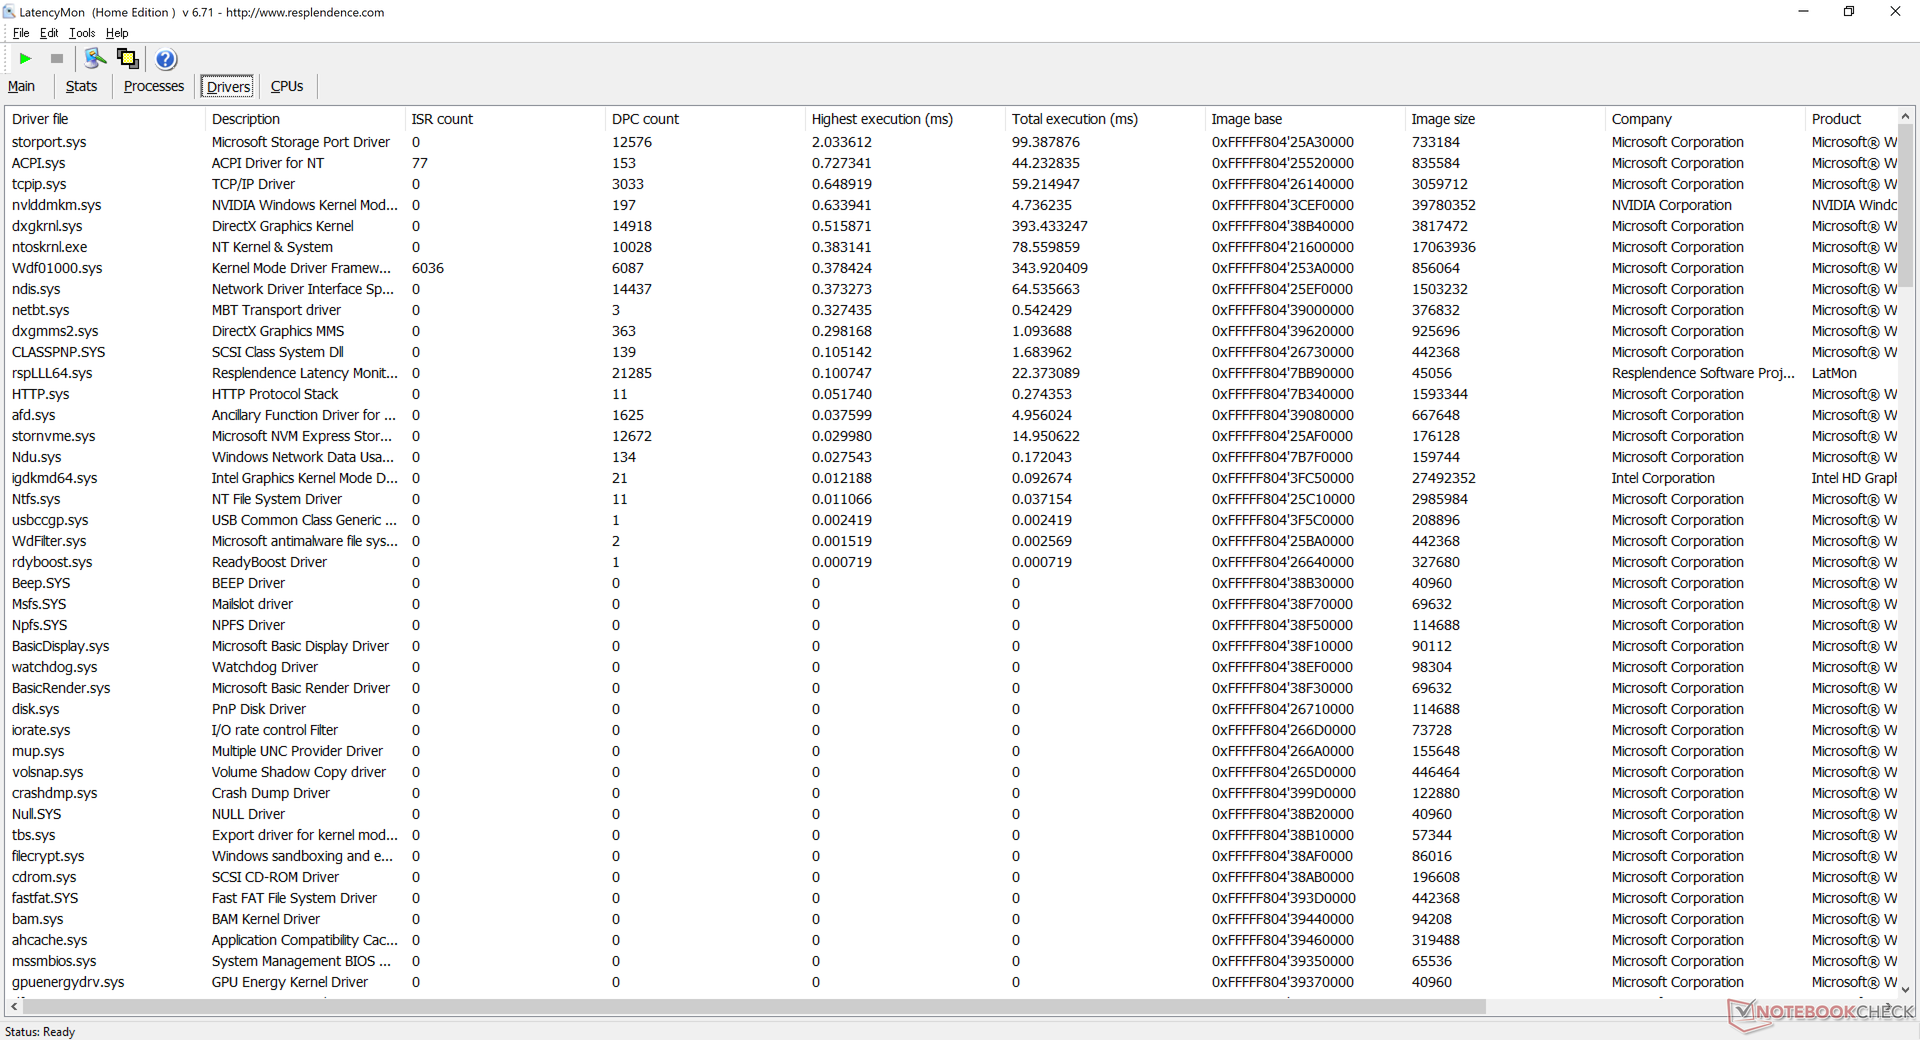
LatencyMon mostra problemas de latência do DPC ao abrir várias abas e páginas do navegador em nossa página inicial. A reprodução de vídeo de 4K a 60 FPS é, de outra forma, suave e sem interrupções de processo ou queda de quadros.
| DPC Latencies / LatencyMon - interrupt to process latency (max), Web, Youtube, Prime95 | |
| MSI GT76 Titan DT 10SGS | |
| Asus Strix G17 G712LWS | |
| Schenker XMG Neo 17 (Early 2021, RTX 3070, 5800H) | |
| Razer Blade Pro 17 2021 (QHD Touch) | |
| Razer Blade Pro 17 RTX 2070 Max-Q 300 Hz | |
| MSI GS75 10SF-609US | |
* ... menor é melhor
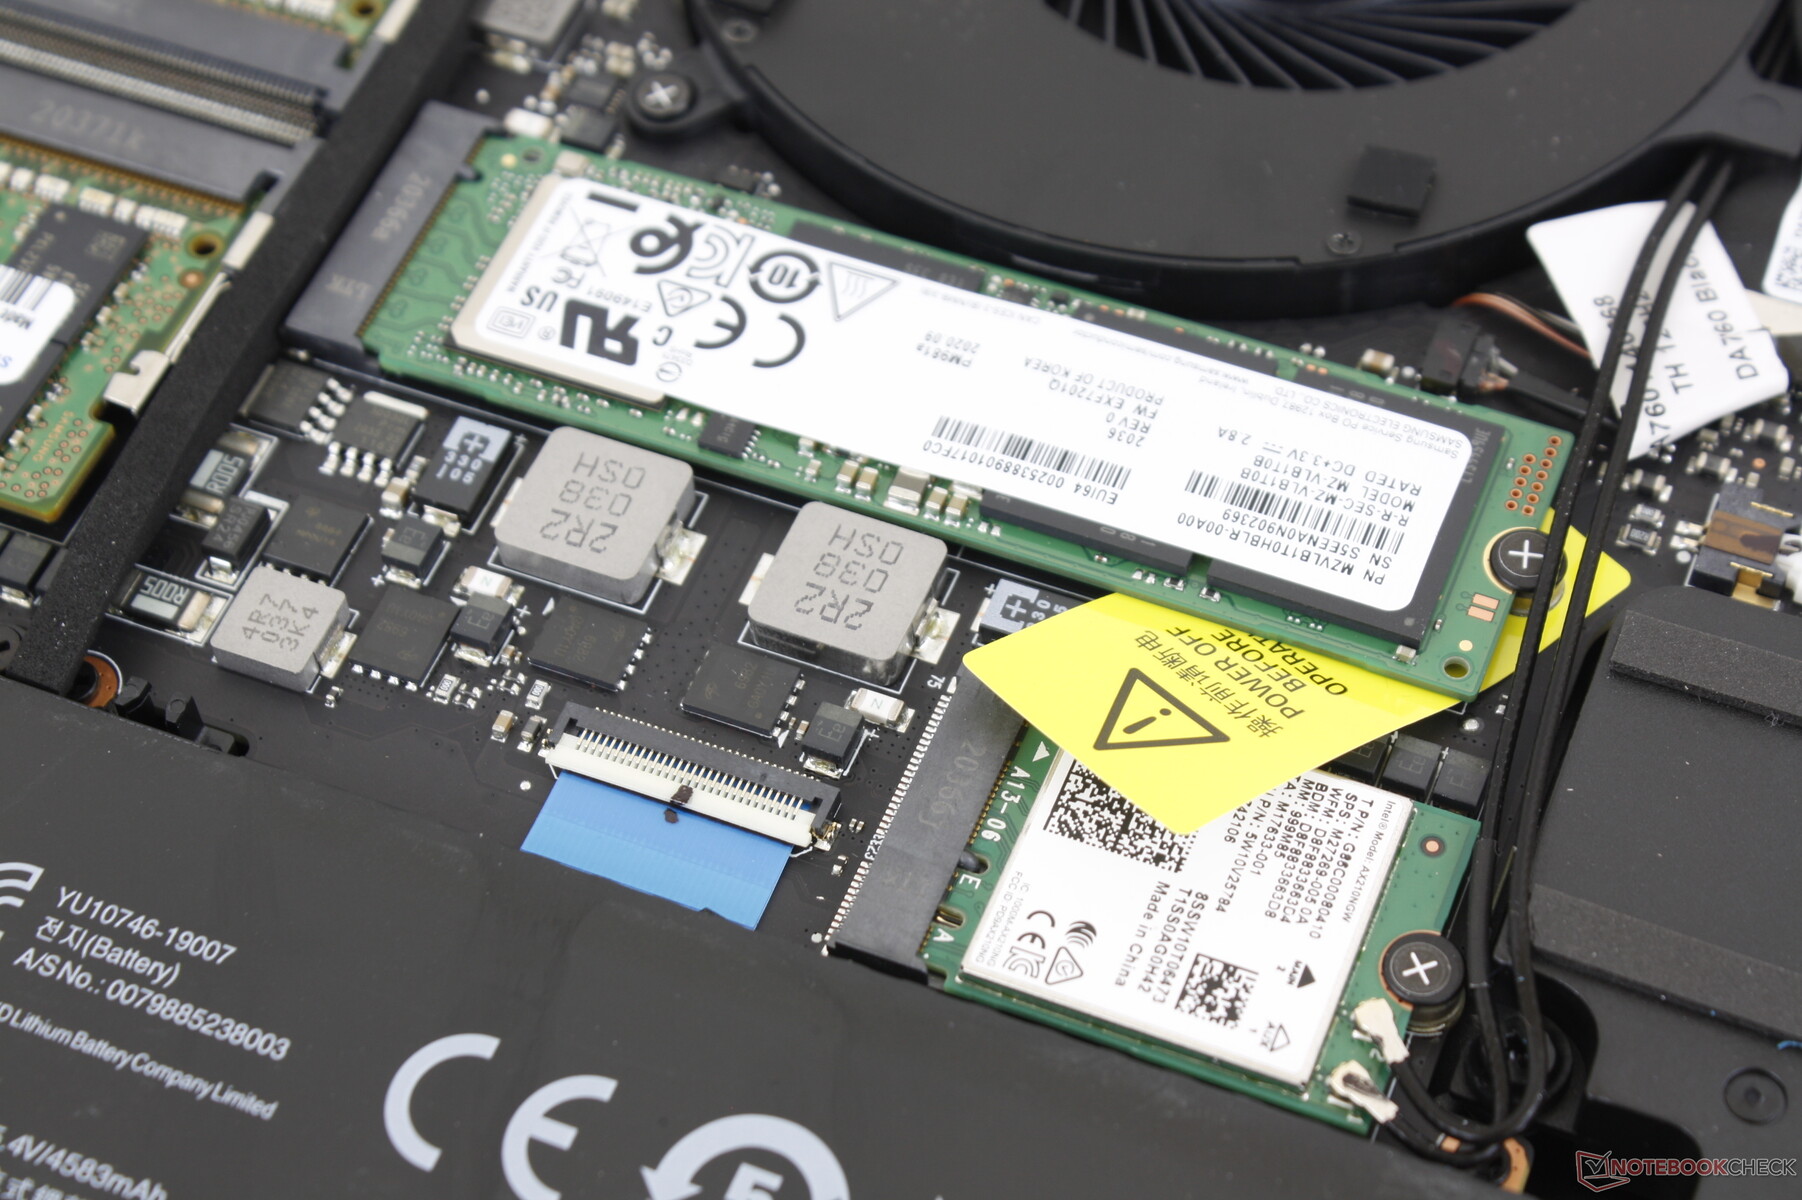
Dispositivos de armazenamento
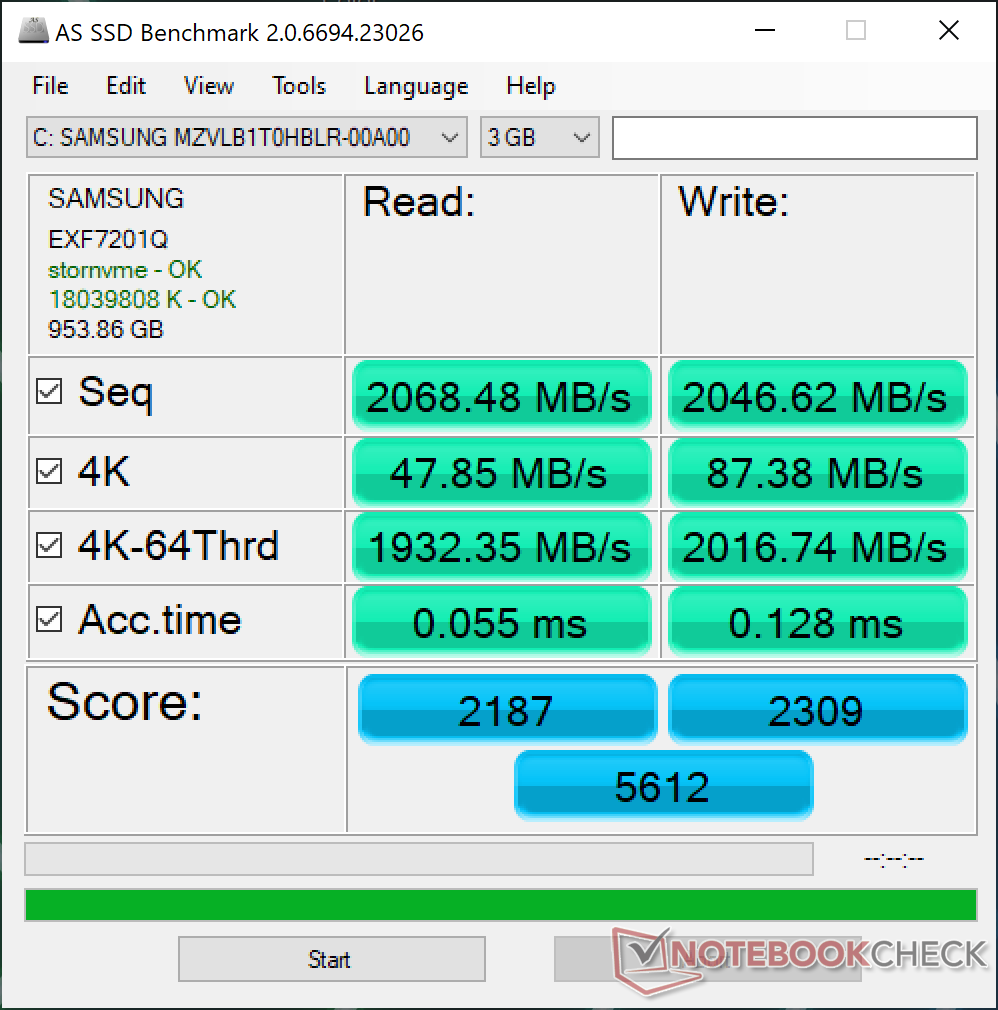
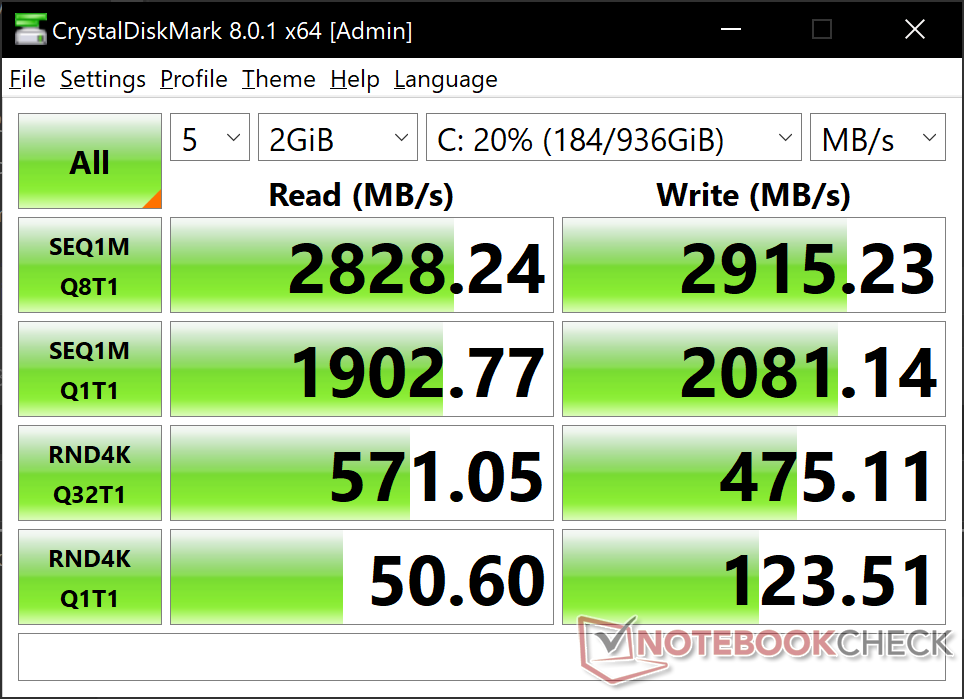
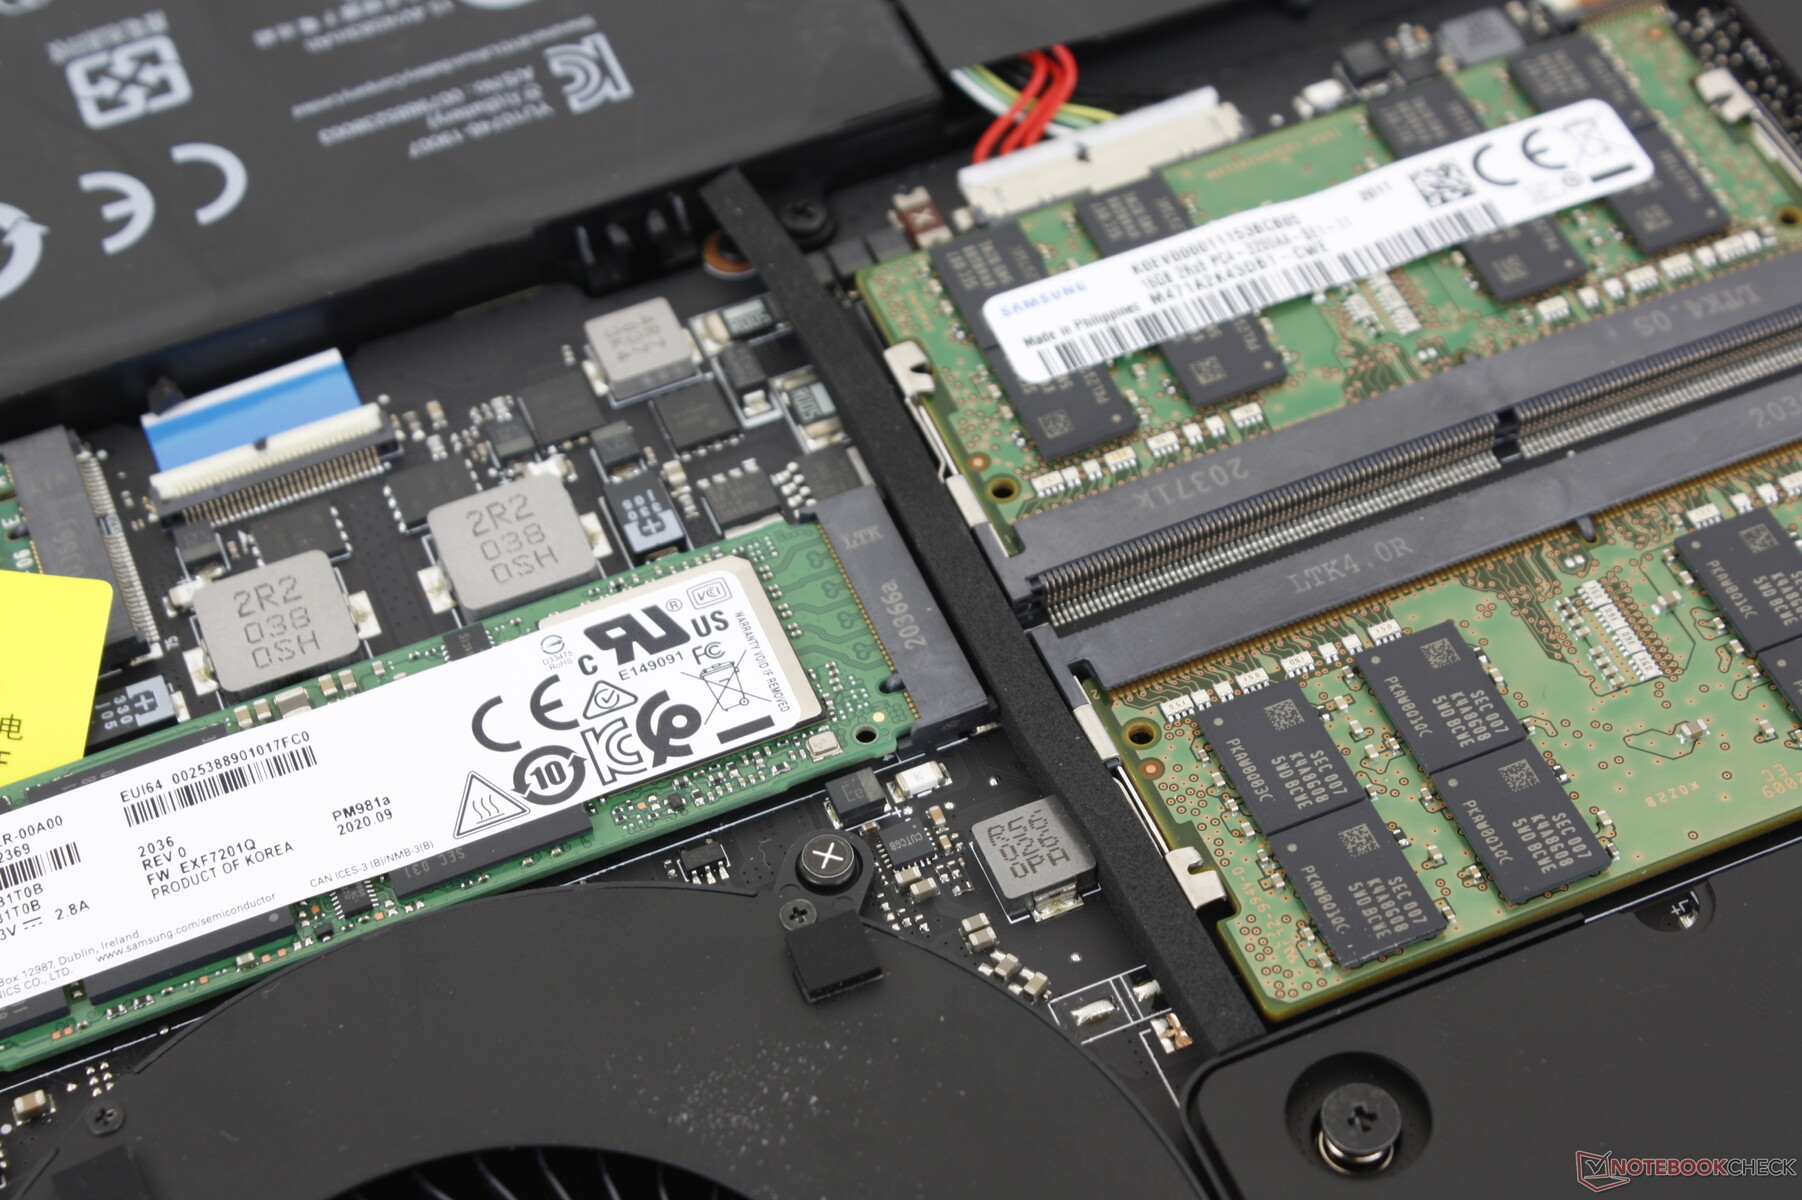
Os laptops Razer Blade geralmente vêm com Samsung ou Lite-On SSDs e o modelo 2021 não é diferente. Nossa configuração utiliza um Samsung PM981a de 1 TB que é mais rápido e mais caro que o SSD Intel de 1 TB 660p, como encontrado em muitos laptops Asus. Talvez a próxima geração do Blade Pro 17 possa integrar slots PCIe 4.0 para taxas de transferência ainda mais rápidas.
Mais referências de armazenamento e comparações podem ser encontradas em nossa mesa aqui.
| Razer Blade Pro 17 2021 (QHD Touch) Samsung PM981a MZVLB1T0HBLR | Razer Blade Pro 17 RTX 2070 Max-Q 300 Hz Lite-On CA5-8D512 | Asus Strix G17 G712LWS Intel SSD 660p 1TB SSDPEKNW010T8 | MSI GS66 Stealth 10UG WDC PC SN730 SDBPNTY-1T00 | Schenker XMG Neo 17 (Early 2021, RTX 3070, 5800H) Samsung SSD 970 EVO Plus 500GB | |
|---|---|---|---|---|---|
| AS SSD | -30% | -29% | 4% | 26% | |
| Seq Read (MB/s) | 2068 | 2019 -2% | 1778 -14% | 2198 6% | 3020 46% |
| Seq Write (MB/s) | 2047 | 1314 -36% | 1478 -28% | 2596 27% | 2631 29% |
| 4K Read (MB/s) | 47.85 | 46.61 -3% | 49.76 4% | 43.81 -8% | 60.3 26% |
| 4K Write (MB/s) | 87.4 | 90.2 3% | 117.9 35% | 115.5 32% | 171.6 96% |
| 4K-64 Read (MB/s) | 1932 | 665 -66% | 591 -69% | 1692 -12% | 1410 -27% |
| 4K-64 Write (MB/s) | 2017 | 813 -60% | 875 -57% | 2162 7% | 2324 15% |
| Access Time Read * (ms) | 0.055 | 0.058 -5% | 0.082 -49% | 0.056 -2% | 0.045 18% |
| Access Time Write * (ms) | 0.128 | 0.167 -30% | 0.041 68% | 0.098 23% | 0.024 81% |
| Score Read (Points) | 2187 | 913 -58% | 818 -63% | 1956 -11% | 1773 -19% |
| Score Write (Points) | 2309 | 1034 -55% | 1140 -51% | 2537 10% | 2759 19% |
| Score Total (Points) | 5612 | 2392 -57% | 2377 -58% | 5513 -2% | 5429 -3% |
| Copy ISO MB/s (MB/s) | 2400 | 1715 -29% | 1495 -38% | 2236 -7% | |
| Copy Program MB/s (MB/s) | 684 | 622 -9% | 446 -35% | 690 1% | |
| Copy Game MB/s (MB/s) | 1629 | 1506 -8% | 697 -57% | 1546 -5% | |
| CrystalDiskMark 5.2 / 6 | 6% | -9% | 11% | 31% | |
| Write 4K (MB/s) | 123.5 | 119 -4% | 141.1 14% | 163.1 32% | 206.1 67% |
| Read 4K (MB/s) | 45.96 | 51.9 13% | 60.9 33% | 48.97 7% | 53 15% |
| Write Seq (MB/s) | 1861 | 2258 21% | 1681 -10% | 2607 40% | 3018 62% |
| Read Seq (MB/s) | 1584 | 2283 44% | 1602 1% | 2316 46% | 2575 63% |
| Write 4K Q32T1 (MB/s) | 466.4 | 491 5% | 406.6 -13% | 338 -28% | 535 15% |
| Read 4K Q32T1 (MB/s) | 566 | 540 -5% | 470.2 -17% | 475.6 -16% | 608 7% |
| Write Seq Q32T1 (MB/s) | 2981 | 2253 -24% | 1759 -41% | 3090 4% | 3242 9% |
| Read Seq Q32T1 (MB/s) | 3260 | 3172 -3% | 1932 -41% | 3421 5% | 3617 11% |
| Média Total (Programa/Configurações) | -12% /
-17% | -19% /
-22% | 8% /
7% | 29% /
28% |
* ... menor é melhor

Disk Throttling: DiskSpd Read Loop, Queue Depth 8
Desempenho da GPU
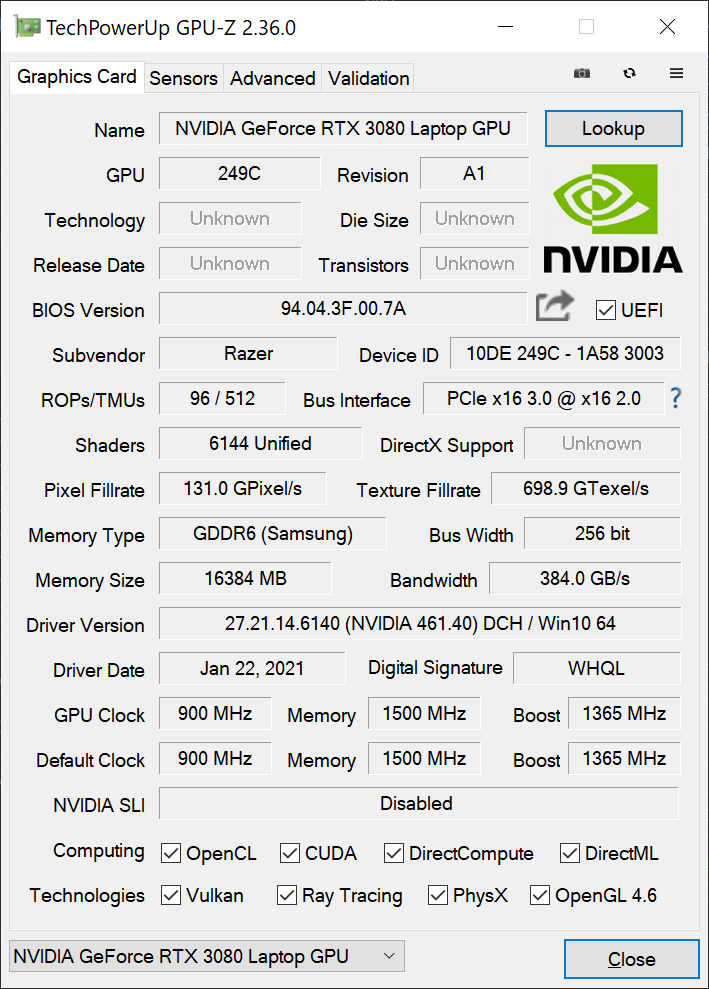
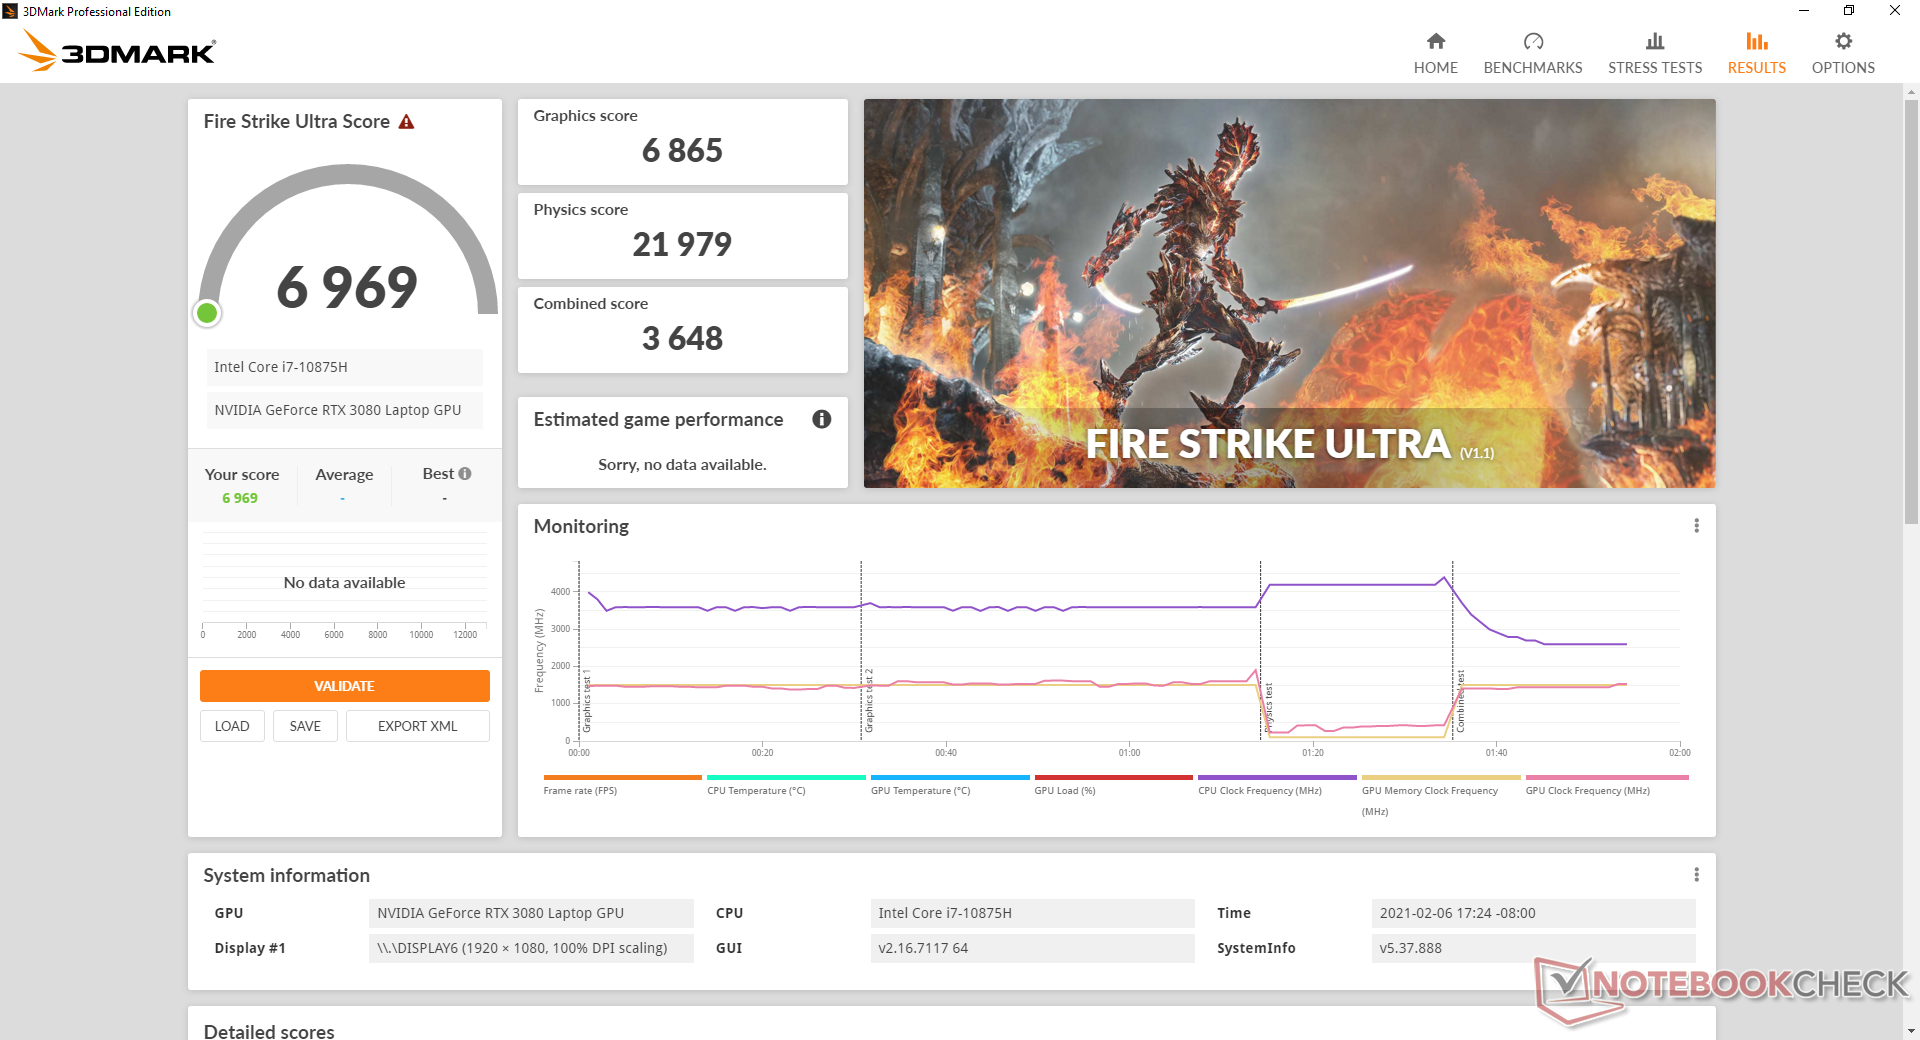
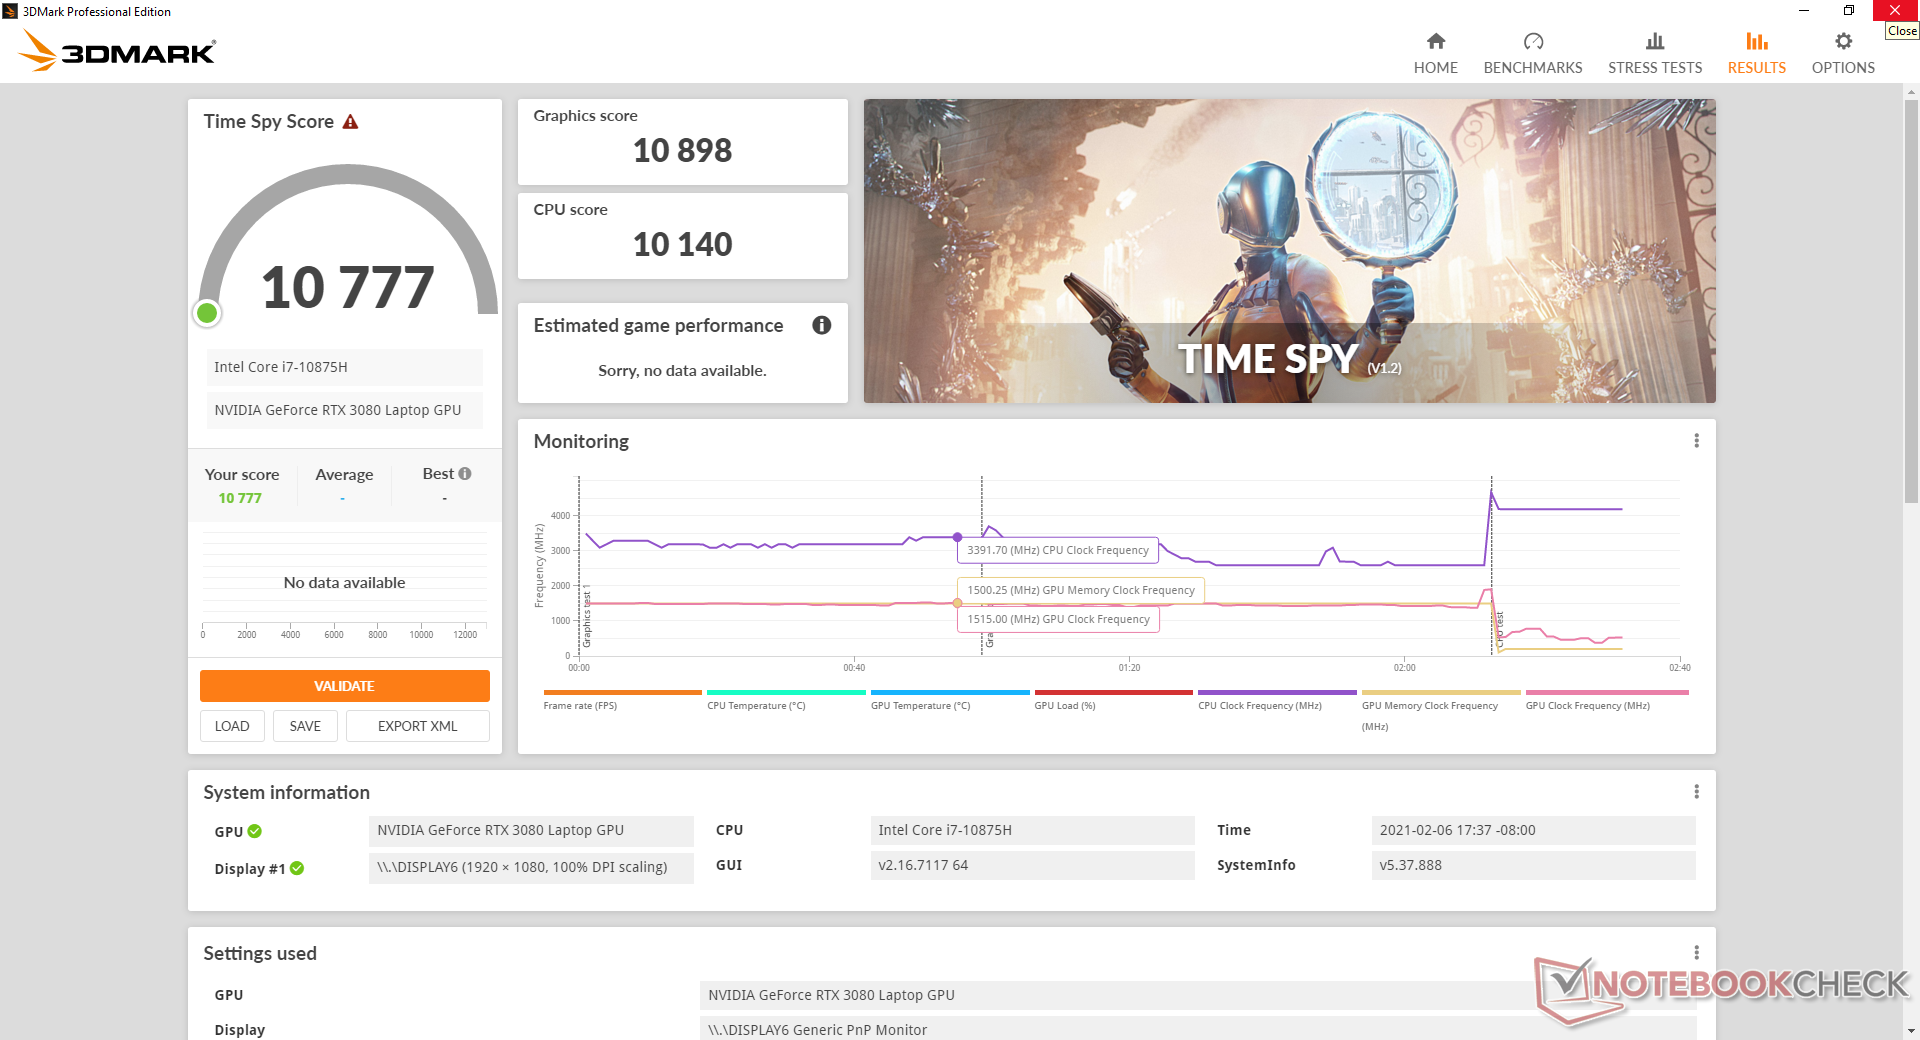
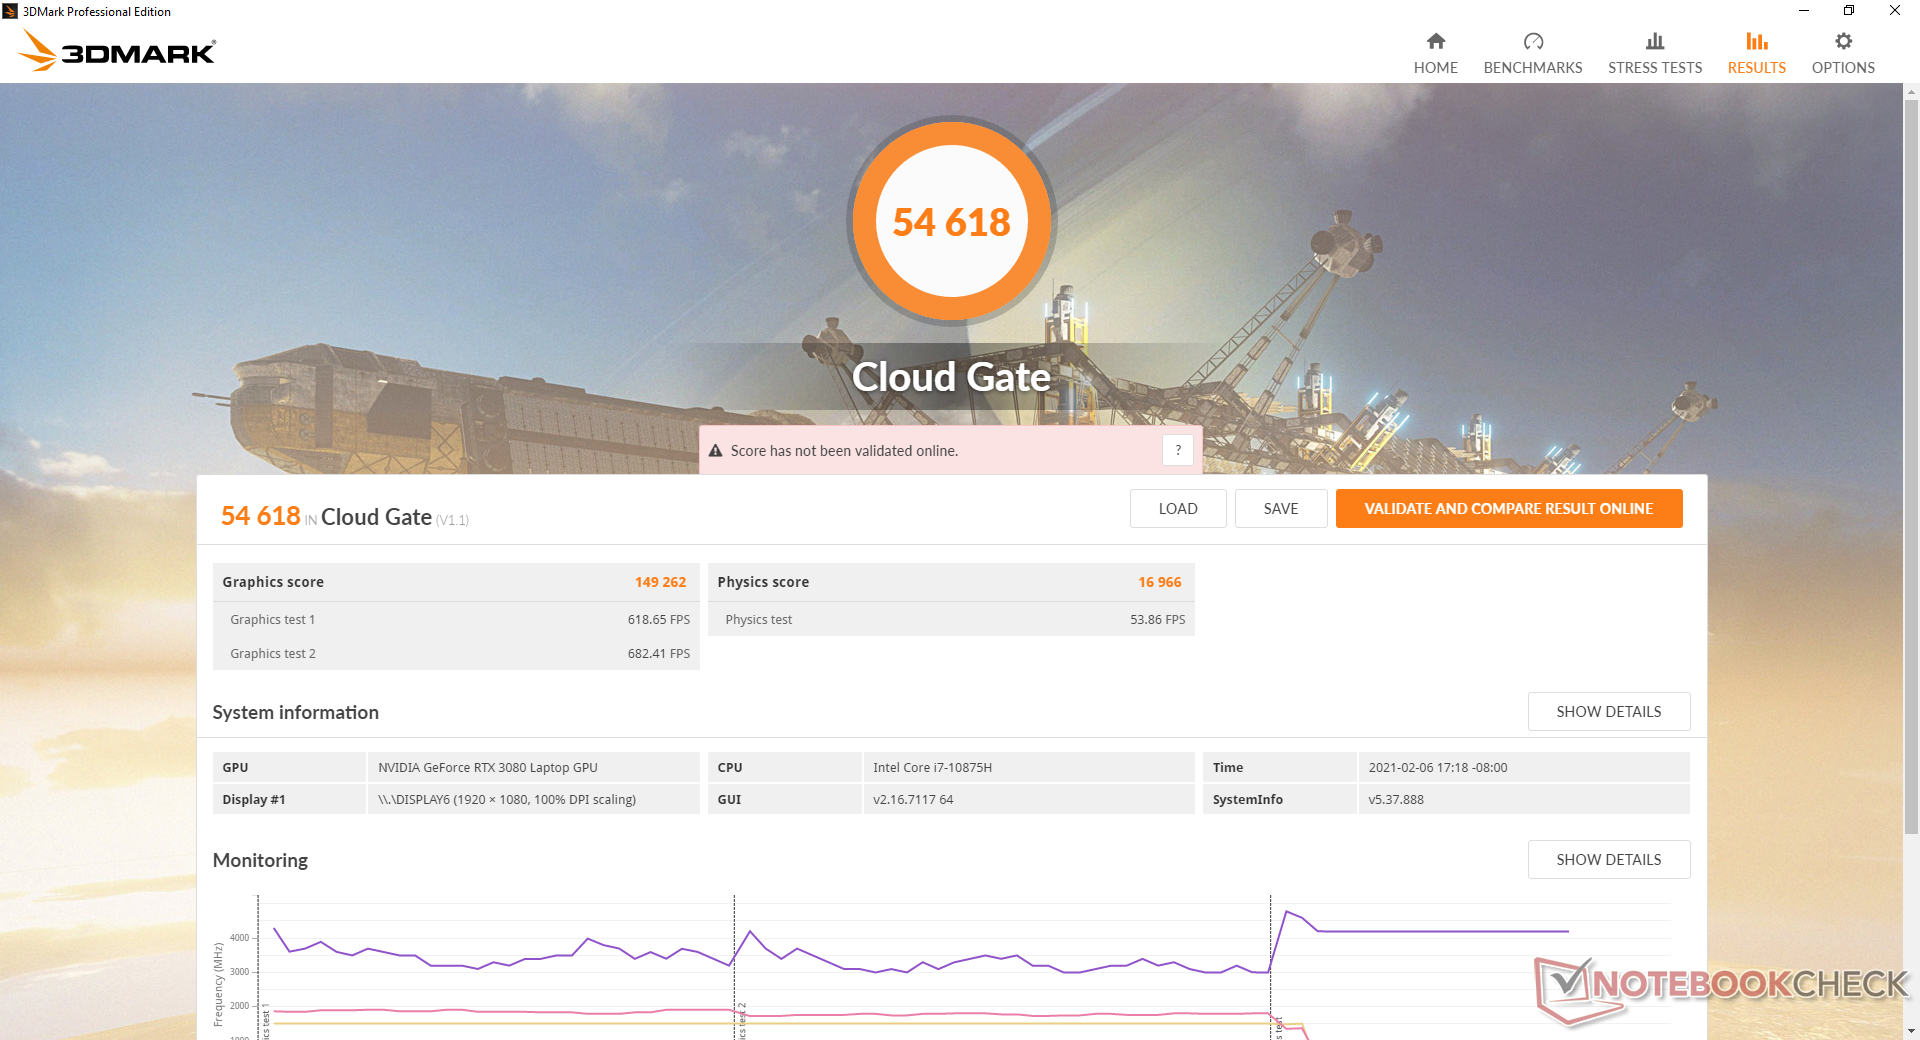
O móvel GeForce RTX 3080 na última Razer é cerca de 20 a 30% mais rápido do que o RTX 2080 Max-Q na configuração do ano passado. É um ganho moderado de gênero para gênero que fica pálido em comparação com a GPU de desktop do mesmo nome. Os jogadores de desktop com suas "próprias" GPUsGeForce RTX 3080 podem rodar jogos pelo menos 50% mais rápido do que a versão móvel aqui.
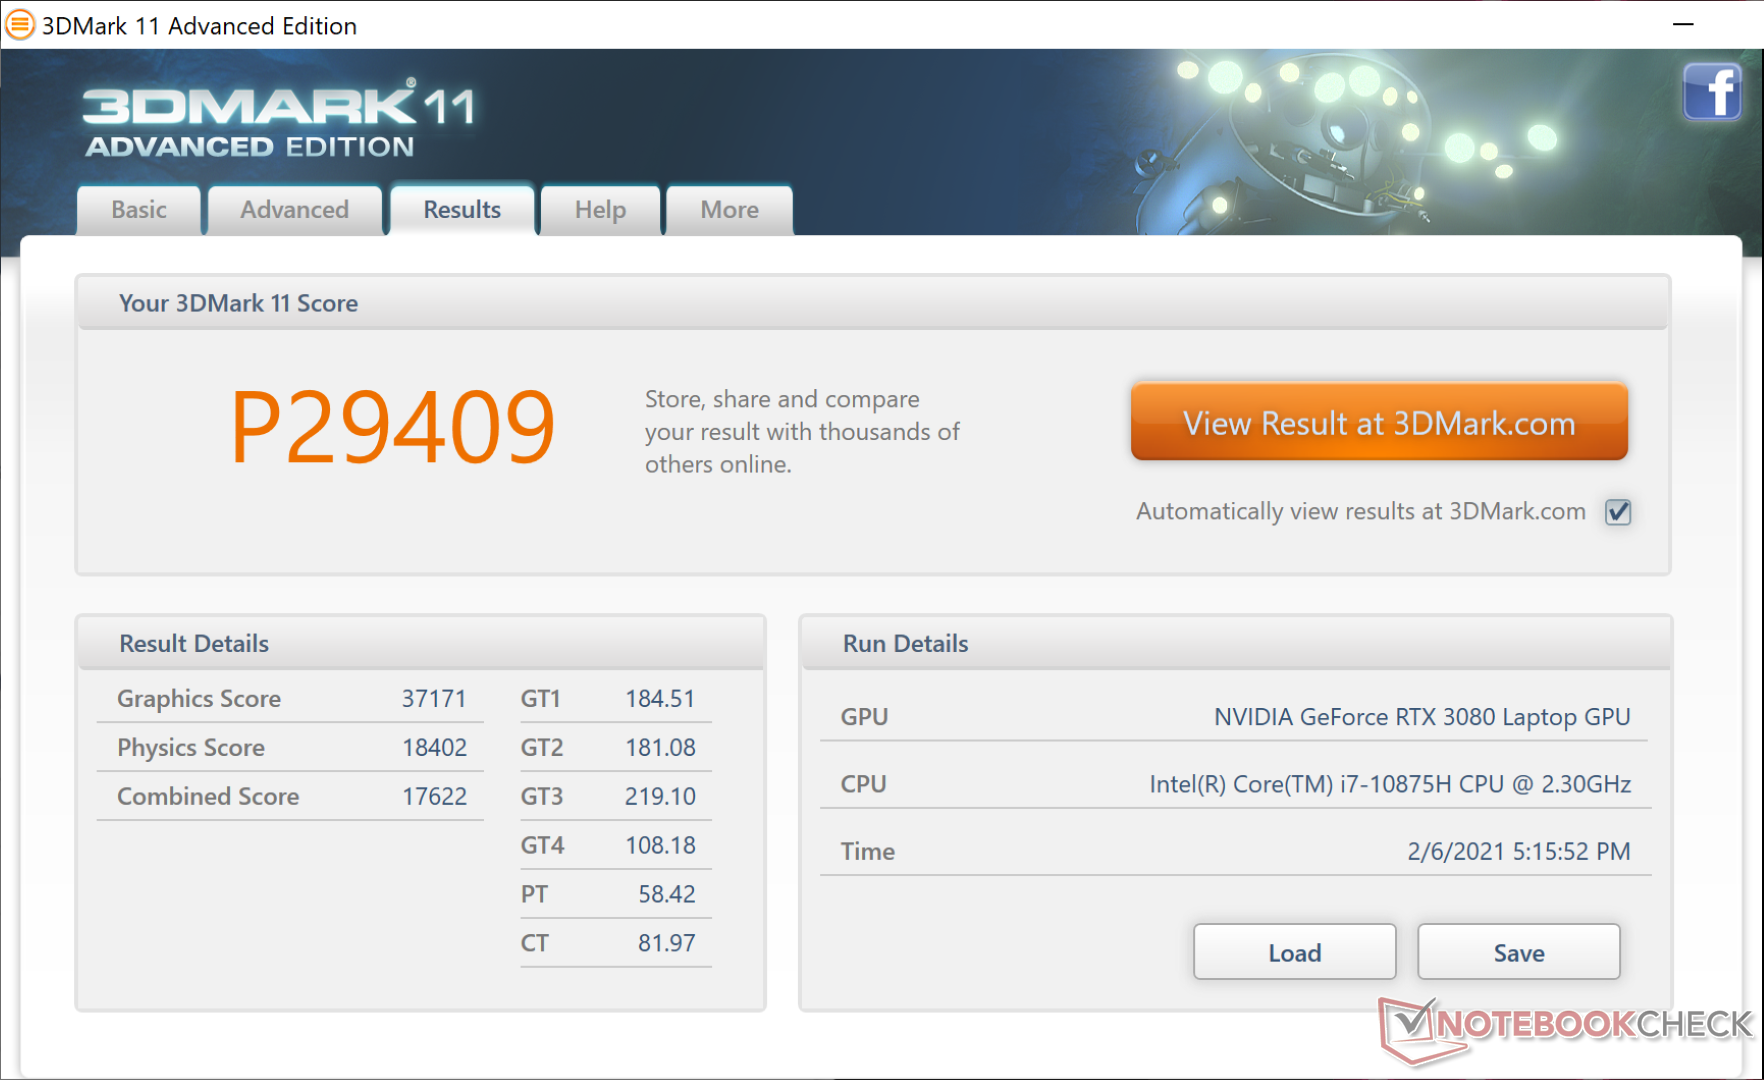

| 3DMark 11 Performance | 29409 pontos | |
| 3DMark Cloud Gate Standard Score | 54618 pontos | |
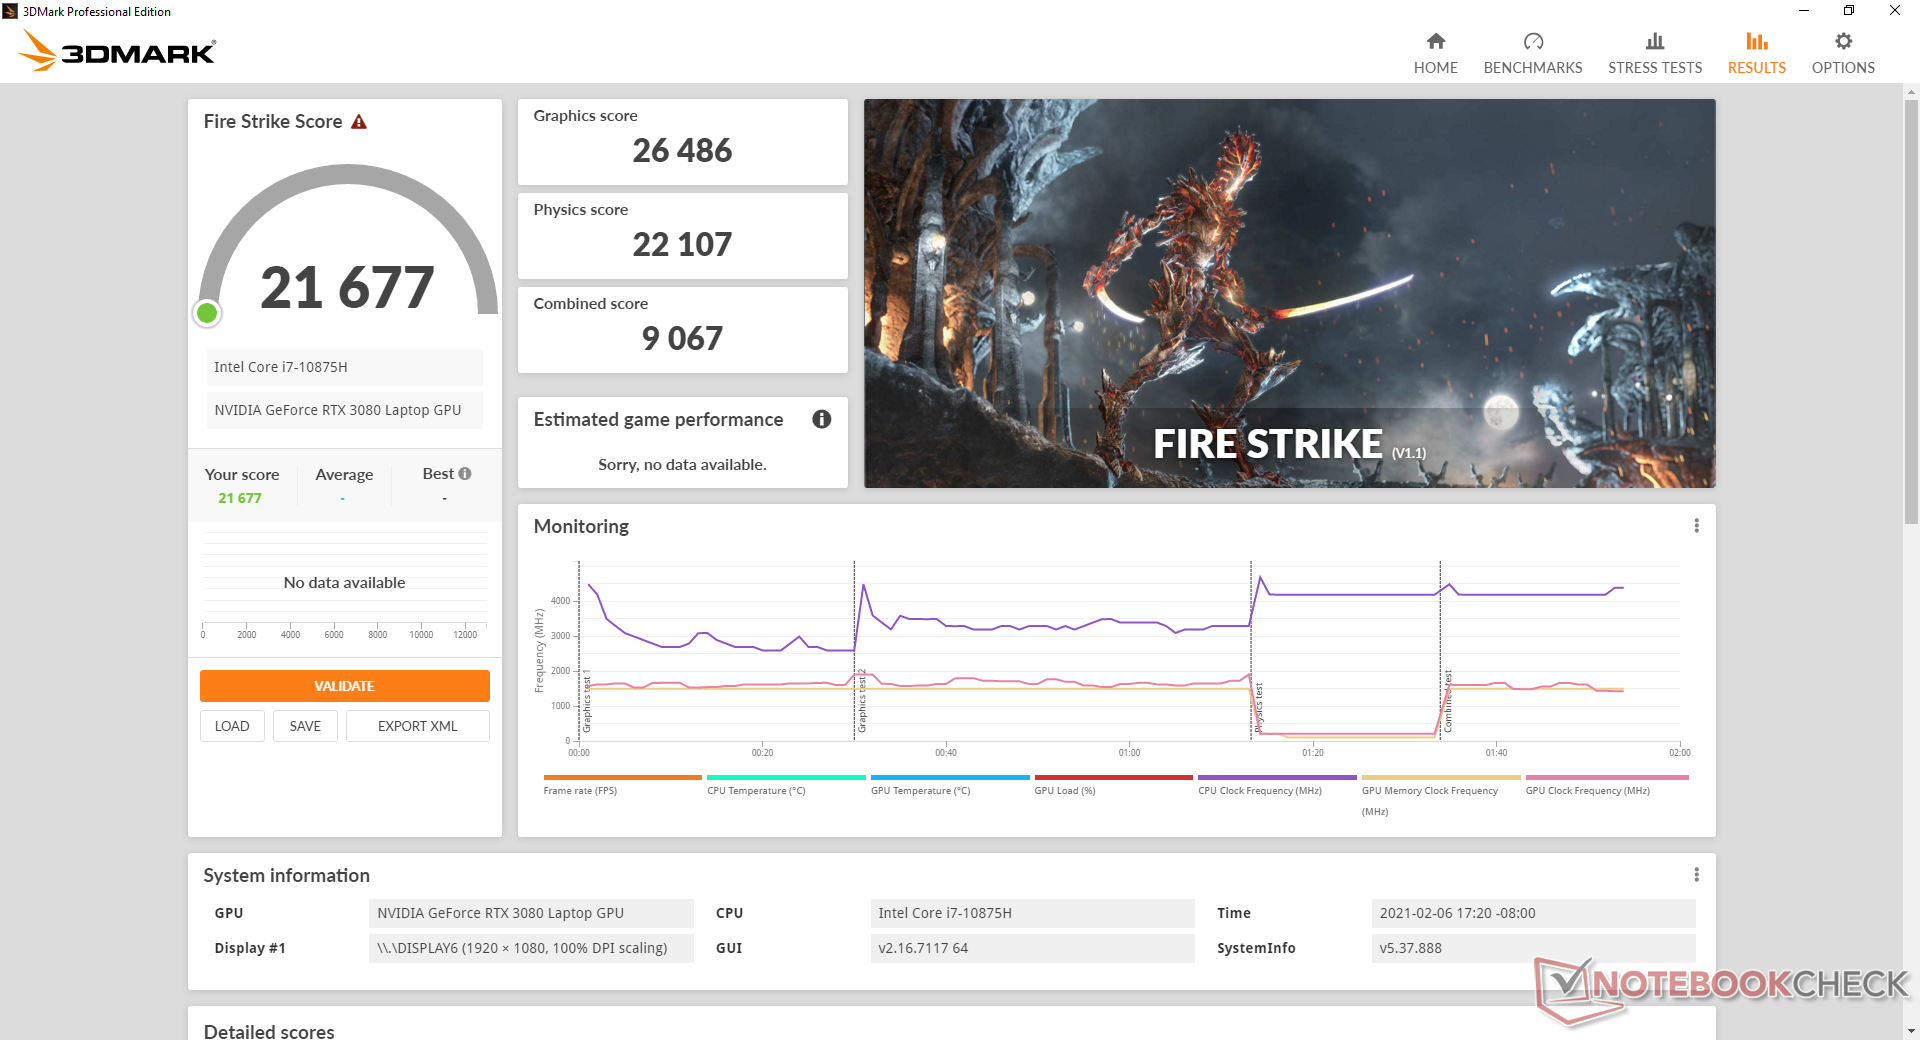
| 3DMark Fire Strike Score | 21677 pontos | |
| 3DMark Time Spy Score | 10777 pontos | |
Ajuda | ||
| baixo | média | alto | ultra | QHD | 4K | |
|---|---|---|---|---|---|---|
| GTA V (2015) | 181 | 174 | 164 | 99.5 | 92.5 | 106 |
| The Witcher 3 (2015) | 368 | 288.6 | 208.1 | 108.3 | 80 | |
| Dota 2 Reborn (2015) | 158 | 147 | 139 | 134 | 128 | |
| Final Fantasy XV Benchmark (2018) | 176 | 140 | 109 | 84.3 | 49.3 | |
| X-Plane 11.11 (2018) | 126 | 113 | 92.3 | 79 | ||
| Strange Brigade (2018) | 437 | 278 | 223 | 197 | 143 | 84.1 |
Emissions
Ruído do sistema
O ruído e o comportamento dos ventiladores são similares ao modelo do ano passado. O sistema é silencioso quando ocioso na área de trabalho no modo High Performance, mas mesmo a menor carga como navegação na web ou streaming de vídeo pode fazer com que o ruído do ventilador salte para 31 dB(A). Para evitar a pulsação do RPM, as configurações do Power Saver devem ser ativadas quando o desempenho extra não for necessário.
O ruído do ventilador quando jogando no modo balanceado padrão será estável em cerca de 42 dB(A). Se os ventiladores forem ajustados manualmente ao máximo, o ruído do ventilador pode ir até a faixa de 54 dB(A), o que não é incomum para laptops ultrafinos para jogos sob carga.
O modo Nvidia Whisper 2.0 não está disponível aqui ao contrário do MSI GS66 10UG.
| Razer Blade Pro 17 2021 (QHD Touch) GeForce RTX 3080 Laptop GPU, i7-10875H, Samsung PM981a MZVLB1T0HBLR | Razer Blade Pro 17 RTX 2070 Max-Q 300 Hz GeForce RTX 2070 Max-Q, i7-10875H, Lite-On CA5-8D512 | Schenker XMG Neo 17 (Early 2021, RTX 3070, 5800H) GeForce RTX 3070 Laptop GPU, R7 5800H, Samsung SSD 970 EVO Plus 500GB | MSI GT76 Titan DT 10SGS GeForce RTX 2080 Super Mobile, i9-10900K, 2x WDC PC SN730 SDBPNTY-1T00 (RAID 0) | Asus Strix G17 G712LWS GeForce RTX 2070 Super Mobile, i7-10750H, Intel SSD 660p 1TB SSDPEKNW010T8 | MSI GS75 10SF-609US GeForce RTX 2070 Max-Q, i7-10875H, WDC PC SN730 SDBPNTY-512G | |
|---|---|---|---|---|---|---|
| Noise | -2% | -8% | -2% | -11% | -10% | |
| desligado / ambiente * (dB) | 26.1 | 28.2 -8% | 24 8% | 26.4 -1% | 25 4% | 26.2 -0% |
| Idle Minimum * (dB) | 26.1 | 28.2 -8% | 29 -11% | 27.5 -5% | 32 -23% | 31.2 -20% |
| Idle Average * (dB) | 26.5 | 28.2 -6% | 32 -21% | 27.5 -4% | 34 -28% | 31.4 -18% |
| Idle Maximum * (dB) | 30.7 | 30.5 1% | 38 -24% | 29.8 3% | 37 -21% | 34 -11% |
| Load Average * (dB) | 43.5 | 42.2 3% | 49 -13% | 30.9 29% | 51 -17% | 49.5 -14% |
| Witcher 3 ultra * (dB) | 54 | 53 2% | 53 2% | 60.7 -12% | 50 7% | 50.6 6% |
| Load Maximum * (dB) | 55 | 55.5 -1% | 55 -0% | 66.6 -21% | 53 4% | 60.7 -10% |
* ... menor é melhor
Barulho
| Ocioso |
| 26.1 / 26.5 / 30.7 dB |
| Carga |
| 43.5 / 55 dB |
 | ||
30 dB silencioso 40 dB(A) audível 50 dB(A) ruidosamente alto |
||
min: | ||
Temperatura
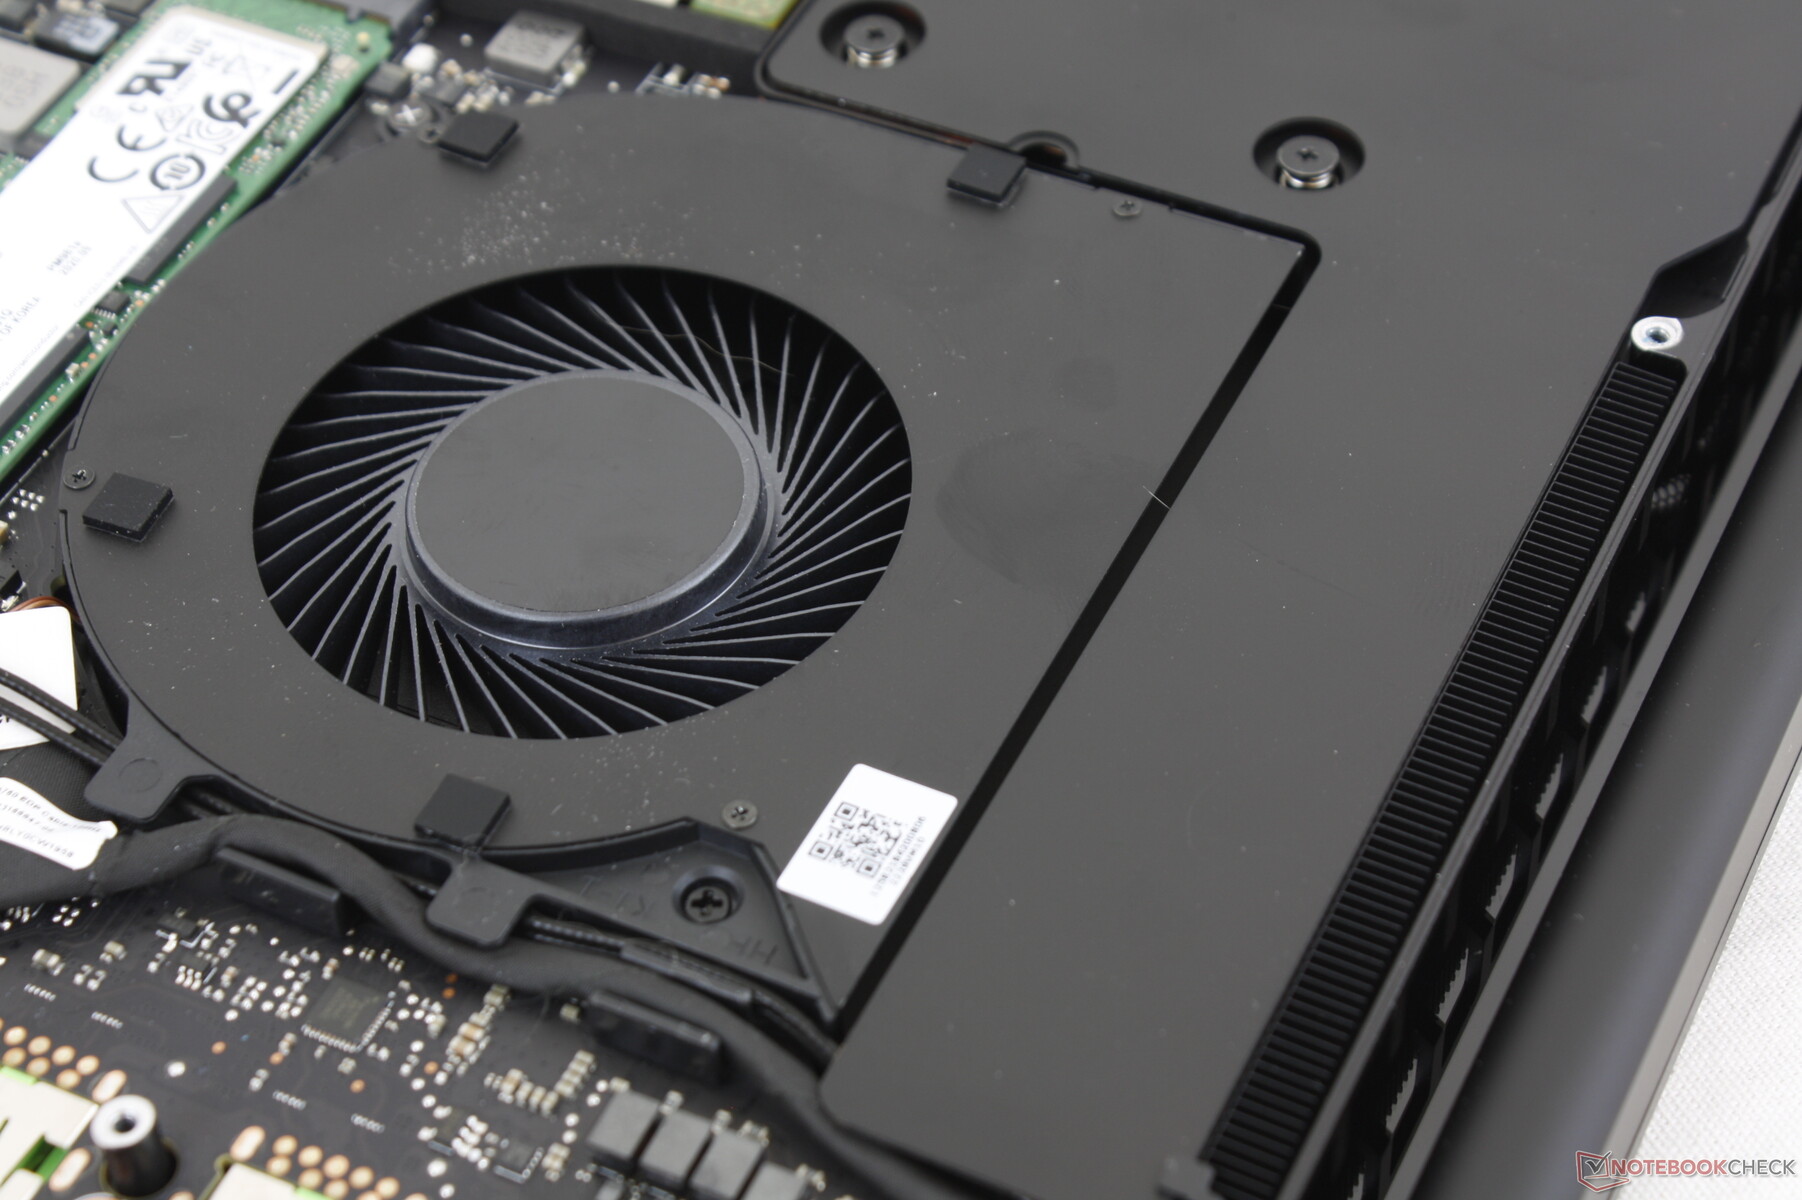
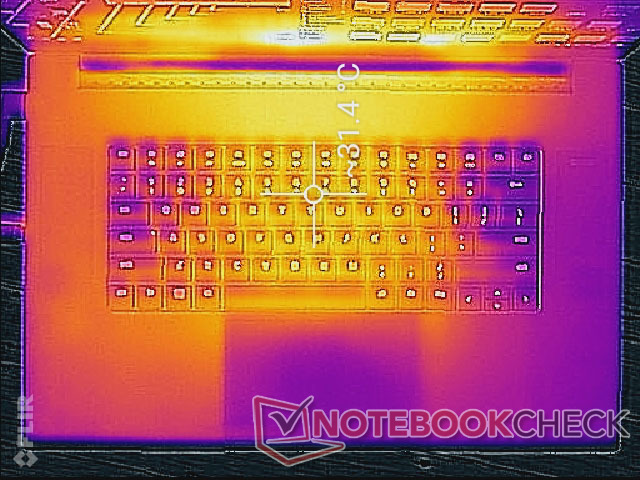
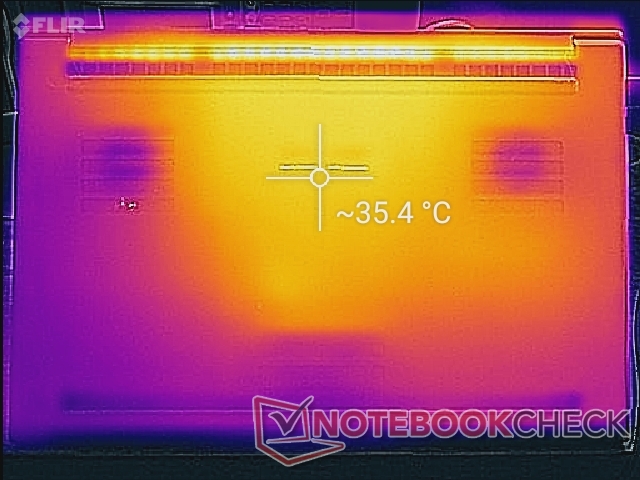
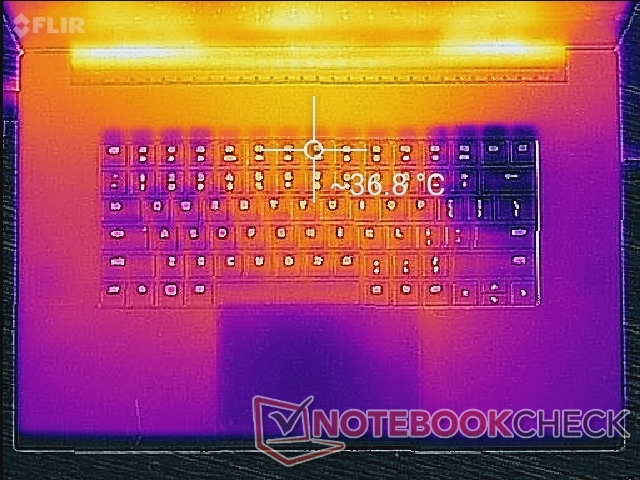
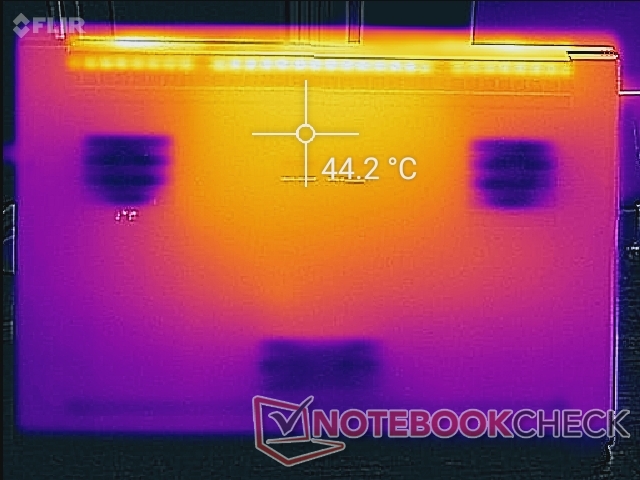
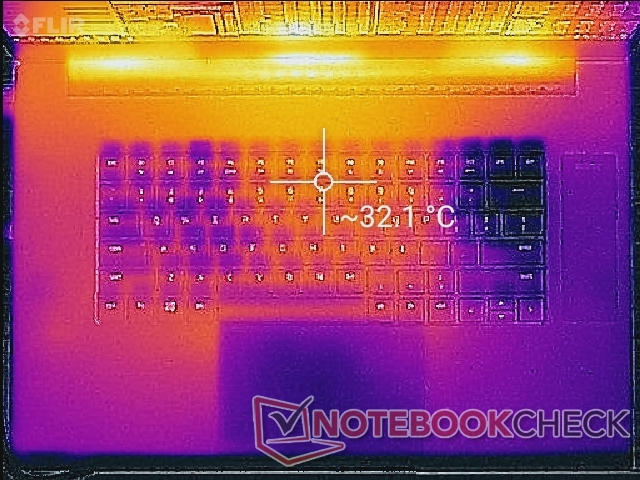
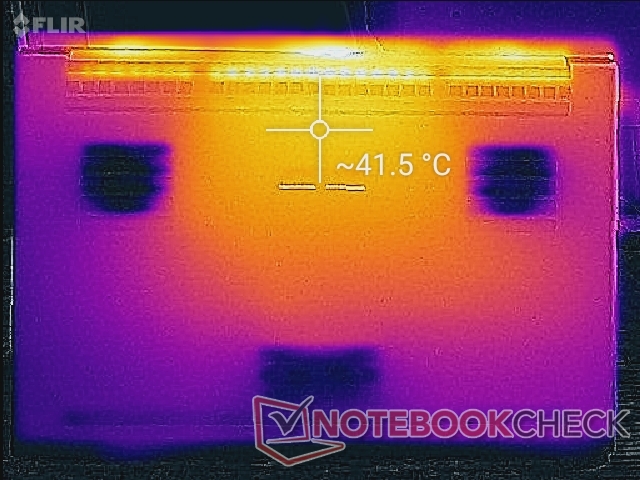
As temperaturas superficiais ainda são relativamente quentes com pontos quentes entre 36 C e 45 C na parte superior e inferior, respectivamente, quando se realizam jogos. Os descansos da palma da mão serão mais quentes do que na maioria dos outros laptops de jogos devido ao desenho unibloco apertado do Razer. O calor não é quente o suficiente para ser um empecilho, mas é definitivamente perceptível na palma da mão quando se joga. Movendo os dois pequenos ventiladores por baixo do clickpad para os descansos para a palma da mão, ao invés disso, poderia ajudar a esfriar os descansos para a palma da mão.
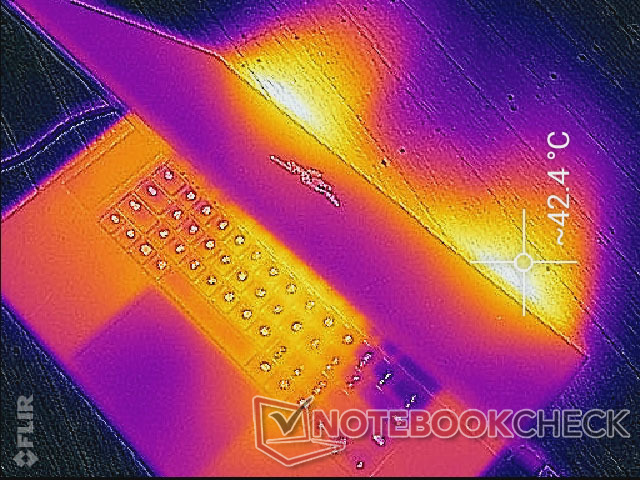
(+) A temperatura máxima no lado superior é 38.2 °C / 101 F, em comparação com a média de 40.4 °C / 105 F , variando de 21.2 a 68.8 °C para a classe Gaming.
(±) A parte inferior aquece até um máximo de 42.2 °C / 108 F, em comparação com a média de 43.2 °C / 110 F
(+) Em uso inativo, a temperatura média para o lado superior é 29.3 °C / 85 F, em comparação com a média do dispositivo de 33.9 °C / ### class_avg_f### F.
(±) Jogando The Witcher 3, a temperatura média para o lado superior é 33.1 °C / 92 F, em comparação com a média do dispositivo de 33.9 °C / ## #class_avg_f### F.
(+) Os apoios para as mãos e o touchpad são mais frios que a temperatura da pele, com um máximo de 30.4 °C / 86.7 F e, portanto, são frios ao toque.
(±) A temperatura média da área do apoio para as mãos de dispositivos semelhantes foi 28.8 °C / 83.8 F (-1.6 °C / -2.9 F).
Teste de estresse
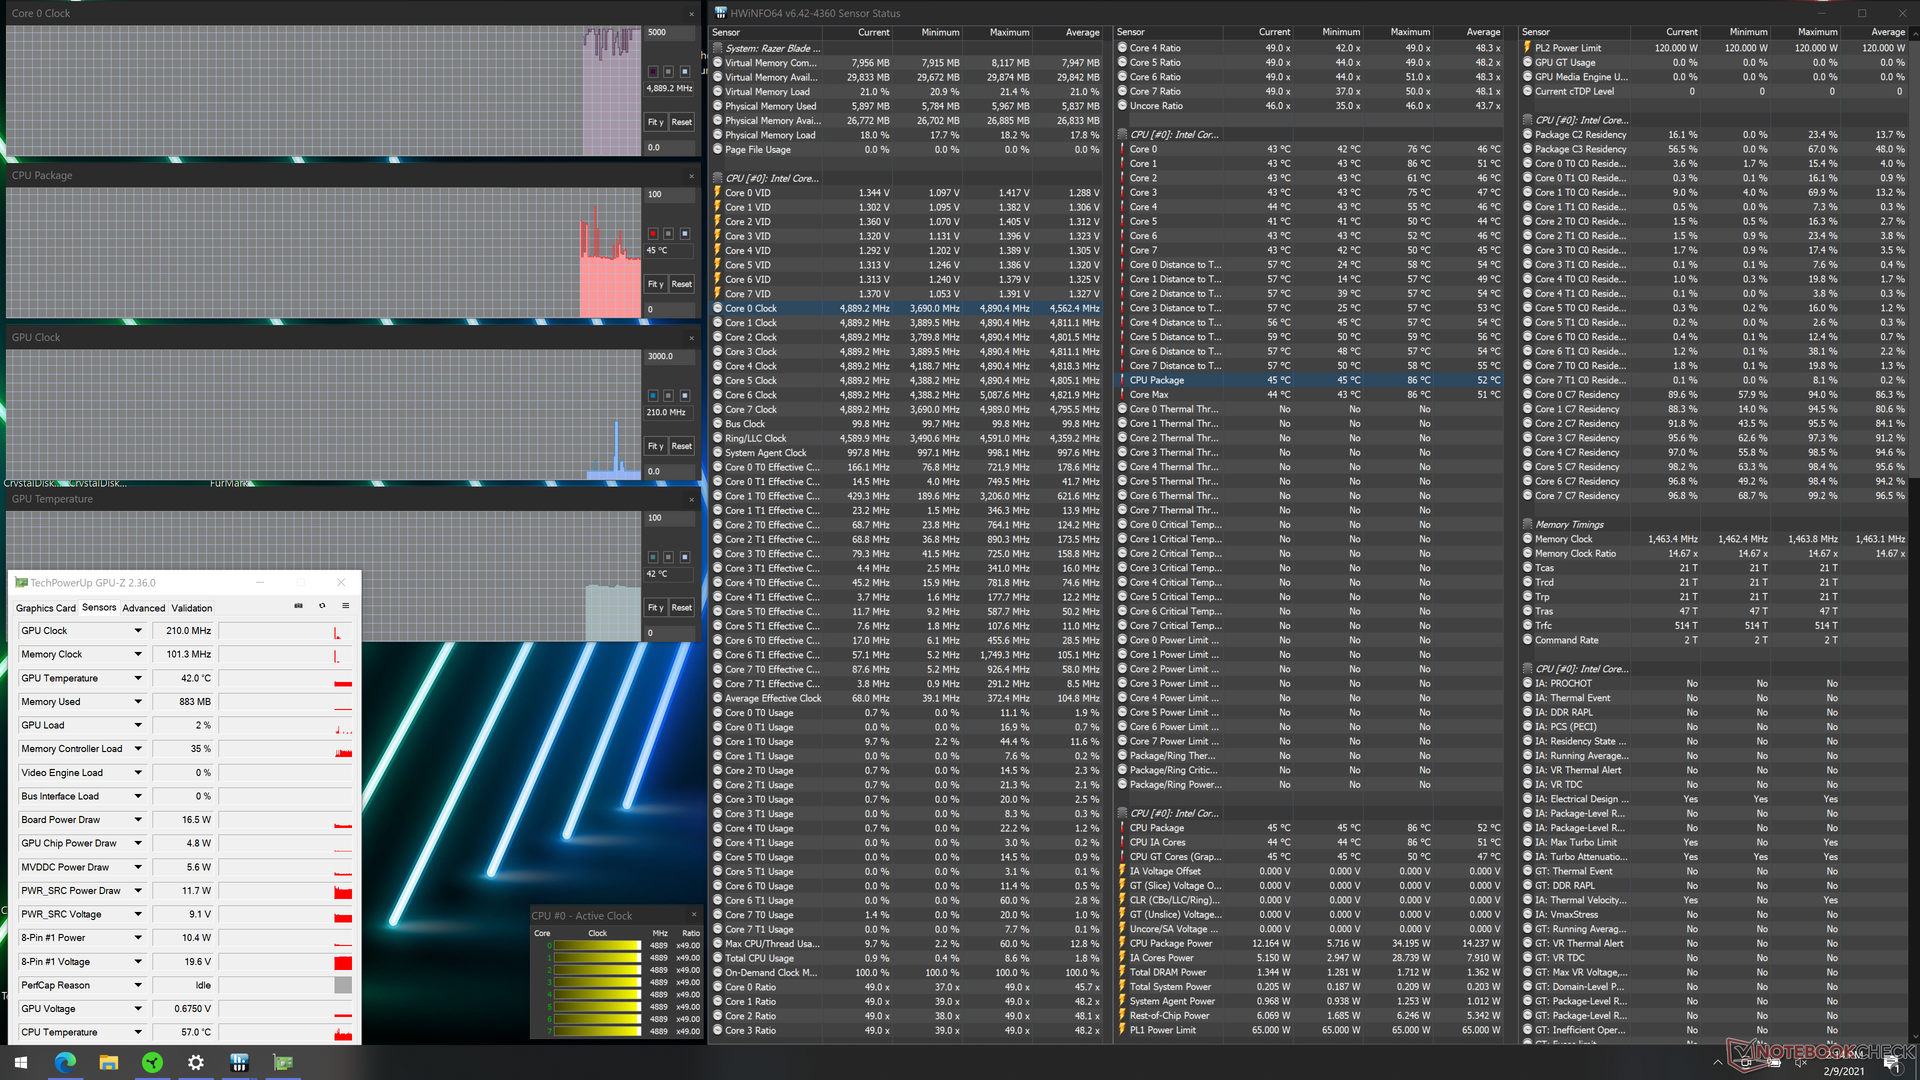
Quando estressada com Prime95, a CPU aumentaria para apenas 2,8 a 3,2 GHz e não mais, o que é bastante decepcionante porque o Core i7-10875H é capaz de acelerar as taxas do relógio Turbo Boost. O Core i7-10870H no concorrente MSI GS66, por exemplo, pode impulsionar até 4 GHz pelo menos temporariamente. Também não temos certeza se isto é intencional por parte da Razer porque a temperatura do núcleo se estabilizaria em apenas 70 C para ser um pouco mais fria do que a que estamos normalmente acostumados nos laptops Core-H. Note que tínhamos ajustado nosso sistema para o modo High Performance com a CPU e GPU ajustados ao máximo via Synapse antes de rodar o Prime95 e, portanto, o sistema deveria estar com seu melhor desempenho neste cenário.
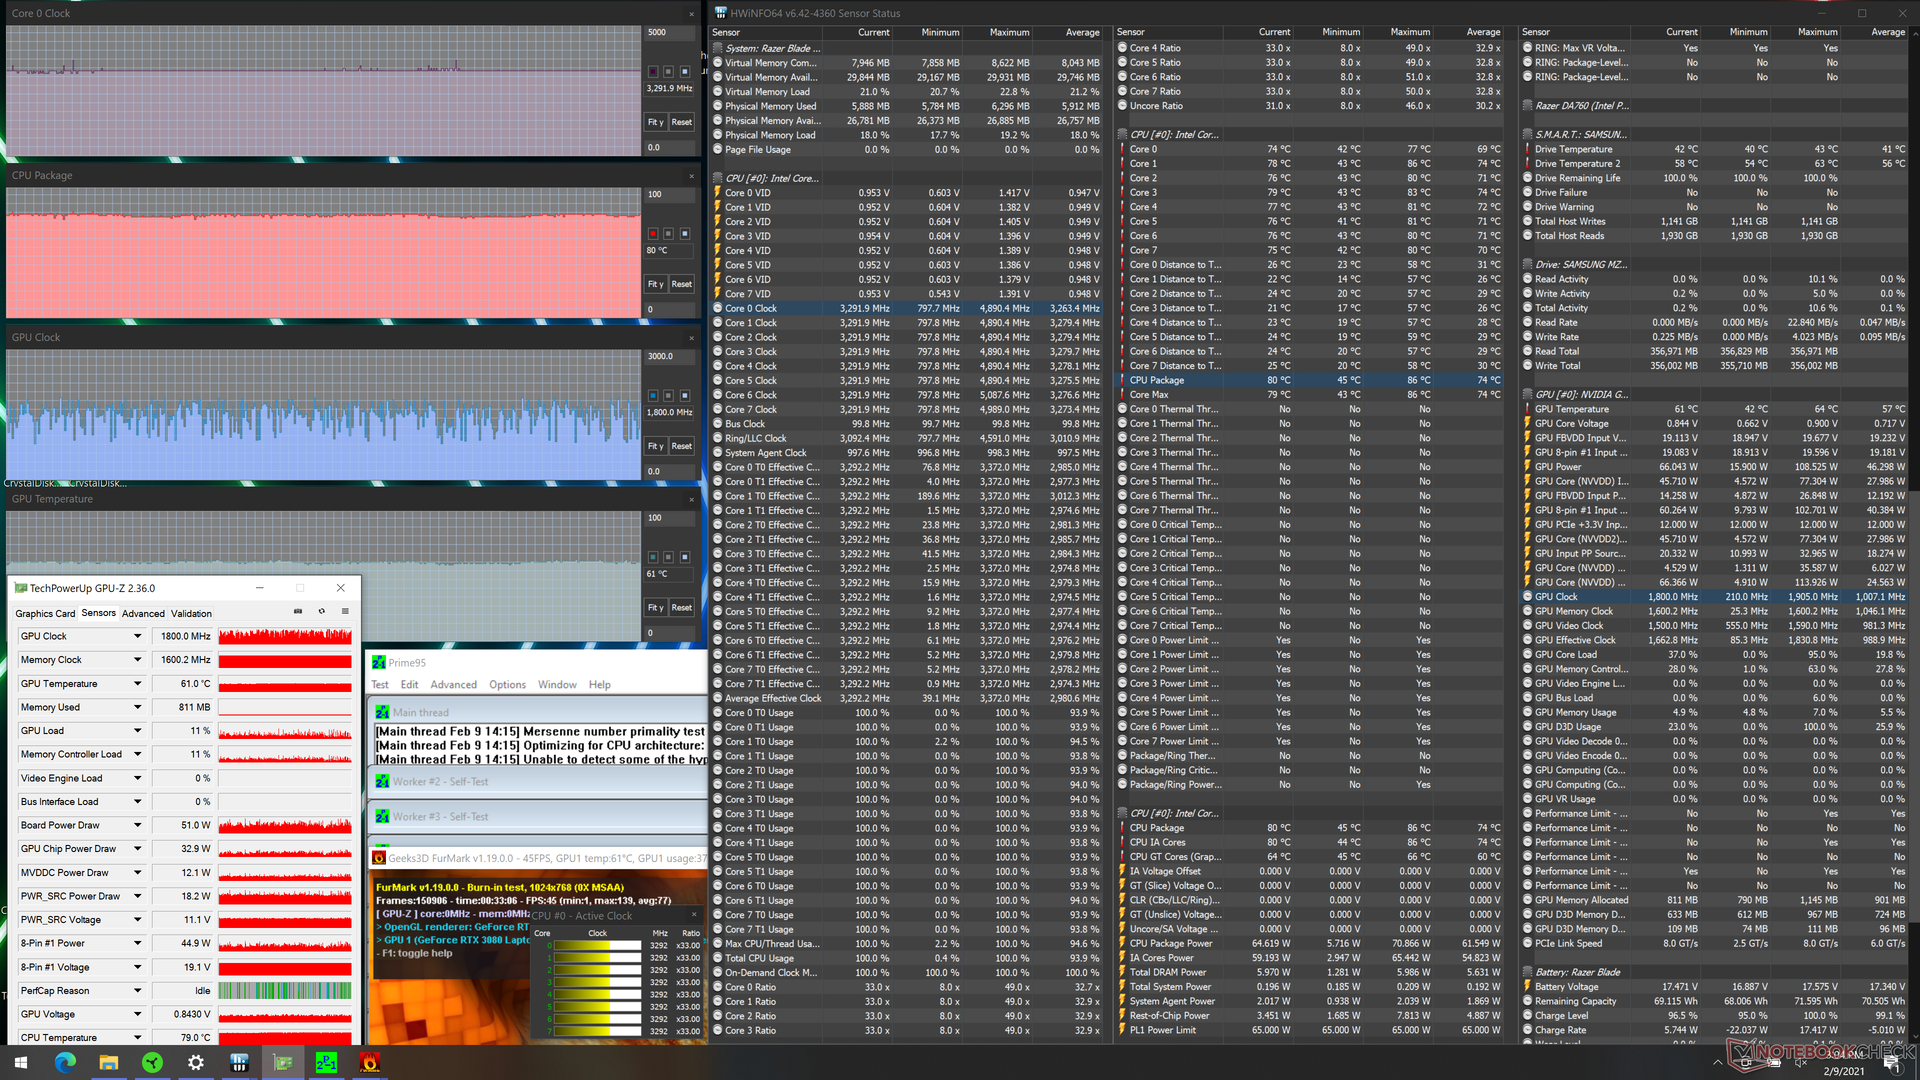
Ao rodar Prime95 e FurMark simultaneamente, a CPU permanece relativamente estável em 3,3 GHz e 80 C enquanto a GPU acelera bastante. De acordo com a GPU-Z, as taxas de clock e o consumo de energia da placa girariam entre 930 MHz a 1815 MHz e 40 W a 103,5 W, respectivamente.
O desempenho da GPU é felizmente muito mais estável quando se joga no mundo real. Witcher 3 stress, por exemplo, faz com que a GPU se estabilize em 1560 MHz e em uma absorção de potência da placa de 98 W com temperaturas centrais relativamente baixas na faixa média de 60 C.
Funcionando com bateria limita o desempenho. Uma Time Spy funcionando com baterias retornaria pontuações de Física e Gráficos de apenas 2731 e 2349 pontos, respectivamente, em comparação com 10140 e 10989 pontos quando em rede.
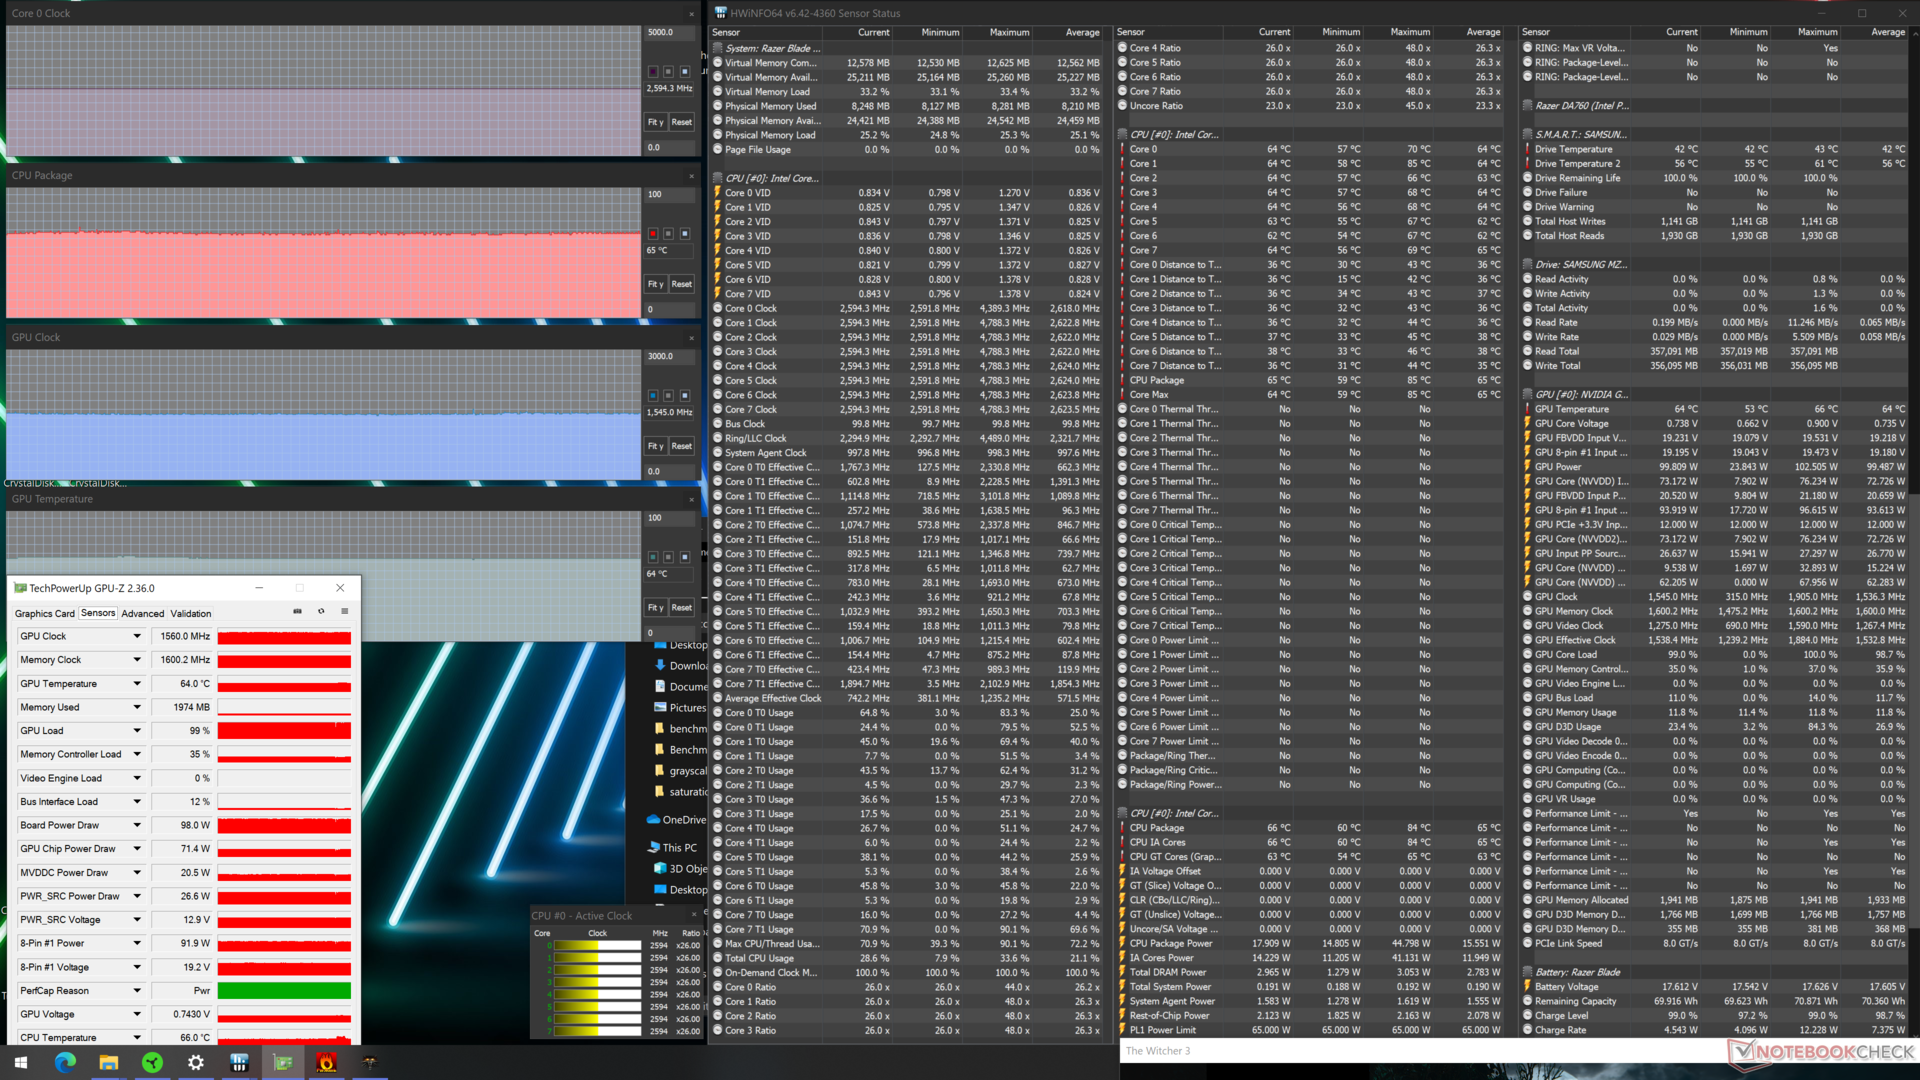
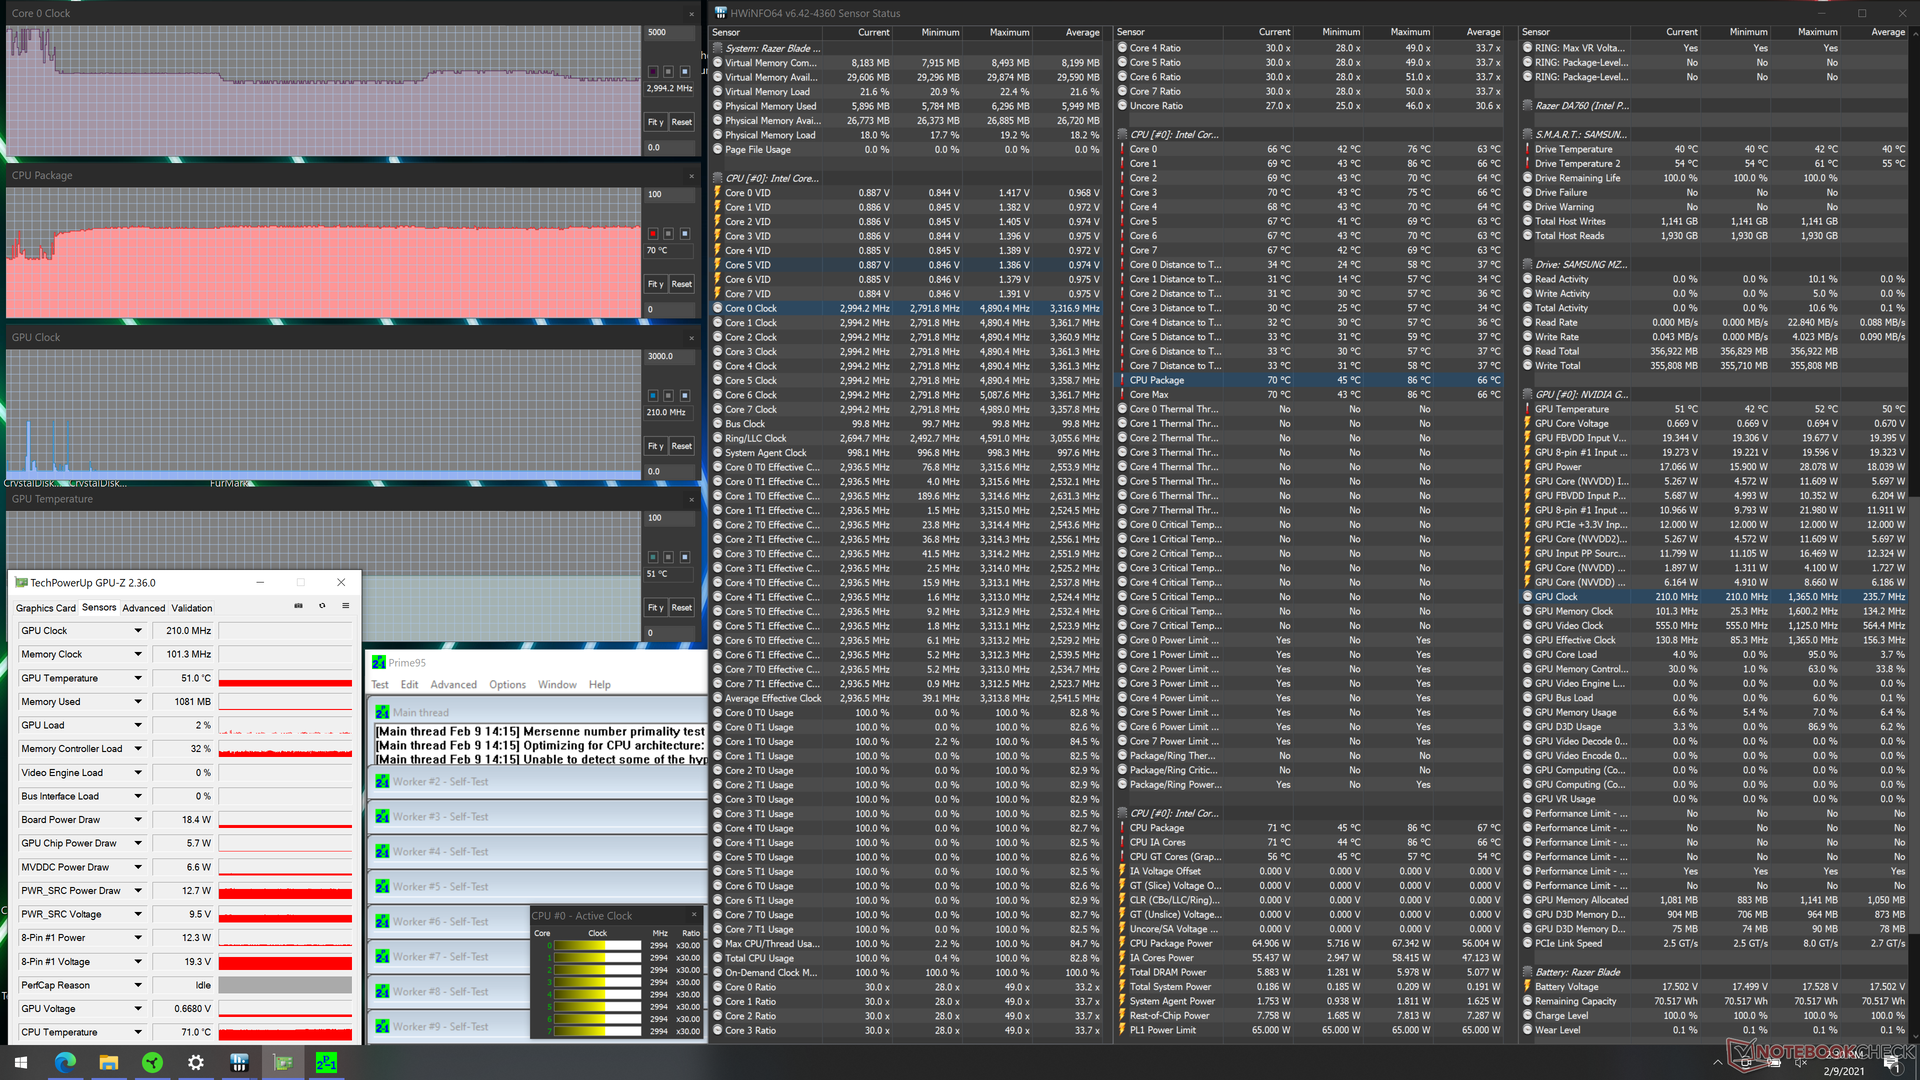
| RelógioCPU (GHz) | RelógioGPU (MHz) | Temperaturamédiada CPU (°C) | Temperaturamédiada GPU (°C) | |
| System Idle | -- | ----45 | 42 | |
| Prime95 Stress | 2.8 - 3.2 | --70 | 51 | |
| Prime95 + FurMark Stress | 3.3 | 930 - 1815 | 80 | 61 |
| Witcher 3 Stress | 2.6 | 1560 | 65 | 64 |
Oradores


Razer Blade Pro 17 2021 (QHD Touch) análise de áudio
(+) | os alto-falantes podem tocar relativamente alto (###valor### dB)
Graves 100 - 315Hz
(-) | quase nenhum baixo - em média 19.5% menor que a mediana
(±) | a linearidade dos graves é média (11.2% delta para a frequência anterior)
Médios 400 - 2.000 Hz
(+) | médios equilibrados - apenas 3.4% longe da mediana
(+) | médios são lineares (3.6% delta para frequência anterior)
Altos 2 - 16 kHz
(+) | agudos equilibrados - apenas 2.8% longe da mediana
(+) | os máximos são lineares (5.2% delta da frequência anterior)
Geral 100 - 16.000 Hz
(+) | o som geral é linear (13.6% diferença em relação à mediana)
Comparado com a mesma classe
» 20% de todos os dispositivos testados nesta classe foram melhores, 7% semelhantes, 73% piores
» O melhor teve um delta de 6%, a média foi 18%, o pior foi 132%
Comparado com todos os dispositivos testados
» 15% de todos os dispositivos testados foram melhores, 4% semelhantes, 82% piores
» O melhor teve um delta de 4%, a média foi 23%, o pior foi 134%
Apple MacBook 12 (Early 2016) 1.1 GHz análise de áudio
(+) | os alto-falantes podem tocar relativamente alto (###valor### dB)
Graves 100 - 315Hz
(±) | graves reduzidos - em média 11.3% menor que a mediana
(±) | a linearidade dos graves é média (14.2% delta para a frequência anterior)
Médios 400 - 2.000 Hz
(+) | médios equilibrados - apenas 2.4% longe da mediana
(+) | médios são lineares (5.5% delta para frequência anterior)
Altos 2 - 16 kHz
(+) | agudos equilibrados - apenas 2% longe da mediana
(+) | os máximos são lineares (4.5% delta da frequência anterior)
Geral 100 - 16.000 Hz
(+) | o som geral é linear (10.2% diferença em relação à mediana)
Comparado com a mesma classe
» 7% de todos os dispositivos testados nesta classe foram melhores, 2% semelhantes, 90% piores
» O melhor teve um delta de 5%, a média foi 18%, o pior foi 53%
Comparado com todos os dispositivos testados
» 5% de todos os dispositivos testados foram melhores, 1% semelhantes, 94% piores
» O melhor teve um delta de 4%, a média foi 23%, o pior foi 134%
Energy Management
Consumo de energia
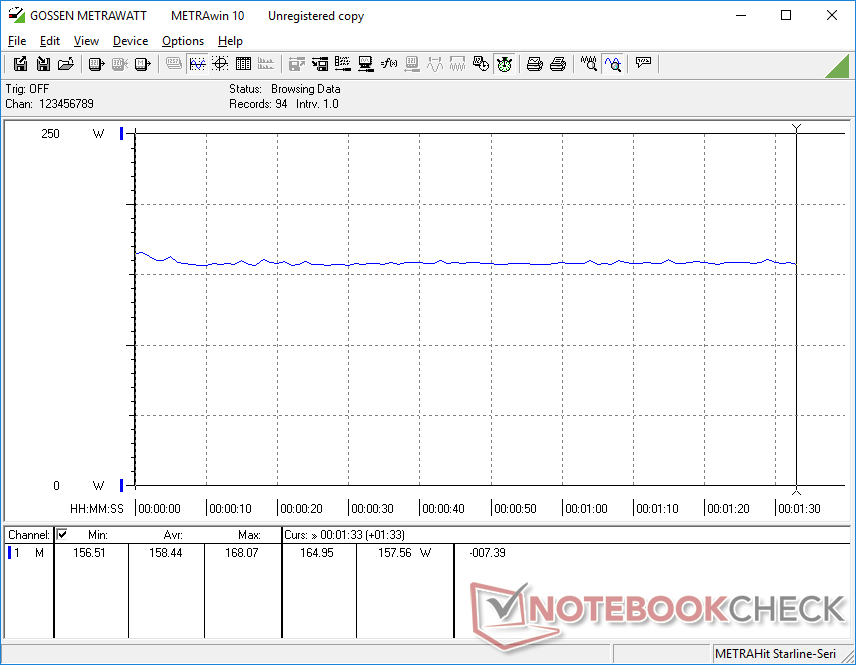
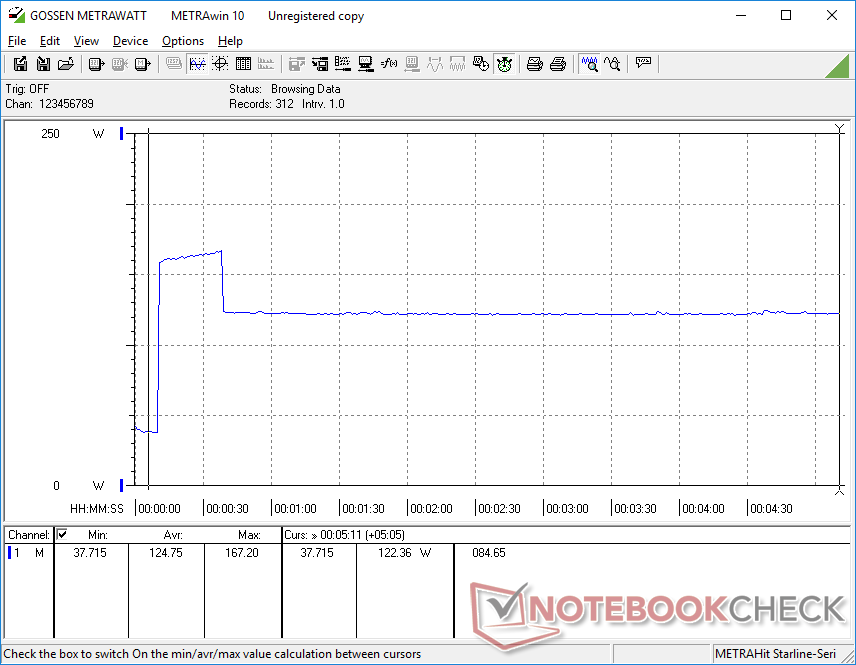
O Idling no desktop desenha 15 W no mínimo quando todas as configurações estão sintonizadas no modo Power Saver, incluindo a GPU integrada. O Idling no modo High Performance com a GPU discreta ativa pode consumir mais do dobro a 37 W
Quando se joga, os resultados são semelhantes ao que observamos no RTX 2070-powered Blade Pro 17 e no MSI GS66. Portanto, os proprietários estão obtendo um desempenho gráfico 25 a 35 por cento mais rápido nos mesmos níveis de consumo de energia para um maior desempenho gen-to-gen por watt
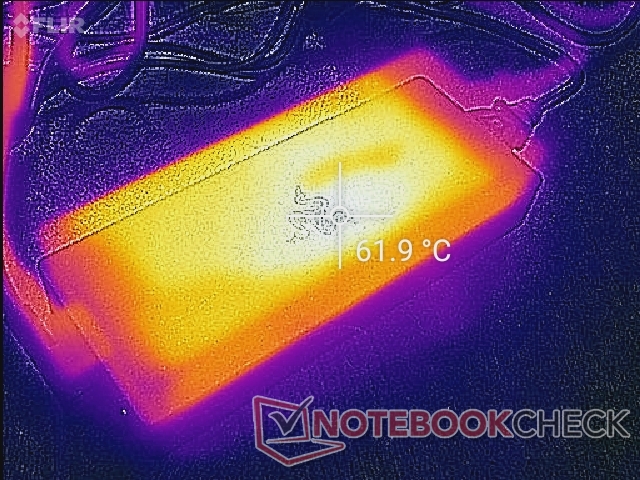
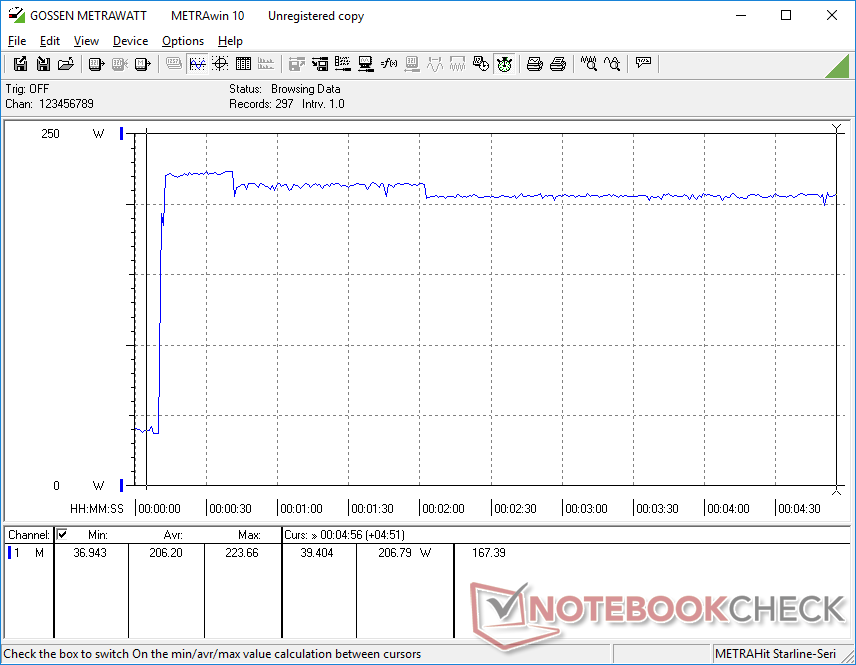
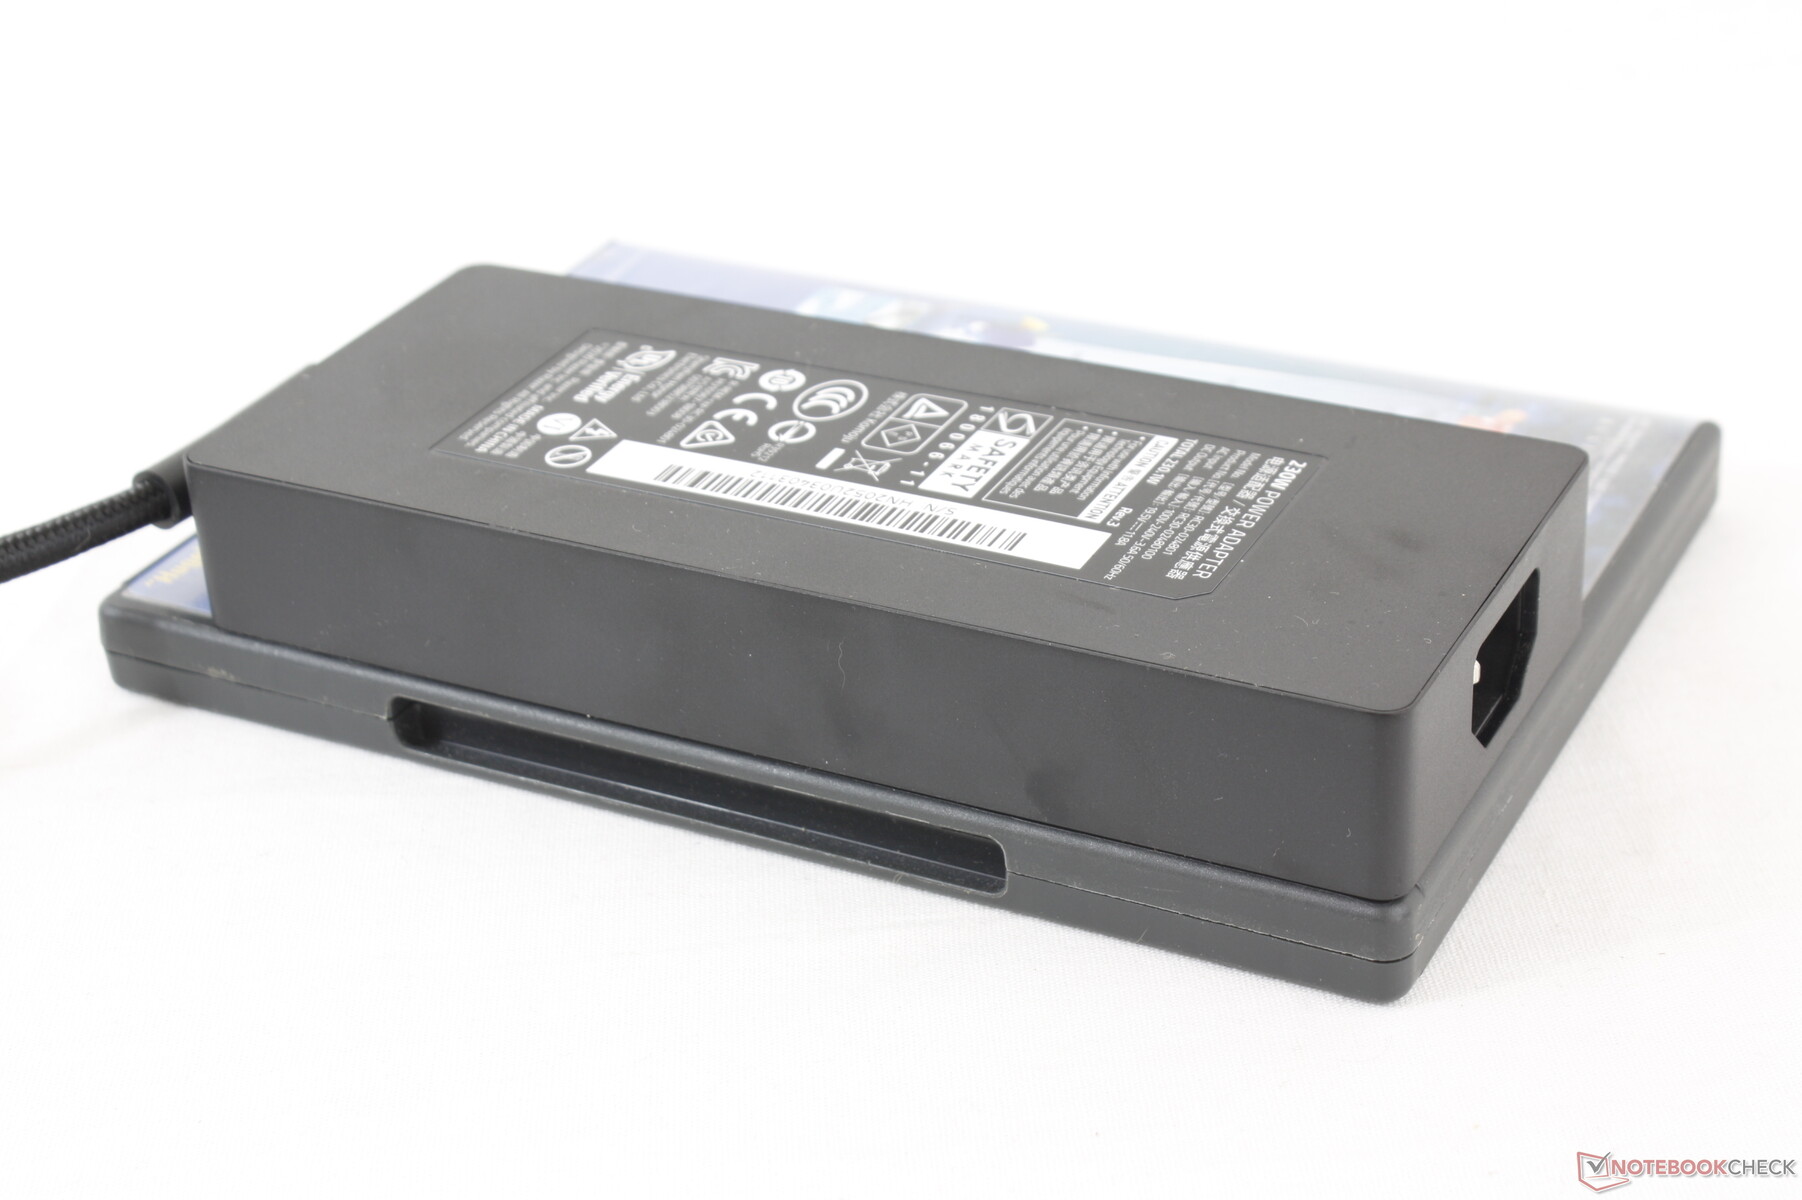
Executando simultaneamente o Prime95 e o FurMark, o adaptador CA de 230 W tiraria 224 W do pequeno-médio (17 x 7 x 2,5 cm). A taxa de carga será mais lenta se o funcionamento com cargas tão extremas.
| desligado | |
| Ocioso | |
| Carga |
|
Key:
min: | |
| Razer Blade Pro 17 2021 (QHD Touch) i7-10875H, GeForce RTX 3080 Laptop GPU, Samsung PM981a MZVLB1T0HBLR, IPS, 3840x2160, 17.3" | Razer Blade Pro 17 RTX 2070 Max-Q 300 Hz i7-10875H, GeForce RTX 2070 Max-Q, Lite-On CA5-8D512, IPS, 1920x1080, 17.3" | Schenker XMG Neo 17 (Early 2021, RTX 3070, 5800H) R7 5800H, GeForce RTX 3070 Laptop GPU, Samsung SSD 970 EVO Plus 500GB, IPS, 2560x1440, 17.3" | MSI GT76 Titan DT 10SGS i9-10900K, GeForce RTX 2080 Super Mobile, 2x WDC PC SN730 SDBPNTY-1T00 (RAID 0), IPS, 3840x2160, 17.3" | Asus Strix G17 G712LWS i7-10750H, GeForce RTX 2070 Super Mobile, Intel SSD 660p 1TB SSDPEKNW010T8, IPS, 1920x1080, 17.3" | MSI GS75 10SF-609US i7-10875H, GeForce RTX 2070 Max-Q, WDC PC SN730 SDBPNTY-512G, IPS, 1920x1080, 17.3" | |
|---|---|---|---|---|---|---|
| Power Consumption | -5% | 4% | -69% | 10% | -6% | |
| Idle Minimum * (Watt) | 15.2 | 19.6 -29% | 13 14% | 25.9 -70% | 10 34% | 19.2 -26% |
| Idle Average * (Watt) | 20.3 | 21.7 -7% | 16 21% | 38 -87% | 14 31% | 22.4 -10% |
| Idle Maximum * (Watt) | 37.3 | 36.1 3% | 26 30% | 53.2 -43% | 25 33% | 34.7 7% |
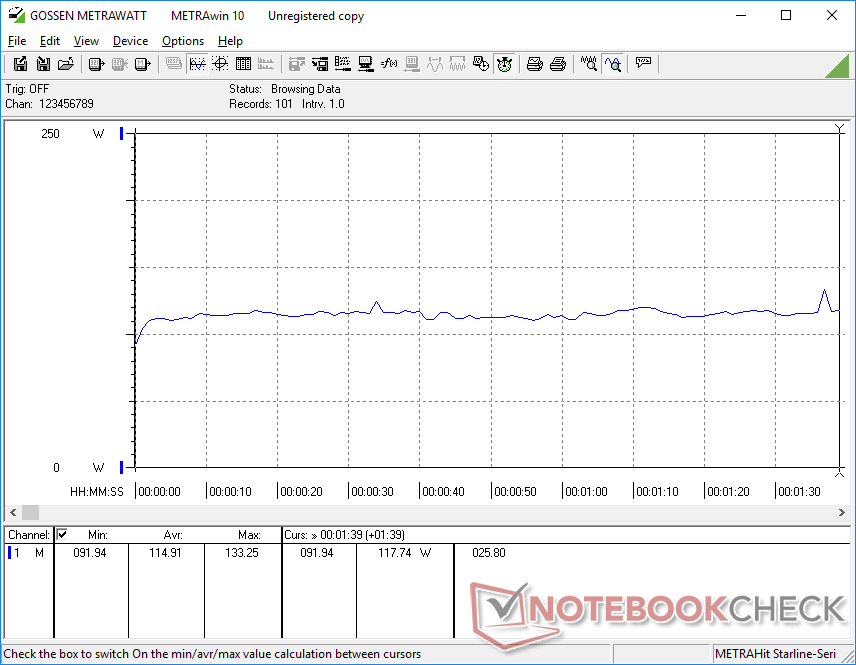
| Load Average * (Watt) | 114.9 | 115.6 -1% | 125 -9% | 123.8 -8% | 134 -17% | 106.7 7% |
| Witcher 3 ultra * (Watt) | 158.4 | 157 1% | 187 -18% | 312.5 -97% | 186 -17% | 160.5 -1% |
| Load Maximum * (Watt) | 223.7 | 219.9 2% | 259 -16% | 459.8 -106% | 230 -3% | 248.7 -11% |
* ... menor é melhor
Vida útil da bateria
Os tempos de funcionamento são aproximadamente os mesmos do modelo do ano passado, se não um pouco mais longos, com cerca de 6 horas de uso da WLAN no mundo real. O MSI GS66 pode funcionar por ainda mais tempo, pois vem com uma bateria de maior capacidade (99 Wh vs 70 Wh).
O carregamento da capacidade vazia à plena leva cerca de 1,5 a 2 horas. Os carregadores USB-C de terceiros também funcionam, embora com taxas de recarga muito mais lentas.
| Razer Blade Pro 17 2021 (QHD Touch) i7-10875H, GeForce RTX 3080 Laptop GPU, 70.5 Wh | Razer Blade Pro 17 RTX 2070 Max-Q 300 Hz i7-10875H, GeForce RTX 2070 Max-Q, 70 Wh | Schenker XMG Neo 17 (Early 2021, RTX 3070, 5800H) R7 5800H, GeForce RTX 3070 Laptop GPU, 62 Wh | MSI GT76 Titan DT 10SGS i9-10900K, GeForce RTX 2080 Super Mobile, 90 Wh | Asus Strix G17 G712LWS i7-10750H, GeForce RTX 2070 Super Mobile, 66 Wh | MSI GS75 10SF-609US i7-10875H, GeForce RTX 2070 Max-Q, 80.25 Wh | |
|---|---|---|---|---|---|---|
| Duração da bateria | -17% | -48% | -59% | -0% | 54% | |
| Reader / Idle (h) | 9.9 | 4.7 -53% | 9.1 -8% | 8.6 -13% | ||
| WiFi v1.3 (h) | 5.9 | 4.9 -17% | 3.5 -41% | 2.4 -59% | 5.5 -7% | 4.9 -17% |
| Load (h) | 1.4 | 0.7 -50% | 1.6 14% | 4.1 193% |
Pro
Contra
Veredicto
O móvel GeForce RTX 3080 aqui oferece cerca de 15% a 25% mais rápido desempenho gráfico bruto do que o RTX 2080 Super Max-Q que foi o GPU mais rápido disponível para o 2020 Blade Pro 17. A partir desta escrita, nossa configuração RTX 3080 vem com o dobro da RAM (32 GB vs. 16 GB) do que a configuração do RTX 2080 Super Max-Q por apenas $100 USD a mais ($3500 vs. $3600) quando todas as outras especificações são mantidas iguais. Se você estiver no mercado para um novo Razer, então você pode também gastar os $100 extras tanto para o desempenho extra de RAM como GPU ou esperar por cortes de preços mais acentuados nos modelos mais antigos de 2020.
O Razer Blade Pro 2021 é um pequeno refinamento do 2020 Blade Pro, apesar do salto para GeForce RTX 30 gráficos. O desempenho é um pouco melhor para um desempenho ligeiramente superior por dólar.
Os ganhos entre Nvidia mobile Turing e mobile Ampere não são tão grandes quanto os ganhos entre desktop Turing e desktop Ampere porque o mobile Ampere é limitado pelos mesmos tetos TGP que o mobile Turing. No final das contas, os jogadores de laptop não vão perder muito indo com um laptop mais antigo GeForce RTX 20, especialmente se eles puderem encontrar um à venda.
Preço e disponibilidade
Razer Blade Pro 17 2021 (QHD Touch)
- 02/15/2021 v7 (old)
Allen Ngo
Price comparison

