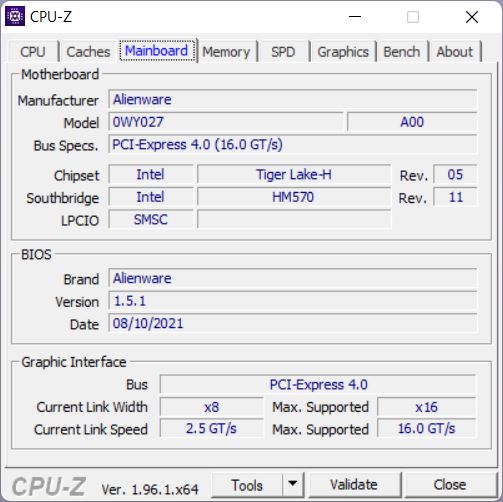
Revisão do laptop Alienware m15 R6: Mais eficiente, mas o RTX 3080 é mais lento do que no predecessor
É bastante surpreendente, quantos modelos da m15 a Dell introduziu em tão pouco tempo. Já testamos o m15 R4, o m15 R5, e agora o m15 R6 - todos eles neste ano.
O que é confuso é que como o R6 agora contém uma CPU Tiger Lake, ele realmente é um sucessor do R4 com a CPU Comet Lake e mais um irmão do R5 com o processador AMD. O case e muitas outras características correspondem ao R5 m15, razão pela qual não discutiremos as características do case, dispositivos de entrada, equipamentos de conexão, etc., a menos que haja algumas mudanças. Você pode encontrar informações sobre estas áreas em nosso revisão do Alienware m15 R5.
Naturalmente, também comparamos o Intel m15 R6 com o Intel m15 R6 AMD m15 R5e o m15 R4 Predecessor do Cometa Lakee, além disso, também com o Aorus 15P YDoModelo Razer Blade 15 proe o Schenker XMG Neo 15
Possible competitors in Comparison
Avaliação | Data | Modelo | Peso | Altura | Size | Resolução | Preço |
|---|---|---|---|---|---|---|---|
| 86.1 % v7 (old) | 11/2021 | Alienware m15 R6, i7-11800H RTX 3080 i7-11800H, GeForce RTX 3080 Laptop GPU | 2.5 kg | 22.85 mm | 15.60" | 1920x1080 | |
| 84.7 % v7 (old) | 06/2021 | Alienware m15 R5 Ryzen Edition R7 5800H, GeForce RTX 3060 Laptop GPU | 2.5 kg | 22.85 mm | 15.60" | 1920x1080 | |
| 86.1 % v7 (old) | 06/2021 | Alienware m15 R4 RTX 3080 i9-10980HK, GeForce RTX 3080 Laptop GPU | 2.4 kg | 20 mm | 15.60" | 1920x1080 | |
| 86.4 % v7 (old) | 06/2021 | Aorus 15P YD i7-11800H, GeForce RTX 3080 Laptop GPU | 2.2 kg | 27 mm | 15.60" | 1920x1080 | |
| 87 % v7 (old) | 06/2021 | Schenker XMG Neo 15 Tiger Lake i7-11800H, GeForce RTX 3080 Laptop GPU | 2.2 kg | 26 mm | 15.60" | 2560x1440 | |
| 88.9 % v7 (old) | 07/2021 | Razer Blade 15 Advanced (Mid 2021) i7-11800H, GeForce RTX 3080 Laptop GPU | 2 kg | 16.99 mm | 15.60" | 1920x1080 |
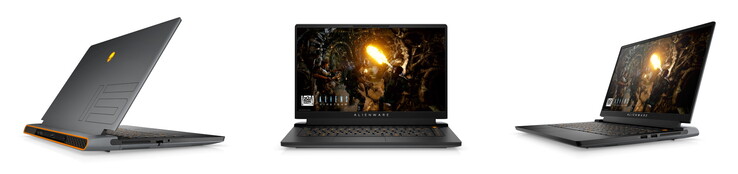
Estojo - Design bem conhecido
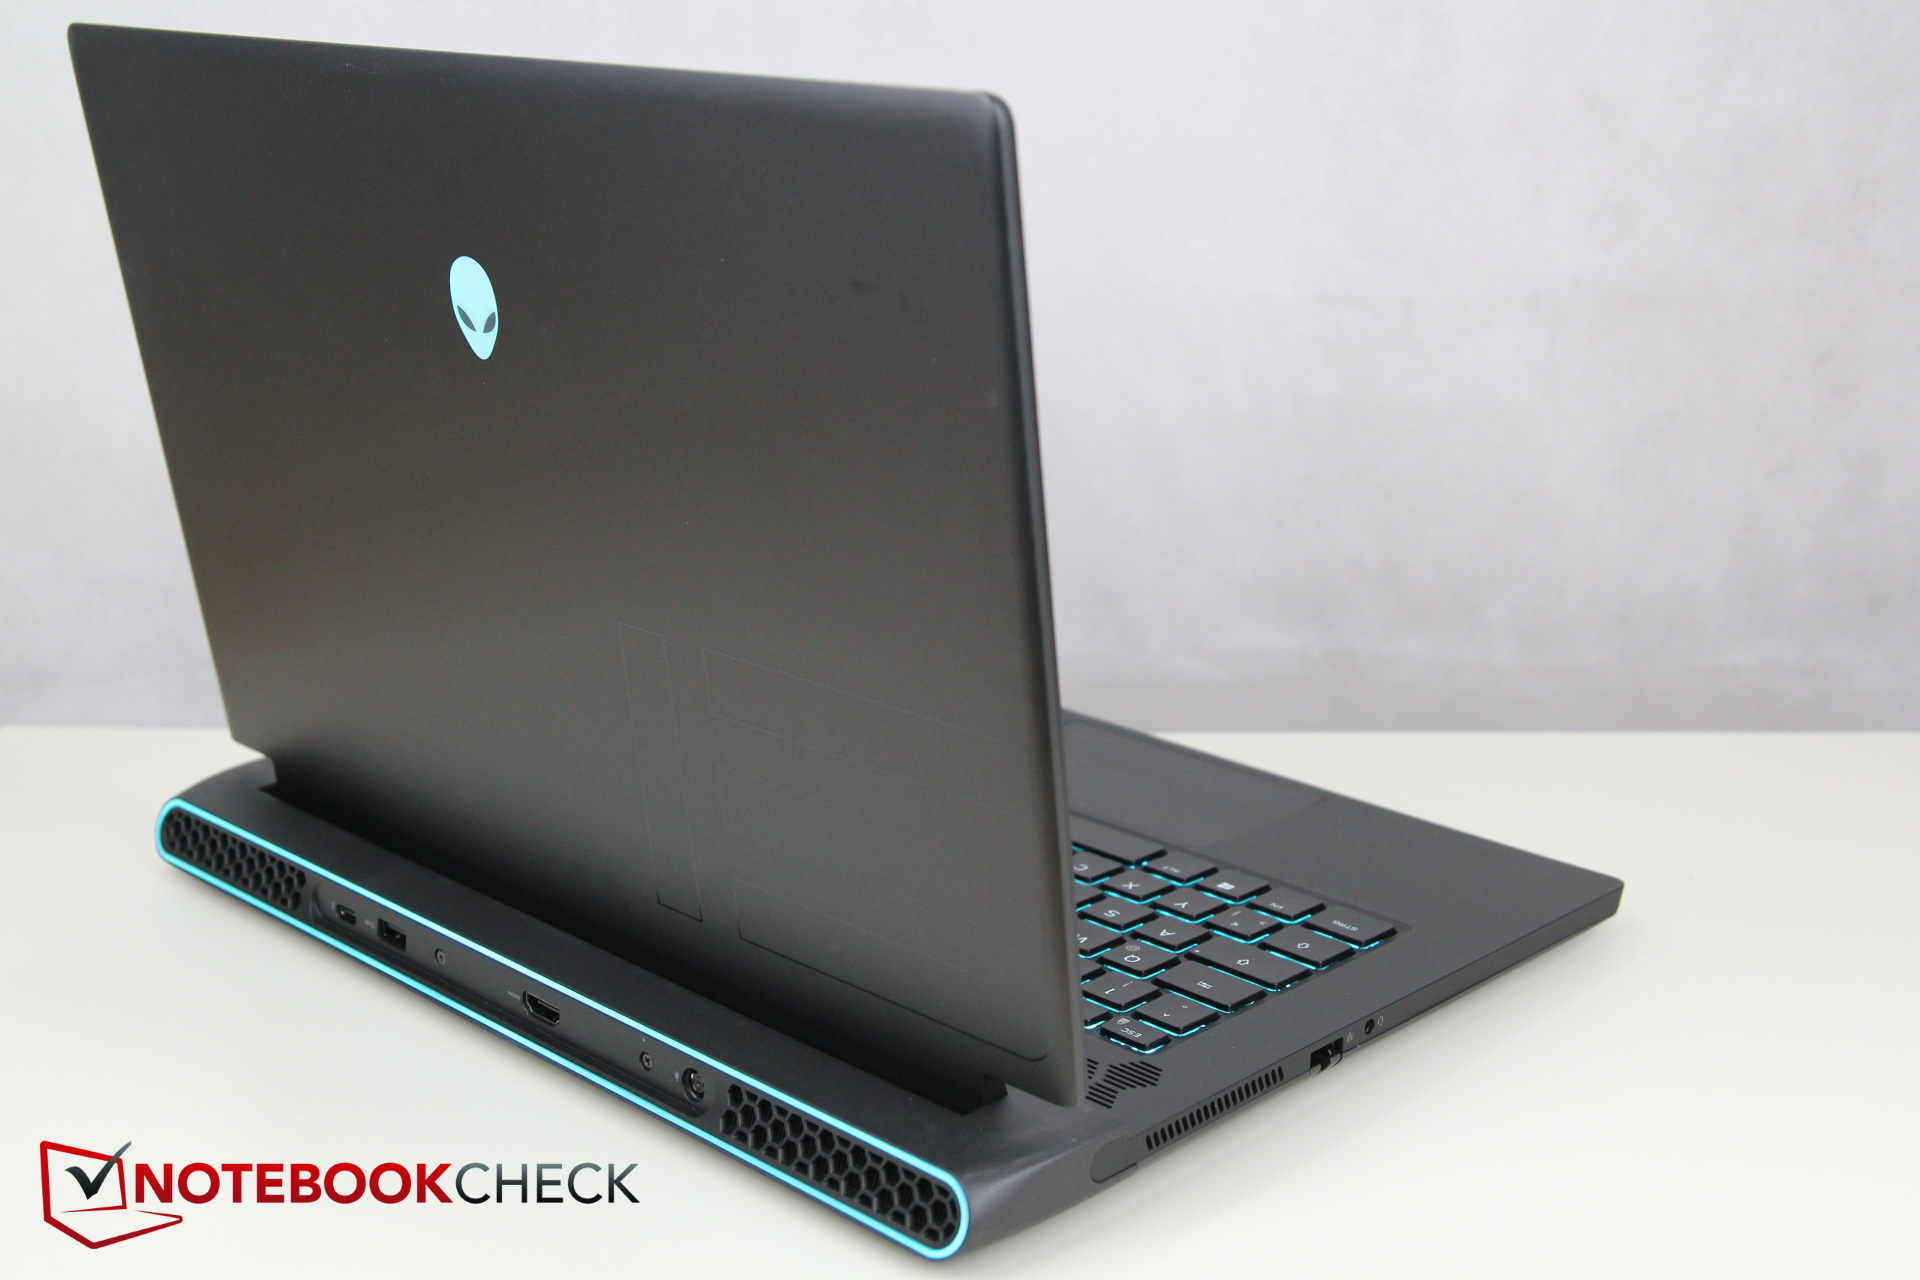
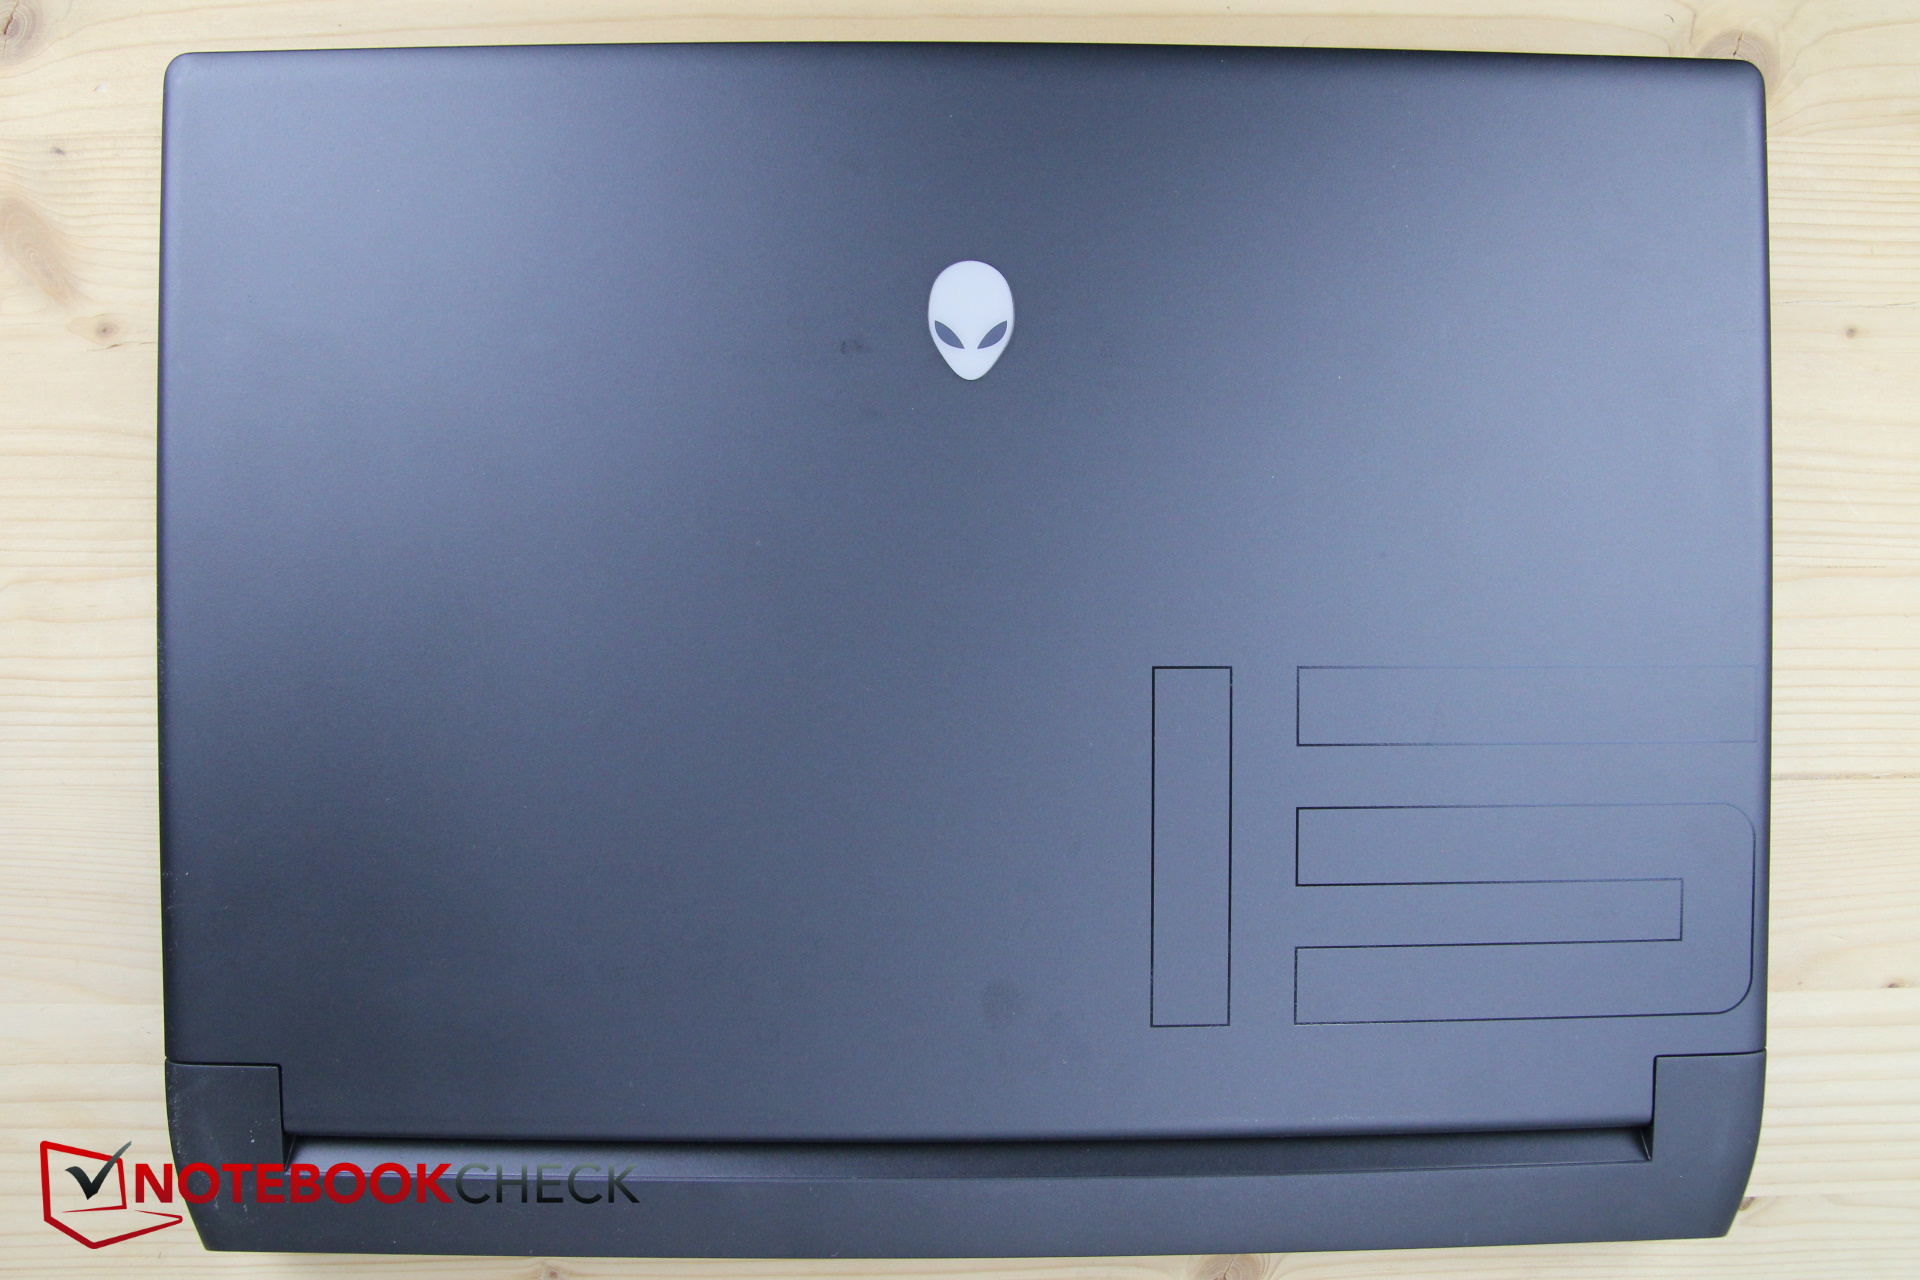
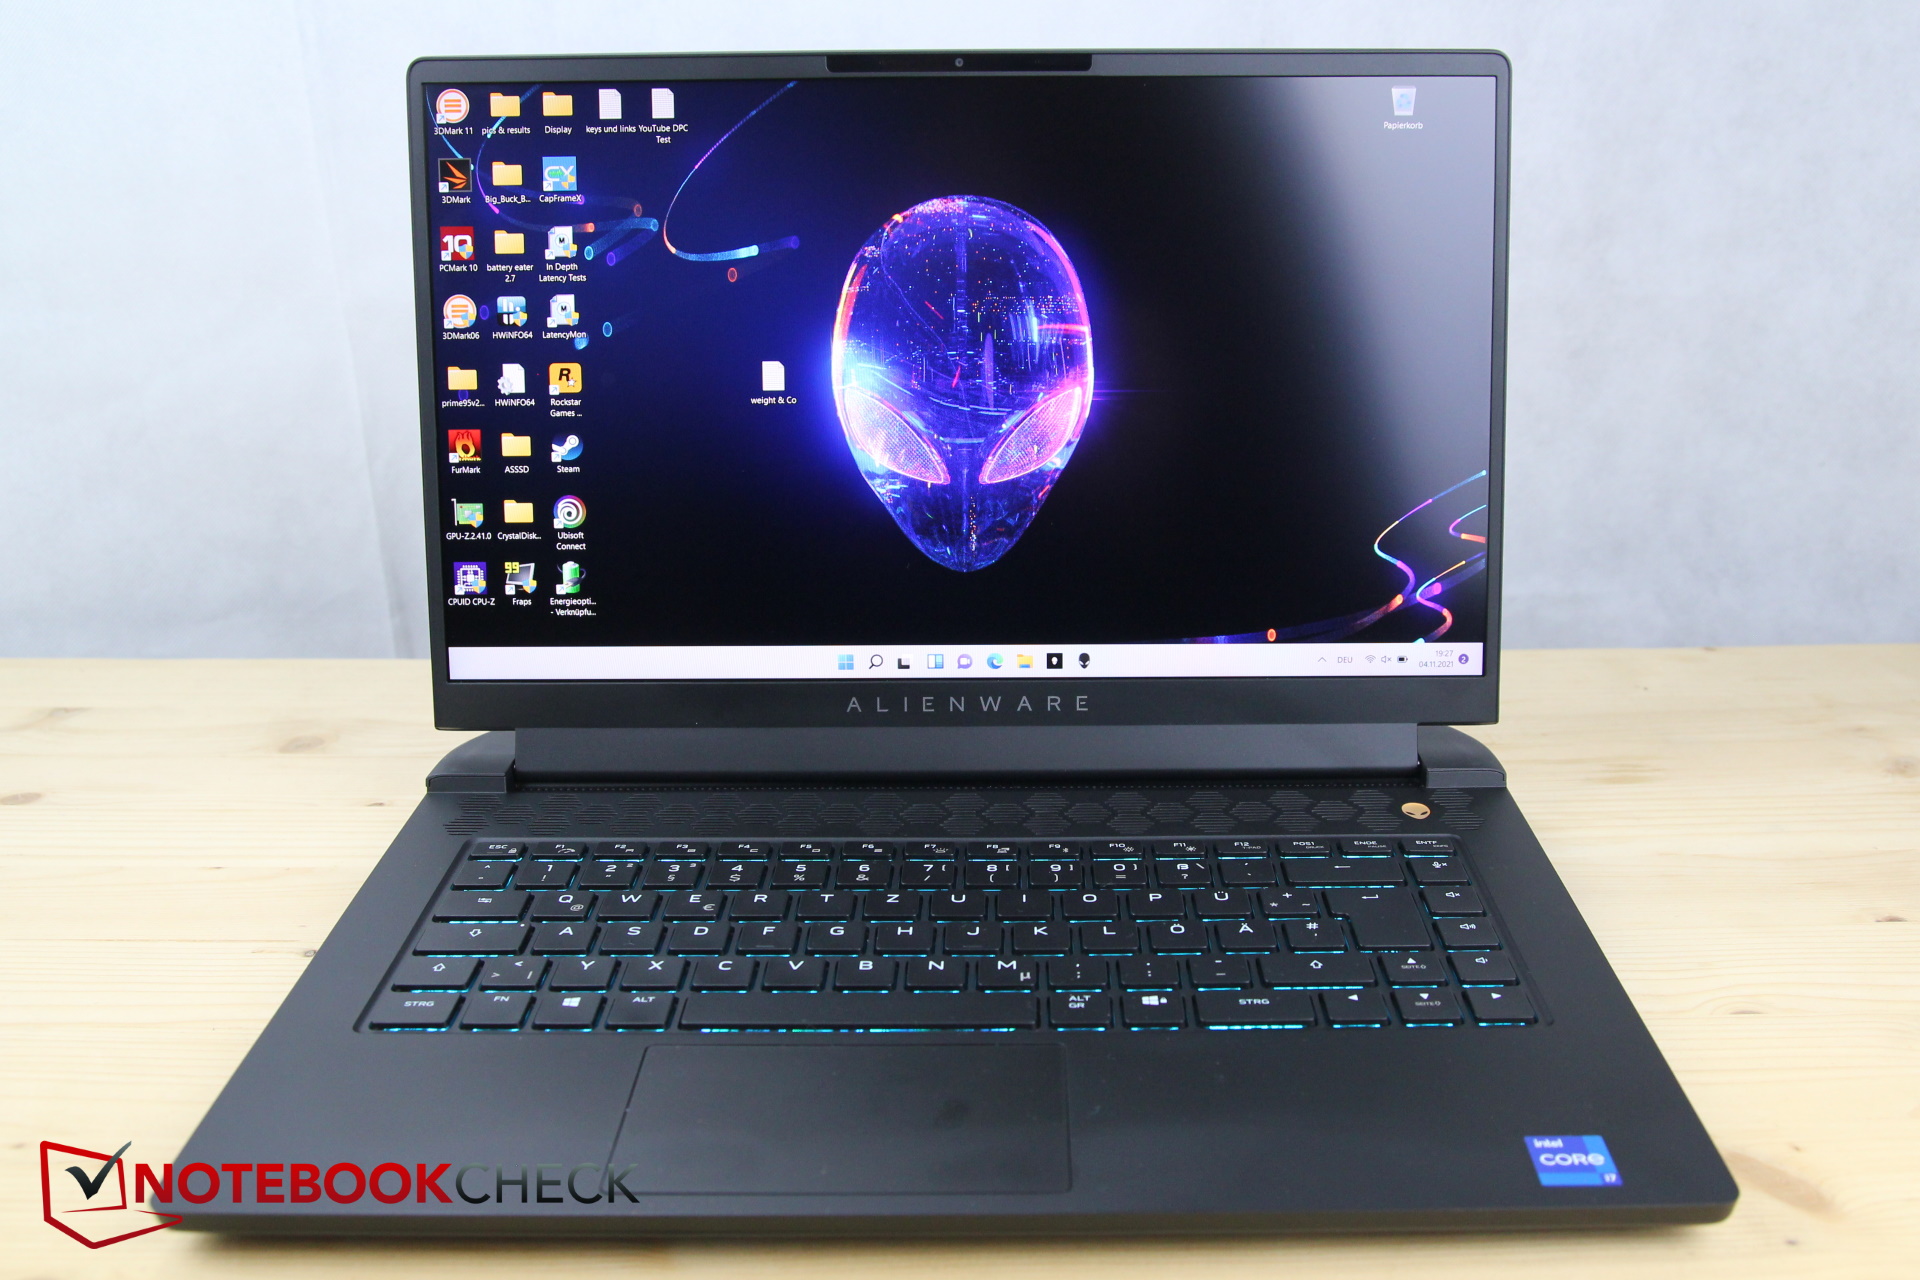
Os laptops alienígenas são conhecidos por seu grande sistema de refrigeração na parte de trás, por isso não é de se surpreender que o modelo atual também seja significativamente mais profundo do que os concorrentes de outros fabricantes. Mas pelo menos é ligeiramente mais fino do que o Schenker ou o Aorus, embora nenhum dos modelos seja capaz de vencer o Razer Blade a este respeito
Com um peso de 2,5 kg (~5,5 lb), os laptops Alienware também são 200 - 500 g (~7 - 18 oz) mais pesados do que os dispositivos de comparação
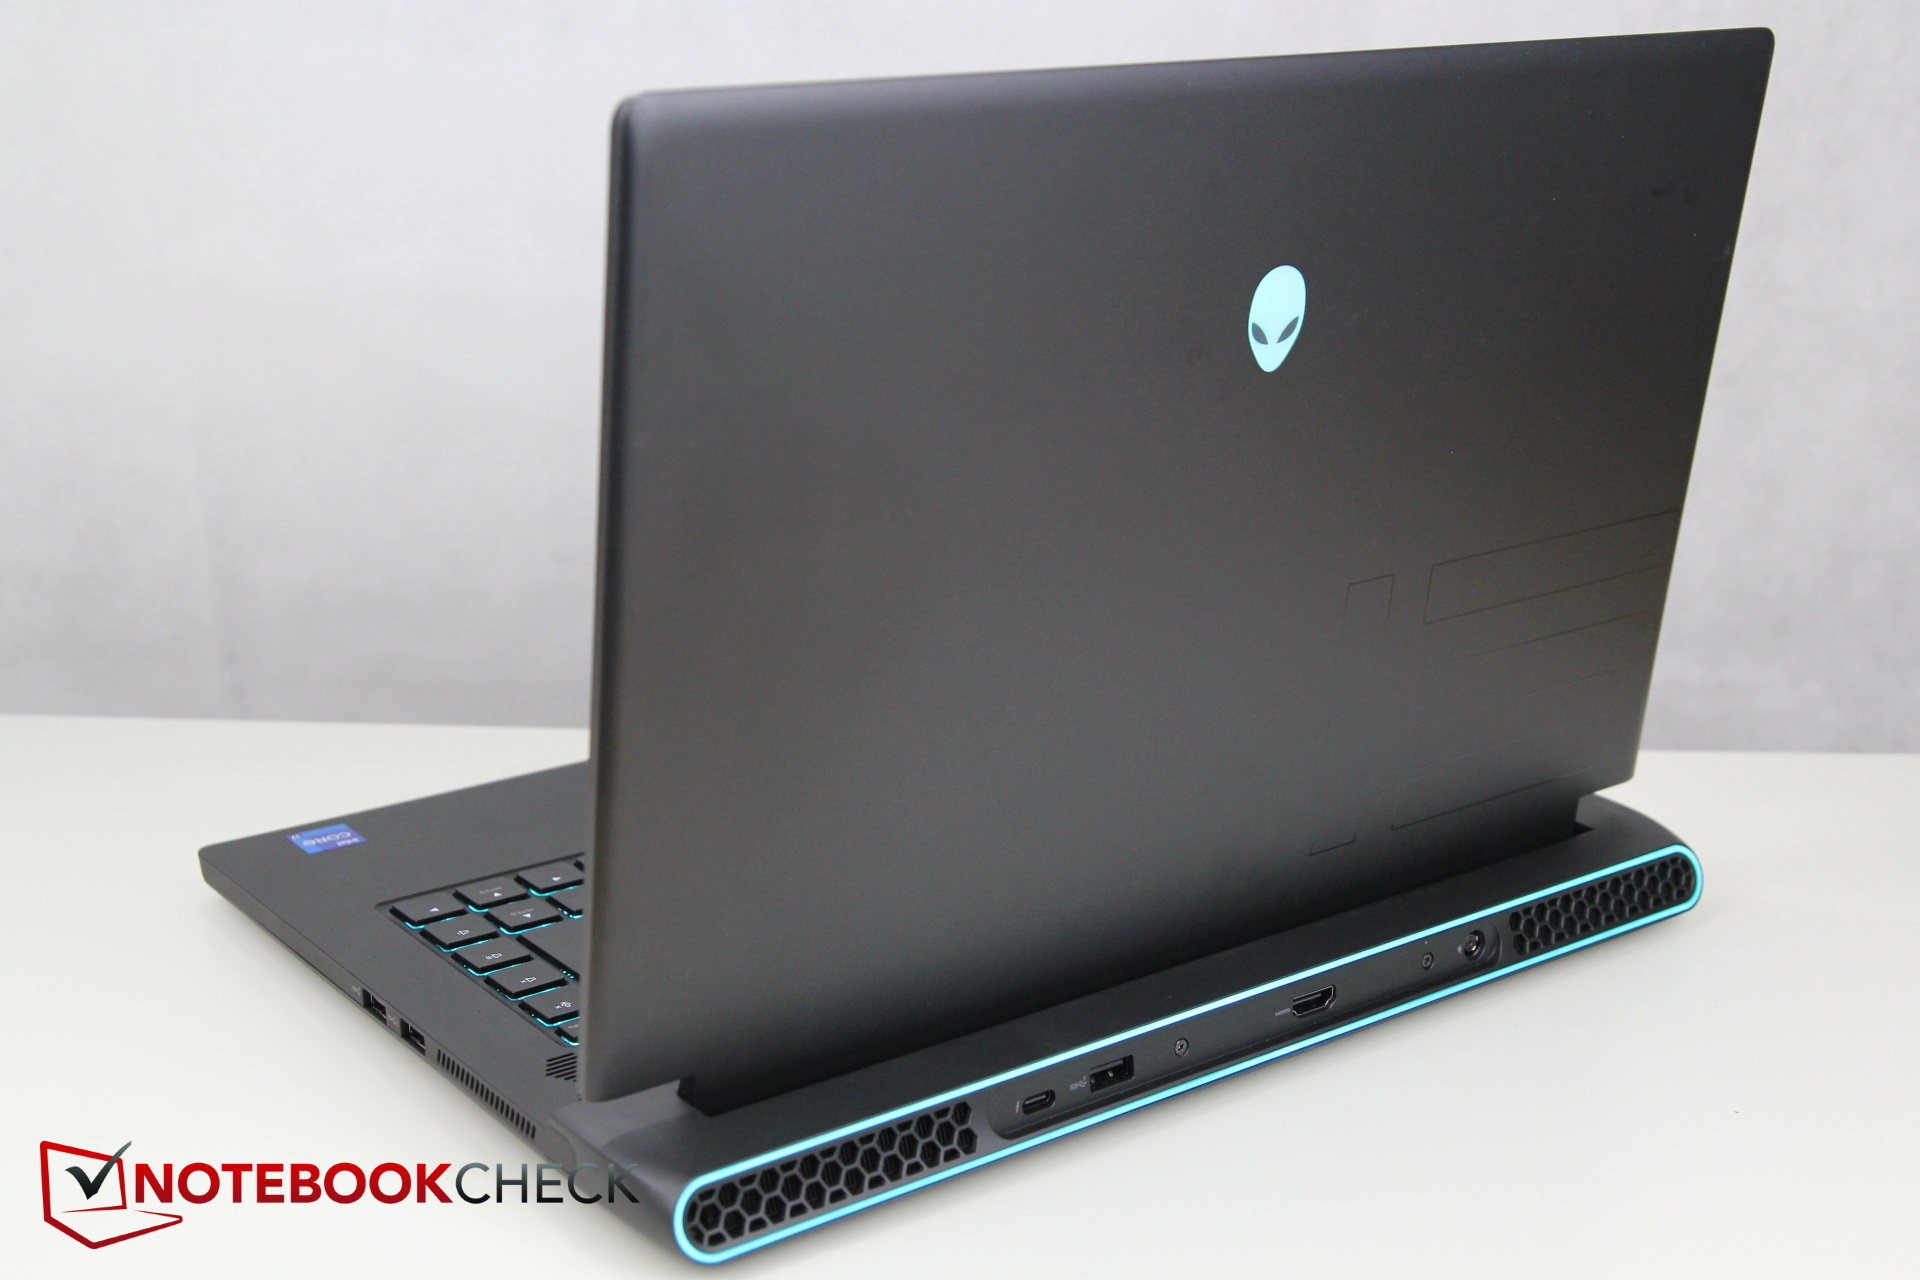
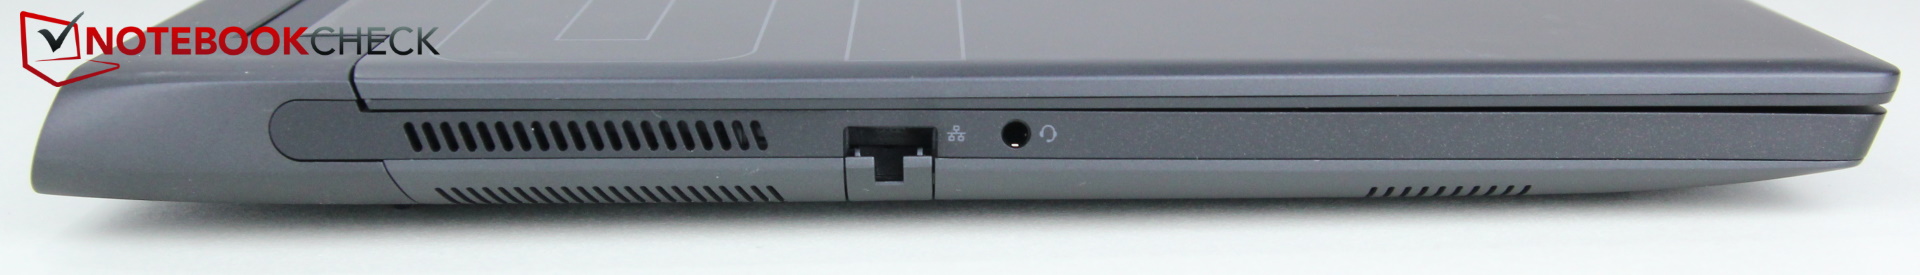
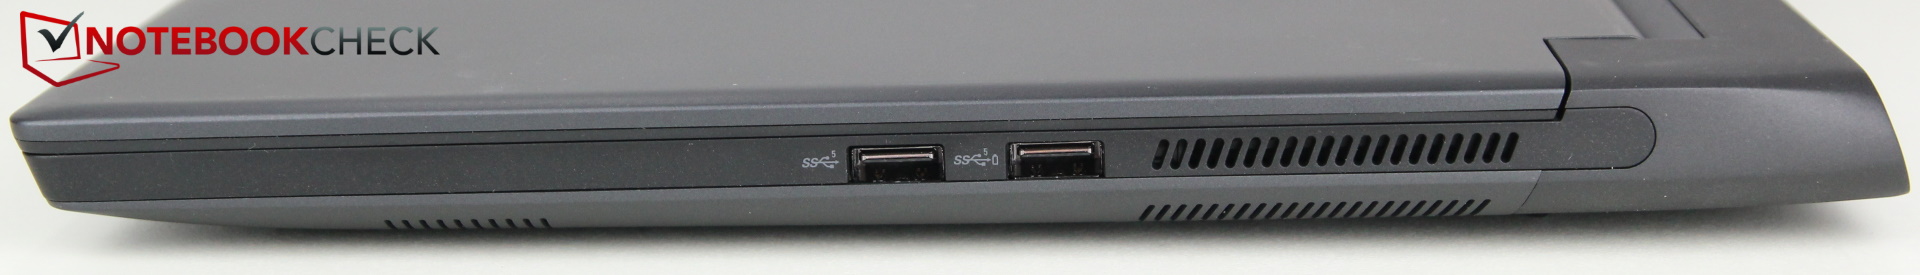
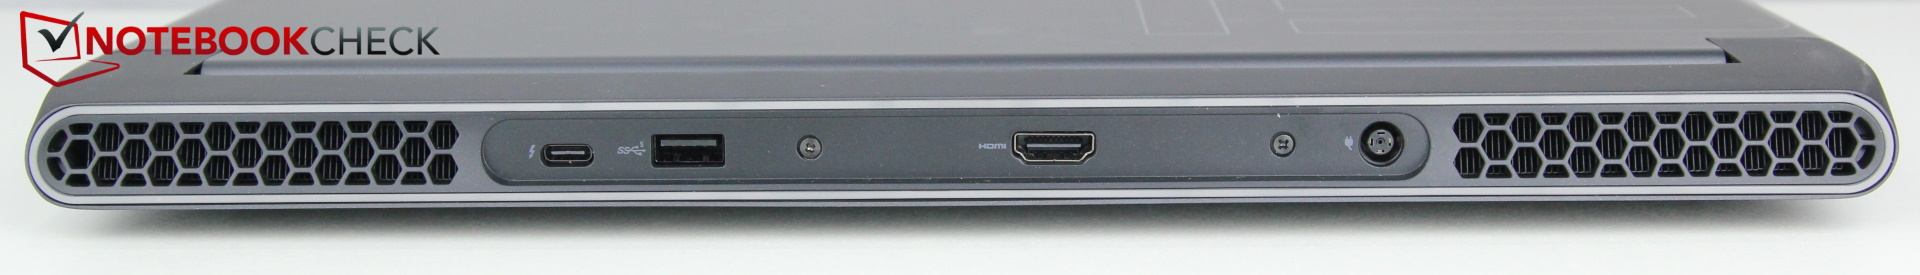
Equipamento de conexão - Intel Alienware com Thunderbolt
Em contraste com a versão m15 R5 AMD, o m15 R6 agora suporta Thunderbolt 4 graças à CPU Intel, e a porta USB-C correspondente também suporta USB 3.2 Gen 2 em vez da Gen 1. Além disso, a porta USB-C agora também suporta Power Delivery, o que significa que ele pode ser usado para recarga, mas somente a até 15 watts. Caso contrário, as conexões permaneceram as mesmas
Comunicação
Webcam


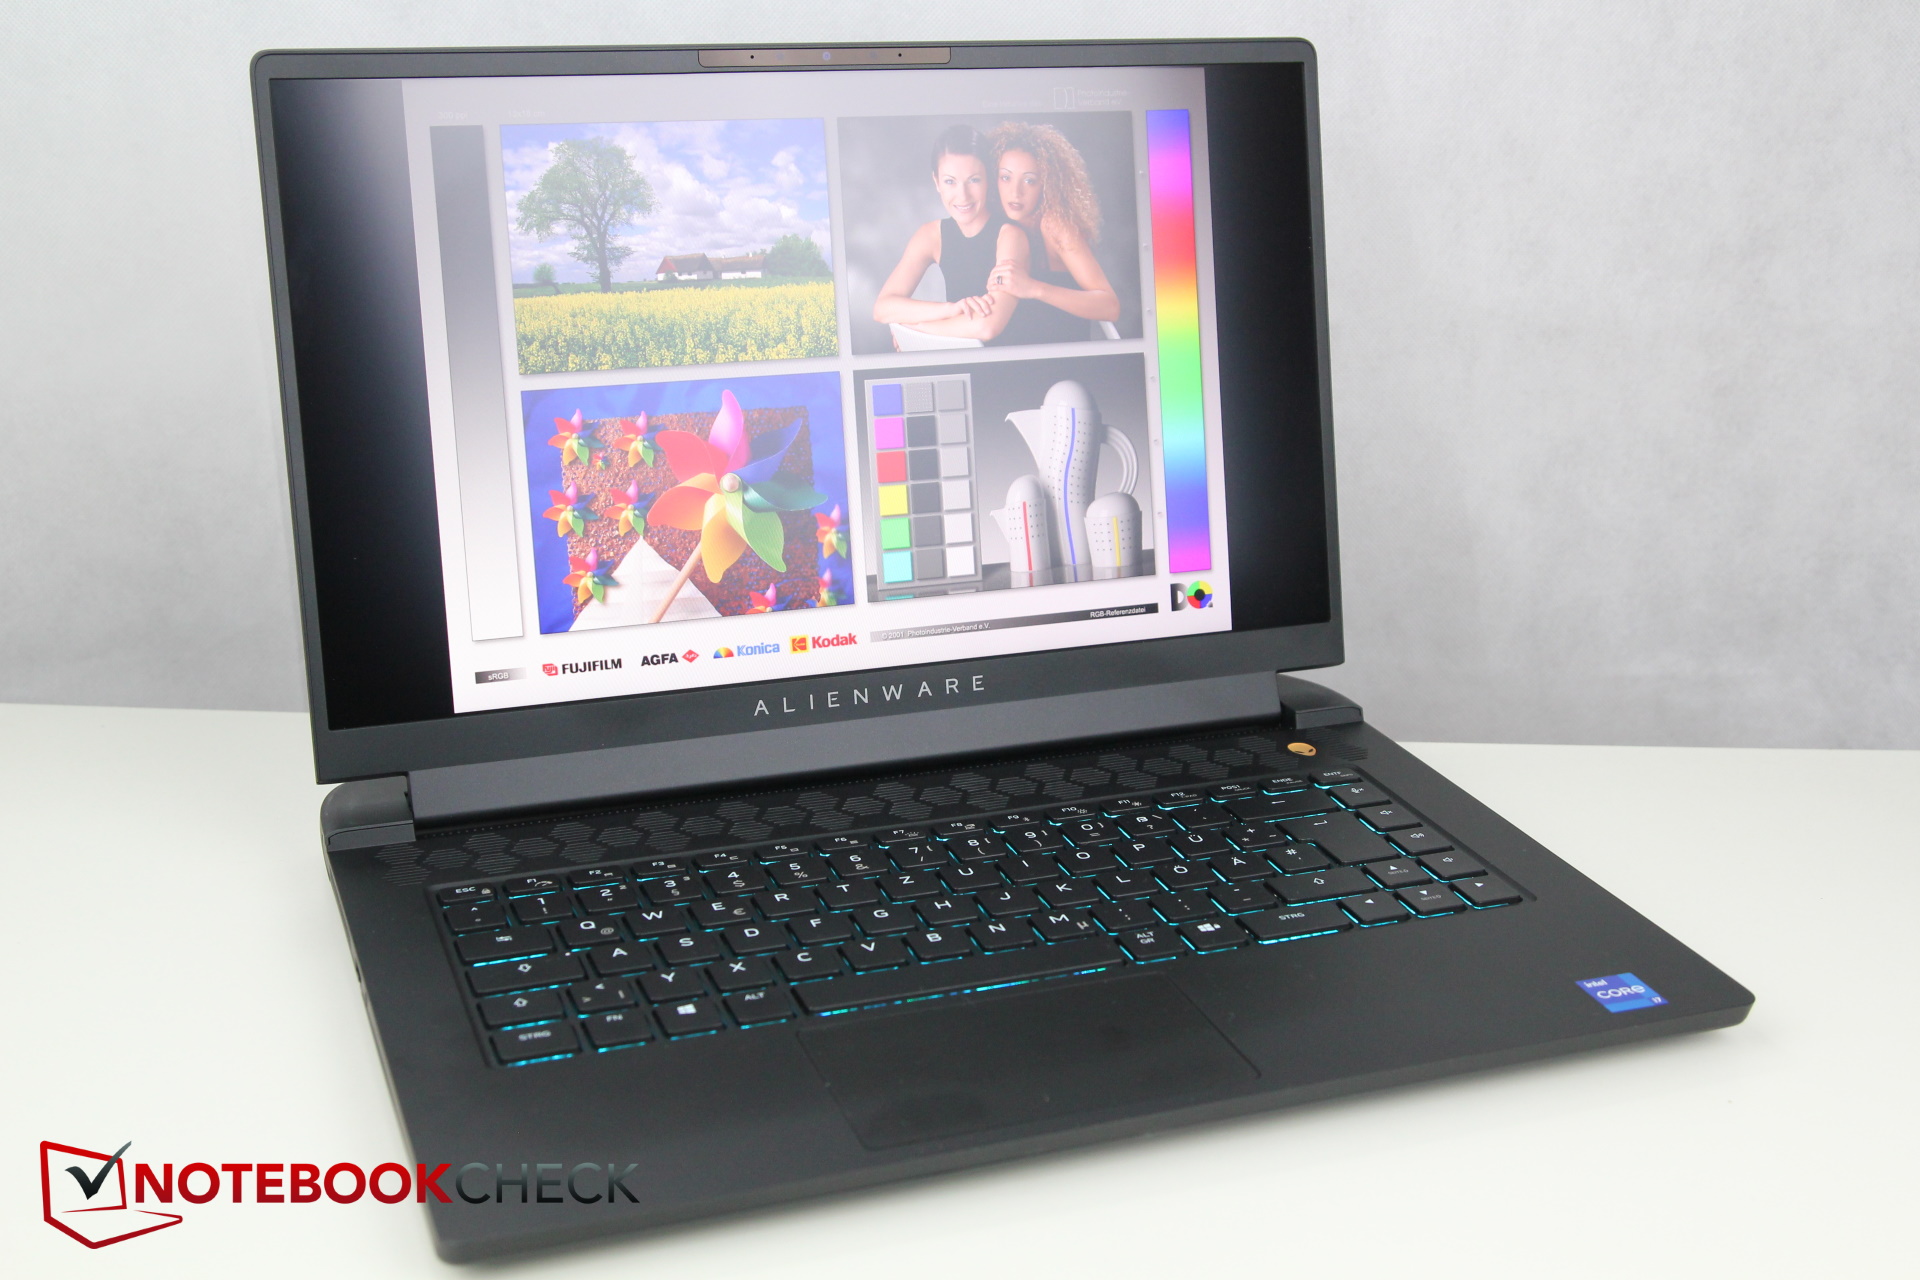
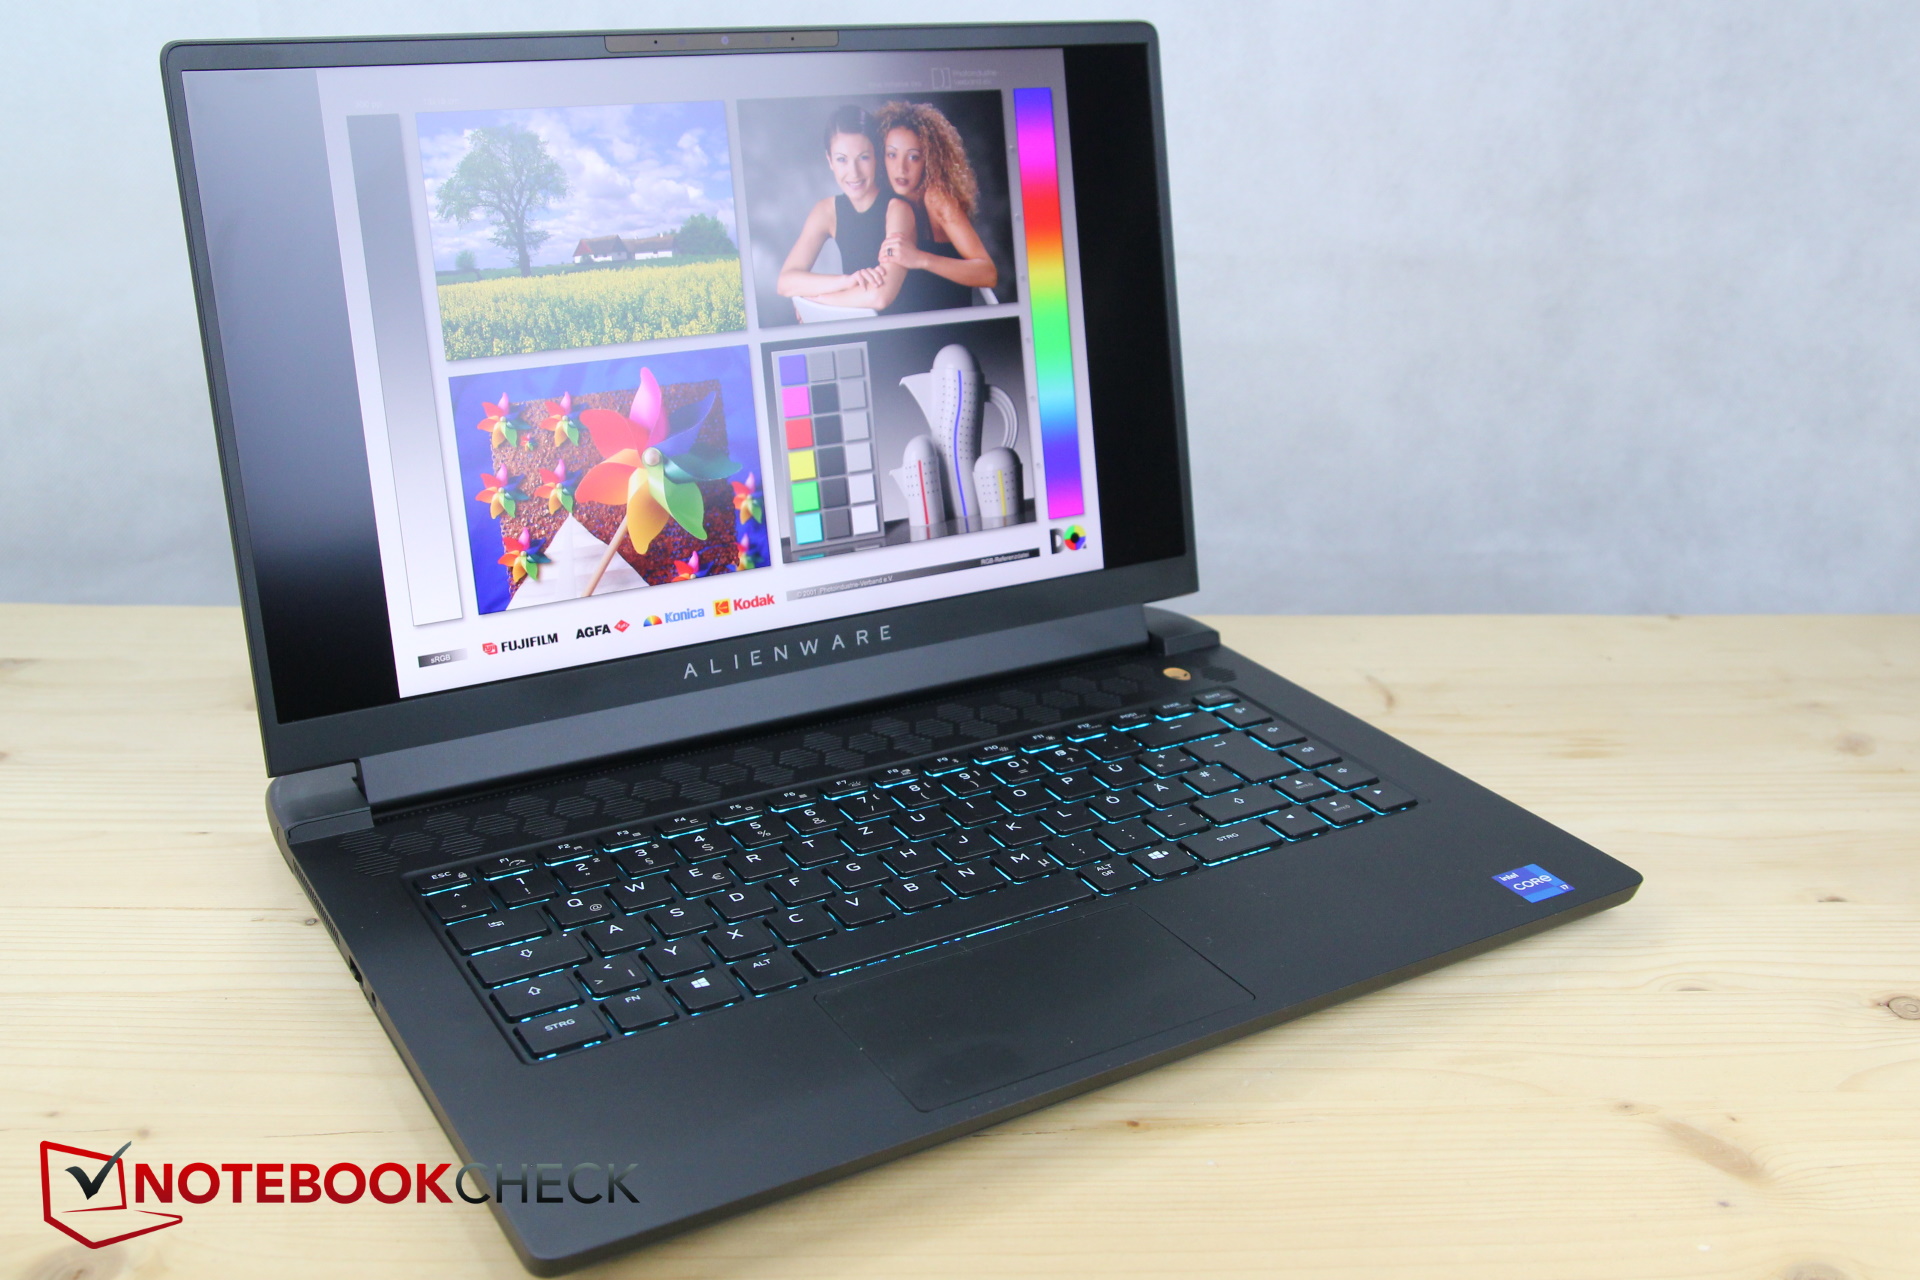
Visor - Velocidade aumentada para 360 Hz
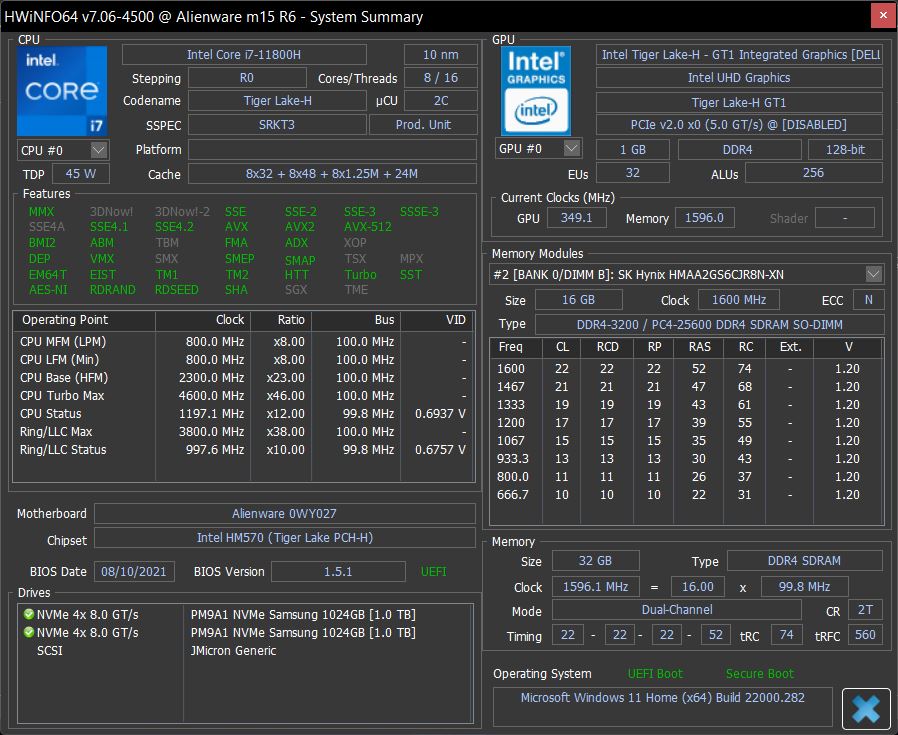
De acordo com a HWinfo, o display é o mesmo painel FHD fosco da AU Optronics como no m15 R5. Entretanto, o modelo atual oferece uma velocidade de atualização de 360 Hz, enquanto que no AMD m15 "apenas" master 165 Hz. Alternativamente, você também pode adquirir o R6 com o mesmo painel 165-Hz, e além disso, um painel QHD com 240 Hz também está disponível. Mas por que não existe a opção de 4K para um laptop para jogos com o RTX 3080?
Apesar de compartilhar a mesma etiqueta, os valores de ambos os painéis também são diferentes. Enquanto o brilho é ligeiramente melhor, sua distribuição é pior. O valor negro e o contraste também são um pouco piores do que no modelo irmão
Os tempos de resposta muito curtos e, portanto, excepcionais dos dois painéis, são positivos
| |||||||||||||||||||||||||
iluminação: 85 %
iluminação com acumulador: 360 cd/m²
Contraste: 1026:1 (Preto: 0.35 cd/m²)
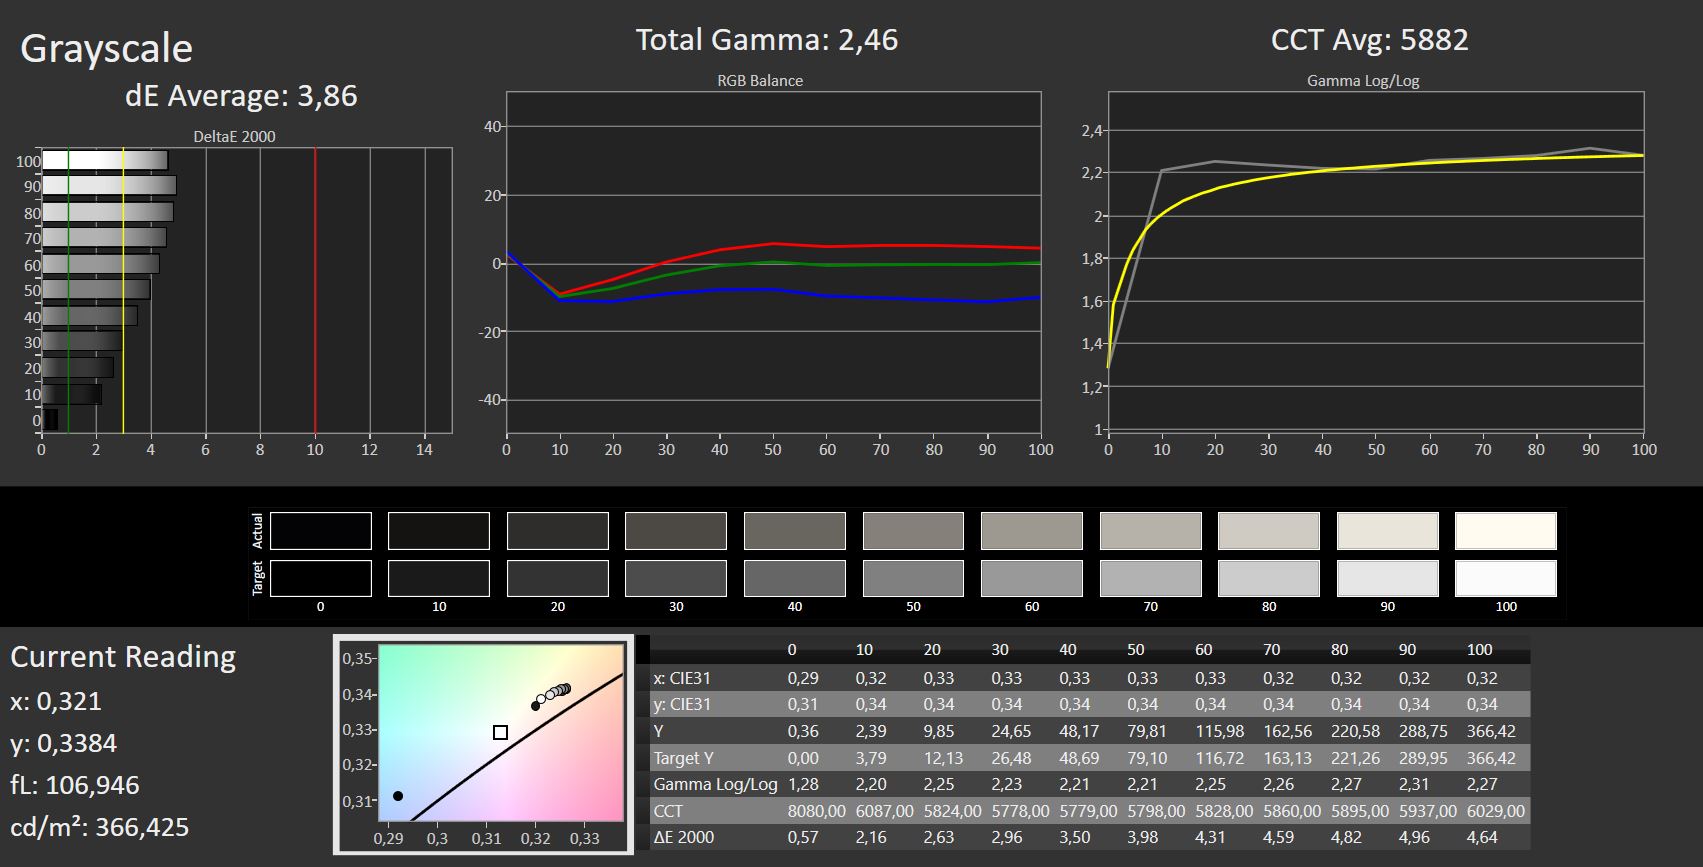
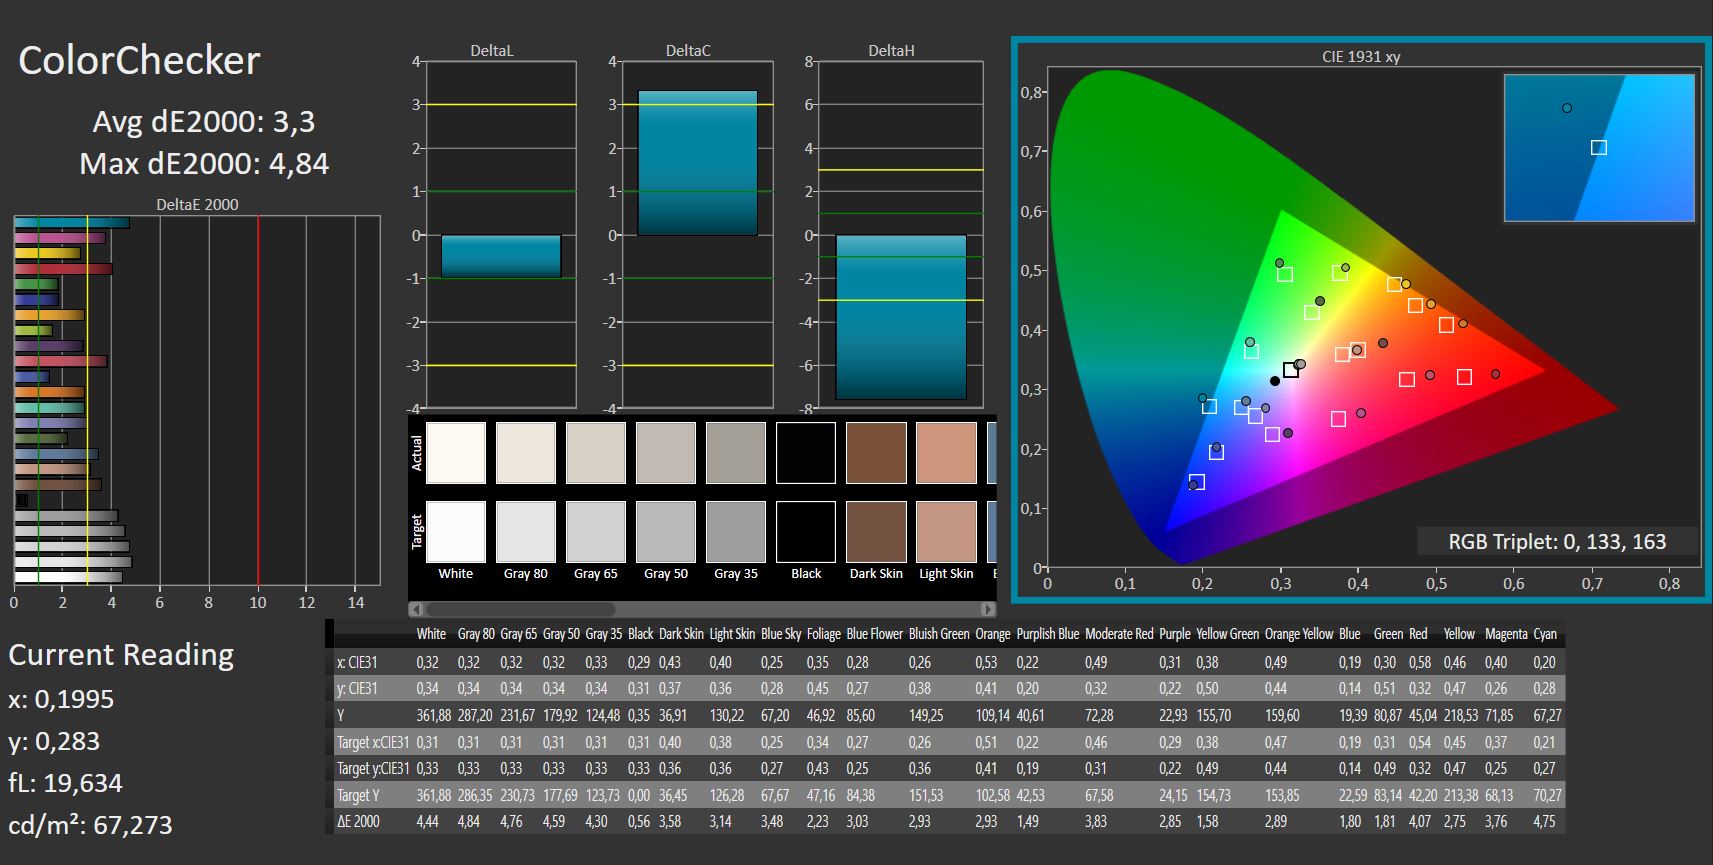
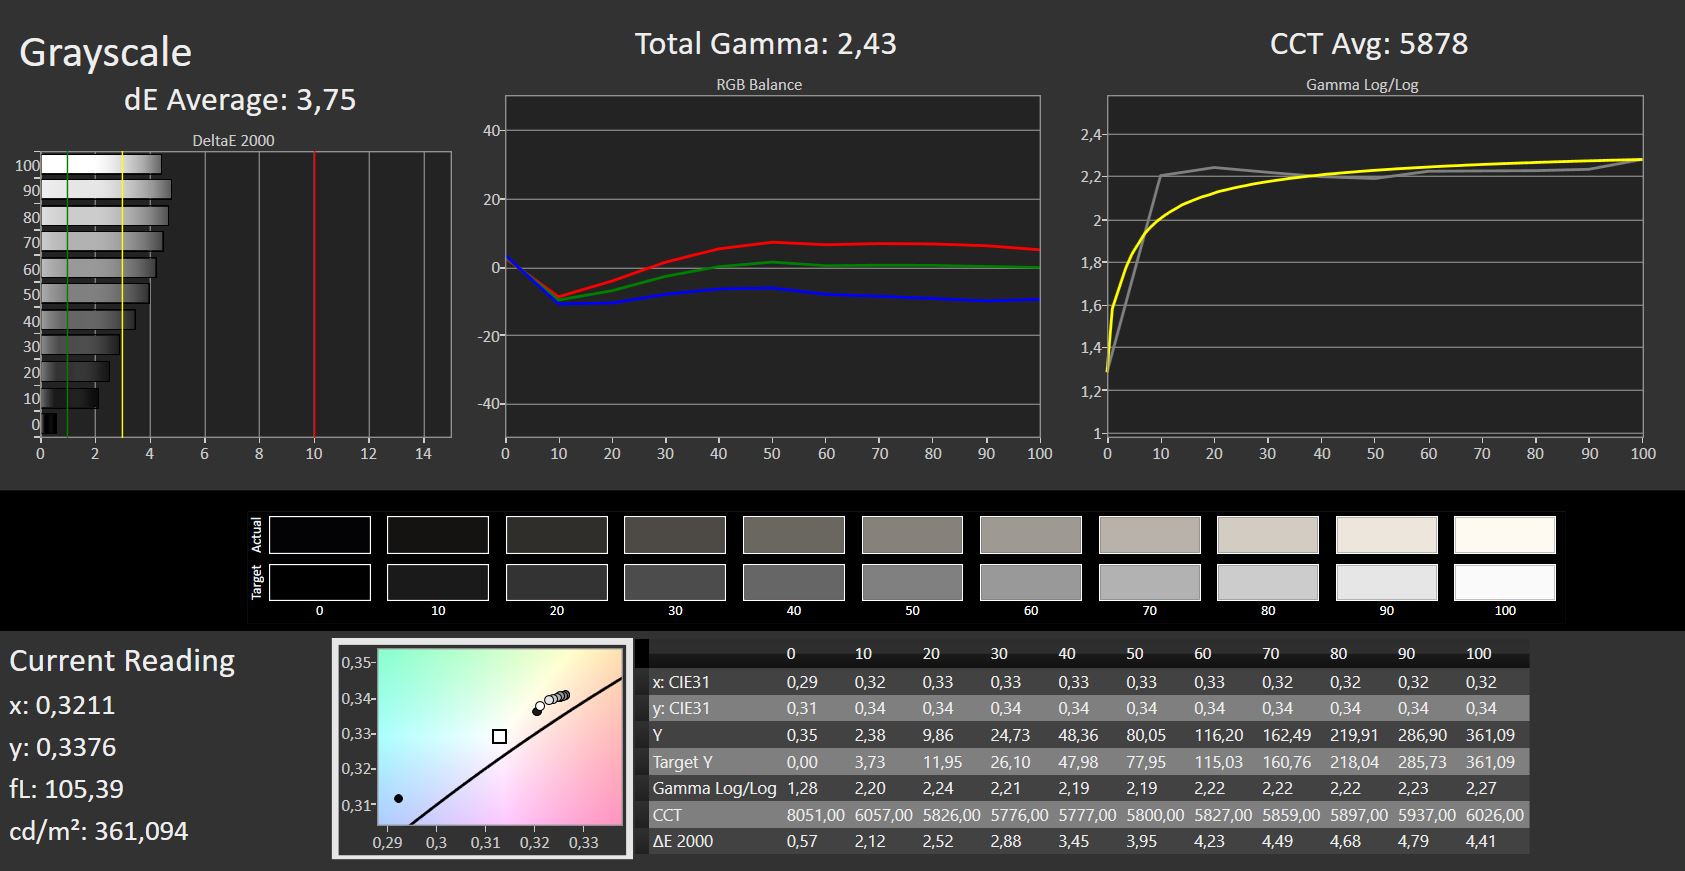
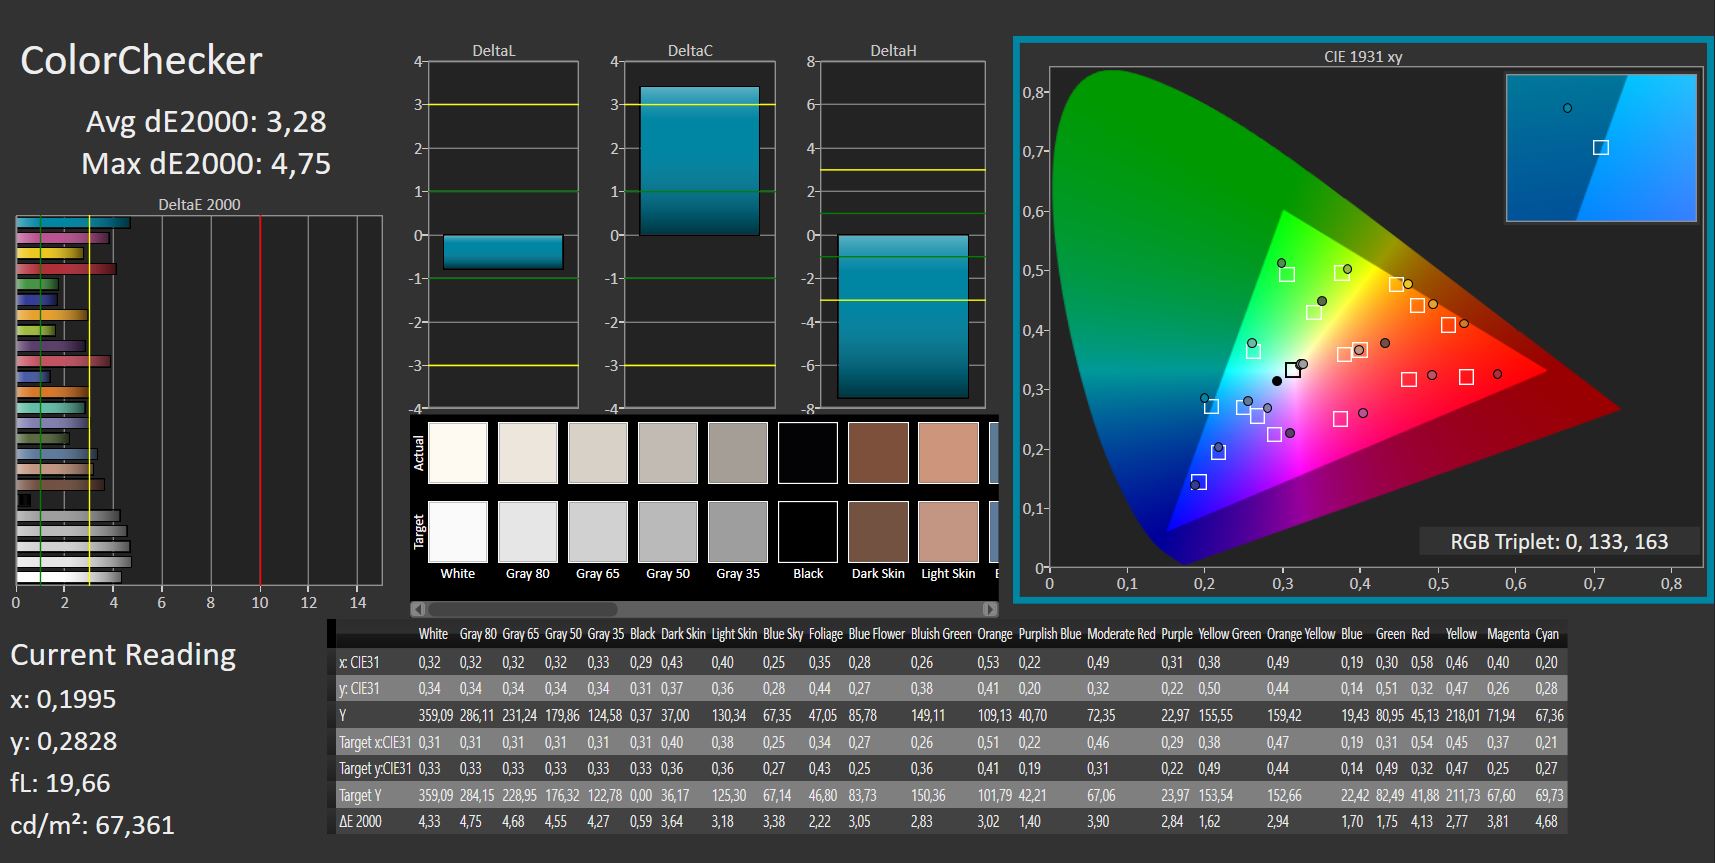
ΔE ColorChecker Calman: 3.3 | ∀{0.5-29.43 Ø4.71}
calibrated: 3.28
ΔE Greyscale Calman: 3.66 | ∀{0.09-98 Ø4.96}
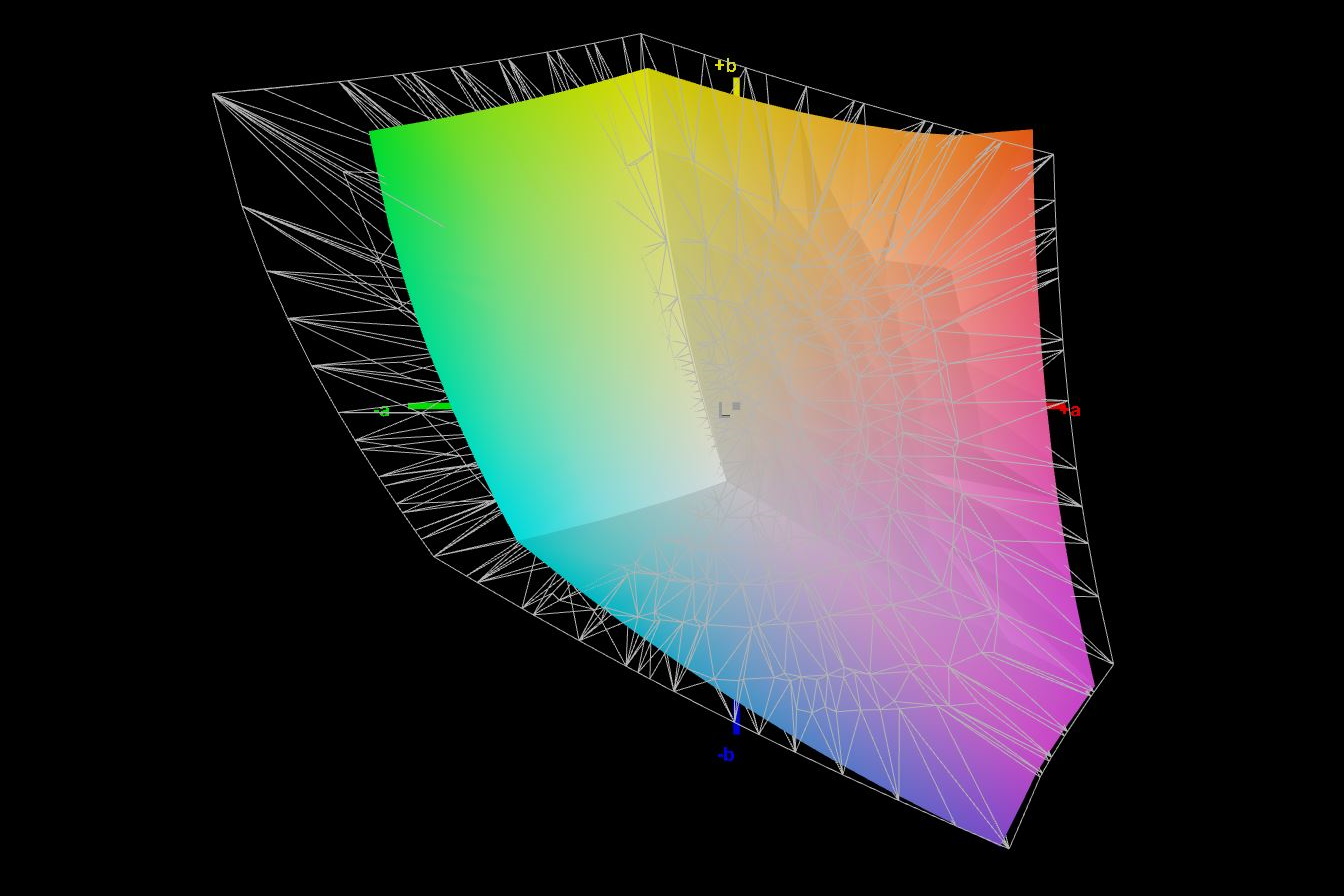
75.7% AdobeRGB 1998 (Argyll 3D)
99.5% sRGB (Argyll 3D)
74.1% Display P3 (Argyll 3D)
Gamma: 2.43
CCT: 5896 K
| Alienware m15 R6, i7-11800H RTX 3080 AU Optronics AUO9092 (B156HAN), IPS, 1920x1080, 15.6" | Alienware m15 R5 Ryzen Edition B156HAN, IPS, 1920x1080, 15.6" | Alienware m15 R4 RTX 3080 LG Philips LGD066E (156WFG), IPS, 1920x1080, 15.6" | Aorus 15P YD BOE09B9, IPS, 1920x1080, 15.6" | Schenker XMG Neo 15 Tiger Lake BOE CQ NE156QHM-NY2, IPS, 2560x1440, 15.6" | Razer Blade 15 Advanced (Mid 2021) TL156VDXP02-0, IPS, 1920x1080, 15.6" | |
|---|---|---|---|---|---|---|
| Display | -4% | -3% | -5% | -7% | ||
| Display P3 Coverage (%) | 74.1 | 70.1 -5% | 70.2 -5% | 68.6 -7% | 66.9 -10% | |
| sRGB Coverage (%) | 99.5 | 99.8 0% | 98.5 -1% | 98.6 -1% | 97.1 -2% | |
| AdobeRGB 1998 Coverage (%) | 75.7 | 71.5 -6% | 72.4 -4% | 69.3 -8% | 69 -9% | |
| Response Times | -47% | -121% | -236% | -293% | -65% | |
| Response Time Grey 50% / Grey 80% * (ms) | 2.8 | 4 ? -43% | 7.6 ? -171% | 14 ? -400% | 16 ? -471% | 4.2 ? -50% |
| Response Time Black / White * (ms) | 5.6 | 8.4 ? -50% | 9.6 ? -71% | 9.6 ? -71% | 12 ? -114% | 10 ? -79% |
| PWM Frequency (Hz) | ||||||
| Screen | 15% | 24% | -9% | -8% | 13% | |
| Brightness middle (cd/m²) | 359 | 329 -8% | 347 -3% | 337 -6% | 324 -10% | 353.4 -2% |
| Brightness (cd/m²) | 344 | 321 -7% | 318 -8% | 316 -8% | 307 -11% | 340 -1% |
| Brightness Distribution (%) | 85 | 92 8% | 86 1% | 85 0% | 91 7% | 92 8% |
| Black Level * (cd/m²) | 0.35 | 0.27 23% | 0.31 11% | 0.31 11% | 0.27 23% | 0.31 11% |
| Contrast (:1) | 1026 | 1219 19% | 1119 9% | 1087 6% | 1200 17% | 1140 11% |
| Colorchecker dE 2000 * | 3.3 | 2.78 16% | 1.68 49% | 3.87 -17% | 3.36 -2% | 2.17 34% |
| Colorchecker dE 2000 max. * | 4.84 | 4.88 -1% | 3.03 37% | 8.09 -67% | 9.87 -104% | 5.69 -18% |
| Colorchecker dE 2000 calibrated * | 3.28 | 1.63 50% | 1.08 67% | 1.15 65% | 1.23 62% | 1.05 68% |
| Greyscale dE 2000 * | 3.66 | 2.5 32% | 1.8 51% | 6.1 -67% | 5.8 -58% | 3.4 7% |
| Gamma | 2.43 91% | 2.106 104% | 2.262 97% | 2.132 103% | 2.311 95% | 2.2 100% |
| CCT | 5896 110% | 6201 105% | 6592 99% | 6891 94% | 7087 92% | 6830 95% |
| Color Space (Percent of AdobeRGB 1998) (%) | 76 | 71 | 72 | 69 | ||
| Color Space (Percent of sRGB) (%) | 99 | 94 | 94 | 93 | ||
| Média Total (Programa/Configurações) | -16% /
4% | -34% /
-3% | -83% /
-40% | -102% /
-48% | -20% /
-2% |
* ... menor é melhor
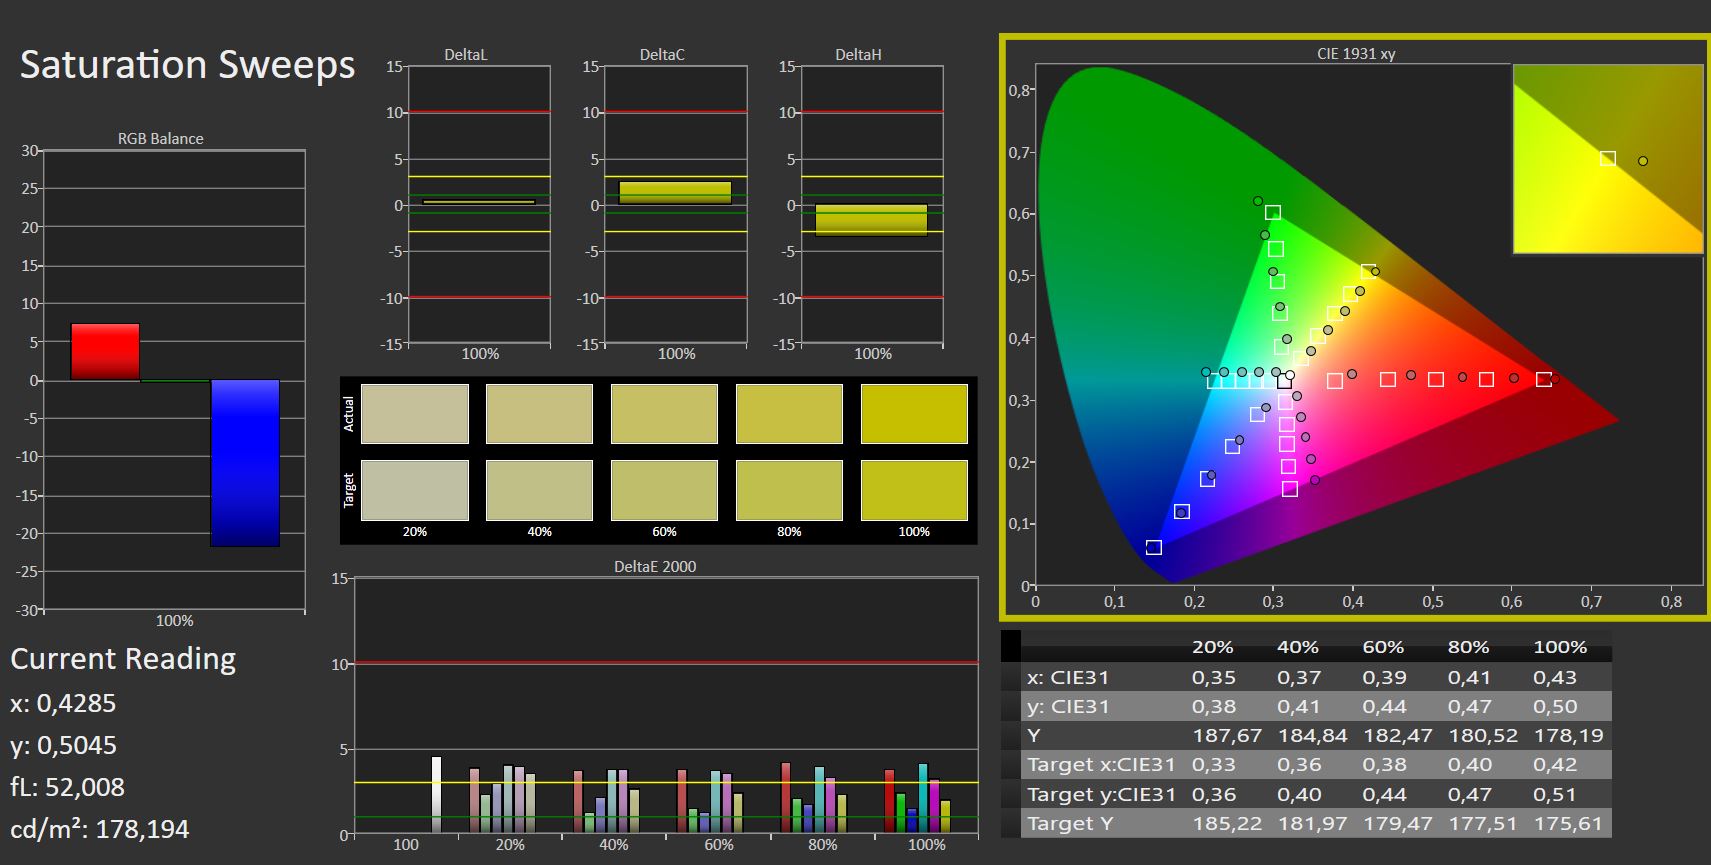
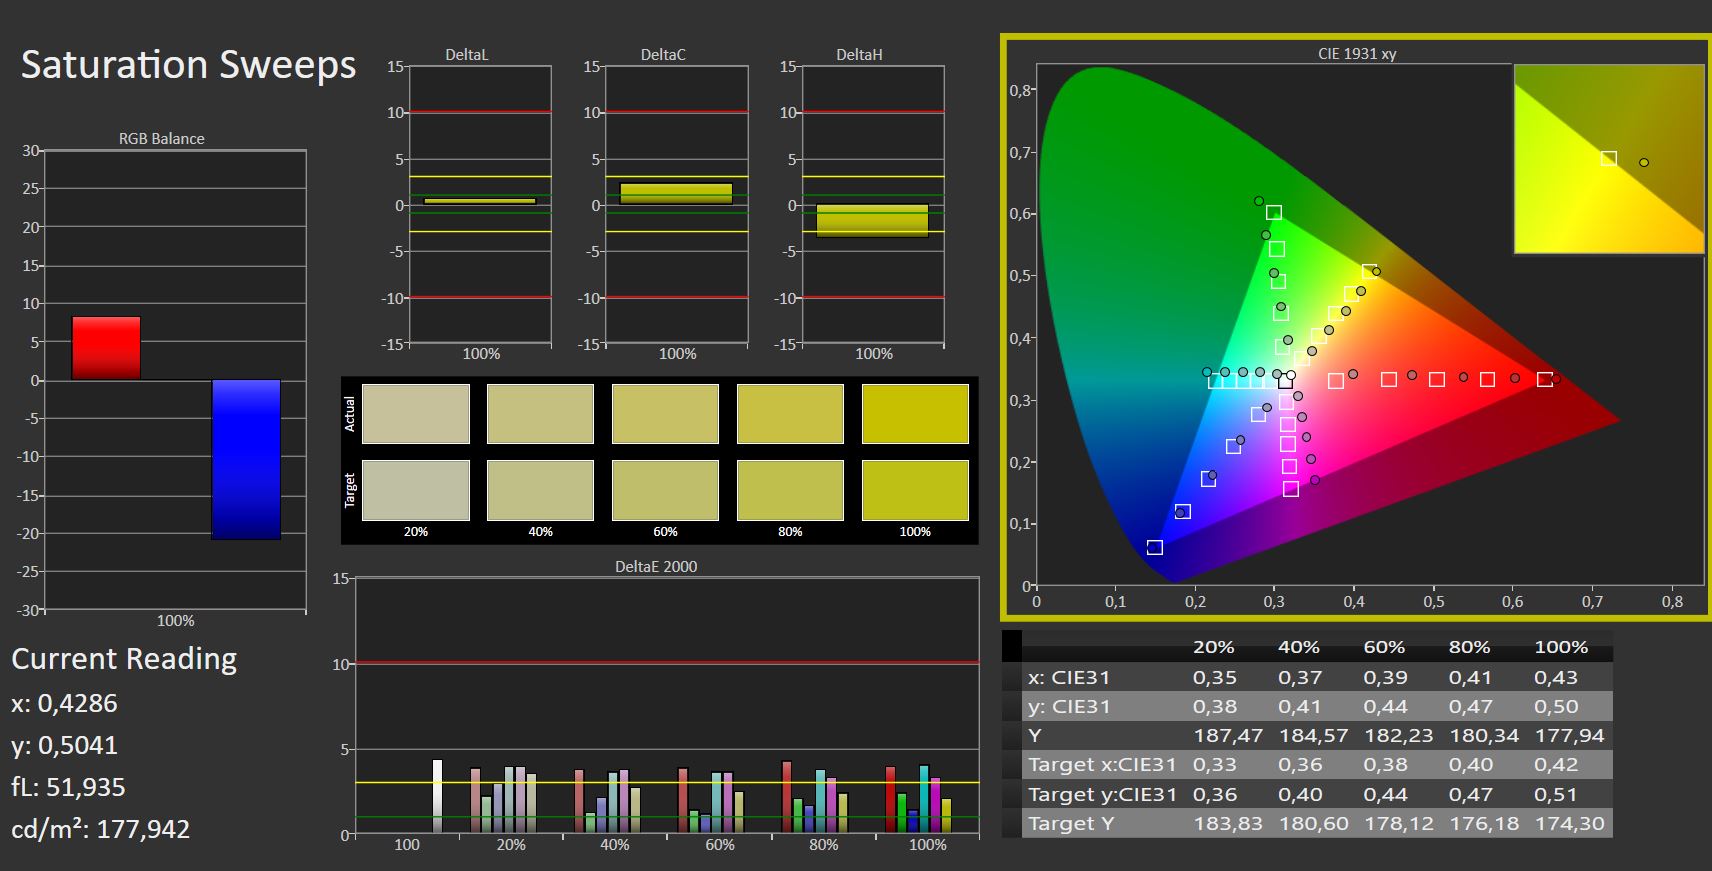
Com quase 100% sRGB e cerca de 76% AdobeRGB, a cobertura do espaço de cor é muito boa, enquanto muitos concorrentes não atingem bem esses valores
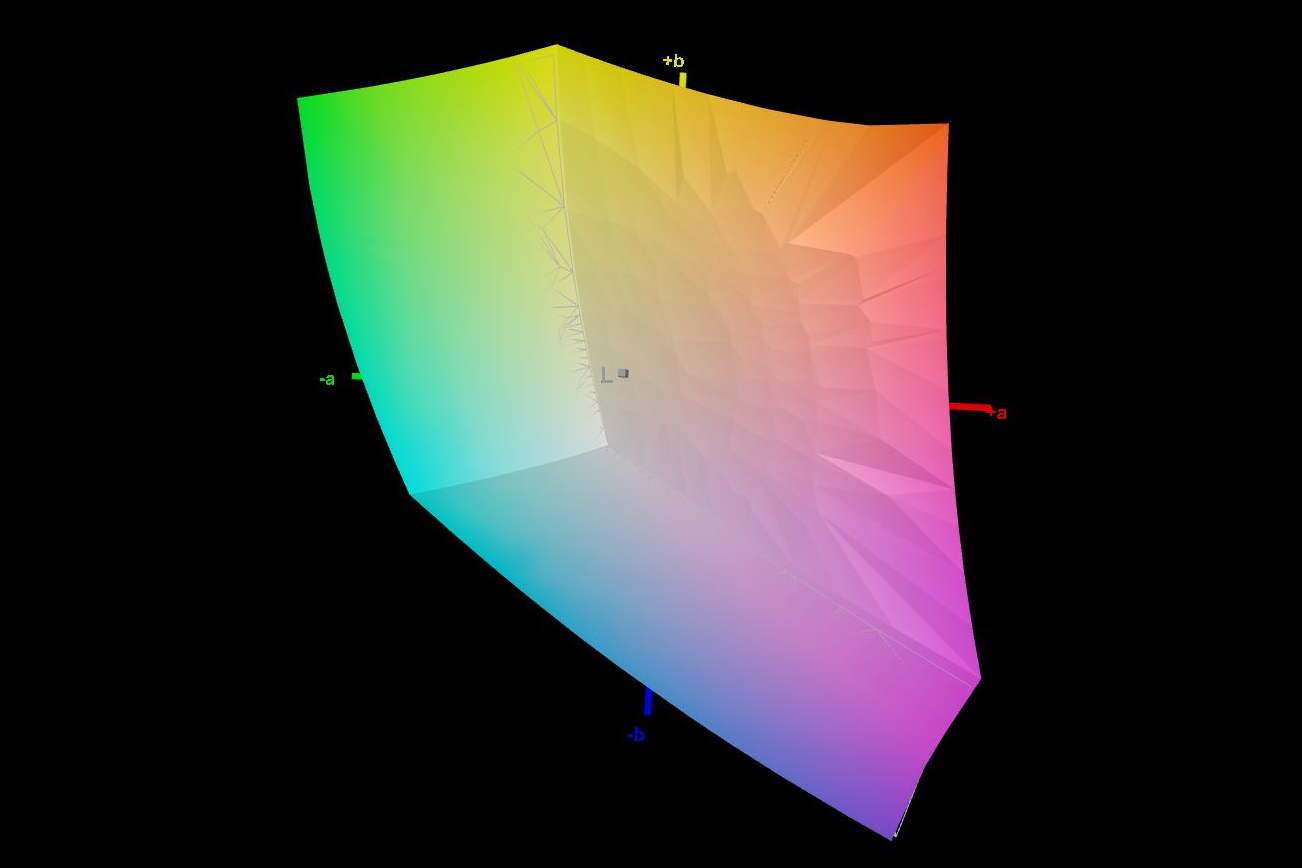
O visor já está bastante bem calibrado no estado de entrega, e uma calibração manual não traz quase nenhuma melhoria significativa em termos de desvios de cor.
Exibir tempos de resposta
| ↔ Tempo de resposta preto para branco | ||
|---|---|---|
| 5.6 ms ... ascensão ↗ e queda ↘ combinadas | ↗ ms ascensão | 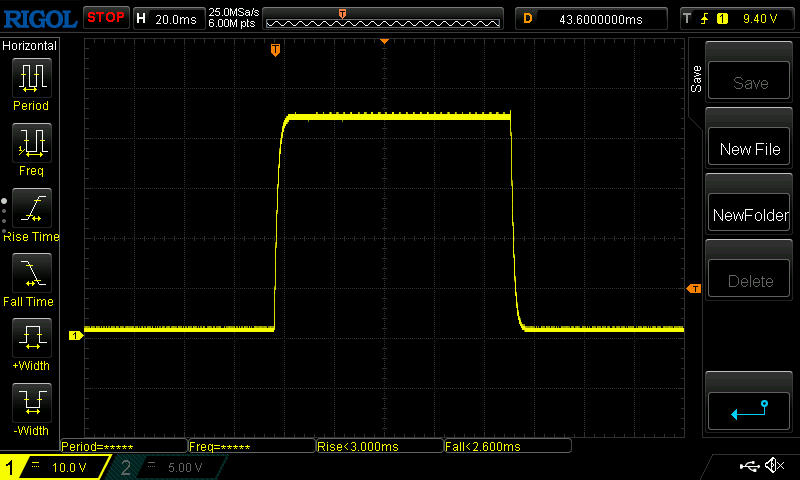 |
| ↘ ms queda | ||
| A tela mostra taxas de resposta muito rápidas em nossos testes e deve ser muito adequada para jogos em ritmo acelerado. Em comparação, todos os dispositivos testados variam de 0.1 (mínimo) a 240 (máximo) ms. » 18 % de todos os dispositivos são melhores. Isso significa que o tempo de resposta medido é melhor que a média de todos os dispositivos testados (19.8 ms). | ||
| ↔ Tempo de resposta 50% cinza a 80% cinza | ||
| 2.8 ms ... ascensão ↗ e queda ↘ combinadas | ↗ ms ascensão | 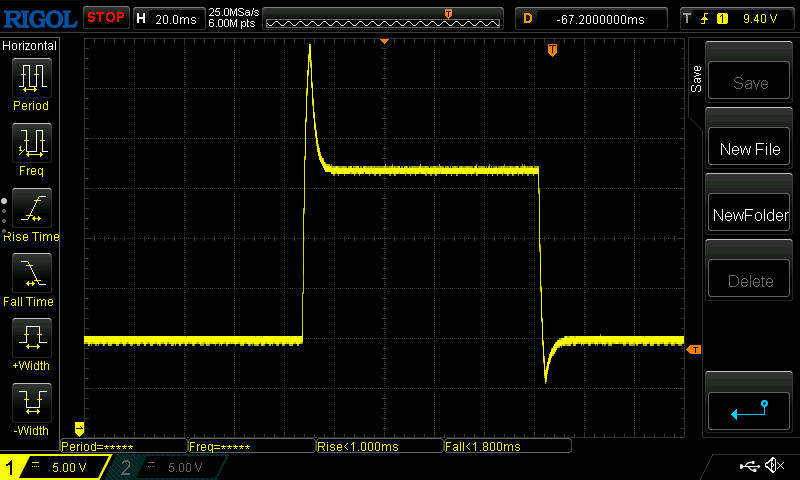 |
| ↘ ms queda | ||
| A tela mostra taxas de resposta muito rápidas em nossos testes e deve ser muito adequada para jogos em ritmo acelerado. Em comparação, todos os dispositivos testados variam de 0.165 (mínimo) a 636 (máximo) ms. » 12 % de todos os dispositivos são melhores. Isso significa que o tempo de resposta medido é melhor que a média de todos os dispositivos testados (31 ms). | ||
Cintilação da tela / PWM (modulação por largura de pulso)
| Tela tremeluzindo / PWM não detectado | 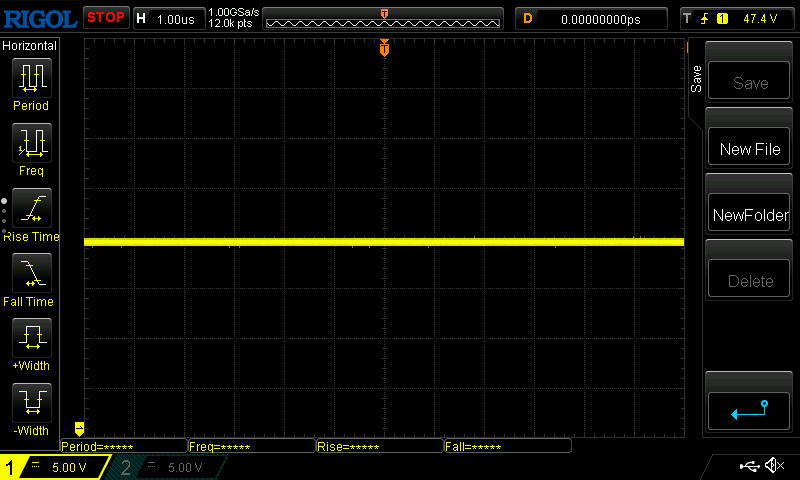 | ||
[pwm_comparison] Em comparação: 52 % de todos os dispositivos testados não usam PWM para escurecer a tela. Se PWM foi detectado, uma média de 7757 (mínimo: 5 - máximo: 343500) Hz foi medida. | |||
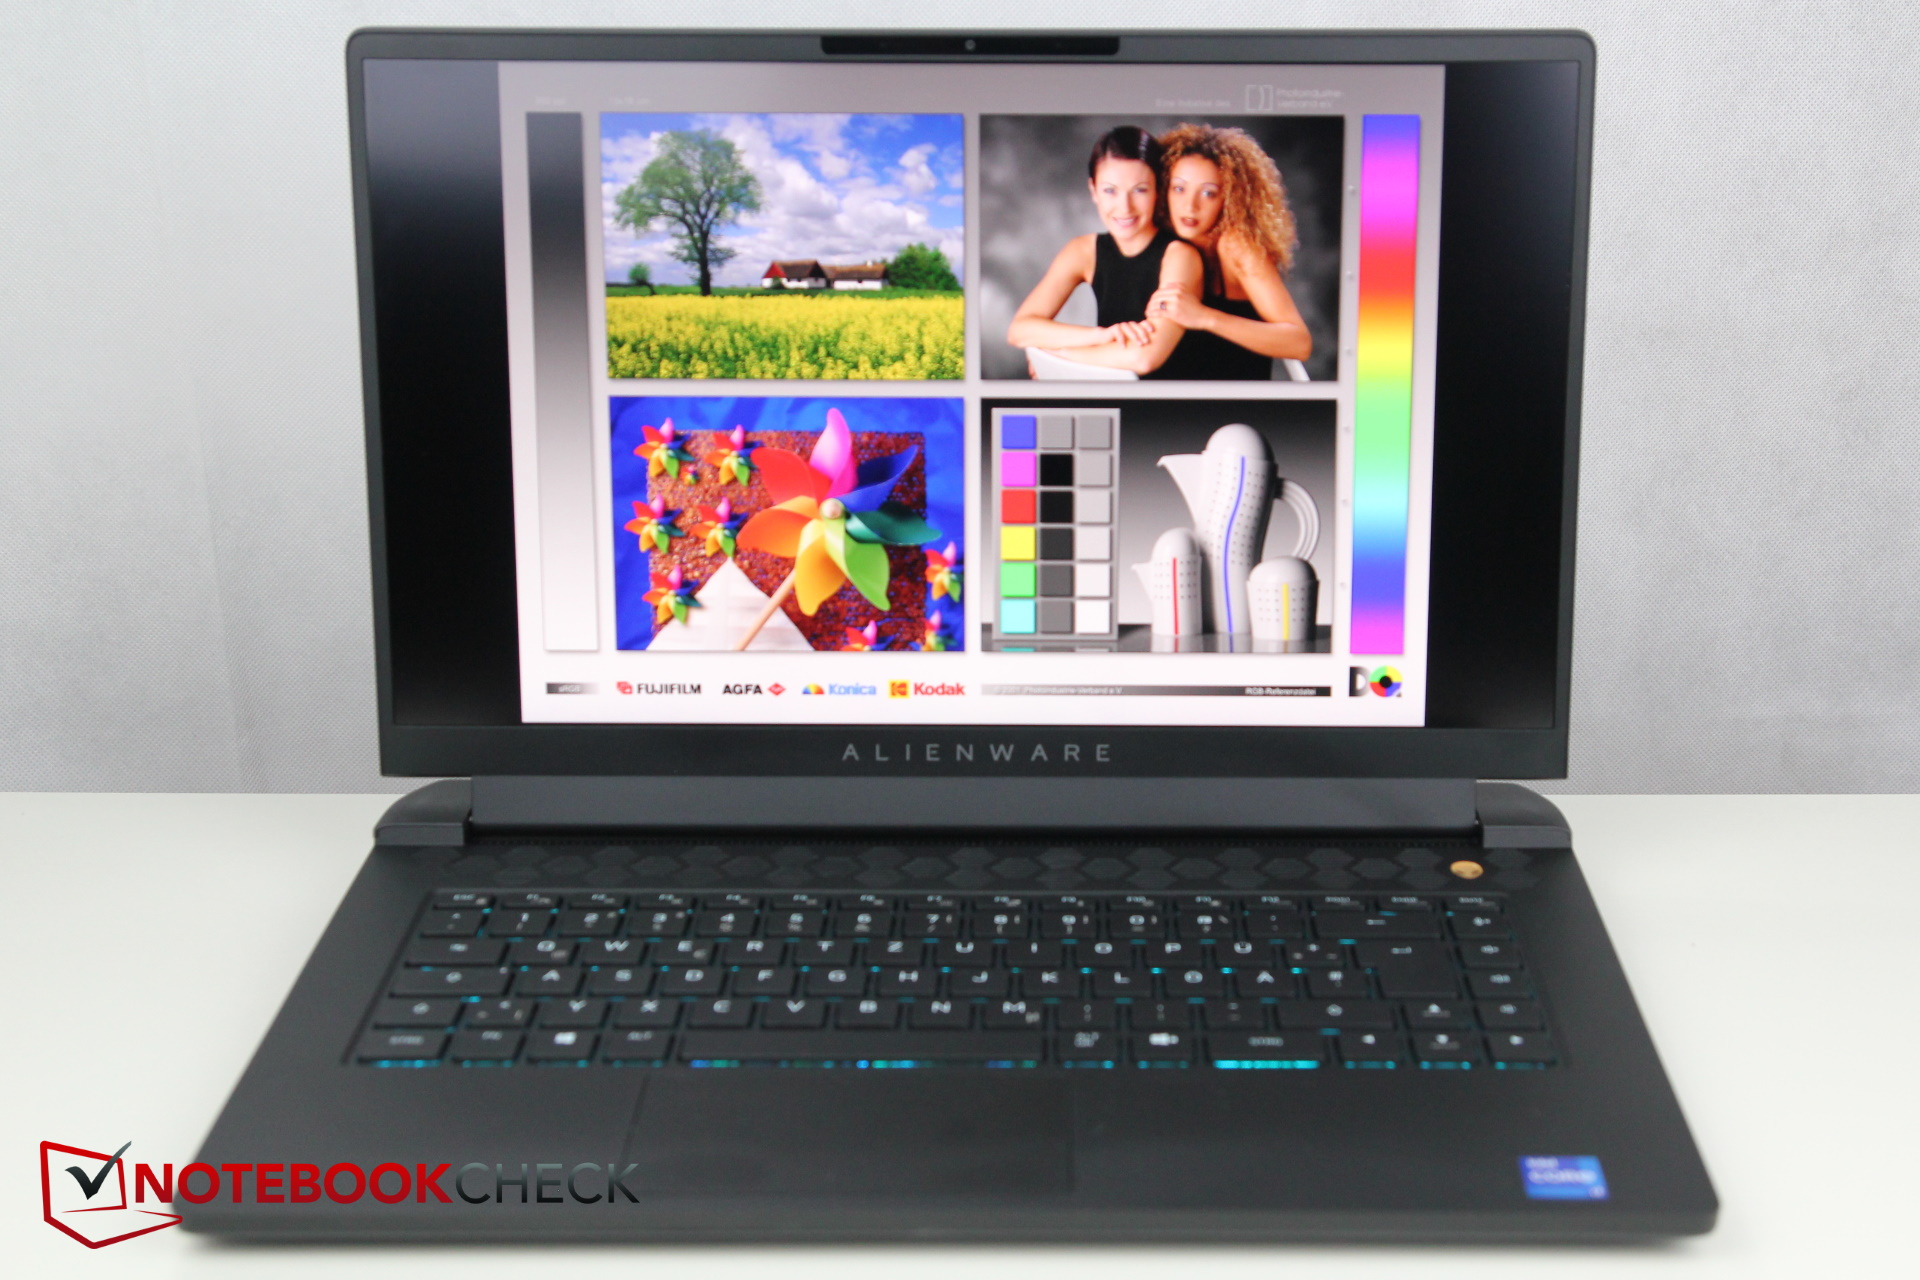
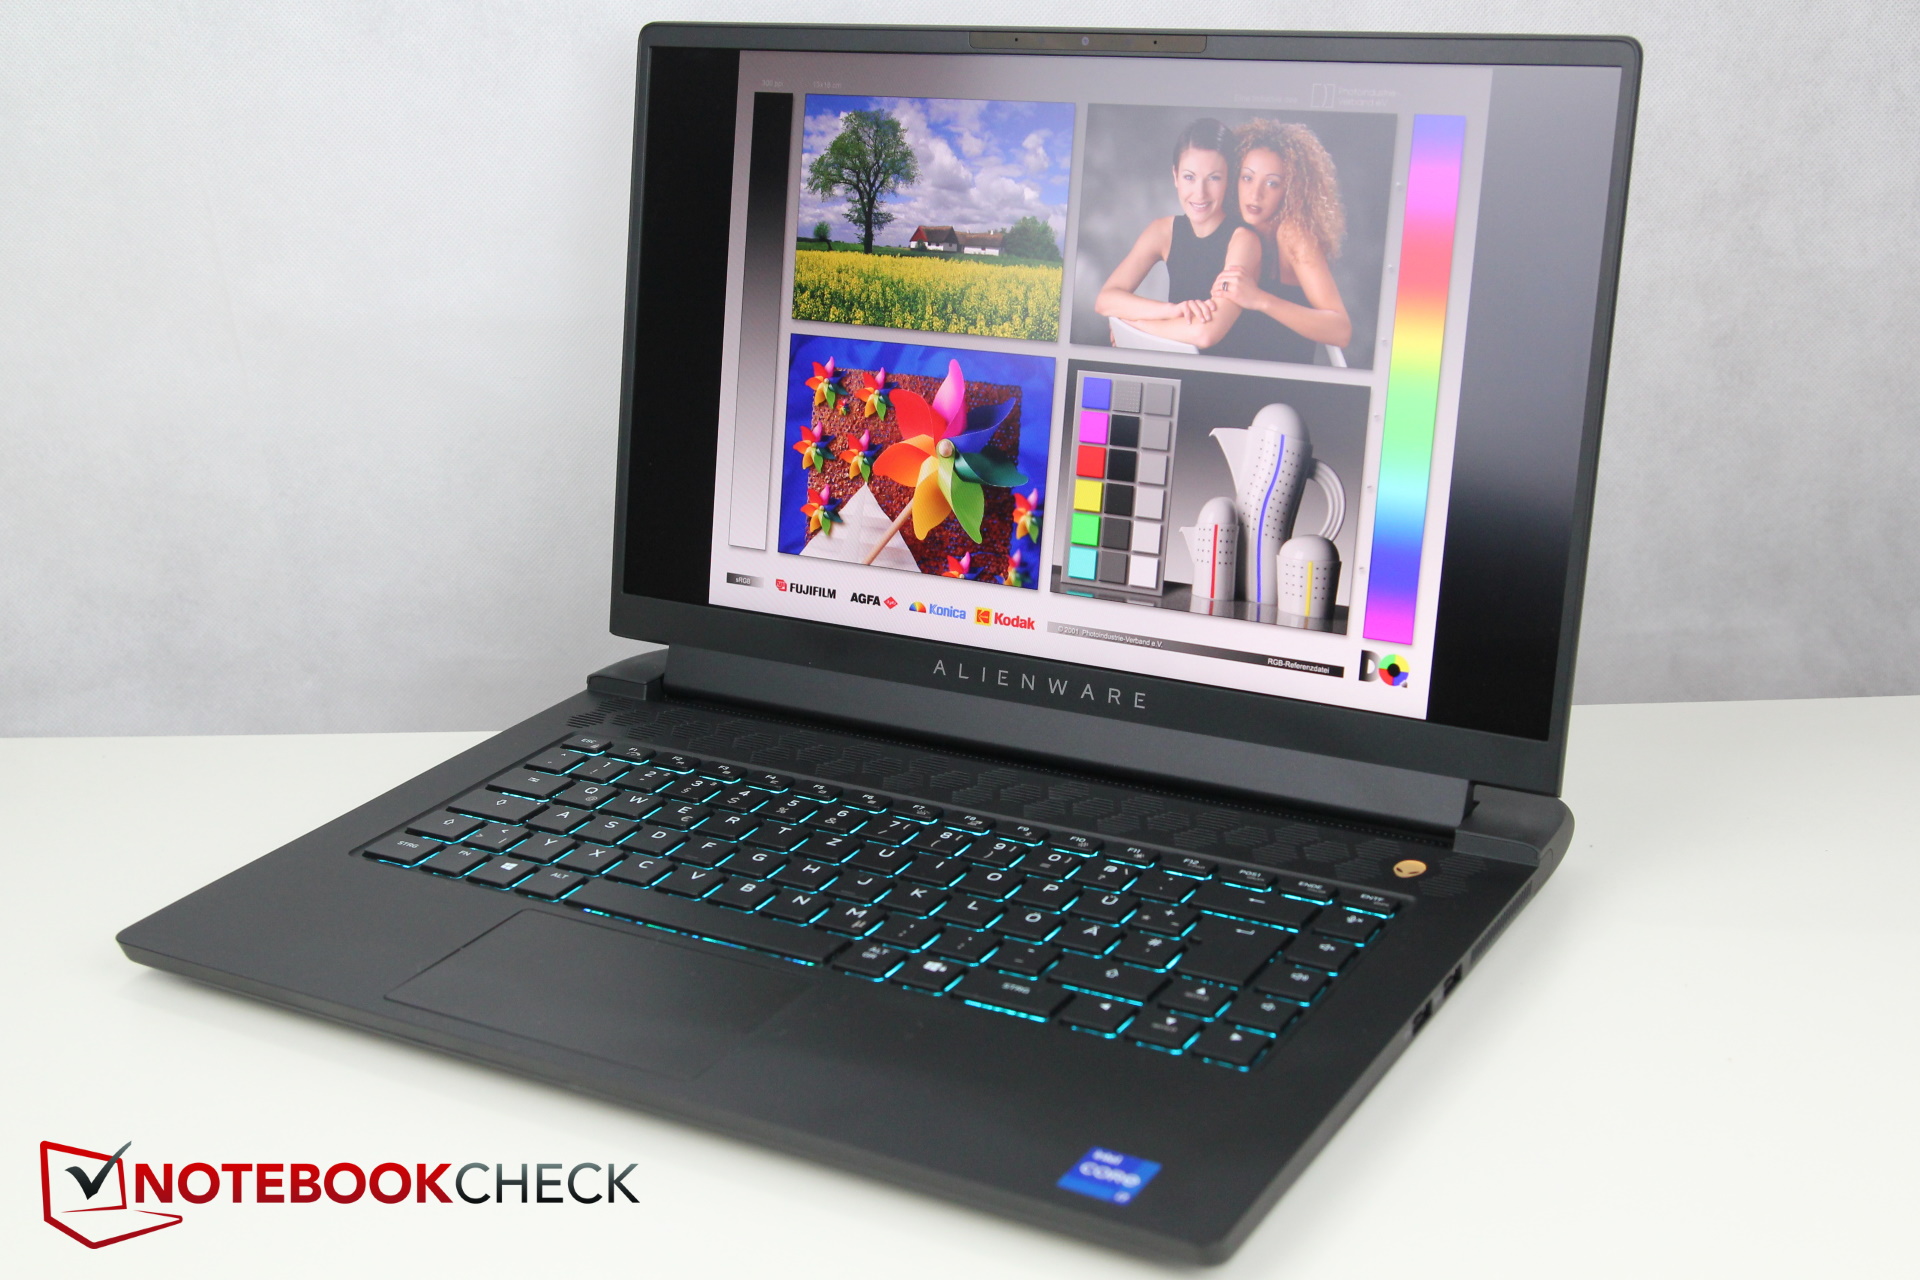
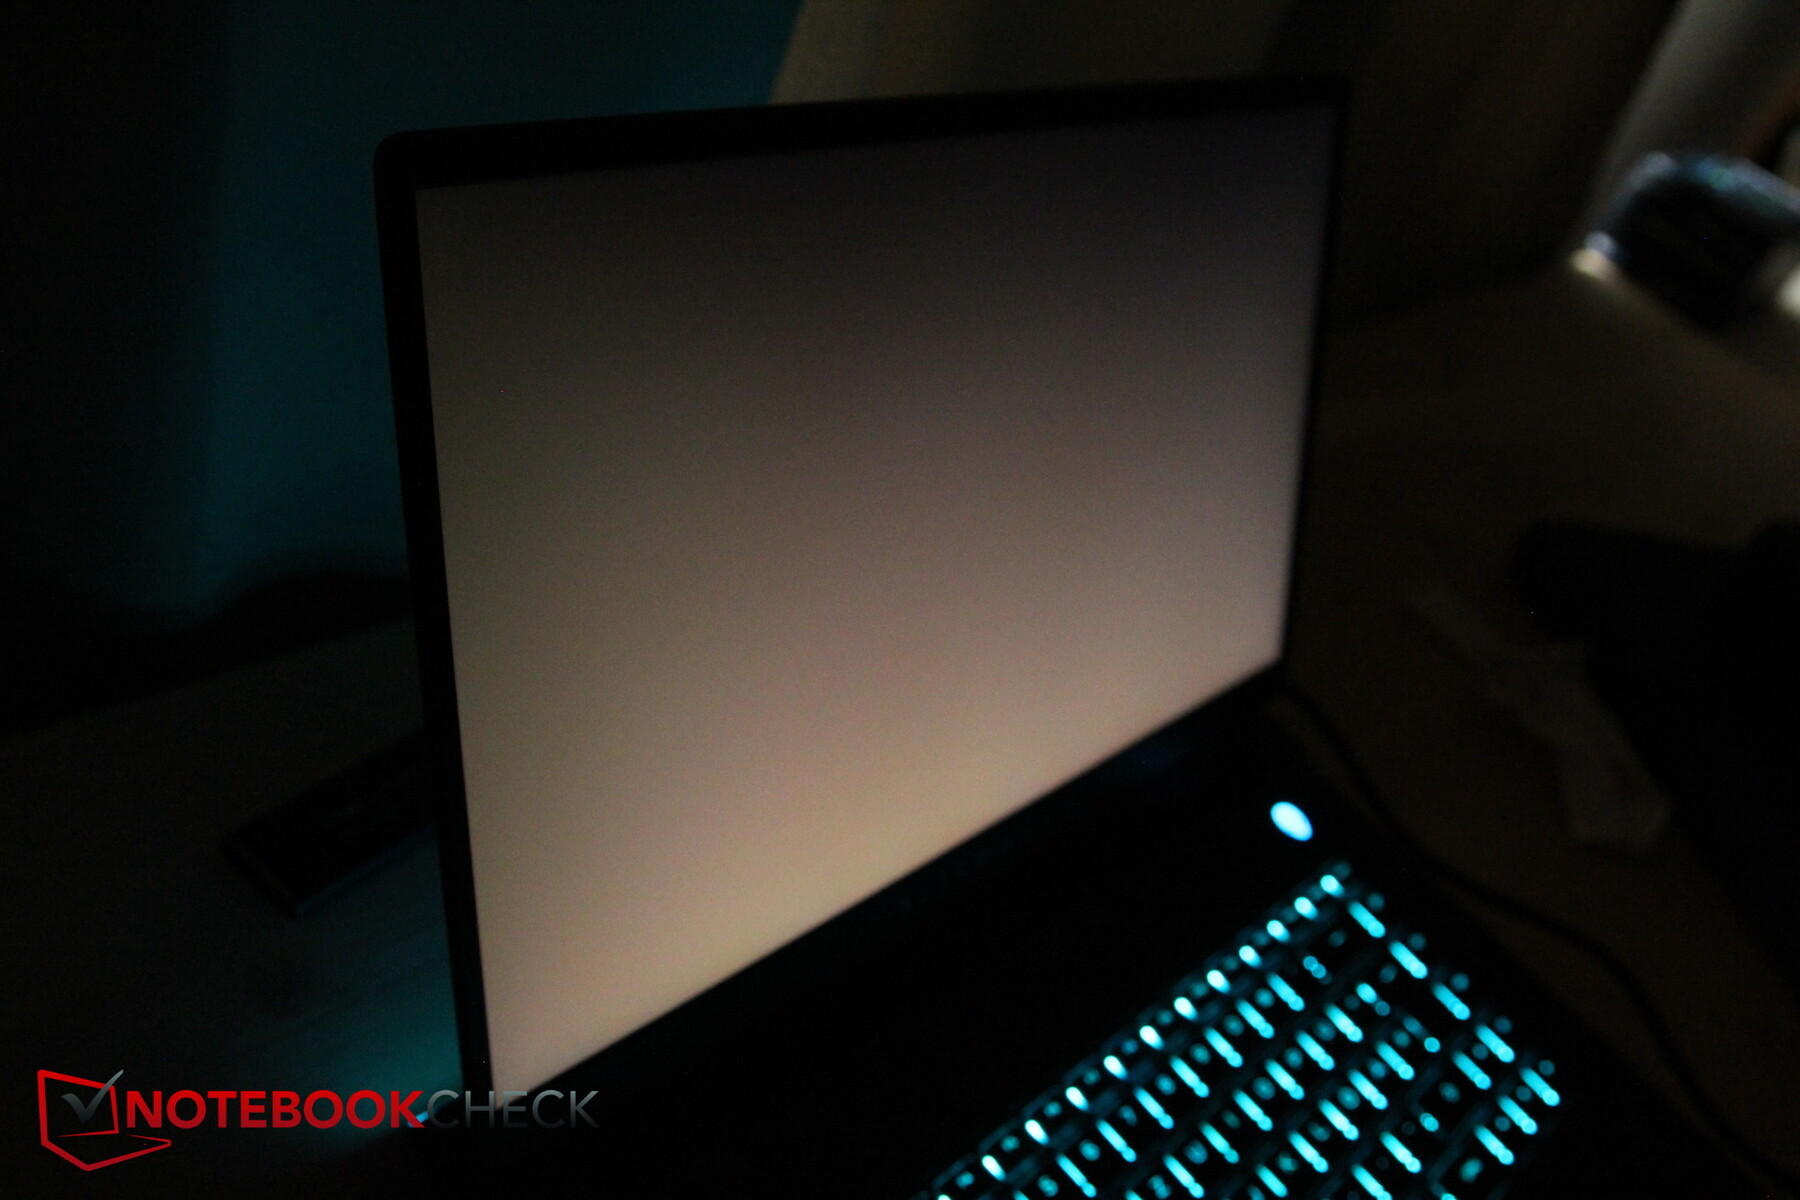
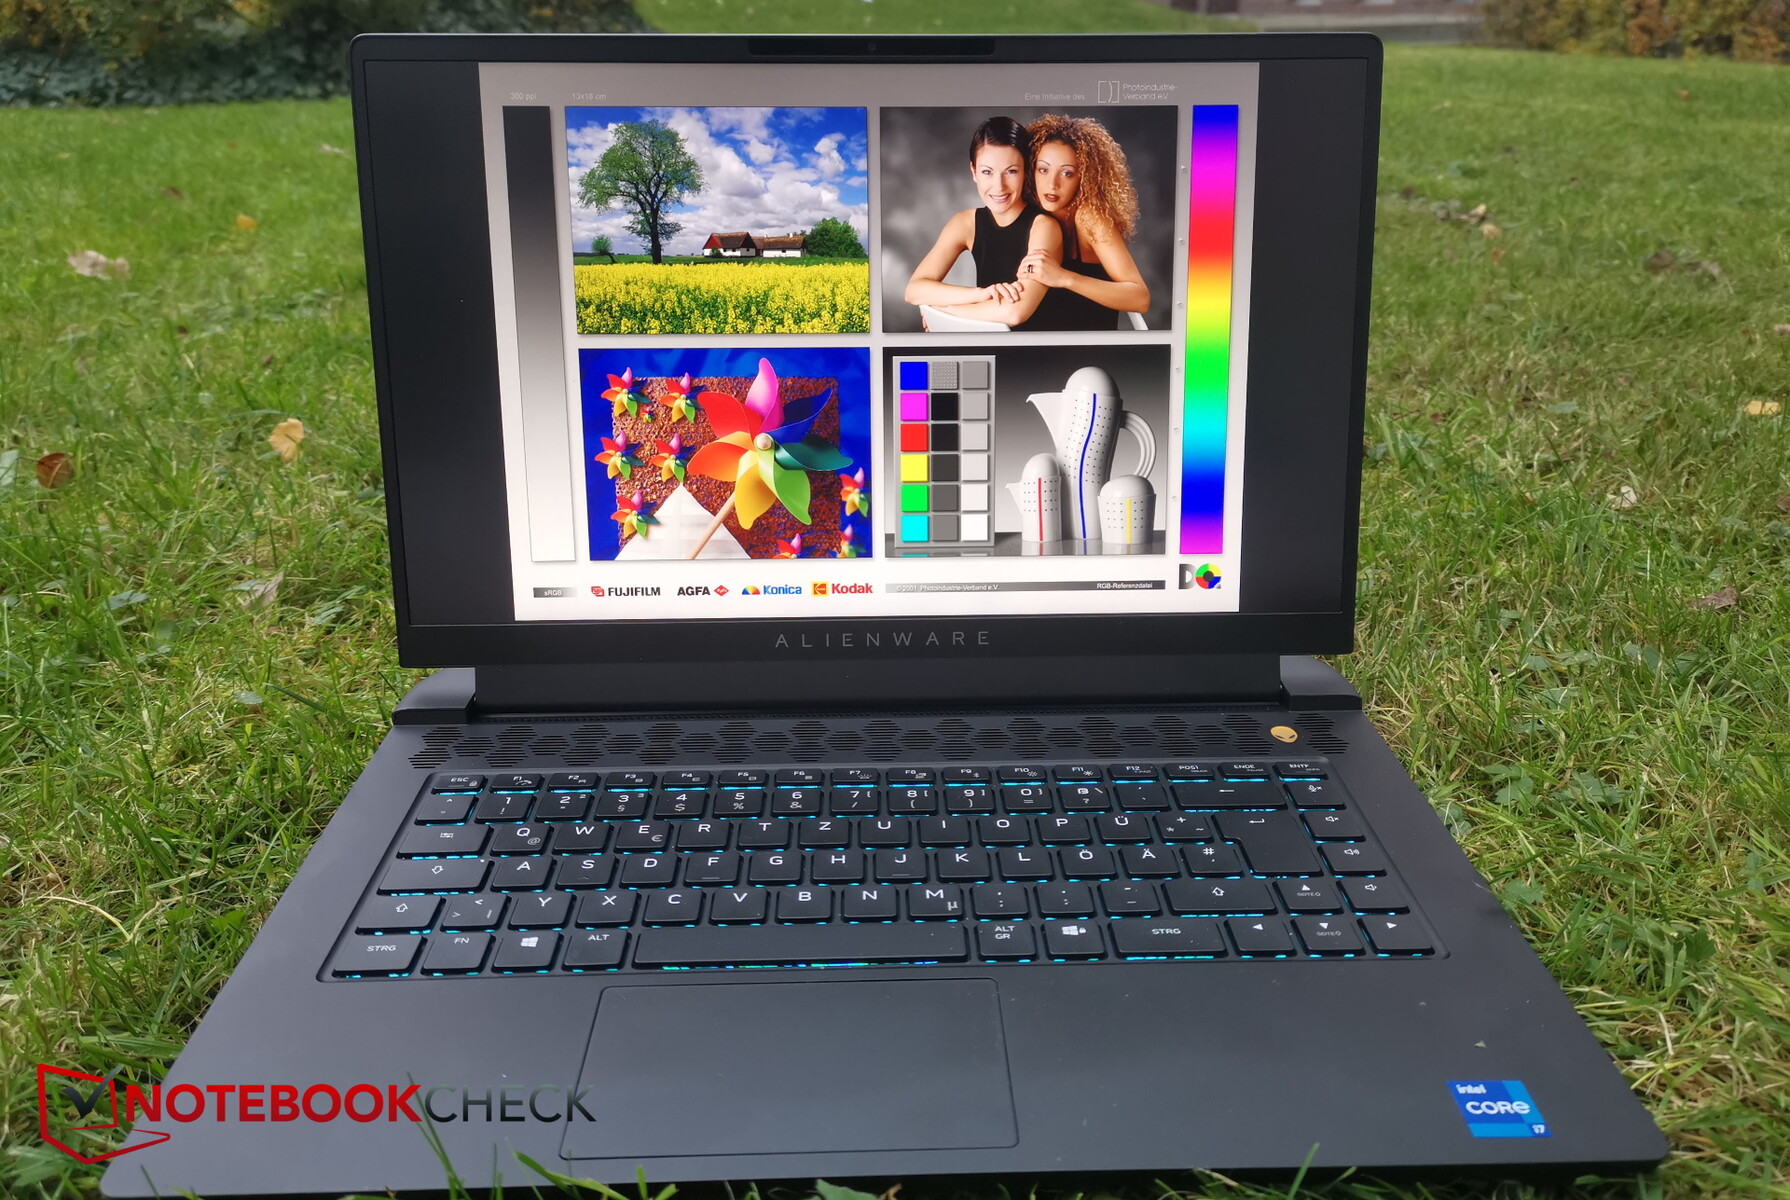
O fato de não haver muito sol durante este teste contribui para uma leitura mais fácil do conteúdo da tela do Alienware. Mesmo em ângulos de visão acentuados, o visor mate e bastante brilhante garante uma boa legibilidade, pelo menos em dias nublados e na sombra
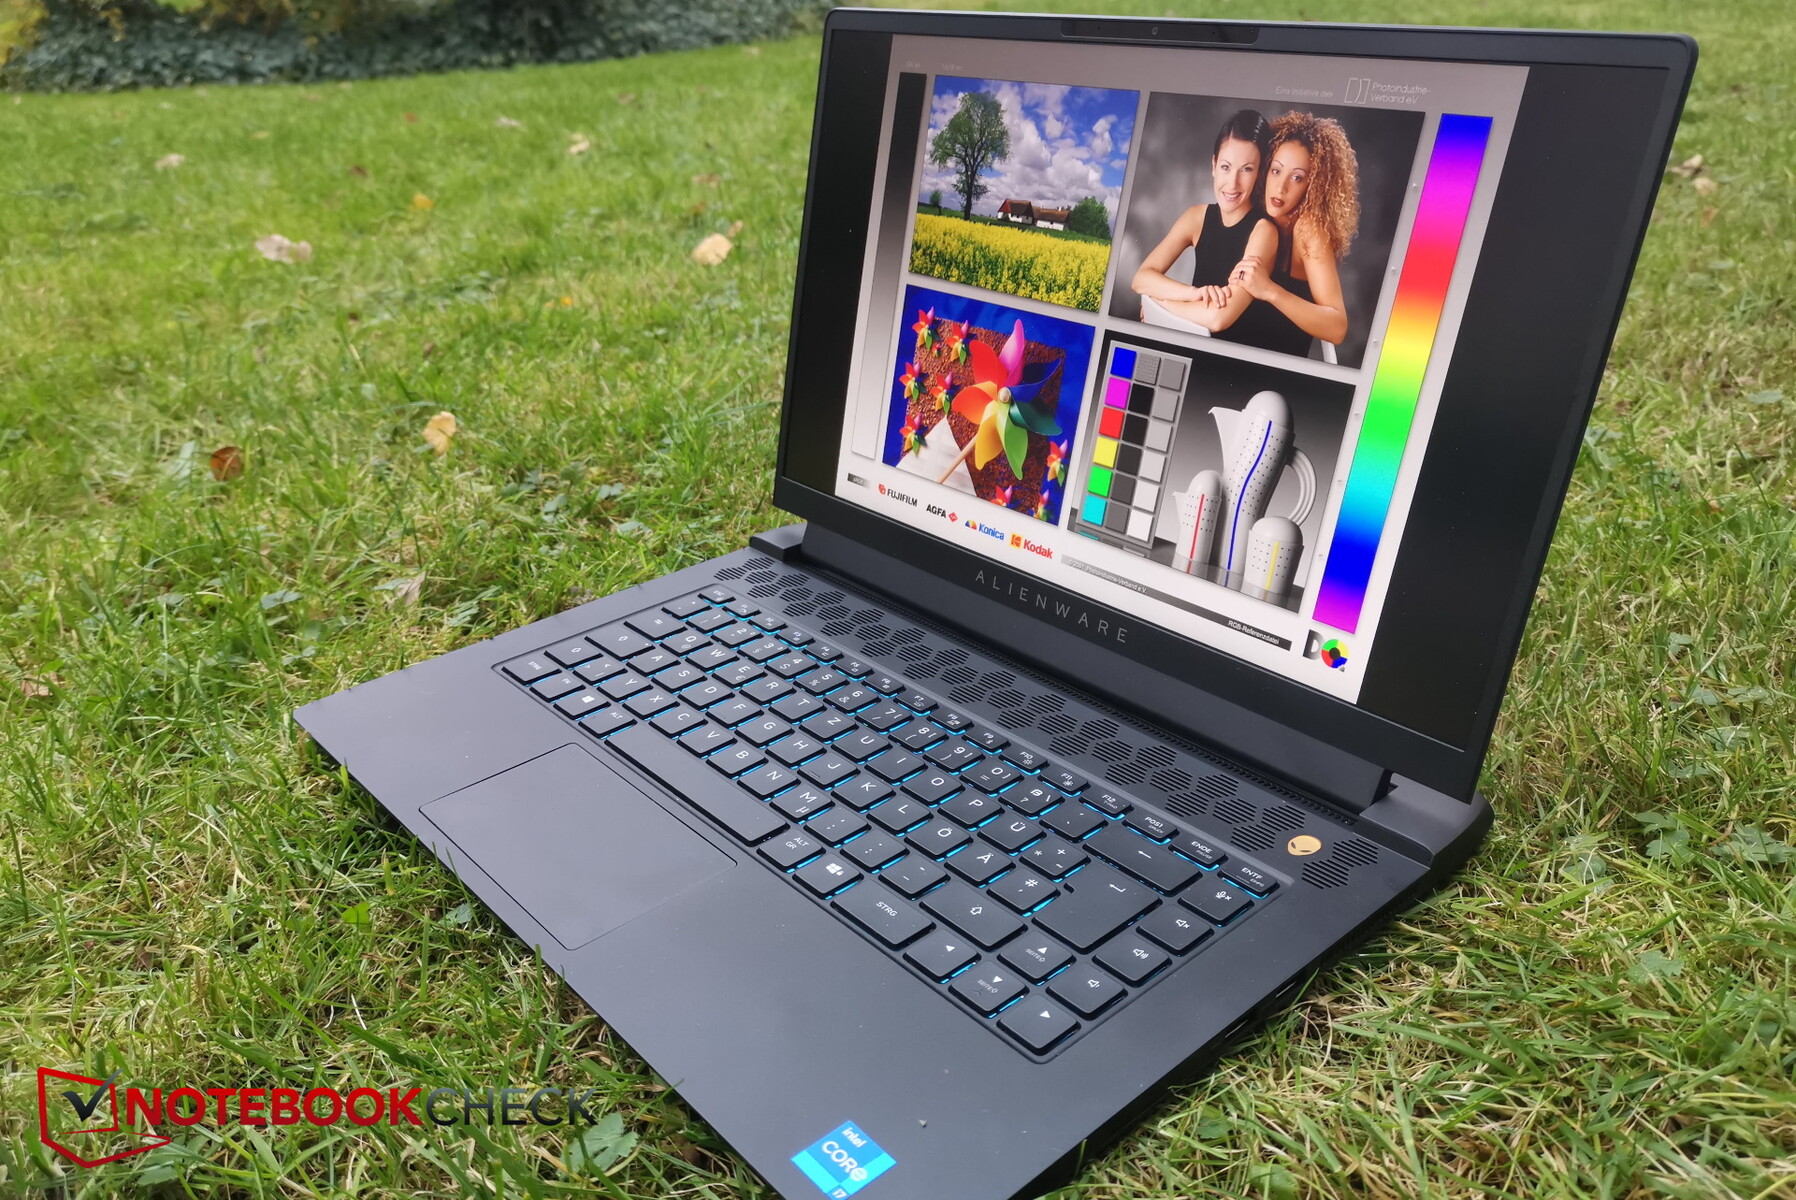
Como é típico para as telas IPS, a estabilidade do ângulo de visão é menos um assunto. Entretanto, ainda é perceptível que o brilho é melhor ao olhar diretamente para a tela do que a partir de ângulos de visão íngremes, mas esta ligeira diminuição ainda é aceitável.

Desempenho - Apenas 125 W para o RTX 3080
Com seuIntel Core i7-11800He NVIDIA GeForce RTX 3080 GPU móvelnossa unidade de teste representa a parte superior das configurações. Alternativamente, você também pode configurar o Alienware, que pode ser claramente considerado um laptop para jogos, com um RTX 3070 ou RTX 3060, e mesmo com um Intel Core i5 11400HCPU
Condições de teste
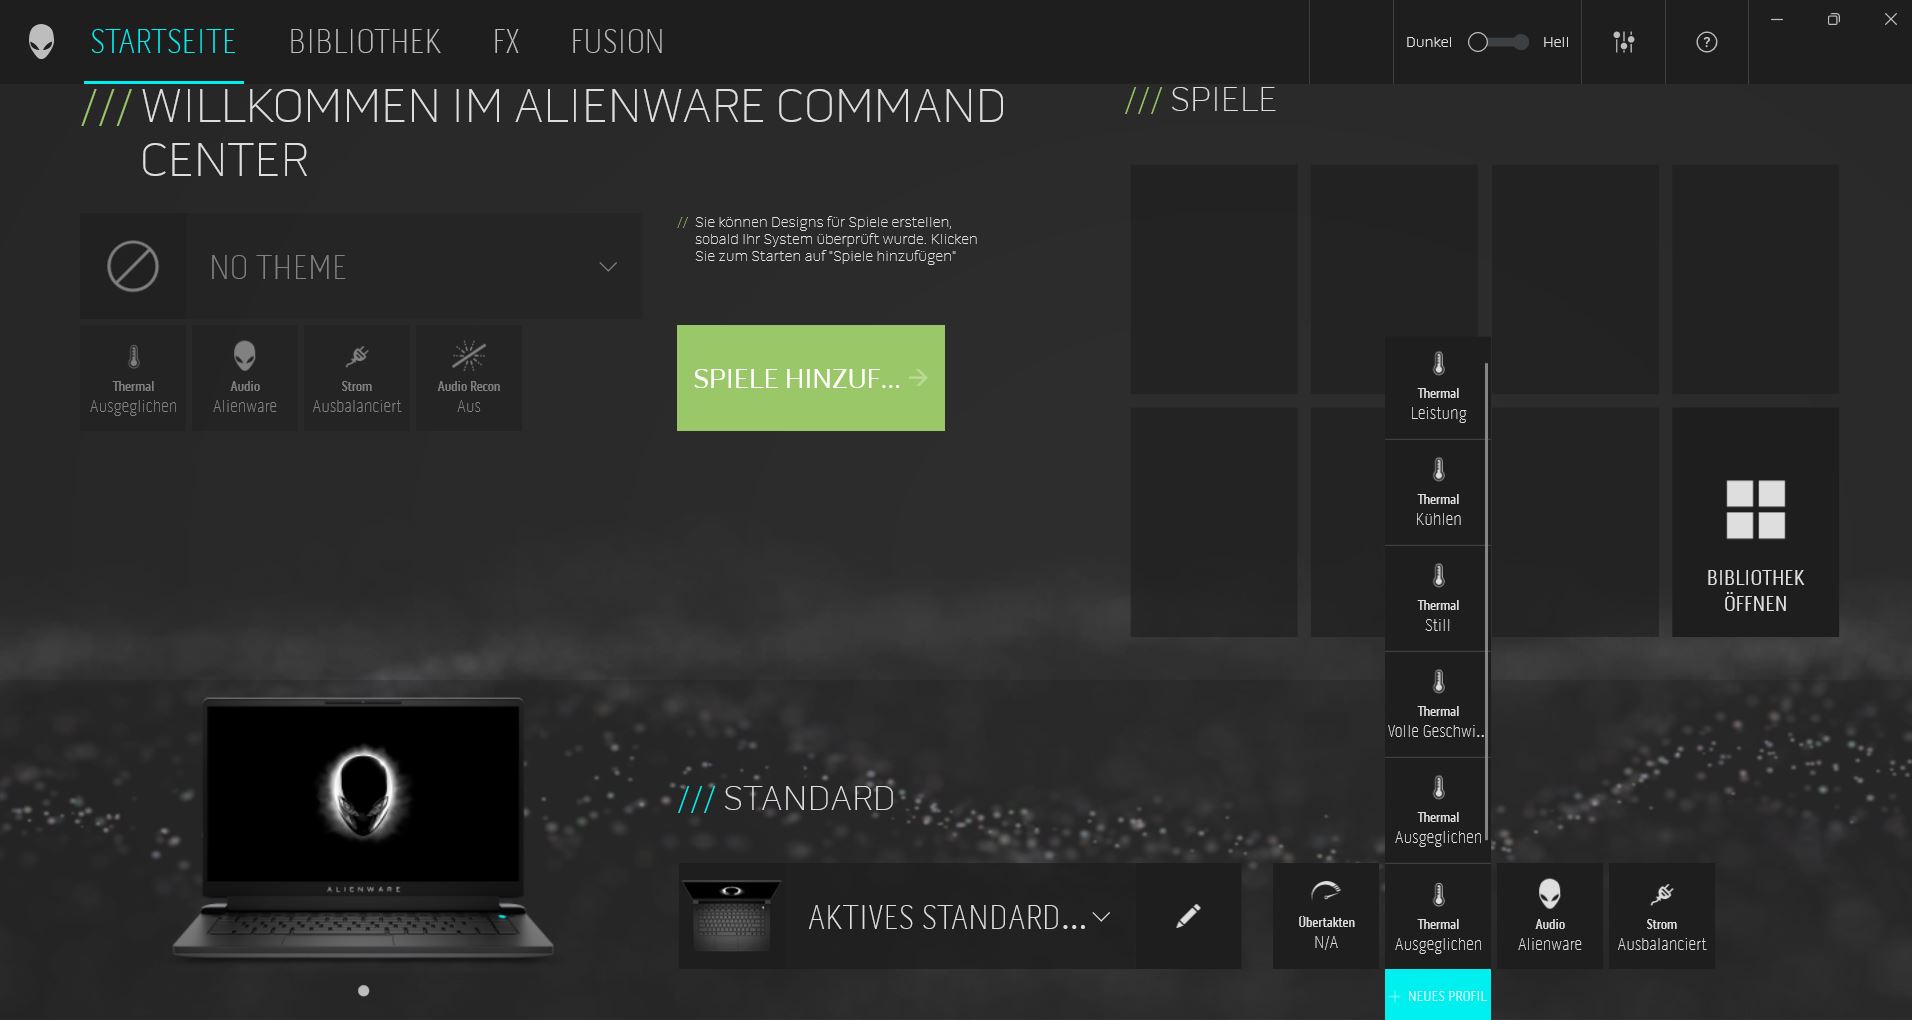
O Centro de Comando Alienware oferece muitos perfis de ventilador com nomes não muito intuitivos, e a descrição do modo é implementada apenas por um sistema de pequenas estrelas. Quais poderiam ser as diferenças entre "Performance", "Full Performance" e "Cooling"? Uma vez que os ventiladores sempre aumentam o ruído em todos os três modos, mesmo durante a operação ociosa ("Full Performance" é ainda mais alto do que o ruído no modo "Performance"), nós executamos os benchmarks e as medições de ruído no modo "Balanceado". Mesmo que isto contradiga nossa abordagem de testar laptops de jogos usando o modo de maior desempenho, pelo menos a medição de ruído fará sentido.
O Centro de Comando de Alienware (ACC) também precisa de um tempo particularmente longo para completar o carregamento durante cada partida do sistema. Mesmo quando subjetivamente todos os outros processos Windows terminaram de carregar, o ACC ainda precisa de mais tempo. Embora você já possa iniciá-lo, ainda não é possível selecionar os modos de ventilação na visão geral por algum tempo
O comportamento do Alienware ao ligá-lo também é estranho. Ao pressionar o botão de ligar, ele se acende em azul por vários segundos, mas depois nada mais acontece. Somente quando você aperta o botão por uma segunda vez o laptop realmente inicia - muito irritante!
O Windows 11 é instalado como sistema operacional, o que ainda pode levar a alguns problemas com alguns benchmarks
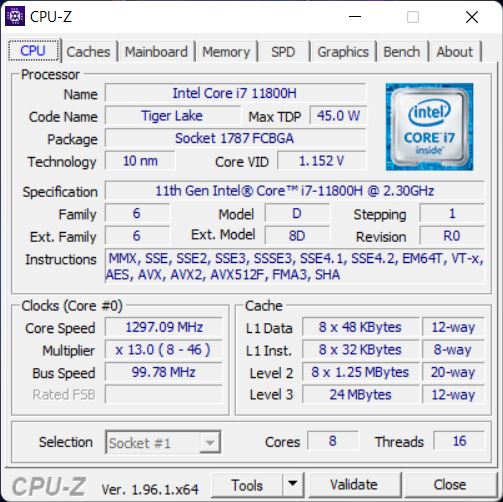
Processador
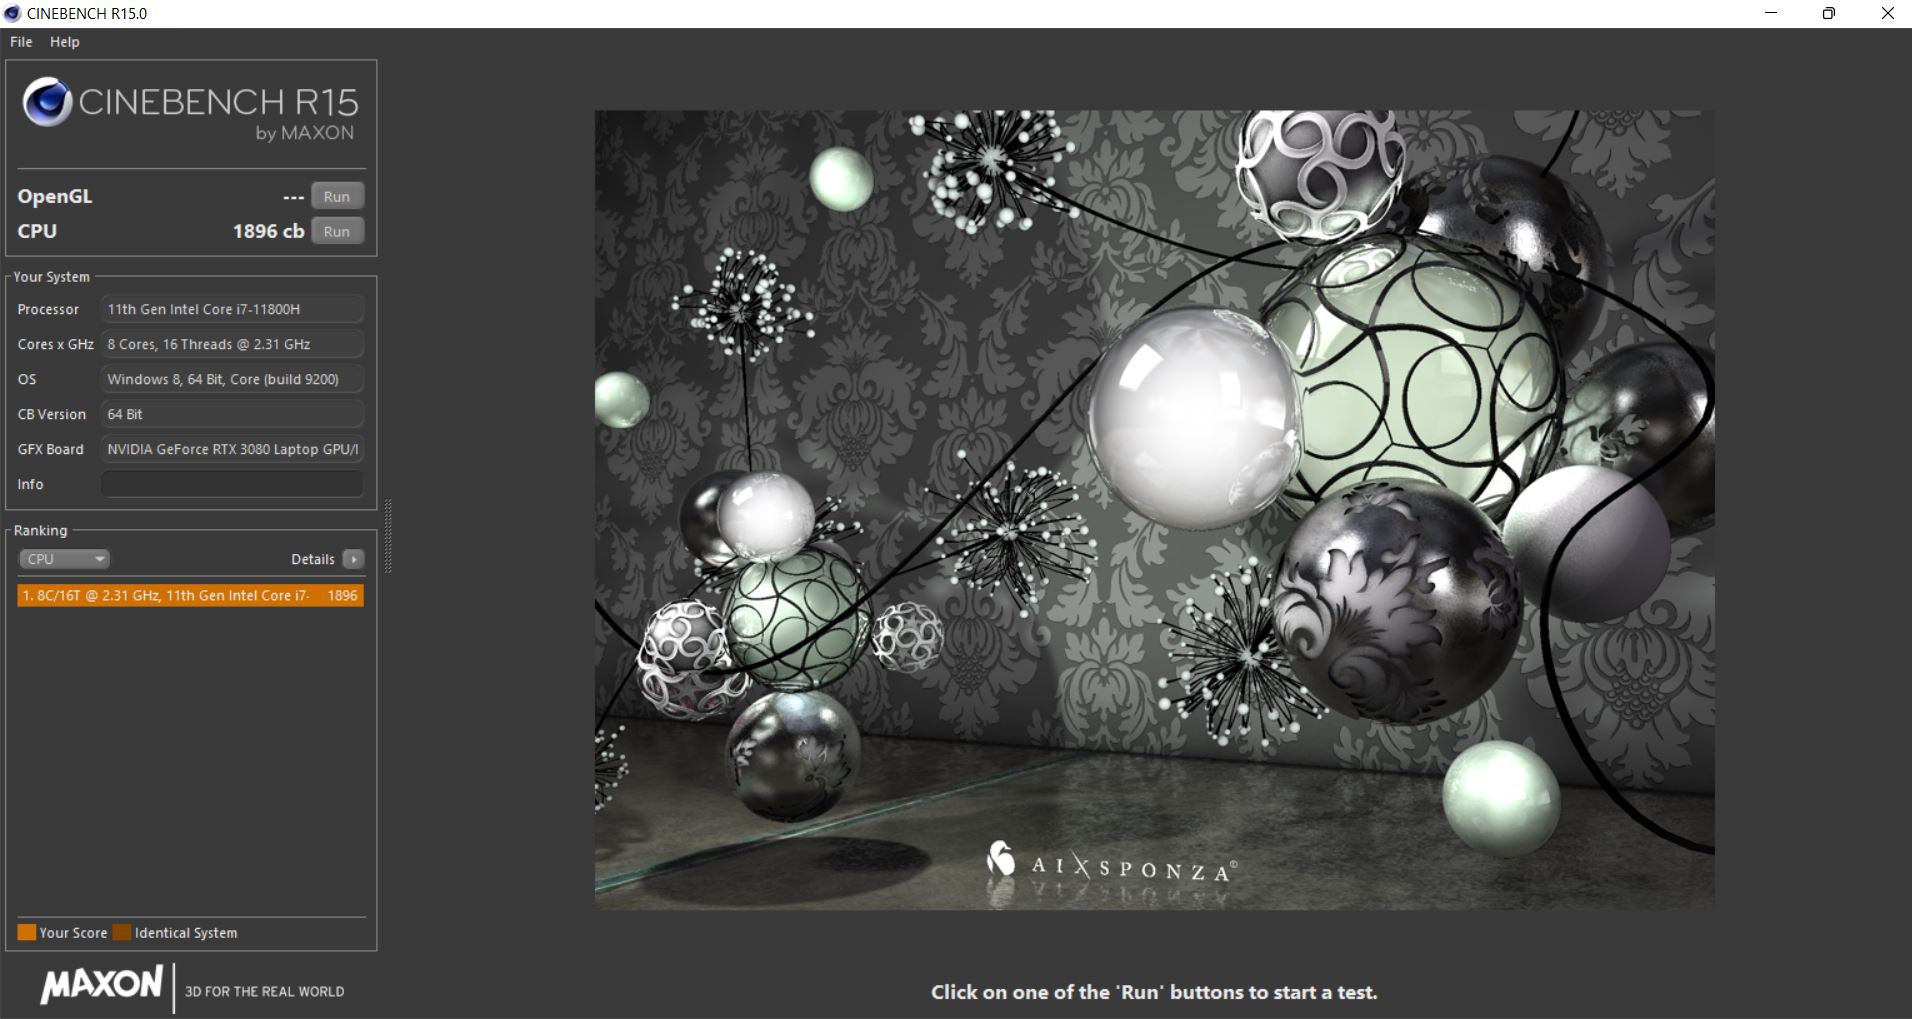
OIntel Core i7-11800Hvem da série Tiger Lake, e seus 8 núcleos podem atingir velocidades de relógio entre 2,3 e 4,6 GHz (single core Turbo)
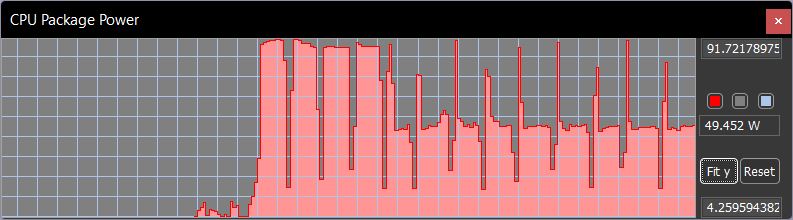
No loop Cinebench, medimos uma ligeira queda de desempenho após as primeiras quatro corridas. Depois disso, o desempenho é comparável ao do Intel Core i7-11800H no Aorus. Durante as primeiras quatro corridas, o TDP está em torno de 90 watts. Depois disso, começa a ficar limitado, e em cada nova corrida, o TDP só atingirá o máximo brevemente, antes de cair para cerca de 50 watts
Na comparação direta, o Core i7-11800H no Schenker oferece o melhor desempenho, mas na maioria das vezes o Alienware coloca cerca de 5% atrás.
No modo de bateria, o desempenho da CPU Cinebench R15 cai apenas cerca de 10% em comparação com o desempenho no início
Cinebench R15 Multi Constant Load Test
Cinebench R23: Multi Core | Single Core
Cinebench R20: CPU (Multi Core) | CPU (Single Core)
Cinebench R15: CPU Multi 64Bit | CPU Single 64Bit
Blender: v2.79 BMW27 CPU
7-Zip 18.03: 7z b 4 | 7z b 4 -mmt1
Geekbench 5.5: Multi-Core | Single-Core
HWBOT x265 Benchmark v2.2: 4k Preset
LibreOffice : 20 Documents To PDF
R Benchmark 2.5: Overall mean
| CPU Performance rating | |
| Média da turma Gaming | |
| Schenker XMG Neo 15 Tiger Lake | |
| Alienware m15 R6, i7-11800H RTX 3080 | |
| Alienware m15 R5 Ryzen Edition | |
| Razer Blade 15 Advanced (Mid 2021) -2! | |
| Média Intel Core i7-11800H | |
| Aorus 15P YD -2! | |
| Alienware m15 R4 RTX 3080 | |
| Cinebench R23 / Multi Core | |
| Média da turma Gaming (10488 - 42661, n=107, últimos 2 anos) | |
| Schenker XMG Neo 15 Tiger Lake | |
| Alienware m15 R6, i7-11800H RTX 3080 | |
| Razer Blade 15 Advanced (Mid 2021) | |
| Alienware m15 R5 Ryzen Edition | |
| Média Intel Core i7-11800H (6508 - 14088, n=48) | |
| Alienware m15 R4 RTX 3080 | |
| Cinebench R23 / Single Core | |
| Média da turma Gaming (1166 - 2415, n=107, últimos 2 anos) | |
| Schenker XMG Neo 15 Tiger Lake | |
| Razer Blade 15 Advanced (Mid 2021) | |
| Média Intel Core i7-11800H (1386 - 1522, n=45) | |
| Alienware m15 R6, i7-11800H RTX 3080 | |
| Alienware m15 R5 Ryzen Edition | |
| Alienware m15 R4 RTX 3080 | |
| Cinebench R20 / CPU (Multi Core) | |
| Média da turma Gaming (4029 - 16433, n=106, últimos 2 anos) | |
| Schenker XMG Neo 15 Tiger Lake | |
| Aorus 15P YD | |
| Alienware m15 R5 Ryzen Edition | |
| Razer Blade 15 Advanced (Mid 2021) | |
| Alienware m15 R6, i7-11800H RTX 3080 | |
| Média Intel Core i7-11800H (2498 - 5408, n=50) | |
| Alienware m15 R4 RTX 3080 | |
| Cinebench R20 / CPU (Single Core) | |
| Média da turma Gaming (442 - 913, n=106, últimos 2 anos) | |
| Aorus 15P YD | |
| Razer Blade 15 Advanced (Mid 2021) | |
| Schenker XMG Neo 15 Tiger Lake | |
| Alienware m15 R6, i7-11800H RTX 3080 | |
| Média Intel Core i7-11800H (520 - 586, n=47) | |
| Alienware m15 R5 Ryzen Edition | |
| Alienware m15 R4 RTX 3080 | |
| Cinebench R15 / CPU Multi 64Bit | |
| Média da turma Gaming (1578 - 6330, n=105, últimos 2 anos) | |
| Schenker XMG Neo 15 Tiger Lake | |
| Alienware m15 R6, i7-11800H RTX 3080 | |
| Alienware m15 R5 Ryzen Edition | |
| Aorus 15P YD | |
| Média Intel Core i7-11800H (1342 - 2173, n=50) | |
| Razer Blade 15 Advanced (Mid 2021) | |
| Alienware m15 R4 RTX 3080 | |
| Cinebench R15 / CPU Single 64Bit | |
| Média da turma Gaming (188.8 - 350, n=106, últimos 2 anos) | |
| Alienware m15 R5 Ryzen Edition | |
| Aorus 15P YD | |
| Schenker XMG Neo 15 Tiger Lake | |
| Razer Blade 15 Advanced (Mid 2021) | |
| Alienware m15 R6, i7-11800H RTX 3080 | |
| Média Intel Core i7-11800H (201 - 231, n=46) | |
| Alienware m15 R4 RTX 3080 | |
| Blender / v2.79 BMW27 CPU | |
| Aorus 15P YD | |
| Alienware m15 R4 RTX 3080 | |
| Média Intel Core i7-11800H (217 - 454, n=46) | |
| Alienware m15 R6, i7-11800H RTX 3080 | |
| Razer Blade 15 Advanced (Mid 2021) | |
| Alienware m15 R5 Ryzen Edition | |
| Schenker XMG Neo 15 Tiger Lake | |
| Média da turma Gaming (79 - 330, n=104, últimos 2 anos) | |
| 7-Zip 18.03 / 7z b 4 | |
| Média da turma Gaming (33491 - 148086, n=105, últimos 2 anos) | |
| Schenker XMG Neo 15 Tiger Lake | |
| Alienware m15 R5 Ryzen Edition | |
| Razer Blade 15 Advanced (Mid 2021) | |
| Alienware m15 R6, i7-11800H RTX 3080 | |
| Alienware m15 R4 RTX 3080 | |
| Média Intel Core i7-11800H (33718 - 56758, n=46) | |
| Aorus 15P YD | |
| 7-Zip 18.03 / 7z b 4 -mmt1 | |
| Média da turma Gaming (4199 - 7436, n=105, últimos 2 anos) | |
| Schenker XMG Neo 15 Tiger Lake | |
| Alienware m15 R5 Ryzen Edition | |
| Aorus 15P YD | |
| Média Intel Core i7-11800H (5138 - 5732, n=46) | |
| Razer Blade 15 Advanced (Mid 2021) | |
| Alienware m15 R6, i7-11800H RTX 3080 | |
| Alienware m15 R4 RTX 3080 | |
| Geekbench 5.5 / Multi-Core | |
| Média da turma Gaming (6460 - 28263, n=105, últimos 2 anos) | |
| Schenker XMG Neo 15 Tiger Lake | |
| Alienware m15 R6, i7-11800H RTX 3080 | |
| Aorus 15P YD | |
| Média Intel Core i7-11800H (4655 - 9851, n=40) | |
| Alienware m15 R4 RTX 3080 | |
| Alienware m15 R5 Ryzen Edition | |
| Geekbench 5.5 / Single-Core | |
| Média da turma Gaming (986 - 2474, n=105, últimos 2 anos) | |
| Schenker XMG Neo 15 Tiger Lake | |
| Aorus 15P YD | |
| Alienware m15 R6, i7-11800H RTX 3080 | |
| Média Intel Core i7-11800H (1429 - 1625, n=40) | |
| Alienware m15 R5 Ryzen Edition | |
| Alienware m15 R4 RTX 3080 | |
| HWBOT x265 Benchmark v2.2 / 4k Preset | |
| Média da turma Gaming (11.5 - 44.4, n=105, últimos 2 anos) | |
| Schenker XMG Neo 15 Tiger Lake | |
| Razer Blade 15 Advanced (Mid 2021) | |
| Alienware m15 R5 Ryzen Edition | |
| Média Intel Core i7-11800H (7.38 - 17.4, n=46) | |
| Alienware m15 R6, i7-11800H RTX 3080 | |
| Alienware m15 R4 RTX 3080 | |
| Aorus 15P YD | |
| LibreOffice / 20 Documents To PDF | |
| Alienware m15 R4 RTX 3080 | |
| Alienware m15 R5 Ryzen Edition | |
| Média da turma Gaming (33.2 - 88.8, n=105, últimos 2 anos) | |
| Schenker XMG Neo 15 Tiger Lake | |
| Média Intel Core i7-11800H (38.6 - 59.9, n=45) | |
| Razer Blade 15 Advanced (Mid 2021) | |
| Alienware m15 R6, i7-11800H RTX 3080 | |
| Aorus 15P YD | |
| R Benchmark 2.5 / Overall mean | |
| Alienware m15 R4 RTX 3080 | |
| Média Intel Core i7-11800H (0.548 - 0.615, n=46) | |
| Aorus 15P YD | |
| Alienware m15 R6, i7-11800H RTX 3080 | |
| Schenker XMG Neo 15 Tiger Lake | |
| Razer Blade 15 Advanced (Mid 2021) | |
| Alienware m15 R5 Ryzen Edition | |
| Média da turma Gaming (0.3439 - 0.759, n=106, últimos 2 anos) | |
* ... menor é melhor
AIDA64: FP32 Ray-Trace | FPU Julia | CPU SHA3 | CPU Queen | FPU SinJulia | FPU Mandel | CPU AES | CPU ZLib | FP64 Ray-Trace | CPU PhotoWorxx
| Performance rating | |
| Média da turma Gaming | |
| Alienware m15 R6, i7-11800H RTX 3080 | |
| Alienware m15 R5 Ryzen Edition | |
| Média Intel Core i7-11800H | |
| Alienware m15 R4 RTX 3080 | |
| Aorus 15P YD -9! | |
| Schenker XMG Neo 15 Tiger Lake -9! | |
| Razer Blade 15 Advanced (Mid 2021) -9! | |
| AIDA64 / FP32 Ray-Trace | |
| Média da turma Gaming (10227 - 85542, n=105, últimos 2 anos) | |
| Alienware m15 R6, i7-11800H RTX 3080 | |
| Alienware m15 R5 Ryzen Edition | |
| Alienware m15 R4 RTX 3080 | |
| Média Intel Core i7-11800H (8772 - 15961, n=20) | |
| AIDA64 / FPU Julia | |
| Média da turma Gaming (51376 - 238426, n=105, últimos 2 anos) | |
| Alienware m15 R5 Ryzen Edition | |
| Alienware m15 R4 RTX 3080 | |
| Alienware m15 R6, i7-11800H RTX 3080 | |
| Média Intel Core i7-11800H (39404 - 65636, n=20) | |
| AIDA64 / CPU SHA3 | |
| Média da turma Gaming (2180 - 10115, n=105, últimos 2 anos) | |
| Alienware m15 R6, i7-11800H RTX 3080 | |
| Média Intel Core i7-11800H (2599 - 4439, n=20) | |
| Alienware m15 R4 RTX 3080 | |
| Alienware m15 R5 Ryzen Edition | |
| AIDA64 / CPU Queen | |
| Média da turma Gaming (49785 - 173351, n=90, últimos 2 anos) | |
| Alienware m15 R5 Ryzen Edition | |
| Alienware m15 R4 RTX 3080 | |
| Alienware m15 R6, i7-11800H RTX 3080 | |
| Média Intel Core i7-11800H (85233 - 91941, n=20) | |
| AIDA64 / FPU SinJulia | |
| Média da turma Gaming (4424 - 33636, n=105, últimos 2 anos) | |
| Alienware m15 R5 Ryzen Edition | |
| Alienware m15 R4 RTX 3080 | |
| Alienware m15 R6, i7-11800H RTX 3080 | |
| Média Intel Core i7-11800H (6420 - 9792, n=20) | |
| AIDA64 / FPU Mandel | |
| Média da turma Gaming (25115 - 128721, n=105, últimos 2 anos) | |
| Alienware m15 R5 Ryzen Edition | |
| Alienware m15 R6, i7-11800H RTX 3080 | |
| Média Intel Core i7-11800H (23365 - 39464, n=20) | |
| Alienware m15 R4 RTX 3080 | |
| AIDA64 / CPU AES | |
| Alienware m15 R6, i7-11800H RTX 3080 | |
| Média Intel Core i7-11800H (74617 - 149388, n=20) | |
| Alienware m15 R5 Ryzen Edition | |
| Média da turma Gaming (39258 - 247074, n=105, últimos 2 anos) | |
| Alienware m15 R4 RTX 3080 | |
| AIDA64 / CPU ZLib | |
| Média da turma Gaming (574 - 2531, n=105, últimos 2 anos) | |
| Alienware m15 R6, i7-11800H RTX 3080 | |
| Alienware m15 R5 Ryzen Edition | |
| Alienware m15 R4 RTX 3080 | |
| Média Intel Core i7-11800H (461 - 830, n=43) | |
| Aorus 15P YD | |
| Schenker XMG Neo 15 Tiger Lake | |
| Razer Blade 15 Advanced (Mid 2021) | |
| AIDA64 / FP64 Ray-Trace | |
| Média da turma Gaming (5509 - 45446, n=105, últimos 2 anos) | |
| Alienware m15 R6, i7-11800H RTX 3080 | |
| Alienware m15 R5 Ryzen Edition | |
| Alienware m15 R4 RTX 3080 | |
| Média Intel Core i7-11800H (4545 - 8717, n=21) | |
| AIDA64 / CPU PhotoWorxx | |
| Média da turma Gaming (12271 - 89891, n=105, últimos 2 anos) | |
| Alienware m15 R6, i7-11800H RTX 3080 | |
| Média Intel Core i7-11800H (11898 - 26757, n=21) | |
| Alienware m15 R4 RTX 3080 | |
| Alienware m15 R5 Ryzen Edition | |
Desempenho do sistema
O benchmark PCMark 10 não diferencia muito bem os concorrentes uns dos outros, pelo menos não na pontuação geral. O Razer Blade parece estar um pouco à frente nos sub-testes, mas o Alienware está desafiando-o, ficando cerca de 5% atrás apenas no benchmark Essentials
| PCMark 10 / Score | |
| Média da turma Gaming (5828 - 12414, n=93, últimos 2 anos) | |
| Razer Blade 15 Advanced (Mid 2021) | |
| Aorus 15P YD | |
| Schenker XMG Neo 15 Tiger Lake | |
| Alienware m15 R6, i7-11800H RTX 3080 | |
| Média Intel Core i7-11800H, NVIDIA GeForce RTX 3080 Laptop GPU (6673 - 7470, n=11) | |
| Alienware m15 R4 RTX 3080 | |
| Alienware m15 R5 Ryzen Edition | |
| PCMark 10 / Essentials | |
| Razer Blade 15 Advanced (Mid 2021) | |
| Média da turma Gaming (8810 - 11935, n=97, últimos 2 anos) | |
| Aorus 15P YD | |
| Média Intel Core i7-11800H, NVIDIA GeForce RTX 3080 Laptop GPU (9862 - 11064, n=11) | |
| Schenker XMG Neo 15 Tiger Lake | |
| Alienware m15 R6, i7-11800H RTX 3080 | |
| Alienware m15 R4 RTX 3080 | |
| Alienware m15 R5 Ryzen Edition | |
| PCMark 10 / Productivity | |
| Média da turma Gaming (6845 - 25323, n=95, últimos 2 anos) | |
| Alienware m15 R6, i7-11800H RTX 3080 | |
| Alienware m15 R4 RTX 3080 | |
| Aorus 15P YD | |
| Média Intel Core i7-11800H, NVIDIA GeForce RTX 3080 Laptop GPU (8278 - 9803, n=11) | |
| Razer Blade 15 Advanced (Mid 2021) | |
| Schenker XMG Neo 15 Tiger Lake | |
| Alienware m15 R5 Ryzen Edition | |
| PCMark 10 / Digital Content Creation | |
| Média da turma Gaming (7602 - 19954, n=95, últimos 2 anos) | |
| Schenker XMG Neo 15 Tiger Lake | |
| Razer Blade 15 Advanced (Mid 2021) | |
| Alienware m15 R6, i7-11800H RTX 3080 | |
| Média Intel Core i7-11800H, NVIDIA GeForce RTX 3080 Laptop GPU (9881 - 11323, n=11) | |
| Aorus 15P YD | |
| Alienware m15 R4 RTX 3080 | |
| Alienware m15 R5 Ryzen Edition | |
| PCMark 10 Score | 7177 pontos | |
Ajuda | ||
| AIDA64 / Memory Copy | |
| Média da turma Gaming (21750 - 129946, n=105, últimos 2 anos) | |
| Alienware m15 R6, i7-11800H RTX 3080 | |
| Média Intel Core i7-11800H (24508 - 48144, n=21) | |
| Alienware m15 R5 Ryzen Edition | |
| Alienware m15 R4 RTX 3080 | |
| AIDA64 / Memory Read | |
| Média da turma Gaming (22956 - 118858, n=105, últimos 2 anos) | |
| Alienware m15 R6, i7-11800H RTX 3080 | |
| Média Intel Core i7-11800H (25882 - 50365, n=20) | |
| Alienware m15 R5 Ryzen Edition | |
| Alienware m15 R4 RTX 3080 | |
| AIDA64 / Memory Write | |
| Média da turma Gaming (22297 - 135096, n=105, últimos 2 anos) | |
| Alienware m15 R6, i7-11800H RTX 3080 | |
| Média Intel Core i7-11800H (22240 - 46214, n=20) | |
| Alienware m15 R4 RTX 3080 | |
| Alienware m15 R5 Ryzen Edition | |
| AIDA64 / Memory Latency | |
| Média da turma Gaming (75.3 - 259, n=105, últimos 2 anos) | |
| Alienware m15 R6, i7-11800H RTX 3080 | |
| Alienware m15 R5 Ryzen Edition | |
| Alienware m15 R4 RTX 3080 | |
| Média Intel Core i7-11800H (71.9 - 104.1, n=44) | |
| Aorus 15P YD | |
| Schenker XMG Neo 15 Tiger Lake | |
| Razer Blade 15 Advanced (Mid 2021) | |
* ... menor é melhor
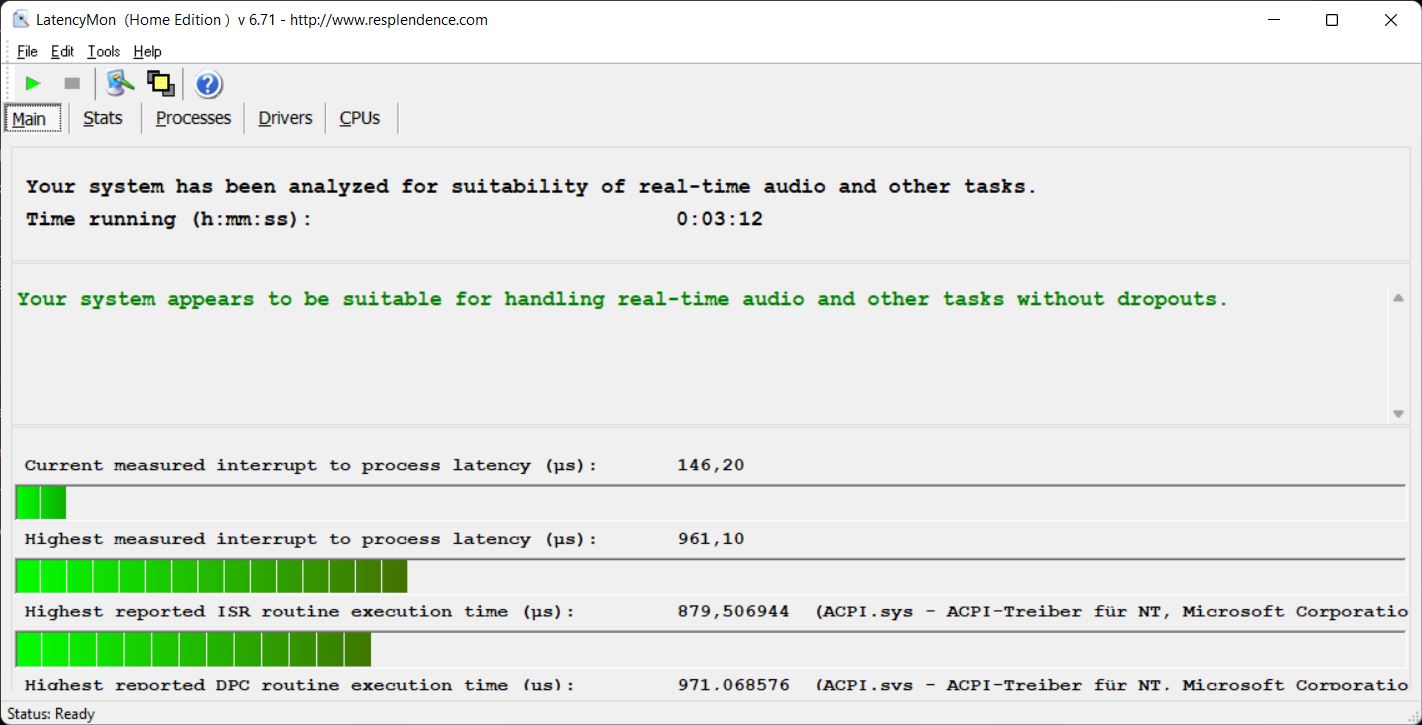
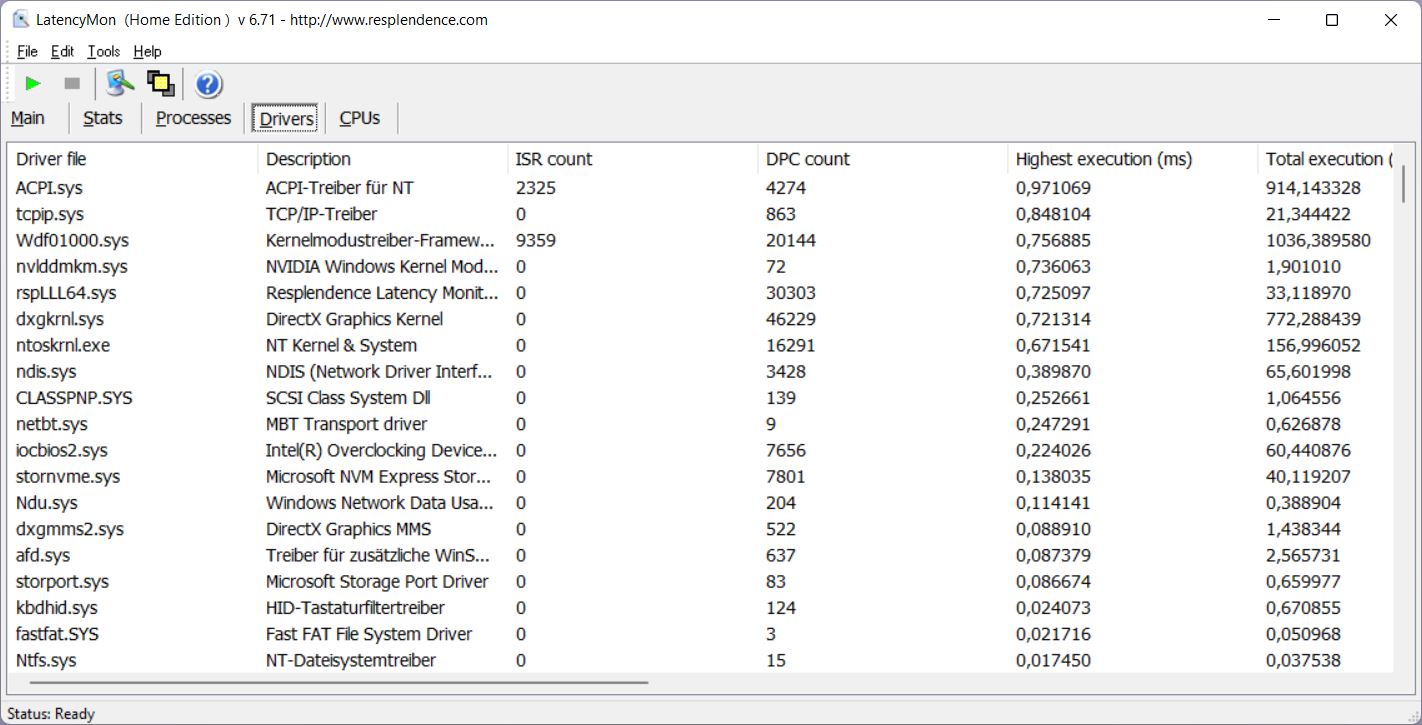
Latências DPC
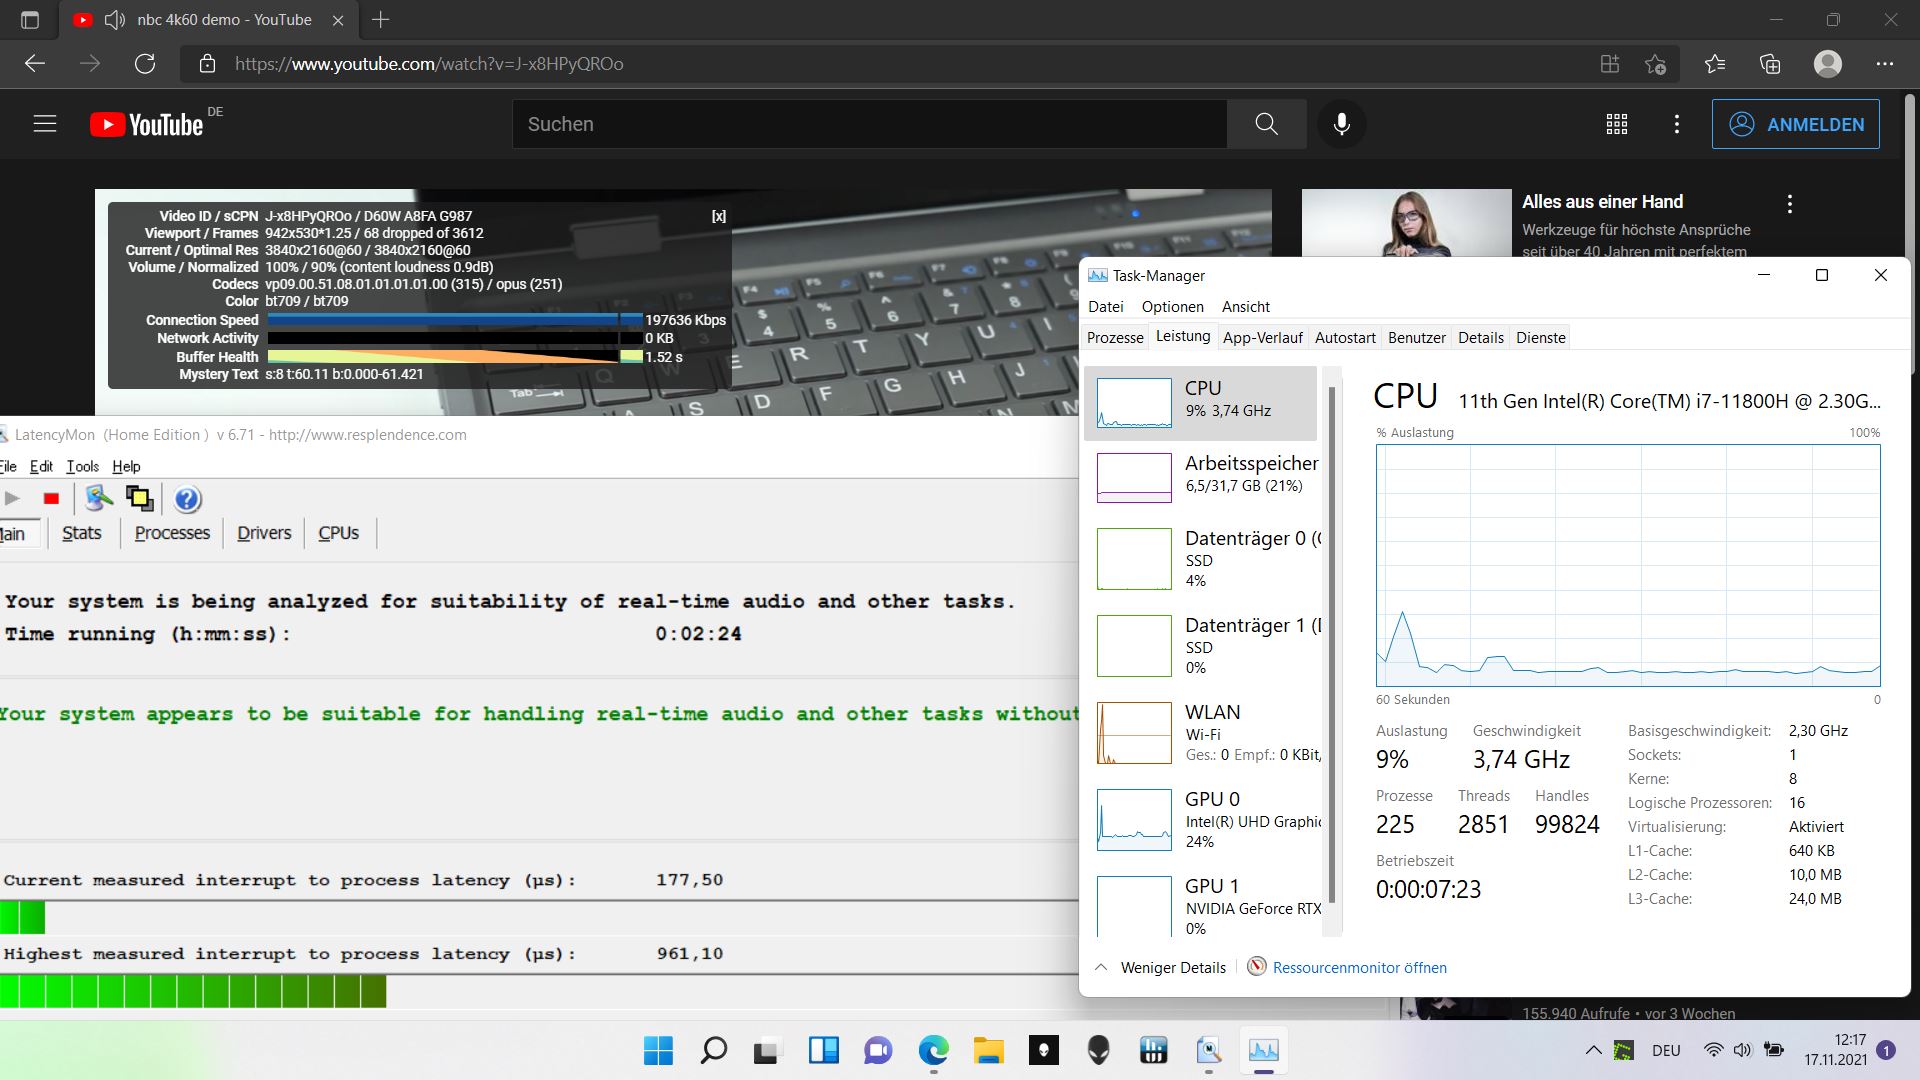
A ferramenta LatencyMon não detecta nenhum atraso significativo, nem ao abrir várias abas do navegador, nem ao transmitir vídeos ou durante a carga da CPU via Prime95. Por outro lado, nosso vídeo 4K/60 fps no YouTube foi reproduzido com um total de 68 quadros descartados
| DPC Latencies / LatencyMon - interrupt to process latency (max), Web, Youtube, Prime95 | |
| Razer Blade 15 Advanced (Mid 2021) | |
| Alienware m15 R6, i7-11800H RTX 3080 | |
| Aorus 15P YD | |
| Alienware m15 R4 RTX 3080 | |
| Schenker XMG Neo 15 Tiger Lake | |
| Alienware m15 R5 Ryzen Edition | |
* ... menor é melhor
Solução de armazenamento
A Dell equipou o m15 R6 com dois SSDs NVMe de 1 TB da Samsung, portanto há uma grande quantidade de armazenamento com um total de 2 TB. Apesar de o Samsung PM9A1 ocupar o terceiro lugar em nosso Banco de dados SSDA R6 não consegue sequer se aproximar de suas velocidades teoricamente altas. Há aqui algum potencial desperdiçado, mas a velocidade ainda não é ruim de forma alguma

* ... menor é melhor
Constant Performance Reading: DiskSpd Read Loop, Queue Depth 8
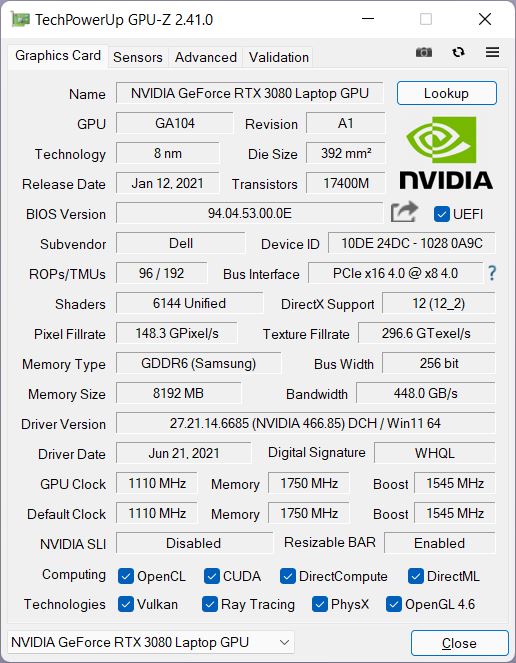
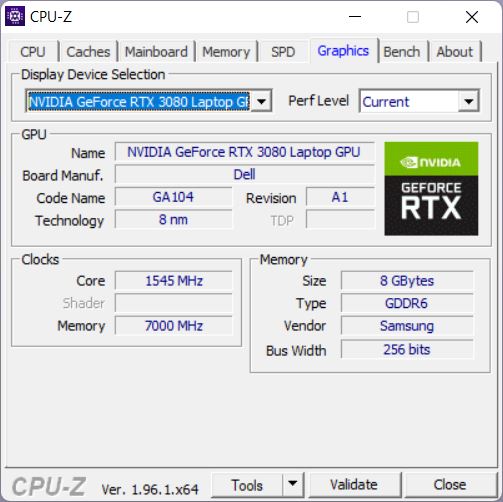
Placa Gráfica
O R6 contém um NVIDIA GeForce RTX 3080 GPU móvelque é capaz de consumir 125 watts, incluindo 10 watts de impulso dinâmico. Considerando o fato de que alguns laptops RTX 3080 são configurados com até 165 watts, isto parece bastante baixo, particularmente para um laptop Alienware. Por exemplo, mesmo o R6 com a opção RTX 3070 é capaz de consumir 130 watts
Nos testes do 3DMark, o desempenho do Alienware corresponde bastante exatamente à média, em termos de seu RTX 3080. Entretanto, o "antigo" R4 com o RTX 3080 e Intel Core i9-10980HK A CPU do Comet Lake é visivelmente mais rápida na maior parte do tempo. Isto não é uma surpresa, já que a GPU no R4 é capaz de usar 140 watts.
No modo de bateria, o funcionamento do 3DMark 11 resulta em apenas 16.083 pontos em vez dos 30.178 pontos anteriores, o que corresponde a uma diminuição de 47%
| 3DMark 11 Performance | 30178 pontos | |
| 3DMark Cloud Gate Standard Score | 53399 pontos | |
| 3DMark Fire Strike Score | 24014 pontos | |
| 3DMark Time Spy Score | 10763 pontos | |
Ajuda | ||
Desempenho nos jogos
Apesar do RTX 3080 ligeiramente apressado, o Alienware é capaz de exibir todos os jogos modernos com o máximo de detalhes e em resolução Full HD, e deve haver até mesmo reservas suficientes para resoluções de 4K.
De modo geral, o desempenho do R6 está novamente bastante próximo da média de outros laptops com um RTX 3080 de nosso banco de dados. Entretanto, a maioria de seus concorrentes diretos ainda são mais rápidos, com o antigo m15 R4 no topo. Parece um pouco estranho que se limite o desempenho em comparação com o predecessor, possivelmente para poder proporcionar um melhor resfriamento do sistema.
Os modos de ventilação parecem ter pouca influência sobre o desempenho. No modo Performance, muitos jogos apenas pouco ou nada se beneficiarão do resfriamento adicional teórico (GTA V), mas em alguns jogos podemos ver uma vantagem mínima (Strange Brigade, + 3-5%).
| New World | |
| 1920x1080 Medium Video Quality | |
| Alienware m15 R6, i7-11800H RTX 3080 | |
| Média NVIDIA GeForce RTX 3080 Laptop GPU (80.8 - 105.4, n=4) | |
| 1920x1080 High Video Quality | |
| Alienware m15 R6, i7-11800H RTX 3080 | |
| Média NVIDIA GeForce RTX 3080 Laptop GPU (75.1 - 96.7, n=4) | |
| 1920x1080 Very High Video Quality | |
| Alienware m15 R6, i7-11800H RTX 3080 | |
| Média NVIDIA GeForce RTX 3080 Laptop GPU (71.5 - 90.4, n=4) | |
Durante uma hora de funcionamento O Witcher 3, a taxa de quadros cai apenas ligeiramente, de modo que o desempenho é bastante constante, e os outliers ou quedas permanecem a exceção
The Witcher 3 FPS Chart
| baixo | média | alto | ultra | |
|---|---|---|---|---|
| GTA V (2015) | 183 | 177 | 166 | 99.5 |
| The Witcher 3 (2015) | 312 | 276 | 149 | 108.4 |
| Dota 2 Reborn (2015) | 168 | 151 | 144 | 135 |
| X-Plane 11.11 (2018) | 127 | 110 | 87.9 | |
| Far Cry 5 (2018) | 132 | 126 | 119 | 113 |
| Strange Brigade (2018) | 424 | 261 | 216 | 190 |
| New World (2021) | 115.5 | 95.7 | 91.3 | 84 |
Emissões - Mais quentes que a maioria dos concorrentes
Emissões sonoras
Durante a operação ociosa, os ventiladores dos 6 frequentemente permanecem desligados, pelo menos no modo Equilibrado ou Silencioso. No modo Performance, eles também são barulhentos durante a operação ociosa, e também no modo "Refrigeração". No modo de desempenho total, eles se tornam ainda mais altos.
No modo Equilibrado, os ventiladores podem até mesmo ser reversos de tempos em tempos em operação máxima ociosa, até um nível de ruído de cerca de 30 dB. Sob carga média (3DMark06, primeira referência), o R6 agora permanece ainda mais silencioso do que alguns de seus concorrentes.
Por outro lado, os ventiladores fazem muito barulho sob carga pesada. Mas pelo menos eles não são mais altos do que o Aorus ou o Schenker aqui também. Entretanto, este não é o caso quando se usa o modo Full Performance. Portanto, cada usuário tem que decidir por si mesmo se alguns quadros a mais também valem o aumento do nível de ruído.
Sob alguns tipos de carga (3DMark06), podemos ouvir um ruído eletrônico na forma de um zumbido. Provavelmente ele só é perceptível sob um nível de carga médio, e depois disso ele será abafado pelo ruído do ventilador.
Barulho
| Ocioso |
| 23 / 23 / 30 dB |
| Carga |
| 41.26 / 53.37 dB |
 | ||
30 dB silencioso 40 dB(A) audível 50 dB(A) ruidosamente alto |
||
min: | ||
| Alienware m15 R6, i7-11800H RTX 3080 GeForce RTX 3080 Laptop GPU, i7-11800H, Samsung PM9A1 MZVL21T0HCLR | Alienware m15 R5 Ryzen Edition GeForce RTX 3060 Laptop GPU, R7 5800H, Toshiba KBG40ZNS512G NVMe | Alienware m15 R4 RTX 3080 GeForce RTX 3080 Laptop GPU, i9-10980HK, 2x WDC PC SN730 SDBPNTY-512G (RAID 0) | Aorus 15P YD GeForce RTX 3080 Laptop GPU, i7-11800H, Samsung PM9A1 MZVL21T0HCLR | Schenker XMG Neo 15 Tiger Lake GeForce RTX 3080 Laptop GPU, i7-11800H, Samsung SSD 980 Pro 1TB MZ-V8P1T0BW | Razer Blade 15 Advanced (Mid 2021) GeForce RTX 3080 Laptop GPU, i7-11800H, SSSTC CA6-8D1024 | |
|---|---|---|---|---|---|---|
| Noise | -4% | -7% | -10% | -11% | 0% | |
| desligado / ambiente * (dB) | 23 | 24 -4% | 25 -9% | 25 -9% | 25 -9% | 25.1 -9% |
| Idle Minimum * (dB) | 23 | 24 -4% | 25 -9% | 26 -13% | 27 -17% | 25.3 -10% |
| Idle Average * (dB) | 23 | 25 -9% | 29 -26% | 30 -30% | 30 -30% | 25.3 -10% |
| Idle Maximum * (dB) | 30 | 35 -17% | 33 -10% | 34 -13% | 32 -7% | 25.3 16% |
| Load Average * (dB) | 41.26 | 44 -7% | 48 -16% | 43 -4% | 46 -11% | 42 -2% |
| Witcher 3 ultra * (dB) | 53.4 | 48 10% | 46 14% | 50 6% | 52 3% | 45.6 15% |
| Load Maximum * (dB) | 53.37 | 50 6% | 49 8% | 57 -7% | 55 -3% | 51.6 3% |
* ... menor é melhor
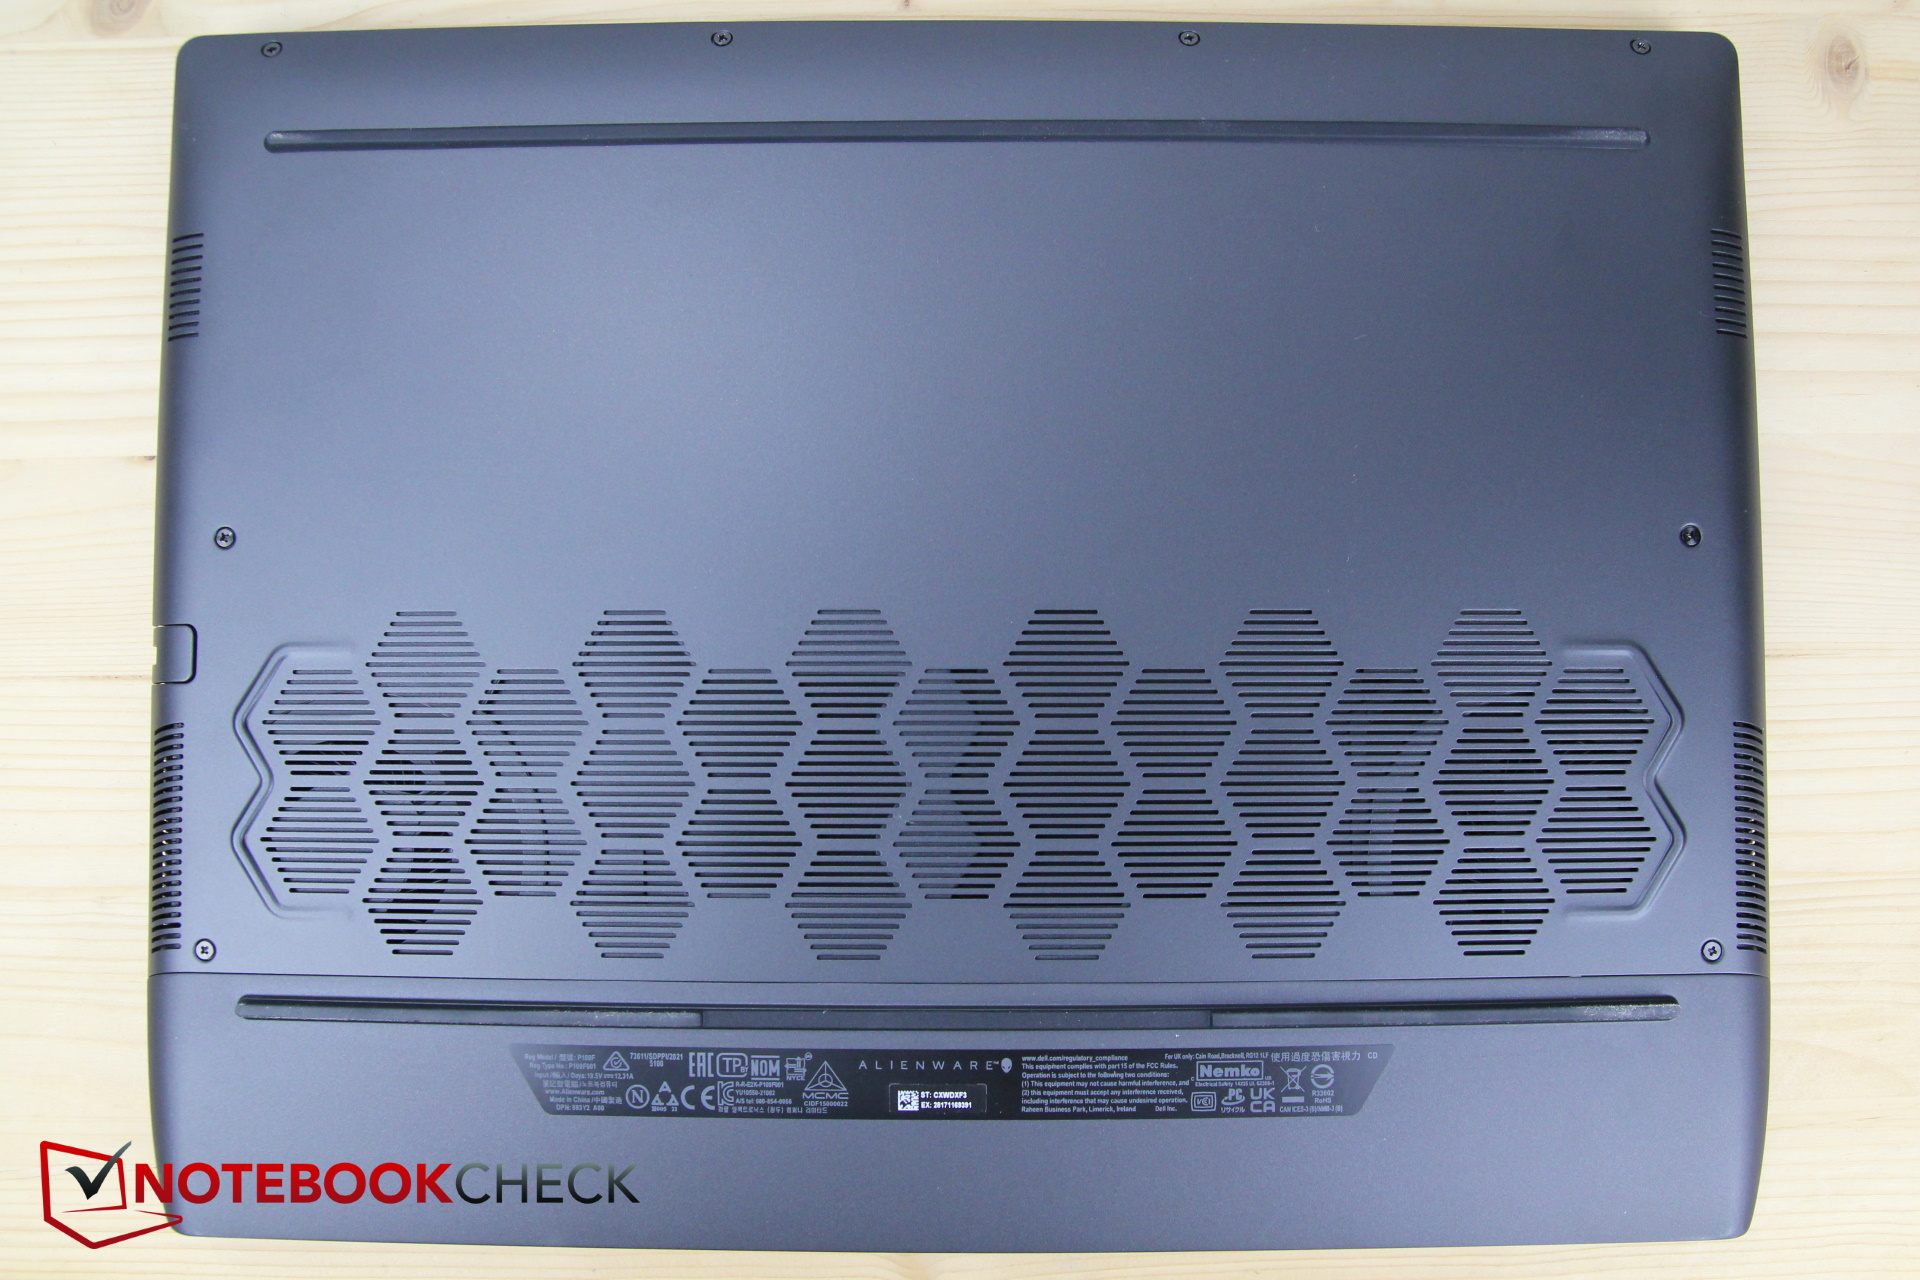
Temperatura
Em operação ociosa, o R6 agora permanece mais frio do que o R4. No entanto, sob carga, ele fica igualmente quente novamente, e que embora pelo menos o desempenho 3D seja ligeiramente inferior.
Sob forte tensão, as superfícies na parte superior e inferior podem atingir temperaturas de cerca de 60 °C (140 °F), o que definitivamente não é mais adequado para operação na volta de uma pessoa. Por outro lado, aqueles que vivem em uma cabana fria de jardim podem lucrar com o R6 de algumas outras maneiras: Enquanto joga, a temperatura ao redor das chaves WASD ainda atinge uma temperatura aconchegante de 40 - 45 °C (104 - 113 °F), mas pelo menos os descansos da palma permanecem relativamente frios
Curiosamente, o R5 com o RTX 3060 mais fraco e o Ryzen 7 5800H se torna igualmente quente. Entretanto, o resto dos concorrentes permanece visivelmente mais frio
(-) A temperatura máxima no lado superior é 61 °C / 142 F, em comparação com a média de 40.4 °C / 105 F , variando de 21.2 a 68.8 °C para a classe Gaming.
(-) A parte inferior aquece até um máximo de 58 °C / 136 F, em comparação com a média de 43.2 °C / 110 F
(+) Em uso inativo, a temperatura média para o lado superior é 29.6 °C / 85 F, em comparação com a média do dispositivo de 33.9 °C / ### class_avg_f### F.
(-) Jogando The Witcher 3, a temperatura média para o lado superior é 40.7 °C / 105 F, em comparação com a média do dispositivo de 33.9 °C / ## #class_avg_f### F.
(±) Os apoios para as mãos e o touchpad podem ficar muito quentes ao toque, com um máximo de 39 °C / 102.2 F.
(-) A temperatura média da área do apoio para as mãos de dispositivos semelhantes foi 28.8 °C / 83.8 F (-10.2 °C / -18.4 F).
| Alienware m15 R6, i7-11800H RTX 3080 Intel Core i7-11800H, NVIDIA GeForce RTX 3080 Laptop GPU | Alienware m15 R5 Ryzen Edition AMD Ryzen 7 5800H, NVIDIA GeForce RTX 3060 Laptop GPU | Alienware m15 R4 RTX 3080 Intel Core i9-10980HK, NVIDIA GeForce RTX 3080 Laptop GPU | Aorus 15P YD Intel Core i7-11800H, NVIDIA GeForce RTX 3080 Laptop GPU | Schenker XMG Neo 15 Tiger Lake Intel Core i7-11800H, NVIDIA GeForce RTX 3080 Laptop GPU | Razer Blade 15 Advanced (Mid 2021) Intel Core i7-11800H, NVIDIA GeForce RTX 3080 Laptop GPU | |
|---|---|---|---|---|---|---|
| Heat | 2% | -7% | 9% | 15% | 7% | |
| Maximum Upper Side * (°C) | 61 | 62 -2% | 59 3% | 49 20% | 39 36% | 51 16% |
| Maximum Bottom * (°C) | 58 | 61 -5% | 61 -5% | 57 2% | 50 14% | 52 10% |
| Idle Upper Side * (°C) | 38 | 36 5% | 43 -13% | 33 13% | 34 11% | 35.2 7% |
| Idle Bottom * (°C) | 36 | 33 8% | 41 -14% | 36 -0% | 37 -3% | 37.8 -5% |
* ... menor é melhor
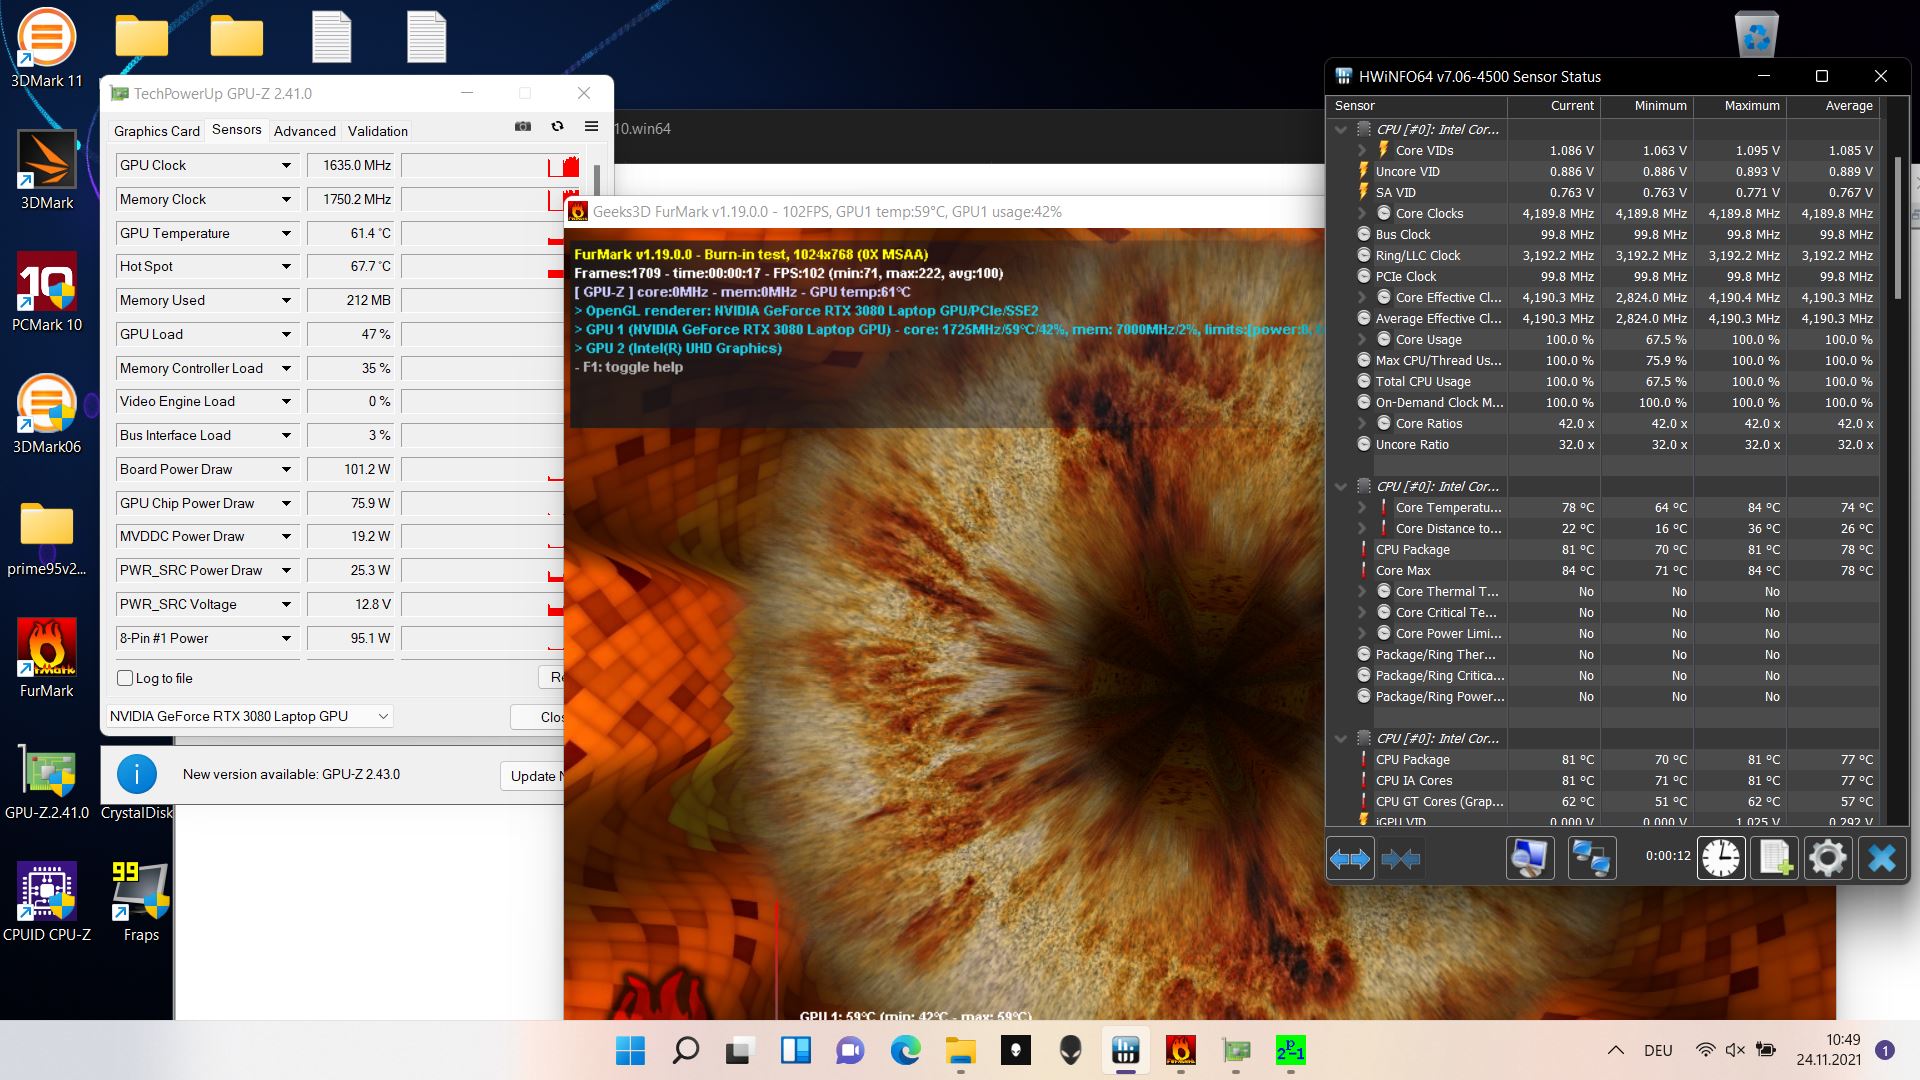
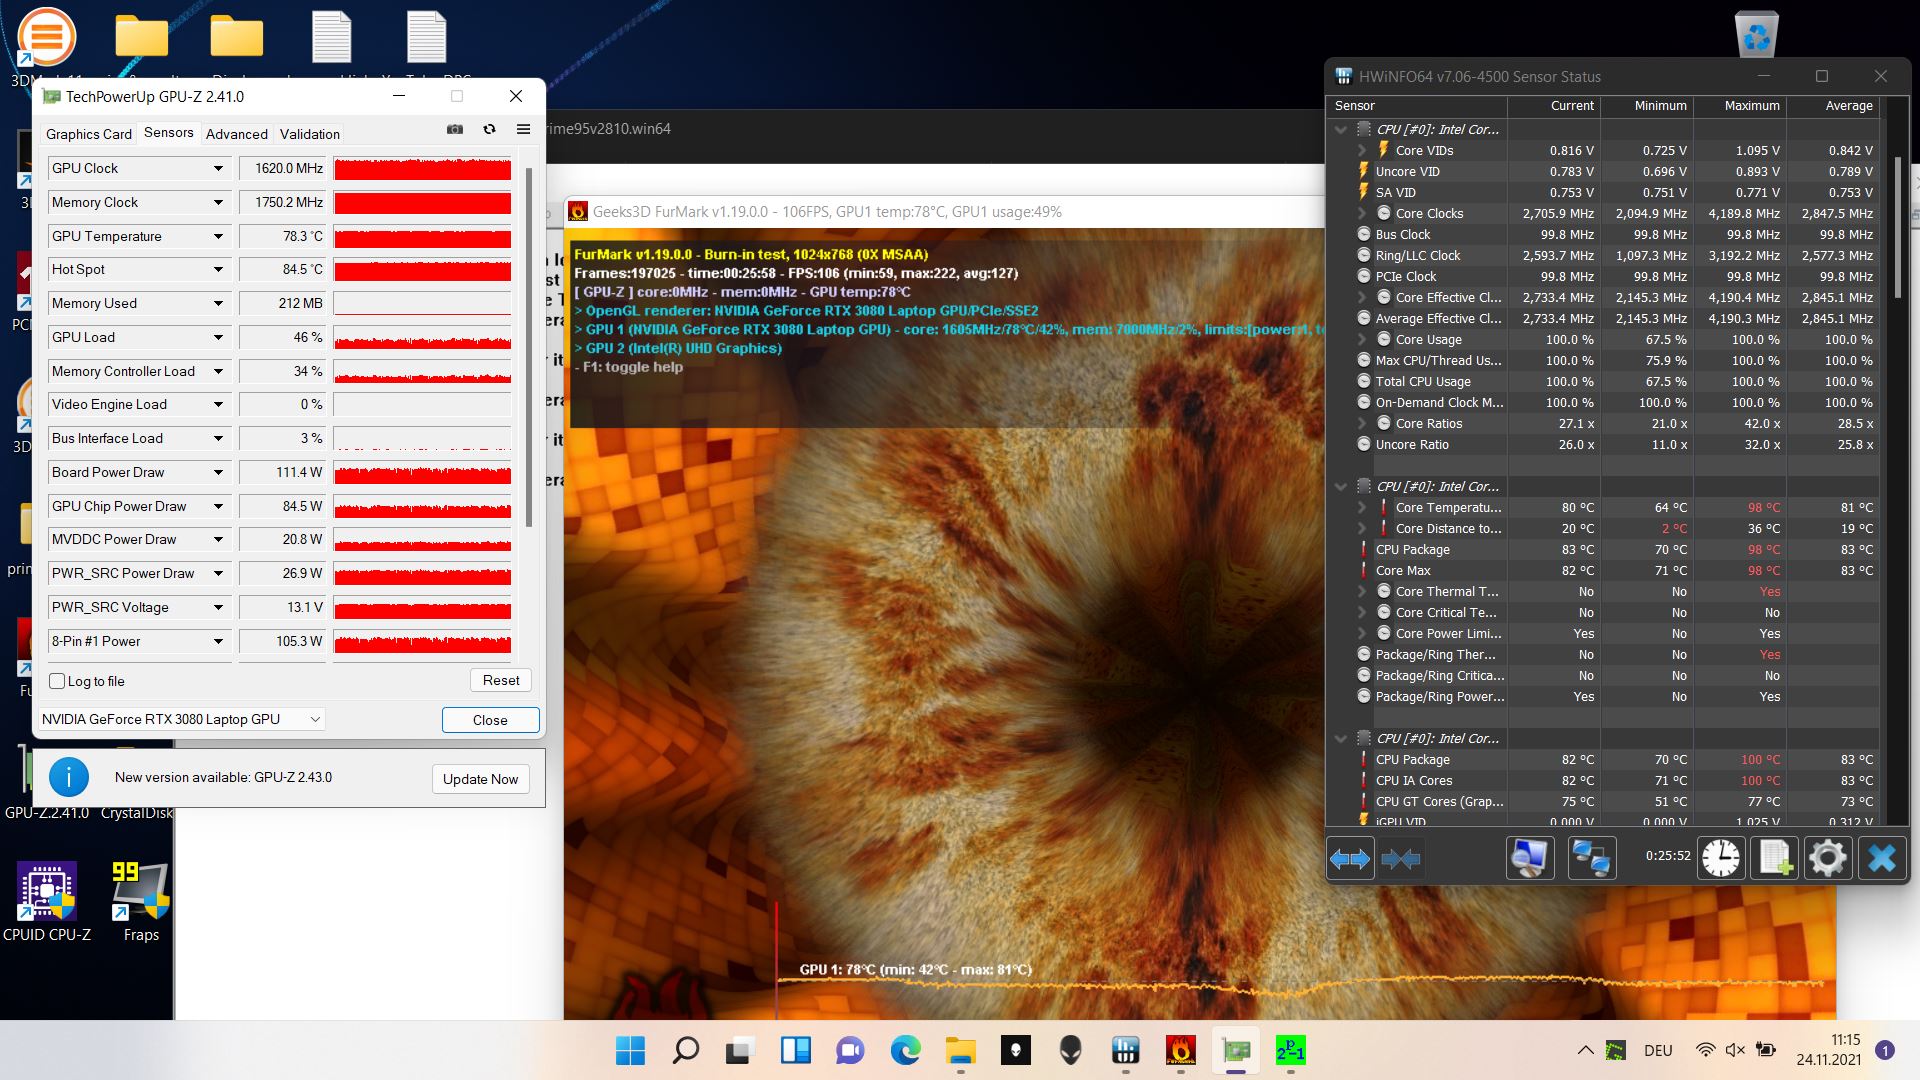
Teste de estresse
No teste de estresse de uma hora, os núcleos começam em torno de 4,2 GHz. Depois de menos de meia hora, a velocidade do relógio é de apenas 2,7 GHz. Até o final, ela varia ligeiramente entre 2,7 e 2,9 GHz
Durante este tempo, as temperaturas dos núcleos permanecem a 80 °C (176 °F), mesmo que possam aumentar temporariamente até 98 °C (208 °F), o que provoca estrangulamento térmico
Ao mesmo tempo, a velocidade do relógio da GPU varia entre 1,3 e 1,7 GHz durante todo o teste. Sua temperatura fica em torno de 77 °C (171 °F), e o ponto quente atinge cerca de 85 °C (185 °F)
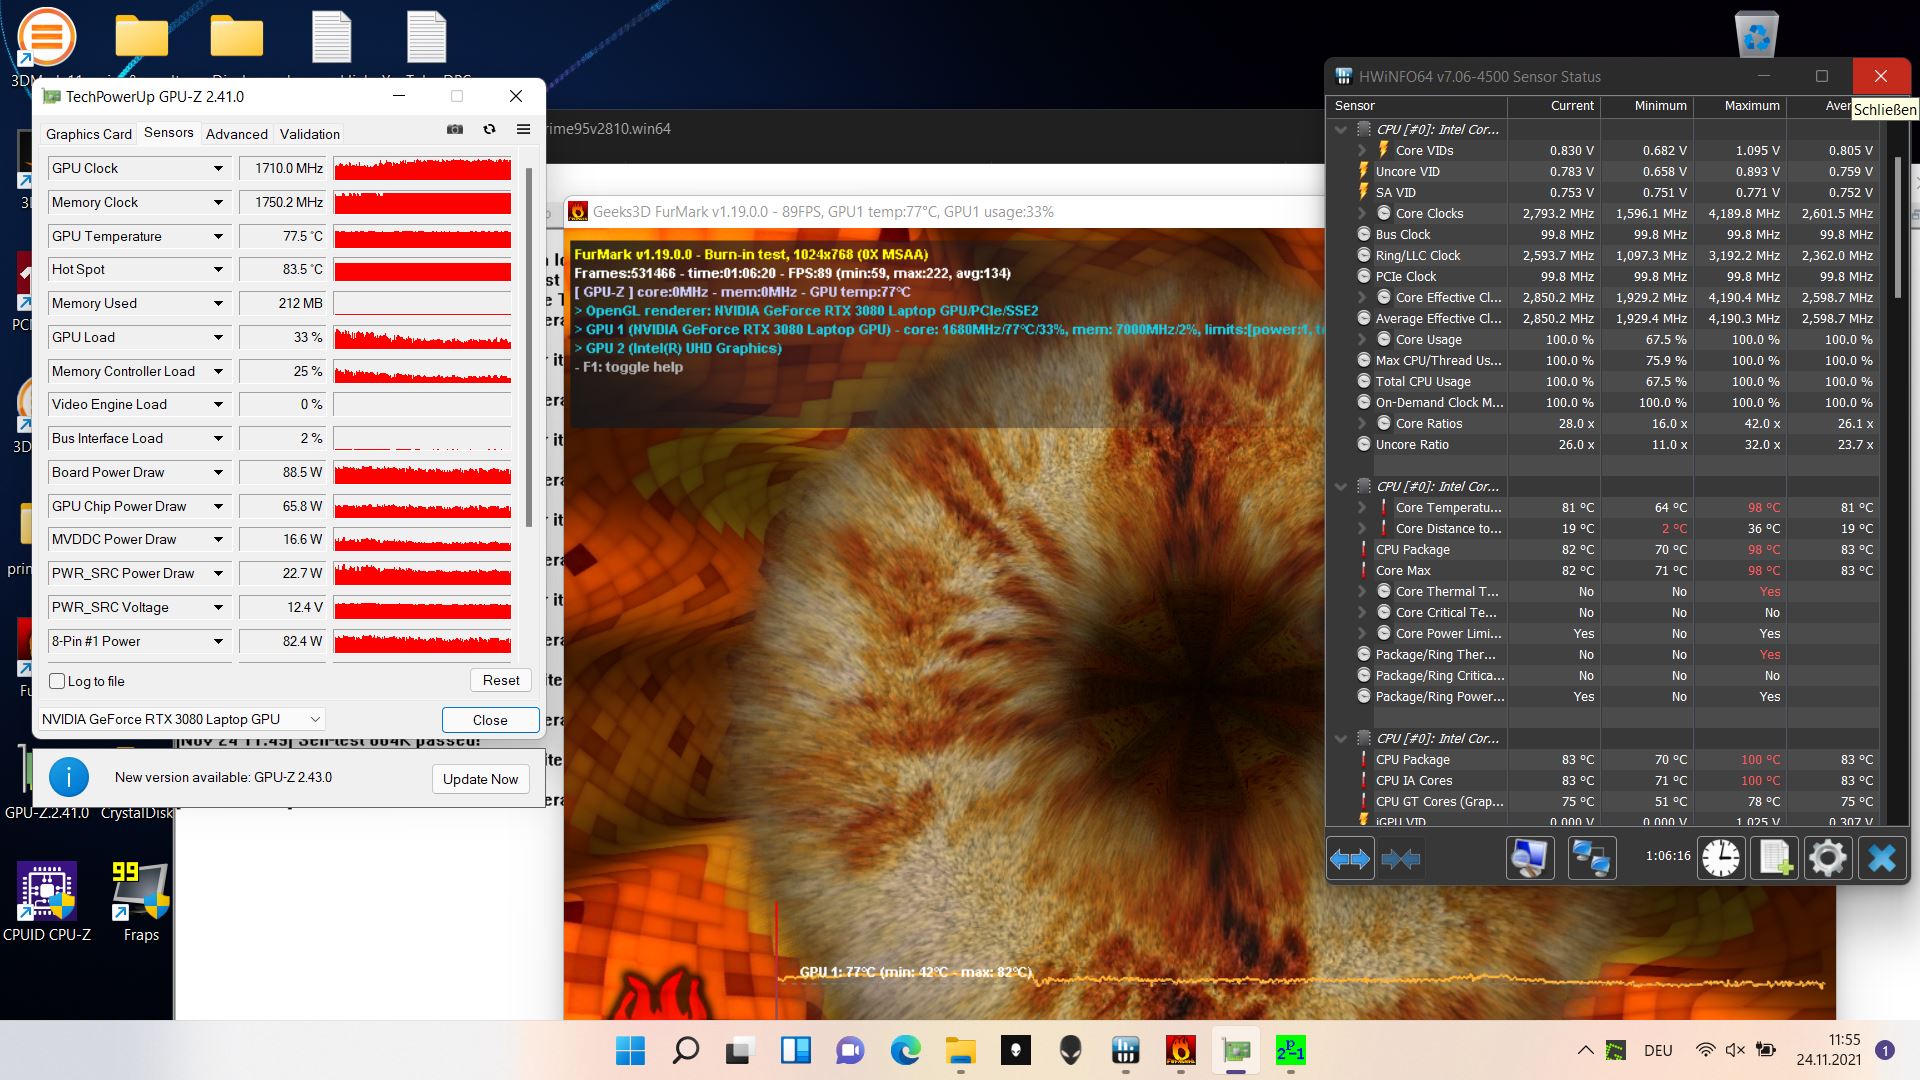
| RelógioCPU (GHz) | RelógioGPU (MHz) | Temperaturamédiada CPU (°C) | Temperaturamédiada GPU (°C) | |
| Prime95 + FurMark Stress | 2.7 - 2.9 | 1.395 - 1.710 | 80 | 77 |
Oradores
O aspecto positivo é que o orador pode se tornar bastante alto. Mas, infelizmente, falta-lhes o baixo, e também ouvimos modelos melhores em termos de meio. Por causa dos ventiladores altos, o uso de fones de ouvido é recomendado de qualquer forma, e há uma porta de áudio para isso
Alienware m15 R6, i7-11800H RTX 3080 análise de áudio
(+) | os alto-falantes podem tocar relativamente alto (###valor### dB)
Graves 100 - 315Hz
(-) | quase nenhum baixo - em média 23.8% menor que a mediana
(±) | a linearidade dos graves é média (12% delta para a frequência anterior)
Médios 400 - 2.000 Hz
(±) | médios mais altos - em média 8.3% maior que a mediana
(+) | médios são lineares (6.9% delta para frequência anterior)
Altos 2 - 16 kHz
(+) | agudos equilibrados - apenas 3.3% longe da mediana
(+) | os máximos são lineares (5.7% delta da frequência anterior)
Geral 100 - 16.000 Hz
(±) | a linearidade do som geral é média (21.8% diferença em relação à mediana)
Comparado com a mesma classe
» 78% de todos os dispositivos testados nesta classe foram melhores, 6% semelhantes, 16% piores
» O melhor teve um delta de 6%, a média foi 18%, o pior foi 132%
Comparado com todos os dispositivos testados
» 62% de todos os dispositivos testados foram melhores, 7% semelhantes, 31% piores
» O melhor teve um delta de 4%, a média foi 23%, o pior foi 134%
Apple MacBook 12 (Early 2016) 1.1 GHz análise de áudio
(+) | os alto-falantes podem tocar relativamente alto (###valor### dB)
Graves 100 - 315Hz
(±) | graves reduzidos - em média 11.3% menor que a mediana
(±) | a linearidade dos graves é média (14.2% delta para a frequência anterior)
Médios 400 - 2.000 Hz
(+) | médios equilibrados - apenas 2.4% longe da mediana
(+) | médios são lineares (5.5% delta para frequência anterior)
Altos 2 - 16 kHz
(+) | agudos equilibrados - apenas 2% longe da mediana
(+) | os máximos são lineares (4.5% delta da frequência anterior)
Geral 100 - 16.000 Hz
(+) | o som geral é linear (10.2% diferença em relação à mediana)
Comparado com a mesma classe
» 7% de todos os dispositivos testados nesta classe foram melhores, 2% semelhantes, 90% piores
» O melhor teve um delta de 5%, a média foi 18%, o pior foi 53%
Comparado com todos os dispositivos testados
» 5% de todos os dispositivos testados foram melhores, 1% semelhantes, 94% piores
» O melhor teve um delta de 4%, a média foi 23%, o pior foi 134%
Gerenciamento de energia - Mais eficiente do que o predecessor
Consumo de energia
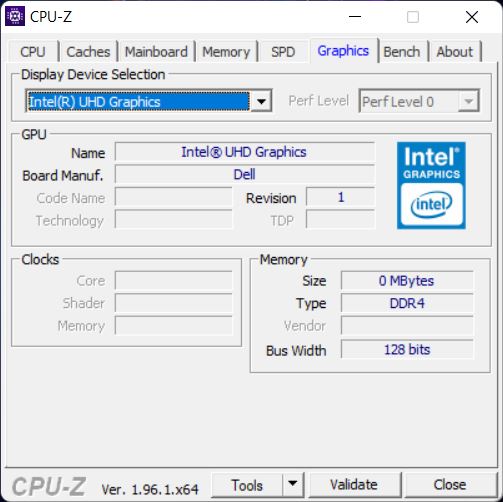
Graças à chaveamento Optimus, o R6 agora consome visivelmente menos energia que o R4, pelo menos durante a operação ociosa. Sob carga, o consumo também é ligeiramente inferior ao dos concorrentes, mas isto também pode ser devido ao menor desempenho 3D.
Medimos um consumo máximo de pouco mais de 200 watts, o que significa que a fonte de alimentação de 240 watts deve ser suficiente para poder recarregar o dispositivo de forma confiável em qualquer situação
| Ocioso | |
| Carga |
|
Key:
min: | |
| Alienware m15 R6, i7-11800H RTX 3080 i7-11800H, GeForce RTX 3080 Laptop GPU, Samsung PM9A1 MZVL21T0HCLR, IPS, 1920x1080, 15.6" | Alienware m15 R5 Ryzen Edition R7 5800H, GeForce RTX 3060 Laptop GPU, Toshiba KBG40ZNS512G NVMe, IPS, 1920x1080, 15.6" | Alienware m15 R4 RTX 3080 i9-10980HK, GeForce RTX 3080 Laptop GPU, 2x WDC PC SN730 SDBPNTY-512G (RAID 0), IPS, 1920x1080, 15.6" | Aorus 15P YD i7-11800H, GeForce RTX 3080 Laptop GPU, Samsung PM9A1 MZVL21T0HCLR, IPS, 1920x1080, 15.6" | Schenker XMG Neo 15 Tiger Lake i7-11800H, GeForce RTX 3080 Laptop GPU, Samsung SSD 980 Pro 1TB MZ-V8P1T0BW, IPS, 2560x1440, 15.6" | Razer Blade 15 Advanced (Mid 2021) i7-11800H, GeForce RTX 3080 Laptop GPU, SSSTC CA6-8D1024, IPS, 1920x1080, 15.6" | Média NVIDIA GeForce RTX 3080 Laptop GPU | Média da turma Gaming | |
|---|---|---|---|---|---|---|---|---|
| Power Consumption | 4% | -70% | -29% | -0% | -18% | -24% | -6% | |
| Idle Minimum * (Watt) | 14 | 11 21% | 37 -164% | 23 -64% | 15 -7% | 19.5 -39% | 19.8 ? -41% | 13 ? 7% |
| Idle Average * (Watt) | 18 | 14 22% | 40 -122% | 25 -39% | 17 6% | 23.3 -29% | 24.3 ? -35% | 19 ? -6% |
| Idle Maximum * (Watt) | 29 | 25 14% | 53 -83% | 35 -21% | 22 24% | 40.1 -38% | 33.3 ? -15% | 24.6 ? 15% |
| Load Average * (Watt) | 93 | 123 -32% | 121 -30% | 101 -9% | 101 -9% | 98.9 -6% | 108.1 ? -16% | 110.7 ? -19% |
| Witcher 3 ultra * (Watt) | 190 | 176 7% | 193 -2% | 190 -0% | 195 -3% | 174 8% | ||
| Load Maximum * (Watt) | 203 | 226 -11% | 246 -21% | 280 -38% | 230 -13% | 214 -5% | 230 ? -13% | 259 ? -28% |
* ... menor é melhor
Power Consumption The Witcher 3 / Stress Test
Power Consumption with an External Monitor
Vida útil da bateria
Apesar de sua GPU mais potente, o R6 não está equipado com uma bateria maior que o R5 com o RTX 3060. Entretanto, isto não parece ter necessariamente um efeito negativo sobre a vida útil da bateria, uma vez que durante nossos testes de bateria, a GPU integrada está ativa a maior parte do tempo. Os resultados dos testes WLAN estão ao nível dos olhos, e somente quando jogando vídeos, o R6 dura visivelmente menos tempo com 5,5 horas do que o R5 com 8 horas.
| Alienware m15 R6, i7-11800H RTX 3080 i7-11800H, GeForce RTX 3080 Laptop GPU, 84 Wh | Alienware m15 R5 Ryzen Edition R7 5800H, GeForce RTX 3060 Laptop GPU, 86 Wh | Alienware m15 R4 RTX 3080 i9-10980HK, GeForce RTX 3080 Laptop GPU, 86 Wh | Aorus 15P YD i7-11800H, GeForce RTX 3080 Laptop GPU, 99 Wh | Schenker XMG Neo 15 Tiger Lake i7-11800H, GeForce RTX 3080 Laptop GPU, 93 Wh | Razer Blade 15 Advanced (Mid 2021) i7-11800H, GeForce RTX 3080 Laptop GPU, 80 Wh | Média da turma Gaming | |
|---|---|---|---|---|---|---|---|
| Duração da bateria | 5% | -60% | 19% | 29% | 18% | 28% | |
| H.264 (h) | 5.6 | 8.8 57% | 1.9 -66% | 5.9 5% | 8.32 ? 49% | ||
| WiFi v1.3 (h) | 5 | 5.1 2% | 1.8 -64% | 5.3 6% | 5.6 12% | 5.9 18% | 7.11 ? 42% |
| Load (h) | 1.6 | 0.9 -44% | 0.8 -50% | 2.1 31% | 2.7 69% | 1.502 ? -6% | |
| Reader / Idle (h) | 14.7 | 7.5 | 8.27 ? | ||||
| Witcher 3 ultra (h) | 1.6 | 0.8 |
Pro
Contra
Veredicto - Por que tanto calor?
Em comparação com o R4, a atualização Tiger Lake torna o R6 principalmente mais eficiente e frugal, mas não necessariamente mais rápido. Mesmo que o desempenho da CPU tenha aumentado, o desempenho 3D diminuiu devido ao TGP mais baixo. Isto também reduz o consumo. Os modos de resfriamento parecem ter pouca influência no desempenho, e o RTX 3080 ainda não obtém uma alocação maior de energia.
O desempenho da CPU é comparável ao do Ryzen m15 R5. Além disso, há a vantagem do suporte do Thunderbolt. Mas, caso contrário, o R5 e o R6 são extremamente similares. Portanto, você deve escolher de acordo com o preço e o quão importante o Thunderbolt é para você.
O sistema de resfriamento ainda revela uma maior necessidade de otimização: Apesar do baixo consumo de energia do RTX 3080, as superfícies do Alienware ficam mais quentes do que na maioria dos concorrentes, alguns dos quais oferecem um desempenho 3D superior.
O m15 R6 é mais eficiente e frugal do que seu predecessor R4. No entanto, o RTX 3080 é aqui asfixiado, e as superfícies do Alienware ainda ficam muito quentes.
OAorus 15P YDproduz um desempenho minimamente superior enquanto permanece mais frio, mas também tem um consumo maior. OSchenker XMG Neo 15também oferece um desempenho 3D significativamente maior e também permanece mais frio. Além disso, oferece uma maior duração da bateria, mas, por outro lado, também é ainda mais alto.
Preço e Disponibilidade
Várias configurações do m15 R6 estão atualmente disponíveis no site Dell a partir de cerca de US$ 1200. A Amazônia oferece um produto de alta qualidade configuração por $1783
Alienware m15 R6, i7-11800H RTX 3080
- 11/25/2021 v7 (old)
Christian Hintze
Price comparison

