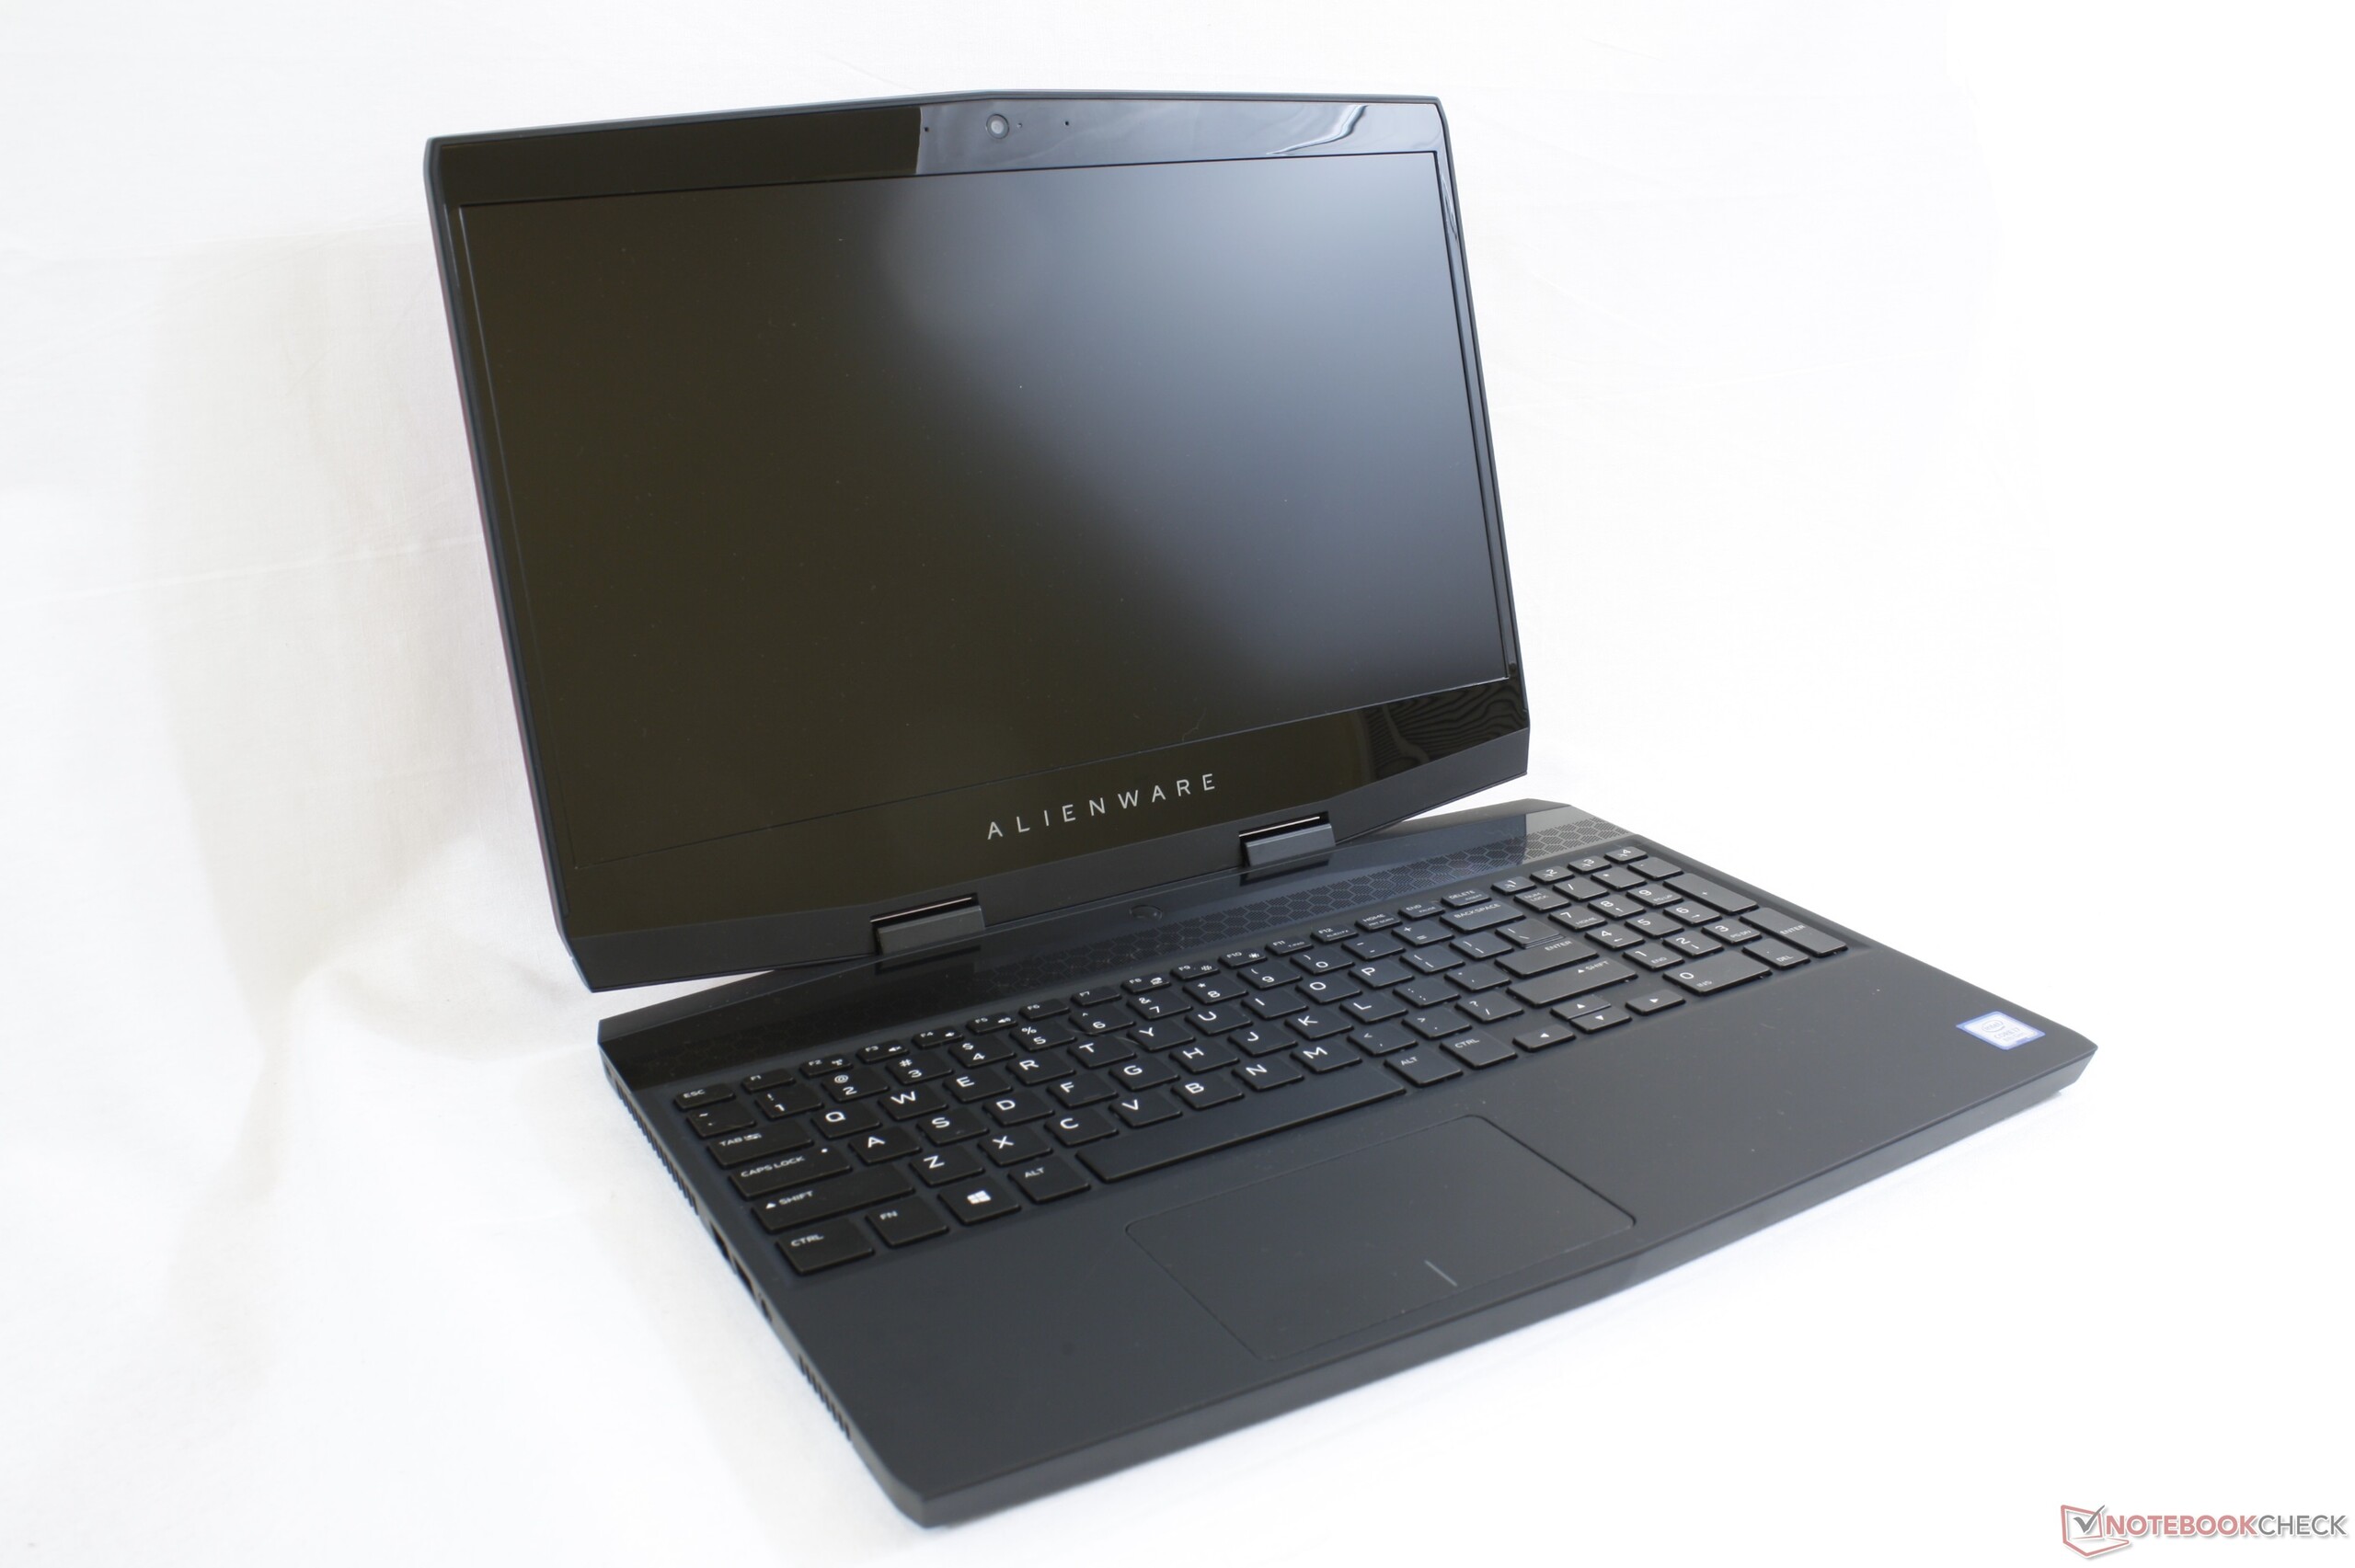
Breve Análise do Portátil Alienware m15 (i7-8750H, GTX 1070 Max-Q)
| |||||||||||||||||||||||||
iluminação: 86 %
iluminação com acumulador: 353.6 cd/m²
Contraste: 1179:1 (Preto: 0.3 cd/m²)
ΔE ColorChecker Calman: 4.55 | ∀{0.5-29.43 Ø4.71}
calibrated: 3.37
ΔE Greyscale Calman: 4.1 | ∀{0.09-98 Ø4.96}
88.9% sRGB (Argyll 1.6.3 3D)
57.9% AdobeRGB 1998 (Argyll 1.6.3 3D)
64.5% AdobeRGB 1998 (Argyll 3D)
89.4% sRGB (Argyll 3D)
63.5% Display P3 (Argyll 3D)
Gamma: 2.27
CCT: 7434 K
| Alienware m15 GTX 1070 Max-Q AU Optronics B156HAN, IPS, 15.6", 1920x1080 | Razer Blade 15 2018 LGD05C0, IPS, 15.6", 1920x1080 | Alienware 15 R4 LG Philips LP156WF6 (LGD0540), IPS, 15.6", 1920x1080 | MSI GS65 8RF-019DE Stealth Thin AU Optronics B156HAN08.0 (AUO80ED), IPS, 15.6", 1920x1080 | Asus Zephyrus S GX531GS AU Optronics B156HAN08.2 (AUO82ED), IPS, 15.6", 1920x1080 | Gigabyte Aero 15X v8 LGD05C0, IPS, 15.6", 1920x1080 | |
|---|---|---|---|---|---|---|
| Display | 3% | -1% | 4% | 3% | 2% | |
| Display P3 Coverage (%) | 63.5 | 64.3 1% | 65.7 3% | 66.2 4% | 66.7 5% | 63.6 0% |
| sRGB Coverage (%) | 89.4 | 93.7 5% | 86.4 -3% | 92.1 3% | 91.2 2% | 93.8 5% |
| AdobeRGB 1998 Coverage (%) | 64.5 | 65.5 2% | 63.1 -2% | 67.2 4% | 66.7 3% | 64.9 1% |
| Response Times | 2% | -105% | -3% | 38% | 7% | |
| Response Time Grey 50% / Grey 80% * (ms) | 18 ? | 17.2 ? 4% | 37.6 ? -109% | 17.6 ? 2% | 7.4 ? 59% | 16.8 ? 7% |
| Response Time Black / White * (ms) | 12 ? | 12 ? -0% | 24 ? -100% | 12.8 ? -7% | 10 ? 17% | 11.2 ? 7% |
| PWM Frequency (Hz) | 20830 ? | |||||
| Screen | 10% | -7% | 16% | 13% | 18% | |
| Brightness middle (cd/m²) | 353.6 | 290 -18% | 292 -17% | 254 -28% | 294 -17% | 313 -11% |
| Brightness (cd/m²) | 346 | 281 -19% | 278 -20% | 262 -24% | 275 -21% | 300 -13% |
| Brightness Distribution (%) | 86 | 82 -5% | 88 2% | 89 3% | 84 -2% | 78 -9% |
| Black Level * (cd/m²) | 0.3 | 0.3 -0% | 0.29 3% | 0.22 27% | 0.24 20% | 0.33 -10% |
| Contrast (:1) | 1179 | 967 -18% | 1007 -15% | 1155 -2% | 1225 4% | 948 -20% |
| Colorchecker dE 2000 * | 4.55 | 2.85 37% | 4.9 -8% | 2.37 48% | 2.57 44% | 1.29 72% |
| Colorchecker dE 2000 max. * | 7.91 | 6.27 21% | 10.08 -27% | 4.71 40% | 4.88 38% | 2.04 74% |
| Colorchecker dE 2000 calibrated * | 3.37 | 1.39 59% | 2.27 33% | 1.84 45% | 2.14 36% | |
| Greyscale dE 2000 * | 4.1 | 2.4 41% | 4.89 -19% | 1.58 61% | 2.41 41% | 0.69 83% |
| Gamma | 2.27 97% | 2.34 94% | 2.36 93% | 2.48 89% | 2.5 88% | 2.43 91% |
| CCT | 7434 87% | 6718 97% | 7598 86% | 6785 96% | 6370 102% | 6550 99% |
| Color Space (Percent of AdobeRGB 1998) (%) | 57.9 | 60 4% | 56 -3% | 60 4% | 59 2% | 60 4% |
| Color Space (Percent of sRGB) (%) | 88.9 | 94 6% | 86 -3% | 92 3% | 91 2% | 94 6% |
| Média Total (Programa/Configurações) | 5% /
8% | -38% /
-18% | 6% /
11% | 18% /
15% | 9% /
13% |
* ... menor é melhor
Exibir tempos de resposta
| ↔ Tempo de resposta preto para branco | ||
|---|---|---|
| 12 ms ... ascensão ↗ e queda ↘ combinadas | ↗ 6.8 ms ascensão | 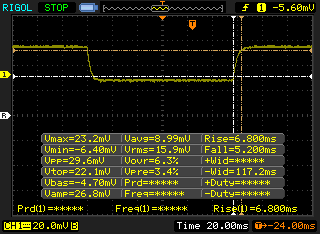 |
| ↘ 5.2 ms queda | ||
| A tela mostra boas taxas de resposta em nossos testes, mas pode ser muito lenta para jogadores competitivos. Em comparação, todos os dispositivos testados variam de 0.1 (mínimo) a 240 (máximo) ms. » 32 % de todos os dispositivos são melhores. Isso significa que o tempo de resposta medido é melhor que a média de todos os dispositivos testados (19.8 ms). | ||
| ↔ Tempo de resposta 50% cinza a 80% cinza | ||
| 18 ms ... ascensão ↗ e queda ↘ combinadas | ↗ 9.2 ms ascensão | 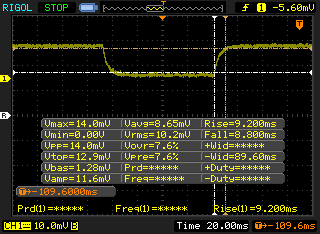 |
| ↘ 8.8 ms queda | ||
| A tela mostra boas taxas de resposta em nossos testes, mas pode ser muito lenta para jogadores competitivos. Em comparação, todos os dispositivos testados variam de 0.165 (mínimo) a 636 (máximo) ms. » 32 % de todos os dispositivos são melhores. Isso significa que o tempo de resposta medido é melhor que a média de todos os dispositivos testados (31 ms). | ||
Cintilação da tela / PWM (modulação por largura de pulso)
| Tela tremeluzindo / PWM não detectado | 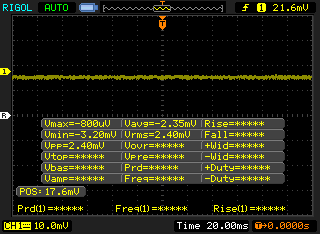 | ||
[pwm_comparison] Em comparação: 52 % de todos os dispositivos testados não usam PWM para escurecer a tela. Se PWM foi detectado, uma média de 7757 (mínimo: 5 - máximo: 343500) Hz foi medida. | |||
| Cinebench R10 | |
| Rendering Multiple CPUs 32Bit | |
| Schenker XMG Ultra 17 Coffee Lake Refresh | |
| Média Intel Core i7-8750H (29664 - 35307, n=25) | |
| Dell Inspiron 15 7000 7577 4K | |
| Dell XPS 13 9370 i7 UHD | |
| Rendering Single 32Bit | |
| Schenker XMG Ultra 17 Coffee Lake Refresh | |
| Média Intel Core i7-8750H (6236 - 6645, n=25) | |
| Dell XPS 13 9370 i7 UHD | |
| Dell Inspiron 15 7000 7577 4K | |
| wPrime 2.10 - 1024m | |
| Dell XPS 13 9370 i7 UHD | |
| Dell Inspiron 15 7000 7577 4K | |
| Média Intel Core i7-8750H (125.5 - 180.5, n=6) | |
* ... menor é melhor
| PCMark 8 Home Score Accelerated v2 | 4418 pontos | |
| PCMark 8 Work Score Accelerated v2 | 5407 pontos | |
| PCMark 10 Score | 5426 pontos | |
Ajuda | ||
| Alienware m15 GTX 1070 Max-Q Toshiba XG5 KXG50ZNV512G | Razer Blade 15 2018 Samsung PM961 NVMe MZVLW512HMJP | Alienware 15 R4 Toshiba XG5 KXG50ZNV256G | MSI GS65 Stealth Thin 8RE-051US Samsung SSD PM981 MZVLB256HAHQ | Asus Zephyrus S GX531GS WDC PC SN520 SDAPNUW-512G | Gigabyte Aero 15X v8 Toshiba NVMe THNSN5512GPU7 | |
|---|---|---|---|---|---|---|
| AS SSD | 42% | -24% | 0% | 21% | -0% | |
| Seq Read (MB/s) | 1967 | 2376 21% | 2441 24% | 1612 -18% | 903 -54% | 2213 13% |
| Seq Write (MB/s) | 1135 | 1521 34% | 300.4 -74% | 1475 30% | 1261 11% | 1163 2% |
| 4K Read (MB/s) | 29.17 | 46.45 59% | 32.87 13% | 43.09 48% | 40.02 37% | 23.36 -20% |
| 4K Write (MB/s) | 93.4 | 93.6 0% | 94.8 1% | 83.8 -10% | 103.6 11% | 80.4 -14% |
| 4K-64 Read (MB/s) | 995 | 1300 31% | 437.4 -56% | 611 -39% | 1030 4% | 847 -15% |
| 4K-64 Write (MB/s) | 656 | 1204 84% | 310.5 -53% | 570 -13% | 1285 96% | 742 13% |
| Access Time Read * (ms) | 0.116 | 0.051 56% | 0.116 -0% | 0.071 39% | 0.129 -11% | 0.119 -3% |
| Access Time Write * (ms) | 0.063 | 0.038 40% | 0.053 16% | 0.045 29% | 0.036 43% | 0.046 27% |
| Score Read (Points) | 1221 | 1584 30% | 714 -42% | 815 -33% | 1161 -5% | 1092 -11% |
| Score Write (Points) | 862 | 1450 68% | 435 -50% | 802 -7% | 1515 76% | 939 9% |
| Score Total (Points) | 2667 | 3806 43% | 1416 -47% | 2039 -24% | 3294 24% | 2536 -5% |
| Copy ISO MB/s (MB/s) | 642 | |||||
| Copy Program MB/s (MB/s) | 431.5 | |||||
| Copy Game MB/s (MB/s) | 706 | |||||
| CrystalDiskMark 5.2 / 6 | 49% | -10% | 49% | 36% | 36% | |
| Write 4K (MB/s) | 107.4 | 94.2 -12% | 96.8 -10% | 91.5 -15% | 98.2 -9% | 94.4 -12% |
| Read 4K (MB/s) | 42.91 | 39.23 -9% | 35.73 -17% | 40.41 -6% | 39.43 -8% | 37.65 -12% |
| Write Seq (MB/s) | 467.5 | 1483 217% | 362.3 -23% | 1528 227% | 1386 196% | 1335 186% |
| Read Seq (MB/s) | 2335 | 1371 -41% | 2110 -10% | 1235 -47% | 1100 -53% | 1404 -40% |
| Write 4K Q32T1 (MB/s) | 289.7 | 296.2 2% | 318.6 10% | 259 -11% | 270.3 -7% | 268.6 -7% |
| Read 4K Q32T1 (MB/s) | 354.4 | 342.5 -3% | 366.7 3% | 364.9 3% | 340.3 -4% | 332.8 -6% |
| Write Seq Q32T1 (MB/s) | 460.9 | 1527 231% | 351 -24% | 1529 232% | 1454 215% | 1375 198% |
| Read Seq Q32T1 (MB/s) | 3111 | 3280 5% | 2813 -10% | 3472 12% | 1681 -46% | 2627 -16% |
| Média Total (Programa/Configurações) | 46% /
45% | -17% /
-18% | 25% /
21% | 29% /
27% | 18% /
15% |
* ... menor é melhor

| 3DMark 11 Performance | 17408 pontos | |
| 3DMark Cloud Gate Standard Score | 35886 pontos | |
| 3DMark Fire Strike Score | 14119 pontos | |
Ajuda | ||
| baixo | média | alto | ultra | |
|---|---|---|---|---|
| BioShock Infinite (2013) | 291.6 | 247.6 | 242.8 | 136.8 |
| The Witcher 3 (2015) | 254 | 173.9 | 101.6 | 54.2 |
| Rise of the Tomb Raider (2016) | 217.5 | 166 | 102.8 | 85.1 |
| Alienware m15 GTX 1070 Max-Q GeForce GTX 1070 Max-Q, i7-8750H, Toshiba XG5 KXG50ZNV512G | Razer Blade 15 2018 GeForce GTX 1070 Max-Q, i7-8750H, Samsung PM961 NVMe MZVLW512HMJP | Alienware 15 R4 GeForce GTX 1070 Mobile, i9-8950HK, Toshiba XG5 KXG50ZNV256G | MSI GS65 Stealth Thin 8RE-051US GeForce GTX 1060 Mobile, i7-8750H, Samsung SSD PM981 MZVLB256HAHQ | Asus Zephyrus S GX531GS GeForce GTX 1070 Max-Q, i7-8750H, WDC PC SN520 SDAPNUW-512G | Gigabyte Aero 15X v8 GeForce GTX 1070 Max-Q, i7-8750H, Toshiba NVMe THNSN5512GPU7 | |
|---|---|---|---|---|---|---|
| Noise | -6% | -19% | 1% | -14% | -10% | |
| desligado / ambiente * (dB) | 28.6 | 29 -1% | 29 -1% | 28.4 1% | 29 -1% | 29 -1% |
| Idle Minimum * (dB) | 28.6 | 29 -1% | 32 -12% | 28.4 1% | 33 -15% | 30 -5% |
| Idle Average * (dB) | 28.6 | 30 -5% | 33 -15% | 28.4 1% | 34 -19% | 31 -8% |
| Idle Maximum * (dB) | 28.6 | 38 -33% | 50 -75% | 29.6 -3% | 40 -40% | 35 -22% |
| Load Average * (dB) | 40.8 | 46 -13% | 50 -23% | 43.5 -7% | 47 -15% | 49 -20% |
| Witcher 3 ultra * (dB) | 49.6 | 49 1% | 51 -3% | 45.7 8% | 51 -3% | 51 -3% |
| Load Maximum * (dB) | 49.6 | 46 7% | 51 -3% | 45.7 8% | 53 -7% | 54 -9% |
* ... menor é melhor
Barulho
| Ocioso |
| 28.6 / 28.6 / 28.6 dB |
| Carga |
| 40.8 / 49.6 dB |
 | ||
30 dB silencioso 40 dB(A) audível 50 dB(A) ruidosamente alto |
||
min: | ||
(-) A temperatura máxima no lado superior é 52 °C / 126 F, em comparação com a média de 40.4 °C / 105 F , variando de 21.2 a 68.8 °C para a classe Gaming.
(-) A parte inferior aquece até um máximo de 55.6 °C / 132 F, em comparação com a média de 43.2 °C / 110 F
(+) Em uso inativo, a temperatura média para o lado superior é 27.6 °C / 82 F, em comparação com a média do dispositivo de 33.9 °C / ### class_avg_f### F.
(-) Jogando The Witcher 3, a temperatura média para o lado superior é 38.5 °C / 101 F, em comparação com a média do dispositivo de 33.9 °C / ## #class_avg_f### F.
(+) Os apoios para as mãos e o touchpad são mais frios que a temperatura da pele, com um máximo de 30.6 °C / 87.1 F e, portanto, são frios ao toque.
(±) A temperatura média da área do apoio para as mãos de dispositivos semelhantes foi 28.8 °C / 83.8 F (-1.8 °C / -3.3 F).
Alienware m15 GTX 1070 Max-Q análise de áudio
(±) | o volume do alto-falante é médio, mas bom (###valor### dB)
Graves 100 - 315Hz
(-) | quase nenhum baixo - em média 19.7% menor que a mediana
(±) | a linearidade dos graves é média (10.8% delta para a frequência anterior)
Médios 400 - 2.000 Hz
(±) | médios mais altos - em média 8.5% maior que a mediana
(±) | a linearidade dos médios é média (11.6% delta para frequência anterior)
Altos 2 - 16 kHz
(+) | agudos equilibrados - apenas 2.5% longe da mediana
(±) | a linearidade dos máximos é média (8.5% delta para frequência anterior)
Geral 100 - 16.000 Hz
(±) | a linearidade do som geral é média (24.7% diferença em relação à mediana)
Comparado com a mesma classe
» 89% de todos os dispositivos testados nesta classe foram melhores, 4% semelhantes, 8% piores
» O melhor teve um delta de 6%, a média foi 18%, o pior foi 132%
Comparado com todos os dispositivos testados
» 75% de todos os dispositivos testados foram melhores, 5% semelhantes, 19% piores
» O melhor teve um delta de 4%, a média foi 23%, o pior foi 134%
Apple MacBook 12 (Early 2016) 1.1 GHz análise de áudio
(+) | os alto-falantes podem tocar relativamente alto (###valor### dB)
Graves 100 - 315Hz
(±) | graves reduzidos - em média 11.3% menor que a mediana
(±) | a linearidade dos graves é média (14.2% delta para a frequência anterior)
Médios 400 - 2.000 Hz
(+) | médios equilibrados - apenas 2.4% longe da mediana
(+) | médios são lineares (5.5% delta para frequência anterior)
Altos 2 - 16 kHz
(+) | agudos equilibrados - apenas 2% longe da mediana
(+) | os máximos são lineares (4.5% delta da frequência anterior)
Geral 100 - 16.000 Hz
(+) | o som geral é linear (10.2% diferença em relação à mediana)
Comparado com a mesma classe
» 7% de todos os dispositivos testados nesta classe foram melhores, 2% semelhantes, 90% piores
» O melhor teve um delta de 5%, a média foi 18%, o pior foi 53%
Comparado com todos os dispositivos testados
» 5% de todos os dispositivos testados foram melhores, 1% semelhantes, 94% piores
» O melhor teve um delta de 4%, a média foi 23%, o pior foi 134%
| desligado | |
| Ocioso | |
| Carga |
|
Key:
min: | |
| Alienware m15 GTX 1070 Max-Q i7-8750H, GeForce GTX 1070 Max-Q, Toshiba XG5 KXG50ZNV512G, IPS, 1920x1080, 15.6" | Razer Blade 15 2018 i7-8750H, GeForce GTX 1070 Max-Q, Samsung PM961 NVMe MZVLW512HMJP, IPS, 1920x1080, 15.6" | Alienware 15 R4 i9-8950HK, GeForce GTX 1070 Mobile, Toshiba XG5 KXG50ZNV256G, IPS, 1920x1080, 15.6" | MSI GS65 Stealth Thin 8RE-051US i7-8750H, GeForce GTX 1060 Mobile, Samsung SSD PM981 MZVLB256HAHQ, IPS, 1920x1080, 15.6" | Asus Zephyrus S GX531GS i7-8750H, GeForce GTX 1070 Max-Q, WDC PC SN520 SDAPNUW-512G, IPS, 1920x1080, 15.6" | Alienware 15 R3 Max-Q i7-7820HK, GeForce GTX 1080 Max-Q, LiteOn CX2-8B256, IPS, 1920x1080, 15.6" | |
|---|---|---|---|---|---|---|
| Power Consumption | -25% | -77% | 1% | -52% | -71% | |
| Idle Minimum * (Watt) | 7.6 | 14 -84% | 23 -203% | 8.7 -14% | 17 -124% | 22 -189% |
| Idle Average * (Watt) | 13.8 | 17 -23% | 26 -88% | 13 6% | 20 -45% | 26 -88% |
| Idle Maximum * (Watt) | 14.6 | 21 -44% | 30 -105% | 14.3 2% | 29 -99% | 33 -126% |
| Load Average * (Watt) | 97.6 | 95 3% | 111 -14% | 107.4 -10% | 112 -15% | 86 12% |
| Witcher 3 ultra * (Watt) | 145.8 | 141 3% | 182 -25% | 129 12% | 152 -4% | 159 -9% |
| Load Maximum * (Watt) | 172.5 | 179 -4% | 222 -29% | 151.5 12% | 211 -22% | 215 -25% |
* ... menor é melhor
| Alienware m15 GTX 1070 Max-Q i7-8750H, GeForce GTX 1070 Max-Q, 90 Wh | Razer Blade 15 2018 i7-8750H, GeForce GTX 1070 Max-Q, 80 Wh | Alienware 15 R4 i9-8950HK, GeForce GTX 1070 Mobile, 99 Wh | MSI GS65 Stealth Thin 8RE-051US i7-8750H, GeForce GTX 1060 Mobile, 82 Wh | Asus Zephyrus S GX531GS i7-8750H, GeForce GTX 1070 Max-Q, 50 Wh | Gigabyte Aero 15X v8 i7-8750H, GeForce GTX 1070 Max-Q, 94.24 Wh | |
|---|---|---|---|---|---|---|
| Duração da bateria | -33% | -39% | -24% | -64% | 29% | |
| Reader / Idle (h) | 10.5 | 6.4 -39% | 6.2 -41% | 3.6 -66% | 12.7 21% | |
| WiFi v1.3 (h) | 7.7 | 5.4 -30% | 5.1 -34% | 6.2 -19% | 2.6 -66% | 8.6 12% |
| Load (h) | 1.7 | 1.2 -29% | 1 -41% | 1.2 -29% | 0.7 -59% | 2.6 53% |
Pro
Contra
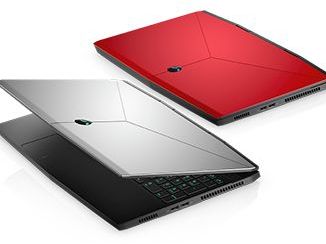
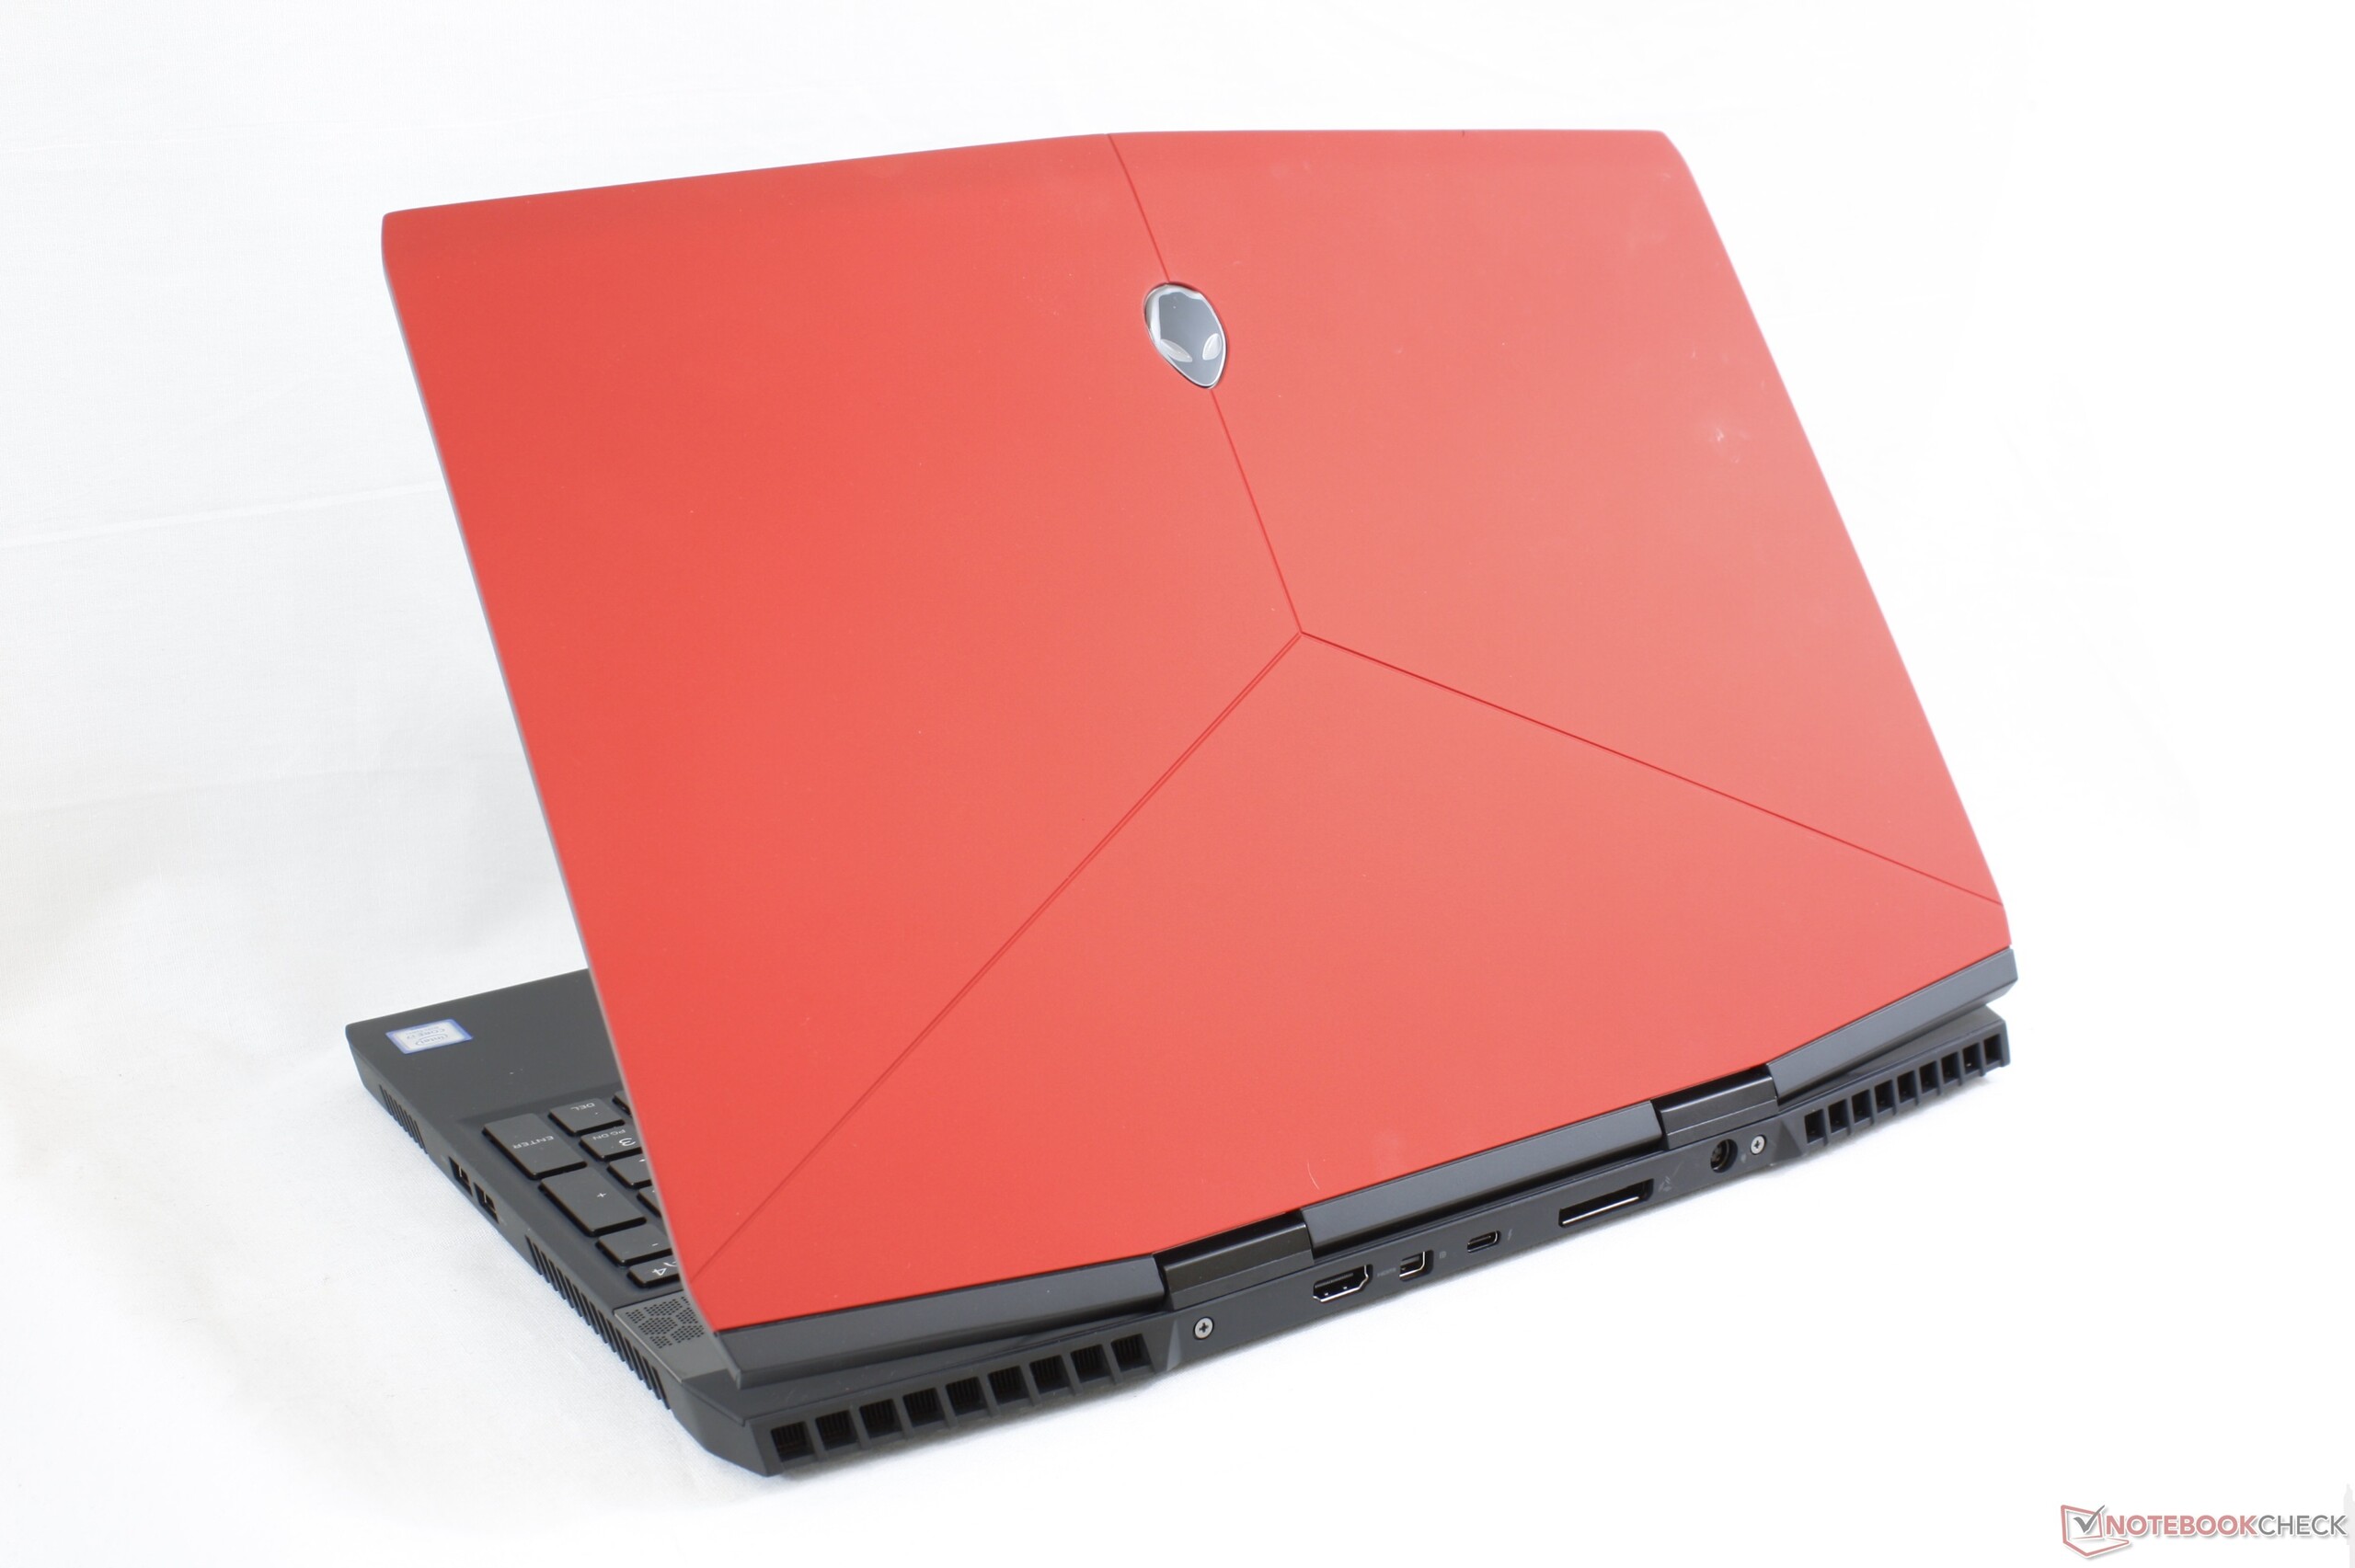
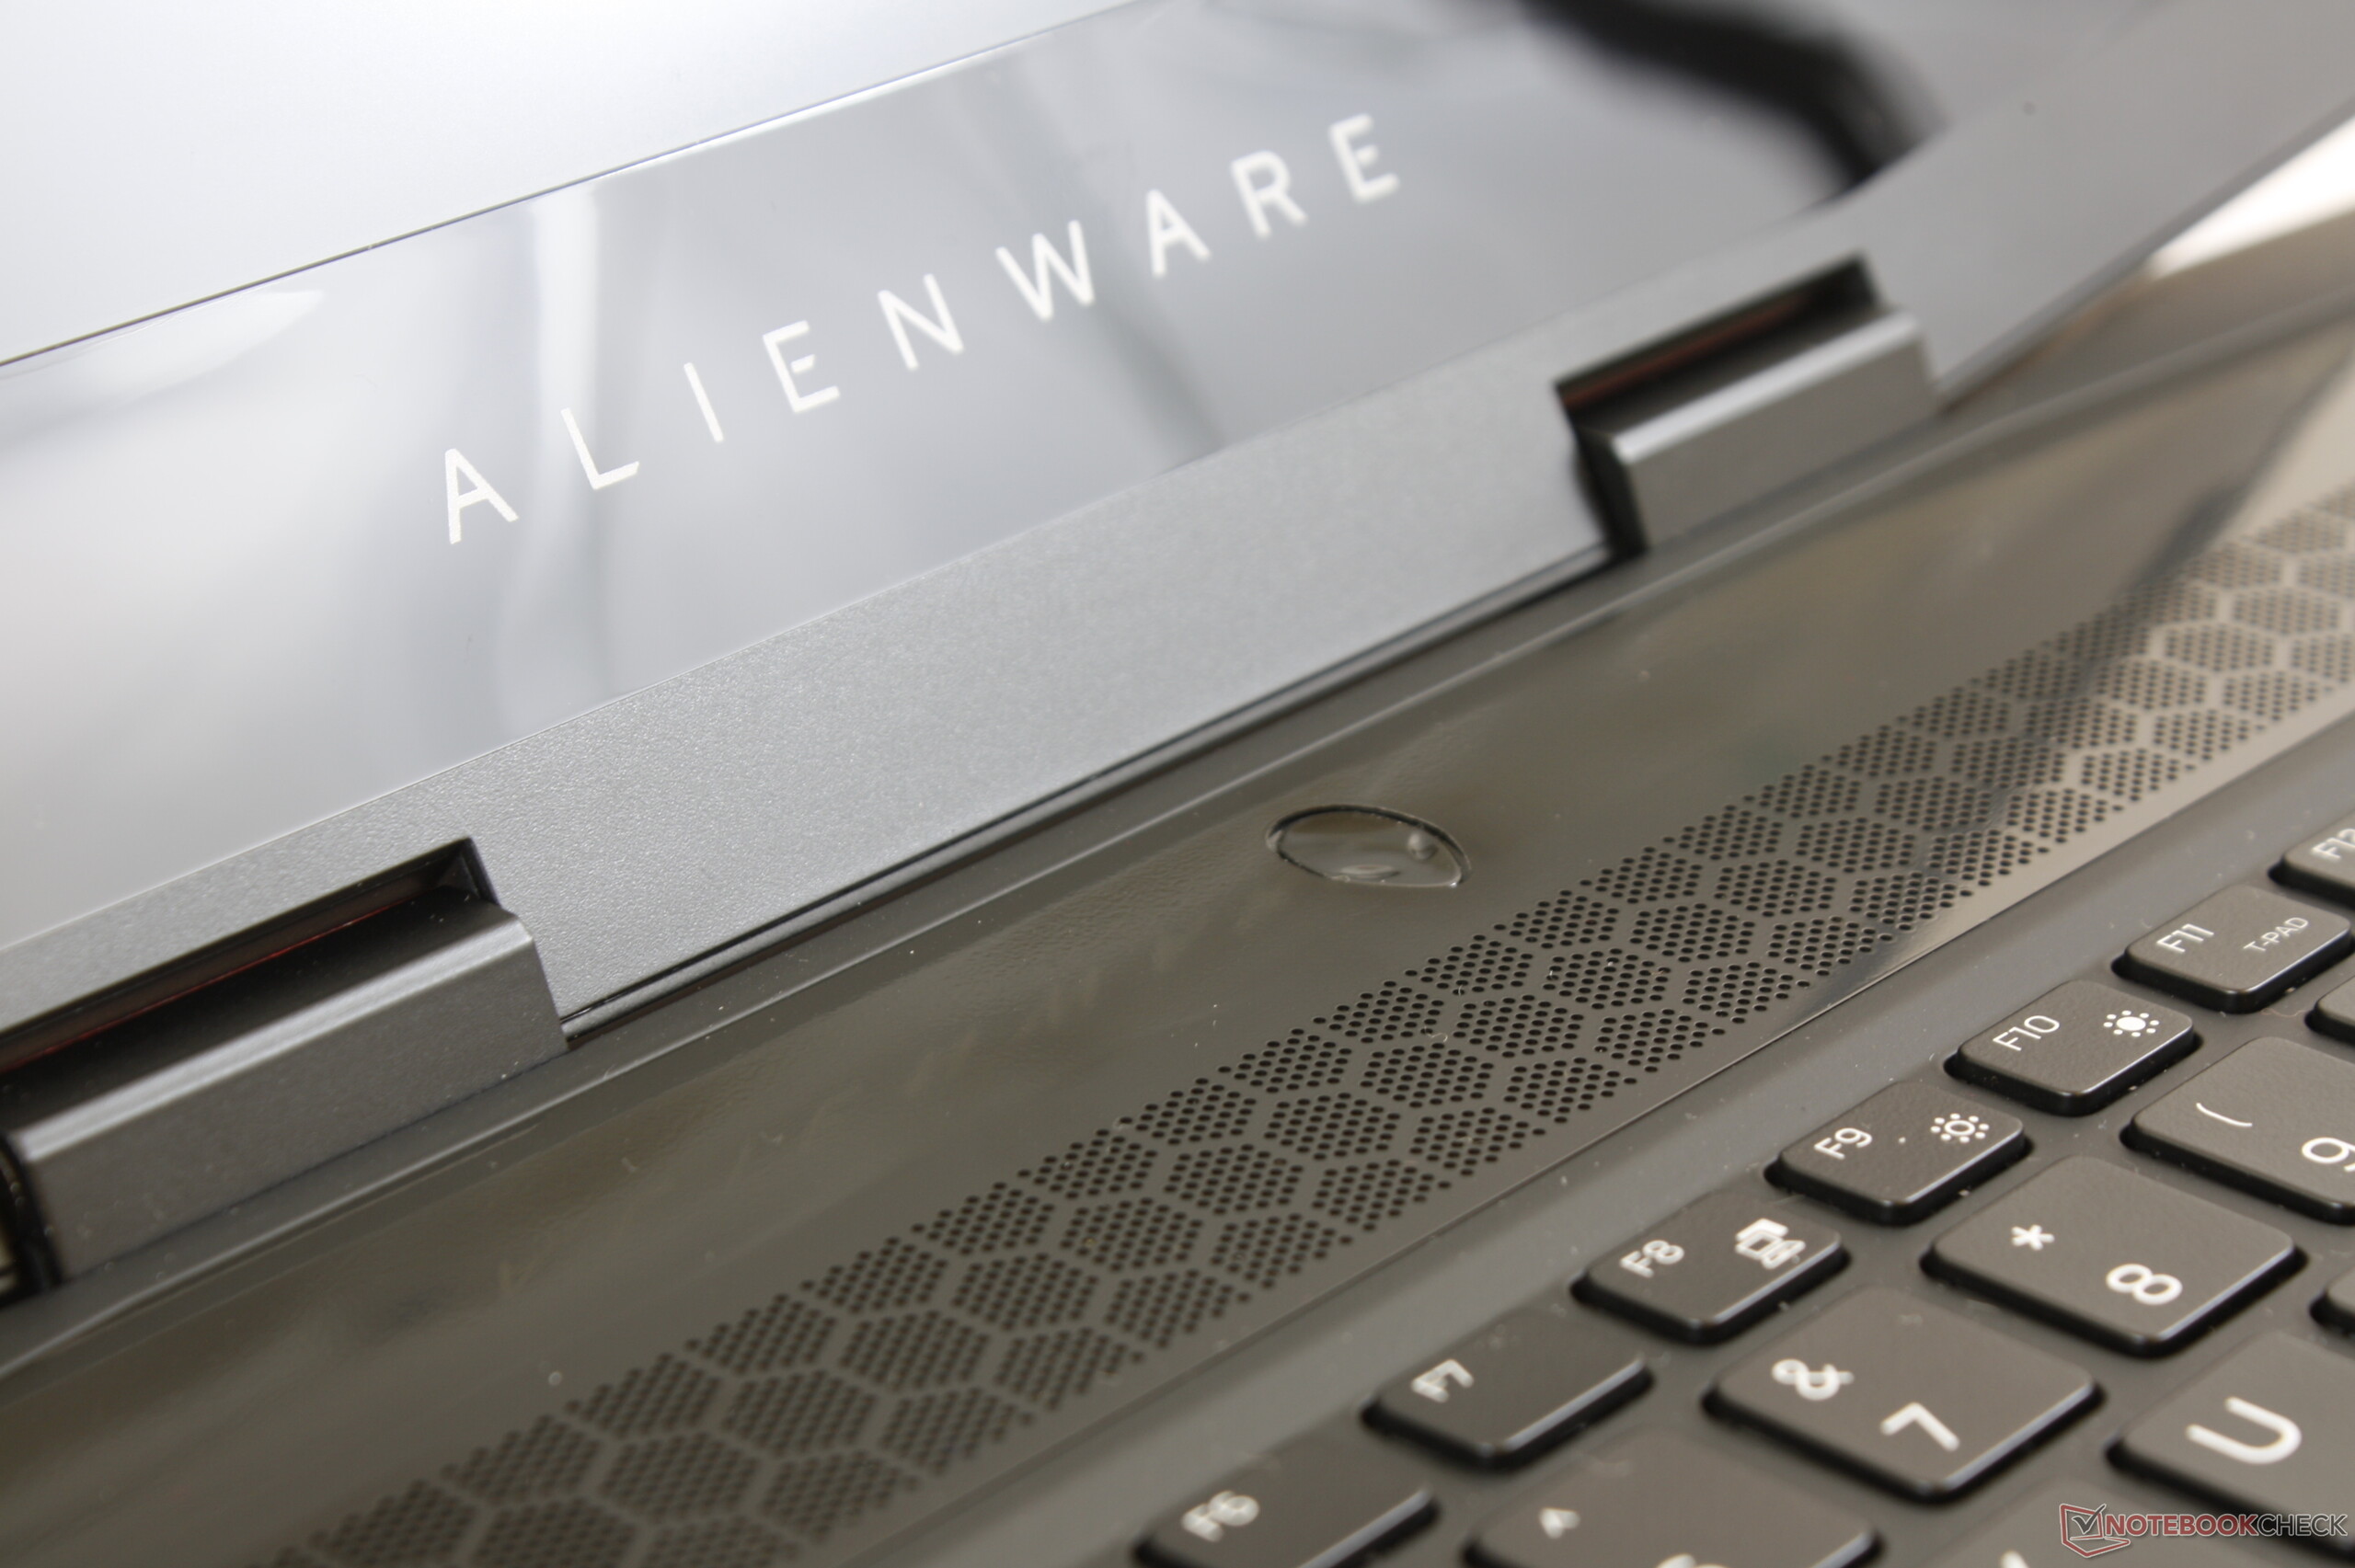
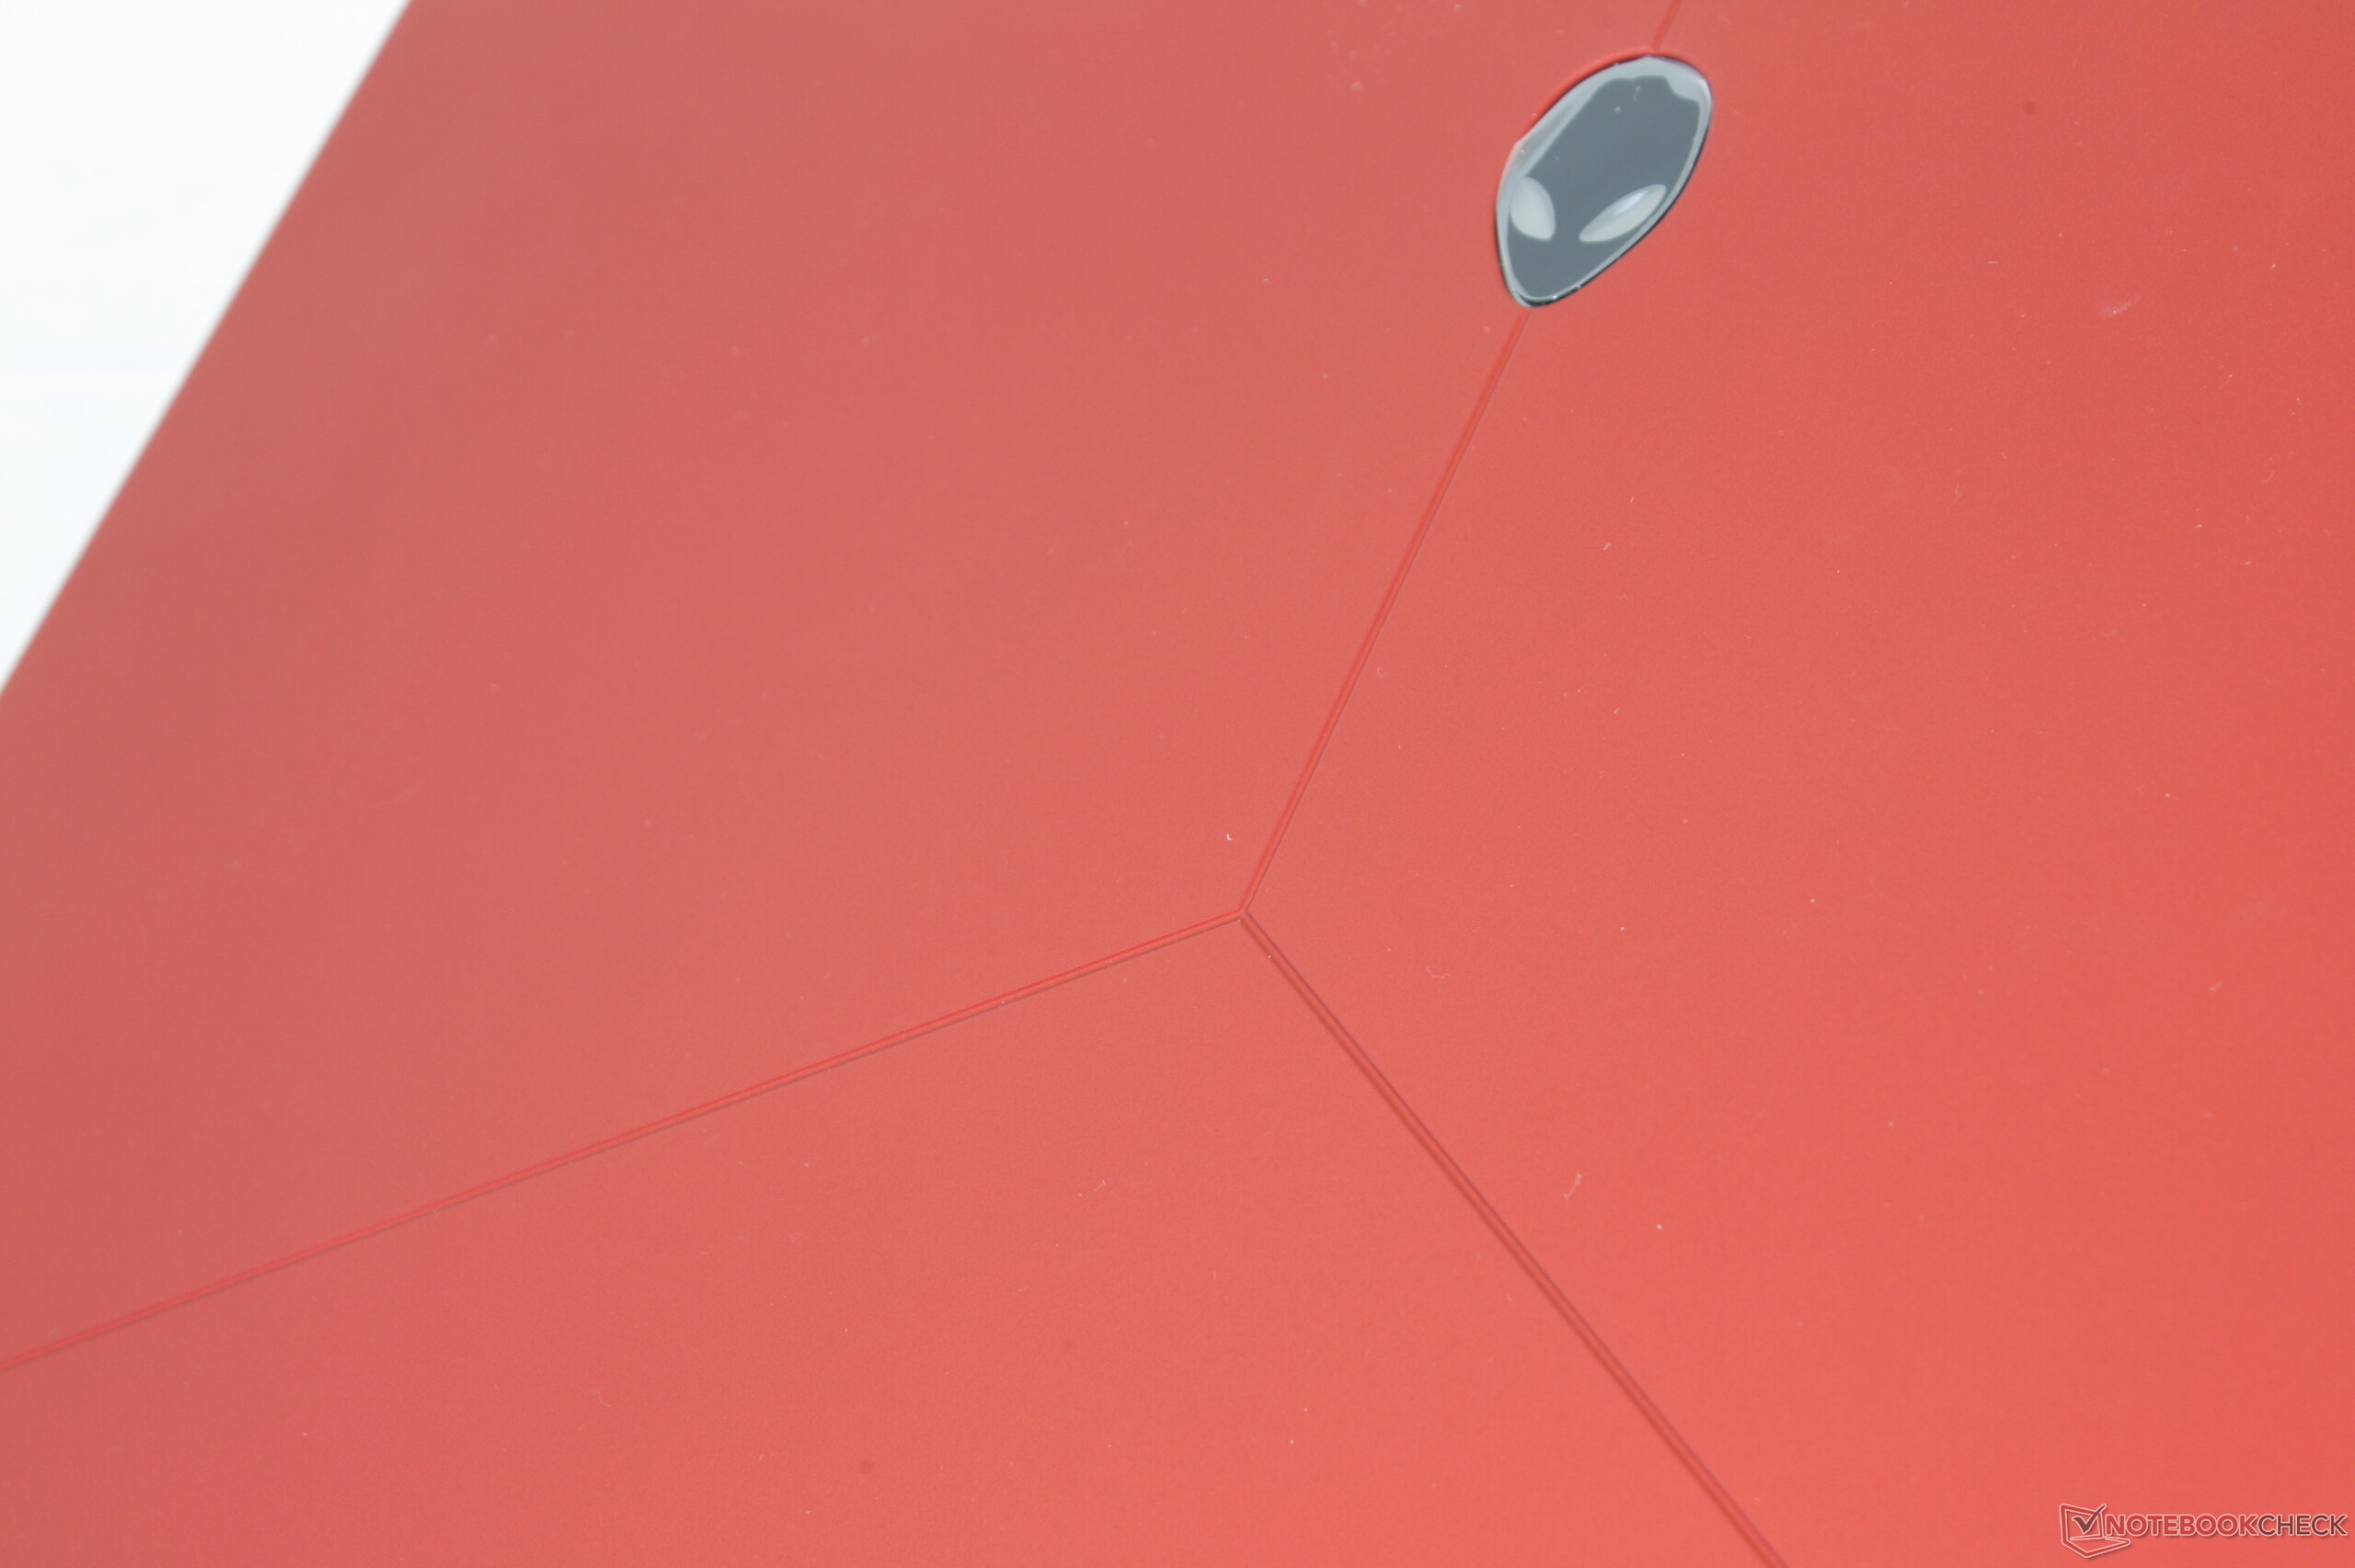
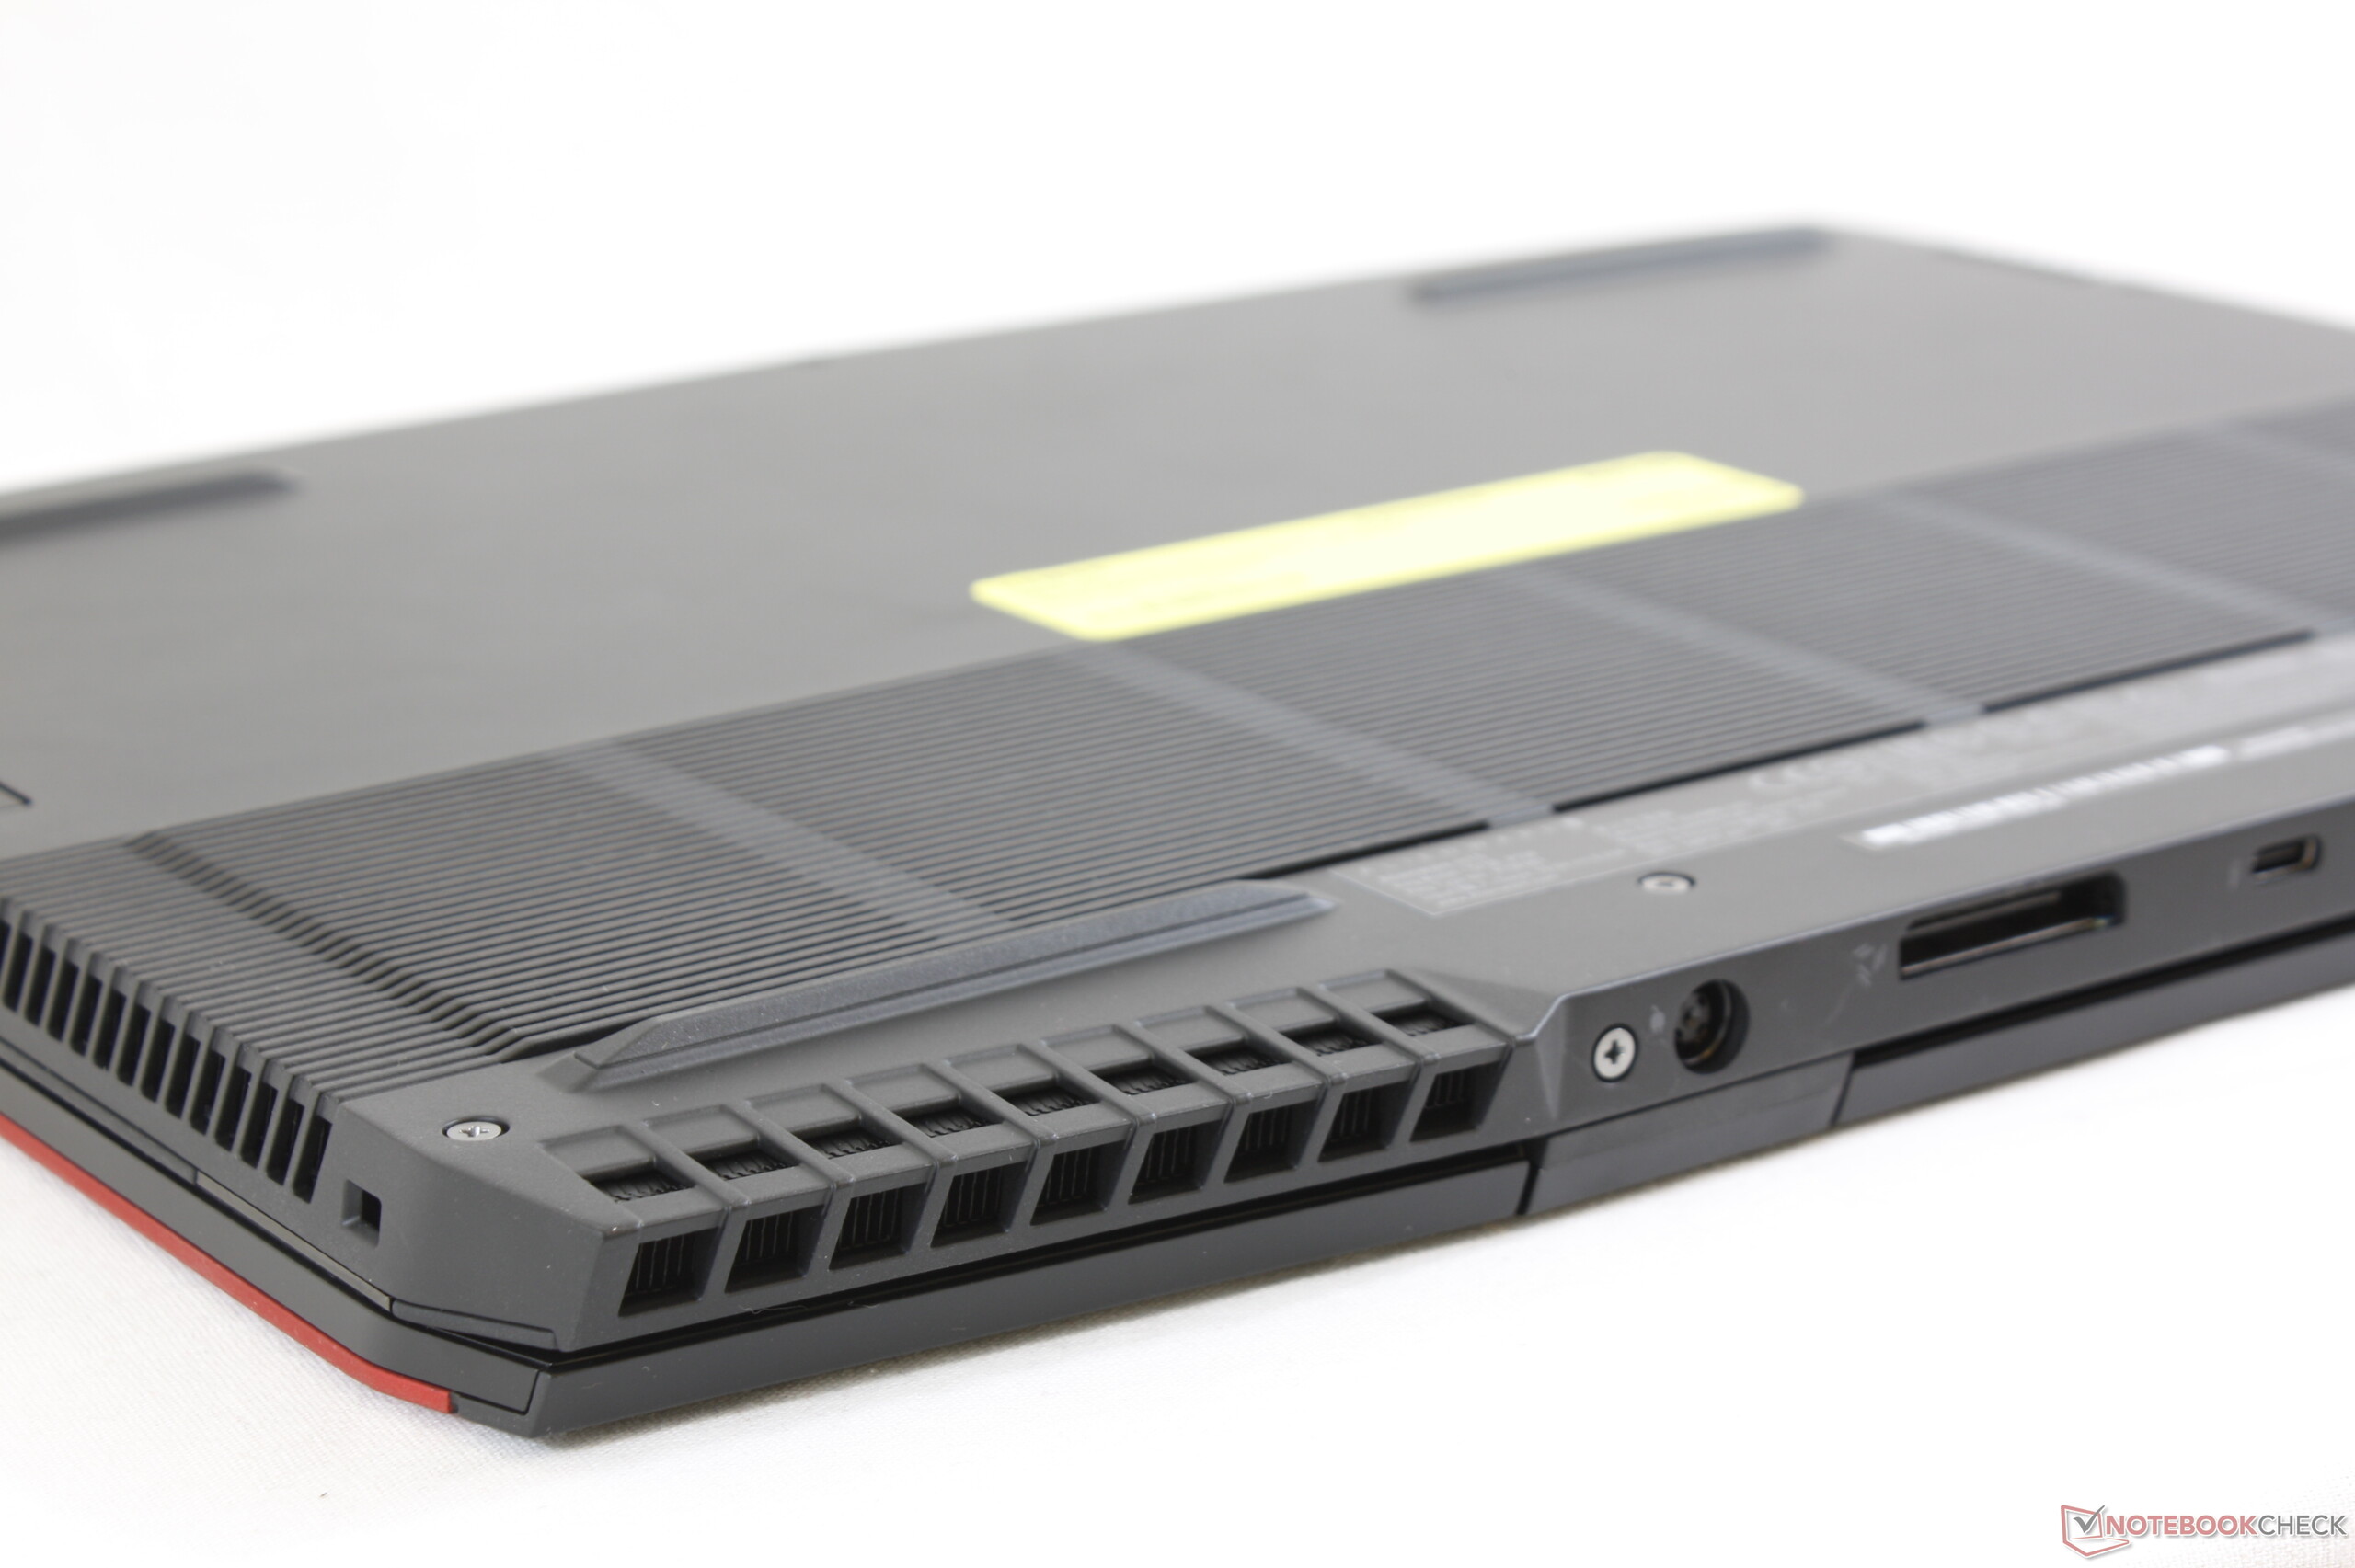
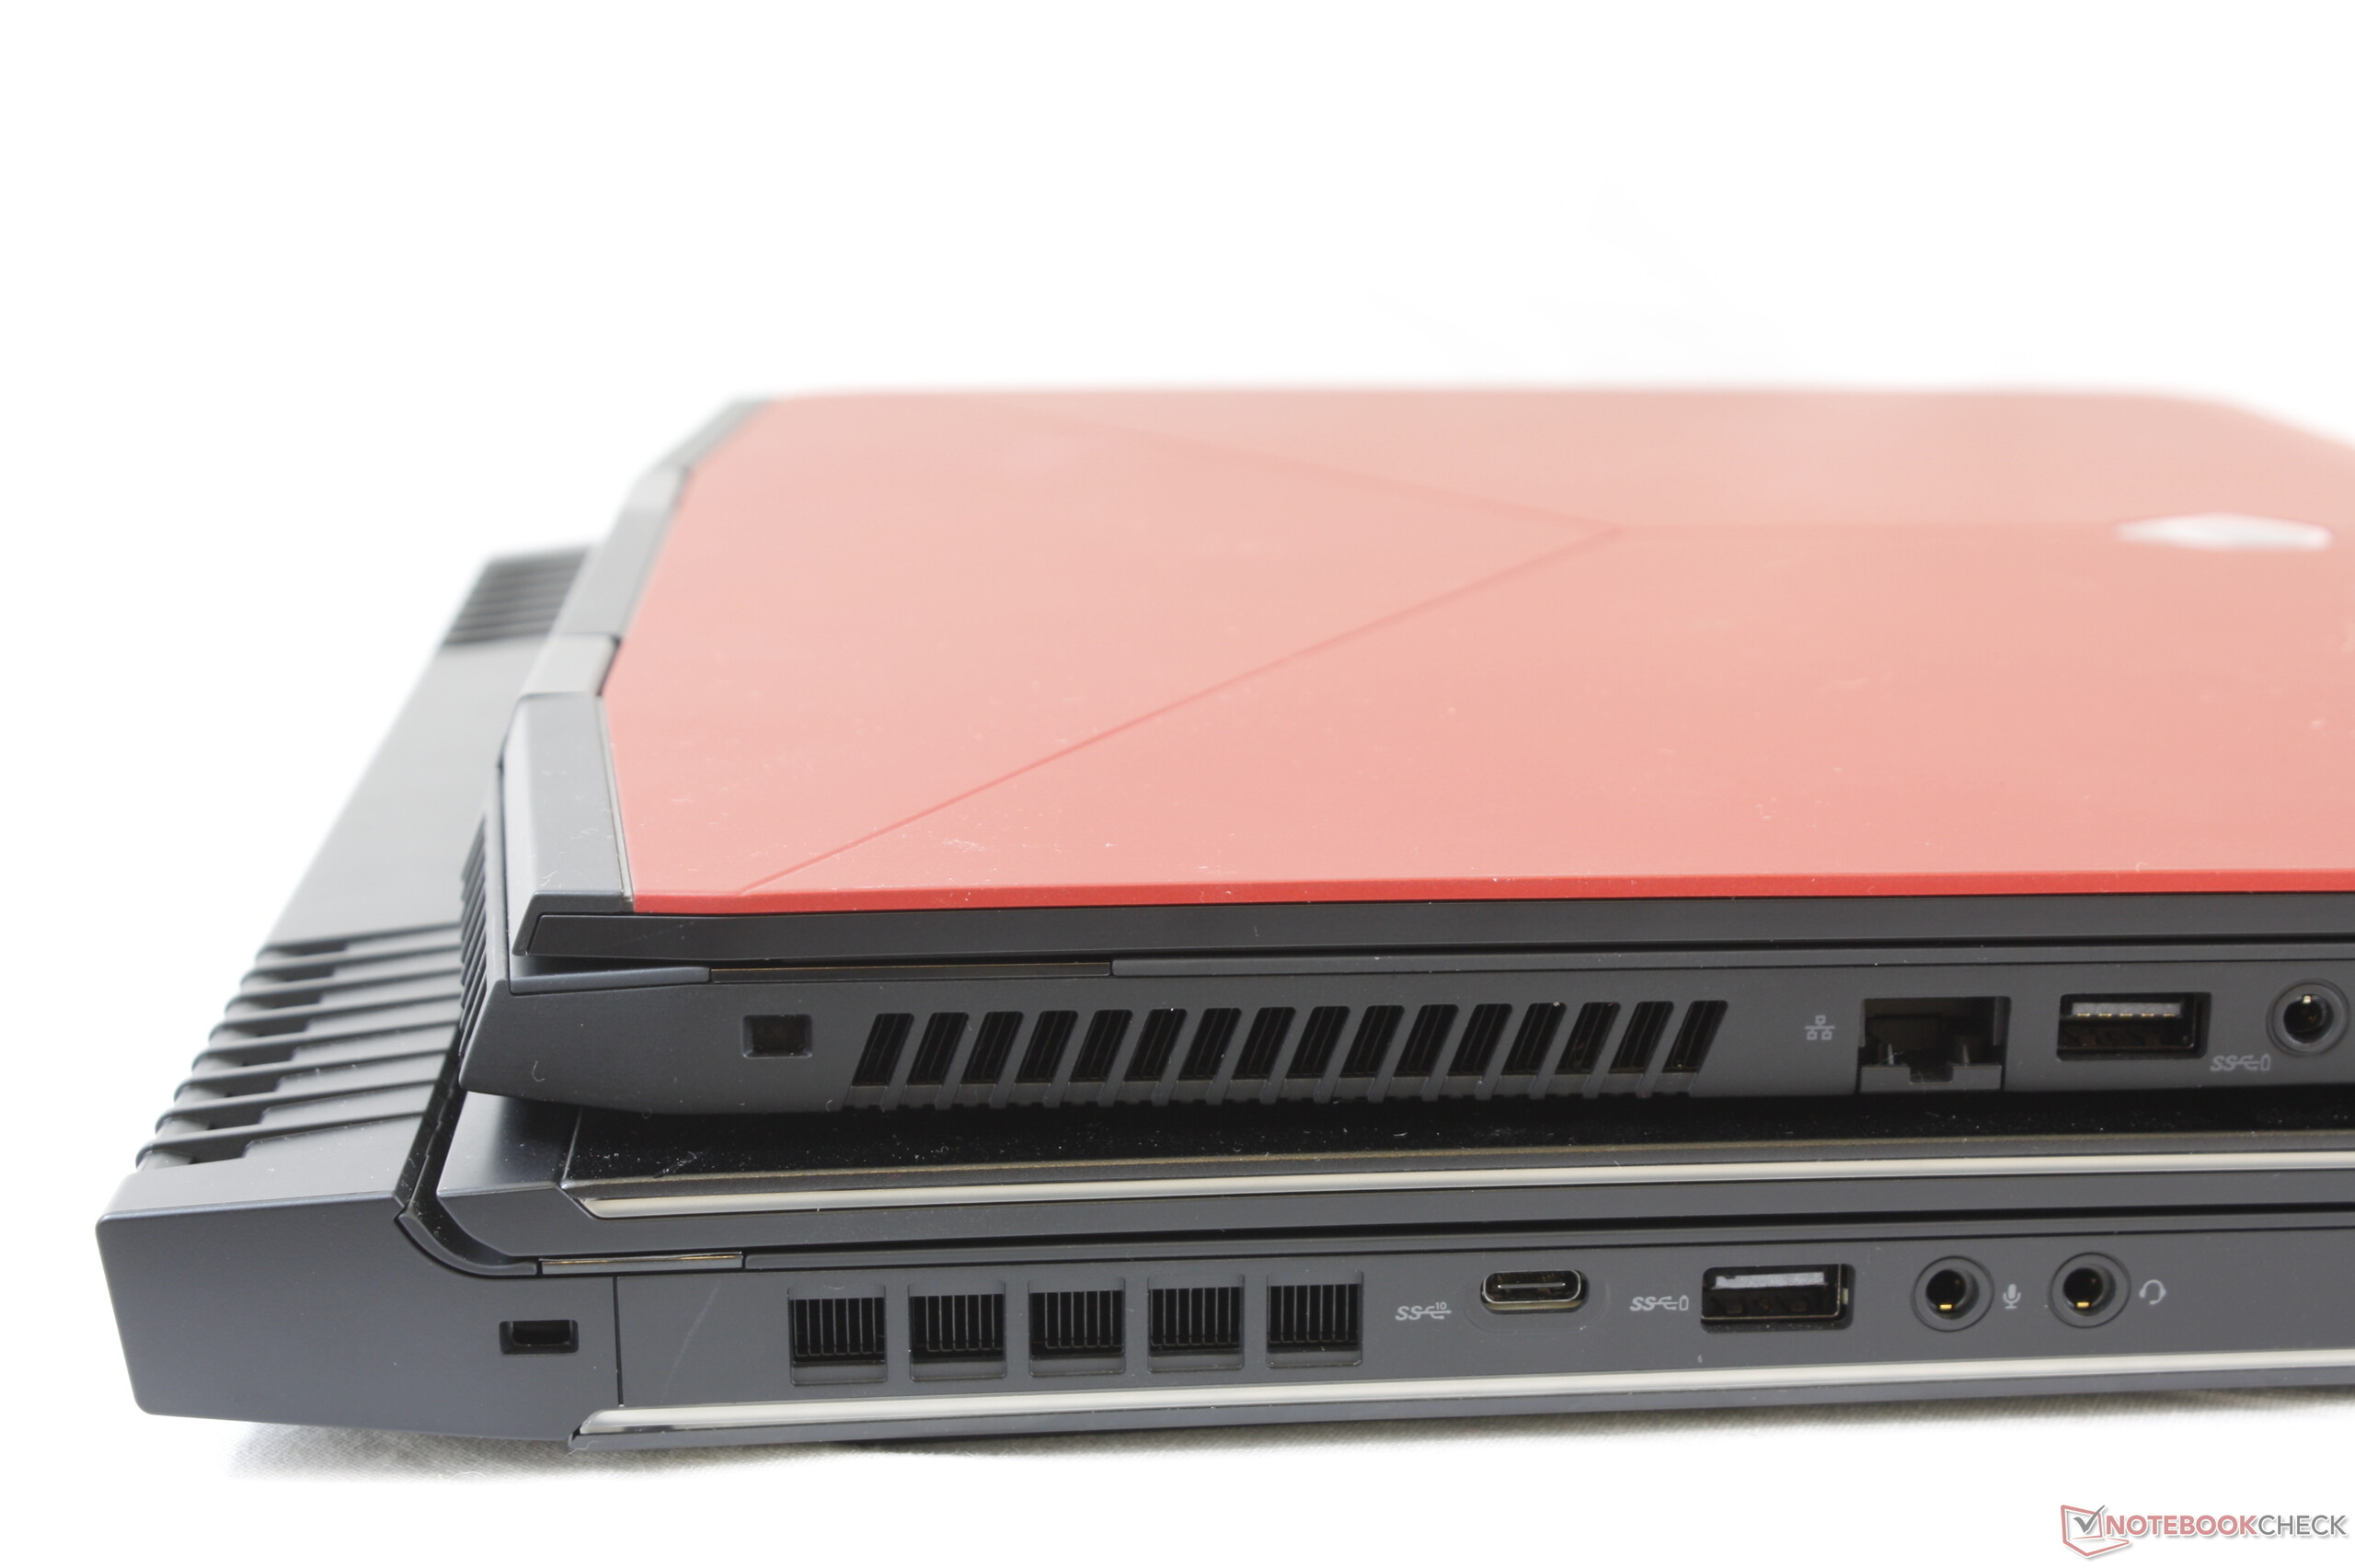
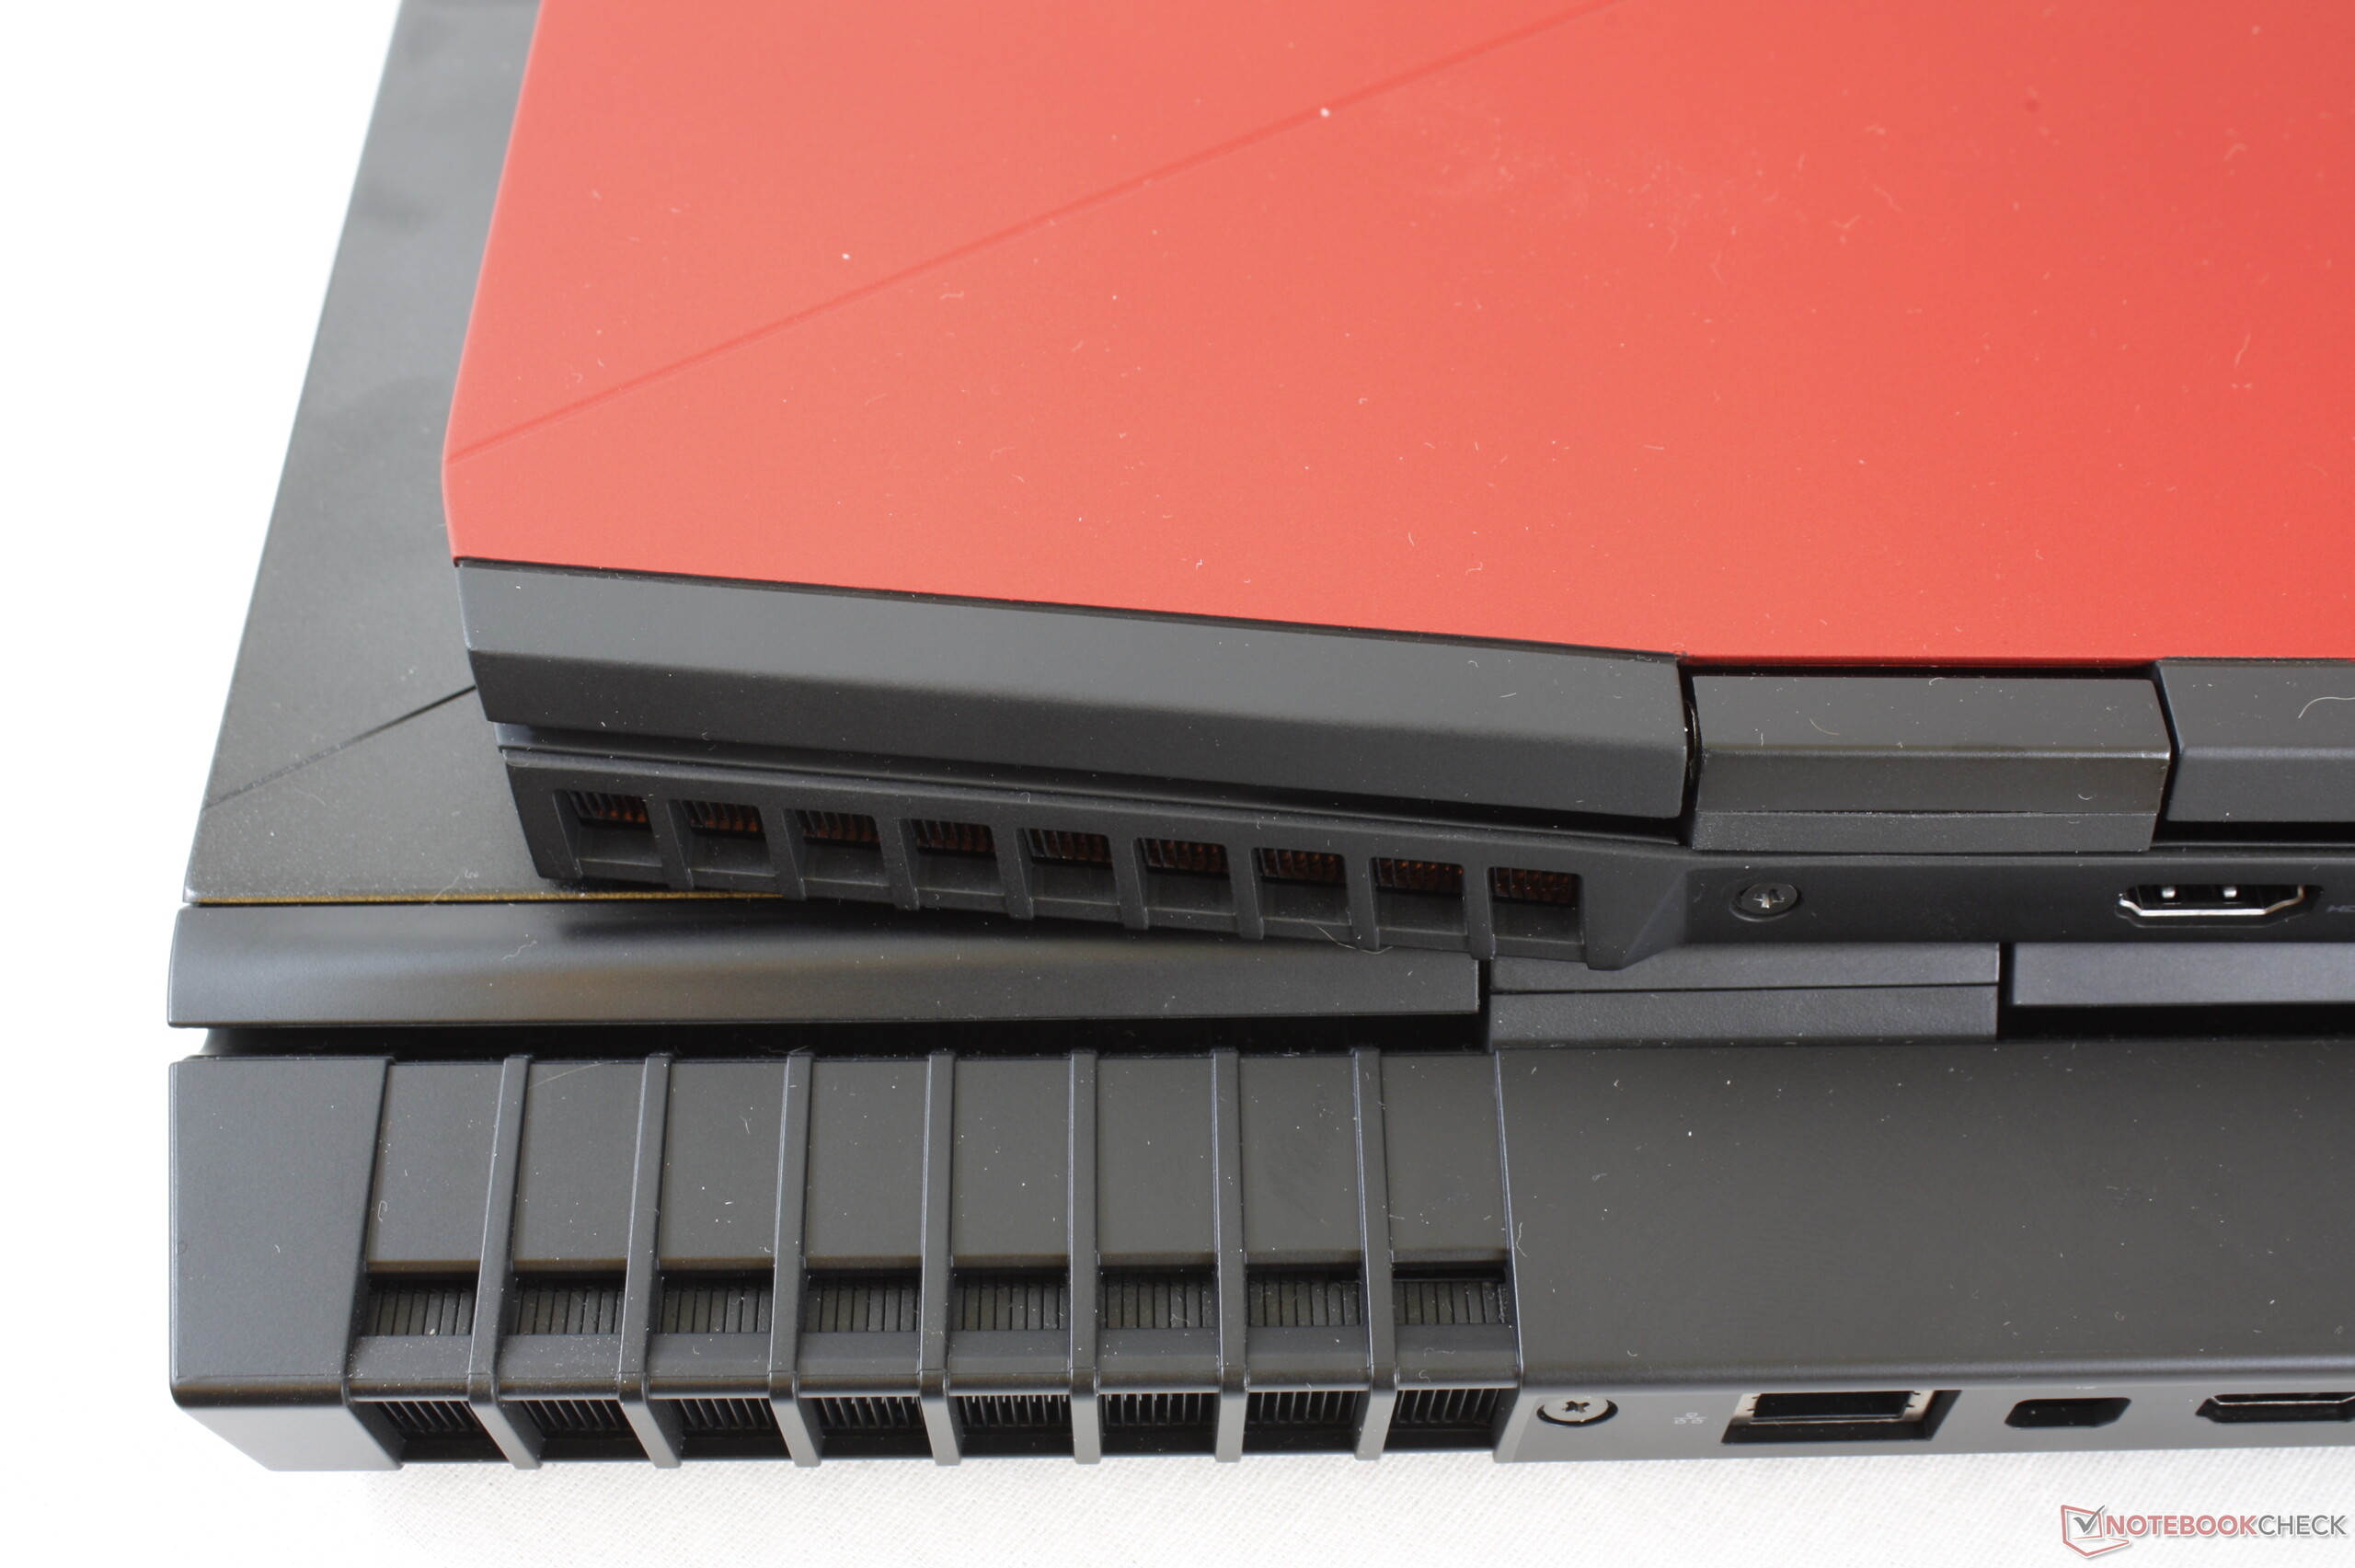
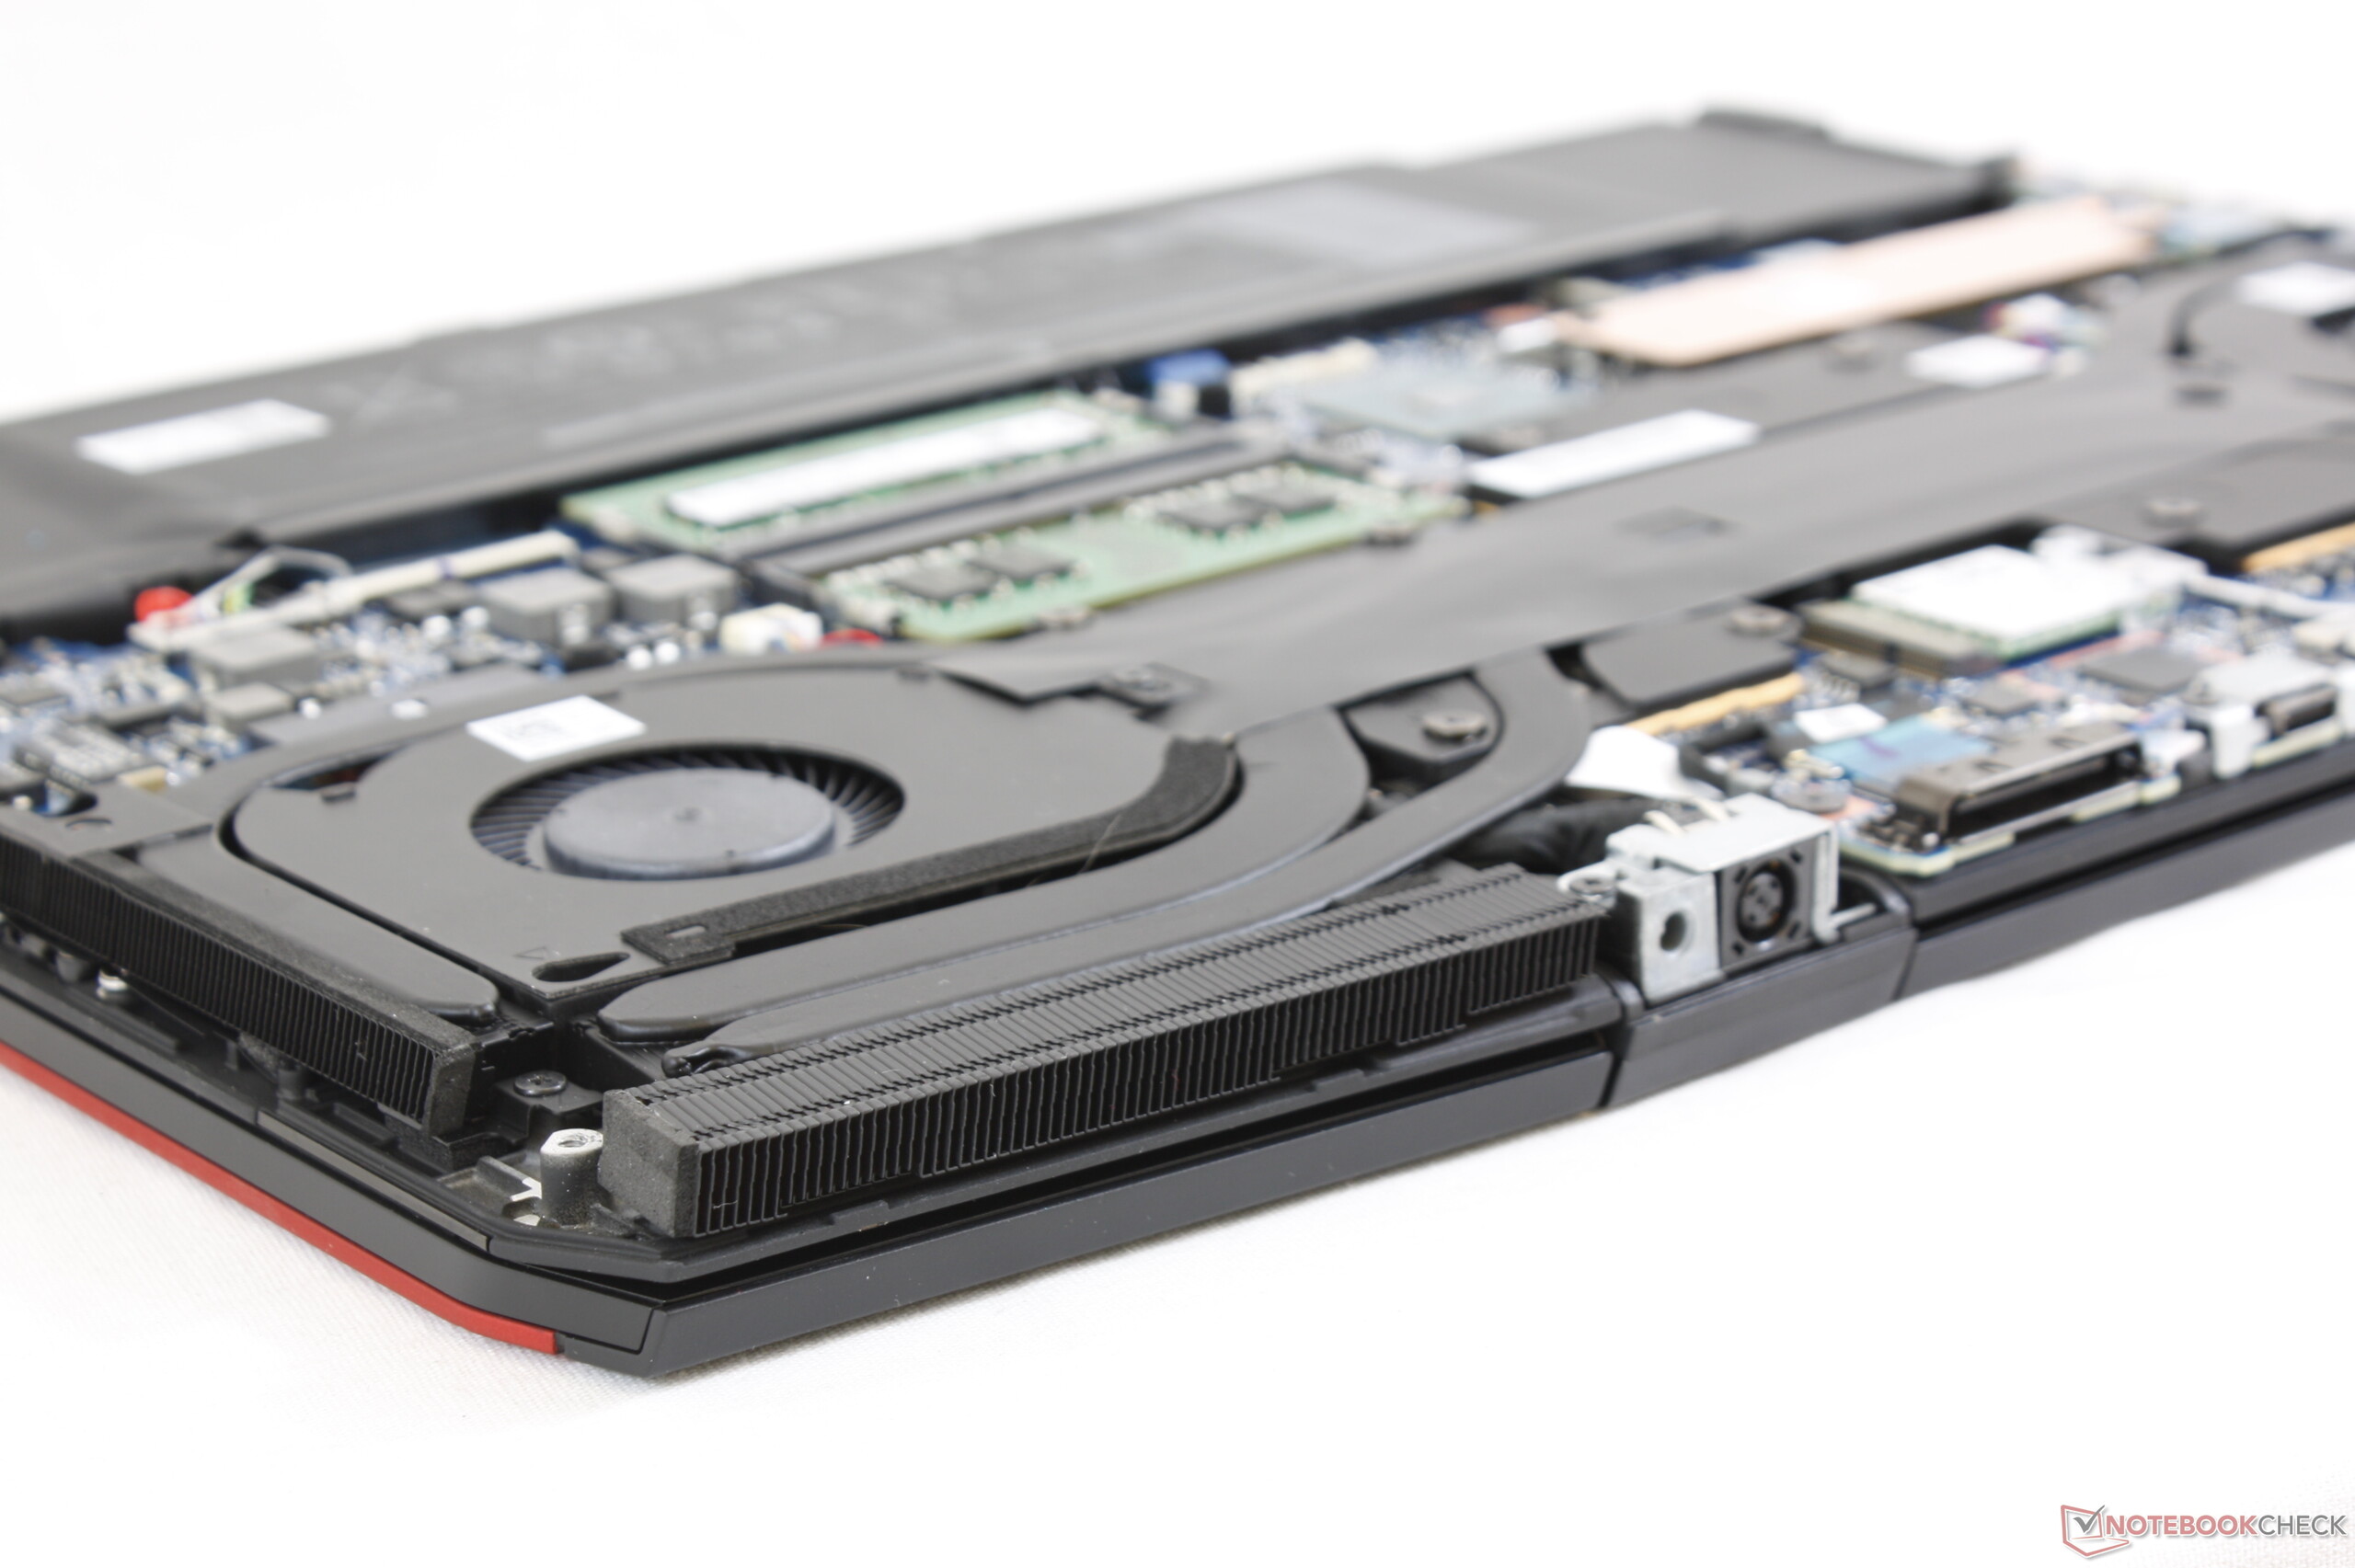
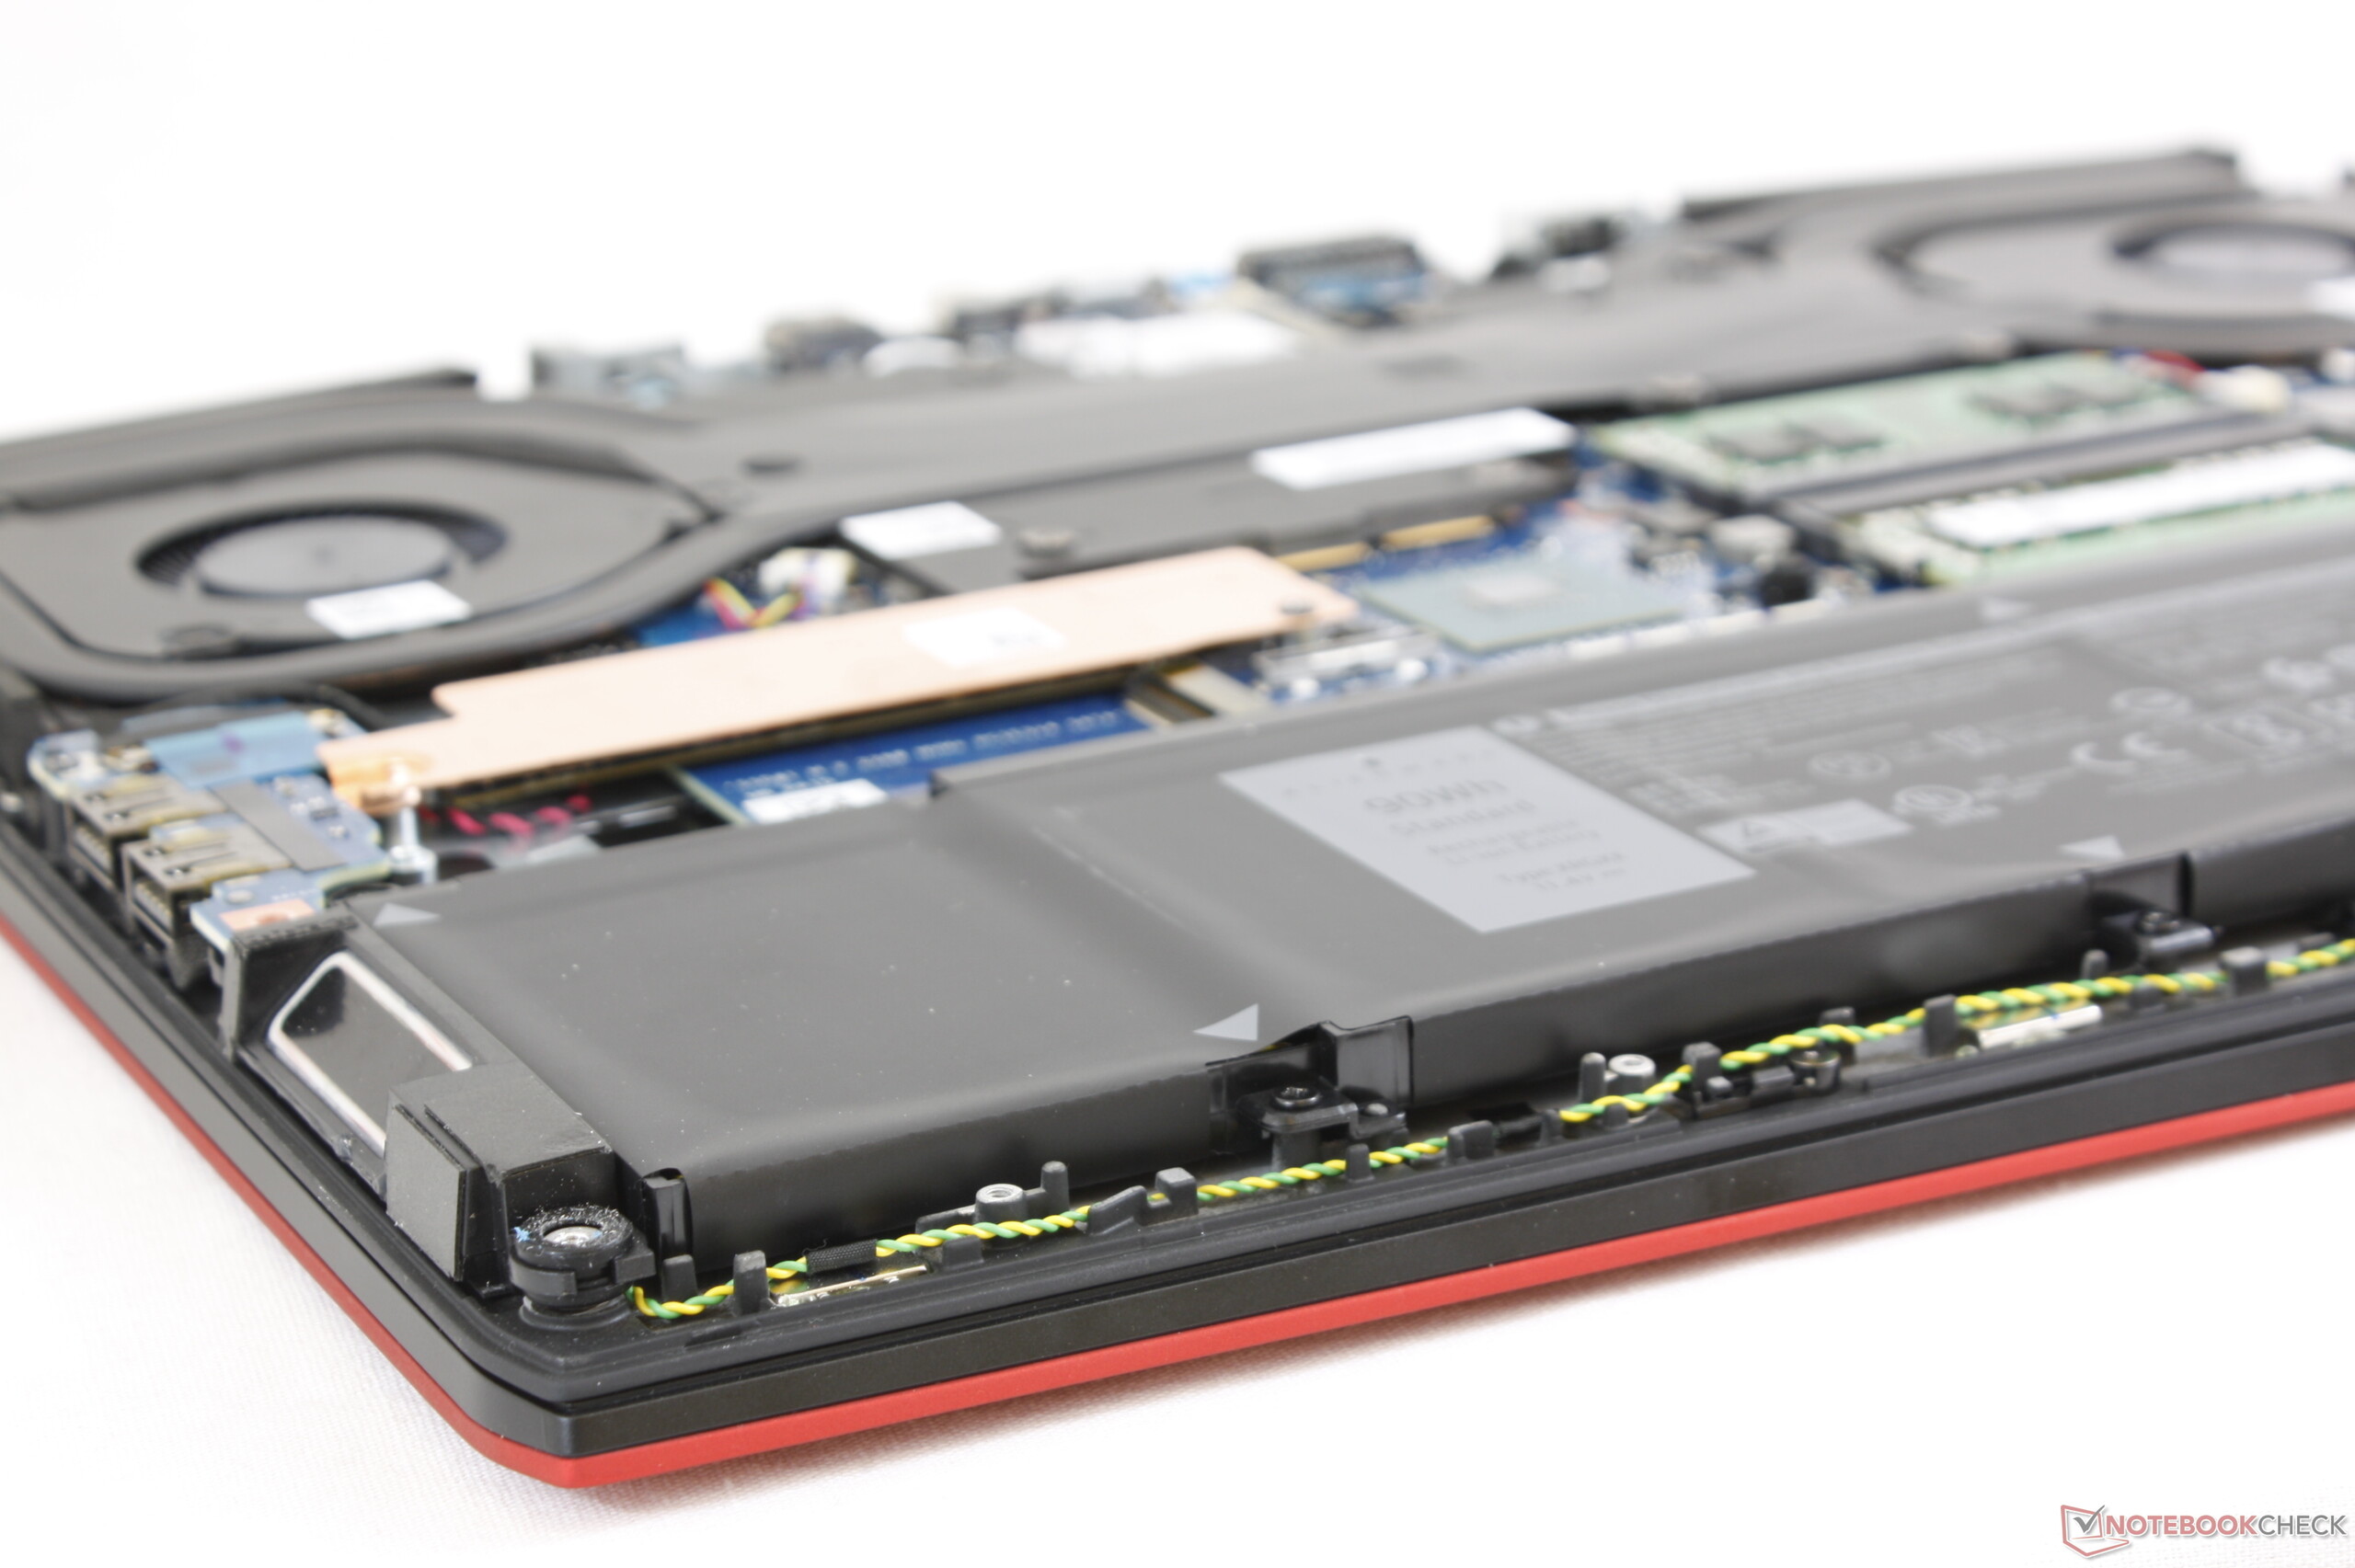
Os portáteis da Alienware são tradicionalmente conhecidos por serem maiores, mais resistentes e mais coloridos do que portáteis de jogos concorrentes. O Alienware m15 provavelmente foi uma perspectiva de design muito desafiadora a este respeito, pois deve equilibrar todos os fatores acima mencionados, enquanto parece tão fino e pequeno como algo como um Razer Blade 15 ou MSI GS65. É verdade que o novo chassi é um pouco mais fraco que o Alienware 15 R4 com pequenos recortes na seleção de portas, iluminação RGB, rigidez de dobradiça, compartimentos de armazenamento e capacidade de bateria, mas o pacote significativamente mais leve pode valer a pena para muitos usuários. Na verdade, ele ainda oferece alguns recursos não encontrados em sua alternativa maior, incluindo maior duração da bateria e um teclado numérico dedicado.
Comparando o Alienware m15 com o GS65, Blade 15, Aero 15x, Zephyrus GX531, ou Predator Triton 700 seria um teste mais justo. O sistema é mais grosso e pesado que muitas dessas alternativas ultrafinas, mas também é mais resistente do que a maioria com o benefício adicional de durações da bateria mais longos e mais opções de armazenamento interno. A melhor surpresa talvez seja a excelente sustentação do Turbo Boost da CPU para um desempenho de CPU mais rápido do que outros ultrafinos equipados com o mesmo processador i7-8750H, incluindo o Blade 15.
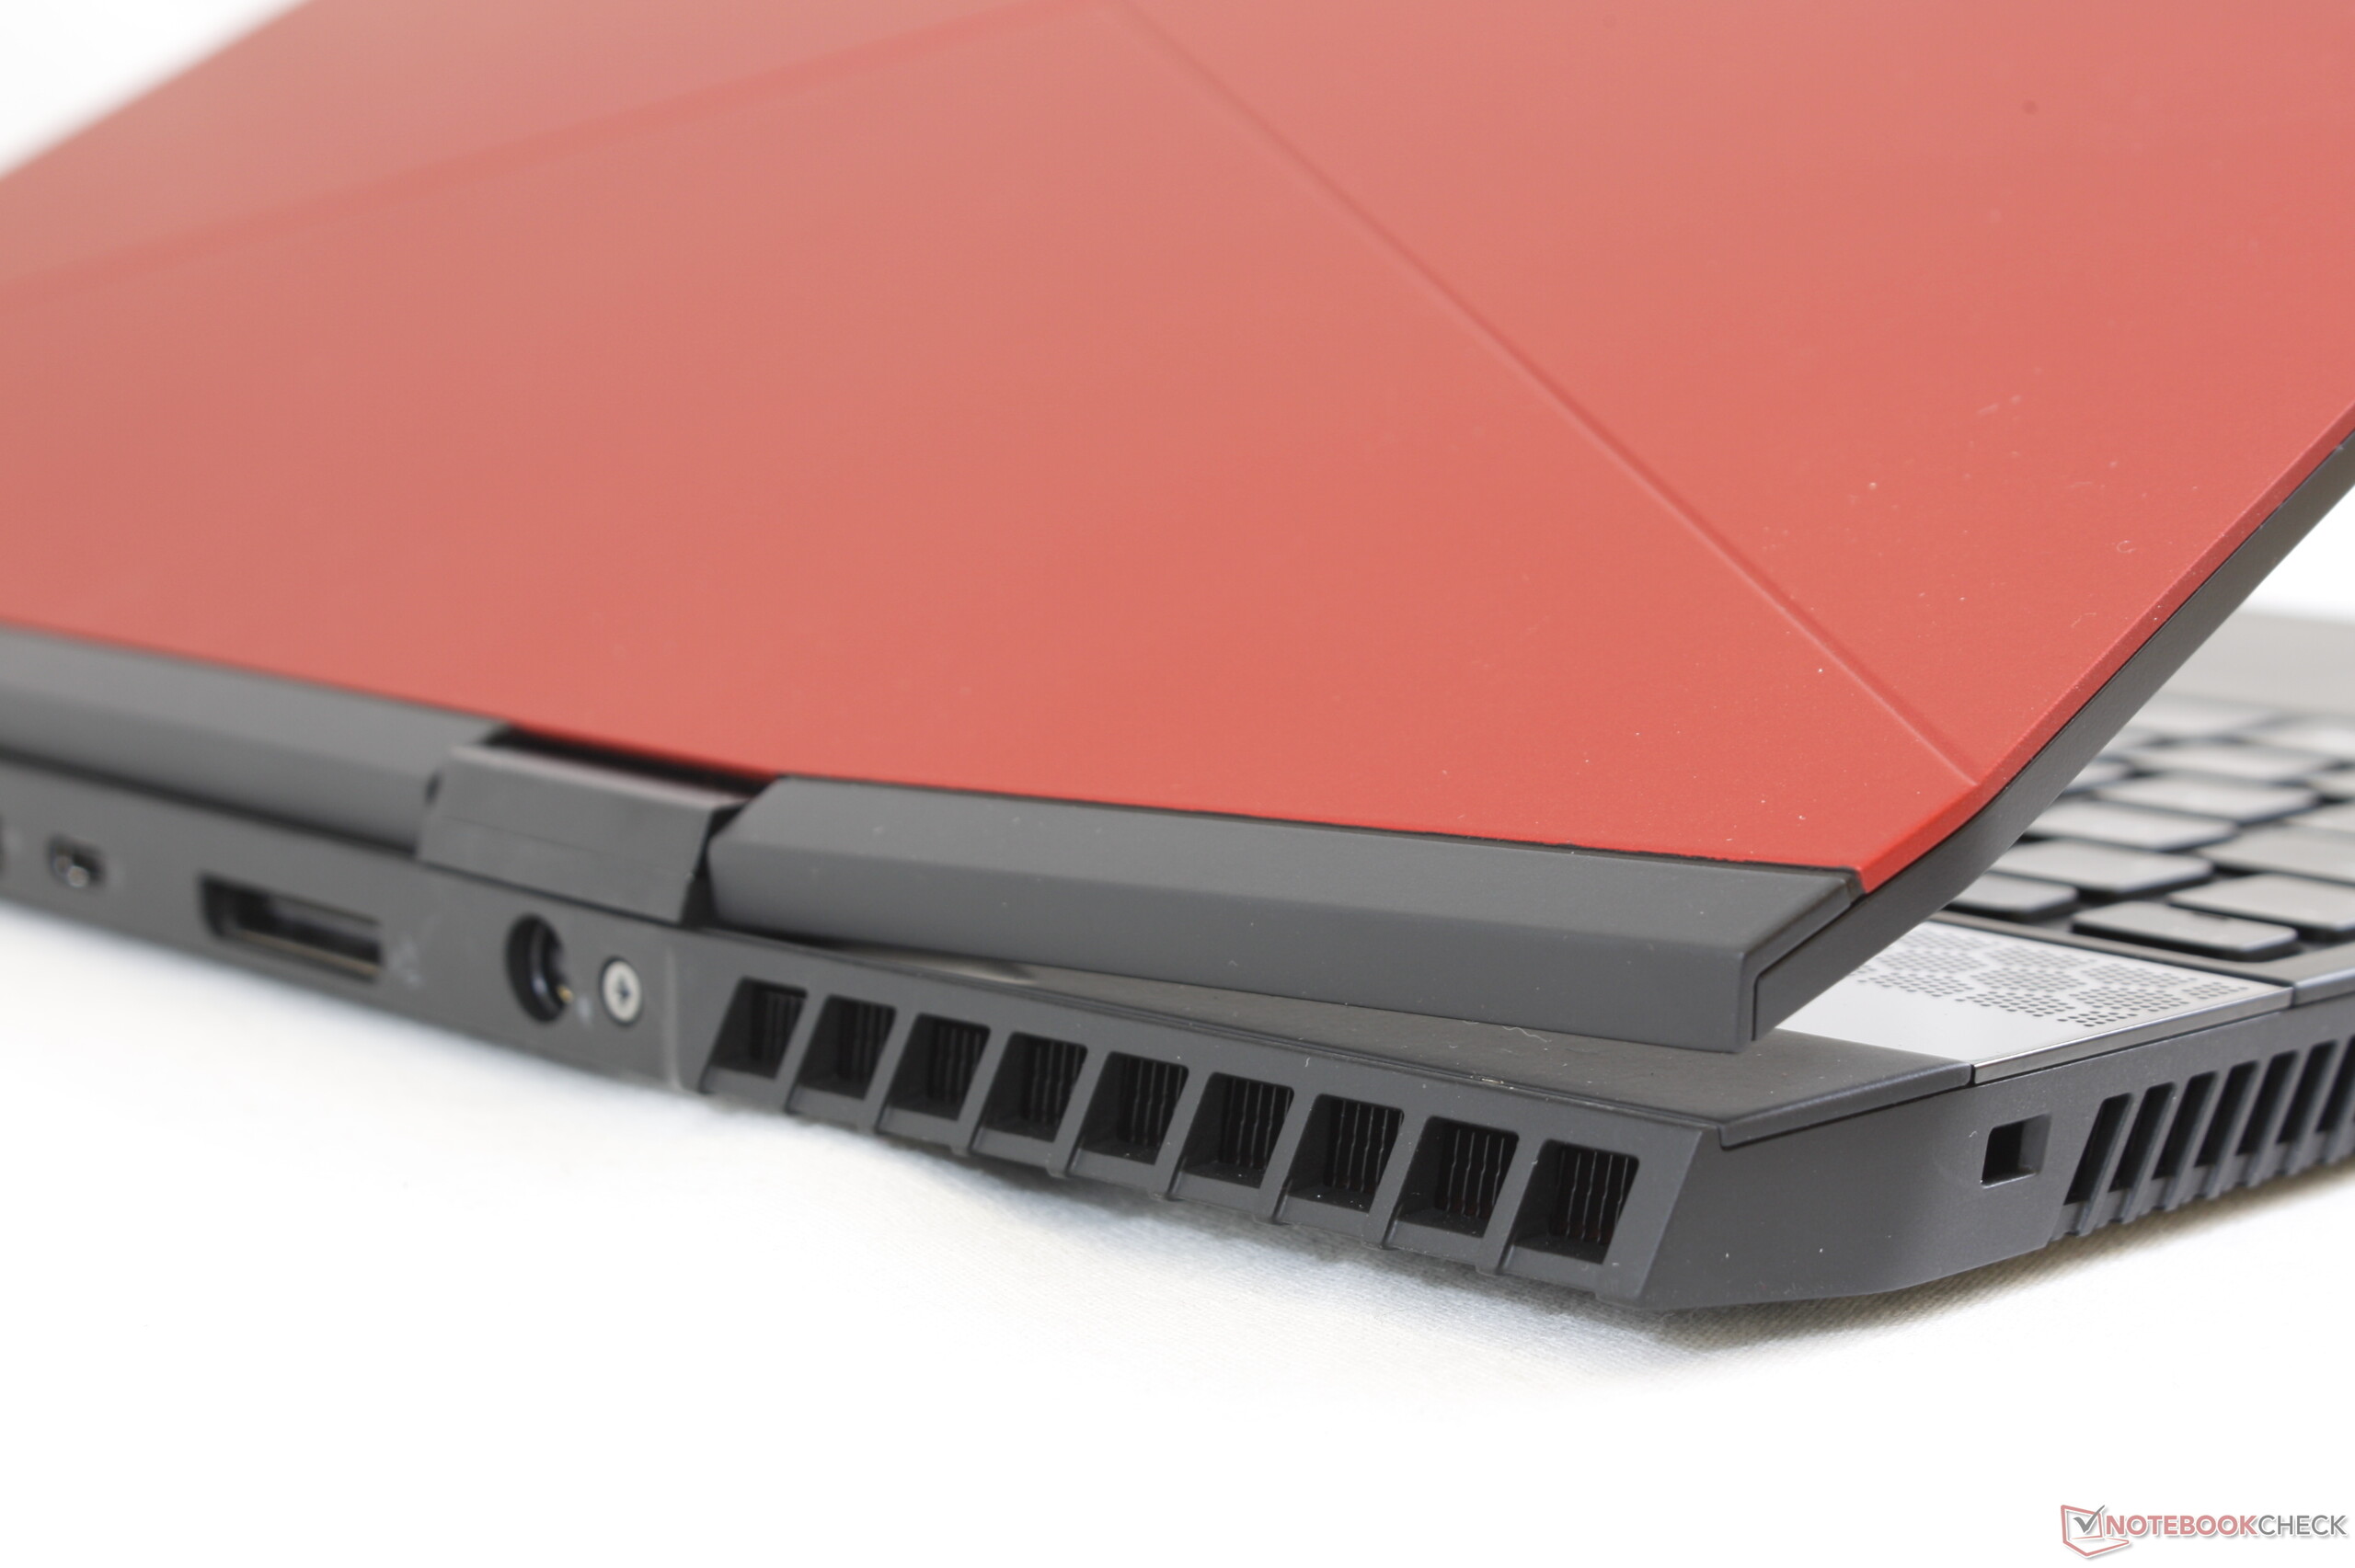
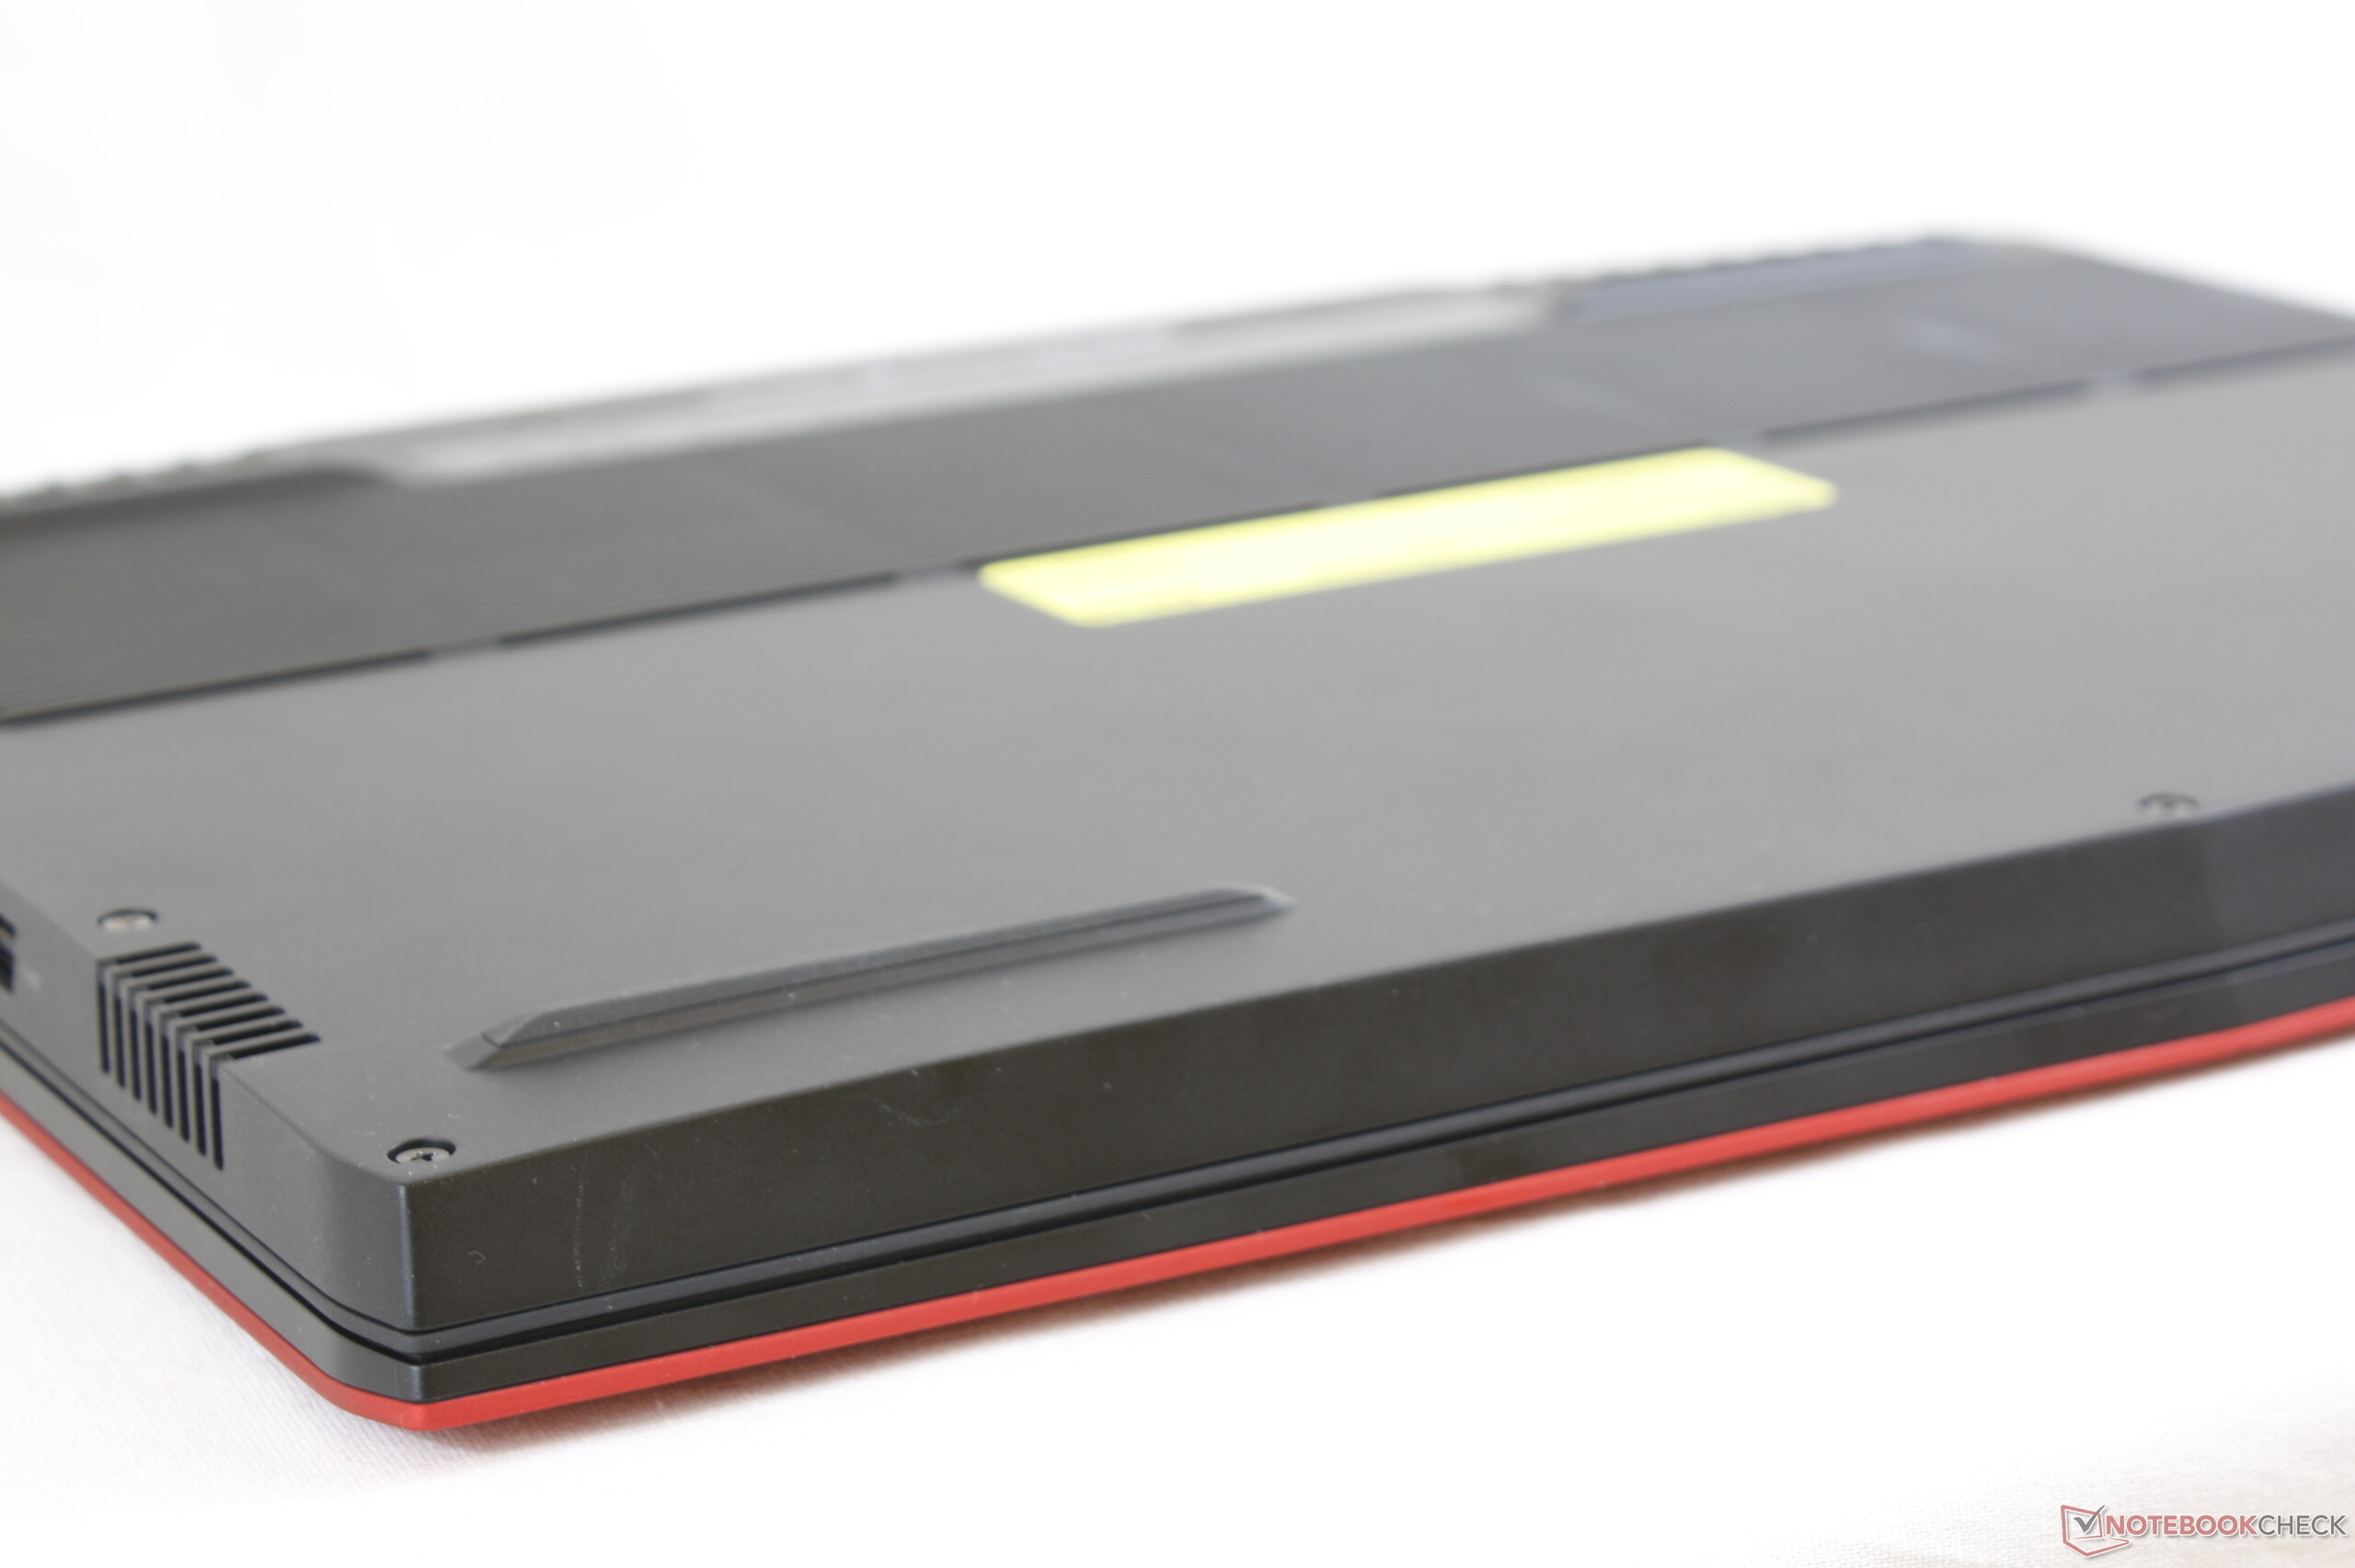
Há uma série de inconvenientes que impedem o m15 de ser o cão superior em sua categoria ultrafina. Além do perfil ligeiramente mais grosso, a falta de iluminação RGB por tecla é uma desvantagem. A resposta das teclas, do clickpad, o ruído do ventilador e a qualidade do alto-falante não são nada de especial e meramente medianos para sua classe de tamanho. Cosmeticamente, alguns usuários podem ser espantados pelos marcos refletivos, apoios para as mãos propensos a digitais ou portas traseiras de difícil alcance. No entanto, qualquer um que esteja indeciso por um Alienware 15 R4 ou portátil ultrafino para jogos deve dar uma olhada no Alienware m15, já que oferece algumas vantagens não encontradas em modelos concorrentes.
O Alienware m15 funciona como um meio-termo sólido para jogadores que desejam designs super finos sem sacrificar a rigidez de alternativas maiores. Sua alta sustentabilidade do Turbo Boost e longa duração da bateria são vantagens inesperadas em relação à concorrência, considerando o tamanho pequeno do chassi.
Alienware m15 GTX 1070 Max-Q
- 12/11/2018 v6 (old)
Allen Ngo
Price comparison
