Razer Blade 15 Advanced Model 11th Gen Intel (2021) Revisão: Pequenas mudanças, grandes ganhos da CPU
Embora a Lâmina 15 fosse já refrescado no início deste ano com CPUs Intel Coffee Lake-H de 10ª geração e uma tela de 360 Hz, a Razer foi rápida em atualizar a série mais uma vez, uma vez que a Intel disponibilizou suas 11ª geração Tiger Lake-H SKUs de processador. O resultado final é um modelo visualmente semelhante, mas com várias atualizações internas que os entusiastas e jogadores irão apreciar.
Recomendamos verificar nossa revisão existente no início de 2021 e Modelos 2020 Lâmina 15 como esta 11ª versão gen compartilha o mesmo display de 360 Hz, teclado e esqueleto de seus predecessores imediatos. Esta página focalizará as diferenças de desempenho que os usuários podem esperar entre as opções da 10ª e 11ª geração da Intel Blade 15.
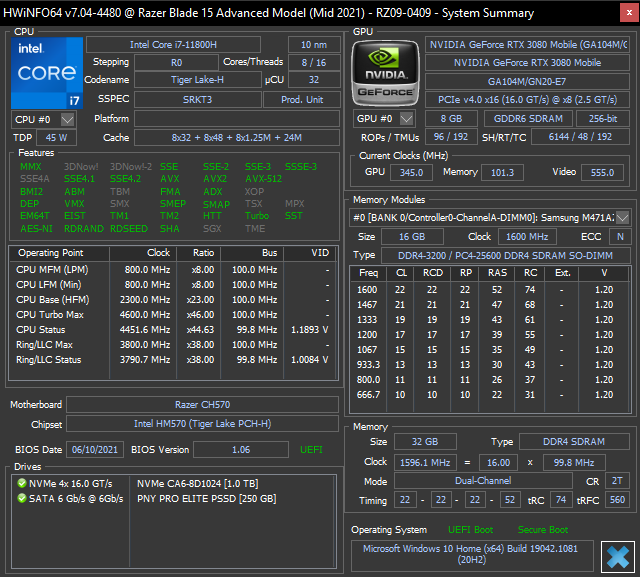
Nossa configuração exata com o Core i7-11800H, display 360 Hz, 1 TB PCIe 4 SSD, 32 GB RAM, e GeForce RTX 3080 pode ser encontrado online por US$3100. Outras SKUs também estão disponíveis em diferentes resoluções, taxas de atualização, capacidades RAM/SSD, e GPUs RTX. Uma opção em particular inclui o Core i9-11900H para torná-lo o primeiro modelo Blade 15 com uma opção Core i9
As alternativas para o Blade 15 incluem outros laptops ultramodernos para jogos como o MSI GS66, Asus Zephyrus série S, Série Aorusou o Dell Alienware X15
Mais análise da Razer:
potential competitors in comparison
Avaliação | Data | Modelo | Peso | Altura | Size | Resolução | Preço |
|---|---|---|---|---|---|---|---|
| 88.9 % v7 (old) | 07/2021 | Razer Blade 15 Advanced (Mid 2021) i7-11800H, GeForce RTX 3080 Laptop GPU | 2 kg | 16.99 mm | 15.60" | 1920x1080 | |
| 85.9 % v7 (old) | 06/2021 | Asus TUF Gaming F15 FX506HM i7-11800H, GeForce RTX 3060 Laptop GPU | 2.3 kg | 24.9 mm | 15.60" | 1920x1080 | |
| 84.7 % v7 (old) | 06/2021 | Alienware m15 R5 Ryzen Edition R7 5800H, GeForce RTX 3060 Laptop GPU | 2.5 kg | 22.85 mm | 15.60" | 1920x1080 | |
| 86.4 % v7 (old) | 06/2021 | Aorus 15P YD i7-11800H, GeForce RTX 3080 Laptop GPU | 2.2 kg | 27 mm | 15.60" | 1920x1080 | |
| 83.3 % v7 (old) | 03/2020 | Schenker XMG Pro 15 i7-9750H, GeForce RTX 2070 Mobile | 2.5 kg | 30 mm | 15.60" | 1920x1080 |
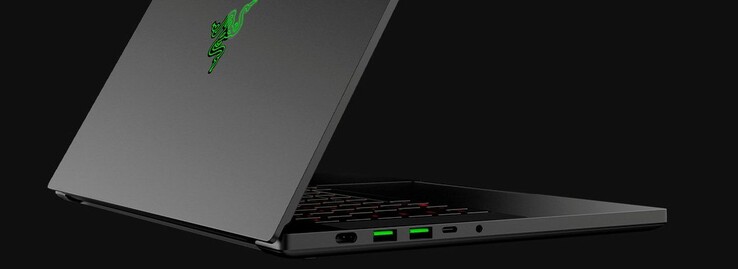
Estojo - Fino e leve com desempenho ultra-elevado
Como o chassi permanece idêntico ano após ano, aqui estão as principais diferenças entre a versão Blade 15 do 10º gênero e a versão mais recente do 11º gênero
- Intel 11th gen Tiger Lake-H Core i7-11800H e opções de CPU Core i9-10900H
- Maior PL2 (90 W a 160 W) Objetivo do Turbo Boost da CPU
- GPU foi atualizado de 95 W TGP para 105 W TGP
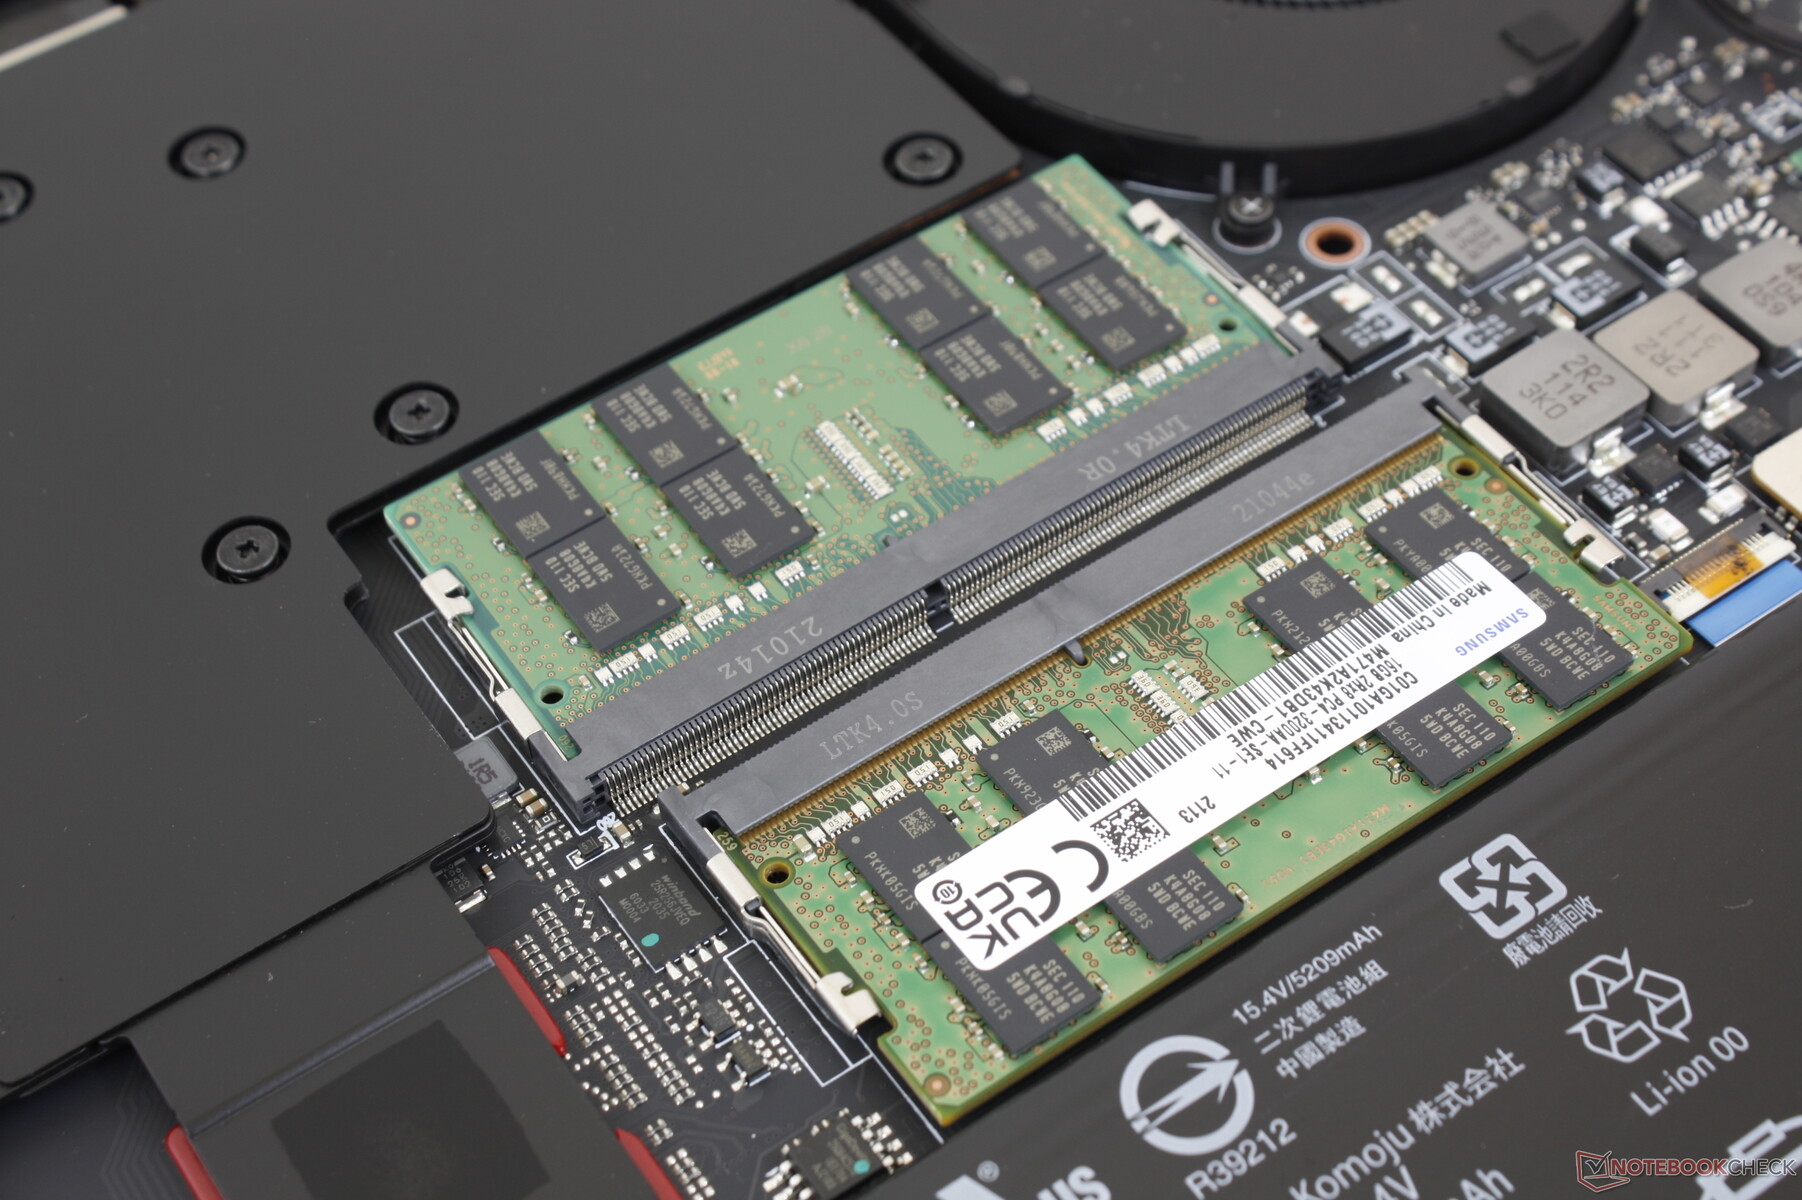
- Suporte completo para até duas SSDs PCI 4 NVMe
- Apoio total ao Thunderbolt 4
- Webcam foi atualizada de 1 MP para 2 MP (ou 720p para 1080p)
Ambas as portas USB-C suportam Fornecimento de energia, carregamento, dados e DisplayPort-out. No entanto, não conseguimos colocar a DisplayPort-out trabalhando em nossa unidade de teste, por isso recomendamos aos usuários que verifiquem isso novamente após a compra.
Comunicação
Webcam
Ainda não há obturador de câmera, apesar da atualização de 720p para 1080p. Além disso, os usuários só podem gravar em até 30 FPS sem modo 60 FPS.

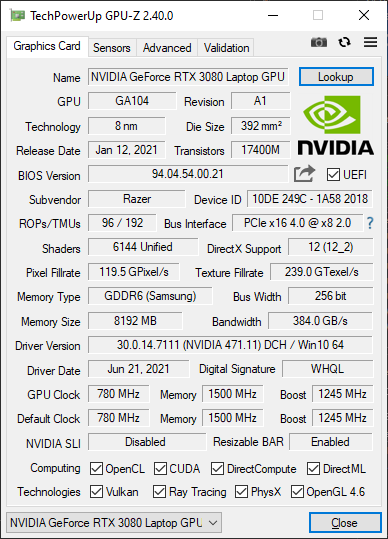
 GeForce RTX 3080 Laptop GPU, i7-11800H, SSSTC CA6-8D1024")
 GeForce RTX 3080 Laptop GPU, i7-11800H, SSSTC CA6-8D1024")
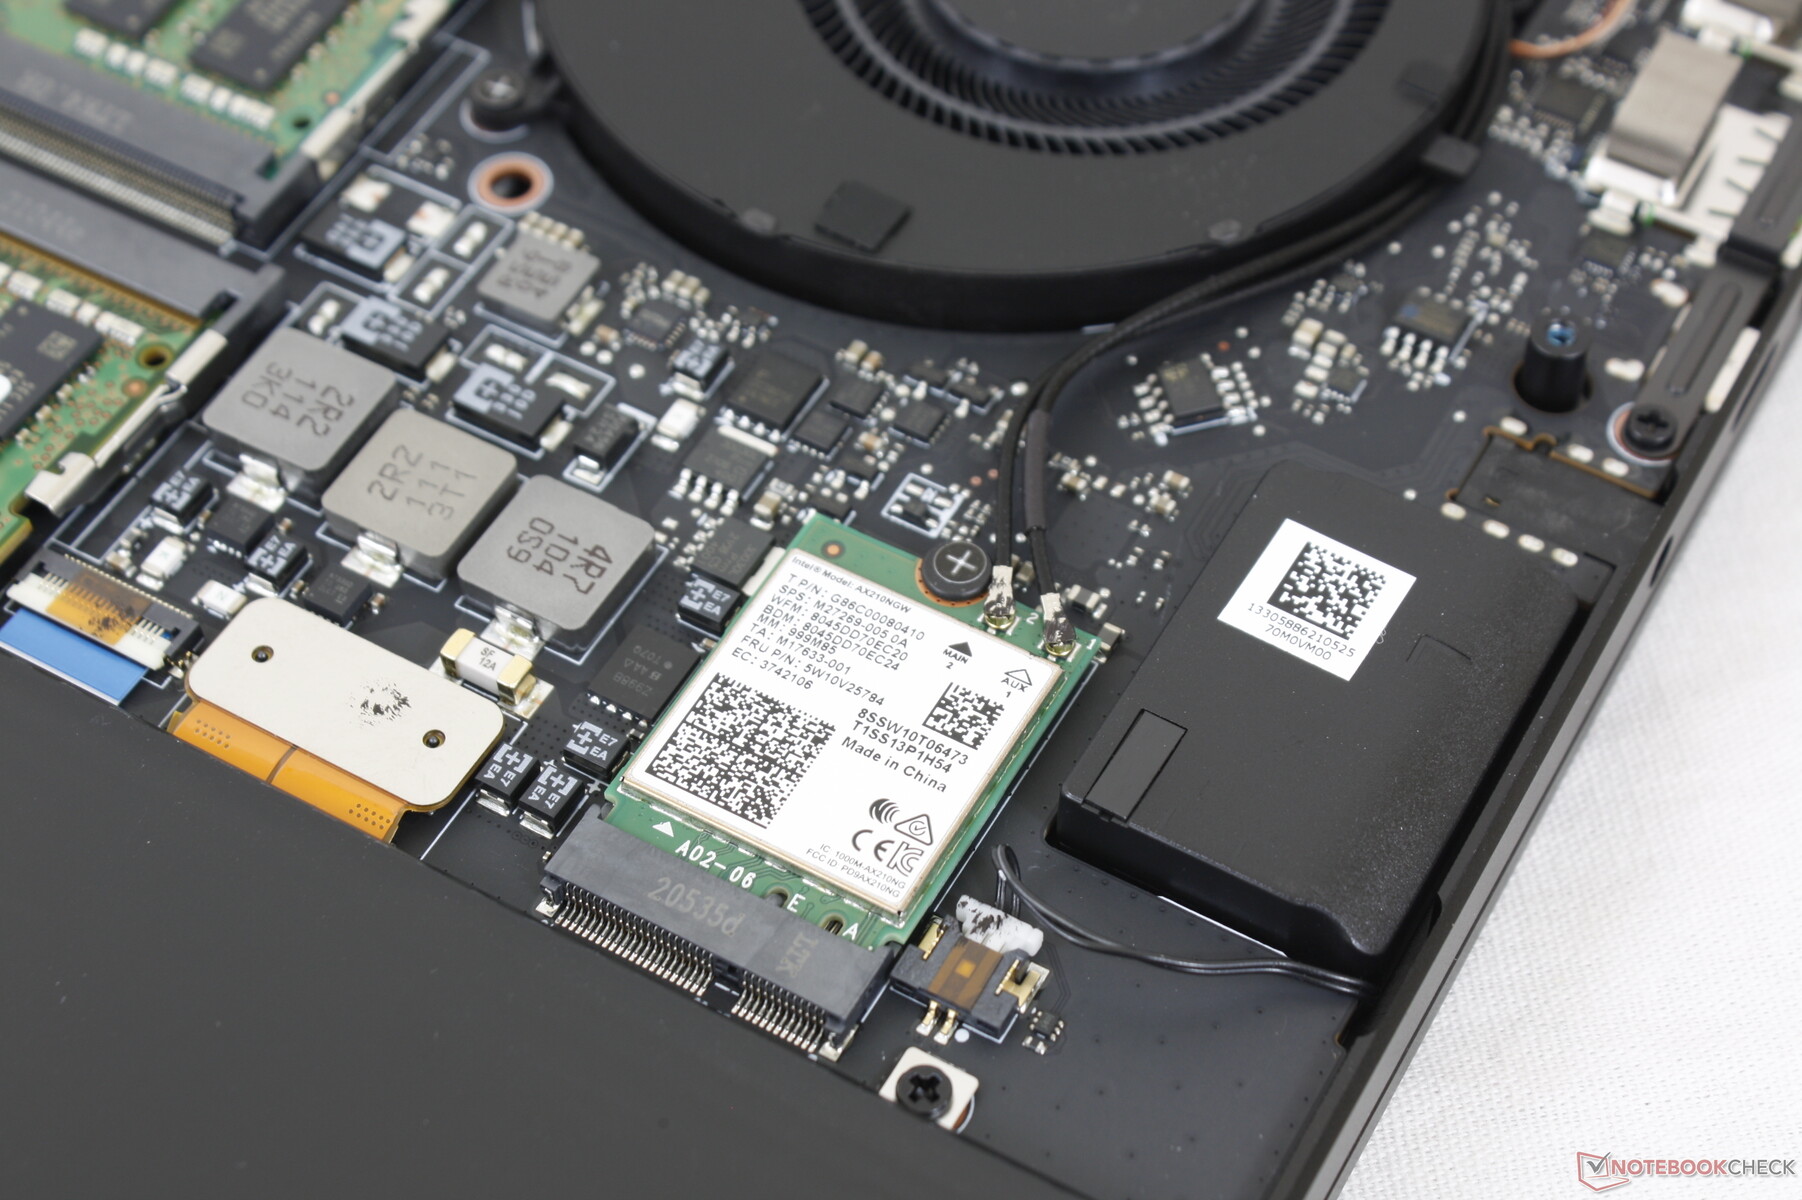
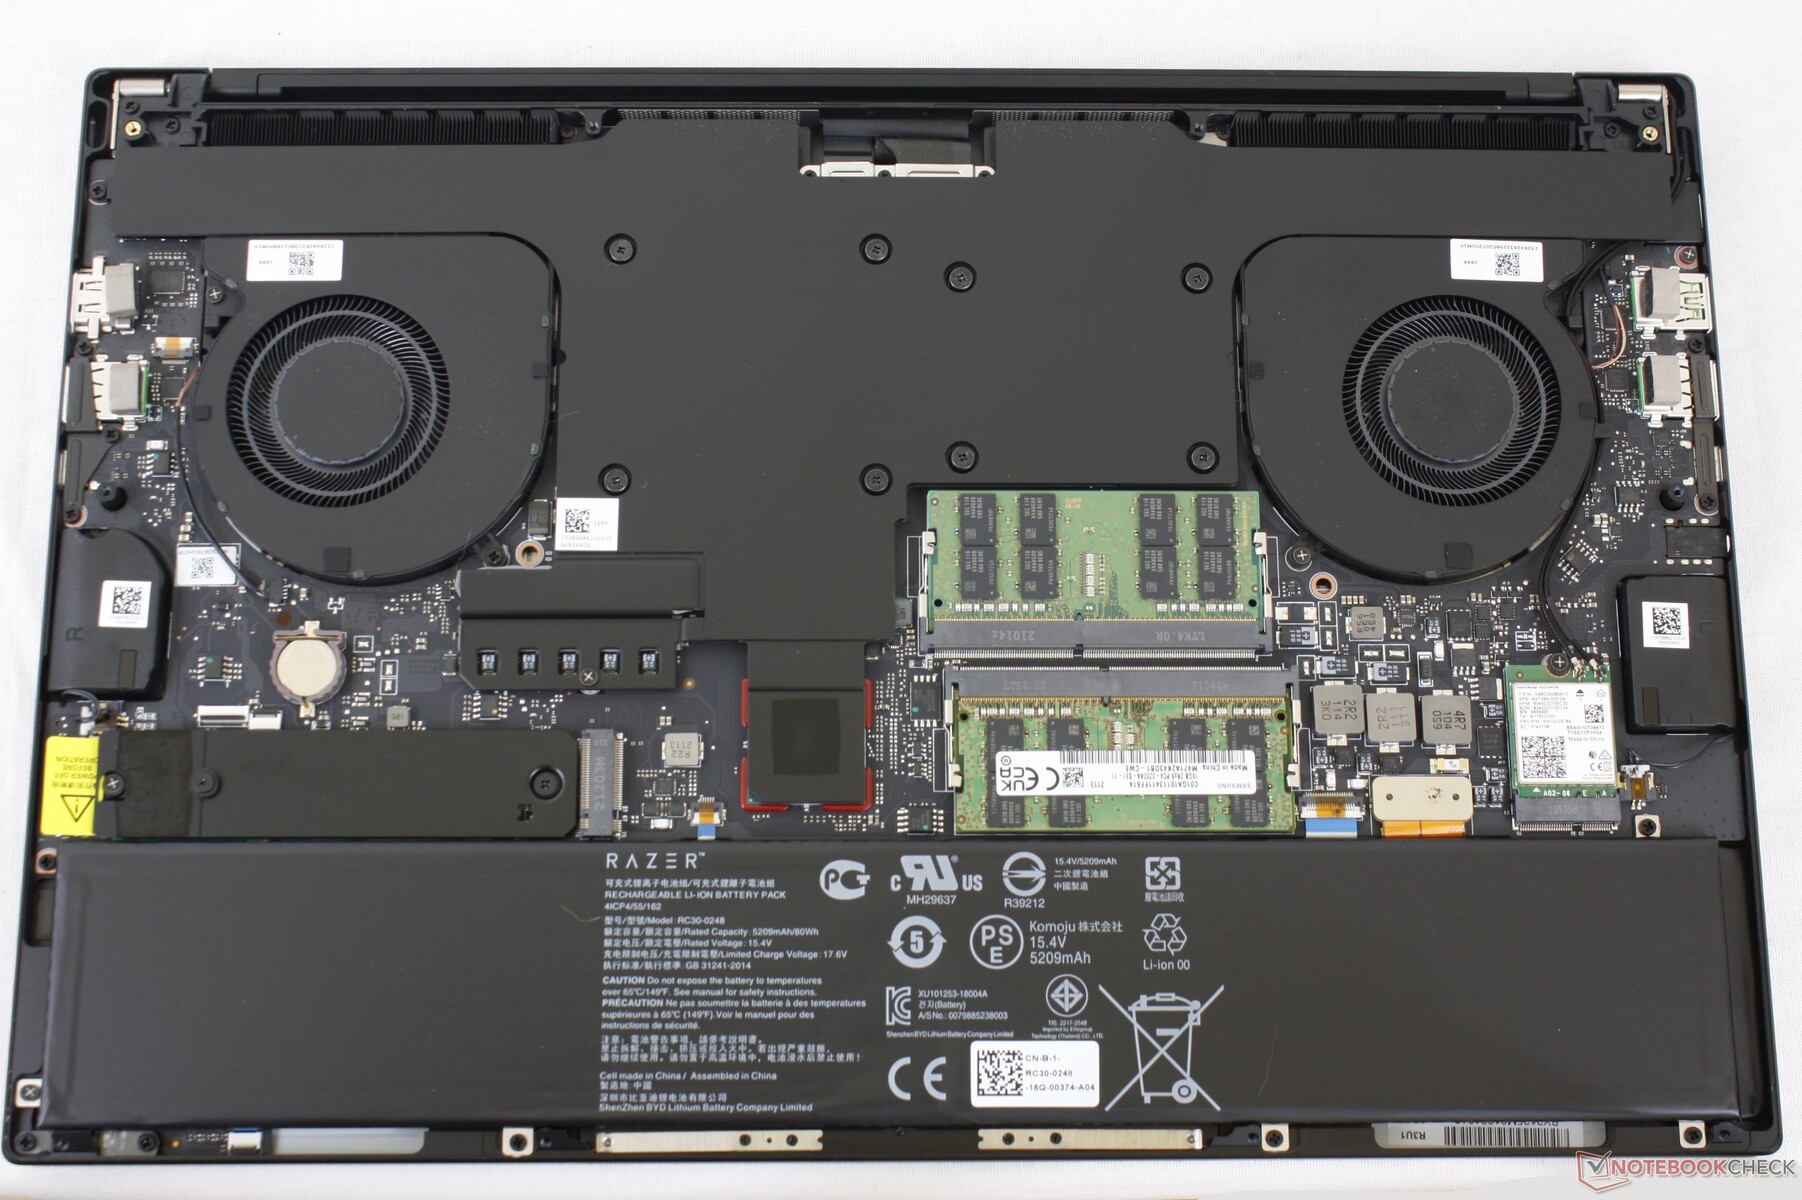
Manutenção
Mostrar
Nosso modelo de meados de 2021 vem com o mesmo painel IPS TL156VDXP02-0 que o encontrado no modelo do início de 2021. A maioria dos atributos são os mesmos, mas com uma diferença interessante: os tempos de resposta cinza a cinza são notavelmente mais rápidos neste modelo mais novo, mesmo após dupla verificação. Não temos certeza se esta foi uma mudança deliberada do fabricante ou se houve um erro de medição em nosso modelo do 10º gênero do início de 2021, mas certamente apreciamos os tempos de resposta rápidos não menos que isso.
A G-Sync não é suportada no display interno.
| |||||||||||||||||||||||||
iluminação: 92 %
iluminação com acumulador: 353.4 cd/m²
Contraste: 1140:1 (Preto: 0.31 cd/m²)
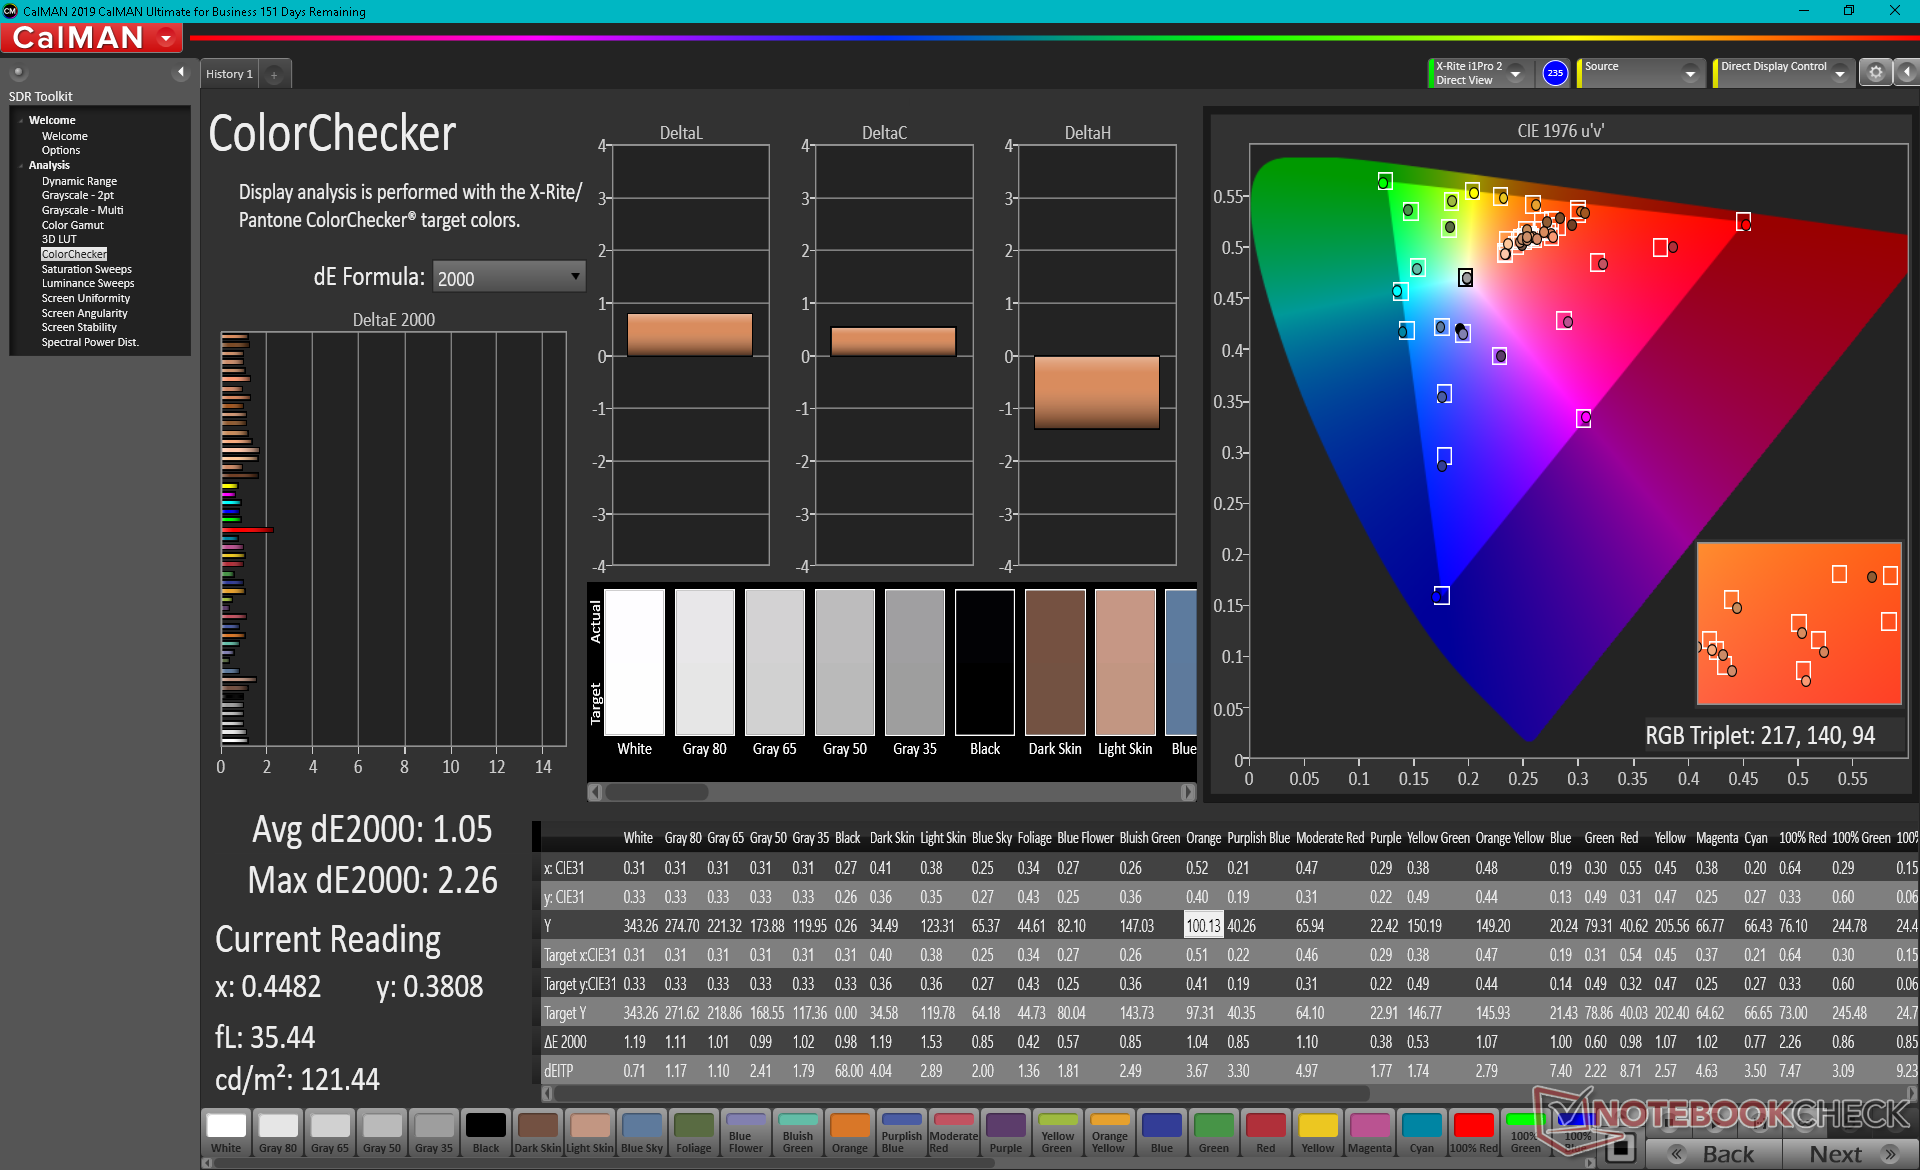
ΔE ColorChecker Calman: 2.17 | ∀{0.5-29.43 Ø4.71}
calibrated: 1.05
ΔE Greyscale Calman: 3.4 | ∀{0.09-98 Ø4.96}
69% AdobeRGB 1998 (Argyll 3D)
97.1% sRGB (Argyll 3D)
66.9% Display P3 (Argyll 3D)
Gamma: 2.2
CCT: 6830 K
| Razer Blade 15 Advanced (Mid 2021) TL156VDXP02-0, IPS, 15.6", 1920x1080 | Razer Blade 15 Advanced Model Early 2021 TL156VDXP02-0, IPS, 15.6", 1920x1080 | Razer Blade 15 RTX 2080 Super Max-Q AU Optronics B156HAN12.0, IPS, 15.6", 1920x1080 | Asus TUF Gaming F15 FX506HM Chi Mei N156HRA-EA1, IPS, 15.6", 1920x1080 | Alienware m15 R5 Ryzen Edition B156HAN, IPS, 15.6", 1920x1080 | Aorus 15P YD BOE09B9, IPS, 15.6", 1920x1080 | |
|---|---|---|---|---|---|---|
| Display | -1% | 3% | -36% | 4% | ||
| Display P3 Coverage (%) | 66.9 | 65.9 -1% | 70.2 5% | 41.9 -37% | 70.2 5% | |
| sRGB Coverage (%) | 97.1 | 96.4 -1% | 99 2% | 62.9 -35% | 98.5 1% | |
| AdobeRGB 1998 Coverage (%) | 69 | 68 -1% | 71.4 3% | 43.3 -37% | 72.4 5% | |
| Response Times | -143% | -17% | -346% | 11% | -115% | |
| Response Time Grey 50% / Grey 80% * (ms) | 4.2 ? | 16 ? -281% | 6 ? -43% | 28.4 ? -576% | 4 ? 5% | 14 ? -233% |
| Response Time Black / White * (ms) | 10 ? | 10.4 ? -4% | 9 ? 10% | 21.6 ? -116% | 8.4 ? 16% | 9.6 ? 4% |
| PWM Frequency (Hz) | ||||||
| Screen | 20% | 3% | -74% | -4% | -26% | |
| Brightness middle (cd/m²) | 353.4 | 338 -4% | 347 -2% | 268.3 -24% | 329 -7% | 337 -5% |
| Brightness (cd/m²) | 340 | 334 -2% | 328 -4% | 257 -24% | 321 -6% | 316 -7% |
| Brightness Distribution (%) | 92 | 94 2% | 89 -3% | 84 -9% | 92 0% | 85 -8% |
| Black Level * (cd/m²) | 0.31 | 0.24 23% | 0.285 8% | 0.34 -10% | 0.27 13% | 0.31 -0% |
| Contrast (:1) | 1140 | 1408 24% | 1218 7% | 789 -31% | 1219 7% | 1087 -5% |
| Colorchecker dE 2000 * | 2.17 | 1.39 36% | 2.35 -8% | 5.05 -133% | 2.78 -28% | 3.87 -78% |
| Colorchecker dE 2000 max. * | 5.69 | 3.31 42% | 4.15 27% | 15.43 -171% | 4.88 14% | 8.09 -42% |
| Colorchecker dE 2000 calibrated * | 1.05 | 0.97 8% | 1.16 -10% | 3.21 -206% | 1.63 -55% | 1.15 -10% |
| Greyscale dE 2000 * | 3.4 | 1.6 53% | 3.04 11% | 5.5 -62% | 2.5 26% | 6.1 -79% |
| Gamma | 2.2 100% | 2.291 96% | 2.35 94% | 2.35 94% | 2.106 104% | 2.132 103% |
| CCT | 6830 95% | 6626 98% | 6658 98% | 7392 88% | 6201 105% | 6891 94% |
| Color Space (Percent of AdobeRGB 1998) (%) | 68 | 65 | 76 | 72 | ||
| Color Space (Percent of sRGB) (%) | 89 | 99 | 99 | 94 | ||
| Média Total (Programa/Configurações) | -41% /
-8% | -4% /
0% | -152% /
-105% | 4% /
-1% | -46% /
-32% |
* ... menor é melhor
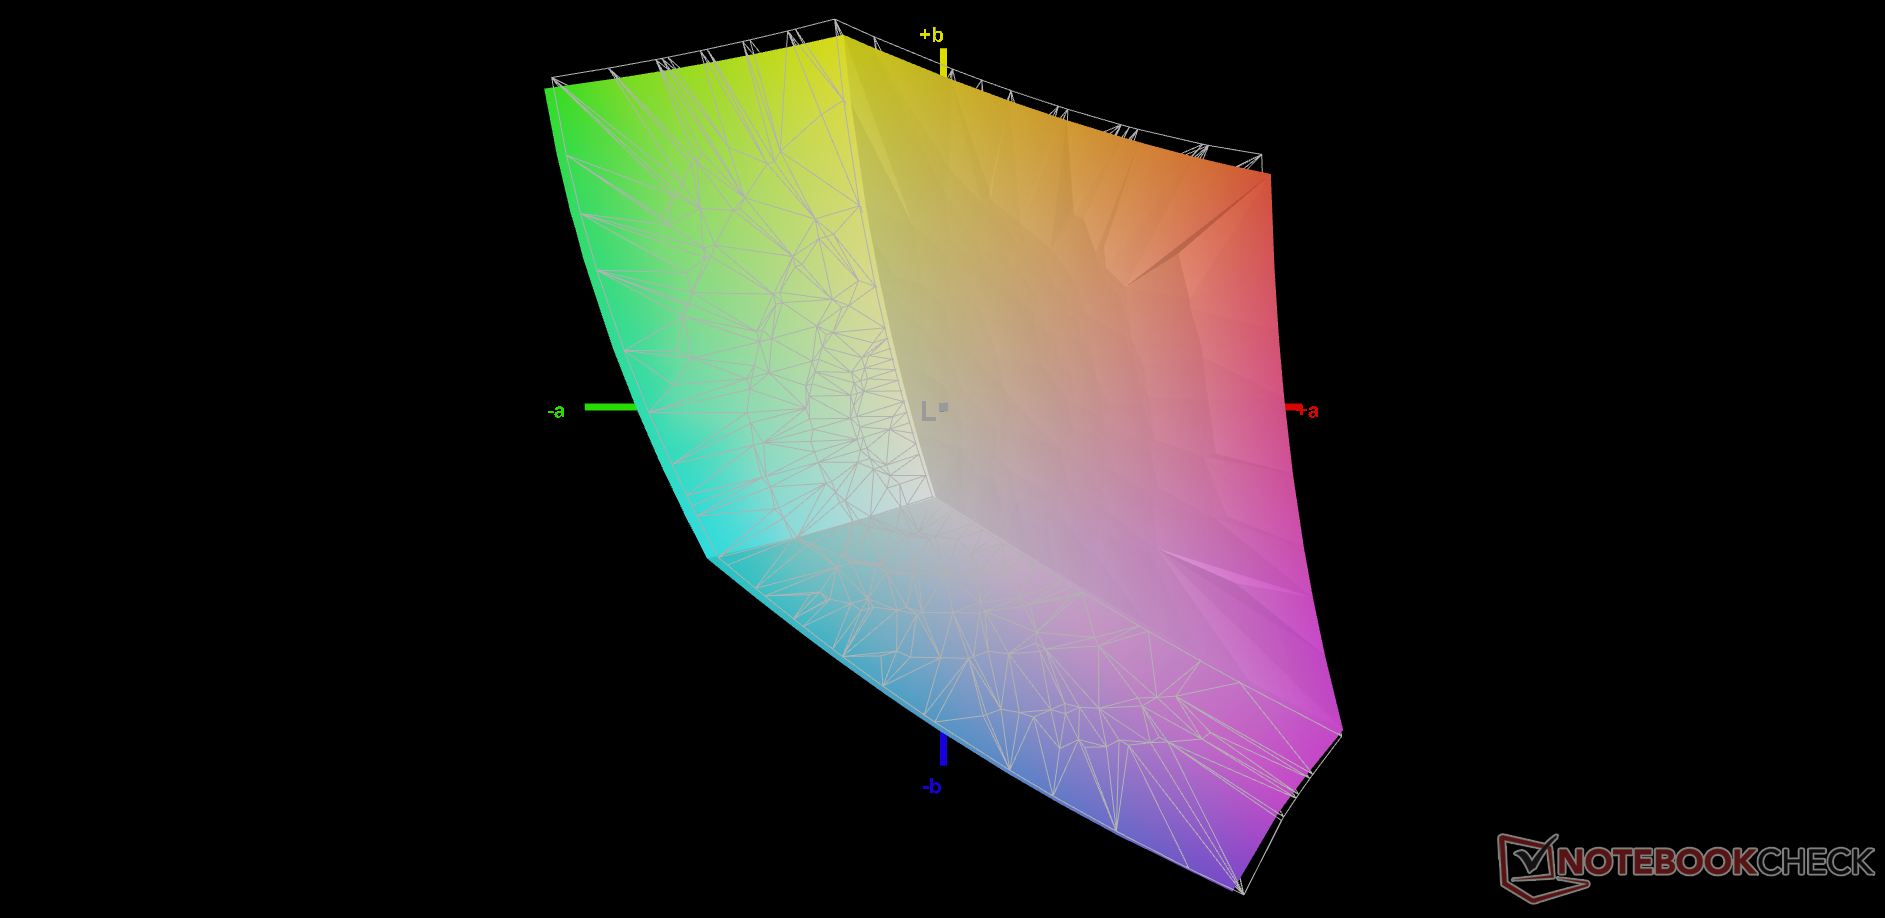
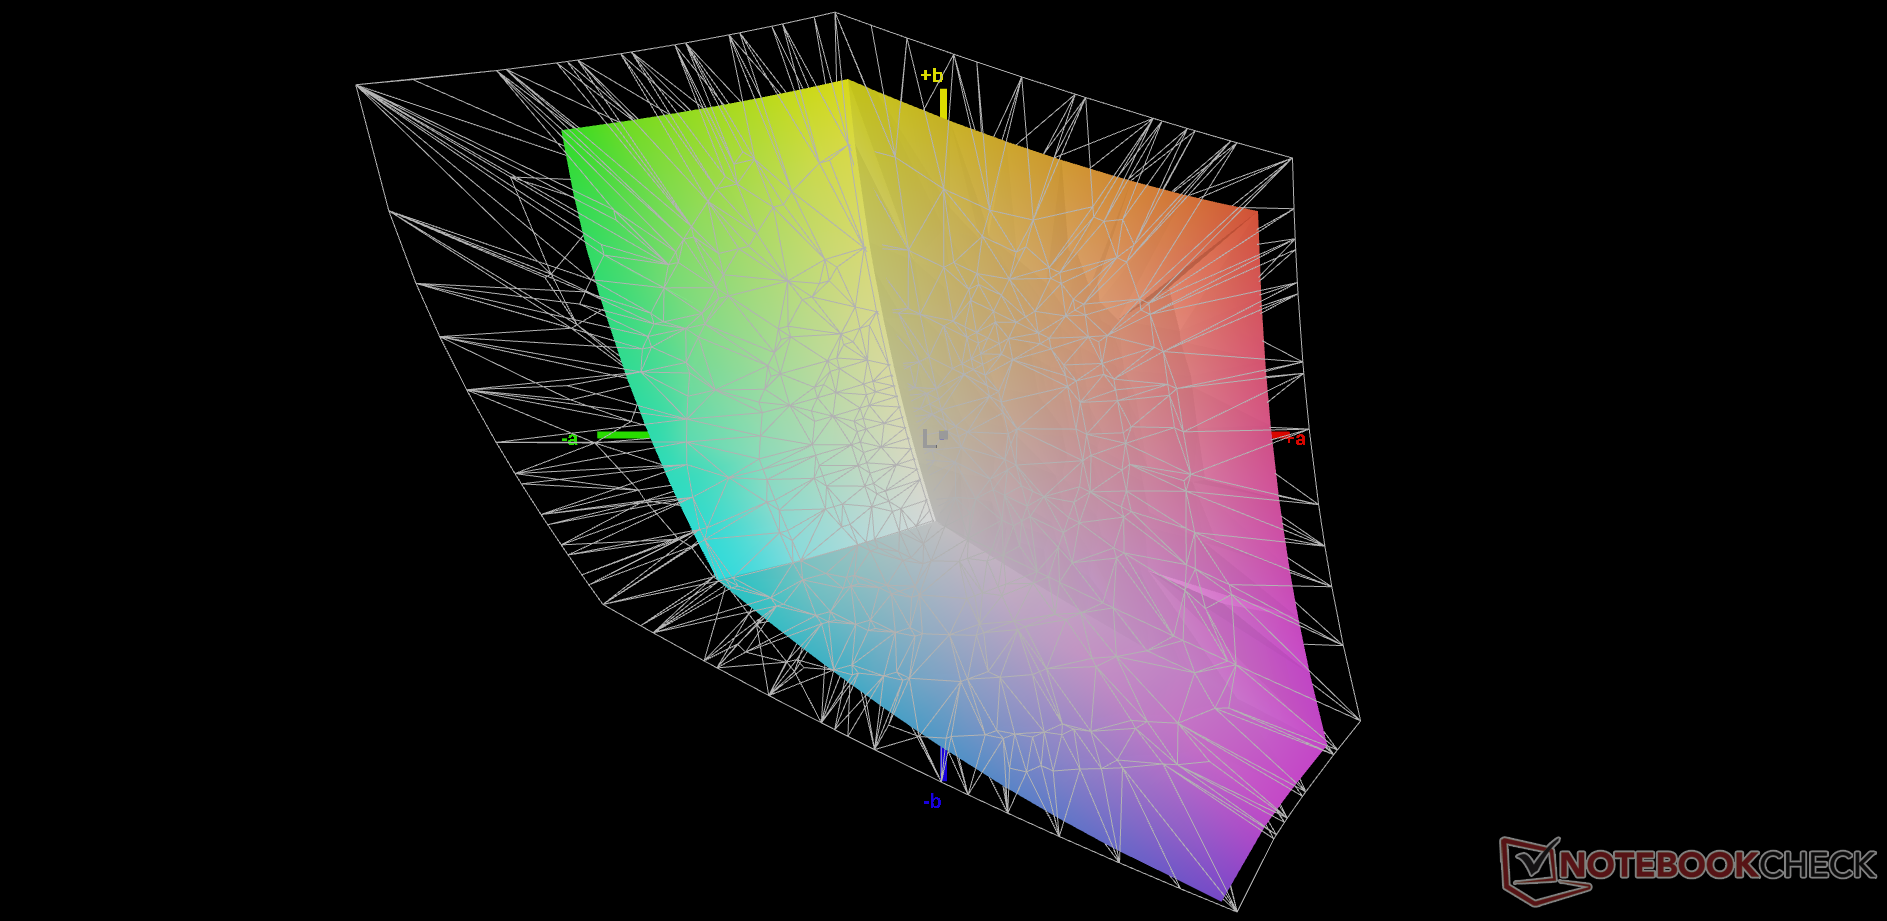
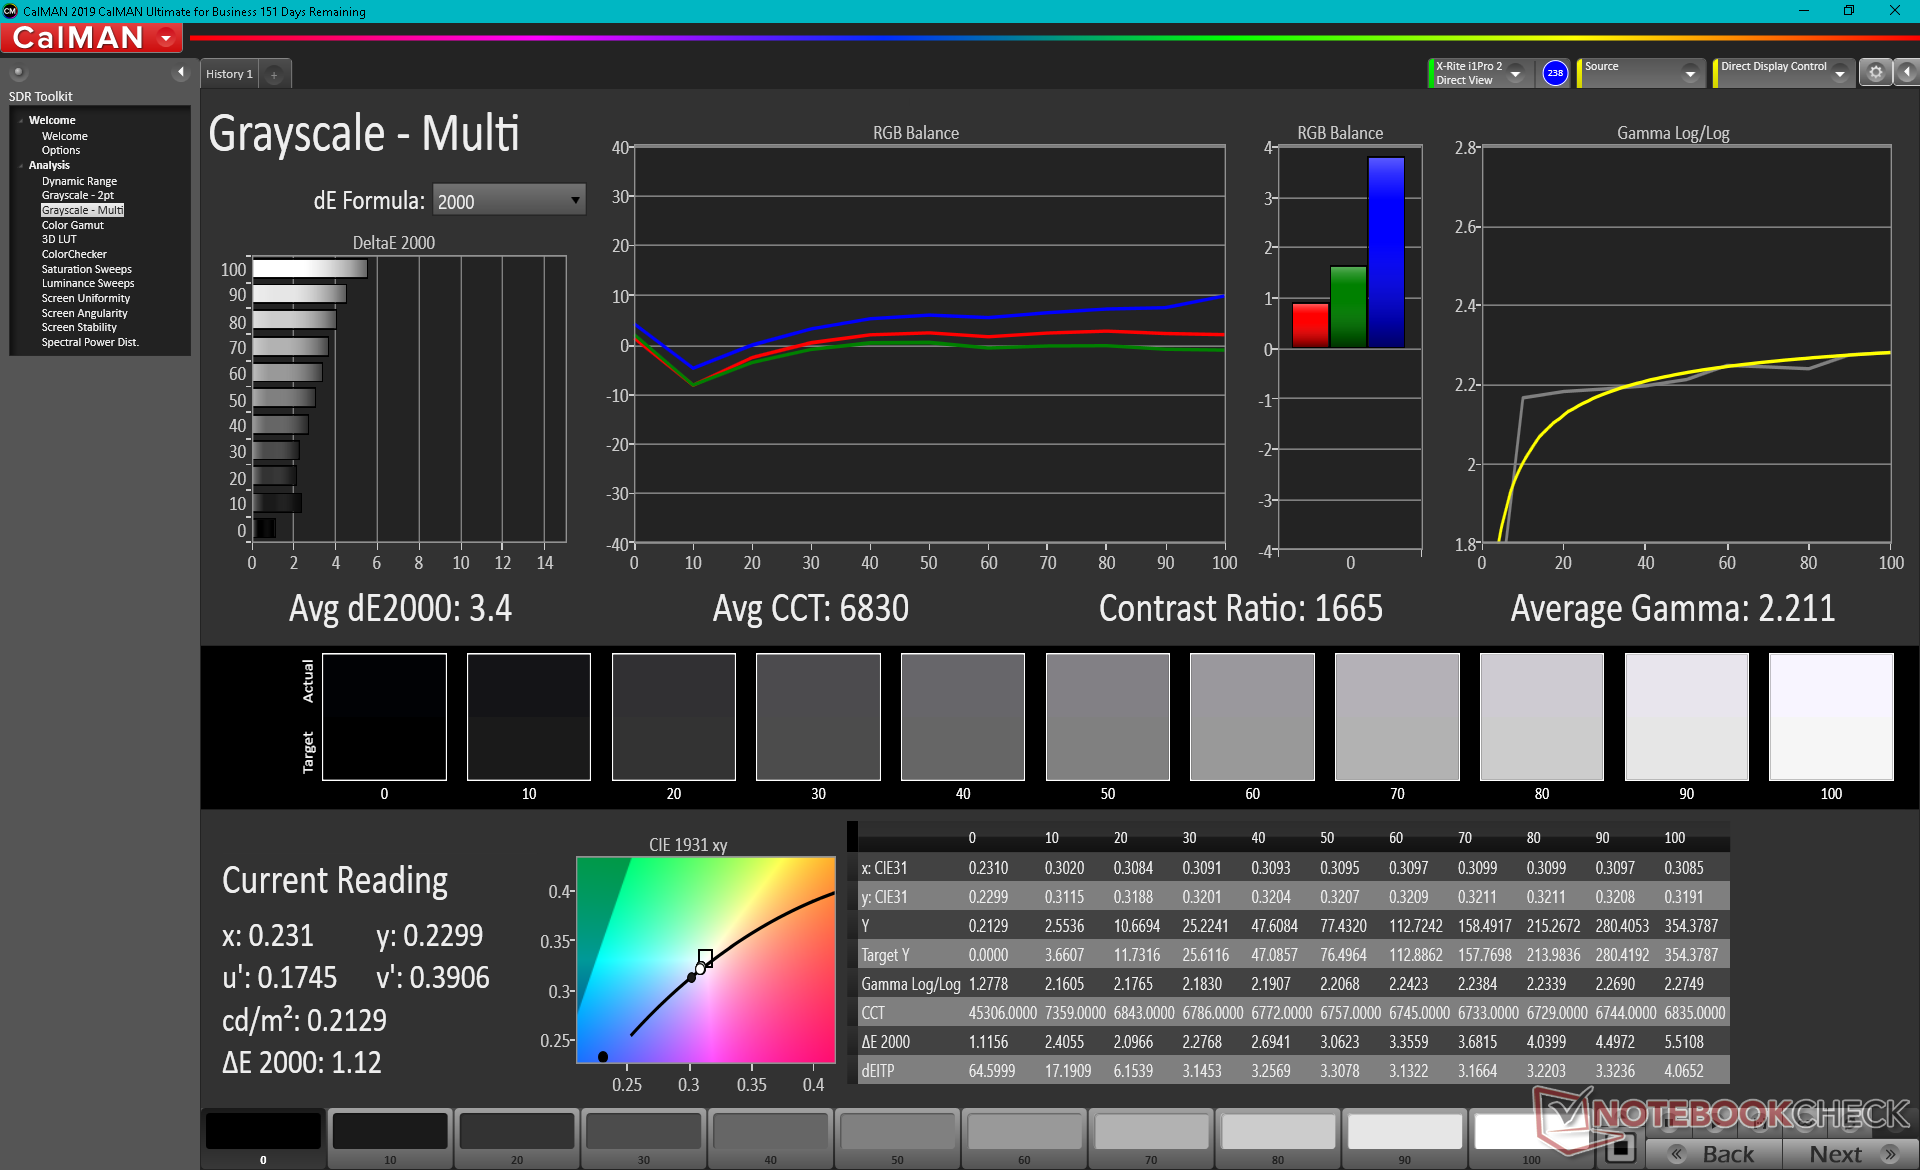
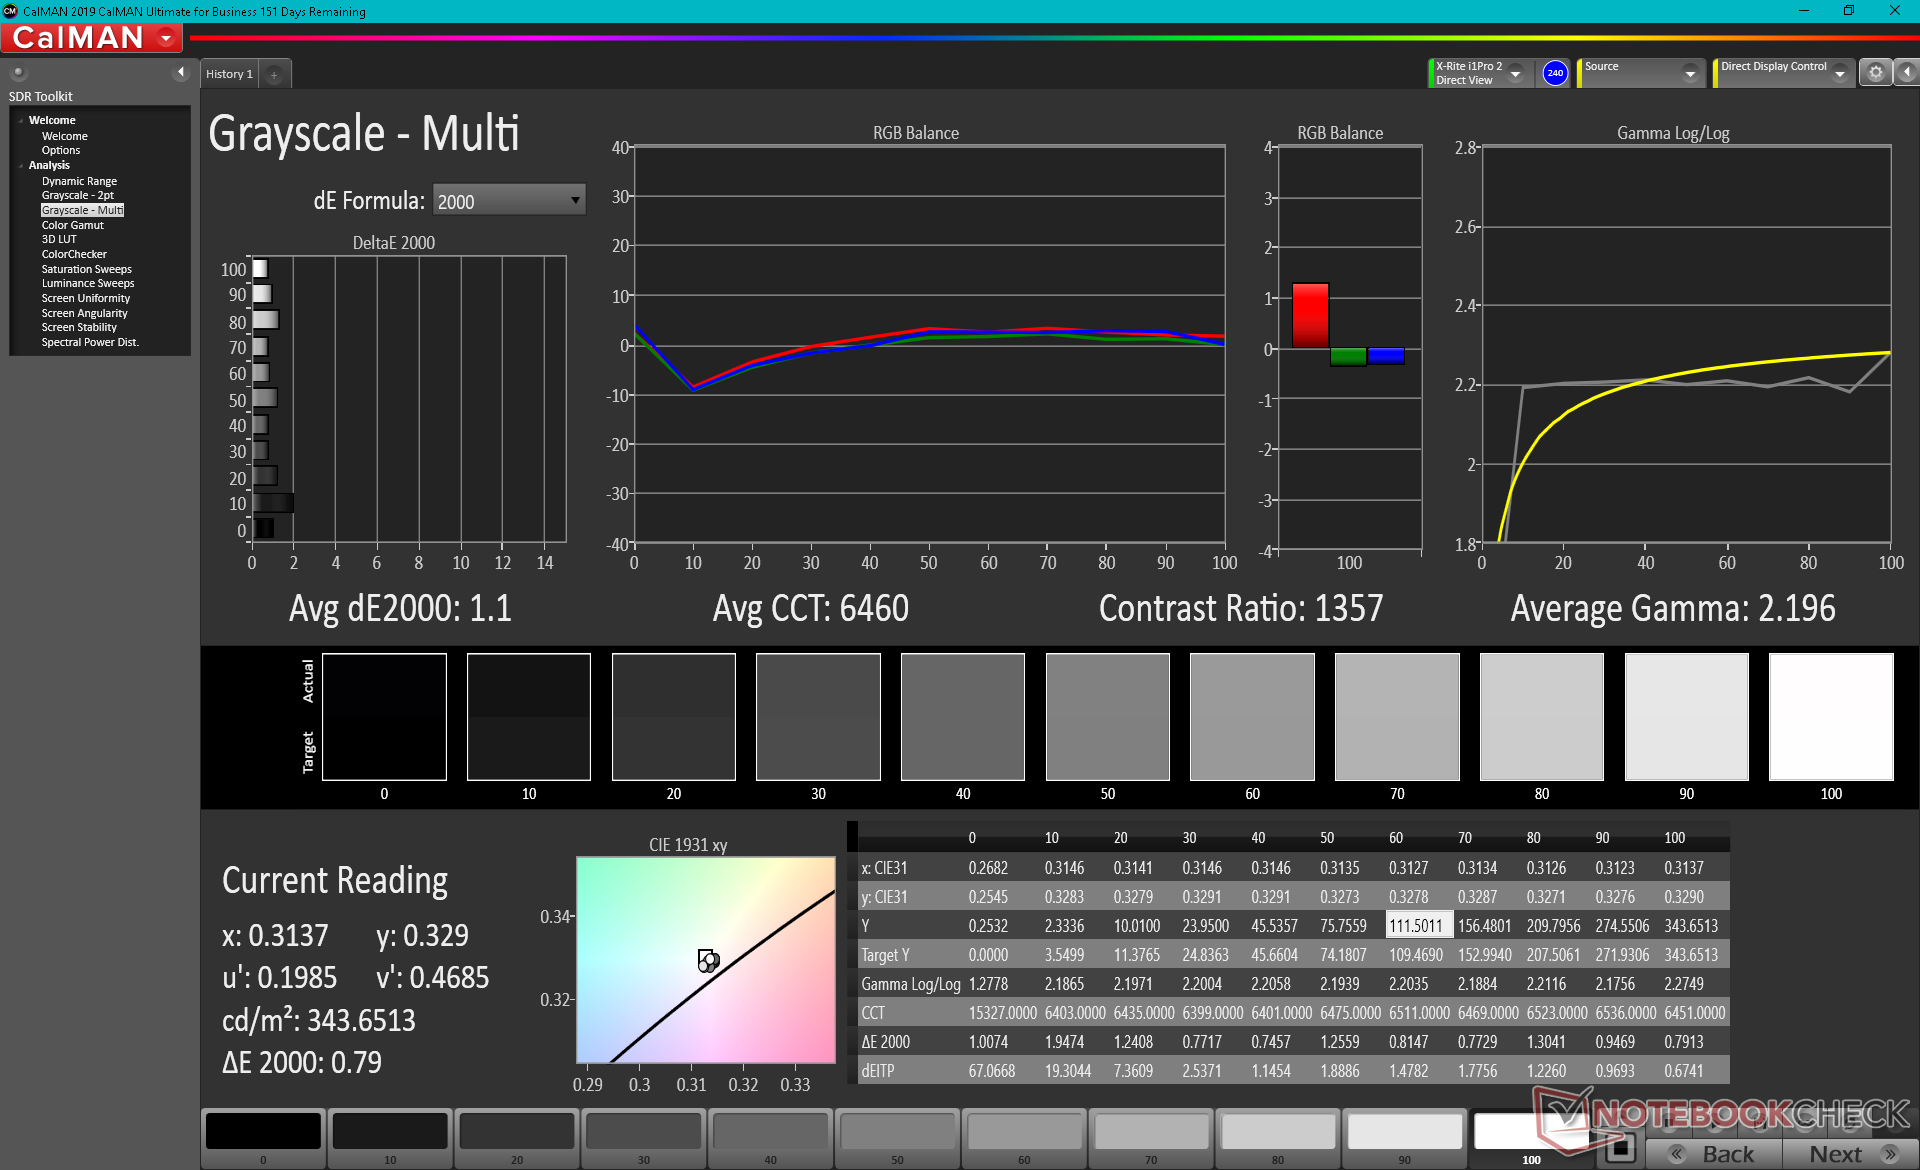
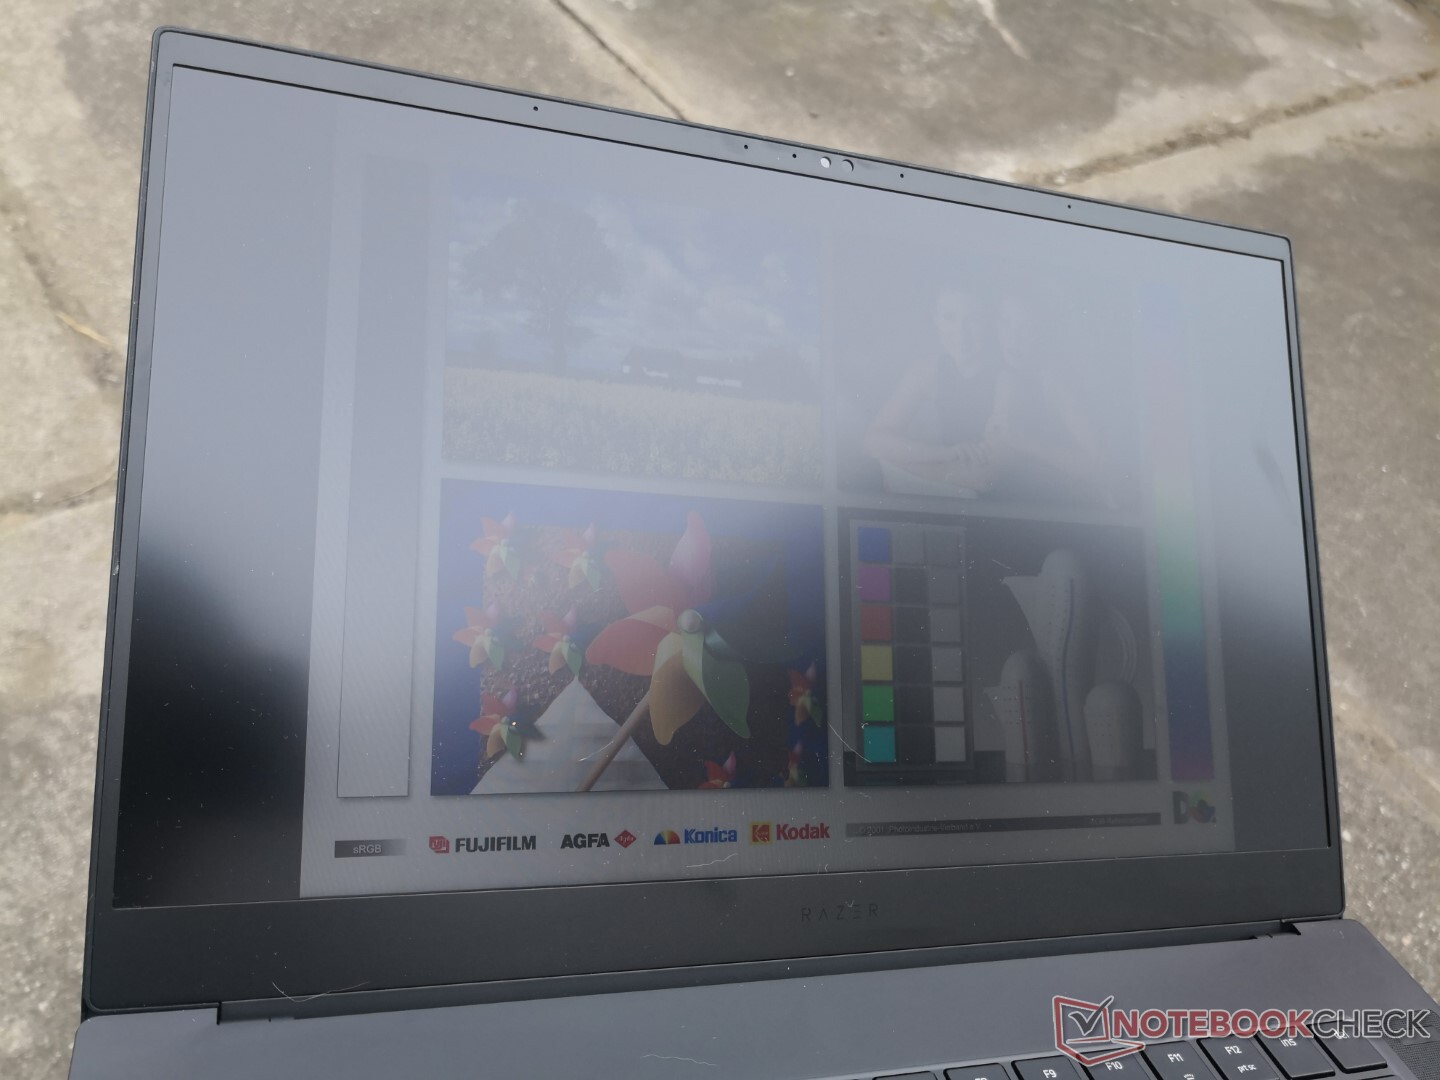
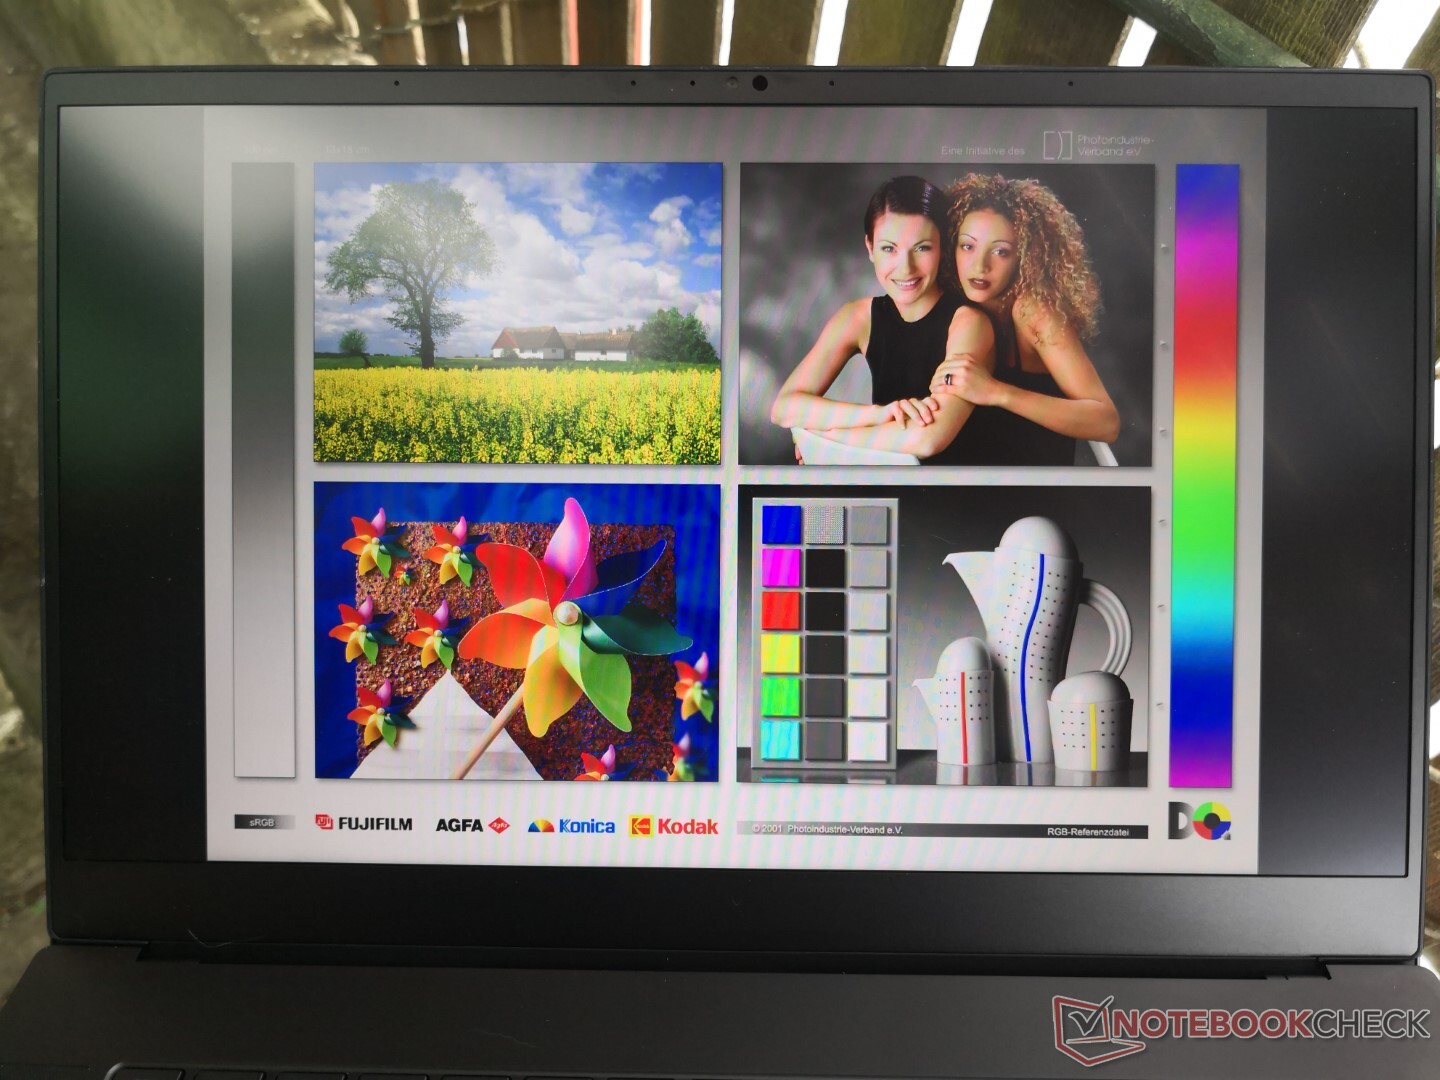
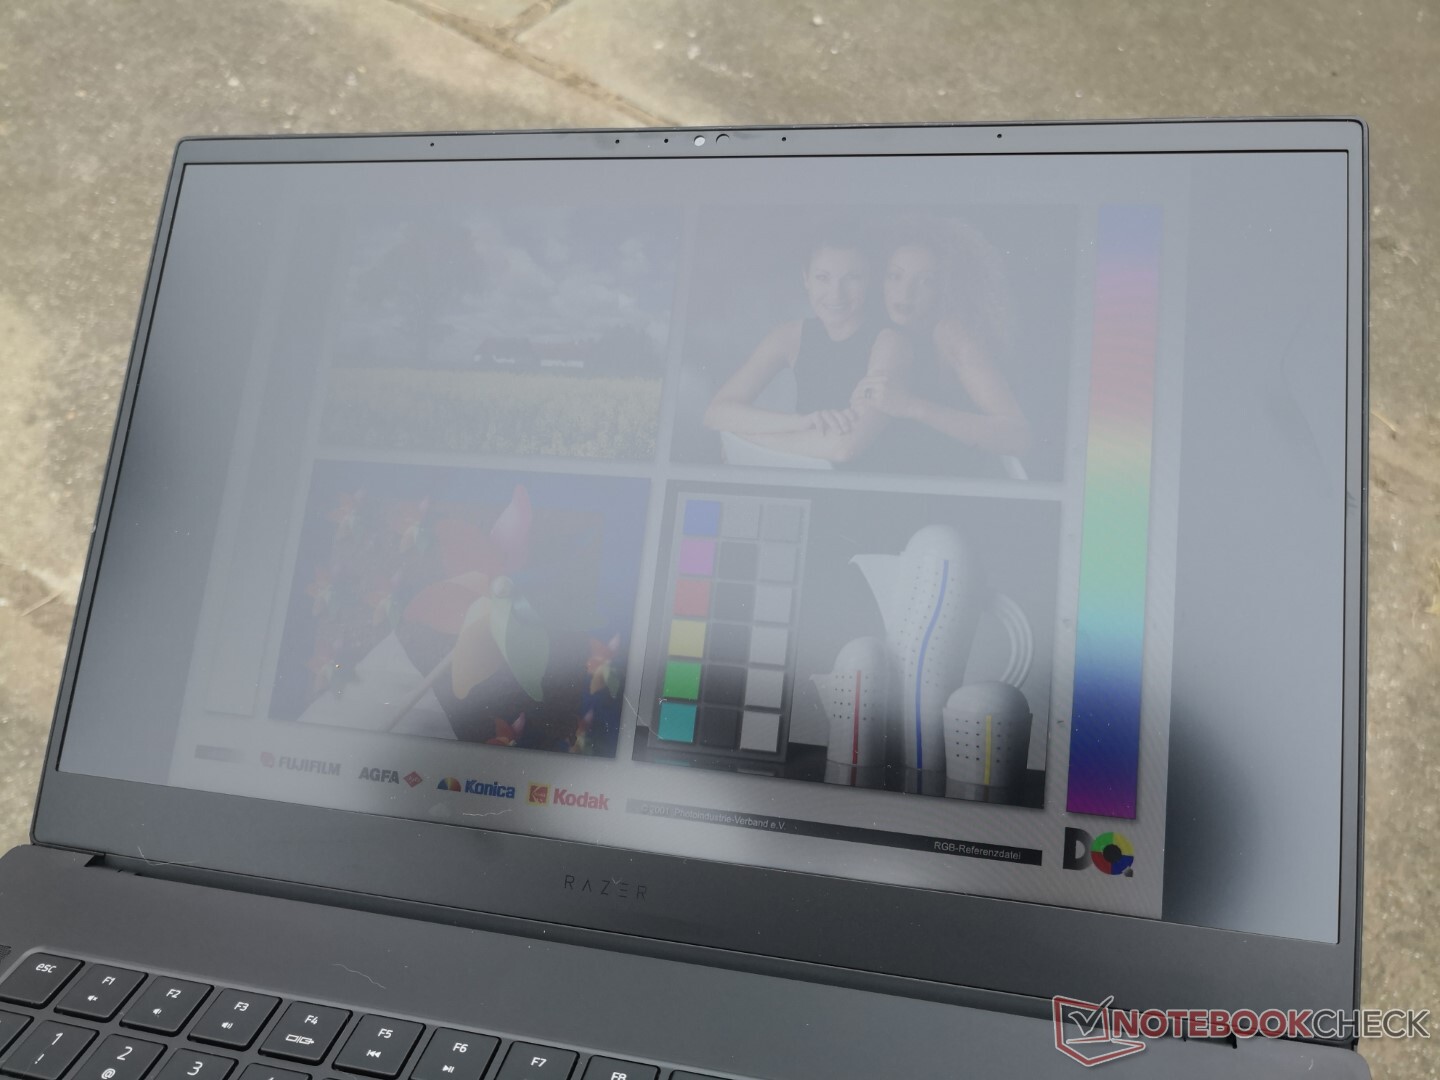
O display é calibrado de fábrica fora da caixa, mas não parece ser perfeito. Nossas medidas independentes do colorímetro do X-Rite mostram valores médios de escala de cinza e deltaE de cor de 3,5 e 2,17, respectivamente, o que sugere que pode haver espaço para melhorias. Somos capazes de empurrar os valores deltaE para apenas 1,1 e 1,05 após calibrarmos nós mesmos a tela.

Exibir tempos de resposta
| ↔ Tempo de resposta preto para branco | ||
|---|---|---|
| 10 ms ... ascensão ↗ e queda ↘ combinadas | ↗ 5.2 ms ascensão | 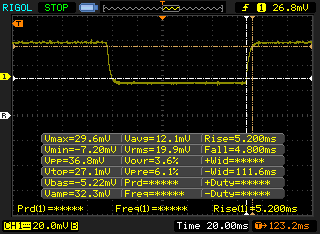 |
| ↘ 4.8 ms queda | ||
| A tela mostra boas taxas de resposta em nossos testes, mas pode ser muito lenta para jogadores competitivos. Em comparação, todos os dispositivos testados variam de 0.1 (mínimo) a 240 (máximo) ms. » 27 % de todos os dispositivos são melhores. Isso significa que o tempo de resposta medido é melhor que a média de todos os dispositivos testados (19.8 ms). | ||
| ↔ Tempo de resposta 50% cinza a 80% cinza | ||
| 4.2 ms ... ascensão ↗ e queda ↘ combinadas | ↗ 2.6 ms ascensão | 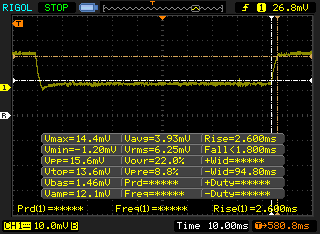 |
| ↘ 1.6 ms queda | ||
| A tela mostra taxas de resposta muito rápidas em nossos testes e deve ser muito adequada para jogos em ritmo acelerado. Em comparação, todos os dispositivos testados variam de 0.165 (mínimo) a 636 (máximo) ms. » 16 % de todos os dispositivos são melhores. Isso significa que o tempo de resposta medido é melhor que a média de todos os dispositivos testados (31 ms). | ||
Cintilação da tela / PWM (modulação por largura de pulso)
| Tela tremeluzindo / PWM não detectado | 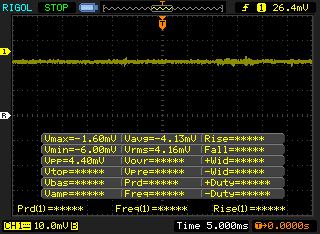 | ||
[pwm_comparison] Em comparação: 52 % de todos os dispositivos testados não usam PWM para escurecer a tela. Se PWM foi detectado, uma média de 7757 (mínimo: 5 - máximo: 343500) Hz foi medida. | |||

Desempenho
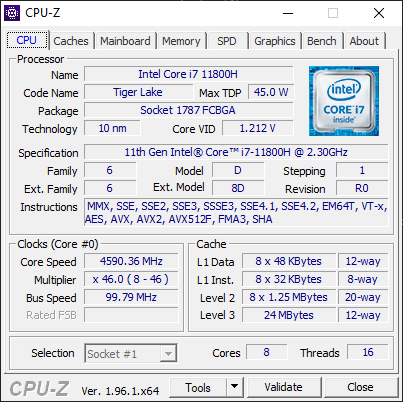
Processador
O desempenho da CPU está significativamente à frente do Núcleo i7-10875H no 10º gênero Lâmina 15 em até 20% e 80% em padrões de referência de rosca única e de rosca múltipla, respectivamente. O processador da 10ª geração Blade 15 teve um desempenho inferior de qualquer forma e por isso é bom ver que a 11ª geração Blade 15 está de volta ao bom caminho em termos de desempenho da CPU. As pontuações estão dentro dos pontos percentuais de um dígito do média do Core i7-11800H laptop em nosso banco de dados, enquanto a i7-10875H na lâmina 15 mais antiga estaria atrasada em até 20%.
A atualização para o Core i9-11900H SKU provavelmente aumentaria o desempenho em apenas alguns pontos percentuais se o nosso Asus ROG Zephyrus S17 GX703HSD for de alguma indicação.
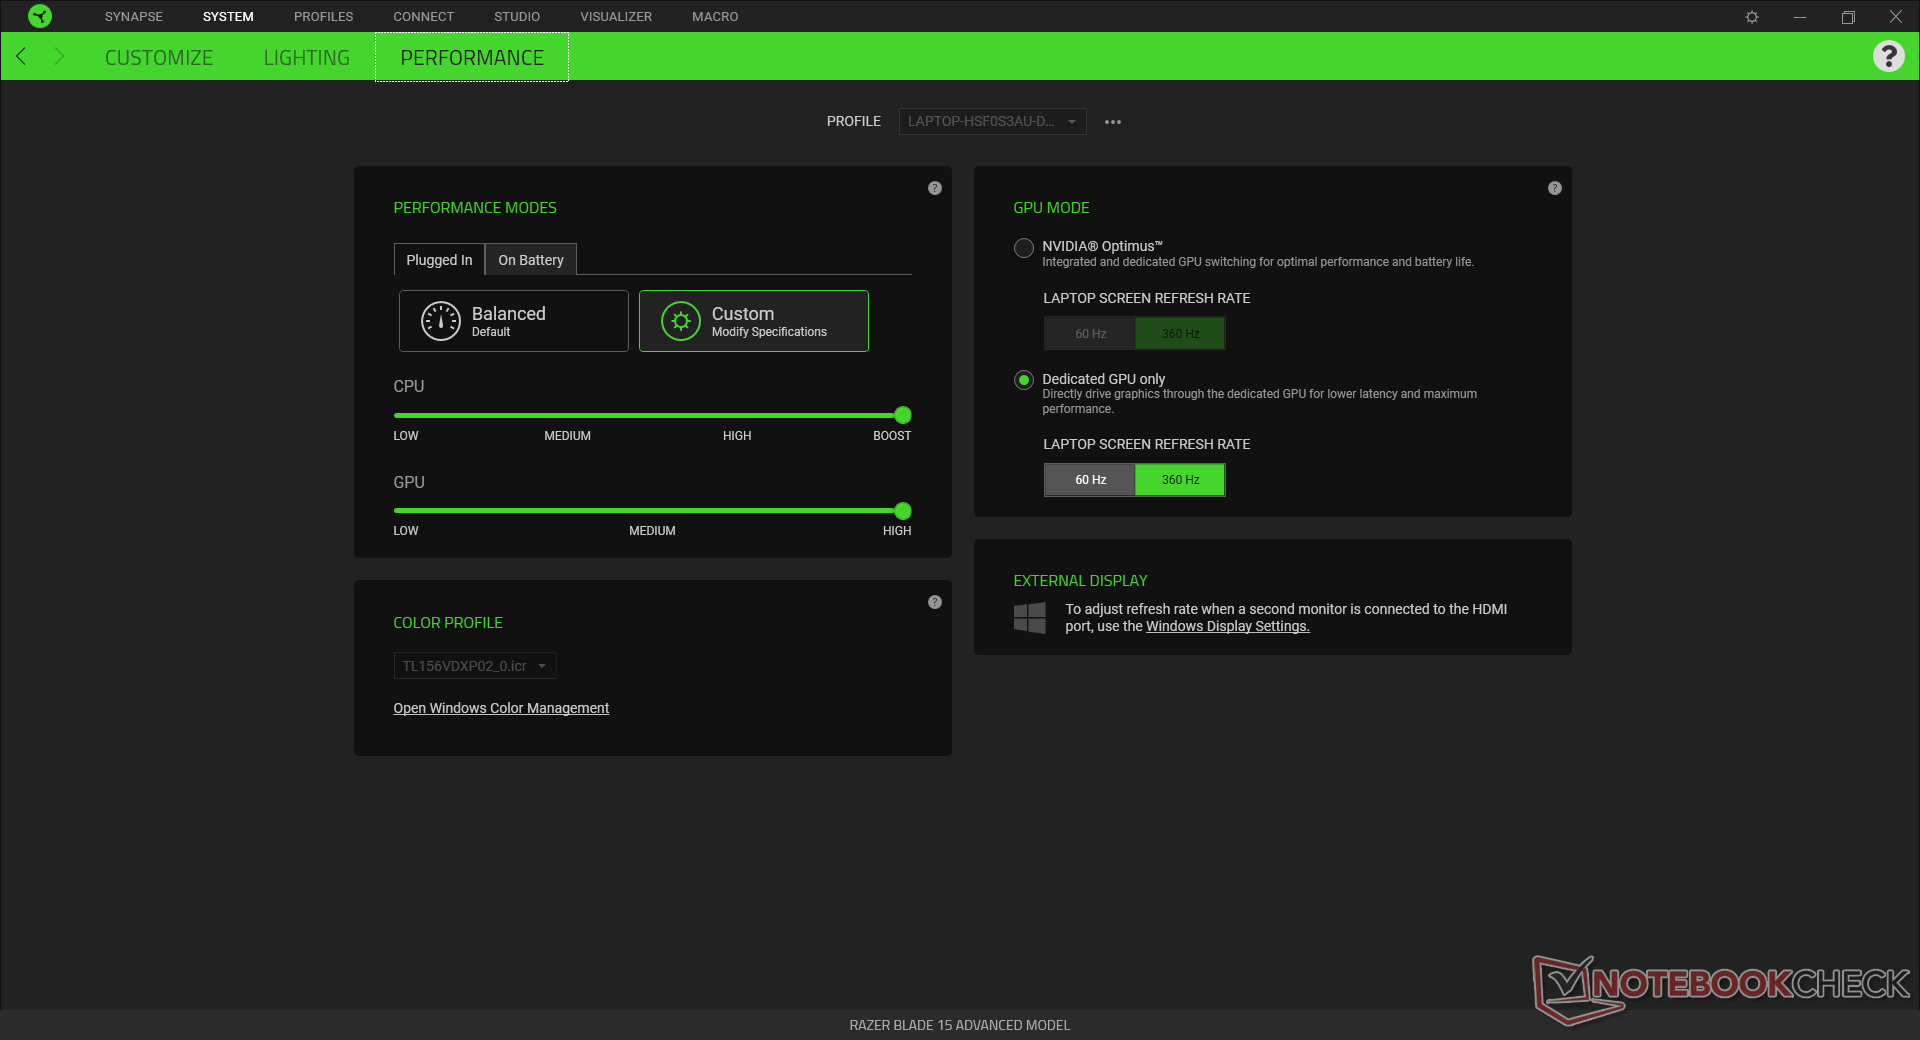
A sustentabilidade do desempenho é excelente, sem flutuações nas pontuações ou taxas de relógio ao longo do tempo, como mostra nosso gráfico de loop do CineBench R15 xT abaixo. Todos os benchmarks foram realizados com o sistema definido para 'Boost' e 'High' via Razer Synapse.
Cinebench R15 Multi Loop
Cinebench R23: Multi Core | Single Core
Cinebench R15: CPU Multi 64Bit | CPU Single 64Bit
Blender: v2.79 BMW27 CPU
7-Zip 18.03: 7z b 4 -mmt1 | 7z b 4
Geekbench 5.5: Single-Core | Multi-Core
HWBOT x265 Benchmark v2.2: 4k Preset
LibreOffice : 20 Documents To PDF
R Benchmark 2.5: Overall mean
* ... menor é melhor
Desempenho do sistema
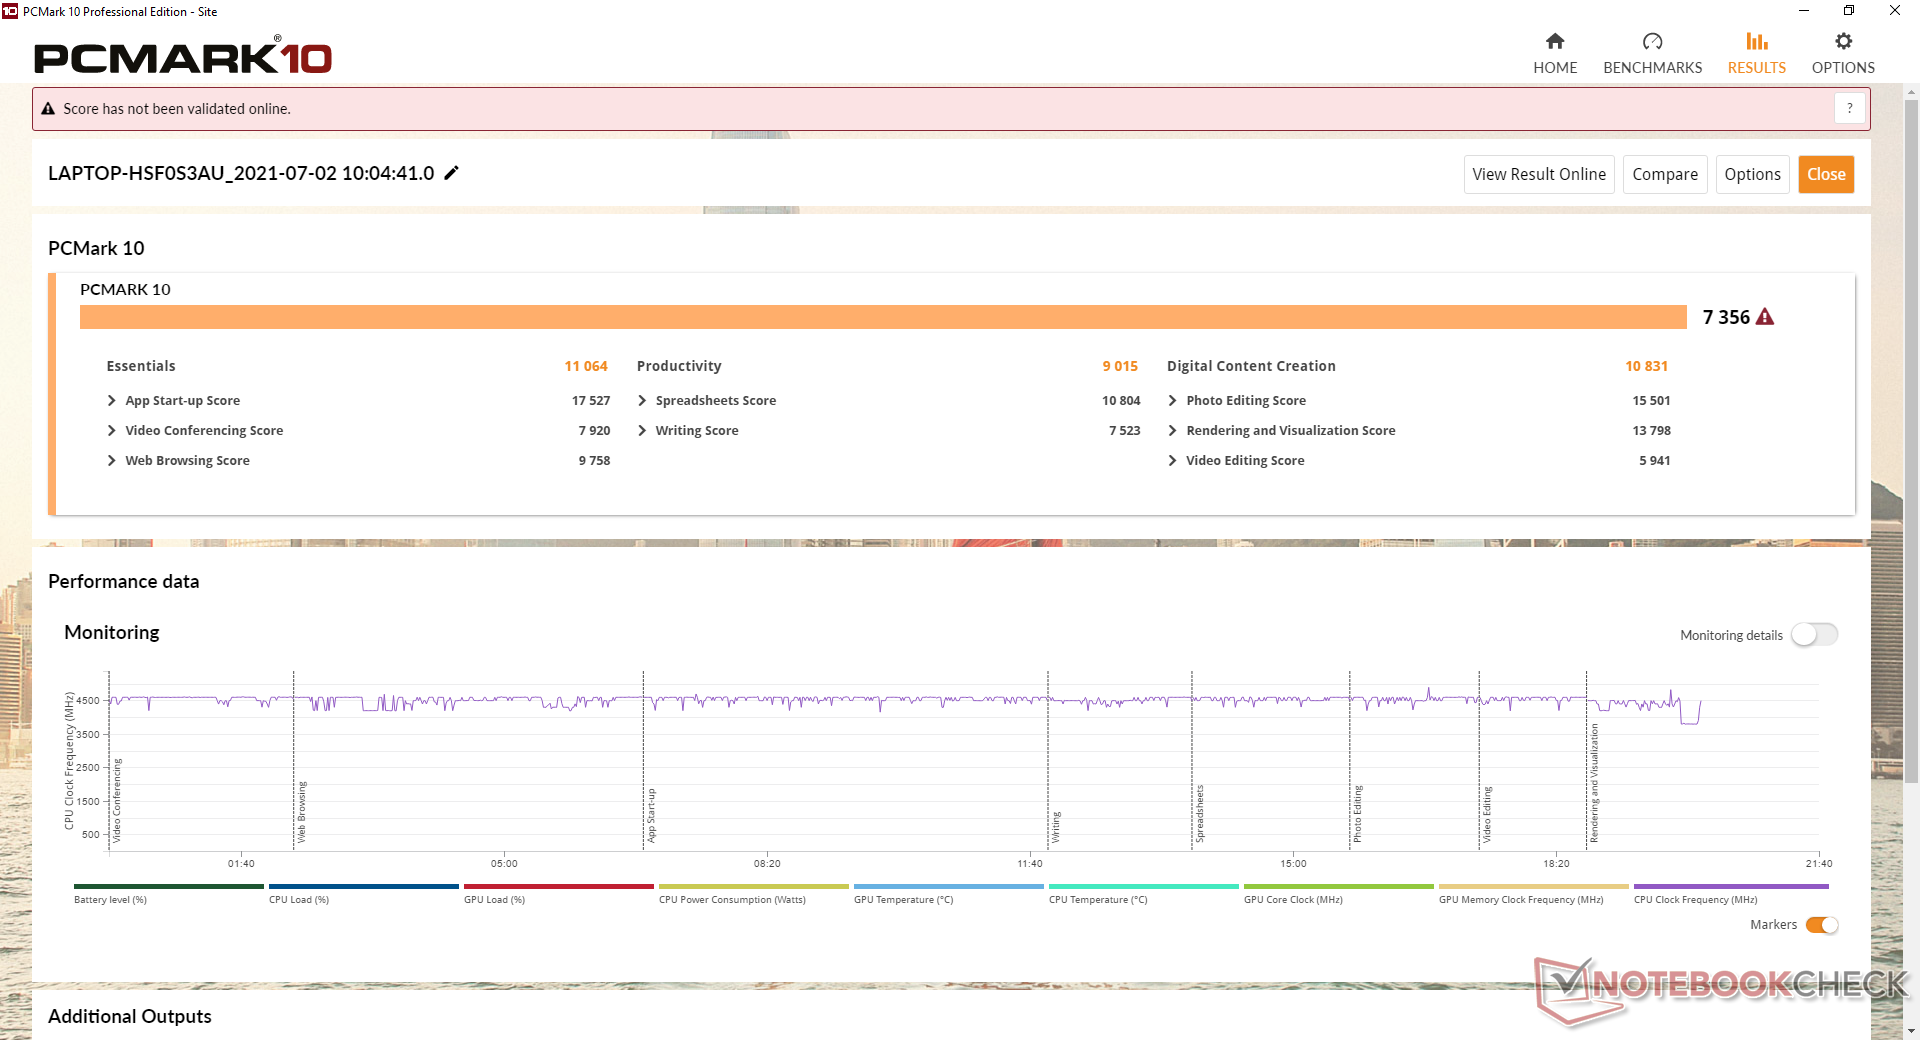
A pontuação PCMark está consistentemente à frente do 10º gênero Blade 15 por pontos percentuais de dois dígitos em muitos casos. Suspeitamos que a PCIe 4 SSD super-rápida está desempenhando um papel importante aqui, já que o benchmark tende a favorecer sistemas com desempenho de armazenamento rápido.
| PCMark 10 / Score | |
| Razer Blade 15 Advanced (Mid 2021) | |
| Aorus 15P YD | |
| Média Intel Core i7-11800H, NVIDIA GeForce RTX 3080 Laptop GPU (6673 - 7470, n=11) | |
| Asus TUF Gaming F15 FX506HM | |
| Alienware m15 R5 Ryzen Edition | |
| Razer Blade 15 Advanced Model Early 2021 | |
| Razer Blade 15 RTX 2080 Super Max-Q | |
| PCMark 10 / Essentials | |
| Razer Blade 15 Advanced (Mid 2021) | |
| Aorus 15P YD | |
| Asus TUF Gaming F15 FX506HM | |
| Média Intel Core i7-11800H, NVIDIA GeForce RTX 3080 Laptop GPU (9862 - 11064, n=11) | |
| Alienware m15 R5 Ryzen Edition | |
| Razer Blade 15 Advanced Model Early 2021 | |
| Razer Blade 15 RTX 2080 Super Max-Q | |
| PCMark 10 / Productivity | |
| Aorus 15P YD | |
| Média Intel Core i7-11800H, NVIDIA GeForce RTX 3080 Laptop GPU (8278 - 9803, n=11) | |
| Razer Blade 15 Advanced (Mid 2021) | |
| Alienware m15 R5 Ryzen Edition | |
| Asus TUF Gaming F15 FX506HM | |
| Razer Blade 15 Advanced Model Early 2021 | |
| Razer Blade 15 RTX 2080 Super Max-Q | |
| PCMark 10 / Digital Content Creation | |
| Razer Blade 15 Advanced (Mid 2021) | |
| Média Intel Core i7-11800H, NVIDIA GeForce RTX 3080 Laptop GPU (9881 - 11323, n=11) | |
| Aorus 15P YD | |
| Asus TUF Gaming F15 FX506HM | |
| Alienware m15 R5 Ryzen Edition | |
| Razer Blade 15 Advanced Model Early 2021 | |
| Razer Blade 15 RTX 2080 Super Max-Q | |
| PCMark 10 Score | 7356 pontos | |
Ajuda | ||
Latência do DPC
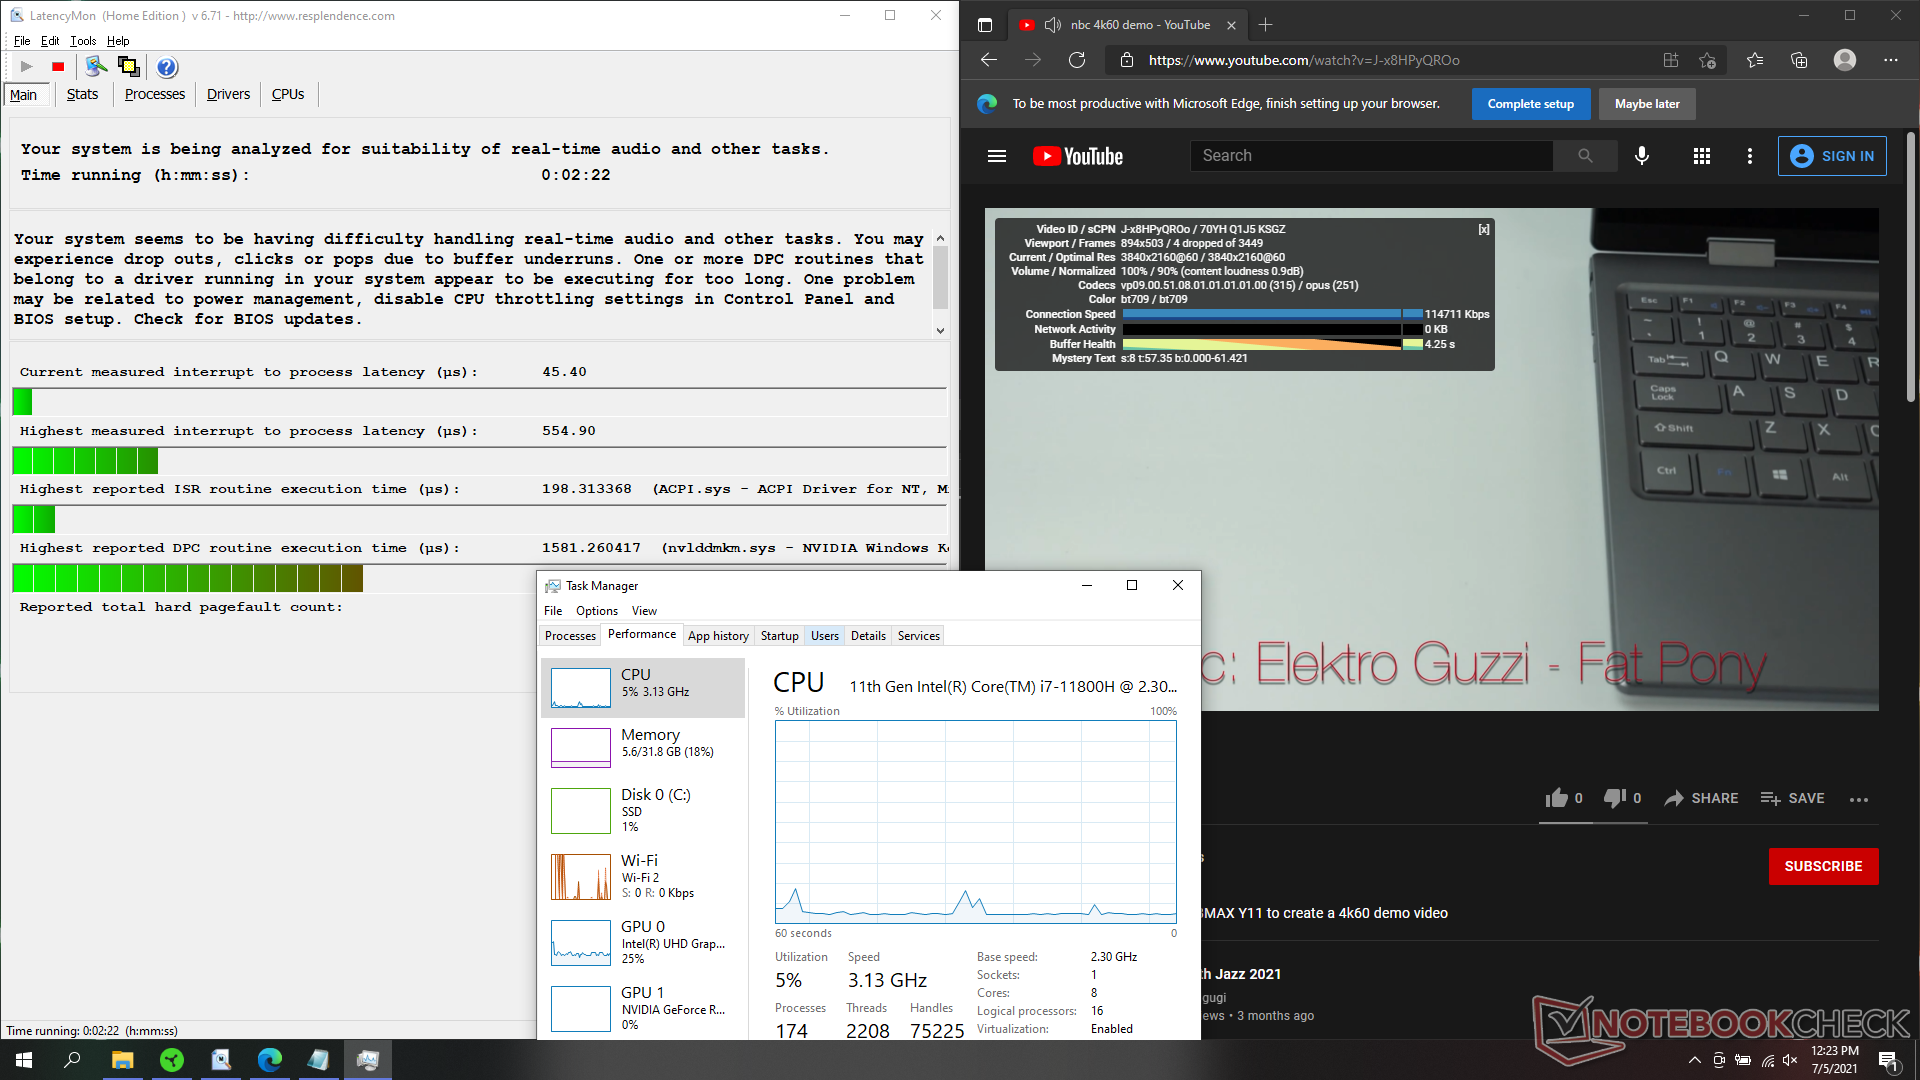
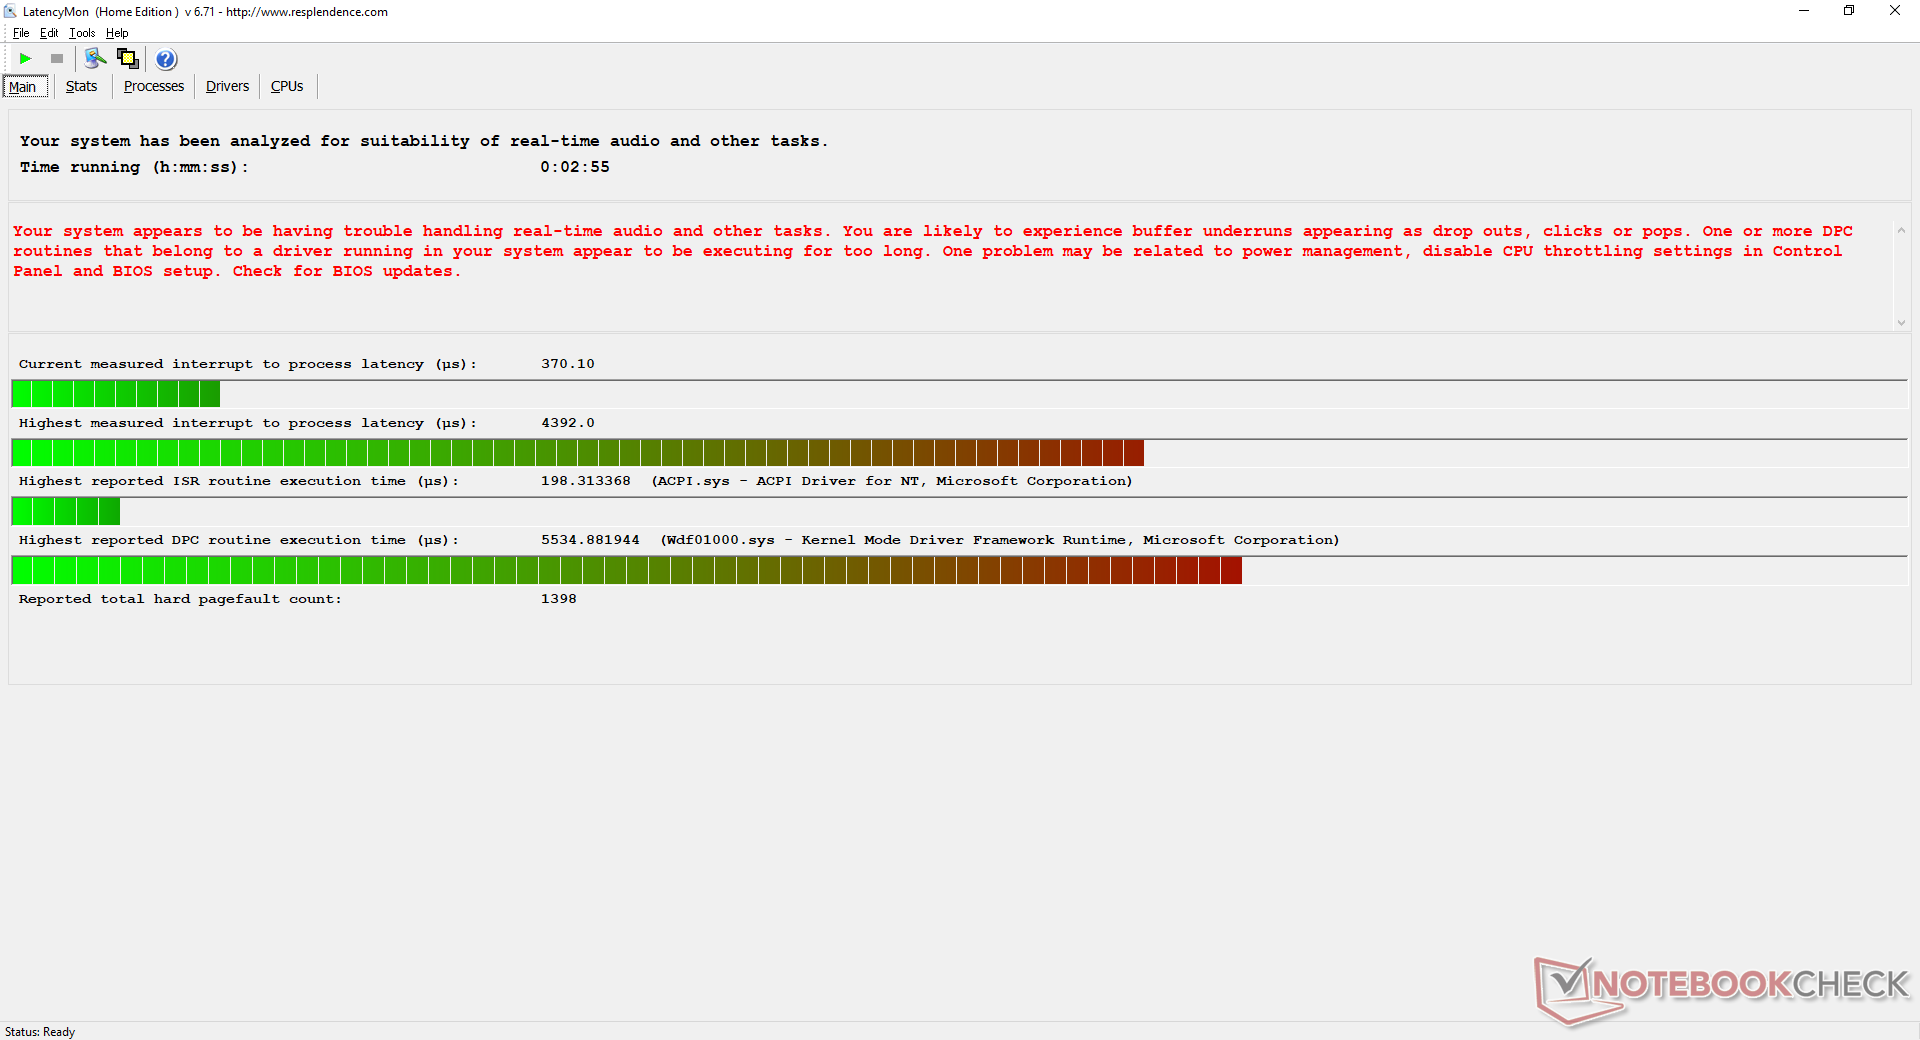
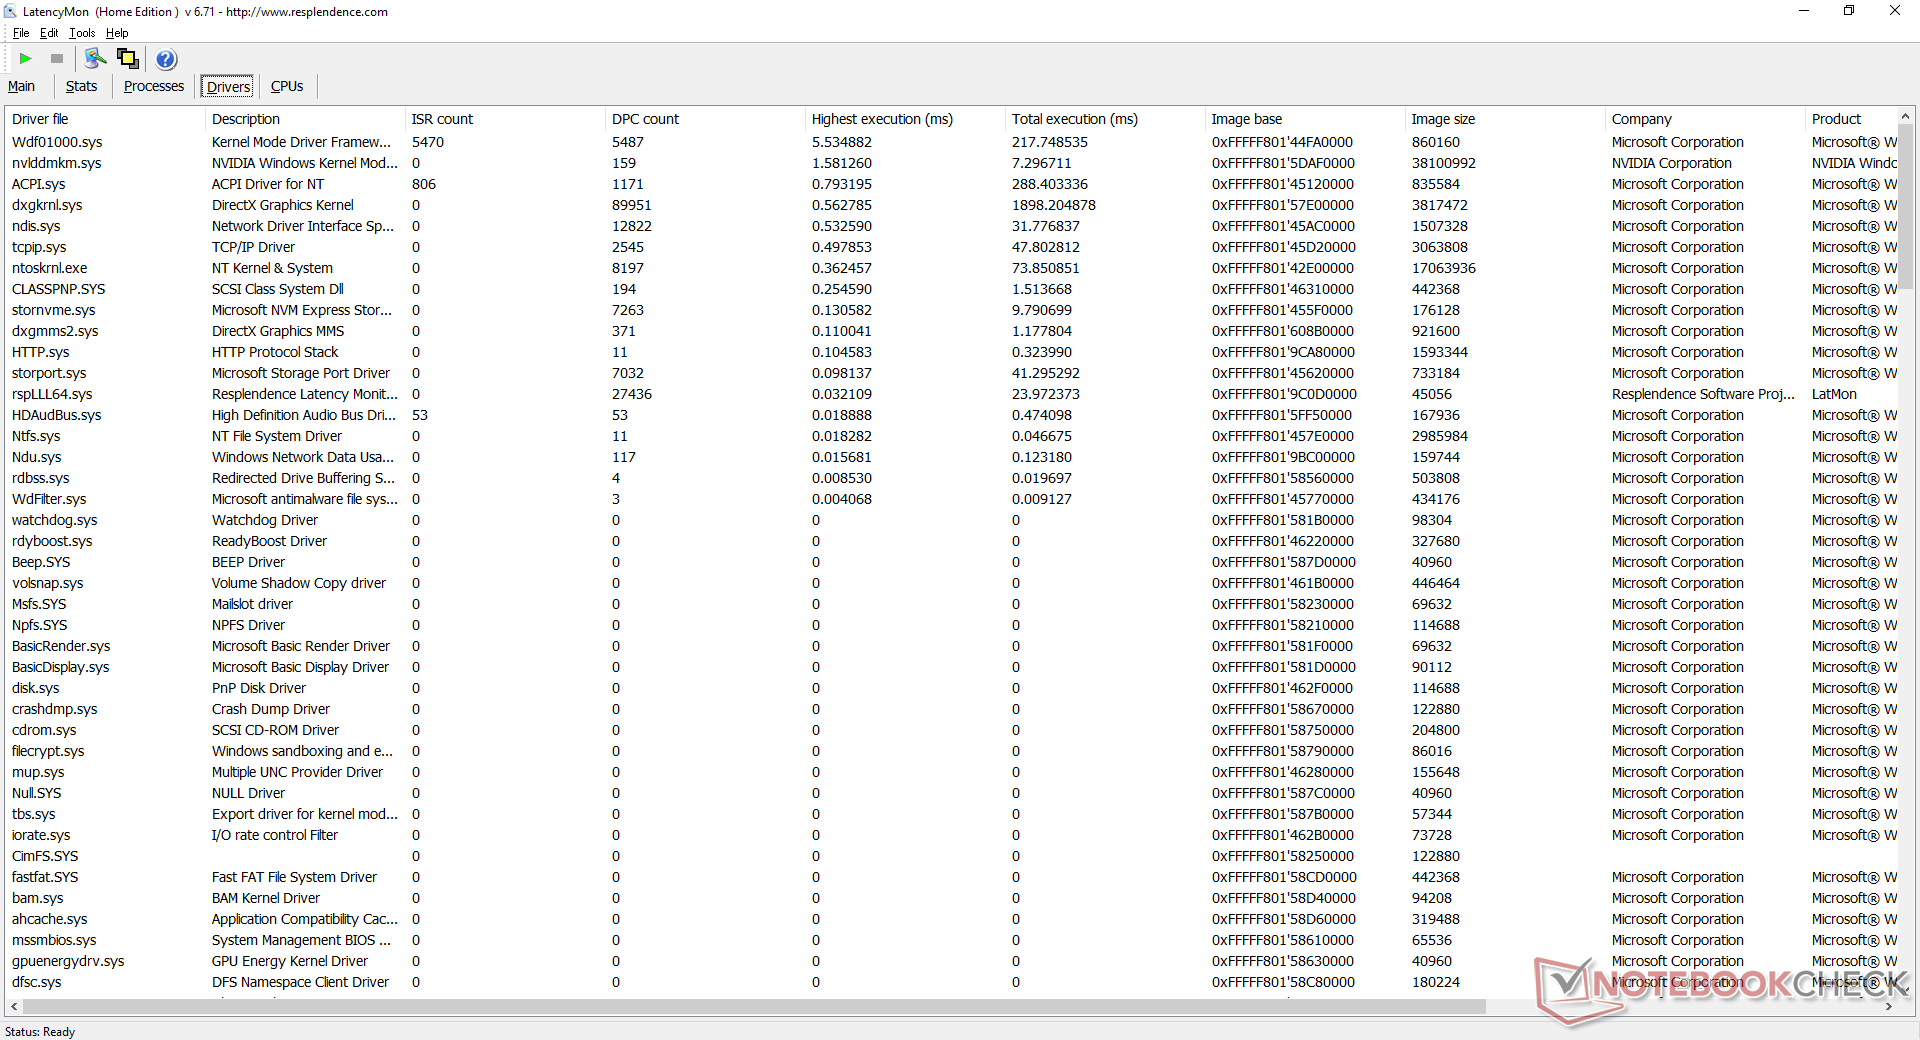
LatencyMon não revela grandes problemas de latência de DPC ao navegar na web ou no fluxo de vídeo a 4K. Uma vez que a CPU esteja muito estressada, no entanto, a latência atingiria o pico de 4392 μs. Testamos isto duas vezes com Prime95 e os resultados são repetíveis.
| DPC Latencies / LatencyMon - interrupt to process latency (max), Web, Youtube, Prime95 | |
| Razer Blade 15 Advanced (Mid 2021) | |
| Asus TUF Gaming F15 FX506HM | |
| Razer Blade 15 RTX 2080 Super Max-Q | |
| Aorus 15P YD | |
| Razer Blade 15 Advanced Model Early 2021 | |
| Alienware m15 R5 Ryzen Edition | |
* ... menor é melhor
Dispositivos de armazenamento
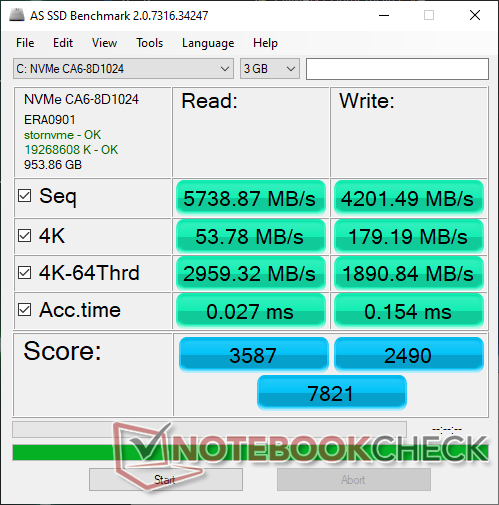
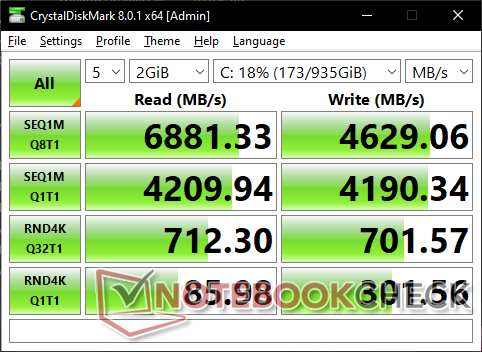
Um fator diferenciador importante que separa o 11º gênero Blade 15 de todos os modelos anteriores é seu suporte para SSDs NVMe PCIe 4 rápidos. De fato, as taxas sequenciais de leitura e escrita aqui se aproximam de 6800+ MB/s e 4800 MB/s, respectivamente, em comparação com "apenas" 3200 MB/s e 3000 MB/s no 10º gênero Blade 15 com seu Samsung PM981a.
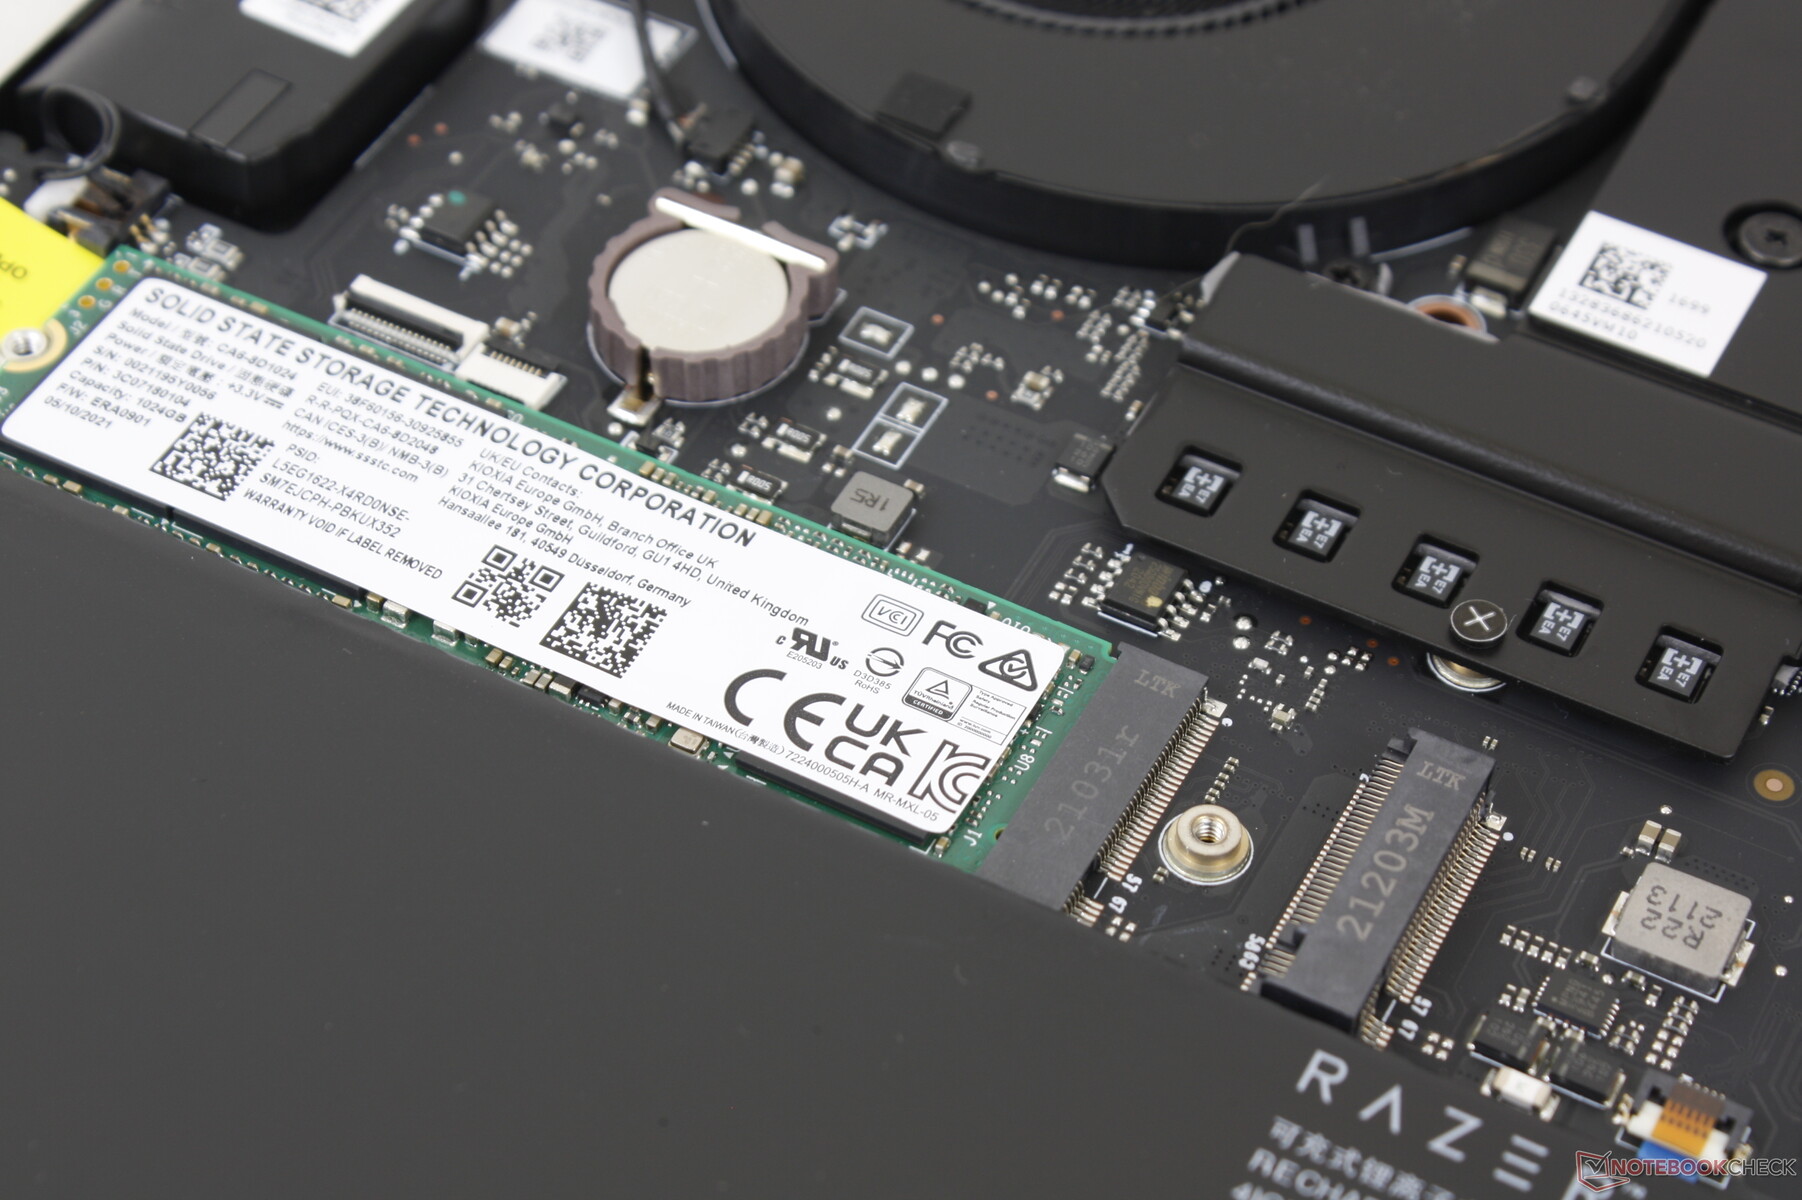
Curiosamente, o SSD PCIe 4 aqui vem do SSSTC em vez do Samsung ou Lite-On. Quase todos os outros laptops Blade vêm com Samsung e Lite-On SSDs e, portanto, isto foi inesperado de se ver em nossa unidade de teste. O SSD Samsung PM9A1 PCIe 4 NVMe parece ser um pouco mais rápido do que nossa solução SSSTC
| Razer Blade 15 Advanced (Mid 2021) SSSTC CA6-8D1024 | Razer Blade 15 Advanced Model Early 2021 Samsung PM981a MZVLB1T0HBLR | Asus TUF Gaming F15 FX506HM SK Hynix HFM001TD3JX013N | Alienware m15 R5 Ryzen Edition Toshiba KBG40ZNS512G NVMe | Aorus 15P YD Samsung PM9A1 MZVL21T0HCLR | |
|---|---|---|---|---|---|
| AS SSD | -30% | -27% | -69% | 13% | |
| Seq Read (MB/s) | 5739 | 2112 -63% | 2873 -50% | 2082 -64% | 5376 -6% |
| Seq Write (MB/s) | 4201 | 2024 -52% | 1619 -61% | 825 -80% | 3669 -13% |
| 4K Read (MB/s) | 53.8 | 46.53 -14% | 57.5 7% | 42.41 -21% | 56.5 5% |
| 4K Write (MB/s) | 179.2 | 89.7 -50% | 149.6 -17% | 98.3 -45% | 157.7 -12% |
| 4K-64 Read (MB/s) | 2959 | 1747 -41% | 1252 -58% | 1255 -58% | 2720 -8% |
| 4K-64 Write (MB/s) | 1891 | 1962 4% | 2196 16% | 738 -61% | 3366 78% |
| Access Time Read * (ms) | 0.027 | 0.052 -93% | 0.04 -48% | 0.109 -304% | 0.04 -48% |
| Access Time Write * (ms) | 0.154 | 0.04 74% | 0.082 47% | 0.17 -10% | 0.027 82% |
| Score Read (Points) | 3587 | 2004 -44% | 1597 -55% | 1506 -58% | 3314 -8% |
| Score Write (Points) | 2490 | 2254 -9% | 2508 1% | 918 -63% | 3890 56% |
| Score Total (Points) | 7821 | 5280 -32% | 4869 -38% | 3136 -60% | 8804 13% |
| Copy ISO MB/s (MB/s) | 3027 | 2128 -30% | 1583 -48% | 1391 -54% | |
| Copy Program MB/s (MB/s) | 1177 | 707 -40% | 964 -18% | 645 -45% | |
| Copy Game MB/s (MB/s) | 2170 | 1471 -32% | 943 -57% | 1101 -49% | |
| CrystalDiskMark 5.2 / 6 | -46% | -40% | -54% | 0% | |
| Write 4K (MB/s) | 295.6 | 138 -53% | 168.1 -43% | 116.9 -60% | 230.4 -22% |
| Read 4K (MB/s) | 85.7 | 47.41 -45% | 65.1 -24% | 44.56 -48% | 91.8 7% |
| Write Seq (MB/s) | 4149 | 1922 -54% | 2124 -49% | 1552 -63% | 4301 4% |
| Read Seq (MB/s) | 4203 | 1673 -60% | 2204 -48% | 1682 -60% | 4474 6% |
| Write 4K Q32T1 (MB/s) | 715 | 445.5 -38% | 455.3 -36% | 497.8 -30% | 656 -8% |
| Read 4K Q32T1 (MB/s) | 709 | 534 -25% | 465.6 -34% | 436.8 -38% | 722 2% |
| Write Seq Q32T1 (MB/s) | 4681 | 2976 -36% | 2911 -38% | 1461 -69% | 5198 11% |
| Read Seq Q32T1 (MB/s) | 6905 | 3232 -53% | 3519 -49% | 2364 -66% | 7065 2% |
| Média Total (Programa/Configurações) | -38% /
-36% | -34% /
-32% | -62% /
-64% | 7% /
7% |
* ... menor é melhor

Disk Throttling: DiskSpd Read Loop, Queue Depth 8
Desempenho da GPU
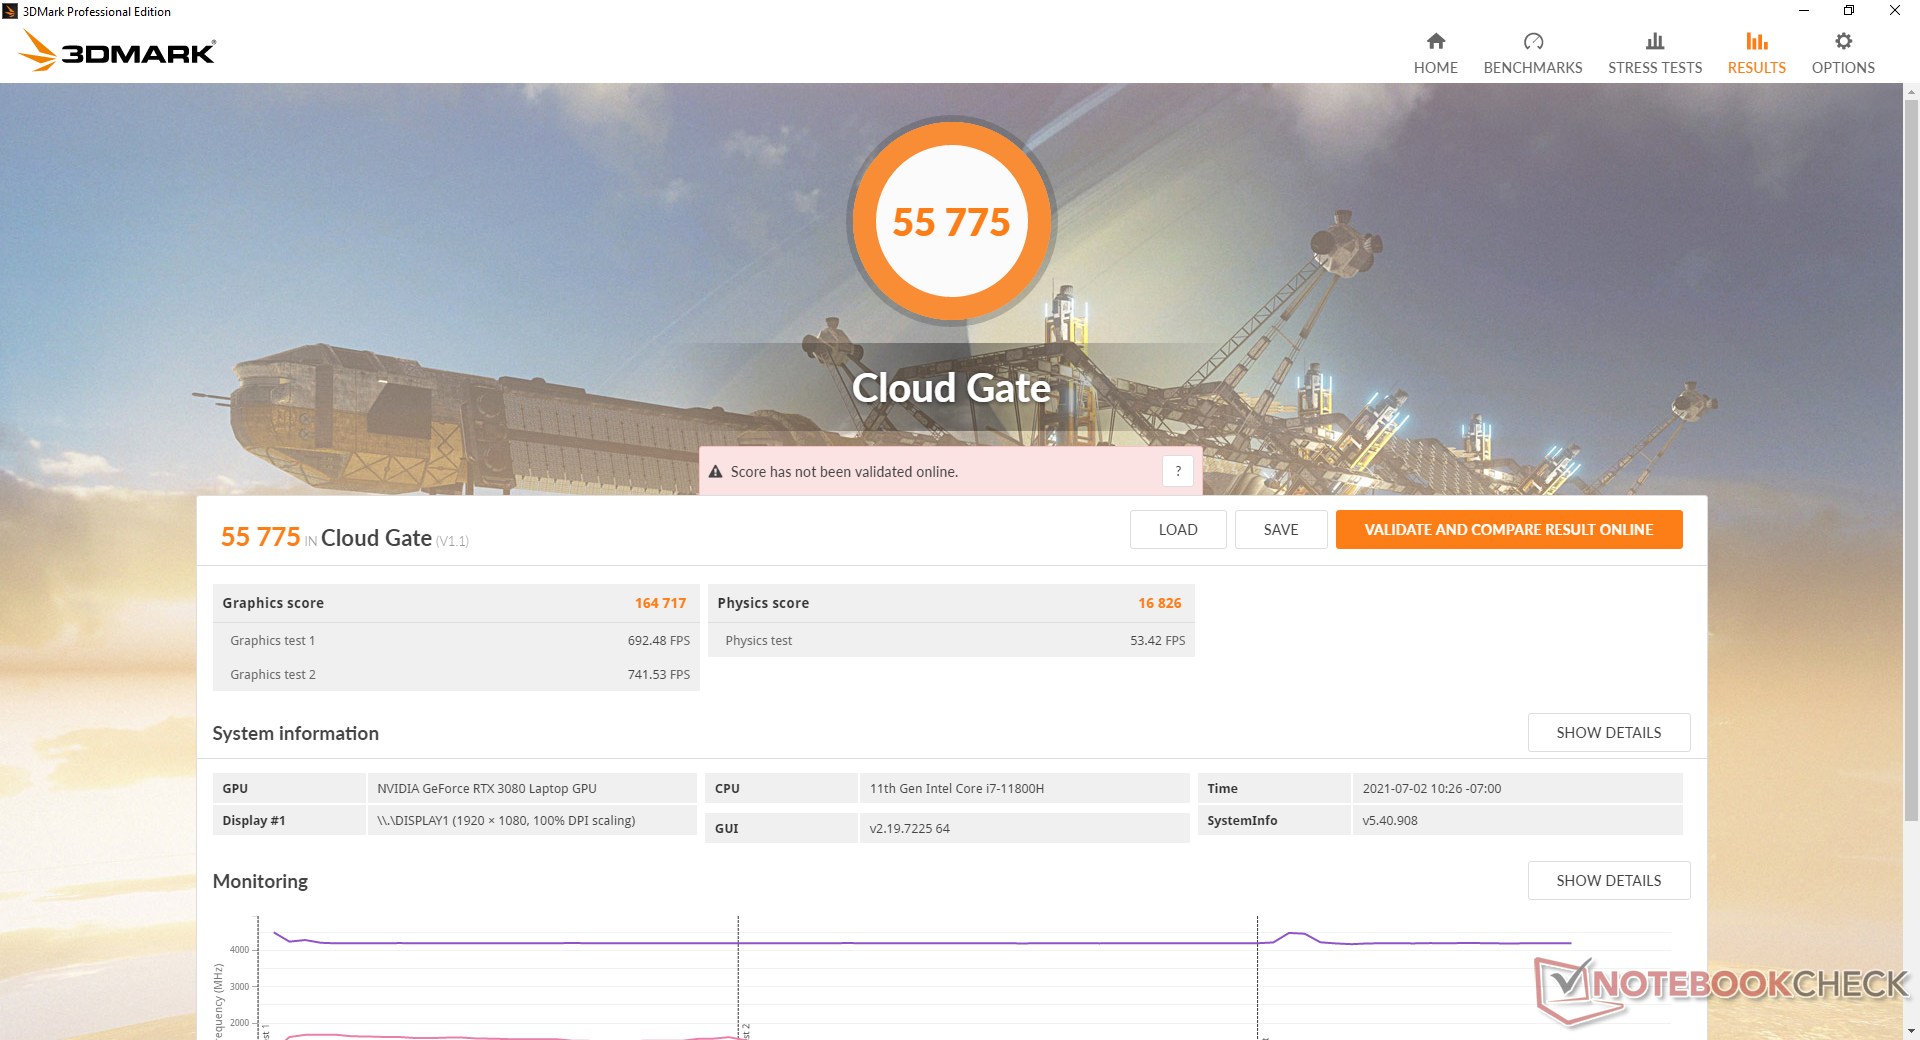
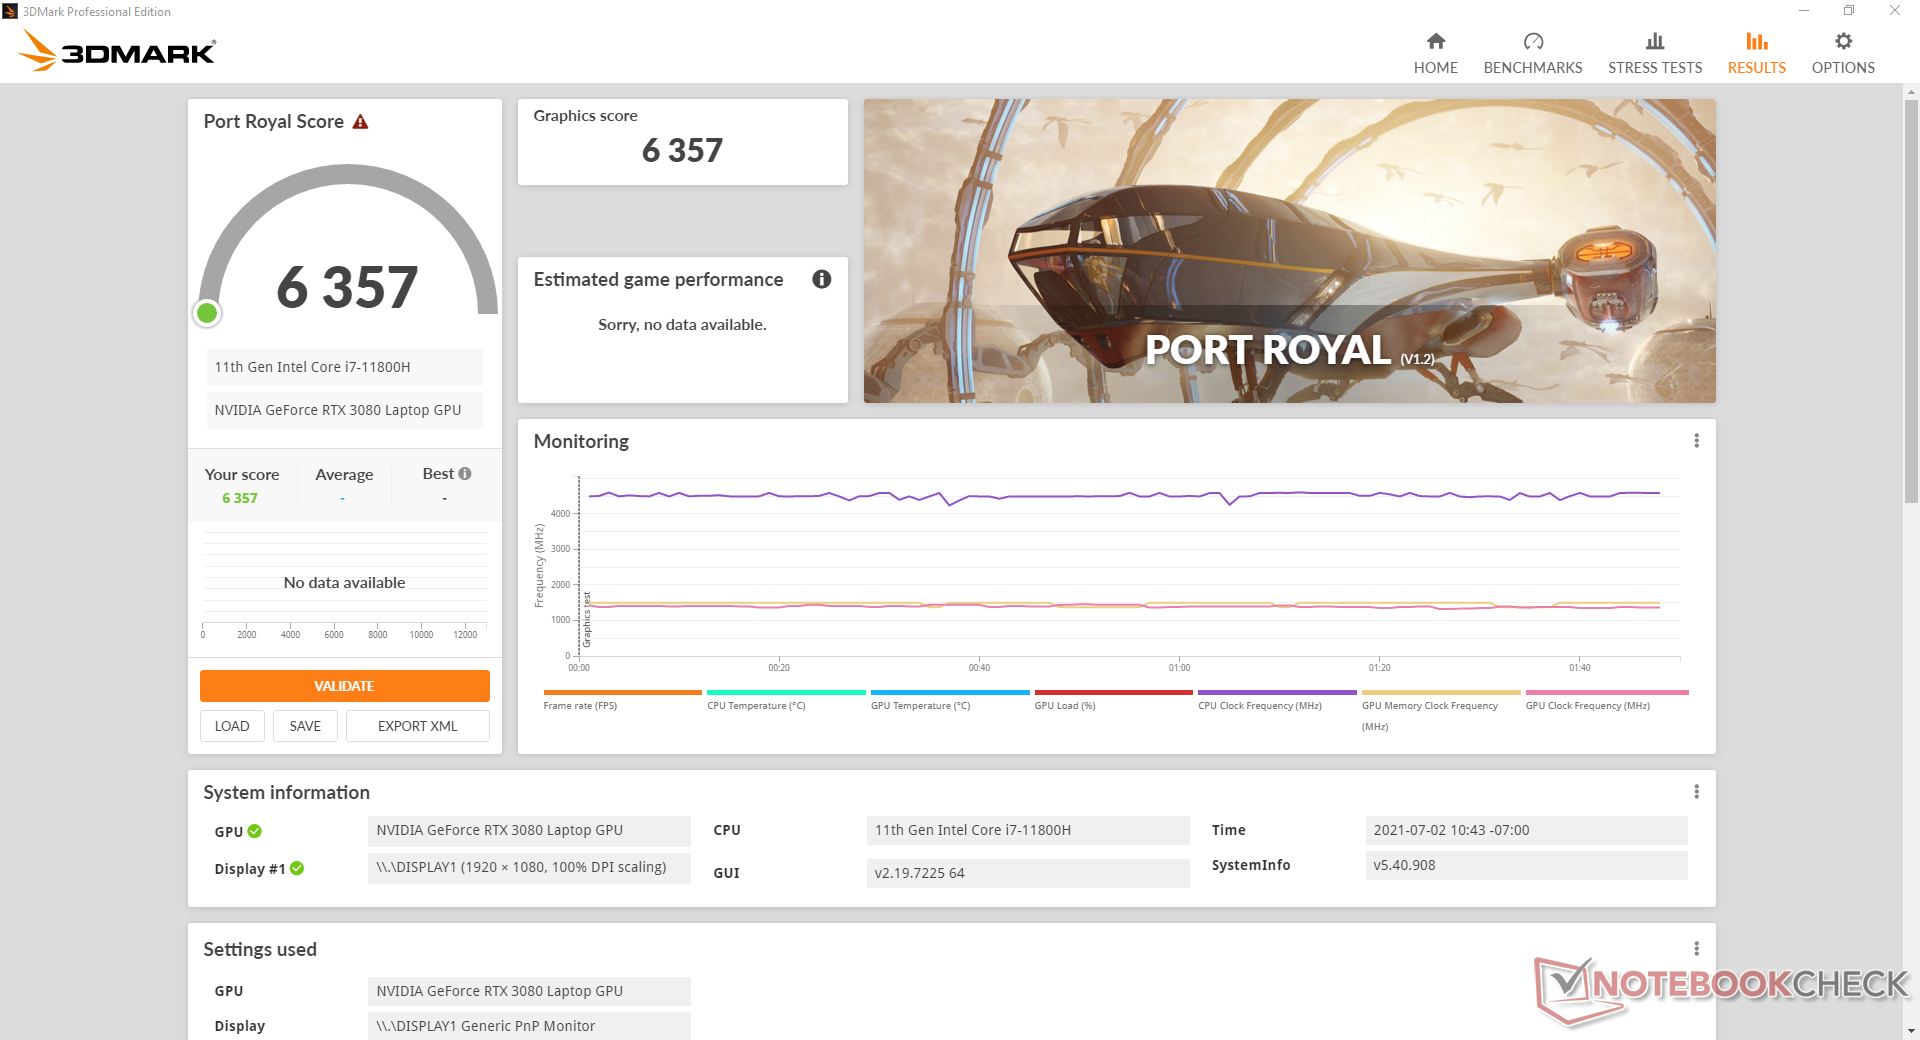
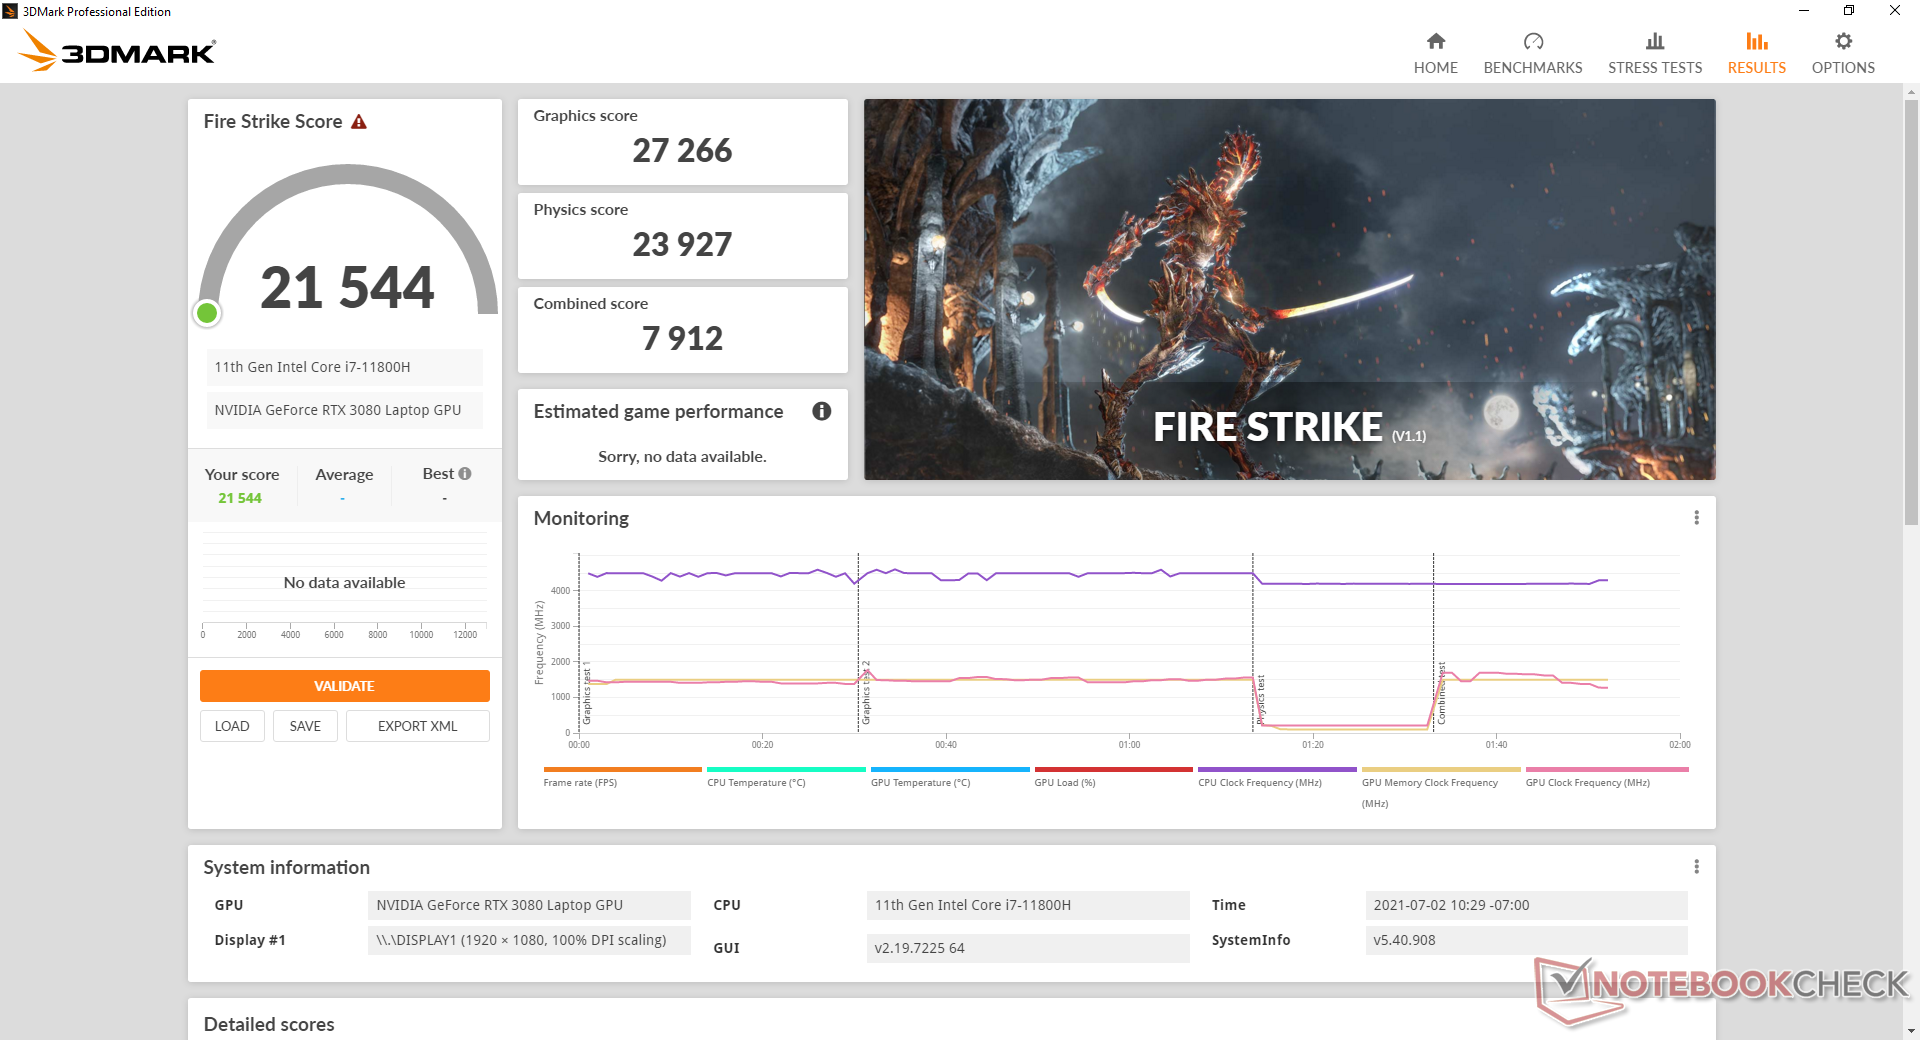
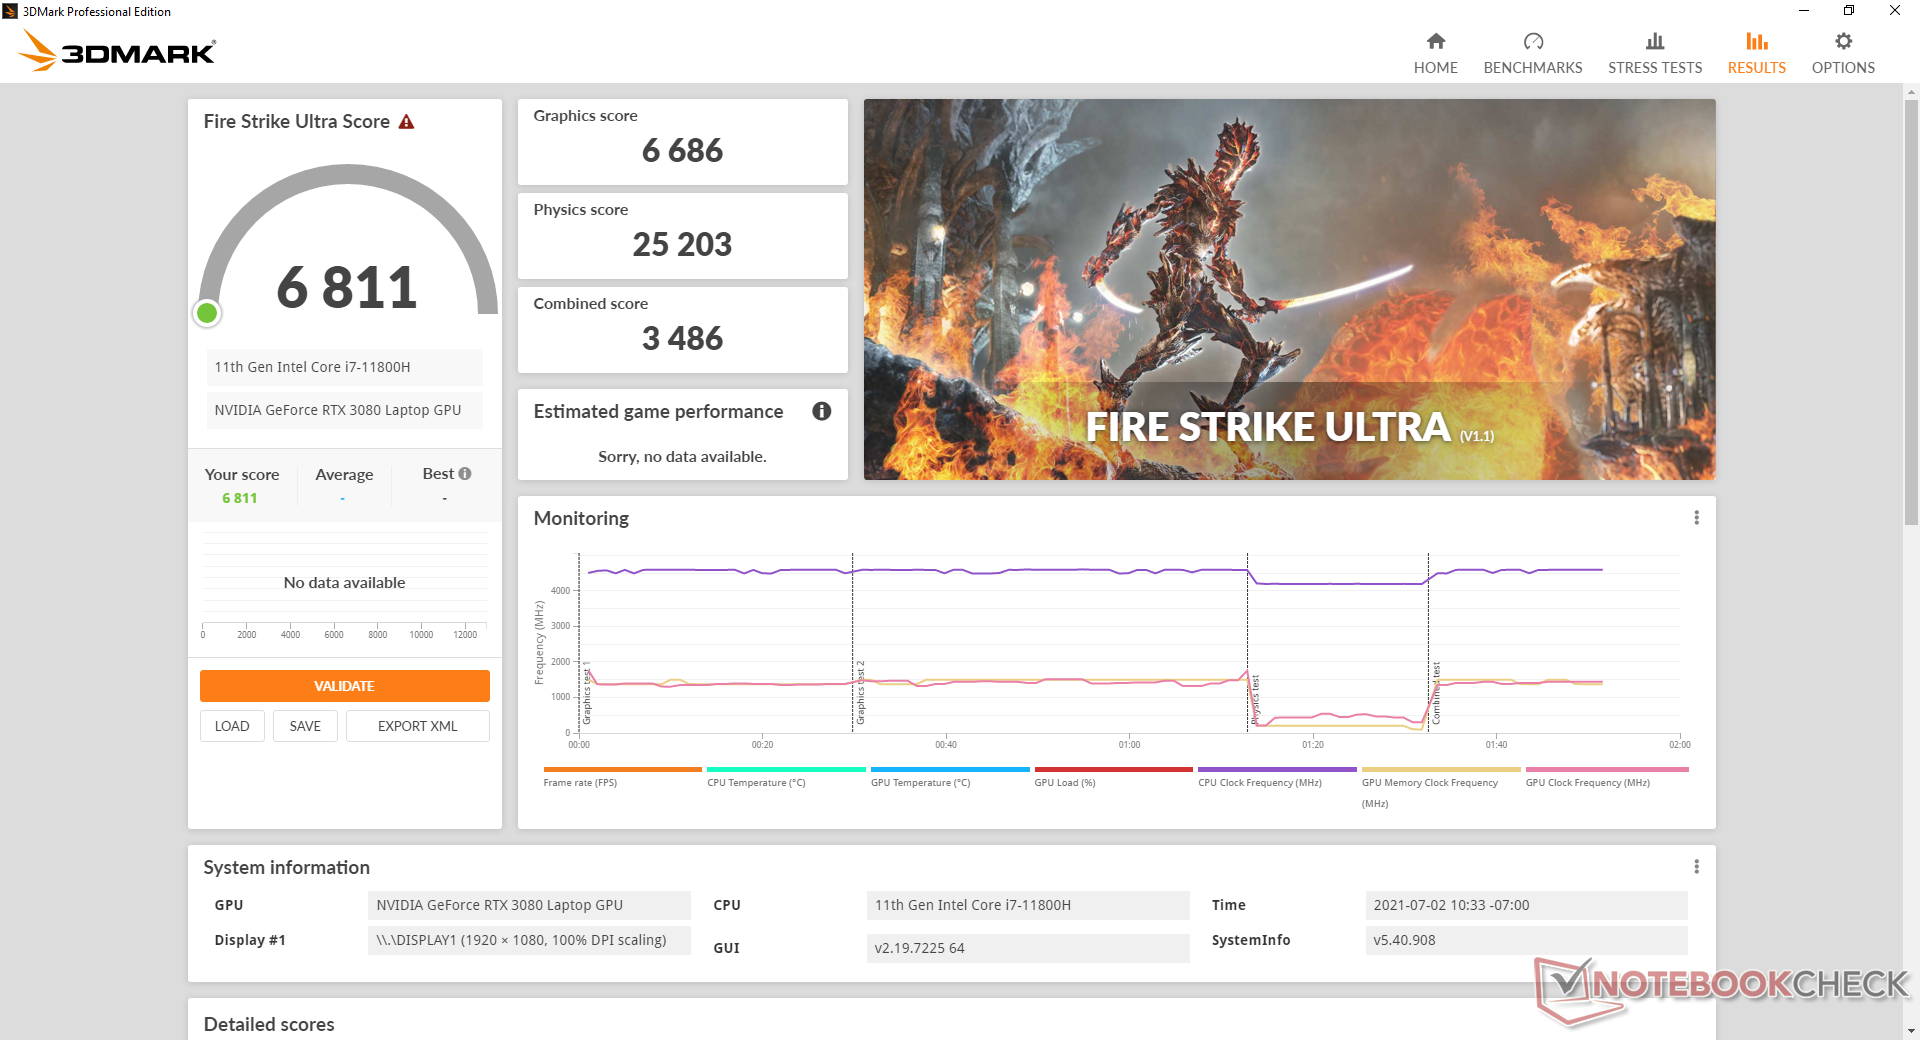
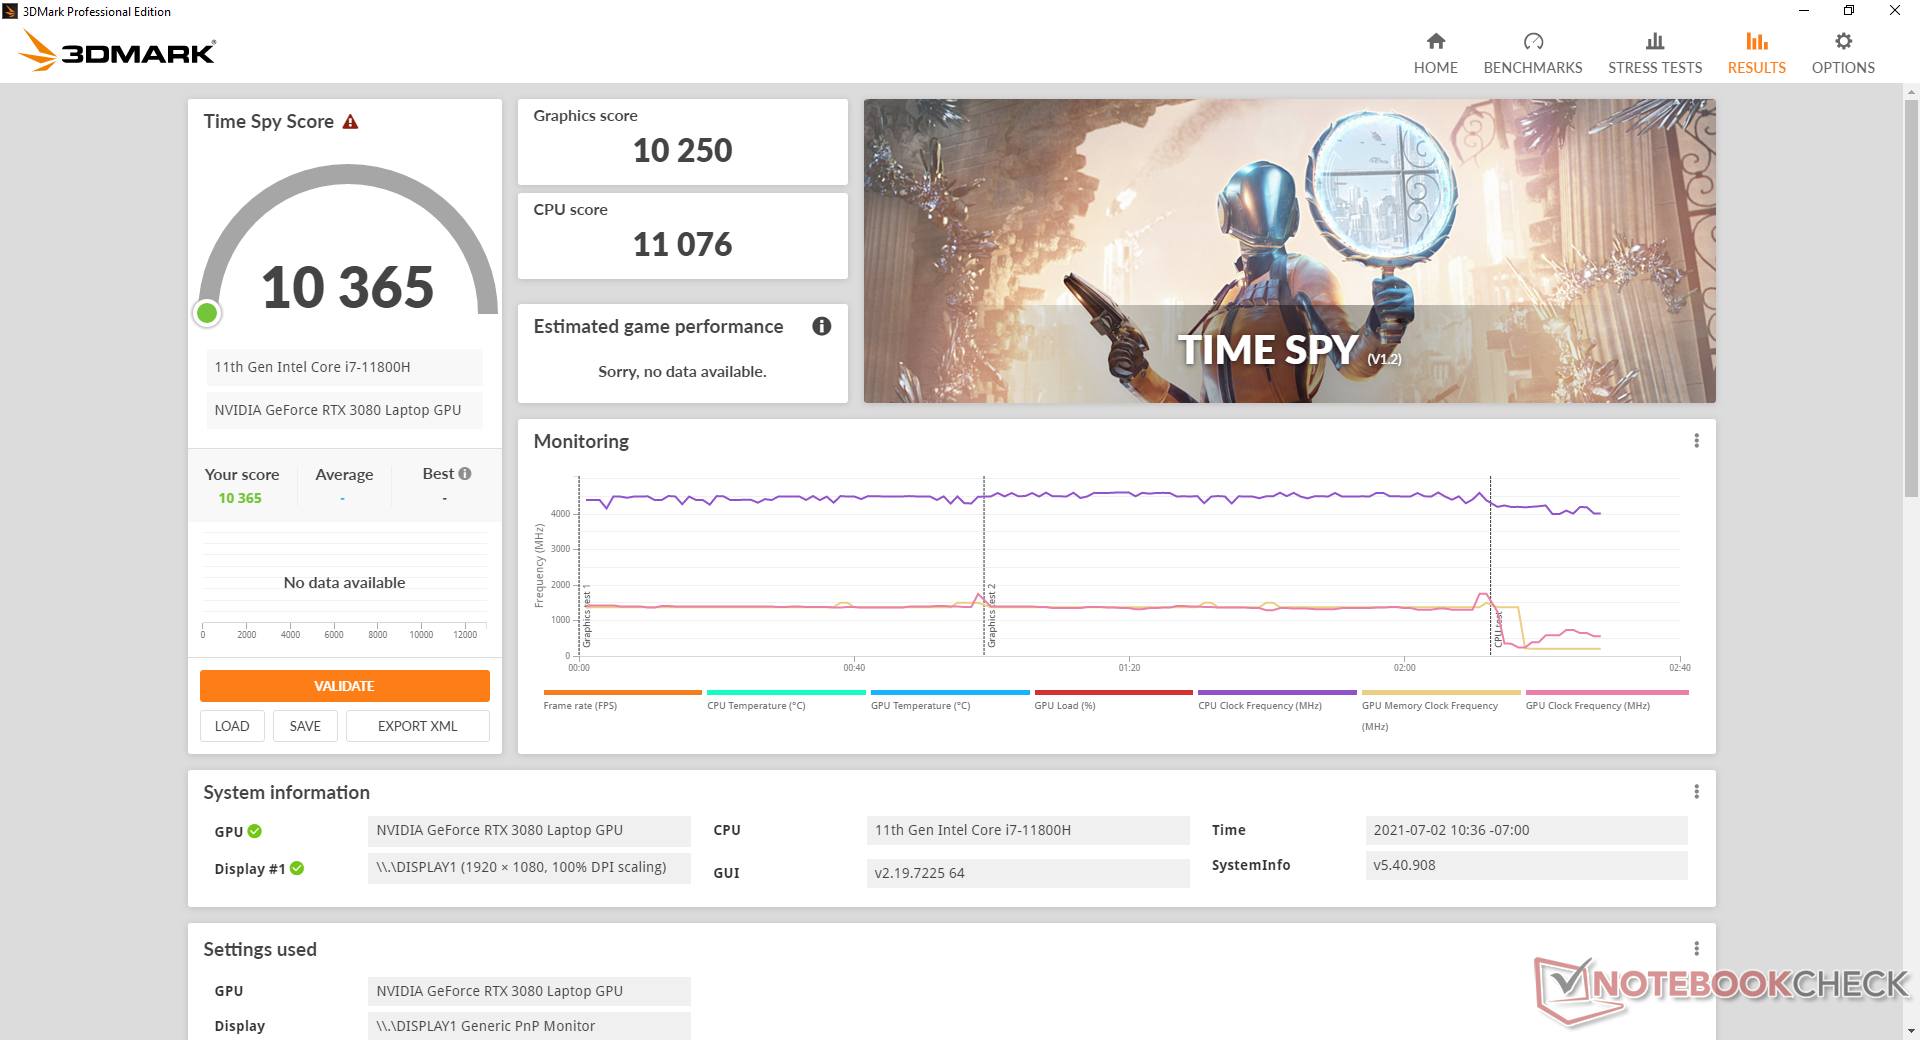
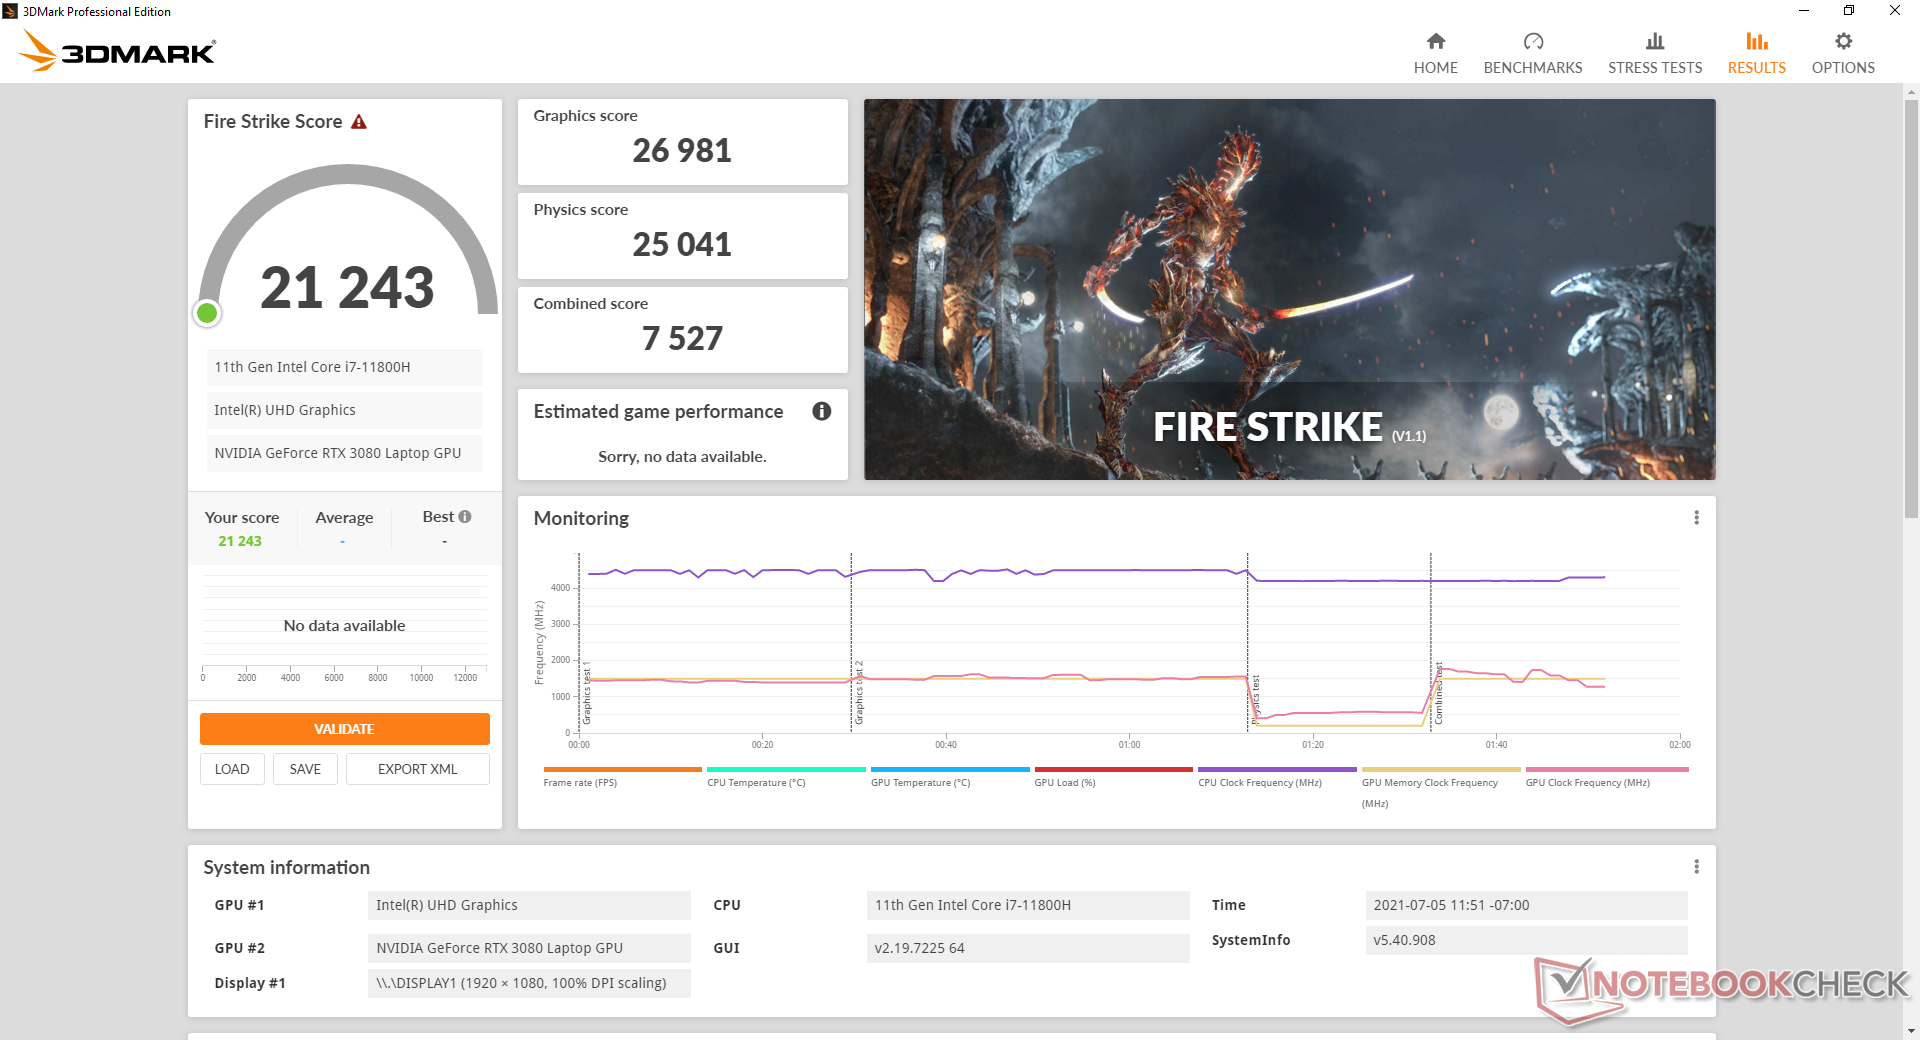
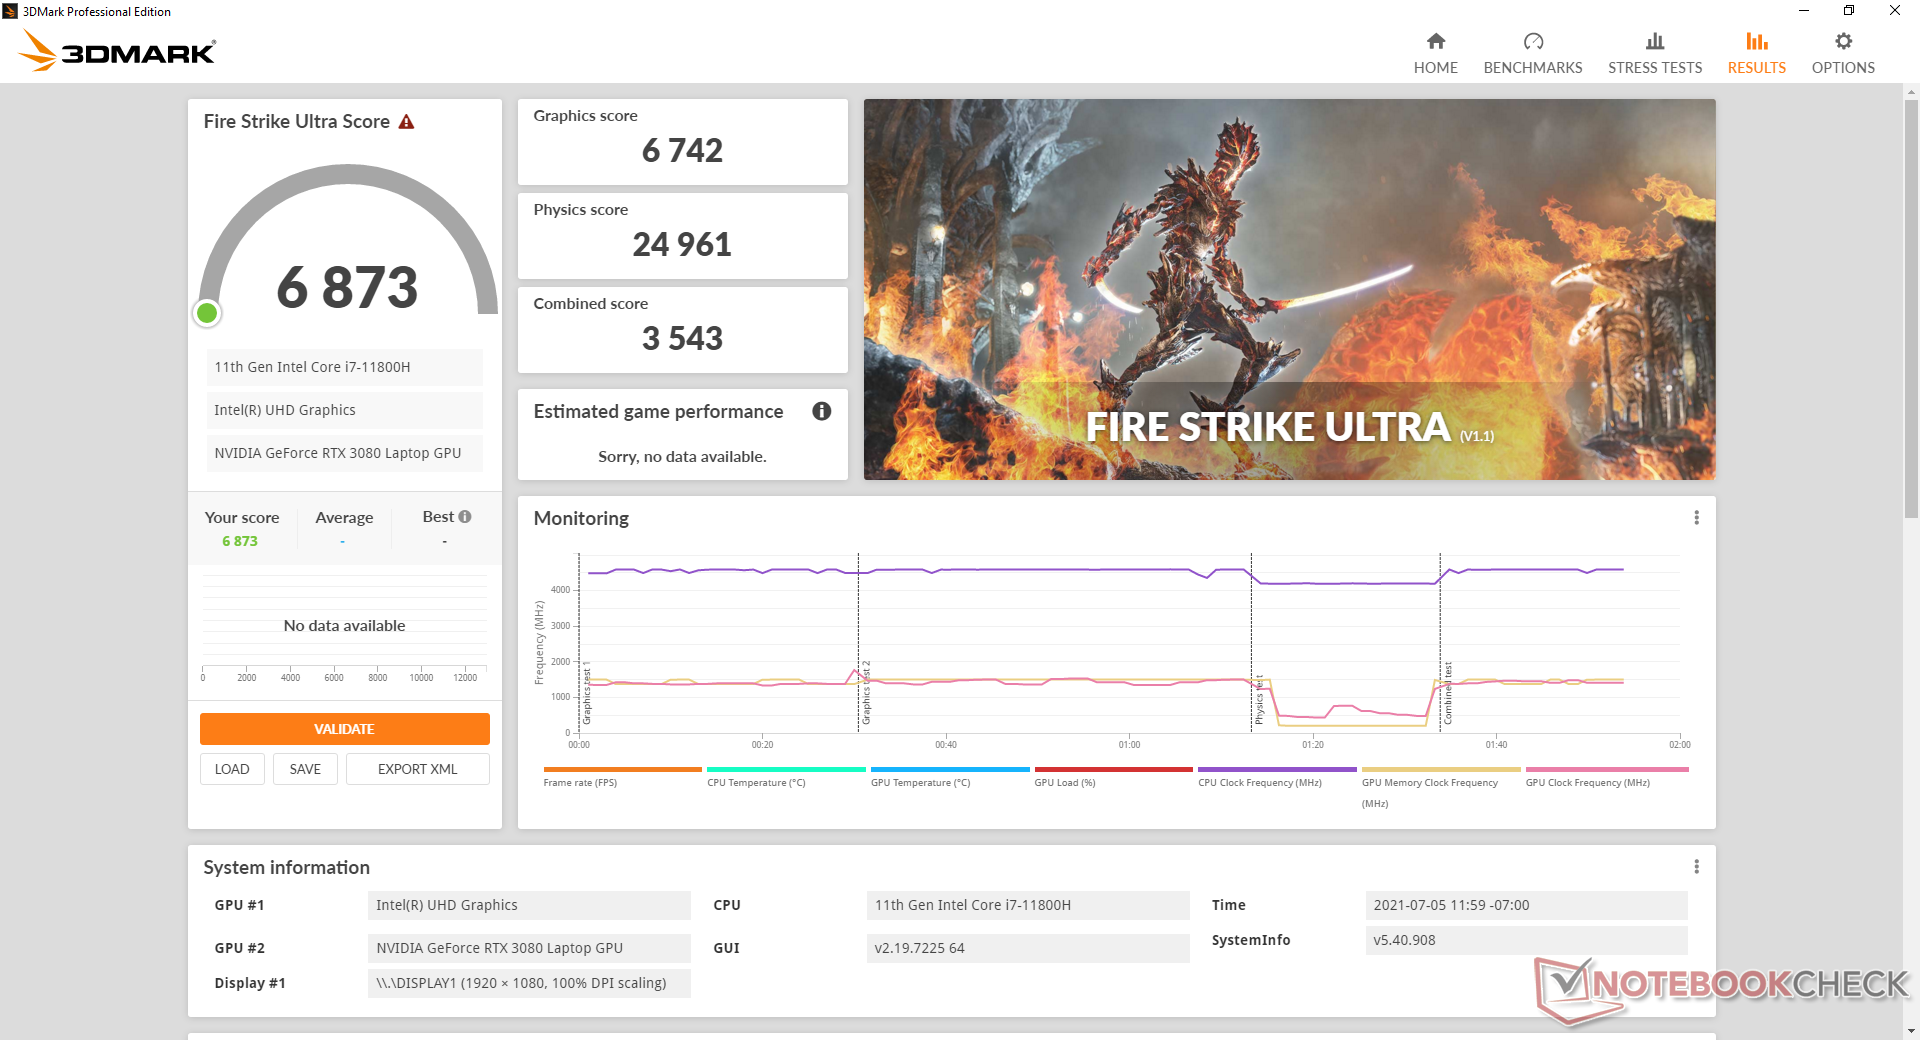
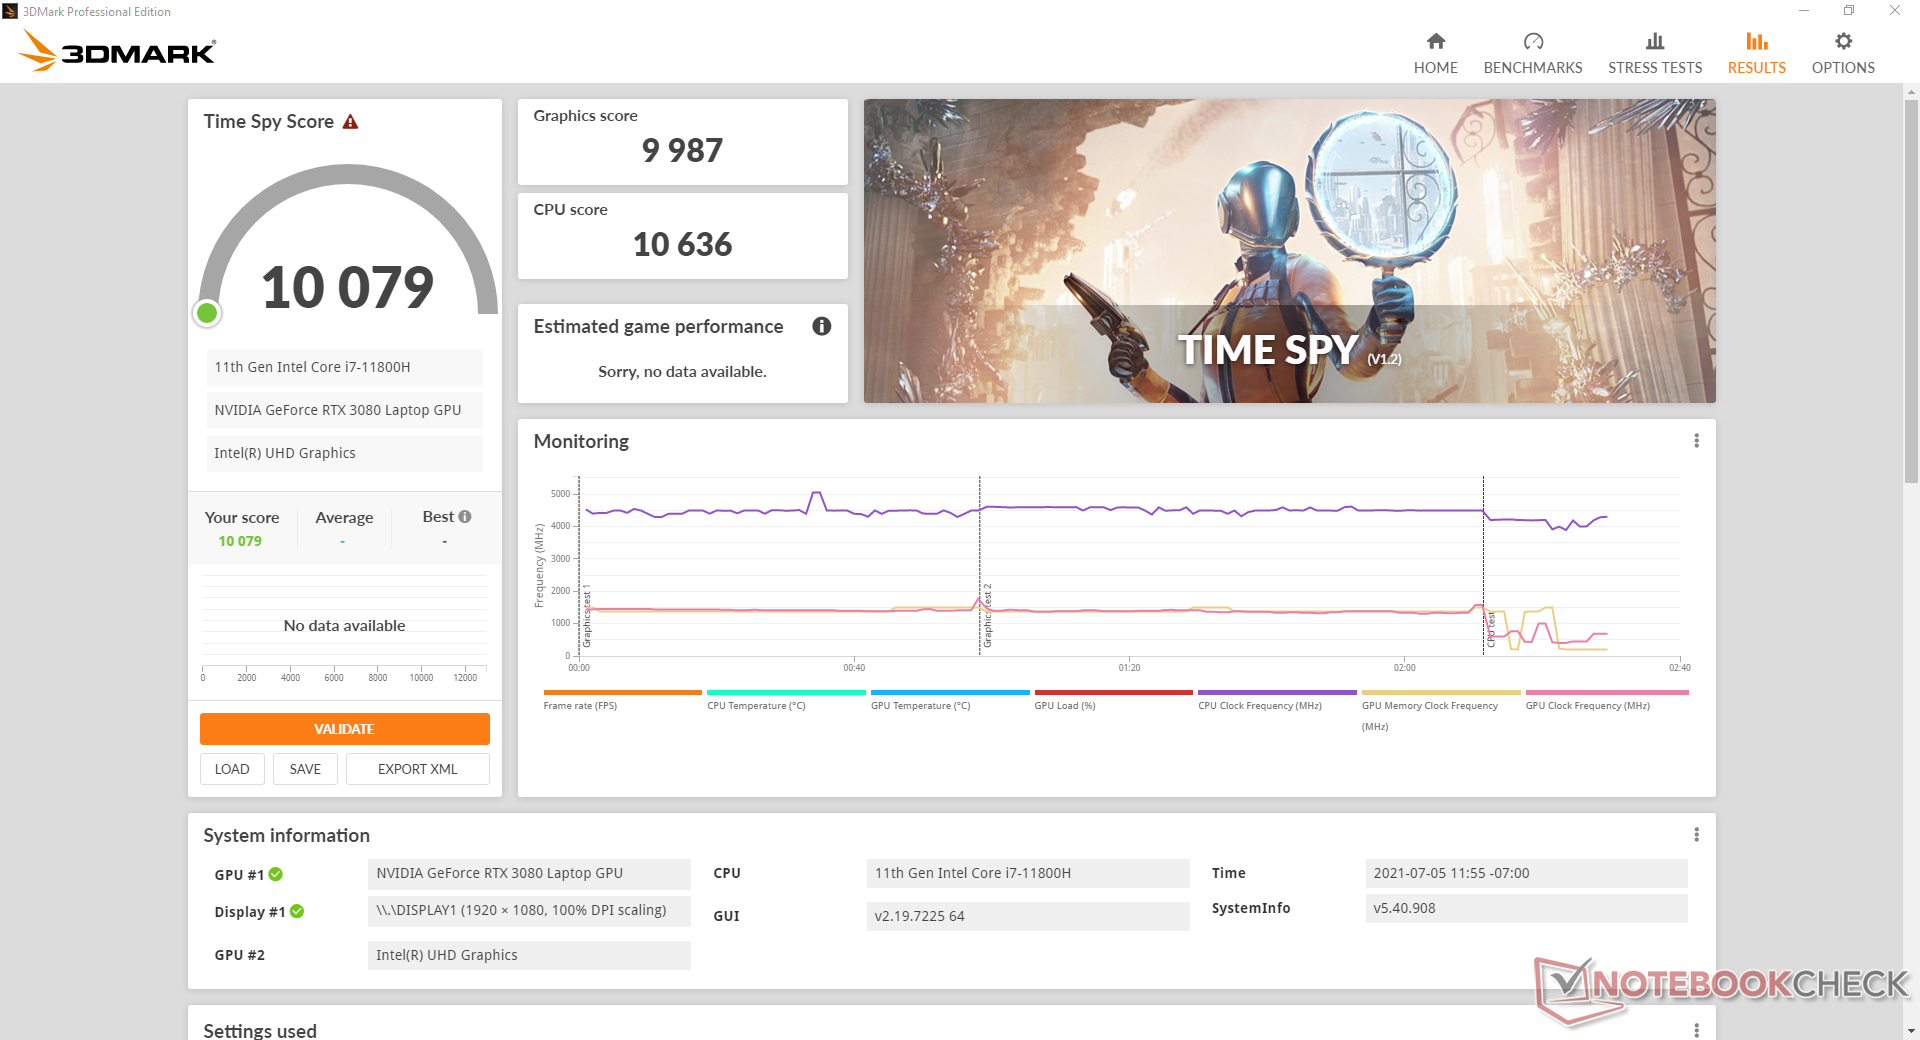
As pontuações 3DMark são 9 a 14% mais altas do que na 10ª geração Intel Blade 15 com exatamente a mesma GPU Nvidia (embora com TGP mais baixa). Assim, os usuários no mercado de um Blade 15 podem querer considerar este último modelo do 11º gênero sobre o 10º gênero para o menor impulso gráfico. Laptops maiores com o mesmo RTX 3080 como o MSI GE76 11UH podem funcionar ainda mais rápido que nosso Razer, uma vez que são capazes de tetos TGP mais altos.
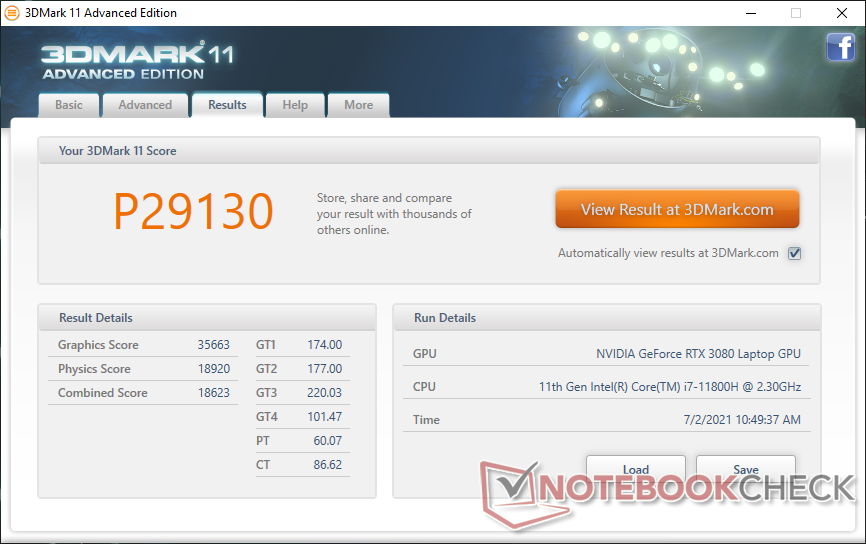
| 3DMark 11 Performance | 29130 pontos | |
| 3DMark Cloud Gate Standard Score | 55775 pontos | |
| 3DMark Fire Strike Score | 21544 pontos | |
| 3DMark Time Spy Score | 10365 pontos | |
Ajuda | ||
Desempenho nos jogos
O desempenho em jogos do mundo real é idêntico ao da 10ª geração Intel Blade 15 na pior das hipóteses e até 30% mais rápido na melhor das hipóteses, com base em nossos jogos testados. Os usuários verão os maiores benefícios ao rodar jogos sem demanda em resoluções ou configurações inferiores onde o desempenho tende a ser limitado pela CPU, como em DOTA 2 ou X-Plane. Jogos mais exigentes como o Assassin's Creed Valhalla verão apenas pequenos incrementos.
Veja nosso dedicado GeForce Página móvel RTX 3080 para obter mais informações técnicas e benchmarks.
Witcher 3 FPS Chart
| baixo | média | alto | ultra | |
|---|---|---|---|---|
| GTA V (2015) | 186 | 180 | 175 | 110 |
| The Witcher 3 (2015) | 465.4 | 317.3 | 197.3 | 102.8 |
| Dota 2 Reborn (2015) | 174 | 157 | 151 | 142 |
| Final Fantasy XV Benchmark (2018) | 199 | 130 | 97.1 | |
| X-Plane 11.11 (2018) | 138 | 123 | 97.3 | |
| Strange Brigade (2018) | 507 | 253 | 204 | 179 |
| Shadow of the Tomb Raider (2018) | 146 | 127 | 124 | 115 |
| Assassin´s Creed Valhalla (2020) | 134 | 93 | 79 | 68 |
Emissions
Ruído do sistema
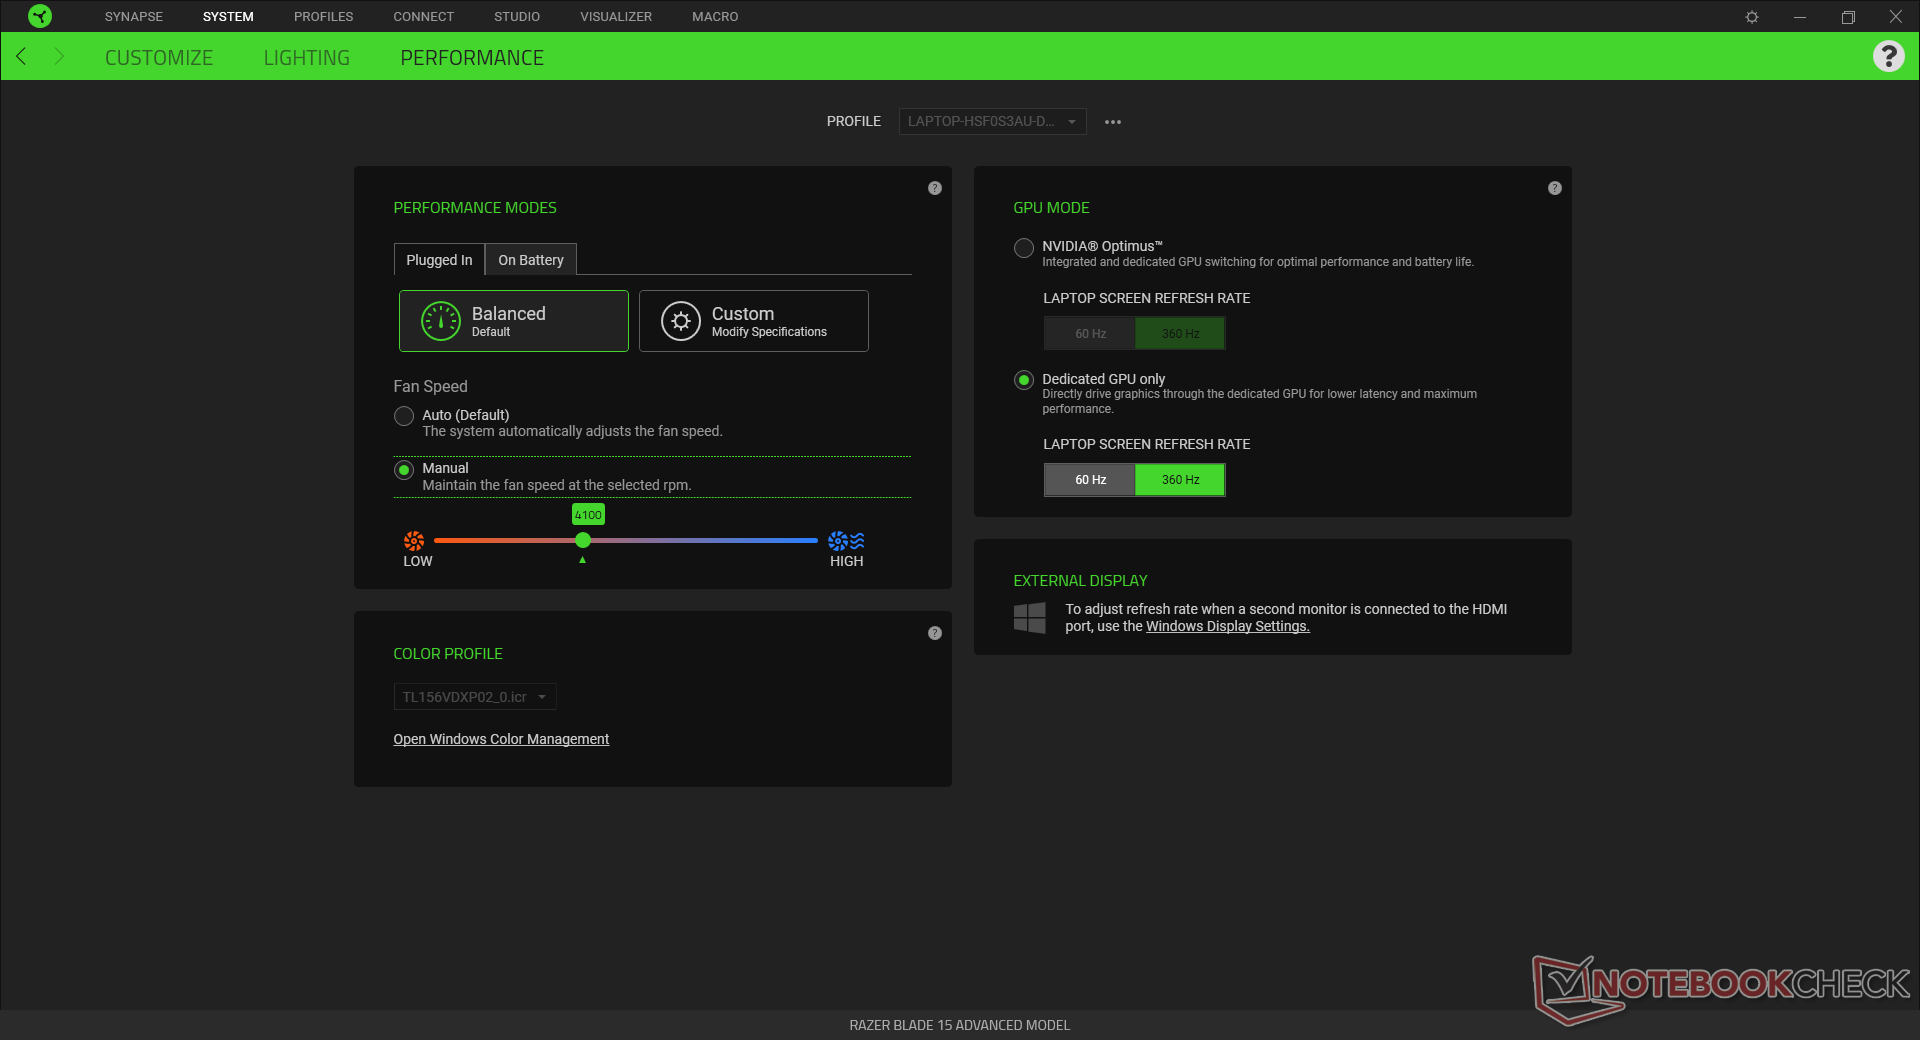
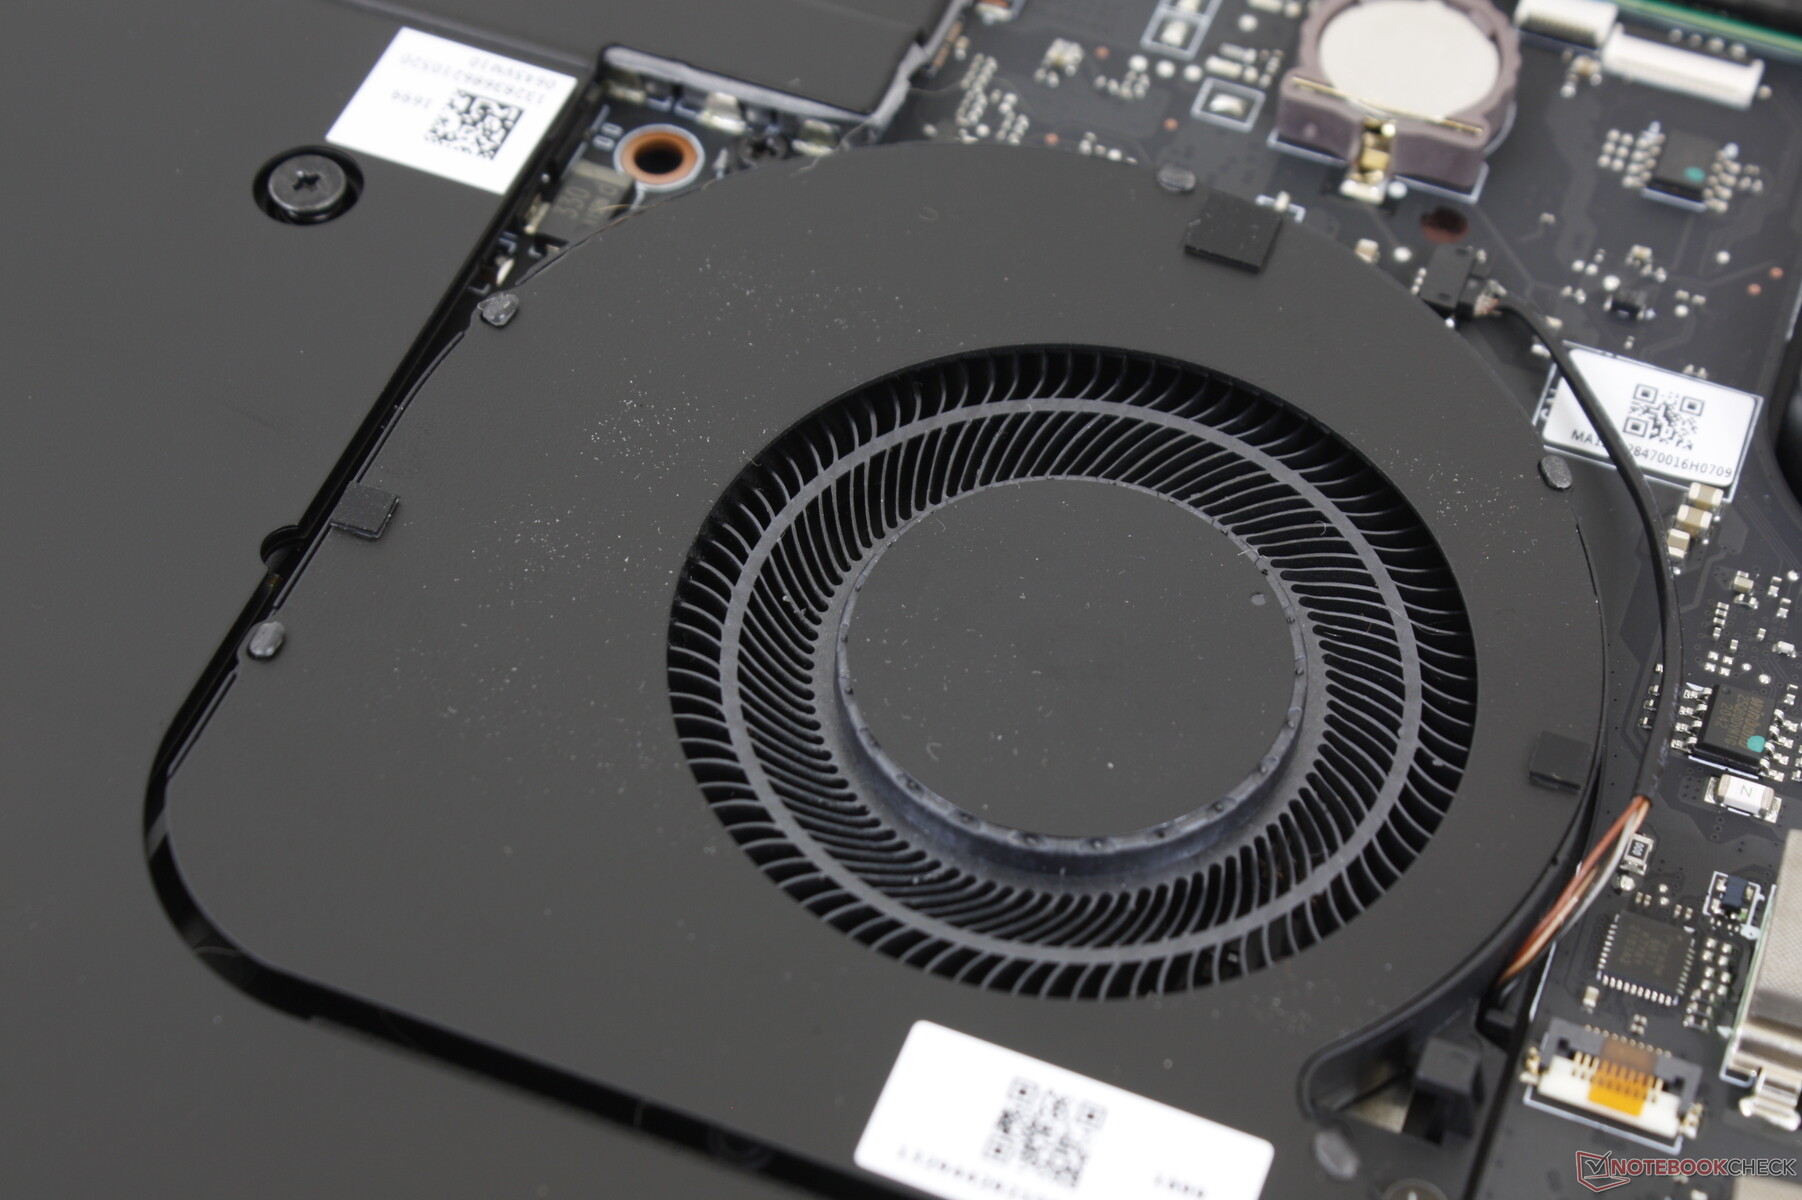
O comportamento do ruído do ventilador é em grande parte o mesmo que o que descobrimos no 10º gênero Intel Blade 15. Os usuários podem querer ajustar os ventiladores para o modo automático com Optimus ativo ou então eles irão pulsar com mais freqüência quando navegarem na web ou quando transmitirem vídeo. Os ventiladores geralmente ficarão ociosos quando o sistema for ajustado para suas configurações de desempenho mais baixas, mas um ruído de cerca de 29 a 31 dB(A) será mais realista durante o uso real.
As cargas de jogo aumentarão o ruído dos ventiladores para a faixa de 46 a 52 dB(A), que na verdade é ligeiramente mais alto do que o que gravamos no modelo Intel do 10º gênero. É certamente um laptop barulhento, mas não é significativamente diferente de outros laptops para jogos em sua classe de tamanho.
Nossa unidade sofre de algum leve ruído eletrônico ou lamúria da bobina. Somos capazes de captar um ruído audível de 25,3 dB(A) contra um fundo silencioso de 25,1 dB(A) simplesmente por inatividade no desktop.
| Razer Blade 15 Advanced (Mid 2021) GeForce RTX 3080 Laptop GPU, i7-11800H, SSSTC CA6-8D1024 | Razer Blade 15 Advanced Model Early 2021 GeForce RTX 3080 Laptop GPU, i7-10875H, Samsung PM981a MZVLB1T0HBLR | Razer Blade 15 RTX 2080 Super Max-Q GeForce RTX 2080 Super Max-Q, i7-10875H, Samsung PM981a MZVLB1T0HBLR | Asus TUF Gaming F15 FX506HM GeForce RTX 3060 Laptop GPU, i7-11800H, SK Hynix HFM001TD3JX013N | Alienware m15 R5 Ryzen Edition GeForce RTX 3060 Laptop GPU, R7 5800H, Toshiba KBG40ZNS512G NVMe | Aorus 15P YD GeForce RTX 3080 Laptop GPU, i7-11800H, Samsung PM9A1 MZVL21T0HCLR | |
|---|---|---|---|---|---|---|
| Noise | -8% | -12% | 7% | -5% | -11% | |
| desligado / ambiente * (dB) | 25.1 | 24 4% | 30.1 -20% | 24.8 1% | 24 4% | 25 -0% |
| Idle Minimum * (dB) | 25.3 | 26 -3% | 30.1 -19% | 24.6 3% | 24 5% | 26 -3% |
| Idle Average * (dB) | 25.3 | 28 -11% | 30.1 -19% | 24.9 2% | 25 1% | 30 -19% |
| Idle Maximum * (dB) | 25.3 | 40 -58% | 30.1 -19% | 24.9 2% | 35 -38% | 34 -34% |
| Load Average * (dB) | 42 | 45 -7% | 46.8 -11% | 27.1 35% | 44 -5% | 43 -2% |
| Witcher 3 ultra * (dB) | 45.6 | 43 6% | 48.4 -6% | 46.4 -2% | 48 -5% | 50 -10% |
| Load Maximum * (dB) | 51.6 | 45 13% | 46 11% | 49 5% | 50 3% | 57 -10% |
* ... menor é melhor
Barulho
| Ocioso |
| 25.3 / 25.3 / 25.3 dB |
| Carga |
| 42 / 51.6 dB |
 | ||
30 dB silencioso 40 dB(A) audível 50 dB(A) ruidosamente alto |
||
min: | ||
Temperatura
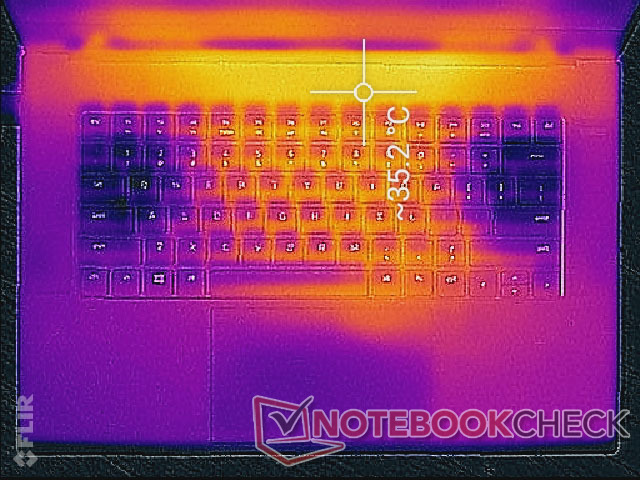
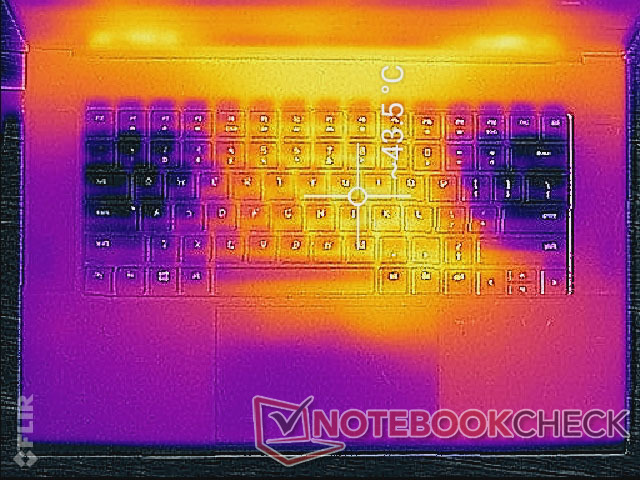
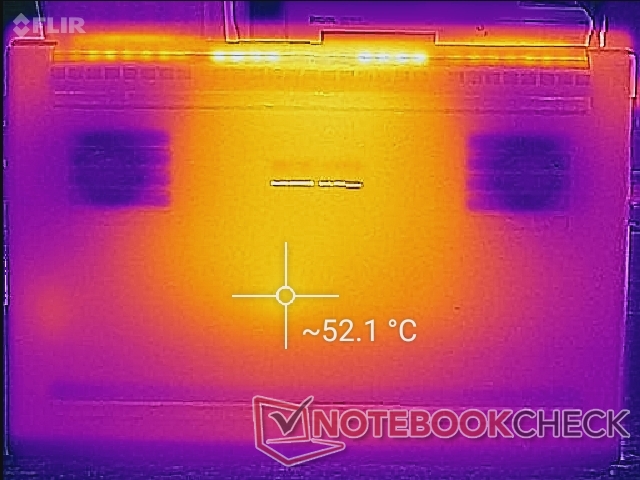
Os hot spots superficiais podem ser tão quentes quanto 52 C quando os jogos não são muito mais frios ou quentes do que o que gravamos no modelo Intel Blade 15 da 10ª geração. Os descansos da palma da mão podem ficar muito mais quentes do que na maioria dos outros laptops a quase 40 C, enquanto as teclas WASD permanecem mais frias, uma vez que os ventiladores estão aspirando ar frio através das teclas.
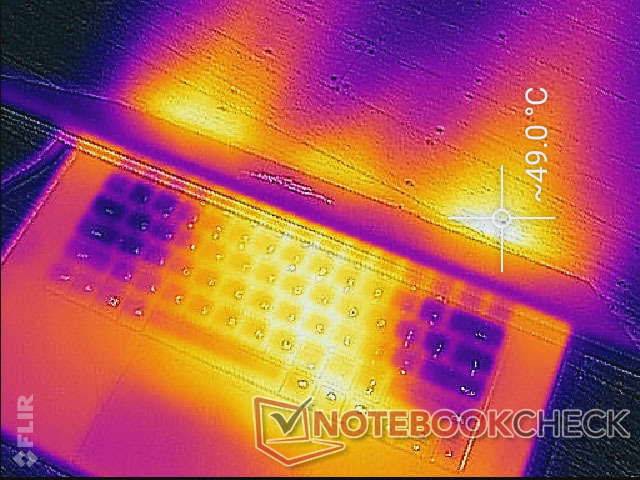
(-) A temperatura máxima no lado superior é 51 °C / 124 F, em comparação com a média de 40.4 °C / 105 F , variando de 21.2 a 68.8 °C para a classe Gaming.
(-) A parte inferior aquece até um máximo de 52 °C / 126 F, em comparação com a média de 43.2 °C / 110 F
(+) Em uso inativo, a temperatura média para o lado superior é 30.7 °C / 87 F, em comparação com a média do dispositivo de 33.9 °C / ### class_avg_f### F.
(±) Jogando The Witcher 3, a temperatura média para o lado superior é 36.2 °C / 97 F, em comparação com a média do dispositivo de 33.9 °C / ## #class_avg_f### F.
(±) Os apoios para as mãos e o touchpad podem ficar muito quentes ao toque, com um máximo de 38.6 °C / 101.5 F.
(-) A temperatura média da área do apoio para as mãos de dispositivos semelhantes foi 28.8 °C / 83.8 F (-9.8 °C / -17.7 F).


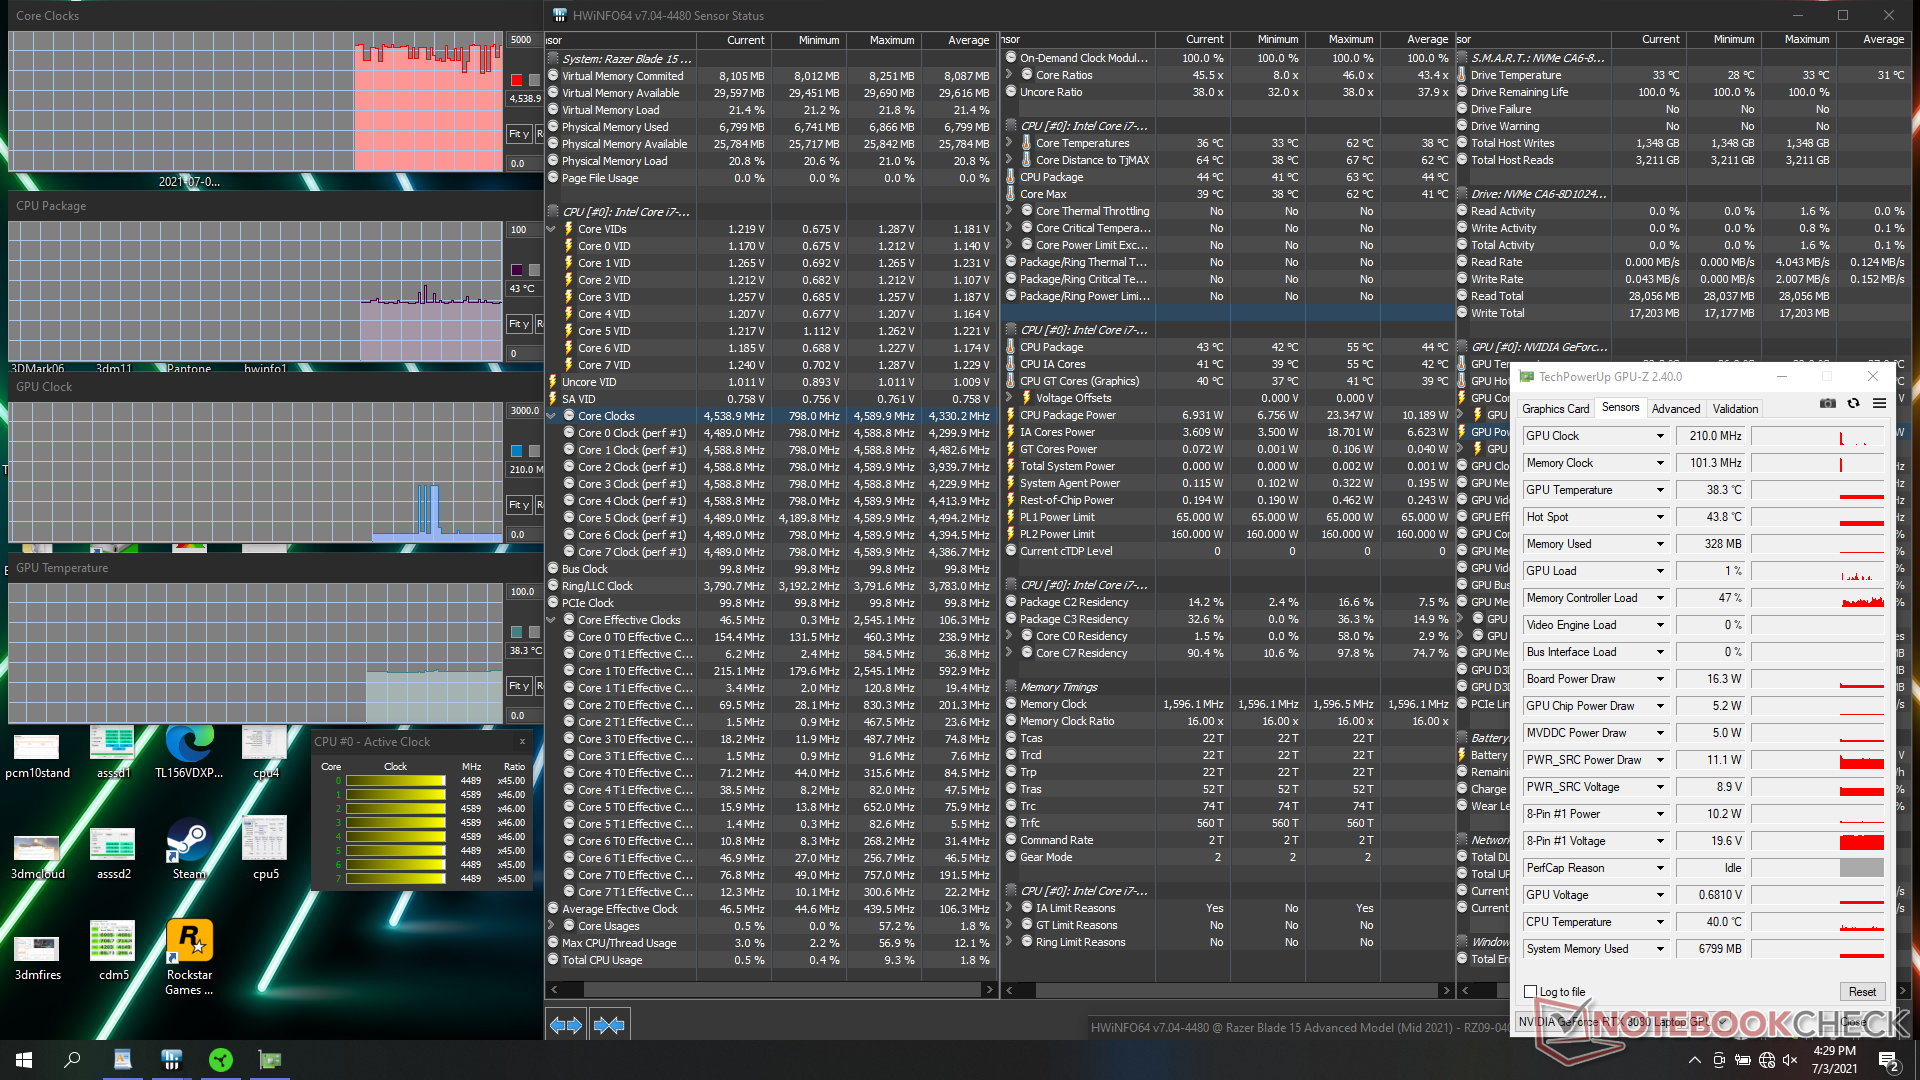
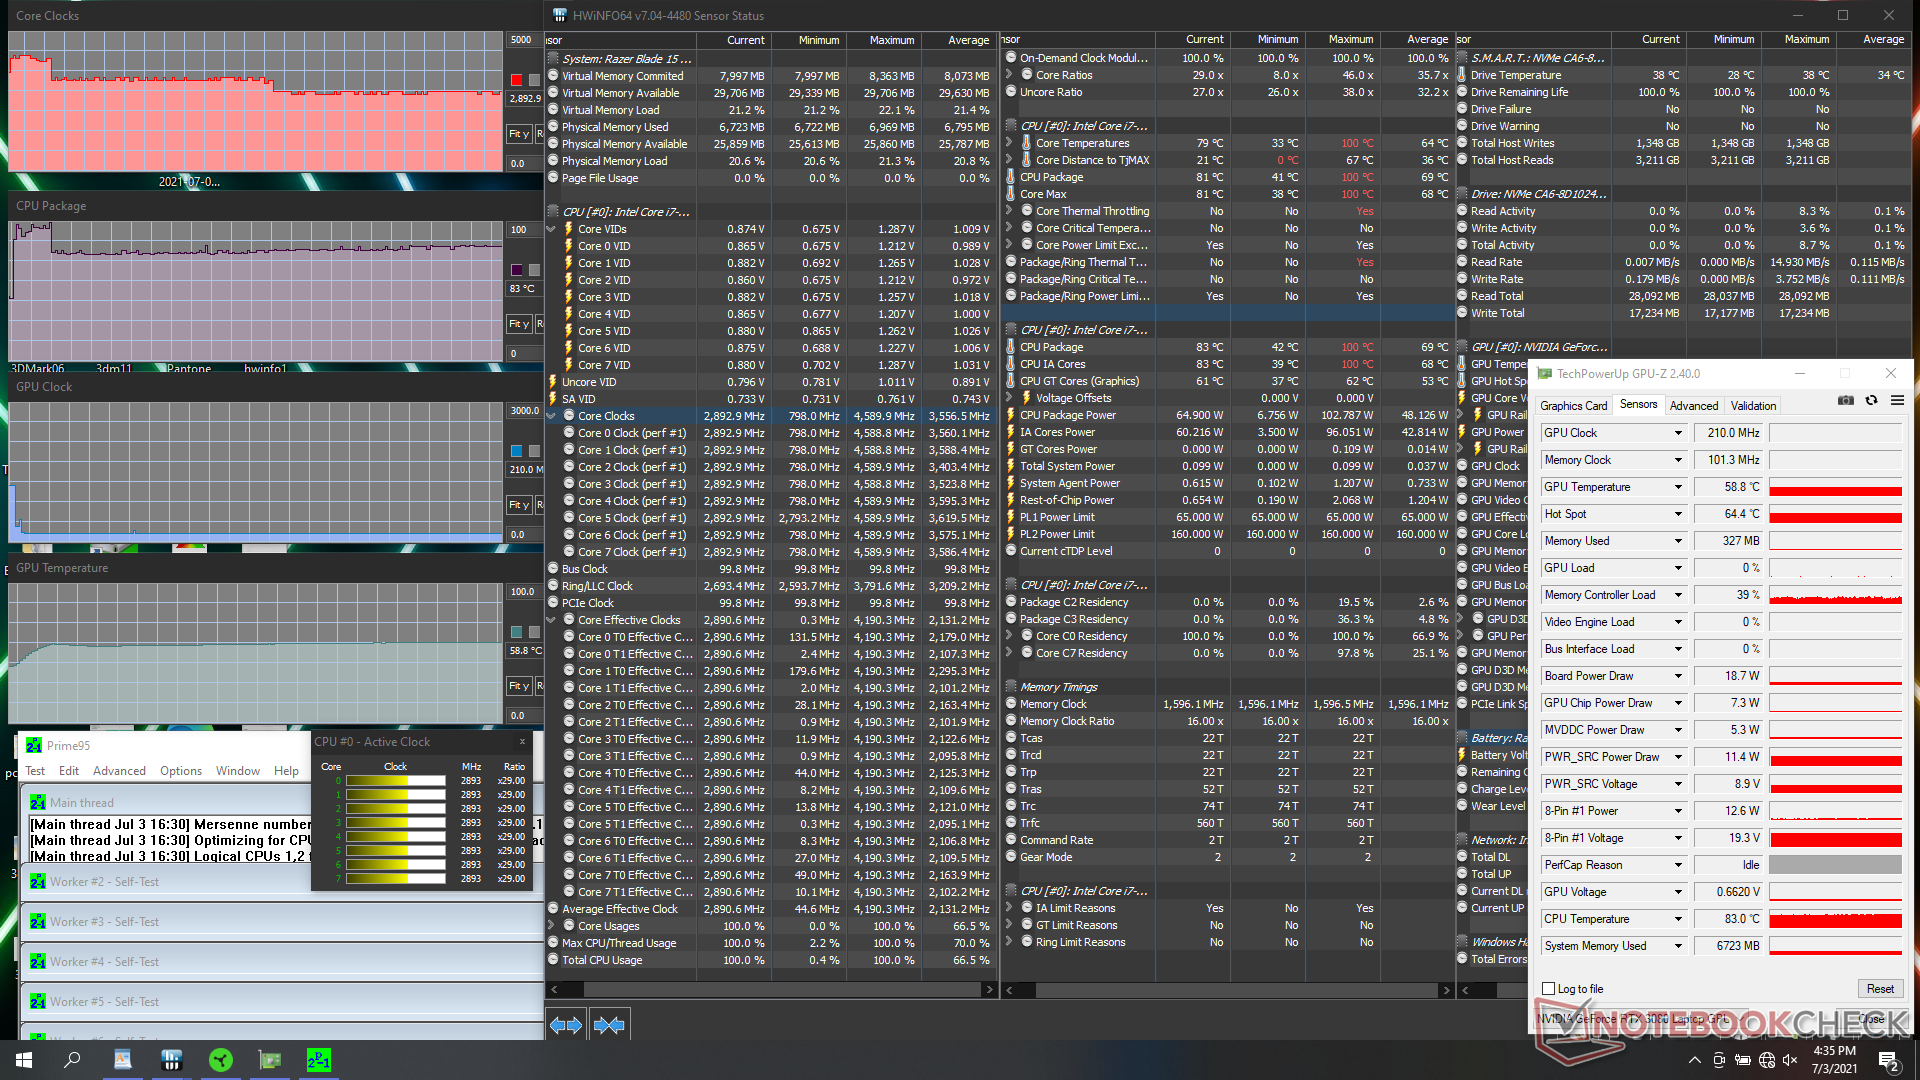
Teste de estresse
Quando estressada com Prime95, a CPU aumentaria para 4,2 GHz durante apenas os primeiros segundos até que a temperatura central atingisse 100 C. Depois disso, as taxas de relógio cairiam para a faixa de 3,3 a 3,4 GHz a fim de manter temperaturas mais frias. Após mais alguns minutos, as taxas de relógio eventualmente se estabilizariam na faixa de 2,8 a 2,9 GHz para uma temperatura central plana de 83 C
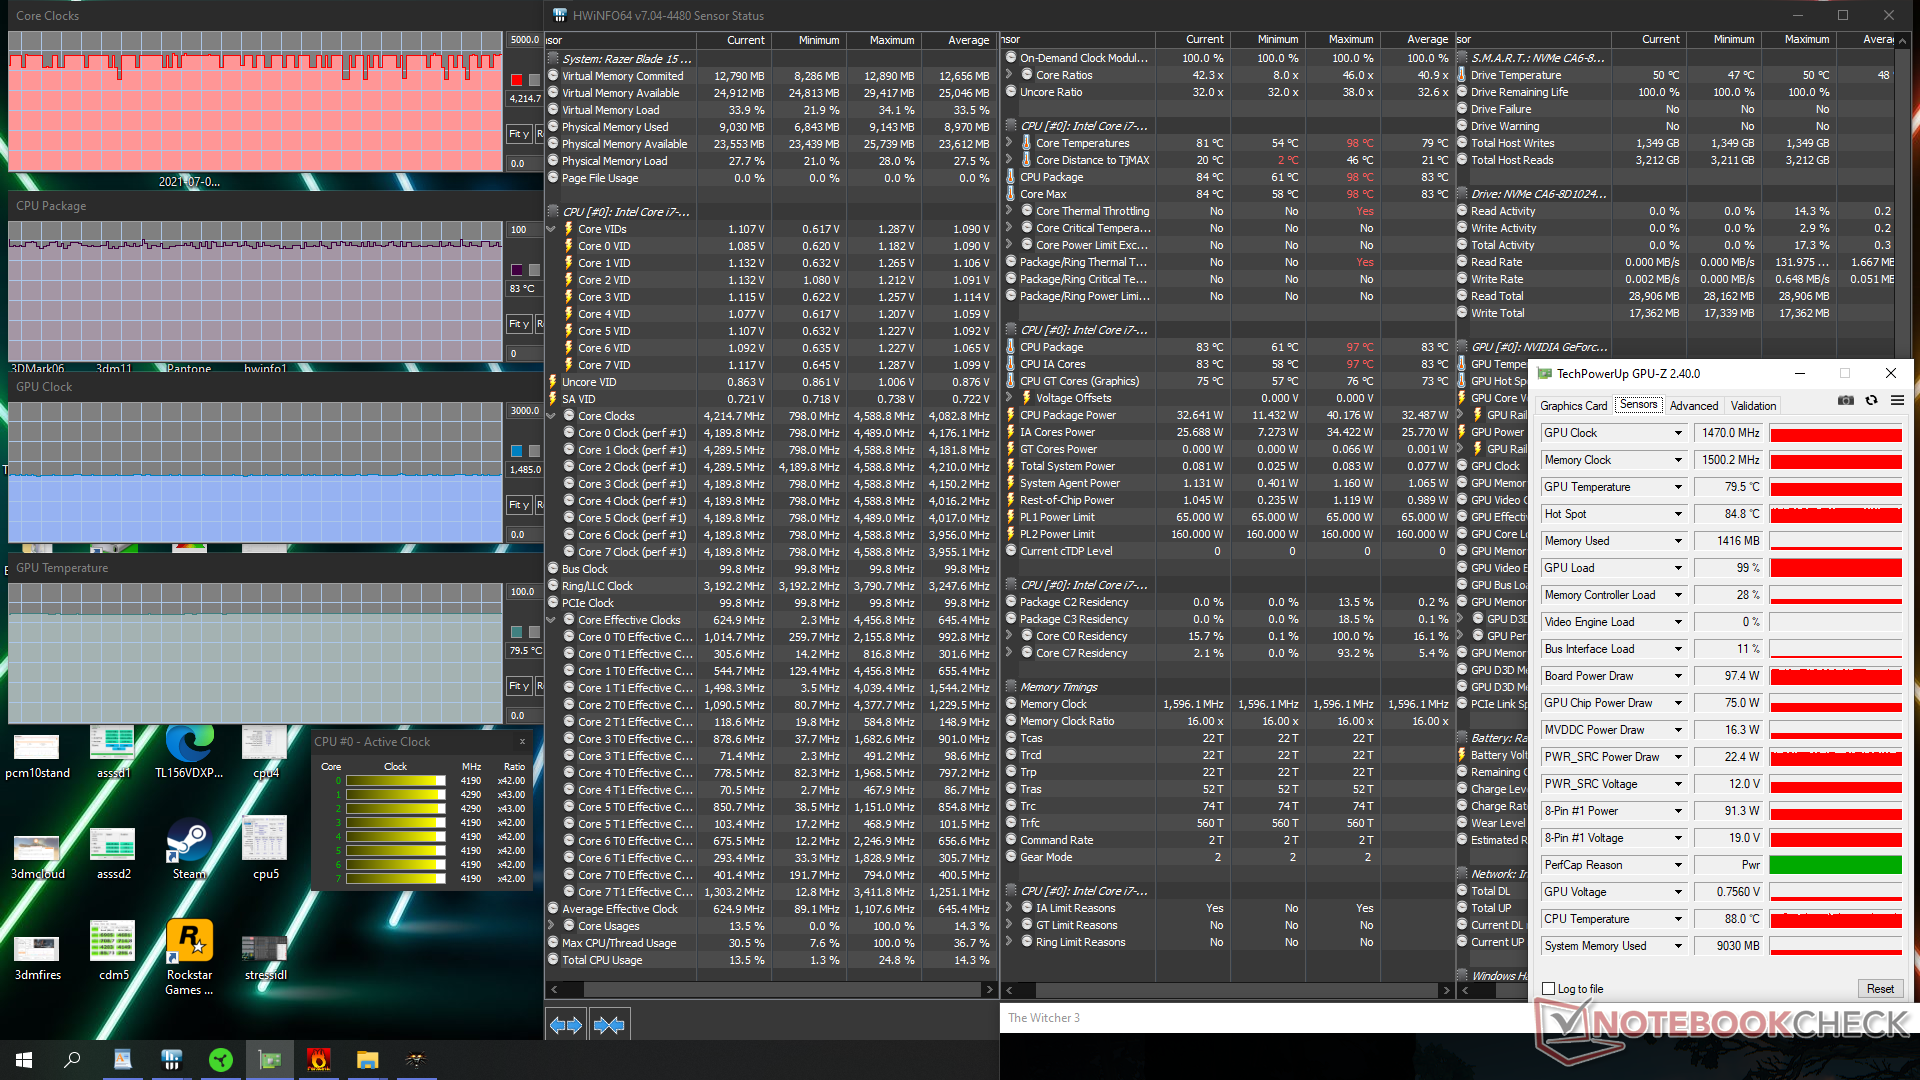
Rodando Witcher 3 mostra a CPU e a GPU estabilizando em 83 C e 80 C, respectivamente, em comparação com 73 C e 71 C no 10º gênero Blade 15. As temperaturas do núcleo são notavelmente mais quentes como resultado, mas felizmente elas vêm com um desempenho geral mais rápido, como exemplificado pelos padrões de referência acima. Os tetos PL2 e TGP mais altos são provavelmente responsáveis por estas temperaturas mais altas do núcleo. GPU-Z informa que a potência da placa GPU é de cerca de 97 W ao rodar o jogo, sendo apenas ligeiramente inferior ao TGP alvo de 105 W.
O funcionamento com a energia da bateria limitará o desempenho. Um Fire Strike rodando com baterias retornaria pontuações de Física e Gráficos de 11073 e 18527 pontos, respectivamente, em comparação com 23927 e 27266 pontos quando em rede elétrica.
| RelógioCPU (GHz) | RelógioGPU (MHz) | Temperaturamédiada CPU (°C) | Temperaturamédiada GPU (°C) | |
| System Idle | -- | --43 | 38 | |
| Prime95 Stress | 2.9 | -- | 83 | 59 |
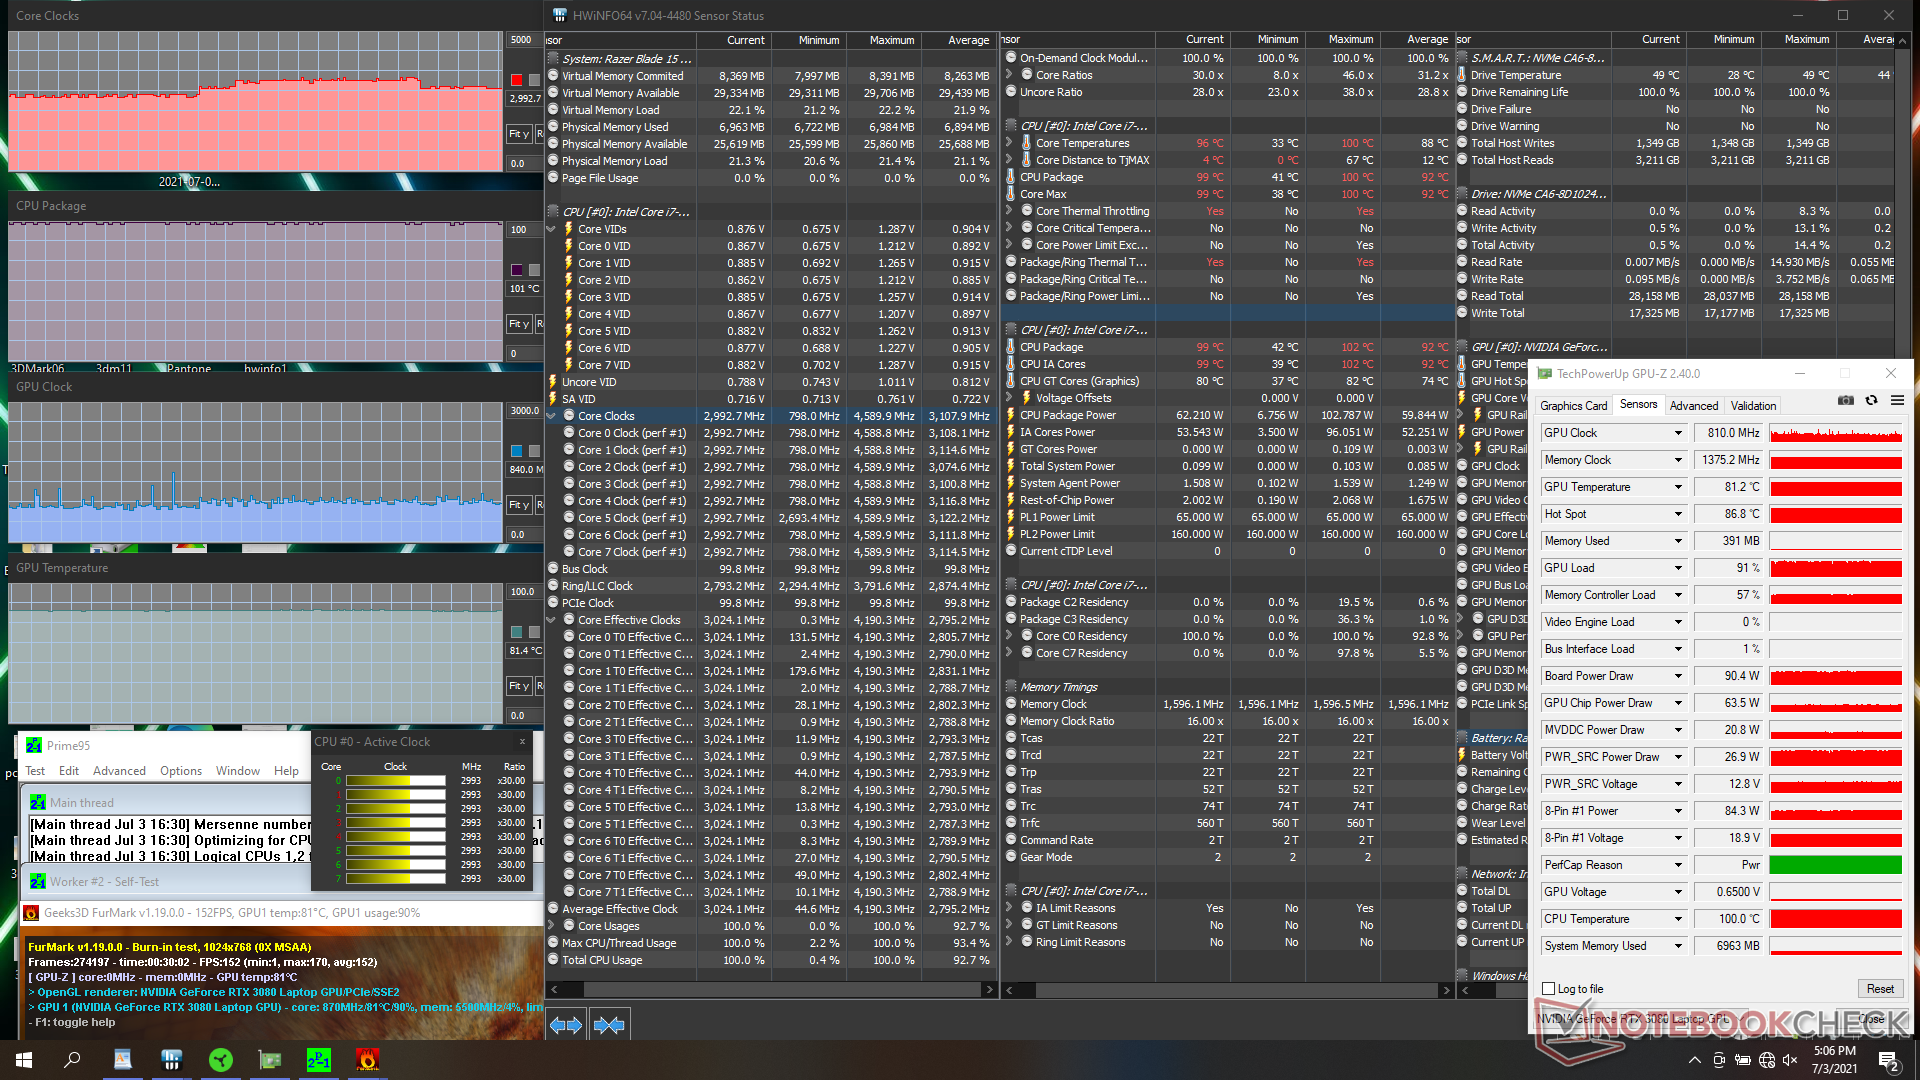
| Prime95 + FurMark Stress | 2.7 - 3.3 | 680 - 1100 | 100 | 81 |
| Witcher 3 Stress | 3.3 - 4.3 | 1470 | 83 | 80 |
Oradores
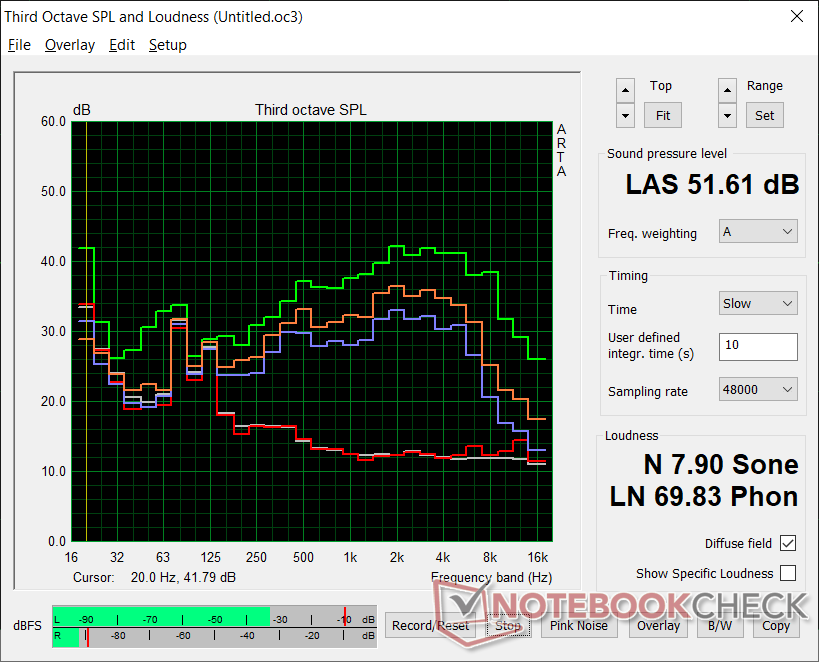
Razer Blade 15 Advanced (Mid 2021) análise de áudio
(+) | os alto-falantes podem tocar relativamente alto (###valor### dB)
Graves 100 - 315Hz
(-) | quase nenhum baixo - em média 20.1% menor que a mediana
(±) | a linearidade dos graves é média (12.8% delta para a frequência anterior)
Médios 400 - 2.000 Hz
(+) | médios equilibrados - apenas 3.6% longe da mediana
(+) | médios são lineares (4.1% delta para frequência anterior)
Altos 2 - 16 kHz
(+) | agudos equilibrados - apenas 4.9% longe da mediana
(±) | a linearidade dos máximos é média (8.3% delta para frequência anterior)
Geral 100 - 16.000 Hz
(±) | a linearidade do som geral é média (15.8% diferença em relação à mediana)
Comparado com a mesma classe
» 37% de todos os dispositivos testados nesta classe foram melhores, 7% semelhantes, 56% piores
» O melhor teve um delta de 6%, a média foi 18%, o pior foi 132%
Comparado com todos os dispositivos testados
» 24% de todos os dispositivos testados foram melhores, 5% semelhantes, 70% piores
» O melhor teve um delta de 4%, a média foi 23%, o pior foi 134%
Apple MacBook 12 (Early 2016) 1.1 GHz análise de áudio
(+) | os alto-falantes podem tocar relativamente alto (###valor### dB)
Graves 100 - 315Hz
(±) | graves reduzidos - em média 11.3% menor que a mediana
(±) | a linearidade dos graves é média (14.2% delta para a frequência anterior)
Médios 400 - 2.000 Hz
(+) | médios equilibrados - apenas 2.4% longe da mediana
(+) | médios são lineares (5.5% delta para frequência anterior)
Altos 2 - 16 kHz
(+) | agudos equilibrados - apenas 2% longe da mediana
(+) | os máximos são lineares (4.5% delta da frequência anterior)
Geral 100 - 16.000 Hz
(+) | o som geral é linear (10.2% diferença em relação à mediana)
Comparado com a mesma classe
» 7% de todos os dispositivos testados nesta classe foram melhores, 2% semelhantes, 90% piores
» O melhor teve um delta de 5%, a média foi 18%, o pior foi 53%
Comparado com todos os dispositivos testados
» 5% de todos os dispositivos testados foram melhores, 1% semelhantes, 94% piores
» O melhor teve um delta de 4%, a média foi 23%, o pior foi 134%
Energy Management
Consumo de energia
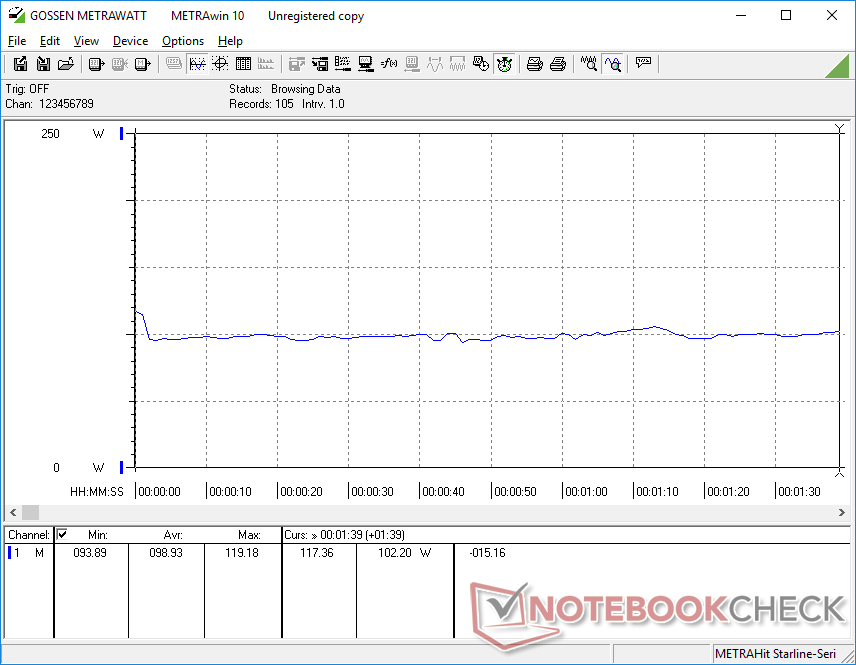
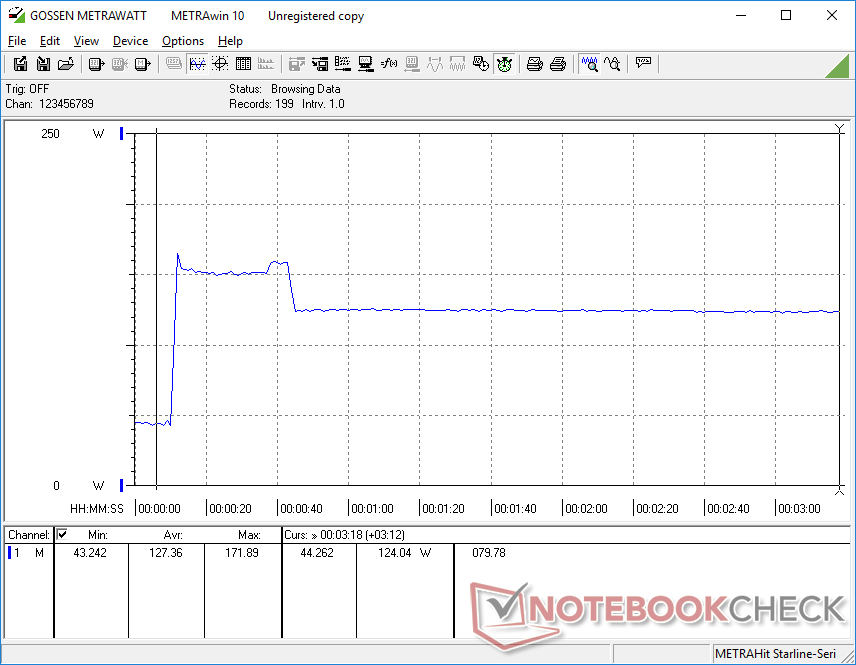
O novo modelo Intel da 11ª geração é mais ávido de energia do que o anterior modo Intel da 10ª geração, o que pode explicar os menores tempos de funcionamento da bateria que registramos na próxima seção abaixo. Simplesmente ociosos na área de trabalho com a configuração de brilho mais baixa no modo Power Saver com a GPU integrada ativa ainda atrairiam quase 20 W. Ociosos na área de trabalho com a GPU discreta ativa e no modo High Performance dobrariam esta demanda.
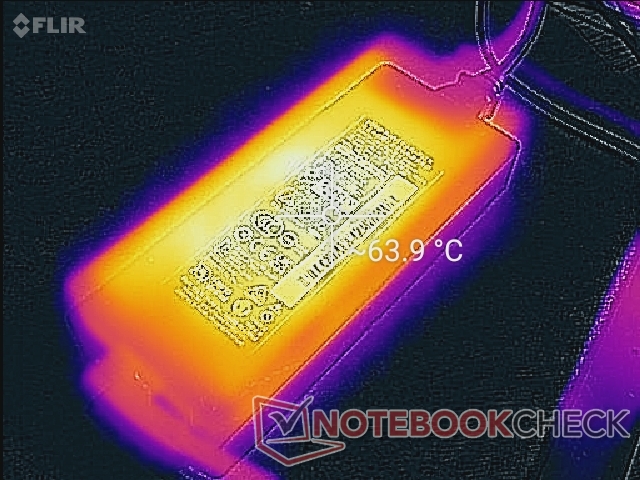
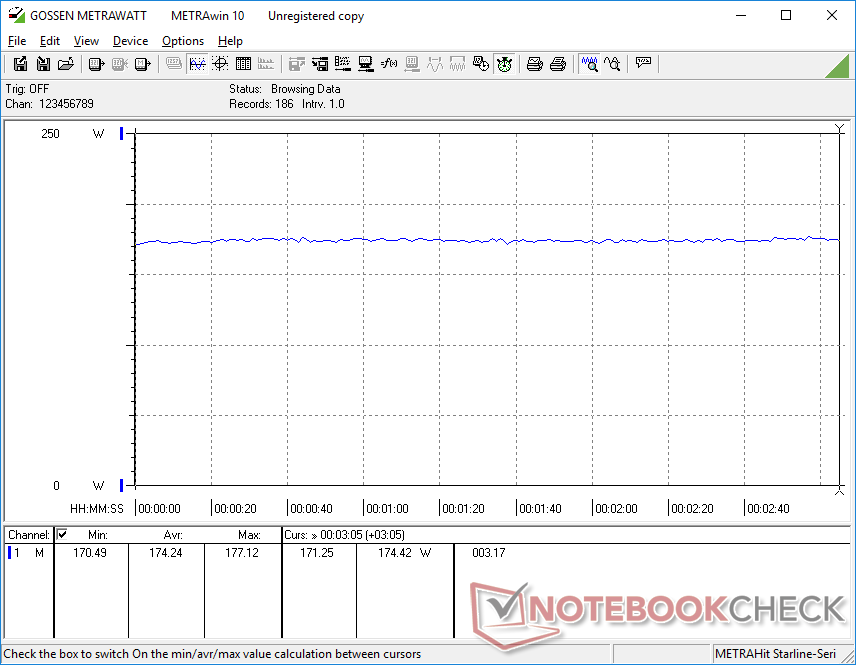
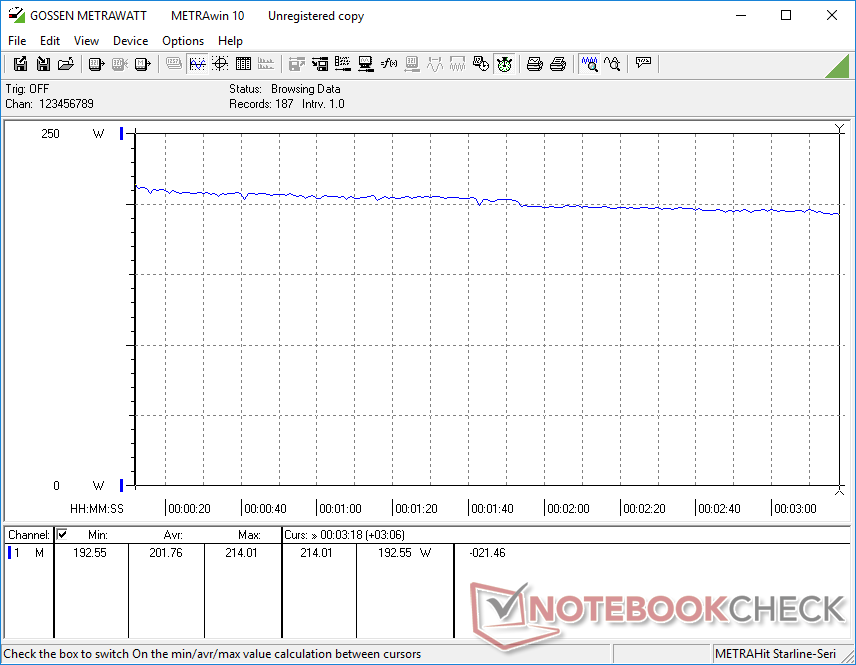
Executando Witcher 3, a média de 174 W é alta, mas ainda assim inferior à da Aorus 15P com a mesma CPU e GPU. Somos capazes de gravar um consumo máximo de 214 W a partir do adaptador AC de 230 W (~17 x 7 x 2,5 cm) de tamanho médio.
| desligado | |
| Ocioso | |
| Carga |
|
Key:
min: | |
| Razer Blade 15 Advanced (Mid 2021) i7-11800H, GeForce RTX 3080 Laptop GPU, SSSTC CA6-8D1024, IPS, 1920x1080, 15.6" | Razer Blade 15 Advanced Model Early 2021 i7-10875H, GeForce RTX 3080 Laptop GPU, Samsung PM981a MZVLB1T0HBLR, IPS, 1920x1080, 15.6" | Razer Blade 15 RTX 2080 Super Max-Q i7-10875H, GeForce RTX 2080 Super Max-Q, Samsung PM981a MZVLB1T0HBLR, IPS, 1920x1080, 15.6" | Asus TUF Gaming F15 FX506HM i7-11800H, GeForce RTX 3060 Laptop GPU, SK Hynix HFM001TD3JX013N, IPS, 1920x1080, 15.6" | Alienware m15 R5 Ryzen Edition R7 5800H, GeForce RTX 3060 Laptop GPU, Toshiba KBG40ZNS512G NVMe, IPS, 1920x1080, 15.6" | Aorus 15P YD i7-11800H, GeForce RTX 3080 Laptop GPU, Samsung PM9A1 MZVL21T0HCLR, IPS, 1920x1080, 15.6" | |
|---|---|---|---|---|---|---|
| Power Consumption | 28% | 26% | 29% | 15% | -9% | |
| Idle Minimum * (Watt) | 19.5 | 13 33% | 10.6 46% | 9.5 51% | 11 44% | 23 -18% |
| Idle Average * (Watt) | 23.3 | 15 36% | 13.1 44% | 12.1 48% | 14 40% | 25 -7% |
| Idle Maximum * (Watt) | 40.1 | 22 45% | 15.8 61% | 22.5 44% | 25 38% | 35 13% |
| Load Average * (Watt) | 98.9 | 98 1% | 131 -32% | 99.5 -1% | 123 -24% | 101 -2% |
| Witcher 3 ultra * (Watt) | 174 | 126 28% | 146 16% | 157 10% | 176 -1% | 190 -9% |
| Load Maximum * (Watt) | 214 | 165 23% | 169 21% | 173.5 19% | 226 -6% | 280 -31% |
* ... menor é melhor
Power Consumption Witcher 3
Vida útil da bateria
A navegação na Web em modo balanceado com o iGPU ativo e com 150 nit de brilho é algumas horas mais curta do que o que gravamos no 10º gênero Blade 15. Os usuários podem ser capazes de fazer essa diferença configurando o sistema para o modo de economia de energia e a taxa de atualização para 60 Hz em vez da taxa padrão de 360 Hz.
Os usuários podem recarregar via USB-C através de qualquer porta.
| Razer Blade 15 Advanced (Mid 2021) i7-11800H, GeForce RTX 3080 Laptop GPU, 80 Wh | Razer Blade 15 Advanced Model Early 2021 i7-10875H, GeForce RTX 3080 Laptop GPU, 80 Wh | Razer Blade 15 RTX 2080 Super Max-Q i7-10875H, GeForce RTX 2080 Super Max-Q, 80 Wh | Asus TUF Gaming F15 FX506HM i7-11800H, GeForce RTX 3060 Laptop GPU, 90 Wh | Alienware m15 R5 Ryzen Edition R7 5800H, GeForce RTX 3060 Laptop GPU, 86 Wh | Aorus 15P YD i7-11800H, GeForce RTX 3080 Laptop GPU, 99 Wh | |
|---|---|---|---|---|---|---|
| Duração da bateria | 53% | 3% | 34% | -14% | -10% | |
| WiFi v1.3 (h) | 5.9 | 9 53% | 6.1 3% | 7.9 34% | 5.1 -14% | 5.3 -10% |
| Reader / Idle (h) | 14.4 | 8.7 | 11 | 14.7 | 7.5 | |
| Load (h) | 2 | 1.9 | 2 | 0.9 | 2.1 | |
| Witcher 3 ultra (h) | 1.6 |
Pro
Contra
Veredicto
Como o Core i7-10875H no modelo Blade 15 do 10º gênero teria um desempenho inferior quando estressado, tivemos medo de ver o mesmo com o Core i7-11800H no mais novo modelo Blade 15 do 11º gênero. Felizmente, este não foi o caso. A CPU no novo Blade 15 estaria dentro de apenas alguns pontos percentuais da média do laptop em nosso banco de dados equipado com o mesmo modelo i7-11800H. Os usuários estão recebendo um aumento de pelo menos 30% no desempenho bruto multi-tarefa em relação à i7-10875H na antiga Blade 15. O desempenho da GPU bruta também aumentou de 10 a 15% devido em parte à meta TGP mais alta. Alguns jogos verão aumentos similares nas taxas de quadros, dependendo de quão pesados podem ser de CPU.
O último Blade 15 de 2021 é a versão mais rápida de si mesmo até agora, especialmente em termos de potência de CPU. No entanto, seu desempenho geral nos jogos é apenas uma melhoria marginal em relação ao modelo Blade 15 do início de 2021, que tem apenas alguns meses.
A CPU e a GPU mais rápidas vêm ao custo de temperaturas centrais mais altas, maior consumo de energia e menor duração da bateria do que na 10ª geração da Intel Blade 15. Estes inconvenientes podem desviar os usuários que procuram maximizar a eficiência energética, mas os caçadores de desempenho podem aceitar com prazer estes inconvenientes para os processadores mais rápidos, webcam de maior resolução, suporte PCIe 4 NVMe SSD, e compatibilidade com Thunderbolt 4.
Preço e disponibilidade
O 11º gênero Intel Blade 15 ainda não está amplamente disponível nos canais de terceiros a partir desta redação. Encomenda diretamente da Razer pode ser a melhor maneira de garantir uma unidade.
Razer Blade 15 Advanced (Mid 2021)
- 07/07/2021 v7 (old)
Allen Ngo
Price comparison

