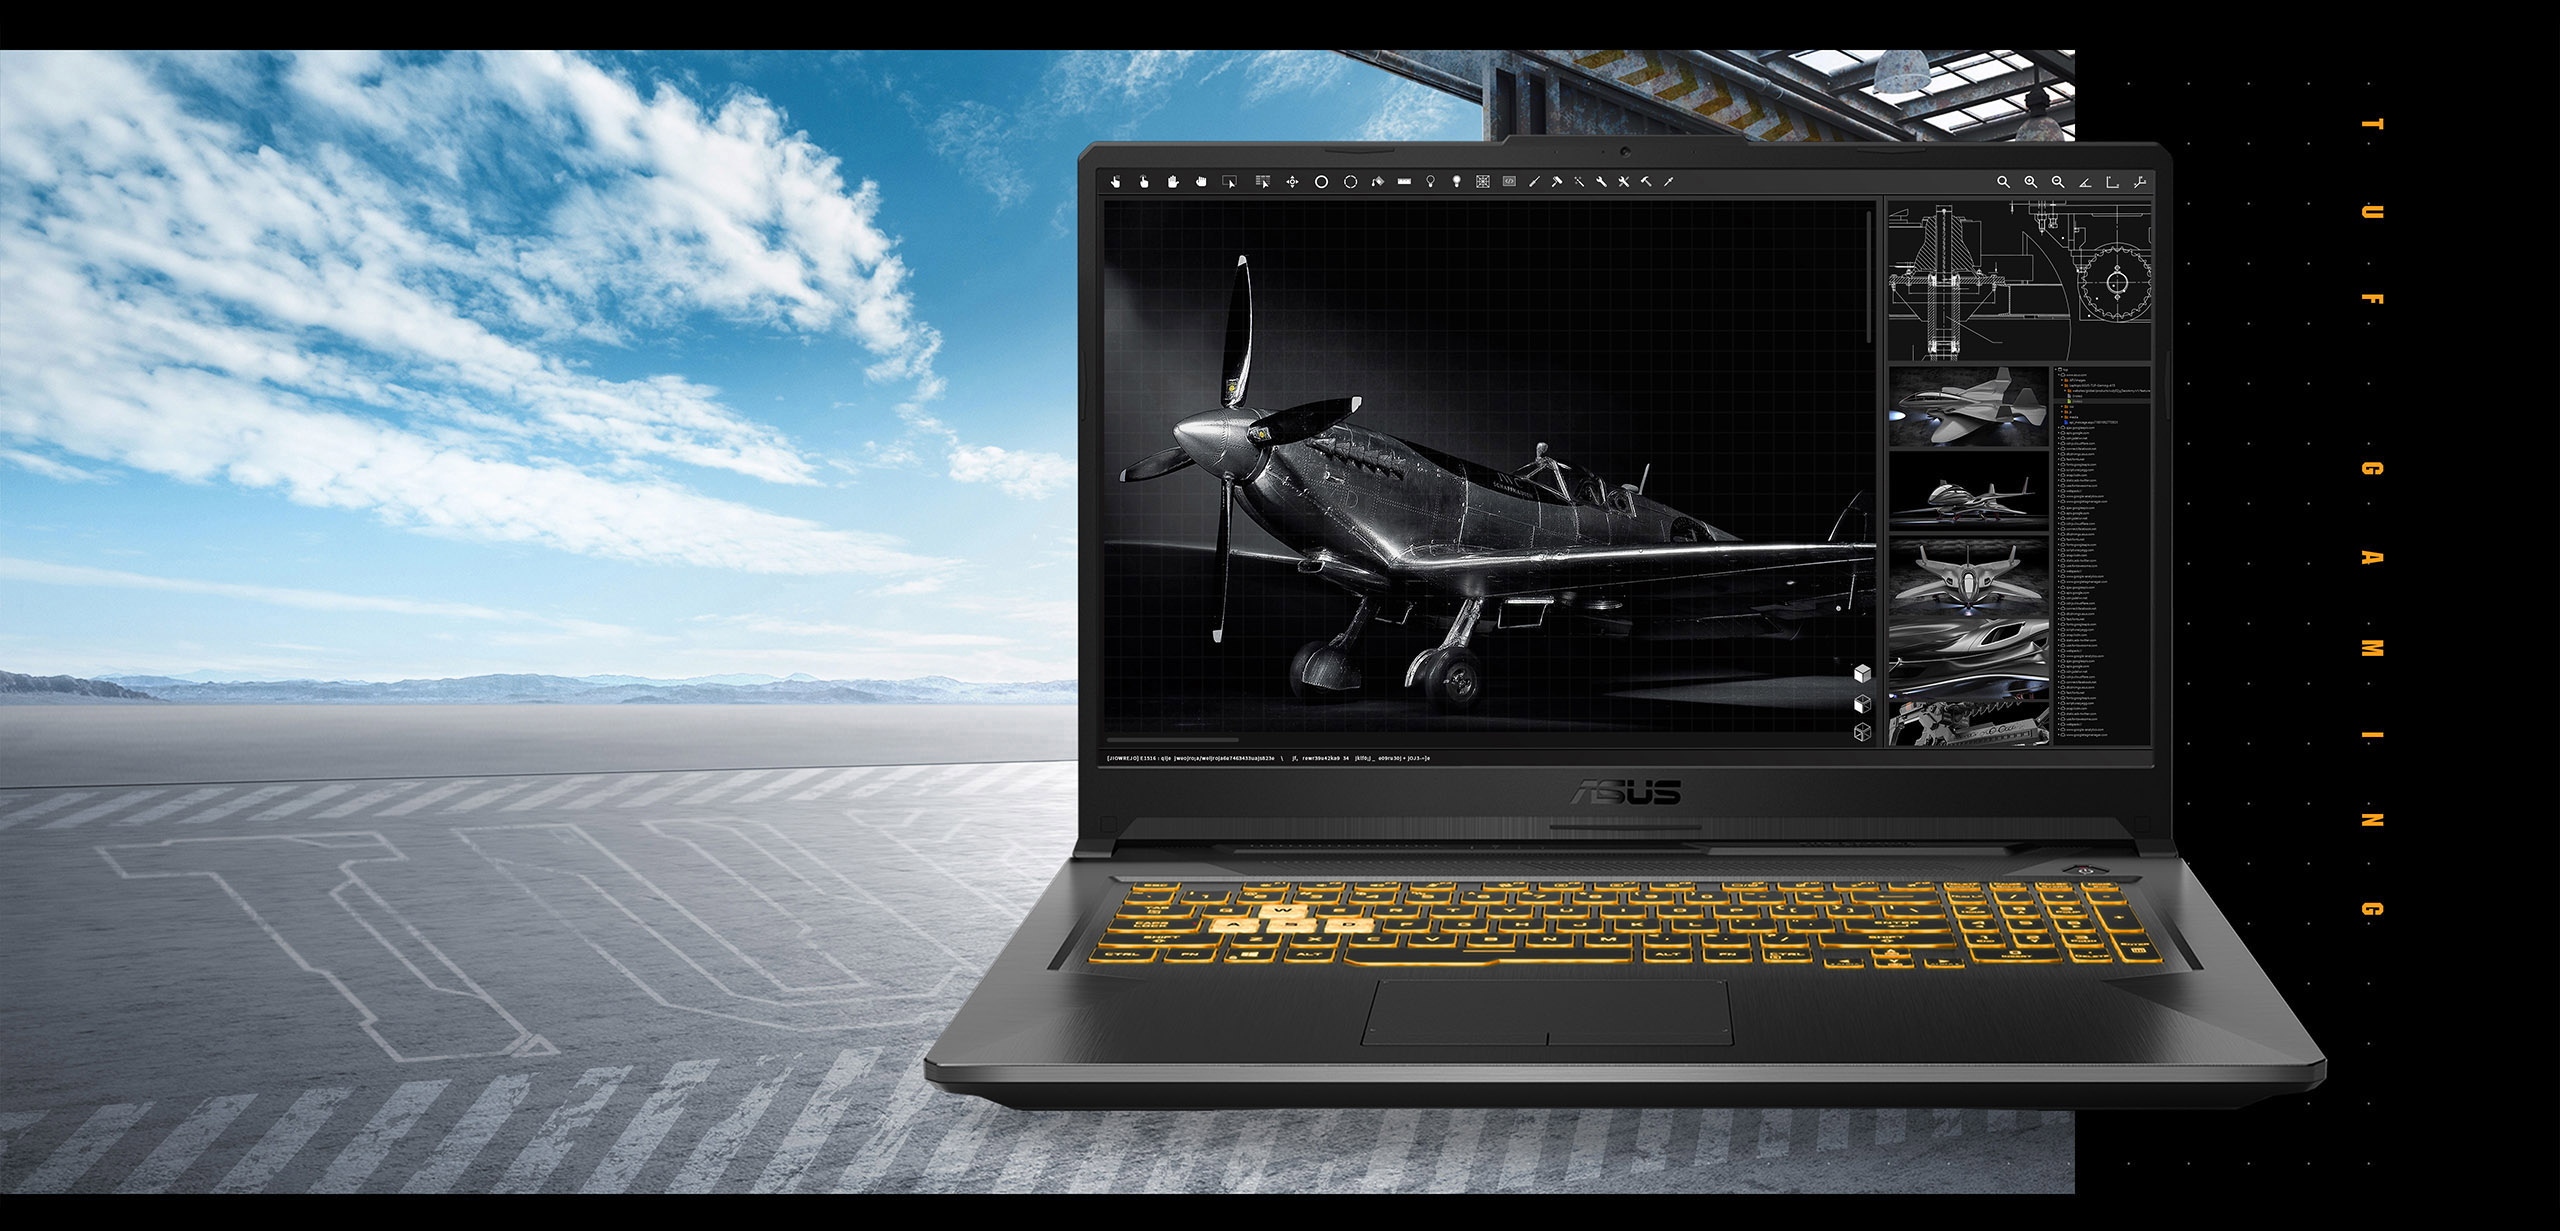
Revisão do laptop Asus TUF Gaming F17: Bom dispositivo para jogos com RTX 3060, mas com exibição média apesar de 144 Hz
A Asus nos enviou seu novo e acessível laptop para jogos TUF com um processador Tiger Lake e um RTX 3060. No ano passado, revisamos o TUF A17, um modelo da série anterior equipado com um Ryzen 7 e um GTX 1660 Ti. O novo modelo deve ser muito mais rápido, pelo menos em aplicações gráficas e jogos, embora o TGP total de 95 watts esteja bastante no intervalo de desempenho médio a mais baixo de um RTX 3060. O display agora suporta 144 Hz em vez dos antigos 120 Hz.
Além do predecessor virtual, naturalmente também queremos compará-lo com a concorrência encontrada no mesmo segmento de preço. Isto inclui principalmente o Schenker XMG Core 17, mas também oMSI Alpha 17e, por falta de concorrência adicional de 17 polegadas, oMSI GF65 Thine oAcer Nitro 5 AN515-55rivais de 15 polegadas.
Como o exterior permanece o mesmo, não entraremos em detalhes sobre o caso, manutenção, dispositivos de entrada, etc., desde que não haja mudanças. Estas informações podem ser encontradas na revisão do siterevisão do Asus TUF A17.
Possible contenders in comparison
Avaliação | Data | Modelo | Peso | Altura | Size | Resolução | Preço |
|---|---|---|---|---|---|---|---|
| 82.8 % v7 (old) | 06/2021 | Asus TUF Gaming F17 FX706HM i9-11900H, GeForce RTX 3060 Laptop GPU | 2.7 kg | 26 mm | 17.30" | 1920x1080 | |
| 82.9 % v7 (old) | 05/2020 | Asus TUF A17 FA706IU-AS76 R7 4800H, GeForce GTX 1660 Ti Mobile | 2.6 kg | 26 mm | 17.30" | 1920x1080 | |
| 83.9 % v7 (old) | 06/2021 | Schenker XMG Core 17 (Early 2021) i7-10870H, GeForce RTX 3060 Laptop GPU | 2.5 kg | 30.05 mm | 17.30" | 2560x1440 | |
| 83.3 % v7 (old) | 02/2021 | MSI Alpha 17 A4DEK R7 4800H, Radeon RX 5600M | 2.6 kg | 28 mm | 17.30" | 1920x1080 | |
| 80.4 % v7 (old) | 03/2021 | MSI GF65 Thin 10UE i7-10750H, GeForce RTX 3060 Laptop GPU | 1.9 kg | 21.7 mm | 15.60" | 1920x1080 | |
| 80.5 % v7 (old) | 05/2021 | Acer Aspire Nitro 5 AN515-55-57GF i5-10300H, GeForce RTX 3060 Laptop GPU | 2.3 kg | 23.9 mm | 15.60" | 1920x1080 |
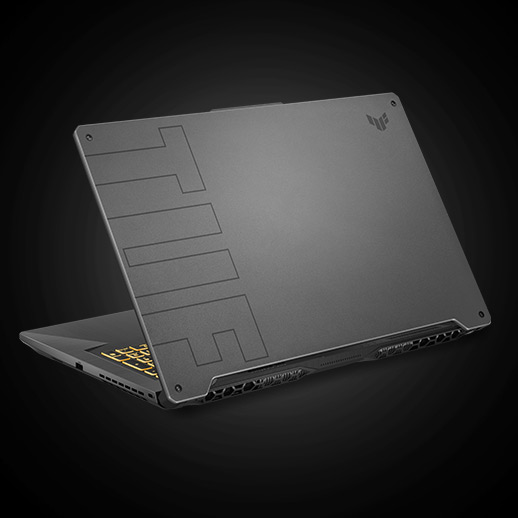
Estojo - Mais pequeno e com mais metal


O MSI Alfa é ligeiramente mais profundo e grosso, enquanto o Schenker XMG é mais grosso, mas menor em geral. Nosso F17 é praticamente o dispositivo mais pesado em comparação
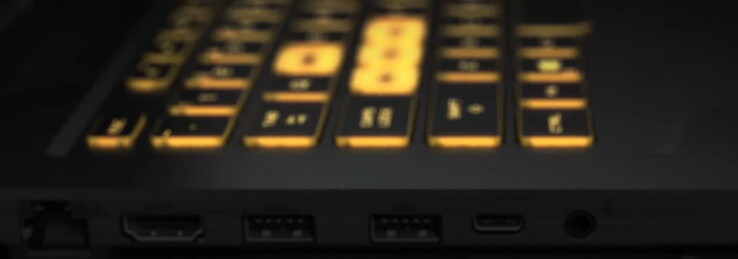
Conectividade - Thunderbolt 4
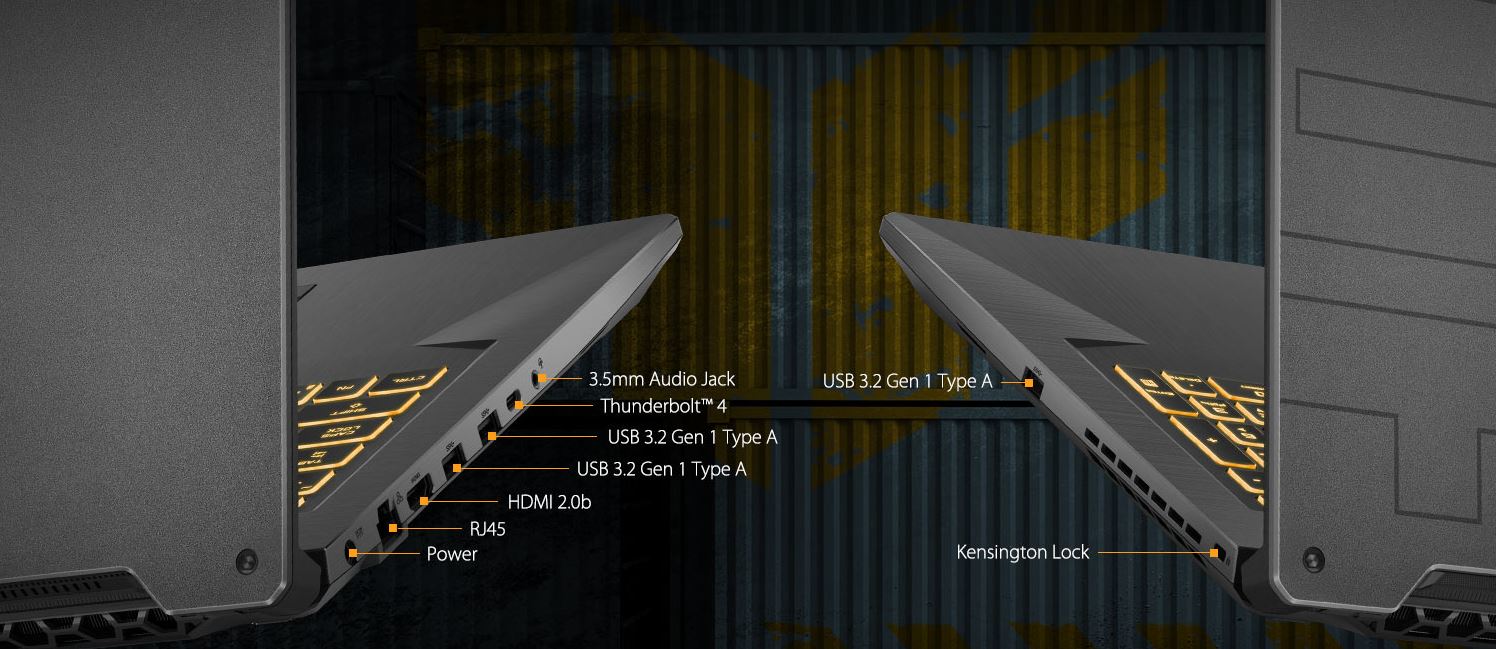
É ótimo que o F17 tenha agora integrado o Thunderbolt 4. As demais portas são as padrão, e sua distribuição está fortemente concentrada no lado esquerdo, o que é muito conveniente para os usuários destros. Não há portas na frente ou atrás. Uma característica que falta é o leitor de cartões SD
Comunicação
Em termos de Bluetooth, o F17 oferece o mais recente Bluetooth 5.2, mas o dispositivo Asus fica para trás em termos de velocidade de transferência Wi-Fi. A velocidade de recepção de dados em particular está abaixo da média; o A17 também não pontuou particularmente bem a este respeito, e a concorrência é mais rápida
Webcam


Segurança
Um espaço para uma fechadura Kensington está disponível, e o TPM 2.0 também é suportado.
Acessórios
Com exceção dos folhetos habituais, o único extra é uma folha de papel tamanho A5 com adesivos de jogo TUF
Garantia
O fabricante fornece uma garantia padrão de um ano
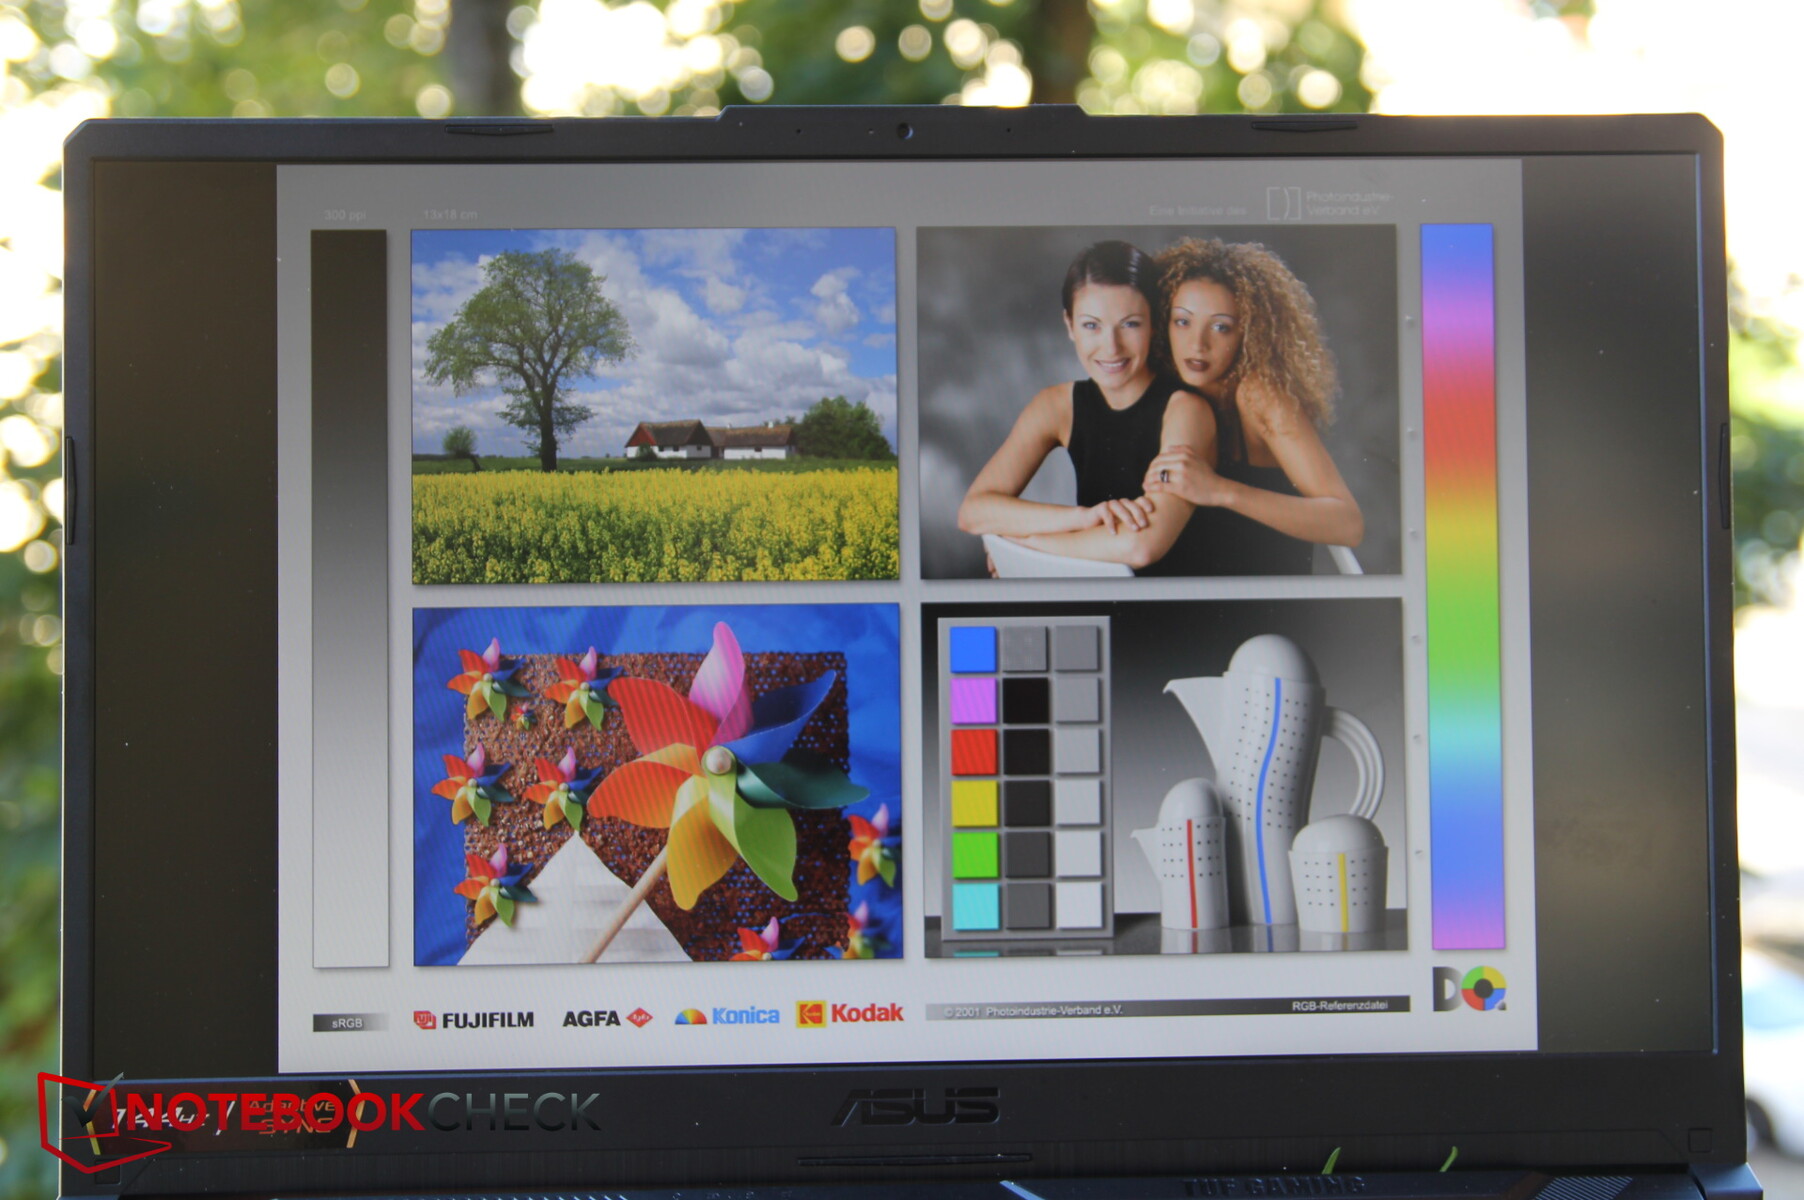
Display - Há melhores opções
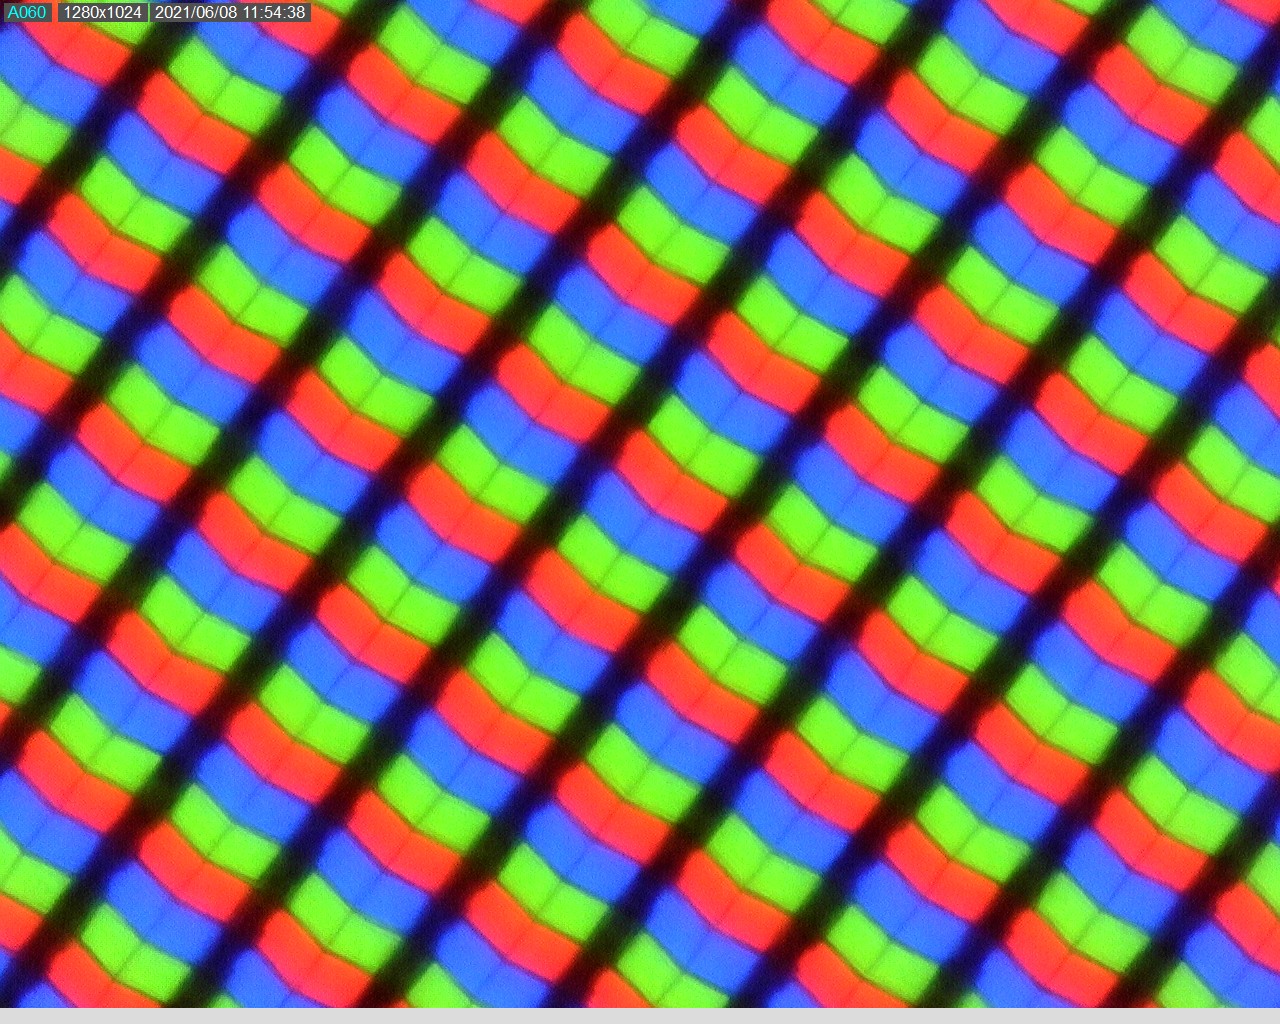
Não temos a configuração superior quando se trata da tela, já que ainda existe uma variante com uma cobertura sRGB de 100% e uma taxa de atualização de 300 Hz.
O modelo atual é uma tela IPS Full HD de 17,3 polegadas mate com uma taxa de atualização de 144 Hz e Adaptive Sync. O painel da AU Optronics oferece tudo menos taxas máximas, o que não é incomum nesta faixa de preço. A concorrência é ainda pior aqui em alguns casos, e apenas a tela da Schenker é melhor.
A média de luminosidade de 264 lêndeas é apenas boa, mas a distribuição de luminosidade de apenas 79% é extremamente desigual. A luminosidade máxima é fortemente reduzida na energia da bateria, e registramos apenas 144 lêndeas, mas isto pode ser desativado no motorista.
Infelizmente, os tempos de resposta também não são bons para um dispositivo de jogo, o que pode ter um impacto negativo em atiradores muito rápidos.
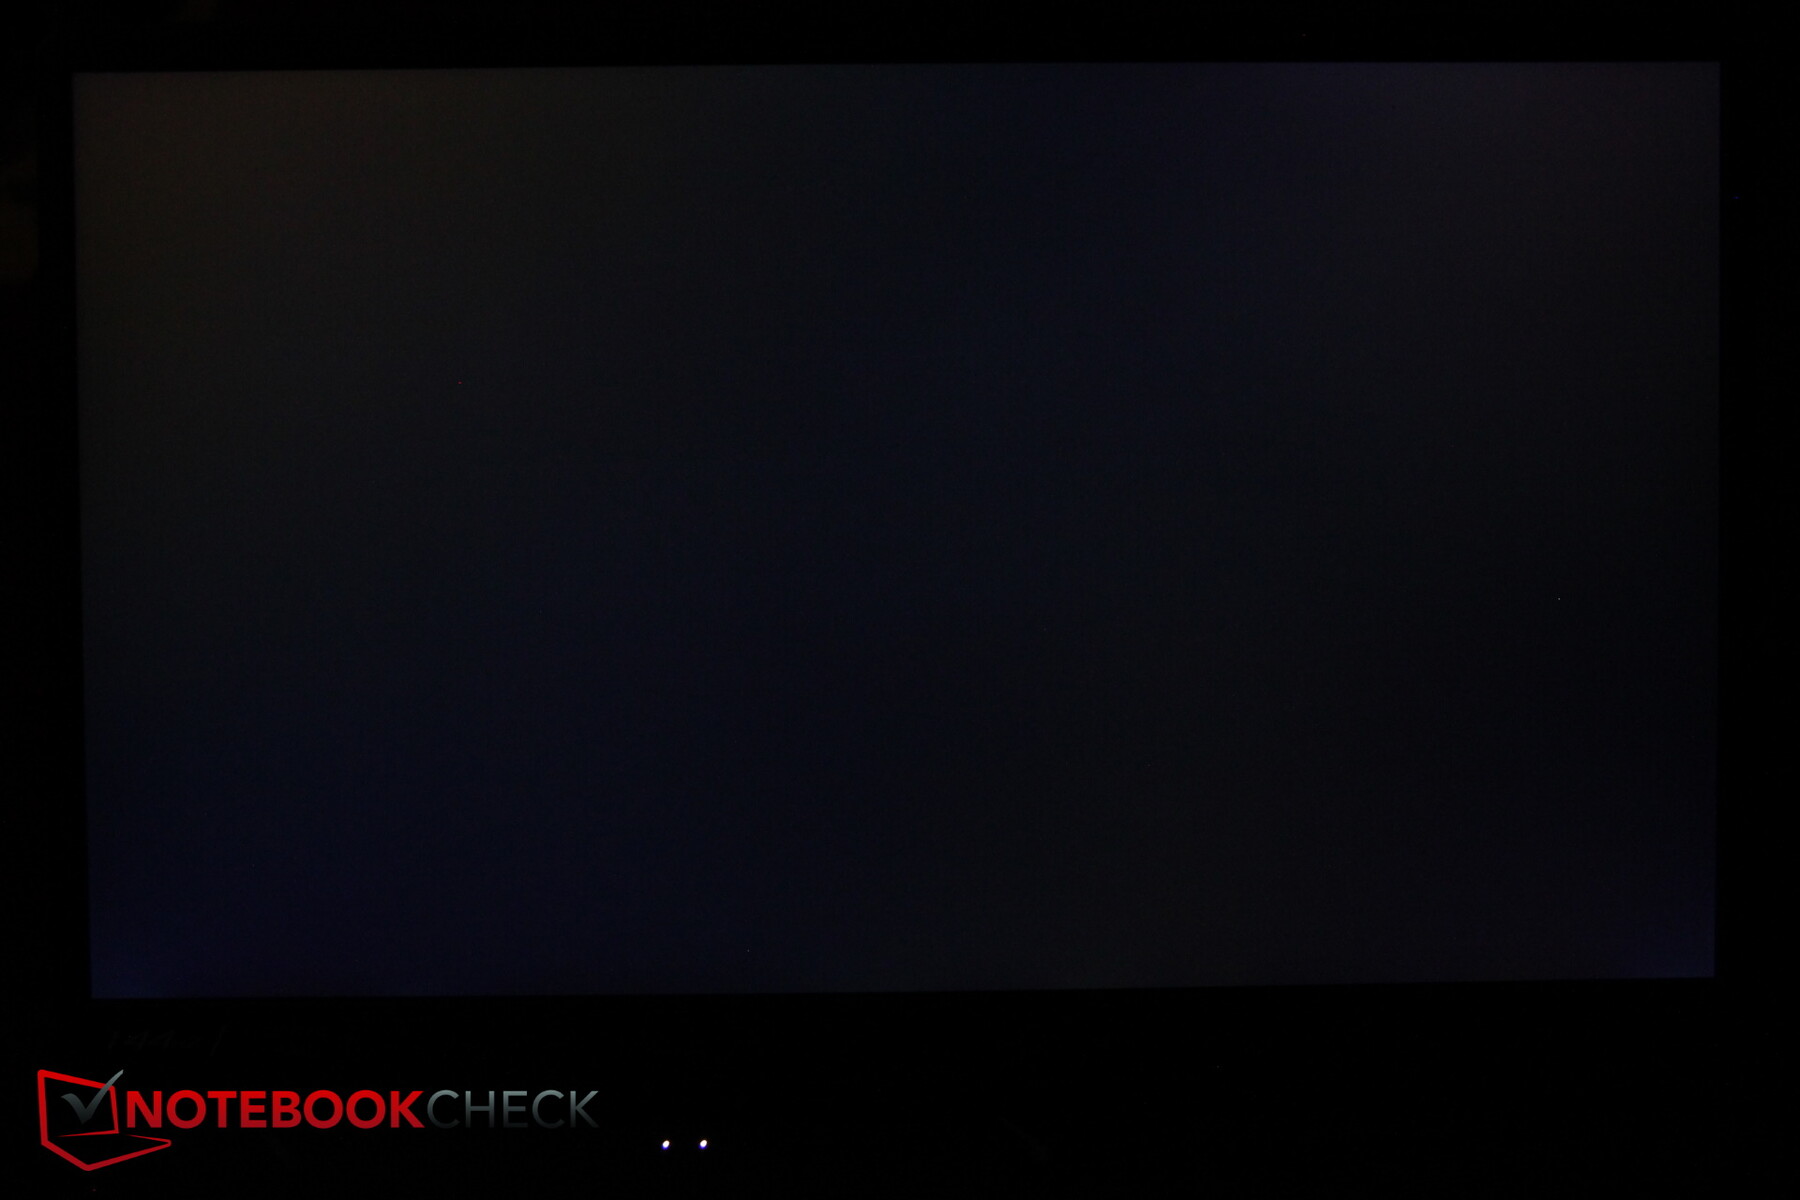
O sangramento da tela está minimamente presente ao longo dos cantos e bordas, mas é quase imperceptível mesmo em cenas escuras e, portanto, não incomoda.
| |||||||||||||||||||||||||
iluminação: 79 %
iluminação com acumulador: 144 cd/m²
Contraste: 831:1 (Preto: 0.32 cd/m²)
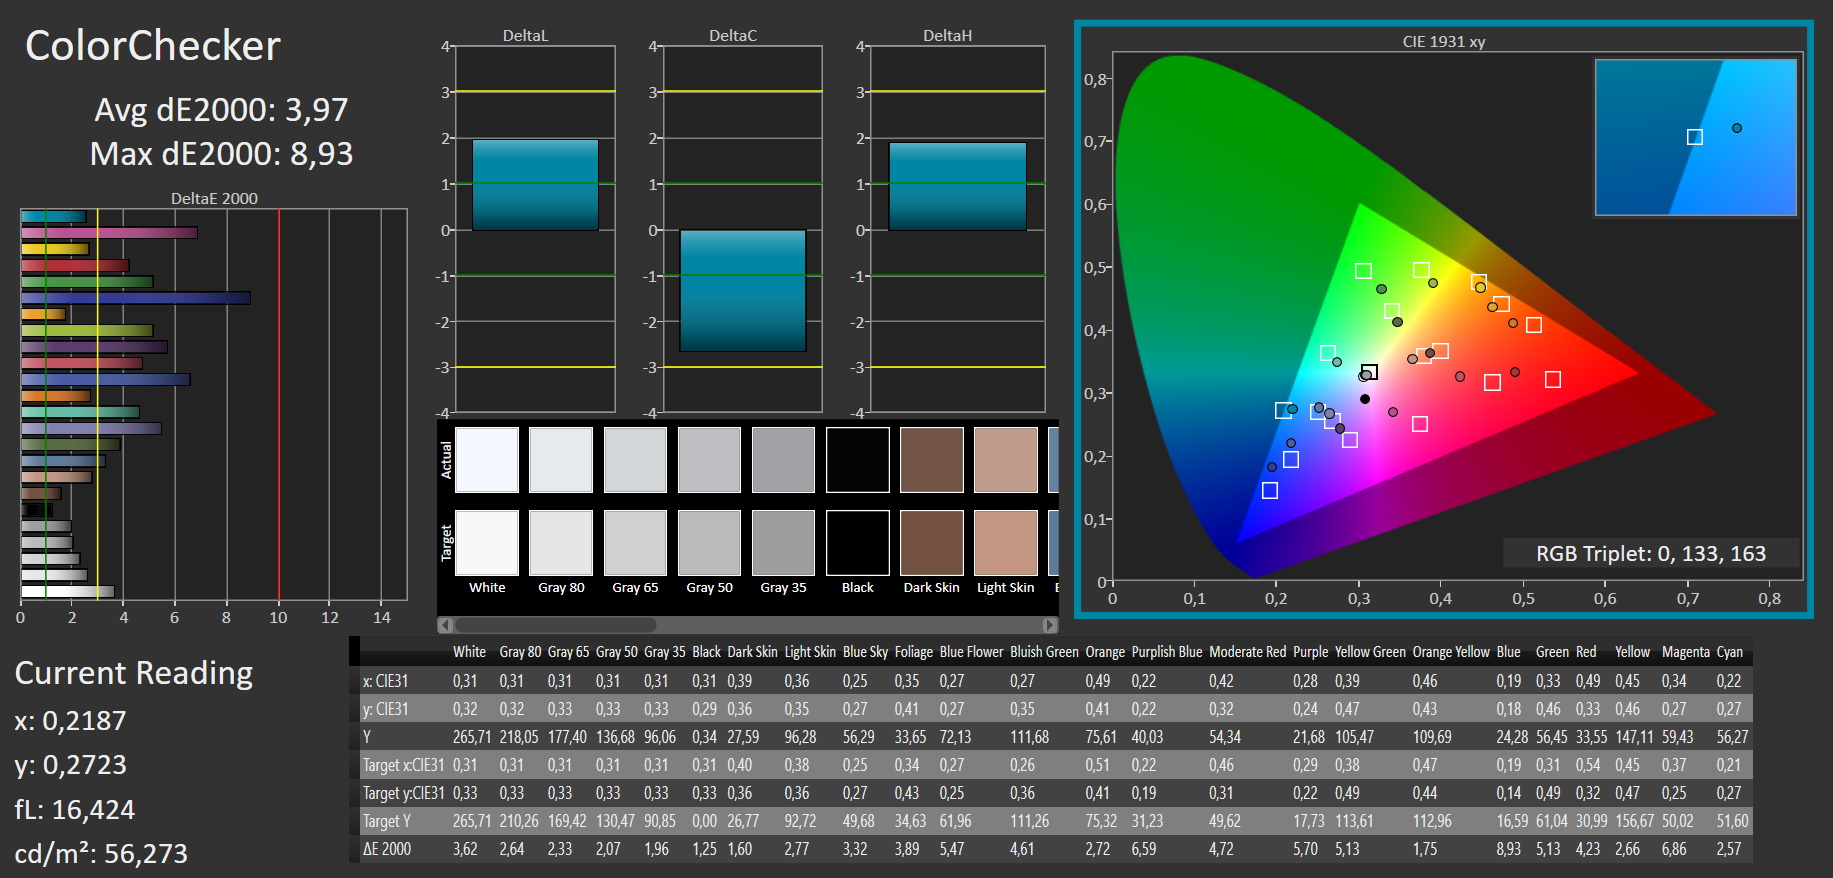
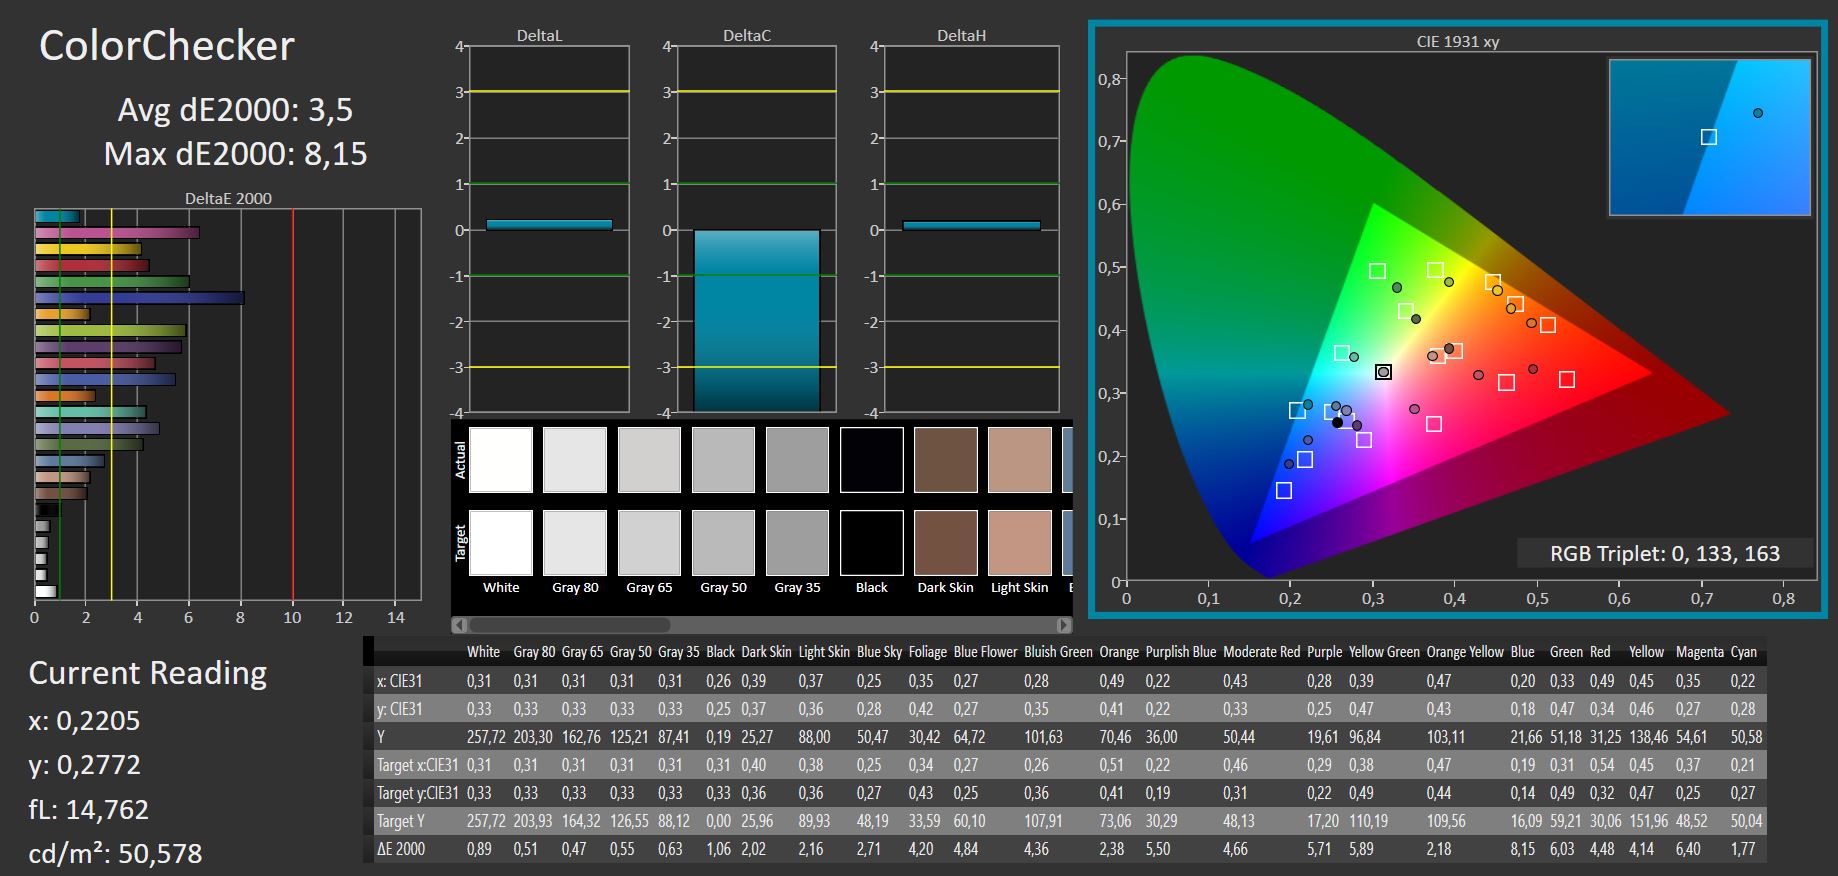
ΔE ColorChecker Calman: 3.97 | ∀{0.5-29.43 Ø4.71}
calibrated: 3.5
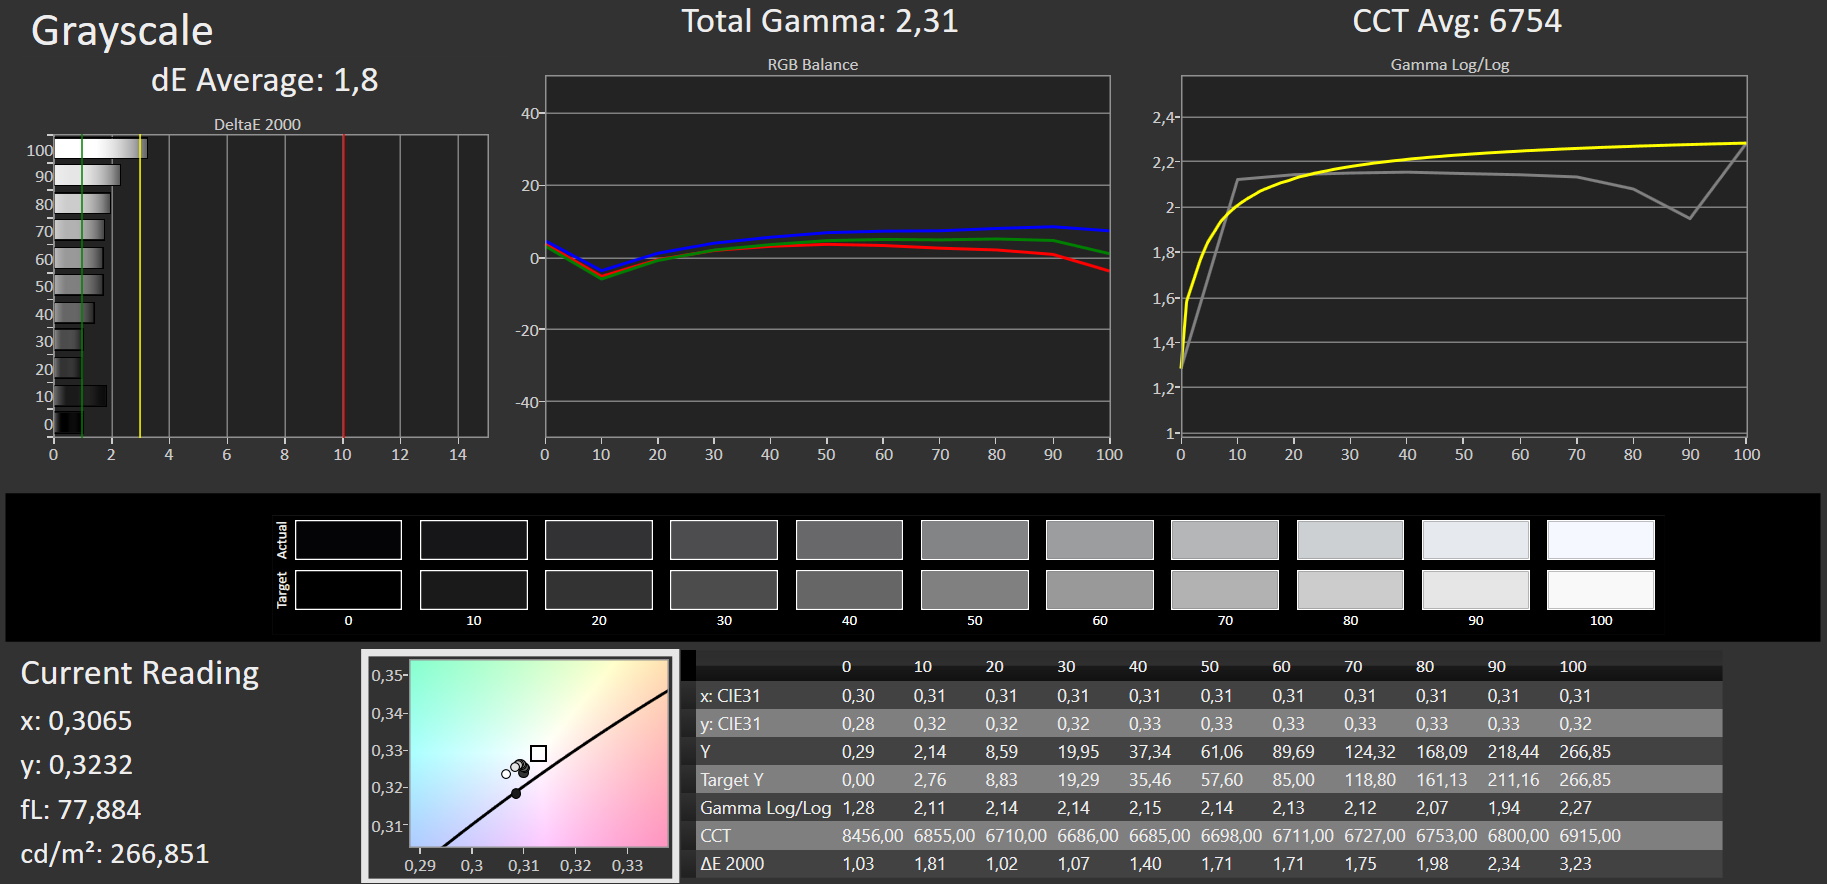
ΔE Greyscale Calman: 1.8 | ∀{0.09-98 Ø4.96}
60% sRGB (Argyll 1.6.3 3D)
41.4% AdobeRGB 1998 (Argyll 1.6.3 3D)
41.4% AdobeRGB 1998 (Argyll 3D)
60% sRGB (Argyll 3D)
40.1% Display P3 (Argyll 3D)
Gamma: 2.31
CCT: 6754 K
| Asus TUF Gaming F17 FX706HM AU Optronics AUI8294 (B173HAN04.9), IPS, 1920x1080, 17.3" | Asus TUF A17 FA706IU-AS76 BOE NV173FHM-NX1, IPS, 1920x1080, 17.3" | Schenker XMG Core 17 (Early 2021) BOE CQ NE173QHM-NY2, IPS, 2560x1440, 17.3" | MSI Alpha 17 A4DEK AU Optronics AUO978F, IPS, 1920x1080, 17.3" | MSI GF65 Thin 10UE AU Optronics B156HAN08.4, IPS, 1920x1080, 15.6" | |
|---|---|---|---|---|---|
| Display | 1% | 67% | -1% | -6% | |
| Display P3 Coverage (%) | 40.1 | 40.55 1% | 68.1 70% | 39.55 -1% | 37.65 -6% |
| sRGB Coverage (%) | 60 | 59.7 0% | 98.5 64% | 59.2 -1% | 56.3 -6% |
| AdobeRGB 1998 Coverage (%) | 41.4 | 41.89 1% | 69.3 67% | 40.86 -1% | 38.9 -6% |
| Response Times | 23% | 52% | -27% | -28% | |
| Response Time Grey 50% / Grey 80% * (ms) | 32.4 | 22.4 ? 31% | 16.8 ? 48% | 40 ? -23% | 36.8 ? -14% |
| Response Time Black / White * (ms) | 22.4 | 19.2 ? 14% | 10 ? 55% | 29.2 ? -30% | 31.6 ? -41% |
| PWM Frequency (Hz) | |||||
| Screen | -12% | 18% | -13% | -18% | |
| Brightness middle (cd/m²) | 266 | 264.8 0% | 370 39% | 254 -5% | 266.5 0% |
| Brightness (cd/m²) | 264 | 253 -4% | 333 26% | 254 -4% | 262 -1% |
| Brightness Distribution (%) | 79 | 90 14% | 84 6% | 93 18% | 91 15% |
| Black Level * (cd/m²) | 0.32 | 0.31 3% | 0.38 -19% | 0.23 28% | 0.18 44% |
| Contrast (:1) | 831 | 854 3% | 974 17% | 1104 33% | 1481 78% |
| Colorchecker dE 2000 * | 3.97 | 4.73 -19% | 2.41 39% | 4.12 -4% | 5.33 -34% |
| Colorchecker dE 2000 max. * | 8.93 | 18.89 -112% | 7.32 18% | 19.66 -120% | 18.28 -105% |
| Colorchecker dE 2000 calibrated * | 3.5 | 4.64 -33% | 1.19 66% | 3.78 -8% | 4.36 -25% |
| Greyscale dE 2000 * | 1.8 | 1.4 22% | 3.9 -117% | 3.2 -78% | 4.5 -150% |
| Gamma | 2.31 95% | 2.16 102% | 2.287 96% | 2.179 101% | 2.35 94% |
| CCT | 6754 96% | 6641 98% | 7302 89% | 6754 96% | 6289 103% |
| Color Space (Percent of AdobeRGB 1998) (%) | 41.4 | 38.4 -7% | 69 67% | 41 -1% | 35.6 -14% |
| Color Space (Percent of sRGB) (%) | 60 | 59.3 -1% | 93 55% | 59 -2% | 55.8 -7% |
| Média Total (Programa/Configurações) | 4% /
-5% | 46% /
31% | -14% /
-12% | -17% /
-17% |
* ... menor é melhor
O nível de preto é aceitável, mas o contraste é claramente inferior a 1.000:1 e poderia ser melhorado como resultado.
O visor está bastante bem calibrado, pelo menos, e os desvios de cor são bastante baixos. A calibragem manual permite apenas que estes sejam reduzidos ao mínimo.
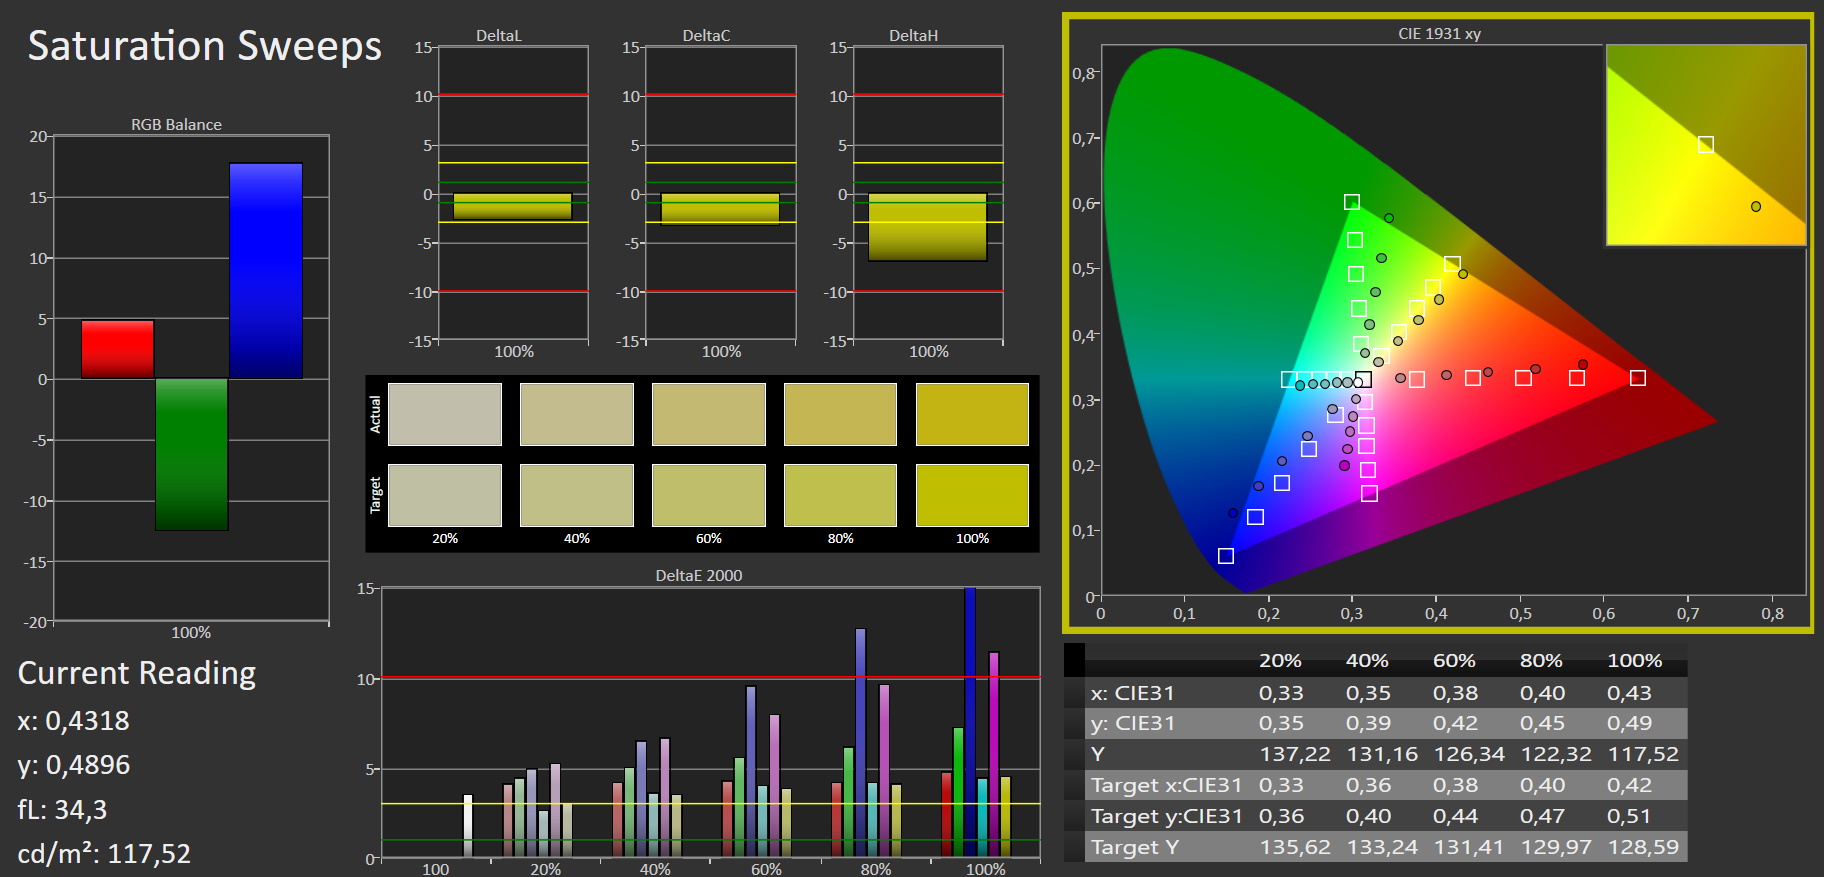

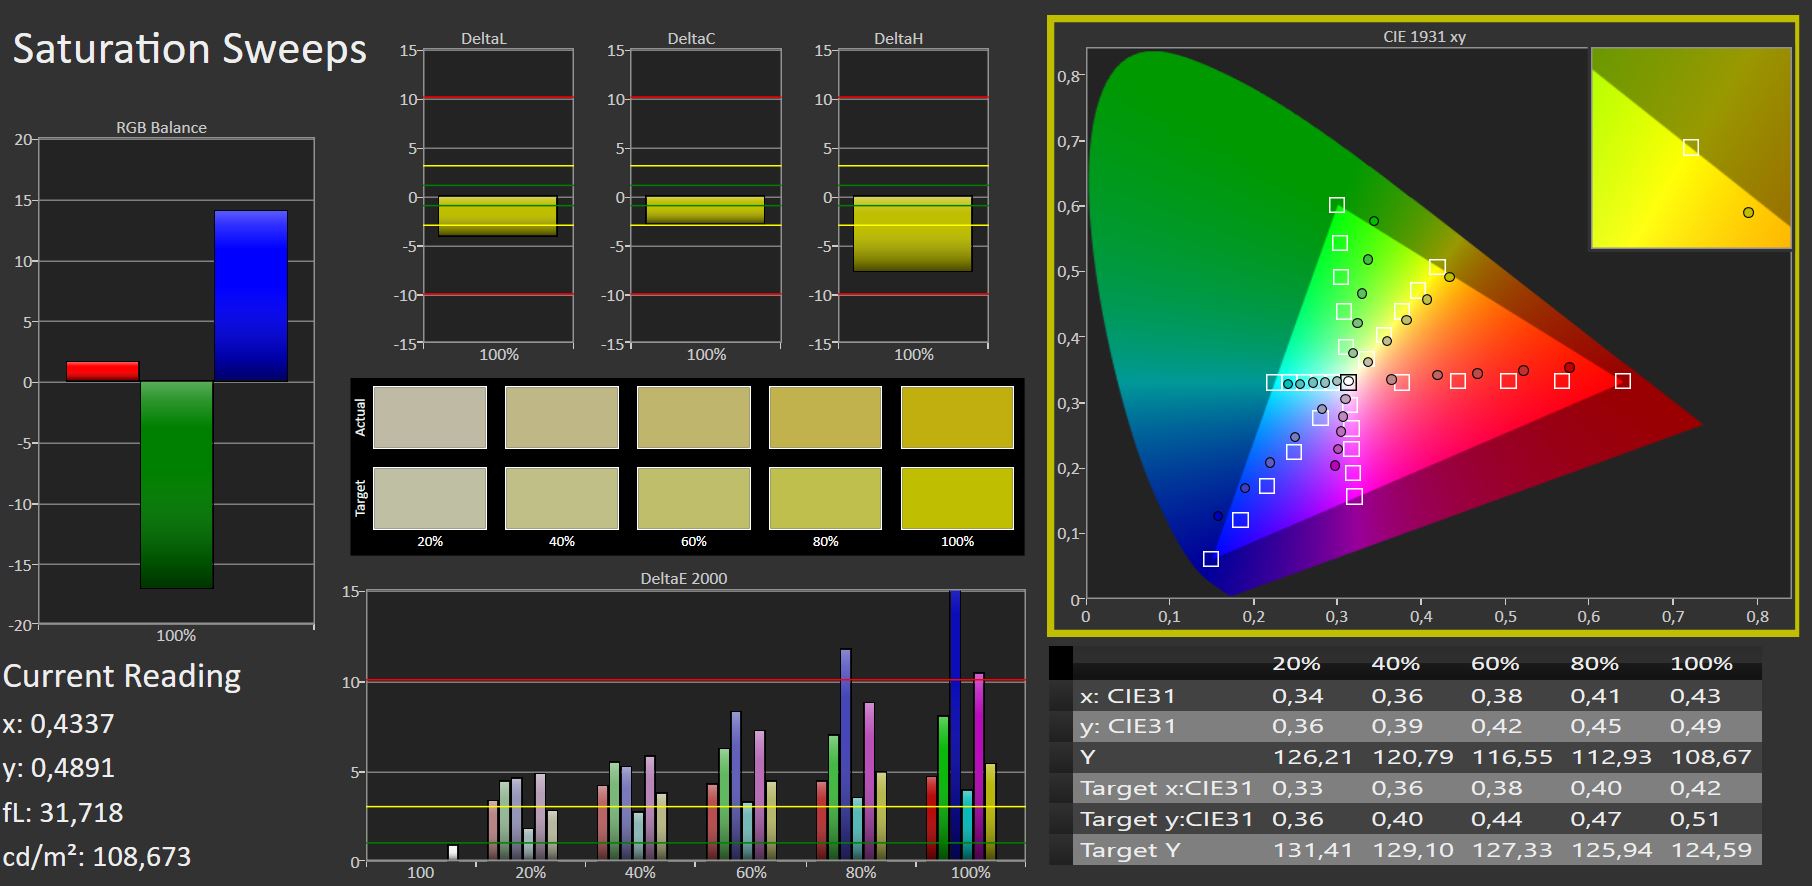
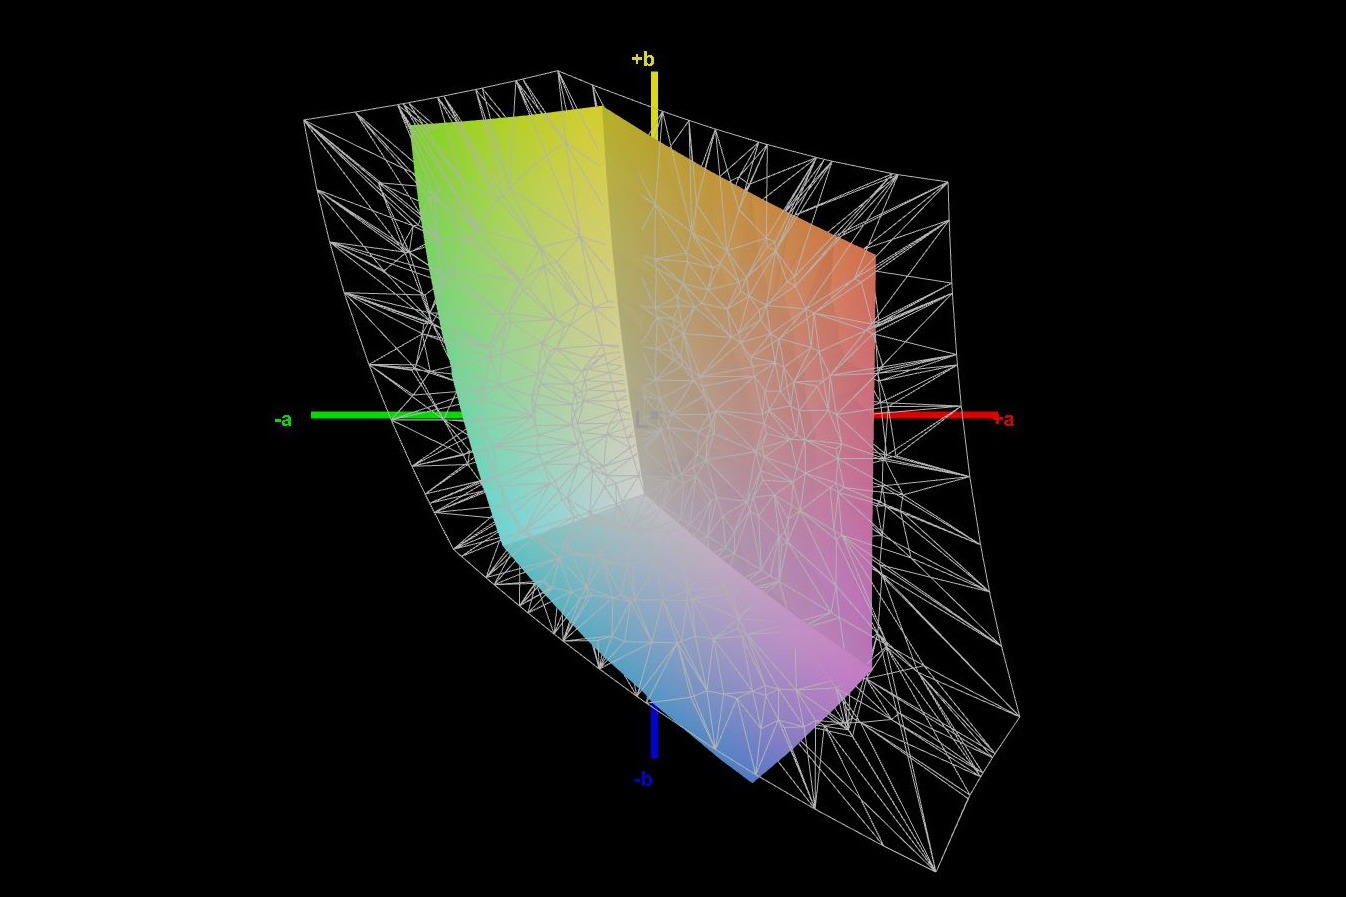
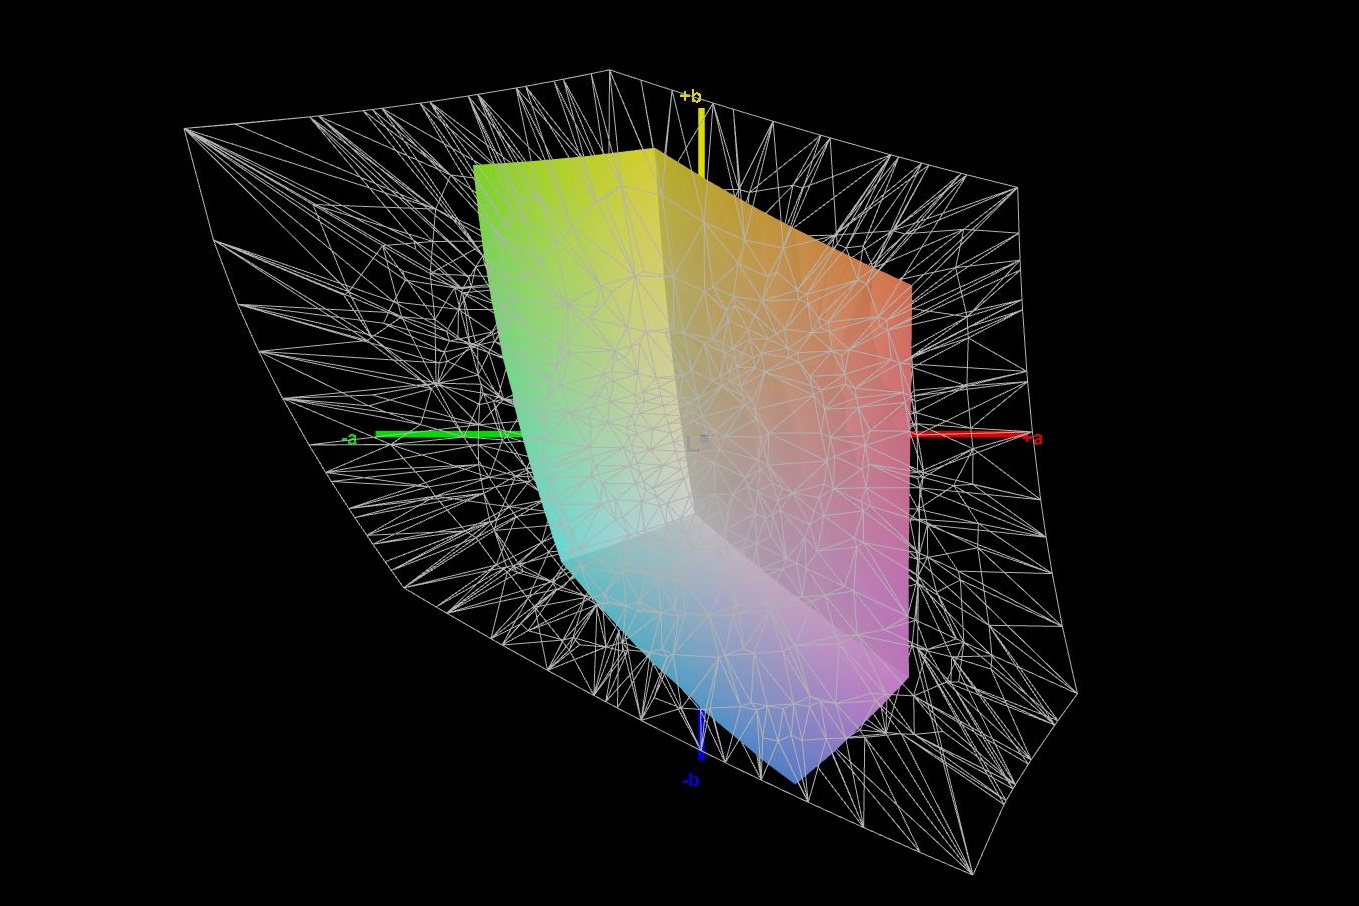
O espaço de cor disponível é bastante estreito; apenas 60% do sRGB e 41% do AdobeRGB não são taxas particularmente boas. No entanto, a concorrência tem uma pontuação semelhante aqui, e apenas o portátil Schenker ligeiramente mais caro pode fazer um trabalho melhor
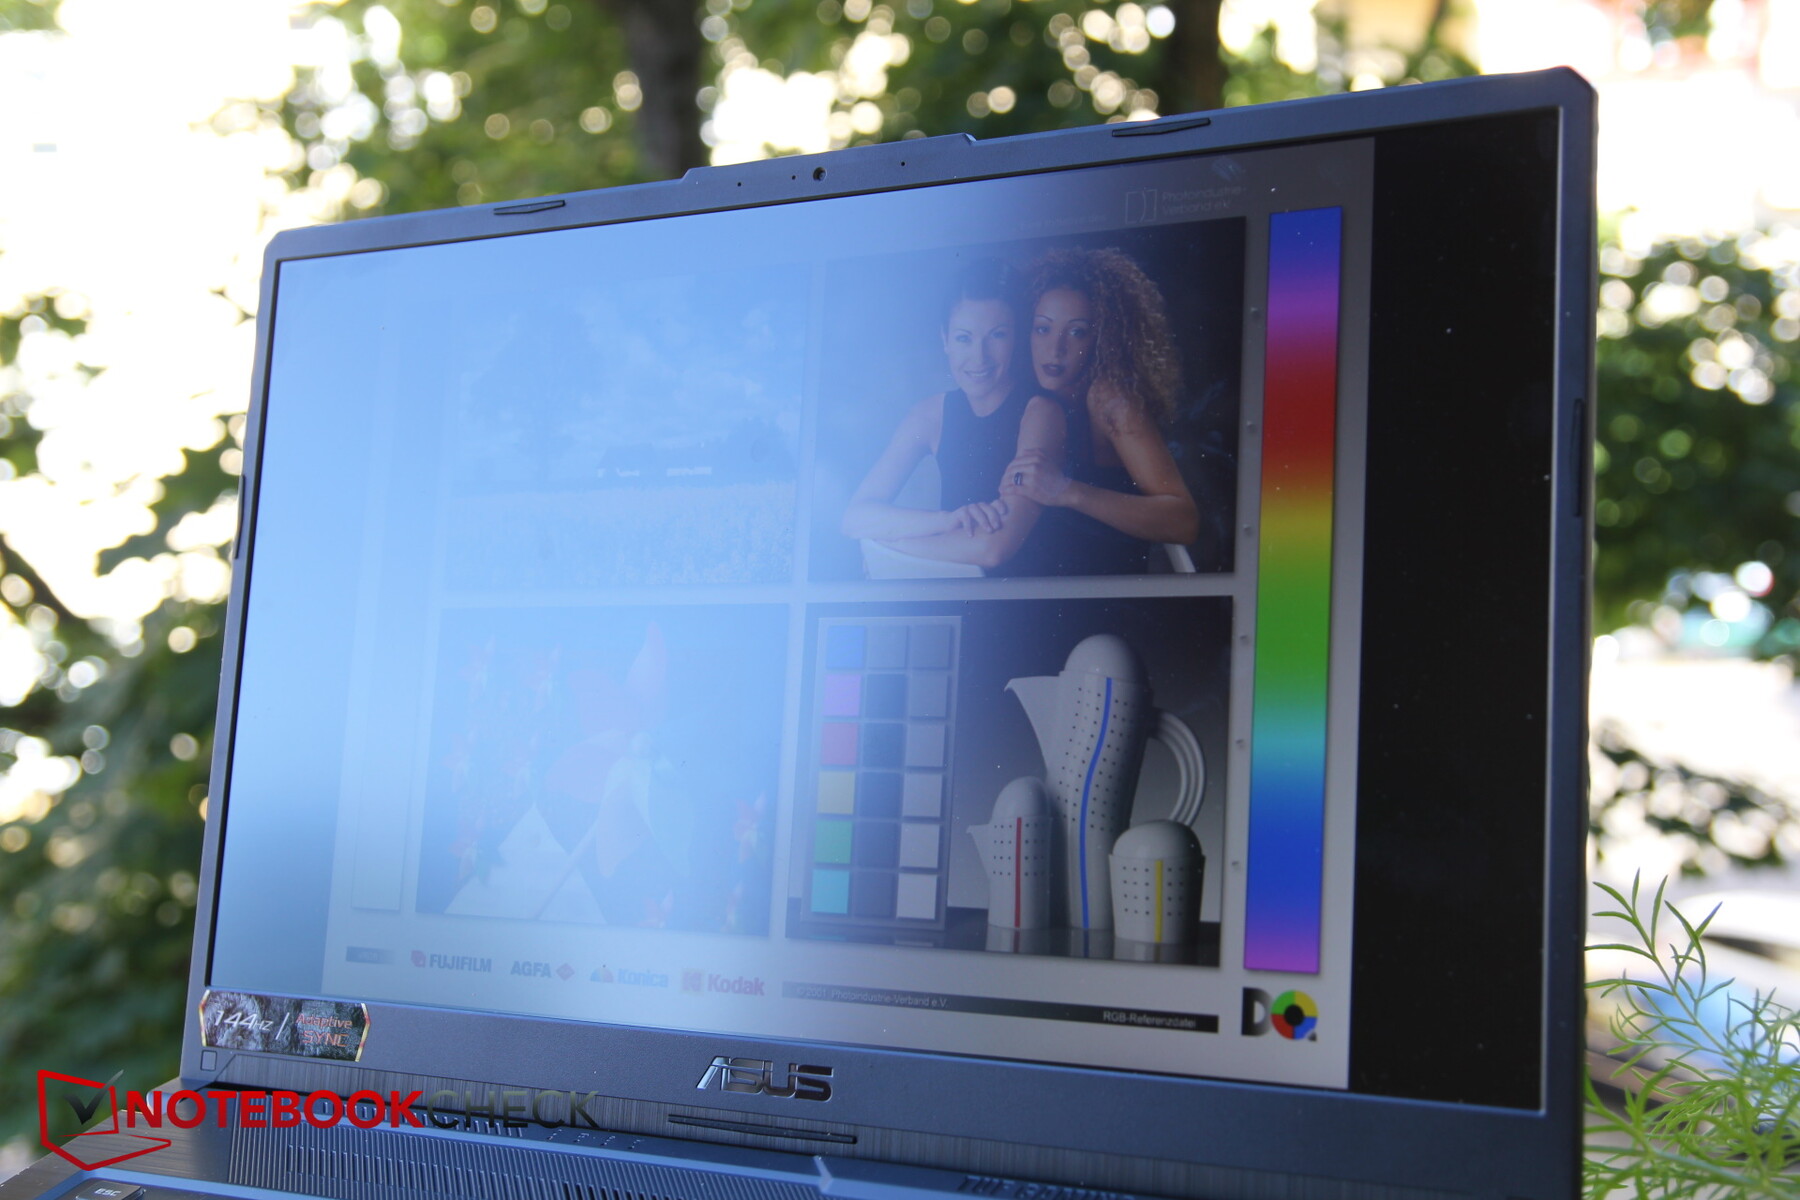
Embora a superfície fosca elimine a maioria dos reflexos, já que o brilho já moderado é reduzido adicionalmente de forma considerável na energia da bateria, a visibilidade externa não é ótima. Recomendamos procurar um local com muita sombra e visualizar a tela a partir de um ângulo direto
Exibir tempos de resposta
| ↔ Tempo de resposta preto para branco | ||
|---|---|---|
| 22.4 ms ... ascensão ↗ e queda ↘ combinadas | ↗ ms ascensão |  |
| ↘ ms queda | ||
| A tela mostra boas taxas de resposta em nossos testes, mas pode ser muito lenta para jogadores competitivos. Em comparação, todos os dispositivos testados variam de 0.1 (mínimo) a 240 (máximo) ms. » 51 % de todos os dispositivos são melhores. Isso significa que o tempo de resposta medido é pior que a média de todos os dispositivos testados (19.8 ms). | ||
| ↔ Tempo de resposta 50% cinza a 80% cinza | ||
| 32.4 ms ... ascensão ↗ e queda ↘ combinadas | ↗ ms ascensão |  |
| ↘ ms queda | ||
| A tela mostra taxas de resposta lentas em nossos testes e será insatisfatória para os jogadores. Em comparação, todos os dispositivos testados variam de 0.165 (mínimo) a 636 (máximo) ms. » 44 % de todos os dispositivos são melhores. Isso significa que o tempo de resposta medido é semelhante à média de todos os dispositivos testados (31 ms). | ||
Cintilação da tela / PWM (modulação por largura de pulso)
| Tela tremeluzindo / PWM não detectado |  | ||
[pwm_comparison] Em comparação: 52 % de todos os dispositivos testados não usam PWM para escurecer a tela. Se PWM foi detectado, uma média de 7754 (mínimo: 5 - máximo: 343500) Hz foi medida. | |||
Considerando que este é um painel IPS, a estabilidade do ângulo de visão poderia ser melhor. Quando se olha para a tela de ângulos oblíquos, as perdas de brilho podem definitivamente ser notadas muito rapidamente

Desempenho - Atende bem às expectativas
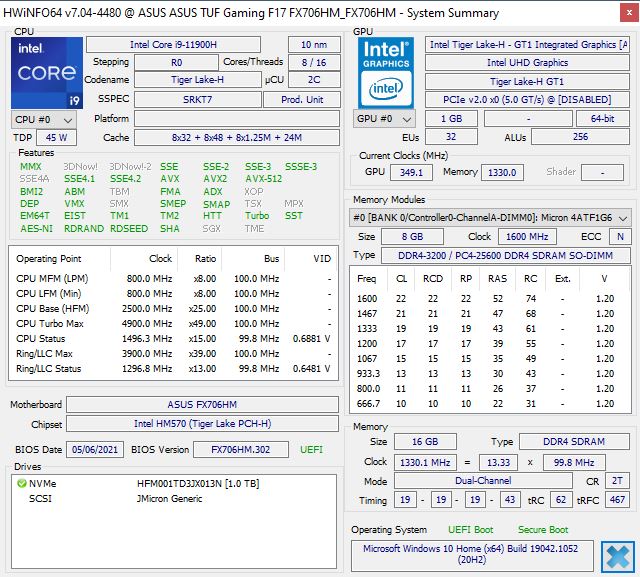
Como os jogos já estão incluídos no nome da F17, o laptop tem que provar a si mesmo precisamente neste campo. UmIntel Core i9-11900H junto com um Nvidia GeForce RTX 3060 GPU laptop, e 16 GB de RAM ilustram estas ambições, ainda que os laptops de 17 polegadas freqüentemente apresentem hardware de desempenho ainda maior. Mas o F17 é também um dispositivo de jogos para clientes conscientes dos preços, razão pela qual o TUF Gaming também estará disponível com umRTX 3050ou3050 Tiem um futuropróximo. Da mesma forma, esta CPU representa a configuração superior, com os modelos Core i7 e Core i5 também disponíveis como alternativas.
O software MyAsus trata teoricamente de todos os perfis de desempenho e ventiladores relevantes. Teoricamente, porque o Asus parece estar usando um novo software no momento, e somos apontados para o programa Asus Armoury Crate dentro do MyAsus. Todas as configurações relevantes podem realmente ser encontradas aqui, mas o software está bastante desorganizado. Definimos o perfil do ventilador como "Windows" para os benchmarks, o que, esperamos, significa que o Windows decide, resultando em que seus perfis de desempenho tenham prioridade. Definimos a barra deslizante do Windows como "Melhor Desempenho".
Processador
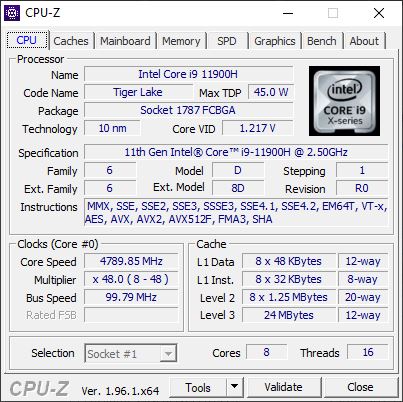
AIntel Core i9-11900Hé uma CPU octa-core com núcleos que funcionam a uma velocidade de relógio de base de 2,5 GHz. Todos os núcleos podem funcionar simultaneamente a 4,4 GHz no modo Turbo, e um só núcleo pode alcançar até 4,9 GHz. O TDP é teoricamente de 45 watts, mas pode ser configurado.
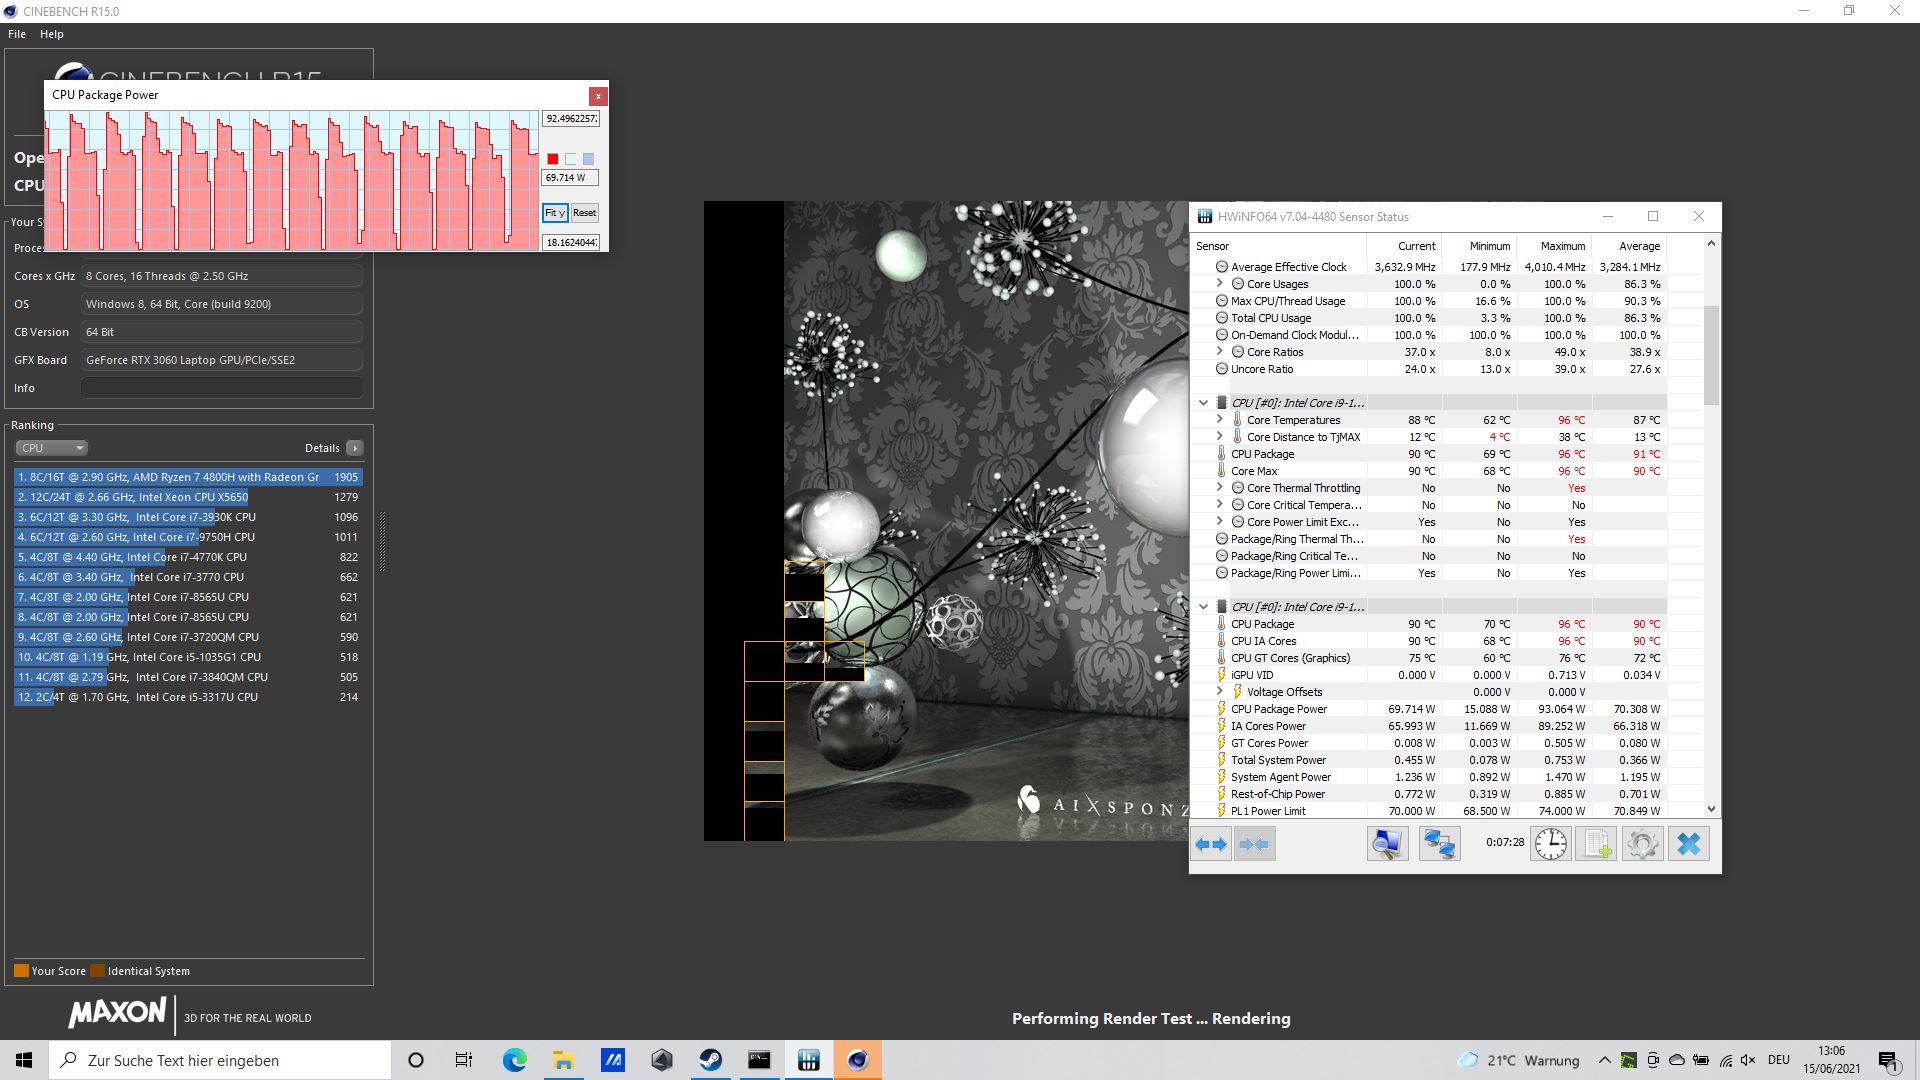
O desempenho é relativamente constante no loop multithread Cinebench. No início de uma corrida, o TDP sobe brevemente para 92 watts (mais tarde apenas 85 watts), e cai para cerca de 68 watts após metade de uma corrida. A CPU às vezes só administra de 80 a 85 watts no início de uma corrida subseqüente devido a uma alta temperatura central, e os 92 watts só se aplicam às primeiras corridas.
No geral, a i9-11900H está no mesmo nível da Ryzen 7 4800H do ano passado encontrada na Schenker XMG ou na TUF A17 quando se trata do teste multithread Cinebench. Entretanto, o desempenho parece cair um pouco mais com o tempo; é também um pouco mais errático e marginalmente menos constante.
Com a energia da bateria, o F17 só pontua 1.358 pontos em vez dos 1.700 a 2.000 pontos anteriores, o que significa que o desempenho de sua CPU é bastante estrangulado.
Cinebench R20: CPU (Single Core) | CPU (Multi Core)
Cinebench R15: CPU Single 64Bit | CPU Multi 64Bit
Blender: v2.79 BMW27 CPU
7-Zip 18.03: 7z b 4 -mmt1 | 7z b 4
Geekbench 5.5: Single-Core | Multi-Core
HWBOT x265 Benchmark v2.2: 4k Preset
LibreOffice : 20 Documents To PDF
R Benchmark 2.5: Overall mean
| Cinebench R23 / Single Core | |
| Média da turma Gaming (1166 - 2415, n=107, últimos 2 anos) | |
| Média Intel Core i9-11900H (1574 - 1605, n=4) | |
| Asus TUF Gaming F17 FX706HM | |
| MSI GF65 Thin 10UE | |
| Schenker XMG Core 17 (Early 2021) | |
| Acer Aspire Nitro 5 AN515-55-57GF | |
| Cinebench R23 / Multi Core | |
| Média da turma Gaming (10488 - 42661, n=107, últimos 2 anos) | |
| Média Intel Core i9-11900H (11135 - 13012, n=4) | |
| Asus TUF Gaming F17 FX706HM | |
| Schenker XMG Core 17 (Early 2021) | |
| MSI GF65 Thin 10UE | |
| Acer Aspire Nitro 5 AN515-55-57GF | |
| Cinebench R20 / CPU (Single Core) | |
| Média da turma Gaming (442 - 913, n=106, últimos 2 anos) | |
| Média Intel Core i9-11900H (600 - 615, n=5) | |
| Asus TUF Gaming F17 FX706HM | |
| MSI Alpha 17 A4DEK | |
| MSI GF65 Thin 10UE | |
| Asus TUF A17 FA706IU-AS76 | |
| Schenker XMG Core 17 (Early 2021) | |
| Acer Aspire Nitro 5 AN515-55-57GF | |
| Cinebench R20 / CPU (Multi Core) | |
| Média da turma Gaming (4029 - 16433, n=106, últimos 2 anos) | |
| Média Intel Core i9-11900H (4324 - 5160, n=5) | |
| MSI Alpha 17 A4DEK | |
| Asus TUF Gaming F17 FX706HM | |
| Asus TUF A17 FA706IU-AS76 | |
| Schenker XMG Core 17 (Early 2021) | |
| MSI GF65 Thin 10UE | |
| Acer Aspire Nitro 5 AN515-55-57GF | |
| Cinebench R15 / CPU Single 64Bit | |
| Média da turma Gaming (188.8 - 350, n=106, últimos 2 anos) | |
| Asus TUF Gaming F17 FX706HM | |
| Média Intel Core i9-11900H (236 - 243, n=5) | |
| MSI GF65 Thin 10UE | |
| Schenker XMG Core 17 (Early 2021) | |
| MSI Alpha 17 A4DEK | |
| Asus TUF A17 FA706IU-AS76 | |
| Acer Aspire Nitro 5 AN515-55-57GF | |
| Cinebench R15 / CPU Multi 64Bit | |
| Média da turma Gaming (1578 - 6330, n=105, últimos 2 anos) | |
| Média Intel Core i9-11900H (1770 - 2211, n=5) | |
| Asus TUF Gaming F17 FX706HM | |
| MSI Alpha 17 A4DEK | |
| Asus TUF A17 FA706IU-AS76 | |
| Schenker XMG Core 17 (Early 2021) | |
| MSI GF65 Thin 10UE | |
| Acer Aspire Nitro 5 AN515-55-57GF | |
| Blender / v2.79 BMW27 CPU | |
| Acer Aspire Nitro 5 AN515-55-57GF | |
| MSI GF65 Thin 10UE | |
| Schenker XMG Core 17 (Early 2021) | |
| Asus TUF A17 FA706IU-AS76 | |
| MSI Alpha 17 A4DEK | |
| Média Intel Core i9-11900H (231 - 270, n=5) | |
| Asus TUF Gaming F17 FX706HM | |
| Média da turma Gaming (79 - 330, n=104, últimos 2 anos) | |
| 7-Zip 18.03 / 7z b 4 -mmt1 | |
| Média da turma Gaming (4199 - 7436, n=105, últimos 2 anos) | |
| Asus TUF Gaming F17 FX706HM | |
| Média Intel Core i9-11900H (5582 - 6018, n=5) | |
| Schenker XMG Core 17 (Early 2021) | |
| MSI GF65 Thin 10UE | |
| Acer Aspire Nitro 5 AN515-55-57GF | |
| Asus TUF A17 FA706IU-AS76 | |
| MSI Alpha 17 A4DEK | |
| 7-Zip 18.03 / 7z b 4 | |
| Média da turma Gaming (33491 - 148086, n=105, últimos 2 anos) | |
| Média Intel Core i9-11900H (49486 - 57263, n=5) | |
| MSI Alpha 17 A4DEK | |
| Asus TUF Gaming F17 FX706HM | |
| Asus TUF A17 FA706IU-AS76 | |
| Schenker XMG Core 17 (Early 2021) | |
| MSI GF65 Thin 10UE | |
| Acer Aspire Nitro 5 AN515-55-57GF | |
| Geekbench 5.5 / Single-Core | |
| Média da turma Gaming (986 - 2474, n=105, últimos 2 anos) | |
| Média Intel Core i9-11900H (1576 - 1692, n=5) | |
| Asus TUF Gaming F17 FX706HM | |
| MSI GF65 Thin 10UE | |
| Schenker XMG Core 17 (Early 2021) | |
| MSI Alpha 17 A4DEK | |
| Acer Aspire Nitro 5 AN515-55-57GF | |
| Asus TUF A17 FA706IU-AS76 | |
| Geekbench 5.5 / Multi-Core | |
| Média da turma Gaming (6460 - 28263, n=105, últimos 2 anos) | |
| Média Intel Core i9-11900H (7725 - 9856, n=5) | |
| MSI Alpha 17 A4DEK | |
| Asus TUF A17 FA706IU-AS76 | |
| Asus TUF Gaming F17 FX706HM | |
| Schenker XMG Core 17 (Early 2021) | |
| MSI GF65 Thin 10UE | |
| Acer Aspire Nitro 5 AN515-55-57GF | |
| HWBOT x265 Benchmark v2.2 / 4k Preset | |
| Média da turma Gaming (11.5 - 44.4, n=105, últimos 2 anos) | |
| Média Intel Core i9-11900H (13.6 - 16.7, n=5) | |
| Asus TUF Gaming F17 FX706HM | |
| MSI Alpha 17 A4DEK | |
| Asus TUF A17 FA706IU-AS76 | |
| Schenker XMG Core 17 (Early 2021) | |
| MSI GF65 Thin 10UE | |
| Acer Aspire Nitro 5 AN515-55-57GF | |
| LibreOffice / 20 Documents To PDF | |
| Asus TUF A17 FA706IU-AS76 | |
| Acer Aspire Nitro 5 AN515-55-57GF | |
| MSI Alpha 17 A4DEK | |
| Schenker XMG Core 17 (Early 2021) | |
| Média da turma Gaming (33.2 - 88.8, n=105, últimos 2 anos) | |
| Asus TUF Gaming F17 FX706HM | |
| MSI GF65 Thin 10UE | |
| Média Intel Core i9-11900H (40.5 - 49.3, n=5) | |
| R Benchmark 2.5 / Overall mean | |
| Acer Aspire Nitro 5 AN515-55-57GF | |
| Asus TUF A17 FA706IU-AS76 | |
| MSI GF65 Thin 10UE | |
| Schenker XMG Core 17 (Early 2021) | |
| MSI Alpha 17 A4DEK | |
| Média Intel Core i9-11900H (0.52 - 0.544, n=5) | |
| Asus TUF Gaming F17 FX706HM | |
| Média da turma Gaming (0.3439 - 0.759, n=106, últimos 2 anos) | |
* ... menor é melhor
Desempenho do sistema
Nosso F17 ocupa facilmente o primeiro lugar no PCMark 10, enquanto o A17 e o XMG ficam 7% a 20% atrás, dependendo do teste
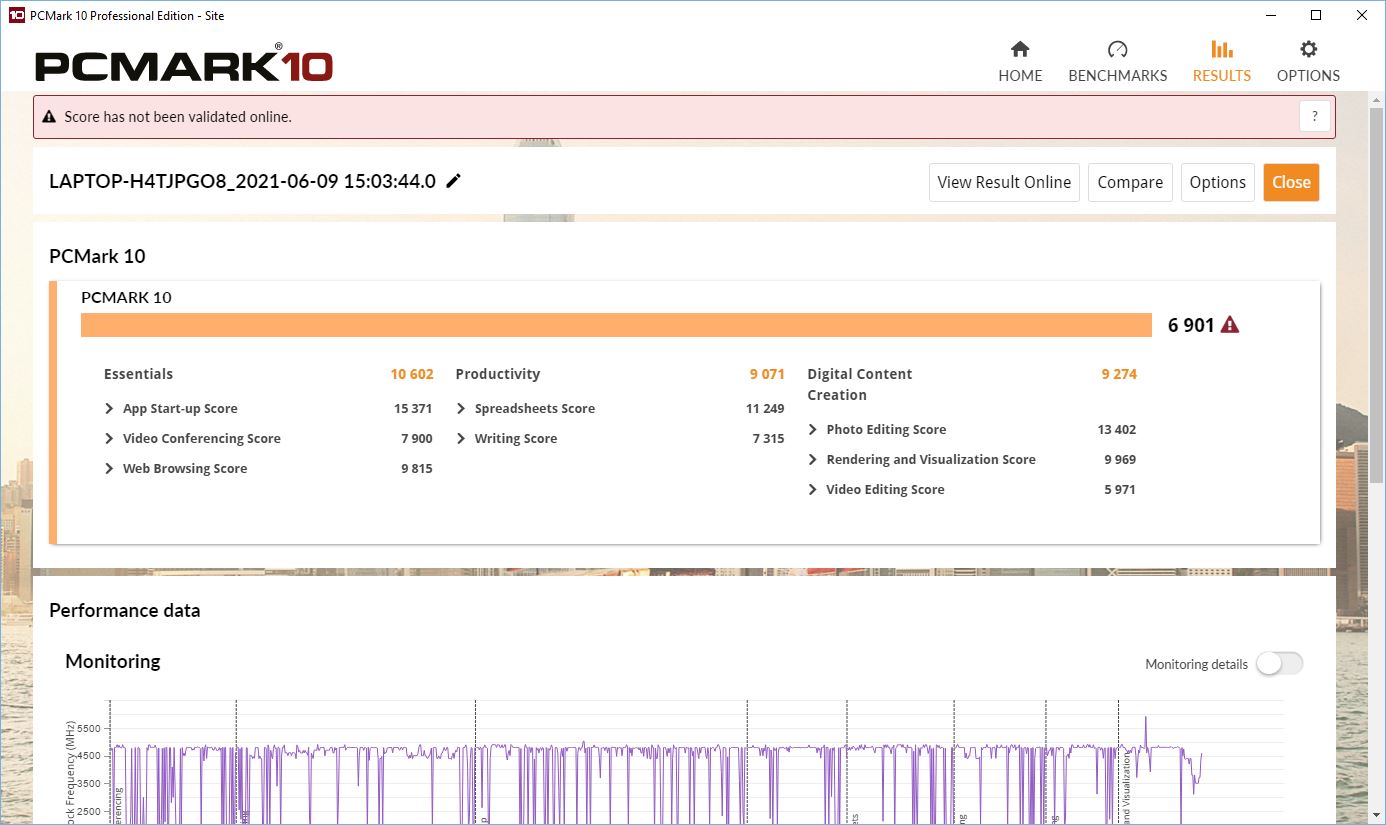
| PCMark 10 Score | 6901 pontos | |
Ajuda | ||
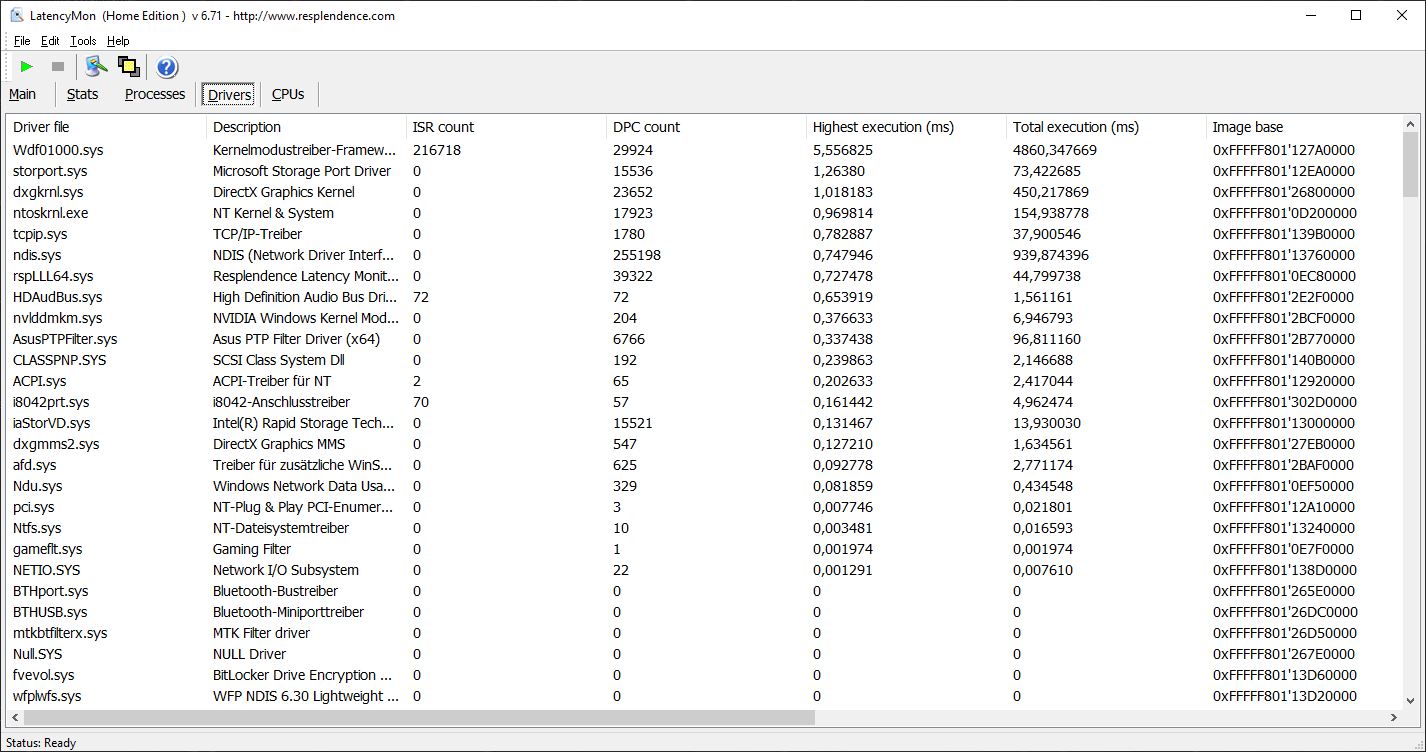
Latências DPC
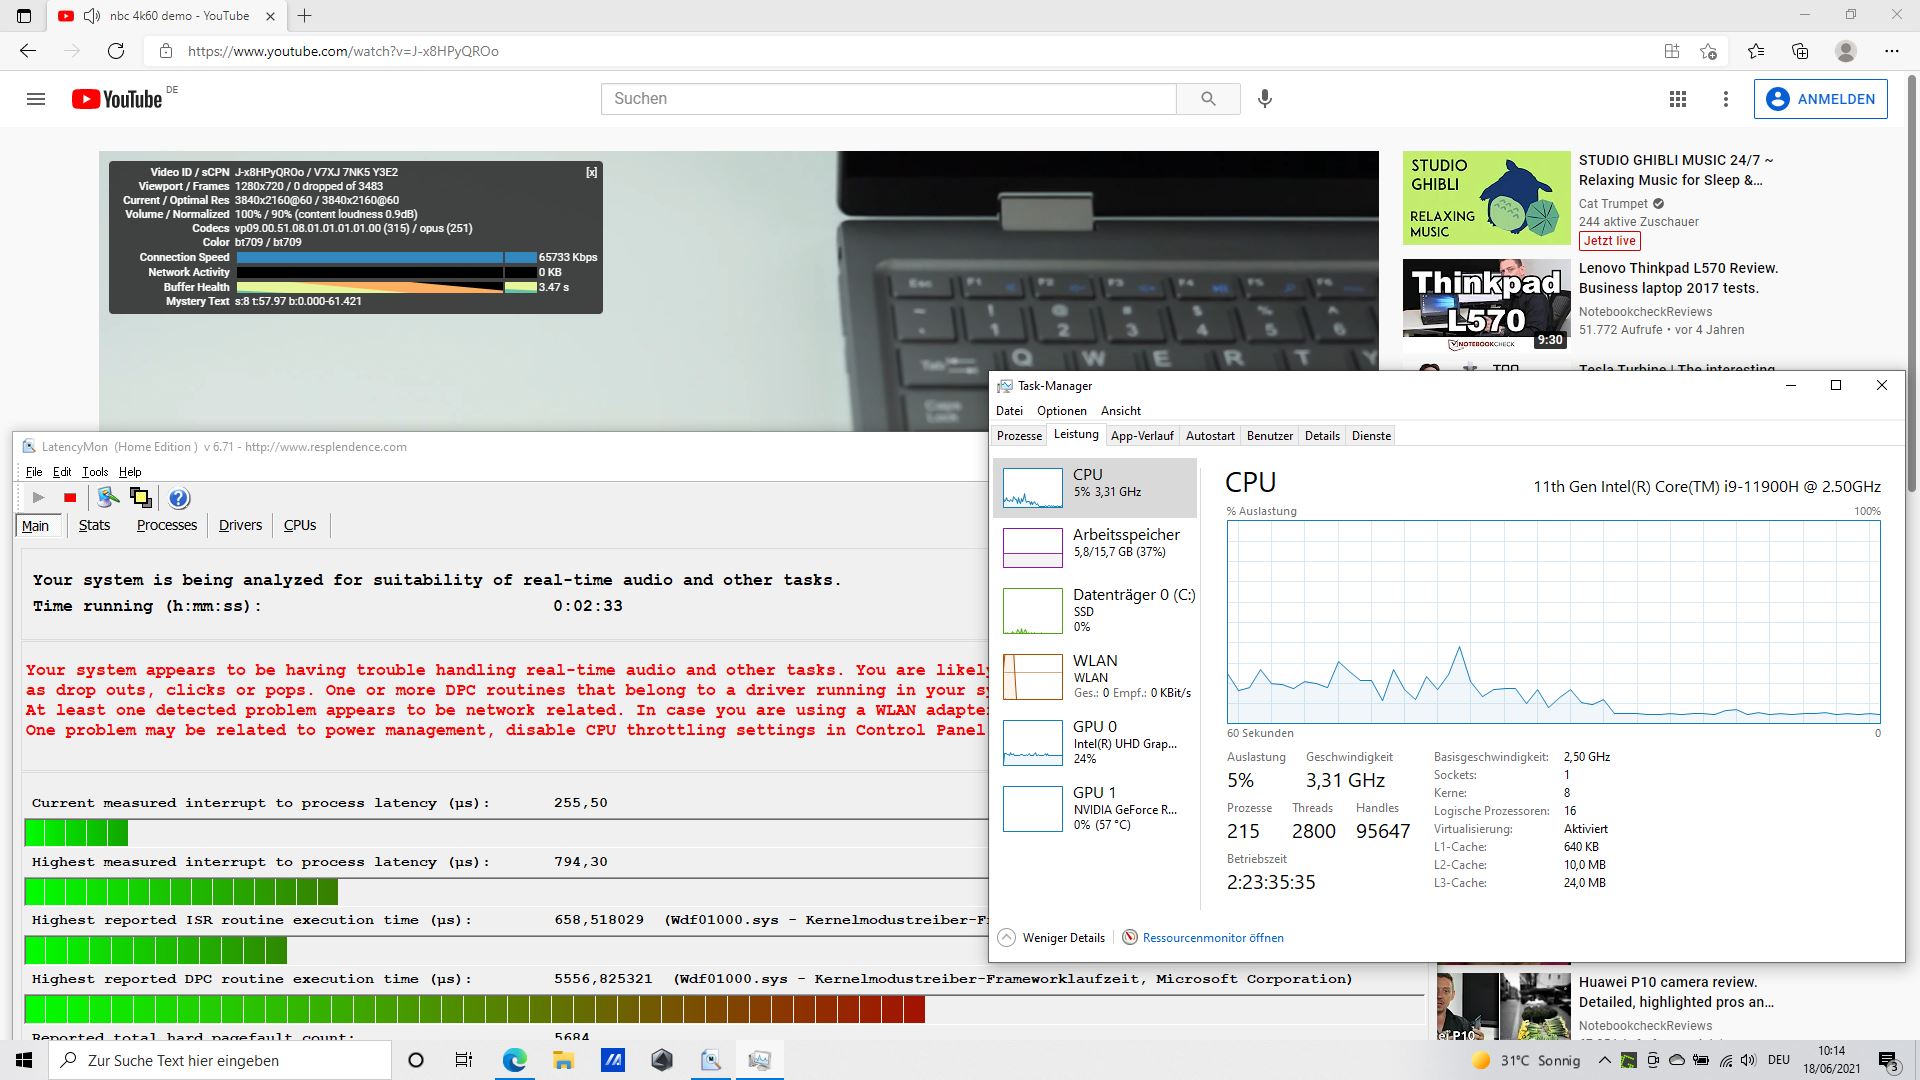
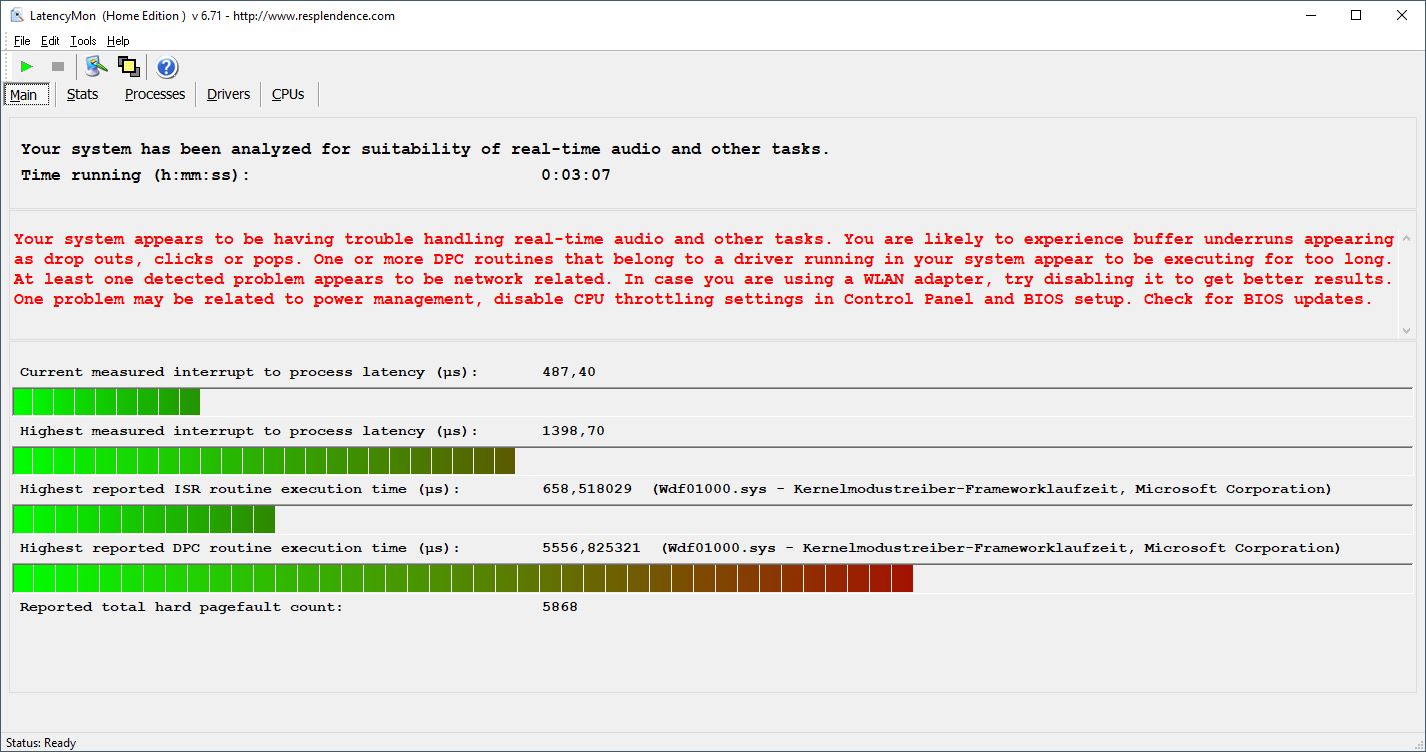
O F17 não fica atolado ao abrir várias abas do navegador, mas fica ao reproduzir nosso vídeo de 4K/60 fps no YouTube. Não houve queda de quadros para reclamar pelo menos, mas LatencyMon ainda detectou latências, o que significa que pode haver problemas ao reproduzir áudio em tempo real. O Kernel Mode Driver Framework Runtime é particularmente problemático
| DPC Latencies / LatencyMon - interrupt to process latency (max), Web, Youtube, Prime95 | |
| Asus TUF A17 FA706IU-AS76 | |
| MSI Alpha 17 A4DEK | |
| Asus TUF Gaming F17 FX706HM | |
| Schenker XMG Core 17 (Early 2021) | |
* ... menor é melhor
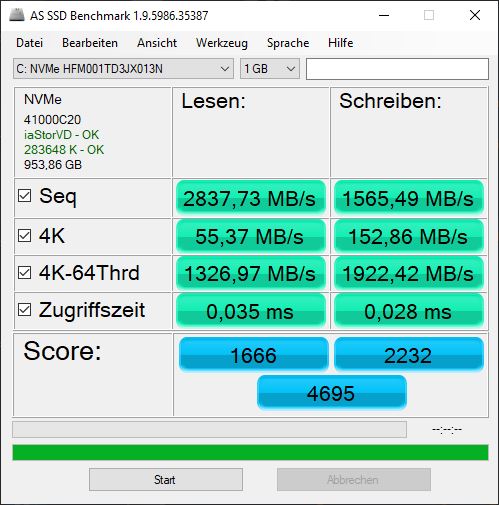
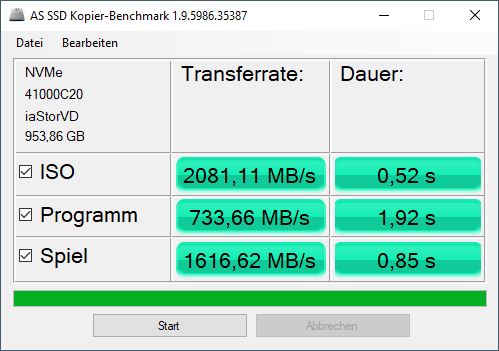
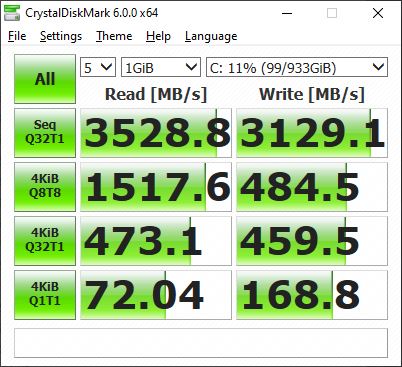
Armazenamento
O armazenamento em massa consiste de um SSD NVMe de 1 TB, mas o F17 também está disponível com um SSD menor de 512 GB. Esta unidade de armazenamento está classificada em 28º lugar em nosso artigoHDD/SSD Benchmarks. Ele atinge bons índices em comparação e consegue deixar para trás a competição montada (orçamento), o que certamente é uma razão para o desempenho comparativamente bom do sistema
| Asus TUF Gaming F17 FX706HM SK Hynix HFM001TD3JX013N | Asus TUF A17 FA706IU-AS76 Intel SSD 660p 1TB SSDPEKNW010T8 | Schenker XMG Core 17 (Early 2021) Samsung SSD 970 EVO Plus 1TB | MSI Alpha 17 A4DEK Kingston OM8PCP3512F-AB | MSI GF65 Thin 10UE Samsung SSD PM981 MZVLB1T0HALR | Acer Aspire Nitro 5 AN515-55-57GF WDC PC SN530 SDBPNPZ-512G | Apple MacBook 12 (Early 2016) 1.1 GHz Apple SSD AP0256 | Acer Predator Helios 300 PH315-53-77N5 WDC PC SN730 SDBQNTY-512GB | Média SK Hynix HFM001TD3JX013N | |
|---|---|---|---|---|---|---|---|---|---|
| CrystalDiskMark 5.2 / 6 | -12% | -1% | -24% | -12% | -26% | -12% | 3% | ||
| Write 4K (MB/s) | 168.8 | 189.7 12% | 145.7 -14% | 204.7 21% | 157.3 -7% | 118 -30% | 137.5 -19% | 155.8 ? -8% | |
| Read 4K (MB/s) | 72 | 62.3 -13% | 51.3 -29% | 50.4 -30% | 46.69 -35% | 48.5 -33% | 48.24 -33% | 57 ? -21% | |
| Write Seq (MB/s) | 1681 | 3036 | 985 | 2389 | 1828 | 2644 | 3943 ? | ||
| Read Seq (MB/s) | 1608 | 2837 | 1193 | 2196 | 1530 | 1718 | 2180 ? | ||
| Write 4K Q32T1 (MB/s) | 459.5 | 468.6 2% | 511 11% | 537 17% | 407.6 -11% | 400 -13% | 416.6 -9% | 452 ? -2% | |
| Read 4K Q32T1 (MB/s) | 473.1 | 541 14% | 582 23% | 300 -37% | 519 10% | 493 4% | 525 11% | 447 ? -6% | |
| Write Seq Q32T1 (MB/s) | 3129 | 1770 -43% | 3294 5% | 982 -69% | 2401 -23% | 1828 -42% | 2705 -14% | 2859 ? -9% | |
| Read Seq Q32T1 (MB/s) | 3529 | 1898 -46% | 3522 0% | 1985 -44% | 3344 -5% | 2128 -40% | 3213 -9% | 3515 ? 0% | |
| Write 4K Q8T8 (MB/s) | 484.5 | 791 ? 63% | |||||||
| Read 4K Q8T8 (MB/s) | 1518 | 1649 ? 9% | |||||||
| AS SSD | -50% | -0% | -54% | -12% | -49% | -116% | -19% | -11% | |
| Seq Read (MB/s) | 2837 | 1320 -53% | 2876 1% | 251.9 -91% | 3002 6% | 1479 -48% | 1056 -63% | 2753 -3% | 2839 ? 0% |
| Seq Write (MB/s) | 1565 | 1539 -2% | 2803 79% | 925 -41% | 2420 55% | 1715 10% | 651 -58% | 2495 59% | 1917 ? 22% |
| 4K Read (MB/s) | 55.4 | 56.3 2% | 55.3 0% | 58.2 5% | 48.46 -13% | 27.8 -50% | 16.4 -70% | 38.64 -30% | 53 ? -4% |
| 4K Write (MB/s) | 152.9 | 158.5 4% | 106.9 -30% | 98 -36% | 114.3 -25% | 106 -31% | 22.1 -86% | 88.8 -42% | 127.3 ? -17% |
| 4K-64 Read (MB/s) | 1327 | 586 -56% | 1662 25% | 461.4 -65% | 1873 41% | 406 -69% | 509 -62% | 952 -28% | 1369 ? 3% |
| 4K-64 Write (MB/s) | 1922 | 820 -57% | 2101 9% | 924 -52% | 1882 -2% | 1119 -42% | 283 -85% | 1568 -18% | 1939 ? 1% |
| Access Time Read * (ms) | 0.035 | 0.043 -23% | 0.067 -91% | 0.09 -157% | 0.045 -29% | 0.128 -266% | 0.186 -431% | 0.0468 ? -34% | |
| Access Time Write * (ms) | 0.028 | 0.113 -304% | 0.037 -32% | 0.022 21% | 0.101 -261% | 0.04 -43% | 0.044 -57% | 0.0532 ? -90% | |
| Score Read (Points) | 1666 | 775 -53% | 2005 20% | 545 -67% | 2221 33% | 581 -65% | 1266 -24% | 1706 ? 2% | |
| Score Write (Points) | 2232 | 1132 -49% | 2488 11% | 1114 -50% | 2238 0% | 1396 -37% | 1906 -15% | 2258 ? 1% | |
| Score Total (Points) | 4695 | 2333 -50% | 5520 18% | 1994 -58% | 5565 19% | 2294 -51% | 3811 -19% | 4797 ? 2% | |
| Copy ISO MB/s (MB/s) | 2081 | 1736 -17% | 2029 -2% | 2421 16% | 1747 -16% | 545 -74% | 2037 -2% | 1908 ? -8% | |
| Copy Program MB/s (MB/s) | 734 | 553 -25% | 691 -6% | 705 -4% | 975 33% | 475.6 -35% | 665 ? -9% | ||
| Copy Game MB/s (MB/s) | 1617 | 1264 -22% | 1513 -6% | 1490 -8% | 1453 -10% | 1018 -37% | 1349 ? -17% | ||
| Média Total (Programa/Configurações) | -31% /
-39% | -1% /
-0% | -39% /
-43% | -12% /
-12% | -38% /
-42% | -116% /
-116% | -16% /
-17% | -4% /
-6% |
* ... menor é melhor

Continuous load read: DiskSpd Read Loop, Queue Depth 8
Placa gráfica
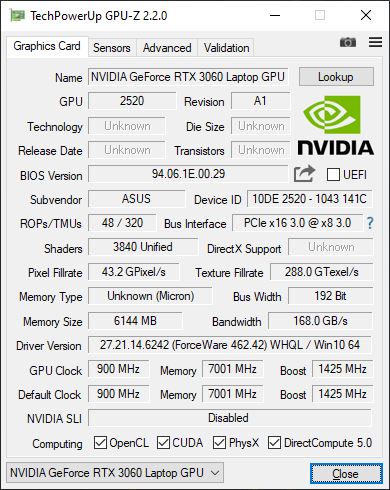
A Asus utilizou um RTX 3060
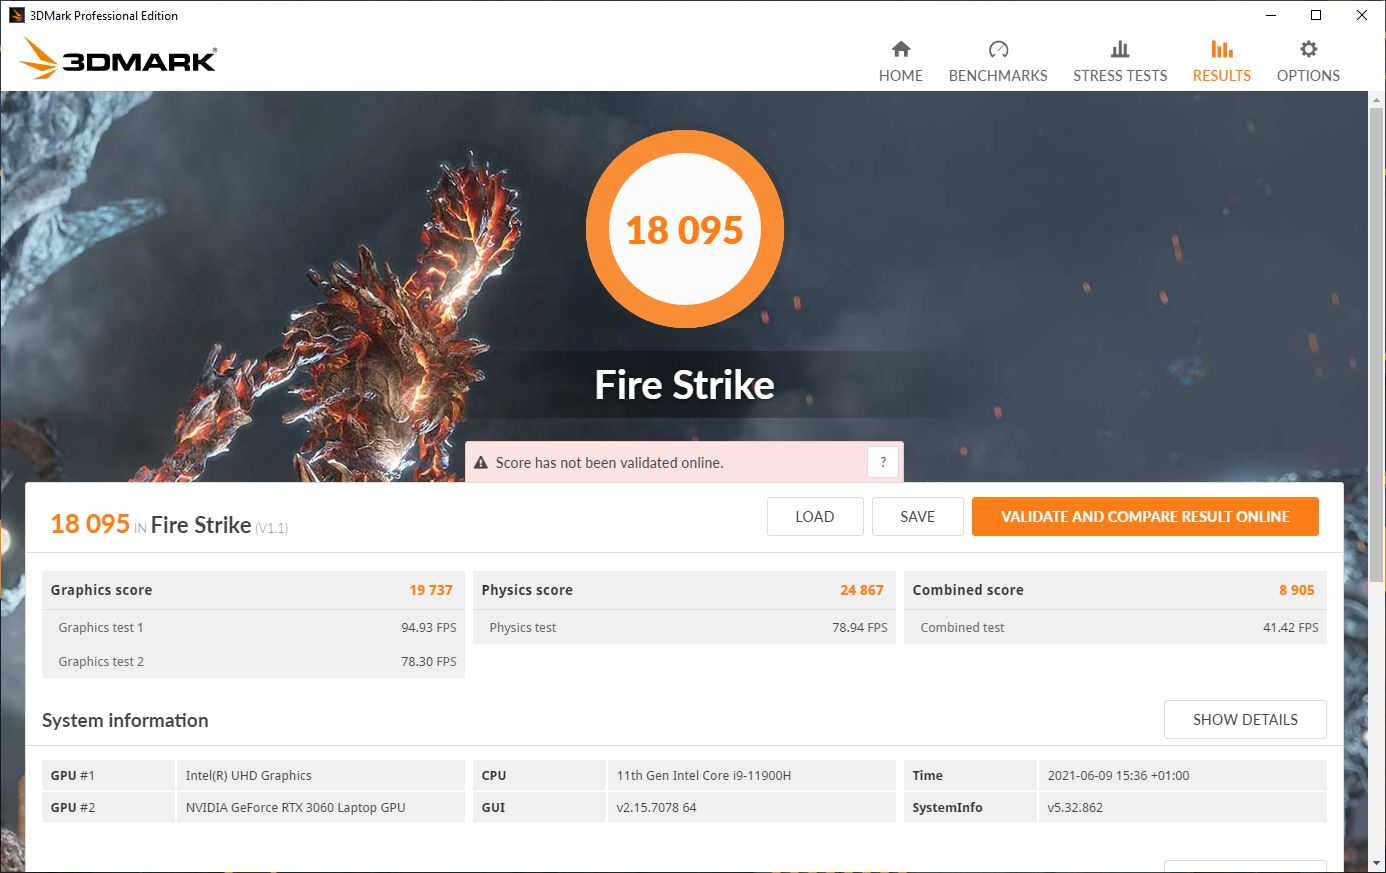
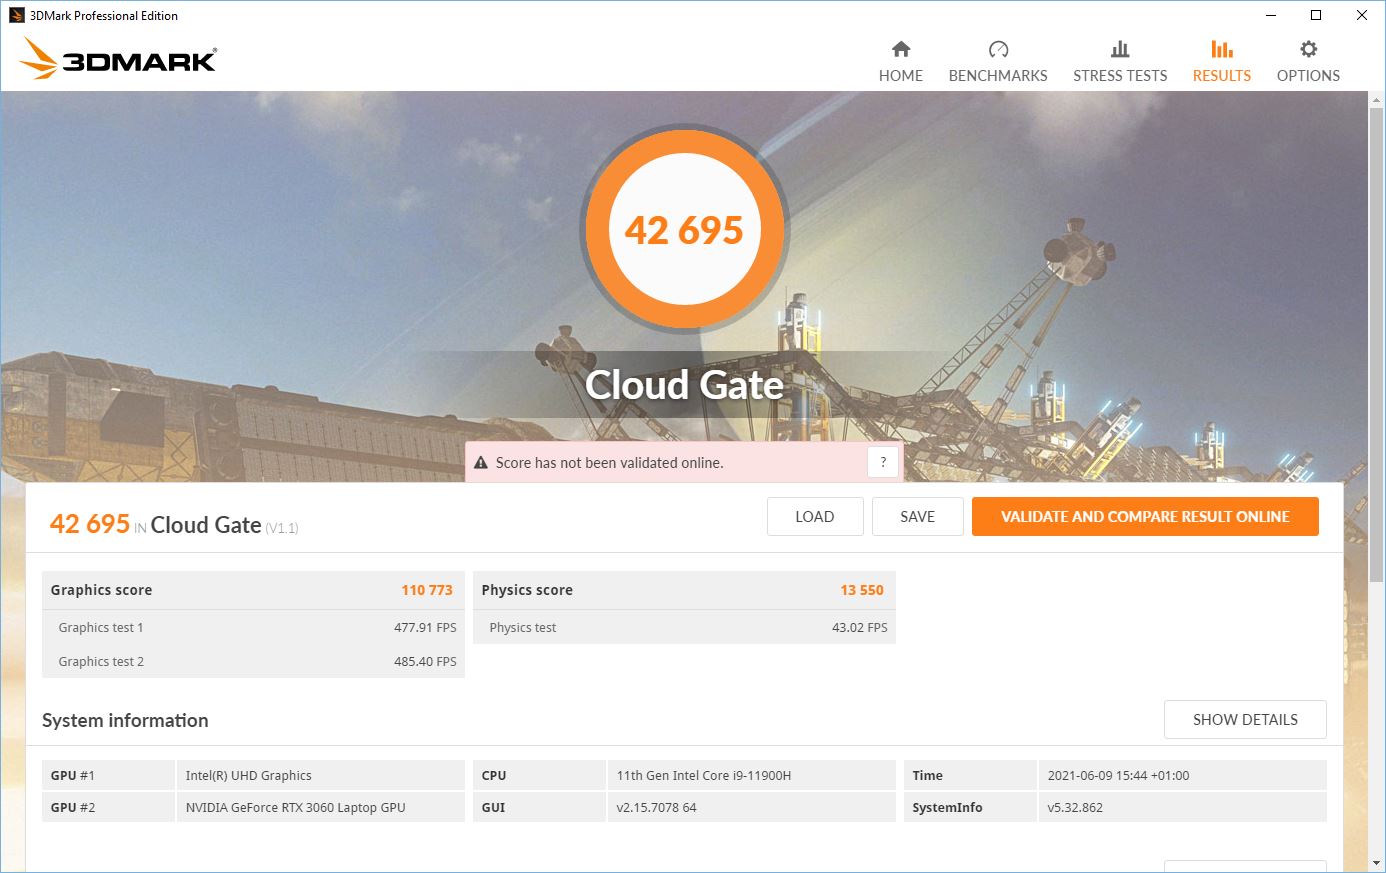
Nvidia GeForce </span>, mas o F17 em breve estará disponível com um RTX 3050 e sua variante Ti também. O TGP de um RTX 3060 varia de cerca de 60 a 130 watts, o que significa que seu desempenho é muito variável, dependendo do modelo. No TUF Gaming F17, o TGP incluindo o Dynamic Boost é de 95 watts; portanto, ele está posicionado aproximadamente no meio da faixa de desempenho.</p> <p style>Conseqüentemente, a carta tem um desempenho em torno do nível médio esperado. Na maioria dos casos, o XMG Pro está 3% à frente do nosso F17, apesar de seu TGP mais alto de 130 watts. O A17 com seu 1660 Ti é batido em cerca de 25% a 80%.</p> <p style>O funcionamento do 3DMark 11 novamente com a energia da bateria só rende 19.609 pontos gráficos em vez dos 25.793 pontos anteriores quando ligado à tomada. Em outras palavras, o desempenho gráfico é reduzido em cerca de 24% quando o laptop está em movimento.</p>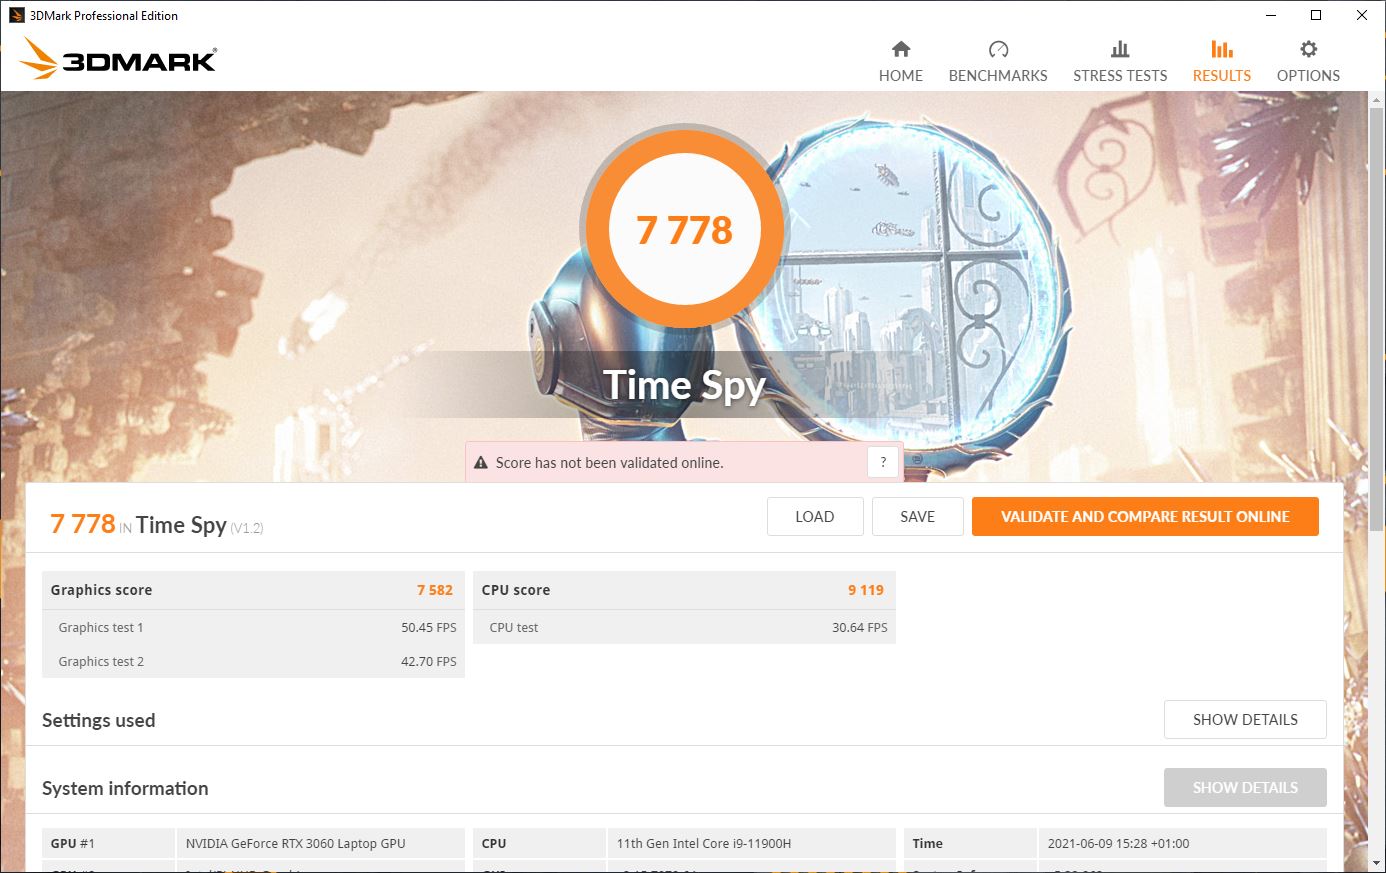
| 3DMark 11 Performance | 22367 pontos | |
| 3DMark Cloud Gate Standard Score | 42695 pontos | |
| 3DMark Fire Strike Score | 18095 pontos | |
| 3DMark Time Spy Score | 7778 pontos | |
Ajuda | ||
Desempenho do jogo
A placa gráfica deve ser capaz de executar todos os jogos mais recentes sem problemas com resolução Full HD e o máximo de detalhes. No The Witcher 3, o dispositivo Schenker tem apenas uma vantagem de cerca de 5% com seu TGP superior. O jogo também funciona suavemente em configurações Ultra com resolução Full HD e 74 fps. Em todos os jogos que testamos, o RTX 3060 na F17 executa cerca de 3% a 5% abaixo de uma média RTX 3060. Enquanto o Schenker é cerca de 7% mais rápido, ele também tem um TGP muito mais alto
As taxas de quadros Witcher 3permanecem bastante constantes ao longo do tempo; elas só parecem flutuar mais fortemente no final do período de teste de uma hora
| baixo | média | alto | ultra | |
|---|---|---|---|---|
| GTA V (2015) | 181 | 173 | 141 | 80.4 |
| The Witcher 3 (2015) | 328.6 | 218.6 | 140.7 | 74 |
| Dota 2 Reborn (2015) | 165 | 147 | 135 | 121 |
| Final Fantasy XV Benchmark (2018) | 140 | 95.1 | 72.3 | |
| X-Plane 11.11 (2018) | 118 | 97.1 | 80.1 | |
| Far Cry 5 (2018) | 146 | 107 | 100 | 93 |
| Strange Brigade (2018) | 367 | 187 | 149 | 130 |
Emissões - Relativamente silenciosas e equilibradas
Emissões sonoras
Utilizando pelo menos o perfil do ventilador "Windows" (e a configuração "Best Performance" no Windows), o F17 opera de forma bastante silenciosa, adaptando-se dinamicamente às suas necessidades de resfriamento sem nunca se tornar irritantemente alto. No entanto, um modo de desempenho "Turbo" também pode ser selecionado no software Armoury Crate; ele permite o eGPU independentemente do nível de carga, tornando os ventiladores um pouco mais altos no processo. No entanto, eles não funcionam em velocidade máxima sem considerar pelo menos a carga, mas, em vez disso, adaptam-se dinamicamente a ele também neste modo
Barulho
| Ocioso |
| 26 / 31 / 33 dB |
| Carga |
| 48 / 49 dB |
 | ||
30 dB silencioso 40 dB(A) audível 50 dB(A) ruidosamente alto |
||
min: | ||
| Asus TUF Gaming F17 FX706HM GeForce RTX 3060 Laptop GPU, i9-11900H, SK Hynix HFM001TD3JX013N | Asus TUF A17 FA706IU-AS76 GeForce GTX 1660 Ti Mobile, R7 4800H, Intel SSD 660p 1TB SSDPEKNW010T8 | Schenker XMG Core 17 (Early 2021) GeForce RTX 3060 Laptop GPU, i7-10870H, Samsung SSD 970 EVO Plus 1TB | MSI Alpha 17 A4DEK Radeon RX 5600M, R7 4800H, Kingston OM8PCP3512F-AB | MSI GF65 Thin 10UE GeForce RTX 3060 Laptop GPU, i7-10750H, Samsung SSD PM981 MZVLB1T0HALR | Acer Aspire Nitro 5 AN515-55-57GF GeForce RTX 3060 Laptop GPU, i5-10300H, WDC PC SN530 SDBPNPZ-512G | |
|---|---|---|---|---|---|---|
| Noise | -4% | -8% | -1% | -4% | 1% | |
| desligado / ambiente * (dB) | 25 | 28.7 -15% | 25 -0% | 25 -0% | 24.7 1% | 25 -0% |
| Idle Minimum * (dB) | 26 | 28.7 -10% | 30 -15% | 31 -19% | 33.1 -27% | 25 4% |
| Idle Average * (dB) | 31 | 30.5 2% | 32 -3% | 32 -3% | 33.1 -7% | 30 3% |
| Idle Maximum * (dB) | 33 | 32.5 2% | 36 -9% | 33 -0% | 33.1 -0% | 33 -0% |
| Load Average * (dB) | 48 | 42.5 11% | 53 -10% | 38 21% | 42.7 11% | 46 4% |
| Witcher 3 ultra * (dB) | 47 | 50.1 -7% | 51 -9% | 46 2% | 40.6 14% | 47 -0% |
| Load Maximum * (dB) | 49 | 53.4 -9% | 54 -10% | 54 -10% | 59.4 -21% | 50 -2% |
* ... menor é melhor
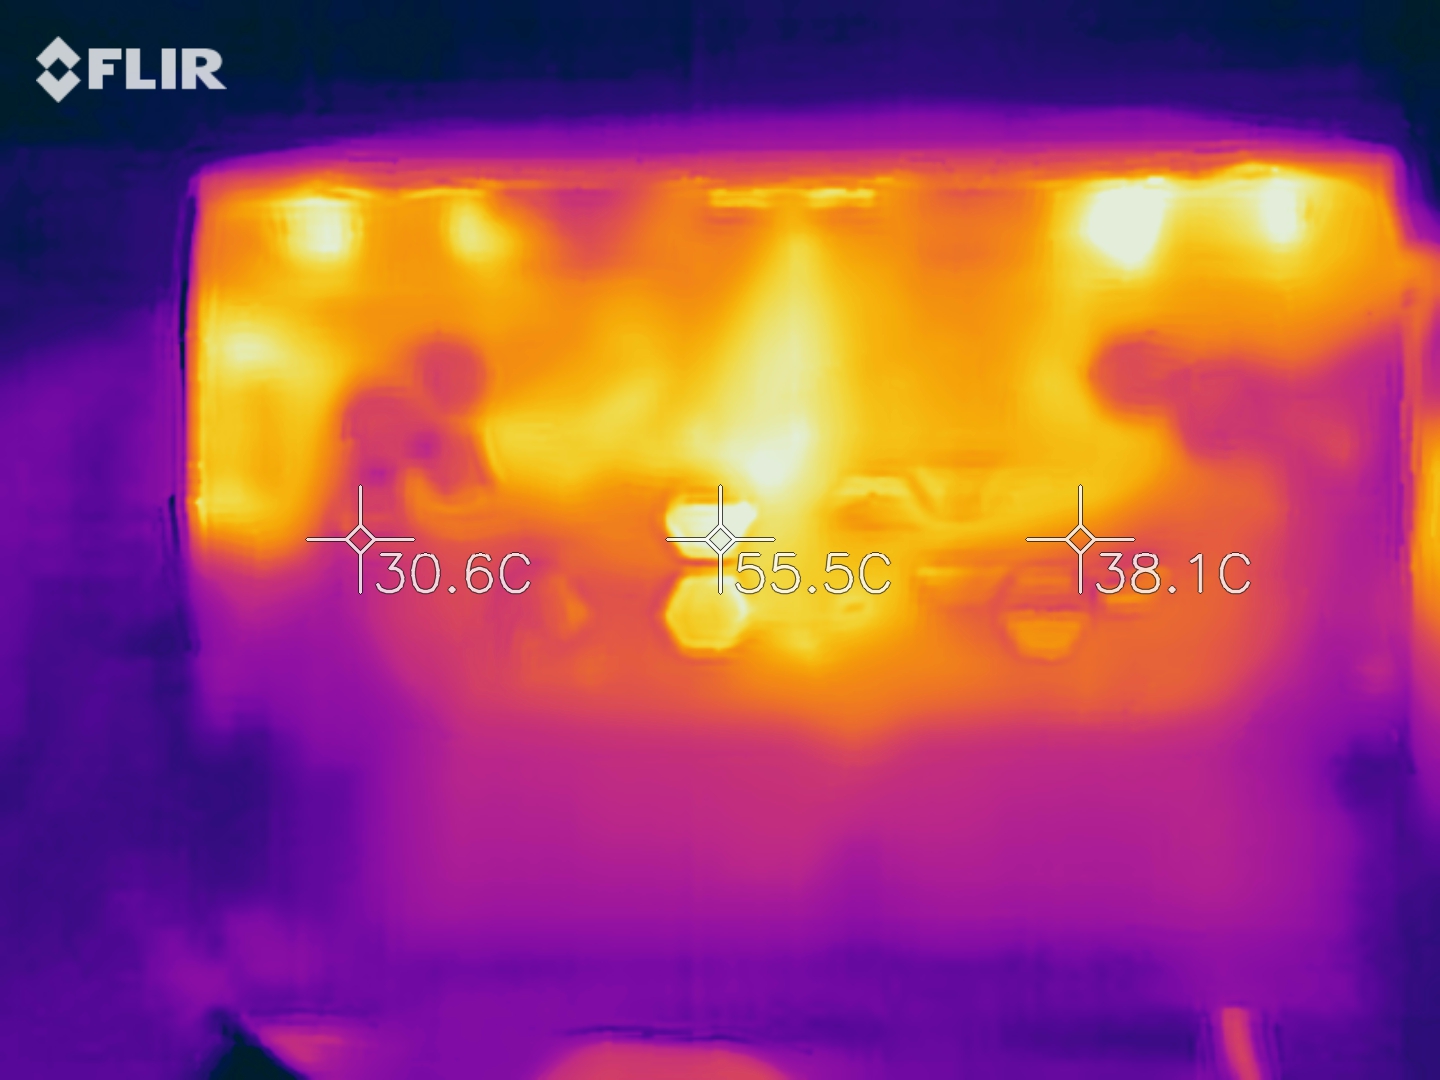
Temperatura
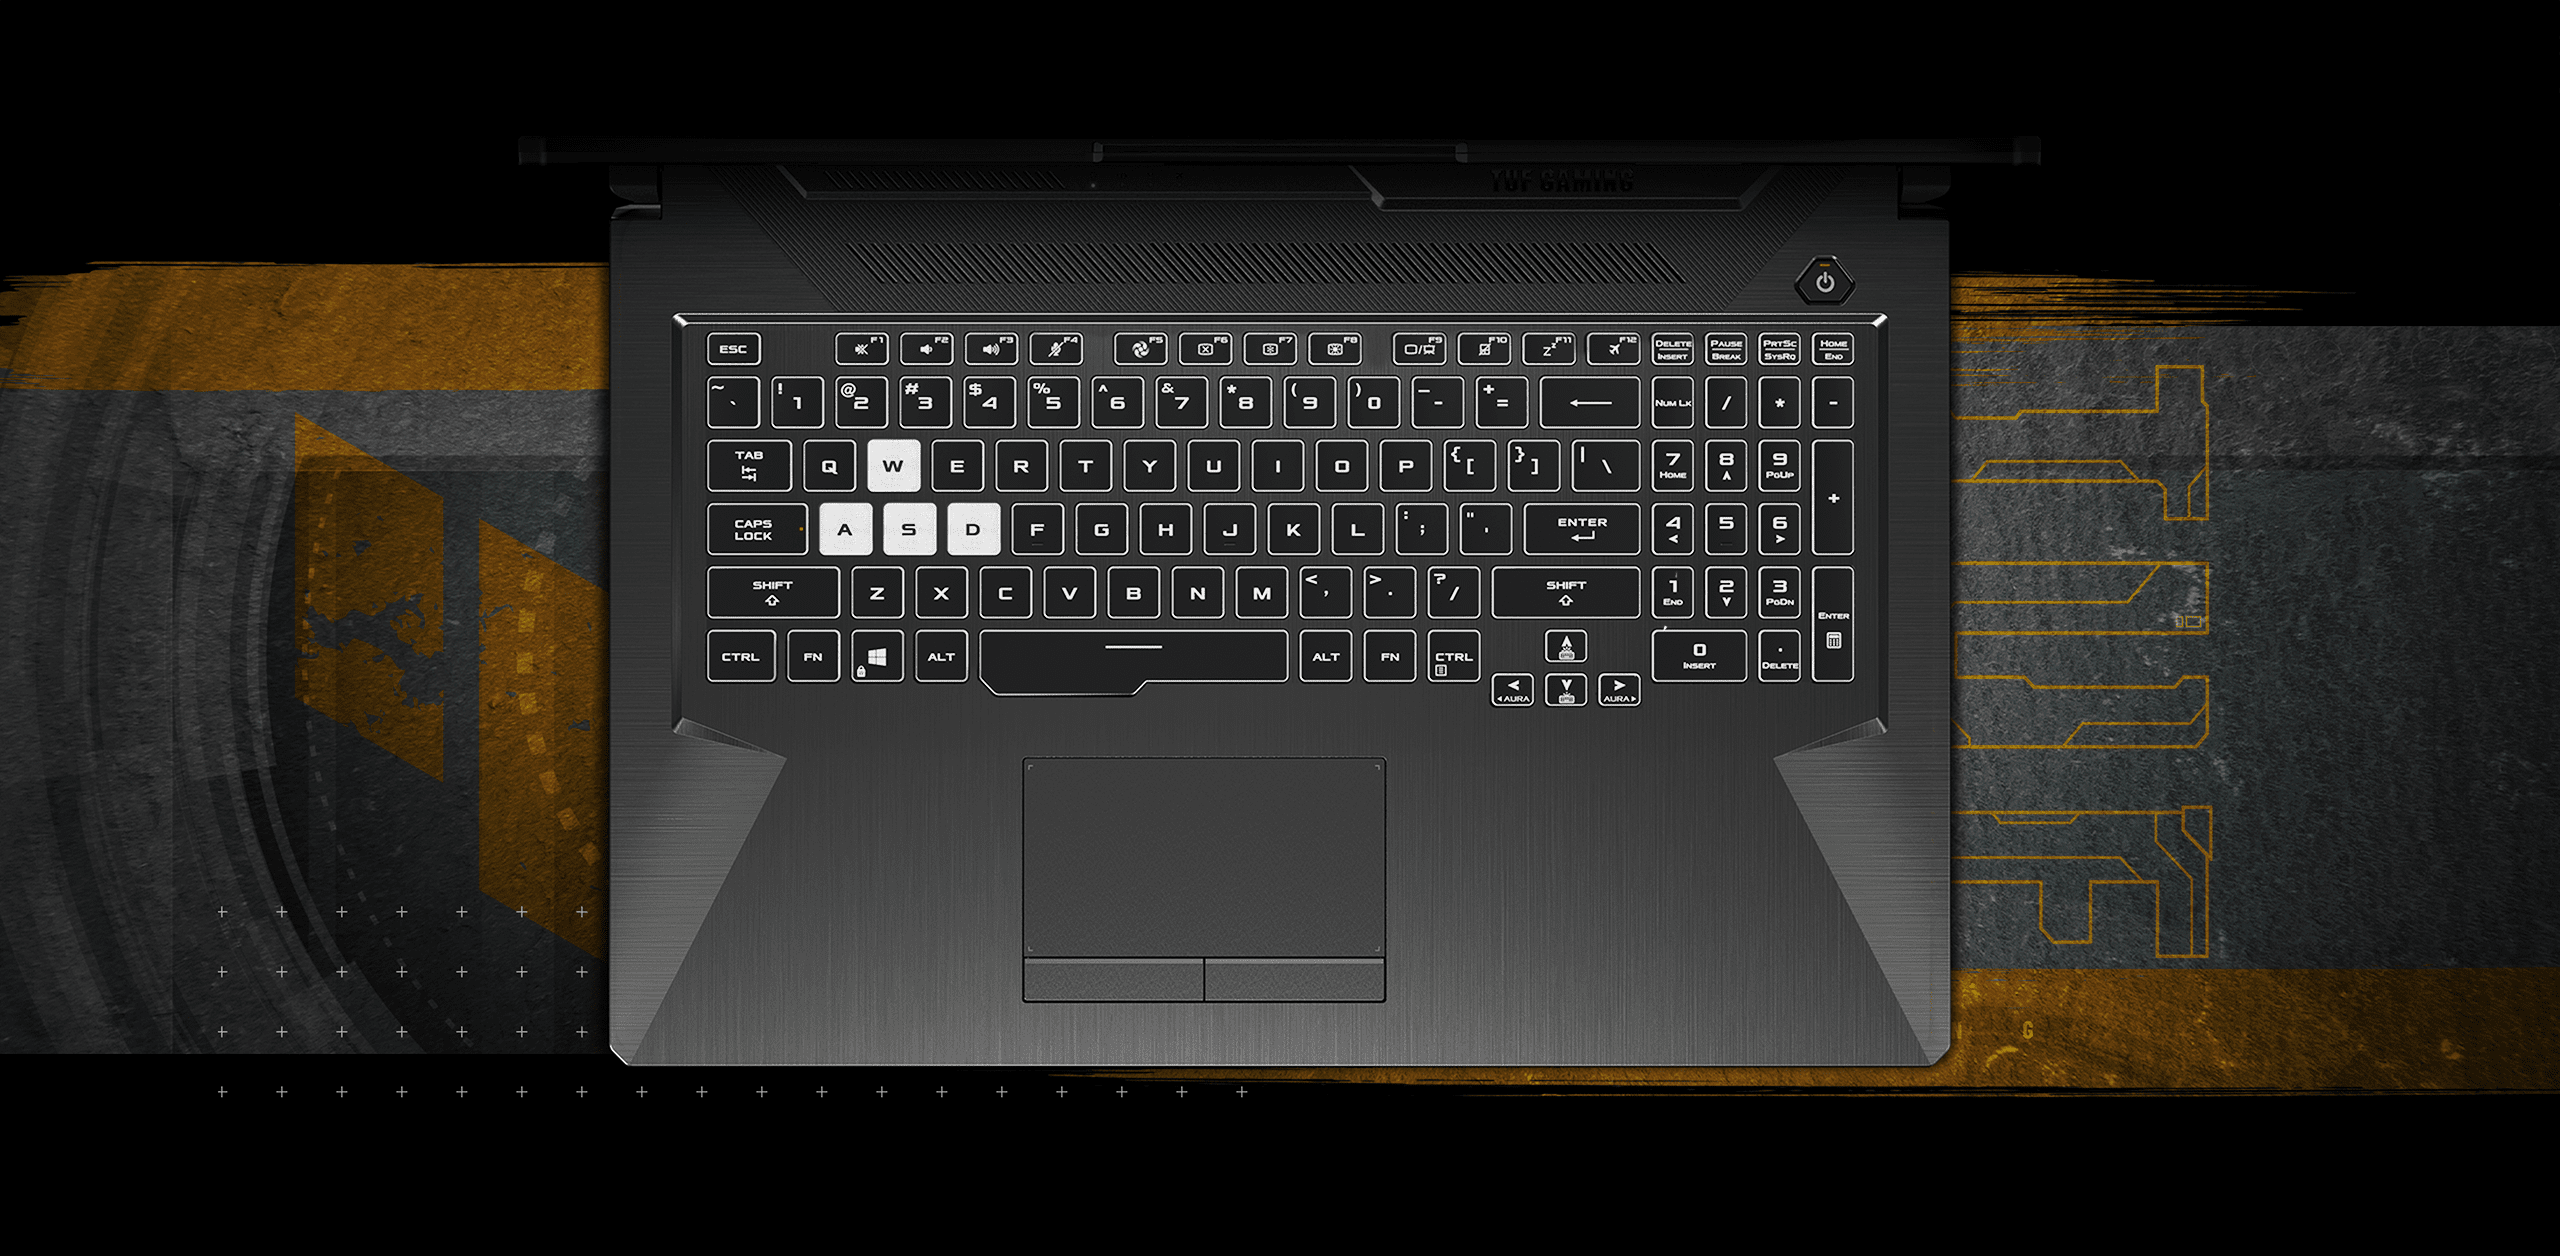
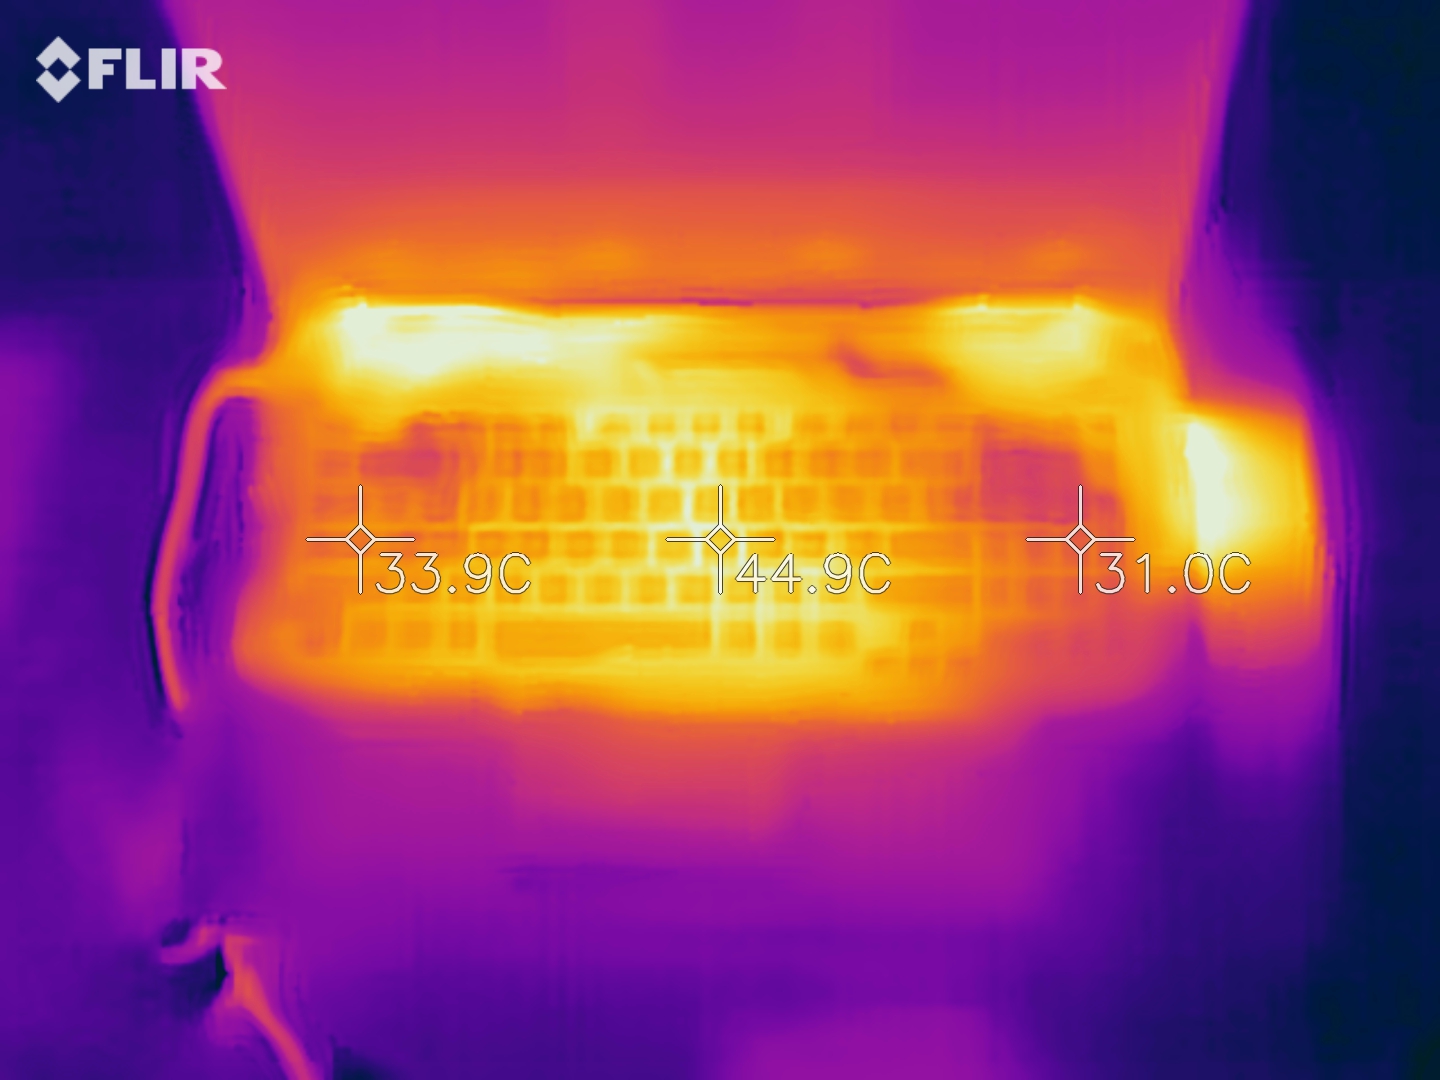
Sob carga máxima, o F17 aquece até pouco menos de 60 °C (~140 °F). Os pontos quentes estão à esquerda e à direita em direção ao display; os descansos da palma da mão permanecem sempre na temperatura mais fria e até mesmo as chaves WASD não ficam excessivamente quentes
(-) A temperatura máxima no lado superior é 58.5 °C / 137 F, em comparação com a média de 40.4 °C / 105 F , variando de 21.2 a 68.8 °C para a classe Gaming.
(-) A parte inferior aquece até um máximo de 58.5 °C / 137 F, em comparação com a média de 43.2 °C / 110 F
(±) Em uso inativo, a temperatura média para o lado superior é 34 °C / 93 F, em comparação com a média do dispositivo de 33.9 °C / ### class_avg_f### F.
(-) Jogando The Witcher 3, a temperatura média para o lado superior é 39.8 °C / 104 F, em comparação com a média do dispositivo de 33.9 °C / ## #class_avg_f### F.
(+) Os apoios para as mãos e o touchpad são mais frios que a temperatura da pele, com um máximo de 31 °C / 87.8 F e, portanto, são frios ao toque.
(-) A temperatura média da área do apoio para as mãos de dispositivos semelhantes foi 28.8 °C / 83.8 F (-2.2 °C / -4 F).
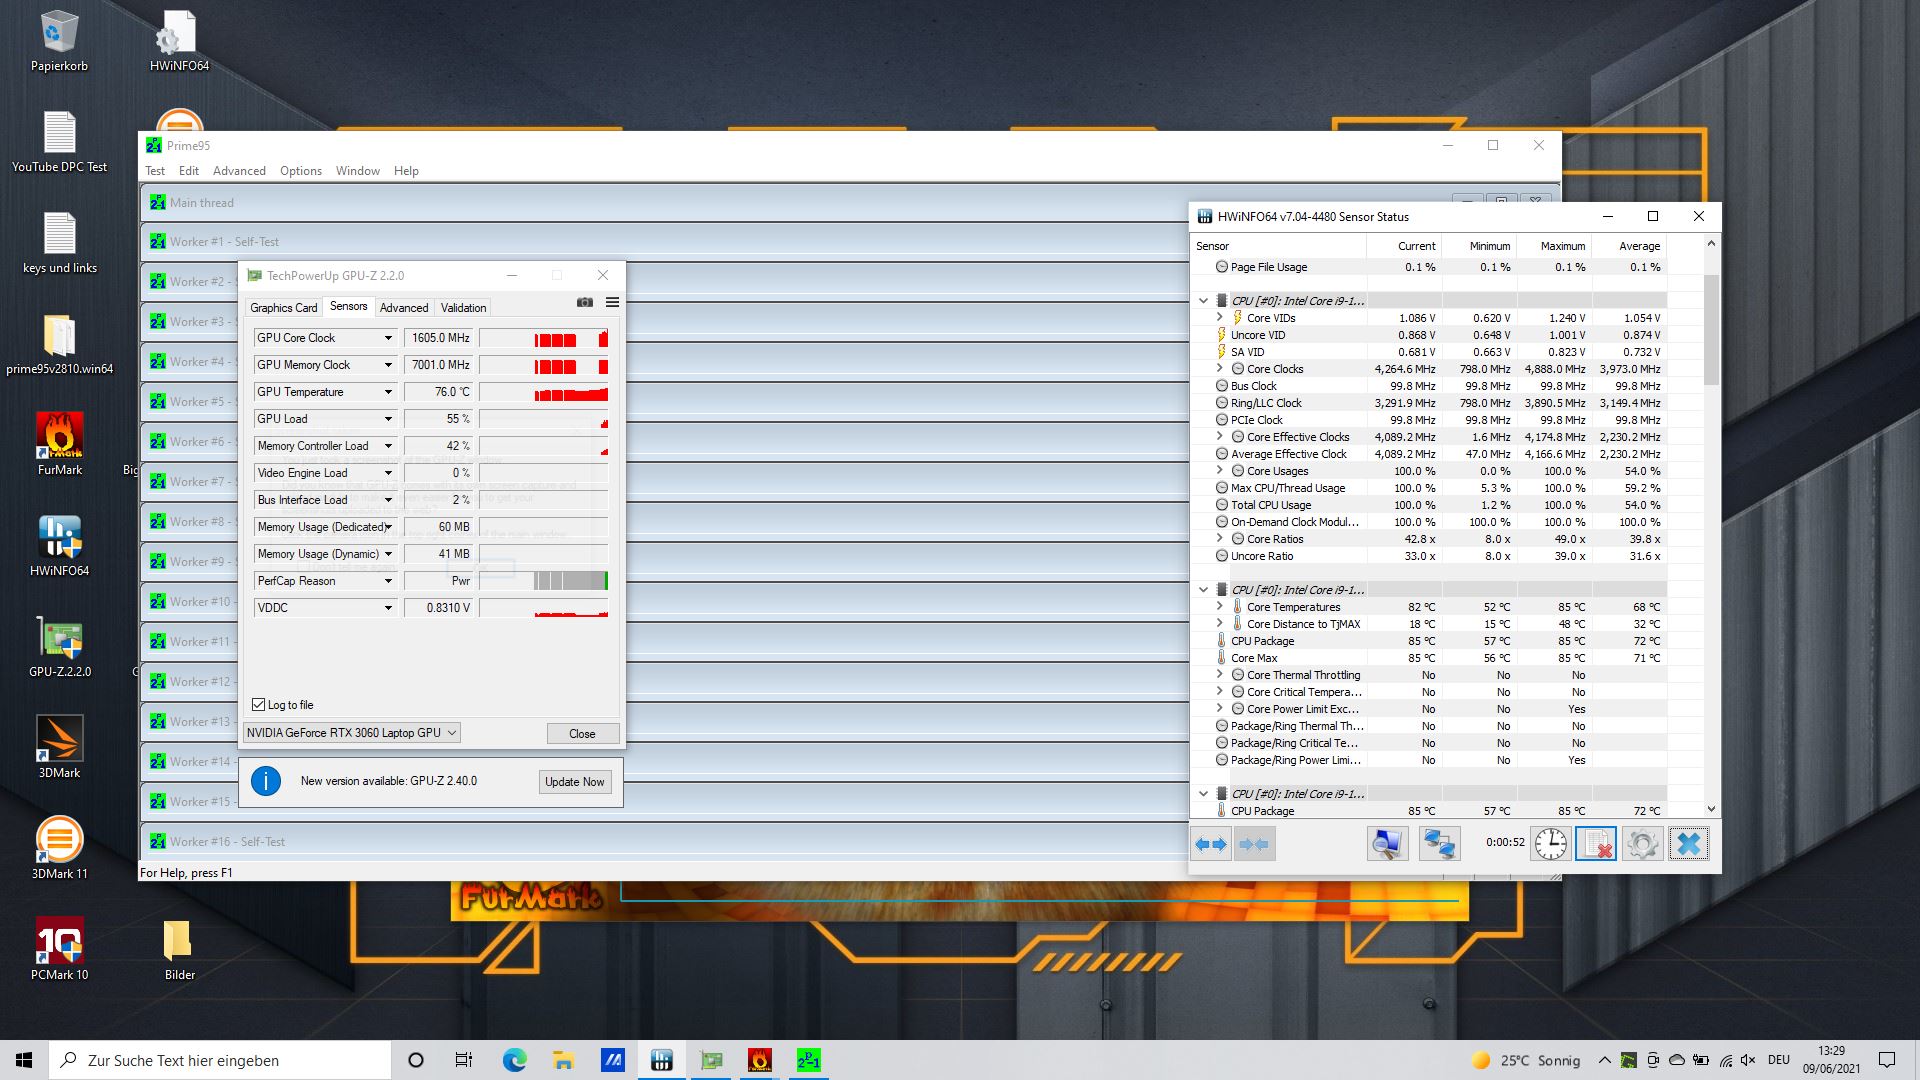
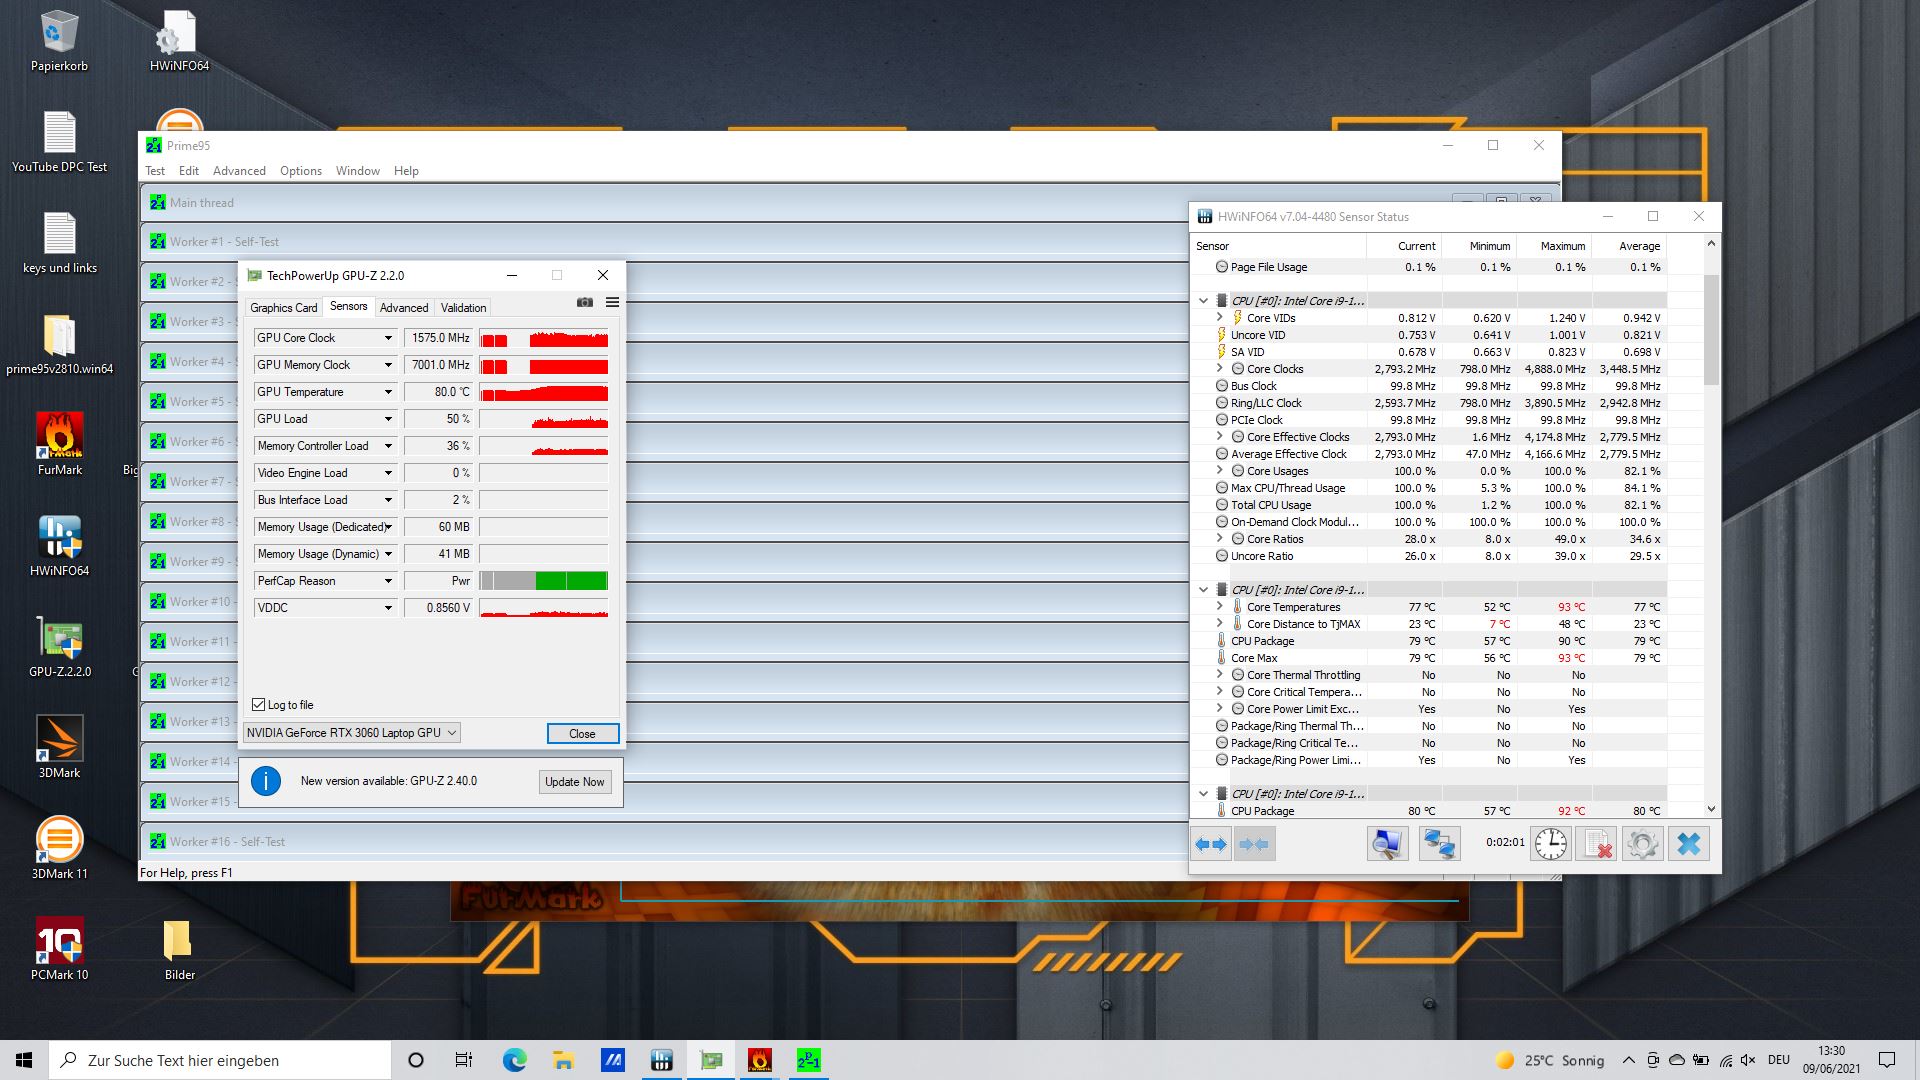
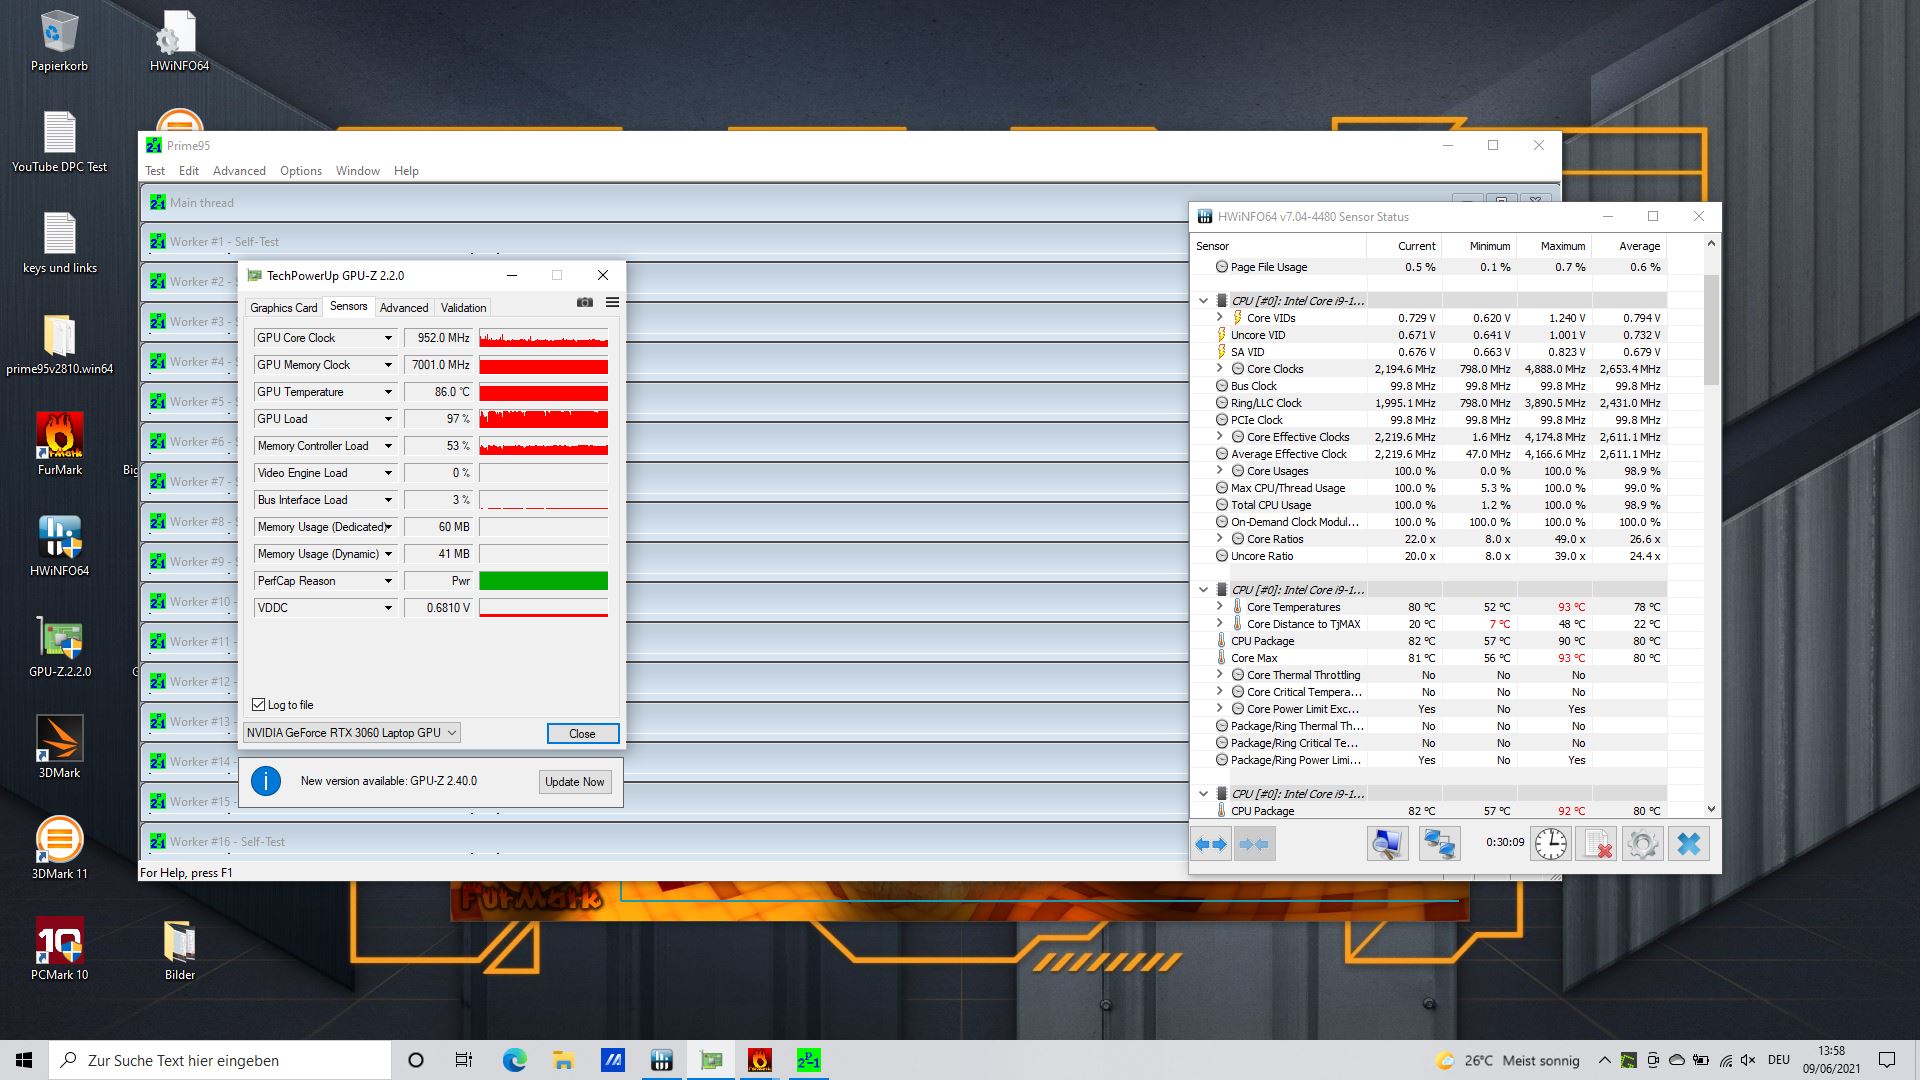
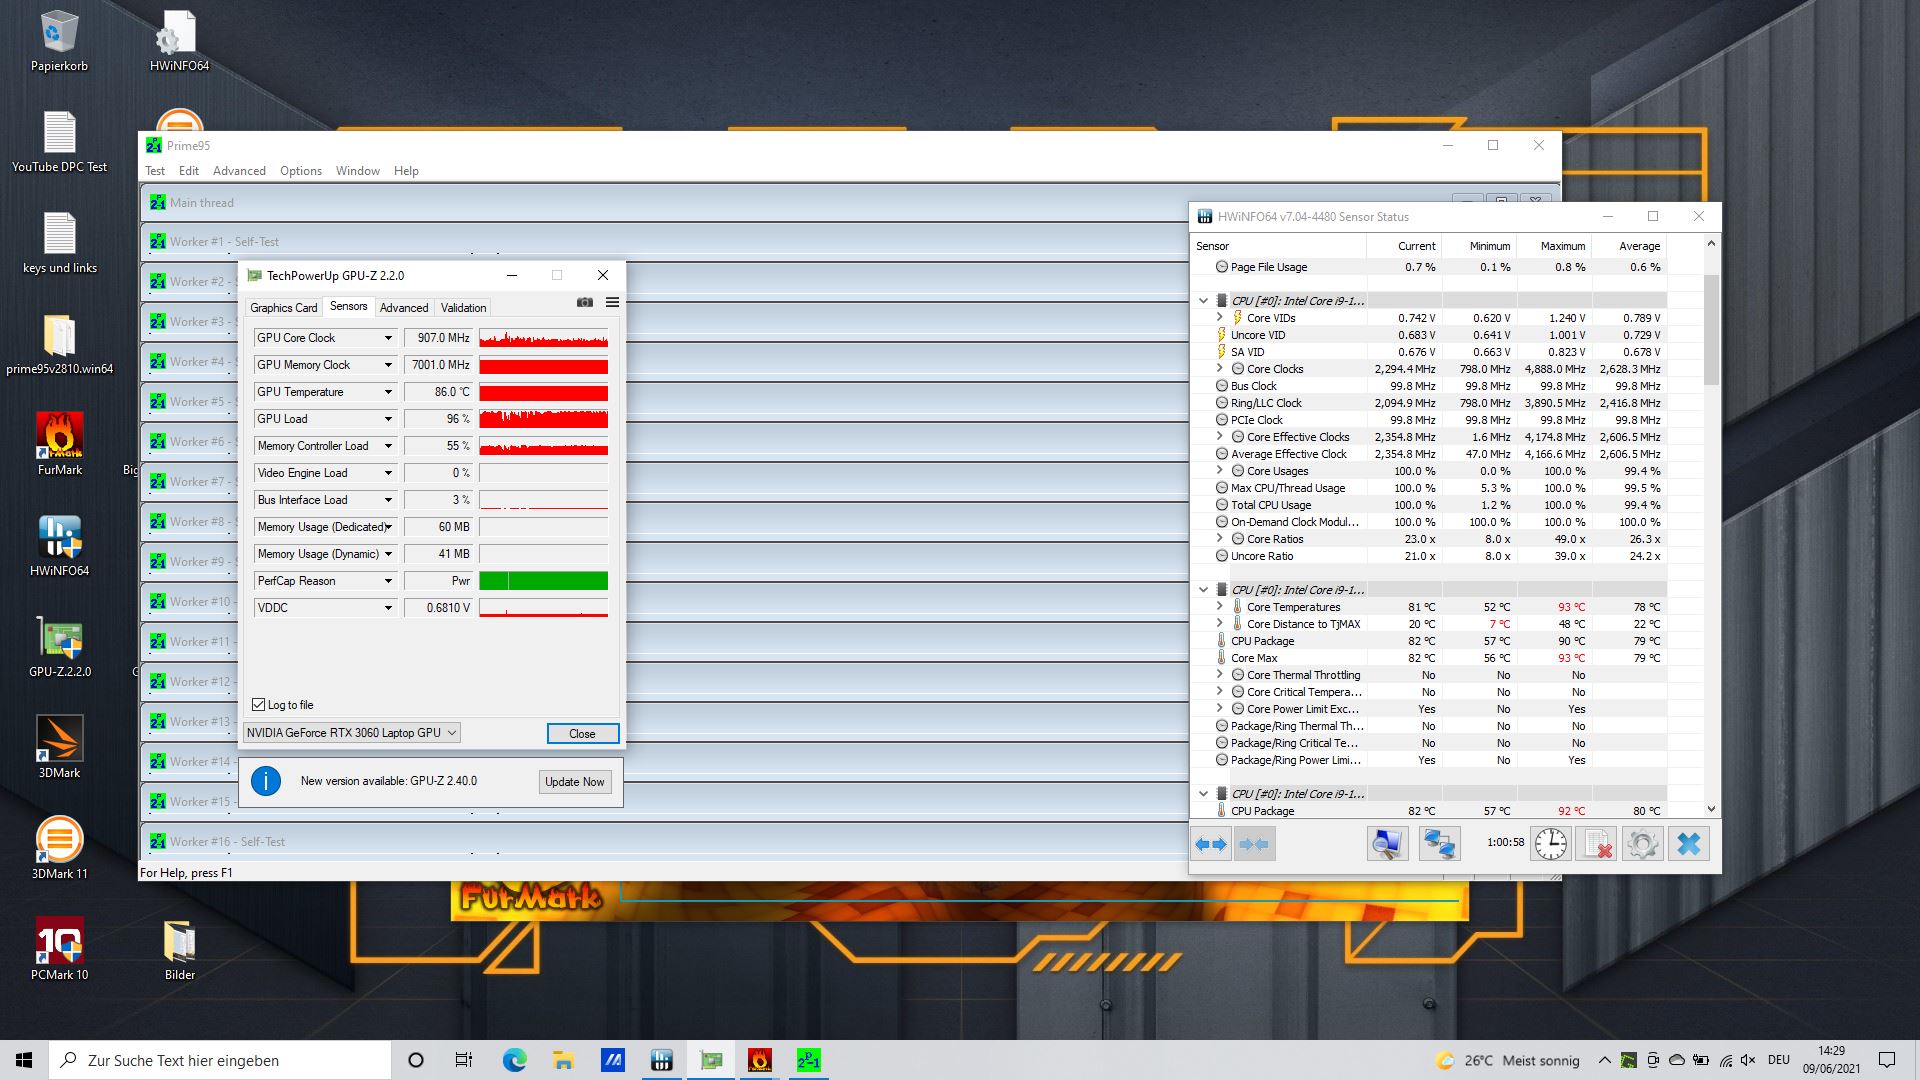
O Asus começa nosso teste de estresse em torno de 4,3 GHz. O estrangulamento térmico entra em ação após pouco tempo, já que as temperaturas centrais atingem mais de 90 °C (~194 °F). A velocidade do relógio da CPU acaba se fixando em torno de 2,3 GHz e, conseqüentemente, ligeiramente abaixo da taxa do relógio de base de 2,5 GHz.
A taxa de relógio da placa gráfica é de cerca de 1,6 GHz no início. Ela cai bastante continuamente ao longo da duração do teste para finalmente atingir 900 MHz.
Um novo 3DMark 11 funciona diretamente após o teste de estresse, resultando em uma pontuação de 22.300, em vez dos 25.793 pontos originais. Isto significa que o laptop precisa de algum tempo para se recuperar, mas a perda de desempenho não é muito alta.
Oradores
Os alto-falantes são, na melhor das hipóteses, médios em comparação com o desempenho já abaixo do esperado dos atuais alto-falantes para laptops. Eles são um pouco silenciosos demais, não há praticamente nenhum baixo, e até mesmo os médios e altos poderiam ser mais equilibrados.
Portanto, dispositivos de áudio externos como fones de ouvido, que podem ser conectados usando a tomada combinada de fones de ouvido, são recomendados.
Asus TUF Gaming F17 FX706HM análise de áudio
(±) | o volume do alto-falante é médio, mas bom (###valor### dB)
Graves 100 - 315Hz
(-) | quase nenhum baixo - em média 15.8% menor que a mediana
(±) | a linearidade dos graves é média (8.7% delta para a frequência anterior)
Médios 400 - 2.000 Hz
(±) | médios mais altos - em média 5.5% maior que a mediana
(+) | médios são lineares (6.8% delta para frequência anterior)
Altos 2 - 16 kHz
(+) | agudos equilibrados - apenas 3.2% longe da mediana
(±) | a linearidade dos máximos é média (9.3% delta para frequência anterior)
Geral 100 - 16.000 Hz
(±) | a linearidade do som geral é média (17.8% diferença em relação à mediana)
Comparado com a mesma classe
» 53% de todos os dispositivos testados nesta classe foram melhores, 10% semelhantes, 37% piores
» O melhor teve um delta de 6%, a média foi 18%, o pior foi 132%
Comparado com todos os dispositivos testados
» 36% de todos os dispositivos testados foram melhores, 8% semelhantes, 56% piores
» O melhor teve um delta de 4%, a média foi 23%, o pior foi 134%
Schenker XMG Core 17 (Early 2021) análise de áudio
(+) | os alto-falantes podem tocar relativamente alto (###valor### dB)
Graves 100 - 315Hz
(-) | quase nenhum baixo - em média 27.5% menor que a mediana
(±) | a linearidade dos graves é média (12.8% delta para a frequência anterior)
Médios 400 - 2.000 Hz
(+) | médios equilibrados - apenas 2.3% longe da mediana
(+) | médios são lineares (5.4% delta para frequência anterior)
Altos 2 - 16 kHz
(+) | agudos equilibrados - apenas 3.5% longe da mediana
(±) | a linearidade dos máximos é média (9.9% delta para frequência anterior)
Geral 100 - 16.000 Hz
(±) | a linearidade do som geral é média (17.5% diferença em relação à mediana)
Comparado com a mesma classe
» 49% de todos os dispositivos testados nesta classe foram melhores, 12% semelhantes, 39% piores
» O melhor teve um delta de 6%, a média foi 18%, o pior foi 132%
Comparado com todos os dispositivos testados
» 34% de todos os dispositivos testados foram melhores, 8% semelhantes, 58% piores
» O melhor teve um delta de 4%, a média foi 23%, o pior foi 134%
Gerenciamento de energia - Bateria grande e baixo consumo de energia
Consumo de energia
O F17 consome apenas alguns pontos percentuais a mais do que o A17 com seu GTX 1660 Ti, enquanto o XMG Pro, que é cerca de 7% mais rápido em aplicações gráficas, consome 30% a mais. Em geral, o TUF Gaming tem um consumo de energia relativamente baixo. Medimos um consumo máximo de 190 watts, que deve ser facilmente coberto pelo adaptador de energia de 200 watts
| desligado | |
| Ocioso | |
| Carga |
|
Key:
min: | |
| Asus TUF Gaming F17 FX706HM i9-11900H, GeForce RTX 3060 Laptop GPU, SK Hynix HFM001TD3JX013N, IPS, 1920x1080, 17.3" | Asus TUF A17 FA706IU-AS76 R7 4800H, GeForce GTX 1660 Ti Mobile, Intel SSD 660p 1TB SSDPEKNW010T8, IPS, 1920x1080, 17.3" | Schenker XMG Core 17 (Early 2021) i7-10870H, GeForce RTX 3060 Laptop GPU, Samsung SSD 970 EVO Plus 1TB, IPS, 2560x1440, 17.3" | MSI Alpha 17 A4DEK R7 4800H, Radeon RX 5600M, Kingston OM8PCP3512F-AB, IPS, 1920x1080, 17.3" | MSI GF65 Thin 10UE i7-10750H, GeForce RTX 3060 Laptop GPU, Samsung SSD PM981 MZVLB1T0HALR, IPS, 1920x1080, 15.6" | Acer Aspire Nitro 5 AN515-55-57GF i5-10300H, GeForce RTX 3060 Laptop GPU, WDC PC SN530 SDBPNPZ-512G, IPS, 1920x1080, 15.6" | Média NVIDIA GeForce RTX 3060 Laptop GPU | Média da turma Gaming | |
|---|---|---|---|---|---|---|---|---|
| Power Consumption | 7% | -30% | 1% | 10% | 21% | -14% | -36% | |
| Idle Minimum * (Watt) | 10.3 | 7.4 28% | 13 -26% | 9 13% | 5.4 48% | 5 51% | 10.4 ? -1% | 13 ? -26% |
| Idle Average * (Watt) | 13.1 | 10.5 20% | 16 -22% | 12 8% | 12.8 2% | 9 31% | 14.5 ? -11% | 19 ? -45% |
| Idle Maximum * (Watt) | 14.1 | 17 -21% | 29 -106% | 18 -28% | 19.5 -38% | 13 8% | 21.4 ? -52% | 24.6 ? -74% |
| Load Average * (Watt) | 110 | 103.7 6% | 100 9% | 76 31% | 86.6 21% | 84 24% | 109.3 ? 1% | 110.7 ? -1% |
| Witcher 3 ultra * (Watt) | 138 | 128.1 7% | 173 -25% | 136 1% | 115.7 16% | 125 9% | ||
| Load Maximum * (Watt) | 190 | 183.2 4% | 213 -12% | 222 -17% | 175.2 8% | 190 -0% | 206 ? -8% | 259 ? -36% |
* ... menor é melhor
Duração da bateria
Com 90 Wh, a bateria é bastante grande; isto tem um efeito muito positivo nos tempos de execução, que são surpreendentemente longos para um laptop para jogos. Os concorrentes Schenker XMG Pro e MSI Alpha estão equipados apenas com baterias de 62 Wh e 65 Wh, respectivamente.
No teste WLAN, o F17 durou 7,5 horas inteiras e, portanto, cerca de 2,5 horas a mais do que o XMG Pro.
| Asus TUF Gaming F17 FX706HM i9-11900H, GeForce RTX 3060 Laptop GPU, 90 Wh | Asus TUF A17 FA706IU-AS76 R7 4800H, GeForce GTX 1660 Ti Mobile, 90 Wh | Schenker XMG Core 17 (Early 2021) i7-10870H, GeForce RTX 3060 Laptop GPU, 62 Wh | MSI Alpha 17 A4DEK R7 4800H, Radeon RX 5600M, 65 Wh | MSI GF65 Thin 10UE i7-10750H, GeForce RTX 3060 Laptop GPU, 51 Wh | Acer Aspire Nitro 5 AN515-55-57GF i5-10300H, GeForce RTX 3060 Laptop GPU, 57.5 Wh | Média da turma Gaming | |
|---|---|---|---|---|---|---|---|
| Duração da bateria | 22% | -43% | -22% | -48% | -31% | -16% | |
| H.264 (h) | 8.5 | 4.7 -45% | 6.2 -27% | 8.32 ? -2% | |||
| WiFi v1.3 (h) | 7.6 | 8.5 12% | 4.9 -36% | 7.3 -4% | 4.6 -39% | 5.7 -25% | 7.11 ? -6% |
| Load (h) | 2.5 | 3.3 32% | 1.3 -48% | 1.5 -40% | 1.1 -56% | 1.5 -40% | 1.502 ? -40% |
| Reader / Idle (h) | 9.1 | 7.7 | 10.5 | 11.1 | 8.27 ? |
Pro
Contra
Veredicto - Computador portátil para jogos de bom orçamento
O RTX 3060 na F17 tem apenas um TGP máximo de 95 watts, mas só tem um desempenho marginalmente mais lento nos jogos do que o XMG Pro com seu TGP de 130 watts. Como resultado, você definitivamente não vai errar com o orçamento do laptop para jogos em termos de desempenho. O Thunderbolt 4 certamente não é um dado adquirido para um dispositivo de jogo econômico, e os clientes também ficarão satisfeitos com o SSD, que é bom para esta faixa de preço e, acima de tudo, com a forte duração da bateria. Além disso, a tela suporta Adaptive Sync e 144 Hz.
Entretanto, as taxas restantes do monitor são menos impressionantes, e a conexão Wi-Fi fraca também é digna de crítica. Mas os aspectos positivos prevalecem de longe, de modo que os usuários obterão um bom laptop para jogos com o F17. A única pergunta agora é a que preço o laptop será vendido, o que determinará se é recomendável comprá-lo ou se existem melhores alternativas nesta faixa de preço.
O TUF Gaming F17 oferece um bom desempenho de jogo, Thunderbolt 4, e 144 Hz com Adaptive Sync. Entretanto, a tela poderia ser melhor, assim como o desempenho Wi-Fi.
Preço e disponibilidade
Asus TUF Gaming F17 FX706HM
- 06/24/2021 v7 (old)
Christian Hintze
Price comparison

