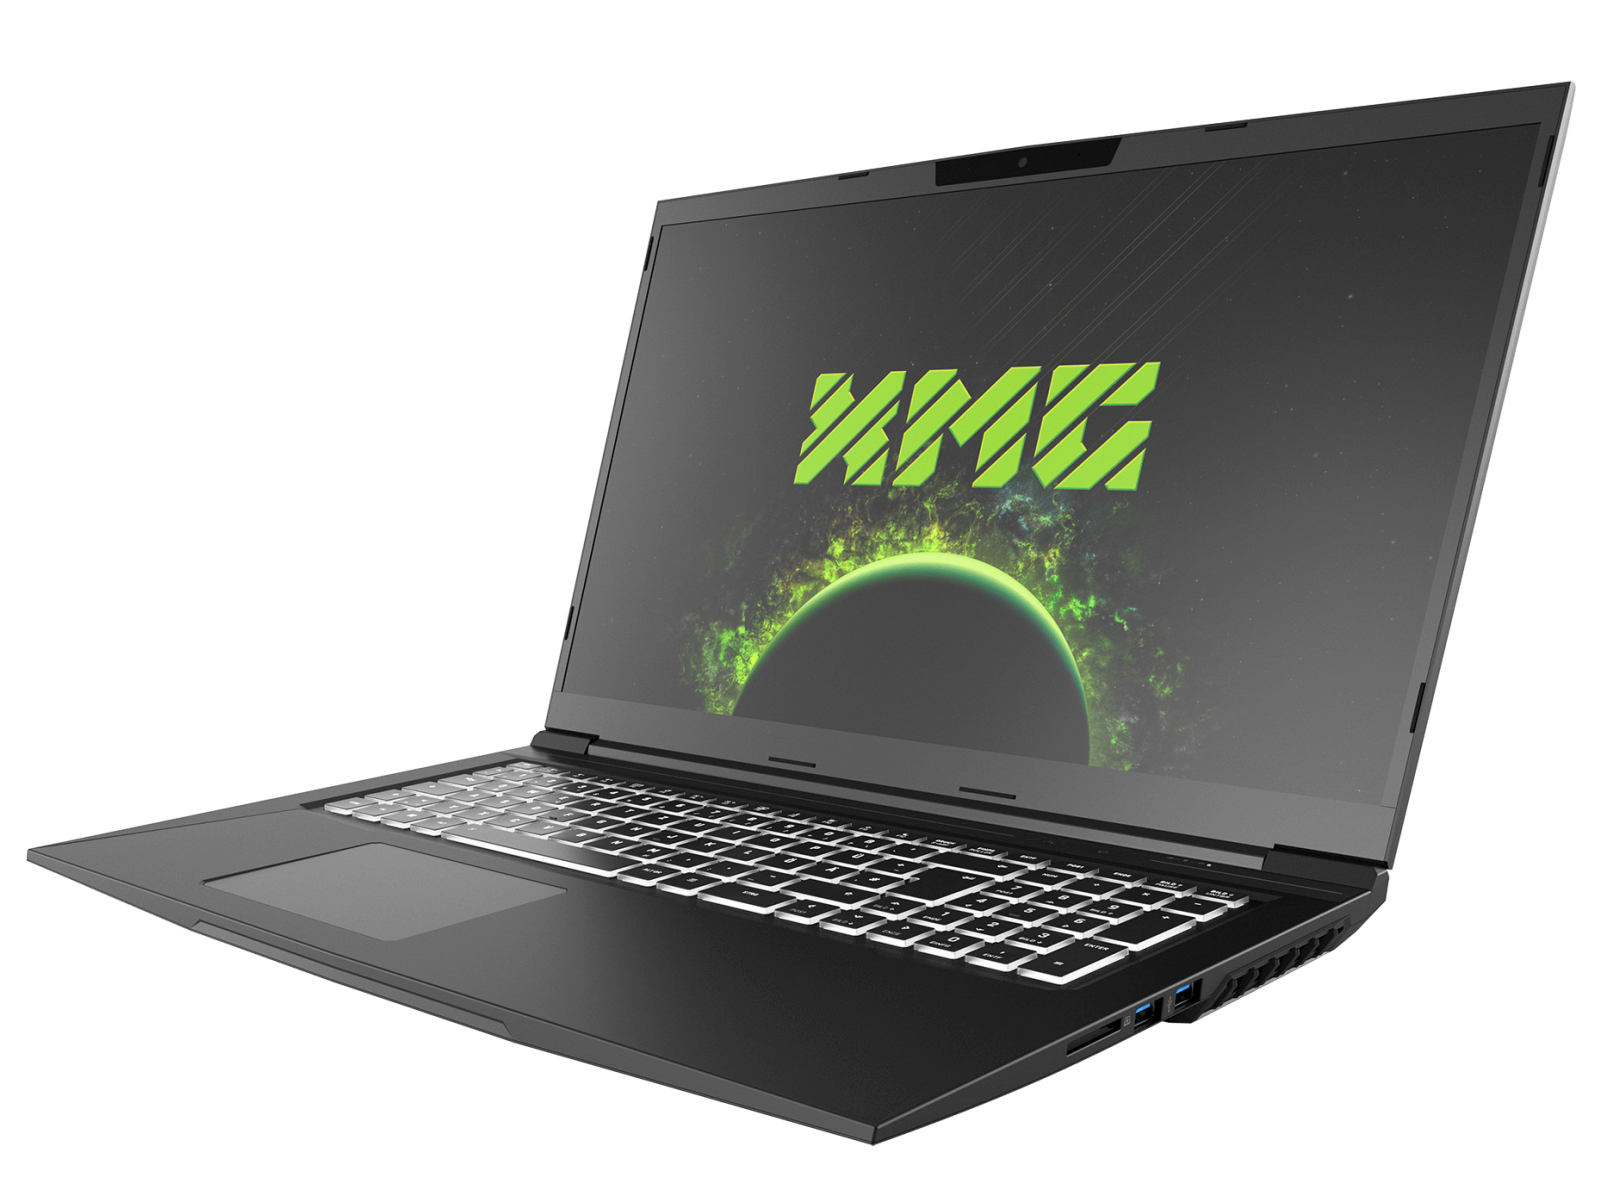
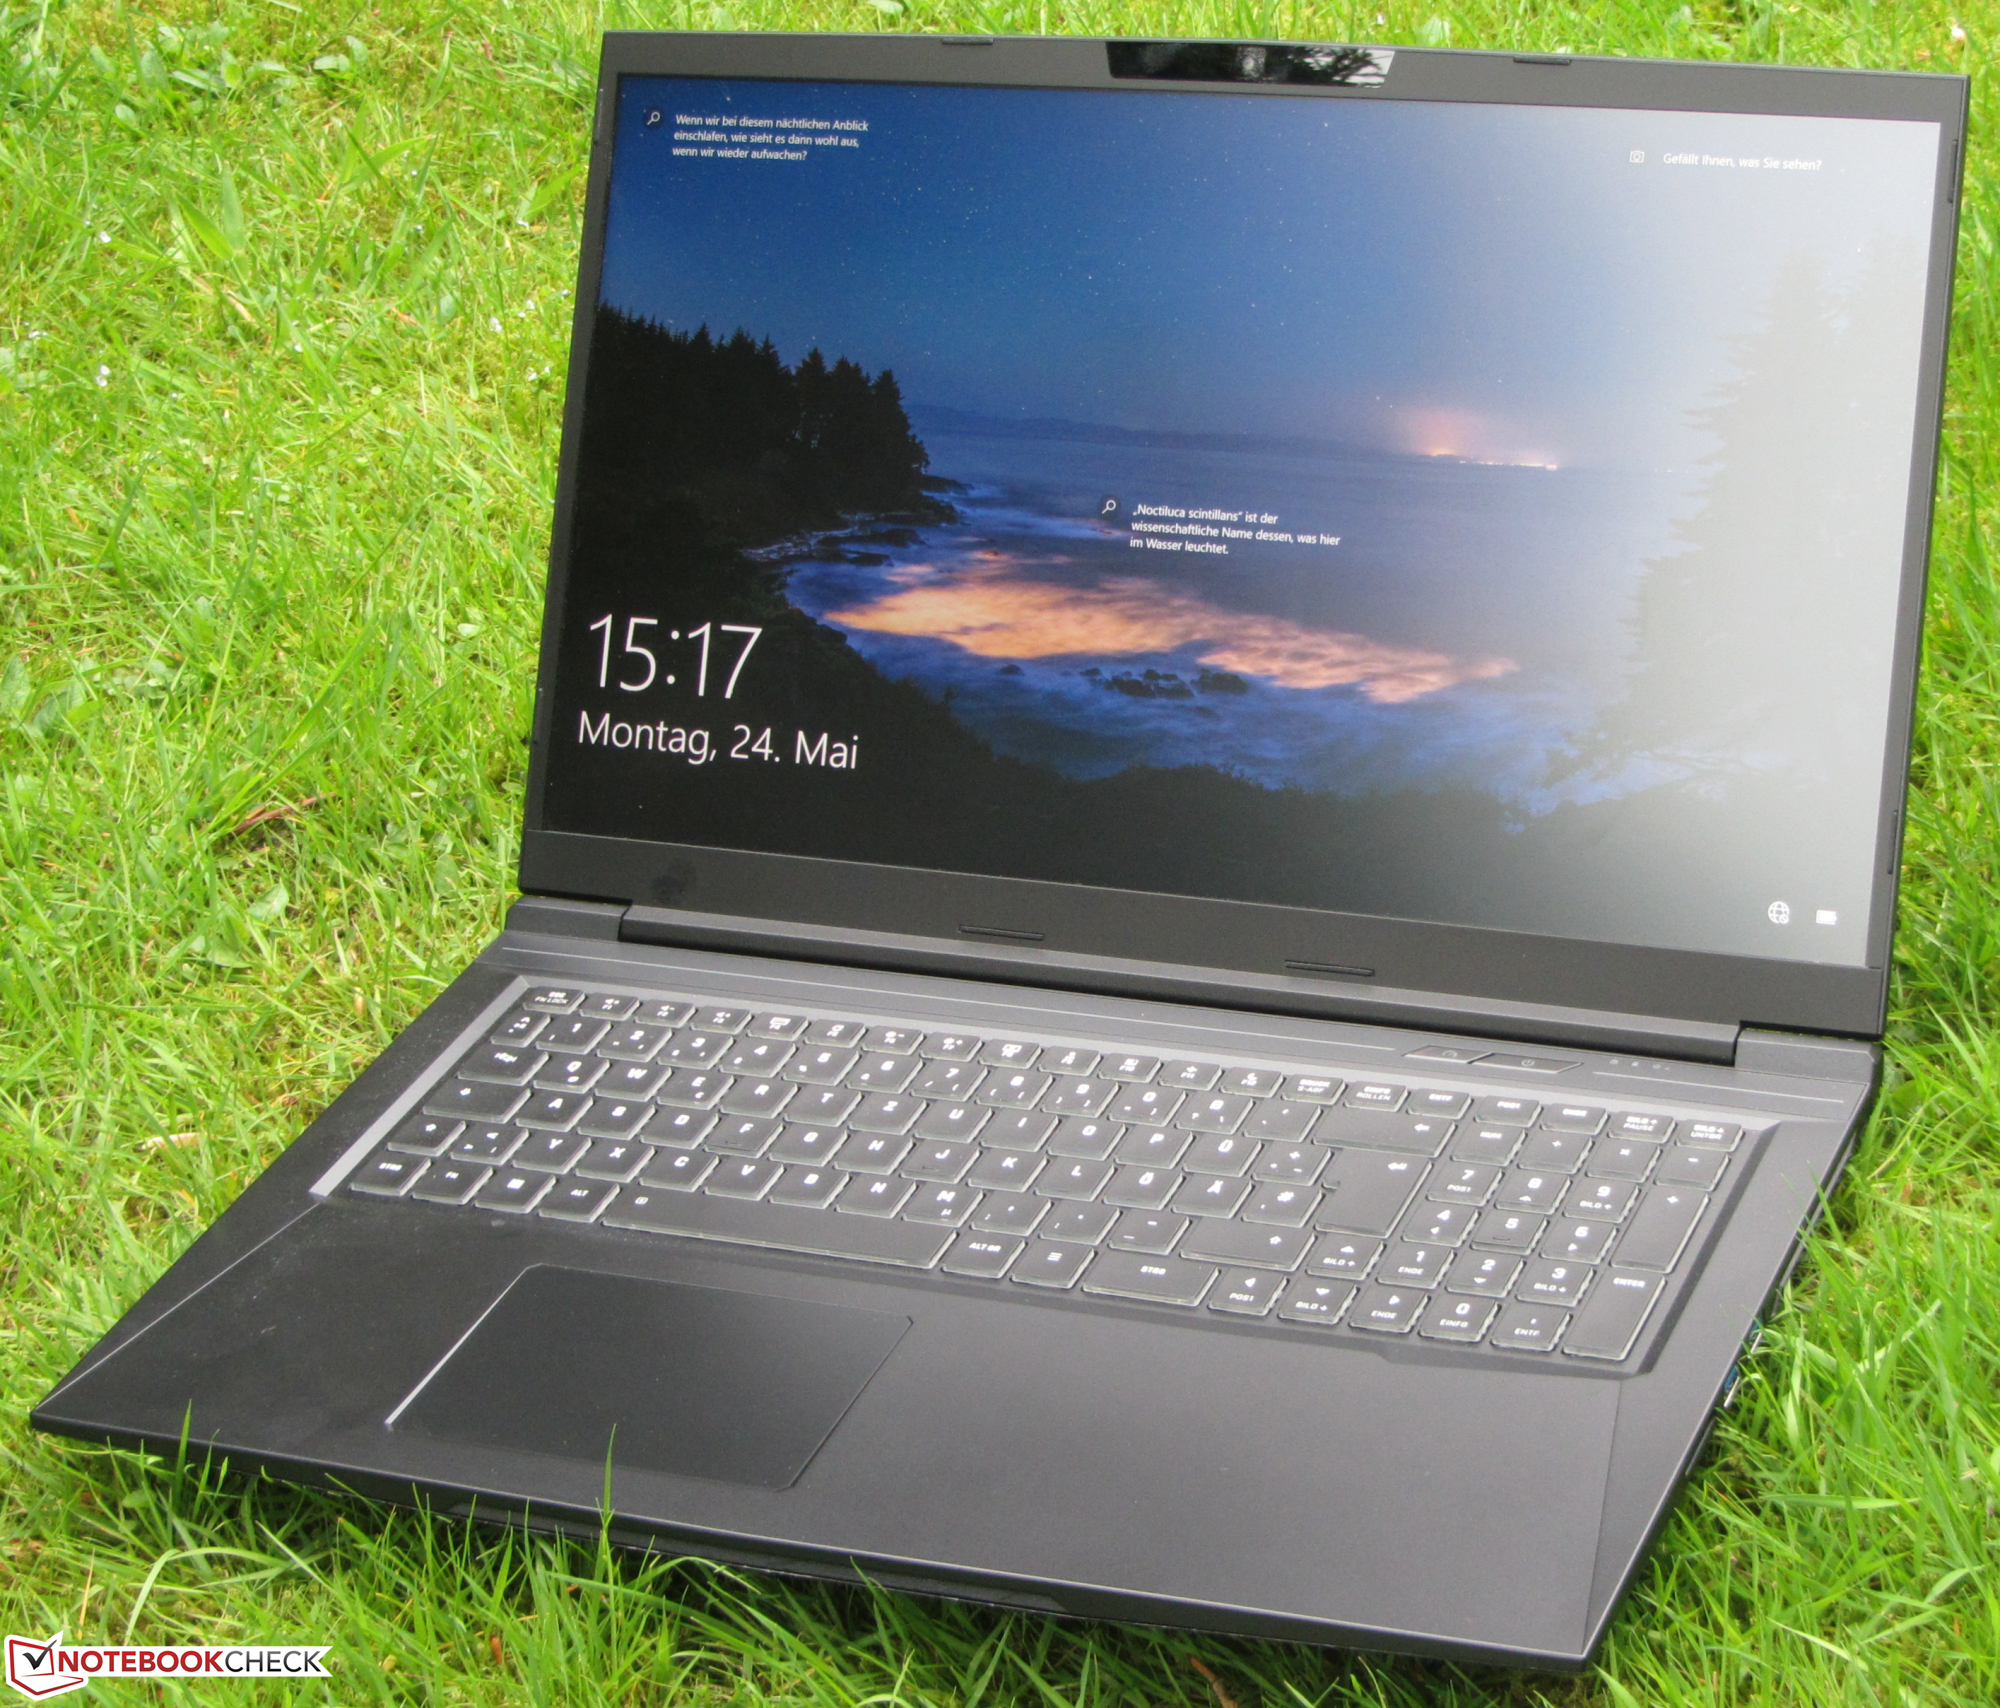
Revisão Schenker XMG Core 17 (Tongfang GM7MG0R): Laptop de jogo configurável com tela WQHD

Com o XMG Core 17 (início de 2021), a Schenker está adicionando um laptop de jogos de gama média superior a suas ofertas. A unidade de teste que nos é fornecida é administrada por um Núcleo i7-10870Hprocessador e umGeForce RTX-3060 laptopGPU. Os concorrentes incluem dispositivos tais como a MSI Alfa 17 A4DEKoAcer Predator Helios 300 PH317-54e o Medion Erazer Beast X10.
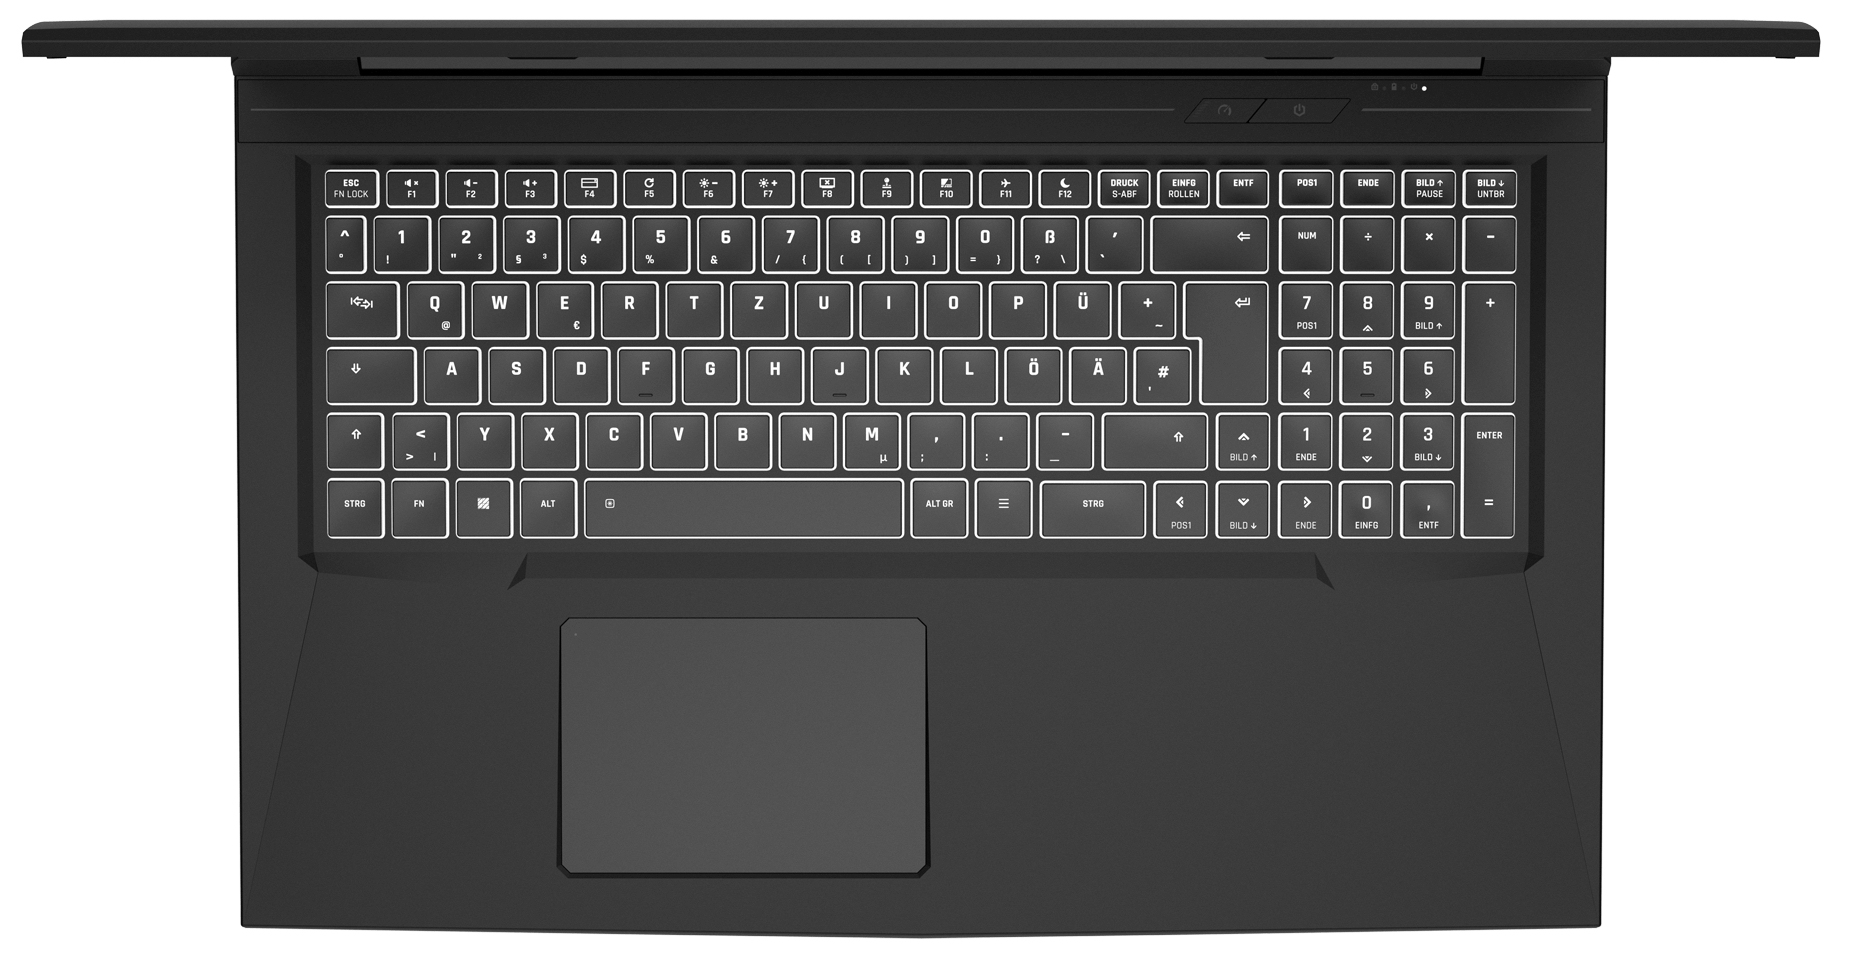
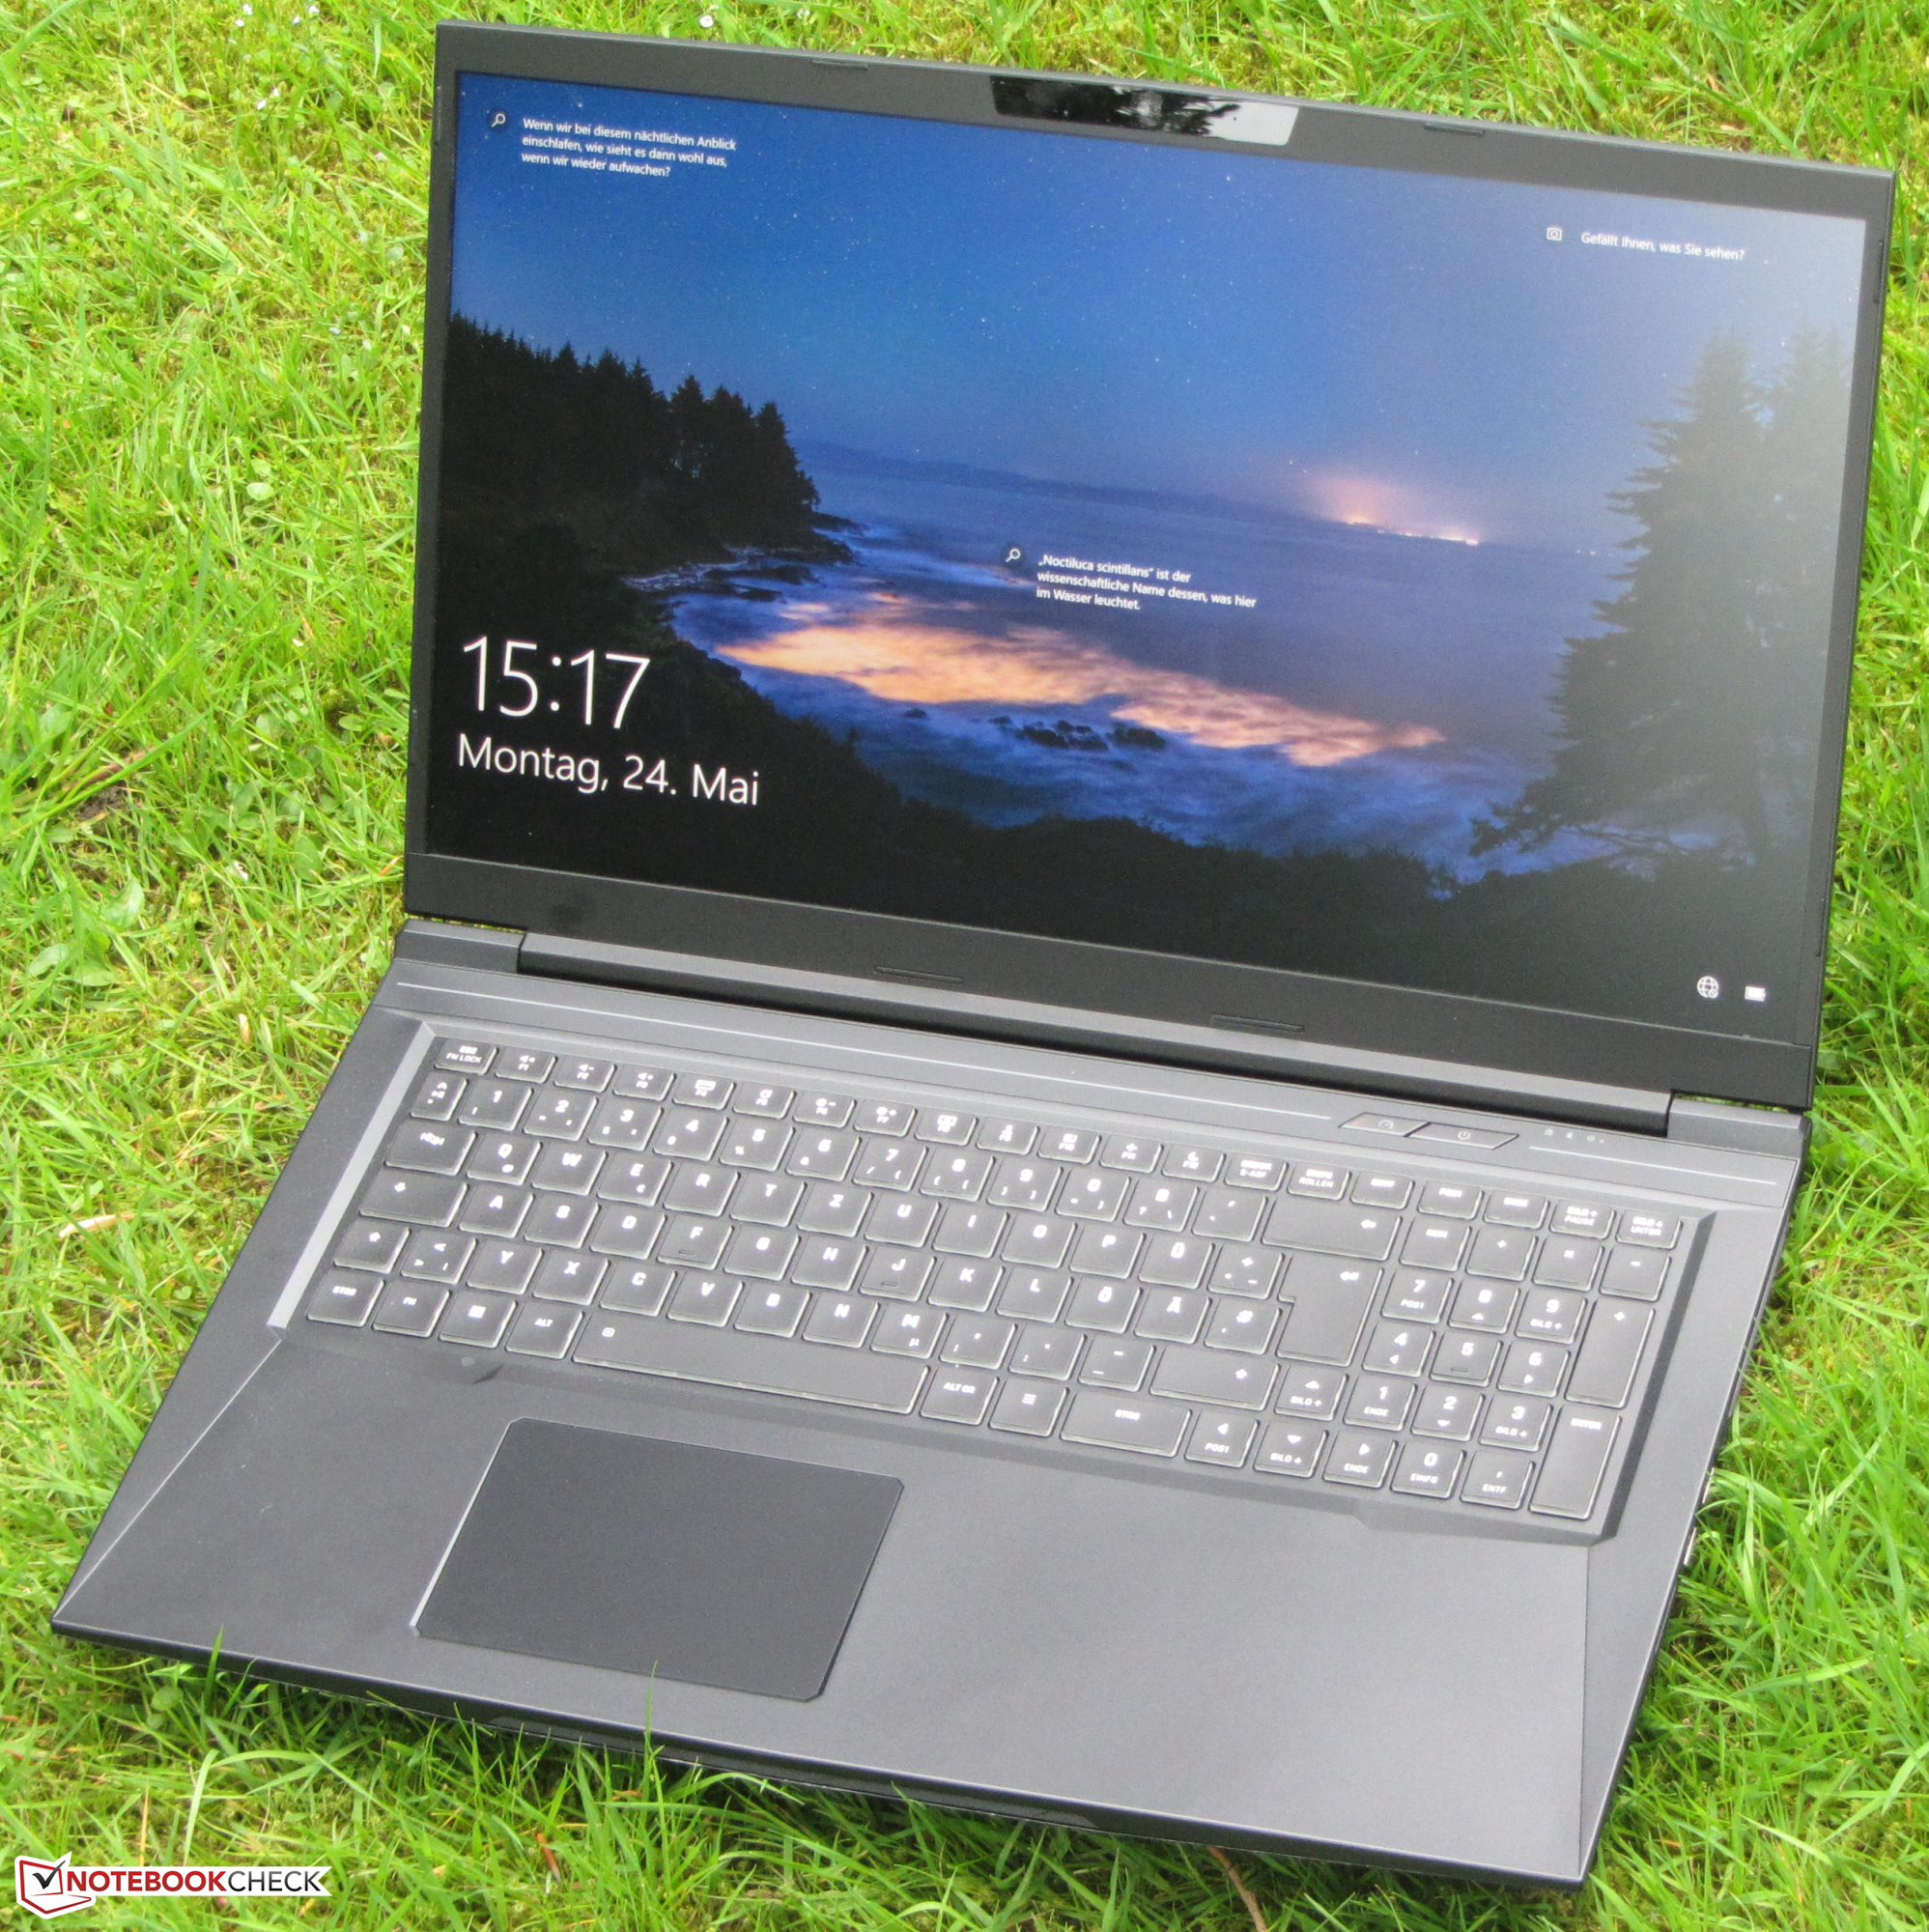
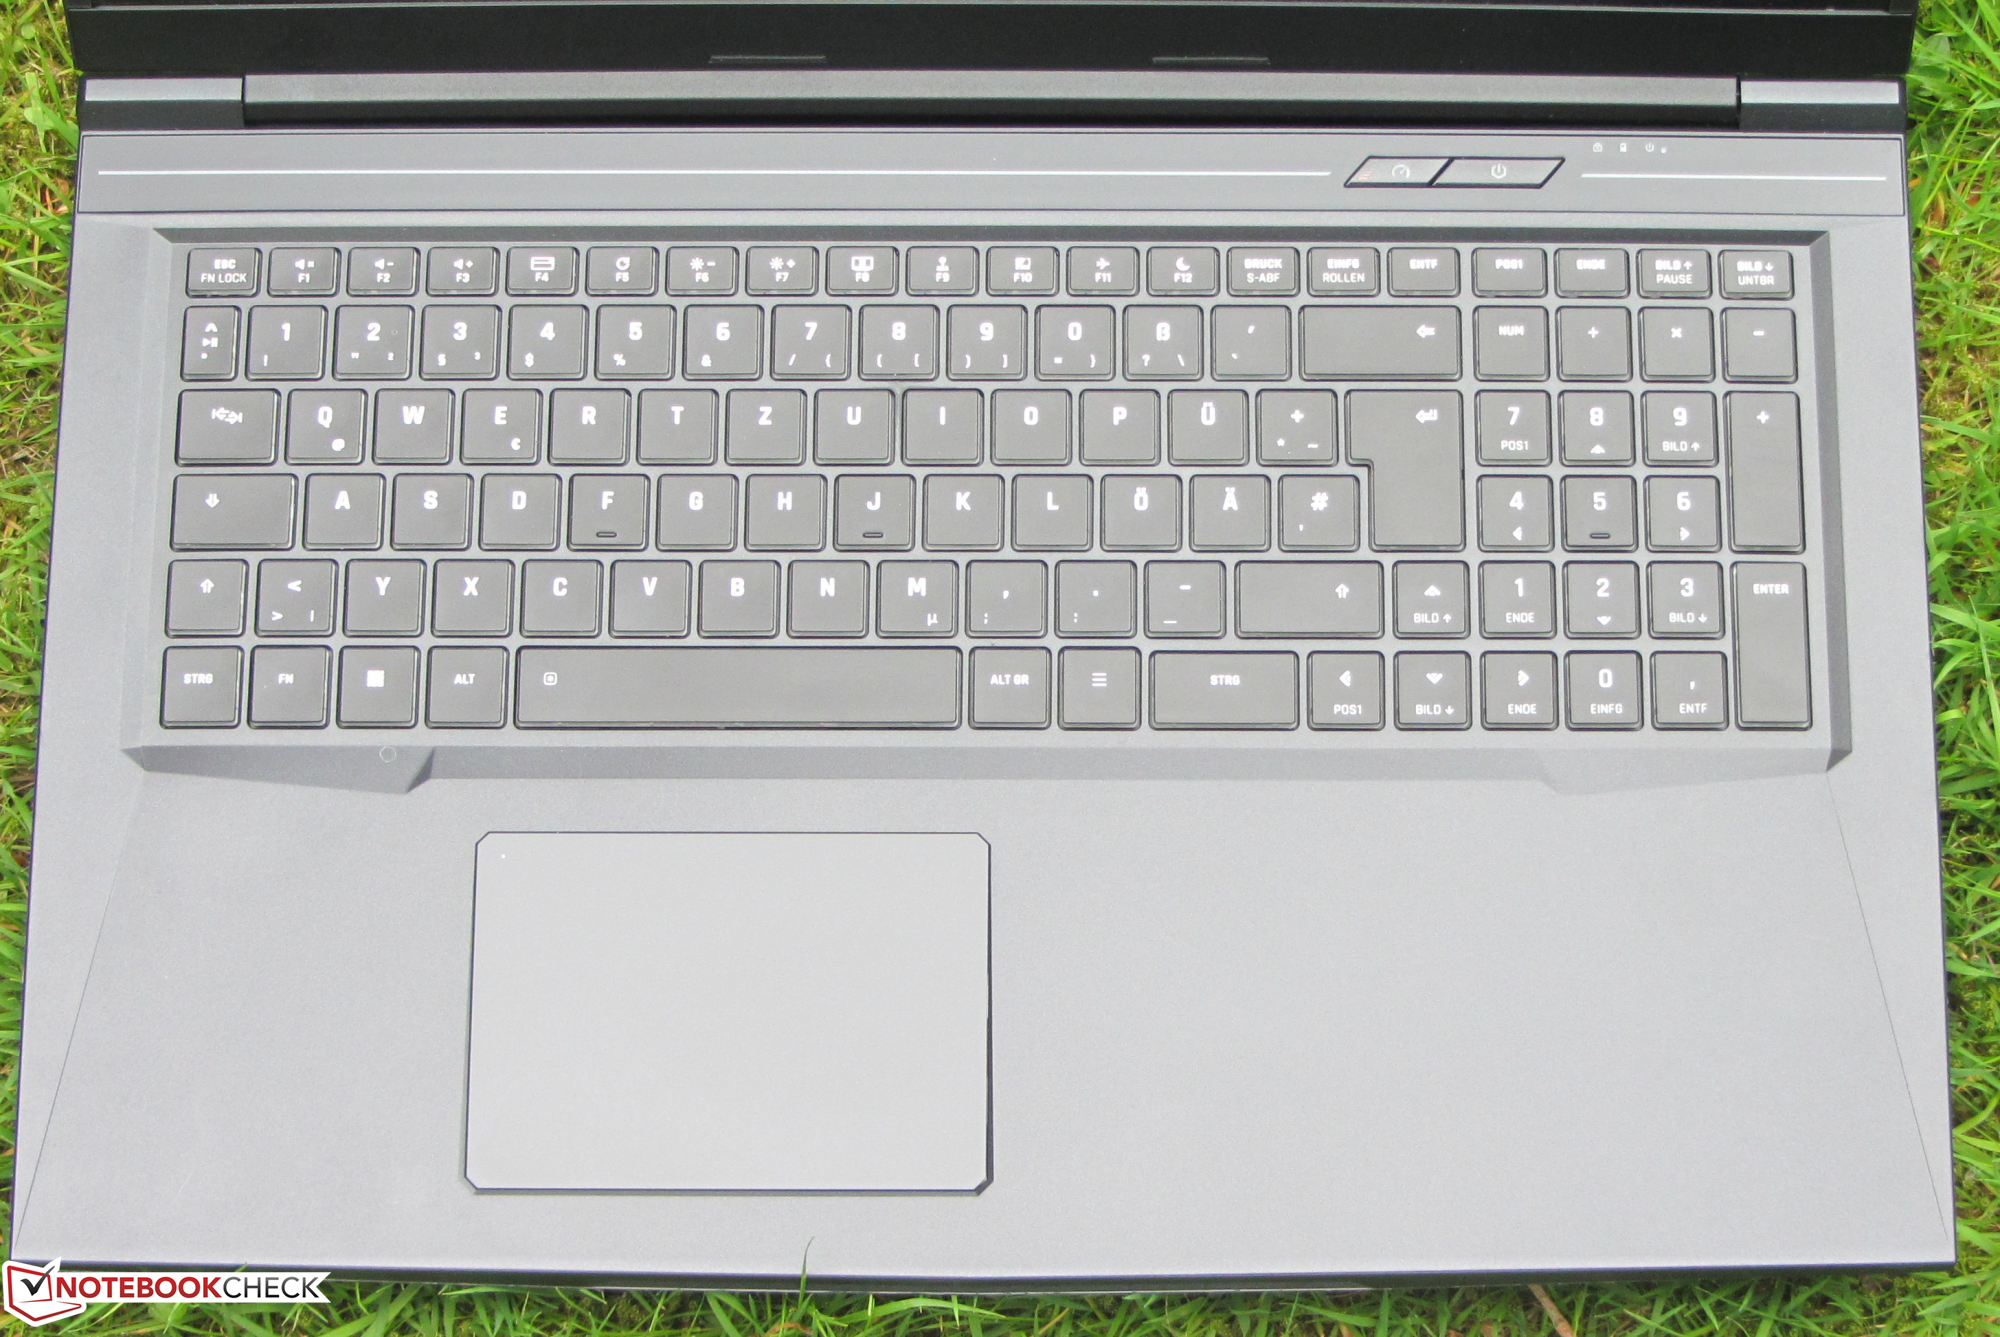
Como a construção do laptop é em grande parte idêntica à de seus dois predecessores, não discutiremos o caso, equipamentos de conexão, dispositivos de entrada e alto-falantes, exceto quando houver diferenças. Você pode encontrar as informações correspondentes sobre estas características em nossa revisão doXMG Core 17 (2019).
Possible Competitors in the Comparison
Avaliação | Data | Modelo | Peso | Altura | Size | Resolução | Preço |
|---|---|---|---|---|---|---|---|
| 83.9 % v7 (old) | 06/2021 | Schenker XMG Core 17 (Early 2021) i7-10870H, GeForce RTX 3060 Laptop GPU | 2.5 kg | 30.05 mm | 17.30" | 2560x1440 | |
| 83.3 % v7 (old) | 02/2021 | MSI Alpha 17 A4DEK R7 4800H, Radeon RX 5600M | 2.6 kg | 28 mm | 17.30" | 1920x1080 | |
| 83.6 % v7 (old) | 10/2020 | Acer Predator Helios 300 PH317-54-75G8 i7-10750H, GeForce RTX 2060 Mobile | 2.8 kg | 25 mm | 17.30" | 1920x1080 | |
| 84.7 % v7 (old) | 11/2020 | Medion Erazer Beast X10 MD61804 i7-10750H, GeForce RTX 2070 Super Max-Q | 2.3 kg | 24.6 mm | 17.30" | 1920x1080 |
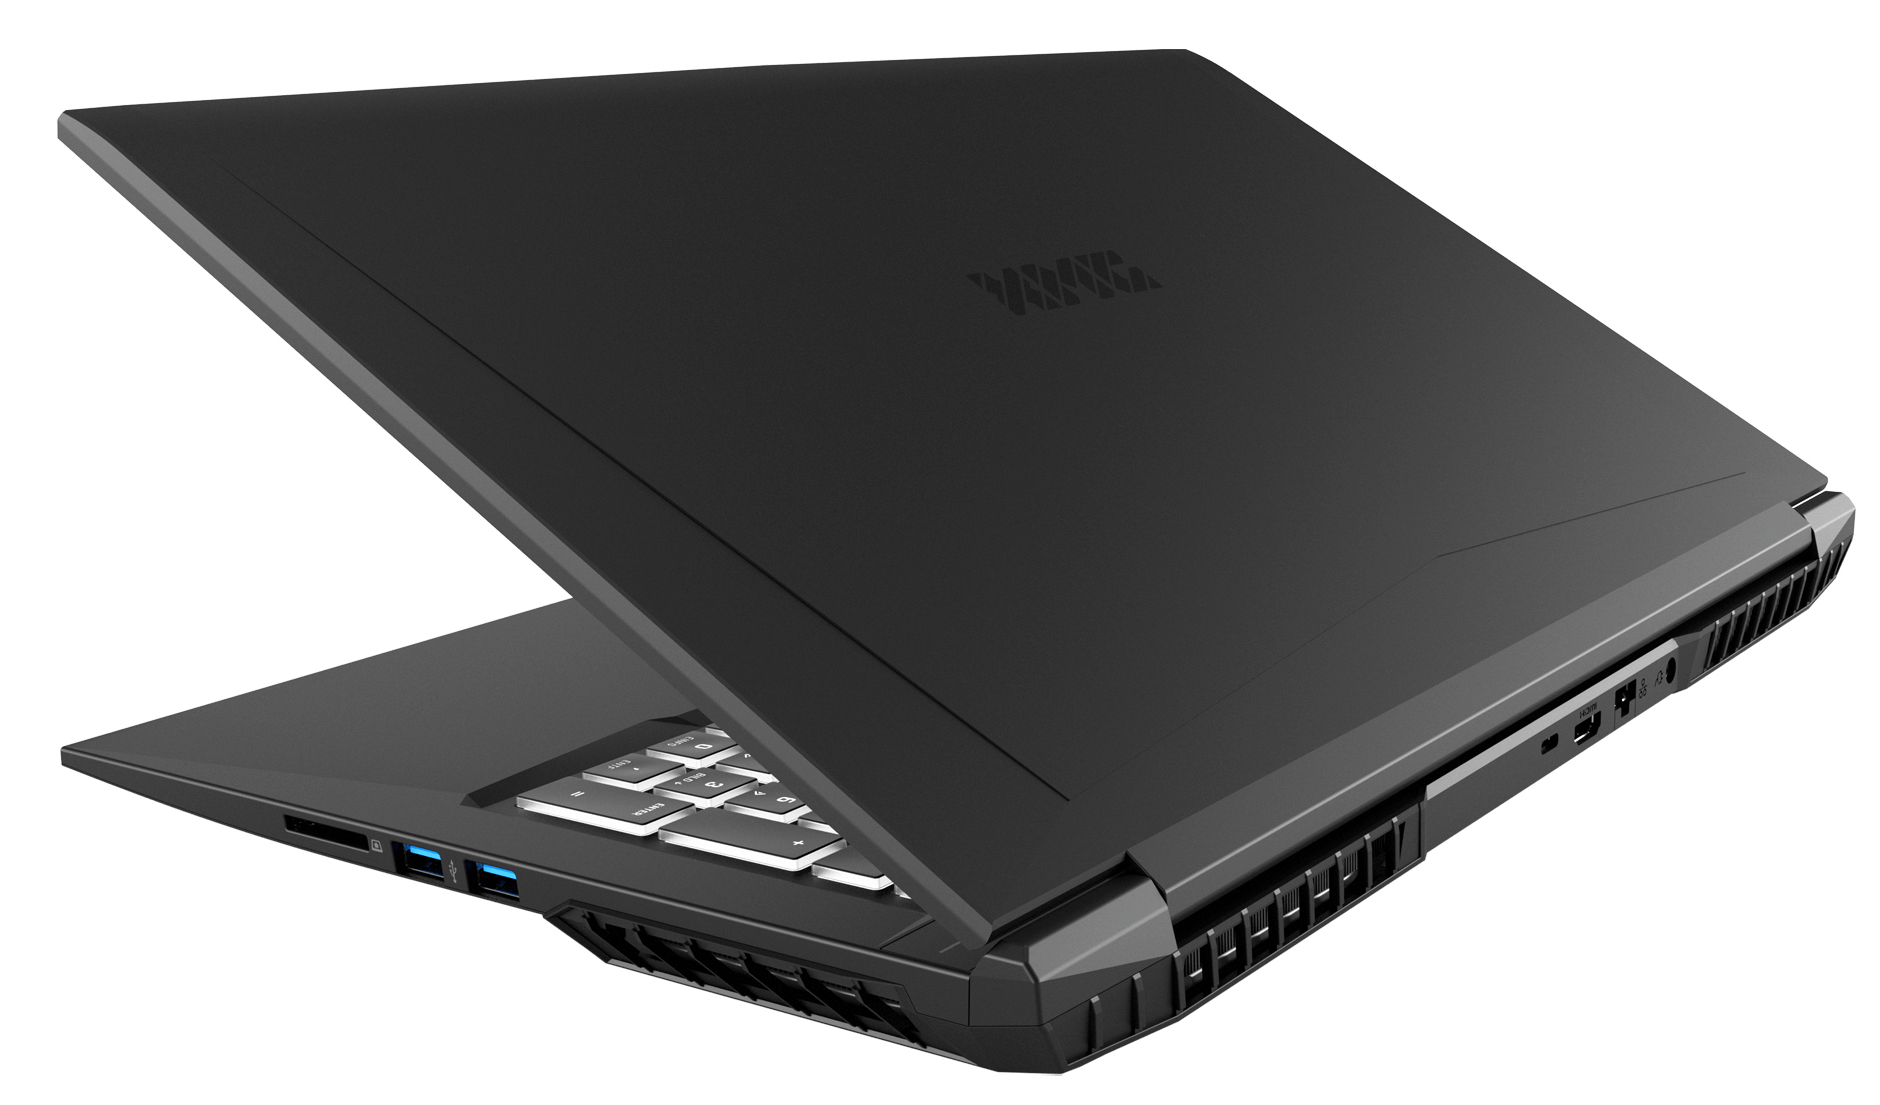
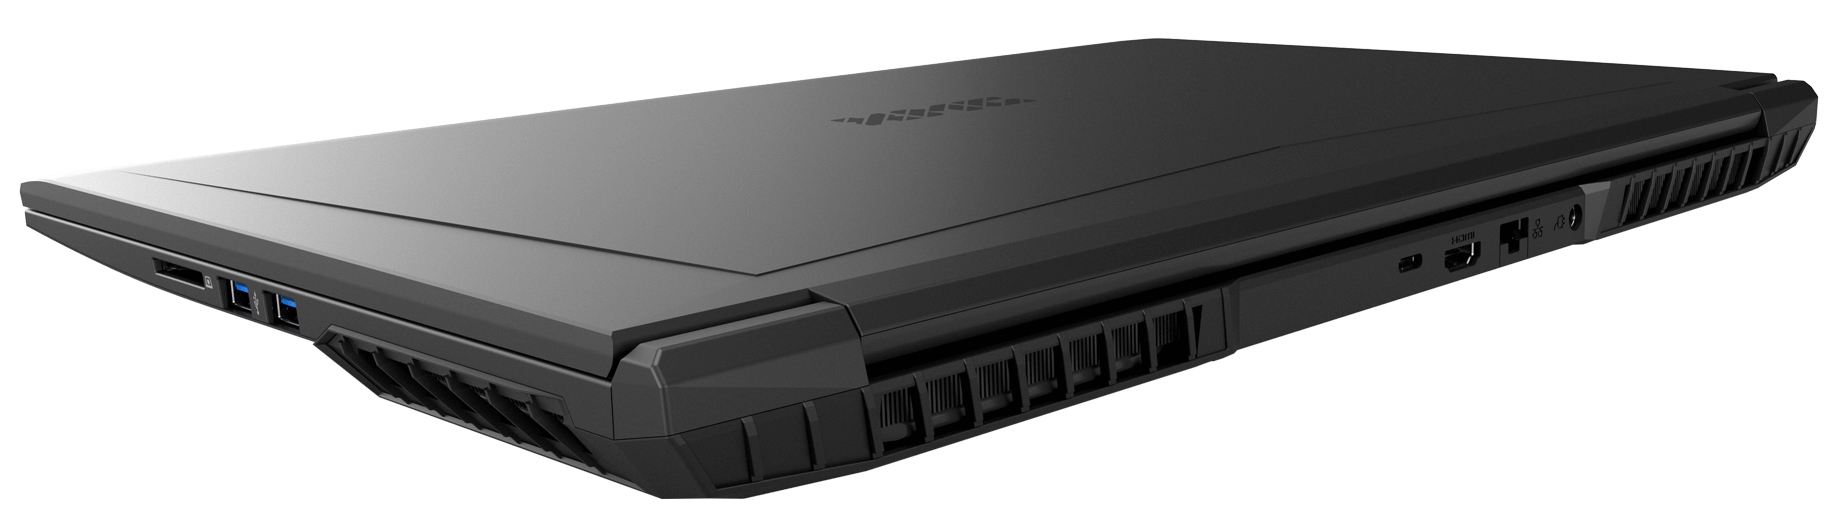
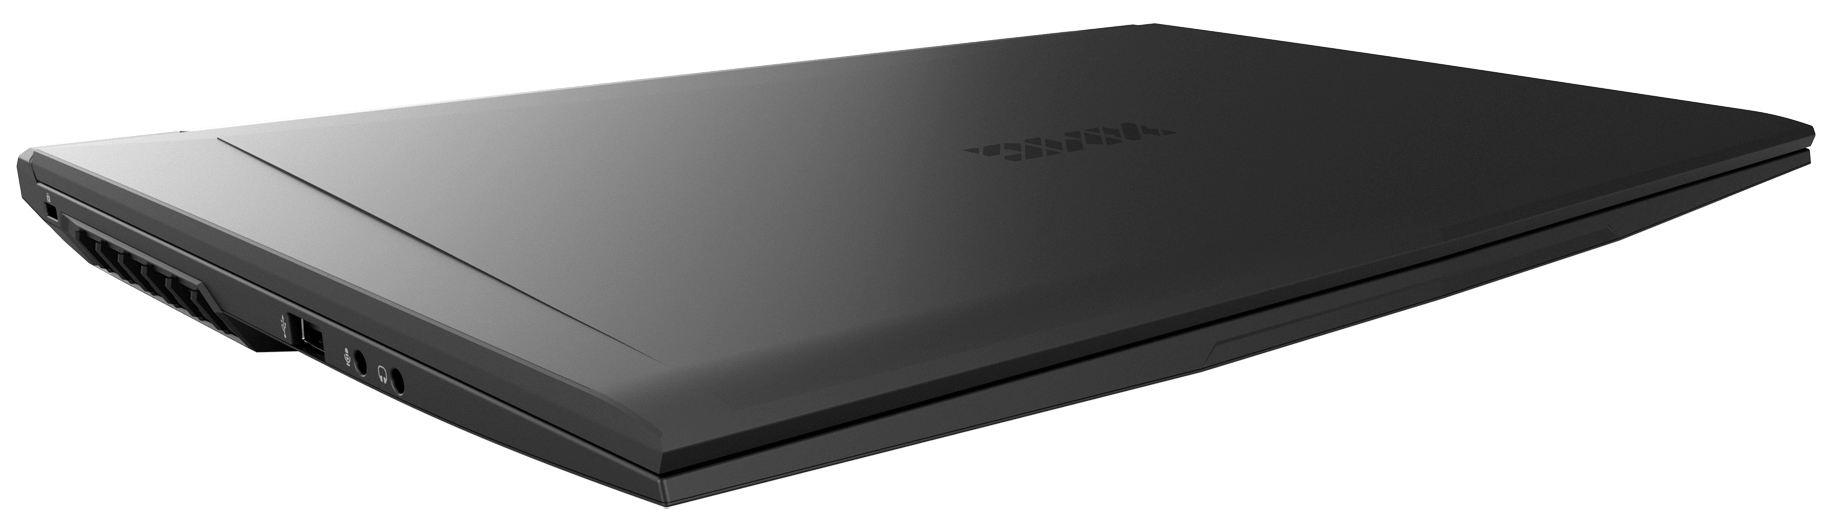
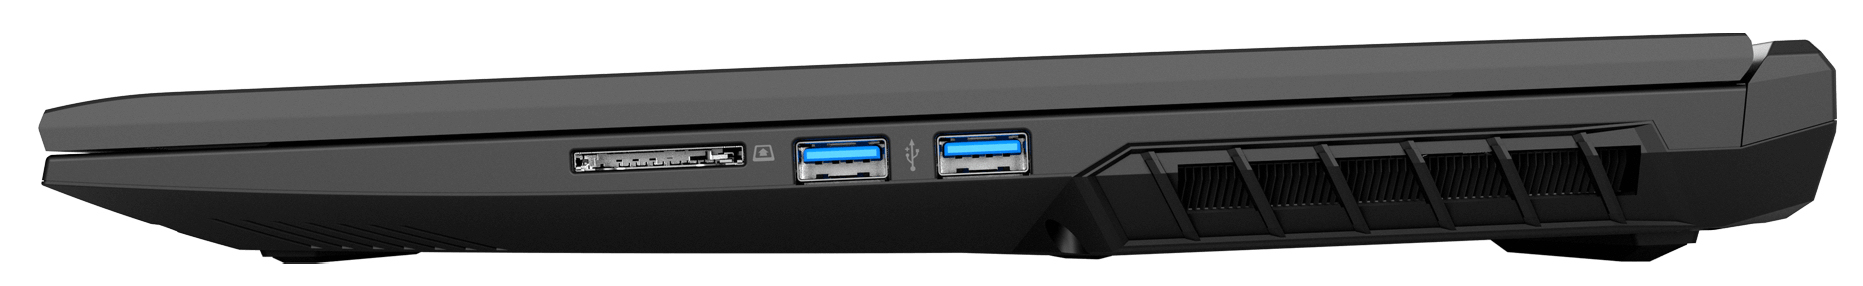
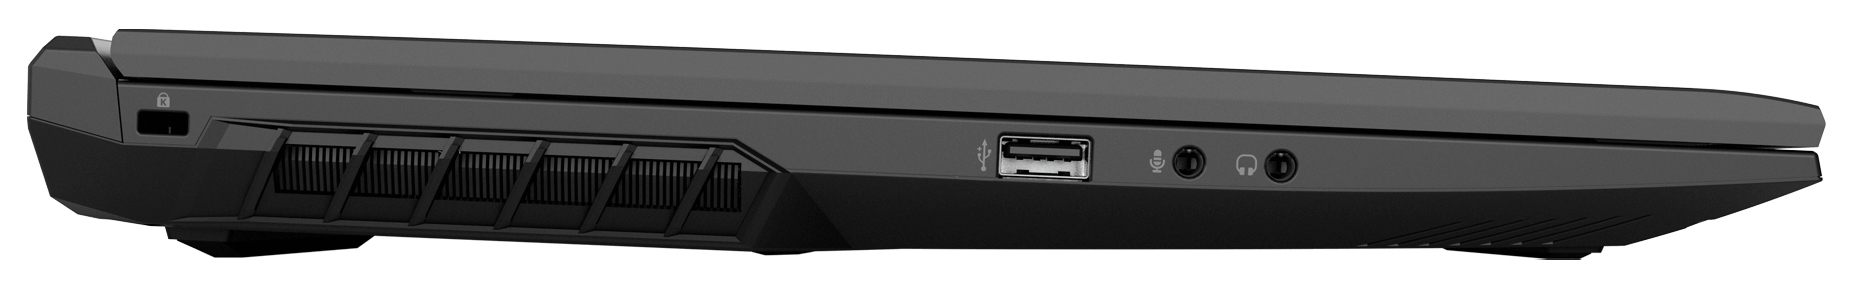
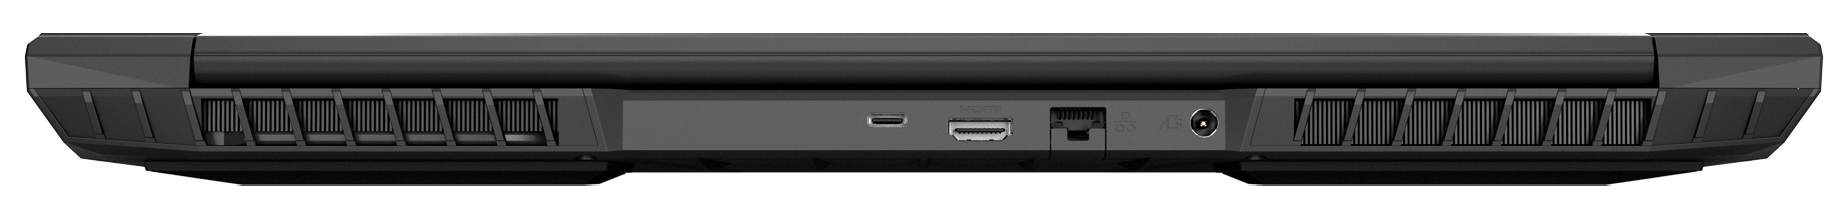
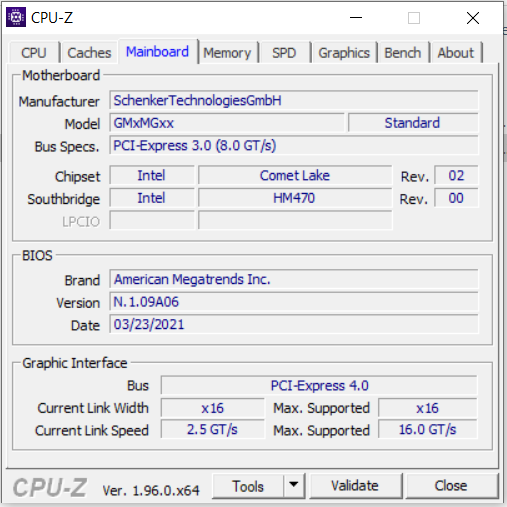
Conexões - O portátil Schenker não oferece Thunderbolt
Em termos de conexões, algo mudou em comparação com os predecessores: As duas conexões Mini-DisplayPort foram removidas, e a porta USB-C agora suporta o padrão USB 3.2 Gen 2 (antes: USB 3.2 Gen 1) e também DisplayPort via USB-C.
| SD Card Reader | |
| average JPG Copy Test (av. of 3 runs) | |
| Média da turma Gaming (20.9 - 210, n=54, últimos 2 anos) | |
| MSI Alpha 17 A4DEK (Toshiba Exceria Pro SDXC 64 GB UHS-II) | |
| Schenker XMG Core 17 (Toshiba Exceria Pro SDXC 64 GB UHS-II) | |
| Schenker XMG Core 17 Comet Lake (Toshiba Exceria Pro SDXC 64 GB UHS-II) | |
| Schenker XMG Core 17 (Early 2021) (AV PRO microSD 128 GB V60) | |
| maximum AS SSD Seq Read Test (1GB) | |
| Média da turma Gaming (25.5 - 261, n=51, últimos 2 anos) | |
| MSI Alpha 17 A4DEK (Toshiba Exceria Pro SDXC 64 GB UHS-II) | |
| Schenker XMG Core 17 (Toshiba Exceria Pro SDXC 64 GB UHS-II) | |
| Schenker XMG Core 17 Comet Lake (Toshiba Exceria Pro SDXC 64 GB UHS-II) | |
| Schenker XMG Core 17 (Early 2021) (AV PRO microSD 128 GB V60) | |
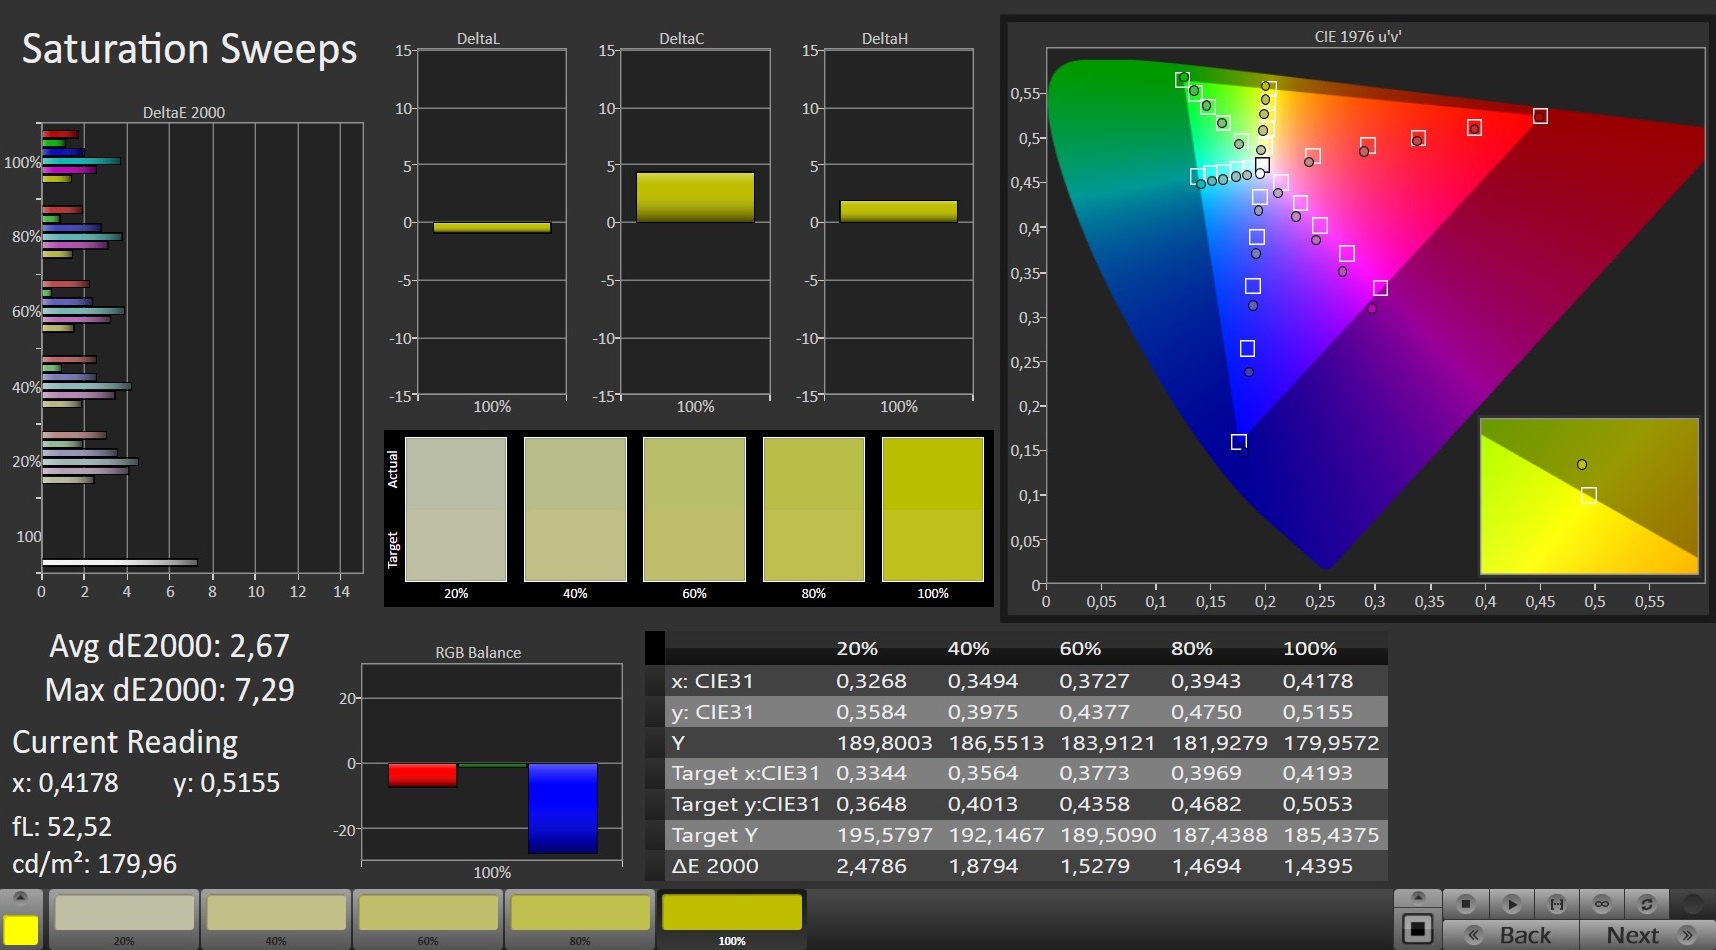
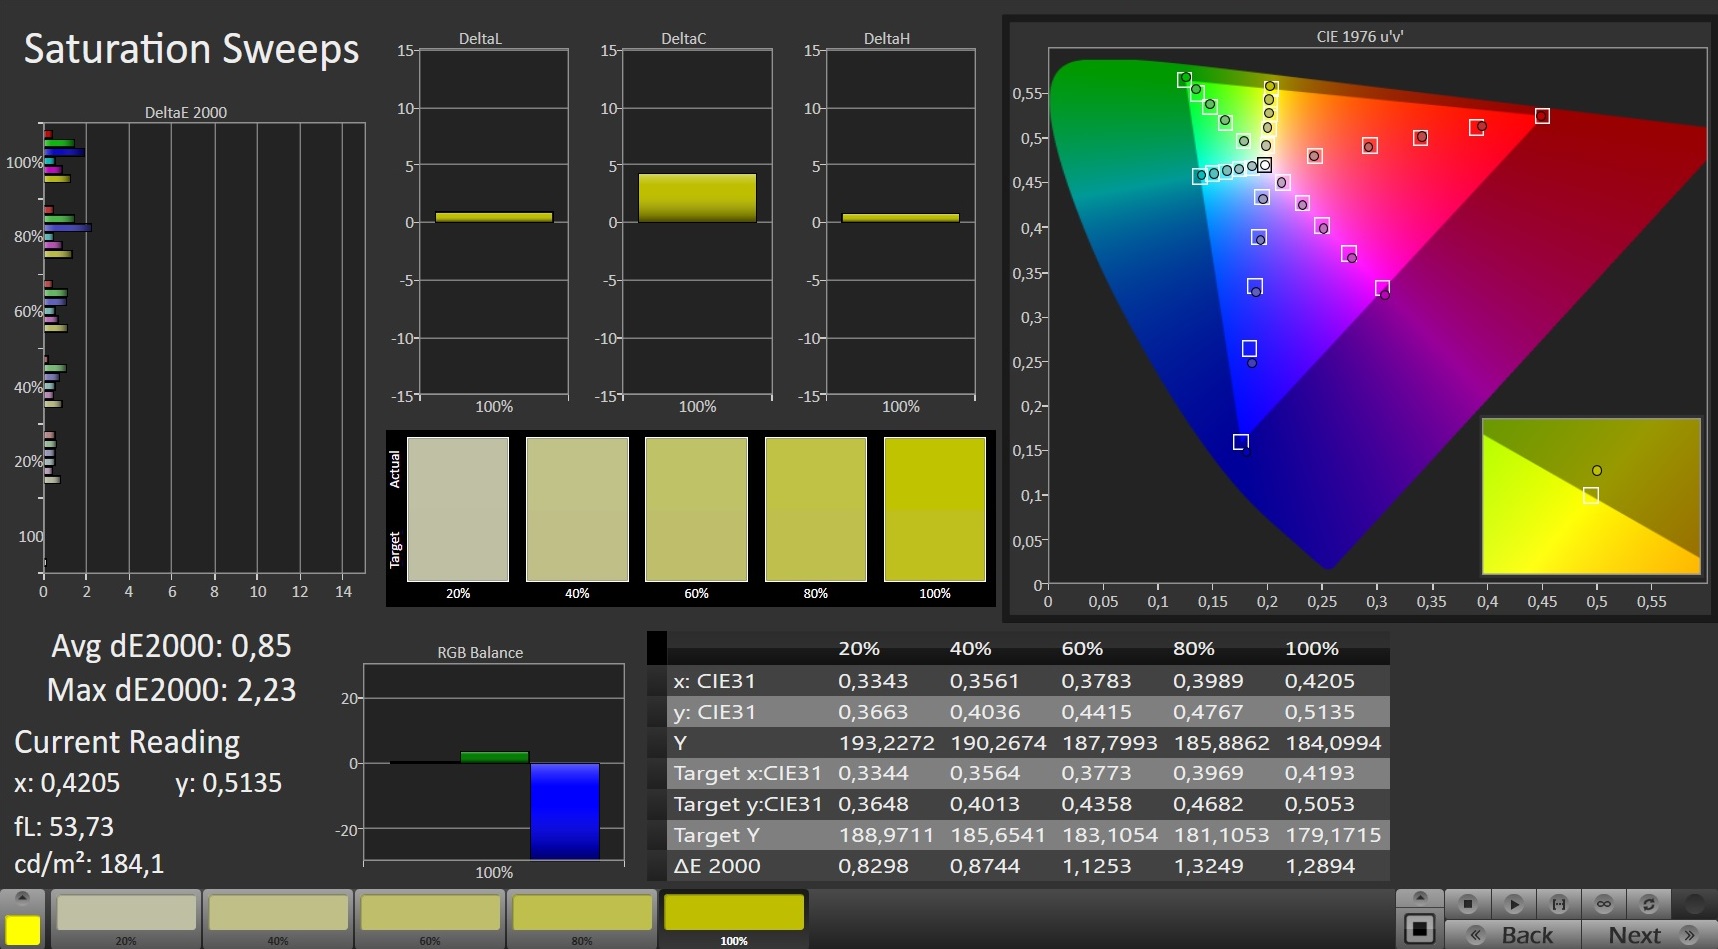
Display - 165 Hz WQHD IPS
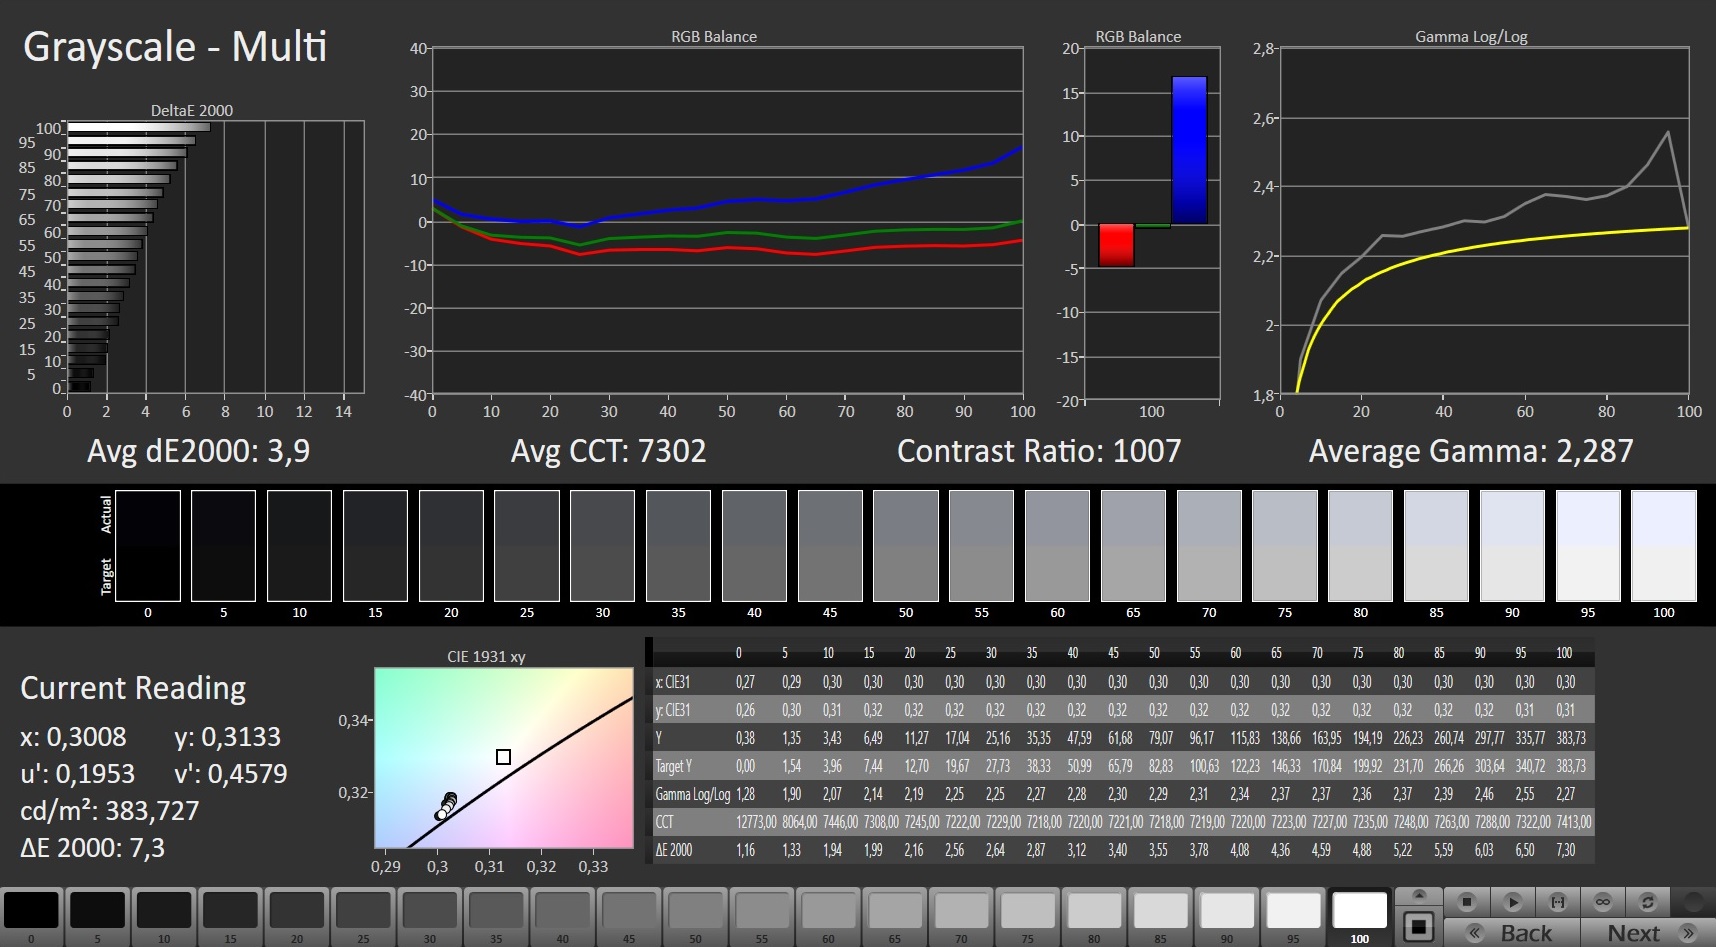
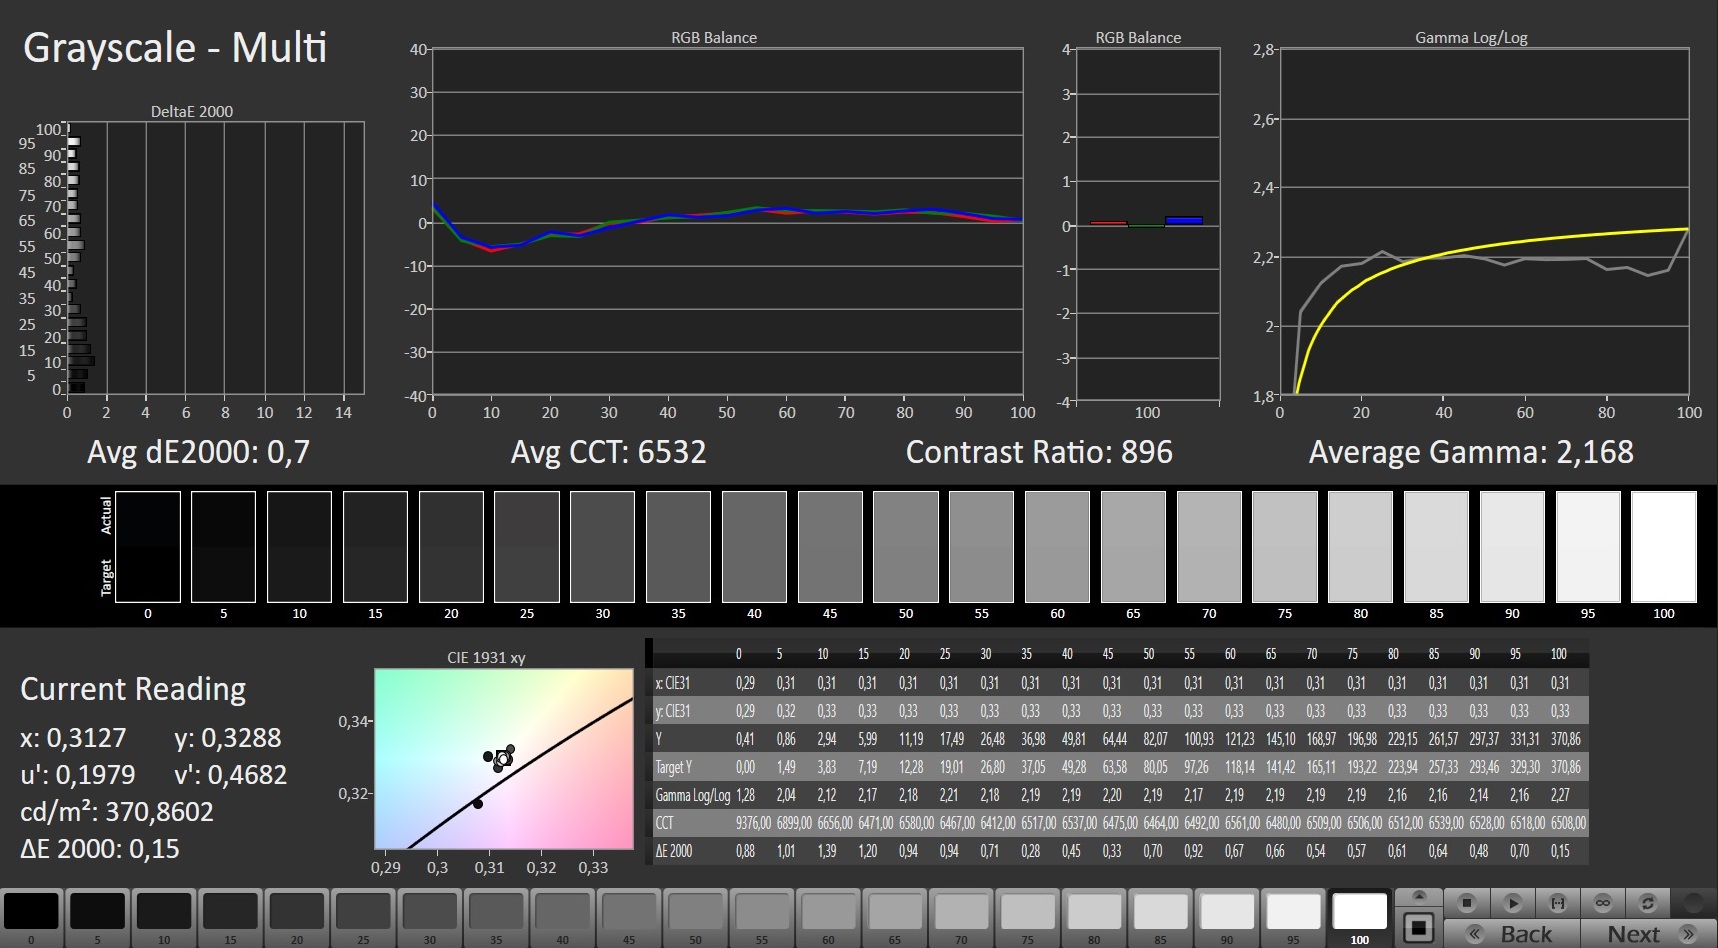
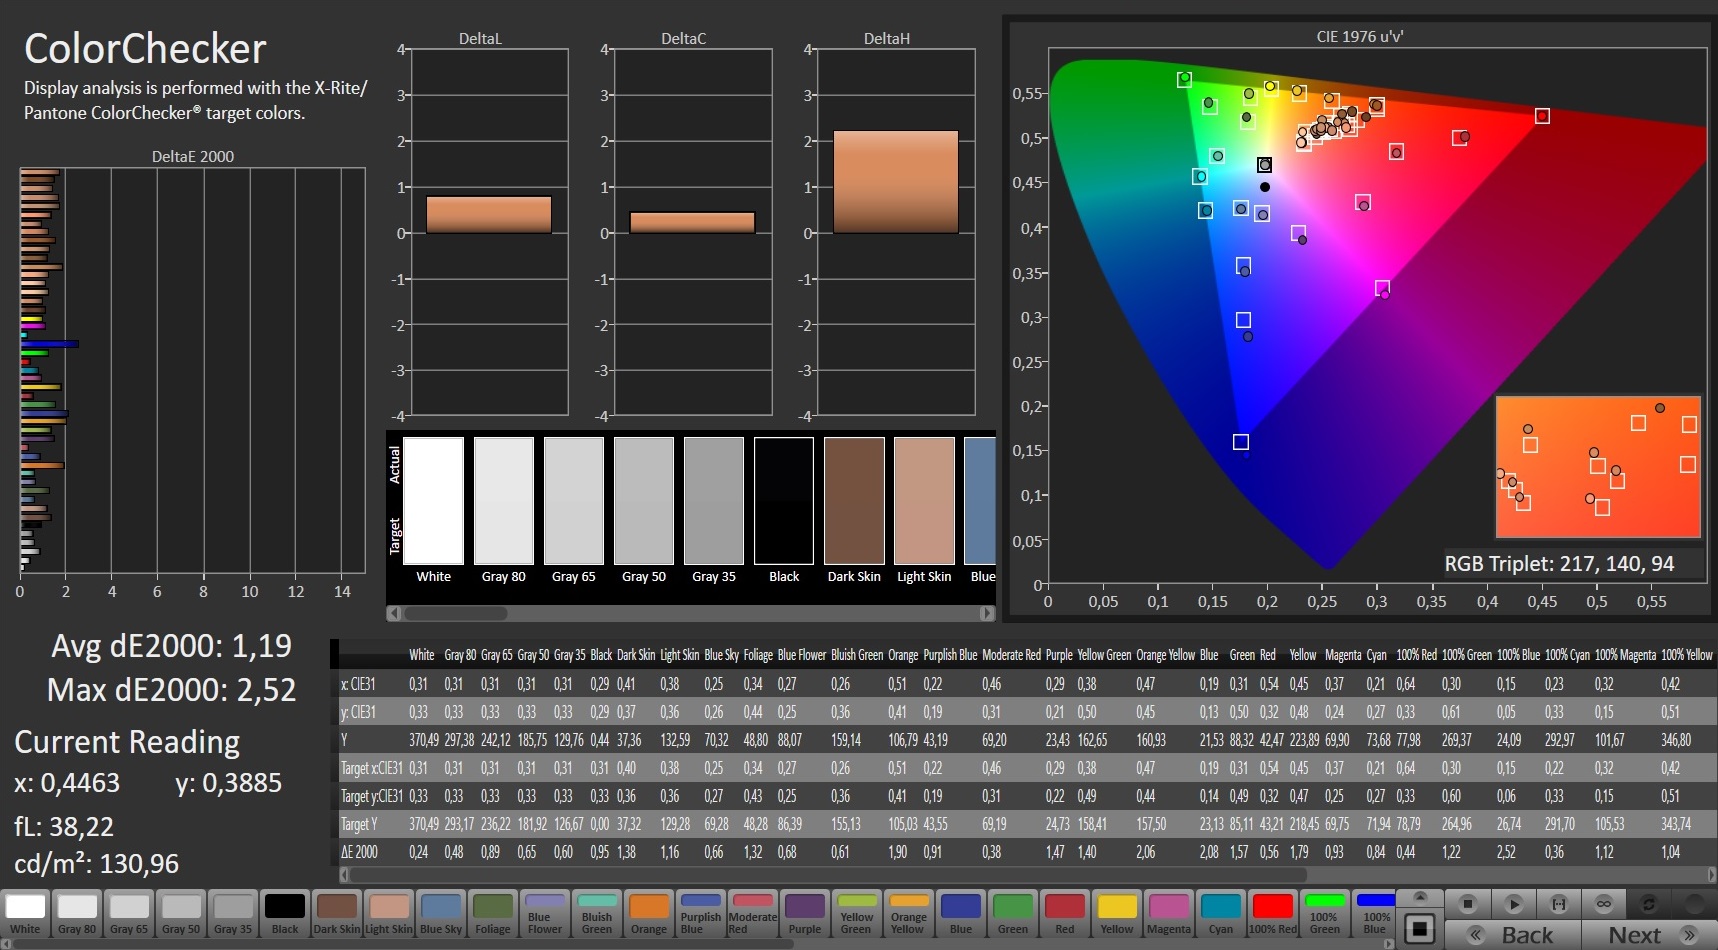
Enquanto o valor de brilho (332,7 cd/m²) do visor mate de 17,3 polegadas (2560 x 1440 pixels) se revela bom, o contraste (974:1) poderia usar alguma melhoria, mal faltando o alvo (> 1000:1). O painel de 165-Hz oferece tempos de resposta rápidos e não produz nenhum PWM cintilante. Alternativamente, a Schenker também oferece a opção de um display FHD (IPS, 144 Hz)
| |||||||||||||||||||||||||
iluminação: 84 %
iluminação com acumulador: 370 cd/m²
Contraste: 974:1 (Preto: 0.38 cd/m²)
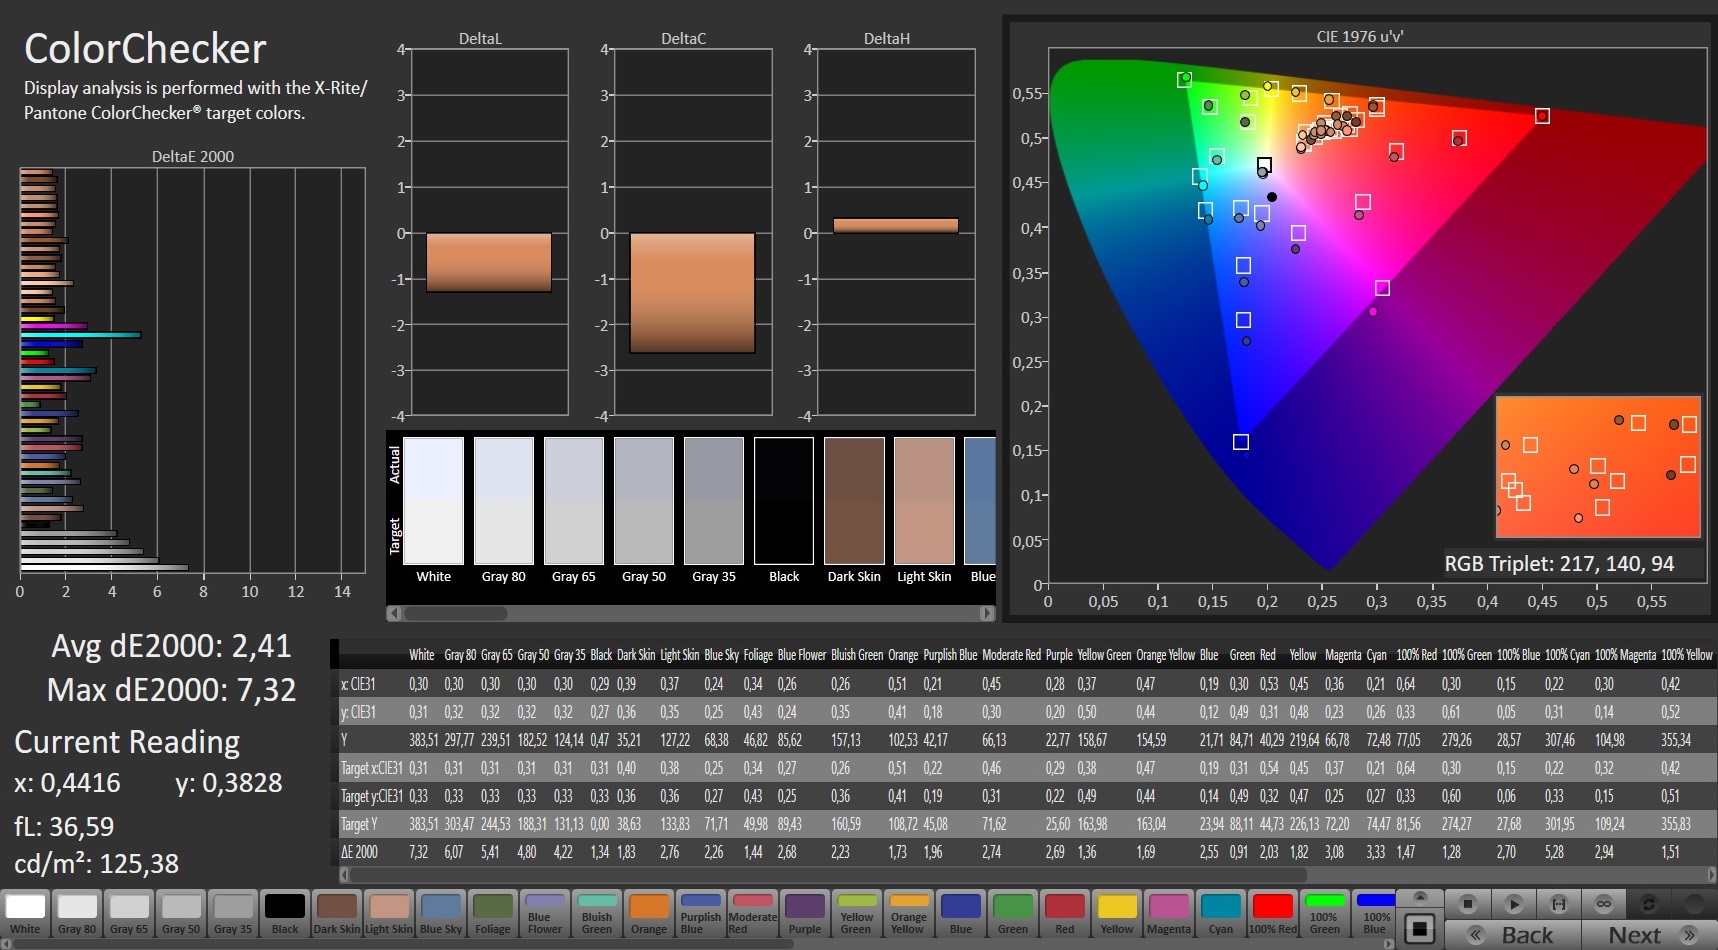
ΔE ColorChecker Calman: 2.41 | ∀{0.5-29.43 Ø4.71}
calibrated: 1.19
ΔE Greyscale Calman: 3.9 | ∀{0.09-98 Ø4.96}
93% sRGB (Argyll 1.6.3 3D)
69% AdobeRGB 1998 (Argyll 1.6.3 3D)
69.3% AdobeRGB 1998 (Argyll 3D)
98.5% sRGB (Argyll 3D)
68.1% Display P3 (Argyll 3D)
Gamma: 2.287
CCT: 7302 K
| Schenker XMG Core 17 (Early 2021) BOE CQ NE173QHM-NY2, IPS, 2560x1440, 17.3" | MSI Alpha 17 A4DEK AU Optronics AUO978F, IPS, 1920x1080, 17.3" | Acer Predator Helios 300 PH317-54-75G8 Chi Mei N173HCE-G33, IPS, 1920x1080, 17.3" | Medion Erazer Beast X10 MD61804 LG Phillips LP173WFG-SPB3, IPS, 1920x1080, 17.3" | Schenker XMG Core 17 LG Philips LP173WFG-SPB1 (LGD0615), IPS, 1920x1080, 17.3" | Schenker XMG Core 17 Comet Lake BOE HF NV173FHM-N44, IPS, 1920x1080, 17.3" | |
|---|---|---|---|---|---|---|
| Display | -41% | -6% | -4% | -4% | -5% | |
| Display P3 Coverage (%) | 68.1 | 39.55 -42% | 62.6 -8% | 64.5 -5% | 64.4 -5% | 65.3 -4% |
| sRGB Coverage (%) | 98.5 | 59.2 -40% | 94.3 -4% | 95.6 -3% | 95.6 -3% | 92.6 -6% |
| AdobeRGB 1998 Coverage (%) | 69.3 | 40.86 -41% | 64.7 -7% | 65.6 -5% | 65.6 -5% | 66.5 -4% |
| Response Times | -165% | -3% | 7% | 9% | -3% | |
| Response Time Grey 50% / Grey 80% * (ms) | 16.8 ? | 40 ? -138% | 16.4 ? 2% | 14.4 ? 14% | 14.4 ? 14% | 17.6 ? -5% |
| Response Time Black / White * (ms) | 10 ? | 29.2 ? -192% | 10.8 ? -8% | 10 ? -0% | 9.6 ? 4% | 10 ? -0% |
| PWM Frequency (Hz) | 24510 ? | 1000 ? | ||||
| Screen | -46% | 27% | -5% | 1% | -16% | |
| Brightness middle (cd/m²) | 370 | 254 -31% | 322 -13% | 313 -15% | 329 -11% | 315 -15% |
| Brightness (cd/m²) | 333 | 254 -24% | 308 -8% | 297 -11% | 286 -14% | 298 -11% |
| Brightness Distribution (%) | 84 | 93 11% | 92 10% | 88 5% | 79 -6% | 88 5% |
| Black Level * (cd/m²) | 0.38 | 0.23 39% | 0.18 53% | 0.27 29% | 0.3 21% | 0.29 24% |
| Contrast (:1) | 974 | 1104 13% | 1789 84% | 1159 19% | 1097 13% | 1086 11% |
| Colorchecker dE 2000 * | 2.41 | 4.12 -71% | 1.53 37% | 2.96 -23% | 2.52 -5% | 4.3 -78% |
| Colorchecker dE 2000 max. * | 7.32 | 19.66 -169% | 3.14 57% | 9.83 -34% | 6.9 6% | 7.3 -0% |
| Colorchecker dE 2000 calibrated * | 1.19 | 3.78 -218% | 0.74 38% | 1.03 13% | 1.31 -10% | 2.29 -92% |
| Greyscale dE 2000 * | 3.9 | 3.2 18% | 1.9 51% | 4.9 -26% | 2.98 24% | 4.3 -10% |
| Gamma | 2.287 96% | 2.179 101% | 2.144 103% | 2.187 101% | 2.38 92% | 2.084 106% |
| CCT | 7302 89% | 6754 96% | 6809 95% | 7559 86% | 6738 96% | 7434 87% |
| Color Space (Percent of AdobeRGB 1998) (%) | 69 | 41 -41% | 65 -6% | 66 -4% | 60 -13% | 66 -4% |
| Color Space (Percent of sRGB) (%) | 93 | 59 -37% | 87 -6% | 89 -4% | 95 2% | 92 -1% |
| Média Total (Programa/Configurações) | -84% /
-60% | 6% /
17% | -1% /
-3% | 2% /
1% | -8% /
-12% |
* ... menor é melhor
No estado de entrega, o visor oferece uma boa reprodução de cores, atendendo ao alvo (Delta E < 3) com um desvio de cor de 2,41. O mostrador não sofre de uma coloração azul. Através da calibração, é possível obter algumas melhorias, com o desvio de cor caindo para 1,19 e o display em escala de cinza se tornando mais equilibrado. Os espaços de cor AdobeRGB (69%) e sRGB (93%) não são totalmente cobertos
Exibir tempos de resposta
| ↔ Tempo de resposta preto para branco | ||
|---|---|---|
| 10 ms ... ascensão ↗ e queda ↘ combinadas | ↗ 4.8 ms ascensão | 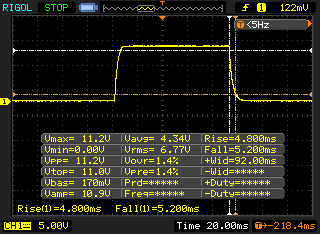 |
| ↘ 5.2 ms queda | ||
| A tela mostra boas taxas de resposta em nossos testes, mas pode ser muito lenta para jogadores competitivos. Em comparação, todos os dispositivos testados variam de 0.1 (mínimo) a 240 (máximo) ms. » 27 % de todos os dispositivos são melhores. Isso significa que o tempo de resposta medido é melhor que a média de todos os dispositivos testados (19.8 ms). | ||
| ↔ Tempo de resposta 50% cinza a 80% cinza | ||
| 16.8 ms ... ascensão ↗ e queda ↘ combinadas | ↗ 8.4 ms ascensão | 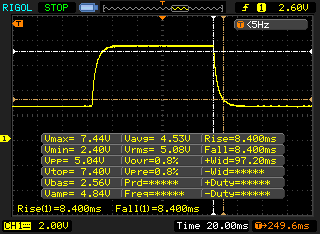 |
| ↘ 8.4 ms queda | ||
| A tela mostra boas taxas de resposta em nossos testes, mas pode ser muito lenta para jogadores competitivos. Em comparação, todos os dispositivos testados variam de 0.165 (mínimo) a 636 (máximo) ms. » 31 % de todos os dispositivos são melhores. Isso significa que o tempo de resposta medido é melhor que a média de todos os dispositivos testados (31 ms). | ||
Cintilação da tela / PWM (modulação por largura de pulso)
| Tela tremeluzindo / PWM não detectado | 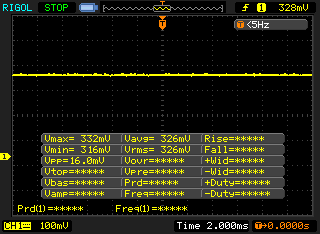 | ||
[pwm_comparison] Em comparação: 52 % de todos os dispositivos testados não usam PWM para escurecer a tela. Se PWM foi detectado, uma média de 7754 (mínimo: 5 - máximo: 343500) Hz foi medida. | |||
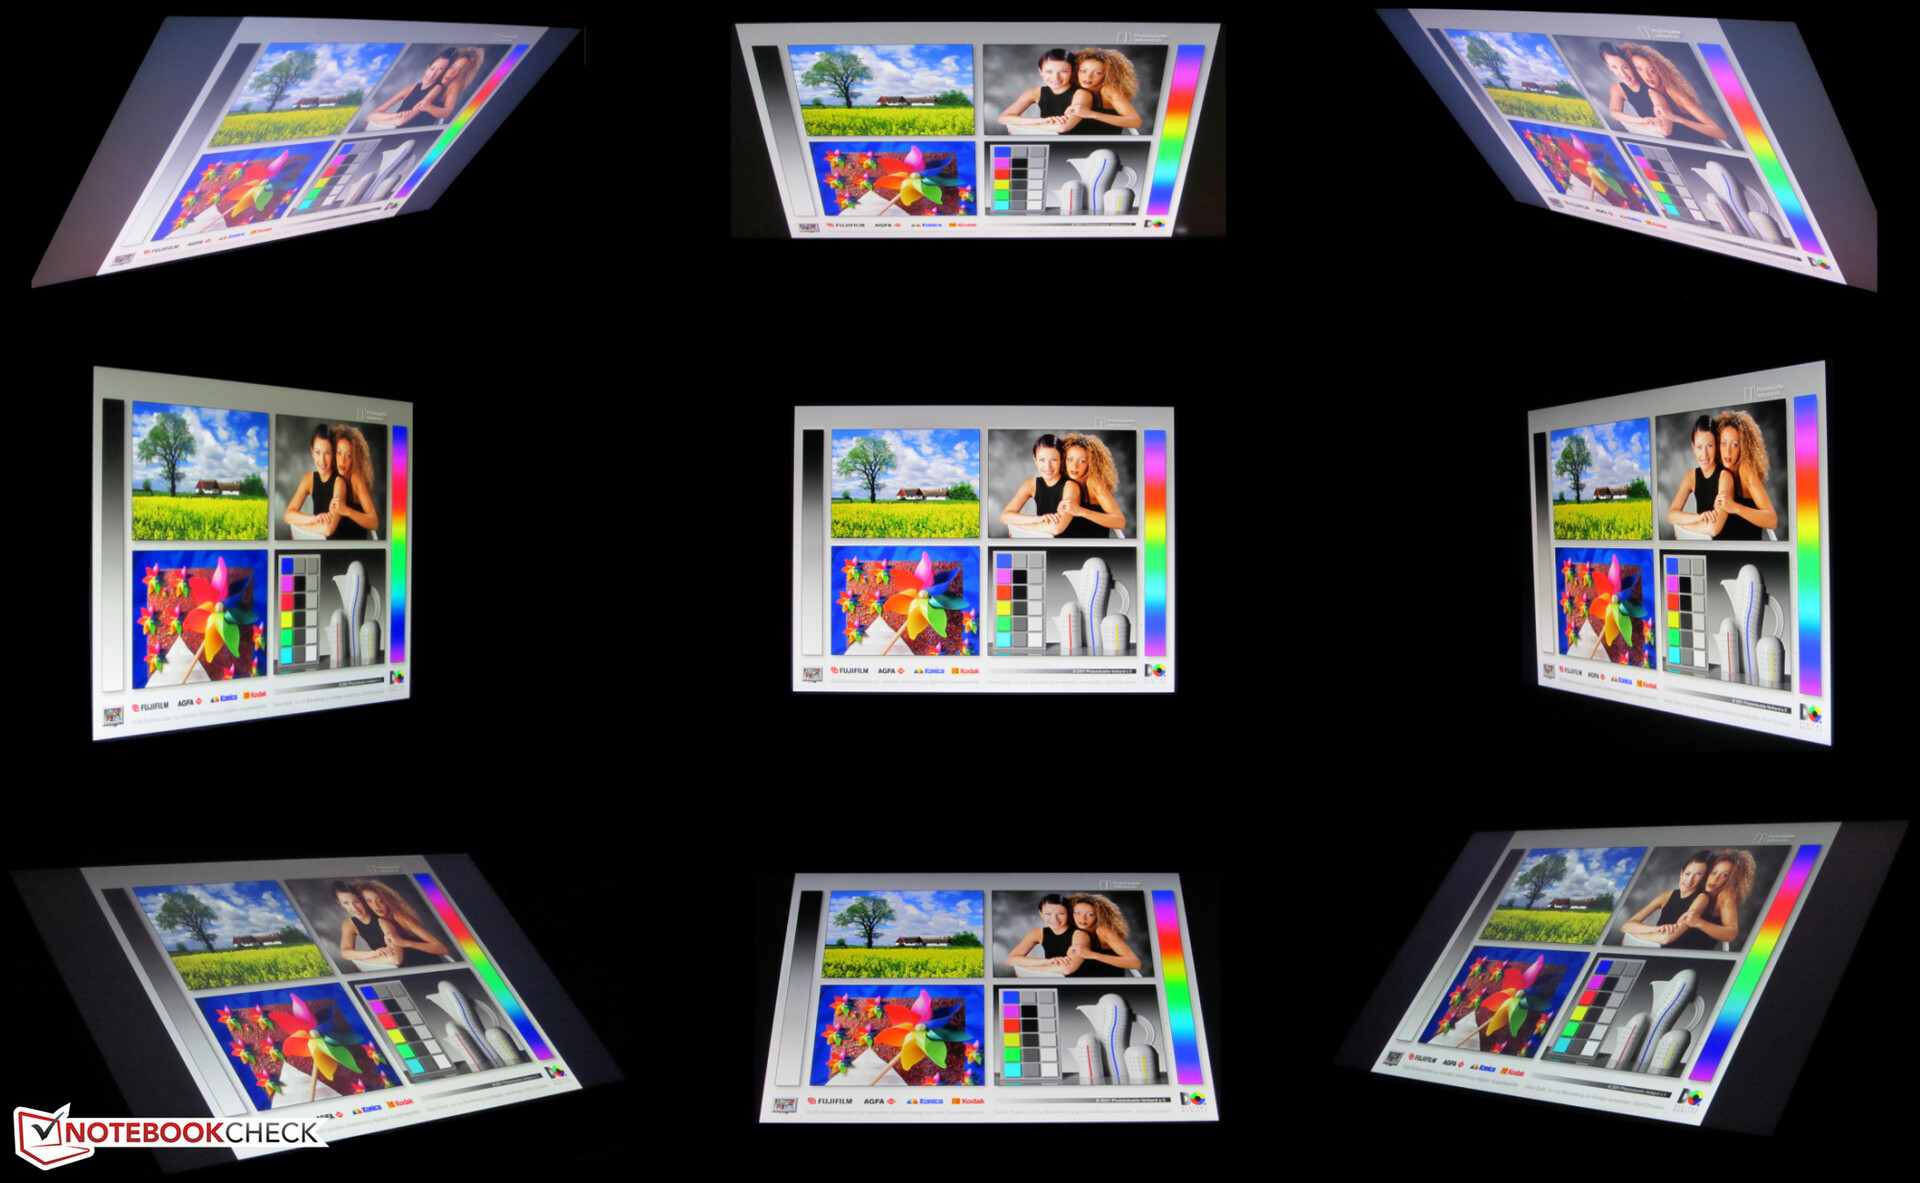
Os ângulos de visualização do painel IPS são estáveis e o conteúdo do display pode ser lido de qualquer posição. Ao ar livre, o conteúdo do display pode ser lido se o sol não estiver muito claro
Desempenho - Suficiente para os próximos anos
O XMG Core 17 é capaz de trazer cada jogo atual para a tela suavemente e também atinge uma boa figura em todas as outras áreas de aplicação

Condições de teste
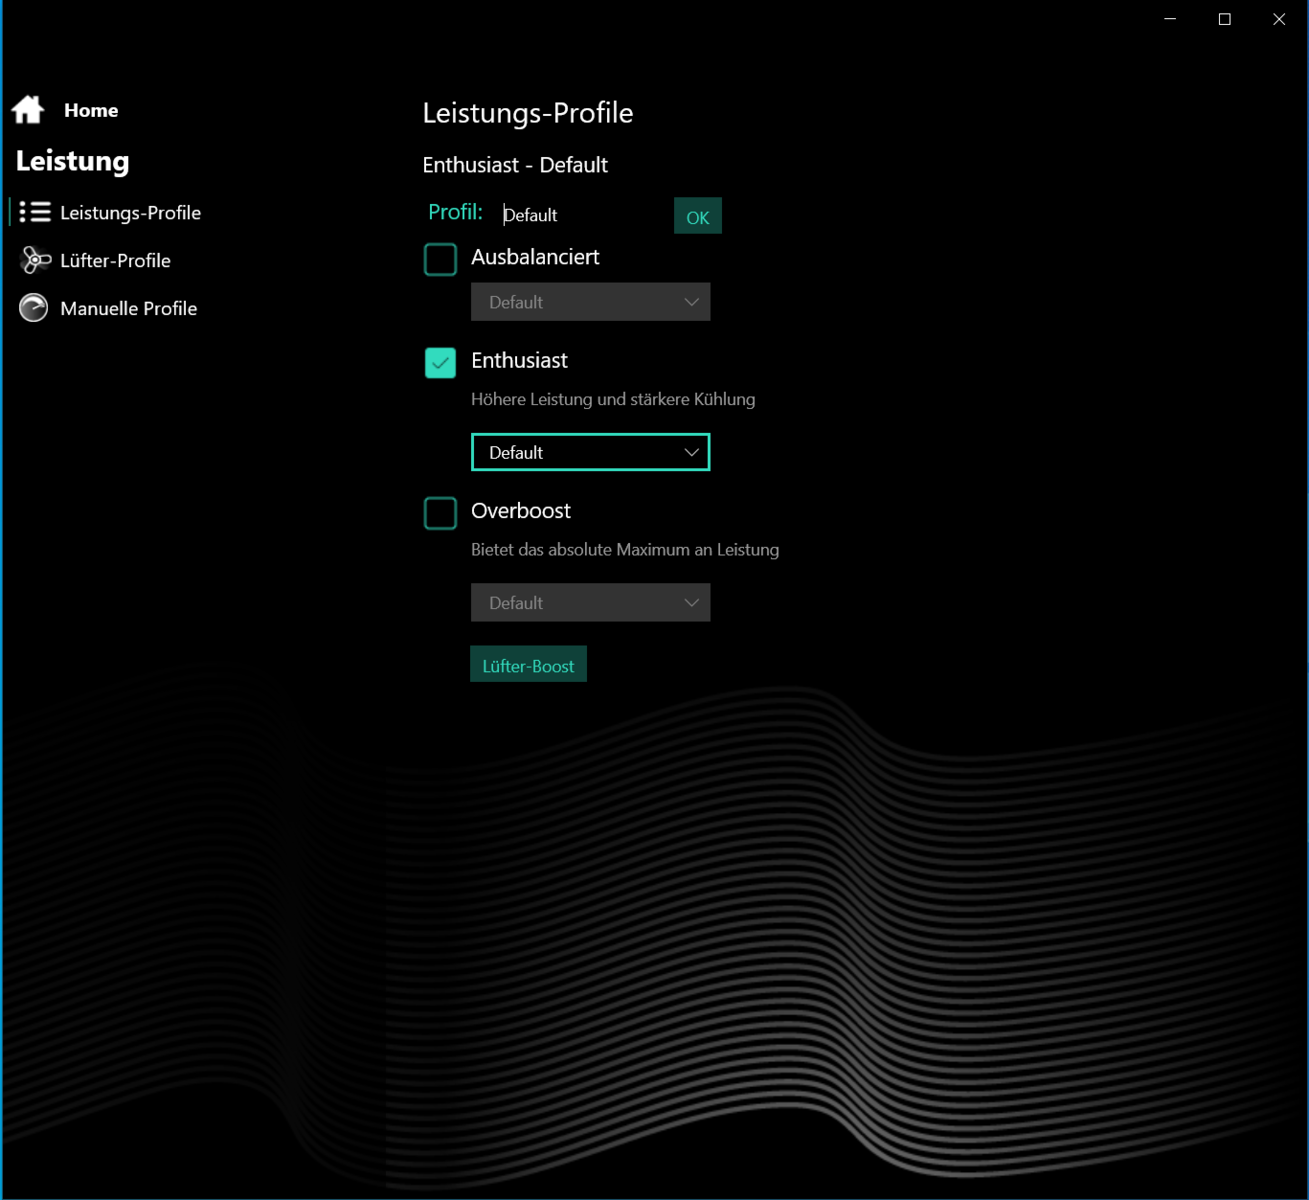
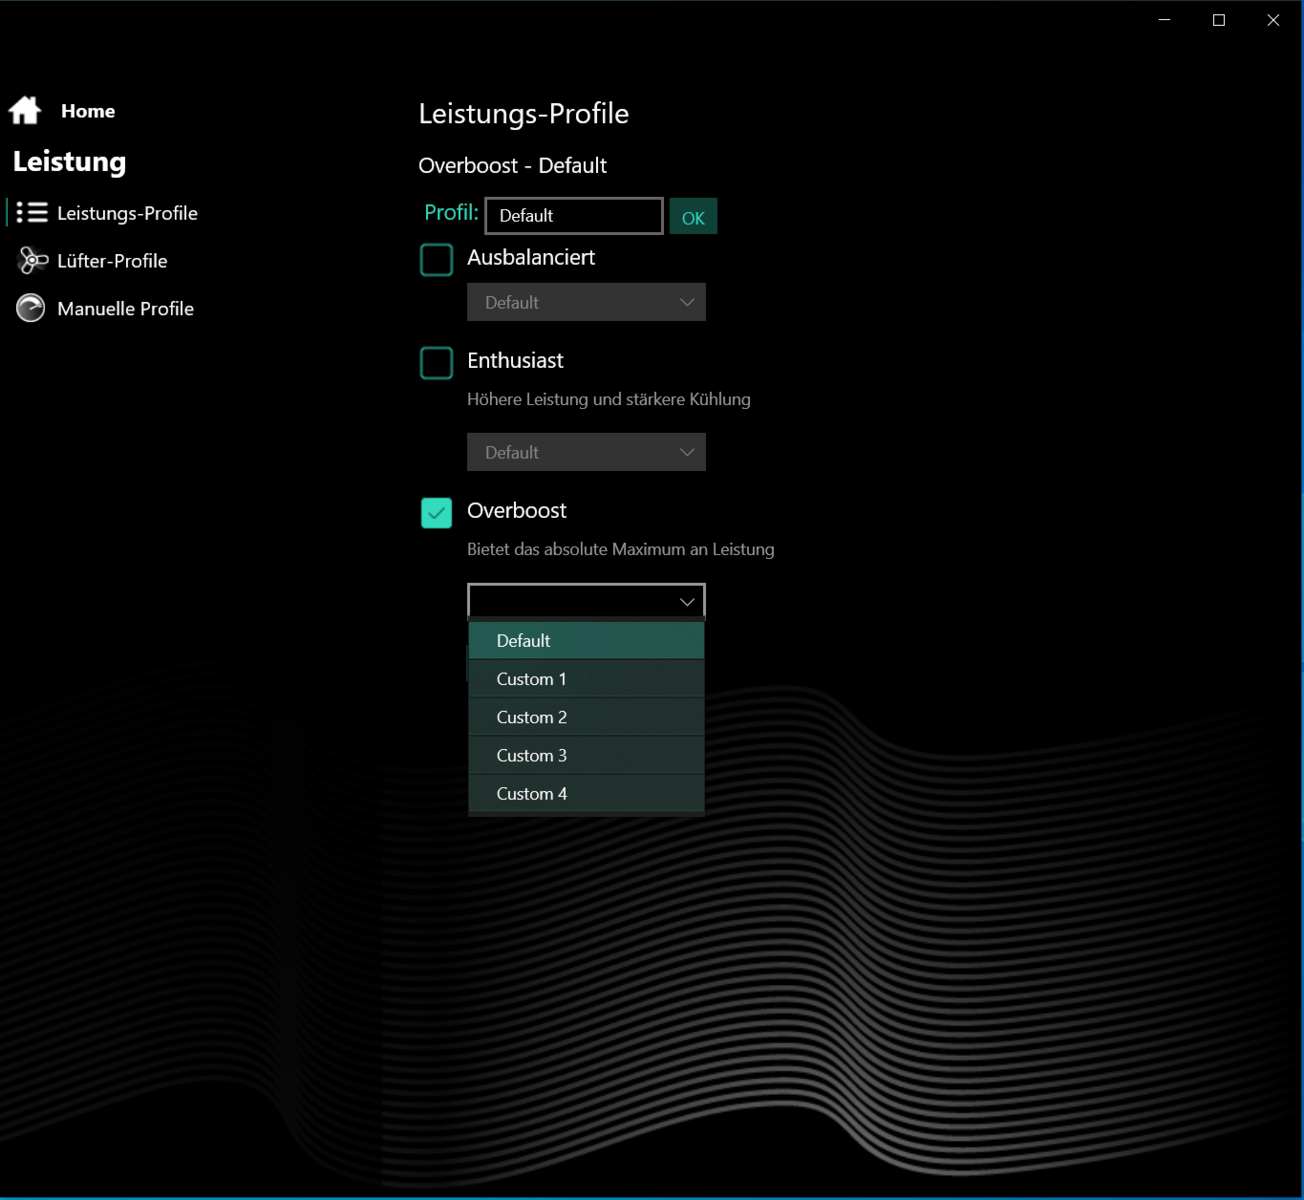
Você pode alternar entre os três perfis de desempenho "Balanceado", "Enthusiast" e "Overboost" através do Centro de Controle pré-instalado ou da chave de comutação de perfil (ao lado do botão de alimentação). Para nosso teste, usamos o perfil "Enthusiast" (PL1/PL2: 60 watts) e o controle automático do ventilador. Vários pontos de referência também foram executados com o perfil "Overboost" (PL1/PL2: 75 watts) ativado. Durante os testes de bateria, utilizamos o perfil "Balanceado" (PL1/PL2: 35 watts).
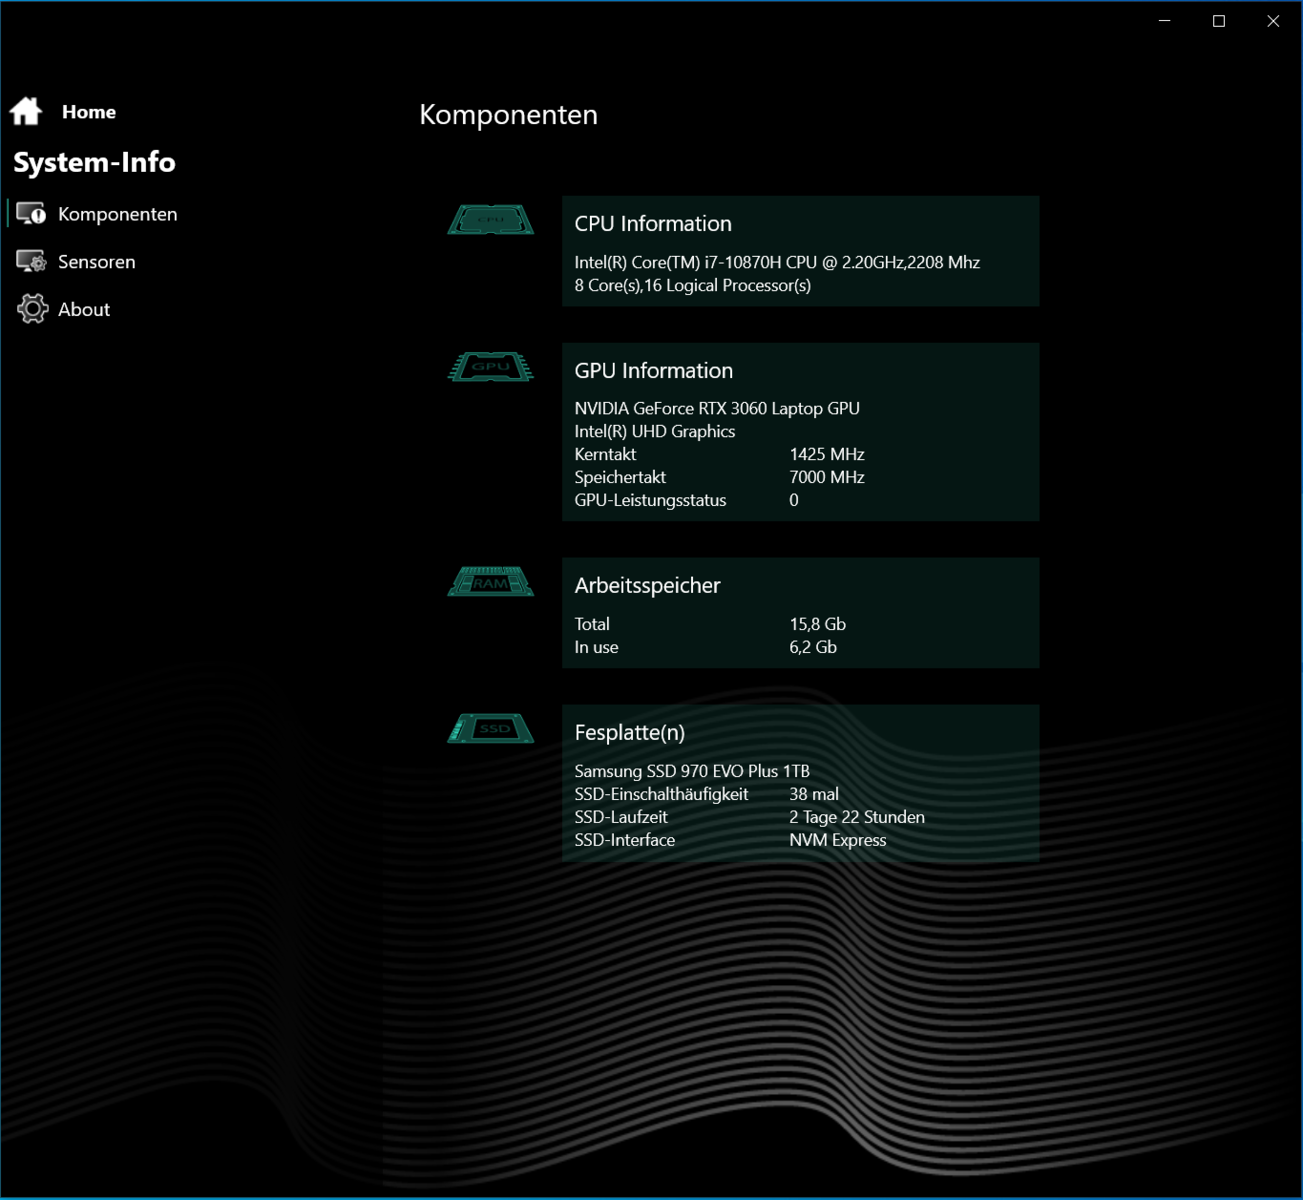
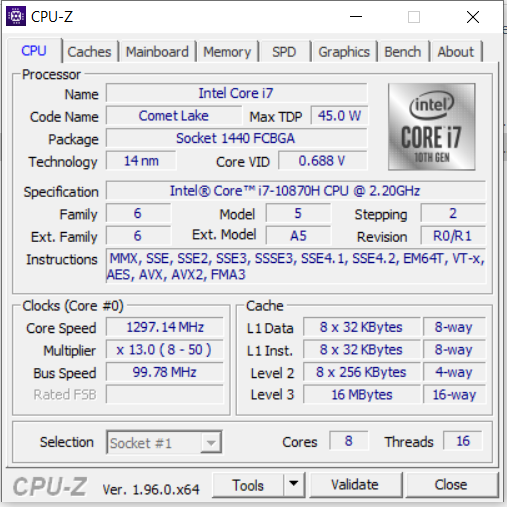
Processador
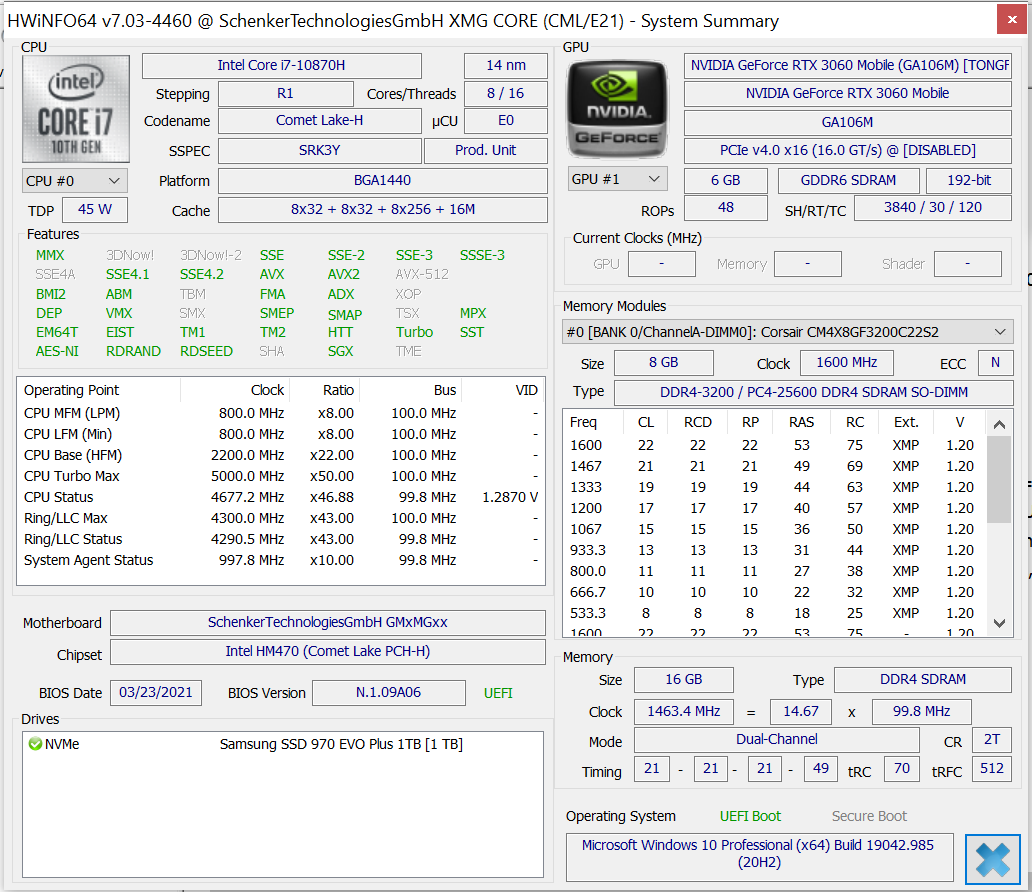
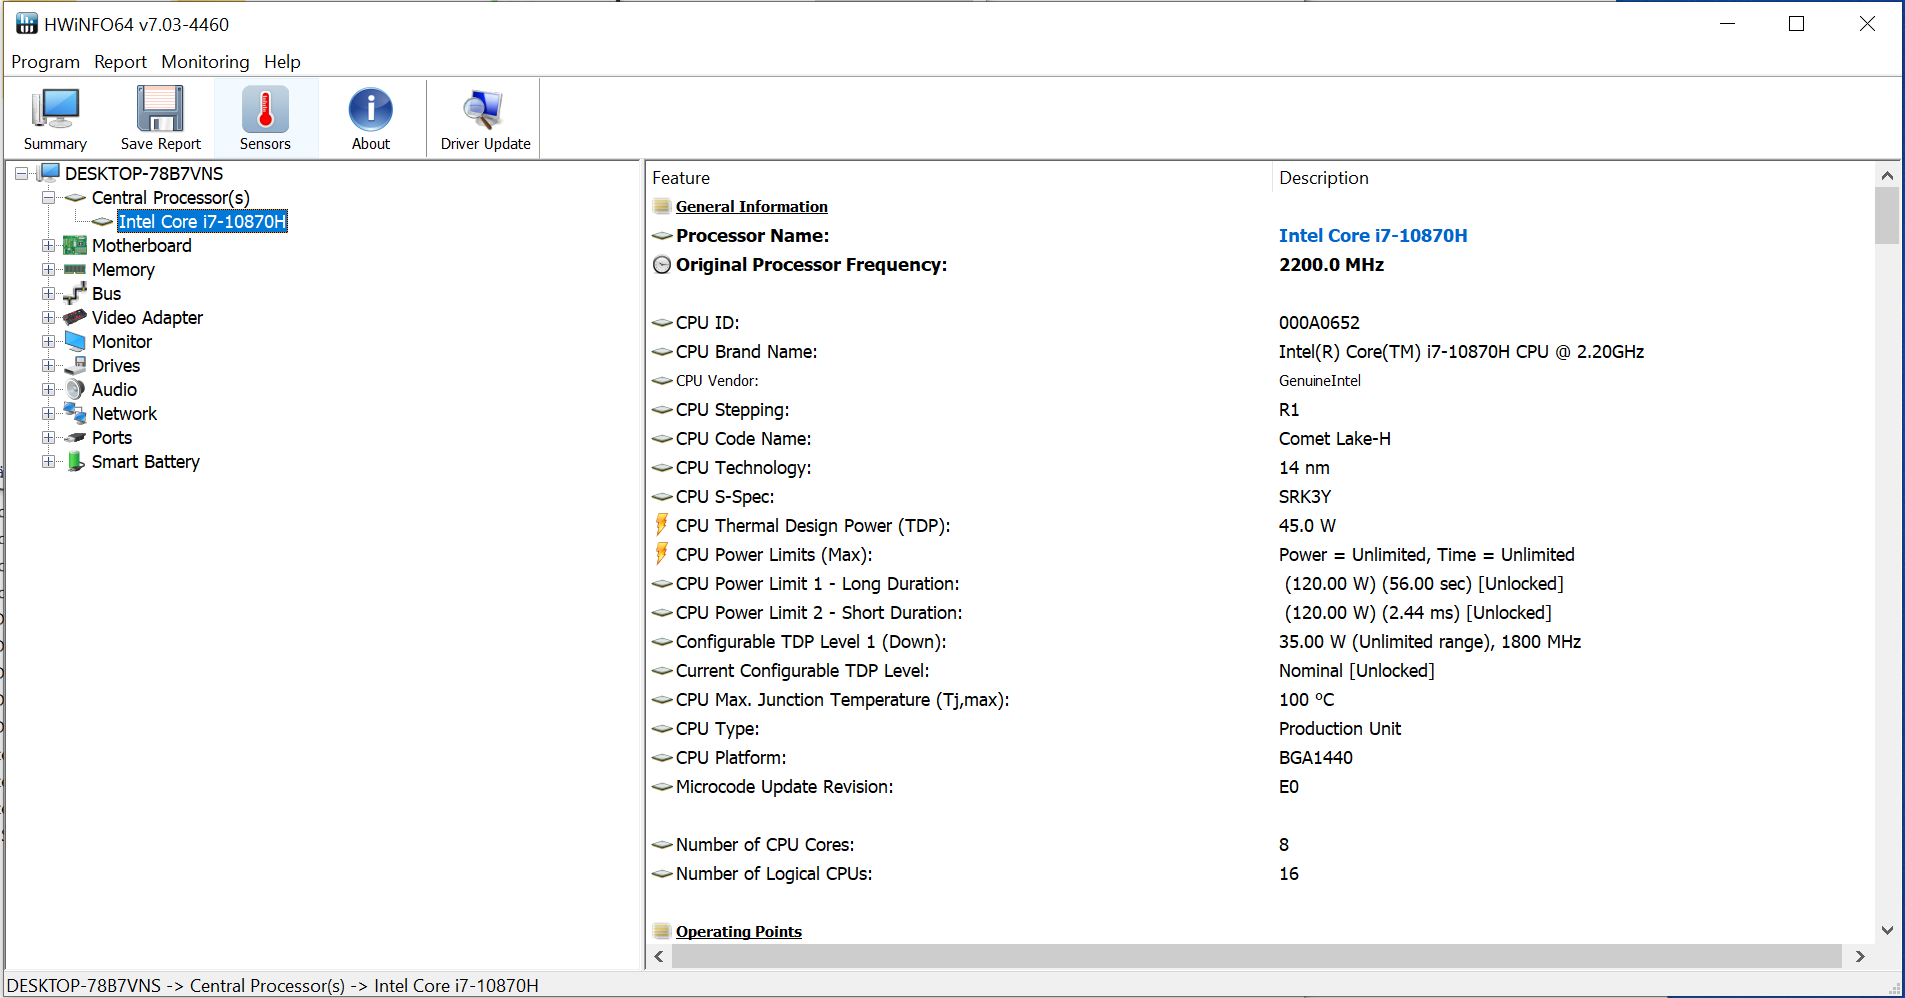
ONúcleo i7-10870HO processador octa-core (Comet Lake) funciona a uma velocidade de relógio básica de 2,2 GHz. Através do Turbo, isto pode ser aumentado até um máximo de 4,2 GHz (oito núcleos) e 5 GHz (um núcleo). Suporta hiperthreading (dois fios por núcleo).
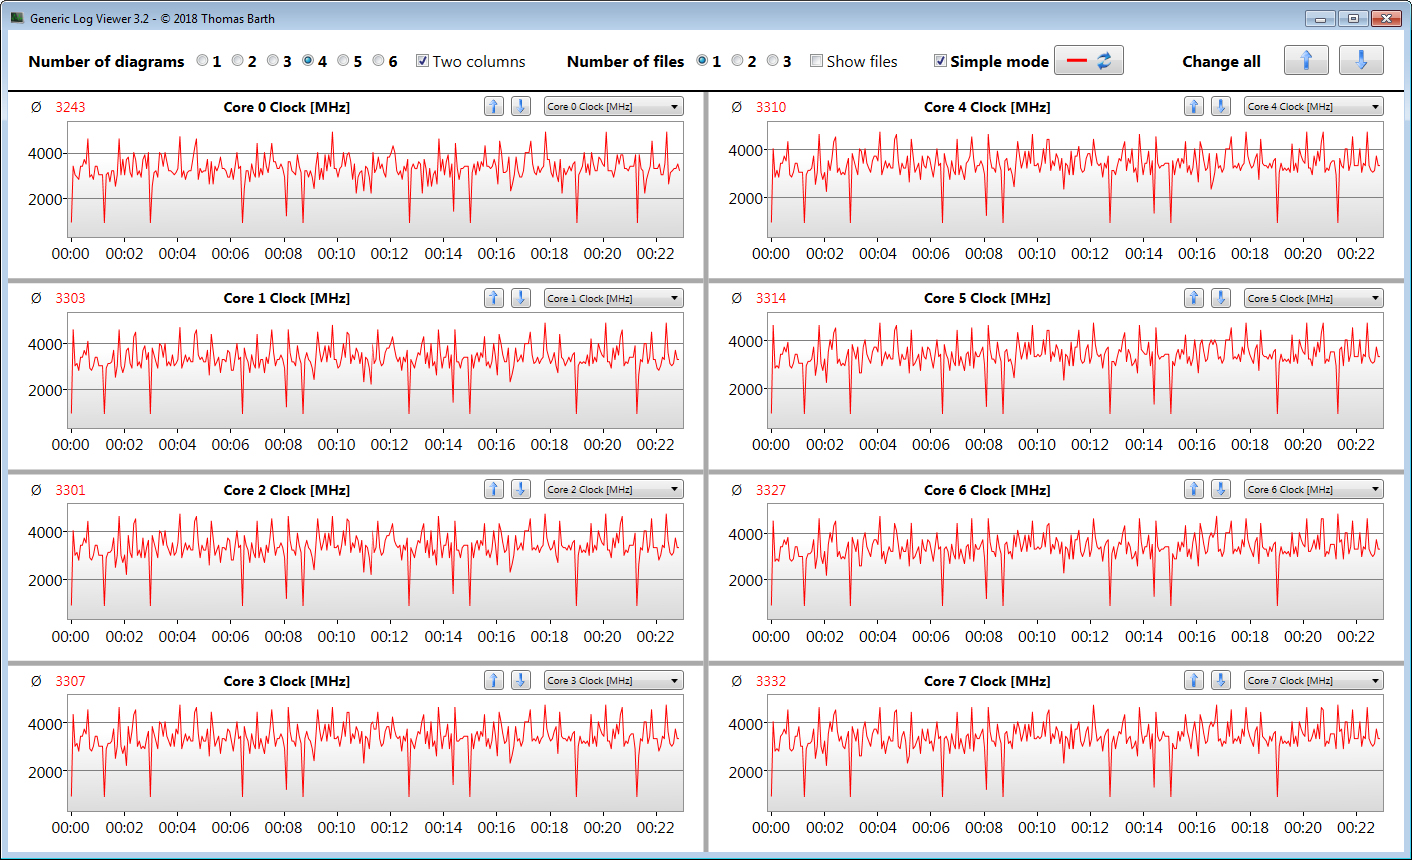
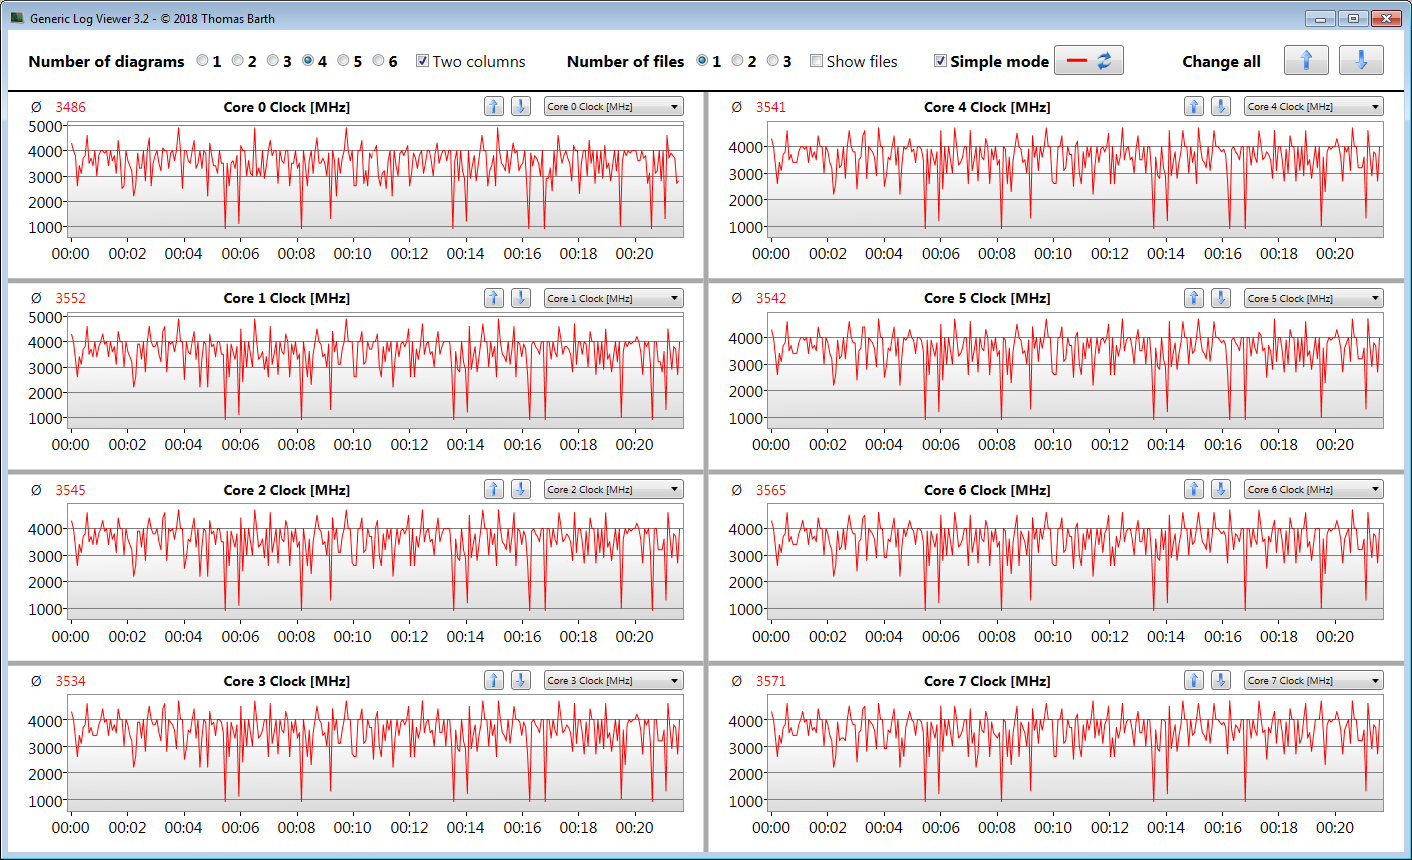
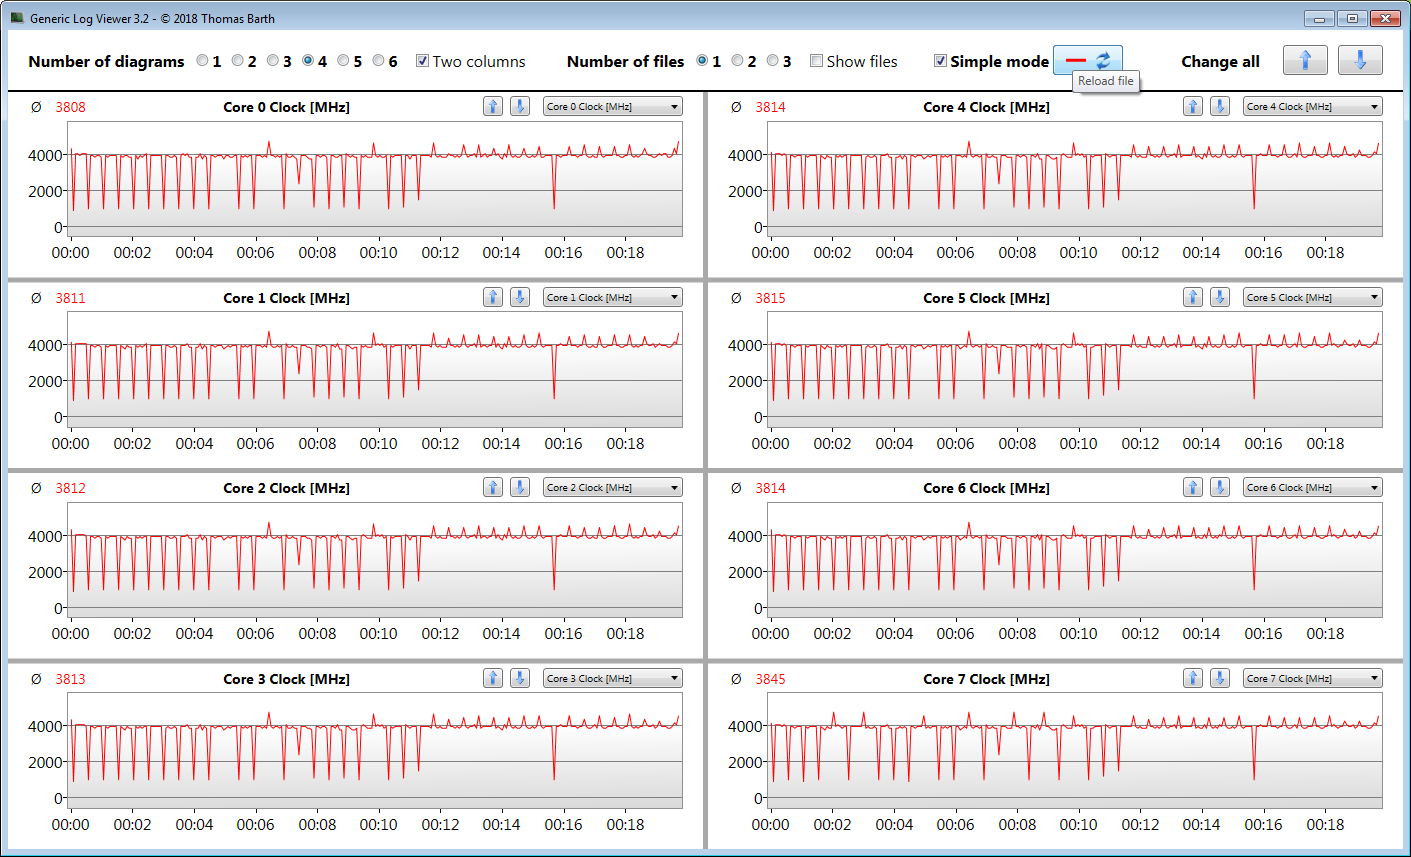
O processador passa pelos testes de CPU do benchmark Cinebench R15 em 3 a 3,8 GHz (multi-thread) e 4 a 4,8 GHz (single thread). Na operação por bateria, a CPU opera em velocidades de relógio entre 2,6 e 2,9 GHz (multifios) e entre 2,4 e 4,2 GHz (rosca única).
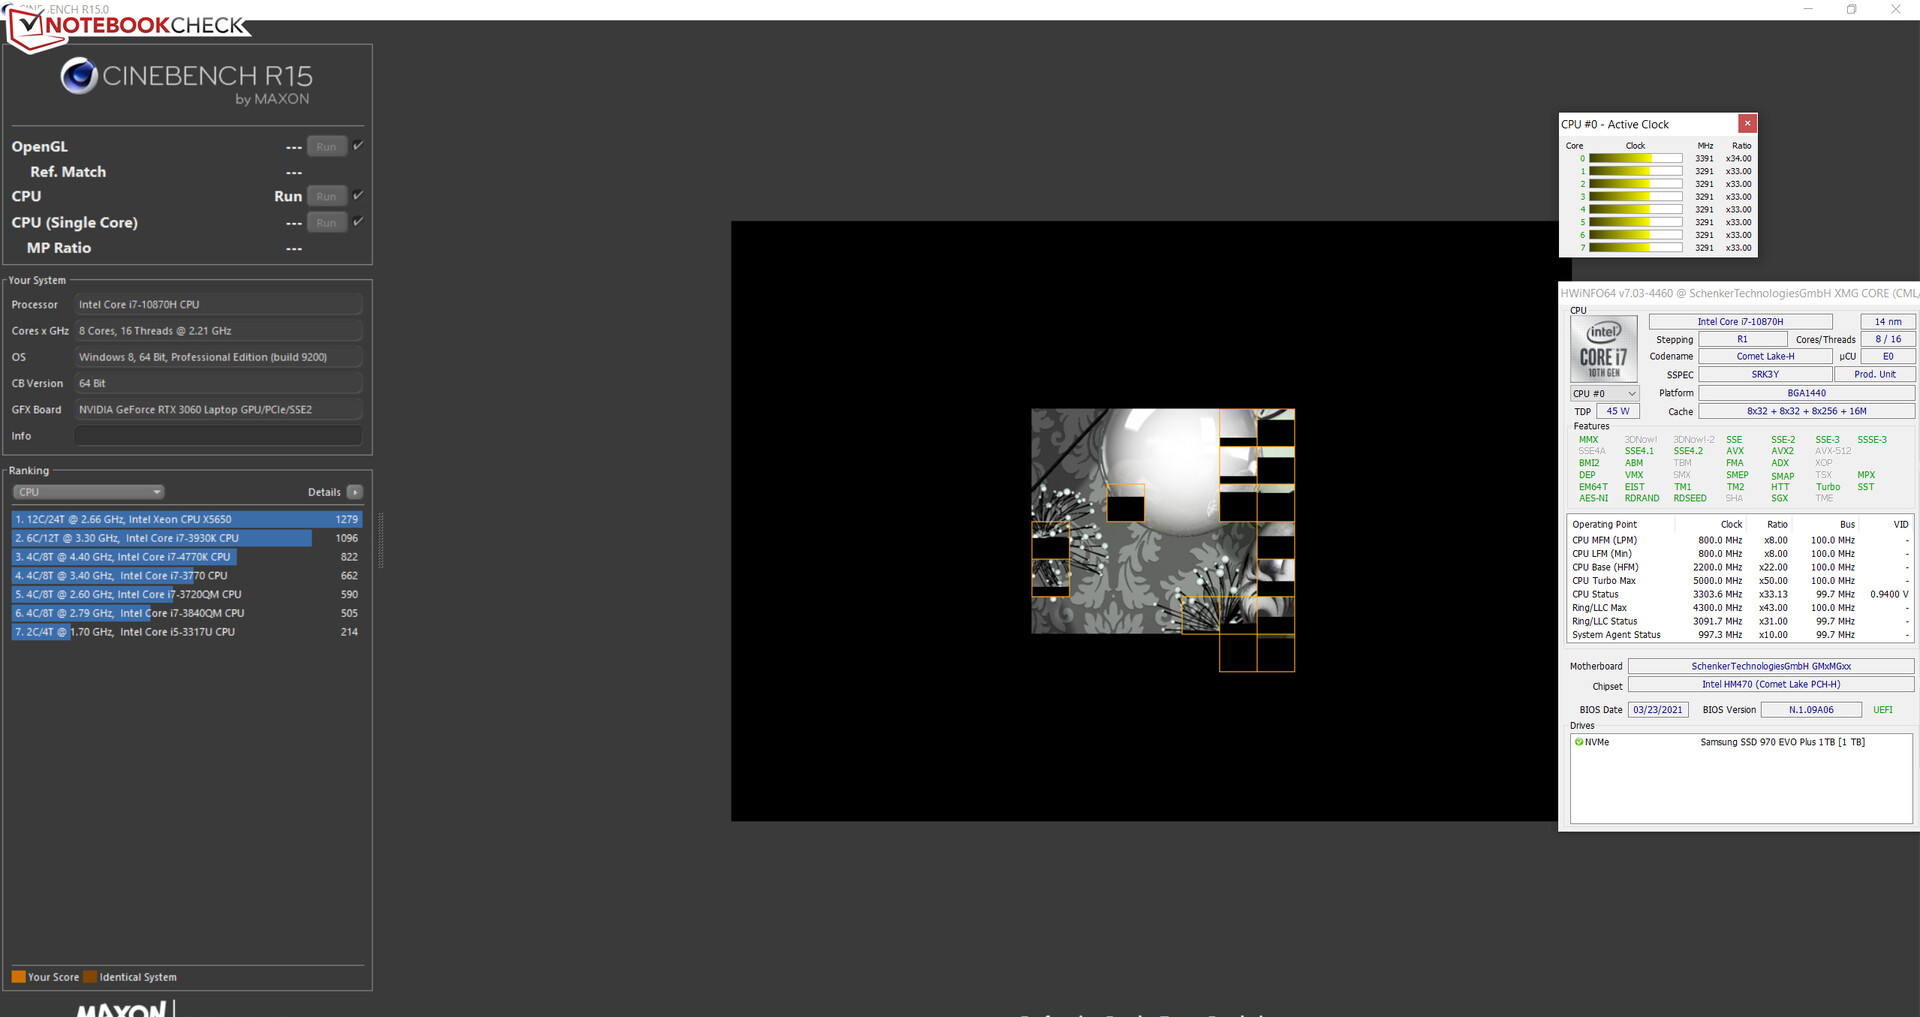
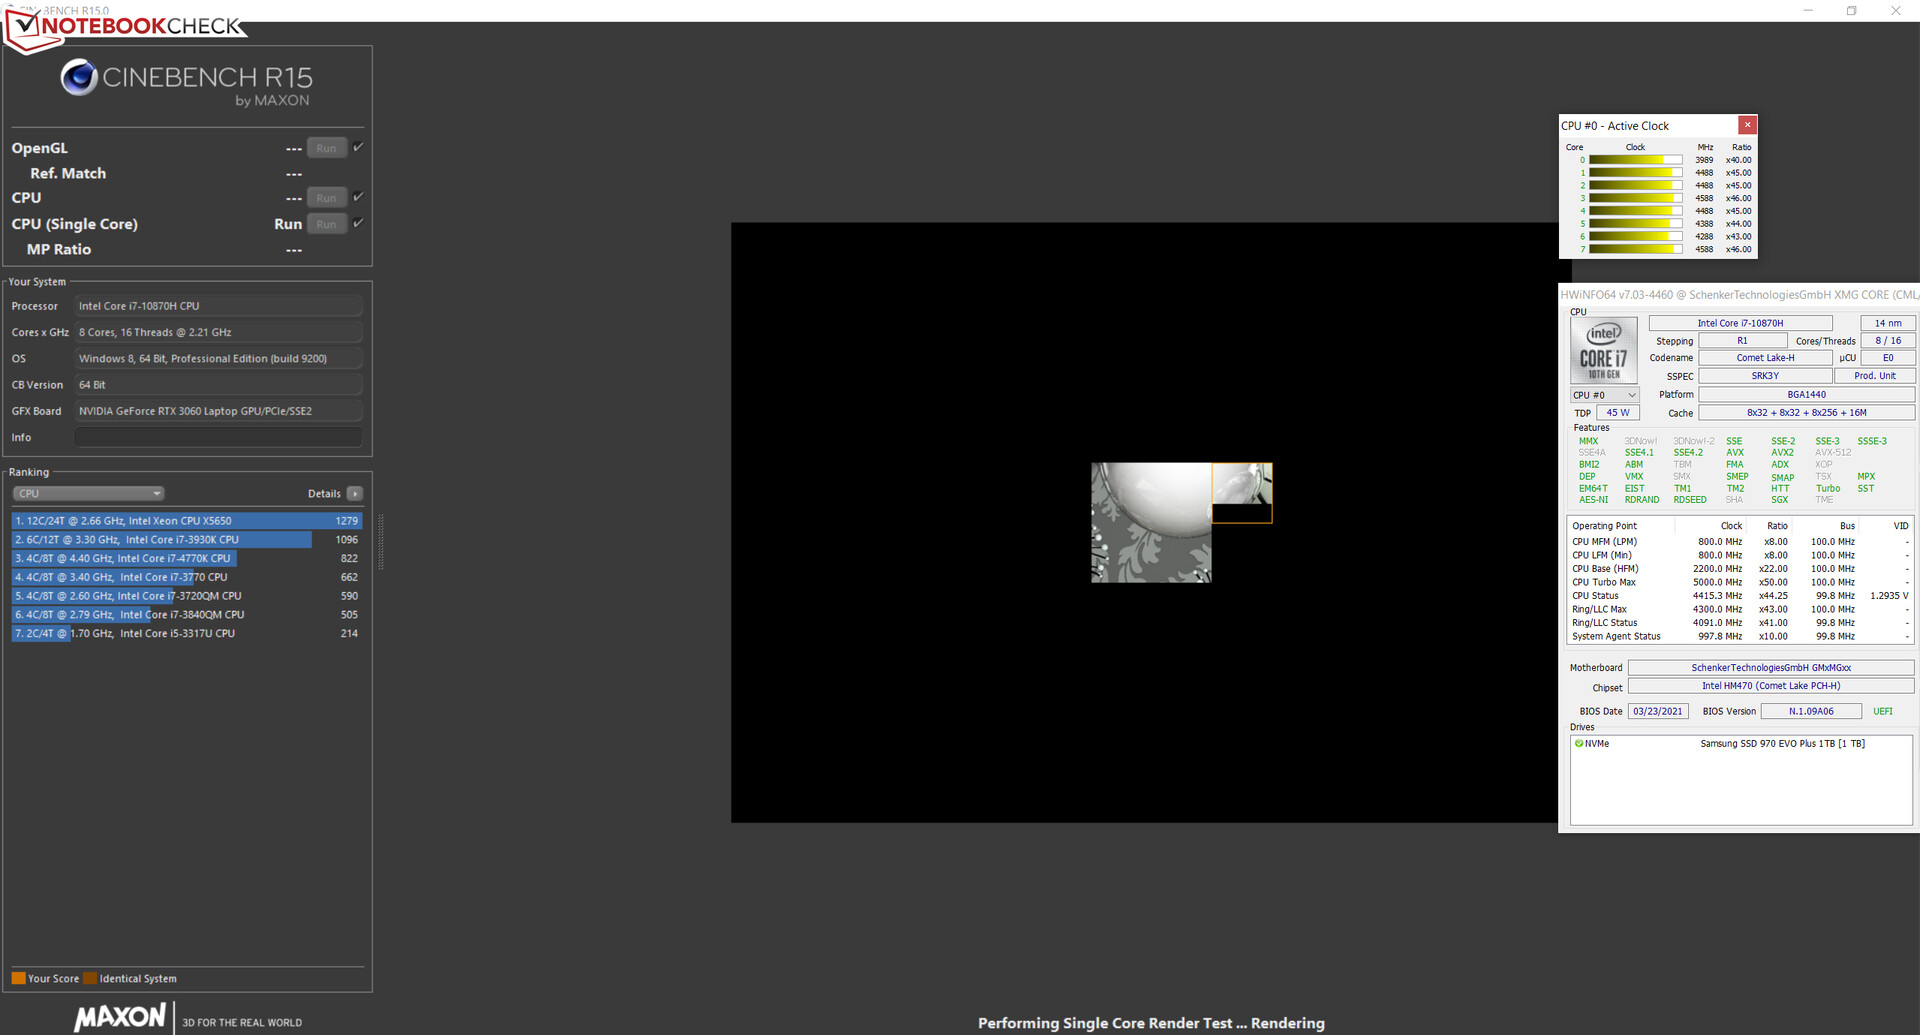
Avaliamos se a CPU Turbo também é utilizada constantemente na operação de rede elétrica executando o teste multi-tarefa do benchmark Cinebench R15 por pelo menos 30 minutos em um loop constante. O Turbo é usado em um nível médio. O perfil de desempenho "Overboost" só faz com que a velocidade do relógio aumente ligeiramente.
Em geral, o Core i7 não faz pleno uso de suas capacidades nos benchmarks multi-tarefas. Para obter mais desempenho dele, os limites de potência da CPU precisariam ser aumentados, o que seria possível através do Centro de Controle pré-instalado, onde o máximo configurável seria 120 watts (PL1/PL2). Também executamos o loop CB15 com esta configuração de desempenho a fim de testá-lo - sem encontrar nenhum problema.
* ... menor é melhor
Desempenho do sistema
O sistema de funcionamento rápido e suave também oferecerá desempenho suficiente para os próximos anos para áreas de aplicação exigentes, como jogos e processamento de vídeo e imagem. Os resultados do PC-Mark também são bons.
| PCMark 8 Home Score Accelerated v2 | 4073 pontos | |
| PCMark 8 Creative Score Accelerated v2 | 5816 pontos | |
| PCMark 8 Work Score Accelerated v2 | 5375 pontos | |
| PCMark 10 Score | 5685 pontos | |
Ajuda | ||
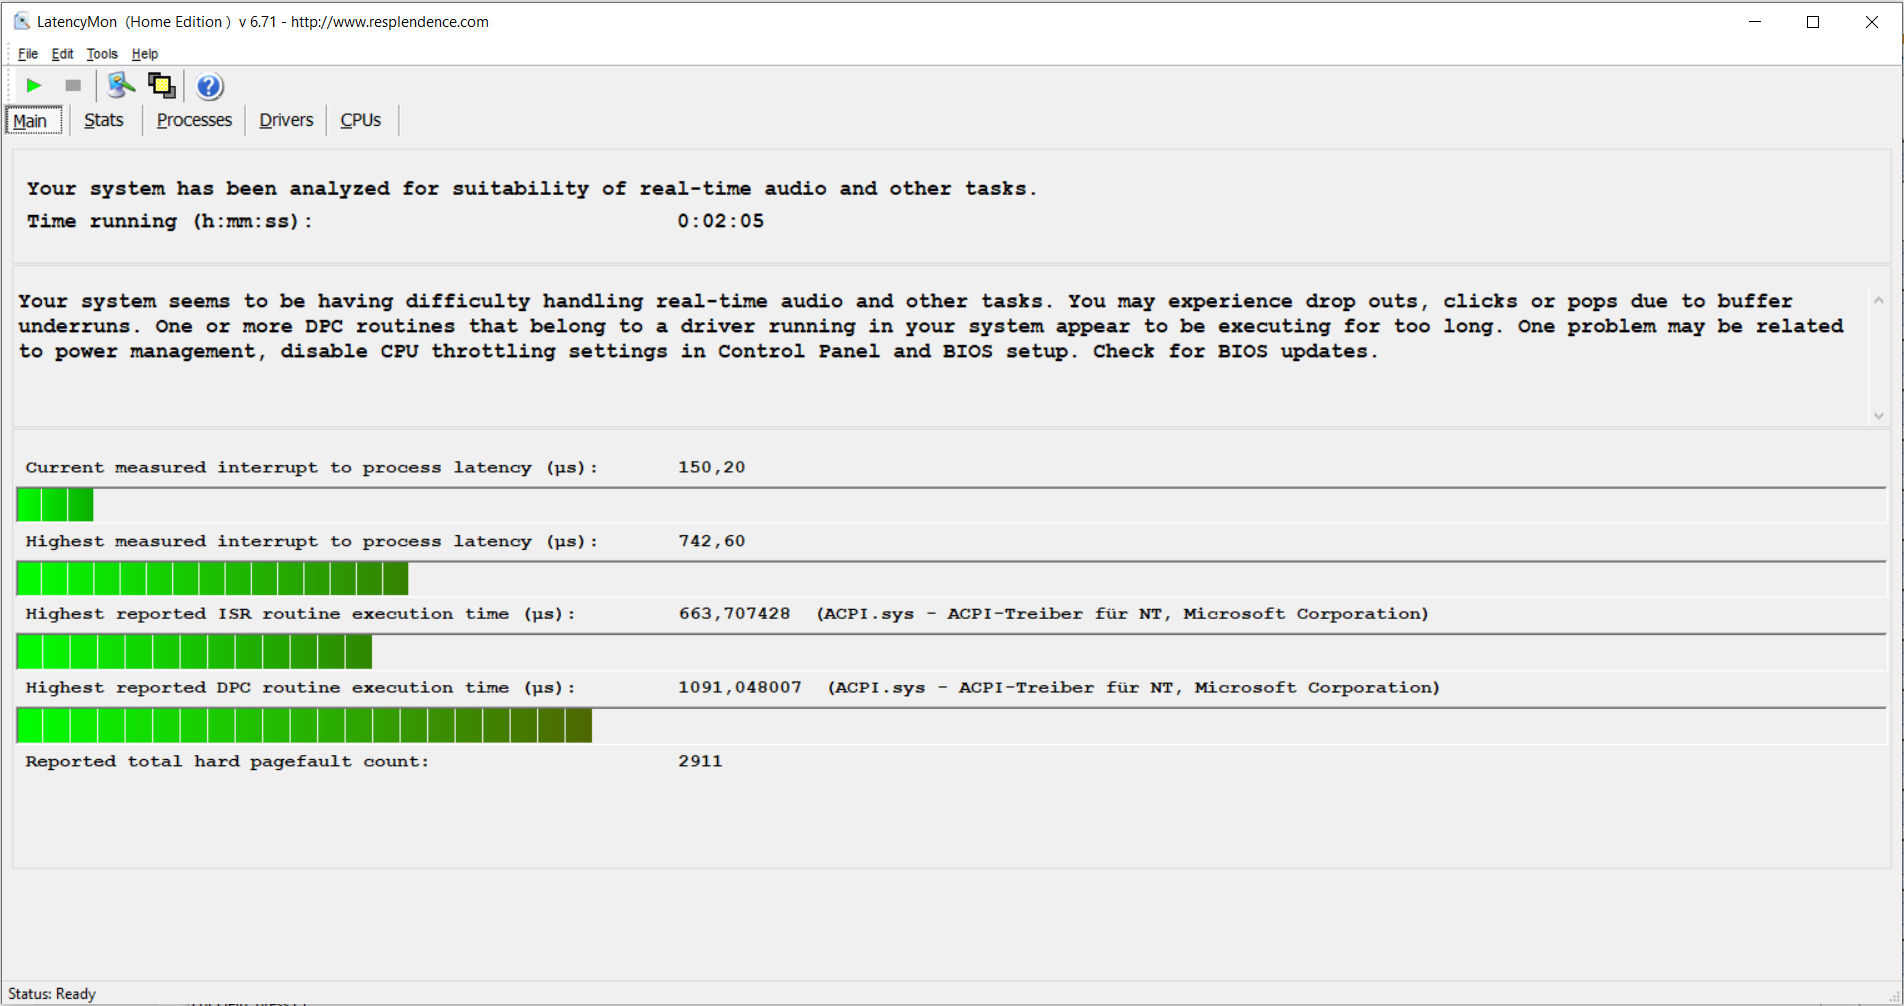
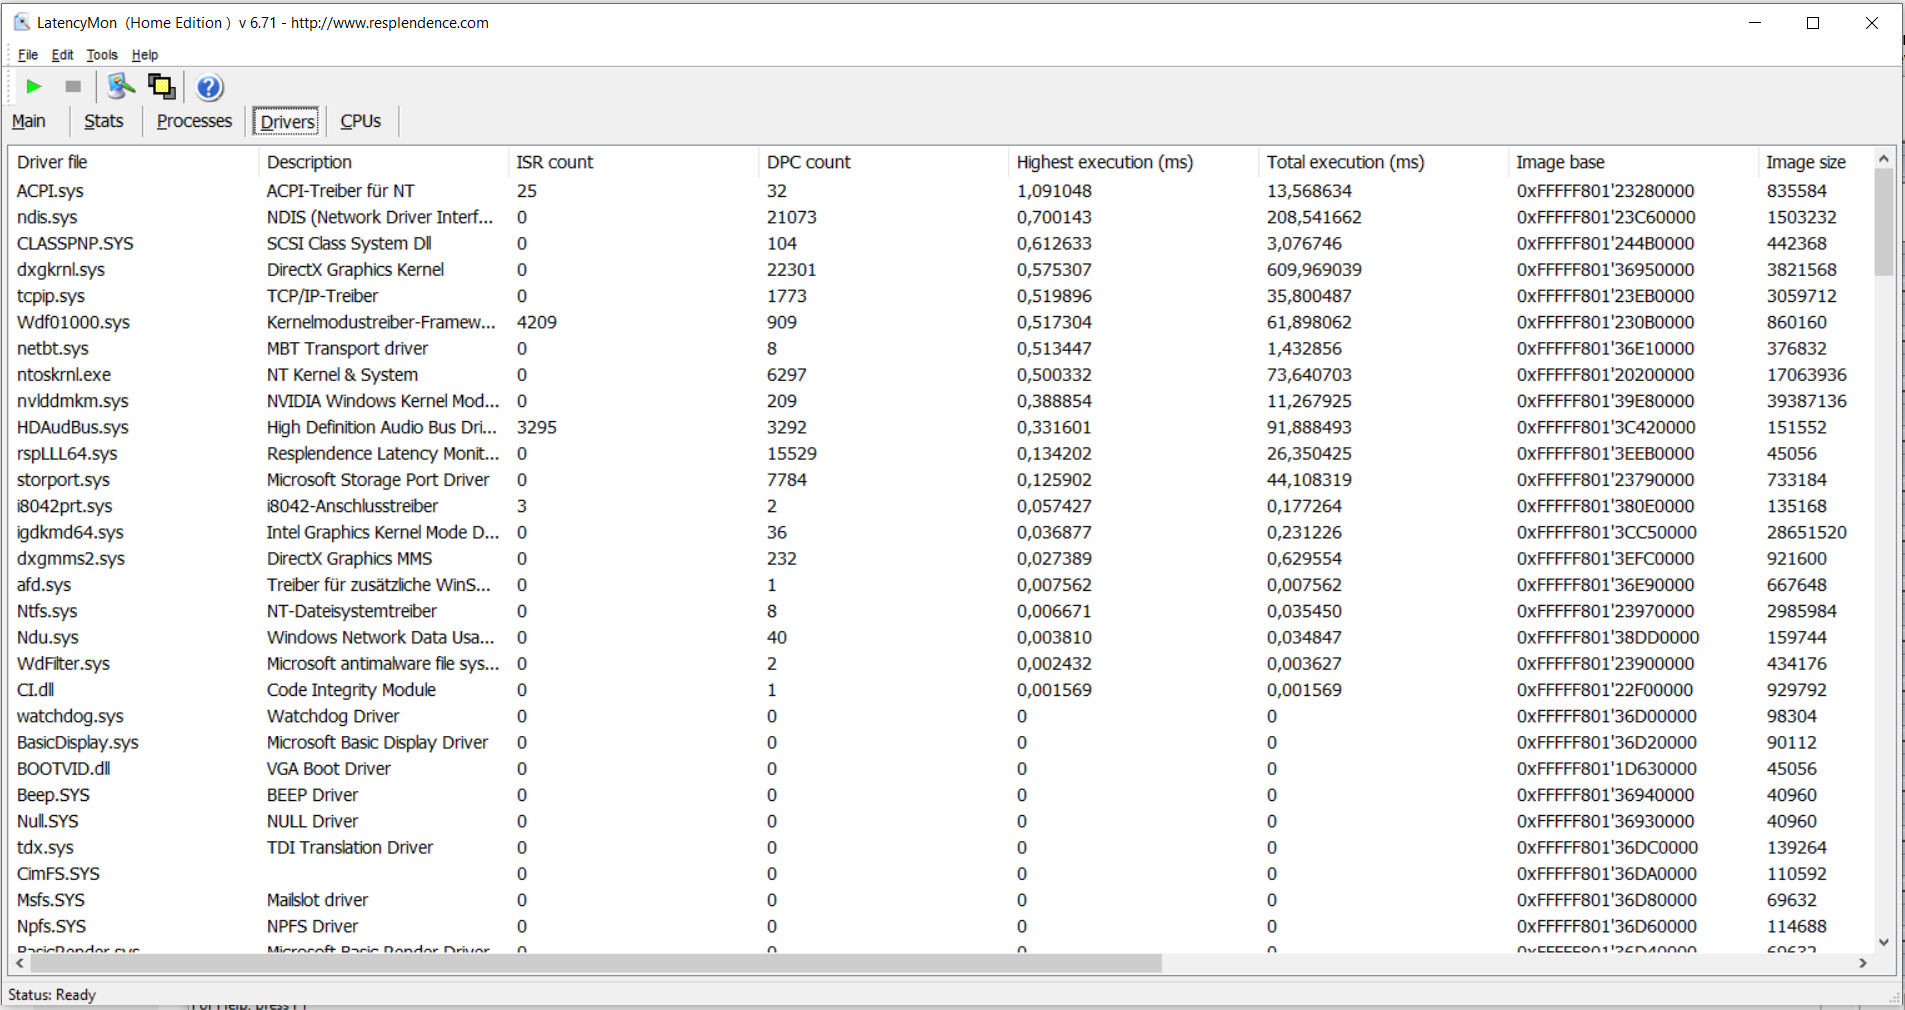
Latências DPC
Em nosso teste padronizado de Monitor de Latência (navegação na web, reprodução de vídeo 4K, Prime95 de alta carga), pudemos observar algum comportamento conspícuo em termos das latências do DPC. Isto significa que o sistema não parece ser adequado para o processamento de vídeo e áudio em tempo real
| DPC Latencies / LatencyMon - interrupt to process latency (max), Web, Youtube, Prime95 | |
| MSI Alpha 17 A4DEK | |
| Schenker XMG Core 17 Comet Lake | |
| Medion Erazer Beast X10 MD61804 | |
| Schenker XMG Core 17 (Early 2021) | |
| Acer Predator Helios 300 PH317-54-75G8 | |
* ... menor é melhor
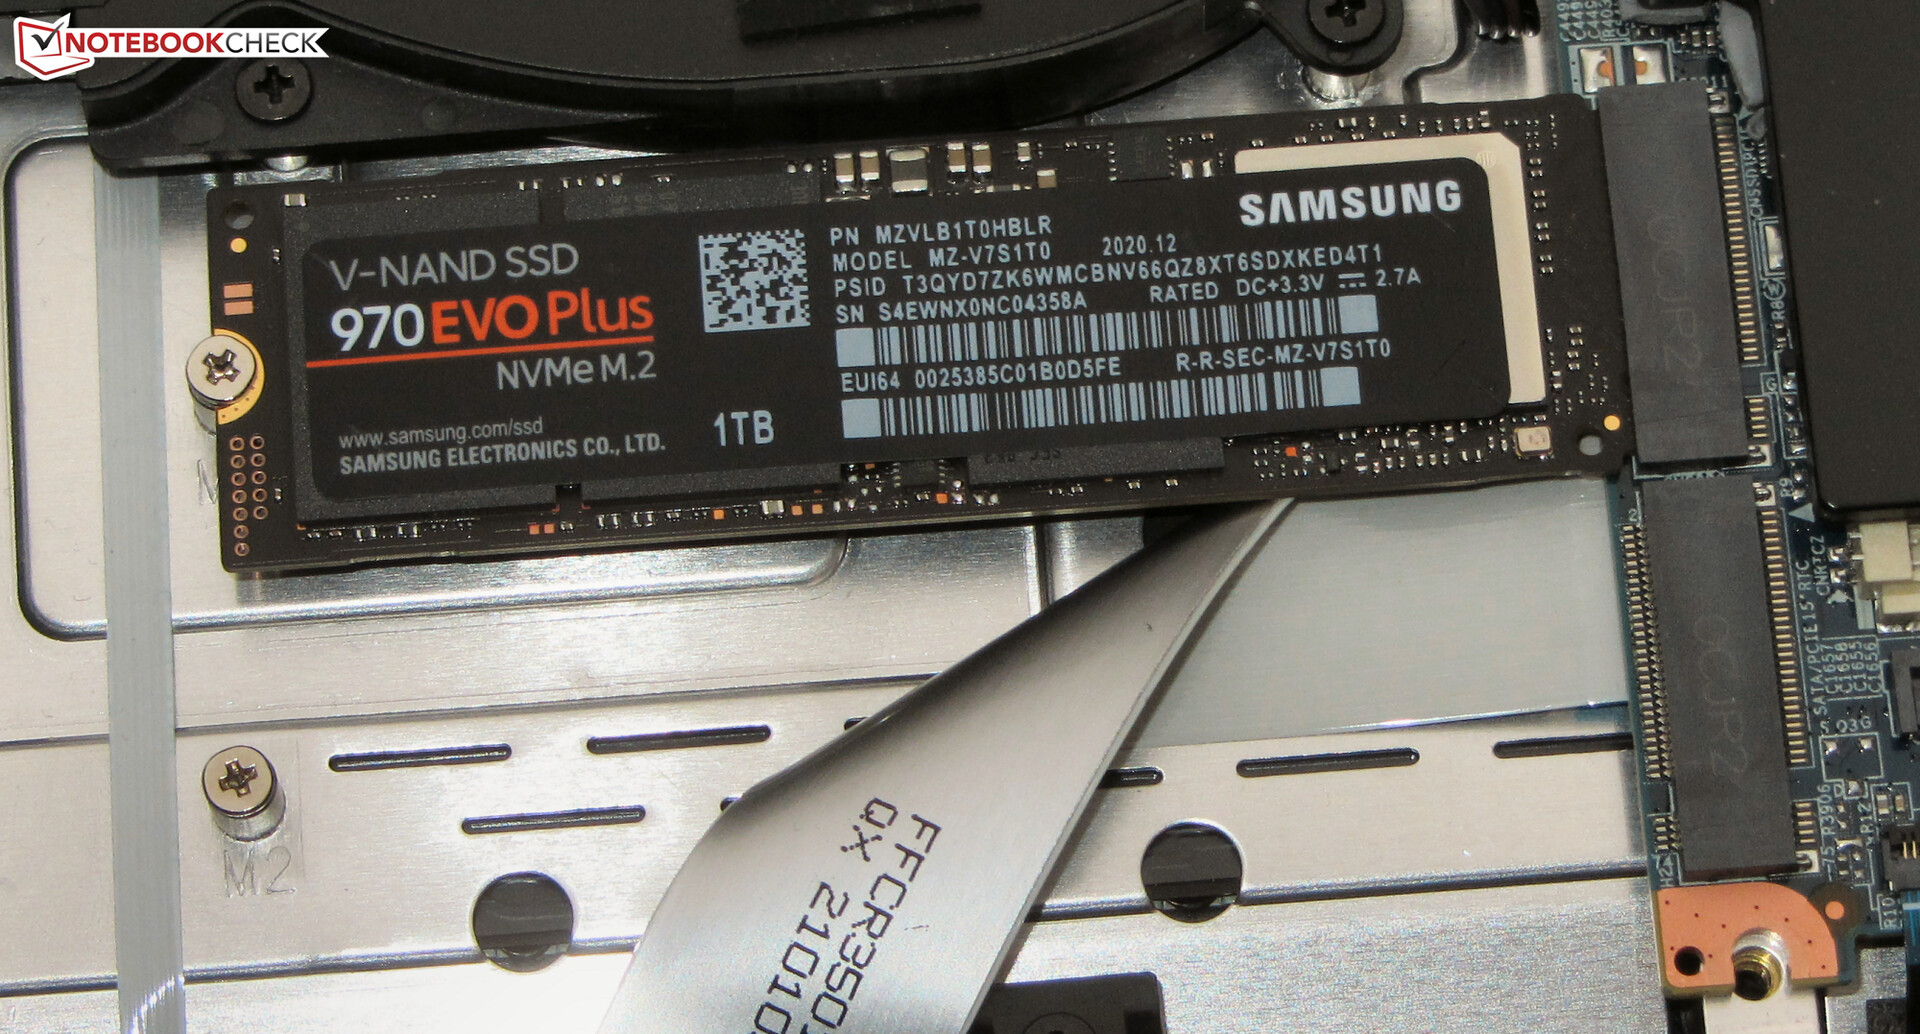
Solução de armazenamento
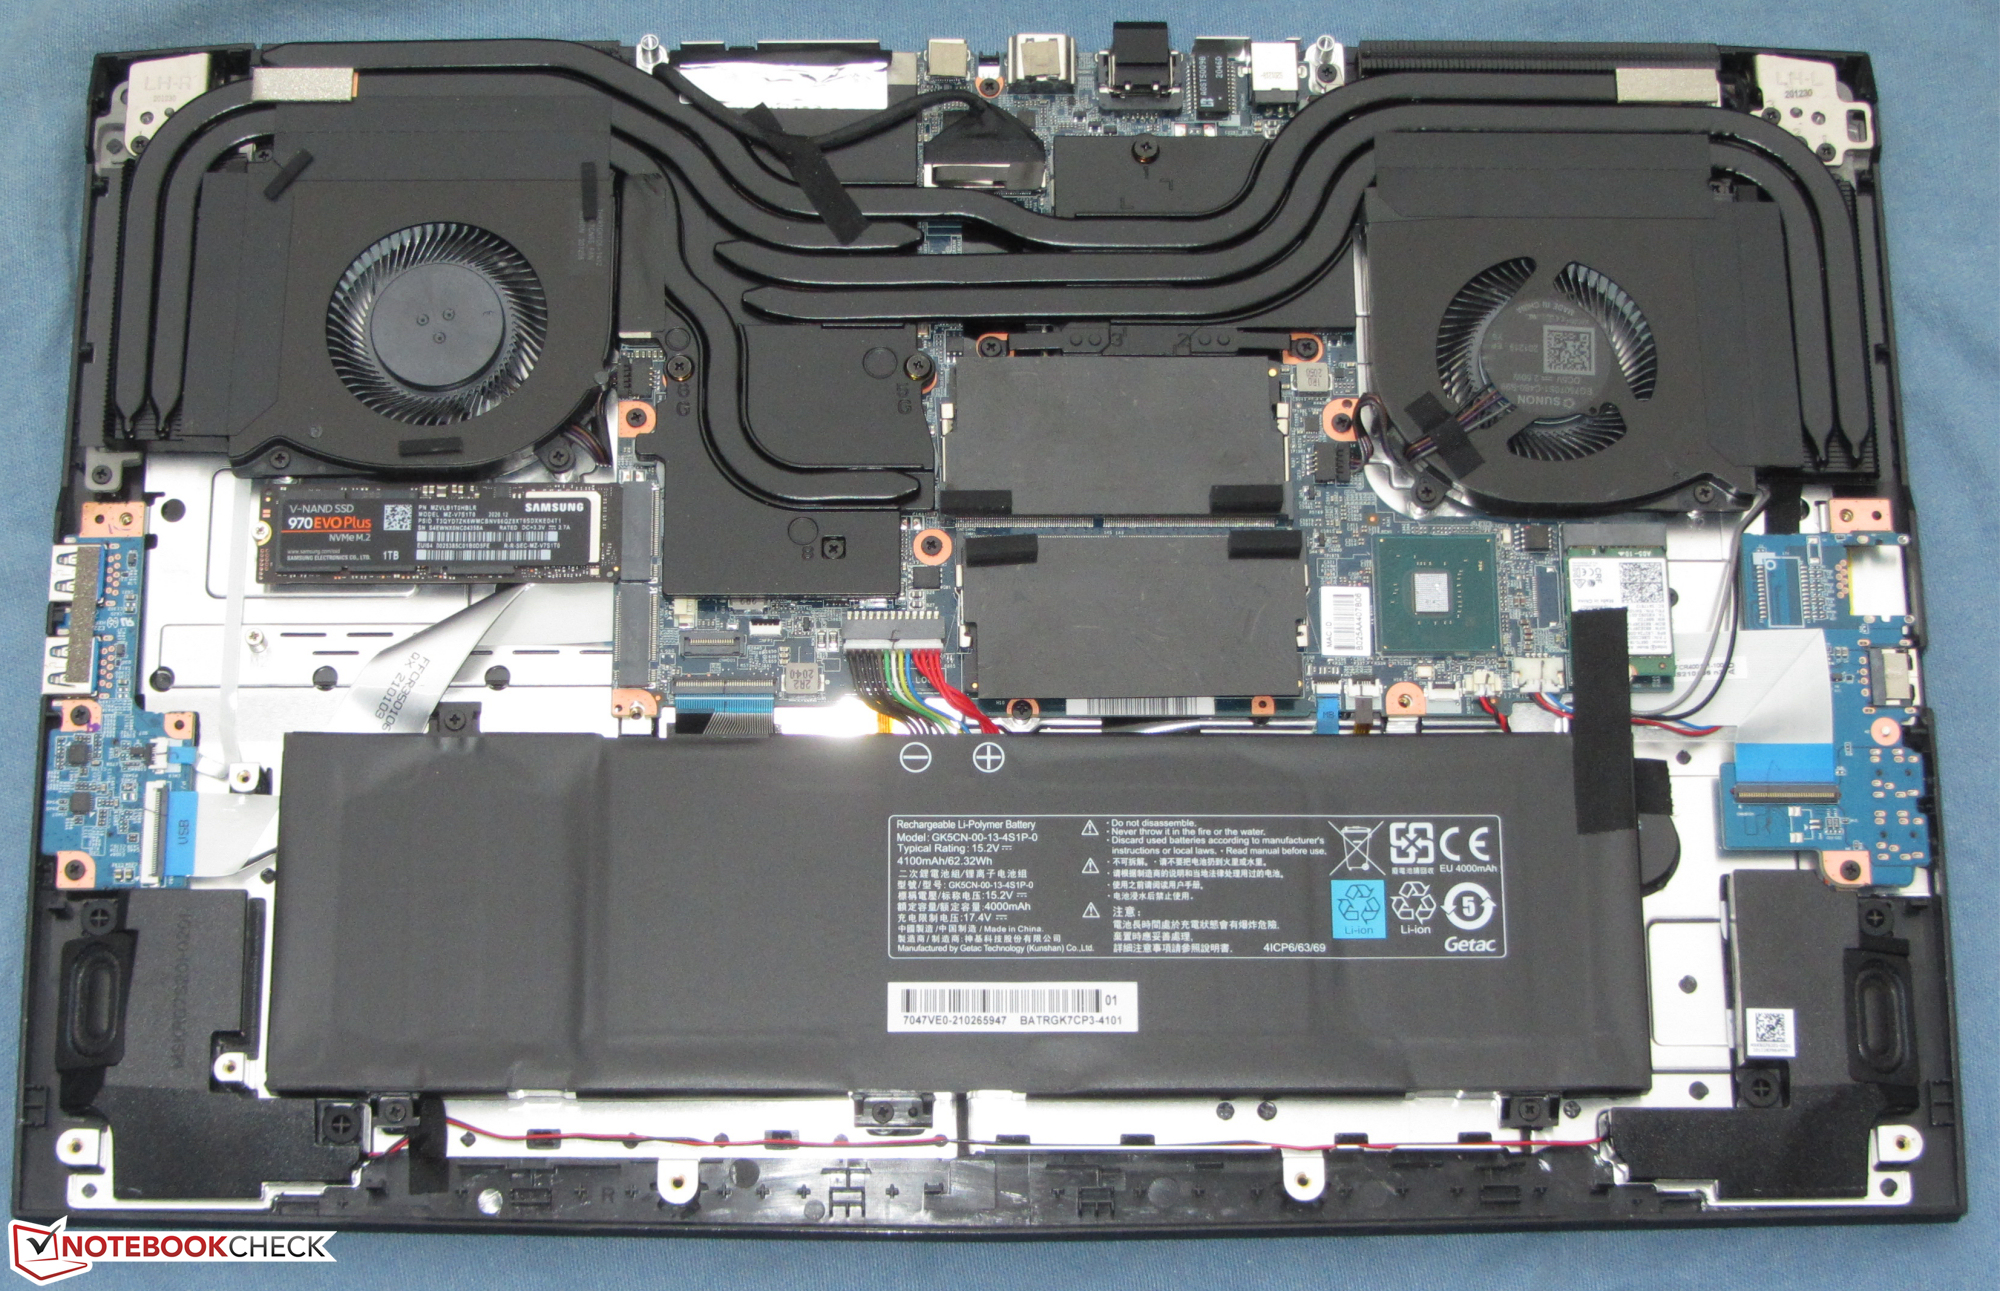
Um SSD NVMe (M.2-2280) da Samsung serve como a unidade do sistema. Ele oferece 1 TB de armazenamento e oferece boas taxas de transferência. O laptop é capaz de aceitar um total de dois NVMe SSDs, e o RAID-0 é suportado.

| Schenker XMG Core 17 (Early 2021) Samsung SSD 970 EVO Plus 1TB | MSI Alpha 17 A4DEK Kingston OM8PCP3512F-AB | Acer Predator Helios 300 PH317-54-75G8 WDC PC SN730 SDBQNTY-1T00 | Medion Erazer Beast X10 MD61804 Samsung PM981a MZVLB1T0HBLR | Schenker XMG Core 17 Samsung SSD 970 EVO Plus 500GB | Schenker XMG Core 17 Comet Lake Samsung SSD 970 EVO Plus 1TB | |
|---|---|---|---|---|---|---|
| CrystalDiskMark 5.2 / 6 | -31% | -12% | -17% | -29% | 4% | |
| Write 4K (MB/s) | 145.7 | 204.7 40% | 141.9 -3% | 151 4% | 99.3 -32% | 169.5 16% |
| Read 4K (MB/s) | 51.3 | 50.4 -2% | 48.75 -5% | 49.29 -4% | 38.47 -25% | 51.5 0% |
| Write Seq (MB/s) | 3036 | 985 -68% | 2734 -10% | 1109 -63% | 1449 -52% | 3009 -1% |
| Read Seq (MB/s) | 2837 | 1193 -58% | 1921 -32% | 1049 -63% | 1237 -56% | 2959 4% |
| Write 4K Q32T1 (MB/s) | 511 | 537 5% | 422.6 -17% | 494.4 -3% | 364.4 -29% | 536 5% |
| Read 4K Q32T1 (MB/s) | 582 | 300 -48% | 509 -13% | 569 -2% | 421.9 -28% | 621 7% |
| Write Seq Q32T1 (MB/s) | 3294 | 982 -70% | 3055 -7% | 3017 -8% | 3276 -1% | 3339 1% |
| Read Seq Q32T1 (MB/s) | 3522 | 1985 -44% | 3257 -8% | 3542 1% | 3338 -5% | 3561 1% |
| AS SSD | -43% | -11% | -3% | -20% | 11% | |
| Seq Read (MB/s) | 2876 | 251.9 -91% | 2828 -2% | 2470 -14% | 2283 -21% | 2937 2% |
| Seq Write (MB/s) | 2803 | 925 -67% | 2677 -4% | 2473 -12% | 2779 -1% | 2858 2% |
| 4K Read (MB/s) | 55.3 | 58.2 5% | 39.94 -28% | 50.2 -9% | 29.99 -46% | 50.3 -9% |
| 4K Write (MB/s) | 106.9 | 98 -8% | 100.9 -6% | 124.4 16% | 99.1 -7% | 130.6 22% |
| 4K-64 Read (MB/s) | 1662 | 461.4 -72% | 1562 -6% | 1711 3% | 1156 -30% | 1710 3% |
| 4K-64 Write (MB/s) | 2101 | 924 -56% | 1867 -11% | 1848 -12% | 2333 11% | 2355 12% |
| Access Time Read * (ms) | 0.067 | 0.09 -34% | 0.039 42% | 0.092 -37% | 0.037 45% | |
| Access Time Write * (ms) | 0.037 | 0.022 41% | 0.037 -0% | 0.029 22% | 0.037 -0% | 0.028 24% |
| Score Read (Points) | 2005 | 545 -73% | 1885 -6% | 2008 0% | 1414 -29% | 2054 2% |
| Score Write (Points) | 2488 | 1114 -55% | 2236 -10% | 2220 -11% | 2710 9% | 2771 11% |
| Score Total (Points) | 5520 | 1994 -64% | 5076 -8% | 5257 -5% | 4871 -12% | 5873 6% |
| Copy ISO MB/s (MB/s) | 2029 | 1870 -8% | 1909 -6% | 1394 -31% | 2225 10% | |
| Copy Program MB/s (MB/s) | 691 | 545 -21% | 588 -15% | 379.8 -45% | 779 13% | |
| Copy Game MB/s (MB/s) | 1513 | 1083 -28% | 975 -36% | 976 -35% | 1590 5% | |
| Média Total (Programa/Configurações) | -37% /
-38% | -12% /
-11% | -10% /
-8% | -25% /
-23% | 8% /
8% |
* ... menor é melhor
Constant Performance Reads: DiskSpd Read Loop, Queue Depth 8
Placa Gráfica
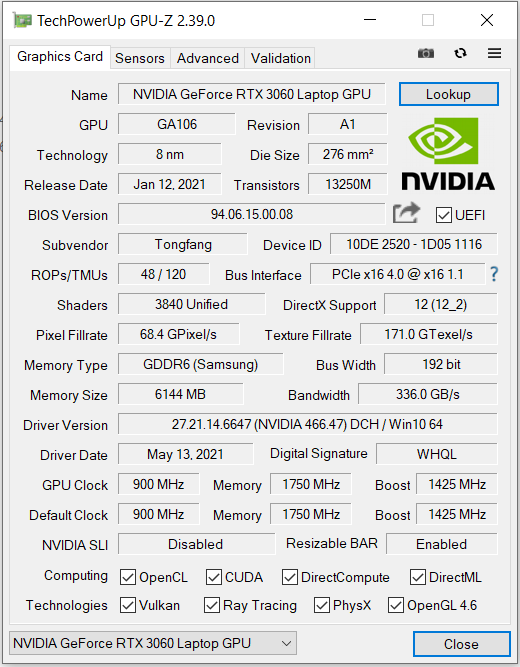
OGeForce RTX-3060O núcleo gráfico do laptop representa o atual modelo básico da Nvidia para a GPU high end. A GPU é capaz de usar o rápido armazenamento gráfico GDDR6 (6144 MB). O UHD Graphics-630O núcleo gráfico integrado ao processador está ativo, e o laptop usa a solução de comutação gráfica Optimus da Nvidia. A GPU GeForce pode ser desativada na BIOS.
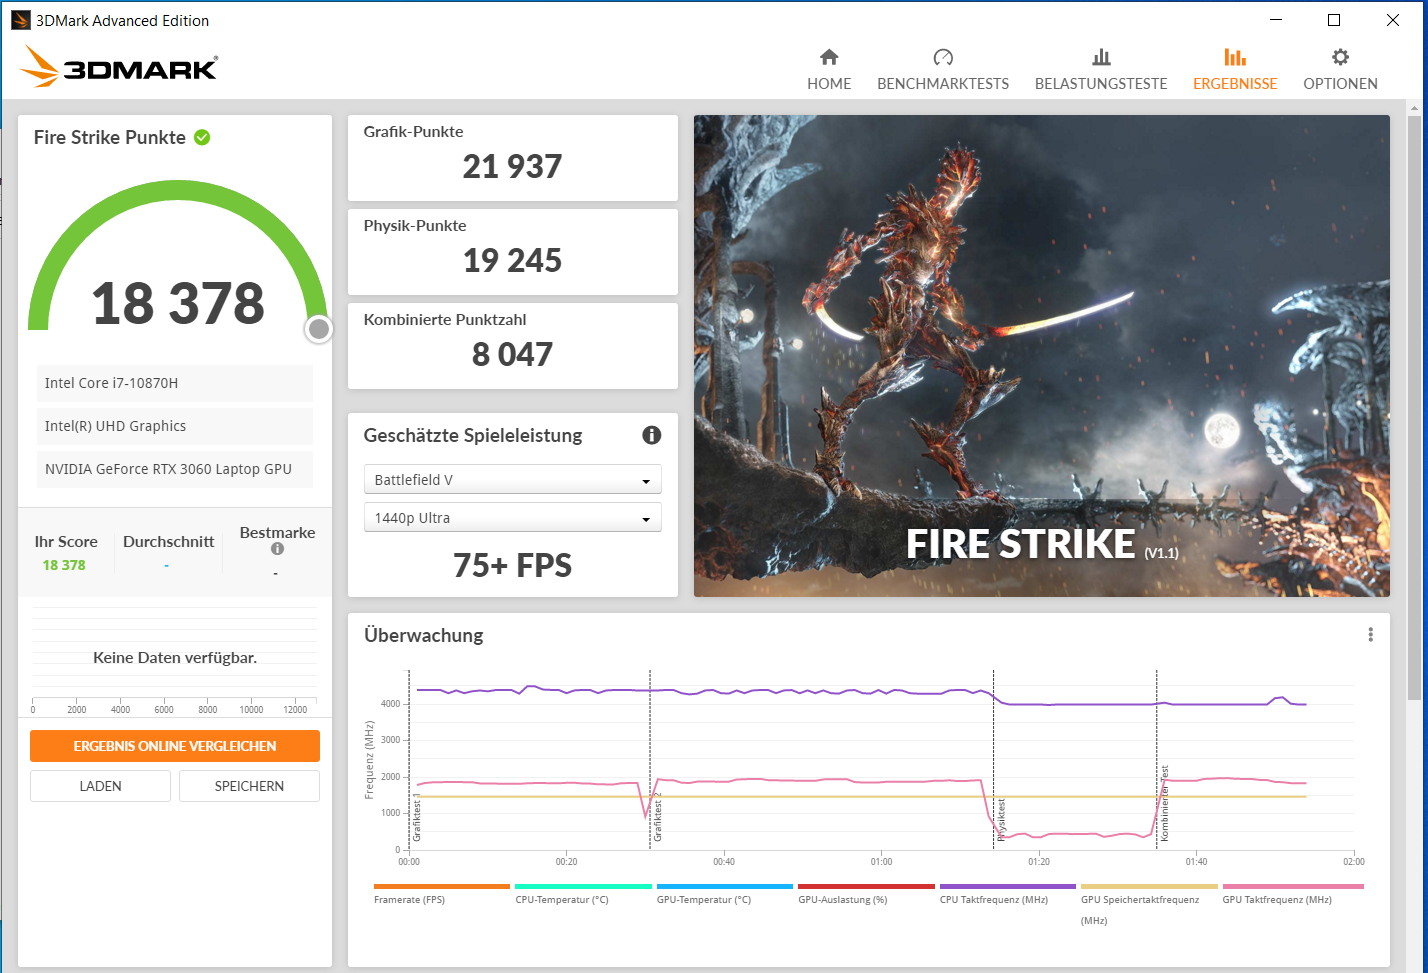
Os fabricantes de laptops são capazes de configurar o TGP e com isso o máximo desempenho computacional disponível de um núcleo gráfico RTX 3000 de forma bastante livre, desde que se mantenham dentro dos limites definidos pela Nvidia (Visão geral de todos os computadores portáteis RTX 3060 incluindo seus TGPsA Schenker estende esta opção aos usuários, permitindo-lhes ajustar livremente o TGP até o máximo de 130 watts (115 watts + 15 watts de Dynamic Boost).
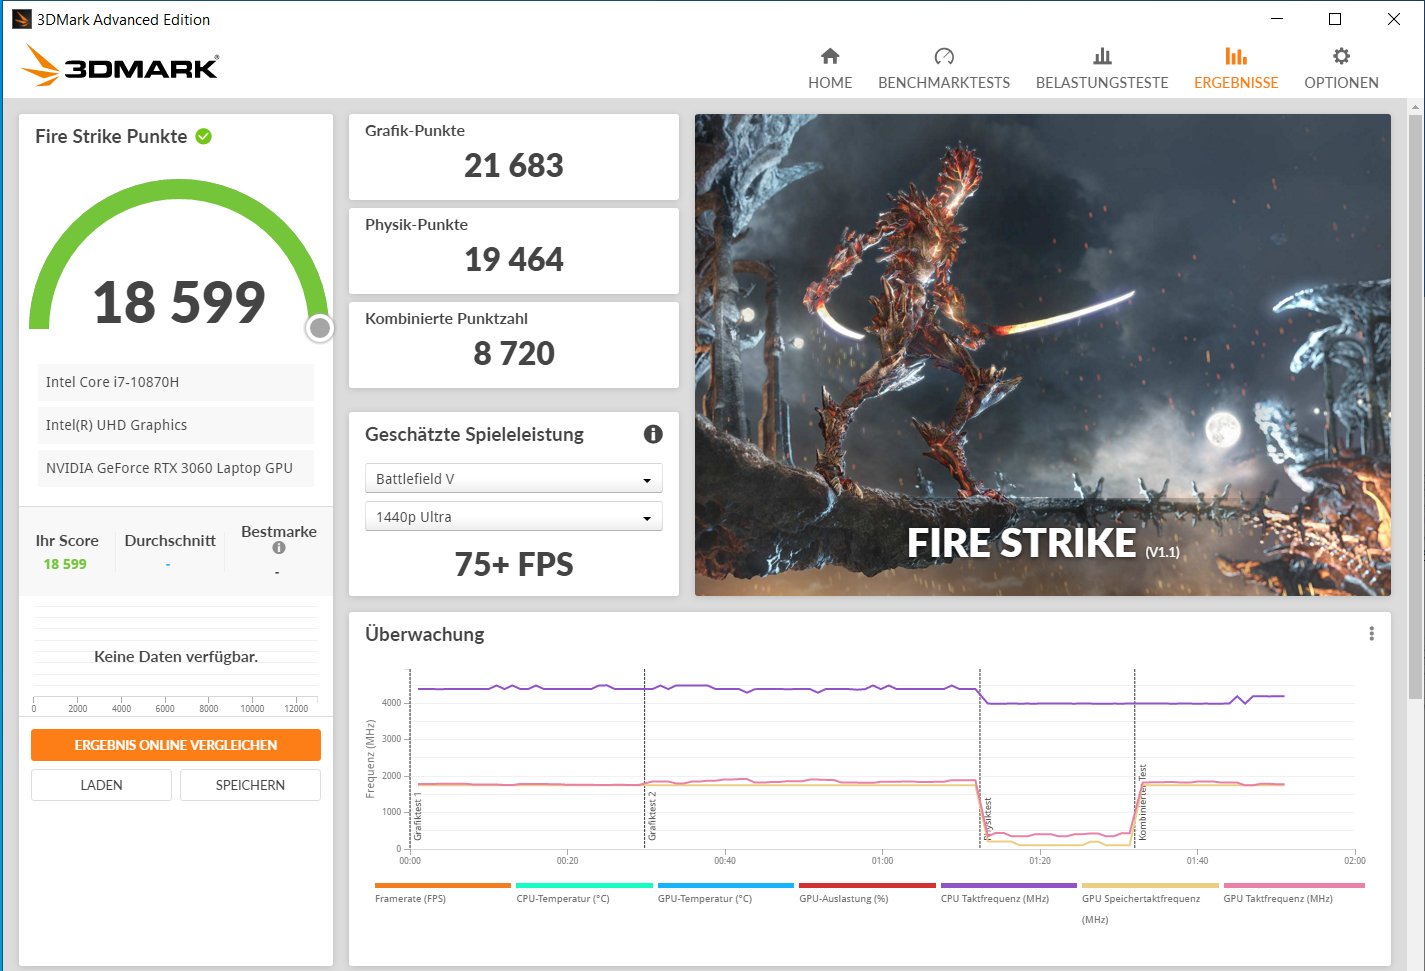
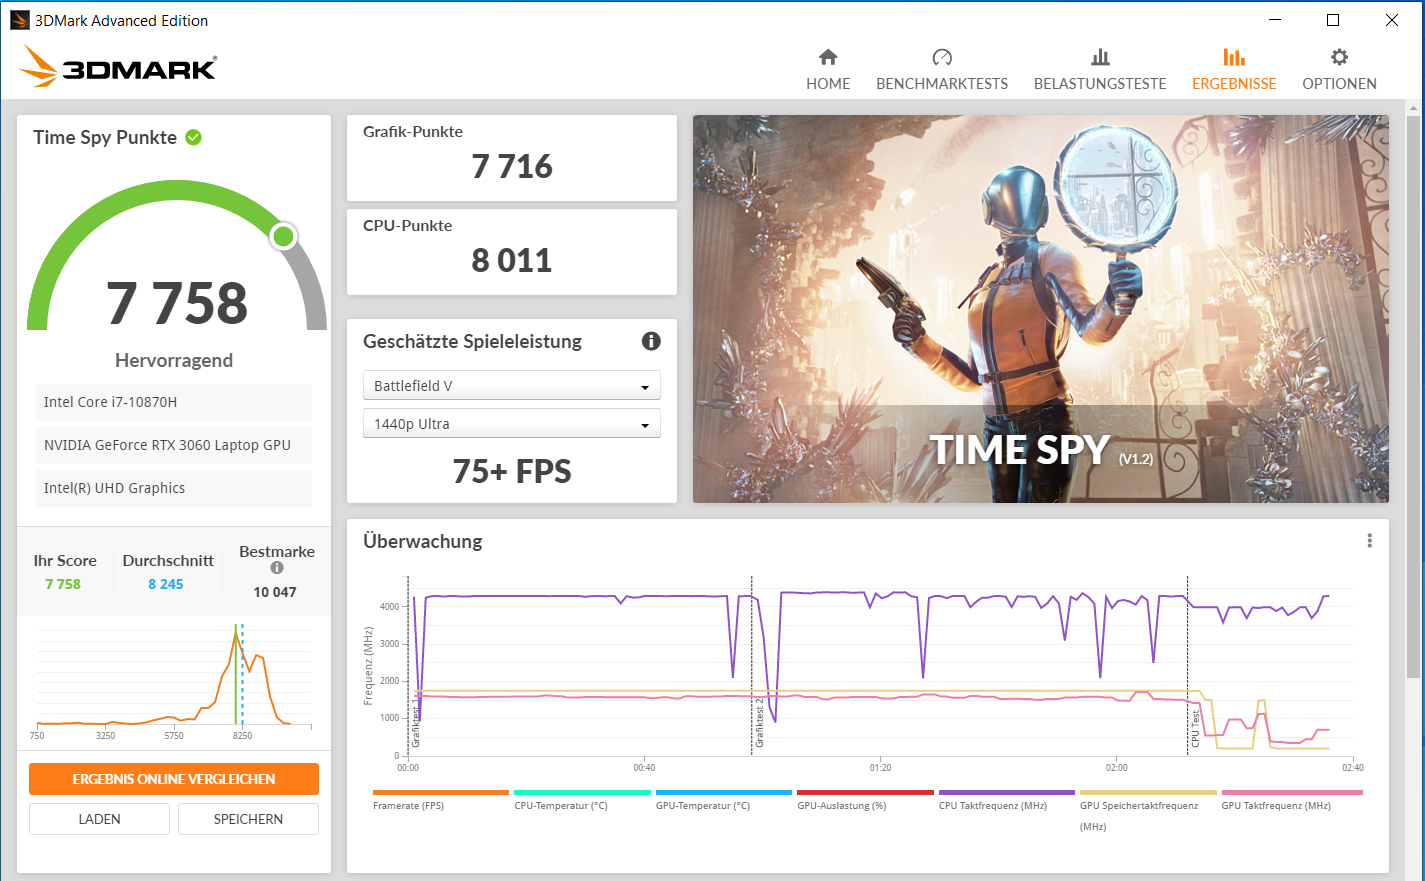
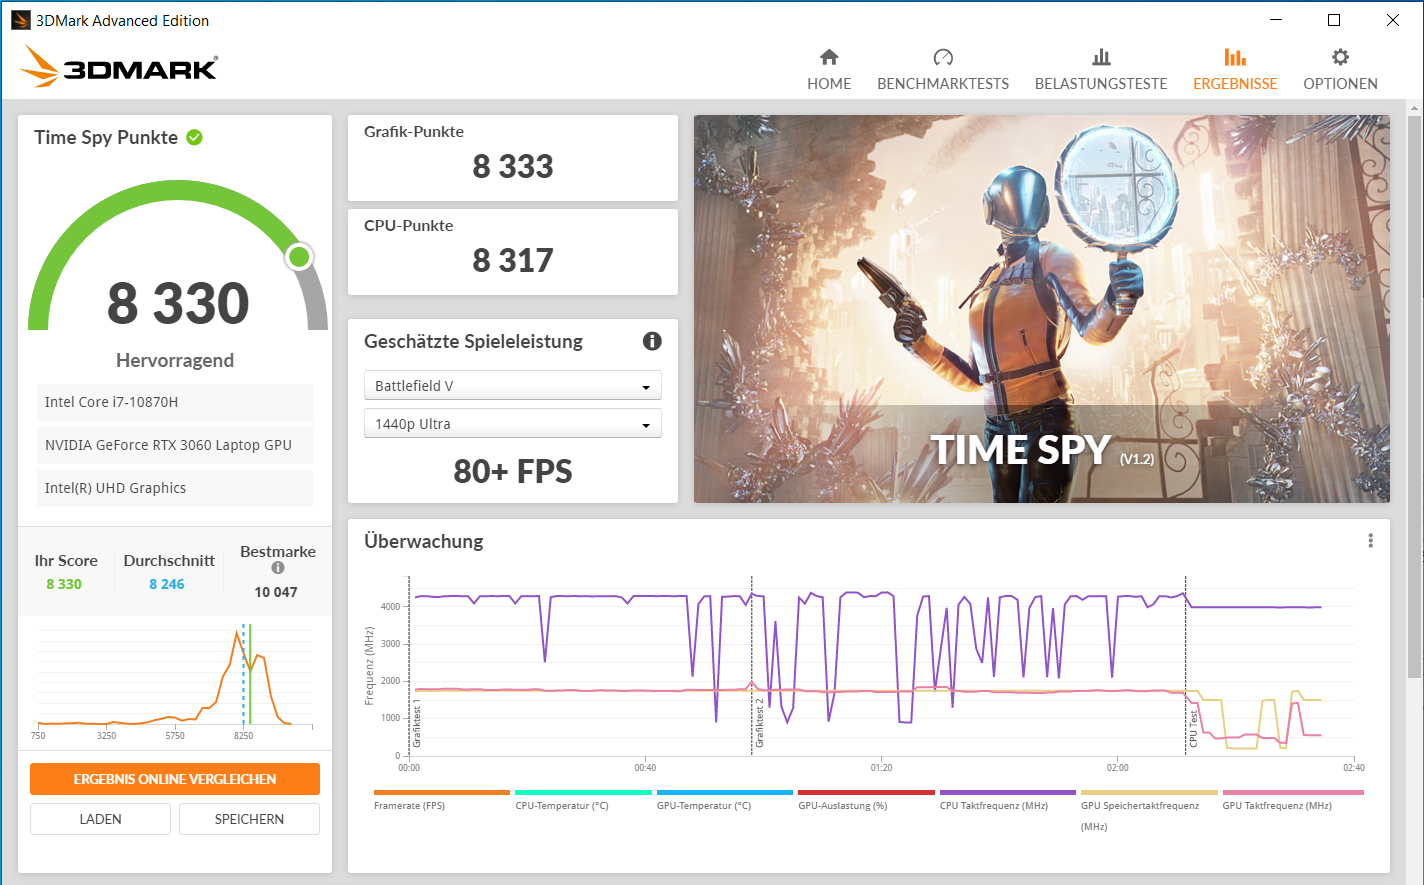
Entretanto, a uma alta TGP, o aumento de desempenho acaba sendo limitado: Ainda que o perfil "Overboost" (115 watts + 5 watts Dynamic Boost) usa um TGP que é cerca de 26% maior do que o perfil "Enthusiast" (90 watts + 5 watts Dynamic Boost)Os resultados alcançados nos testes são apenas até 10% mais altos. Isto vale tanto para os testes de GPU quanto para os benchmarks de jogos.


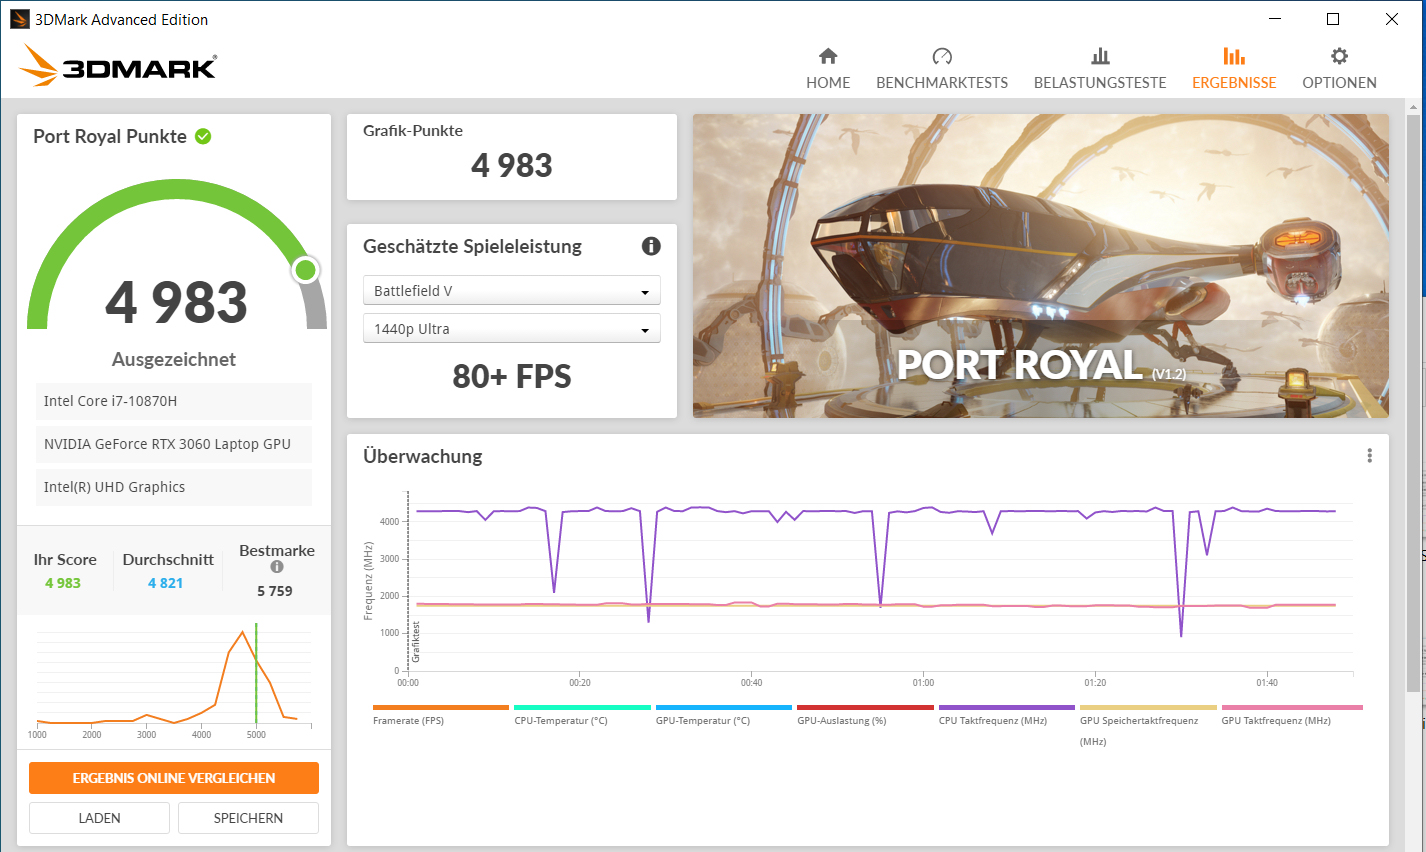

| 3DMark 11 Performance | 21813 pontos | |
| 3DMark Cloud Gate Standard Score | 41707 pontos | |
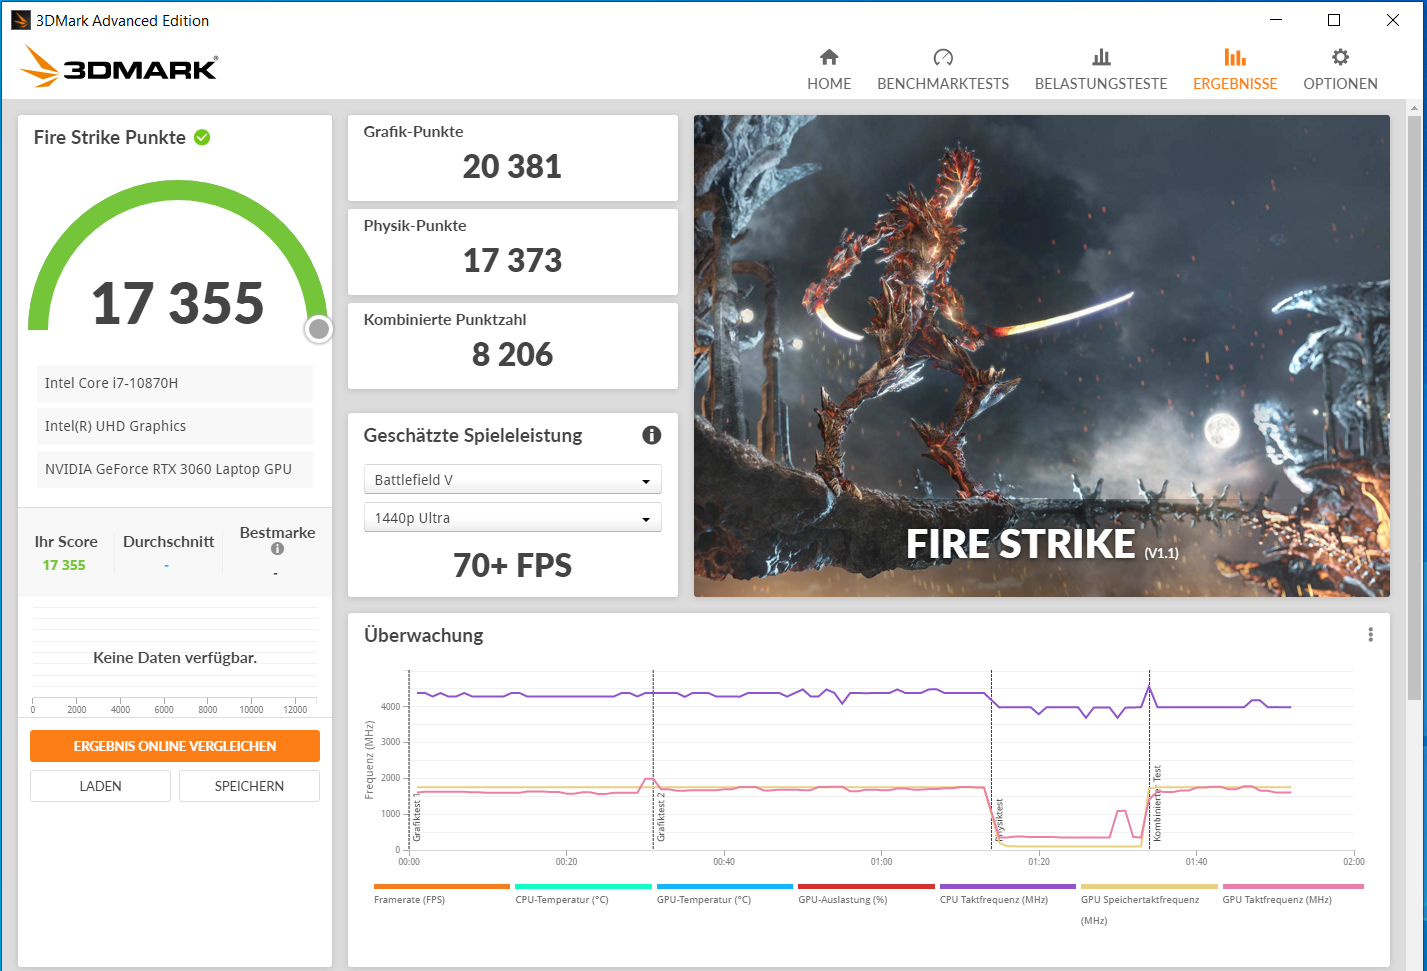
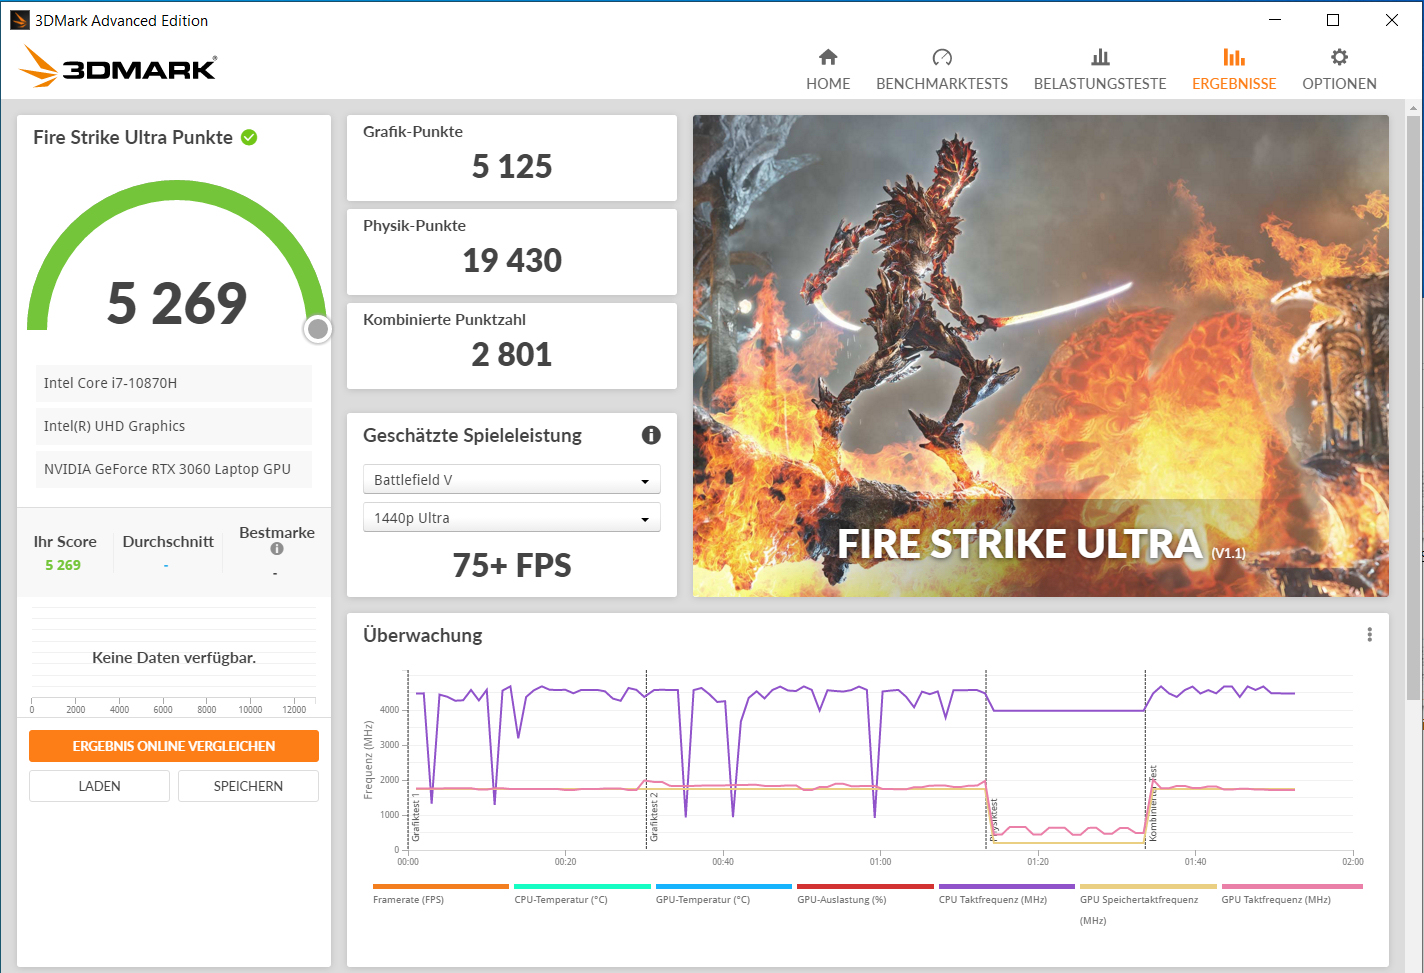
| 3DMark Fire Strike Score | 17355 pontos | |
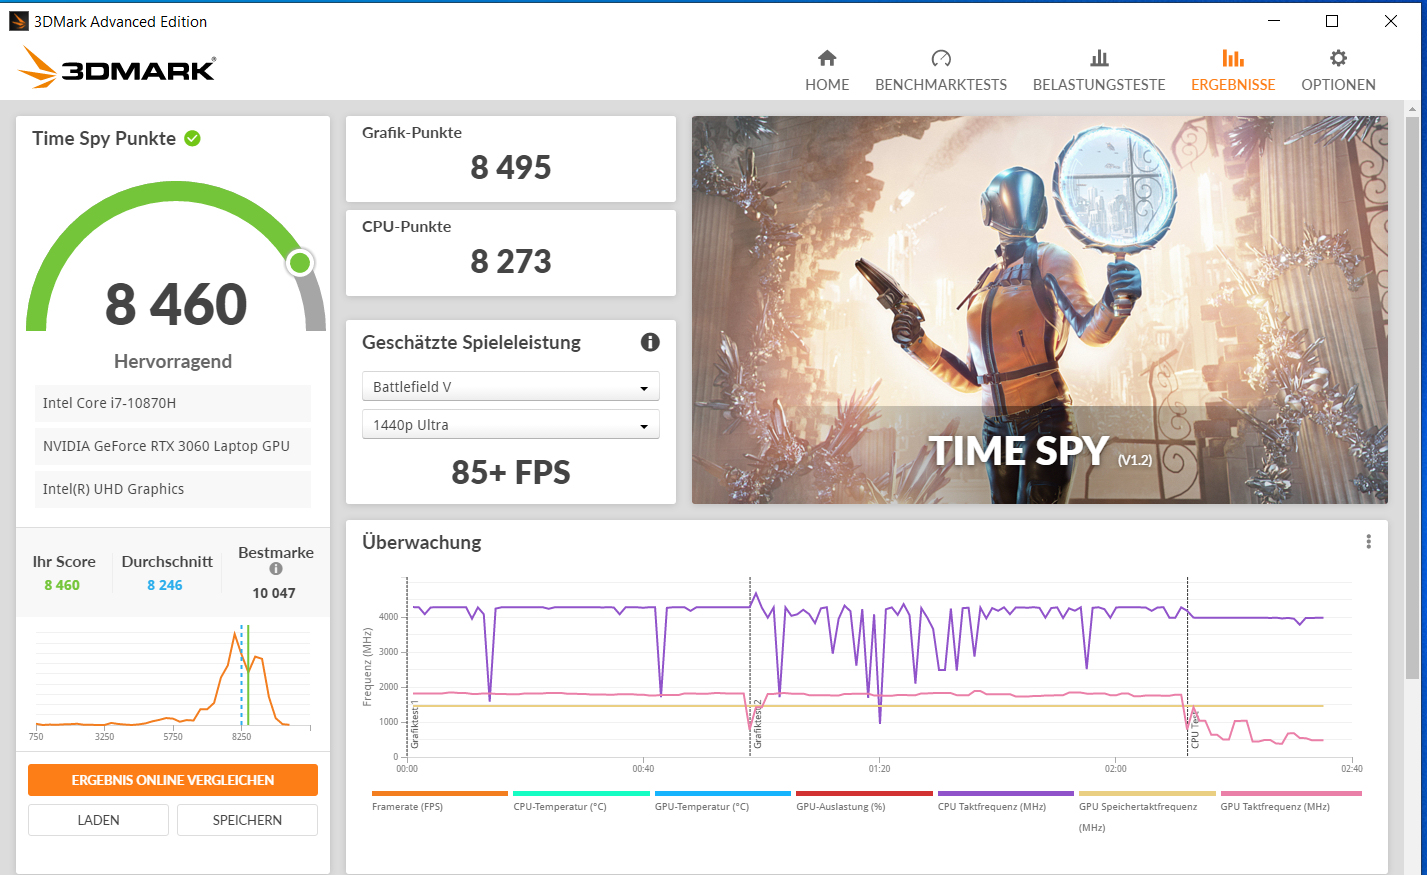
| 3DMark Time Spy Score | 7758 pontos | |
Ajuda | ||
| 3DMark | |
| 1920x1080 Fire Strike Graphics | |
| Média da turma Gaming (12242 - 62849, n=115, últimos 2 anos) | |
| Schenker XMG Core 17 (Early 2021) (Overboost, TGP: 130 Watt) | |
| Schenker XMG Core 17 (Early 2021) (Overboost) | |
| Medion Erazer Beast X10 MD61804 | |
| Média NVIDIA GeForce RTX 3060 Laptop GPU (16354 - 23109, n=49) | |
| Schenker XMG Core 17 (Early 2021) | |
| MSI Alpha 17 A4DEK | |
| Acer Predator Helios 300 PH317-54-75G8 | |
| Schenker XMG Core 17 | |
| Schenker XMG Core 17 Comet Lake | |
| 2560x1440 Time Spy Graphics | |
| Média da turma Gaming (5012 - 26212, n=115, últimos 2 anos) | |
| Schenker XMG Core 17 (Early 2021) (Overboost, TGP: 130 Watt) | |
| Schenker XMG Core 17 (Early 2021) (Overboost) | |
| Média NVIDIA GeForce RTX 3060 Laptop GPU (6285 - 9235, n=49) | |
| Medion Erazer Beast X10 MD61804 | |
| Schenker XMG Core 17 (Early 2021) | |
| Acer Predator Helios 300 PH317-54-75G8 | |
| MSI Alpha 17 A4DEK | |
| Schenker XMG Core 17 | |
| Schenker XMG Core 17 Comet Lake | |
Desempenho nos jogos
O hardware é capaz de trazer todos os jogos atuais para a tela com suavidade. Geralmente, pode-se usar a resolução total da tela (2560 x 1440 pixels, WQHD) e configurações de alta a máxima qualidade enquanto se joga. A resolução FHD permitiria um nível máximo de qualidade durante todo o jogo.
Em comparação com todos os computadores portáteis RTX 3060 que testamos até agora, o Core 17 se sai muito bem. Geralmente as diferenças nas taxas de quadros entre os dispositivos não se tornam muito grandes, apesar das diferentes configurações TGP. Como mostram os resultados do Core 17, mesmo um aumento significativo do valor do TGP só levará a um ligeiro aumento nas taxas de quadros
| The Witcher 3 - 1920x1080 Ultra Graphics & Postprocessing (HBAO+) | |
| Média da turma Gaming (104.7 - 240, n=7, últimos 2 anos) | |
| Medion Erazer Beast X10 MD61804 | |
| Schenker XMG Core 15 Ampere | |
| Schenker XMG Core 17 (Early 2021) (Overboost) | |
| Razer Blade 15 Base Edition 2021, i7-10750H RTX 3060 | |
| Schenker XMG Core 17 (Early 2021) | |
| Schenker XMG Core 17 (Early 2021, RTX 3060, 5800H) | |
| Média NVIDIA GeForce RTX 3060 Laptop GPU (58.2 - 91.5, n=48) | |
| Acer Aspire Nitro 5 AN515-55-57GF | |
| MSI GF65 Thin 10UE | |
| Acer Predator Helios 300 PH317-54-75G8 | |
| MSI Alpha 17 A4DEK | |
| Schenker XMG Core 17 | |
| Schenker XMG Core 17 Comet Lake | |
| Dota 2 Reborn - 1920x1080 ultra (3/3) best looking | |
| Média da turma Gaming (84.8 - 248, n=107, últimos 2 anos) | |
| Média NVIDIA GeForce RTX 3060 Laptop GPU (90.7 - 154.8, n=49) | |
| Schenker XMG Core 17 (Early 2021, RTX 3060, 5800H) | |
| Razer Blade 15 Base Edition 2021, i7-10750H RTX 3060 | |
| Schenker XMG Core 17 (Early 2021) | |
| Acer Aspire Nitro 5 AN515-55-57GF | |
| Schenker XMG Core 17 Comet Lake | |
| Schenker XMG Core 17 (Early 2021) (Overboost) | |
| MSI Alpha 17 A4DEK | |
| Schenker XMG Core 15 Ampere | |
| MSI GF65 Thin 10UE | |
| X-Plane 11.11 - 1920x1080 high (fps_test=3) | |
| Média da turma Gaming (55.5 - 143.5, n=109, últimos 2 anos) | |
| Média NVIDIA GeForce RTX 3060 Laptop GPU (61.9 - 109.3, n=48) | |
| Razer Blade 15 Base Edition 2021, i7-10750H RTX 3060 | |
| Schenker XMG Core 17 (Early 2021, RTX 3060, 5800H) | |
| Schenker XMG Core 17 Comet Lake | |
| Schenker XMG Core 17 (Early 2021) (Overboost) | |
| Schenker XMG Core 17 (Early 2021) | |
| Acer Aspire Nitro 5 AN515-55-57GF | |
| Schenker XMG Core 15 Ampere | |
| MSI GF65 Thin 10UE | |
| MSI Alpha 17 A4DEK | |
| Final Fantasy XV Benchmark | |
| 2560x1440 High Quality | |
| Média da turma Gaming (32.5 - 184.3, n=87, últimos 2 anos) | |
| Schenker XMG Core 17 (Early 2021) (1.3, Overboost, TGP: 130 Watt) | |
| Schenker XMG Core 17 (Early 2021) (1.3, Overboost) | |
| Schenker XMG Core 17 (Early 2021) (1.3) | |
| Média NVIDIA GeForce RTX 3060 Laptop GPU (41.1 - 73.7, n=25) | |
| MSI GF65 Thin 10UE (1.3) | |
| 1920x1080 High Quality | |
| Média da turma Gaming (41 - 215, n=95, últimos 2 anos) | |
| Schenker XMG Core 17 (Early 2021) (1.3, Overboost, TGP: 130 Watt) | |
| Schenker XMG Core 17 (Early 2021) (1.3, Overboost) | |
| Razer Blade 15 Base Edition 2021, i7-10750H RTX 3060 (1.3) | |
| Schenker XMG Core 17 (Early 2021) (1.3) | |
| Média NVIDIA GeForce RTX 3060 Laptop GPU (55 - 100.9, n=42) | |
| Acer Aspire Nitro 5 AN515-55-57GF (1.3) | |
| MSI GF65 Thin 10UE (1.3) | |
| Schenker XMG Core 17 | |
| MSI Alpha 17 A4DEK | |
| Strange Brigade | |
| 2560x1440 ultra AA:ultra AF:16 | |
| Média da turma Gaming (52.8 - 354, n=76, últimos 2 anos) | |
| Schenker XMG Core 17 (Early 2021) (1.47.22.14 D3D12, Overboost) | |
| Schenker XMG Core 17 (Early 2021) (1.47.22.14 D3D12, Overboost, TGP: 130 Watt) | |
| Schenker XMG Core 17 (Early 2021) (1.47.22.14 D3D12) | |
| Média NVIDIA GeForce RTX 3060 Laptop GPU (75.4 - 118.4, n=17) | |
| 1920x1080 ultra AA:ultra AF:16 | |
| Média da turma Gaming (76.3 - 458, n=87, últimos 2 anos) | |
| Schenker XMG Core 17 (Early 2021) (1.47.22.14 D3D12, Overboost, TGP: 130 Watt) | |
| Schenker XMG Core 17 (Early 2021) (1.47.22.14 D3D12, Overboost) | |
| Razer Blade 15 Base Edition 2021, i7-10750H RTX 3060 (1.47.22.14 D3D12) | |
| Média NVIDIA GeForce RTX 3060 Laptop GPU (102.2 - 166.3, n=43) | |
| Schenker XMG Core 17 (Early 2021) (1.47.22.14 D3D12) | |
| Acer Aspire Nitro 5 AN515-55-57GF (1.47.22.14 D3D12) | |
| MSI GF65 Thin 10UE (1.47.22.14 D3D12) | |
| Shadow of the Tomb Raider | |
| 1920x1080 Highest Preset AA:T | |
| Média da turma Gaming (96 - 116, n=2, últimos 2 anos) | |
| Schenker XMG Core 17 (Early 2021) | |
| Média NVIDIA GeForce RTX 3060 Laptop GPU (84 - 95, n=4) | |
| Schenker XMG Core 17 (Early 2021, RTX 3060, 5800H) | |
| Schenker XMG Core 15 Ampere | |
| Acer Predator Helios 300 PH317-54-75G8 | |
| 2560x1440 Highest Preset AA:T | |
| Schenker XMG Core 15 Ampere | |
| Média NVIDIA GeForce RTX 3060 Laptop GPU (66 - 71, n=3) | |
| Schenker XMG Core 17 (Early 2021, RTX 3060, 5800H) | |
| Schenker XMG Core 17 (Early 2021) | |
| Far Cry 5 | |
| 1920x1080 Ultra Preset AA:T | |
| Média da turma Gaming (70 - 151, n=6, últimos 2 anos) | |
| Schenker XMG Core 17 (Early 2021) (Overboost, TGP: 130 Watt) | |
| Schenker XMG Core 17 (Early 2021) | |
| Média NVIDIA GeForce RTX 3060 Laptop GPU (80 - 120, n=31) | |
| Schenker XMG Core 17 (Early 2021) (Overboost) | |
| Schenker XMG Core 15 Ampere | |
| MSI GF65 Thin 10UE | |
| Acer Aspire Nitro 5 AN515-55-57GF | |
| Schenker XMG Core 17 | |
| 2560x1440 Ultra Preset AA:T | |
| Média da turma Gaming (93 - 149, n=5, últimos 2 anos) | |
| Schenker XMG Core 17 (Early 2021) (Overboost, TGP: 130 Watt) | |
| Schenker XMG Core 15 Ampere | |
| Schenker XMG Core 17 (Early 2021) (Overboost) | |
| Schenker XMG Core 17 (Early 2021) | |
| Média NVIDIA GeForce RTX 3060 Laptop GPU (58 - 92, n=12) | |
| GTA V | |
| 1920x1080 Highest AA:4xMSAA + FX AF:16x | |
| Média da turma Gaming (48.3 - 186.9, n=94, últimos 2 anos) | |
| Schenker XMG Core 17 (Early 2021, RTX 3060, 5800H) | |
| Schenker XMG Core 17 (Early 2021) (Overboost) | |
| Média NVIDIA GeForce RTX 3060 Laptop GPU (69.2 - 109.8, n=46) | |
| Schenker XMG Core 17 (Early 2021) (Overboost, TGP: 130 Watt) | |
| Schenker XMG Core 17 (Early 2021) | |
| Razer Blade 15 Base Edition 2021, i7-10750H RTX 3060 | |
| Acer Aspire Nitro 5 AN515-55-57GF | |
| MSI GF65 Thin 10UE | |
| 2560x1440 Highest AA:4xMSAA + FX AF:16x | |
| Média da turma Gaming (36.9 - 183.9, n=72, últimos 2 anos) | |
| Schenker XMG Core 17 (Early 2021) (Overboost, TGP: 130 Watt) | |
| Schenker XMG Core 17 (Early 2021) (Overboost) | |
| Schenker XMG Core 17 (Early 2021) | |
| Média NVIDIA GeForce RTX 3060 Laptop GPU (52 - 86.5, n=23) | |
| Performance rating - Percent | |
| Média da turma Gaming -1! | |
| Schenker XMG Core 17 (Early 2021, RTX 3060, 5800H) -7! | |
| Schenker XMG Core 15 Ampere -6! | |
| Média NVIDIA GeForce RTX 3060 Laptop GPU | |
| Schenker XMG Core 17 (Early 2021) | |
| Schenker XMG Core 17 (Early 2021) -5! | |
| Schenker XMG Core 17 (Early 2021) -2! | |
| Razer Blade 15 Base Edition 2021, i7-10750H RTX 3060 -7! | |
| Acer Aspire Nitro 5 AN515-55-57GF -6! | |
| Schenker XMG Core 17 Comet Lake -10! | |
| Acer Predator Helios 300 PH317-54-75G8 -11! | |
| MSI GF65 Thin 10UE -5! | |
| Medion Erazer Beast X10 MD61804 -12! | |
| Schenker XMG Core 17 -10! | |
| MSI Alpha 17 A4DEK -9! | |
| The Witcher 3 - 1920x1080 Ultra Graphics & Postprocessing (HBAO+) | |
| Média da turma Gaming (104.7 - 240, n=7, últimos 2 anos) | |
| Medion Erazer Beast X10 MD61804 | |
| Schenker XMG Core 15 Ampere | |
| Schenker XMG Core 17 (Early 2021) (Overboost) | |
| Razer Blade 15 Base Edition 2021, i7-10750H RTX 3060 | |
| Schenker XMG Core 17 (Early 2021) | |
| Schenker XMG Core 17 (Early 2021, RTX 3060, 5800H) | |
| Média NVIDIA GeForce RTX 3060 Laptop GPU (58.2 - 91.5, n=48) | |
| Acer Aspire Nitro 5 AN515-55-57GF | |
| MSI GF65 Thin 10UE | |
| Acer Predator Helios 300 PH317-54-75G8 | |
| MSI Alpha 17 A4DEK | |
| Schenker XMG Core 17 | |
| Schenker XMG Core 17 Comet Lake | |
| Dota 2 Reborn - 1920x1080 ultra (3/3) best looking | |
| Média da turma Gaming (84.8 - 248, n=107, últimos 2 anos) | |
| Média NVIDIA GeForce RTX 3060 Laptop GPU (90.7 - 154.8, n=49) | |
| Schenker XMG Core 17 (Early 2021, RTX 3060, 5800H) | |
| Razer Blade 15 Base Edition 2021, i7-10750H RTX 3060 | |
| Schenker XMG Core 17 (Early 2021) | |
| Acer Aspire Nitro 5 AN515-55-57GF | |
| Schenker XMG Core 17 Comet Lake | |
| Schenker XMG Core 17 (Early 2021) (Overboost) | |
| MSI Alpha 17 A4DEK | |
| Schenker XMG Core 15 Ampere | |
| MSI GF65 Thin 10UE | |
| X-Plane 11.11 - 1920x1080 high (fps_test=3) | |
| Média da turma Gaming (55.5 - 143.5, n=109, últimos 2 anos) | |
| Média NVIDIA GeForce RTX 3060 Laptop GPU (61.9 - 109.3, n=48) | |
| Razer Blade 15 Base Edition 2021, i7-10750H RTX 3060 | |
| Schenker XMG Core 17 (Early 2021, RTX 3060, 5800H) | |
| Schenker XMG Core 17 Comet Lake | |
| Schenker XMG Core 17 (Early 2021) (Overboost) | |
| Schenker XMG Core 17 (Early 2021) | |
| Acer Aspire Nitro 5 AN515-55-57GF | |
| Schenker XMG Core 15 Ampere | |
| MSI GF65 Thin 10UE | |
| MSI Alpha 17 A4DEK | |
| Final Fantasy XV Benchmark | |
| 2560x1440 High Quality | |
| Média da turma Gaming (32.5 - 184.3, n=87, últimos 2 anos) | |
| Schenker XMG Core 17 (Early 2021) (1.3, Overboost, TGP: 130 Watt) | |
| Schenker XMG Core 17 (Early 2021) (1.3, Overboost) | |
| Schenker XMG Core 17 (Early 2021) (1.3) | |
| Média NVIDIA GeForce RTX 3060 Laptop GPU (41.1 - 73.7, n=25) | |
| MSI GF65 Thin 10UE (1.3) | |
| 1920x1080 High Quality | |
| Média da turma Gaming (41 - 215, n=95, últimos 2 anos) | |
| Schenker XMG Core 17 (Early 2021) (1.3, Overboost, TGP: 130 Watt) | |
| Schenker XMG Core 17 (Early 2021) (1.3, Overboost) | |
| Razer Blade 15 Base Edition 2021, i7-10750H RTX 3060 (1.3) | |
| Schenker XMG Core 17 (Early 2021) (1.3) | |
| Média NVIDIA GeForce RTX 3060 Laptop GPU (55 - 100.9, n=42) | |
| Acer Aspire Nitro 5 AN515-55-57GF (1.3) | |
| MSI GF65 Thin 10UE (1.3) | |
| Schenker XMG Core 17 | |
| MSI Alpha 17 A4DEK | |
| Strange Brigade | |
| 2560x1440 ultra AA:ultra AF:16 | |
| Média da turma Gaming (52.8 - 354, n=76, últimos 2 anos) | |
| Schenker XMG Core 17 (Early 2021) (1.47.22.14 D3D12, Overboost) | |
| Schenker XMG Core 17 (Early 2021) (1.47.22.14 D3D12, Overboost, TGP: 130 Watt) | |
| Schenker XMG Core 17 (Early 2021) (1.47.22.14 D3D12) | |
| Média NVIDIA GeForce RTX 3060 Laptop GPU (75.4 - 118.4, n=17) | |
| 1920x1080 ultra AA:ultra AF:16 | |
| Média da turma Gaming (76.3 - 458, n=87, últimos 2 anos) | |
| Schenker XMG Core 17 (Early 2021) (1.47.22.14 D3D12, Overboost, TGP: 130 Watt) | |
| Schenker XMG Core 17 (Early 2021) (1.47.22.14 D3D12, Overboost) | |
| Razer Blade 15 Base Edition 2021, i7-10750H RTX 3060 (1.47.22.14 D3D12) | |
| Média NVIDIA GeForce RTX 3060 Laptop GPU (102.2 - 166.3, n=43) | |
| Schenker XMG Core 17 (Early 2021) (1.47.22.14 D3D12) | |
| Acer Aspire Nitro 5 AN515-55-57GF (1.47.22.14 D3D12) | |
| MSI GF65 Thin 10UE (1.47.22.14 D3D12) | |
| Shadow of the Tomb Raider | |
| 1920x1080 Highest Preset AA:T | |
| Média da turma Gaming (96 - 116, n=2, últimos 2 anos) | |
| Schenker XMG Core 17 (Early 2021) | |
| Média NVIDIA GeForce RTX 3060 Laptop GPU (84 - 95, n=4) | |
| Schenker XMG Core 17 (Early 2021, RTX 3060, 5800H) | |
| Schenker XMG Core 15 Ampere | |
| Acer Predator Helios 300 PH317-54-75G8 | |
| 2560x1440 Highest Preset AA:T | |
| Schenker XMG Core 15 Ampere | |
| Média NVIDIA GeForce RTX 3060 Laptop GPU (66 - 71, n=3) | |
| Schenker XMG Core 17 (Early 2021, RTX 3060, 5800H) | |
| Schenker XMG Core 17 (Early 2021) | |
| Far Cry 5 | |
| 1920x1080 Ultra Preset AA:T | |
| Média da turma Gaming (70 - 151, n=6, últimos 2 anos) | |
| Schenker XMG Core 17 (Early 2021) (Overboost, TGP: 130 Watt) | |
| Schenker XMG Core 17 (Early 2021) | |
| Média NVIDIA GeForce RTX 3060 Laptop GPU (80 - 120, n=31) | |
| Schenker XMG Core 17 (Early 2021) (Overboost) | |
| Schenker XMG Core 15 Ampere | |
| MSI GF65 Thin 10UE | |
| Acer Aspire Nitro 5 AN515-55-57GF | |
| Schenker XMG Core 17 | |
| 2560x1440 Ultra Preset AA:T | |
| Média da turma Gaming (93 - 149, n=5, últimos 2 anos) | |
| Schenker XMG Core 17 (Early 2021) (Overboost, TGP: 130 Watt) | |
| Schenker XMG Core 15 Ampere | |
| Schenker XMG Core 17 (Early 2021) (Overboost) | |
| Schenker XMG Core 17 (Early 2021) | |
| Média NVIDIA GeForce RTX 3060 Laptop GPU (58 - 92, n=12) | |
| GTA V | |
| 1920x1080 Highest AA:4xMSAA + FX AF:16x | |
| Média da turma Gaming (48.3 - 186.9, n=94, últimos 2 anos) | |
| Schenker XMG Core 17 (Early 2021, RTX 3060, 5800H) | |
| Schenker XMG Core 17 (Early 2021) (Overboost) | |
| Média NVIDIA GeForce RTX 3060 Laptop GPU (69.2 - 109.8, n=46) | |
| Schenker XMG Core 17 (Early 2021) (Overboost, TGP: 130 Watt) | |
| Schenker XMG Core 17 (Early 2021) | |
| Razer Blade 15 Base Edition 2021, i7-10750H RTX 3060 | |
| Acer Aspire Nitro 5 AN515-55-57GF | |
| MSI GF65 Thin 10UE | |
| 2560x1440 Highest AA:4xMSAA + FX AF:16x | |
| Média da turma Gaming (36.9 - 183.9, n=72, últimos 2 anos) | |
| Schenker XMG Core 17 (Early 2021) (Overboost, TGP: 130 Watt) | |
| Schenker XMG Core 17 (Early 2021) (Overboost) | |
| Schenker XMG Core 17 (Early 2021) | |
| Média NVIDIA GeForce RTX 3060 Laptop GPU (52 - 86.5, n=23) | |
A fim de avaliar se as taxas de quadros também permanecem em sua maioria constantes durante um período de tempo mais longo, executamos o jogo"The Witcher 3" por cerca de 60 minutos com resolução Full HD e configurações de qualidade máxima, sem mover o personagem do jogo. Não notamos nenhuma queda nas taxas de quadros.
| baixo | média | alto | ultra | QHD | |
|---|---|---|---|---|---|
| GTA V (2015) | 179 | 172 | 150 | 86.9 | 74.3 |
| The Witcher 3 (2015) | 302 | 229 | 144 | 79.5 | |
| Dota 2 Reborn (2015) | 146 | 136 | 124 | 118 | |
| Final Fantasy XV Benchmark (2018) | 141 | 105 | 79.9 | 59.6 | |
| X-Plane 11.11 (2018) | 89.5 | 81.7 | 68.7 | ||
| Far Cry 5 (2018) | 145 | 113 | 108 | 102 | 82 |
| Strange Brigade (2018) | 345 | 191 | 154 | 134 | 101 |
| Shadow of the Tomb Raider (2018) | 113 | 106 | 102 | 95 | 66 |
| Watch Dogs Legion (2020) | 82.1 | 77 | 70.7 | 50.8 | 33.9 |
| Dirt 5 (2020) | 140 | 102 | 89.1 | 71.5 | 56.1 |
| Yakuza Like a Dragon (2020) | 127 | 106 | 105 | 92.2 | 61.8 |
| Outriders (2021) | 122 | 103 | 98.9 | 90.1 | 65.1 |
| Resident Evil Village (2021) | 160 | 140 | 136 | 121 | 81.6 |
| Mass Effect Legendary Edition (2021) | 109 | 92.9 | 91.9 | ||
| Days Gone (2021) | 173 | 121 | 107 | 81.1 | 58.9 |
Emissões - O computador Schenker pode produzir muito ruído
Emissões sonoras
Durante a operação ociosa e sob cargas baixas, o desenvolvimento do ruído permanece dentro dos limites. Os ventiladores então geralmente funcionam a baixas velocidades. Sob carga, eles irão se recuperar, e registramos um nível máximo de ruído de 54 dB(A) (teste de estresse) e 51 dB(A) (" Witcher 3teste "), o que torna o uso de um fone de ouvido quase um requisito
Barulho
| Ocioso |
| 30 / 32 / 36 dB |
| Carga |
| 53 / 54 dB |
 | ||
30 dB silencioso 40 dB(A) audível 50 dB(A) ruidosamente alto |
||
min: | ||
| Schenker XMG Core 17 (Early 2021) i7-10870H, GeForce RTX 3060 Laptop GPU | MSI Alpha 17 A4DEK R7 4800H, Radeon RX 5600M | Acer Predator Helios 300 PH317-54-75G8 i7-10750H, GeForce RTX 2060 Mobile | Medion Erazer Beast X10 MD61804 i7-10750H, GeForce RTX 2070 Super Max-Q | Schenker XMG Core 17 i7-9750H, GeForce GTX 1660 Ti Mobile | Schenker XMG Core 17 Comet Lake i7-10750H, GeForce GTX 1650 Ti Mobile | Média da turma Gaming | |
|---|---|---|---|---|---|---|---|
| Noise | 6% | 6% | 3% | 1% | 9% | 11% | |
| desligado / ambiente * (dB) | 25 | 25 -0% | 24 4% | 25 -0% | 30 -20% | 25 -0% | 24.1 ? 4% |
| Idle Minimum * (dB) | 30 | 31 -3% | 25 17% | 26 13% | 30 -0% | 25 17% | 26 ? 13% |
| Idle Average * (dB) | 32 | 32 -0% | 30 6% | 29 9% | 32 -0% | 31 3% | 27.4 ? 14% |
| Idle Maximum * (dB) | 36 | 33 8% | 37 -3% | 35 3% | 35 3% | 32 11% | 30.1 ? 16% |
| Load Average * (dB) | 53 | 38 28% | 48 9% | 52 2% | 47 11% | 48 9% | 43.6 ? 18% |
| Witcher 3 ultra * (dB) | 51 | 46 10% | 50 2% | 53 -4% | 48 6% | 44 14% | |
| Load Maximum * (dB) | 54 | 54 -0% | 52 4% | 55 -2% | 51 6% | 51 6% | 54.2 ? -0% |
* ... menor é melhor
Temperaturas
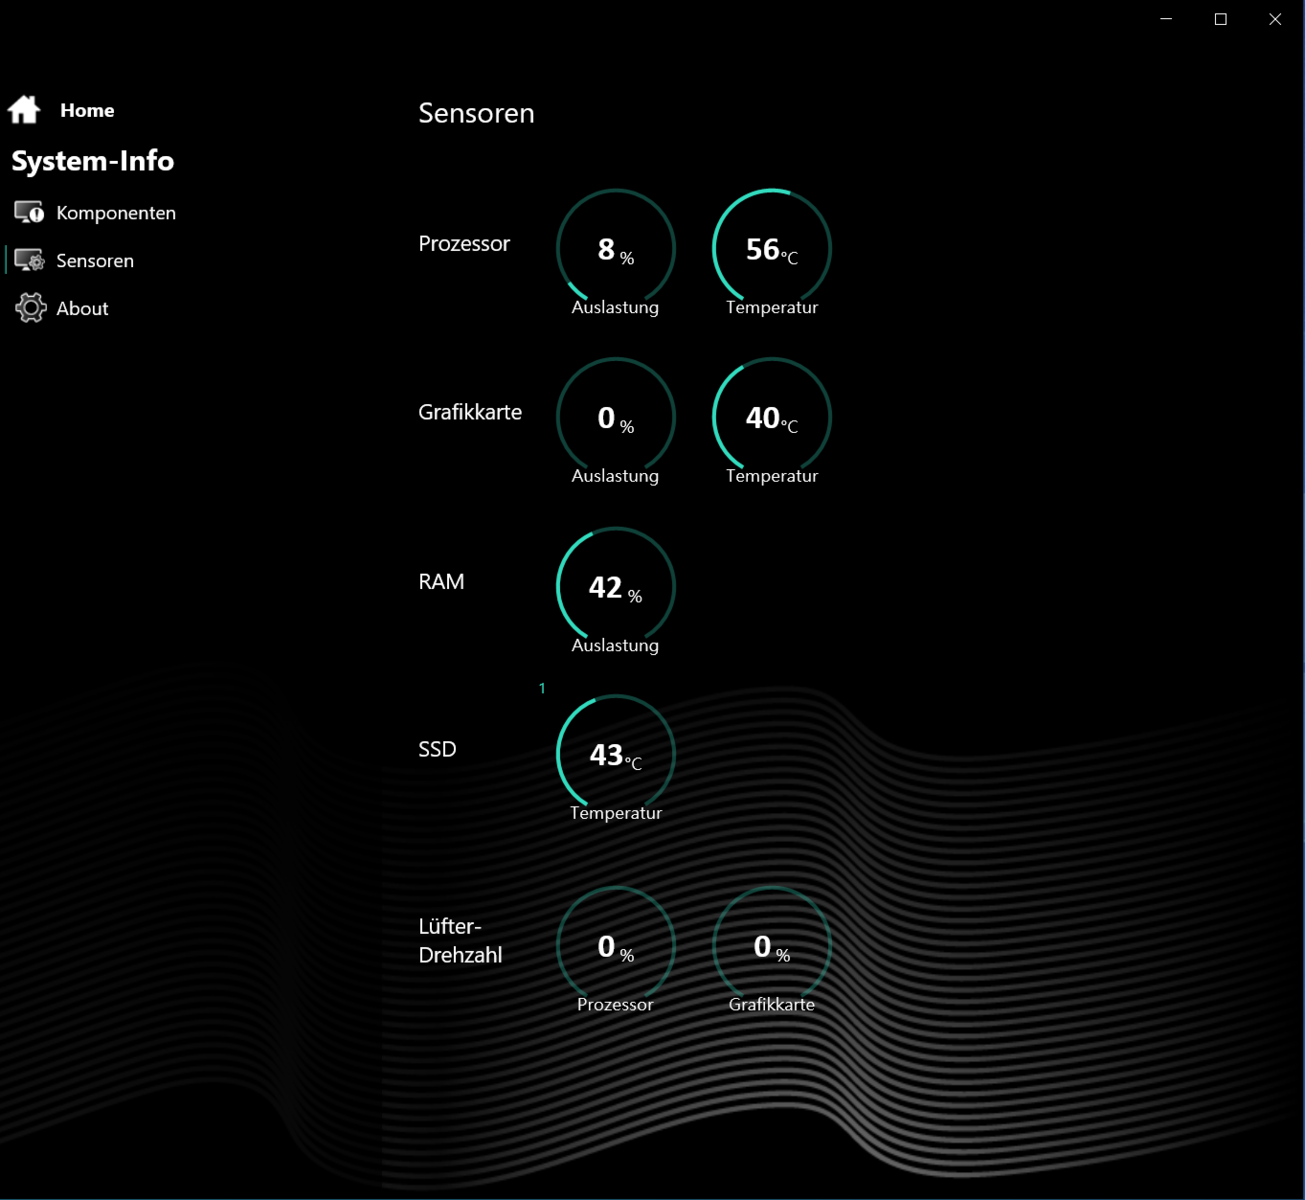
A CPU e a GPU passam por nosso teste de estresse (Prime95 e Furmark funcionando por pelo menos uma hora) a 3,2 GHz e 1327 MHz, respectivamente. O teste de estresse representa um cenário extremo, e usamos este teste para avaliar se o sistema também permanece estável sob carga total
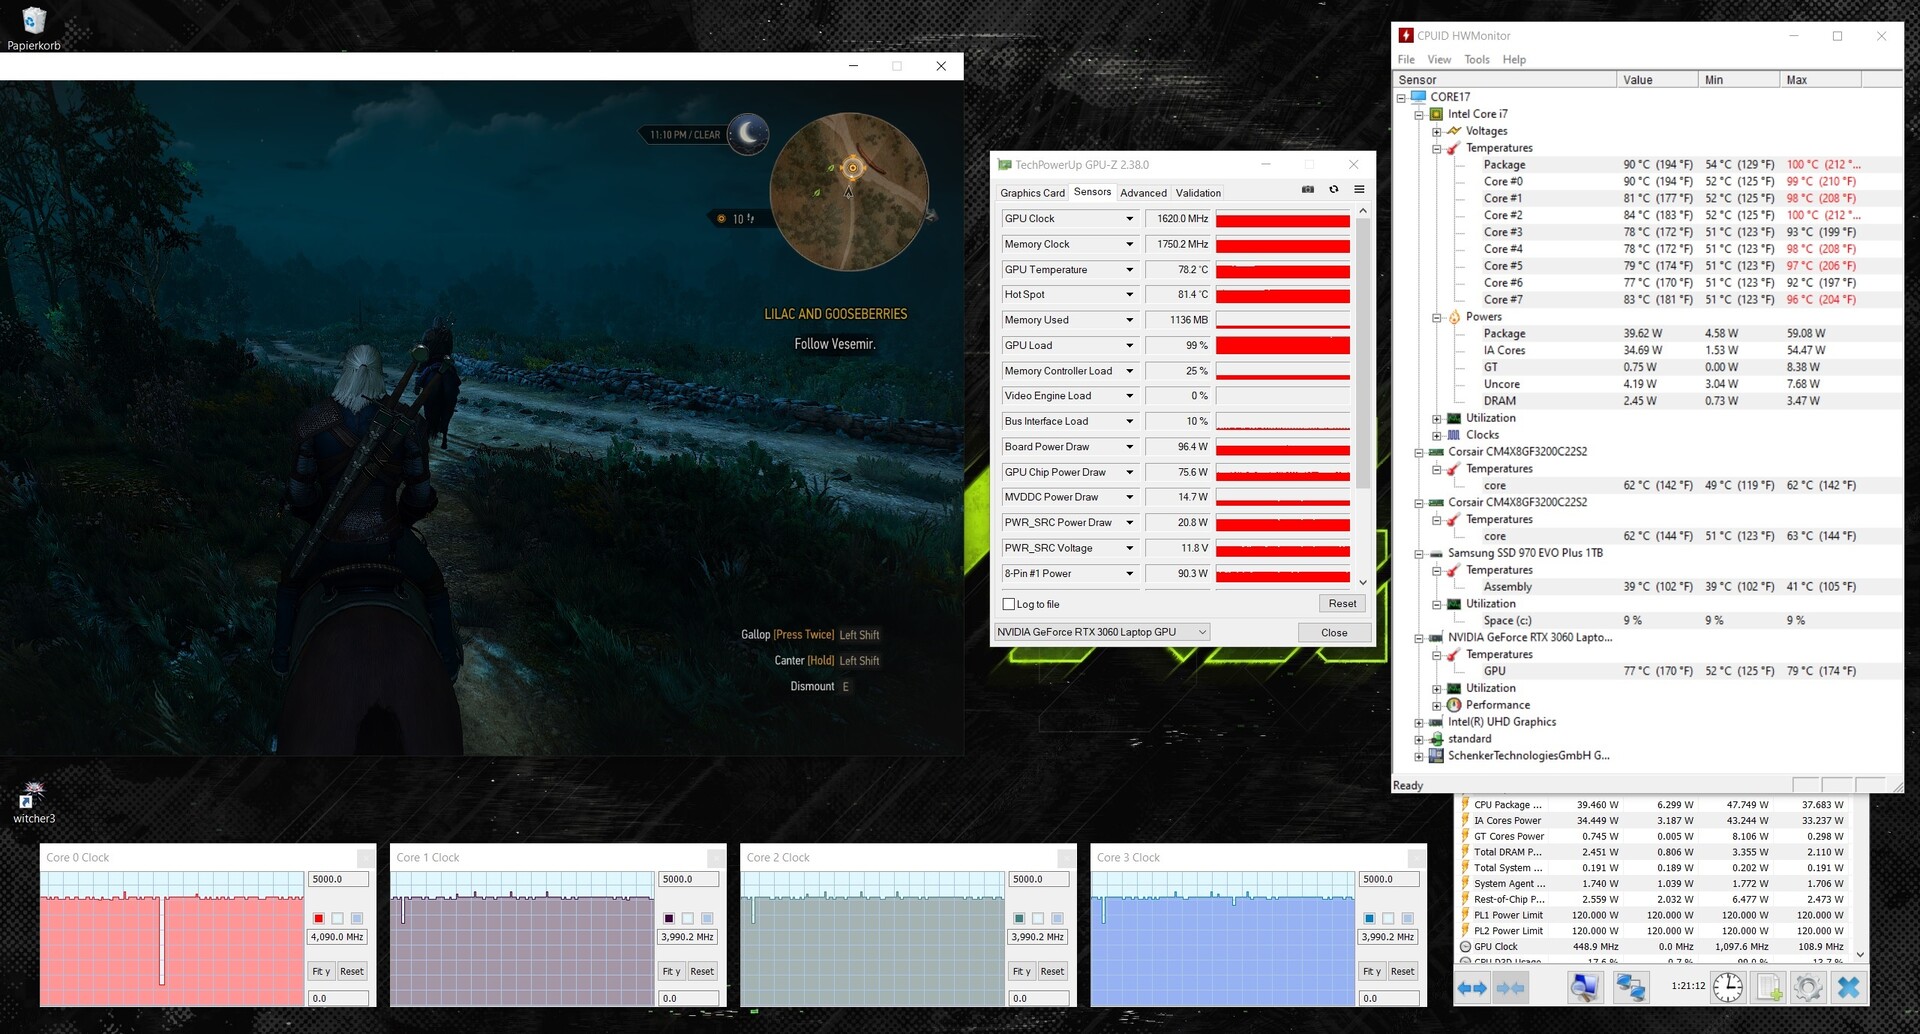
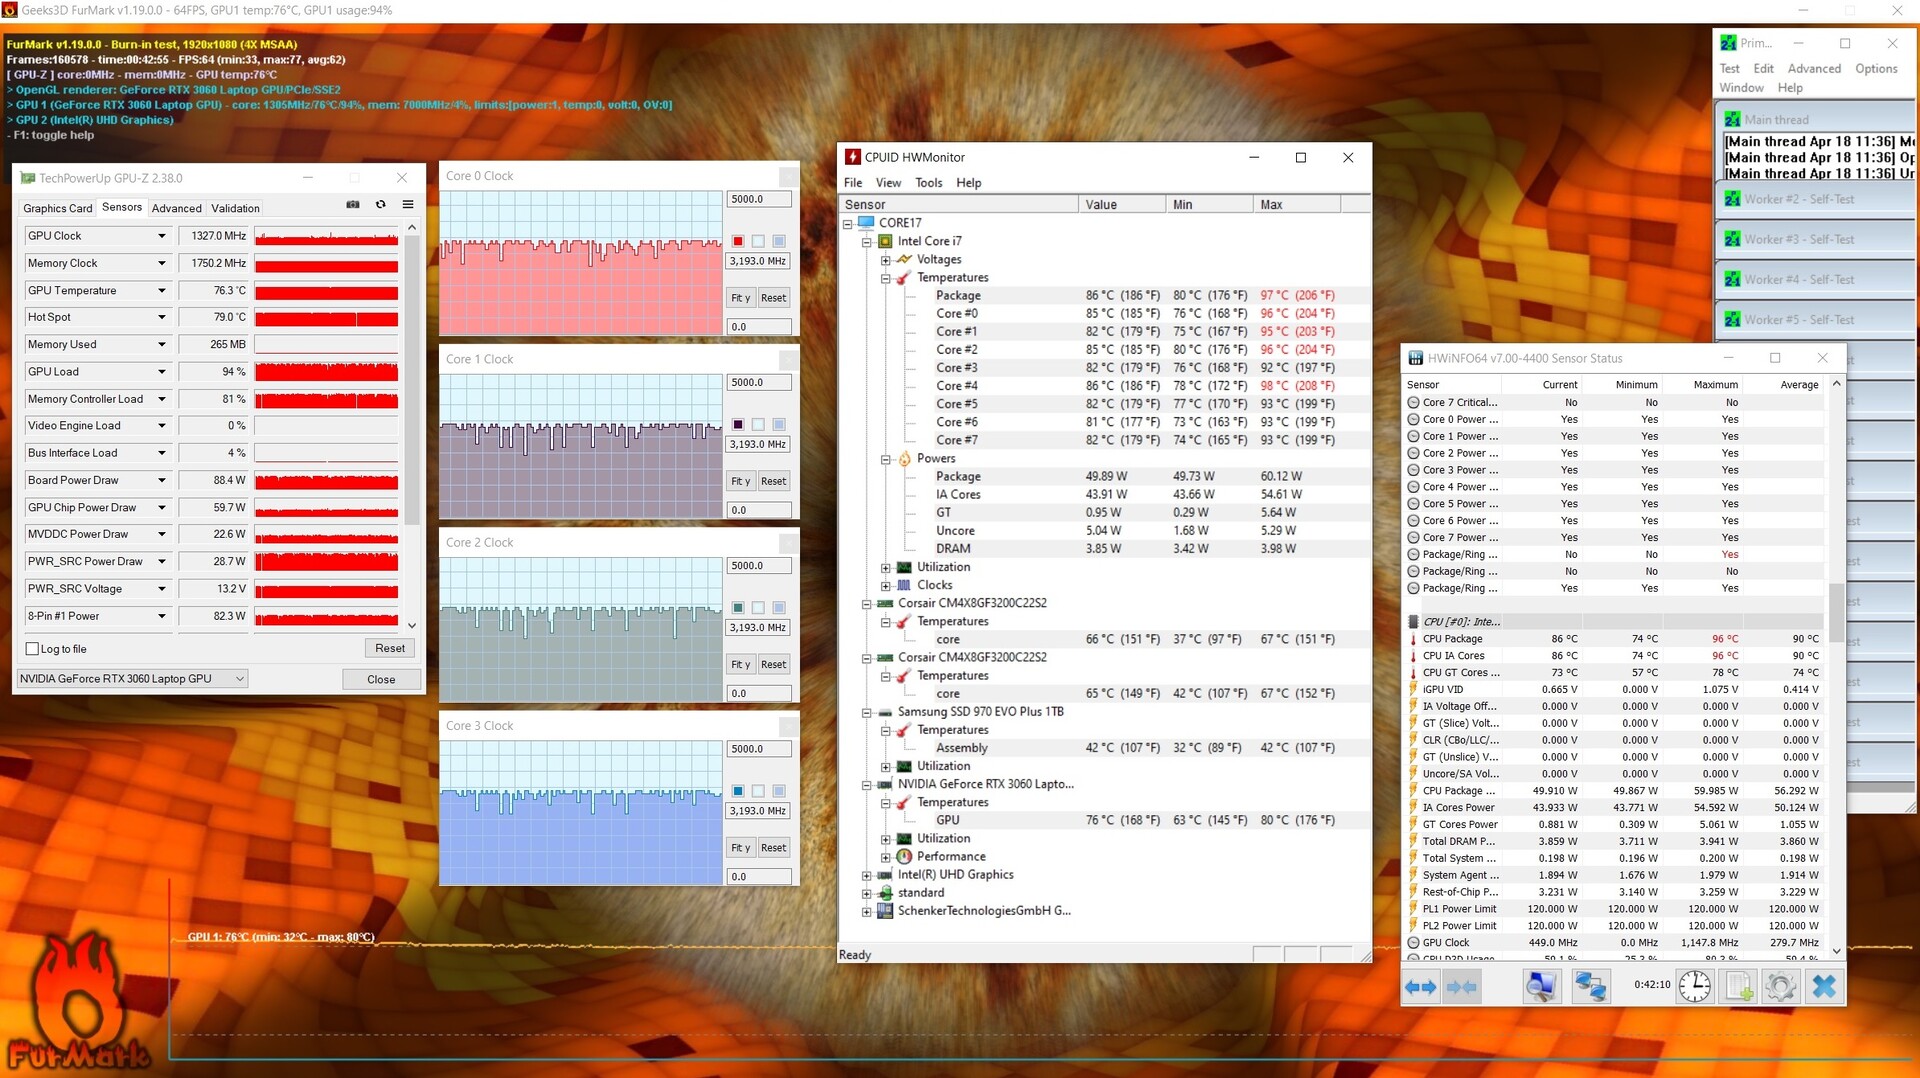
Considerando o hardware dentro do laptop, ele não esquenta muito durante o teste de estresse. O desenvolvimento do calor se torna minimamente maior quando executamos nosso teste"The Witcher 3". Em ambos os casos, você não deve executar o laptop no seu colo.
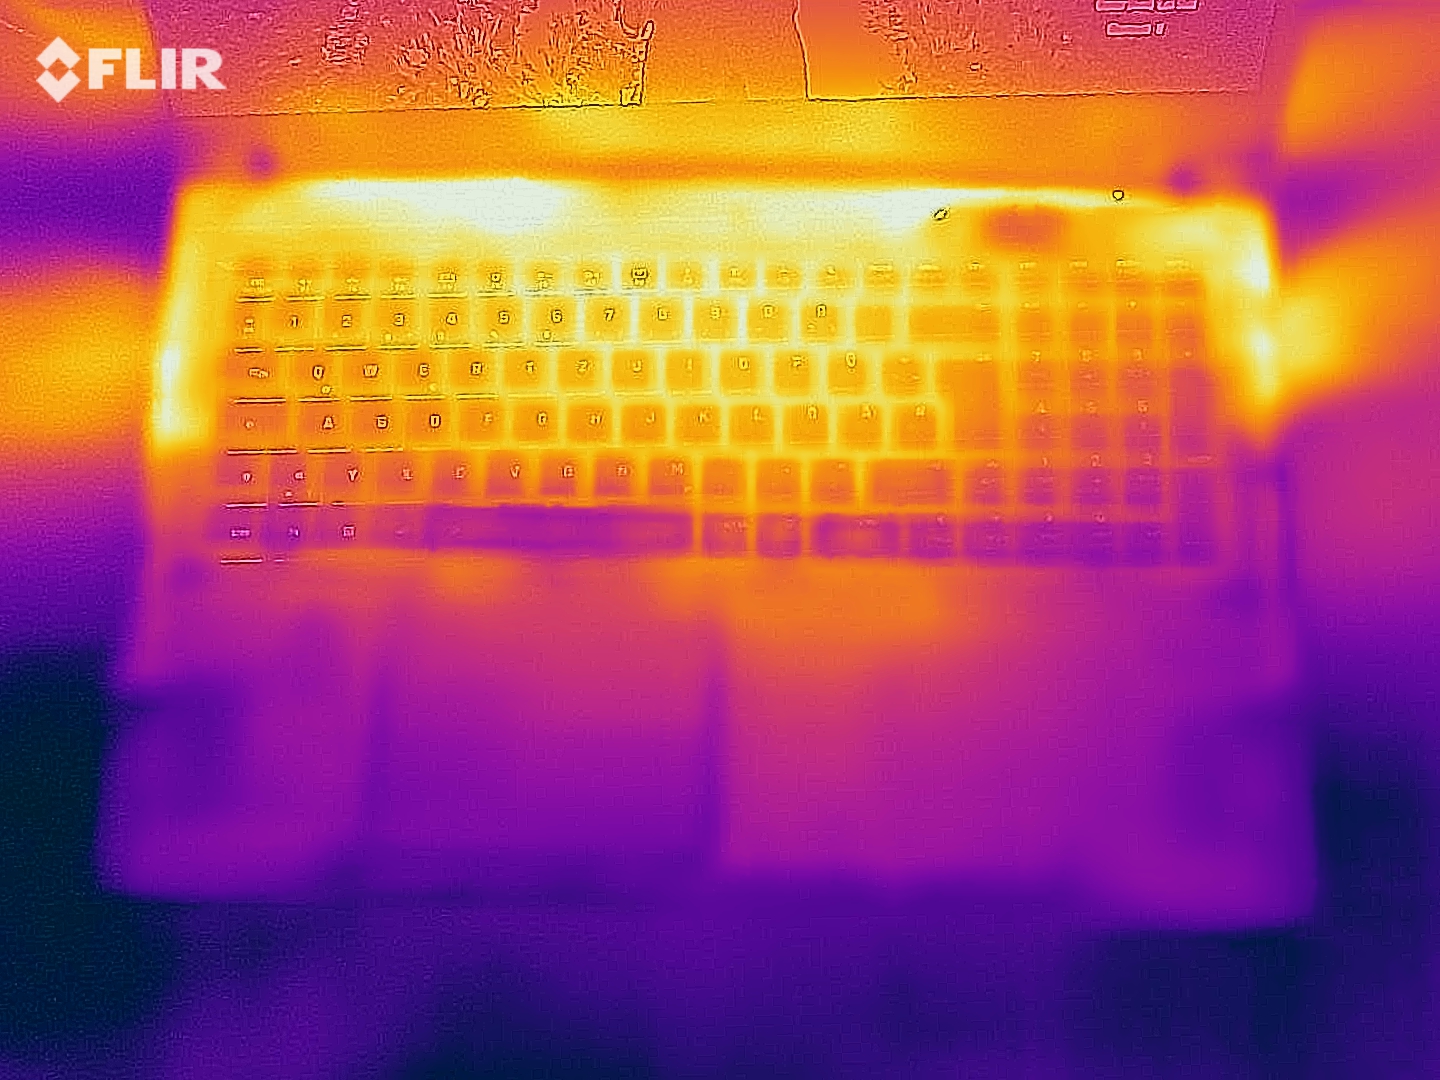
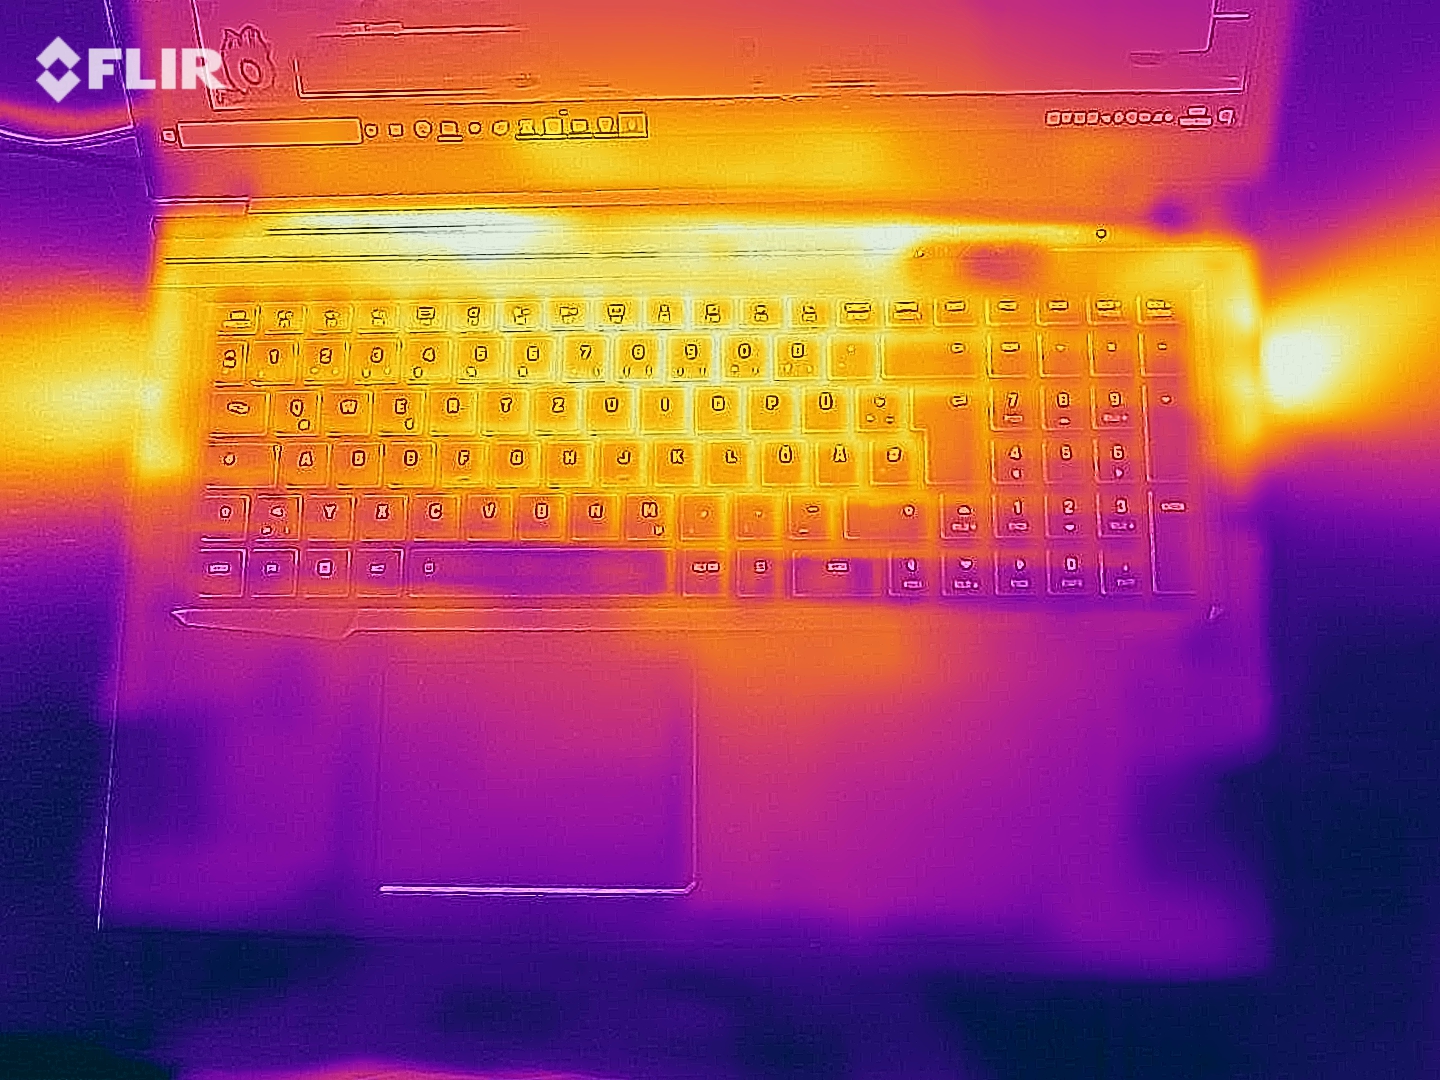
(±) A temperatura máxima no lado superior é 44 °C / 111 F, em comparação com a média de 40.4 °C / 105 F , variando de 21.2 a 68.8 °C para a classe Gaming.
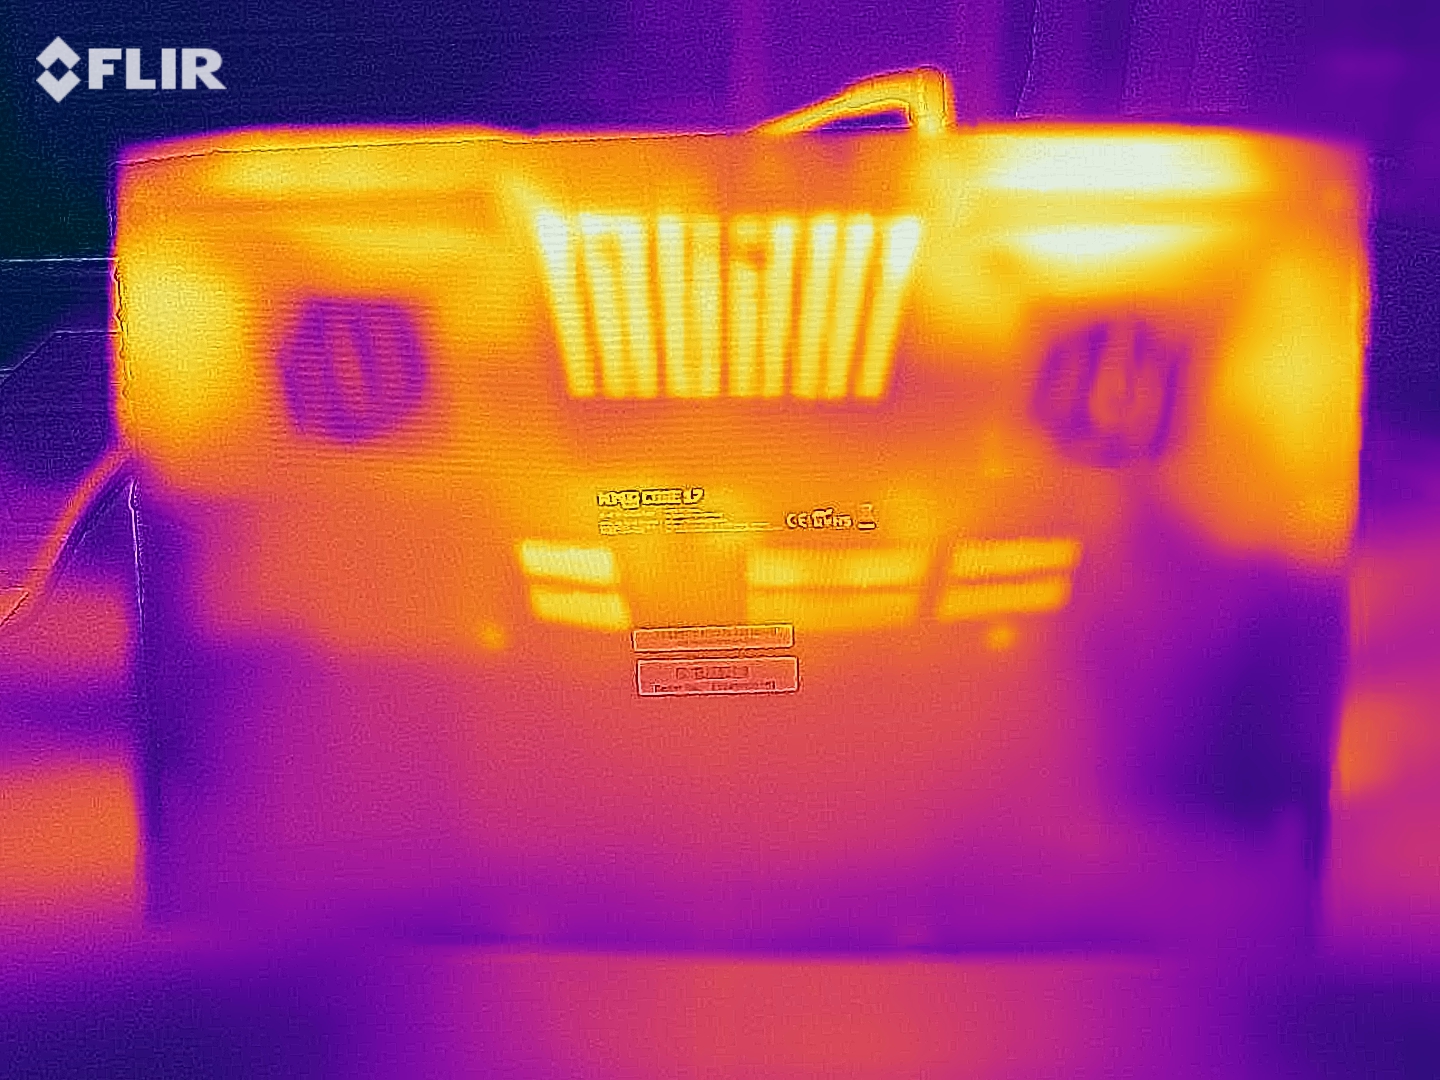
(-) A parte inferior aquece até um máximo de 50 °C / 122 F, em comparação com a média de 43.2 °C / 110 F
(+) Em uso inativo, a temperatura média para o lado superior é 28.9 °C / 84 F, em comparação com a média do dispositivo de 33.9 °C / ### class_avg_f### F.
(±) Jogando The Witcher 3, a temperatura média para o lado superior é 37.3 °C / 99 F, em comparação com a média do dispositivo de 33.9 °C / ## #class_avg_f### F.
(+) Os apoios para as mãos e o touchpad estão atingindo a temperatura máxima da pele (32 °C / 89.6 F) e, portanto, não estão quentes.
(-) A temperatura média da área do apoio para as mãos de dispositivos semelhantes foi 28.8 °C / 83.8 F (-3.2 °C / -5.8 F).
| Schenker XMG Core 17 (Early 2021) i7-10870H, GeForce RTX 3060 Laptop GPU | MSI Alpha 17 A4DEK R7 4800H, Radeon RX 5600M | Acer Predator Helios 300 PH317-54-75G8 i7-10750H, GeForce RTX 2060 Mobile | Medion Erazer Beast X10 MD61804 i7-10750H, GeForce RTX 2070 Super Max-Q | Schenker XMG Core 17 i7-9750H, GeForce GTX 1660 Ti Mobile | Schenker XMG Core 17 Comet Lake i7-10750H, GeForce GTX 1650 Ti Mobile | Média da turma Gaming | |
|---|---|---|---|---|---|---|---|
| Heat | 16% | -6% | -4% | -2% | 7% | 1% | |
| Maximum Upper Side * (°C) | 44 | 44 -0% | 53 -20% | 51 -16% | 47 -7% | 45 -2% | 45.2 ? -3% |
| Maximum Bottom * (°C) | 50 | 43 14% | 59 -18% | 56 -12% | 50 -0% | 48 4% | 48.1 ? 4% |
| Idle Upper Side * (°C) | 30 | 25 17% | 29 3% | 31 -3% | 34 -13% | 27 10% | 31 ? -3% |
| Idle Bottom * (°C) | 36 | 24 33% | 32 11% | 30 17% | 32 11% | 30 17% | 34.2 ? 5% |
* ... menor é melhor
Oradores
Schenker XMG Core 17 (Early 2021) análise de áudio
(+) | os alto-falantes podem tocar relativamente alto (###valor### dB)
Graves 100 - 315Hz
(-) | quase nenhum baixo - em média 27.5% menor que a mediana
(±) | a linearidade dos graves é média (12.8% delta para a frequência anterior)
Médios 400 - 2.000 Hz
(+) | médios equilibrados - apenas 2.3% longe da mediana
(+) | médios são lineares (5.4% delta para frequência anterior)
Altos 2 - 16 kHz
(+) | agudos equilibrados - apenas 3.5% longe da mediana
(±) | a linearidade dos máximos é média (9.9% delta para frequência anterior)
Geral 100 - 16.000 Hz
(±) | a linearidade do som geral é média (17.5% diferença em relação à mediana)
Comparado com a mesma classe
» 49% de todos os dispositivos testados nesta classe foram melhores, 12% semelhantes, 39% piores
» O melhor teve um delta de 6%, a média foi 18%, o pior foi 132%
Comparado com todos os dispositivos testados
» 34% de todos os dispositivos testados foram melhores, 8% semelhantes, 58% piores
» O melhor teve um delta de 4%, a média foi 23%, o pior foi 134%
Gerenciamento de energia - O Core 17 proporciona uma vida útil aceitável da bateria
Consumo de energia
Não há nada que se destaque em termos de consumo de energia. Em toda a gama de cargas, os valores permanecem em um nível normal para o hardware utilizado aqui. O fornecimento de energia é avaliado em 180 watts
| desligado | |
| Ocioso | |
| Carga |
|
Key:
min: | |
| Schenker XMG Core 17 (Early 2021) i7-10870H, GeForce RTX 3060 Laptop GPU | MSI Alpha 17 A4DEK R7 4800H, Radeon RX 5600M | Acer Predator Helios 300 PH317-54-75G8 i7-10750H, GeForce RTX 2060 Mobile | Medion Erazer Beast X10 MD61804 i7-10750H, GeForce RTX 2070 Super Max-Q | Schenker XMG Core 17 i7-9750H, GeForce GTX 1660 Ti Mobile | Schenker XMG Core 17 Comet Lake i7-10750H, GeForce GTX 1650 Ti Mobile | Média da turma Gaming | |
|---|---|---|---|---|---|---|---|
| Power Consumption | 23% | 25% | -23% | 21% | 16% | -7% | |
| Idle Minimum * (Watt) | 13 | 9 31% | 6 54% | 19 -46% | 10 23% | 12 8% | 13 ? -0% |
| Idle Average * (Watt) | 16 | 12 25% | 11 31% | 22 -38% | 13 19% | 15 6% | 19 ? -19% |
| Idle Maximum * (Watt) | 29 | 18 38% | 19 34% | 30 -3% | 21 28% | 24 17% | 24.6 ? 15% |
| Load Average * (Watt) | 100 | 76 24% | 96 4% | 118 -18% | 89 11% | 105 -5% | 110.7 ? -11% |
| Witcher 3 ultra * (Watt) | 173 | 136 21% | 144 17% | 176 -2% | 128 26% | 93 46% | |
| Load Maximum * (Watt) | 213 | 222 -4% | 197 8% | 274 -29% | 177 17% | 168 21% | 259 ? -22% |
* ... menor é melhor
Vida útil da bateria
No teste WLAN (carregamento de sites via roteiro) e no teste de vídeo (curta-metragem Big Buck Bunny running in a loop; codificação H.264, FHD), o Core 17 dura 4:53 horas e 4:43 horas, respectivamente. Durante ambos os testes, as funções de economia de energia do laptop são desativadas, e o brilho da tela é reduzido para cerca de 150 cd/m². Durante a execução do teste de vídeo, os módulos de comunicação também foram desligados
| Schenker XMG Core 17 (Early 2021) i7-10870H, GeForce RTX 3060 Laptop GPU, 62 Wh | MSI Alpha 17 A4DEK R7 4800H, Radeon RX 5600M, 65 Wh | Acer Predator Helios 300 PH317-54-75G8 i7-10750H, GeForce RTX 2060 Mobile, 59 Wh | Medion Erazer Beast X10 MD61804 i7-10750H, GeForce RTX 2070 Super Max-Q, 91.2 Wh | Schenker XMG Core 17 i7-9750H, GeForce GTX 1660 Ti Mobile, 46.74 Wh | Schenker XMG Core 17 Comet Lake i7-10750H, GeForce GTX 1650 Ti Mobile, 62.3 Wh | Média da turma Gaming | |
|---|---|---|---|---|---|---|---|
| Duração da bateria | 33% | 26% | 56% | 4% | 4% | 36% | |
| Reader / Idle (h) | 7.7 | 10.5 36% | 8.2 6% | 11.4 48% | 8.1 5% | 8.27 ? 7% | |
| H.264 (h) | 4.7 | 5.9 26% | 8.5 81% | 5.3 13% | 8.32 ? 77% | ||
| WiFi v1.3 (h) | 4.9 | 7.3 49% | 5.1 4% | 6.8 39% | 4.7 -4% | 5.1 4% | 7.11 ? 45% |
| Load (h) | 1.3 | 1.5 15% | 2.2 69% | 2 54% | 1.3 0% | 1.502 ? 16% |
Pro
Contra
Veredicto
A CPUCore i7-10870H(maxPL1/2: 120 watts) eGeForce RTX-3060 GPU para laptop (maxTGP:130 watts) trazem todos os jogos atuais para a tela com suavidade. Você não terá que se preocupar com oestrangulamento, e a CPU e a GPU são sempre capazes de manter seu desempenho constante.
Com o XMG Core 17 (Início de 2021), a Schenker fornece um computador portátil para jogos de médio alcance bem arredondado.
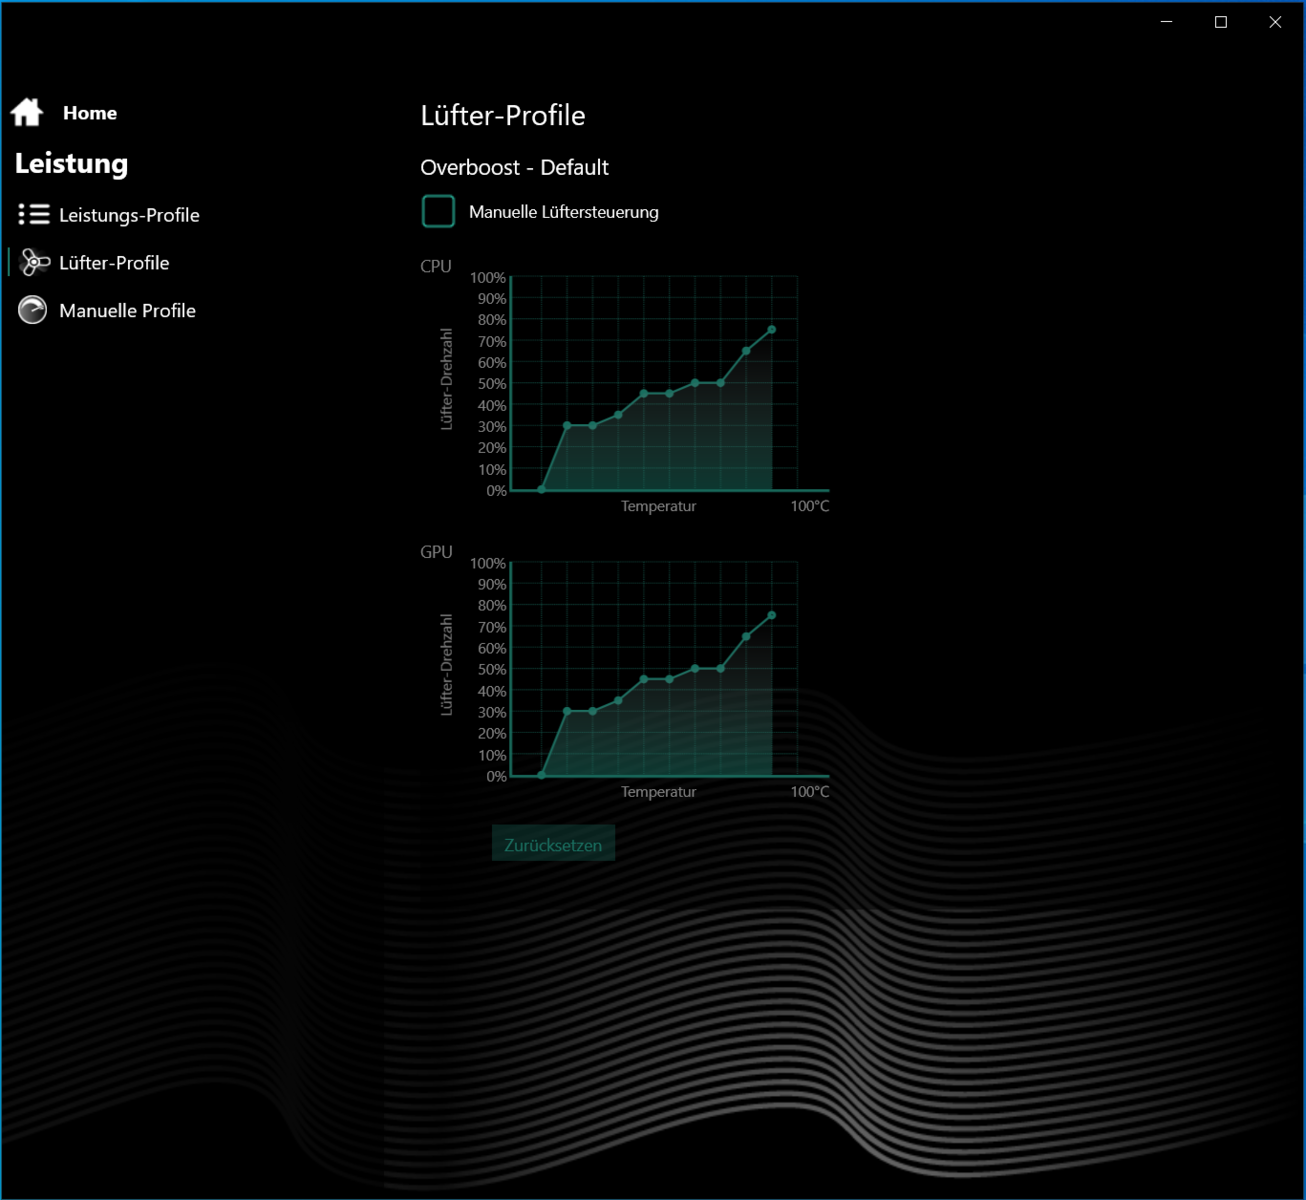
Enquanto o controle automático do ventilador torna o laptop muito barulhento sob carga, você pode fazer alguns ajustes aqui, e o Centro de Controle oferece controle manual das curvas do ventilador. Particularmente durante os jogos ("O Witcher 3 teste "), ainda há algum potencial de otimização em comparação com outros laptops RTX 3060.
A tela (WQHD, IPS, 165 Hz) oferece um bom valor de brilho, ângulos de visão estáveis, tempos de resposta curtos, uma boa reprodução de cores e uma cobertura de espaço de cores muito decente. Entretanto, o contraste poderia ser maior e a vida útil da bateria também não é muito inspiradora para ninguém.
Observe que algumas das avaliações das categorias únicas são diferentes das do Core 17 a partir de 2019, uma vez que atualizamos o sistema de avaliação. Isto significa que as avaliações de ambos os modelos do Core 17 não são comparáveis.
Preço e Disponibilidade
O Schenker XMG Core 17 (Início de 2021) pode ser configurado individualmente no site Schenker (Bestware) loja online a partir de cerca de 1450 Euros (~$1773). A configuração do equipamento fornecido para testes está disponível por cerca de 1840 Euros (~$2250)
Schenker XMG Core 17 (Early 2021)
- 05/31/2021 v7 (old)
Sascha Mölck
Price comparison

