AMD Ryzen 7 5700U vs. Ryzen 5 5500U: Lenovo Yoga 6 13 revisão de conversível
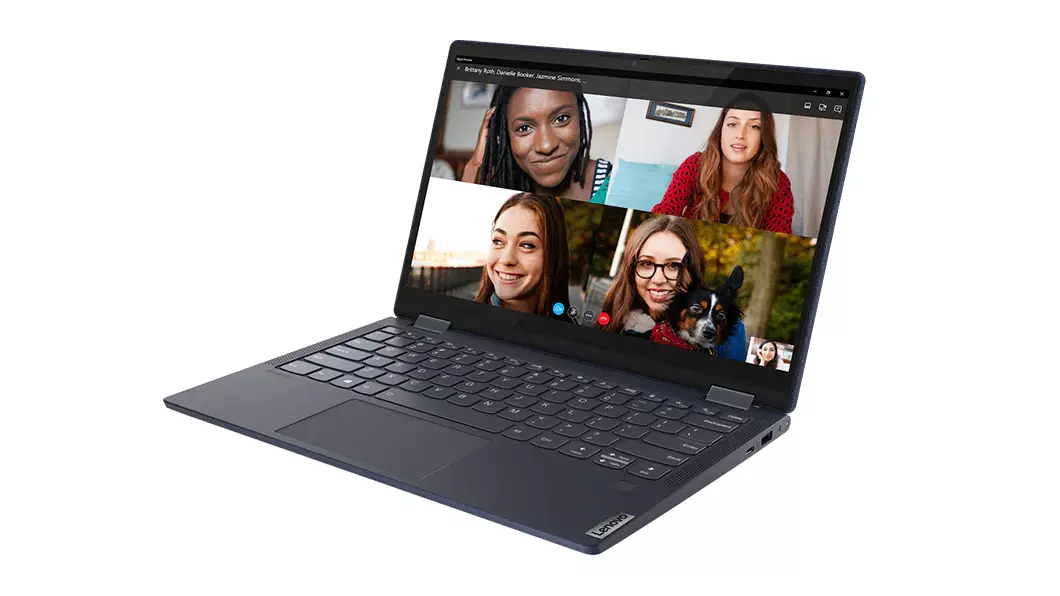
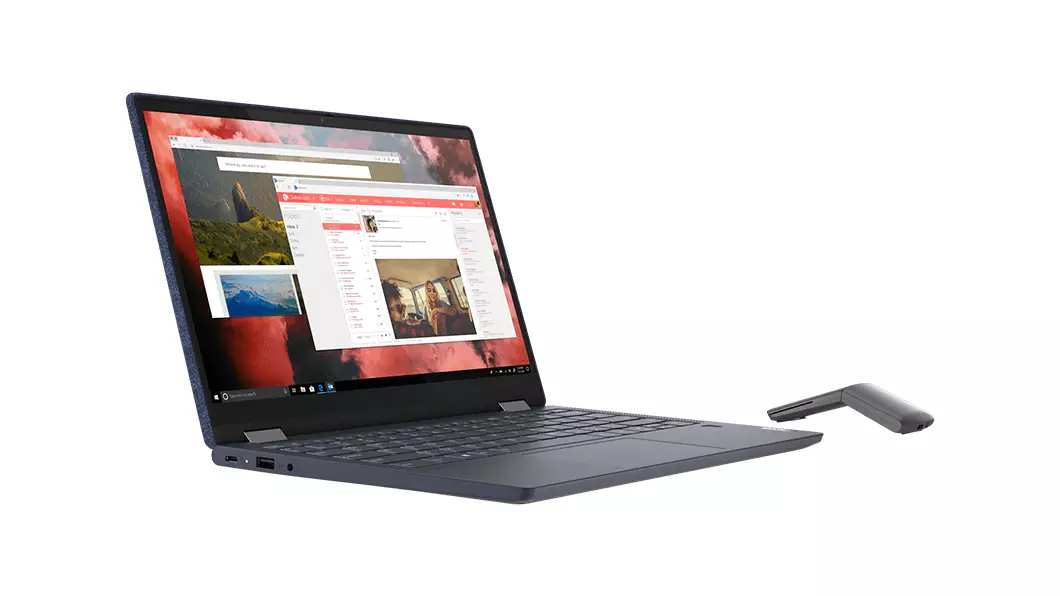
Quando revisamos a Lenovo Yoga 6 13 há alguns meses, descobrimos que ela oferece um desempenho melhor do que a média e uma ótima tela sensível ao toque de 1080p para sua categoria de médio alcance. Nossa unidade de teste foi a configuração mais baixa, porém, com "apenas" a CPU Ryzen 5 5500U, 8 GB de RAM e 256 GB de NVMe SSD por cerca de US$800. Desta vez, quisemos verificar a configuração mais alta de US$ 1000 com a CPU Ryzen 7 5700U, 16 GB de RAM e 1 TB de SSD NVMe para ver o que os usuários podem esperar se decidirem pagar um pouco mais.
Recomendamos verificar nosso revisão existente sobre o Ryzen 5 Yoga 6 13 como todos os nossos comentários sobre o teclado, chassis e outras características físicas do modelo ainda se aplicam aqui no Ryzen 7 Yoga 6 13. A série midrange Yoga 6 se situa entre o orçamento mais barato IdeaPad série Flex 3 e mais caro Yoga série 9.
Mais análises da Lenovo:
potential competitors in comparison
Avaliação | Data | Modelo | Peso | Altura | Size | Resolução | Preço |
|---|---|---|---|---|---|---|---|
| 85 % v7 (old) | 10/2021 | Lenovo Yoga 6 13ALC6 R7 5700U, Vega 8 | 1.3 kg | 18.2 mm | 13.30" | 1920x1080 | |
| 84.7 % v7 (old) | 07/2021 | Lenovo Yoga 6 13 82ND0009US R5 5500U, Vega 7 | 1.3 kg | 18.2 mm | 13.30" | 1920x1080 | |
| 86.7 % v7 (old) | 10/2021 | Dell XPS 13 9310 2-in-1 i7-1165G7, Iris Xe G7 96EUs | 1.3 kg | 14.35 mm | 13.40" | 1920x1200 | |
| 85.7 % v7 (old) | 06/2021 | Acer Spin 3 SP313-51N-56YV i5-1135G7, Iris Xe G7 80EUs | 1.4 kg | 16 mm | 13.30" | 2560x1600 | |
| 83.7 % v7 (old) | 05/2021 | Lenovo IdeaPad Flex 5 CB 13IML05 82B80010GE i5-10210U, UHD Graphics 620 | 1.4 kg | 17.95 mm | 13.30" | 1920x1080 | |
| 85.5 % v7 (old) | 07/2020 | HP Envy x360 13-ay0010nr R5 4500U, Vega 6 | 1.3 kg | 16.4 mm | 13.30" | 1920x1080 |
Caso

Comunicação
Webcam


Manutenção
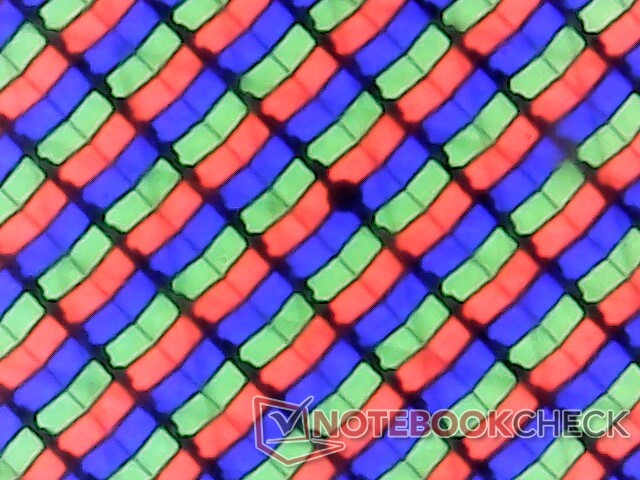
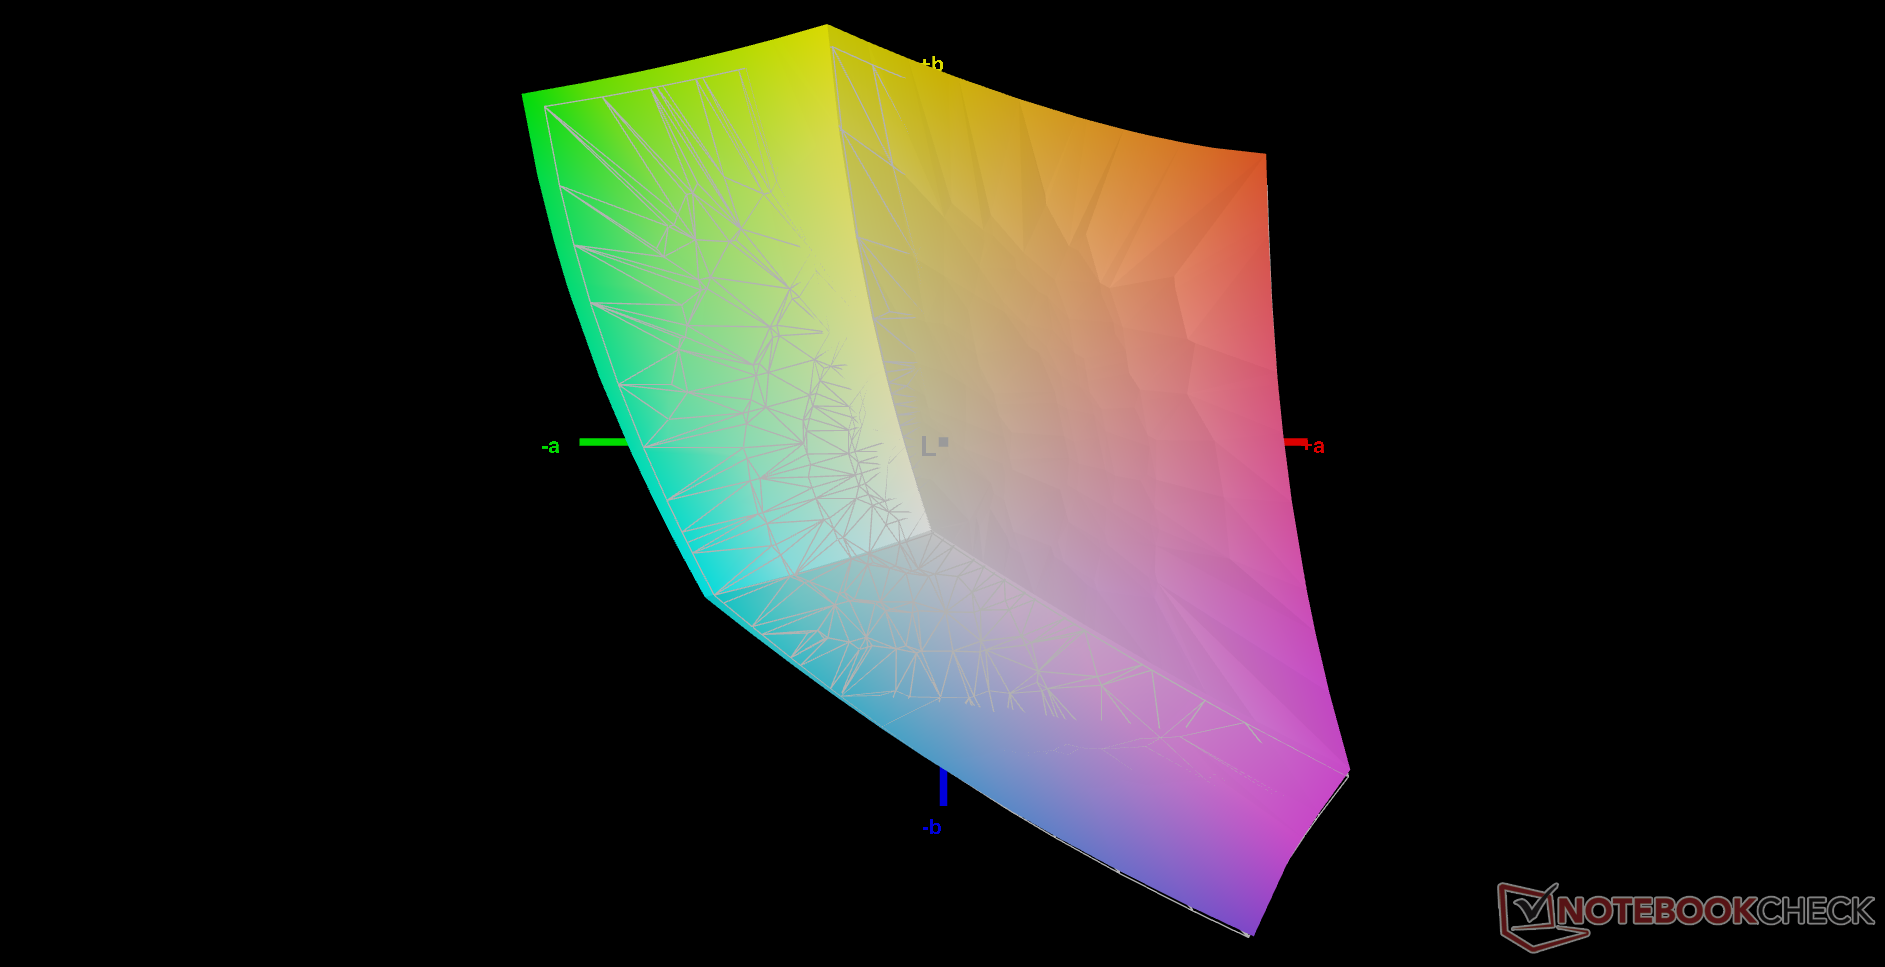
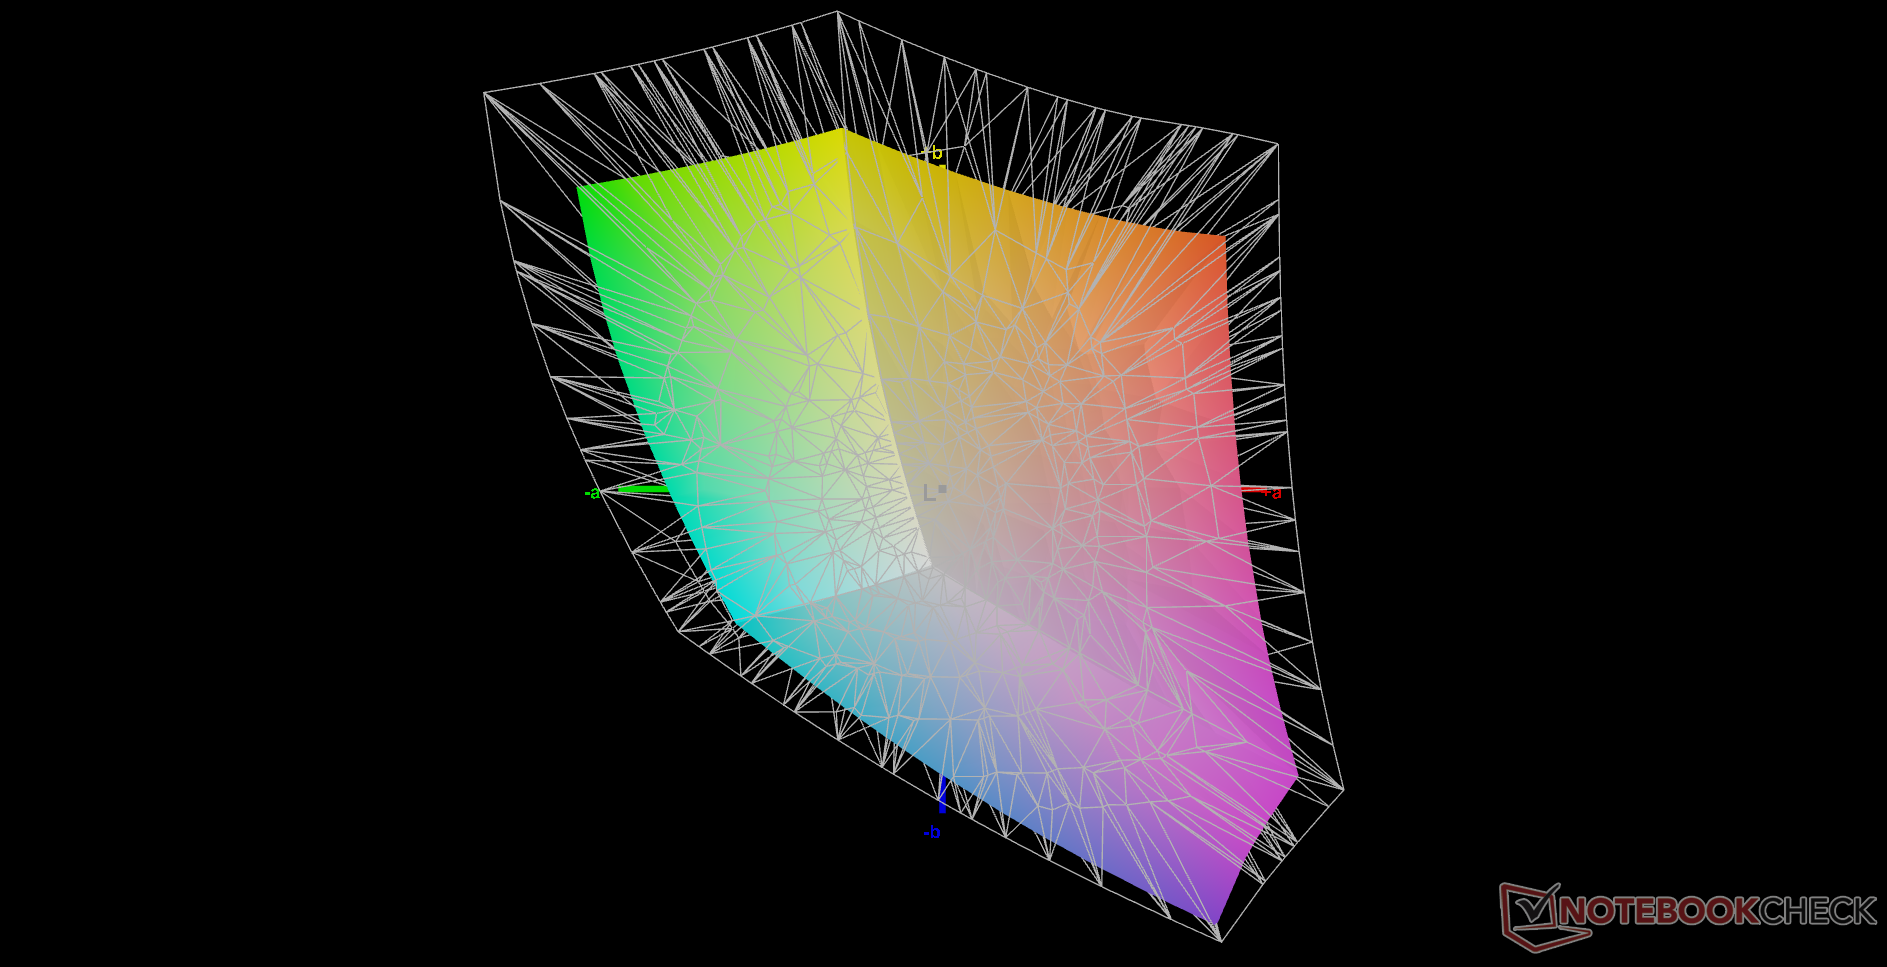
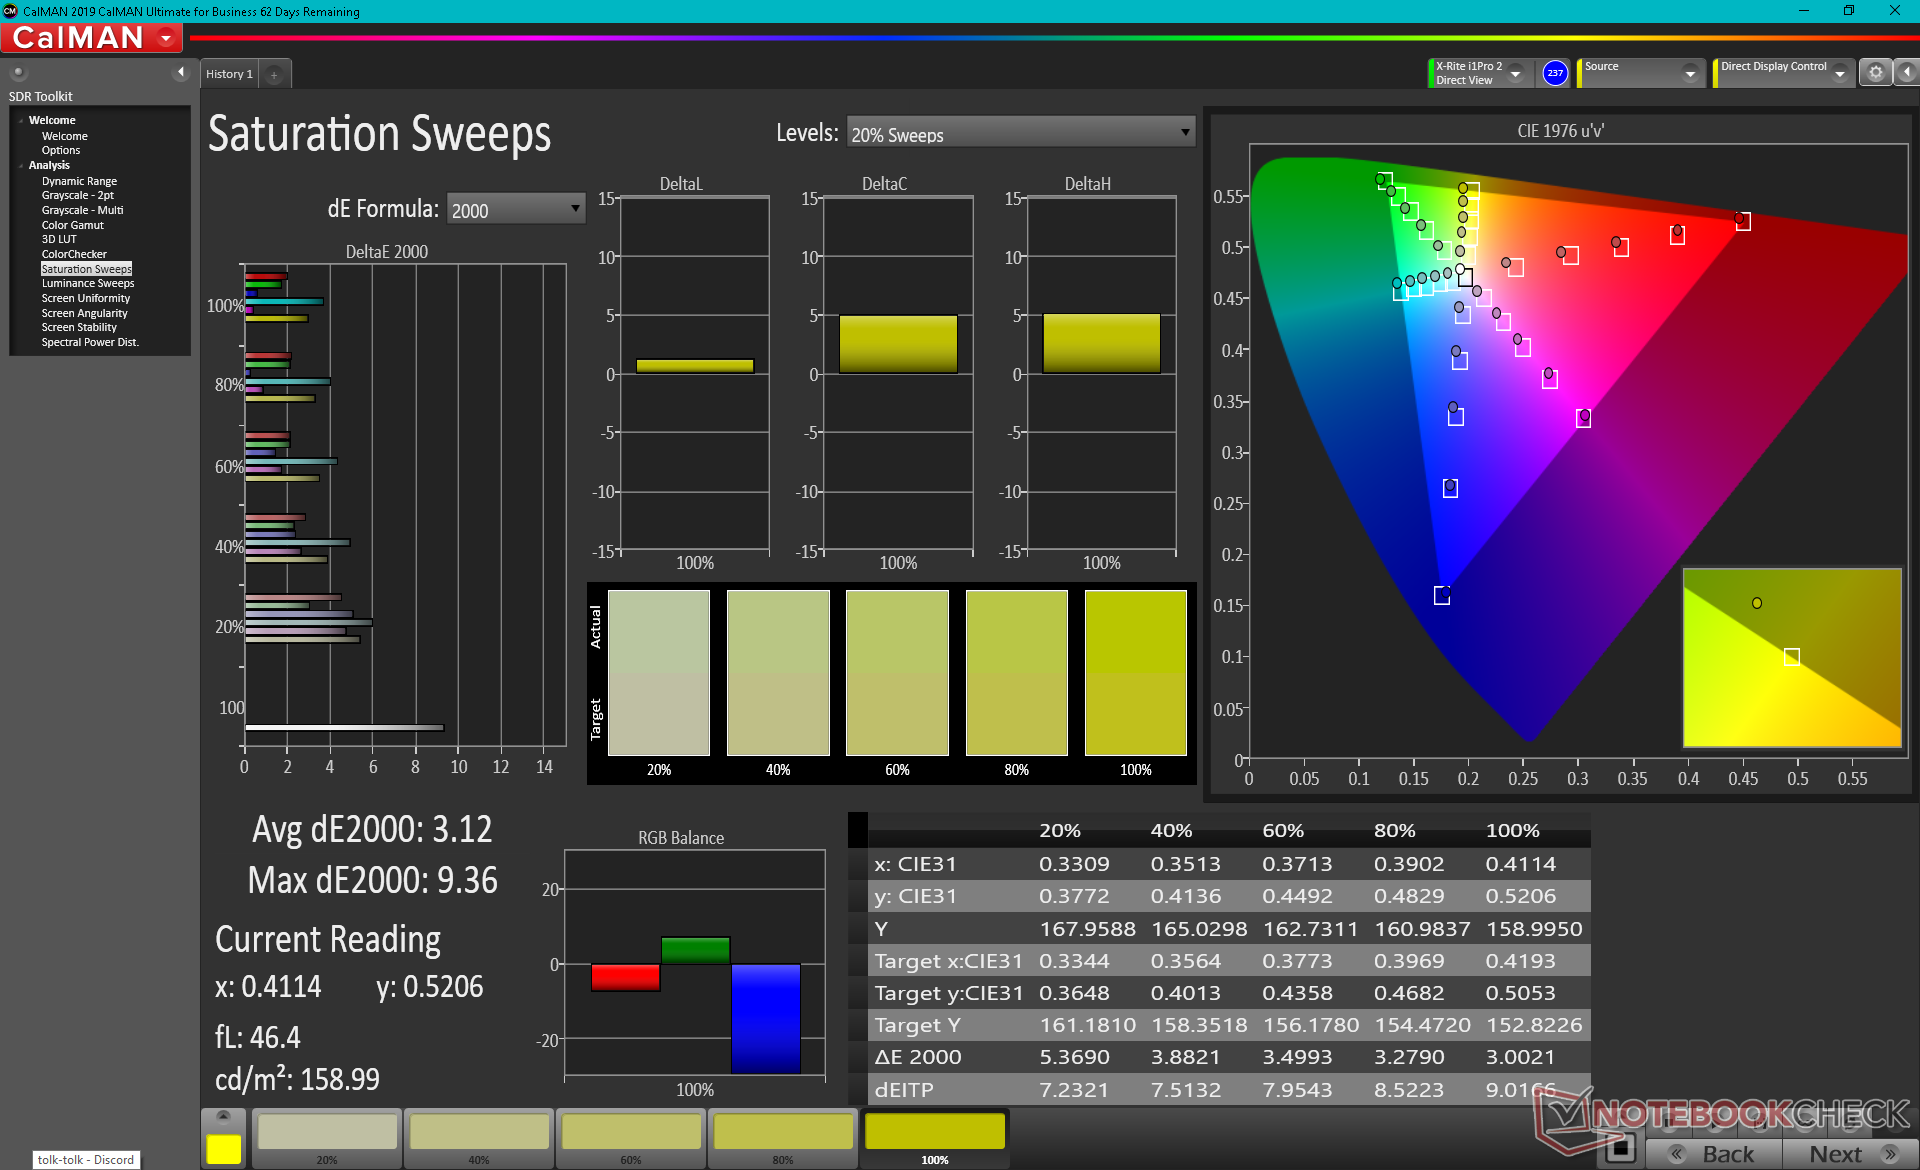
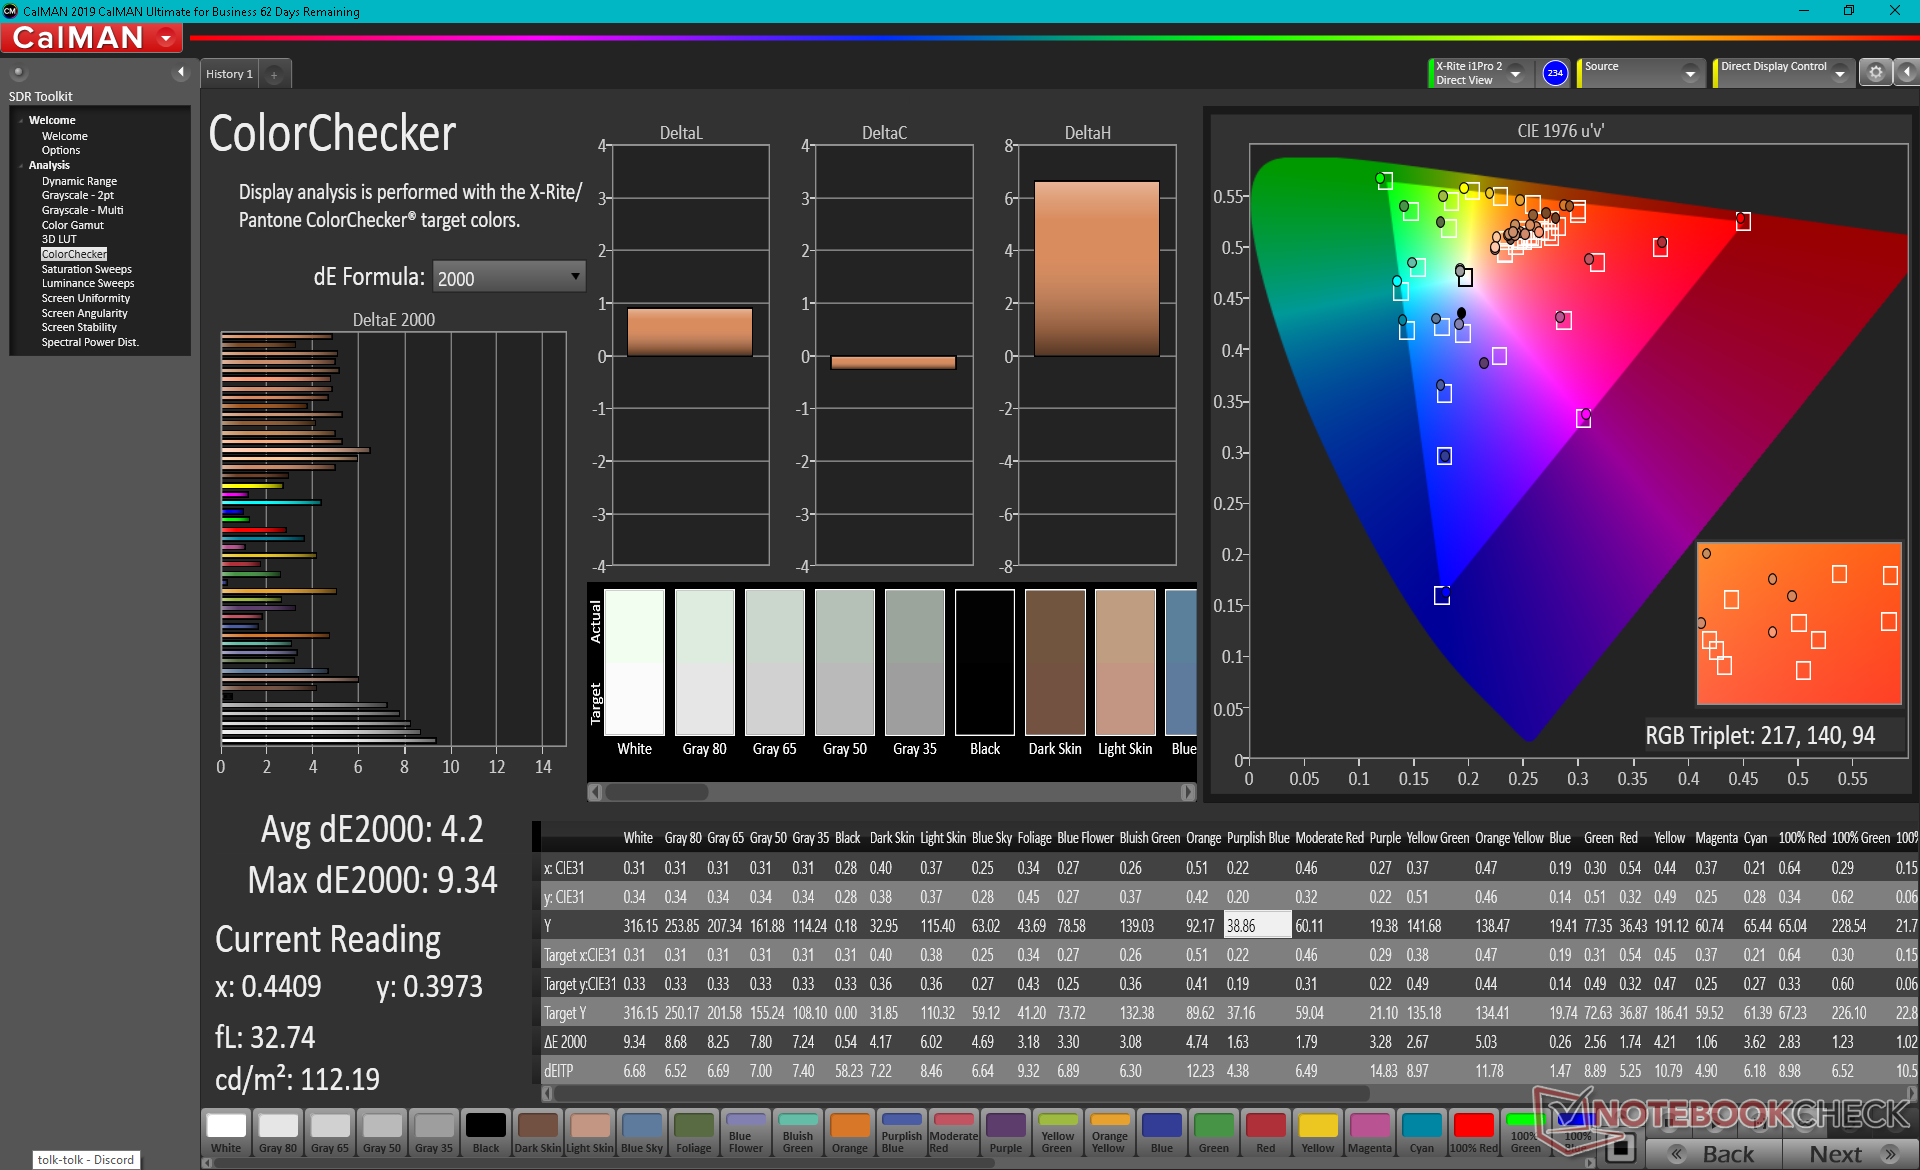
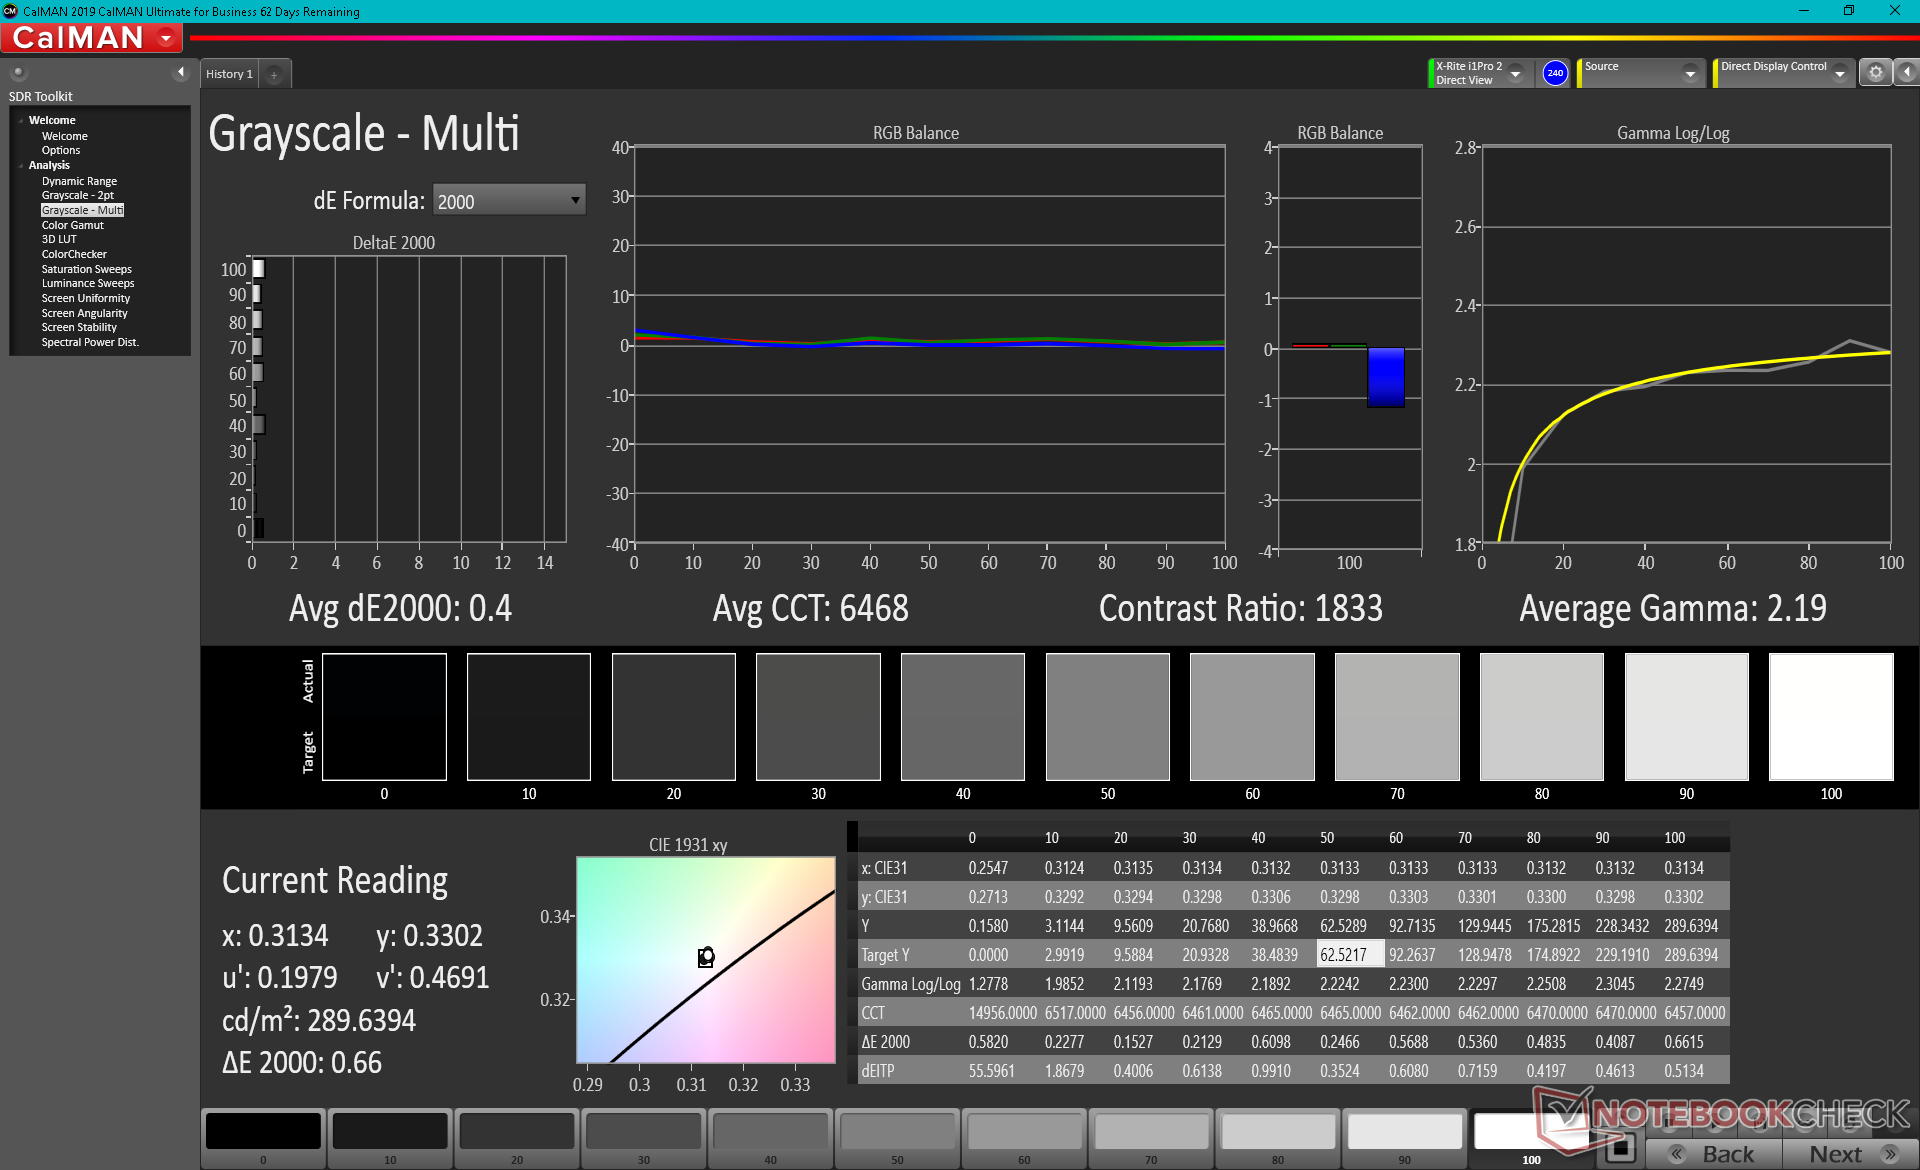
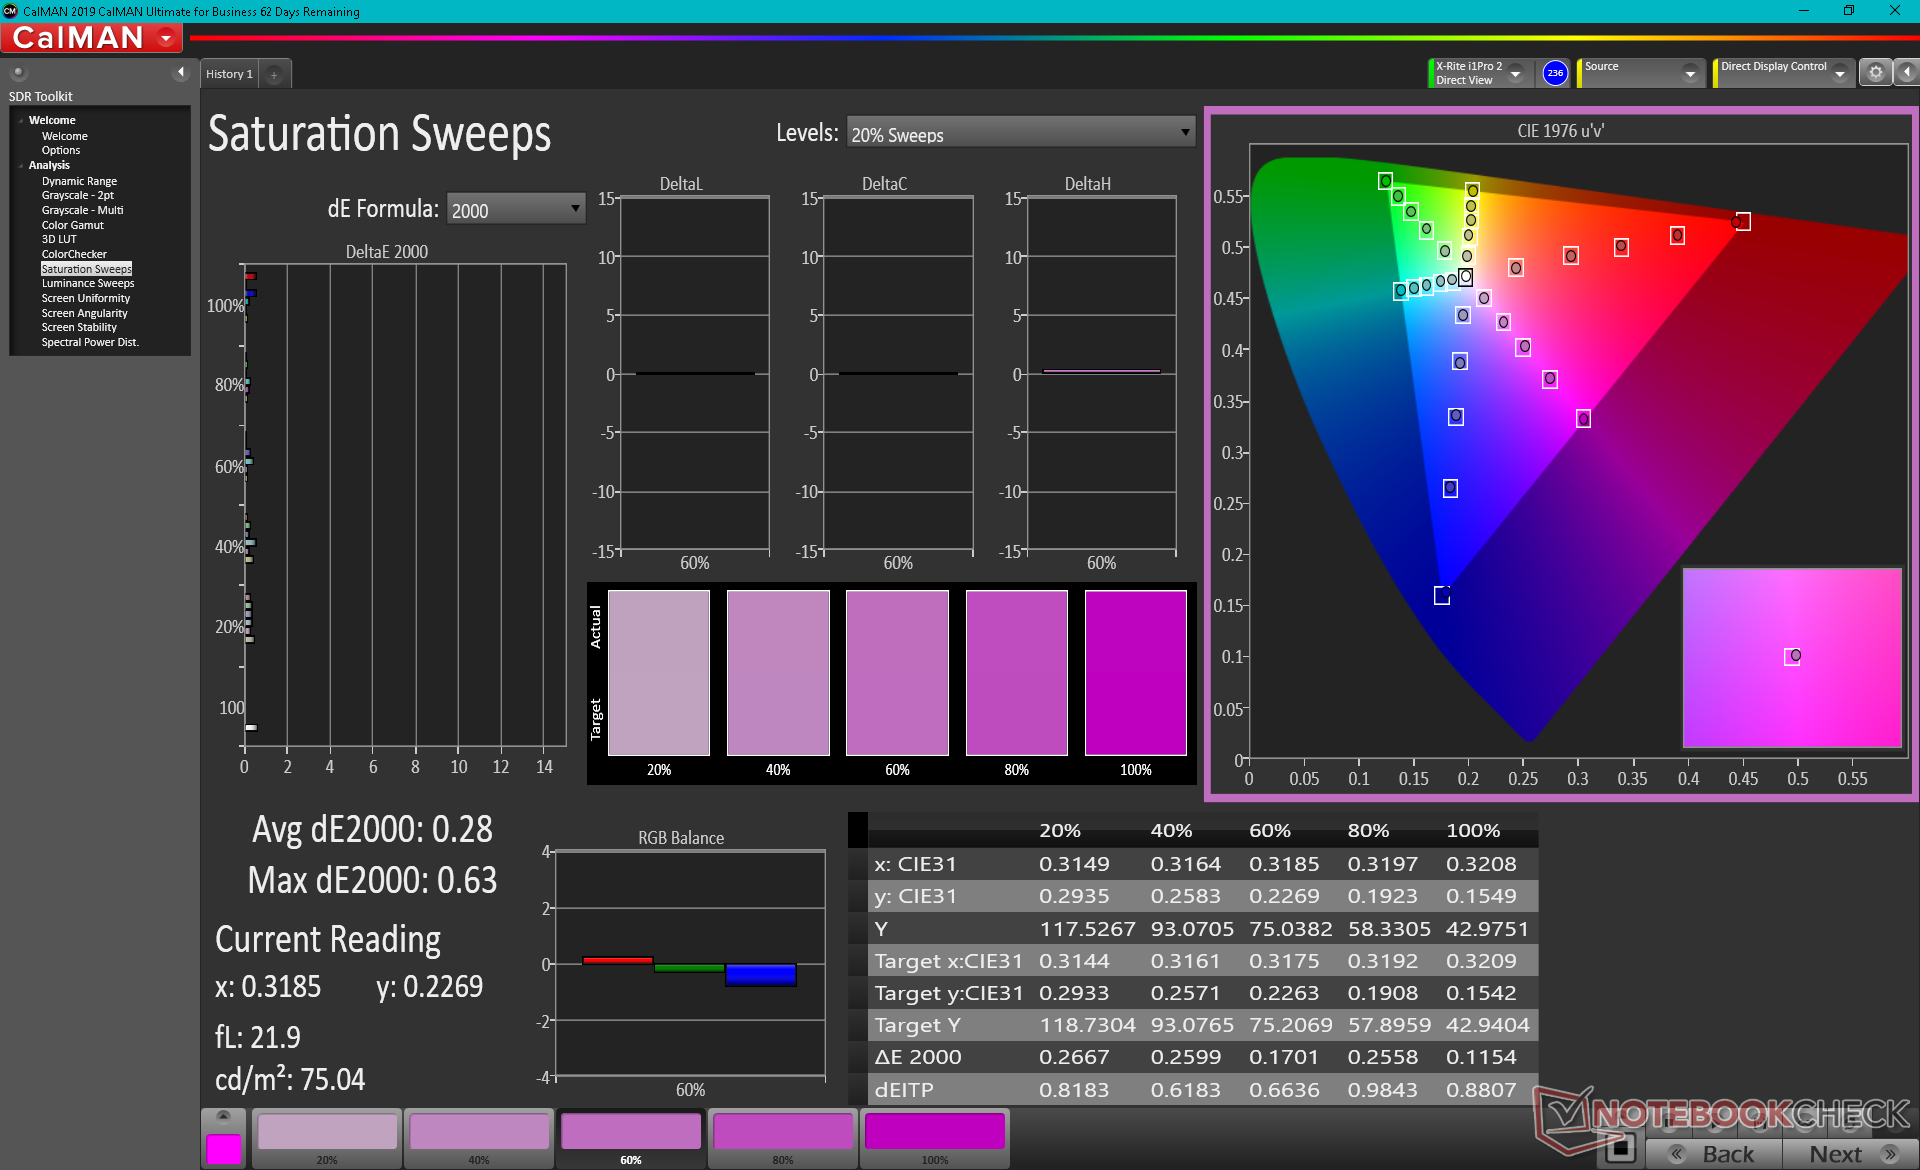
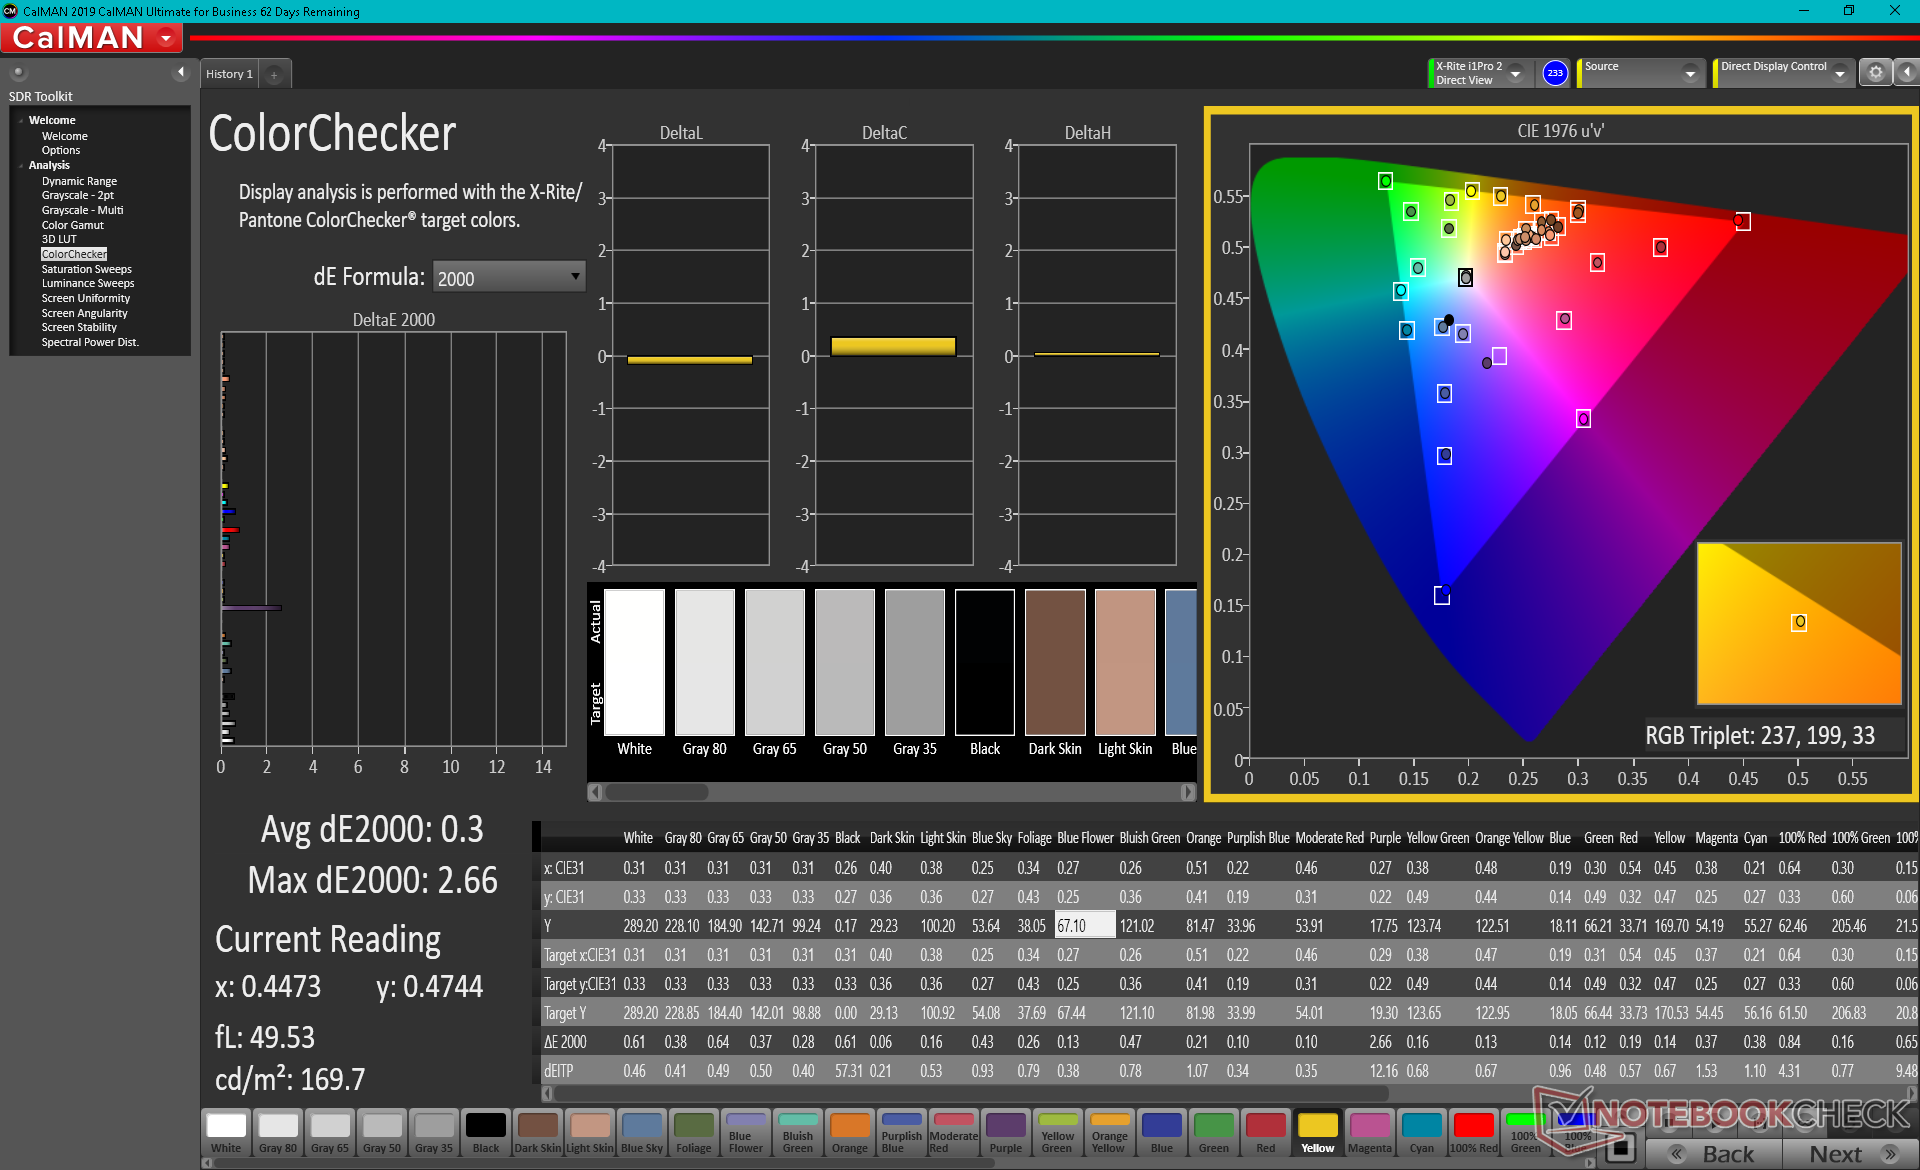
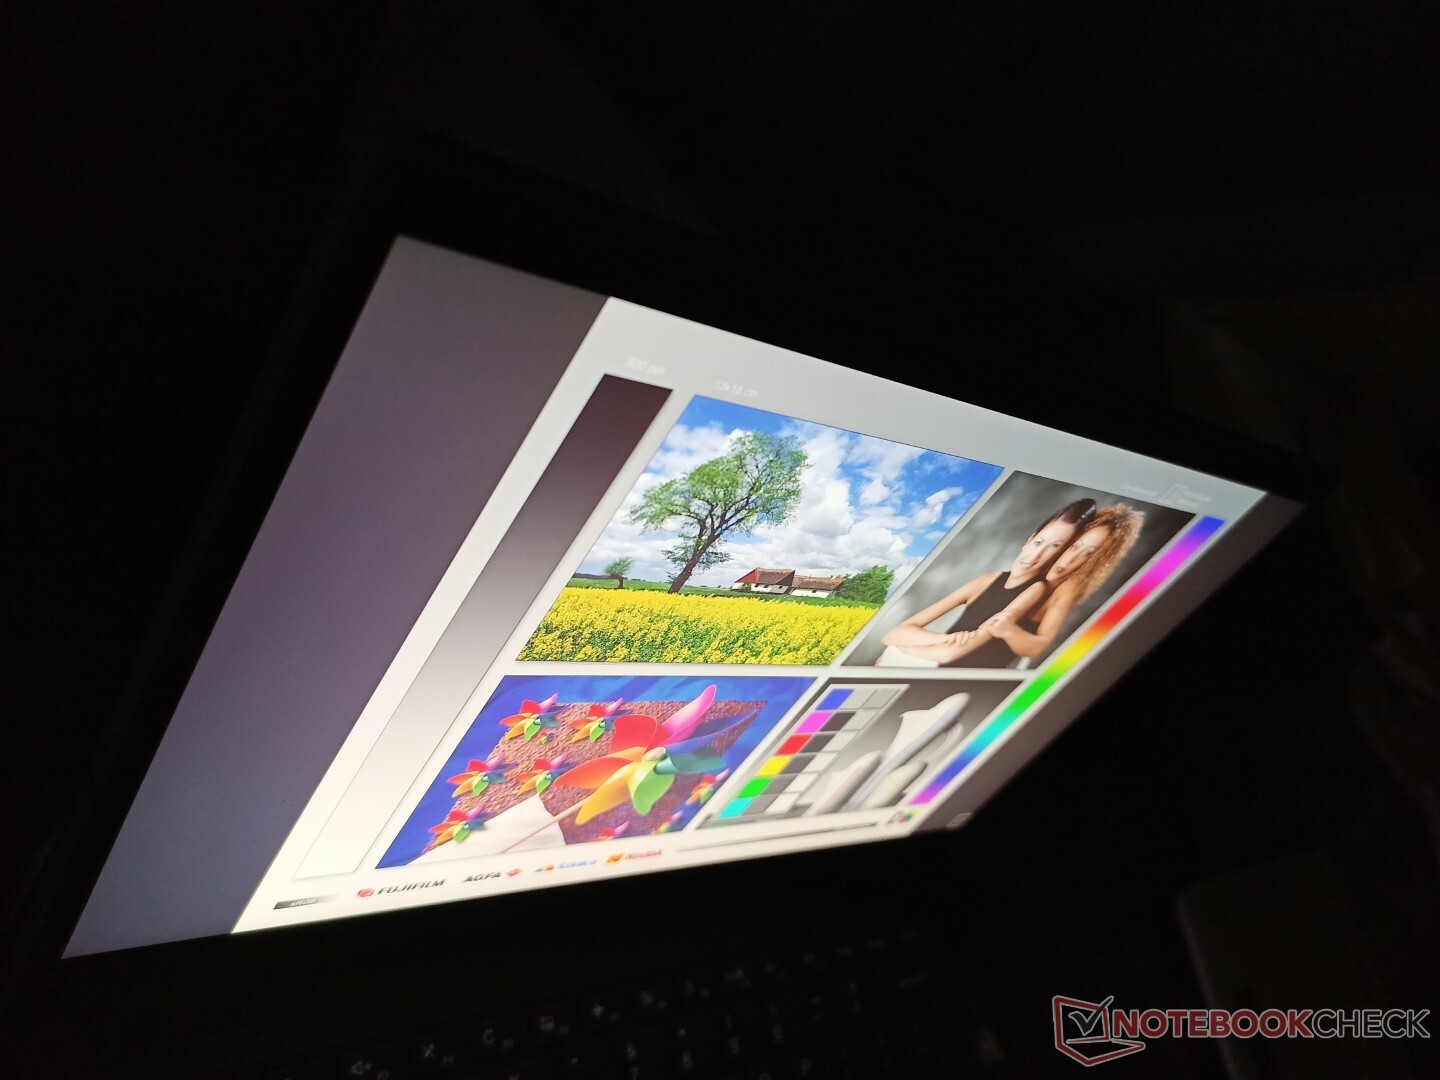
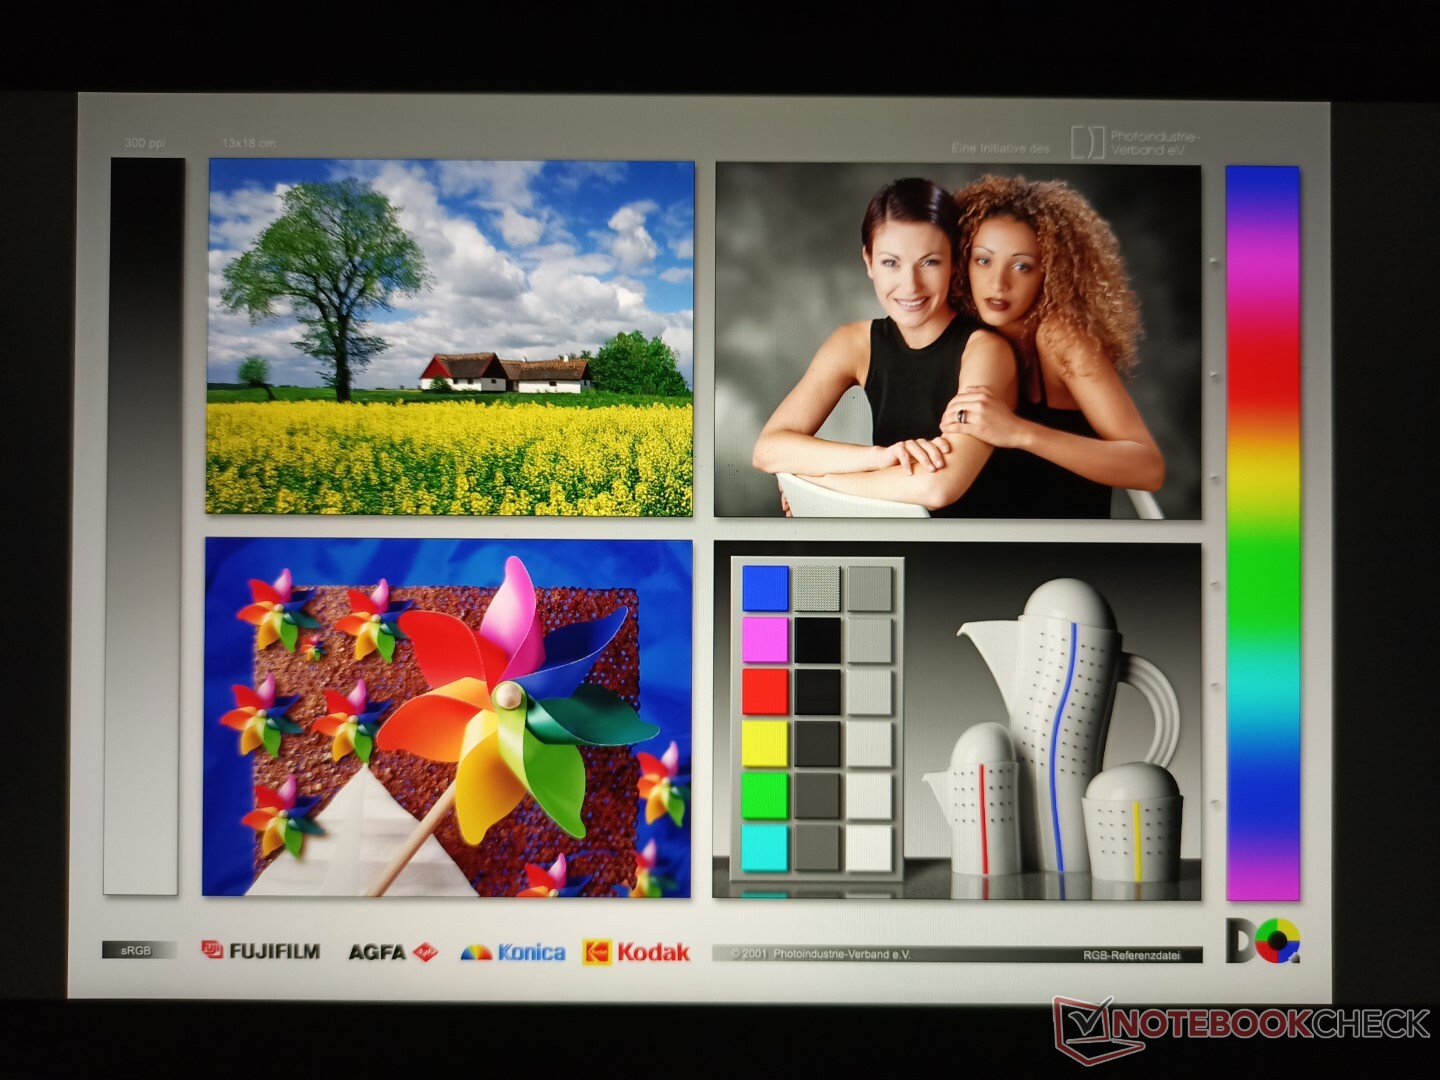
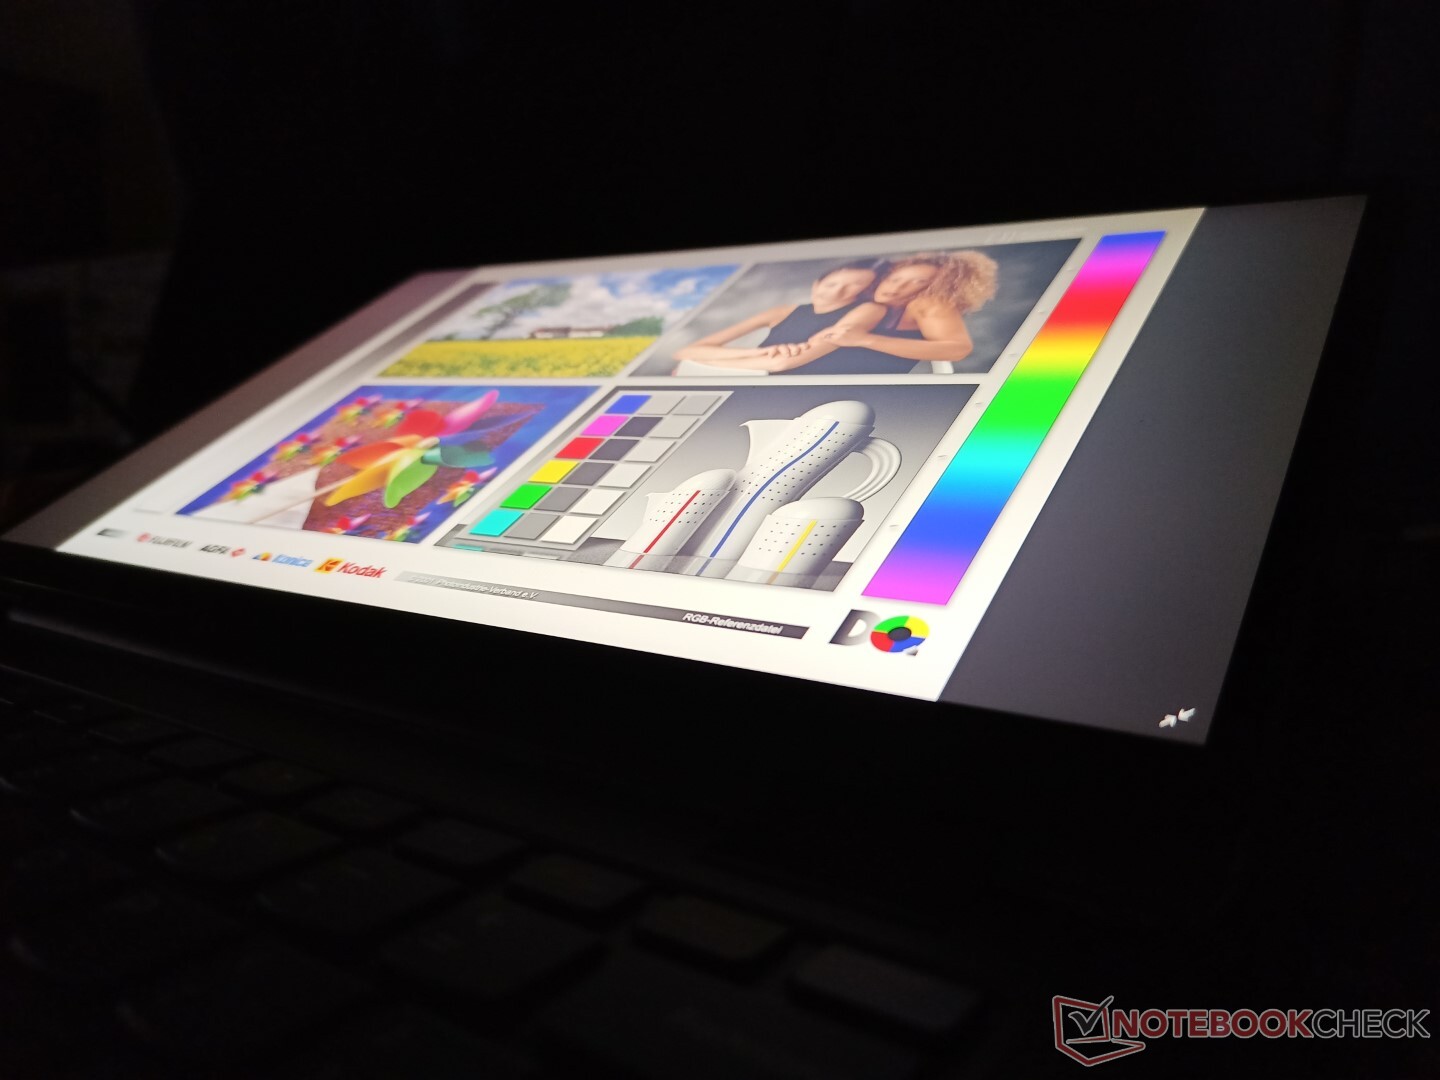
Display - Sharp com cobertura sRGB completa
A Lenovo usa o mesmo AU Optronics B133HAN05.F 1080p IPS touchscreen para todas as suas atuais Yoga 6 13 SKUs. Tanto a cobertura de cores (>99% sRGB) quanto o contraste (~1500:1) são excelentes e melhores do que o esperado para um conversível de médio alcance, mas os tempos de resposta são relativamente lentos para a detecção de fantasmas, especialmente se estiver jogando. O brilho máximo de cerca de 300 lêndeas é decente para o preço, enquanto alternativas mais caras como o XPS 13 9310 2 em 1 ou HP Envy x360 13 são visivelmente mais brilhantes para uma visualização ao ar livre mais confortável.
| |||||||||||||||||||||||||
iluminação: 95 %
iluminação com acumulador: 319.6 cd/m²
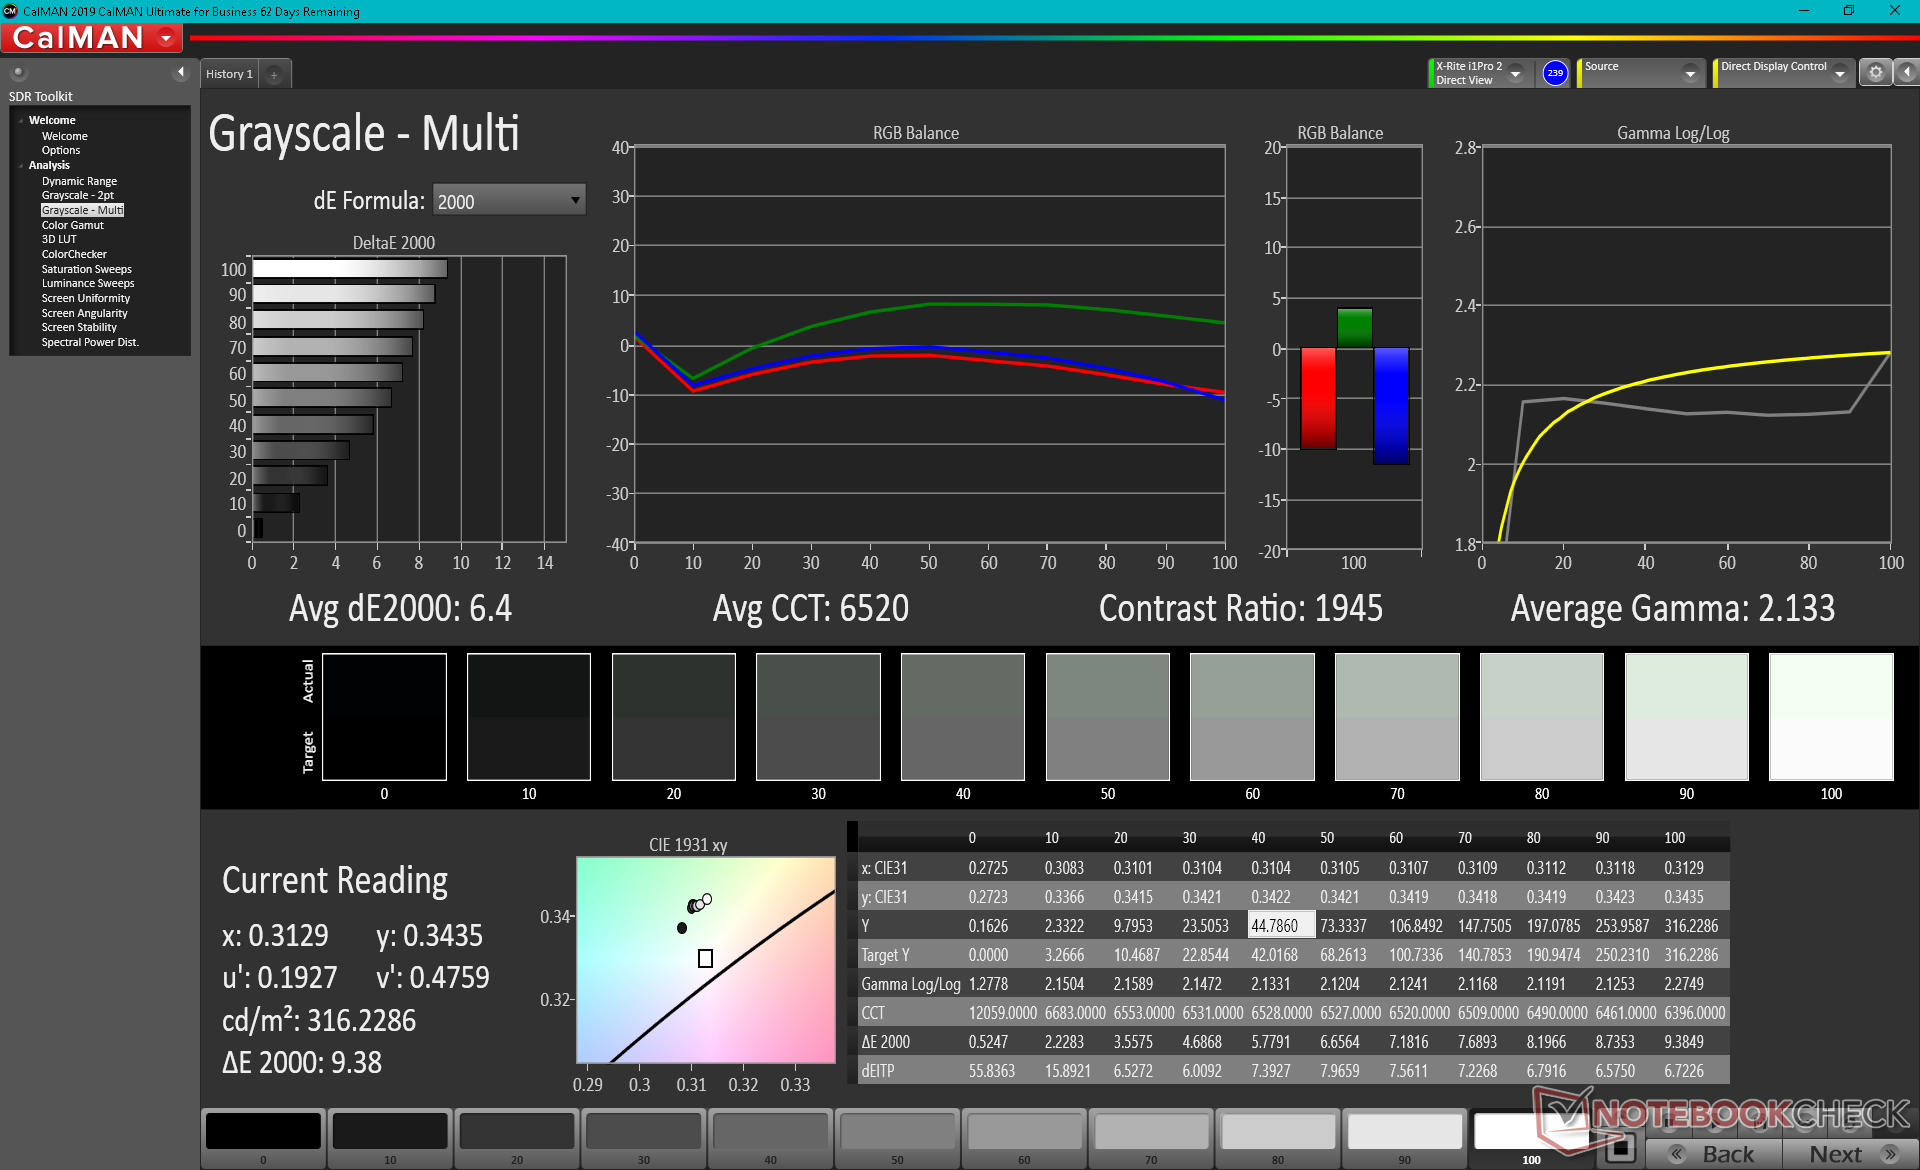
Contraste: 1598:1 (Preto: 0.2 cd/m²)
ΔE ColorChecker Calman: 4.2 | ∀{0.5-29.43 Ø4.71}
calibrated: 0.3
ΔE Greyscale Calman: 6.4 | ∀{0.09-98 Ø4.96}
72% AdobeRGB 1998 (Argyll 3D)
99.1% sRGB (Argyll 3D)
69.9% Display P3 (Argyll 3D)
Gamma: 2.13
CCT: 6520 K
| Lenovo Yoga 6 13ALC6 AU Optronics B133HAN05.F, IPS, 13.3", 1920x1080 | Lenovo Yoga 6 13 82ND0009US AU Optronics B133HAN05.F, IPS, 13.3", 1920x1080 | Dell XPS 13 9310 2-in-1 Sharp LQ134N1, IPS, 13.4", 1920x1200 | Acer Spin 3 SP313-51N-56YV AU Optronics AUOB493, IPS, 13.3", 2560x1600 | Lenovo IdeaPad Flex 5 CB 13IML05 82B80010GE IPS, 13.3", 1920x1080 | HP Envy x360 13-ay0010nr IPS, 13.3", 1920x1080 | |
|---|---|---|---|---|---|---|
| Display | -0% | 0% | 7% | -5% | ||
| Display P3 Coverage (%) | 69.9 | 69.7 0% | 69.7 0% | 78.8 13% | 65.9 -6% | |
| sRGB Coverage (%) | 99.1 | 99.2 0% | 99 0% | 99.8 1% | 97.4 -2% | |
| AdobeRGB 1998 Coverage (%) | 72 | 71.4 -1% | 71.7 0% | 77.6 8% | 67.8 -6% | |
| Response Times | 21% | -2% | 7% | 19% | 15% | |
| Response Time Grey 50% / Grey 80% * (ms) | 52 ? | 46.8 ? 10% | 55.6 ? -7% | 52 ? -0% | 47 ? 10% | 47.6 ? 8% |
| Response Time Black / White * (ms) | 41.6 ? | 28.8 ? 31% | 40.4 ? 3% | 36 ? 13% | 30 ? 28% | 32.4 ? 22% |
| PWM Frequency (Hz) | 2500 ? | 25000 ? | ||||
| Screen | -28% | -10% | -60% | 10% | -18% | |
| Brightness middle (cd/m²) | 319.6 | 291.5 -9% | 555.7 74% | 338 6% | 242 -24% | 452.6 42% |
| Brightness (cd/m²) | 316 | 294 -7% | 528 67% | 307 -3% | 232 -27% | 438 39% |
| Brightness Distribution (%) | 95 | 93 -2% | 90 -5% | 83 -13% | 85 -11% | 93 -2% |
| Black Level * (cd/m²) | 0.2 | 0.19 5% | 0.35 -75% | 0.27 -35% | 0.235 -17% | 0.29 -45% |
| Contrast (:1) | 1598 | 1534 -4% | 1588 -1% | 1252 -22% | 1030 -36% | 1561 -2% |
| Colorchecker dE 2000 * | 4.2 | 3.83 9% | 4.83 -15% | 4.63 -10% | 1.99 53% | 2.67 36% |
| Colorchecker dE 2000 max. * | 9.34 | 8.43 10% | 8.46 9% | 9.99 -7% | 2.77 70% | 4.11 56% |
| Colorchecker dE 2000 calibrated * | 0.3 | 1.07 -257% | 0.76 -153% | 1.64 -447% | 1.36 -353% | |
| Greyscale dE 2000 * | 6.4 | 6.2 3% | 6.1 5% | 6.76 -6% | 1.78 72% | 2.1 67% |
| Gamma | 2.13 103% | 2.2 100% | 1.98 111% | 2.37 93% | 2.31 95% | 2.01 109% |
| CCT | 6520 100% | 6469 100% | 6686 97% | 5934 110% | 6567 99% | 6505 100% |
| Color Space (Percent of AdobeRGB 1998) (%) | 68 | 62.2 | ||||
| Color Space (Percent of sRGB) (%) | 98 | 97.6 | ||||
| Média Total (Programa/Configurações) | -2% /
-15% | -4% /
-7% | -15% /
-36% | 15% /
12% | -3% /
-10% |
* ... menor é melhor
Exibir tempos de resposta
| ↔ Tempo de resposta preto para branco | ||
|---|---|---|
| 41.6 ms ... ascensão ↗ e queda ↘ combinadas | ↗ 22 ms ascensão | 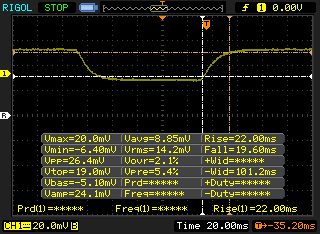 |
| ↘ 19.6 ms queda | ||
| A tela mostra taxas de resposta lentas em nossos testes e será insatisfatória para os jogadores. Em comparação, todos os dispositivos testados variam de 0.1 (mínimo) a 240 (máximo) ms. » 98 % de todos os dispositivos são melhores. Isso significa que o tempo de resposta medido é pior que a média de todos os dispositivos testados (19.8 ms). | ||
| ↔ Tempo de resposta 50% cinza a 80% cinza | ||
| 52 ms ... ascensão ↗ e queda ↘ combinadas | ↗ 25.2 ms ascensão | 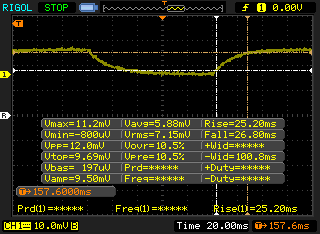 |
| ↘ 26.8 ms queda | ||
| A tela mostra taxas de resposta lentas em nossos testes e será insatisfatória para os jogadores. Em comparação, todos os dispositivos testados variam de 0.165 (mínimo) a 636 (máximo) ms. » 88 % de todos os dispositivos são melhores. Isso significa que o tempo de resposta medido é pior que a média de todos os dispositivos testados (31 ms). | ||
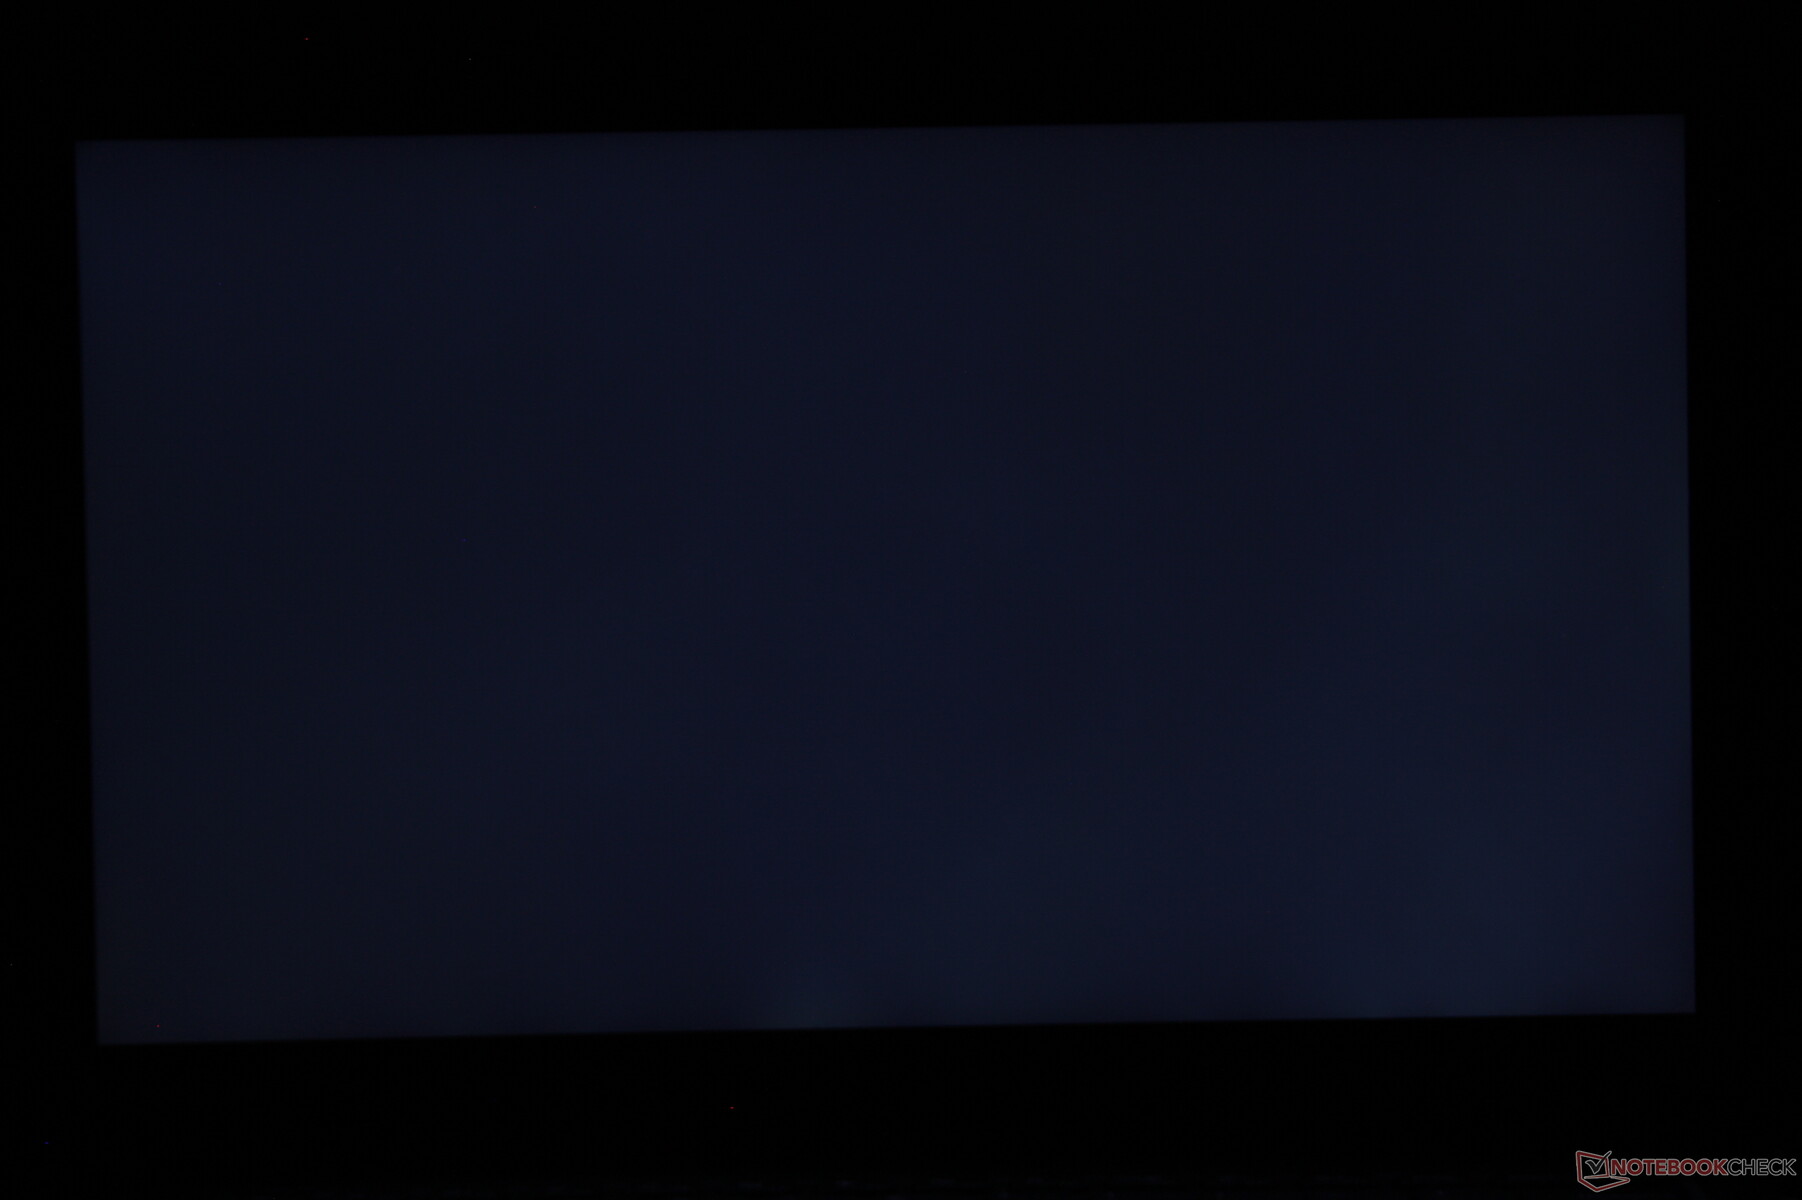
Cintilação da tela / PWM (modulação por largura de pulso)
| Tela tremeluzindo / PWM não detectado | 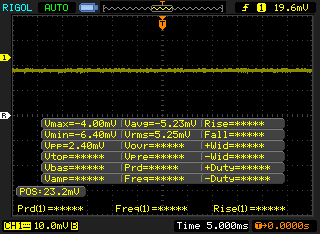 | ||
[pwm_comparison] Em comparação: 52 % de todos os dispositivos testados não usam PWM para escurecer a tela. Se PWM foi detectado, uma média de 7754 (mínimo: 5 - máximo: 343500) Hz foi medida. | |||
Desempenho - Octa-Core para Menos
| Especificação | Ryzen 5 5500U Zen 2 | Ryzen 7 5700U Zen 2 |
|---|---|---|
| Núcleos | 6 (12 roscas) | 8 (16 fios) |
| Relógio de freqüência (GHz) | 2.1 - 4.0 | 1.8 - 4.3 |
| L1/L2/L3 Cache | 0.384/3/8 MB | 0.512/4/8 MB |
| GPU integrado | Radeon Vega 7 4000 Raven Raven Ridge | Radeon Vega 8 4000 Raven Raven Ridge |
| Dutos | 448 Unificado | 512 Unificado |
| Taxa de relógio GPU (MHz) | Até 1600 | Até 1750 |
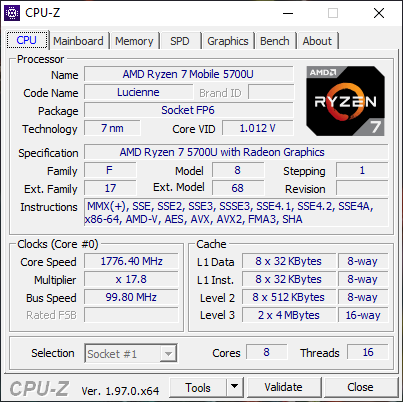
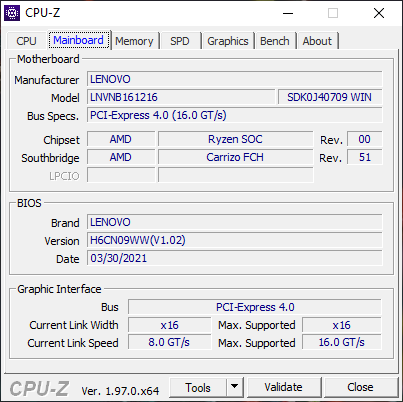
Processador
O desempenho bruto multi-fio é cerca de 15% a 20% mais rápido do que o Ryzen 5 5500U de acordo com os benchmarks do CineBench devido em parte ao nosso Ryzen 7 5700U tendo dois núcleos adicionais. O desempenho de uma única rosca também é um pouco mais rápido em alguns pontos percentuais. Qualquer uma das opções será mais rápida do que a Intel concorrente Núcleo i7-1165G7 em cargas de trabalho com múltiplas roscas
A sustentabilidade do desempenho é excelente especialmente para um conversível em que os relógios Turbo Boost tendem a ser de curta duração. O CineBench R15 xT em loop mostra pontuações consistentes do início ao fim, enquanto o Core i7-1165G7 no XPS 13 9310 2 em 1 cicláveis.
Cinebench R15 Multi Loop
Cinebench R23: Multi Core | Single Core
Cinebench R15: CPU Multi 64Bit | CPU Single 64Bit
Blender: v2.79 BMW27 CPU
7-Zip 18.03: 7z b 4 -mmt1 | 7z b 4
Geekbench 5.5: Single-Core | Multi-Core
HWBOT x265 Benchmark v2.2: 4k Preset
LibreOffice : 20 Documents To PDF
R Benchmark 2.5: Overall mean
| Cinebench R20 / CPU (Multi Core) | |
| Lenovo Yoga Slim 7-14ARE | |
| Média AMD Ryzen 7 5700U (1887 - 3877, n=21) | |
| HP Pavilion Aero 13 be0097nr | |
| Lenovo Yoga 6 13ALC6 | |
| Asus VivoBook Flip 14 TM420IA | |
| Lenovo Yoga 6 13 82ND0009US | |
| Dell XPS 13 7390 Core i7-10710U | |
| Dell XPS 13 9310 2-in-1 | |
| Dell Inspiron 13 5301-0D0XN | |
| Asus VivoBook S13 S333JA-DS51 | |
| Asus ZenBook 13 UX325JA | |
| HP Envy 13-aq0003ng | |
| Dynabook Portege A30-E-174 | |
| Cinebench R20 / CPU (Single Core) | |
| HP Pavilion Aero 13 be0097nr | |
| Dell Inspiron 13 5301-0D0XN | |
| Lenovo Yoga 6 13ALC6 | |
| Média AMD Ryzen 7 5700U (471 - 495, n=21) | |
| Dell XPS 13 9310 2-in-1 | |
| Lenovo Yoga Slim 7-14ARE | |
| Asus VivoBook Flip 14 TM420IA | |
| Dell XPS 13 7390 Core i7-10710U | |
| Asus ZenBook 13 UX325JA | |
| Lenovo Yoga 6 13 82ND0009US | |
| Dynabook Portege A30-E-174 | |
| Asus VivoBook S13 S333JA-DS51 | |
| HP Envy 13-aq0003ng | |
| Cinebench R23 / Multi Core | |
| Lenovo Yoga Slim 7-14ARE | |
| Média AMD Ryzen 7 5700U (4861 - 10139, n=20) | |
| HP Pavilion Aero 13 be0097nr | |
| Lenovo Yoga 6 13ALC6 | |
| Lenovo Yoga 6 13 82ND0009US | |
| Dell XPS 13 9310 2-in-1 | |
| Asus VivoBook S13 S333JA-DS51 | |
| Dell Inspiron 13 5301-0D0XN | |
| Cinebench R23 / Single Core | |
| HP Pavilion Aero 13 be0097nr | |
| Dell XPS 13 9310 2-in-1 | |
| Dell Inspiron 13 5301-0D0XN | |
| Lenovo Yoga 6 13ALC6 | |
| Média AMD Ryzen 7 5700U (1177 - 1268, n=20) | |
| Lenovo Yoga Slim 7-14ARE | |
| Lenovo Yoga 6 13 82ND0009US | |
| Asus VivoBook S13 S333JA-DS51 | |
| Cinebench R15 / CPU Multi 64Bit | |
| Lenovo Yoga Slim 7-14ARE | |
| Média AMD Ryzen 7 5700U (856 - 1691, n=20) | |
| HP Pavilion Aero 13 be0097nr | |
| Lenovo Yoga 6 13ALC6 | |
| Dell XPS 13 7390 Core i7-10710U | |
| Asus VivoBook Flip 14 TM420IA | |
| Lenovo Yoga 6 13 82ND0009US | |
| Dell XPS 13 9310 2-in-1 | |
| Asus ZenBook 13 UX325JA | |
| Dell Inspiron 13 5301-0D0XN | |
| Asus VivoBook S13 S333JA-DS51 | |
| HP Envy 13-aq0003ng | |
| Dynabook Portege A30-E-174 | |
| Cinebench R15 / CPU Single 64Bit | |
| HP Pavilion Aero 13 be0097nr | |
| Dell Inspiron 13 5301-0D0XN | |
| Lenovo Yoga 6 13ALC6 | |
| Média AMD Ryzen 7 5700U (181 - 190, n=19) | |
| Asus ZenBook 13 UX325JA | |
| Lenovo Yoga Slim 7-14ARE | |
| Asus VivoBook Flip 14 TM420IA | |
| Dell XPS 13 7390 Core i7-10710U | |
| Lenovo Yoga 6 13 82ND0009US | |
| HP Envy 13-aq0003ng | |
| Dell XPS 13 9310 2-in-1 | |
| Dynabook Portege A30-E-174 | |
| Asus VivoBook S13 S333JA-DS51 | |
| Geekbench 5.5 / Single-Core | |
| Dell Inspiron 13 5301-0D0XN | |
| Asus ZenBook 13 UX325JA | |
| Média AMD Ryzen 7 5700U (1105 - 1205, n=19) | |
| Asus VivoBook Flip 14 TM420IA | |
| Lenovo Yoga Slim 7-14ARE | |
| Lenovo Yoga Slim 7-14ARE | |
| Asus VivoBook S13 S333JA-DS51 | |
| Geekbench 5.5 / Multi-Core | |
| Lenovo Yoga Slim 7-14ARE | |
| Lenovo Yoga Slim 7-14ARE | |
| Média AMD Ryzen 7 5700U (4254 - 7635, n=19) | |
| Asus VivoBook Flip 14 TM420IA | |
| Dell Inspiron 13 5301-0D0XN | |
| Asus ZenBook 13 UX325JA | |
| Asus VivoBook S13 S333JA-DS51 | |
| LibreOffice / 20 Documents To PDF | |
| Lenovo Yoga 6 13 82ND0009US | |
| Média AMD Ryzen 7 5700U (52.4 - 75.5, n=20) | |
| Lenovo Yoga 6 13ALC6 | |
| Asus VivoBook S13 S333JA-DS51 | |
| Lenovo Yoga Slim 7-14ARE | |
| Asus VivoBook Flip 14 TM420IA | |
| HP Pavilion Aero 13 be0097nr | |
| Dell Inspiron 13 5301-0D0XN | |
| Asus ZenBook 13 UX325JA | |
Cinebench R23: Multi Core | Single Core
Cinebench R15: CPU Multi 64Bit | CPU Single 64Bit
Blender: v2.79 BMW27 CPU
7-Zip 18.03: 7z b 4 -mmt1 | 7z b 4
Geekbench 5.5: Single-Core | Multi-Core
HWBOT x265 Benchmark v2.2: 4k Preset
LibreOffice : 20 Documents To PDF
R Benchmark 2.5: Overall mean
* ... menor é melhor
Desempenho do sistema
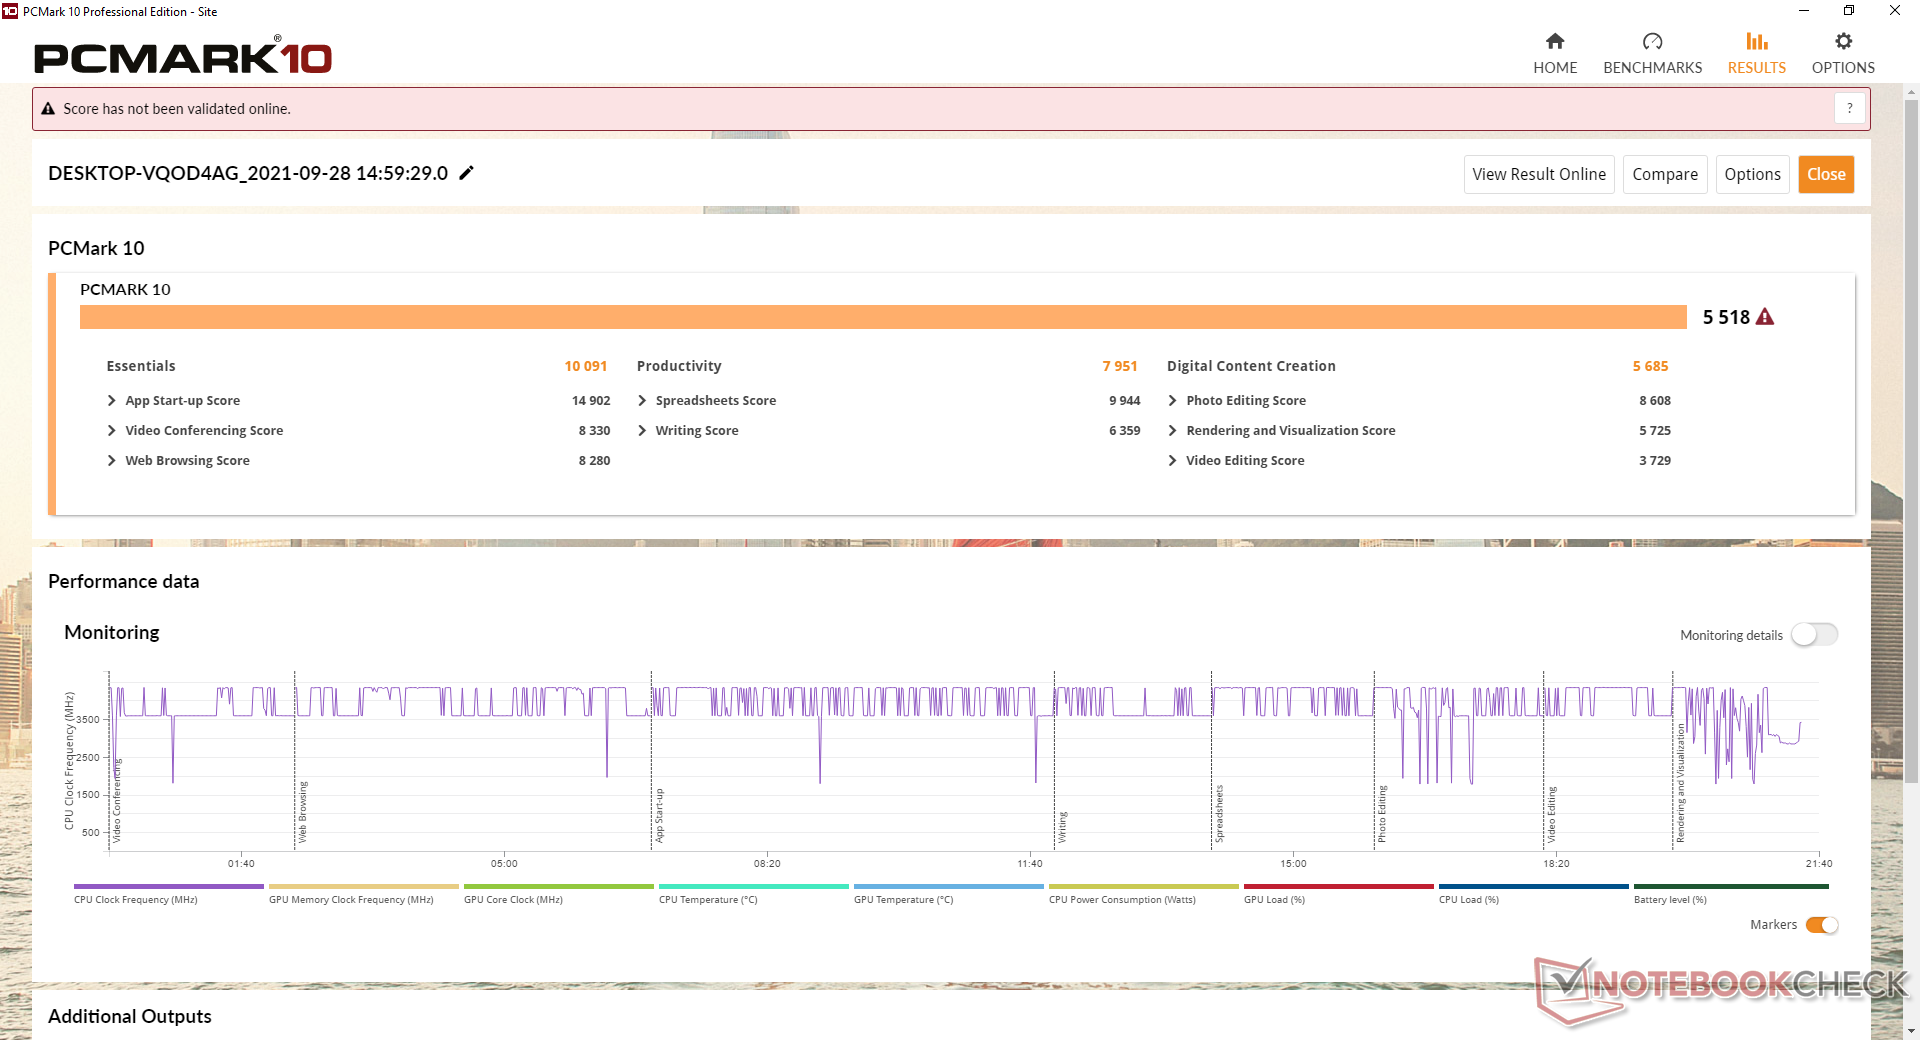
As referências PCMark 10 são consistentemente mais altas do que as que registramos na SKU Ryzen 5, embora por apenas margens percentuais de um dígito. As pontuações gerais são comparáveis às mais caras do Dell XPS 13 9310 2 em 1, da Intel.
| PCMark 10 / Score | |
| Lenovo Yoga 6 13ALC6 | |
| Lenovo Yoga 6 13 82ND0009US | |
| Dell XPS 13 9310 2-in-1 | |
| Média AMD Ryzen 7 5700U, AMD Radeon RX Vega 8 (Ryzen 4000/5000) (4325 - 5518, n=15) | |
| HP Envy x360 13-ay0010nr | |
| Acer Spin 3 SP313-51N-56YV | |
| PCMark 10 / Essentials | |
| Dell XPS 13 9310 2-in-1 | |
| Lenovo Yoga 6 13ALC6 | |
| Lenovo Yoga 6 13 82ND0009US | |
| Acer Spin 3 SP313-51N-56YV | |
| HP Envy x360 13-ay0010nr | |
| Média AMD Ryzen 7 5700U, AMD Radeon RX Vega 8 (Ryzen 4000/5000) (8025 - 10091, n=15) | |
| PCMark 10 / Productivity | |
| Lenovo Yoga 6 13ALC6 | |
| Média AMD Ryzen 7 5700U, AMD Radeon RX Vega 8 (Ryzen 4000/5000) (7001 - 8457, n=15) | |
| HP Envy x360 13-ay0010nr | |
| Lenovo Yoga 6 13 82ND0009US | |
| Dell XPS 13 9310 2-in-1 | |
| Acer Spin 3 SP313-51N-56YV | |
| PCMark 10 / Digital Content Creation | |
| Lenovo Yoga 6 13ALC6 | |
| Média AMD Ryzen 7 5700U, AMD Radeon RX Vega 8 (Ryzen 4000/5000) (3738 - 5964, n=15) | |
| Lenovo Yoga 6 13 82ND0009US | |
| Dell XPS 13 9310 2-in-1 | |
| Acer Spin 3 SP313-51N-56YV | |
| HP Envy x360 13-ay0010nr | |
| PCMark 10 Score | 5518 pontos | |
Ajuda | ||
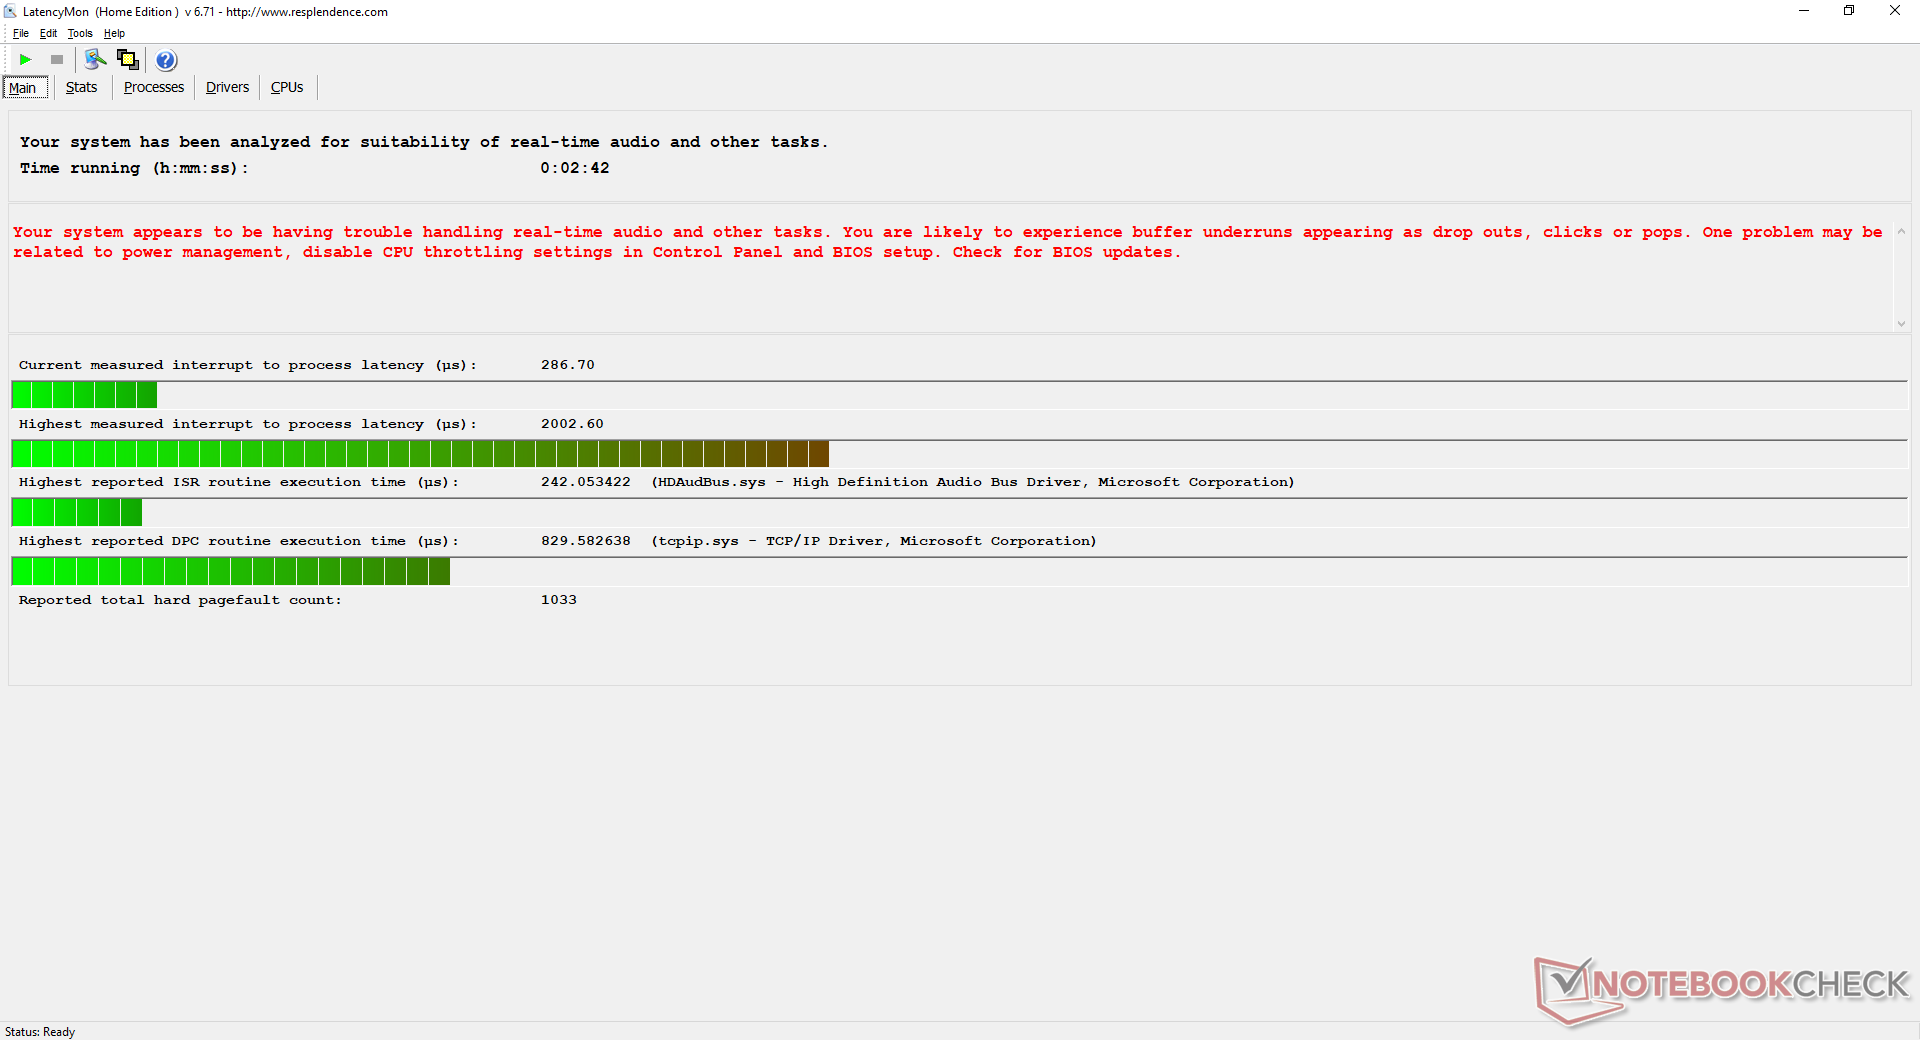
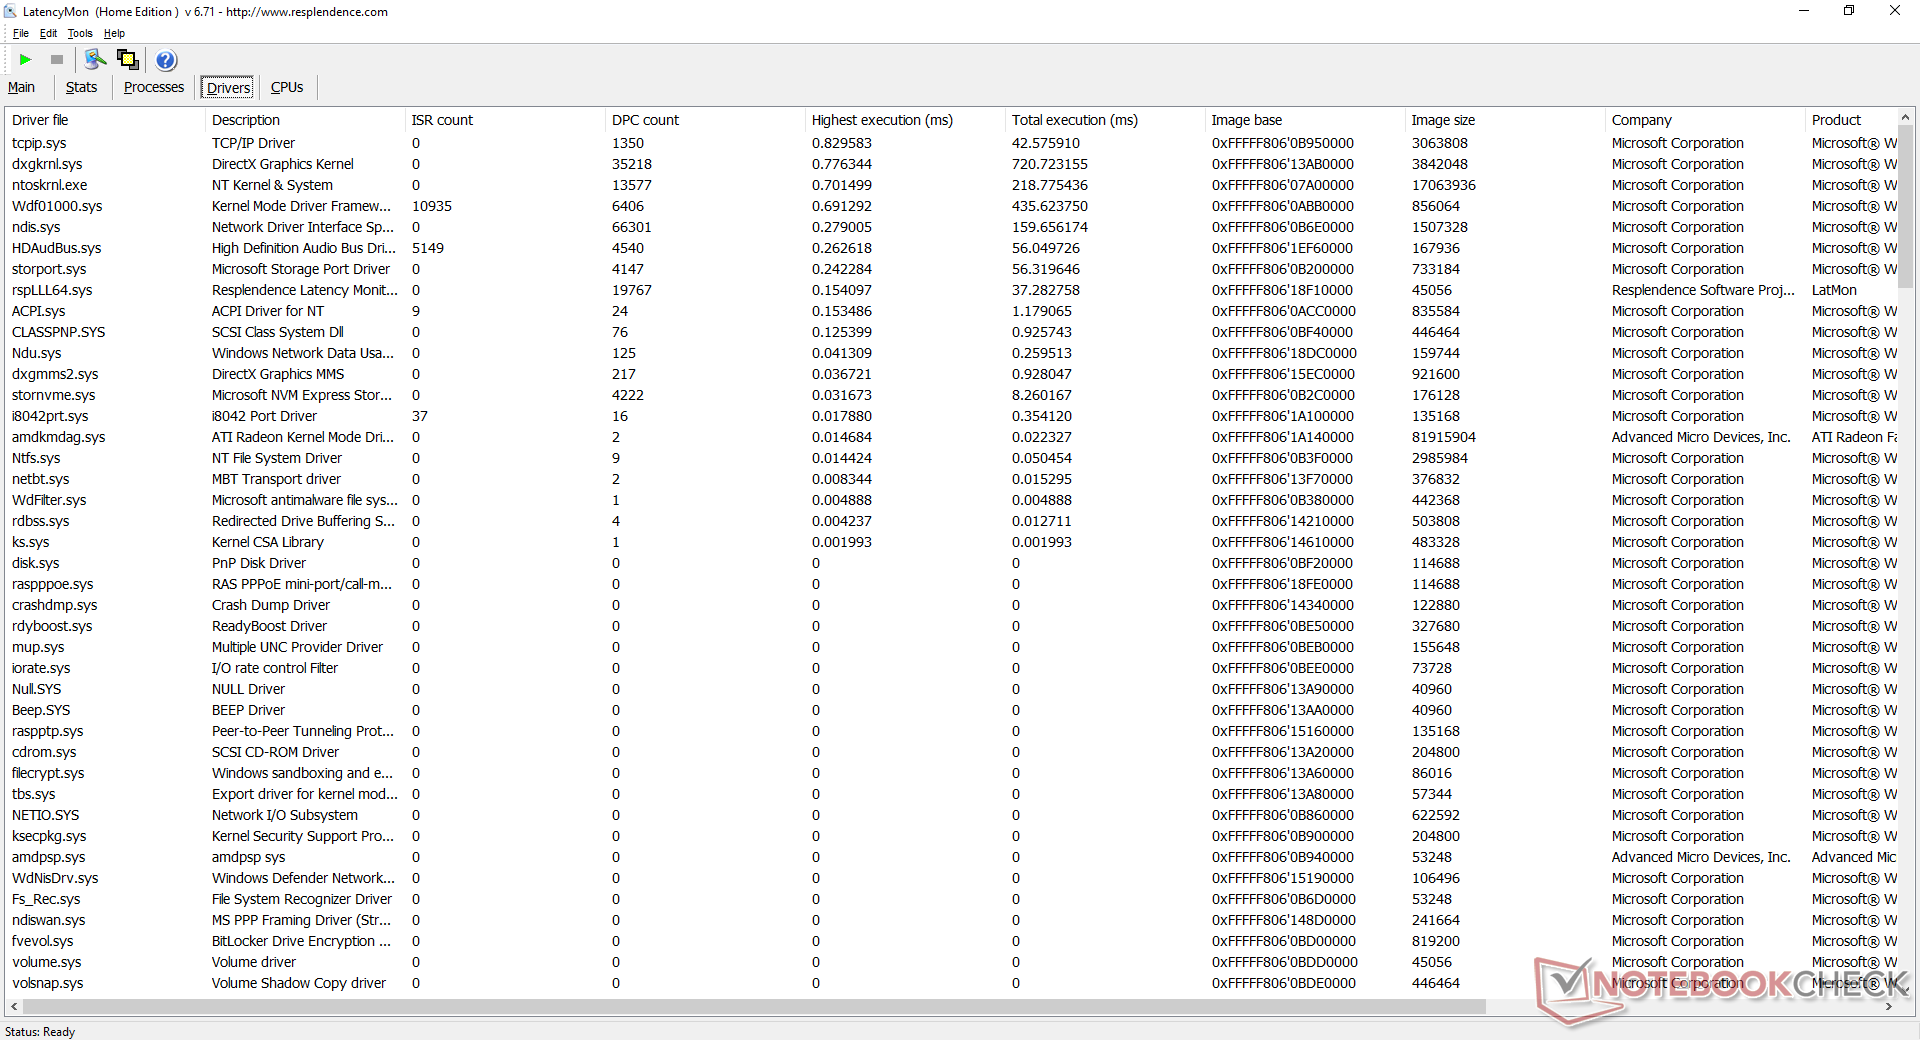
Latência do DPC
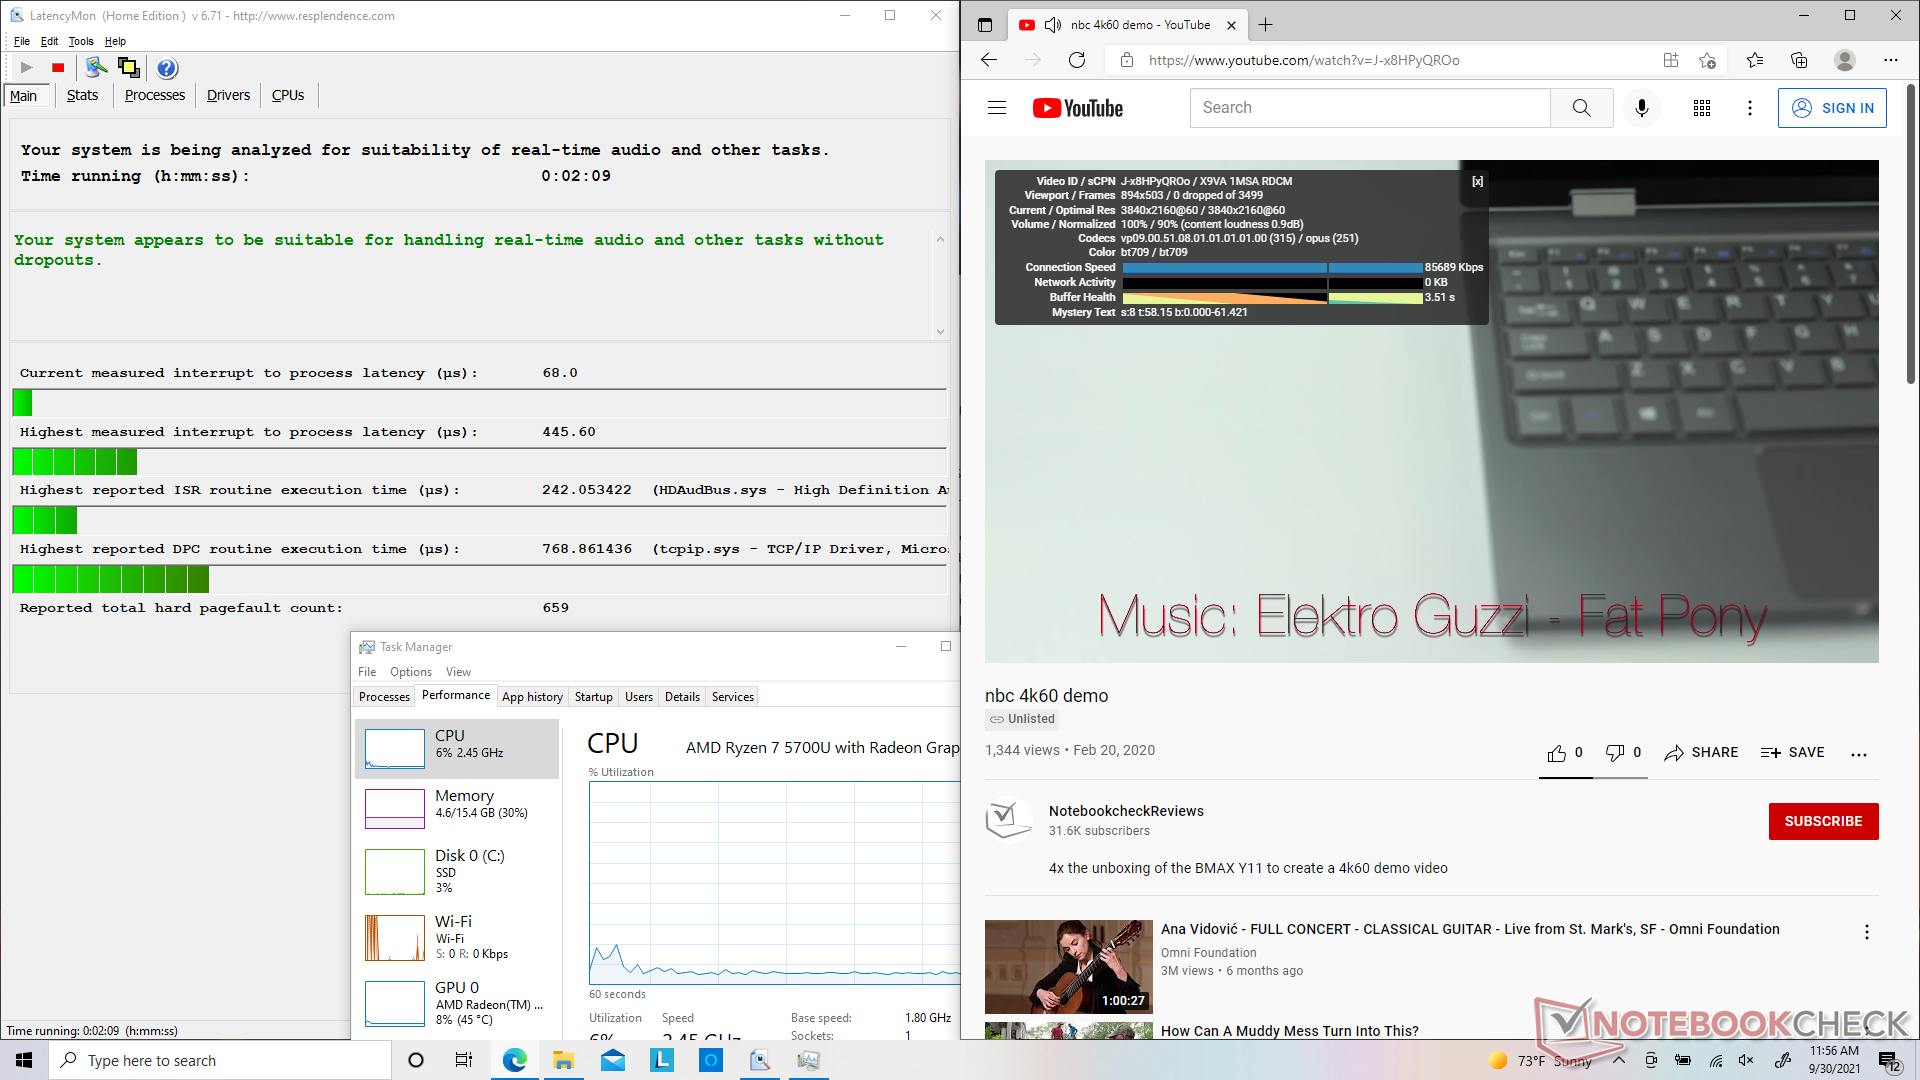
LatencyMon não mostra problemas de latência DPC ao abrir abas múltiplas do navegador em nossa página inicial ou ao reproduzir um vídeo de 4K a 60 FPS. Entretanto, a latência saltaria abruptamente ao executar o Prime95, que é muito semelhante ao que observamos em nossa SKU Ryzen 5.
| DPC Latencies / LatencyMon - interrupt to process latency (max), Web, Youtube, Prime95 | |
| Lenovo Yoga 6 13ALC6 | |
| Lenovo Yoga 6 13 82ND0009US | |
| HP Envy x360 13-ay0010nr | |
| Acer Spin 3 SP313-51N-56YV | |
| Dell XPS 13 9310 2-in-1 | |
* ... menor é melhor
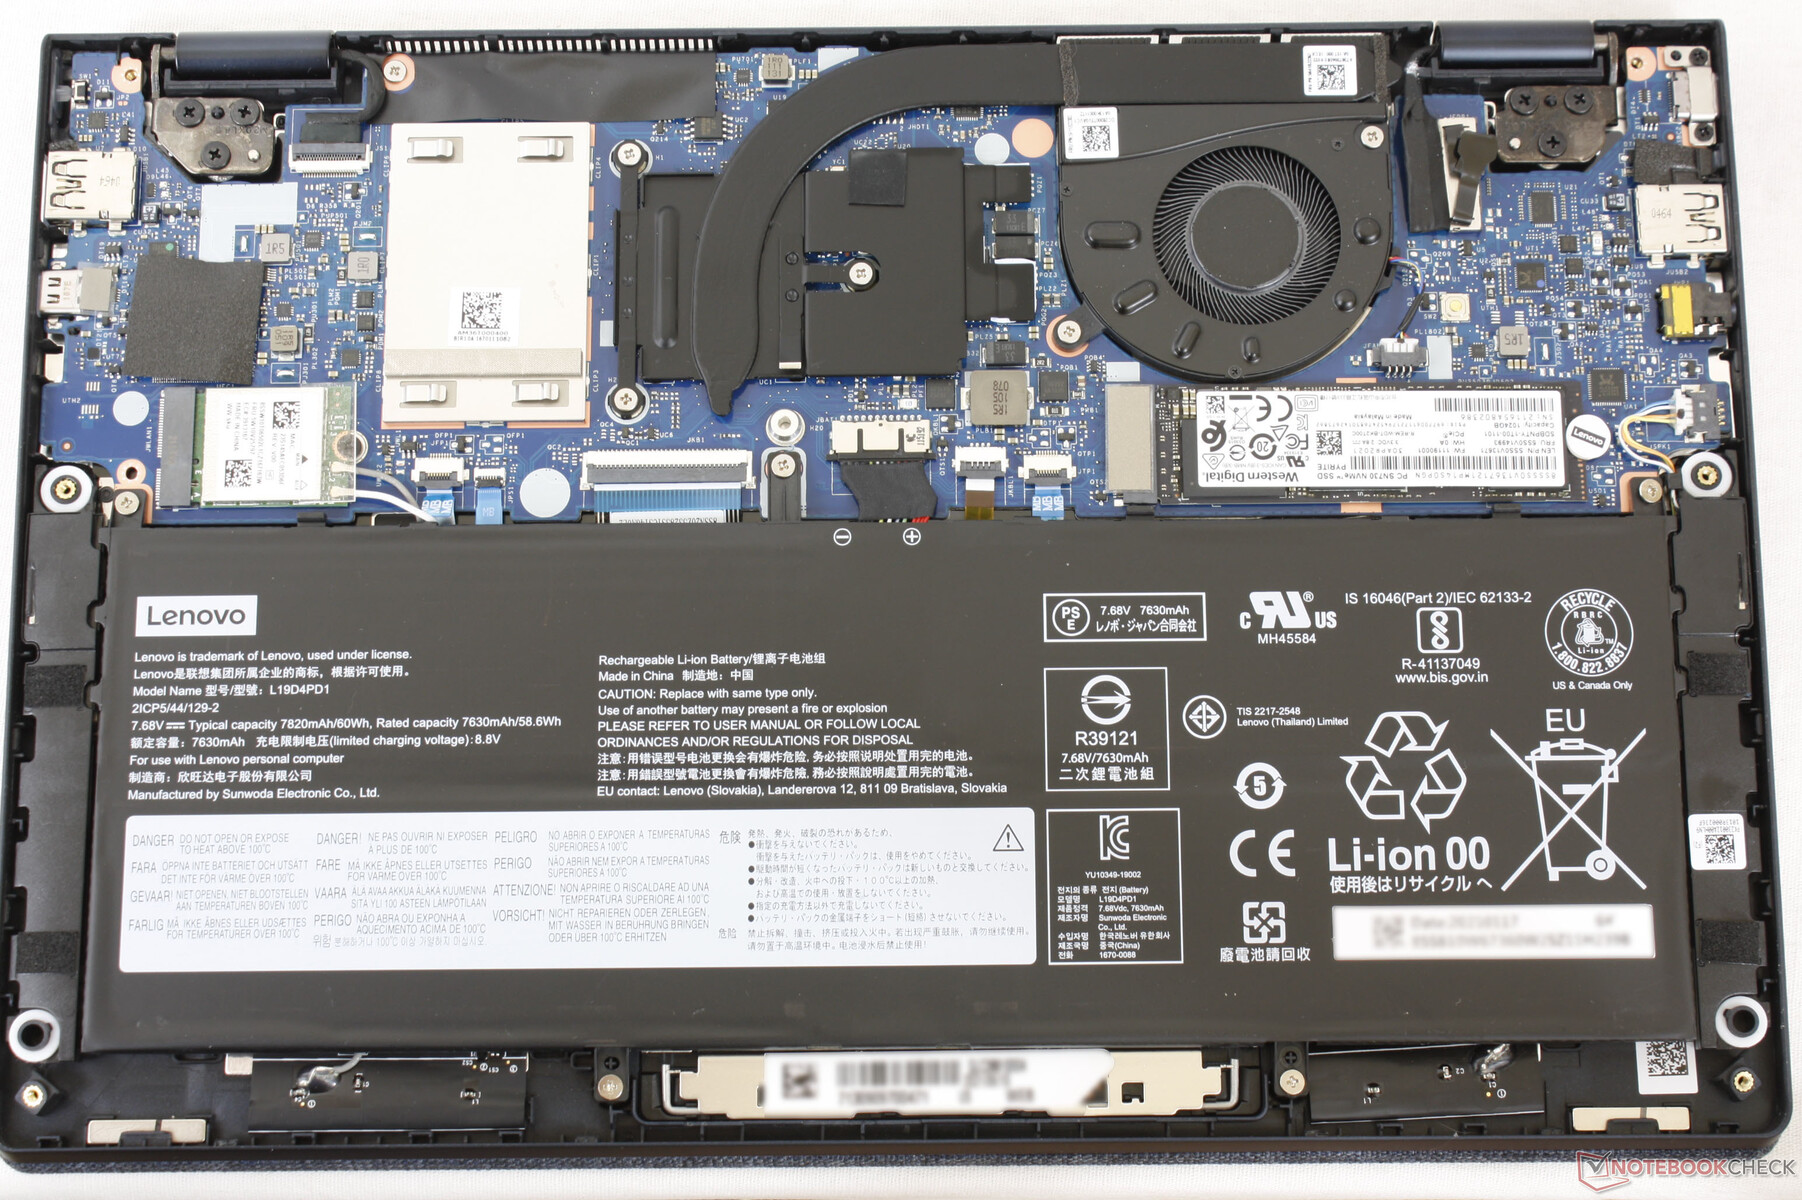
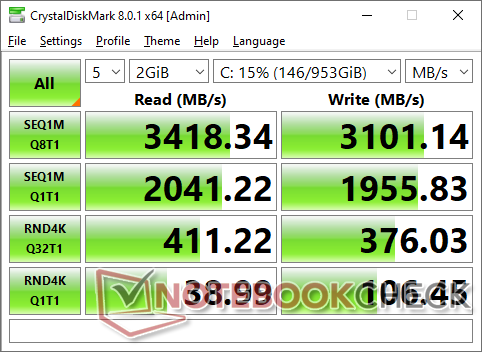
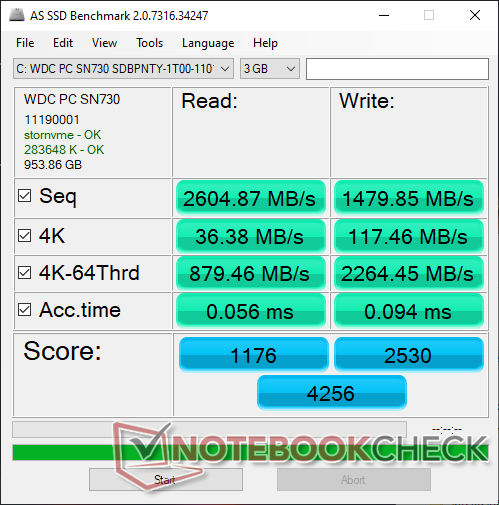
Dispositivos de armazenamento
Nossa unidade Ryzen 7 vem configurada com uma unidade Western Digital SN730 de 1 TB mais alta em vez da SN530 de 256 GB em nossa unidade original Ryzen 5. As taxas de transferência são significativamente mais rápidas, especialmente ao escrever dados com velocidades próximas de 3100 MB/s.
| Lenovo Yoga 6 13ALC6 WDC PC SN730 SDBPNTY-1T00 | Lenovo Yoga 6 13 82ND0009US WDC PC SN530 SDBPMPZ-265G | Dell XPS 13 9310 2-in-1 Toshiba BG4 KBG40ZPZ512G | Acer Spin 3 SP313-51N-56YV Kingston OM8PCP3512F-AB | HP Envy x360 13-ay0010nr Toshiba KBG30ZMV256G | |
|---|---|---|---|---|---|
| AS SSD | -51% | -46% | -33% | -79% | |
| Seq Read (MB/s) | 2605 | 1860 -29% | 2031 -22% | 1748 -33% | 1135 -56% |
| Seq Write (MB/s) | 1480 | 500 -66% | 776 -48% | 941 -36% | 628 -58% |
| 4K Read (MB/s) | 36.38 | 36.26 0% | 49.55 36% | 44.06 21% | 42.49 17% |
| 4K Write (MB/s) | 117.5 | 118.6 1% | 112.2 -5% | 77.7 -34% | 96.9 -18% |
| 4K-64 Read (MB/s) | 879 | 419 -52% | 1058 20% | 451.1 -49% | 614 -30% |
| 4K-64 Write (MB/s) | 2264 | 219 -90% | 328.9 -85% | 926 -59% | 256.4 -89% |
| Access Time Read * (ms) | 0.056 | 0.102 -82% | 0.072 -29% | 0.188 -236% | 0.162 -189% |
| Access Time Write * (ms) | 0.094 | 0.17 -81% | 0.518 -451% | 0.043 54% | 0.592 -530% |
| Score Read (Points) | 1176 | 641 -45% | 1311 11% | 670 -43% | 770 -35% |
| Score Write (Points) | 2530 | 388 -85% | 519 -79% | 1098 -57% | 416 -84% |
| Score Total (Points) | 4256 | 1300 -69% | 2447 -43% | 2084 -51% | 1567 -63% |
| Copy ISO MB/s (MB/s) | 1210 | 880 -27% | 1103 -9% | 969 -20% | 843 -30% |
| Copy Program MB/s (MB/s) | 238.4 | 185.3 -22% | 331.7 39% | 609 155% | 367.9 54% |
| Copy Game MB/s (MB/s) | 715 | 212.7 -70% | 828 16% | 232.4 -67% | 727 2% |
| CrystalDiskMark 5.2 / 6 | -28% | -9% | 3% | -36% | |
| Write 4K (MB/s) | 113.8 | 89.2 -22% | 129.6 14% | 286.1 151% | 94.8 -17% |
| Read 4K (MB/s) | 39.64 | 33.09 -17% | 52.2 32% | 48.89 23% | 45.5 15% |
| Write Seq (MB/s) | 1921 | 988 -49% | 1310 -32% | 982 -49% | 732 -62% |
| Read Seq (MB/s) | 2025 | 1322 -35% | 1726 -15% | 1301 -36% | 959 -53% |
| Write 4K Q32T1 (MB/s) | 339.3 | 332.6 -2% | 334.7 -1% | 625 84% | 224.6 -34% |
| Read 4K Q32T1 (MB/s) | 407.6 | 389.3 -4% | 447.6 10% | 301 -26% | 365.2 -10% |
| Write Seq Q32T1 (MB/s) | 3089 | 984 -68% | 1410 -54% | 981 -68% | 864 -72% |
| Read Seq Q32T1 (MB/s) | 3386 | 2461 -27% | 2390 -29% | 1631 -52% | 1580 -53% |
| Média Total (Programa/Configurações) | -40% /
-43% | -28% /
-33% | -15% /
-19% | -58% /
-63% |
* ... menor é melhor

Disk Throttling: DiskSpd Read Loop, Queue Depth 8
GPU Performance - Perto, mas não muito Iris Xe
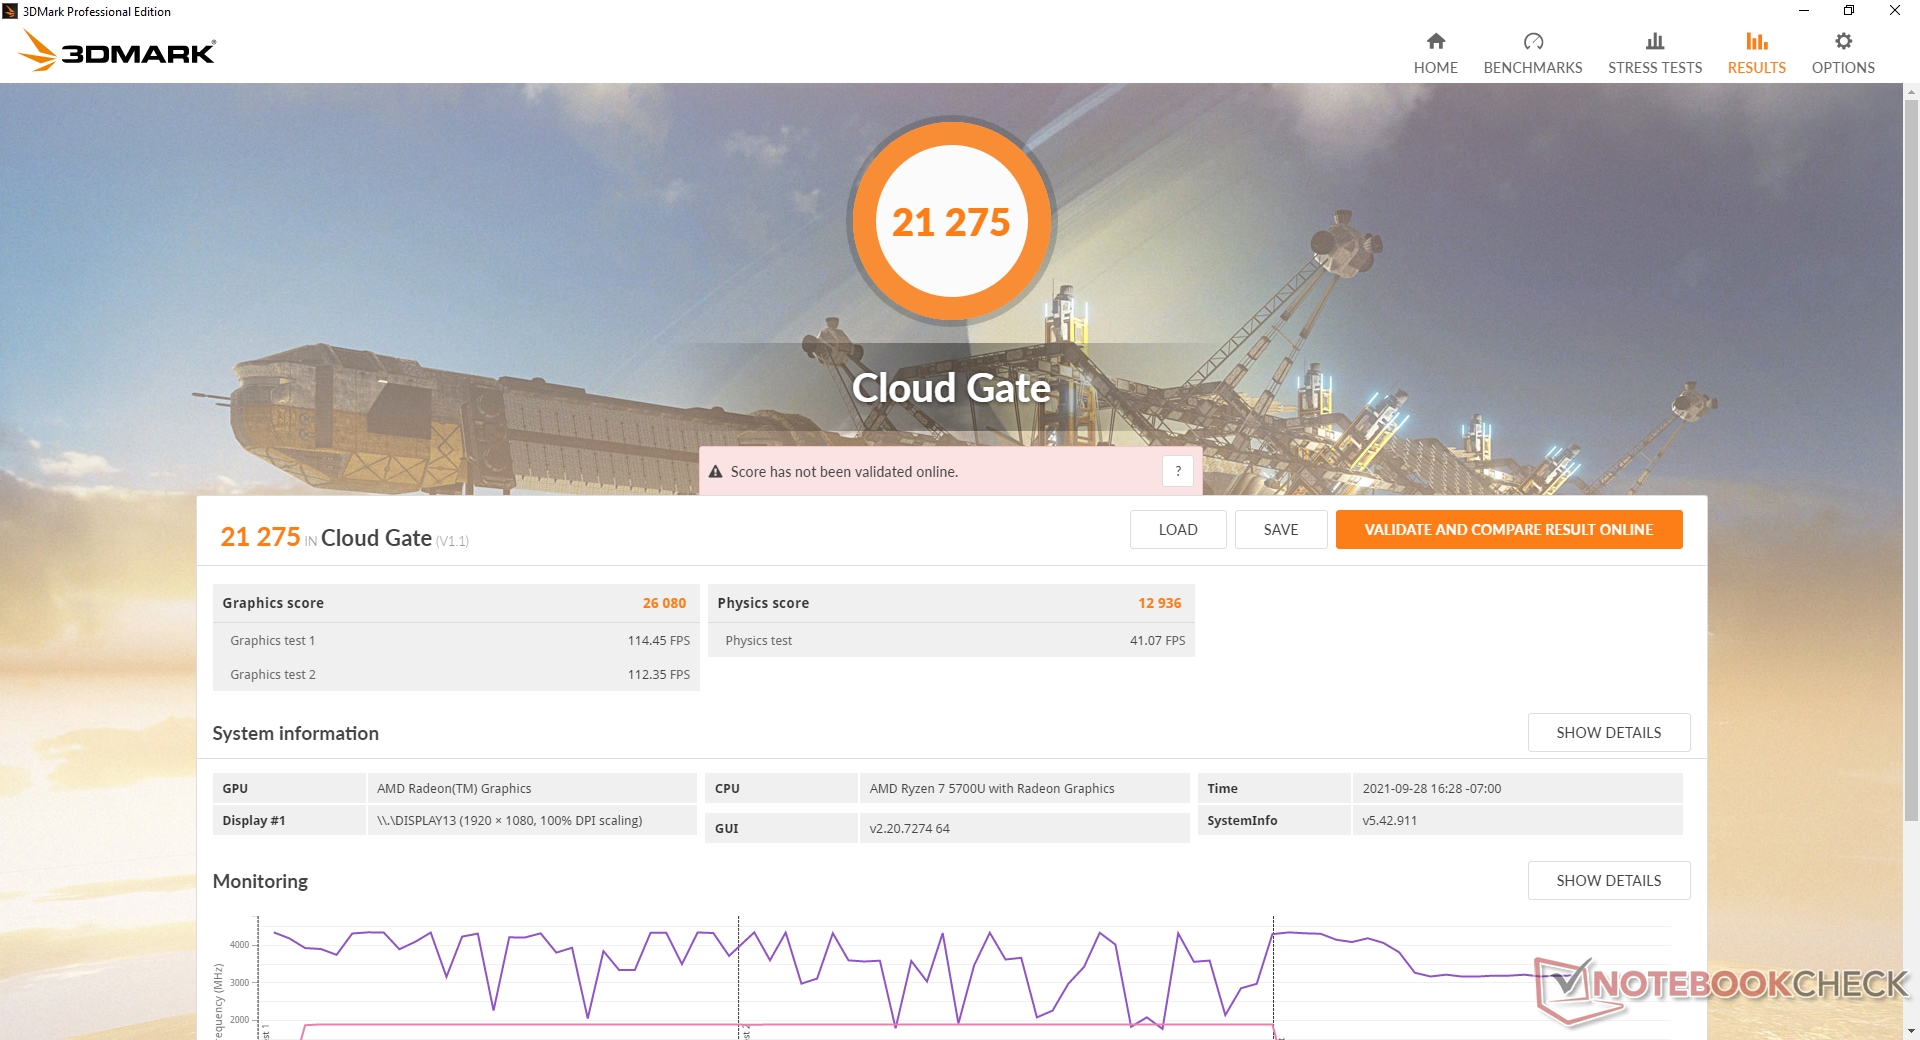
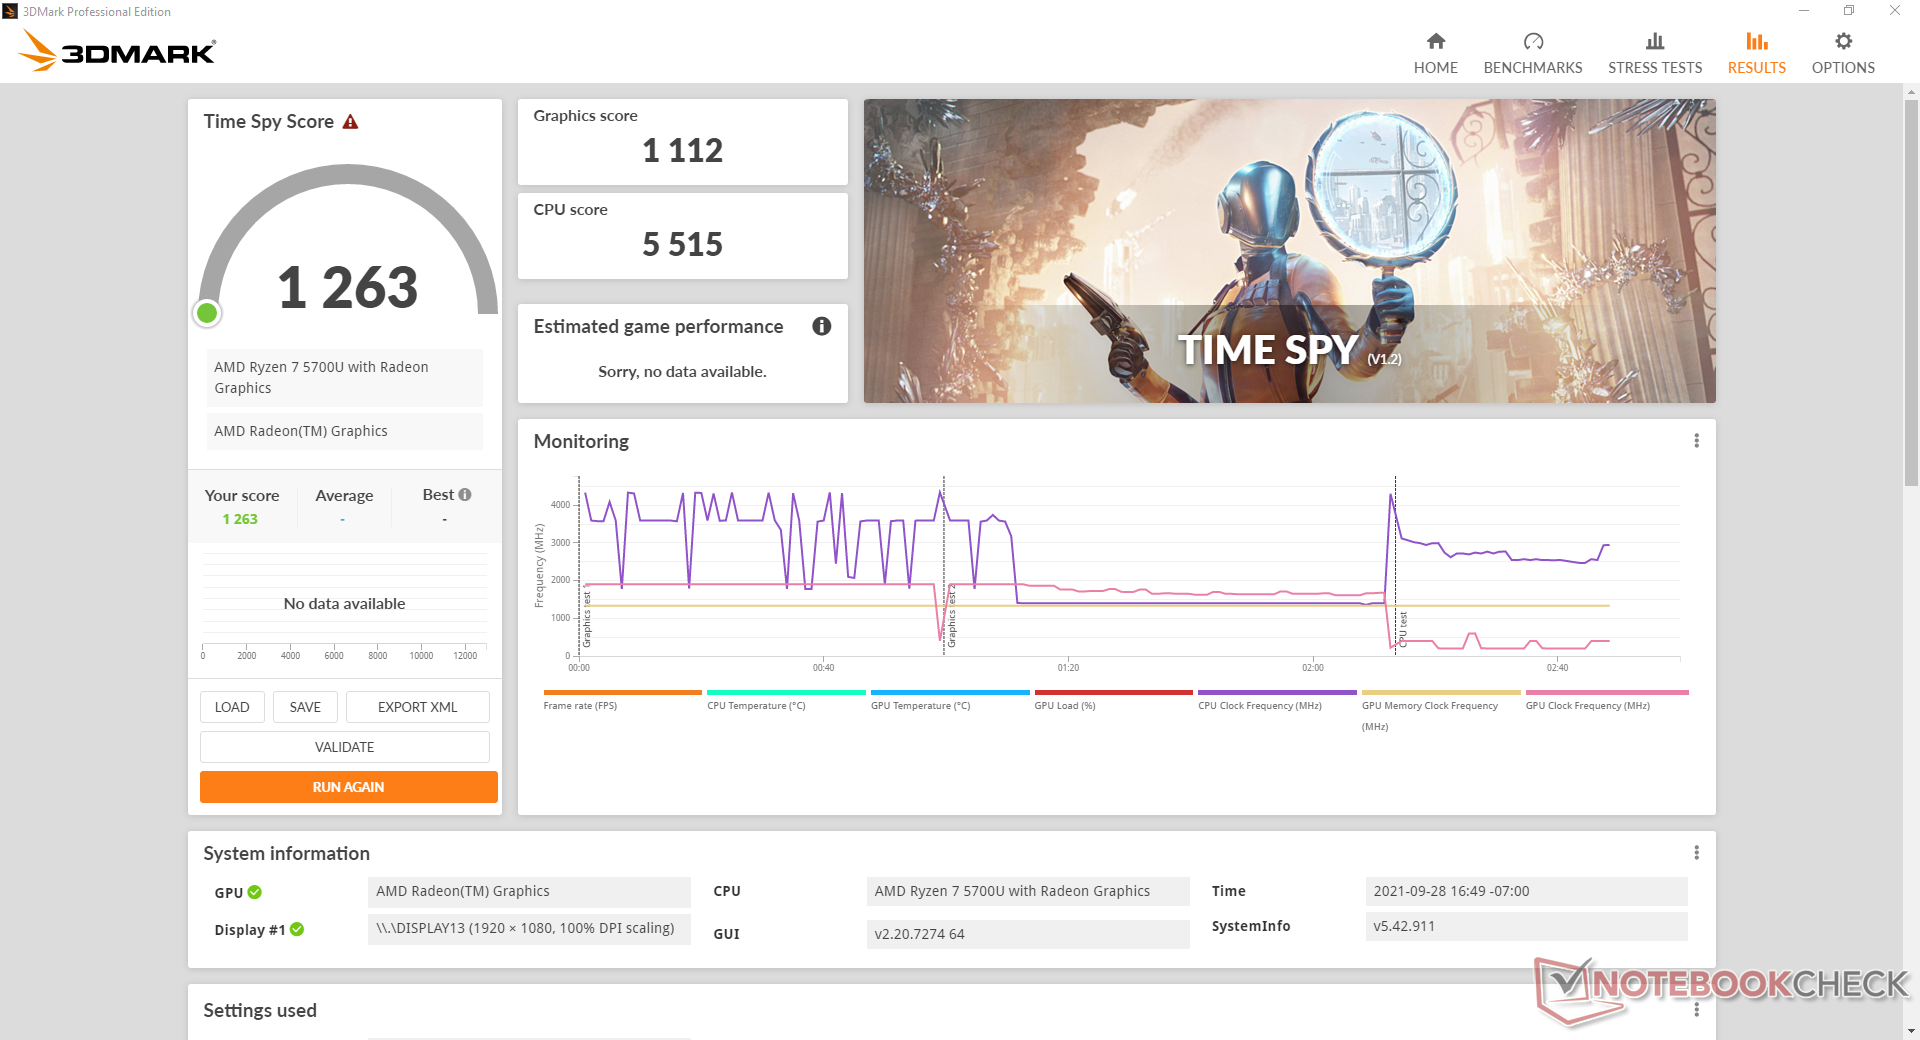
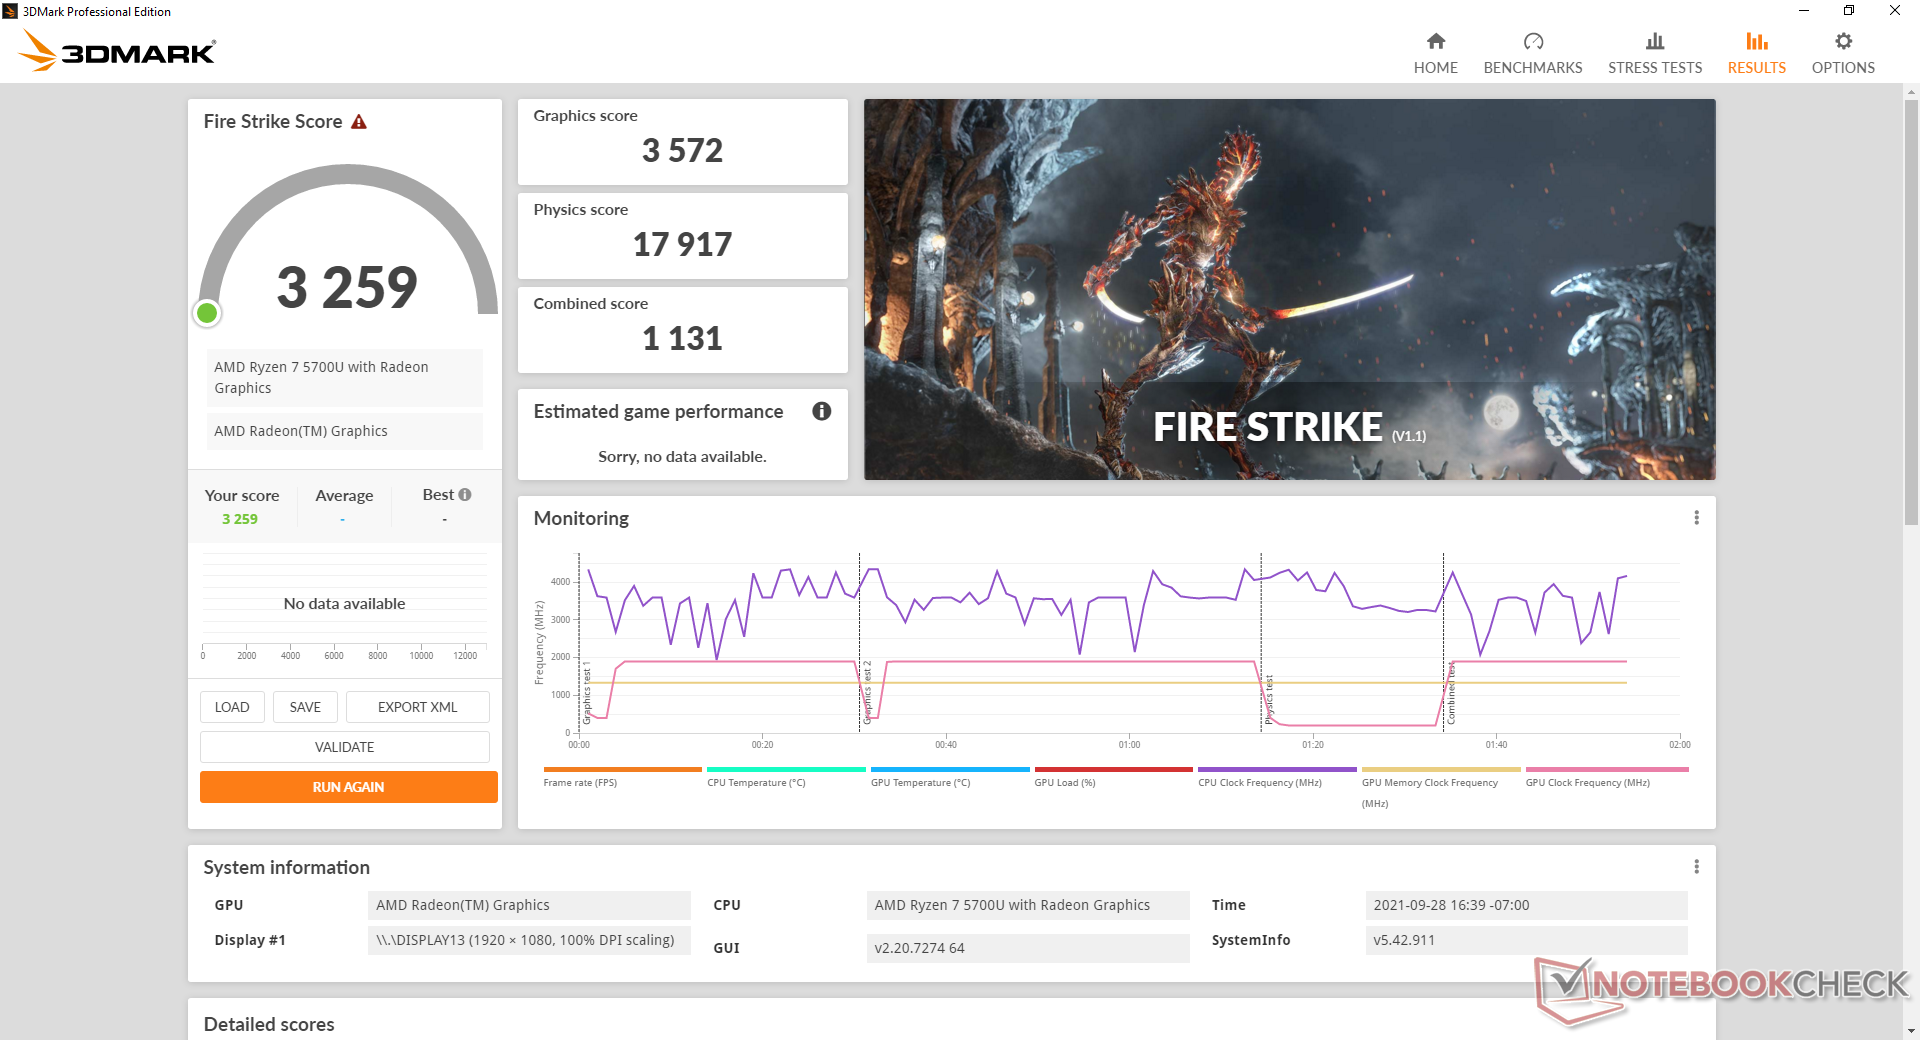
3DMark mostram nossos benchmarks integrados Radeon RX Vega 8 no Ryzen 7 5700U, para ser cerca de 10 a 15 por cento mais rápido que o Radeon RX Vega 7 no Ryzen 5 5500U. Nos jogos reais, porém, nosso Vega 8 seria apenas cerca de 5 a 10% mais rápido, apesar de nossa unidade de teste Ryzen 8 vir com o dobro da RAM e núcleos adicionais. É claro que o gargalo envolve a ficha gráfica na maioria dos cenários de jogos.
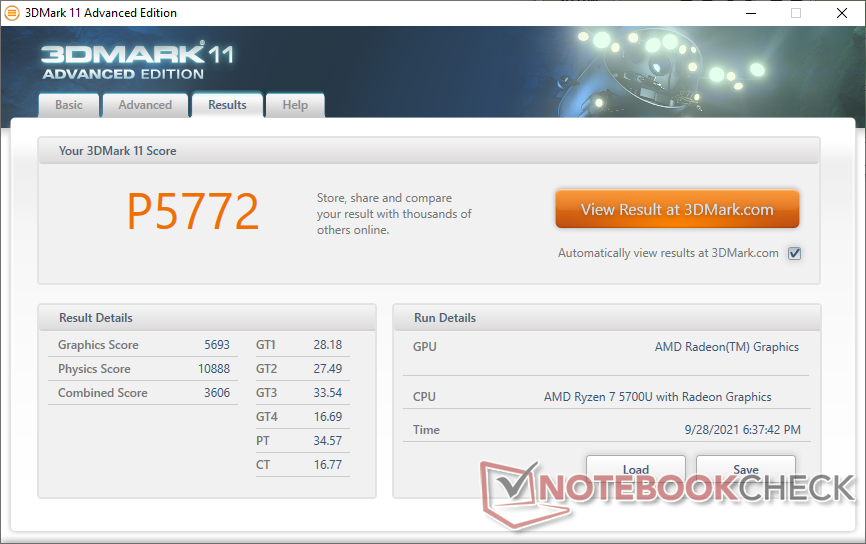
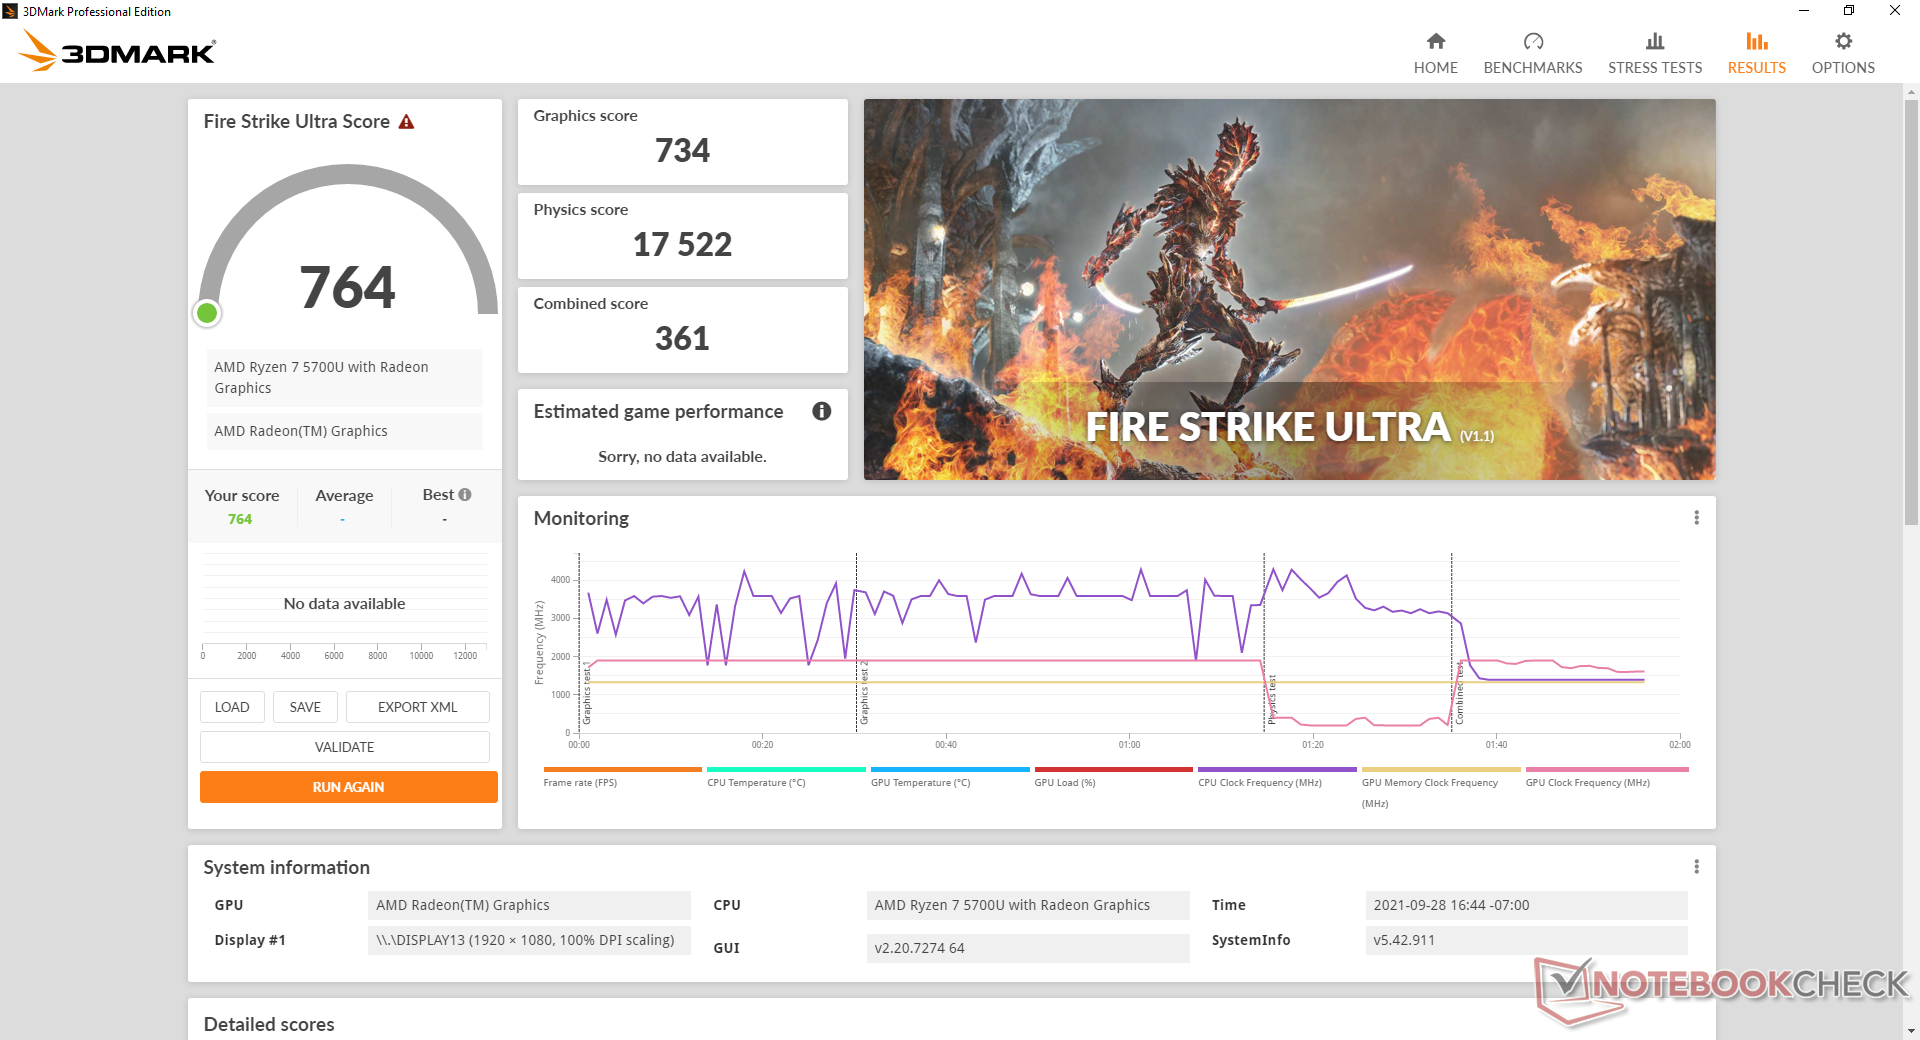
| 3DMark 11 Performance | 5772 pontos | |
| 3DMark Cloud Gate Standard Score | 21275 pontos | |
| 3DMark Fire Strike Score | 3259 pontos | |
| 3DMark Time Spy Score | 1263 pontos | |
Ajuda | ||
Witcher 3 FPS Chart
| baixo | média | alto | ultra | |
|---|---|---|---|---|
| GTA V (2015) | 88.7 | 24.5 | 9.82 | |
| The Witcher 3 (2015) | 70.7 | 23.3 | 15.2 | |
| Dota 2 Reborn (2015) | 93.7 | 73.7 | 45.7 | 43.4 |
| Final Fantasy XV Benchmark (2018) | 31.7 | 16.6 | 11.2 | |
| X-Plane 11.11 (2018) | 38.2 | 30.8 | 27 | |
| Far Cry 5 (2018) | 39 | 18 | 17 | 16 |
| Strange Brigade (2018) | 74.1 | 28.9 | 24.3 | 20.7 |
Emissions — Quiet Under Certain Power Profiles
Ruído do sistema
O ruído dos ventiladores é semelhante ao que observamos no SKU Ryzen 5, já que os sistemas operam sob níveis semelhantes de TDP. Quando ajustado para o modo Extreme Performance através do software Lenovo Vantage, o ruído do ventilador pulsaria com mais freqüência e alcançaria a máxima RPM também mais rapidamente. Os usuários vão querer ajustar o sistema para Refrigeração Inteligente ou Economia de Bateria quando navegarem ou transmitirem vídeo para um ruído do ventilador mais estável e tolerável de 27 dB(A).
Nossa unidade exibiria um ruído eletrônico menor ou uma bobina que felizmente só é audível quando se coloca um ouvido perto das teclas do teclado
| Lenovo Yoga 6 13ALC6 Vega 8, R7 5700U, WDC PC SN730 SDBPNTY-1T00 | Lenovo Yoga 6 13 82ND0009US Vega 7, R5 5500U, WDC PC SN530 SDBPMPZ-265G | Dell XPS 13 9310 2-in-1 Iris Xe G7 96EUs, i7-1165G7, Toshiba BG4 KBG40ZPZ512G | Acer Spin 3 SP313-51N-56YV Iris Xe G7 80EUs, i5-1135G7, Kingston OM8PCP3512F-AB | Lenovo IdeaPad Flex 5 CB 13IML05 82B80010GE UHD Graphics 620, i5-10210U, Samsung PM991 MZALQ128HBHQ-000L2 | HP Envy x360 13-ay0010nr Vega 6, R5 4500U, Toshiba KBG30ZMV256G | |
|---|---|---|---|---|---|---|
| Noise | -1% | 0% | 1% | 0% | -12% | |
| desligado / ambiente * (dB) | 24.3 | 25.1 -3% | 24.3 -0% | 25.5 -5% | 26.5 -9% | 28 -15% |
| Idle Minimum * (dB) | 25.2 | 25.1 -0% | 24.8 2% | 25.5 -1% | 26.5 -5% | 28 -11% |
| Idle Average * (dB) | 25.2 | 25.1 -0% | 24.8 2% | 25.5 -1% | 26.5 -5% | 28 -11% |
| Idle Maximum * (dB) | 25.2 | 25.1 -0% | 24.8 2% | 25.5 -1% | 26.5 -5% | 28.5 -13% |
| Load Average * (dB) | 38.6 | 41 -6% | 38 2% | 34.5 11% | 32.6 16% | 41.1 -6% |
| Witcher 3 ultra * (dB) | 38.1 | 38.6 -1% | 38 -0% | |||
| Load Maximum * (dB) | 38.6 | 38.7 -0% | 41.5 -8% | 38.7 -0% | 35.5 8% | 43.5 -13% |
* ... menor é melhor
Barulho
| Ocioso |
| 25.2 / 25.2 / 25.2 dB |
| Carga |
| 38.6 / 38.6 dB |
 | ||
30 dB silencioso 40 dB(A) audível 50 dB(A) ruidosamente alto |
||
min: | ||
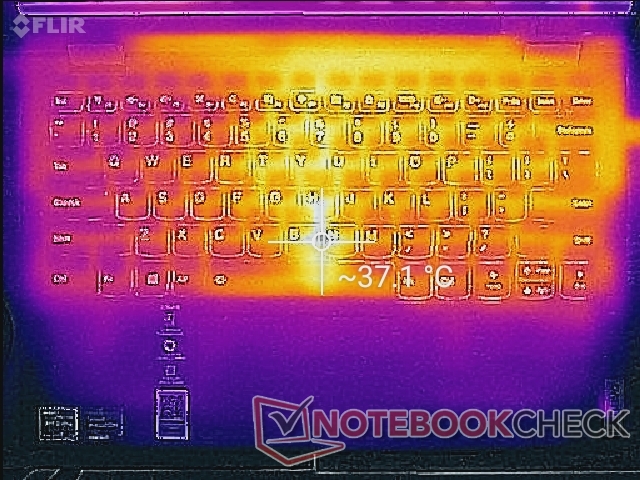
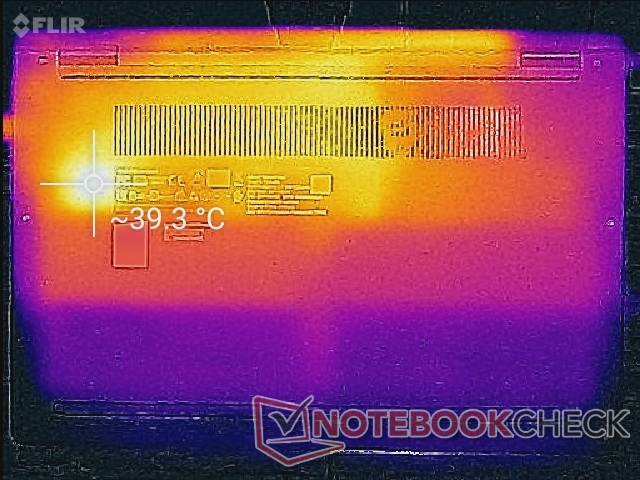
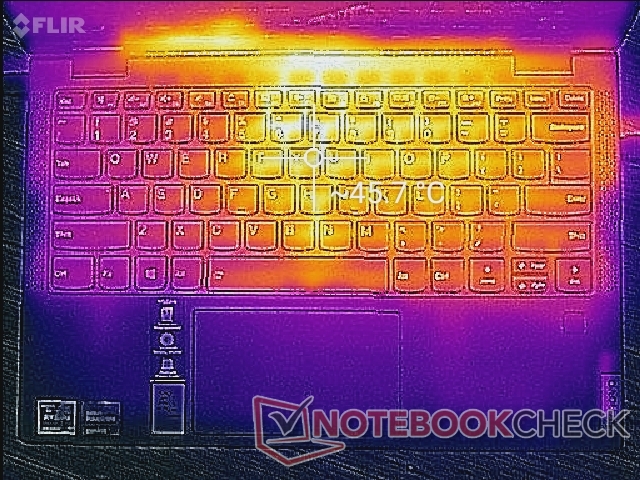
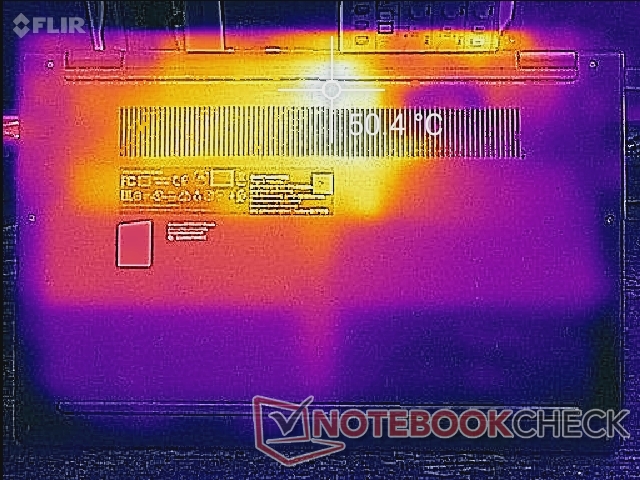
Temperatura
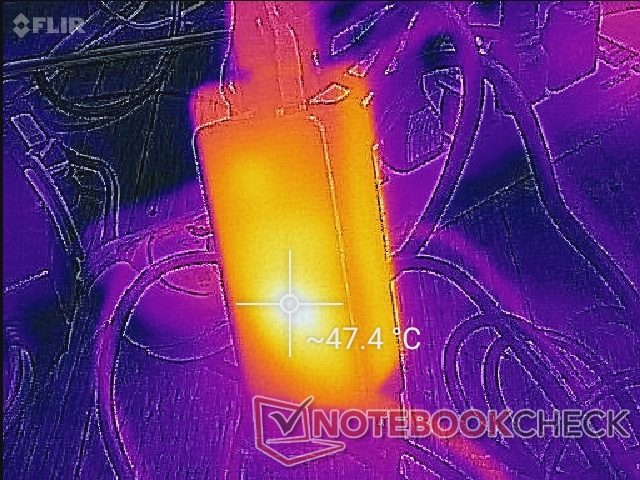
As temperaturas de superfície quando sob carga podem ser de até 45 a 50 C perto do centro do teclado e na parte traseira semelhantes ao que gravamos no XPS 13 9310 2 em 1. Curiosamente, o módulo WLAN pode ficar bastante quente mesmo quando simplesmente ocioso na área de trabalho, como mostrado por nossas imagens abaixo, talvez devido a downloads de software de fundo.
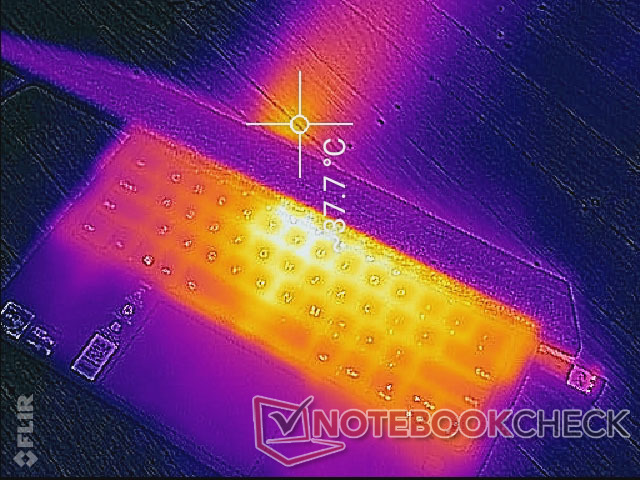
(-) A temperatura máxima no lado superior é 45.2 °C / 113 F, em comparação com a média de 35.4 °C / 96 F , variando de 19.6 a 60 °C para a classe Convertible.
(-) A parte inferior aquece até um máximo de 50.6 °C / 123 F, em comparação com a média de 36.9 °C / 98 F
(+) Em uso inativo, a temperatura média para o lado superior é 30 °C / 86 F, em comparação com a média do dispositivo de 30.3 °C / ### class_avg_f### F.
(+) Os apoios para as mãos e o touchpad são mais frios que a temperatura da pele, com um máximo de 26 °C / 78.8 F e, portanto, são frios ao toque.
(±) A temperatura média da área do apoio para as mãos de dispositivos semelhantes foi 28 °C / 82.4 F (+2 °C / 3.6 F).
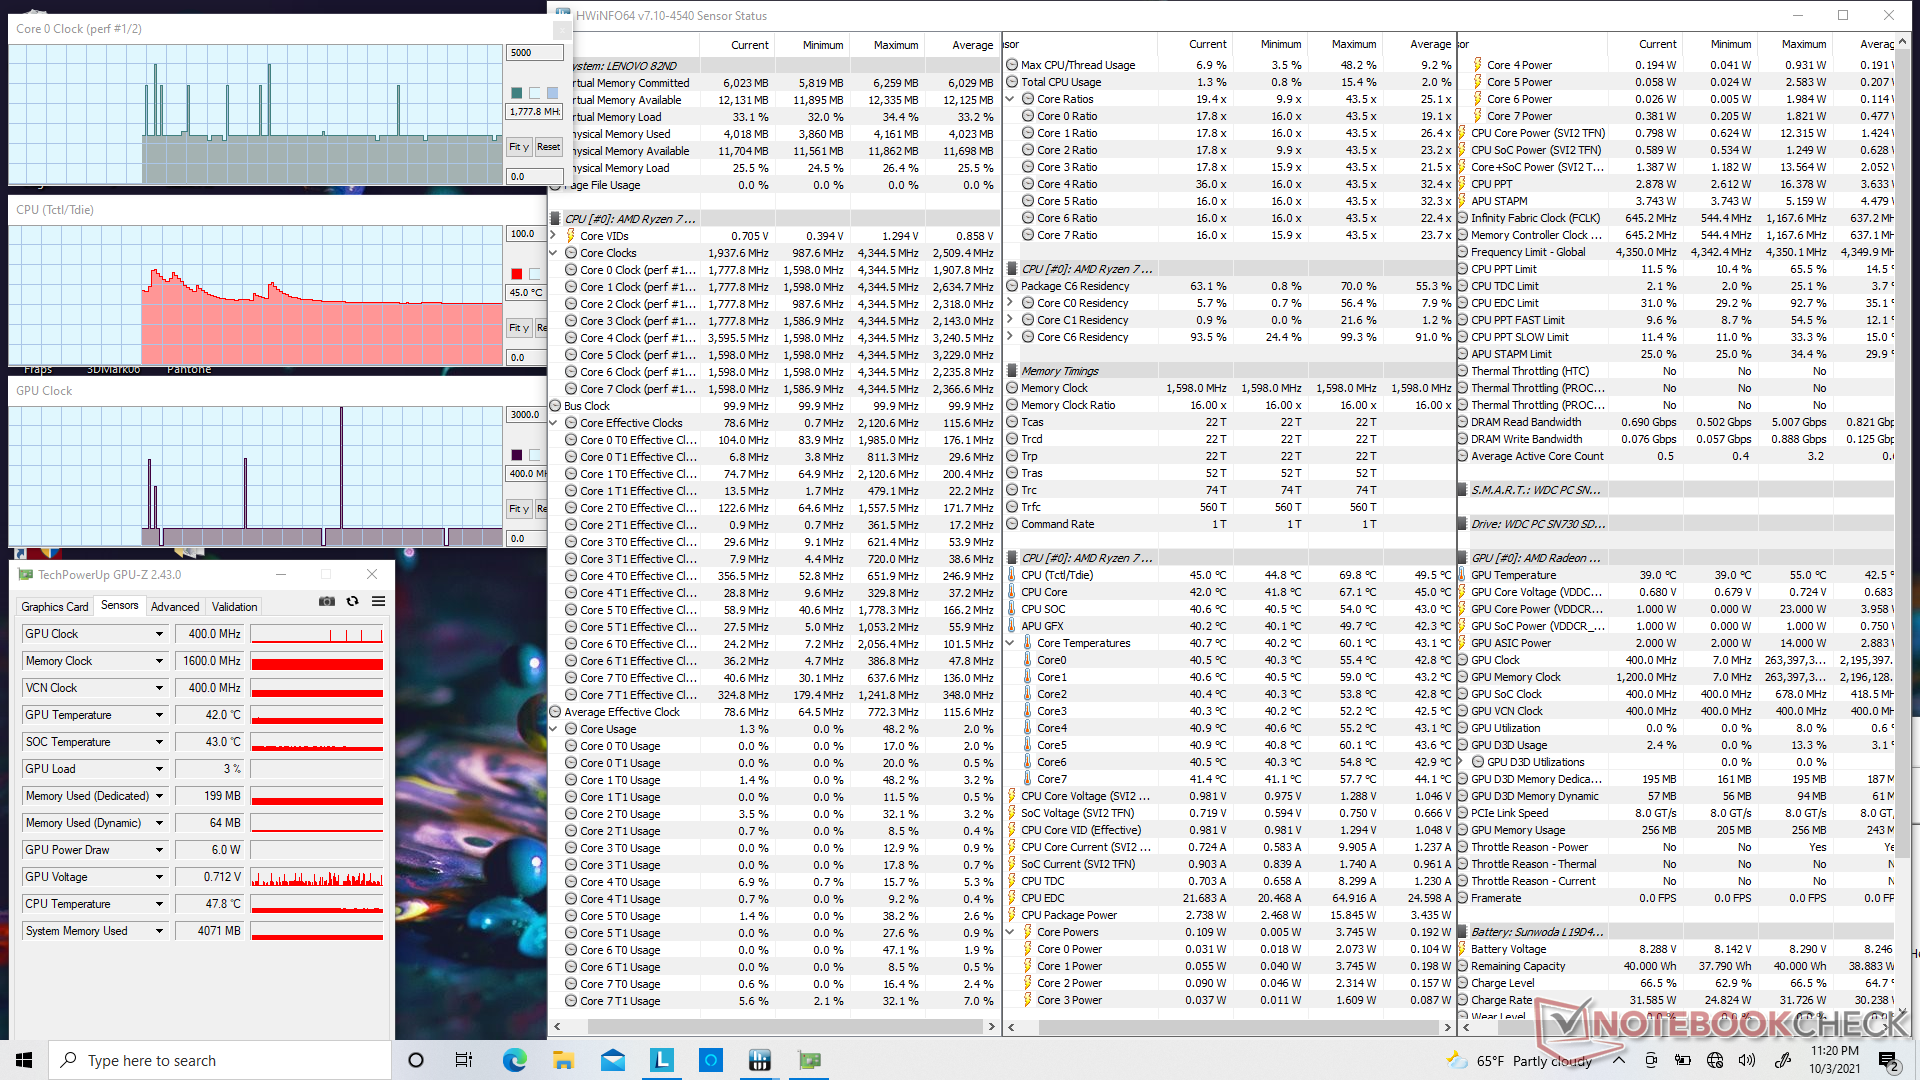
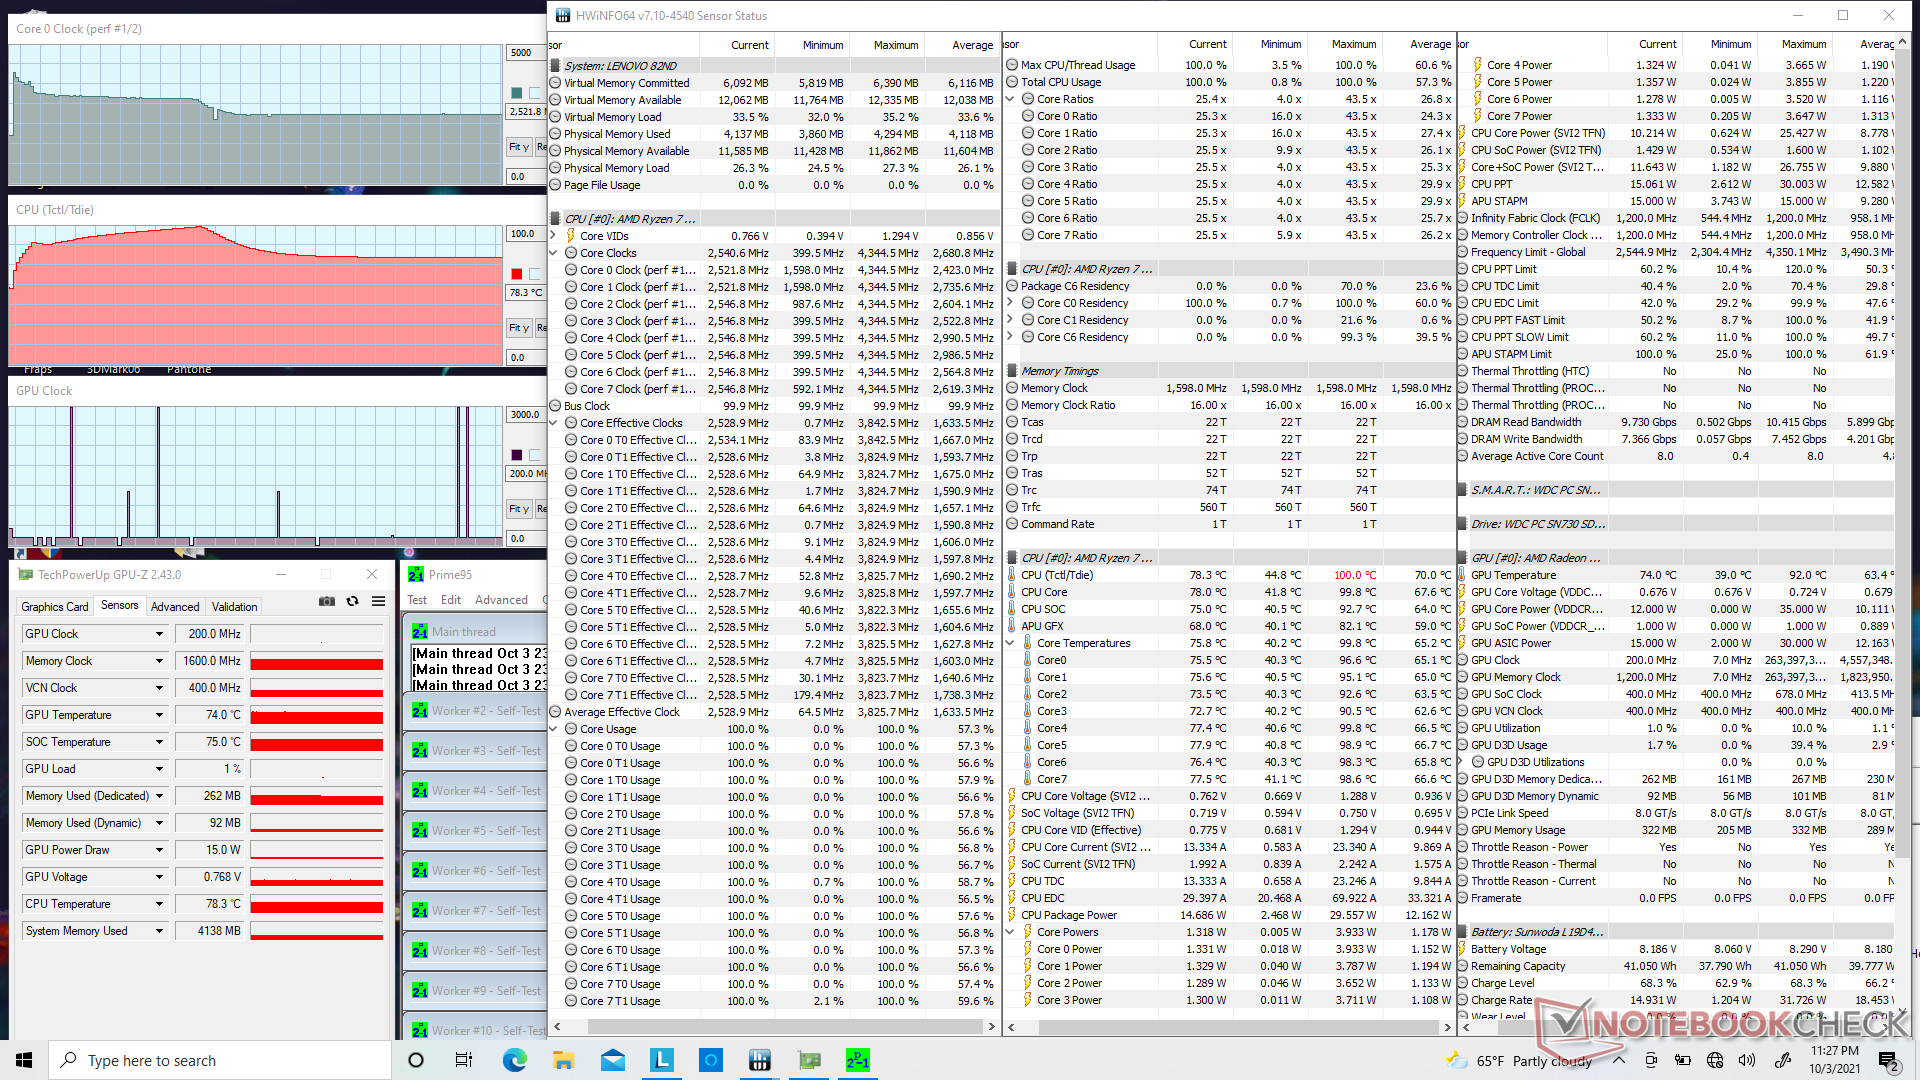
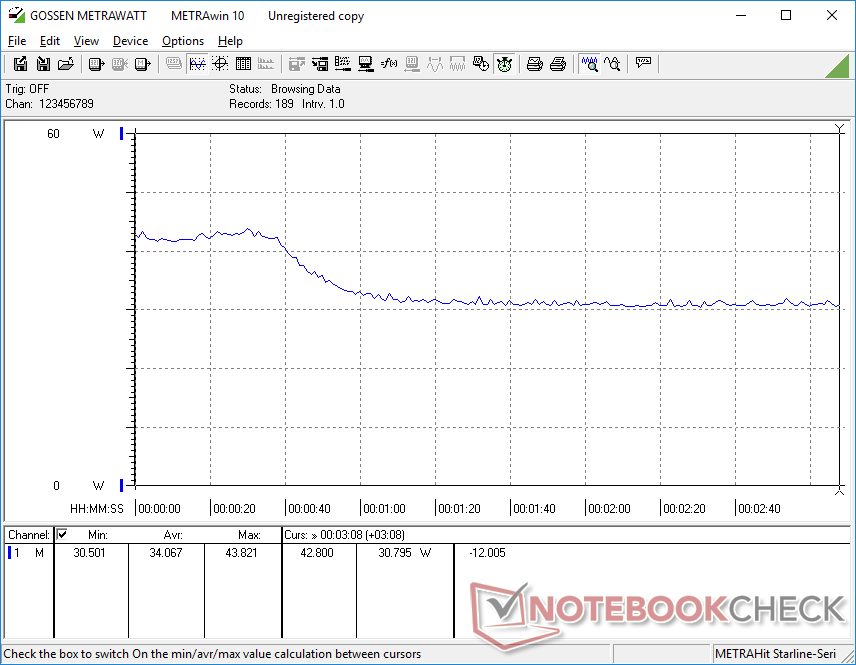
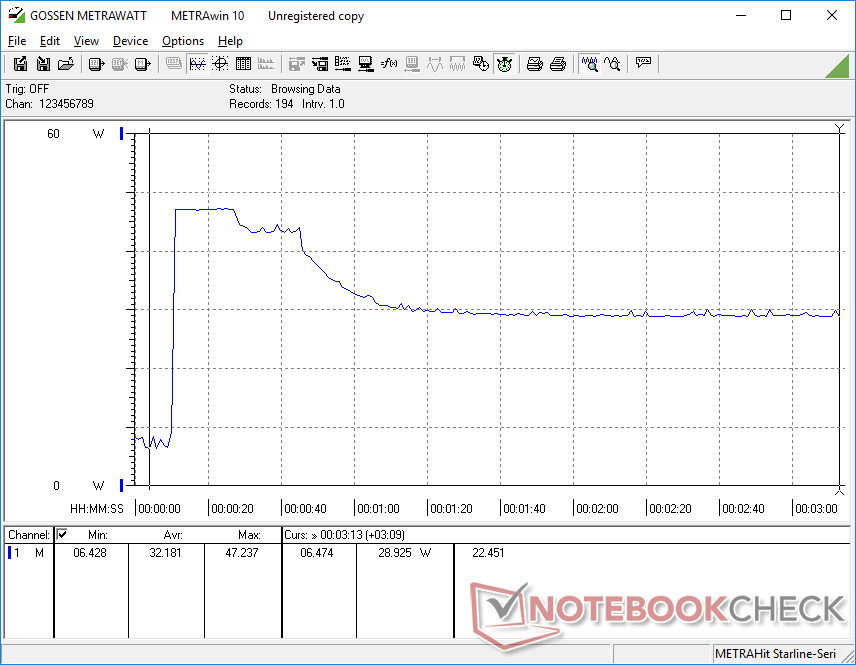
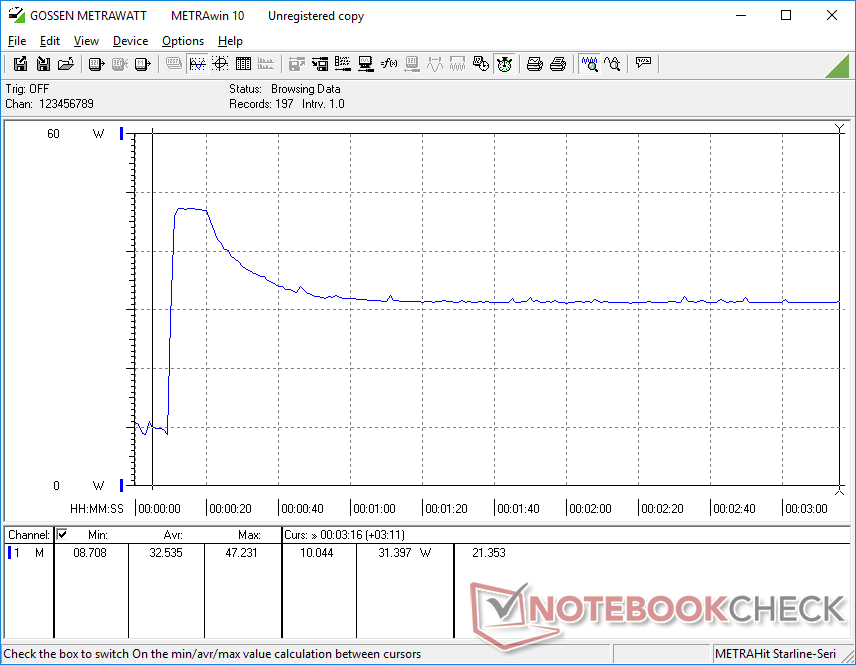
Teste de estresse - Apenas um pouco mais quente
Ao rodar Prime95, a CPU aumentaria para 3,9 GHz por apenas os primeiros segundos até atingir uma temperatura central de 89 C. Aí, as taxas de relógio cairiam para a faixa de 3,1 a 3,2 GHz durante os próximos minutos antes de finalmente se fixarem em 2,5 GHz e 78 C. Observaríamos resultados similares, mas ligeiramente mais frios, na SKU Ryzen 5, onde as taxas de relógio da CPU e a temperatura se estabilizariam em 2,6 GHz e 72 C
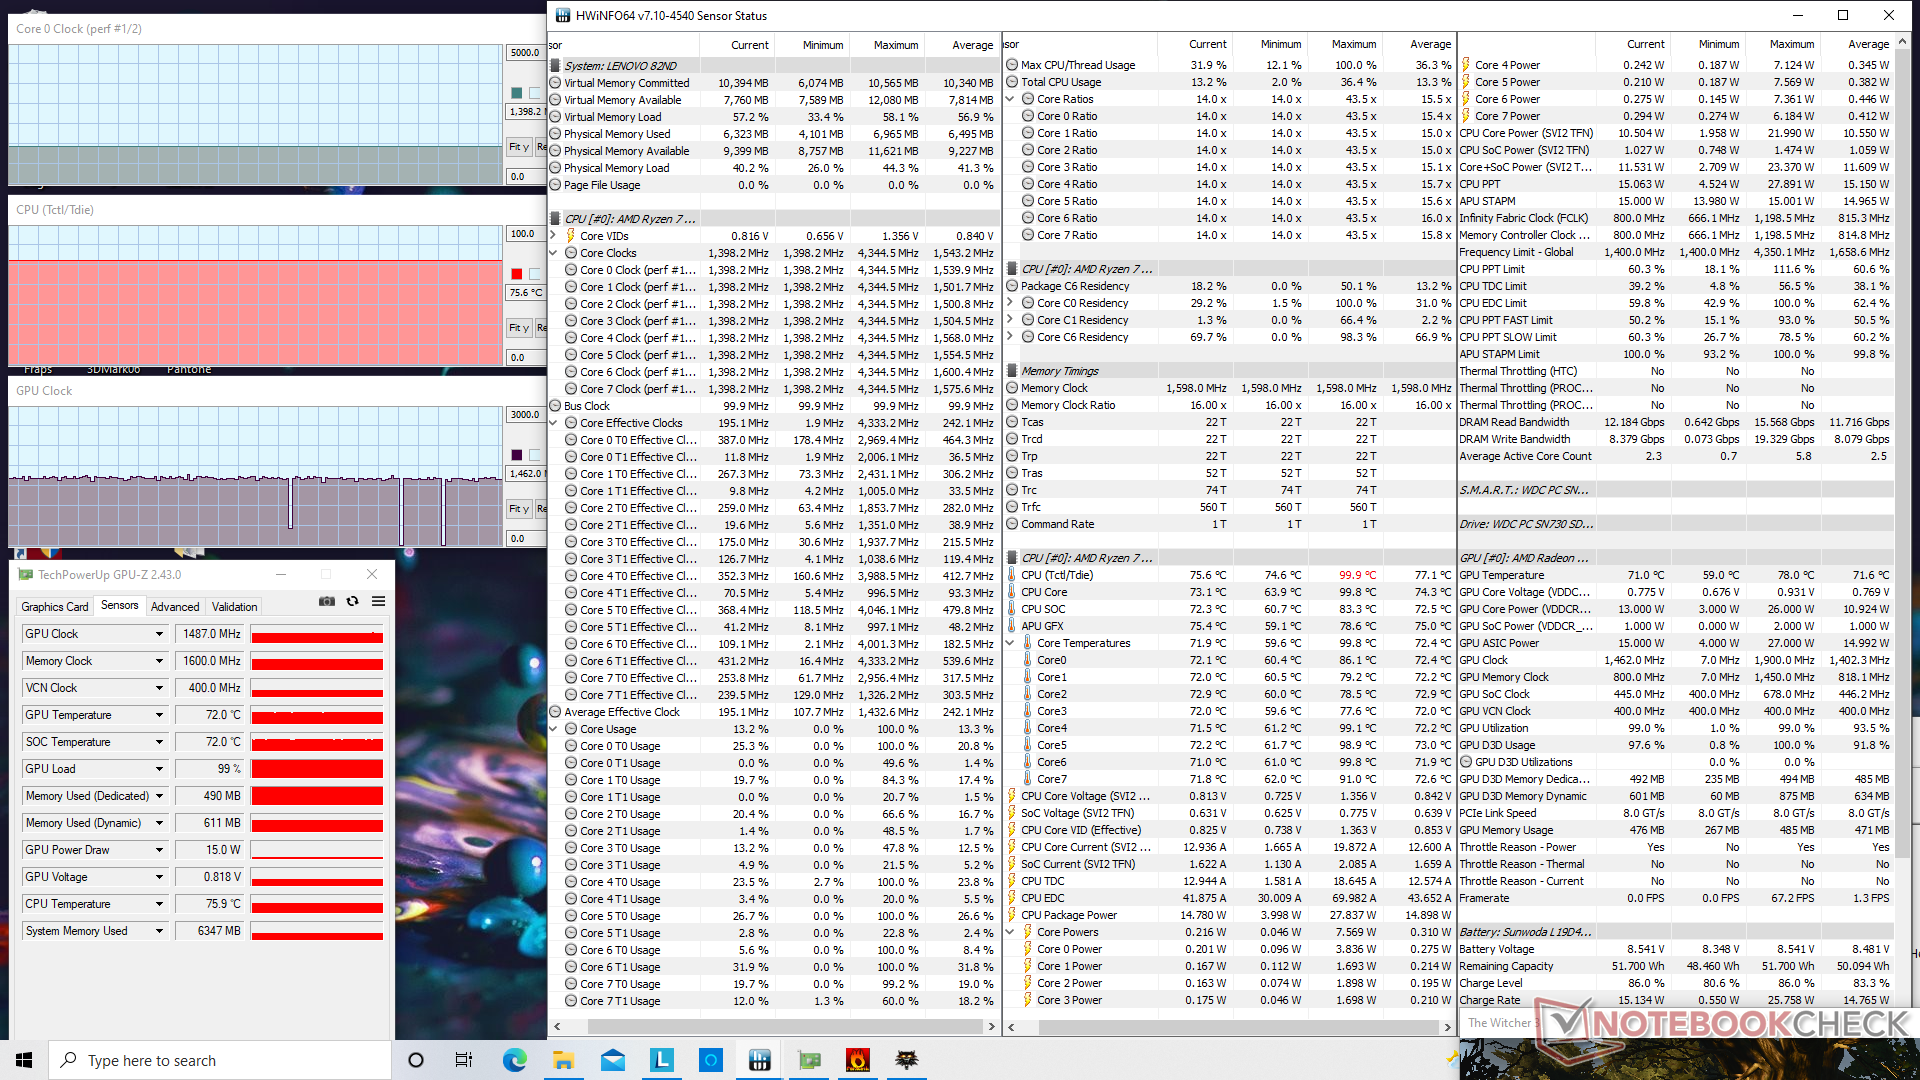
Ao rodar Witcher 3, o relógio GPU, relógio de memória e temperatura estabilizariam em 1487 MHz, 1600 MHz e 72 C em comparação a 1400 MHz, 1333 MHz e 66 C na SKU Ryzen 5. Os usuários verão um desempenho mais rápido nos jogos da SKU Ryzen 7, embora com temperaturas centrais ligeiramente mais altas
O funcionamento com energia da bateria terá um leve impacto no desempenho. Um teste 3DMark 11 com baterias retornaria pontuações de Física e Gráficos de 10889 e 5526 pontos, respectivamente, em comparação com 10888 e 5693 pontos quando em rede elétrica.
| RelógioCPU (GHz) | RelógioGPU (MHz) | Temperaturamédiada CPU (°C) | |
| System Idle | -- | --45 | |
| Prime95 Stress | 2.5 | --78 | |
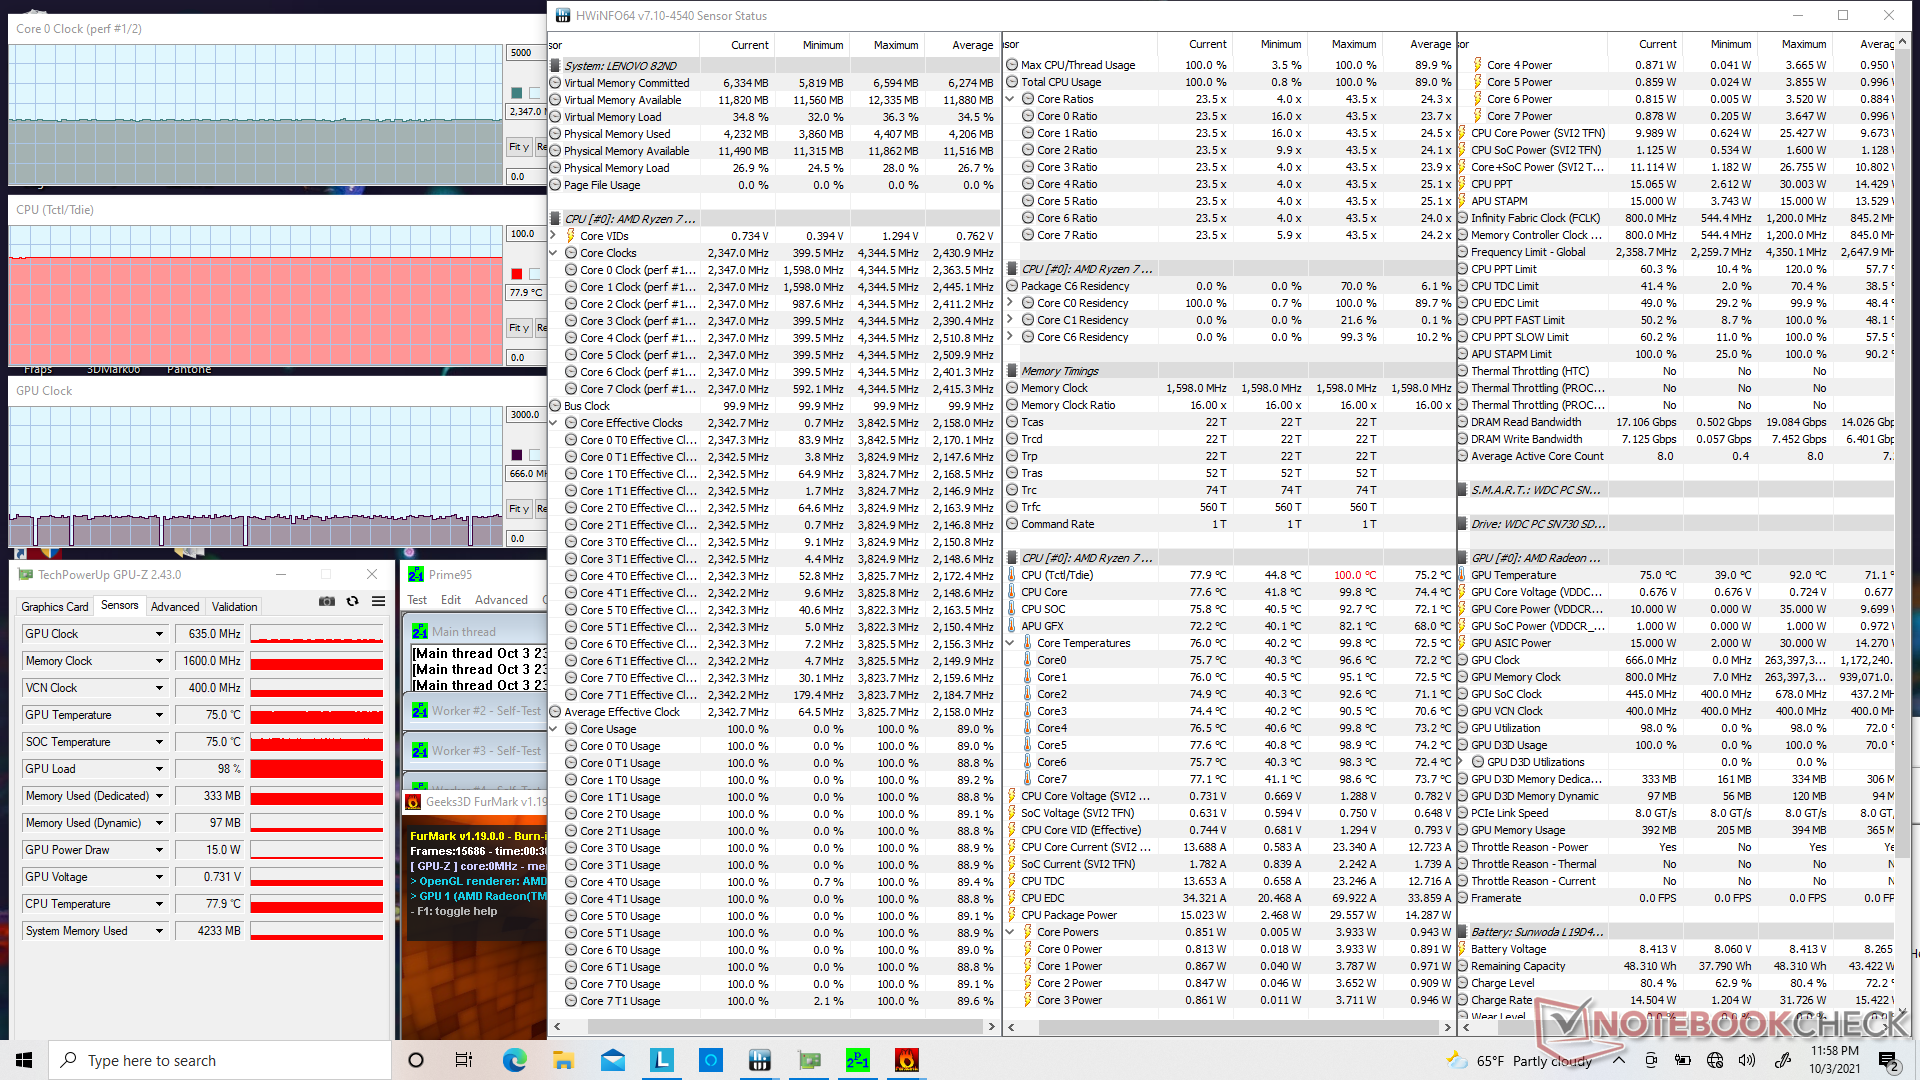
| Prime95 + FurMark Stress | 2.4 | 635 | 78 |
| Witcher 3 Stress | 1.4 | 1487 | 72 |
Oradores

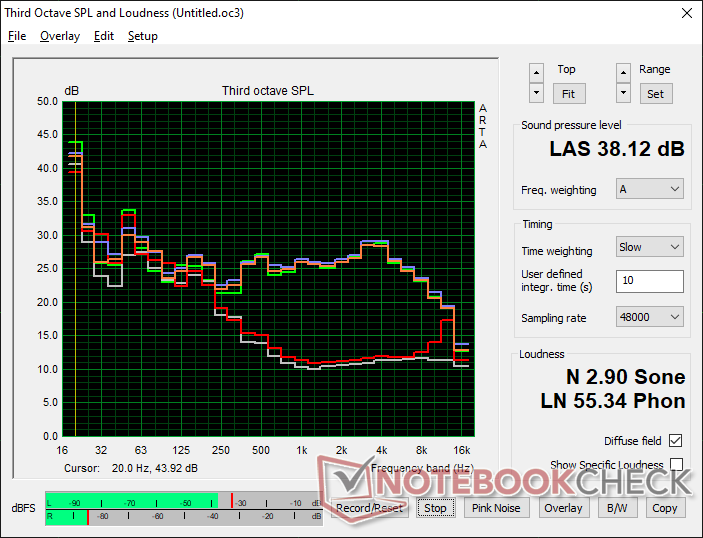
Lenovo Yoga 6 13ALC6 análise de áudio
(±) | o volume do alto-falante é médio, mas bom (###valor### dB)
Graves 100 - 315Hz
(-) | quase nenhum baixo - em média 17% menor que a mediana
(±) | a linearidade dos graves é média (9.6% delta para a frequência anterior)
Médios 400 - 2.000 Hz
(+) | médios equilibrados - apenas 3.7% longe da mediana
(+) | médios são lineares (3.1% delta para frequência anterior)
Altos 2 - 16 kHz
(+) | agudos equilibrados - apenas 3.9% longe da mediana
(+) | os máximos são lineares (5.1% delta da frequência anterior)
Geral 100 - 16.000 Hz
(±) | a linearidade do som geral é média (17.2% diferença em relação à mediana)
Comparado com a mesma classe
» 33% de todos os dispositivos testados nesta classe foram melhores, 8% semelhantes, 59% piores
» O melhor teve um delta de 6%, a média foi 20%, o pior foi 57%
Comparado com todos os dispositivos testados
» 32% de todos os dispositivos testados foram melhores, 8% semelhantes, 60% piores
» O melhor teve um delta de 4%, a média foi 23%, o pior foi 134%
Apple MacBook 12 (Early 2016) 1.1 GHz análise de áudio
(+) | os alto-falantes podem tocar relativamente alto (###valor### dB)
Graves 100 - 315Hz
(±) | graves reduzidos - em média 11.3% menor que a mediana
(±) | a linearidade dos graves é média (14.2% delta para a frequência anterior)
Médios 400 - 2.000 Hz
(+) | médios equilibrados - apenas 2.4% longe da mediana
(+) | médios são lineares (5.5% delta para frequência anterior)
Altos 2 - 16 kHz
(+) | agudos equilibrados - apenas 2% longe da mediana
(+) | os máximos são lineares (4.5% delta da frequência anterior)
Geral 100 - 16.000 Hz
(+) | o som geral é linear (10.2% diferença em relação à mediana)
Comparado com a mesma classe
» 7% de todos os dispositivos testados nesta classe foram melhores, 2% semelhantes, 90% piores
» O melhor teve um delta de 5%, a média foi 18%, o pior foi 53%
Comparado com todos os dispositivos testados
» 5% de todos os dispositivos testados foram melhores, 1% semelhantes, 94% piores
» O melhor teve um delta de 4%, a média foi 23%, o pior foi 134%
Energy Management
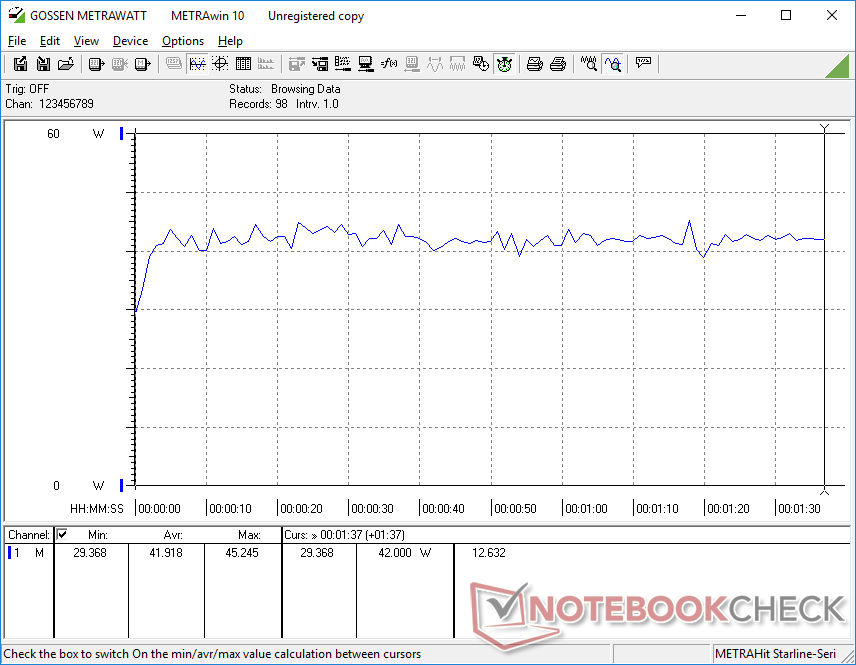
Consumo de energia
O consumo de energia é apenas marginalmente superior à configuração Ryzen 5 5500U por apenas um ou dois watts, no máximo. Em geral, o sistema é mais ávido de energia do que um Tiger Lake-U Core i5 ou Core i7 Ultrabook como o Acer Spin 3 SP313 enquanto oferece tanto um desempenho gráfico ligeiramente mais lento quanto um desempenho superior da CPU multi-tarefa.
| desligado | |
| Ocioso | |
| Carga |
|
Key:
min: | |
| Lenovo Yoga 6 13ALC6 R7 5700U, Vega 8, WDC PC SN730 SDBPNTY-1T00, IPS, 1920x1080, 13.3" | Lenovo Yoga 6 13 82ND0009US R5 5500U, Vega 7, WDC PC SN530 SDBPMPZ-265G, IPS, 1920x1080, 13.3" | Dell XPS 13 9310 2-in-1 i7-1165G7, Iris Xe G7 96EUs, Toshiba BG4 KBG40ZPZ512G, IPS, 1920x1200, 13.4" | Acer Spin 3 SP313-51N-56YV i5-1135G7, Iris Xe G7 80EUs, Kingston OM8PCP3512F-AB, IPS, 2560x1600, 13.3" | Lenovo IdeaPad Flex 5 CB 13IML05 82B80010GE i5-10210U, UHD Graphics 620, Samsung PM991 MZALQ128HBHQ-000L2, IPS, 1920x1080, 13.3" | HP Envy x360 13-ay0010nr R5 4500U, Vega 6, Toshiba KBG30ZMV256G, IPS, 1920x1080, 13.3" | |
|---|---|---|---|---|---|---|
| Power Consumption | 4% | 14% | 13% | 26% | 10% | |
| Idle Minimum * (Watt) | 4.9 | 5 -2% | 2.6 47% | 3.5 29% | 3.7 24% | 3.9 20% |
| Idle Average * (Watt) | 6.6 | 6.3 5% | 6.4 3% | 6.6 -0% | 5.5 17% | 5.8 12% |
| Idle Maximum * (Watt) | 7.8 | 6.9 12% | 7.7 1% | 8.5 -9% | 6.5 17% | 6 23% |
| Load Average * (Watt) | 41.9 | 41.5 1% | 29.9 29% | 32.2 23% | 27 36% | 41.5 1% |
| Witcher 3 ultra * (Watt) | 34.1 | 33.2 3% | 32.2 6% | 32.5 5% | ||
| Load Maximum * (Watt) | 47.3 | 46.5 2% | 47.5 -0% | 34.5 27% | 30.6 35% | 50.4 -7% |
* ... menor é melhor
Power Consumption Witcher 3 / Stresstest
Vida útil da bateria - O suficiente para um dia de trabalho
A vida útil da bateria WLAN é cerca de uma hora menor do que a que registramos no SKU Ryzen 5. Mesmo assim, o tempo de execução de 12 horas ainda será mais do que suficiente para a maioria dos usuários
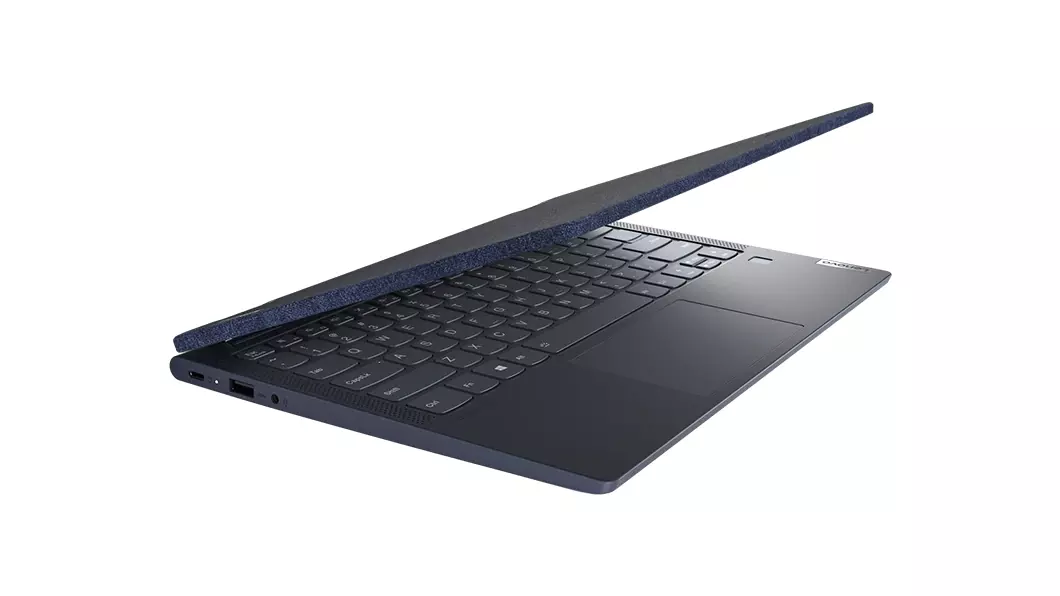
A carga desde a capacidade vazia até a plena leva cerca de 2 horas. Tenha em mente que somente a porta USB-C esquerda suporta o carregamento.
| Lenovo Yoga 6 13ALC6 R7 5700U, Vega 8, 60 Wh | Lenovo Yoga 6 13 82ND0009US R5 5500U, Vega 7, 60 Wh | Dell XPS 13 9310 2-in-1 i7-1165G7, Iris Xe G7 96EUs, 51 Wh | Acer Spin 3 SP313-51N-56YV i5-1135G7, Iris Xe G7 80EUs, 48 Wh | Lenovo IdeaPad Flex 5 CB 13IML05 82B80010GE i5-10210U, UHD Graphics 620, 51 Wh | HP Envy x360 13-ay0010nr R5 4500U, Vega 6, 51 Wh | |
|---|---|---|---|---|---|---|
| Duração da bateria | 9% | -12% | -33% | -37% | -2% | |
| WiFi v1.3 (h) | 12.1 | 13.2 9% | 10.7 -12% | 8.1 -33% | 7.6 -37% | 11.8 -2% |
| Reader / Idle (h) | 17.5 | 25.4 | 31.9 | |||
| Load (h) | 2 | 3.4 | 1.8 | 1.9 |
Pro
Contra
Veredicto - Processador muito rápido para um Conversível de 13 polegadas
A atualização para a configuração do Ryzen 7 5700U a partir do Ryzen 5 5500U irá proporcionar aos usuários um desempenho multi-linhas 15 a 20% mais rápido e um desempenho gráfico 10 a 15% mais rápido, ao custo de temperaturas centrais ligeiramente mais quentes e uma hora de vida útil mais curta da bateria. Se você quiser apertar o máximo de energia possível da Lenovo Yoga 6 13, então a configuração do Ryzen 7 pode valer a pena considerar especialmente, uma vez que está vendendo a varejo por apenas 50 dólares a mais no momento.
Alto desempenho com cores sRGB completas e um preço barato fazem da Lenovo Yoga 6 13 conversível visualmente única uma compra muito atraente. A RAM soldada, entretanto, é difícil de ignorar, especialmente quando a maioria das vendas inclui apenas 8 GB.
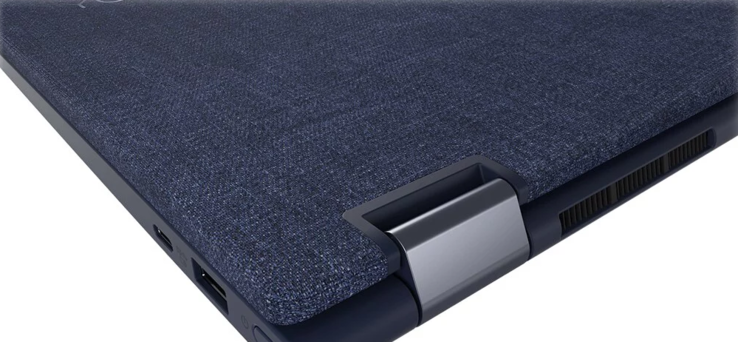
Quanto ao próprio sistema Lenovo, ele continua sendo um dos conversíveis mais rápidos em sua categoria de 13 polegadas em termos de desempenho de CPU, semelhante ao que concluímos com o IdeaPad Flex 5 14 polegadas. Seu tecido de tampa externa tem seu prós e contrasquando comparado com o alumínio comum, enquanto a RAM soldada pode ser um fator de desligamento para alguns. Se tais características são importantes para você, então o barato AMD Asus VivoBook Flip 14 pode oferecer níveis de desempenho semelhantes, embora com uma tela sensível ao toque mais fraca e menos colorida.
Preço e disponibilidade
Lenovo Yoga 6 13ALC6
- 10/04/2021 v7 (old)
Allen Ngo
Price comparison

