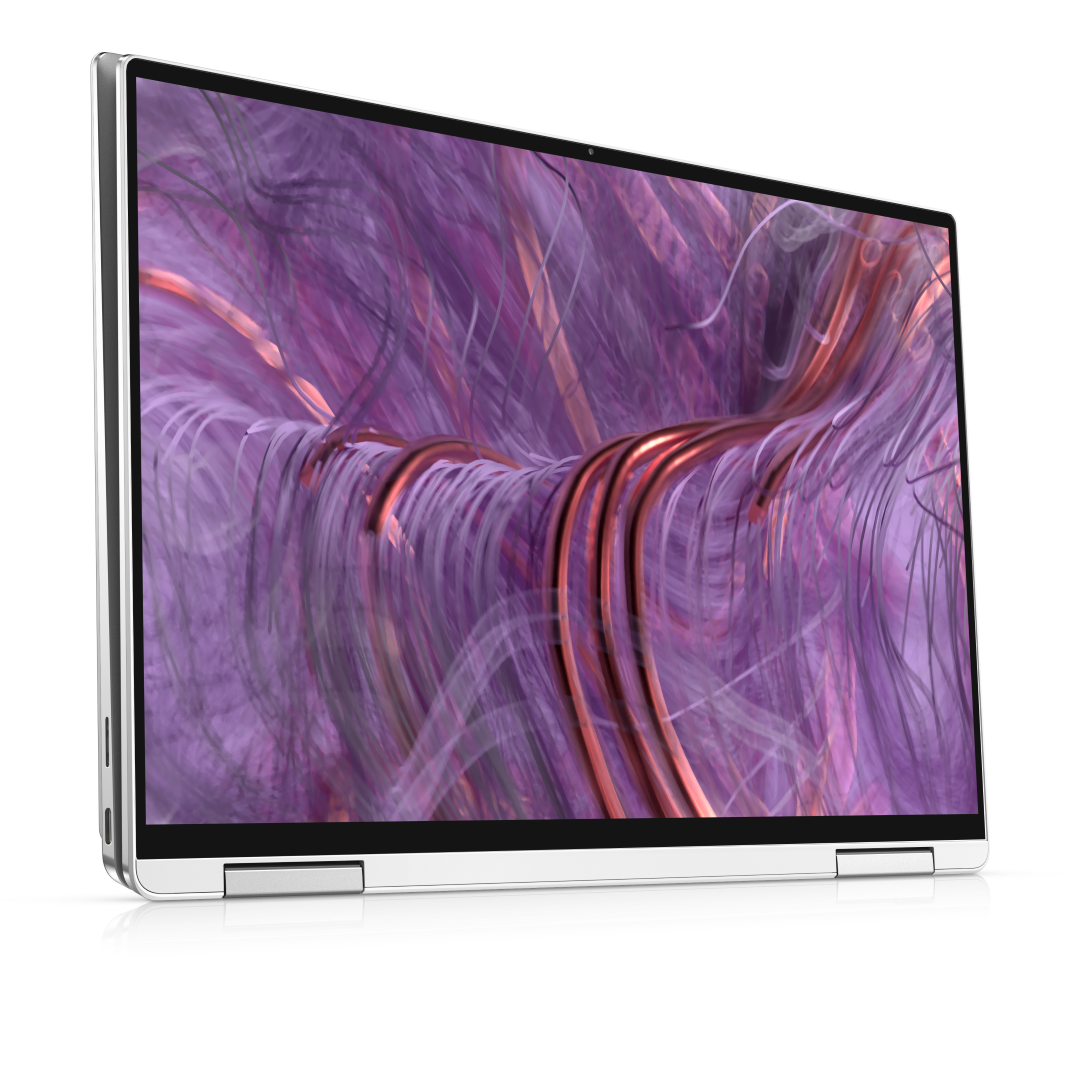
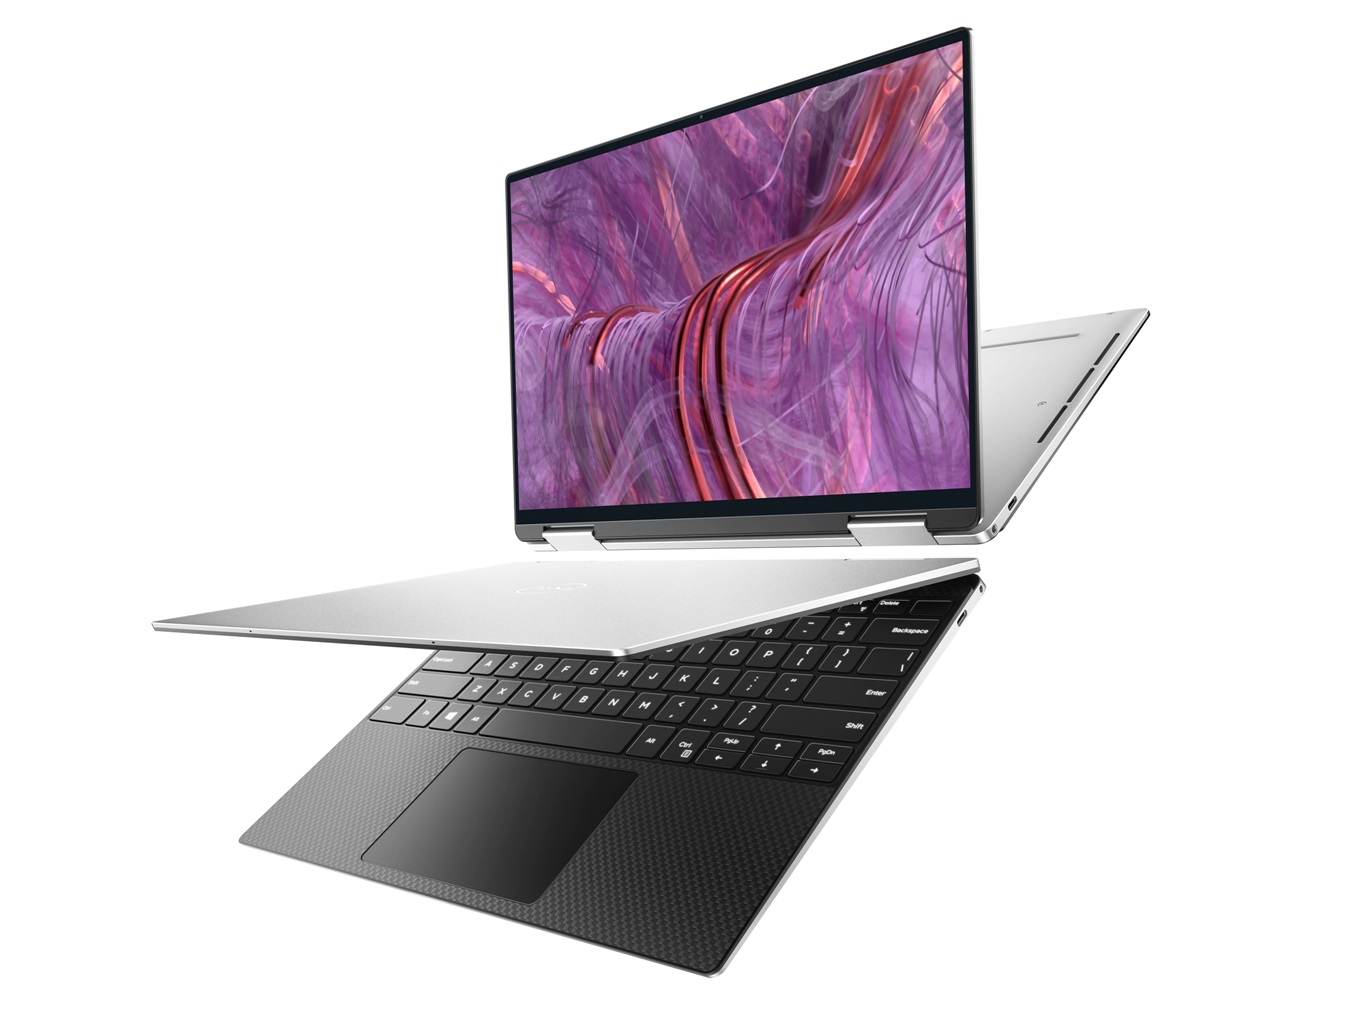
Revisão 2-em-1 do Dell XPS 13 9310: Melhor que o XPS 13 7390 2 em 1 de uma forma específica
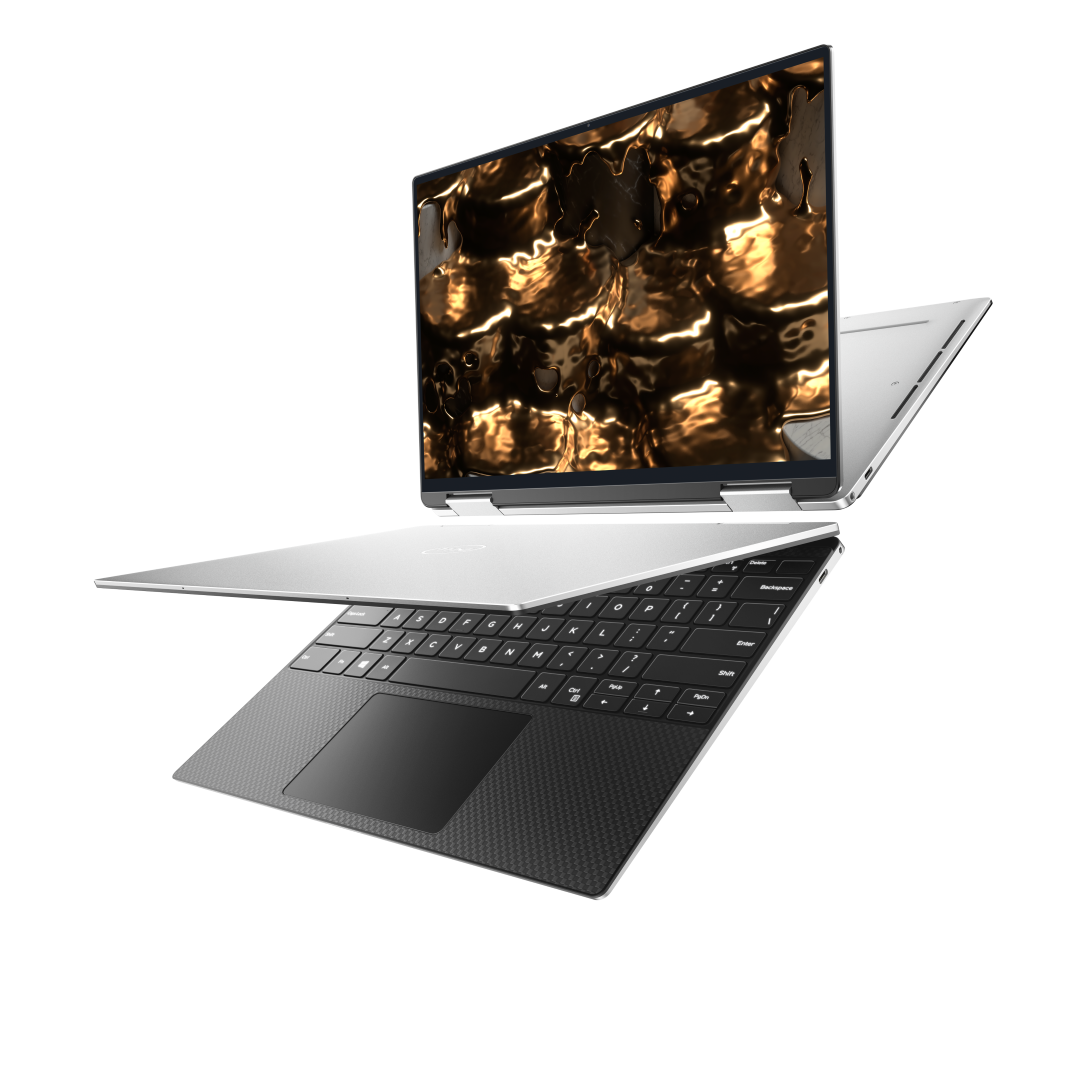
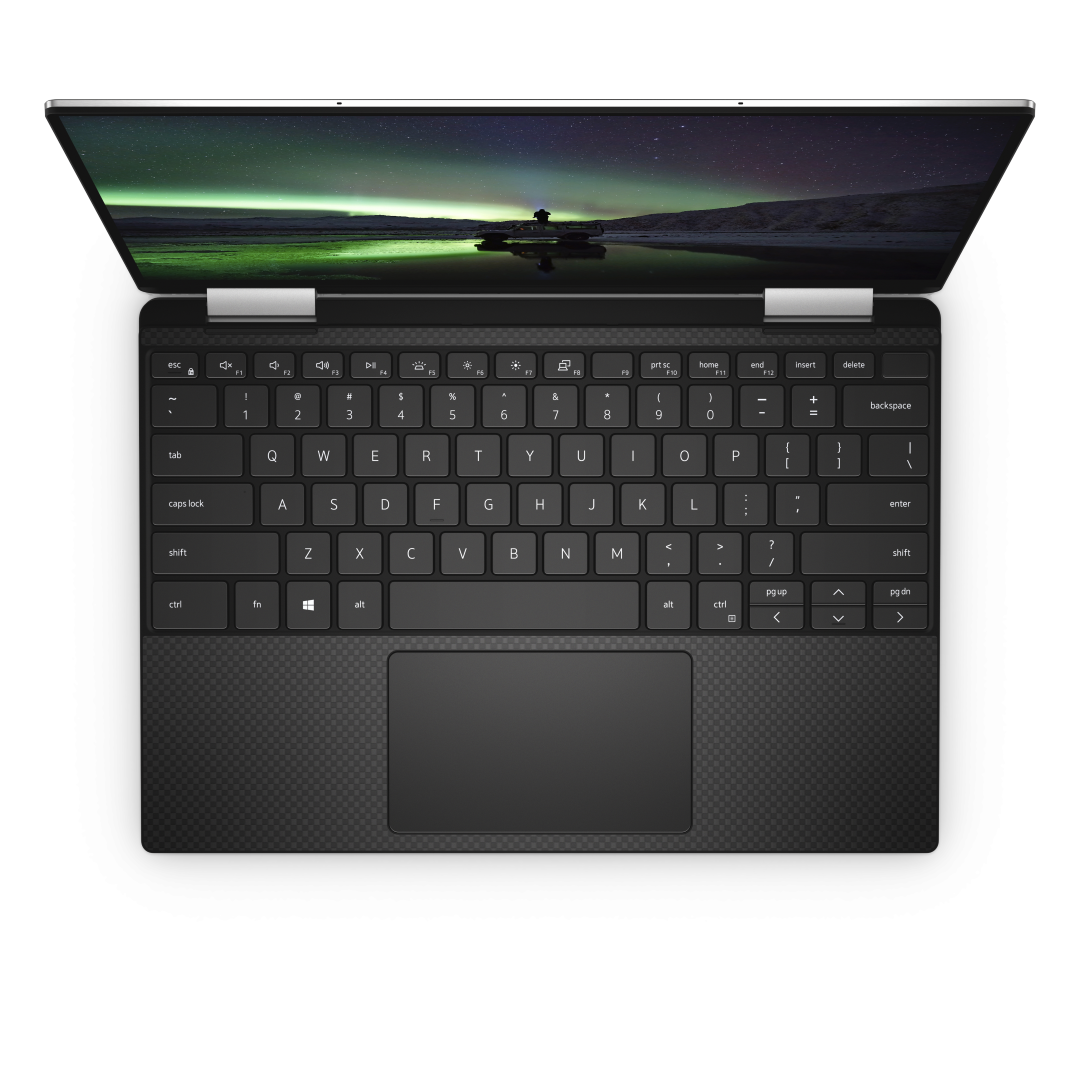
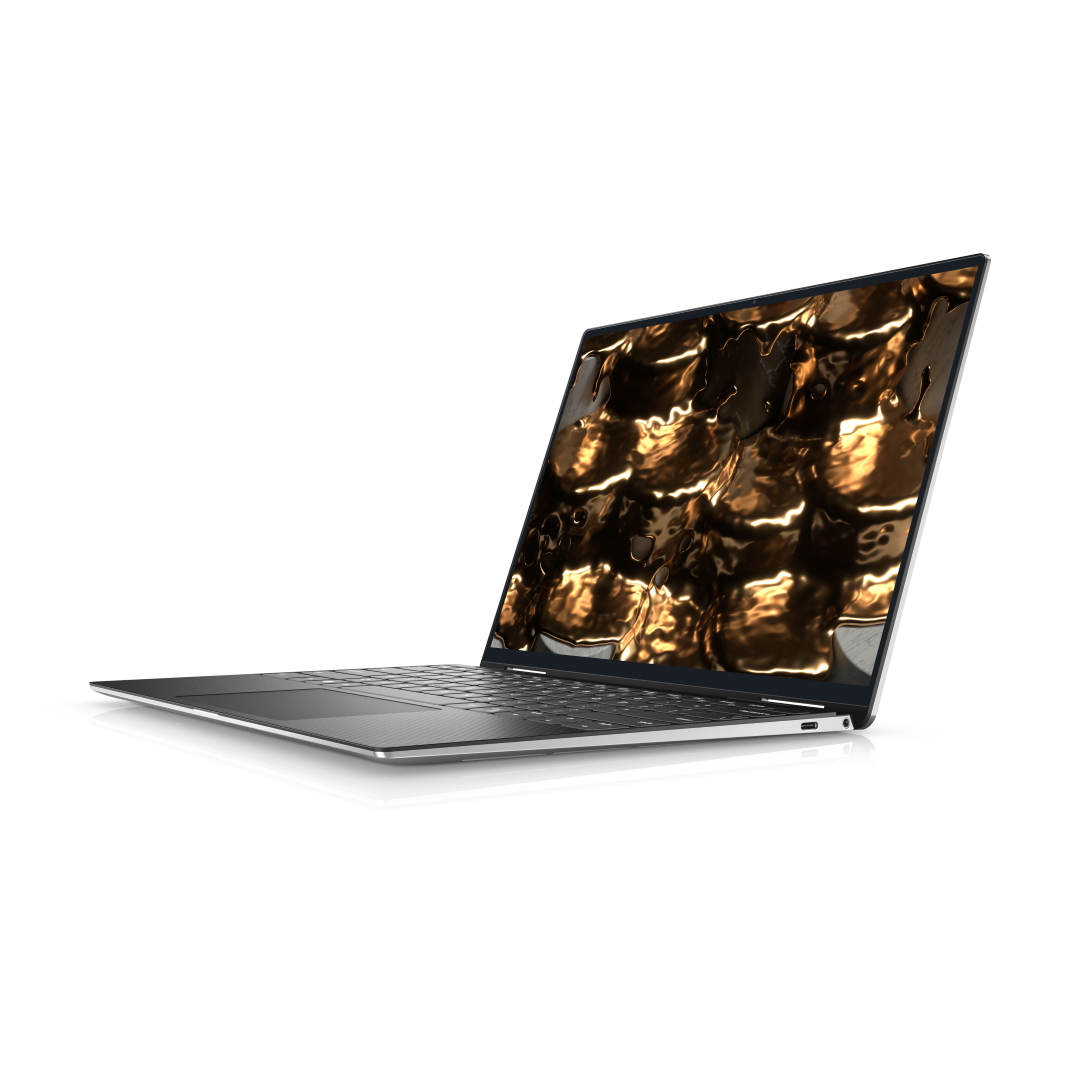
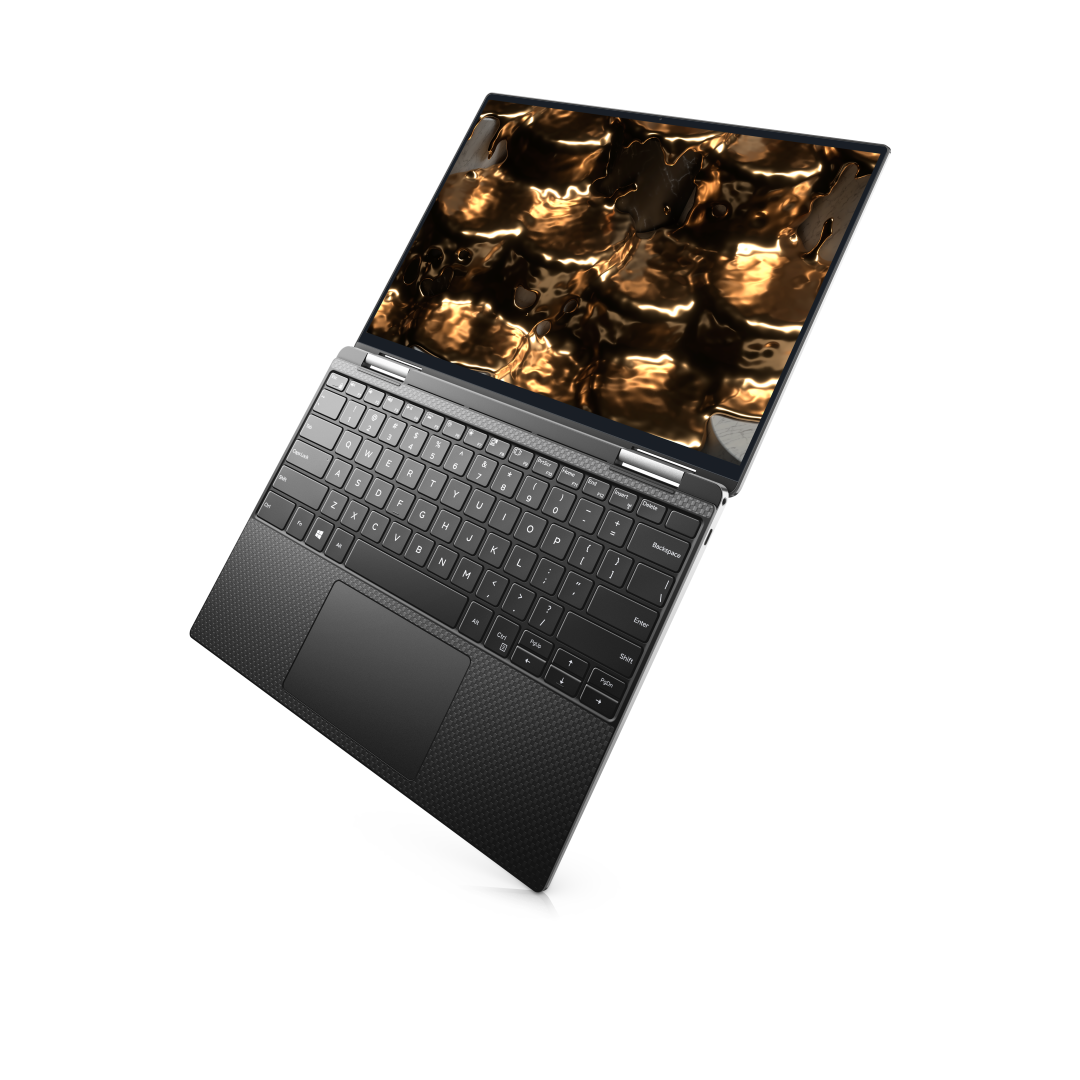
O Dell XPS 13 9310 2 em 1 compartilha o mesmo chassi do XPS 13 7390 2 em 1 de 2019, mas com opções mais recentes da Intel Tiger Lake-U 11º gênero para substituir as opções mais antigas Ice Lake 10º gênero. Assim, as principais características do 7390 2 em 1 permanecem intactas no 9310 2 em 1, incluindo as teclas do teclado MagLev, o resfriador da câmara de vapor, a tela sensível ao toque de 13,4 polegadas 16:10, e a webcam devidamente posicionada.
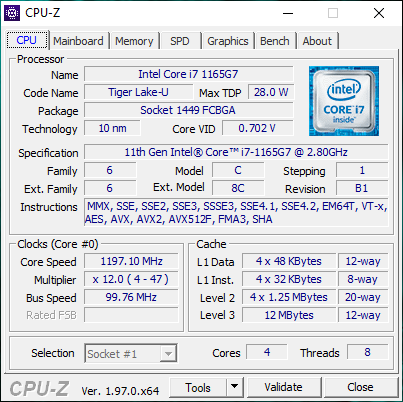
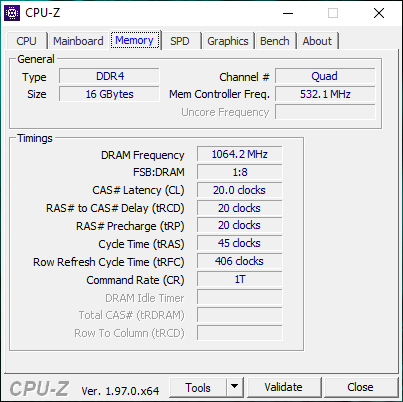
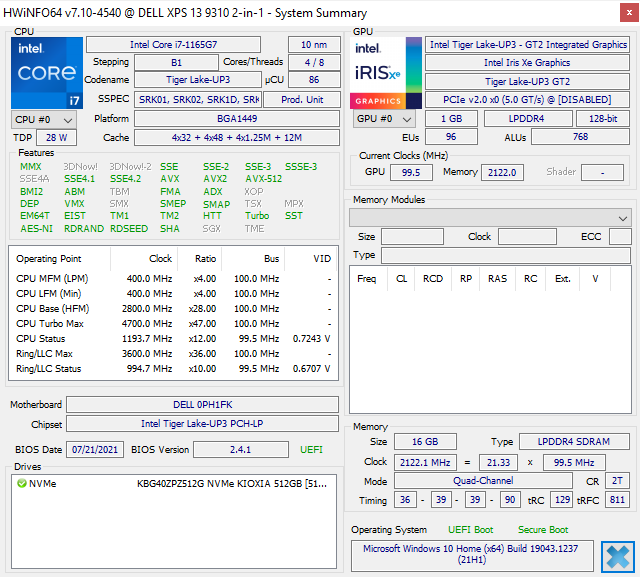
Nossa unidade de teste foi configurada com a CPU Core i7-1165G7, 16 GB LPDDR4x 4267 MHz RAM, e 1920 x 1200 touchscreen por aproximadamente $1600 USD. Outras opções incluem uma CPU Core i5-1135G7 com metade da memória RAM ou uma tela de maior resolução 3840 x 2400. Não há opções OLED disponíveis, ao contrário do XPS 13 9310 clamshell.
Recomendamos verificar nosso revisão existente sobre o XPS 13 7390 2 em 1 para saber mais sobre as características físicas do chassi, pois todos os nossos comentários também se aplicam ao 9310 2 em 1. Esta revisão se concentrará no desempenho do XPS 13 9310 2 em 1 e no que os usuários podem esperar ganhar com o 7390 2 em 1 mais antigo, mas visualmente idêntico.
Os concorrentes neste espaço incluem outros sub-portáteis de 13 polegadas conversíveis como o Lenovo Yoga 6 13, Asus ZenBook Flip 13, Samsung Galaxy Book Pro 360 13ou MSI Summit E13 Flip. Uma versão clamshell do XPS 13 9310 2 em 1 também está disponível simplesmente chamada XPS 13 9310.
Mais análises da Dell
potential competitors in comparison
Avaliação | Data | Modelo | Peso | Altura | Size | Resolução | Preço |
|---|---|---|---|---|---|---|---|
| 86.7 % v7 (old) | 10/2021 | Dell XPS 13 9310 2-in-1 i7-1165G7, Iris Xe G7 96EUs | 1.3 kg | 14.35 mm | 13.40" | 1920x1200 | |
| 88.1 % v7 (old) | 11/2020 | Dell XPS 13 9310 Core i7 FHD i7-1165G7, Iris Xe G7 96EUs | 1.3 kg | 14.8 mm | 13.40" | 1920x1200 | |
| 86.3 % v7 (old) | 10/2019 | Dell XPS 13 7390 2-in-1 Core i7 i7-1065G7, Iris Plus Graphics G7 (Ice Lake 64 EU) | 1.3 kg | 13 mm | 13.40" | 1920x1200 | |
| 84.7 % v7 (old) | 07/2021 | Lenovo Yoga 6 13 82ND0009US R5 5500U, Vega 7 | 1.3 kg | 18.2 mm | 13.30" | 1920x1080 | |
| 86.3 % v7 (old) | 07/2021 | Asus ZenBook Flip 13 UX363EA-HP069T i7-1165G7, Iris Xe G7 96EUs | 1.2 kg | 13 mm | 13.30" | 1920x1080 | |
| 85.4 % v7 (old) | 06/2021 | Samsung Galaxy Book Pro 360 13 i5-1135G7, Iris Xe G7 80EUs | 1.1 kg | 13 mm | 13.20" | 1920x1080 |
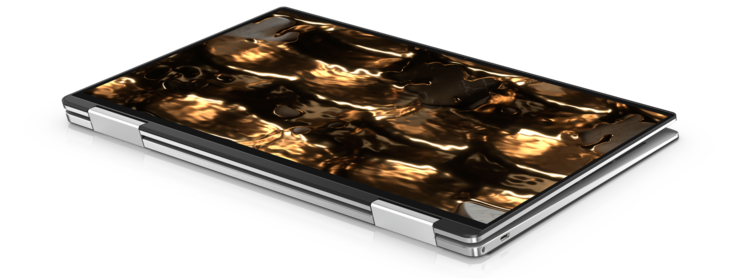
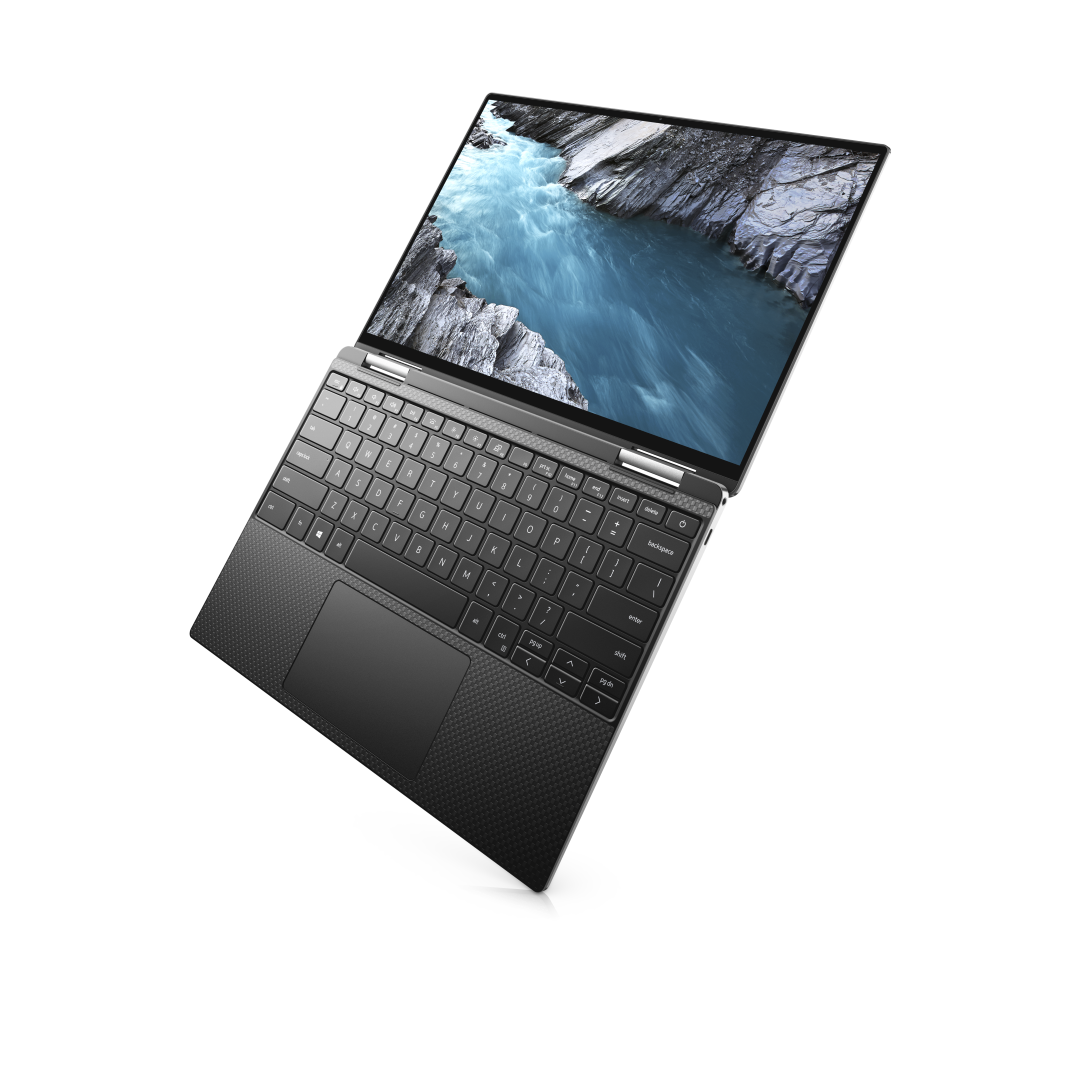
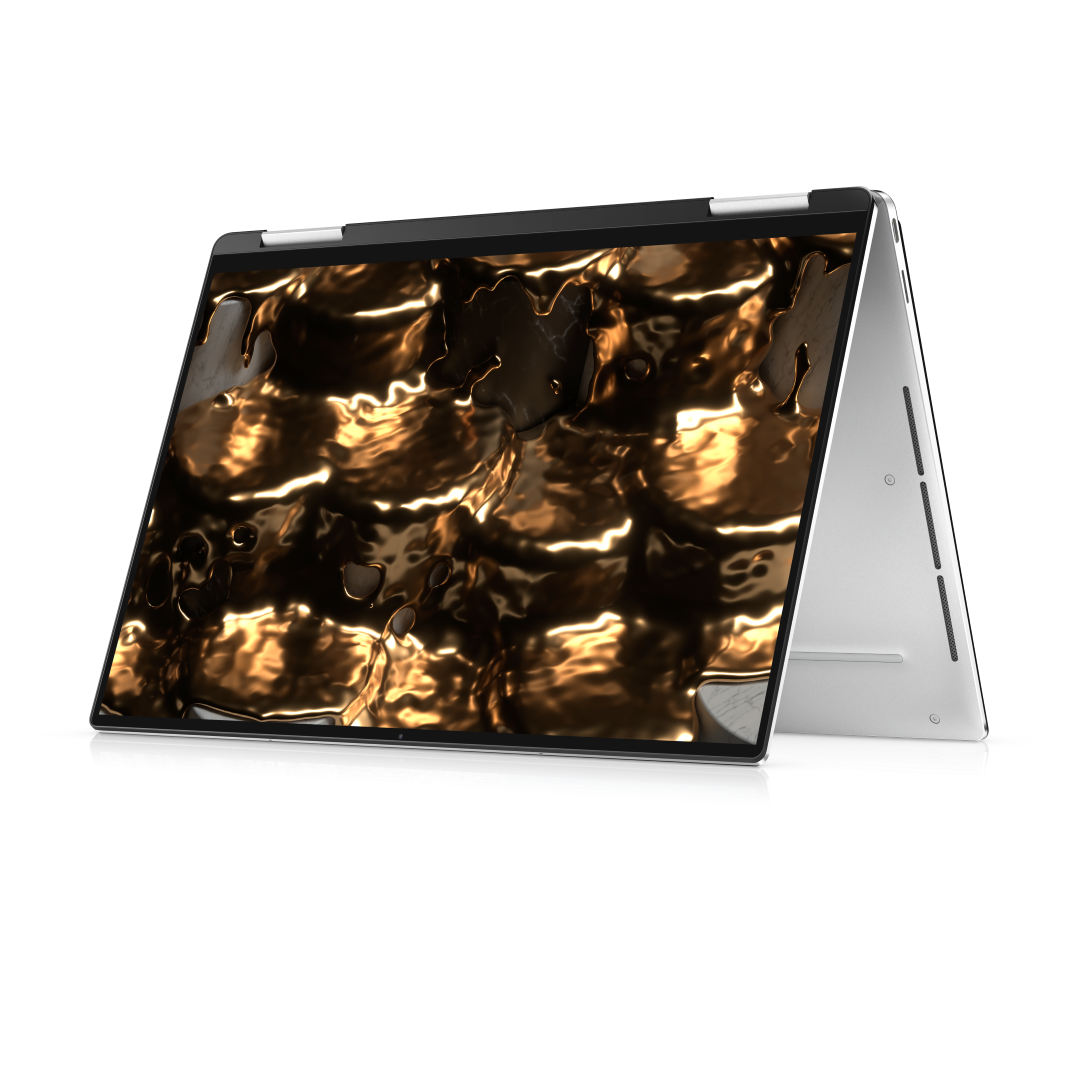
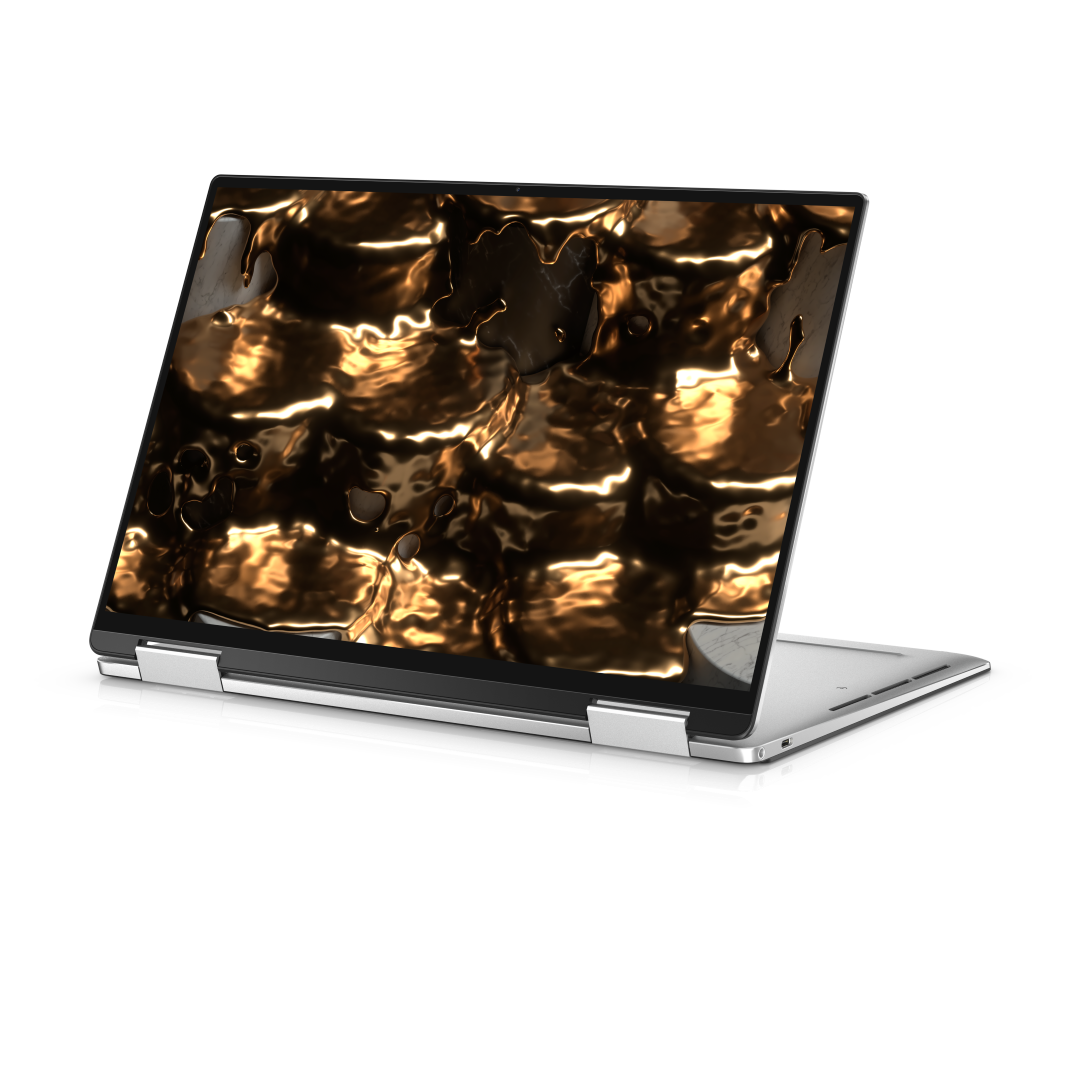
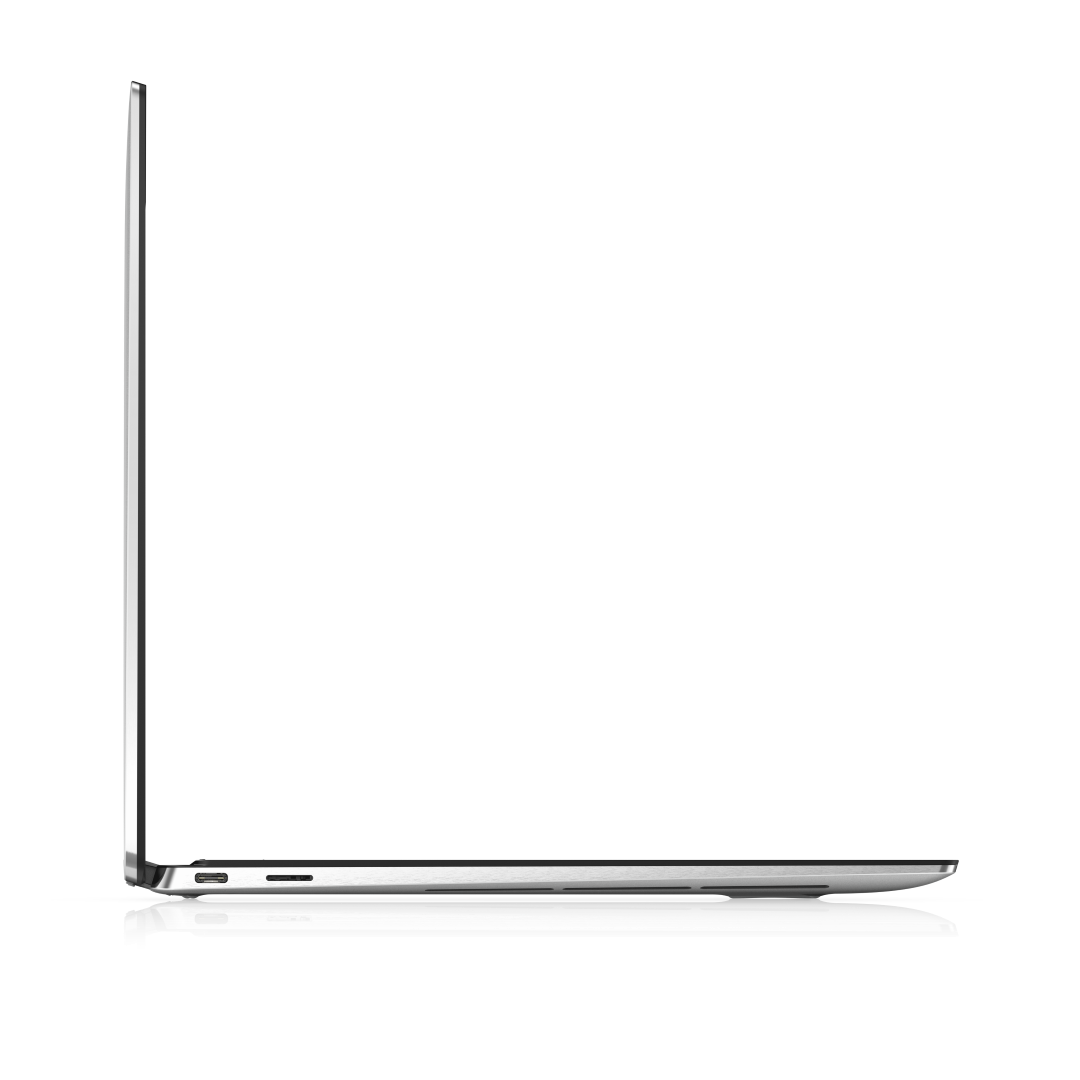
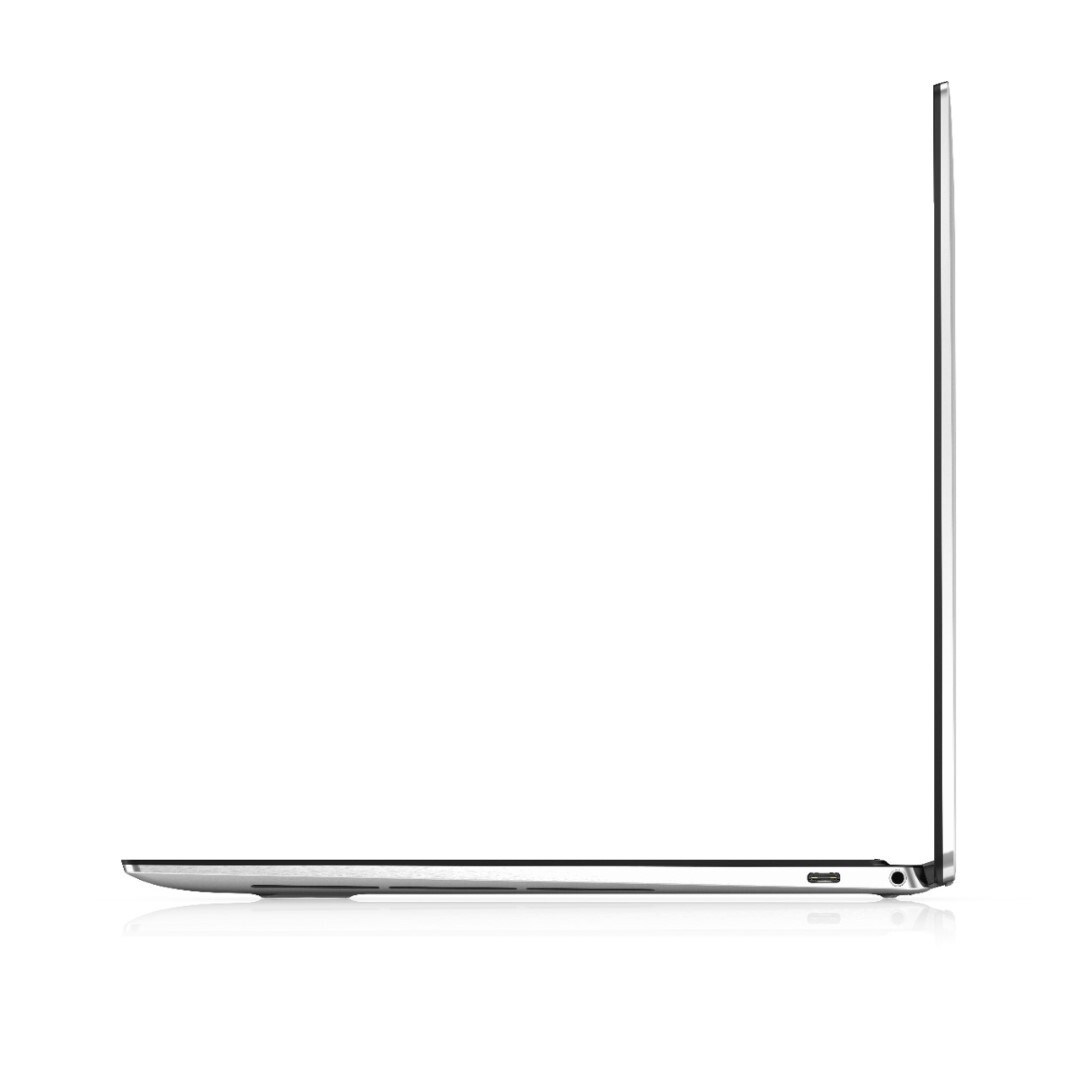
Estojo - Ainda o mais elegante conversível em torno
O chassi permanece idêntico ao XPS 13 7390 2 em 1. Entretanto, a forma como a Dell mede as dimensões mudou desde então e, portanto, as medidas oficiais são agora 14,35 x 297 x 207 mm em vez de 13 x 296 x 207 mm no antigo 7390 2 em 1.
Conectividade - Agora com Thunderbolt 4
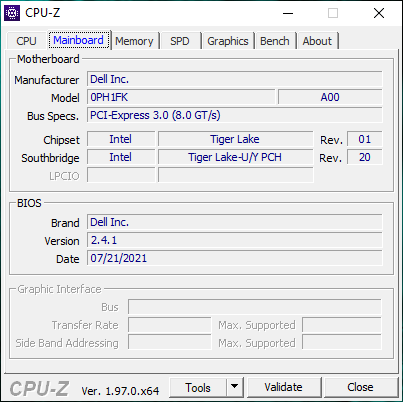
As duas portas Thunderbolt 3 no modelo da geração anterior foram atualizadas para Thunderbolt 4. Isto não fará diferença para a maioria dos usuários, exceto para aqueles que pretendem conectar gráficos externos.
Leitor de cartões SD
| SD Card Reader | |
| average JPG Copy Test (av. of 3 runs) | |
| Dell XPS 13 9310 Core i7 FHD (Toshiba Exceria Pro M501 64 GB UHS-II) | |
| Dell XPS 13 9310 2-in-1 (AV Pro V60) | |
| Dell XPS 13 7390 2-in-1 Core i7 (Toshiba Exceria Pro M501 64 GB UHS-II) | |
| Samsung Galaxy Book Pro 360 13 | |
| maximum AS SSD Seq Read Test (1GB) | |
| Dell XPS 13 9310 Core i7 FHD (Toshiba Exceria Pro M501 64 GB UHS-II) | |
| Dell XPS 13 9310 2-in-1 (AV Pro V60) | |
| Dell XPS 13 7390 2-in-1 Core i7 (Toshiba Exceria Pro M501 64 GB UHS-II) | |
| Samsung Galaxy Book Pro 360 13 | |
Comunicação
Webcam
A webcam de baixa resolução 720p permanece inalterada, o que é um verdadeiro aborrecimento. A último laptop Razer Blade atualizou sua webcam de 720p para 1080p sem nenhuma outra mudança no chassi e, portanto, teria sido ótimo ver algo semelhante nesta atualização do XPS 13.


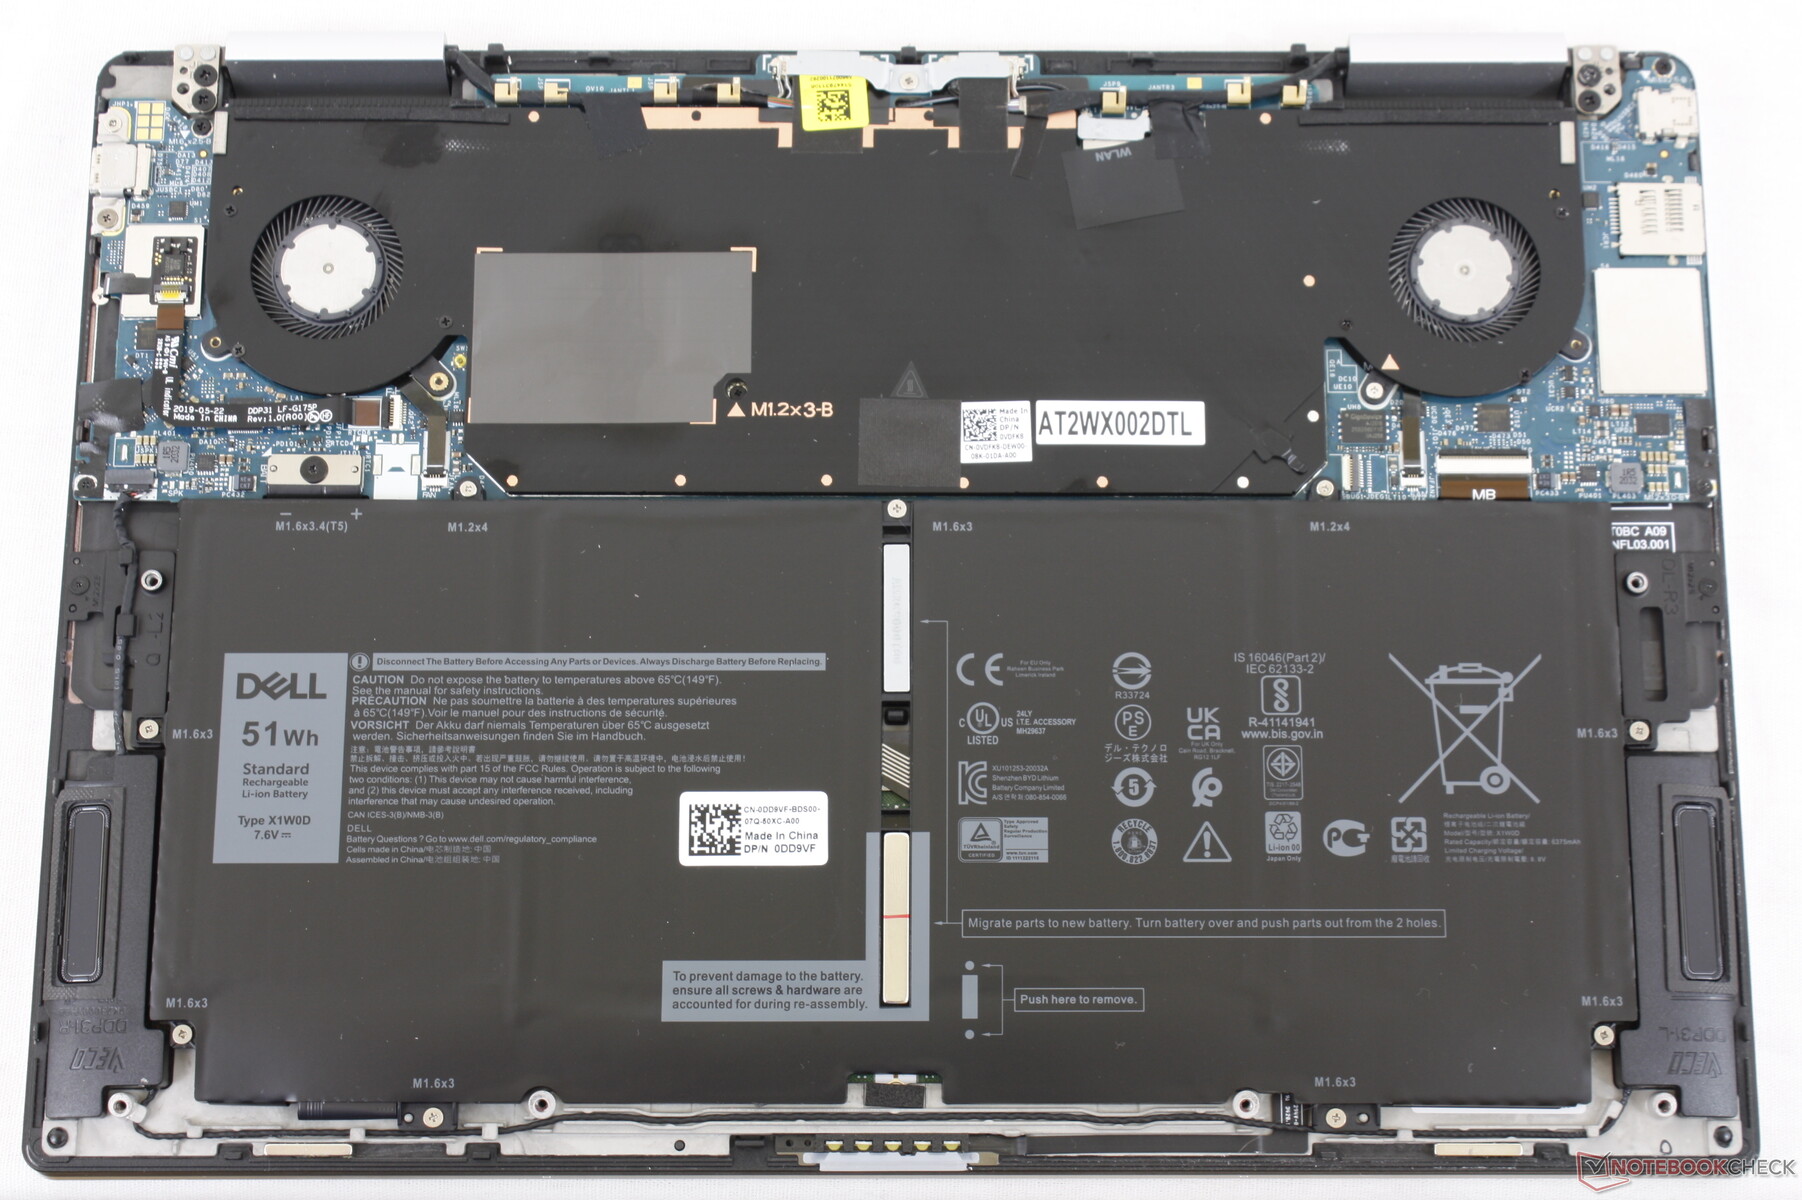
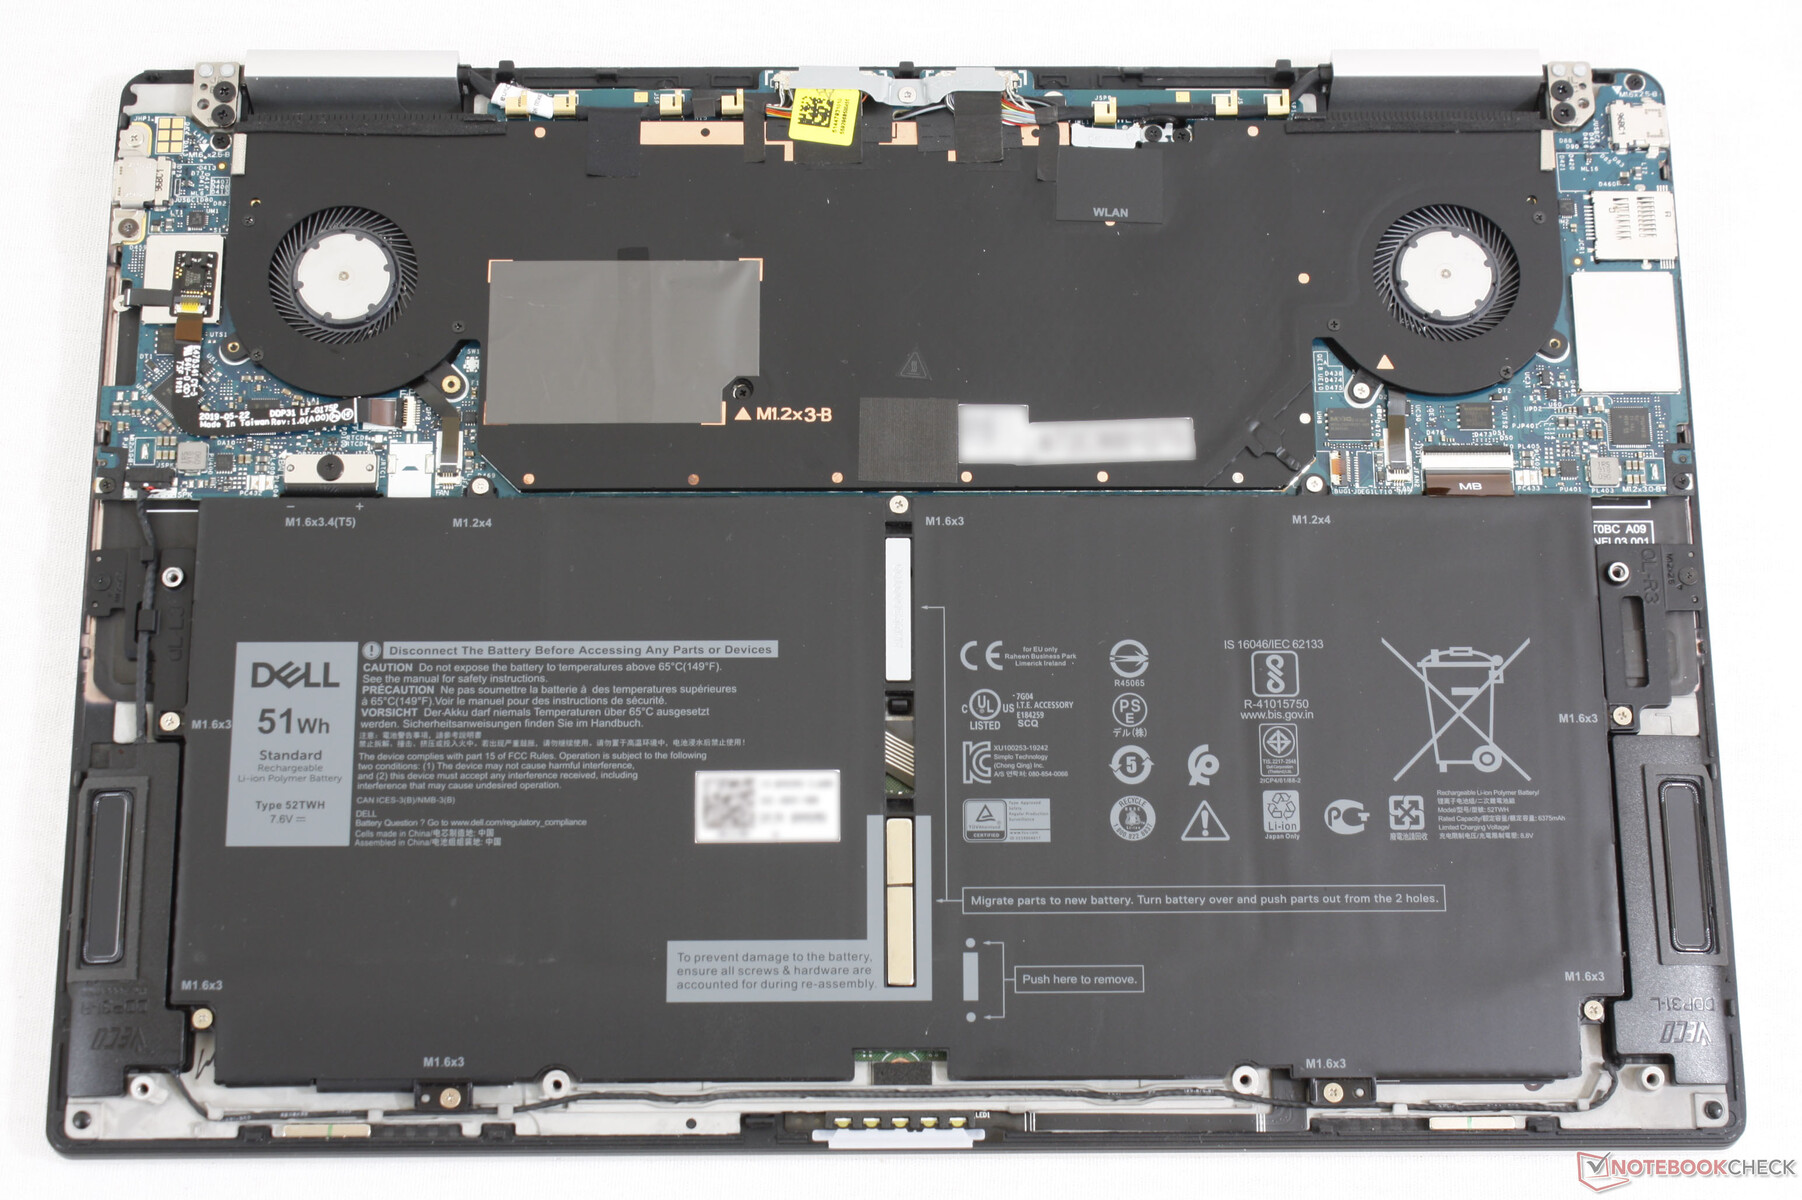
Manutenção
Acessórios e Garantia
Extras incluem um adaptador USB-C para USB-A já que o sistema não integra portas USB-A de tamanho completo. A embalagem também é feita completamente de materiais reciclados e 25% de plástico oceânico, que são bons toques ambientais
A garantia padrão limitada de um ano aplica-se com muitas opções de extensão se comprada diretamente da Dell.
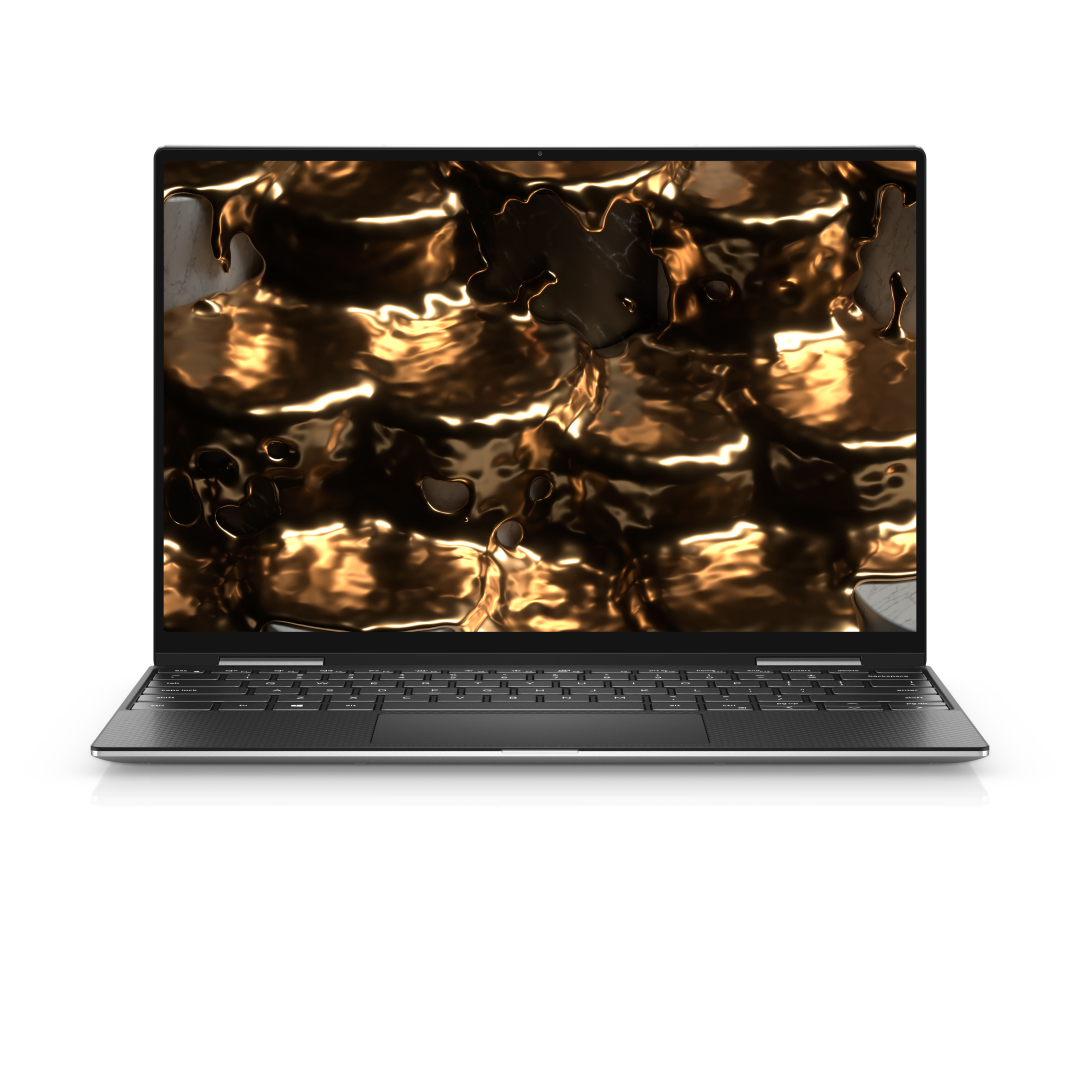
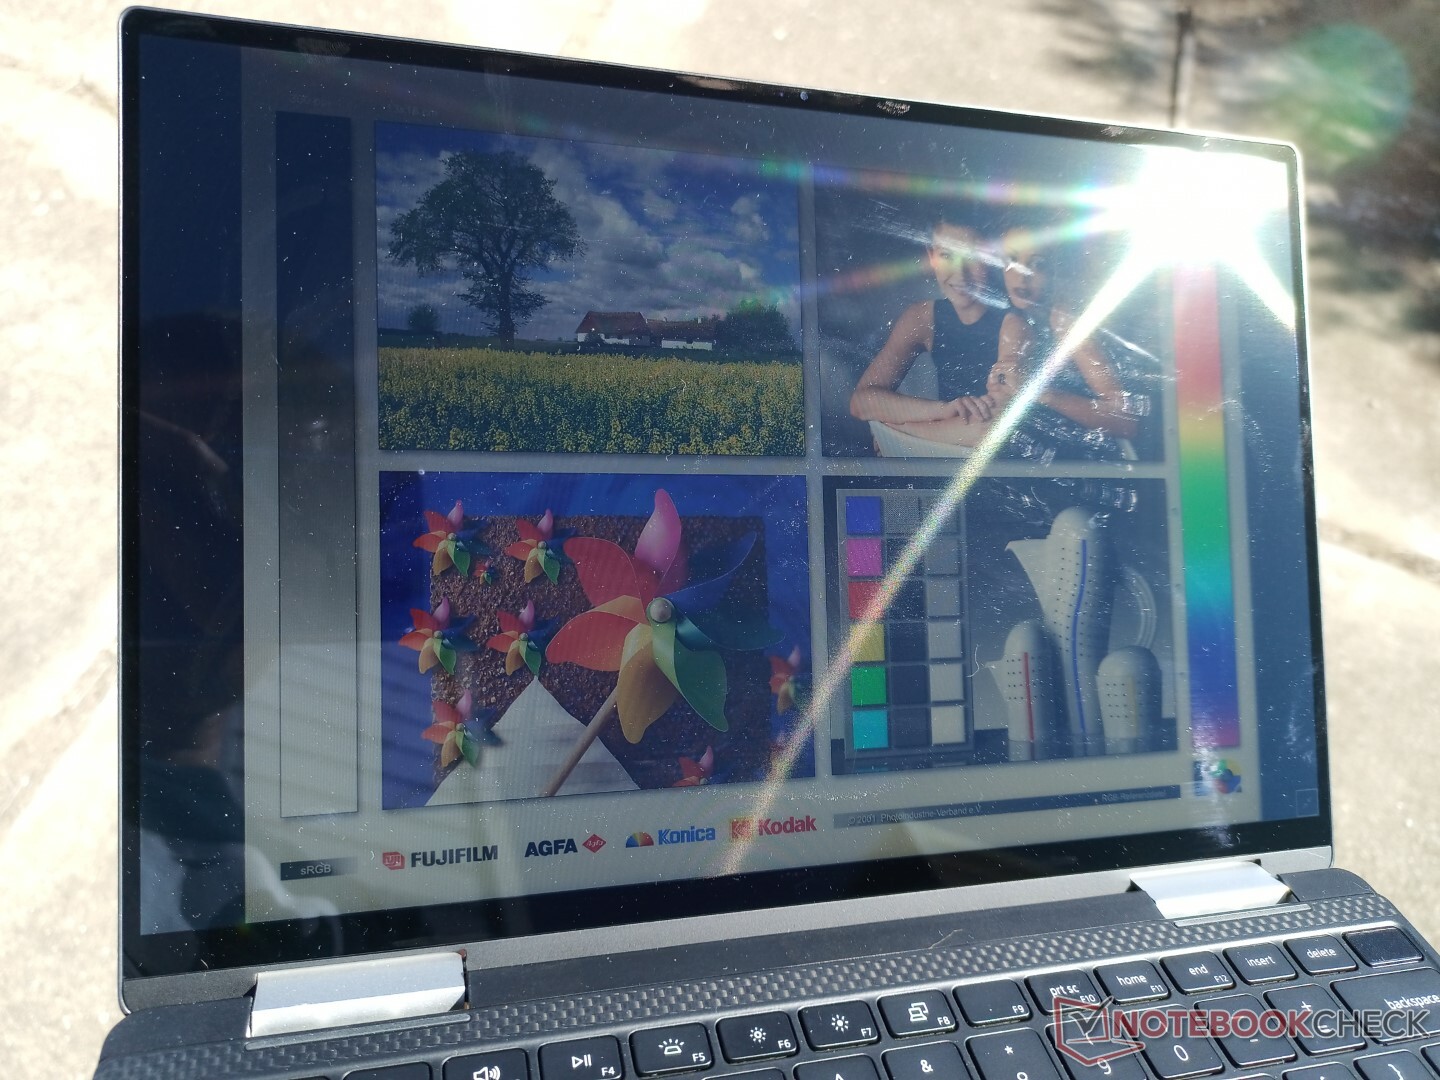
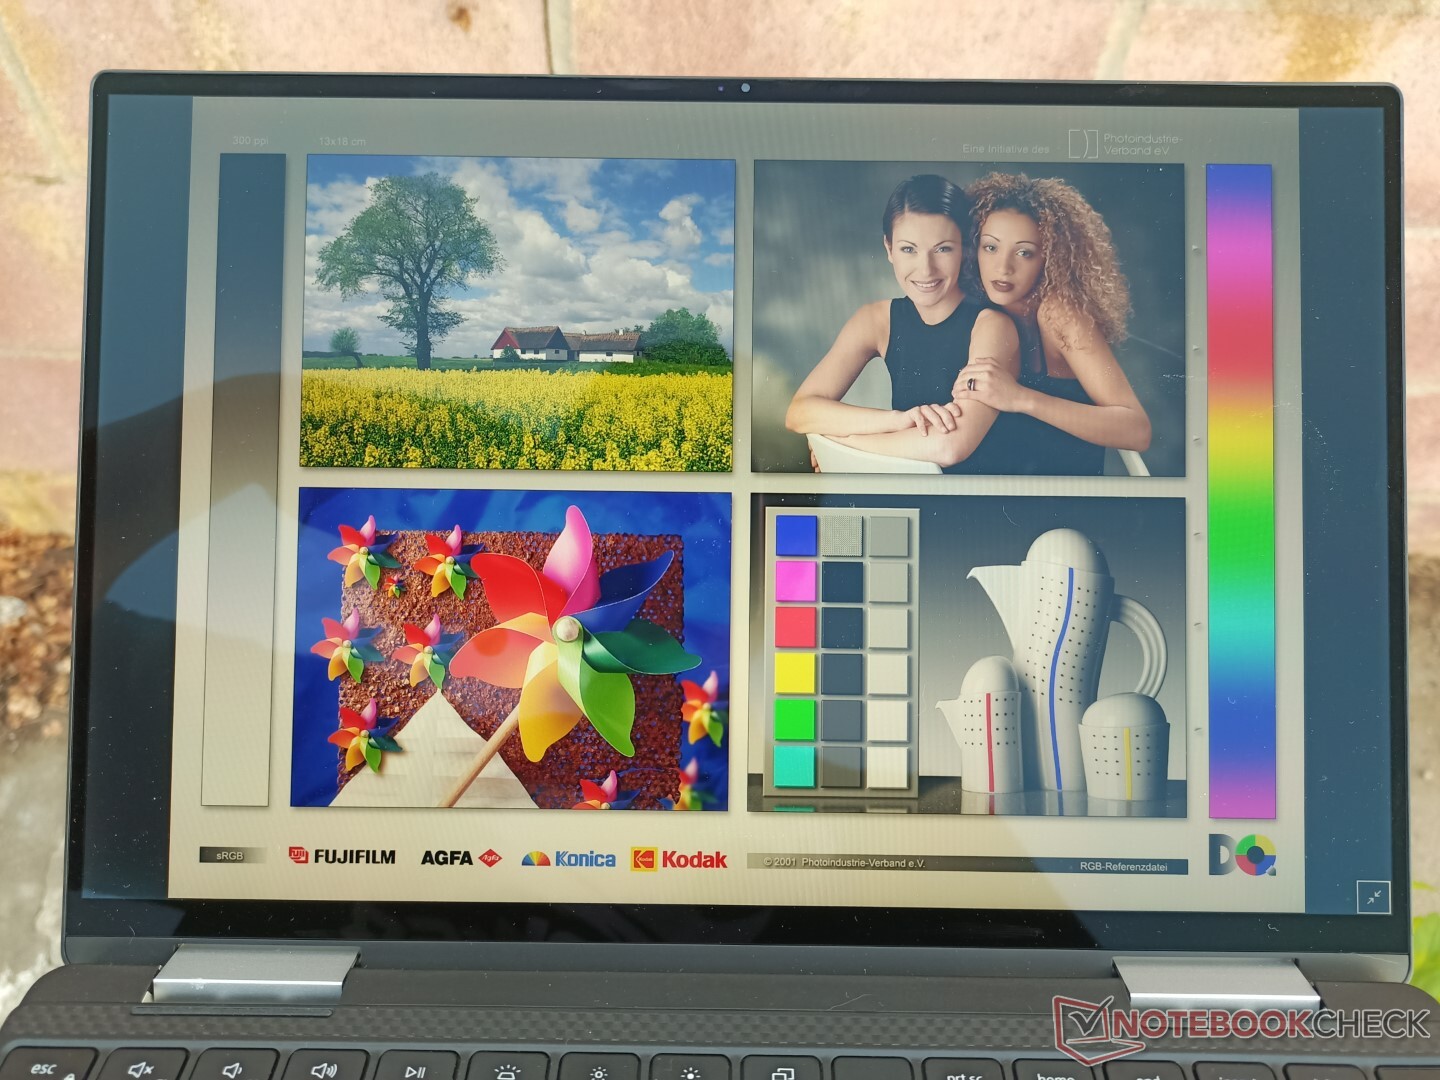
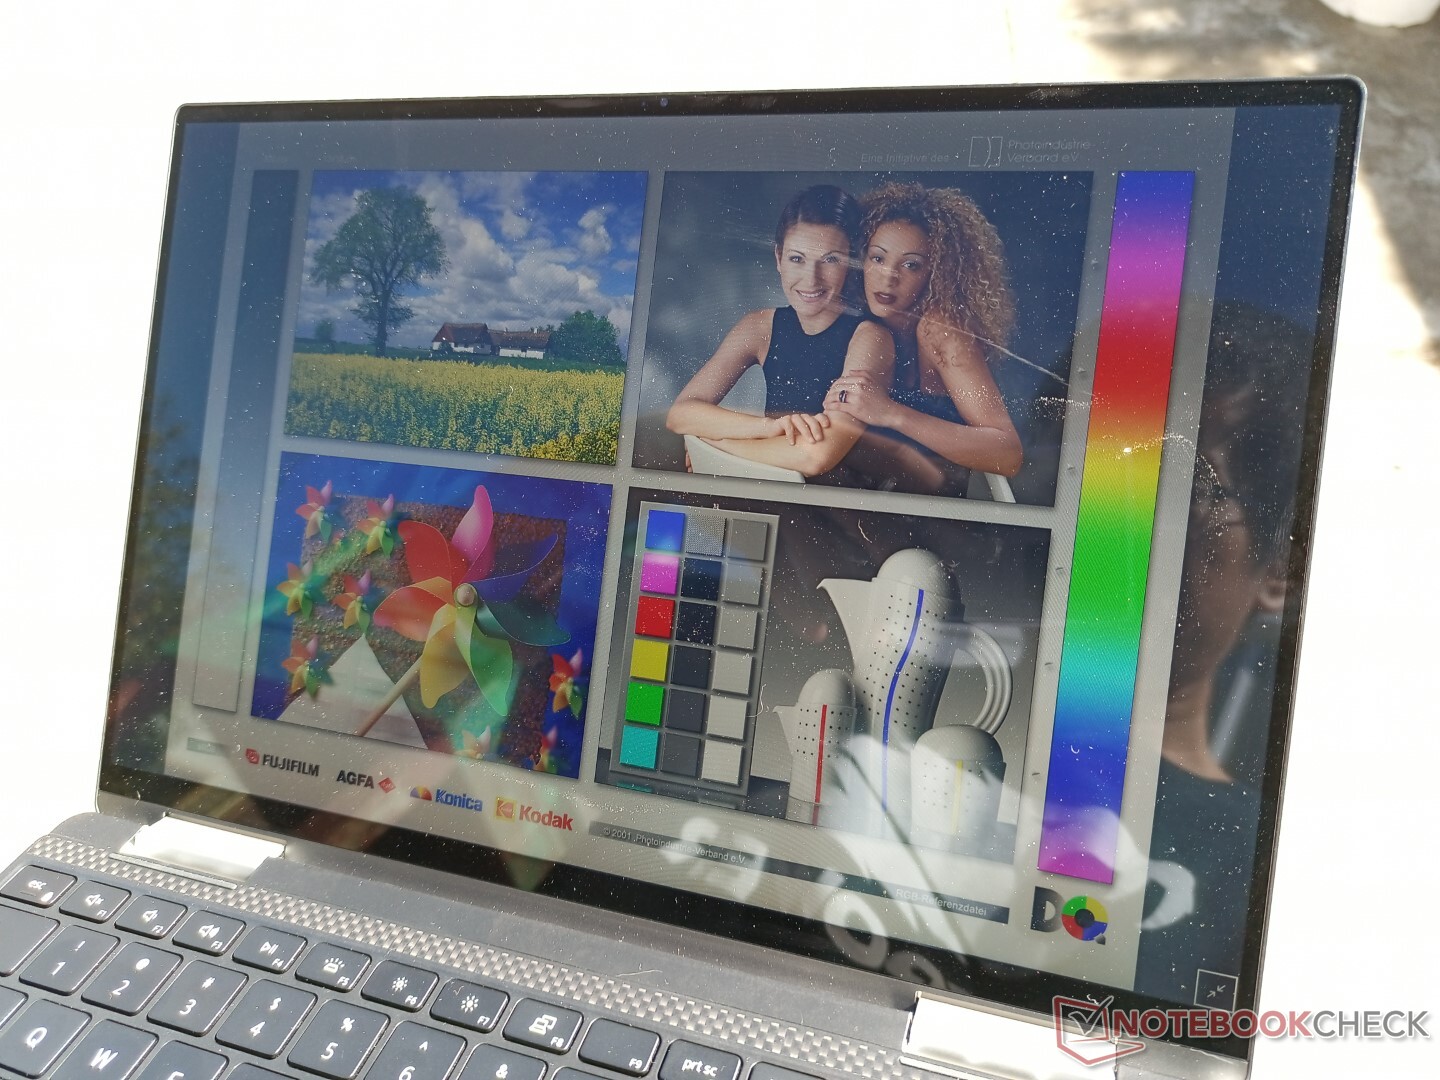
Mostrar - Já vimos isto antes
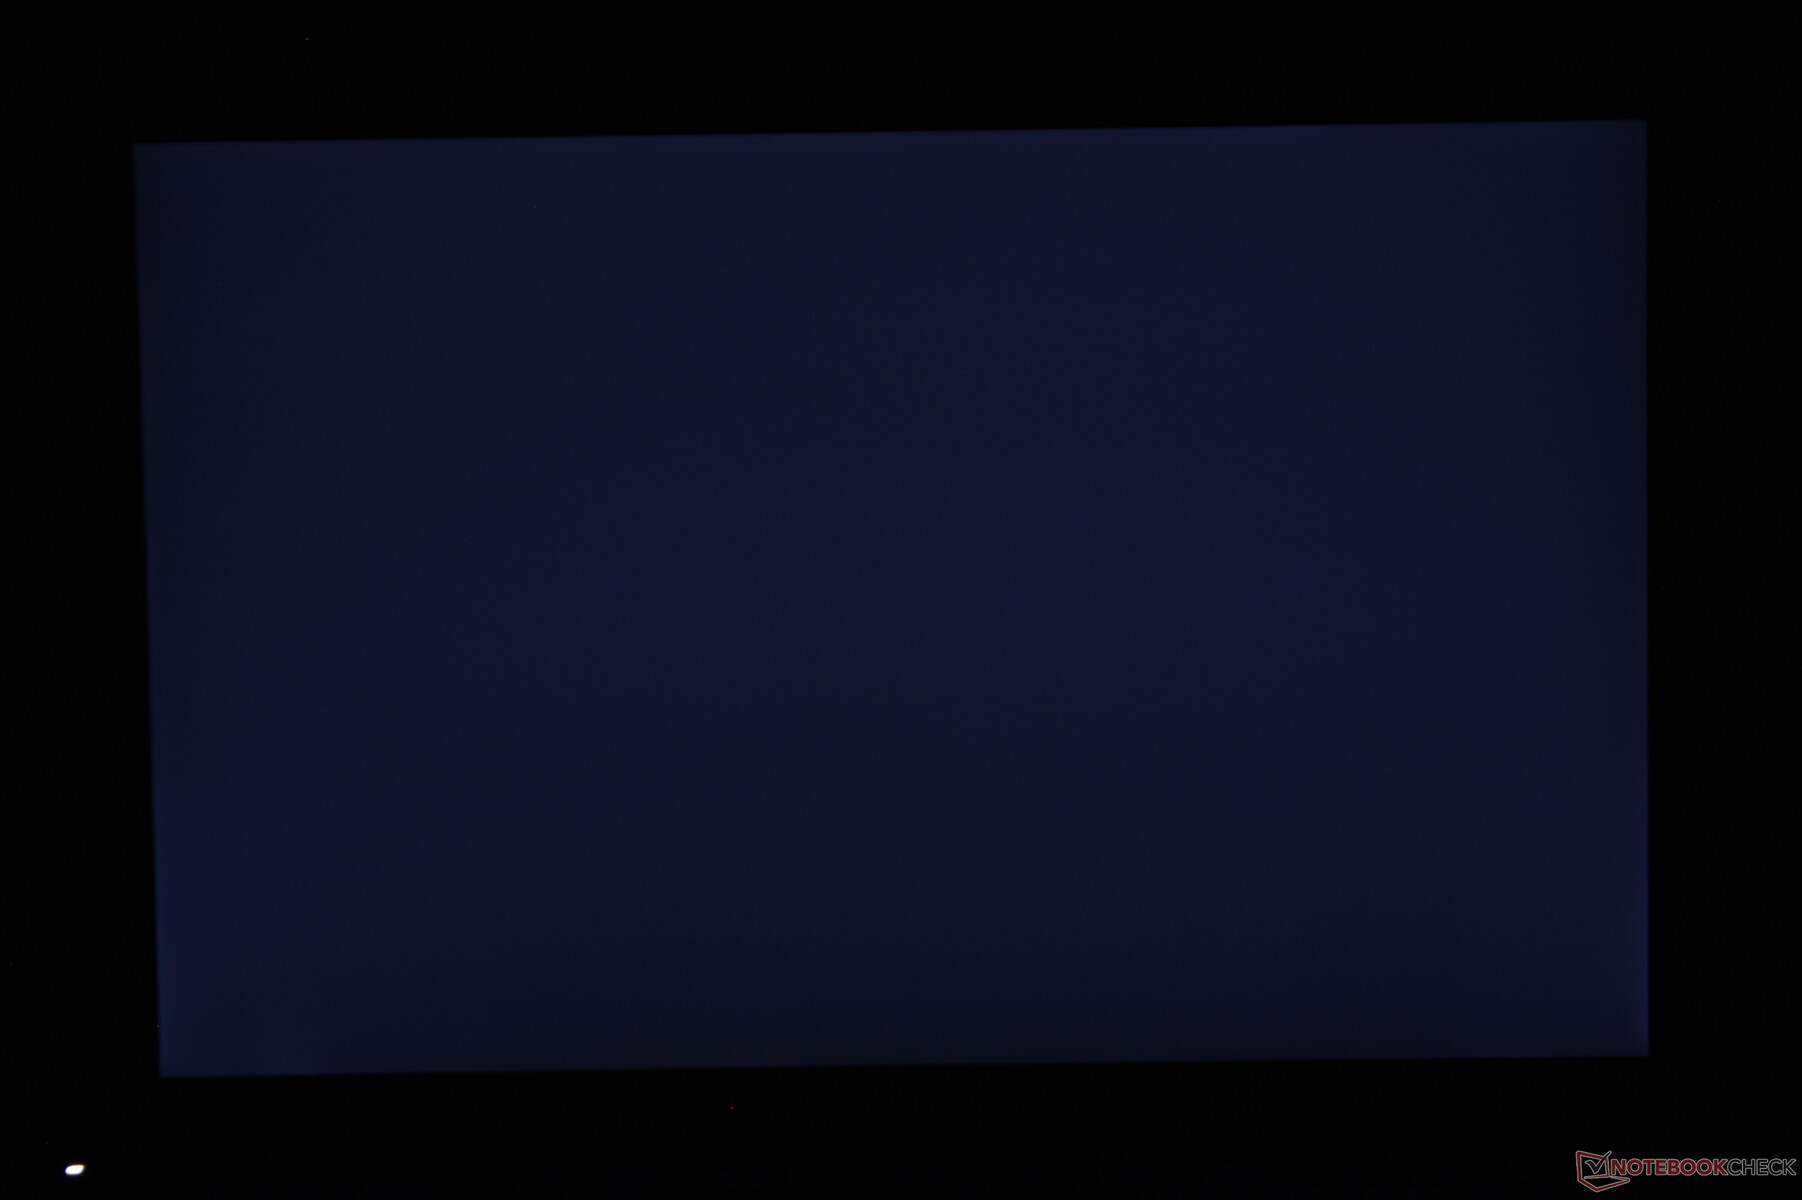
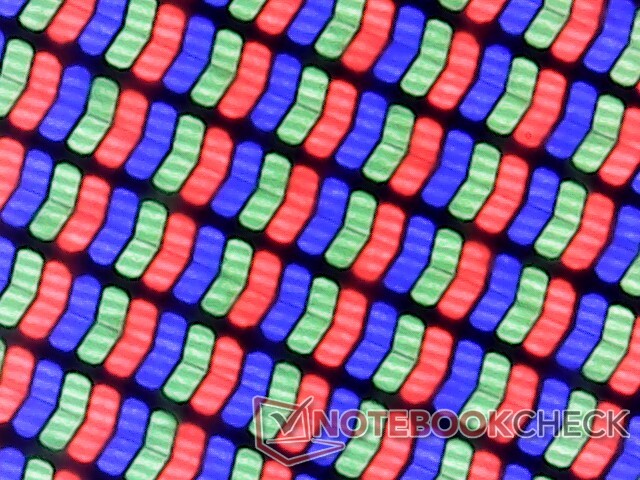
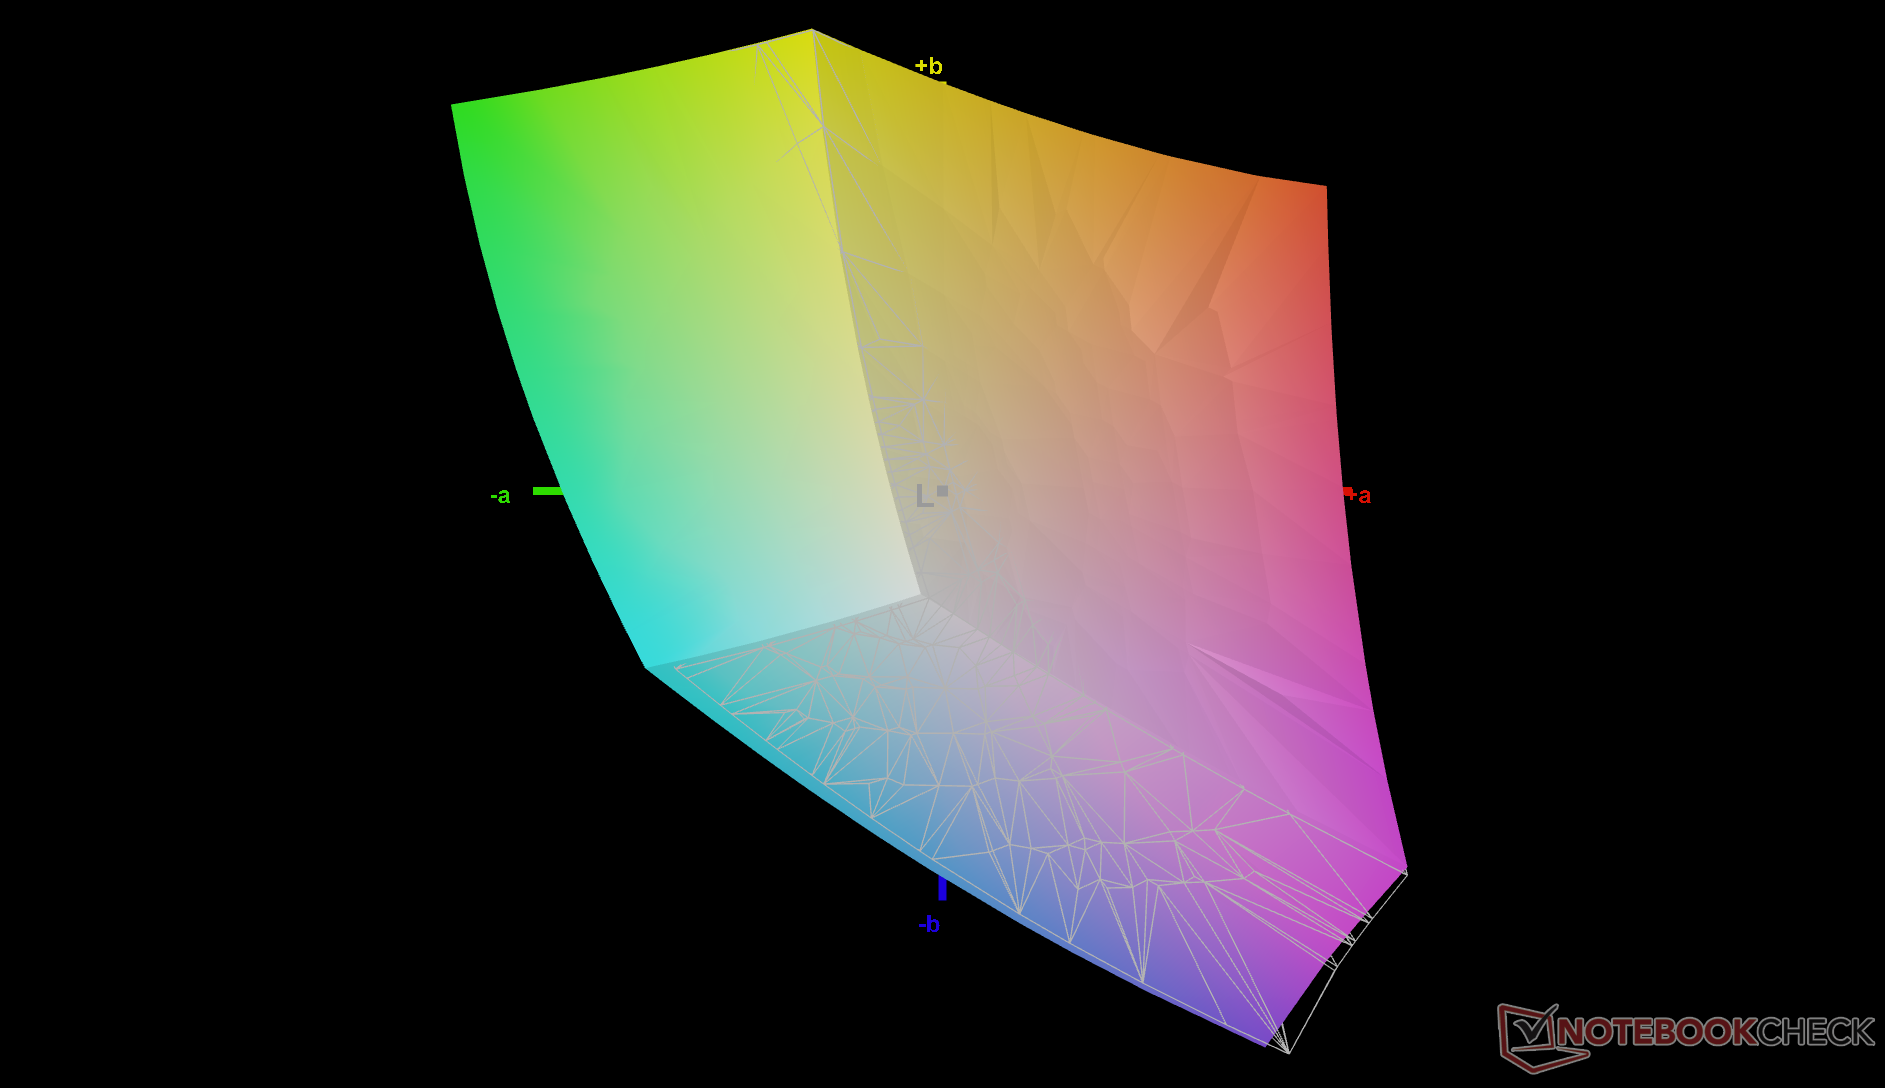
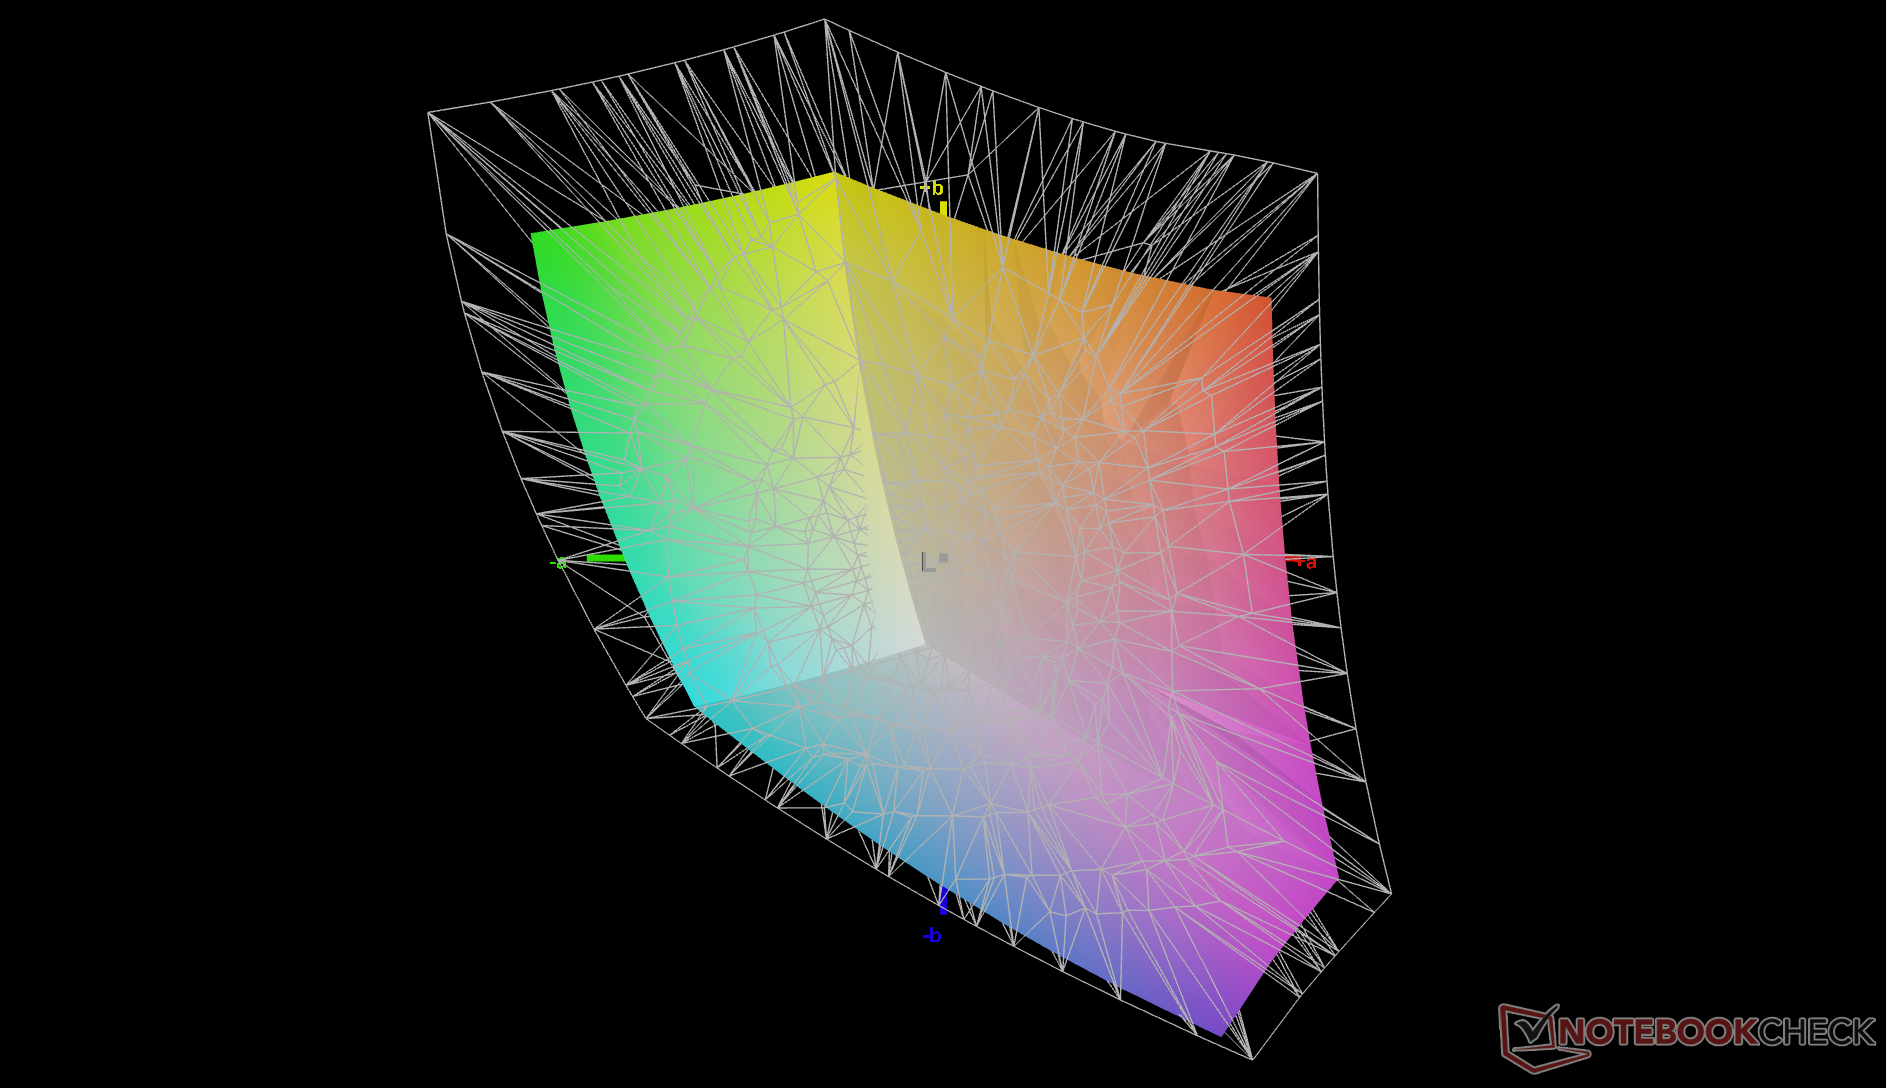
A Dell está usando o mesmo painel IPS 1200p Sharp LQ134N1 em todos os seus laptops 16:10 XPS 13 incluindo o XPS 13 7390 2 em 1, XPS 13 9300 clamshell, XPS 13 9310 clamshell, e nosso XPS 13 9310 2 em 1. Isto não é necessariamente uma coisa ruim, pois continua sendo um painel brilhante de 13,4 polegadas de alta qualidade com excelente cobertura de cores (>99% sRGB), alto contraste e pixels nítidos sem nenhum problema de granulosidade. O lento tempo de resposta preto-branco ainda é um ponto fraco, o que significa que o fantasma é muito perceptível, especialmente se estiver jogando.
Está disponível uma opção UHD+ (3840 x 2400) de resolução mais alta que suspeitamos ser o mesmo painel IPS Sharp LQ134R1 que se encontra no XPS 13 9300.
| |||||||||||||||||||||||||
iluminação: 90 %
iluminação com acumulador: 555.7 cd/m²
Contraste: 1588:1 (Preto: 0.35 cd/m²)
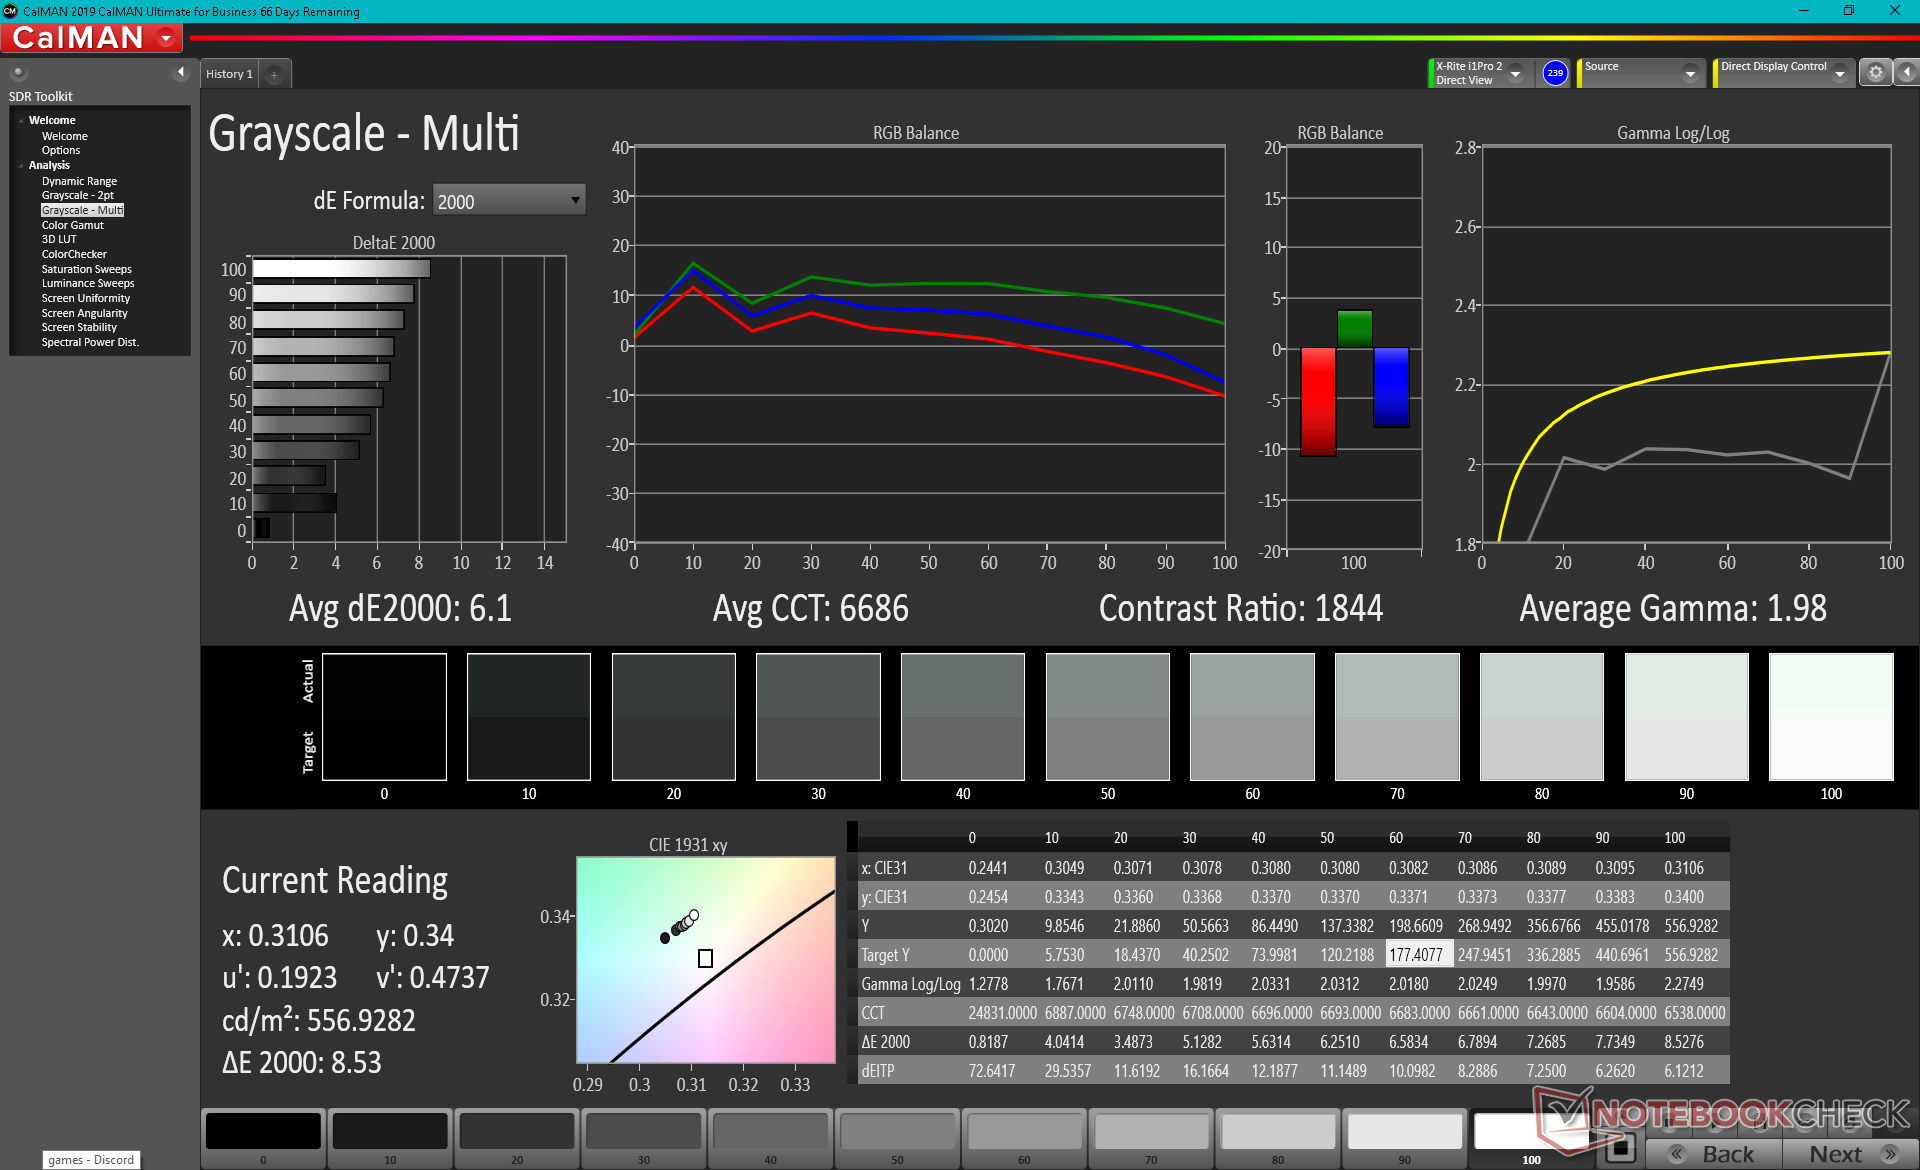
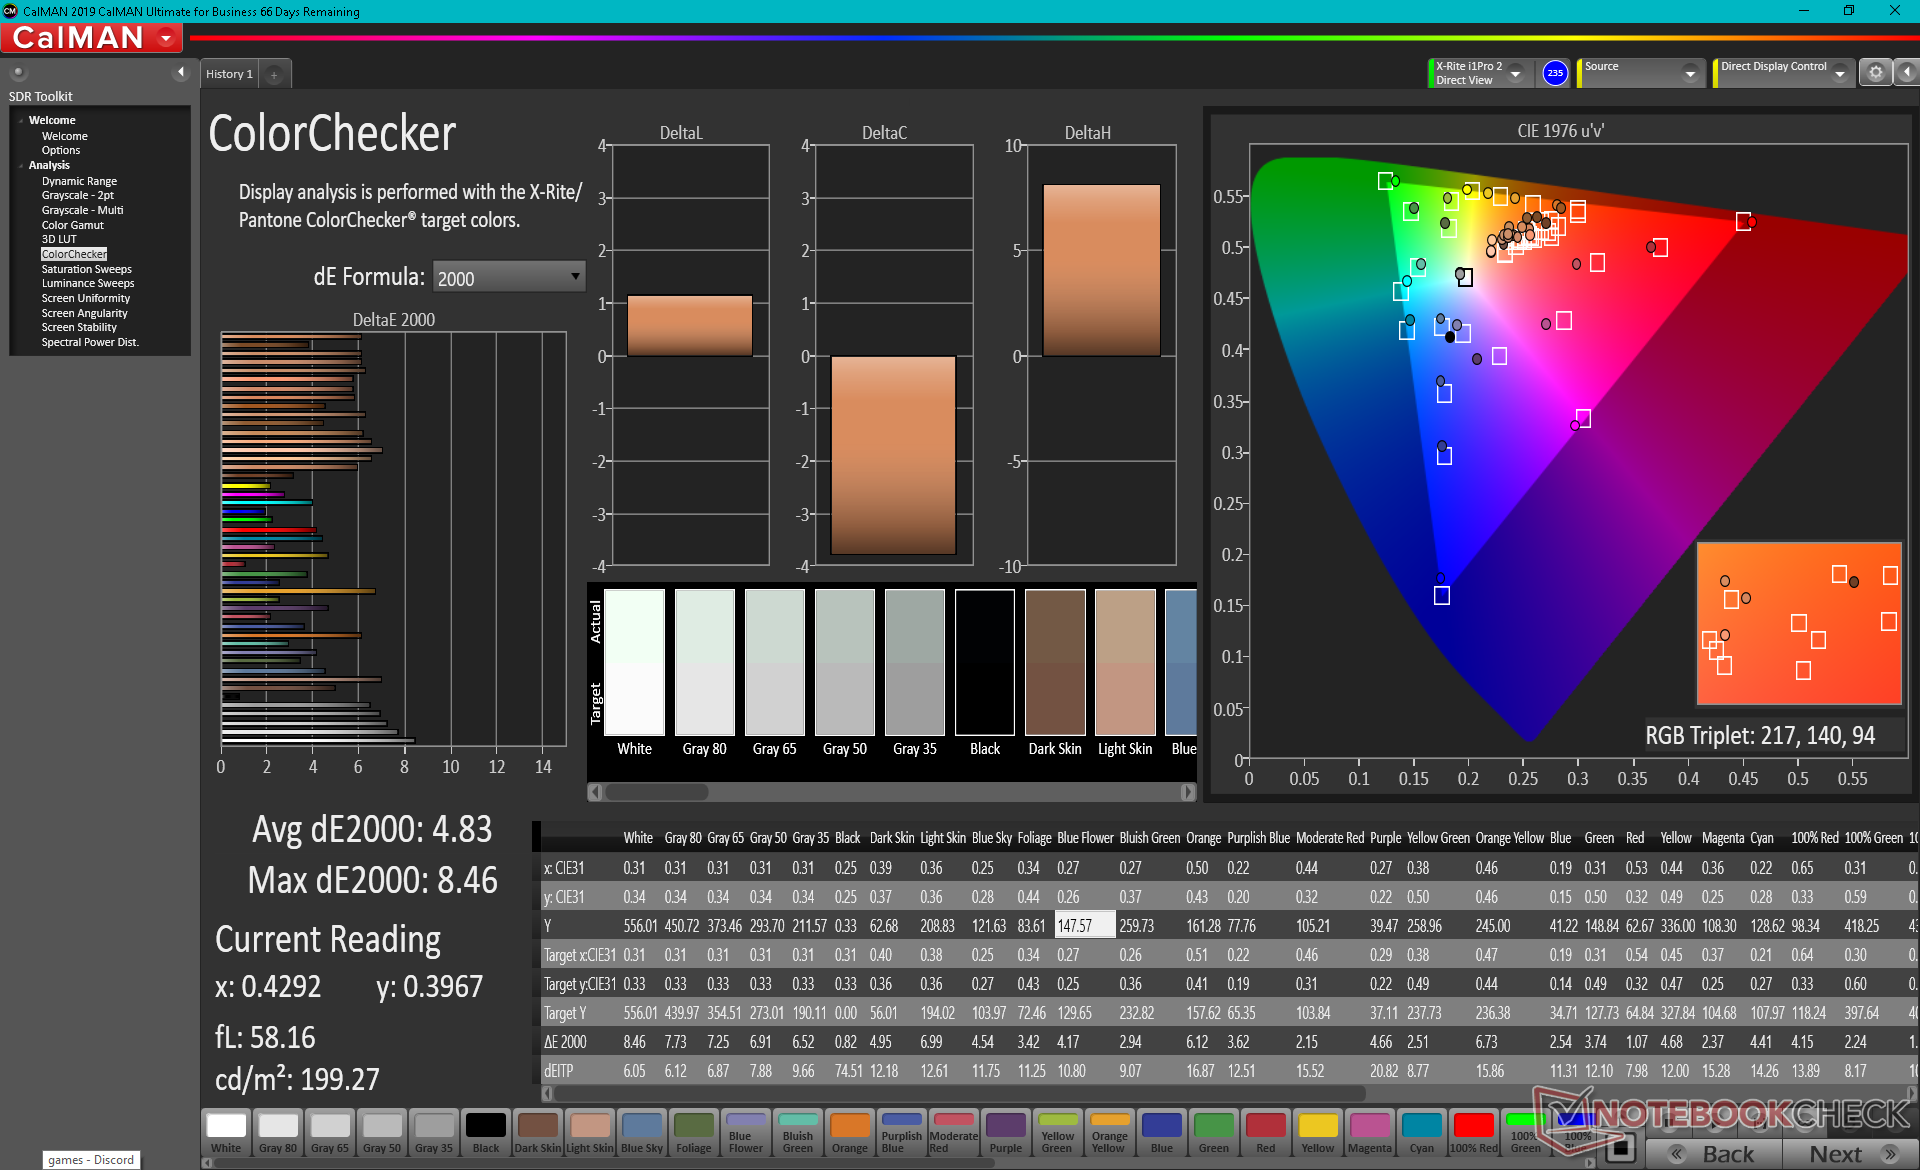
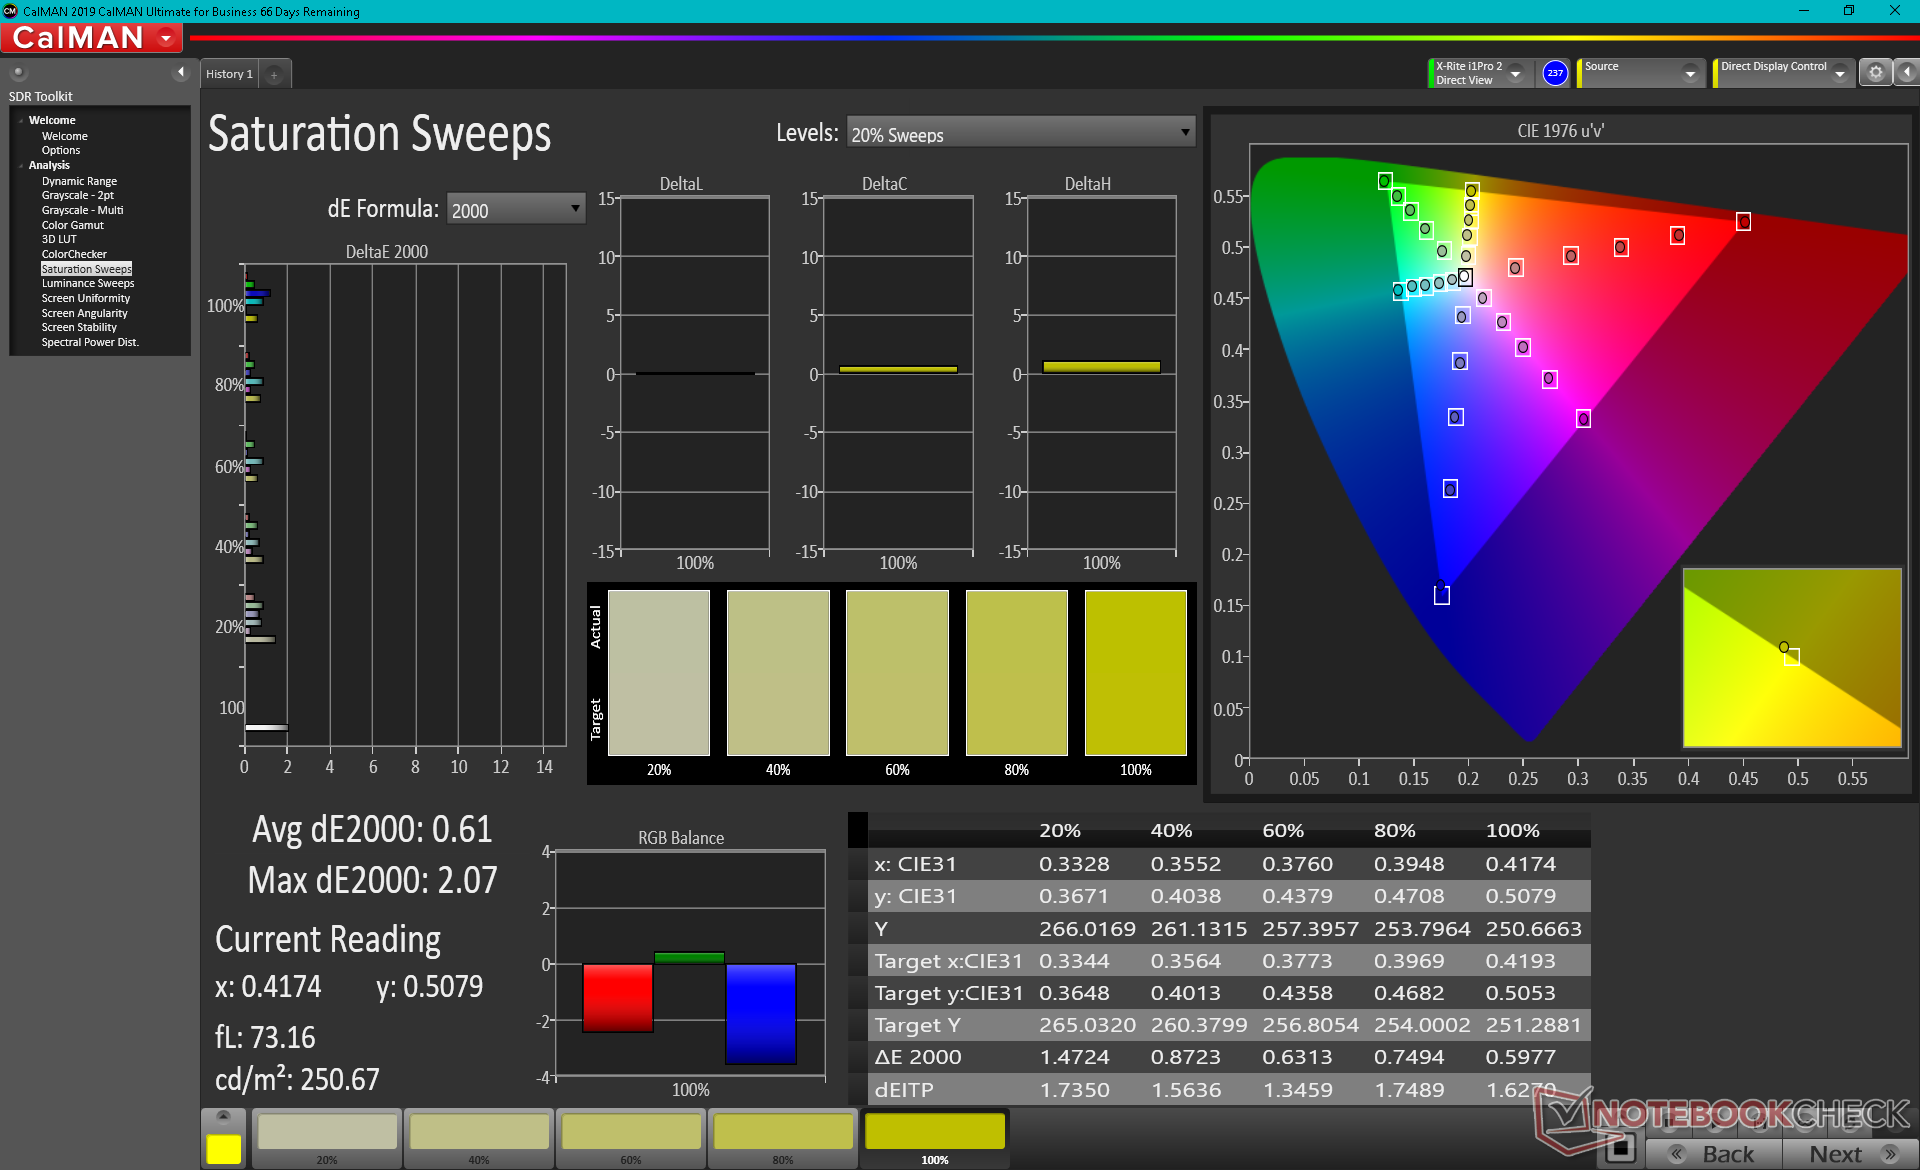
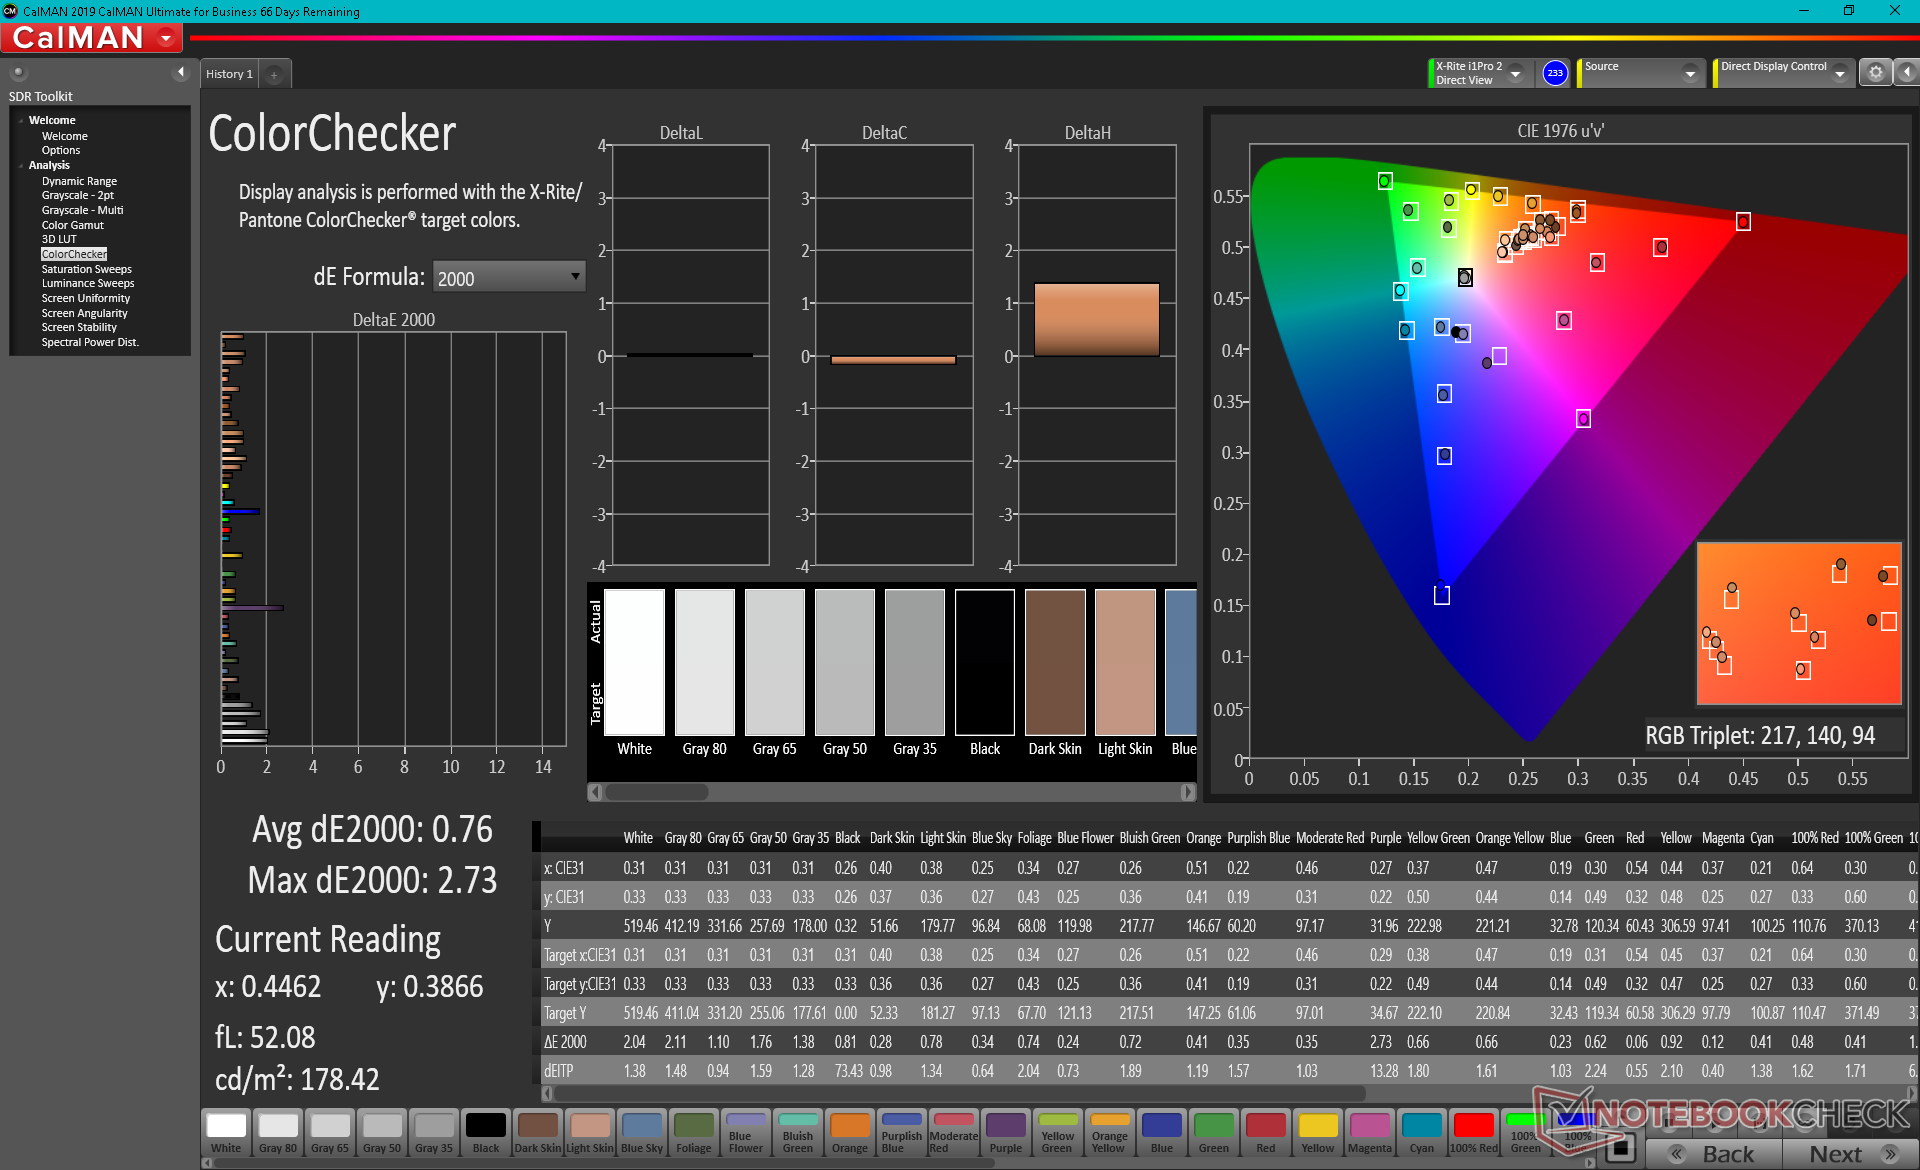
ΔE ColorChecker Calman: 4.83 | ∀{0.5-29.43 Ø4.71}
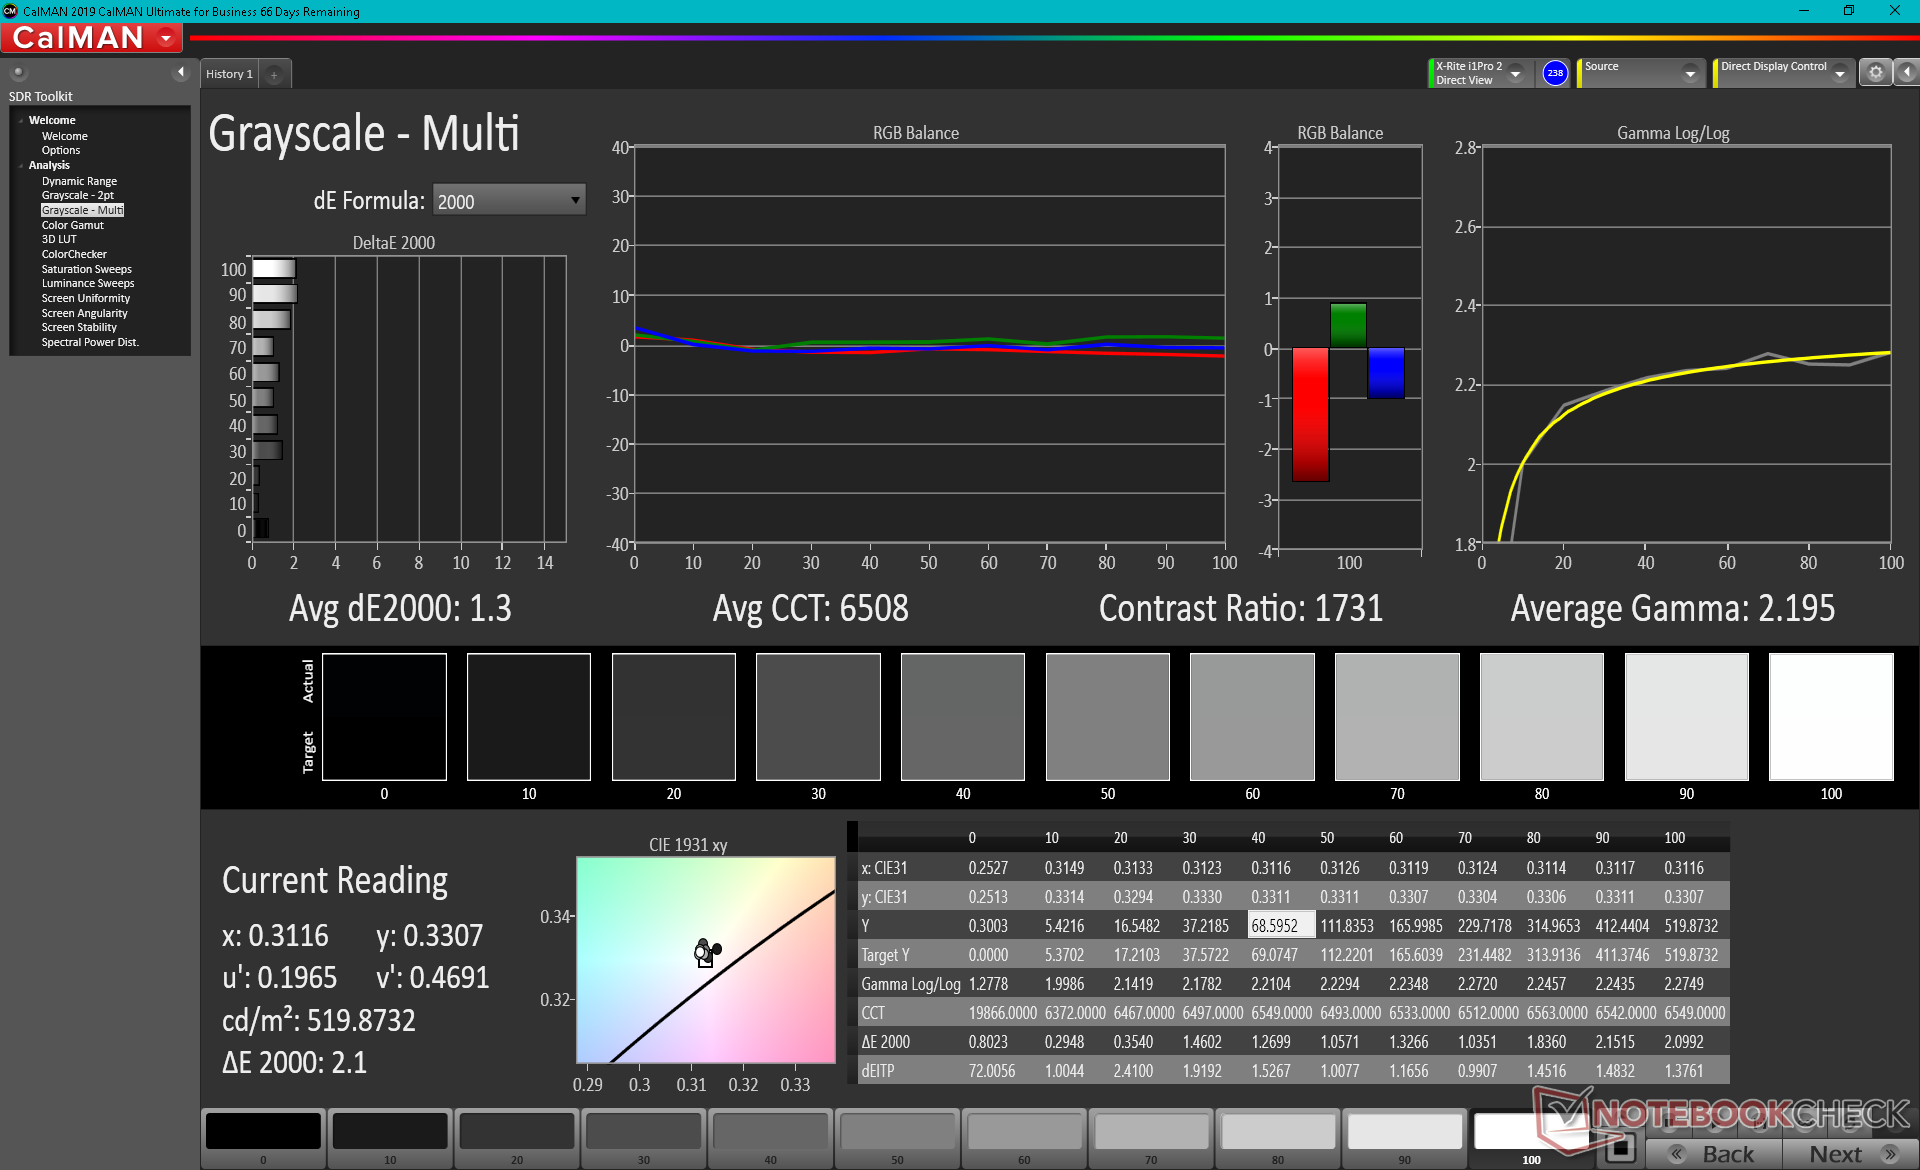
calibrated: 0.76
ΔE Greyscale Calman: 6.1 | ∀{0.09-98 Ø4.96}
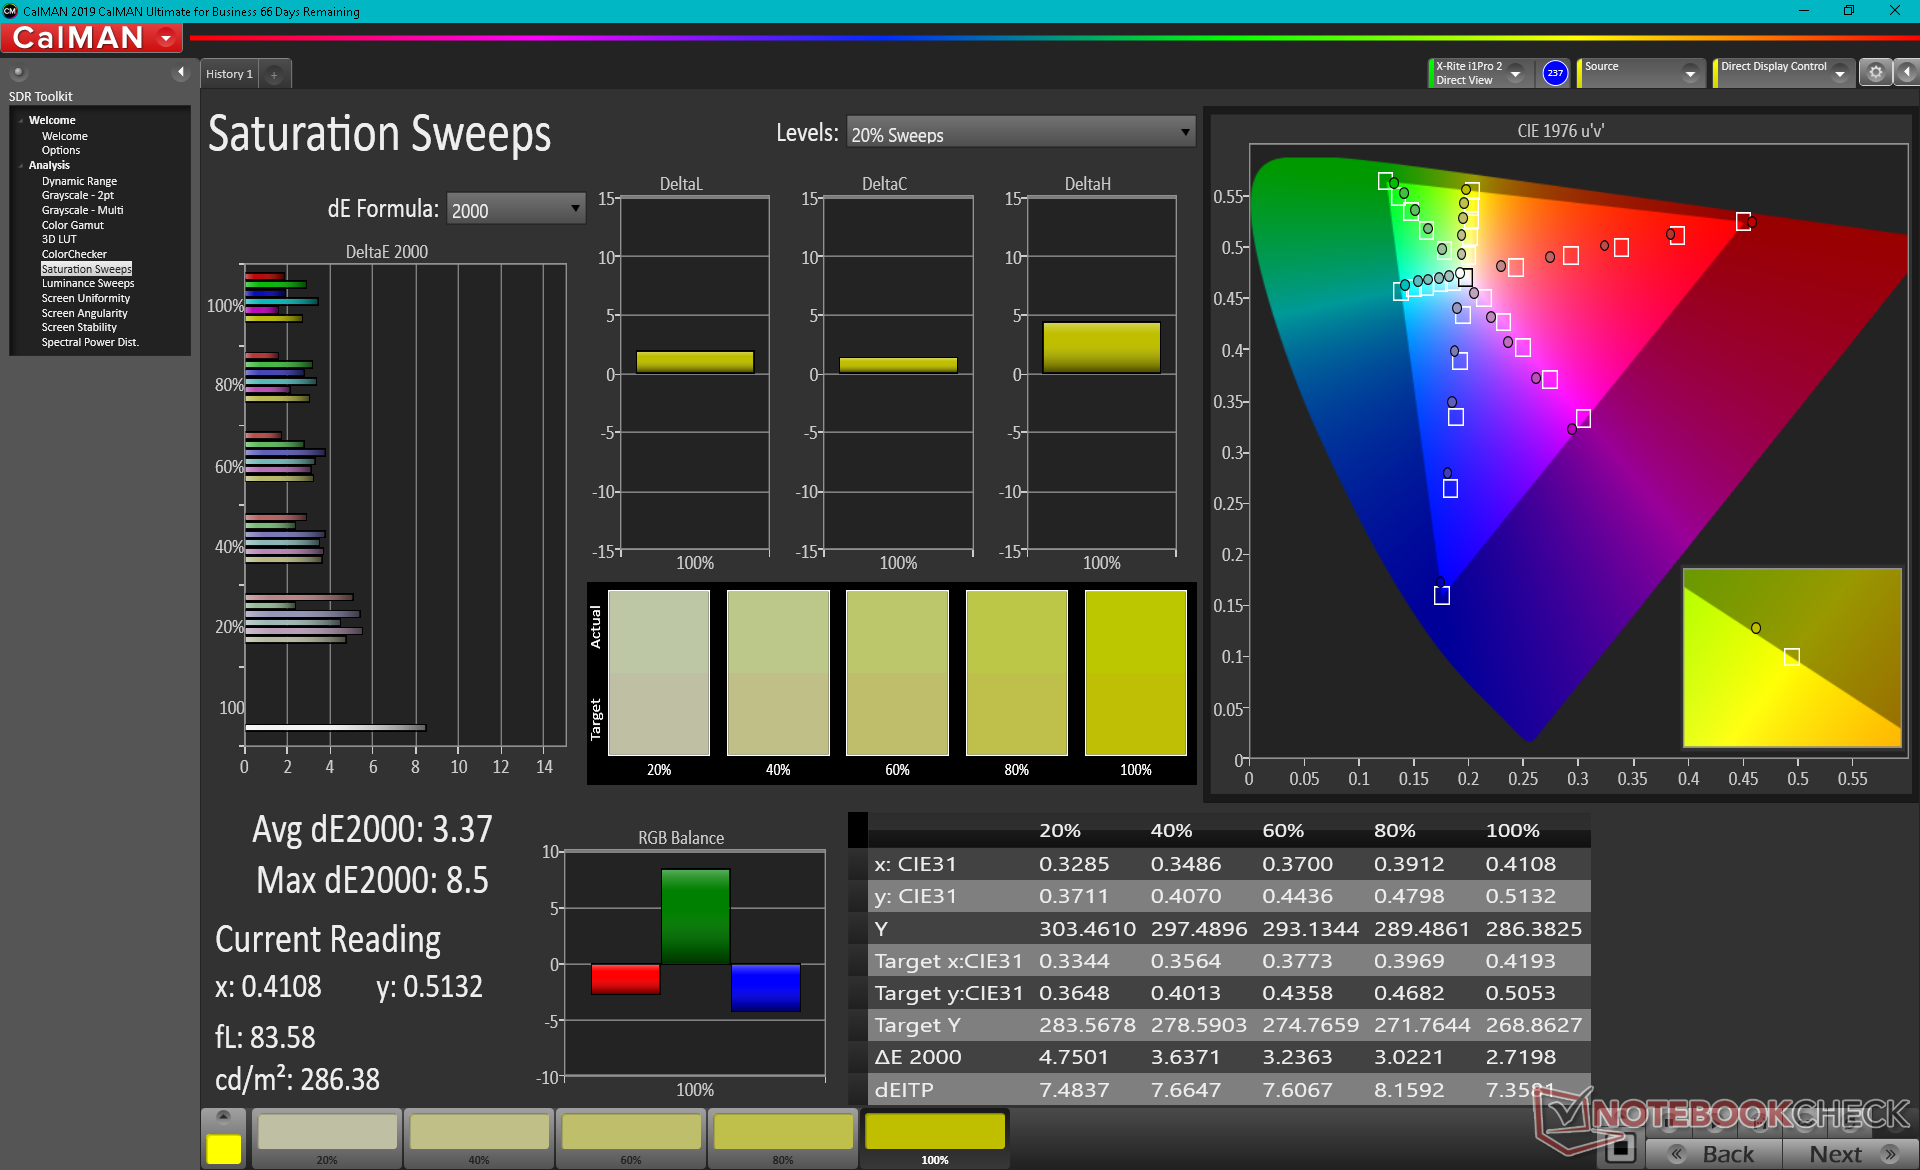
71.7% AdobeRGB 1998 (Argyll 3D)
99% sRGB (Argyll 3D)
69.7% Display P3 (Argyll 3D)
Gamma: 1.98
CCT: 6686 K
| Dell XPS 13 9310 2-in-1 Sharp LQ134N1, IPS, 13.4", 1920x1200 | Dell XPS 13 9310 Core i7 FHD Sharp LQ134N1, IPS, 13.4", 1920x1200 | Dell XPS 13 7390 2-in-1 Core i7 Sharp LQ134N1, IPS, 13.4", 1920x1200 | Lenovo Yoga 6 13 82ND0009US AU Optronics B133HAN05.F, IPS, 13.3", 1920x1080 | Asus ZenBook Flip 13 UX363EA-HP069T Samsung, SDC414A, OLED, 13.3", 1920x1080 | Samsung Galaxy Book Pro 360 13 AMOLED, 13.2", 1920x1080 | |
|---|---|---|---|---|---|---|
| Display | 1% | 0% | 0% | 26% | ||
| Display P3 Coverage (%) | 69.7 | 70.9 2% | 69.9 0% | 69.7 0% | 99.4 43% | |
| sRGB Coverage (%) | 99 | 99.1 0% | 99.2 0% | 99.2 0% | 100 1% | |
| AdobeRGB 1998 Coverage (%) | 71.7 | 72.9 2% | 71.5 0% | 71.4 0% | 96 34% | |
| Response Times | 12% | 21% | 23% | 96% | 96% | |
| Response Time Grey 50% / Grey 80% * (ms) | 55.6 ? | 52 ? 6% | 47.6 ? 14% | 46.8 ? 16% | 2 ? 96% | 2 ? 96% |
| Response Time Black / White * (ms) | 40.4 ? | 33.2 ? 18% | 29.2 ? 28% | 28.8 ? 29% | 2 ? 95% | 2 ? 95% |
| PWM Frequency (Hz) | 2500 ? | 2475 ? | 2500 ? | 60 | 60 ? | |
| Screen | -2% | 7% | -8% | -38% | 235% | |
| Brightness middle (cd/m²) | 555.7 | 543.3 -2% | 549.8 -1% | 291.5 -48% | 353 -36% | 287 -48% |
| Brightness (cd/m²) | 528 | 524 -1% | 520 -2% | 294 -44% | 359 -32% | 289 -45% |
| Brightness Distribution (%) | 90 | 92 2% | 86 -4% | 93 3% | 95 6% | 96 7% |
| Black Level * (cd/m²) | 0.35 | 0.38 -9% | 0.39 -11% | 0.19 46% | 0.1 71% | 0.01 97% |
| Contrast (:1) | 1588 | 1430 -10% | 1410 -11% | 1534 -3% | 3530 122% | 28700 1707% |
| Colorchecker dE 2000 * | 4.83 | 3.02 37% | 2.12 56% | 3.83 21% | 3.98 18% | 2.24 54% |
| Colorchecker dE 2000 max. * | 8.46 | 7.61 10% | 3.66 57% | 8.43 -0% | 53.07 -527% | 3.69 56% |
| Colorchecker dE 2000 calibrated * | 0.76 | 1.23 -62% | 1.37 -80% | 1.07 -41% | ||
| Greyscale dE 2000 * | 6.1 | 5 18% | 2.6 57% | 6.2 -2% | 1.41 77% | 2.73 55% |
| Gamma | 1.98 111% | 2.02 109% | 2.3 96% | 2.2 100% | 2.39 92% | 2.46 89% |
| CCT | 6686 97% | 6550 99% | 6884 94% | 6469 100% | 6346 102% | 6523 100% |
| Color Space (Percent of AdobeRGB 1998) (%) | 66.8 | 65.4 | ||||
| Color Space (Percent of sRGB) (%) | 99.6 | 99.7 | ||||
| Média Total (Programa/Configurações) | 4% /
1% | 9% /
7% | 5% /
-2% | 29% /
-11% | 119% /
166% |
* ... menor é melhor
Exibir tempos de resposta
| ↔ Tempo de resposta preto para branco | ||
|---|---|---|
| 40.4 ms ... ascensão ↗ e queda ↘ combinadas | ↗ 22 ms ascensão | 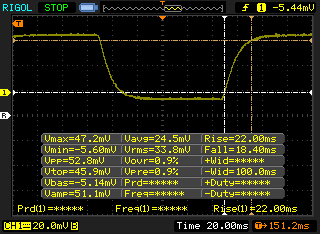 |
| ↘ 18.4 ms queda | ||
| A tela mostra taxas de resposta lentas em nossos testes e será insatisfatória para os jogadores. Em comparação, todos os dispositivos testados variam de 0.1 (mínimo) a 240 (máximo) ms. » 98 % de todos os dispositivos são melhores. Isso significa que o tempo de resposta medido é pior que a média de todos os dispositivos testados (19.8 ms). | ||
| ↔ Tempo de resposta 50% cinza a 80% cinza | ||
| 55.6 ms ... ascensão ↗ e queda ↘ combinadas | ↗ 27.6 ms ascensão | 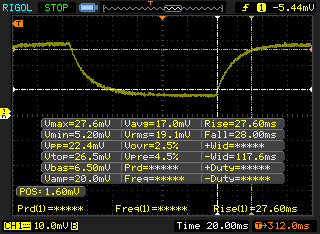 |
| ↘ 28 ms queda | ||
| A tela mostra taxas de resposta lentas em nossos testes e será insatisfatória para os jogadores. Em comparação, todos os dispositivos testados variam de 0.165 (mínimo) a 636 (máximo) ms. » 92 % de todos os dispositivos são melhores. Isso significa que o tempo de resposta medido é pior que a média de todos os dispositivos testados (31 ms). | ||
Cintilação da tela / PWM (modulação por largura de pulso)
| Tela tremeluzindo/PWM detectado | 2500 Hz | ≤ 25 % configuração de brilho | 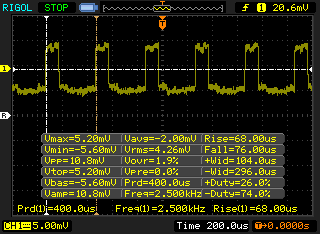 |
A luz de fundo da tela pisca em 2500 Hz (pior caso, por exemplo, utilizando PWM) Cintilação detectada em uma configuração de brilho de 25 % e abaixo. Não deve haver cintilação ou PWM acima desta configuração de brilho. A frequência de 2500 Hz é bastante alta, então a maioria dos usuários sensíveis ao PWM não deve notar nenhuma oscilação. [pwm_comparison] Em comparação: 52 % de todos os dispositivos testados não usam PWM para escurecer a tela. Se PWM foi detectado, uma média de 7754 (mínimo: 5 - máximo: 343500) Hz foi medida. | |||

Desempenho - Intel Tiger Lake-U para o Resgate
Processador - Desempenho abaixo do esperado
O desempenho da CPU flutua muito como o que observamos na concha XPS 9310 equipada com o mesmo Núcleo i7-1165G7 processador. As pontuações do CineBench R15 xT podem variar de 480 a 750 pontos, respectivamente, em comparação com as taxas de relógio mais consistentes do XPS 13 7390 2 em 1 ou ZenBook Flip 13. O desempenho do processador pode, portanto, ser mais lento do que a última geração Núcleo i7-1065G7 às vezes.
Nossa unidade foi ajustada para o modo Ultra Performance através do software Dell Power Manager antes de executar quaisquer benchmarks para as mais altas pontuações possíveis.
Cinebench R15 Multi Loop
Cinebench R23: Multi Core | Single Core
Cinebench R15: CPU Multi 64Bit | CPU Single 64Bit
Blender: v2.79 BMW27 CPU
7-Zip 18.03: 7z b 4 -mmt1 | 7z b 4
Geekbench 5.5: Single-Core | Multi-Core
HWBOT x265 Benchmark v2.2: 4k Preset
LibreOffice : 20 Documents To PDF
R Benchmark 2.5: Overall mean
| Cinebench R23 / Multi Core | |
| Lenovo Yoga Slim 7-14ARE | |
| Asus ZenBook 13 OLED UM325UA | |
| Lenovo Yoga 6 13 82ND0009US | |
| Média Intel Core i7-1165G7 (2525 - 6862, n=64) | |
| Dell XPS 13 9310 OLED | |
| Dell XPS 13 9310 2-in-1 | |
| HP Spectre x360 13-aw2003dx | |
| Asus VivoBook S13 S333JA-DS51 | |
| Cinebench R23 / Single Core | |
| Dell XPS 13 9310 OLED | |
| Média Intel Core i7-1165G7 (1110 - 1539, n=59) | |
| Dell XPS 13 9310 2-in-1 | |
| HP Spectre x360 13-aw2003dx | |
| Asus ZenBook 13 OLED UM325UA | |
| Lenovo Yoga Slim 7-14ARE | |
| Lenovo Yoga 6 13 82ND0009US | |
| Asus VivoBook S13 S333JA-DS51 | |
| Geekbench 5.5 / Single-Core | |
| Dell XPS 13 9310 OLED | |
| Média Intel Core i7-1165G7 (1302 - 1595, n=77) | |
| HP Spectre x360 13-aw2003dx | |
| Asus Zenbook S UX393JA | |
| HP Envy 13-ba0001ng | |
| Asus ZenBook 13 OLED UM325UA | |
| Lenovo Yoga Slim 7-14ARE | |
| Lenovo Yoga Slim 7-14ARE | |
| Asus VivoBook S13 S333JA-DS51 | |
| Geekbench 5.5 / Multi-Core | |
| Lenovo Yoga Slim 7-14ARE | |
| Lenovo Yoga Slim 7-14ARE | |
| Asus ZenBook 13 OLED UM325UA | |
| Dell XPS 13 9310 OLED | |
| HP Spectre x360 13-aw2003dx | |
| Média Intel Core i7-1165G7 (3078 - 5926, n=77) | |
| Asus Zenbook S UX393JA | |
| Asus VivoBook S13 S333JA-DS51 | |
| HP Envy 13-ba0001ng | |
| HWBOT x265 Benchmark v2.2 / 4k Preset | |
| Lenovo Yoga Slim 7-14ARE | |
| Asus ZenBook 13 OLED UM325UA | |
| Lenovo Yoga 6 13 82ND0009US | |
| Dell XPS 13 9310 OLED | |
| Dell XPS 13 9310 2-in-1 | |
| Média Intel Core i7-1165G7 (1.39 - 8.47, n=80) | |
| HP Spectre x360 13-aw2003dx | |
| Dell XPS 13 7390 Core i7-10710U | |
| Asus VivoBook S13 S333JA-DS51 | |
| Asus Zenbook S UX393JA | |
| HP Envy 13-ba0001ng | |
| LibreOffice / 20 Documents To PDF | |
| Lenovo Yoga 6 13 82ND0009US | |
| Asus VivoBook S13 S333JA-DS51 | |
| Asus ZenBook 13 OLED UM325UA | |
| Lenovo Yoga Slim 7-14ARE | |
| HP Envy 13-ba0001ng | |
| HP Spectre x360 13-aw2003dx | |
| Média Intel Core i7-1165G7 (21.5 - 88.1, n=78) | |
| Asus Zenbook S UX393JA | |
| Dell XPS 13 9310 OLED | |
| R Benchmark 2.5 / Overall mean | |
| Asus VivoBook S13 S333JA-DS51 | |
| Asus Zenbook S UX393JA | |
| HP Envy 13-ba0001ng | |
| HP Spectre x360 13-aw2003dx | |
| Lenovo Yoga 6 13 82ND0009US | |
| Lenovo Yoga Slim 7-14ARE | |
| Dell XPS 13 9310 2-in-1 | |
| Asus ZenBook 13 OLED UM325UA | |
| Dell XPS 13 9310 OLED | |
| Média Intel Core i7-1165G7 (0.552 - 1.002, n=80) | |
* ... menor é melhor
Desempenho do sistema
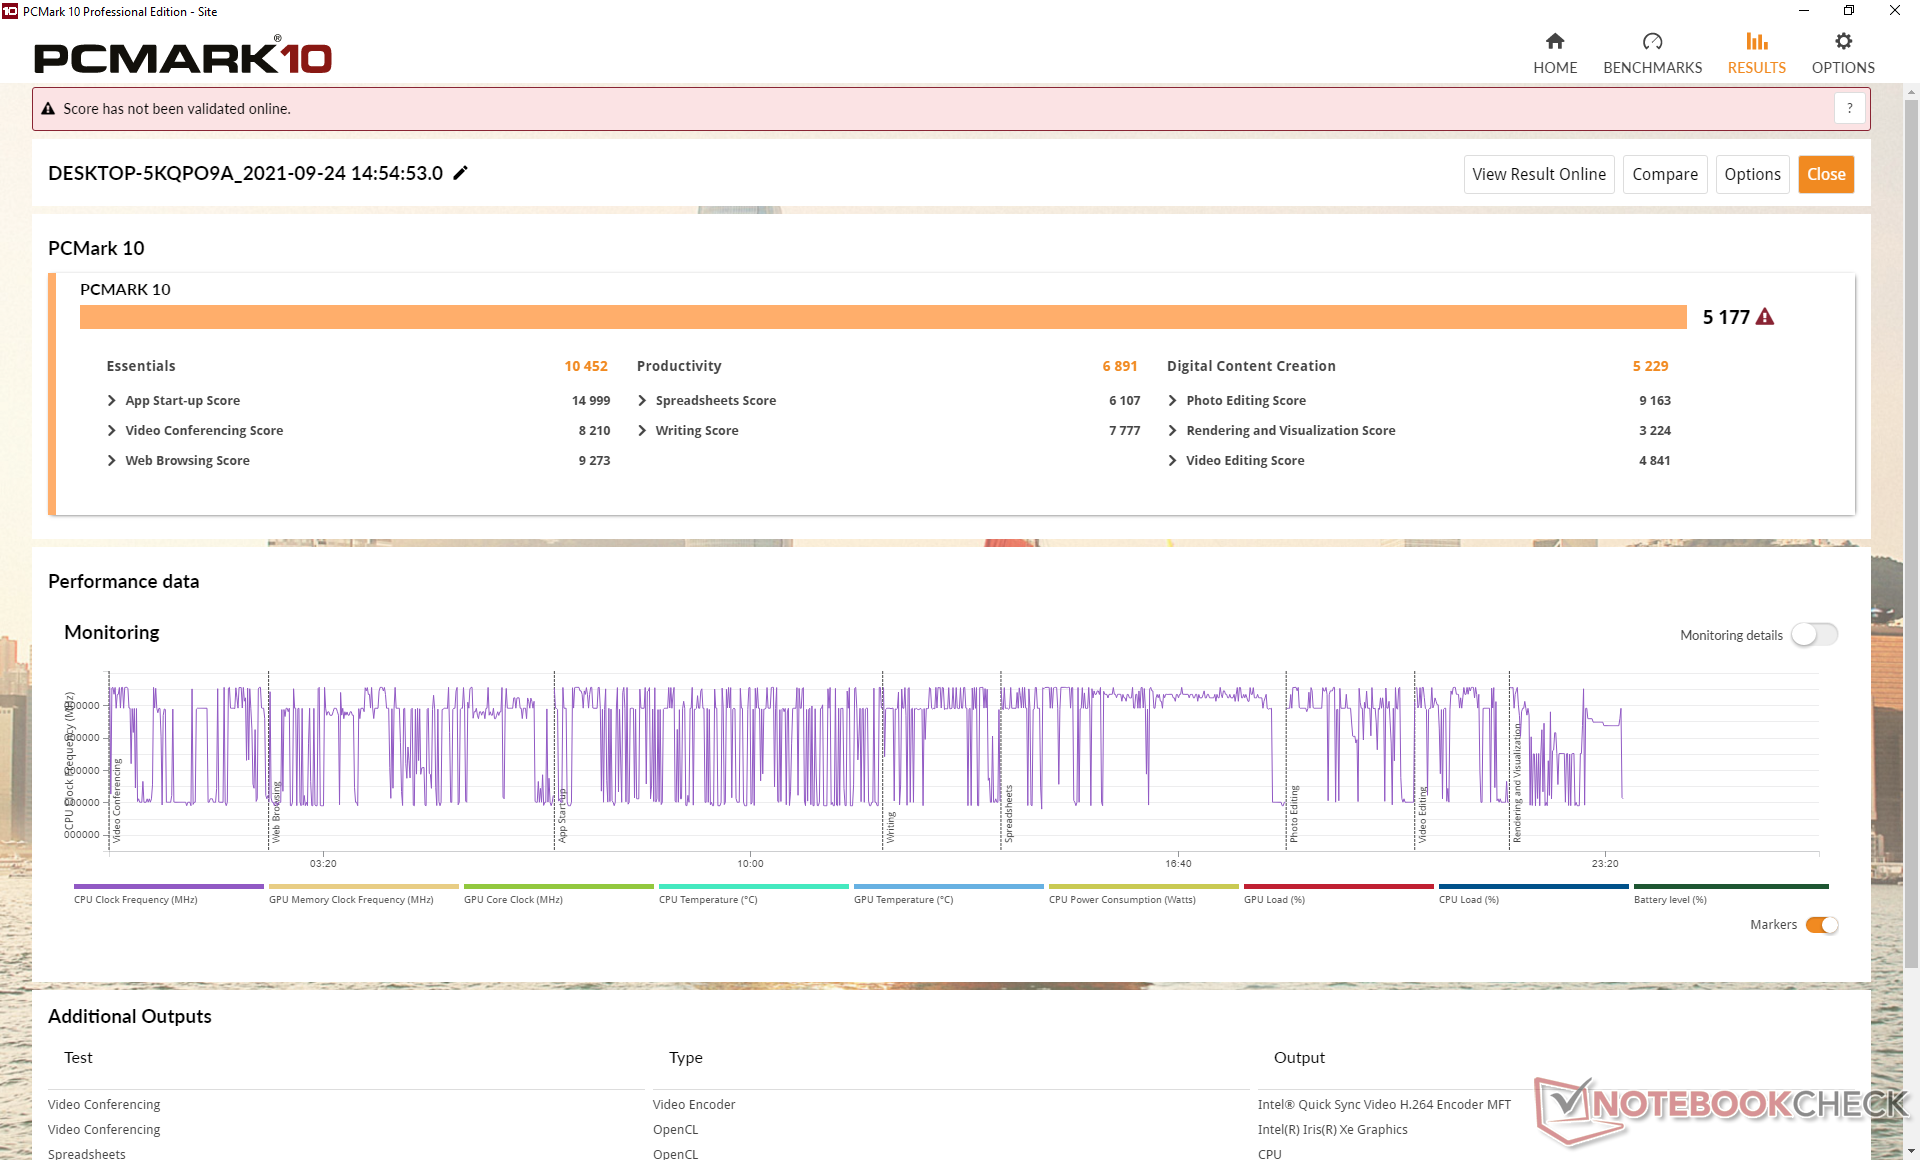
A pontuação PCMark 10 é onde esperamos que seja relativa a outros laptops equipados com a mesma CPU Core i7. O maior ganho em relação ao antigo XPS 13 7390 2 em 1 está no benchmark de criação de conteúdo digital pesado da GPU, onde nosso Iris Xe pode ter um desempenho superior ao do Iris Plus G7.
| PCMark 10 / Score | |
| Lenovo Yoga 6 13 82ND0009US | |
| Dell XPS 13 9310 2-in-1 | |
| Média Intel Core i7-1165G7, Intel Iris Xe Graphics G7 96EUs (4531 - 5454, n=50) | |
| Dell XPS 13 9310 Core i7 FHD | |
| Asus ZenBook Flip 13 UX363EA-HP069T | |
| Dell XPS 13 7390 2-in-1 Core i7 | |
| Samsung Galaxy Book Pro 360 13 | |
| PCMark 10 / Essentials | |
| Dell XPS 13 9310 2-in-1 | |
| Asus ZenBook Flip 13 UX363EA-HP069T | |
| Média Intel Core i7-1165G7, Intel Iris Xe Graphics G7 96EUs (8997 - 11505, n=50) | |
| Lenovo Yoga 6 13 82ND0009US | |
| Dell XPS 13 9310 Core i7 FHD | |
| Dell XPS 13 7390 2-in-1 Core i7 | |
| Samsung Galaxy Book Pro 360 13 | |
| PCMark 10 / Productivity | |
| Lenovo Yoga 6 13 82ND0009US | |
| Dell XPS 13 7390 2-in-1 Core i7 | |
| Asus ZenBook Flip 13 UX363EA-HP069T | |
| Dell XPS 13 9310 2-in-1 | |
| Dell XPS 13 9310 Core i7 FHD | |
| Média Intel Core i7-1165G7, Intel Iris Xe Graphics G7 96EUs (5570 - 7136, n=50) | |
| Samsung Galaxy Book Pro 360 13 | |
| PCMark 10 / Digital Content Creation | |
| Lenovo Yoga 6 13 82ND0009US | |
| Dell XPS 13 9310 2-in-1 | |
| Média Intel Core i7-1165G7, Intel Iris Xe Graphics G7 96EUs (4083 - 5550, n=50) | |
| Dell XPS 13 9310 Core i7 FHD | |
| Samsung Galaxy Book Pro 360 13 | |
| Asus ZenBook Flip 13 UX363EA-HP069T | |
| Dell XPS 13 7390 2-in-1 Core i7 | |
| PCMark 10 Score | 5177 pontos | |
Ajuda | ||
Latência do DPC
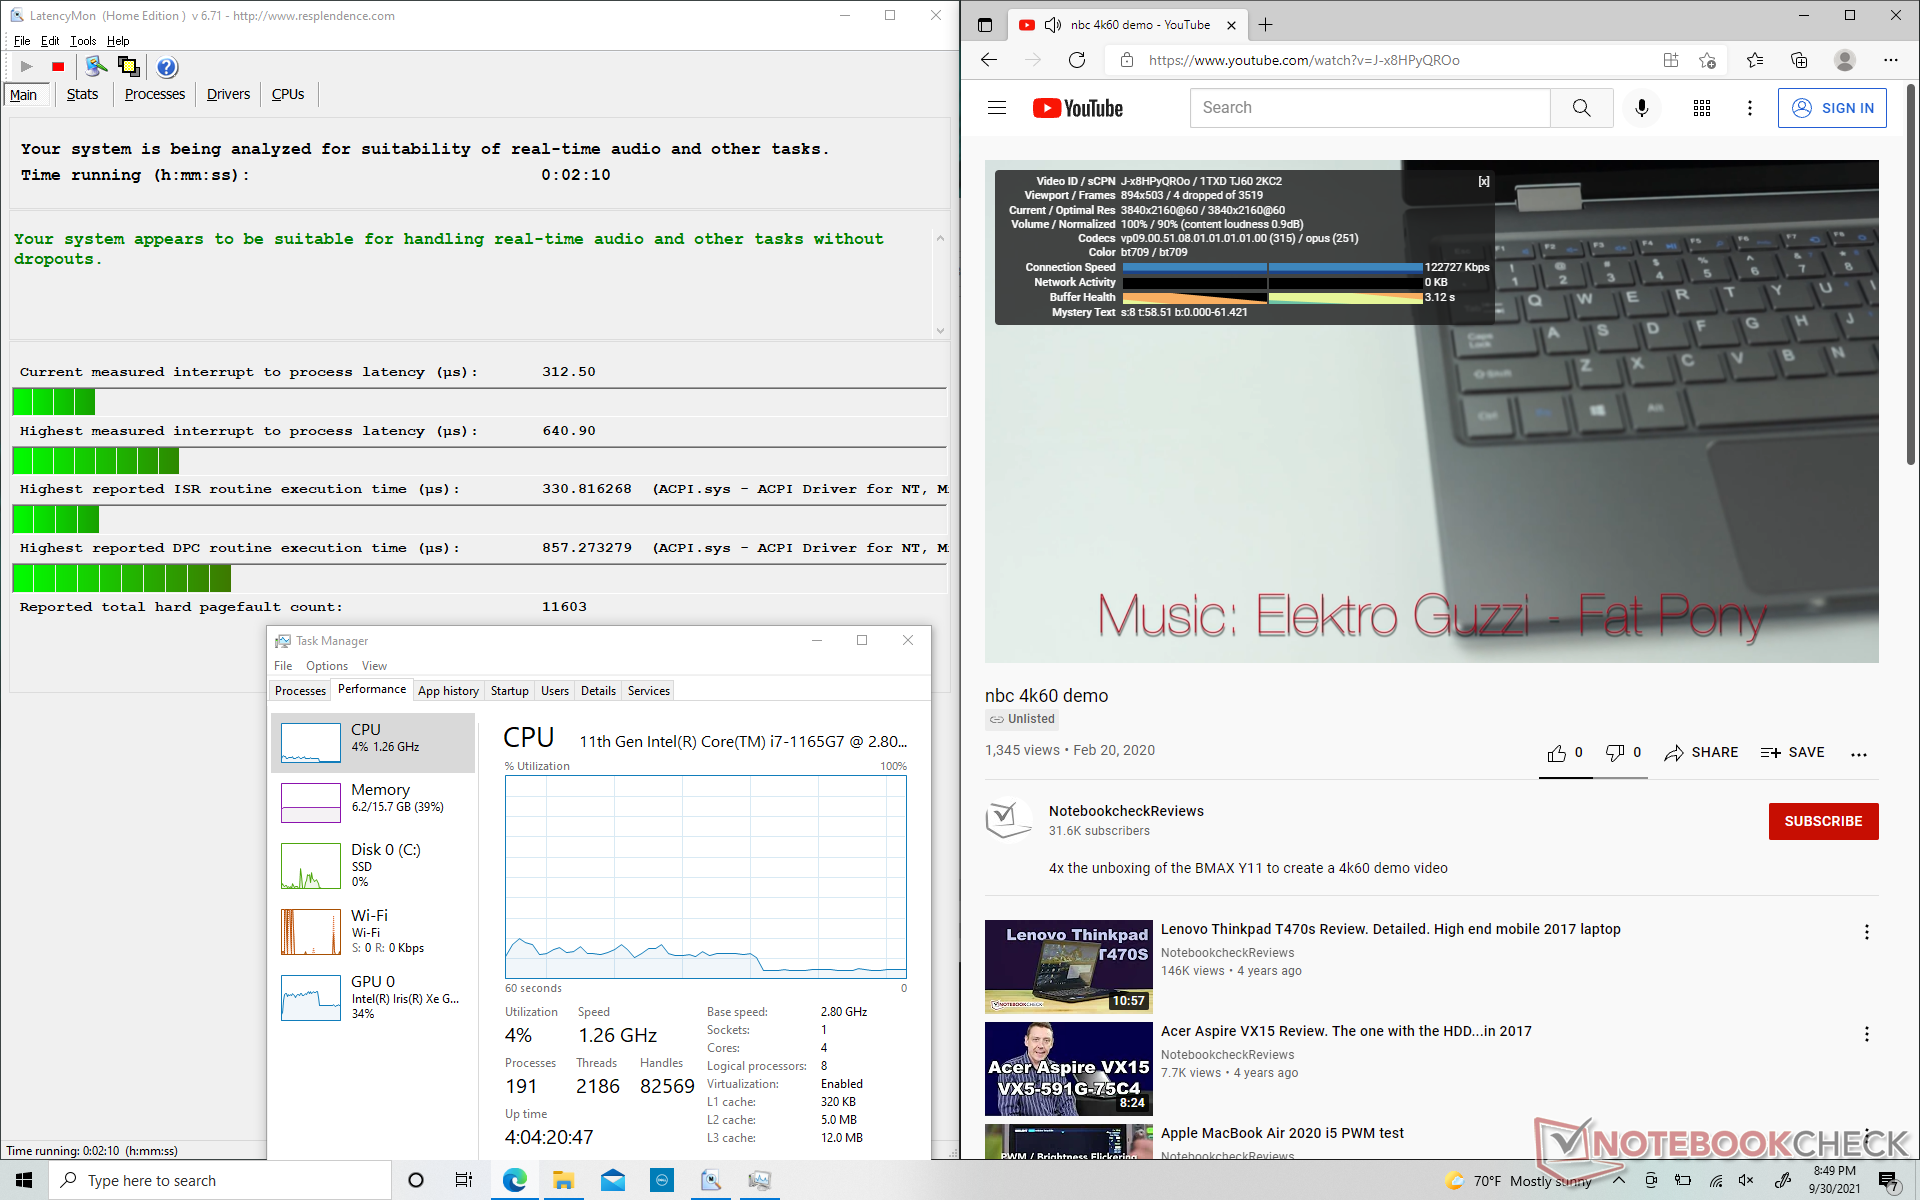
LatencyMon não mostra problemas de latência ao abrir várias abas em nossa página inicial ou ao executar Prime95 stress. A reprodução de 4K UHD a 60 FPS também é suave.
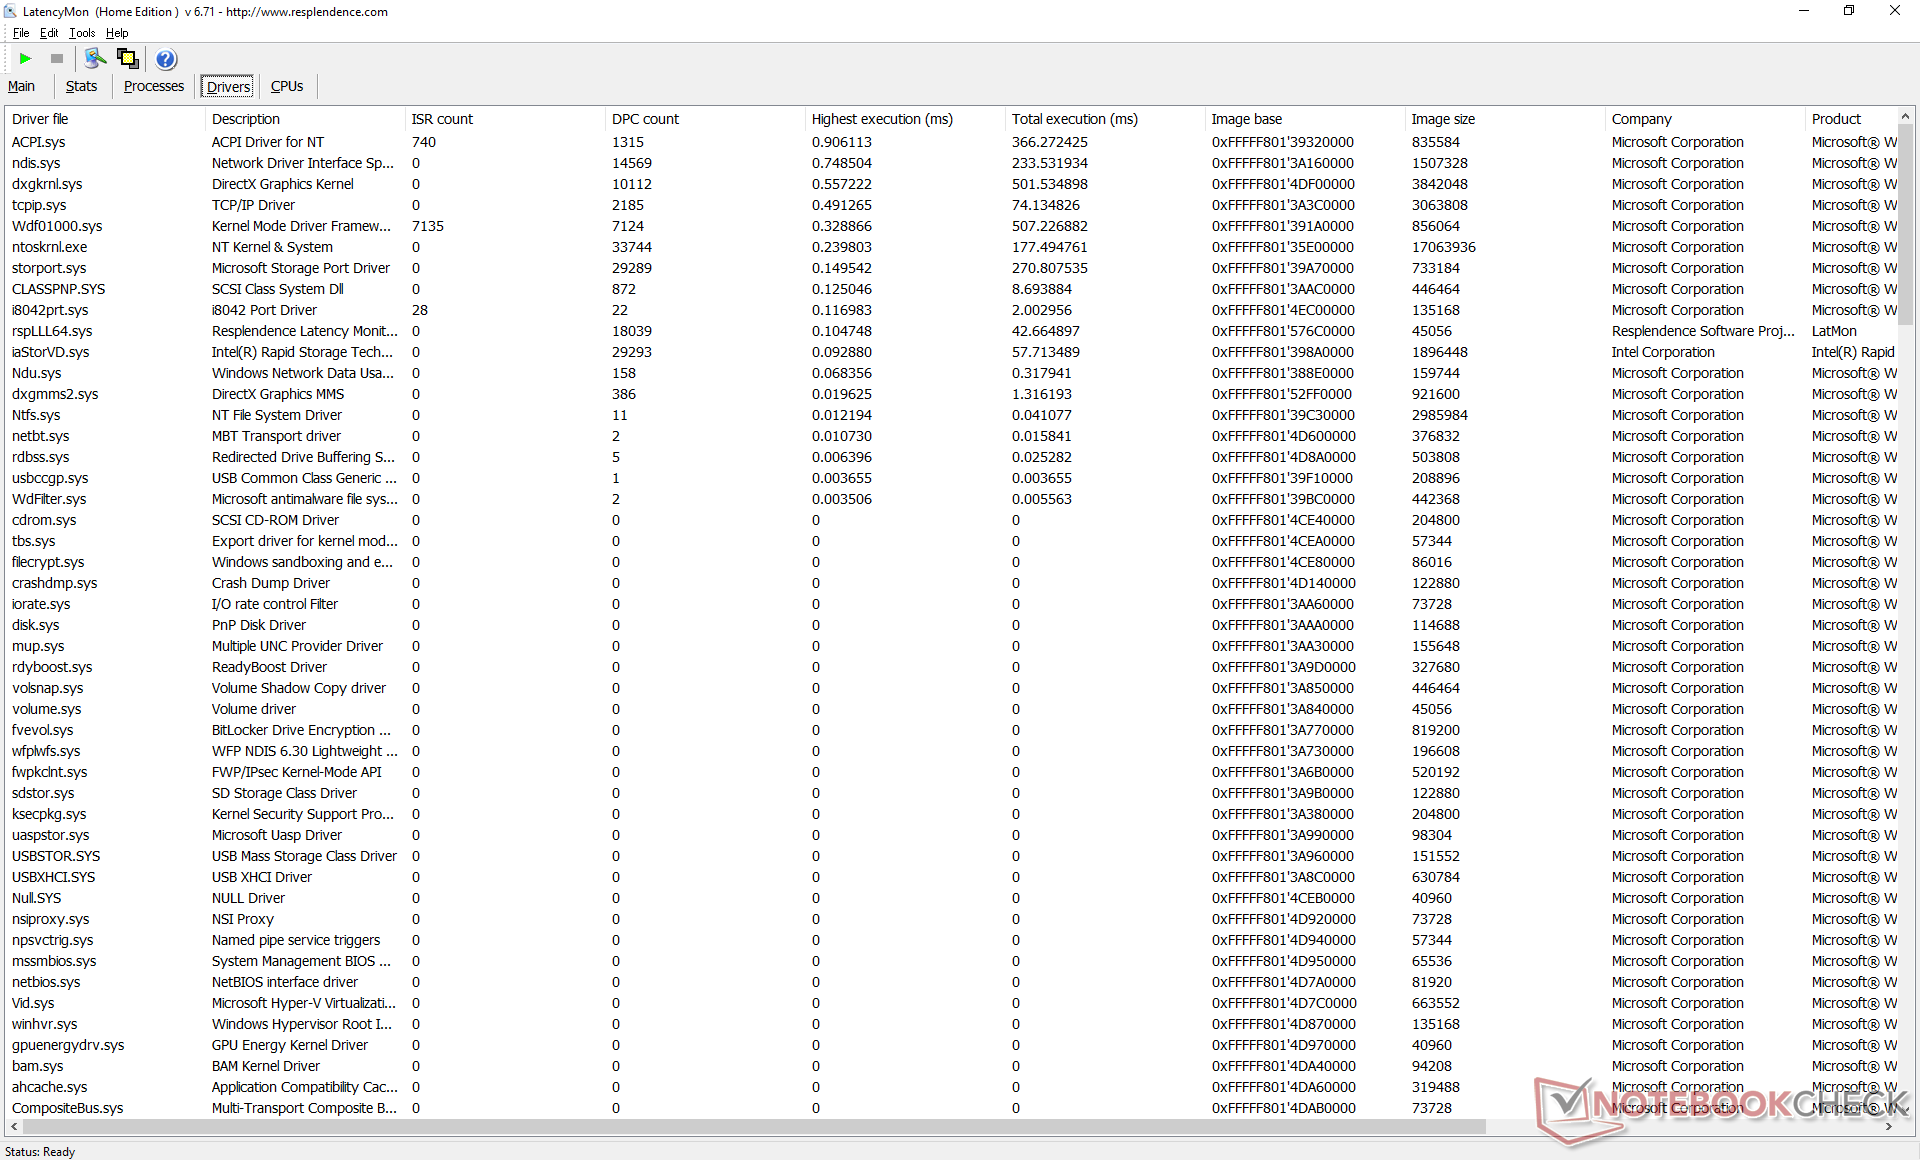
| DPC Latencies / LatencyMon - interrupt to process latency (max), Web, Youtube, Prime95 | |
| Samsung Galaxy Book Pro 360 13 | |
| Asus ZenBook Flip 13 UX363EA-HP069T | |
| Lenovo Yoga 6 13 82ND0009US | |
| Dell XPS 13 9310 Core i7 FHD | |
| Dell XPS 13 9310 2-in-1 | |
* ... menor é melhor
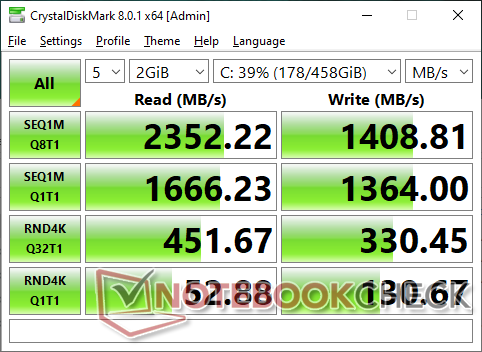
Dispositivos de armazenamento
Nossa unidade de teste é enviada com o mesmoToshiba BG4 PCIe3 NVMe SSD como encontrado no antigo XPS 13 7390 2 em 1. Entretanto, não ficaríamos surpresos ao ver algumas unidades embarcadas com SSDs Micron. Não há suporte para velocidades PCIe4, ao contrário do que acontece no último Vaio Z.
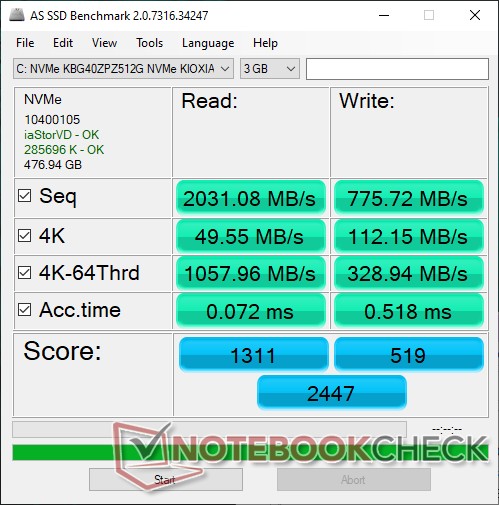
| Dell XPS 13 9310 2-in-1 Toshiba BG4 KBG40ZPZ512G | Dell XPS 13 9310 Core i7 FHD Micron 2300 512GB MTFDHBA512TDV | Dell XPS 13 7390 2-in-1 Core i7 Toshiba BG4 KBG40ZPZ512G | Lenovo Yoga 6 13 82ND0009US WDC PC SN530 SDBPMPZ-265G | Samsung Galaxy Book Pro 360 13 Samsung PM991 MZVLQ256HAJD | |
|---|---|---|---|---|---|
| AS SSD | 70% | 2% | -28% | 15% | |
| Seq Read (MB/s) | 2031 | 2091 3% | 1801 -11% | 1860 -8% | 1771 -13% |
| Seq Write (MB/s) | 776 | 1396 80% | 1125 45% | 500 -36% | 894 15% |
| 4K Read (MB/s) | 49.55 | 49.29 -1% | 39.7 -20% | 36.26 -27% | 53.5 8% |
| 4K Write (MB/s) | 112.2 | 104.2 -7% | 67 -40% | 118.6 6% | 157.8 41% |
| 4K-64 Read (MB/s) | 1058 | 827 -22% | 1253 18% | 419 -60% | 478.1 -55% |
| 4K-64 Write (MB/s) | 328.9 | 1636 397% | 209 -36% | 219 -33% | 741 125% |
| Access Time Read * (ms) | 0.072 | 0.066 8% | 0.069 4% | 0.102 -42% | 0.156 -117% |
| Access Time Write * (ms) | 0.518 | 0.365 30% | 0.625 -21% | 0.17 67% | 0.023 96% |
| Score Read (Points) | 1311 | 1086 -17% | 1472 12% | 641 -51% | 709 -46% |
| Score Write (Points) | 519 | 1880 262% | 388 -25% | 388 -25% | 988 90% |
| Score Total (Points) | 2447 | 3499 43% | 2583 6% | 1300 -47% | 2034 -17% |
| Copy ISO MB/s (MB/s) | 1103 | 1544 40% | 1293 17% | 880 -20% | 960 -13% |
| Copy Program MB/s (MB/s) | 331.7 | 613 85% | 560 69% | 185.3 -44% | 648 95% |
| Copy Game MB/s (MB/s) | 828 | 1451 75% | 927 12% | 212.7 -74% | 882 7% |
| CrystalDiskMark 5.2 / 6 | 24% | -3% | -20% | -12% | |
| Write 4K (MB/s) | 129.6 | 97.5 -25% | 106.7 -18% | 89.2 -31% | 170.6 32% |
| Read 4K (MB/s) | 52.2 | 50.9 -2% | 49.94 -4% | 33.09 -37% | 44.51 -15% |
| Write Seq (MB/s) | 1310 | 1811 38% | 1223 -7% | 988 -25% | 872 -33% |
| Read Seq (MB/s) | 1726 | 1836 6% | 1801 4% | 1322 -23% | 1188 -31% |
| Write 4K Q32T1 (MB/s) | 334.7 | 521 56% | 325.3 -3% | 332.6 -1% | 483.1 44% |
| Read 4K Q32T1 (MB/s) | 447.6 | 357.5 -20% | 551 23% | 389.3 -13% | 284.3 -36% |
| Write Seq Q32T1 (MB/s) | 1410 | 2879 104% | 1224 -13% | 984 -30% | 950 -33% |
| Read Seq Q32T1 (MB/s) | 2390 | 3204 34% | 2350 -2% | 2461 3% | 1872 -22% |
| Média Total (Programa/Configurações) | 47% /
53% | -1% /
0% | -24% /
-25% | 2% /
6% |
* ... menor é melhor

Disk Throttling: DiskSpd Read Loop, Queue Depth 8
GPU Performance - Grandes Ganhos sobre a Iris Plus G7
Iris Xe O desempenho gráfico é uma melhoria significativa em relação ao Iris Plus G7 no XPS 13 7390 2 em 1 do ano passado em até 60% a 90% de acordo com os 3DMark benchmarks. Os usuários devem ver os maiores saltos para títulos que suportam o DX12 sobre o DX11.
O desempenho nem sempre é estável, no entanto. Por exemplo, simplesmente ociosos em Witcher 3 em configurações baixas por uma hora resultaria em taxas de quadros flutuantes entre 70 e 98 FPS. Assim, embora o desempenho seja ótimo em média, ele pode periodicamente mergulhar mais lentamente por uma margem bem maior. Este comportamento é algo que também observamos nos modelos XPS 13 da geração anterior.
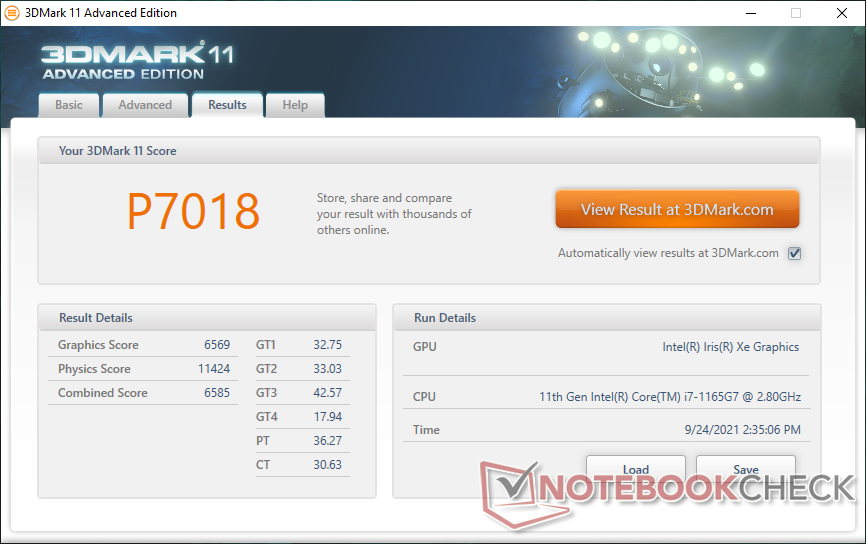
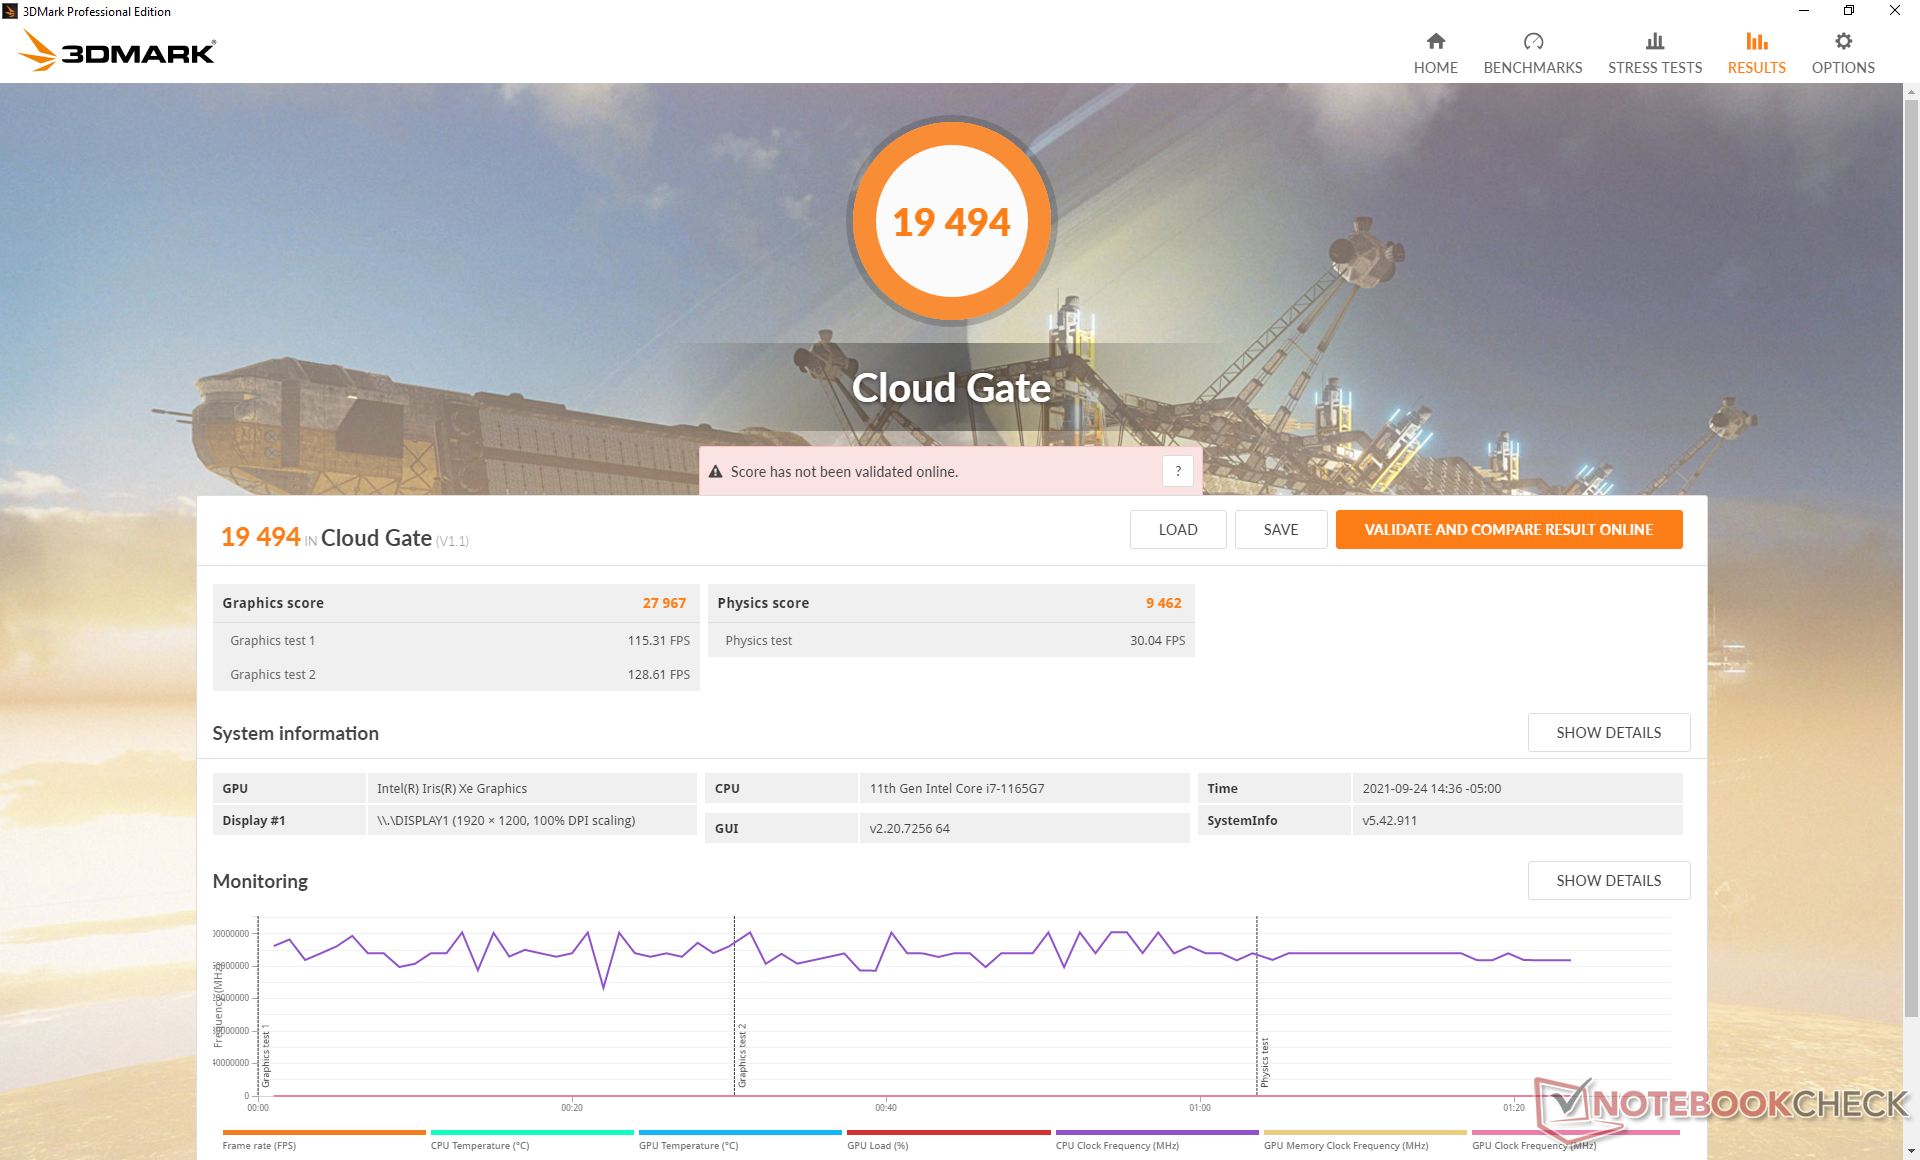
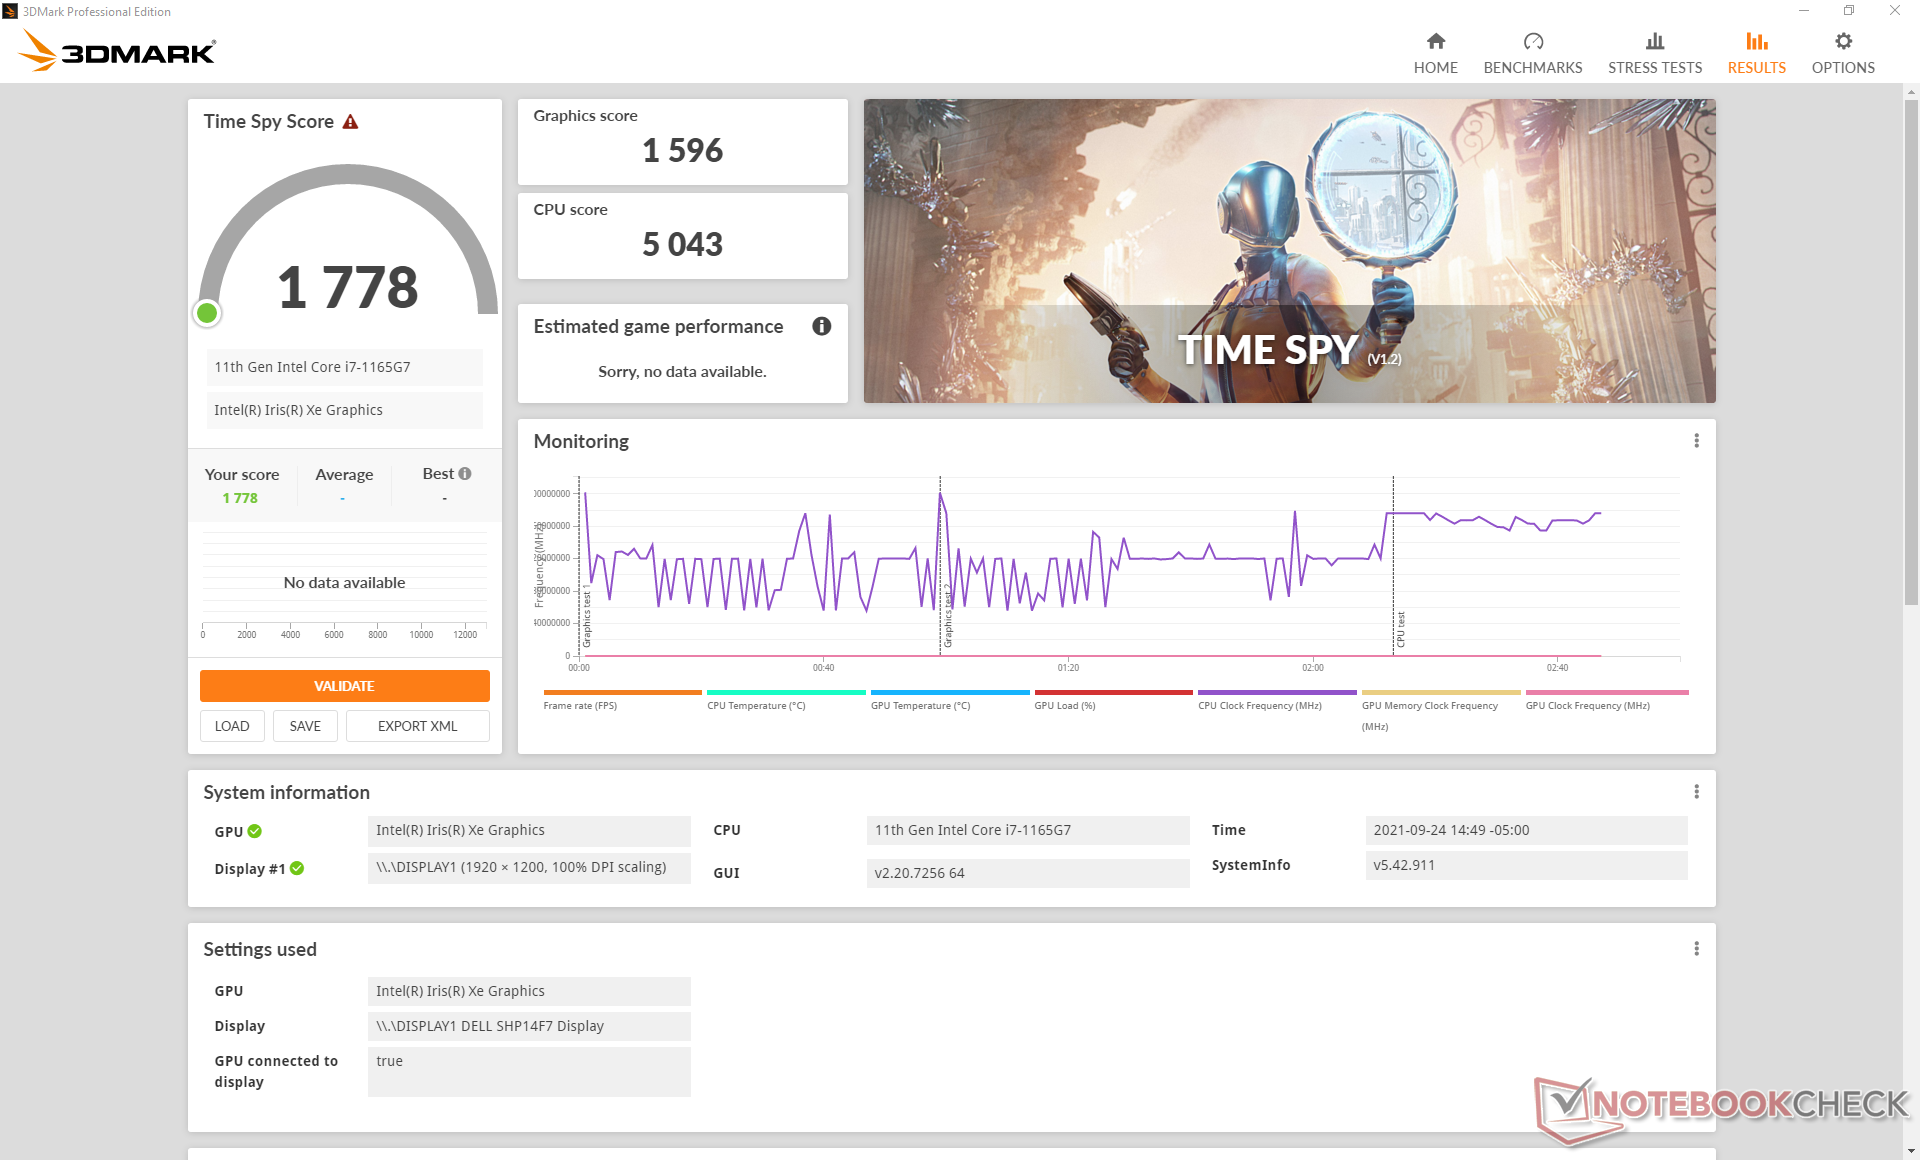
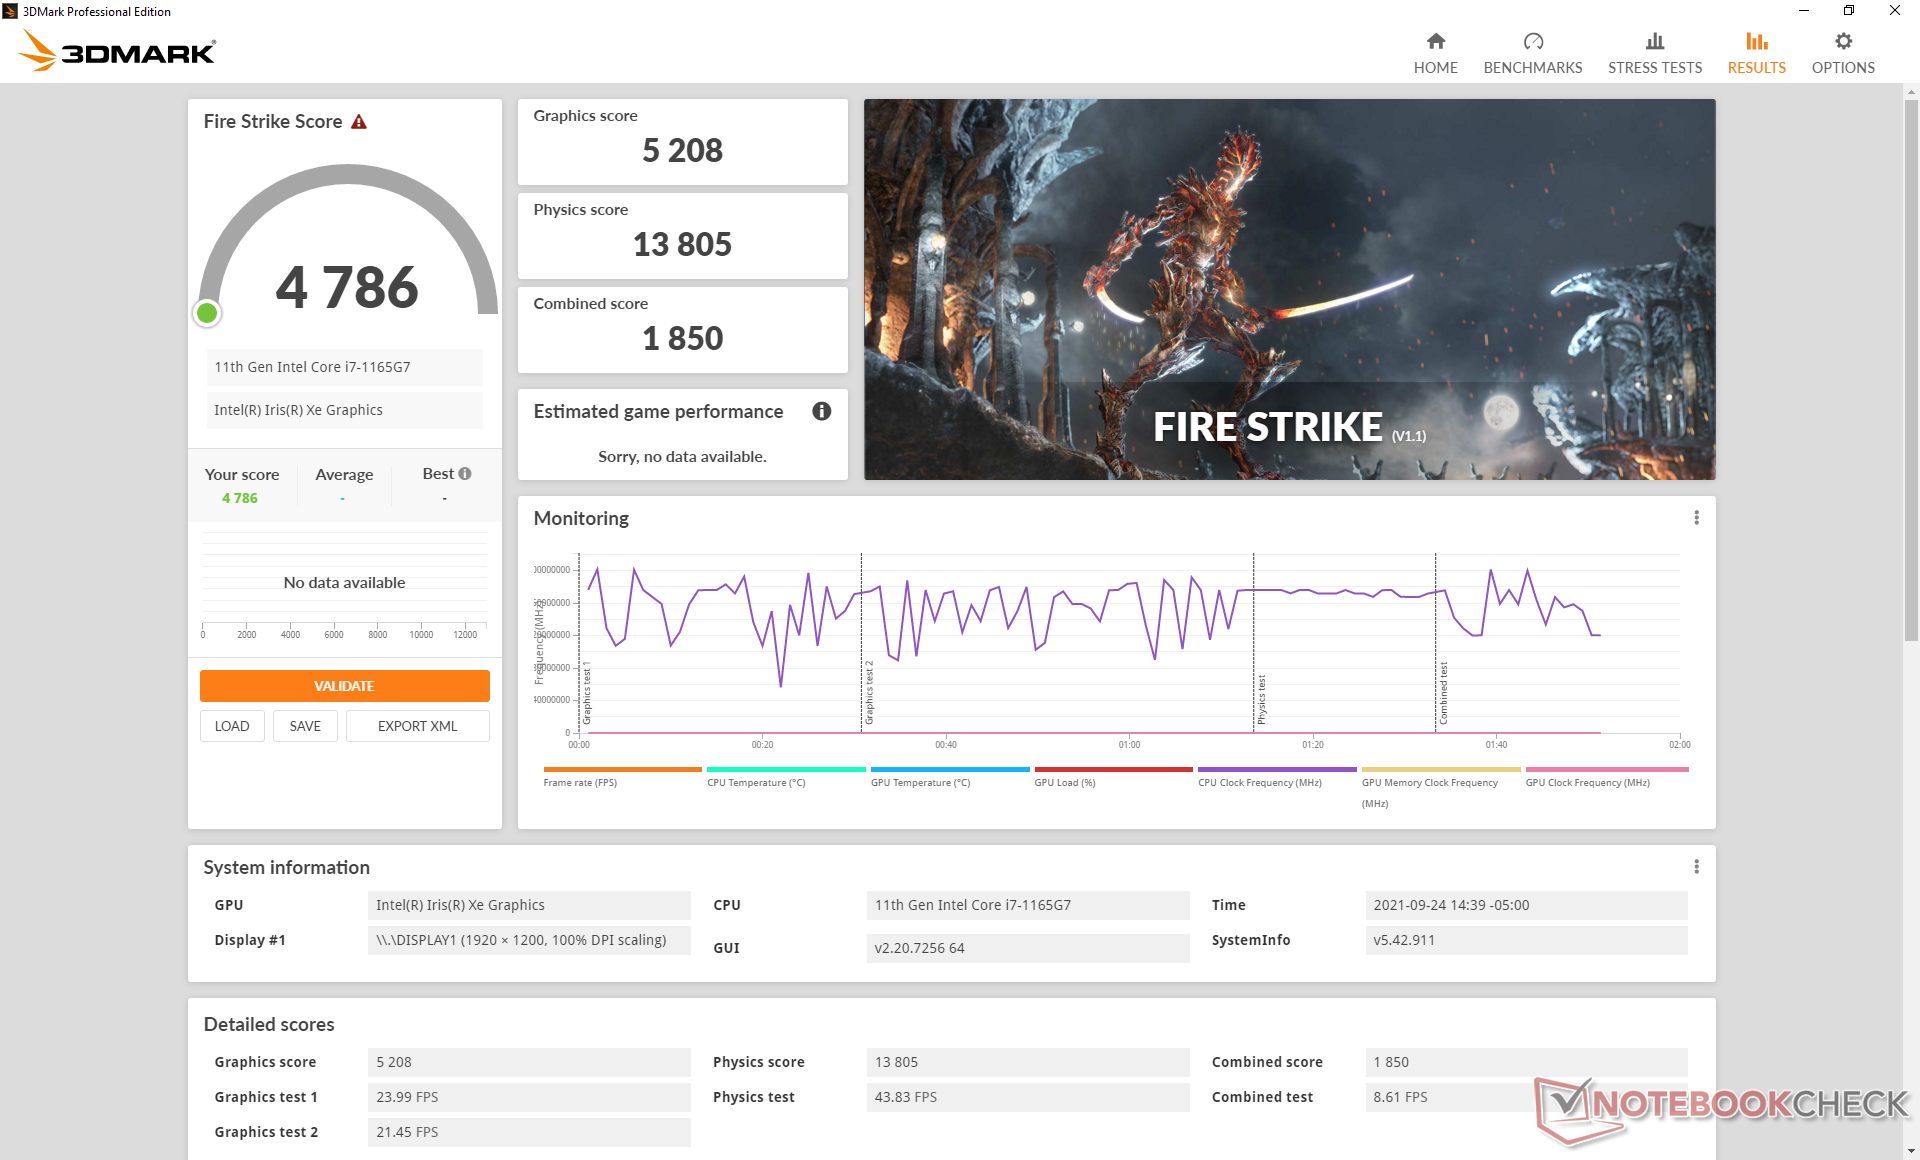
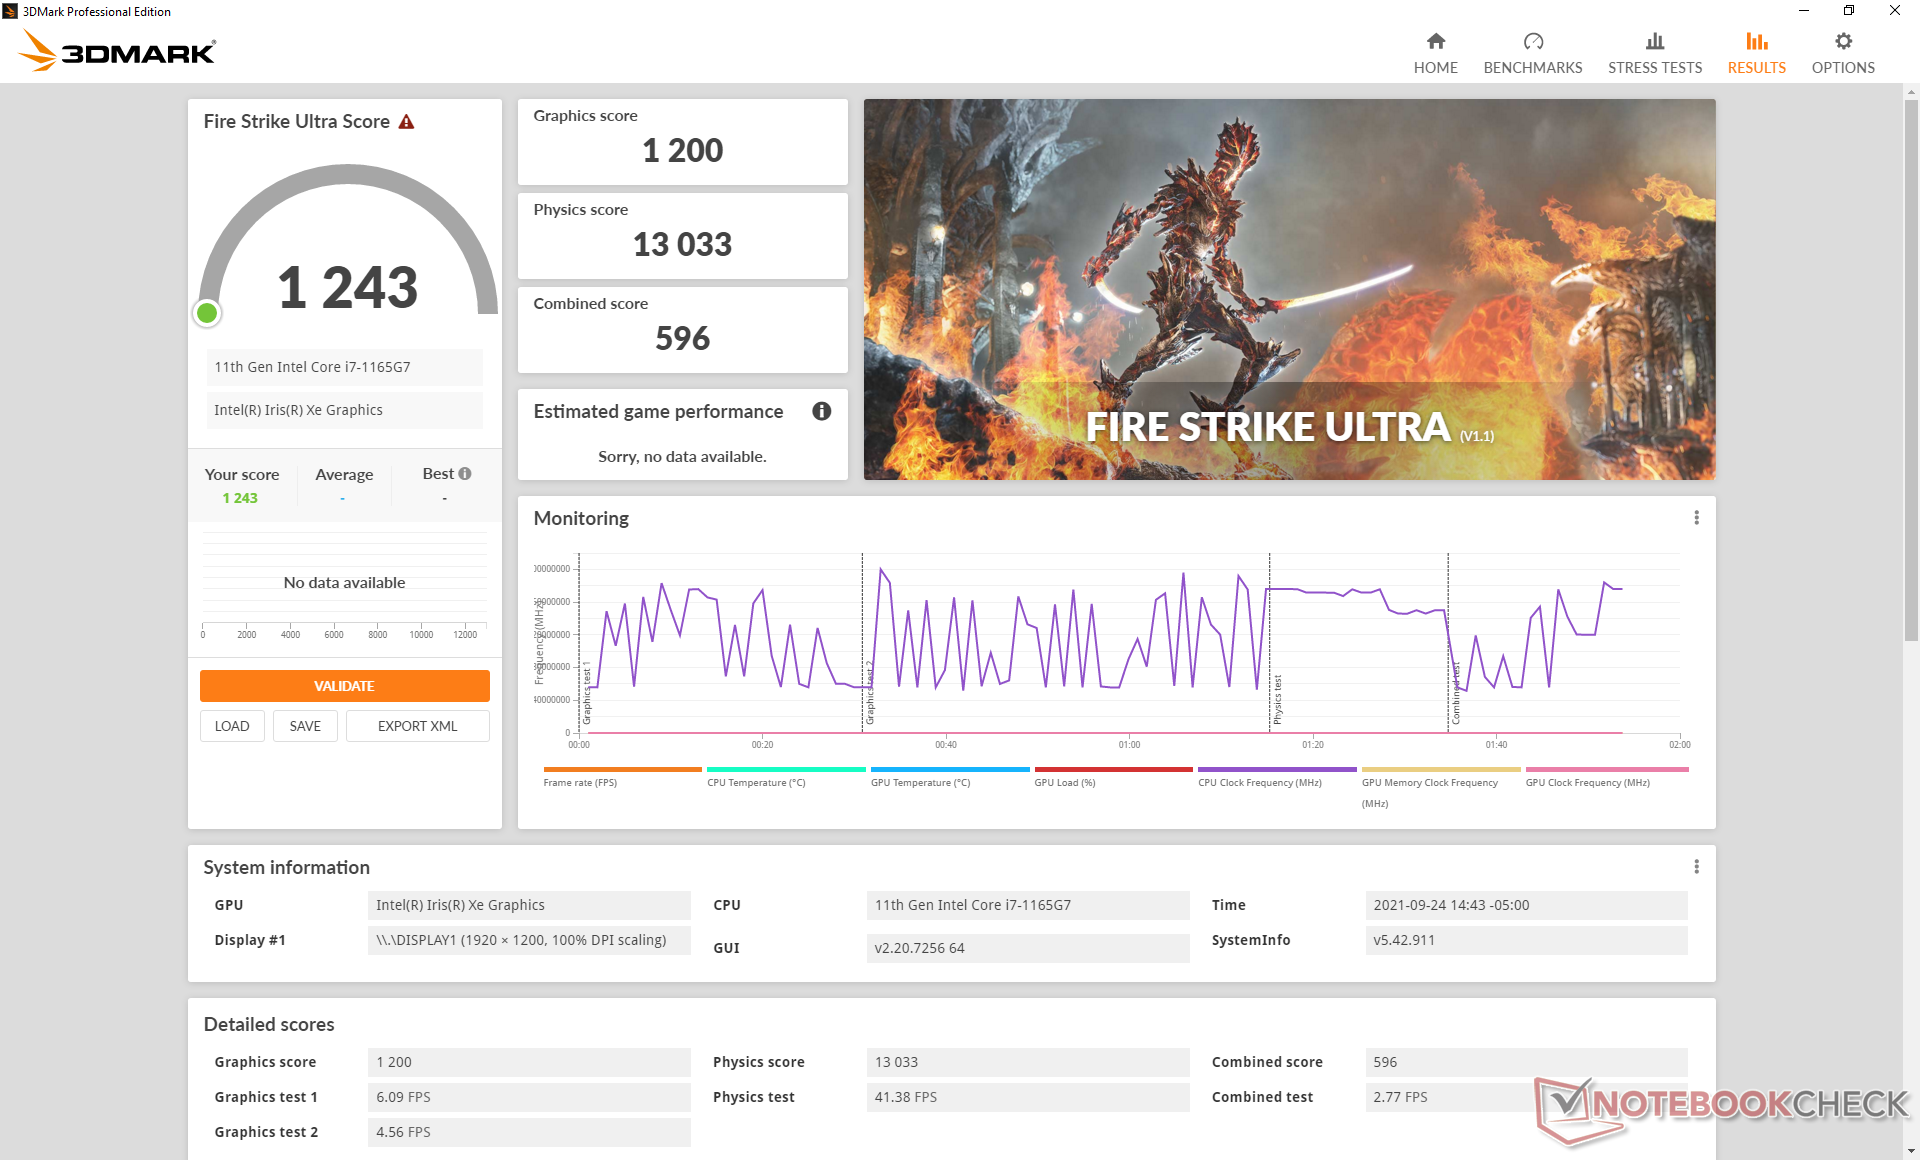
| 3DMark 11 Performance | 7018 pontos | |
| 3DMark Cloud Gate Standard Score | 19494 pontos | |
| 3DMark Fire Strike Score | 4786 pontos | |
| 3DMark Time Spy Score | 1778 pontos | |
Ajuda | ||
| GTA V | |
| 1024x768 Lowest Settings possible | |
| Lenovo Yoga Slim 7-14ARE | |
| Média Intel Iris Xe Graphics G7 96EUs (52 - 166.4, n=168) | |
| Dell XPS 13 9310 2-in-1 | |
| Lenovo Yoga 6 13 82ND0009US | |
| 1920x1080 Lowest Settings possible | |
| Dell XPS 13 9310 2-in-1 | |
| Média Intel Iris Xe Graphics G7 96EUs (34.7 - 132.1, n=141) | |
| Lenovo Yoga Slim 7-14ARE | |
| Lenovo Yoga 6 13 82ND0009US | |
| 1366x768 Normal/Off AF:4x | |
| Média Intel Iris Xe Graphics G7 96EUs (24.1 - 152.7, n=169) | |
| Dell XPS 13 9310 2-in-1 | |
| 1920x1080 Normal/Off AF:4x | |
| Dell XPS 13 9310 2-in-1 | |
| Lenovo Yoga Slim 7-14ARE | |
| Média Intel Iris Xe Graphics G7 96EUs (20 - 119.3, n=142) | |
| Lenovo Yoga 6 13 82ND0009US | |
| 1920x1080 High/On (Advanced Graphics Off) AA:2xMSAA + FX AF:8x | |
| Lenovo Yoga Slim 7-14ARE | |
| Dell XPS 13 9310 2-in-1 | |
| Média Intel Iris Xe Graphics G7 96EUs (9.39 - 51.6, n=162) | |
| Lenovo Yoga 6 13 82ND0009US | |
| 1920x1080 Highest AA:4xMSAA + FX AF:16x | |
| Lenovo Yoga Slim 7-14ARE | |
| Dell XPS 13 9310 2-in-1 | |
| Média Intel Iris Xe Graphics G7 96EUs (4.13 - 22.9, n=156) | |
| Lenovo Yoga 6 13 82ND0009US | |
| Far Cry 5 | |
| 1280x720 Low Preset AA:T | |
| Dell XPS 13 9310 2-in-1 | |
| Média Intel Iris Xe Graphics G7 96EUs (23 - 75, n=93) | |
| 1920x1080 Low Preset AA:T | |
| Média Intel Iris Xe Graphics G7 96EUs (15 - 48, n=41) | |
| Dell XPS 13 9310 2-in-1 | |
| 1920x1080 Medium Preset AA:T | |
| Média Intel Iris Xe Graphics G7 96EUs (14 - 39, n=91) | |
| Dell XPS 13 9310 2-in-1 | |
| 1920x1080 High Preset AA:T | |
| Média Intel Iris Xe Graphics G7 96EUs (10 - 35, n=89) | |
| Dell XPS 13 9310 2-in-1 | |
| 1920x1080 Ultra Preset AA:T | |
| Média Intel Iris Xe Graphics G7 96EUs (11 - 33, n=75) | |
| Dell XPS 13 9310 2-in-1 | |
Witcher 3 FPS Chart
| baixo | média | alto | ultra | |
|---|---|---|---|---|
| GTA V (2015) | 96.7 | 80.5 | 25.4 | 10 |
| The Witcher 3 (2015) | 86.2 | 54.3 | 29.9 | 14.7 |
| Dota 2 Reborn (2015) | 109 | 61.4 | 52.8 | 52.8 |
| Final Fantasy XV Benchmark (2018) | 36.8 | 21.8 | 15.9 | |
| X-Plane 11.11 (2018) | 23.5 | 31.9 | 31.3 | |
| Far Cry 5 (2018) | 49 | 23 | 22 | 22 |
| Strange Brigade (2018) | 78.1 | 36.8 | 29.4 | 24 |
Emissions
Ruído do sistema - Silencioso sob a maioria das cargas baixas a médias
O comportamento do ventilador é quase idêntico ao que observamos no XPS 13 7390 2 em 1. A principal diferença é que o ruído dos ventiladores pode aumentar mais cedo quando se trabalha com cargas elevadas como 3DMark 06 possivelmente devido aos limites mais altos de Turbo Boost e PL2 de Tiger Lake-U quando comparado a Ice Lake. Caso contrário, os usuários podem esperar um ruído do ventilador entre 38 a 43 dB(A) ao executar cargas exigentes ou até 27,2 dB(A) ao fazer streaming de vídeo ou navegar na web contra um fundo silencioso de 24,3 dB(A). O novo Galaxy Book Pro 360 13 exibiria resultados semelhantes.
| Dell XPS 13 9310 2-in-1 Iris Xe G7 96EUs, i7-1165G7, Toshiba BG4 KBG40ZPZ512G | Dell XPS 13 9310 Core i7 FHD Iris Xe G7 96EUs, i7-1165G7, Micron 2300 512GB MTFDHBA512TDV | Dell XPS 13 7390 2-in-1 Core i7 Iris Plus Graphics G7 (Ice Lake 64 EU), i7-1065G7, Toshiba BG4 KBG40ZPZ512G | Lenovo Yoga 6 13 82ND0009US Vega 7, R5 5500U, WDC PC SN530 SDBPMPZ-265G | Asus ZenBook Flip 13 UX363EA-HP069T Iris Xe G7 96EUs, i7-1165G7, WDC PC SN730 SDBPNTY-1T00 | Samsung Galaxy Book Pro 360 13 Iris Xe G7 80EUs, i5-1135G7, Samsung PM991 MZVLQ256HAJD | |
|---|---|---|---|---|---|---|
| Noise | 4% | -8% | -1% | -12% | -7% | |
| desligado / ambiente * (dB) | 24.3 | 25.7 -6% | 28.1 -16% | 25.1 -3% | 27 -11% | 27 -11% |
| Idle Minimum * (dB) | 24.8 | 25.7 -4% | 28.1 -13% | 25.1 -1% | 27 -9% | 27 -9% |
| Idle Average * (dB) | 24.8 | 25.7 -4% | 28.1 -13% | 25.1 -1% | 27 -9% | 27 -9% |
| Idle Maximum * (dB) | 24.8 | 25.9 -4% | 28.1 -13% | 25.1 -1% | 27 -9% | 27 -9% |
| Load Average * (dB) | 38 | 26.2 31% | 31.7 17% | 41 -8% | 46 -21% | 40.7 -7% |
| Witcher 3 ultra * (dB) | 38 | 36.5 4% | 43.4 -14% | 38.6 -2% | ||
| Load Maximum * (dB) | 41.5 | 36.6 12% | 43.4 -5% | 38.7 7% | 46.6 -12% | 40.7 2% |
* ... menor é melhor
Barulho
| Ocioso |
| 24.8 / 24.8 / 24.8 dB |
| Carga |
| 38 / 41.5 dB |
 | ||
30 dB silencioso 40 dB(A) audível 50 dB(A) ruidosamente alto |
||
min: | ||
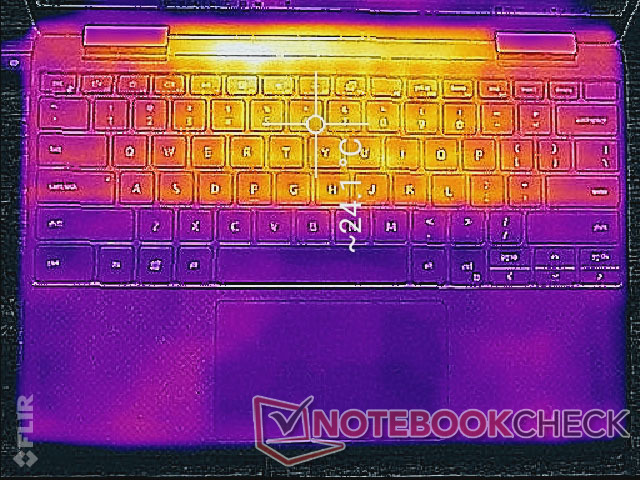
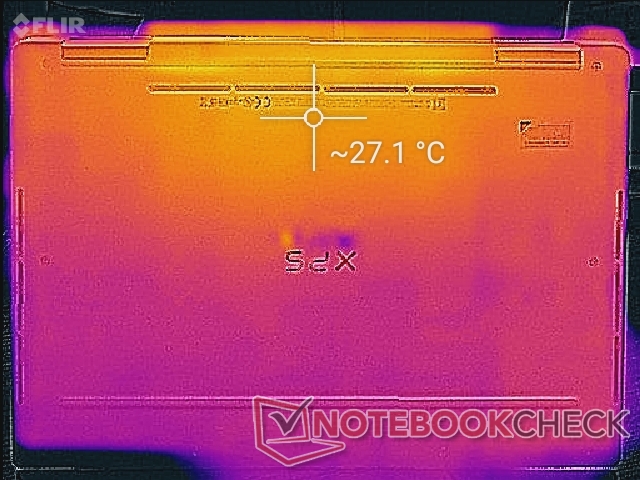
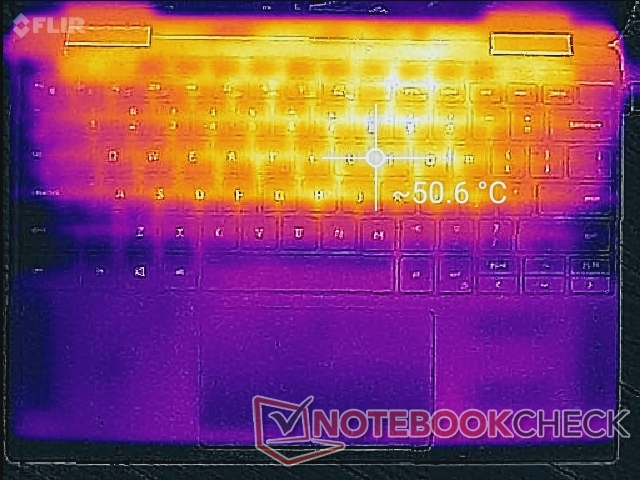
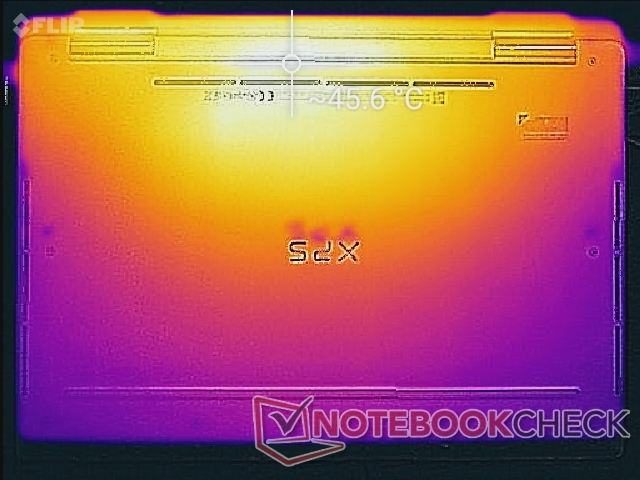
Temperatura - Descansos relativamente frios para palma
As temperaturas de superfície são quase idênticas ao que observamos no site Ice Lake- com o XPS 13 7390 2 em 1 a cerca de 50 C e 57 C nos pontos quentes superiores e inferiores, respectivamente. O deck do teclado continua a ser visivelmente mais quente do que na maioria dos outros sub-portáteis, incluindo o novoSamsung Galaxy Book Pro 360.
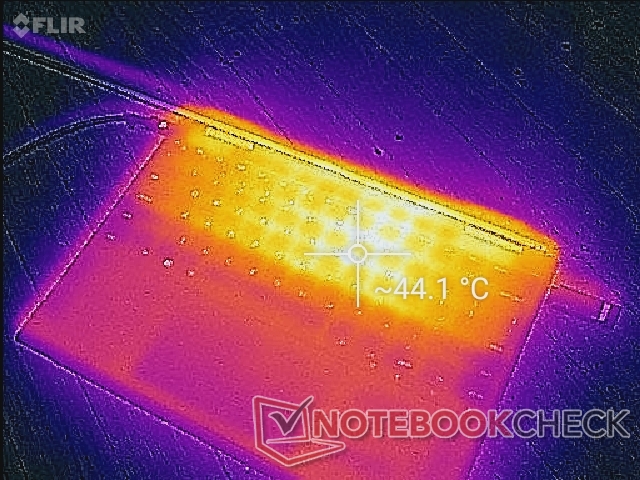
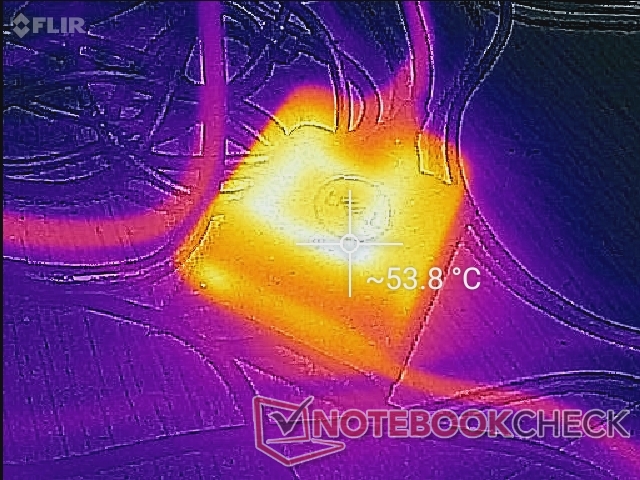
(-) A temperatura máxima no lado superior é 51 °C / 124 F, em comparação com a média de 35.4 °C / 96 F , variando de 19.6 a 60 °C para a classe Convertible.
(-) A parte inferior aquece até um máximo de 45.4 °C / 114 F, em comparação com a média de 36.9 °C / 98 F
(+) Em uso inativo, a temperatura média para o lado superior é 22.9 °C / 73 F, em comparação com a média do dispositivo de 30.3 °C / ### class_avg_f### F.
(+) Os apoios para as mãos e o touchpad são mais frios que a temperatura da pele, com um máximo de 30.6 °C / 87.1 F e, portanto, são frios ao toque.
(-) A temperatura média da área do apoio para as mãos de dispositivos semelhantes foi 28 °C / 82.4 F (-2.6 °C / -4.7 F).
Teste de Estresse - Taxas de Relógio de Ciclismo e Taxas de Armação
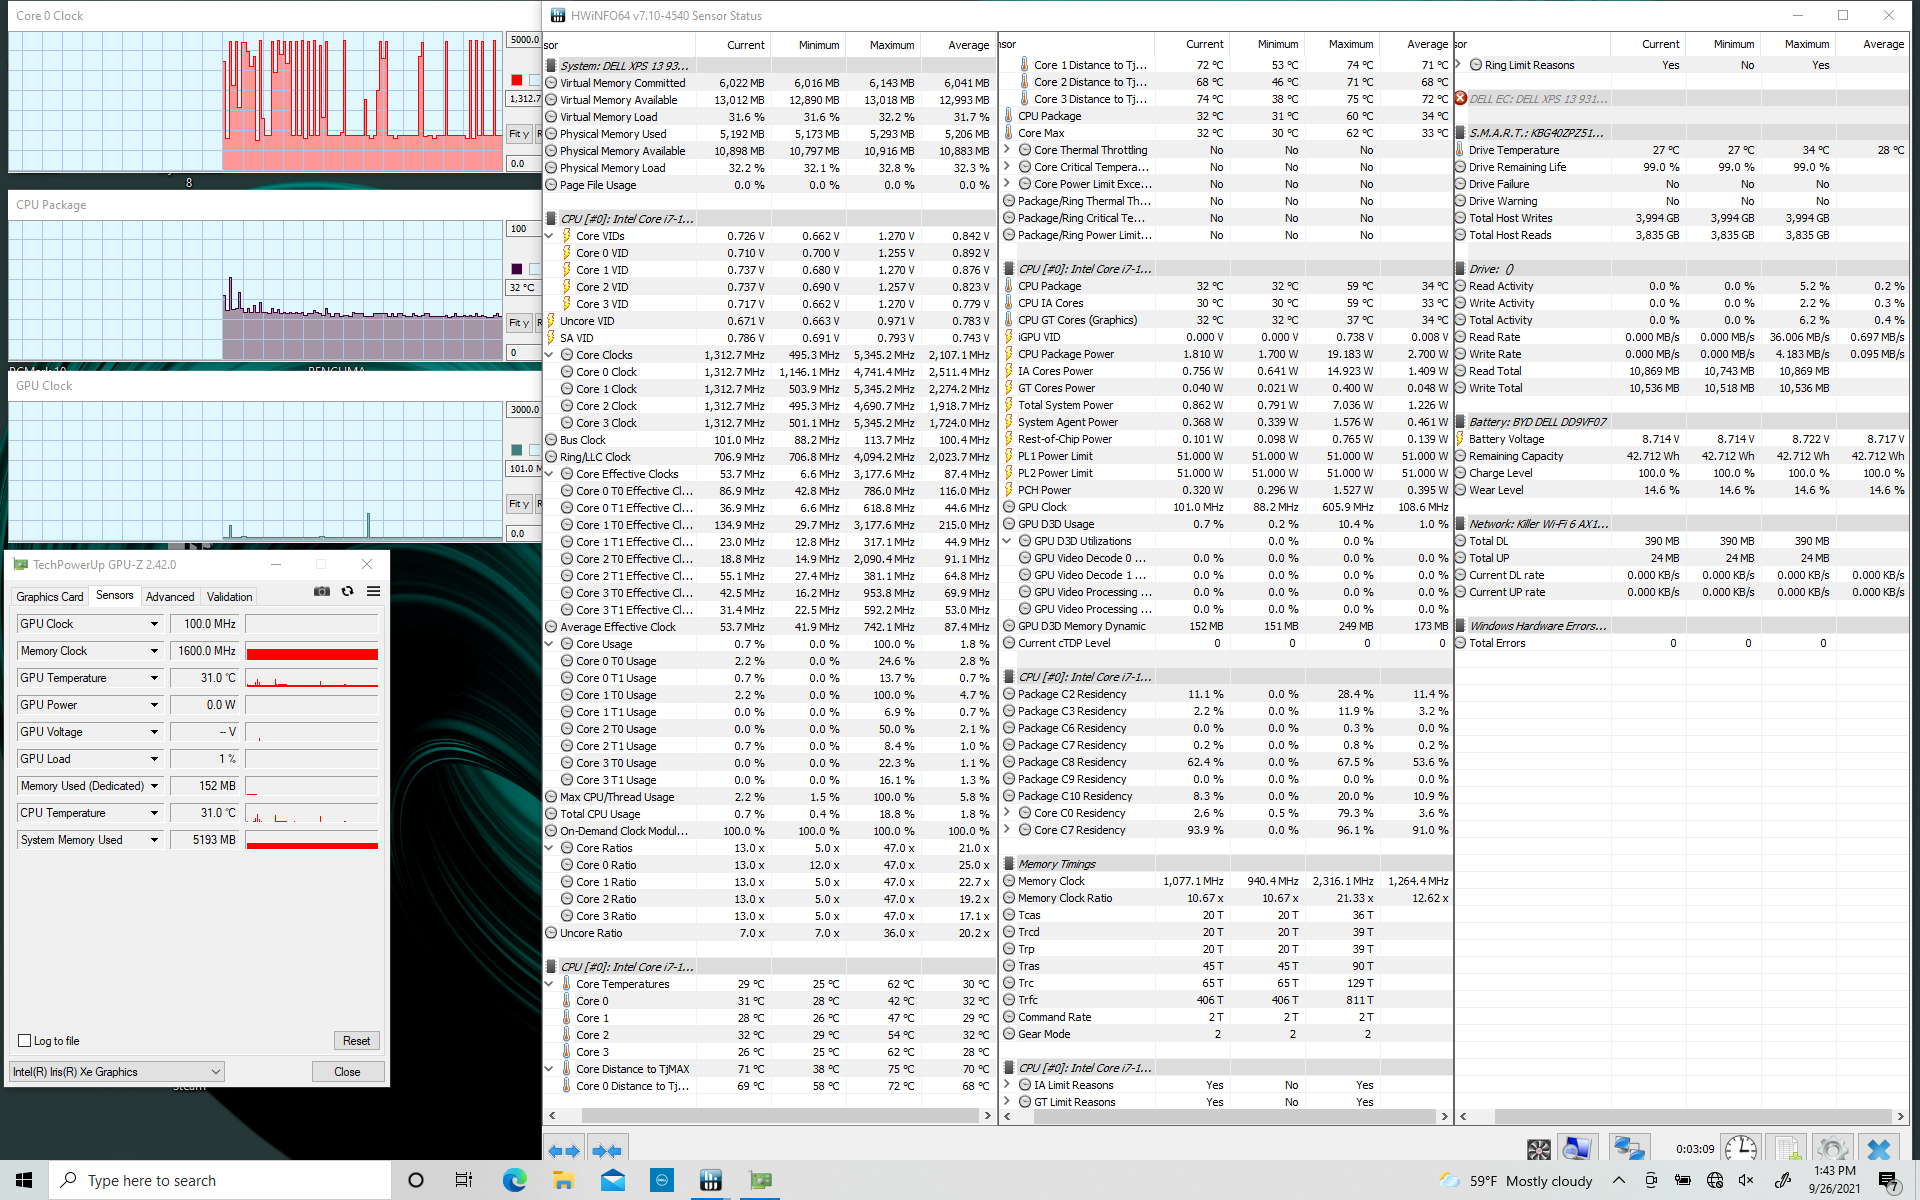
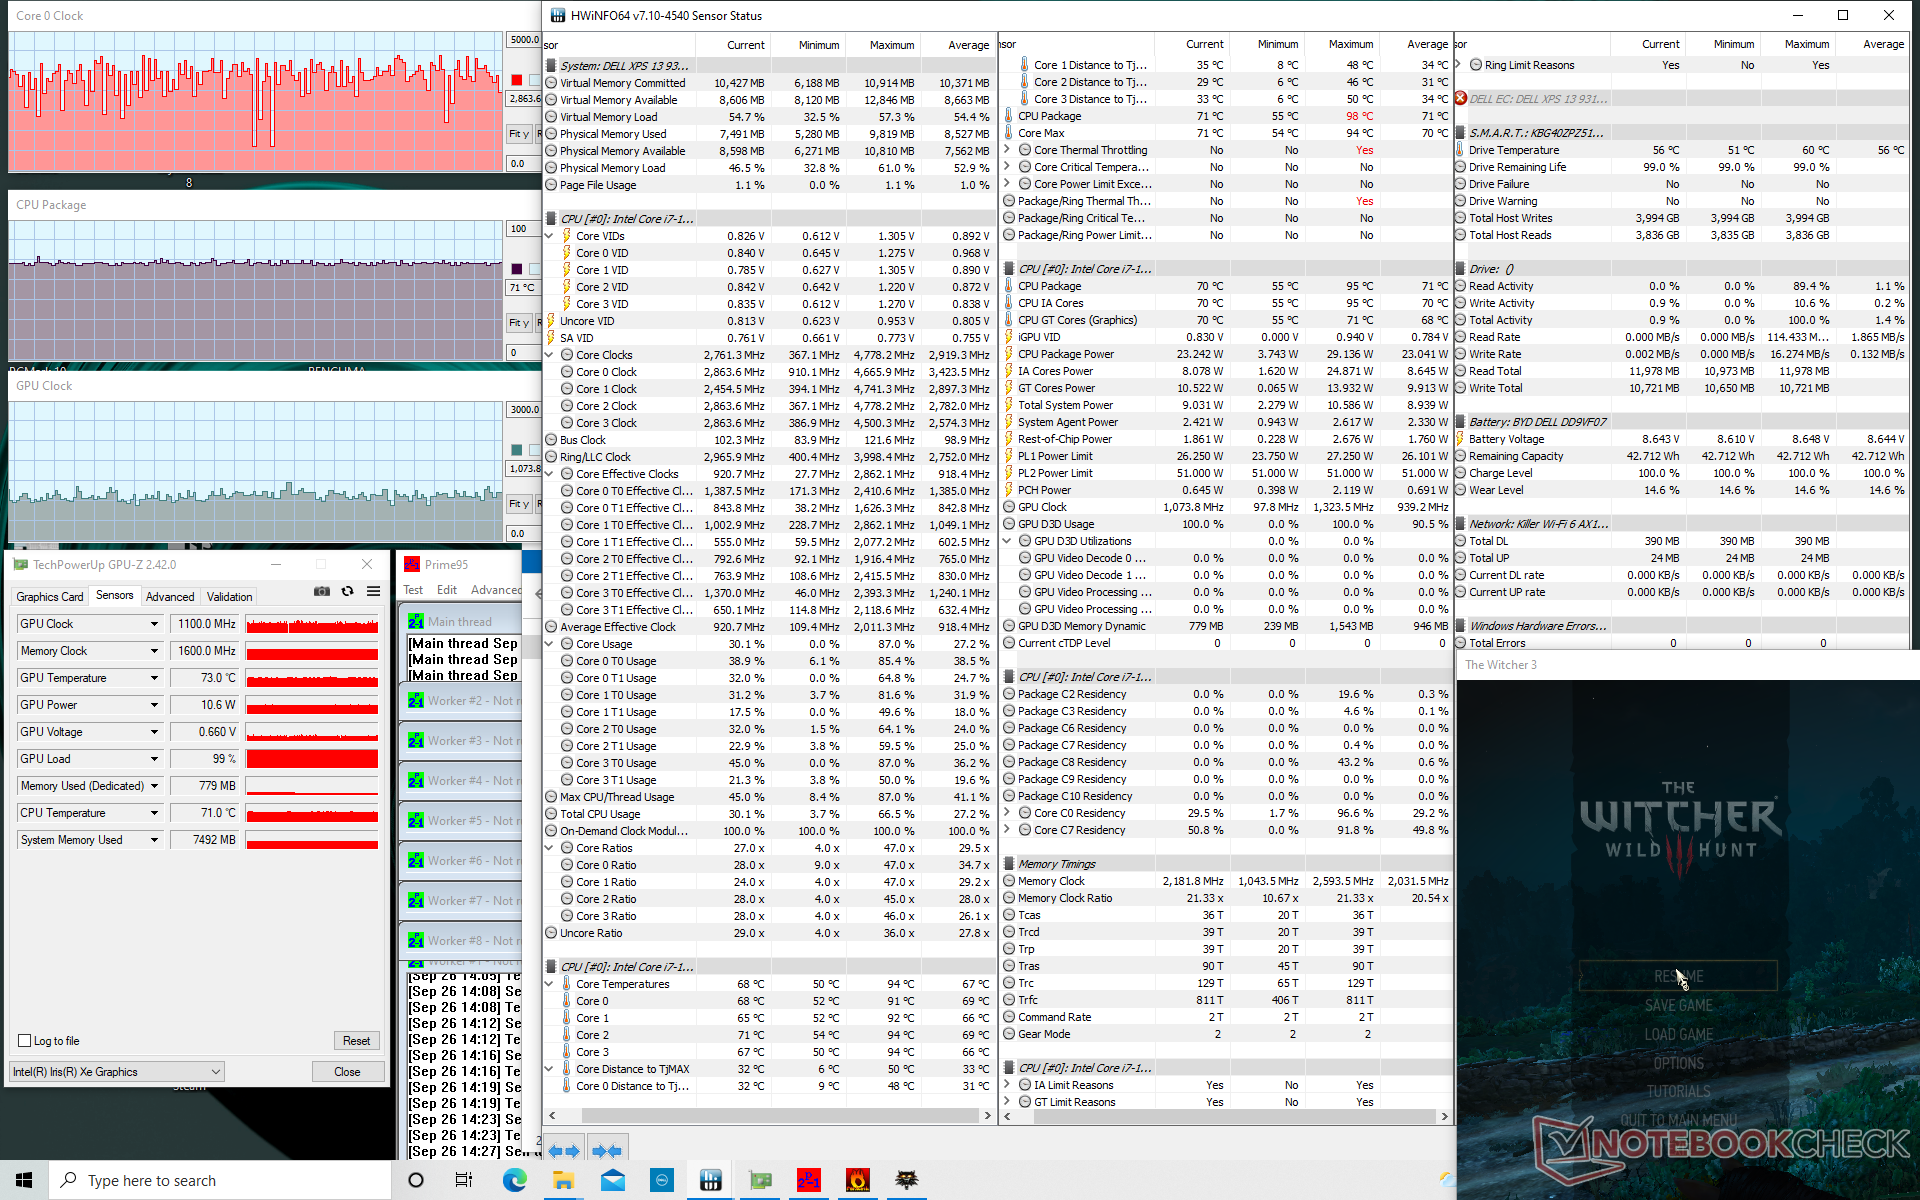
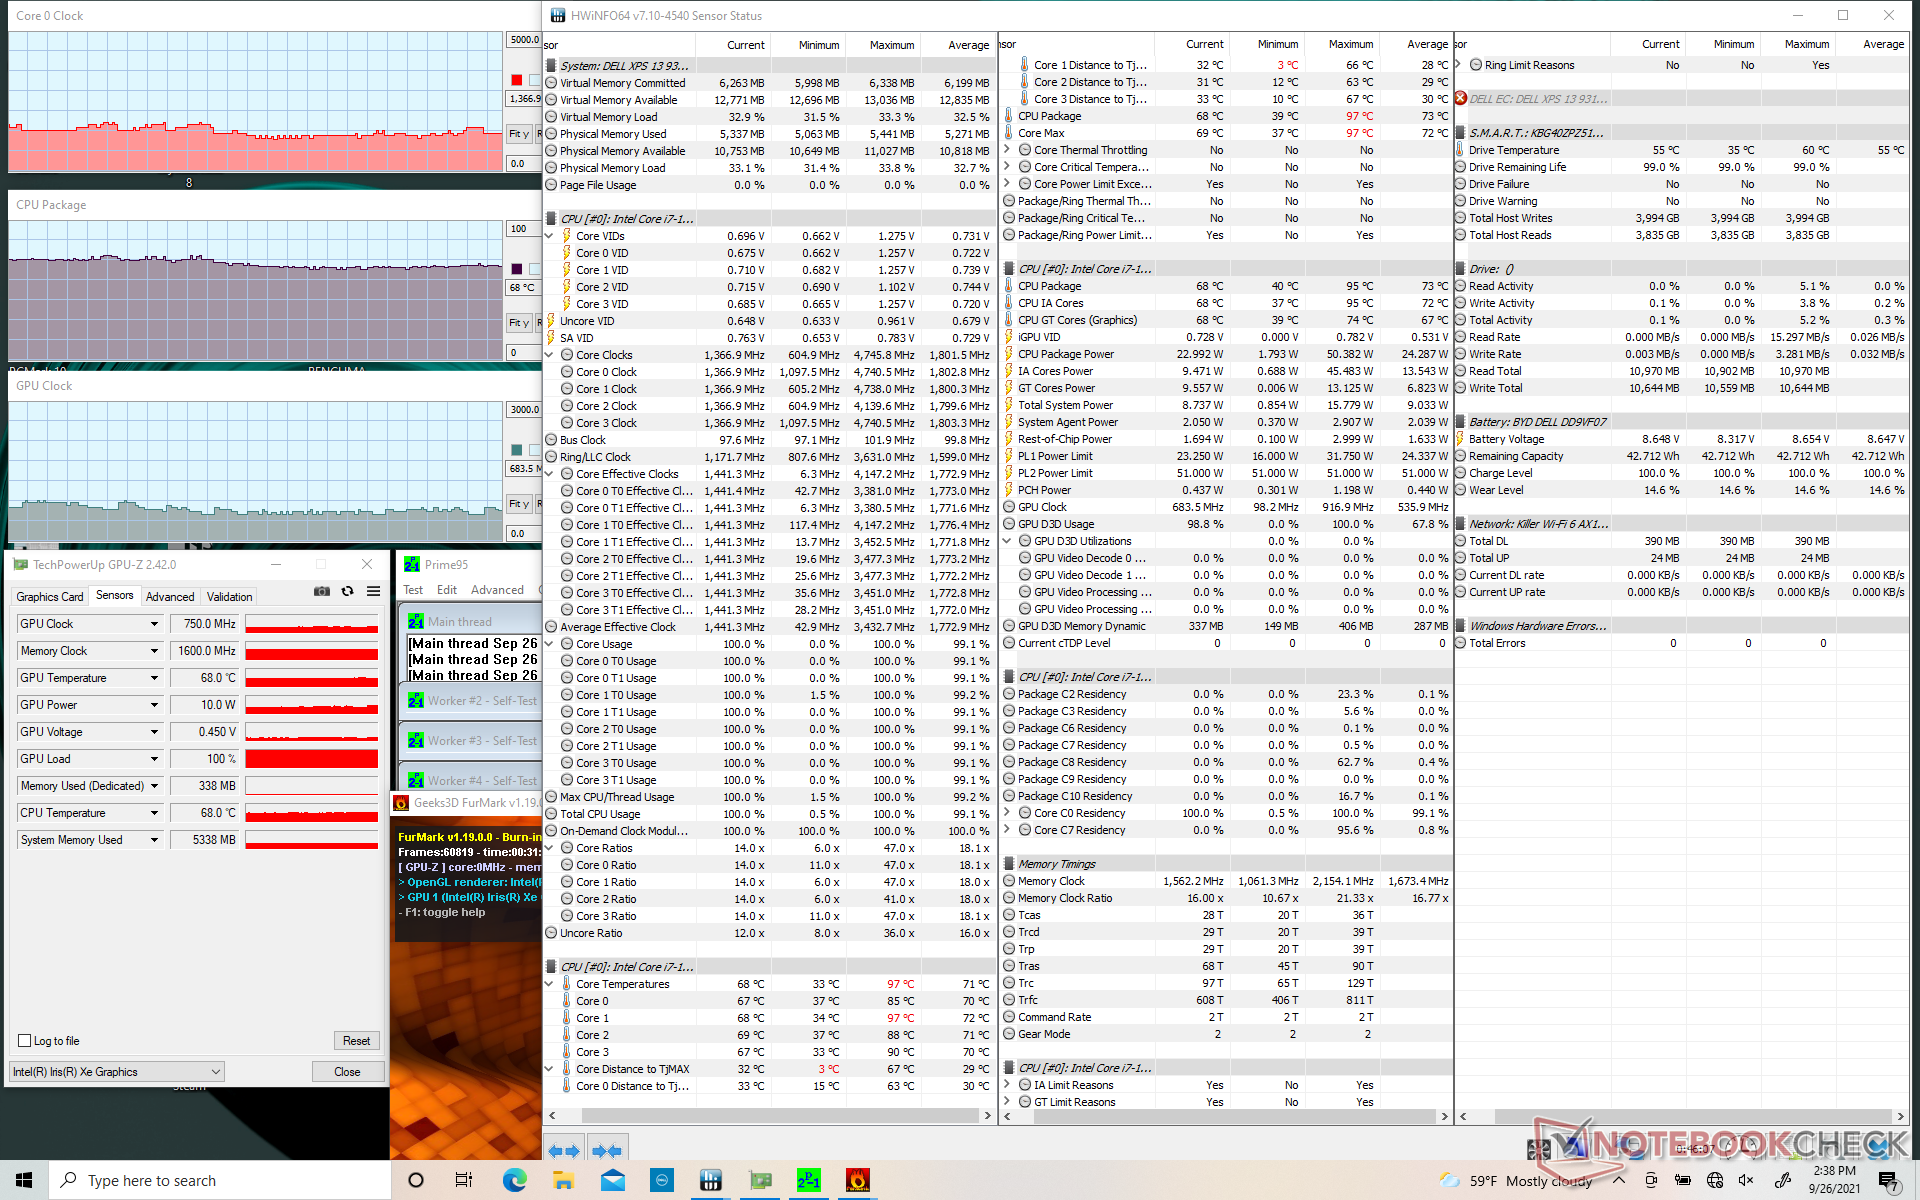
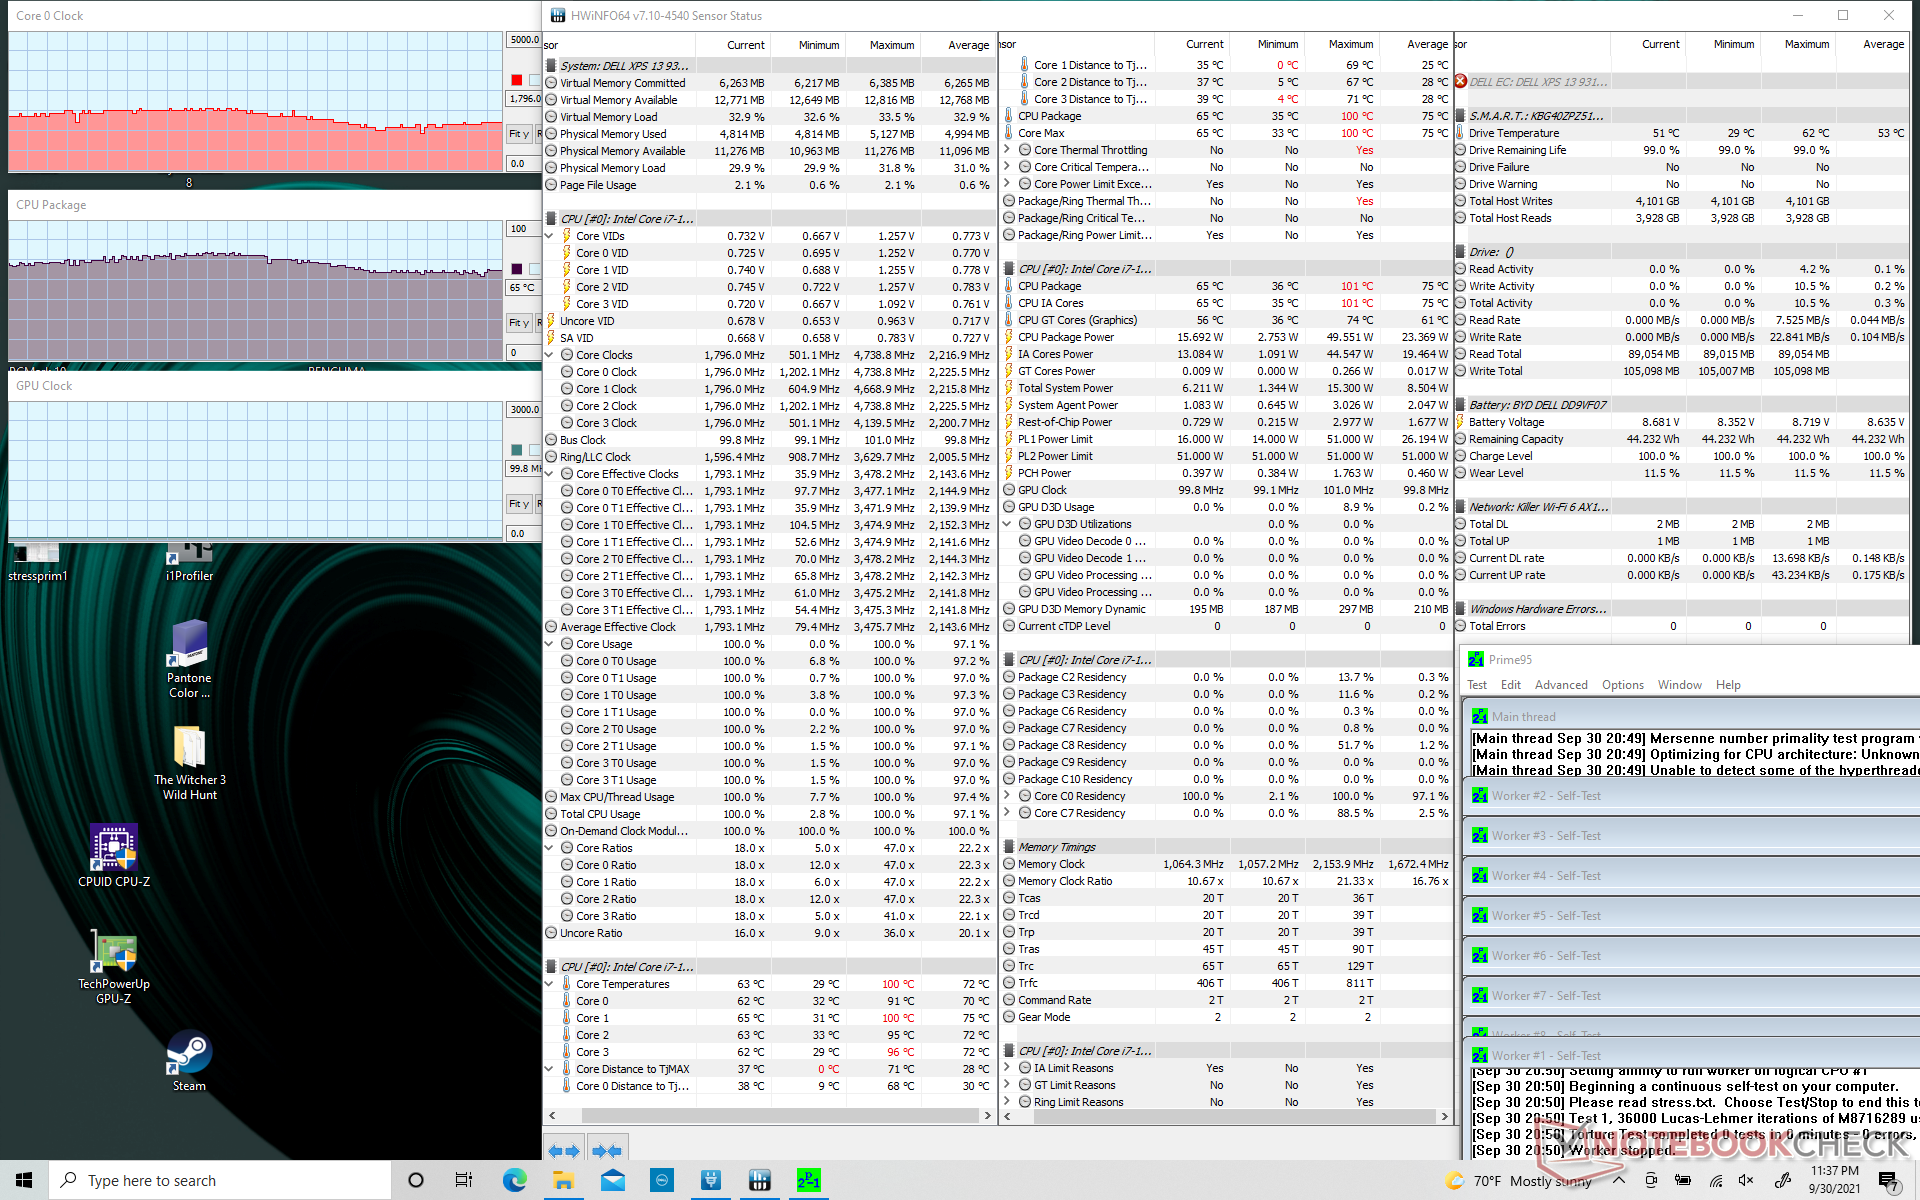
Quando estressado com Prime95, as taxas de relógio da CPU e a temperatura aumentariam e permaneceriam estáveis até 2,9 GHz e 100 C durante os primeiros minutos. Depois disso, as taxas de relógio e a temperatura cairiam e se estabilizariam na faixa de 1,8 a 2,2 GHz e 66 a 75 C, respectivamente, mesmo quando definidas para o modo Ultra Performance através do software Dell Power Manager. Em comparação, o XPS 13 7390 2 em 1 do tipo Ice Lake estabilizaria tanto em taxas de relógio centrais quanto em temperaturas mais altas. Assim, parece que o mais novo XPS 13 9310 2 em 1 está visando temperaturas centrais mais baixas, embora ao custo de um maior desempenho do Turbo Boost. As taxas de relógio de ciclismo quando sob tensão espelham nossas pontuações de loop de ciclismo CineBench R15 xT de cima
As taxas de relógio GPU também cicatrizariam entre 800 e 1280 MHz ao rodar Witcher 3 que também espelham nossas taxas de quadro de ciclismo mencionadas acima. É lamentável que não exista uma "opção de desempenho estável" disponível no XPS 13 para usuários que possam preferir este comportamento de ciclismo
O funcionamento com energia de bateria limitará o desempenho. Um teste 3DMark 11 com baterias retornaria pontuações de Física e Gráficos de 9805 e 5106 pontos, respectivamente, em comparação com 11424 e 6569 pontos quando em rede elétrica.

| RelógioCPU (GHz) | RelógioGPU (MHz) | Temperaturamédiada CPU (°C) | |
| System Idle | -- | --32 | |
| Prime95 Stress | 1.8 - 2.2 | ----66 - 75 | |
| Prime95 + FurMark Stress | 1.4 - 1.6 | ~650 - 750 | 68 |
| Witcher 3 Stress | ~0.6 - 1.4 | ~800 - 1280 | 71 |
Oradores

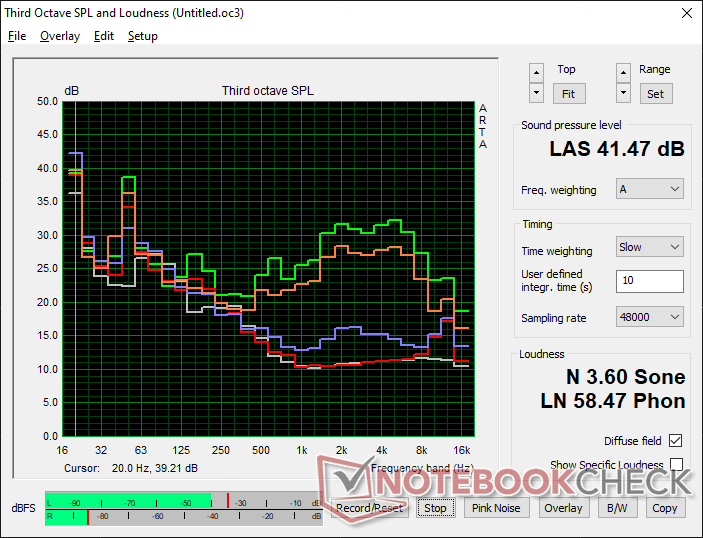
Dell XPS 13 9310 2-in-1 análise de áudio
(±) | o volume do alto-falante é médio, mas bom (###valor### dB)
Graves 100 - 315Hz
(±) | graves reduzidos - em média 11.7% menor que a mediana
(±) | a linearidade dos graves é média (10.6% delta para a frequência anterior)
Médios 400 - 2.000 Hz
(±) | médios mais altos - em média 6.1% maior que a mediana
(+) | médios são lineares (4.1% delta para frequência anterior)
Altos 2 - 16 kHz
(+) | agudos equilibrados - apenas 1.4% longe da mediana
(+) | os máximos são lineares (3.6% delta da frequência anterior)
Geral 100 - 16.000 Hz
(+) | o som geral é linear (12.7% diferença em relação à mediana)
Comparado com a mesma classe
» 16% de todos os dispositivos testados nesta classe foram melhores, 2% semelhantes, 82% piores
» O melhor teve um delta de 6%, a média foi 20%, o pior foi 57%
Comparado com todos os dispositivos testados
» 12% de todos os dispositivos testados foram melhores, 3% semelhantes, 86% piores
» O melhor teve um delta de 4%, a média foi 23%, o pior foi 134%
Apple MacBook 12 (Early 2016) 1.1 GHz análise de áudio
(+) | os alto-falantes podem tocar relativamente alto (###valor### dB)
Graves 100 - 315Hz
(±) | graves reduzidos - em média 11.3% menor que a mediana
(±) | a linearidade dos graves é média (14.2% delta para a frequência anterior)
Médios 400 - 2.000 Hz
(+) | médios equilibrados - apenas 2.4% longe da mediana
(+) | médios são lineares (5.5% delta para frequência anterior)
Altos 2 - 16 kHz
(+) | agudos equilibrados - apenas 2% longe da mediana
(+) | os máximos são lineares (4.5% delta da frequência anterior)
Geral 100 - 16.000 Hz
(+) | o som geral é linear (10.2% diferença em relação à mediana)
Comparado com a mesma classe
» 7% de todos os dispositivos testados nesta classe foram melhores, 2% semelhantes, 90% piores
» O melhor teve um delta de 5%, a média foi 18%, o pior foi 53%
Comparado com todos os dispositivos testados
» 5% de todos os dispositivos testados foram melhores, 1% semelhantes, 94% piores
» O melhor teve um delta de 4%, a média foi 23%, o pior foi 134%
Energy Management
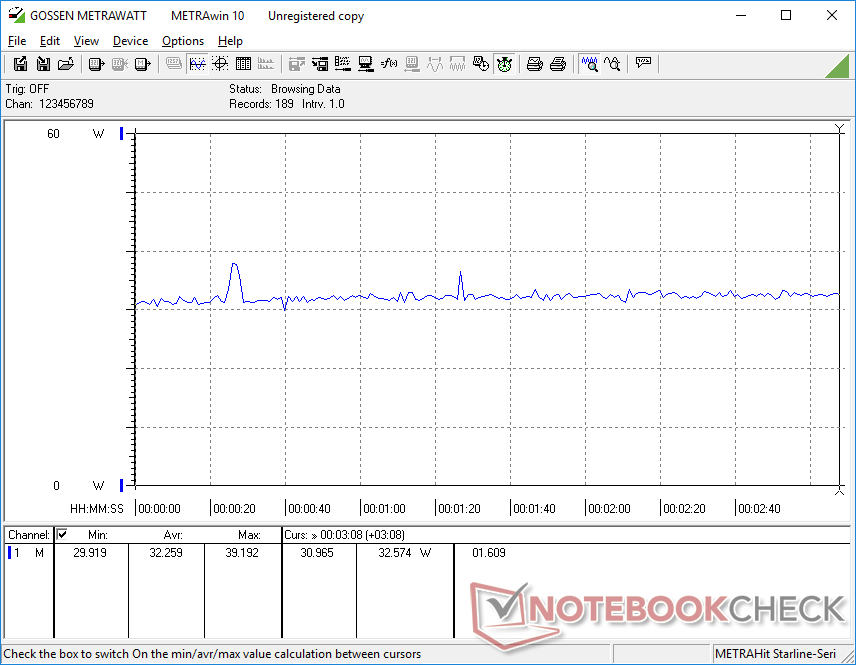
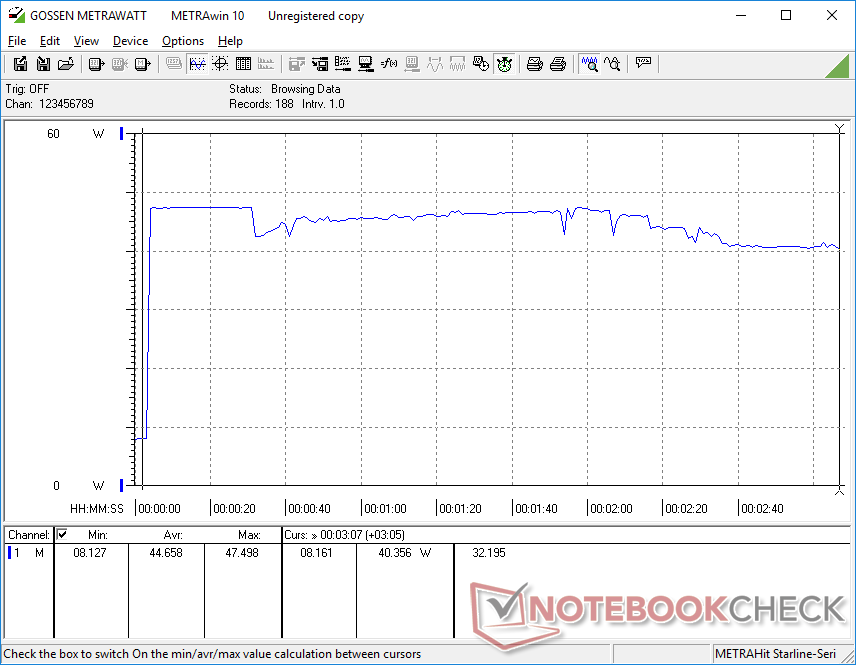
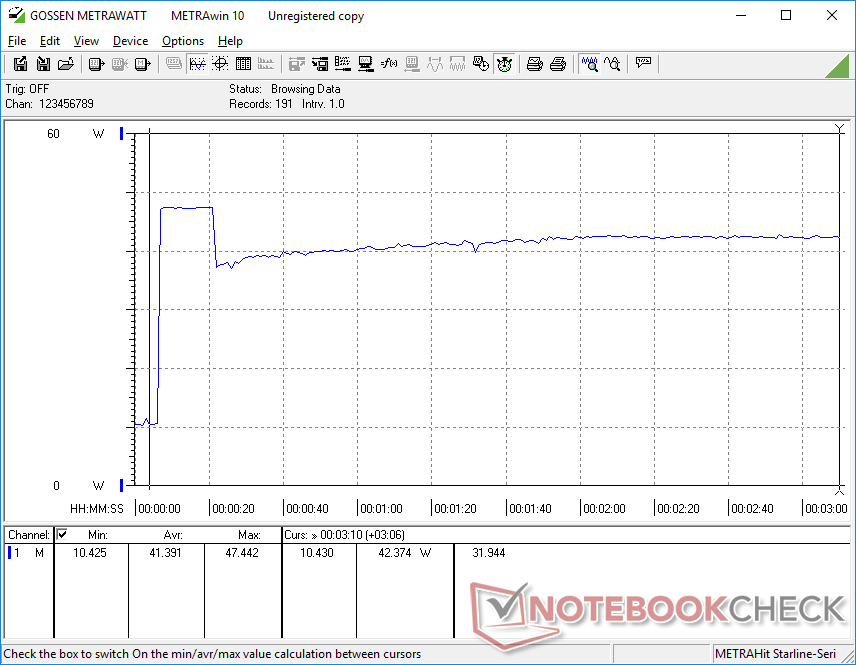
Consumo de energia - Muito mais eficiente em termos de energia
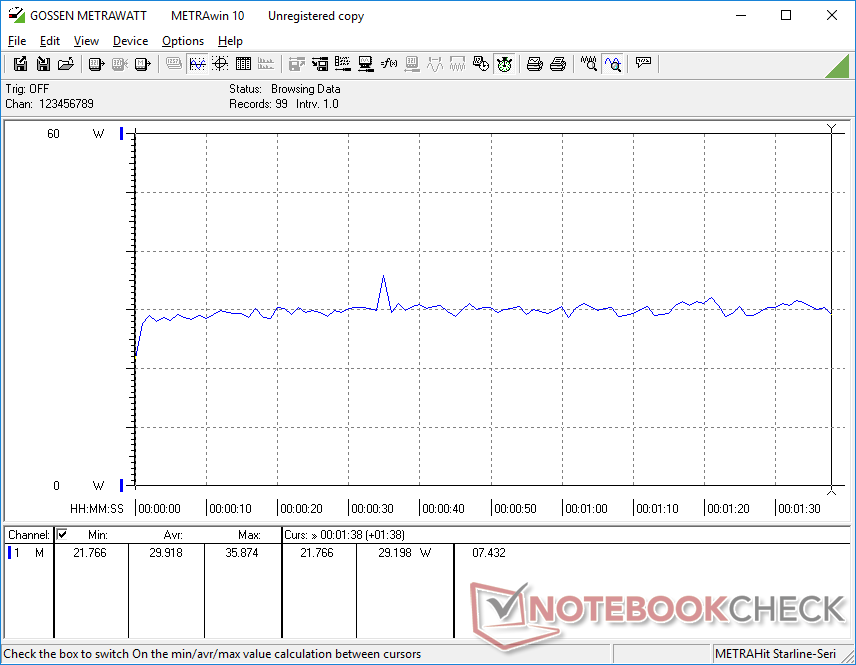
O sistema consome menos energia nos jogos do que no antigo XPS 13 7390 2 em 1, apesar do aumento substancial no desempenho gráfico. Isto mostra o quanto o Iris Xe pode ser superior ao Iris Plus G7 tanto em termos de eficiência energética quanto de desempenho.
| desligado | |
| Ocioso | |
| Carga |
|
Key:
min: | |
| Dell XPS 13 9310 2-in-1 i7-1165G7, Iris Xe G7 96EUs, Toshiba BG4 KBG40ZPZ512G, IPS, 1920x1200, 13.4" | Dell XPS 13 9310 Core i7 FHD i7-1165G7, Iris Xe G7 96EUs, Micron 2300 512GB MTFDHBA512TDV, IPS, 1920x1200, 13.4" | Dell XPS 13 7390 2-in-1 Core i7 i7-1065G7, Iris Plus Graphics G7 (Ice Lake 64 EU), Toshiba BG4 KBG40ZPZ512G, IPS, 1920x1200, 13.4" | Lenovo Yoga 6 13 82ND0009US R5 5500U, Vega 7, WDC PC SN530 SDBPMPZ-265G, IPS, 1920x1080, 13.3" | Asus ZenBook Flip 13 UX363EA-HP069T i7-1165G7, Iris Xe G7 96EUs, WDC PC SN730 SDBPNTY-1T00, OLED, 1920x1080, 13.3" | Samsung Galaxy Book Pro 360 13 i5-1135G7, Iris Xe G7 80EUs, Samsung PM991 MZVLQ256HAJD, AMOLED, 1920x1080, 13.2" | |
|---|---|---|---|---|---|---|
| Power Consumption | -11% | -9% | -20% | -11% | -22% | |
| Idle Minimum * (Watt) | 2.6 | 3.9 -50% | 2.6 -0% | 5 -92% | 4.4 -69% | 5 -92% |
| Idle Average * (Watt) | 6.4 | 5.9 8% | 5.3 17% | 6.3 2% | 7.4 -16% | 6 6% |
| Idle Maximum * (Watt) | 7.7 | 6.3 18% | 7 9% | 6.9 10% | 11.3 -47% | 11.7 -52% |
| Load Average * (Watt) | 29.9 | 39.7 -33% | 43.1 -44% | 41.5 -39% | 22 26% | 28 6% |
| Witcher 3 ultra * (Watt) | 32.2 | 34.8 -8% | 43.1 -34% | 33.2 -3% | 22.8 29% | 28.3 12% |
| Load Maximum * (Watt) | 47.5 | 47.5 -0% | 49 -3% | 46.5 2% | 42.5 11% | 53 -12% |
* ... menor é melhor
Power Consumption Witcher 3 / Stresstest
Duração da bateria - Tempos de funcionamento de dois dígitos
Os tempos de execução são muito próximos ao que registramos no clamshell XPS 13 9310, sendo quase duas horas mais longos do que no antigo XPS 13 7390 2 em 1. Com 11 horas de navegação WLAN no mundo real, a bateria deve ser suficiente para um dia de uso produtivo
A carga de vazio a plena capacidade ainda leva cerca de 1,5 horas. O adaptador USB-C de 45 W também pode ser usado para carregar outros dispositivos.
| Dell XPS 13 9310 2-in-1 i7-1165G7, Iris Xe G7 96EUs, 51 Wh | Dell XPS 13 9310 Core i7 FHD i7-1165G7, Iris Xe G7 96EUs, 52 Wh | Dell XPS 13 7390 2-in-1 Core i7 i7-1065G7, Iris Plus Graphics G7 (Ice Lake 64 EU), 51 Wh | Lenovo Yoga 6 13 82ND0009US R5 5500U, Vega 7, 60 Wh | Asus ZenBook Flip 13 UX363EA-HP069T i7-1165G7, Iris Xe G7 96EUs, 67 Wh | Samsung Galaxy Book Pro 360 13 i5-1135G7, Iris Xe G7 80EUs, 63 Wh | |
|---|---|---|---|---|---|---|
| Duração da bateria | 5% | -16% | -16% | -6% | 12% | |
| Reader / Idle (h) | 25.4 | 30 18% | 17.5 -31% | 20.5 -19% | 31.3 23% | |
| WiFi v1.3 (h) | 10.7 | 11 3% | 9 -16% | 13.2 23% | 10.7 0% | 12.1 13% |
| Load (h) | 3.4 | 3.2 -6% | 2 -41% | 3.4 0% | 3.4 0% |
Pro
Contra
Veredicto - Mais rápido, sem custos adicionais
O XPS 13 9310 2 em 1 oferece desempenho gráfico significativamente mais rápido do que o XPS 13 7390 2 em 1. Melhor ainda, o sistema realiza isto sob o mesmo envelope de energia, o que significa que os usuários estão obtendo melhores gráficos sem a necessidade de sacrificar os tempos de funcionamento da bateria, temperaturas de superfície ou ruído do ventilador ao longo do caminho. Se você fizer muito trabalho de edição gráfica, então sem dúvida você se beneficiará muito se mudar para o Iris Xe do antigo UHD Graphics ou do Iris Plus G7 do ano passado.
Intel Iris Xe tem sido uma grande vantagem para a série XPS 13, mas as taxas de clock da CPU e GPU instáveis quando comparadas à maioria dos outros Ultrabooks ou subnotebooks podem ser irritantes para alguns usuários de energia.
Infelizmente, o desempenho do processador mal melhorou a partir do Core i7 XPS 13 7390 2 em 1. As taxas de relógio tendem a flutuar muito mais rapidamente em nosso Core i7 XPS 13 9310 2 em 1, enquanto a falta de quaisquer novas opções de exibição é um incentivo a menos para possuir o modelo mais novo. Como resultado, muitos usuários domésticos encontrarão pouco a ganhar na melhor das hipóteses com o XPS 13 9310 2 em 1 quando comparado com o XPS 13 7390 2 em 1, especialmente quando o modelo mais antigo pode ser encontrado mais barato.
Preço e disponibilidade
Dell XPS 13 9310 2-in-1
- 10/02/2021 v7 (old)
Allen Ngo
Price comparison

