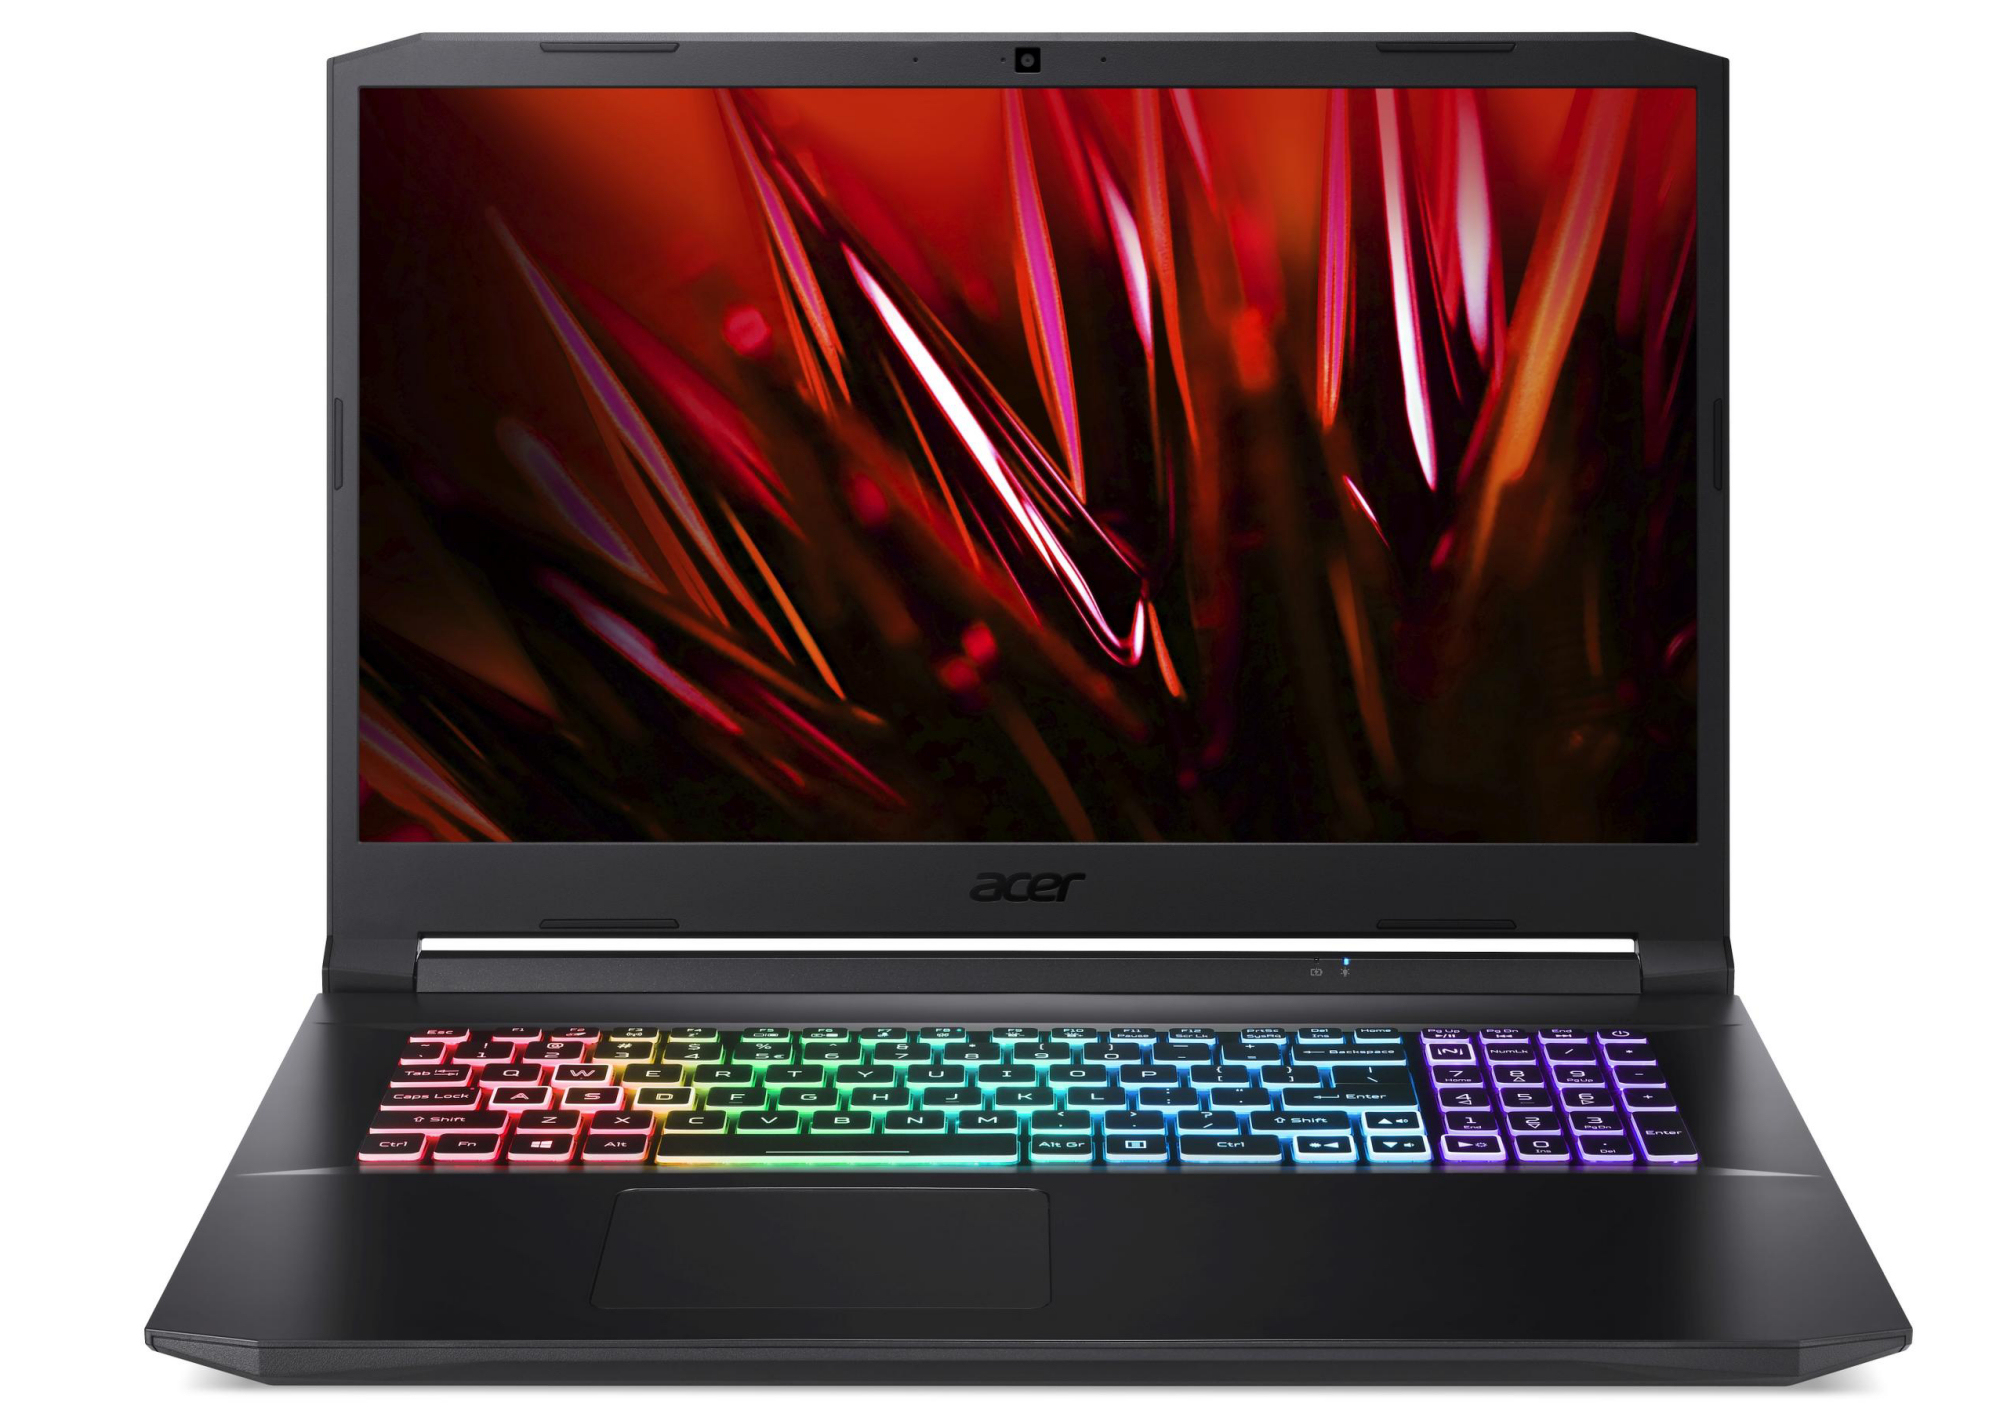
Acer Nitro 5 AN517-41 em revisão: GeForce RTX 3070 na contra-câmara

A Acer tem um notebook para jogos de médio porte na classe de 17,3 polegadas em sua linha com o Nitro 5, que é alimentado por um Ryzen 7-5800HAPU e um GeForce RTX-3070 Laptop Núcleo gráfico. A variante de configuração que temos está disponível por pouco menos de 1.500 Euros (~$1764). Os concorrentes incluem dispositivos como oMSI GP76 Leopard 10UGoSchenker XMG Core 17 (Início de 2021), oAsus TUF Gaming F17 FX706HM, e oMSI Katana GF76 11UE - os três últimos são os cadernos RTX 3060 que têm o mesmo preço do Nitro 5.
Notebooks RTX 3070 de 17,3 polegadas de preço comparável praticamente não são encontrados atualmente em nosso banco de dados. Portanto, também consideramos os dispositivos RTX 3070 de 15,6 polegadas, tais como o Asus TUF Gaming A15 FA506QR e o Aorus 15G XC. 17.Existem contrapartidas de 3 polegadas de ambos os computadores.
Possible competitors in comparison
Avaliação | Data | Modelo | Peso | Altura | Size | Resolução | Preço |
|---|---|---|---|---|---|---|---|
| 81.3 % v7 (old) | 08/2021 | Acer Nitro 5 AN517-41-R5Z7 R7 5800H, GeForce RTX 3070 Laptop GPU | 2.7 kg | 24.9 mm | 17.30" | 1920x1080 | |
| 80.4 % v7 (old) | 06/2021 | MSI Katana GF76 11UE i7-11800H, GeForce RTX 3060 Laptop GPU | 2.7 kg | 25.2 mm | 17.30" | 1920x1080 | |
| 83.9 % v7 (old) | 06/2021 | Schenker XMG Core 17 (Early 2021) i7-10870H, GeForce RTX 3060 Laptop GPU | 2.5 kg | 30.05 mm | 17.30" | 2560x1440 | |
| 82.8 % v7 (old) | 06/2021 | Asus TUF Gaming F17 FX706HM i9-11900H, GeForce RTX 3060 Laptop GPU | 2.7 kg | 26 mm | 17.30" | 1920x1080 | |
| 85.1 % v7 (old) | 03/2021 | MSI GP76 Leopard 10UG i7-10750H, GeForce RTX 3070 Laptop GPU | 2.9 kg | 26 mm | 17.30" | 1920x1080 | |
| 86.4 % v7 (old) | 02/2021 | Aorus 15G XC i7-10870H, GeForce RTX 3070 Laptop GPU | 2.1 kg | 23 mm | 15.60" | 1920x1080 | |
| 85 % v7 (old) | 07/2021 | Asus TUF Gaming A15 FA506QR-AZ061T R7 5800H, GeForce RTX 3070 Laptop GPU | 2.3 kg | 24 mm | 15.60" | 1920x1080 |
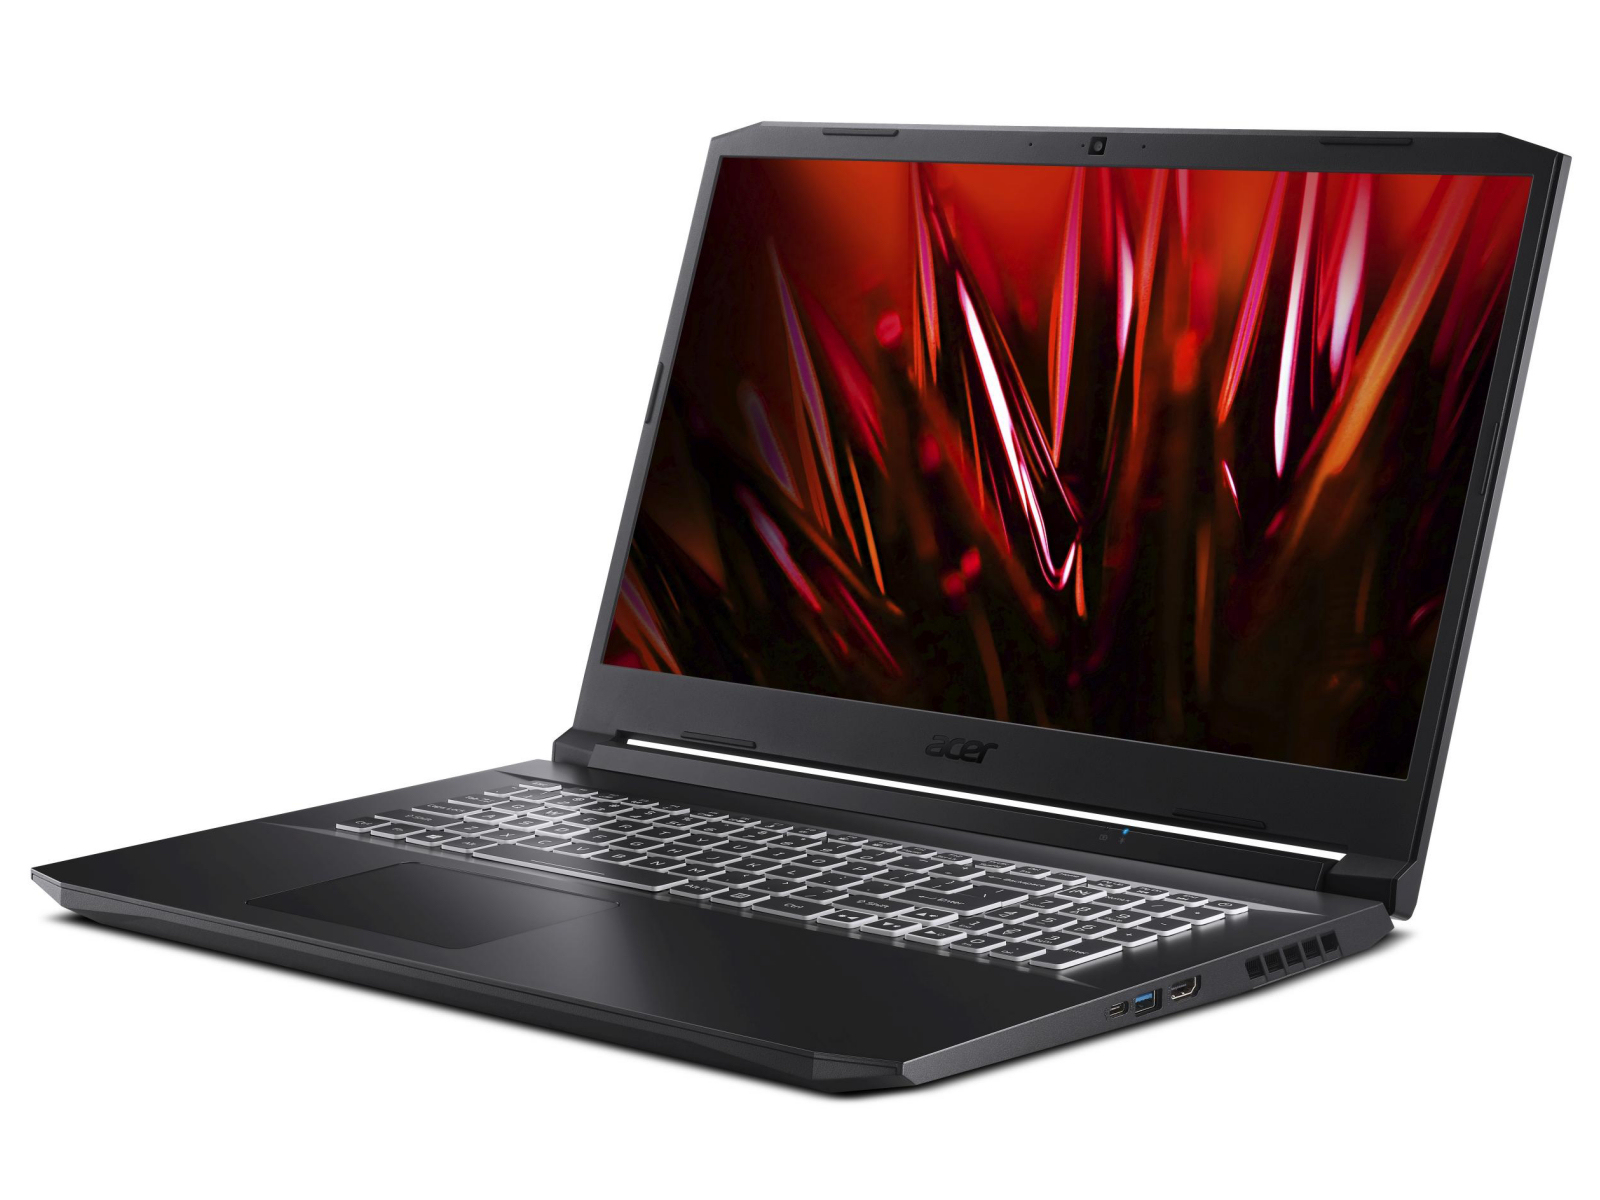
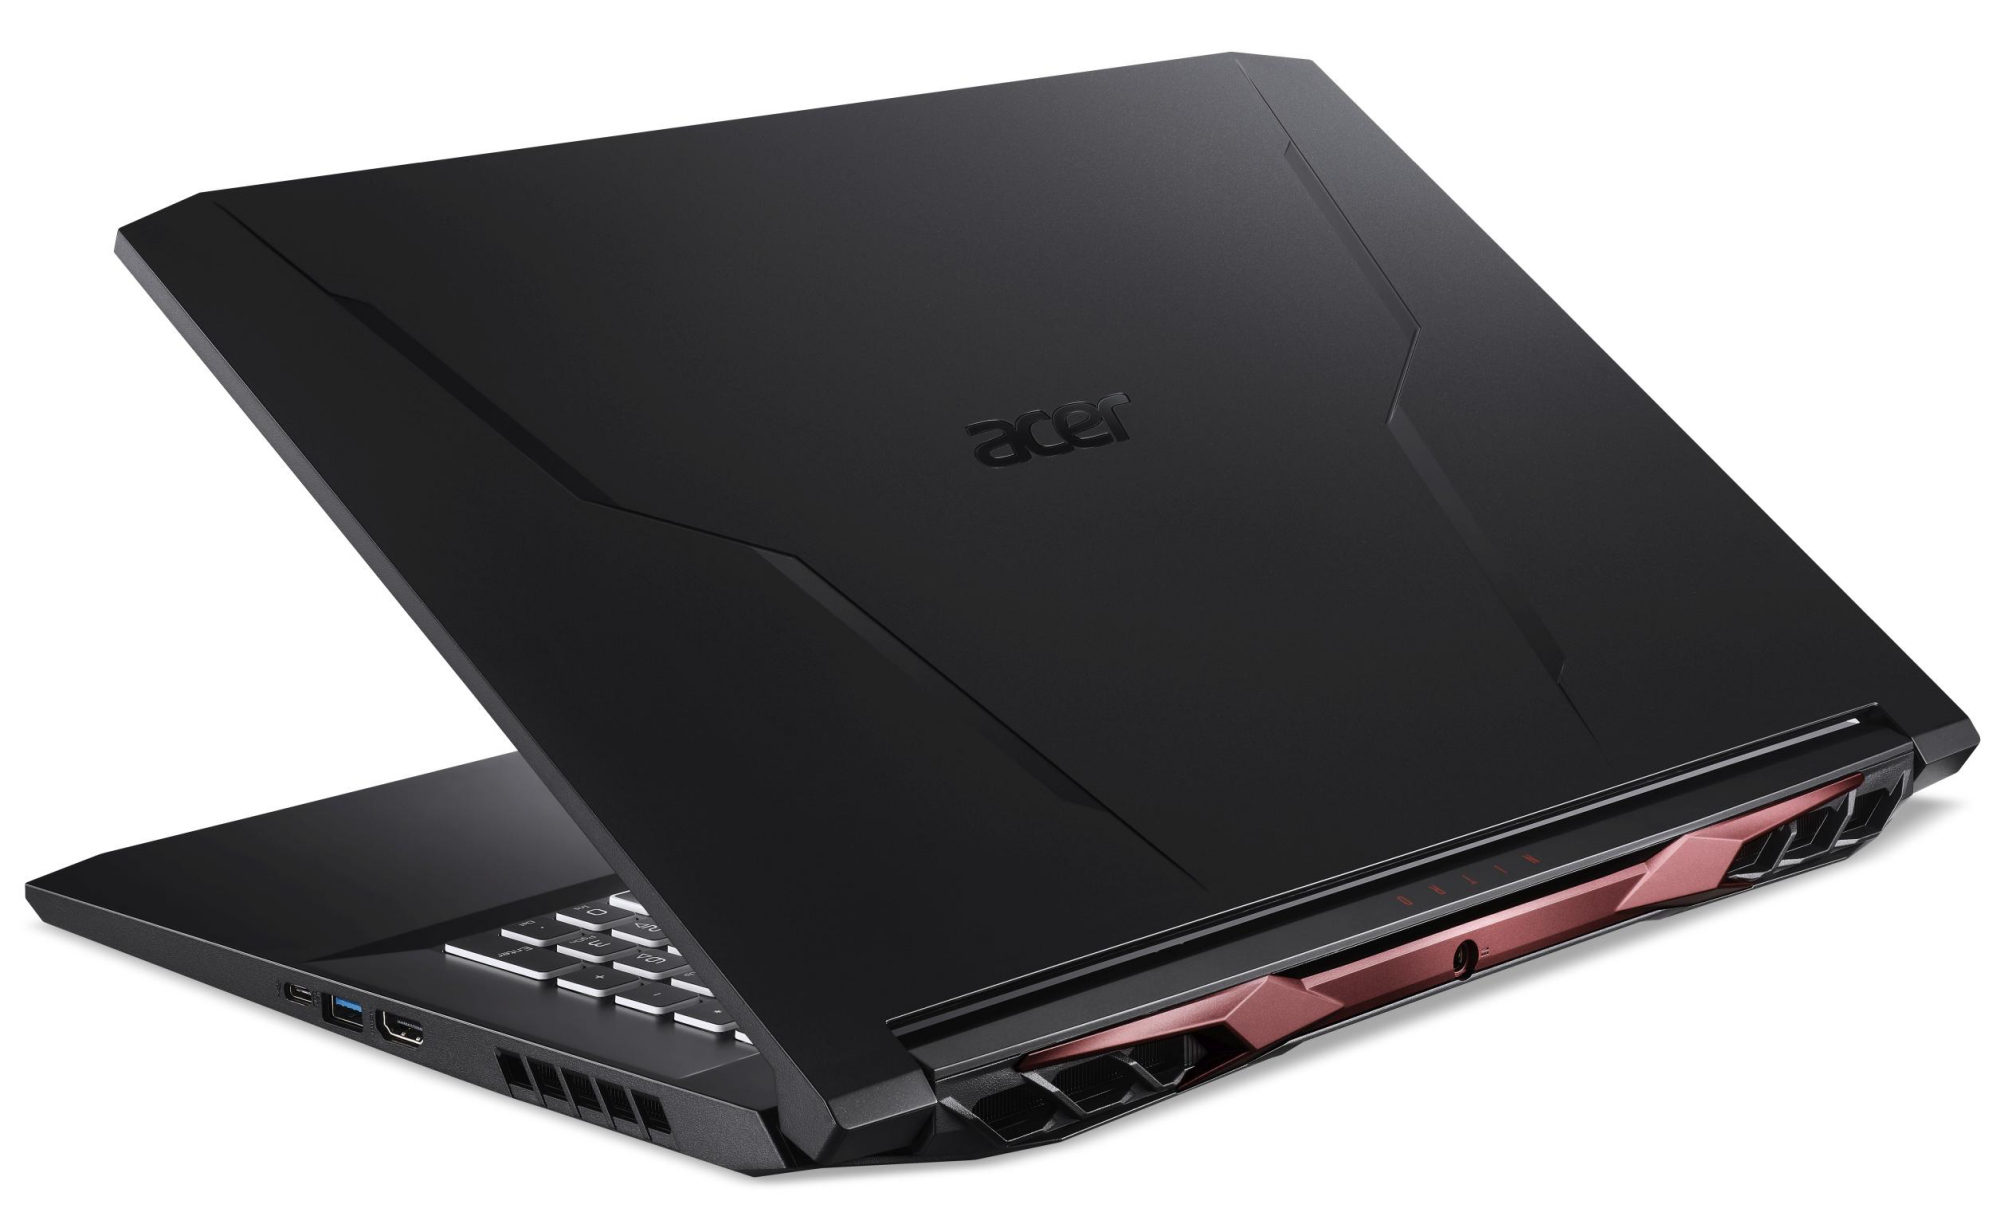
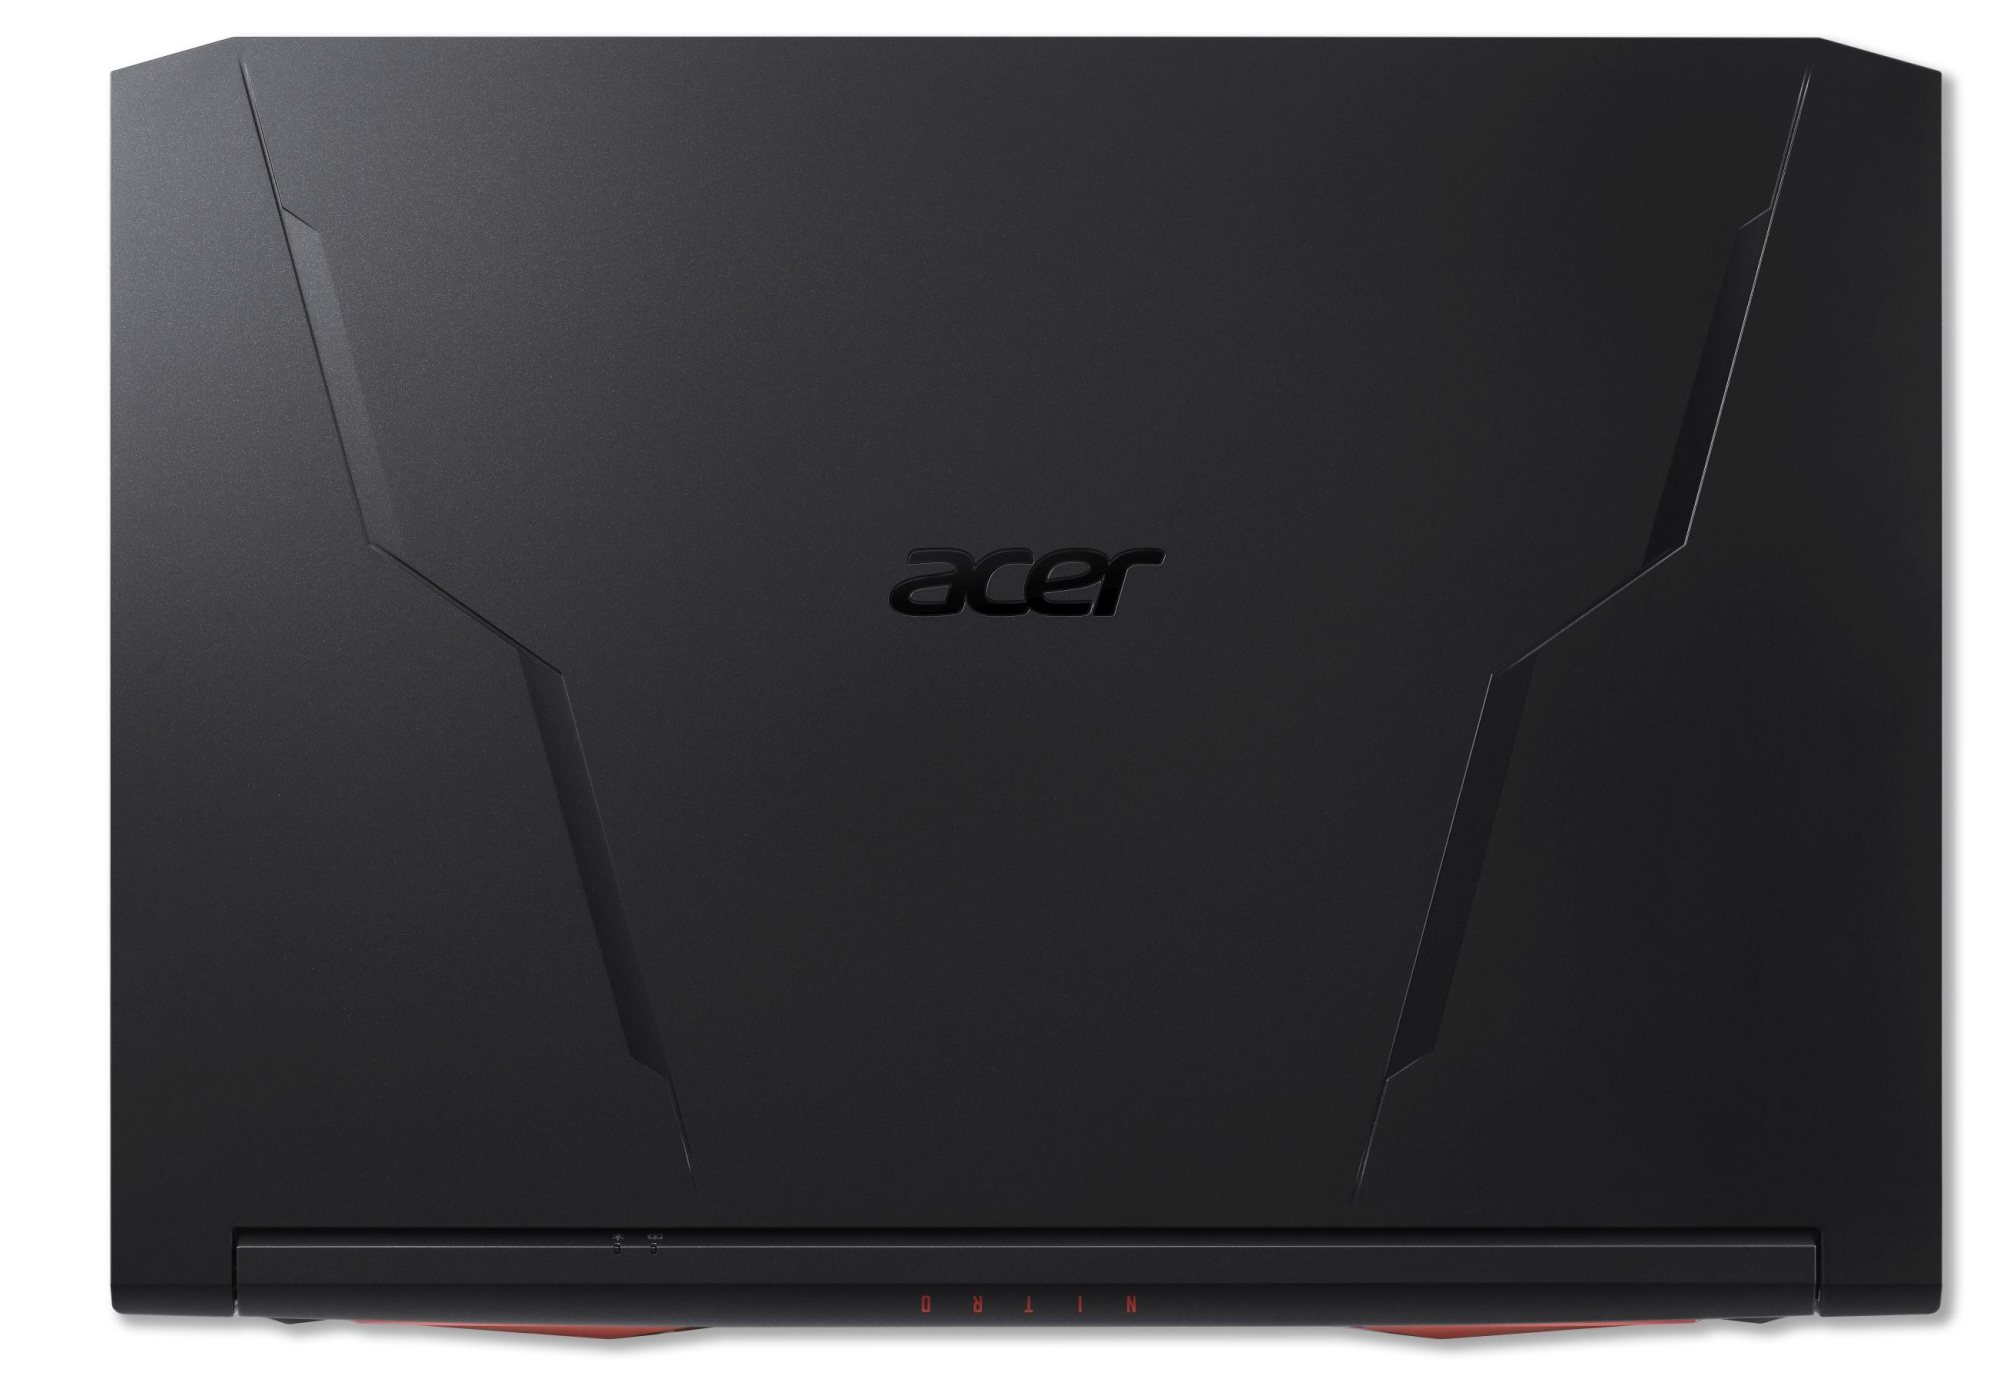
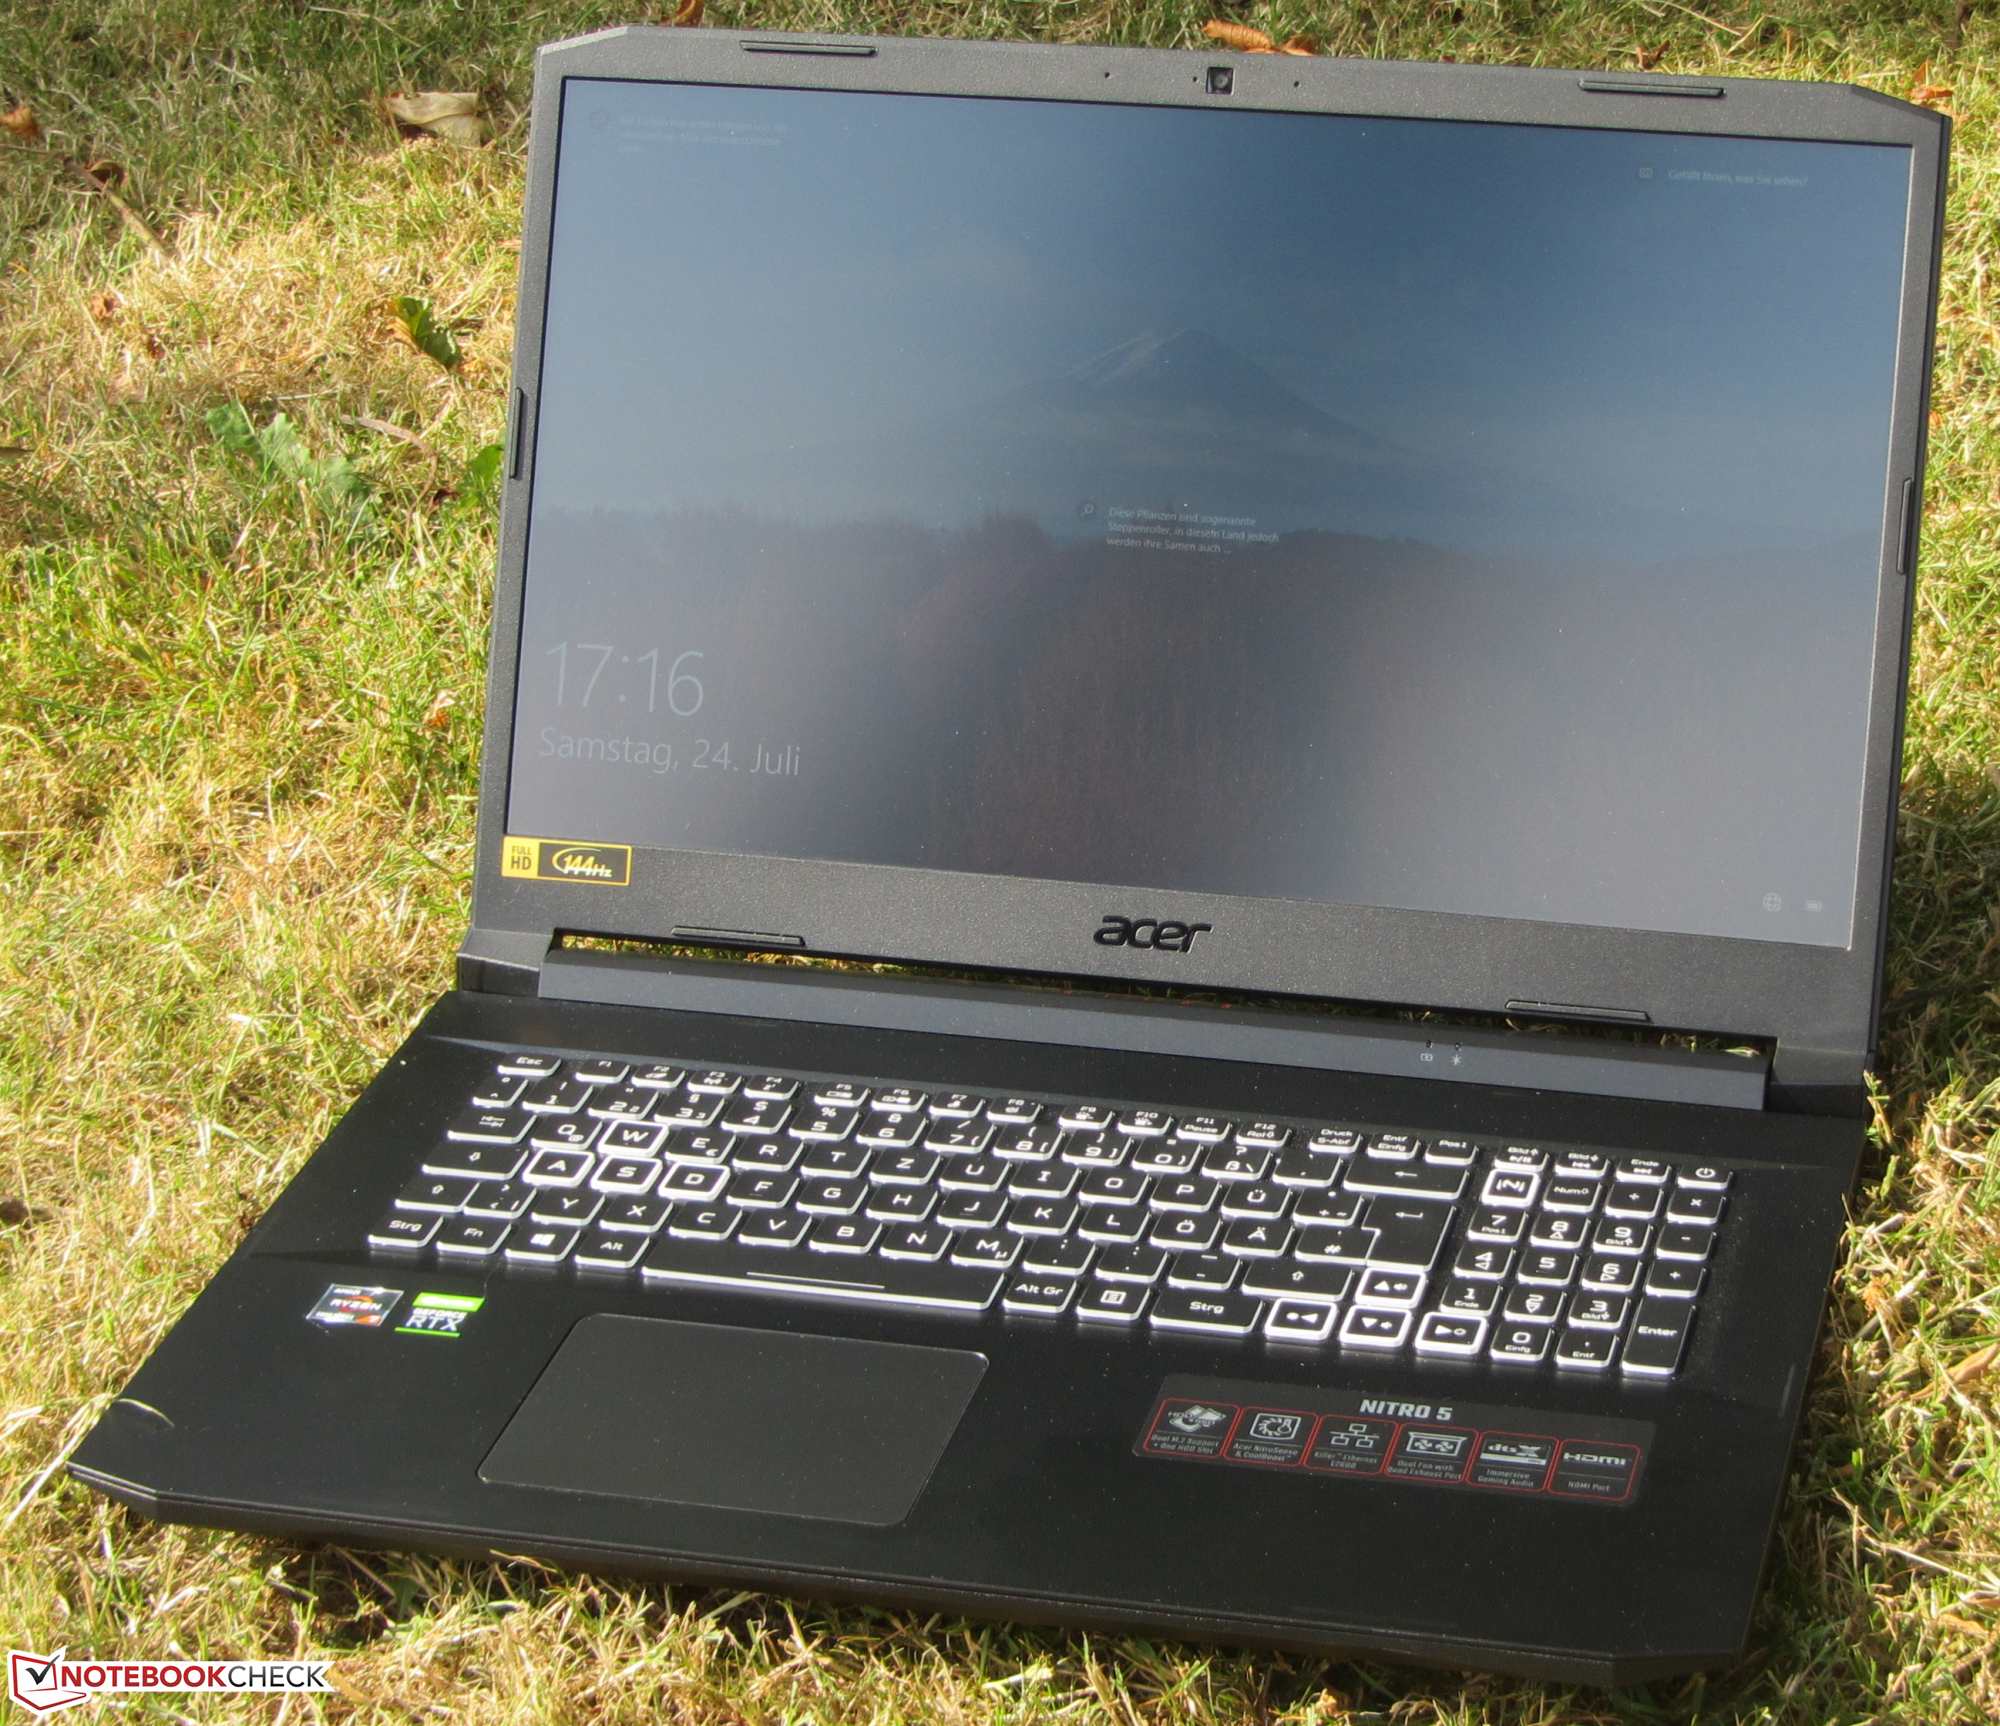
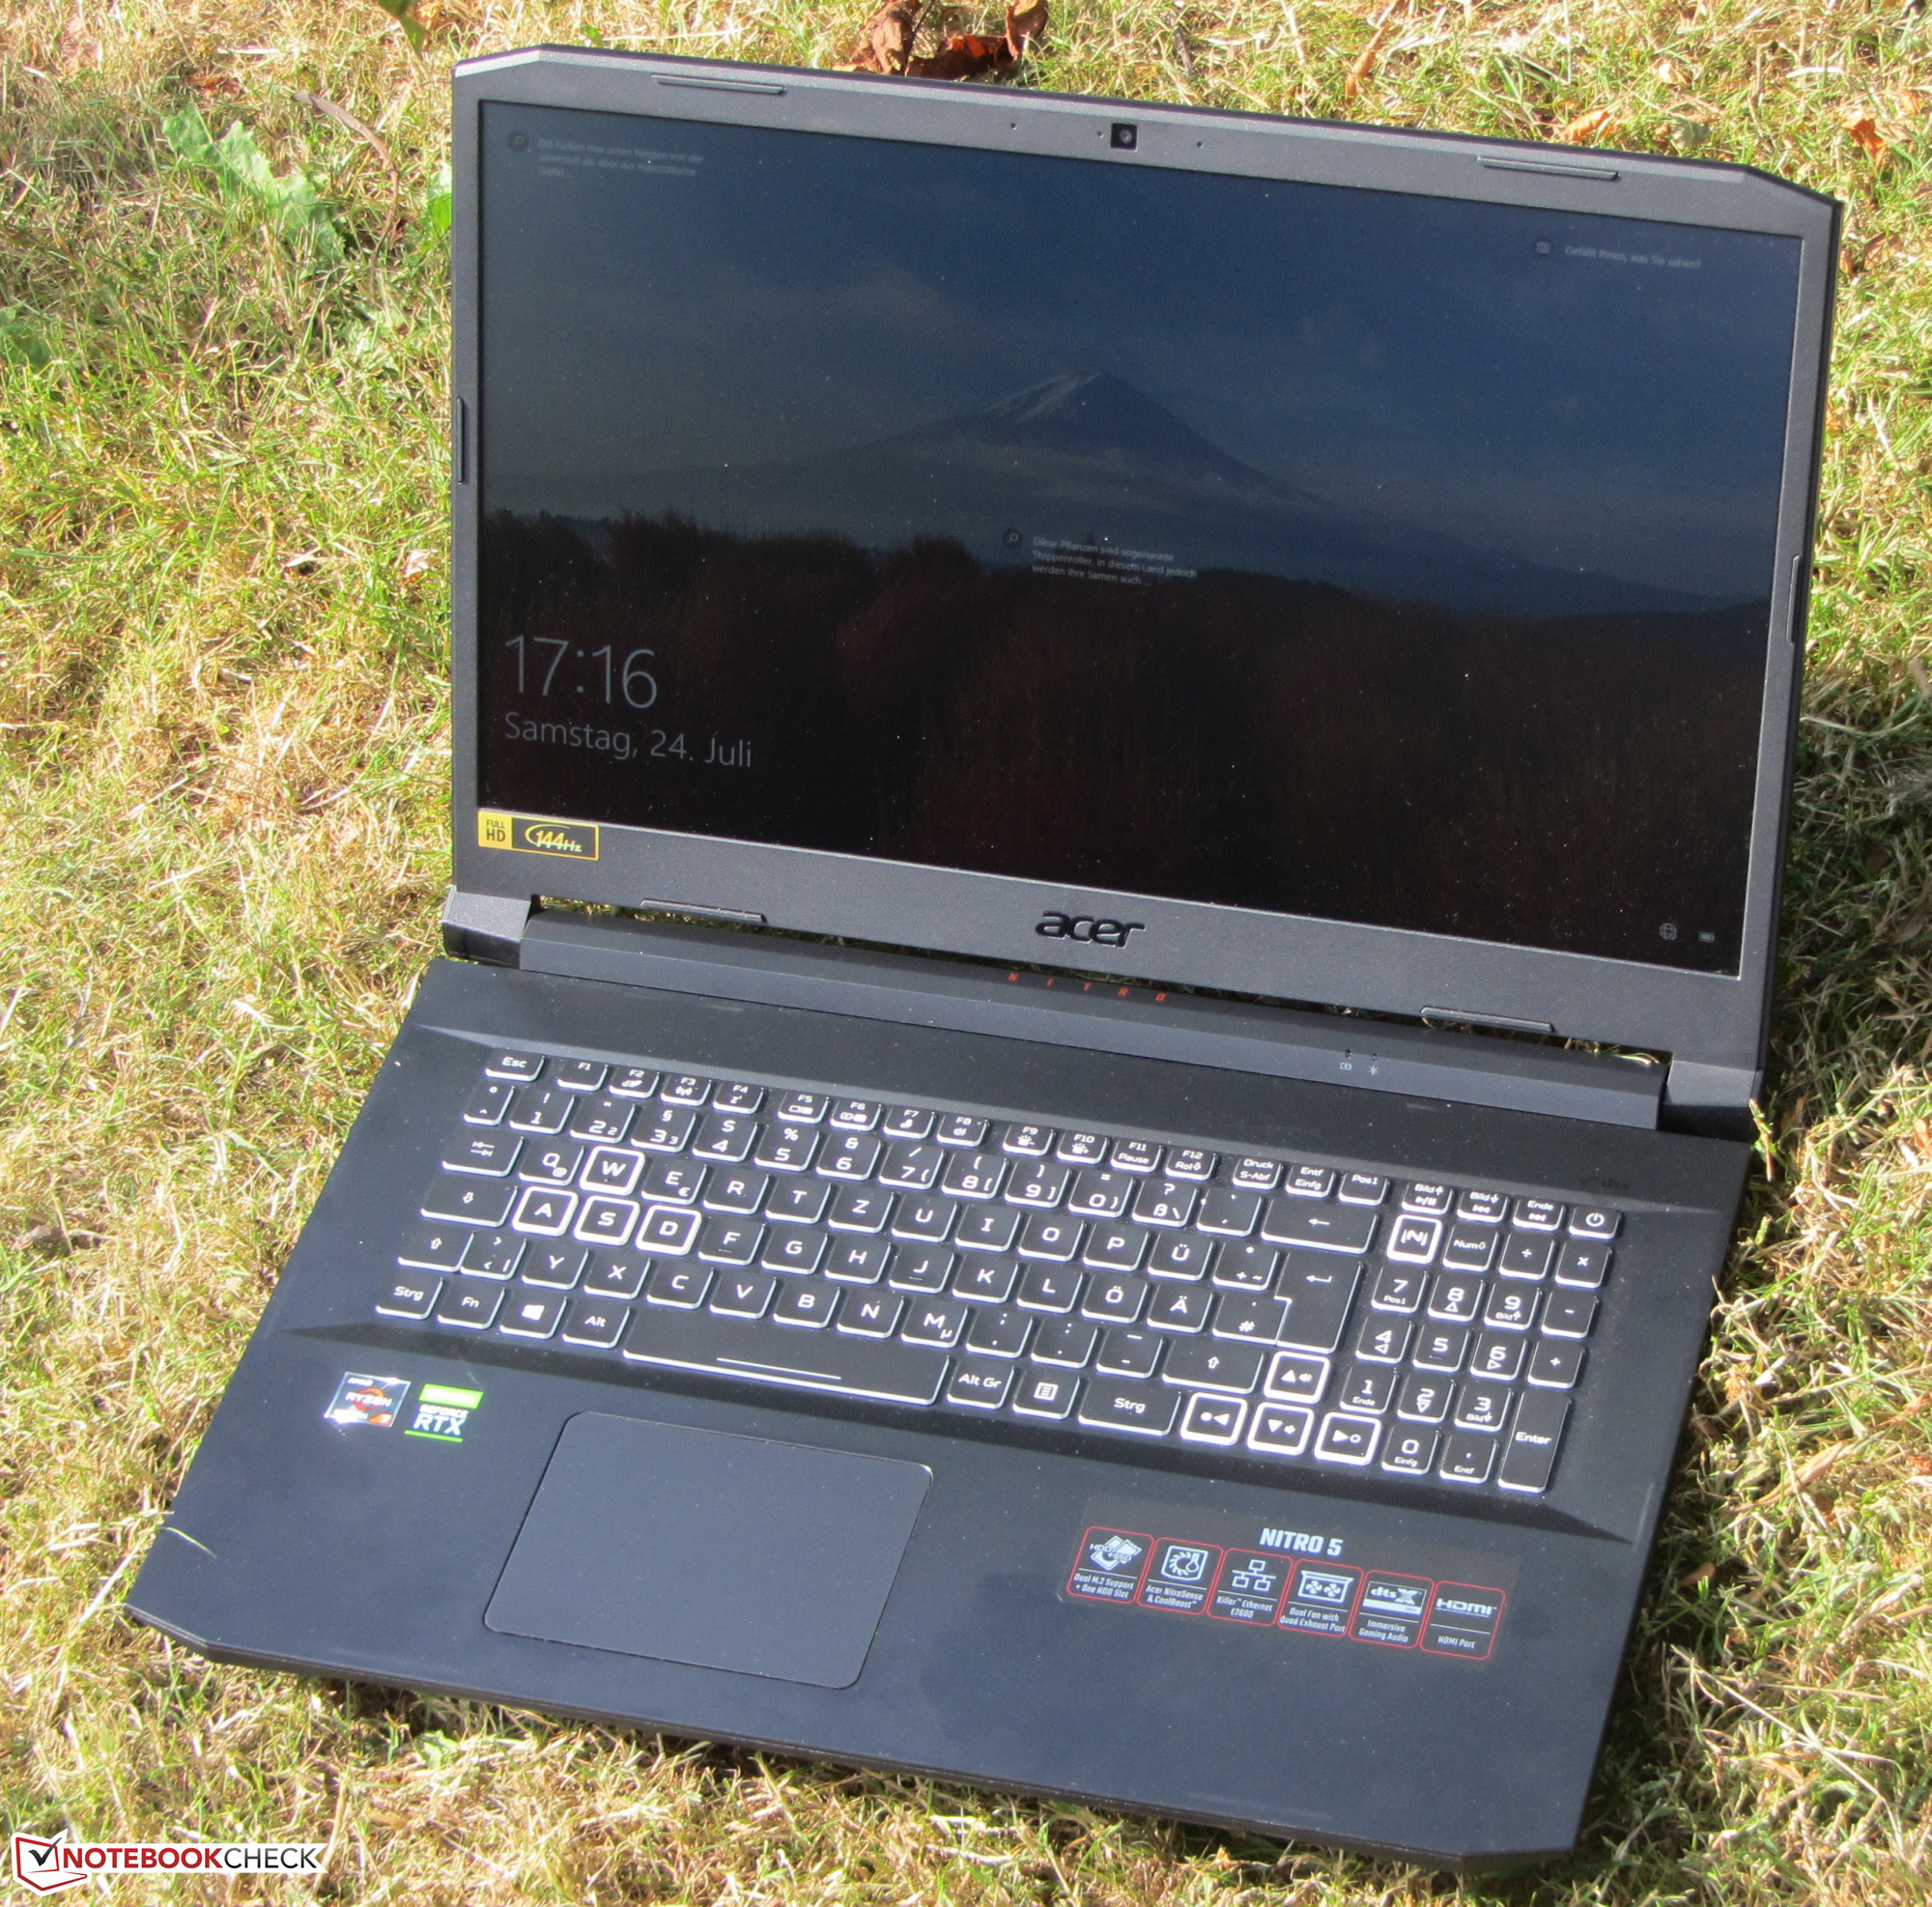
Estojo - Nitro 5 com estojo plástico
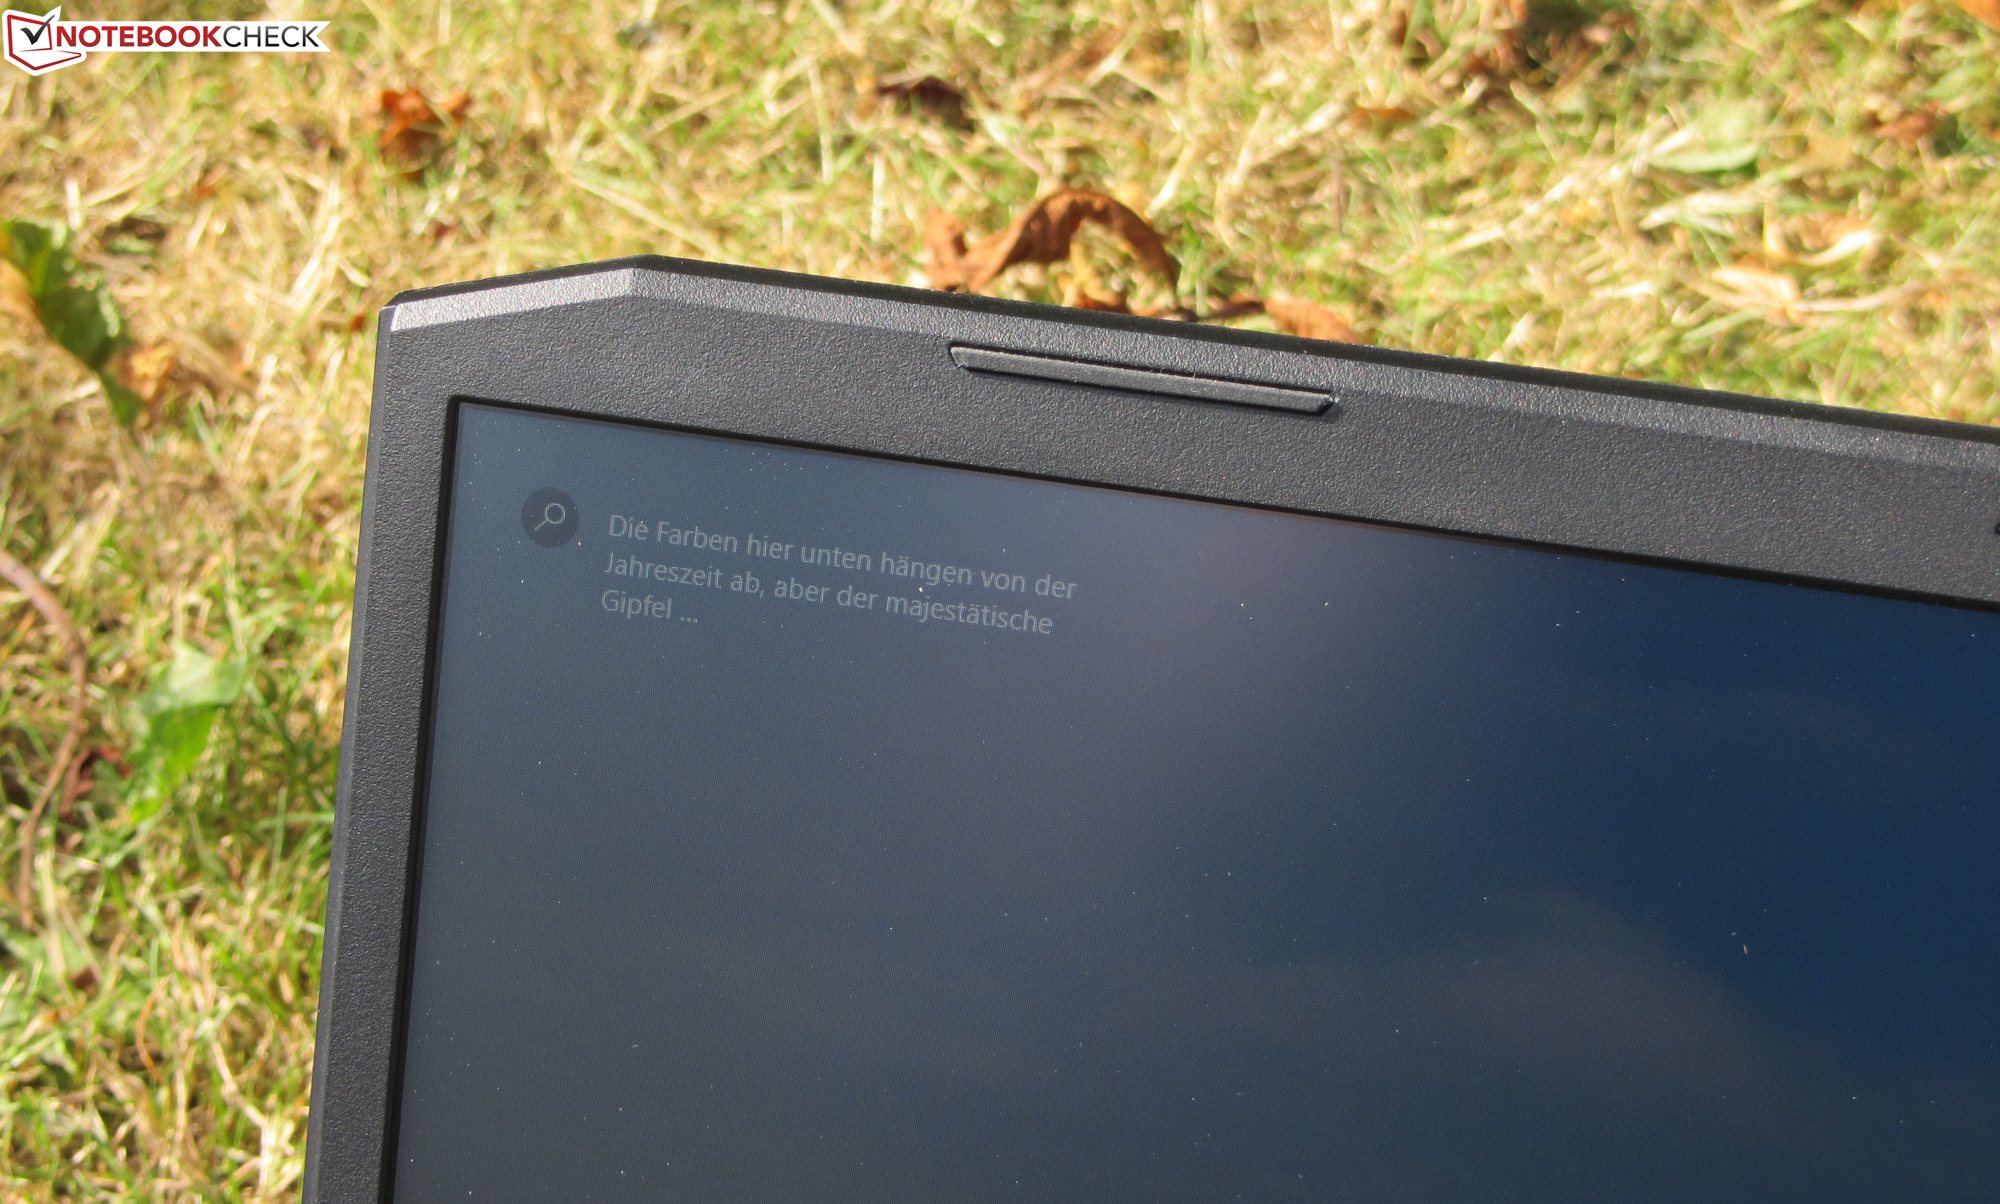
A Acer não utiliza materiais de alta aparência para o estojo Nitro 5. O estojo é feito de plástico preto. A área vermelha entre as aberturas de ar traseiras e as letras vermelhas "Nitro" na tampa da dobradiça acrescentam um pouco de cor. As superfícies lisas do chassi são bastante suscetíveis a impressões digitais. Não há nenhuma escotilha de manutenção. A bateria está aparafusada no interior.
O computador não revela nenhuma falha de fabricação. As lacunas são corretas e não há saliências de material. Há espaço para melhorias em termos de estabilidade e rigidez: A unidade base e especialmente a tampa podem ser torcidas um pouco demais. A pressão sobre as costas da tampa não leva a mudanças de imagem. As dobradiças mantêm a tampa firmemente na posição. A abertura da tampa com uma mão é possível.
Dentro de nosso campo de comparação, o Nitro 5 e oMSI GP76 são os maiores dispositivos em termos de área de superfície. Em termos de peso, a maioria dos cadernos está ao par. O Schenker XMG Core 17 (Início de 2021) é consideravelmente mais compacto e leve que a concorrência, enquanto o MSI GP76 é o que mais pesa.
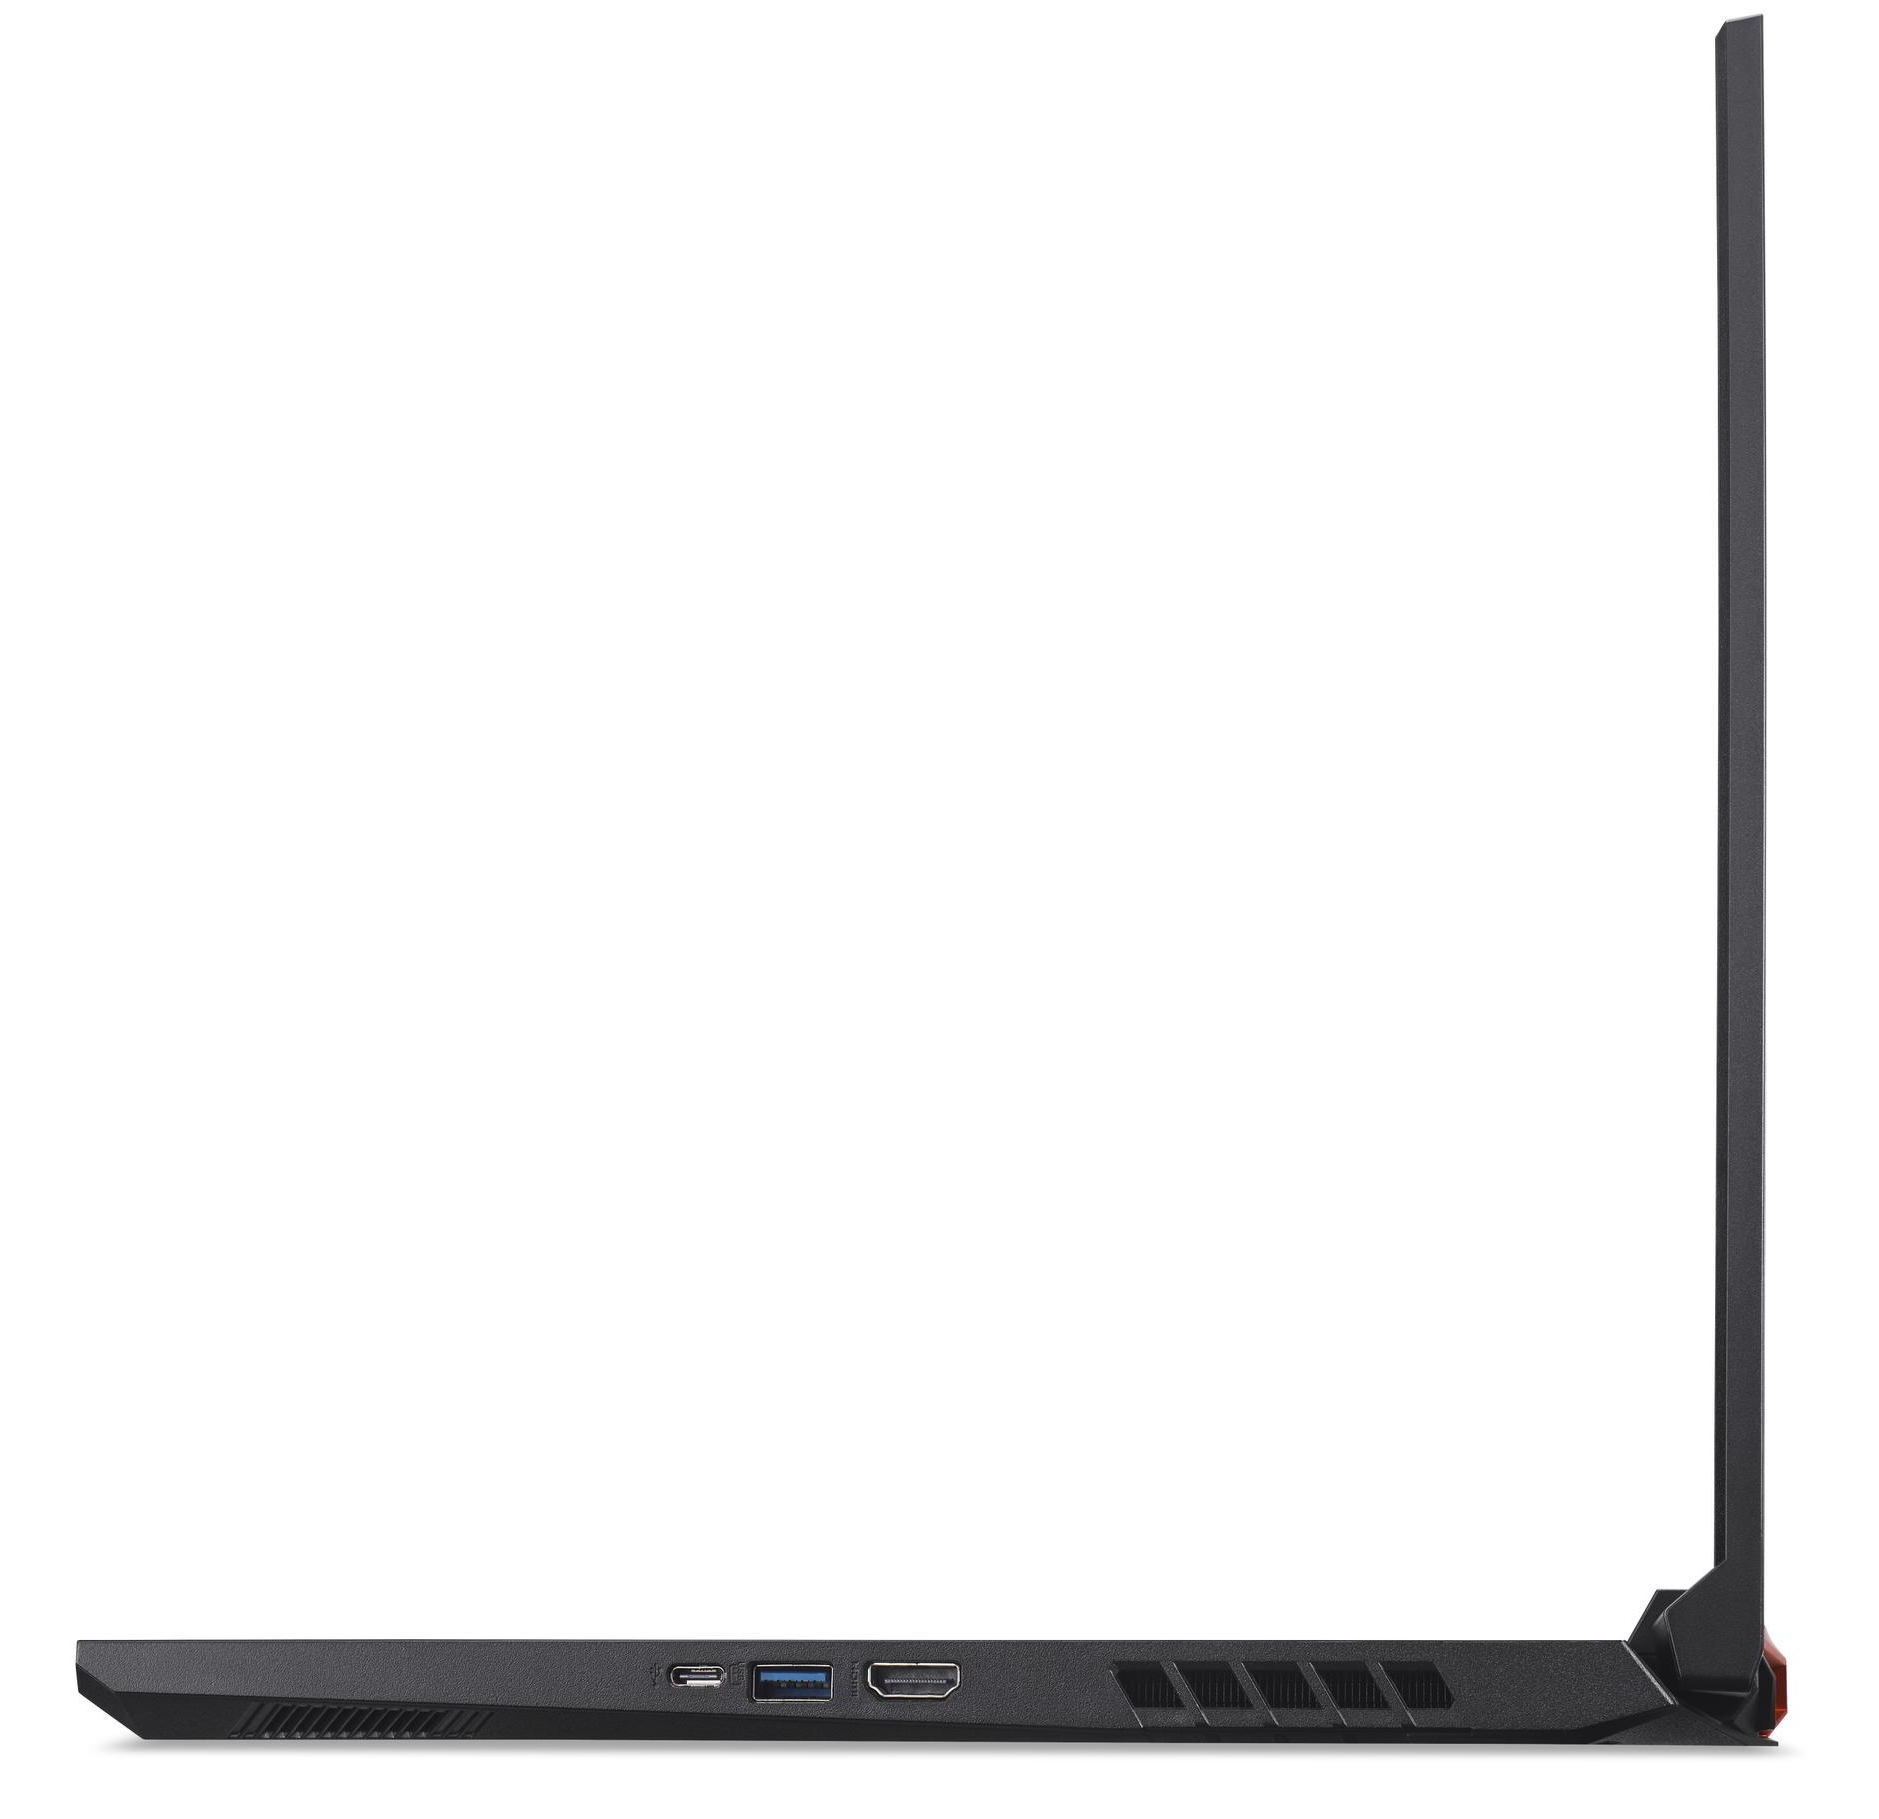
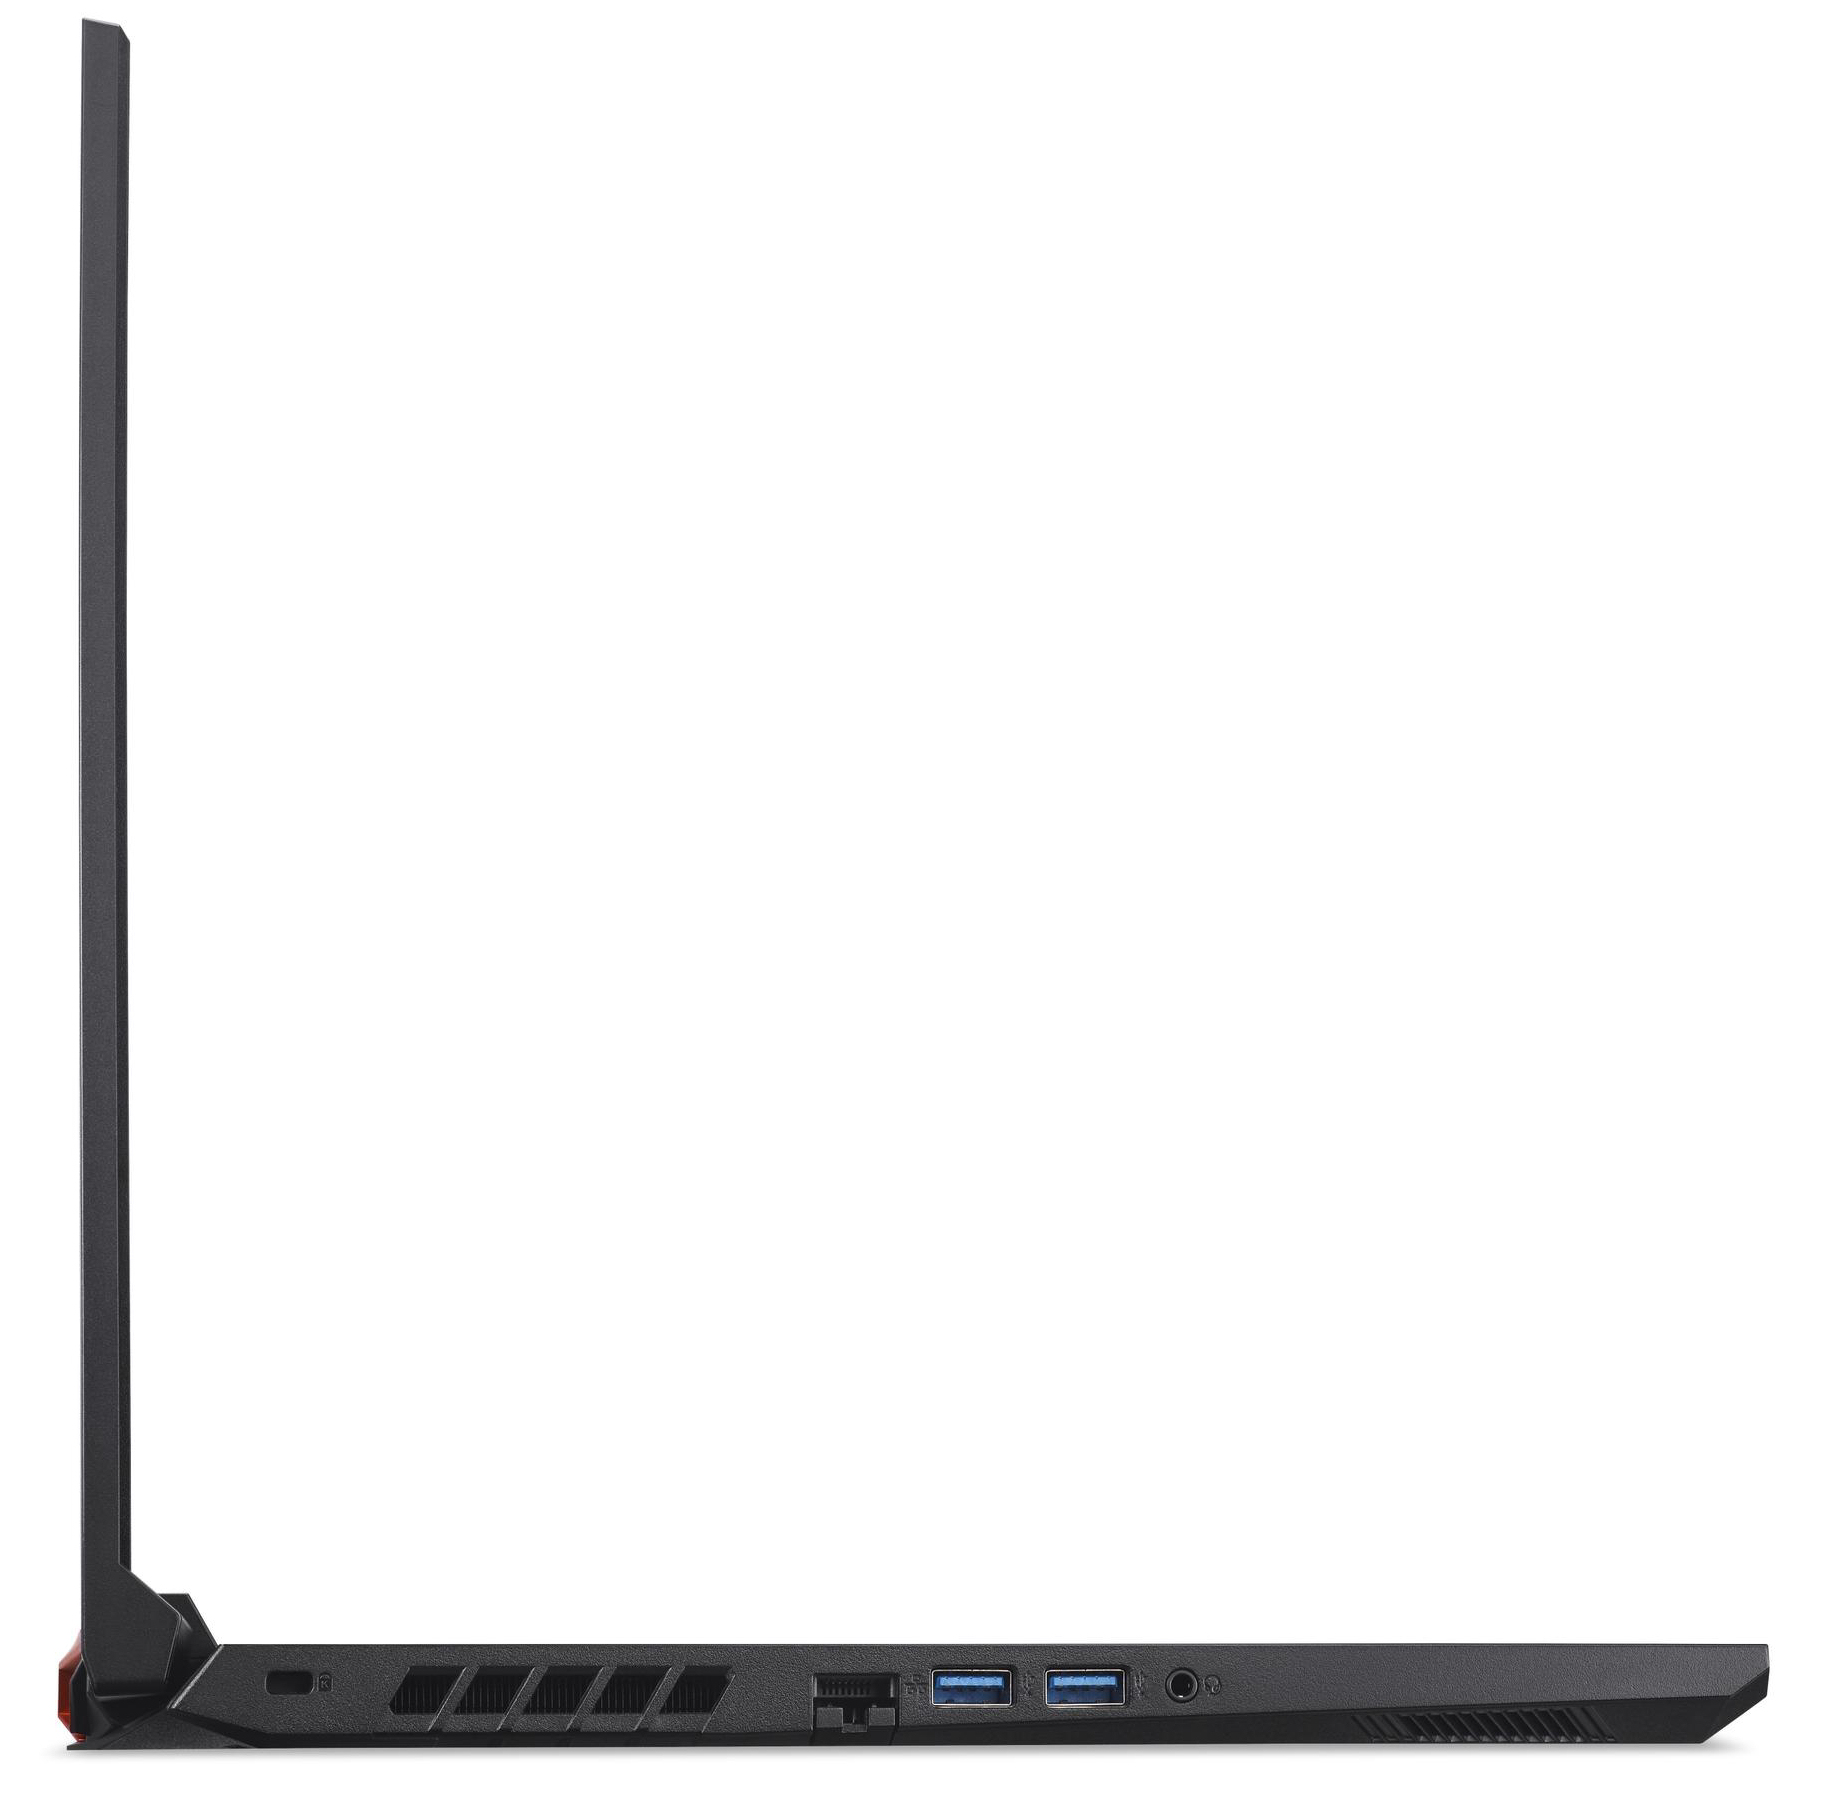
Equipamento - o computador Acer não tem Thunderbolt para oferecer
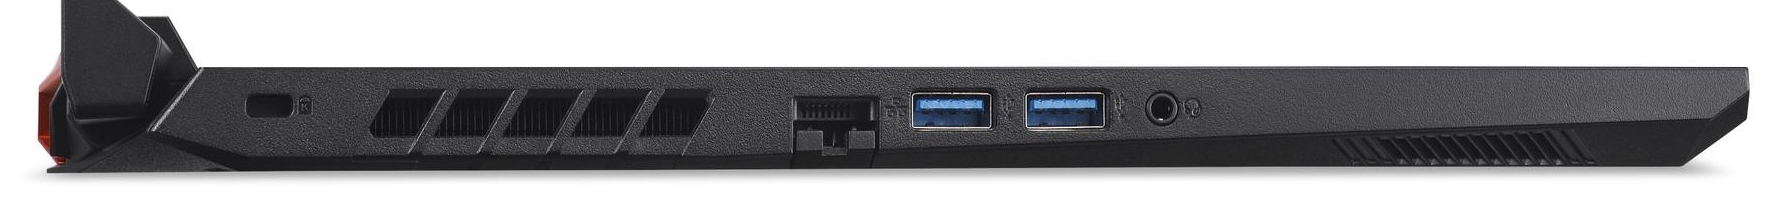
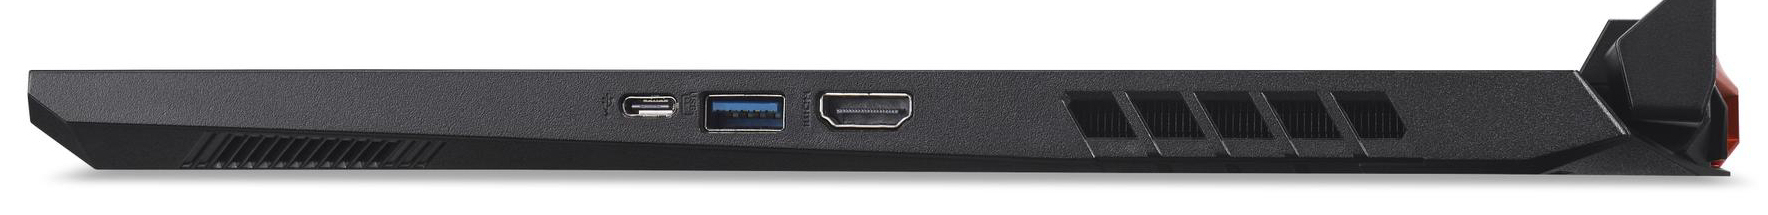
A Nitro oferece três portas USB-A (2x USB 3.2 Gen 1, 1x USB 3.2 Gen 2) e uma porta USB-C (USB 3.2 Gen 2). Esta última não suporta PowerDeliveryou Displayport-per-USB-C. Portanto, há apenas uma saída de vídeo com a porta HDMI. A Acer não equipou o notebook com um leitor de cartão de memória
Comunicação
O chip WLAN (Mediatek MT7921) suporta o padrão 802.11ax e oferece a funcionalidade Bluetooth 5. As taxas de dados determinadas sob condições ótimas (nenhum outro dispositivo WLAN nas proximidades, pequena distância entre o notebook e o PC do servidor) ficam aquém das capacidades do chip. Suspeitamos de um problema de driver.As conexões de redecom fiosão tratadas por um controlador Ethernet Killer E2600 Gigabit. Ele executa suas tarefas sem problemas.
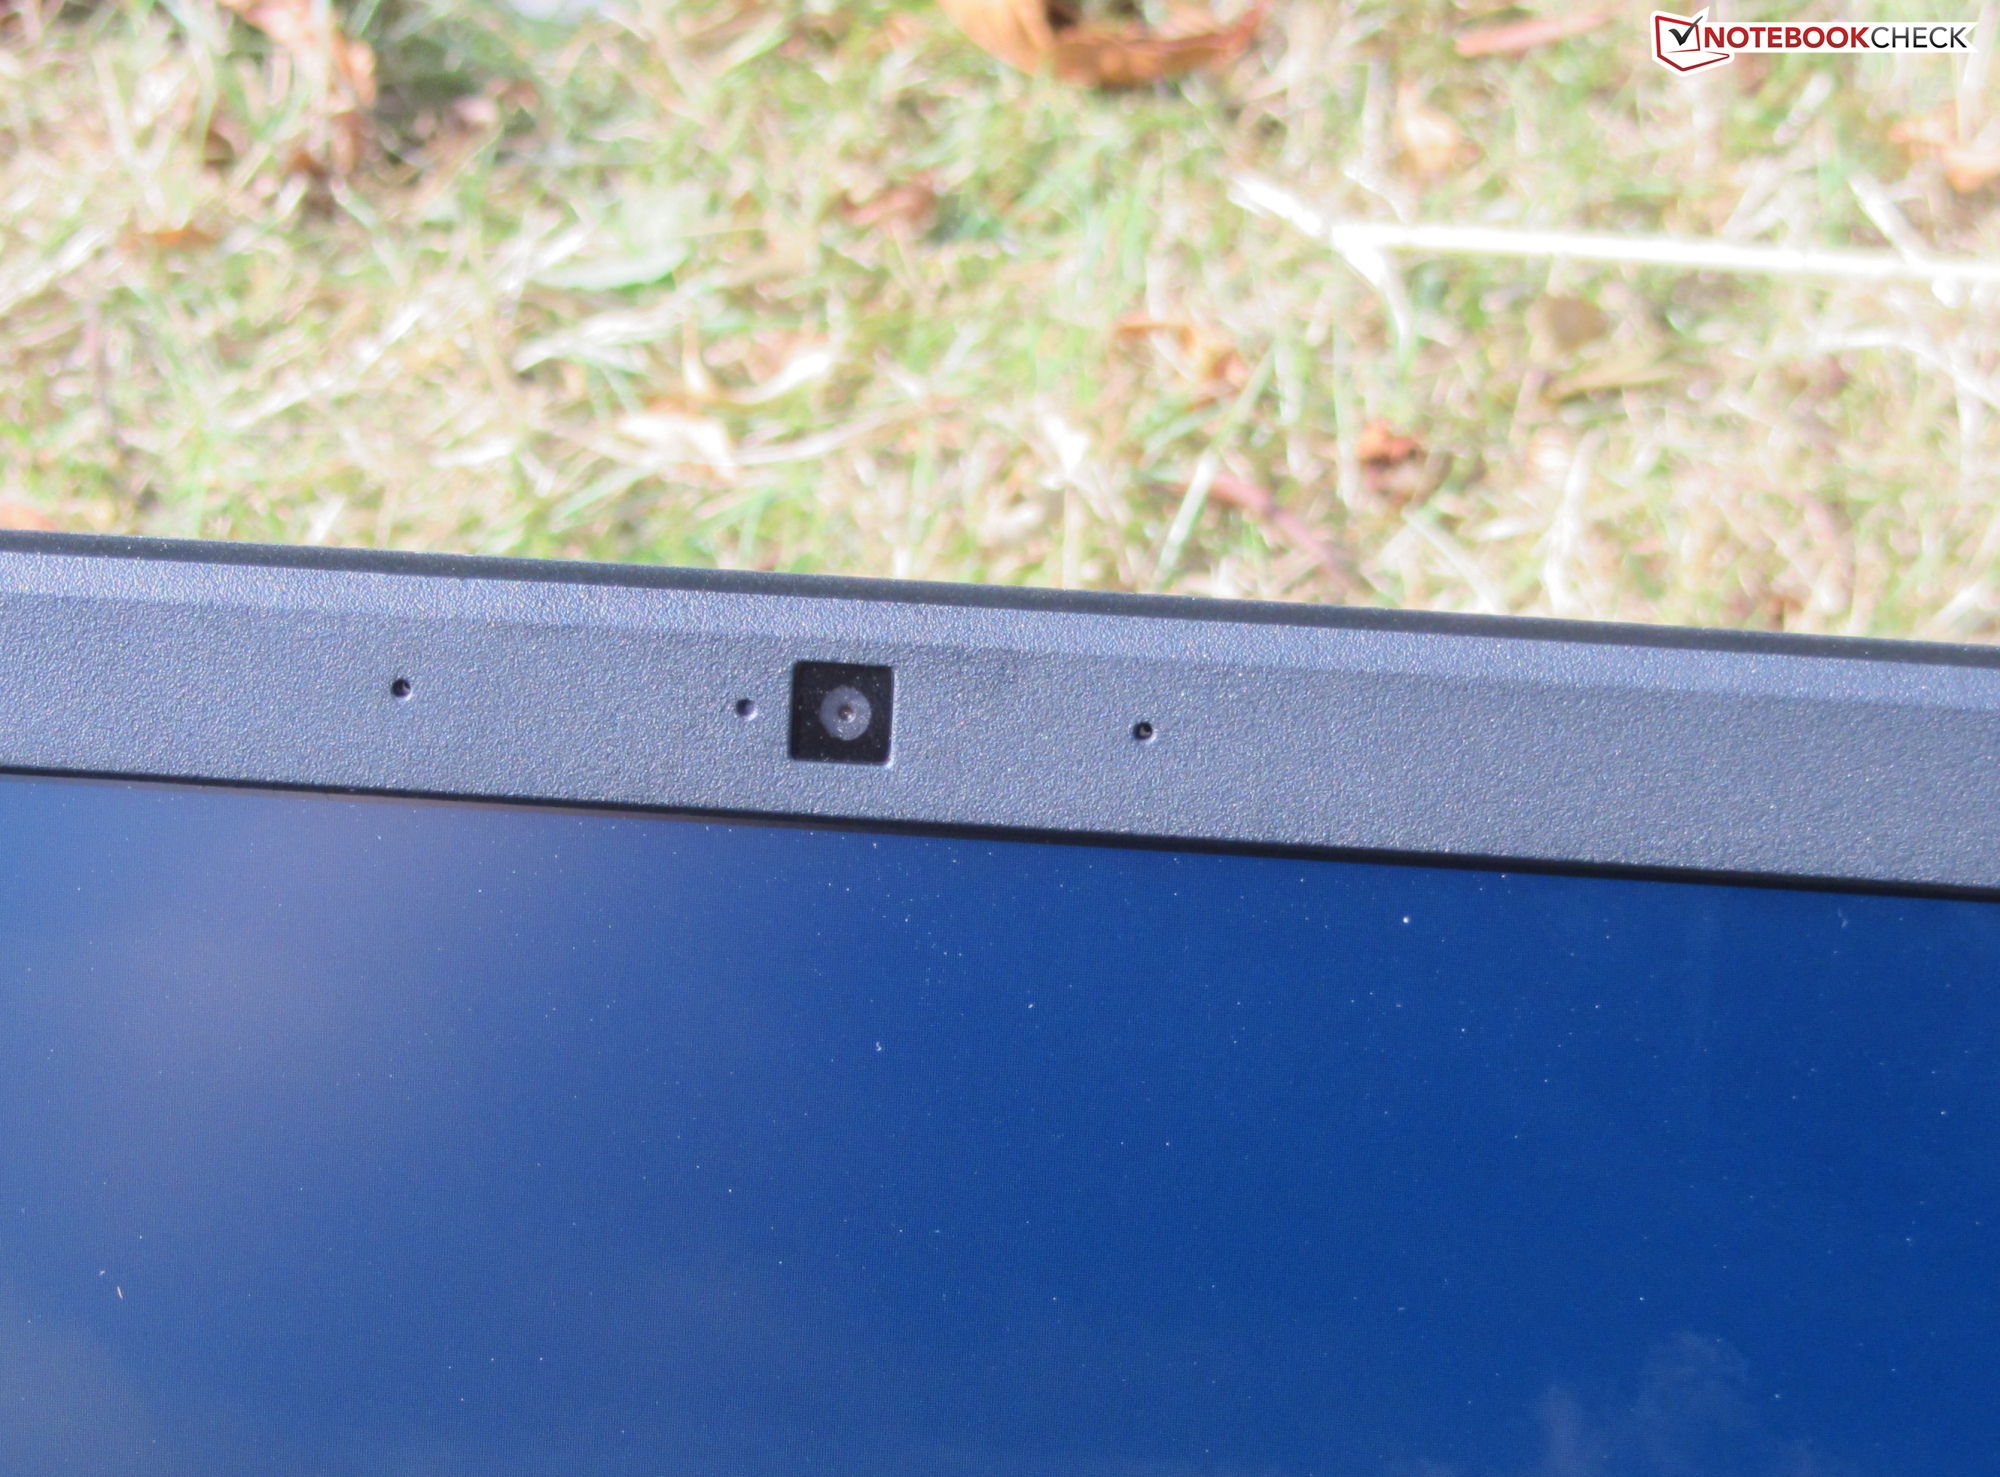
Webcam
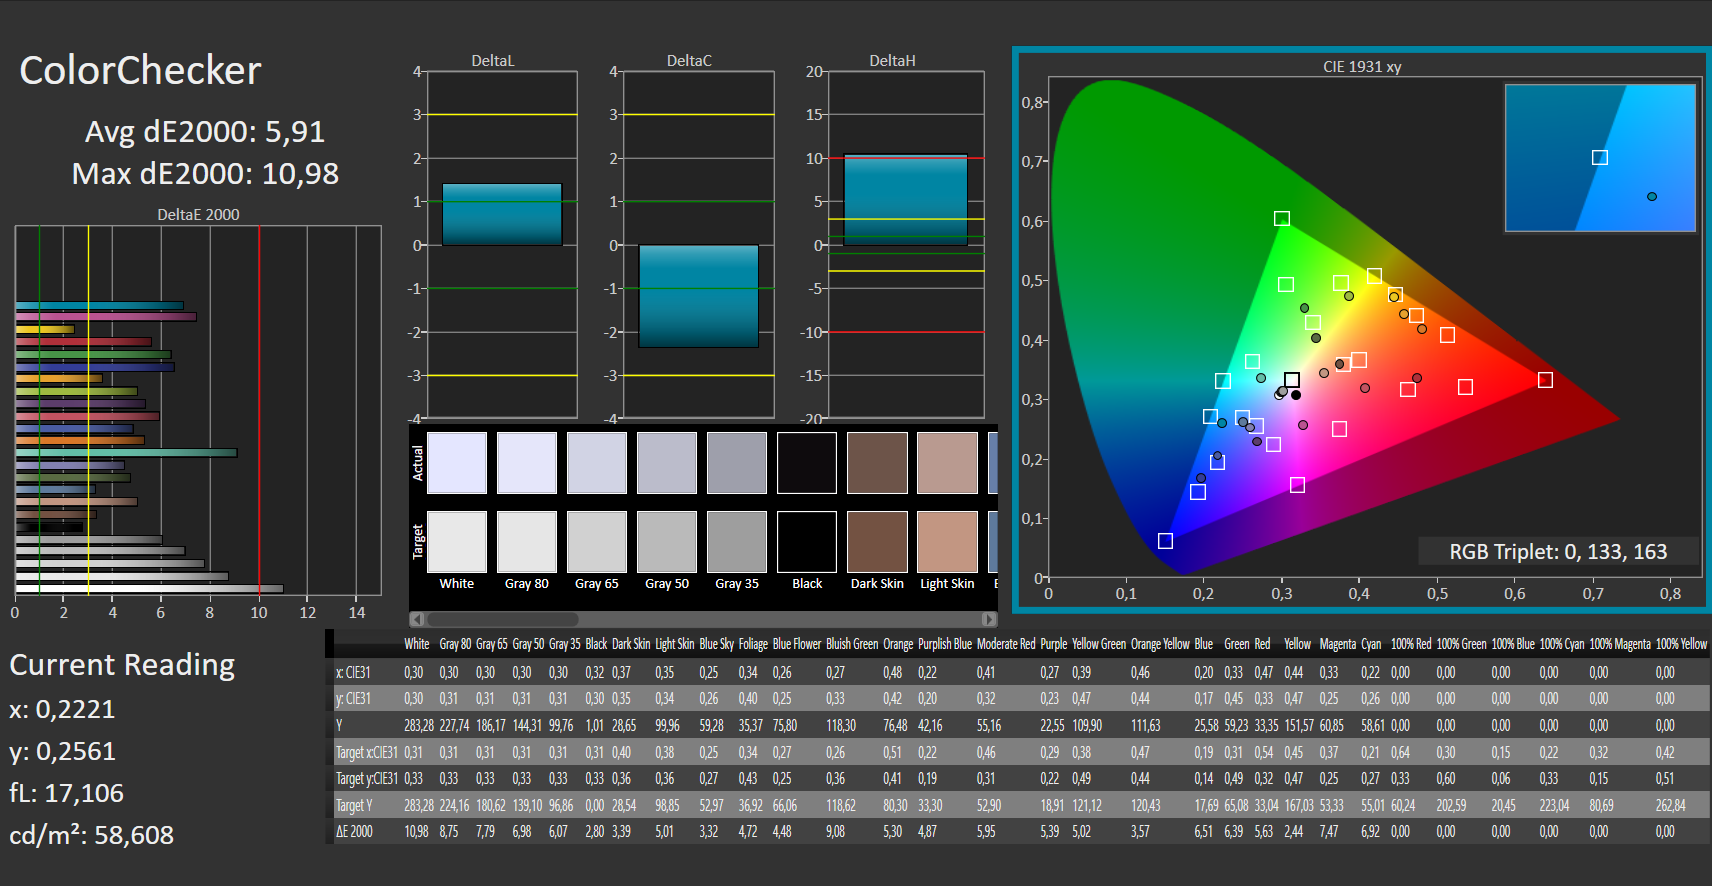
A webcam (0,9 MP) produz imagens em uma resolução máxima de 1.280 x 720 pixels. A precisão da cor é um problema. Com um desvio de quase 12, o alvo (DeltaE menos de 3) é claramente perdido


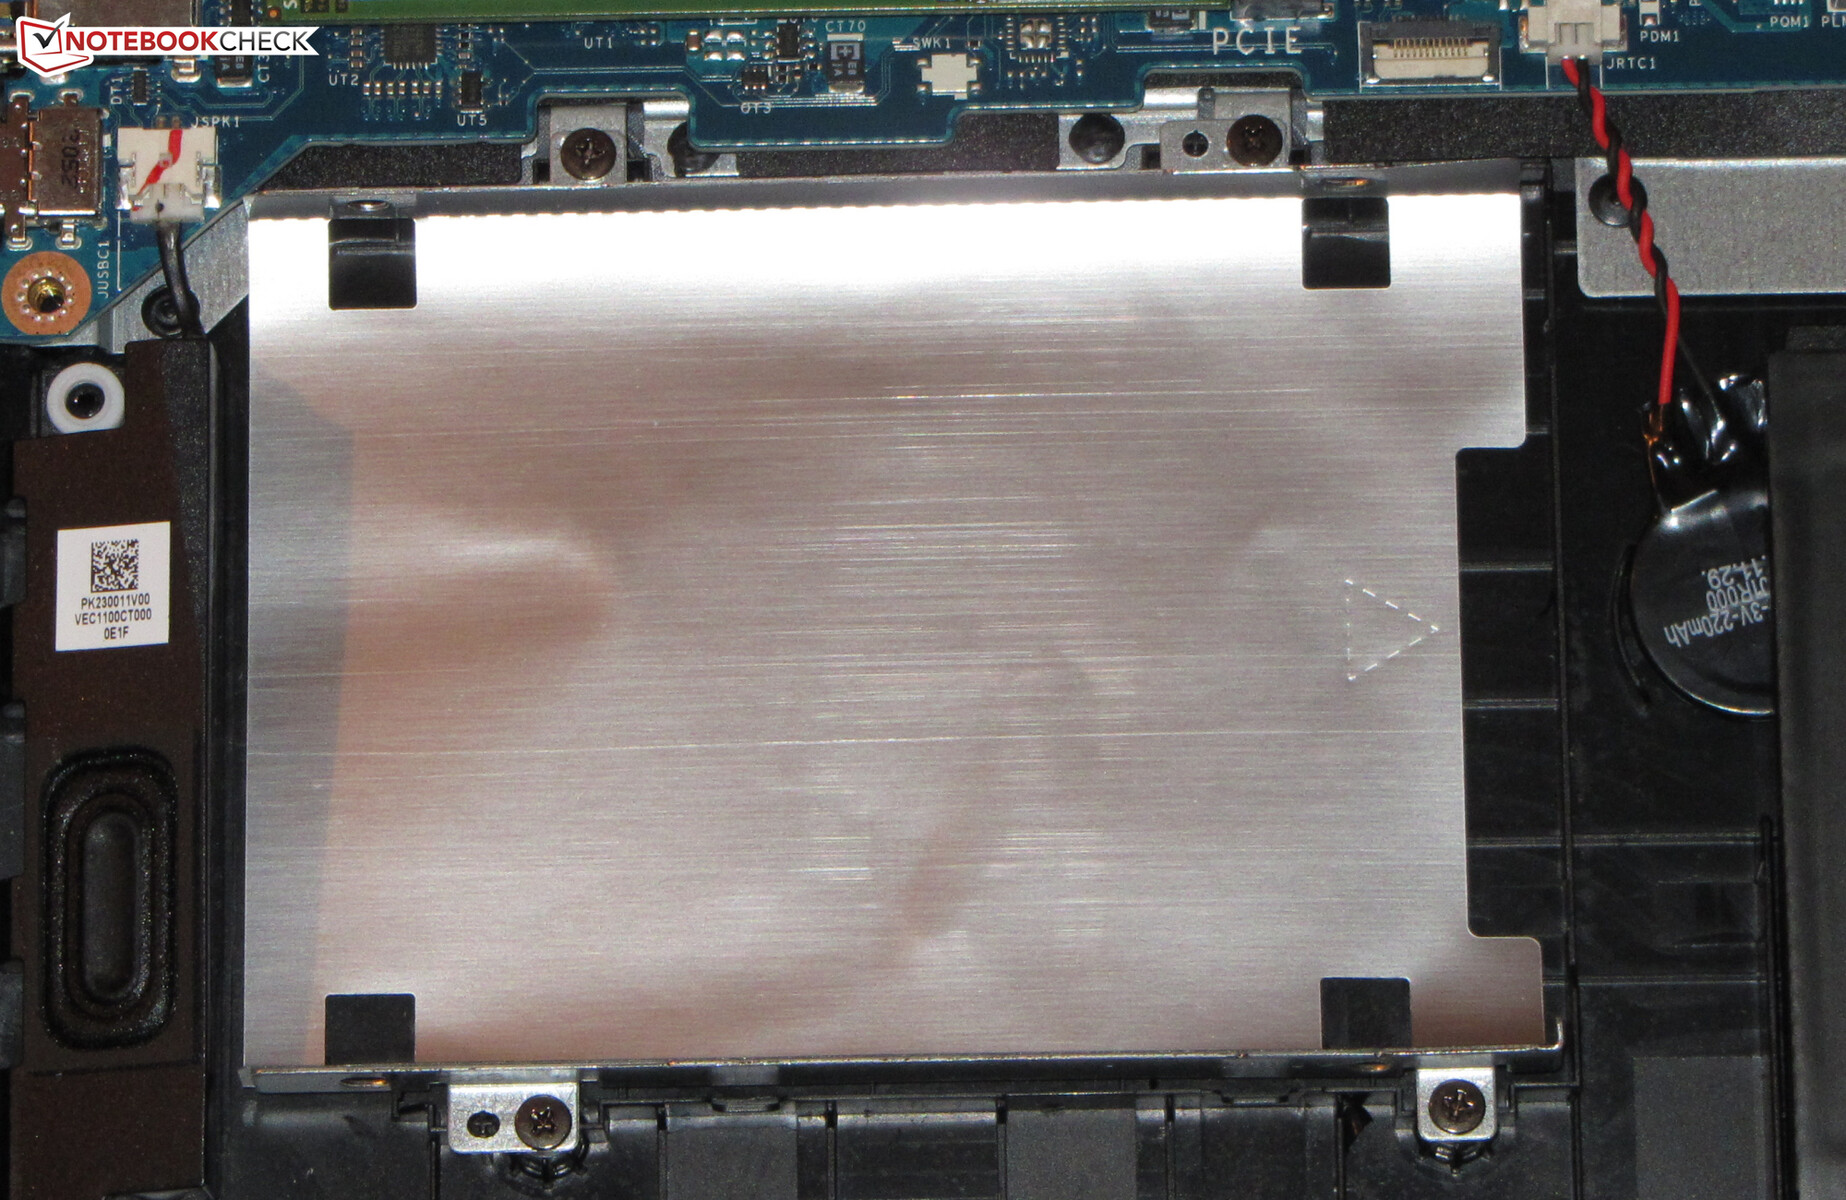
Acessórios
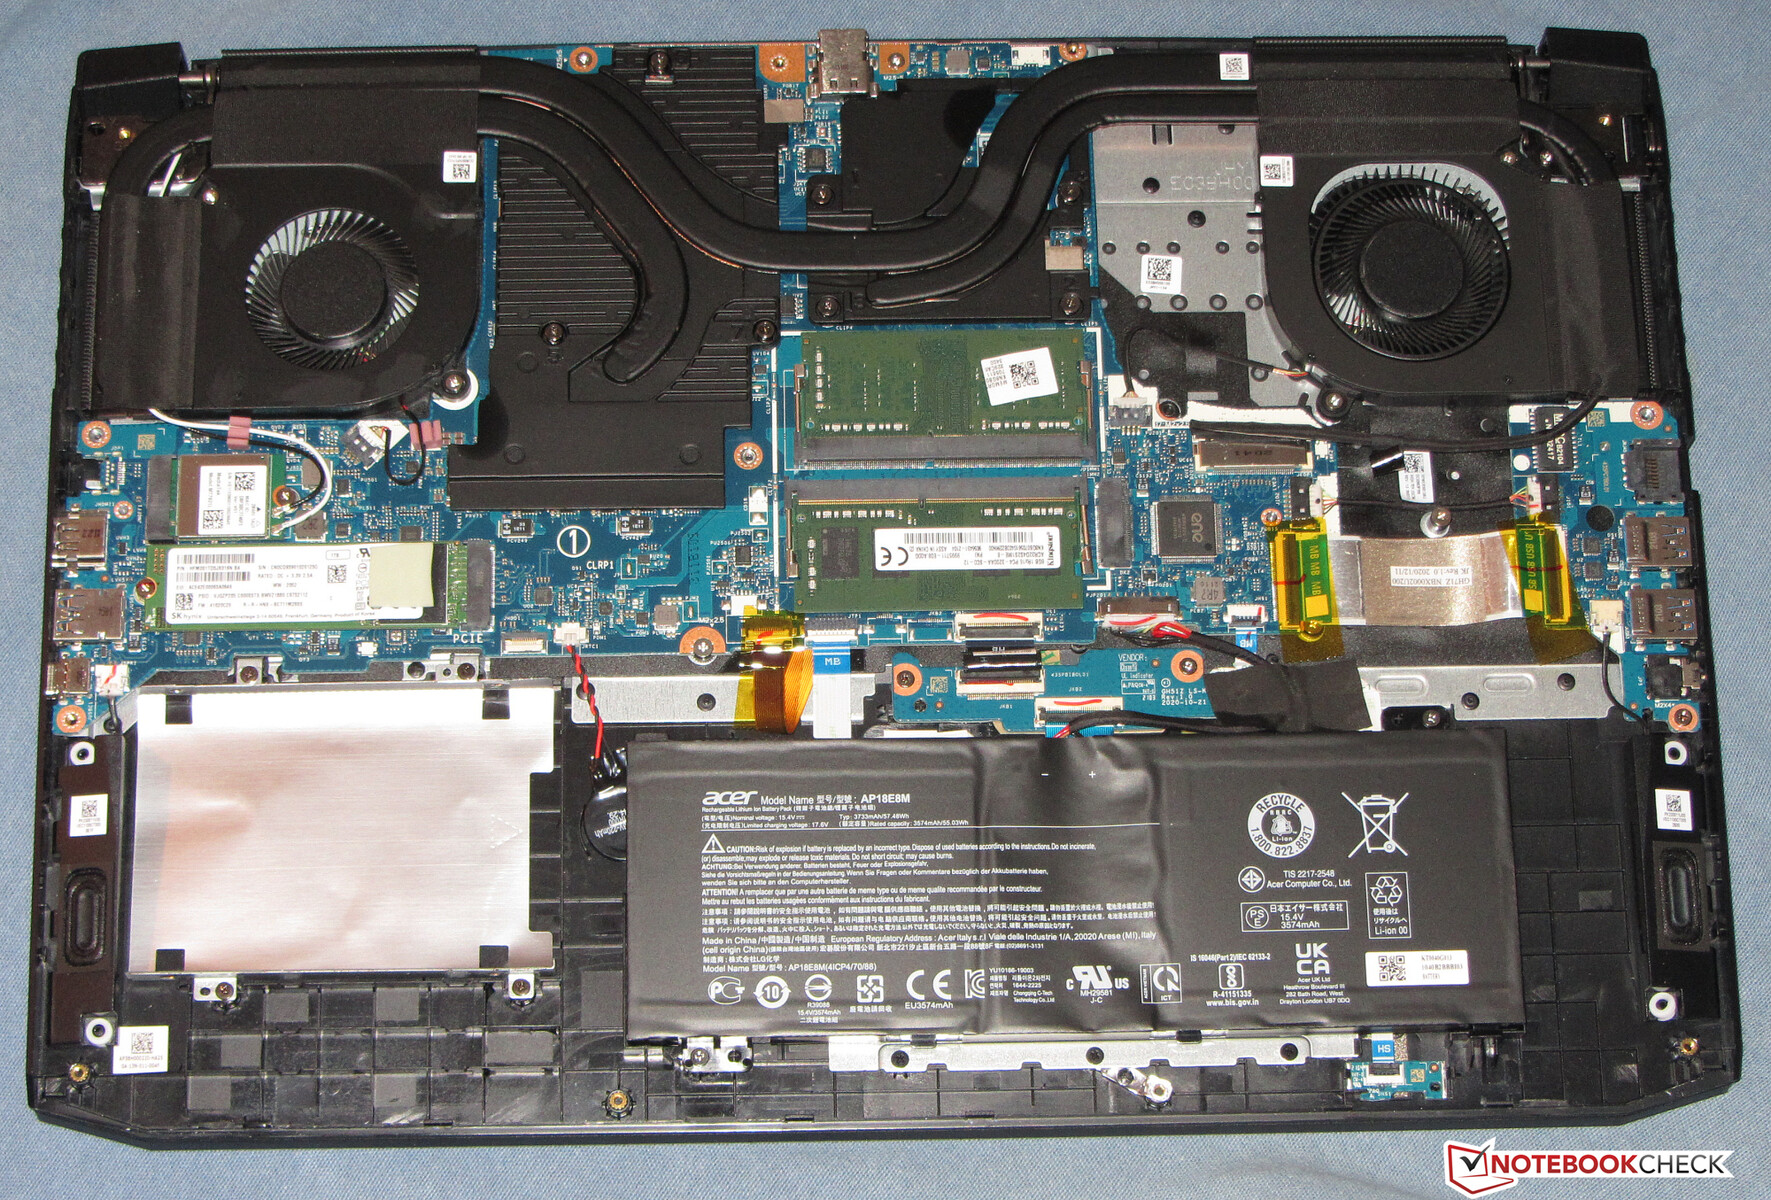
O notebook vem com os documentos habituais: Um guia de início rápido e informações sobre garantia. Além disso, um cabo de fita curto incluindo um conector SATA está incluído, que seria necessário para instalar um meio de armazenamento de 2,5 polegadas. A estrutura de montagem correspondente já está dentro do notebook
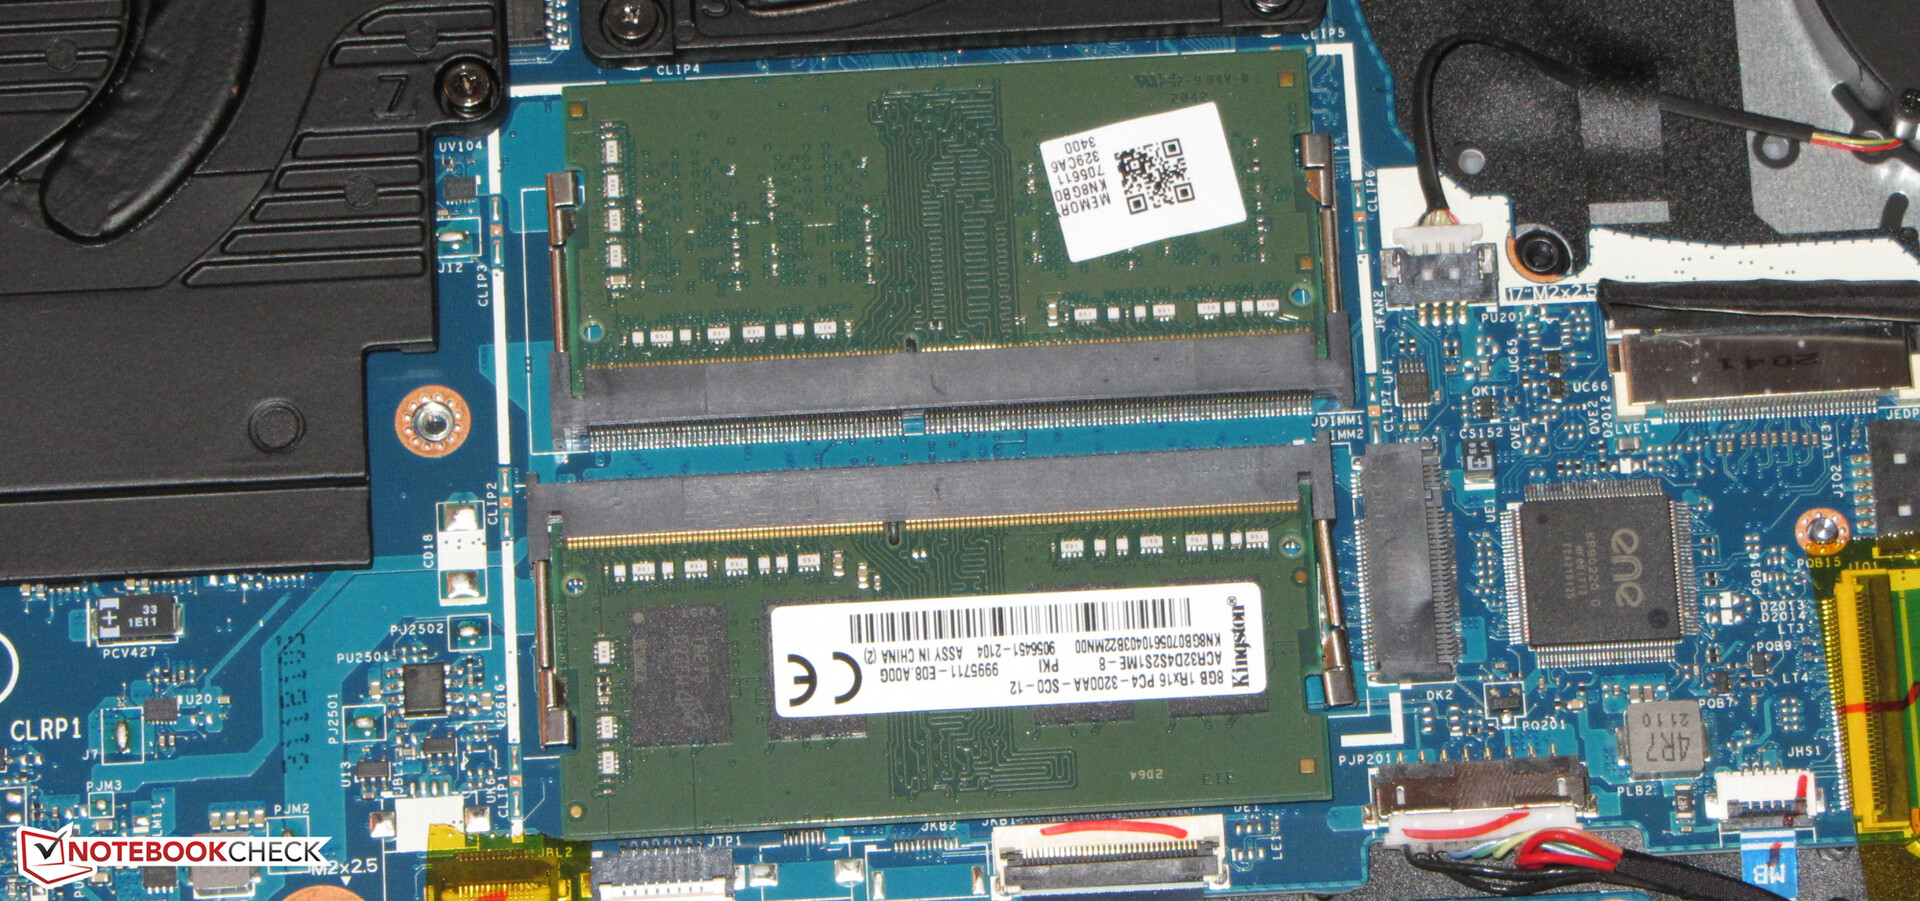
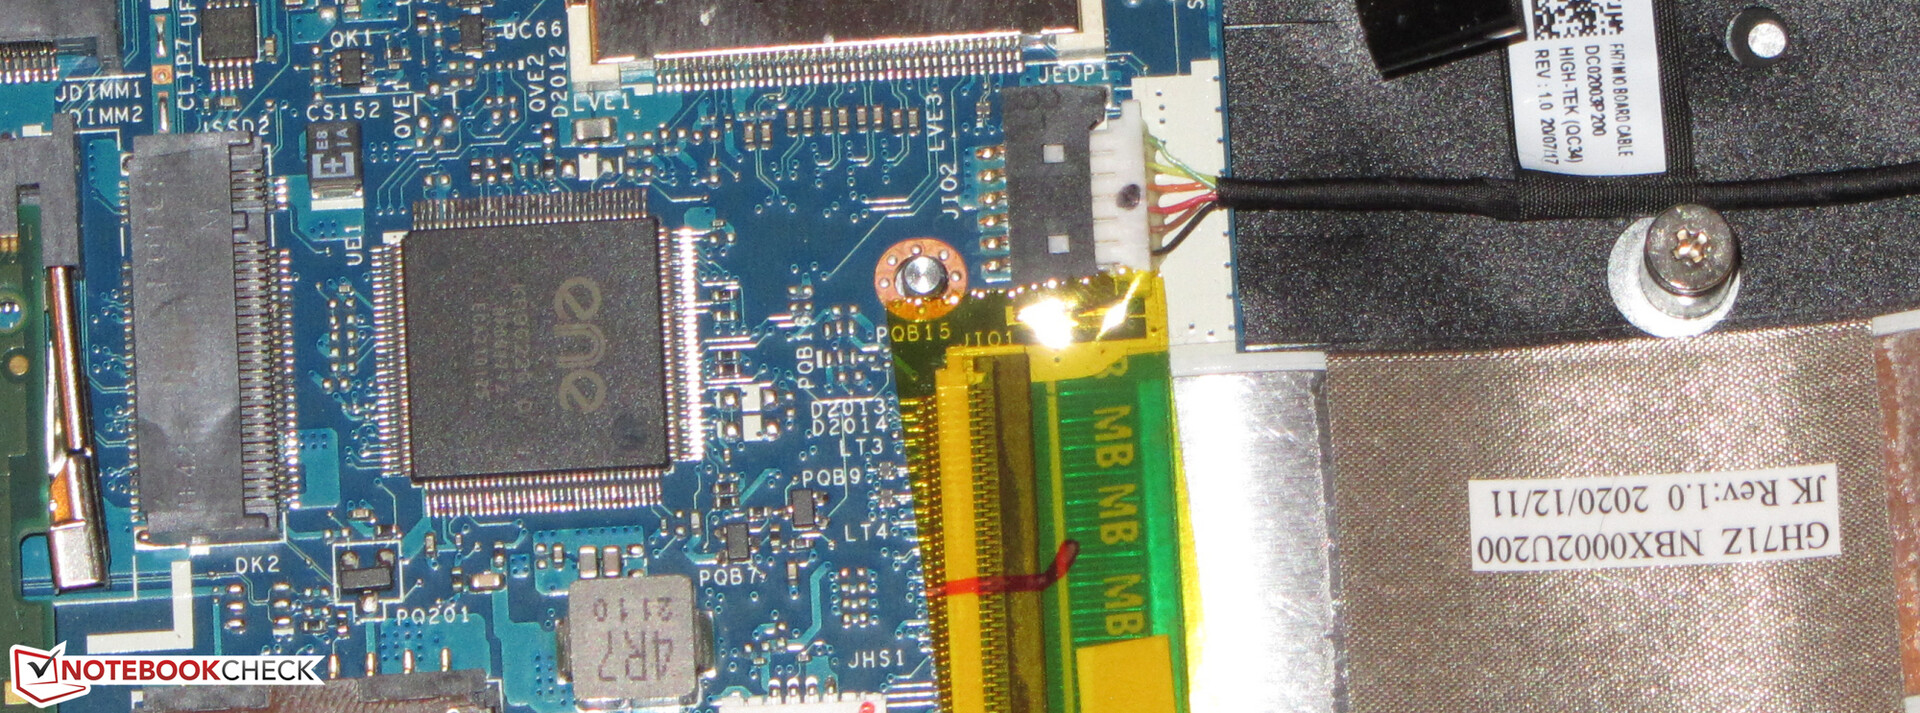
Manutenção
O acesso às entranhas requer a desmontagem da casca inferior. Depois de remover todos os parafusos no fundo do dispositivo, o invólucro inferior pode ser desmontado com a ajuda de uma espátula plana ou de uma junta mais lisa. Deve-se tomar cuidado aqui: O invólucro do fundo é às vezes bastante apertado.
Garantia
A Acer concede ao equipamento de 17,3 polegadas uma garantia de dois anos. Uma extensão para três anos custa pouco menos de 100 Euros (~$118)
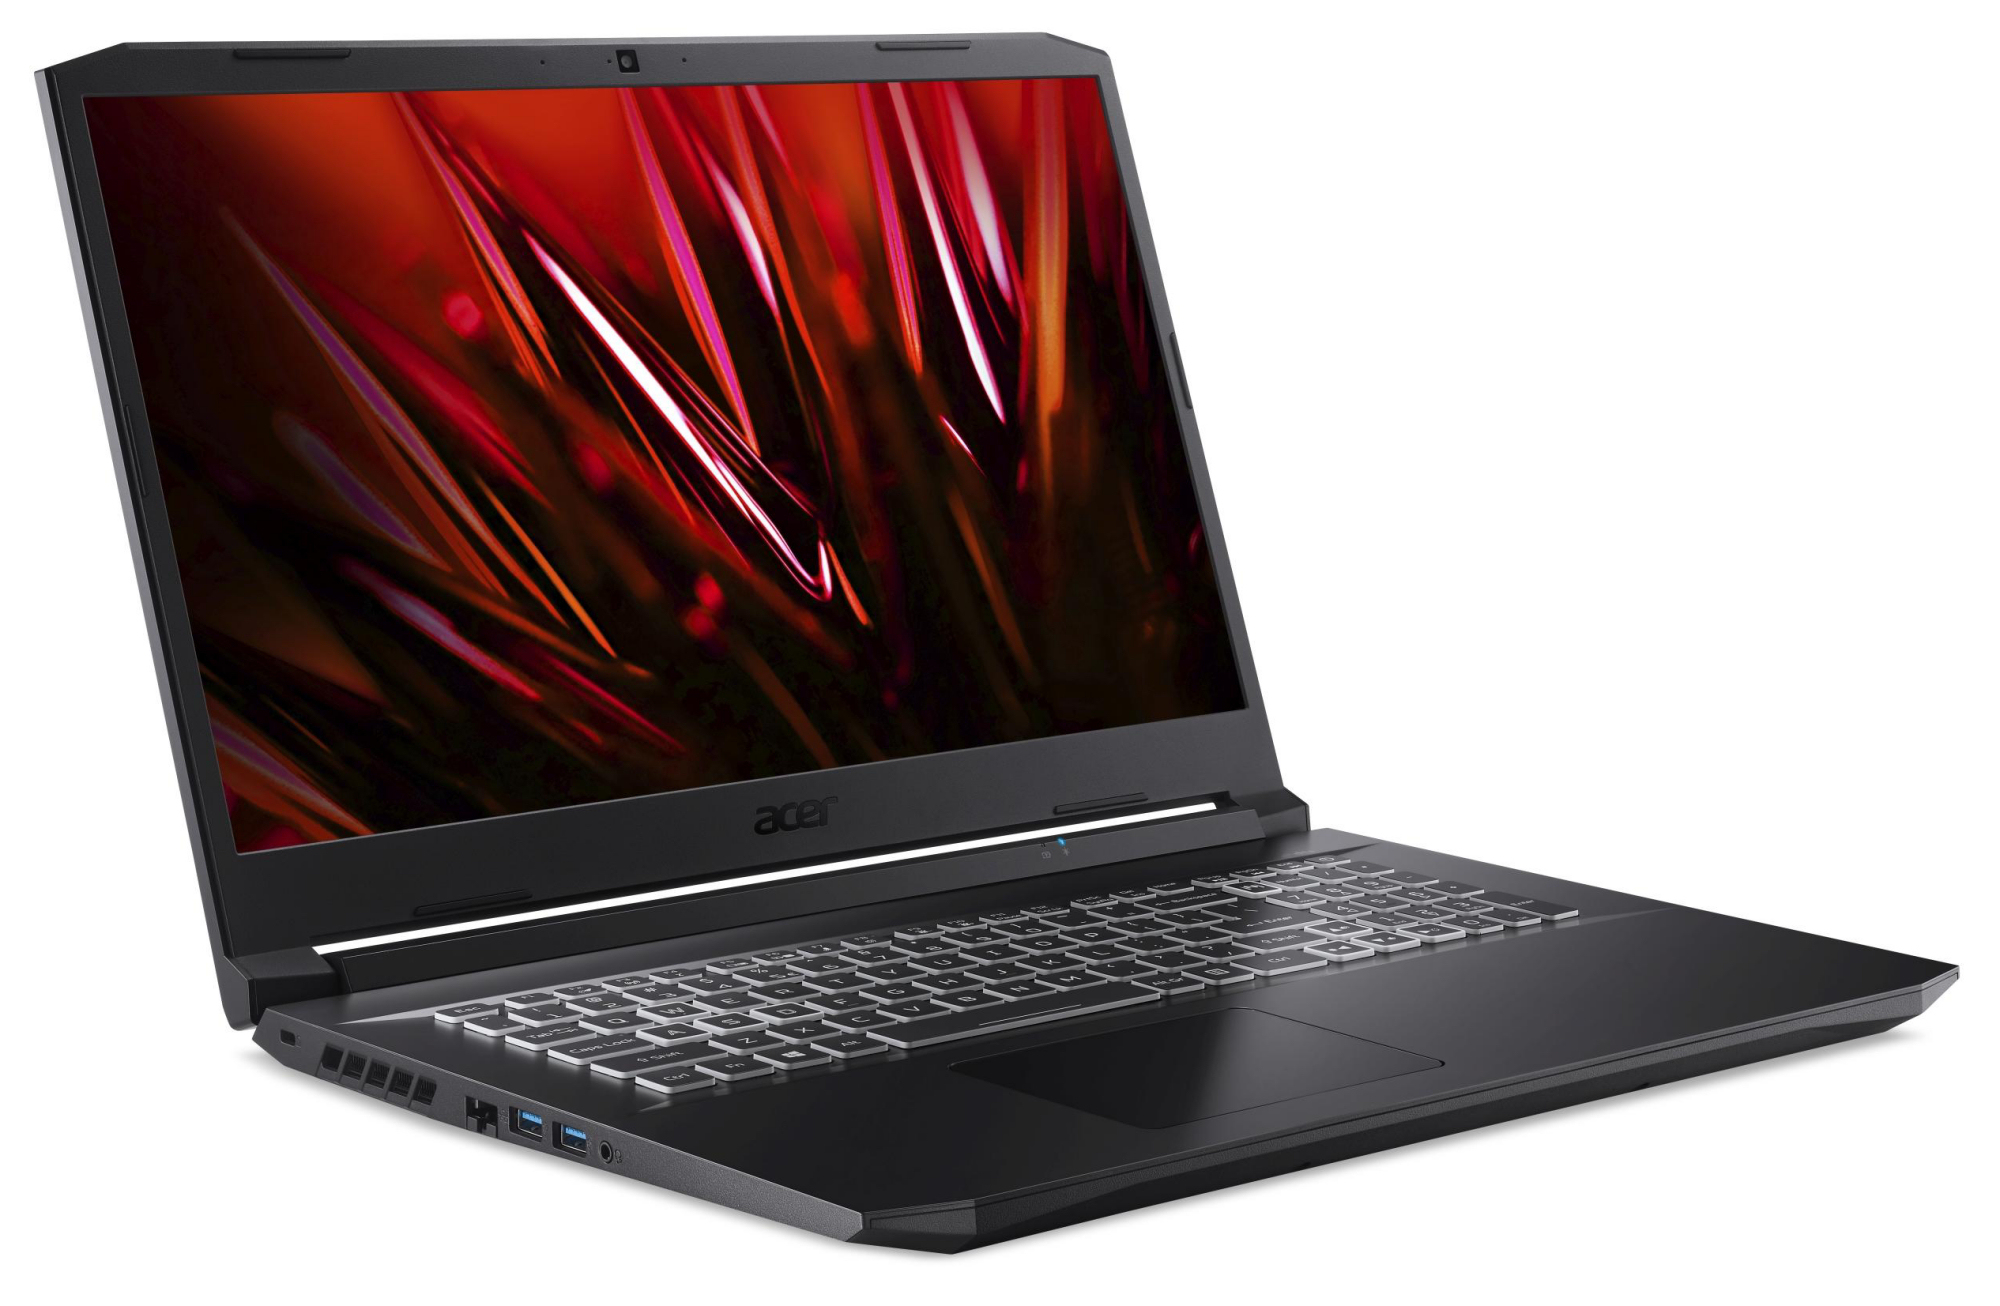
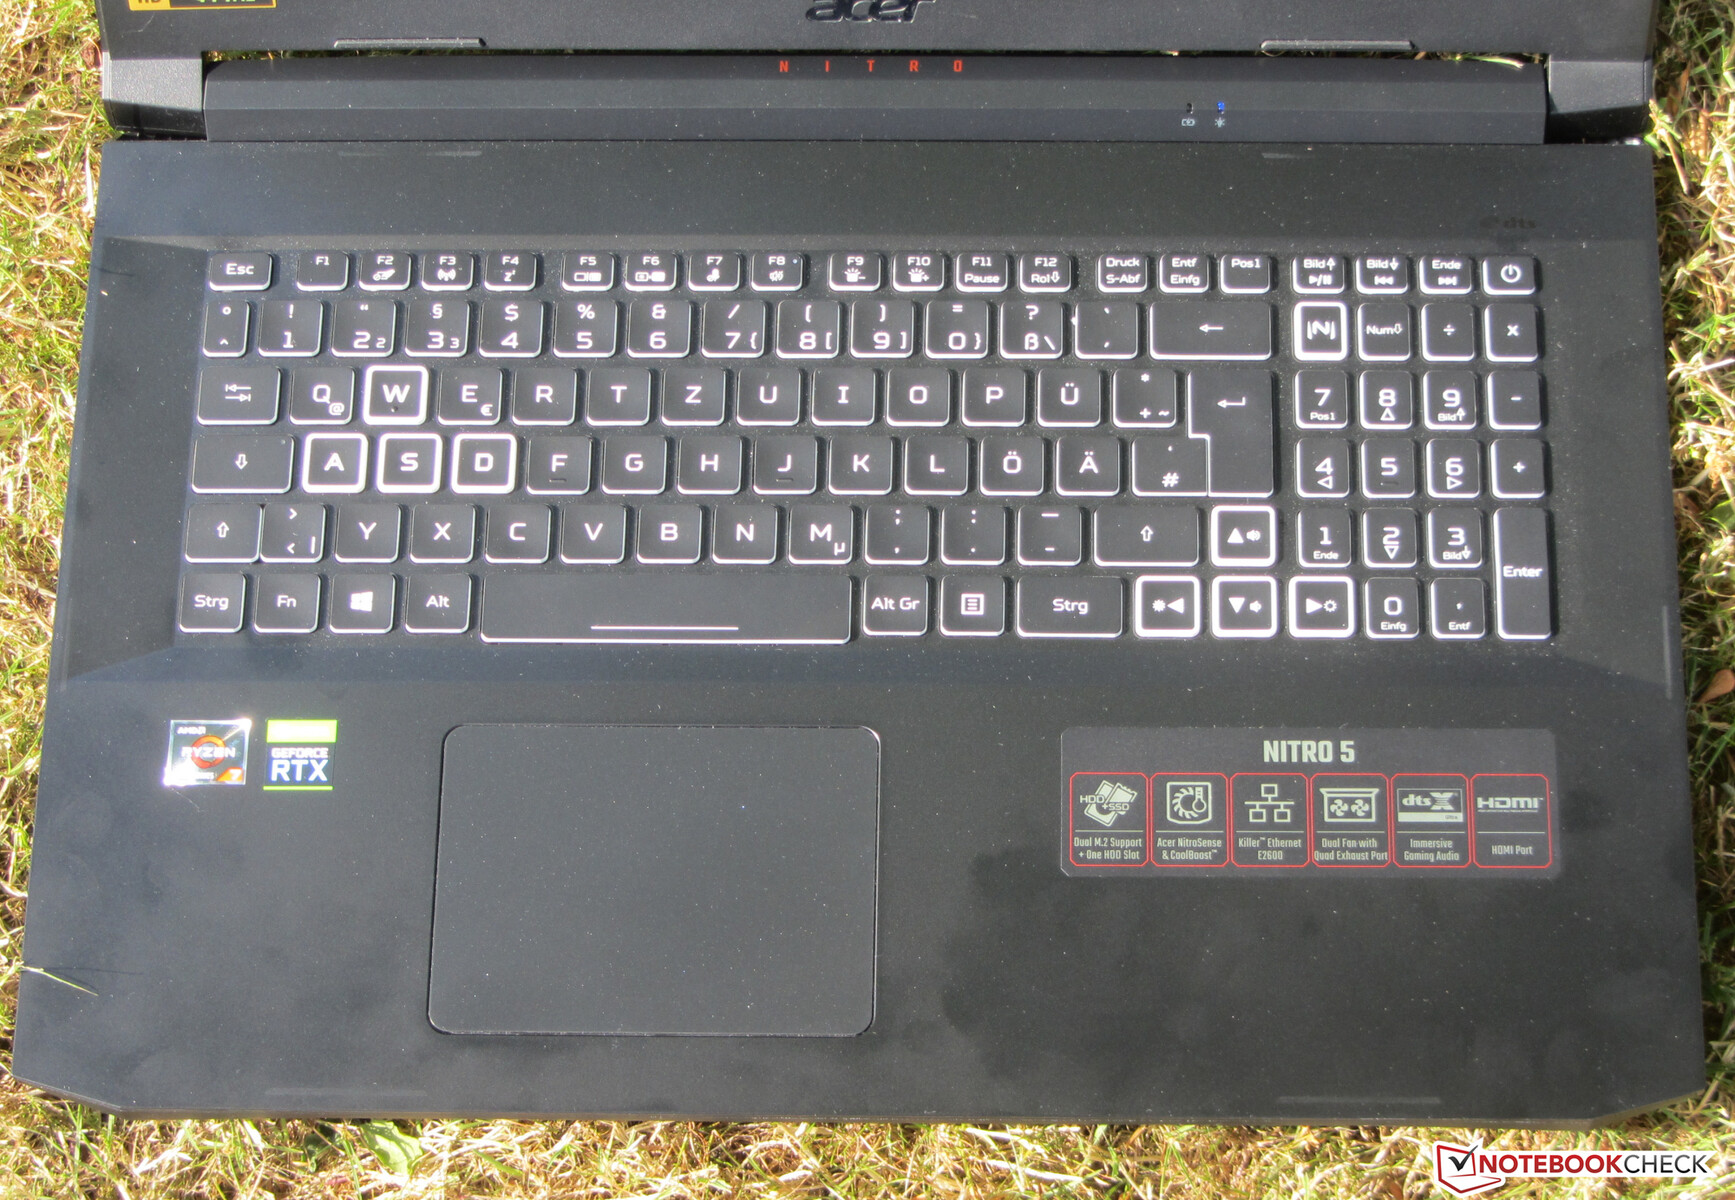
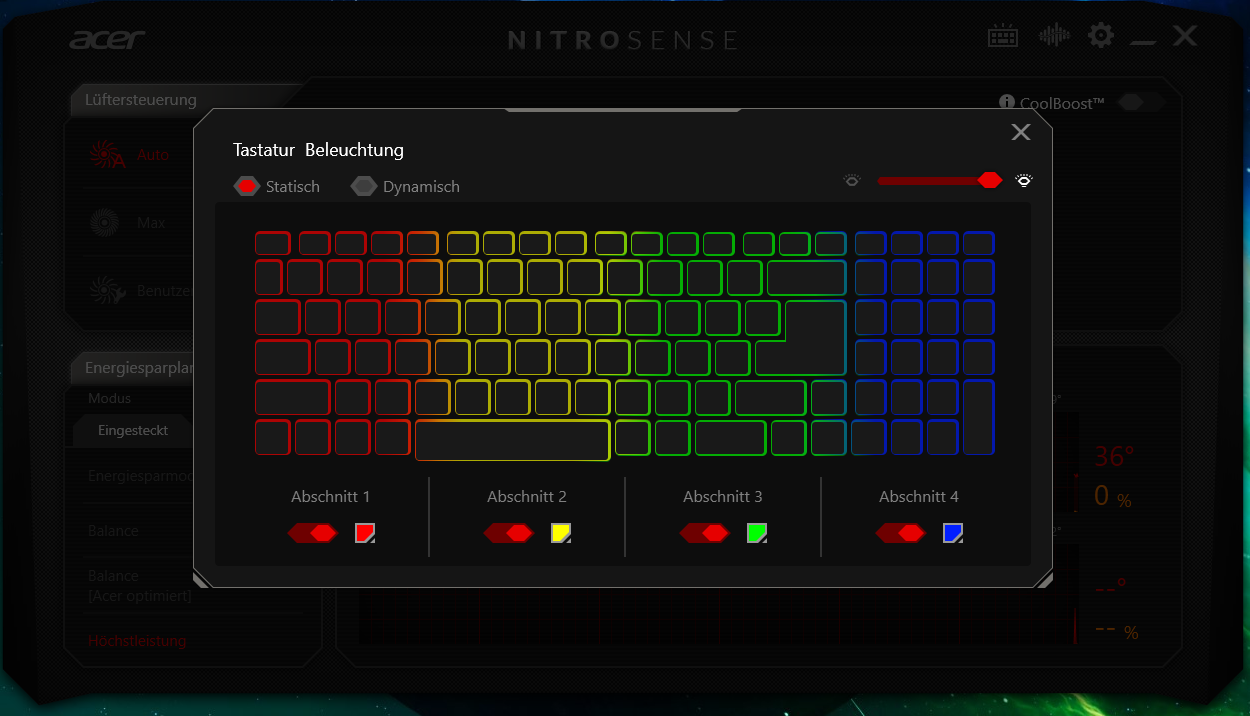
Dispositivos de entrada - Teclado com iluminação RGB
Teclado
As teclas principais (letras, linha de números) do teclado em chiclet iluminado têm uma curvatura ligeiramente côncava. As outras teclas (teclas de função, teclado numérico) têm um design plano. Elas oferecem um curso médio e um ponto de pressão claro. A resistência das teclas é bastante aceitável, mas poderia ser mais nítida para nosso gosto. O teclado rende um pouco durante a digitação. Isto não se mostrou aborrecido. Em resumo, a Acer fornece um teclado que é adequado para o uso diário
Touchpad
A superfície lisa do ClickPad multitouch-capable (cerca de 10,6 x 7,8 cm/~4,2 x 3,1 polegadas) facilita o deslizamento dos dedos. Ele também responde às entradas nos cantos. A almofada tem um curso curto e um ponto de pressão claro
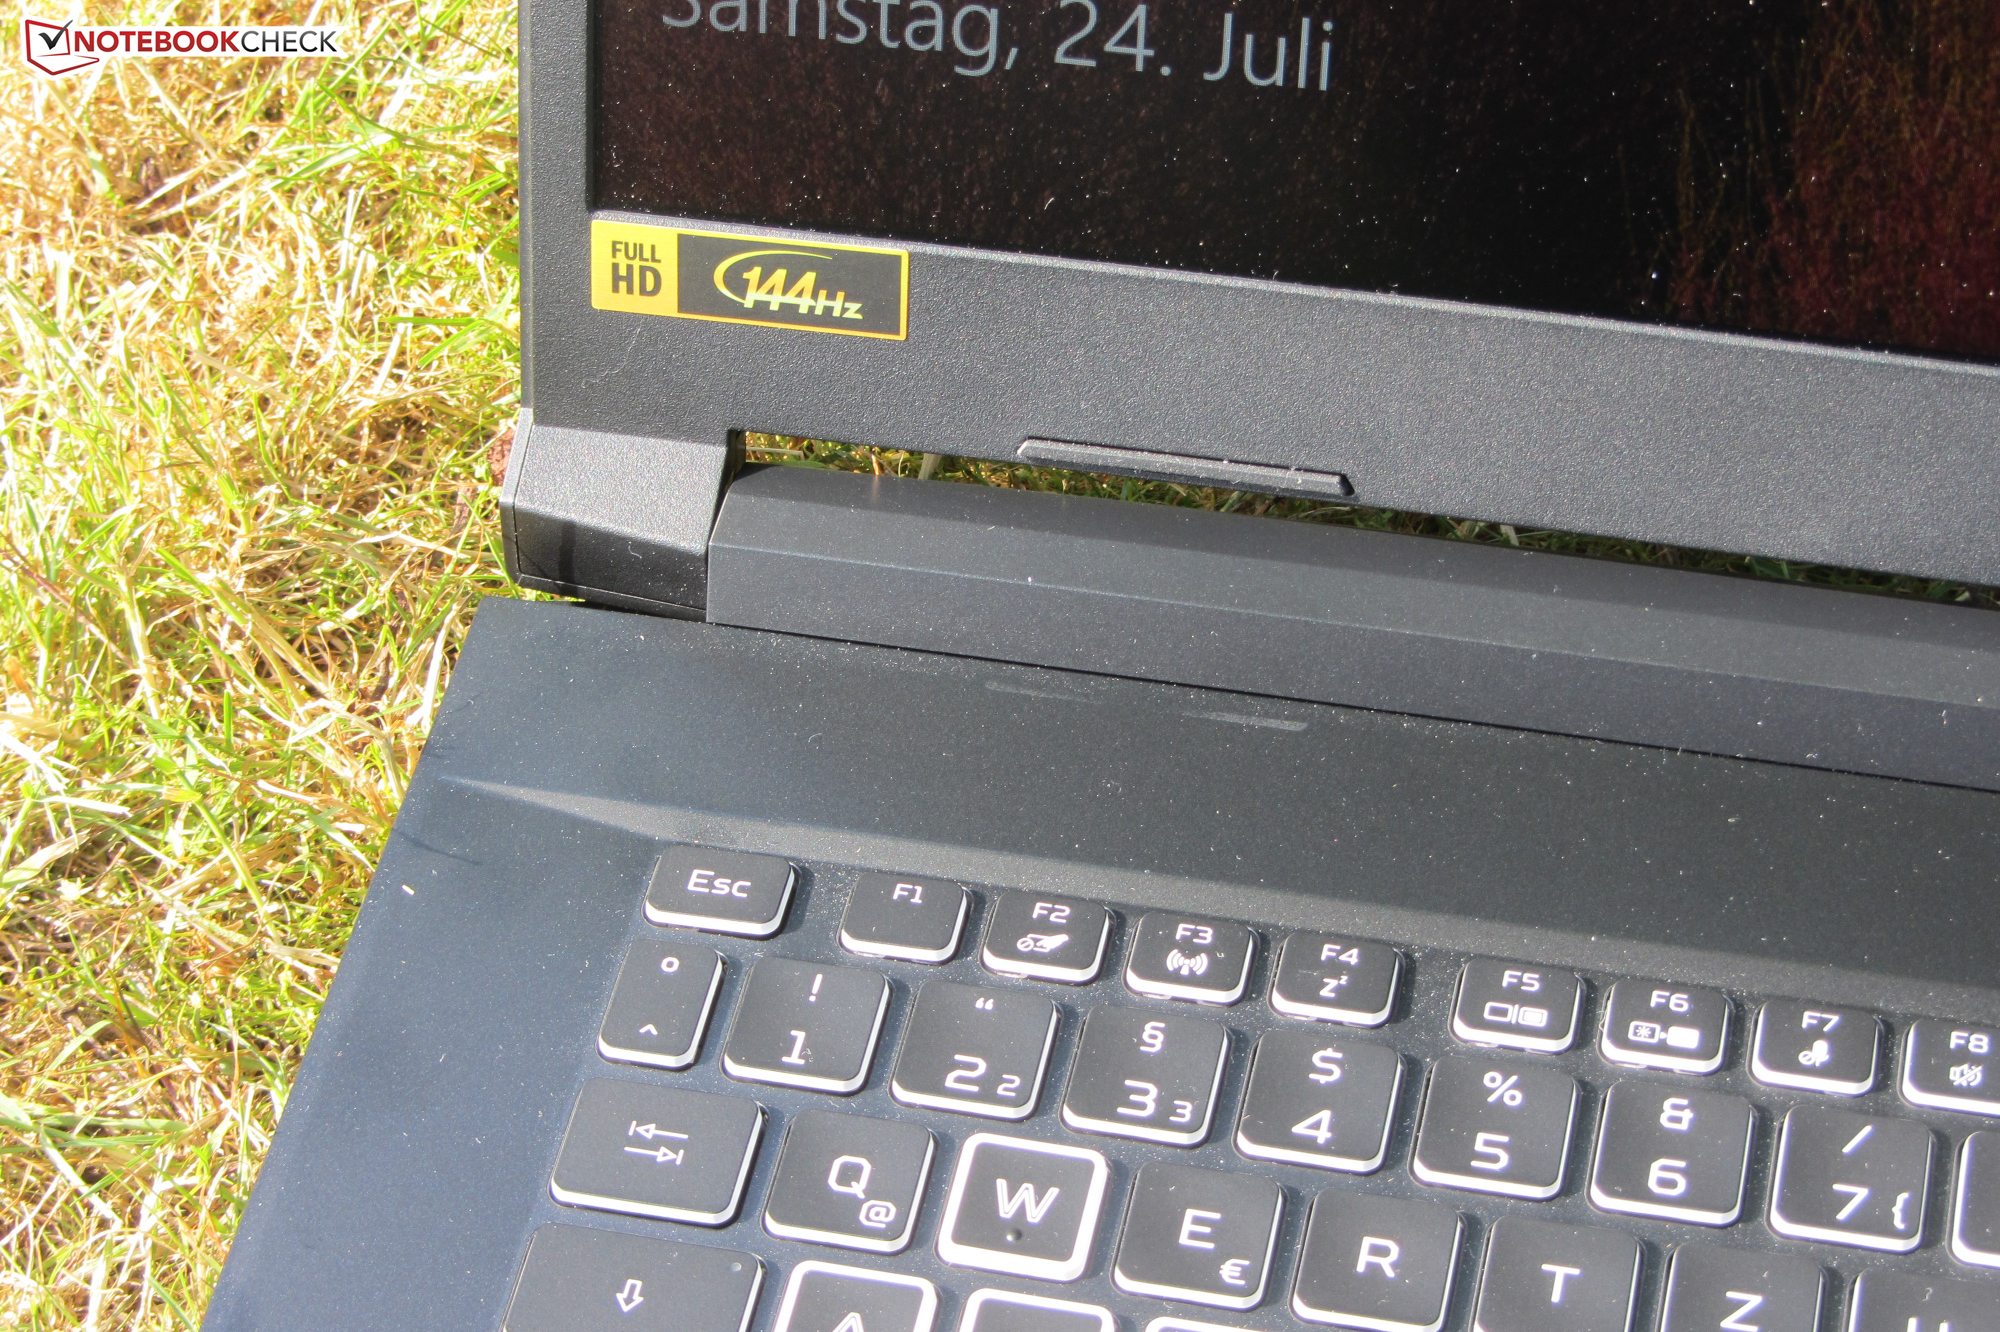
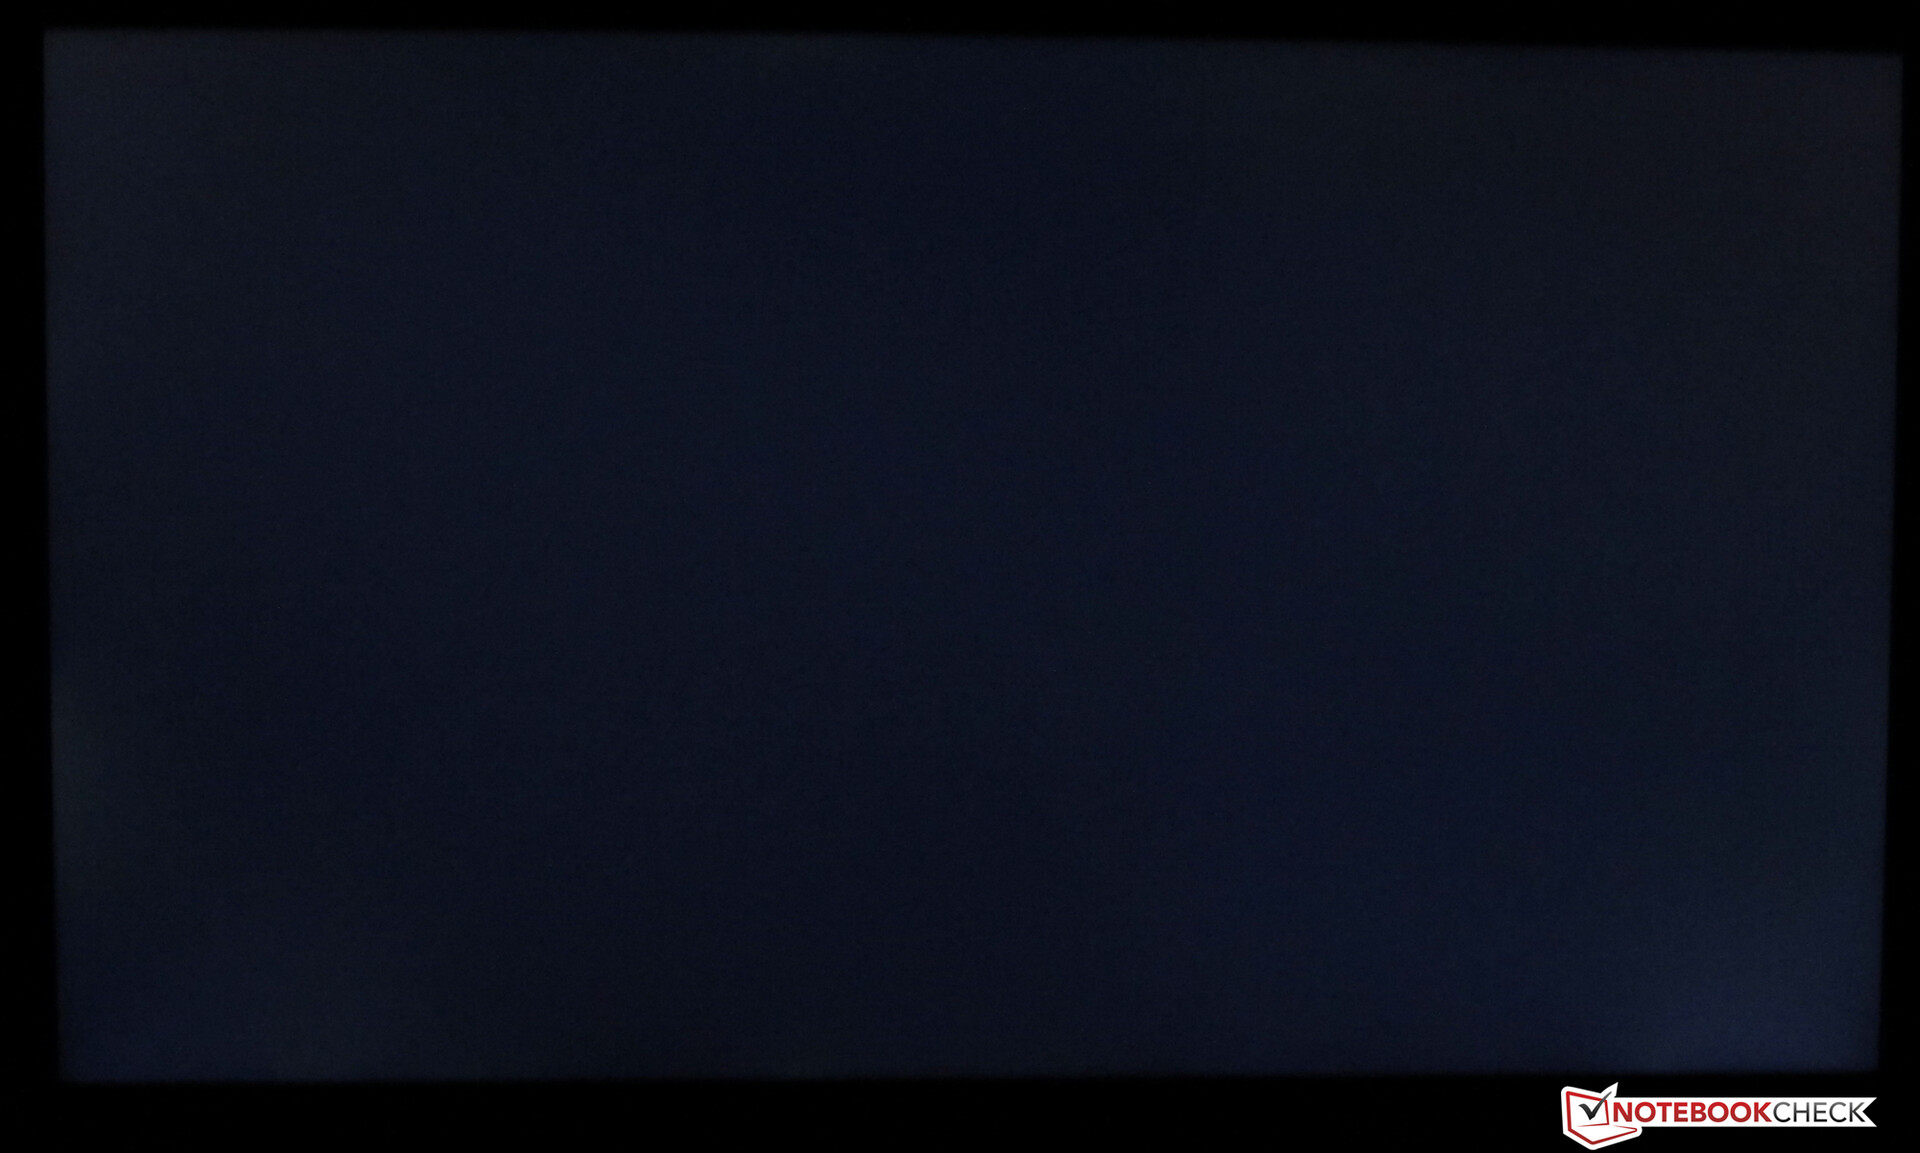
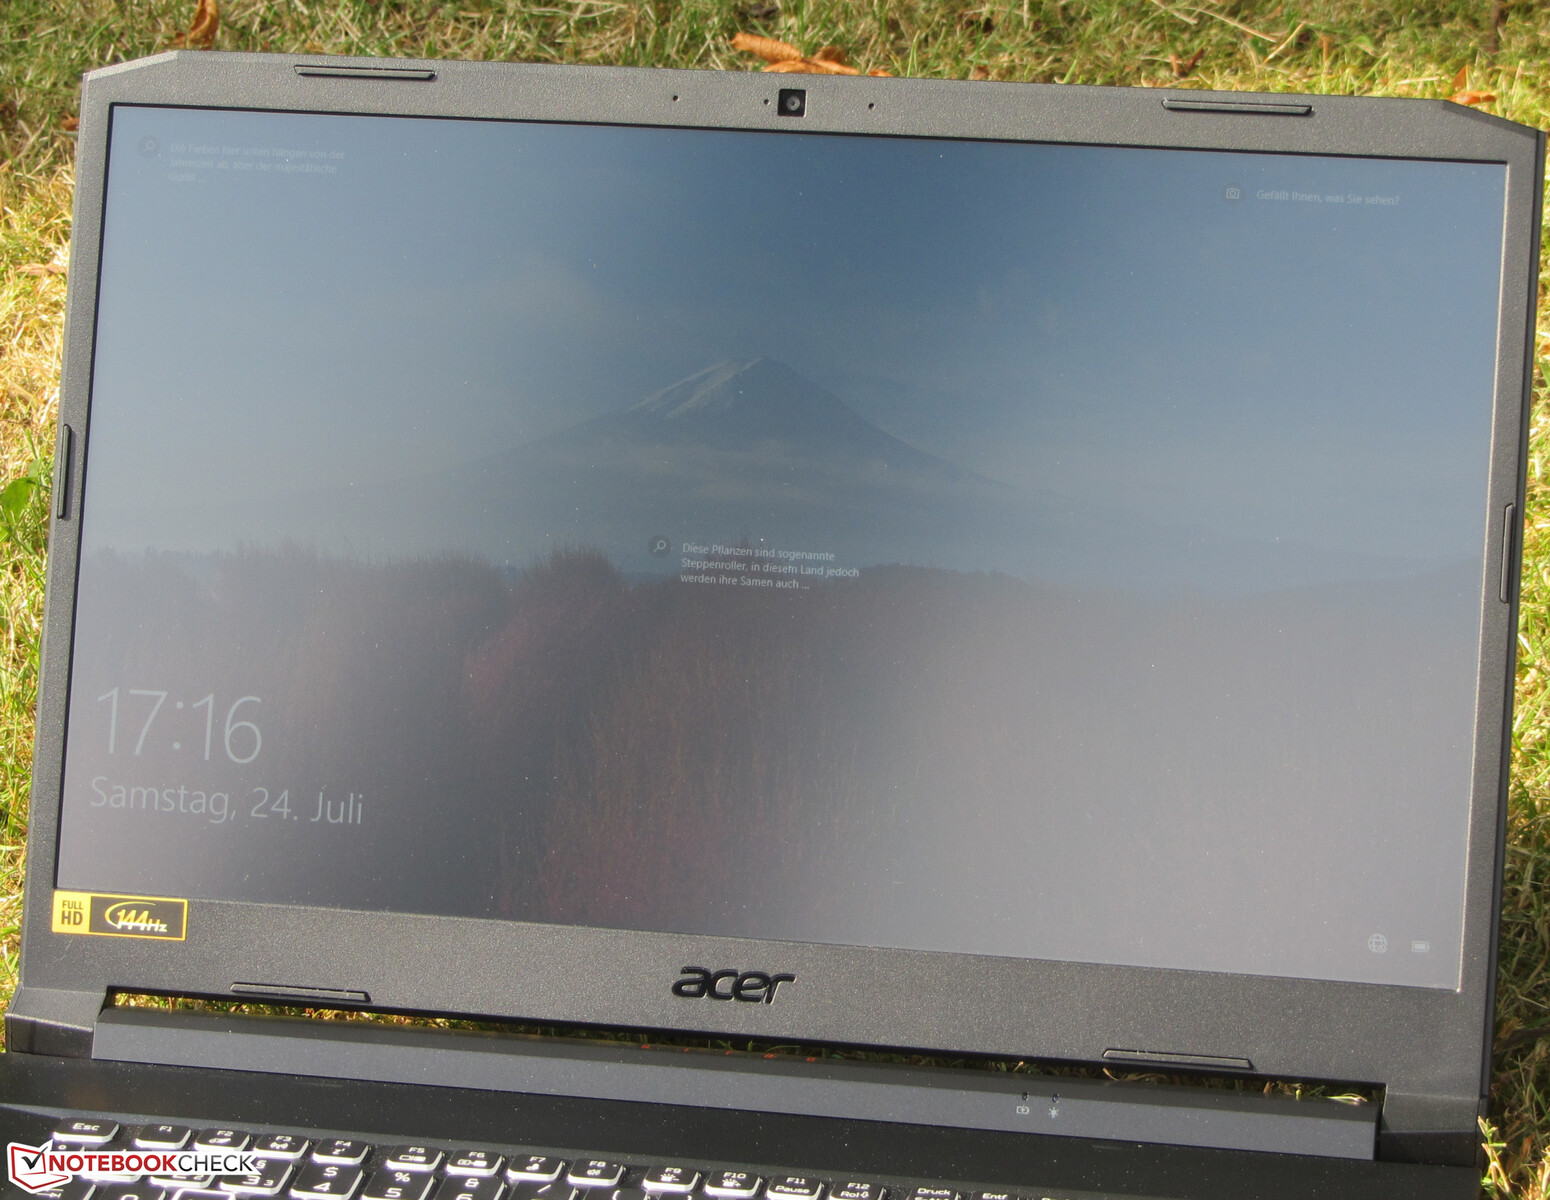
Visor - IPS 144 Hz
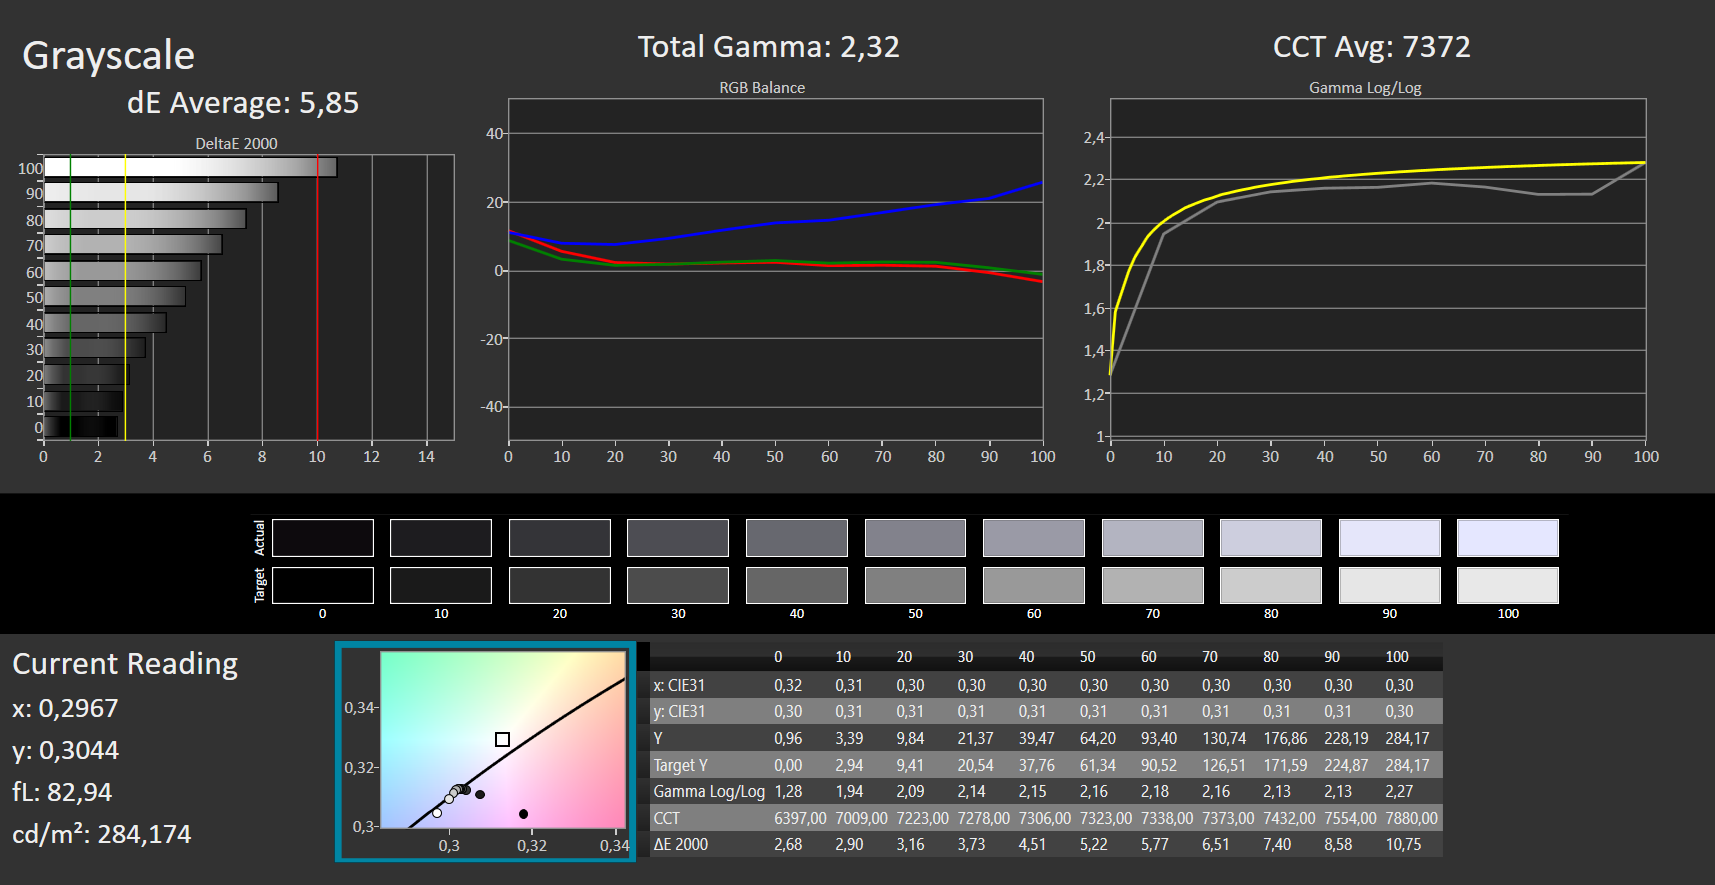
Enquanto o visor mate de 17,3 polegadas (1.920 x 1.080 pixels) proporciona um bom contraste (1.175:1), o brilho médio (255,1 cd/m²) é muito baixo.Consideramos que valores acima de 300 cd/m² são bons. O painel de 144 Hz oferece tempos de resposta curtos. A cintilação PWM não pôde ser detectada
| |||||||||||||||||||||||||
iluminação: 85 %
iluminação com acumulador: 283 cd/m²
Contraste: 1175:1 (Preto: 0.24 cd/m²)
ΔE ColorChecker Calman: 5.91 | ∀{0.5-29.43 Ø4.71}
ΔE Greyscale Calman: 5.85 | ∀{0.09-98 Ø4.96}
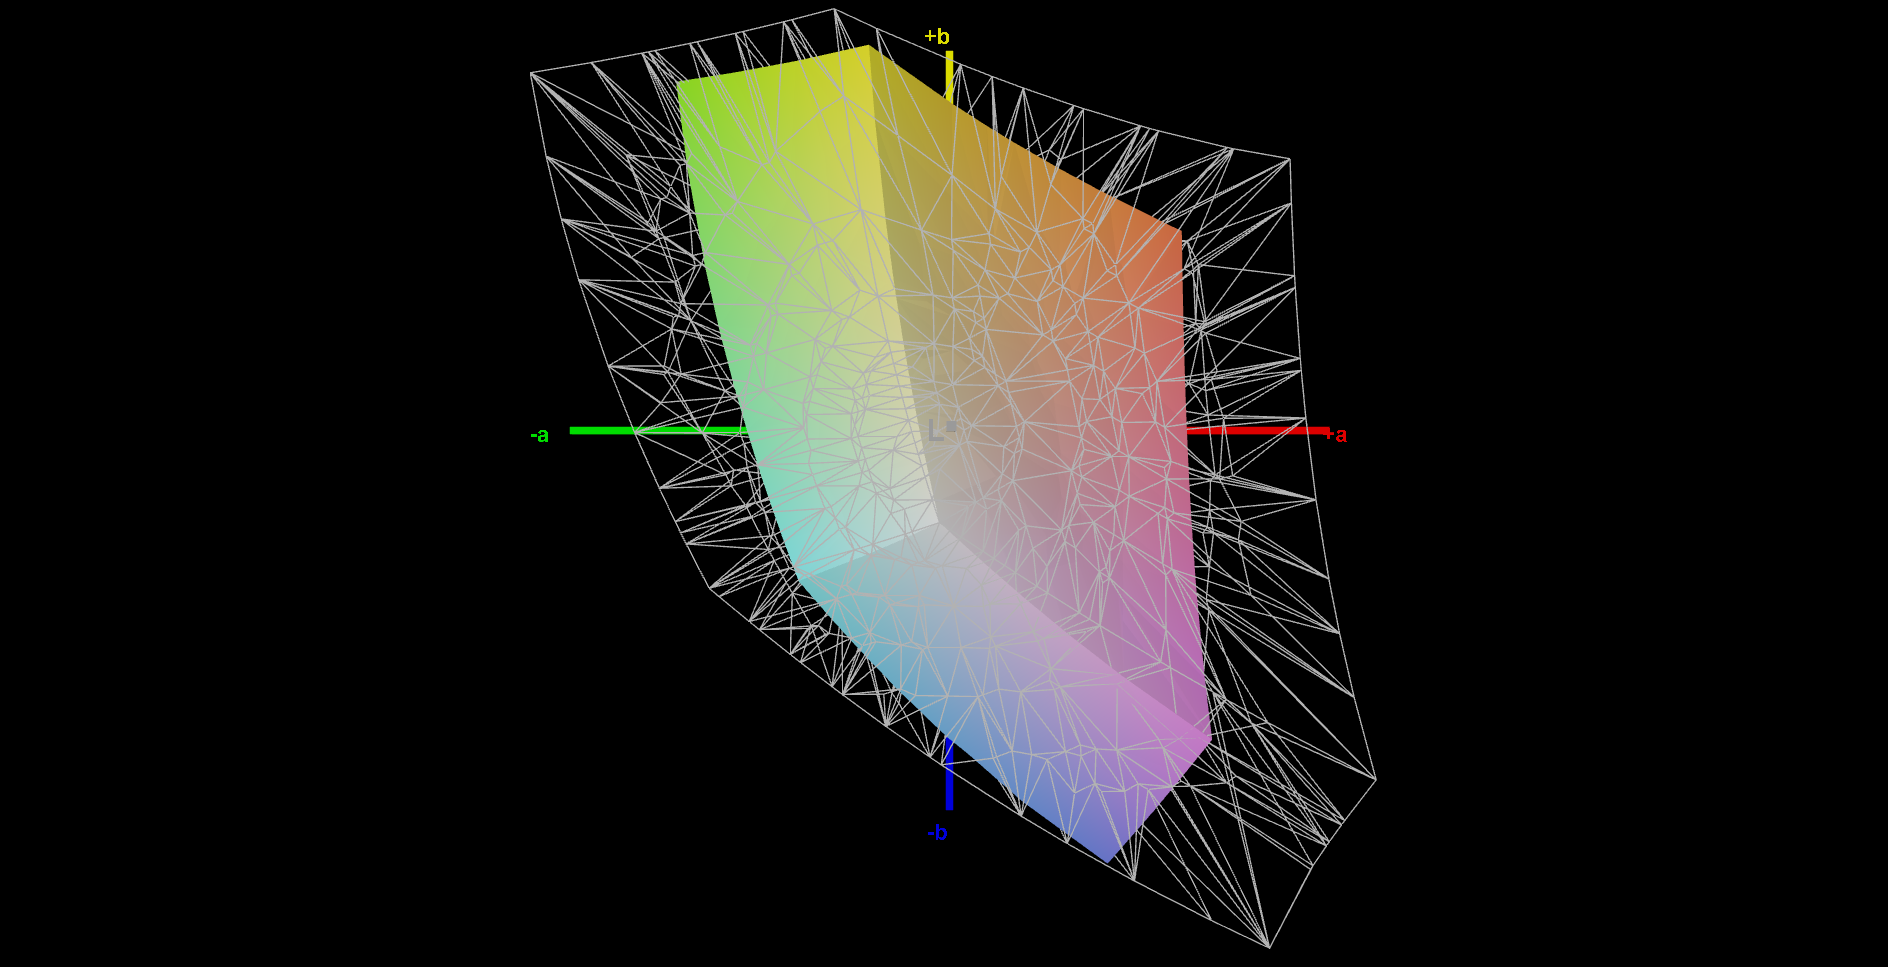
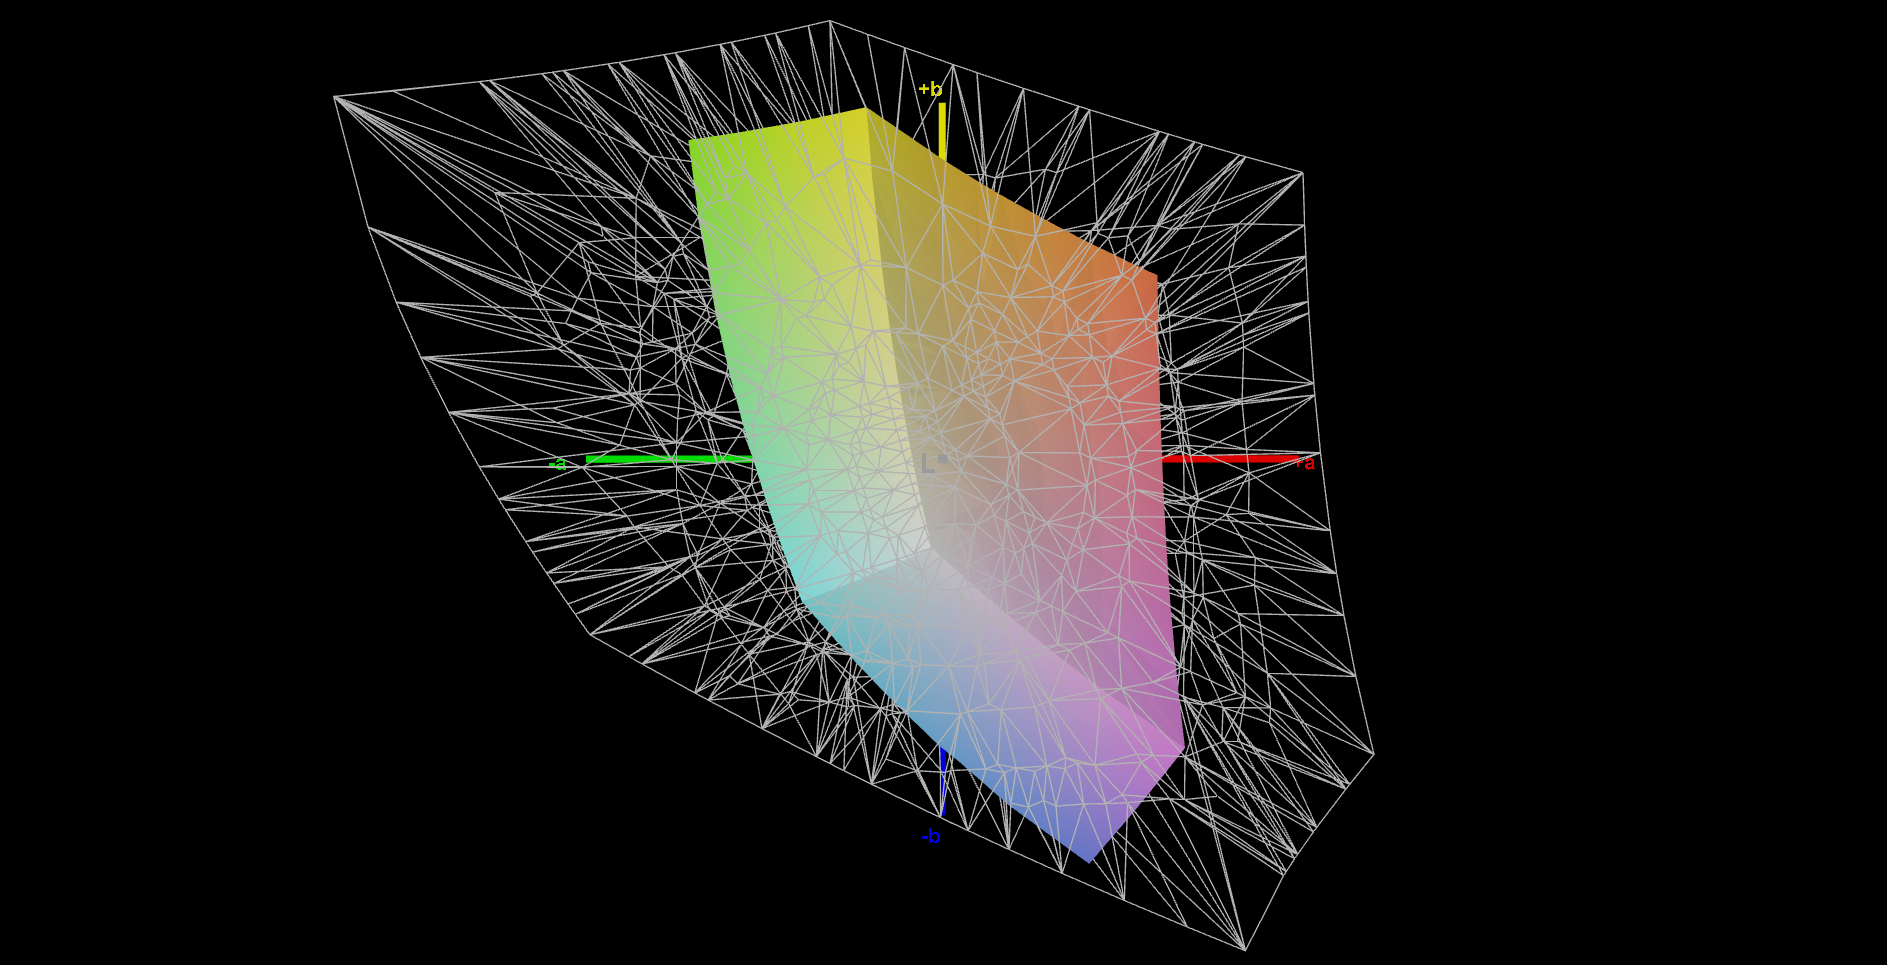
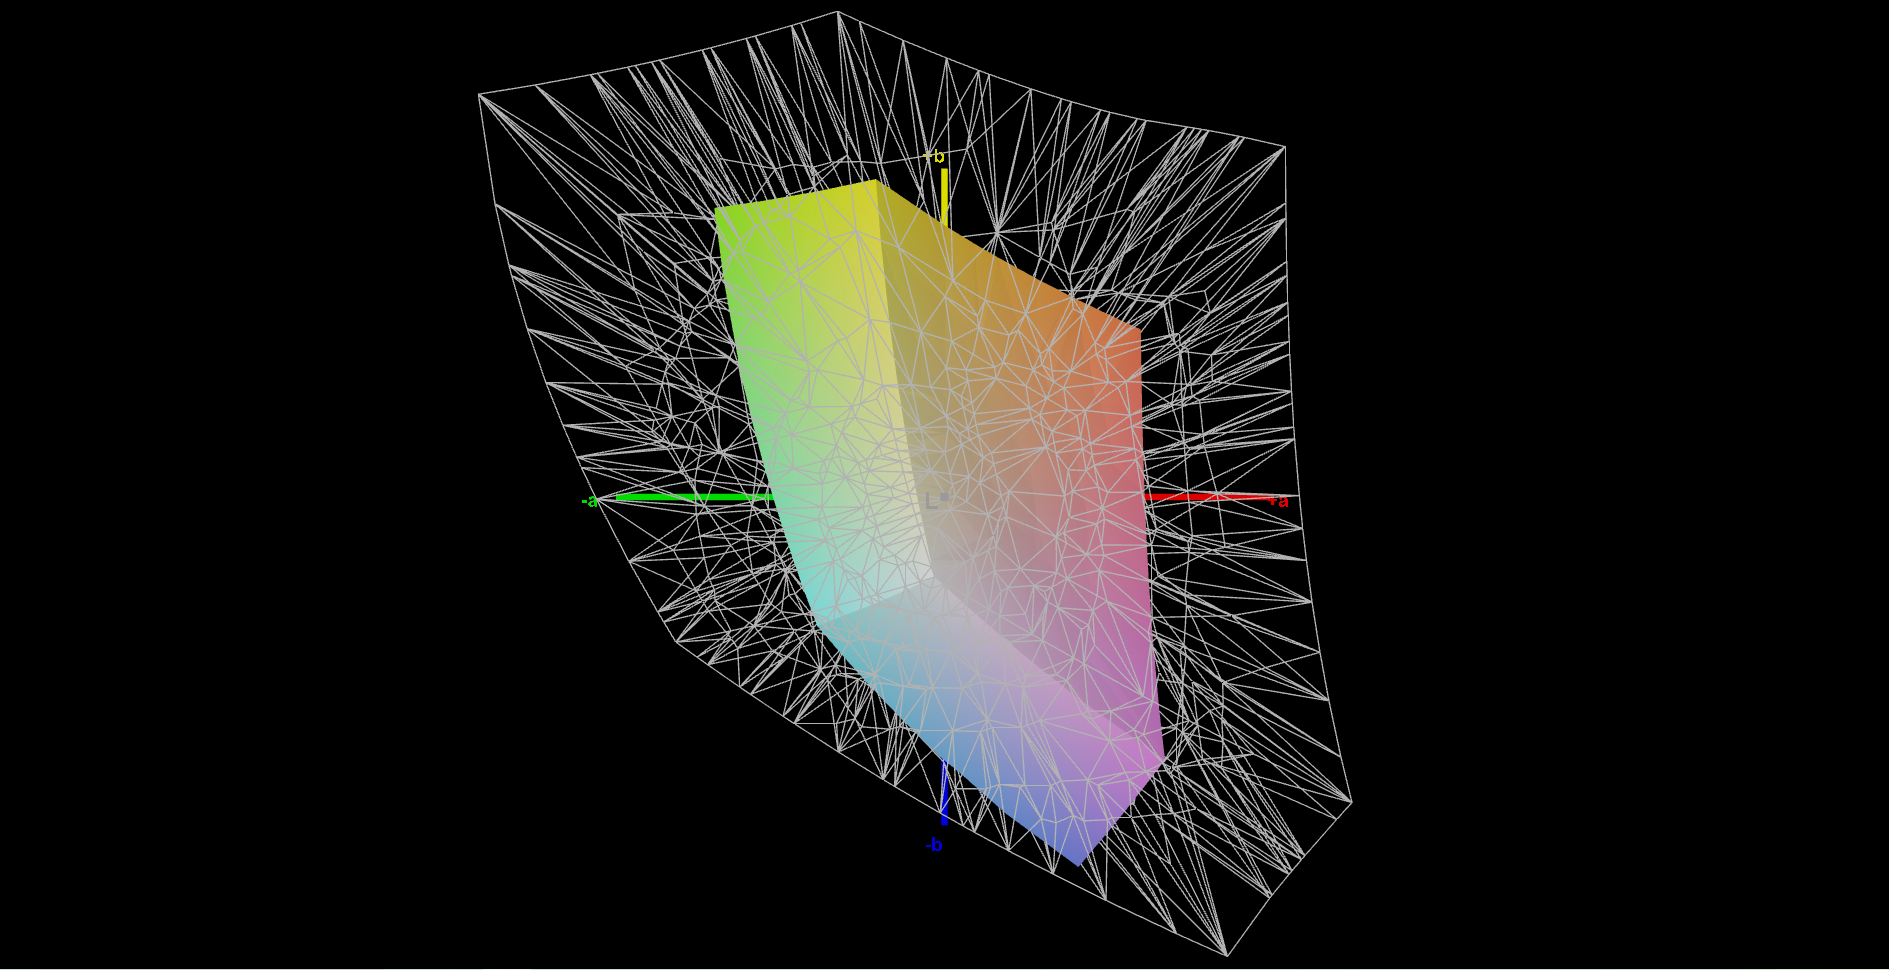
55% sRGB (Argyll 1.6.3 3D)
35% AdobeRGB 1998 (Argyll 1.6.3 3D)
37.9% AdobeRGB 1998 (Argyll 3D)
55.3% sRGB (Argyll 3D)
36.7% Display P3 (Argyll 3D)
Gamma: 2.32
CCT: 7372 K
| Acer Nitro 5 AN517-41-R5Z7 BOE NV173FHM-NX4, IPS, 1920x1080, 17.3" | MSI Katana GF76 11UE AU Optronics B173HAN04.9, IPS, 1920x1080, 17.3" | Schenker XMG Core 17 (Early 2021) BOE CQ NE173QHM-NY2, IPS, 2560x1440, 17.3" | Asus TUF Gaming F17 FX706HM AU Optronics AUI8294 (B173HAN04.9), IPS, 1920x1080, 17.3" | MSI GP76 Leopard 10UG Chi Mei CMN176E, IPS, 1920x1080, 17.3" | |
|---|---|---|---|---|---|
| Display | 8% | 82% | 9% | 76% | |
| Display P3 Coverage (%) | 36.7 | 39.8 8% | 68.1 86% | 40.1 9% | 64.7 76% |
| sRGB Coverage (%) | 55.3 | 59.5 8% | 98.5 78% | 60 8% | 96.4 74% |
| AdobeRGB 1998 Coverage (%) | 37.9 | 41.12 8% | 69.3 83% | 41.4 9% | 66.9 77% |
| Response Times | -95% | 18% | -70% | 41% | |
| Response Time Grey 50% / Grey 80% * (ms) | 18 ? | 36.8 ? -104% | 16.8 ? 7% | 32.4 -80% | 7.4 ? 59% |
| Response Time Black / White * (ms) | 14 ? | 26 ? -86% | 10 ? 29% | 22.4 -60% | 10.8 ? 23% |
| PWM Frequency (Hz) | 24510 ? | ||||
| Screen | -2% | 28% | 8% | 34% | |
| Brightness middle (cd/m²) | 282 | 260 -8% | 370 31% | 266 -6% | 328 16% |
| Brightness (cd/m²) | 255 | 251 -2% | 333 31% | 264 4% | 314 23% |
| Brightness Distribution (%) | 85 | 85 0% | 84 -1% | 79 -7% | 87 2% |
| Black Level * (cd/m²) | 0.24 | 0.26 -8% | 0.38 -58% | 0.32 -33% | 0.29 -21% |
| Contrast (:1) | 1175 | 1000 -15% | 974 -17% | 831 -29% | 1131 -4% |
| Colorchecker dE 2000 * | 5.91 | 3.9 34% | 2.41 59% | 3.97 33% | 1.93 67% |
| Colorchecker dE 2000 max. * | 10.98 | 20.64 -88% | 7.32 33% | 8.93 19% | 4.94 55% |
| Greyscale dE 2000 * | 5.85 | 1.6 73% | 3.9 33% | 1.8 69% | 2.8 52% |
| Gamma | 2.32 95% | 2.068 106% | 2.287 96% | 2.31 95% | 2.18 101% |
| CCT | 7372 88% | 6511 100% | 7302 89% | 6754 96% | 7023 93% |
| Color Space (Percent of AdobeRGB 1998) (%) | 35 | 69 97% | 41.4 18% | 67 91% | |
| Color Space (Percent of sRGB) (%) | 55 | 93 69% | 60 9% | 89 62% | |
| Colorchecker dE 2000 calibrated * | 3.71 | 1.19 | 3.5 | 0.68 | |
| Média Total (Programa/Configurações) | -30% /
-14% | 43% /
37% | -18% /
-2% | 50% /
43% |
* ... menor é melhor
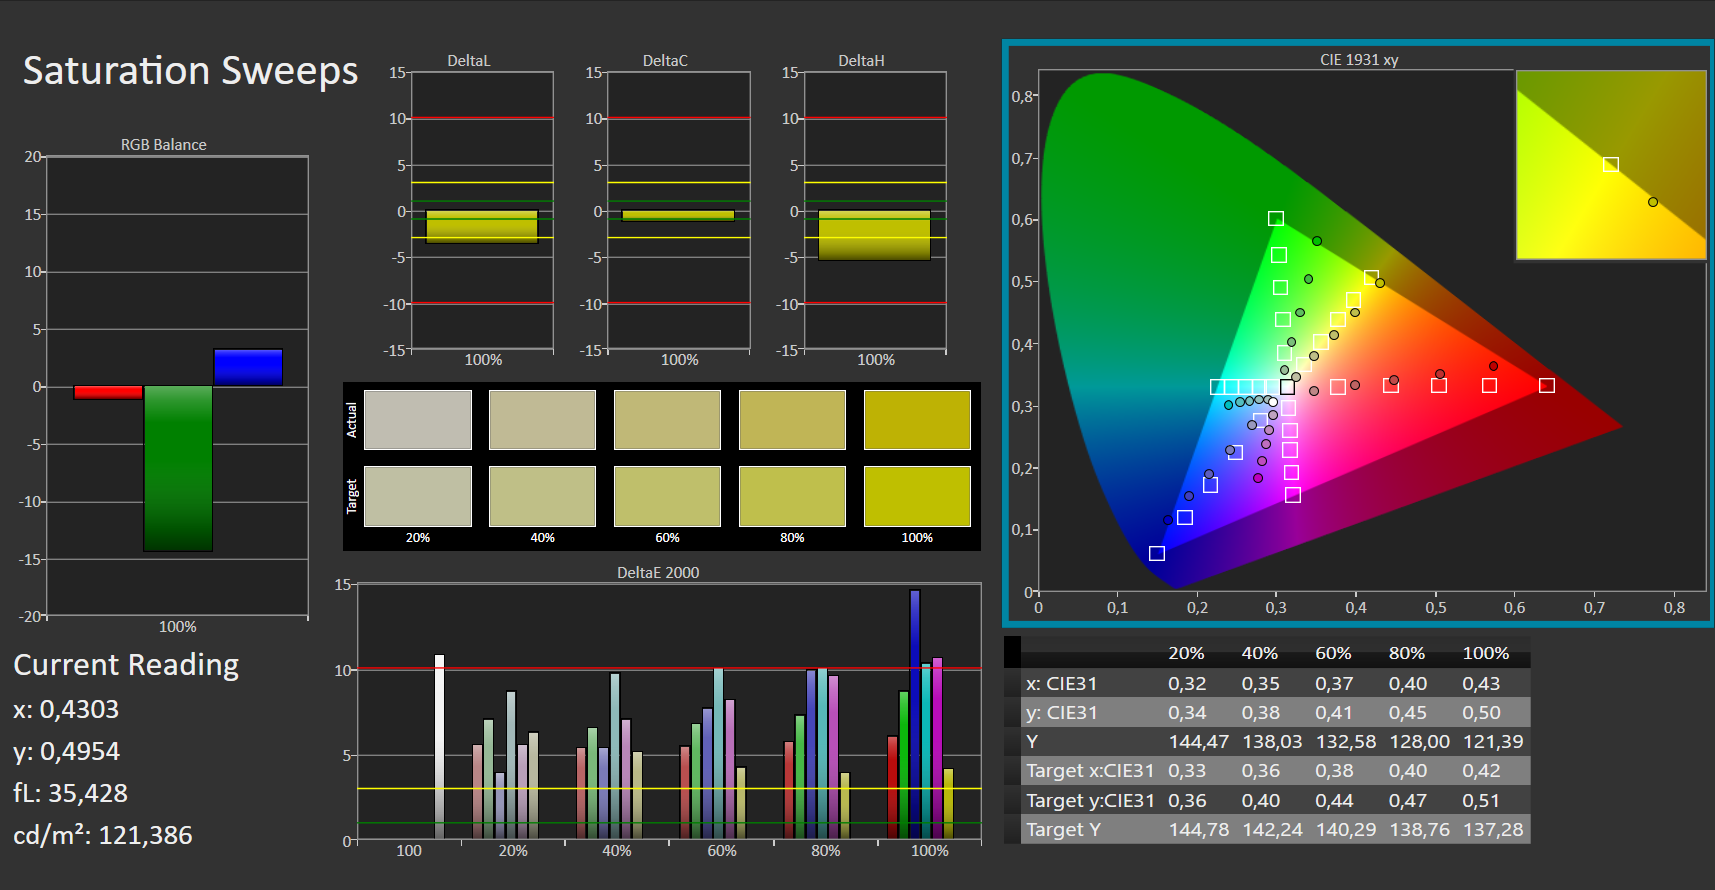
A tela mostra uma reprodução de cores bastante decente em seu estado de entrega. Entretanto, o alvo (Delta E menos de 3) não é atingido com um desvio de cor de Delta E 2000 de quase 6. A tela não sofre de um elenco azul. Os espaços de cor AdobeRGB (38%), sRGB (55%) e DCI-P3 (37%) não são completamente reproduzidos.
Exibir tempos de resposta
| ↔ Tempo de resposta preto para branco | ||
|---|---|---|
| 14 ms ... ascensão ↗ e queda ↘ combinadas | ↗ 7 ms ascensão |  |
| ↘ 7 ms queda | ||
| A tela mostra boas taxas de resposta em nossos testes, mas pode ser muito lenta para jogadores competitivos. Em comparação, todos os dispositivos testados variam de 0.1 (mínimo) a 240 (máximo) ms. » 34 % de todos os dispositivos são melhores. Isso significa que o tempo de resposta medido é melhor que a média de todos os dispositivos testados (19.8 ms). | ||
| ↔ Tempo de resposta 50% cinza a 80% cinza | ||
| 18 ms ... ascensão ↗ e queda ↘ combinadas | ↗ 8 ms ascensão |  |
| ↘ 10 ms queda | ||
| A tela mostra boas taxas de resposta em nossos testes, mas pode ser muito lenta para jogadores competitivos. Em comparação, todos os dispositivos testados variam de 0.165 (mínimo) a 636 (máximo) ms. » 32 % de todos os dispositivos são melhores. Isso significa que o tempo de resposta medido é melhor que a média de todos os dispositivos testados (31 ms). | ||
Cintilação da tela / PWM (modulação por largura de pulso)
| Tela tremeluzindo / PWM não detectado |  | ||
[pwm_comparison] Em comparação: 52 % de todos os dispositivos testados não usam PWM para escurecer a tela. Se PWM foi detectado, uma média de 7754 (mínimo: 5 - máximo: 343500) Hz foi medida. | |||
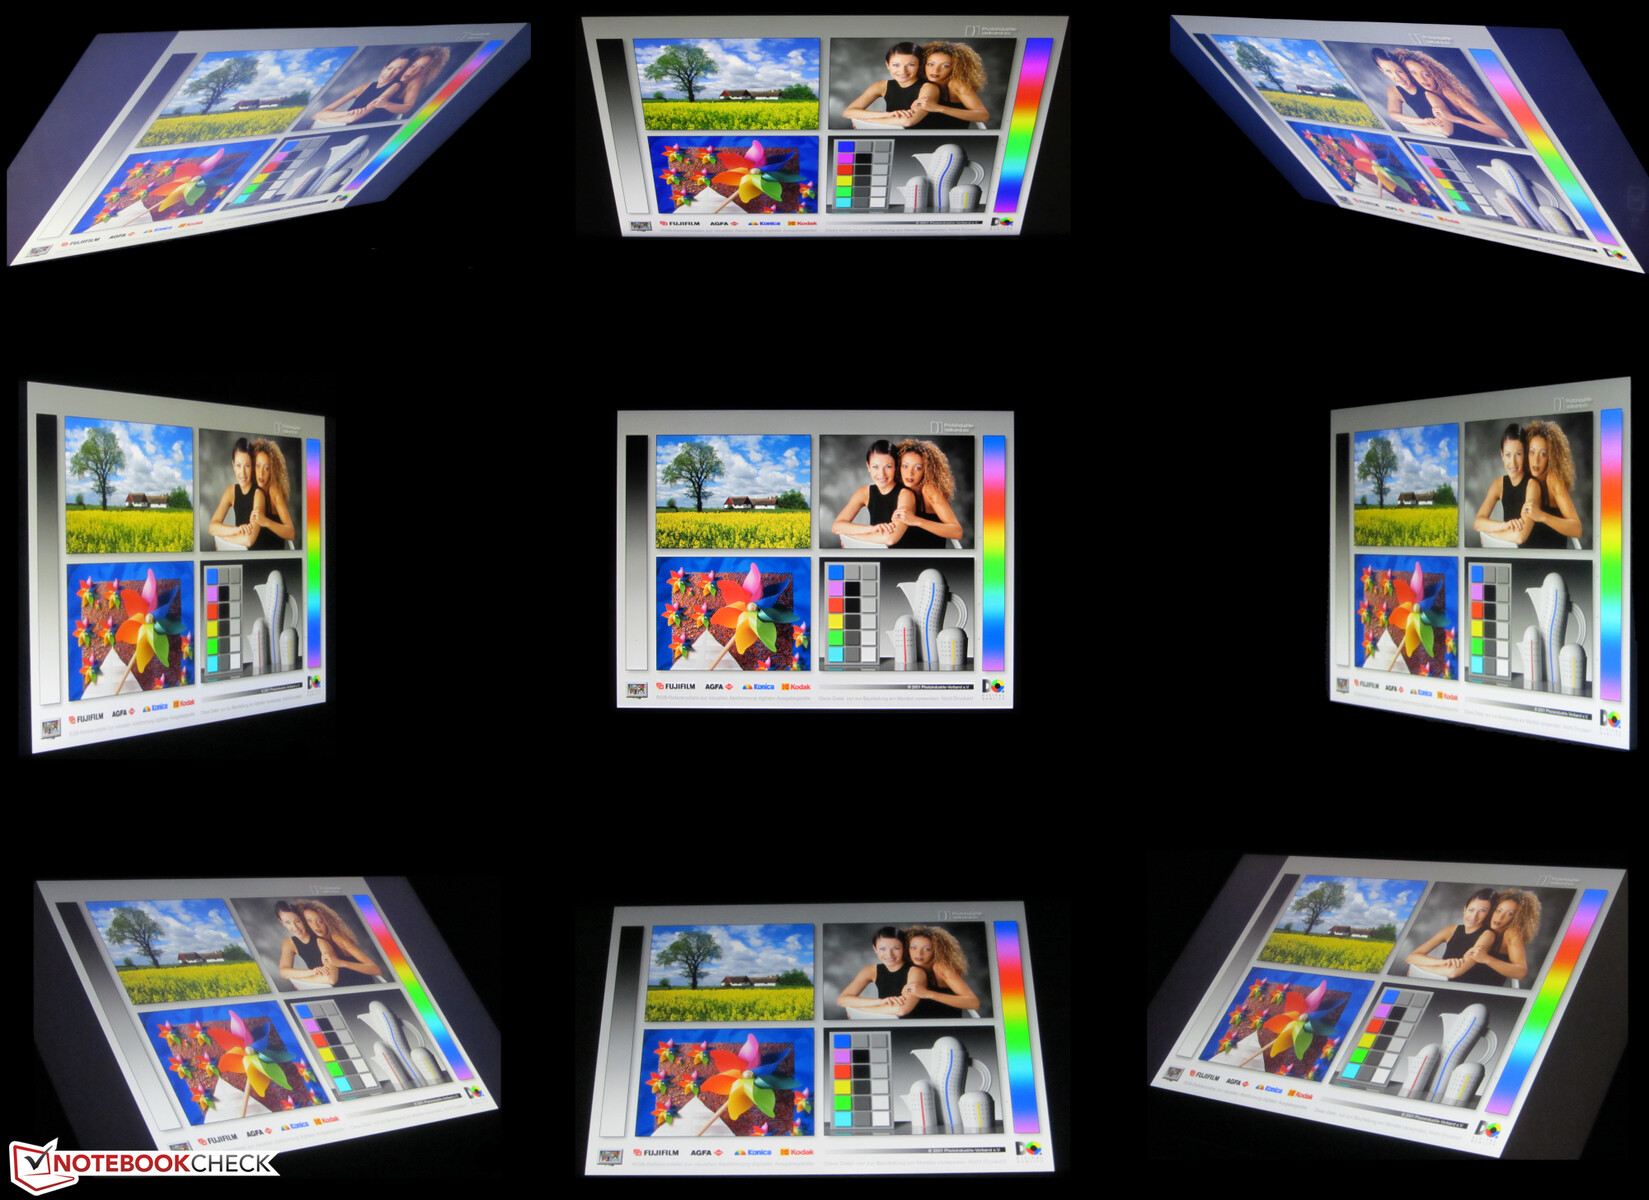
O painel IPS estável em ângulo de visão pode ser lido a partir de qualquer posição. Ao ar livre, a leitura do visor é possível na sombra ou sob céus nublados
Desempenho - Potência Ryzen 7
Com o Nitro 5 AN517-41, a Acer tem um notebook para jogos de 17,3 polegadas em sua linha de produtos, que traz cada jogo atual suavemente para a tela e também corta um bom número em todas as outras áreas de aplicação
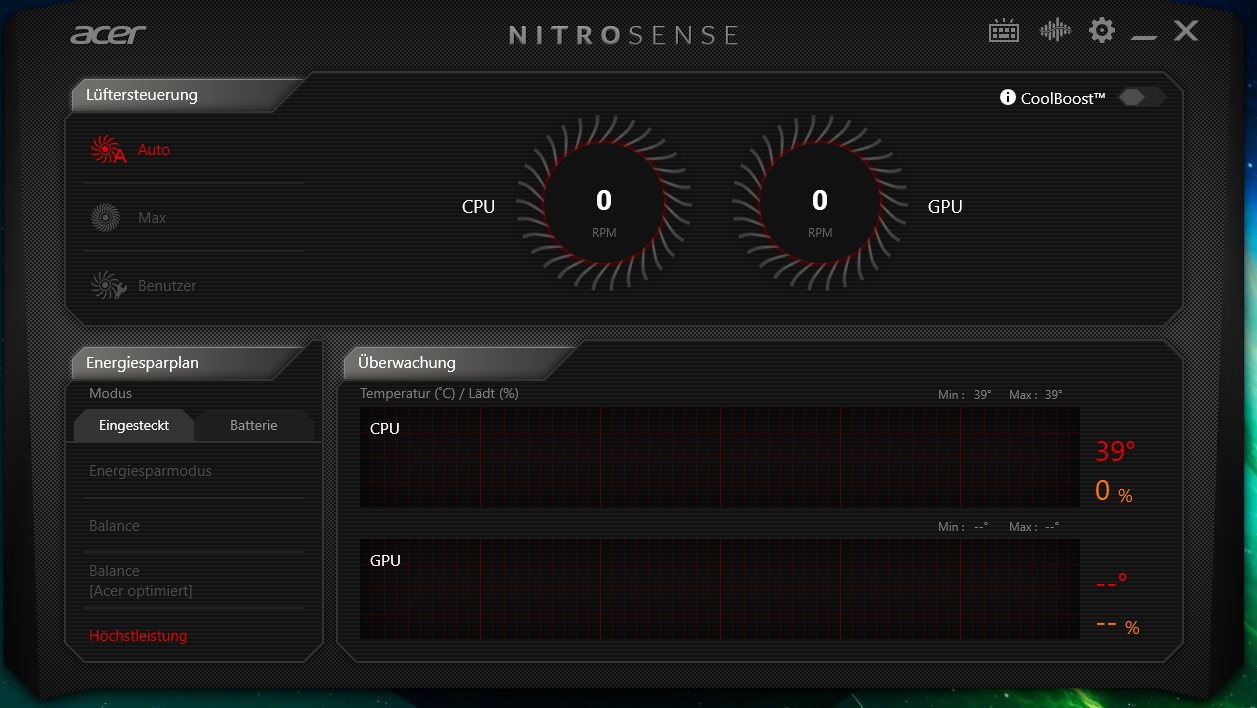
Condições de teste
O software NitroSense pré-instalado oferece vários perfis de desempenho e permite influenciar os dois ventiladores. Realizamos todos os benchmarks com o perfil de desempenho "High Performance" e utilizamos o controle automático dos ventiladores. Os perfis de desempenho correspondem aos perfis padrão do Windows 10.
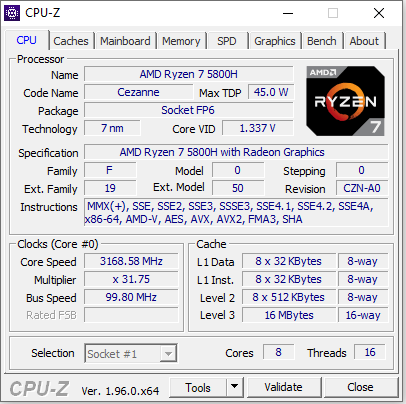
Processador
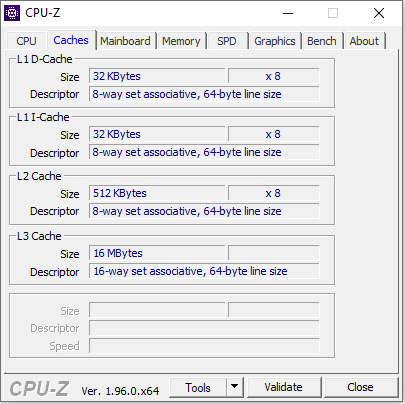
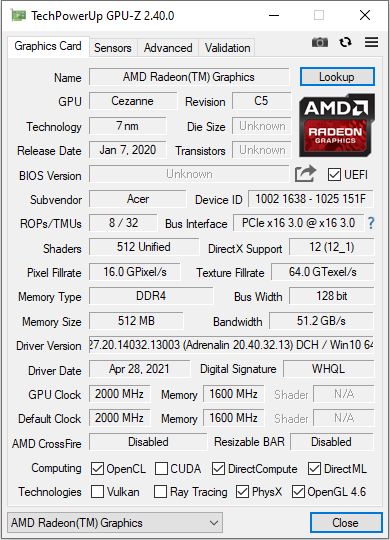
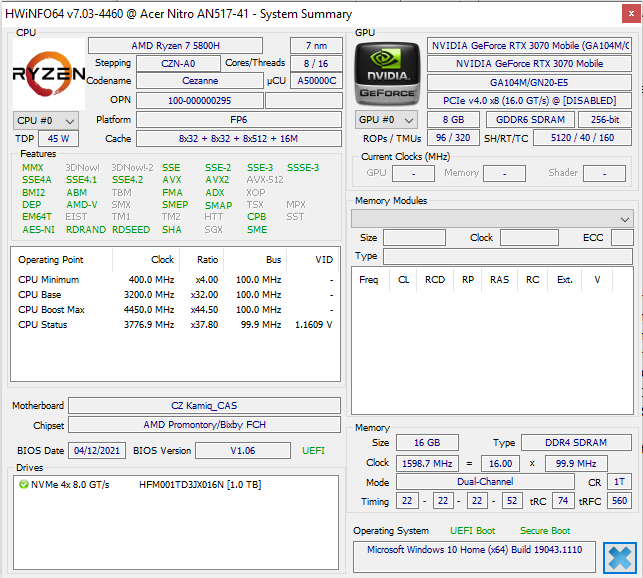
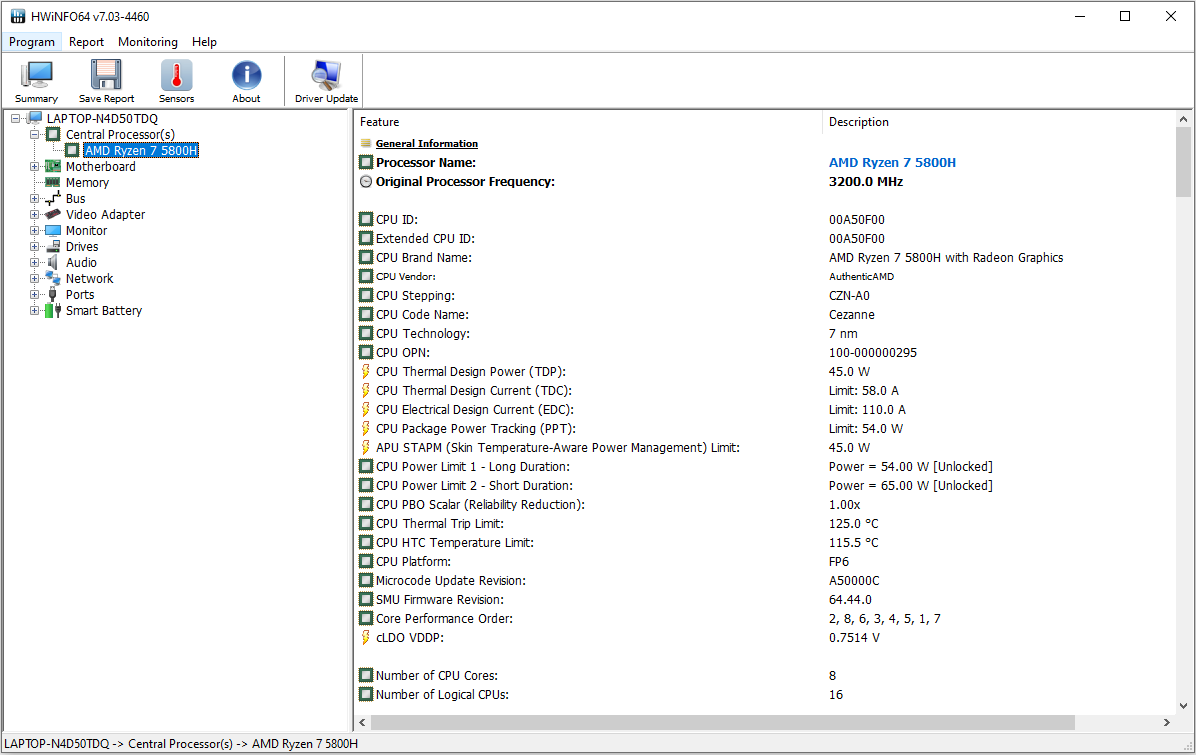
A parte da CPU do Ryzen 7-5800HAPU (Cezanne) consiste em um processador de oito núcleos que opera com uma velocidade de base de 3,2 GHz. Um aumento de até 4,4 GHz é possível via Turbo. É suportado multithreading simultâneo (dois fios podem ser processados por núcleo).
O teste multi-tarefa do benchmark Cinebench R15 é processado com 3,7 GHz (operação em rede) ou 2,5 a 3,5 GHz (operação em bateria). O teste de rosca única é sempre executado com 3,4 a 4,4 GHz.
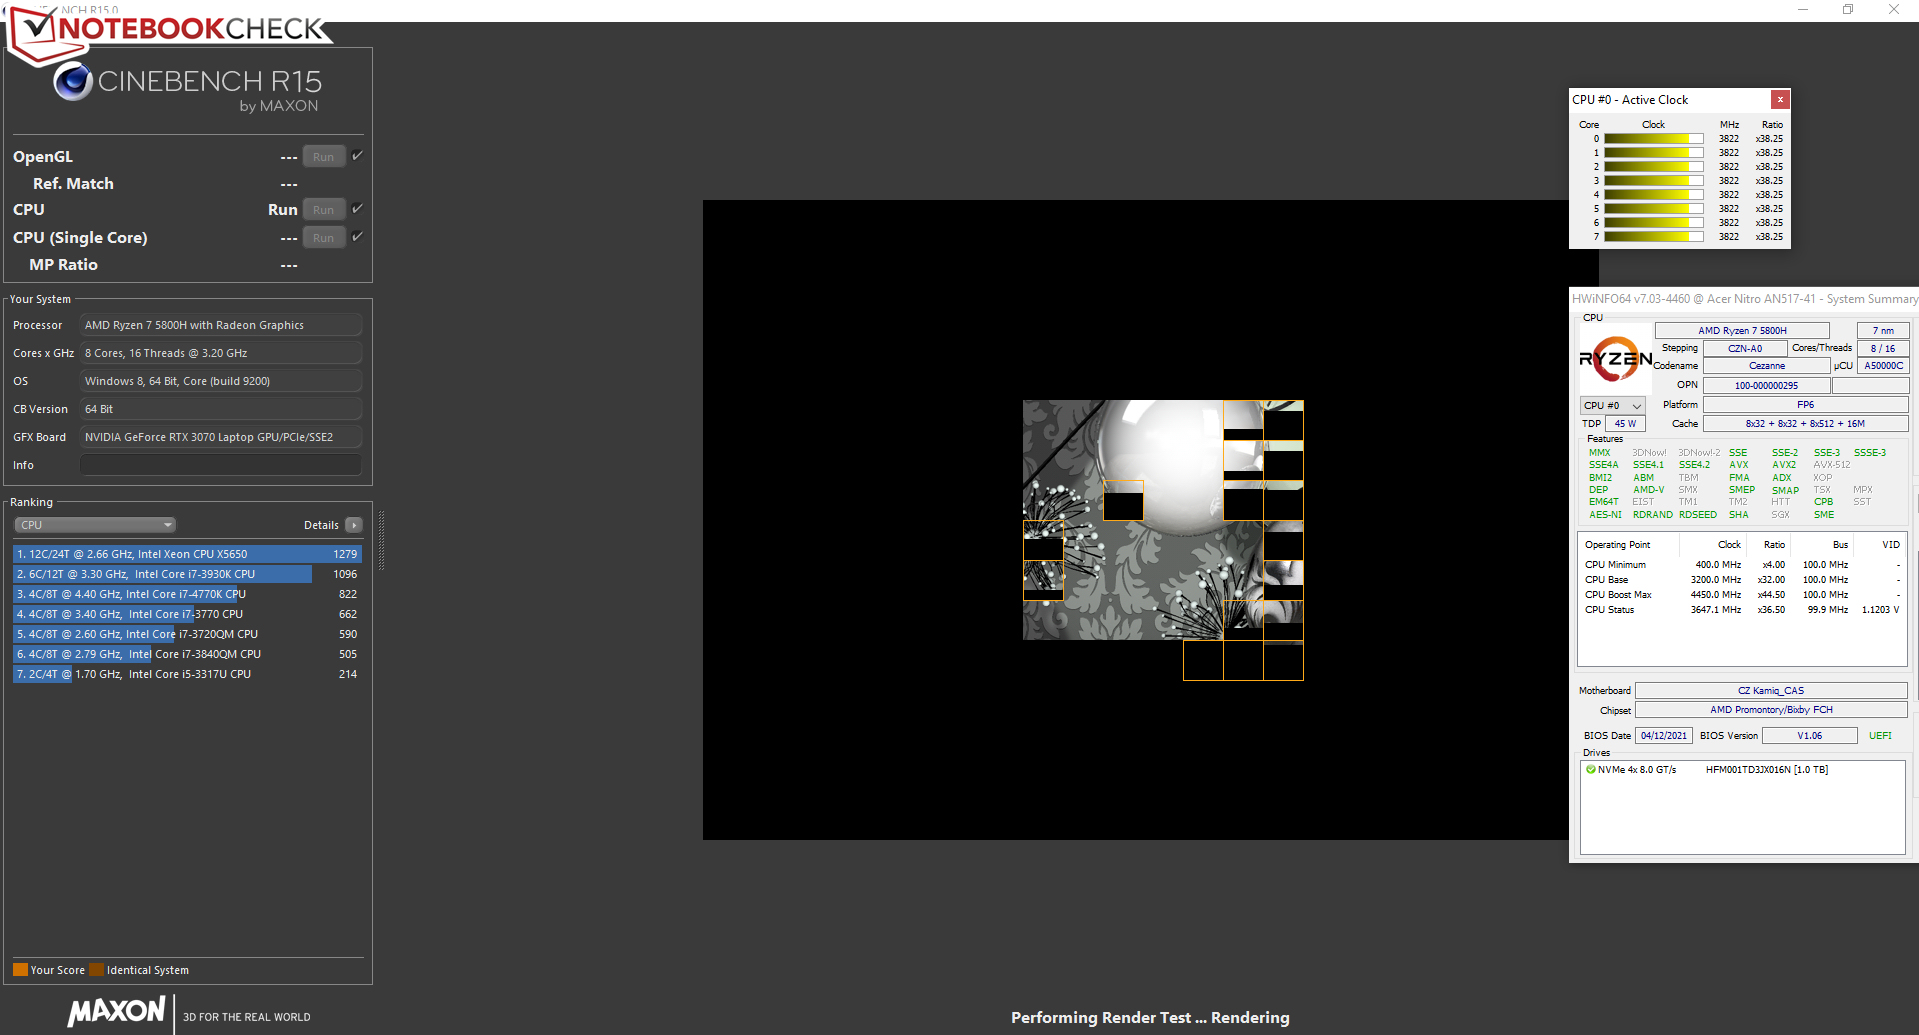
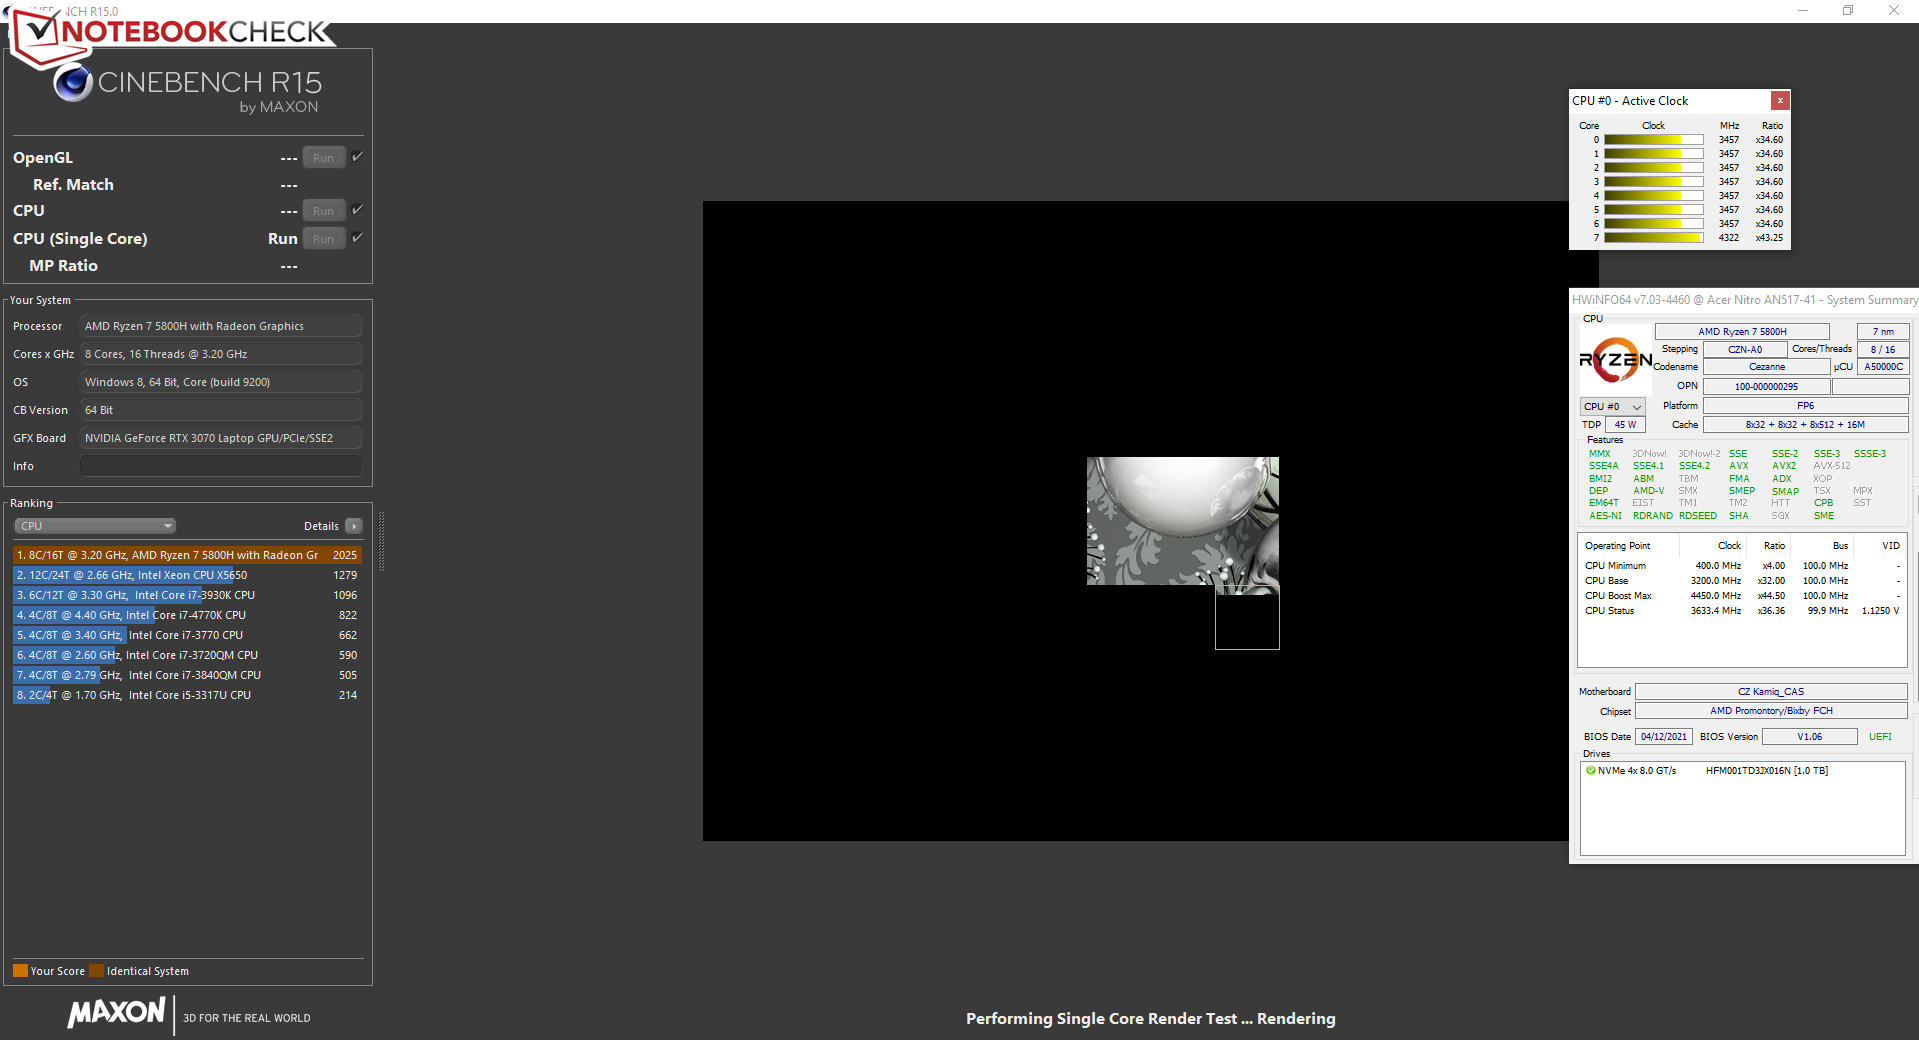
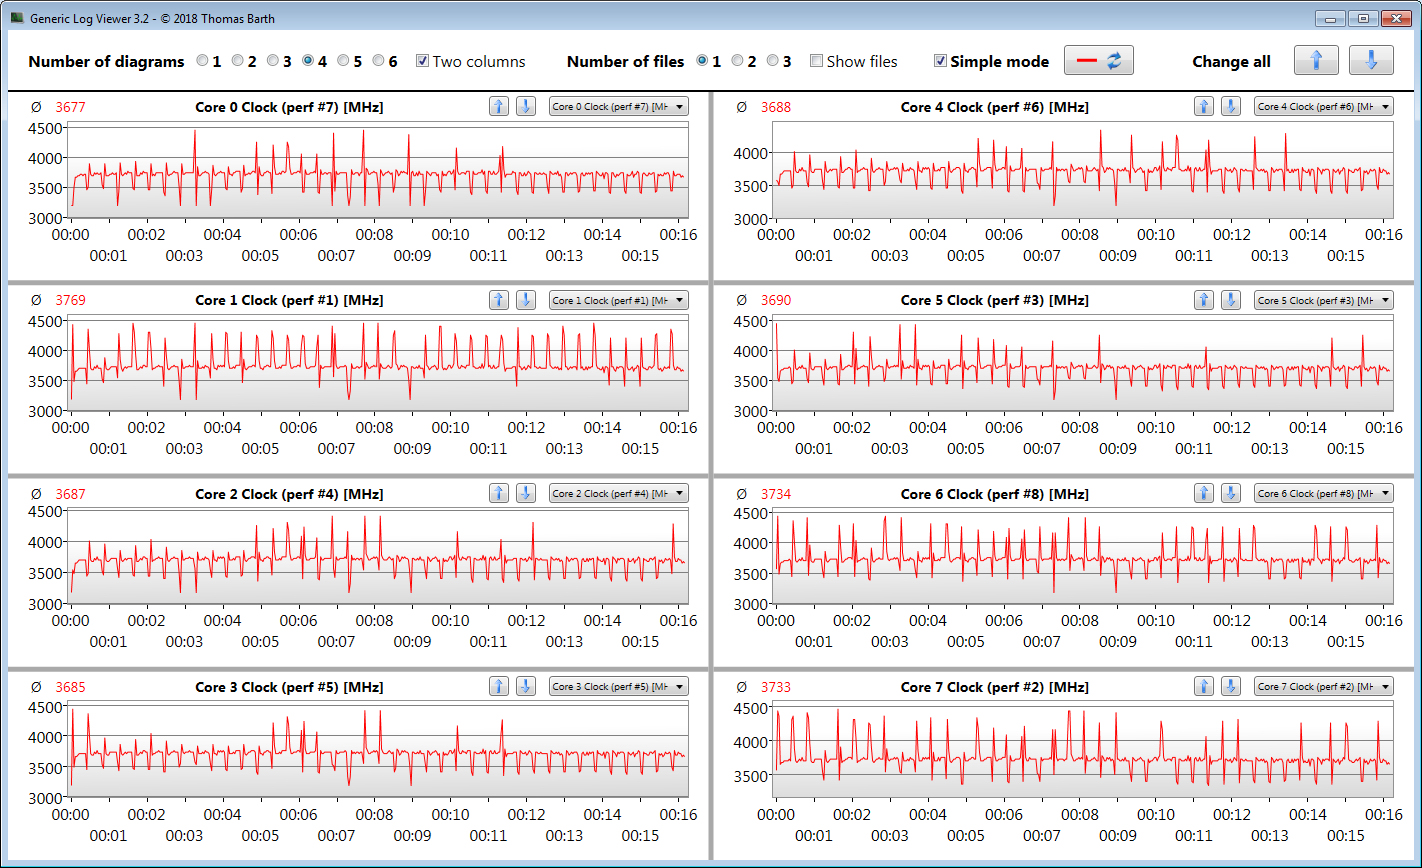
Verificamos se a CPU Turbo também é usada permanentemente na operação de rede elétrica, executando o teste multi-tarefa do benchmark Cinebench R15 em um loop por pelo menos 30 minutos. O Turbo é usado em um nível médio.
* ... menor é melhor
Desempenho do sistema
O sistema ágil e de funcionamento suave oferece poder de computação suficiente para áreas de aplicação ávidas de desempenho, como jogos, edição de vídeo e processamento de imagens nos próximos anos. Além disso, os resultados do PCMark são muito bons
| PCMark 8 Home Score Accelerated v2 | 5154 pontos | |
| PCMark 8 Creative Score Accelerated v2 | 6097 pontos | |
| PCMark 8 Work Score Accelerated v2 | 6217 pontos | |
| PCMark 10 Score | 6749 pontos | |
Ajuda | ||
| PCMark 10 / Score | |
| Média da turma Gaming (5828 - 12414, n=93, últimos 2 anos) | |
| Asus TUF Gaming A15 FA506QR-AZ061T | |
| Asus TUF Gaming F17 FX706HM | |
| Média AMD Ryzen 7 5800H, NVIDIA GeForce RTX 3070 Laptop GPU (6717 - 6983, n=6) | |
| Acer Nitro 5 AN517-41-R5Z7 | |
| MSI Katana GF76 11UE | |
| Aorus 15G XC | |
| MSI GP76 Leopard 10UG | |
| Schenker XMG Core 17 (Early 2021) | |
| PCMark 10 / Essentials | |
| Média da turma Gaming (8810 - 11935, n=97, últimos 2 anos) | |
| Asus TUF Gaming F17 FX706HM | |
| Asus TUF Gaming A15 FA506QR-AZ061T | |
| Acer Nitro 5 AN517-41-R5Z7 | |
| Média AMD Ryzen 7 5800H, NVIDIA GeForce RTX 3070 Laptop GPU (9548 - 10226, n=6) | |
| MSI Katana GF76 11UE | |
| Aorus 15G XC | |
| Schenker XMG Core 17 (Early 2021) | |
| MSI GP76 Leopard 10UG | |
| PCMark 10 / Productivity | |
| Média da turma Gaming (6845 - 25323, n=95, últimos 2 anos) | |
| Asus TUF Gaming A15 FA506QR-AZ061T | |
| Acer Nitro 5 AN517-41-R5Z7 | |
| Média AMD Ryzen 7 5800H, NVIDIA GeForce RTX 3070 Laptop GPU (8849 - 9514, n=6) | |
| Asus TUF Gaming F17 FX706HM | |
| MSI Katana GF76 11UE | |
| Aorus 15G XC | |
| MSI GP76 Leopard 10UG | |
| Schenker XMG Core 17 (Early 2021) | |
| PCMark 10 / Digital Content Creation | |
| Média da turma Gaming (7602 - 19954, n=95, últimos 2 anos) | |
| Média AMD Ryzen 7 5800H, NVIDIA GeForce RTX 3070 Laptop GPU (8948 - 10389, n=6) | |
| Asus TUF Gaming F17 FX706HM | |
| Asus TUF Gaming A15 FA506QR-AZ061T | |
| Acer Nitro 5 AN517-41-R5Z7 | |
| Aorus 15G XC | |
| MSI Katana GF76 11UE | |
| MSI GP76 Leopard 10UG | |
| Schenker XMG Core 17 (Early 2021) | |
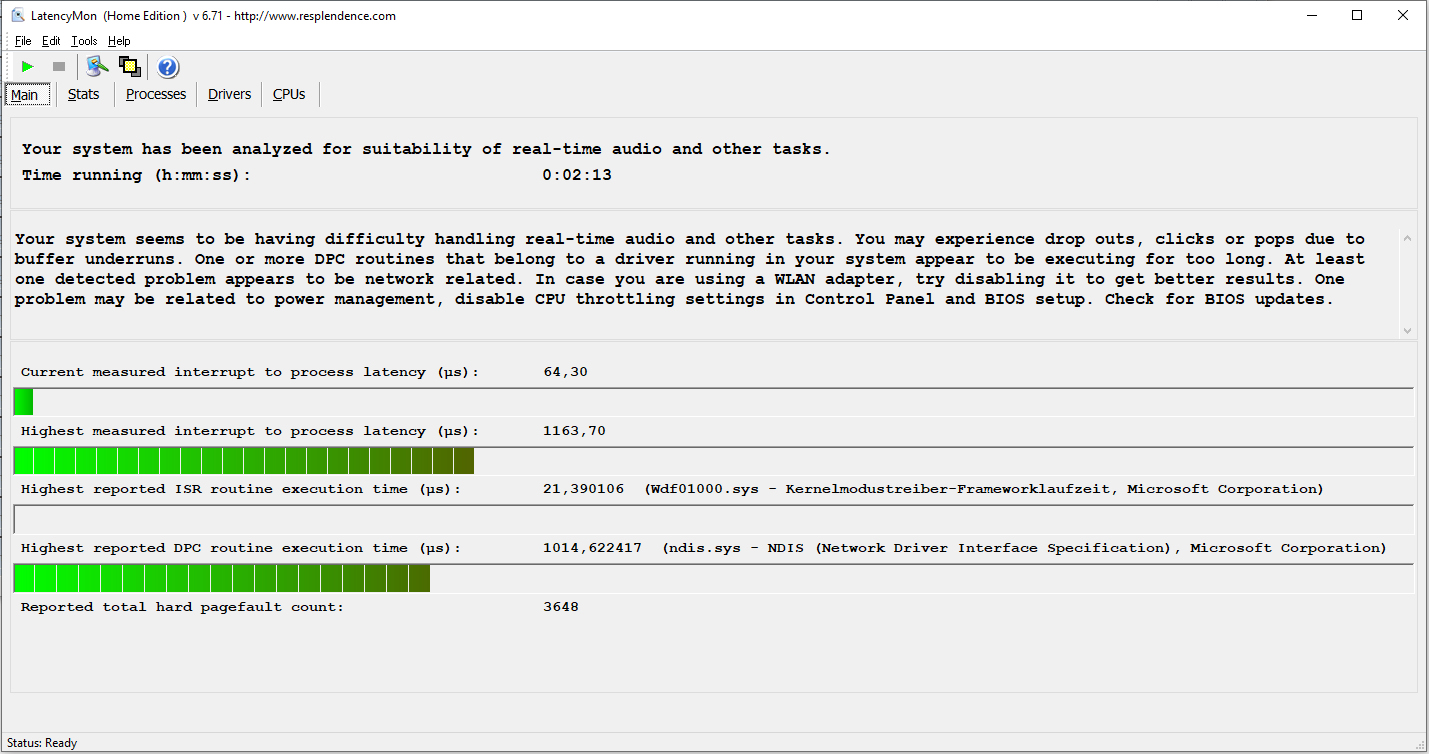
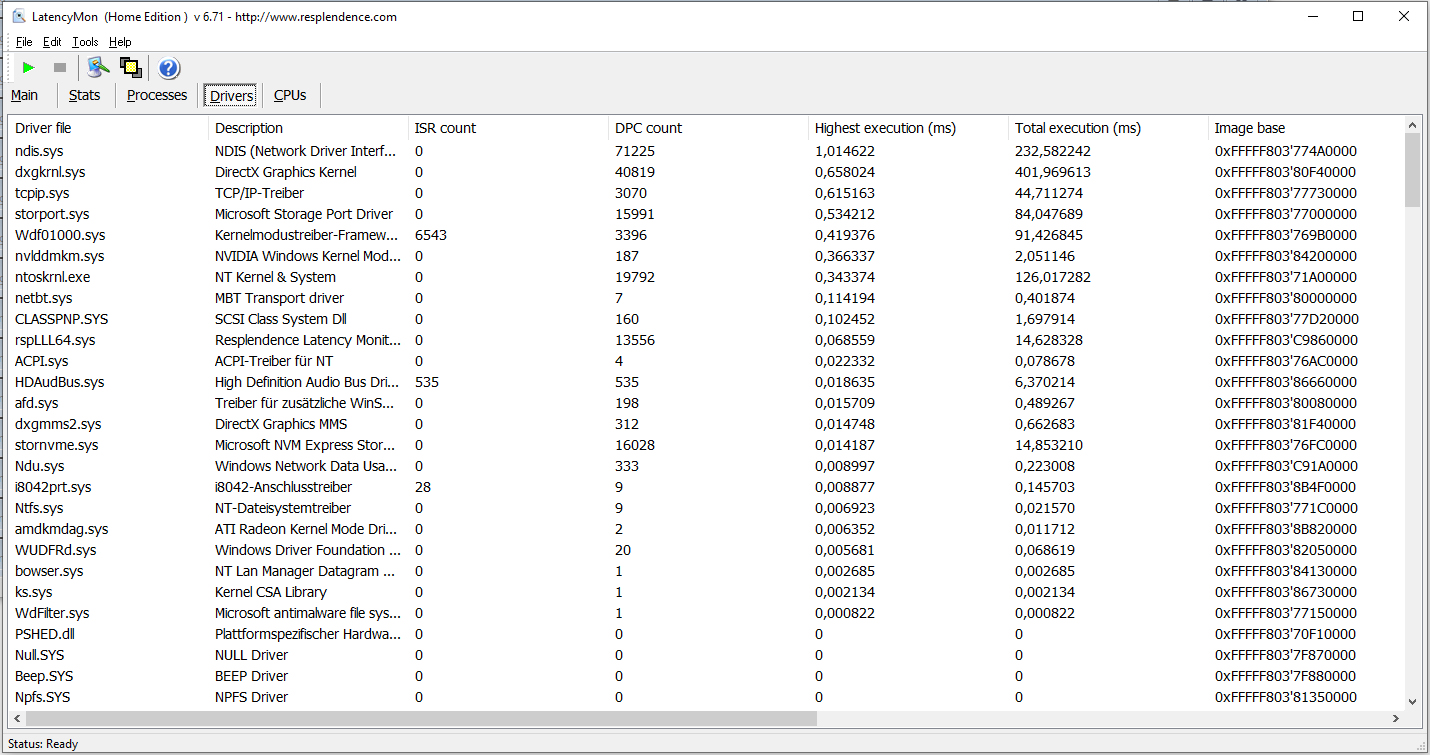
Latências DPC
O teste de monitor de latência padronizado (navegação na web, reprodução de vídeo 4K, Prime95 de alta carga) revelou latências DPC conspícuas. O sistema não parece ser adequado para edição de vídeo e áudio em tempo real
| DPC Latencies / LatencyMon - interrupt to process latency (max), Web, Youtube, Prime95 | |
| MSI Katana GF76 11UE | |
| Asus TUF Gaming F17 FX706HM | |
| Acer Nitro 5 AN517-41-R5Z7 | |
| MSI GP76 Leopard 10UG | |
| Schenker XMG Core 17 (Early 2021) | |
* ... menor é melhor
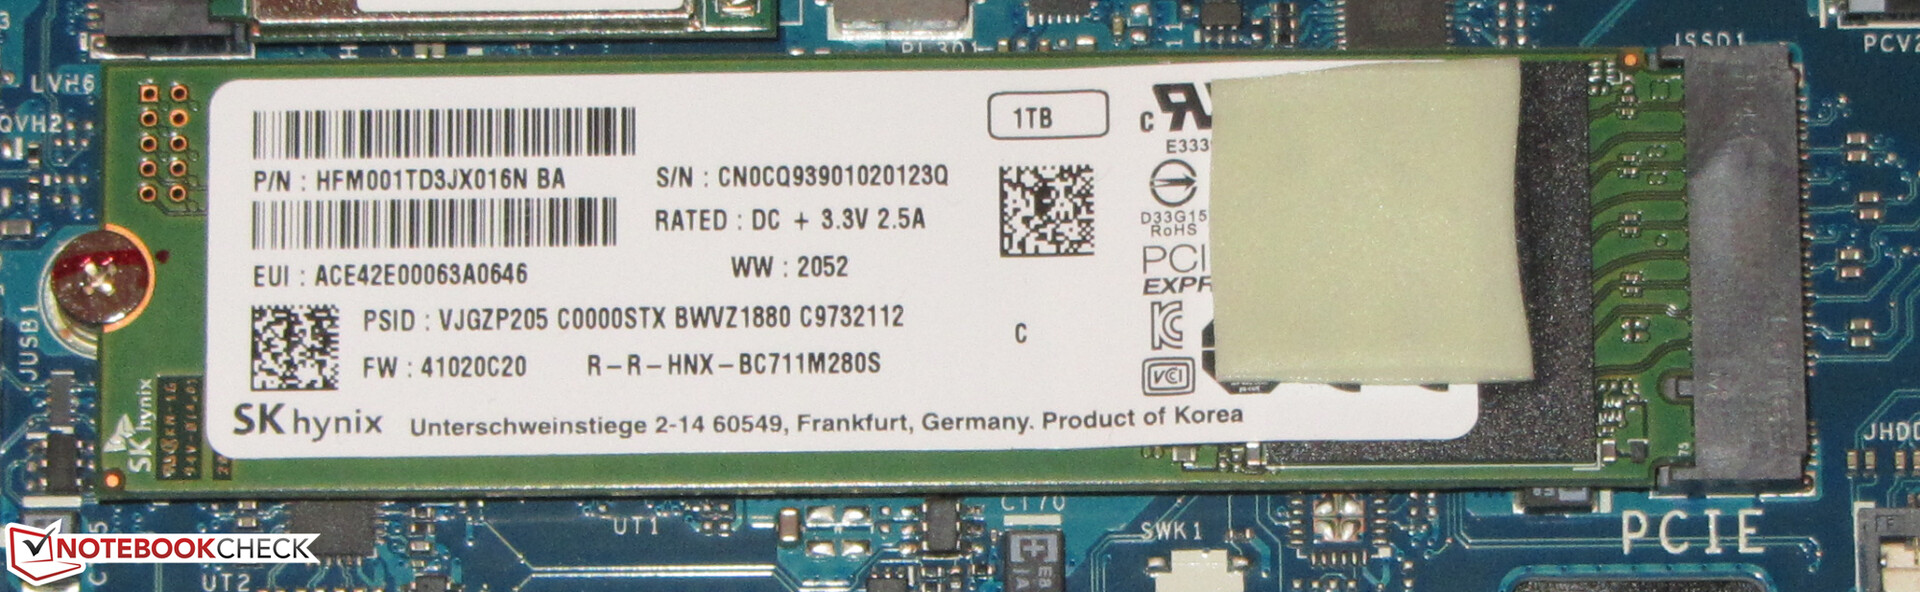
Armazenamento em massa
Um SSD NVMe (M.2-2280) da SK Hynix serve como acionador do sistema. Ele fornece 1 TB de espaço de armazenamento e oferece boas taxas de transferência. Não é um dos principais modelos de SSD.
O notebook também tem espaço para um segundo M.2-2280 SSD (NVMe) e um dispositivo de armazenamento de 2,5 polegadas (o slot SATA e os parafusos estão na caixa, a estrutura de montagem está dentro do notebook).

| Acer Nitro 5 AN517-41-R5Z7 SK Hynix BC711 1TB HFM001TD3JX016N | MSI Katana GF76 11UE Kingston OM8PCP3512F-AB | Schenker XMG Core 17 (Early 2021) Samsung SSD 970 EVO Plus 1TB | Asus TUF Gaming F17 FX706HM SK Hynix HFM001TD3JX013N | MSI GP76 Leopard 10UG Kingston OM8PCP3512F-AB | Aorus 15G XC ESR512GTLCG-EAC-4 | Asus TUF Gaming A15 FA506QR-AZ061T SK Hynix HFM001TD3JX013N | Média SK Hynix BC711 1TB HFM001TD3JX016N | |
|---|---|---|---|---|---|---|---|---|
| CrystalDiskMark 5.2 / 6 | -38% | 5% | 1% | -37% | -10% | 3% | -0% | |
| Write 4K (MB/s) | 146.7 | 107.3 -27% | 145.7 -1% | 168.8 15% | 143.7 -2% | 137.6 -6% | 182.5 24% | 140.1 ? -4% |
| Read 4K (MB/s) | 63.7 | 45.46 -29% | 51.3 -19% | 72 13% | 45.1 -29% | 45.87 -28% | 73.2 15% | 64.2 ? 1% |
| Write Seq (MB/s) | 2954 | 978 -67% | 3036 3% | 978 -67% | 2304 -22% | 3005 2% | 2944 ? 0% | |
| Read Seq (MB/s) | 1974 | 1255 -36% | 2837 44% | 1163 -41% | 1052 -47% | 2358 19% | 2169 ? 10% | |
| Write 4K Q32T1 (MB/s) | 496.9 | 579 17% | 511 3% | 459.5 -8% | 519 4% | 601 21% | 389.5 -22% | 468 ? -6% |
| Read 4K Q32T1 (MB/s) | 549 | 299.6 -45% | 582 6% | 473.1 -14% | 302.7 -45% | 677 23% | 463.8 -16% | 533 ? -3% |
| Write Seq Q32T1 (MB/s) | 3062 | 978 -68% | 3294 8% | 3129 2% | 981 -68% | 2536 -17% | 3166 3% | 3073 ? 0% |
| Read Seq Q32T1 (MB/s) | 3580 | 1977 -45% | 3522 -2% | 3529 -1% | 1983 -45% | 3372 -6% | 3590 0% | 3582 ? 0% |
| Write 4K Q8T8 (MB/s) | 484.5 | |||||||
| Read 4K Q8T8 (MB/s) | 1518 | |||||||
| AS SSD | -63% | 1% | -1% | -46% | -21% | -1% | 4% | |
| Seq Read (MB/s) | 2891 | 1704 -41% | 2876 -1% | 2837 -2% | 1659 -43% | 2048 -29% | 3133 8% | 2933 ? 1% |
| Seq Write (MB/s) | 2692 | 716 -73% | 2803 4% | 1565 -42% | 921 -66% | 2403 -11% | 2969 10% | 2713 ? 1% |
| 4K Read (MB/s) | 52.6 | 37.77 -28% | 55.3 5% | 55.4 5% | 51 -3% | 48.27 -8% | 55.2 5% | 54.2 ? 3% |
| 4K Write (MB/s) | 134.9 | 66 -51% | 106.9 -21% | 152.9 13% | 120.1 -11% | 101.6 -25% | 129.7 -4% | 134.5 ? 0% |
| 4K-64 Read (MB/s) | 1845 | 441.2 -76% | 1662 -10% | 1327 -28% | 463.5 -75% | 1606 -13% | 1891 2% | 1850 ? 0% |
| 4K-64 Write (MB/s) | 2142 | 735 -66% | 2101 -2% | 1922 -10% | 909 -58% | 1473 -31% | 1795 -16% | 2154 ? 1% |
| Access Time Read * (ms) | 0.191 | 0.067 | 0.035 | 0.179 | 0.131 | 0.052 | ||
| Access Time Write * (ms) | 0.028 | 0.053 -89% | 0.037 -32% | 0.028 -0% | 0.032 -14% | 0.038 -36% | 0.028 -0% | 0.028 ? -0% |
| Score Read (Points) | 2186 | 649 -70% | 2005 -8% | 1666 -24% | 680 -69% | 1859 -15% | 2259 3% | 2197 ? 1% |
| Score Write (Points) | 2546 | 872 -66% | 2488 -2% | 2232 -12% | 1121 -56% | 1815 -29% | 2221 -13% | 2560 ? 1% |
| Score Total (Points) | 5842 | 1816 -69% | 5520 -6% | 4695 -20% | 2130 -64% | 4645 -20% | 5630 -4% | 5871 ? 0% |
| Copy ISO MB/s (MB/s) | 2130 | 912 -57% | 2029 -5% | 2081 -2% | 1188 -44% | 2195 ? 3% | ||
| Copy Program MB/s (MB/s) | 642 | 278.9 -57% | 691 8% | 734 14% | 488.1 -24% | 660 ? 3% | ||
| Copy Game MB/s (MB/s) | 821 | 144.6 -82% | 1513 84% | 1617 97% | 878 7% | 1157 ? 41% | ||
| Média Total (Programa/Configurações) | -51% /
-54% | 3% /
3% | 0% /
-0% | -42% /
-42% | -16% /
-17% | 1% /
1% | 2% /
3% |
* ... menor é melhor
Continuous load read: DiskSpd Read Loop, Queue Depth 8
Placa gráfica
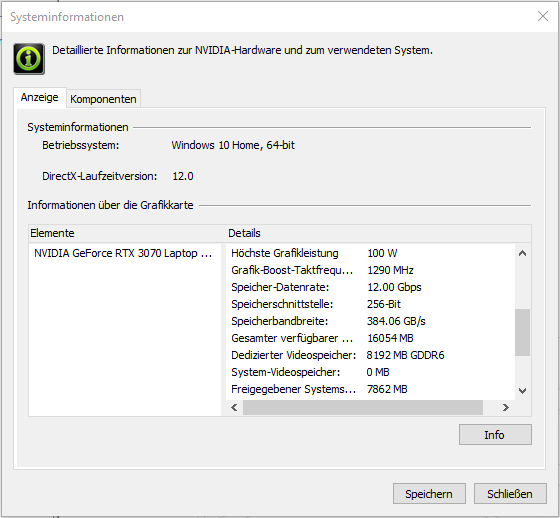
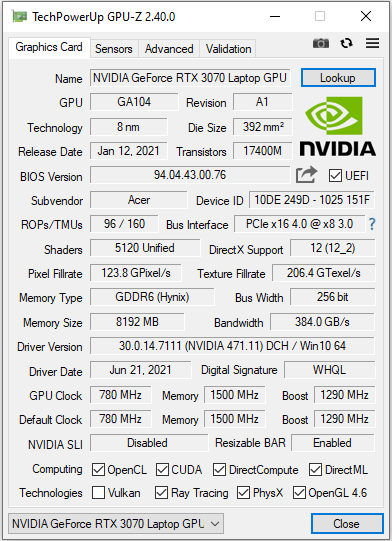
O desempenho real de um núcleo gráfico RTX-3000 depende do TGP máximo que um fabricante de notebooks escolhe dentro dos limites definidos pela Nvidia. A Acer concede oGeForce RTX-3070 Laptop GPU (Visão geral de todos os computadores portáteis RTX-3070 incluindo os TGPs) um TGP máximo de 100 watts.
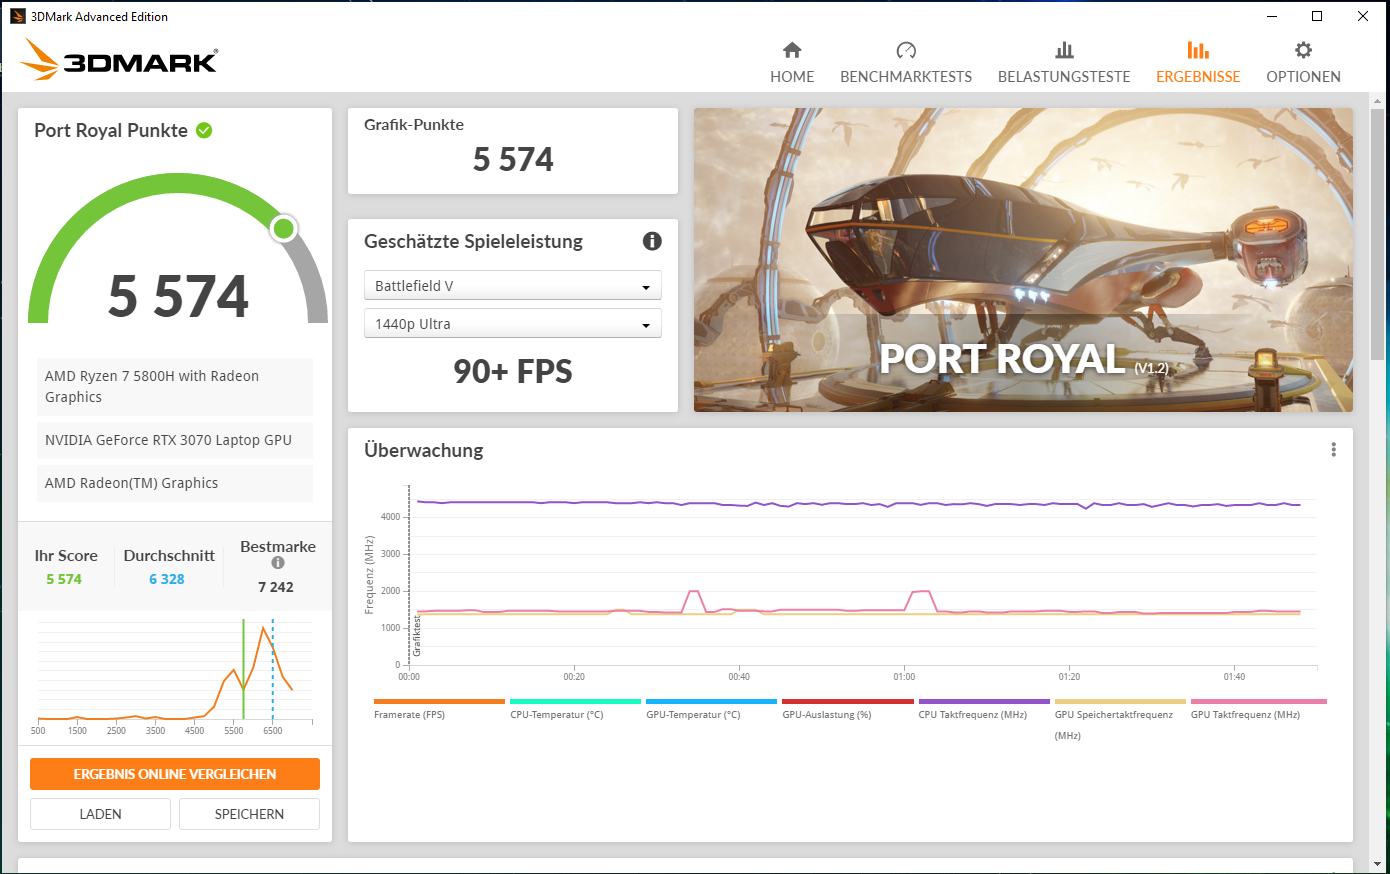
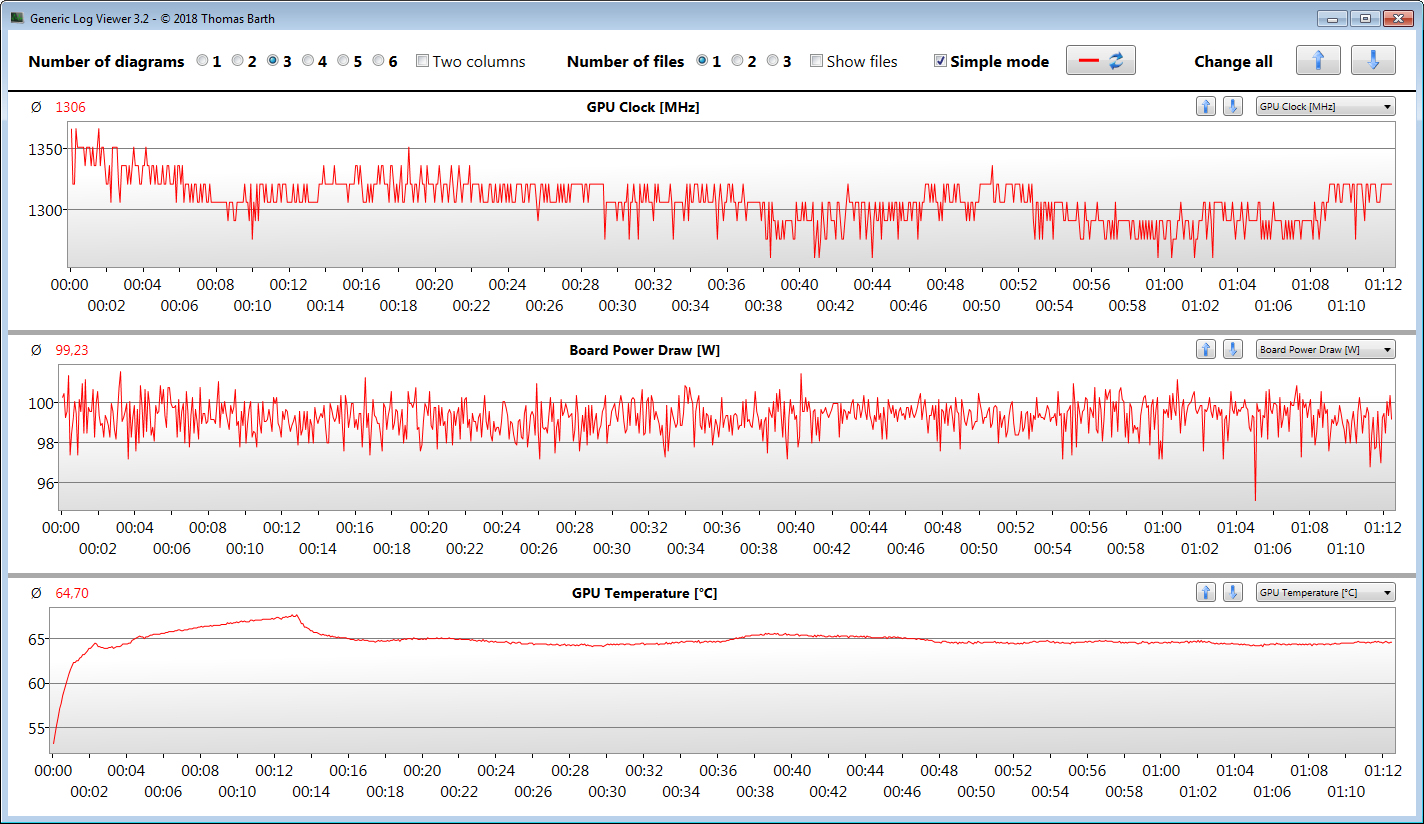
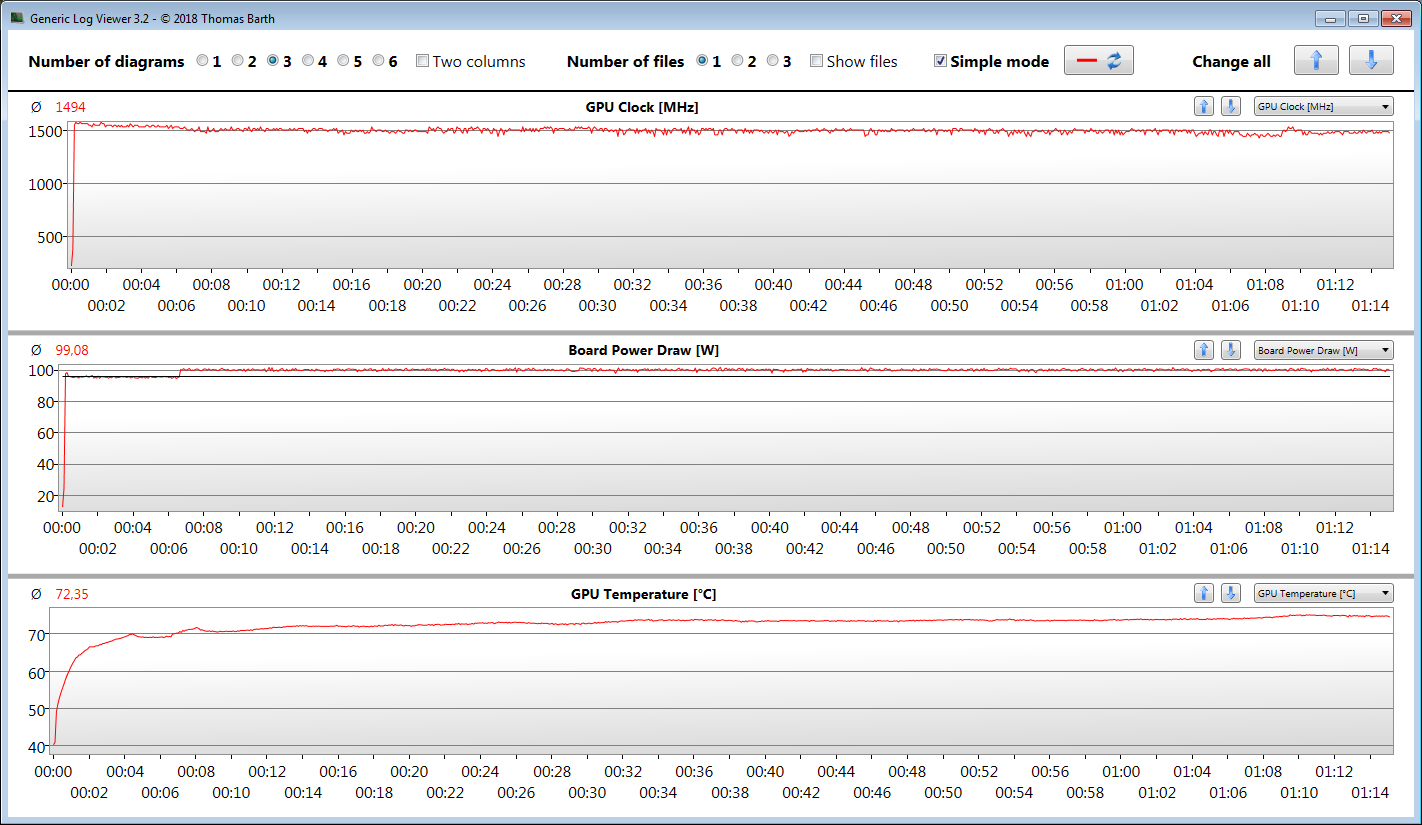
A GPU faz decentemente e entrega resultados em um nível abaixo da média RTX-3070. Há espaço para melhorias: Uma atualização de firmware lançada pela Acer aumenta um pouco o desempenho da GPU e aproxima os resultados do benchmark da média do RTX-3070.
Entretanto, a atualização não causa um aumento no TGP - ele permanece a 100 watts de acordo com as informações do sistema da Nvidia. Presumivelmente, a Acer moveu os limites de temperatura para cima -pelo menoséissoque otesteWitcher 3 mostra. Após a atualização do FW, a GPU passa pelo teste com um relógio mais alto e atinge uma temperatura média mais alta (65 °C vs. 72 °C/149 °F vs. ~162 °F).
O RTX 3070 pode utilizar a rápida memória gráfica GDDR6 (8.192 MB). O Vega-8 núcleo gráfico integrado no processador está ativo e o notebook funciona com a solução gráfica de comutação Optimus da Nvidia.
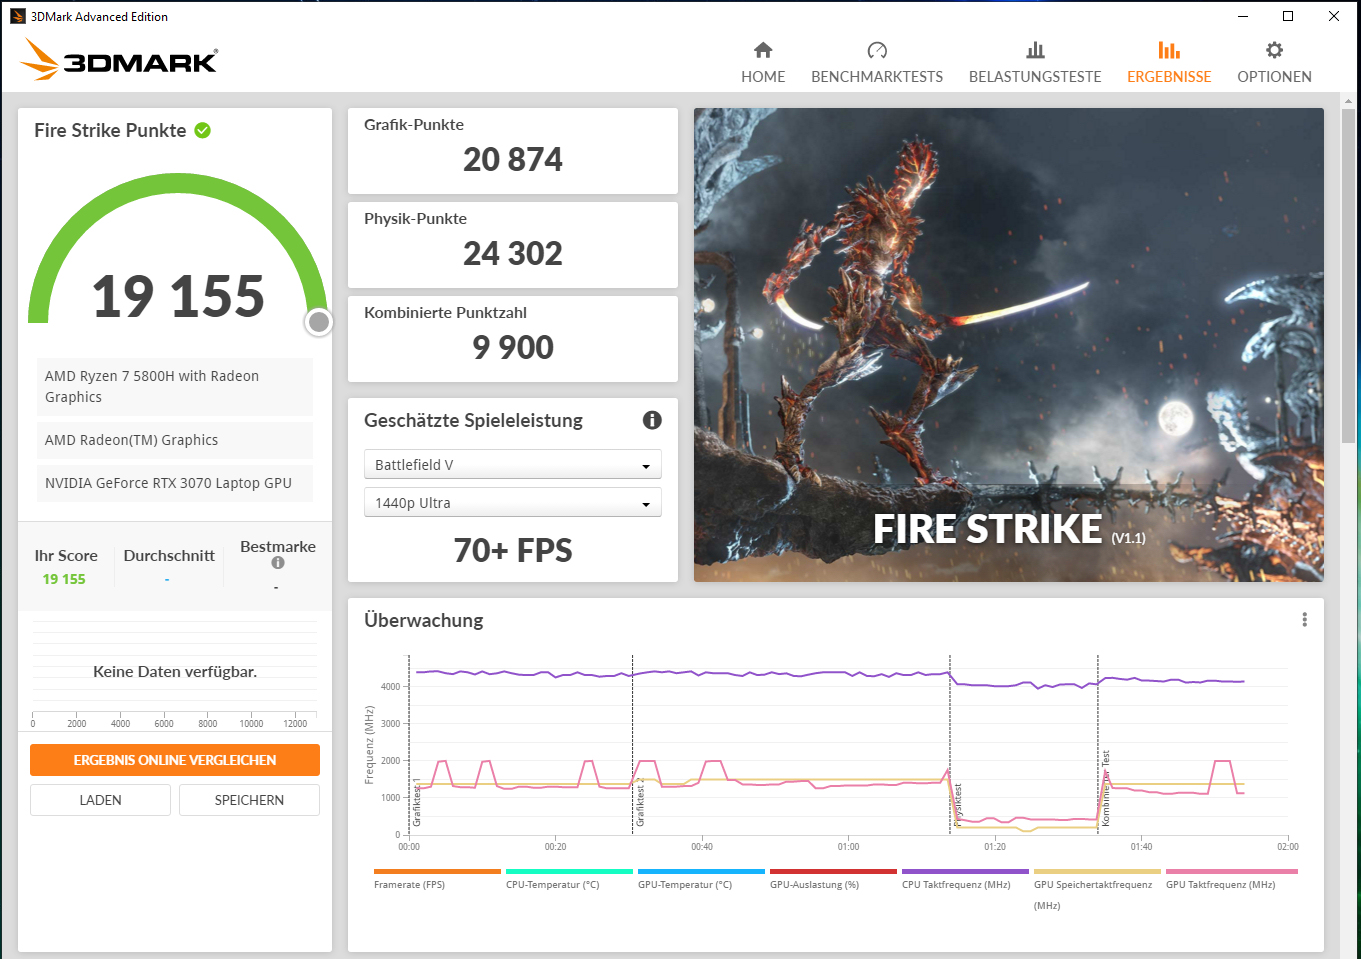
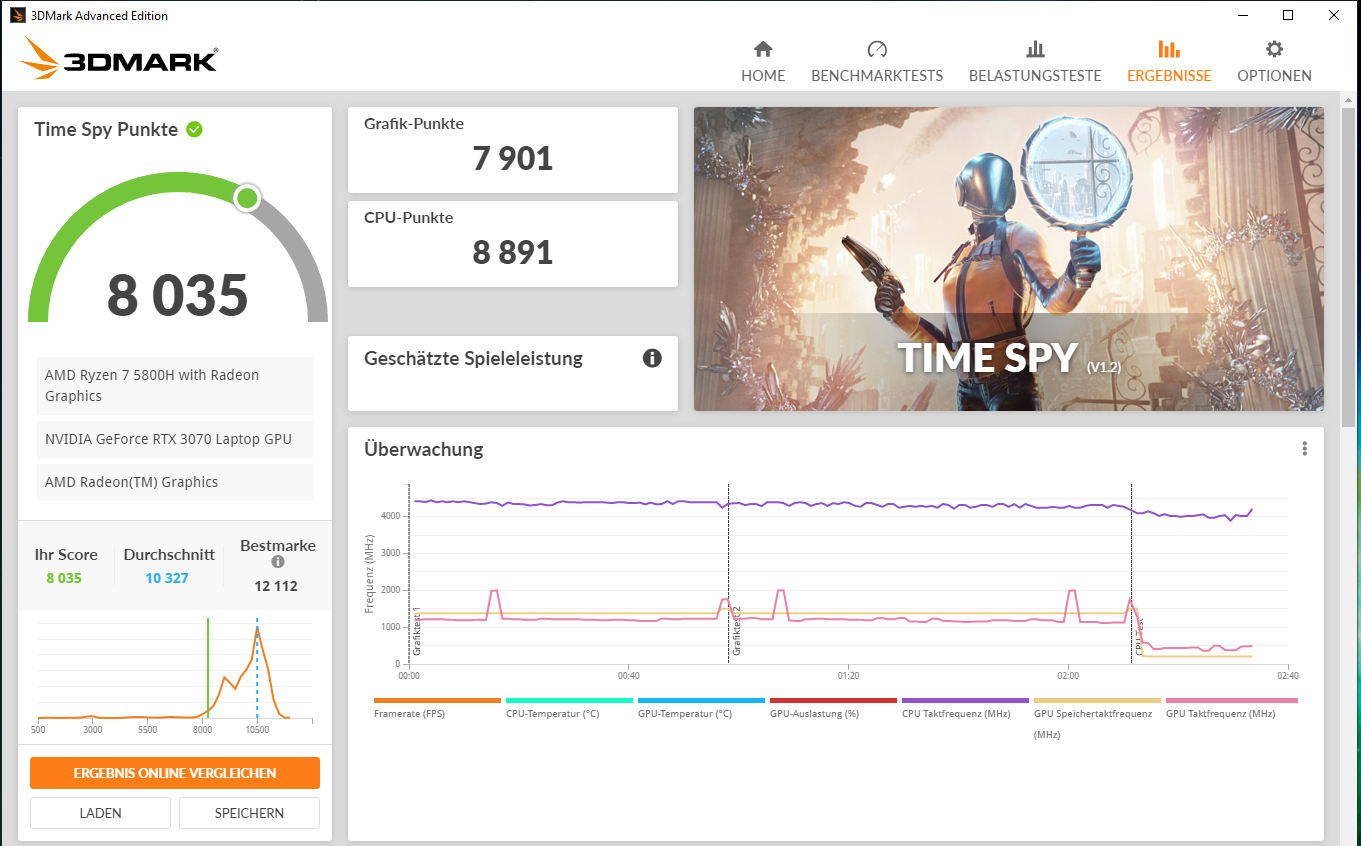
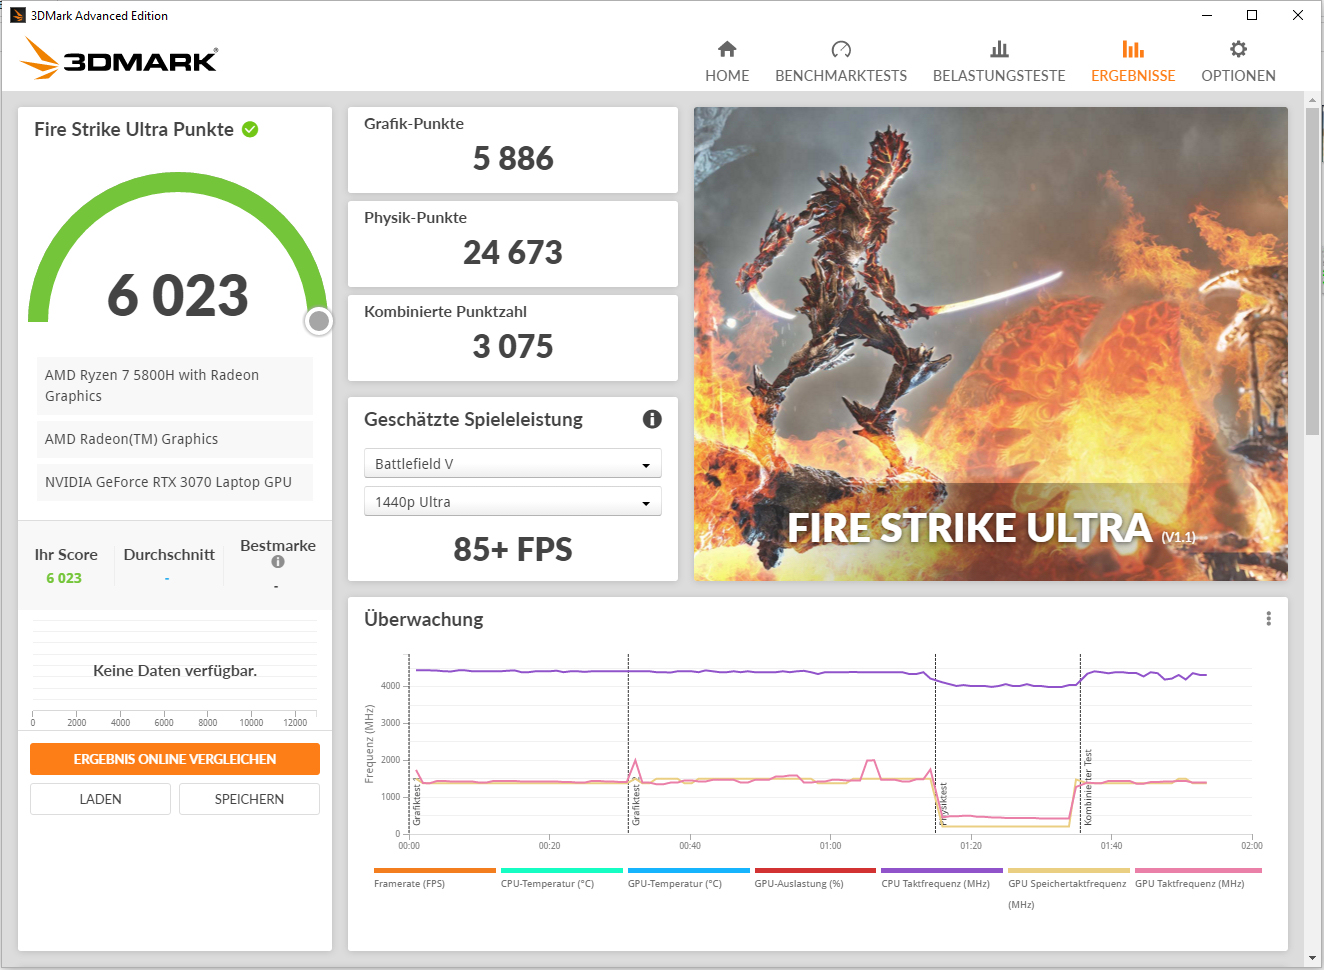
| 3DMark 11 Performance | 22631 pontos | |
| 3DMark Cloud Gate Standard Score | 45032 pontos | |
| 3DMark Fire Strike Score | 19155 pontos | |
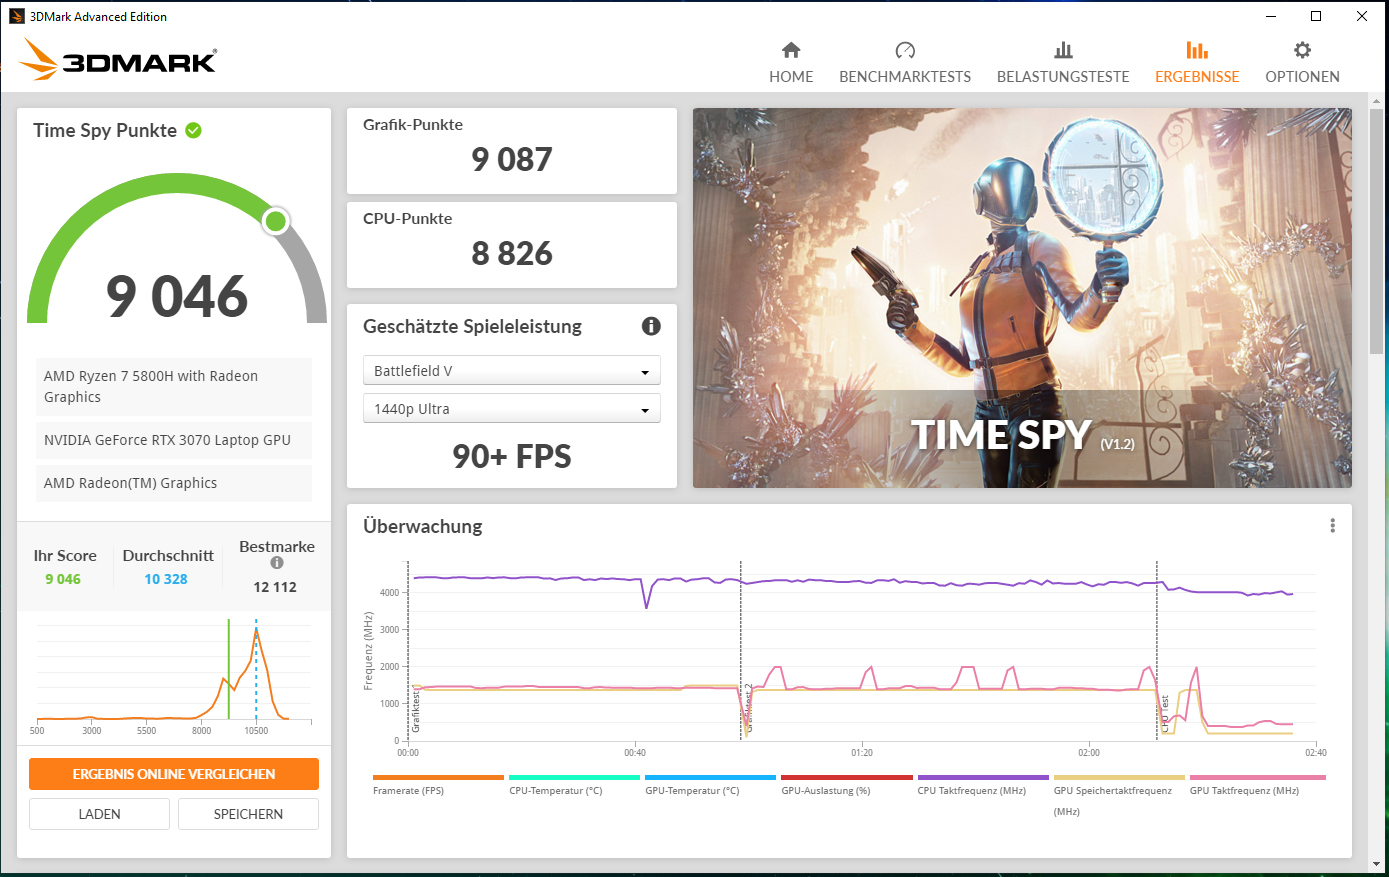
| 3DMark Time Spy Score | 8035 pontos | |
Ajuda | ||
| 3DMark 11 - 1280x720 Performance GPU | |
| Média da turma Gaming (21841 - 80022, n=104, últimos 2 anos) | |
| MSI GP76 Leopard 10UG | |
| Aorus 15G XC | |
| Média NVIDIA GeForce RTX 3070 Laptop GPU (12535 - 38275, n=54) | |
| Acer Nitro 5 AN517-41-R5Z7 (FW-Update) | |
| Asus TUF Gaming A15 FA506QR-AZ061T | |
| Acer Nitro 5 AN517-41-R5Z7 | |
| Schenker XMG Core 17 (Early 2021) | |
| Asus TUF Gaming F17 FX706HM | |
| MSI Katana GF76 11UE | |
| 3DMark | |
| 1920x1080 Fire Strike Graphics | |
| Média da turma Gaming (12242 - 62849, n=115, últimos 2 anos) | |
| MSI GP76 Leopard 10UG | |
| Aorus 15G XC | |
| Média NVIDIA GeForce RTX 3070 Laptop GPU (7178 - 29128, n=52) | |
| Acer Nitro 5 AN517-41-R5Z7 (FW-Update) | |
| Asus TUF Gaming A15 FA506QR-AZ061T | |
| Acer Nitro 5 AN517-41-R5Z7 | |
| Schenker XMG Core 17 (Early 2021) | |
| Asus TUF Gaming F17 FX706HM | |
| MSI Katana GF76 11UE | |
| 2560x1440 Time Spy Graphics | |
| Média da turma Gaming (5012 - 26212, n=115, últimos 2 anos) | |
| MSI GP76 Leopard 10UG | |
| Aorus 15G XC | |
| Média NVIDIA GeForce RTX 3070 Laptop GPU (2644 - 11019, n=53) | |
| Acer Nitro 5 AN517-41-R5Z7 (FW-Update) | |
| Asus TUF Gaming A15 FA506QR-AZ061T | |
| Acer Nitro 5 AN517-41-R5Z7 | |
| Schenker XMG Core 17 (Early 2021) | |
| Asus TUF Gaming F17 FX706HM | |
| MSI Katana GF76 11UE | |
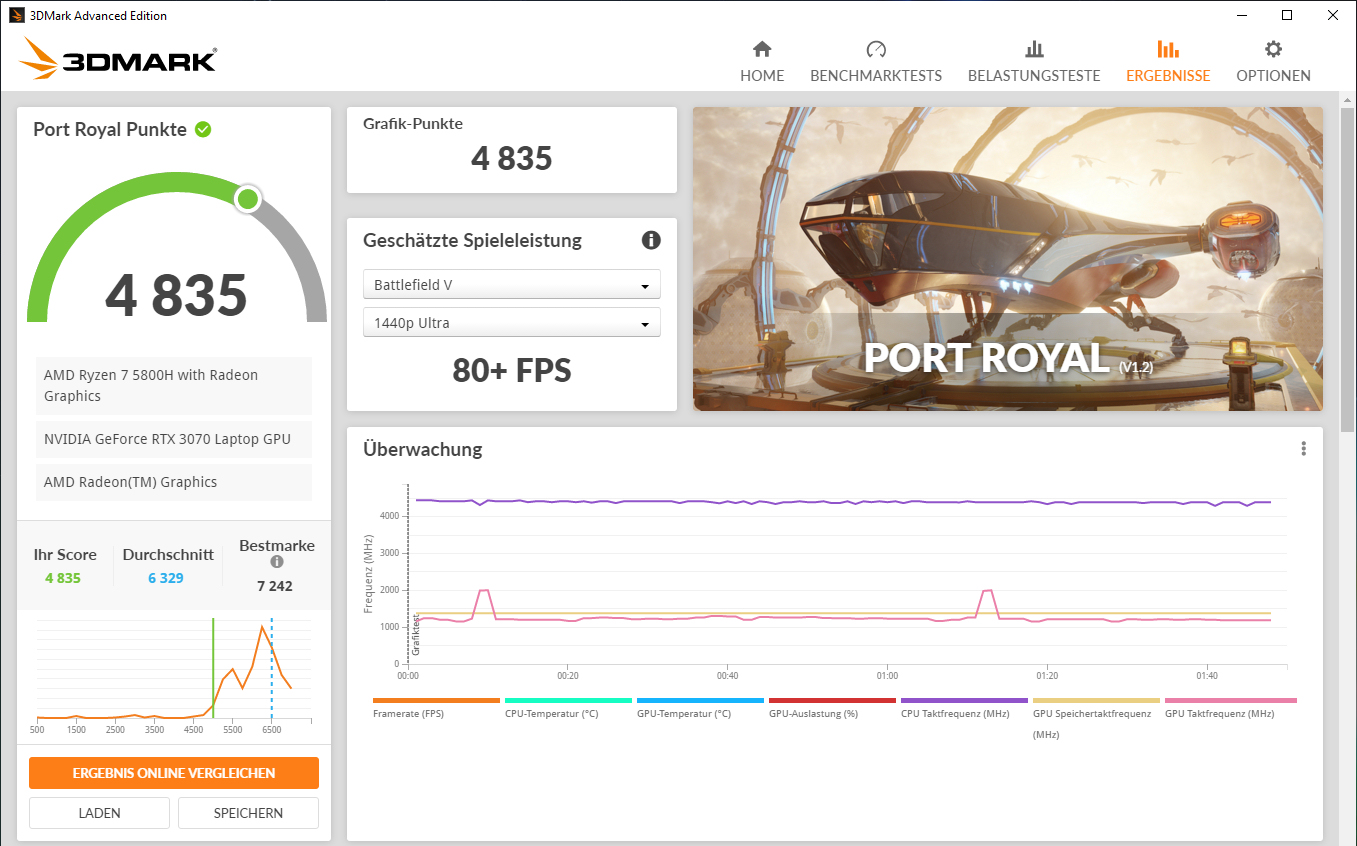
| 2560x1440 Port Royal Graphics | |
| Média da turma Gaming (4395 - 17286, n=71, últimos 2 anos) | |
| Média NVIDIA GeForce RTX 3070 Laptop GPU (1640 - 6542, n=39) | |
| Acer Nitro 5 AN517-41-R5Z7 (FW-Update) | |
| Acer Nitro 5 AN517-41-R5Z7 | |
| Schenker XMG Core 17 (Early 2021) | |
| MSI Katana GF76 11UE | |
Desempenho do jogo
O laptop exibe todos os jogos atuais suavemente na tela. A resolução FHD (1.920 x 1.080 pixels) e as configurações de qualidade máxima geralmente podem ser selecionadas. O Nitro fornece taxas de quadros abaixo da média dos notebooks RTX-3070 testados até agora. Após executar a atualização FW acima mencionada, as taxas de quadros de alguns jogos aumentam ligeiramente e se aproximam da média dos RTX-3070
| The Witcher 3 - 1920x1080 Ultra Graphics & Postprocessing (HBAO+) | |
| Média da turma Gaming (104.7 - 240, n=7, últimos 2 anos) | |
| MSI GP76 Leopard 10UG | |
| Aorus 15G XC | |
| Média NVIDIA GeForce RTX 3070 Laptop GPU (34.9 - 109, n=52) | |
| Acer Nitro 5 AN517-41-R5Z7 (FW-Update) | |
| Schenker XMG Core 17 (Early 2021) | |
| Acer Nitro 5 AN517-41-R5Z7 | |
| Asus TUF Gaming A15 FA506QR-AZ061T | |
| Asus TUF Gaming F17 FX706HM | |
| MSI Katana GF76 11UE | |
| Dota 2 Reborn - 1920x1080 ultra (3/3) best looking | |
| Média da turma Gaming (84.8 - 248, n=107, últimos 2 anos) | |
| MSI Katana GF76 11UE | |
| Asus TUF Gaming F17 FX706HM | |
| Média NVIDIA GeForce RTX 3070 Laptop GPU (26.9 - 163.9, n=58) | |
| Aorus 15G XC | |
| Schenker XMG Core 17 (Early 2021) | |
| MSI GP76 Leopard 10UG | |
| Acer Nitro 5 AN517-41-R5Z7 | |
| Asus TUF Gaming A15 FA506QR-AZ061T | |
| Acer Nitro 5 AN517-41-R5Z7 (FW-Update) | |
| X-Plane 11.11 - 1920x1080 high (fps_test=3) | |
| Média da turma Gaming (55.5 - 143.5, n=109, últimos 2 anos) | |
| MSI Katana GF76 11UE | |
| Média NVIDIA GeForce RTX 3070 Laptop GPU (12.4 - 118.8, n=61) | |
| MSI GP76 Leopard 10UG | |
| Asus TUF Gaming F17 FX706HM | |
| Aorus 15G XC | |
| Acer Nitro 5 AN517-41-R5Z7 (FW-Update) | |
| Acer Nitro 5 AN517-41-R5Z7 | |
| Schenker XMG Core 17 (Early 2021) | |
| Asus TUF Gaming A15 FA506QR-AZ061T | |
| Final Fantasy XV Benchmark - 1920x1080 High Quality | |
| Média da turma Gaming (41 - 215, n=95, últimos 2 anos) | |
| MSI GP76 Leopard 10UG | |
| Média NVIDIA GeForce RTX 3070 Laptop GPU (27.9 - 107, n=49) | |
| Acer Nitro 5 AN517-41-R5Z7 (1.3, FW-Update) | |
| Asus TUF Gaming A15 FA506QR-AZ061T (1.3) | |
| Schenker XMG Core 17 (Early 2021) (1.3) | |
| Acer Nitro 5 AN517-41-R5Z7 (1.3) | |
| MSI Katana GF76 11UE (1.3) | |
| Asus TUF Gaming F17 FX706HM (1.3) | |
| GTA V - 1920x1080 Highest AA:4xMSAA + FX AF:16x | |
| Média da turma Gaming (48.3 - 186.9, n=94, últimos 2 anos) | |
| Média NVIDIA GeForce RTX 3070 Laptop GPU (21.7 - 125.8, n=50) | |
| Schenker XMG Core 17 (Early 2021) | |
| Acer Nitro 5 AN517-41-R5Z7 (FW-Update) | |
| Asus TUF Gaming A15 FA506QR-AZ061T | |
| Acer Nitro 5 AN517-41-R5Z7 | |
| MSI Katana GF76 11UE | |
| Asus TUF Gaming F17 FX706HM | |
| Strange Brigade - 1920x1080 ultra AA:ultra AF:16 | |
| Média da turma Gaming (76.3 - 458, n=87, últimos 2 anos) | |
| Média NVIDIA GeForce RTX 3070 Laptop GPU (36.2 - 194, n=46) | |
| Acer Nitro 5 AN517-41-R5Z7 (1.47.22.14 D3D12, FW-Update) | |
| Asus TUF Gaming A15 FA506QR-AZ061T (1.47.22.14 D3D12) | |
| Acer Nitro 5 AN517-41-R5Z7 (1.47.22.14 D3D12) | |
| Schenker XMG Core 17 (Early 2021) (1.47.22.14 D3D12) | |
| Asus TUF Gaming F17 FX706HM (1.47.22.14 D3D12) | |
| MSI Katana GF76 11UE (1.47.22.14 D3D12) | |
| Dirt 5 - 1920x1080 Ultra High Preset | |
| Média NVIDIA GeForce RTX 3070 Laptop GPU (50 - 96, n=11) | |
| Acer Nitro 5 AN517-41-R5Z7 (FW-Update) | |
| Schenker XMG Core 17 (Early 2021) | |
| Acer Nitro 5 AN517-41-R5Z7 | |
| MSI Katana GF76 11UE | |
| Far Cry 5 - 1920x1080 Ultra Preset AA:T | |
| Média da turma Gaming (70 - 151, n=6, últimos 2 anos) | |
| MSI GP76 Leopard 10UG | |
| Média NVIDIA GeForce RTX 3070 Laptop GPU (89 - 140, n=36) | |
| Schenker XMG Core 17 (Early 2021) | |
| Asus TUF Gaming A15 FA506QR-AZ061T | |
| Acer Nitro 5 AN517-41-R5Z7 (FW-Update) | |
| Acer Nitro 5 AN517-41-R5Z7 | |
| Asus TUF Gaming F17 FX706HM | |
| MSI Katana GF76 11UE | |
Para verificar se as taxas de quadros permanecem em grande parte constantes durante um período mais longo, nós executamos o jogo "O Witcher 3" por cerca de 60 minutos com resolução Full HD e ajustes de qualidade máxima. O personagem do jogo não é movido. Uma queda nas taxas de quadros não é notada
Witcher 3 FPS-Diagram
| baixo | média | alto | ultra | |
|---|---|---|---|---|
| GTA V (2015) | 172 | 134 | 81.3 | |
| The Witcher 3 (2015) | 253 | 213 | 135 | 78.4 |
| Dota 2 Reborn (2015) | 140 | 134 | 116 | 110 |
| Final Fantasy XV Benchmark (2018) | 148 | 101 | 76.7 | |
| X-Plane 11.11 (2018) | 96.5 | 83.4 | 70.4 | |
| Far Cry 5 (2018) | 123 | 103 | 98 | 94 |
| Strange Brigade (2018) | 303 | 172 | 152 | 138 |
| Dirt 5 (2020) | 181 | 105 | 86.5 | 71.5 |
Emissões - O computador Acer aquece moderadamente
Emissões sonoras
Os dois ventiladores operam a baixa velocidade em modo inativo e mal são audíveis. Ocasionalmente, eles ficam parados, mas este estado de coisas acaba sob carga. O nível máximo de pressão sonora está um pouco abaixo de 50 dB(A) (teste de tensão, carga média). O desenvolvimento do ruído é aceitável no modo de jogo
Barulho
| Ocioso |
| 26 / 33.1 / 31.3 dB |
| Carga |
| 49.8 / 49.6 dB |
 | ||
30 dB silencioso 40 dB(A) audível 50 dB(A) ruidosamente alto |
||
min: | ||
| Acer Nitro 5 AN517-41-R5Z7 R7 5800H, GeForce RTX 3070 Laptop GPU | MSI Katana GF76 11UE i7-11800H, GeForce RTX 3060 Laptop GPU | Schenker XMG Core 17 (Early 2021) i7-10870H, GeForce RTX 3060 Laptop GPU | Asus TUF Gaming F17 FX706HM i9-11900H, GeForce RTX 3060 Laptop GPU | Média NVIDIA GeForce RTX 3070 Laptop GPU | Média da turma Gaming | |
|---|---|---|---|---|---|---|
| Noise | -10% | -6% | 2% | 3% | 5% | |
| desligado / ambiente * (dB) | 26 | 25 4% | 25 4% | 25 4% | 24.9 ? 4% | 24.1 ? 7% |
| Idle Minimum * (dB) | 26 | 33 -27% | 30 -15% | 26 -0% | 26.7 ? -3% | 26 ? -0% |
| Idle Average * (dB) | 33.1 | 34 -3% | 32 3% | 31 6% | 28.7 ? 13% | 27.4 ? 17% |
| Idle Maximum * (dB) | 31.3 | 35 -12% | 36 -15% | 33 -5% | 31.7 ? -1% | 30.1 ? 4% |
| Load Average * (dB) | 49.8 | 53 -6% | 53 -6% | 48 4% | 45 ? 10% | 43.6 ? 12% |
| Load Maximum * (dB) | 49.6 | 57 -15% | 54 -9% | 49 1% | 52.6 ? -6% | 54.2 ? -9% |
| Witcher 3 ultra * (dB) | 49 | 51 | 47 |
* ... menor é melhor
Temperatura
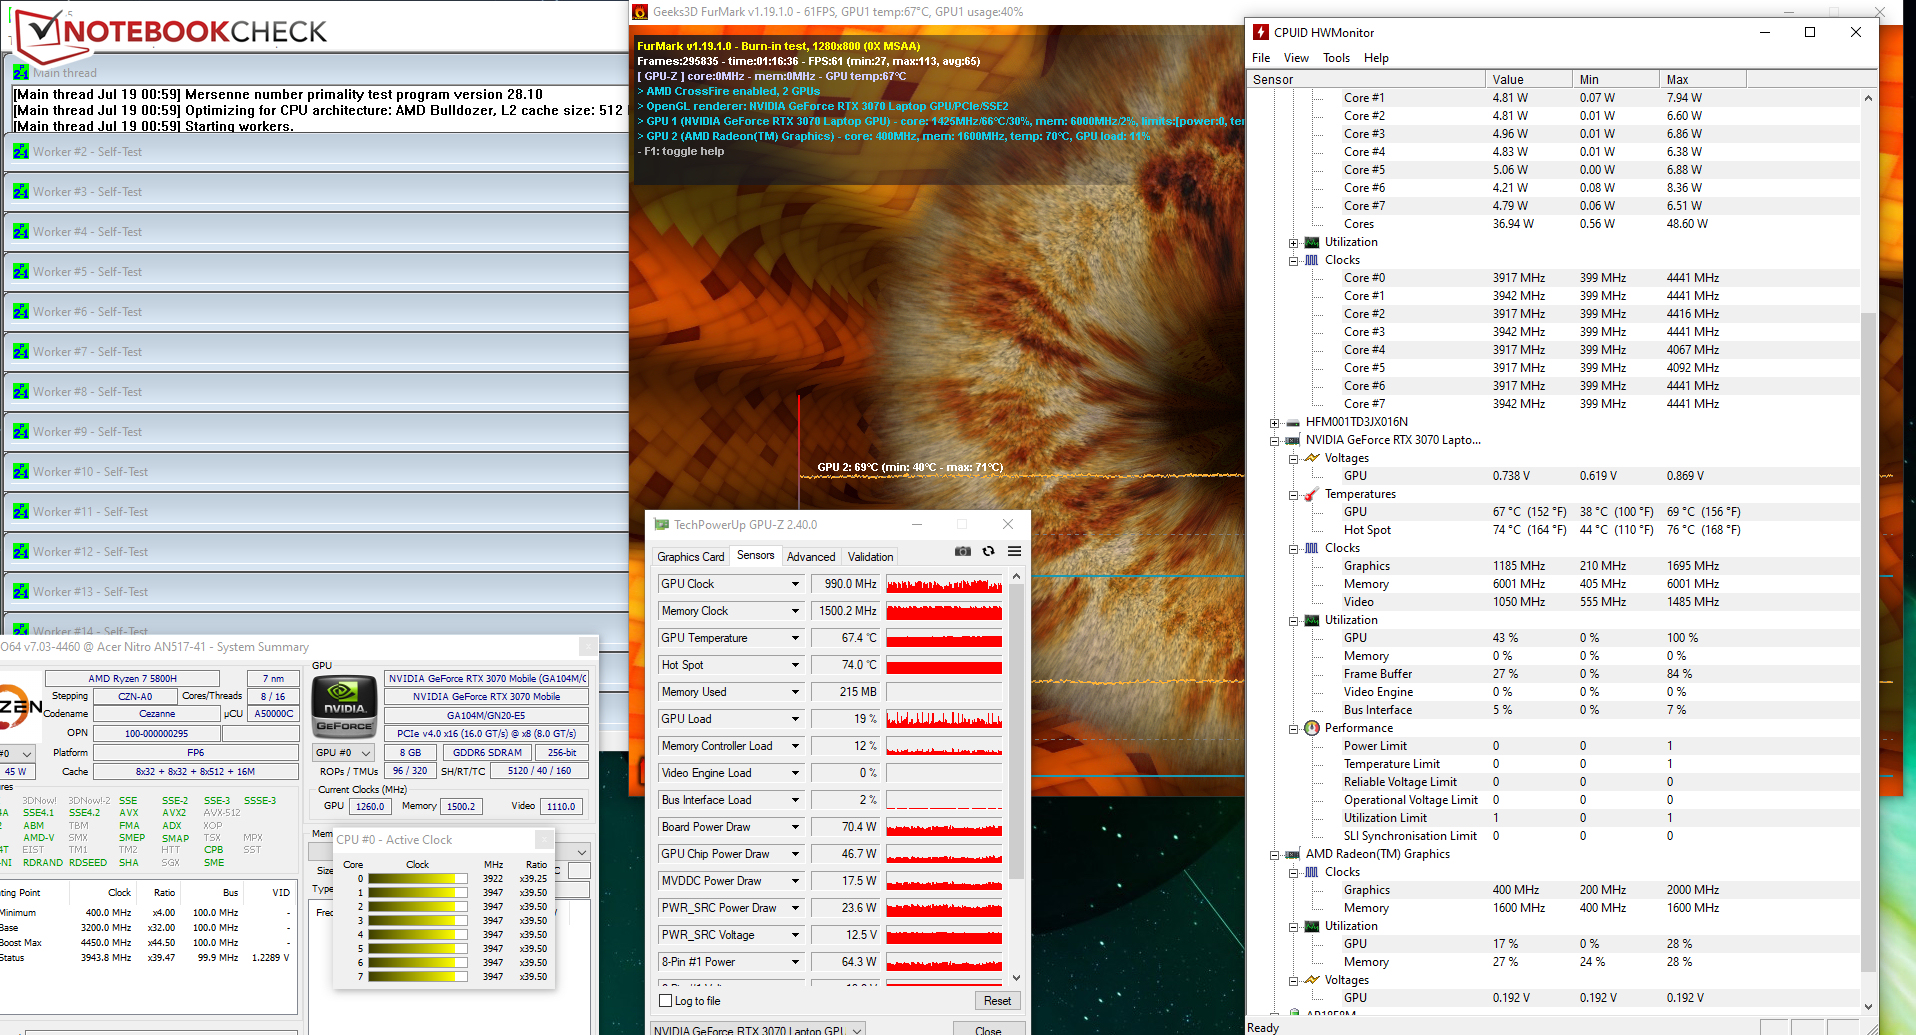
Nosso teste de estresse (Prime95 e FurMark funcionam por pelo menos uma hora) funciona a CPU e GPU a 3,9 GHz e 500 a 1000 MHz, respectivamente. O teste de estresse representa um cenário extremo. Utilizamos este teste para verificar se o sistema funciona de forma estável em carga máxima
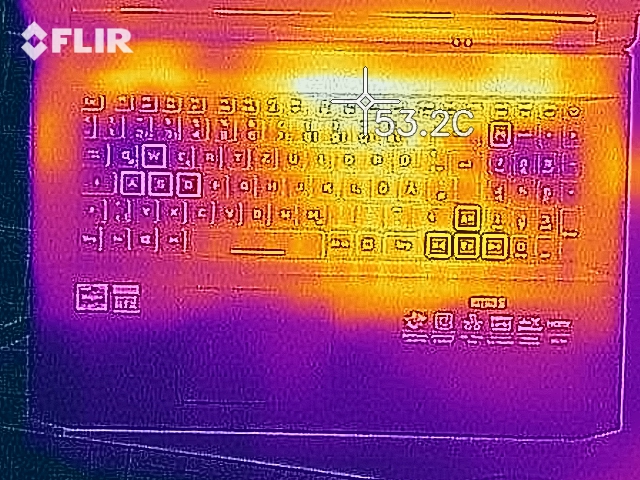
O notebook aquece moderadamente. Durante o teste de estresse, uma temperatura acima de 50 °C (122 °F)foi atingida apenas em um ponto de medição. As temperaturas estão dentro de uma zona verde em uso diário
(±) A temperatura máxima no lado superior é 44 °C / 111 F, em comparação com a média de 40.4 °C / 105 F , variando de 21.2 a 68.8 °C para a classe Gaming.
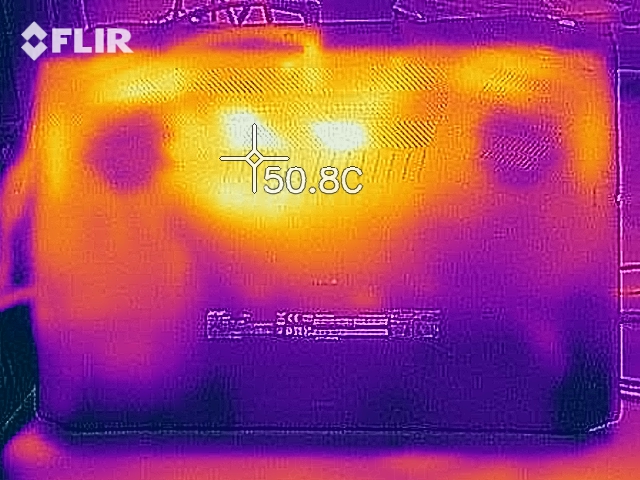
(-) A parte inferior aquece até um máximo de 52.7 °C / 127 F, em comparação com a média de 43.2 °C / 110 F
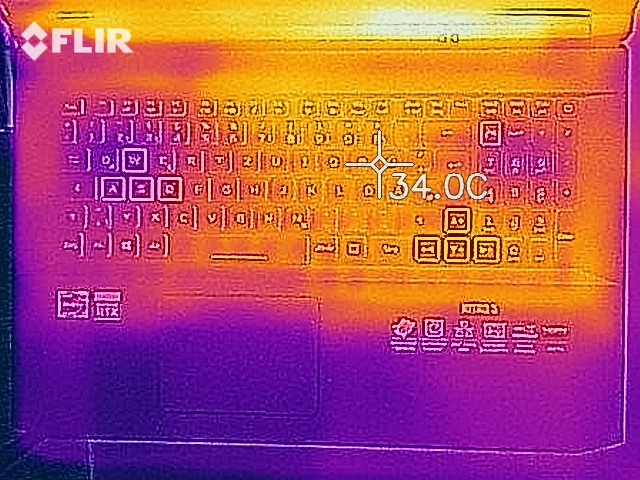
(+) Em uso inativo, a temperatura média para o lado superior é 28.9 °C / 84 F, em comparação com a média do dispositivo de 33.9 °C / ### class_avg_f### F.
(+) Os apoios para as mãos e o touchpad são mais frios que a temperatura da pele, com um máximo de 26.9 °C / 80.4 F e, portanto, são frios ao toque.
(±) A temperatura média da área do apoio para as mãos de dispositivos semelhantes foi 28.8 °C / 83.8 F (+1.9 °C / 3.4 F).
| Acer Nitro 5 AN517-41-R5Z7 R7 5800H, GeForce RTX 3070 Laptop GPU | MSI Katana GF76 11UE i7-11800H, GeForce RTX 3060 Laptop GPU | Schenker XMG Core 17 (Early 2021) i7-10870H, GeForce RTX 3060 Laptop GPU | Asus TUF Gaming F17 FX706HM i9-11900H, GeForce RTX 3060 Laptop GPU | Média NVIDIA GeForce RTX 3070 Laptop GPU | Média da turma Gaming | |
|---|---|---|---|---|---|---|
| Heat | -1% | 0% | -21% | -4% | 1% | |
| Maximum Upper Side * (°C) | 44 | 51 -16% | 44 -0% | 58.5 -33% | 47.8 ? -9% | 45.2 ? -3% |
| Maximum Bottom * (°C) | 52.7 | 52 1% | 50 5% | 58.5 -11% | 52.9 ? -0% | 48.1 ? 9% |
| Idle Upper Side * (°C) | 32.6 | 32 2% | 30 8% | 38 -17% | 32.4 ? 1% | 31 ? 5% |
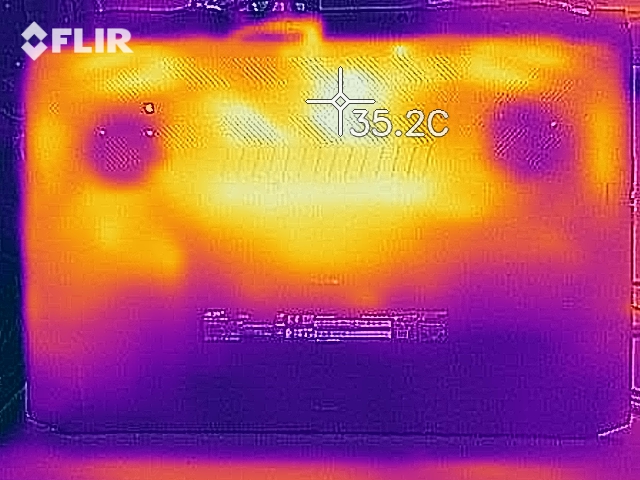
| Idle Bottom * (°C) | 32.1 | 29 10% | 36 -12% | 39 -21% | 34.2 ? -7% | 34.2 ? -7% |
* ... menor é melhor
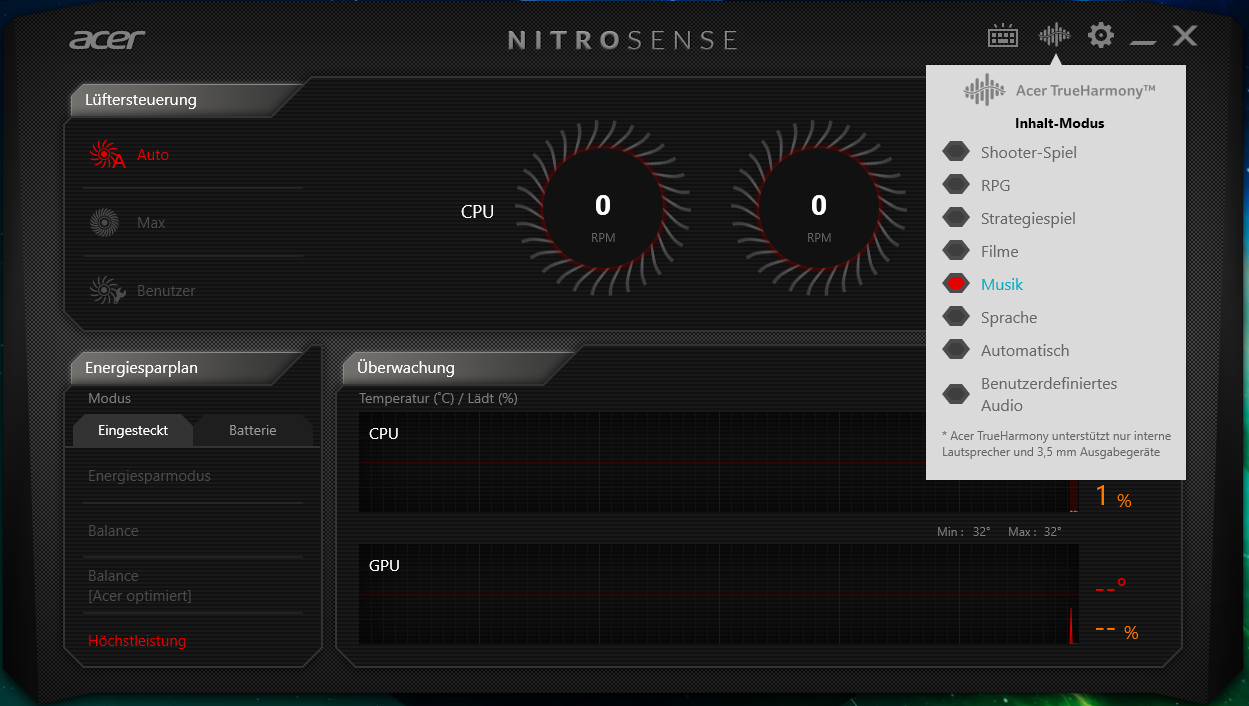
Orador
Os alto-falantes estéreo produzem um som decente que carece de graves. Os fones de ouvido ou alto-falantes externos são recomendados para uma melhor experiência sonora
Acer Nitro 5 AN517-41-R5Z7 análise de áudio
(±) | o volume do alto-falante é médio, mas bom (###valor### dB)
Graves 100 - 315Hz
(-) | quase nenhum baixo - em média 27.4% menor que a mediana
(±) | a linearidade dos graves é média (11.3% delta para a frequência anterior)
Médios 400 - 2.000 Hz
(+) | médios equilibrados - apenas 4.1% longe da mediana
(±) | a linearidade dos médios é média (8.7% delta para frequência anterior)
Altos 2 - 16 kHz
(±) | máximos mais altos - em média 6% maior que a mediana
(+) | os máximos são lineares (5% delta da frequência anterior)
Geral 100 - 16.000 Hz
(±) | a linearidade do som geral é média (22.5% diferença em relação à mediana)
Comparado com a mesma classe
» 81% de todos os dispositivos testados nesta classe foram melhores, 5% semelhantes, 14% piores
» O melhor teve um delta de 6%, a média foi 18%, o pior foi 132%
Comparado com todos os dispositivos testados
» 66% de todos os dispositivos testados foram melhores, 6% semelhantes, 28% piores
» O melhor teve um delta de 4%, a média foi 23%, o pior foi 134%
MSI GP76 Leopard 10UG análise de áudio
(+) | os alto-falantes podem tocar relativamente alto (###valor### dB)
Graves 100 - 315Hz
(-) | quase nenhum baixo - em média 18.5% menor que a mediana
(±) | a linearidade dos graves é média (10.8% delta para a frequência anterior)
Médios 400 - 2.000 Hz
(+) | médios equilibrados - apenas 2.9% longe da mediana
(+) | médios são lineares (2.4% delta para frequência anterior)
Altos 2 - 16 kHz
(+) | agudos equilibrados - apenas 2.8% longe da mediana
(+) | os máximos são lineares (4.2% delta da frequência anterior)
Geral 100 - 16.000 Hz
(+) | o som geral é linear (13.2% diferença em relação à mediana)
Comparado com a mesma classe
» 19% de todos os dispositivos testados nesta classe foram melhores, 4% semelhantes, 77% piores
» O melhor teve um delta de 6%, a média foi 18%, o pior foi 132%
Comparado com todos os dispositivos testados
» 13% de todos os dispositivos testados foram melhores, 3% semelhantes, 84% piores
» O melhor teve um delta de 4%, a média foi 23%, o pior foi 134%
Gerenciamento de energia - O notebook de jogos Nitro fornece tempos de funcionamento de bateria sólida
Consumo de energia
Registramos um consumo máximo de energia de 25,2 watts em modo inativo. O teste de estresse e Witcher 3 teste aumentam o consumo de energia até 157 watts e 135 watts em média, respectivamente. O diagrama seguinte ilustra o consumo de energia razoavelmente constante do notebook durante o teste de Witcher 3 teste. A potência nominal da fonte de alimentação é de 180 watts
| desligado | |
| Ocioso | |
| Carga |
|
Key:
min: | |
Energy consumption Witcher 3
| Acer Nitro 5 AN517-41-R5Z7 R7 5800H, GeForce RTX 3070 Laptop GPU | MSI Katana GF76 11UE i7-11800H, GeForce RTX 3060 Laptop GPU | Schenker XMG Core 17 (Early 2021) i7-10870H, GeForce RTX 3060 Laptop GPU | Asus TUF Gaming F17 FX706HM i9-11900H, GeForce RTX 3060 Laptop GPU | MSI GP76 Leopard 10UG i7-10750H, GeForce RTX 3070 Laptop GPU | Aorus 15G XC i7-10870H, GeForce RTX 3070 Laptop GPU | Asus TUF Gaming A15 FA506QR-AZ061T R7 5800H, GeForce RTX 3070 Laptop GPU | Média NVIDIA GeForce RTX 3070 Laptop GPU | Média da turma Gaming | |
|---|---|---|---|---|---|---|---|---|---|
| Power Consumption | 18% | 1% | 21% | 1% | 2% | 19% | -2% | -0% | |
| Idle Minimum * (Watt) | 18.7 | 9 52% | 13 30% | 10.3 45% | 12 36% | 13 30% | 10.2 45% | 15.6 ? 17% | 13 ? 30% |
| Idle Average * (Watt) | 22 | 13 41% | 16 27% | 13.1 40% | 16 27% | 16 27% | 12.8 42% | 20.1 ? 9% | 19 ? 14% |
| Idle Maximum * (Watt) | 25.2 | 20 21% | 29 -15% | 14.1 44% | 28 -11% | 30 -19% | 15 40% | 29.4 ? -17% | 24.6 ? 2% |
| Load Average * (Watt) | 134.7 | 102 24% | 100 26% | 110 18% | 92 32% | 92 32% | 130 3% | 110.8 ? 18% | 110.7 ? 18% |
| Witcher 3 ultra * (Watt) | 135 | 149 -10% | 173 -28% | 138 -2% | 198 -47% | 154 -14% | 137 -1% | ||
| Load Maximum * (Watt) | 157 | 187 -19% | 213 -36% | 190 -21% | 210 -34% | 223 -42% | 184 -17% | 214 ? -36% | 259 ? -65% |
* ... menor é melhor
Duração da bateria
O equipamento de 17,3 polegadas atinge tempos de execução de 5:34 h e 7:00 h no teste WLAN (chamada de sites através de um roteiro) e teste de vídeo (curta-metragem Big Buck Bunny (codificação H.264, FHD) em um loop), respectivamente. Durante ambos os testes, os recursos de economia de energia do notebook são desativados e o brilho do visor é ajustado para cerca de 150 cd/m². Os módulos sem fio também são desabilitados para o teste de vídeo
| Acer Nitro 5 AN517-41-R5Z7 R7 5800H, GeForce RTX 3070 Laptop GPU, 57.5 Wh | MSI Katana GF76 11UE i7-11800H, GeForce RTX 3060 Laptop GPU, 53 Wh | Schenker XMG Core 17 (Early 2021) i7-10870H, GeForce RTX 3060 Laptop GPU, 62 Wh | Asus TUF Gaming F17 FX706HM i9-11900H, GeForce RTX 3060 Laptop GPU, 90 Wh | MSI GP76 Leopard 10UG i7-10750H, GeForce RTX 3070 Laptop GPU, 65 Wh | Aorus 15G XC i7-10870H, GeForce RTX 3070 Laptop GPU, 99 Wh | Asus TUF Gaming A15 FA506QR-AZ061T R7 5800H, GeForce RTX 3070 Laptop GPU, 90 Wh | Média da turma Gaming | |
|---|---|---|---|---|---|---|---|---|
| Duração da bateria | -34% | -19% | 45% | -38% | 16% | 82% | 9% | |
| Reader / Idle (h) | 10.1 | 4.8 -52% | 7.7 -24% | 5.6 -45% | 9.6 -5% | 17.4 72% | 8.27 ? -18% | |
| H.264 (h) | 7 | 3.9 -44% | 4.7 -33% | 8.5 21% | 6.5 -7% | 8.32 ? 19% | ||
| WiFi v1.3 (h) | 5.6 | 3.7 -34% | 4.9 -12% | 7.6 36% | 4.2 -25% | 6.3 13% | 11.4 104% | 7.11 ? 27% |
| Load (h) | 1.4 | 1.3 -7% | 1.3 -7% | 2.5 79% | 0.8 -43% | 2.3 64% | 2.4 71% | 1.502 ? 7% |
| Witcher 3 ultra (h) | 0.8 |
Pro
Contra
Veredicto - Jogador sólido de médio alcance
O Nitro 5 não pertence ao grupo superior dos computadores portáteis RTX 3070: Em comparação com os notebooks RTX 3070 testados até agora, o computador fornece taxas de quadros abaixo da média - isto se deve ao TGP de 100 watts. O desempenho da GPU pode ser um pouco aumentado com uma atualização de firmware. O dispositivo pontua com um alto nível de desempenho da CPU.
O Acer Nitro 5 AN517-41 oferece uma grande performance para o Euro.
O estrangulamento não é uma preocupação. A CPU e a GPU podem produzir seu desempenho constantemente. O laptop aquece moderadamente sob carga. O desenvolvimento do ruído está no nível habitual da classe. A instalação da atualização do FW deve aumentar um pouco o desenvolvimento de calor e ruído.
A tela (FHD, IPS, 144 Hz) oferece ângulos de visão estáveis, bom contraste, superfície fosca, tempos de resposta curtos e reprodução de cores decentes. A luminosidade média e a cobertura do espaço de cor são muito baixas.
Uma alternativa para o Nitro 5 seria o MSI GP76 Leopardo 10UG. O computador vem com uma GPU para laptop GeForce RTX-3070 que roda com o TGP máximo possível de 140 watts. Entretanto, o GP76 fornece menos potência de CPU do que o Nitro 5.
Dentro de alguns dias, a revisão do RTX-3070 Nitro 5 será seguida por uma revisão de um modelo irmão equipado com uma GPU para laptop GeForce RTX-3080.
Preço e disponibilidade
O Acer Nitro 5 AN517-41-R5Z7 (Ryzen 7-5800H, GeForce RTX 3070, 16 GB RAM, 1 TB SSD, Windows 10 Home) está disponível por um preço de 1.499 Euros (~$1763) em Notebooksbilliger.de. O aparelho está esgotado no momento
Acer Nitro 5 AN517-41-R5Z7
- 08/02/2021 v7 (old)
Sascha Mölck
Price comparison
