Lenovo Legion 5 17 com RTX 3060 em revisão: Laptop de jogo forte com CPU AMD Ryzen de geração atual

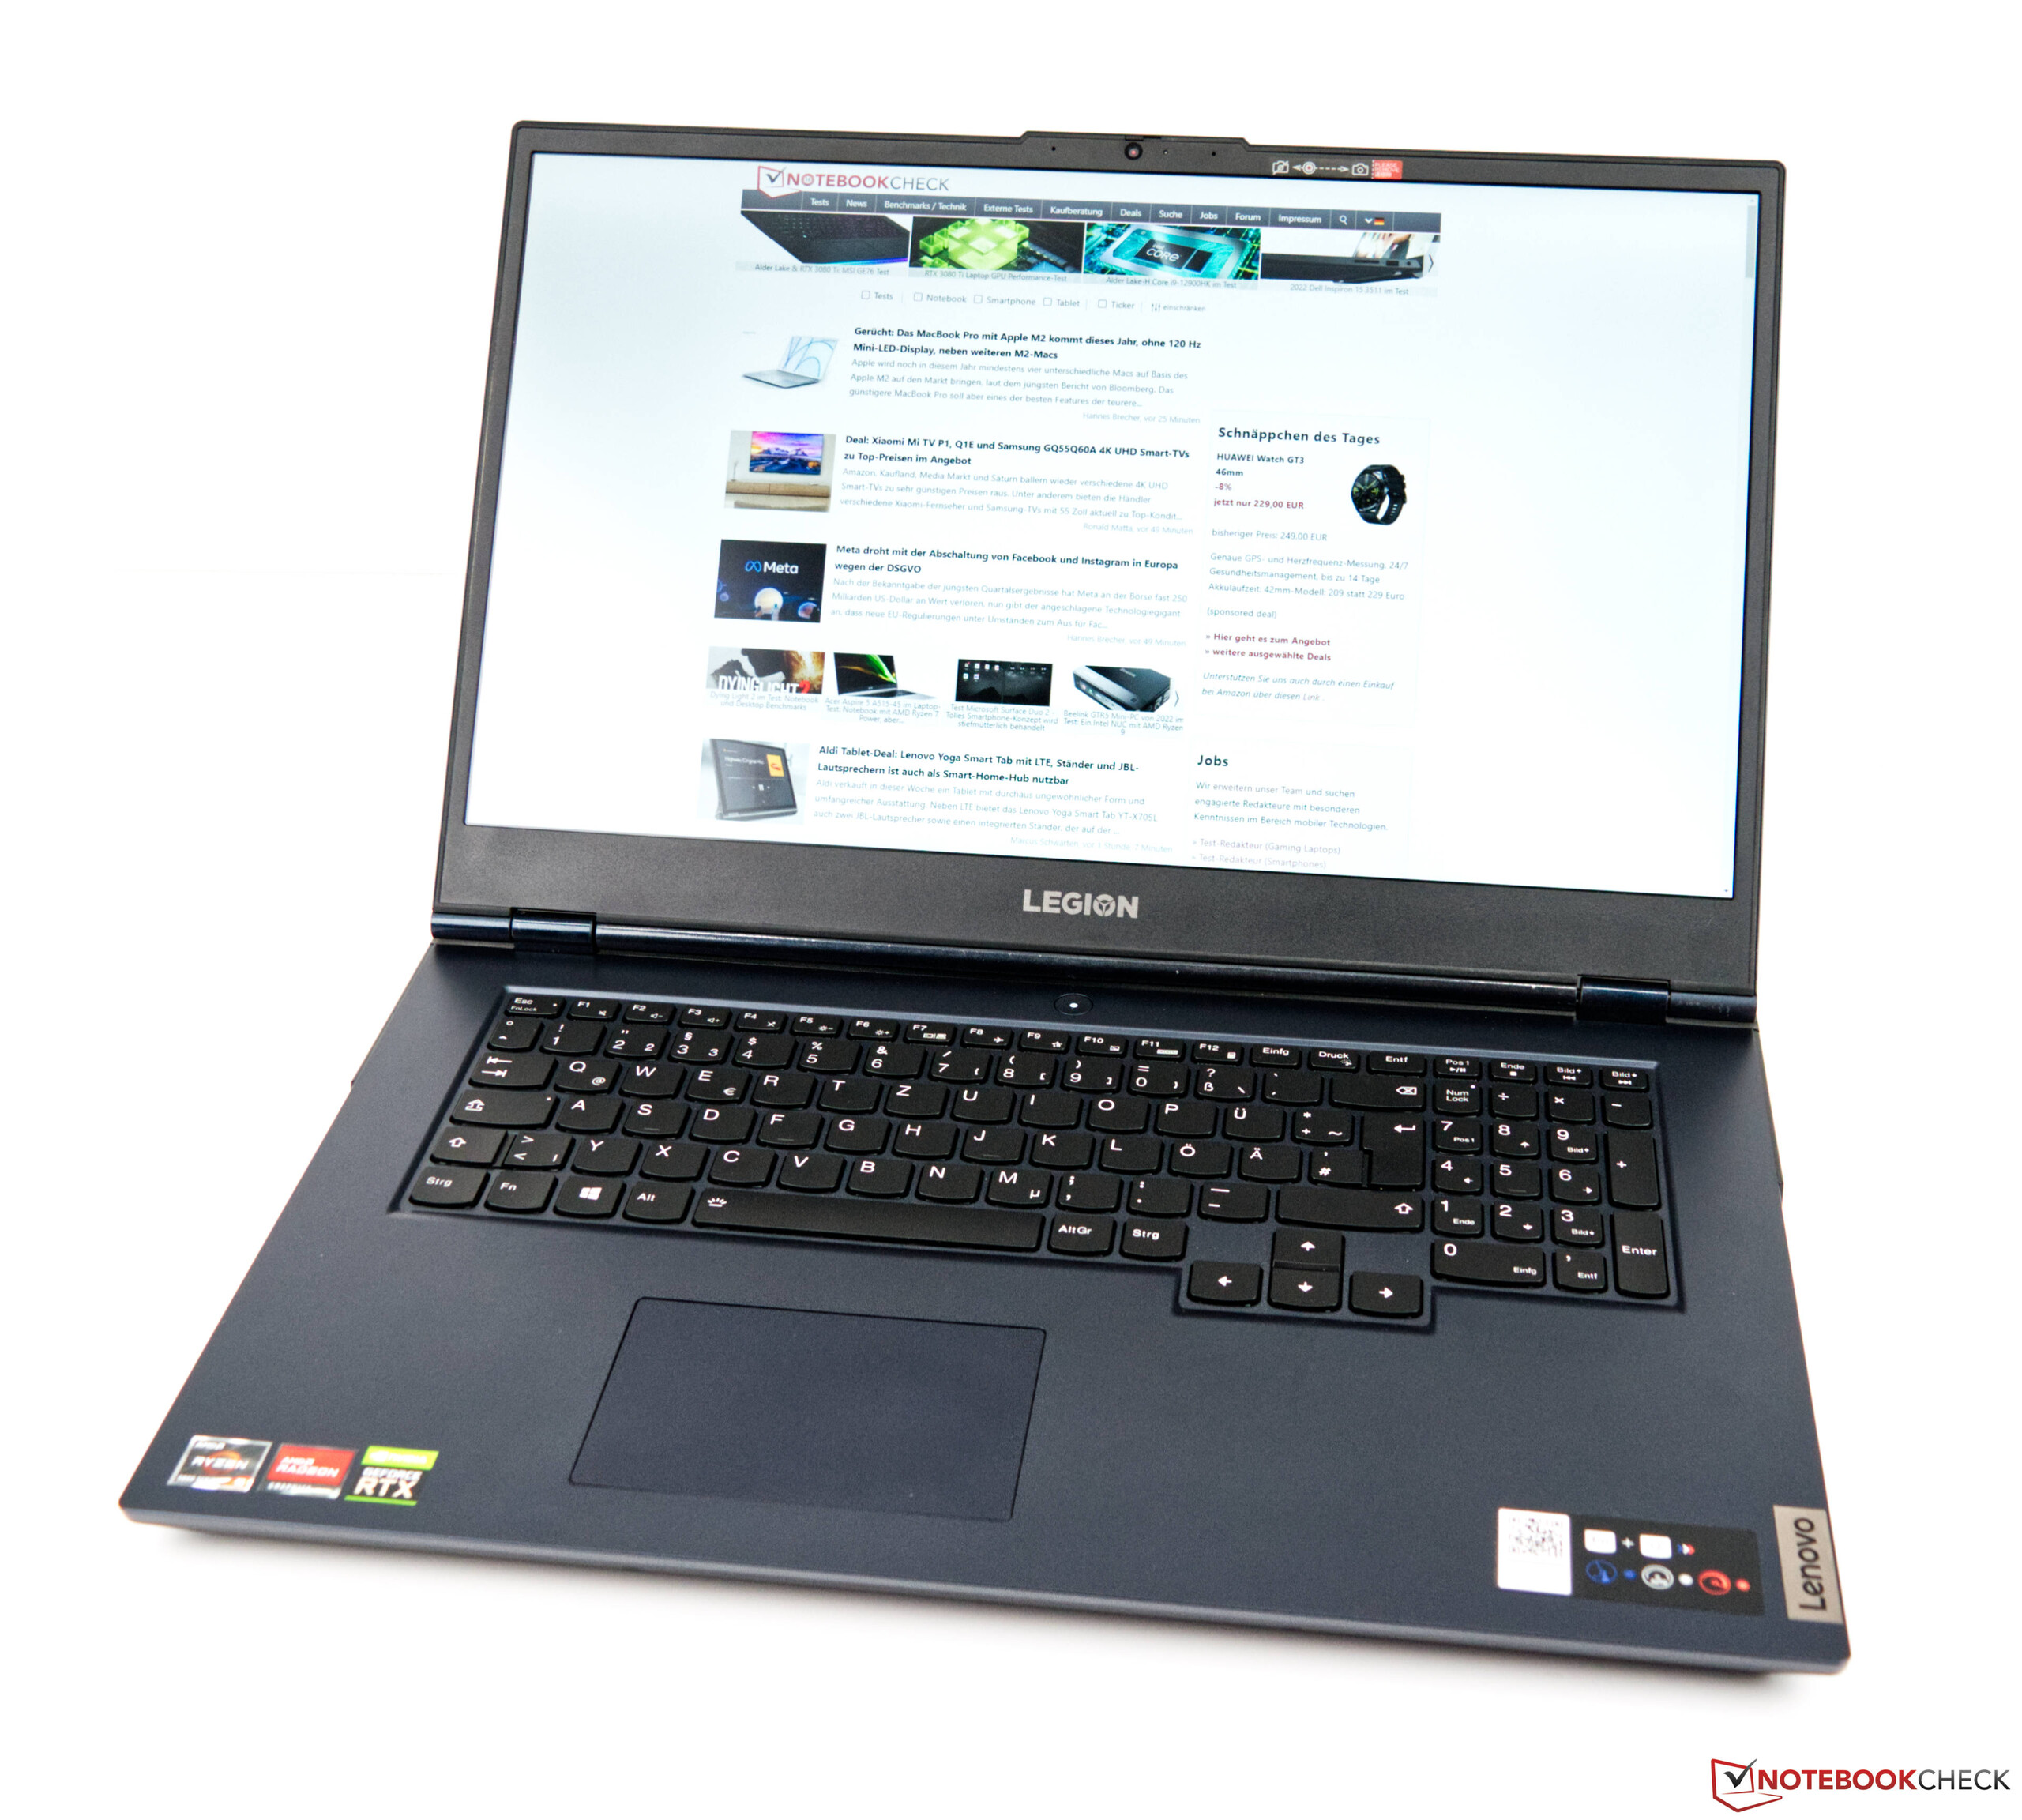
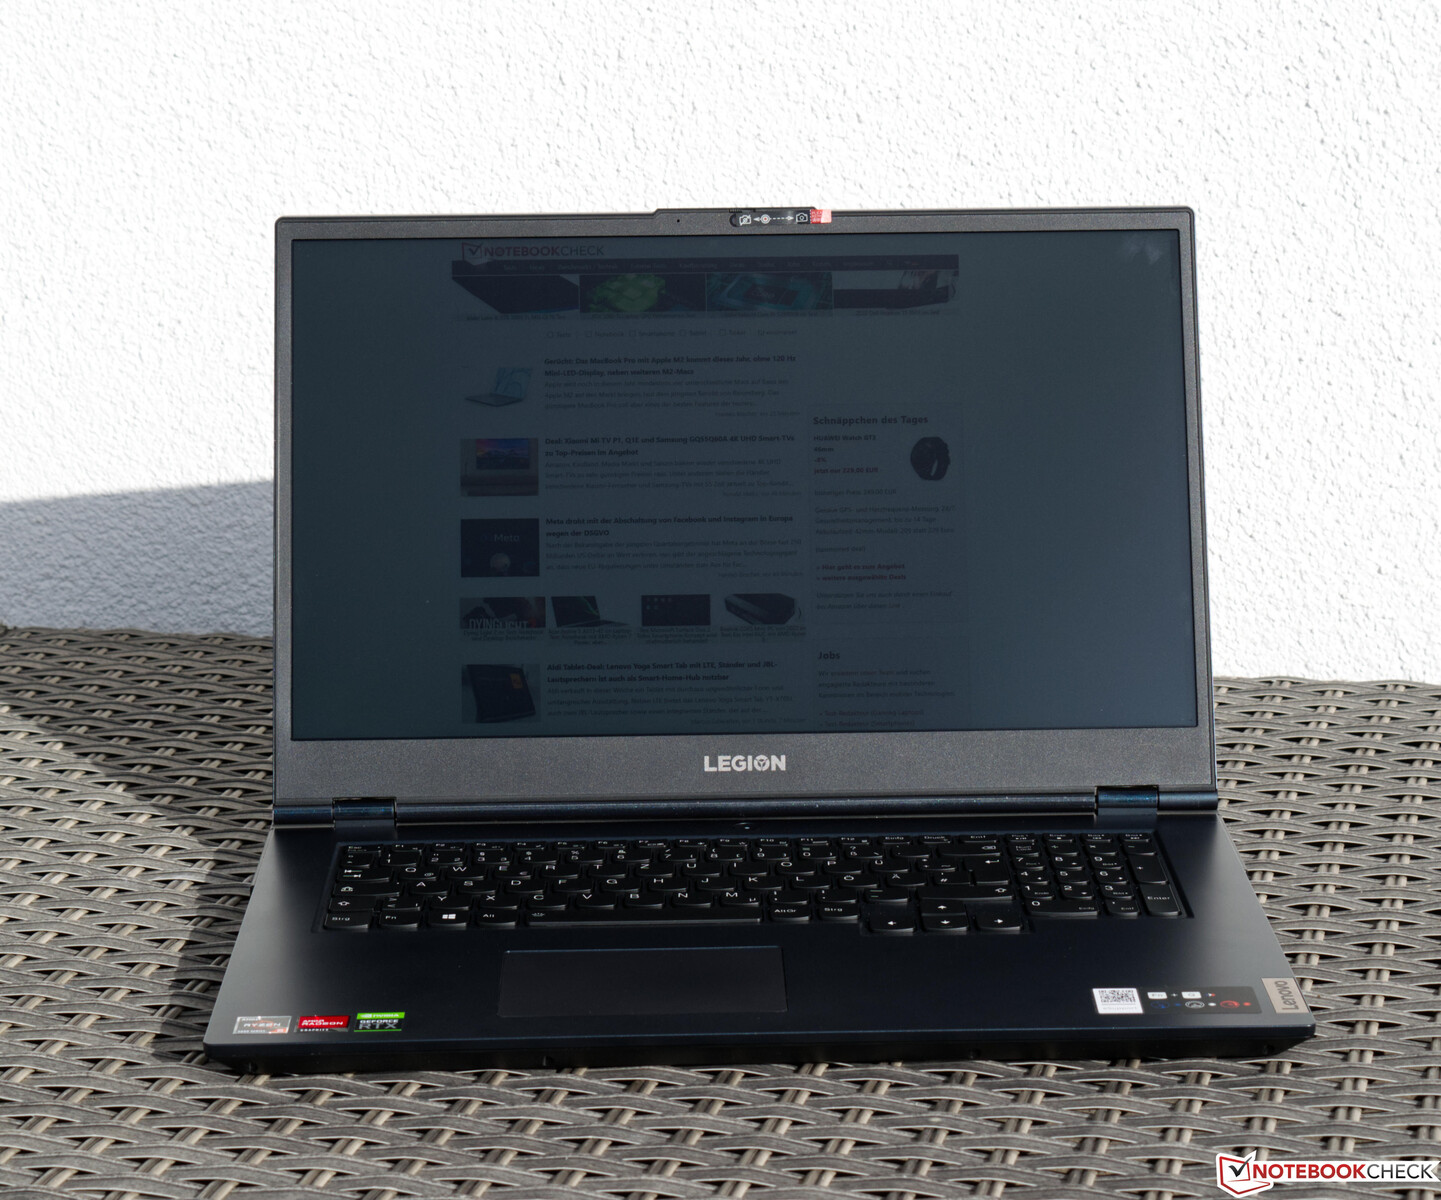
A série Legion da Lenovo tem sido um nome doméstico no cenário dos jogos há muito tempo. O Legion 5 está longe de ser discreto visualmente, já que seu design marcante também chegou ao último modelo de 2022, que é baseado em um APU AMD.
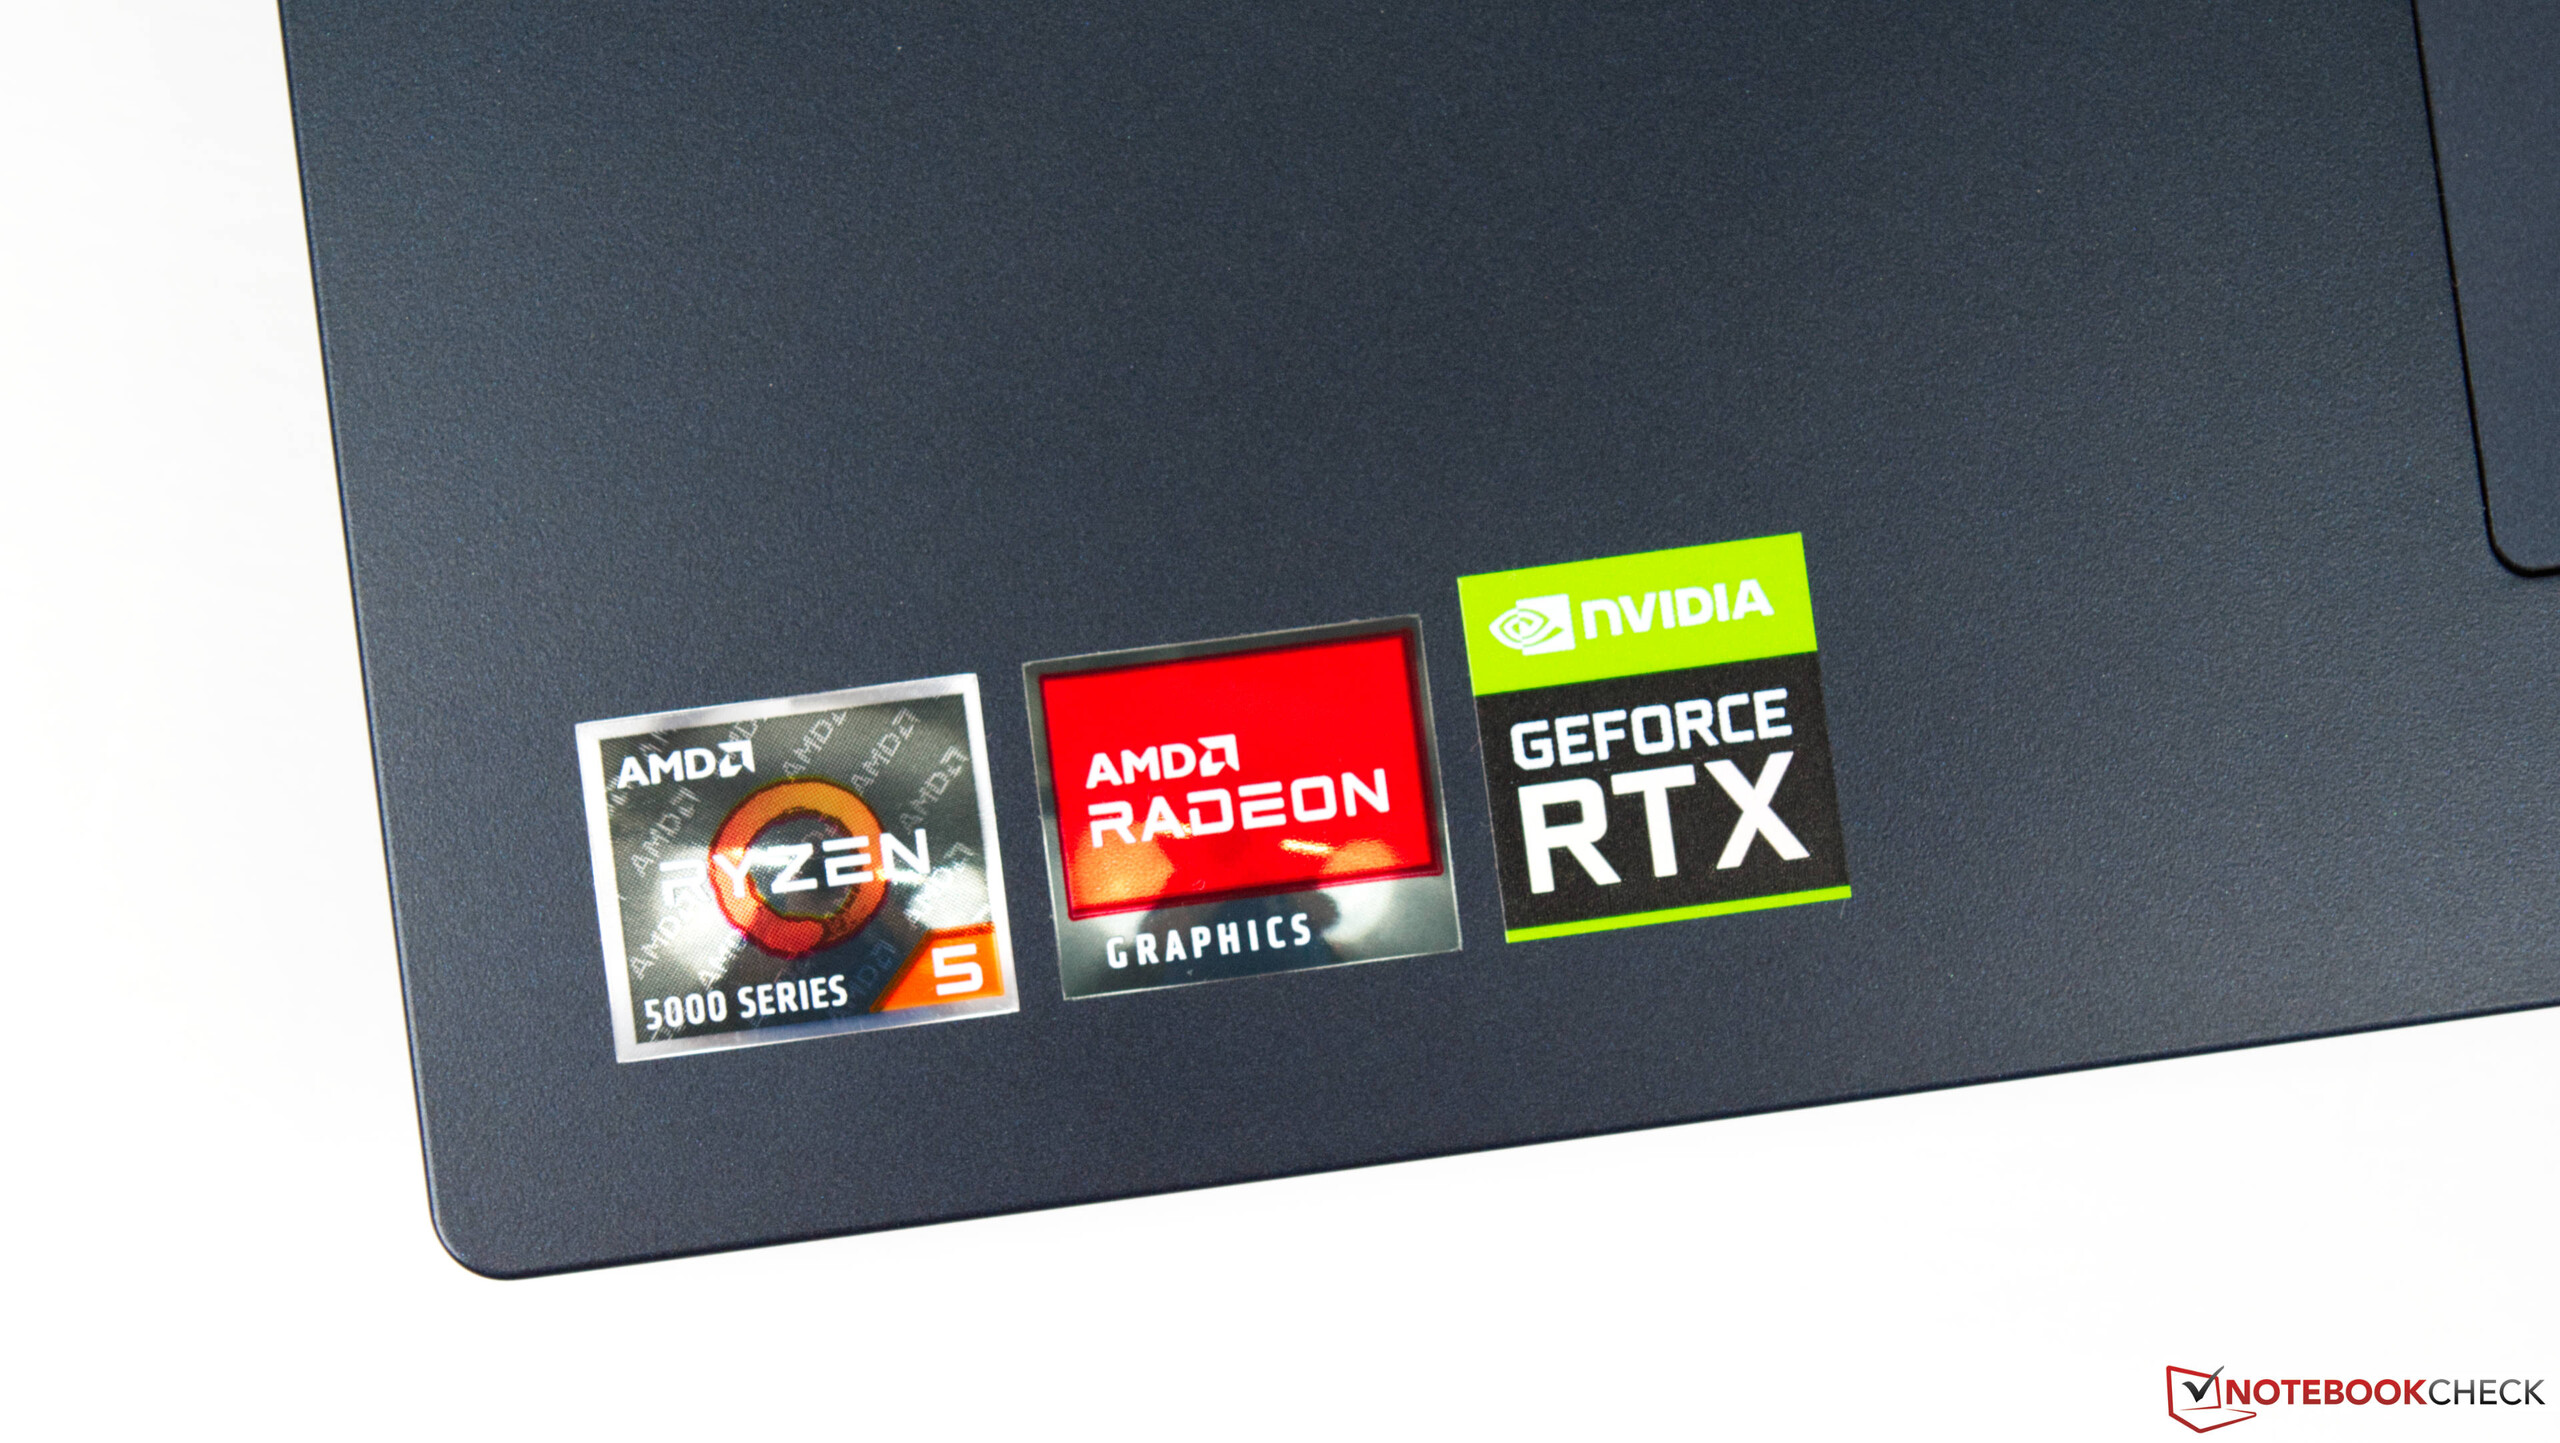
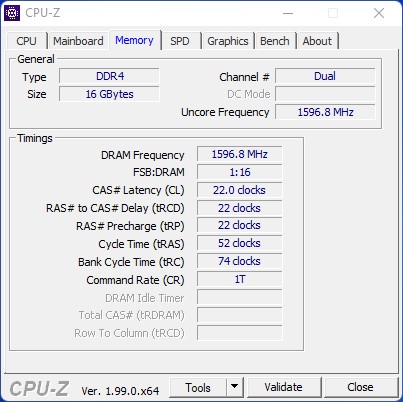
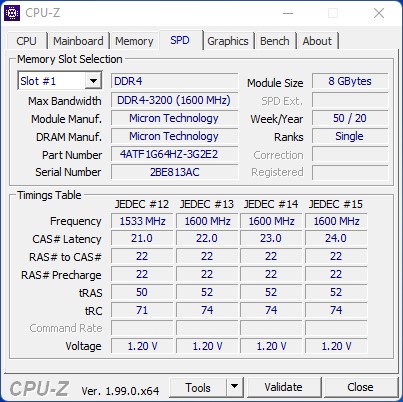
No topo da tabela AMD Ryzen 5 5600H e o AMD Ryzen 7 5800Hos usuários podem escolher entre três GPUs Nvidia diferentes. O modelo base GeForce RTX 3050 da Lenovo Legion 5 17 começa em 1150 USD, enquanto nossa configuração de teste com uma GPU móvel GeForce RTX 3060 está disponível por aproximadamente 1220 USD. Pelo preço, os usuários também recebem um display de 144-Hz 1080p, 16 GB de RAM, e um SSD NVMe de 512-GB. A edição Home do Windows 11 está incluída por padrão. O sistema pode ser configurado de acordo com suas preferências através da loja online da Lenovo.
Usamos dispositivos equipados de forma semelhante para fins de comparação. A tabela abaixo mostra os concorrentes que escolhemos
Possíveis concorrentes em comparação
Avaliação | Data | Modelo | Peso | Altura | Size | Resolução | Preço |
|---|---|---|---|---|---|---|---|
| 85.2 % v7 (old) | 02/2022 | Lenovo Legion 5 17ACH6H-82JY0003GE R5 5600H, GeForce RTX 3060 Laptop GPU | 3.1 kg | 24.3 mm | 17.30" | 1920x1080 | |
| 83.9 % v7 (old) | 06/2021 | Schenker XMG Core 17 (Early 2021) i7-10870H, GeForce RTX 3060 Laptop GPU | 2.5 kg | 30.05 mm | 17.30" | 2560x1440 | |
| 82.8 % v7 (old) | 06/2021 | Asus TUF Gaming F17 FX706HM i9-11900H, GeForce RTX 3060 Laptop GPU | 2.7 kg | 26 mm | 17.30" | 1920x1080 | |
| 80.4 % v7 (old) | 06/2021 | MSI Katana GF76 11UE i7-11800H, GeForce RTX 3060 Laptop GPU | 2.7 kg | 25.2 mm | 17.30" | 1920x1080 | |
| 83.4 % v7 (old) | 11/2021 | Schenker XMG Apex 17 M21 R7 5800H, GeForce RTX 3070 Laptop GPU | 2.6 kg | 32.4 mm | 17.30" | 1920x1080 | |
| 83.2 % v7 (old) | 10/2021 | Gigabyte A7 X1 R9 5900HX, GeForce RTX 3070 Laptop GPU | 2.5 kg | 34 mm | 17.30" | 1920x1080 |
Caso
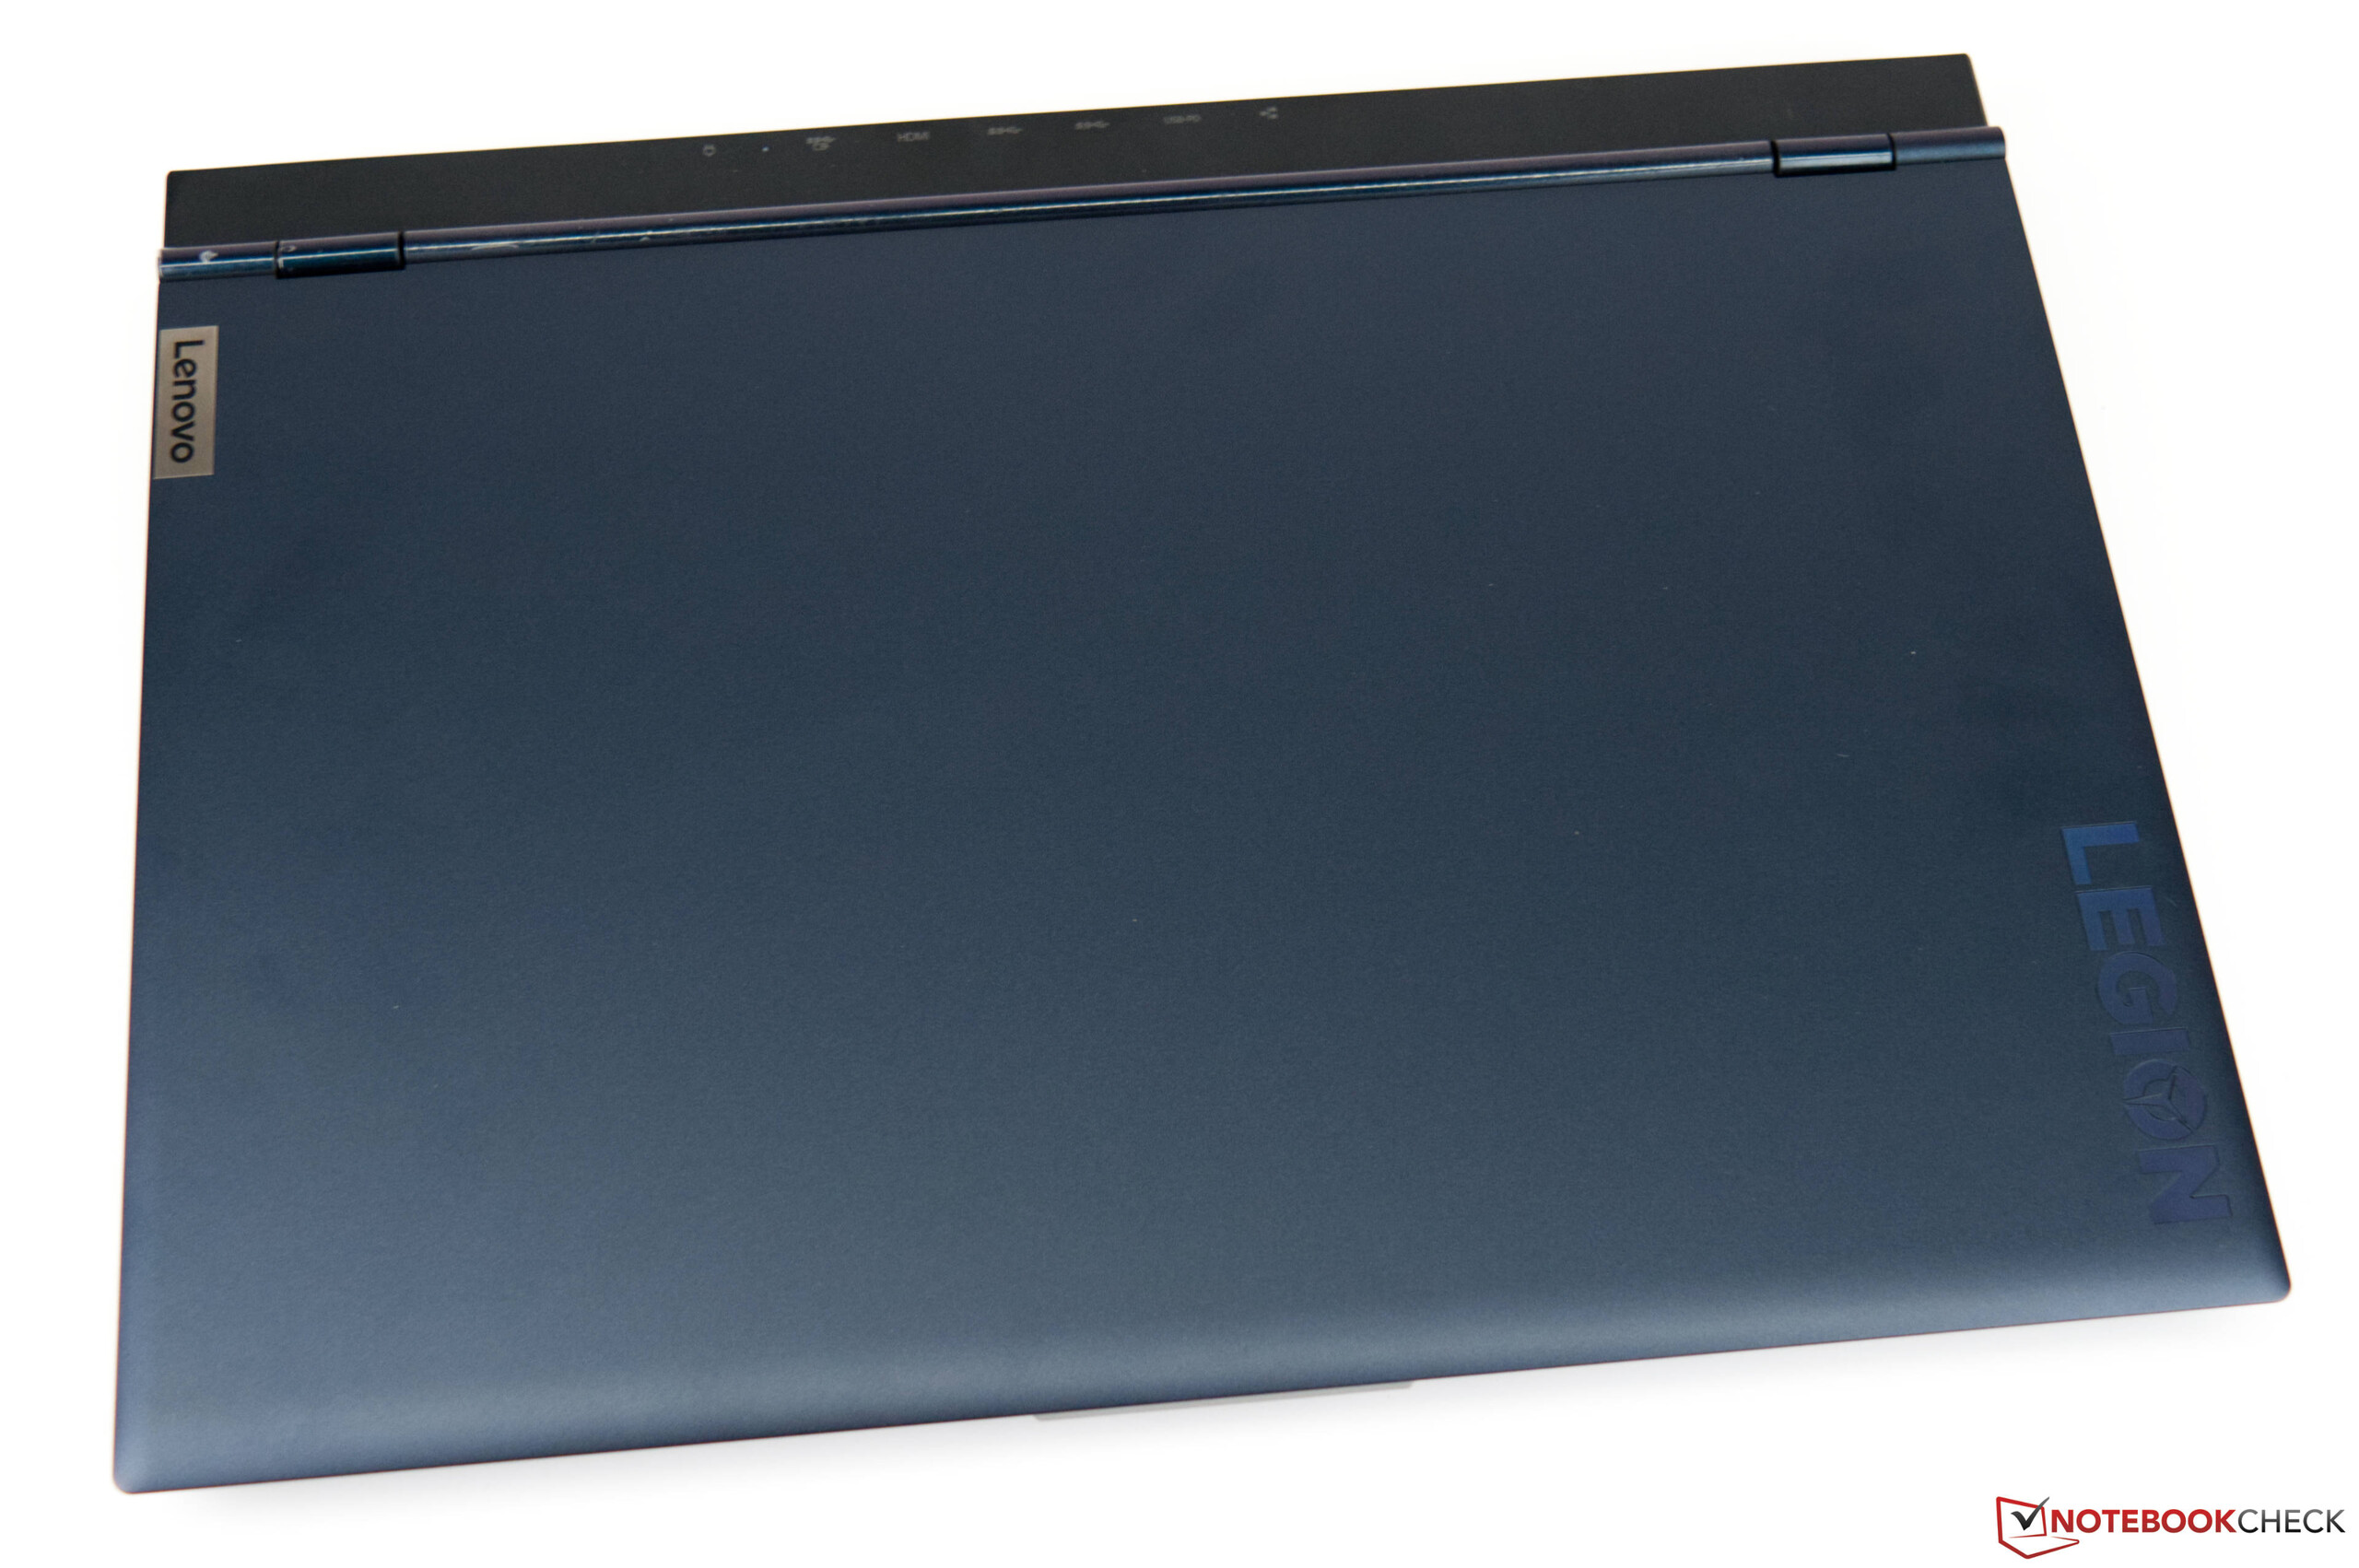
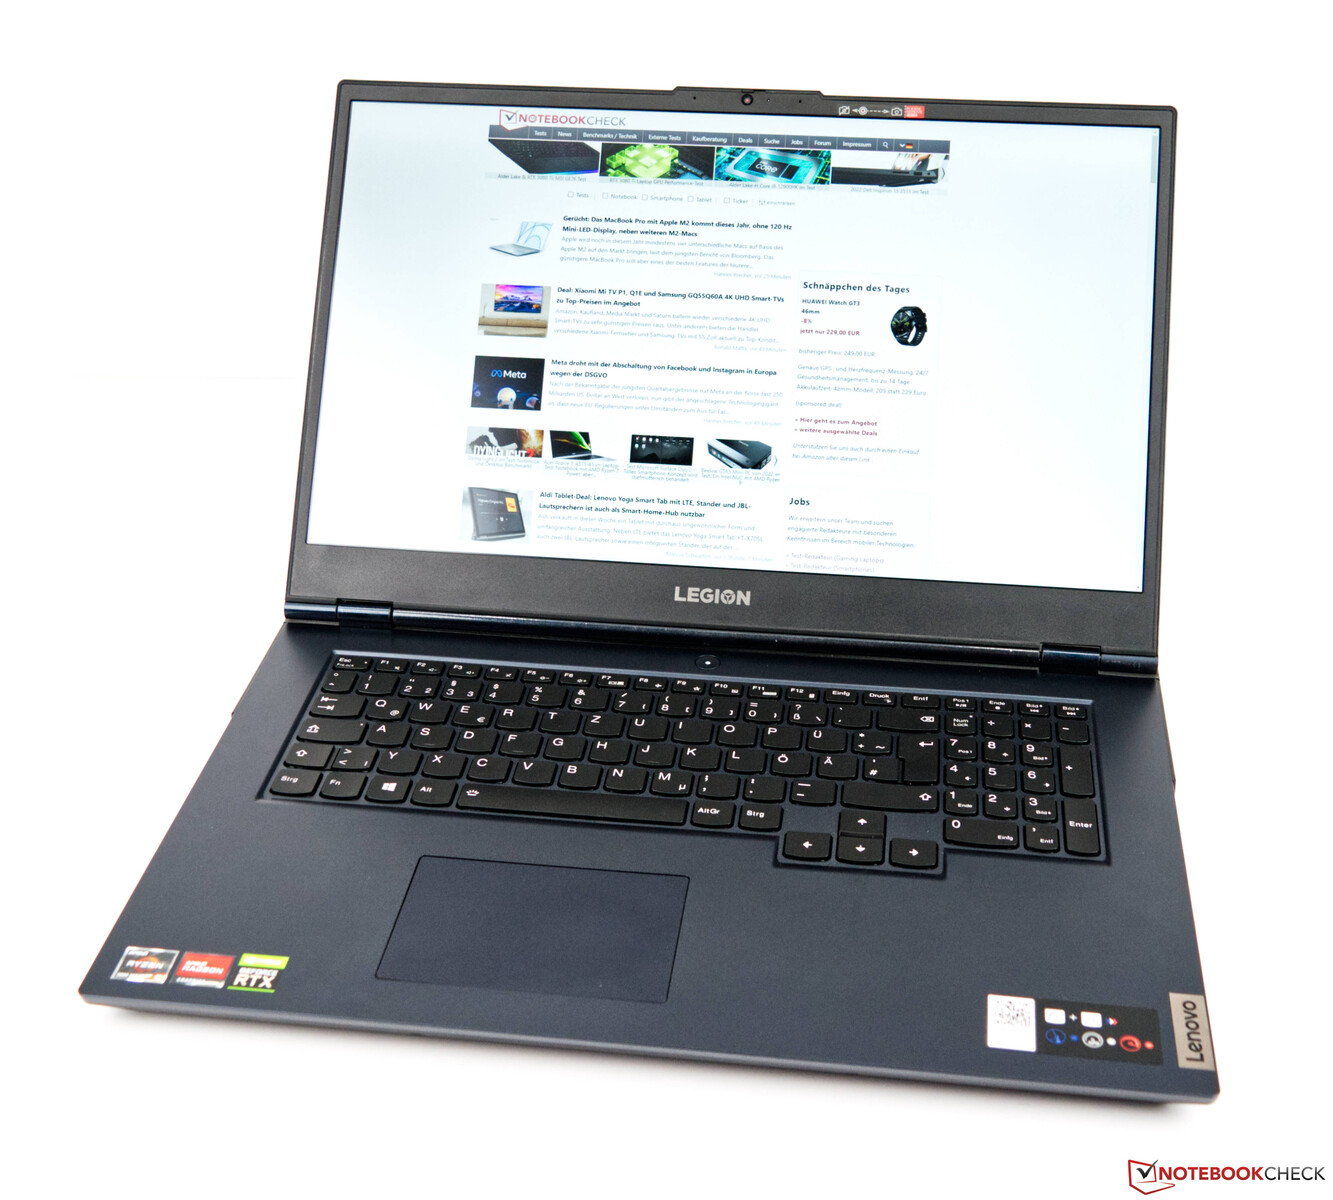
Esteticamente, a Lenovo Legion 5 17 é muito claramente um laptop para jogos. A tampa é enfeitada por acentos visuais na forma do logotipo Legion. A Lenovo Legion 5 17 vem sem qualquer iluminação RGB. A seleção de materiais é boa, pois o dispositivo parece muito superior apesar da construção à base de plástico. Embora a base seja decentemente rígida, embora o centro da área do teclado ceda ligeiramente sob pressão. Isto não é muito pronunciado, no entanto. Gostaríamos de ter visto um nível semelhante de rigidez para a tampa, que infelizmente é muito suscetível a torção. Pelo menos, ela é bastante resistente contra aplicações concentradas de pressão. A tampa pode ser aberta até um amplo ângulo máximo de 180°. As duas dobradiças previnem, de forma confiável, a formação de teetering. Além disso, a base é pesada o suficiente para a abertura com uma só mão
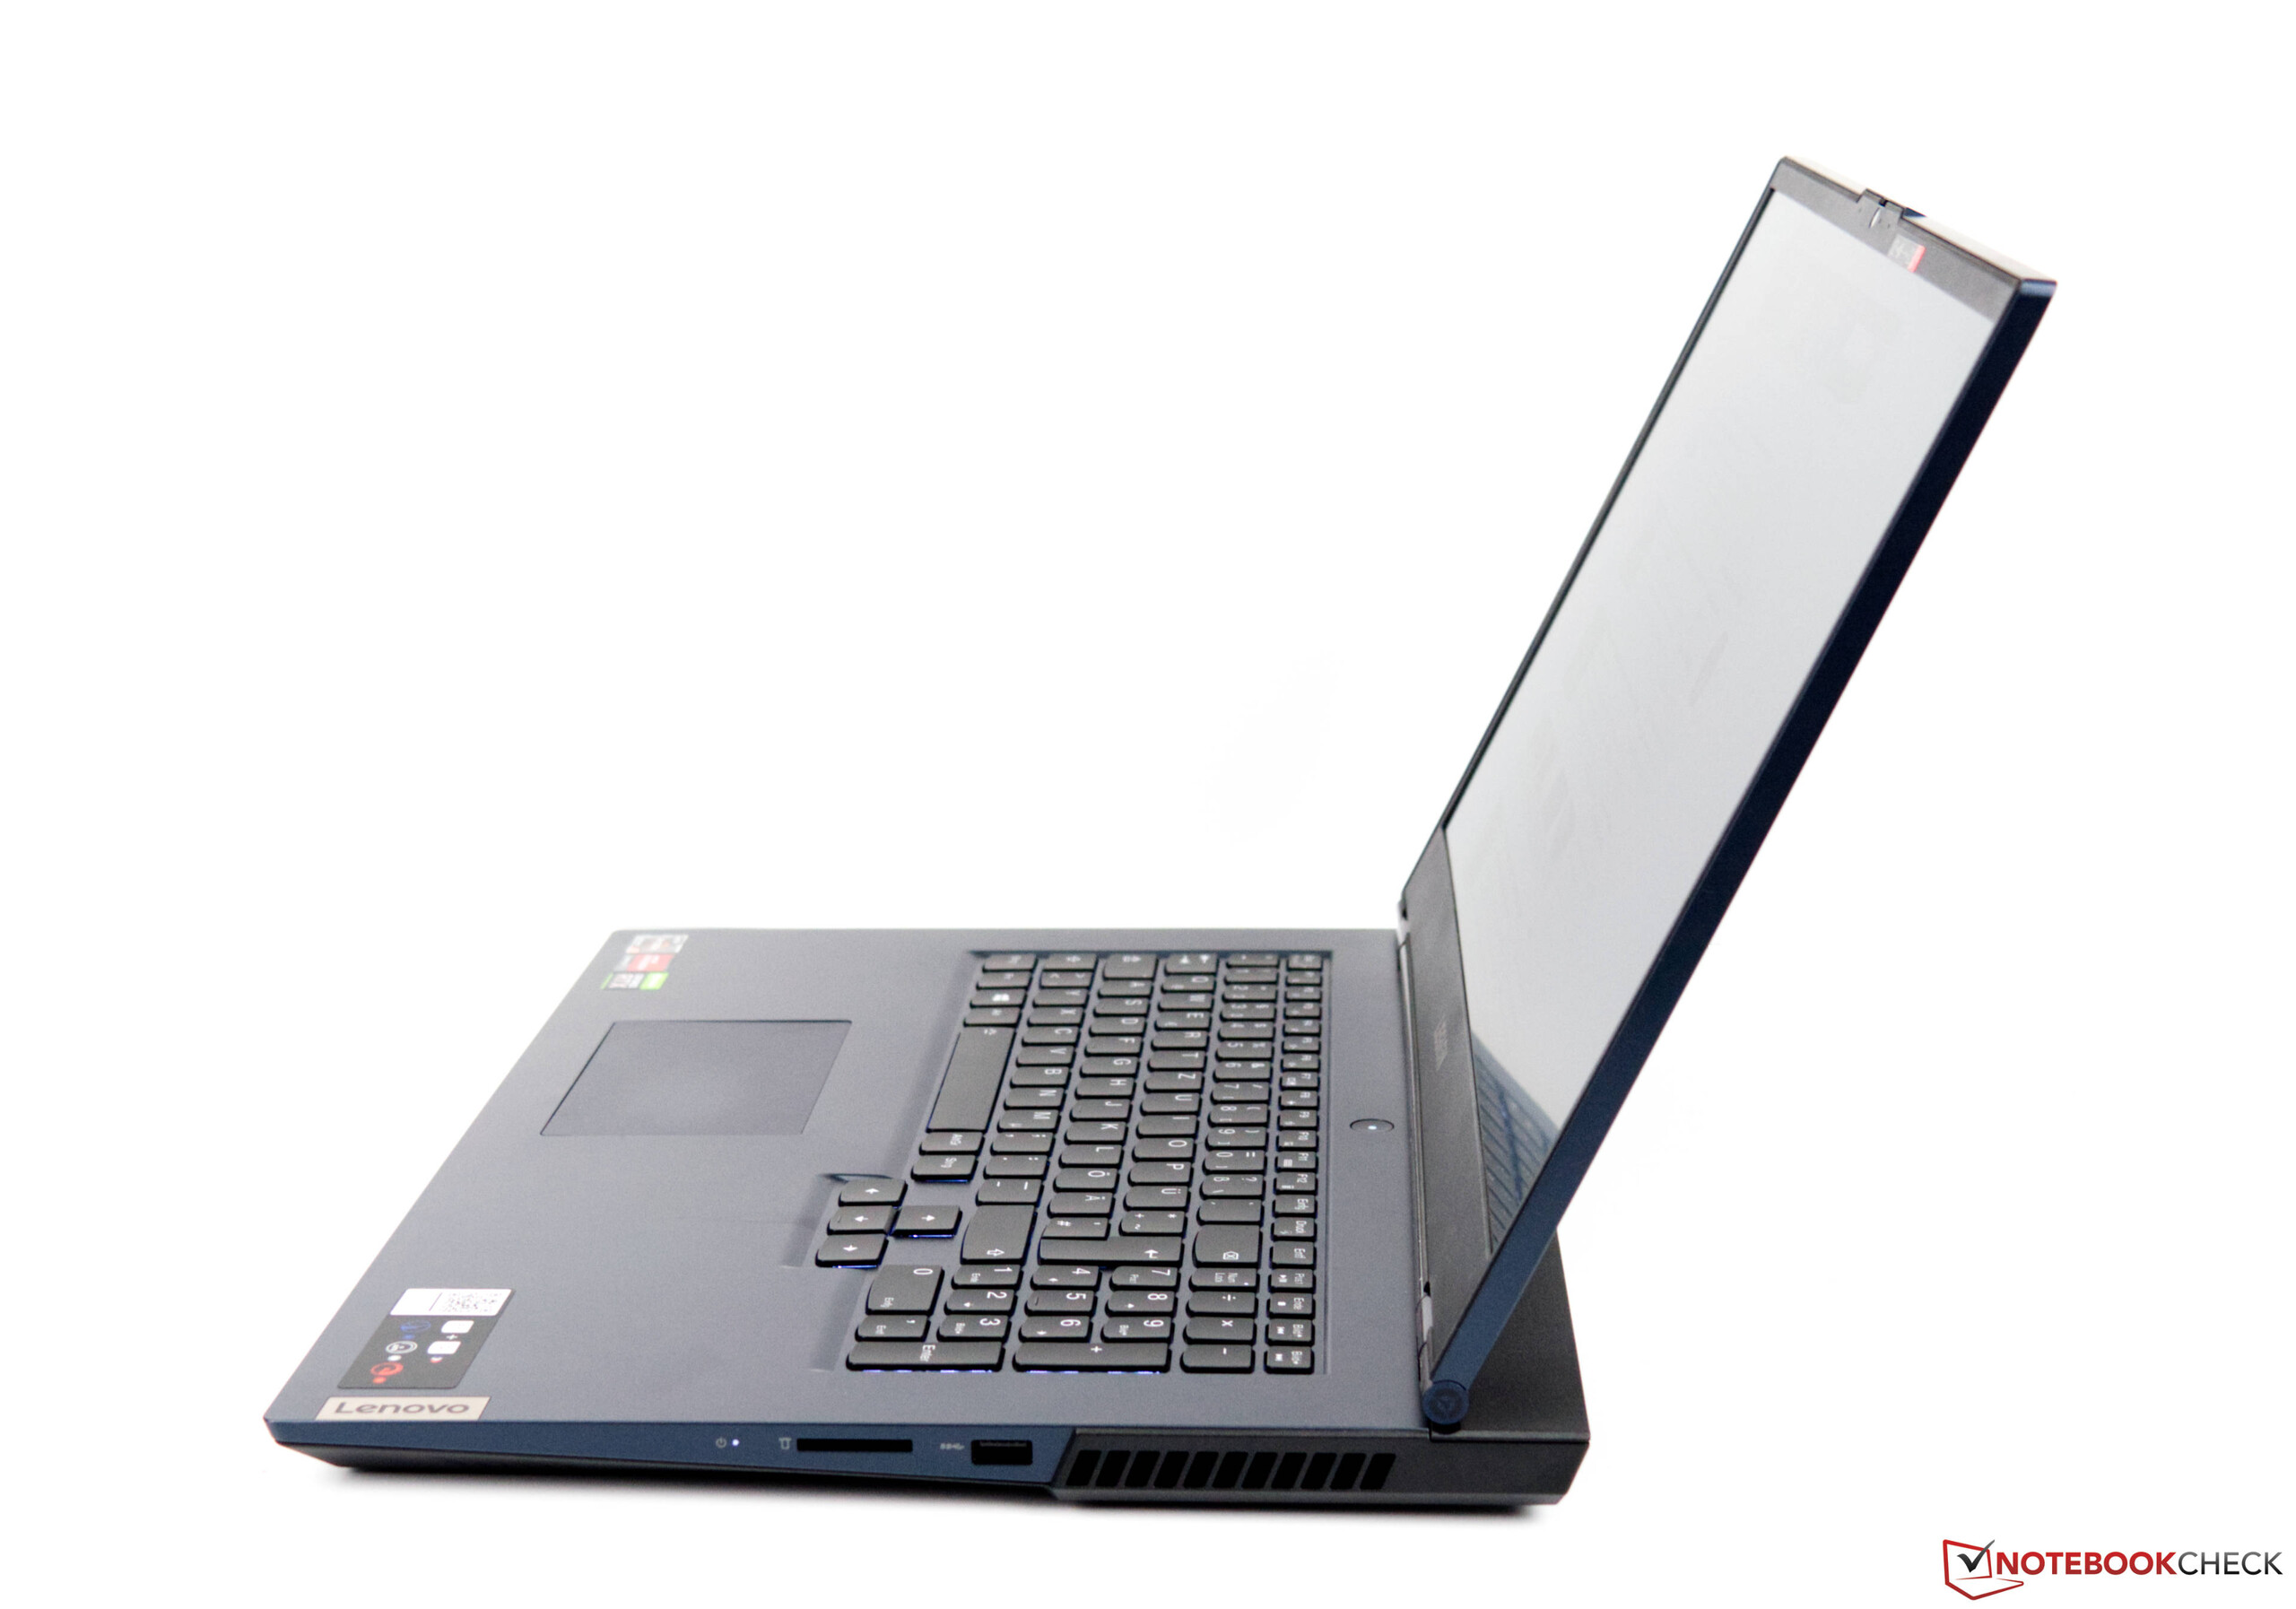
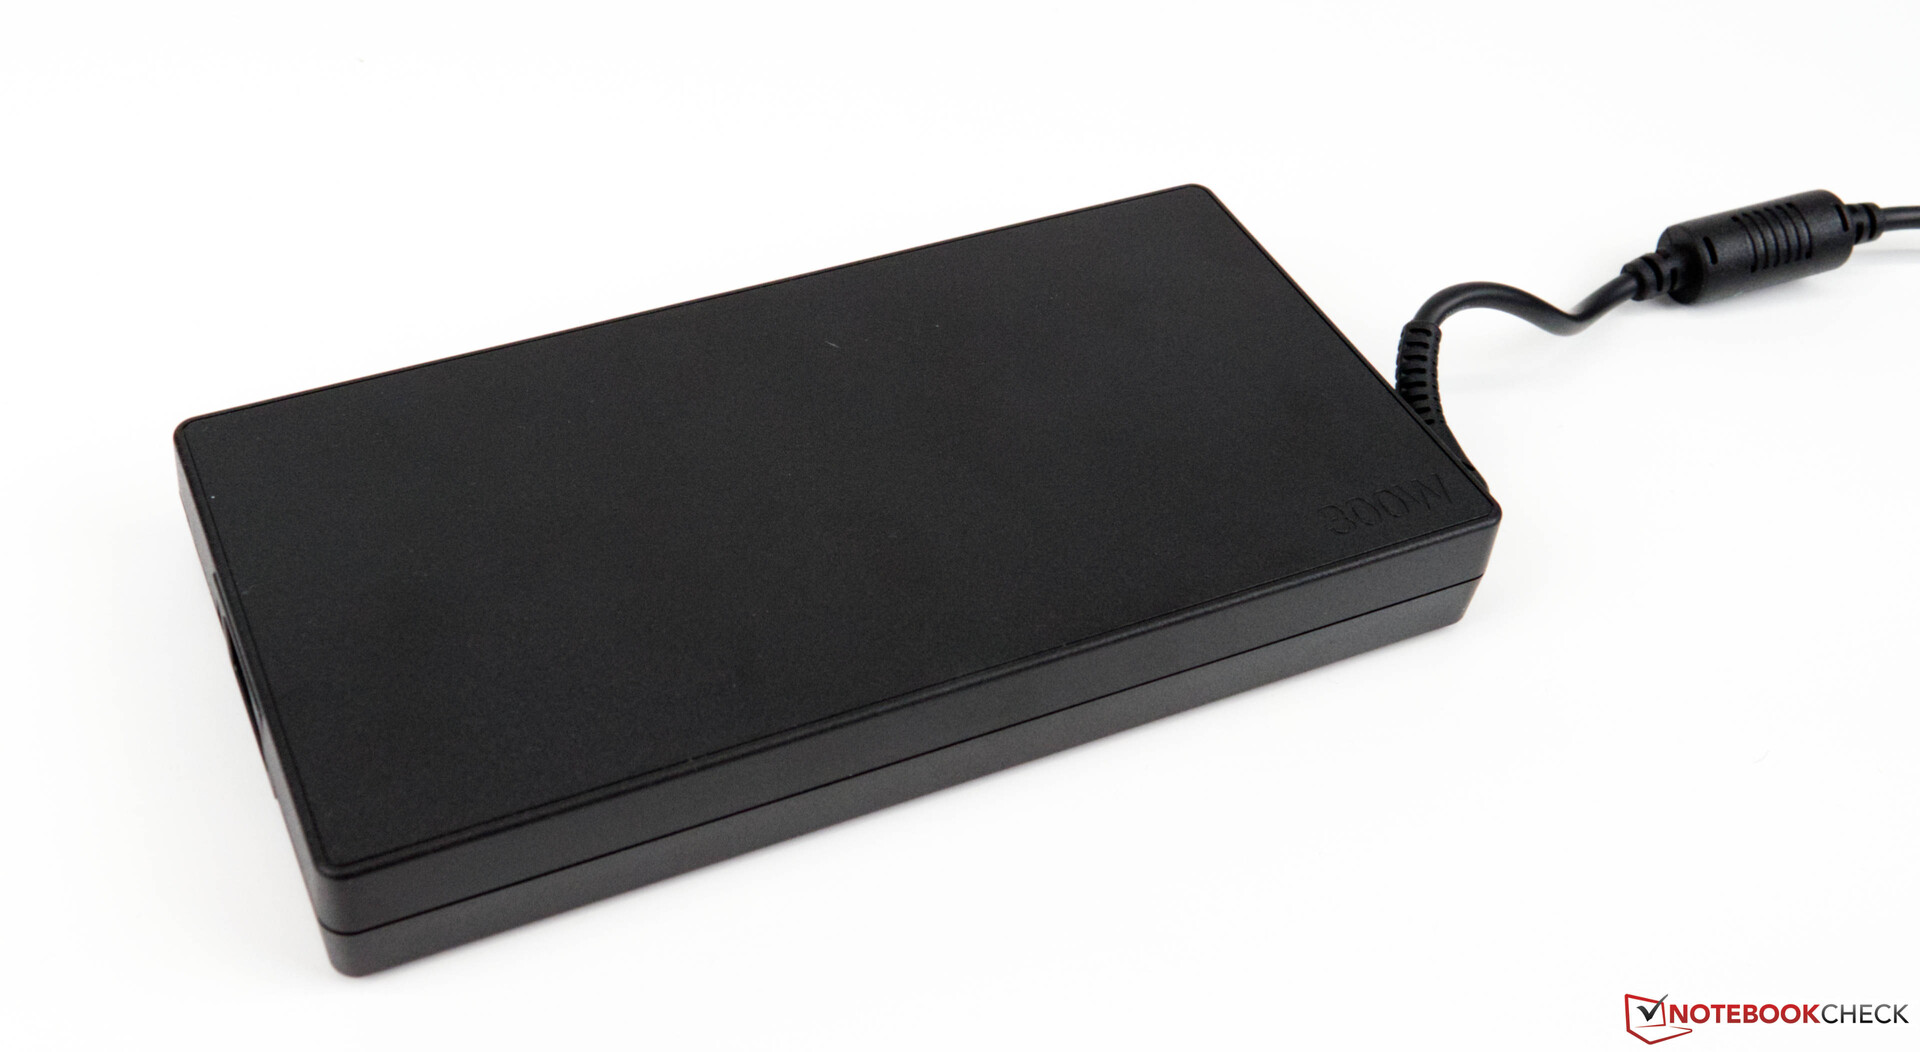
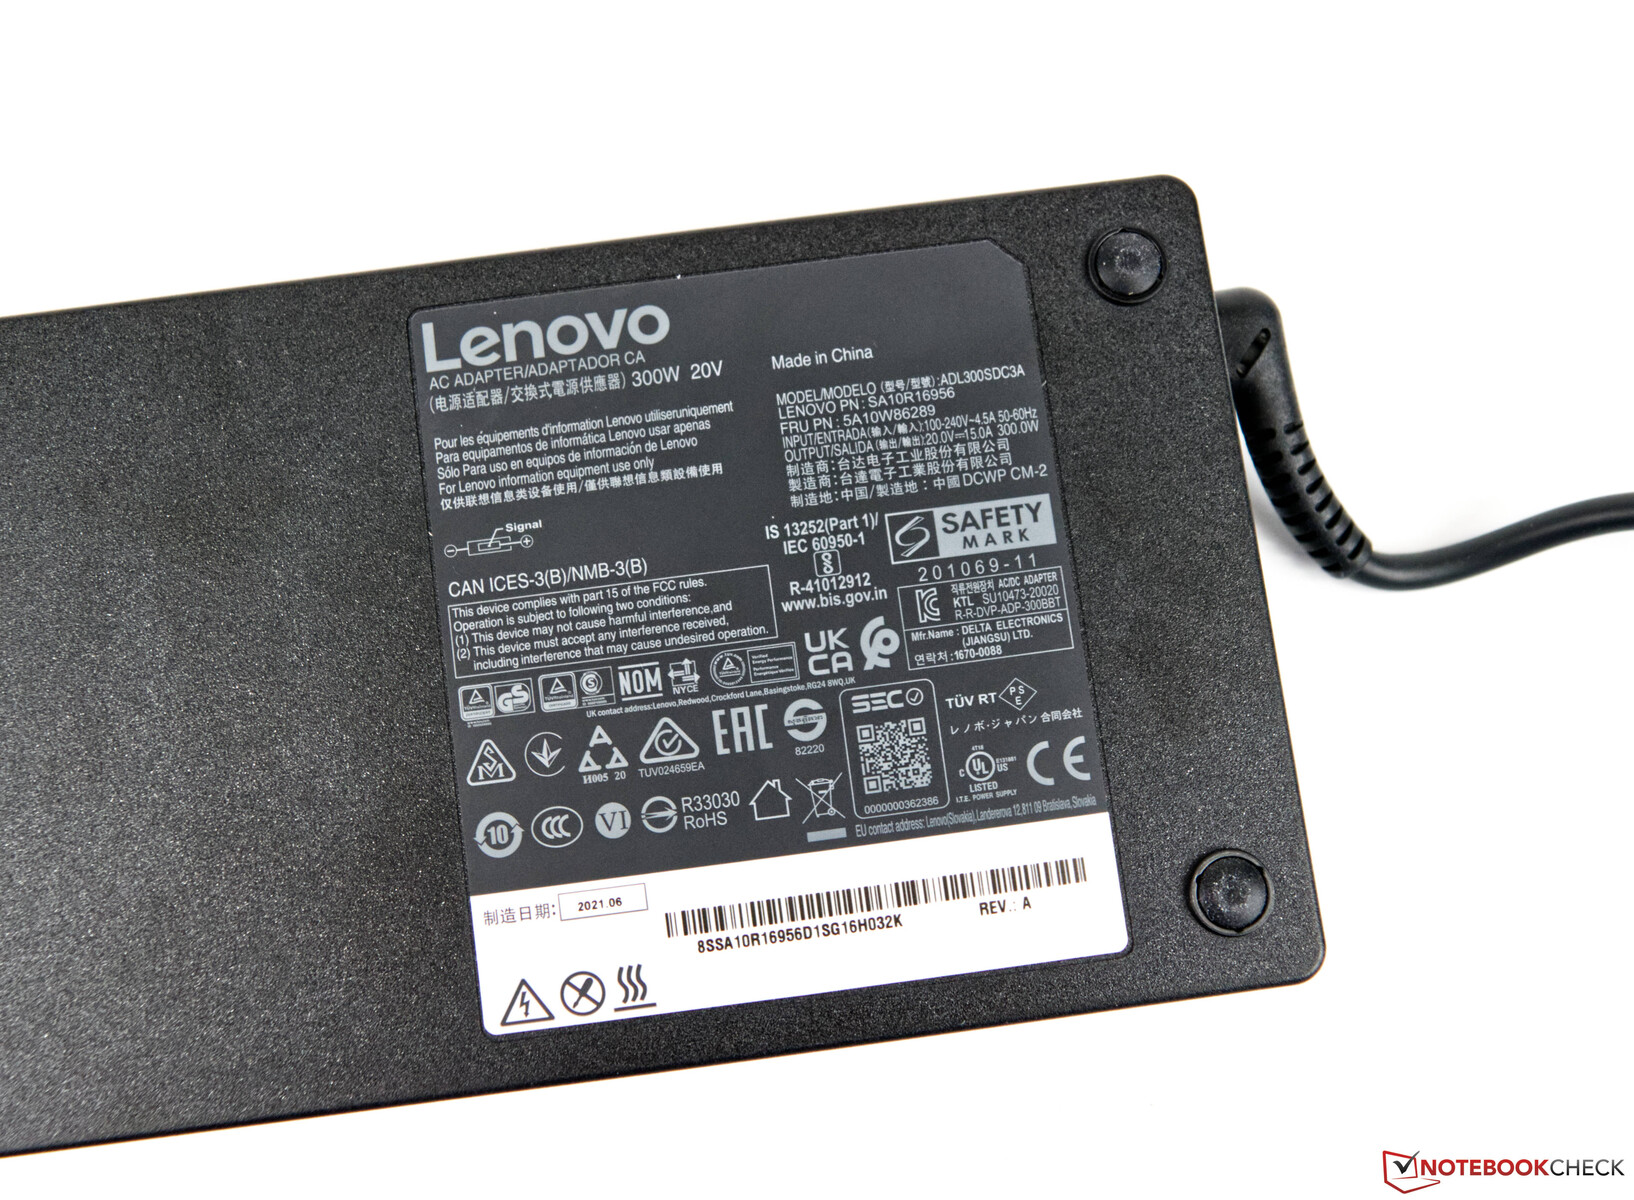
Com 3,1 kg (~6,83 lbs), a Lenovo Legion 5 17 é significativamente mais pesada do que seus concorrentes. Da mesma forma, a pegada da nossa unidade de teste é maior. O adaptador AC de 300 watts, que é fino e potente, pesa pouco mais de um quilograma (~2,2 lbs)
Conectividade
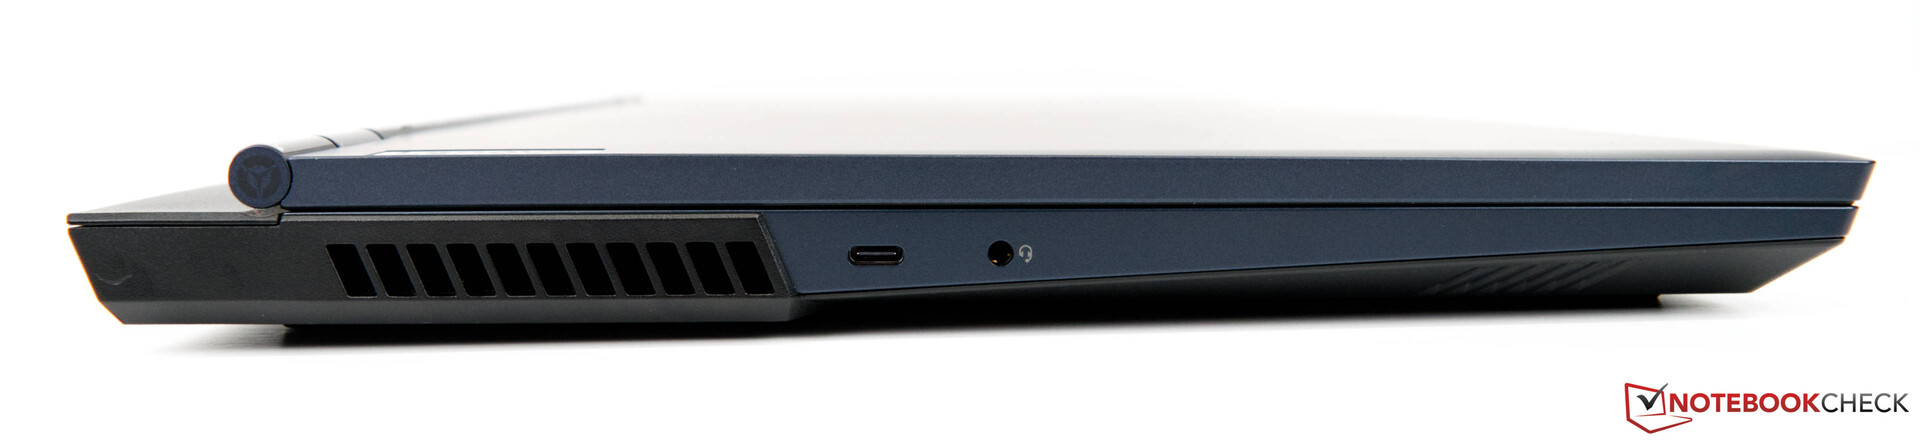
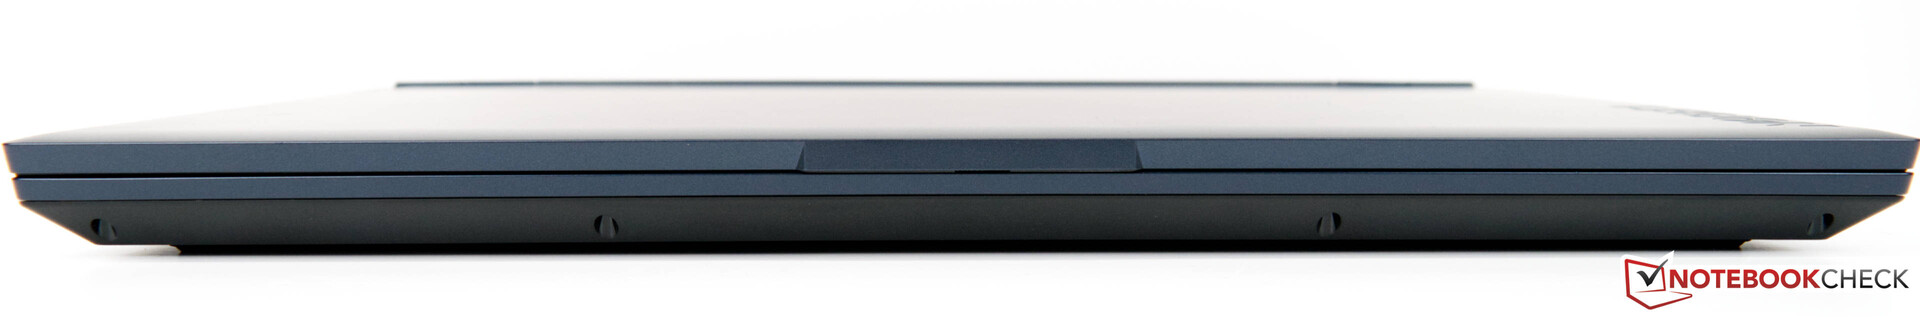
Quando se trata da seleção de portos, a Lenovo Legion 5 17 oferece uma boa variedade de portos e um layout sensato. A maioria dos portos está na parte de trás. Entretanto, ainda há uma porta USB em cada lado e um leitor de cartões SD. Ainda há algum espaço para melhorias, já que o espaço na parte de trás do dispositivo poderia ter sido usado para manter as portas mais afastadas e dar às portas USB, em particular, um pouco mais de espaço para respirar
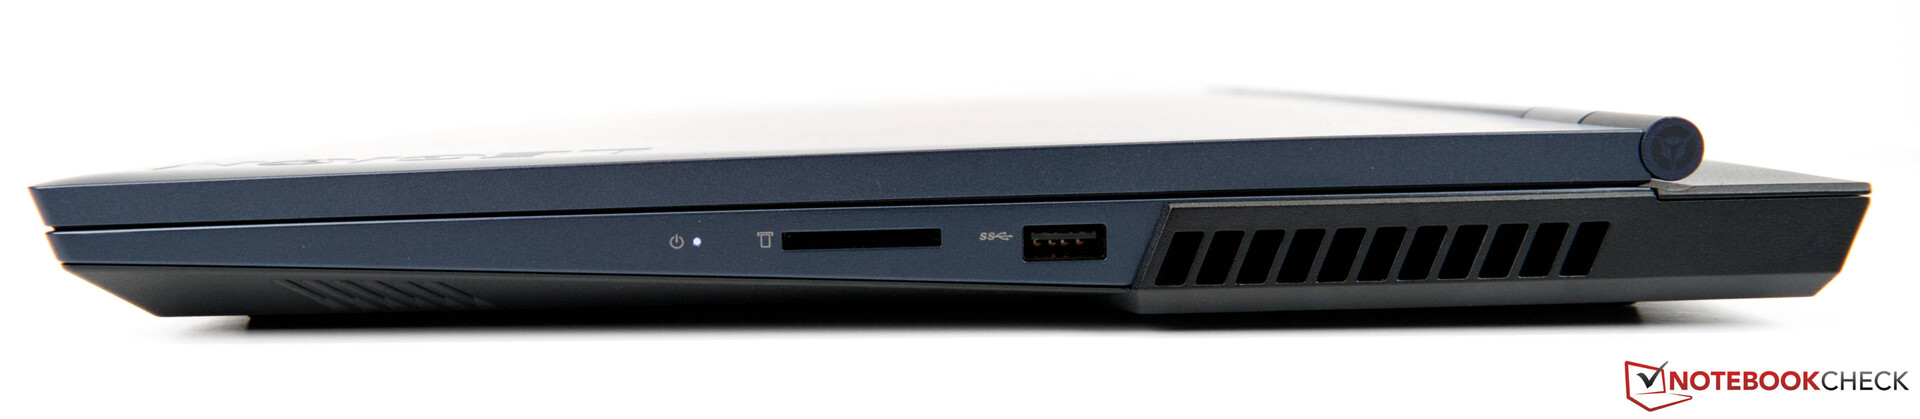
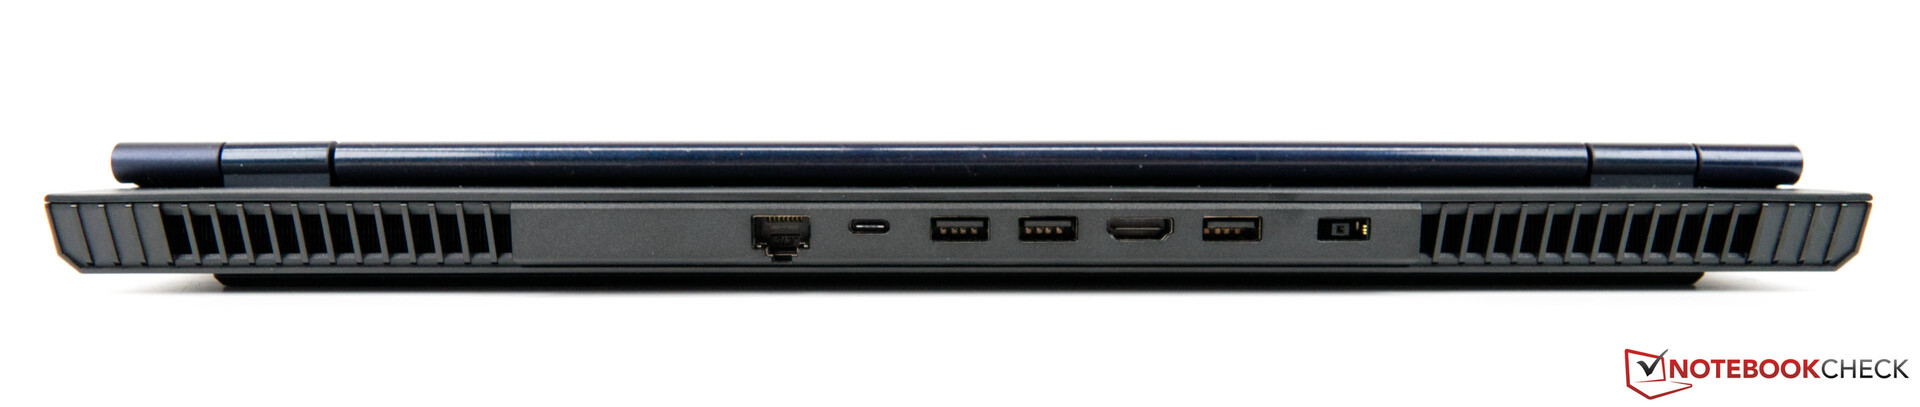
Leitor de cartões SD
Ao contrário da Lenovo Legion Y740-17IRHg, a Lenovo equipou mais uma vez o Legion 5 17 com um leitor de cartões SD de tamanho normal. Ele oferece velocidades USB 3.0 e atinge perto de 90 MB/s durante nossa leitura sequencial de referência. Para este fim, usamos nosso cartão de referência (Angelbird AV Pro V60)
| SD Card Reader | |
| average JPG Copy Test (av. of 3 runs) | |
| Média da turma Gaming (20.9 - 210, n=54, últimos 2 anos) | |
| Lenovo Legion 5 17ACH6H-82JY0003GE (AV Pro SD microSD 128 GB V60) | |
| Schenker XMG Core 17 (Early 2021) (AV PRO microSD 128 GB V60) | |
| maximum AS SSD Seq Read Test (1GB) | |
| Média da turma Gaming (25.5 - 261, n=51, últimos 2 anos) | |
| Lenovo Legion 5 17ACH6H-82JY0003GE (AV Pro SD microSD 128 GB V60) | |
| Schenker XMG Core 17 (Early 2021) (AV PRO microSD 128 GB V60) | |
Comunicação
A Lenovo Legion 5 17 está equipada com um módulo Wi-Fi da Realtek. Em nosso teste, o módulo Wi-Fi funciona suficientemente bem para o uso diário. Em comparação aos concorrentes equipados com módulos Intel rápidos, nossa amostra de teste tem um desempenho significativamente pior. No geral, o desempenho do módulo Wi-Fi da Realtek fica atrás em comparação com a média dos resultados da classe de jogos
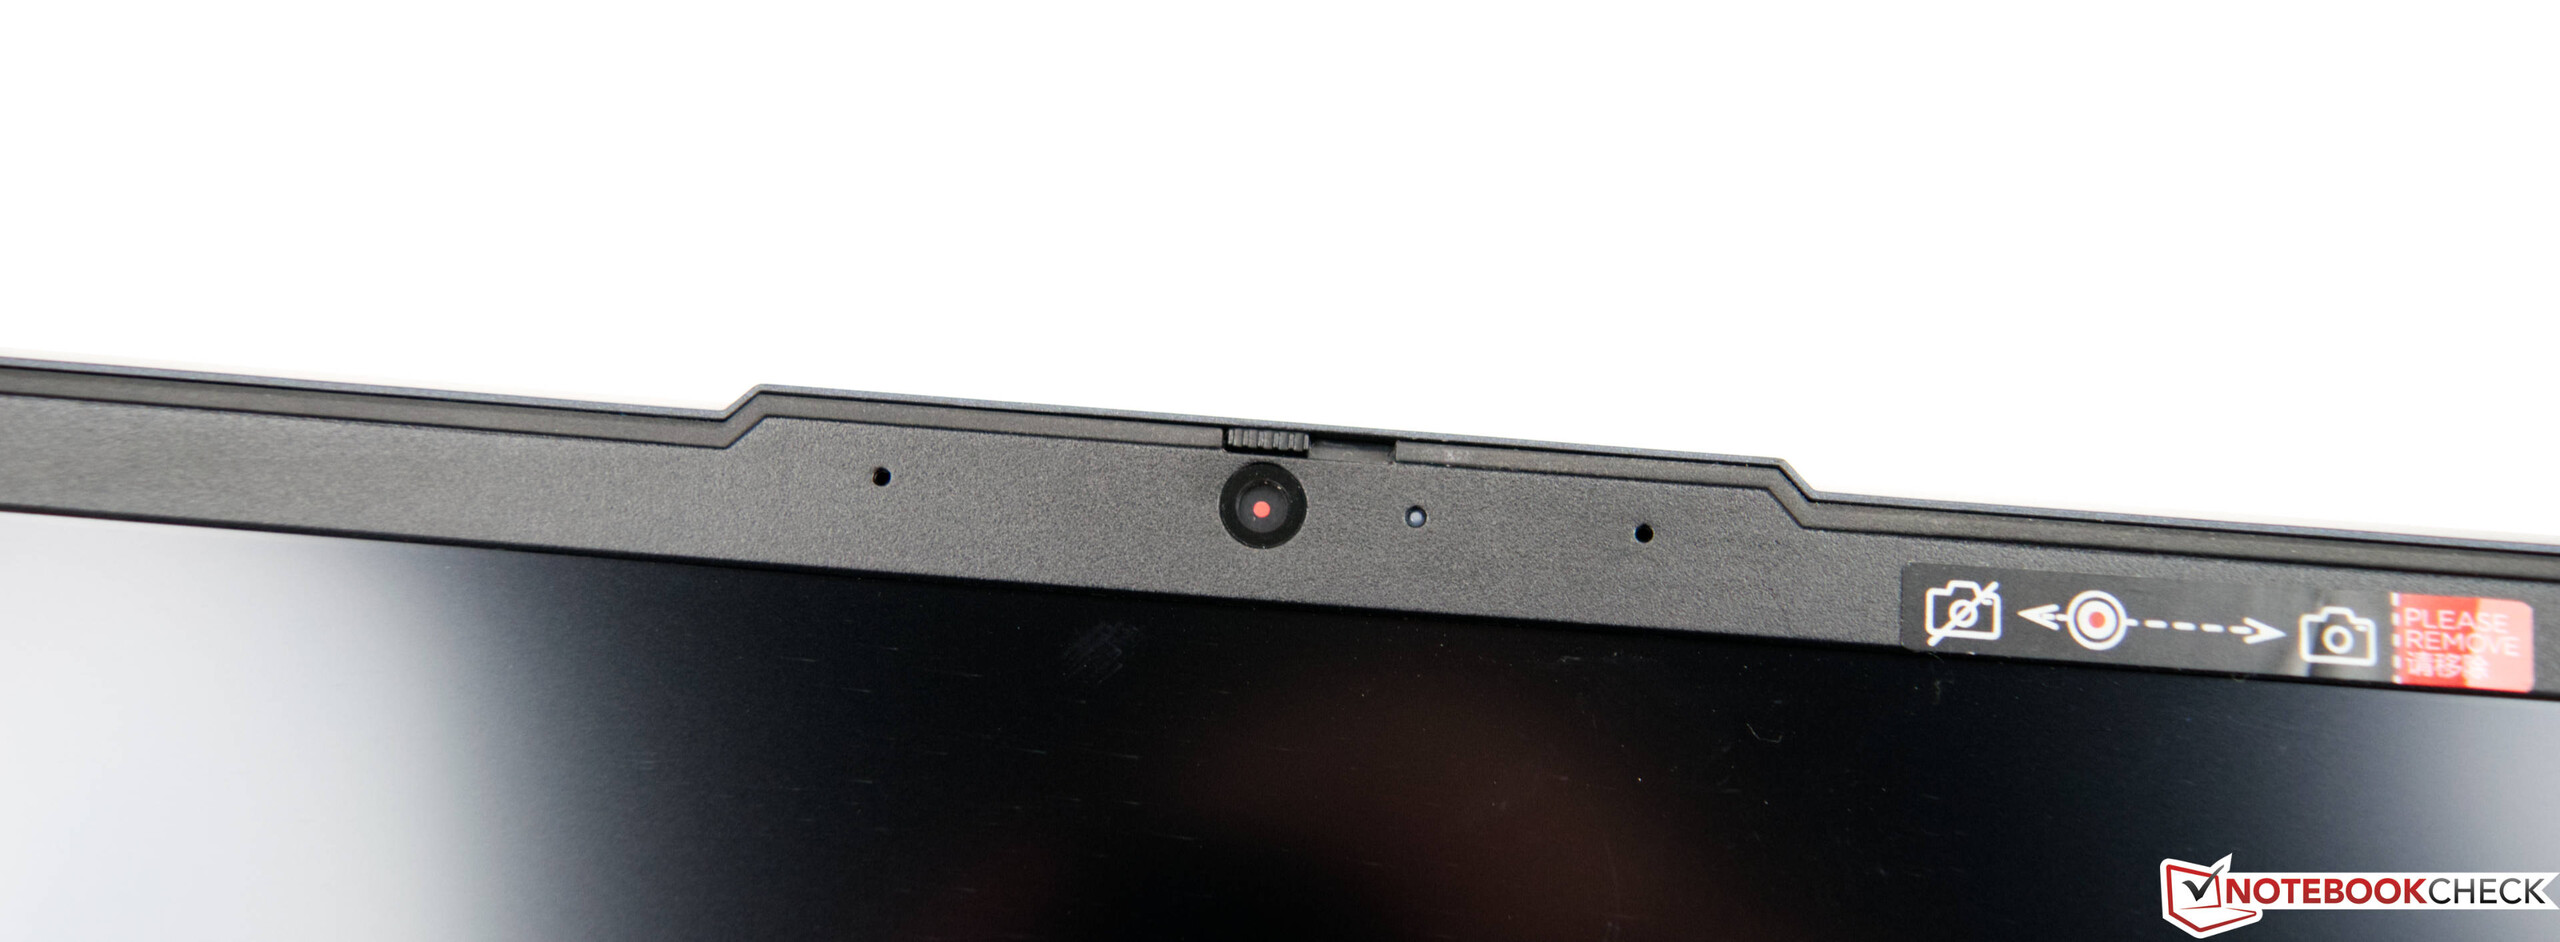
Webcam
Quase não há por aí laptops com boa qualidade de webcam. Conseqüentemente, a Lenovo Legion 5 17 está faltando em termos de precisão de cor e nitidez, como mostram as imagens


Acessórios
O escopo da entrega inclui um adaptador AC de 300 watts que pesa cerca de 1 kg (~2,2 lbs) e alguns panfletos
Mainetenance
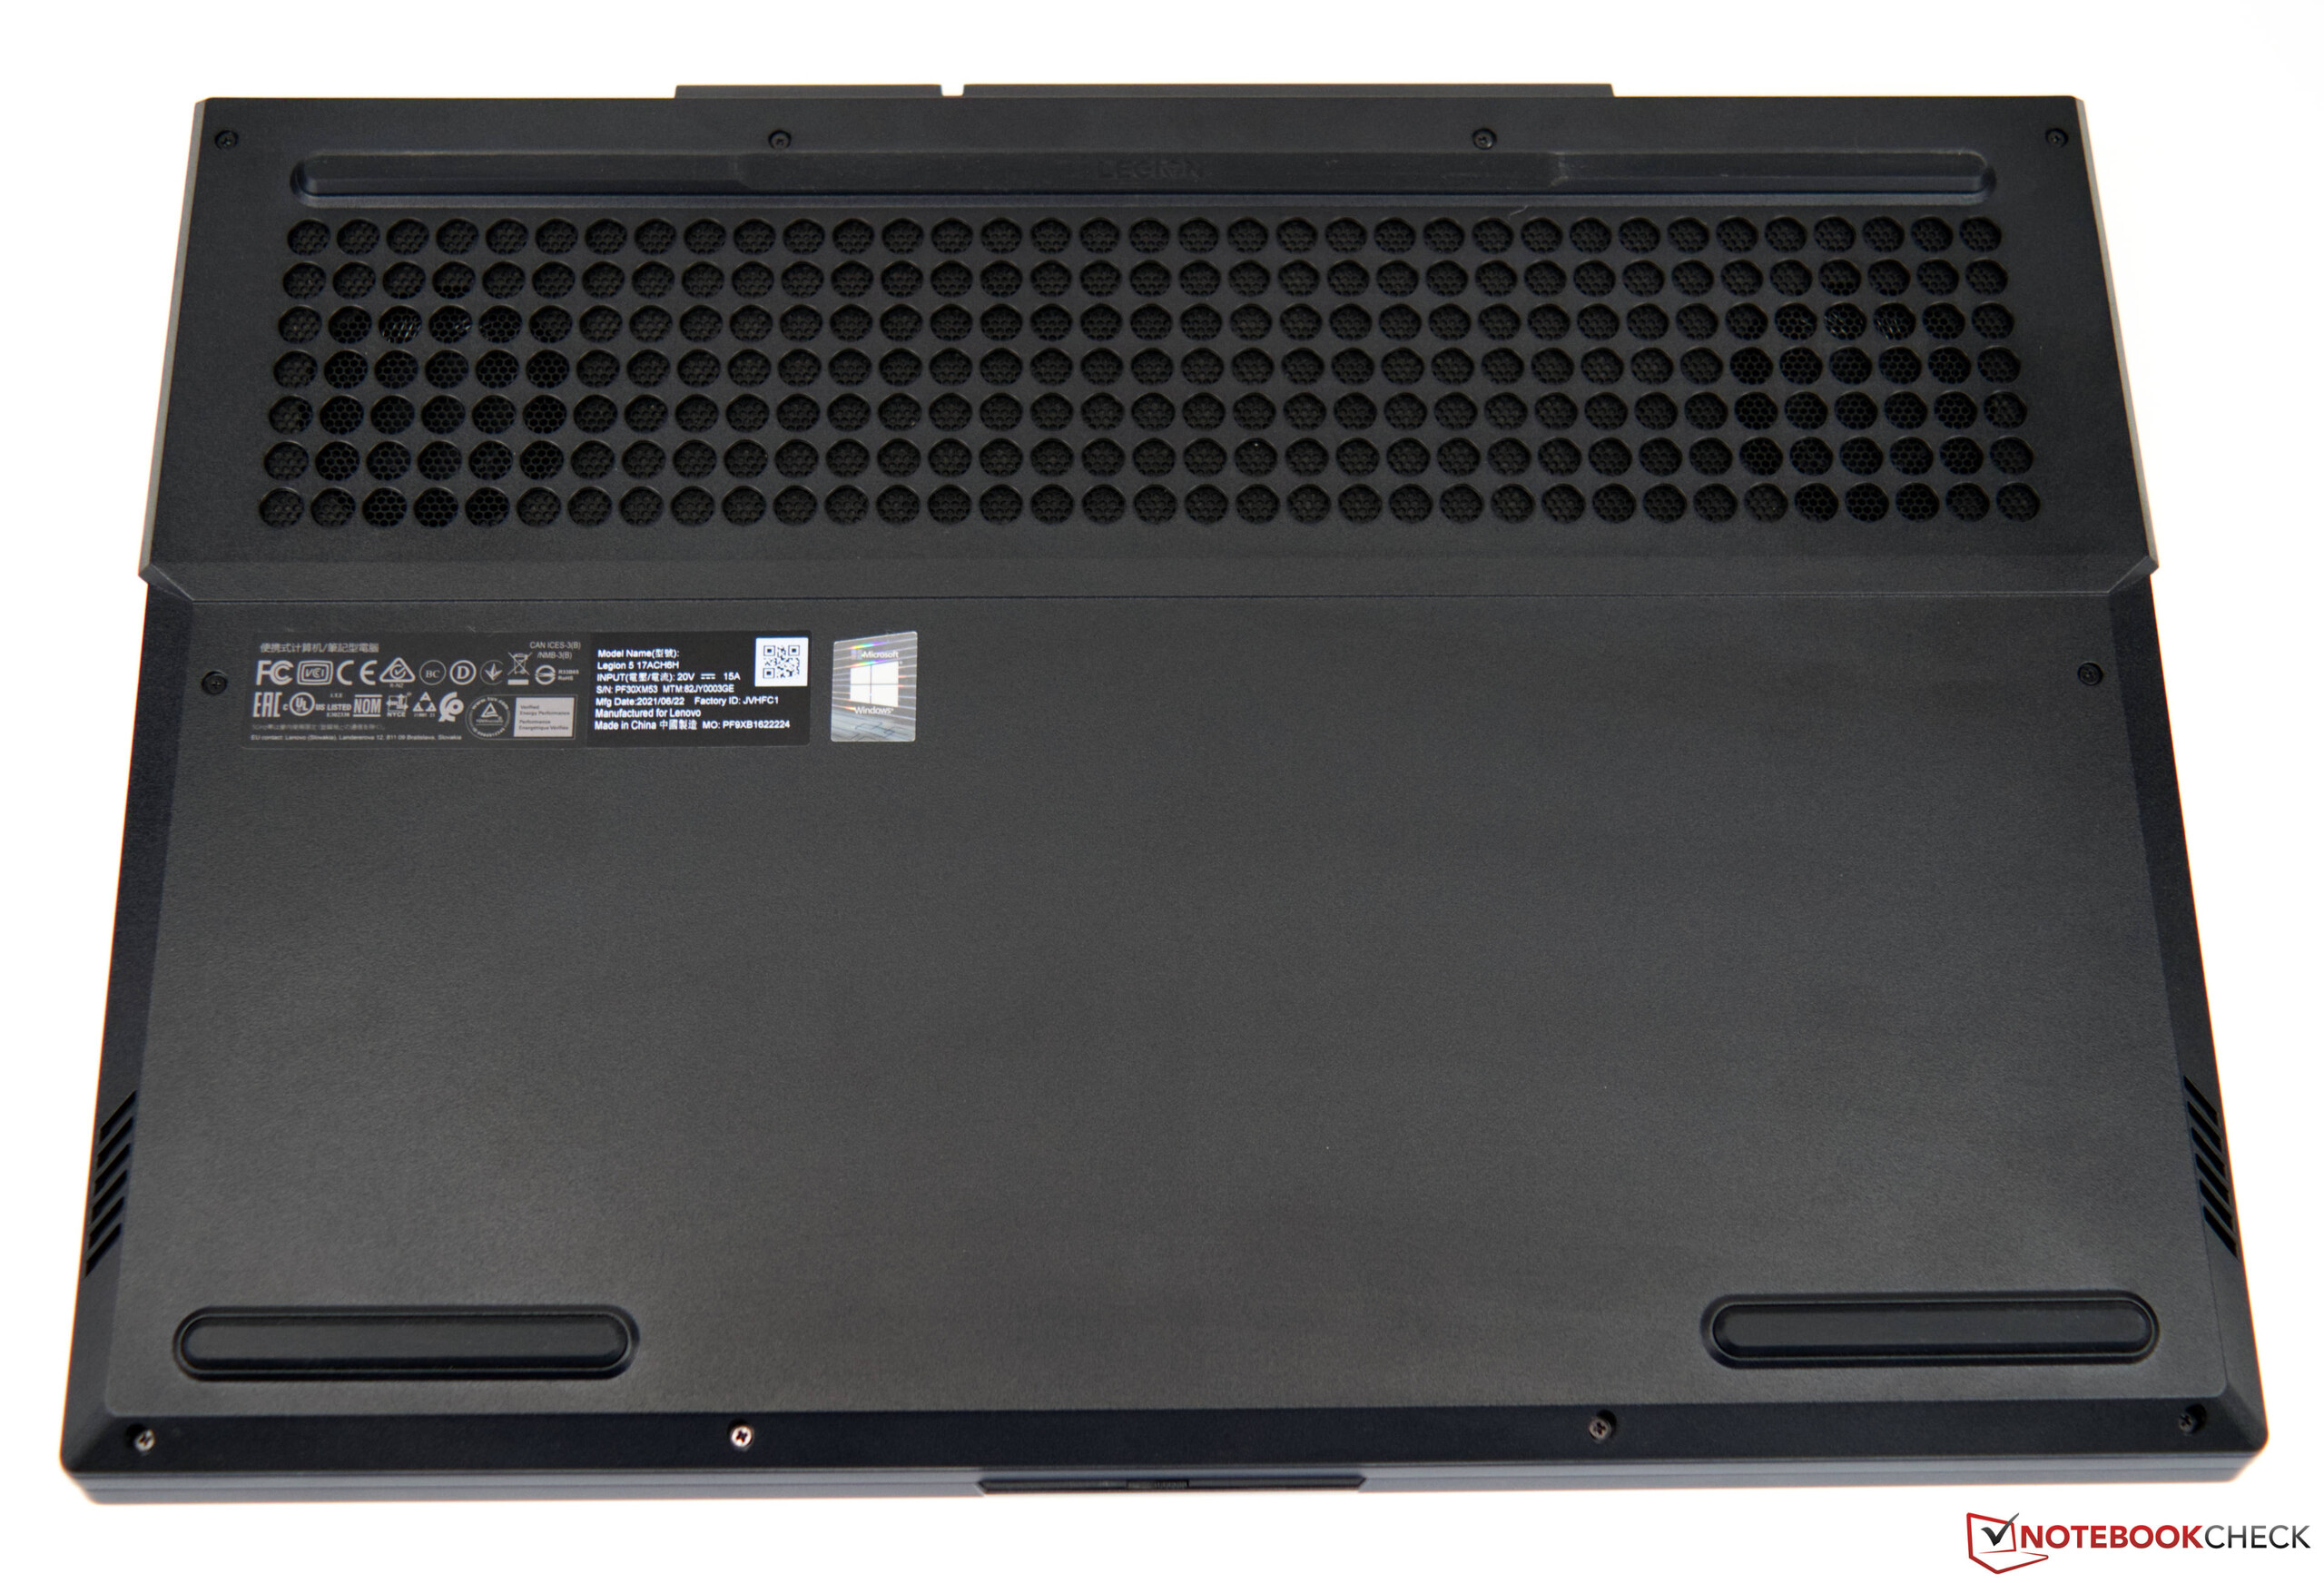
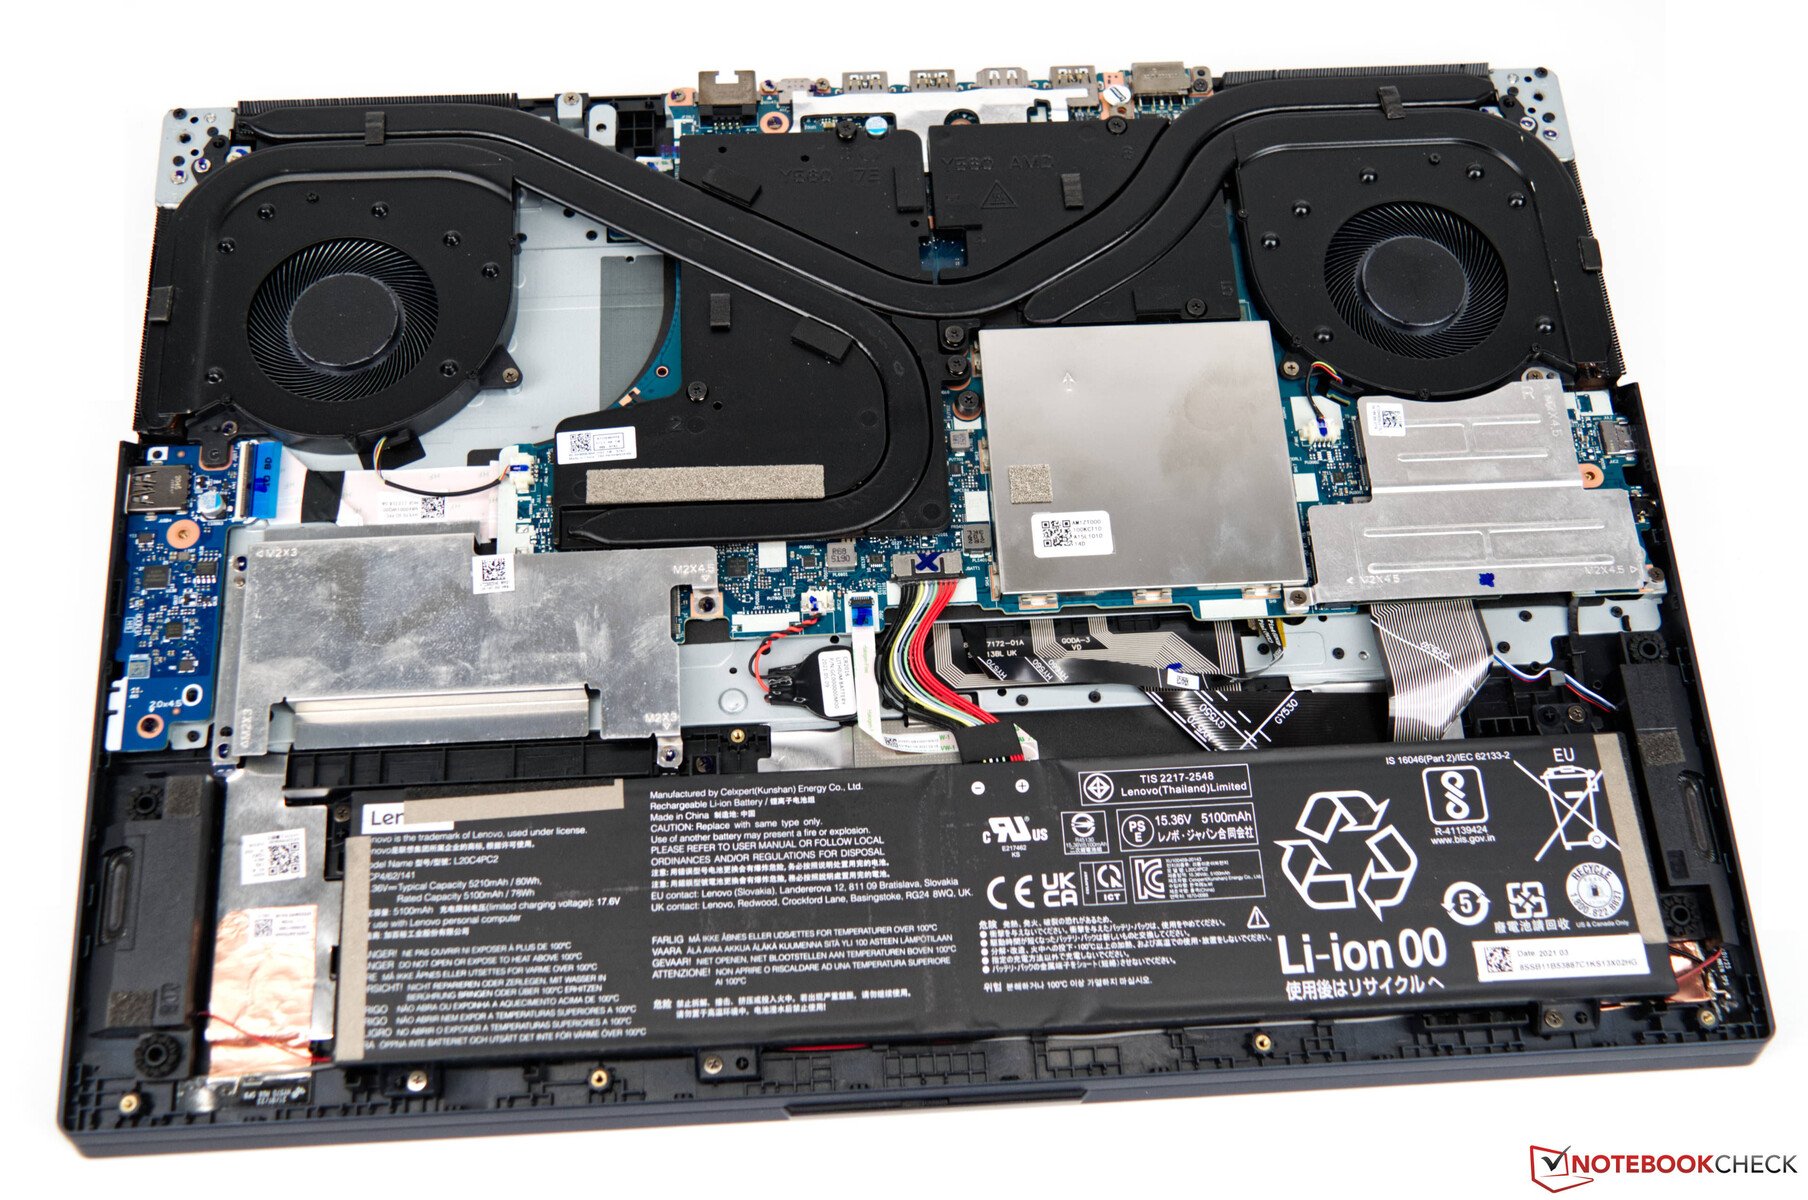
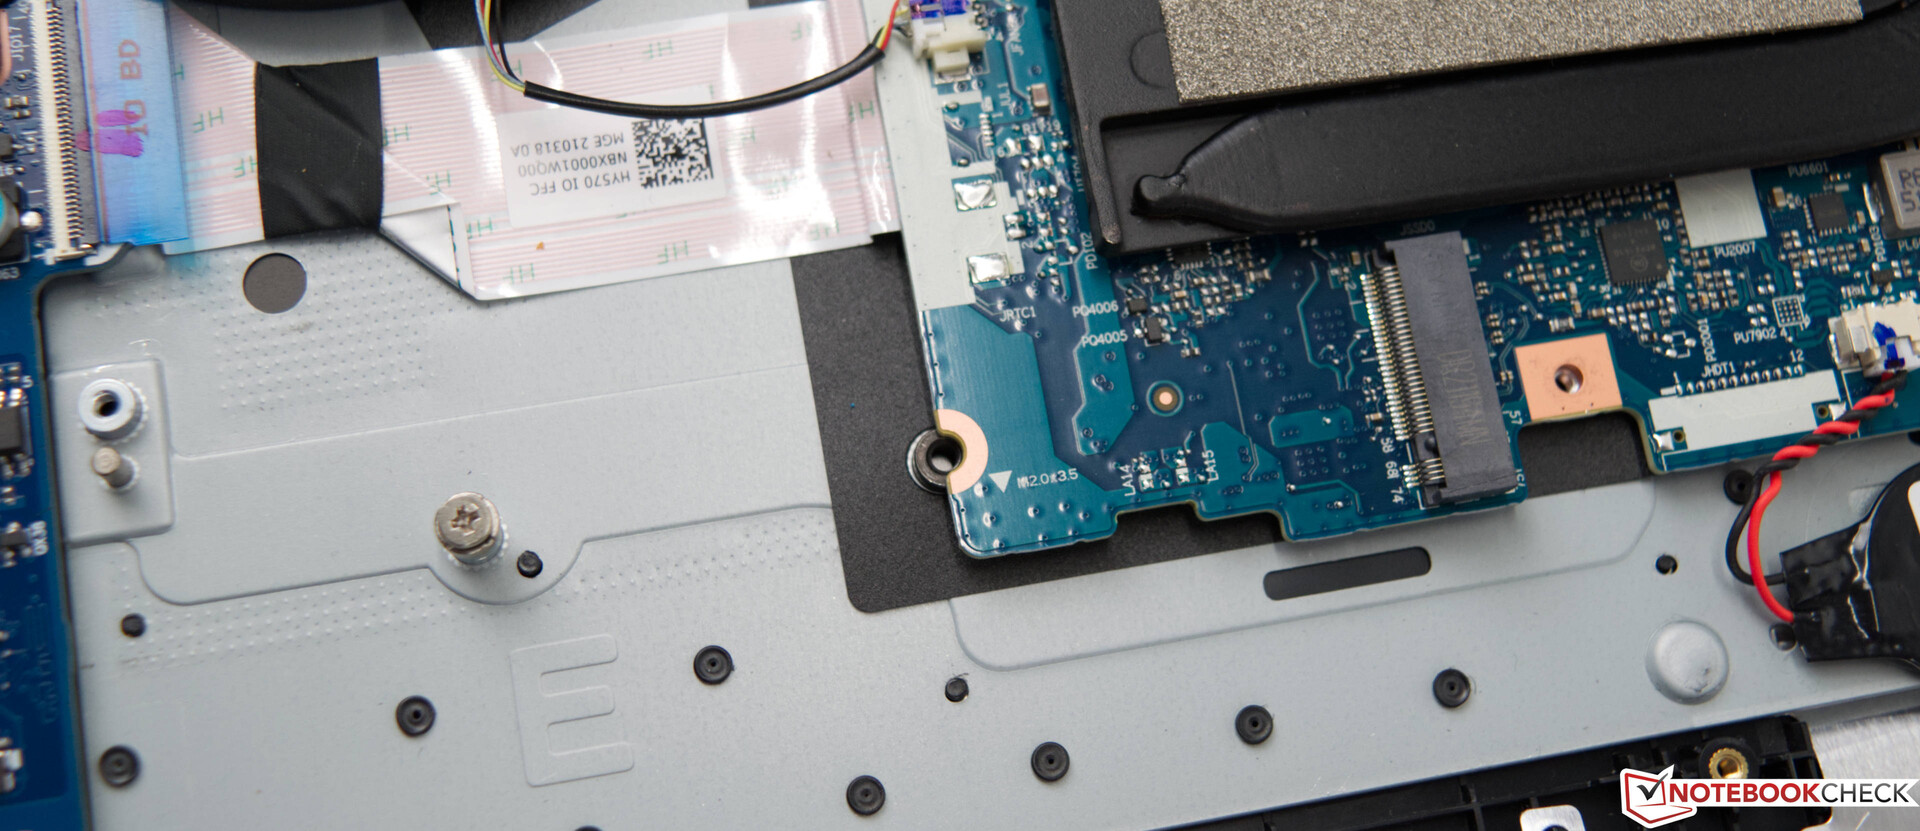
A placa inferior tem que ser removida para que os usuários tenham acesso aos componentes. Recomenda-se o uso de ferramentas apropriadas para evitar danos acidentais ao laptop. Uma tampa adicional protege os dois módulos de RAM e os dois slots SSD. A bateria de 80-Wh e a solução de resfriamento, que consiste em três tubos de calor e dois ventiladores, ocupam a maioridade da sala
Garantia
A Lenovo oferece uma garantia de 1 ano de depósito ou de carry-in com opções de extensão de garantia ao comprar em sua loja on-line
Dispositivos de entrada
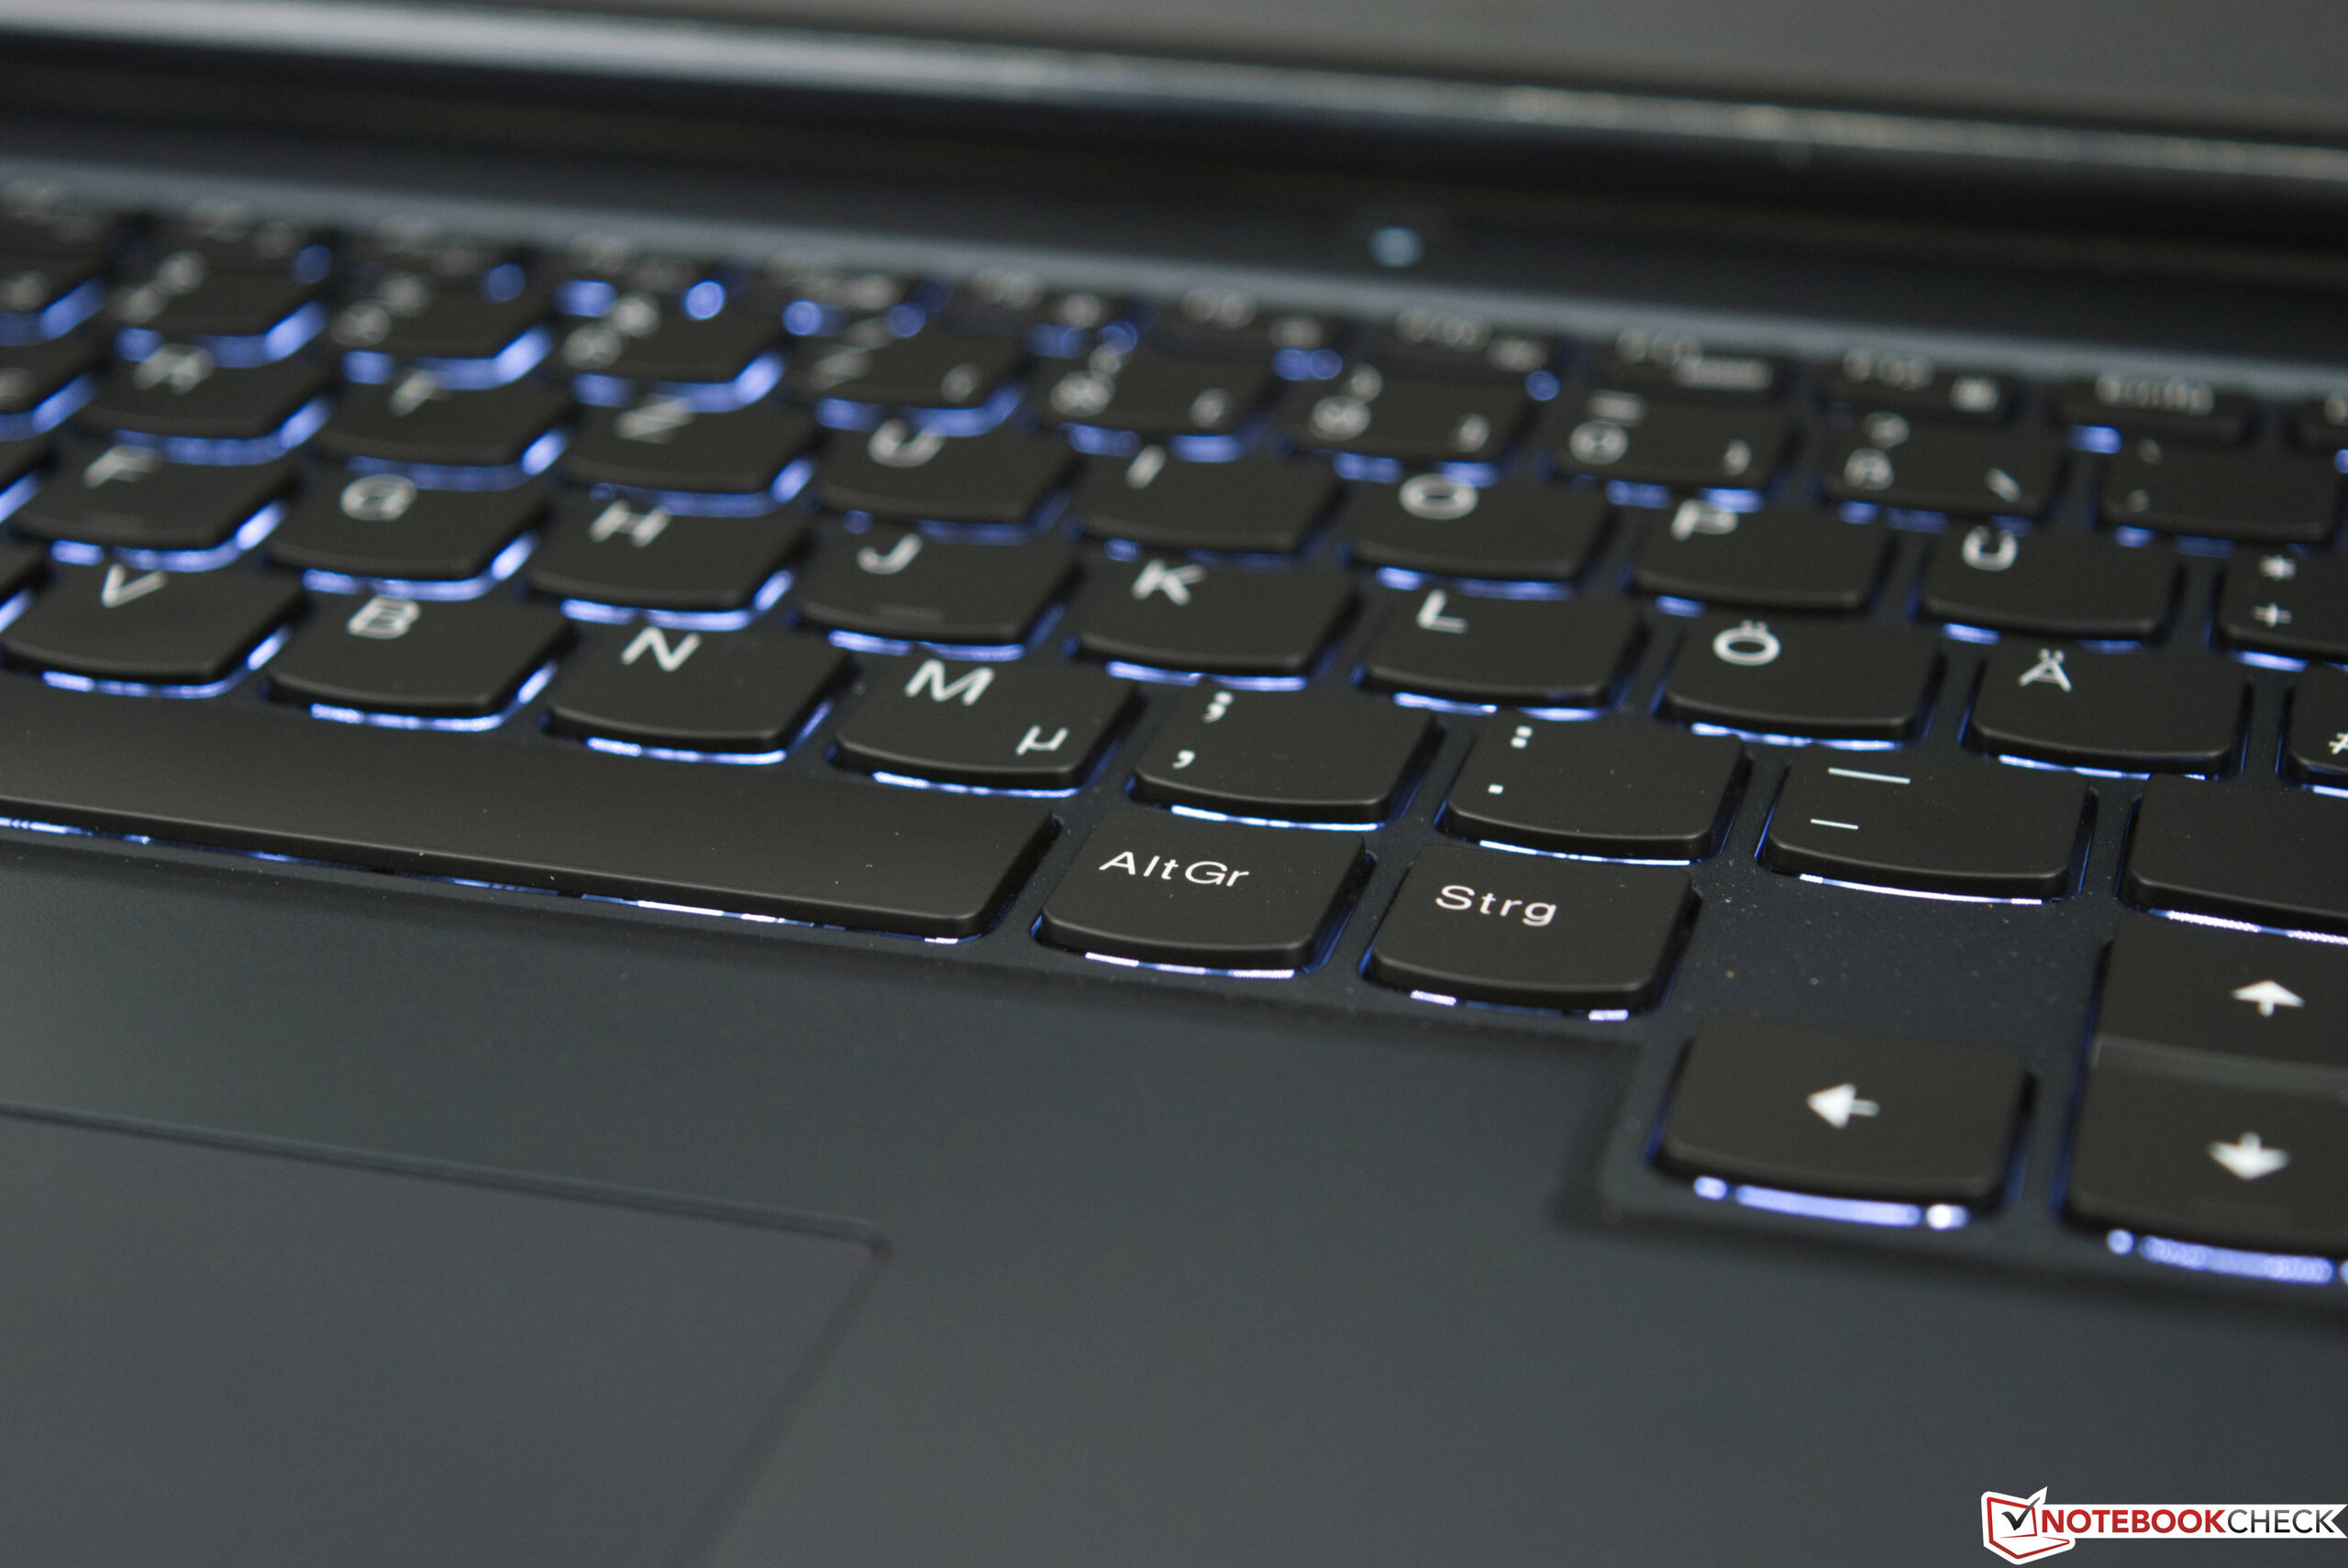
Teclado
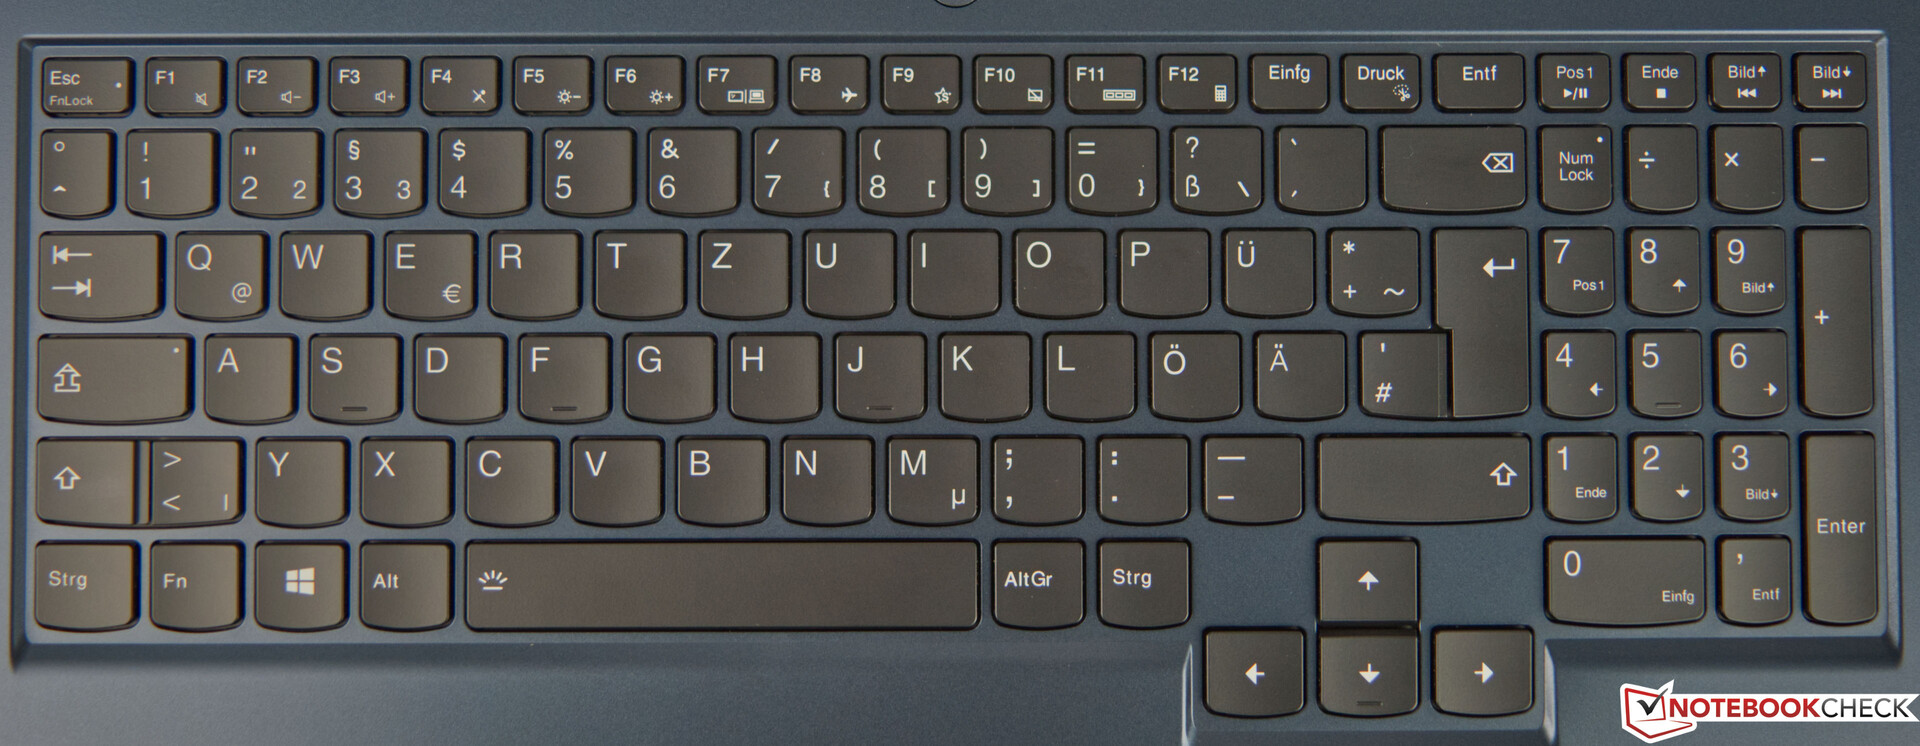
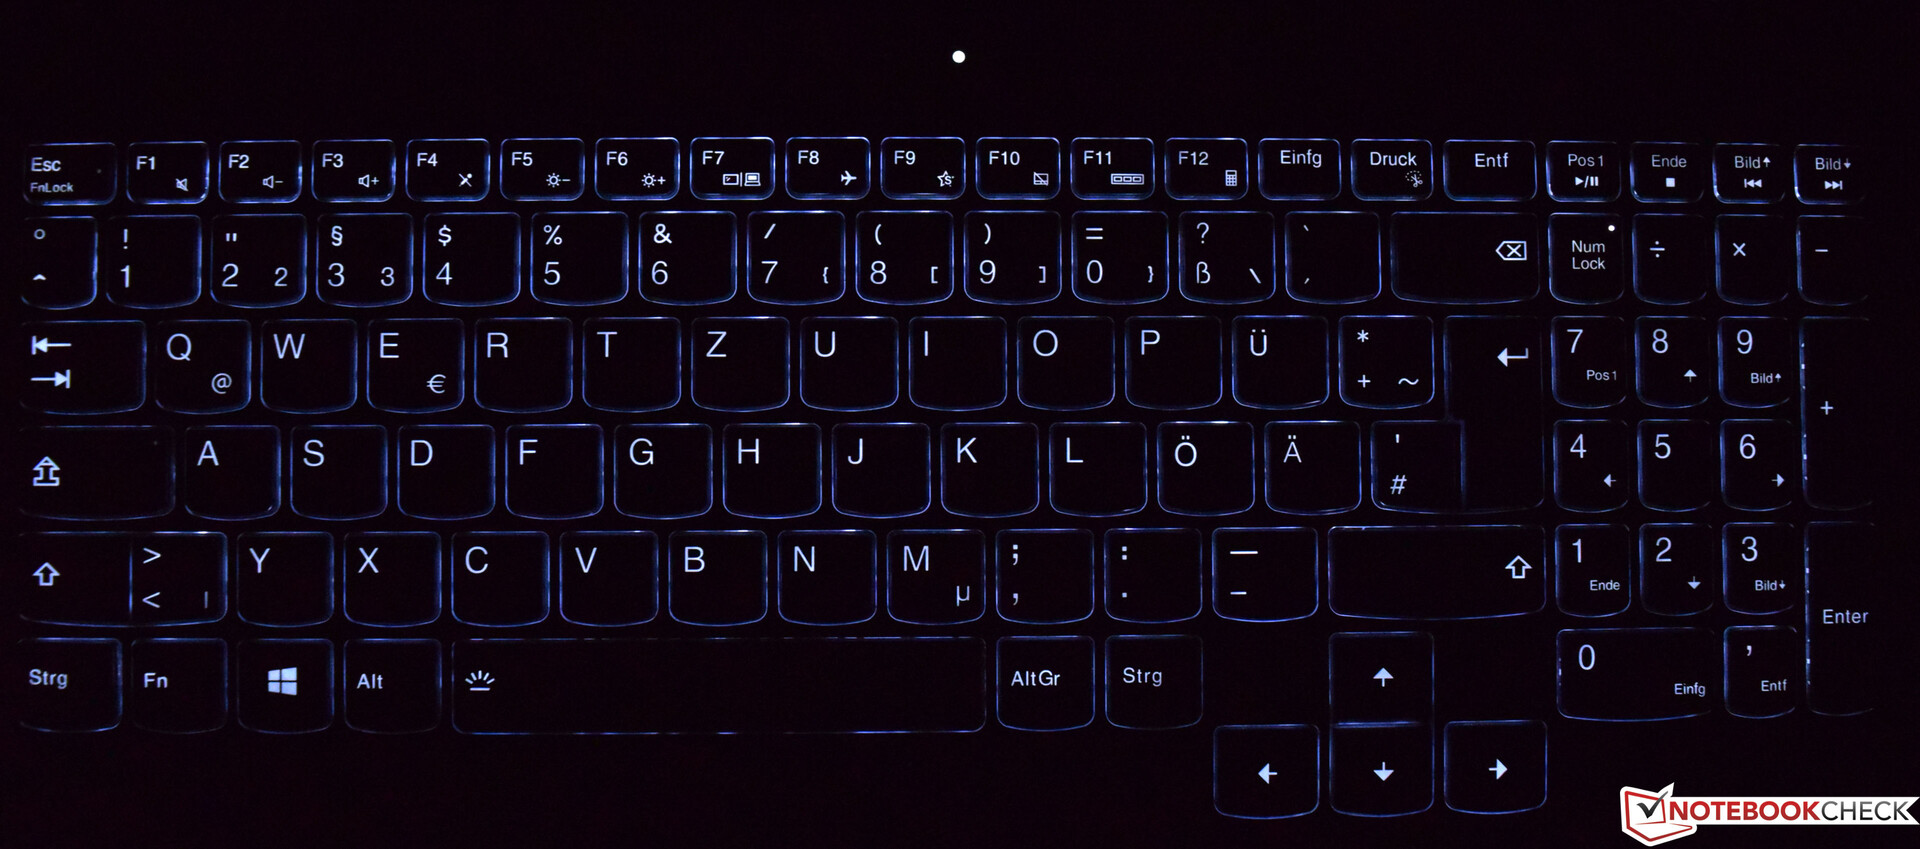
A Lenovo equipa o Legion 5 17 com um teclado chiclet de 6 linhas com luz de fundo sutil e dois níveis de brilho. Se desejar, a retroiluminação também pode ser totalmente desativada. As teclas são suficientemente grandes e as teclas com setas são de tamanho normal. O curso raso de apenas 1,5 mm é acompanhado por um feedback um pouco monótono e um ponto de atuação distinto. Como resultado, as teclas não se sentem esponjosas
Touchpad
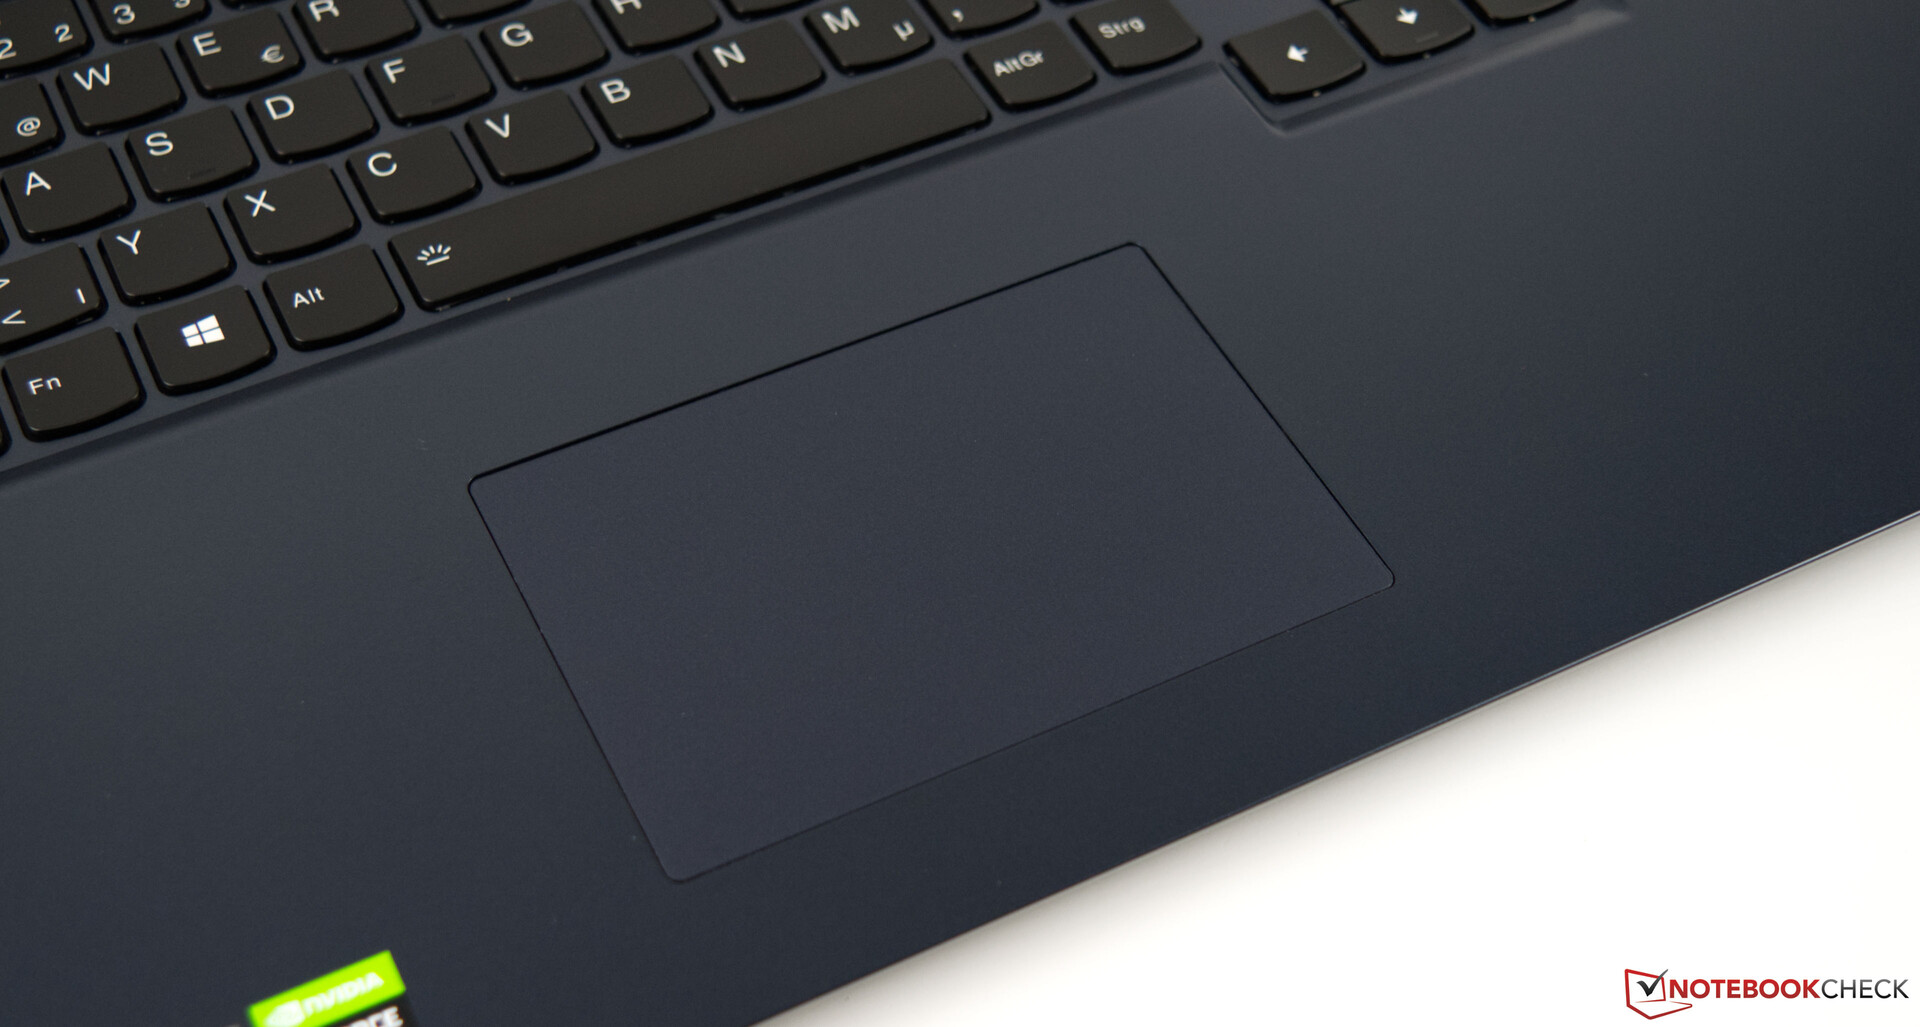
O touchpad integrado ocupa uma área de 7 x 10,5 cm (2,8 x 4,1 pol.) e parece um pouco perdido no grande apoio de palma. A superfície lisa é muito responsiva e responde muito rapidamente às entradas. Não detectamos comportamento inconsistente de nenhuma área do touchpad da nossa unidade de teste. Os dois botões estão localizados na parte inferior e produzem um clique audível distinto quando pressionados. Achamos que a posição do touchpad é um pouco distante demais para a esquerda. Muitas vezes pressionamos acidentalmente o botão direito do mouse ao invés do esquerdo durante o uso diário
Visor - 144 Hz e sem PWM
A Lenovo Legion 5 17 vem com um painel Dolby Vision mate e uma taxa de atualização de 144-Hz. A tela de 17 polegadas tem uma resolução nativa de 1920 x 1080 pixels para uma densidade de 127 PPI. Alternativamente, o Legion 5 17 também está disponível com um painel tradicional de 60-Hz.
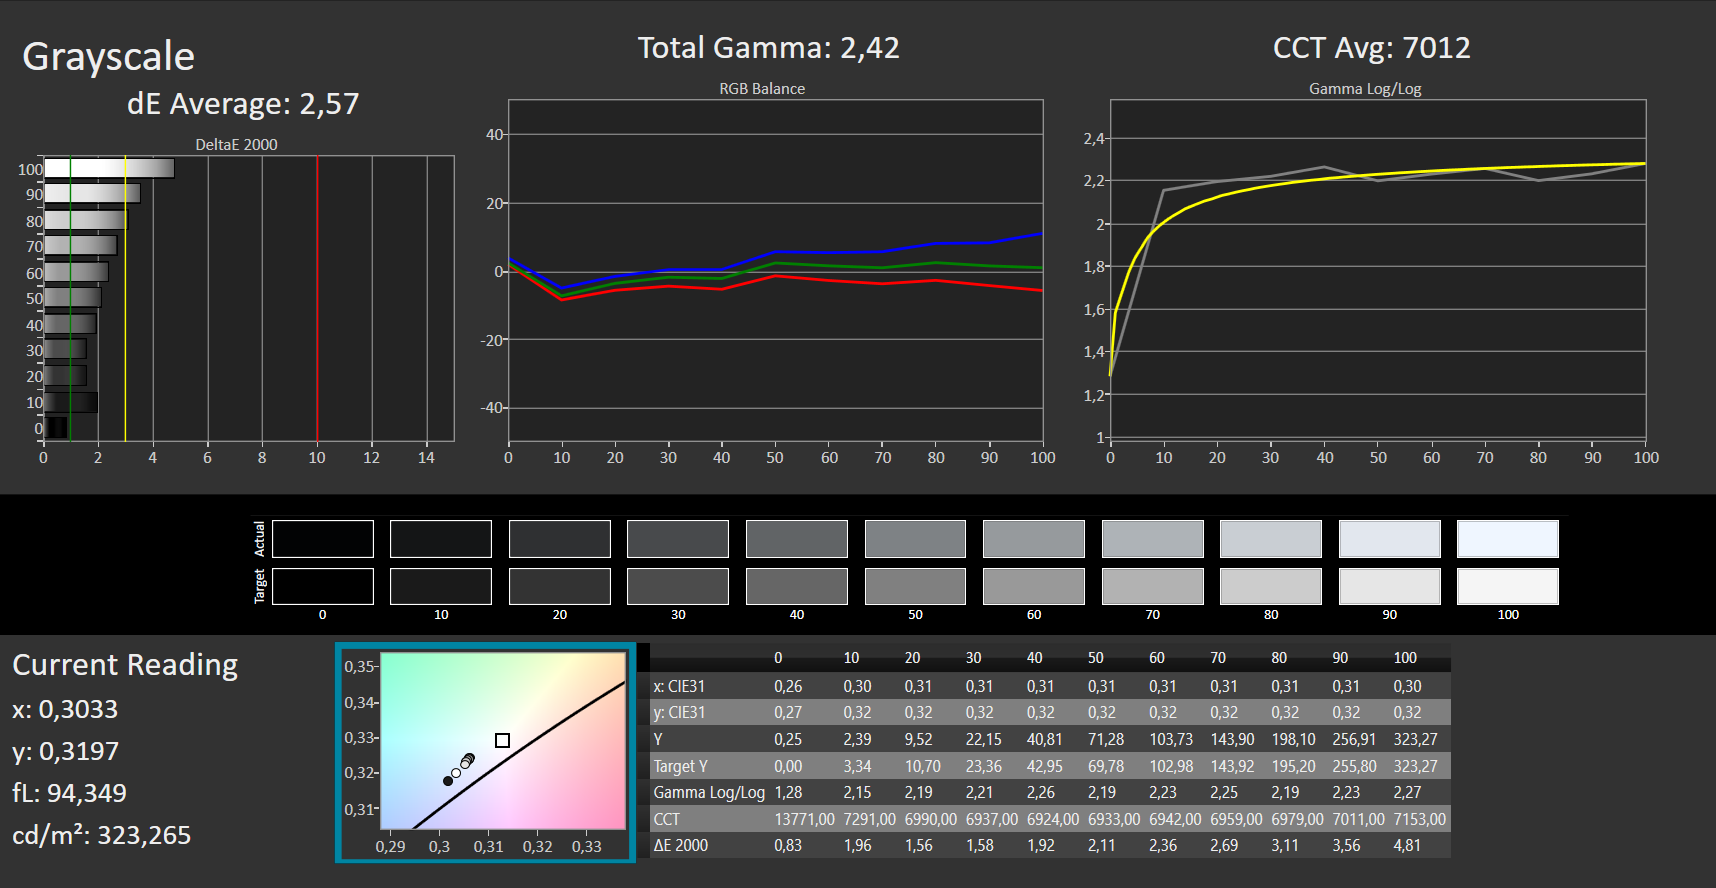
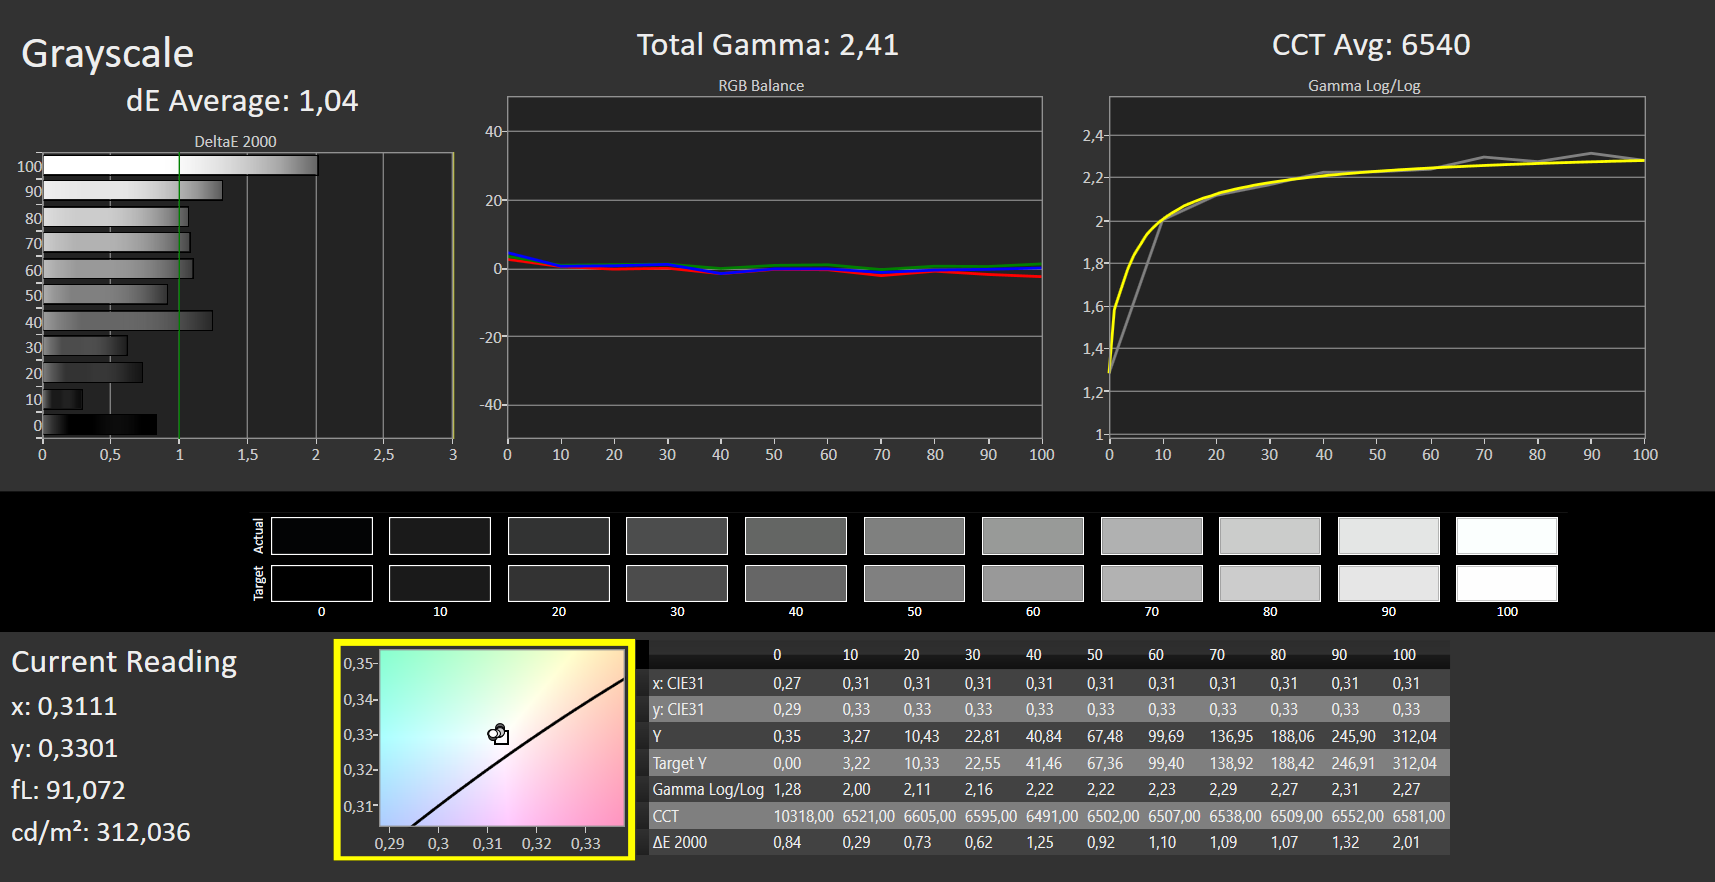
Conseguimos confirmar a luminosidade anunciada do painel com nossas próprias medidas. Com 305 lêndeas, ele só excede ligeiramente o valor prometido (300 lêndeas). A relação de contraste de 1292:1 corresponde às nossas expectativas para um painel IPS. Entretanto, os concorrentes não conseguem acompanhar devido a seus valores negros ligeiramente piores.
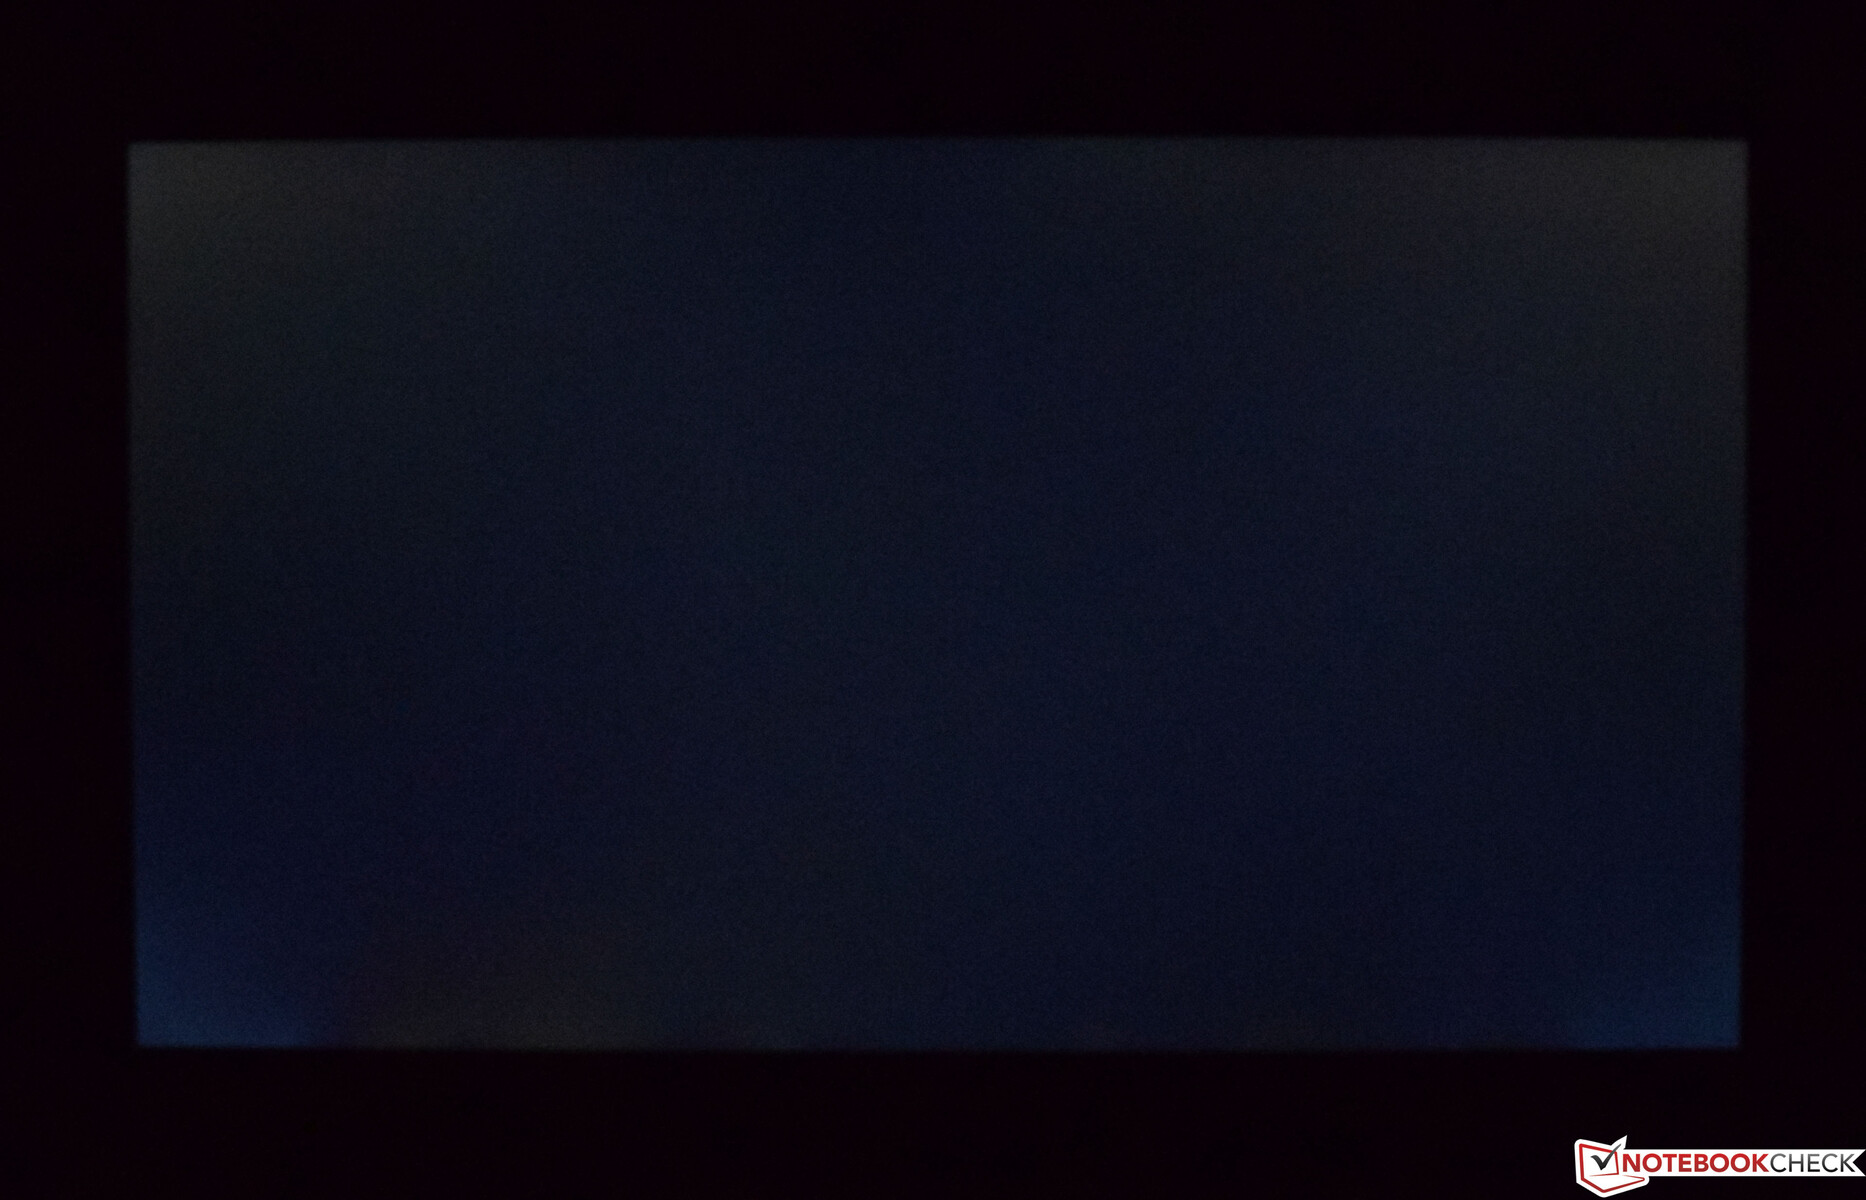
Os usuários da Lenovo Legion 5 17 não terão que se preocupar com a tensão ocular do PWM, pois ele não depende do PWM para controlar o brilho da tela. Infelizmente, nosso dispositivo de teste sofre de sangramento de luz de fundo. Durante as cenas escuras, há um sangramento significativo na tela ao redor das bordas
| |||||||||||||||||||||||||
iluminação: 89 %
iluminação com acumulador: 325 cd/m²
Contraste: 1292:1 (Preto: 0.25 cd/m²)
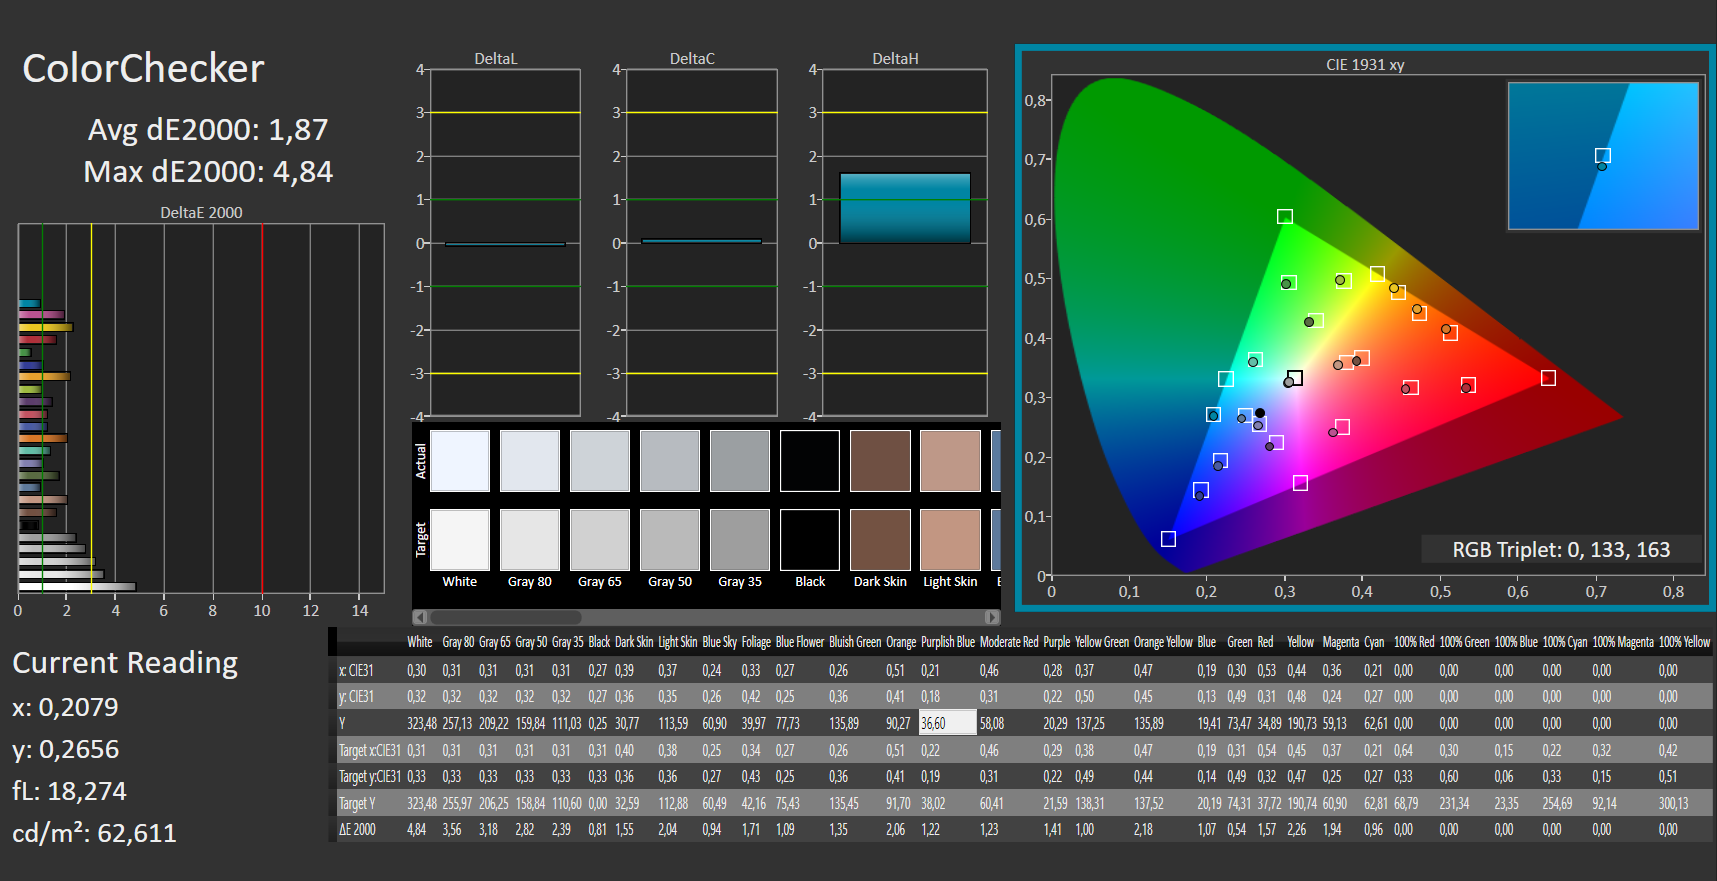
ΔE ColorChecker Calman: 1.87 | ∀{0.5-29.43 Ø4.71}
calibrated: 0.92
ΔE Greyscale Calman: 2.57 | ∀{0.09-98 Ø4.96}
66.7% AdobeRGB 1998 (Argyll 3D)
97.2% sRGB (Argyll 3D)
64.8% Display P3 (Argyll 3D)
Gamma: 2.42
CCT: 7012 K
| Lenovo Legion 5 17ACH6H-82JY0003GE LEN173FHD, IPS, 1920x1080, 17.3" | Schenker XMG Core 17 (Early 2021) BOE CQ NE173QHM-NY2, IPS, 2560x1440, 17.3" | Asus TUF Gaming F17 FX706HM AU Optronics AUI8294 (B173HAN04.9), IPS, 1920x1080, 17.3" | MSI Katana GF76 11UE AU Optronics B173HAN04.9, IPS, 1920x1080, 17.3" | Schenker XMG Apex 17 M21 LG Philips LP173WFG-SPB3, IPS, 1920x1080, 17.3" | Gigabyte A7 X1 AU Optronics AUO8E8D, IPS, 1920x1080, 17.3" | |
|---|---|---|---|---|---|---|
| Display | 3% | -38% | -39% | -1% | -5% | |
| Display P3 Coverage (%) | 64.8 | 68.1 5% | 40.1 -38% | 39.8 -39% | 65 0% | 61.5 -5% |
| sRGB Coverage (%) | 97.2 | 98.5 1% | 60 -38% | 59.5 -39% | 95.9 -1% | 90.9 -6% |
| AdobeRGB 1998 Coverage (%) | 66.7 | 69.3 4% | 41.4 -38% | 41.12 -38% | 65.8 -1% | 63.2 -5% |
| Response Times | -12% | -133% | -167% | -9% | -14% | |
| Response Time Grey 50% / Grey 80% * (ms) | 15 ? | 16.8 ? -12% | 32.4 -116% | 36.8 ? -145% | 15.2 ? -1% | 16 ? -7% |
| Response Time Black / White * (ms) | 9 ? | 10 ? -11% | 22.4 -149% | 26 ? -189% | 10.4 ? -16% | 10.8 ? -20% |
| PWM Frequency (Hz) | ||||||
| Screen | -24% | -61% | -85% | -30% | -50% | |
| Brightness middle (cd/m²) | 323 | 370 15% | 266 -18% | 260 -20% | 292 -10% | 325 1% |
| Brightness (cd/m²) | 305 | 333 9% | 264 -13% | 251 -18% | 285 -7% | 318 4% |
| Brightness Distribution (%) | 89 | 84 -6% | 79 -11% | 85 -4% | 94 6% | 95 7% |
| Black Level * (cd/m²) | 0.25 | 0.38 -52% | 0.32 -28% | 0.26 -4% | 0.355 -42% | 0.29 -16% |
| Contrast (:1) | 1292 | 974 -25% | 831 -36% | 1000 -23% | 823 -36% | 1121 -13% |
| Colorchecker dE 2000 * | 1.87 | 2.41 -29% | 3.97 -112% | 3.9 -109% | 2.47 -32% | 4.33 -132% |
| Colorchecker dE 2000 max. * | 4.84 | 7.32 -51% | 8.93 -85% | 20.64 -326% | 8.69 -80% | 8.6 -78% |
| Colorchecker dE 2000 calibrated * | 0.92 | 1.19 -29% | 3.5 -280% | 3.71 -303% | 0.96 -4% | 1.95 -112% |
| Greyscale dE 2000 * | 2.57 | 3.9 -52% | 1.8 30% | 1.6 38% | 4.3 -67% | 5.5 -114% |
| Gamma | 2.42 91% | 2.287 96% | 2.31 95% | 2.068 106% | 2.298 96% | 2.142 103% |
| CCT | 7012 93% | 7302 89% | 6754 96% | 6511 100% | 7000 93% | 7893 82% |
| Color Space (Percent of AdobeRGB 1998) (%) | 69 | 41.4 | ||||
| Color Space (Percent of sRGB) (%) | 93 | 60 | ||||
| Média Total (Programa/Configurações) | -11% /
-17% | -77% /
-67% | -97% /
-87% | -13% /
-21% | -23% /
-35% |
* ... menor é melhor
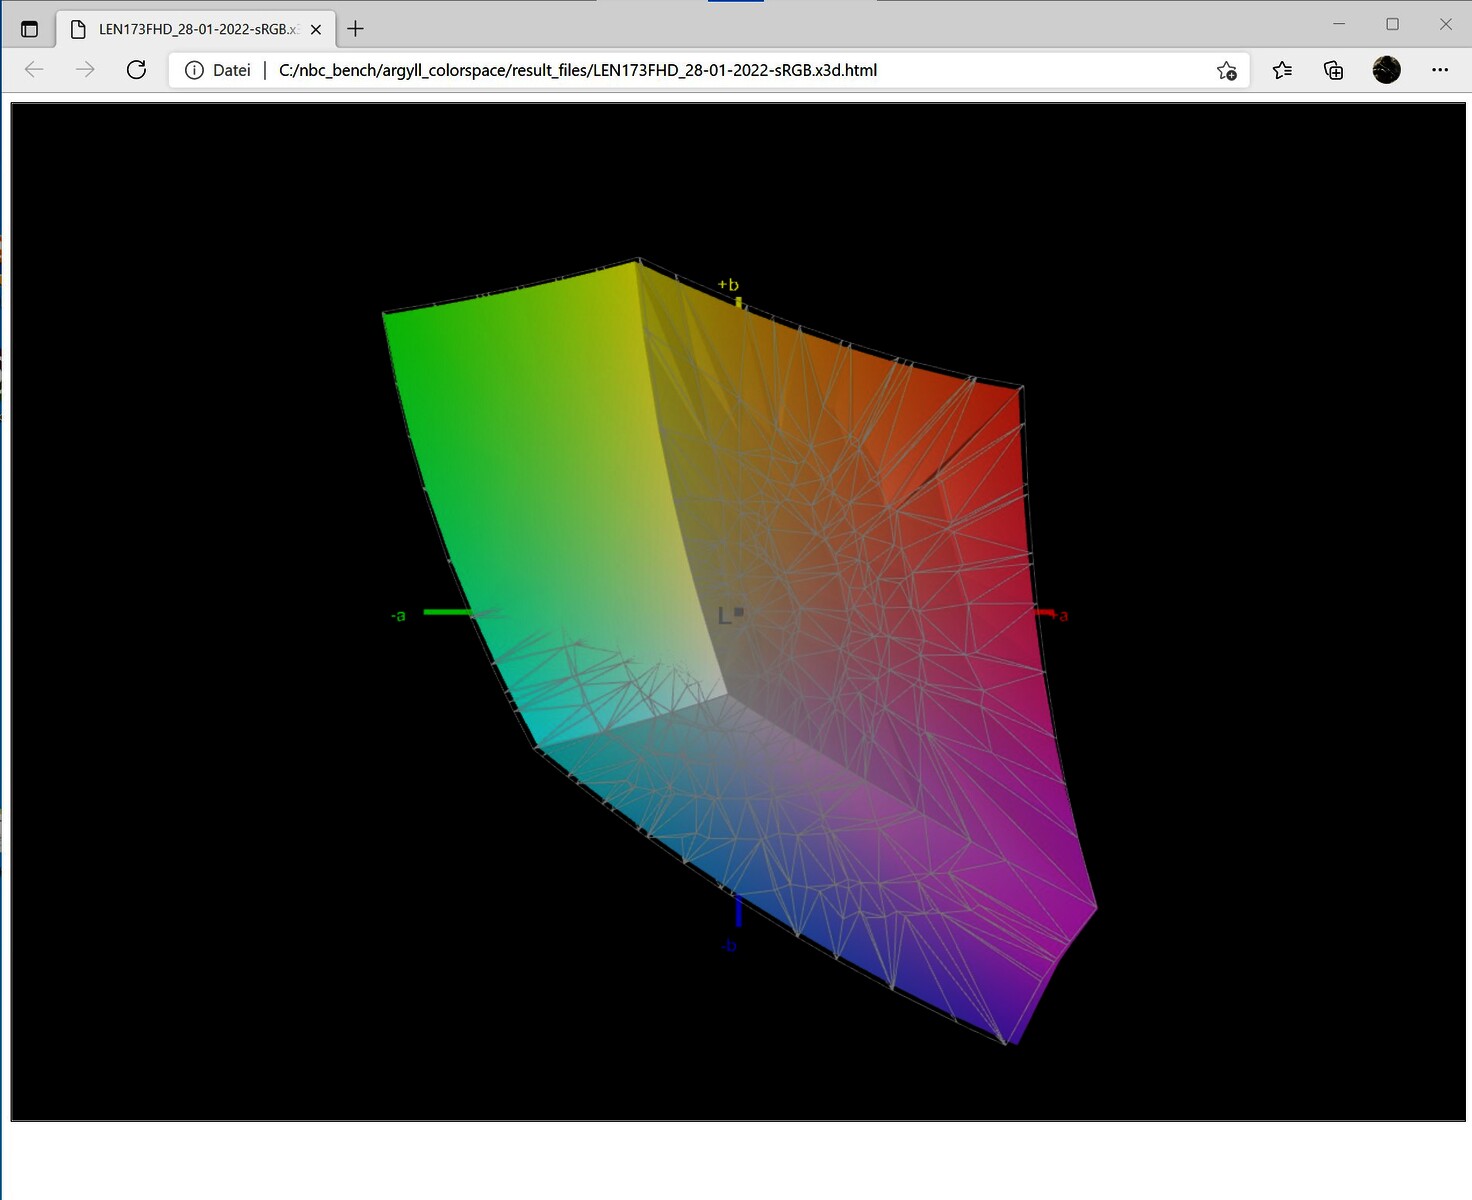
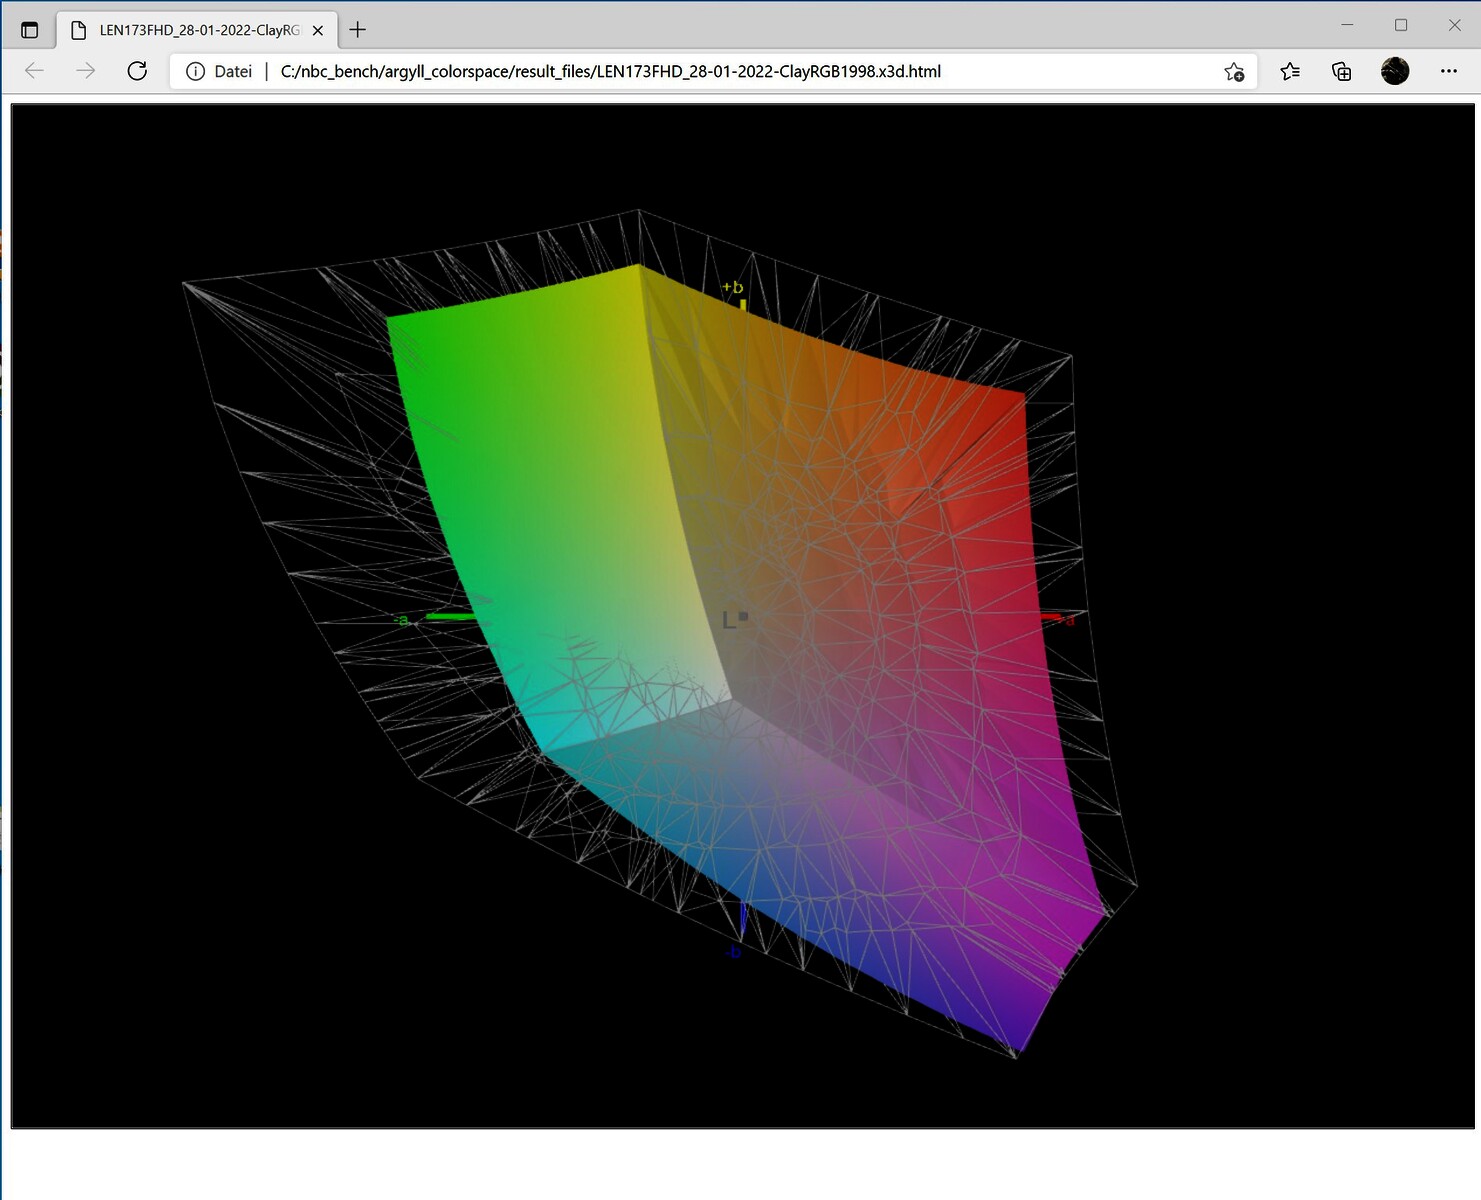
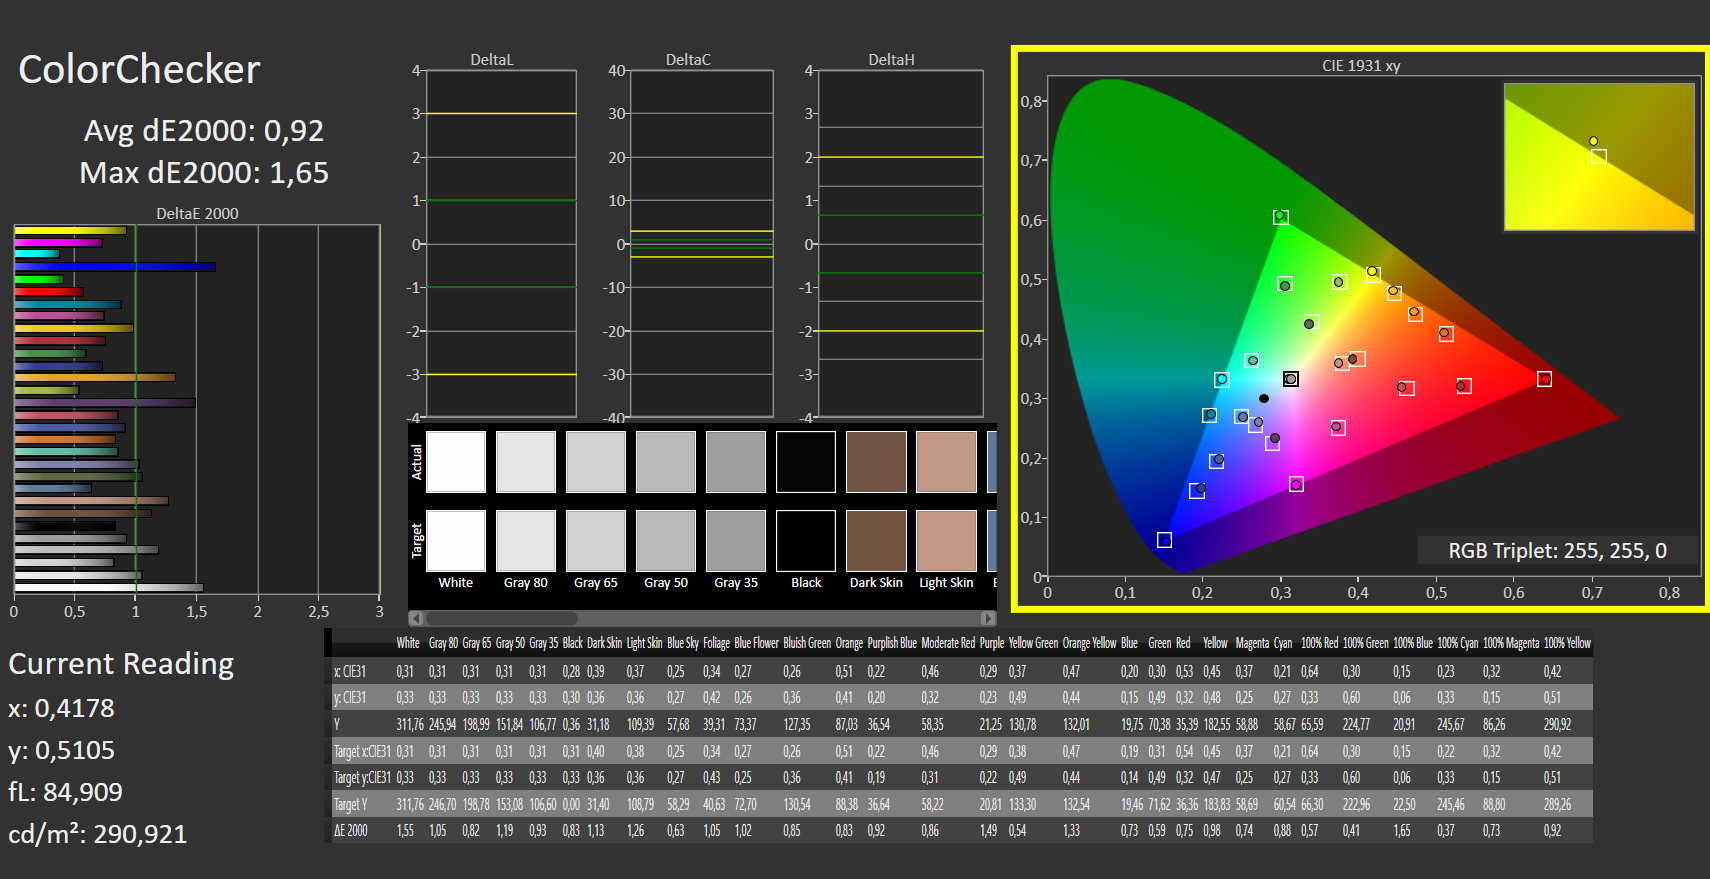
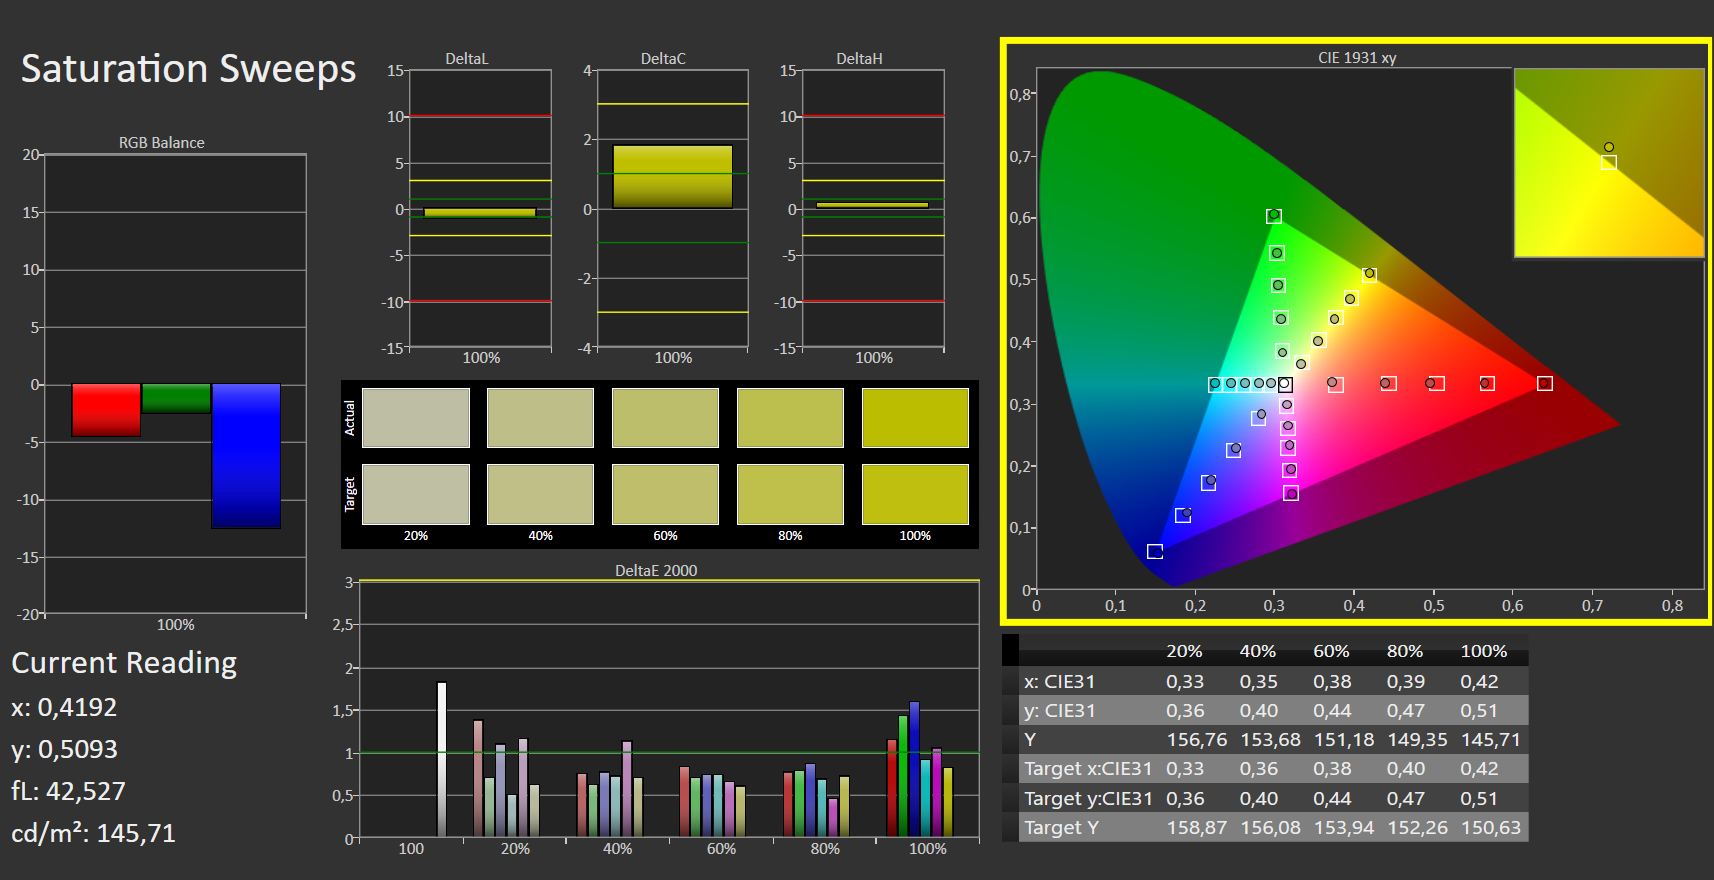
A qualidade de exibição é consistentemente boa em todos os aspectos. Apesar da superfície fosca, não há granulosidade. Além disso, a Lenovo parece ter pré-calibrado a tela da Lenovo Legion 5 17, uma vez que os valores deltaE-2000 da escala de cinza e cores relativas ao espaço de cores sRGB estão dentro da faixa ideal de menos de 3. Embora haja uma tonalidade azul menor, isto é muito comum para as telas IPS. Independentemente disso, fomos capazes de minimizá-la através de nossa calibração manual. Além disso, fomos capazes de melhorar ainda mais os baixos valores deltaE-2000 por uma pequena margem

Exibir tempos de resposta
| ↔ Tempo de resposta preto para branco | ||
|---|---|---|
| 9 ms ... ascensão ↗ e queda ↘ combinadas | ↗ 5 ms ascensão |  |
| ↘ 4 ms queda | ||
| A tela mostra taxas de resposta rápidas em nossos testes e deve ser adequada para jogos. Em comparação, todos os dispositivos testados variam de 0.1 (mínimo) a 240 (máximo) ms. » 25 % de todos os dispositivos são melhores. Isso significa que o tempo de resposta medido é melhor que a média de todos os dispositivos testados (19.8 ms). | ||
| ↔ Tempo de resposta 50% cinza a 80% cinza | ||
| 15 ms ... ascensão ↗ e queda ↘ combinadas | ↗ 7 ms ascensão |  |
| ↘ 8 ms queda | ||
| A tela mostra boas taxas de resposta em nossos testes, mas pode ser muito lenta para jogadores competitivos. Em comparação, todos os dispositivos testados variam de 0.165 (mínimo) a 636 (máximo) ms. » 29 % de todos os dispositivos são melhores. Isso significa que o tempo de resposta medido é melhor que a média de todos os dispositivos testados (31 ms). | ||
Cintilação da tela / PWM (modulação por largura de pulso)
| Tela tremeluzindo / PWM não detectado |  | ||
[pwm_comparison] Em comparação: 52 % de todos os dispositivos testados não usam PWM para escurecer a tela. Se PWM foi detectado, uma média de 7754 (mínimo: 5 - máximo: 343500) Hz foi medida. | |||
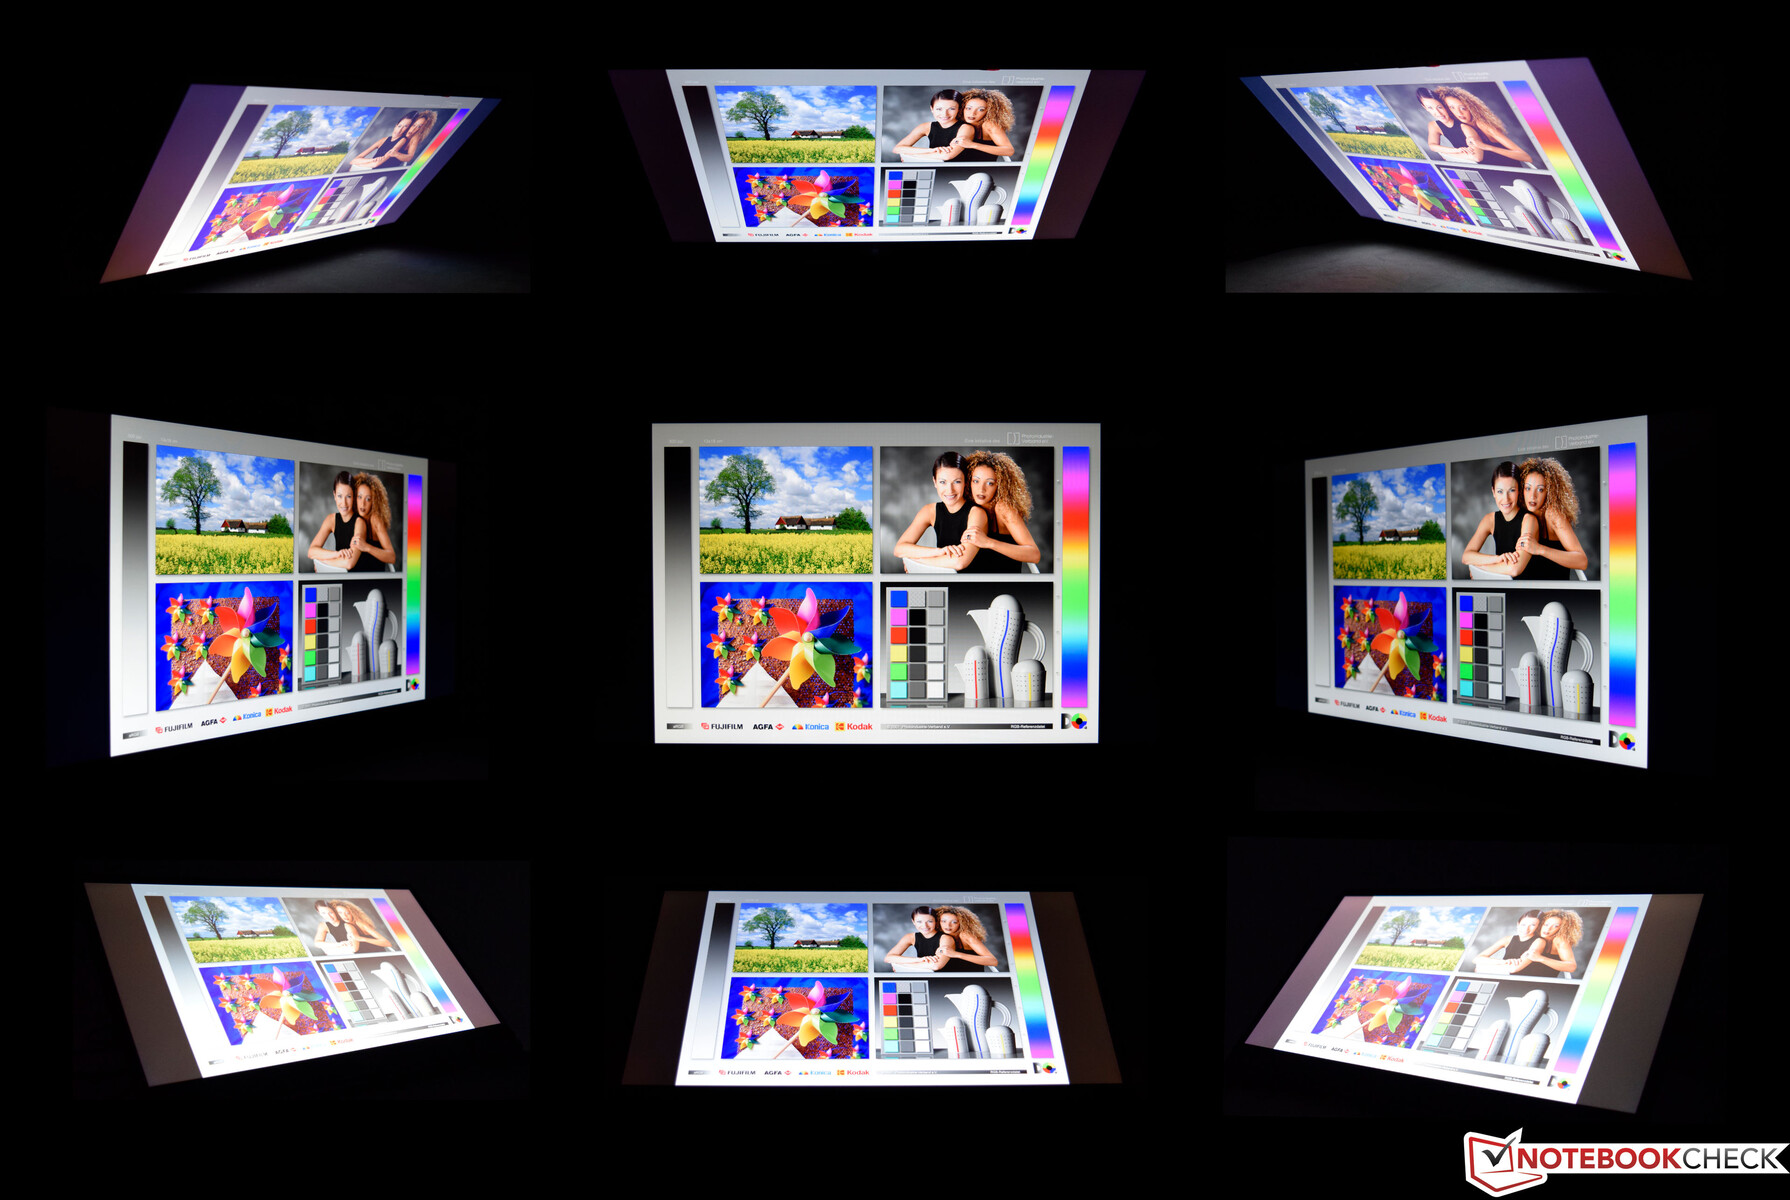
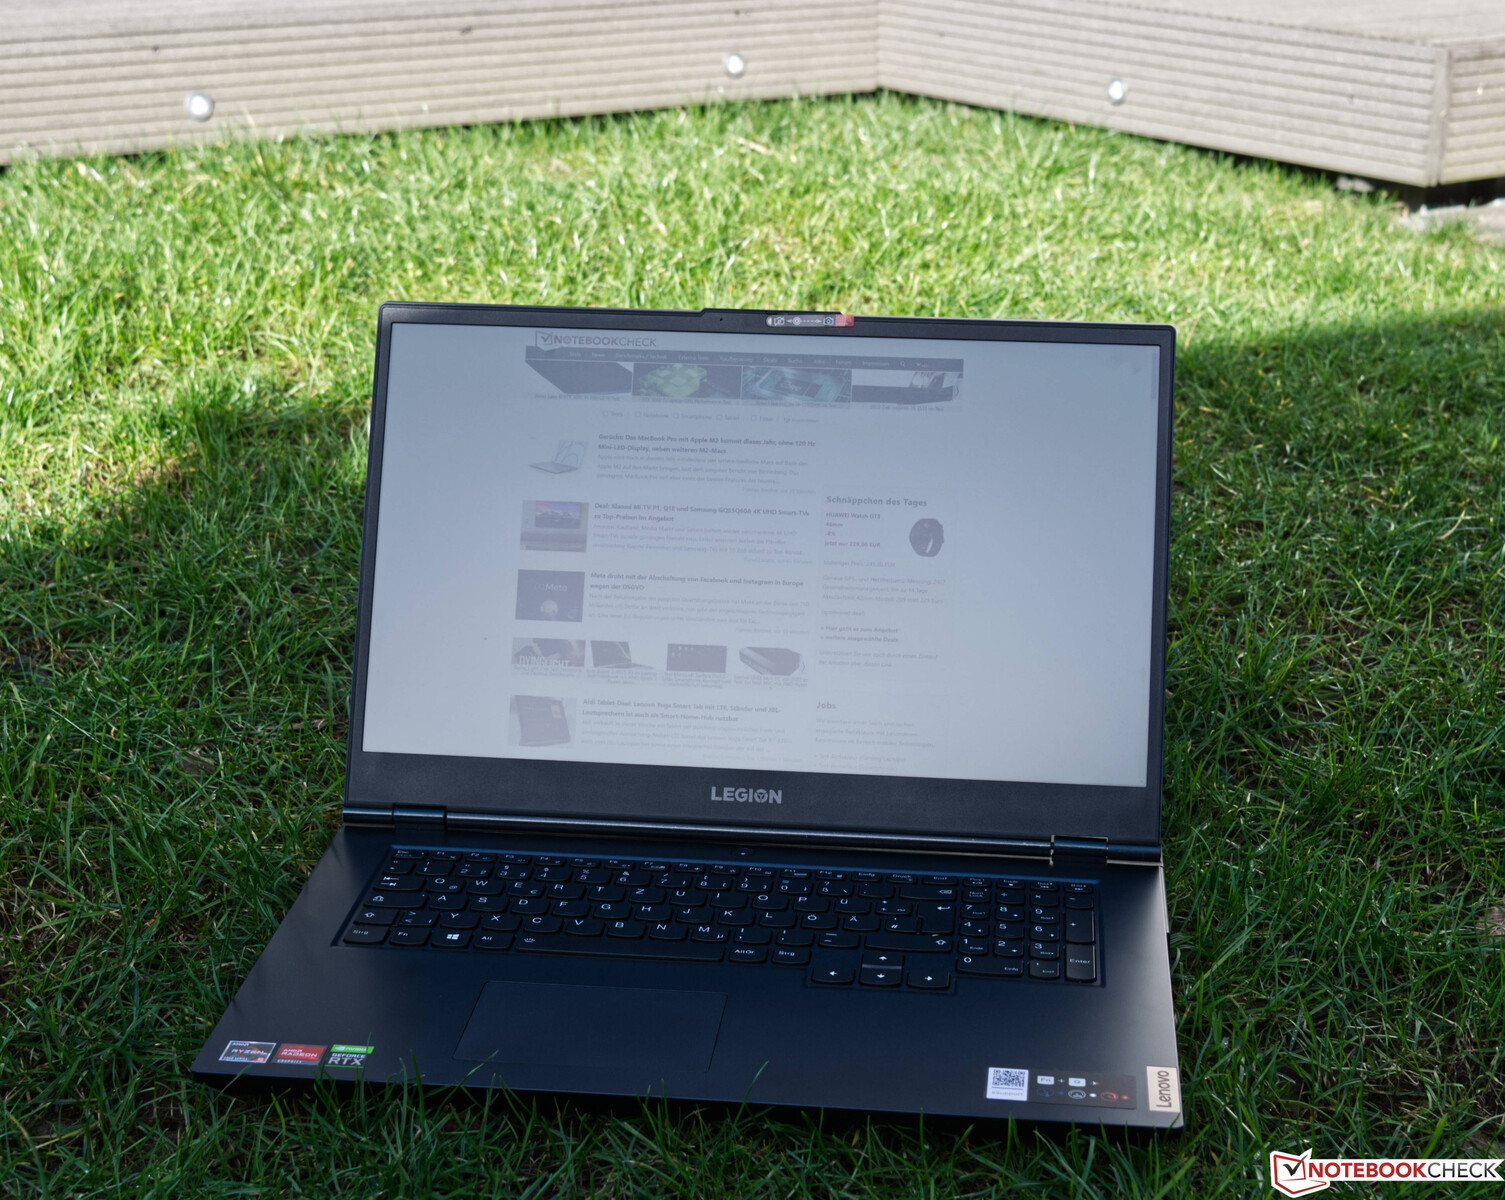
A adequação ao ar livre de nossa Lenovo Legion 5 17 é limitada. Se você optar por usar o laptop ao ar livre de qualquer forma, é recomendável ficar à sombra. O nível de luminosidade é então suficiente para a maioria das tarefas. Nosso teste de ângulo de visão mostra um resultado que é típico para um painel IPS. Apenas as quatro imagens de canto aparecem para mostrar um véu tênue. Durante o uso normal, isto não é visível
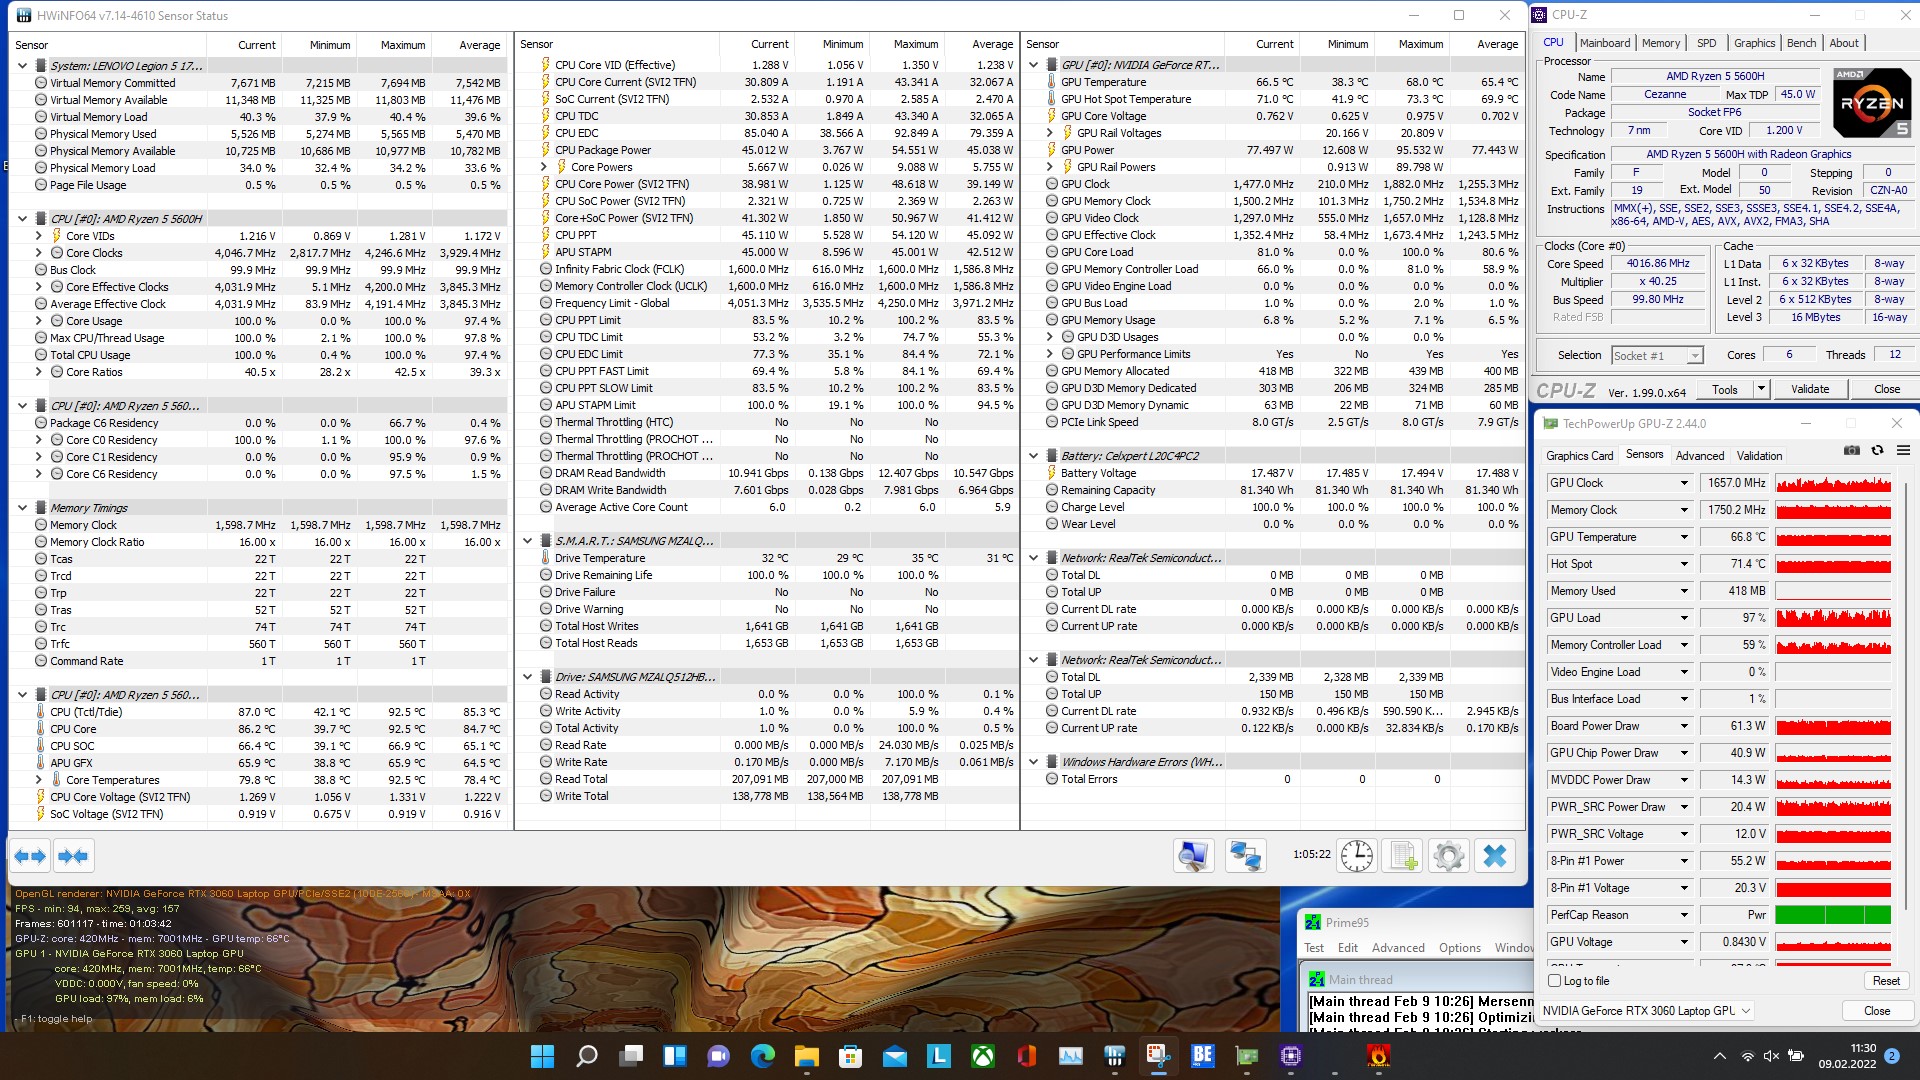
Desempenho
Para um laptop para jogos, o desempenho da CPU e da GPU são a maior prioridade. Se o preço também é uma consideração, todas as estradas eventualmente levam ao Legion 5 17, uma vez que o AMD Ryzen 5 5600H e Nvidia GeForce RTX 3060 GPU móvel trabalham bem juntos para um desempenho sólido de jogo que é inteiramente suficiente para jogos nativos de 1080p. Aqueles que ainda estão procurando um desempenho mais rápido podem configurar a Lenovo Legion 5 17 com um AMD Ryzen 7 5800H e um Nvidia GeForce RTX 3070 GPU móvel. Naturalmente, estas opções vêm com um preço premium
Condições de teste
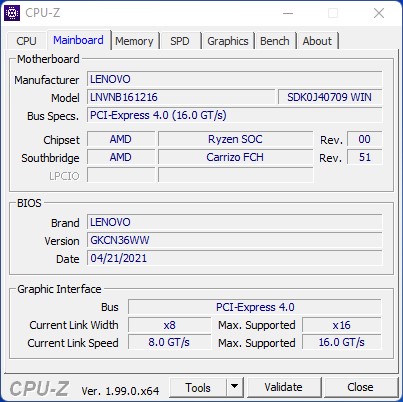
O Lenovo Vantage Center pré-instalado permite que os usuários personalizem várias configurações do sistema. Por exemplo, a performance da GPU pode ser ajustada com os perfis de energia pré-definidos. Todos os benchmarks foram executados com o perfil de performance habilitado. Isto permite que o Nvidia GeForce RTX 3060 tenha acesso a seu orçamento total de energia de 130 watts
Processador
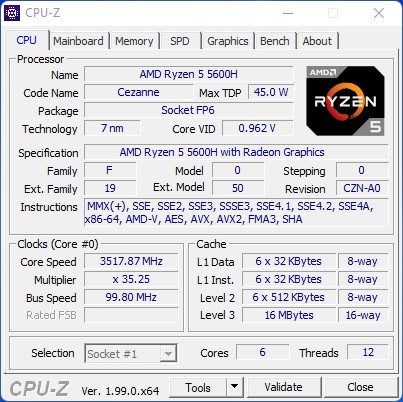
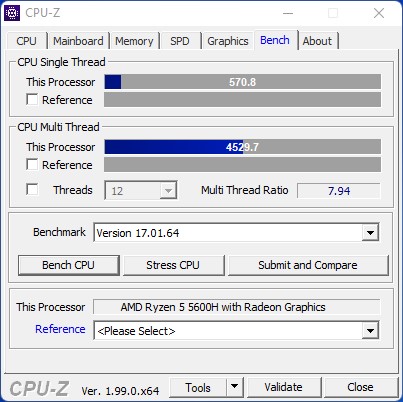
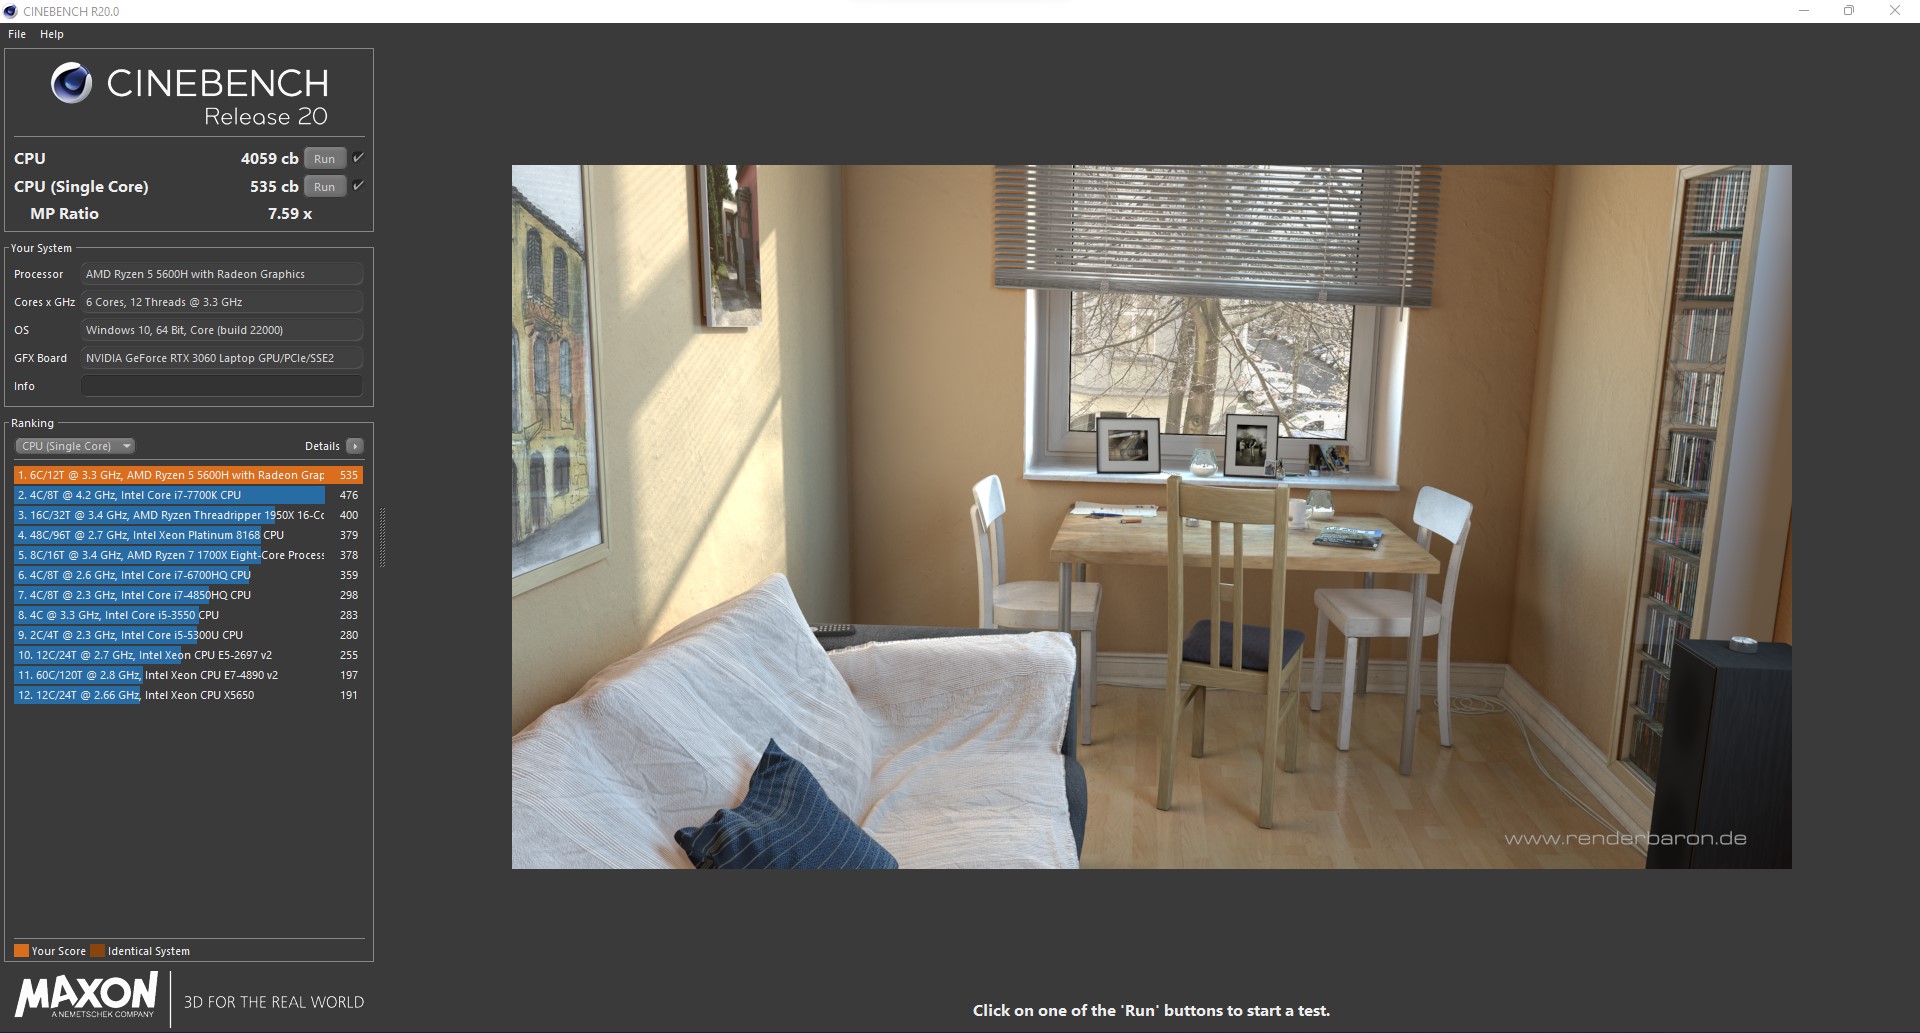
Com seis núcleos e doze fios, a AMD Ryzen 5 5600H oferece um desempenho decentemente rápido. Entretanto, a Lenovo Legion 5 17 não consegue acompanhar seus concorrentes octa-core. A AMD Ryzen 5 5600H ainda tem um bom desempenho e os resultados estão acima da média para esta CPU
Nossa Lenovo Legion 5 17 tem um desempenho relativamente bom em nosso teste de estresse, que consiste em executar Cinebench R15 multi em um loop. O desempenho continua consistente e não observamos nenhuma queda
Mais comparações e benchmarks podem ser encontrados em nosso Tabela comparativa de CPU
Cinebench R15 Multi Loop
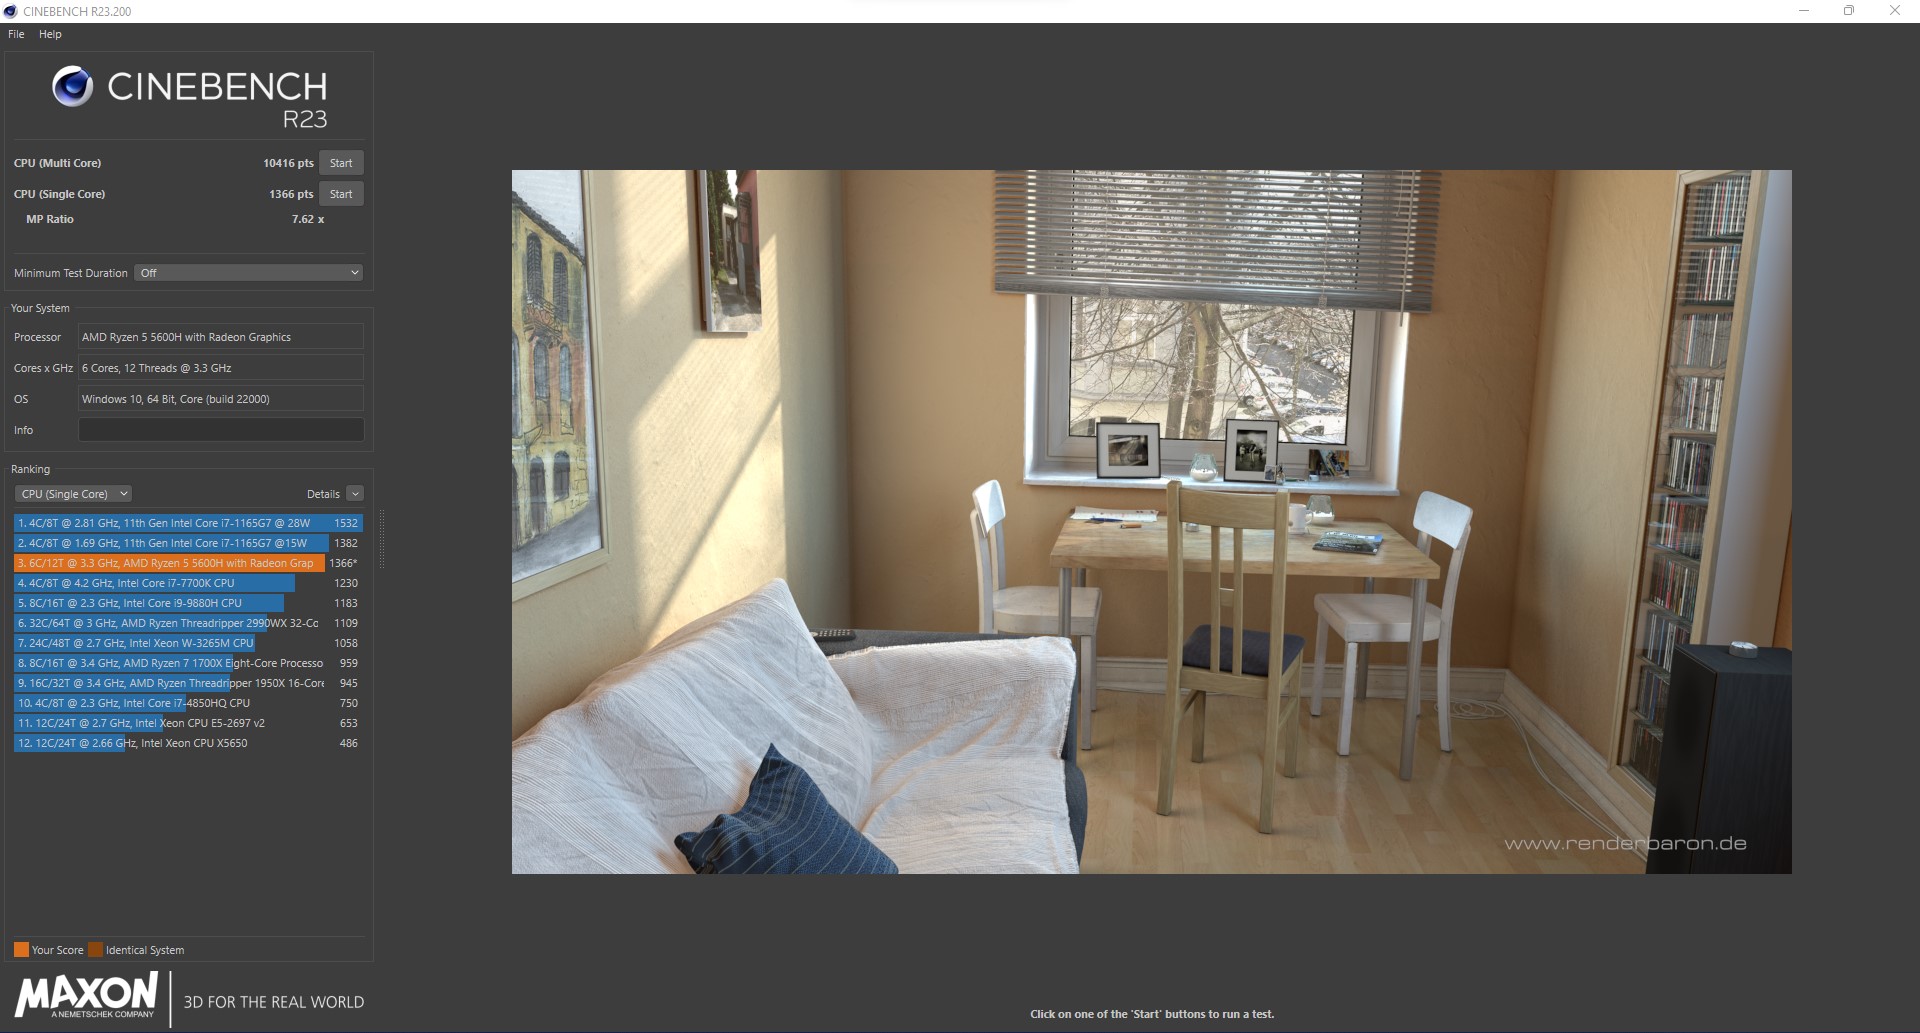
Cinebench R23: Multi Core | Single Core
Cinebench R20: CPU (Multi Core) | CPU (Single Core)
Cinebench R15: CPU Multi 64Bit | CPU Single 64Bit
Blender: v2.79 BMW27 CPU
7-Zip 18.03: 7z b 4 | 7z b 4 -mmt1
Geekbench 5.5: Multi-Core | Single-Core
HWBOT x265 Benchmark v2.2: 4k Preset
LibreOffice : 20 Documents To PDF
R Benchmark 2.5: Overall mean
| CPU Performance rating | |
| Média da turma Gaming | |
| Schenker XMG Apex 17 M21 | |
| Asus TUF Gaming F17 FX706HM | |
| Gigabyte A7 X1 | |
| MSI Katana GF76 11UE | |
| Lenovo Legion 5 17ACH6H-82JY0003GE | |
| Média AMD Ryzen 5 5600H | |
| Schenker XMG Core 17 (Early 2021) | |
| Cinebench R23 / Multi Core | |
| Média da turma Gaming (10488 - 42661, n=107, últimos 2 anos) | |
| Schenker XMG Apex 17 M21 | |
| Gigabyte A7 X1 | |
| Asus TUF Gaming F17 FX706HM | |
| MSI Katana GF76 11UE | |
| Lenovo Legion 5 17ACH6H-82JY0003GE | |
| Média AMD Ryzen 5 5600H (7945 - 10416, n=13) | |
| Schenker XMG Core 17 (Early 2021) | |
| Cinebench R23 / Single Core | |
| Média da turma Gaming (1166 - 2415, n=107, últimos 2 anos) | |
| Asus TUF Gaming F17 FX706HM | |
| MSI Katana GF76 11UE | |
| Gigabyte A7 X1 | |
| Schenker XMG Apex 17 M21 | |
| Lenovo Legion 5 17ACH6H-82JY0003GE | |
| Média AMD Ryzen 5 5600H (1316 - 1381, n=13) | |
| Schenker XMG Core 17 (Early 2021) | |
| Cinebench R20 / CPU (Multi Core) | |
| Média da turma Gaming (4029 - 16433, n=106, últimos 2 anos) | |
| Schenker XMG Apex 17 M21 | |
| Gigabyte A7 X1 | |
| Asus TUF Gaming F17 FX706HM | |
| MSI Katana GF76 11UE | |
| Lenovo Legion 5 17ACH6H-82JY0003GE | |
| Média AMD Ryzen 5 5600H (3074 - 4059, n=16) | |
| Schenker XMG Core 17 (Early 2021) | |
| Cinebench R20 / CPU (Single Core) | |
| Média da turma Gaming (442 - 913, n=106, últimos 2 anos) | |
| Asus TUF Gaming F17 FX706HM | |
| Gigabyte A7 X1 | |
| MSI Katana GF76 11UE | |
| Schenker XMG Apex 17 M21 | |
| Lenovo Legion 5 17ACH6H-82JY0003GE | |
| Média AMD Ryzen 5 5600H (527 - 538, n=15) | |
| Schenker XMG Core 17 (Early 2021) | |
| Cinebench R15 / CPU Multi 64Bit | |
| Média da turma Gaming (1578 - 6330, n=105, últimos 2 anos) | |
| Gigabyte A7 X1 | |
| Schenker XMG Apex 17 M21 | |
| Asus TUF Gaming F17 FX706HM | |
| MSI Katana GF76 11UE | |
| Lenovo Legion 5 17ACH6H-82JY0003GE | |
| Média AMD Ryzen 5 5600H (1319 - 1723, n=16) | |
| Schenker XMG Core 17 (Early 2021) | |
| Cinebench R15 / CPU Single 64Bit | |
| Média da turma Gaming (188.8 - 350, n=106, últimos 2 anos) | |
| Asus TUF Gaming F17 FX706HM | |
| Gigabyte A7 X1 | |
| Schenker XMG Apex 17 M21 | |
| MSI Katana GF76 11UE | |
| Lenovo Legion 5 17ACH6H-82JY0003GE | |
| Média AMD Ryzen 5 5600H (218 - 225, n=14) | |
| Schenker XMG Core 17 (Early 2021) | |
| Blender / v2.79 BMW27 CPU | |
| Schenker XMG Core 17 (Early 2021) | |
| Média AMD Ryzen 5 5600H (300 - 384, n=14) | |
| Lenovo Legion 5 17ACH6H-82JY0003GE | |
| MSI Katana GF76 11UE | |
| Gigabyte A7 X1 | |
| Asus TUF Gaming F17 FX706HM | |
| Schenker XMG Apex 17 M21 | |
| Média da turma Gaming (79 - 330, n=104, últimos 2 anos) | |
| 7-Zip 18.03 / 7z b 4 | |
| Média da turma Gaming (33491 - 148086, n=105, últimos 2 anos) | |
| Schenker XMG Apex 17 M21 | |
| Gigabyte A7 X1 | |
| Asus TUF Gaming F17 FX706HM | |
| Lenovo Legion 5 17ACH6H-82JY0003GE | |
| MSI Katana GF76 11UE | |
| Média AMD Ryzen 5 5600H (36315 - 46562, n=14) | |
| Schenker XMG Core 17 (Early 2021) | |
| 7-Zip 18.03 / 7z b 4 -mmt1 | |
| Média da turma Gaming (4199 - 7436, n=105, últimos 2 anos) | |
| Asus TUF Gaming F17 FX706HM | |
| Gigabyte A7 X1 | |
| Schenker XMG Apex 17 M21 | |
| MSI Katana GF76 11UE | |
| Schenker XMG Core 17 (Early 2021) | |
| Lenovo Legion 5 17ACH6H-82JY0003GE | |
| Média AMD Ryzen 5 5600H (5213 - 5446, n=14) | |
| Geekbench 5.5 / Multi-Core | |
| Média da turma Gaming (6460 - 28263, n=105, últimos 2 anos) | |
| Schenker XMG Apex 17 M21 | |
| MSI Katana GF76 11UE | |
| Asus TUF Gaming F17 FX706HM | |
| Gigabyte A7 X1 | |
| Schenker XMG Core 17 (Early 2021) | |
| Lenovo Legion 5 17ACH6H-82JY0003GE | |
| Média AMD Ryzen 5 5600H (4990 - 7253, n=14) | |
| Geekbench 5.5 / Single-Core | |
| Média da turma Gaming (986 - 2474, n=105, últimos 2 anos) | |
| Asus TUF Gaming F17 FX706HM | |
| MSI Katana GF76 11UE | |
| Gigabyte A7 X1 | |
| Schenker XMG Apex 17 M21 | |
| Lenovo Legion 5 17ACH6H-82JY0003GE | |
| Média AMD Ryzen 5 5600H (1365 - 1445, n=14) | |
| Schenker XMG Core 17 (Early 2021) | |
| HWBOT x265 Benchmark v2.2 / 4k Preset | |
| Média da turma Gaming (11.5 - 44.4, n=105, últimos 2 anos) | |
| Schenker XMG Apex 17 M21 | |
| Asus TUF Gaming F17 FX706HM | |
| Gigabyte A7 X1 | |
| MSI Katana GF76 11UE | |
| Lenovo Legion 5 17ACH6H-82JY0003GE | |
| Média AMD Ryzen 5 5600H (9.92 - 13.3, n=14) | |
| Schenker XMG Core 17 (Early 2021) | |
| LibreOffice / 20 Documents To PDF | |
| Média AMD Ryzen 5 5600H (52.2 - 81.5, n=14) | |
| Gigabyte A7 X1 | |
| Schenker XMG Core 17 (Early 2021) | |
| Lenovo Legion 5 17ACH6H-82JY0003GE | |
| Média da turma Gaming (33.2 - 88.8, n=105, últimos 2 anos) | |
| MSI Katana GF76 11UE | |
| Schenker XMG Apex 17 M21 | |
| Asus TUF Gaming F17 FX706HM | |
| R Benchmark 2.5 / Overall mean | |
| Schenker XMG Core 17 (Early 2021) | |
| MSI Katana GF76 11UE | |
| Média AMD Ryzen 5 5600H (0.526 - 0.596, n=14) | |
| Lenovo Legion 5 17ACH6H-82JY0003GE | |
| Asus TUF Gaming F17 FX706HM | |
| Schenker XMG Apex 17 M21 | |
| Gigabyte A7 X1 | |
| Média da turma Gaming (0.3439 - 0.759, n=106, últimos 2 anos) | |
* ... menor é melhor
AIDA64: FP32 Ray-Trace | FPU Julia | CPU SHA3 | CPU Queen | FPU SinJulia | FPU Mandel | CPU AES | CPU ZLib | FP64 Ray-Trace | CPU PhotoWorxx
| Performance rating | |
| Média da turma Gaming | |
| Lenovo Legion 5 17ACH6H-82JY0003GE | |
| Média AMD Ryzen 5 5600H | |
| AIDA64 / FP32 Ray-Trace | |
| Média da turma Gaming (10227 - 85542, n=105, últimos 2 anos) | |
| Lenovo Legion 5 17ACH6H-82JY0003GE | |
| Média AMD Ryzen 5 5600H (9181 - 12636, n=14) | |
| AIDA64 / FPU Julia | |
| Média da turma Gaming (51376 - 238426, n=105, últimos 2 anos) | |
| Lenovo Legion 5 17ACH6H-82JY0003GE | |
| Média AMD Ryzen 5 5600H (51994 - 78250, n=14) | |
| AIDA64 / CPU SHA3 | |
| Média da turma Gaming (2180 - 10115, n=105, últimos 2 anos) | |
| Lenovo Legion 5 17ACH6H-82JY0003GE | |
| Média AMD Ryzen 5 5600H (1587 - 2675, n=14) | |
| AIDA64 / CPU Queen | |
| Média da turma Gaming (49785 - 173351, n=90, últimos 2 anos) | |
| Lenovo Legion 5 17ACH6H-82JY0003GE | |
| Média AMD Ryzen 5 5600H (66699 - 77213, n=14) | |
| AIDA64 / FPU SinJulia | |
| Média da turma Gaming (4424 - 33636, n=105, últimos 2 anos) | |
| Lenovo Legion 5 17ACH6H-82JY0003GE | |
| Média AMD Ryzen 5 5600H (8340 - 9159, n=14) | |
| AIDA64 / FPU Mandel | |
| Média da turma Gaming (25115 - 128721, n=105, últimos 2 anos) | |
| Lenovo Legion 5 17ACH6H-82JY0003GE | |
| Média AMD Ryzen 5 5600H (28268 - 43274, n=14) | |
| AIDA64 / CPU AES | |
| Média da turma Gaming (39258 - 247074, n=105, últimos 2 anos) | |
| Lenovo Legion 5 17ACH6H-82JY0003GE | |
| Média AMD Ryzen 5 5600H (39852 - 98939, n=14) | |
| AIDA64 / CPU ZLib | |
| Média da turma Gaming (574 - 2531, n=105, últimos 2 anos) | |
| Lenovo Legion 5 17ACH6H-82JY0003GE | |
| Média AMD Ryzen 5 5600H (507 - 649, n=14) | |
| AIDA64 / FP64 Ray-Trace | |
| Média da turma Gaming (5509 - 45446, n=105, últimos 2 anos) | |
| Lenovo Legion 5 17ACH6H-82JY0003GE | |
| Média AMD Ryzen 5 5600H (4811 - 6652, n=14) | |
| AIDA64 / CPU PhotoWorxx | |
| Média da turma Gaming (12271 - 89891, n=105, últimos 2 anos) | |
| Média AMD Ryzen 5 5600H (7419 - 24746, n=14) | |
| Lenovo Legion 5 17ACH6H-82JY0003GE | |
Desempenho do sistema
Em termos de benchmarks de desempenho do sistema, a Lenovo Legion 5 17 alcança bons resultados. Apesar de sua falta de núcleos em comparação com seus concorrentes, ela se mantém admiravelmente alta. Aqui, o desempenho é mais uma vez significativamente mais rápido do que a média da classe
CrossMark: Overall | Productivity | Creativity | Responsiveness
| PCMark 10 / Score | |
| Média da turma Gaming (5828 - 12414, n=93, últimos 2 anos) | |
| Schenker XMG Apex 17 M21 | |
| Asus TUF Gaming F17 FX706HM | |
| Gigabyte A7 X1 | |
| Lenovo Legion 5 17ACH6H-82JY0003GE | |
| MSI Katana GF76 11UE | |
| Média AMD Ryzen 5 5600H, NVIDIA GeForce RTX 3060 Laptop GPU (6341 - 6615, n=2) | |
| Schenker XMG Core 17 (Early 2021) | |
| PCMark 10 / Essentials | |
| Média da turma Gaming (8810 - 11935, n=97, últimos 2 anos) | |
| Asus TUF Gaming F17 FX706HM | |
| Schenker XMG Apex 17 M21 | |
| Gigabyte A7 X1 | |
| Média AMD Ryzen 5 5600H, NVIDIA GeForce RTX 3060 Laptop GPU (9639 - 10127, n=2) | |
| MSI Katana GF76 11UE | |
| Lenovo Legion 5 17ACH6H-82JY0003GE | |
| Schenker XMG Core 17 (Early 2021) | |
| PCMark 10 / Productivity | |
| Média da turma Gaming (6845 - 25323, n=95, últimos 2 anos) | |
| Gigabyte A7 X1 | |
| Schenker XMG Apex 17 M21 | |
| Asus TUF Gaming F17 FX706HM | |
| Lenovo Legion 5 17ACH6H-82JY0003GE | |
| Média AMD Ryzen 5 5600H, NVIDIA GeForce RTX 3060 Laptop GPU (8829 - 9027, n=2) | |
| MSI Katana GF76 11UE | |
| Schenker XMG Core 17 (Early 2021) | |
| PCMark 10 / Digital Content Creation | |
| Média da turma Gaming (7602 - 19954, n=95, últimos 2 anos) | |
| Schenker XMG Apex 17 M21 | |
| Gigabyte A7 X1 | |
| Asus TUF Gaming F17 FX706HM | |
| Lenovo Legion 5 17ACH6H-82JY0003GE | |
| MSI Katana GF76 11UE | |
| Média AMD Ryzen 5 5600H, NVIDIA GeForce RTX 3060 Laptop GPU (7740 - 9026, n=2) | |
| Schenker XMG Core 17 (Early 2021) | |
| CrossMark / Overall | |
| Média da turma Gaming (1366 - 2409, n=94, últimos 2 anos) | |
| Lenovo Legion 5 17ACH6H-82JY0003GE | |
| Média AMD Ryzen 5 5600H, NVIDIA GeForce RTX 3060 Laptop GPU (n=1) | |
| CrossMark / Productivity | |
| Média da turma Gaming (1386 - 2254, n=94, últimos 2 anos) | |
| Lenovo Legion 5 17ACH6H-82JY0003GE | |
| Média AMD Ryzen 5 5600H, NVIDIA GeForce RTX 3060 Laptop GPU (n=1) | |
| CrossMark / Creativity | |
| Média da turma Gaming (1343 - 2786, n=94, últimos 2 anos) | |
| Lenovo Legion 5 17ACH6H-82JY0003GE | |
| Média AMD Ryzen 5 5600H, NVIDIA GeForce RTX 3060 Laptop GPU (n=1) | |
| CrossMark / Responsiveness | |
| Média da turma Gaming (1226 - 2334, n=94, últimos 2 anos) | |
| Lenovo Legion 5 17ACH6H-82JY0003GE | |
| Média AMD Ryzen 5 5600H, NVIDIA GeForce RTX 3060 Laptop GPU (n=1) | |
| PCMark 10 Score | 6615 pontos | |
Ajuda | ||
| AIDA64 / Memory Copy | |
| Média da turma Gaming (21750 - 129946, n=105, últimos 2 anos) | |
| Lenovo Legion 5 17ACH6H-82JY0003GE | |
| Média AMD Ryzen 5 5600H (20549 - 42141, n=14) | |
| AIDA64 / Memory Read | |
| Média da turma Gaming (22956 - 118858, n=105, últimos 2 anos) | |
| Lenovo Legion 5 17ACH6H-82JY0003GE | |
| Média AMD Ryzen 5 5600H (22917 - 47595, n=14) | |
| AIDA64 / Memory Write | |
| Média da turma Gaming (22297 - 135096, n=105, últimos 2 anos) | |
| Lenovo Legion 5 17ACH6H-82JY0003GE | |
| Média AMD Ryzen 5 5600H (20226 - 44872, n=14) | |
| AIDA64 / Memory Latency | |
| Média da turma Gaming (75.3 - 259, n=105, últimos 2 anos) | |
| Média AMD Ryzen 5 5600H (75 - 89.1, n=14) | |
| Lenovo Legion 5 17ACH6H-82JY0003GE | |
* ... menor é melhor
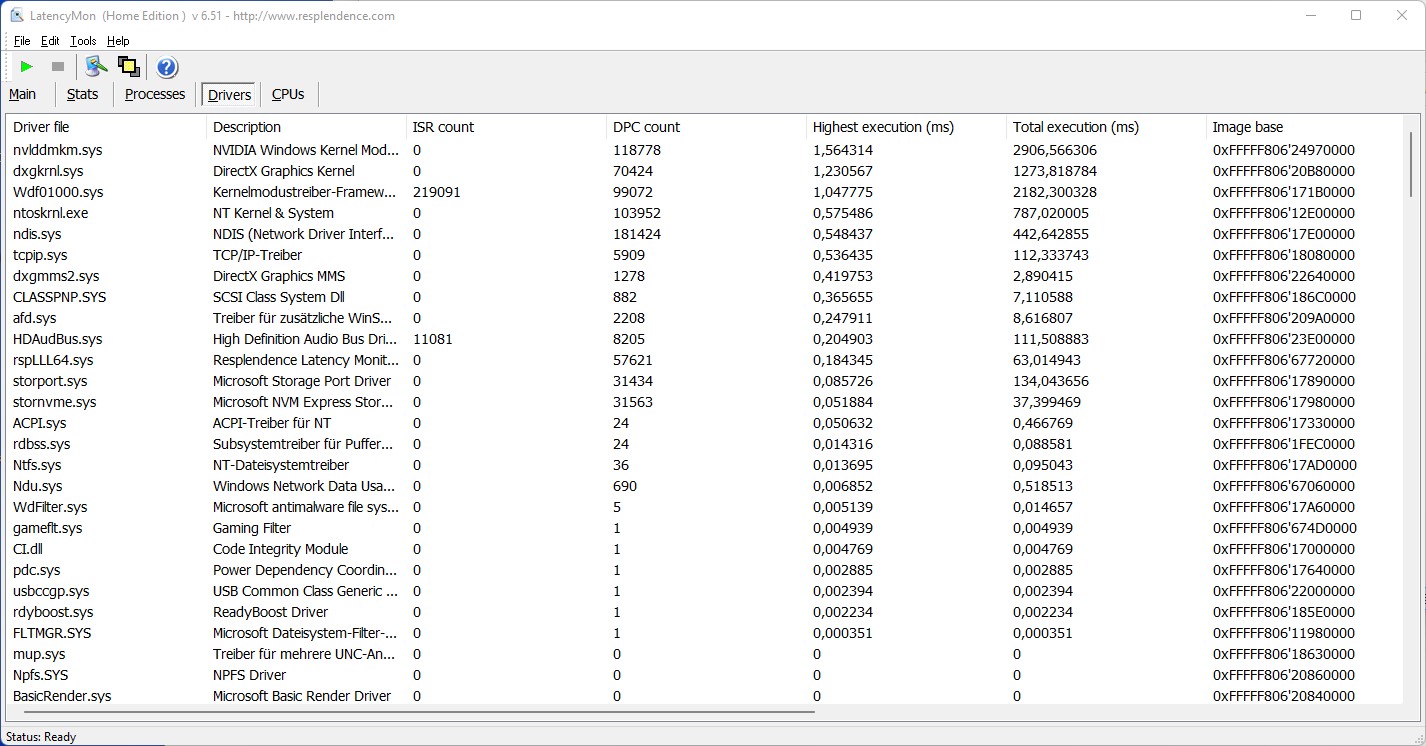
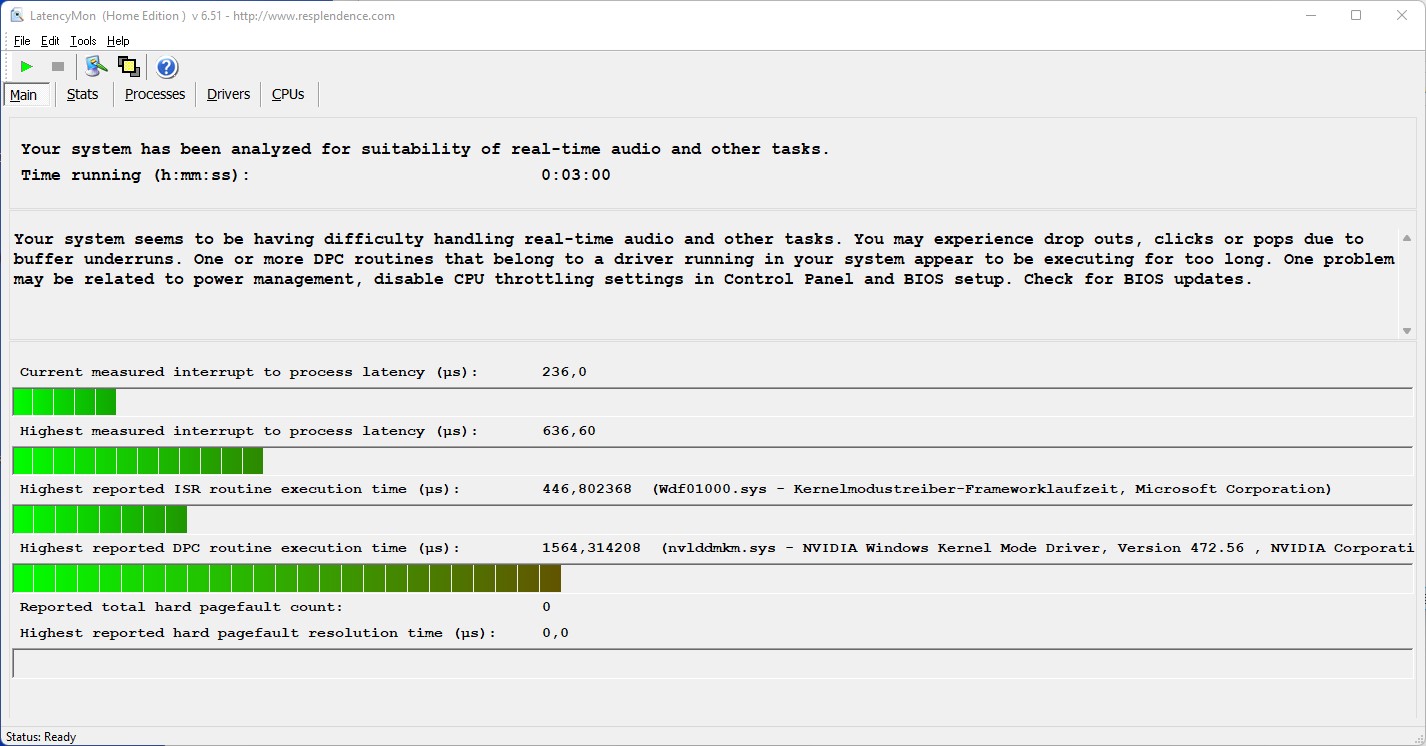
Latências DPC
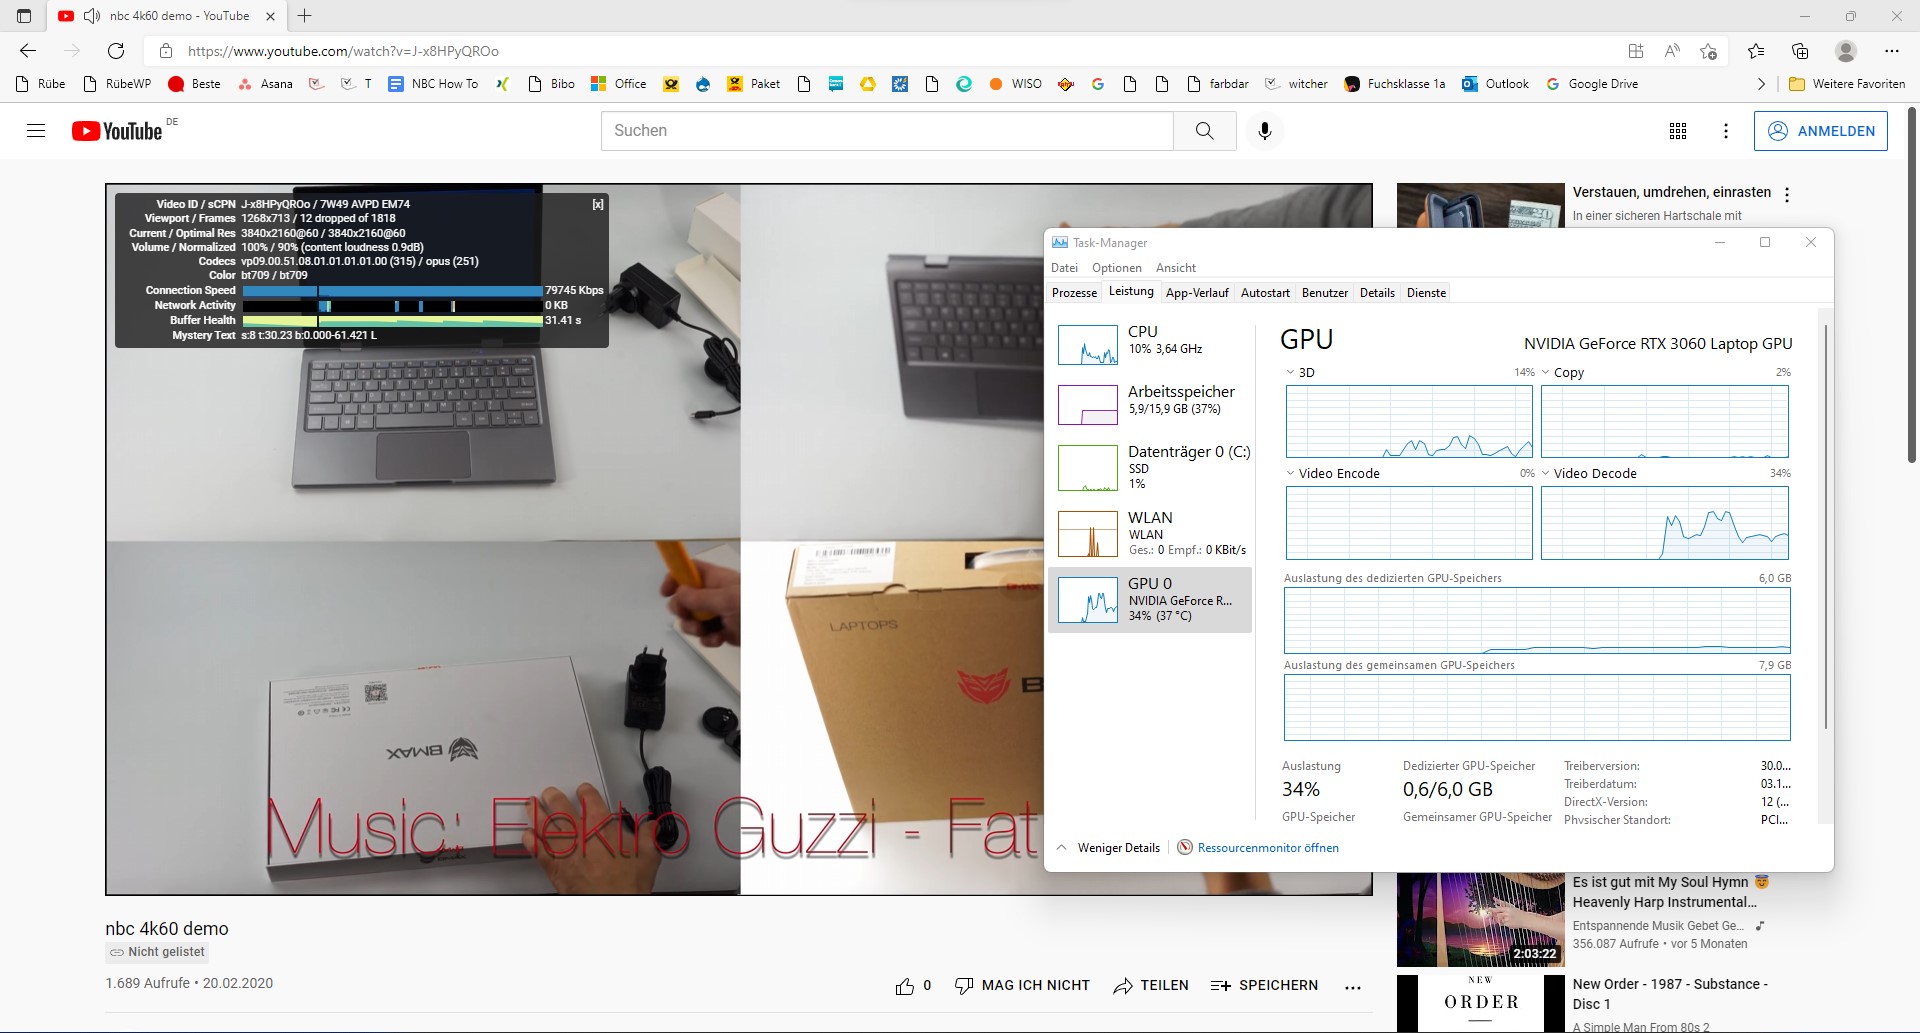
A abertura de múltiplas abas do navegador em Edge e a reprodução de um vídeo de 4K YouTube não produziram resultados problemáticos. As latências só aumentam ligeiramente depois de rodar Prime95. A carga da GPU durante nosso viideo de teste é de aproximadamente 30 %
| DPC Latencies / LatencyMon - interrupt to process latency (max), Web, Youtube, Prime95 | |
| MSI Katana GF76 11UE | |
| Lenovo Legion 5 17ACH6H-82JY0003GE | |
| Schenker XMG Apex 17 M21 | |
| Asus TUF Gaming F17 FX706HM | |
| Gigabyte A7 X1 | |
| Schenker XMG Core 17 (Early 2021) | |
* ... menor é melhor
Solução de armazenamento
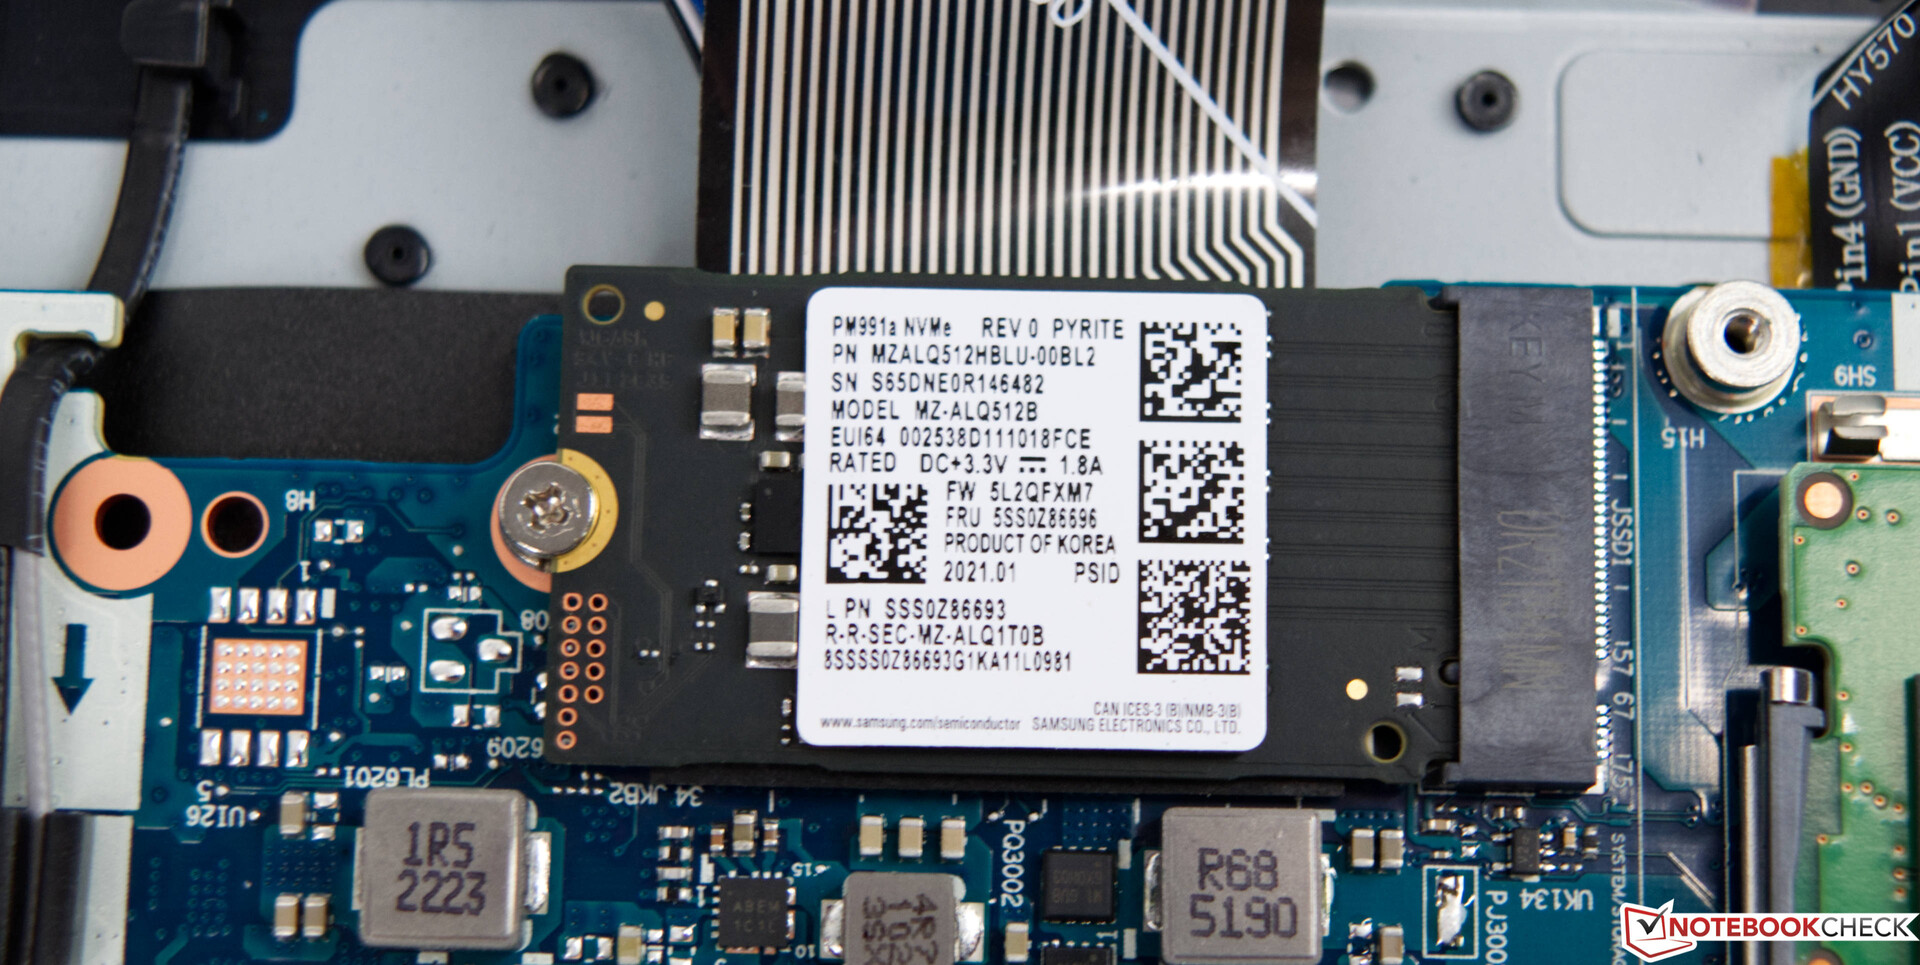
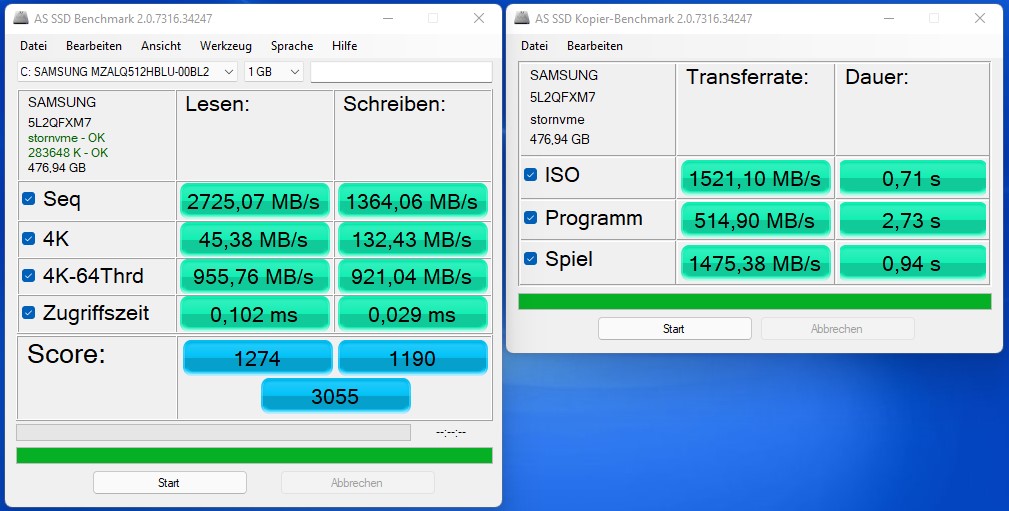
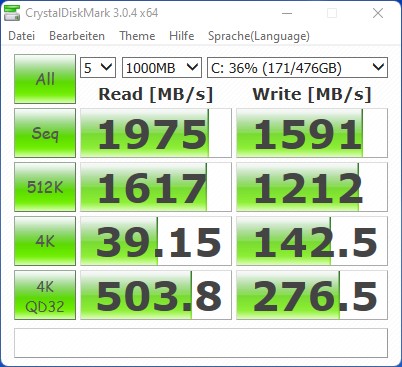
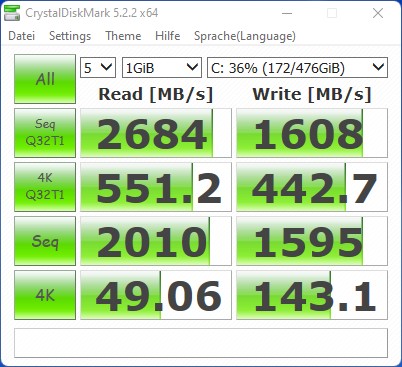
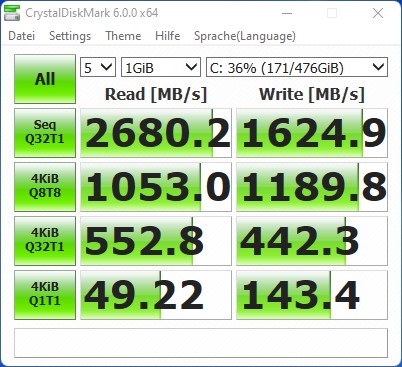
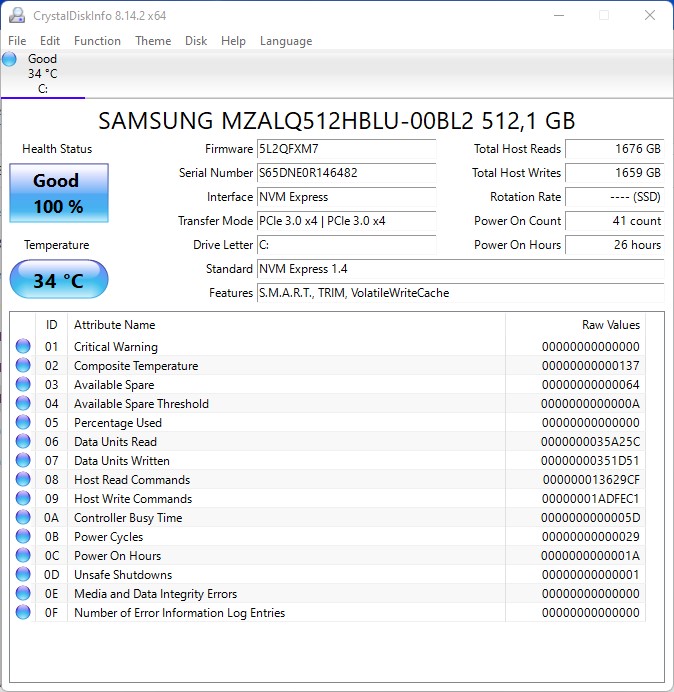
Para o Legion 5 17, a Lenovo conta com um rápido SSD da Samsung. Neste caso, ela tem uma capacidade de 512 GB e usa a interface rápida M.2 PCIe para transferências de dados. Como mostram nossos resultados, no entanto, esta configuração não consegue acompanhar a concorrência. Com 512 GB, a capacidade também não é exatamente massiva. Em um laptop para jogos, esperamos pelo menos 1 TB de espaço de armazenamento
Mais comparações e referências podem ser encontradas em nosso tabela comparativa

* ... menor é melhor
Disk Throttling: DiskSpd Read Loop, Queue Depth 8
Desempenho da GPU
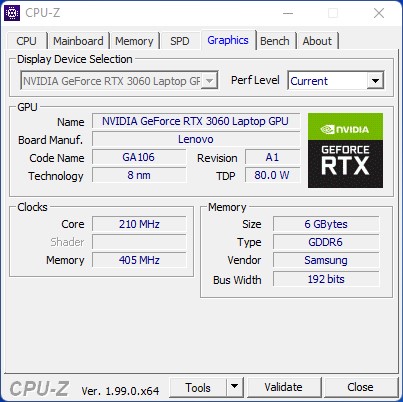
Para nosso dispositivo de teste, o Nvidia GeForce RTX 3060 GPU móvel serve como a placa gráfica. Devido ao limite de potência configurável de 80 a 130 watts, o desempenho de diferentes modelos pode variar muito. Aqui, a GPU móvel Nvidia GeForce RTX 3060 pode consumir até 130 watts quando configurada para o modo de desempenho através da ferramenta Lenovo Vantage. Como resultado, ela alcança excelentes resultados em benchmarks sintéticos. A Lenovo Legion 5 17 está atrás apenas em alguns pontos percentuais em comparação com a muito mais potente Schenker XMG Apex 17 M21.
Mais comparações e referências podem ser encontradas em nosso GTabela de comparação PU
| 3DMark Ice Storm Standard Score | 201496 pontos | |
| 3DMark Cloud Gate Standard Score | 44638 pontos | |
| 3DMark Fire Strike Score | 19801 pontos | |
| 3DMark Fire Strike Extreme Score | 10073 pontos | |
| 3DMark Time Spy Score | 8579 pontos | |
Ajuda | ||
Desempenho nos jogos
Em termos de desempenho do jogo, a Lenovo 5 17 fica atrás da maioria dos dispositivos em nossa comparação. Os concorrentes baseados nos SoCs da Intel parecem alcançar melhores resultados nos jogos. Independentemente disso, não queremos baixar o desempenho absoluto do nosso dispositivo de teste. As taxas de quadros são altas e até mesmo os títulos atuais, como o Far Cry 6, funcionam suavemente com a resolução de tela nativa e com o máximo de detalhes
| The Witcher 3 | |
| 1920x1080 High Graphics & Postprocessing (Nvidia HairWorks Off) | |
| Média da turma Gaming (341 - 404, n=2, últimos 2 anos) | |
| Schenker XMG Apex 17 M21 | |
| Média NVIDIA GeForce RTX 3060 Laptop GPU (81 - 186.8, n=41) | |
| Schenker XMG Core 17 (Early 2021) | |
| Asus TUF Gaming F17 FX706HM | |
| MSI Katana GF76 11UE | |
| Lenovo Legion 5 17ACH6H-82JY0003GE | |
| 1920x1080 Ultra Graphics & Postprocessing (HBAO+) | |
| Média da turma Gaming (104.7 - 240, n=7, últimos 2 anos) | |
| Schenker XMG Apex 17 M21 | |
| Gigabyte A7 X1 | |
| Lenovo Legion 5 17ACH6H-82JY0003GE | |
| Schenker XMG Core 17 (Early 2021) | |
| Média NVIDIA GeForce RTX 3060 Laptop GPU (58.2 - 91.5, n=48) | |
| Asus TUF Gaming F17 FX706HM | |
| MSI Katana GF76 11UE | |
O desempenho permanece consistente durante nosso The Witcher 3 teste de estresse em ultra-sistemas. Assim, não esperamos que as taxas de quadros caiam para níveis inatingíveis, mesmo após sessões de jogo prolongadas
Witcher 3 FPS Chart
| baixo | média | alto | ultra | |
|---|---|---|---|---|
| GTA V (2015) | 172 | 167 | 149 | 78.6 |
| The Witcher 3 (2015) | 281 | 221 | 125 | 81.4 |
| Dota 2 Reborn (2015) | 138.8 | 127.8 | 119.3 | 117.6 |
| Final Fantasy XV Benchmark (2018) | 157 | 113 | 85.2 | |
| X-Plane 11.11 (2018) | 95 | 86.3 | 71.3 | |
| Far Cry 5 (2018) | 125 | 111 | 106 | 99 |
| Strange Brigade (2018) | 353 | 225 | 180 | 155 |
| Far Cry New Dawn (2019) | 107 | 96 | 94 | 86 |
| Metro Exodus (2019) | 151 | 104 | 79.8 | 62.3 |
| Borderlands 3 (2019) | 116 | 102 | 90.3 | 74.3 |
| F1 2020 (2020) | 239 | 204 | 193 | 142 |
| F1 2021 (2021) | 257 | 233 | 198 | 107 |
| Far Cry 6 (2021) | 102 | 90.8 | 81.2 | 59.8 |
Emissões
Ruído do sistema
Para laptops de jogos, o nível de ruído da solução de resfriamento é muitas vezes um grande problema. As características de alto desempenho são frequentemente acompanhadas por um sistema ruidoso. O Lenovo Legioin 5 17 atinge um bom equilíbrio. A solução de resfriamento, que consiste de três tubos de calor e dois ventiladores, é eficaz e relativamente silenciosa na maioria dos casos. Enquanto ocioso, o dispositivo é muitas vezes completamente silencioso. Com 37,5 dB(A), o Lenovo Legion 5 17 é um dos laptops mais silenciosos para jogos. Na pior das hipóteses, medimos até 51 dB(A) durante nosso teste de estresse
Barulho
| Ocioso |
| 25 / 25 / 30.5 dB |
| Carga |
| 37.5 / 51 dB |
 | ||
30 dB silencioso 40 dB(A) audível 50 dB(A) ruidosamente alto |
||
min: | ||
| Lenovo Legion 5 17ACH6H-82JY0003GE GeForce RTX 3060 Laptop GPU, R5 5600H, Samsung PM991a MZALQ512HBLU | Schenker XMG Core 17 (Early 2021) GeForce RTX 3060 Laptop GPU, i7-10870H, Samsung SSD 970 EVO Plus 1TB | Asus TUF Gaming F17 FX706HM GeForce RTX 3060 Laptop GPU, i9-11900H, SK Hynix HFM001TD3JX013N | MSI Katana GF76 11UE GeForce RTX 3060 Laptop GPU, i7-11800H, Kingston OM8PCP3512F-AB | Schenker XMG Apex 17 M21 GeForce RTX 3070 Laptop GPU, R7 5800H, Samsung SSD 970 EVO Plus 1TB | Gigabyte A7 X1 GeForce RTX 3070 Laptop GPU, R9 5900HX, ESR512GTLCG-EAC-4 | |
|---|---|---|---|---|---|---|
| Noise | -19% | -10% | -23% | -14% | -16% | |
| desligado / ambiente * (dB) | 25 | 25 -0% | 25 -0% | 25 -0% | 25 -0% | 24 4% |
| Idle Minimum * (dB) | 25 | 30 -20% | 26 -4% | 33 -32% | 25 -0% | 25 -0% |
| Idle Average * (dB) | 25 | 32 -28% | 31 -24% | 34 -36% | 28 -12% | 29 -16% |
| Idle Maximum * (dB) | 30.5 | 36 -18% | 33 -8% | 35 -15% | 31 -2% | 35 -15% |
| Load Average * (dB) | 37.5 | 53 -41% | 48 -28% | 53 -41% | 57 -52% | 58 -55% |
| Load Maximum * (dB) | 51 | 54 -6% | 49 4% | 57 -12% | 59 -16% | 59 -16% |
| Witcher 3 ultra * (dB) | 51 | 47 | 49 | 57 | 57 |
* ... menor é melhor
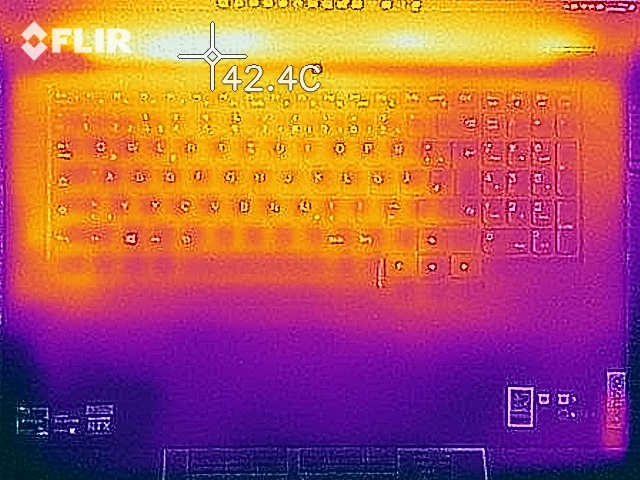
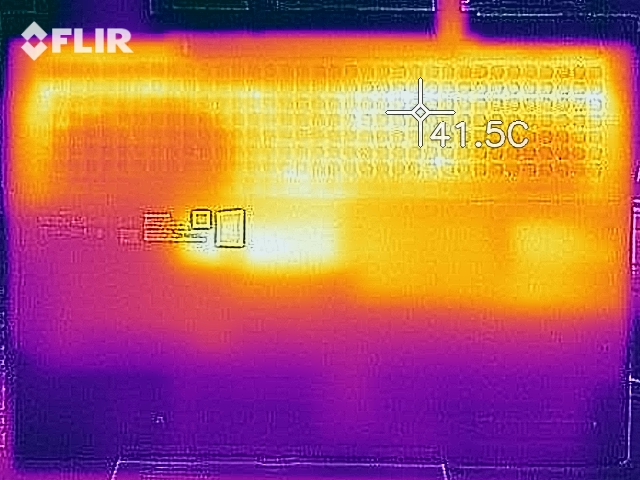
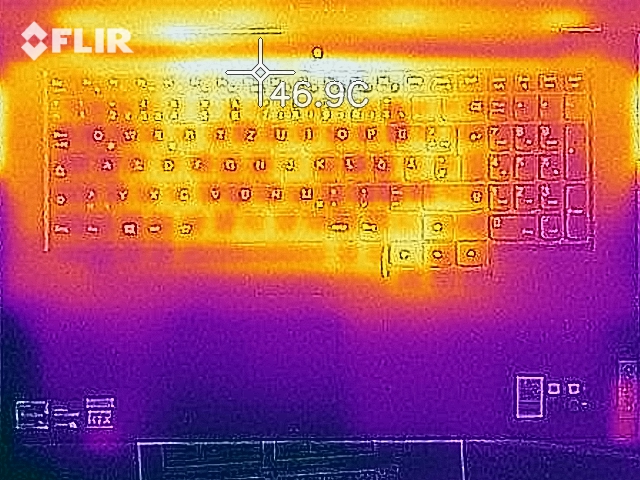
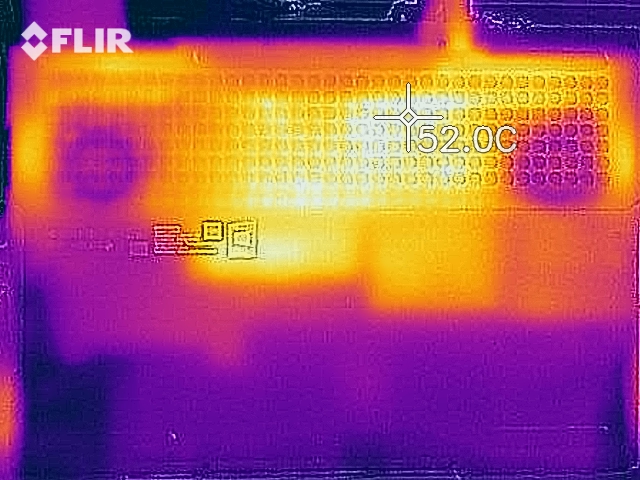
Temperatura
A Lenovo Legion 5 17 lida muito bem com seu desenvolvimento térmico de modo geral. Com uma temperatura máxima de 51 °C (123,8 °F), as temperaturas de superfície também não são problemáticas. Temos visto muito pior nesta categoria. Ainda assim, desaconselhamos o uso do dispositivo em suas pernas, já que isso pode afetar negativamente o fluxo de ar. O SoC e a GPU atingem 92,5 °C (198,5 °F) e 73,3 °C (163,94 °F), respectivamente, durante nosso teste de estresse. Todos estes valores são não críticos, o que explica porque a Lenovo Legion 5 17 não teve que estrangular durante nossos cenários de carga (por exemplo: Cinebench R15 multi loop e The Witcher 3)
(±) A temperatura máxima no lado superior é 42.2 °C / 108 F, em comparação com a média de 40.4 °C / 105 F , variando de 21.2 a 68.8 °C para a classe Gaming.
(-) A parte inferior aquece até um máximo de 50.9 °C / 124 F, em comparação com a média de 43.2 °C / 110 F
(+) Em uso inativo, a temperatura média para o lado superior é 29.1 °C / 84 F, em comparação com a média do dispositivo de 33.9 °C / ### class_avg_f### F.
(+) Os apoios para as mãos e o touchpad são mais frios que a temperatura da pele, com um máximo de 25.6 °C / 78.1 F e, portanto, são frios ao toque.
(+) A temperatura média da área do apoio para as mãos de dispositivos semelhantes foi 28.8 °C / 83.8 F (+3.2 °C / 5.7 F).
| Lenovo Legion 5 17ACH6H-82JY0003GE AMD Ryzen 5 5600H, NVIDIA GeForce RTX 3060 Laptop GPU | Schenker XMG Core 17 (Early 2021) Intel Core i7-10870H, NVIDIA GeForce RTX 3060 Laptop GPU | Asus TUF Gaming F17 FX706HM Intel Core i9-11900H, NVIDIA GeForce RTX 3060 Laptop GPU | MSI Katana GF76 11UE Intel Core i7-11800H, NVIDIA GeForce RTX 3060 Laptop GPU | Schenker XMG Apex 17 M21 AMD Ryzen 7 5800H, NVIDIA GeForce RTX 3070 Laptop GPU | Gigabyte A7 X1 AMD Ryzen 9 5900HX, NVIDIA GeForce RTX 3070 Laptop GPU | |
|---|---|---|---|---|---|---|
| Heat | -1% | -22% | -2% | 6% | 7% | |
| Maximum Upper Side * (°C) | 42.2 | 44 -4% | 58.5 -39% | 51 -21% | 45 -7% | 44 -4% |
| Maximum Bottom * (°C) | 50.9 | 50 2% | 58.5 -15% | 52 -2% | 49 4% | 49 4% |
| Idle Upper Side * (°C) | 34.3 | 30 13% | 38 -11% | 32 7% | 27 21% | 27 21% |
| Idle Bottom * (°C) | 32 | 36 -13% | 39 -22% | 29 9% | 30 6% | 30 6% |
* ... menor é melhor
Oradores
O sistema vem com dois alto-falantes estéreo. O som é equilibrado em geral e não há uma falta completa de graves. Infelizmente, a Lenovo decidiu não equipar o Legion 5 17 com um subwoofer dedicado. Para uma experiência de áudio ideal, recomendamos um fone de ouvido. Modelos apropriados podem ser conectados através da tomada de áudio de 3,5 mm ou USB
Lenovo Legion 5 17ACH6H-82JY0003GE análise de áudio
(±) | o volume do alto-falante é médio, mas bom (###valor### dB)
Graves 100 - 315Hz
(-) | quase nenhum baixo - em média 19.1% menor que a mediana
(±) | a linearidade dos graves é média (13.8% delta para a frequência anterior)
Médios 400 - 2.000 Hz
(+) | médios equilibrados - apenas 3% longe da mediana
(+) | médios são lineares (5% delta para frequência anterior)
Altos 2 - 16 kHz
(+) | agudos equilibrados - apenas 4.8% longe da mediana
(+) | os máximos são lineares (6.7% delta da frequência anterior)
Geral 100 - 16.000 Hz
(±) | a linearidade do som geral é média (15.8% diferença em relação à mediana)
Comparado com a mesma classe
» 37% de todos os dispositivos testados nesta classe foram melhores, 7% semelhantes, 56% piores
» O melhor teve um delta de 6%, a média foi 18%, o pior foi 132%
Comparado com todos os dispositivos testados
» 24% de todos os dispositivos testados foram melhores, 5% semelhantes, 70% piores
» O melhor teve um delta de 4%, a média foi 23%, o pior foi 134%
Gigabyte A7 X1 análise de áudio
(+) | os alto-falantes podem tocar relativamente alto (###valor### dB)
Graves 100 - 315Hz
(-) | quase nenhum baixo - em média 30.3% menor que a mediana
(±) | a linearidade dos graves é média (13.4% delta para a frequência anterior)
Médios 400 - 2.000 Hz
(±) | médios mais altos - em média 6.8% maior que a mediana
(±) | a linearidade dos médios é média (11.3% delta para frequência anterior)
Altos 2 - 16 kHz
(+) | agudos equilibrados - apenas 4.4% longe da mediana
(+) | os máximos são lineares (5.4% delta da frequência anterior)
Geral 100 - 16.000 Hz
(±) | a linearidade do som geral é média (23.5% diferença em relação à mediana)
Comparado com a mesma classe
» 85% de todos os dispositivos testados nesta classe foram melhores, 5% semelhantes, 10% piores
» O melhor teve um delta de 6%, a média foi 18%, o pior foi 132%
Comparado com todos os dispositivos testados
» 70% de todos os dispositivos testados foram melhores, 6% semelhantes, 24% piores
» O melhor teve um delta de 4%, a média foi 23%, o pior foi 134%
Gestão de energia
Consumo de energia
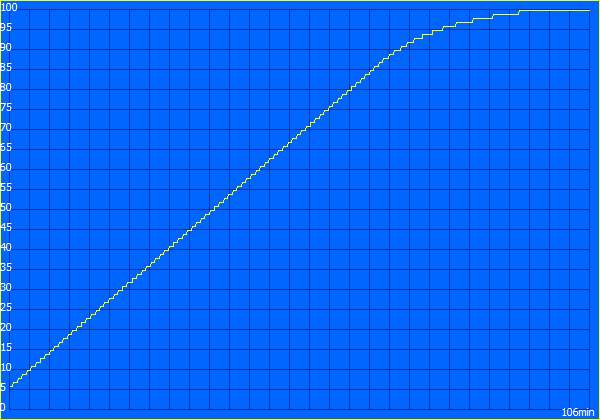
O consumo de energia da Lenovo Legion 5 17 durante ociosidade poderia ter sido significativamente melhor. Isto acaba custando-lhe pontos importantes em nosso ranking. Um bom exemplo para esta categoria é a Asus TUF Gaming F17. Em contraste, o Legion 5 17 é agradavelmente econômico sob carga e enquanto joga. Medimos um consumo máximo de 170 watts. Isto faz com que o adaptador AC de 300 watts pareça quase excessivo
| desligado | |
| Ocioso | |
| Carga |
|
Key:
min: | |
| Lenovo Legion 5 17ACH6H-82JY0003GE R5 5600H, GeForce RTX 3060 Laptop GPU, Samsung PM991a MZALQ512HBLU, IPS, 1920x1080, 17.3" | Schenker XMG Core 17 (Early 2021) i7-10870H, GeForce RTX 3060 Laptop GPU, Samsung SSD 970 EVO Plus 1TB, IPS, 2560x1440, 17.3" | Asus TUF Gaming F17 FX706HM i9-11900H, GeForce RTX 3060 Laptop GPU, SK Hynix HFM001TD3JX013N, IPS, 1920x1080, 17.3" | MSI Katana GF76 11UE i7-11800H, GeForce RTX 3060 Laptop GPU, Kingston OM8PCP3512F-AB, IPS, 1920x1080, 17.3" | Schenker XMG Apex 17 M21 R7 5800H, GeForce RTX 3070 Laptop GPU, Samsung SSD 970 EVO Plus 1TB, IPS, 1920x1080, 17.3" | Gigabyte A7 X1 R9 5900HX, GeForce RTX 3070 Laptop GPU, ESR512GTLCG-EAC-4, IPS, 1920x1080, 17.3" | Média NVIDIA GeForce RTX 3060 Laptop GPU | Média da turma Gaming | |
|---|---|---|---|---|---|---|---|---|
| Power Consumption | -3% | 19% | 16% | 2% | -1% | 13% | -3% | |
| Idle Minimum * (Watt) | 15.6 | 13 17% | 10.3 34% | 9 42% | 10 36% | 12 23% | 10.4 ? 33% | 13 ? 17% |
| Idle Average * (Watt) | 20.7 | 16 23% | 13.1 37% | 13 37% | 14 32% | 14 32% | 14.5 ? 30% | 19 ? 8% |
| Idle Maximum * (Watt) | 22.9 | 29 -27% | 14.1 38% | 20 13% | 20 13% | 19 17% | 21.4 ? 7% | 24.6 ? -7% |
| Load Average * (Watt) | 134 | 100 25% | 110 18% | 102 24% | 112 16% | 118 12% | 109.3 ? 18% | 110.7 ? 17% |
| Witcher 3 ultra * (Watt) | 135 | 173 -28% | 138 -2% | 149 -10% | 202 -50% | 205 -52% | ||
| Load Maximum * (Watt) | 170 | 213 -25% | 190 -12% | 187 -10% | 231 -36% | 229 -35% | 206 ? -21% | 259 ? -52% |
* ... menor é melhor
Energy Consumption Witcher 3 / Stress test
Energy Consumption external Monitor
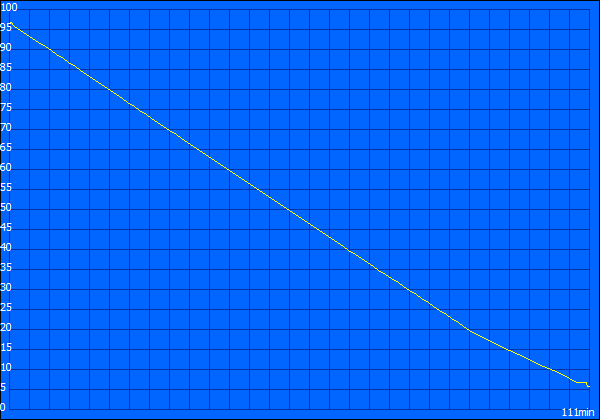
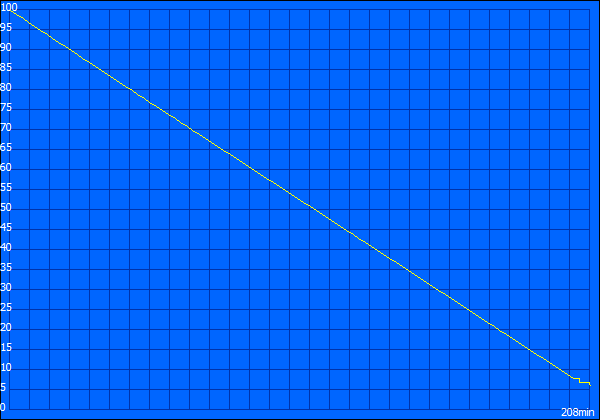
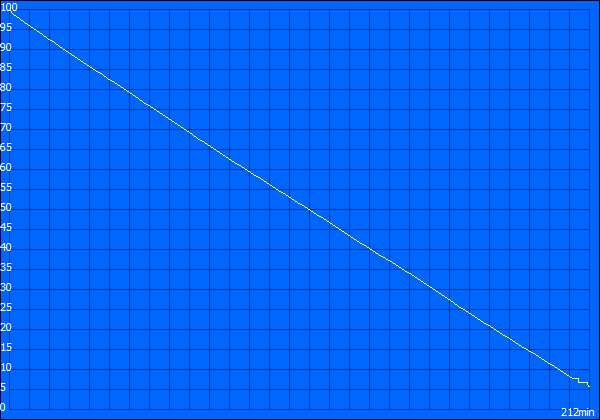
Vida útil da bateria
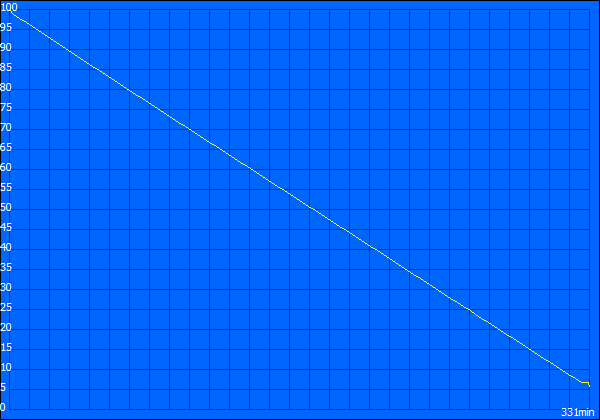
Com sua bateria fixa de 80-Wh, a Lenovo Legion 5 17 dura apenas 4,5 horas em nosso teste Wi-Fi. No entanto, vários concorrentes também não se saem muito melhor neste caso. Aqui, apenas o Asus TUF Gaming F17 é capaz de se diferenciar com uma vida útil significativamente mais longa da bateria. Como a Lenovo Legion 5 17 está equipada com a segunda maior bateria em nossa comparação, ainda esperamos mais. Pelo menos a duração da bateria é suficiente para uma noite de cinema quando totalmente carregada.
Deve-se notar que a performance da CPU e da GPU é ligeiramente acelerada no modo de bateria. No entanto, este é o caso de quase todos os laptops de jogos atuais

| Lenovo Legion 5 17ACH6H-82JY0003GE R5 5600H, GeForce RTX 3060 Laptop GPU, 80 Wh | Schenker XMG Core 17 (Early 2021) i7-10870H, GeForce RTX 3060 Laptop GPU, 62 Wh | Asus TUF Gaming F17 FX706HM i9-11900H, GeForce RTX 3060 Laptop GPU, 90 Wh | MSI Katana GF76 11UE i7-11800H, GeForce RTX 3060 Laptop GPU, 53 Wh | Schenker XMG Apex 17 M21 R7 5800H, GeForce RTX 3070 Laptop GPU, 49 Wh | Gigabyte A7 X1 R9 5900HX, GeForce RTX 3070 Laptop GPU, 48.96 Wh | Média da turma Gaming | |
|---|---|---|---|---|---|---|---|
| Duração da bateria | 13% | 83% | -13% | -3% | -15% | 57% | |
| Reader / Idle (h) | 5.5 | 7.7 40% | 4.8 -13% | 7 27% | 8.27 ? 50% | ||
| H.264 (h) | 3.5 | 4.7 34% | 8.5 143% | 3.9 11% | 8.32 ? 138% | ||
| WiFi v1.3 (h) | 4.4 | 4.9 11% | 7.6 73% | 3.7 -16% | 4.9 11% | 4.7 7% | 7.11 ? 62% |
| Load (h) | 1.9 | 1.3 -32% | 2.5 32% | 1.3 -32% | 1 -47% | 1.2 -37% | 1.502 ? -21% |
| Witcher 3 ultra (h) | 0.8 |
Pro
Contra
Veredicto - Sistema de jogo sólido sem grandes fraquezas
O Lenovo Legion 5 17 é um laptop para jogos da geração atual de 17 polegadas e equipado com a mais recente CPU AMD e uma poderosa GPU, que consegue atingir seu potencial máximo. O AMD Ryzen 5 5600H é uma escolha muito boa para este laptop e capaz de manter seu nível de desempenho por longos períodos de tempo. Nosso modelo de teste só fica para trás consistentemente em uma comparação direta com seus concorrentes que muitas vezes estão equipados com oito núcleos e 16 roscas. Apesar disso, o Legion 5 17 deixa uma excelente impressão e é quase capaz de acompanhar um Nvidia GeForce RTX 3070 GPU móvel em padrões sintéticos graças a sua não-limitada Nvidia GeForce RTX 3060 GPU móvel. Também ficamos satisfeitos com o display de 17 polegadas, que vem pré-calibrado na ex-fábrica. Isto é algo que gostaríamos de ver mais. A taxa de atualização de 144-Hz designa claramente a Lenovo para jogos. Entretanto, ela também é bem adequada para edição de vídeo ou foto graças a seus baixos valores deltaE-2000
O Lenovo Legion 5 17 é um laptop para jogos sólido com uma CPU AMD Ryzen atualizada e um Nvidia GeForce GPU sem limitações artificiais
No geral, a Lenovo Legion 5 17 é um laptop sólido para jogos com uma grande seleção de portas. Infelizmente, falta o Thunderbolt, embora o rápido desempenho da GPU possa compensar isto. Não há realmente nenhuma fraqueza importante. Esperávamos mais vida útil da bateria, devido à grande capacidade da bateria. O tamanho e a posição do touchpad devem ser potencialmente revisados. Dito isto, o touchpad provavelmente será pouco mais do que um pensamento posterior, já que a maioria dos usuários vai conectar um mouse externo na maioria dos casos. Além disso, o sistema só produz níveis moderados de ruído sob carga. A este respeito, estamos acostumados a resultados muito piores. Aconselhamos a não ser mesquinho no que diz respeito às opções de armazenamento. Pelo menos 1 TB de armazenamento deveria ser a norma para um laptop para jogos. Felizmente, o dispositivo tem um slot para um drive secundário
Preço e Disponibilidade
No momento de escrever, o laptop está à venda diretamente da loja online da Lenovo por cerca de 1220 USD em vez de cerca de 1500 USD e listado como o modelo "premium". Entretanto, deve-se observar que a remessa levará pelo menos 2 meses
Lenovo Legion 5 17ACH6H-82JY0003GE
- 02/21/2022 v7 (old)
Sebastian Bade
Price comparison

