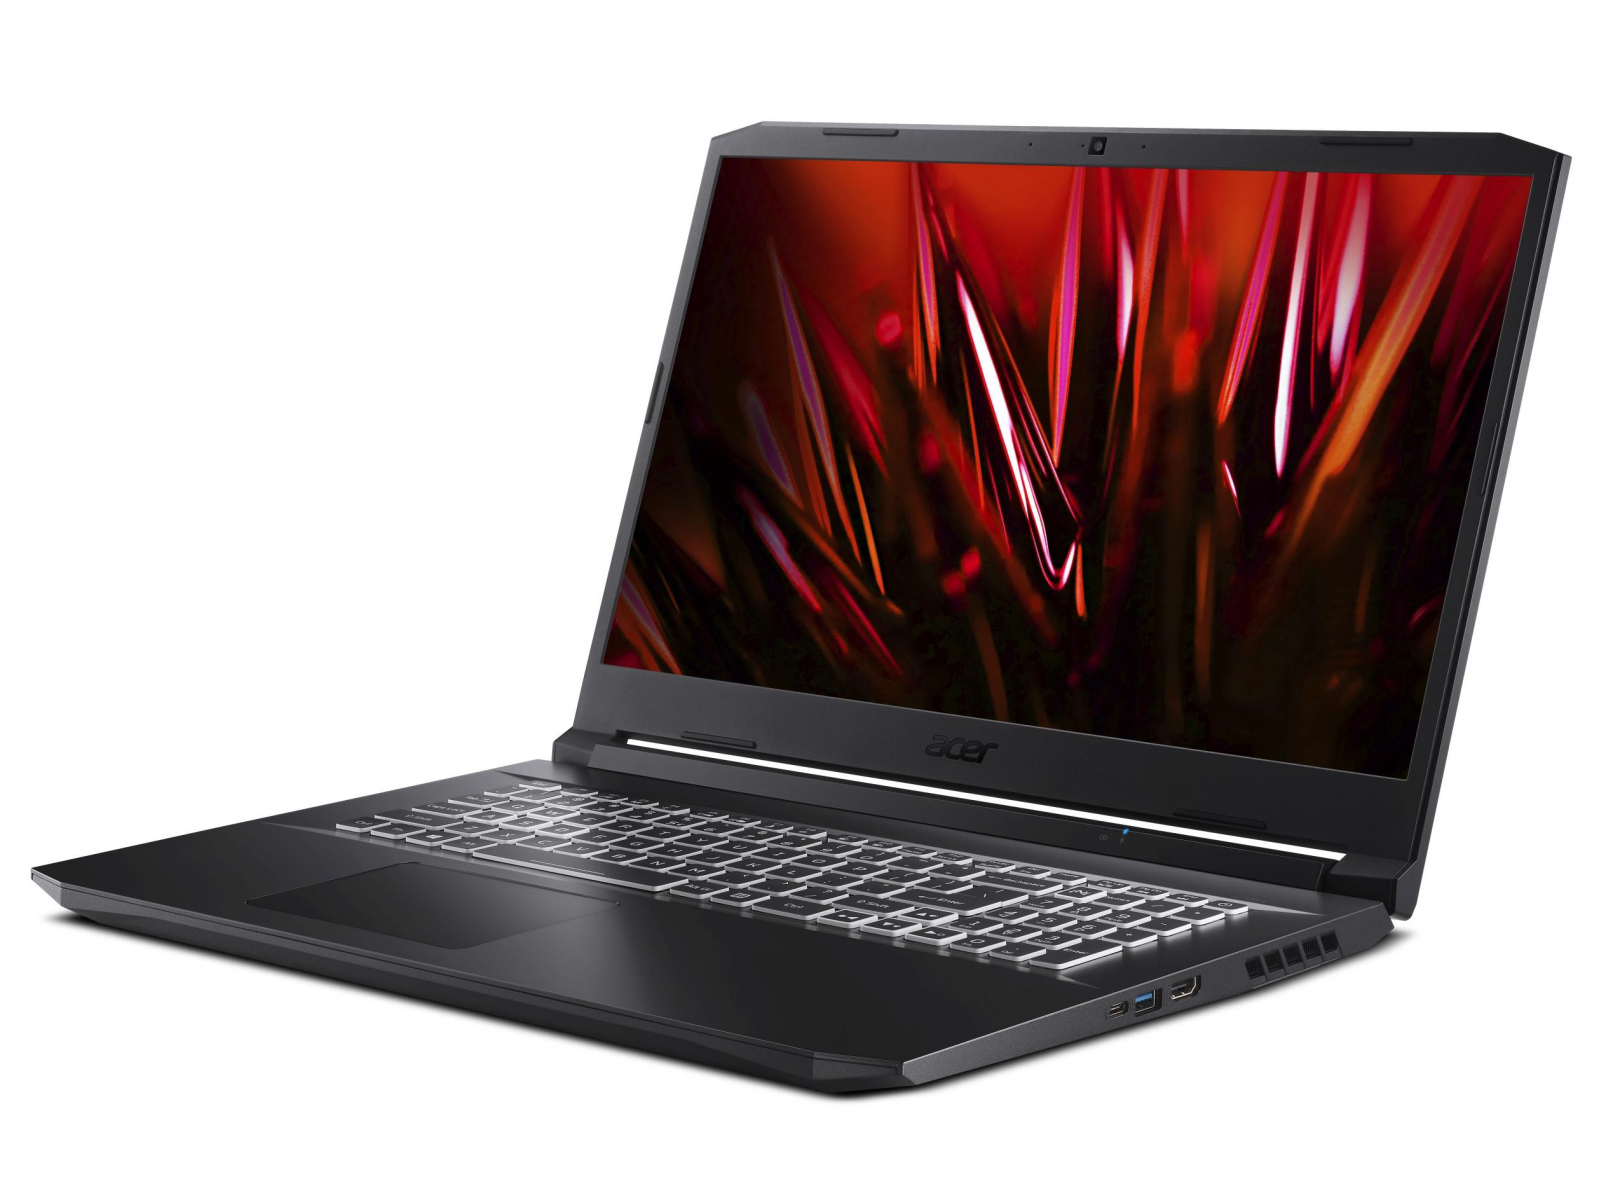
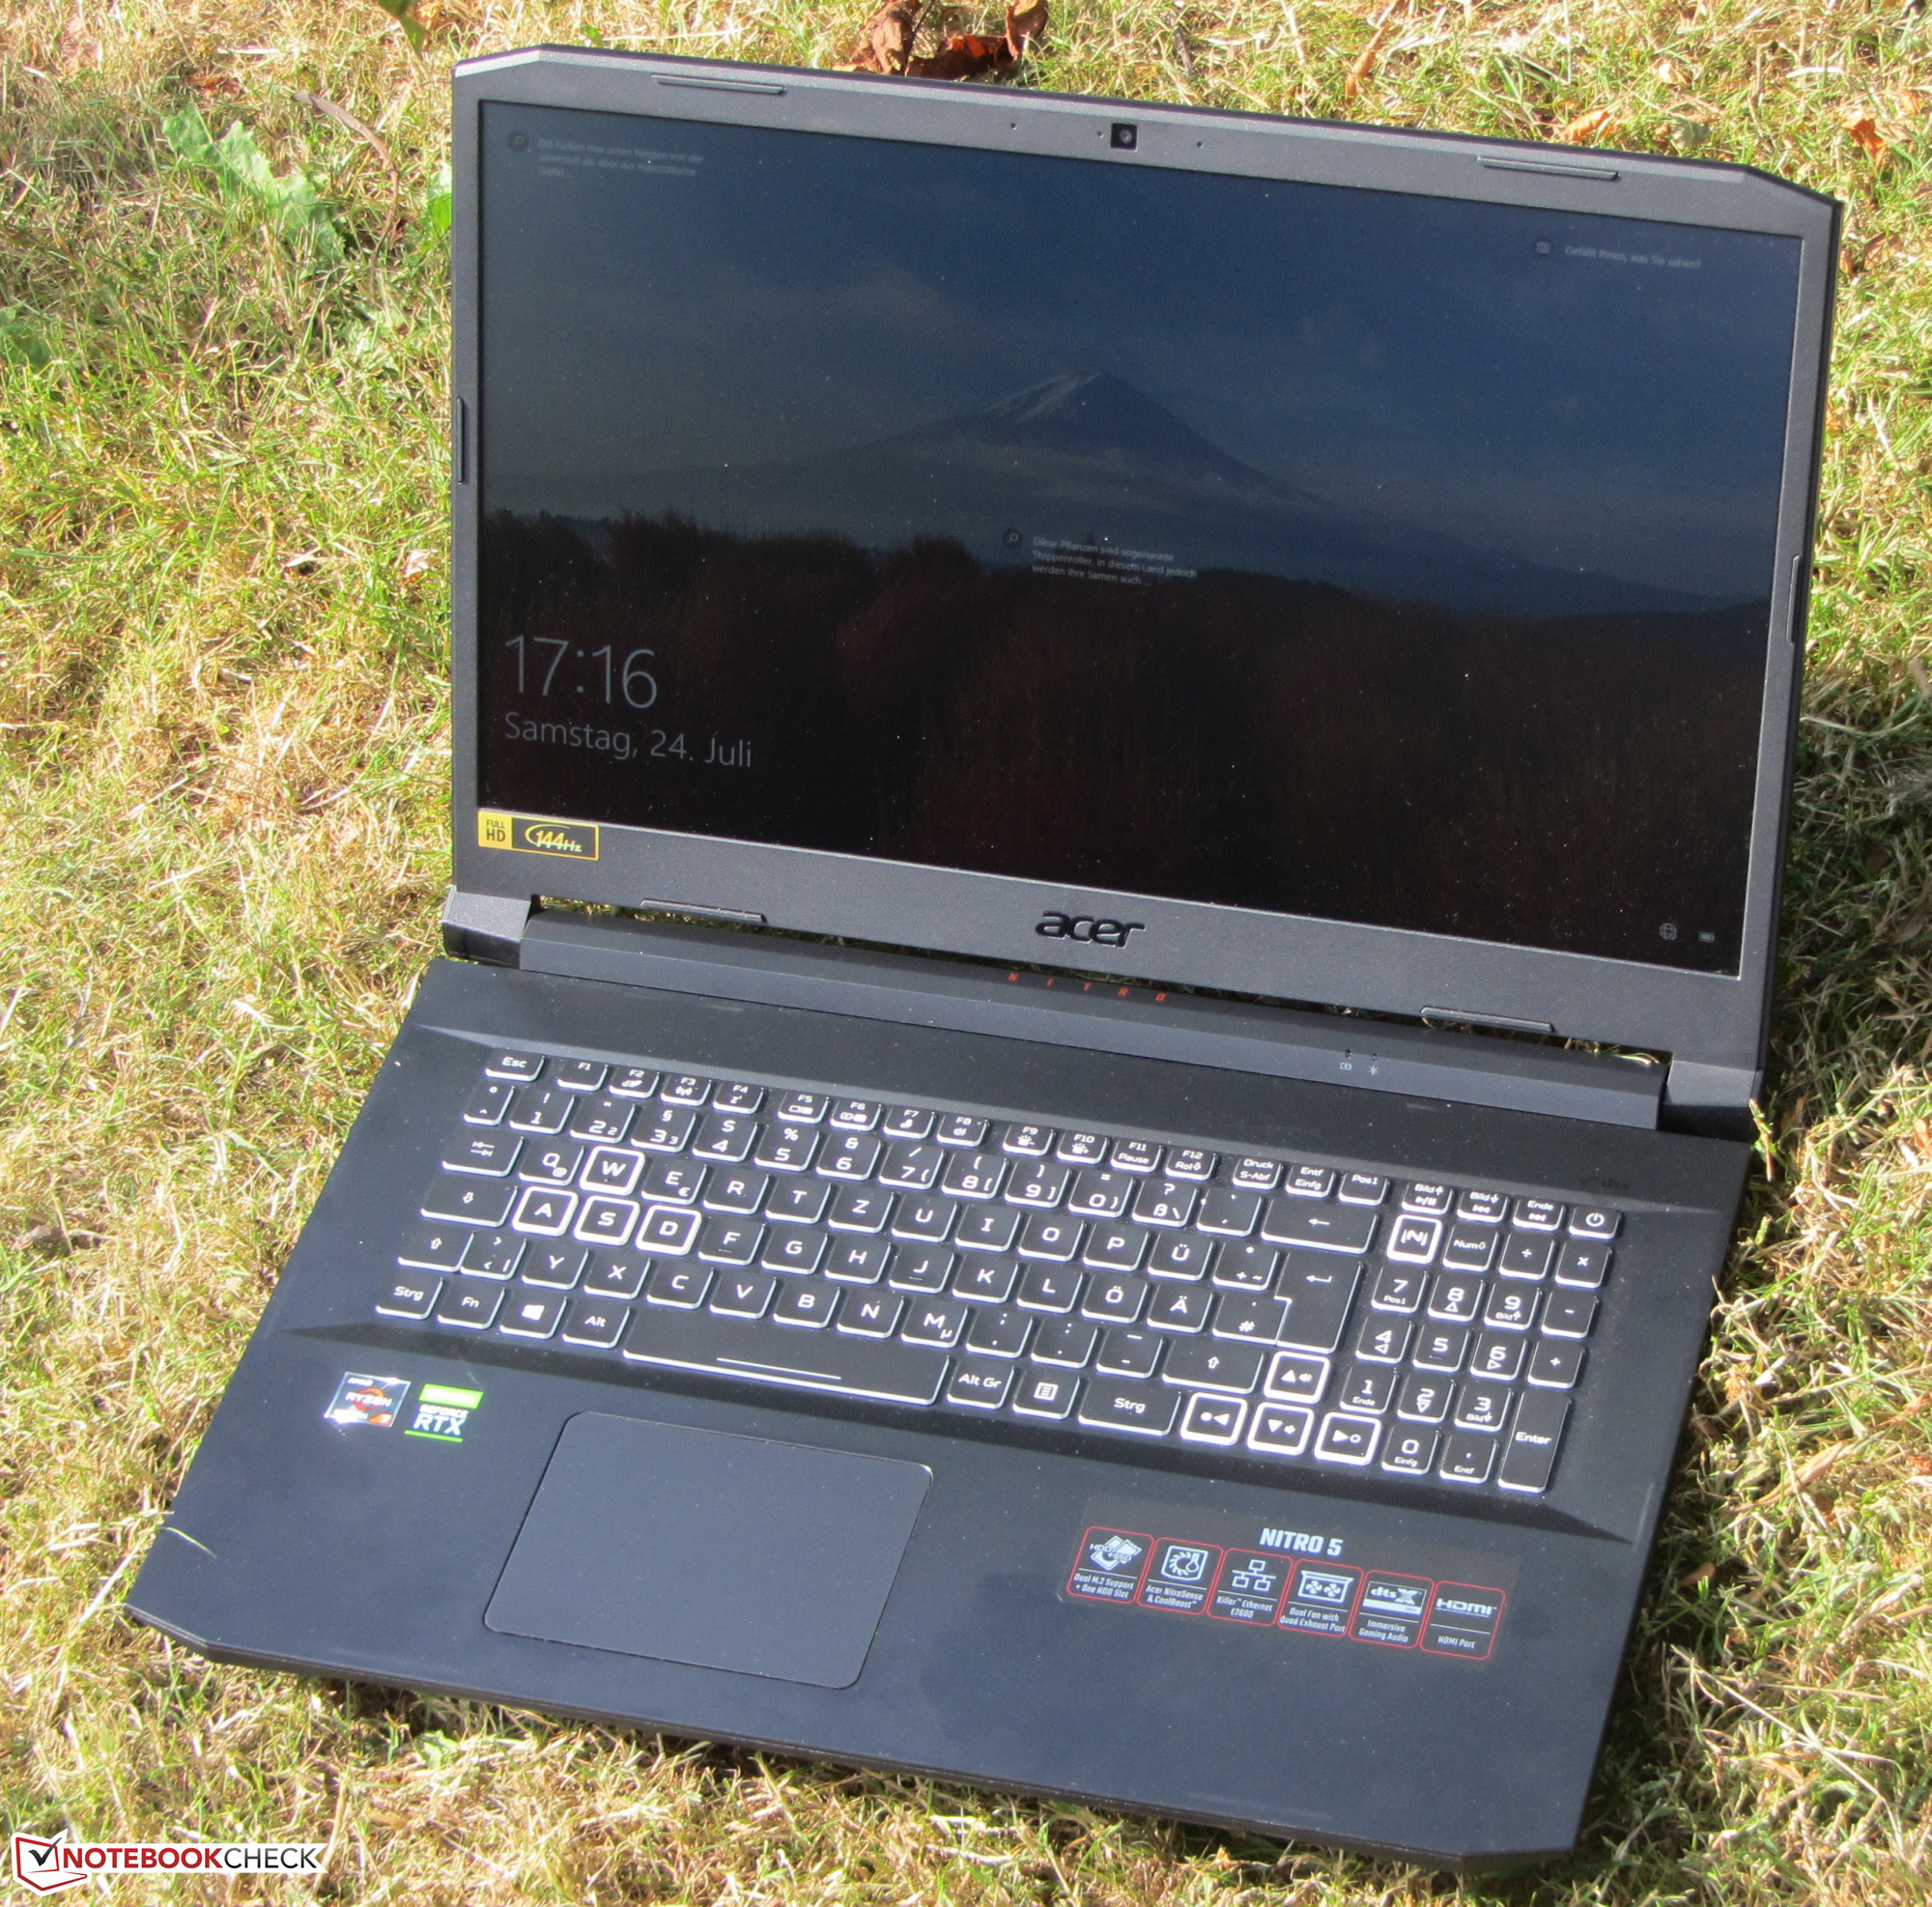
Acer Nitro 5 AN517-41 em revisão: RTX 3080 só pode se desenvolver de forma limitada

O notebook para jogos da Acer de 17,3 polegadas é alimentado por um Ryzen 7-5800HAPU e um GeForce RTX-3080 Laptop GPU. A variante de configuração que temos está disponível por pouco menos de 2.000 euros (~$2359). Os concorrentes incluem dispositivos como o Medion Erazer Beast X25o MSI GP76 Leopardo 10UGe o Schenker XMG Neo 17.
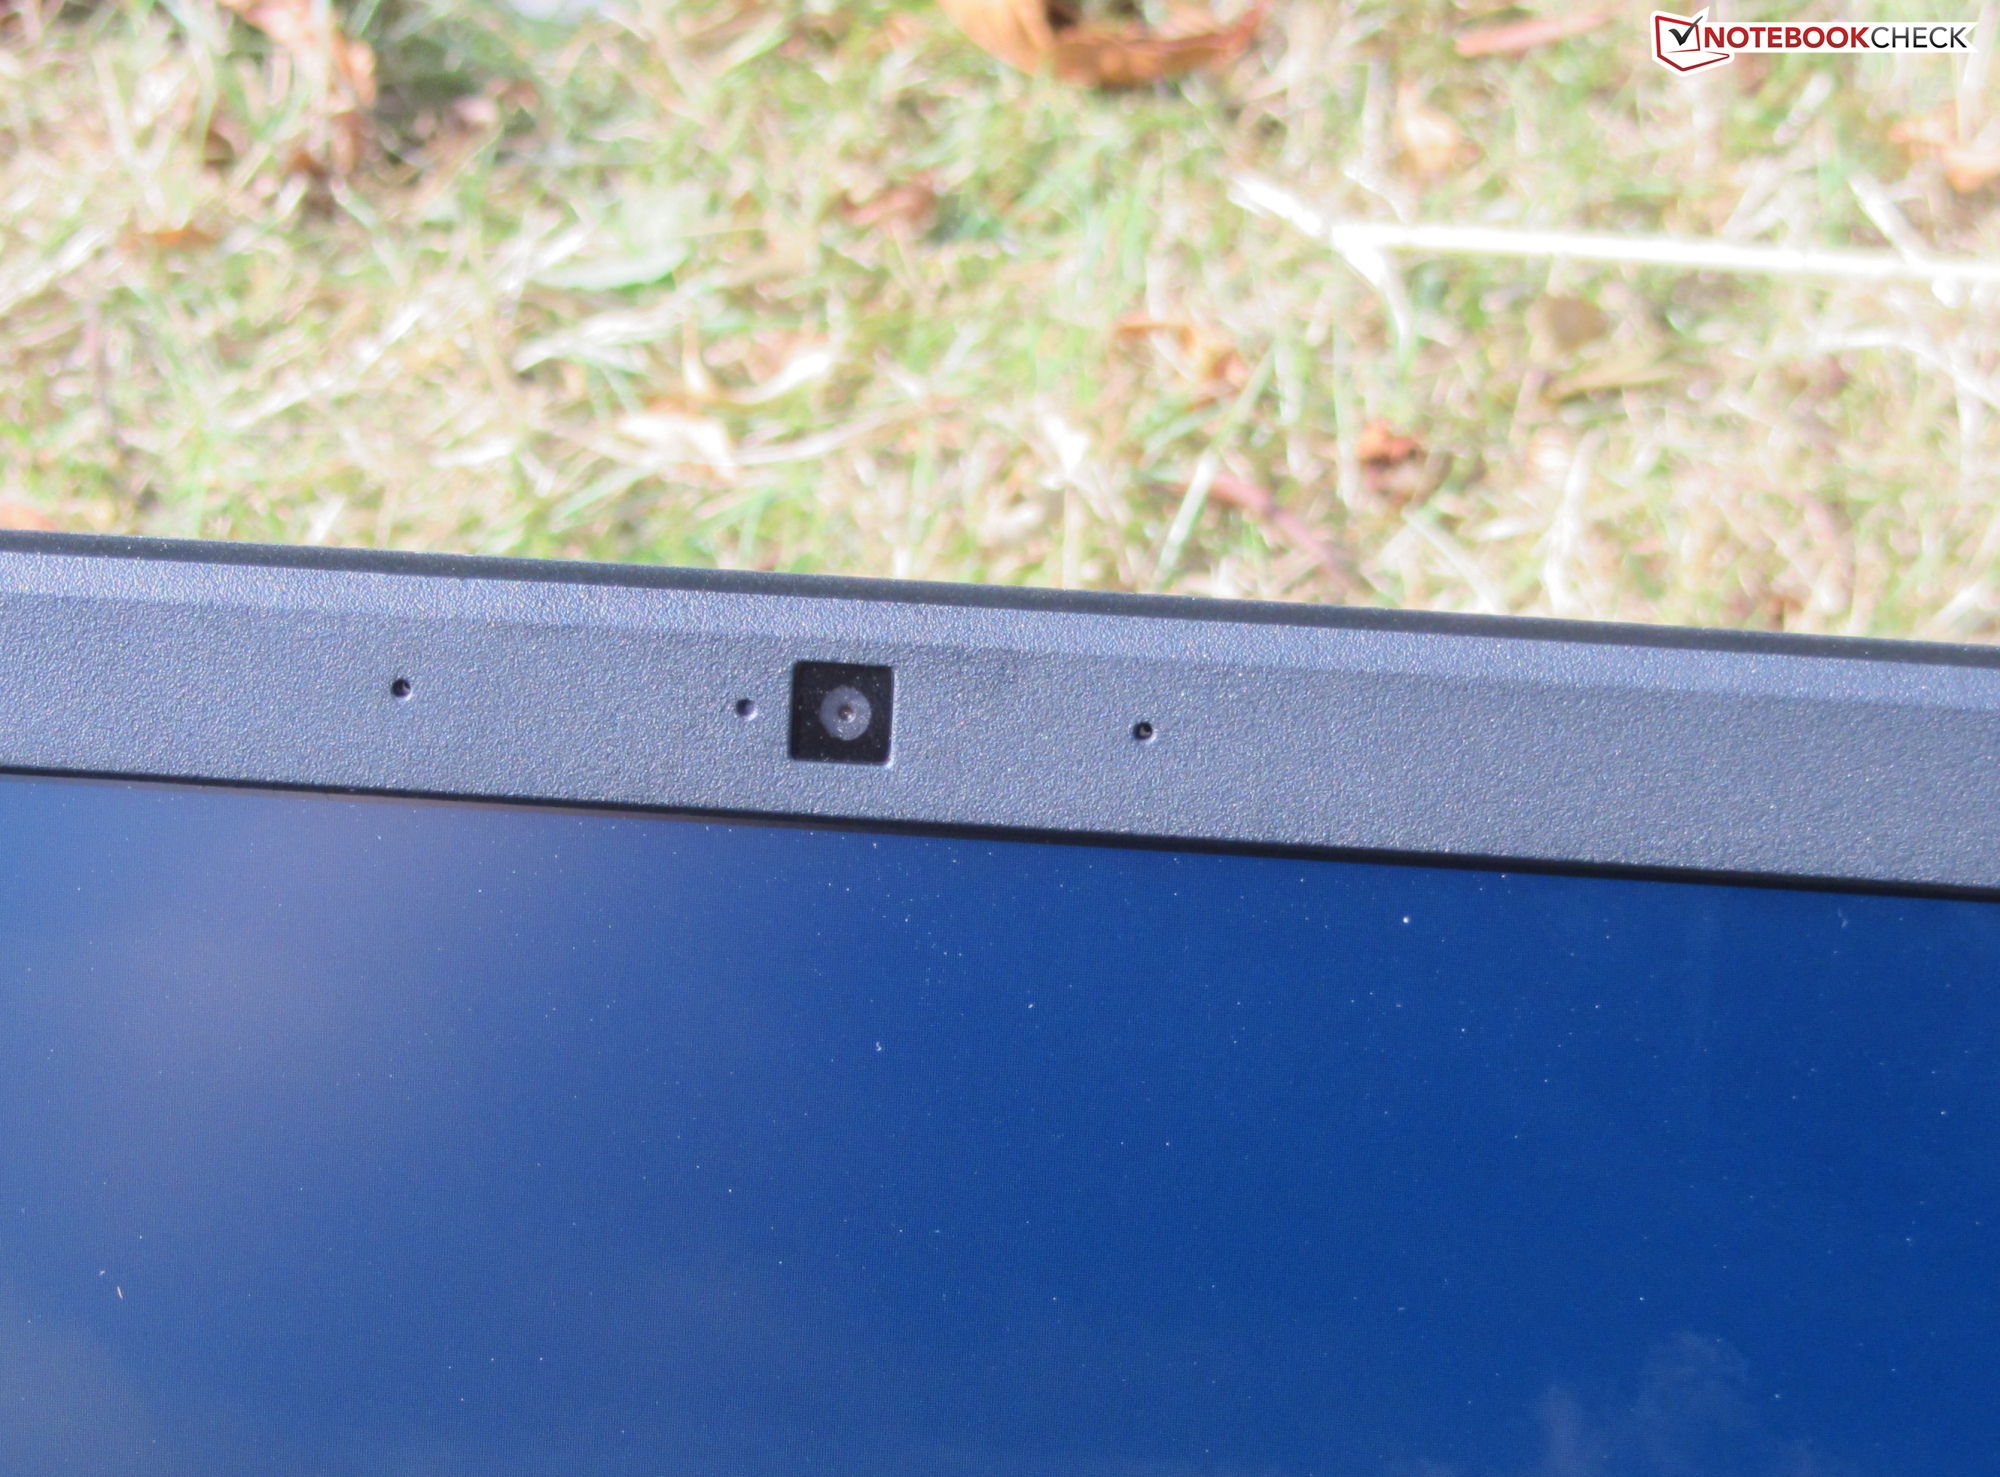
Como já testamos um modelo irmão com a mesma construção, não entraremos no caso, o equipamento, os dispositivos de entrada, os alto-falantes e a tela nesta revisão. As informações correspondentes podem ser encontradas no Revisão do RTX-3070 Nitro 5.
Possible competitors in comparison
Avaliação | Data | Modelo | Peso | Altura | Size | Resolução | Preço |
|---|---|---|---|---|---|---|---|
| 82 % v7 (old) | 08/2021 | Acer Nitro 5 AN517-41-R9S5 R7 5800H, GeForce RTX 3080 Laptop GPU | 2.7 kg | 24.9 mm | 17.30" | 1920x1080 | |
| 85.1 % v7 (old) | 03/2021 | MSI GP76 Leopard 10UG i7-10750H, GeForce RTX 3070 Laptop GPU | 2.9 kg | 26 mm | 17.30" | 1920x1080 | |
| 85.1 % v7 (old) | 01/2021 | Schenker XMG Neo 17 (Early 2021, RTX 3070, 5800H) R7 5800H, GeForce RTX 3070 Laptop GPU | 2.5 kg | 27 mm | 17.30" | 2560x1440 | |
| 85 % v7 (old) | 07/2021 | Medion Erazer Beast X25 R9 5900HX, GeForce RTX 3080 Laptop GPU | 2.3 kg | 23 mm | 17.30" | 1920x1080 |
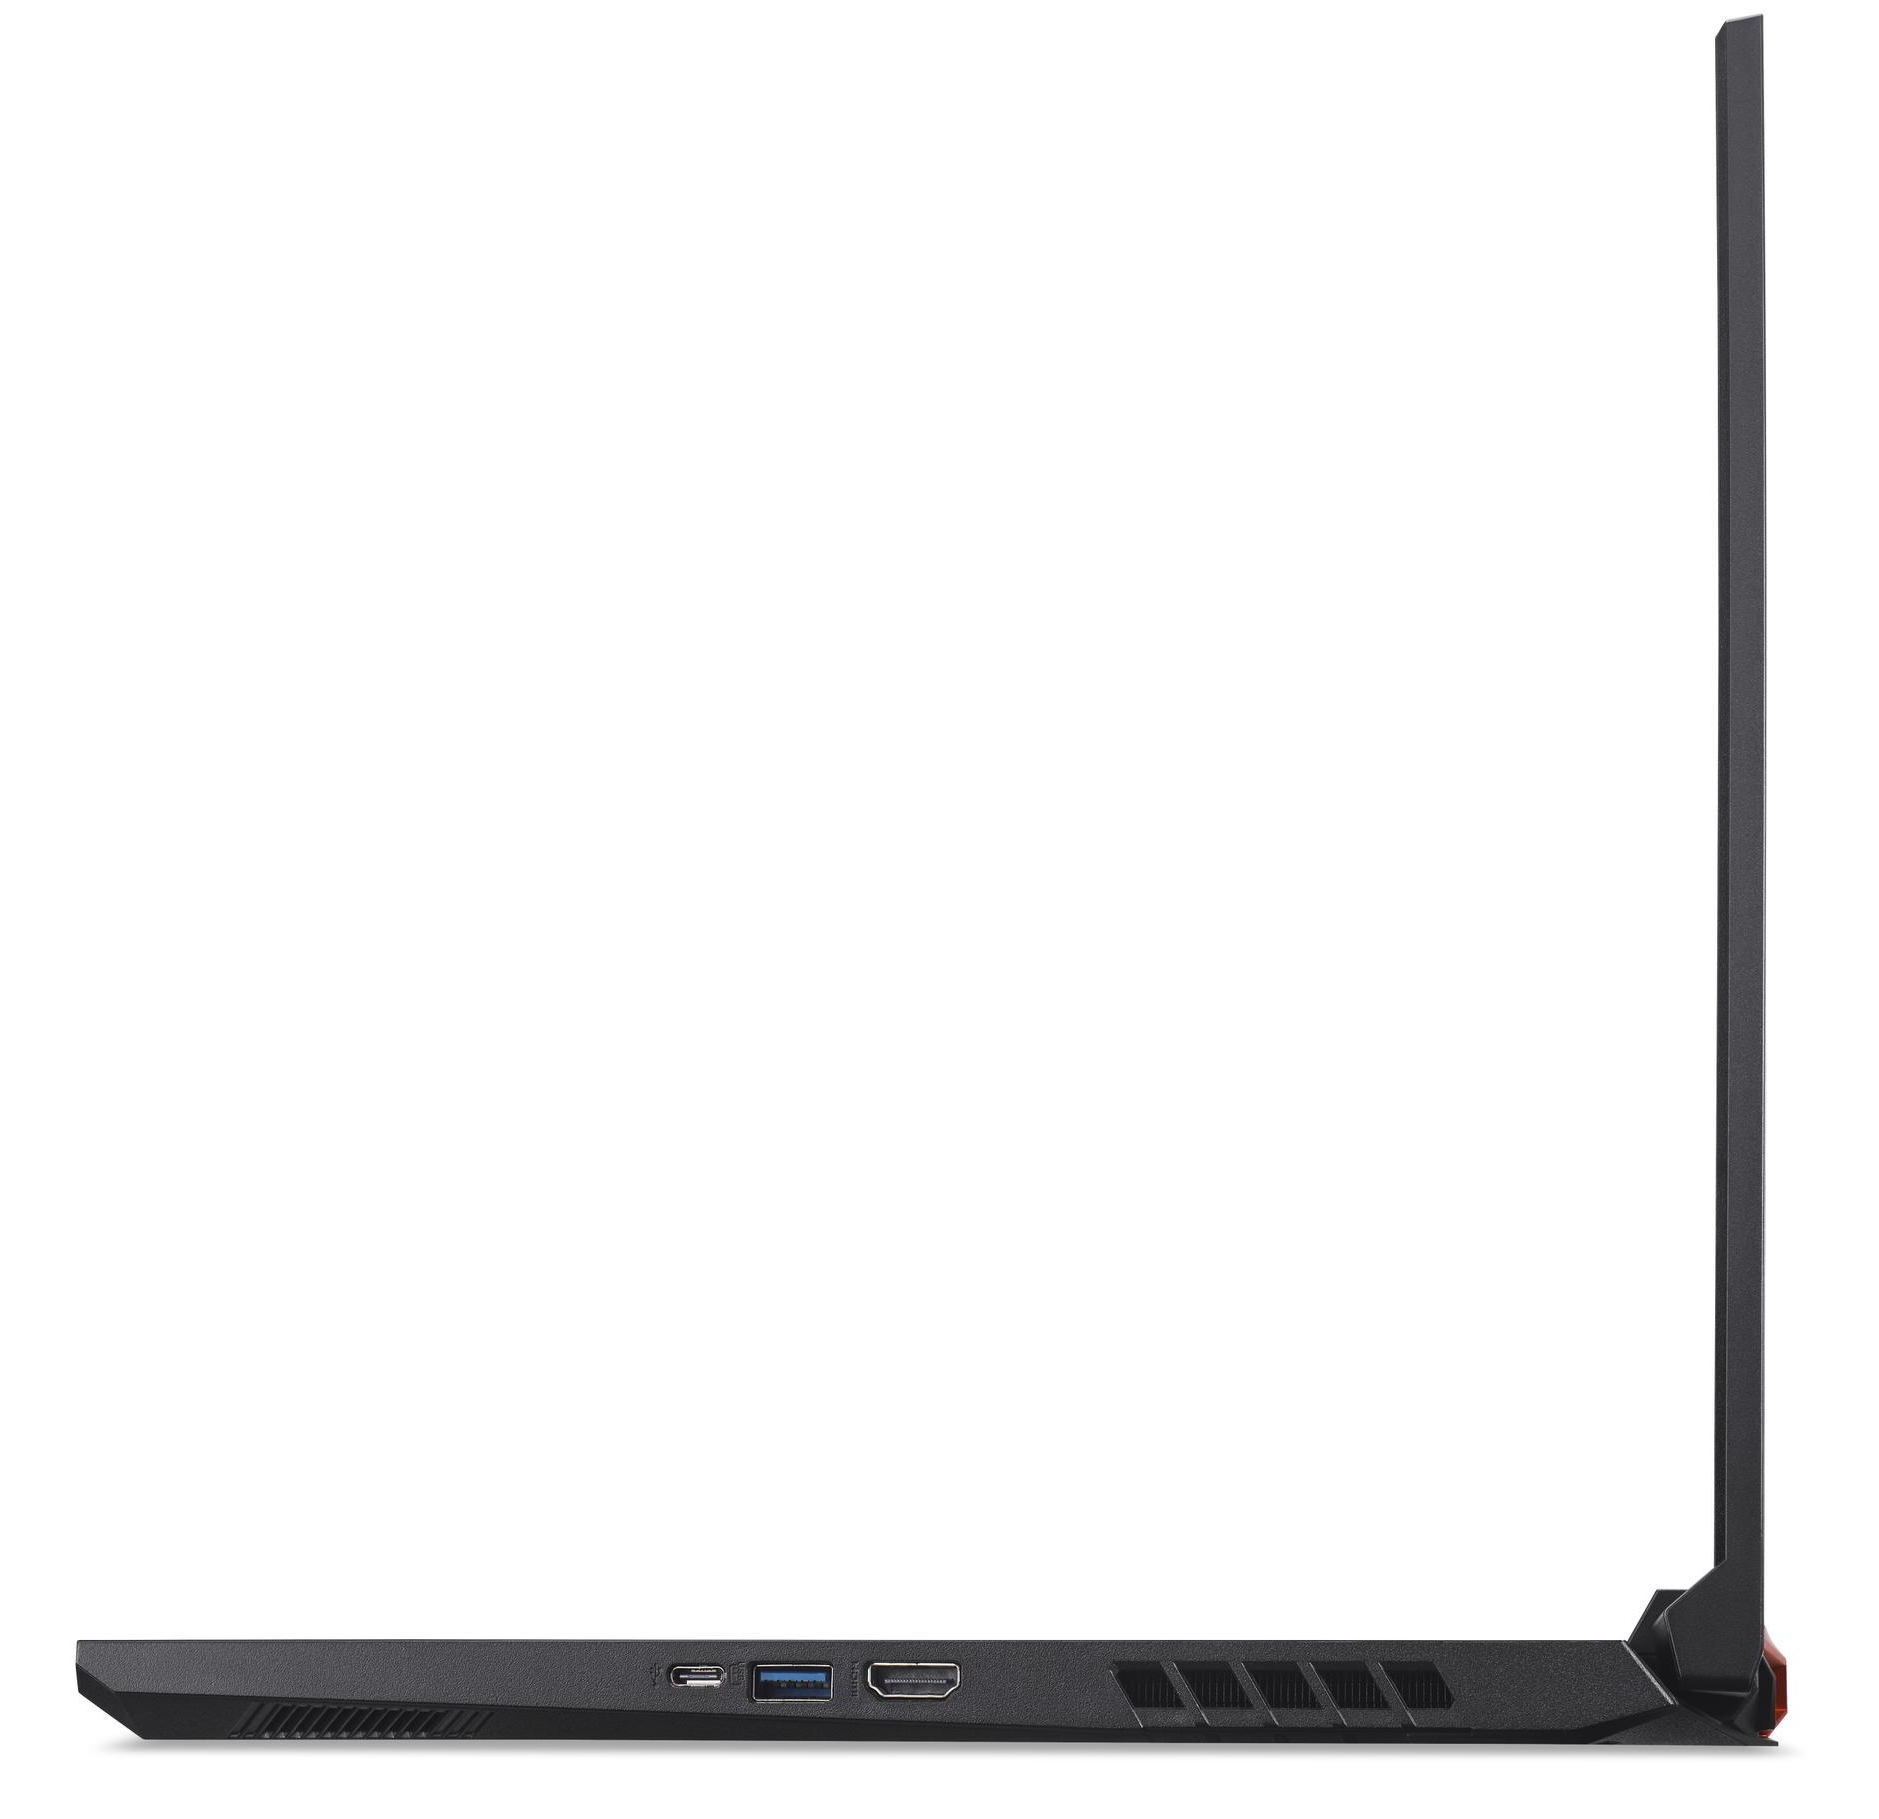
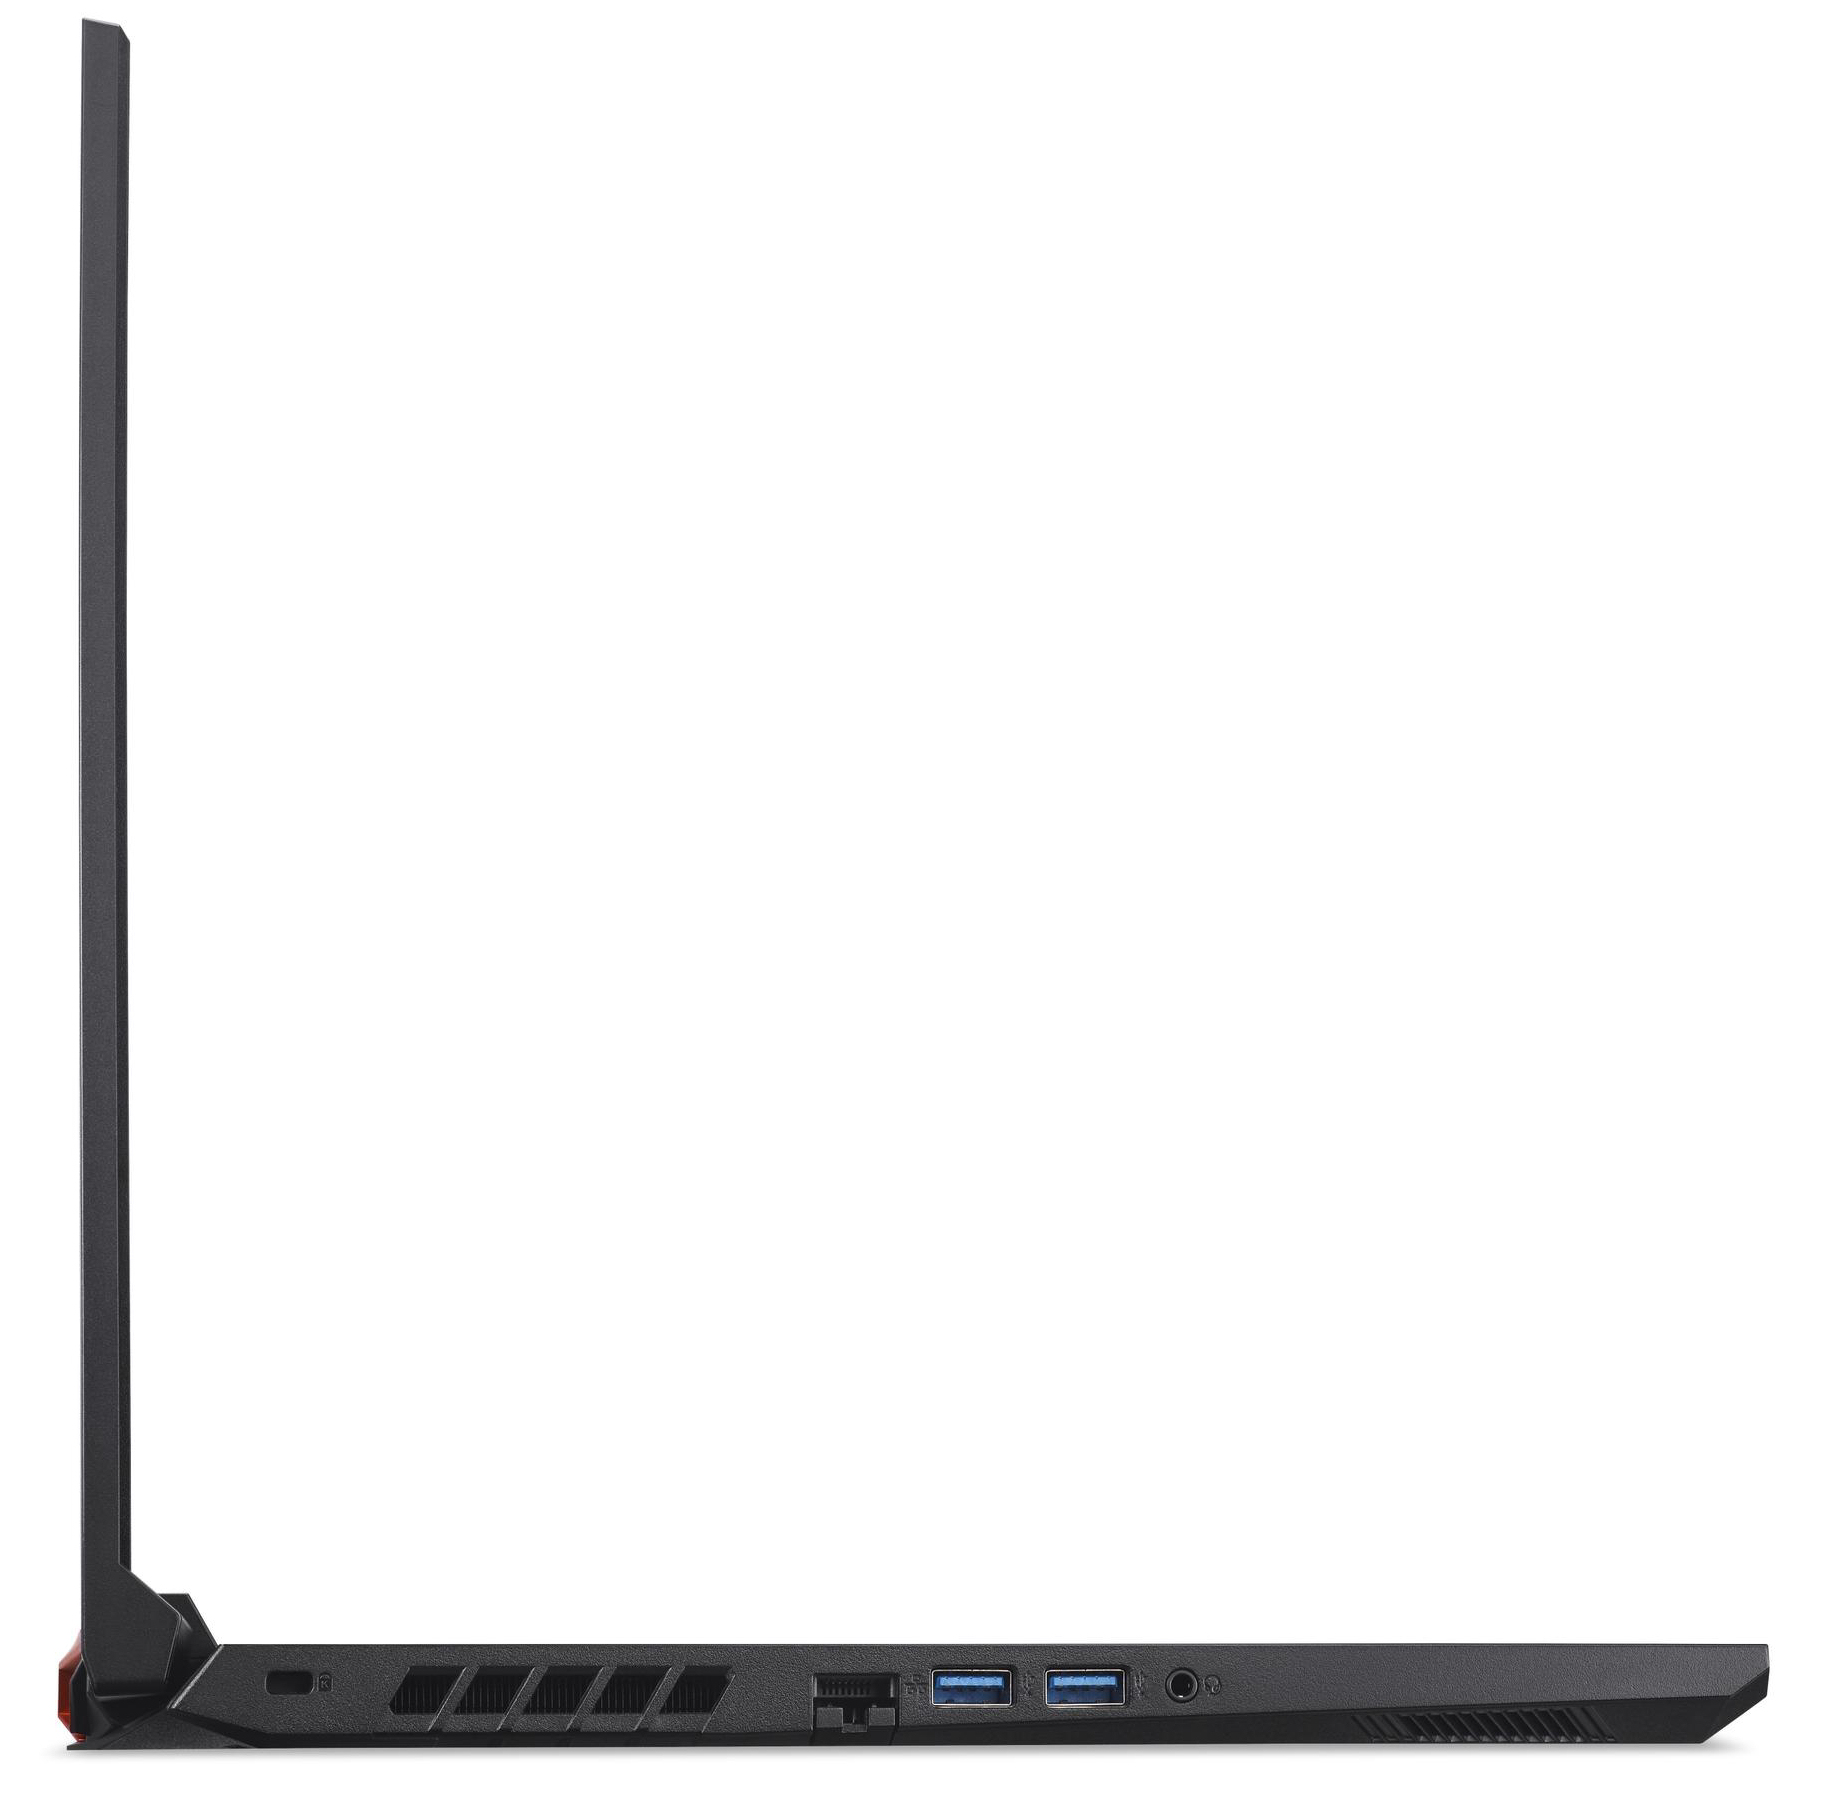
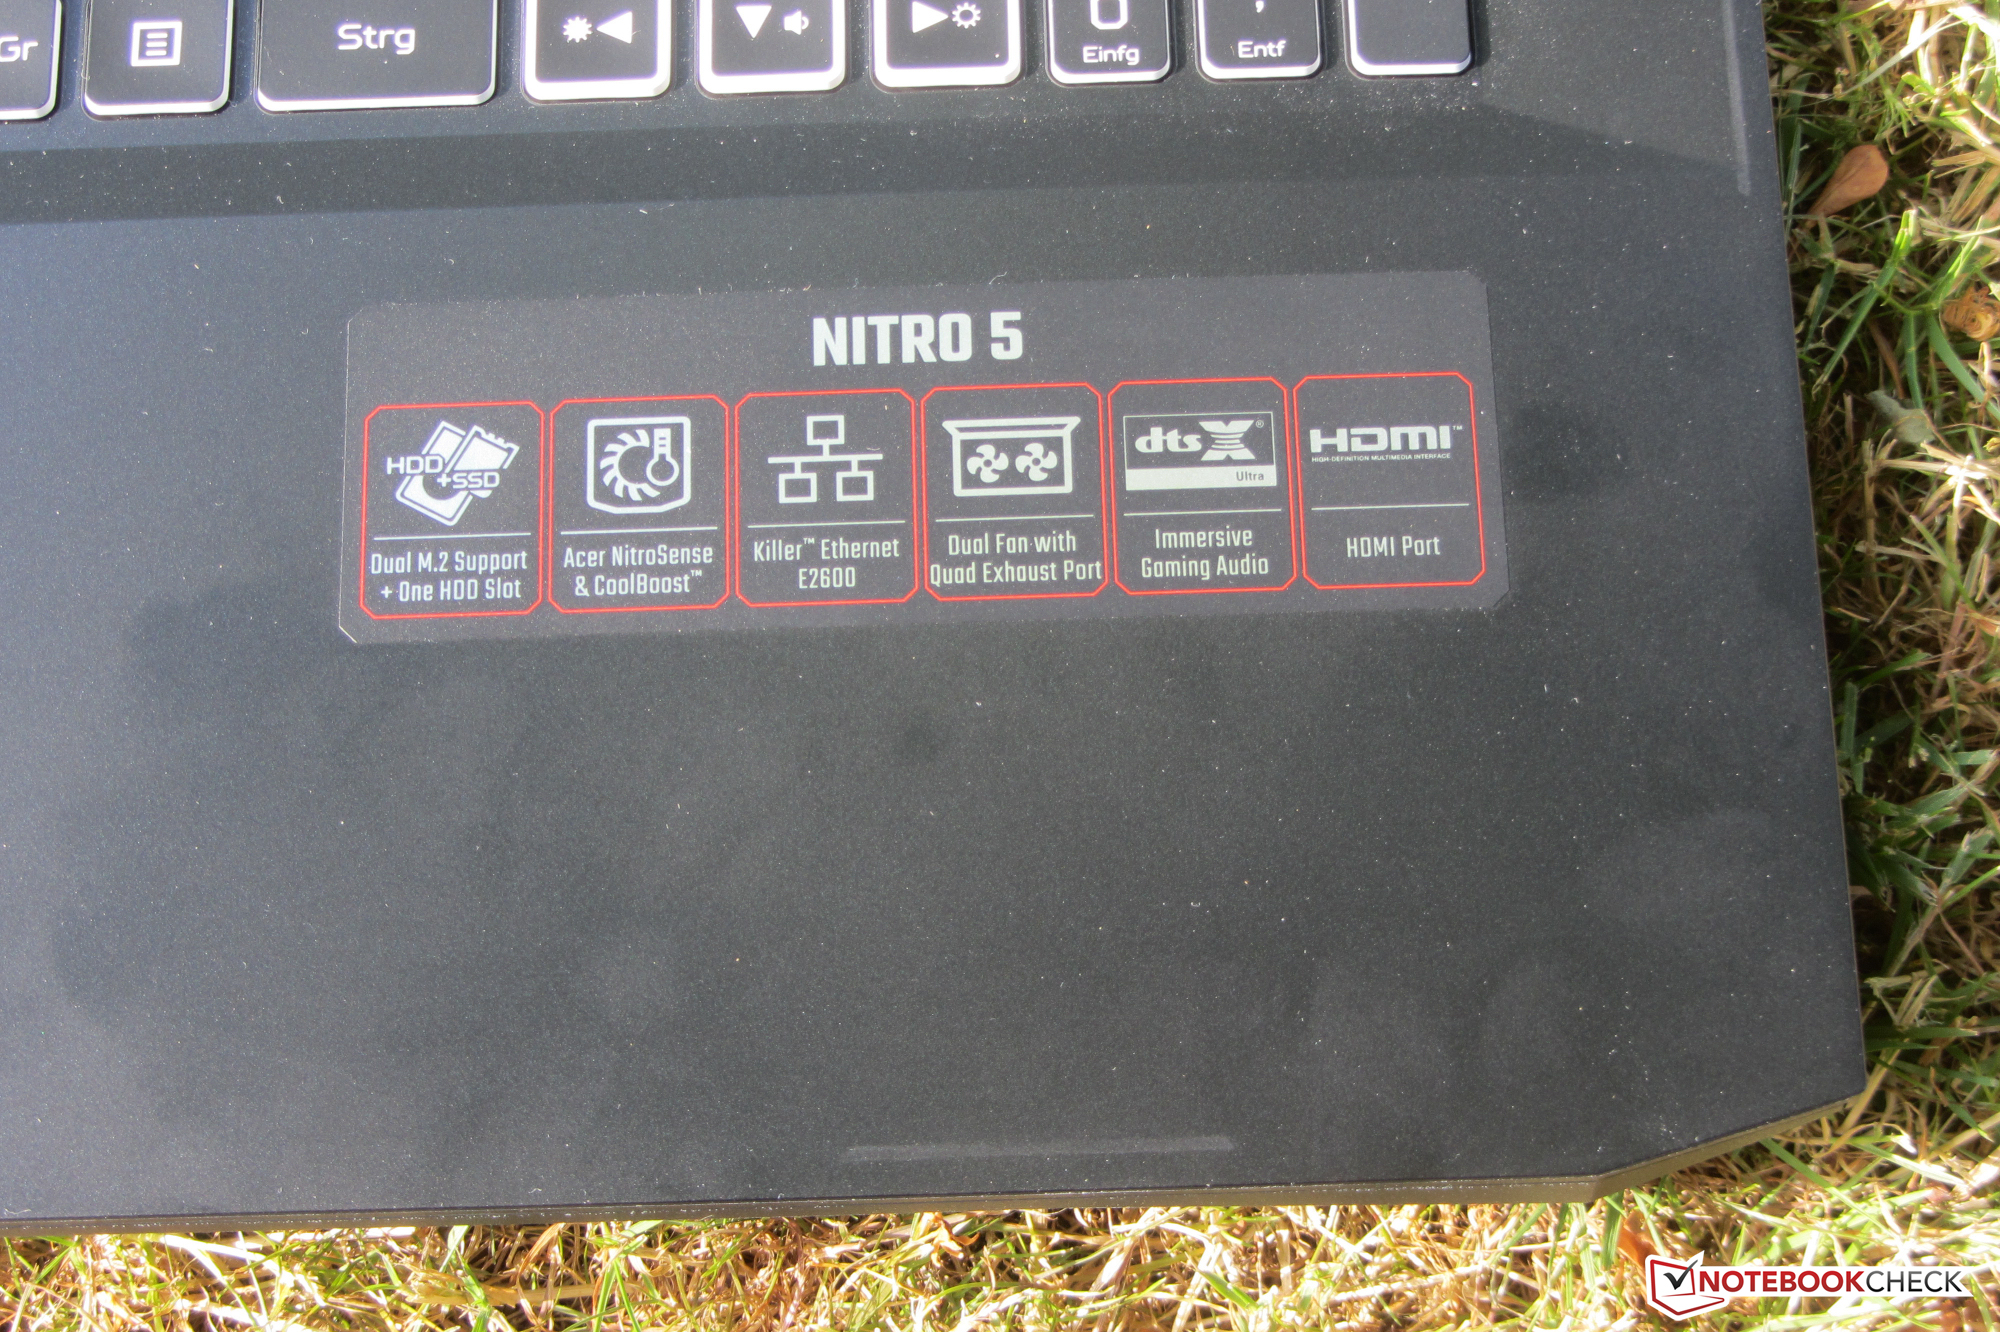
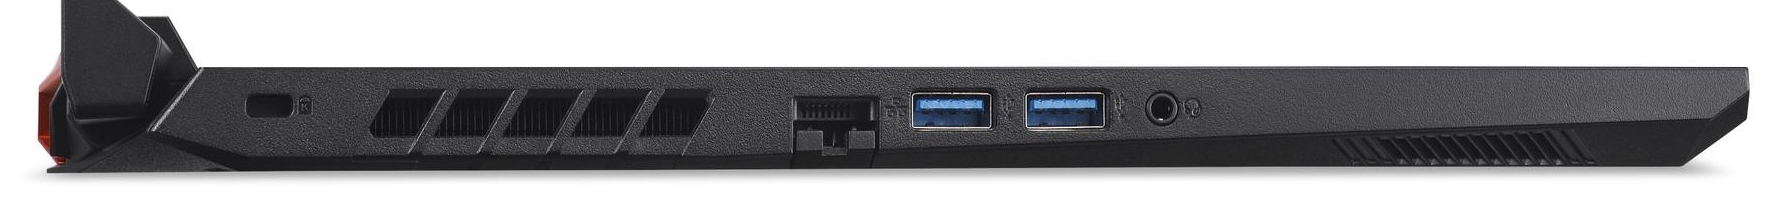
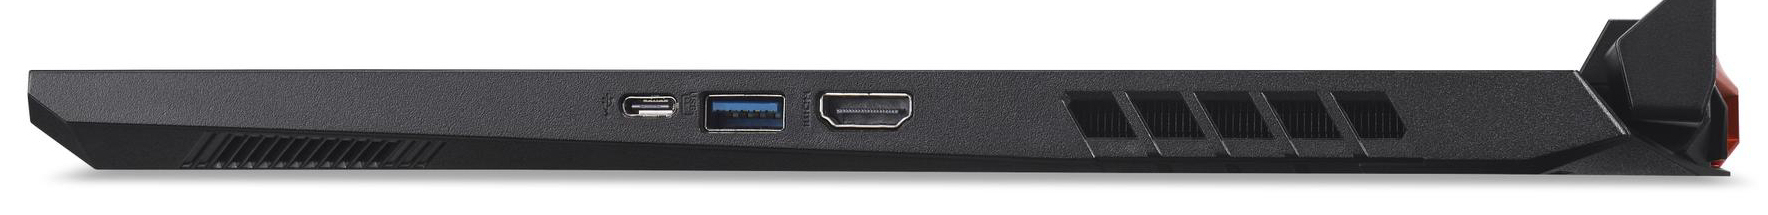
Equipamento de conexão


 GeForce RTX 3070 Laptop GPU, R7 5800H, Samsung SSD 970 EVO Plus 500GB")
 GeForce RTX 3070 Laptop GPU, R7 5800H, Samsung SSD 970 EVO Plus 500GB")


Visor - IPS 144 Hz
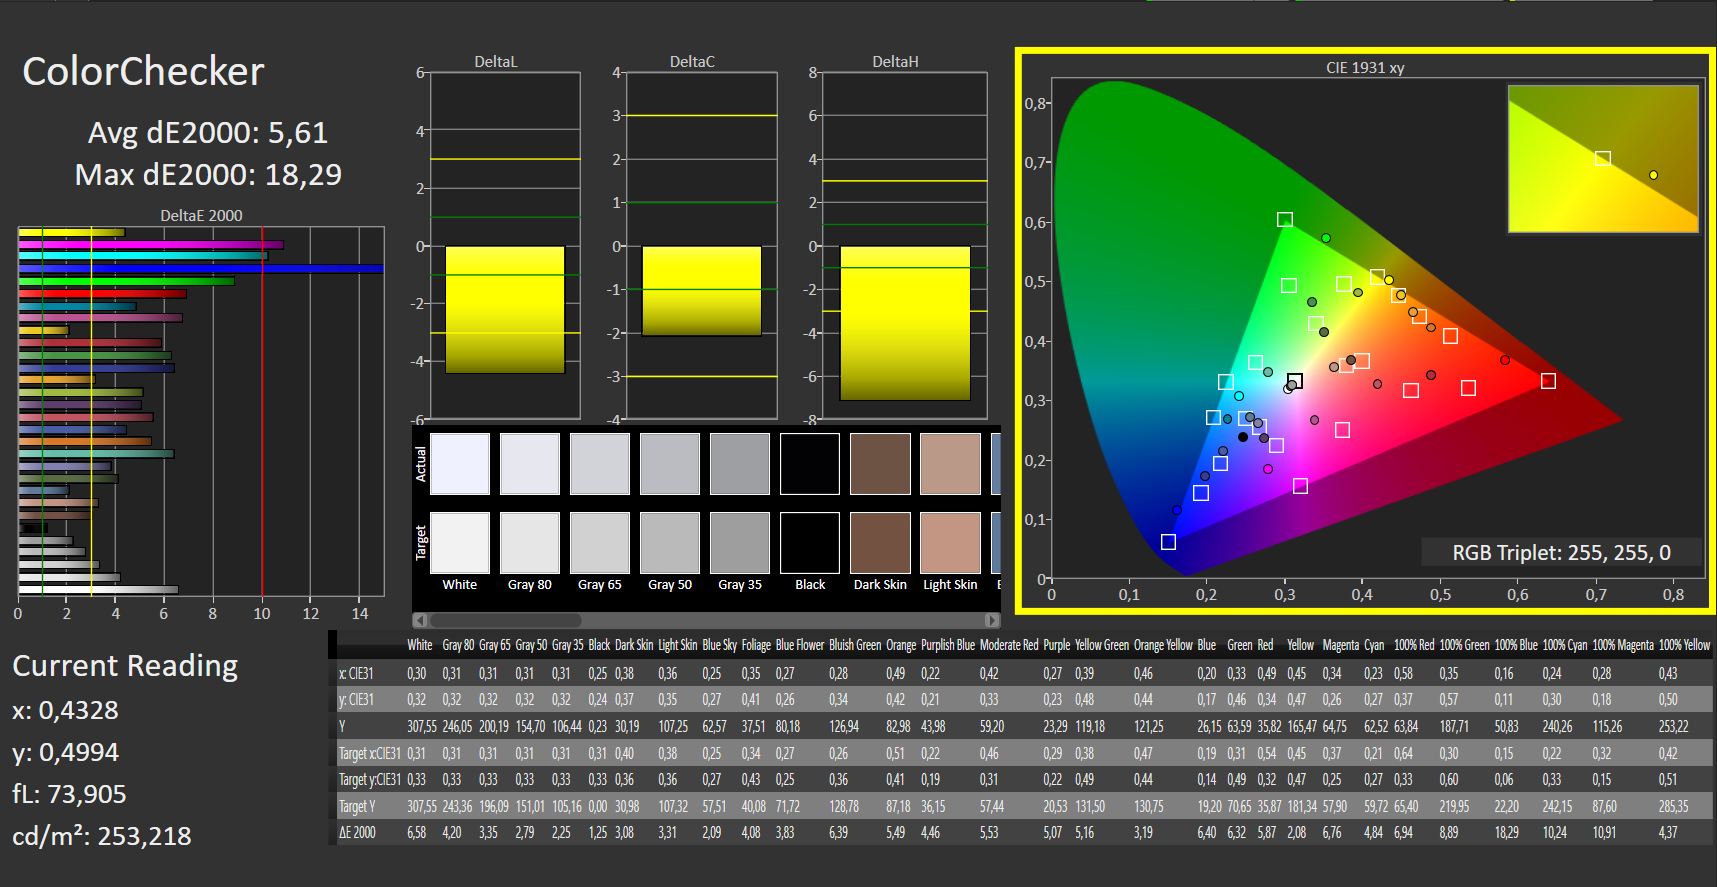
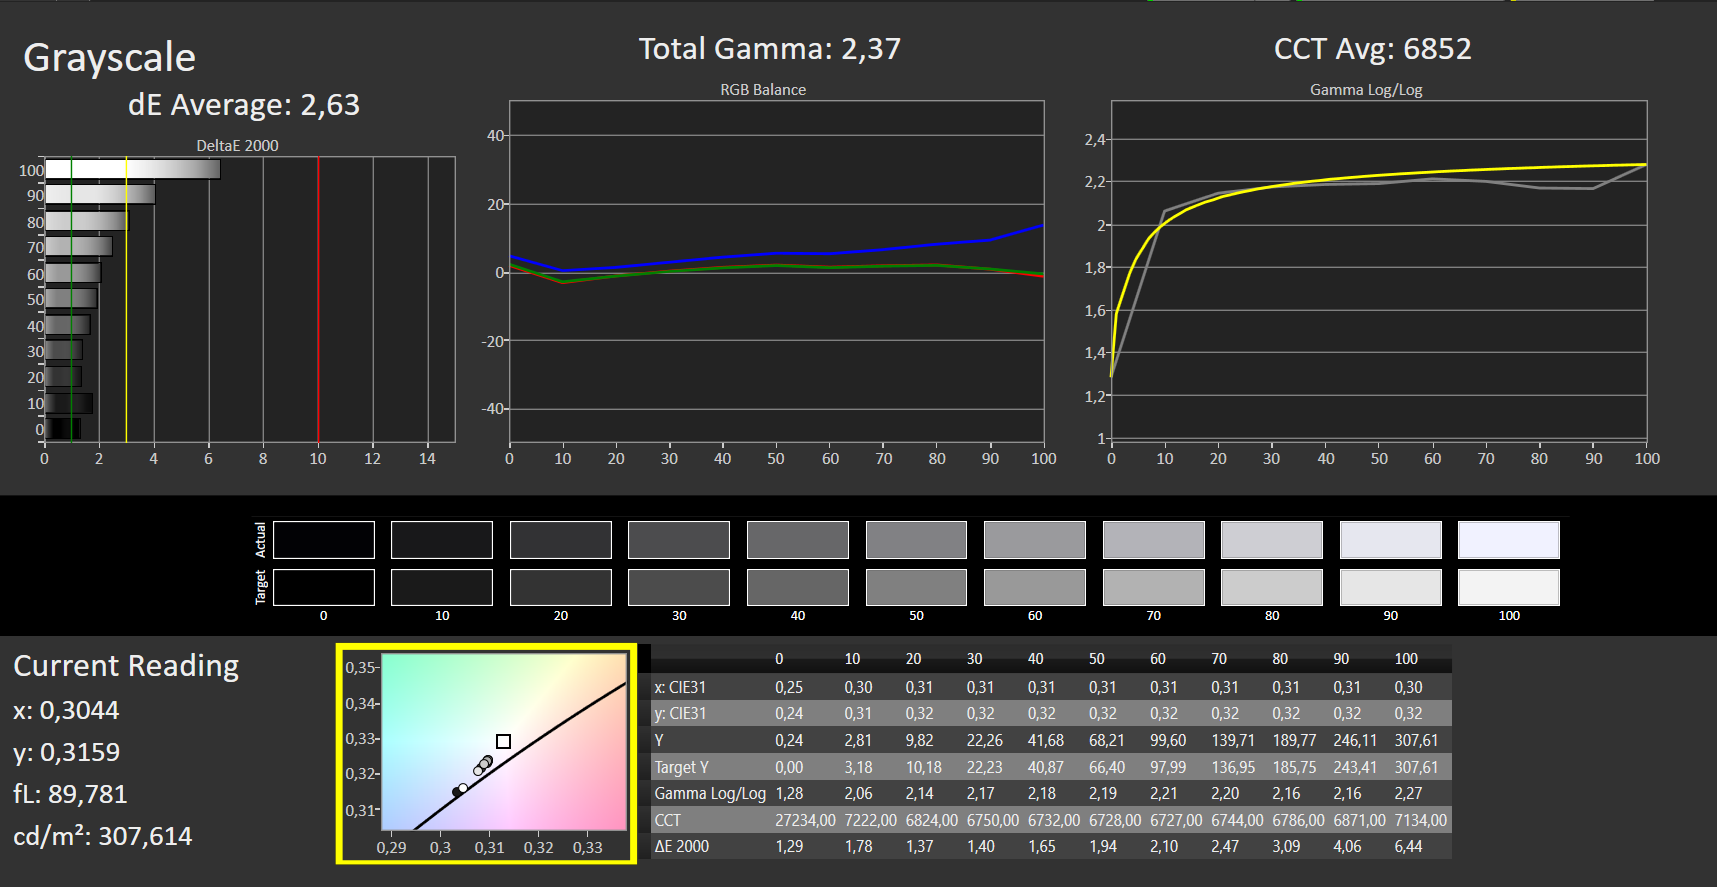
Enquanto o contraste (1.279:1) da tela de 17,3 polegadas estável e responsiva (FHD, IPS, 144 Hz) atinge o alvo (> 1.000:1), o brilho médio (263,9 cd/m²) é muito baixo. Consideramos que os valores acima de 300 cd/m² são bons. A reprodução de cores no estado de entrega é decente.
Este é o mesmo painel que também é usado no Modelo irmão RTX-3070. No entanto, os valores medidos diferem ligeiramente - uma condição normal. Duas telas idênticas nunca coincidem completamente
| |||||||||||||||||||||||||
iluminação: 76 %
iluminação com acumulador: 307 cd/m²
Contraste: 1279:1 (Preto: 0.24 cd/m²)
ΔE ColorChecker Calman: 5.61 | ∀{0.5-29.43 Ø4.71}
ΔE Greyscale Calman: 2.63 | ∀{0.09-98 Ø4.96}
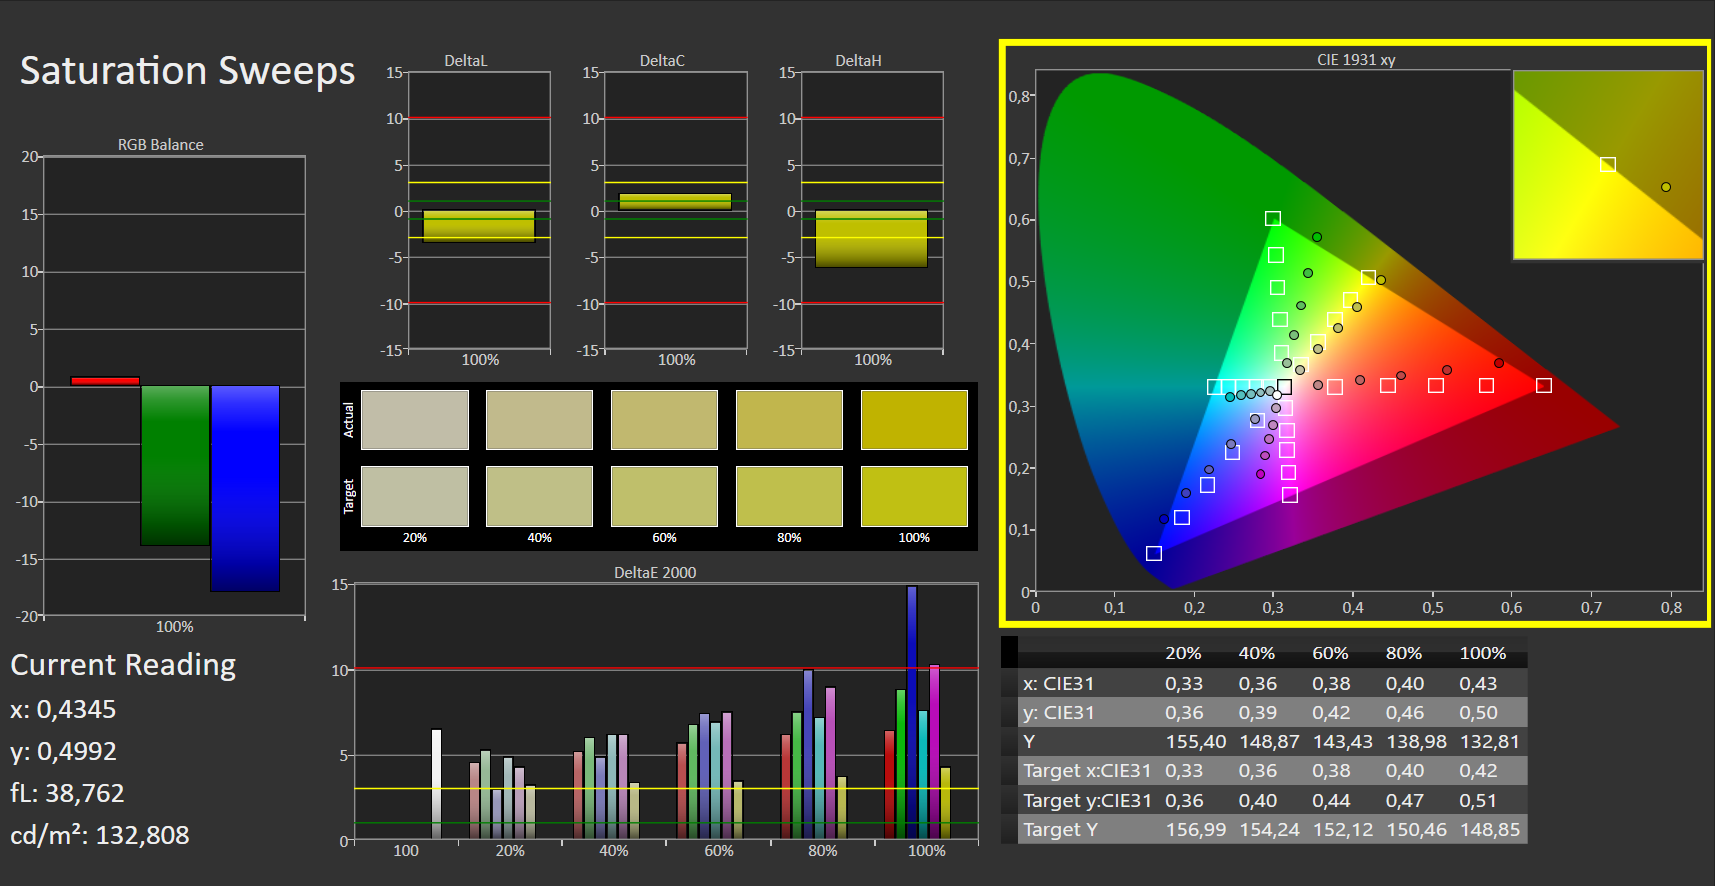
55% sRGB (Argyll 1.6.3 3D)
35% AdobeRGB 1998 (Argyll 1.6.3 3D)
37.9% AdobeRGB 1998 (Argyll 3D)
55.3% sRGB (Argyll 3D)
36.7% Display P3 (Argyll 3D)
Gamma: 2.37
CCT: 6852 K
| Acer Nitro 5 AN517-41-R9S5 BOE NV173FHM-NX4, IPS, 1920x1080, 17.3" | Acer Nitro 5 AN517-41-R5Z7 BOE NV173FHM-NX4, IPS, 1920x1080, 17.3" | MSI GP76 Leopard 10UG Chi Mei CMN176E, IPS, 1920x1080, 17.3" | Schenker XMG Neo 17 (Early 2021, RTX 3070, 5800H) BOE NE173QHM-NY2 (BOE0977), IPS, 2560x1440, 17.3" | Medion Erazer Beast X25 BOE NE173FHM-NZ1 (BOE0884), IPS, 1920x1080, 17.3" | |
|---|---|---|---|---|---|
| Display | 0% | 76% | 87% | 87% | |
| Display P3 Coverage (%) | 36.7 | 36.7 0% | 64.7 76% | 70.5 92% | 70.4 92% |
| sRGB Coverage (%) | 55.3 | 55.3 0% | 96.4 74% | 99.5 80% | 99.8 80% |
| AdobeRGB 1998 Coverage (%) | 37.9 | 37.9 0% | 66.9 77% | 71.8 89% | 71.6 89% |
| Response Times | 0% | 41% | 18% | 55% | |
| Response Time Grey 50% / Grey 80% * (ms) | 18 ? | 18 ? -0% | 7.4 ? 59% | 16.8 ? 7% | 9.2 ? 49% |
| Response Time Black / White * (ms) | 14 ? | 14 ? -0% | 10.8 ? 23% | 10 ? 29% | 5.6 ? 60% |
| PWM Frequency (Hz) | 24510 ? | ||||
| Screen | -9% | 29% | 31% | 10% | |
| Brightness middle (cd/m²) | 307 | 282 -8% | 328 7% | 410 34% | 329 7% |
| Brightness (cd/m²) | 264 | 255 -3% | 314 19% | 381 44% | 315 19% |
| Brightness Distribution (%) | 76 | 85 12% | 87 14% | 88 16% | 88 16% |
| Black Level * (cd/m²) | 0.24 | 0.24 -0% | 0.29 -21% | 0.37 -54% | 0.33 -38% |
| Contrast (:1) | 1279 | 1175 -8% | 1131 -12% | 1108 -13% | 997 -22% |
| Colorchecker dE 2000 * | 5.61 | 5.91 -5% | 1.93 66% | 2.55 55% | 2.03 64% |
| Colorchecker dE 2000 max. * | 18.29 | 10.98 40% | 4.94 73% | 4.33 76% | 5.5 70% |
| Greyscale dE 2000 * | 2.63 | 5.85 -122% | 2.8 -6% | 3.4 -29% | 3.5 -33% |
| Gamma | 2.37 93% | 2.32 95% | 2.18 101% | 2.275 97% | 2.223 99% |
| CCT | 6852 95% | 7372 88% | 7023 93% | 6637 98% | 6526 100% |
| Color Space (Percent of AdobeRGB 1998) (%) | 35 | 35 0% | 67 91% | 72 106% | |
| Color Space (Percent of sRGB) (%) | 55 | 55 0% | 89 62% | 95 73% | |
| Colorchecker dE 2000 calibrated * | 0.68 | 1.28 | 0.82 | ||
| Média Total (Programa/Configurações) | -3% /
-6% | 49% /
40% | 45% /
40% | 51% /
35% |
* ... menor é melhor
Exibir tempos de resposta
| ↔ Tempo de resposta preto para branco | ||
|---|---|---|
| 14 ms ... ascensão ↗ e queda ↘ combinadas | ↗ 7 ms ascensão |  |
| ↘ 7 ms queda | ||
| A tela mostra boas taxas de resposta em nossos testes, mas pode ser muito lenta para jogadores competitivos. Em comparação, todos os dispositivos testados variam de 0.1 (mínimo) a 240 (máximo) ms. » 34 % de todos os dispositivos são melhores. Isso significa que o tempo de resposta medido é melhor que a média de todos os dispositivos testados (19.8 ms). | ||
| ↔ Tempo de resposta 50% cinza a 80% cinza | ||
| 18 ms ... ascensão ↗ e queda ↘ combinadas | ↗ 8 ms ascensão |  |
| ↘ 10 ms queda | ||
| A tela mostra boas taxas de resposta em nossos testes, mas pode ser muito lenta para jogadores competitivos. Em comparação, todos os dispositivos testados variam de 0.165 (mínimo) a 636 (máximo) ms. » 32 % de todos os dispositivos são melhores. Isso significa que o tempo de resposta medido é melhor que a média de todos os dispositivos testados (31 ms). | ||
Cintilação da tela / PWM (modulação por largura de pulso)
| Tela tremeluzindo / PWM não detectado |  | ||
[pwm_comparison] Em comparação: 52 % de todos os dispositivos testados não usam PWM para escurecer a tela. Se PWM foi detectado, uma média de 7751 (mínimo: 5 - máximo: 343500) Hz foi medida. | |||
Desempenho - RTX-3080 com TGP baixo
Com o Nitro 5 AN517-41, a Acer tem um notebook para jogos de 17,3 polegadas em sua linha de produtos, que traz cada jogo atual suavemente para a tela e também corta um bom número em todas as outras áreas de aplicação.
Condições de teste
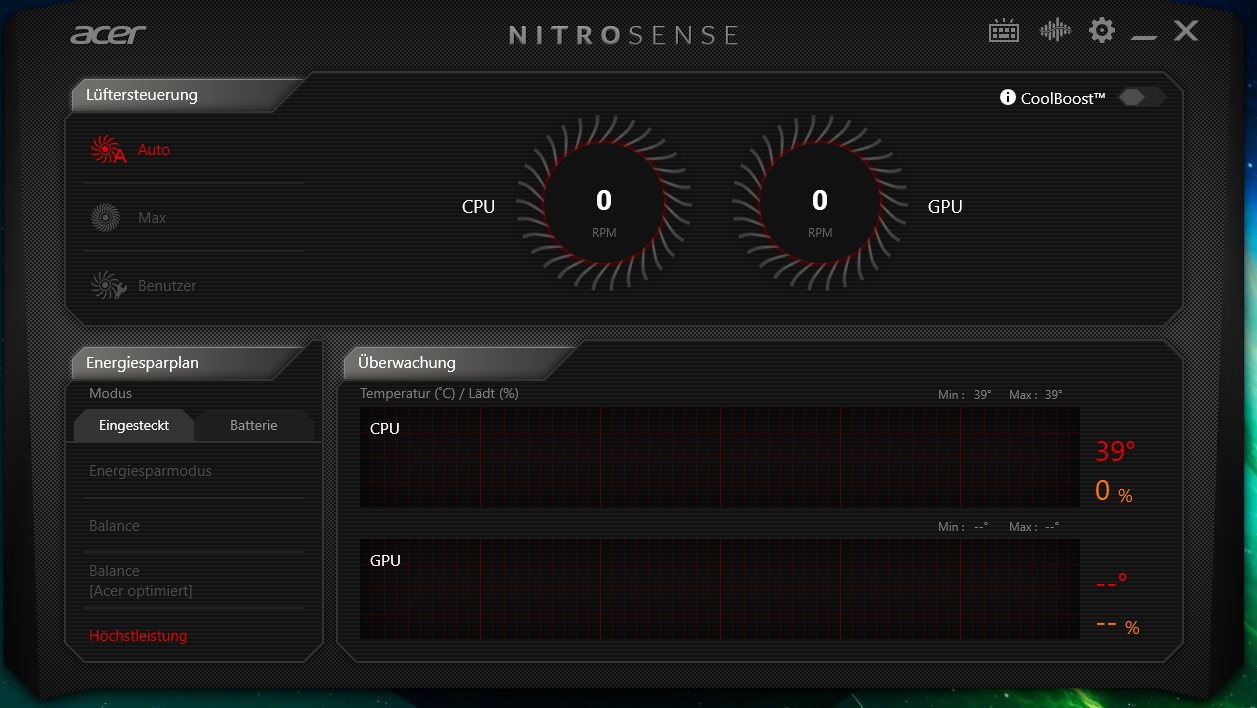
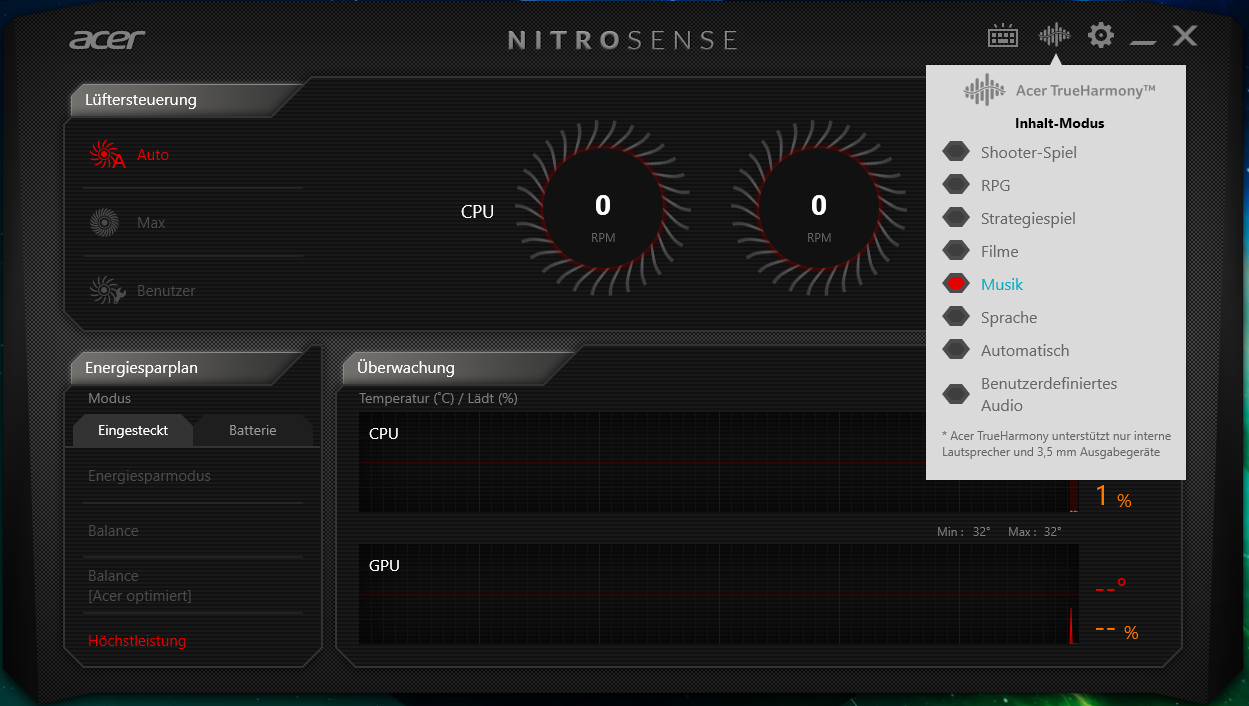
O software NitroSense pré-instalado oferece vários perfis de desempenho e permite influenciar os dois ventiladores. Realizamos todos os benchmarks com o perfil de desempenho "High Performance" e utilizamos o controle automático dos ventiladores. Os perfis de desempenho correspondem aos perfis padrão do Windows 10.
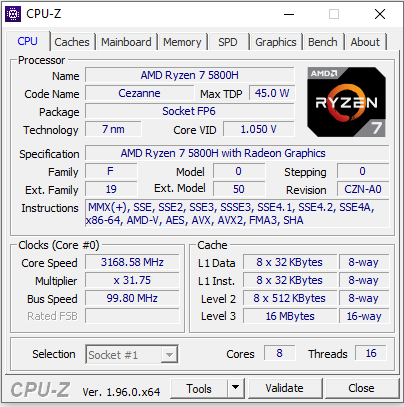
Processador
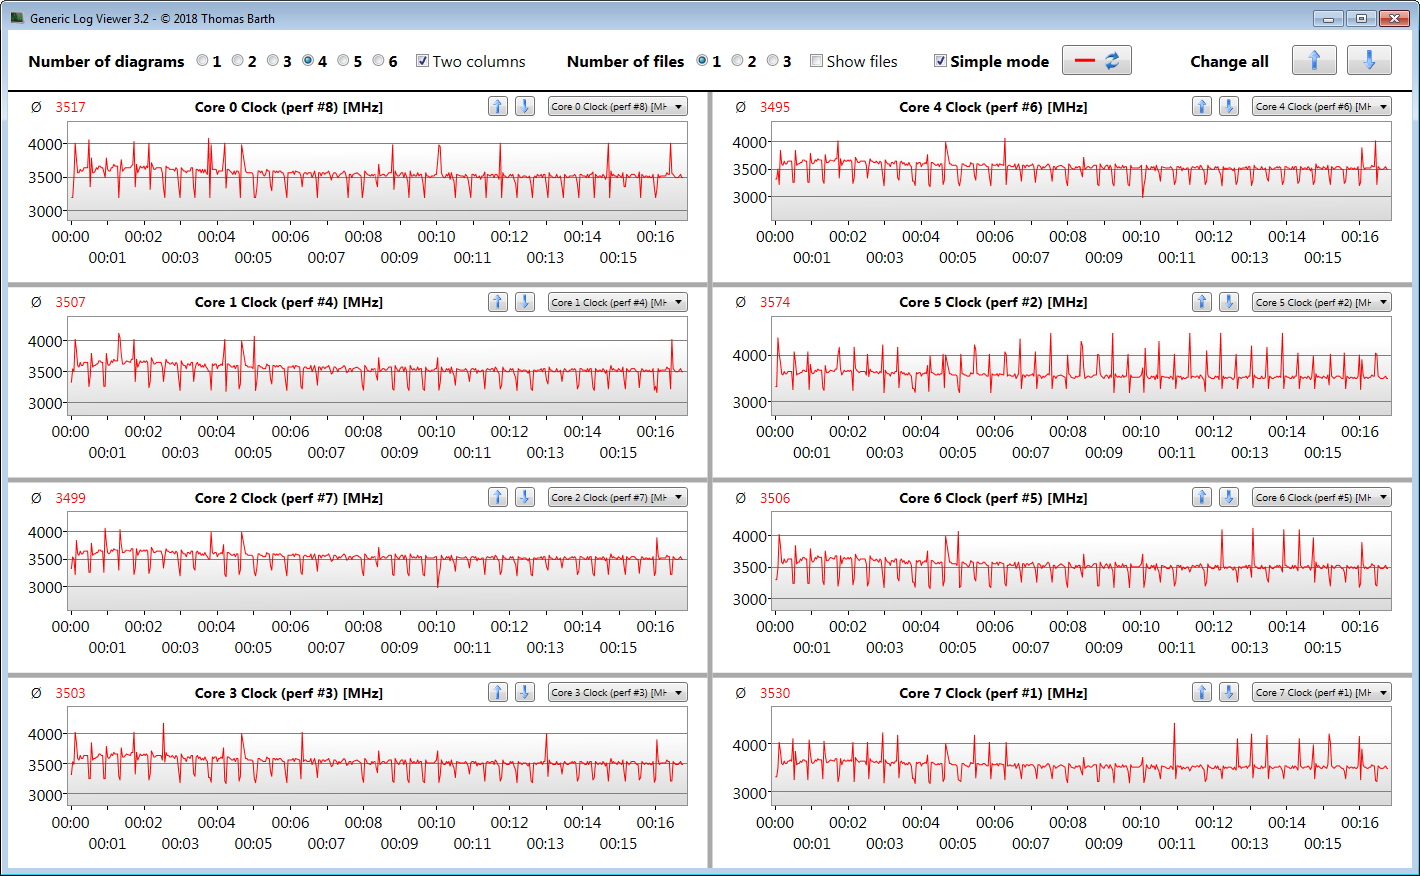
A parte da CPU do Ryzen 7-5800H APU (Cezanne) consiste em um processador de oito núcleos que opera com um relógio de base de 3,2 GHz. Um aumento de até 4,4 GHz é possível via Turbo. É suportado multithreading simultâneo (dois fios por núcleo).
Os testes de CPU do benchmark Cinebench R15 são processados com 3,7 GHz (operação em rede) e 3,2 a 4,4 GHz (rosca única). As taxas de relógio são de 1,9 GHz (multifios) e 1,5 a 1,9 GHz (mono-fios) em modo de bateria.
Verificamos se a CPU Turbo também é usada permanentemente na operação de rede elétrica, executando o teste multi-tarefa do benchmark Cinebench R15 em um loop por pelo menos 30 minutos. O Turbo é usado em um nível baixo
Cinebench R15 Multi Endurance test
* ... menor é melhor
Desempenho do sistema
O sistema funciona sem problemas. Os problemas não ocorreram. O hardware oferece poder de computação suficiente mesmo para aplicações além de jogos. Isto não é menos confirmado pelos bons resultados da PCMark
| PCMark 8 Home Score Accelerated v2 | 5252 pontos | |
| PCMark 8 Creative Score Accelerated v2 | 6230 pontos | |
| PCMark 8 Work Score Accelerated v2 | 6177 pontos | |
| PCMark 10 Score | 6758 pontos | |
Ajuda | ||
| PCMark 10 / Score | |
| Média da turma Gaming (5828 - 12414, n=94, últimos 2 anos) | |
| Schenker XMG Neo 17 (Early 2021, RTX 3070, 5800H) | |
| Medion Erazer Beast X25 | |
| Acer Nitro 5 AN517-41-R9S5 | |
| Média AMD Ryzen 7 5800H, NVIDIA GeForce RTX 3080 Laptop GPU (n=1) | |
| Acer Nitro 5 AN517-41-R5Z7 | |
| MSI GP76 Leopard 10UG | |
| PCMark 10 / Essentials | |
| Média da turma Gaming (8810 - 11935, n=98, últimos 2 anos) | |
| Acer Nitro 5 AN517-41-R9S5 | |
| Média AMD Ryzen 7 5800H, NVIDIA GeForce RTX 3080 Laptop GPU (n=1) | |
| Acer Nitro 5 AN517-41-R5Z7 | |
| Schenker XMG Neo 17 (Early 2021, RTX 3070, 5800H) | |
| Medion Erazer Beast X25 | |
| MSI GP76 Leopard 10UG | |
| PCMark 10 / Productivity | |
| Média da turma Gaming (6845 - 25323, n=96, últimos 2 anos) | |
| Medion Erazer Beast X25 | |
| Acer Nitro 5 AN517-41-R9S5 | |
| Média AMD Ryzen 7 5800H, NVIDIA GeForce RTX 3080 Laptop GPU (n=1) | |
| Acer Nitro 5 AN517-41-R5Z7 | |
| Schenker XMG Neo 17 (Early 2021, RTX 3070, 5800H) | |
| MSI GP76 Leopard 10UG | |
| PCMark 10 / Digital Content Creation | |
| Média da turma Gaming (7602 - 19954, n=96, últimos 2 anos) | |
| Schenker XMG Neo 17 (Early 2021, RTX 3070, 5800H) | |
| Medion Erazer Beast X25 | |
| Acer Nitro 5 AN517-41-R5Z7 | |
| Acer Nitro 5 AN517-41-R9S5 | |
| Média AMD Ryzen 7 5800H, NVIDIA GeForce RTX 3080 Laptop GPU (n=1) | |
| MSI GP76 Leopard 10UG | |
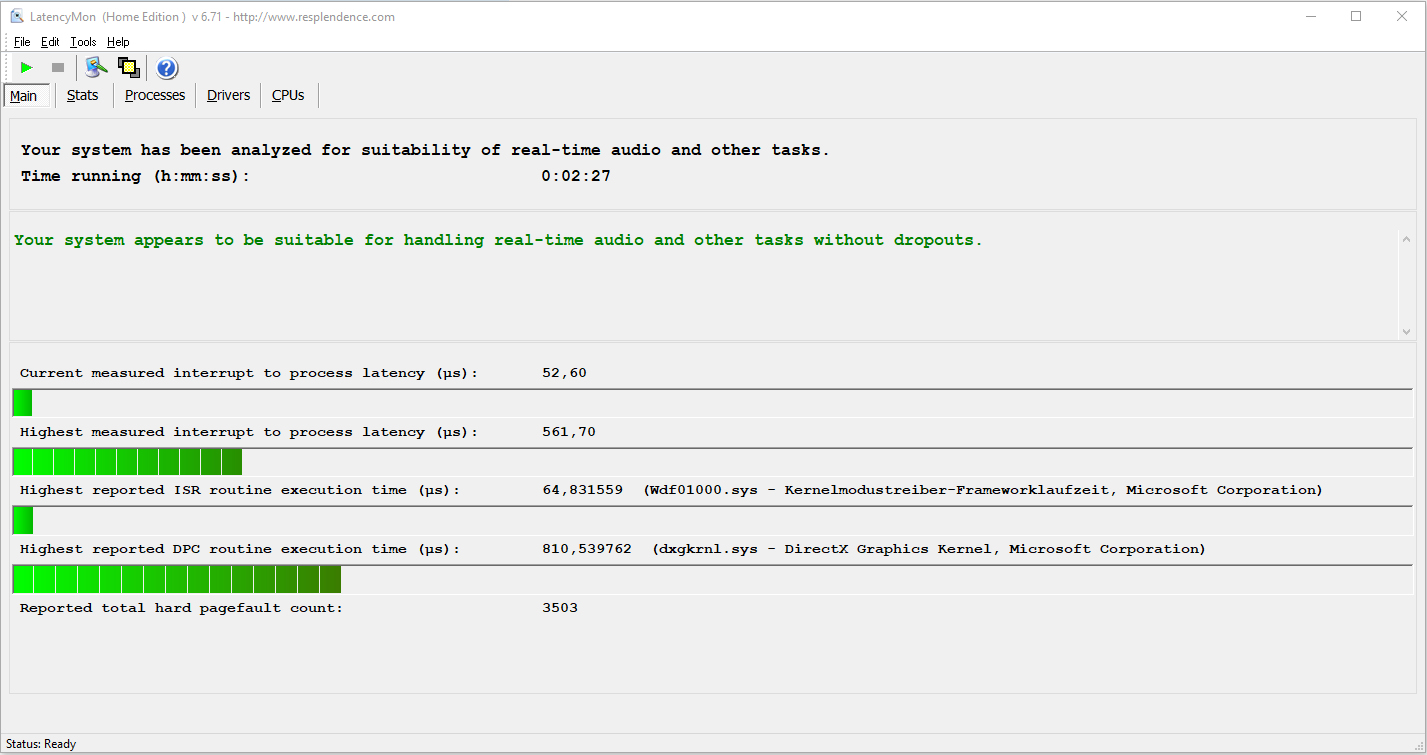
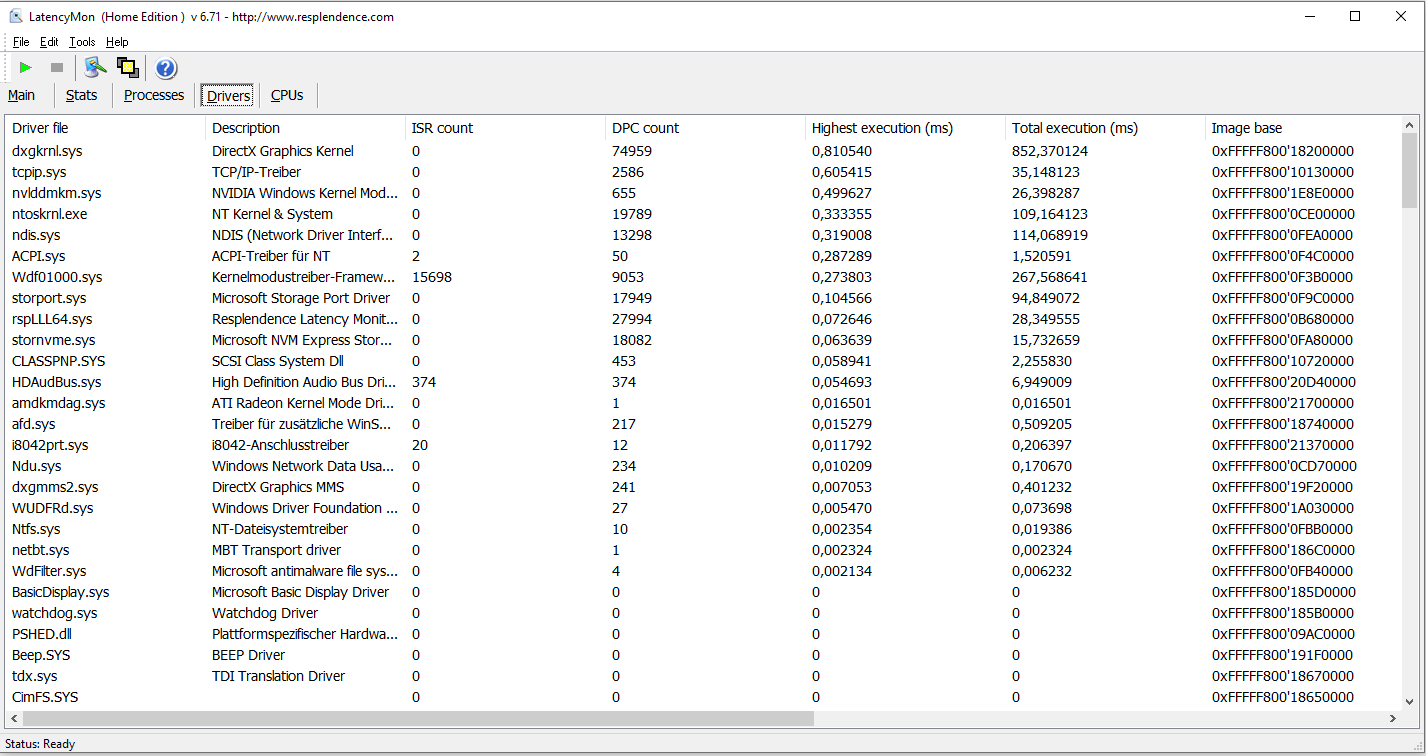
Latências DPC
| DPC Latencies / LatencyMon - interrupt to process latency (max), Web, Youtube, Prime95 | |
| Schenker XMG Neo 17 (Early 2021, RTX 3070, 5800H) | |
| Acer Nitro 5 AN517-41-R5Z7 | |
| MSI GP76 Leopard 10UG | |
| Medion Erazer Beast X25 | |
| Acer Nitro 5 AN517-41-R9S5 | |
* ... menor é melhor
Armazenamento em massa
Um SSD NVMe (M.2-2280) da SK Hynix serve como acionador do sistema. Ele fornece 1 TB de espaço de armazenamento e oferece boas taxas de transferência. O notebook também tem espaço para um segundo M.2-2280 SSD (NVMe) e um dispositivo de armazenamento de 2,5 polegadas (slot SATA, parafusos e estrutura de montagem incluídos)

| Acer Nitro 5 AN517-41-R9S5 SK Hynix BC711 1TB HFM001TD3JX016N | MSI GP76 Leopard 10UG Kingston OM8PCP3512F-AB | Schenker XMG Neo 17 (Early 2021, RTX 3070, 5800H) Samsung SSD 970 EVO Plus 500GB | Acer Nitro 5 AN517-41-R5Z7 SK Hynix BC711 1TB HFM001TD3JX016N | Medion Erazer Beast X25 Samsung PM9A1 MZVL22T0HBLB | Média SK Hynix BC711 1TB HFM001TD3JX016N | Média da turma Gaming | |
|---|---|---|---|---|---|---|---|
| CrystalDiskMark 5.2 / 6 | -35% | 12% | 1% | -1% | 1% | 50% | |
| Write 4K (MB/s) | 133.4 | 143.7 8% | 206.1 54% | 146.7 10% | 129.7 -3% | 140.1 ? 5% | 199.6 ? 50% |
| Read 4K (MB/s) | 64.7 | 45.1 -30% | 53 -18% | 63.7 -2% | 62.4 -4% | 64.2 ? -1% | 78.6 ? 21% |
| Write Seq (MB/s) | 2934 | 978 -67% | 3018 3% | 2954 1% | 2436 -17% | 2944 ? 0% | 3758 ? 28% |
| Read Seq (MB/s) | 2364 | 1163 -51% | 2575 9% | 1974 -16% | 2354 0% | 2169 ? -8% | 3633 ? 54% |
| Write 4K Q32T1 (MB/s) | 438.4 | 519 18% | 535 22% | 496.9 13% | 512 17% | 468 ? 7% | 614 ? 40% |
| Read 4K Q32T1 (MB/s) | 516 | 302.7 -41% | 608 18% | 549 6% | 436.2 -15% | 533 ? 3% | 710 ? 38% |
| Write Seq Q32T1 (MB/s) | 3083 | 981 -68% | 3242 5% | 3062 -1% | 3541 15% | 3073 ? 0% | 5333 ? 73% |
| Read Seq Q32T1 (MB/s) | 3584 | 1983 -45% | 3617 1% | 3580 0% | 3568 0% | 3582 ? 0% | 7102 ? 98% |
| AS SSD | -46% | 1% | -5% | -8% | -3% | 30% | |
| Seq Read (MB/s) | 2974 | 1659 -44% | 3020 2% | 2891 -3% | 2591 -13% | 2933 ? -1% | 5591 ? 88% |
| Seq Write (MB/s) | 2733 | 921 -66% | 2631 -4% | 2692 -2% | 1900 -30% | 2713 ? -1% | 3972 ? 45% |
| 4K Read (MB/s) | 55.7 | 51 -8% | 60.3 8% | 52.6 -6% | 53.9 -3% | 54.2 ? -3% | 71.1 ? 28% |
| 4K Write (MB/s) | 134 | 120.1 -10% | 171.6 28% | 134.9 1% | 112.6 -16% | 134.5 ? 0% | 215 ? 60% |
| 4K-64 Read (MB/s) | 1854 | 463.5 -75% | 1410 -24% | 1845 0% | 1335 -28% | 1850 ? 0% | 1618 ? -13% |
| 4K-64 Write (MB/s) | 2165 | 909 -58% | 2324 7% | 2142 -1% | 2966 37% | 2154 ? -1% | 2935 ? 36% |
| Access Time Read * (ms) | 0.179 | 0.045 | 0.038 | 0.06364 ? | |||
| Access Time Write * (ms) | 0.028 | 0.032 -14% | 0.024 14% | 0.028 -0% | 0.036 -29% | 0.028 ? -0% | 0.03794 ? -36% |
| Score Read (Points) | 2207 | 680 -69% | 1773 -20% | 2186 -1% | 1648 -25% | 2197 ? 0% | 2248 ? 2% |
| Score Write (Points) | 2573 | 1121 -56% | 2759 7% | 2546 -1% | 3269 27% | 2560 ? -1% | 3547 ? 38% |
| Score Total (Points) | 5899 | 2130 -64% | 5429 -8% | 5842 -1% | 5733 -3% | 5871 ? 0% | 6872 ? 16% |
| Copy ISO MB/s (MB/s) | 2260 | 2130 -6% | 2195 ? -3% | 3168 ? 40% | |||
| Copy Program MB/s (MB/s) | 677 | 642 -5% | 660 ? -3% | 981 ? 45% | |||
| Copy Game MB/s (MB/s) | 1493 | 821 -45% | 1157 ? -23% | 2112 ? 41% | |||
| Média Total (Programa/Configurações) | -41% /
-41% | 7% /
6% | -2% /
-3% | -5% /
-5% | -1% /
-1% | 40% /
38% |
* ... menor é melhor
Continuous load read: DiskSpd Read Loop, Queue Depth 8
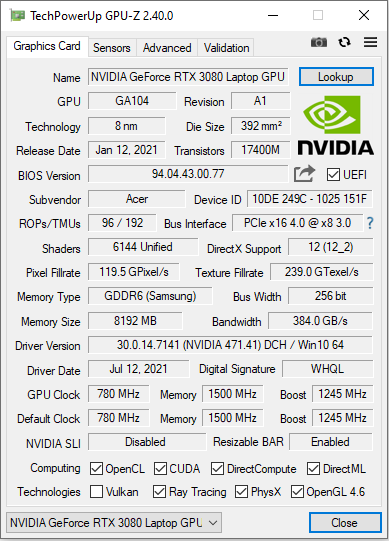
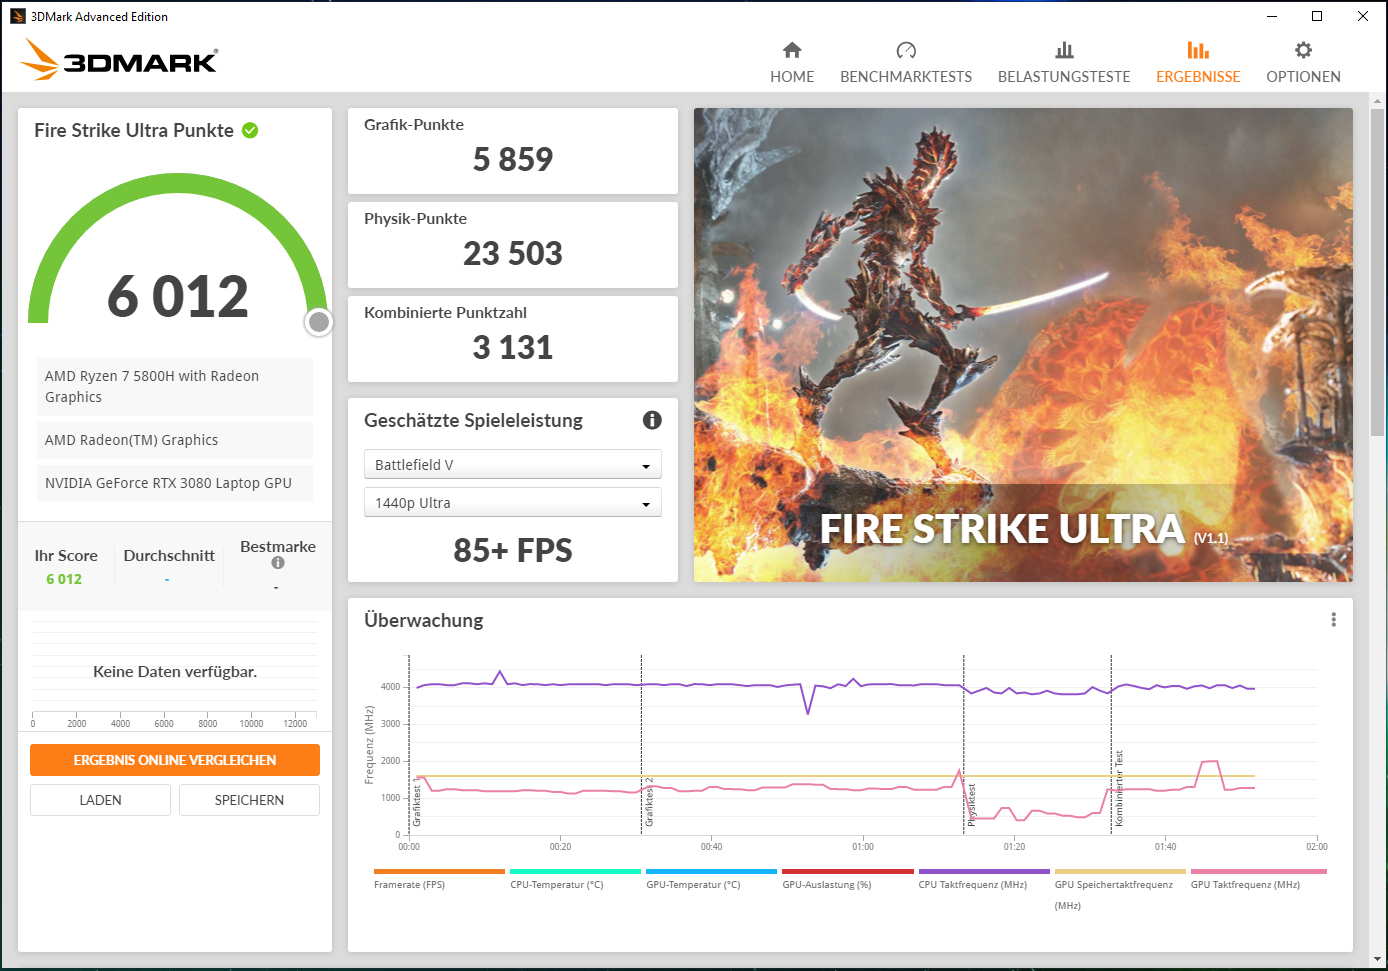
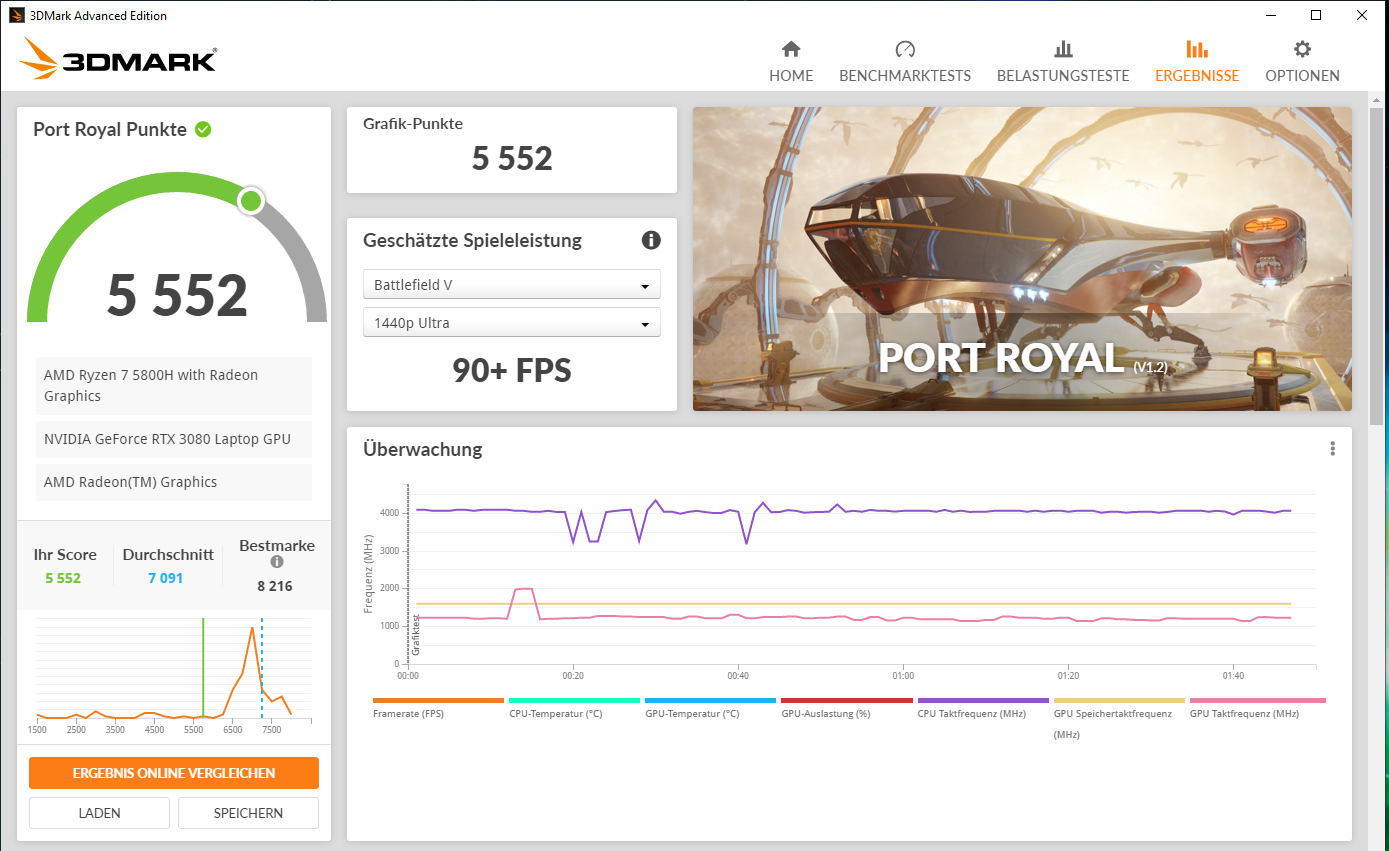
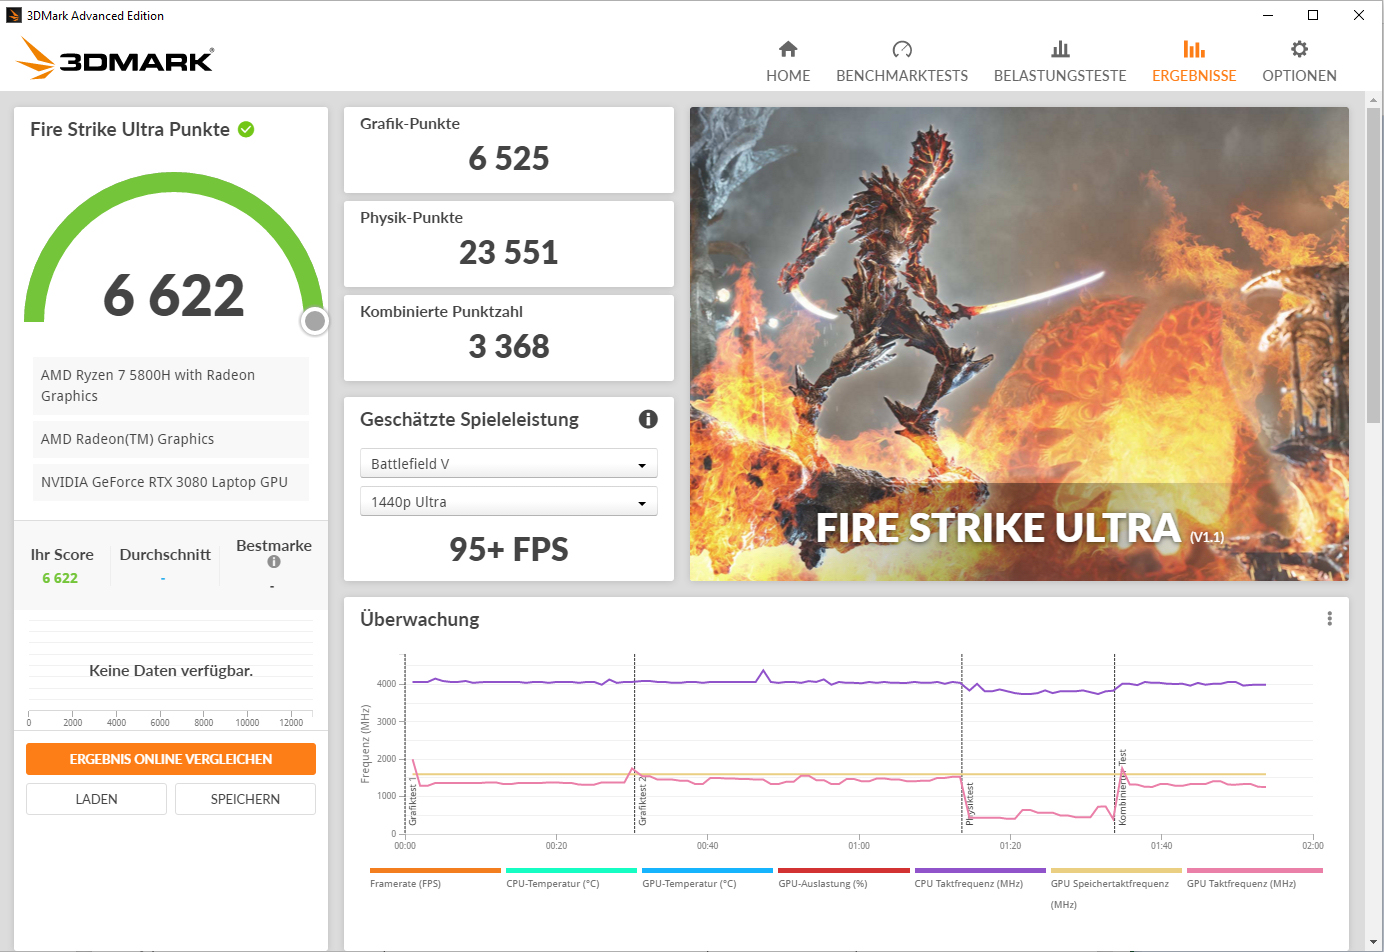
Placa gráfica
O desempenho real de um núcleo gráfico RTX-3000 depende em grande parte do TGP máximo que um fabricante de notebooks escolhe dentro dos limites definidos pela Nvidia. A Acer concede o GeForce RTX-3080 Laptop GPU (Visão geral de todos os computadores portáteis RTX-3080 incluindo os TGPs) um TGP máximo de 100 watts.
A GPU fornece parcialmente os resultados de referência mais baixos que determinamos com o RTX-3080 até o momento. Há potencial para melhorias: Uma atualização do firmware aumenta um pouco o desempenho da GPU e aproxima os resultados da média do RTX-3080. Aatualização não aumenta o TGP. Presumivelmente, a Acer elevou os limites de temperatura - pelo menos o teste Witcher 3 mostra isso.
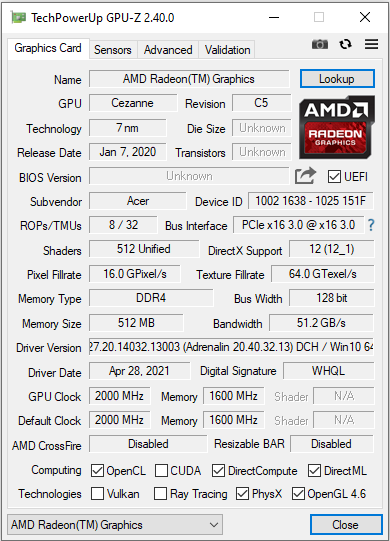
O RTX-3080 pode cair sobre a rápida memória gráfica GDDR6 (8.192 MB). O processador-integrado Vega-8O núcleo gráfico está ativo e o notebook funciona com a solução gráfica de comutação Optimus da Nvidia.
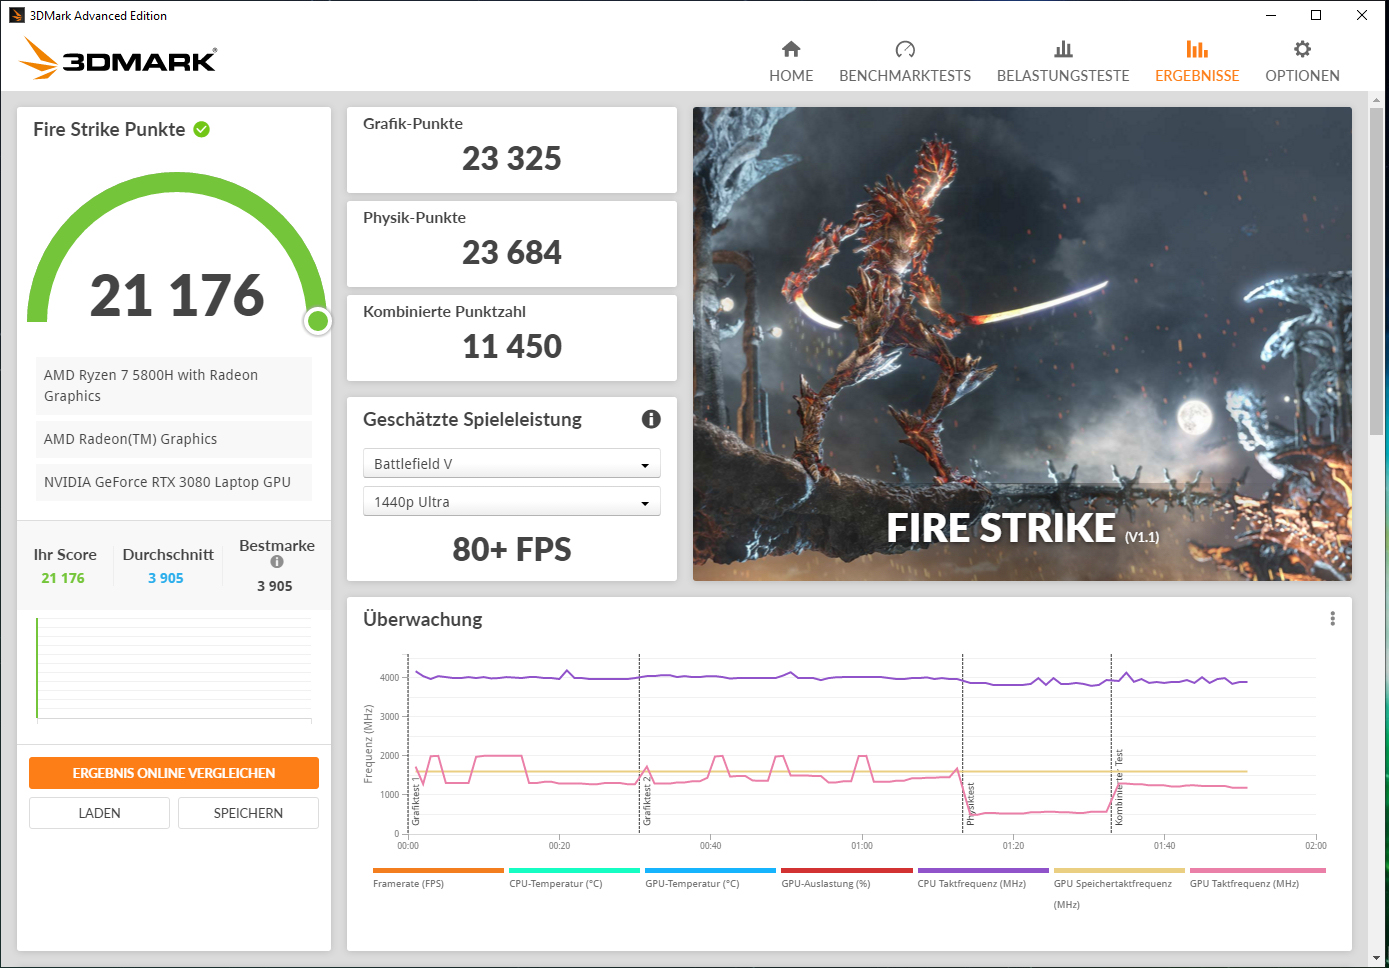
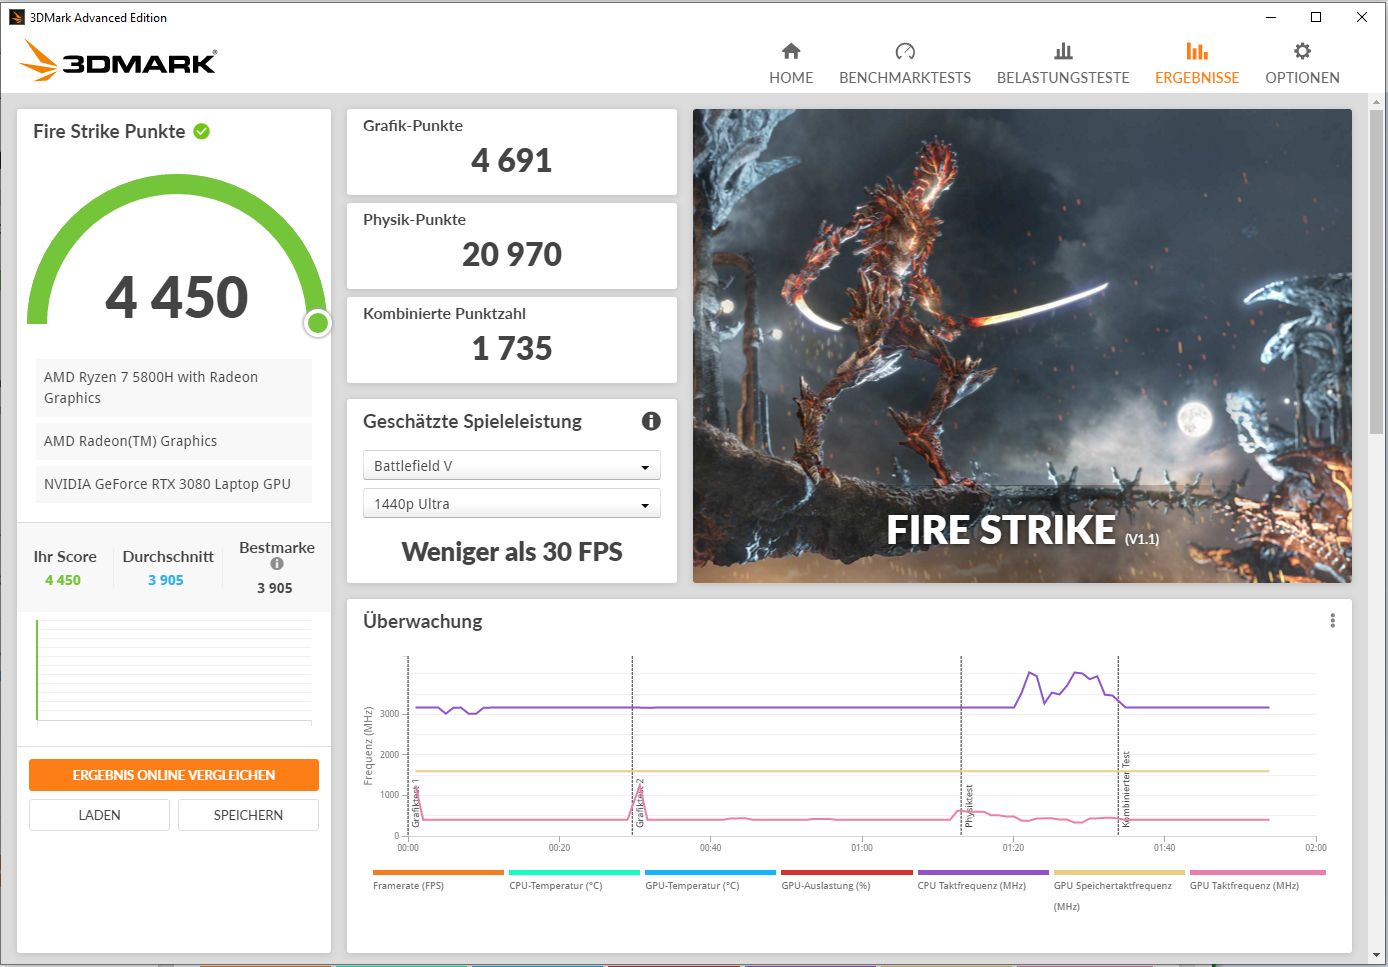
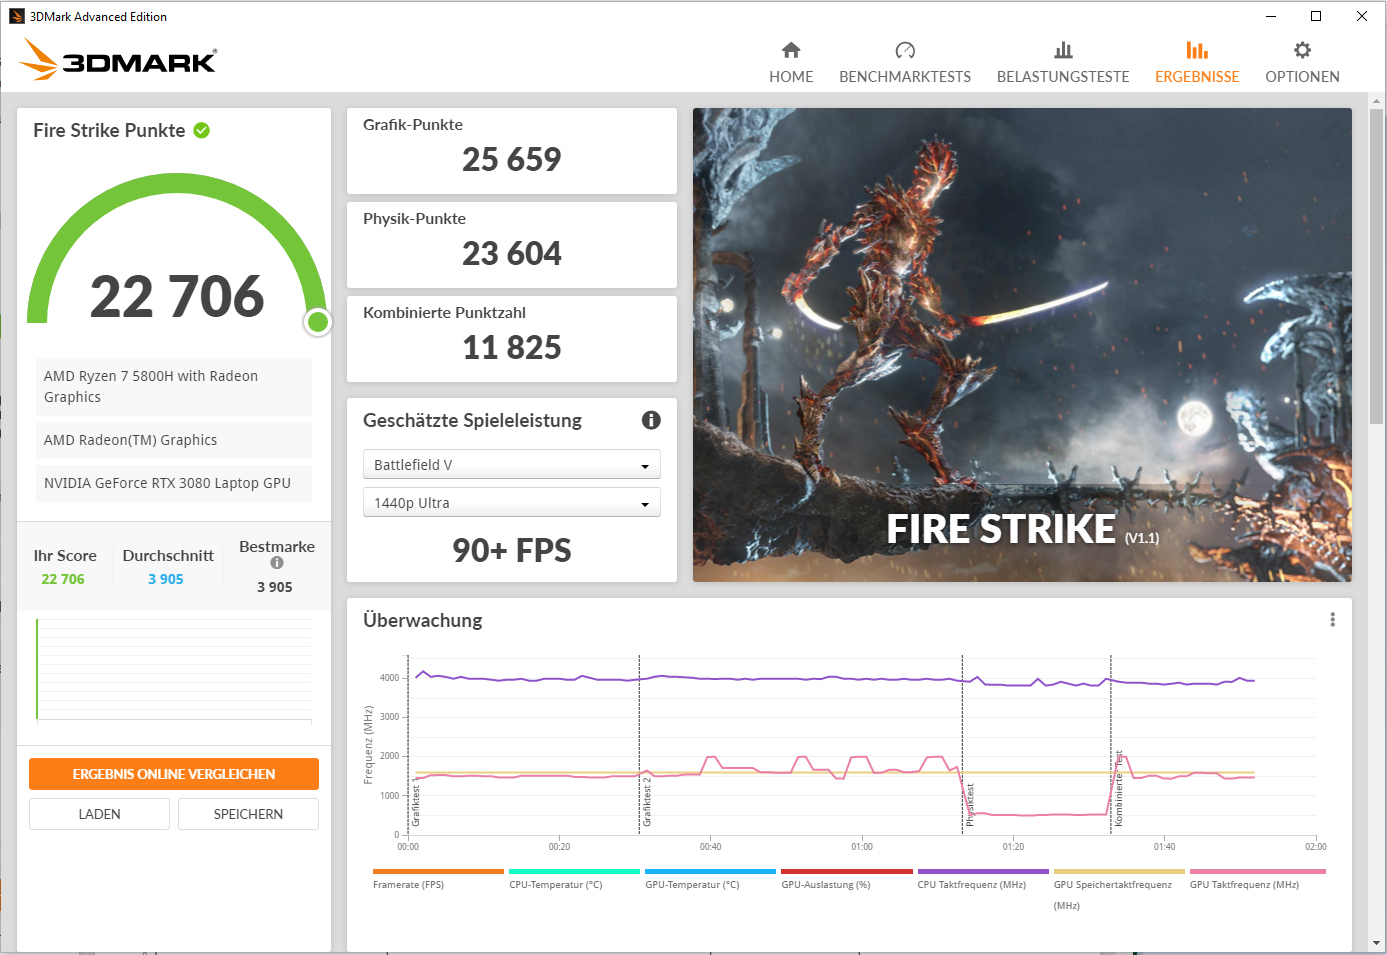
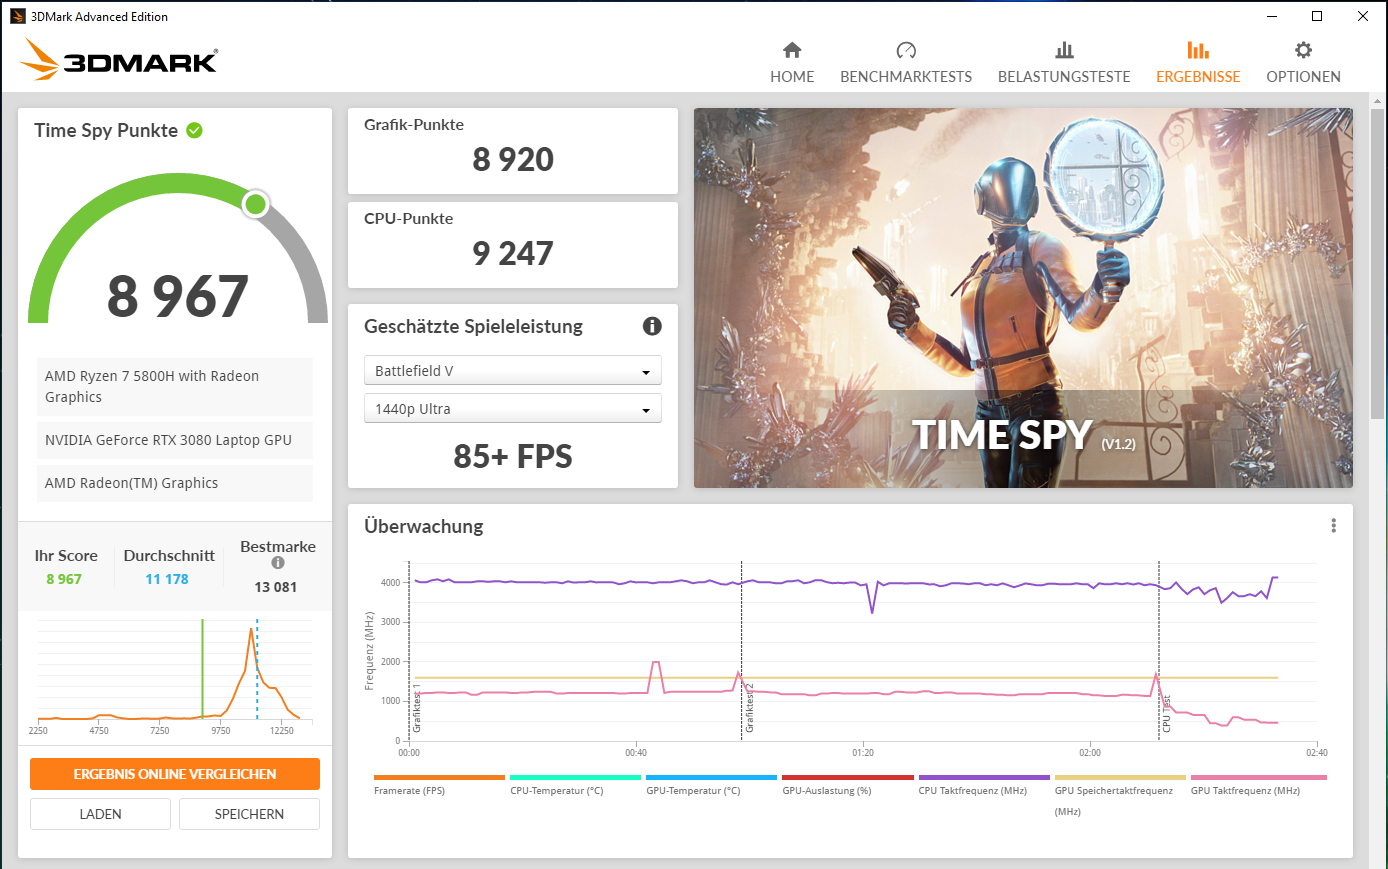
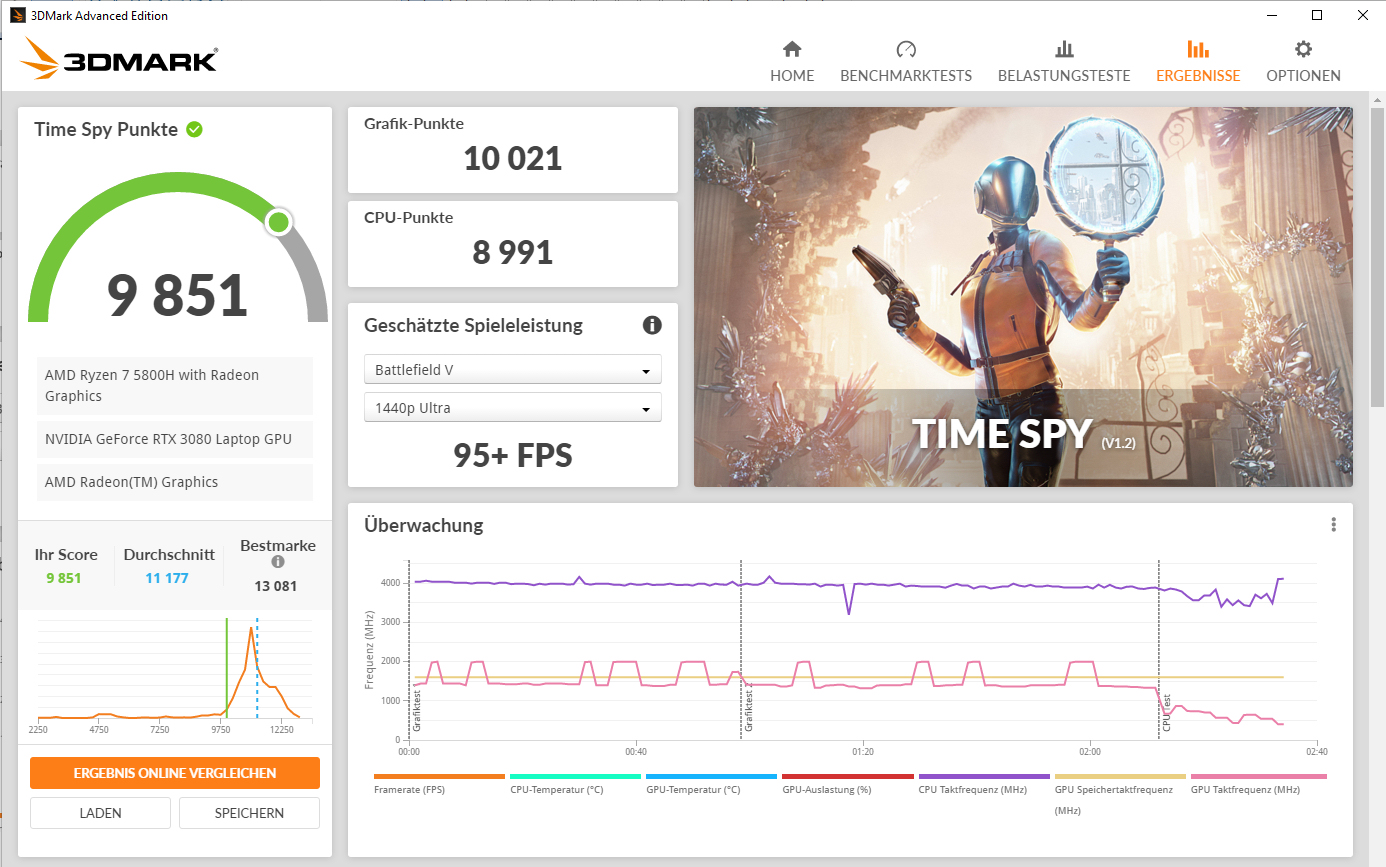

| 3DMark 11 Performance | 25155 pontos | |
| 3DMark Cloud Gate Standard Score | 46255 pontos | |
| 3DMark Fire Strike Score | 21176 pontos | |
| 3DMark Time Spy Score | 8967 pontos | |
Ajuda | ||
| 3DMark 11 - 1280x720 Performance GPU | |
| Média da turma Gaming (21841 - 80022, n=105, últimos 2 anos) | |
| MSI GP76 Leopard 10UG | |
| Média NVIDIA GeForce RTX 3080 Laptop GPU (31288 - 43744, n=40) | |
| Aorus 17G YD | |
| Medion Erazer Beast X25 | |
| Acer Nitro 5 AN517-41-R9S5 | |
| Acer Nitro 5 AN517-41-R9S5 | |
| Acer Nitro 5 AN517-41-R5Z7 | |
Desempenho do jogo
O computador traz todos os jogos atuais suavemente para a tela. A resolução FHD e as configurações de qualidade máxima podem ser selecionadas normalmente. As taxas de quadros estão abaixo da média na comparação RTX-3080.
As taxas de quadros dos jogos que testamos aumentam em até 15% após a instalação da atualização de firmware mencionada. Um aumento geral de desempenho não é observado. No entanto: Mesmo após a execução da atualização, o Nitro permanece atrás de um notebook RTX-3070 nominalmente mais fraco, como o MSI GP76 Leopardo 10UG. Aqui, o GP76 se beneficia do TGP mais alto (140 watts vs. 100 watts).
| The Witcher 3 - 1920x1080 Ultra Graphics & Postprocessing (HBAO+) | |
| Média da turma Gaming (104.7 - 240, n=7, últimos 2 anos) | |
| MSI GP76 Leopard 10UG | |
| Aorus 17G YD | |
| Média NVIDIA GeForce RTX 3080 Laptop GPU (85.1 - 123, n=40) | |
| Schenker XMG Neo 17 (Early 2021, RTX 3070, 5800H) | |
| Medion Erazer Beast X25 | |
| Acer Nitro 5 AN517-41-R9S5 (FW-Update) | |
| Acer Nitro 5 AN517-41-R9S5 | |
| Acer Nitro 5 AN517-41-R5Z7 | |
| Dota 2 Reborn - 1920x1080 ultra (3/3) best looking | |
| Média da turma Gaming (84.8 - 252, n=108, últimos 2 anos) | |
| Aorus 17G YD | |
| Schenker XMG Neo 17 (Early 2021, RTX 3070, 5800H) | |
| Média NVIDIA GeForce RTX 3080 Laptop GPU (98 - 156, n=45) | |
| Medion Erazer Beast X25 | |
| MSI GP76 Leopard 10UG | |
| Acer Nitro 5 AN517-41-R9S5 | |
| Acer Nitro 5 AN517-41-R9S5 (FW-Update) | |
| Acer Nitro 5 AN517-41-R5Z7 | |
| X-Plane 11.11 - 1920x1080 high (fps_test=3) | |
| Média da turma Gaming (55.5 - 148.5, n=110, últimos 2 anos) | |
| Média NVIDIA GeForce RTX 3080 Laptop GPU (65.6 - 113, n=44) | |
| Aorus 17G YD | |
| MSI GP76 Leopard 10UG | |
| Schenker XMG Neo 17 (Early 2021, RTX 3070, 5800H) | |
| Acer Nitro 5 AN517-41-R9S5 (FW-Update) | |
| Medion Erazer Beast X25 | |
| Acer Nitro 5 AN517-41-R9S5 | |
| Acer Nitro 5 AN517-41-R5Z7 | |
| Final Fantasy XV Benchmark - 1920x1080 High Quality | |
| Média da turma Gaming (41 - 215, n=95, últimos 2 anos) | |
| Média NVIDIA GeForce RTX 3080 Laptop GPU (55.5 - 115, n=34) | |
| Medion Erazer Beast X25 | |
| Aorus 17G YD (1.3) | |
| Acer Nitro 5 AN517-41-R9S5 (1.3, FW-Update) | |
| MSI GP76 Leopard 10UG | |
| Acer Nitro 5 AN517-41-R9S5 (1.3) | |
| Acer Nitro 5 AN517-41-R5Z7 (1.3) | |
| GTA V - 1920x1080 Highest AA:4xMSAA + FX AF:16x | |
| Média da turma Gaming (48.3 - 186.9, n=94, últimos 2 anos) | |
| Média NVIDIA GeForce RTX 3080 Laptop GPU (68.6 - 114.6, n=34) | |
| Schenker XMG Neo 17 (Early 2021, RTX 3070, 5800H) | |
| Aorus 17G YD | |
| Medion Erazer Beast X25 | |
| Acer Nitro 5 AN517-41-R9S5 | |
| Acer Nitro 5 AN517-41-R9S5 (FW-Update) | |
| Acer Nitro 5 AN517-41-R5Z7 | |
| Strange Brigade - 1920x1080 ultra AA:ultra AF:16 | |
| Média da turma Gaming (76.3 - 458, n=87, últimos 2 anos) | |
| Média NVIDIA GeForce RTX 3080 Laptop GPU (117 - 219, n=34) | |
| Medion Erazer Beast X25 (1.47.22.14 D3D12) | |
| Aorus 17G YD (1.47.22.14 D3D12) | |
| Acer Nitro 5 AN517-41-R9S5 (1.47.22.14 D3D12, FW-Update) | |
| Acer Nitro 5 AN517-41-R9S5 (1.47.22.14 D3D12) | |
| Acer Nitro 5 AN517-41-R5Z7 (1.47.22.14 D3D12) | |
| Dirt 5 - 1920x1080 Ultra High Preset | |
| Acer Nitro 5 AN517-41-R9S5 (FW-Update) | |
| Aorus 17G YD | |
| Média NVIDIA GeForce RTX 3080 Laptop GPU (52 - 110, n=11) | |
| Acer Nitro 5 AN517-41-R9S5 | |
| Acer Nitro 5 AN517-41-R5Z7 | |
| Far Cry 5 - 1920x1080 Ultra Preset AA:T | |
| Média da turma Gaming (70 - 151, n=6, últimos 2 anos) | |
| MSI GP76 Leopard 10UG | |
| Média NVIDIA GeForce RTX 3080 Laptop GPU (75 - 146, n=33) | |
| Medion Erazer Beast X25 | |
| Aorus 17G YD | |
| Acer Nitro 5 AN517-41-R9S5 | |
| Acer Nitro 5 AN517-41-R9S5 (FW-Update) | |
| Acer Nitro 5 AN517-41-R5Z7 | |
Para verificar se as taxas de quadros permanecem em grande parte constantes durante um período mais longo, executamos o jogo"The Witcher 3" por cerca de 60 minutos com resolução Full HD e ajustes de qualidade máxima. O personagem do jogo não é movido. Uma queda nas taxas de quadros não é notada
Witcher 3 FPS-Diagram
| baixo | média | alto | ultra | |
|---|---|---|---|---|
| GTA V (2015) | 178 | 172 | 148 | 89.9 |
| The Witcher 3 (2015) | 293 | 262 | 151 | 87.7 |
| Dota 2 Reborn (2015) | 144 | 139 | 123 | 116 |
| Final Fantasy XV Benchmark (2018) | 165 | 113 | 85.4 | |
| X-Plane 11.11 (2018) | 98.1 | 85.8 | 72 | |
| Far Cry 5 (2018) | 134 | 115 | 110 | 103 |
| Strange Brigade (2018) | 313 | 186 | 165 | 151 |
| Dirt 5 (2020) | 190 | 120 | 97.3 | 76.5 |
Emissions & Energy - Acer computer does not generate excessive heat and noise
Emissões sonoras
Os dois ventiladores operam a baixa velocidade em modo inativo e mal são audíveis. Ocasionalmente, eles ficam parados. Isto não é verdade sob uso pesado. O nível máximo de pressão sonora é de pouco menos de 49 dB(A) (teste de estresse).
Barulho
| Ocioso |
| 26 / 28 / dB |
| HDD |
| 0 dB |
| Carga |
| 41.6 / 48.6 dB |
 | ||
30 dB silencioso 40 dB(A) audível 50 dB(A) ruidosamente alto |
||
min: | ||
| Acer Nitro 5 AN517-41-R9S5 AMD Ryzen 7 5800H, NVIDIA GeForce RTX 3080 Laptop GPU | Acer Nitro 5 AN517-41-R5Z7 AMD Ryzen 7 5800H, NVIDIA GeForce RTX 3070 Laptop GPU | MSI GP76 Leopard 10UG Intel Core i7-10750H, NVIDIA GeForce RTX 3070 Laptop GPU | Schenker XMG Neo 17 (Early 2021, RTX 3070, 5800H) AMD Ryzen 7 5800H, NVIDIA GeForce RTX 3070 Laptop GPU | Medion Erazer Beast X25 AMD Ryzen 9 5900HX, NVIDIA GeForce RTX 3080 Laptop GPU | Aorus 17G YD Intel Core i7-11800H, NVIDIA GeForce RTX 3080 Laptop GPU | |
|---|---|---|---|---|---|---|
| Noise | -8% | -9% | -10% | -9% | -13% | |
| desligado / ambiente * (dB) | 26 | 26 -0% | 24 8% | 24 8% | 25 4% | 25 4% |
| Idle Minimum * (dB) | 26 | 26 -0% | 25 4% | 29 -12% | 26 -0% | 32 -23% |
| Idle Average * (dB) | 28 | 33.1 -18% | 32 -14% | 32 -14% | 30 -7% | 33 -18% |
| Load Average * (dB) | 41.6 | 49.8 -20% | 54 -30% | 49 -18% | 54 -30% | 43 -3% |
| Load Maximum * (dB) | 48.6 | 49.6 -2% | 54 -11% | 55 -13% | 55 -13% | 61 -26% |
| Idle Maximum * (dB) | 31.3 | 34 | 38 | 43 | 39 | |
| Witcher 3 ultra * (dB) | 51 | 53 | 52 | 52 |
* ... menor é melhor
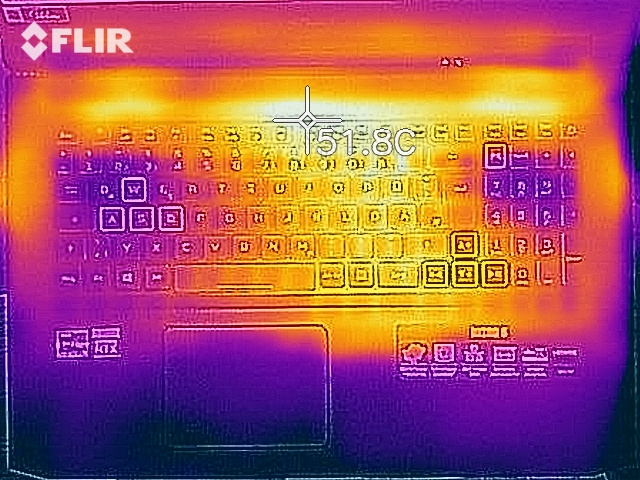
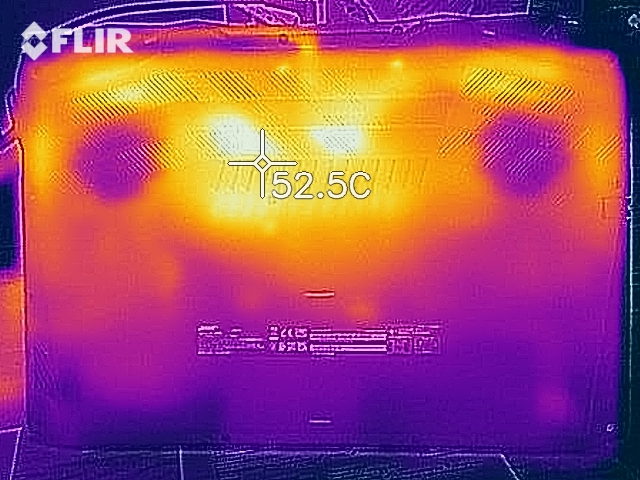
Temperatura
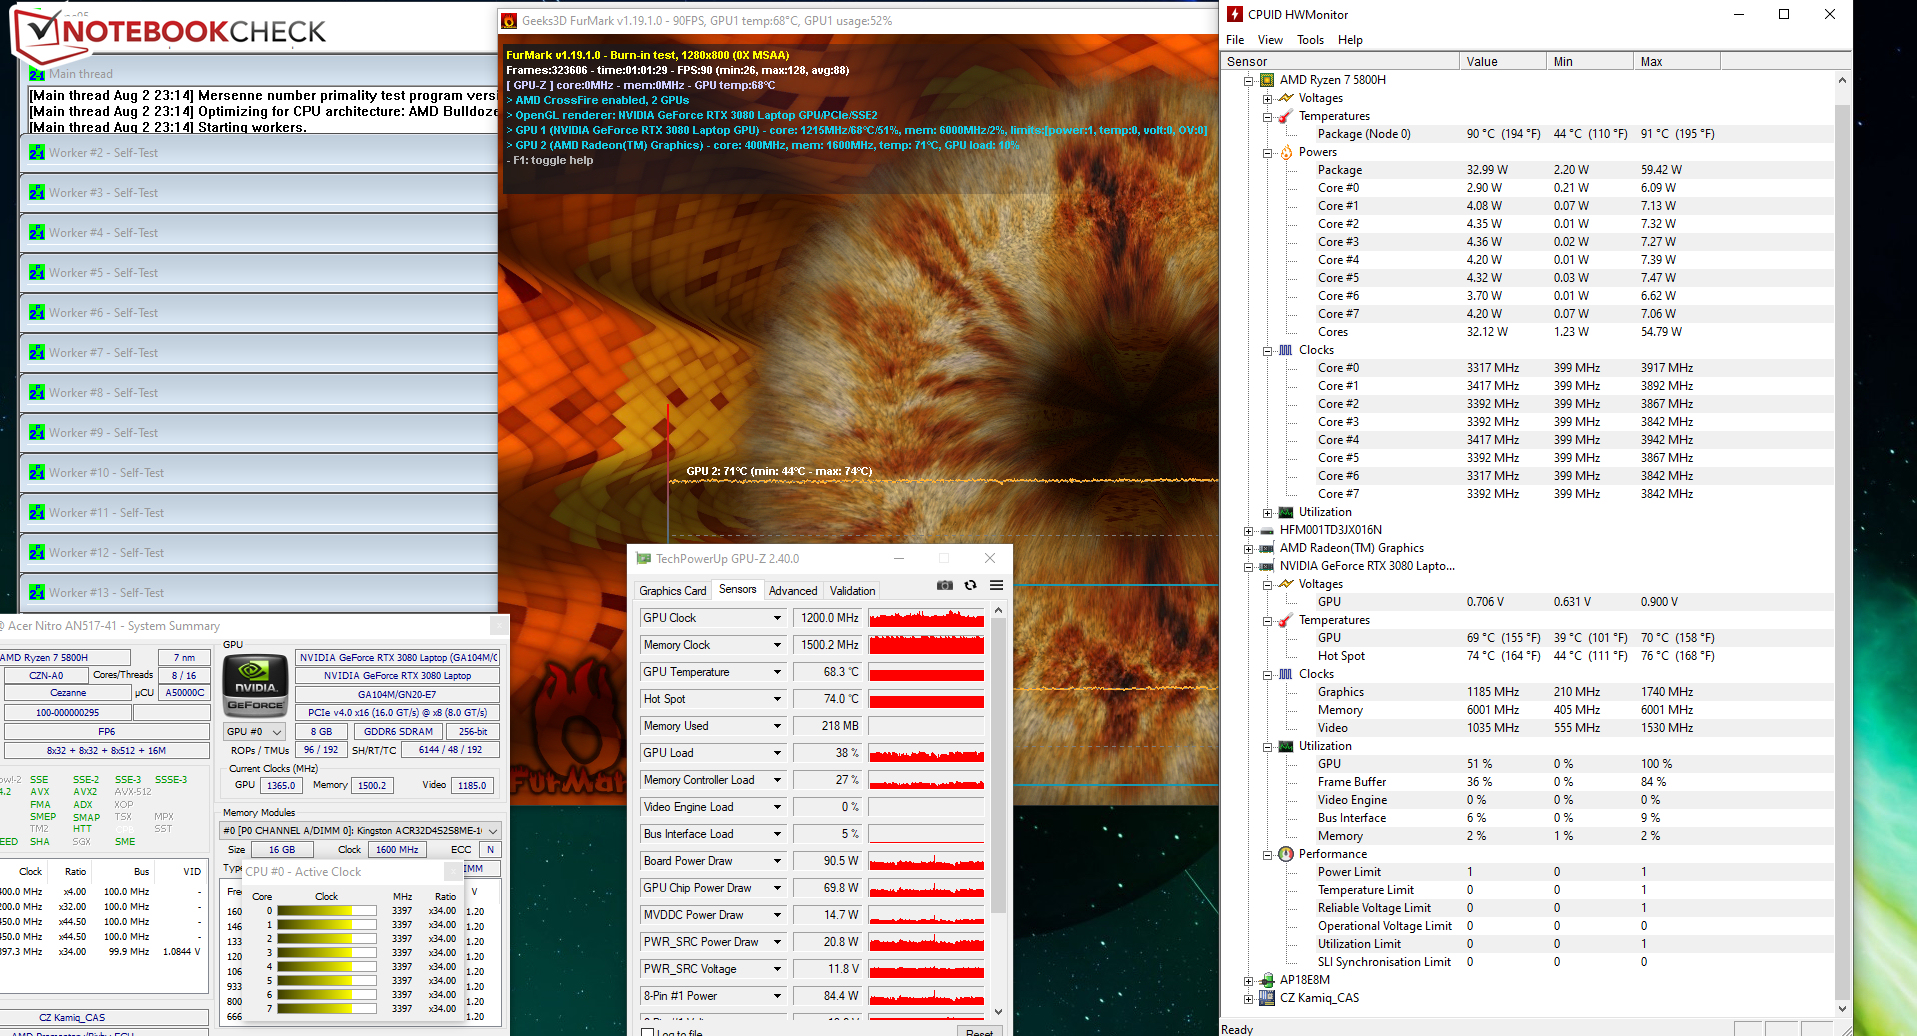
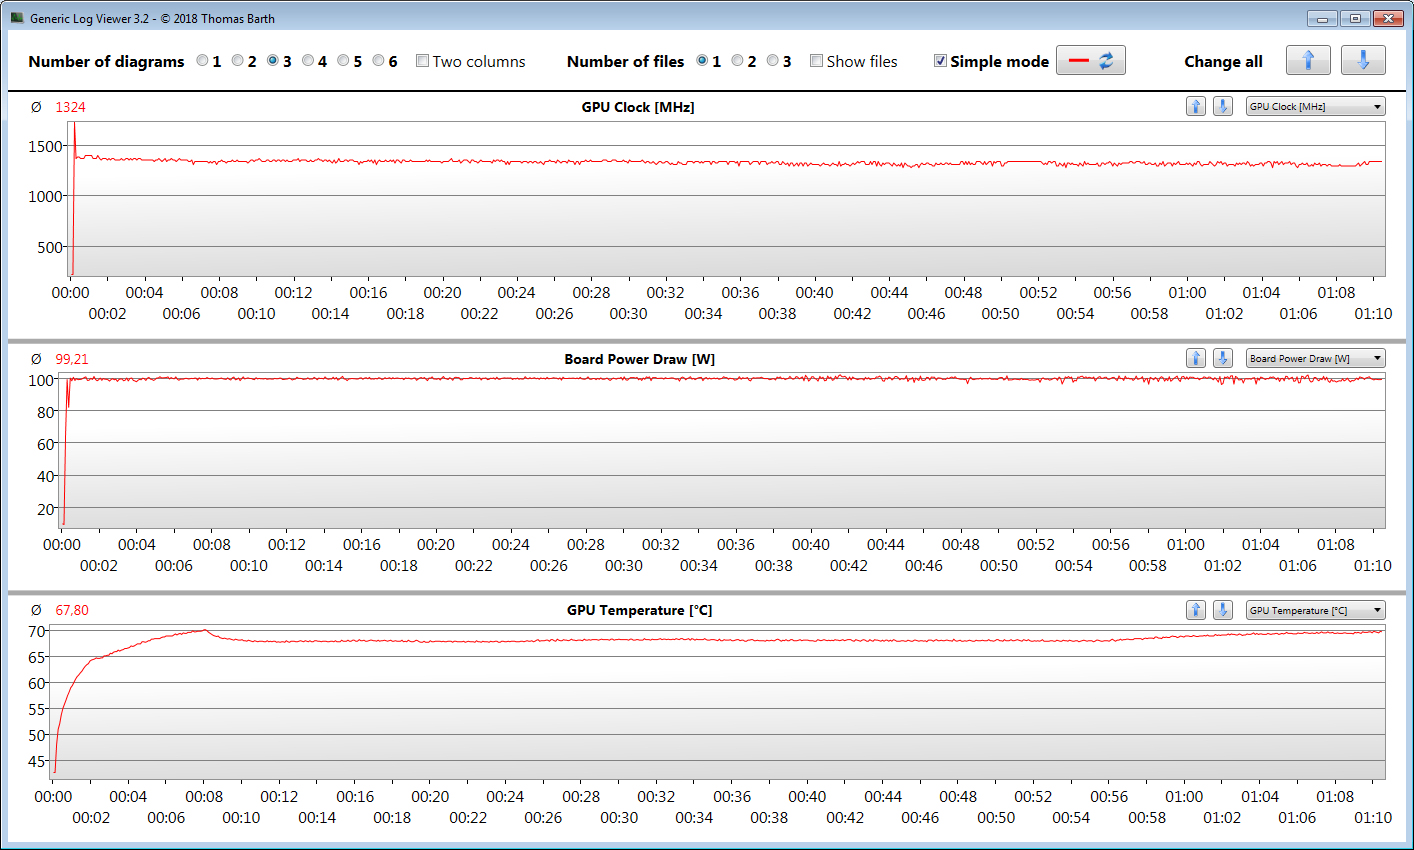
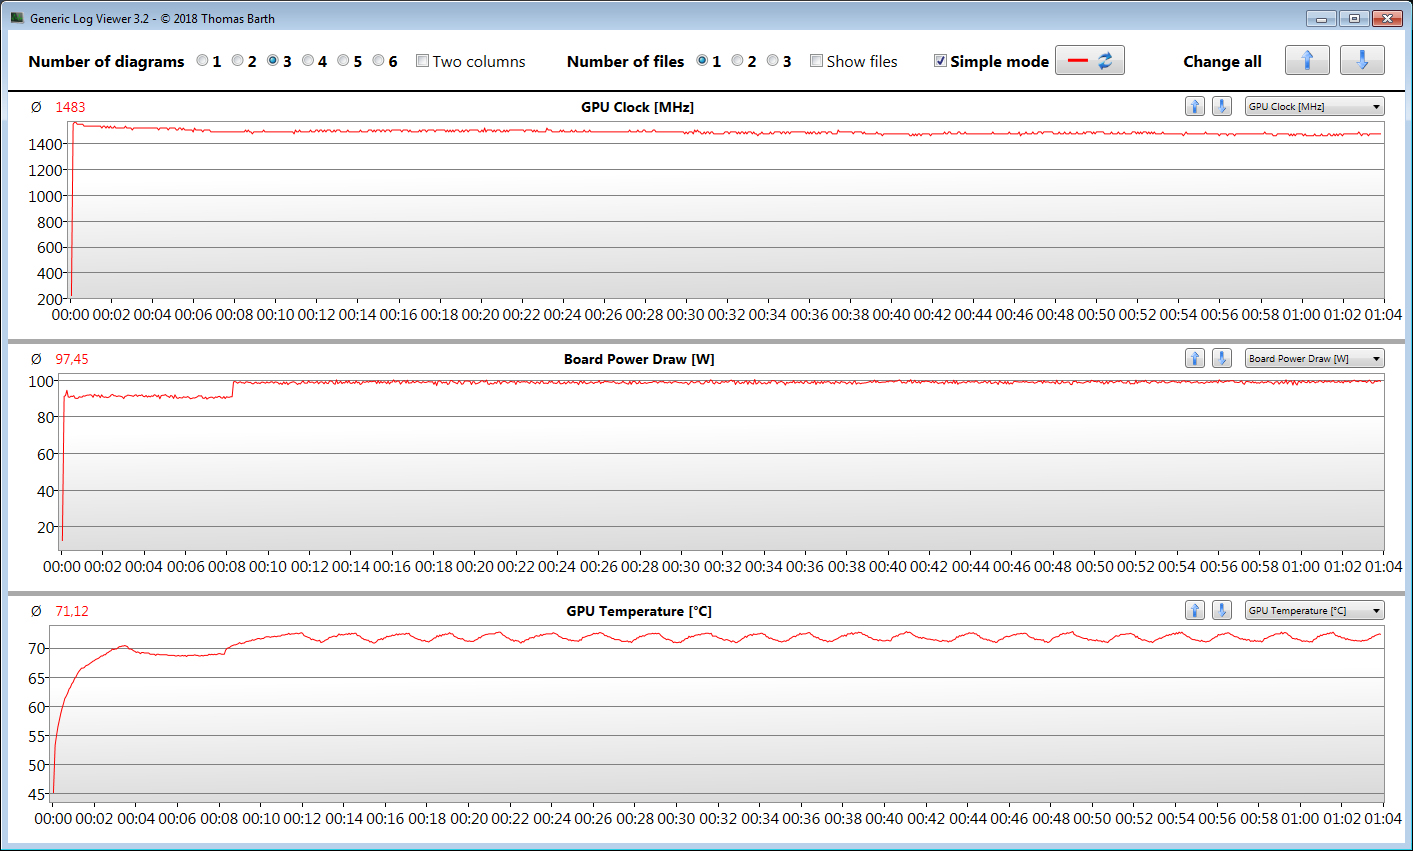
O teste de estresse (Prime95 e FurMark funcionam por uma hora) é realizado pela CPU e GPU a 3,4 GHz e 500 a 1.200 MHz, respectivamente. Este cenário extremo é usado para verificar se o sistema funciona de forma estável sob carga total.
O notebook aquece visivelmente sob carga, mas não em excesso. Durante o teste de estresse, a marca de 50 graus Celsius (122 Fahrenheit) é excedida em dois pontos de medição. As temperaturas estão dentro de uma zona verde em uso diário
(-) A temperatura máxima no lado superior é 46.4 °C / 116 F, em comparação com a média de 40.4 °C / 105 F , variando de 21.2 a 68.8 °C para a classe Gaming.
(-) A parte inferior aquece até um máximo de 56.5 °C / 134 F, em comparação com a média de 43.2 °C / 110 F
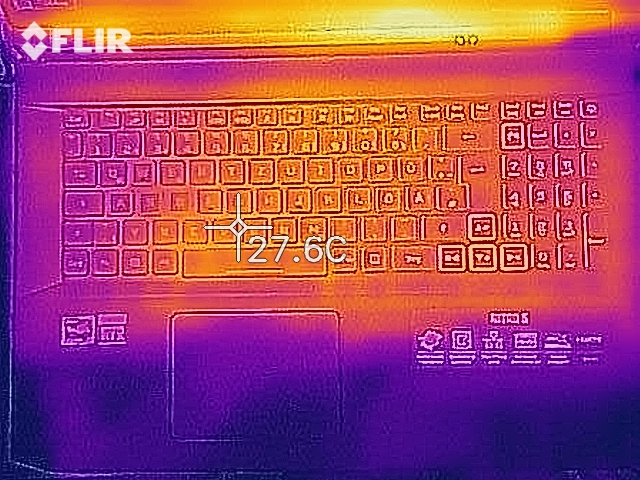
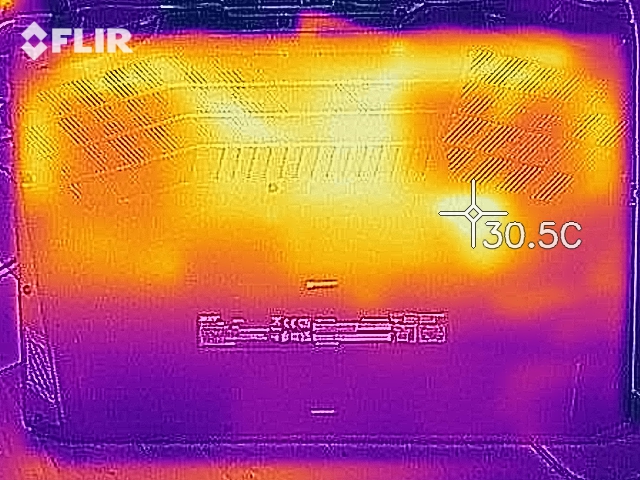
(+) Em uso inativo, a temperatura média para o lado superior é 25.6 °C / 78 F, em comparação com a média do dispositivo de 33.9 °C / ### class_avg_f### F.
(+) Os apoios para as mãos e o touchpad são mais frios que a temperatura da pele, com um máximo de 24.5 °C / 76.1 F e, portanto, são frios ao toque.
(+) A temperatura média da área do apoio para as mãos de dispositivos semelhantes foi 28.8 °C / 83.8 F (+4.3 °C / 7.7 F).
| Acer Nitro 5 AN517-41-R9S5 AMD Ryzen 7 5800H, NVIDIA GeForce RTX 3080 Laptop GPU | Acer Nitro 5 AN517-41-R5Z7 AMD Ryzen 7 5800H, NVIDIA GeForce RTX 3070 Laptop GPU | MSI GP76 Leopard 10UG Intel Core i7-10750H, NVIDIA GeForce RTX 3070 Laptop GPU | Schenker XMG Neo 17 (Early 2021, RTX 3070, 5800H) AMD Ryzen 7 5800H, NVIDIA GeForce RTX 3070 Laptop GPU | Medion Erazer Beast X25 AMD Ryzen 9 5900HX, NVIDIA GeForce RTX 3080 Laptop GPU | Aorus 17G YD Intel Core i7-11800H, NVIDIA GeForce RTX 3080 Laptop GPU | |
|---|---|---|---|---|---|---|
| Heat | -1% | 4% | -5% | -11% | 6% | |
| Maximum Upper Side * (°C) | 46.4 | 44 5% | 43 7% | 47 -1% | 54 -16% | 36 22% |
| Maximum Bottom * (°C) | 56.5 | 52.7 7% | 47 17% | 51 10% | 57 -1% | 52 8% |
| Idle Upper Side * (°C) | 29.4 | 32.6 -11% | 30 -2% | 32 -9% | 34 -16% | 29 1% |
| Idle Bottom * (°C) | 31.2 | 32.1 -3% | 33 -6% | 37 -19% | 35 -12% | 33 -6% |
* ... menor é melhor
Orador
Acer Nitro 5 AN517-41-R9S5 análise de áudio
(±) | o volume do alto-falante é médio, mas bom (###valor### dB)
Graves 100 - 315Hz
(-) | quase nenhum baixo - em média 27.4% menor que a mediana
(±) | a linearidade dos graves é média (11.3% delta para a frequência anterior)
Médios 400 - 2.000 Hz
(+) | médios equilibrados - apenas 4.1% longe da mediana
(±) | a linearidade dos médios é média (8.7% delta para frequência anterior)
Altos 2 - 16 kHz
(±) | máximos mais altos - em média 6% maior que a mediana
(+) | os máximos são lineares (5% delta da frequência anterior)
Geral 100 - 16.000 Hz
(±) | a linearidade do som geral é média (22.5% diferença em relação à mediana)
Comparado com a mesma classe
» 81% de todos os dispositivos testados nesta classe foram melhores, 5% semelhantes, 14% piores
» O melhor teve um delta de 6%, a média foi 18%, o pior foi 132%
Comparado com todos os dispositivos testados
» 66% de todos os dispositivos testados foram melhores, 6% semelhantes, 28% piores
» O melhor teve um delta de 4%, a média foi 23%, o pior foi 134%
Consumo de energia
Registramos um consumo máximo de energia de 12 watts em modo inativo - cerca da metade do que o Modelo irmão RTX-3070. Presumivelmente, uma aplicação de fundo impulsionou o consumo de energia do modelo irmão. Teste de estresse e Witcher 3 teste respectivamente, deixe o consumo de energia subir até 152,5 watts e 132 watts em média. O diagrama seguinte ilustra o consumo de energia razoavelmente constante do notebook durante o teste Witcher 3 teste e o teste de estresse. A potência nominal da fonte de alimentação é de 180 watts
| desligado | |
| Ocioso | |
| Carga |
|
Key:
min: | |
Energy absorption Witcher 3 / Stresstest
| Acer Nitro 5 AN517-41-R9S5 AMD Ryzen 7 5800H, NVIDIA GeForce RTX 3080 Laptop GPU | Acer Nitro 5 AN517-41-R5Z7 AMD Ryzen 7 5800H, NVIDIA GeForce RTX 3070 Laptop GPU | MSI GP76 Leopard 10UG Intel Core i7-10750H, NVIDIA GeForce RTX 3070 Laptop GPU | Schenker XMG Neo 17 (Early 2021, RTX 3070, 5800H) AMD Ryzen 7 5800H, NVIDIA GeForce RTX 3070 Laptop GPU | Medion Erazer Beast X25 AMD Ryzen 9 5900HX, NVIDIA GeForce RTX 3080 Laptop GPU | Aorus 17G YD Intel Core i7-11800H, NVIDIA GeForce RTX 3080 Laptop GPU | |
|---|---|---|---|---|---|---|
| Power Consumption | -54% | -45% | -52% | -92% | -96% | |
| Idle Minimum * (Watt) | 8.5 | 18.7 -120% | 12 -41% | 13 -53% | 22 -159% | 24 -182% |
| Idle Average * (Watt) | 11.7 | 22 -88% | 16 -37% | 16 -37% | 26 -122% | 26 -122% |
| Idle Maximum * (Watt) | 12 | 25.2 -110% | 28 -133% | 26 -117% | 34 -183% | 38 -217% |
| Load Average * (Watt) | 132 | 134.7 -2% | 92 30% | 125 5% | 120 9% | 101 23% |
| Witcher 3 ultra * (Watt) | 132 | 135 -2% | 198 -50% | 187 -42% | 189 -43% | 164 -24% |
| Load Maximum * (Watt) | 152.5 | 157 -3% | 210 -38% | 259 -70% | 231 -51% | 230 -51% |
* ... menor é melhor
Duração da bateria
A AN517-41 atinge um tempo de execução de 5:41 h em nosso teste WLAN prático. A carga ao chamar os sites é mapeada através de um roteiro
Pro
Contra
Veredicto - Nitro travado
Por pouco menos de 2.000 euros (~$2359), o Nitro 5 é um notebook para jogos bem equipado e bem equipado. ORyzen 7-5800H APU, GeForce RTX-3080 Laptop GPU, 32 GB de RAM (modo de canal duplo, máx. 64 GB) e um SSD de 1 TB equipam o computador para todas as áreas de aplicação comuns.
A Nitro 5 tem um lugar na parte inferior da tabela entre os notebooks RTX-3080. No entanto, a Acer montou aqui um pacote bem completo.
O desempenho de jogo abaixo da média é devido ao TGP relativamente baixo de 100 watts. Portanto, o Nitro tem que competir com um notebook RTX-3070 nominalmente mais fraco, como o MSI GP76 Leopardo 10UG. Odesempenhoda GPUpode ser aumentado através de uma atualização de firmware, mas o ganho é apenas moderado. A Nitro ainda não pode passar o MSI GP76.
A CPU e a GPU podem constantemente desdobrar seu desempenho em um nível elevado. O laptop aquece visivelmente sob carga, mas não excessivamente. O desenvolvimento do ruído está em um nível padrão de classe. A instalação da atualização do FW deve aumentar um pouco o desenvolvimento de calor e ruído.
A tela (FHD, IPS, 144 Hz) oferece ângulos de visão estáveis, bom contraste, superfície fosca, tempos de resposta curtos e reprodução de cores decentes. A luminosidade média e a cobertura do espaço de cor são muito baixas.
Uma alternativa para o Nitro 5 seria o preço comparável MSI GP76 Leopardo 10UG. Ela oferece um pouco mais de GPU, mas significativamente menos desempenho da CPU do que a Nitro 5. Além disso, o laptop MSI tem apenas 16 GB de RAM e um SSD de 512 GB.
Preço e disponibilidade
O Acer Nitro 5 AN517-41-R9S5 (Ryzen 7-5800H, GeForce RTX-3080, 32 GB RAM, 1 TB SSD, Windows 10 Home) está disponível por um preço de 1.999 Euros (~$2358) em Cyberport.de
Acer Nitro 5 AN517-41-R9S5
- 08/06/2021 v7 (old)
Sascha Mölck
Price comparison
