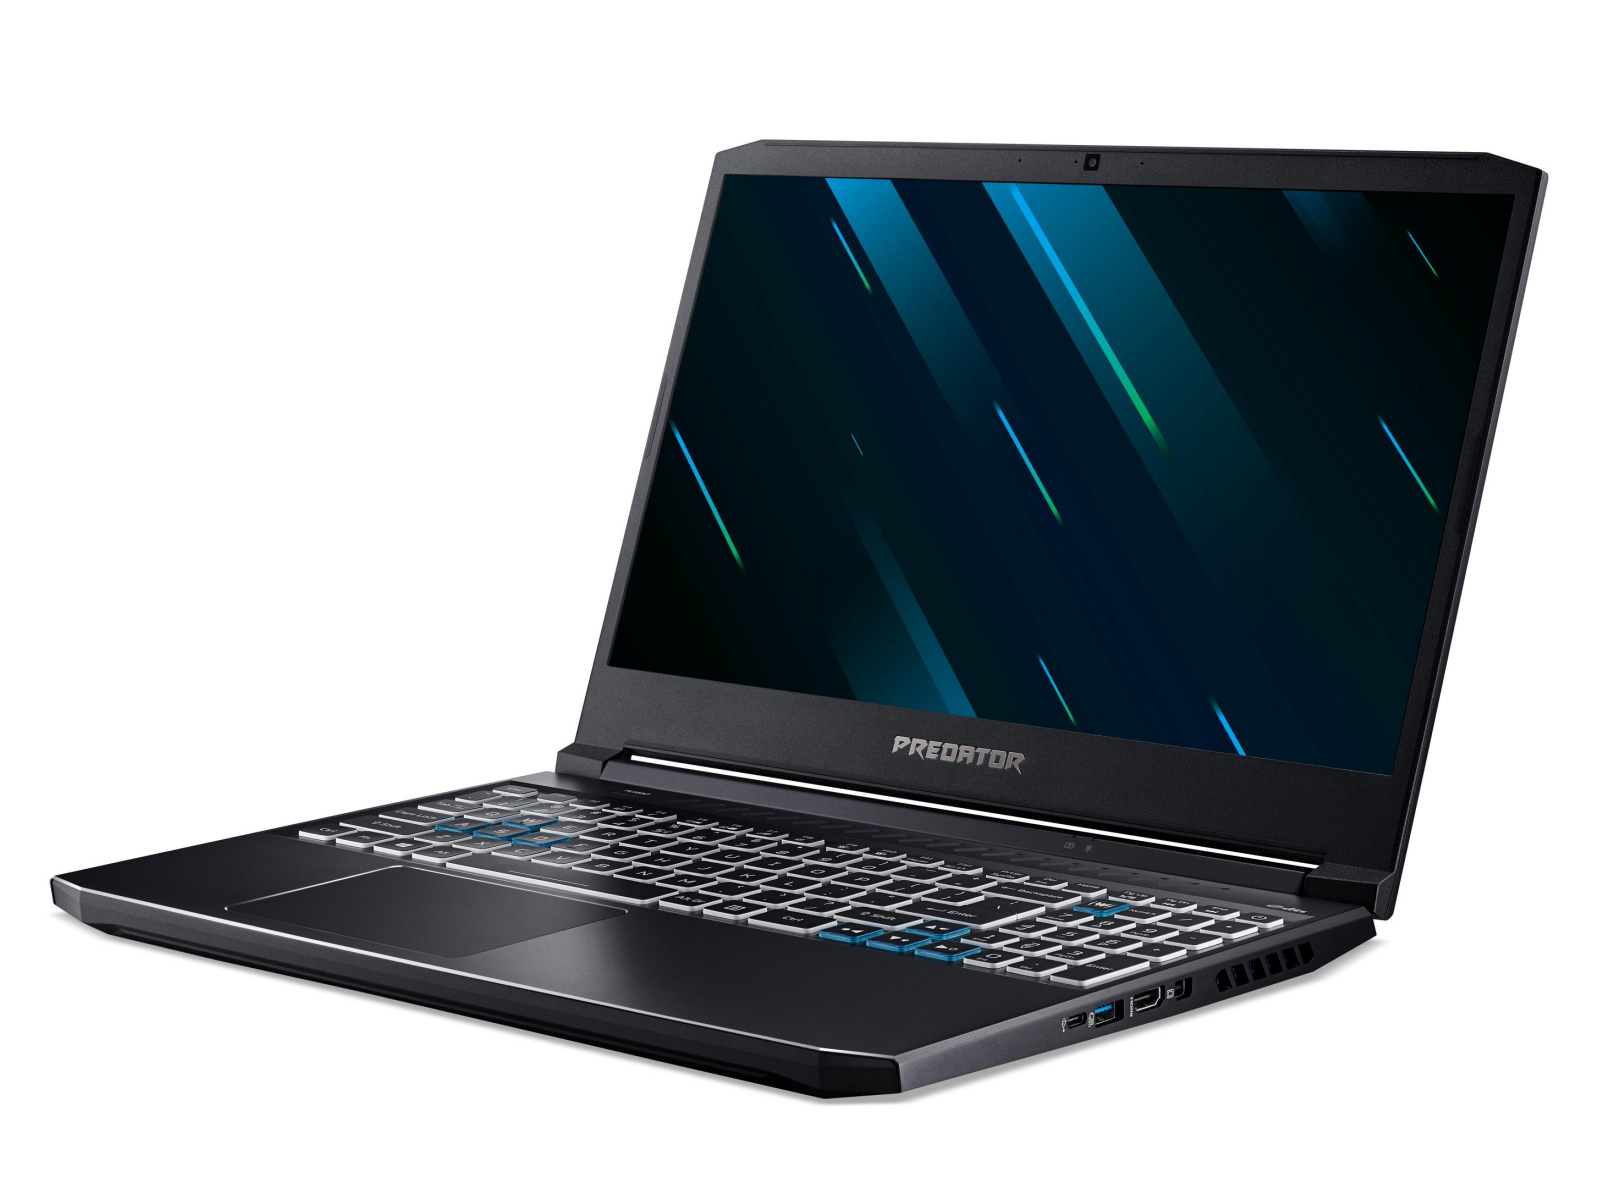
Acer Predator Helios 300 PH315-53 em revisão: A atualização prevê (ligeiramente) mais potência RTX 3070

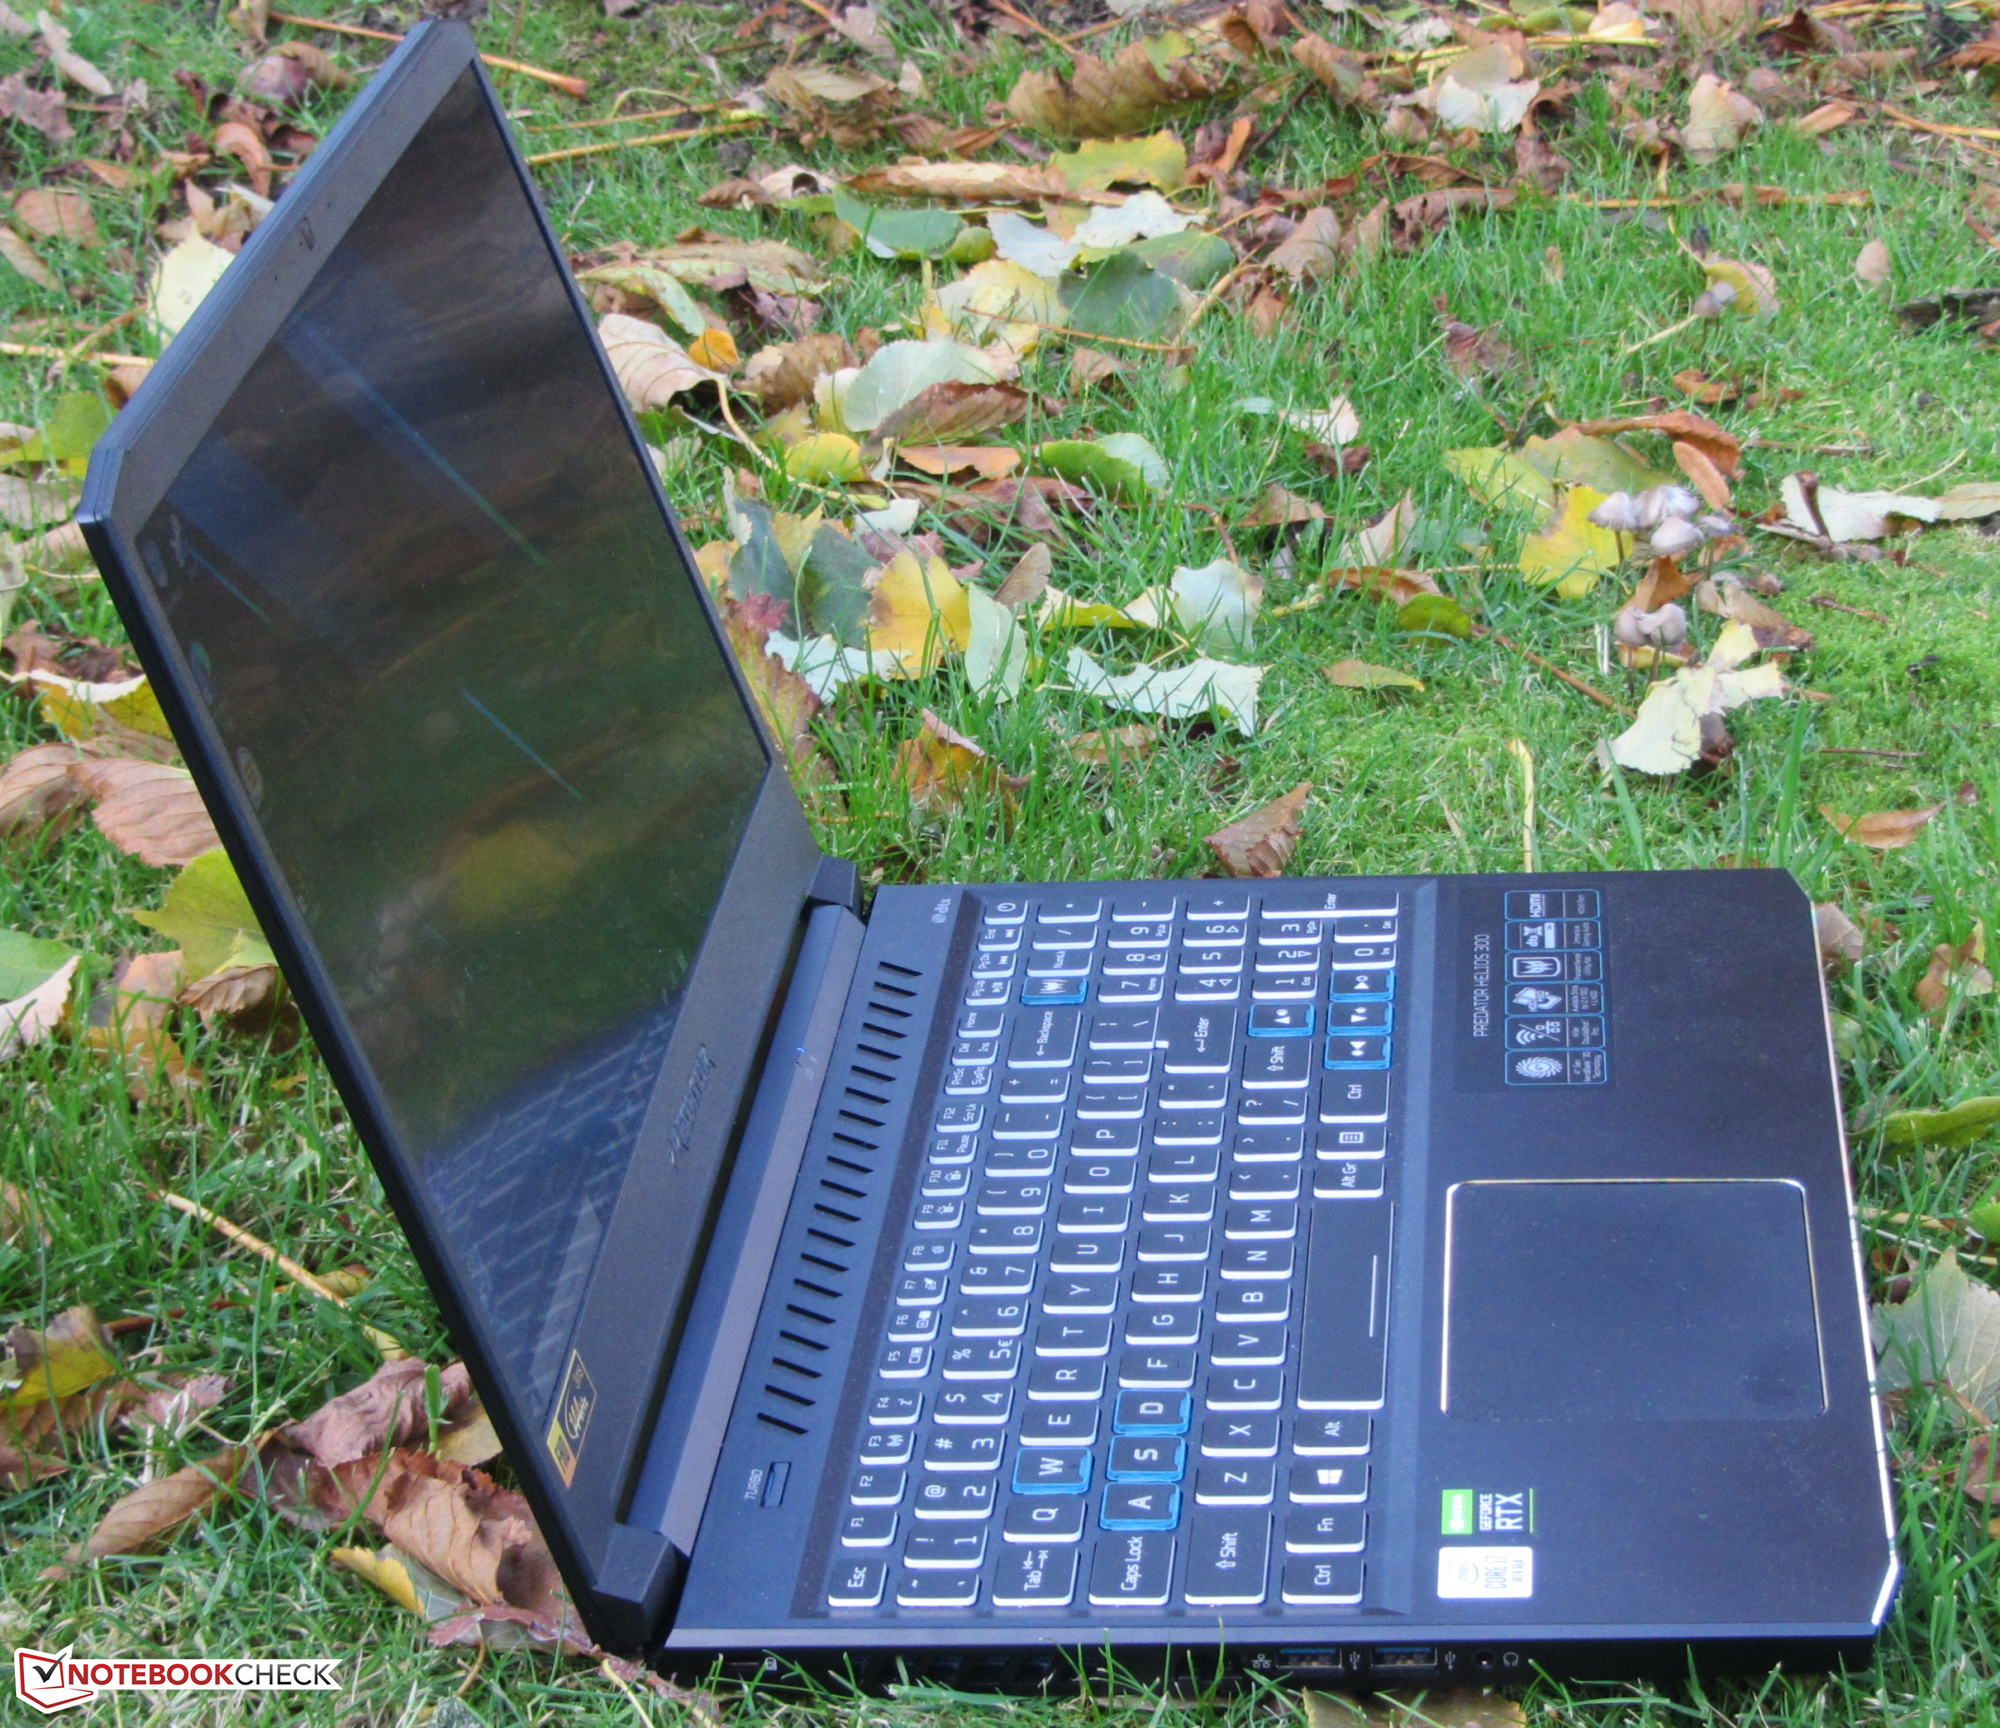
O Predator Helios 300 é um laptop para jogos no formato de 15,6 polegadas. O dispositivo é alimentado por umprocessadorCore i7-10750H e umlaptopGeForce RTX 3070GPU. Os concorrentes incluem dispositivos como o Aorus 15G XC, oMSI GS66 Stealth 10UG, e o Asus ROG Strix G15 G513QR.
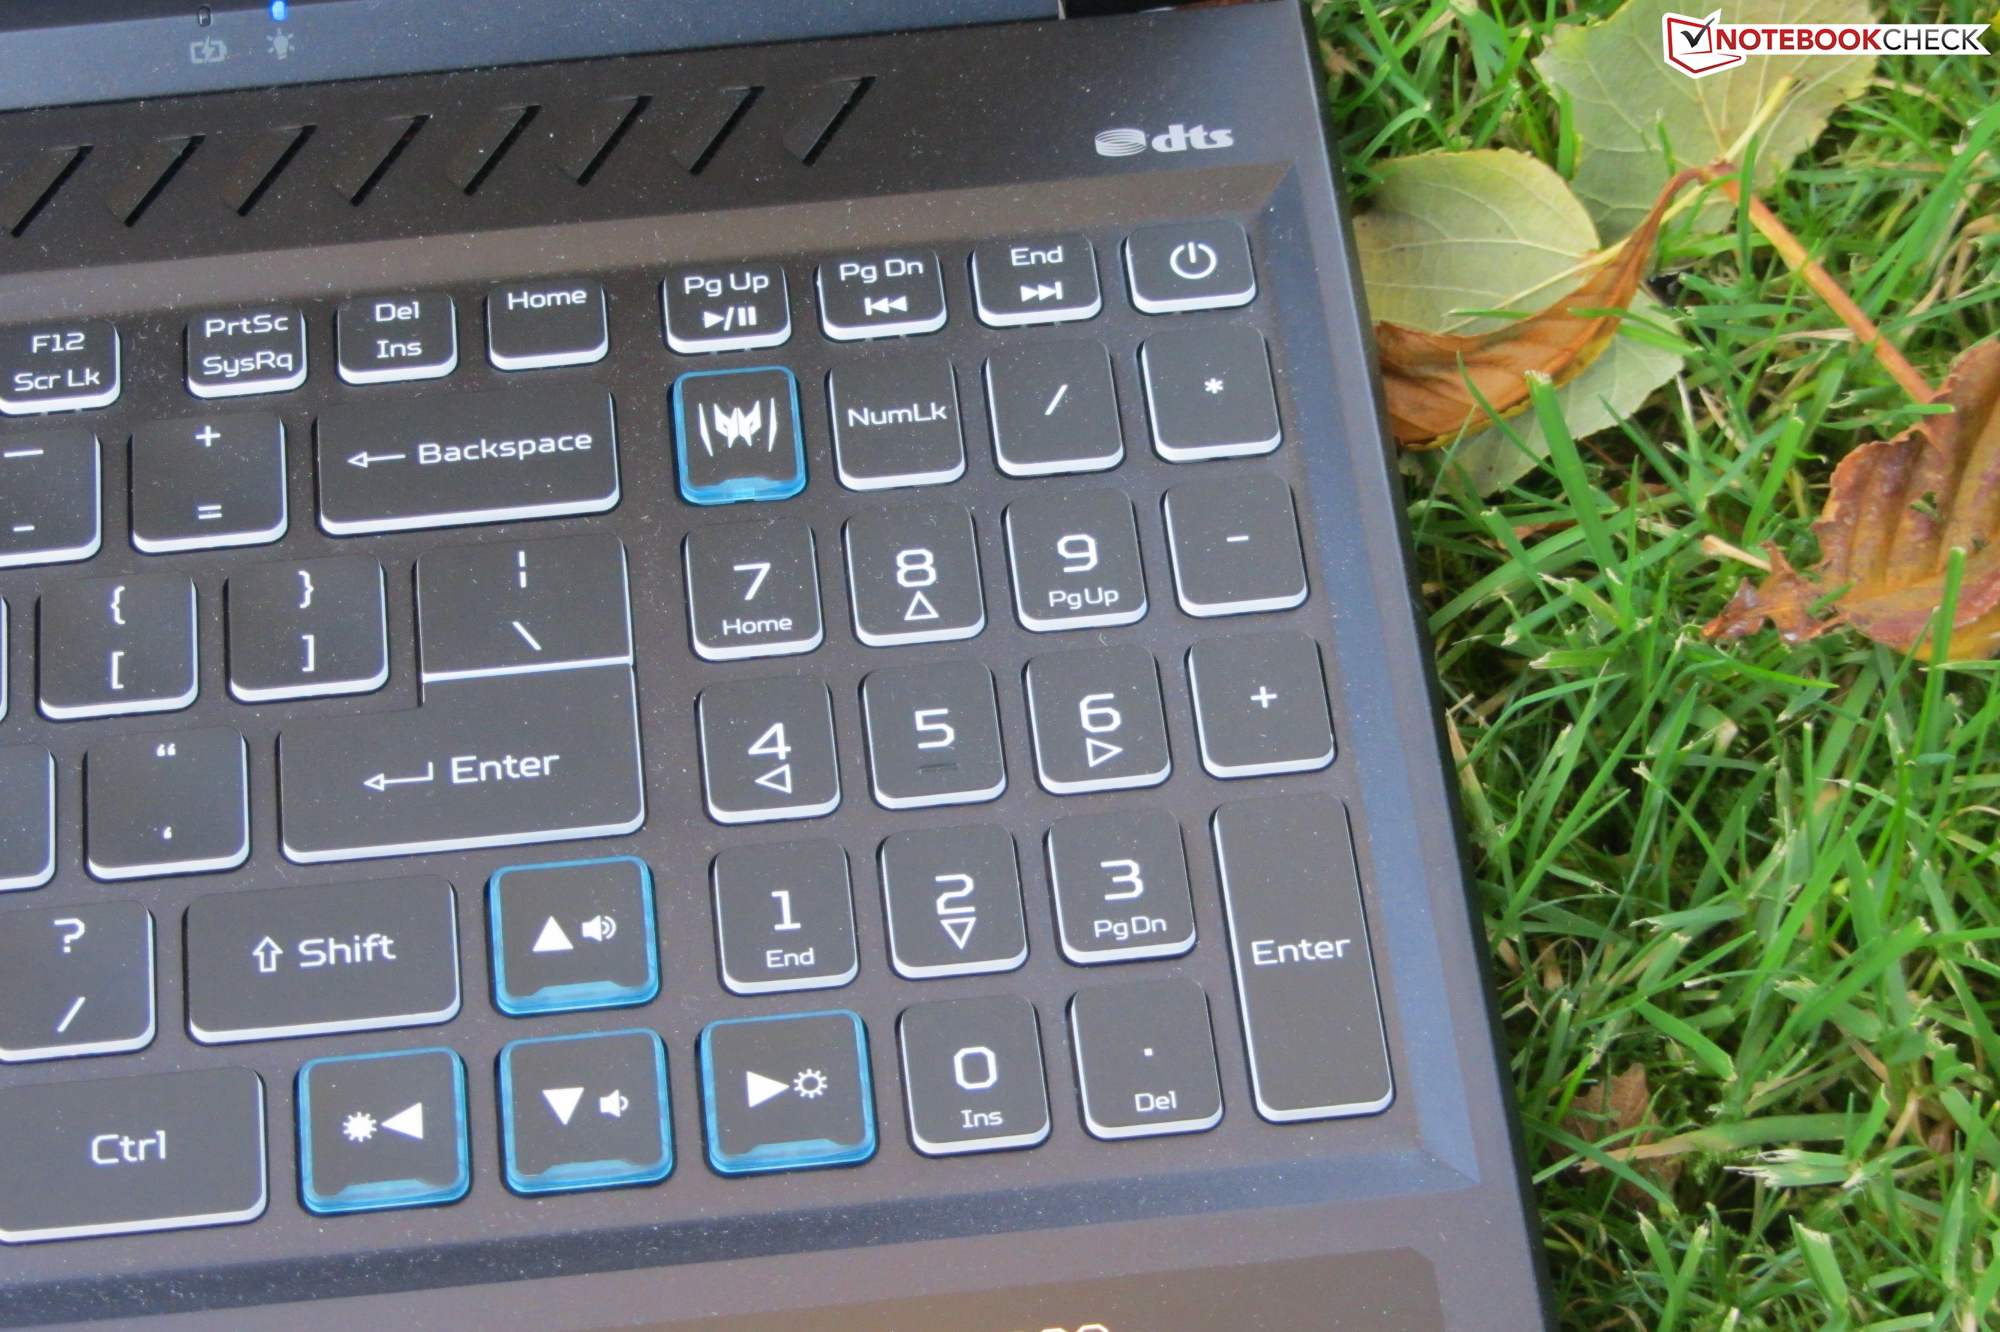
Como já revisamos um dos modelos irmãos do Predator, não entraremos no caso, a conectividade, os dispositivos de entrada e os alto-falantes. As informações correspondentes podem ser encontradas na revisãodo Acer Predator Helios 300 PH315-53-77N5. Também vale a pena dar uma olhada na revisão dedo predecessor semelhante.
Possible contenders in comparison
Avaliação | Data | Modelo | Peso | Altura | Size | Resolução | Preço |
|---|---|---|---|---|---|---|---|
| 83.8 % v7 (old) | 07/2021 | Acer Predator Helios 300 PH315-53-786B i7-10750H, GeForce RTX 3070 Laptop GPU | 2.2 kg | 22.9 mm | 15.60" | 1920x1080 | |
| 86.4 % v7 (old) | 02/2021 | Aorus 15G XC i7-10870H, GeForce RTX 3070 Laptop GPU | 2.1 kg | 23 mm | 15.60" | 1920x1080 | |
| 84 % v7 (old) | 02/2021 | MSI GS66 Stealth 10UG i7-10870H, GeForce RTX 3070 Laptop GPU | 2.1 kg | 19.8 mm | 15.60" | 1920x1080 | |
| 85 % v7 (old) | 02/2021 | Asus ROG Strix G15 G513QR R9 5900HX, GeForce RTX 3070 Laptop GPU | 2.3 kg | 27.2 mm | 15.60" | 1920x1080 |


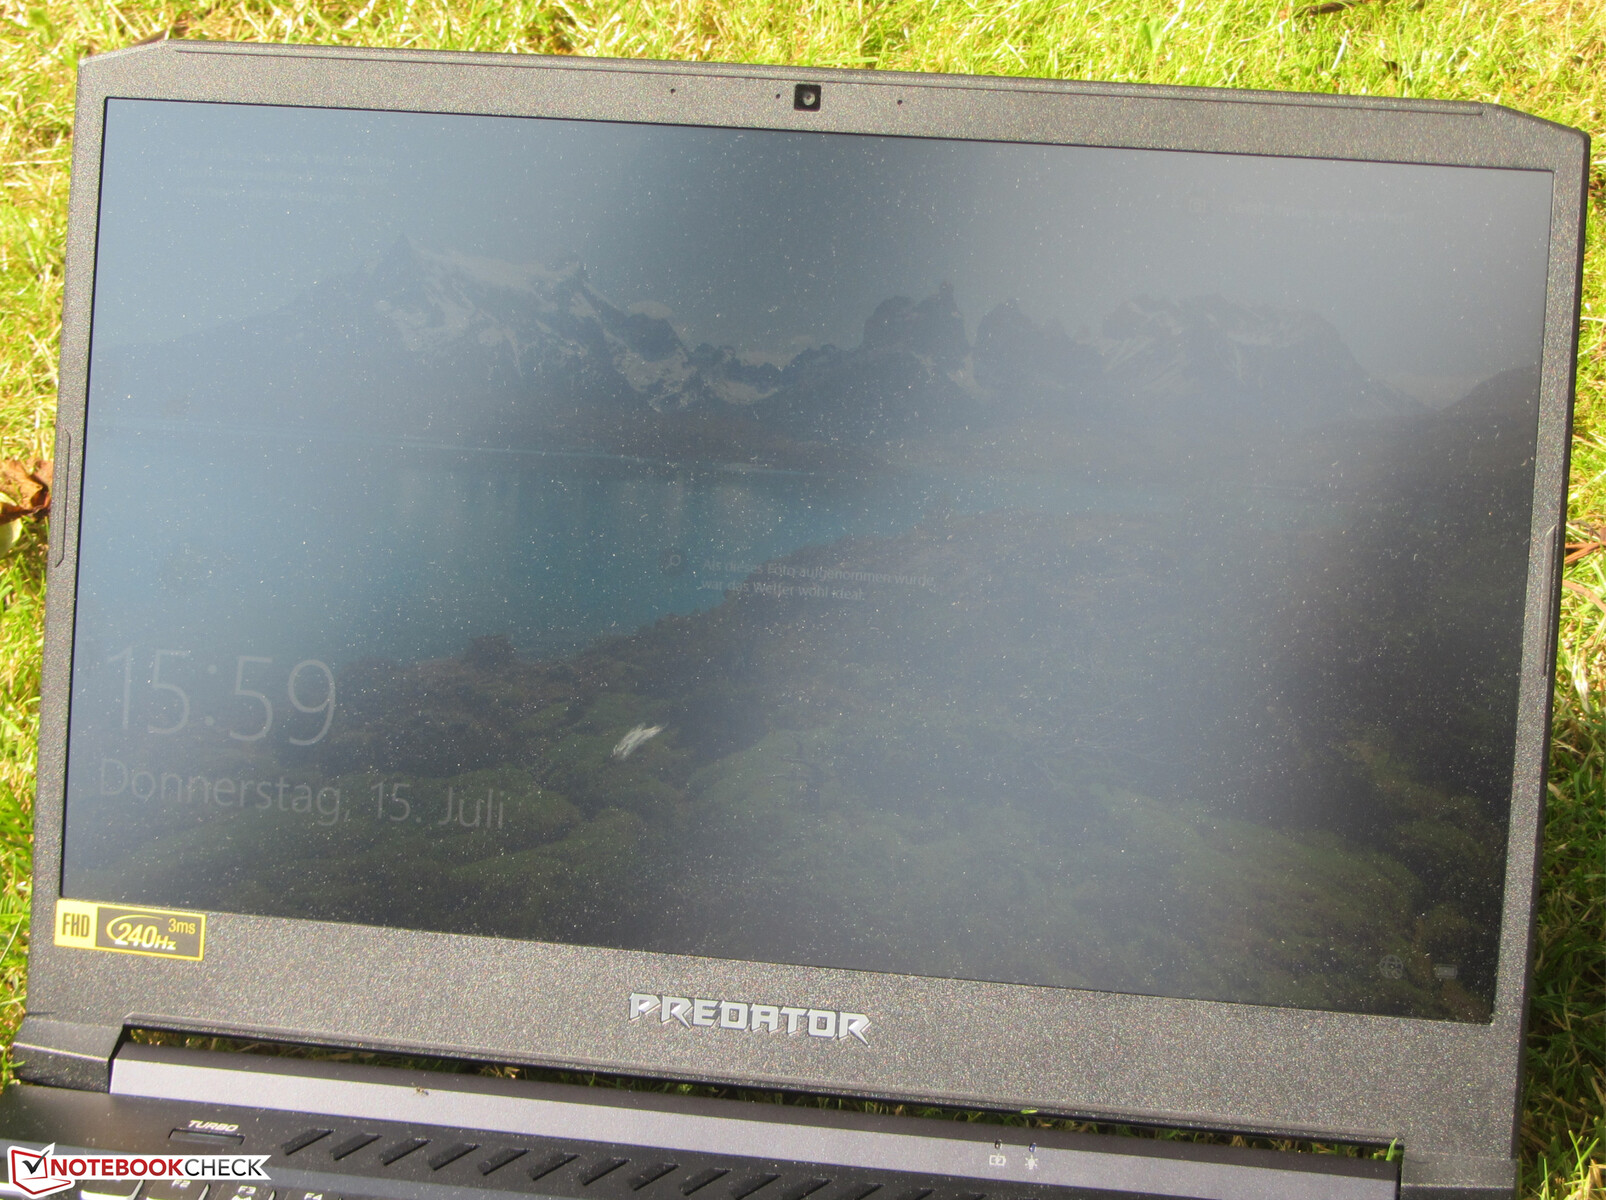
Visor - IPS 240 Hz
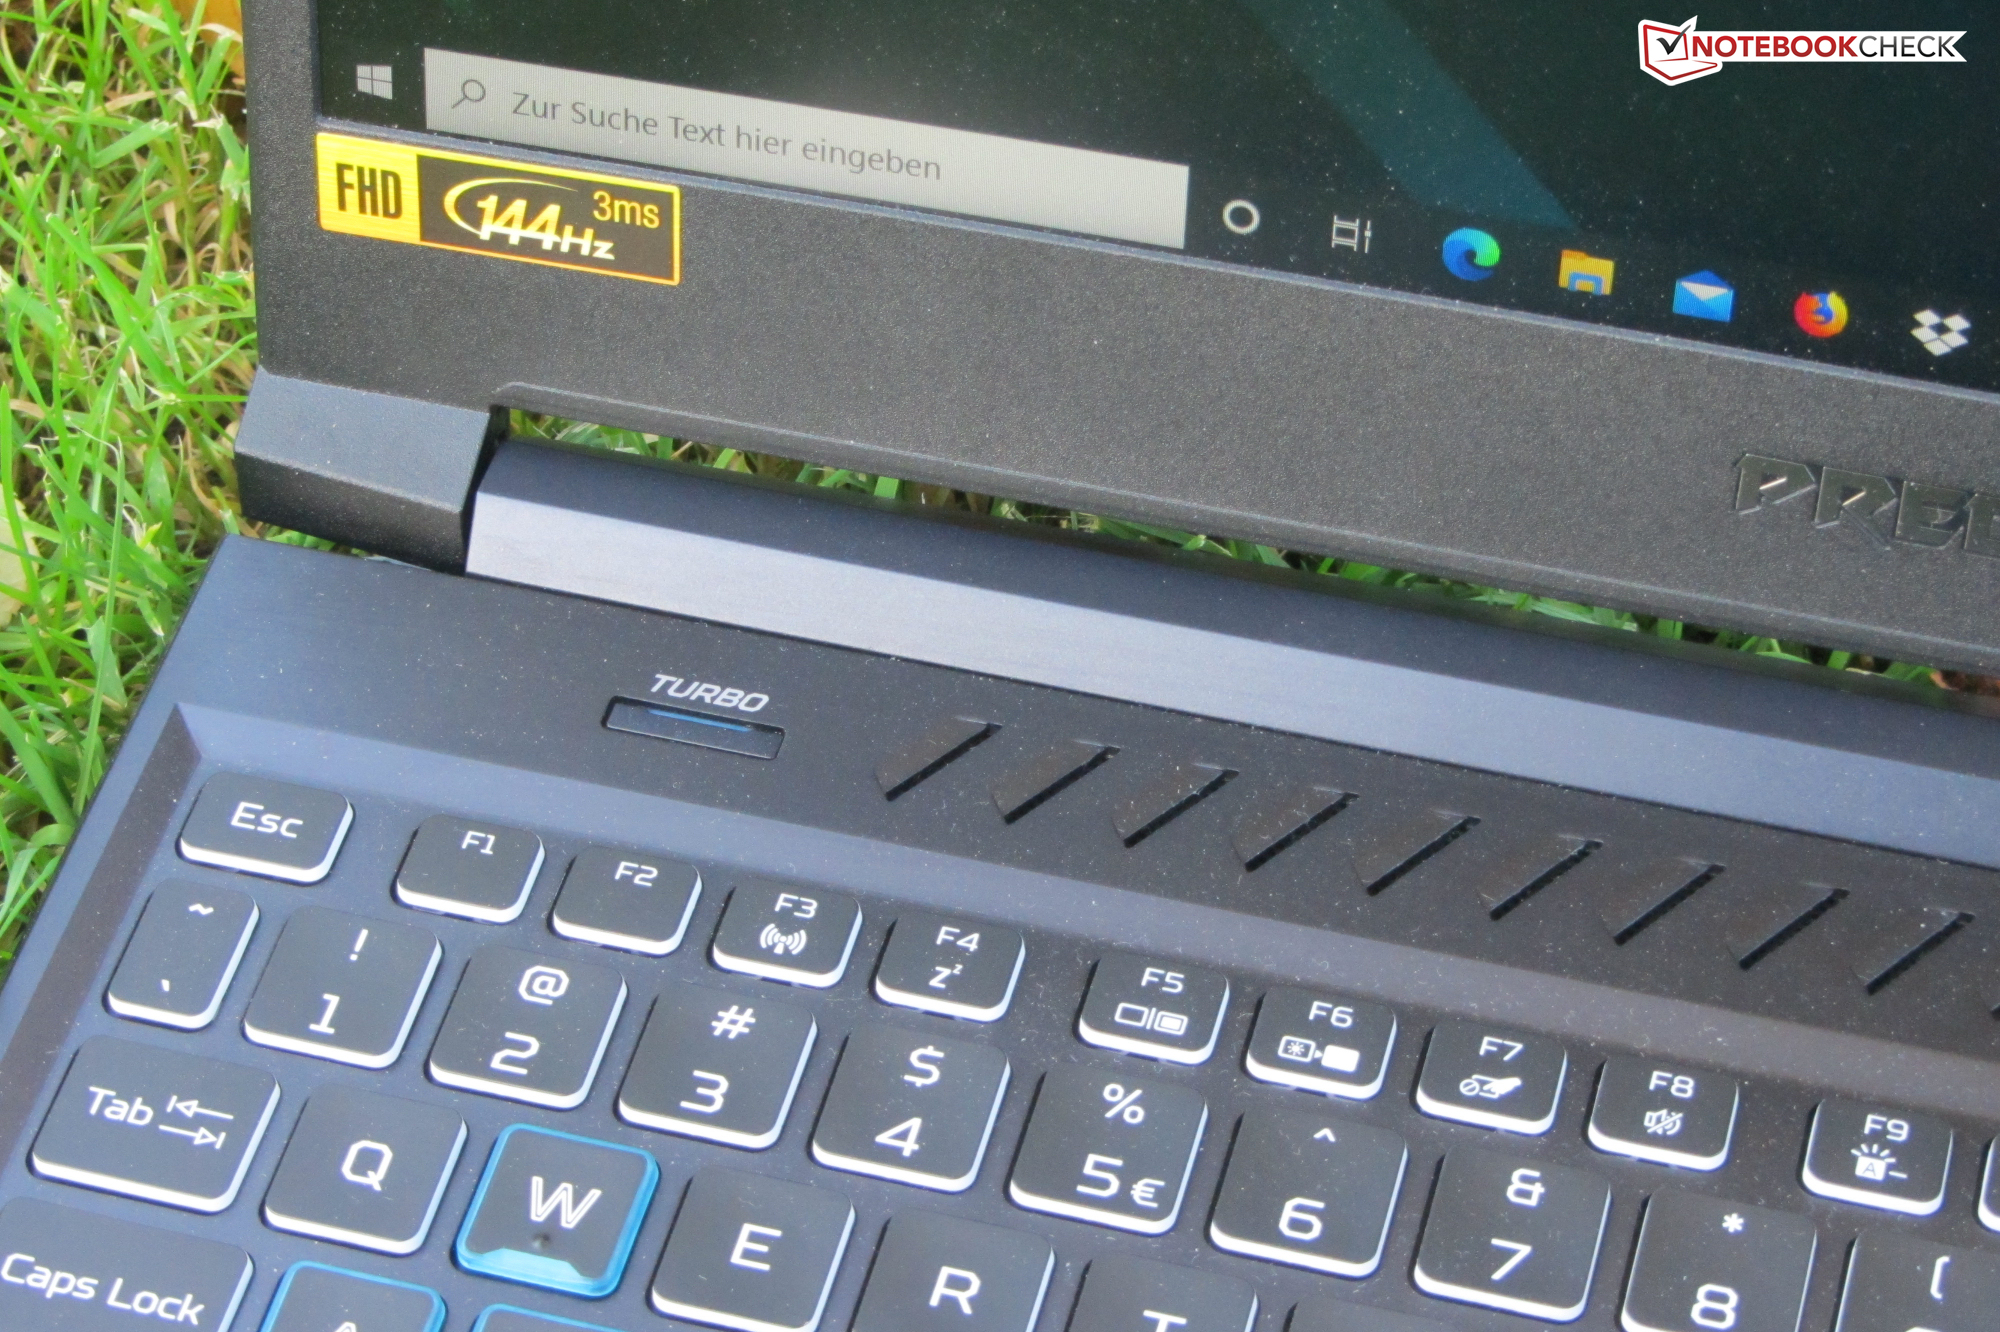
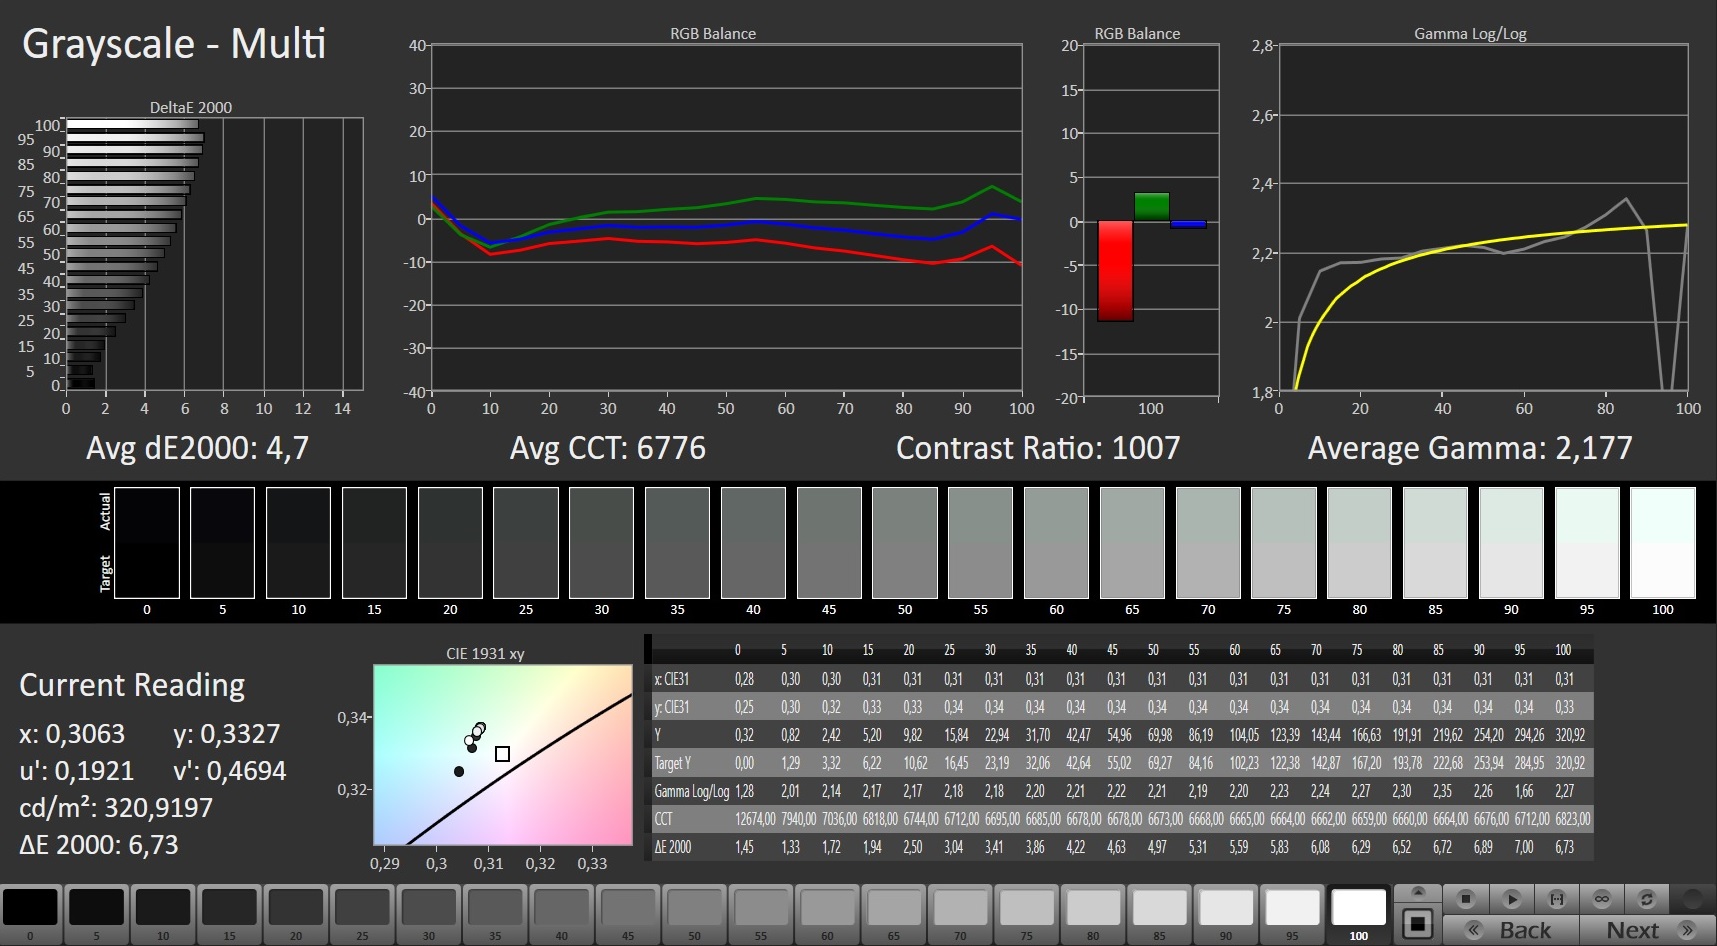
O brilho (290,4 cd/m²) e o contraste (975:1) da tela mate de 15,6 polegadas (1920x1080 pixels) não atingem as respectivas metas (300 cd/m² e 1.000:1). O painel de 240 Hz tem tempos de resposta rápidos.
Em níveis de brilho de 13% e abaixo, a cintilação ocorre a uma freqüência de 23.580 Hz. Devido à alta freqüência, mesmo usuários sensíveis devem ser poupados de dores de cabeça e/ou problemas oculares.
| |||||||||||||||||||||||||
iluminação: 87 %
iluminação com acumulador: 312 cd/m²
Contraste: 975:1 (Preto: 0.32 cd/m²)
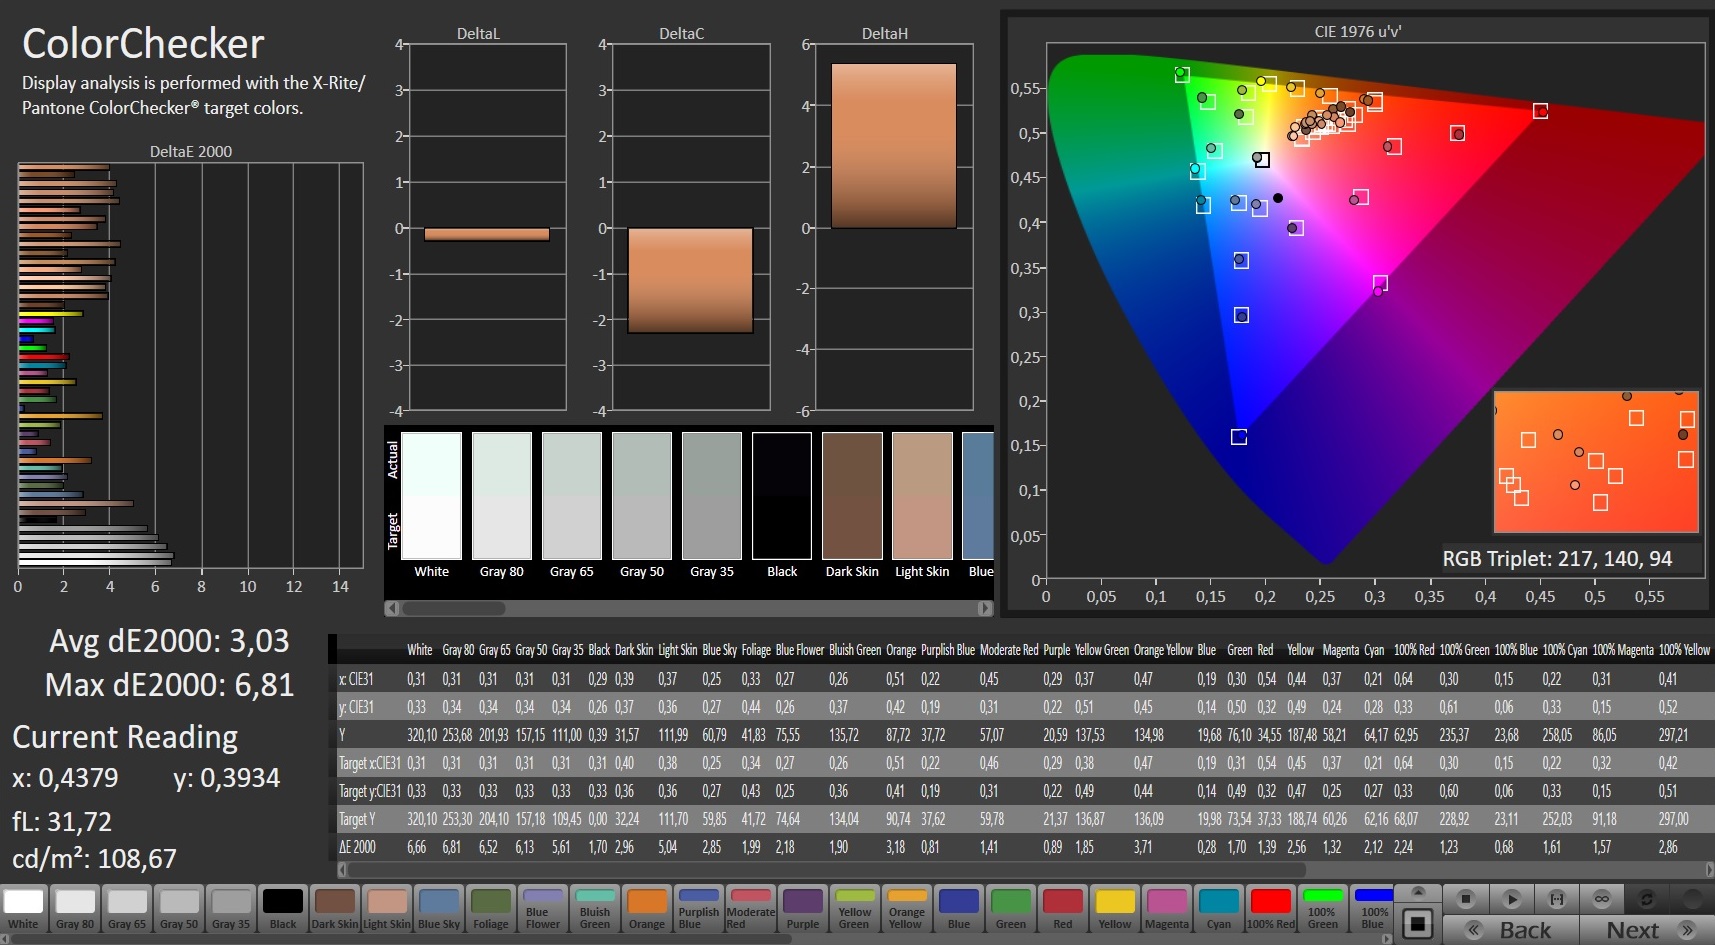
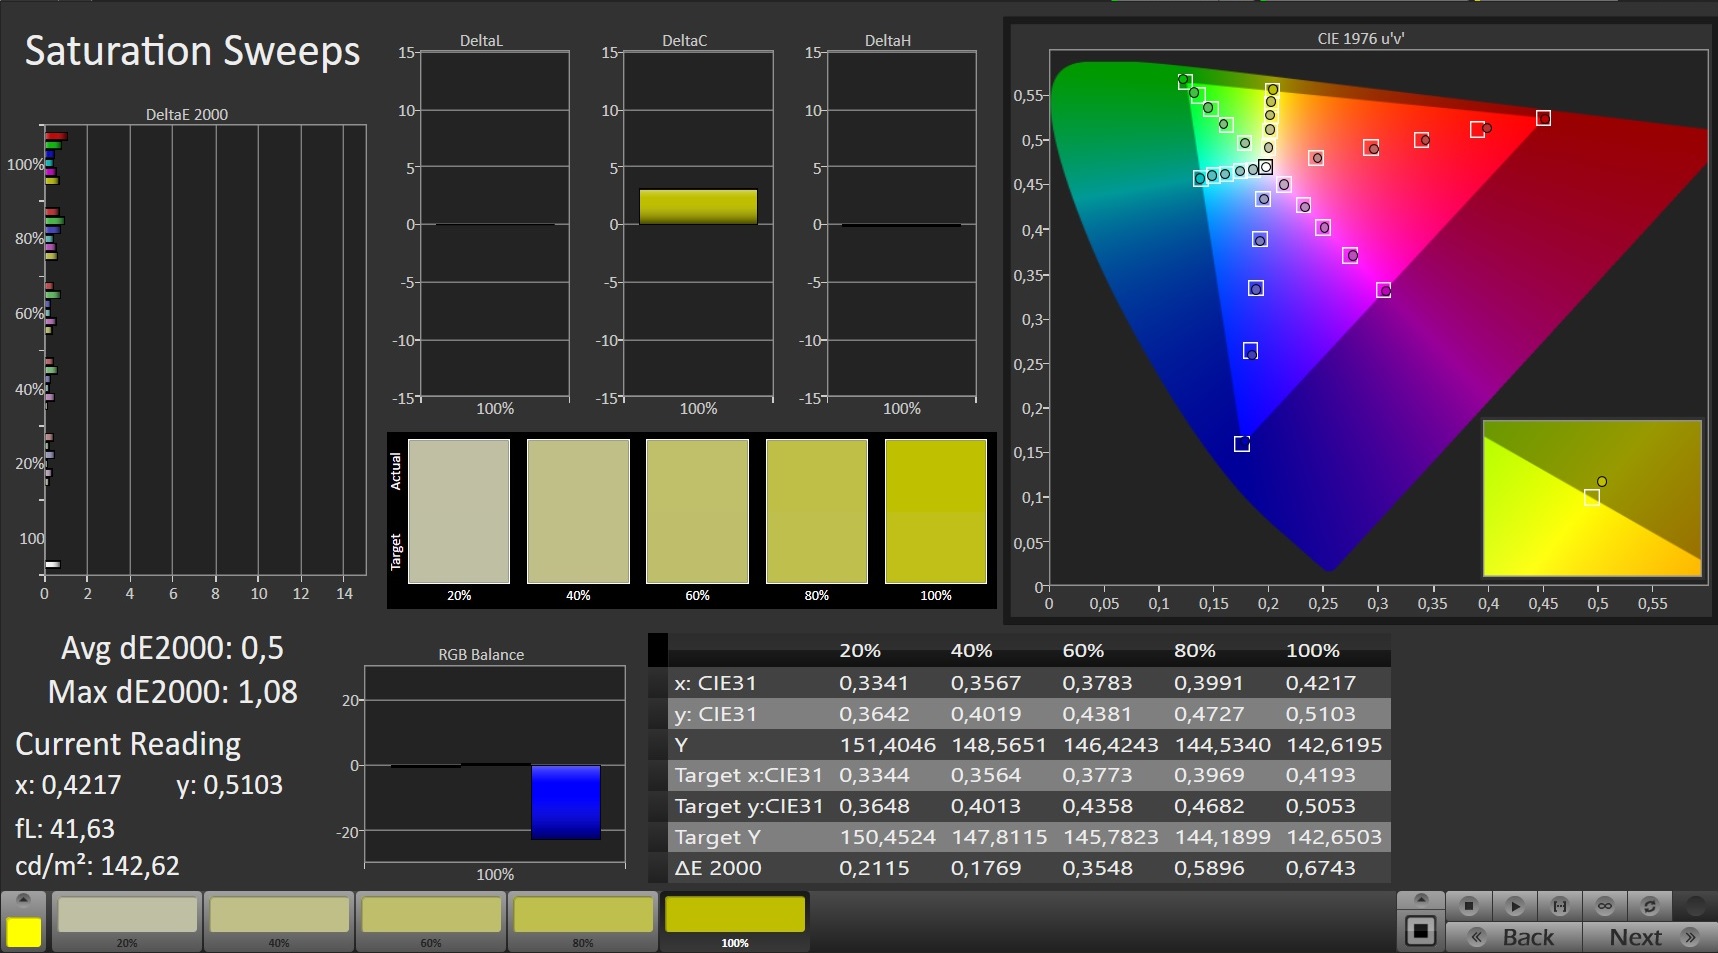
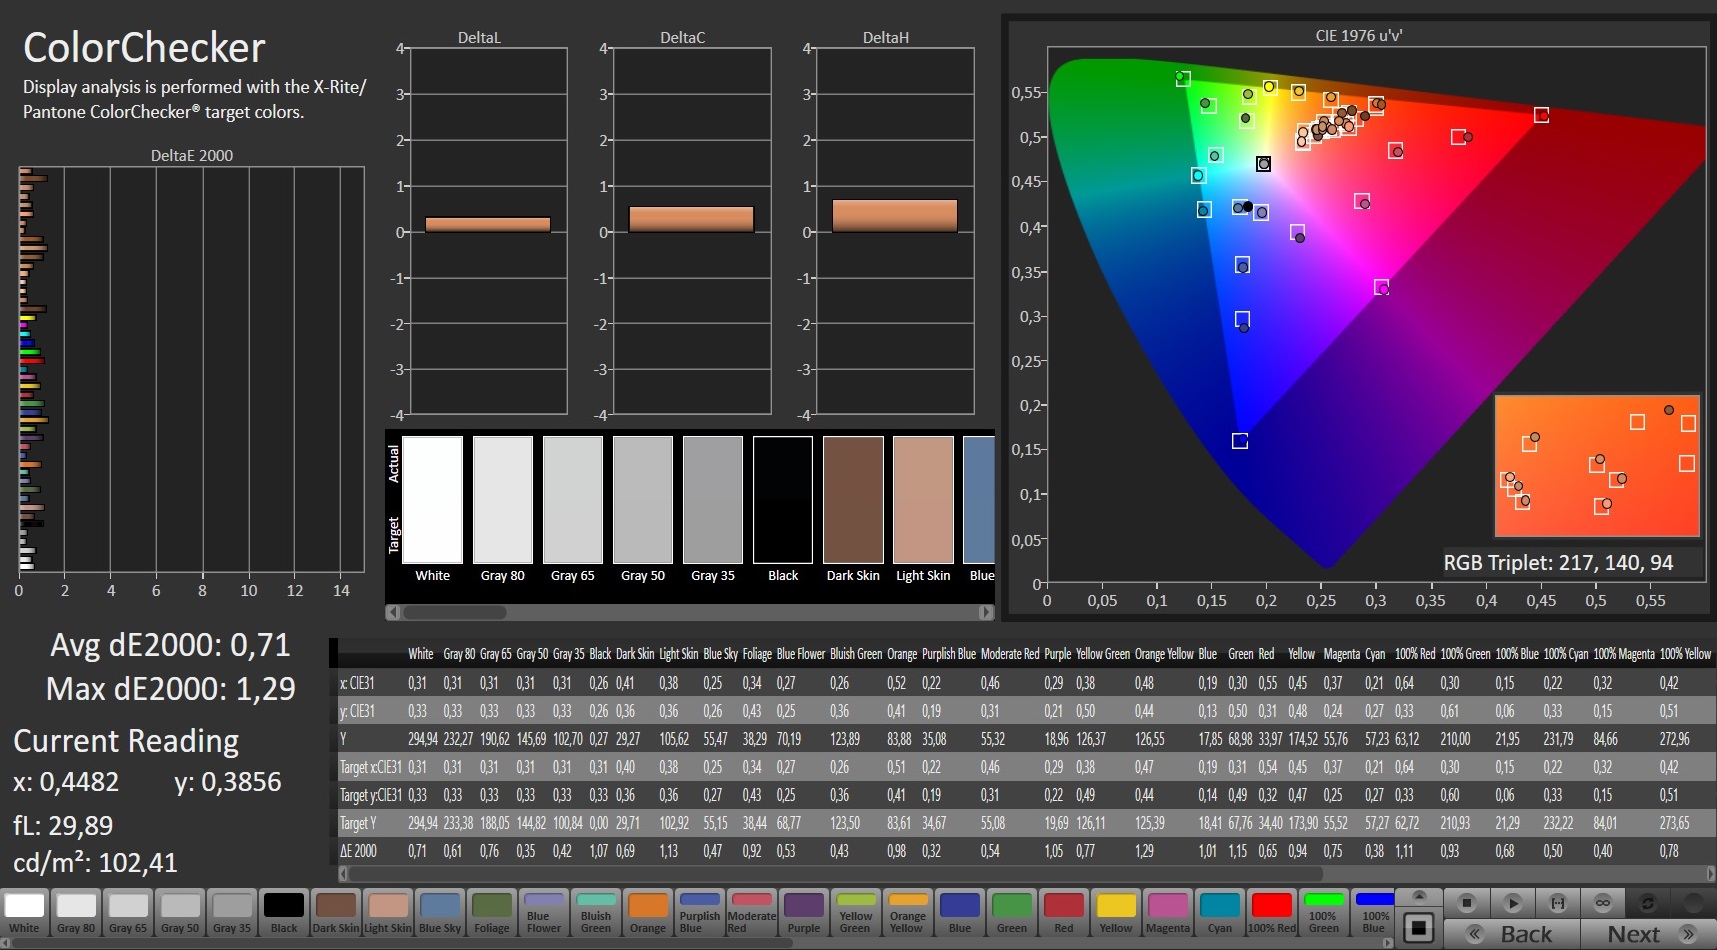
ΔE ColorChecker Calman: 3.03 | ∀{0.5-29.43 Ø4.71}
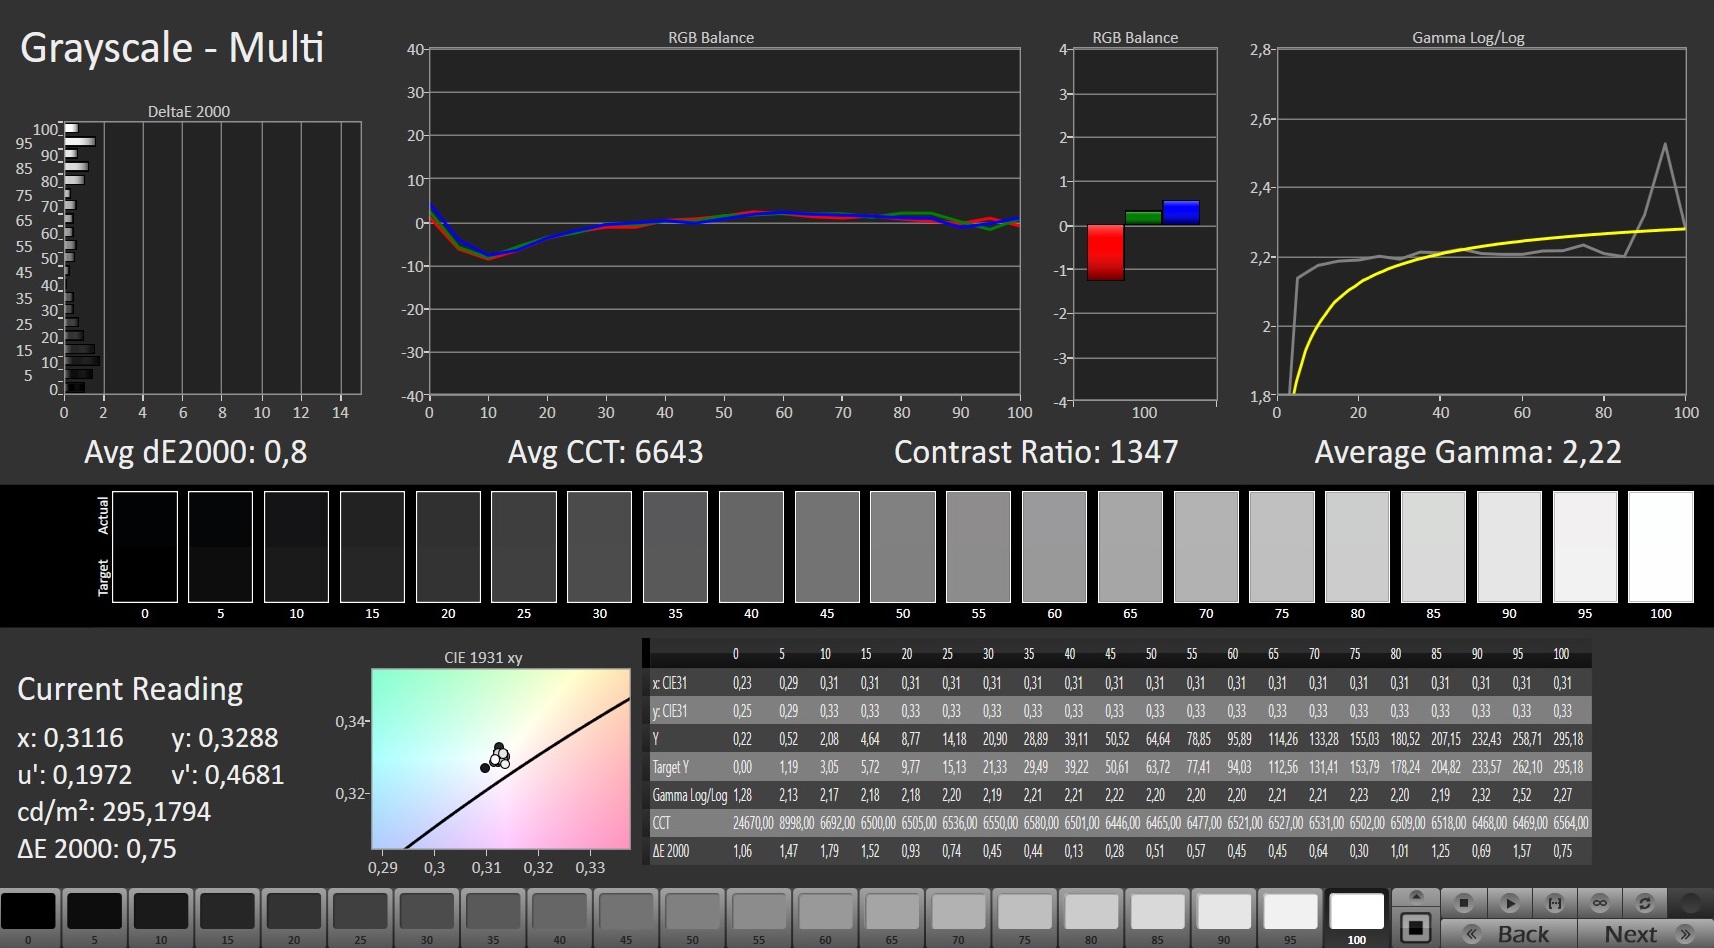
calibrated: 0.71
ΔE Greyscale Calman: 4.7 | ∀{0.09-98 Ø4.96}
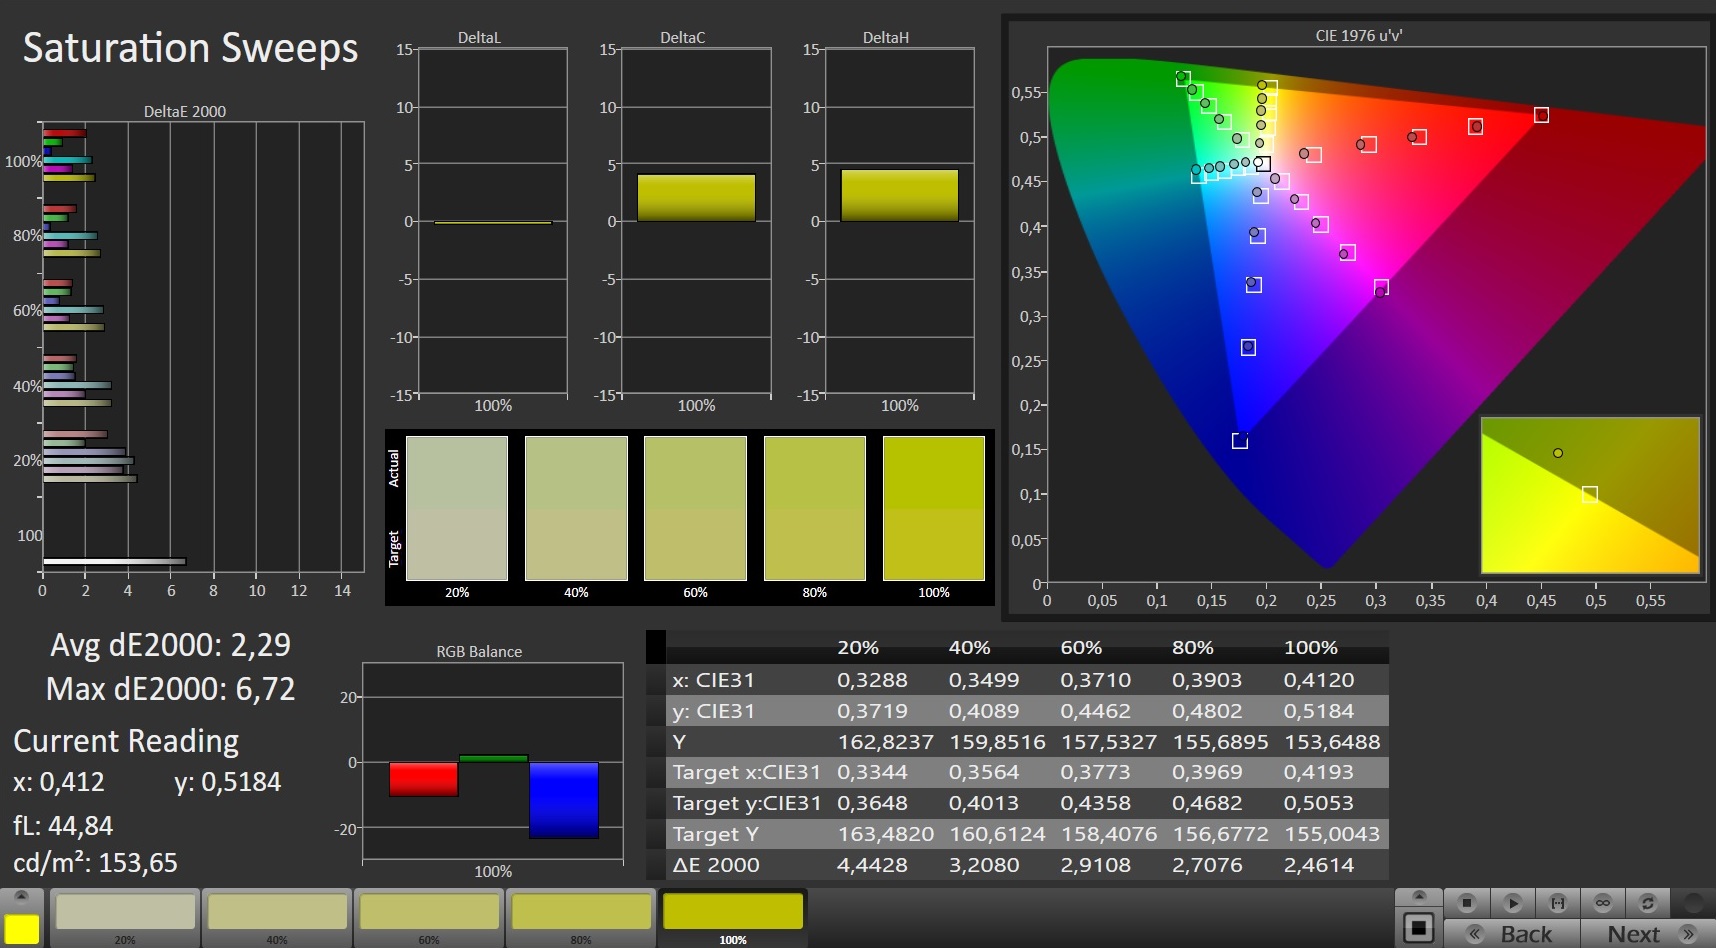
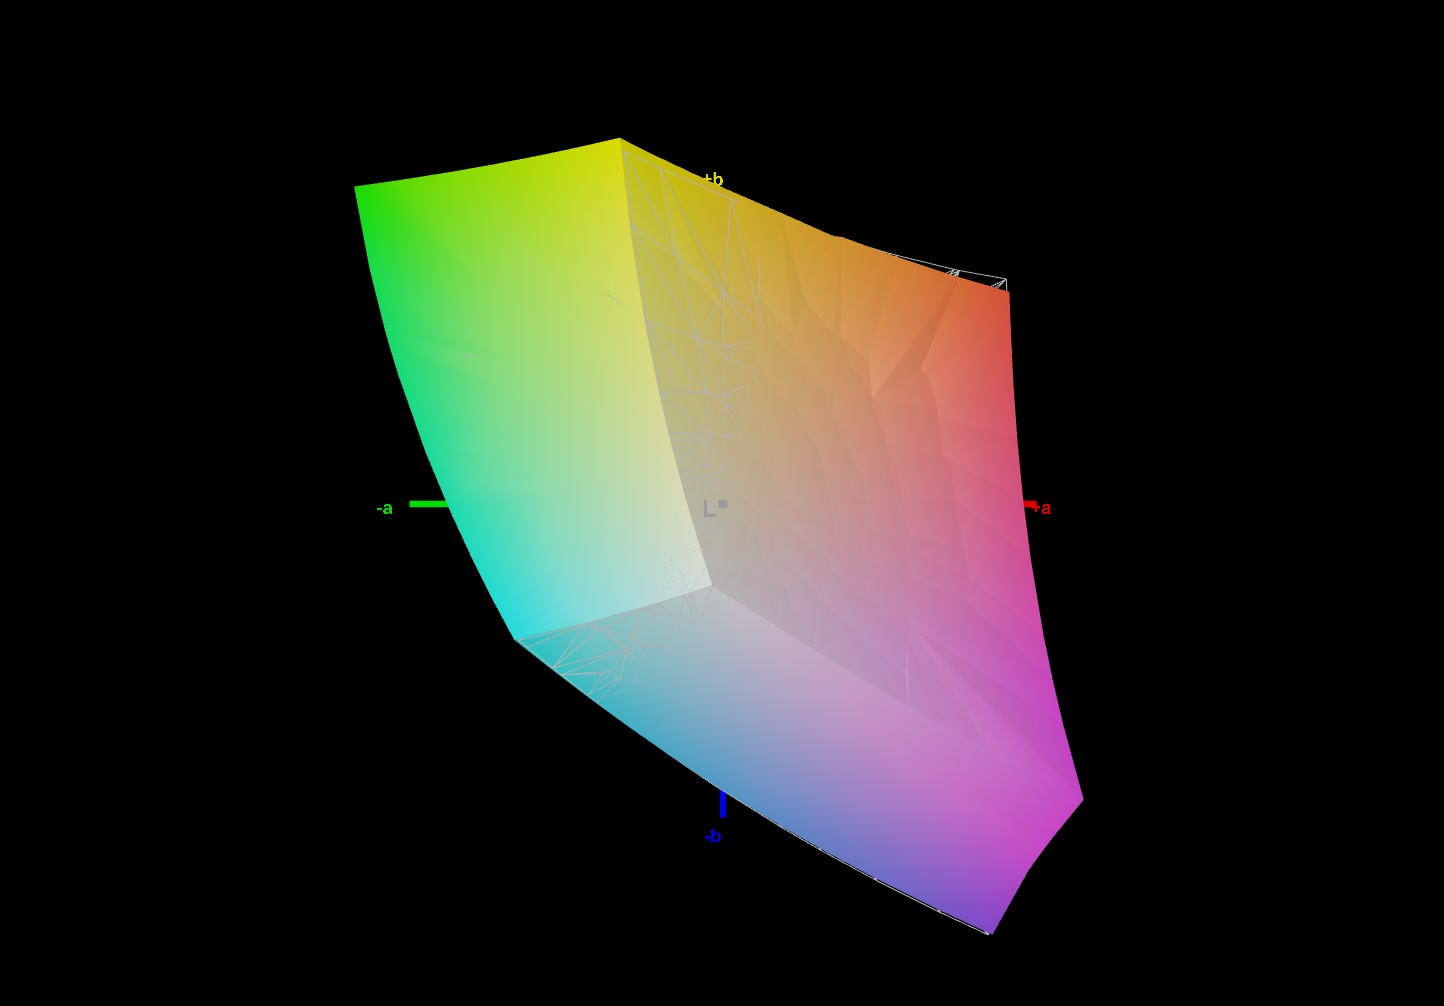
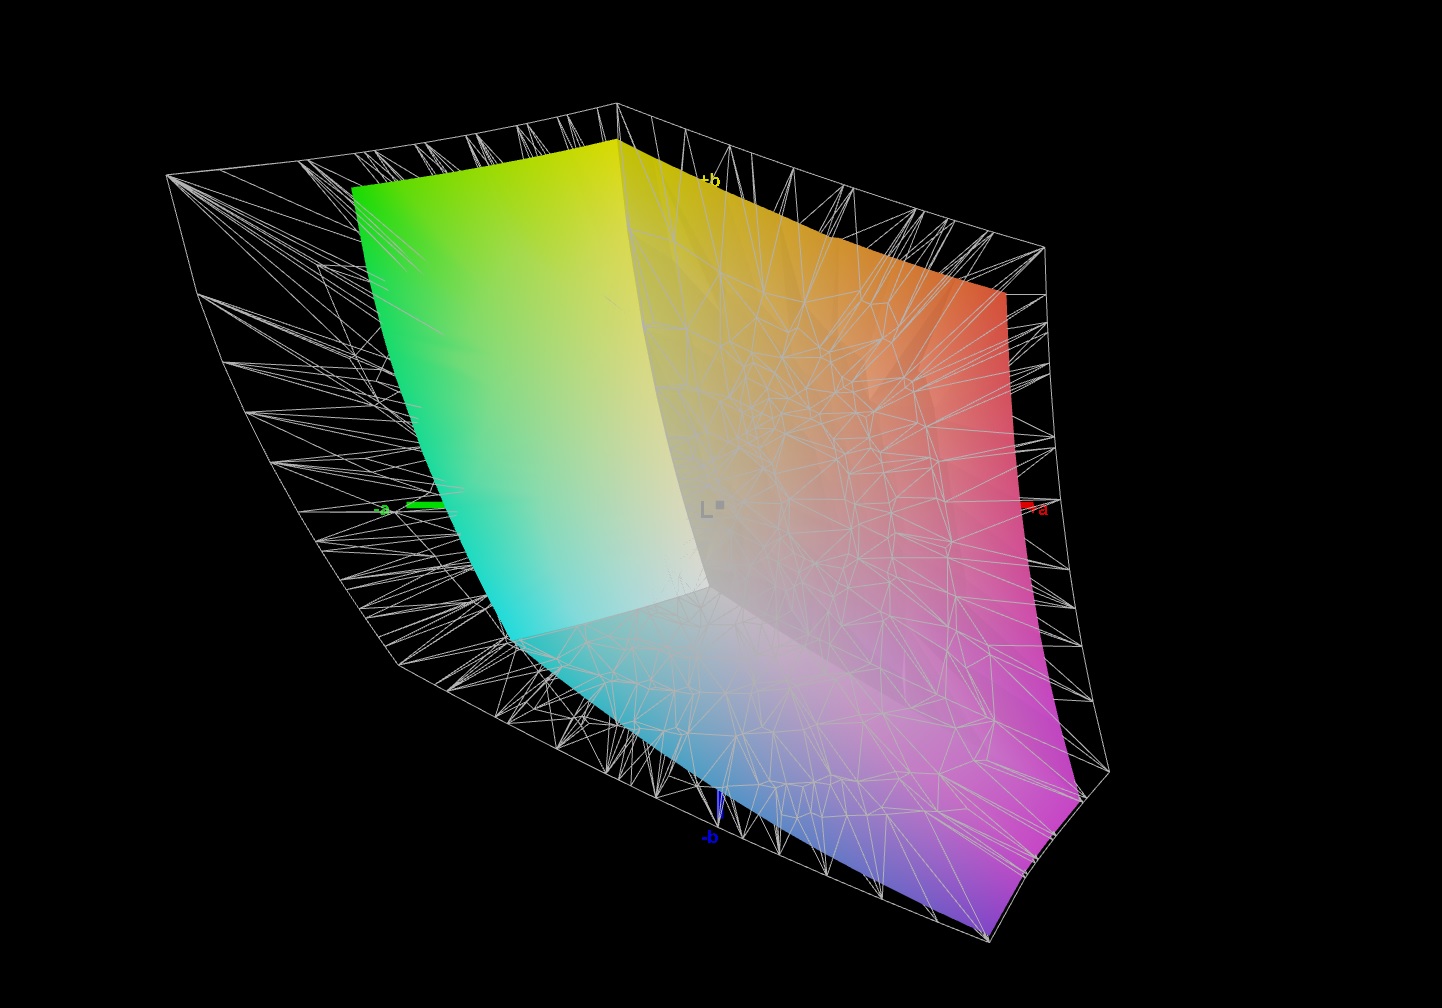
70.4% AdobeRGB 1998 (Argyll 3D)
99.4% sRGB (Argyll 3D)
68.4% Display P3 (Argyll 3D)
Gamma: 2.177
CCT: 6676 K
| Acer Predator Helios 300 PH315-53-786B Sharp LQ156M1JW09, IPS, 1920x1080, 15.6" | Aorus 15G XC Sharp LQ156M1JW03, IPS, 1920x1080, 15.6" | MSI GS66 Stealth 10UG AU Optronics B156HAN12.0, IPS, 1920x1080, 15.6" | Asus ROG Strix G15 G513QR LQ156M1JW25, IPS, 1920x1080, 15.6" | Acer Predator Helios 300 PH315-53-77N5 AU Optronics B156HAN08.2, IPS, 1920x1080, 15.6" | |
|---|---|---|---|---|---|
| Display | -4% | -1% | -3% | -6% | |
| Display P3 Coverage (%) | 68.4 | 65.6 -4% | 67.7 -1% | 67.7 -1% | 65.2 -5% |
| sRGB Coverage (%) | 99.4 | 97.5 -2% | 98.4 -1% | 94.3 -5% | 92.3 -7% |
| AdobeRGB 1998 Coverage (%) | 70.4 | 67.1 -5% | 69.1 -2% | 68.2 -3% | 66.3 -6% |
| Response Times | 17% | -11% | 23% | -16% | |
| Response Time Grey 50% / Grey 80% * (ms) | 15.2 ? | 9.6 ? 37% | 14.4 ? 5% | 8.2 ? 46% | 17 ? -12% |
| Response Time Black / White * (ms) | 9.2 ? | 9.6 ? -4% | 11.6 ? -26% | 9.2 ? -0% | 11 ? -20% |
| PWM Frequency (Hz) | 23580 ? | 24040 ? | |||
| Screen | 22% | -7% | 1% | 1% | |
| Brightness middle (cd/m²) | 312 | 288 -8% | 259.5 -17% | 308 -1% | 319 2% |
| Brightness (cd/m²) | 290 | 270 -7% | 264 -9% | 288 -1% | 294 1% |
| Brightness Distribution (%) | 87 | 89 2% | 90 3% | 86 -1% | 83 -5% |
| Black Level * (cd/m²) | 0.32 | 0.25 22% | 0.25 22% | 0.23 28% | 0.22 31% |
| Contrast (:1) | 975 | 1152 18% | 1038 6% | 1339 37% | 1450 49% |
| Colorchecker dE 2000 * | 3.03 | 1.19 61% | 2.52 17% | 3.28 -8% | 4.42 -46% |
| Colorchecker dE 2000 max. * | 6.81 | 3.79 44% | 5.55 19% | 8.51 -25% | 8.54 -25% |
| Colorchecker dE 2000 calibrated * | 0.71 | 0.71 -0% | 1.93 -172% | 0.83 -17% | |
| Greyscale dE 2000 * | 4.7 | 1.6 66% | 1.7 64% | 5 -6% | 4.84 -3% |
| Gamma | 2.177 101% | 2.229 99% | 2.04 108% | 2.057 107% | 2.39 92% |
| CCT | 6676 97% | 6539 99% | 6414 101% | 7393 88% | 6850 95% |
| Color Space (Percent of AdobeRGB 1998) (%) | 67 | 63.3 | 68 | 60 | |
| Color Space (Percent of sRGB) (%) | 90 | 98.8 | 90 | 92 | |
| Média Total (Programa/Configurações) | 12% /
16% | -6% /
-7% | 7% /
3% | -7% /
-4% |
* ... menor é melhor
O visor mostra uma boa reprodução da cor fora da caixa, e falha o alvo (DeltaE menos de 3) por uma largura de cabelo com um desvio de cor de 3,03. Ele não sofre de uma coloração azul, e melhorias podem ser alcançadas por meio de calibração: O desvio cai para 0,71, e os tons de cinza são exibidos de forma mais equilibrada. O espaço de cor sRGB é mapeado para 99%. Os espaços de cor AdobeRGB (70%) e DCI-P3 (68%) não são totalmente reproduzidos
Exibir tempos de resposta
| ↔ Tempo de resposta preto para branco | ||
|---|---|---|
| 9.2 ms ... ascensão ↗ e queda ↘ combinadas | ↗ 4.8 ms ascensão | 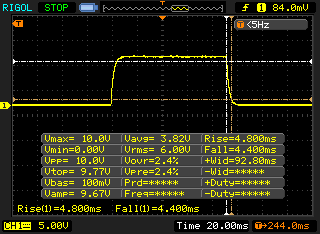 |
| ↘ 4.4 ms queda | ||
| A tela mostra taxas de resposta rápidas em nossos testes e deve ser adequada para jogos. Em comparação, todos os dispositivos testados variam de 0.1 (mínimo) a 240 (máximo) ms. » 26 % de todos os dispositivos são melhores. Isso significa que o tempo de resposta medido é melhor que a média de todos os dispositivos testados (19.8 ms). | ||
| ↔ Tempo de resposta 50% cinza a 80% cinza | ||
| 15.2 ms ... ascensão ↗ e queda ↘ combinadas | ↗ 7.6 ms ascensão | 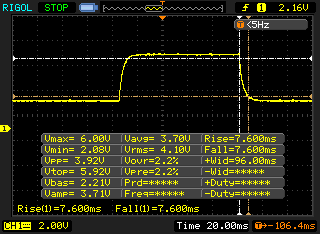 |
| ↘ 7.6 ms queda | ||
| A tela mostra boas taxas de resposta em nossos testes, mas pode ser muito lenta para jogadores competitivos. Em comparação, todos os dispositivos testados variam de 0.165 (mínimo) a 636 (máximo) ms. » 29 % de todos os dispositivos são melhores. Isso significa que o tempo de resposta medido é melhor que a média de todos os dispositivos testados (31 ms). | ||
Cintilação da tela / PWM (modulação por largura de pulso)
| Tela tremeluzindo/PWM detectado | 23580 Hz | ≤ 13 % configuração de brilho | 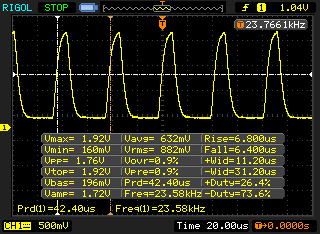 |
A luz de fundo da tela pisca em 23580 Hz (pior caso, por exemplo, utilizando PWM) Cintilação detectada em uma configuração de brilho de 13 % e abaixo. Não deve haver cintilação ou PWM acima desta configuração de brilho. A frequência de 23580 Hz é bastante alta, então a maioria dos usuários sensíveis ao PWM não deve notar nenhuma oscilação. [pwm_comparison] Em comparação: 52 % de todos os dispositivos testados não usam PWM para escurecer a tela. Se PWM foi detectado, uma média de 7754 (mínimo: 5 - máximo: 343500) Hz foi medida. | |||
O painel IPS estável em ângulo de visão pode ser lido a partir de qualquer posição. A leitura do visor ao ar livre é possível se o sol não estiver muito claro e/ou se você procurar lugares à sombra

Desempenho - Suficiente para os próximos anos
Com o Predator Helios 300, a Acer tem um laptop de 15,6 polegadas em sua linha de produtos, que traz cada jogo moderno para a tela com suavidade

Condições de teste
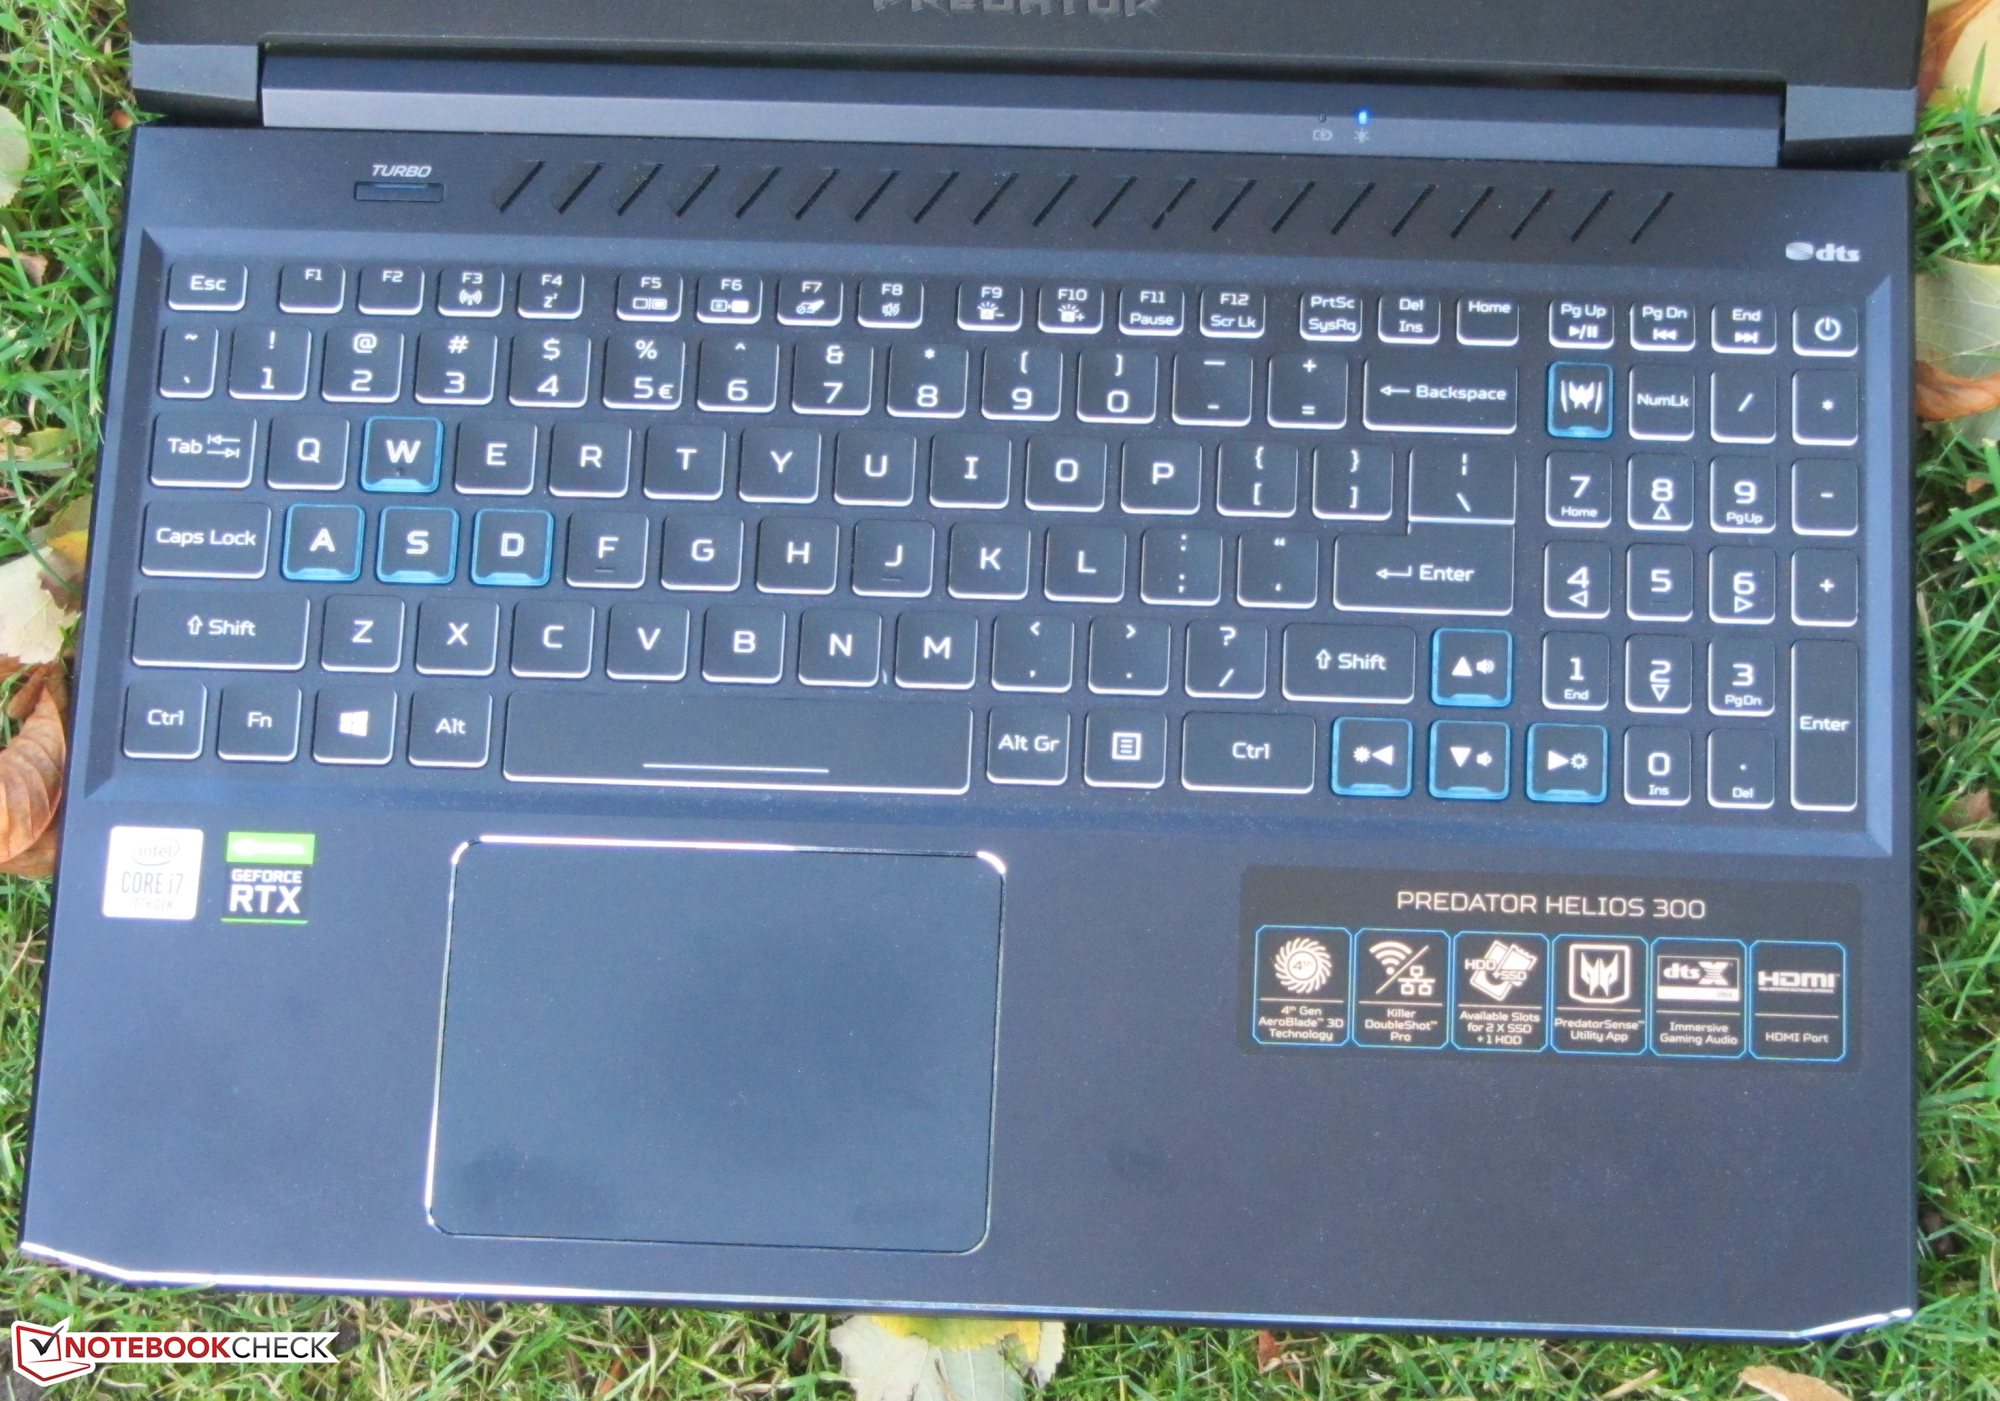
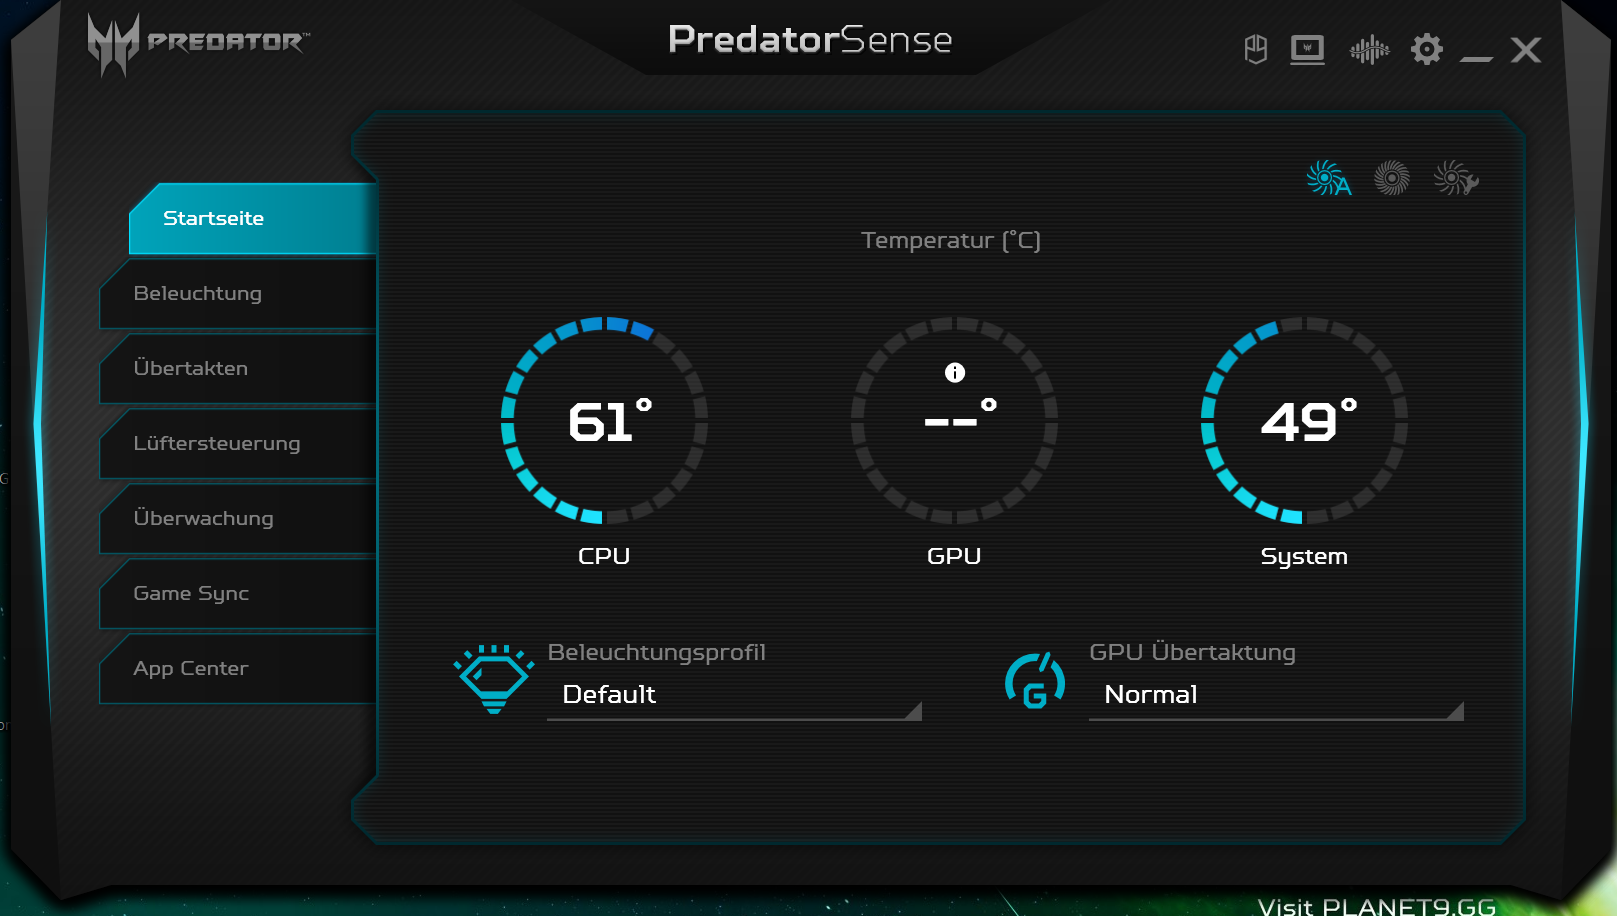
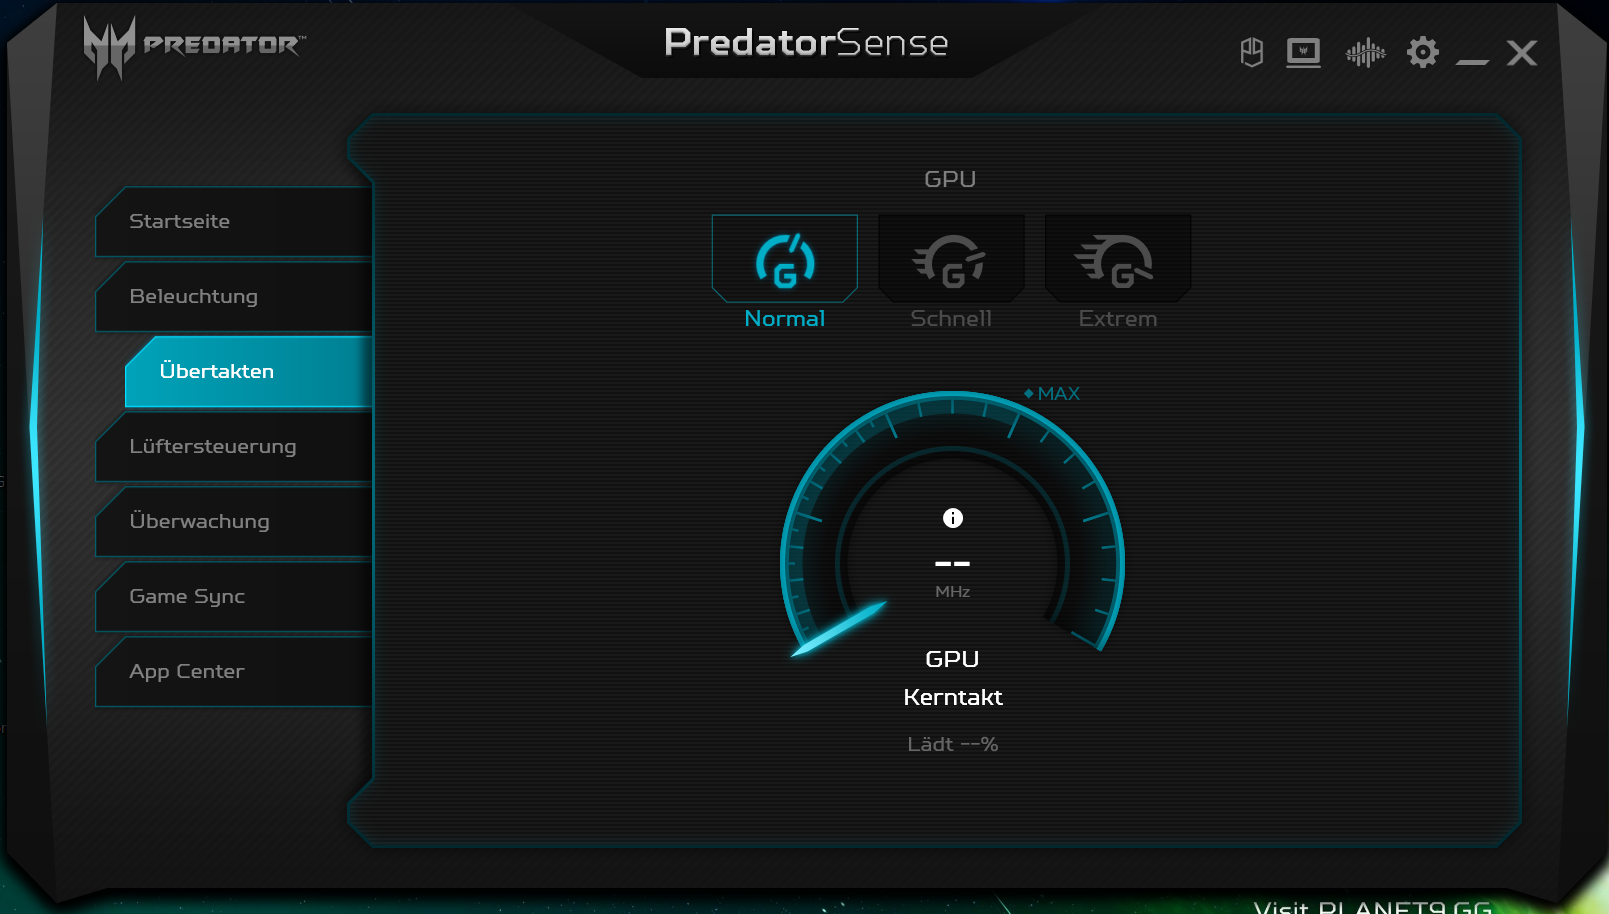
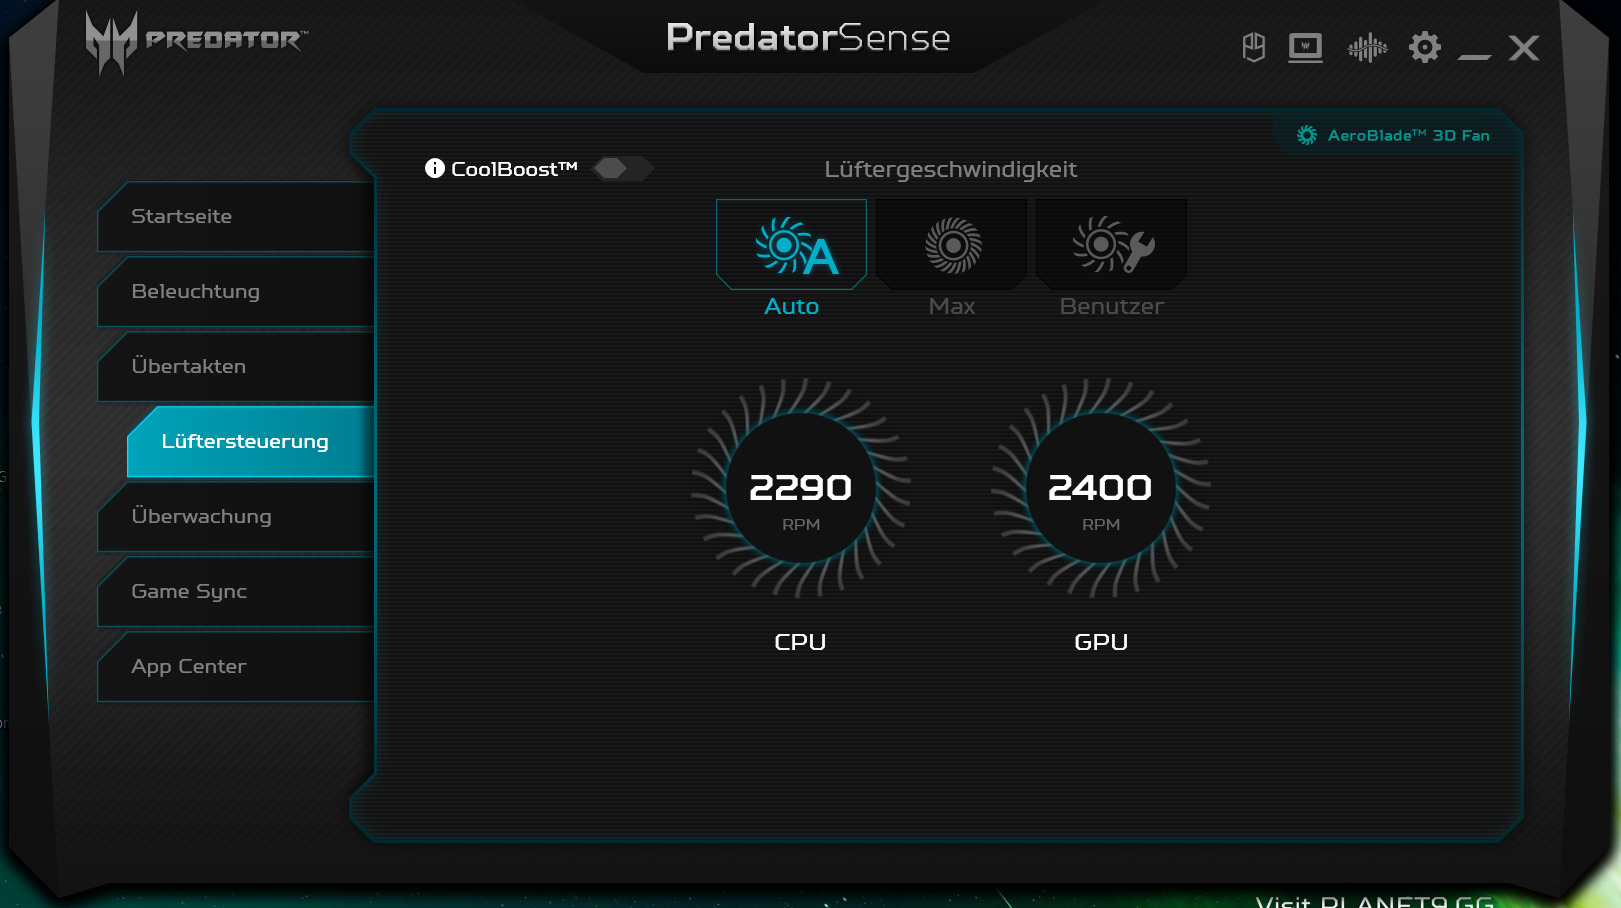
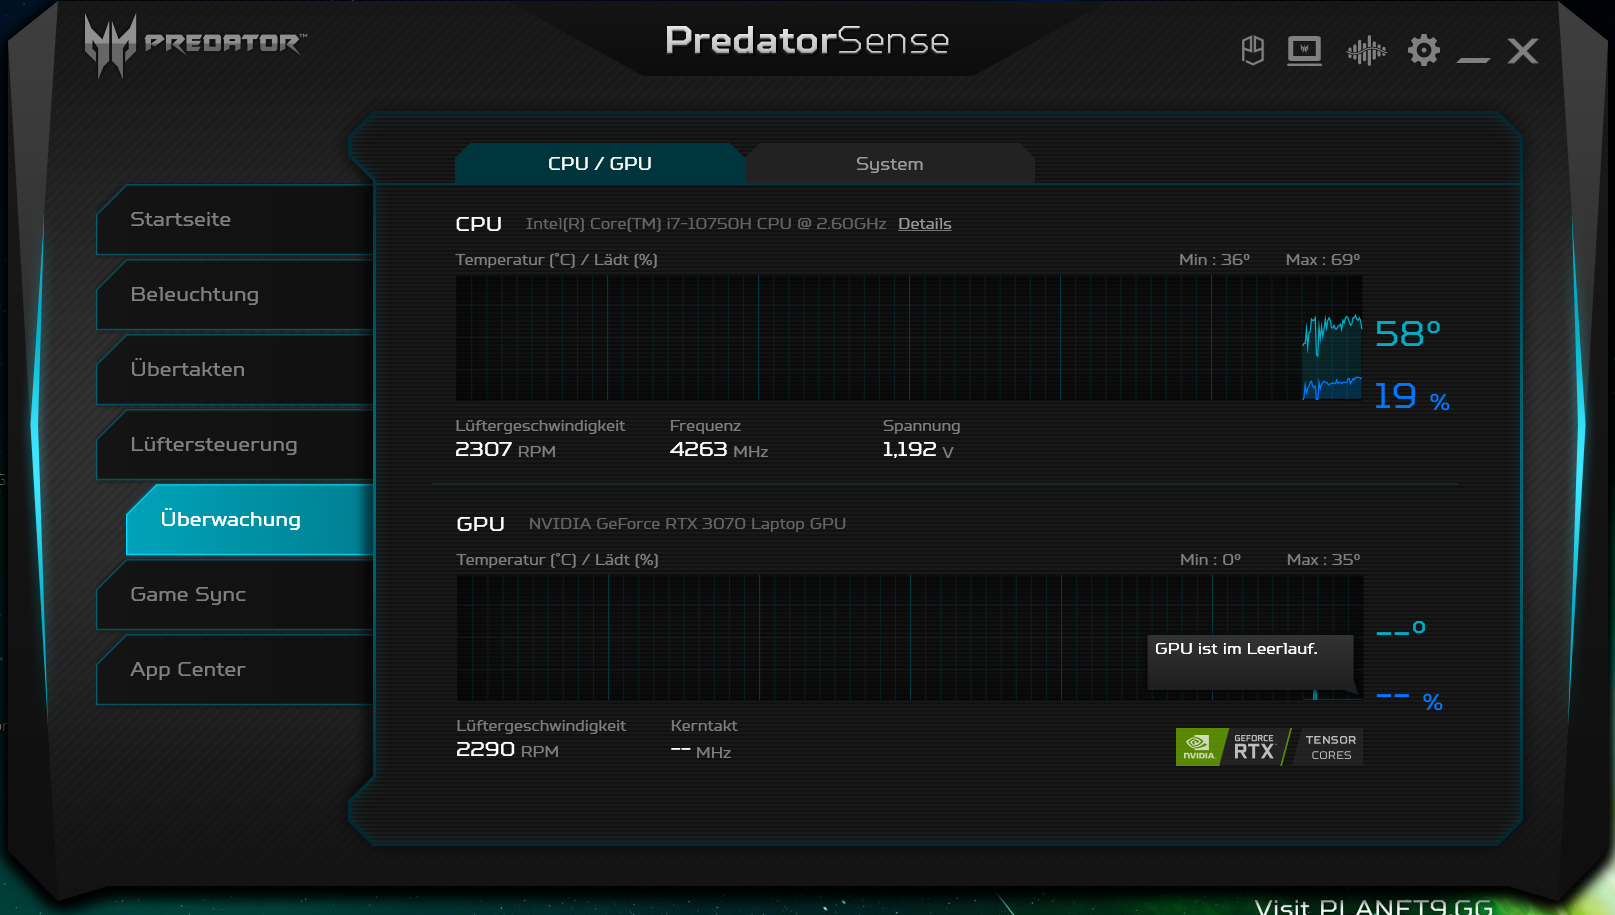
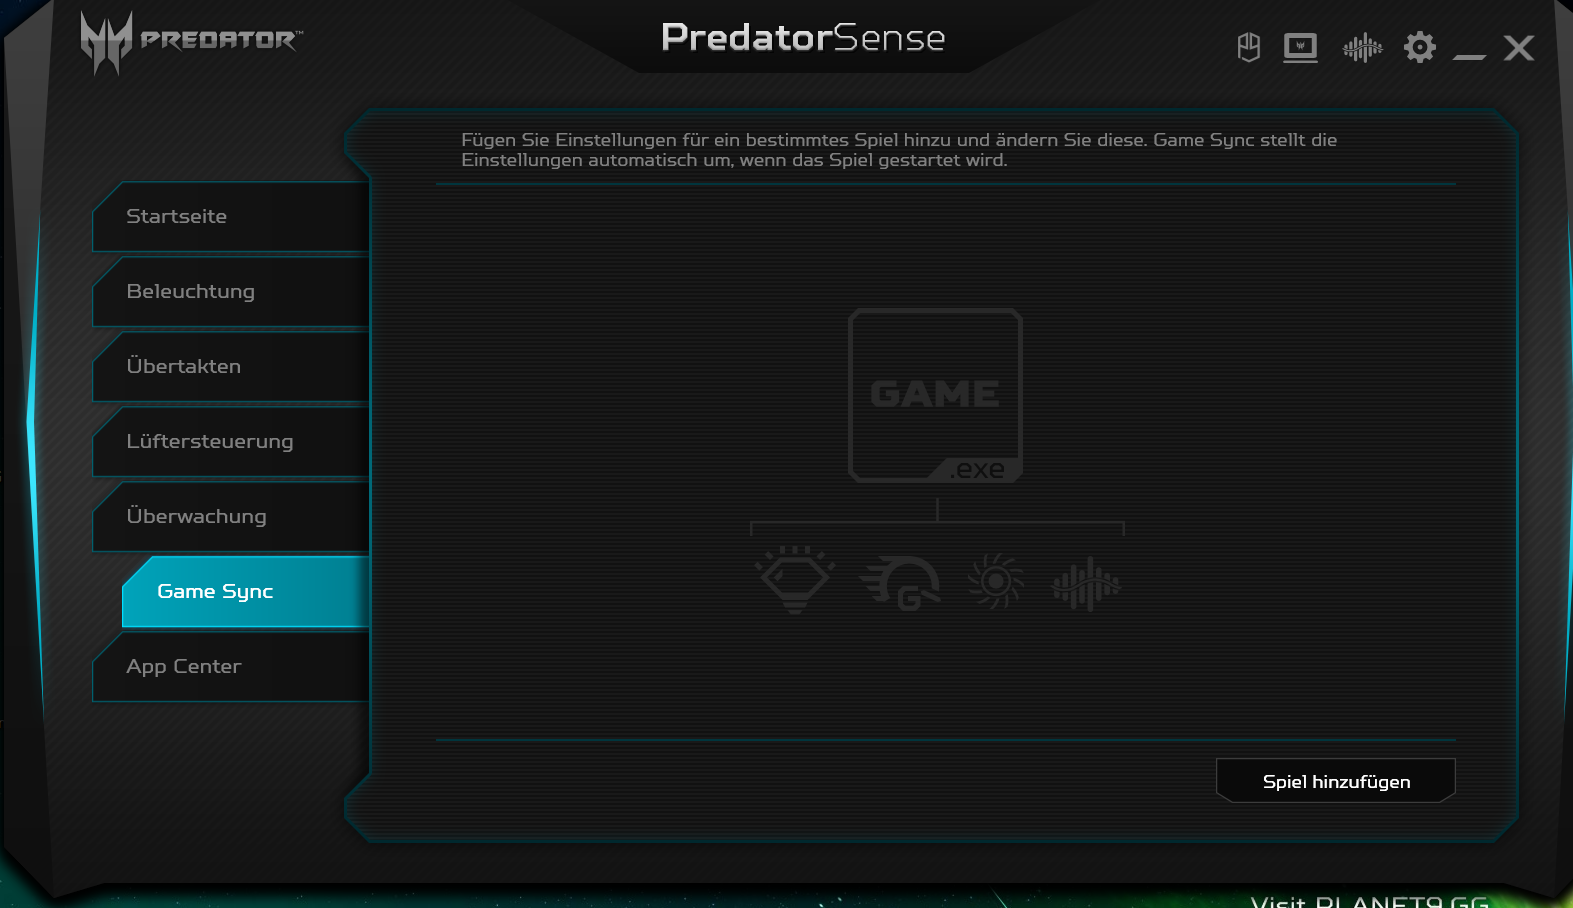
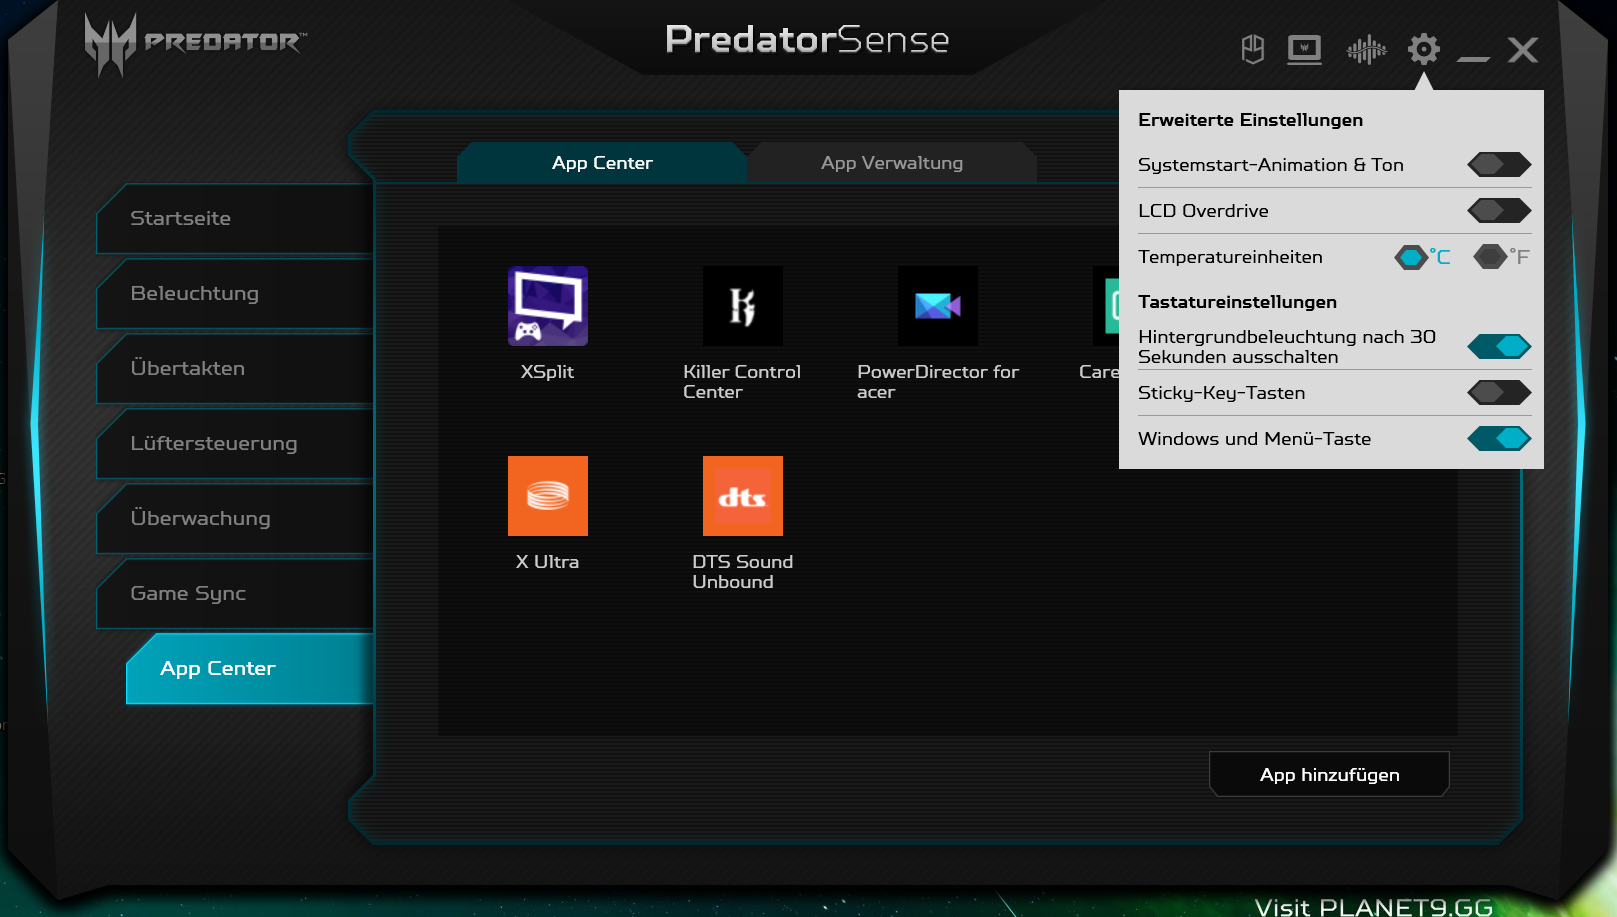
O software Predator Sense pré-instalado permite aos usuários ajustar o controle do ventilador e fazer overclock automático da GPU. Os perfis da GPU "Normal", "Rápido" e "Extremo" estão disponíveis. Utilizamos o controle automático do ventilador e o perfil "Normal". Pressionando o botão "Turbo" (localizado acima do teclado) habilita o perfil "Extreme" da GPU e permite que os ventiladores funcionem continuamente na potência máxima

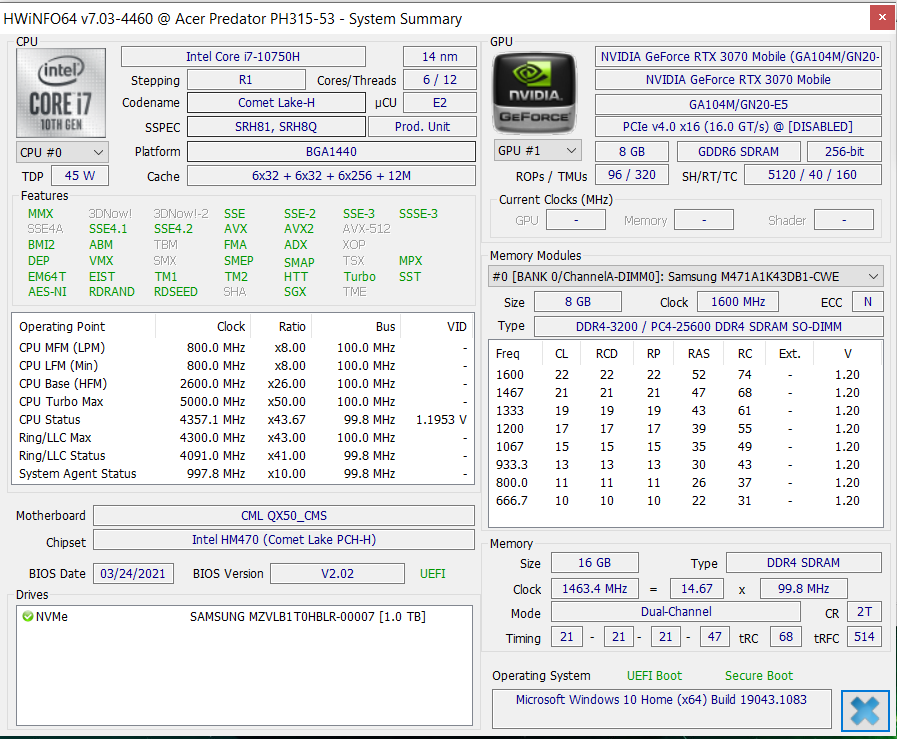
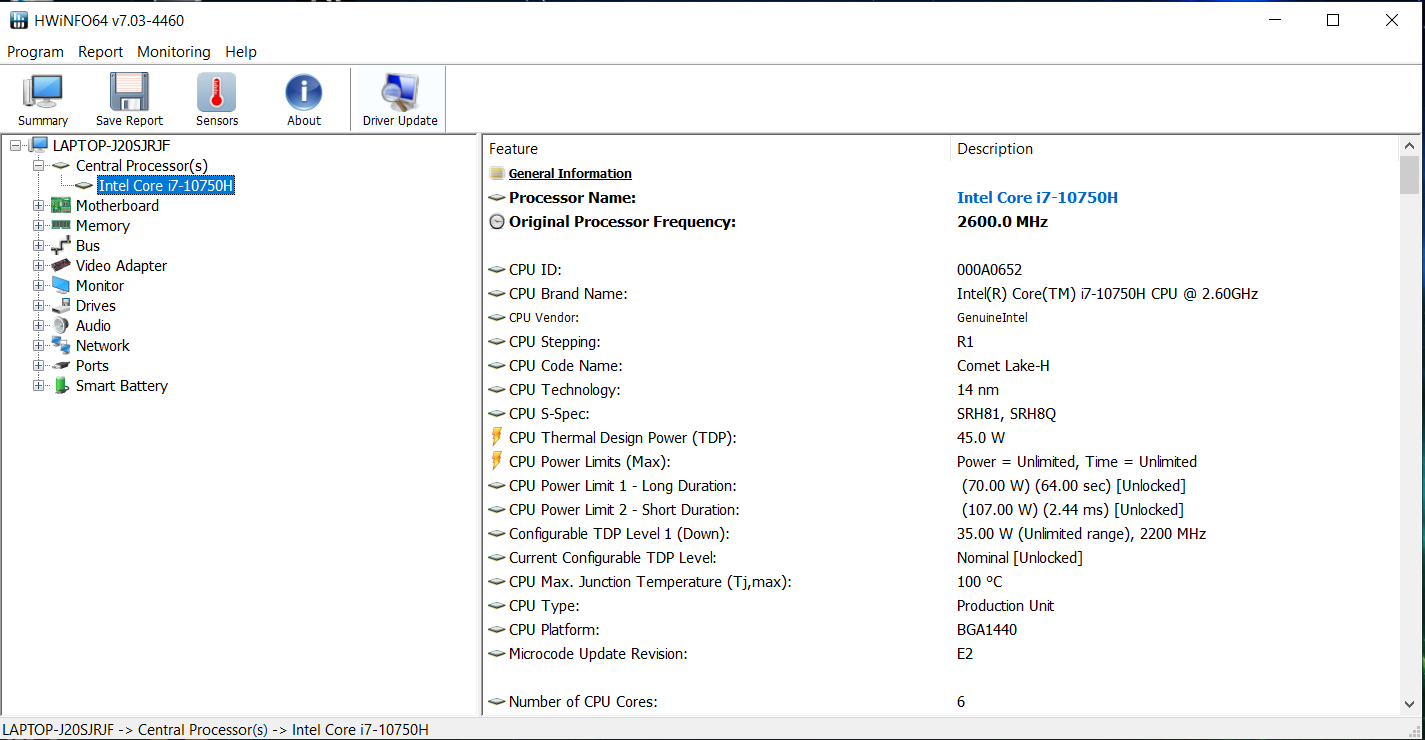
Processador
OCore-i7-10750H processadorhexa-core
(Comet Lake) opera a uma velocidade de relógio de base de 2,6 GHz. Um aumento para 4,3 GHz (seis núcleos) ou 5 GHz (um núcleo) é possível via Turbo. Suporta hiper-Threading (dois fios por núcleo).O teste multi-tarefa do benchmark Cinebench R15 é processado em 2,8 a 4,2 GHz. O teste de rosca única é executado em 4,2 a 4,4 GHz. Na potência da bateria, as taxas de relógio são de 1,9 a 2,7 GHz (multifios) e 2,5 a 3,2 GHz (mono-fios), respectivamente.
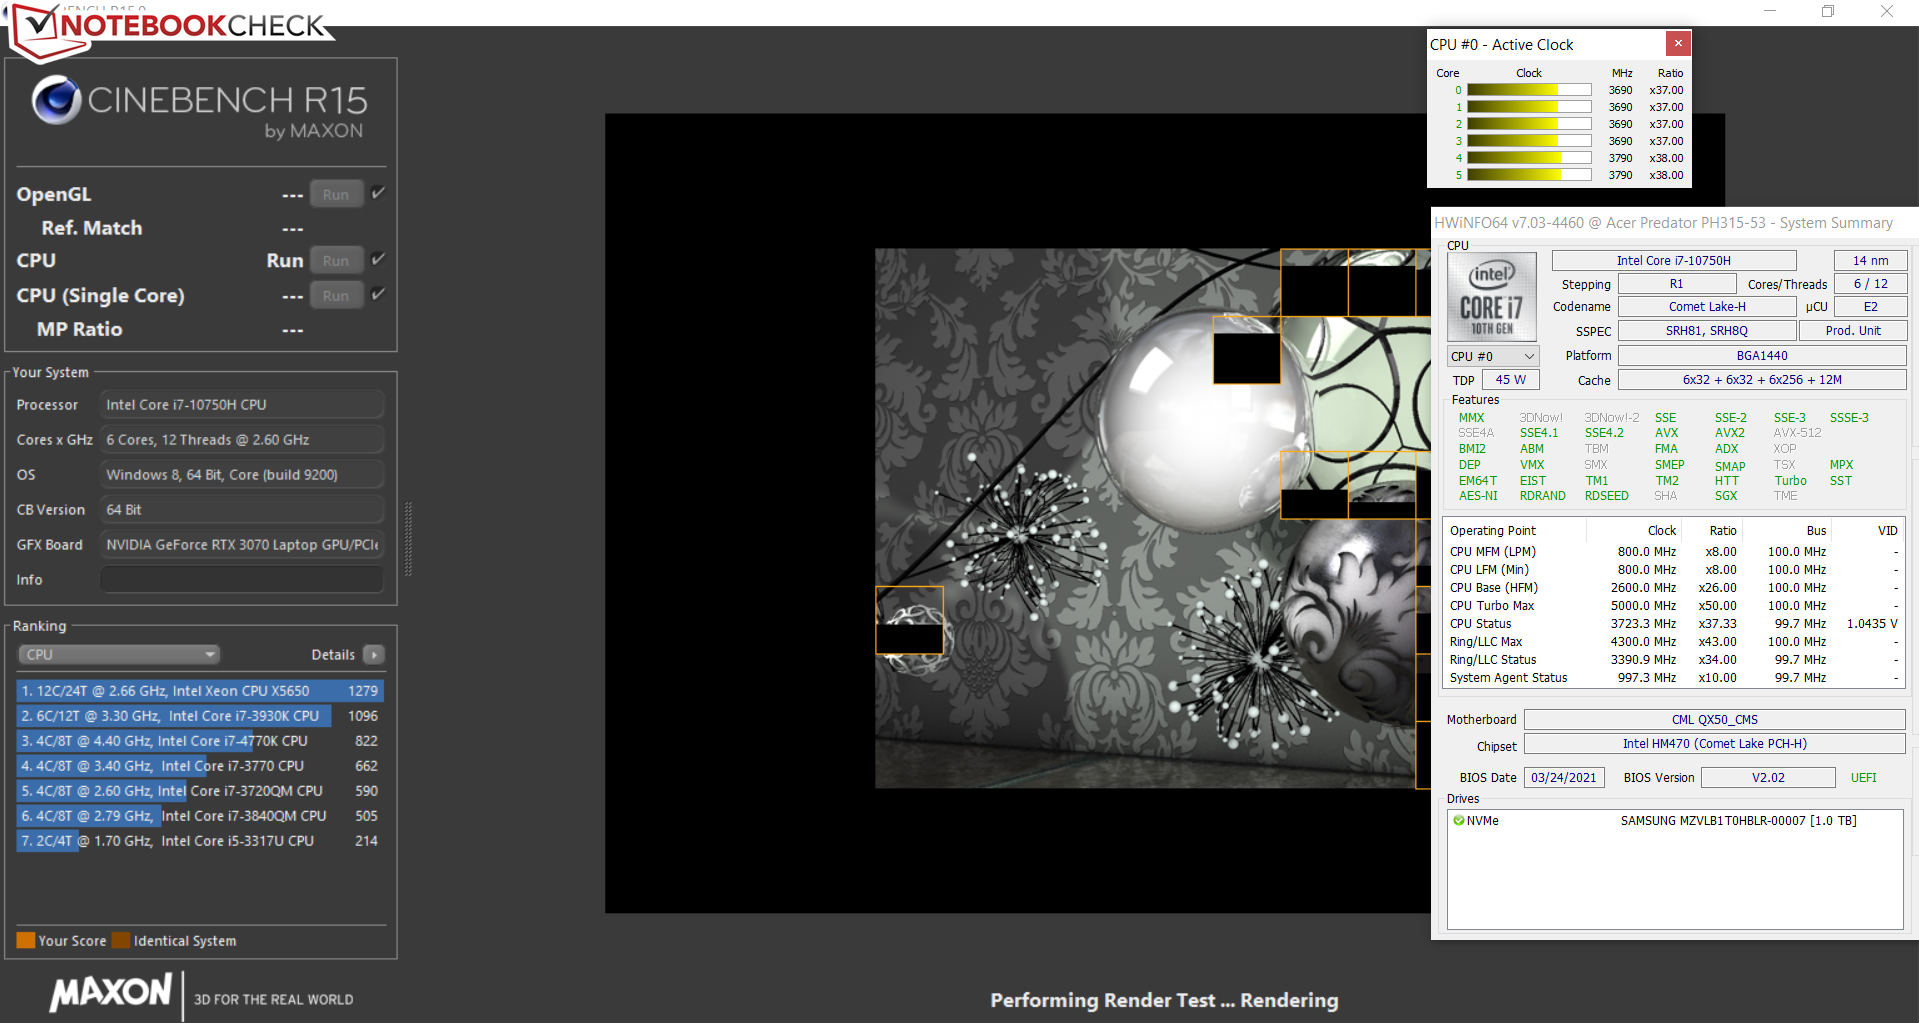
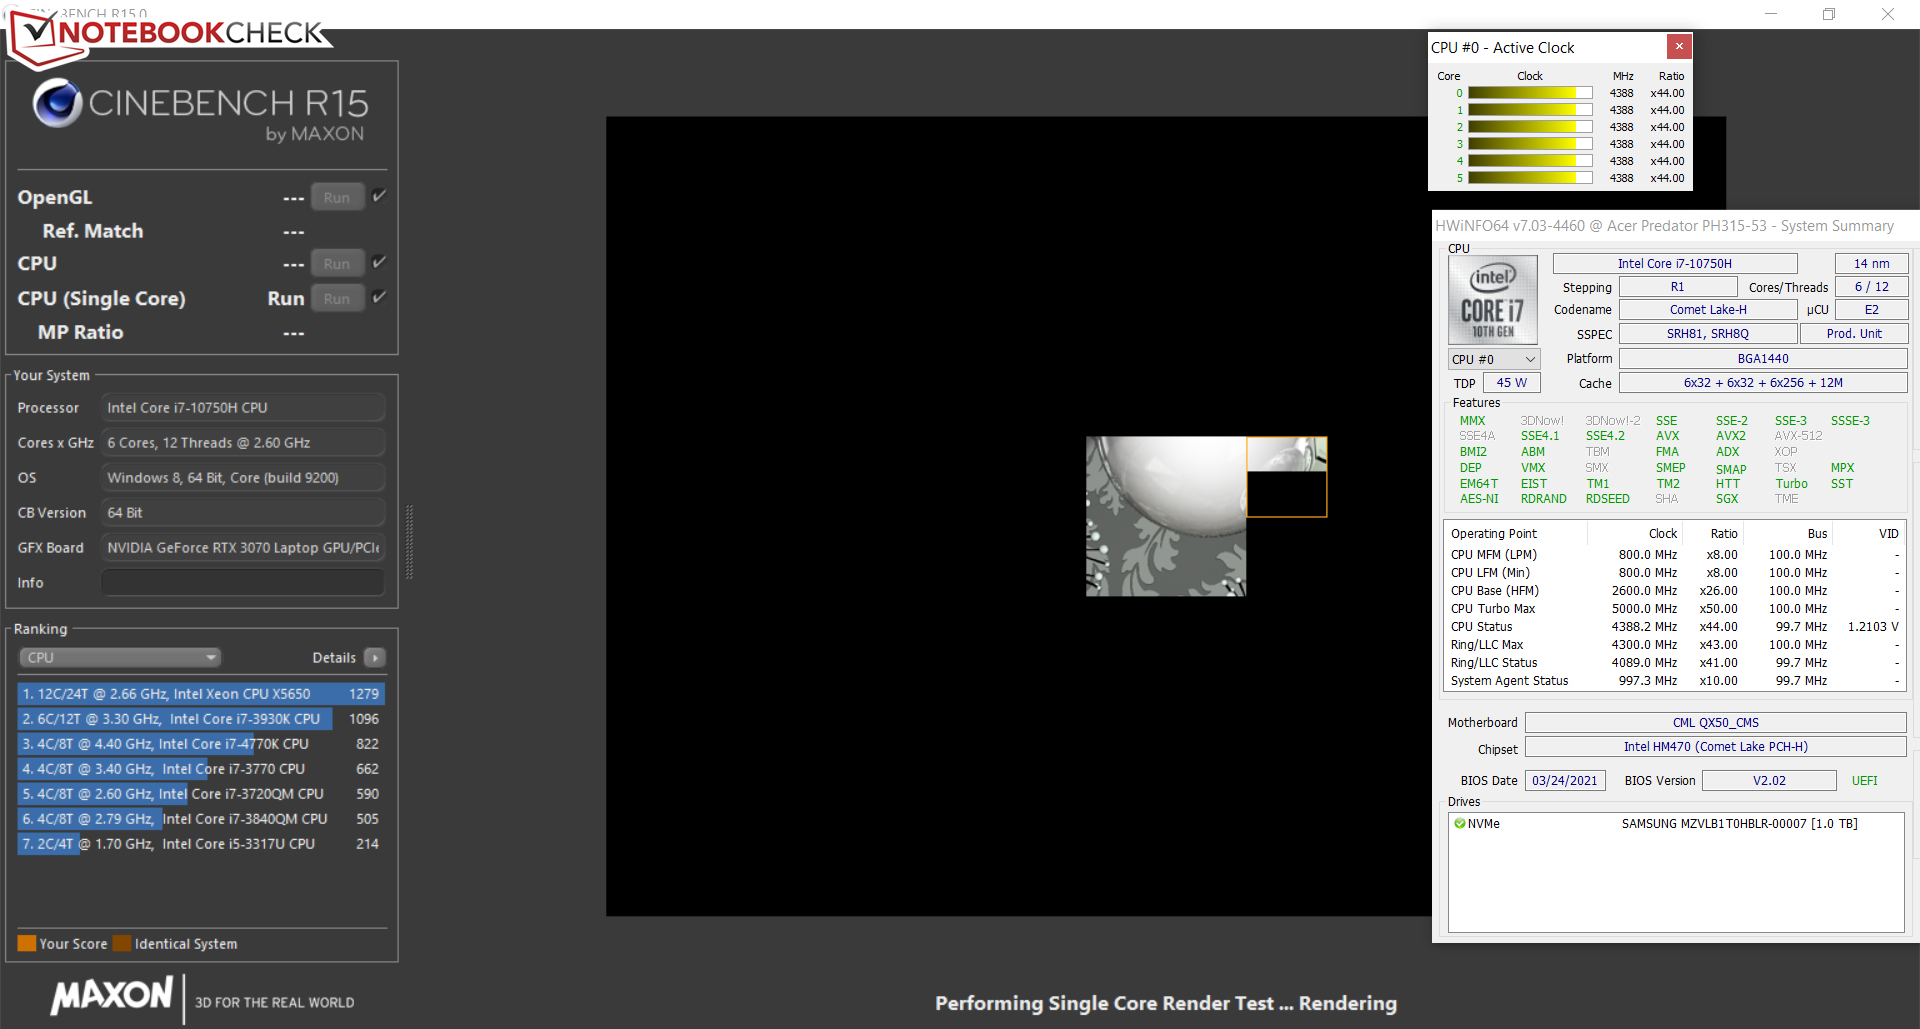
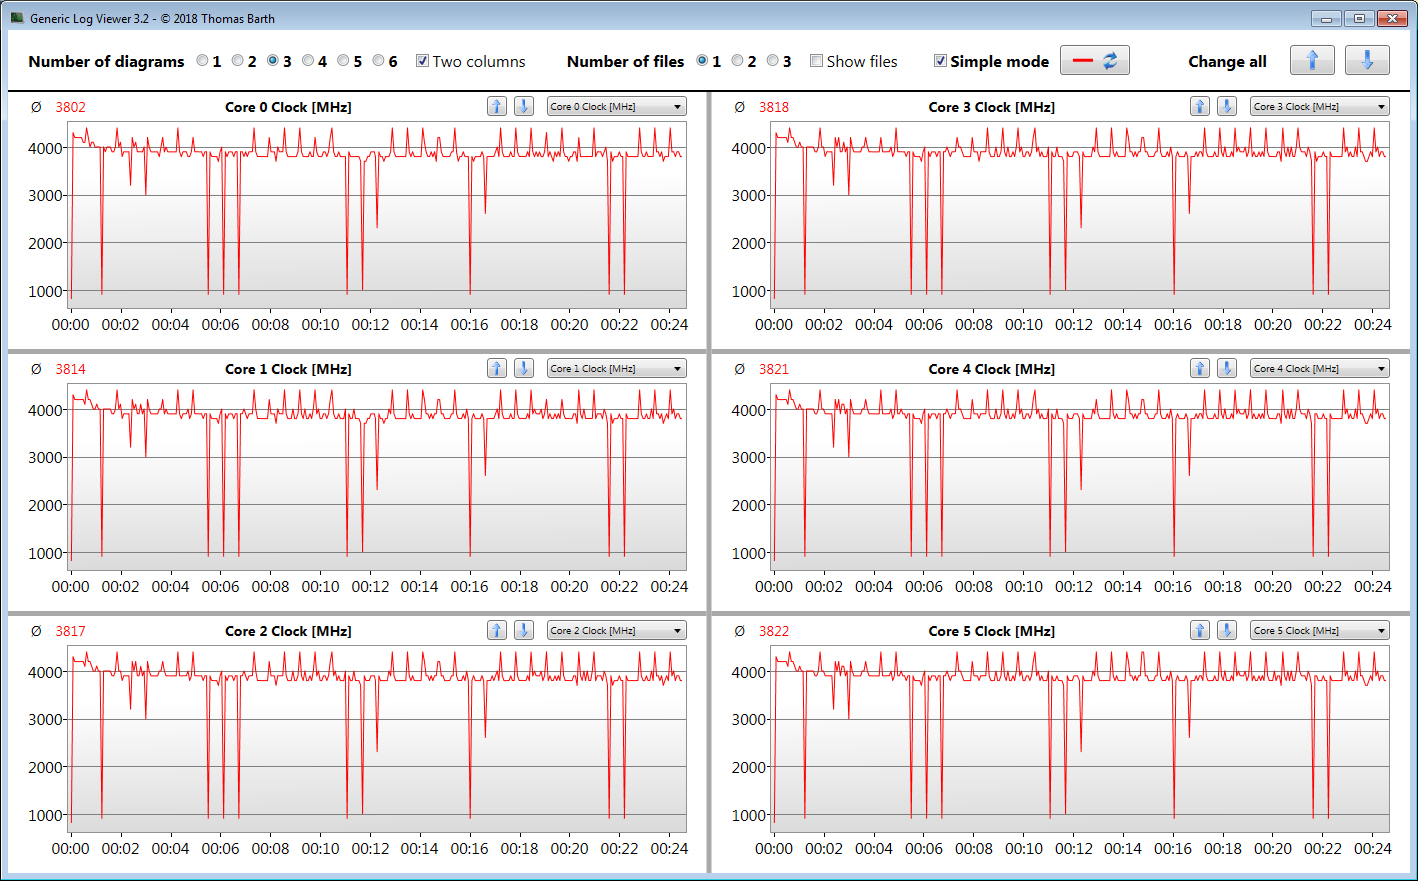
Verificamos se a CPU Turbo é utilizada de forma consistente quando conectada, executando o teste multithread do benchmark Cinebench R15 em um loop contínuo por pelo menos 30 minutos. O Turbo faz efeito a um nível bastante alto.
* ... menor é melhor
Desempenho do sistema
O sistema rápido e suave oferece poder de computação suficiente para aplicações exigentes como jogos e edição de imagens para os próximos anos. Isto é acompanhado de bons resultados PCMark
| PCMark 8 Home Score Accelerated v2 | 4275 pontos | |
| PCMark 8 Creative Score Accelerated v2 | 6202 pontos | |
| PCMark 8 Work Score Accelerated v2 | 5604 pontos | |
| PCMark 10 Score | 6034 pontos | |
Ajuda | ||
| PCMark 10 / Score | |
| Média da turma Gaming (5828 - 12414, n=93, últimos 2 anos) | |
| Asus ROG Strix G15 G513QR | |
| Aorus 15G XC | |
| MSI GS66 Stealth 10UG | |
| Acer Predator Helios 300 PH315-53-786B | |
| Média Intel Core i7-10750H, NVIDIA GeForce RTX 3070 Laptop GPU (6017 - 6034, n=2) | |
| Acer Predator Helios 300 PH315-53-77N5 | |
| PCMark 10 / Essentials | |
| Média da turma Gaming (8810 - 11935, n=97, últimos 2 anos) | |
| MSI GS66 Stealth 10UG | |
| Acer Predator Helios 300 PH315-53-77N5 | |
| Aorus 15G XC | |
| Acer Predator Helios 300 PH315-53-786B | |
| Média Intel Core i7-10750H, NVIDIA GeForce RTX 3070 Laptop GPU (8652 - 8953, n=2) | |
| PCMark 10 / Productivity | |
| Média da turma Gaming (6845 - 25323, n=95, últimos 2 anos) | |
| Aorus 15G XC | |
| Média Intel Core i7-10750H, NVIDIA GeForce RTX 3070 Laptop GPU (8022 - 8657, n=2) | |
| Acer Predator Helios 300 PH315-53-77N5 | |
| Acer Predator Helios 300 PH315-53-786B | |
| MSI GS66 Stealth 10UG | |
| PCMark 10 / Digital Content Creation | |
| Média da turma Gaming (7602 - 19954, n=95, últimos 2 anos) | |
| Aorus 15G XC | |
| MSI GS66 Stealth 10UG | |
| Acer Predator Helios 300 PH315-53-786B | |
| Média Intel Core i7-10750H, NVIDIA GeForce RTX 3070 Laptop GPU (7893 - 8300, n=2) | |
| Acer Predator Helios 300 PH315-53-77N5 | |
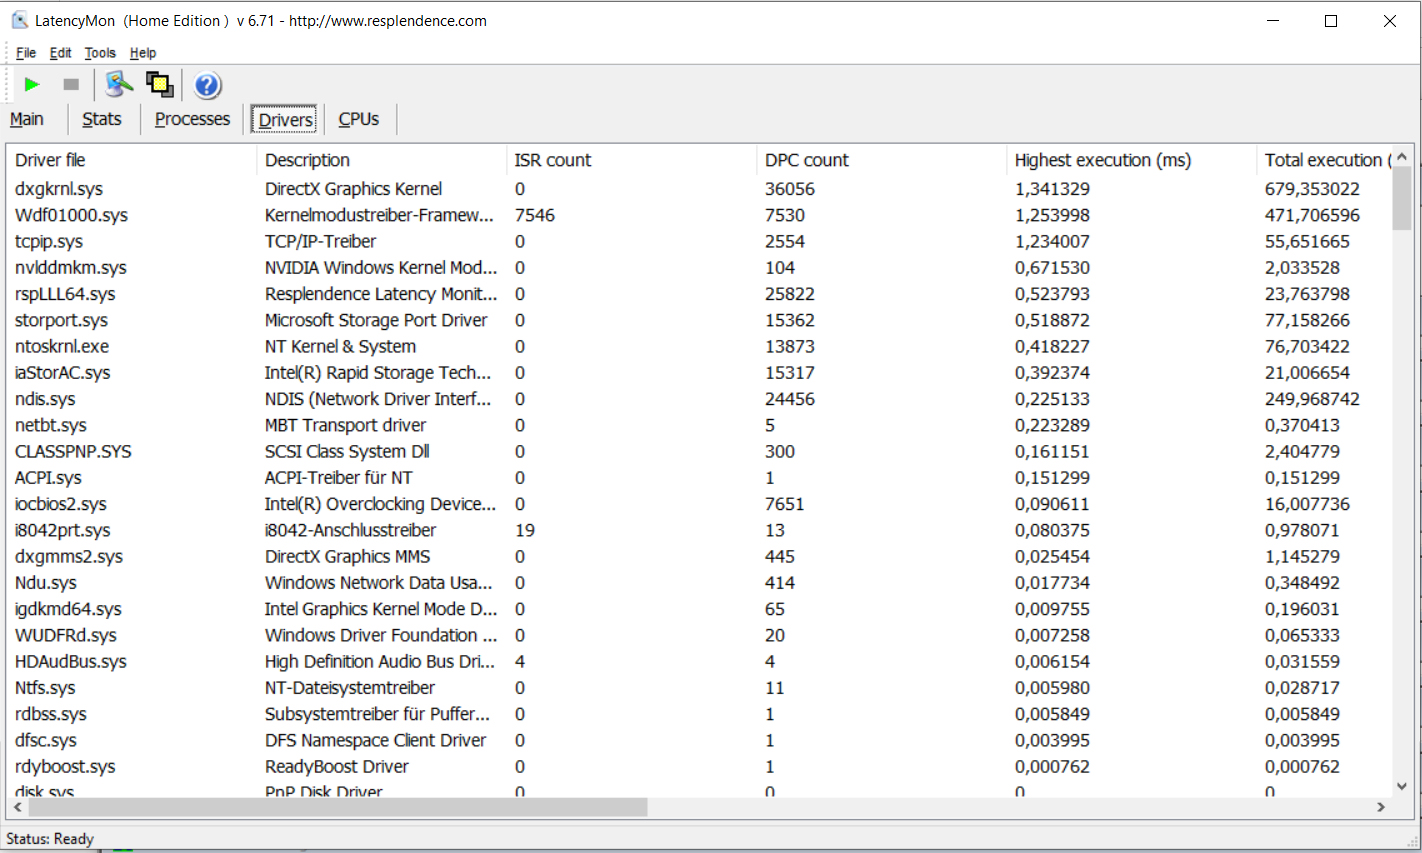
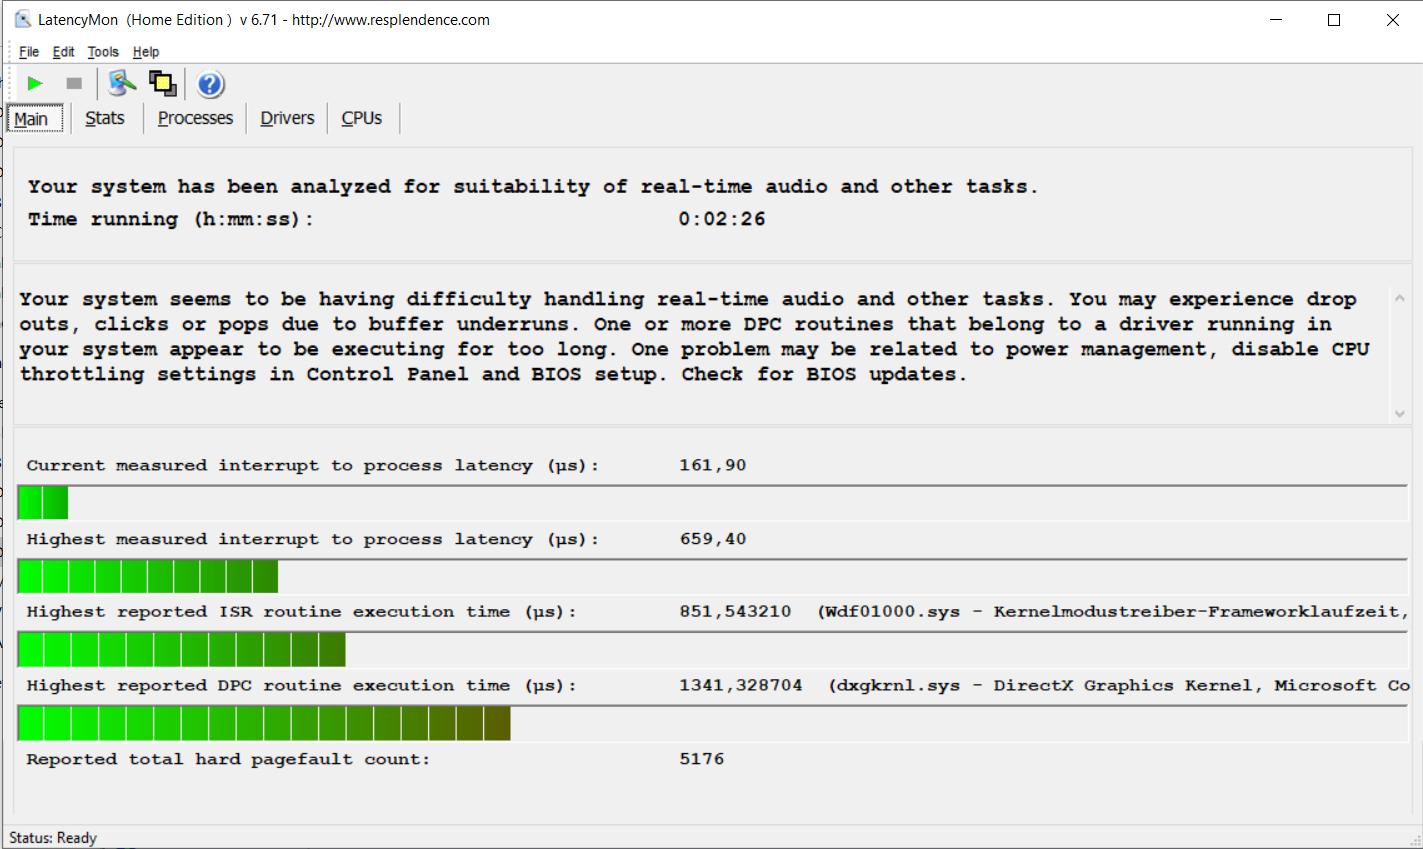
Latências DPC
Nosso teste de monitor de latência padronizado (navegação na web, reprodução de vídeo 4K, Prime95 de alta carga) revelou irregularidades em termos de latências DPC. O sistema não parece ser adequado para edição de vídeo e áudio em tempo real
| DPC Latencies / LatencyMon - interrupt to process latency (max), Web, Youtube, Prime95 | |
| Aorus 15G XC | |
| Acer Predator Helios 300 PH315-53-77N5 | |
| MSI GS66 Stealth 10UG | |
| Acer Predator Helios 300 PH315-53-786B | |
| Asus ROG Strix G15 G513QR | |
* ... menor é melhor
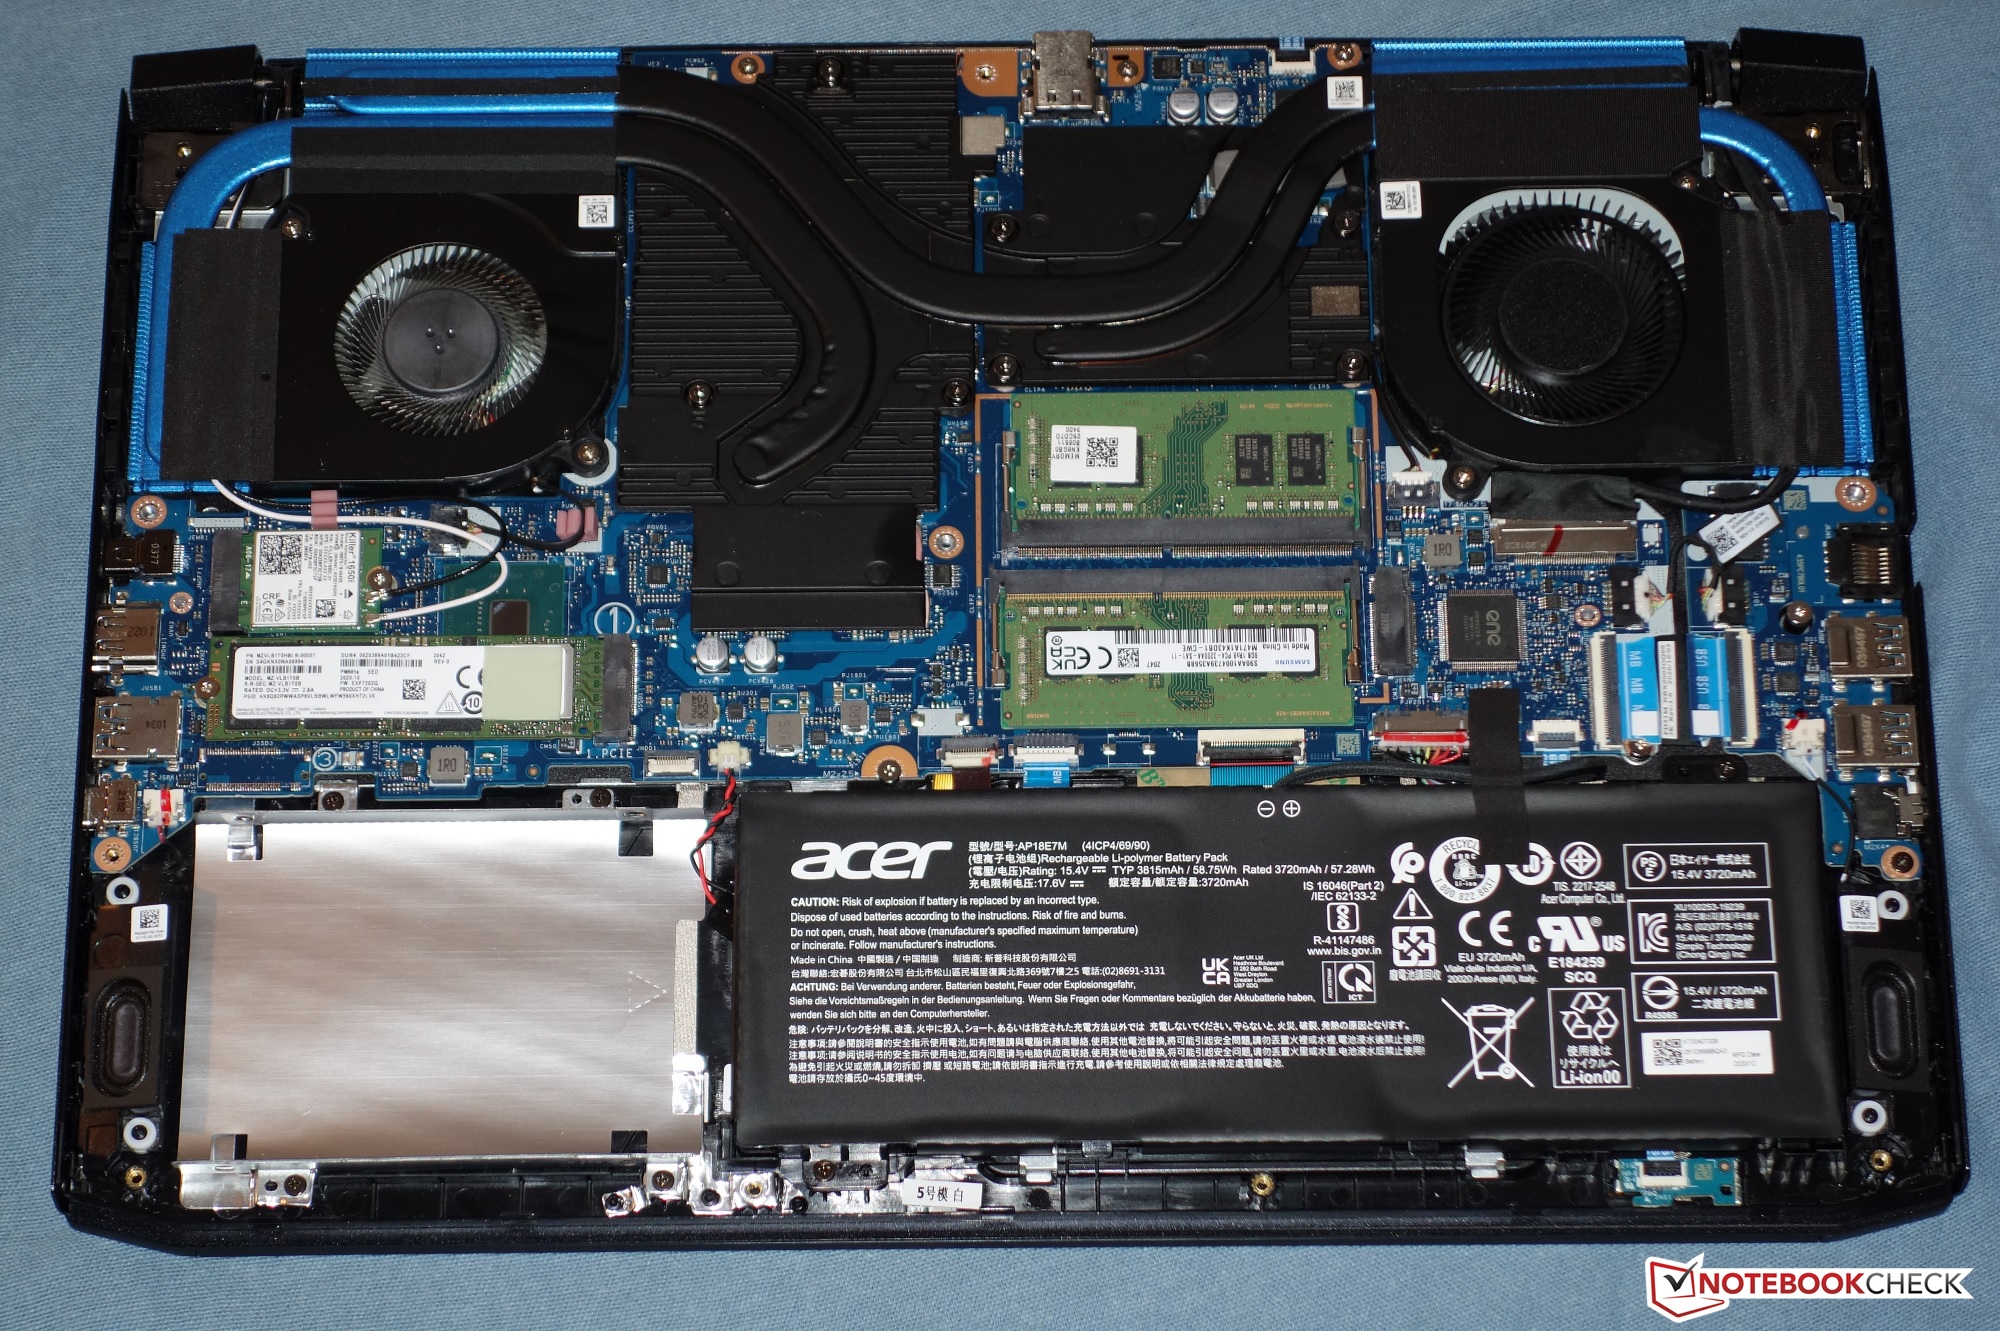
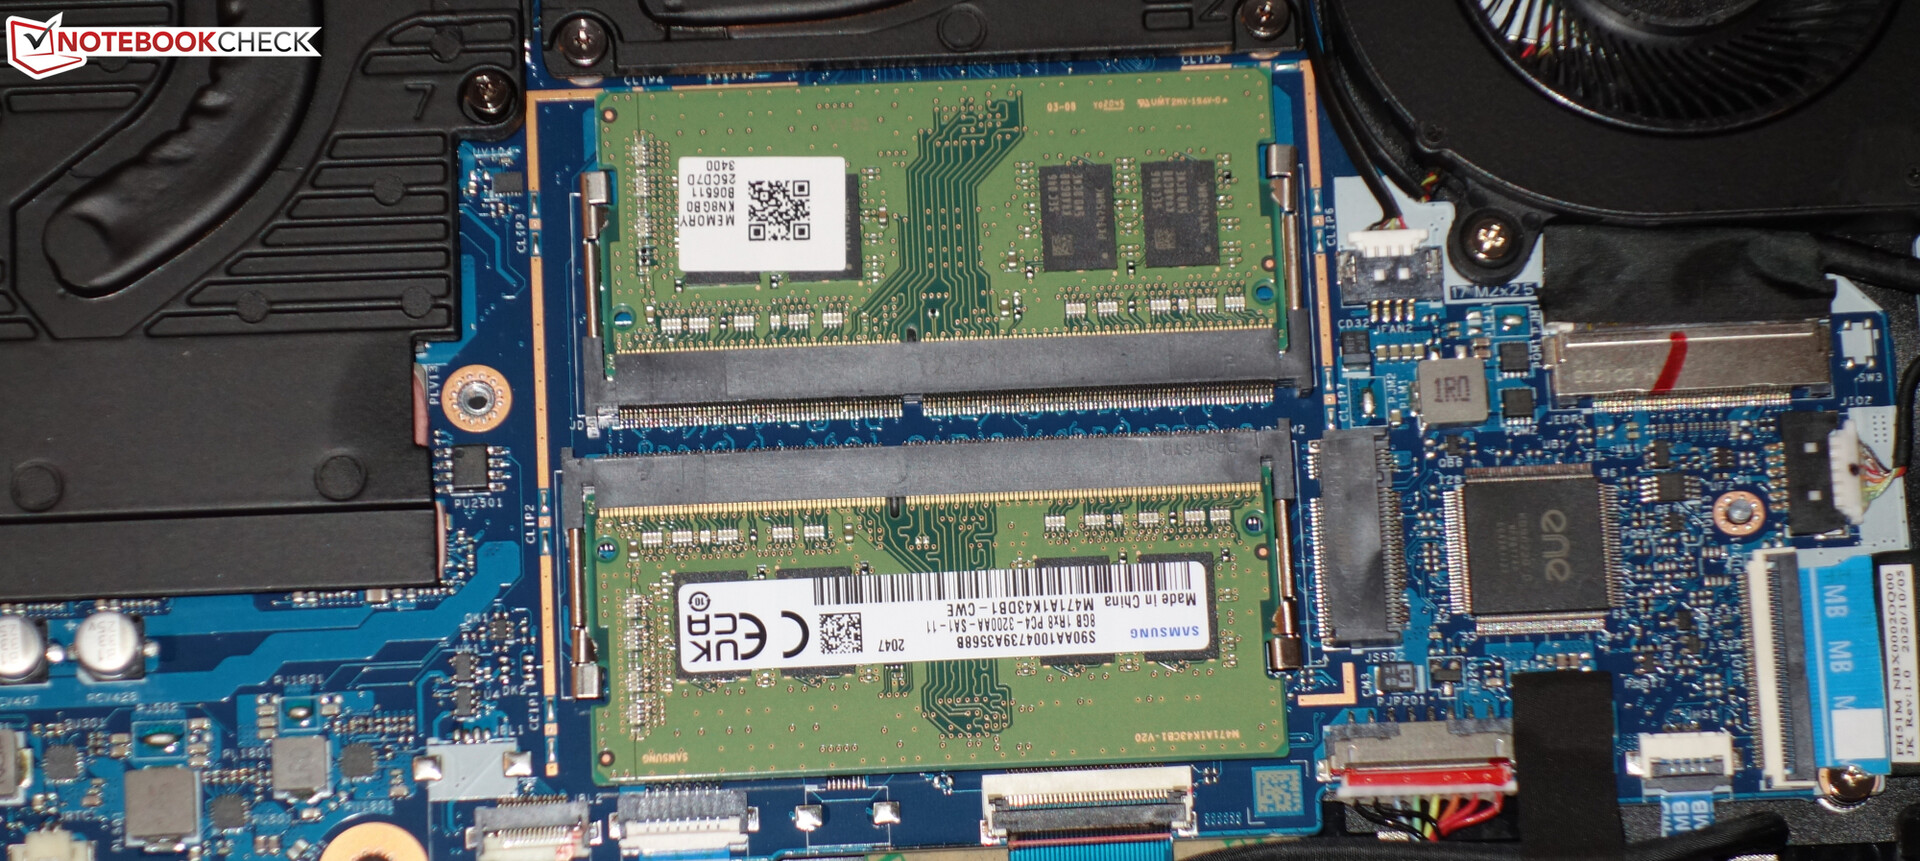
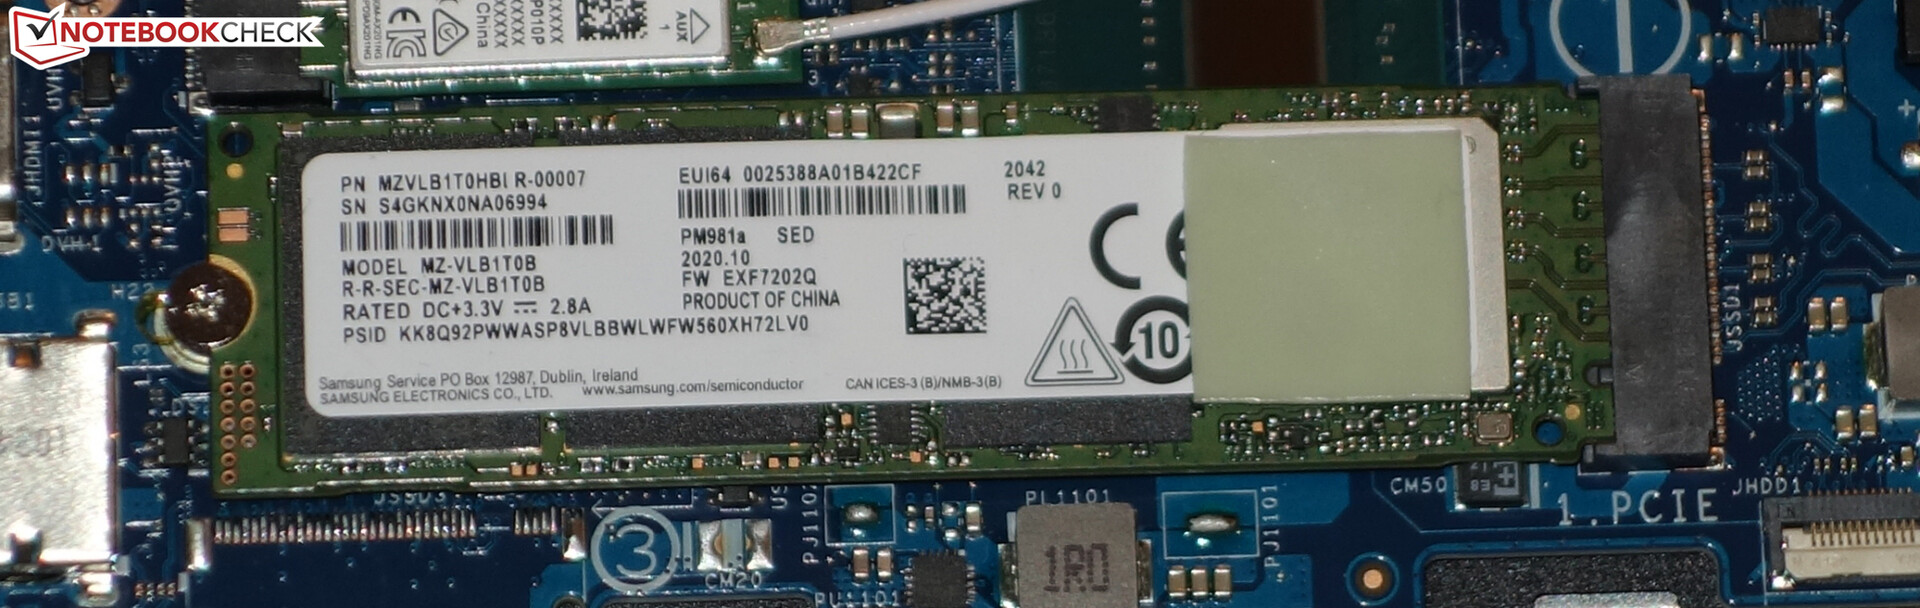
Armazenamento
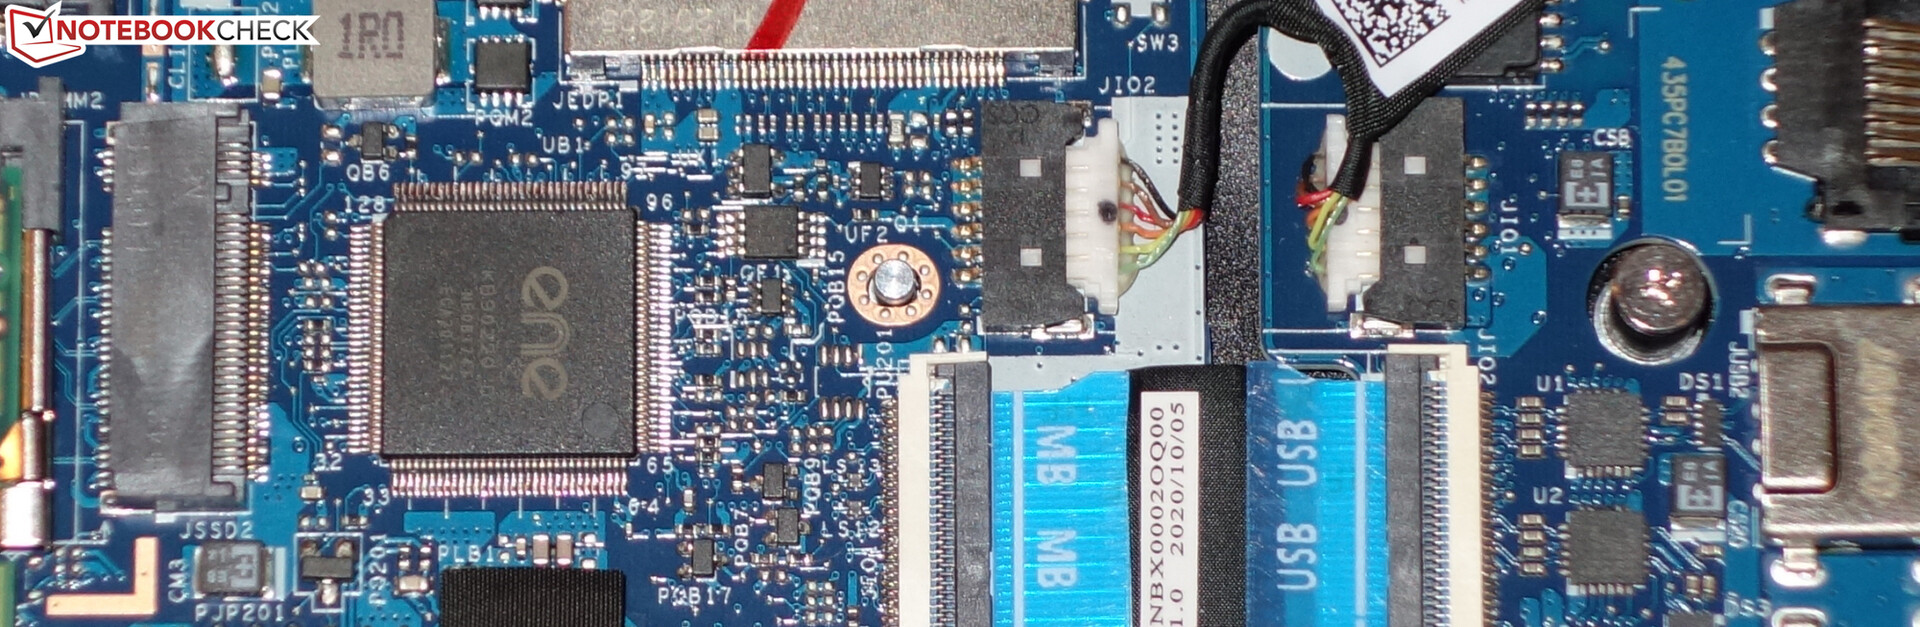
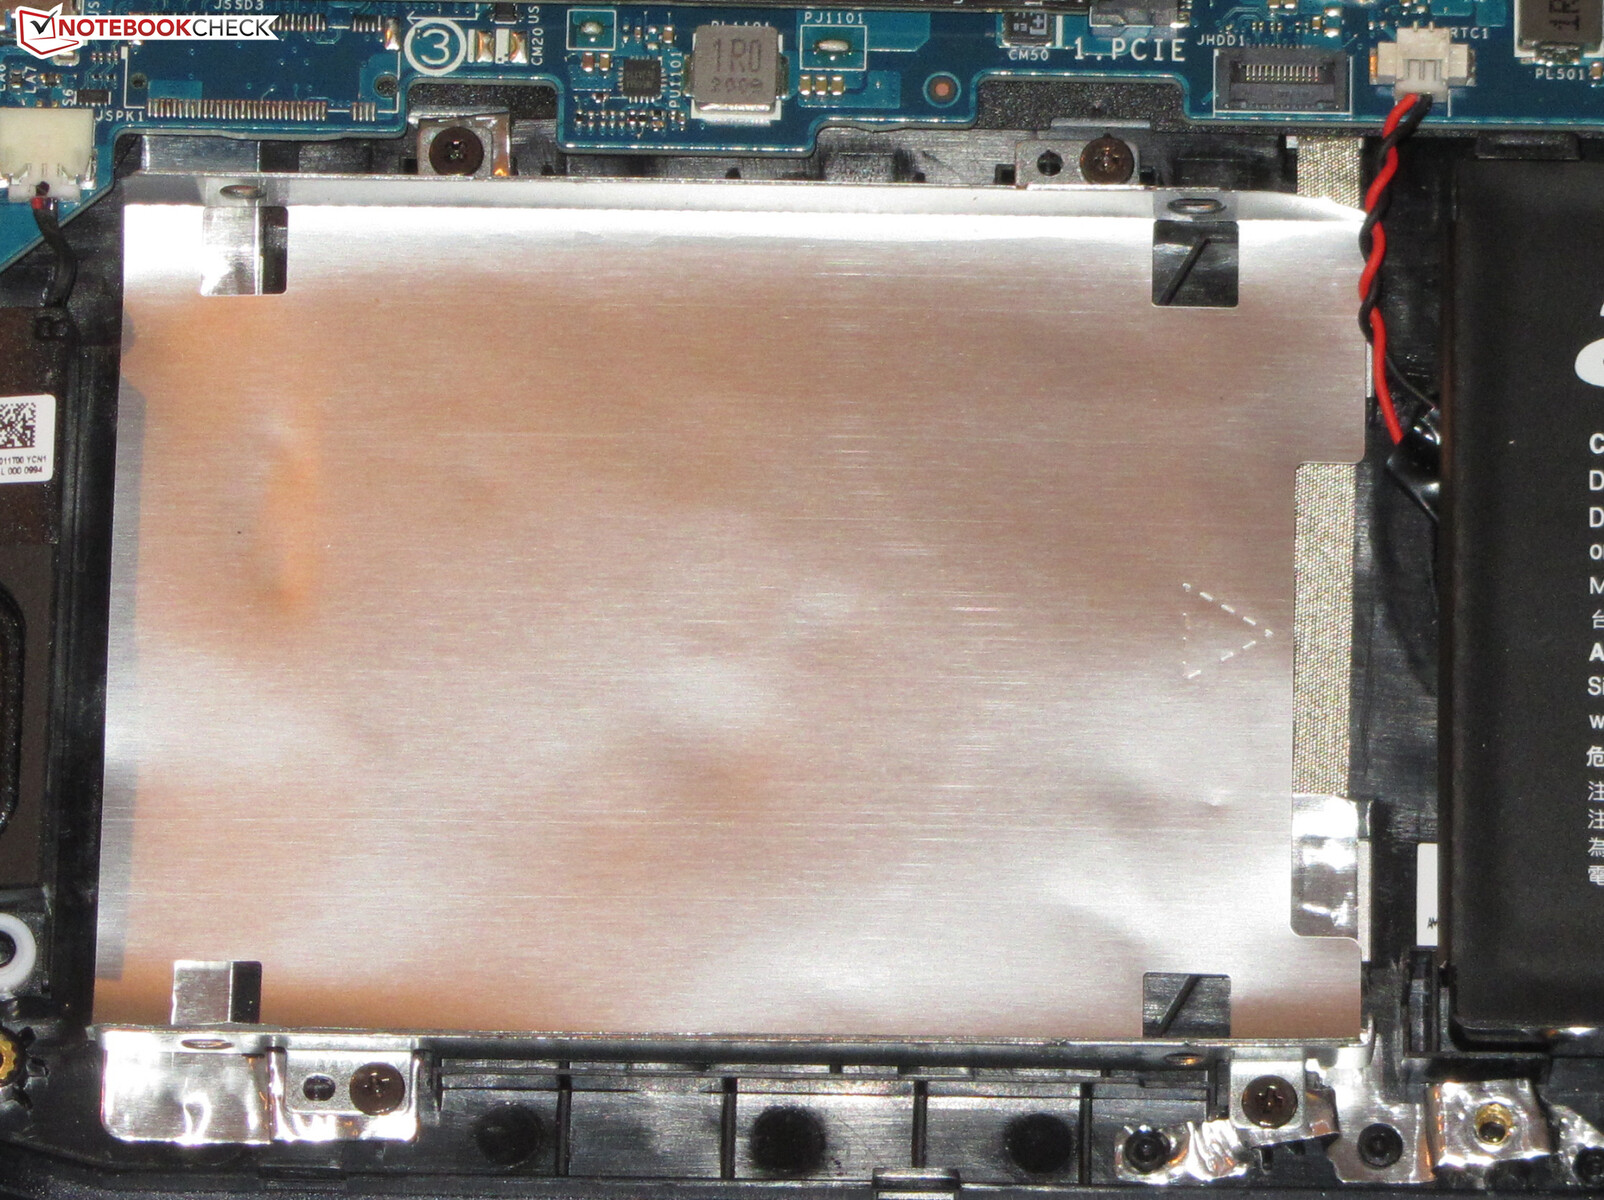
Um SSD NVMe (M.2-2280) da Samsung serve como a unidade do sistema. Ele fornece 1 TB de espaço de armazenamento e oferece boas taxas de transferência. O laptop pode conter um total de dois NVMe SSDs. O RAID 0 também é suportado. O Predator também tem espaço para um dispositivo de armazenamento de 2,5 polegadas. O slot SATA necessário (na caixa) e a estrutura de montagem (dentro do laptop) estão incluídos

| Acer Predator Helios 300 PH315-53-786B Samsung PM981a MZVLB1T0HBLR | Aorus 15G XC ESR512GTLCG-EAC-4 | MSI GS66 Stealth 10UG WDC PC SN730 SDBPNTY-1T00 | Asus ROG Strix G15 G513QR SK Hynix HFM001TD3JX013N | Acer Predator Helios 300 PH315-53-77N5 WDC PC SN730 SDBQNTY-512GB | |
|---|---|---|---|---|---|
| AS SSD | -11% | -4% | -1% | -15% | |
| Seq Read (MB/s) | 2792 | 2048 -27% | 2198 -21% | 2881 3% | 2753 -1% |
| Seq Write (MB/s) | 2311 | 2403 4% | 2596 12% | 1570 -32% | 2495 8% |
| 4K Read (MB/s) | 48.34 | 48.27 0% | 43.81 -9% | 52.4 8% | 38.64 -20% |
| 4K Write (MB/s) | 93.9 | 101.6 8% | 115.5 23% | 124 32% | 88.8 -5% |
| 4K-64 Read (MB/s) | 1516 | 1606 6% | 1692 12% | 1334 -12% | 952 -37% |
| 4K-64 Write (MB/s) | 1940 | 1473 -24% | 2162 11% | 2189 13% | 1568 -19% |
| Access Time Read * (ms) | 0.131 | 0.056 | 0.055 | ||
| Access Time Write * (ms) | 0.04 | 0.038 5% | 0.098 -145% | 0.03 25% | 0.044 -10% |
| Score Read (Points) | 1843 | 1859 1% | 1956 6% | 1675 -9% | 1266 -31% |
| Score Write (Points) | 2265 | 1815 -20% | 2537 12% | 2470 9% | 1906 -16% |
| Score Total (Points) | 5030 | 4645 -8% | 5513 10% | 4943 -2% | 3811 -24% |
| Copy ISO MB/s (MB/s) | 1921 | 1188 -38% | 2236 16% | 1277 -34% | 2037 6% |
| Copy Program MB/s (MB/s) | 581 | 488.1 -16% | 690 19% | 575 -1% | 475.6 -18% |
| Copy Game MB/s (MB/s) | 1454 | 878 -40% | 1546 6% | 1272 -13% | 1018 -30% |
* ... menor é melhor
Continuous load read: DiskSpd Read Loop, Queue Depth 8
Placa gráfica
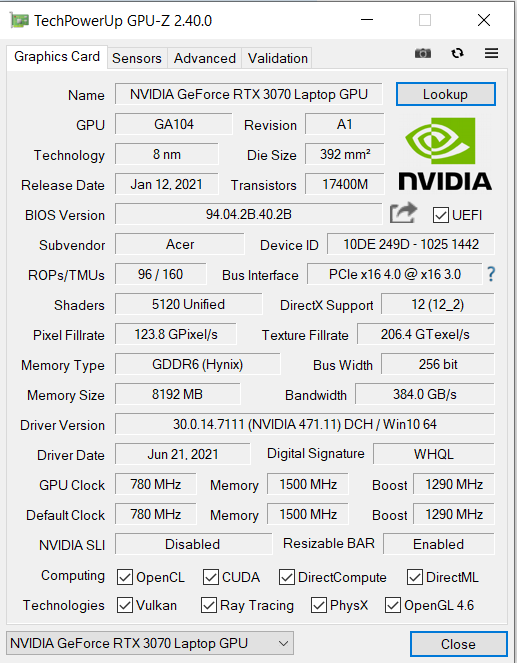
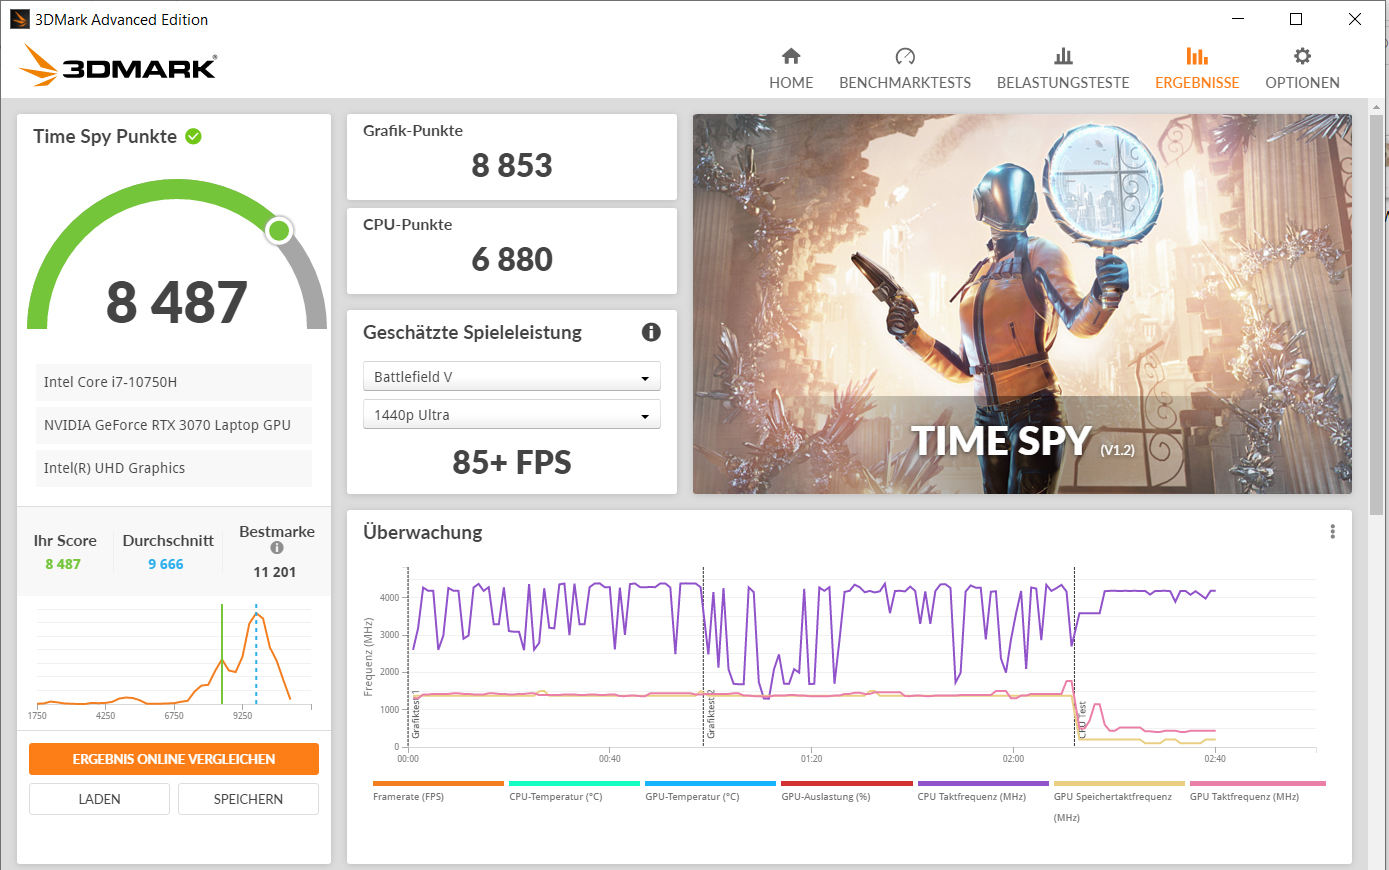
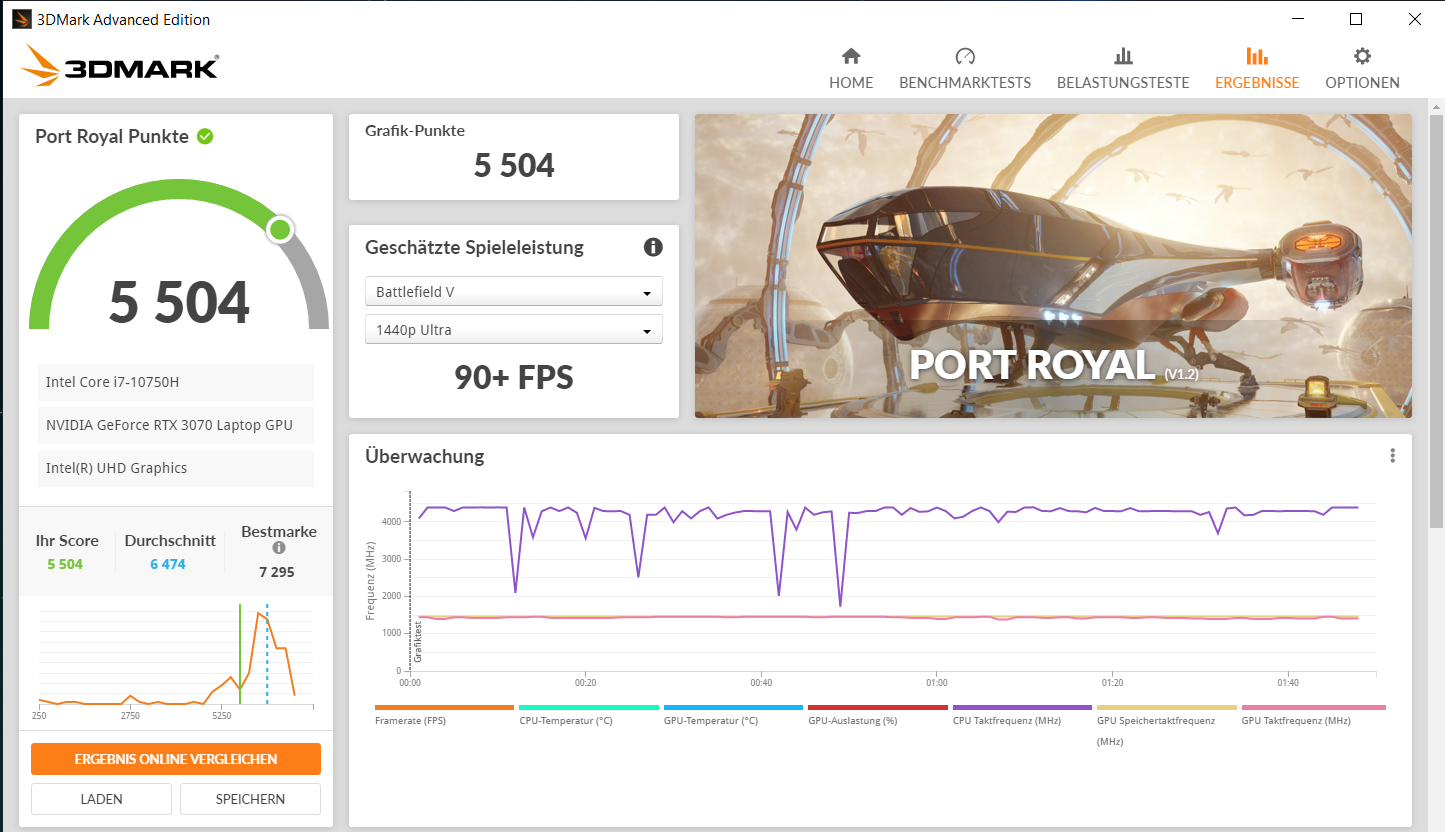
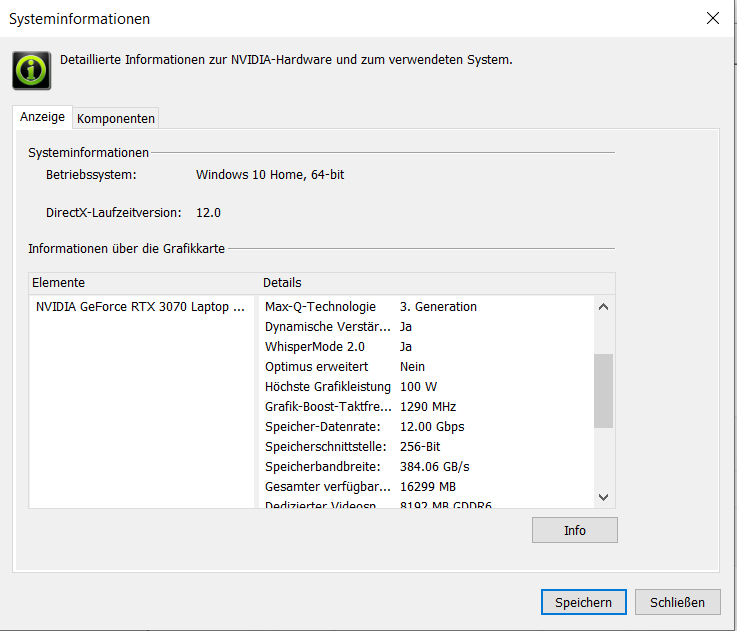
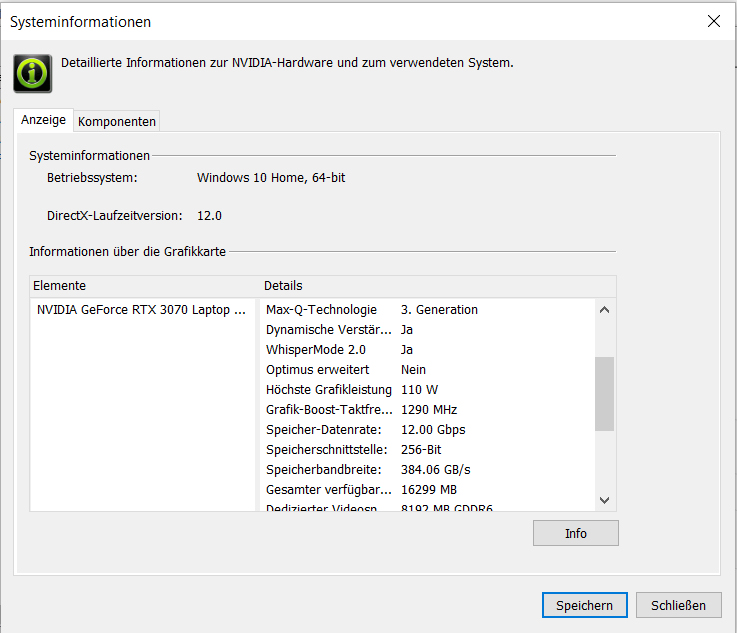
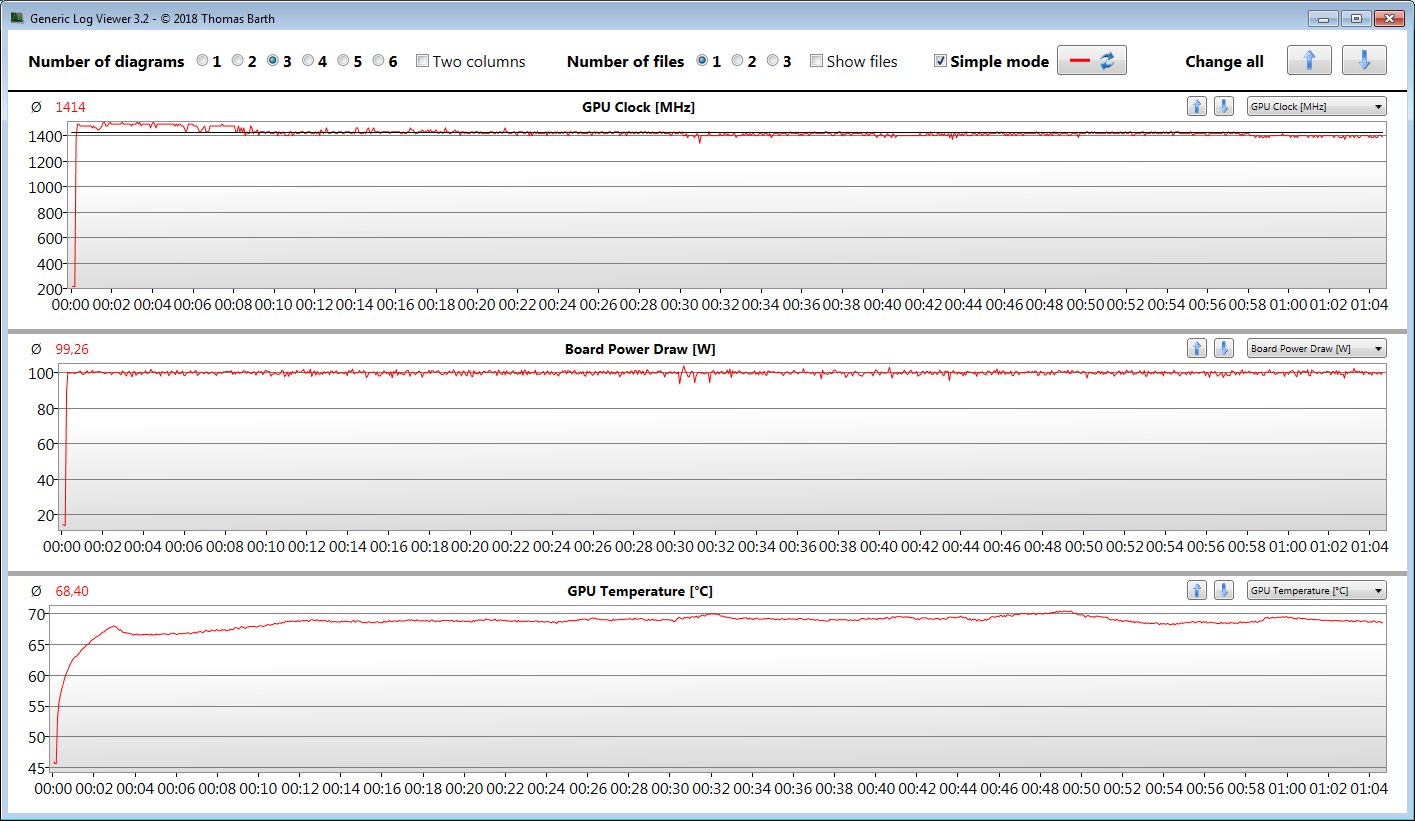
O desempenho real de um núcleo gráfico RTX 3000 depende do TGP máximo que um fabricante de laptop seleciona dentro dos limites definidos pela Nvidia. A Acer forneceu originalmente olaptopGeForce RTX 3070GPU (visão geral de todos os laptops RTX 3070 incluindo seus TGPs) com um TGP máximo de 100 watts. Uma atualização de firmware (encontrada na seção de downloadsdo site da Acer) aumenta o TGP para 110 watts - também informamos sobre isso anteriormente.
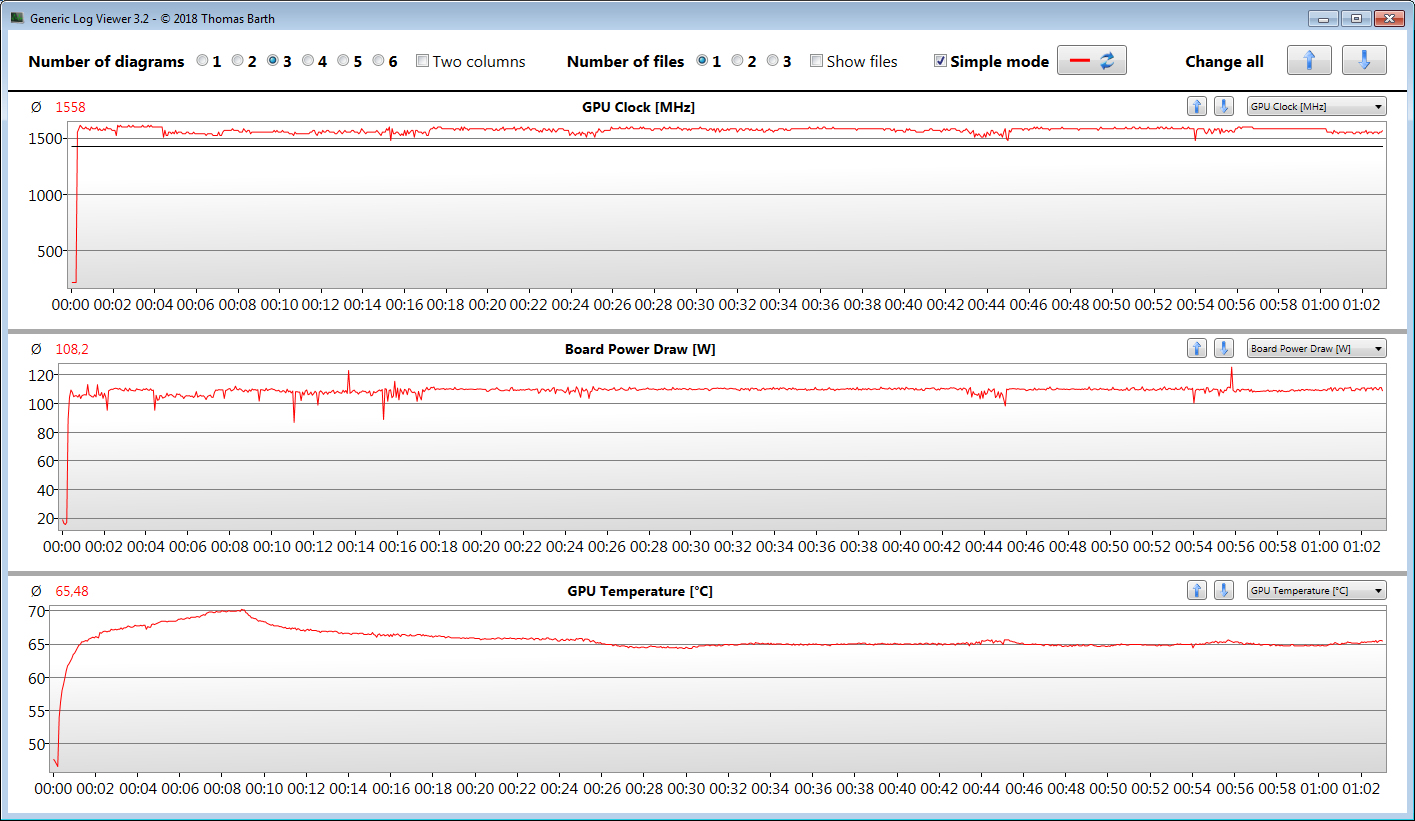
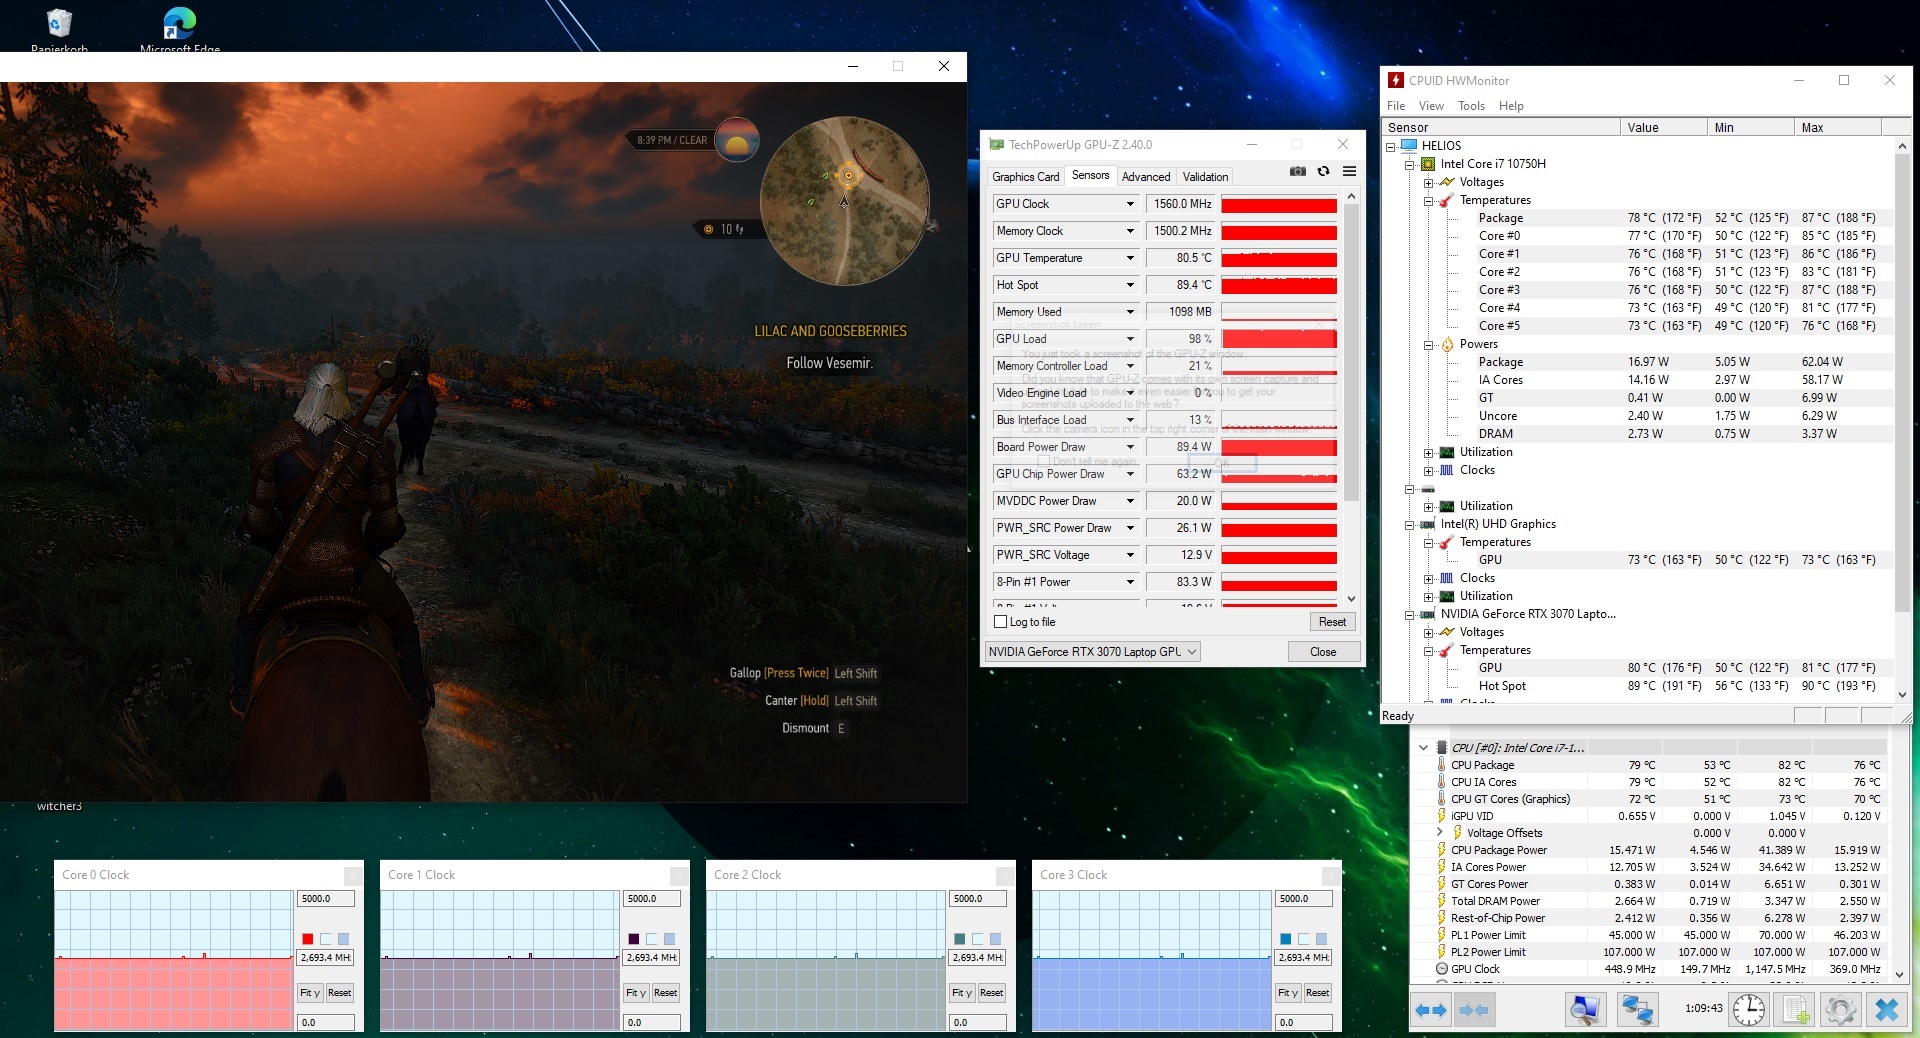
O GPU tem um desempenho decente e fornece resultados médios (TGP de 100 watts) ou ligeiramente acima da média (TGP de 110 watts) do benchmark RTX 3070. O novo TGP máximo de 110 watts é usado quando o perfil "Extremo" da GPU é ativado, e também pode ser mantido por um período de tempo prolongado (veja nossoteste Witcher 3 The )
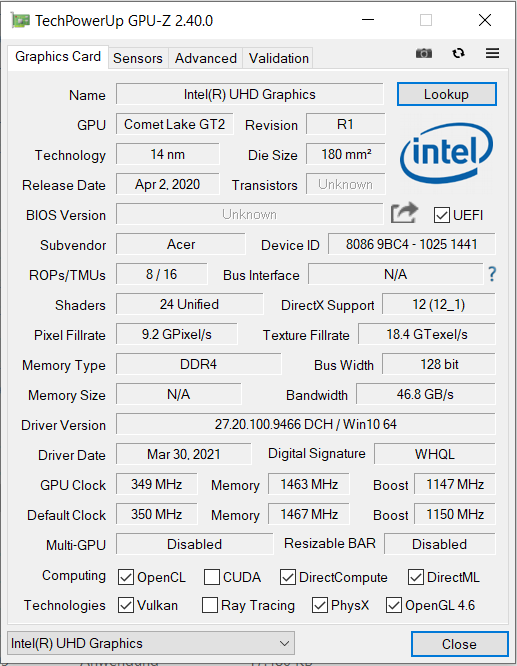
O UHD Graphics 630GPU integrado ao processador está ativo, e o laptop funciona com a solução de comutação gráfica Optimus da Nvidia.

| 3DMark 11 Performance | 23408 pontos | |
| 3DMark Cloud Gate Standard Score | 38982 pontos | |
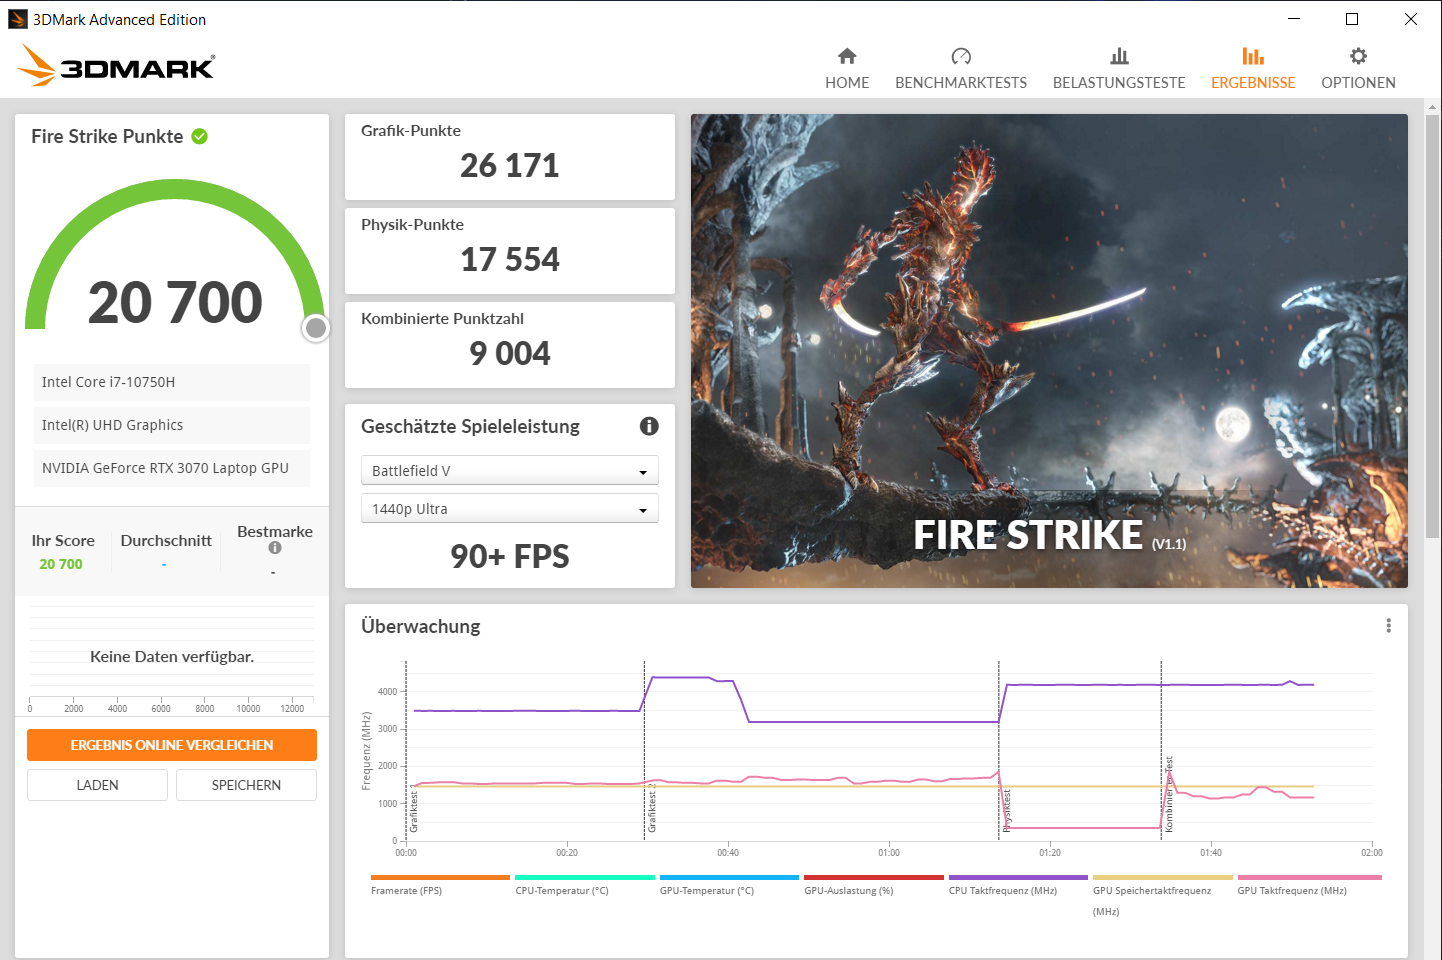
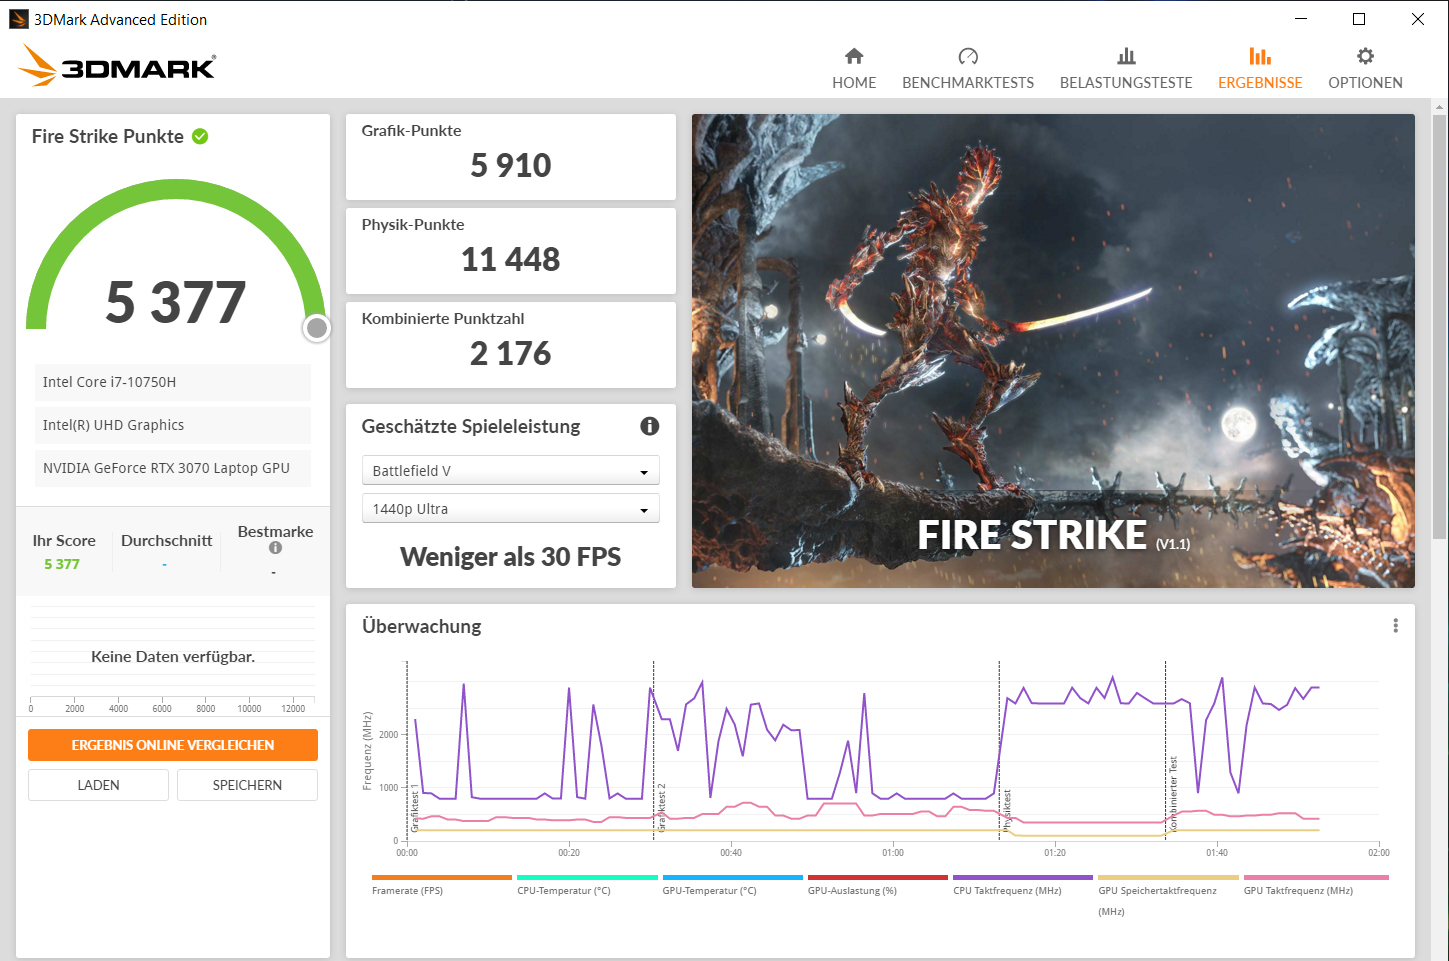
| 3DMark Fire Strike Score | 19478 pontos | |
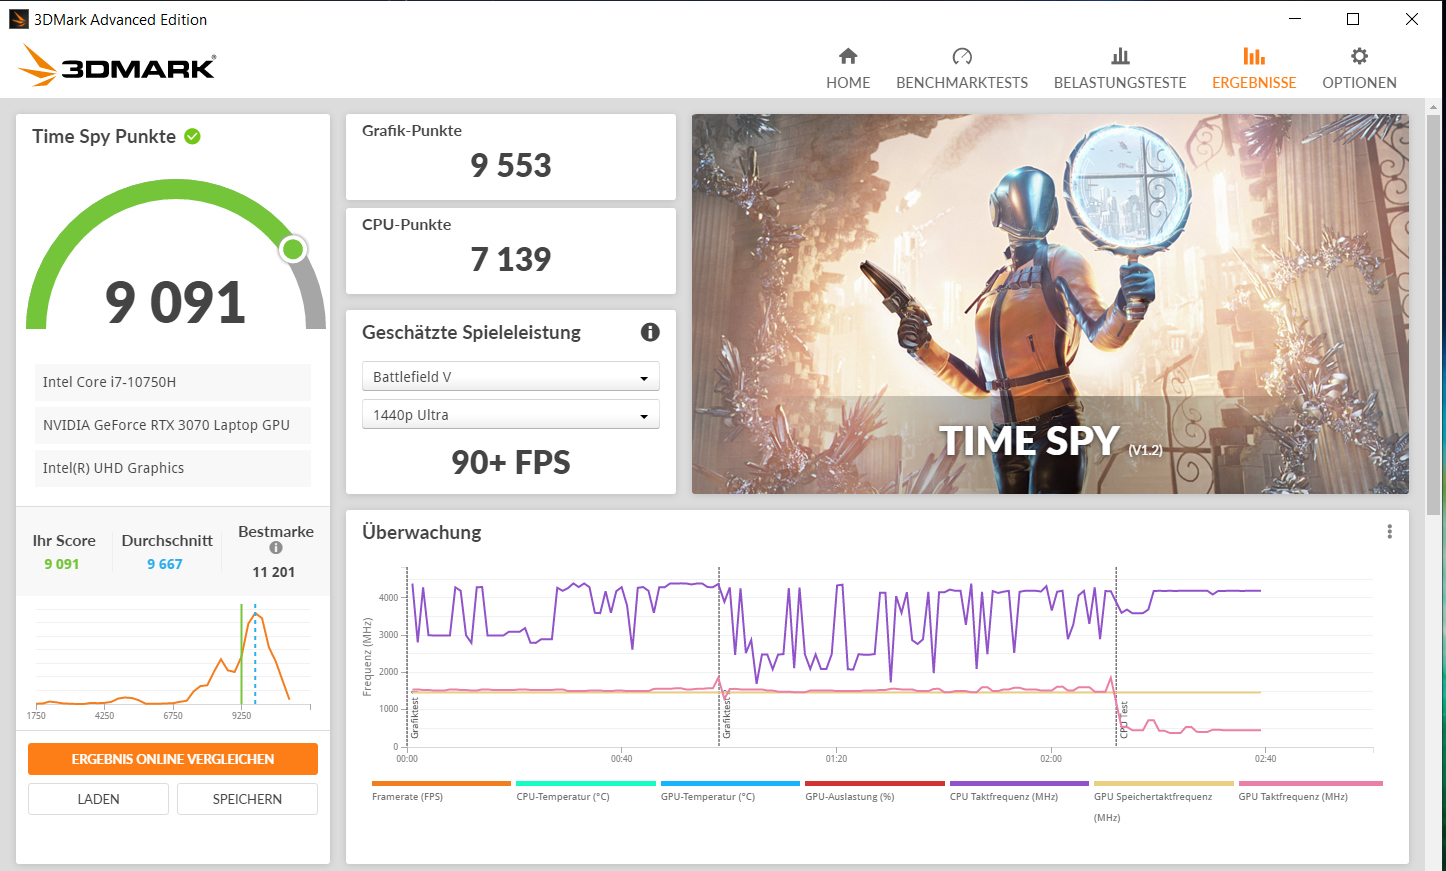
| 3DMark Time Spy Score | 8487 pontos | |
Ajuda | ||
| 3DMark 11 - 1280x720 Performance GPU | |
| Média da turma Gaming (21841 - 80022, n=104, últimos 2 anos) | |
| Acer Predator Helios 300 PH315-53-786B (Extrem, TGP 110W) | |
| Asus ROG Strix G15 G513QR | |
| Aorus 15G XC | |
| Média NVIDIA GeForce RTX 3070 Laptop GPU (12535 - 38275, n=54) | |
| Acer Predator Helios 300 PH315-53-786B | |
| MSI GS66 Stealth 10UG | |
| Acer Predator Helios 300 PH315-53-77N5 | |
| 3DMark | |
| 1920x1080 Fire Strike Graphics | |
| Média da turma Gaming (12242 - 62849, n=115, últimos 2 anos) | |
| Acer Predator Helios 300 PH315-53-786B (Extrem, TGP 110W) | |
| Asus ROG Strix G15 G513QR | |
| Aorus 15G XC | |
| Acer Predator Helios 300 PH315-53-786B | |
| Média NVIDIA GeForce RTX 3070 Laptop GPU (7178 - 29128, n=52) | |
| MSI GS66 Stealth 10UG | |
| Acer Predator Helios 300 PH315-53-77N5 | |
| 2560x1440 Time Spy Graphics | |
| Média da turma Gaming (5012 - 26212, n=115, últimos 2 anos) | |
| Asus ROG Strix G15 G513QR | |
| Acer Predator Helios 300 PH315-53-786B (Extrem, TGP 110W) | |
| Aorus 15G XC | |
| Média NVIDIA GeForce RTX 3070 Laptop GPU (2644 - 11019, n=53) | |
| MSI GS66 Stealth 10UG | |
| Acer Predator Helios 300 PH315-53-786B | |
| Acer Predator Helios 300 PH315-53-77N5 | |
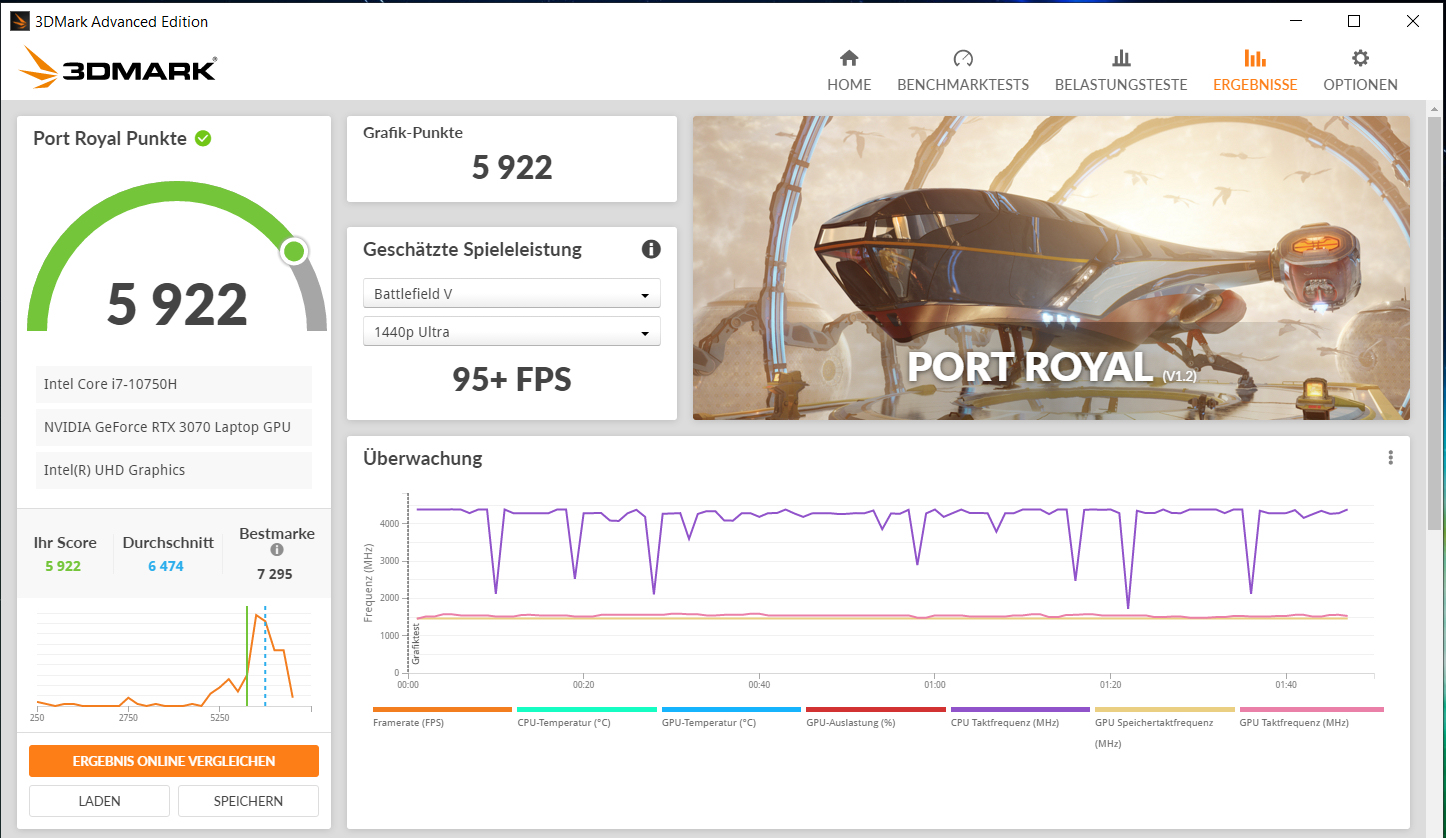
| 2560x1440 Port Royal Graphics | |
| Média da turma Gaming (4395 - 17286, n=71, últimos 2 anos) | |
| Acer Predator Helios 300 PH315-53-786B (Extrem, TGP 110W) | |
| Média NVIDIA GeForce RTX 3070 Laptop GPU (1640 - 6542, n=39) | |
| Acer Predator Helios 300 PH315-53-786B | |
| MSI GS66 Stealth 10UG | |
| Acer Predator Helios 300 PH315-53-77N5 | |
Desempenho do jogo
O laptop traz todos os jogos mais recentes suavemente para a tela. A resolução Full HD (1920x1080 pixels) e as configurações de qualidade máxima podem ser selecionadas normalmente. O Predator fornece taxas de quadros que giram em torno da média dos laptops que testamos até agora com o RTX 3070. O aumento do TGP para 110 watts leva a uma melhoria nas taxas de quadros em alguns títulos. Uma melhoria geral não é identificável
| The Witcher 3 - 1920x1080 Ultra Graphics & Postprocessing (HBAO+) | |
| Média da turma Gaming (104.7 - 240, n=7, últimos 2 anos) | |
| Acer Predator Helios 300 PH315-53-786B (Extrem, TGP 110W) | |
| Asus ROG Strix G15 G513QR | |
| Aorus 15G XC | |
| Média NVIDIA GeForce RTX 3070 Laptop GPU (34.9 - 109, n=52) | |
| Acer Predator Helios 300 PH315-53-786B | |
| MSI GS66 Stealth 10UG | |
| Acer Predator Helios 300 PH315-53-77N5 | |
| Dota 2 Reborn - 1920x1080 ultra (3/3) best looking | |
| Média da turma Gaming (84.8 - 248, n=107, últimos 2 anos) | |
| Média NVIDIA GeForce RTX 3070 Laptop GPU (26.9 - 163.9, n=58) | |
| Aorus 15G XC | |
| Acer Predator Helios 300 PH315-53-786B | |
| Acer Predator Helios 300 PH315-53-786B (Extrem, TGP 110W) | |
| MSI GS66 Stealth 10UG | |
| Asus ROG Strix G15 G513QR | |
| X-Plane 11.11 - 1920x1080 high (fps_test=3) | |
| Média da turma Gaming (55.5 - 143.5, n=109, últimos 2 anos) | |
| Média NVIDIA GeForce RTX 3070 Laptop GPU (12.4 - 118.8, n=61) | |
| Aorus 15G XC | |
| MSI GS66 Stealth 10UG | |
| Acer Predator Helios 300 PH315-53-786B | |
| Acer Predator Helios 300 PH315-53-786B | |
| Asus ROG Strix G15 G513QR | |
| Final Fantasy XV Benchmark - 1920x1080 High Quality | |
| Média da turma Gaming (41 - 215, n=95, últimos 2 anos) | |
| Asus ROG Strix G15 G513QR (1.3) | |
| MSI GS66 Stealth 10UG (1.3) | |
| Acer Predator Helios 300 PH315-53-786B (1.3, Extrem, TGP 110W) | |
| Média NVIDIA GeForce RTX 3070 Laptop GPU (27.9 - 107, n=49) | |
| Acer Predator Helios 300 PH315-53-786B (1.3) | |
| GTA V - 1920x1080 Highest AA:4xMSAA + FX AF:16x | |
| Média da turma Gaming (48.3 - 186.9, n=94, últimos 2 anos) | |
| Média NVIDIA GeForce RTX 3070 Laptop GPU (21.7 - 125.8, n=50) | |
| MSI GS66 Stealth 10UG | |
| Acer Predator Helios 300 PH315-53-786B | |
| Acer Predator Helios 300 PH315-53-786B (Extrem, TGP 110W) | |
| Asus ROG Strix G15 G513QR | |
| Strange Brigade - 1920x1080 ultra AA:ultra AF:16 | |
| Média da turma Gaming (76.3 - 458, n=87, últimos 2 anos) | |
| Acer Predator Helios 300 PH315-53-786B (1.47.22.14 D3D12, Extrem, TGP 110W) | |
| Acer Predator Helios 300 PH315-53-786B (1.47.22.14 D3D12) | |
| Média NVIDIA GeForce RTX 3070 Laptop GPU (36.2 - 194, n=46) | |
| Asus ROG Strix G15 G513QR (1.47.22.14 D3D12) | |
| MSI GS66 Stealth 10UG (1.47.22.14 D3D12) | |
| Far Cry 5 - 1920x1080 Ultra Preset AA:T | |
| Média da turma Gaming (70 - 151, n=6, últimos 2 anos) | |
| Média NVIDIA GeForce RTX 3070 Laptop GPU (89 - 140, n=36) | |
| Acer Predator Helios 300 PH315-53-786B (Extrem, TGP 110W) | |
| Acer Predator Helios 300 PH315-53-786B | |
| Asus ROG Strix G15 G513QR | |
| Dirt 5 - 1920x1080 Ultra High Preset | |
| Média NVIDIA GeForce RTX 3070 Laptop GPU (50 - 96, n=11) | |
| Acer Predator Helios 300 PH315-53-786B | |
| Acer Predator Helios 300 PH315-53-786B (Extrem, TGP 110W) | |
| Serious Sam 4 - 1920x1080 Ultra (DX12) AA:2xMS | |
| Média NVIDIA GeForce RTX 3070 Laptop GPU (66.4 - 82.1, n=5) | |
| Acer Predator Helios 300 PH315-53-786B (Extrem, TGP 110W) | |
| Acer Predator Helios 300 PH315-53-786B | |
| Acer Predator Helios 300 PH315-53-77N5 | |
| Watch Dogs Legion | |
| 1920x1080 Ultra Preset (DX12) | |
| Média NVIDIA GeForce RTX 3070 Laptop GPU (55 - 73, n=7) | |
| Acer Predator Helios 300 PH315-53-786B (Extrem, TGP 110W) | |
| Acer Predator Helios 300 PH315-53-786B | |
| 1920x1080 Ultra Preset + Ultra Ray Tracing (DX12) | |
| Média NVIDIA GeForce RTX 3070 Laptop GPU (34 - 45.4, n=7) | |
| Acer Predator Helios 300 PH315-53-786B | |
| Acer Predator Helios 300 PH315-53-786B | |
A fim de verificar se as taxas de quadros permanecem em grande parte constantes durante um longo período de tempo, deixamos o jogo O Witcher 3 funcionar por cerca de 60 minutos com resolução Full HD e ajustes de qualidade máxima. O personagem não é movido. Exceto por uma pequena queda de desempenho, uma diminuição nas taxas de quadros não é perceptível.
The Witcher 3 FPS diagram
| baixo | média | alto | ultra | |
|---|---|---|---|---|
| GTA V (2015) | 176 | 169 | 142 | 85 |
| The Witcher 3 (2015) | 259 | 216 | 154 | 91.3 |
| Dota 2 Reborn (2015) | 144 | 131 | 120 | 114 |
| Final Fantasy XV Benchmark (2018) | 137 | 110 | 85.1 | |
| X-Plane 11.11 (2018) | 101 | 86.6 | 74.4 | |
| Far Cry 5 (2018) | 134 | 108 | 103 | 99 |
| Strange Brigade (2018) | 311 | 208 | 179 | 159 |
| Death Stranding (2020) | 137 | 121 | 118 | 115 |
| Serious Sam 4 (2020) | 117 | 82.6 | 78.9 | 69 |
| Watch Dogs Legion (2020) | 79.1 | 74 | 67.8 | 59.5 |
| Dirt 5 (2020) | 176 | 113 | 93.6 | 77.3 |
| Yakuza Like a Dragon (2020) | 113 | 100 | 99.5 | 90.7 |
| Outriders (2021) | 104 | 94 | 93.6 | 89.4 |
| Mass Effect Legendary Edition (2021) | 105 | 94.3 | ||
| Days Gone (2021) | 147 | 121 | 112 | 88.6 |
| F1 2021 (2021) | 205 | 169 | 149 | 96 |
Emissões - O laptop Acer aquece visivelmente
Emissões sonoras
O PH315 pode operar silenciosamente em uso ocioso. No entanto, os ventiladores de vez em quando se invertem. Mas sob carga, o silêncio é história. Os níveis máximos de pressão sonora são 51 dB(A) (teste de estresse) e 49 dB(A) (teste Witcher 3 ), respectivamente. Jogos sem um fone de ouvido não são agradáveis aqui. Um dos ventiladores tende a pulsar sob carga
Barulho
| Ocioso |
| 25 / 27 / 35 dB |
| Carga |
| 46 / 51 dB |
 | ||
30 dB silencioso 40 dB(A) audível 50 dB(A) ruidosamente alto |
||
min: | ||
| Acer Predator Helios 300 PH315-53-786B i7-10750H, GeForce RTX 3070 Laptop GPU | Aorus 15G XC i7-10870H, GeForce RTX 3070 Laptop GPU | MSI GS66 Stealth 10UG i7-10870H, GeForce RTX 3070 Laptop GPU | Asus ROG Strix G15 G513QR R9 5900HX, GeForce RTX 3070 Laptop GPU | Acer Predator Helios 300 PH315-53-77N5 i7-10750H, GeForce RTX 2060 Mobile | Média da turma Gaming | |
|---|---|---|---|---|---|---|
| Noise | -0% | -11% | 0% | 3% | 2% | |
| desligado / ambiente * (dB) | 25 | 25 -0% | 26.2 -5% | 24 4% | 25.2 -1% | 24.1 ? 4% |
| Idle Minimum * (dB) | 25 | 29 -16% | 34 -36% | 25 -0% | 25.2 -1% | 26 ? -4% |
| Idle Average * (dB) | 27 | 30 -11% | 34 -26% | 31 -15% | 25.2 7% | 27.4 ? -1% |
| Idle Maximum * (dB) | 35 | 31 11% | 34 3% | 33 6% | 25.2 28% | 30.1 ? 14% |
| Load Average * (dB) | 46 | 41 11% | 47.2 -3% | 45 2% | 43.5 5% | 43.6 ? 5% |
| Witcher 3 ultra * (dB) | 49 | 47 4% | 46.3 6% | 48 2% | 53.1 -8% | |
| Load Maximum * (dB) | 51 | 51 -0% | 58.2 -14% | 50 2% | 56 -10% | 54.2 ? -6% |
* ... menor é melhor
Temperatura
O teste de estresse (Prime95 e FurMark funcionam por pelo menos uma hora) é executado pela CPU e GPU a 2,7 GHz e 1.365 MHz, respectivamente. O teste de estresse representa um cenário extremo. Utilizamos este teste para verificar se o sistema permanece estável mesmo sob carga total
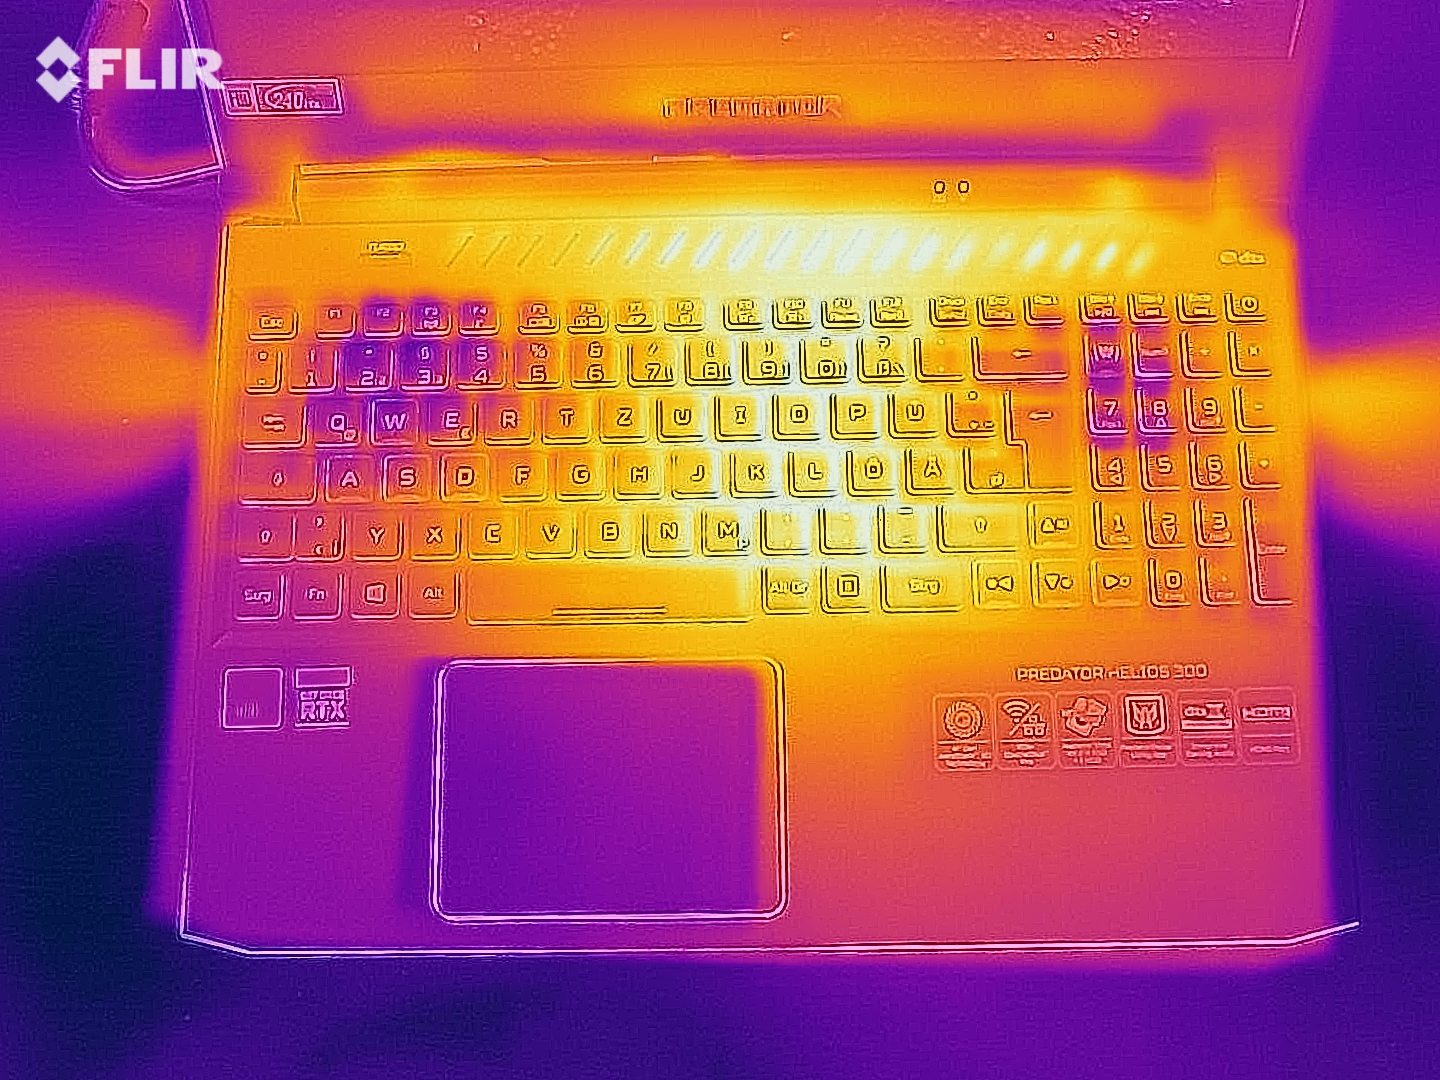
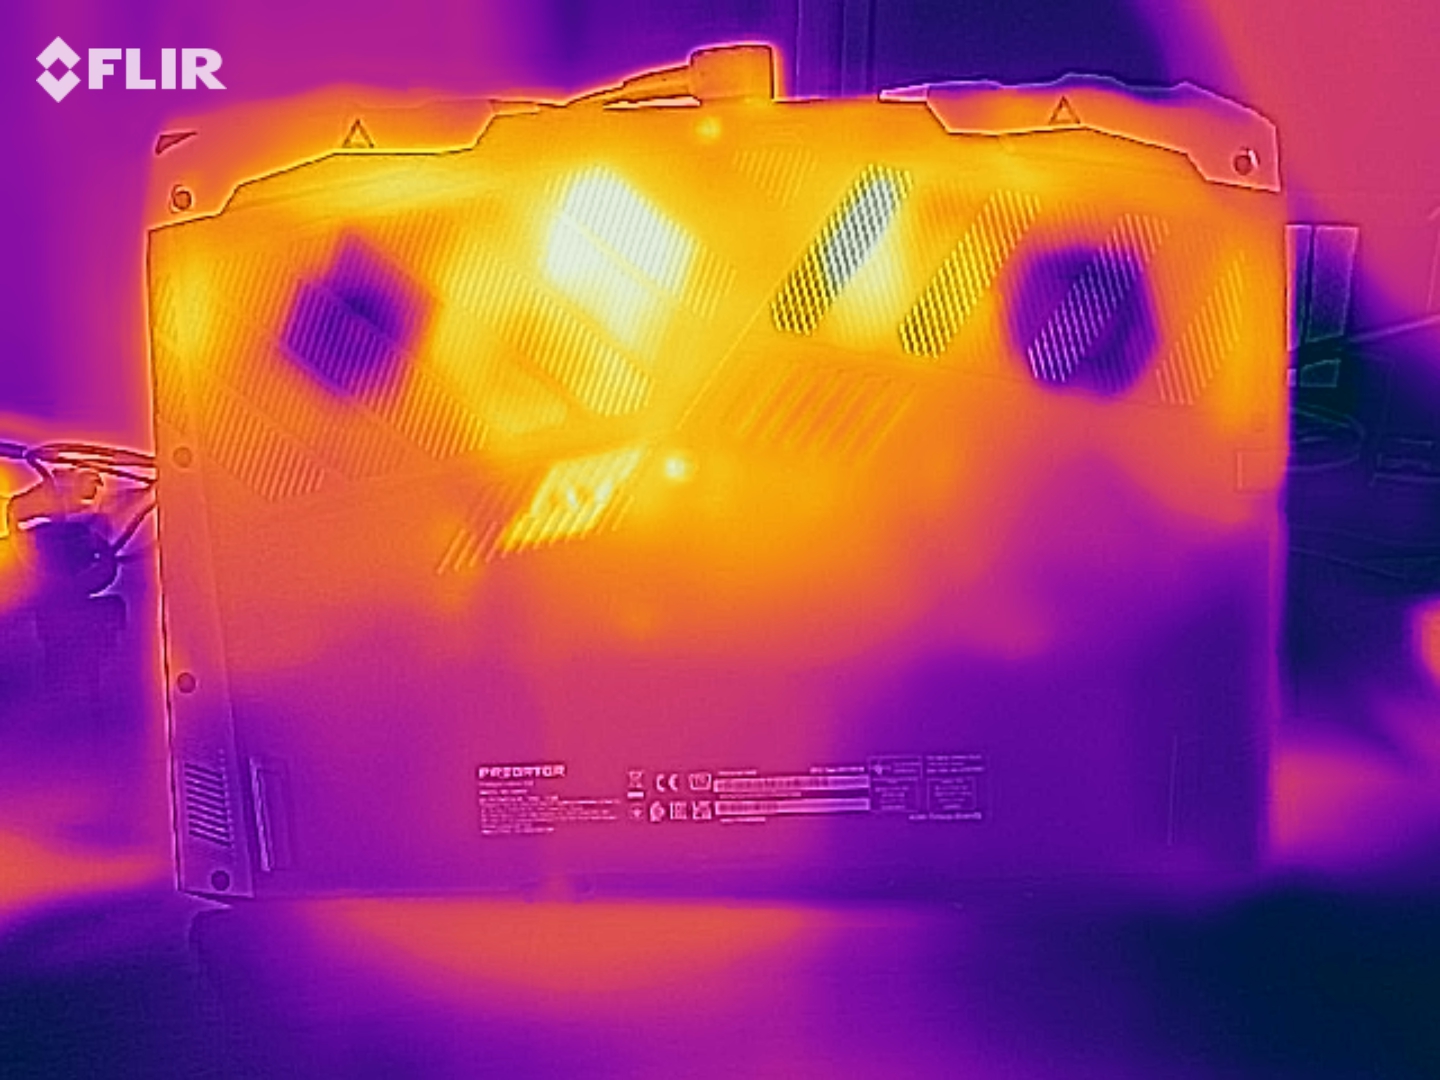
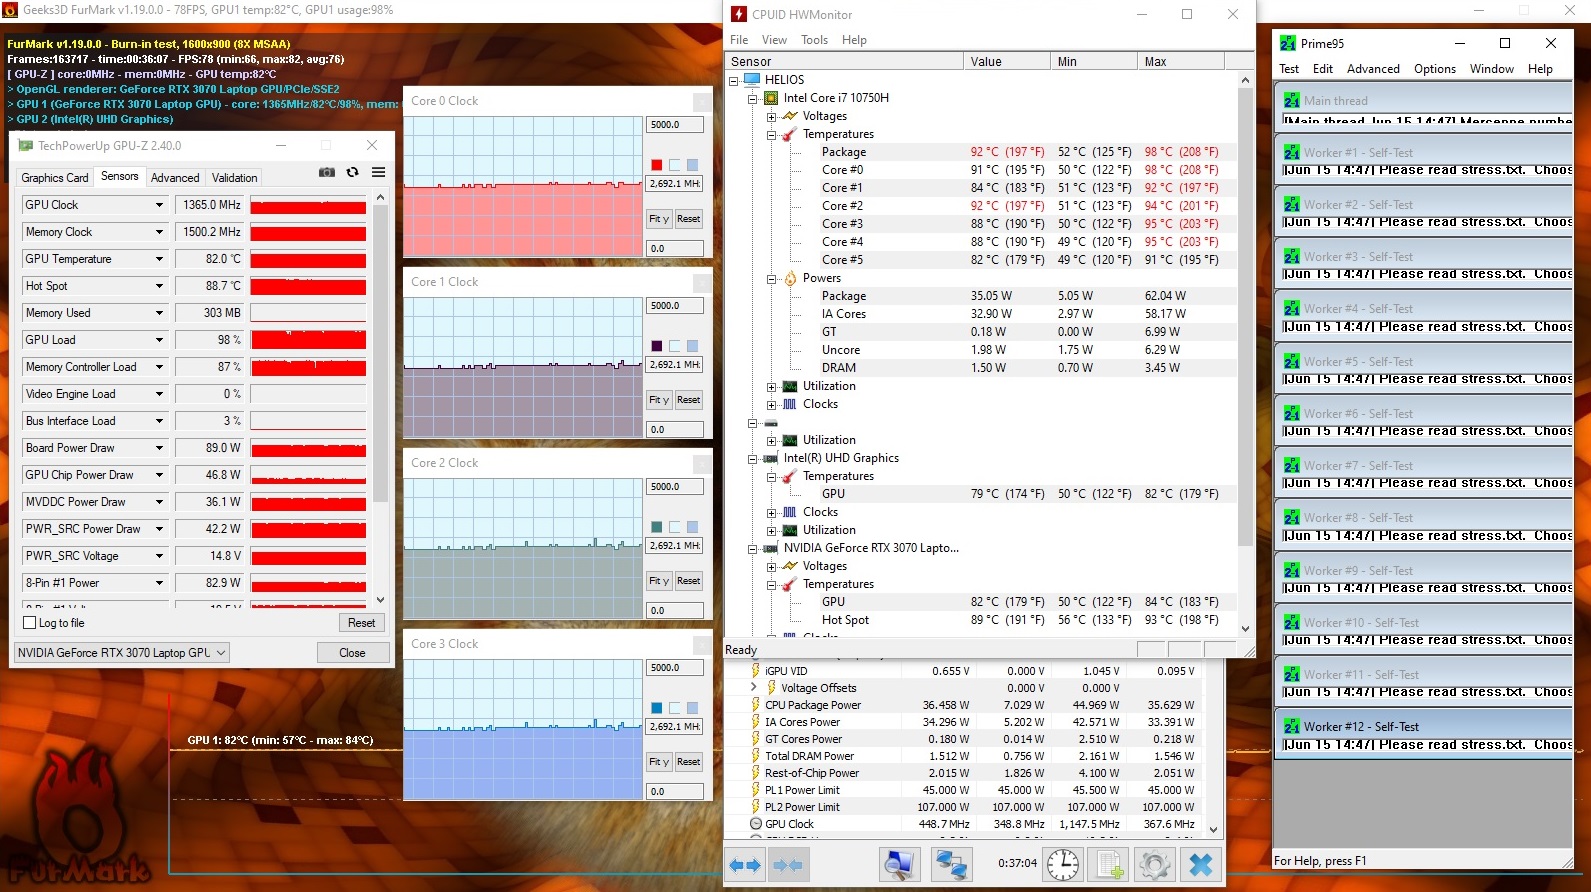
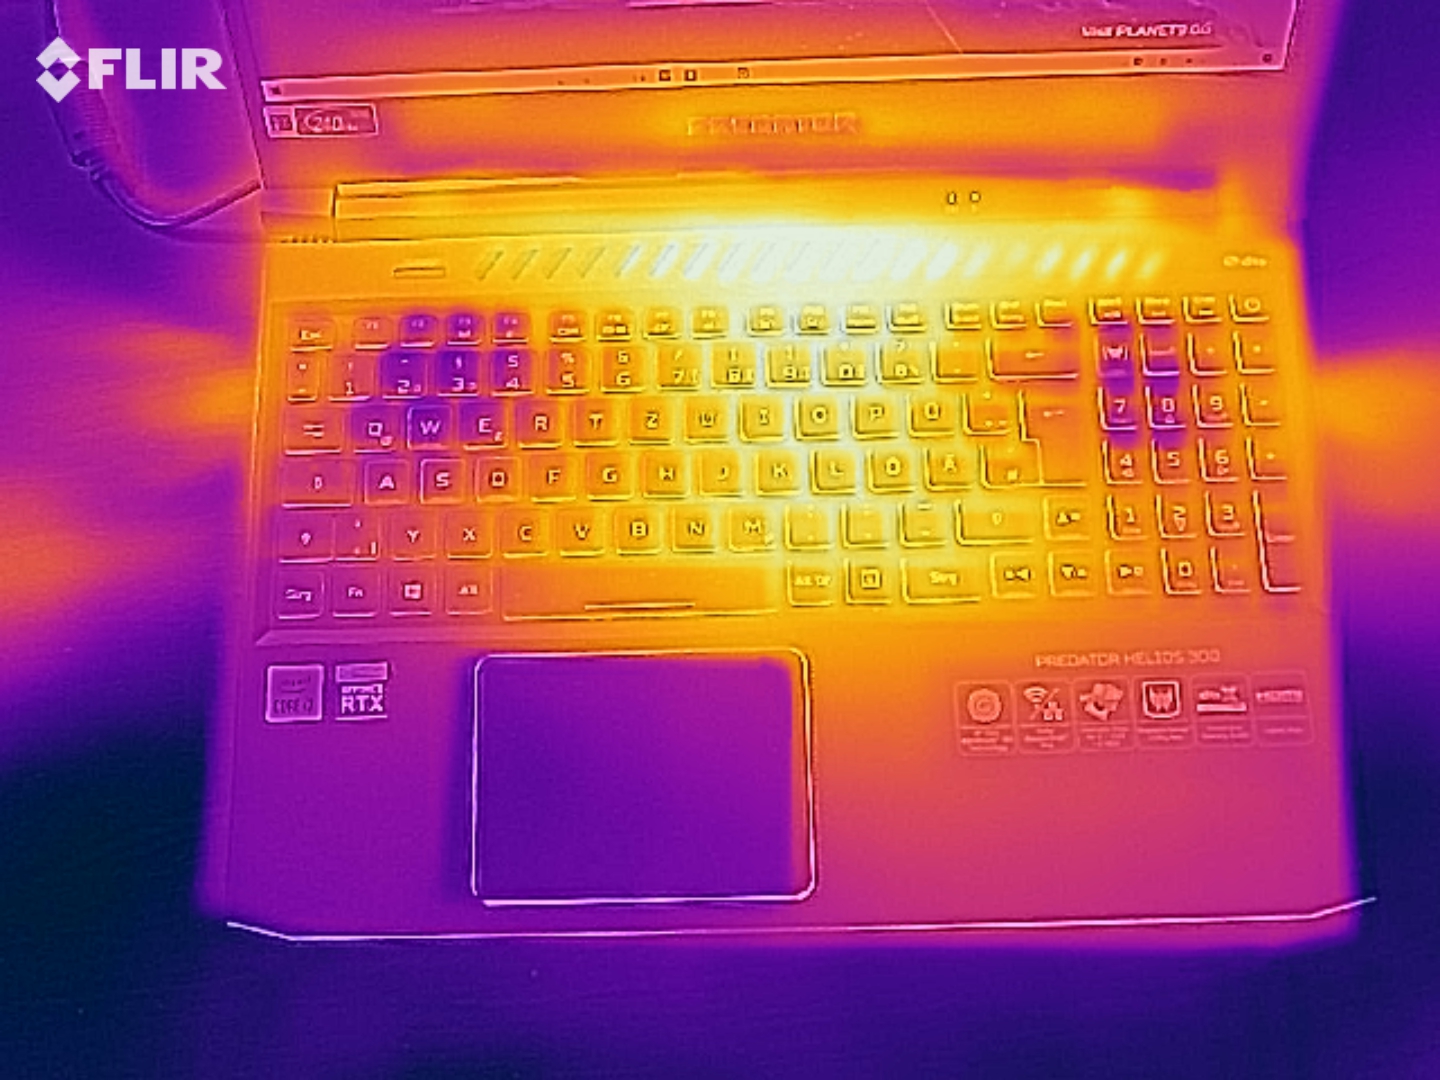
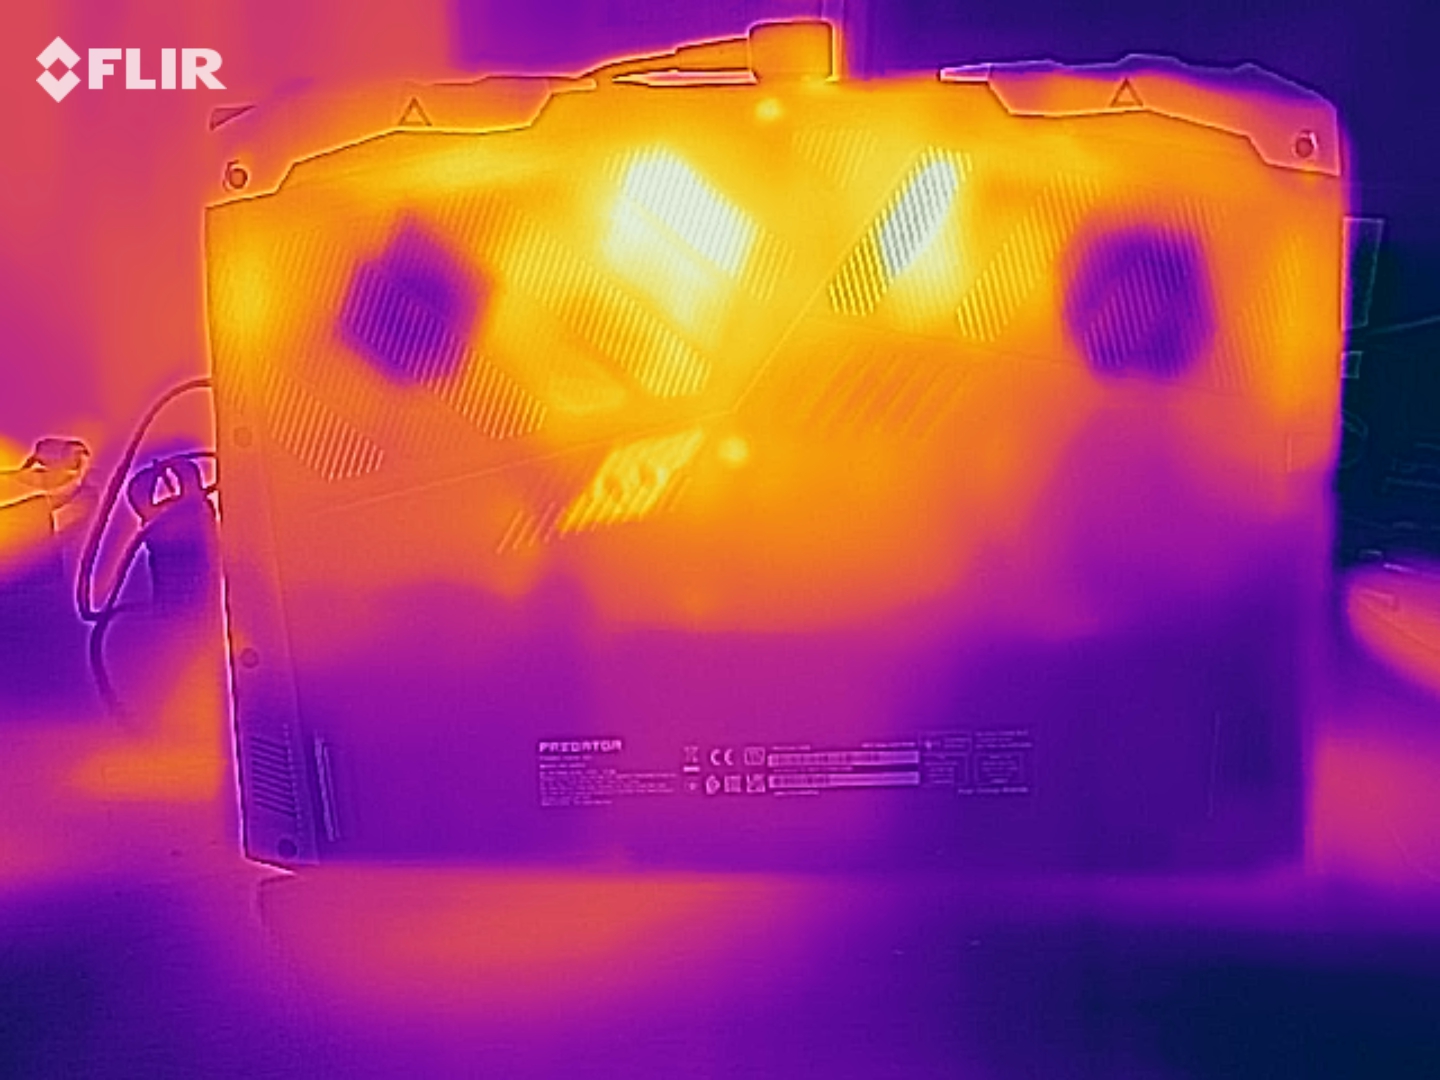
O laptop aquece de forma muito perceptível. Temperaturas acima da faixa de 50 °C (~122 °F) foram registradas em vários pontos de medição durante o teste de tensão, e a marca de 60 °C (~140 °F) foi excedida em um ponto de medição. O desenvolvimento de calor é um pouco menor ao executar nosso teste Witcher 3. O dispositivo não deve ser colocado sobre a volta sob carga
(-) A temperatura máxima no lado superior é 50 °C / 122 F, em comparação com a média de 40.4 °C / 105 F , variando de 21.2 a 68.8 °C para a classe Gaming.
(-) A parte inferior aquece até um máximo de 63 °C / 145 F, em comparação com a média de 43.2 °C / 110 F
(+) Em uso inativo, a temperatura média para o lado superior é 30.1 °C / 86 F, em comparação com a média do dispositivo de 33.9 °C / ### class_avg_f### F.
(-) Jogando The Witcher 3, a temperatura média para o lado superior é 43.9 °C / 111 F, em comparação com a média do dispositivo de 33.9 °C / ## #class_avg_f### F.
(-) Os apoios para as mãos e o touchpad podem ficar muito quentes ao toque, com um máximo de 40 °C / 104 F.
(-) A temperatura média da área do apoio para as mãos de dispositivos semelhantes foi 28.8 °C / 83.8 F (-11.2 °C / -20.2 F).
| Acer Predator Helios 300 PH315-53-786B i7-10750H, GeForce RTX 3070 Laptop GPU | Aorus 15G XC i7-10870H, GeForce RTX 3070 Laptop GPU | MSI GS66 Stealth 10UG i7-10870H, GeForce RTX 3070 Laptop GPU | Asus ROG Strix G15 G513QR R9 5900HX, GeForce RTX 3070 Laptop GPU | Acer Predator Helios 300 PH315-53-77N5 i7-10750H, GeForce RTX 2060 Mobile | Média da turma Gaming | |
|---|---|---|---|---|---|---|
| Heat | 12% | 13% | 9% | 21% | 10% | |
| Maximum Upper Side * (°C) | 50 | 45 10% | 40.2 20% | 49 2% | 44.1 12% | 45.2 ? 10% |
| Maximum Bottom * (°C) | 63 | 61 3% | 45.6 28% | 48 24% | 48 24% | 48.1 ? 24% |
| Idle Upper Side * (°C) | 32 | 27 16% | 28.8 10% | 31 3% | 25.2 21% | 31 ? 3% |
| Idle Bottom * (°C) | 35 | 28 20% | 37.4 -7% | 33 6% | 25.7 27% | 34.2 ? 2% |
* ... menor é melhor
Oradores
Acer Predator Helios 300 PH315-53-786B análise de áudio
(±) | o volume do alto-falante é médio, mas bom (###valor### dB)
Graves 100 - 315Hz
(-) | quase nenhum baixo - em média 19% menor que a mediana
(±) | a linearidade dos graves é média (10% delta para a frequência anterior)
Médios 400 - 2.000 Hz
(±) | médios mais altos - em média 6.4% maior que a mediana
(±) | a linearidade dos médios é média (9.1% delta para frequência anterior)
Altos 2 - 16 kHz
(+) | agudos equilibrados - apenas 0.7% longe da mediana
(+) | os máximos são lineares (1.9% delta da frequência anterior)
Geral 100 - 16.000 Hz
(±) | a linearidade do som geral é média (17% diferença em relação à mediana)
Comparado com a mesma classe
» 45% de todos os dispositivos testados nesta classe foram melhores, 12% semelhantes, 43% piores
» O melhor teve um delta de 6%, a média foi 18%, o pior foi 132%
Comparado com todos os dispositivos testados
» 31% de todos os dispositivos testados foram melhores, 8% semelhantes, 61% piores
» O melhor teve um delta de 4%, a média foi 23%, o pior foi 134%
Aorus 15G XC análise de áudio
(+) | os alto-falantes podem tocar relativamente alto (###valor### dB)
Graves 100 - 315Hz
(-) | quase nenhum baixo - em média 22% menor que a mediana
(±) | a linearidade dos graves é média (10.7% delta para a frequência anterior)
Médios 400 - 2.000 Hz
(±) | médios mais altos - em média 5.7% maior que a mediana
(+) | médios são lineares (5.5% delta para frequência anterior)
Altos 2 - 16 kHz
(+) | agudos equilibrados - apenas 1.9% longe da mediana
(+) | os máximos são lineares (5.6% delta da frequência anterior)
Geral 100 - 16.000 Hz
(±) | a linearidade do som geral é média (17.4% diferença em relação à mediana)
Comparado com a mesma classe
» 48% de todos os dispositivos testados nesta classe foram melhores, 12% semelhantes, 40% piores
» O melhor teve um delta de 6%, a média foi 18%, o pior foi 132%
Comparado com todos os dispositivos testados
» 33% de todos os dispositivos testados foram melhores, 8% semelhantes, 58% piores
» O melhor teve um delta de 4%, a média foi 23%, o pior foi 134%
Gerenciamento de energia - laptop Acer com boa duração da bateria
Consumo de energia
O Predador não nos reserva nenhuma surpresa em termos de consumo de energia. O teste de estresse e nosso teste Witcher 3 elevam o consumo de energia até 220 watts e uma média de 164 watts, respectivamente. A potência nominal do adaptador de energia é de 230 watts. O gráfico a seguir ilustra o consumo de energia razoavelmente constante do laptop durante nosso teste The Witcher 3
| desligado | |
| Ocioso | |
| Carga |
|
Key:
min: | |
Energy consumption during The Witcher 3
| Acer Predator Helios 300 PH315-53-786B i7-10750H, GeForce RTX 3070 Laptop GPU | Aorus 15G XC i7-10870H, GeForce RTX 3070 Laptop GPU | MSI GS66 Stealth 10UG i7-10870H, GeForce RTX 3070 Laptop GPU | Asus ROG Strix G15 G513QR R9 5900HX, GeForce RTX 3070 Laptop GPU | Acer Predator Helios 300 PH315-53-77N5 i7-10750H, GeForce RTX 2060 Mobile | Média da turma Gaming | |
|---|---|---|---|---|---|---|
| Power Consumption | -49% | -49% | -14% | 9% | -68% | |
| Idle Minimum * (Watt) | 4 | 13 -225% | 12.9 -223% | 4 -0% | 2.9 27% | 13 ? -225% |
| Idle Average * (Watt) | 11 | 16 -45% | 15.4 -40% | 9 18% | 13.2 -20% | 19 ? -73% |
| Idle Maximum * (Watt) | 24 | 30 -25% | 27.1 -13% | 36 -50% | 19.8 17% | 24.6 ? -3% |
| Load Average * (Watt) | 91 | 92 -1% | 98.2 -8% | 130 -43% | 105 -15% | 110.7 ? -22% |
| Witcher 3 ultra * (Watt) | 164 | 154 6% | 164.9 -1% | 174 -6% | 127 23% | |
| Load Maximum * (Watt) | 220 | 223 -1% | 232.9 -6% | 227 -3% | 177 20% | 259 ? -18% |
* ... menor é melhor
Duração da bateria
No teste Wi-Fi (acesso a websites usando um roteiro) e no teste de vídeo (o curta-metragem Big Buck Bunny (codificação H.264, Full HD) rodando em loop), o equipamento de 15,6 polegadas atinge tempos de execução de 6:26 horas e 6:46 horas, respectivamente. Os recursos de economia de energia do laptop são desativados durante ambos os testes, e o brilho da tela é ajustado para cerca de 150 cd/m². Além disso, os módulos sem fio são desabilitados para o teste de vídeo
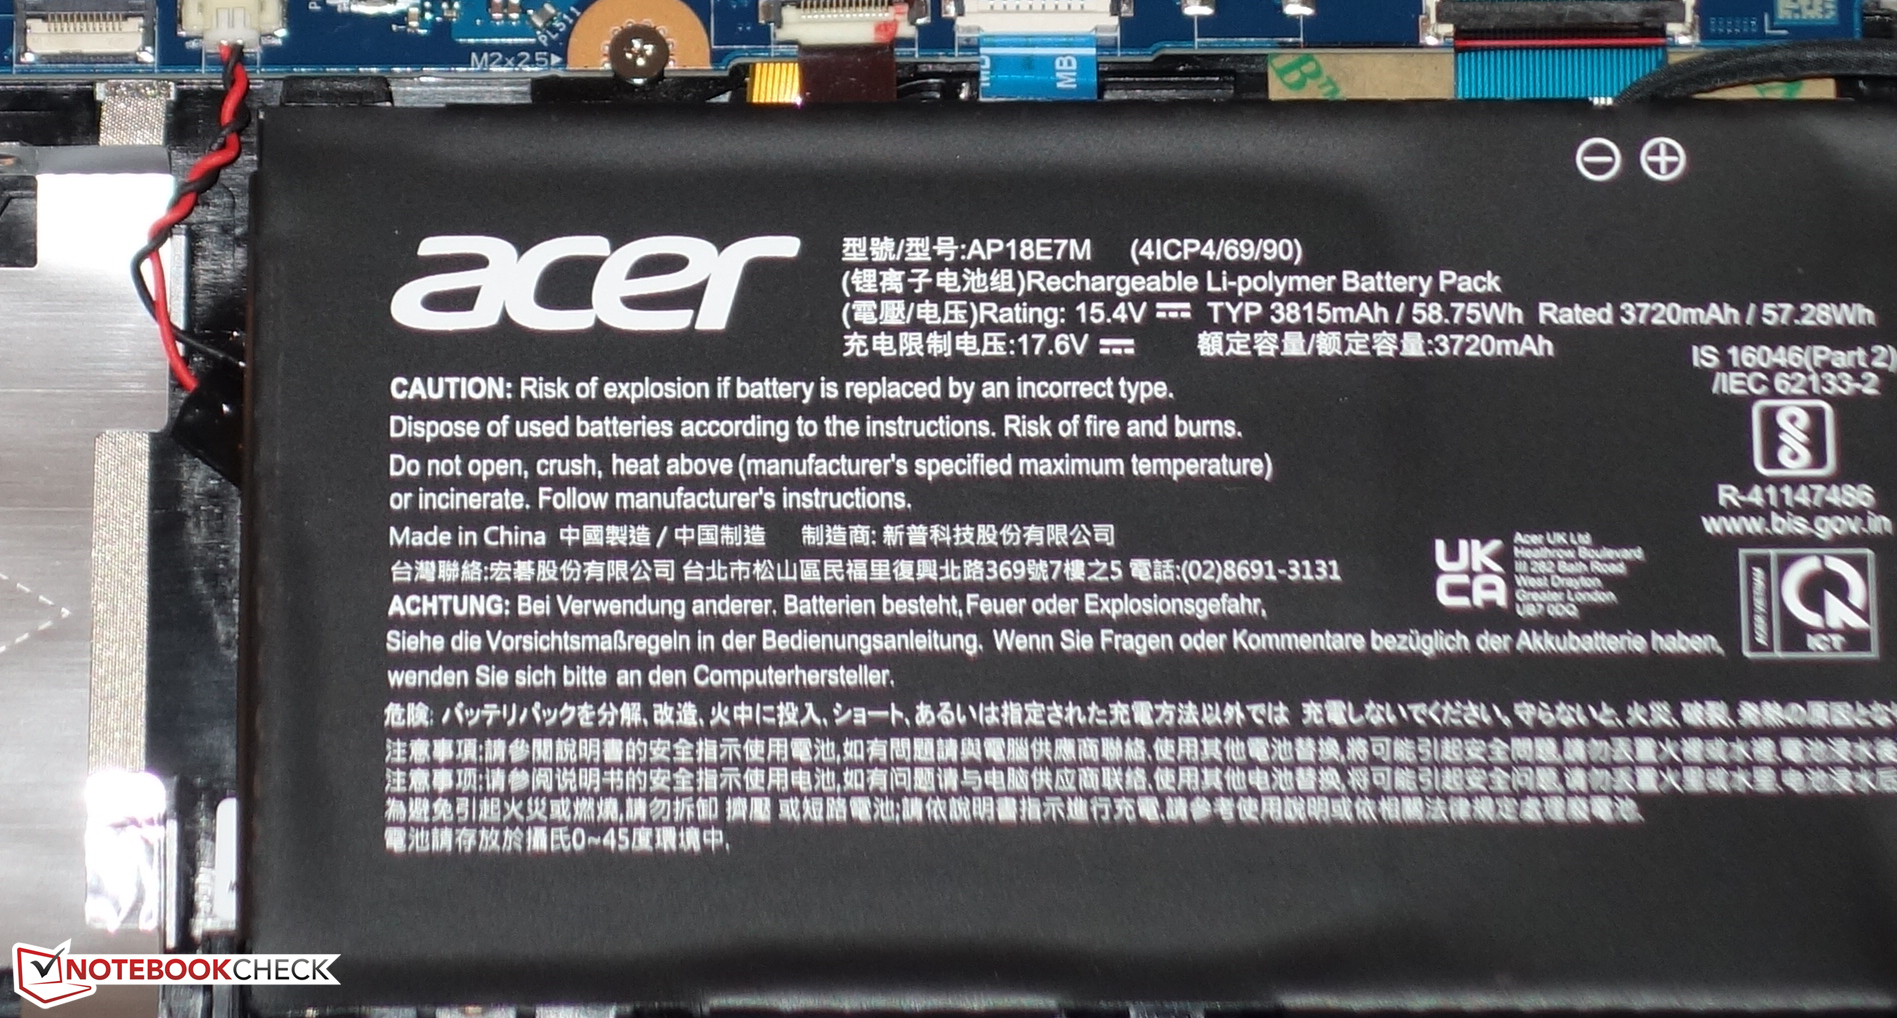
| Acer Predator Helios 300 PH315-53-786B i7-10750H, GeForce RTX 3070 Laptop GPU, 58.75 Wh | Aorus 15G XC i7-10870H, GeForce RTX 3070 Laptop GPU, 99 Wh | MSI GS66 Stealth 10UG i7-10870H, GeForce RTX 3070 Laptop GPU, 99.9 Wh | Asus ROG Strix G15 G513QR R9 5900HX, GeForce RTX 3070 Laptop GPU, 90 Wh | Acer Predator Helios 300 PH315-53-77N5 i7-10750H, GeForce RTX 2060 Mobile, 58.7 Wh | Média da turma Gaming | |
|---|---|---|---|---|---|---|
| Duração da bateria | 10% | 20% | 43% | -7% | 3% | |
| Reader / Idle (h) | 10.6 | 9.6 -9% | 10.8 2% | 10.4 -2% | 8.27 ? -22% | |
| H.264 (h) | 6.8 | 6.5 -4% | 13.5 99% | 5.6 -18% | 8.32 ? 22% | |
| WiFi v1.3 (h) | 6.4 | 6.3 -2% | 7.1 11% | 7.4 16% | 4.7 -27% | 7.11 ? 11% |
| Load (h) | 1.5 | 2.3 53% | 2.2 47% | 1.7 13% | 1.8 20% | 1.502 ? 0% |
Pro
Contra
Veredicto - Sólido laptop para jogos de 240 Hz


O laptop para jogos da Acer se sai muito bem em geral e oferece taxas médias de quadros em comparação com os laptops RTX 3070 que testamos até agora. O desempenho ainda tem algum espaço para melhorias: Uma atualização de firmware aumenta o TGP máximo do GeForce RTX 3070 laptop GPU de 100 a 110 watts - também relatamos sobre isso anteriormente
A Acer tem um computador portátil para jogos bem completo em sua linha de produtos com o Predator Helios 300 PH315-53.
O estrangulamento não é motivo de preocupação. A CPU e a GPU podem desenvolver seu desempenho constantemente. O laptop aquece muito sob carga - mais do que muitos concorrentes. O desenvolvimento de ruídos está no nível de classe habitual
A vida útil da bateria é completamente adequada. Surpreendentemente, o Predator deixa sua modelo irmão bem atrás em nossos testes de tempo de execução no mundo real - apesar das capacidades idênticas da bateria. A tela (Full HD, IPS, 240 Hz) oferece ângulos de visualização estáveis, superfície fosca, tempos de resposta rápidos, reprodução de cores muito decente, boa cobertura de espaço de cor. Entretanto, o brilho e o contraste devem ser maiores. Os respectivos alvos não são atingidos por pouco
O Aorus 15G XCPor exemplo, poderia ser uma alternativa para o Predador. Em termos de preço, está no mesmo nível do laptop Acer, mas oferece mais desempenho da CPU em geral graças ao processador octa-core incorporado.
Preço e disponibilidade
No momento de escrever, o AcerPredator Helios 300 é um pouco difícil de ser encontrado na configuração que revisamos. Entretanto, ele ainda está listado em newegg(Core i7-10750H, GeForce RTX 3070, 16 GB RAM, 512 GB SSD, Windows 10 Home) por US$1.699,99, embora como "fora de estoque" com a opção de ser notificado quando estiver disponível novamente. Alternativamente, você também pode manter o controle de outras lojas comoAmazon, por exemplo
Acer Predator Helios 300 PH315-53-786B
- 07/20/2021 v7 (old)
Sascha Mölck
Price comparison

