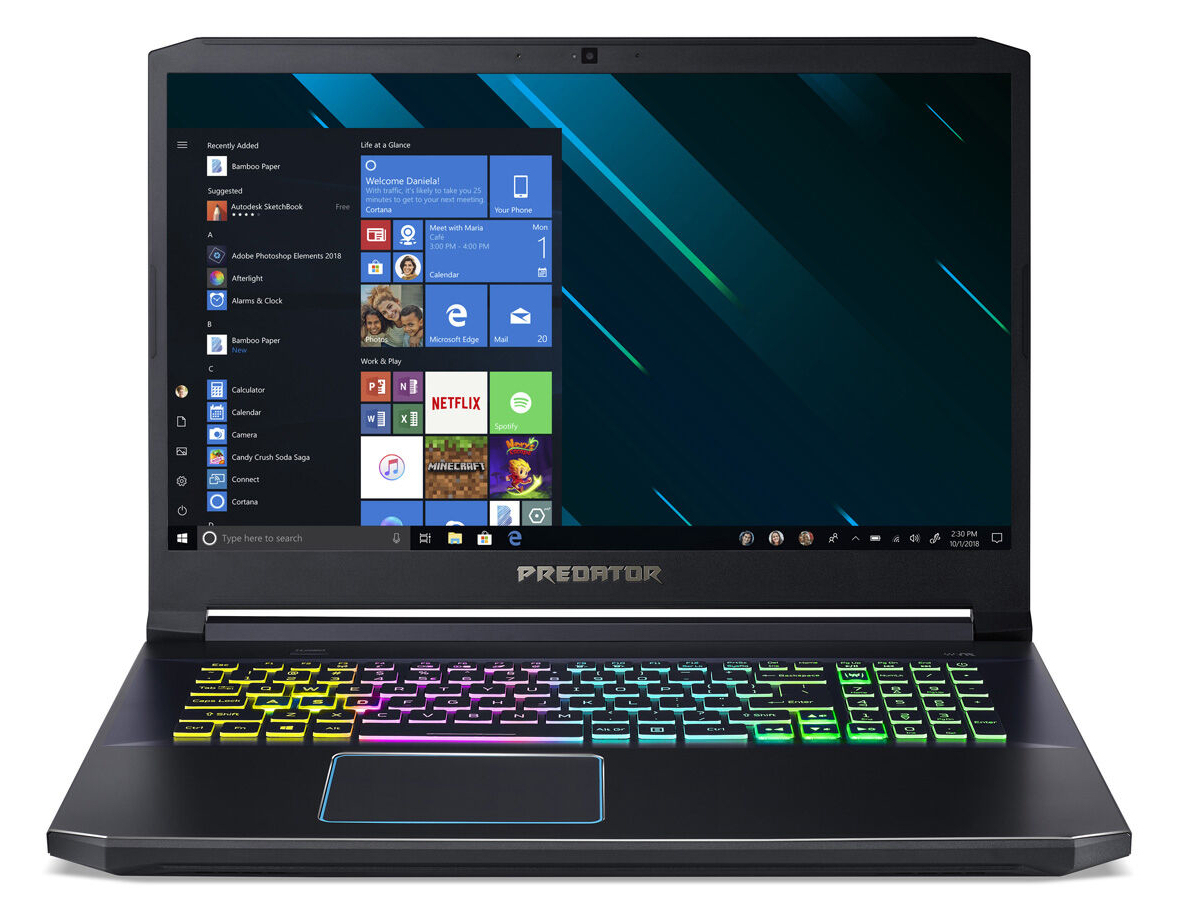
Breve Análise do Acer Predator Helios 300 PH317-54: Overclock da GPU com o pressionar de um botão
Avaliação | Data | Modelo | Peso | Altura | Size | Resolução | Preço |
|---|---|---|---|---|---|---|---|
| 83.6 % v7 (old) | 10/2020 | Acer Predator Helios 300 PH317-54-75G8 i7-10750H, GeForce RTX 2060 Mobile | 2.8 kg | 25 mm | 17.30" | 1920x1080 | |
| 81.5 % v7 (old) | Nexoc GH7 716IG i7-10750H, GeForce GTX 1660 Ti Mobile | 2.5 kg | 29.5 mm | 17.30" | 1920x1080 | ||
| 81.6 % v7 (old) | 10/2020 | Aorus 7 KB i7-10750H, GeForce RTX 2060 Mobile | 2.5 kg | 29 mm | 17.30" | 1920x1080 | |
| 85.1 % v7 (old) | 07/2020 | MSI GE75 Raider 10SE-008US i7-10750H, GeForce RTX 2060 Mobile | 2.6 kg | 27.5 mm | 17.30" | 1920x1080 | |
| 80.9 % v7 (old) | 07/2020 | MSI Bravo 17 A4DDR R7 4800H, Radeon RX 5500M | 2.2 kg | 23 mm | 17.30" | 1920x1080 | |
| 82.9 % v7 (old) | 05/2020 | Asus TUF A17 FA706IU-AS76 R7 4800H, GeForce GTX 1660 Ti Mobile | 2.6 kg | 26 mm | 17.30" | 1920x1080 | |
| 83.2 % v7 (old) | 10/2019 | Lenovo Legion Y740-17IRH i7-9750H, GeForce RTX 2060 Mobile | 3 kg | 23 mm | 17.30" | 1920x1080 |


")
")


| |||||||||||||||||||||||||
iluminação: 92 %
iluminação com acumulador: 322 cd/m²
Contraste: 1789:1 (Preto: 0.18 cd/m²)
ΔE ColorChecker Calman: 1.53 | ∀{0.5-29.43 Ø4.72}
calibrated: 0.74
ΔE Greyscale Calman: 1.9 | ∀{0.09-98 Ø4.97}
87% sRGB (Argyll 1.6.3 3D)
65% AdobeRGB 1998 (Argyll 1.6.3 3D)
64.7% AdobeRGB 1998 (Argyll 3D)
94.3% sRGB (Argyll 3D)
62.6% Display P3 (Argyll 3D)
Gamma: 2.144
CCT: 6809 K
| Acer Predator Helios 300 PH317-54-75G8 Chi Mei N173HCE-G33, IPS, 1920x1080, 17.3" | Nexoc GH7 716IG LG Philips LGD0615, IPS, 1920x1080, 17.3" | Aorus 7 KB LG Philips LP173WFG-SPB1, IPS, 1920x1080, 17.3" | MSI GE75 Raider 10SE-008US Chi Mei N173HCE-G33, IPS, 1920x1080, 17.3" | MSI Bravo 17 A4DDR AU Optronics B173HAN04.7 (AUO479D), IPS, 1920x1080, 17.3" | Asus TUF A17 FA706IU-AS76 BOE NV173FHM-NX1, IPS, 1920x1080, 17.3" | Lenovo Legion Y740-17IRH LG Philips LP173WFG-SPD2 (LGD05E0), IPS, 1920x1080, 17.3" | |
|---|---|---|---|---|---|---|---|
| Display | 2% | 2% | 5% | -35% | -36% | 3% | |
| Display P3 Coverage (%) | 62.6 | 64.6 3% | 64.7 3% | 65.6 5% | 40.54 -35% | 40.55 -35% | 64.8 4% |
| sRGB Coverage (%) | 94.3 | 95.8 2% | 95.6 1% | 98.1 4% | 60.1 -36% | 59.7 -37% | 96 2% |
| AdobeRGB 1998 Coverage (%) | 64.7 | 65.7 2% | 65.7 2% | 67.8 5% | 41.88 -35% | 41.89 -35% | 65.8 2% |
| Response Times | 14% | 14% | 39% | -159% | -58% | 3% | |
| Response Time Grey 50% / Grey 80% * (ms) | 16.4 ? | 15.2 ? 7% | 13.6 ? 17% | 6.8 ? 59% | 40 ? -144% | 22.4 ? -37% | 14.8 ? 10% |
| Response Time Black / White * (ms) | 10.8 ? | 8.6 ? 20% | 9.6 ? 11% | 8.8 ? 19% | 29.6 ? -174% | 19.2 ? -78% | 11.2 ? -4% |
| PWM Frequency (Hz) | 24510 ? | 25000 ? | |||||
| Screen | -64% | -35% | -20% | -80% | -132% | -49% | |
| Brightness middle (cd/m²) | 322 | 303 -6% | 303 -6% | 337.9 5% | 264 -18% | 264.8 -18% | 282 -12% |
| Brightness (cd/m²) | 308 | 277 -10% | 278 -10% | 305 -1% | 244 -21% | 253 -18% | 261 -15% |
| Brightness Distribution (%) | 92 | 86 -7% | 87 -5% | 81 -12% | 88 -4% | 90 -2% | 87 -5% |
| Black Level * (cd/m²) | 0.18 | 0.25 -39% | 0.31 -72% | 0.29 -61% | 0.23 -28% | 0.31 -72% | 0.27 -50% |
| Contrast (:1) | 1789 | 1212 -32% | 977 -45% | 1165 -35% | 1148 -36% | 854 -52% | 1044 -42% |
| Colorchecker dE 2000 * | 1.53 | 4.15 -171% | 2.13 -39% | 2.18 -42% | 3.85 -152% | 4.73 -209% | 3.18 -108% |
| Colorchecker dE 2000 max. * | 3.14 | 10.52 -235% | 7.51 -139% | 3.9 -24% | 9.13 -191% | 18.89 -502% | 8.39 -167% |
| Colorchecker dE 2000 calibrated * | 0.74 | 0.9 -22% | 0.7 5% | 0.69 7% | 3.4 -359% | 4.64 -527% | 0.95 -28% |
| Greyscale dE 2000 * | 1.9 | 5.38 -183% | 3.4 -79% | 3.1 -63% | 1.95 -3% | 1.4 26% | 4.1 -116% |
| Gamma | 2.144 103% | 2.35 94% | 2.156 102% | 2.07 106% | 2.52 87% | 2.16 102% | 2.55 86% |
| CCT | 6809 95% | 7680 85% | 6850 95% | 6882 94% | 6371 102% | 6641 98% | 7260 90% |
| Color Space (Percent of AdobeRGB 1998) (%) | 65 | 61 -6% | 66 2% | 62 -5% | 42 -35% | 38.4 -41% | 61 -6% |
| Color Space (Percent of sRGB) (%) | 87 | 96 10% | 90 3% | 98.2 13% | 60 -31% | 59.3 -32% | 96 10% |
| Média Total (Programa/Configurações) | -16% /
-42% | -6% /
-22% | 8% /
-8% | -91% /
-81% | -75% /
-104% | -14% /
-33% |
* ... menor é melhor
Exibir tempos de resposta
| ↔ Tempo de resposta preto para branco | ||
|---|---|---|
| 10.8 ms ... ascensão ↗ e queda ↘ combinadas | ↗ 5.6 ms ascensão | 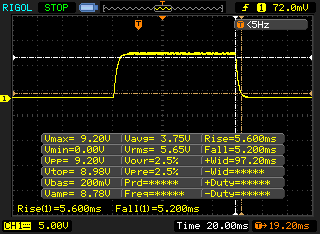 |
| ↘ 5.2 ms queda | ||
| A tela mostra boas taxas de resposta em nossos testes, mas pode ser muito lenta para jogadores competitivos. Em comparação, todos os dispositivos testados variam de 0.1 (mínimo) a 240 (máximo) ms. » 29 % de todos os dispositivos são melhores. Isso significa que o tempo de resposta medido é melhor que a média de todos os dispositivos testados (19.8 ms). | ||
| ↔ Tempo de resposta 50% cinza a 80% cinza | ||
| 16.4 ms ... ascensão ↗ e queda ↘ combinadas | ↗ 8 ms ascensão | 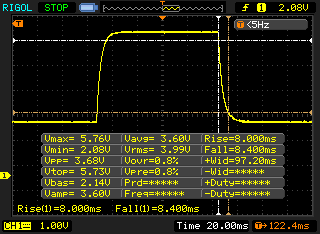 |
| ↘ 8.4 ms queda | ||
| A tela mostra boas taxas de resposta em nossos testes, mas pode ser muito lenta para jogadores competitivos. Em comparação, todos os dispositivos testados variam de 0.165 (mínimo) a 636 (máximo) ms. » 31 % de todos os dispositivos são melhores. Isso significa que o tempo de resposta medido é melhor que a média de todos os dispositivos testados (31 ms). | ||
Cintilação da tela / PWM (modulação por largura de pulso)
| Tela tremeluzindo/PWM detectado | 24510 Hz | ≤ 19 % configuração de brilho | 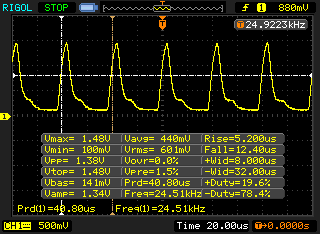 |
A luz de fundo da tela pisca em 24510 Hz (pior caso, por exemplo, utilizando PWM) Cintilação detectada em uma configuração de brilho de 19 % e abaixo. Não deve haver cintilação ou PWM acima desta configuração de brilho. A frequência de 24510 Hz é bastante alta, então a maioria dos usuários sensíveis ao PWM não deve notar nenhuma oscilação. [pwm_comparison] Em comparação: 52 % de todos os dispositivos testados não usam PWM para escurecer a tela. Se PWM foi detectado, uma média de 7753 (mínimo: 5 - máximo: 343500) Hz foi medida. | |||


* ... menor é melhor
| PCMark 8 Home Score Accelerated v2 | 4291 pontos | |
| PCMark 8 Creative Score Accelerated v2 | 4210 pontos | |
| PCMark 8 Work Score Accelerated v2 | 5817 pontos | |
| PCMark 10 Score | 5109 pontos | |
Ajuda | ||
| DPC Latencies / LatencyMon - interrupt to process latency (max), Web, Youtube, Prime95 | |
| Asus TUF A17 FA706IU-AS76 | |
| MSI GE75 Raider 10SE-008US | |
| MSI Bravo 17 A4DDR | |
| Aorus 7 KB | |
| Acer Nitro 5 AN517-52-77DS | |
| Nexoc GH7 716IG | |
| Acer Predator Helios 300 PH317-54-75G8 | |
* ... menor é melhor

| Acer Predator Helios 300 PH317-54-75G8 WDC PC SN730 SDBQNTY-1T00 | Nexoc GH7 716IG Samsung SSD 970 EVO Plus 500GB | Aorus 7 KB ADATA XPG SX8200 Pro (ASX8200PNP-512GT) | MSI GE75 Raider 10SE-008US Samsung SSD PM981 MZVLB512HAJQ | MSI Bravo 17 A4DDR Toshiba KBG30ZMV512G | Asus TUF A17 FA706IU-AS76 Intel SSD 660p 1TB SSDPEKNW010T8 | Lenovo Legion Y740-17IRH WDC PC SN520 SDAPMUW-128G | |
|---|---|---|---|---|---|---|---|
| CrystalDiskMark 5.2 / 6 | 24% | 6% | -3% | -37% | -8% | -49% | |
| Write 4K (MB/s) | 141.9 | 201.6 42% | 158.7 12% | 139.2 -2% | 94.6 -33% | 189.7 34% | 102.7 -28% |
| Read 4K (MB/s) | 48.75 | 54.8 12% | 60.5 24% | 53 9% | 47.12 -3% | 62.3 28% | 29.12 -40% |
| Write Seq (MB/s) | 2734 | 2999 10% | 2365 -13% | 1950 -29% | 850 -69% | 1681 -39% | 362.2 -87% |
| Read Seq (MB/s) | 1921 | 3023 57% | 2696 40% | 2328 21% | 1157 -40% | 1608 -16% | 1010 -47% |
| Write 4K Q32T1 (MB/s) | 422.6 | 545 29% | 418.4 -1% | 408.9 -3% | 277.7 -34% | 468.6 11% | 298.1 -29% |
| Read 4K Q32T1 (MB/s) | 509 | 636 25% | 546 7% | 551 8% | 546 7% | 541 6% | 349.6 -31% |
| Write Seq Q32T1 (MB/s) | 3055 | 3262 7% | 2471 -19% | 1938 -37% | 908 -70% | 1770 -42% | 788 -74% |
| Read Seq Q32T1 (MB/s) | 3257 | 3550 9% | 3242 0% | 3467 6% | 1632 -50% | 1898 -42% | 1490 -54% |
| AS SSD | 22% | -15% | -14% | -78% | -48% | -58% | |
| Seq Read (MB/s) | 2828 | 3008 6% | 2844 1% | 2036 -28% | 1420 -50% | 1320 -53% | 1339 -53% |
| Seq Write (MB/s) | 2677 | 2521 -6% | 2240 -16% | 1835 -31% | 922 -66% | 1539 -43% | 688 -74% |
| 4K Read (MB/s) | 39.94 | 64.3 61% | 53.5 34% | 60.6 52% | 48.51 21% | 56.3 41% | 23.23 -42% |
| 4K Write (MB/s) | 100.9 | 142.5 41% | 121.6 21% | 127.2 26% | 116.8 16% | 158.5 57% | 98.8 -2% |
| 4K-64 Read (MB/s) | 1562 | 1664 7% | 714 -54% | 1601 2% | 928 -41% | 586 -62% | 300.9 -81% |
| 4K-64 Write (MB/s) | 1867 | 2447 31% | 1221 -35% | 1734 -7% | 345.4 -81% | 820 -56% | 204.6 -89% |
| Access Time Read * (ms) | 0.047 | 0.043 | 0.049 | 0.089 | 0.043 | 0.184 | |
| Access Time Write * (ms) | 0.037 | 0.026 30% | 0.031 16% | 0.09 -143% | 0.189 -411% | 0.113 -205% | 0.037 -0% |
| Score Read (Points) | 1885 | 2029 8% | 1052 -44% | 1865 -1% | 1119 -41% | 775 -59% | 458 -76% |
| Score Write (Points) | 2236 | 2842 27% | 1567 -30% | 2045 -9% | 554 -75% | 1132 -49% | 372 -83% |
| Score Total (Points) | 5076 | 5893 16% | 3141 -38% | 4863 -4% | 2232 -56% | 2333 -54% | 1038 -80% |
| Média Total (Programa/Configurações) | 23% /
23% | -5% /
-5% | -9% /
-9% | -58% /
-60% | -28% /
-30% | -54% /
-54% |
* ... menor é melhor
Continuous read speed: DiskSpd Read Loop, Queue Depth 8
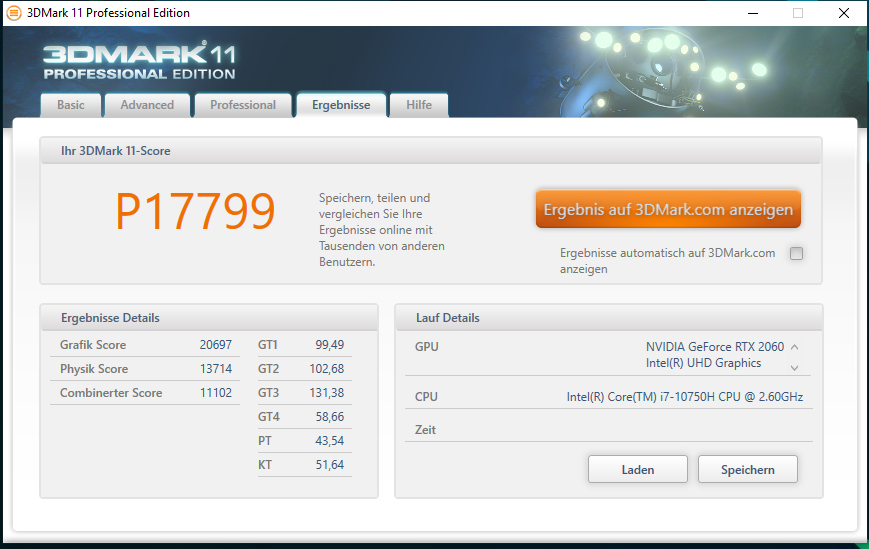
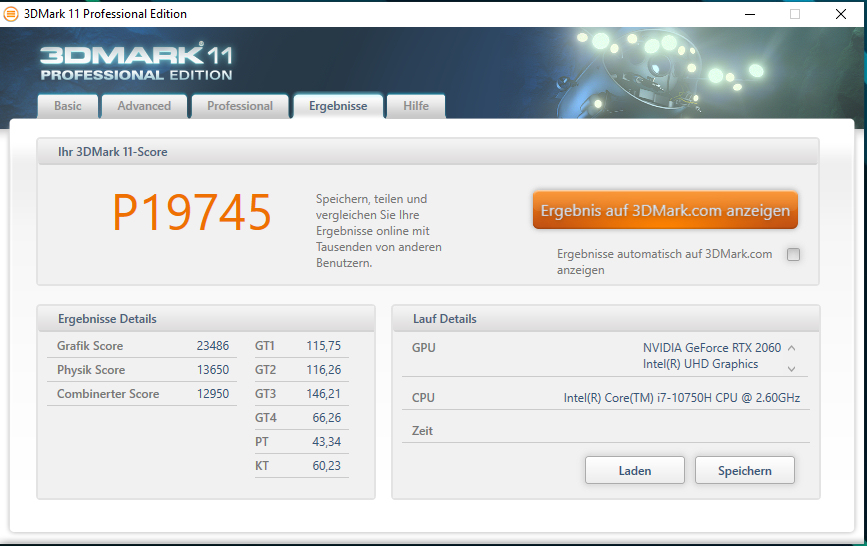
| 3DMark 11 Performance | 17799 pontos | |
| 3DMark Cloud Gate Standard Score | 35548 pontos | |
| 3DMark Fire Strike Score | 14978 pontos | |
| 3DMark Time Spy Score | 6319 pontos | |
Ajuda | ||
| 3DMark 11 - 1280x720 Performance GPU | |
| Média da turma Gaming (21841 - 80022, n=105, últimos 2 anos) | |
| MSI GE75 Raider 10SE-008US | |
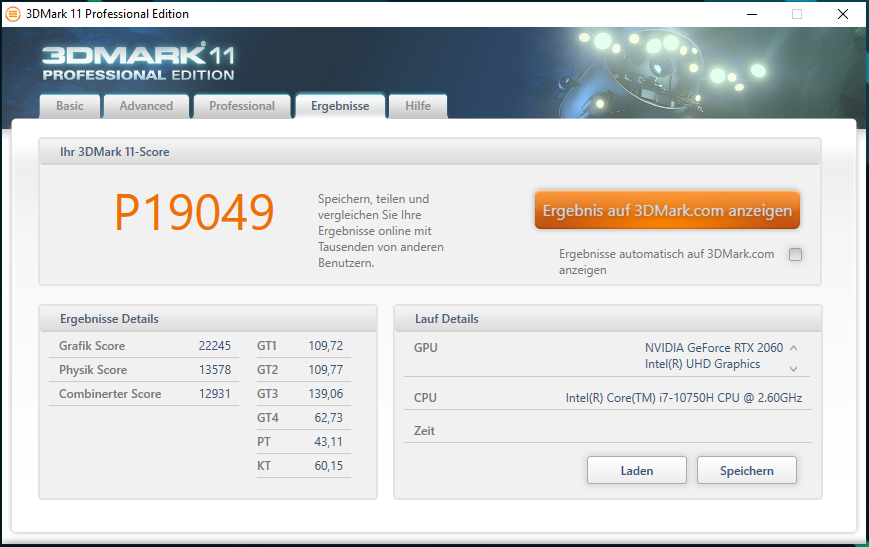
| Acer Predator Helios 300 PH317-54-75G8 (Extrem) | |
| Média NVIDIA GeForce RTX 2060 Mobile (19143 - 24662, n=40) | |
| Aorus 7 KB | |
| Asus TUF A17 FA706IU-AS76 | |
| Acer Predator Helios 300 PH317-54-75G8 | |
| Nexoc GH7 716IG | |
| Acer Nitro 5 AN517-52-77DS | |
| Lenovo Legion Y740-17IRH | |
| MSI Bravo 17 A4DDR | |
| The Witcher 3 - 1920x1080 Ultra Graphics & Postprocessing (HBAO+) | |
| Média da turma Gaming (95 - 240, n=7, últimos 2 anos) | |
| Acer Predator Helios 300 PH317-54-75G8 (Extrem) | |
| Acer Predator Helios 300 PH317-54-75G8 | |
| MSI GE75 Raider 10SE-008US | |
| Acer Nitro 5 AN517-52-77DS | |
| Aorus 7 KB | |
| Média NVIDIA GeForce RTX 2060 Mobile (50.6 - 74, n=40) | |
| Lenovo Legion Y740-17IRH | |
| Asus TUF A17 FA706IU-AS76 | |
| Nexoc GH7 716IG | |
| MSI Bravo 17 A4DDR | |
| Mafia Definitive Edition - 1920x1080 High Preset | |
| Aorus 7 KB | |
| Média NVIDIA GeForce RTX 2060 Mobile (60.2 - 76.1, n=4) | |
| Acer Predator Helios 300 PH317-54-75G8 | |
| Serious Sam 4 - 1920x1080 Ultra (DX12) AA:2xMS | |
| Acer Predator Helios 300 PH317-54-75G8 (Extrem) | |
| Acer Predator Helios 300 PH317-54-75G8 | |
| Aorus 7 KB | |
| Média NVIDIA GeForce RTX 2060 Mobile (50.3 - 63.3, n=6) | |
| Horizon Zero Dawn - 1920x1080 Ultimate Quality | |
| Acer Predator Helios 300 PH317-54-75G8 (Extrem) | |
| Acer Predator Helios 300 PH317-54-75G8 | |
| Média NVIDIA GeForce RTX 2060 Mobile (54 - 67, n=6) | |
| Aorus 7 KB | |
| Doom Eternal - 1920x1080 Ultra Preset | |
| Acer Predator Helios 300 PH317-54-75G8 (Extrem) | |
| Acer Predator Helios 300 PH317-54-75G8 | |
| Aorus 7 KB | |
| Média NVIDIA GeForce RTX 2060 Mobile (98.7 - 138, n=10) | |
| Nexoc GH7 716IG | |
| Acer Nitro 5 AN517-52-77DS | |
| MSI Bravo 17 A4DDR | |
| F1 2020 - 1920x1080 Ultra High Preset AA:T AF:16x | |
| Média NVIDIA GeForce RTX 2060 Mobile (93 - 98, n=4) | |
| Aorus 7 KB | |
| Acer Predator Helios 300 PH317-54-75G8 | |
| baixo | média | alto | ultra | |
|---|---|---|---|---|
| BioShock Infinite (2013) | 341.8 | 302.8 | 277 | 137.4 |
| The Witcher 3 (2015) | 287.9 | 202.1 | 123.3 | 68.5 |
| Shadow of the Tomb Raider (2018) | 116 | 96 | 90 | 79 |
| Doom Eternal (2020) | 199.4 | 141.2 | 127.5 | 124.4 |
| Gears Tactics (2020) | 210.4 | 155.1 | 100.6 | 66.7 |
| F1 2020 (2020) | 218 | 148 | 132 | 94 |
| Horizon Zero Dawn (2020) | 139 | 93 | 78 | 62 |
| Flight Simulator 2020 (2020) | 66.6 | 55 | 42.5 | 30.3 |
| Serious Sam 4 (2020) | 105 | 83.4 | 69.9 | 59.8 |
| Mafia Definitive Edition (2020) | 117.9 | 74.6 | 67.1 | |
| Star Wars Squadrons (2020) | 255 | 202.7 | 176.5 | 156.8 |
Barulho
| Ocioso |
| 25 / 30 / 37 dB |
| Carga |
| 48 / 52 dB |
 | ||
30 dB silencioso 40 dB(A) audível 50 dB(A) ruidosamente alto |
||
min: | ||
| Acer Predator Helios 300 PH317-54-75G8 i7-10750H, GeForce RTX 2060 Mobile | Nexoc GH7 716IG i7-10750H, GeForce GTX 1660 Ti Mobile | Aorus 7 KB i7-10750H, GeForce RTX 2060 Mobile | MSI GE75 Raider 10SE-008US i7-10750H, GeForce RTX 2060 Mobile | MSI Bravo 17 A4DDR R7 4800H, Radeon RX 5500M | Asus TUF A17 FA706IU-AS76 R7 4800H, GeForce GTX 1660 Ti Mobile | Lenovo Legion Y740-17IRH i7-9750H, GeForce RTX 2060 Mobile | |
|---|---|---|---|---|---|---|---|
| Noise | -6% | -15% | -2% | -6% | -2% | -7% | |
| desligado / ambiente * (dB) | 24 | 25 -4% | 25 -4% | 28.4 -18% | 30 -25% | 28.7 -20% | 30 -25% |
| Idle Minimum * (dB) | 25 | 30 -20% | 31 -24% | 30.2 -21% | 33 -32% | 28.7 -15% | 33 -32% |
| Idle Average * (dB) | 30 | 31 -3% | 33 -10% | 30.2 -1% | 34 -13% | 30.5 -2% | 34 -13% |
| Idle Maximum * (dB) | 37 | 33 11% | 48 -30% | 32 14% | 35 5% | 32.5 12% | 35 5% |
| Load Average * (dB) | 48 | 54 -13% | 57 -19% | 33.2 31% | 39 19% | 42.5 11% | 48 -0% |
| Witcher 3 ultra * (dB) | 50 | 53 -6% | 55 -10% | 55 -10% | 48 4% | 50.1 -0% | 46 8% |
| Load Maximum * (dB) | 52 | 57 -10% | 57 -10% | 55 -6% | 52 -0% | 53.4 -3% | 49 6% |
* ... menor é melhor
(-) A temperatura máxima no lado superior é 53 °C / 127 F, em comparação com a média de 40.4 °C / 105 F , variando de 21.2 a 68.8 °C para a classe Gaming.
(-) A parte inferior aquece até um máximo de 59 °C / 138 F, em comparação com a média de 43.2 °C / 110 F
(+) Em uso inativo, a temperatura média para o lado superior é 27.9 °C / 82 F, em comparação com a média do dispositivo de 33.9 °C / ### class_avg_f### F.
(-) Jogando The Witcher 3, a temperatura média para o lado superior é 42.8 °C / 109 F, em comparação com a média do dispositivo de 33.9 °C / ## #class_avg_f### F.
(±) Os apoios para as mãos e o touchpad podem ficar muito quentes ao toque, com um máximo de 39 °C / 102.2 F.
(-) A temperatura média da área do apoio para as mãos de dispositivos semelhantes foi 28.8 °C / 83.8 F (-10.2 °C / -18.4 F).
| Acer Predator Helios 300 PH317-54-75G8 i7-10750H, GeForce RTX 2060 Mobile | Nexoc GH7 716IG i7-10750H, GeForce GTX 1660 Ti Mobile | Aorus 7 KB i7-10750H, GeForce RTX 2060 Mobile | MSI GE75 Raider 10SE-008US i7-10750H, GeForce RTX 2060 Mobile | MSI Bravo 17 A4DDR R7 4800H, Radeon RX 5500M | Asus TUF A17 FA706IU-AS76 R7 4800H, GeForce GTX 1660 Ti Mobile | Lenovo Legion Y740-17IRH i7-9750H, GeForce RTX 2060 Mobile | |
|---|---|---|---|---|---|---|---|
| Heat | 6% | -7% | -2% | 14% | 5% | 7% | |
| Maximum Upper Side * (°C) | 53 | 49 8% | 48 9% | 44.2 17% | 48 9% | 47.6 10% | 43 19% |
| Maximum Bottom * (°C) | 59 | 54 8% | 52 12% | 49 17% | 50 15% | 50.8 14% | 46 22% |
| Idle Upper Side * (°C) | 29 | 29 -0% | 37 -28% | 33.6 -16% | 25 14% | 33 -14% | 31 -7% |
| Idle Bottom * (°C) | 32 | 30 6% | 38 -19% | 39.6 -24% | 26 19% | 29 9% | 34 -6% |
* ... menor é melhor
Acer Predator Helios 300 PH317-54-75G8 análise de áudio
(±) | o volume do alto-falante é médio, mas bom (###valor### dB)
Graves 100 - 315Hz
(-) | quase nenhum baixo - em média 23.3% menor que a mediana
(±) | a linearidade dos graves é média (12% delta para a frequência anterior)
Médios 400 - 2.000 Hz
(+) | médios equilibrados - apenas 3.9% longe da mediana
(+) | médios são lineares (6.4% delta para frequência anterior)
Altos 2 - 16 kHz
(+) | agudos equilibrados - apenas 3% longe da mediana
(+) | os máximos são lineares (4.2% delta da frequência anterior)
Geral 100 - 16.000 Hz
(±) | a linearidade do som geral é média (17.5% diferença em relação à mediana)
Comparado com a mesma classe
» 49% de todos os dispositivos testados nesta classe foram melhores, 12% semelhantes, 40% piores
» O melhor teve um delta de 6%, a média foi 18%, o pior foi 132%
Comparado com todos os dispositivos testados
» 34% de todos os dispositivos testados foram melhores, 8% semelhantes, 58% piores
» O melhor teve um delta de 4%, a média foi 23%, o pior foi 134%
| desligado | |
| Ocioso | |
| Carga |
|
Key:
min: | |
| Acer Predator Helios 300 PH317-54-75G8 i7-10750H, GeForce RTX 2060 Mobile | Nexoc GH7 716IG i7-10750H, GeForce GTX 1660 Ti Mobile | Aorus 7 KB i7-10750H, GeForce RTX 2060 Mobile | MSI GE75 Raider 10SE-008US i7-10750H, GeForce RTX 2060 Mobile | MSI Bravo 17 A4DDR R7 4800H, Radeon RX 5500M | Asus TUF A17 FA706IU-AS76 R7 4800H, GeForce GTX 1660 Ti Mobile | Lenovo Legion Y740-17IRH i7-9750H, GeForce RTX 2060 Mobile | |
|---|---|---|---|---|---|---|---|
| Power Consumption | -1% | -48% | -53% | 4% | 1% | -57% | |
| Idle Minimum * (Watt) | 6 | 5 17% | 15 -150% | 14.7 -145% | 9 -50% | 7.4 -23% | 20 -233% |
| Idle Average * (Watt) | 11 | 10 9% | 17 -55% | 20.4 -85% | 10 9% | 10.5 5% | 21 -91% |
| Idle Maximum * (Watt) | 19 | 20 -5% | 22 -16% | 26.9 -42% | 13 32% | 17 11% | 26 -37% |
| Load Average * (Watt) | 96 | 113 -18% | 137 -43% | 93.2 3% | 69 28% | 103.7 -8% | 97 -1% |
| Witcher 3 ultra * (Watt) | 144 | 132 8% | 161 -12% | 185.4 -29% | 128 11% | 128.1 11% | 139 3% |
| Load Maximum * (Watt) | 197 | 225 -14% | 225 -14% | 237.8 -21% | 214 -9% | 183.2 7% | 168 15% |
* ... menor é melhor
| Acer Predator Helios 300 PH317-54-75G8 i7-10750H, GeForce RTX 2060 Mobile, 59 Wh | Nexoc GH7 716IG i7-10750H, GeForce GTX 1660 Ti Mobile, 48.96 Wh | Aorus 7 KB i7-10750H, GeForce RTX 2060 Mobile, 49 Wh | MSI GE75 Raider 10SE-008US i7-10750H, GeForce RTX 2060 Mobile, 65 Wh | MSI Bravo 17 A4DDR R7 4800H, Radeon RX 5500M, 51 Wh | Asus TUF A17 FA706IU-AS76 R7 4800H, GeForce GTX 1660 Ti Mobile, 90 Wh | Lenovo Legion Y740-17IRH i7-9750H, GeForce RTX 2060 Mobile, 76 Wh | |
|---|---|---|---|---|---|---|---|
| Duração da bateria | -23% | -13% | -27% | -15% | 43% | -27% | |
| Reader / Idle (h) | 8.2 | 8.9 9% | 8.6 5% | 7.7 -6% | 9.1 11% | 6.9 -16% | |
| H.264 (h) | 5.9 | 5.6 -5% | 4.3 -27% | ||||
| WiFi v1.3 (h) | 5.1 | 4.2 -18% | 4.7 -8% | 3.7 -27% | 5.2 2% | 8.5 67% | 4.3 -16% |
| Load (h) | 2.2 | 0.9 -59% | 1.2 -45% | 1.3 -41% | 3.3 50% | 1.1 -50% |
Pro
Contra
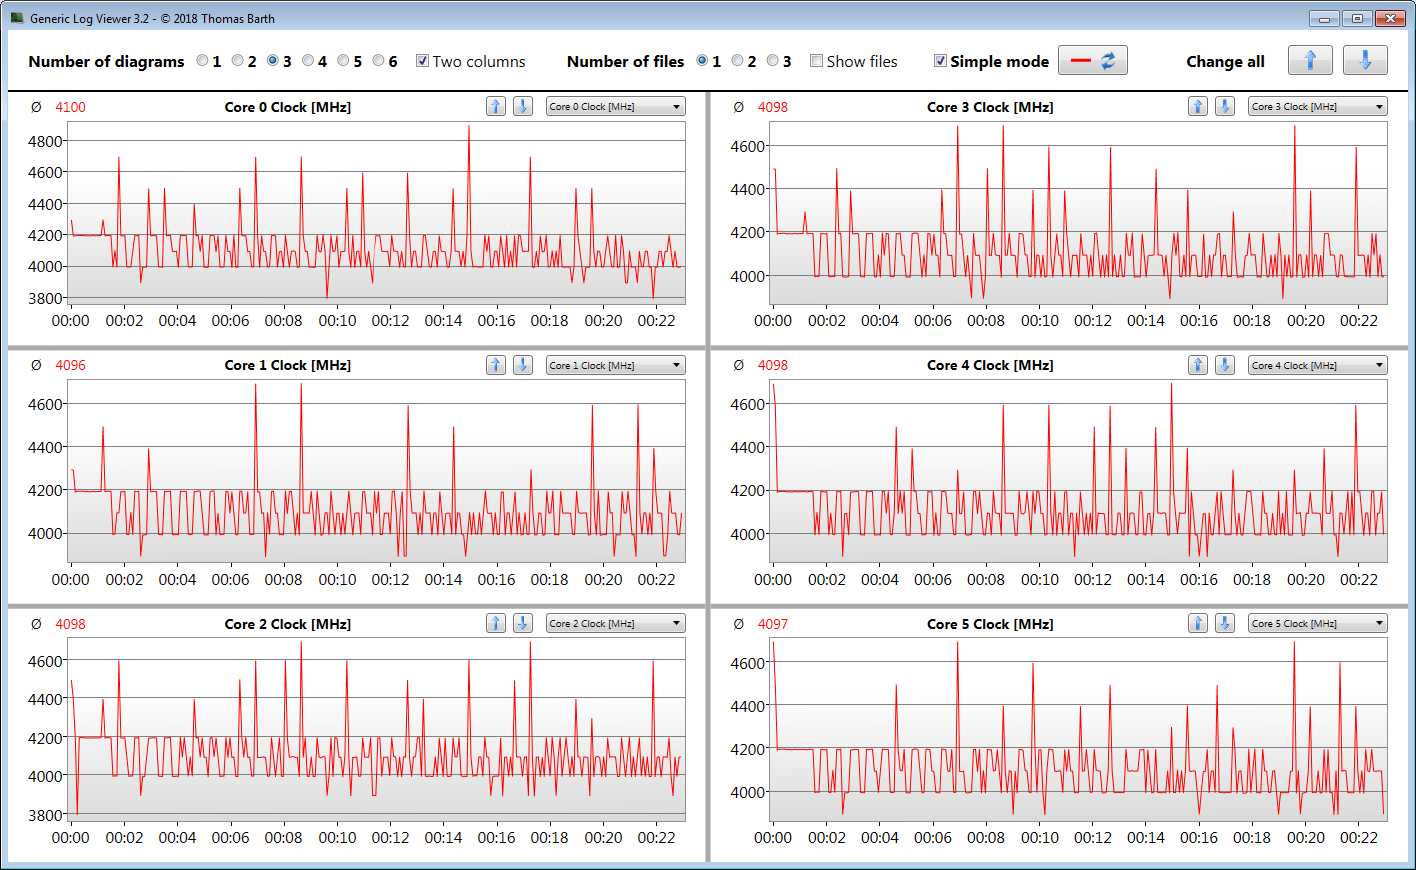
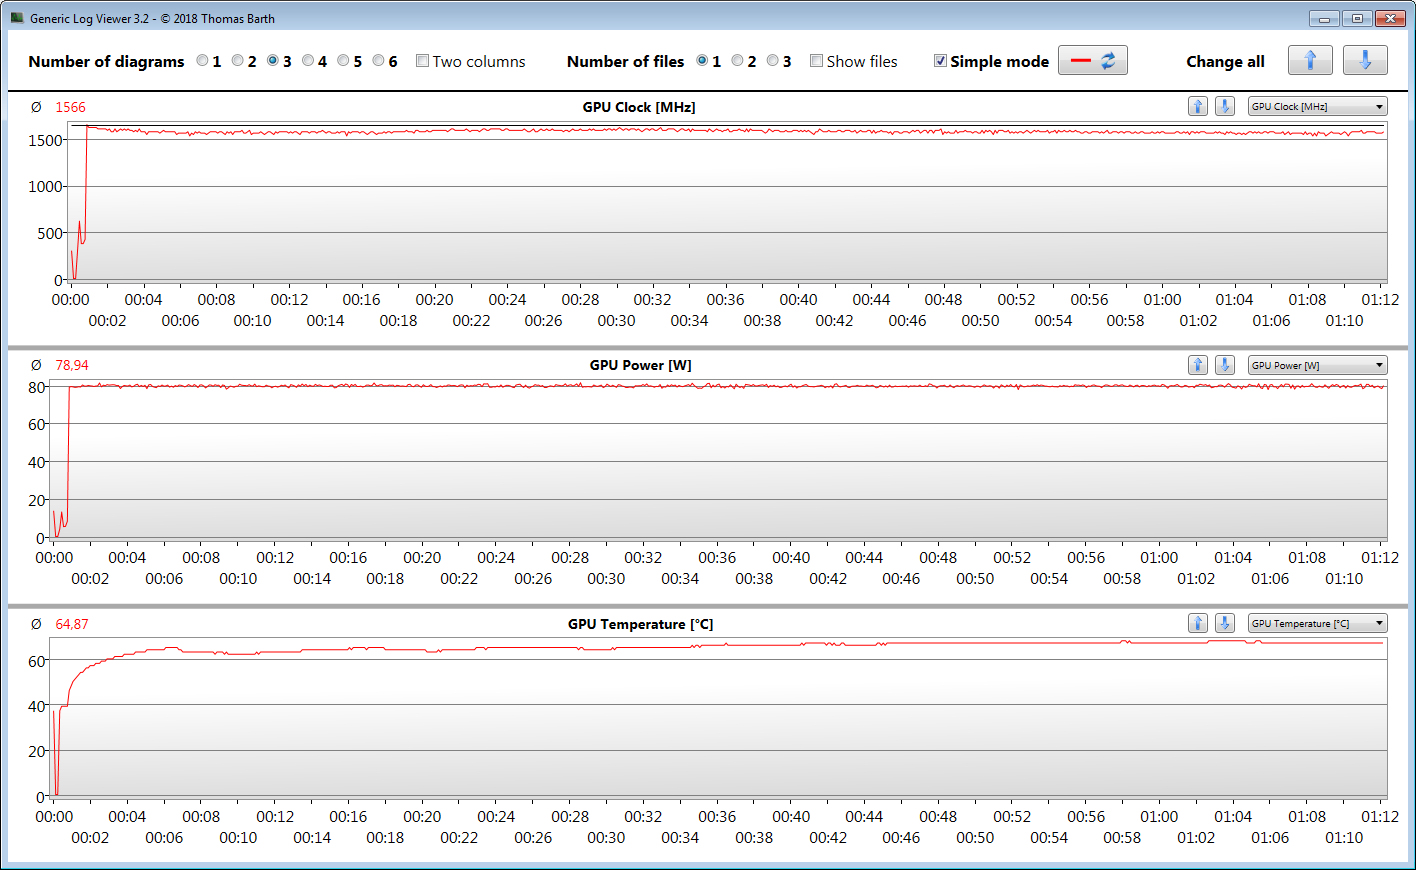
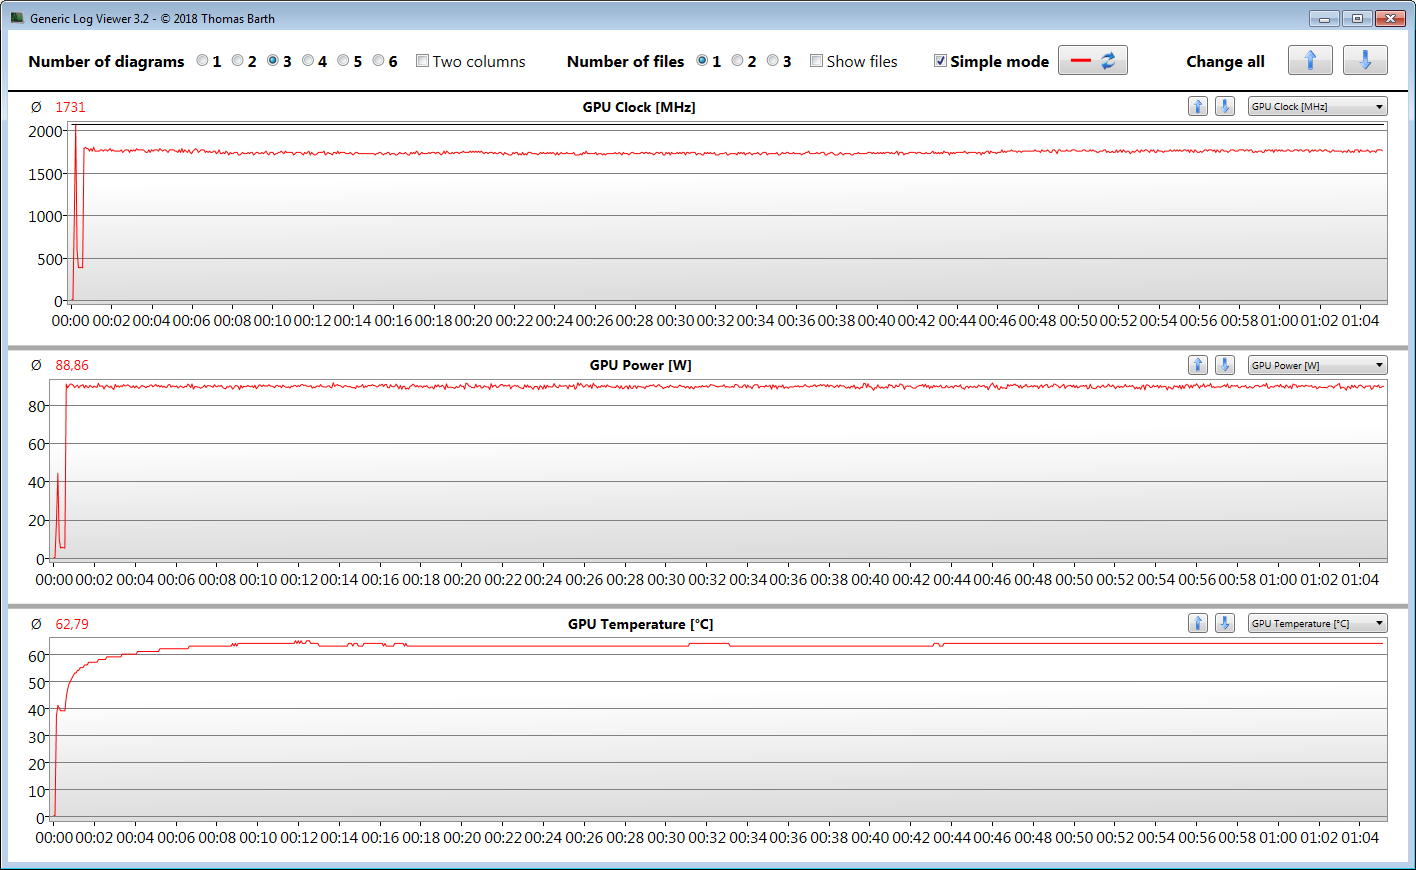
O Core i7-10750H e o GeForce RTX 2060 podem rodar todos os jogos atuais em 1080p em configurações altas ou máximas. A placa gráfica pode ter overclock automático se necessário.
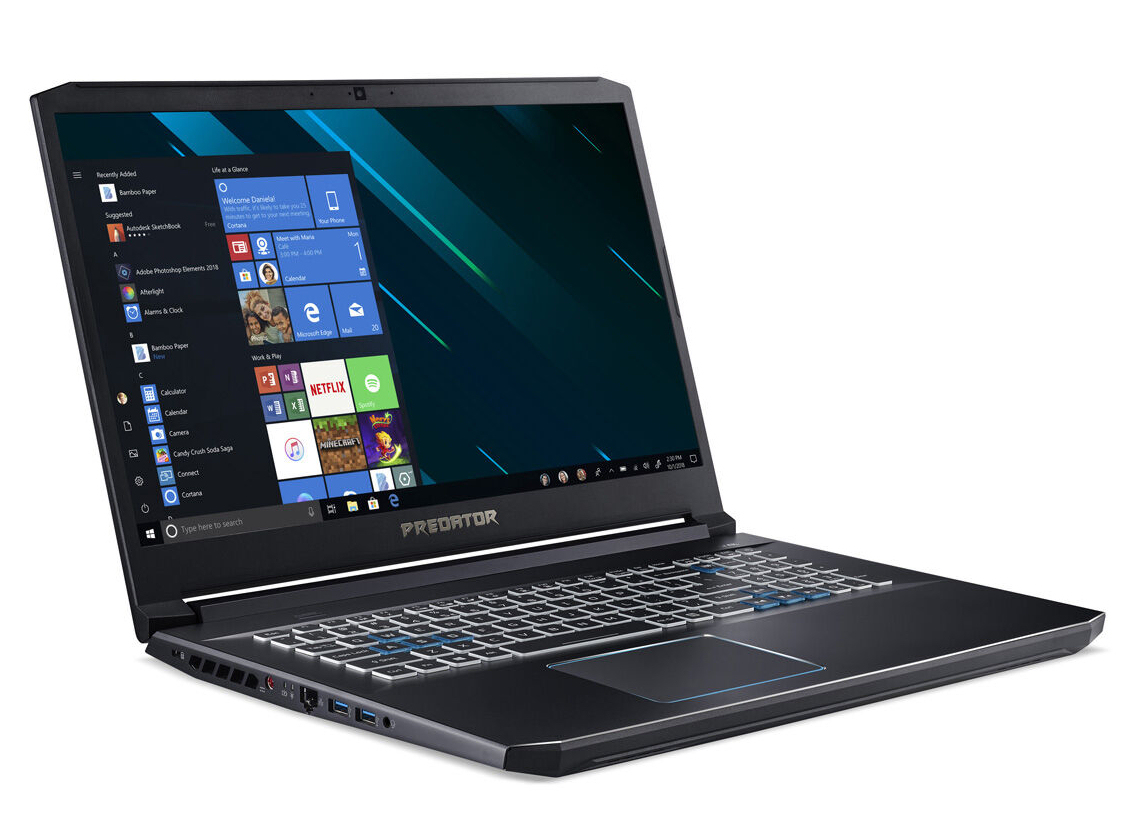
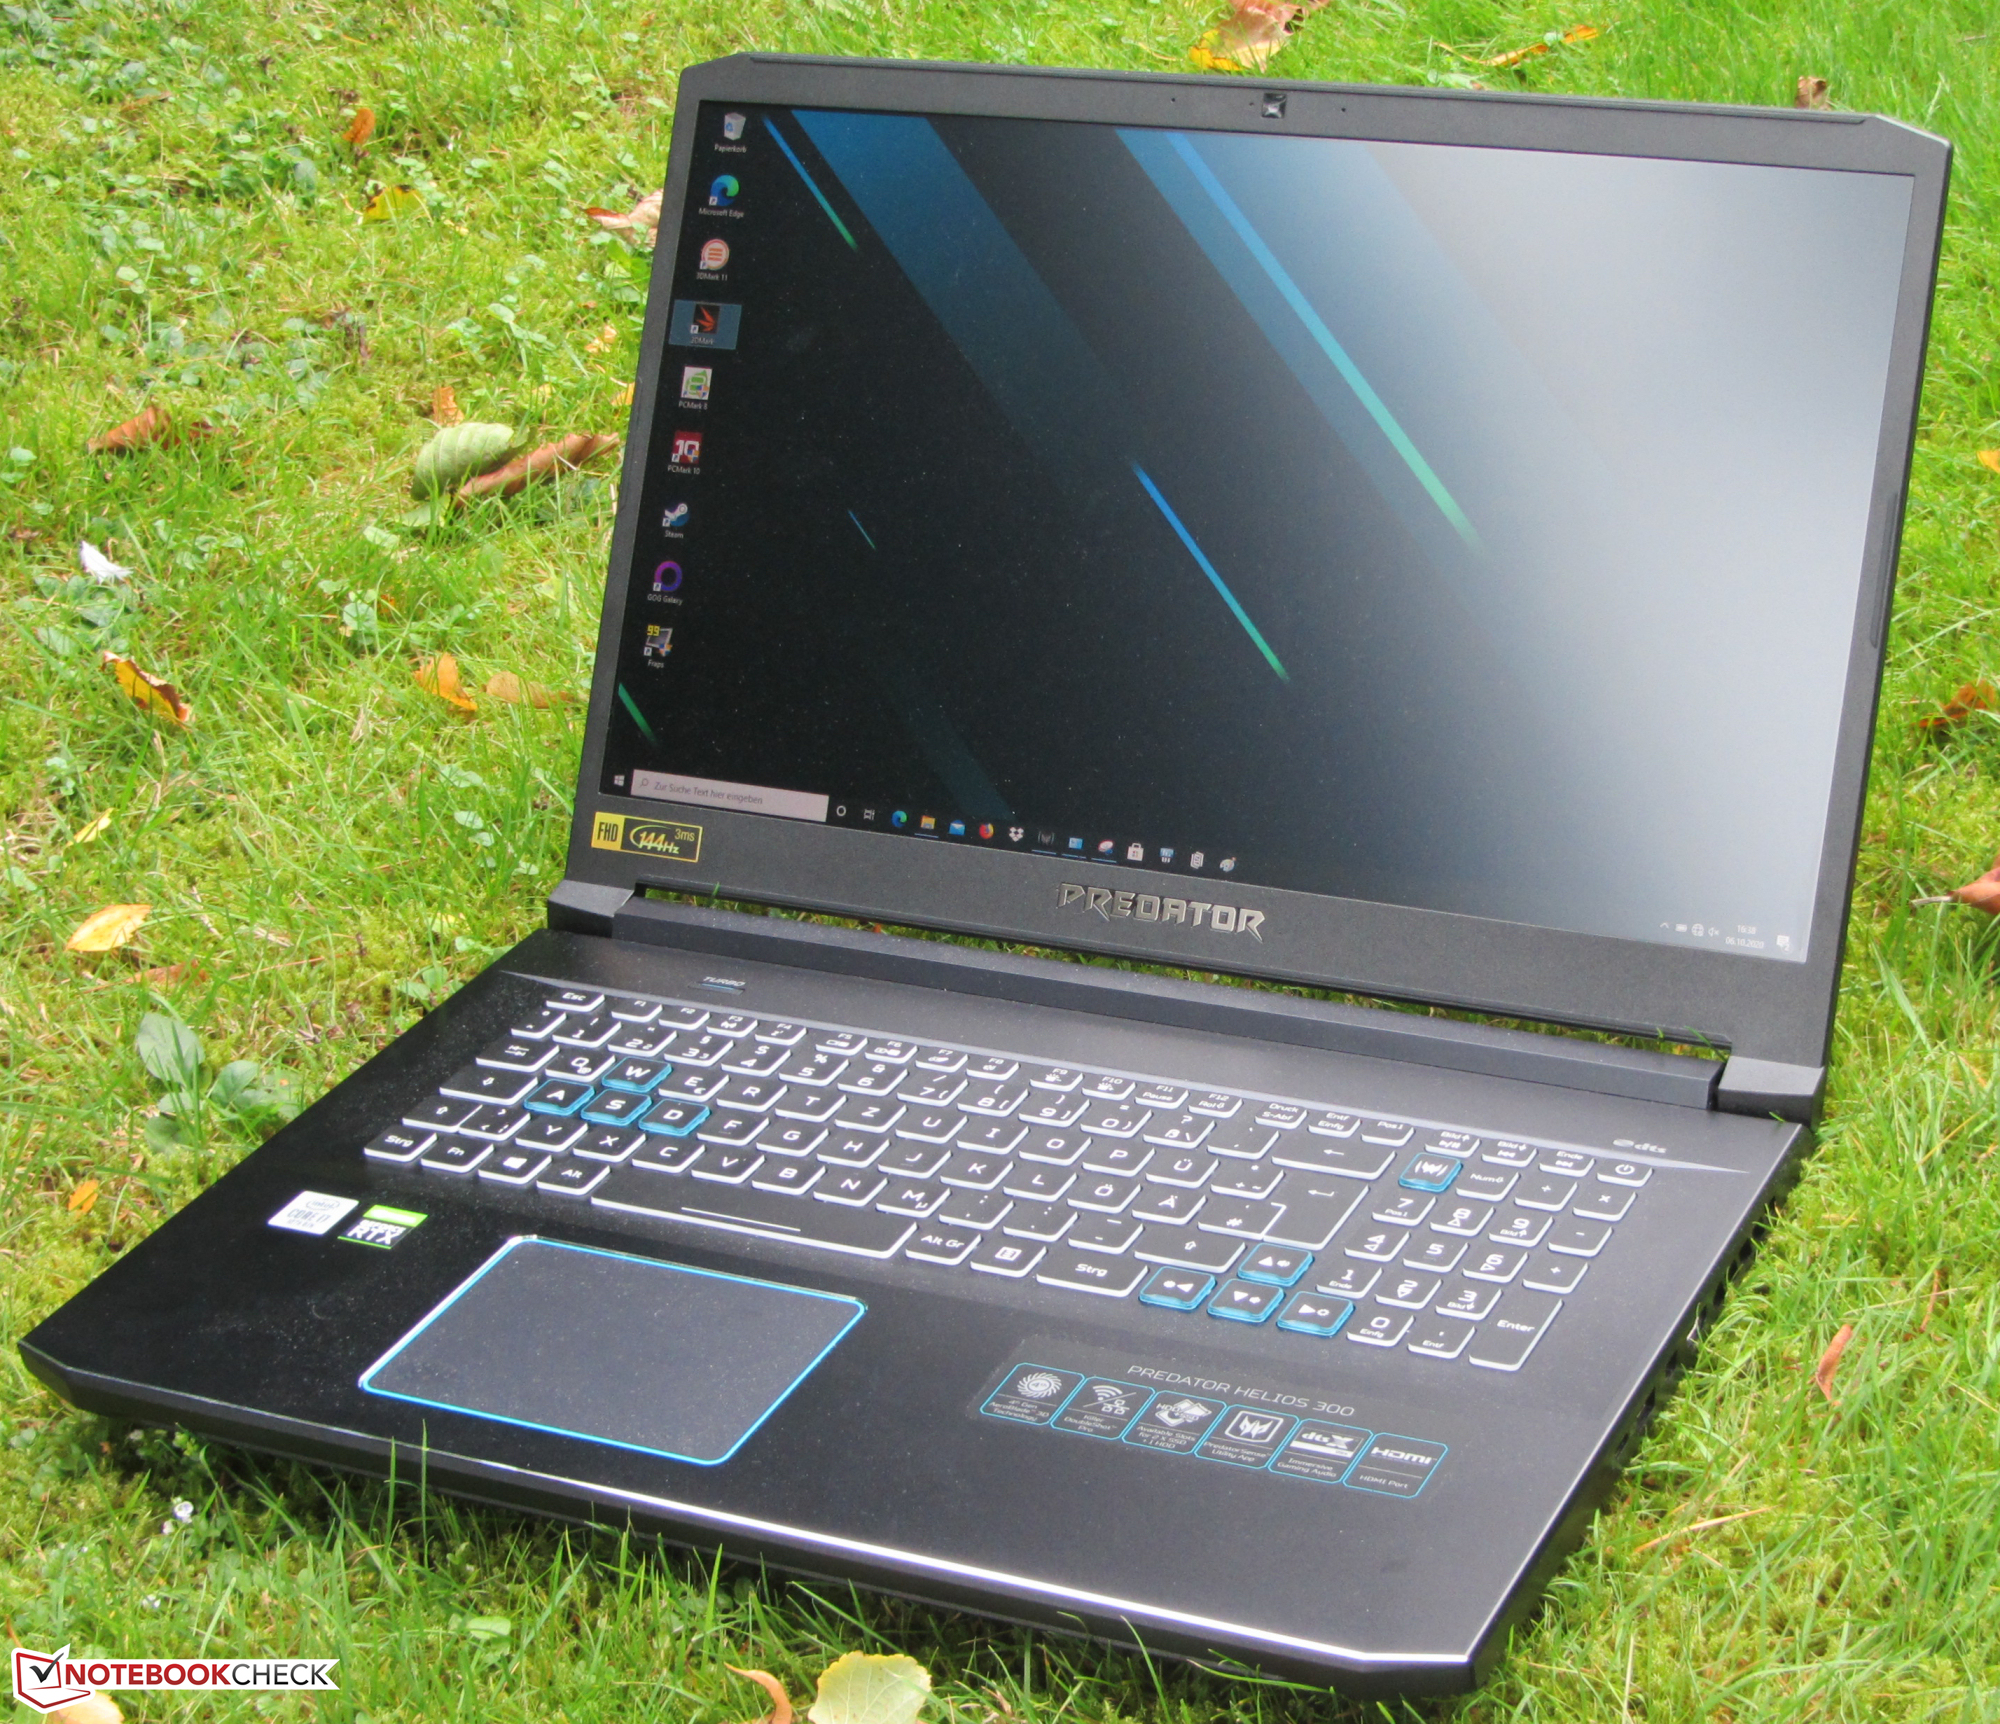
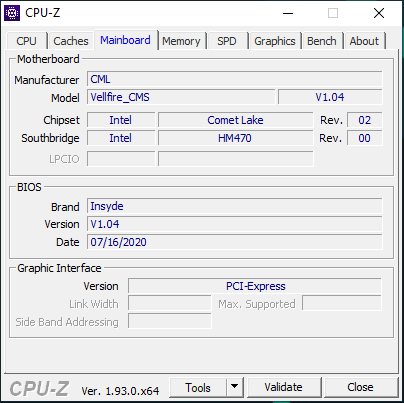
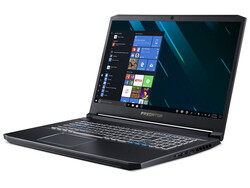
O Predator Helios 300 PH317-54 da Acer é um portátil completo que oferece várias opções de atualização.
Um dos dois slots M.2 (quando duas unidades de estado sólido NVMe estão instaladas, podem ser configuradas para funcionar em RAID 0) é ocupado por um rápido SSD NVMe de 1 TB, que oferece espaço de armazenamento suficiente para jogos e outros aplicativos. Um dispositivo de armazenamento adicional de 2,5 polegadas também pode ser instalado. Essas atualizações exigirão a abertura do dispositivo.
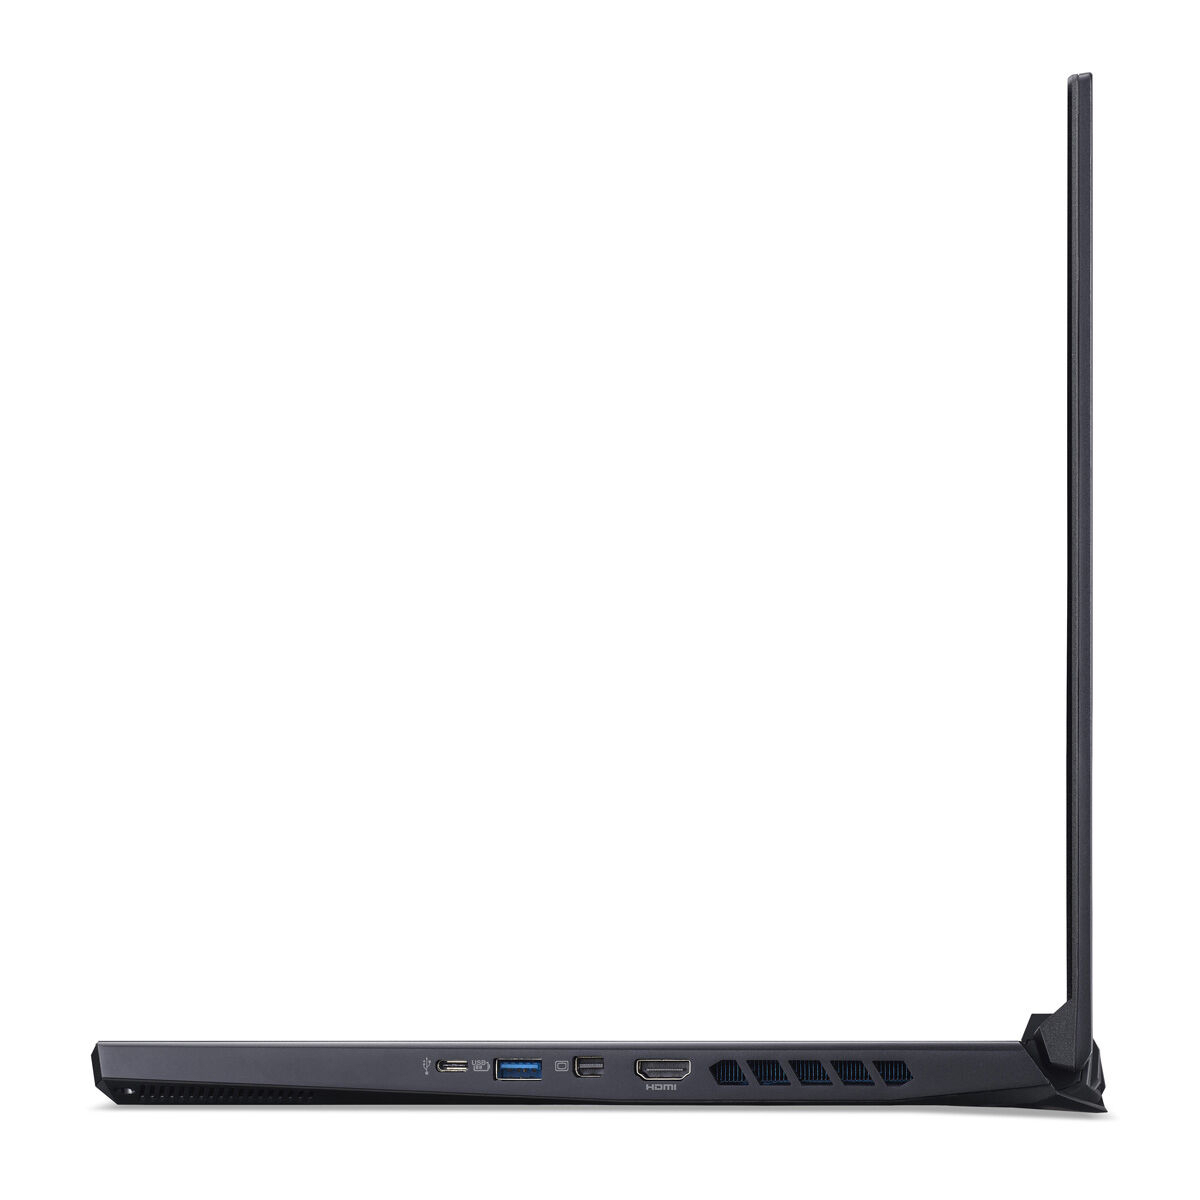
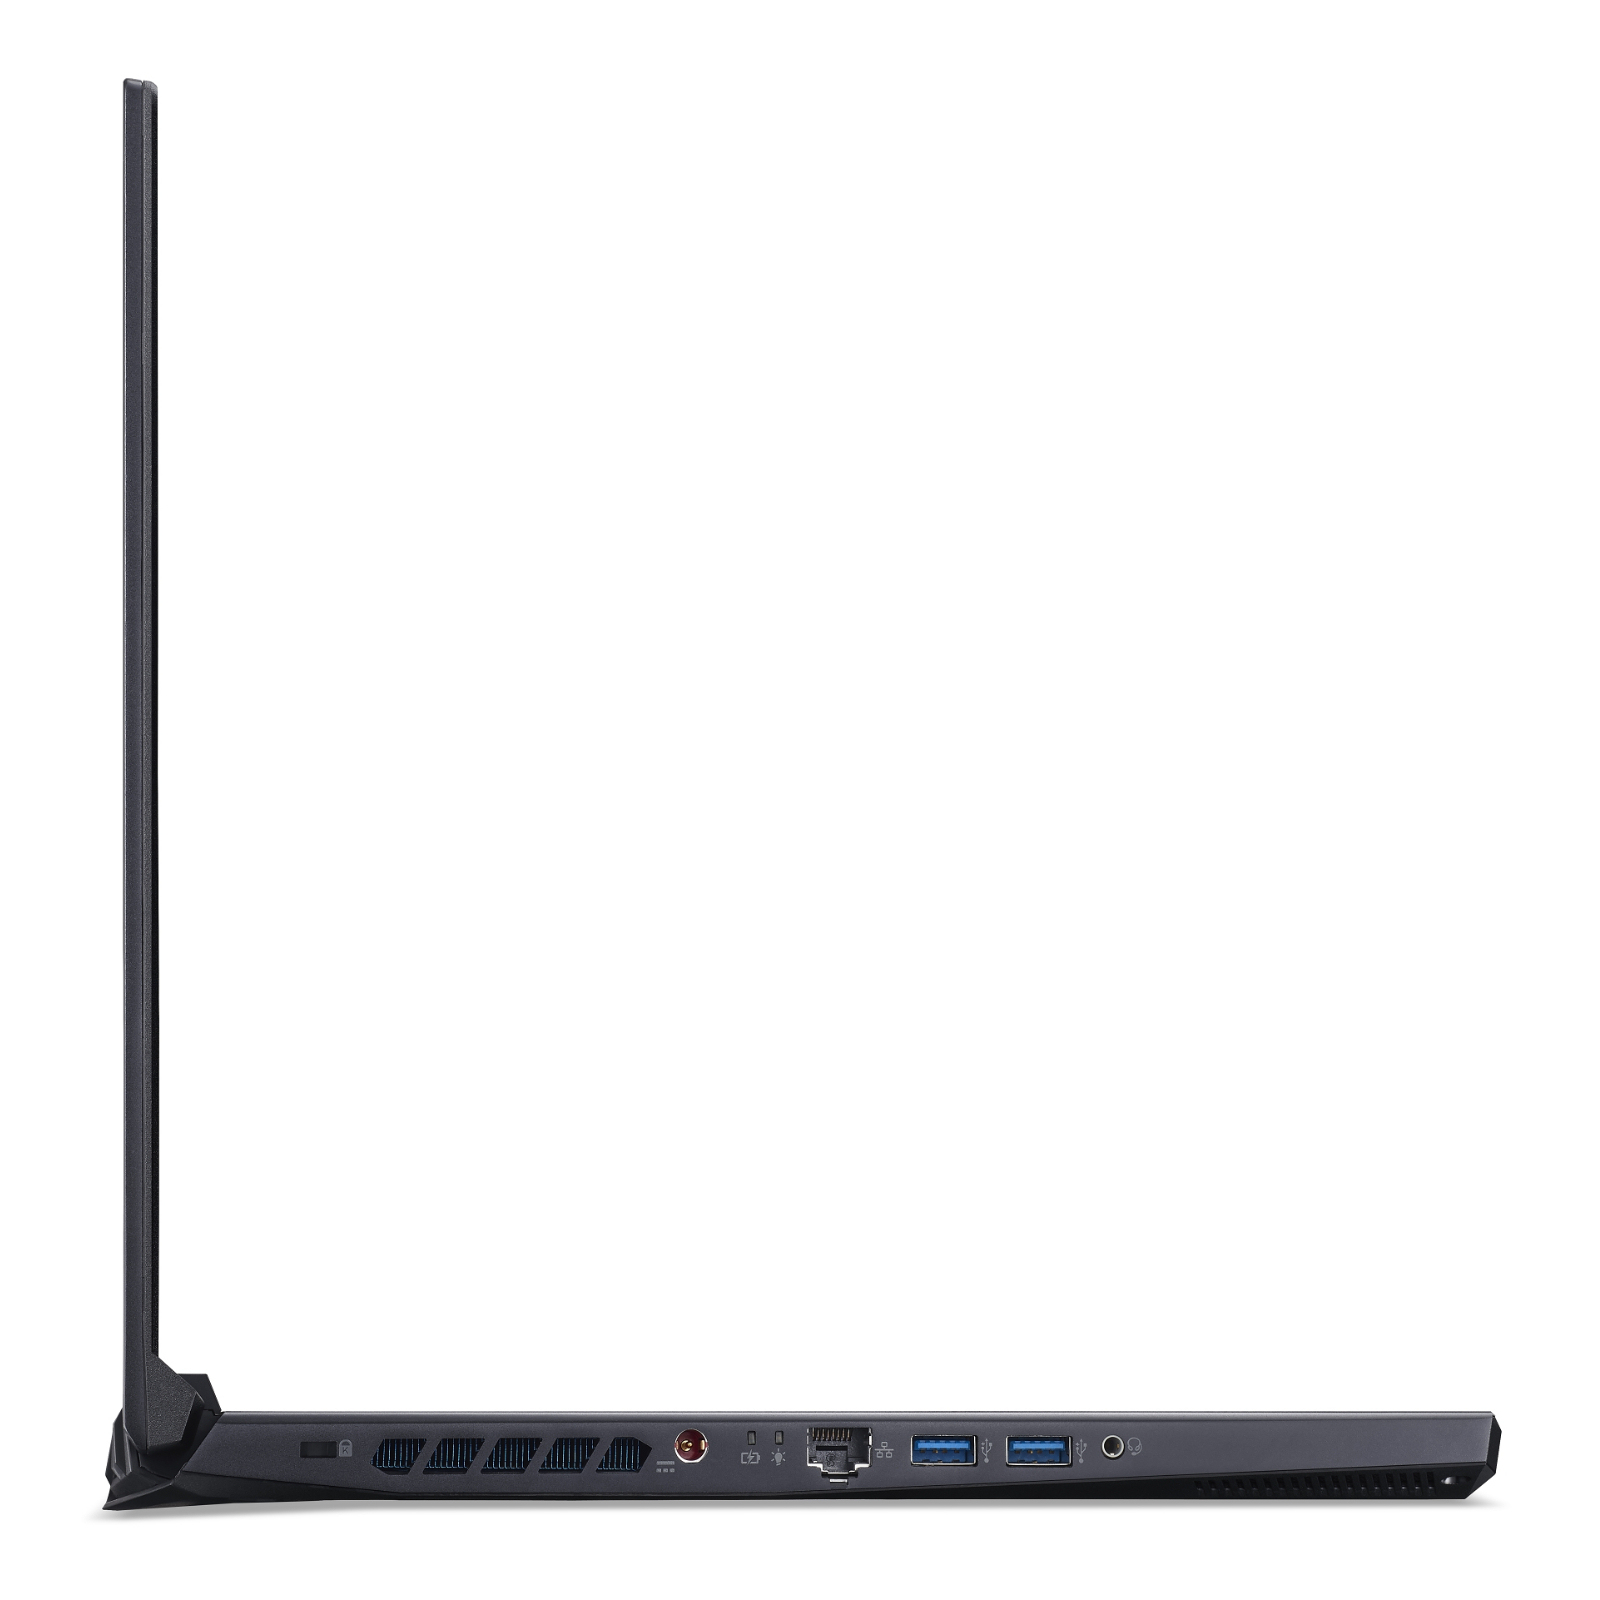
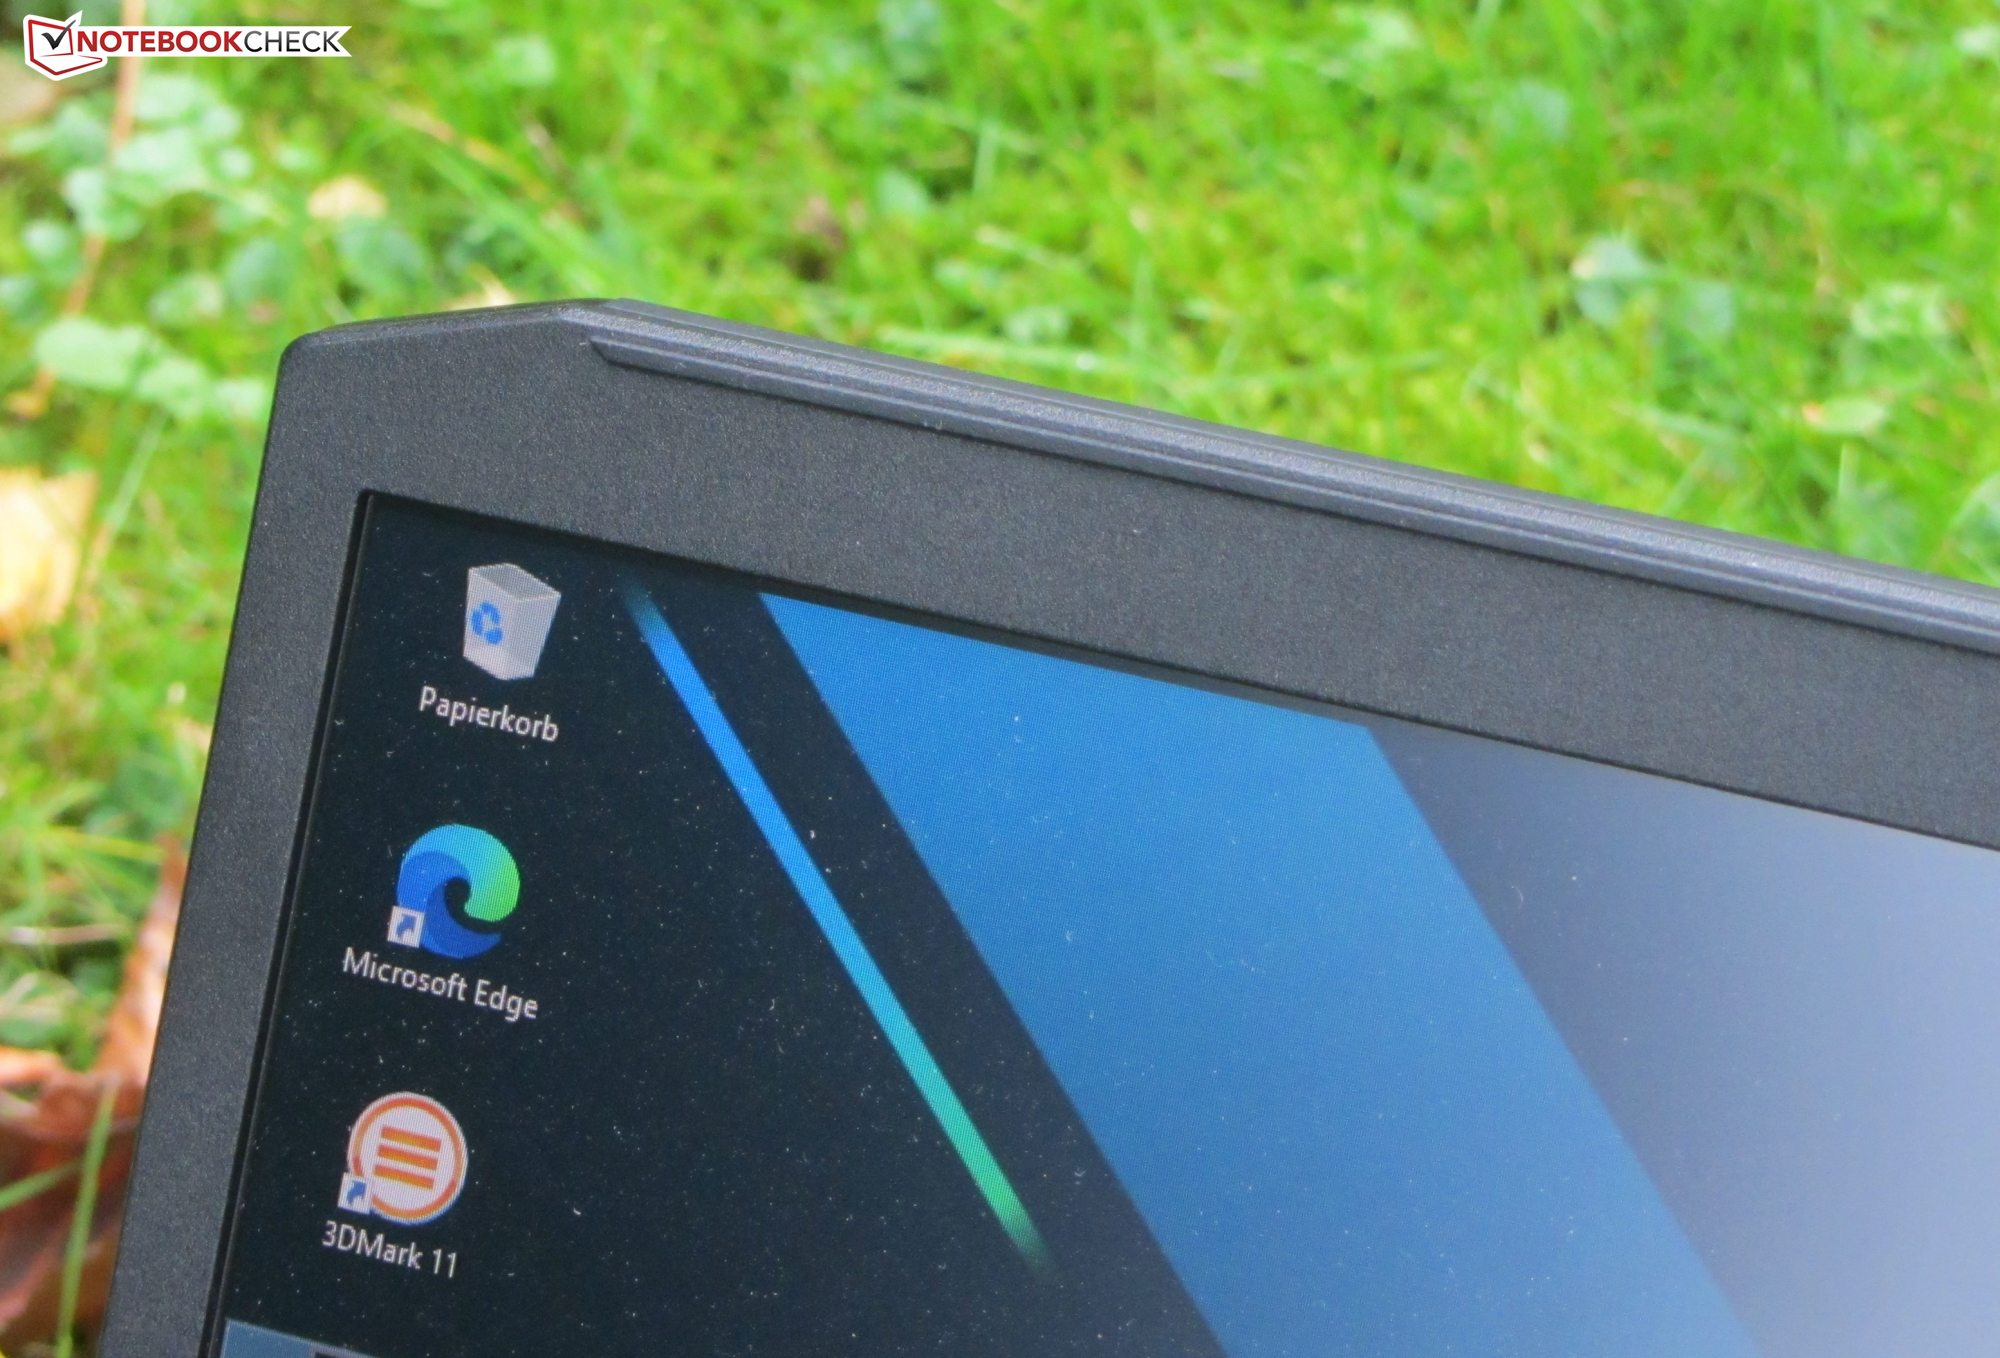
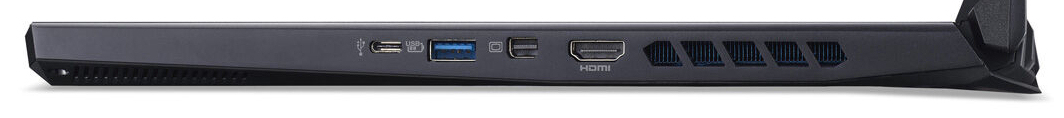
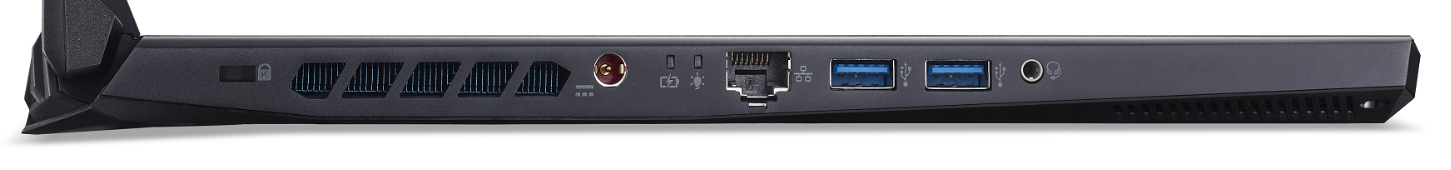
O Predator Helios 300 vem com todas as portas necessárias. No entanto, uma porta Thunderbolt 3 não está incluída. A porta USB 3.2 Gen 2 Type-C não suporta a funcionalidade DisplayPort sobre USB-C nem USB Power Delivery. A tela IPS Full HD de 144 Hz oferece uma superfície de tela mate, bons ângulos de visão, brilho suficiente, boa relação de contraste, tempos de resposta rápidos e excelente reprodução de cores.
Acer Predator Helios 300 PH317-54-75G8
- 10/09/2020 v7 (old)
Sascha Mölck