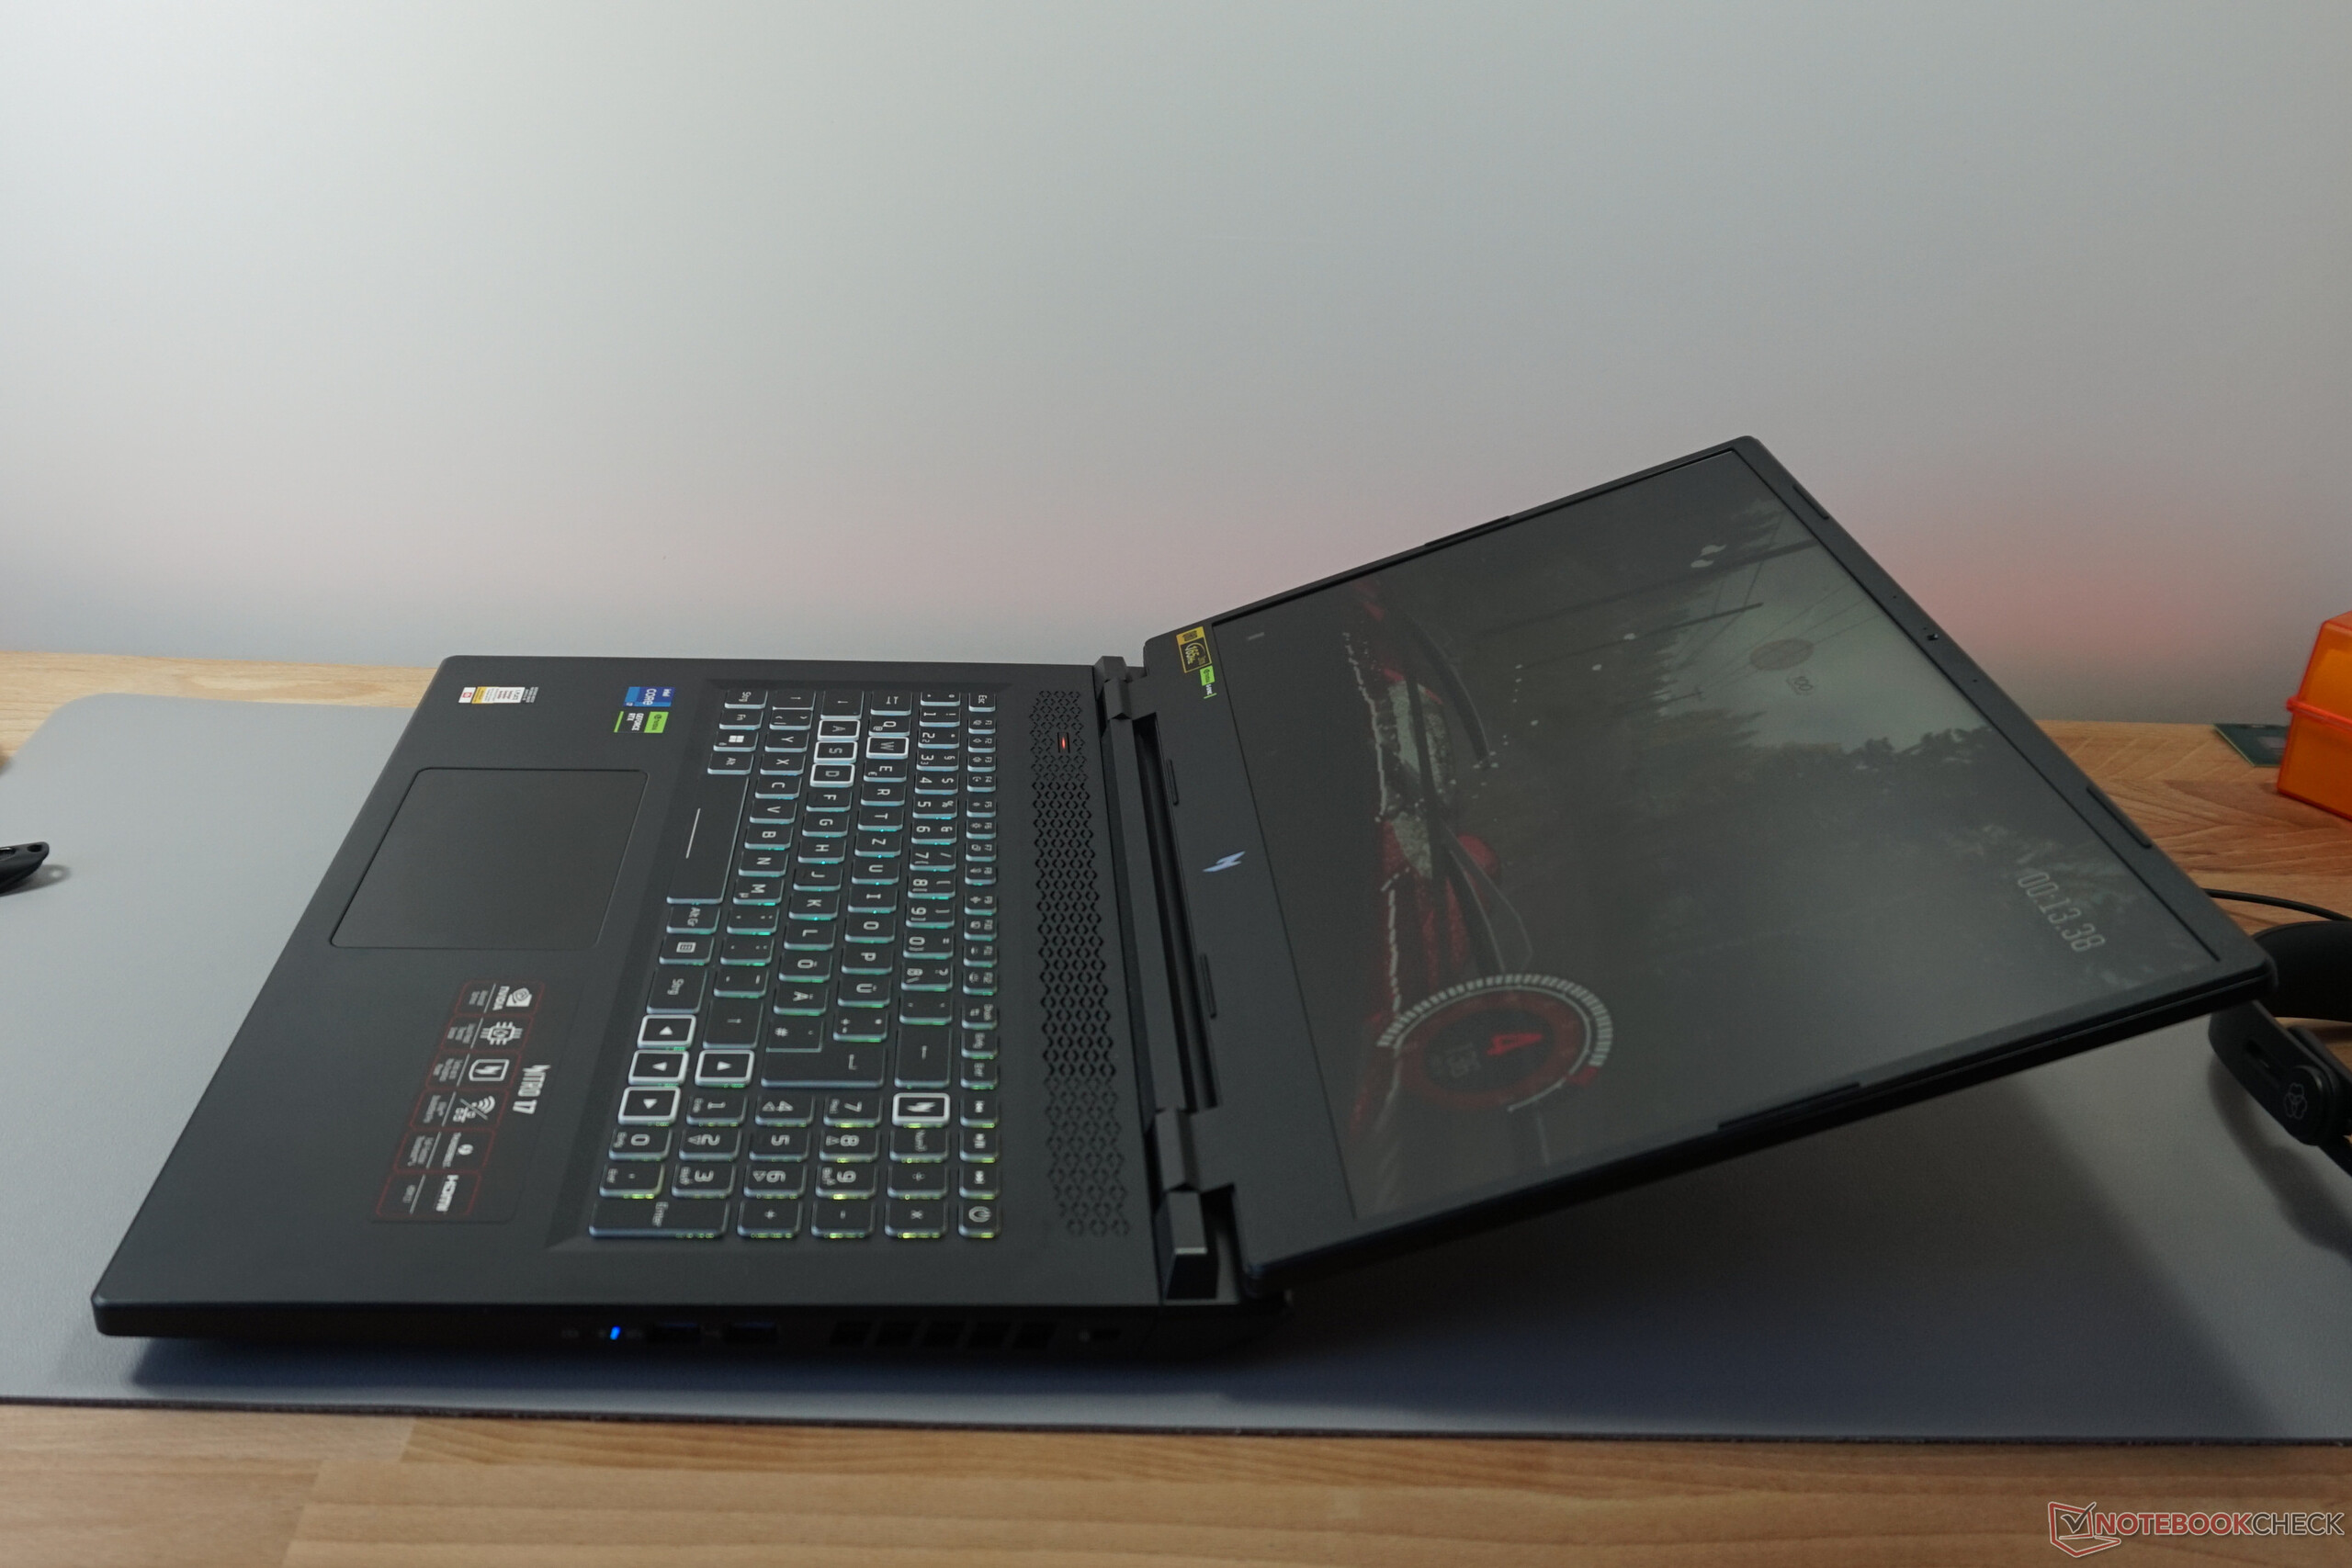
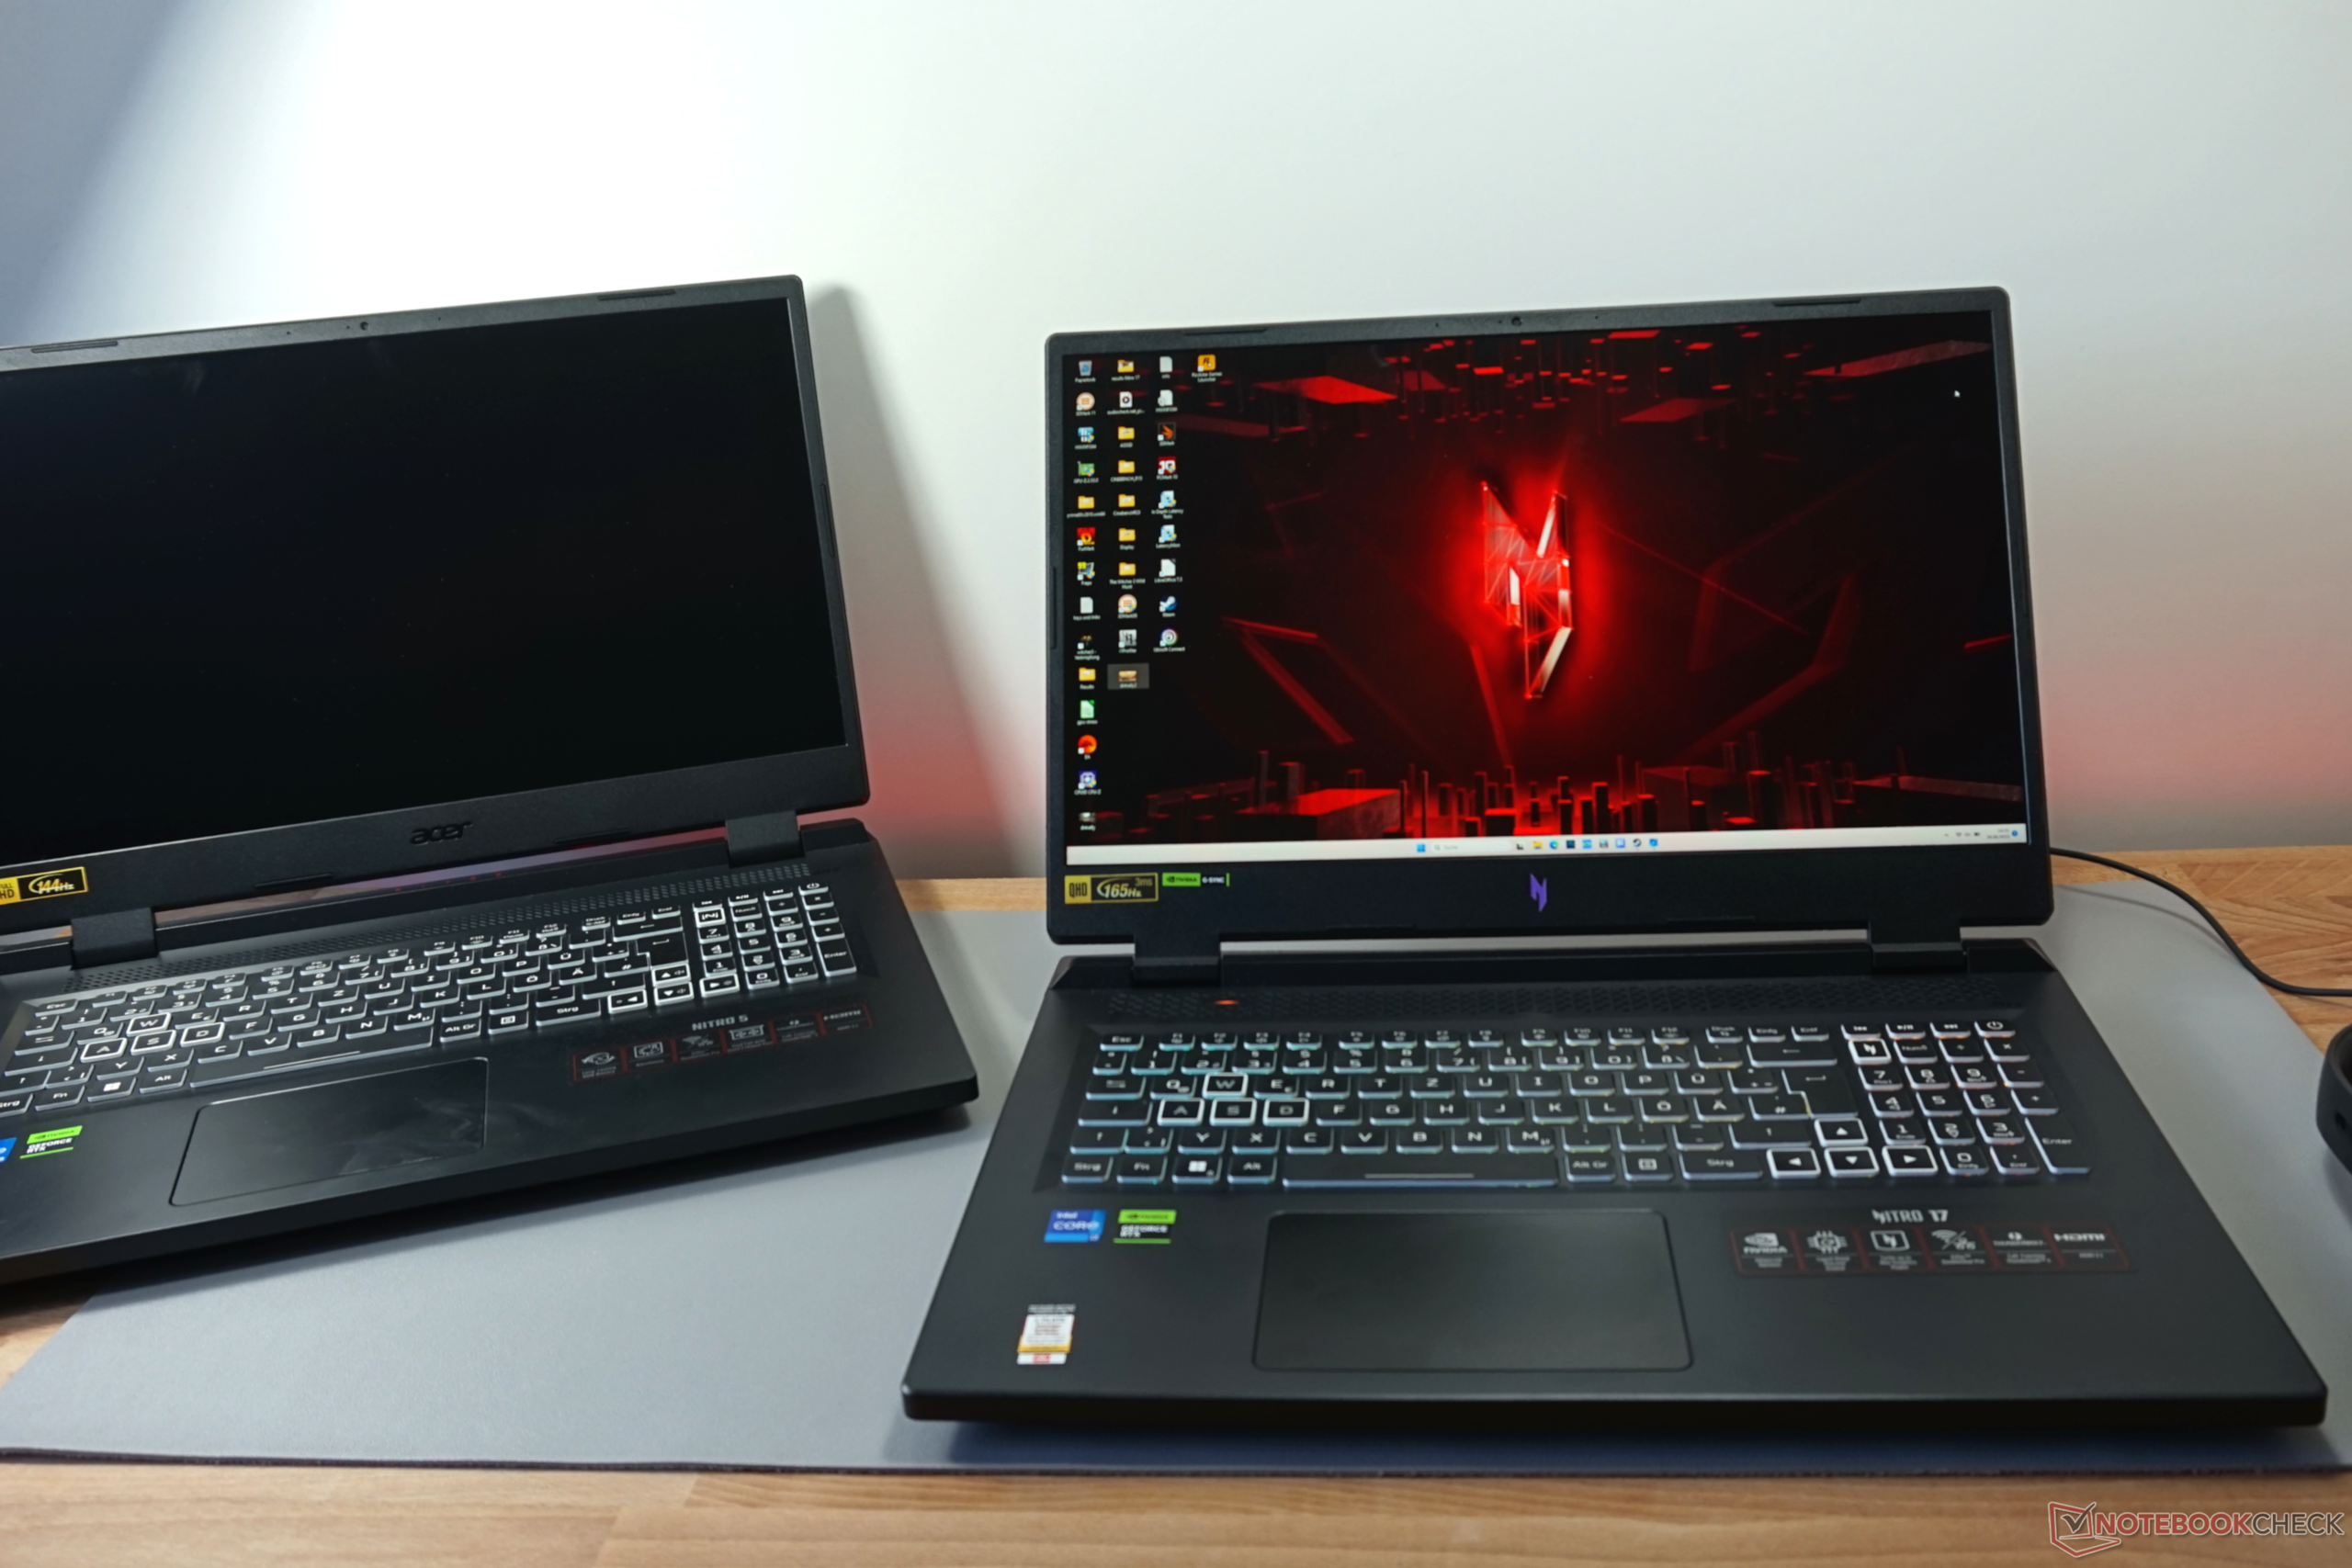
Análise do Acer Nitro 17 Ryzen edition: O laptop para jogos QHD com uma RTX 4070

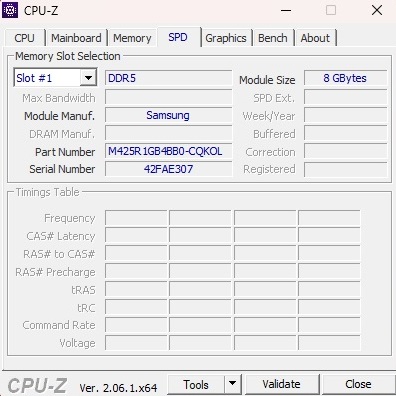
Depois de testar anteriormente um modelo com oCore i7-13700HeGeForce RTX 4060agora vamos dar uma olhada no irmão do laptop com preço semelhante, o AN17-41-R9LN, com um processador AMD e umaGeForce RTX 4070(Semelhante à versão Intel, um painel QHD 16:9 com uma taxa de atualização de 165 Hz e uma resolução de 2.560 x 1.440 pixels é usado como tela. Além disso, há 2x 8 GB de RAM DDR5-4800 e um SSD NVMe de 1 TB instalado. Também não há surpresas em seu sistema operacional, pois o laptop tem o Windows 11 Home instalado.
Os concorrentes do Nitro 17 incluem outros notebooks para jogos de 17 polegadas com uma RTX 4070, como oMSI Pulse 17 B13VGKe oSchenker XMG Focus 17 (E23)ou o Asus ROG Strix G17 G713PI- todos eles podem ser encontrados nas tabelas como dispositivos de comparação.
Possíveis concorrentes em comparação
Avaliação | Data | Modelo | Peso | Altura | Size | Resolução | Preço |
|---|---|---|---|---|---|---|---|
| 86.9 % v7 (old) | 09/2023 | Acer Nitro 17 AN17-41-R9LN R7 7735HS, GeForce RTX 4070 Laptop GPU | 3 kg | 29 mm | 17.30" | 2560x1440 | |
| 87.2 % v7 (old) | 07/2023 | Acer Nitro 17 AN17-51-71ER i7-13700H, GeForce RTX 4060 Laptop GPU | 3 kg | 30.3 mm | 17.30" | 2560x1440 | |
| 86.3 % v7 (old) | 07/2023 | MSI Pulse 17 B13VGK i7-13700H, GeForce RTX 4070 Laptop GPU | 2.7 kg | 27.2 mm | 17.30" | 1920x1080 | |
| 85.9 % v7 (old) | 06/2023 | Schenker XMG Focus 17 (E23) i9-13900HX, GeForce RTX 4070 Laptop GPU | 2.9 kg | 29.3 mm | 17.30" | 2560x1440 | |
| 88.4 % v7 (old) | 04/2023 | Asus ROG Strix G17 G713PI R9 7945HX, GeForce RTX 4070 Laptop GPU | 2.8 kg | 30.7 mm | 17.30" | 2560x1440 |
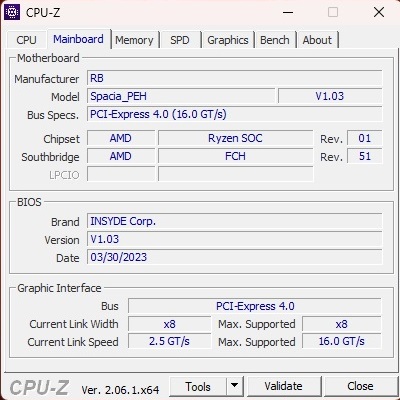
Como o gabinete do dispositivo é idêntico ao da Intel, com exceção das opções de conectividade (a variante da AMD não tem uma porta Thunderbolt 4 e, em vez disso, tem 2 portas USB 4), não vamos nos aprofundar em seu gabinete, recursos e dispositivos de entrada neste artigo. Você pode encontrar as informações correspondentes na análise do AN17-51-71ER.


Leitor de cartão SD
| SD Card Reader | |
| average JPG Copy Test (av. of 3 runs) | |
| Média da turma Gaming (20.9 - 210, n=54, últimos 2 anos) | |
| Schenker XMG Focus 17 (E23) | |
| Acer Nitro 17 AN17-41-R9LN (AV PRO microSD 128 GB V60) | |
| Acer Nitro 17 AN17-51-71ER | |
| maximum AS SSD Seq Read Test (1GB) | |
| Média da turma Gaming (25.5 - 261, n=51, últimos 2 anos) | |
| Schenker XMG Focus 17 (E23) | |
| Acer Nitro 17 AN17-41-R9LN (AV PRO microSD 128 GB V60) | |
| Acer Nitro 17 AN17-51-71ER | |
Comunicação
Webcam


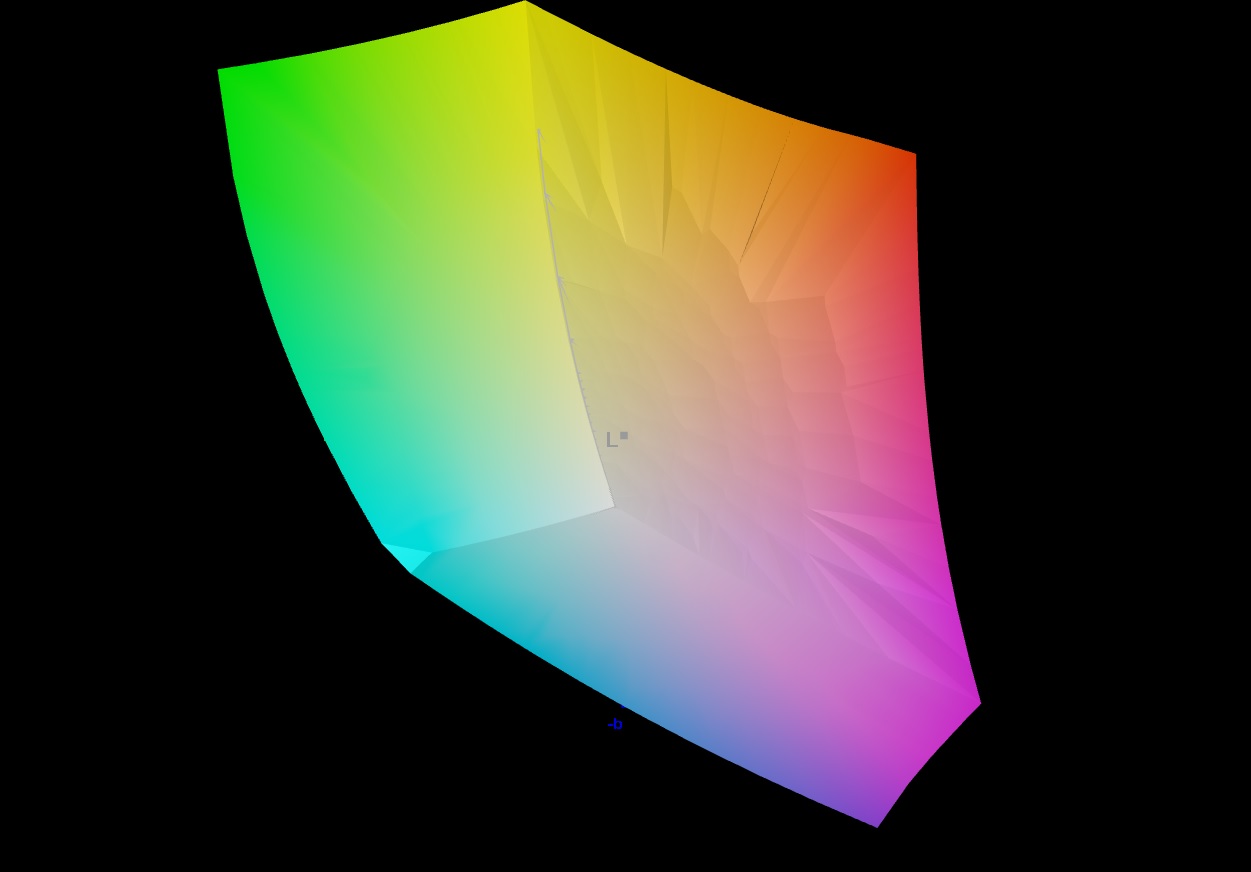
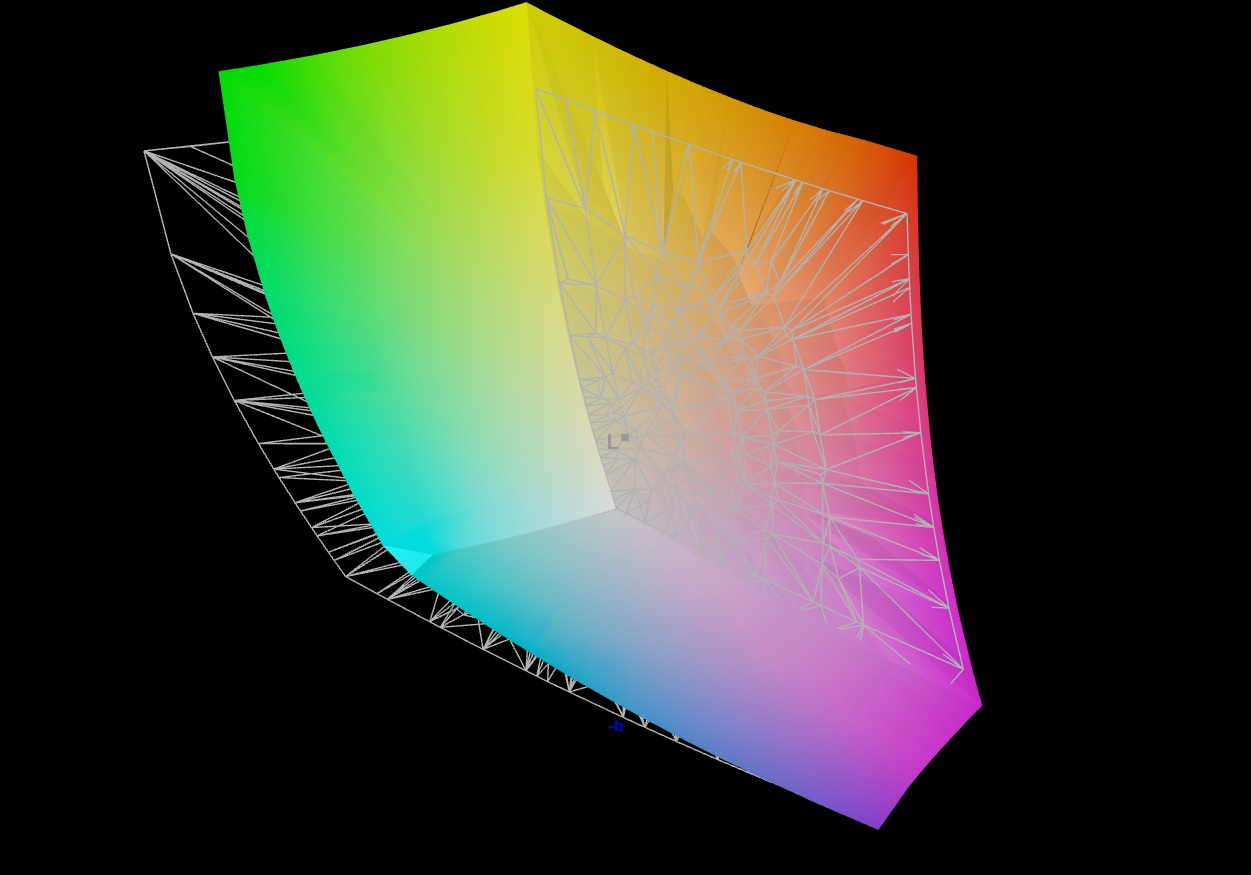
Tela
O modelo da AMD apresenta a mesma tela QHD que a versão da Intel, o que é bem-vindo devido aos seus bons resultados de medição e valores de imagem.
| |||||||||||||||||||||||||
iluminação: 88 %
iluminação com acumulador: 350 cd/m²
Contraste: 1000:1 (Preto: 0.35 cd/m²)
ΔE ColorChecker Calman: 2.03 | ∀{0.5-29.43 Ø4.71}
calibrated: 0.56
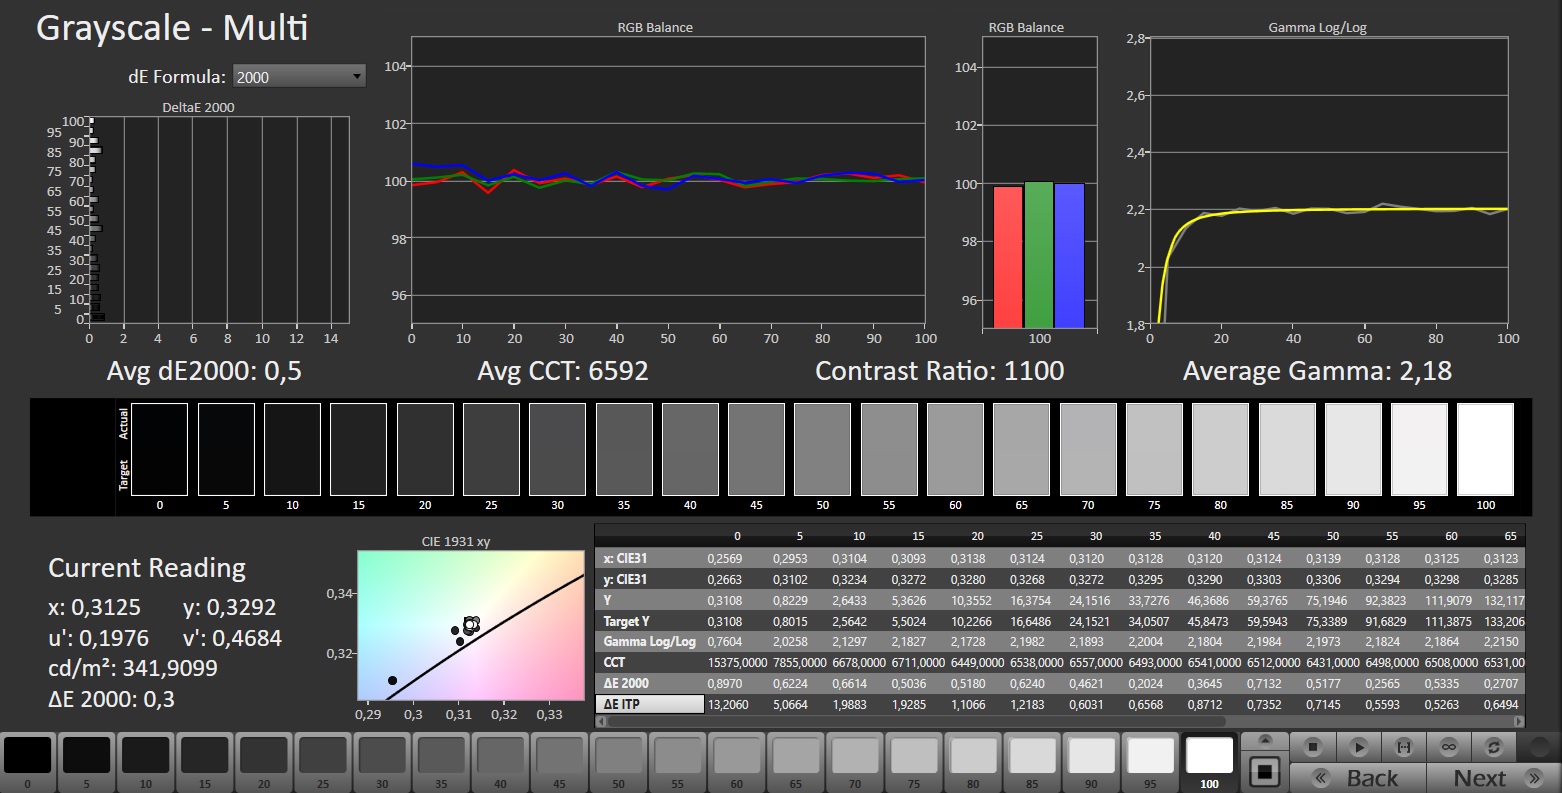
ΔE Greyscale Calman: 2.4 | ∀{0.09-98 Ø4.96}
86% AdobeRGB 1998 (Argyll 3D)
100% sRGB (Argyll 3D)
98% Display P3 (Argyll 3D)
Gamma: 2.071
CCT: 6961 K
| Acer Nitro 17 AN17-41-R9LN NE173QHM-NY6 (BOE0B7C), IPS, 2560x1440, 17.3" | Acer Nitro 17 AN17-51-71ER BOE0B7C NE173QHM-NY6, , 2560x1440, 17.3" | MSI Pulse 17 B13VGK AU Optronics B173HAN04.9, IPS, 1920x1080, 17.3" | Schenker XMG Focus 17 (E23) BOE09F9 NE173QHM-NZ1, IPS, 2560x1440, 17.3" | Asus ROG Strix G17 G713PI BOE0B69, IPS, 2560x1440, 17.3" | |
|---|---|---|---|---|---|
| Display | 0% | -53% | -1% | 0% | |
| Display P3 Coverage (%) | 98 | 98.3 0% | 38.4 -61% | 96.6 -1% | 98.3 0% |
| sRGB Coverage (%) | 100 | 100 0% | 57.5 -43% | 99.9 0% | 100 0% |
| AdobeRGB 1998 Coverage (%) | 86 | 85.7 0% | 39.7 -54% | 84.5 -2% | 85.9 0% |
| Response Times | 2% | -146% | -21% | 32% | |
| Response Time Grey 50% / Grey 80% * (ms) | 14.3 ? | 14.8 ? -3% | 31.2 ? -118% | 16.4 ? -15% | 5.3 ? 63% |
| Response Time Black / White * (ms) | 8.6 ? | 8 ? 7% | 23.6 ? -174% | 10.8 ? -26% | 8.6 ? -0% |
| PWM Frequency (Hz) | |||||
| Screen | -86% | -112% | -7% | 11% | |
| Brightness middle (cd/m²) | 350 | 361 3% | 254 -27% | 349 0% | 327 -7% |
| Brightness (cd/m²) | 337 | 326 -3% | 250 -26% | 318 -6% | 320 -5% |
| Brightness Distribution (%) | 88 | 87 -1% | 91 3% | 82 -7% | 89 1% |
| Black Level * (cd/m²) | 0.35 | 0.6 -71% | 0.14 60% | 0.56 -60% | 0.38 -9% |
| Contrast (:1) | 1000 | 602 -40% | 1814 81% | 623 -38% | 861 -14% |
| Colorchecker dE 2000 * | 2.03 | 3.83 -89% | 4.52 -123% | 1.08 47% | 1.01 50% |
| Colorchecker dE 2000 max. * | 5.02 | 5.71 -14% | 21.22 -323% | 3.05 39% | 4.01 20% |
| Colorchecker dE 2000 calibrated * | 0.56 | 3.48 -521% | 4.52 -707% | 1.08 -93% | 0.41 27% |
| Greyscale dE 2000 * | 2.4 | 3.29 -37% | 1 58% | 1.14 52% | 1.6 33% |
| Gamma | 2.071 106% | 2.29 96% | 2.44 90% | 2.41 91% | 2.168 101% |
| CCT | 6961 93% | 6679 97% | 6502 100% | 6687 97% | 6659 98% |
| Média Total (Programa/Configurações) | -28% /
-55% | -104% /
-104% | -10% /
-8% | 14% /
11% |
* ... menor é melhor
Seu painel IPS pode não ser o mais brilhante, com 337 cd/m² em média, mas, desde que você fique em ambientes fechados, seus níveis de brilho são bons. Seus tempos de reação, valor de preto (0,35 cd/m²) e contraste (1.000:1) também provam não ser motivo para o laptop se esconder dos concorrentes - embora ainda haja um pouco de espaço para melhorias.
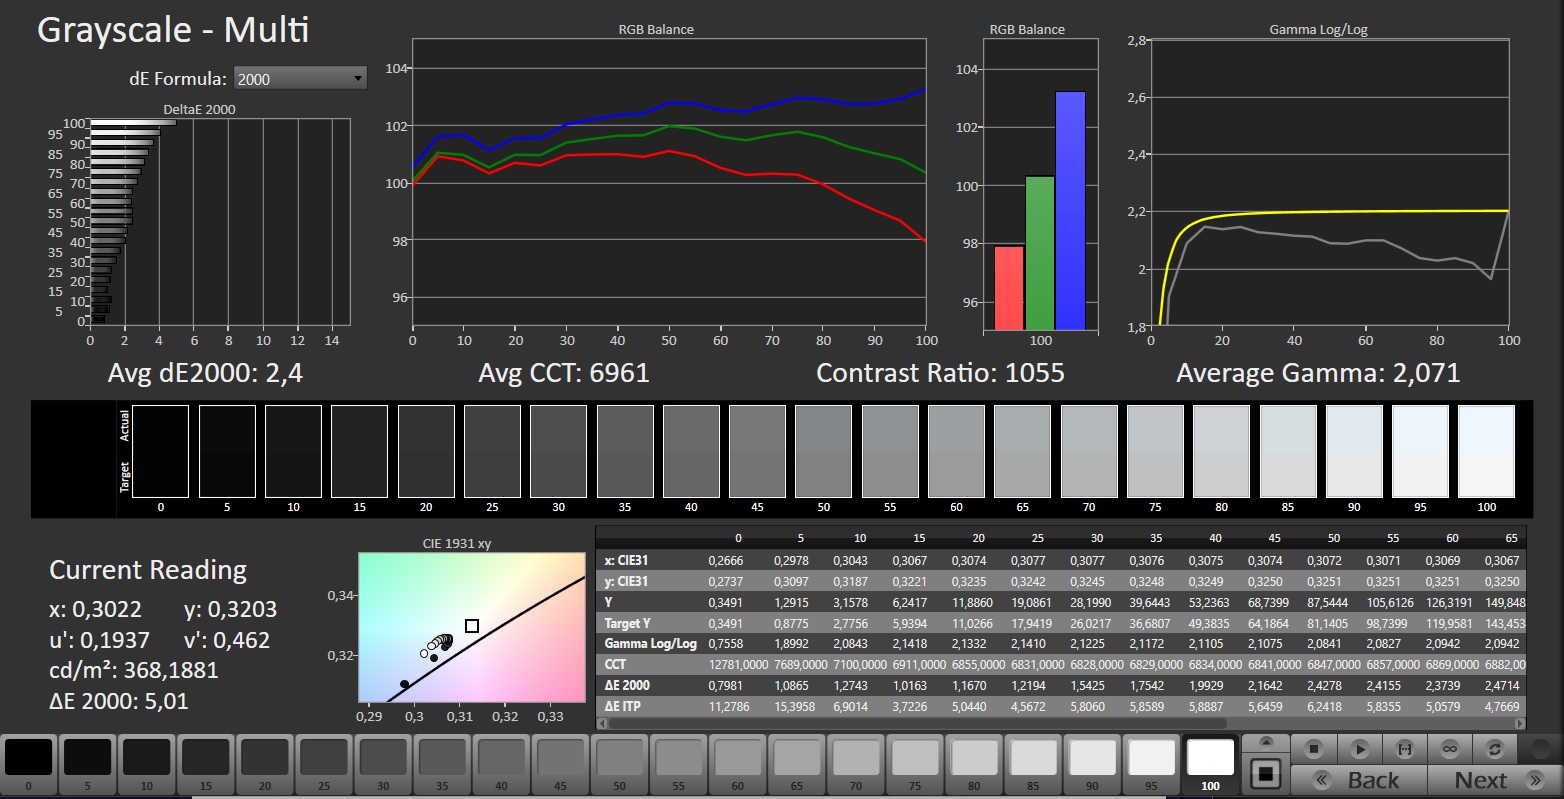
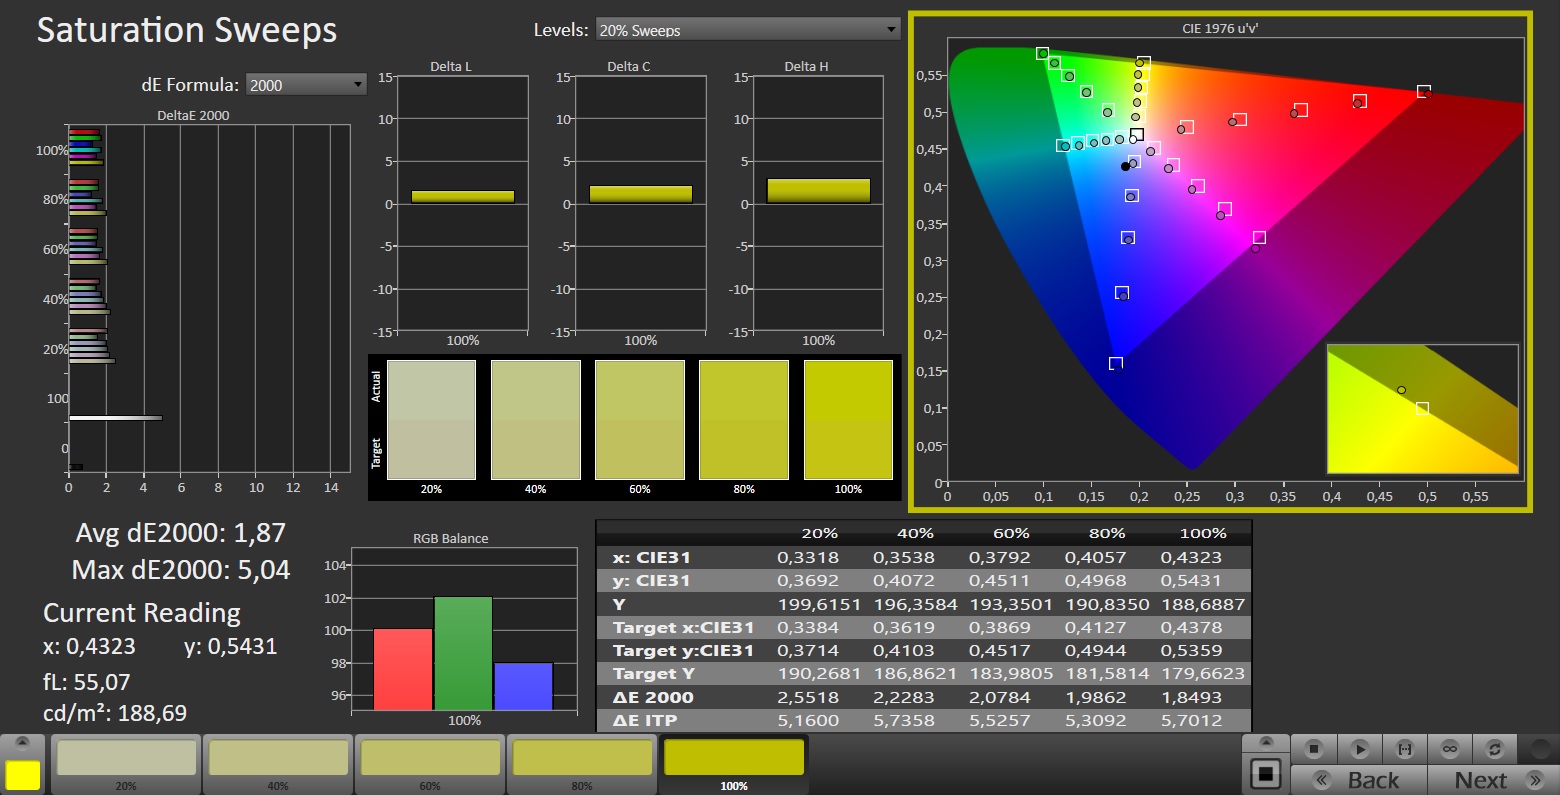
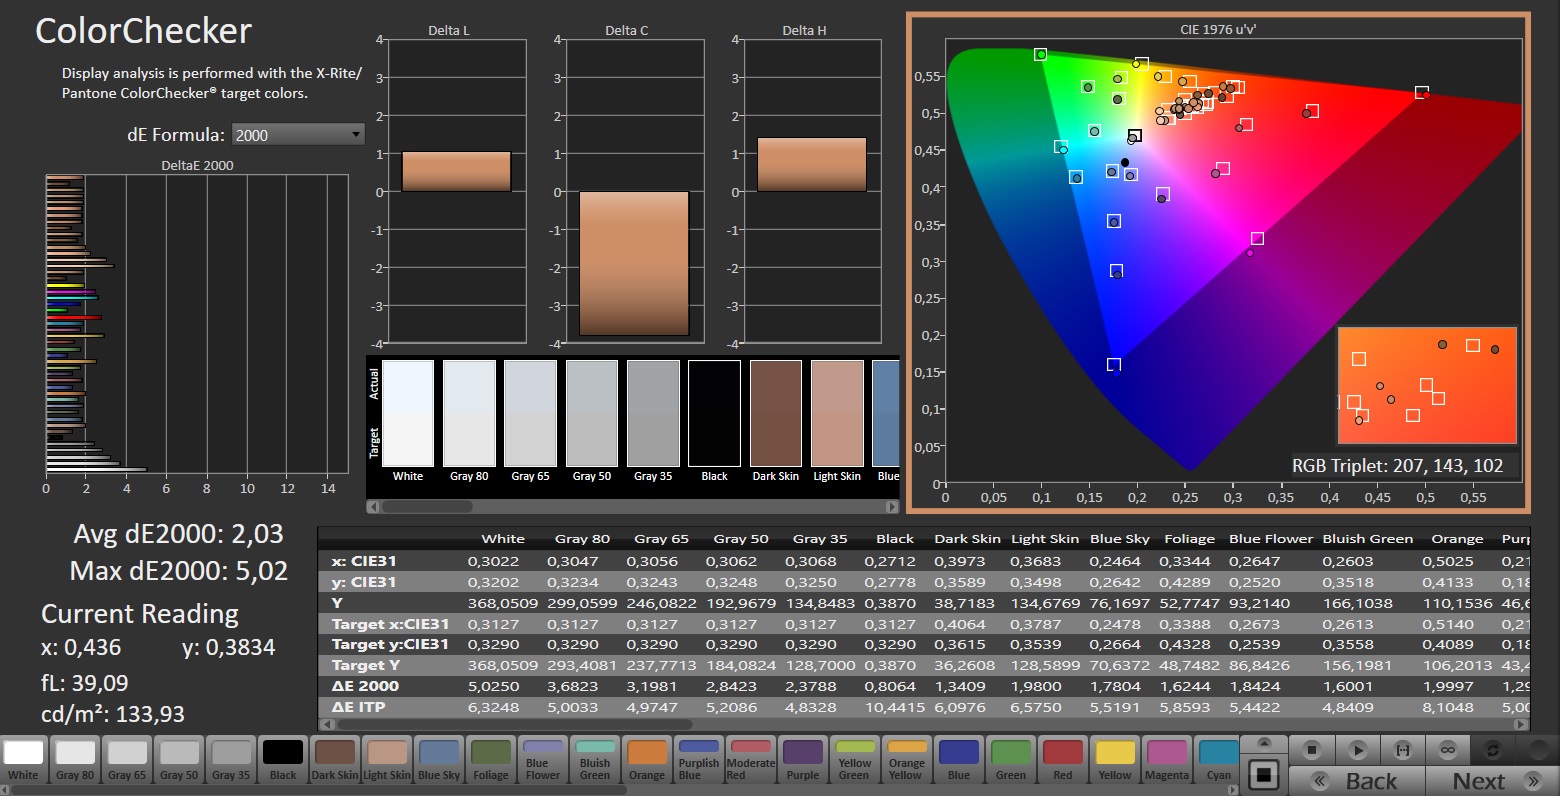
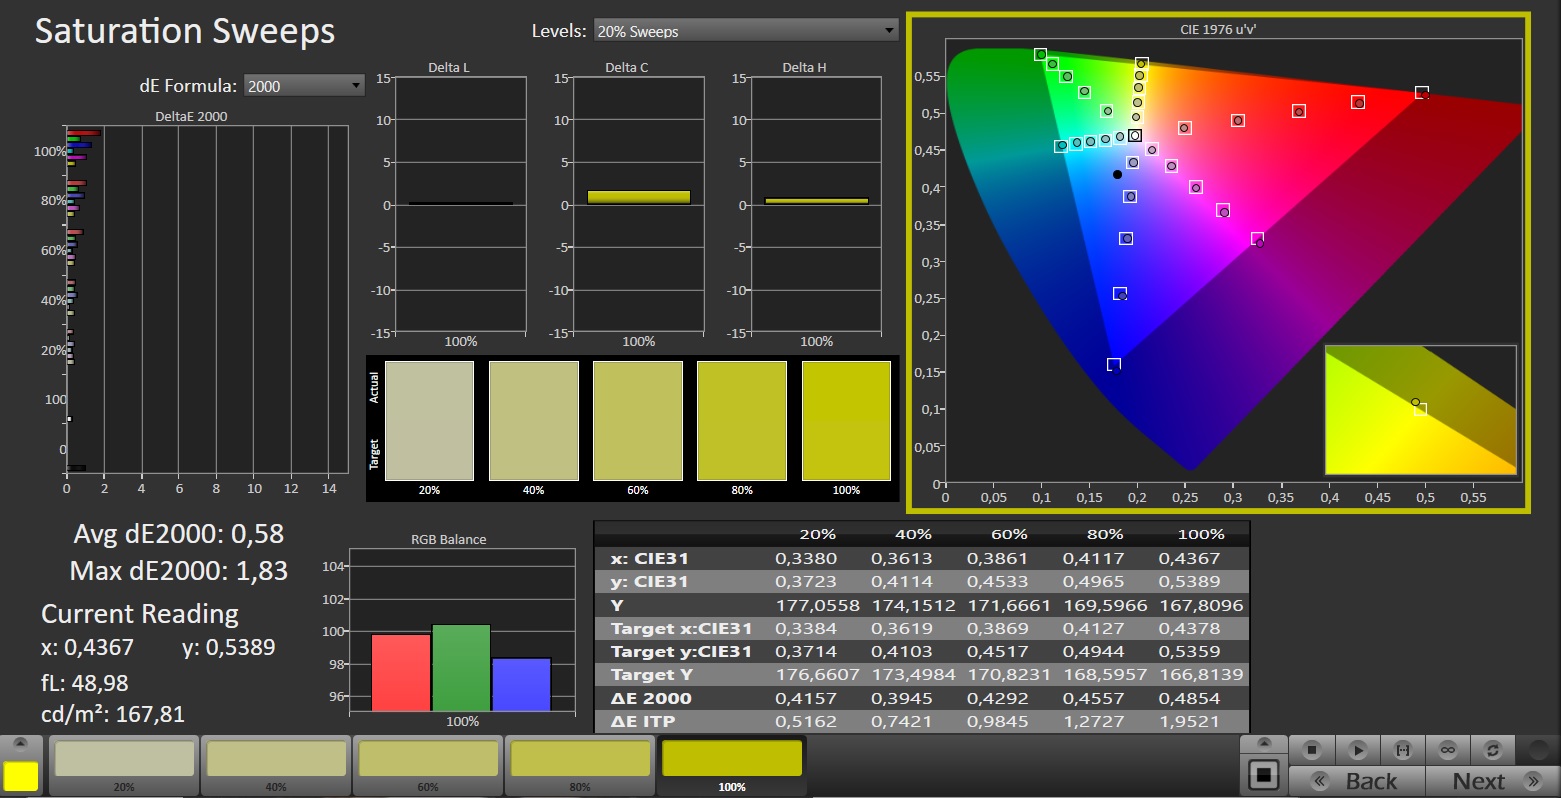
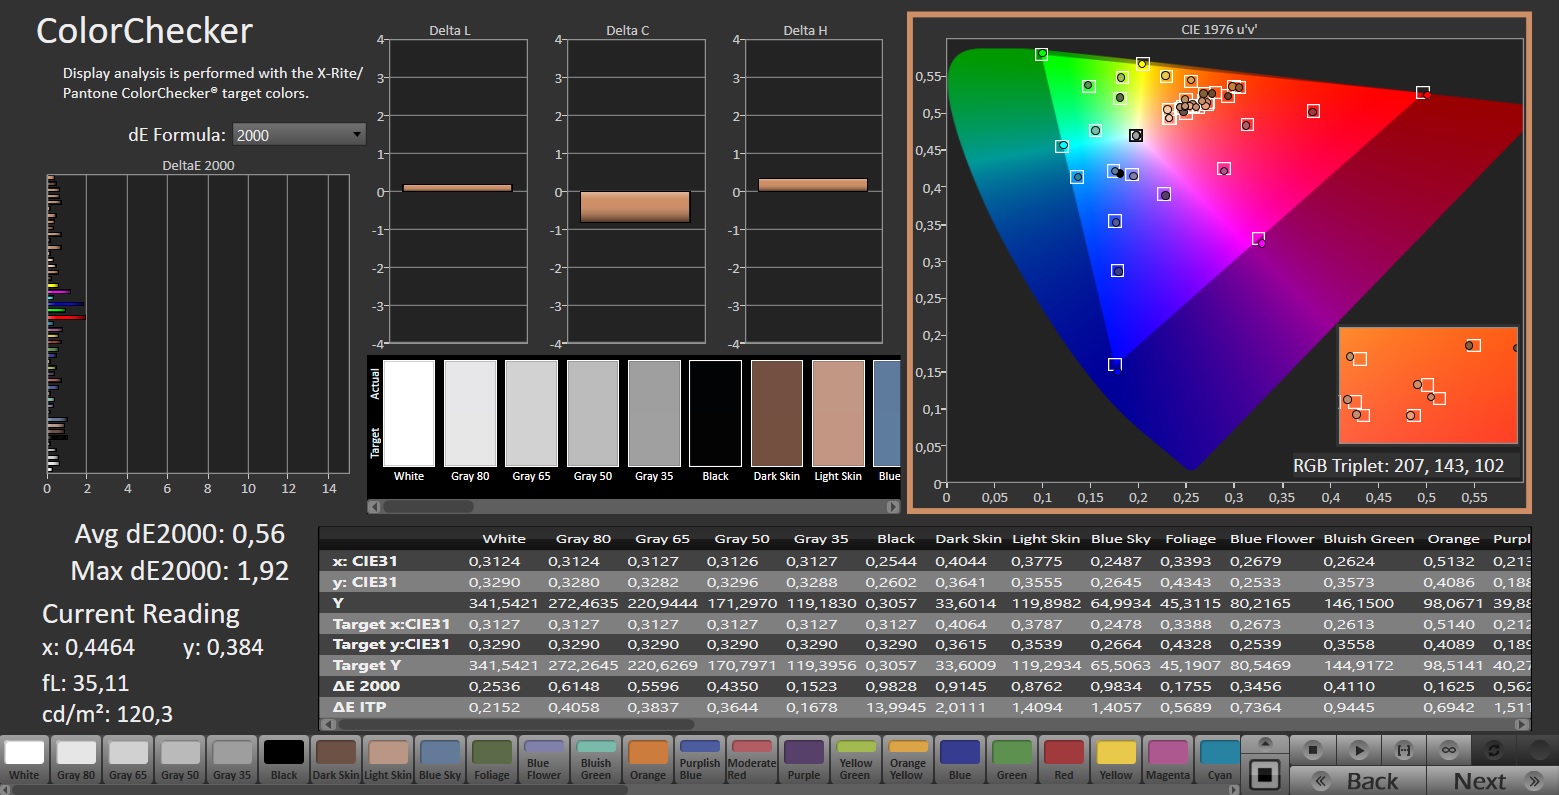
Para um laptop para jogos, seus espaços de cores (100% sRGB, 98% P3 e 86% AdobeRGB) são excepcionalmente bons. Sua precisão de cores também é boa e não requer muita calibração.

Os ângulos de visão do laptop são típicos de um painel IPS, portanto, muito bons. Infelizmente, nosso dispositivo de teste teve um pequeno problema com o sangramento da tela nas bordas do monitor.
Exibir tempos de resposta
| ↔ Tempo de resposta preto para branco | ||
|---|---|---|
| 8.6 ms ... ascensão ↗ e queda ↘ combinadas | ↗ 3.8 ms ascensão | 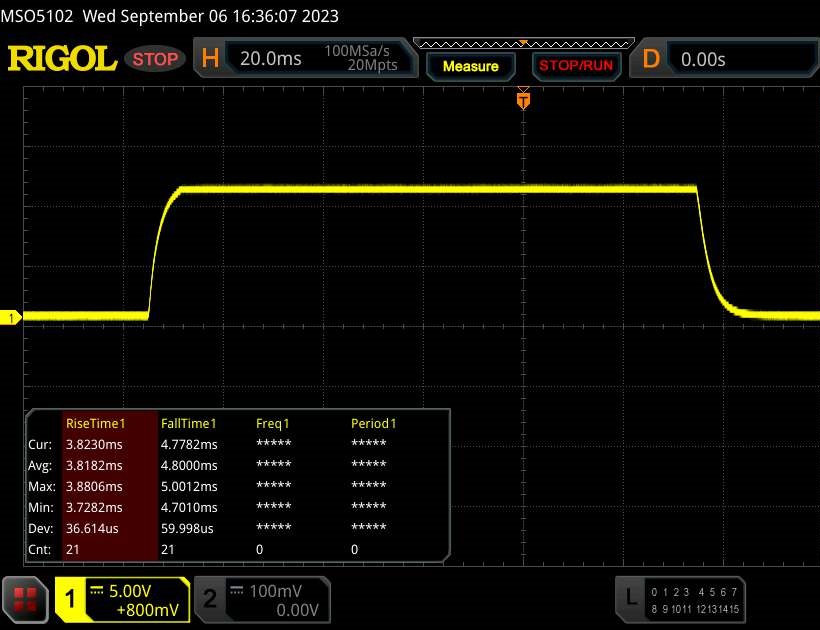 |
| ↘ 4.8 ms queda | ||
| A tela mostra taxas de resposta rápidas em nossos testes e deve ser adequada para jogos. Em comparação, todos os dispositivos testados variam de 0.1 (mínimo) a 240 (máximo) ms. » 24 % de todos os dispositivos são melhores. Isso significa que o tempo de resposta medido é melhor que a média de todos os dispositivos testados (19.8 ms). | ||
| ↔ Tempo de resposta 50% cinza a 80% cinza | ||
| 14.3 ms ... ascensão ↗ e queda ↘ combinadas | ↗ 7.1 ms ascensão | 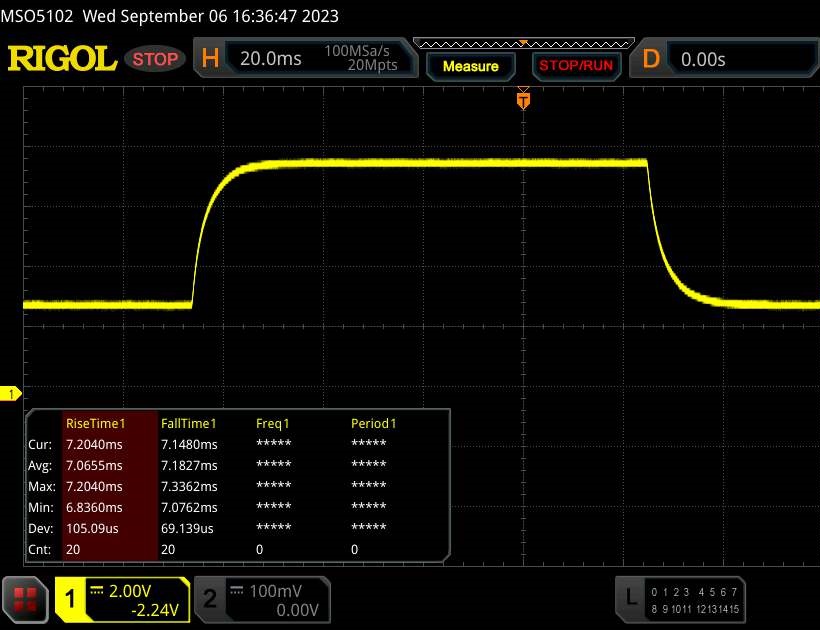 |
| ↘ 7.2 ms queda | ||
| A tela mostra boas taxas de resposta em nossos testes, mas pode ser muito lenta para jogadores competitivos. Em comparação, todos os dispositivos testados variam de 0.165 (mínimo) a 636 (máximo) ms. » 28 % de todos os dispositivos são melhores. Isso significa que o tempo de resposta medido é melhor que a média de todos os dispositivos testados (31 ms). | ||
Cintilação da tela / PWM (modulação por largura de pulso)
| Tela tremeluzindo / PWM não detectado |  | ||
[pwm_comparison] Em comparação: 52 % de todos os dispositivos testados não usam PWM para escurecer a tela. Se PWM foi detectado, uma média de 7754 (mínimo: 5 - máximo: 343500) Hz foi medida. | |||
Desempenho
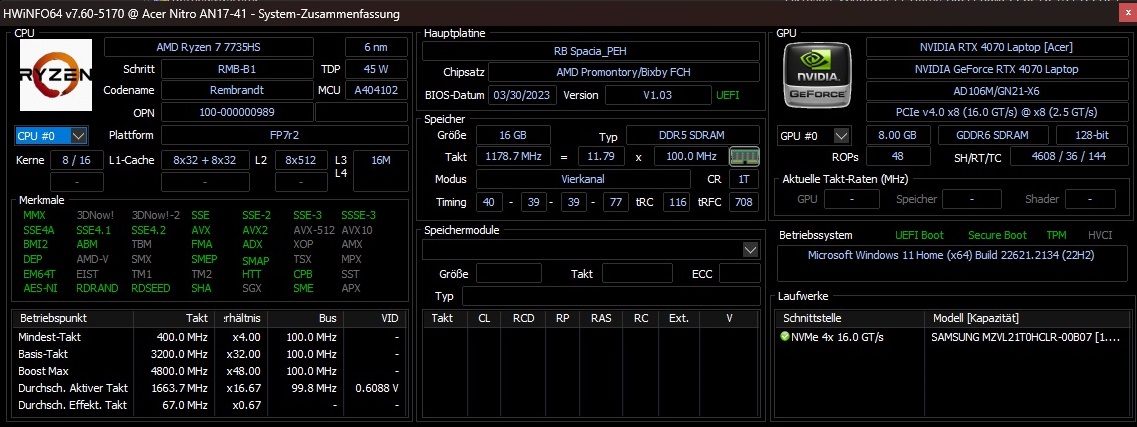
Embora oRyzen 7 7735HStenha que se contentar com a arquitetura Zen 3+ mais antiga (alguns modelos 7000 já contam com o Zen 4), ainda assim consideraríamos o Nitro 17 AN17-41-R9LN no campo da faixa média superior. Seus 16 GB de RAM e SSD de 1 TB não são mais um destaque no ano de 2023, mas ainda são adequados.
Condições de teste
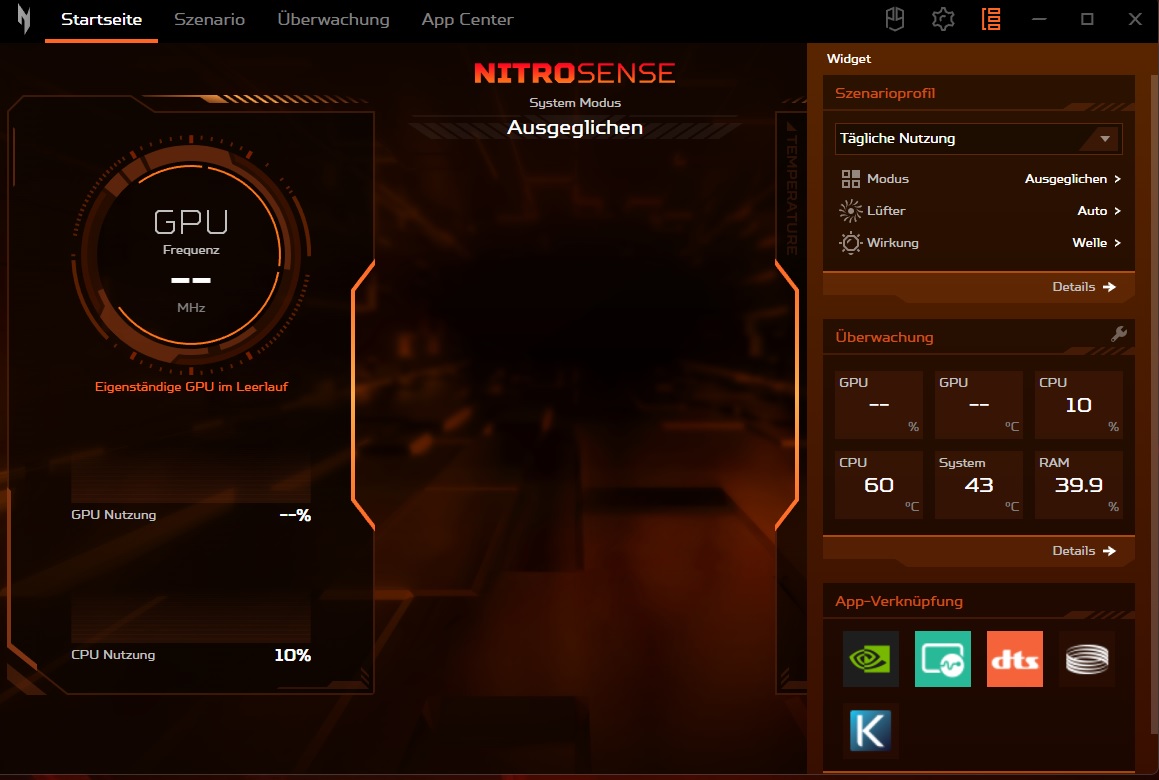
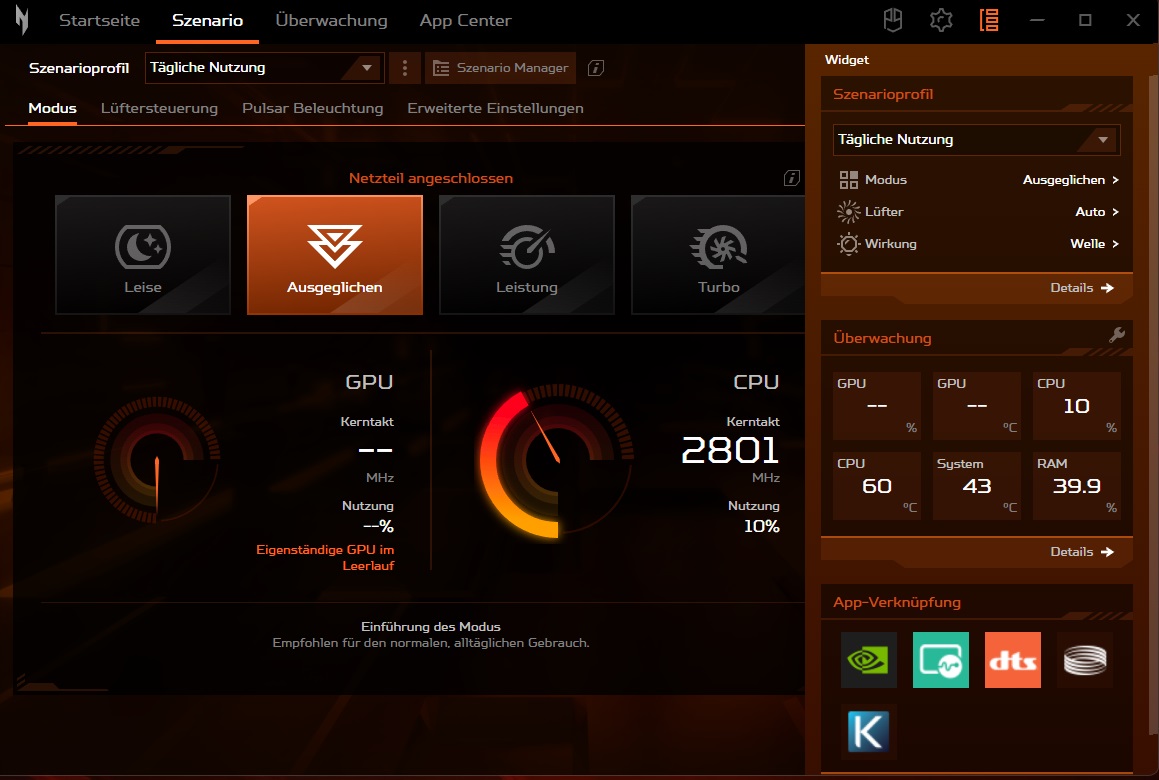
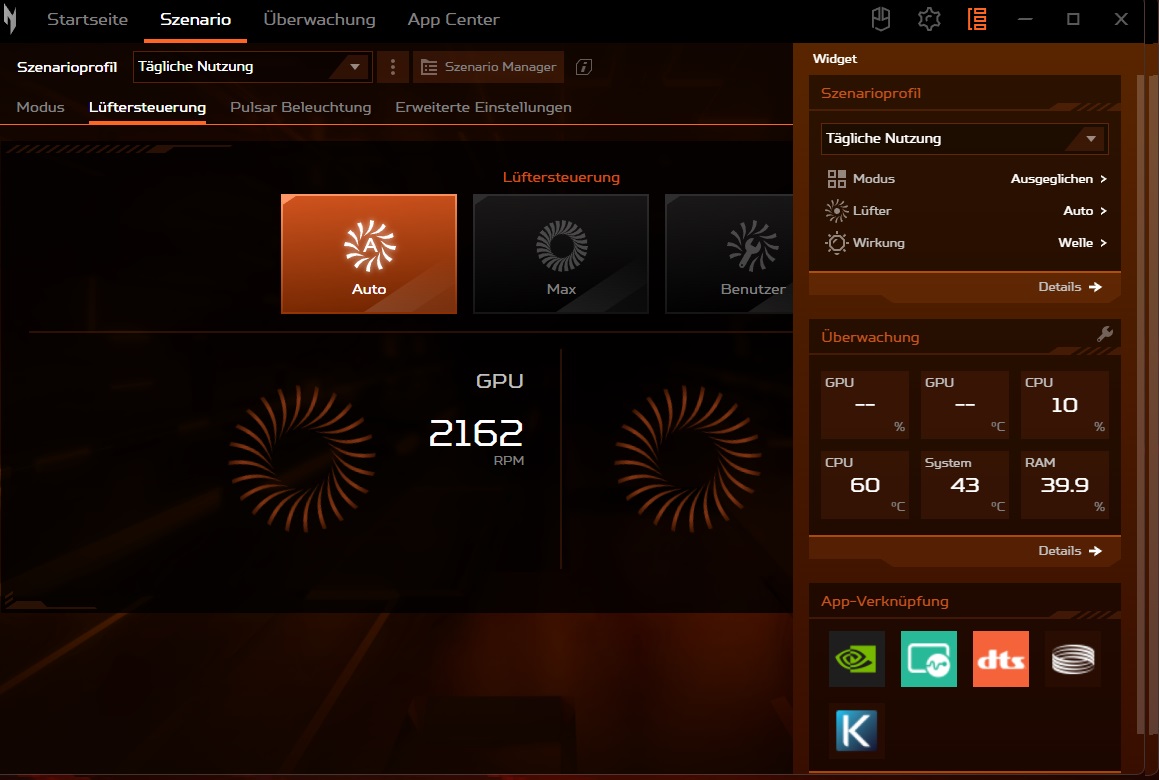
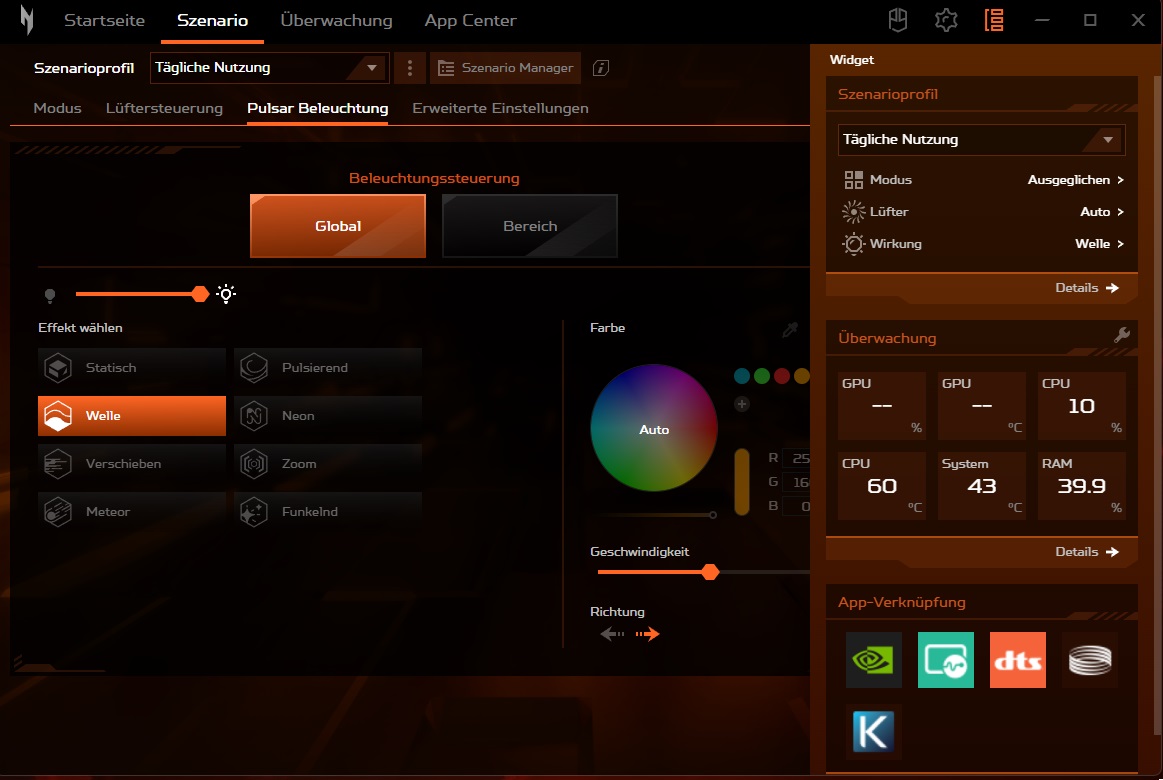
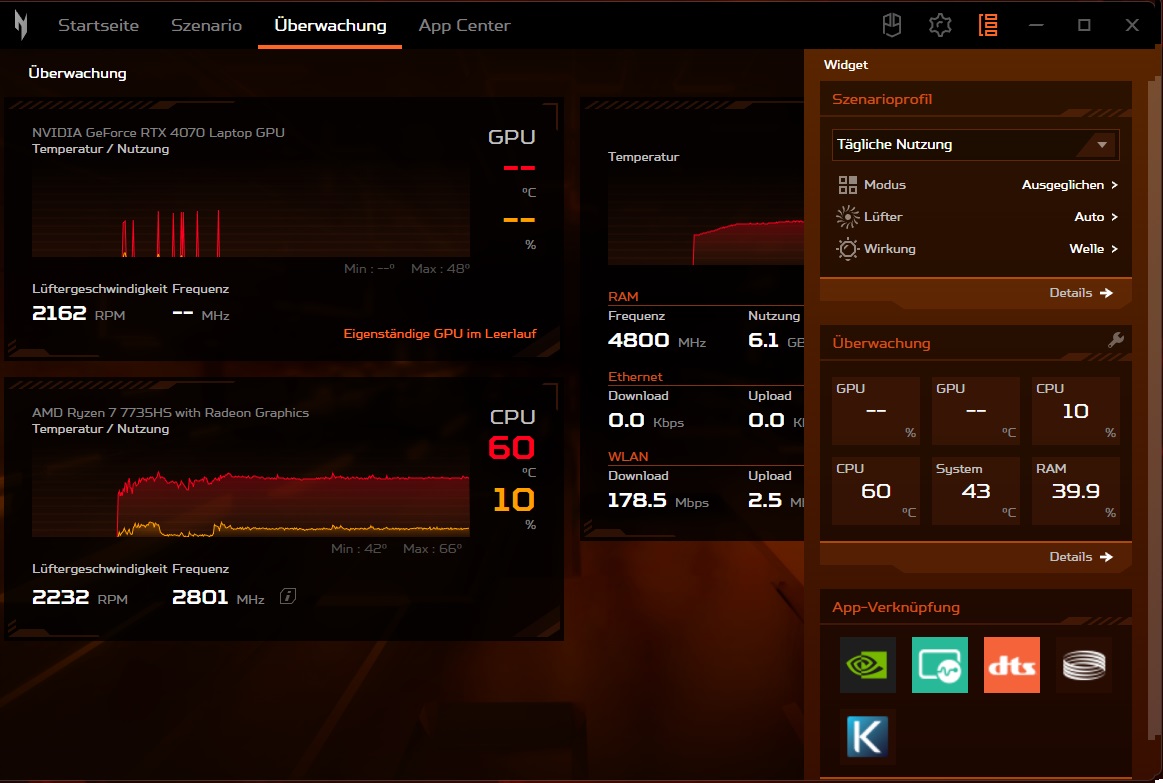
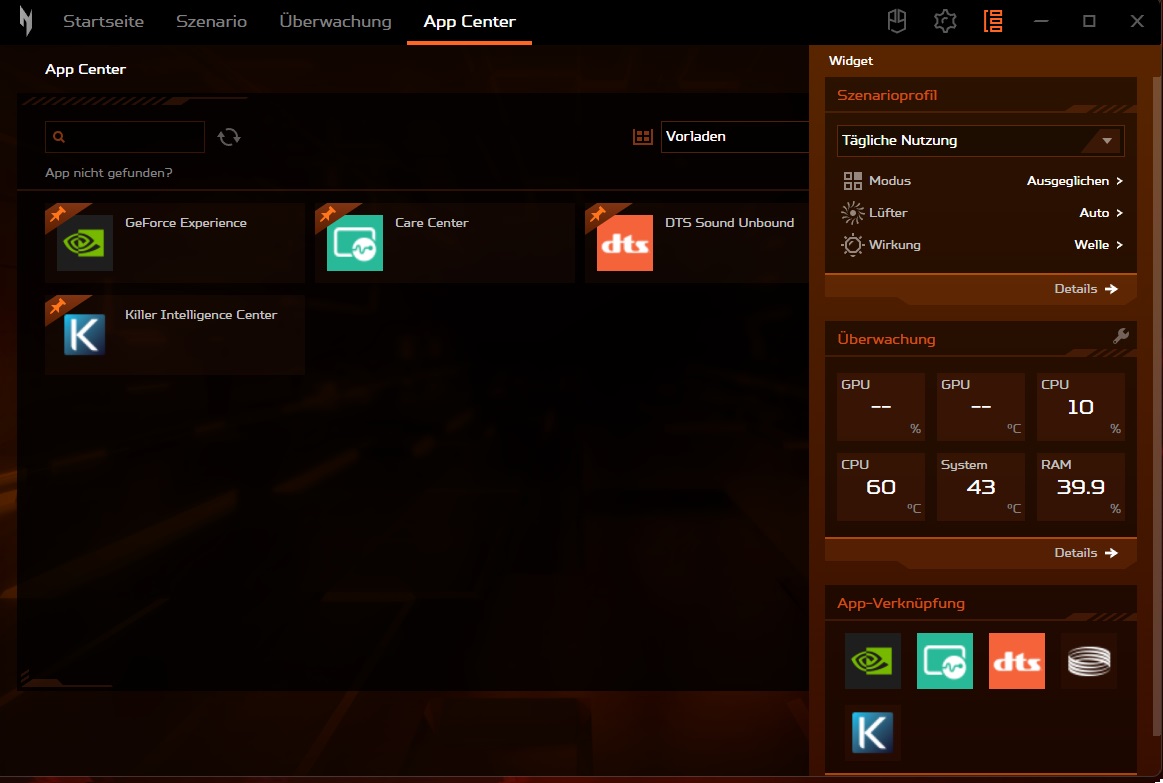
A Acer pré-instalou uma ferramenta chamada Nitro Sense, que pode ser usada para fazer várias alterações no sistema (por exemplo, a iluminação do teclado). Os diferentes modos de desempenho são especialmente importantes para o uso diário. Como não foi possível determinar um aumento real na taxa de quadros a partir dos aplicativos 3D, mas as emissões de ruído aumentaram significativamente, realizamos todas as medições no modo Balanced, que representa o ponto ideal, por assim dizer. O controle da ventoinha estava sempre no modo automático.
| Witcher 3 (FHD/Ultra) | Silencioso | Balanceado | Desempenho | Turbo |
|---|---|---|---|---|
| Desempenho | 60 - 100 fps | ~110 fps | ~111 fps | ~112 fps |
| Ruído | ~38 dB(A) | ~44 dB(A) | ~54 dB(A) | ~61 dB(A) |
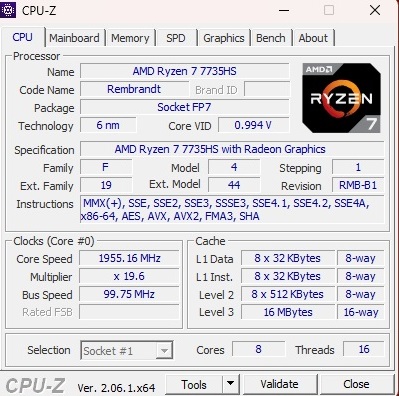
Processador
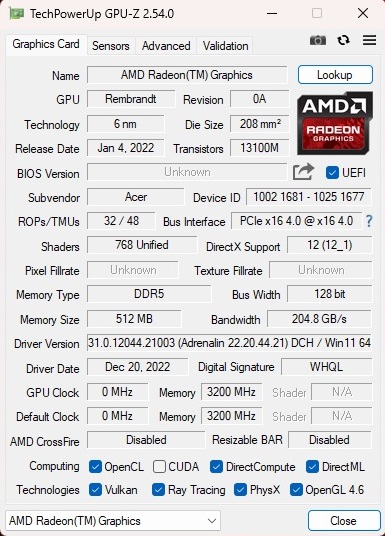
O Ryzen 7 7735HS é um processador octa-core que tem 16 MB de cache L3 e pode processar até 16 threads ao mesmo tempo graças ao SMT. A AMD indicou o modelo de 6 nm como tendo uma taxa de clock de 3,2 a 4,75 GHz sob carga, o que não é pouco nem muito. Uma de suas maiores vantagens é sua iGPU comparativamente poderosa. Durante tarefas pouco exigentes (o dispositivo suporta Advanced Optimus), apenas aRadeon 680M integrada ao processador está ativa, o que pode competir com as GPUs mais antigas de nível básico e, em parte, também de médio porte.
O Ryzen 7 7735HS teve um bom desempenho, mas não excessivo, durante os benchmarks. Seu desempenho foi (como esperado) ligeiramente pior do que o de seu concorrente (mais caro) da Intel, o Core i7-13700H, que possui 14 núcleos e pode processar 20 threads simultaneamente. Em comparação com umCore i9-13900HXou umRyzen 9 7945HXcom arquitetura Zen 4, o 7735HS não teve chance e se saiu um pouco pior. Mesmo assim, o desempenho da CPU permaneceu muito consistente de acordo com nosso loop Cinebench - isso não pode ser dito de todos os outros laptops.
Cinebench R15 Multi continuous test
* ... menor é melhor
AIDA64: FP32 Ray-Trace | FPU Julia | CPU SHA3 | CPU Queen | FPU SinJulia | FPU Mandel | CPU AES | CPU ZLib | FP64 Ray-Trace | CPU PhotoWorxx
| Performance rating | |
| Asus ROG Strix G17 G713PI | |
| Média da turma Gaming | |
| Schenker XMG Focus 17 (E23) | |
| Acer Nitro 17 AN17-51-71ER | |
| MSI Pulse 17 B13VGK | |
| Acer Nitro 17 AN17-41-R9LN | |
| Média AMD Ryzen 7 7735HS | |
| AIDA64 / FP32 Ray-Trace | |
| Asus ROG Strix G17 G713PI | |
| Média da turma Gaming (10227 - 85542, n=105, últimos 2 anos) | |
| Schenker XMG Focus 17 (E23) | |
| MSI Pulse 17 B13VGK | |
| Acer Nitro 17 AN17-51-71ER | |
| Acer Nitro 17 AN17-41-R9LN | |
| Média AMD Ryzen 7 7735HS (11831 - 17161, n=16) | |
| AIDA64 / FPU Julia | |
| Asus ROG Strix G17 G713PI | |
| Média da turma Gaming (51376 - 238426, n=105, últimos 2 anos) | |
| Schenker XMG Focus 17 (E23) | |
| Acer Nitro 17 AN17-41-R9LN | |
| Média AMD Ryzen 7 7735HS (75370 - 105483, n=16) | |
| MSI Pulse 17 B13VGK | |
| Acer Nitro 17 AN17-51-71ER | |
| AIDA64 / CPU SHA3 | |
| Asus ROG Strix G17 G713PI | |
| Média da turma Gaming (2180 - 10115, n=105, últimos 2 anos) | |
| Schenker XMG Focus 17 (E23) | |
| Acer Nitro 17 AN17-51-71ER | |
| MSI Pulse 17 B13VGK | |
| Acer Nitro 17 AN17-41-R9LN | |
| Média AMD Ryzen 7 7735HS (2499 - 3494, n=16) | |
| AIDA64 / CPU Queen | |
| Asus ROG Strix G17 G713PI | |
| Schenker XMG Focus 17 (E23) | |
| Média da turma Gaming (49785 - 173351, n=90, últimos 2 anos) | |
| Acer Nitro 17 AN17-41-R9LN | |
| Acer Nitro 17 AN17-51-71ER | |
| Média AMD Ryzen 7 7735HS (87486 - 108729, n=15) | |
| MSI Pulse 17 B13VGK | |
| AIDA64 / FPU SinJulia | |
| Asus ROG Strix G17 G713PI | |
| Média da turma Gaming (4424 - 33636, n=105, últimos 2 anos) | |
| Schenker XMG Focus 17 (E23) | |
| Acer Nitro 17 AN17-41-R9LN | |
| Média AMD Ryzen 7 7735HS (11233 - 13097, n=16) | |
| MSI Pulse 17 B13VGK | |
| Acer Nitro 17 AN17-51-71ER | |
| AIDA64 / FPU Mandel | |
| Asus ROG Strix G17 G713PI | |
| Média da turma Gaming (25115 - 128721, n=105, últimos 2 anos) | |
| Acer Nitro 17 AN17-41-R9LN | |
| Schenker XMG Focus 17 (E23) | |
| Média AMD Ryzen 7 7735HS (41400 - 58232, n=16) | |
| MSI Pulse 17 B13VGK | |
| Acer Nitro 17 AN17-51-71ER | |
| AIDA64 / CPU AES | |
| Asus ROG Strix G17 G713PI | |
| Acer Nitro 17 AN17-51-71ER | |
| Média da turma Gaming (39258 - 247074, n=105, últimos 2 anos) | |
| Schenker XMG Focus 17 (E23) | |
| MSI Pulse 17 B13VGK | |
| Média AMD Ryzen 7 7735HS (44013 - 137629, n=16) | |
| Acer Nitro 17 AN17-41-R9LN | |
| AIDA64 / CPU ZLib | |
| Asus ROG Strix G17 G713PI | |
| Schenker XMG Focus 17 (E23) | |
| Média da turma Gaming (574 - 2531, n=105, últimos 2 anos) | |
| Acer Nitro 17 AN17-51-71ER | |
| MSI Pulse 17 B13VGK | |
| Acer Nitro 17 AN17-41-R9LN | |
| Média AMD Ryzen 7 7735HS (651 - 906, n=16) | |
| AIDA64 / FP64 Ray-Trace | |
| Asus ROG Strix G17 G713PI | |
| Média da turma Gaming (5509 - 45446, n=105, últimos 2 anos) | |
| Schenker XMG Focus 17 (E23) | |
| MSI Pulse 17 B13VGK | |
| Acer Nitro 17 AN17-51-71ER | |
| Acer Nitro 17 AN17-41-R9LN | |
| Média AMD Ryzen 7 7735HS (1459 - 9094, n=16) | |
| AIDA64 / CPU PhotoWorxx | |
| Schenker XMG Focus 17 (E23) | |
| Média da turma Gaming (12271 - 89891, n=105, últimos 2 anos) | |
| MSI Pulse 17 B13VGK | |
| Acer Nitro 17 AN17-51-71ER | |
| Asus ROG Strix G17 G713PI | |
| Acer Nitro 17 AN17-41-R9LN | |
| Média AMD Ryzen 7 7735HS (17524 - 30542, n=16) | |
Desempenho do sistema
O desempenho do sistema do laptop foi bom o suficiente para que ele ficasse em algum lugar no meio entre os dispositivos de comparação. os 7.240 pontos no PCMark 10 fazem deste um sistema ágil e capaz de tudo.
CrossMark: Overall | Productivity | Creativity | Responsiveness
| PCMark 10 / Score | |
| Média da turma Gaming (5828 - 12414, n=93, últimos 2 anos) | |
| MSI Pulse 17 B13VGK | |
| Asus ROG Strix G17 G713PI | |
| Acer Nitro 17 AN17-41-R9LN | |
| Média AMD Ryzen 7 7735HS, NVIDIA GeForce RTX 4070 Laptop GPU (7220 - 7240, n=2) | |
| Acer Nitro 17 AN17-51-71ER | |
| Schenker XMG Focus 17 (E23) | |
| PCMark 10 / Essentials | |
| Asus ROG Strix G17 G713PI | |
| Acer Nitro 17 AN17-41-R9LN | |
| Média da turma Gaming (8810 - 11935, n=97, últimos 2 anos) | |
| Média AMD Ryzen 7 7735HS, NVIDIA GeForce RTX 4070 Laptop GPU (10579 - 10690, n=2) | |
| MSI Pulse 17 B13VGK | |
| Acer Nitro 17 AN17-51-71ER | |
| Schenker XMG Focus 17 (E23) | |
| PCMark 10 / Productivity | |
| Média da turma Gaming (6845 - 25323, n=95, últimos 2 anos) | |
| Asus ROG Strix G17 G713PI | |
| MSI Pulse 17 B13VGK | |
| Schenker XMG Focus 17 (E23) | |
| Média AMD Ryzen 7 7735HS, NVIDIA GeForce RTX 4070 Laptop GPU (8893 - 9146, n=2) | |
| Acer Nitro 17 AN17-41-R9LN | |
| Acer Nitro 17 AN17-51-71ER | |
| PCMark 10 / Digital Content Creation | |
| Média da turma Gaming (7602 - 19954, n=95, últimos 2 anos) | |
| Acer Nitro 17 AN17-51-71ER | |
| MSI Pulse 17 B13VGK | |
| Acer Nitro 17 AN17-41-R9LN | |
| Média AMD Ryzen 7 7735HS, NVIDIA GeForce RTX 4070 Laptop GPU (10558 - 10834, n=2) | |
| Schenker XMG Focus 17 (E23) | |
| Asus ROG Strix G17 G713PI | |
| CrossMark / Overall | |
| Asus ROG Strix G17 G713PI | |
| Schenker XMG Focus 17 (E23) | |
| Média da turma Gaming (1366 - 2409, n=94, últimos 2 anos) | |
| MSI Pulse 17 B13VGK | |
| Acer Nitro 17 AN17-51-71ER | |
| Média AMD Ryzen 7 7735HS, NVIDIA GeForce RTX 4070 Laptop GPU (n=1) | |
| CrossMark / Productivity | |
| Asus ROG Strix G17 G713PI | |
| Schenker XMG Focus 17 (E23) | |
| Média da turma Gaming (1386 - 2254, n=94, últimos 2 anos) | |
| MSI Pulse 17 B13VGK | |
| Acer Nitro 17 AN17-51-71ER | |
| Média AMD Ryzen 7 7735HS, NVIDIA GeForce RTX 4070 Laptop GPU (n=1) | |
| CrossMark / Creativity | |
| Asus ROG Strix G17 G713PI | |
| Schenker XMG Focus 17 (E23) | |
| Média da turma Gaming (1343 - 2786, n=94, últimos 2 anos) | |
| MSI Pulse 17 B13VGK | |
| Acer Nitro 17 AN17-51-71ER | |
| Média AMD Ryzen 7 7735HS, NVIDIA GeForce RTX 4070 Laptop GPU (n=1) | |
| CrossMark / Responsiveness | |
| MSI Pulse 17 B13VGK | |
| Schenker XMG Focus 17 (E23) | |
| Média da turma Gaming (1226 - 2334, n=94, últimos 2 anos) | |
| Asus ROG Strix G17 G713PI | |
| Acer Nitro 17 AN17-51-71ER | |
| Média AMD Ryzen 7 7735HS, NVIDIA GeForce RTX 4070 Laptop GPU (n=1) | |
| PCMark 10 Score | 7240 pontos | |
Ajuda | ||
| AIDA64 / Memory Copy | |
| Schenker XMG Focus 17 (E23) | |
| Média da turma Gaming (21750 - 129946, n=105, últimos 2 anos) | |
| MSI Pulse 17 B13VGK | |
| Acer Nitro 17 AN17-51-71ER | |
| Asus ROG Strix G17 G713PI | |
| Acer Nitro 17 AN17-41-R9LN | |
| Média AMD Ryzen 7 7735HS (30324 - 52012, n=16) | |
| AIDA64 / Memory Read | |
| Schenker XMG Focus 17 (E23) | |
| Média da turma Gaming (22956 - 118858, n=105, últimos 2 anos) | |
| MSI Pulse 17 B13VGK | |
| Acer Nitro 17 AN17-51-71ER | |
| Asus ROG Strix G17 G713PI | |
| Acer Nitro 17 AN17-41-R9LN | |
| Média AMD Ryzen 7 7735HS (33938 - 51856, n=16) | |
| AIDA64 / Memory Write | |
| Média da turma Gaming (22297 - 135096, n=105, últimos 2 anos) | |
| Schenker XMG Focus 17 (E23) | |
| Acer Nitro 17 AN17-51-71ER | |
| MSI Pulse 17 B13VGK | |
| Asus ROG Strix G17 G713PI | |
| Acer Nitro 17 AN17-41-R9LN | |
| Média AMD Ryzen 7 7735HS (33175 - 55284, n=16) | |
| AIDA64 / Memory Latency | |
| Acer Nitro 17 AN17-51-71ER | |
| Média da turma Gaming (75.3 - 259, n=105, últimos 2 anos) | |
| MSI Pulse 17 B13VGK | |
| Média AMD Ryzen 7 7735HS (78.2 - 109.8, n=16) | |
| Schenker XMG Focus 17 (E23) | |
| Acer Nitro 17 AN17-41-R9LN | |
| Asus ROG Strix G17 G713PI | |
* ... menor é melhor
Latência DPC
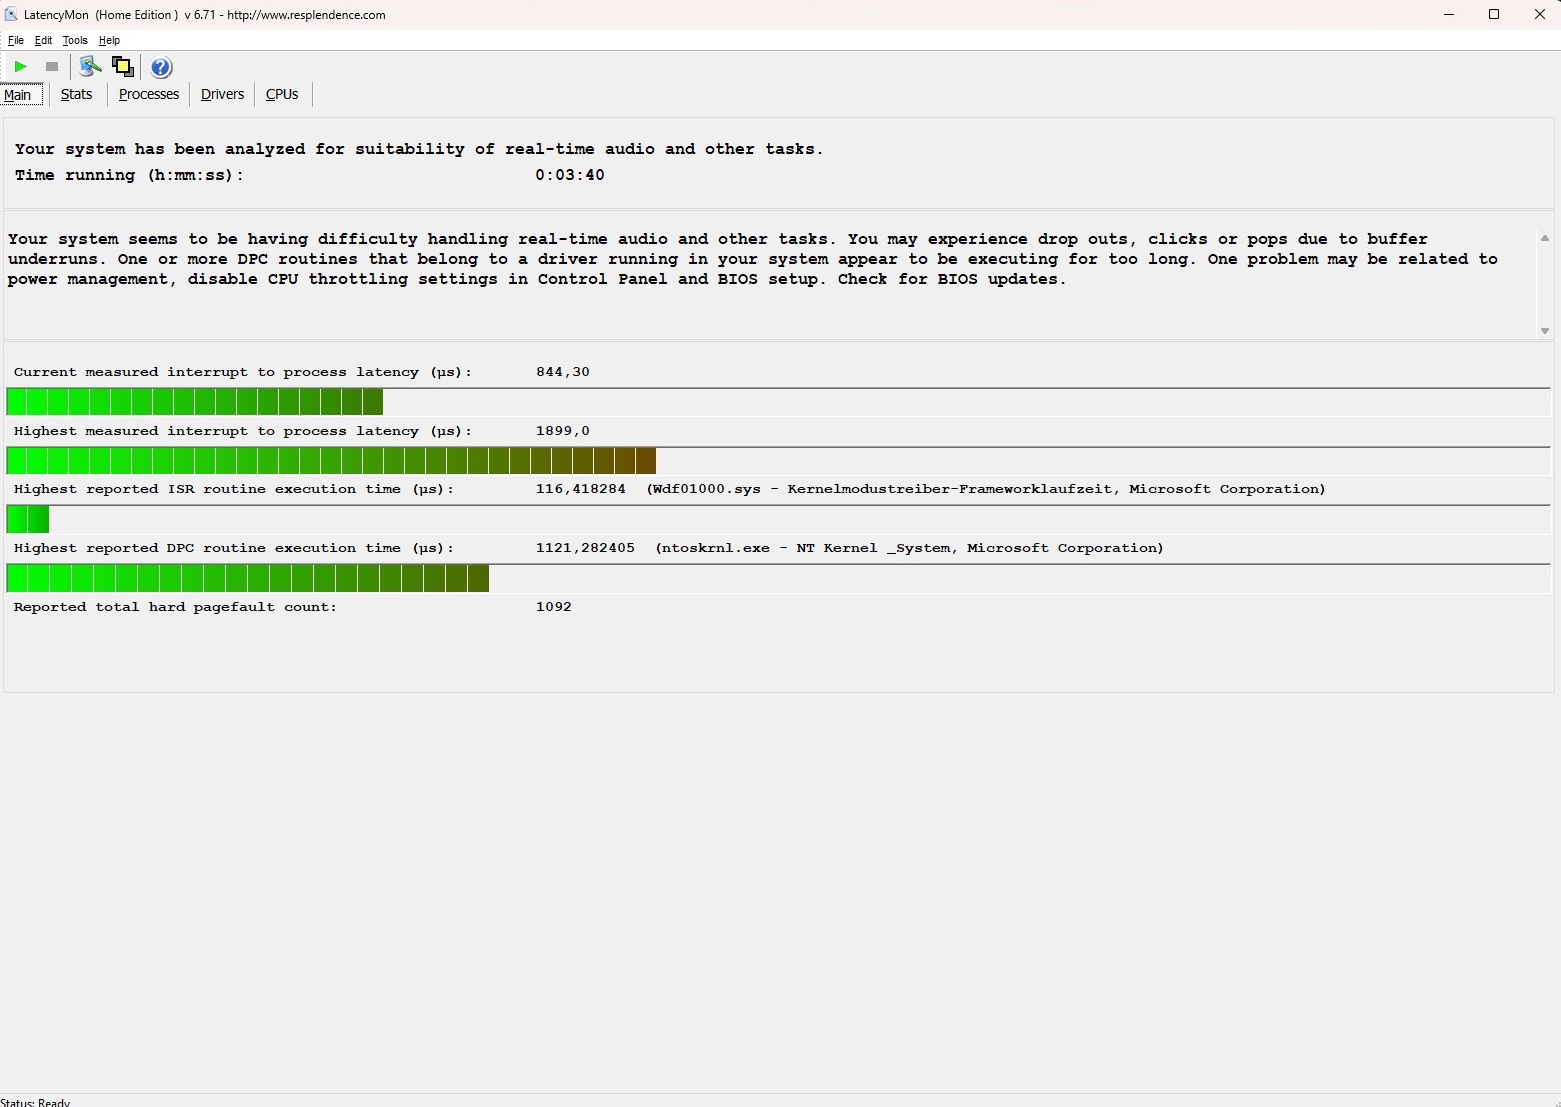
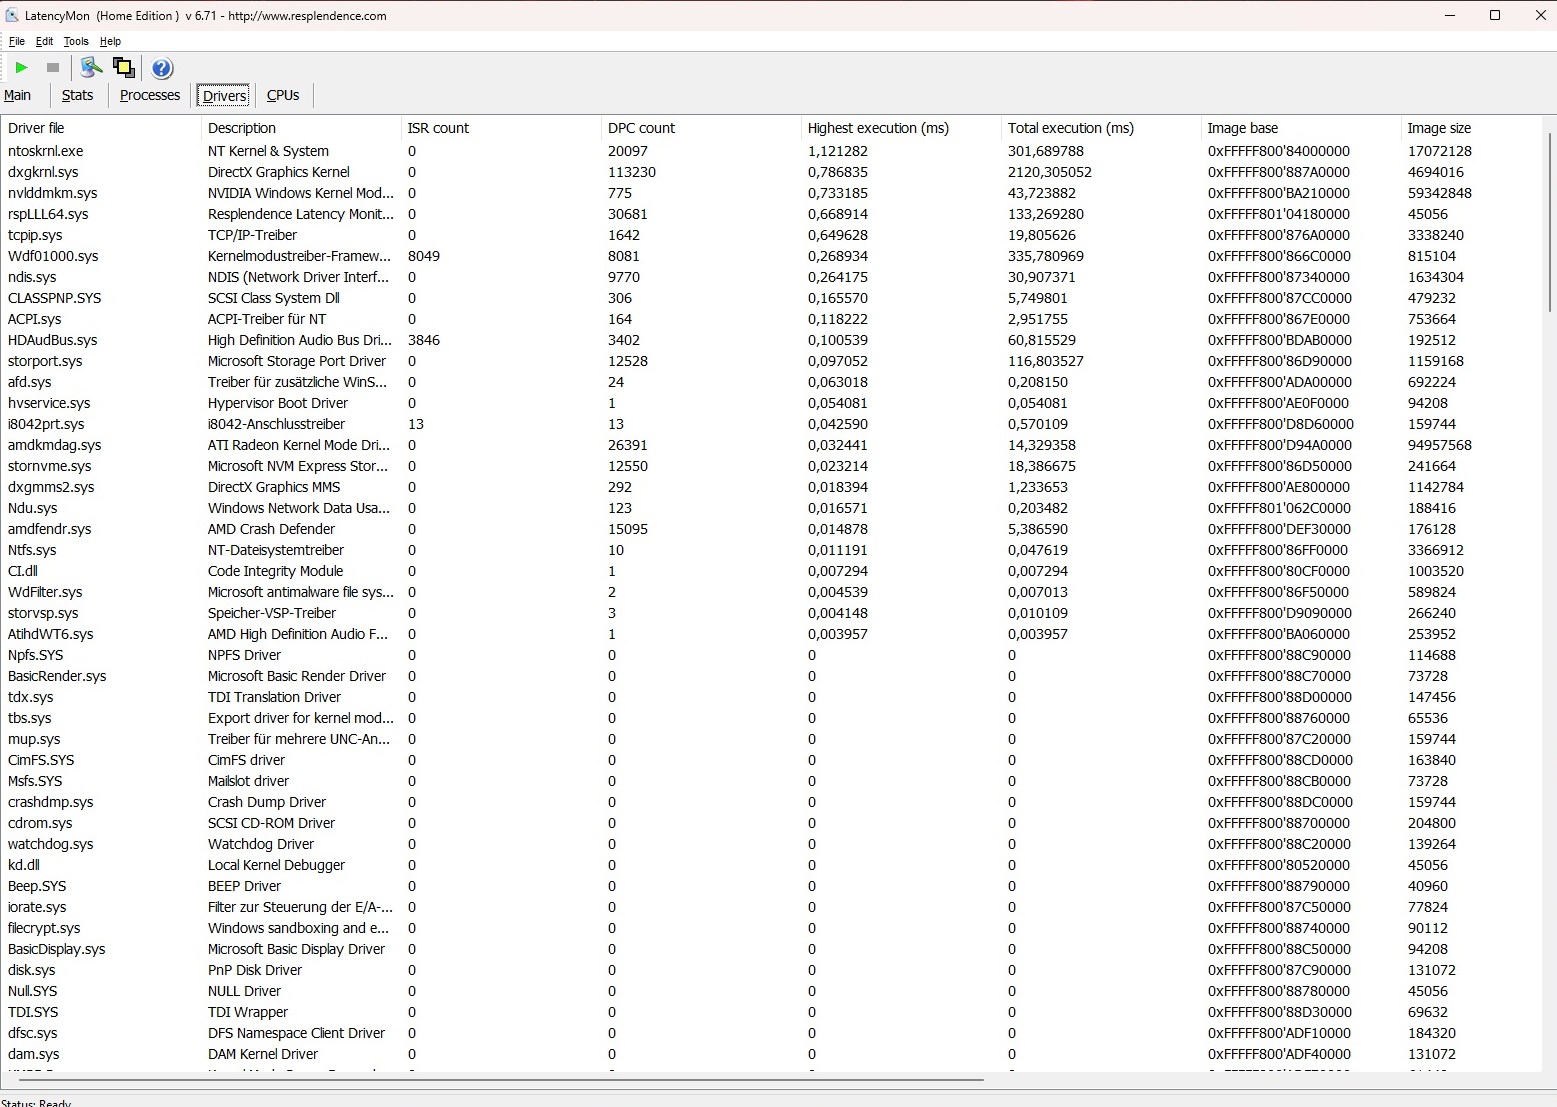
O Nitro 17 tem que aceitar críticas por suas altas latências. De acordo com a ferramenta LatencyMon, o laptop é apenas condicionalmente adequado para edição de vídeo e áudio em tempo real em seu estado de entrega.
| DPC Latencies / LatencyMon - interrupt to process latency (max), Web, Youtube, Prime95 | |
| Acer Nitro 17 AN17-41-R9LN | |
| Asus ROG Strix G17 G713PI | |
| Acer Nitro 17 AN17-51-71ER | |
| MSI Pulse 17 B13VGK | |
| Schenker XMG Focus 17 (E23) | |
* ... menor é melhor
Dispositivos de armazenamento
O laptop está equipado com uma unidade NVMe da Samsung. O modelo PM9A1 apresentou resultados muito bons no benchmark AS SSD, bem como em suas taxas de leitura e gravação. Infelizmente, seu desempenho caiu consideravelmente depois de um tempo e permaneceu muito instável (consulte DiskSpd-Loop).

* ... menor é melhor
Reading continuous performance: DiskSpd Read Loop, Queue Depth 8
Placa de vídeo
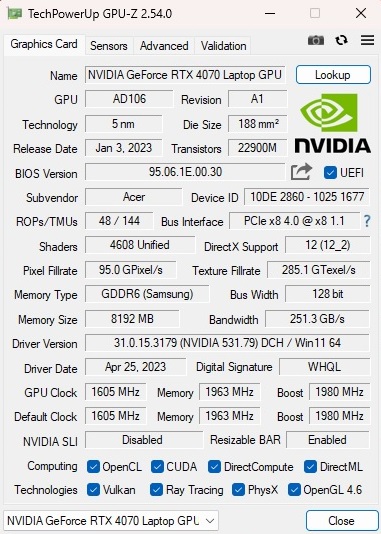
O GeForce RTX 4070 da geração Ada Lovelace da Nvidia cuida dos cálculos gráficos complexos. Devido à sua RAM limitada (8 GB GDDR6) e à interface relativamente estreita (128 bits), classificaríamos esse laptop para jogos como um dispositivo de médio porte superior e não de alto nível. O RTX 4070 tem um TGP de 140 watts, que é o máximo para esse chip gráfico.
Seus resultados de benchmark foram relativamente pouco espetaculares, pois o desempenho da GPU do Nitro 17 é praticamente o mesmo da média do RTX 4070. Sua vitória de desempenho sobre o modelo RTX 4060 é limitada, como pode ser visto em nossa tabela.
| 3DMark Performance rating - Percent | |
| Média da turma Gaming | |
| Schenker XMG Focus 17 (E23) -1! | |
| Asus ROG Strix G17 G713PI -1! | |
| MSI Pulse 17 B13VGK | |
| Média NVIDIA GeForce RTX 4070 Laptop GPU | |
| Acer Nitro 17 AN17-41-R9LN | |
| Acer Nitro 17 AN17-51-71ER -1! | |
| 3DMark 11 Performance | 30265 pontos | |
| 3DMark Ice Storm Standard Score | 215395 pontos | |
| 3DMark Cloud Gate Standard Score | 59285 pontos | |
| 3DMark Fire Strike Score | 25639 pontos | |
| 3DMark Time Spy Score | 10950 pontos | |
Ajuda | ||
* ... menor é melhor
Desempenho em jogos
A situação é semelhante quando se trata de jogos. Aqui, também, seu desempenho foi semelhante à média determinada anteriormente, e a RTX 4070 quase não se saiu melhor do que a RTX 4060 em alguns casos.
| The Witcher 3 - 1920x1080 Ultra Graphics & Postprocessing (HBAO+) | |
| Média da turma Gaming (104.7 - 240, n=7, últimos 2 anos) | |
| Asus ROG Strix G17 G713PI | |
| Schenker XMG Focus 17 (E23) | |
| Média NVIDIA GeForce RTX 4070 Laptop GPU (69.8 - 133.7, n=57) | |
| Acer Nitro 17 AN17-41-R9LN | |
| MSI Pulse 17 B13VGK | |
| Acer Nitro 17 AN17-51-71ER | |
| Final Fantasy XV Benchmark - 1920x1080 High Quality | |
| Média da turma Gaming (41 - 215, n=95, últimos 2 anos) | |
| Schenker XMG Focus 17 (E23) | |
| Asus ROG Strix G17 G713PI | |
| MSI Pulse 17 B13VGK | |
| Média NVIDIA GeForce RTX 4070 Laptop GPU (41 - 131.9, n=65) | |
| Acer Nitro 17 AN17-41-R9LN | |
| Acer Nitro 17 AN17-51-71ER | |
Se você se limitar à resolução Full HD, ou seja, 1.920 x 1.080 pixels, até mesmo jogos exigentes, como Immortals of Aveum, poderão ser executados com o máximo de detalhes e atingir pelo menos 40 FPS. A maioria dos jogos é executada a mais de 60 FPS em FHD. A RTX 4070 também é forte o suficiente para a resolução QHD nativa, com algumas exceções, e a taxa de atualização de 165 Hz da tela raramente é utilizada.
| Armored Core 6 - 2560x1440 Maximum Preset | |
| XMG Pro 15 E23 | |
| Média NVIDIA GeForce RTX 4070 Laptop GPU (76.2 - 85, n=2) | |
| Acer Nitro 17 AN17-41-R9LN | |
| Média da turma Gaming (n=1últimos 2 anos) | |
| Immortals of Aveum - 2560x1440 Ultra AF:16x | |
| XMG Pro 15 E23 | |
| Média NVIDIA GeForce RTX 4070 Laptop GPU (32 - 35, n=2) | |
| Acer Nitro 17 AN17-41-R9LN | |
| Atlas Fallen - 2560x1440 Very High Preset | |
| XMG Pro 15 E23 | |
| Média NVIDIA GeForce RTX 4070 Laptop GPU (80.6 - 89.5, n=2) | |
| Acer Nitro 17 AN17-41-R9LN | |
| Baldur's Gate 3 - 2560x1440 Ultra Preset AA:T | |
| Média da turma Gaming (60 - 175.5, n=85, últimos 2 anos) | |
| Média NVIDIA GeForce RTX 4070 Laptop GPU (54.4 - 89.6, n=25) | |
| XMG Pro 15 E23 | |
| Acer Nitro 17 AN17-41-R9LN | |
| Ratchet & Clank Rift Apart - 2560x1440 Very High Preset AA:T | |
| XMG Pro 15 E23 | |
| Média NVIDIA GeForce RTX 4070 Laptop GPU (48.7 - 49.1, n=3) | |
| Acer Nitro 17 AN17-41-R9LN | |
| Sons of the Forest - 2560x1440 Ultra Preset AA:T | |
| Média NVIDIA GeForce RTX 4070 Laptop GPU (61 - 69.5, n=2) | |
| Acer Nitro 17 AN17-41-R9LN | |
| Atomic Heart - 2560x1440 Atomic Preset | |
| Média NVIDIA GeForce RTX 4070 Laptop GPU (51.6 - 58.9, n=3) | |
| Acer Nitro 17 AN17-41-R9LN | |
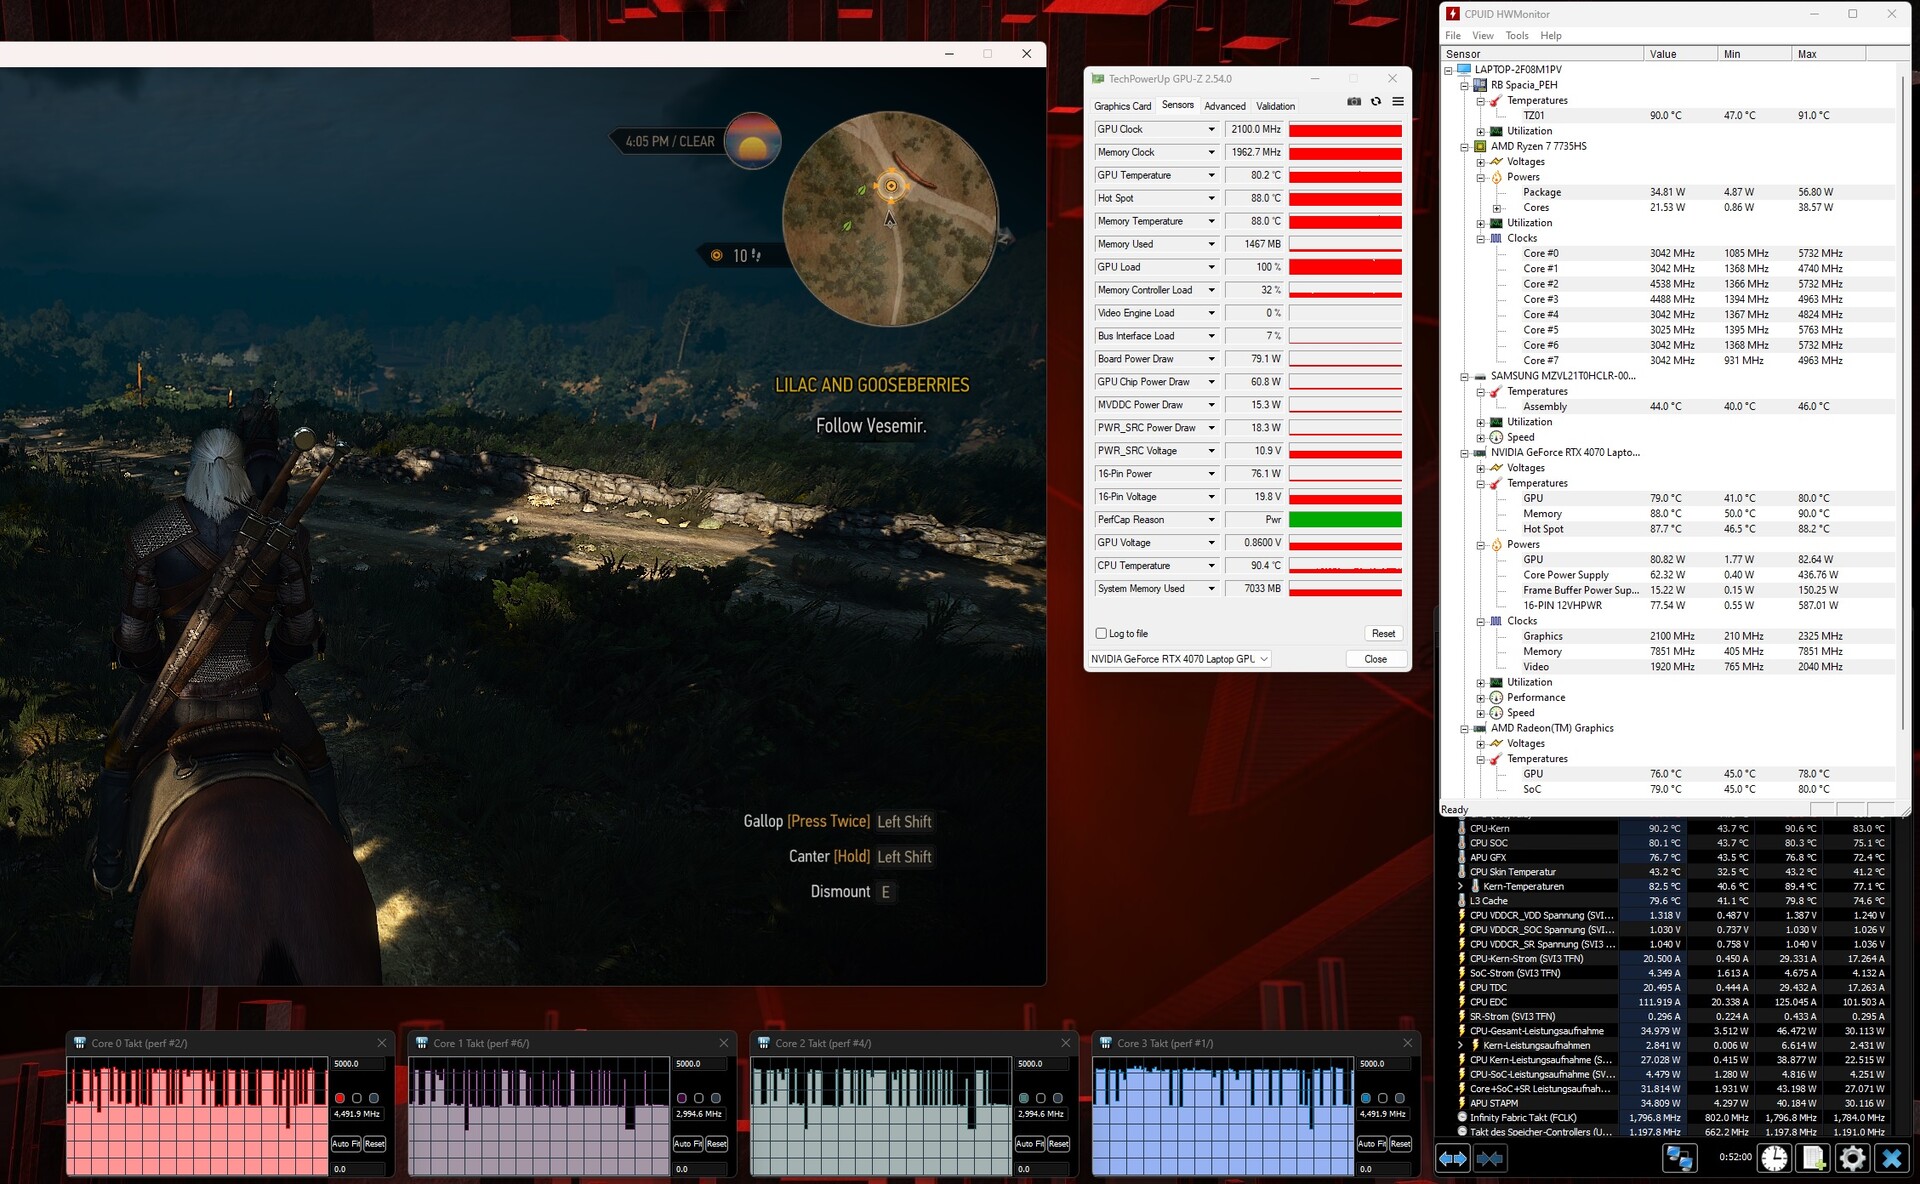
Testamos como o desempenho 3D se comportou em um período de cerca de 60 minutos com a ajuda do site Witcher 3 (FHD/Ultra). Você pode ver na tabela abaixo que não houve quedas na taxa de quadros.
Witcher 3 FPS diagram
| baixo | média | alto | ultra | QHD | |
|---|---|---|---|---|---|
| GTA V (2015) | 168.5 | 152.8 | 94.4 | ||
| The Witcher 3 (2015) | 110 | ||||
| Dota 2 Reborn (2015) | 135.8 | 122.8 | 114.5 | 108.3 | |
| Final Fantasy XV Benchmark (2018) | 144.4 | 106.3 | |||
| X-Plane 11.11 (2018) | 106.3 | 98 | 78.4 | ||
| Strange Brigade (2018) | 278 | 225 | 195 | ||
| Atomic Heart (2023) | 132.5 | 95 | 74.2 | 51.6 | |
| Sons of the Forest (2023) | 73.3 | 71.9 | 71.1 | 61 | |
| Ratchet & Clank Rift Apart (2023) | 72.3 | 60.2 | 56.3 | 48.7 | |
| Atlas Fallen (2023) | 124.7 | 119.9 | 105.3 | 80.6 | |
| Immortals of Aveum (2023) | 57.1 | 46.9 | 32 | ||
| Armored Core 6 (2023) | 92.1 | 91.1 | 87.2 | 76.2 | |
| Baldur's Gate 3 (2023) | 113.9 | 95.3 | 94.4 | 62.5 |
Emissões
Emissões de ruído
Embora os níveis de emissão de ruído fossem bastante incômodos no modo Performance (54 dB) e no modo Turbo (61 dB), os ventiladores ainda eram audíveis no modo Balanced (44 dB), mas não de forma desconfortável. Isso significa que recomendamos o uso dessa configuração. No modo inativo, o laptop de 17 polegadas geralmente se comporta de forma bastante silenciosa. As ventoinhas estão completamente desligadas ou ouve-se apenas um sutil ruído de "whooshing". Os ventiladores raramente giram com rapidez irritante.
Barulho
| Ocioso |
| 25 / 27 / 29 dB |
| Carga |
| 42 / 45 dB |
 | ||
30 dB silencioso 40 dB(A) audível 50 dB(A) ruidosamente alto |
||
min: | ||
| Acer Nitro 17 AN17-41-R9LN R7 7735HS, GeForce RTX 4070 Laptop GPU | Acer Nitro 17 AN17-51-71ER i7-13700H, GeForce RTX 4060 Laptop GPU | MSI Pulse 17 B13VGK i7-13700H, GeForce RTX 4070 Laptop GPU | Schenker XMG Focus 17 (E23) i9-13900HX, GeForce RTX 4070 Laptop GPU | Asus ROG Strix G17 G713PI R9 7945HX, GeForce RTX 4070 Laptop GPU | |
|---|---|---|---|---|---|
| Noise | -4% | 7% | -10% | -5% | |
| desligado / ambiente * (dB) | 24 | 24 -0% | 24 -0% | 24 -0% | 25 -4% |
| Idle Minimum * (dB) | 25 | 24 4% | 24 4% | 24 4% | 26 -4% |
| Idle Average * (dB) | 27 | 24 11% | 24 11% | 24 11% | 29 -7% |
| Idle Maximum * (dB) | 29 | 32.32 -11% | 24 17% | 26.47 9% | 30 -3% |
| Load Average * (dB) | 42 | 35.18 16% | 32.49 23% | 55.72 -33% | 46 -10% |
| Witcher 3 ultra * (dB) | 44 | 54.78 -25% | 46.51 -6% | 57.94 -32% | 46 -5% |
| Load Maximum * (dB) | 45 | 54.78 -22% | 46.51 -3% | 57.94 -29% | 47 -4% |
* ... menor é melhor
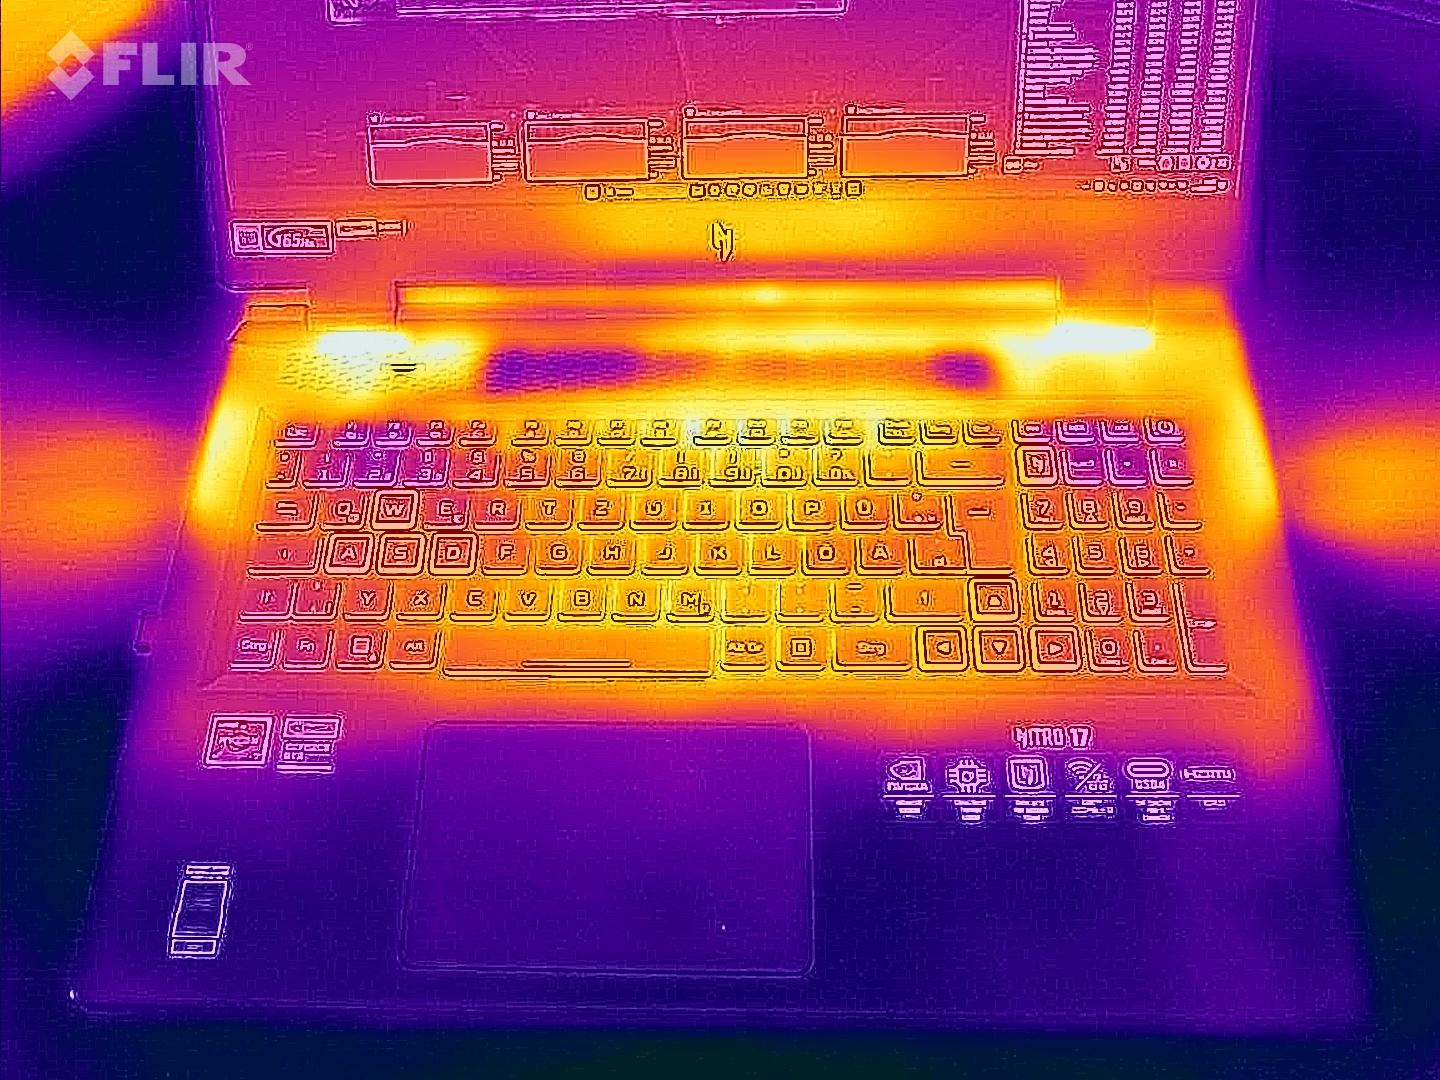
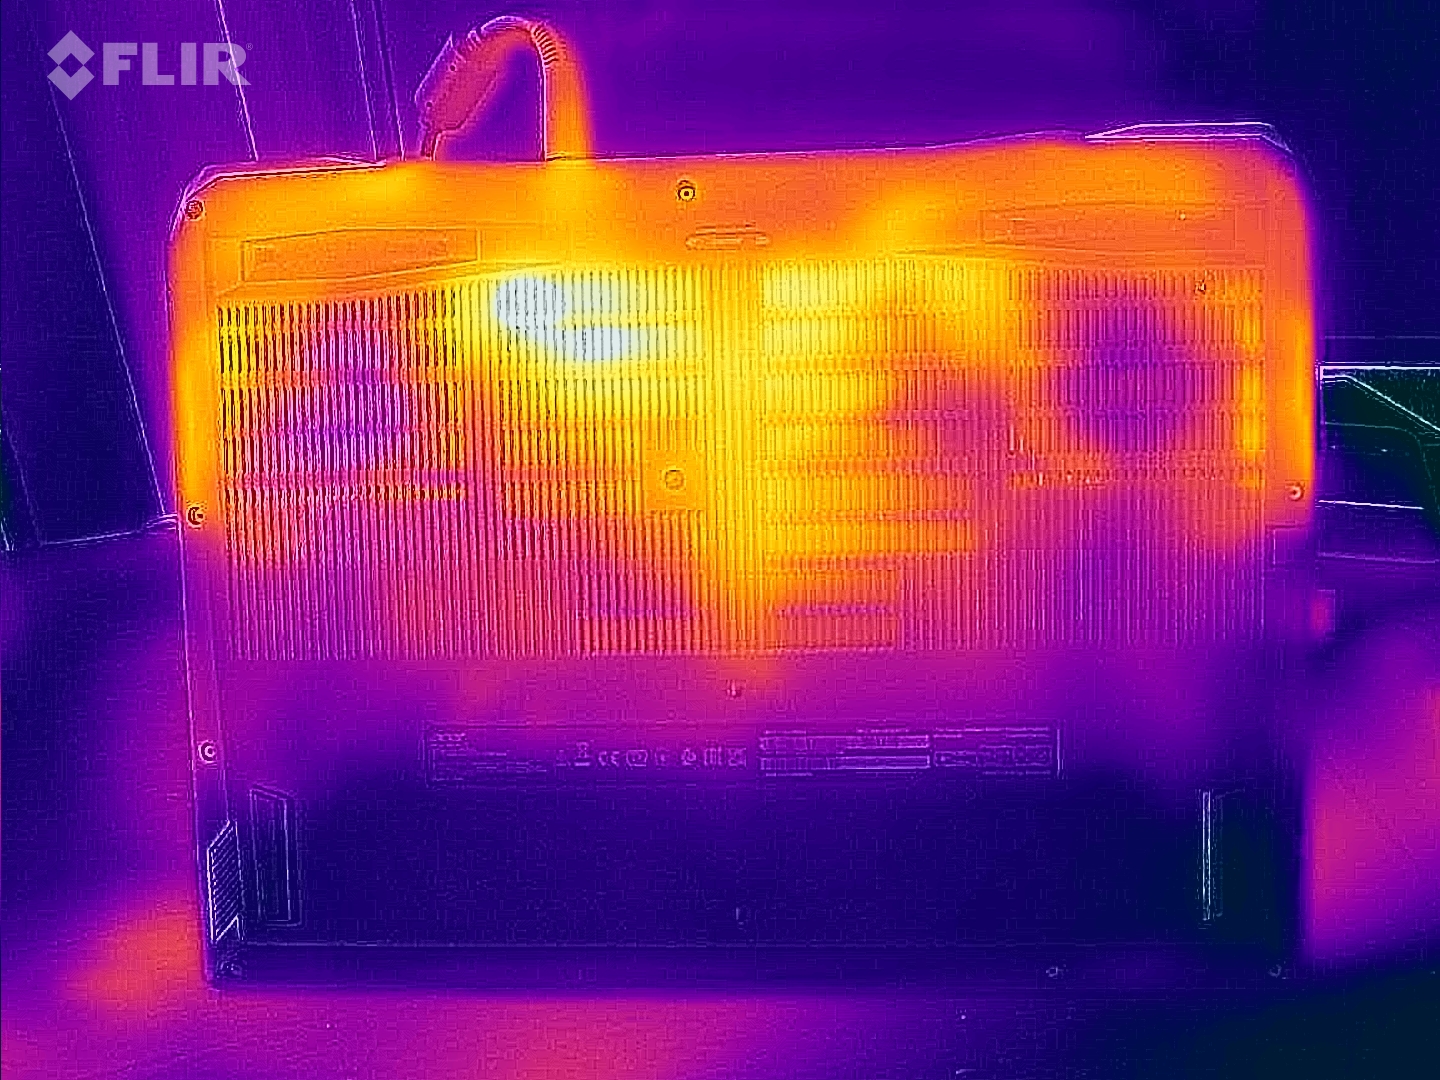
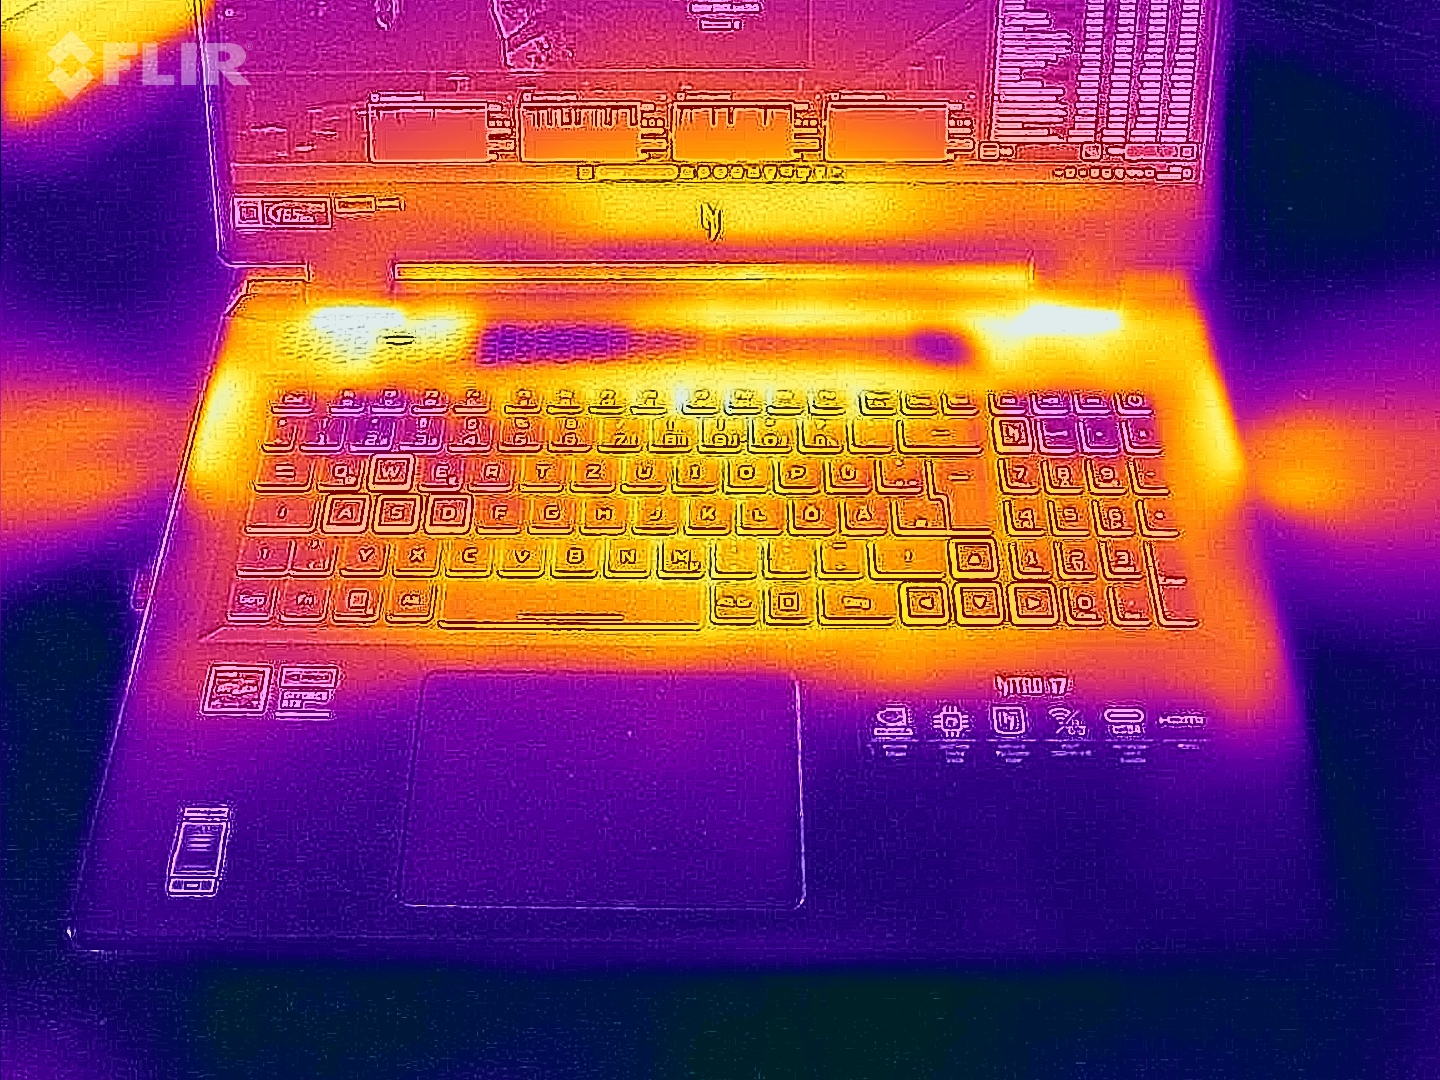
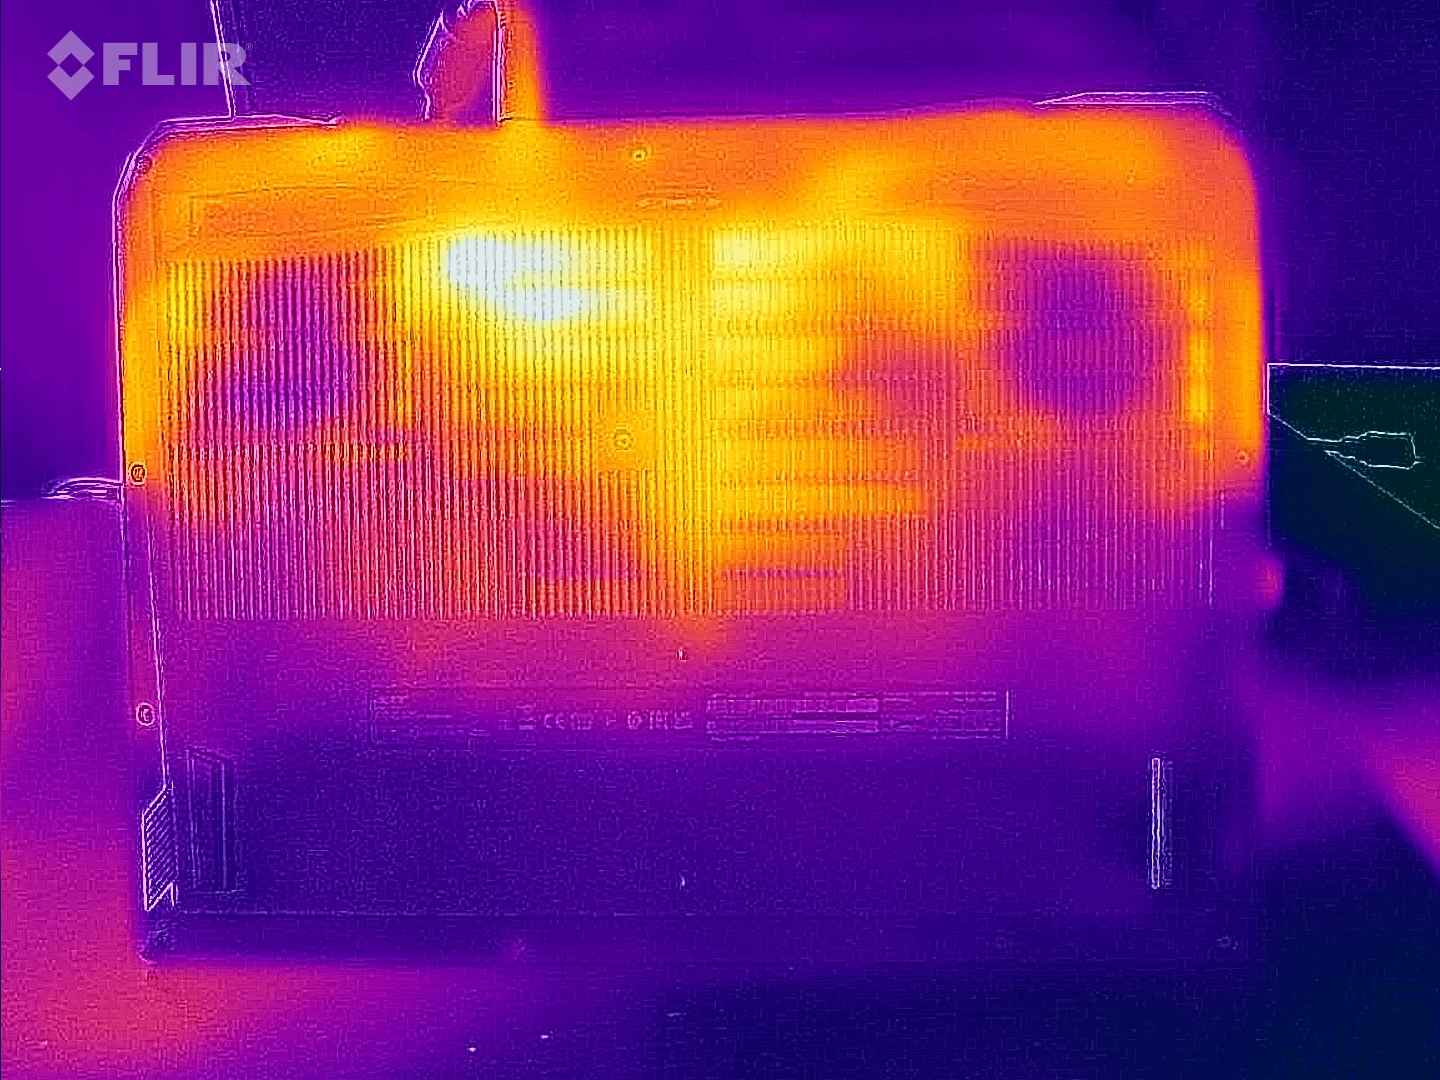
Temperatura
As temperaturas do laptop são semelhantes às de seus concorrentes. Durante o teste Witcher 3 teste de jogos, observamos um máximo de 46 °C na parte superior do gabinete e um máximo de 55 °C na parte inferior. No modo inativo, todo o gabinete permanece bastante frio. Na maioria das vezes, medimos temperaturas abaixo de 30 °C.
(-) A temperatura máxima no lado superior é 47 °C / 117 F, em comparação com a média de 40.4 °C / 105 F , variando de 21.2 a 68.8 °C para a classe Gaming.
(-) A parte inferior aquece até um máximo de 53 °C / 127 F, em comparação com a média de 43.2 °C / 110 F
(+) Em uso inativo, a temperatura média para o lado superior é 28.4 °C / 83 F, em comparação com a média do dispositivo de 33.9 °C / ### class_avg_f### F.
(-) Jogando The Witcher 3, a temperatura média para o lado superior é 38.1 °C / 101 F, em comparação com a média do dispositivo de 33.9 °C / ## #class_avg_f### F.
(+) Os apoios para as mãos e o touchpad estão atingindo a temperatura máxima da pele (34 °C / 93.2 F) e, portanto, não estão quentes.
(-) A temperatura média da área do apoio para as mãos de dispositivos semelhantes foi 28.8 °C / 83.8 F (-5.2 °C / -9.4 F).
| Acer Nitro 17 AN17-41-R9LN AMD Ryzen 7 7735HS, NVIDIA GeForce RTX 4070 Laptop GPU | Acer Nitro 17 AN17-51-71ER Intel Core i7-13700H, NVIDIA GeForce RTX 4060 Laptop GPU | MSI Pulse 17 B13VGK Intel Core i7-13700H, NVIDIA GeForce RTX 4070 Laptop GPU | Schenker XMG Focus 17 (E23) Intel Core i9-13900HX, NVIDIA GeForce RTX 4070 Laptop GPU | Asus ROG Strix G17 G713PI AMD Ryzen 9 7945HX, NVIDIA GeForce RTX 4070 Laptop GPU | |
|---|---|---|---|---|---|
| Heat | -3% | -1% | -13% | 4% | |
| Maximum Upper Side * (°C) | 47 | 46 2% | 48 -2% | 50 -6% | 42 11% |
| Maximum Bottom * (°C) | 53 | 51 4% | 50 6% | 56 -6% | 41 23% |
| Idle Upper Side * (°C) | 30 | 34 -13% | 30 -0% | 37 -23% | 33 -10% |
| Idle Bottom * (°C) | 31 | 33 -6% | 33 -6% | 36 -16% | 34 -10% |
* ... menor é melhor
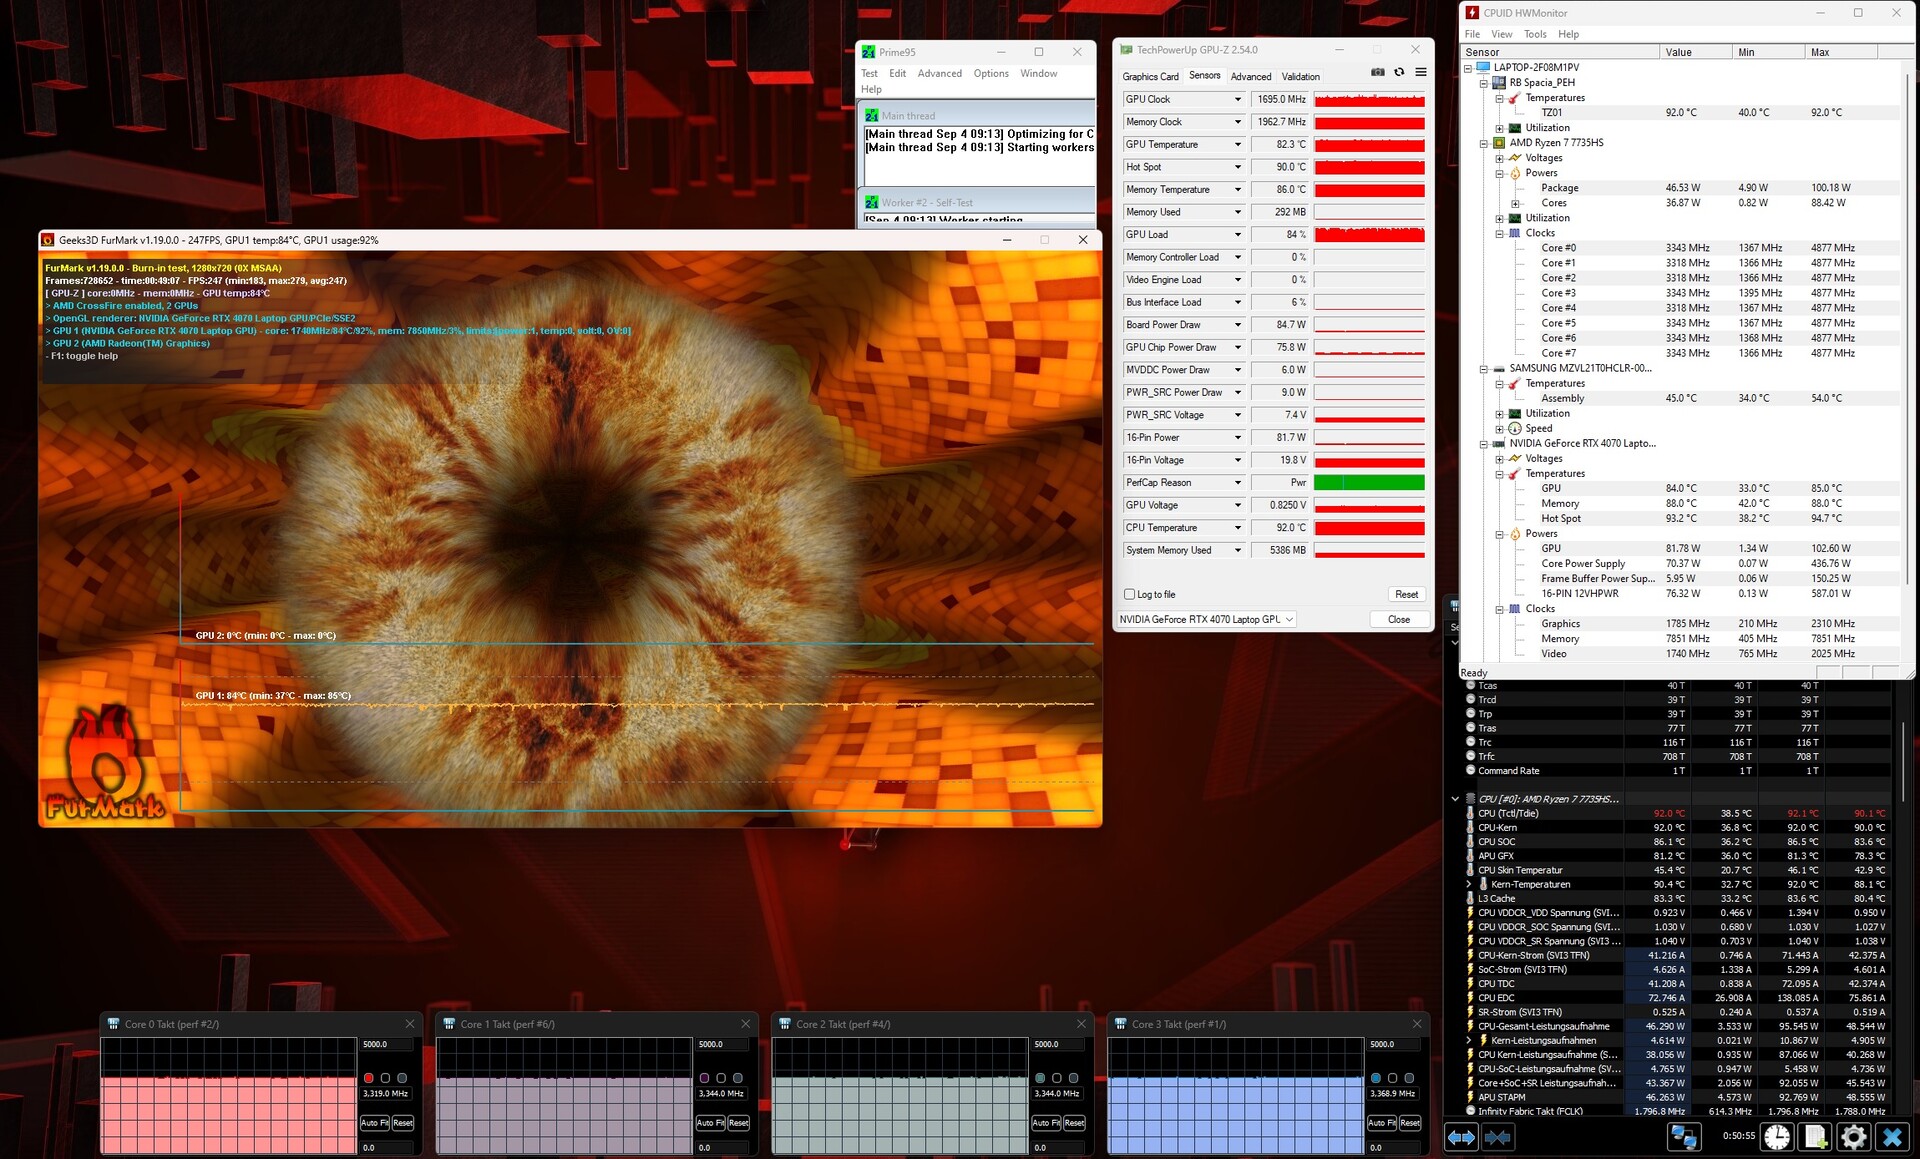
Teste de estresse
O teste de estresse usando as ferramentas Furmark e Prime95 não teve surpresas desagradáveis. Enquanto o Ryzen 7 7735HS se estabilizou em cerca de 3,3 GHz (mas ficou bastante quente, em torno de 90 °C), a RTX 4070 ficou confortável em 1.700 MHz e pouco mais de 80 °C.
Alto-falantes
Acer Nitro 17 AN17-41-R9LN análise de áudio
(+) | os alto-falantes podem tocar relativamente alto (###valor### dB)
Graves 100 - 315Hz
(-) | quase nenhum baixo - em média 28.6% menor que a mediana
(±) | a linearidade dos graves é média (14.2% delta para a frequência anterior)
Médios 400 - 2.000 Hz
(+) | médios equilibrados - apenas 1.4% longe da mediana
(+) | médios são lineares (4% delta para frequência anterior)
Altos 2 - 16 kHz
(+) | agudos equilibrados - apenas 4.3% longe da mediana
(+) | os máximos são lineares (3.3% delta da frequência anterior)
Geral 100 - 16.000 Hz
(±) | a linearidade do som geral é média (17.7% diferença em relação à mediana)
Comparado com a mesma classe
» 52% de todos os dispositivos testados nesta classe foram melhores, 10% semelhantes, 38% piores
» O melhor teve um delta de 6%, a média foi 18%, o pior foi 132%
Comparado com todos os dispositivos testados
» 35% de todos os dispositivos testados foram melhores, 8% semelhantes, 57% piores
» O melhor teve um delta de 4%, a média foi 23%, o pior foi 134%
MSI Pulse 17 B13VGK análise de áudio
(+) | os alto-falantes podem tocar relativamente alto (###valor### dB)
Graves 100 - 315Hz
(±) | graves reduzidos - em média 13.2% menor que a mediana
(±) | a linearidade dos graves é média (12.3% delta para a frequência anterior)
Médios 400 - 2.000 Hz
(±) | médios mais altos - em média 9.4% maior que a mediana
(+) | médios são lineares (5.7% delta para frequência anterior)
Altos 2 - 16 kHz
(+) | agudos equilibrados - apenas 2.9% longe da mediana
(+) | os máximos são lineares (6.7% delta da frequência anterior)
Geral 100 - 16.000 Hz
(±) | a linearidade do som geral é média (15.8% diferença em relação à mediana)
Comparado com a mesma classe
» 37% de todos os dispositivos testados nesta classe foram melhores, 7% semelhantes, 56% piores
» O melhor teve um delta de 6%, a média foi 18%, o pior foi 132%
Comparado com todos os dispositivos testados
» 24% de todos os dispositivos testados foram melhores, 5% semelhantes, 70% piores
» O melhor teve um delta de 4%, a média foi 23%, o pior foi 134%
Gerenciamento de energia
Consumo de energia
As taxas de consumo de energia do laptop foram as esperadas. 10 a 16 watts de consumo ocioso e 79 a 220 watts de consumo de carga também poderiam vir de um dispositivo com um i7-13700H. Não conseguimos entender por que a Acer inclui uma fonte de alimentação volumosa de 330 watts com o laptop. Um modelo mais compacto de 230 watts teria funcionado tão bem quanto.
| desligado | |
| Ocioso | |
| Carga |
|
Key:
min: | |
| Acer Nitro 17 AN17-41-R9LN R7 7735HS, GeForce RTX 4070 Laptop GPU | Acer Nitro 17 AN17-51-71ER i7-13700H, GeForce RTX 4060 Laptop GPU | MSI Pulse 17 B13VGK i7-13700H, GeForce RTX 4070 Laptop GPU | Schenker XMG Focus 17 (E23) i9-13900HX, GeForce RTX 4070 Laptop GPU | Asus ROG Strix G17 G713PI R9 7945HX, GeForce RTX 4070 Laptop GPU | Média da turma Gaming | |
|---|---|---|---|---|---|---|
| Power Consumption | -3% | 12% | -71% | -50% | -43% | |
| Idle Minimum * (Watt) | 10 | 8.3 17% | 9 10% | 17 -70% | 15 -50% | 13 ? -30% |
| Idle Average * (Watt) | 11 | 13.5 -23% | 10.2 7% | 18 -64% | 20 -82% | 19 ? -73% |
| Idle Maximum * (Watt) | 16 | 14.8 7% | 10.8 32% | 25.8 -61% | 29 -81% | 24.6 ? -54% |
| Load Average * (Watt) | 79 | 77 3% | 72 9% | 178 -125% | 121 -53% | 110.7 ? -40% |
| Witcher 3 ultra * (Watt) | 147.5 | 154 -4% | 130 12% | 265 -80% | 179.8 -22% | |
| Load Maximum * (Watt) | 220 | 263 -20% | 221 -0% | 275 -25% | 246 -12% | 259 ? -18% |
* ... menor é melhor
Power consumption Witcher 3 / stress test
Power consumption with external monitor
Tempos de execução
A bateria com capacidade de 90 Wh compete com seus rivais da MSI (Pulse 17) e da Asus (Strix G17). Graças à bateria potente e à comutação de gráficos integrada, é possível esperar bons tempos de execução desse laptop. É interessante notar que as taxas são significativamente mais baixas do que as da contraparte da Intel. Em nosso teste de WLAN no mundo real, com o brilho da tela reduzido para 150 cd/m², a edição da AMD durou apenas um pouco menos de 5 horas, em vez de 8 (suspeitamos de mecanismos de economia de energia defeituosos ou abaixo do ideal no modo de bateria).
| Acer Nitro 17 AN17-41-R9LN R7 7735HS, GeForce RTX 4070 Laptop GPU, 90 Wh | Acer Nitro 17 AN17-51-71ER i7-13700H, GeForce RTX 4060 Laptop GPU, 90 Wh | MSI Pulse 17 B13VGK i7-13700H, GeForce RTX 4070 Laptop GPU, 90 Wh | Schenker XMG Focus 17 (E23) i9-13900HX, GeForce RTX 4070 Laptop GPU, 73 Wh | Asus ROG Strix G17 G713PI R9 7945HX, GeForce RTX 4070 Laptop GPU, 90 Wh | Média da turma Gaming | |
|---|---|---|---|---|---|---|
| Duração da bateria | 58% | 73% | -25% | -17% | 37% | |
| WiFi v1.3 (h) | 5.2 | 8.2 58% | 9 73% | 3.9 -25% | 4.3 -17% | 7.11 ? 37% |
| H.264 (h) | 6.9 | 3.1 | 2.8 | 8.32 ? | ||
| Witcher 3 ultra (h) | 2.5 | 1 | 1.1 | |||
| Load (h) | 2.2 | 1 | 1.502 ? |
Pro
Contra
Veredicto
Em sua maior parte, o Nitro 17 AN17-41-R9LN da Acer é um impressionante laptop para jogos de 17 polegadas. Sua combinação de uma CPU AMD (Ryzen 7 7735HS) e uma GPU Nvidia (GeForce RTX 4070) cria uma harmonia bastante agradável que é suficiente para executar a maioria dos jogos em sua resolução nativa de 2.560 x 1.440 com configurações máximas. No entanto, ele não é o mais preparado para o futuro, devido aos seus escassos 8 GB de VRAM.
Em muitos outros aspectos, o fabricante forneceu um bom laptop para jogos. Suas opções de conectividade e dispositivos de entrada devem ser suficientes para a maioria dos compradores. Uma tela QHD colorida e relativamente rápida completa a configuração.
As emissões de ruído do laptop são, como sempre, altamente dependentes do modo que está sendo usado. Em nosso teste, a configuração "equilibrada" mostrou o melhor compromisso entre desempenho e ruído.
A Acer poderia melhorar um pouco o gabinete e a qualidade do som do Nitro 17. Seu sistema 2.0 integrado não tem muitos graves. As latências e a duração da bateria do laptop (consideravelmente mais curta do que na versão Intel) também são problemas que o fabricante poderia resolver.
Apesar do desempenho mais fraco da CPU e do desempenho 3D pouco melhor em comparação com o modelo RTX 4060 baseado na Intel, ainda recomendamos o modelo da AMD, pois a maioria dos jogos é conhecida por ser limitada pela GPU.
Uma alternativa igual ou um pouco melhor poderia ser o Asus ROG Strix G17 G713PI, que também apresenta uma RTX 4070 - mas também tem uma Ryzen 9 7945HX instalada, que é uma CPU mais moderna e consideravelmente mais rápida. Por sua vez, ela também custa mais.
Preço e disponibilidade
O Acer Nitro 17 AN17-41-R9LN com um Ryzen 7 7735HS, GeForce RTX 4070 e uma tela QHD pode ser encontrado na Amazon por cerca de US$ 1.900.
Acer Nitro 17 AN17-41-R9LN
- 09/07/2023 v7 (old)
Florian Glaser
Transparência
A seleção dos dispositivos a serem analisados é feita pela nossa equipe editorial. A amostra de teste foi fornecida ao autor como empréstimo pelo fabricante ou varejista para fins desta revisão. O credor não teve influência nesta revisão, nem o fabricante recebeu uma cópia desta revisão antes da publicação. Não houve obrigação de publicar esta revisão. Como empresa de mídia independente, a Notebookcheck não está sujeita à autoridade de fabricantes, varejistas ou editores.
É assim que o Notebookcheck está testando
Todos os anos, o Notebookcheck analisa de forma independente centenas de laptops e smartphones usando procedimentos padronizados para garantir que todos os resultados sejam comparáveis. Desenvolvemos continuamente nossos métodos de teste há cerca de 20 anos e definimos padrões da indústria no processo. Em nossos laboratórios de teste, equipamentos de medição de alta qualidade são utilizados por técnicos e editores experientes. Esses testes envolvem um processo de validação em vários estágios. Nosso complexo sistema de classificação é baseado em centenas de medições e benchmarks bem fundamentados, o que mantém a objetividade.Price comparison

