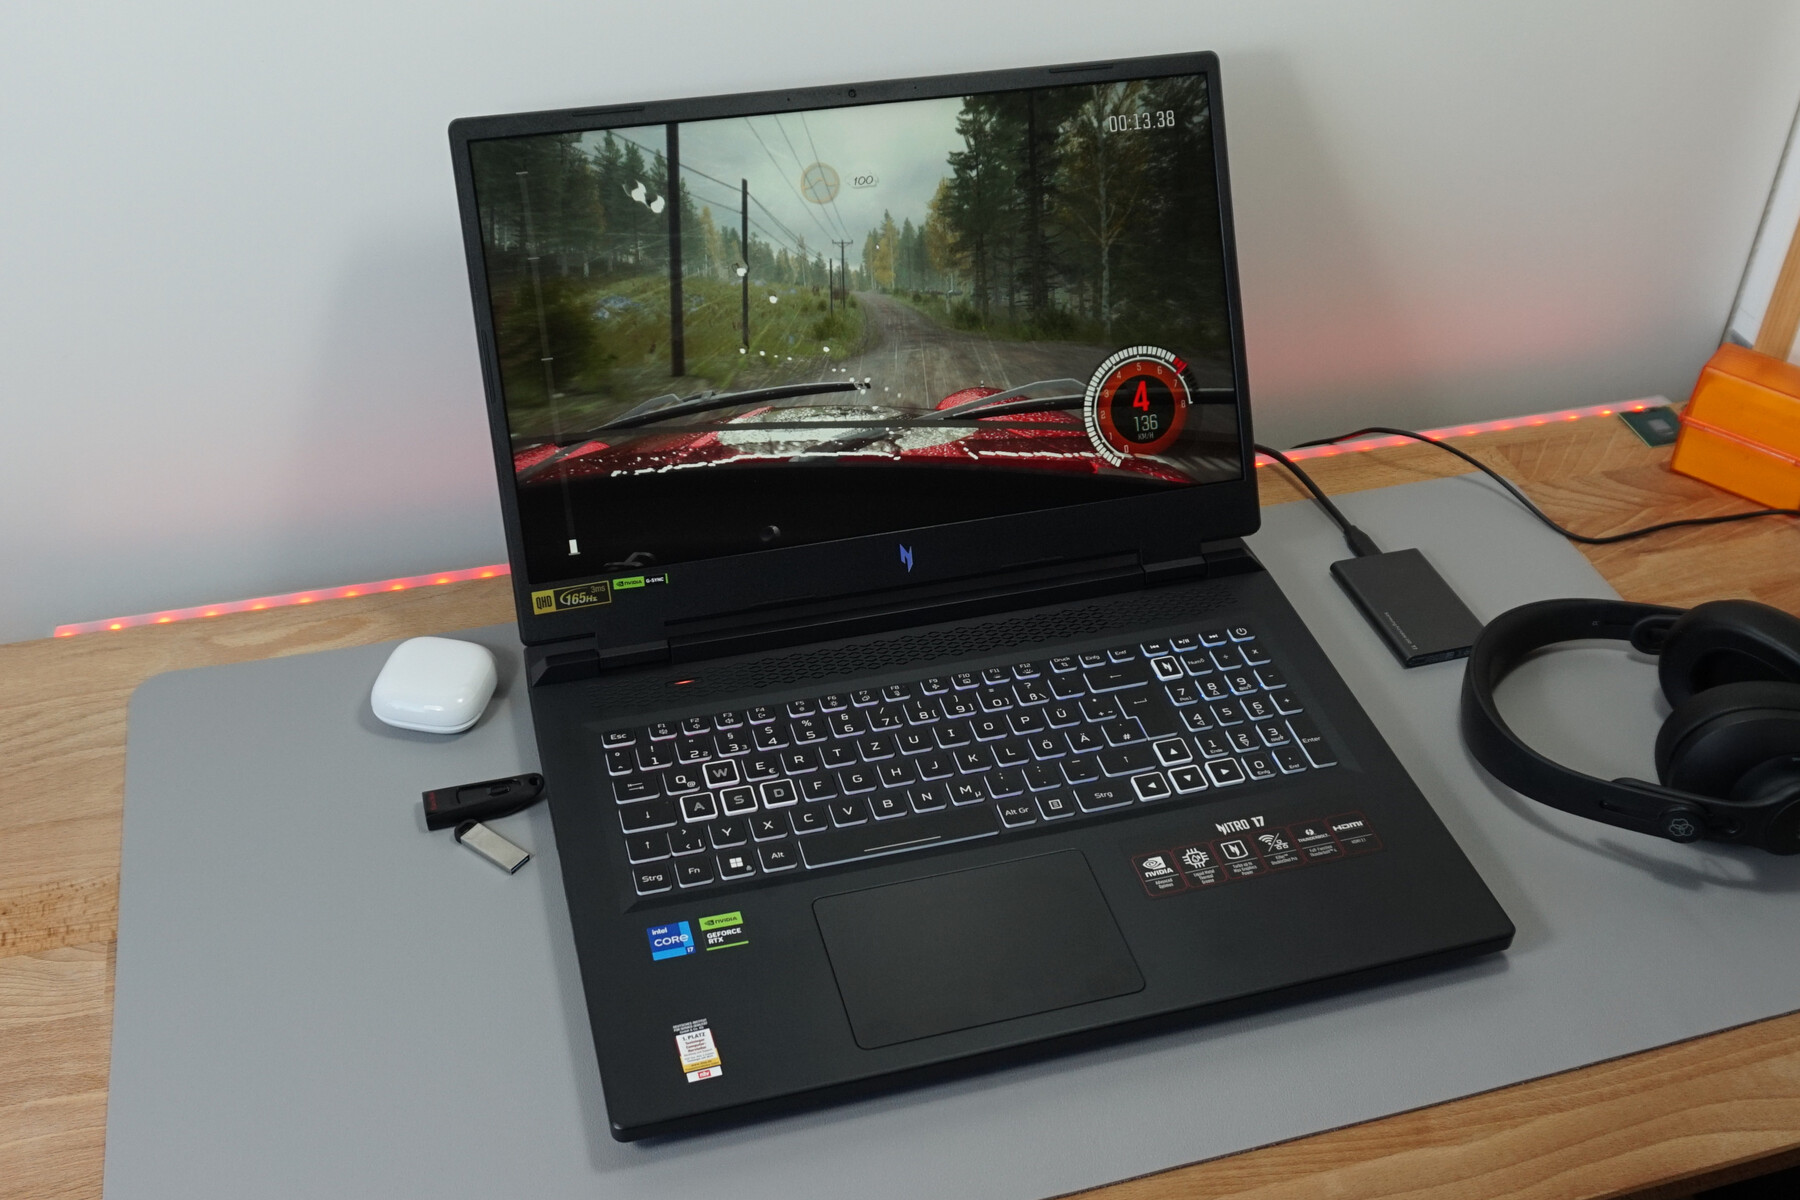
Análise do silencioso laptop Nitro 17 da Acer: A RTX 4060, perfeitamente configurada
O Acer Nitro 17 AN17-51-71ER é um laptop para jogos sólido e de médio porte. Com um Intel Core i7 em vez de um i9, apenas quatro zonas no teclado RGB e muito plástico, os compromissos são necessários, mas ajudam a manter o RRP abaixo de US$ 2.000.
Em troca, a Acer anuncia que o laptop tem taxas de quadros estáveis, do tipo que se pode esperar de um dispositivo bem configurado da série Nvidia GeForce RTX 4000. Quase ainda mais crucial é o resfriamento reputadamente perfeito. Quatro saídas de ar, resfriamento de metal líquido e software de controle fácil de usar fornecem uma base sólida para isso.
Felizmente, alguns pontos fracos incômodos encontrados em seu antecessor direto, oAcer Nitro 5 AN517agora não são mais vistos. Eles não farão falta.
Nossa análise revela como o Nitro 17 está à altura dos concorrentes, como oMedion Erazer Defender P40 ou oLenovo Legion Pro 5. Ambos os notebooks compartilham especificações semelhantes às do nosso dispositivo de análise e vêm equipados com umaRTX 4060 com um TGP máximo de 140 watts. Da mesma forma, o resfriamento terá que ser comprovado no teste.
Possíveis concorrentes em comparação
Avaliação | Data | Modelo | Peso | Altura | Size | Resolução | Preço |
|---|---|---|---|---|---|---|---|
| 87.2 % v7 (old) | 07/2023 | Acer Nitro 17 AN17-51-71ER i7-13700H, GeForce RTX 4060 Laptop GPU | 3 kg | 30.3 mm | 17.30" | 2560x1440 | |
| 87.9 % v7 (old) | 05/2023 | Lenovo Legion Pro 5 16IRX8 i7-13700HX, GeForce RTX 4060 Laptop GPU | 2.5 kg | 26.8 mm | 16.00" | 2560x1600 | |
| 86.9 % v7 (old) | 06/2023 | Asus TUF Gaming A16 FA617XS R9 7940HS, Radeon RX 7600S | 2.2 kg | 22.1 mm | 16.00" | 1920x1200 | |
| 85.9 % v7 (old) | 06/2023 | Schenker XMG Focus 17 (E23) i9-13900HX, GeForce RTX 4070 Laptop GPU | 2.9 kg | 29.3 mm | 17.30" | 2560x1440 | |
| 84.6 % v7 (old) | 05/2023 | Medion Erazer Defender P40 i7-13700HX, GeForce RTX 4060 Laptop GPU | 2.9 kg | 33 mm | 17.30" | 2560x1440 | |
| 83.9 % v7 (old) | 11/2022 | Acer Nitro 5 AN515-46-R1A1 R7 6800H, GeForce RTX 3070 Ti Laptop GPU | 2.5 kg | 26.8 mm | 15.60" | 1920x1080 | |
| 83.2 % v7 (old) | 01/2023 | MSI Pulse GL76 12UGK i7-12700H, GeForce RTX 3070 Laptop GPU | 2.6 kg | 24.2 mm | 17.30" | 1920x1080 |
Case - Um laptop de 17 polegadas de tamanho grande
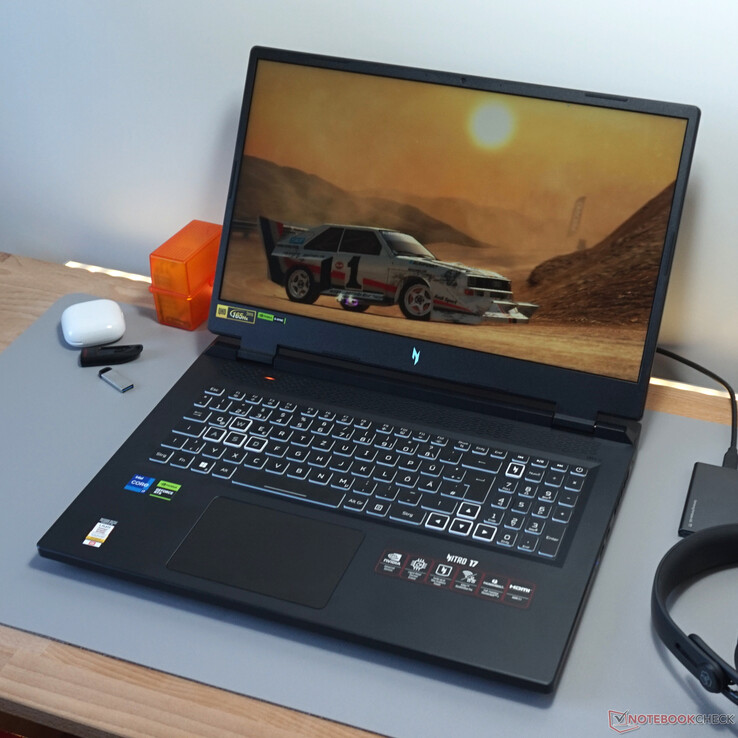
O "N" iridescente na tampa e abaixo da tela revela as credenciais de jogos do Acer Nitro 17. Além disso, há alguns pequenos detalhes coloridos, mas é só isso. A busca por efeitos de iluminação LED ou elementos coloridos que se destaquem no elegante gabinete de plástico é em vão.
A ausência de componentes metálicos não prejudica a robustez do dispositivo. O gabinete não se flexiona, pode ser minimamente torcido e, da mesma forma, também não é possível fazer ruídos. Além disso, a moldura da tela só pode ser levemente dobrada. A tela permanece estável ao ser levantada ou movida e pode ser aberta em um ângulo de mais de 150°. Tudo parece bem organizado.
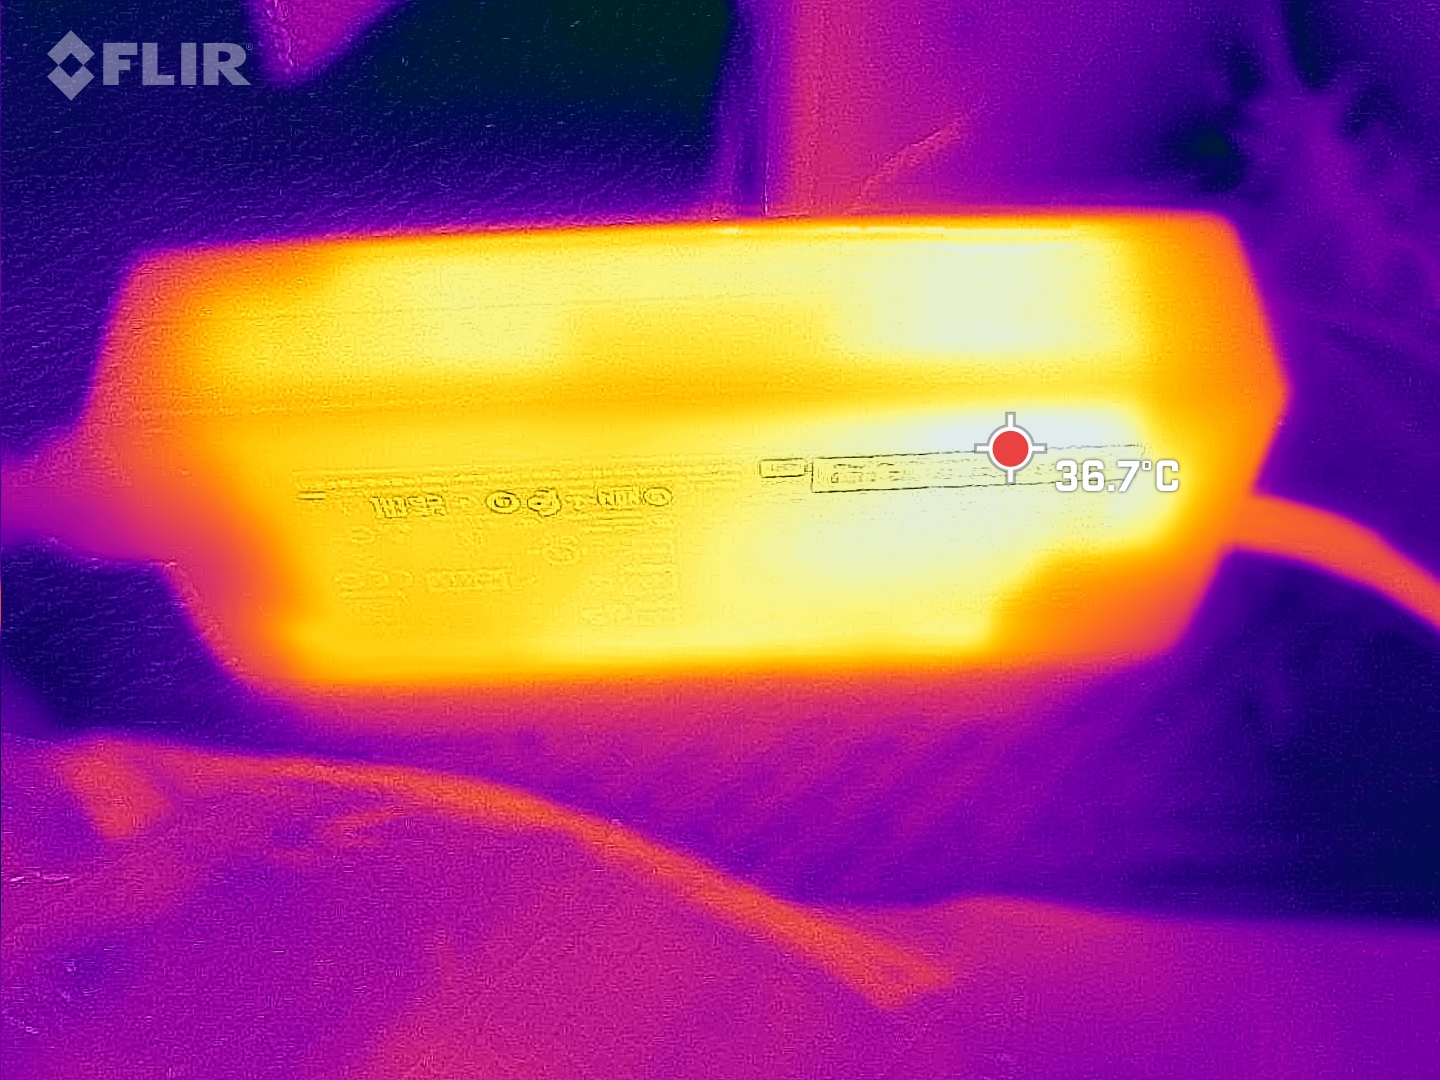
Ao mesmo tempo, o laptop da Acer é pesado e realmente grande. Mesmo entre as máquinas de 17 polegadas, é difícil encontrar outro modelo que seja mais espesso. Em comparação com seu antecessor já grande, o Acer Nitro 517foram adicionados alguns milímetros. Como visto no modelo da geração anterior, o grande resfriamento faz sentir sua presença. O laptop também continua a ganhar peso. Fora dele, é preciso carregar quase 4,3 kg, pois a PSU também é muito pesada, com 1,2 kg.

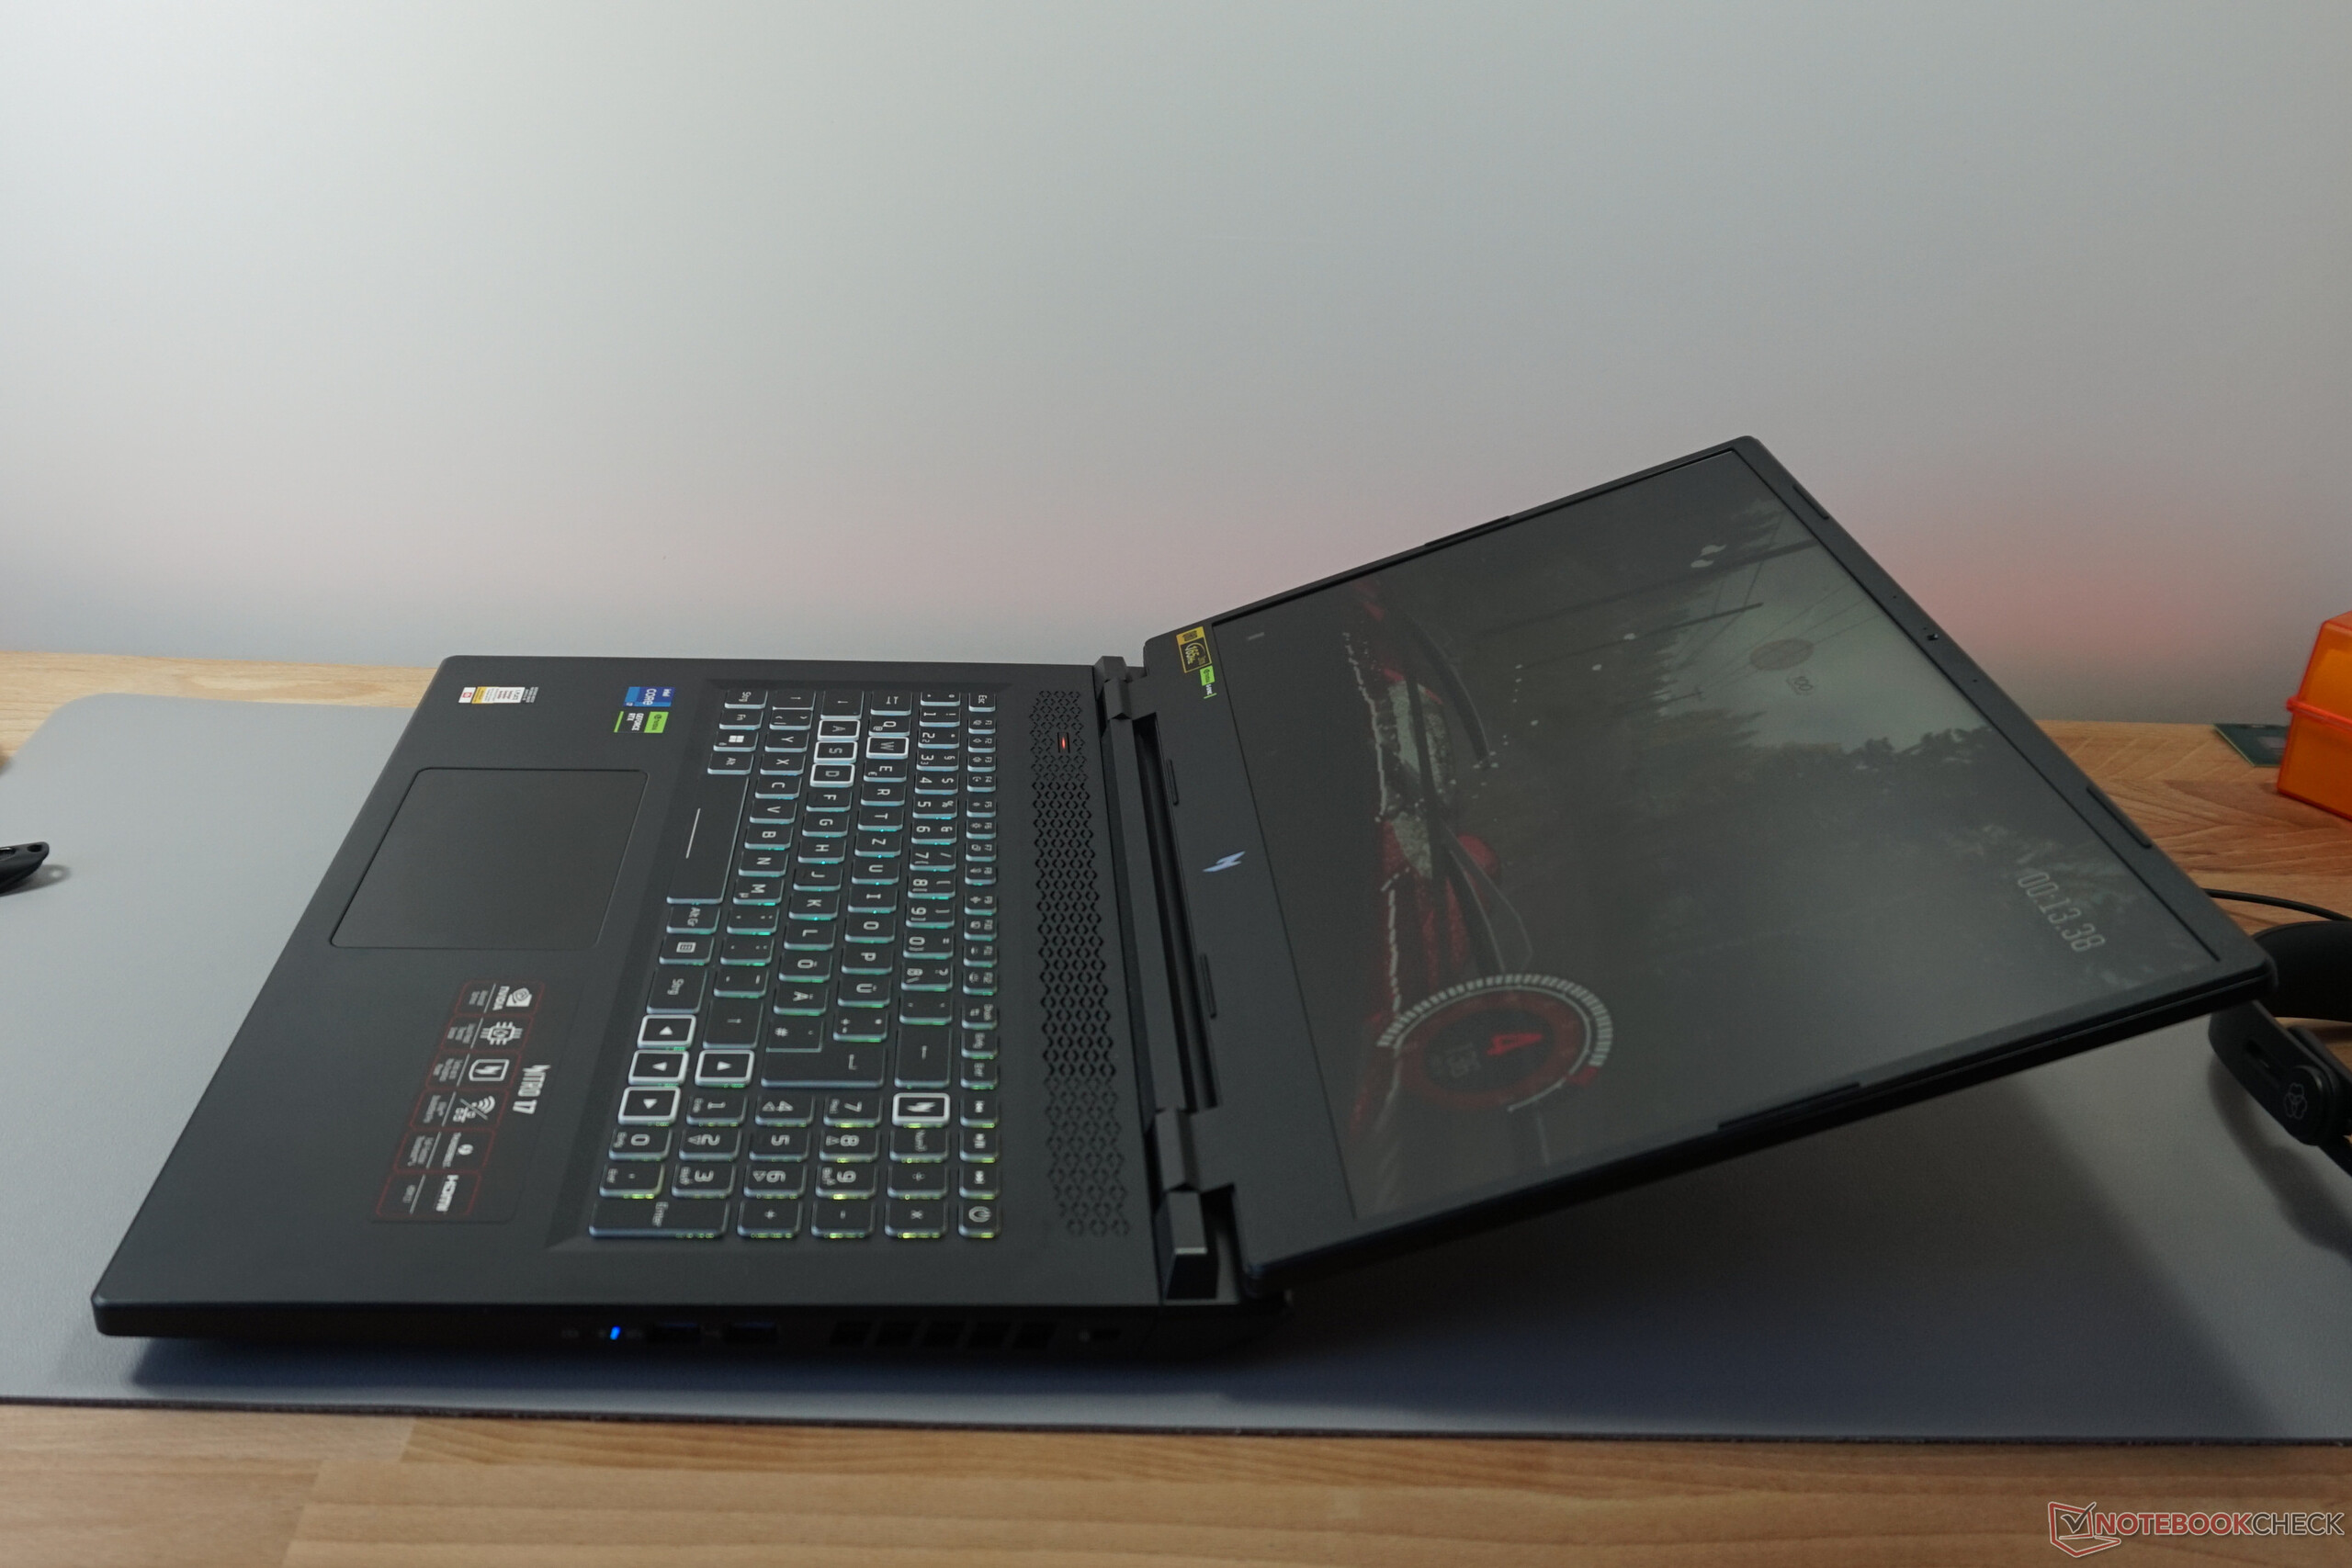


Recursos - Não há reclamações sobre o Nitro 17
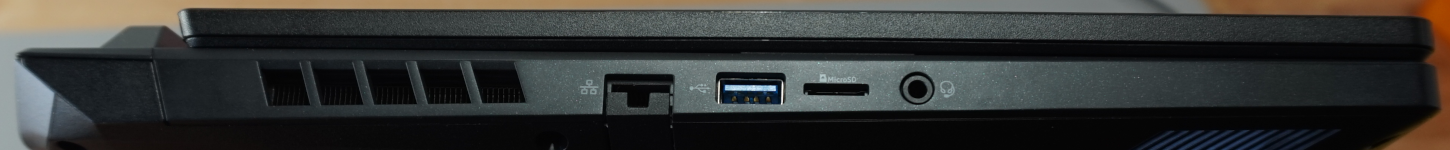
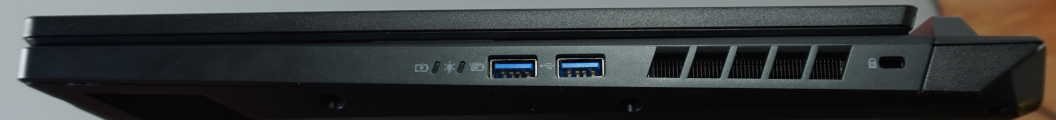
Embora as críticas ao seu antecessor tenham sido justificadas por não ter um leitor de cartão ou uma segunda porta USB-C, o Acer Nitro 17 faz tudo certo. Todas as saídas de vídeo, incluindo Thunderbolt 4, USB-C com suporte a DisplayPort e HDMI, podem ser encontradas na parte traseira do dispositivo. À esquerda e à direita do laptop, temos portas USB-A. Ambas as portas do lado direito permitem até mesmo 10 Gbit/s, o que é suficiente para, entre outras coisas, pendrives USB rápidos e muitos SSDs portáteis.
É um mistério o fato de o leitor de cartão ser apenas uma variante microSD, pois há espaço mais do que suficiente para um maior. A porta LAN também gostaria de ter gerenciado 2,5 Gbit/s em vez de apenas 1 Gbit/s. Para a qualidade e o preço, a seleção de portas do Acer Nitro 17 é absolutamente boa. A quantidade e o desempenho devem se adequar à tarefa, independentemente do cenário do aplicativo.

Leitor de cartão SD
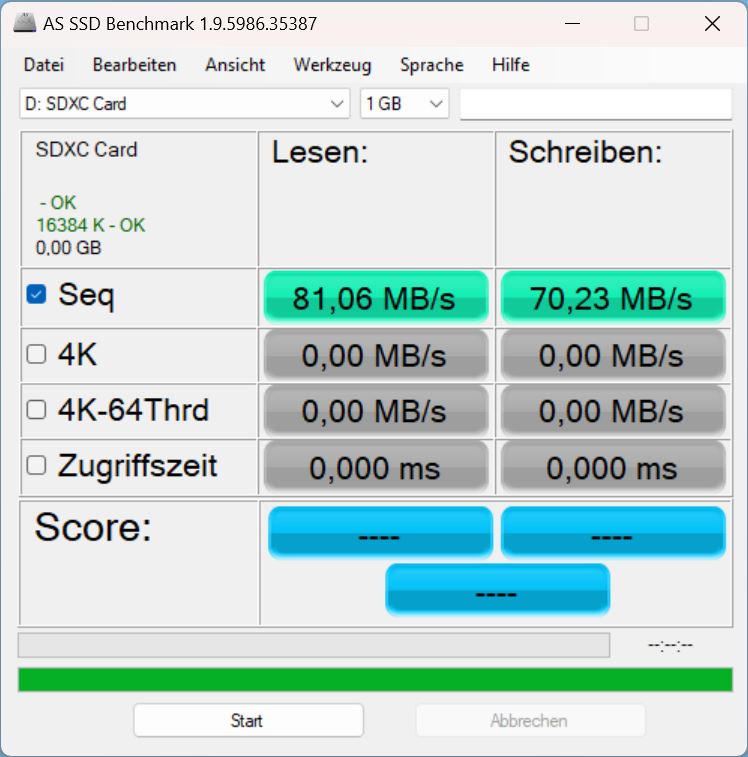
Obtivemos medições significativamente abaixo da média com o cartão de referência AV PRO microSD 128 GB V60. O leitor de cartão microSD integrado é até um terço mais lento do que a média dos laptops para jogos.
Para um cartão de 32 GB, isso significa que há um tempo de espera adicional de mais de 2 minutos durante a leitura de dados.
| SD Card Reader | |
| average JPG Copy Test (av. of 3 runs) | |
| Média da turma Gaming (20.9 - 210, n=54, últimos 2 anos) | |
| Medion Erazer Defender P40 (AV PRO microSD 128 GB V60) | |
| Schenker XMG Focus 17 (E23) | |
| Acer Nitro 17 AN17-51-71ER | |
| maximum AS SSD Seq Read Test (1GB) | |
| Média da turma Gaming (25.5 - 261, n=51, últimos 2 anos) | |
| Medion Erazer Defender P40 (AV PRO microSD 128 GB V60) | |
| Schenker XMG Focus 17 (E23) | |
| Acer Nitro 17 AN17-51-71ER | |
Comunicação
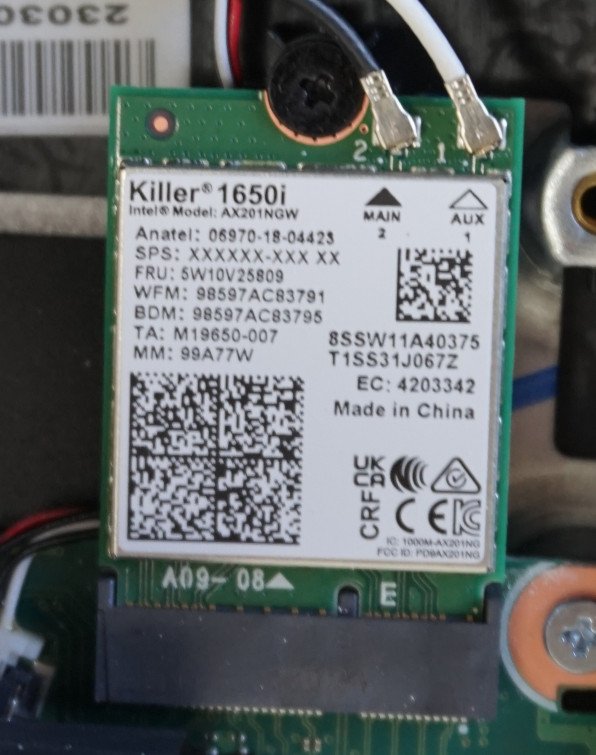
O módulo WLAN, para o qual verificamos os resultados esperados, não tem críticas. No entanto, o Wi-Fi 6E não está integrado, o que significa que várias redes sobrepostas resultarão em uma redução considerável da largura de banda.
Webcam
A câmera HD básica é suficiente para chamadas de vídeo pouco exigentes, embora a baixa resolução seja aparente para o receptor. Os fortes desvios de cor que medimos resultaram da boa função de brilho da câmera. Ela se adaptou rapidamente às mudanças nas condições de iluminação e forneceu imagens de boa qualidade, mesmo com pouca luz, mas isso não é de forma alguma o ideal e ainda assim recomendamos o uso de uma câmera externa.
Da mesma forma, o microfone faz seu trabalho de forma satisfatória. O som é gravado em um volume consistente e pode ser ouvido facilmente a partir de distâncias variadas e em várias direções de fala. Entretanto, ao ajustar o volume, é difícil ignorar o tom metálico e as pequenas distorções.


Manutenção
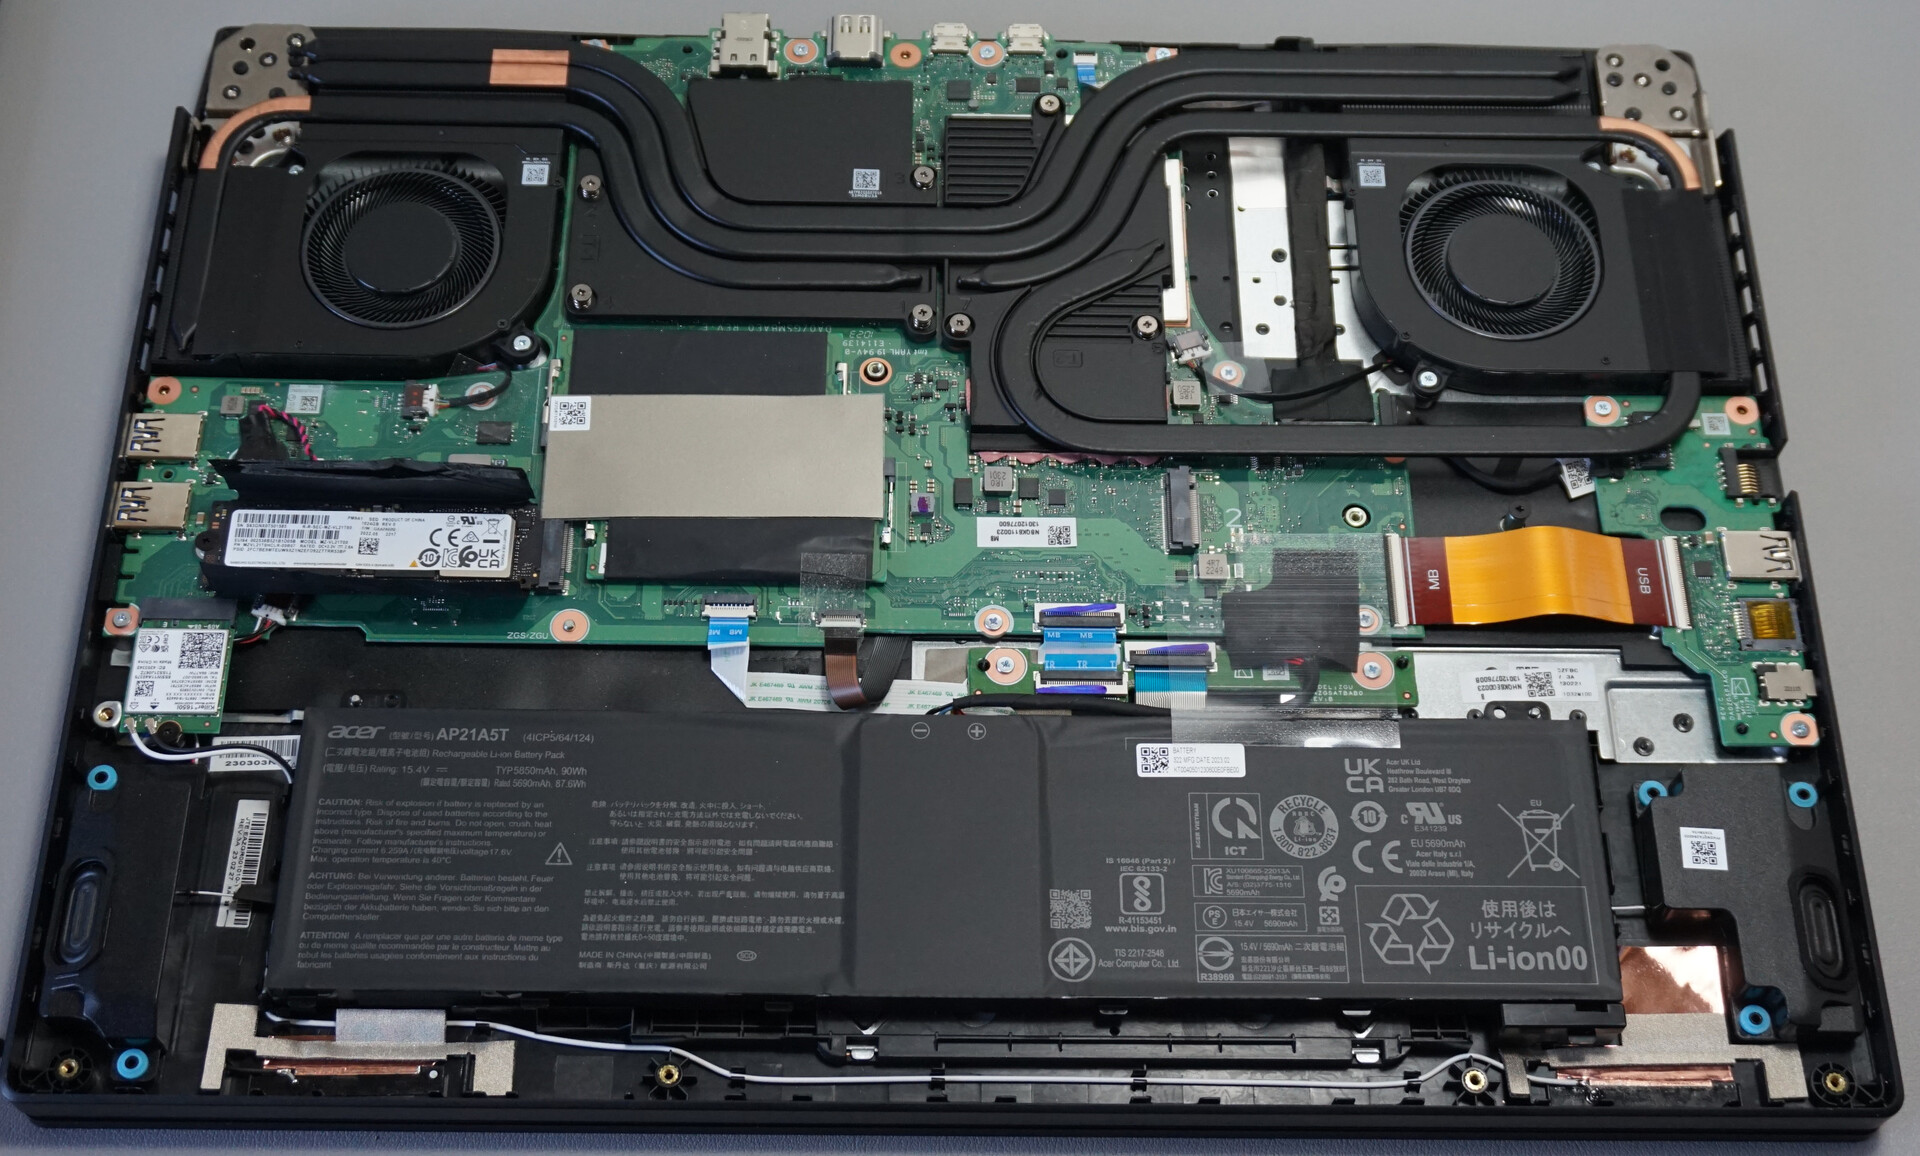
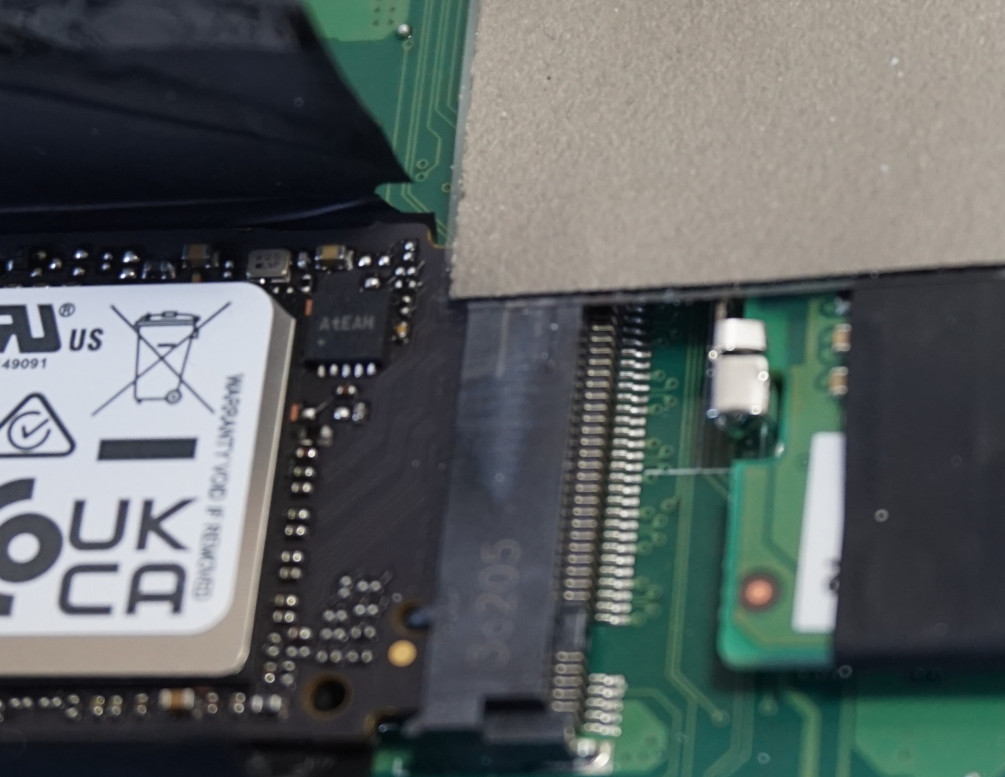
Onze parafusos de cabeça cruzada de fácil acesso precisam ser removidos, permitindo que a placa da base seja retirada com pouca resistência. O melhor lugar para começar parece ser o console de conexão traseiro, pois há poucos clipes de plástico que também prendem a base. Não são necessárias ferramentas adicionais.
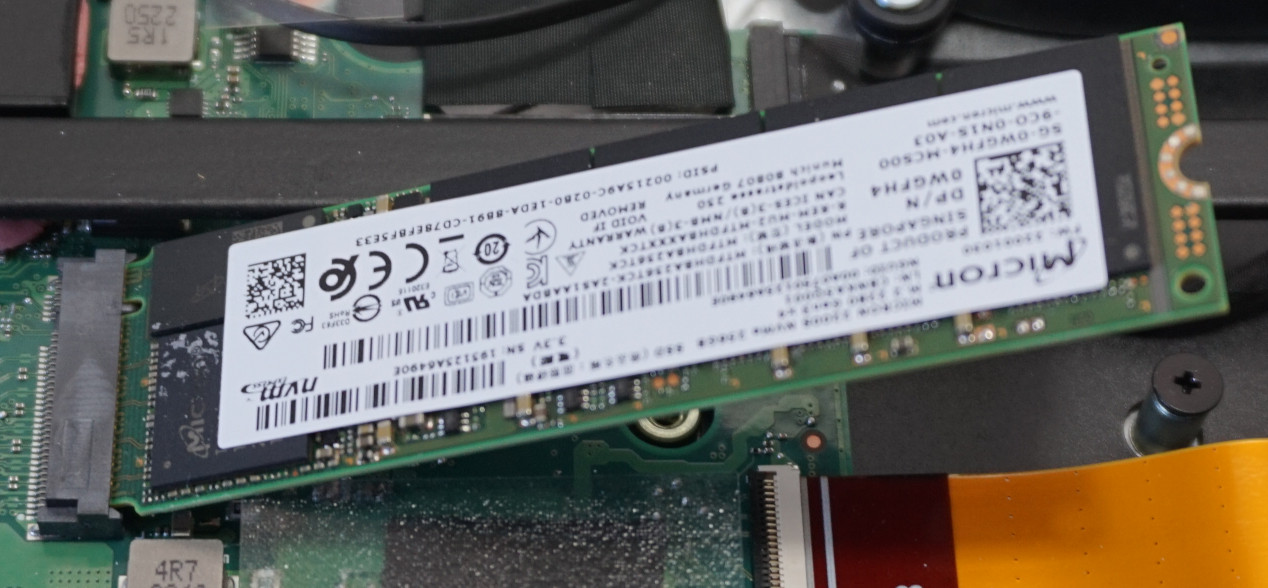
As partes internas são bastante espaçosas, o que não é surpreendente, considerando o espaço oferecido. Há um slot para um SSD M.2 NVMe adicional. A WLAN, o primeiro SSD e a RAM são acessados com a mesma facilidade que a bateria e também podem ser trocados com relativa facilidade.
O que se nota em comparação com o antecessor é a falta de dissipadores de calor adicionais sobre o slot de SSD. Além disso, a almofada de resfriamento da RAM em nosso dispositivo de análise está colada sobre o conector de armazenamento em massa. Isso influenciou nosso teste de estresse e pode ser visto abaixo. Por outro lado, os benchmarks de jogos não foram afetados por isso.
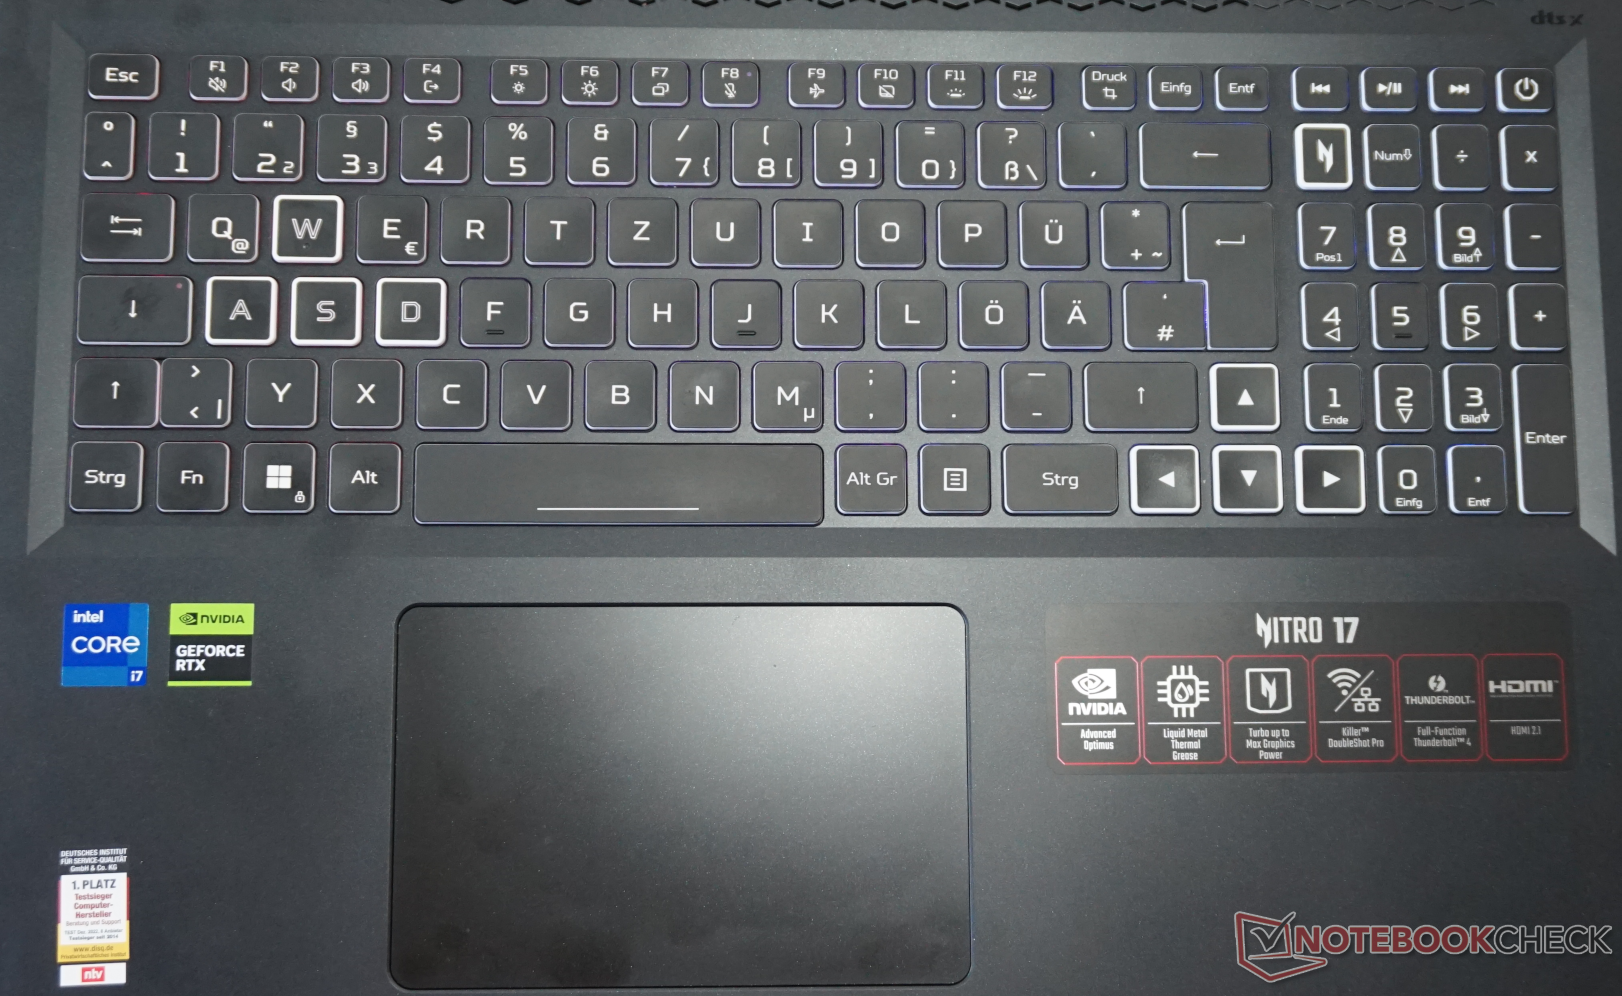
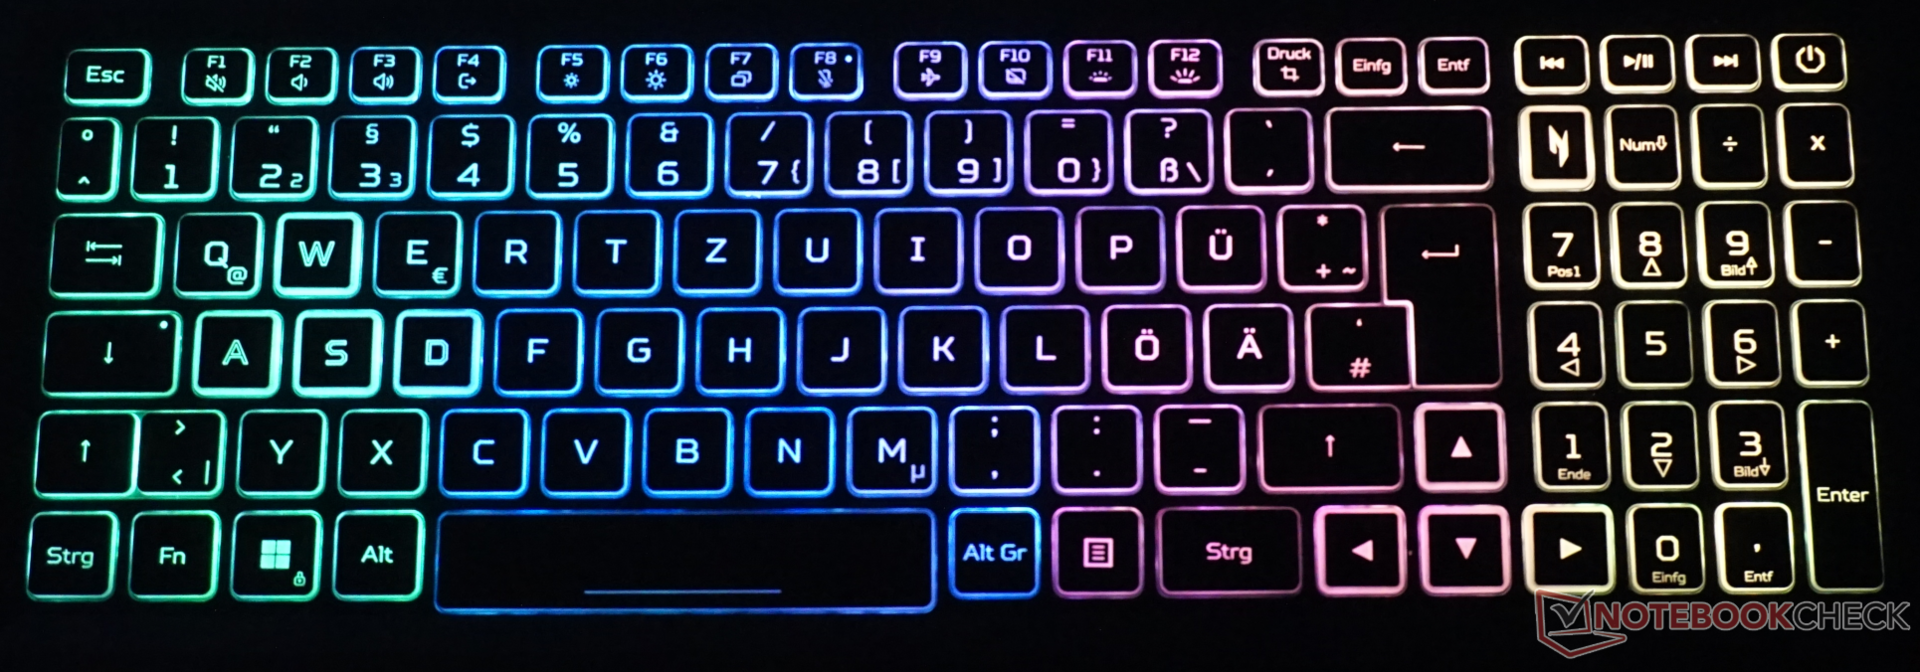
Dispositivos de entrada - Feitos para um laptop para jogos
O teclado com cúpula de borracha e formato plano típico causou o tipo de impressão muito positiva que você associaria a um dispositivo de entrada desse tipo. O deslocamento das teclas de 1,4 mm (nossa medição) garante uma experiência de digitação agradável, mas a resistência poderia ser um pouco mais firme. Como a estrutura do teclado se flexiona minimamente quando é aplicada uma pressão de digitação enérgica, as sessões de digitação contínua não são um problema.
As laterais brancas das teclas são visualmente impressionantes e seu alto contraste faz com que elas realmente se destaquem. Além disso, as teclas "WASD", as teclas de seta e a tecla especial do software NitroSense têm um destaque adicional. A iluminação das teclas é uniforme, mas as opções de personalização são limitadas a quatro zonas e alguns efeitos. Uma ampla gama de cores faz com que elas pareçam muito boas.
Por outro lado, o touchpad é uma decepção. Com quase 8 x 12 cm, ele é bem proporcionado, mas sua precisão e os pontos de pressão das teclas ocultas na área inferior não são nada impressionantes. Além disso, notamos um leve ruído ao colocar e levantar os dedos. Portanto, recomendamos definitivamente o uso de um mouse separado.
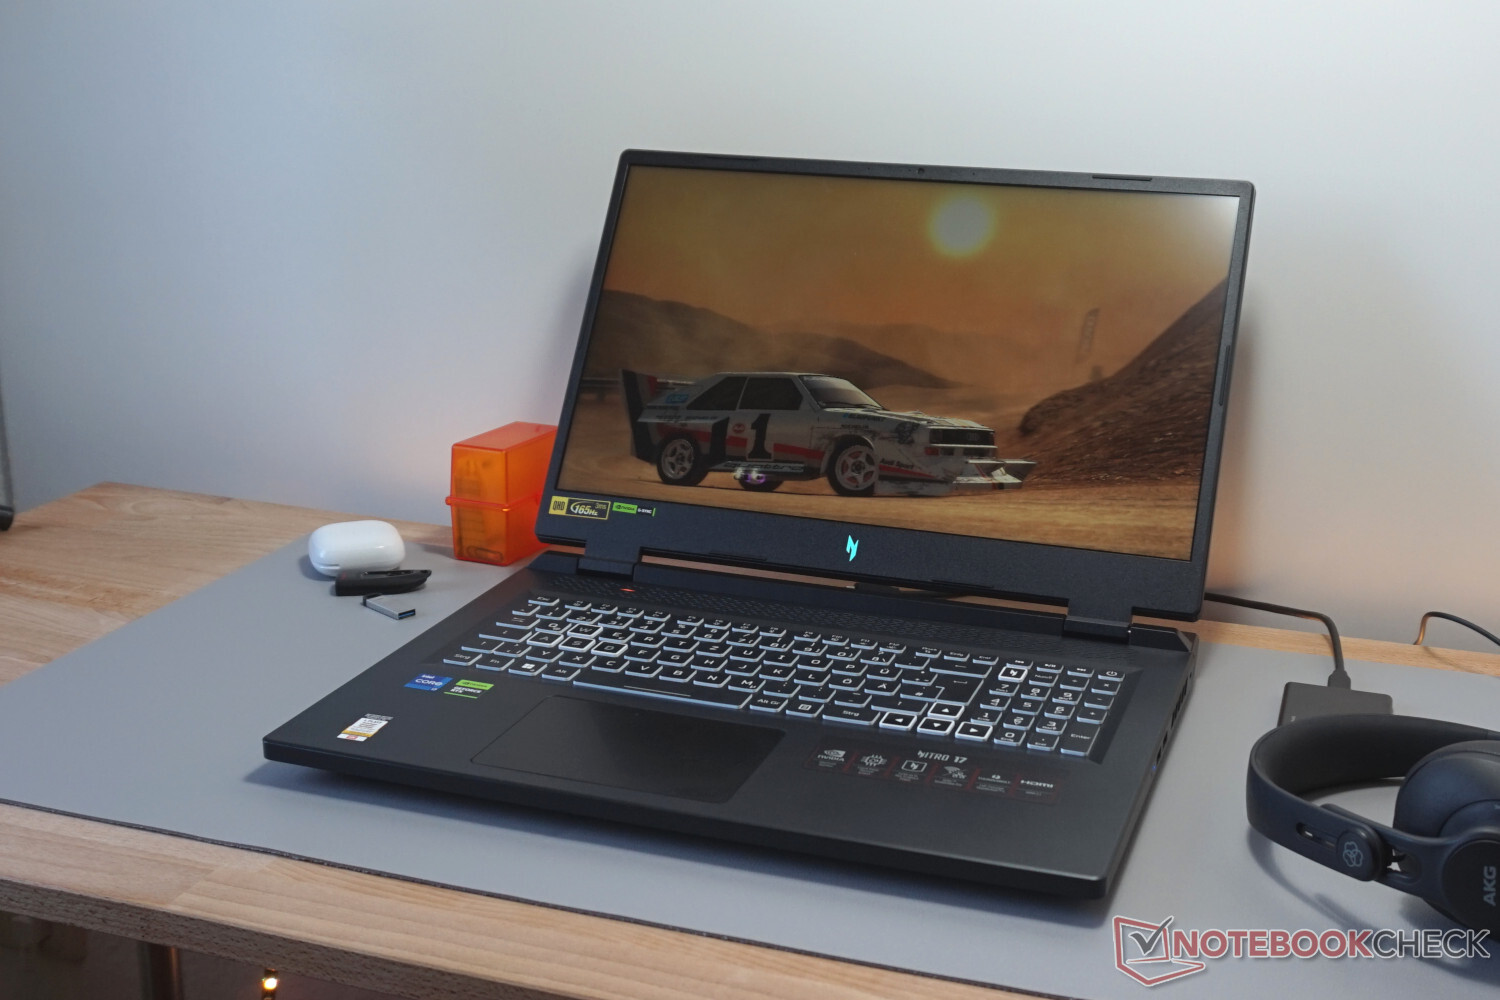
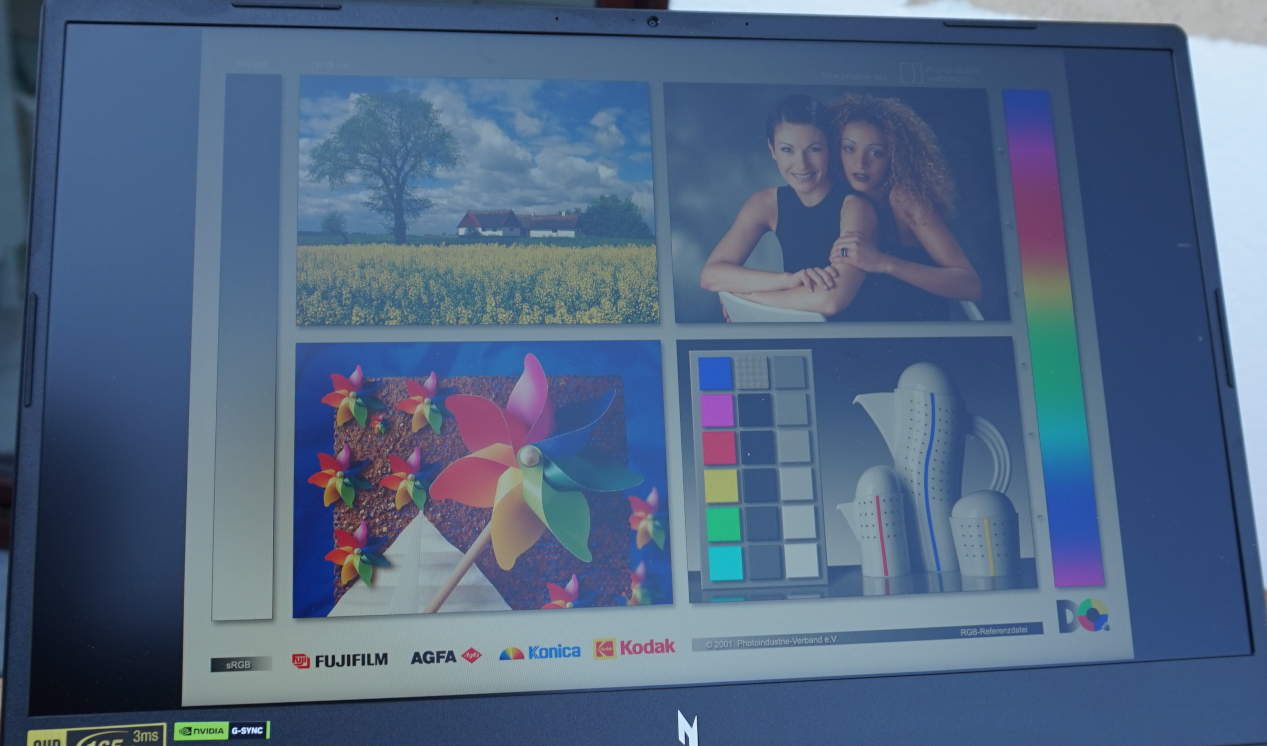
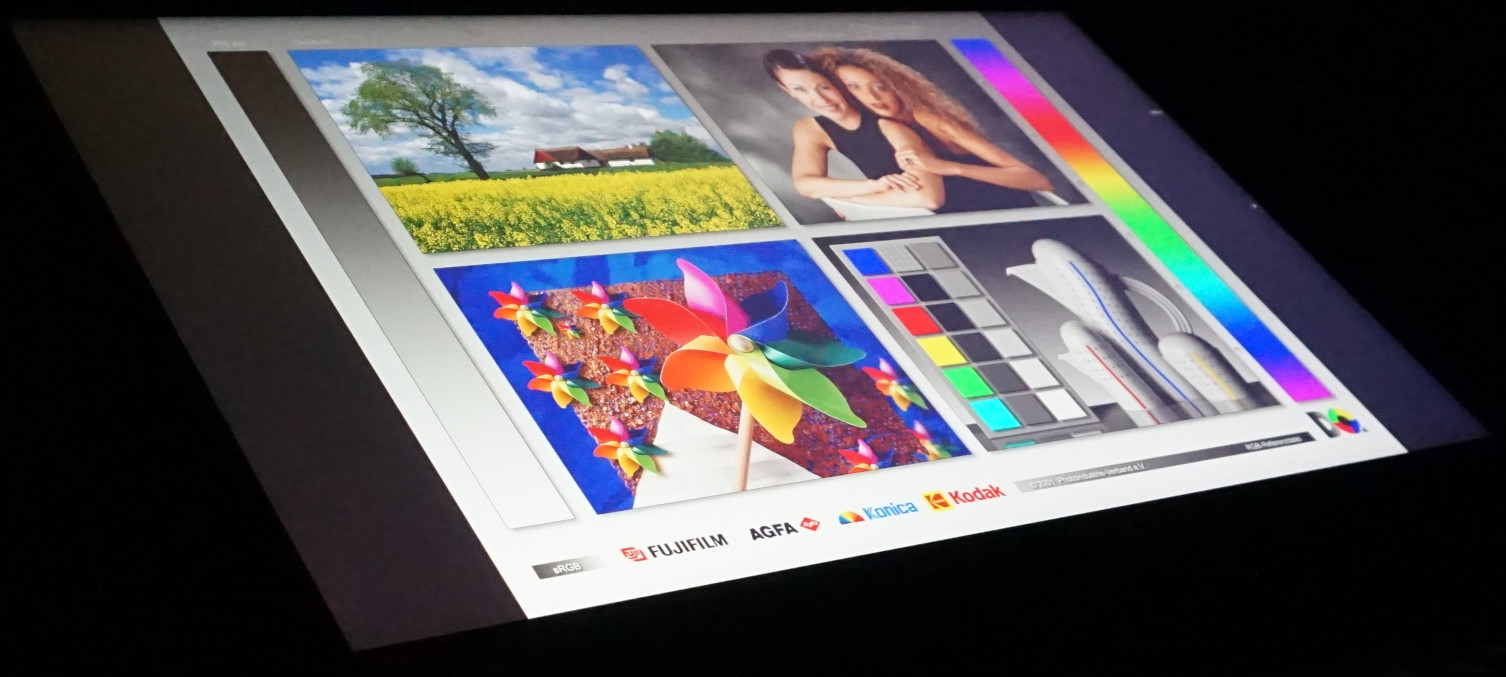
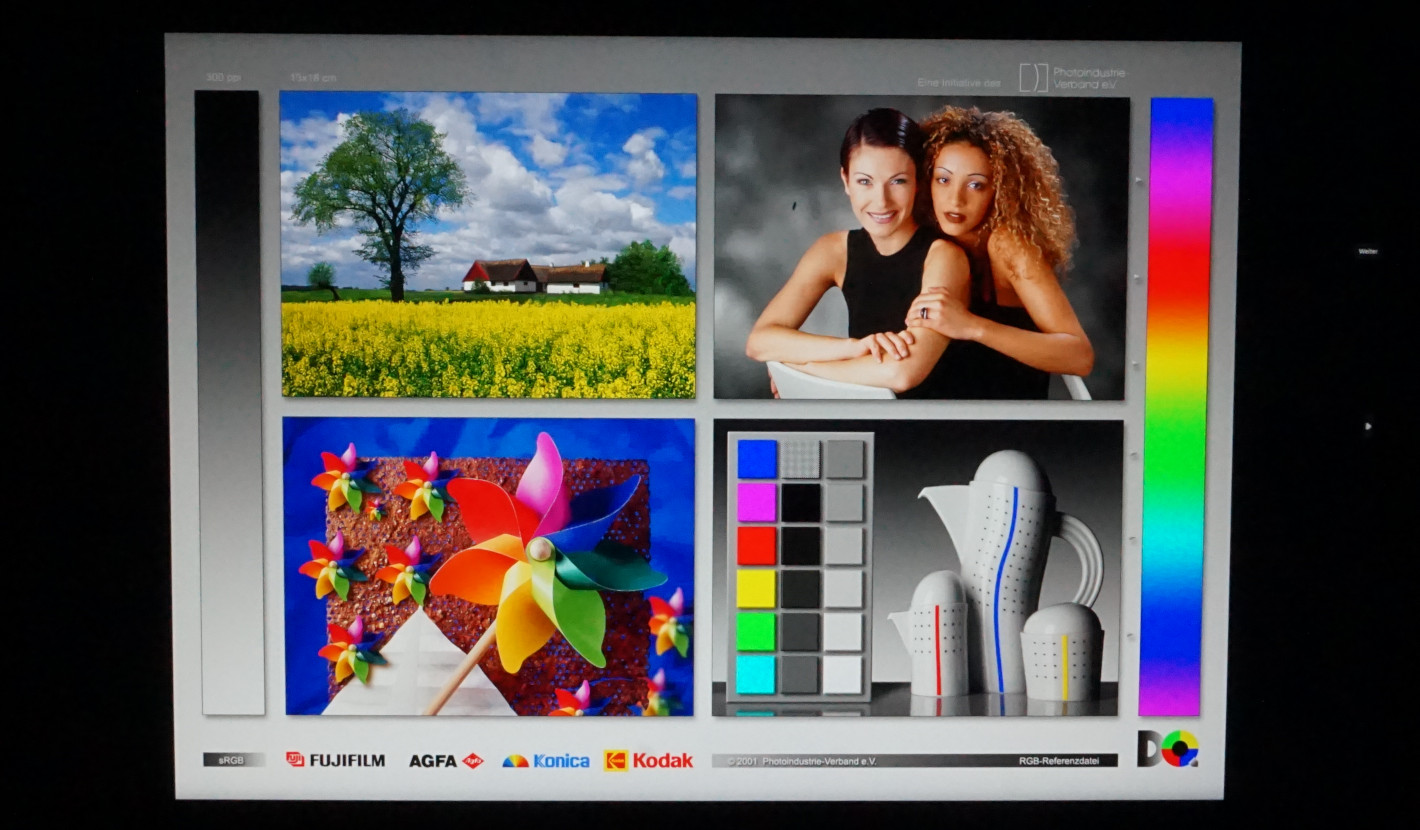
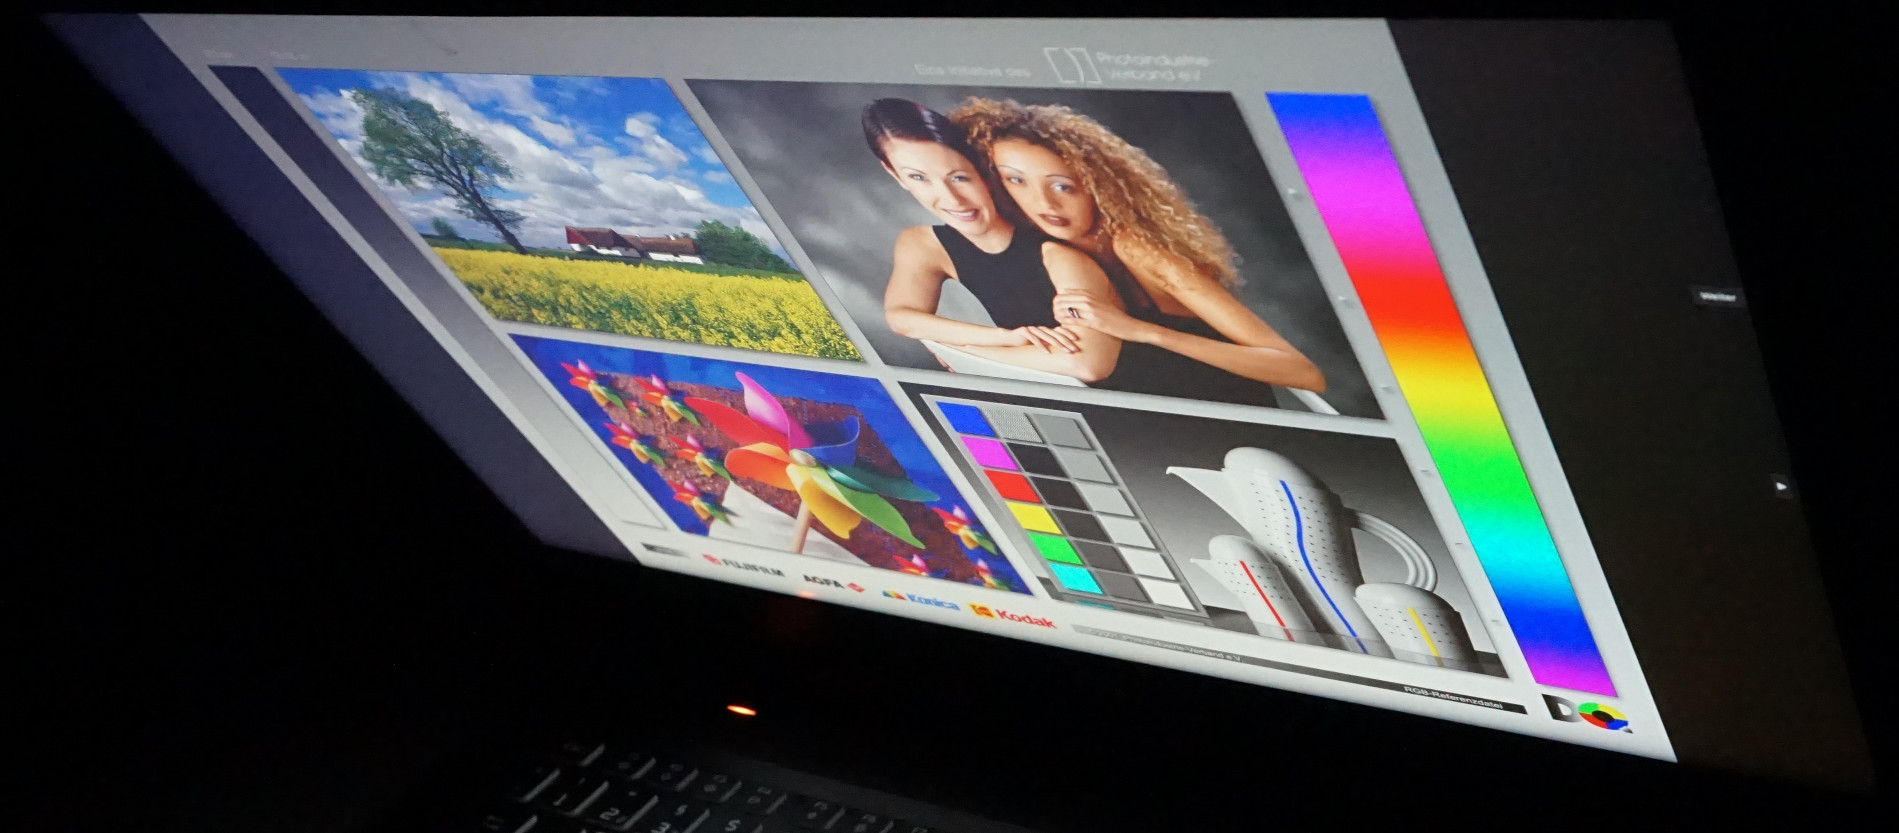
Tela - Em suma, é o ideal para jogos
Não se pode mais dizer que o painel IPS do Nitro 17 possui os pontos fracos latentes vistos no modelo da geração anterior modelo da geração anterior. É necessário um grande esforço para conseguir distinguir pixels individuais na tela de 17,3 polegadas com resolução QHD. O trabalho normal também pode ser feito no dispositivo sem a necessidade de aumentar o tamanho do texto ou dos símbolos.
A taxa de quadros de 165 Hz também é perfeita para jogos. Os tempos de resposta também são muito bons. Além disso, a tela exibe cores fortes e vibrantes que são reproduzidas com precisão, mesmo sem a necessidade de calibração. Com 360 cd/m², o brilho também é mais do que suficiente para uso em desktops.
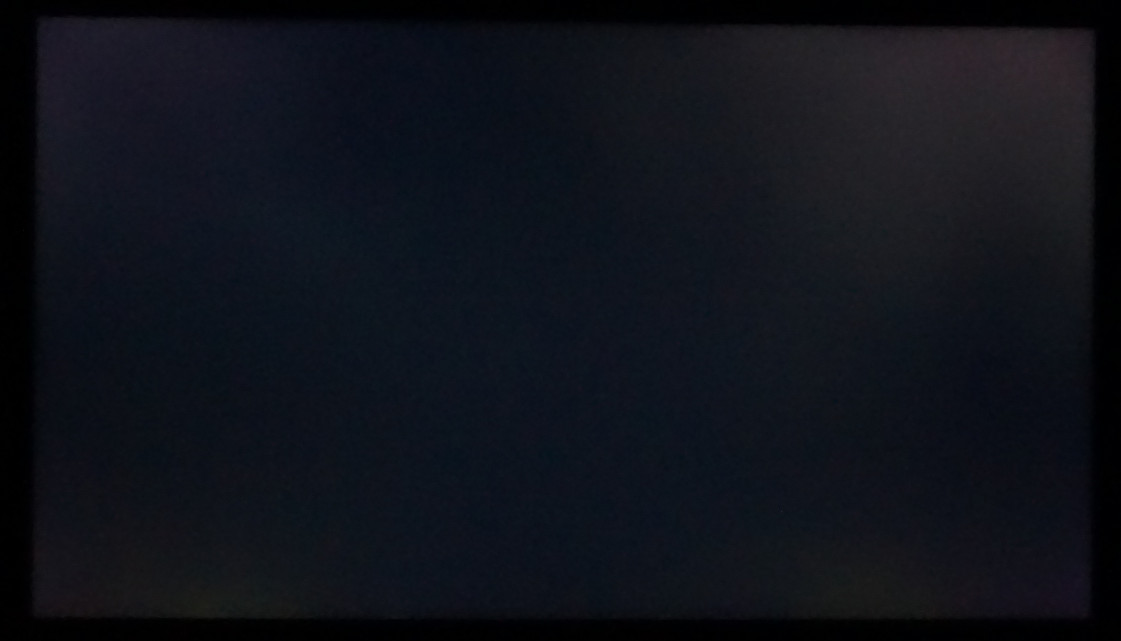
Entretanto, o contraste poderia ser melhor e parece ruim devido a um valor de nível de preto de apenas 600:1. Isso é especialmente perceptível em uma sala completamente escura. Um fundo preto é sempre ligeiramente iluminado e há um sangramento visível da tela no canto superior direito do monitor.
É claro que é possível encontrar telas com mais cores, mais quadros por segundo e maior densidade de pixels, mas, para um laptop de médio porte para jogos, os valores de imagem são muito coerentes.
| |||||||||||||||||||||||||
iluminação: 87 %
iluminação com acumulador: 360 cd/m²
Contraste: 602:1 (Preto: 0.6 cd/m²)
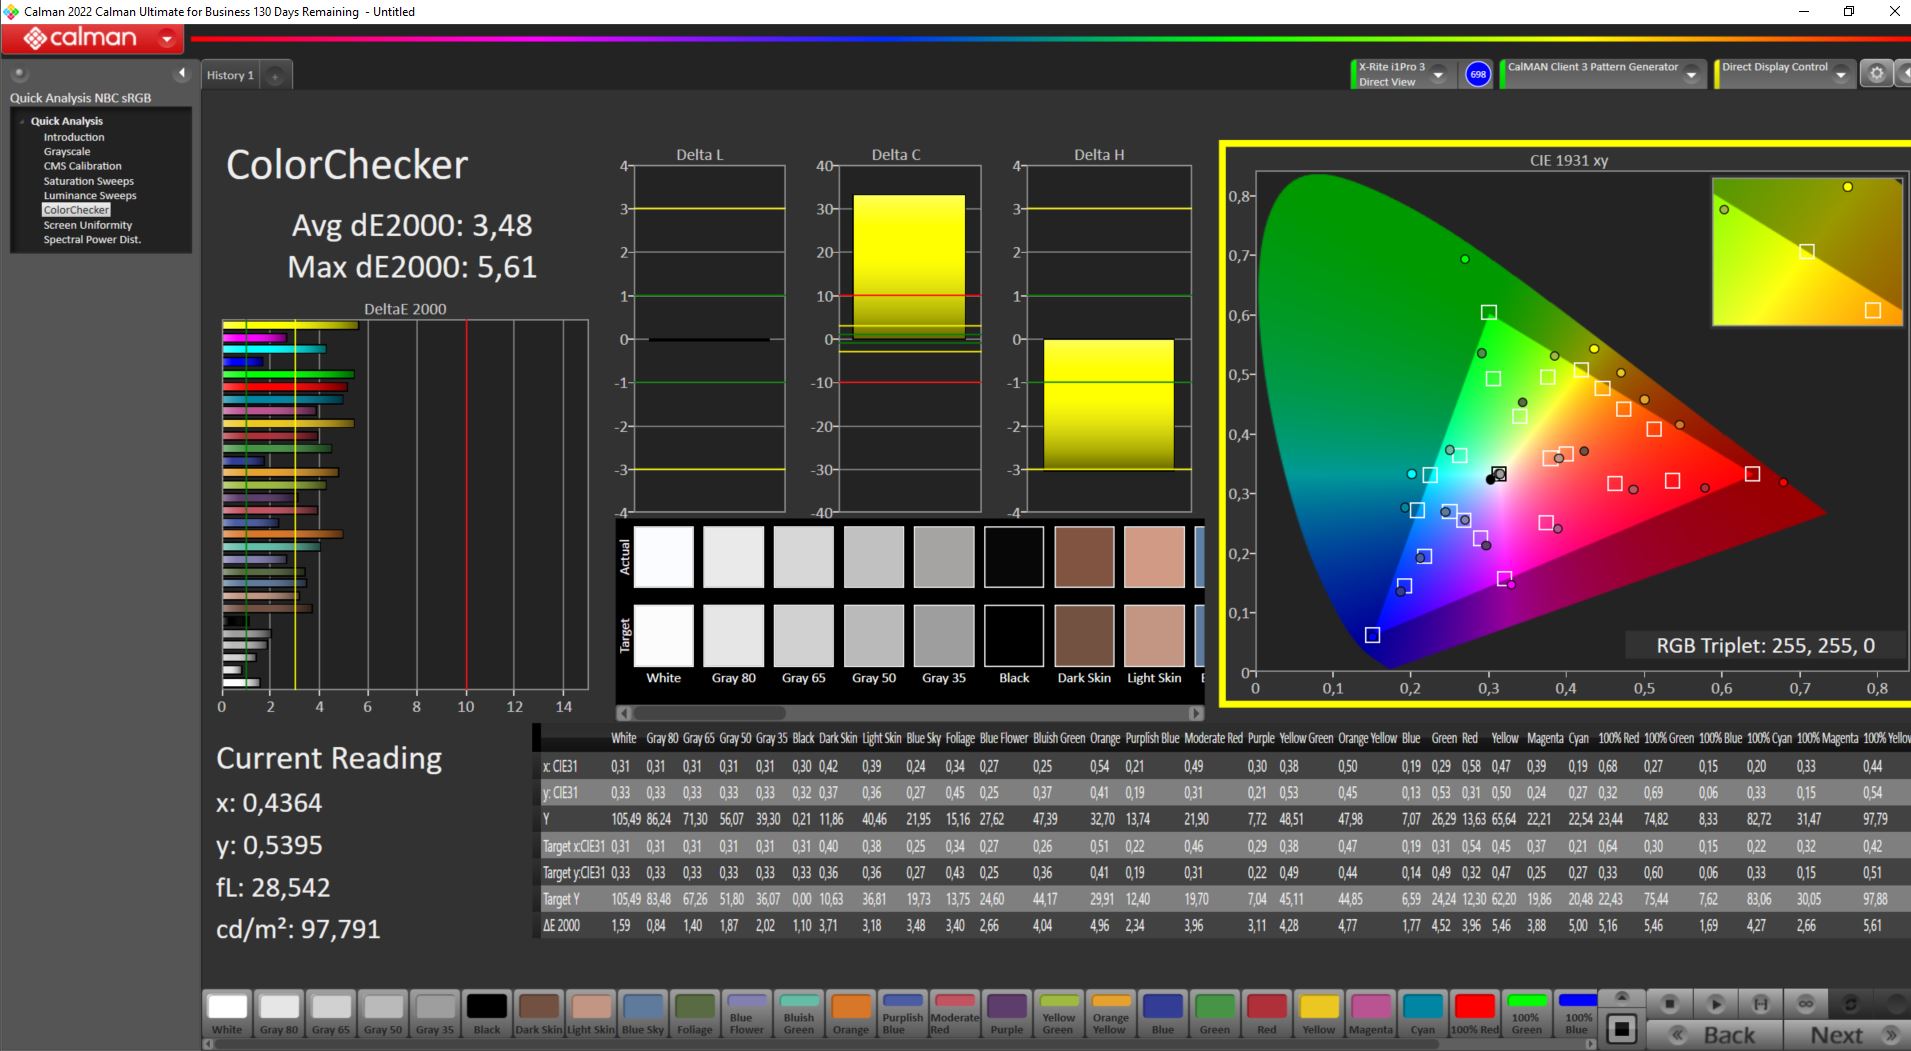
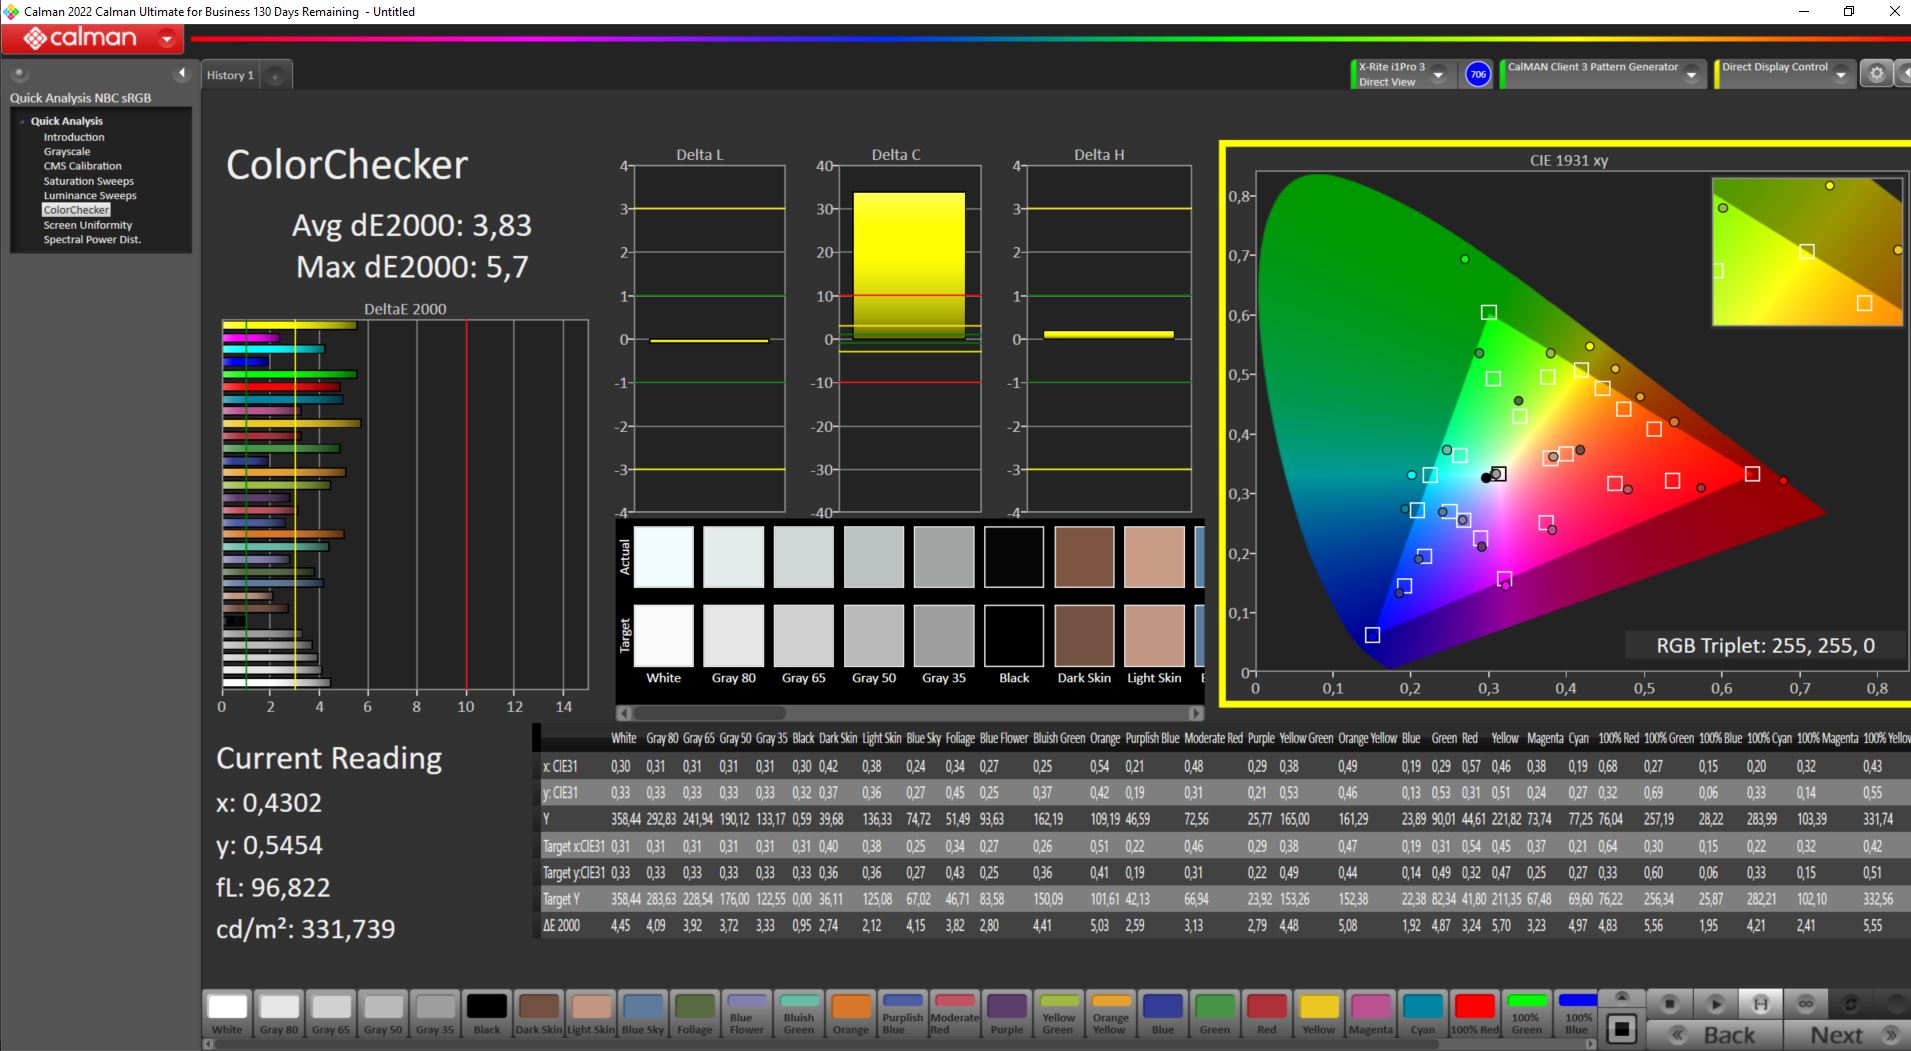
ΔE ColorChecker Calman: 3.83 | ∀{0.5-29.43 Ø4.71}
calibrated: 3.48
ΔE Greyscale Calman: 3.29 | ∀{0.09-98 Ø4.96}
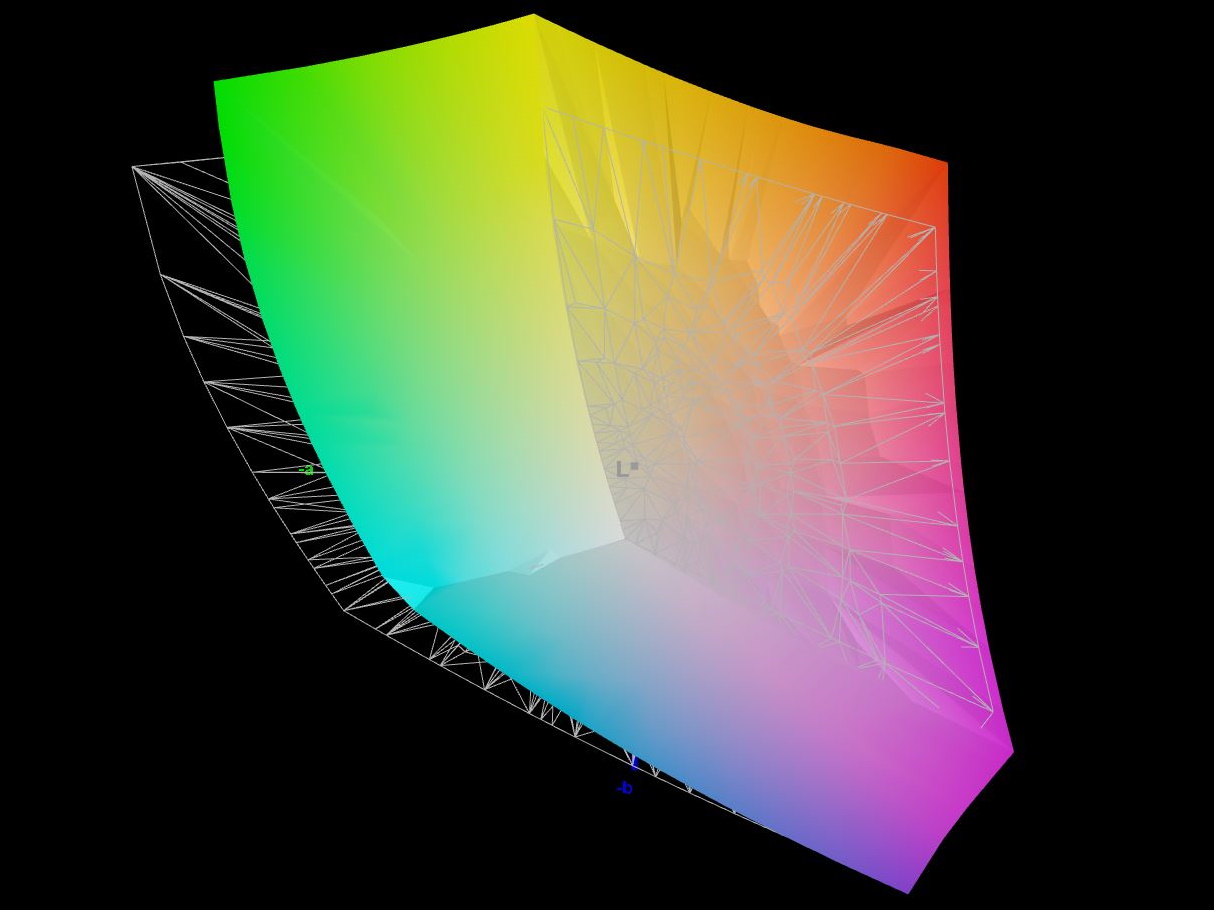
85.7% AdobeRGB 1998 (Argyll 3D)
100% sRGB (Argyll 3D)
98.3% Display P3 (Argyll 3D)
Gamma: 2.29
CCT: 6679 K
| Acer Nitro 17 AN17-51-71ER BOE0B7C NE173QHM-NY6, , 2560x1440, 17.3" | Lenovo Legion Pro 5 16IRX8 AU Optronics B160QAN03.1, IPS, 2560x1600, 16" | Asus TUF Gaming A16 FA617XS BOE NE160WUM-NX2, IPS, 1920x1200, 16" | Schenker XMG Focus 17 (E23) BOE09F9 NE173QHM-NZ1, IPS, 2560x1440, 17.3" | Medion Erazer Defender P40 BOE CQ NE173QHM-NZ3, IPS, 2560x1440, 17.3" | Acer Nitro 5 AN515-46-R1A1 AU Optronics B156HAN12.H, IPS, 1920x1080, 15.6" | MSI Pulse GL76 12UGK Sharp LQ173M1JW08, IPS, 1920x1080, 17.3" | |
|---|---|---|---|---|---|---|---|
| Display | -14% | -17% | -1% | -17% | -17% | -14% | |
| Display P3 Coverage (%) | 98.3 | 71.2 -28% | 69.3 -30% | 96.6 -2% | 68.3 -31% | 68.8 -30% | 71.9 -27% |
| sRGB Coverage (%) | 100 | 98.8 -1% | 97.3 -3% | 99.9 0% | 98.1 -2% | 98.1 -2% | 99.9 0% |
| AdobeRGB 1998 Coverage (%) | 85.7 | 73.3 -14% | 70.7 -18% | 84.5 -1% | 69.8 -19% | 69.7 -19% | 73.7 -14% |
| Response Times | -14% | -15% | -23% | -4% | 6% | 15% | |
| Response Time Grey 50% / Grey 80% * (ms) | 14.8 ? | 14.5 ? 2% | 15.6 ? -5% | 16.4 ? -11% | 14.6 ? 1% | 13 ? 12% | 4.6 ? 69% |
| Response Time Black / White * (ms) | 8 ? | 10.4 ? -30% | 10 ? -25% | 10.8 ? -35% | 8.7 ? -9% | 8 ? -0% | 11.2 ? -40% |
| PWM Frequency (Hz) | |||||||
| Screen | 41% | 41% | 28% | 45% | 19% | 4% | |
| Brightness middle (cd/m²) | 361 | 405.7 12% | 301 -17% | 349 -3% | 364 1% | 327 -9% | 337.7 -6% |
| Brightness (cd/m²) | 326 | 368 13% | 294 -10% | 318 -2% | 343 5% | 320 -2% | 331 2% |
| Brightness Distribution (%) | 87 | 87 0% | 94 8% | 82 -6% | 86 -1% | 93 7% | 82 -6% |
| Black Level * (cd/m²) | 0.6 | 0.38 37% | 0.21 65% | 0.56 7% | 0.28 53% | 0.24 60% | 0.31 48% |
| Contrast (:1) | 602 | 1068 77% | 1433 138% | 623 3% | 1300 116% | 1363 126% | 1089 81% |
| Colorchecker dE 2000 * | 3.83 | 1.65 57% | 1.79 53% | 1.08 72% | 1.67 56% | 3.26 15% | 4.12 -8% |
| Colorchecker dE 2000 max. * | 5.71 | 4.2 26% | 3.48 39% | 3.05 47% | 2.78 51% | 8.73 -53% | 8.89 -56% |
| Colorchecker dE 2000 calibrated * | 3.48 | 0.53 85% | 1.2 66% | 1.08 69% | 1.14 67% | 0.87 75% | 0.98 72% |
| Greyscale dE 2000 * | 3.29 | 1.2 64% | 2.5 24% | 1.14 65% | 1.4 57% | 4.87 -48% | 6.3 -91% |
| Gamma | 2.29 96% | 2.3 96% | 2.265 97% | 2.41 91% | 2.091 105% | 2.3 96% | 2.48 89% |
| CCT | 6679 97% | 6453 101% | 6157 106% | 6687 97% | 6568 99% | 7070 92% | 6542 99% |
| Média Total (Programa/Configurações) | 4% /
21% | 3% /
20% | 1% /
15% | 8% /
25% | 3% /
9% | 2% /
2% |
* ... menor é melhor
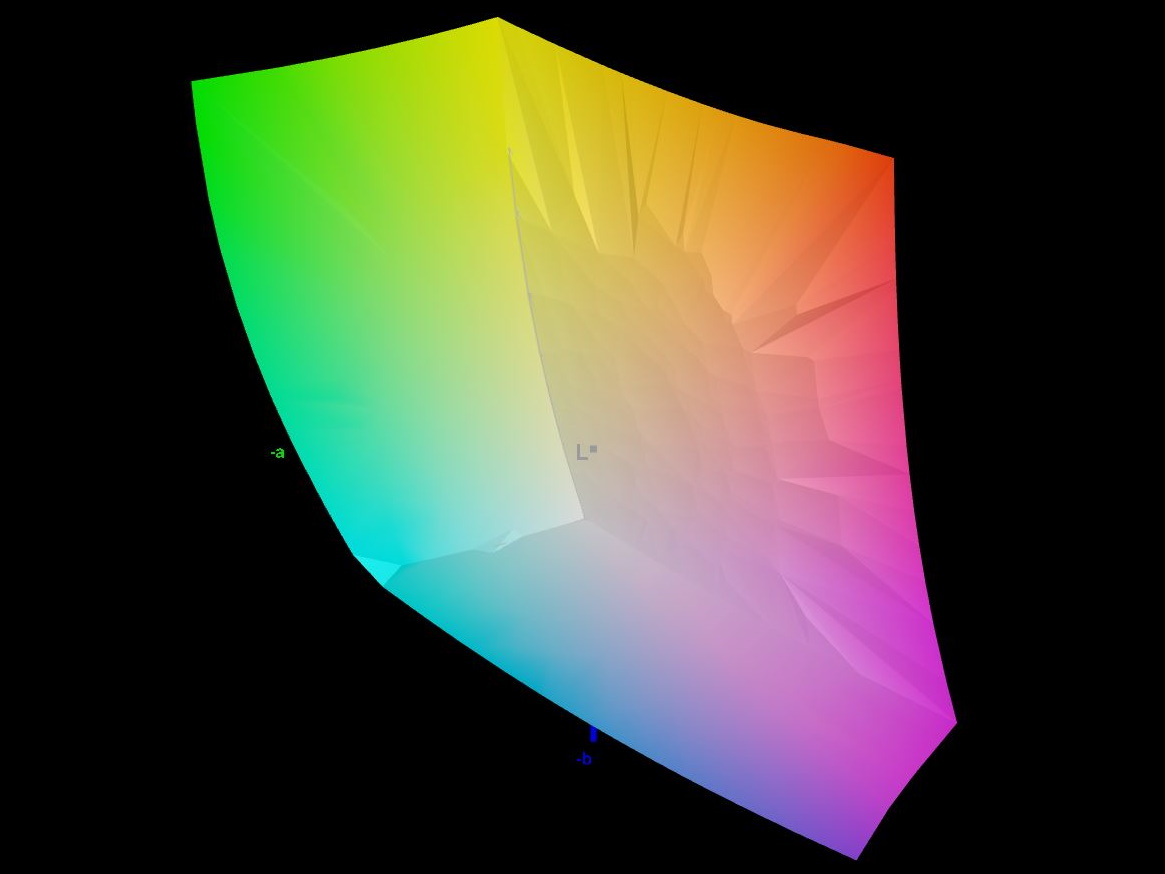
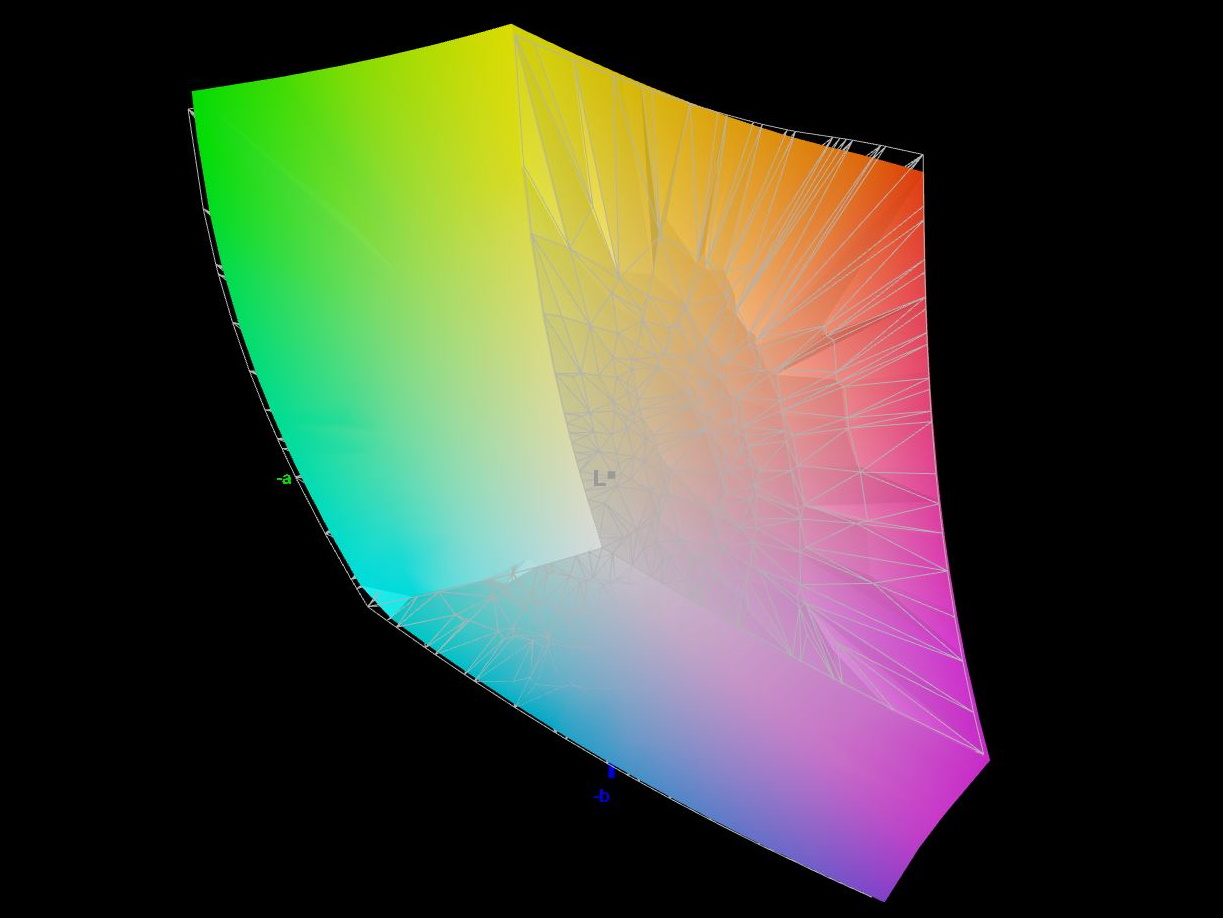
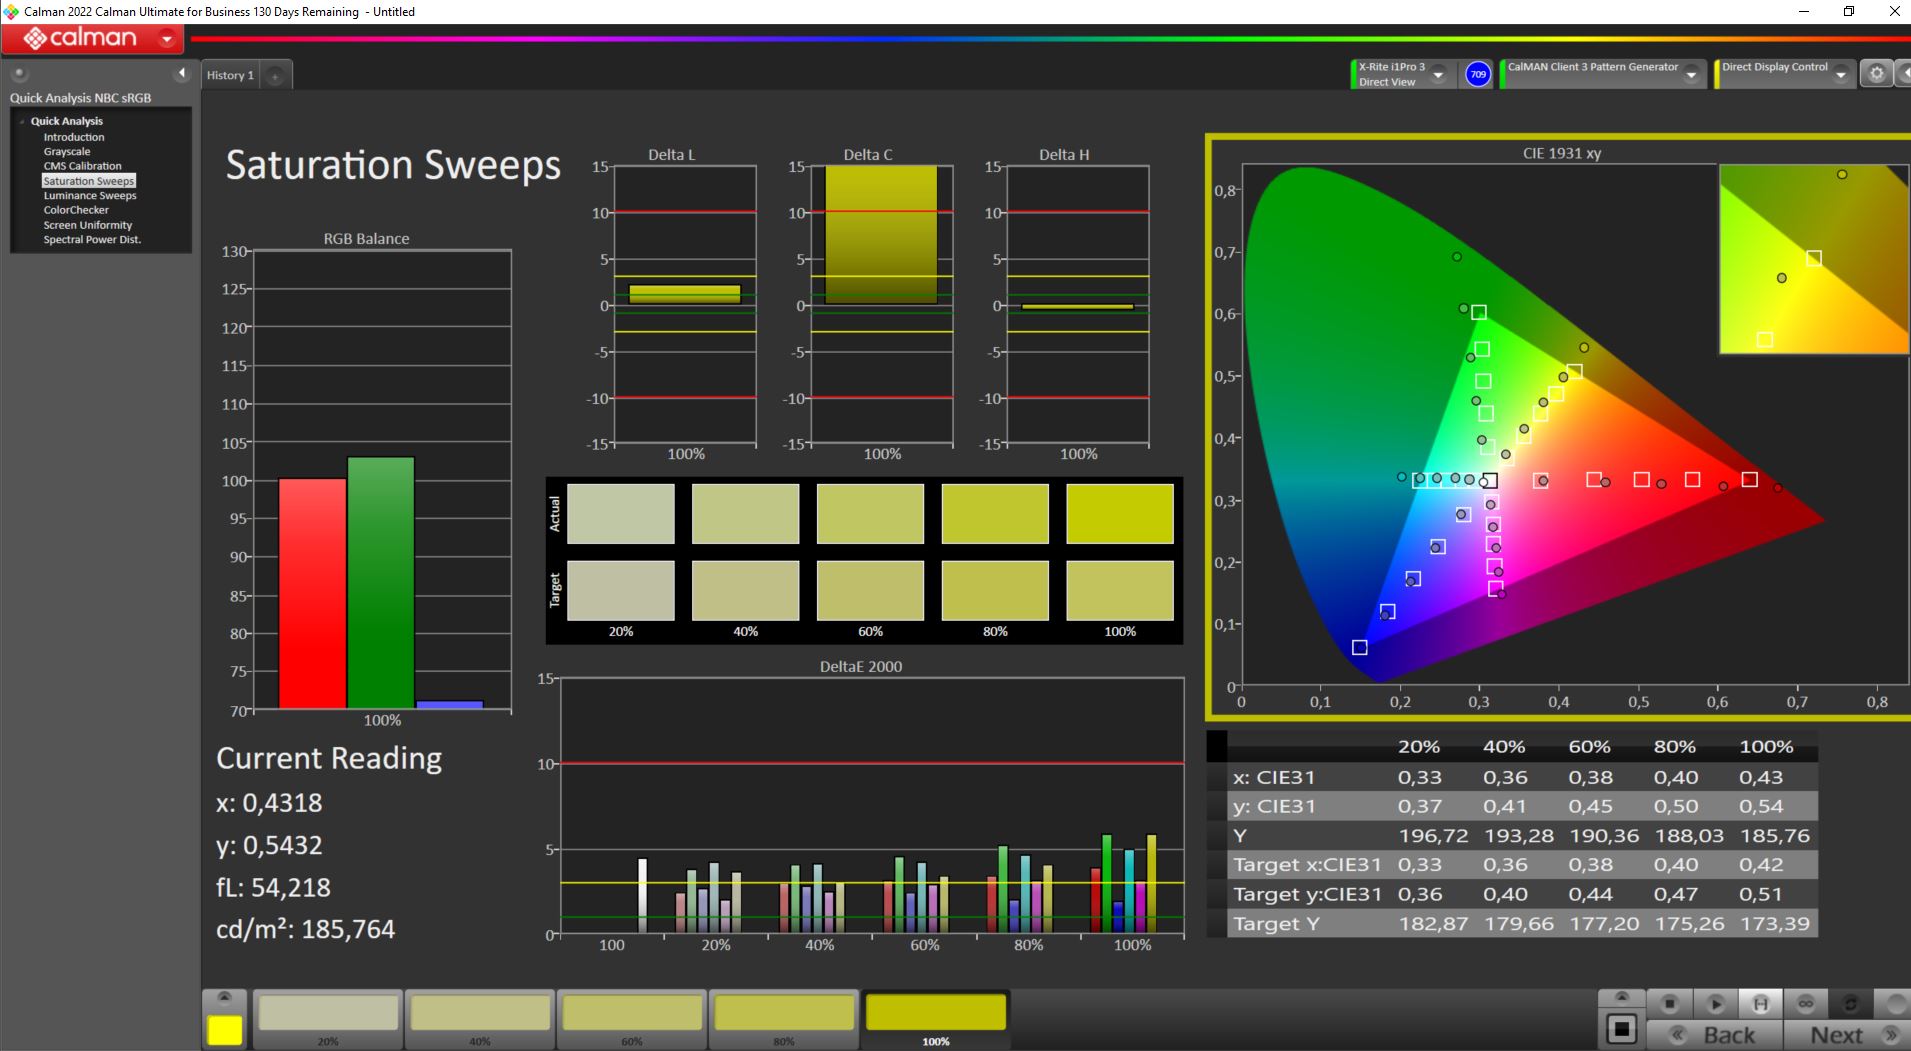
Em termos de reprodução de cores, o Acer Nitro 17 faz um excelente trabalho. O espaço de cores sRGB, que é importante para jogos, é totalmente coberto. Até mesmo o DCI P3, que é usado na produção de filmes, é quase totalmente reproduzido.
Em comparação com laptops semelhantes voltados para jogos, esses resultados são excelentes.
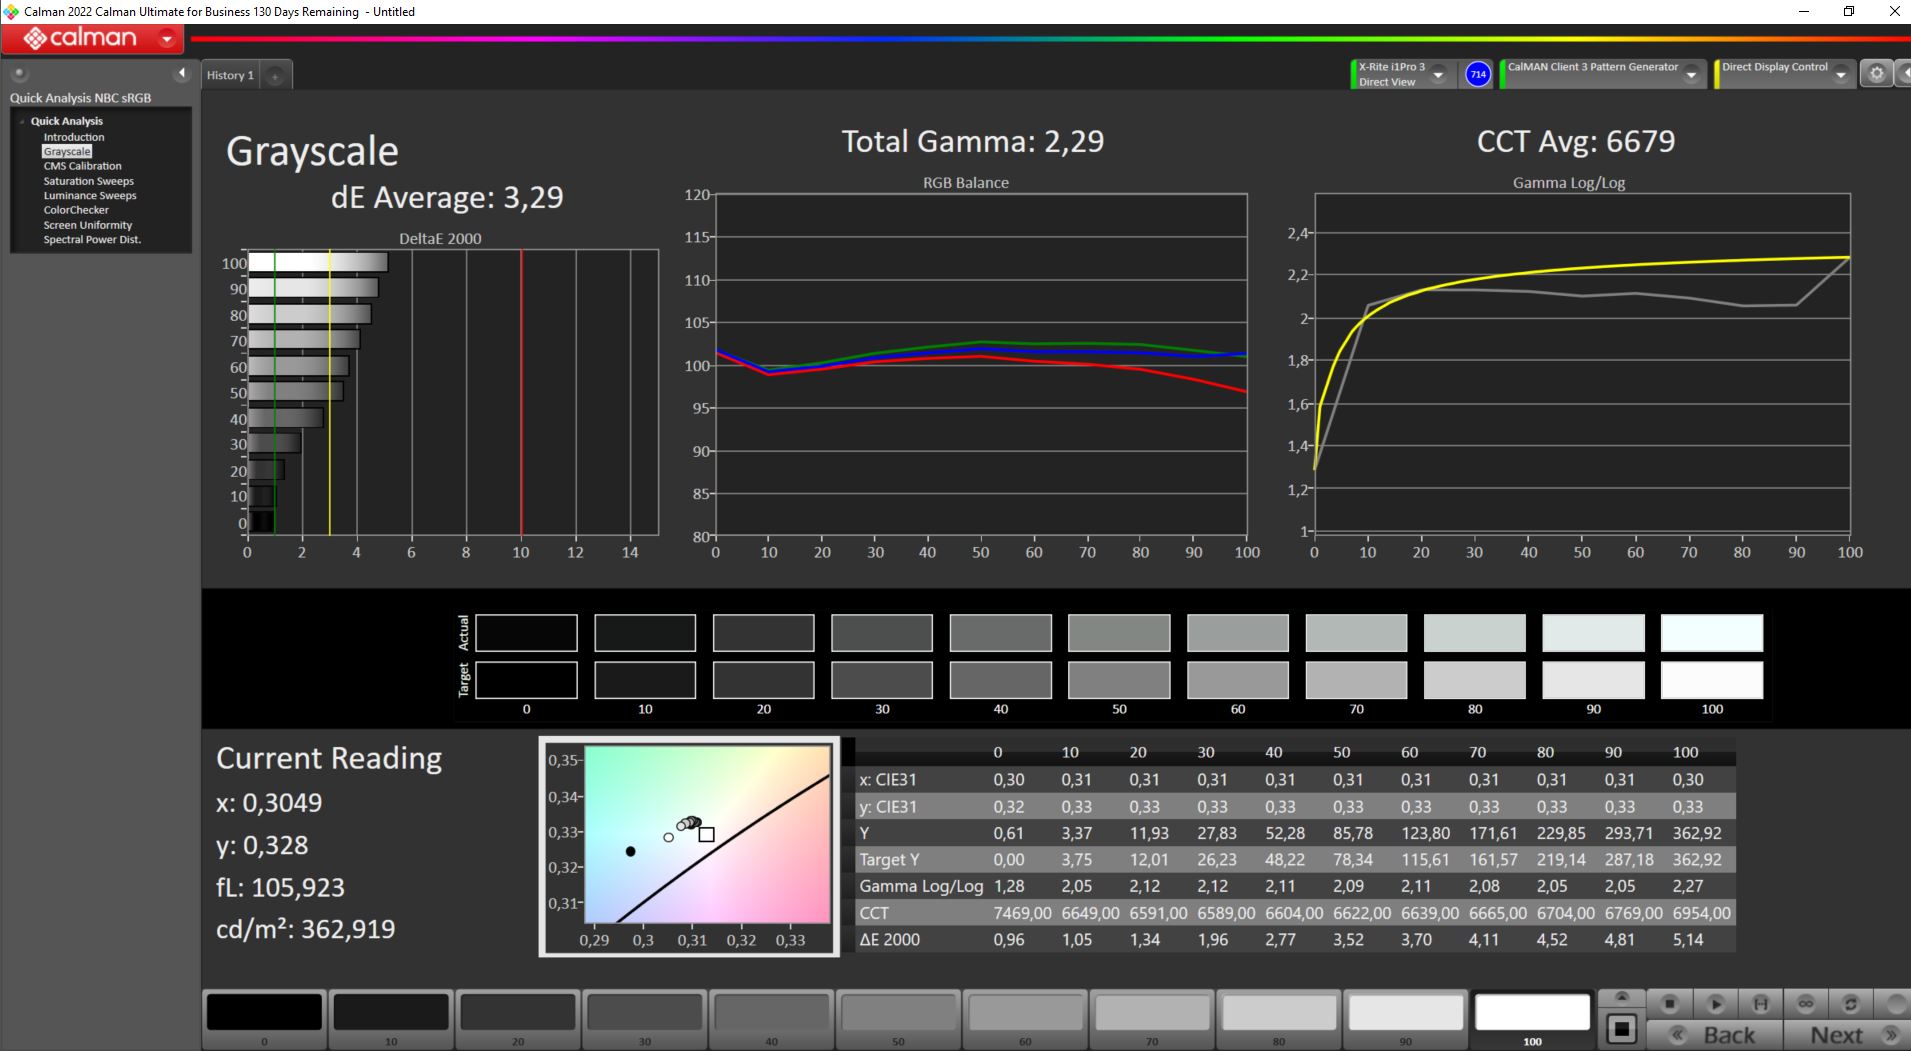
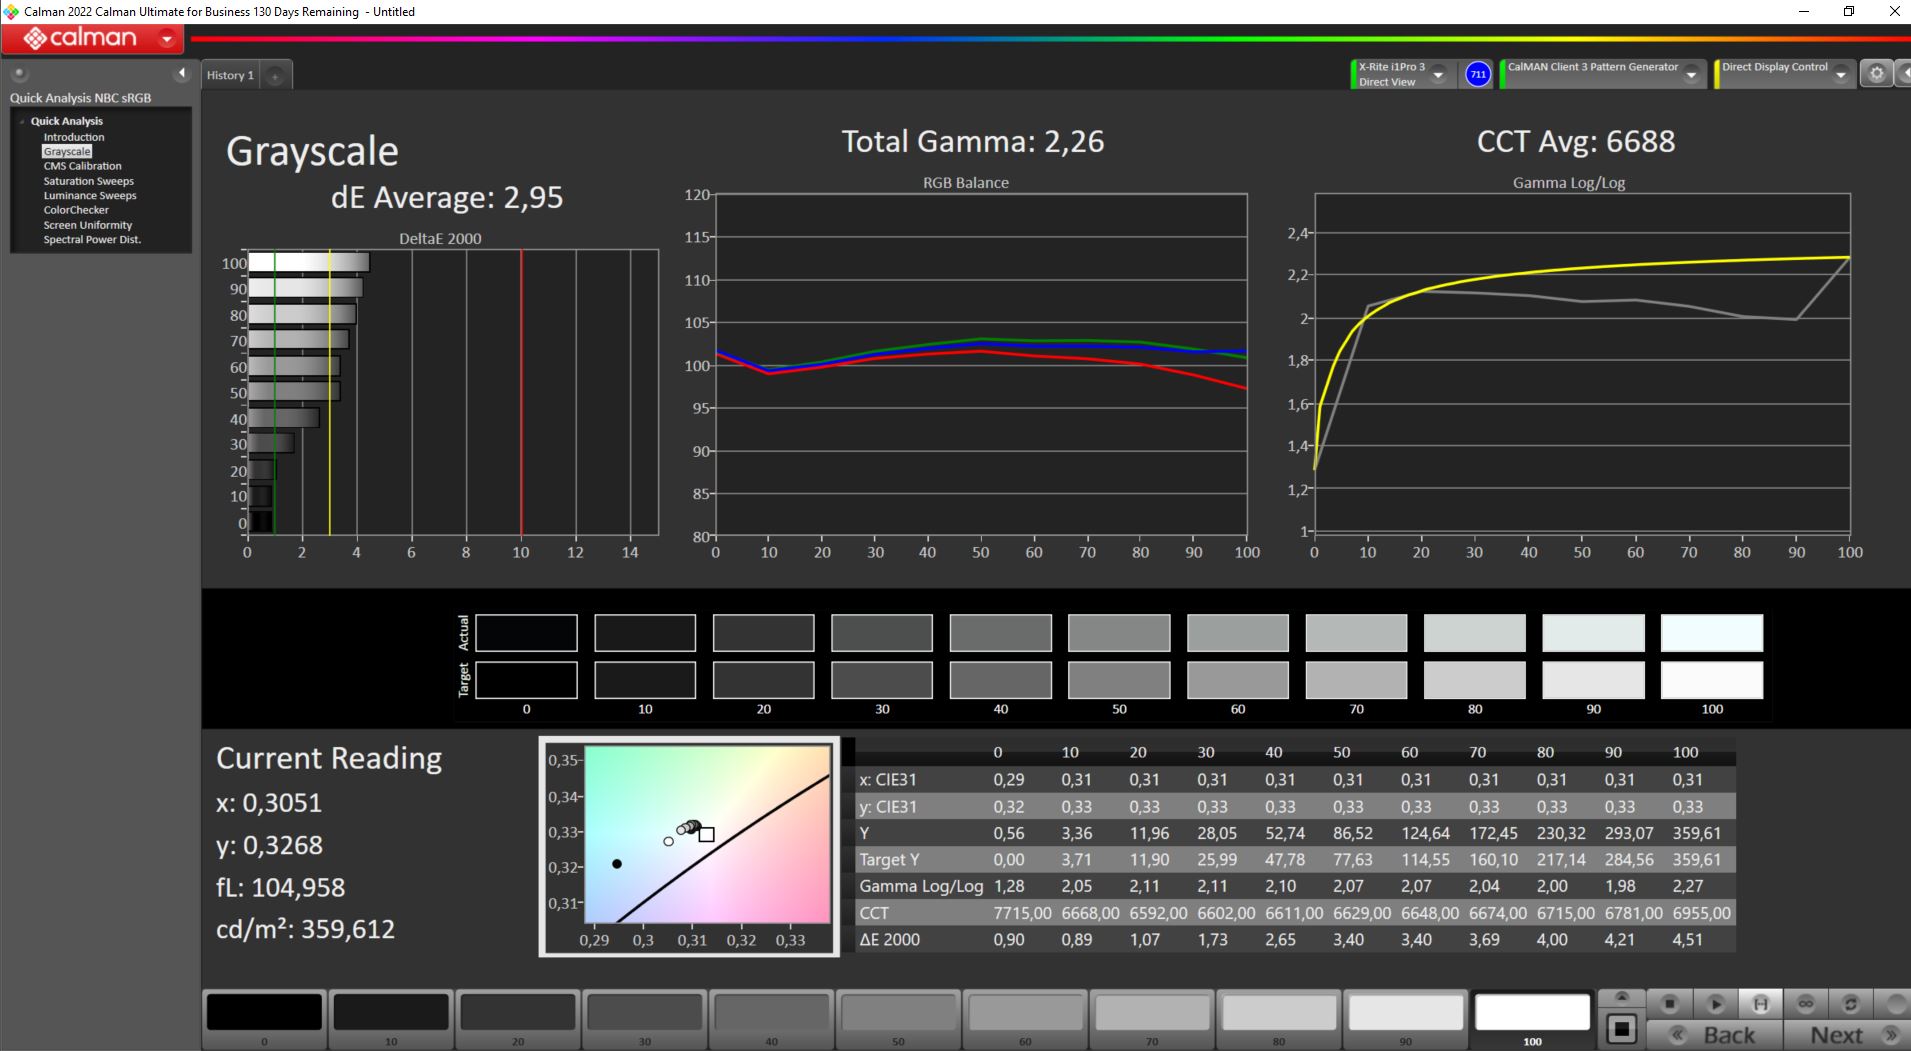
Depois de reduzir o brilho para 50%, o nível de preto de 0,21 (em vez de 0,59) é muito melhor. Ao fazer isso, o contraste também aumenta para quase 900:1. Especialmente à noite, quando o brilho total normalmente não é necessário, a reprodução da imagem melhora de acordo. Até mesmo o desvio de cor DeltaE de 3,5 é menor do que no brilho total.
Medimos um desvio DelatE de 3,8 em relação à reprodução de cores desejada. A calibração não resultou em mais melhorias. Embora olhos bem treinados possam perceber discrepâncias, especialmente quando se trata de tons de amarelo e laranja, não há nada de errado com a reprodução de cores.
Desde que o usuário não pretenda usar o dispositivo para edição profissional de fotos ou vídeos, a tela reproduz as cores com muita naturalidade.


Exibir tempos de resposta
| ↔ Tempo de resposta preto para branco | ||
|---|---|---|
| 8 ms ... ascensão ↗ e queda ↘ combinadas | ↗ 3.4 ms ascensão | 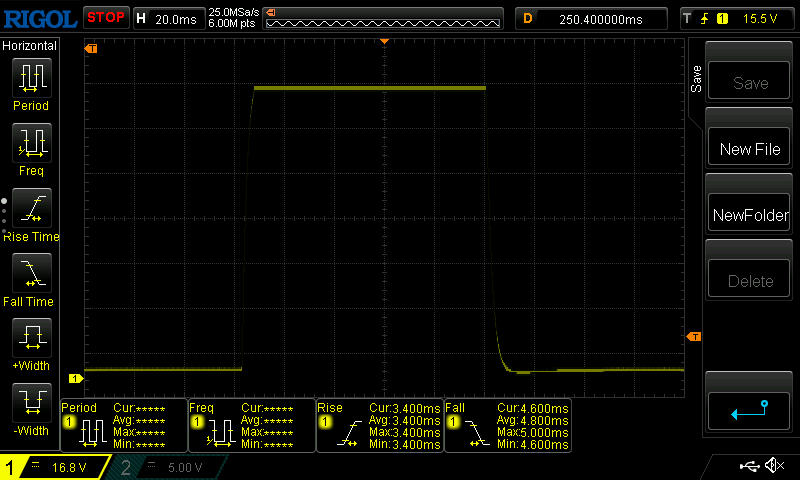 |
| ↘ 4.6 ms queda | ||
| A tela mostra taxas de resposta rápidas em nossos testes e deve ser adequada para jogos. Em comparação, todos os dispositivos testados variam de 0.1 (mínimo) a 240 (máximo) ms. » 22 % de todos os dispositivos são melhores. Isso significa que o tempo de resposta medido é melhor que a média de todos os dispositivos testados (19.8 ms). | ||
| ↔ Tempo de resposta 50% cinza a 80% cinza | ||
| 14.8 ms ... ascensão ↗ e queda ↘ combinadas | ↗ 7 ms ascensão | 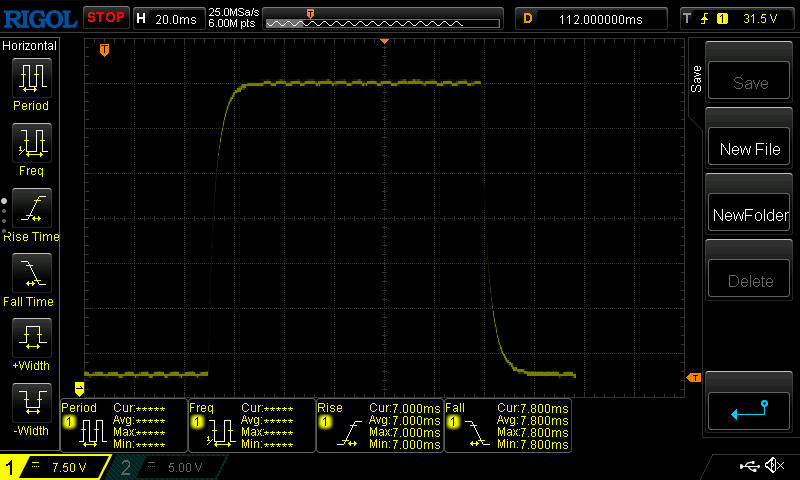 |
| ↘ 7.8 ms queda | ||
| A tela mostra boas taxas de resposta em nossos testes, mas pode ser muito lenta para jogadores competitivos. Em comparação, todos os dispositivos testados variam de 0.165 (mínimo) a 636 (máximo) ms. » 29 % de todos os dispositivos são melhores. Isso significa que o tempo de resposta medido é melhor que a média de todos os dispositivos testados (31 ms). | ||
Cintilação da tela / PWM (modulação por largura de pulso)
| Tela tremeluzindo / PWM não detectado |  | ||
[pwm_comparison] Em comparação: 52 % de todos os dispositivos testados não usam PWM para escurecer a tela. Se PWM foi detectado, uma média de 7757 (mínimo: 5 - máximo: 343500) Hz foi medida. | |||
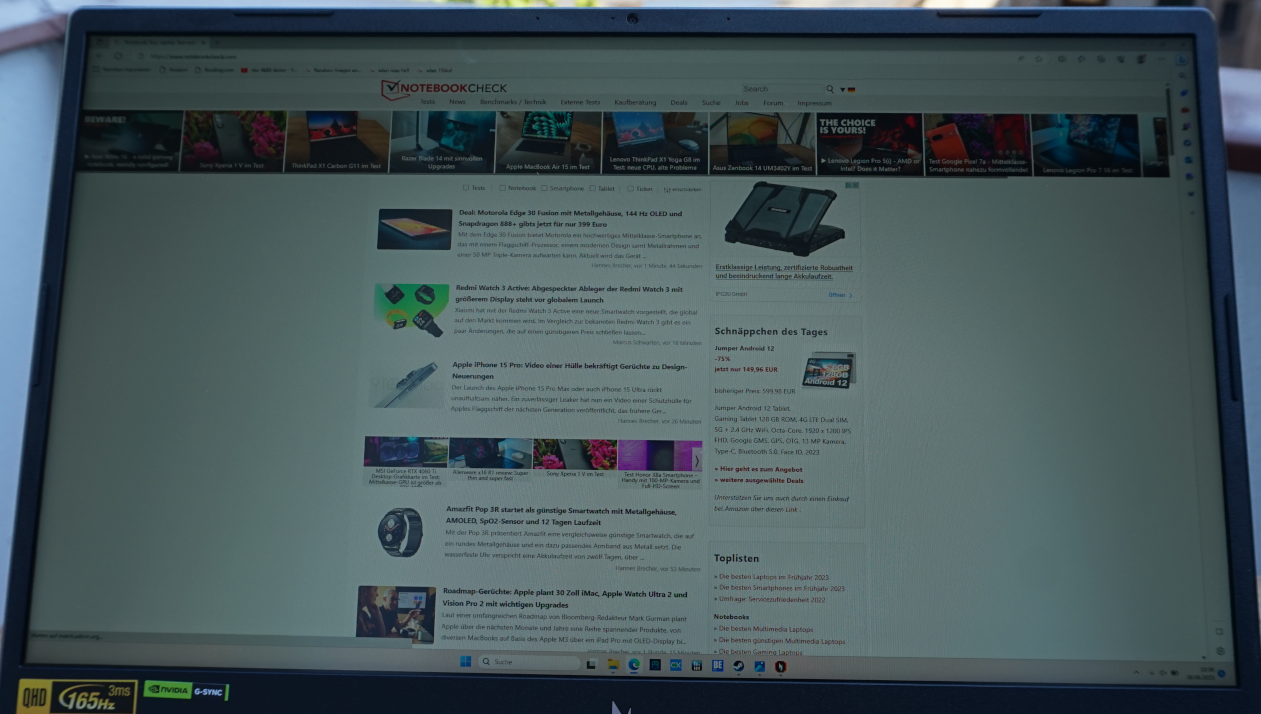
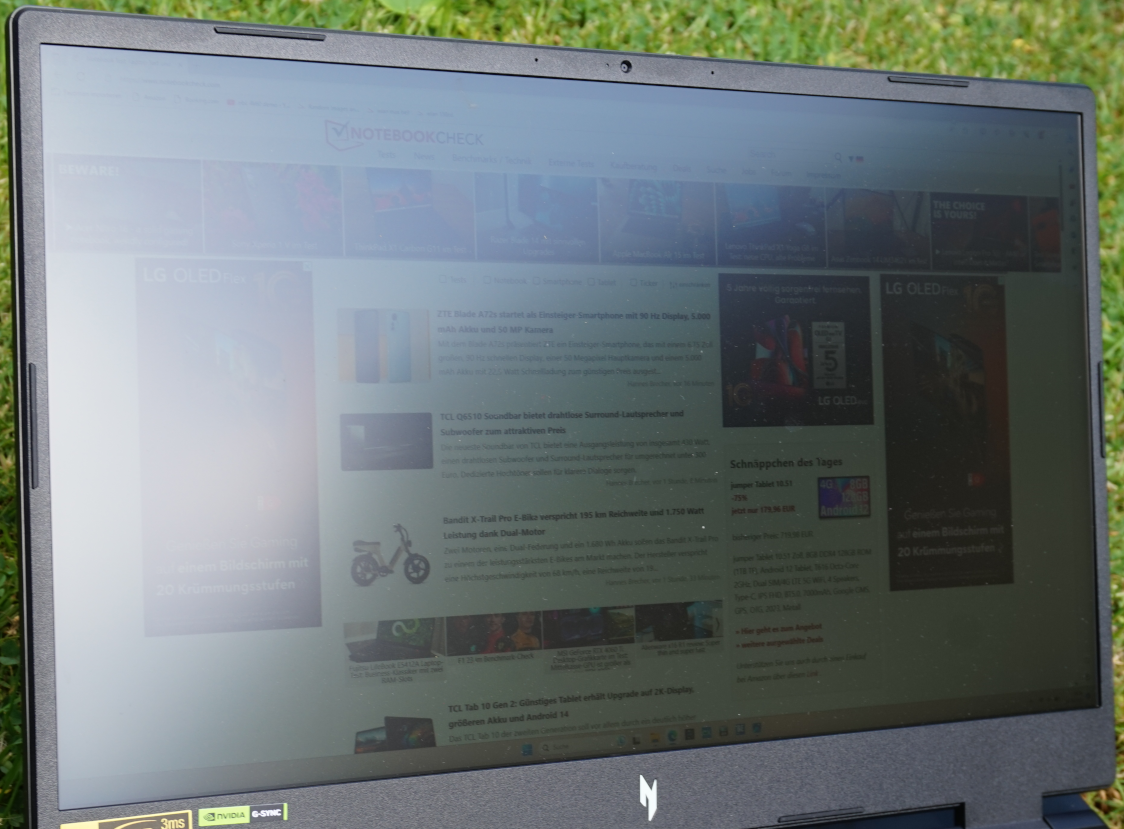
Ao ar livre, em uma varanda ou em uma área sombreada no jardim, o texto e até mesmo as fotos são legíveis. É claro que as cores não aparecem, como desejado. Como esperado, não é possível ver muita coisa sob a luz do sol, mas o texto é legível - apenas.
Mesmo em um ângulo agudo, não é possível ver desvios de cor. Uma leve névoa cinza cobre a imagem em um ângulo de aproximadamente 45°.
Desempenho - O Nitro 17 fica no meio do pacote de jogos
Com a 13ª geração do Intel Core i7 (Raptor Lake)e aNvidia GeForce RTX 4060a maioria dos jogos atuais pode ser reproduzida na resolução QHD nativa da tela, mas com algumas limitações aqui e ali. Desde que suas exigências não sejam muito altas, o laptop para jogos proporcionará um ótimo entretenimento por um bom tempo.
Além do nosso candidato à análise, há atualmente algumas outras variantes do Nitro 17 disponíveis que vêm com o Intel Core i5-13500H ou oi7-13700Hbem como aRTX 4050 ou umaRTX 4060. Os títulos atuais devem ser facilmente jogáveis com o modelo de especificação mais baixa, embora em Full HD.
Condições de teste
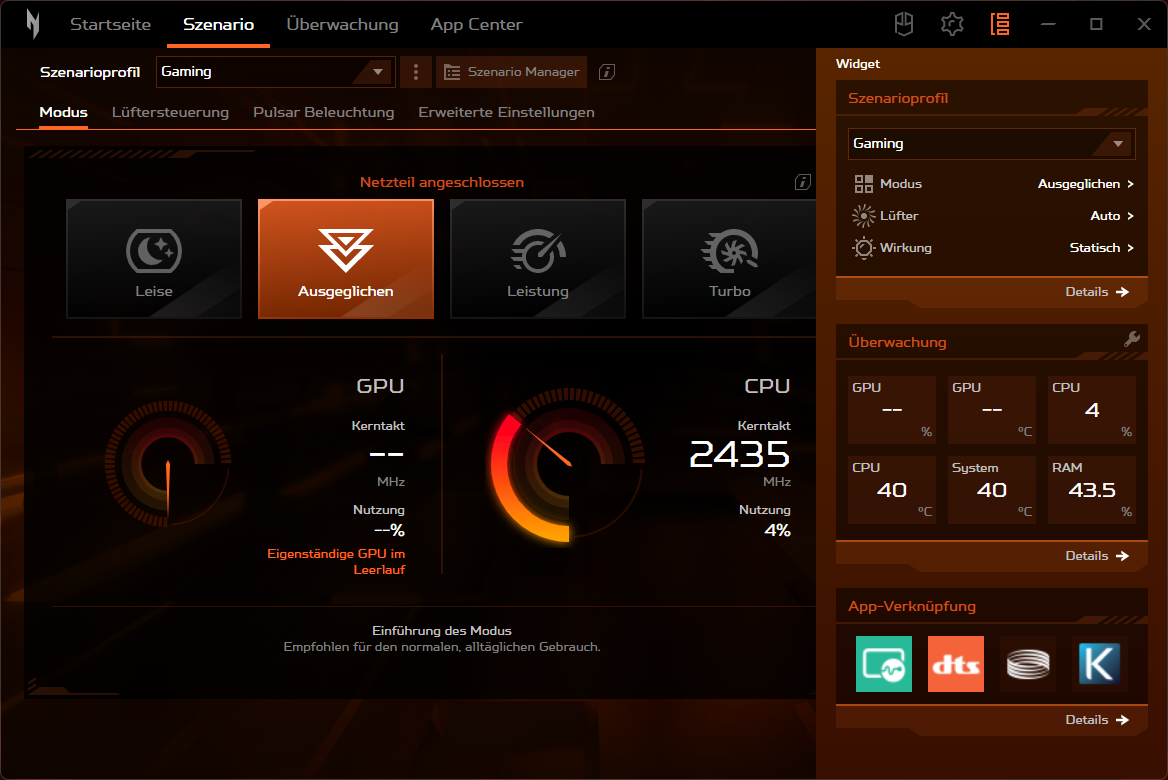
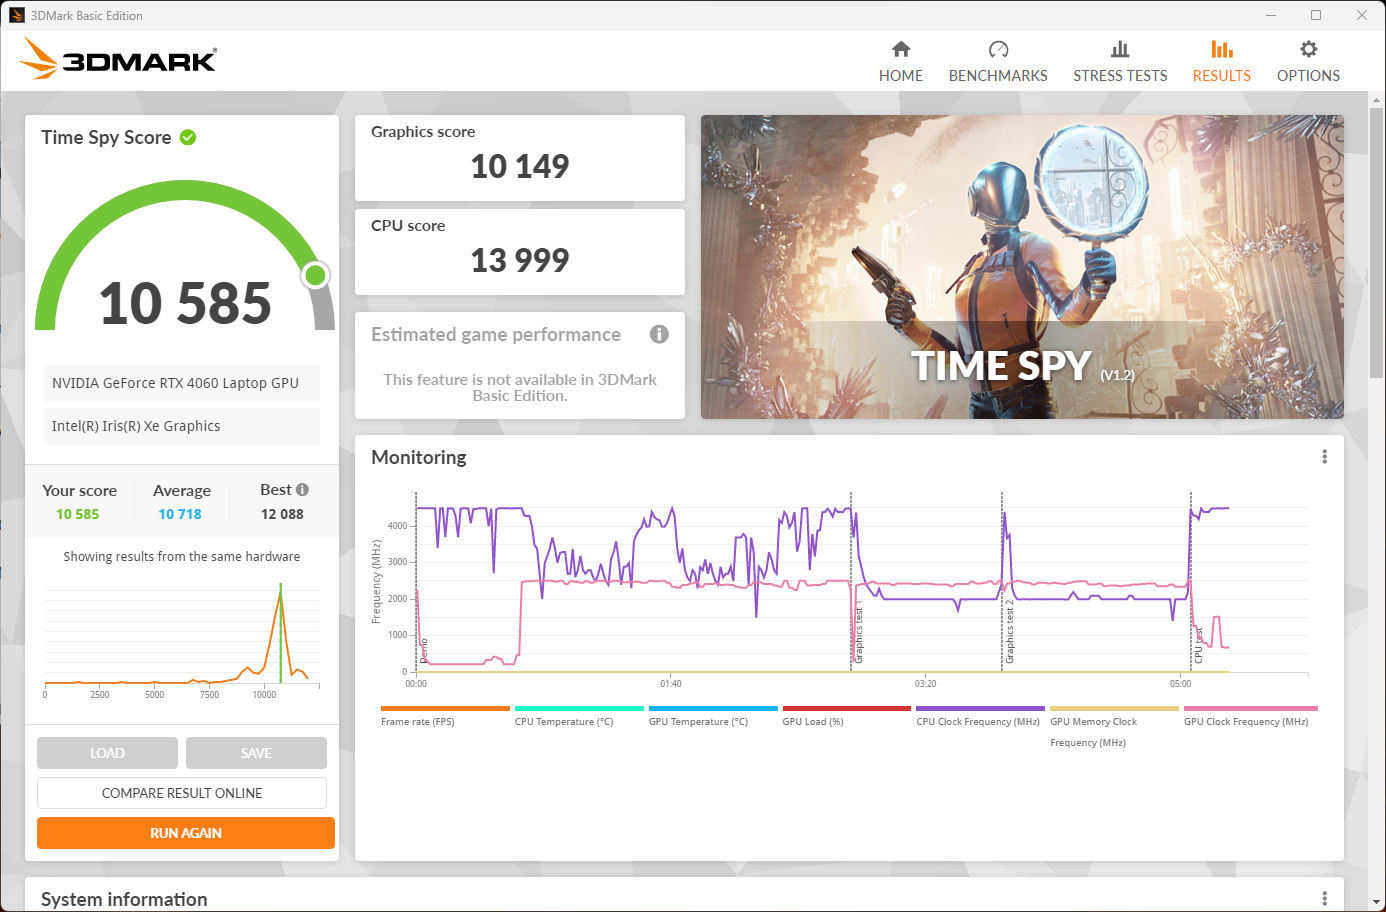
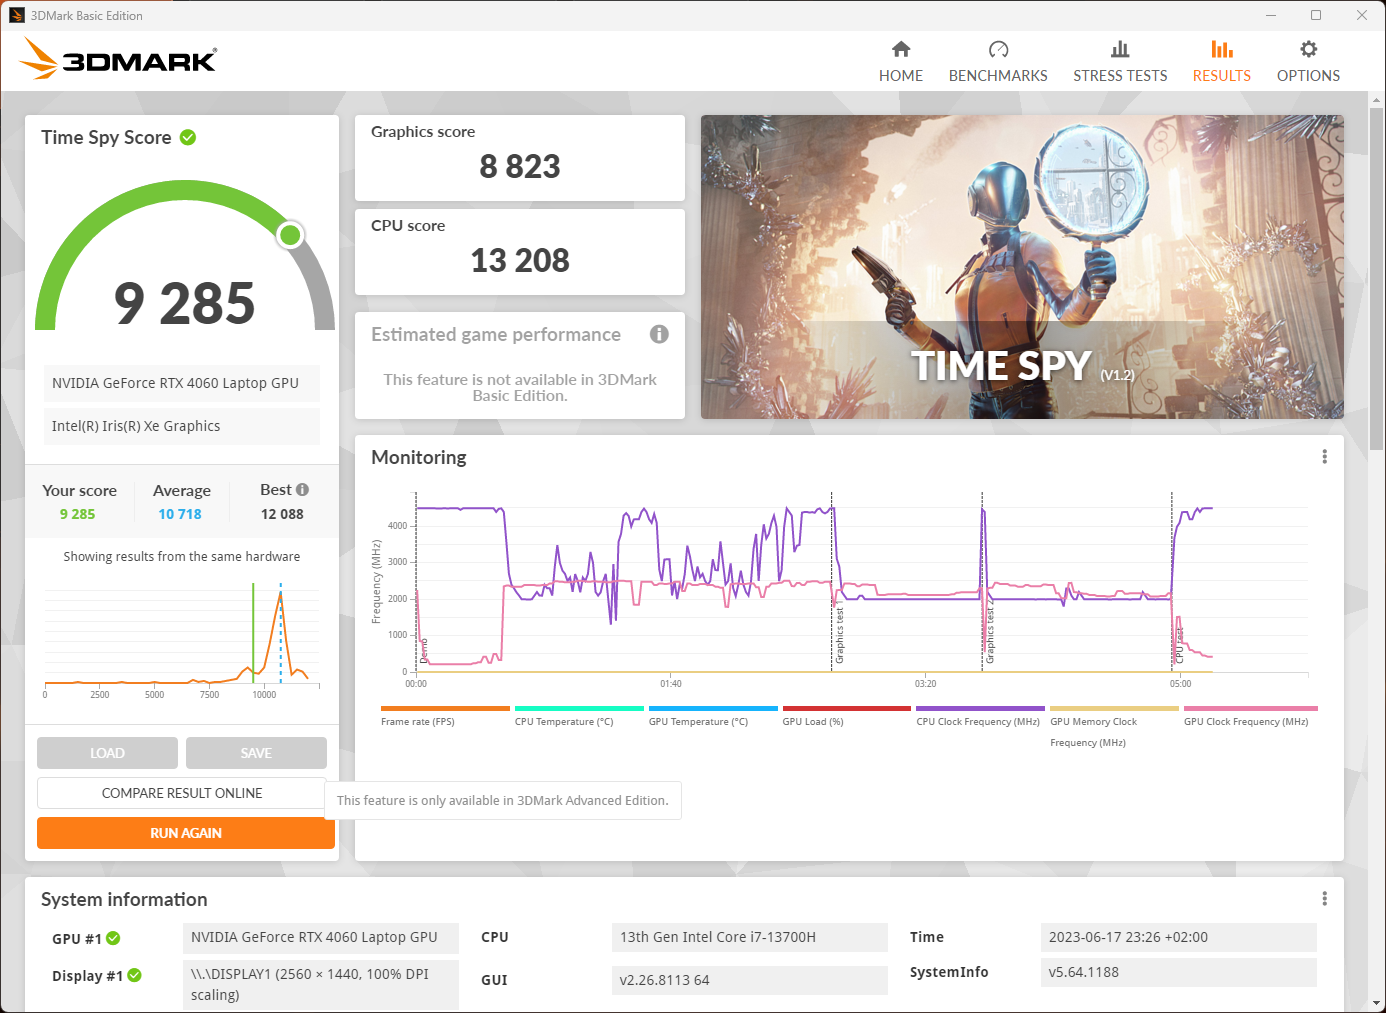
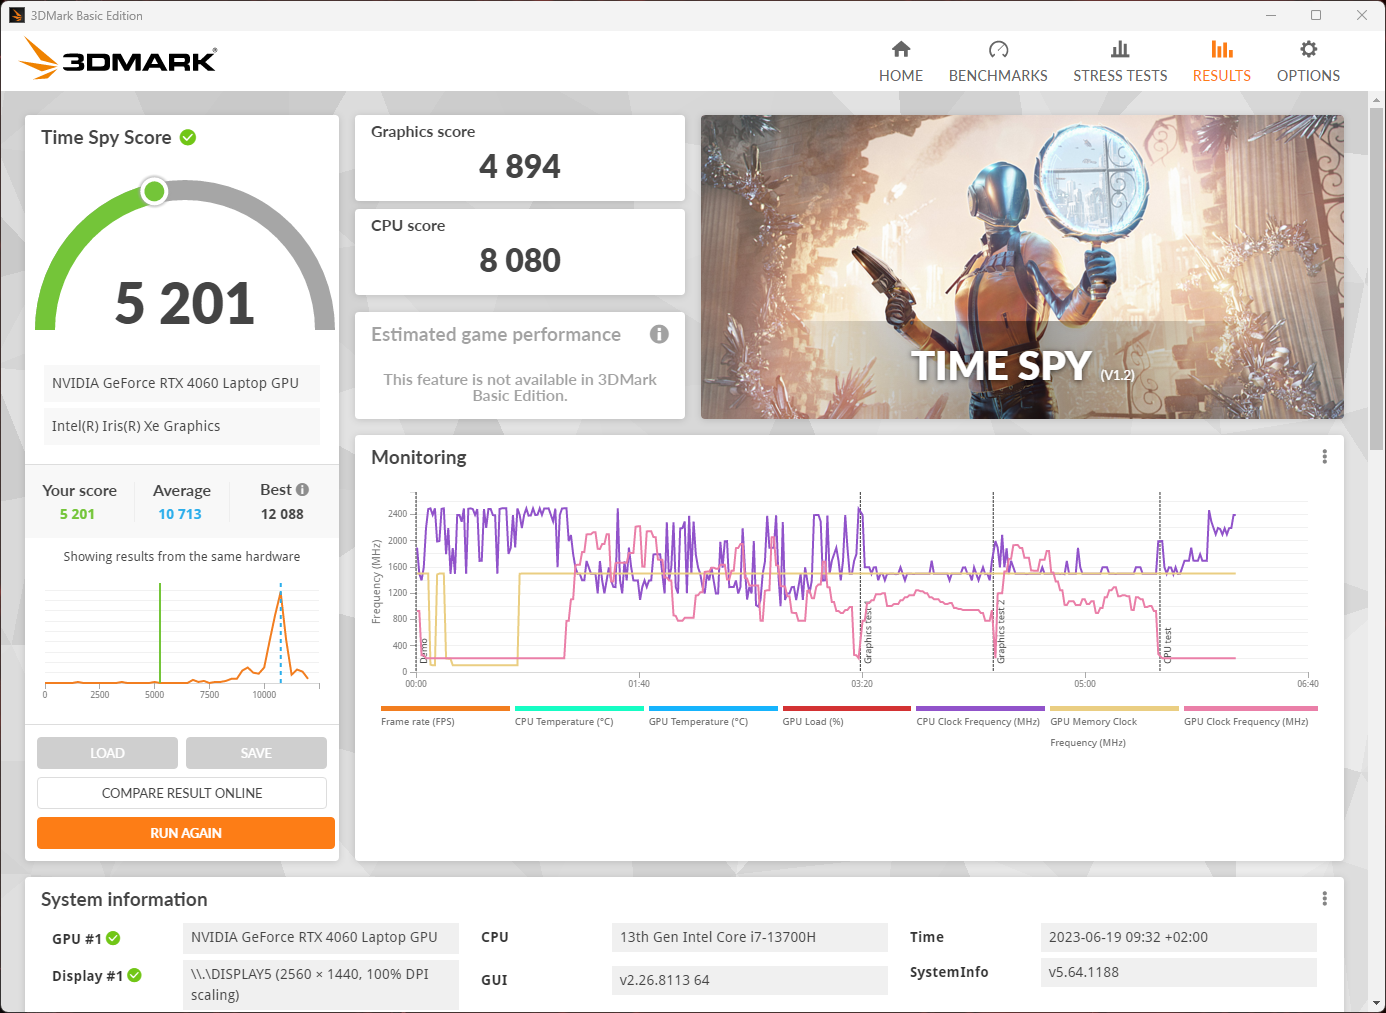
Vários cenários podem ser definidos com o uso do software NitroSense. Enquanto o comportamento da CPU e da GPU é definido para quatro modos de operação possíveis, o comportamento da ventoinha, a iluminação principal e o perfil de som podem ser selecionados de acordo.
Para uma determinação realista dos benchmarks, selecionamos o modo "Desempenho". A Acer recomenda esse modo em suas instruções para uma operação ideal, também durante longos períodos de tempo. O ruído do ventilador no modo "Turbo" é muito mais alto. Em nossos testes, conseguimos obter resultados quase idênticos nos modos "Equilibrado" e "Desempenho" com aproximadamente metade do nível de ruído. Entretanto, a queda de desempenho no modo "Quiet" é considerável, enquanto os ventiladores permanecem audíveis, no mínimo.
Isso significa que o modo de operação balanceado deve ser ideal para a maioria dos cenários de aplicação. O som nos jogos, por meio dos alto-falantes integrados, é perfeitamente audível e o ruído da ventoinha não é particularmente irritante.
| Turbo | Desempenho | Equilibrado | Silencioso | |
| CPU PL2 | 115 watts | 115 watts | 115 watts | 115 watts |
| CPU PL1 | 100 watts | 80 watts | 70 watts | 45 watts |
| Volume (Time Spy) | 58 dB | 55 dB | 43 dB | 38 dB |
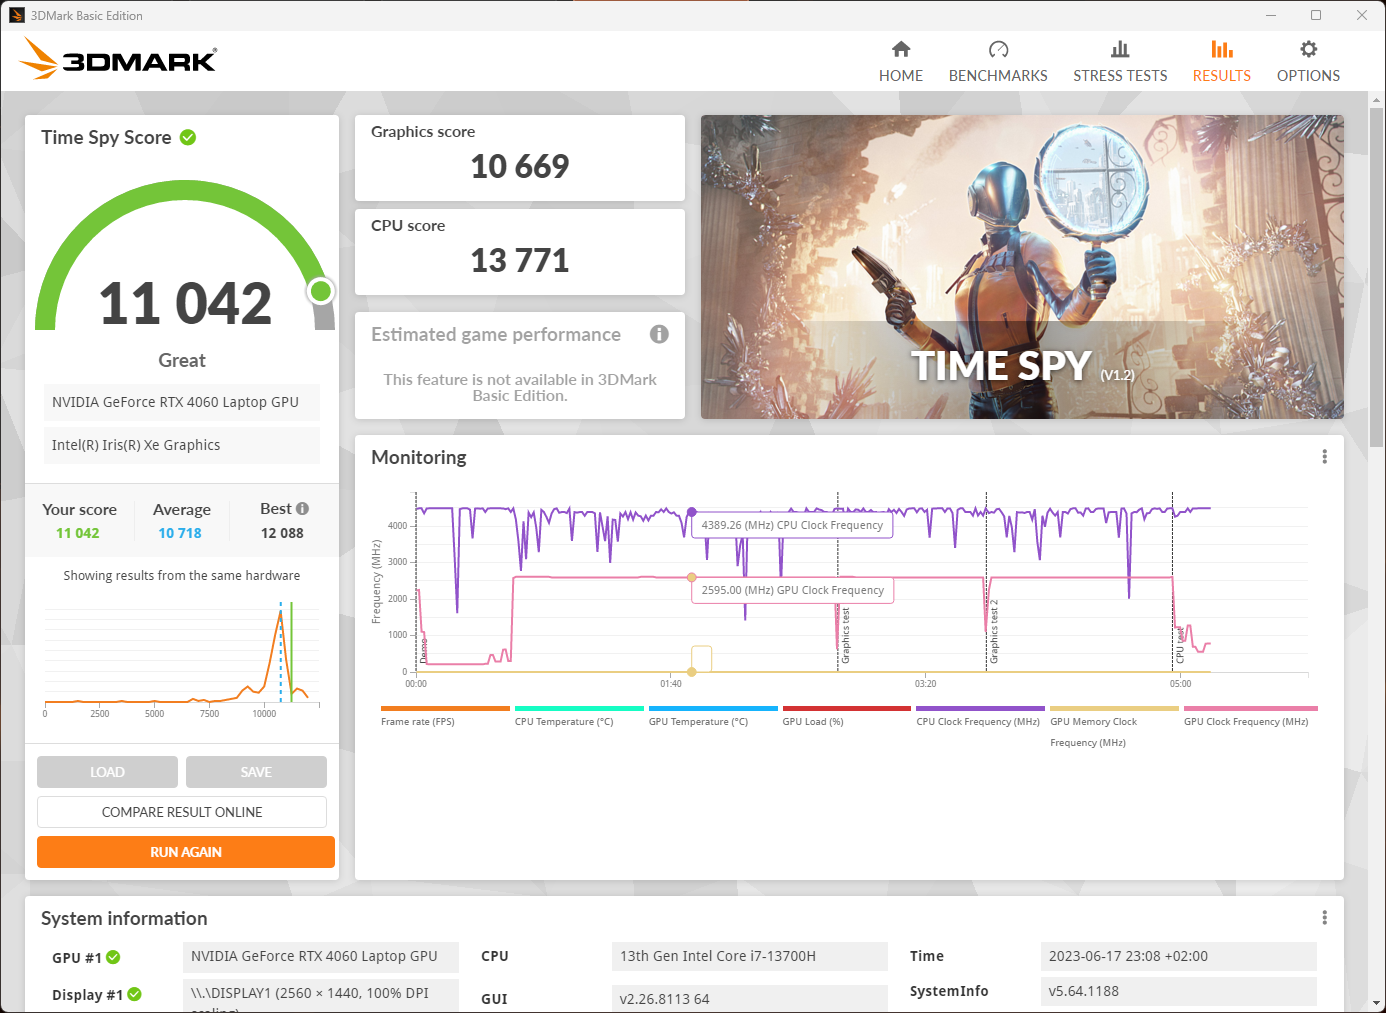
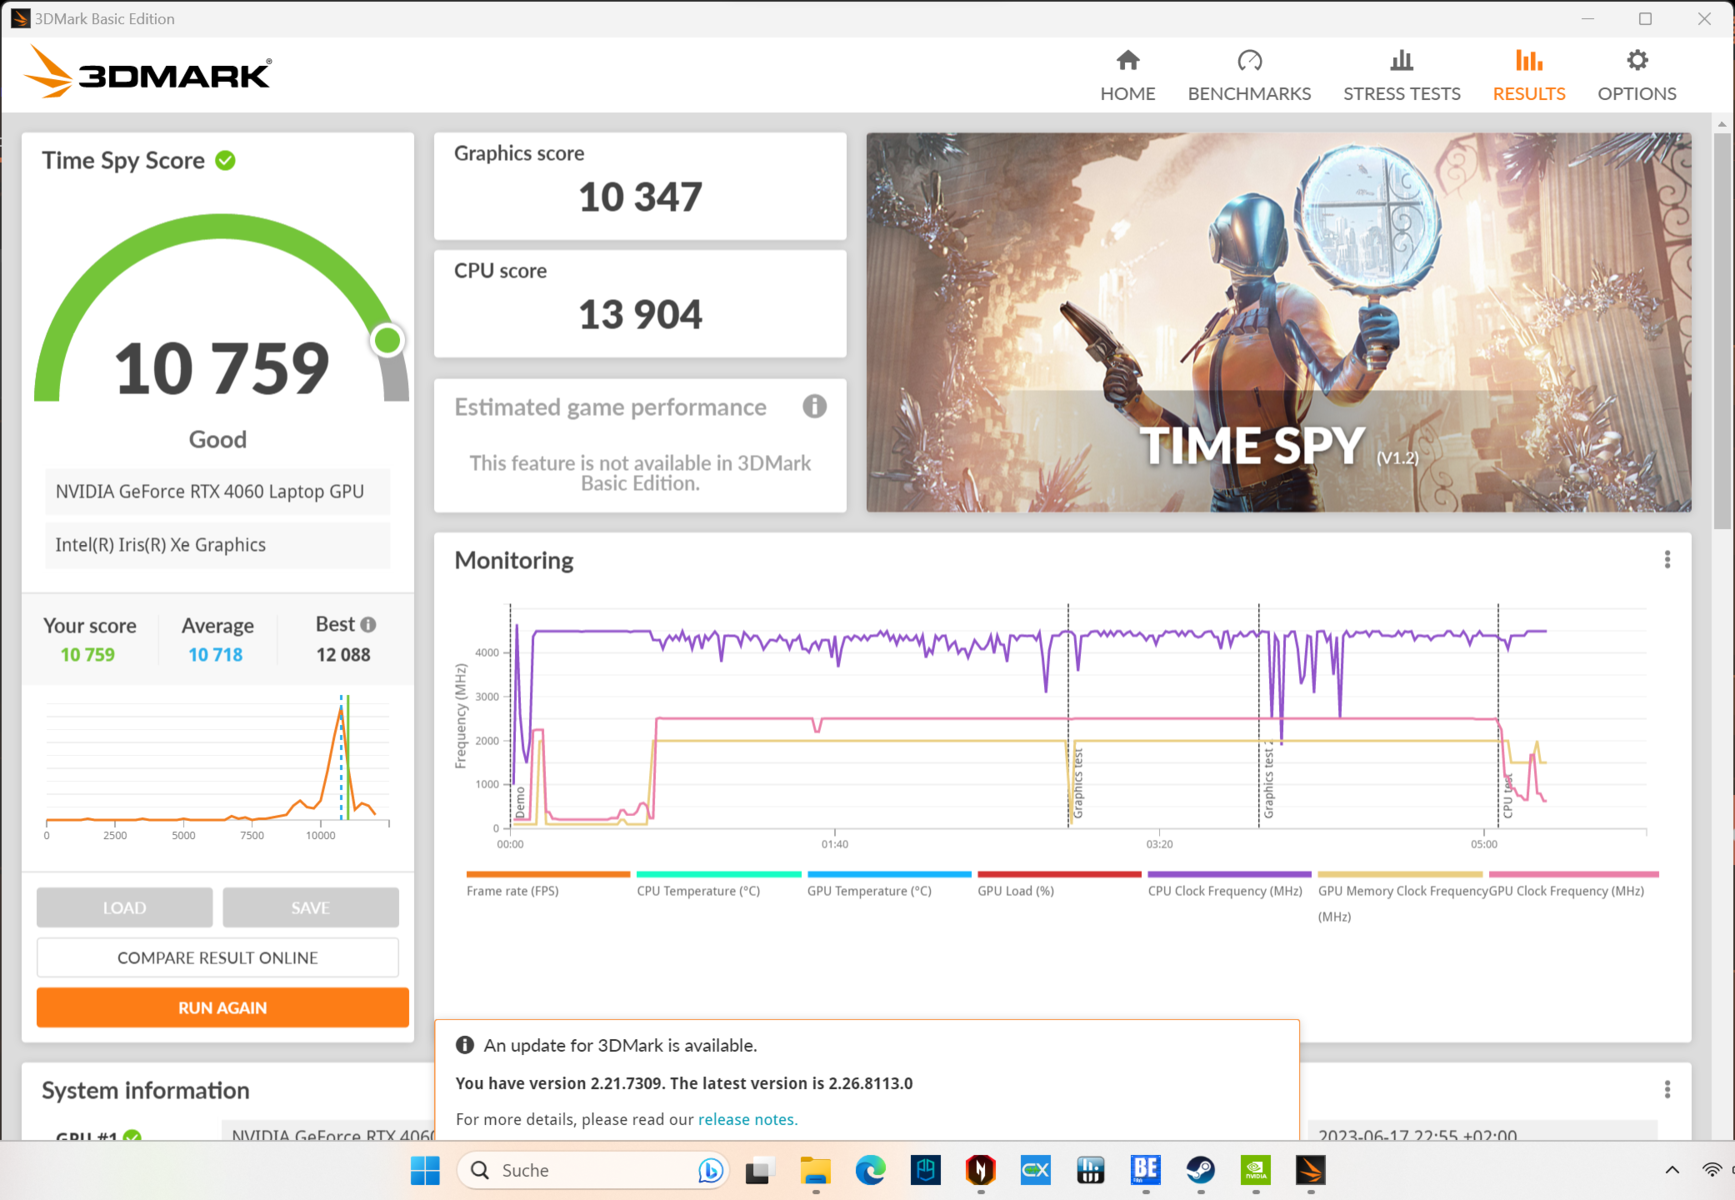
| Pontuação (Time Spy) | 11,042 | 10,759 | 10,608 | 4,210 |
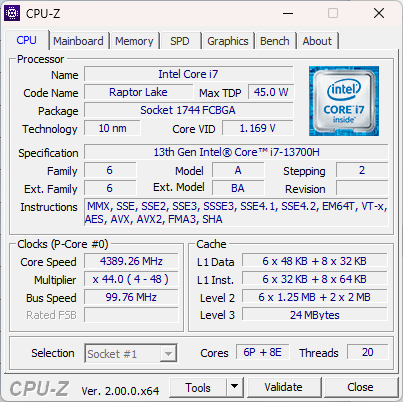
Processador
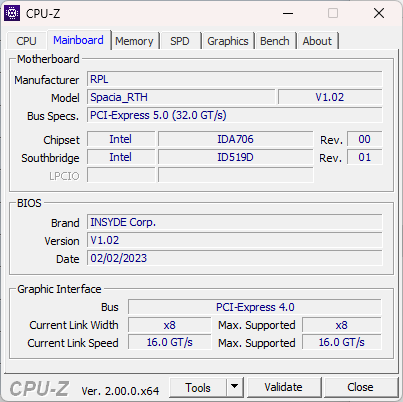
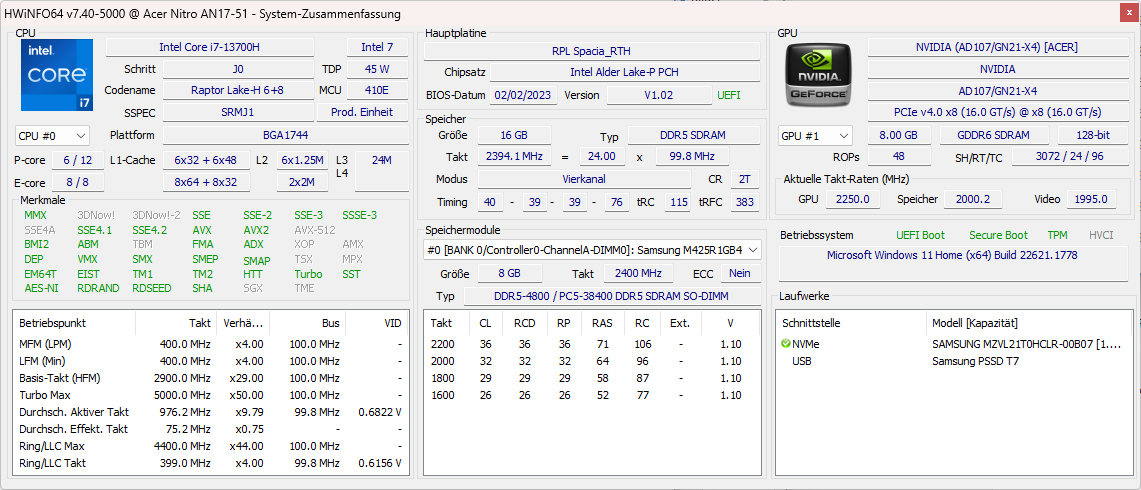
Com oIntel Core i7-13700o Acer Nitro 17 optou por uma CPU muito potente, mas não superlativa. Seu design corresponde em grande parte ao do antecessor, o i7-12700H com seis núcleos de desempenho e oito de eficiência, perfazendo um total de 20 threads. O cache também permaneceu com o mesmo tamanho. Em contrapartida, a taxa de clock teve uma ligeira melhora de 4,7 para 5,0 GHz.
Outros laptops para jogos podem recorrer a uma CPU com especificações melhores, por exemplo, o Intel Core i7-13700HX. No entanto, isso significa que o resfriamento deve ser feito corretamente. Por exemplo, umMedion Erazer Defender P40 iniciou nosso loop contínuo do CineBench R15 com valores 10% melhores, mas ficou empatado após a segunda execução. No final, o Nitro 17 foi quase 20% melhor. Nesse sentido, o desempenho contínuo está em um nível impressionantemente alto.
Por outro lado, para muitos processos e tarefas, a potência disponível por um curto período de tempo é importante. Com relação a isso, oi7-13700H é poderoso para uma CPU móvel, mas fica atrás dos processadores AMD de 7ª geração ou até mesmo dos modelos Intel da série "HX". Um quadro semelhante surgiu quando se tratou do desempenho de núcleo único. O fato de estar limitado a 115 watts em vez dos 157 watts da série "HX" impede melhores resultados. Além disso, no modo "Desempenho", ocorre uma redução repentina no consumo de energia, o que explica os resultados abaixo da média nessa área. Entretanto, com relação à classificação para jogos, isso não desempenha um papel decisivo.
Você pode encontrar mais informações e dados de medição em nossa Lista de benchmark de CPU.
Cinebench R15 Multi Continuous Test
Cinebench R23: Multi Core | Single Core
Cinebench R20: CPU (Multi Core) | CPU (Single Core)
Cinebench R15: CPU Multi 64Bit | CPU Single 64Bit
Blender: v2.79 BMW27 CPU
7-Zip 18.03: 7z b 4 | 7z b 4 -mmt1
Geekbench 5.5: Multi-Core | Single-Core
HWBOT x265 Benchmark v2.2: 4k Preset
LibreOffice : 20 Documents To PDF
R Benchmark 2.5: Overall mean
| CPU Performance rating | |
| Schenker XMG Focus 17 (E23) | |
| Média da turma Gaming | |
| Lenovo Legion Pro 5 16IRX8 | |
| Asus TUF Gaming A16 FA617XS | |
| Medion Erazer Defender P40 | |
| MSI Pulse GL76 12UGK | |
| Média Intel Core i7-13700H | |
| Acer Nitro 17 AN17-51-71ER | |
| Acer Nitro 5 AN515-46-R1A1 | |
| Cinebench R23 / Multi Core | |
| Schenker XMG Focus 17 (E23) | |
| Média da turma Gaming (10488 - 42661, n=107, últimos 2 anos) | |
| Medion Erazer Defender P40 | |
| Lenovo Legion Pro 5 16IRX8 | |
| Acer Nitro 17 AN17-51-71ER | |
| MSI Pulse GL76 12UGK | |
| Asus TUF Gaming A16 FA617XS | |
| Média Intel Core i7-13700H (5890 - 20034, n=29) | |
| Acer Nitro 5 AN515-46-R1A1 | |
| Cinebench R23 / Single Core | |
| Média da turma Gaming (1166 - 2415, n=107, últimos 2 anos) | |
| Schenker XMG Focus 17 (E23) | |
| Média Intel Core i7-13700H (1323 - 1914, n=29) | |
| Asus TUF Gaming A16 FA617XS | |
| MSI Pulse GL76 12UGK | |
| Medion Erazer Defender P40 | |
| Lenovo Legion Pro 5 16IRX8 | |
| Acer Nitro 17 AN17-51-71ER | |
| Acer Nitro 5 AN515-46-R1A1 | |
| Cinebench R20 / CPU (Multi Core) | |
| Média da turma Gaming (4029 - 16433, n=106, últimos 2 anos) | |
| Schenker XMG Focus 17 (E23) | |
| Medion Erazer Defender P40 | |
| Acer Nitro 17 AN17-51-71ER | |
| Lenovo Legion Pro 5 16IRX8 | |
| Asus TUF Gaming A16 FA617XS | |
| MSI Pulse GL76 12UGK | |
| Média Intel Core i7-13700H (2322 - 7674, n=29) | |
| Acer Nitro 5 AN515-46-R1A1 | |
| Cinebench R20 / CPU (Single Core) | |
| Média da turma Gaming (442 - 913, n=106, últimos 2 anos) | |
| Schenker XMG Focus 17 (E23) | |
| Asus TUF Gaming A16 FA617XS | |
| Média Intel Core i7-13700H (508 - 741, n=29) | |
| MSI Pulse GL76 12UGK | |
| Lenovo Legion Pro 5 16IRX8 | |
| Medion Erazer Defender P40 | |
| Acer Nitro 5 AN515-46-R1A1 | |
| Acer Nitro 17 AN17-51-71ER | |
| Cinebench R15 / CPU Multi 64Bit | |
| Schenker XMG Focus 17 (E23) | |
| Média da turma Gaming (1578 - 6330, n=105, últimos 2 anos) | |
| Lenovo Legion Pro 5 16IRX8 | |
| Medion Erazer Defender P40 | |
| Acer Nitro 17 AN17-51-71ER | |
| MSI Pulse GL76 12UGK | |
| Asus TUF Gaming A16 FA617XS | |
| Média Intel Core i7-13700H (905 - 2982, n=29) | |
| Acer Nitro 5 AN515-46-R1A1 | |
| Cinebench R15 / CPU Single 64Bit | |
| Média da turma Gaming (188.8 - 350, n=106, últimos 2 anos) | |
| Schenker XMG Focus 17 (E23) | |
| Asus TUF Gaming A16 FA617XS | |
| Lenovo Legion Pro 5 16IRX8 | |
| Média Intel Core i7-13700H (213 - 278, n=29) | |
| MSI Pulse GL76 12UGK | |
| Acer Nitro 5 AN515-46-R1A1 | |
| Medion Erazer Defender P40 | |
| Acer Nitro 17 AN17-51-71ER | |
| Blender / v2.79 BMW27 CPU | |
| Acer Nitro 5 AN515-46-R1A1 | |
| Média Intel Core i7-13700H (169 - 555, n=29) | |
| Medion Erazer Defender P40 | |
| MSI Pulse GL76 12UGK | |
| Asus TUF Gaming A16 FA617XS | |
| Acer Nitro 17 AN17-51-71ER | |
| Lenovo Legion Pro 5 16IRX8 | |
| Média da turma Gaming (79 - 330, n=104, últimos 2 anos) | |
| Schenker XMG Focus 17 (E23) | |
| 7-Zip 18.03 / 7z b 4 | |
| Schenker XMG Focus 17 (E23) | |
| Média da turma Gaming (33491 - 148086, n=105, últimos 2 anos) | |
| Lenovo Legion Pro 5 16IRX8 | |
| Medion Erazer Defender P40 | |
| Acer Nitro 17 AN17-51-71ER | |
| Asus TUF Gaming A16 FA617XS | |
| MSI Pulse GL76 12UGK | |
| Acer Nitro 5 AN515-46-R1A1 | |
| Média Intel Core i7-13700H (27322 - 76344, n=29) | |
| 7-Zip 18.03 / 7z b 4 -mmt1 | |
| Schenker XMG Focus 17 (E23) | |
| Asus TUF Gaming A16 FA617XS | |
| Média da turma Gaming (4199 - 7436, n=105, últimos 2 anos) | |
| Média Intel Core i7-13700H (4825 - 6238, n=29) | |
| Acer Nitro 5 AN515-46-R1A1 | |
| Lenovo Legion Pro 5 16IRX8 | |
| MSI Pulse GL76 12UGK | |
| Medion Erazer Defender P40 | |
| Acer Nitro 17 AN17-51-71ER | |
| Geekbench 5.5 / Multi-Core | |
| Schenker XMG Focus 17 (E23) | |
| Média da turma Gaming (6460 - 28263, n=105, últimos 2 anos) | |
| Medion Erazer Defender P40 | |
| Lenovo Legion Pro 5 16IRX8 | |
| Acer Nitro 17 AN17-51-71ER | |
| Asus TUF Gaming A16 FA617XS | |
| MSI Pulse GL76 12UGK | |
| Média Intel Core i7-13700H (6165 - 14215, n=29) | |
| Acer Nitro 5 AN515-46-R1A1 | |
| Geekbench 5.5 / Single-Core | |
| Média da turma Gaming (986 - 2474, n=105, últimos 2 anos) | |
| Asus TUF Gaming A16 FA617XS | |
| Schenker XMG Focus 17 (E23) | |
| Média Intel Core i7-13700H (1362 - 1919, n=29) | |
| Lenovo Legion Pro 5 16IRX8 | |
| MSI Pulse GL76 12UGK | |
| Medion Erazer Defender P40 | |
| Acer Nitro 5 AN515-46-R1A1 | |
| Acer Nitro 17 AN17-51-71ER | |
| HWBOT x265 Benchmark v2.2 / 4k Preset | |
| Média da turma Gaming (11.5 - 44.4, n=105, últimos 2 anos) | |
| Schenker XMG Focus 17 (E23) | |
| Lenovo Legion Pro 5 16IRX8 | |
| Medion Erazer Defender P40 | |
| Asus TUF Gaming A16 FA617XS | |
| Acer Nitro 17 AN17-51-71ER | |
| MSI Pulse GL76 12UGK | |
| Acer Nitro 5 AN515-46-R1A1 | |
| Média Intel Core i7-13700H (6.72 - 21.2, n=29) | |
| LibreOffice / 20 Documents To PDF | |
| Acer Nitro 17 AN17-51-71ER | |
| Schenker XMG Focus 17 (E23) | |
| Acer Nitro 5 AN515-46-R1A1 | |
| Medion Erazer Defender P40 | |
| Média da turma Gaming (33.2 - 88.8, n=105, últimos 2 anos) | |
| Média Intel Core i7-13700H (31.3 - 62.4, n=29) | |
| MSI Pulse GL76 12UGK | |
| Asus TUF Gaming A16 FA617XS | |
| Lenovo Legion Pro 5 16IRX8 | |
| R Benchmark 2.5 / Overall mean | |
| Acer Nitro 17 AN17-51-71ER | |
| Medion Erazer Defender P40 | |
| Acer Nitro 5 AN515-46-R1A1 | |
| Lenovo Legion Pro 5 16IRX8 | |
| MSI Pulse GL76 12UGK | |
| Média Intel Core i7-13700H (0.4308 - 0.607, n=29) | |
| Média da turma Gaming (0.3439 - 0.759, n=106, últimos 2 anos) | |
| Asus TUF Gaming A16 FA617XS | |
| Schenker XMG Focus 17 (E23) | |
* ... menor é melhor
AIDA64: FP32 Ray-Trace | FPU Julia | CPU SHA3 | CPU Queen | FPU SinJulia | FPU Mandel | CPU AES | CPU ZLib | FP64 Ray-Trace | CPU PhotoWorxx
| Performance rating | |
| Média da turma Gaming | |
| Schenker XMG Focus 17 (E23) | |
| Asus TUF Gaming A16 FA617XS | |
| Lenovo Legion Pro 5 16IRX8 | |
| Acer Nitro 17 AN17-51-71ER | |
| Acer Nitro 5 AN515-46-R1A1 | |
| MSI Pulse GL76 12UGK | |
| Medion Erazer Defender P40 | |
| Média Intel Core i7-13700H | |
| AIDA64 / FP32 Ray-Trace | |
| Média da turma Gaming (10227 - 85542, n=105, últimos 2 anos) | |
| Asus TUF Gaming A16 FA617XS | |
| Schenker XMG Focus 17 (E23) | |
| Lenovo Legion Pro 5 16IRX8 | |
| Acer Nitro 17 AN17-51-71ER | |
| MSI Pulse GL76 12UGK | |
| Acer Nitro 5 AN515-46-R1A1 | |
| Medion Erazer Defender P40 | |
| Média Intel Core i7-13700H (4986 - 18908, n=29) | |
| AIDA64 / FPU Julia | |
| Média da turma Gaming (51376 - 238426, n=105, últimos 2 anos) | |
| Asus TUF Gaming A16 FA617XS | |
| Schenker XMG Focus 17 (E23) | |
| Lenovo Legion Pro 5 16IRX8 | |
| Acer Nitro 5 AN515-46-R1A1 | |
| Acer Nitro 17 AN17-51-71ER | |
| MSI Pulse GL76 12UGK | |
| Medion Erazer Defender P40 | |
| Média Intel Core i7-13700H (25360 - 92359, n=29) | |
| AIDA64 / CPU SHA3 | |
| Média da turma Gaming (2180 - 10115, n=105, últimos 2 anos) | |
| Schenker XMG Focus 17 (E23) | |
| Lenovo Legion Pro 5 16IRX8 | |
| Asus TUF Gaming A16 FA617XS | |
| Acer Nitro 17 AN17-51-71ER | |
| MSI Pulse GL76 12UGK | |
| Medion Erazer Defender P40 | |
| Acer Nitro 5 AN515-46-R1A1 | |
| Média Intel Core i7-13700H (1339 - 4224, n=29) | |
| AIDA64 / CPU Queen | |
| Schenker XMG Focus 17 (E23) | |
| Asus TUF Gaming A16 FA617XS | |
| Média da turma Gaming (49785 - 173351, n=90, últimos 2 anos) | |
| Lenovo Legion Pro 5 16IRX8 | |
| Medion Erazer Defender P40 | |
| Acer Nitro 5 AN515-46-R1A1 | |
| MSI Pulse GL76 12UGK | |
| Acer Nitro 17 AN17-51-71ER | |
| Média Intel Core i7-13700H (59324 - 107159, n=29) | |
| AIDA64 / FPU SinJulia | |
| Asus TUF Gaming A16 FA617XS | |
| Média da turma Gaming (4424 - 33636, n=105, últimos 2 anos) | |
| Schenker XMG Focus 17 (E23) | |
| Lenovo Legion Pro 5 16IRX8 | |
| Acer Nitro 5 AN515-46-R1A1 | |
| Acer Nitro 17 AN17-51-71ER | |
| Medion Erazer Defender P40 | |
| MSI Pulse GL76 12UGK | |
| Média Intel Core i7-13700H (4800 - 11050, n=29) | |
| AIDA64 / FPU Mandel | |
| Média da turma Gaming (25115 - 128721, n=105, últimos 2 anos) | |
| Asus TUF Gaming A16 FA617XS | |
| Acer Nitro 5 AN515-46-R1A1 | |
| Schenker XMG Focus 17 (E23) | |
| Lenovo Legion Pro 5 16IRX8 | |
| Acer Nitro 17 AN17-51-71ER | |
| MSI Pulse GL76 12UGK | |
| Medion Erazer Defender P40 | |
| Média Intel Core i7-13700H (12321 - 45118, n=29) | |
| AIDA64 / CPU AES | |
| Acer Nitro 17 AN17-51-71ER | |
| MSI Pulse GL76 12UGK | |
| Acer Nitro 5 AN515-46-R1A1 | |
| Média da turma Gaming (39258 - 247074, n=105, últimos 2 anos) | |
| Schenker XMG Focus 17 (E23) | |
| Lenovo Legion Pro 5 16IRX8 | |
| Asus TUF Gaming A16 FA617XS | |
| Média Intel Core i7-13700H (28769 - 151254, n=29) | |
| Medion Erazer Defender P40 | |
| AIDA64 / CPU ZLib | |
| Schenker XMG Focus 17 (E23) | |
| Média da turma Gaming (574 - 2531, n=105, últimos 2 anos) | |
| Lenovo Legion Pro 5 16IRX8 | |
| Acer Nitro 17 AN17-51-71ER | |
| MSI Pulse GL76 12UGK | |
| Asus TUF Gaming A16 FA617XS | |
| Medion Erazer Defender P40 | |
| Média Intel Core i7-13700H (389 - 1215, n=29) | |
| Acer Nitro 5 AN515-46-R1A1 | |
| AIDA64 / FP64 Ray-Trace | |
| Média da turma Gaming (5509 - 45446, n=105, últimos 2 anos) | |
| Asus TUF Gaming A16 FA617XS | |
| Schenker XMG Focus 17 (E23) | |
| Lenovo Legion Pro 5 16IRX8 | |
| Acer Nitro 17 AN17-51-71ER | |
| MSI Pulse GL76 12UGK | |
| Acer Nitro 5 AN515-46-R1A1 | |
| Medion Erazer Defender P40 | |
| Média Intel Core i7-13700H (2540 - 10135, n=29) | |
| AIDA64 / CPU PhotoWorxx | |
| Schenker XMG Focus 17 (E23) | |
| Média da turma Gaming (12271 - 89891, n=105, últimos 2 anos) | |
| Média Intel Core i7-13700H (12872 - 52727, n=29) | |
| Acer Nitro 17 AN17-51-71ER | |
| Lenovo Legion Pro 5 16IRX8 | |
| Medion Erazer Defender P40 | |
| Asus TUF Gaming A16 FA617XS | |
| Acer Nitro 5 AN515-46-R1A1 | |
| MSI Pulse GL76 12UGK | |
Desempenho do sistema
Ao navegar na Internet, criar, renderizar e muito mais, o desempenho permanece consistentemente alto. Os tempos de espera são curtos e os processos de carregamento, a instalação ou desinstalação de programas não apresentam nenhum problema específico ao sistema. Em termos das pontuações do PCMark e do CrossMark, parece haver uma pequena vantagem em usar o modo balanceado. A baixa produção de calor, como resultado do consumo limitado de energia durante cargas repetidas, realmente mostra suas vantagens. Isso significa que esse processador consegue ficar visivelmente acima dos valores que registramos em todos os nossos testes i7-13700Htestados.
CrossMark: Overall | Productivity | Creativity | Responsiveness
| PCMark 10 / Score | |
| Média da turma Gaming (5828 - 12414, n=93, últimos 2 anos) | |
| Asus TUF Gaming A16 FA617XS | |
| Lenovo Legion Pro 5 16IRX8 | |
| MSI Pulse GL76 12UGK | |
| Acer Nitro 17 AN17-51-71ER (Ausgeglichen) | |
| Média Intel Core i7-13700H, NVIDIA GeForce RTX 4060 Laptop GPU (7157 - 7661, n=5) | |
| Acer Nitro 17 AN17-51-71ER | |
| Schenker XMG Focus 17 (E23) | |
| Medion Erazer Defender P40 | |
| Acer Nitro 5 AN515-46-R1A1 | |
| PCMark 10 / Essentials | |
| MSI Pulse GL76 12UGK | |
| Lenovo Legion Pro 5 16IRX8 | |
| Asus TUF Gaming A16 FA617XS | |
| Média Intel Core i7-13700H, NVIDIA GeForce RTX 4060 Laptop GPU (10179 - 11200, n=5) | |
| Média da turma Gaming (8810 - 11935, n=97, últimos 2 anos) | |
| Acer Nitro 17 AN17-51-71ER (Ausgeglichen) | |
| Acer Nitro 5 AN515-46-R1A1 | |
| Acer Nitro 17 AN17-51-71ER | |
| Schenker XMG Focus 17 (E23) | |
| Medion Erazer Defender P40 | |
| PCMark 10 / Productivity | |
| Média da turma Gaming (6845 - 25323, n=95, últimos 2 anos) | |
| Asus TUF Gaming A16 FA617XS | |
| Acer Nitro 17 AN17-51-71ER (Ausgeglichen) | |
| MSI Pulse GL76 12UGK | |
| Medion Erazer Defender P40 | |
| Schenker XMG Focus 17 (E23) | |
| Média Intel Core i7-13700H, NVIDIA GeForce RTX 4060 Laptop GPU (8238 - 10249, n=5) | |
| Lenovo Legion Pro 5 16IRX8 | |
| Acer Nitro 5 AN515-46-R1A1 | |
| Acer Nitro 17 AN17-51-71ER | |
| PCMark 10 / Digital Content Creation | |
| Média da turma Gaming (7602 - 19954, n=95, últimos 2 anos) | |
| Lenovo Legion Pro 5 16IRX8 | |
| Asus TUF Gaming A16 FA617XS | |
| Acer Nitro 17 AN17-51-71ER | |
| MSI Pulse GL76 12UGK | |
| Média Intel Core i7-13700H, NVIDIA GeForce RTX 4060 Laptop GPU (10308 - 11862, n=5) | |
| Acer Nitro 17 AN17-51-71ER (Ausgeglichen) | |
| Schenker XMG Focus 17 (E23) | |
| Medion Erazer Defender P40 | |
| Acer Nitro 5 AN515-46-R1A1 | |
| CrossMark / Overall | |
| Schenker XMG Focus 17 (E23) | |
| Média da turma Gaming (1366 - 2409, n=94, últimos 2 anos) | |
| MSI Pulse GL76 12UGK | |
| Medion Erazer Defender P40 | |
| Asus TUF Gaming A16 FA617XS | |
| Média Intel Core i7-13700H, NVIDIA GeForce RTX 4060 Laptop GPU (1629 - 1849, n=5) | |
| Lenovo Legion Pro 5 16IRX8 | |
| Acer Nitro 17 AN17-51-71ER (Ausgeglichen) | |
| Acer Nitro 17 AN17-51-71ER | |
| Acer Nitro 5 AN515-46-R1A1 | |
| CrossMark / Productivity | |
| Schenker XMG Focus 17 (E23) | |
| Média da turma Gaming (1386 - 2254, n=94, últimos 2 anos) | |
| MSI Pulse GL76 12UGK | |
| Asus TUF Gaming A16 FA617XS | |
| Medion Erazer Defender P40 | |
| Média Intel Core i7-13700H, NVIDIA GeForce RTX 4060 Laptop GPU (1561 - 1743, n=5) | |
| Lenovo Legion Pro 5 16IRX8 | |
| Acer Nitro 17 AN17-51-71ER (Ausgeglichen) | |
| Acer Nitro 17 AN17-51-71ER | |
| Acer Nitro 5 AN515-46-R1A1 | |
| CrossMark / Creativity | |
| Schenker XMG Focus 17 (E23) | |
| Média da turma Gaming (1343 - 2786, n=94, últimos 2 anos) | |
| Medion Erazer Defender P40 | |
| Asus TUF Gaming A16 FA617XS | |
| MSI Pulse GL76 12UGK | |
| Média Intel Core i7-13700H, NVIDIA GeForce RTX 4060 Laptop GPU (1691 - 2064, n=5) | |
| Acer Nitro 17 AN17-51-71ER (Ausgeglichen) | |
| Lenovo Legion Pro 5 16IRX8 | |
| Acer Nitro 17 AN17-51-71ER | |
| Acer Nitro 5 AN515-46-R1A1 | |
| CrossMark / Responsiveness | |
| MSI Pulse GL76 12UGK | |
| Schenker XMG Focus 17 (E23) | |
| Média da turma Gaming (1226 - 2334, n=94, últimos 2 anos) | |
| Lenovo Legion Pro 5 16IRX8 | |
| Acer Nitro 17 AN17-51-71ER | |
| Medion Erazer Defender P40 | |
| Média Intel Core i7-13700H, NVIDIA GeForce RTX 4060 Laptop GPU (1381 - 1656, n=5) | |
| Acer Nitro 17 AN17-51-71ER (Ausgeglichen) | |
| Asus TUF Gaming A16 FA617XS | |
| Acer Nitro 5 AN515-46-R1A1 | |
| PCMark 10 Score | 7157 pontos | |
Ajuda | ||
| AIDA64 / Memory Copy | |
| Schenker XMG Focus 17 (E23) | |
| Média da turma Gaming (21750 - 129946, n=105, últimos 2 anos) | |
| Média Intel Core i7-13700H (24334 - 78081, n=29) | |
| Asus TUF Gaming A16 FA617XS | |
| Lenovo Legion Pro 5 16IRX8 | |
| Acer Nitro 17 AN17-51-71ER | |
| Medion Erazer Defender P40 | |
| Acer Nitro 5 AN515-46-R1A1 | |
| MSI Pulse GL76 12UGK | |
| AIDA64 / Memory Read | |
| Schenker XMG Focus 17 (E23) | |
| Média da turma Gaming (22956 - 118858, n=105, últimos 2 anos) | |
| Lenovo Legion Pro 5 16IRX8 | |
| Medion Erazer Defender P40 | |
| Acer Nitro 17 AN17-51-71ER | |
| Média Intel Core i7-13700H (23681 - 79656, n=29) | |
| Asus TUF Gaming A16 FA617XS | |
| Acer Nitro 5 AN515-46-R1A1 | |
| MSI Pulse GL76 12UGK | |
| AIDA64 / Memory Write | |
| Média da turma Gaming (22297 - 135096, n=105, últimos 2 anos) | |
| Schenker XMG Focus 17 (E23) | |
| Asus TUF Gaming A16 FA617XS | |
| Média Intel Core i7-13700H (22986 - 99898, n=29) | |
| Lenovo Legion Pro 5 16IRX8 | |
| Acer Nitro 17 AN17-51-71ER | |
| Medion Erazer Defender P40 | |
| Acer Nitro 5 AN515-46-R1A1 | |
| MSI Pulse GL76 12UGK | |
| AIDA64 / Memory Latency | |
| Acer Nitro 17 AN17-51-71ER | |
| Média da turma Gaming (75.3 - 259, n=105, últimos 2 anos) | |
| Média Intel Core i7-13700H (82.4 - 136.8, n=29) | |
| MSI Pulse GL76 12UGK | |
| Medion Erazer Defender P40 | |
| Schenker XMG Focus 17 (E23) | |
| Asus TUF Gaming A16 FA617XS | |
| Acer Nitro 5 AN515-46-R1A1 | |
| Lenovo Legion Pro 5 16IRX8 | |
* ... menor é melhor
Latências de DPC
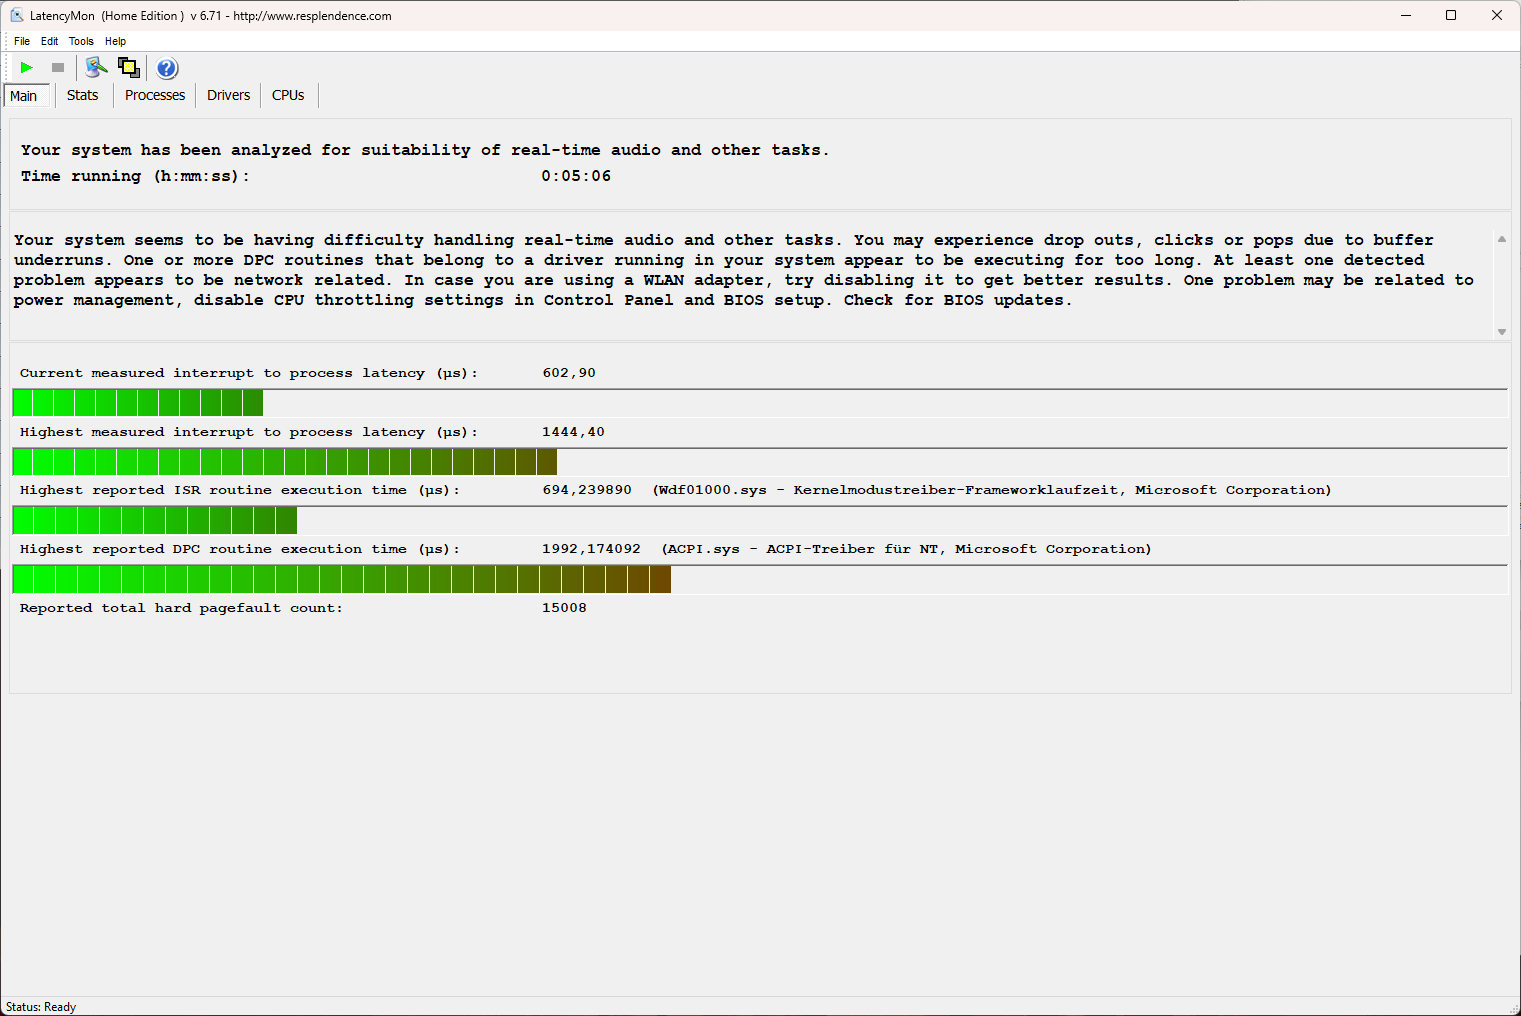
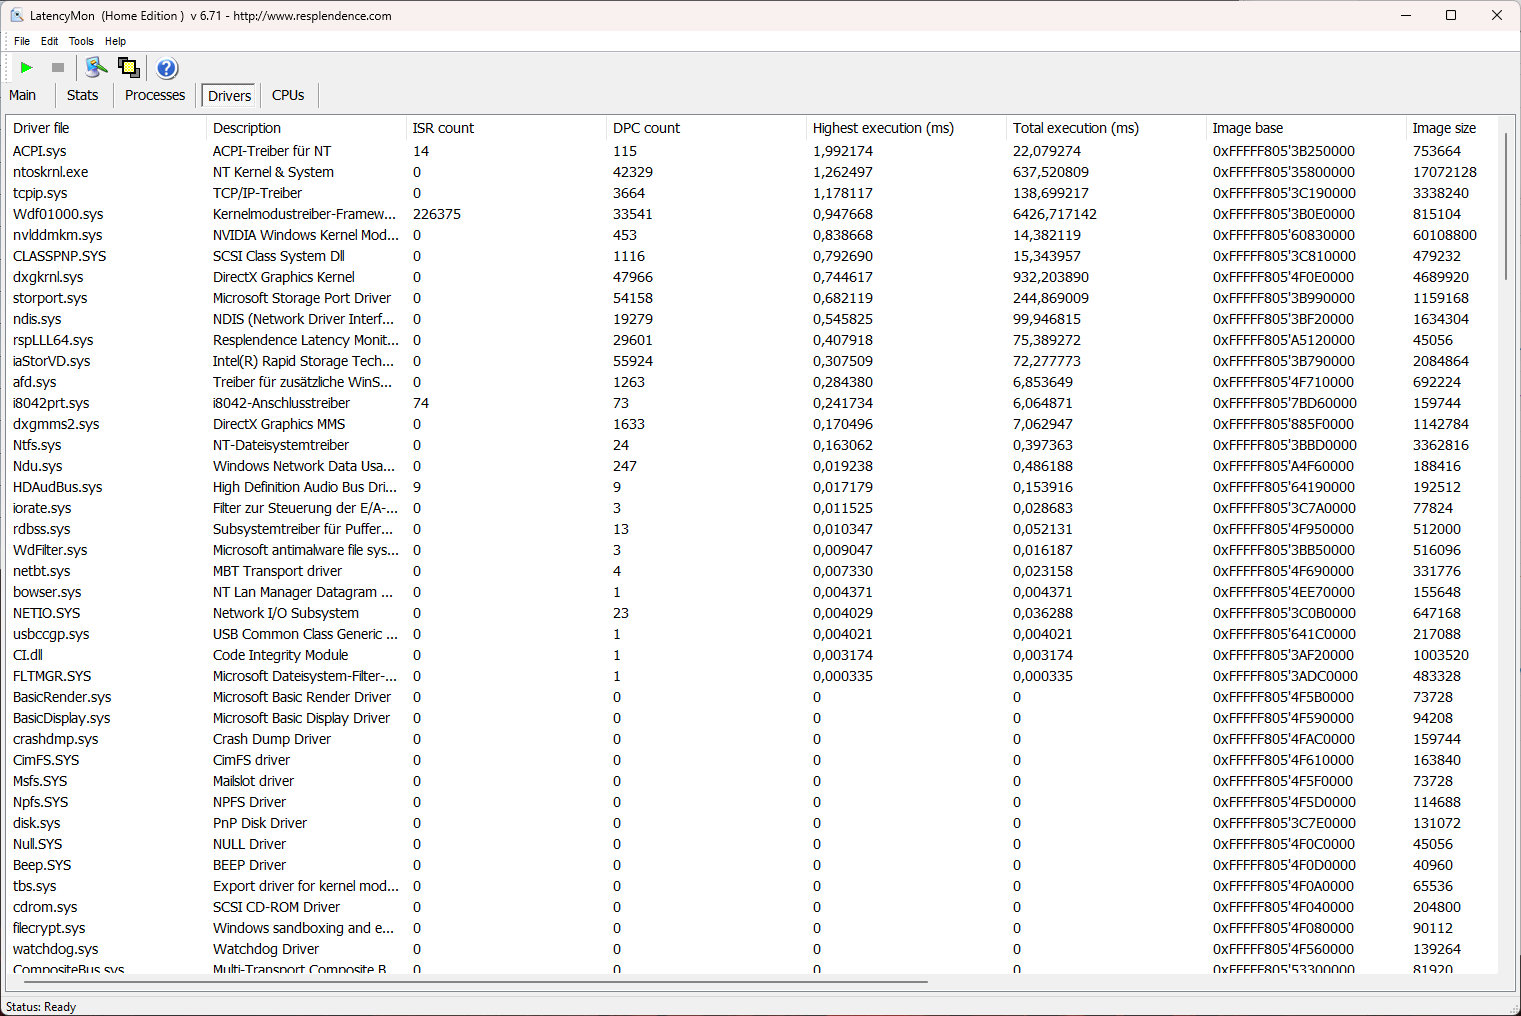
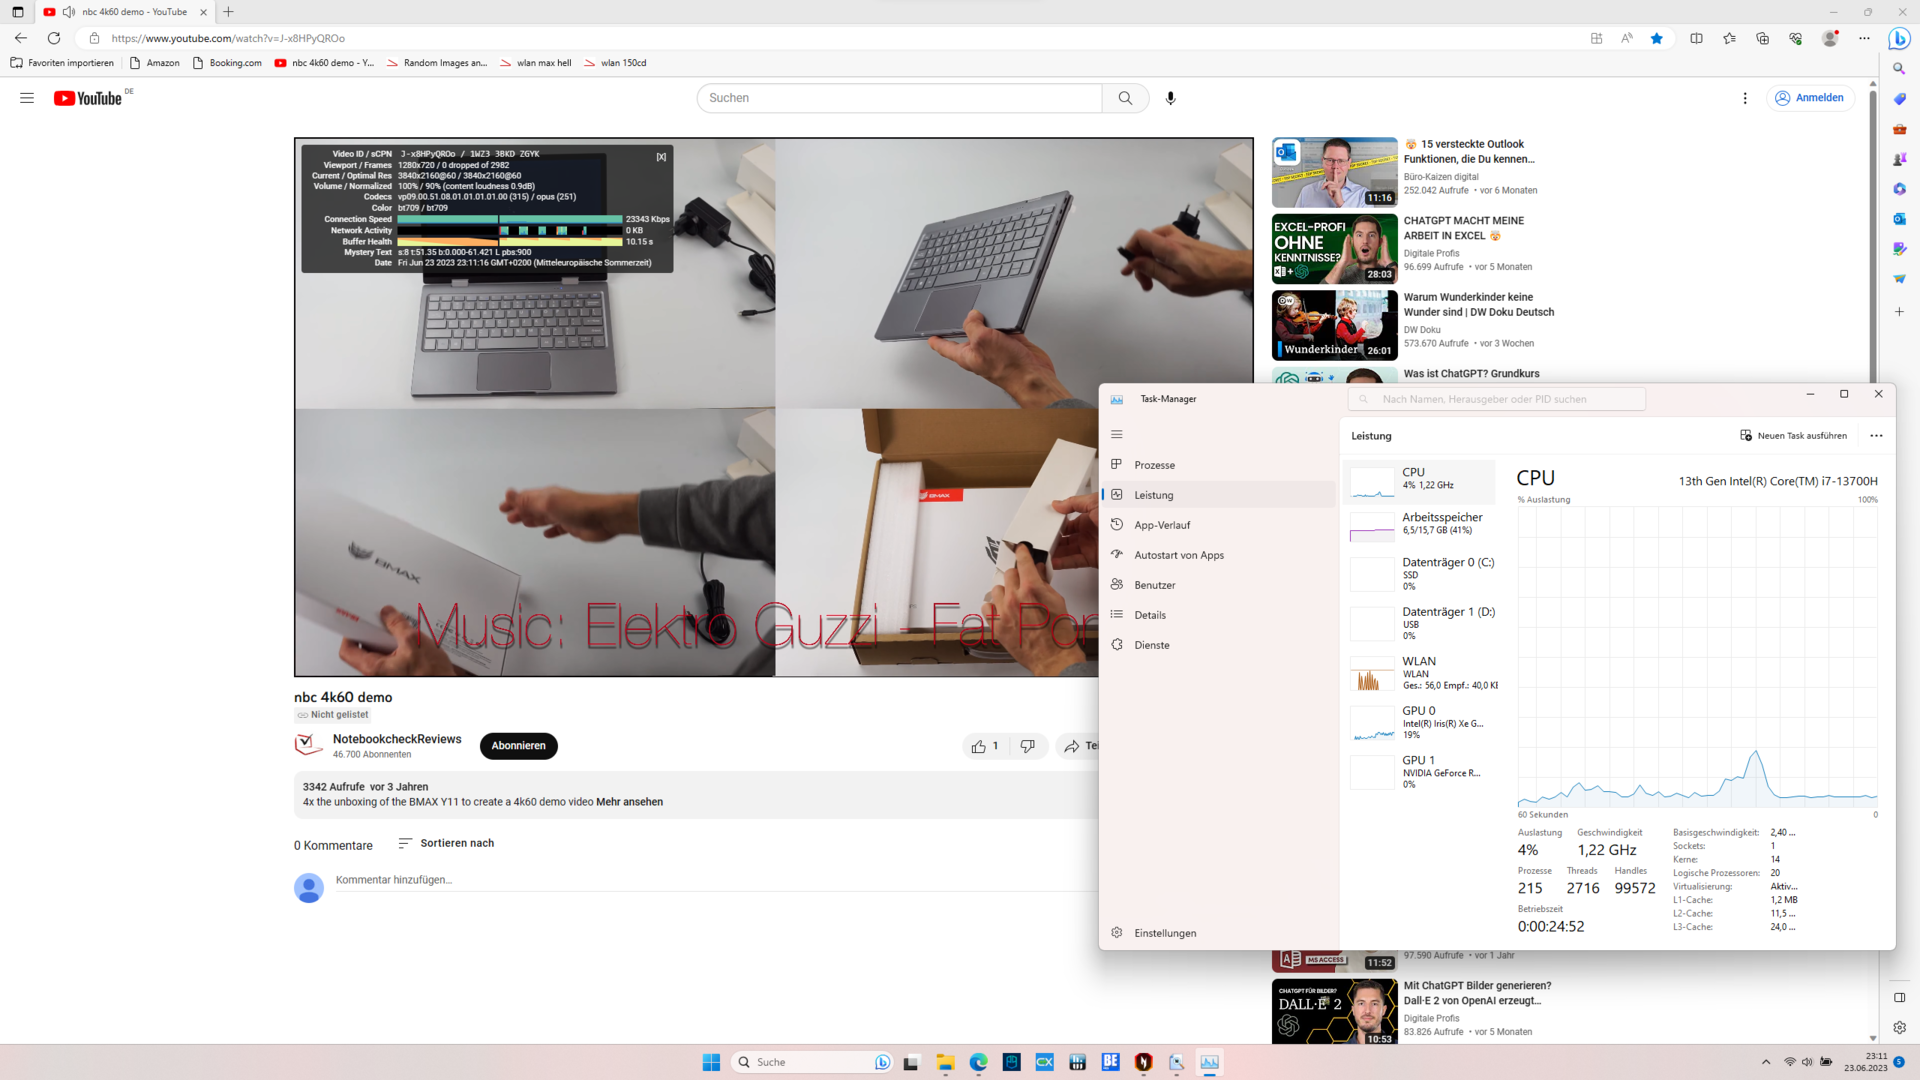
O Nitro 17 não é necessariamente adequado para edição de áudio em tempo real, mas ainda assim foi capaz de lidar com isso com o mínimo de falhas. Em suma, os resultados foram bons. Além disso, quando se trata de reprodução de vídeo 4K, não conseguimos detectar nenhuma queda de quadros.
As atualizações de driver e as alterações de software podem melhorar ou piorar significativamente o desempenho em comparação com nossos resultados determinados.
| DPC Latencies / LatencyMon - interrupt to process latency (max), Web, Youtube, Prime95 | |
| Acer Nitro 5 AN515-46-R1A1 | |
| Medion Erazer Defender P40 | |
| Acer Nitro 17 AN17-51-71ER | |
| Asus TUF Gaming A16 FA617XS | |
| Schenker XMG Focus 17 (E23) | |
| MSI Pulse GL76 12UGK | |
| Lenovo Legion Pro 5 16IRX8 | |
* ... menor é melhor
Armazenamento em massa
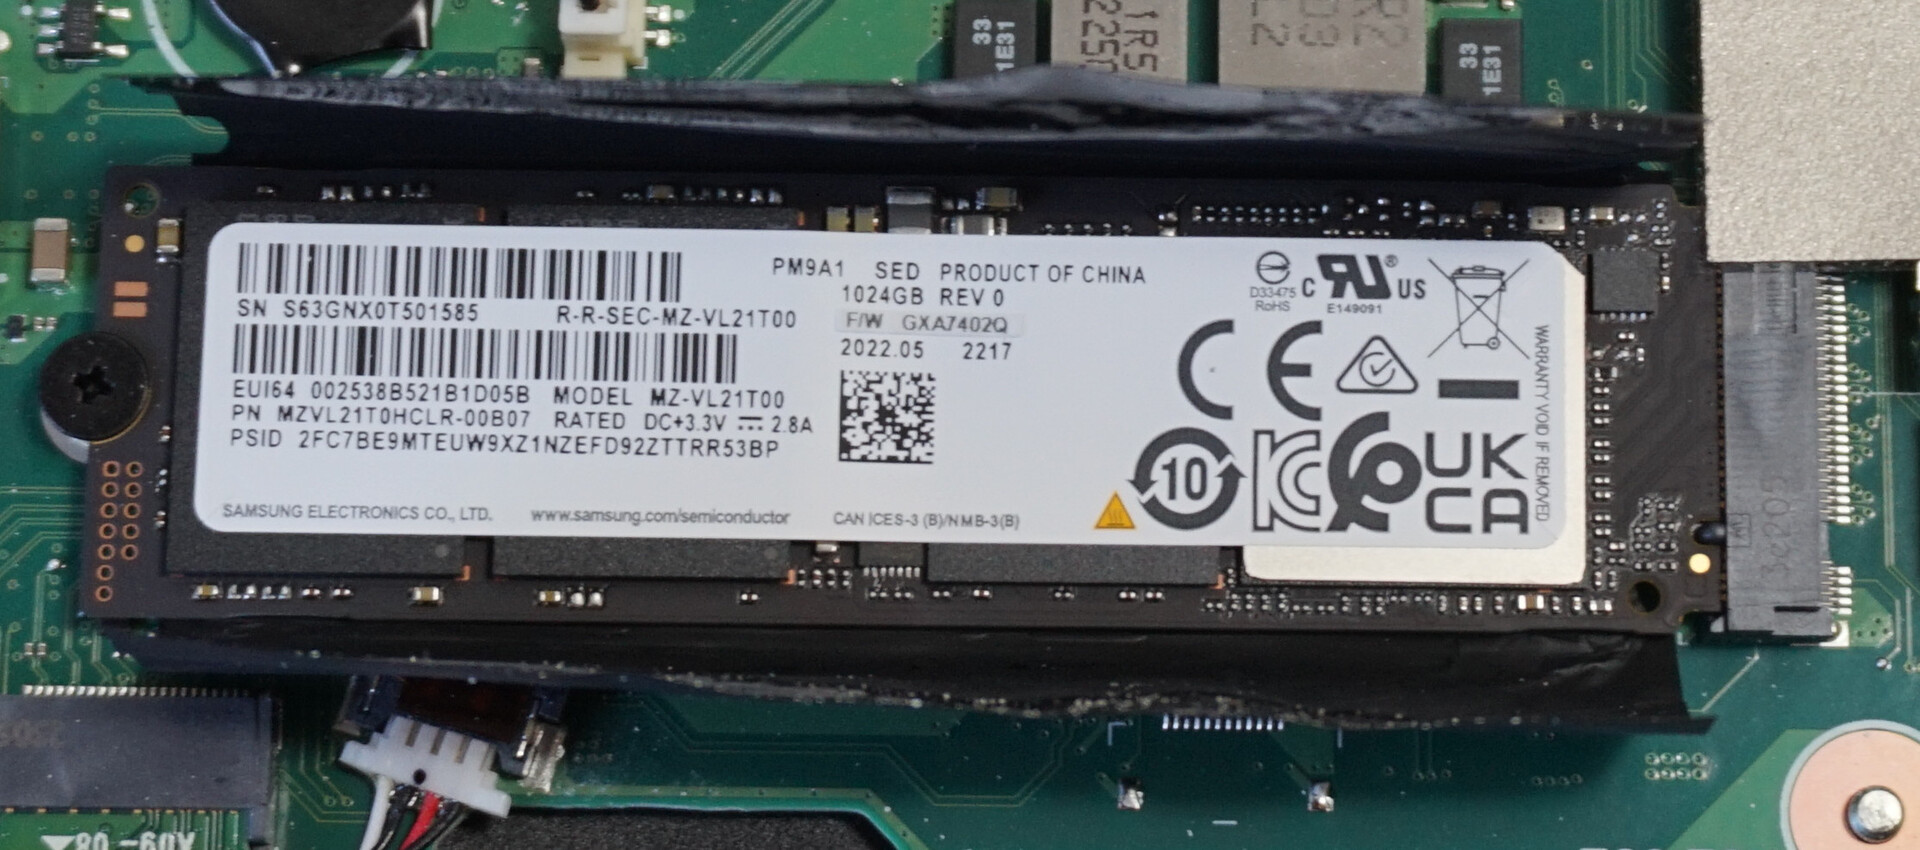
Em nossos testes de desempenho, o SSD PCIe 4.0 da Samsung apresentou resultados impressionantes, distanciando-se bastante da concorrência, especialmente no que se refere às velocidades de leitura e gravação de blocos de 4 kbit.
Por outro lado, o resultado do teste de resistência de leitura sequencial foi realmente ruim. Após velocidades de transferência inicialmente aceitáveis, os valores caíram para menos de 500 MB/s (linha vermelha), o que representa uma fração do possível desempenho teórico. A remoção da almofada de resfriamento da RAM, que chegou até o controlador da SSD em nosso dispositivo de teste, proporcionou uma melhoria de 50% (linha preta). Se os ventiladores forem ajustados para o máximo, a SSD finalmente se comportará como esperado (linha amarela).
A comparação com oLenovo Legion Pro 5 mostra como o teste deve ser feito. O resfriamento, que foi encontrado na placa de base do antecessor, está ausente aqui e é algo que se reflete claramente em nossos resultados.
Entretanto, isso parece ter uma influência insignificante no desempenho dos jogos. No mínimo, não conseguimos determinar nenhum desvio em relação aos concorrentes equipados com hardware semelhante.

| Acer Nitro 17 AN17-51-71ER Samsung PM9A1 MZVL21T0HCLR | Lenovo Legion Pro 5 16IRX8 SK hynix PC801 HFS512GEJ9X115N | Asus TUF Gaming A16 FA617XS Micron 2400 MTFDKBA512QFM | Schenker XMG Focus 17 (E23) Crucial P5 Plus 1TB CT1000P5PSSD8 | Medion Erazer Defender P40 Phison PS5021-E21 1TB | Acer Nitro 5 AN515-46-R1A1 Micron 3400 1TB MTFDKBA1T0TFH | MSI Pulse GL76 12UGK Micron 3400 1TB MTFDKBA1T0TFH | Média Samsung PM9A1 MZVL21T0HCLR | Média da turma Gaming | |
|---|---|---|---|---|---|---|---|---|---|
| Drive Performance rating | |||||||||
| Percent (pt) | 87.1 | 84.5 -3% | 41.6 -52% | 72.3 -17% | 74.9 -14% | 72.1 -17% | 78.4 -10% | 73.9 -15% | 74.7 -14% |
| DiskSpd | -6% | -50% | -11% | -7% | -11% | -1% | -11% | -8% | |
| seq read (MB/s) | 3670 | 5346 46% | 2253 -39% | 3510 -4% | 2501 -32% | 3770 3% | 3889 6% | 3766 ? 3% | 3556 ? -3% |
| seq write (MB/s) | 4284 | 1495 -65% | 1671 -61% | 3961 -8% | 4675 9% | 4216 -2% | 4579 7% | 3581 ? -16% | 3957 ? -8% |
| seq q8 t1 read (MB/s) | 5276 | 7127 35% | 4294 -19% | 6520 24% | 5009 -5% | 6689 27% | 6697 27% | 6483 ? 23% | 7552 ? 43% |
| seq q8 t1 write (MB/s) | 5114 | 4903 -4% | 1773 -65% | 4907 -4% | 4797 -6% | 4664 -9% | 4956 -3% | 4810 ? -6% | 5961 ? 17% |
| 4k q1 t1 read (MB/s) | 70.6 | 65.9 -7% | 32.8 -54% | 53.6 -24% | 51.1 -28% | 59.5 -16% | 69.8 -1% | 76.5 ? 8% | 70.3 ? 0% |
| 4k q1 t1 write (MB/s) | 267 | 328 23% | 132 -51% | 205 -23% | 281 5% | 151.1 -43% | 263 -1% | 188.5 ? -29% | 195.9 ? -27% |
| 4k q32 t16 read (MB/s) | 3726 | 2889 -22% | 1705 -54% | 2835 -24% | 3335 -10% | 2819 -24% | 2861 -23% | 2586 ? -31% | 2264 ? -39% |
| 4k q32 t16 write (MB/s) | 3355 | 1457 -57% | 1585 -53% | 2664 -21% | 3737 11% | 2670 -20% | 2700 -20% | 1959 ? -42% | 1832 ? -45% |
| AS SSD | -7% | -94% | -22% | -17% | -20% | -31% | -20% | -18% | |
| Score Total (Points) | 8345 | 9125 9% | 4261 -49% | 6631 -21% | 7599 -9% | 7145 -14% | 7307 -12% | 6892 ? -17% | 6872 ? -18% |
| Score Read (Points) | 3277 | 3235 -1% | 1830 -44% | 2593 -21% | 2625 -20% | 2804 -14% | 2792 -15% | 2433 ? -26% | 2248 ? -31% |
| Score Write (Points) | 3417 | 4288 25% | 1604 -53% | 2674 -22% | 3618 6% | 2979 -13% | 3117 -9% | 3284 ? -4% | 3547 ? 4% |
| Seq Read (MB/s) | 4853 | 5856.12 21% | 3690.93 -24% | 3344 -31% | 3667.76 -24% | 4920.82 1% | 4843.81 0% | 4901 ? 1% | 5591 ? 15% |
| Seq Write (MB/s) | 4373 | 4750.28 9% | 1633.49 -63% | 4175 -5% | 3884.67 -11% | 3550.64 -19% | 4200.32 -4% | 3334 ? -24% | 3972 ? -9% |
| 4K Read (MB/s) | 73.43 | 77.12 5% | 42.75 -42% | 53.4 -27% | 63.89 -13% | 56.67 -23% | 67.56 -8% | 72.4 ? -1% | 71.1 ? -3% |
| 4K Write (MB/s) | 234.6 | 276.66 18% | 118.17 -50% | 177.9 -24% | 207.32 -12% | 135.96 -42% | 213.7 -9% | 186 ? -21% | 215 ? -8% |
| 4K-64 Read (MB/s) | 2718 | 2572.63 -5% | 1429.83 -47% | 2205 -19% | 2194.79 -19% | 2254.97 -17% | 2240.41 -18% | 1871 ? -31% | 1618 ? -40% |
| 4K-64 Write (MB/s) | 2745 | 3536.78 29% | 1411.25 -49% | 2078 -24% | 3021.8 10% | 2488.35 -9% | 2483.08 -10% | 2764 ? 1% | 2935 ? 7% |
| Access Time Read * (ms) | 0.044 | 0.058 | 0.03 | 0.08 | 0.057 | 0.038 | 0.0377 ? | 0.06364 ? | |
| Access Time Write * (ms) | 0.019 | 0.053 -179% | 0.118 -521% | 0.023 -21% | 0.033 -74% | 0.029 -53% | 0.061 -221% | 0.03431 ? -81% | 0.03794 ? -100% |
| Média Total (Programa/Configurações) | -5% /
-6% | -65% /
-73% | -17% /
-17% | -13% /
-12% | -16% /
-16% | -14% /
-17% | -15% /
-16% | -13% /
-14% |
* ... menor é melhor
Continuous performance Read: DiskSpd Read Loop, Queue Depth 8
Placa de vídeo
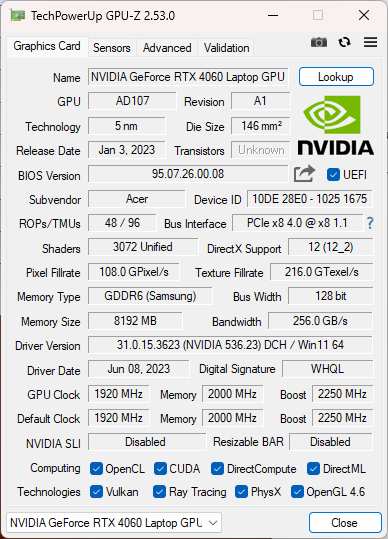
ARTX 4060é uma GPU de médio porte que pode competir de forma confiável com a geração anterior daRTX 3070 Ti. Isso é notável, pois o número de shaders, bem como os vários núcleos para traçado de raios ou cálculos de tensor, foram reduzidos em algo próximo a 50%. Com 8 GB, apenas a VRAM permaneceu a mesma e pode ser um pouco escassa, especialmente quando se trata de resoluções 4K - pelo menos para títulos de jogos individuais.
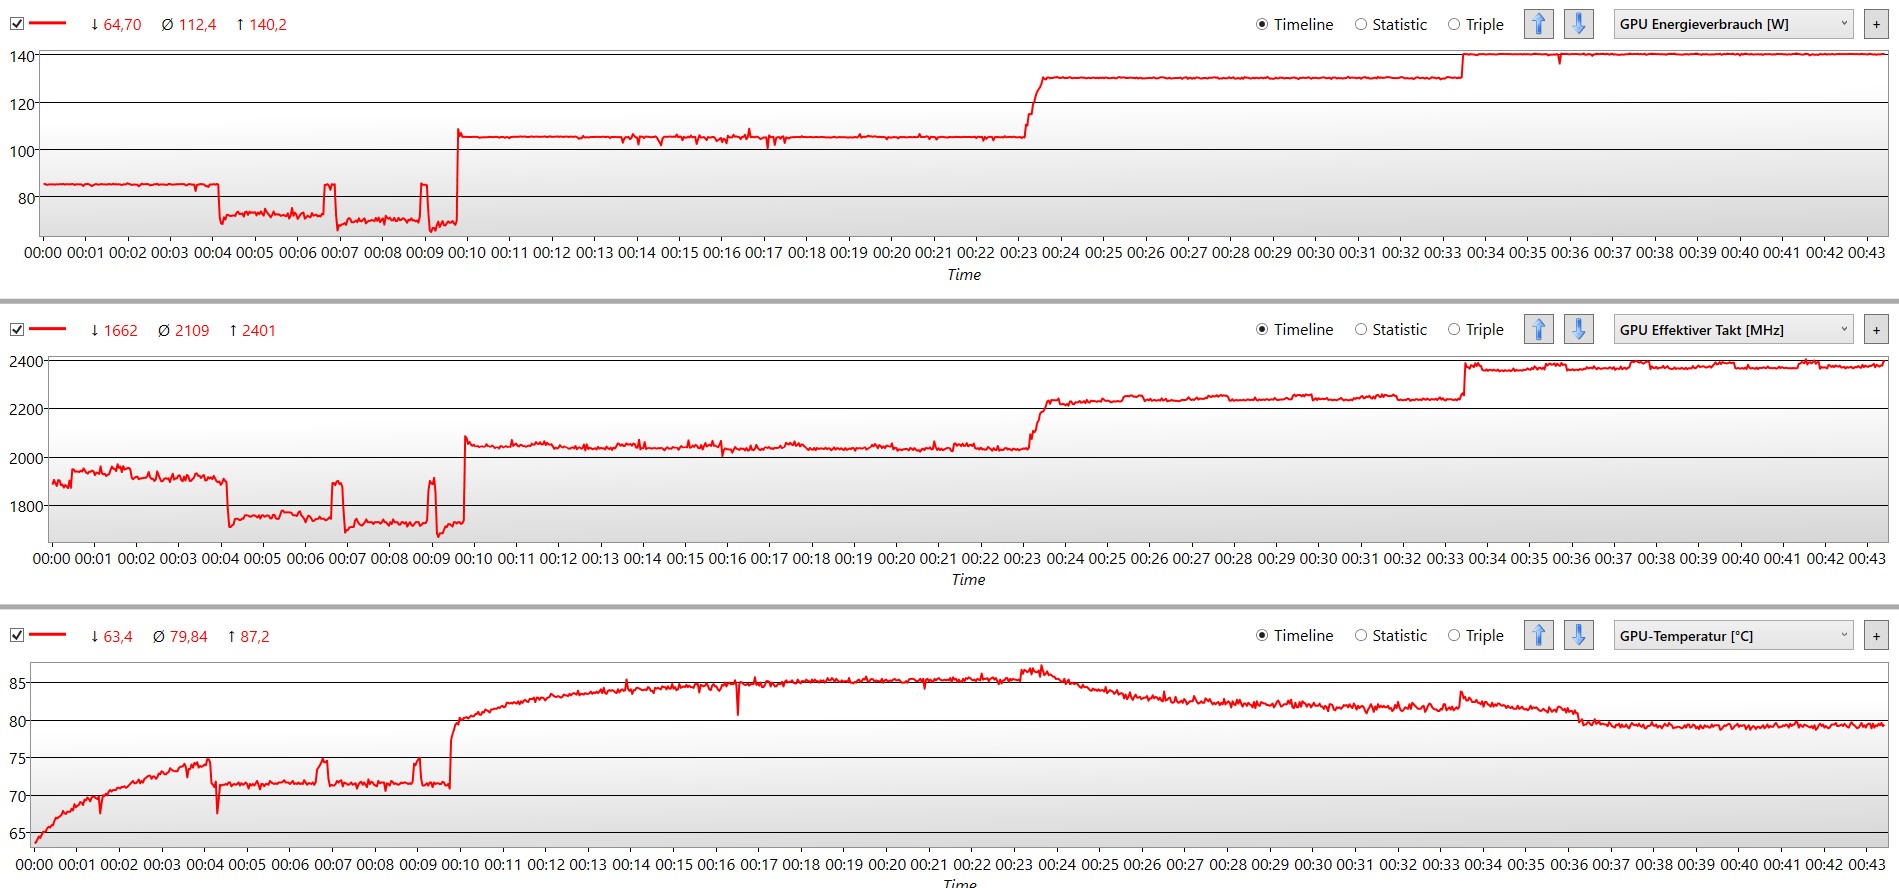
O chip gráfico do Acer Nitro 17 é alimentado com um máximo de 140 watts, sendo que 25 watts são desviados do processador como um impulso dinâmico. O gráfico à direita mostra que o valor no modo "Turbo" também é estável a longo prazo. Nos outros modos, o consumo de energia é reduzido. No modo "Quiet", são necessários 85 watts. No modo "Balanced", são permitidos 105 watts e, no modo "Performance", um máximo de 130 watts é acessado. O modo de bateria não aparece no diagrama. Em seguida, registramos 15 watts, o que é suficiente até mesmo para o The Witcher 3 nas configurações de detalhes mais altas.
O 3DMark foi realizado com uma fonte de alimentação máxima de 130 watts (modo "Performance") e ficou em um nível comparável ao de concorrentes como oErazer Defender P40 ou Legion Pro 5 com uma GPU idêntica. Também nessa área, os resultados do modo balanceado são parcialmente melhores do que os registrados no modo de desempenho, embora a placa de vídeo seja alimentada com apenas 105 watts. Como o processador não é totalmente responsável pela produção de calor, a GPU pode ser executada de forma confiável nesse modo com a potência máxima. Por outro lado, no modo "Desempenho", quando a temperatura crítica é atingida, a velocidade do clock é limitada por um curto período, algo que não acontece tão rapidamente no modo balanceado.
Em uma extensa análise das atuais GPUs Nvidia RTX-4000destacamos que a GPU de baixa especificaçãoRTX 4050e RTX 4060de baixa especificação não apresentam um aumento de desempenho quando o consumo de energia é aumentado para mais de 100 watts.
Você pode encontrar outros benchmarks e informações em nossa Lista de benchmarks de GPU.
| 3DMark Performance rating - Percent | |
| Média da turma Gaming | |
| Schenker XMG Focus 17 (E23) | |
| Acer Nitro 5 AN515-46-R1A1 | |
| Medion Erazer Defender P40 | |
| Acer Nitro 17 AN17-51-71ER | |
| Acer Nitro 17 AN17-51-71ER | |
| Média NVIDIA GeForce RTX 4060 Laptop GPU | |
| Asus TUF Gaming A16 FA617XS | |
| Lenovo Legion Pro 5 16IRX8 -1! | |
| MSI Pulse GL76 12UGK -1! | |
| 3DMark 11 - 1280x720 Performance GPU | |
| Média da turma Gaming (21841 - 80022, n=104, últimos 2 anos) | |
| Schenker XMG Focus 17 (E23) | |
| Lenovo Legion Pro 5 16IRX8 | |
| Acer Nitro 5 AN515-46-R1A1 | |
| Medion Erazer Defender P40 | |
| Acer Nitro 17 AN17-51-71ER (Ausgeglichen) | |
| Acer Nitro 17 AN17-51-71ER | |
| Média NVIDIA GeForce RTX 4060 Laptop GPU (28136 - 38912, n=57) | |
| MSI Pulse GL76 12UGK | |
| Asus TUF Gaming A16 FA617XS | |
| 3DMark 11 Performance | 31129 pontos | |
| 3DMark Cloud Gate Standard Score | 61140 pontos | |
| 3DMark Fire Strike Score | 23561 pontos | |
| 3DMark Time Spy Score | 10759 pontos | |
Ajuda | ||
* ... menor é melhor
Desempenho em jogos
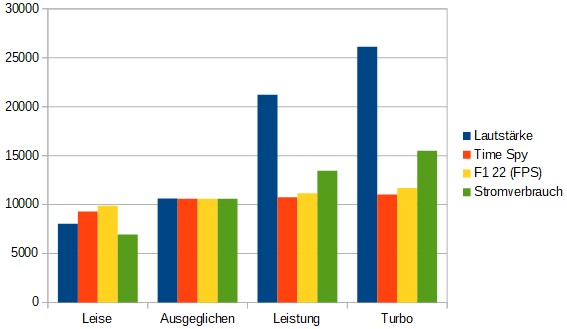
Quando se trata de desempenho em jogos, não há grandes surpresas. Mais uma vez, com sua CPU mais potente, oMedion Erazer Defender P40fica em desvantagem. É provável que haja uma diferença mais significativa em relação ao Acer Nitro 5 AN515com sua RTX 3070 Ti. Mais uma vez, em jogos novos, como F1 22, os dois notebooks para jogos se equivalem. Quase não encontramos nenhuma diferença entre os modos balanceado e de desempenho. Houve mais ou menos um empate quando se tratou da pontuação no 3DMark. Em Witcher 3, o modo balanceado ficou atrás por cerca de 2%. O F1 22 foi cerca de 5% pior.
Além disso, no gráfico à direita, também adicionamos o consumo de energia do sistema e o nível de ruído registrado relacionado ao ganho de desempenho. Para isso, todos os valores foram normalizados no resultado do modo balanceado do 3DMark Time Spy e a escala logarítmica do nível de ruído foi convertida em valores lineares. Com isso, é possível ver que uma melhoria mínima no desempenho é mais fácil para os ouvidos do que para a conta de luz. Como já mencionamos em nossa análise da placa de vídeo, isso mostra claramente que a maximização do TGP da RTX 4060 é responsável por mais emissões, mas não por tanta energia adicional.
| The Witcher 3 - 1920x1080 Ultra Graphics & Postprocessing (HBAO+) | |
| Média da turma Gaming (104.7 - 240, n=7, últimos 2 anos) | |
| Schenker XMG Focus 17 (E23) | |
| Acer Nitro 5 AN515-46-R1A1 | |
| Lenovo Legion Pro 5 16IRX8 | |
| Acer Nitro 17 AN17-51-71ER | |
| Medion Erazer Defender P40 | |
| Asus TUF Gaming A16 FA617XS | |
| MSI Pulse GL76 12UGK | |
| Strange Brigade - 1920x1080 ultra AA:ultra AF:16 | |
| Média da turma Gaming (76.3 - 458, n=87, últimos 2 anos) | |
| Schenker XMG Focus 17 (E23) | |
| Acer Nitro 17 AN17-51-71ER | |
| Medion Erazer Defender P40 | |
| Acer Nitro 5 AN515-46-R1A1 | |
| MSI Pulse GL76 12UGK | |
| Asus TUF Gaming A16 FA617XS | |
| Hogwarts Legacy | |
| 1920x1080 High Preset AA:High T | |
| Schenker XMG Focus 17 (E23) | |
| Média NVIDIA GeForce RTX 4060 Laptop GPU (70.8 - 107.7, n=6) | |
| Acer Nitro 17 AN17-51-71ER | |
| Asus TUF Gaming A16 FA617XS | |
| 1920x1080 Ultra Preset AA:High T | |
| Média da turma Gaming (n=1últimos 2 anos) | |
| Média NVIDIA GeForce RTX 4060 Laptop GPU (61.9 - 91.9, n=6) | |
| Schenker XMG Focus 17 (E23) | |
| Acer Nitro 17 AN17-51-71ER | |
| Asus TUF Gaming A16 FA617XS | |
No teste de resistência Witcher 3, o desempenho do sistema permaneceu estável. As flutuações resultam do ciclo de dia e noite do jogo. As taxas de fps registradas no modo balanceado são quase idênticas, superando, por exemplo, o Medion Erazer Defender P40que consome mais energia.
Uma tendência mínima de diminuição dos valores pode ser observada no modo balanceado (verde). A limitação da velocidade da ventoinha garante uma leve queda na taxa de quadros em uma hora. No final, mesmo no modo de economia de energia, os valores estão um pouco acima de 80 fps.
Witcher 3 FPS diagram
| baixo | média | alto | ultra | QHD | |
|---|---|---|---|---|---|
| GTA V (2015) | 177.8 | 114.1 | |||
| The Witcher 3 (2015) | 210 | 105 | |||
| Dota 2 Reborn (2015) | 153.4 | 135.7 | |||
| Final Fantasy XV Benchmark (2018) | 103.3 | 73.7 | |||
| X-Plane 11.11 (2018) | 111.7 | ||||
| Far Cry 5 (2018) | 151 | 142 | 101 | ||
| Strange Brigade (2018) | 227 | 195.2 | 129.3 | ||
| Cyberpunk 2077 1.6 (2022) | 86.4 | 79.4 | 49.1 | ||
| F1 22 (2022) | 198.4 | 64.2 | 40.9 | ||
| Hogwarts Legacy (2023) | 76 | 65 | 45 | ||
| Star Wars Jedi Survivor (2023) | 66 | 60 | 39 |
Emissões - Jogos também em ambientes silenciosos
Emissões de ruído
No modo de desempenho, o ruído do ventilador é alto e tende a ser insuportável no modo turbo. Se permanecermos, como fizemos, no modo de desempenho, um par de fones de ouvido decente fará o trabalho de suprimir o ruído permanente. Não observamos nenhuma reclamação espontânea ou mudanças frequentes na velocidade da ventoinha.
Na verdade, o Nitro 17 nunca é totalmente silencioso. Mesmo no modo de bateria, as ventoinhas são ocasionalmente audíveis, ficando um pouco mais altas quando se seleciona "Balanced". O ruído ouvido aqui está bem abaixo do volume ambiente e pode ser facilmente abafado pelos alto-falantes integrados. É sempre possível jogar em níveis de desempenho bastante aceitáveis, mesmo em ambientes silenciosos e sem fones de ouvido.
Barulho
| Ocioso |
| 24 / 24 / 32.32 dB |
| Carga |
| 35.18 / 54.78 dB |
 | ||
30 dB silencioso 40 dB(A) audível 50 dB(A) ruidosamente alto |
||
min: | ||
| Acer Nitro 17 AN17-51-71ER GeForce RTX 4060 Laptop GPU, i7-13700H, Samsung PM9A1 MZVL21T0HCLR | Lenovo Legion Pro 5 16IRX8 GeForce RTX 4060 Laptop GPU, i7-13700HX, SK hynix PC801 HFS512GEJ9X115N | Asus TUF Gaming A16 FA617XS Radeon RX 7600S, R9 7940HS, Micron 2400 MTFDKBA512QFM | Schenker XMG Focus 17 (E23) GeForce RTX 4070 Laptop GPU, i9-13900HX, Crucial P5 Plus 1TB CT1000P5PSSD8 | Medion Erazer Defender P40 GeForce RTX 4060 Laptop GPU, i7-13700HX, Phison PS5021-E21 1TB | Acer Nitro 5 AN515-46-R1A1 GeForce RTX 3070 Ti Laptop GPU, R7 6800H, Micron 3400 1TB MTFDKBA1T0TFH | MSI Pulse GL76 12UGK GeForce RTX 3070 Laptop GPU, i7-12700H, Micron 3400 1TB MTFDKBA1T0TFH | |
|---|---|---|---|---|---|---|---|
| Noise | 6% | -2% | -7% | -13% | -16% | -3% | |
| desligado / ambiente * (dB) | 24 | 23 4% | 25 -4% | 24 -0% | 25 -4% | 25 -4% | 24.1 -0% |
| Idle Minimum * (dB) | 24 | 23.1 4% | 25 -4% | 24 -0% | 26 -8% | 25 -4% | 26.9 -12% |
| Idle Average * (dB) | 24 | 23.1 4% | 26 -8% | 24 -0% | 27 -13% | 28.6 -19% | 26.9 -12% |
| Idle Maximum * (dB) | 32.32 | 26.6 18% | 28 13% | 26.47 18% | 32 1% | 44.3 -37% | 27 16% |
| Load Average * (dB) | 35.18 | 34.7 1% | 43 -22% | 55.72 -58% | 53 -51% | 47.6 -35% | 43.8 -25% |
| Witcher 3 ultra * (dB) | 54.78 | 47.6 13% | 51 7% | 57.94 -6% | 56 -2% | 44.7 18% | |
| Load Maximum * (dB) | 54.78 | 54.8 -0% | 53 3% | 57.94 -6% | 64 -17% | 53.6 2% | 58.3 -6% |
* ... menor é melhor
Temperatura
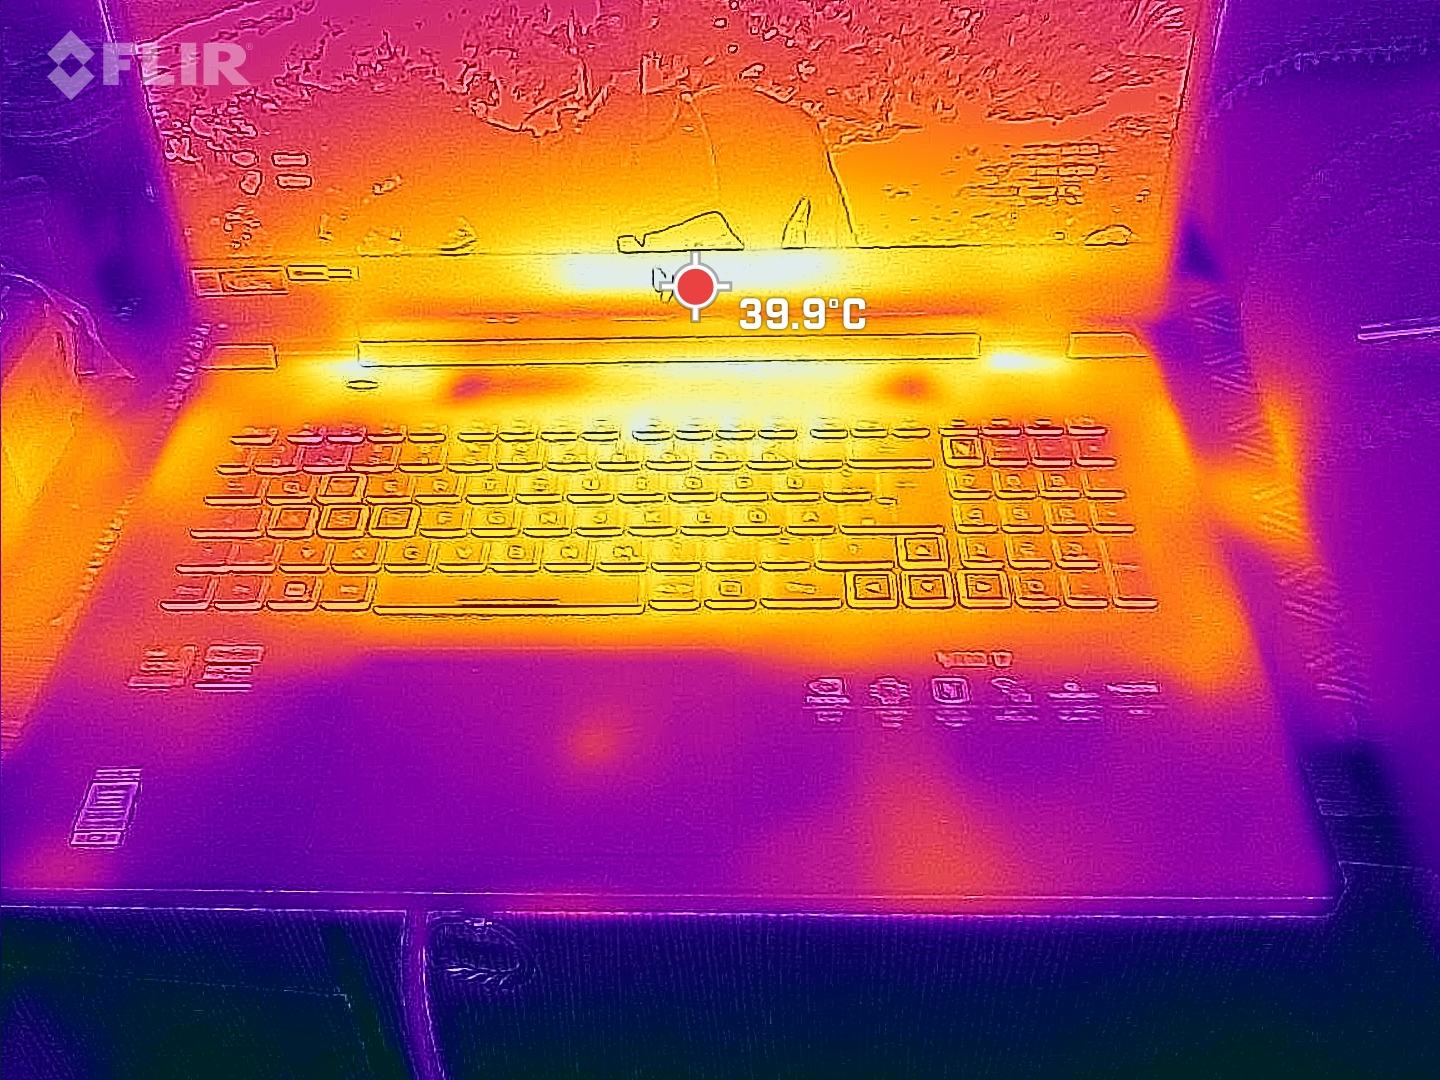
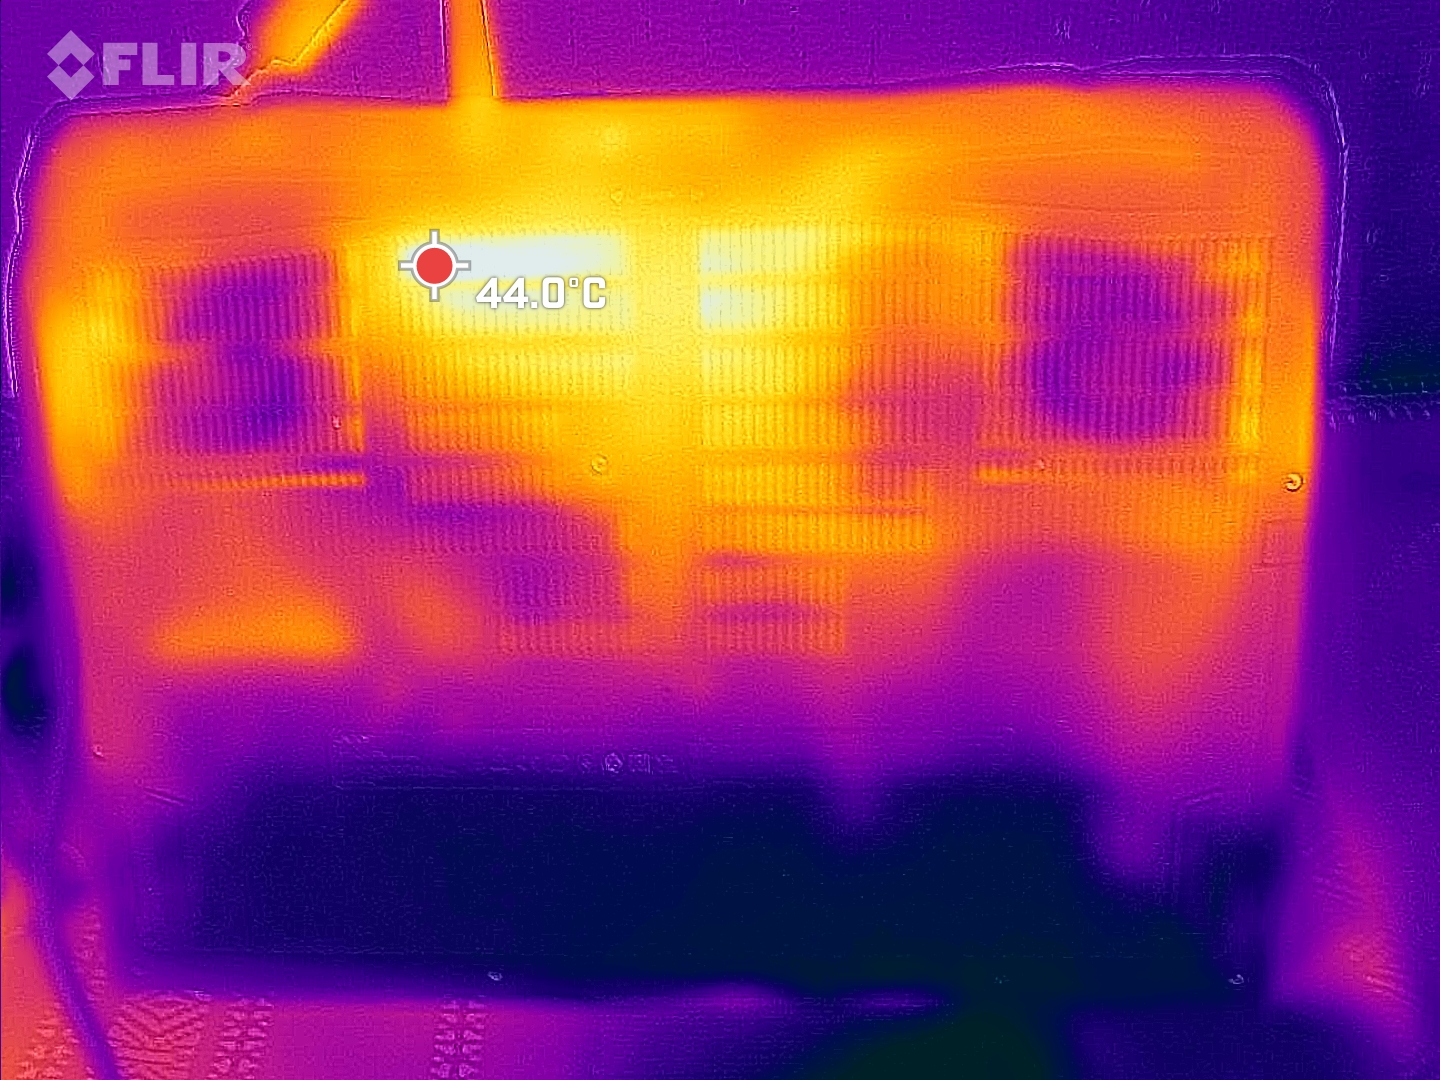
No centro do teclado, medimos bem mais de 40 °C, com as temperaturas subindo um pouco mais na parte inferior do dispositivo. Quando se joga, não se pode dizer que seja uma experiência agradável e o laptop só deve ser usado em uma superfície rígida. Isso também se aplica a tarefas pouco exigentes. Mesmo nessa área, é possível perceber uma produção considerável de calor.
O modo "Equilibrado" não melhora a situação. Com essas configurações, medimos até mesmo uma temperatura mais alta do que quando usamos os modos mais rápido e mais alto. A única coisa que ajuda em dias quentes é aumentar manualmente (e com muita facilidade) a velocidade do ventilador usando o NitroSense.
(-) A temperatura máxima no lado superior é 46 °C / 115 F, em comparação com a média de 40.4 °C / 105 F , variando de 21.2 a 68.8 °C para a classe Gaming.
(-) A parte inferior aquece até um máximo de 51 °C / 124 F, em comparação com a média de 43.2 °C / 110 F
(+) Em uso inativo, a temperatura média para o lado superior é 31.2 °C / 88 F, em comparação com a média do dispositivo de 33.9 °C / ### class_avg_f### F.
(-) Jogando The Witcher 3, a temperatura média para o lado superior é 38.2 °C / 101 F, em comparação com a média do dispositivo de 33.9 °C / ## #class_avg_f### F.
(+) Os apoios para as mãos e o touchpad estão atingindo a temperatura máxima da pele (33 °C / 91.4 F) e, portanto, não estão quentes.
(-) A temperatura média da área do apoio para as mãos de dispositivos semelhantes foi 28.8 °C / 83.8 F (-4.2 °C / -7.6 F).
| Acer Nitro 17 AN17-51-71ER Intel Core i7-13700H, NVIDIA GeForce RTX 4060 Laptop GPU | Lenovo Legion Pro 5 16IRX8 Intel Core i7-13700HX, NVIDIA GeForce RTX 4060 Laptop GPU | Asus TUF Gaming A16 FA617XS AMD Ryzen 9 7940HS, AMD Radeon RX 7600S | Schenker XMG Focus 17 (E23) Intel Core i9-13900HX, NVIDIA GeForce RTX 4070 Laptop GPU | Medion Erazer Defender P40 Intel Core i7-13700HX, NVIDIA GeForce RTX 4060 Laptop GPU | Acer Nitro 5 AN515-46-R1A1 AMD Ryzen 7 6800H, NVIDIA GeForce RTX 3070 Ti Laptop GPU | MSI Pulse GL76 12UGK Intel Core i7-12700H, NVIDIA GeForce RTX 3070 Laptop GPU | |
|---|---|---|---|---|---|---|---|
| Heat | 5% | 3% | -9% | 12% | 4% | 1% | |
| Maximum Upper Side * (°C) | 46 | 42.8 7% | 53 -15% | 50 -9% | 42 9% | 48.1 -5% | 44.2 4% |
| Maximum Bottom * (°C) | 51 | 50 2% | 48 6% | 56 -10% | 45 12% | 49.7 3% | 45.2 11% |
| Idle Upper Side * (°C) | 34 | 29.6 13% | 30 12% | 37 -9% | 28 18% | 30 12% | 35.4 -4% |
| Idle Bottom * (°C) | 33 | 34 -3% | 30 9% | 36 -9% | 30 9% | 31.7 4% | 35 -6% |
* ... menor é melhor
Teste de estresse
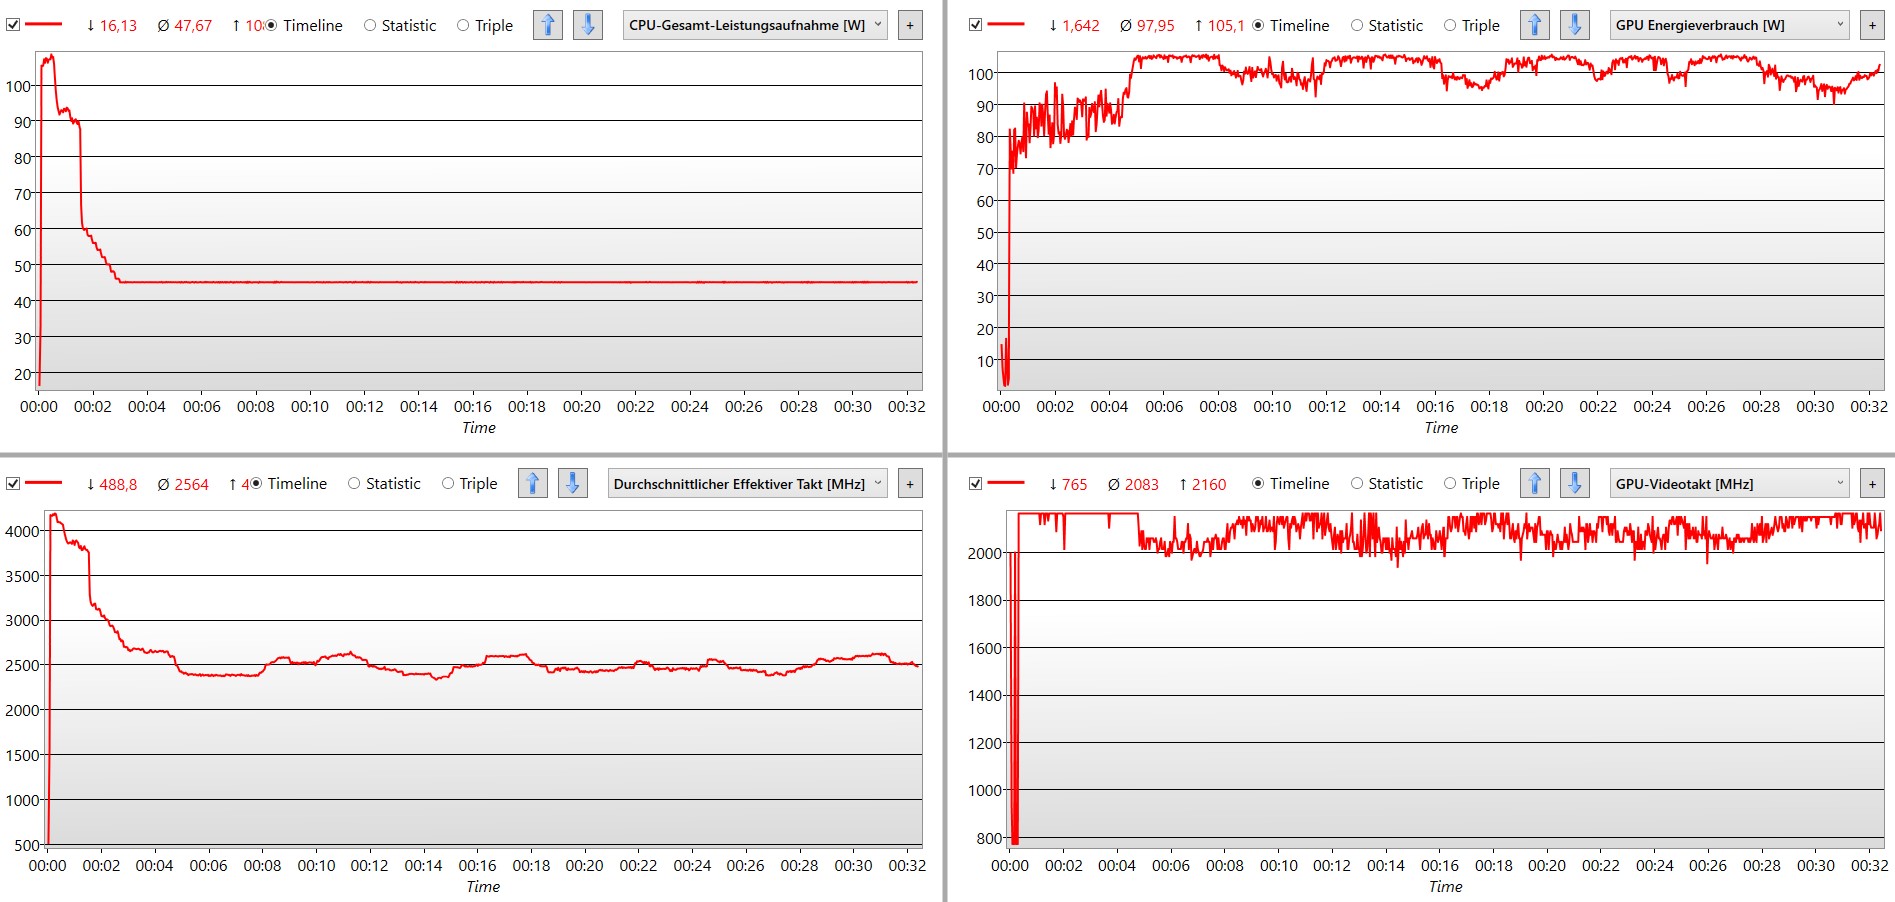
Se o desempenho máximo do sistema for necessário, o consumo de energia do processador aumentará para mais de 100 watts por um curto período e, em seguida, cairá permanentemente para 45 watts. Após um curto período, a velocidade do clock também não ultrapassa 2,5 GHz.
Por outro lado, o chip gráfico é alimentado permanentemente com 105 watts. Com base no fornecimento máximo de 130 watts no modo "Desempenho" e sem o aumento dinâmico - do qual a CPU não pode prescindir no teste de estresse - isso representa a carga máxima possível. As velocidades de clock também permanecem em um nível alto, mas estável, e ficam apenas um pouco abaixo do máximo teórico. Isso torna o Acer Nitro 17 bem equipado para lidar com tarefas graficamente intensivas, mesmo em uso contínuo.
Ao mesmo tempo, as temperaturas dos componentes permanecem abaixo de 90 °C.
Alto-falantes
Os pequenos alto-falantes estéreo do Nitro 17 fazem um bom trabalho ao reproduzir sons graves profundos - para um laptop. Da mesma forma, as vozes soam bem e podem ser ouvidas com precisão e em grande detalhe. Isso significa que as faixas de frequência mais importantes para jogos são bem cobertas.
Até mesmo música pode ser ouvida no laptop, mesmo que falte potência nos médios e graves mais baixos. O resultado é que as músicas de rock e as faixas baseadas em guitarra ou bateria são um pouco menos empolgantes.
Acer Nitro 17 AN17-51-71ER análise de áudio
(±) | o volume do alto-falante é médio, mas bom (###valor### dB)
Graves 100 - 315Hz
(-) | quase nenhum baixo - em média 22% menor que a mediana
(-) | graves não são lineares (16.5% delta para frequência anterior)
Médios 400 - 2.000 Hz
(±) | médios mais altos - em média 5.2% maior que a mediana
(+) | médios são lineares (4.1% delta para frequência anterior)
Altos 2 - 16 kHz
(+) | agudos equilibrados - apenas 1.6% longe da mediana
(+) | os máximos são lineares (5.5% delta da frequência anterior)
Geral 100 - 16.000 Hz
(±) | a linearidade do som geral é média (16.9% diferença em relação à mediana)
Comparado com a mesma classe
» 44% de todos os dispositivos testados nesta classe foram melhores, 11% semelhantes, 44% piores
» O melhor teve um delta de 6%, a média foi 18%, o pior foi 132%
Comparado com todos os dispositivos testados
» 30% de todos os dispositivos testados foram melhores, 8% semelhantes, 62% piores
» O melhor teve um delta de 4%, a média foi 23%, o pior foi 134%
Apple MacBook Pro 16 2021 M1 Pro análise de áudio
(+) | os alto-falantes podem tocar relativamente alto (###valor### dB)
Graves 100 - 315Hz
(+) | bons graves - apenas 3.8% longe da mediana
(+) | o baixo é linear (5.2% delta para a frequência anterior)
Médios 400 - 2.000 Hz
(+) | médios equilibrados - apenas 1.3% longe da mediana
(+) | médios são lineares (2.1% delta para frequência anterior)
Altos 2 - 16 kHz
(+) | agudos equilibrados - apenas 1.9% longe da mediana
(+) | os máximos são lineares (2.7% delta da frequência anterior)
Geral 100 - 16.000 Hz
(+) | o som geral é linear (4.6% diferença em relação à mediana)
Comparado com a mesma classe
» 0% de todos os dispositivos testados nesta classe foram melhores, 0% semelhantes, 100% piores
» O melhor teve um delta de 5%, a média foi 17%, o pior foi 45%
Comparado com todos os dispositivos testados
» 0% de todos os dispositivos testados foram melhores, 0% semelhantes, 100% piores
» O melhor teve um delta de 4%, a média foi 23%, o pior foi 134%
Gerenciamento de energia - O Acer Nitro 17 tem um hardware eficiente
Consumo de energia
Em uso ocioso, o Nitro 17 é muito econômico, com um mínimo de 8 watts e um máximo de 15. Outros notebooks para jogos, como o Schenker XMG Focus 17 (E23)consomem continuamente mais de 17 watts. O teste Witcher 3 destacou a eficiência do componente. Por exemplo, oMedion Erazer Defender P40 requer quase 30 watts adicionais, mas só consegue gerenciar taxas de quadros mais baixas.
Medimos um máximo de 263 watts, o que significa que a monstruosa e pesada PSU de 330 watts é mais do que suficiente.
| desligado | |
| Ocioso | |
| Carga |
|
Key:
min: | |
| Acer Nitro 17 AN17-51-71ER i7-13700H, GeForce RTX 4060 Laptop GPU, Samsung PM9A1 MZVL21T0HCLR, , 2560x1440, 17.3" | Lenovo Legion Pro 5 16IRX8 i7-13700HX, GeForce RTX 4060 Laptop GPU, SK hynix PC801 HFS512GEJ9X115N, IPS, 2560x1600, 16" | Asus TUF Gaming A16 FA617XS R9 7940HS, Radeon RX 7600S, Micron 2400 MTFDKBA512QFM, IPS, 1920x1200, 16" | Schenker XMG Focus 17 (E23) i9-13900HX, GeForce RTX 4070 Laptop GPU, Crucial P5 Plus 1TB CT1000P5PSSD8, IPS, 2560x1440, 17.3" | Medion Erazer Defender P40 i7-13700HX, GeForce RTX 4060 Laptop GPU, Phison PS5021-E21 1TB, IPS, 2560x1440, 17.3" | MSI Pulse GL76 12UGK i7-12700H, GeForce RTX 3070 Laptop GPU, Micron 3400 1TB MTFDKBA1T0TFH, IPS, 1920x1080, 17.3" | Média NVIDIA GeForce RTX 4060 Laptop GPU | Média da turma Gaming | |
|---|---|---|---|---|---|---|---|---|
| Power Consumption | -80% | 10% | -70% | -11% | -24% | -19% | -41% | |
| Idle Minimum * (Watt) | 8.3 | 24.5 -195% | 7 16% | 17 -105% | 8 4% | 12.4 -49% | 11.5 ? -39% | 13 ? -57% |
| Idle Average * (Watt) | 13.5 | 29.2 -116% | 10 26% | 18 -33% | 12 11% | 13.1 3% | 16 ? -19% | 19 ? -41% |
| Idle Maximum * (Watt) | 14.8 | 34.3 -132% | 15 -1% | 25.8 -74% | 18 -22% | 25.3 -71% | 20.3 ? -37% | 24.6 ? -66% |
| Load Average * (Watt) | 77 | 98.7 -28% | 86 -12% | 178 -131% | 101 -31% | 105.4 -37% | 92.9 ? -21% | 110.7 ? -44% |
| Witcher 3 ultra * (Watt) | 154 | 178.6 -16% | 160.6 -4% | 265 -72% | 180.8 -17% | 150 3% | ||
| Load Maximum * (Watt) | 263 | 249.6 5% | 172 35% | 275 -5% | 284 -8% | 240.5 9% | 210 ? 20% | 259 ? 2% |
* ... menor é melhor
Power consumption Witcher 3 / stress test
Power consumption with an external monitor
Duração da bateria
Quando se trata da duração da bateria, o baixo consumo de energia em modo inativo é perceptível. Para um laptop para jogos, o Acer Nitro 17 tem grande resistência, pois conseguiu mais de 8 horas no teste de Wi-Fi com sites que mudavam constantemente. Entretanto, aumentar o brilho ao máximo reduz a duração da bateria em cerca de 2 horas.
Ao jogar no modo de bateria, o Nitro obteve bons resultados. Em vez de simplesmente desligar a GPU e sobrecarregar completamente o processador com um jogo, o laptop da Acer se ajuda com um máximo de 25 watts e a GPU com 15. Isso significa que pudemos jogar o jogo testado The Witcher 3 por quase 2,5 horas antes de o laptop desistir.
| Acer Nitro 17 AN17-51-71ER i7-13700H, GeForce RTX 4060 Laptop GPU, 90 Wh | Lenovo Legion Pro 5 16IRX8 i7-13700HX, GeForce RTX 4060 Laptop GPU, 80 Wh | Asus TUF Gaming A16 FA617XS R9 7940HS, Radeon RX 7600S, 90 Wh | Medion Erazer Defender P40 i7-13700HX, GeForce RTX 4060 Laptop GPU, 73 Wh | Acer Nitro 5 AN515-46-R1A1 R7 6800H, GeForce RTX 3070 Ti Laptop GPU, 57.5 Wh | MSI Pulse GL76 12UGK i7-12700H, GeForce RTX 3070 Laptop GPU, 90 Wh | Média da turma Gaming | |
|---|---|---|---|---|---|---|---|
| Duração da bateria | -59% | 66% | -21% | -23% | -28% | 4% | |
| H.264 (h) | 6.9 | 12.4 80% | 5.7 -17% | 5.7 -17% | 8.32 ? 21% | ||
| WiFi v1.3 (h) | 8.2 | 3.4 -59% | 12.4 51% | 6.2 -24% | 5.8 -29% | 5.9 -28% | 7.11 ? -13% |
| Witcher 3 ultra (h) | 2.5 |
Pro
Contra
Veredicto - O Nitro 17 não possui nenhum ponto fraco real
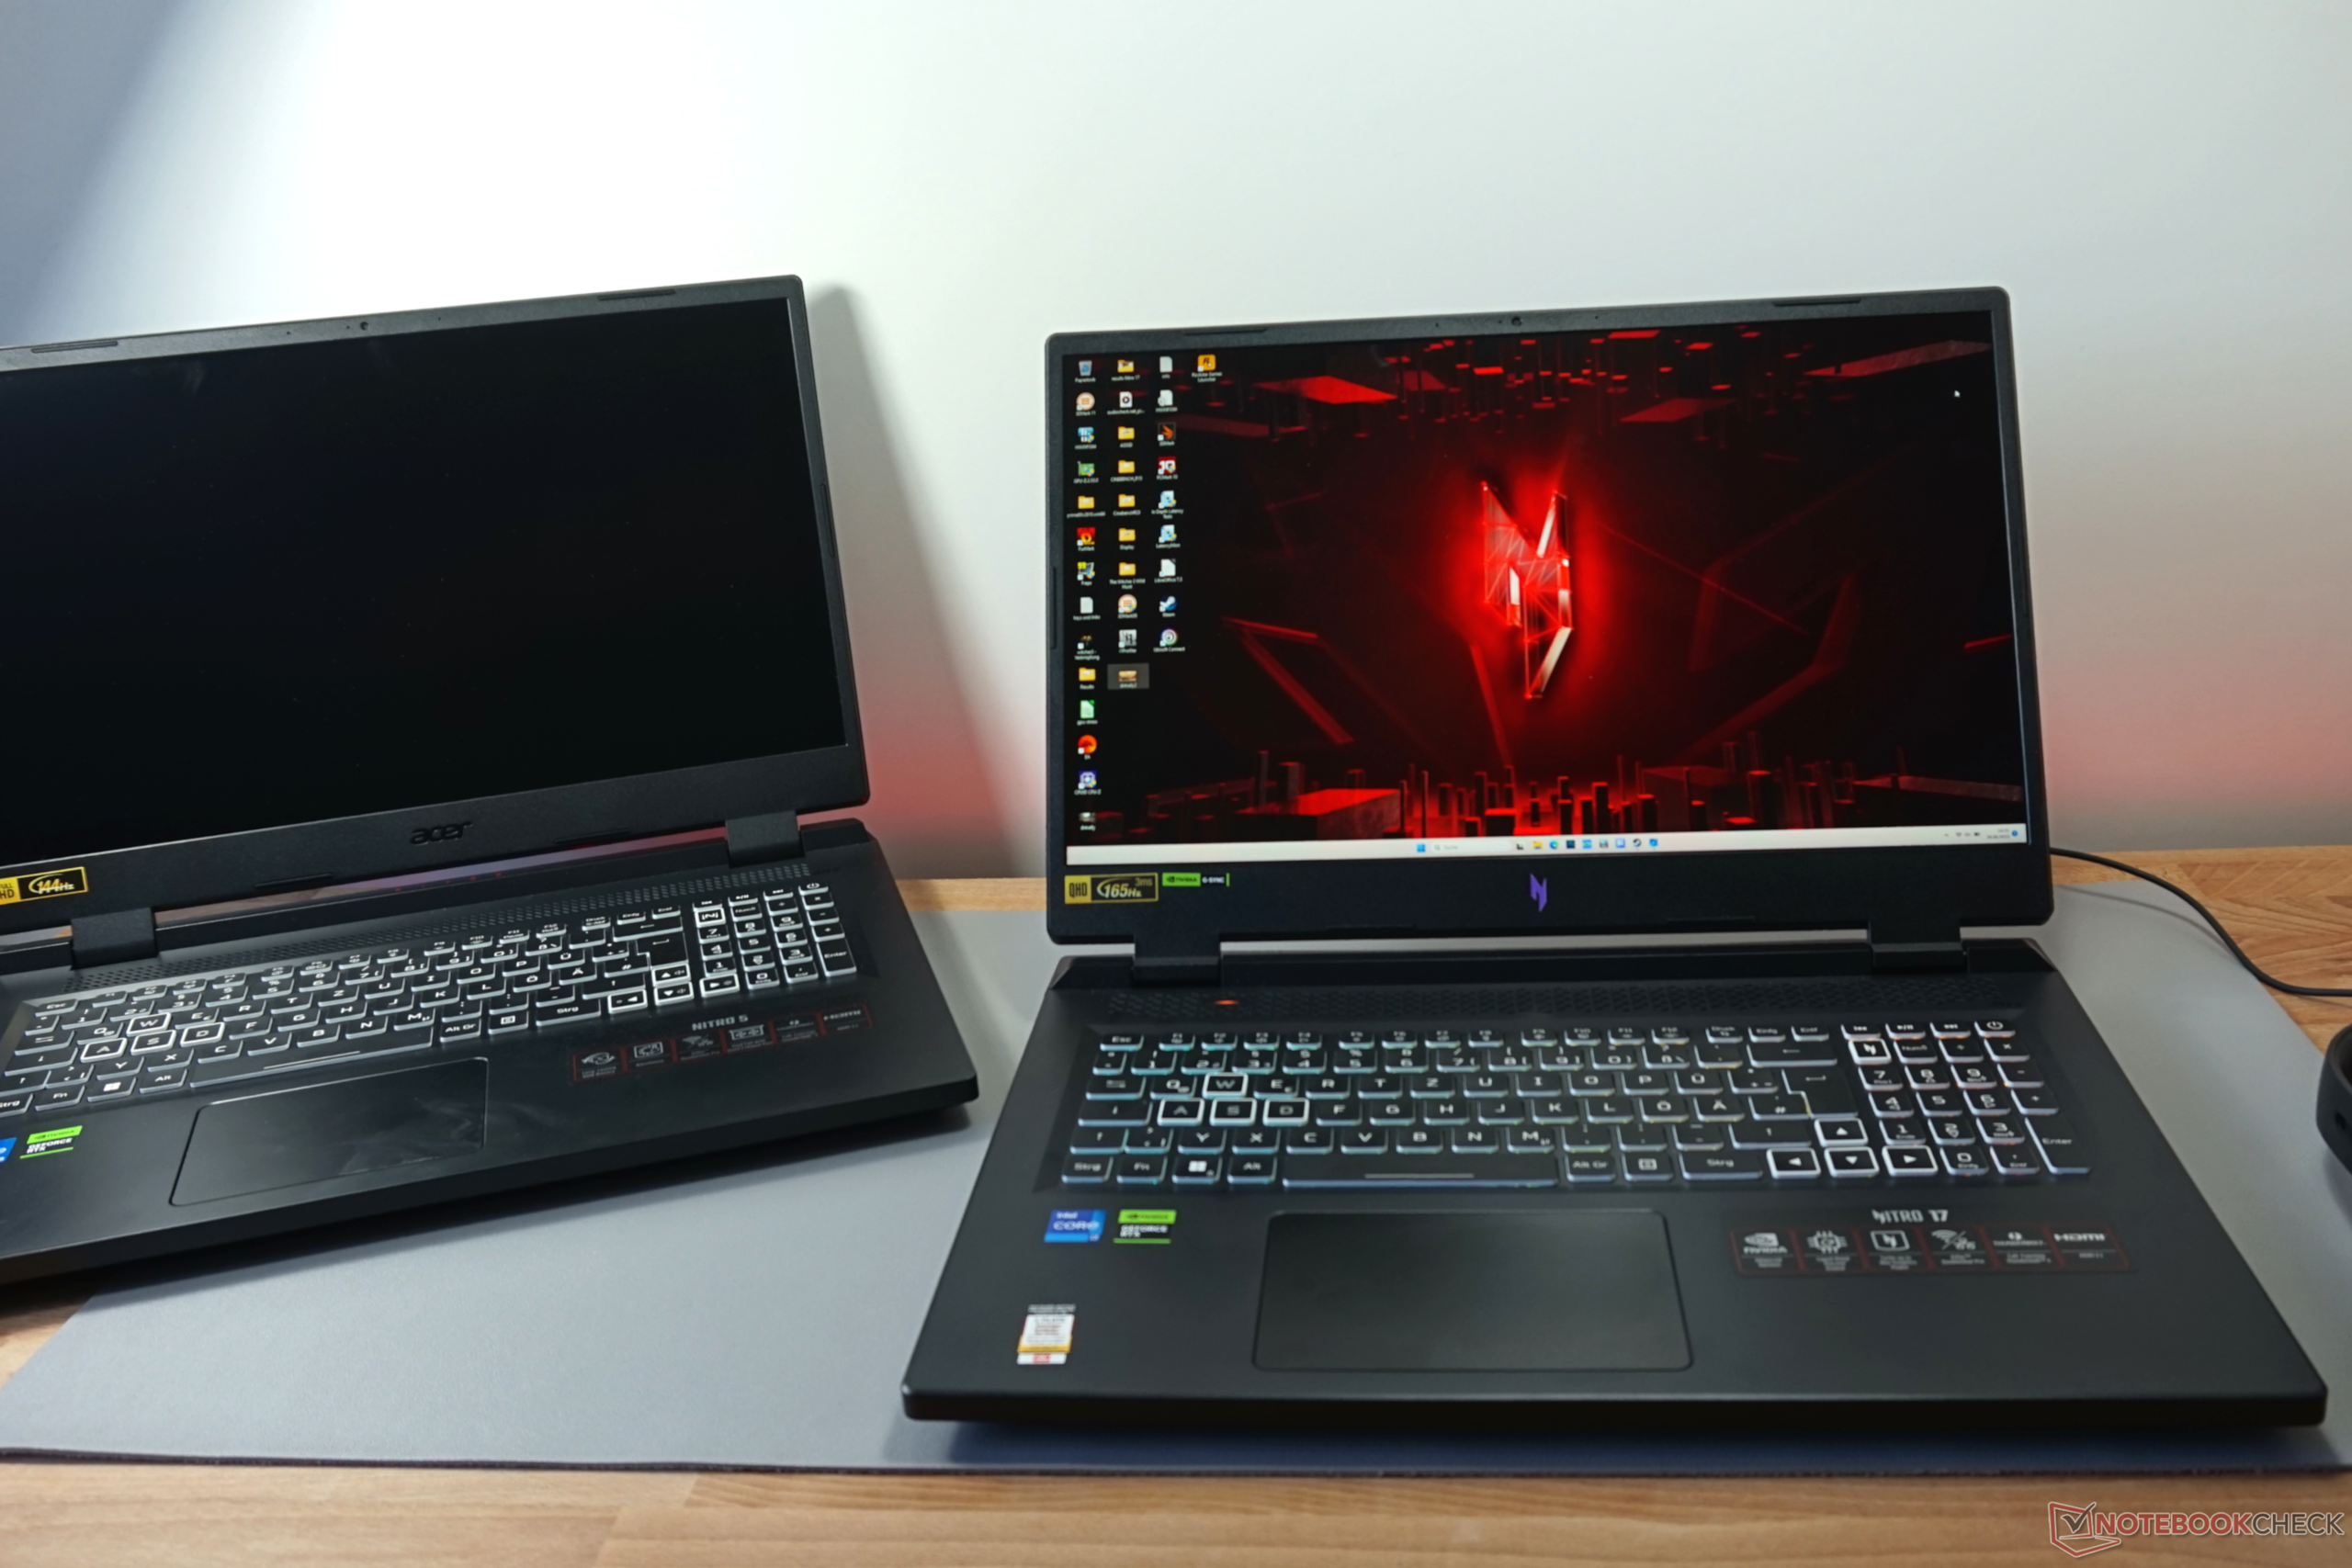
Especialmente quando comparado com seu antecessor, oAcer Nitro 5 AN517-5552- um dispositivo que analisamos no ano passado - o Acer Nitro 17 fez grandes melhorias. A reprodução de cores, o ruído máximo do ventilador e a seleção de portas agora são competitivos.
Em particular, o modo balanceado demonstra de forma impressionante o efeito positivo de reduzir ligeiramente o consumo de energia. O ruído do ventilador cai para um nível tolerável e o consumo de energia é reduzido. Isso significa que você pode jogar sem fones de ouvido e sem ruídos irritantes. As taxas de quadros e os benchmarks sintéticos quase não diminuem. Entretanto, usando essas configurações, nossos sensores mediram as temperaturas mais altas.
Fortes resultados de benchmark, ventoinhas silenciosas e especificações sólidas - o Acer Nitro 17 é um dispositivo de médio porte perfeito.
É claro que existem algumas falhas (desnecessárias). A webcam muito ruim não está mais atualizada. Sem um elemento de resfriamento passivo, a SSD atinge rapidamente seus limites. Embora não seja possível detectar qualquer influência no desempenho dos jogos, o aumento constante da temperatura do laptop deve ter um impacto negativo na vida útil do dispositivo. Além disso, o Acer Nitro 17 é mais pesado e maior do que a maioria dos outros notebooks para jogos com uma tela igualmente grande.
Quem procura mais potência com componentes comparáveis deve dar uma olhada noLenovo Legion Pro 5 16IRX8uma alternativa boa, mas também mais barulhenta, já que esse laptop também é mais fino e mais leve. O (geralmente) mais barato já não é o mais novo do mercado, mas ainda está no mesmo nível na maioria dos jogosAcer Nitro AN517-41-R5Z7com a RTX 3070.
Preço e disponibilidade
Tanto o nosso modelo de análise do Acer Nitro 17 AN17-51-71ER quanto a menor variante do Acer Nitro 17 AN17-51-59VT com um Intel Core i5-13500H e um RTX 4050 estão atualmente indisponíveis nos EUA na loja online da Acer, Amazon e Best Buy. No entanto, nosso modelo de análise pode ser adquirido na loja da Acer no Reino Unido por £1599,99.
Acer Nitro 17 AN17-51-71ER
- 09/07/2023 v7 (old)
Mario Petzold
Transparência
A seleção dos dispositivos a serem analisados é feita pela nossa equipe editorial. A amostra de teste foi fornecida ao autor como empréstimo pelo fabricante ou varejista para fins desta revisão. O credor não teve influência nesta revisão, nem o fabricante recebeu uma cópia desta revisão antes da publicação. Não houve obrigação de publicar esta revisão. Como empresa de mídia independente, a Notebookcheck não está sujeita à autoridade de fabricantes, varejistas ou editores.
É assim que o Notebookcheck está testando
Todos os anos, o Notebookcheck analisa de forma independente centenas de laptops e smartphones usando procedimentos padronizados para garantir que todos os resultados sejam comparáveis. Desenvolvemos continuamente nossos métodos de teste há cerca de 20 anos e definimos padrões da indústria no processo. Em nossos laboratórios de teste, equipamentos de medição de alta qualidade são utilizados por técnicos e editores experientes. Esses testes envolvem um processo de validação em vários estágios. Nosso complexo sistema de classificação é baseado em centenas de medições e benchmarks bem fundamentados, o que mantém a objetividade.Price comparison

