Schenker XMG Focus 17 (E23) em análise: O laptop para jogos com RTX 4070 não economiza no desempenho
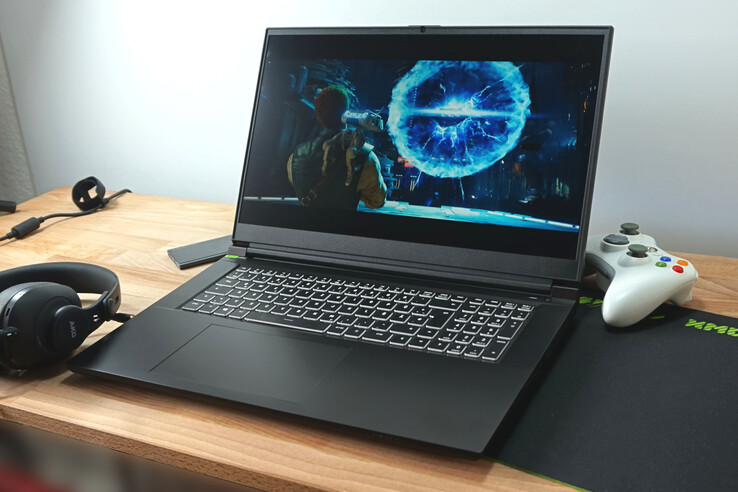
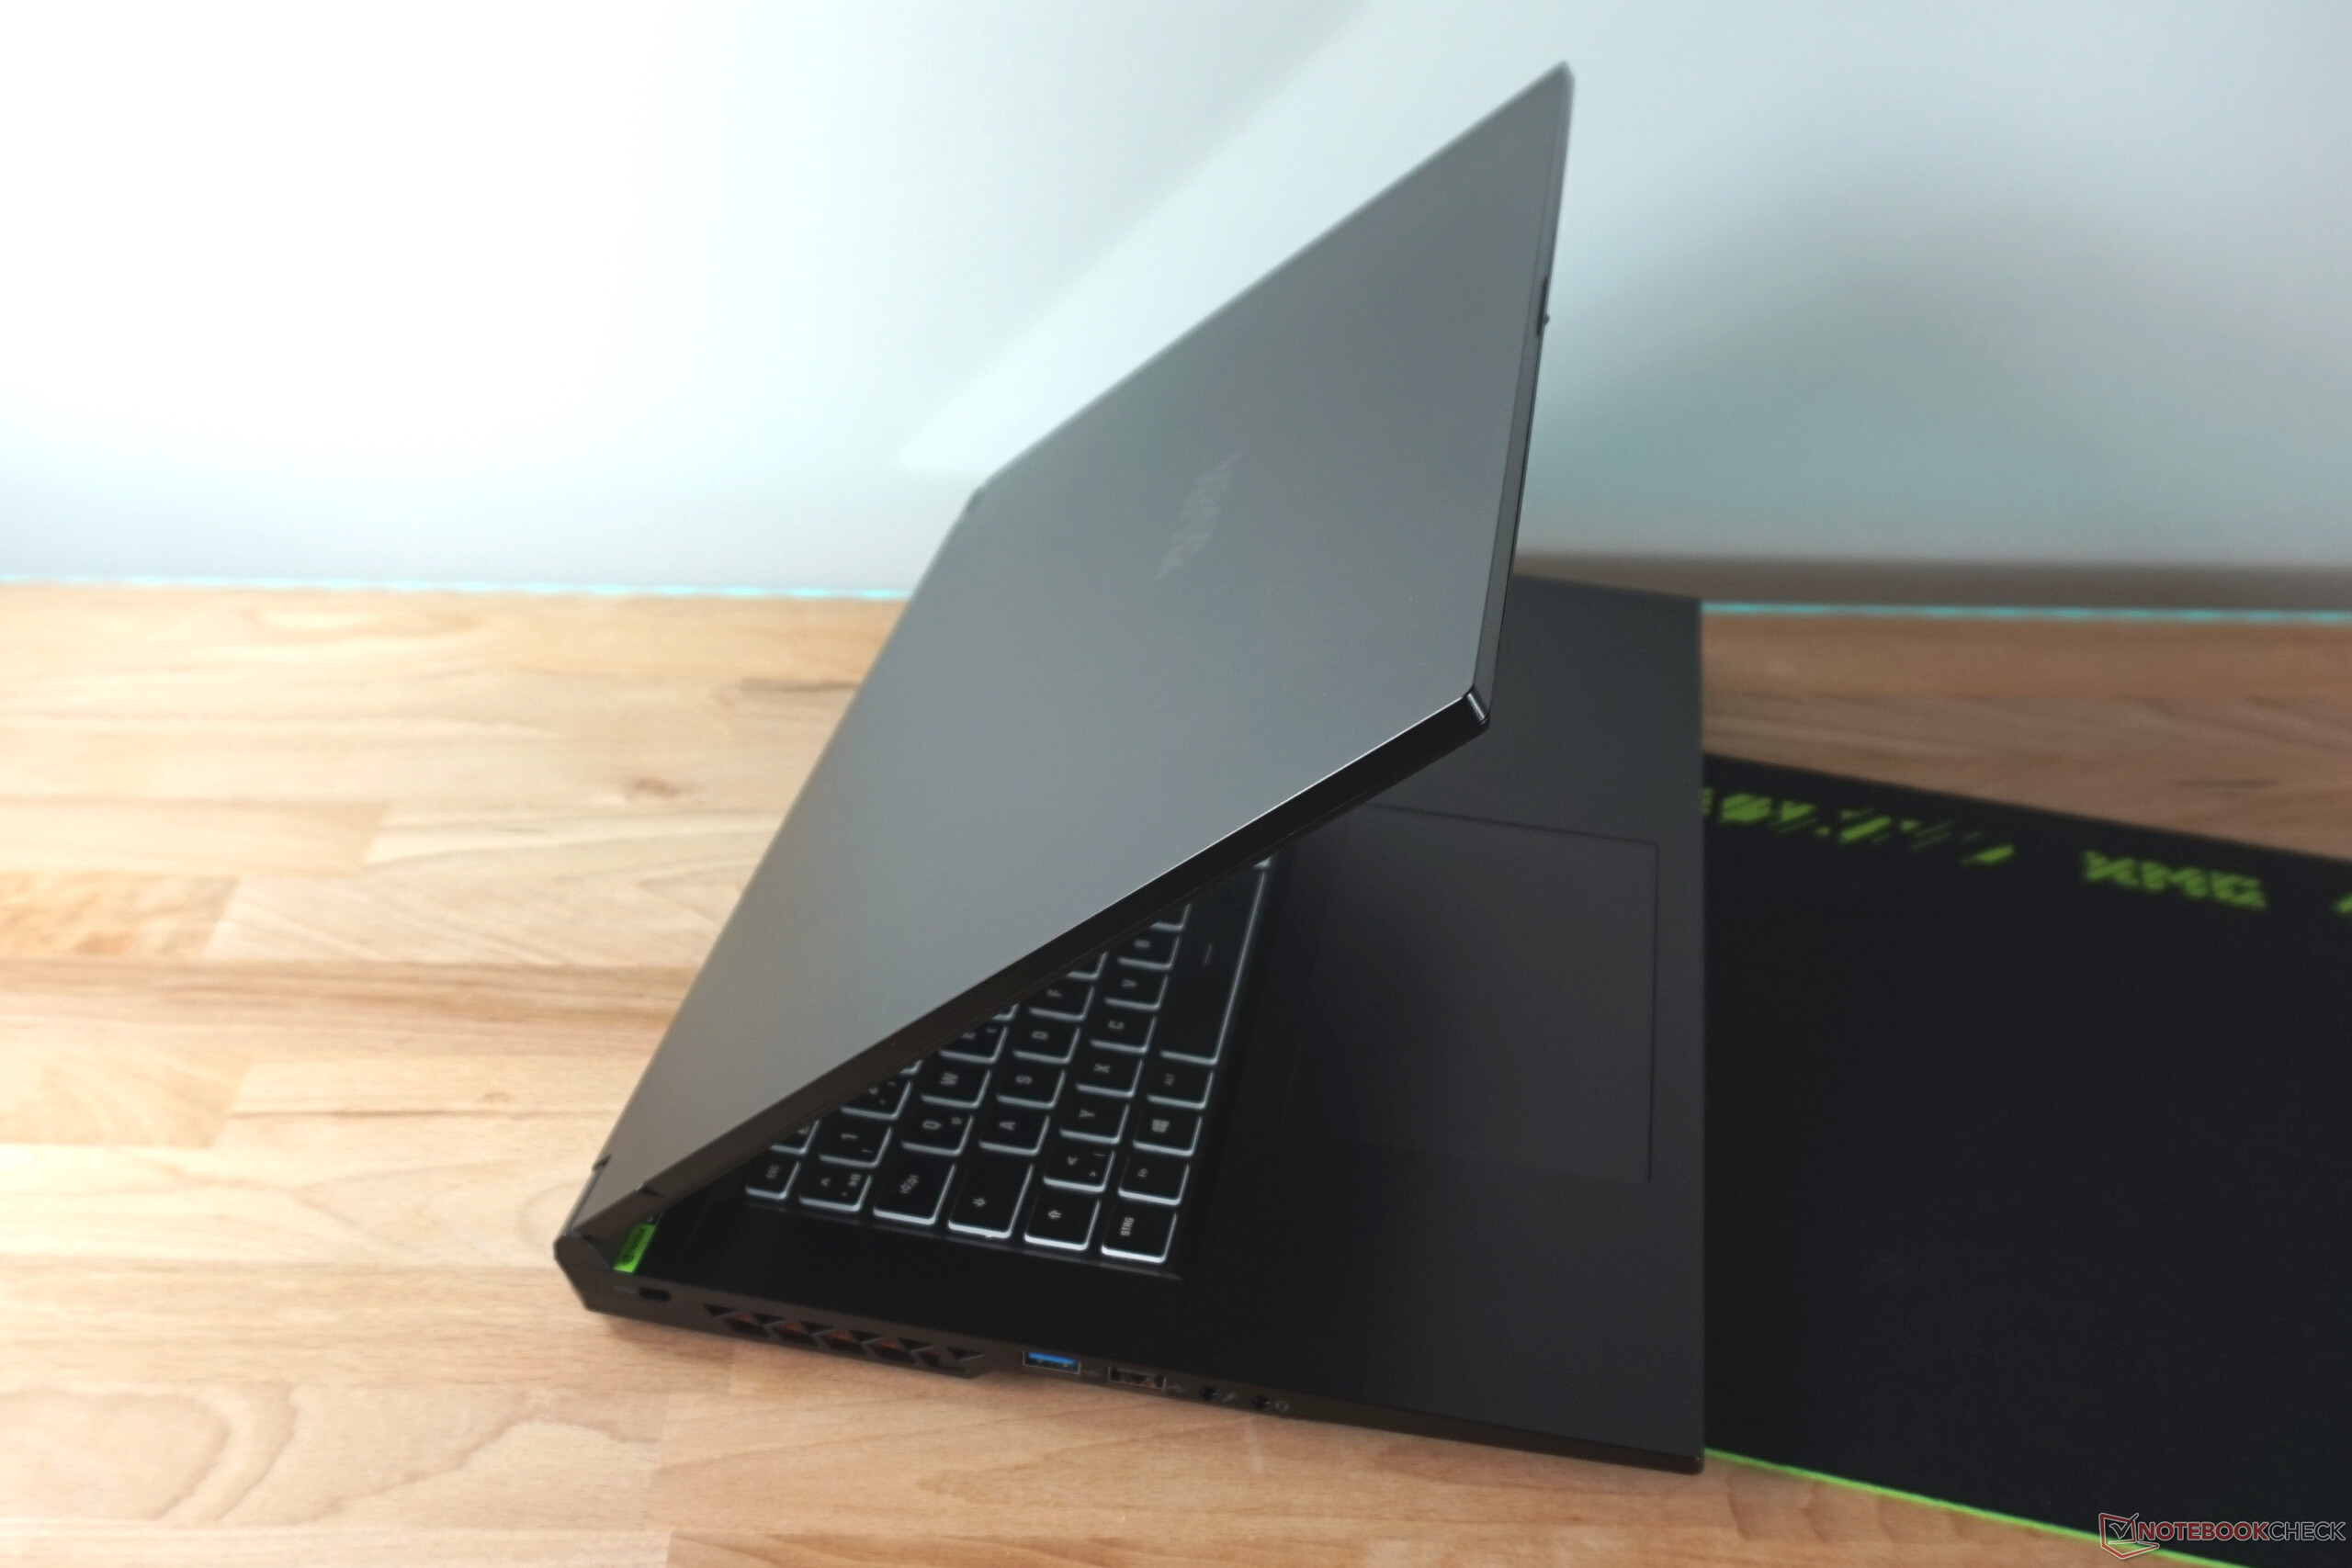
O notebook para jogos Schenker XMG Focus 17 E23 (barebone: NP70SNE-G) concentra-se no essencial. Com o excelente processador processador i9 e, opcionalmente, um processadorRTX 4050, 4060ou 4070há desempenho suficiente para jogos. A tela também oferece 240 Hz e uma quantidade suficiente de pixels.
No entanto, não há extras extraordinários, recursos especiais ou o melhor design. O gabinete mudou em relação à nossa última análise do XMG Focus 17 (Clevo NP70HK)de 2021, de modo que informações mais detalhadas sobre o gabinete, a construção e o equipamento podem ser encontradas neste artigo. Além do desempenho em jogos, o laptop também é bastante modesto. Em troca, ele fica bem abaixo de 2.000 euros (dependendo da configuração) e não é muito mais caro na configuração superior que testamos.
Os rivais, como o Medion Erazer Major X20 ou o Lenovo Legion Pro 5 seguem caminhos semelhantes e usam hardware comparável. No entanto, eles não economizam de forma tão consistente quanto o laptop de Schenker, como mostra nossa atualização de teste detalhada.
Possíveis concorrentes em comparação
Avaliação | Data | Modelo | Peso | Altura | Size | Resolução | Preço |
|---|---|---|---|---|---|---|---|
| 85.9 % v7 (old) | 06/2023 | Schenker XMG Focus 17 (E23) i9-13900HX, GeForce RTX 4070 Laptop GPU | 2.9 kg | 29.3 mm | 17.30" | 2560x1440 | |
| 88.4 % v7 (old) | 05/2023 | Lenovo Legion Pro 5 16ARX8 R7 7745HX, GeForce RTX 4070 Laptop GPU | 2.5 kg | 26.8 mm | 16.00" | 2560x1600 | |
| 89 % v7 (old) | 04/2023 | Medion Erazer Major X20 i9-13900HX, GeForce RTX 4070 Laptop GPU | 2.4 kg | 29 mm | 16.00" | 2560x1600 | |
| 87.6 % v7 (old) | 09/2022 | Schenker XMG Neo 17 M22 R9 6900HX, GeForce RTX 3080 Ti Laptop GPU | 2.8 kg | 27 mm | 17.00" | 2560x1600 | |
| 85.4 % v7 (old) | 03/2023 | HP Omen 17-ck2097ng i9-13900HX, GeForce RTX 4080 Laptop GPU | 2.8 kg | 27 mm | 17.30" | 2560x1440 | |
| 84.6 % v7 (old) | 05/2023 | Medion Erazer Defender P40 i7-13700HX, GeForce RTX 4060 Laptop GPU | 2.9 kg | 33 mm | 17.30" | 2560x1440 |
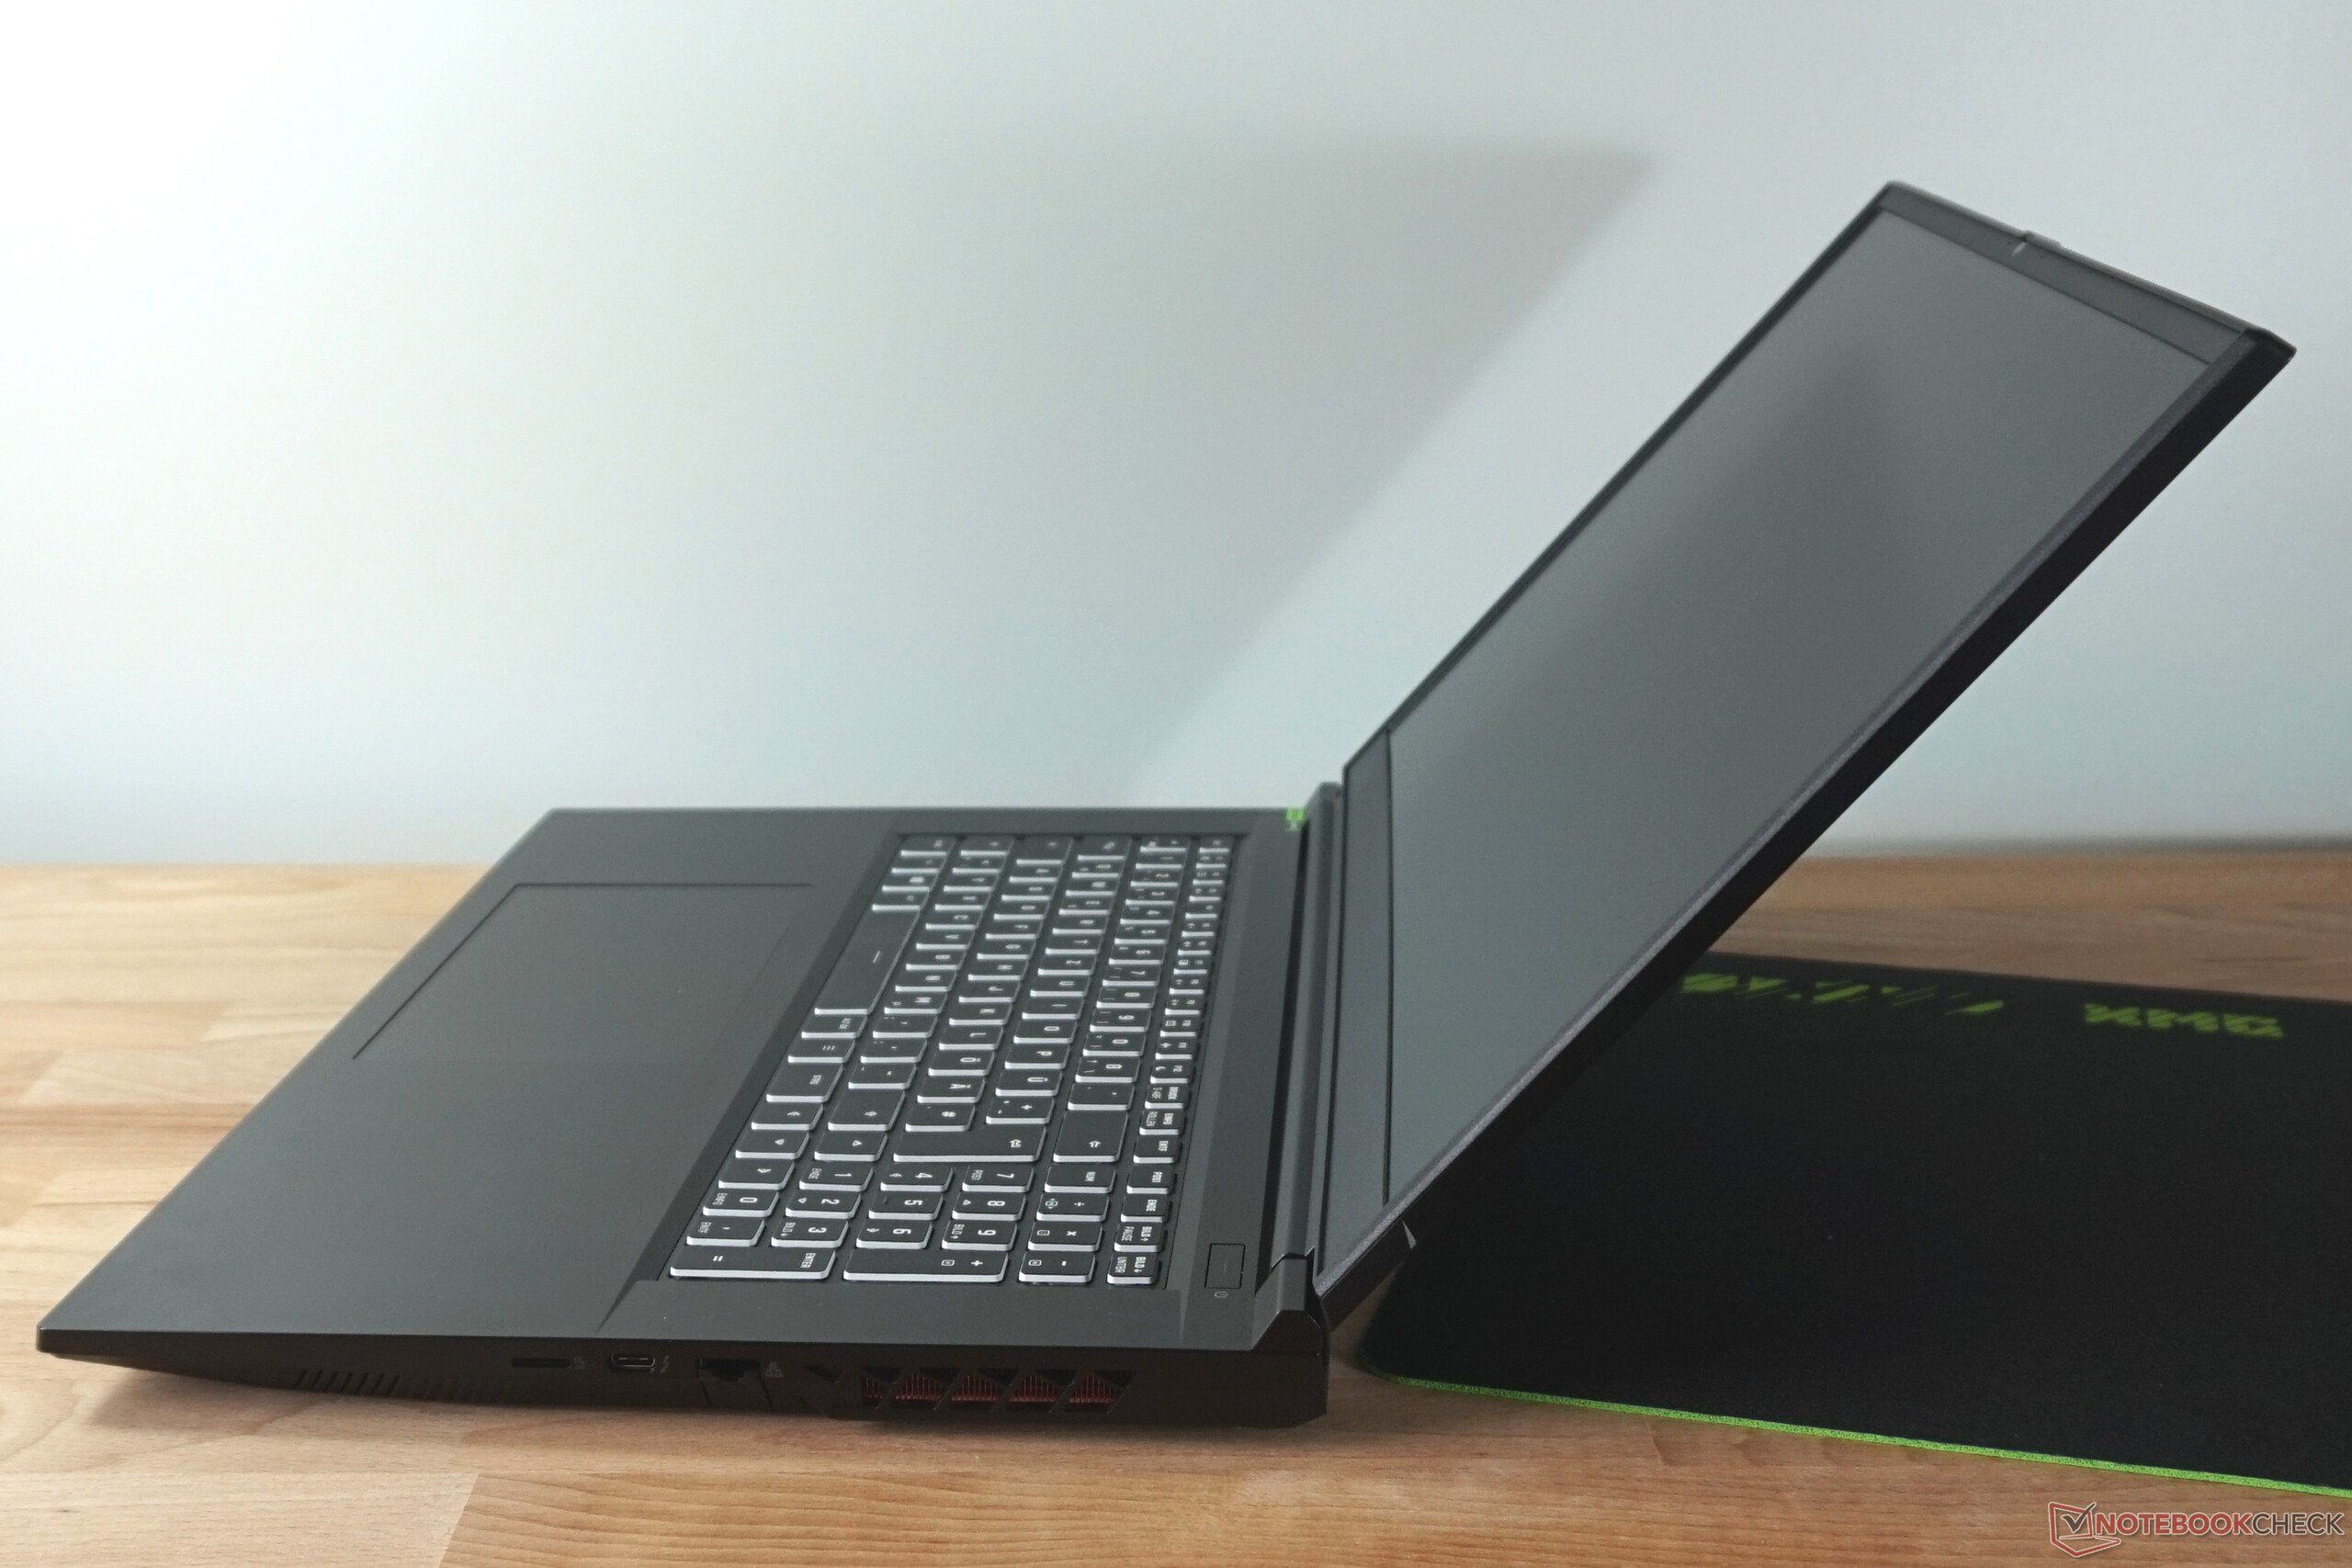
Equipamento - Tudo, desde TB4 até USB 2.0
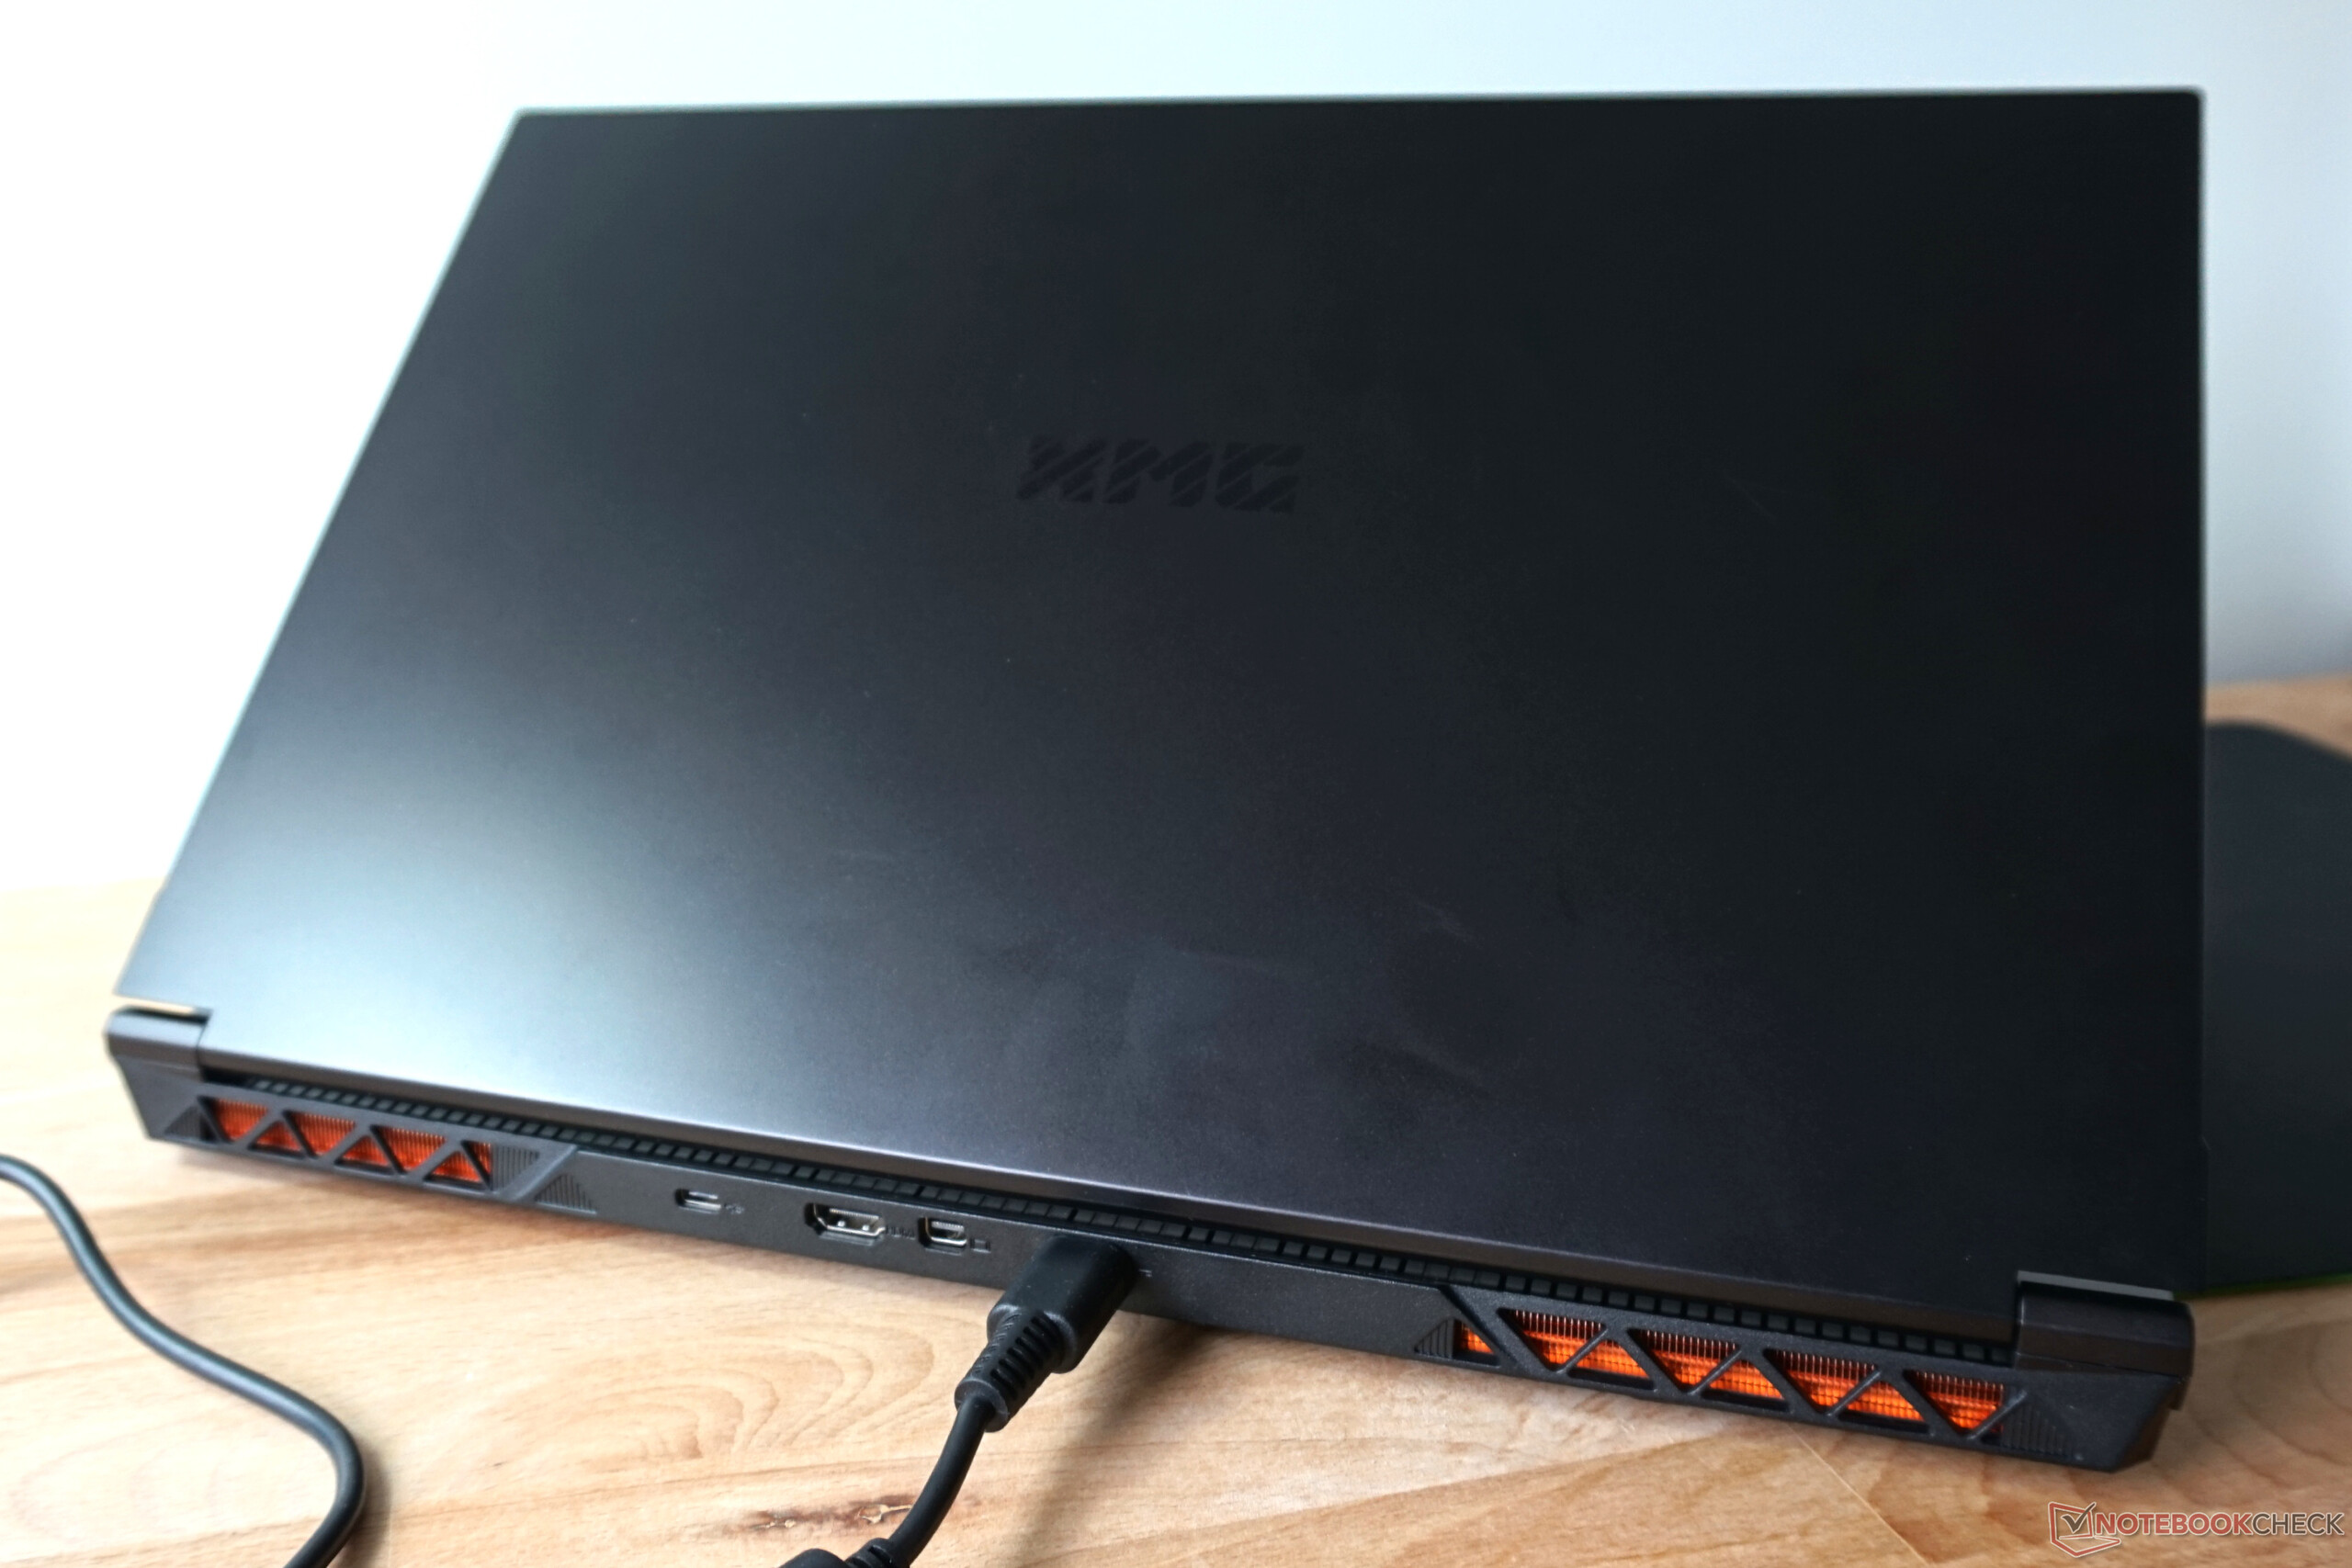
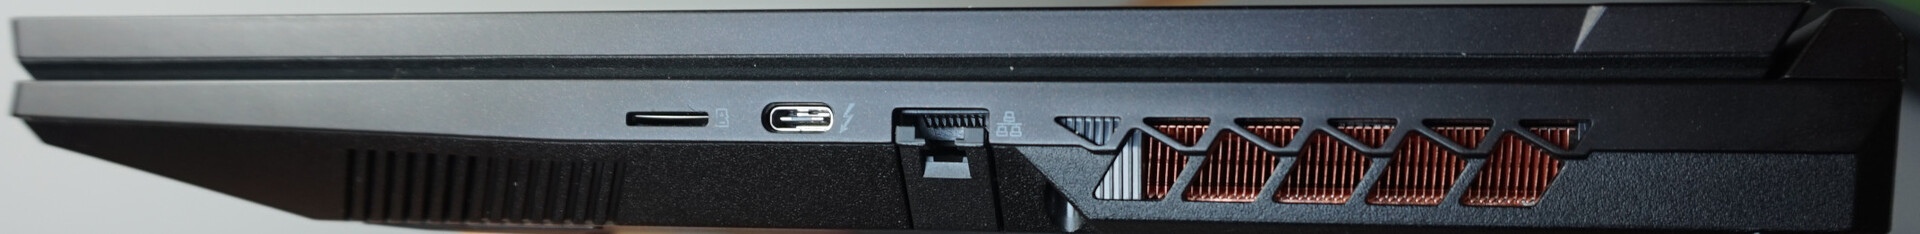
Em comparação com o antecessor, há muitas semelhanças nas portas, mas, felizmente, há algumas atualizações. Ainda há uma porta USB 2.0, que deve ser suficiente para um mouse ou impressora. O mini-DP também foi mantido.
O conector USB-C simples foi movido para a parte traseira e oferece taxas de até 10 Gbit/s, mas não há suporte para PD nem DP. O Thunderbolt 4 está à direita, mas, infelizmente, não há mais porta USB-A. Além disso, o slot de cartão foi reduzido para microSD na versão atual, o que limita consideravelmente a versatilidade.


Leitor de cartão SD
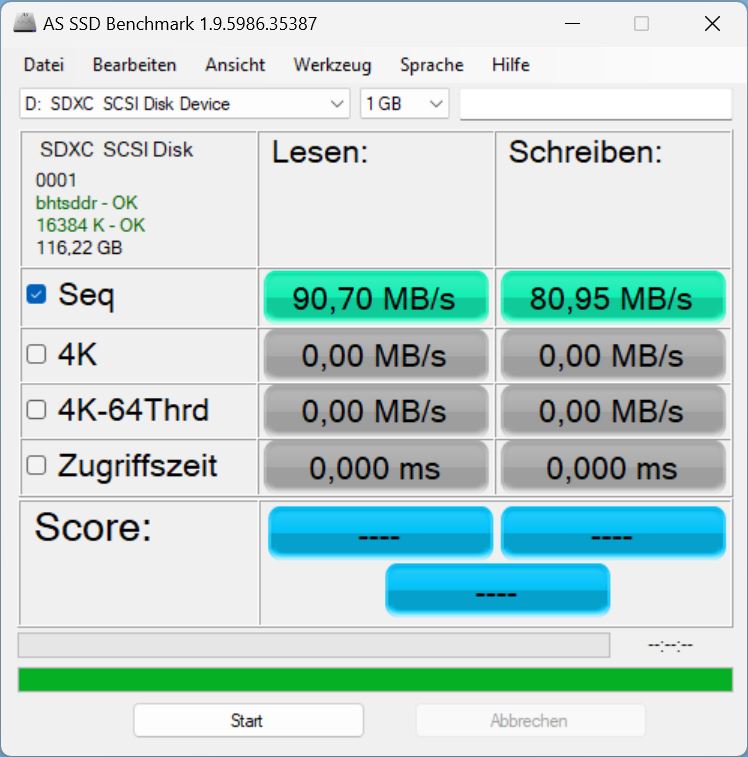
Nossas medições com o cartão AV PRO V60 microSD de 128 GB de referência não são exatamente medianas, mas em parte são um pouco melhores do que as da concorrência. Isso é suficiente para copiar alguns milhares de fotos em poucos minutos.
| SD Card Reader | |
| average JPG Copy Test (av. of 3 runs) | |
| Média da turma Gaming (20.9 - 210, n=54, últimos 2 anos) | |
| Medion Erazer Defender P40 (AV PRO microSD 128 GB V60) | |
| Schenker XMG Focus 17 (E23) | |
| Medion Erazer Major X20 (AV PRO microSD 128 GB V60) | |
| HP Omen 17-ck2097ng (AV PRO microSD 128 GB V60) | |
| Schenker XMG Neo 17 M22 (AV PRO microSD 128 GB V60) | |
| maximum AS SSD Seq Read Test (1GB) | |
| Média da turma Gaming (25.5 - 261, n=51, últimos 2 anos) | |
| Medion Erazer Defender P40 (AV PRO microSD 128 GB V60) | |
| Schenker XMG Focus 17 (E23) | |
| Medion Erazer Major X20 (AV PRO microSD 128 GB V60) | |
| HP Omen 17-ck2097ng (AV PRO microSD 128 GB V60) | |
Comunicação
O módulo WLAN Intel AX211 atende às expectativas. No entanto, as taxas médias típicas só são alcançadas em uma rede de 6 GHz em nossas medições e até mesmo ligeiramente excedidas. A pequena fraqueza em 5 GHz é provavelmente explicada por influências de interferência de redes sem fio vizinhas, que naturalmente não pudemos desativar no teste.

 GeForce RTX 4070 Laptop GPU, i9-13900HX, Crucial P5 Plus 1TB CT1000P5PSSD8")
 GeForce RTX 4070 Laptop GPU, i9-13900HX, Crucial P5 Plus 1TB CT1000P5PSSD8")
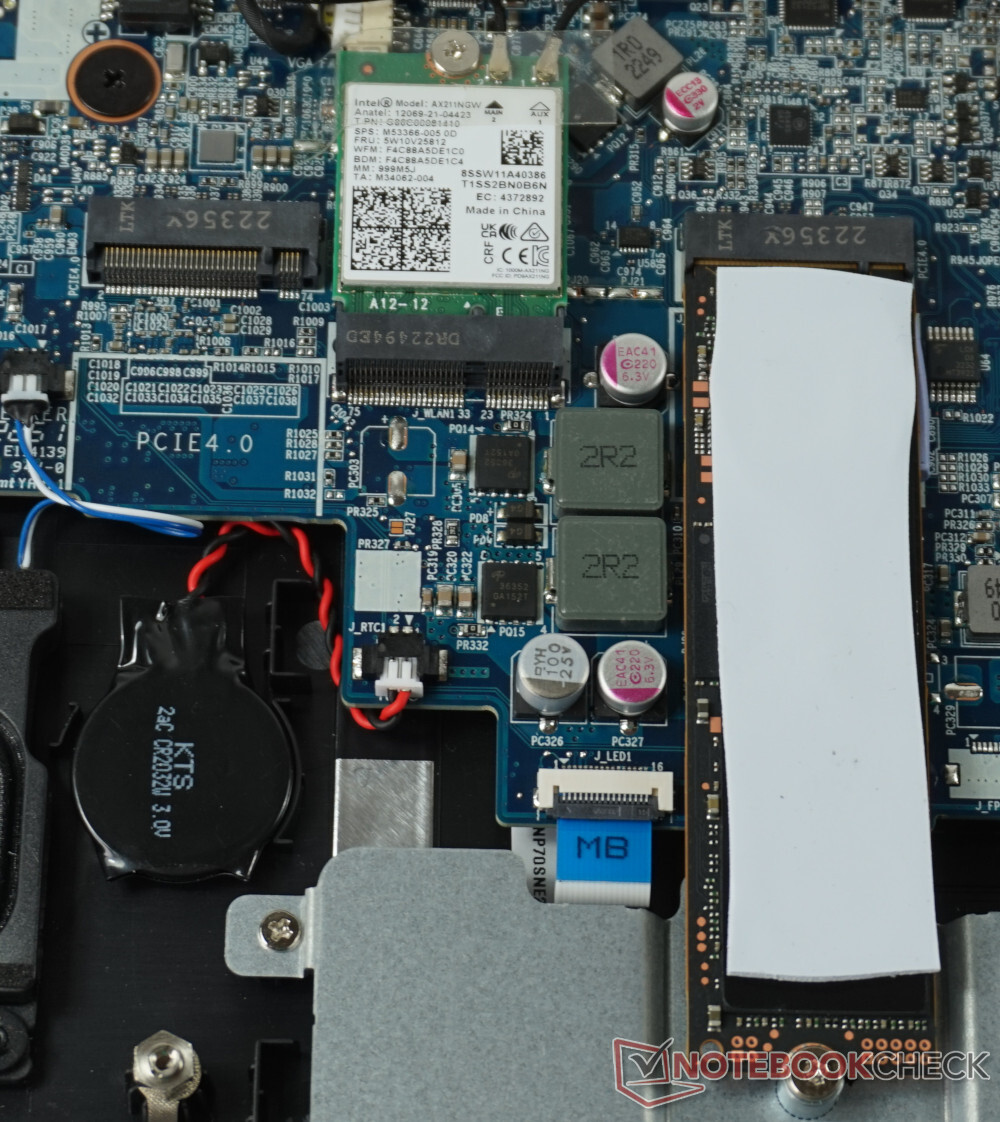
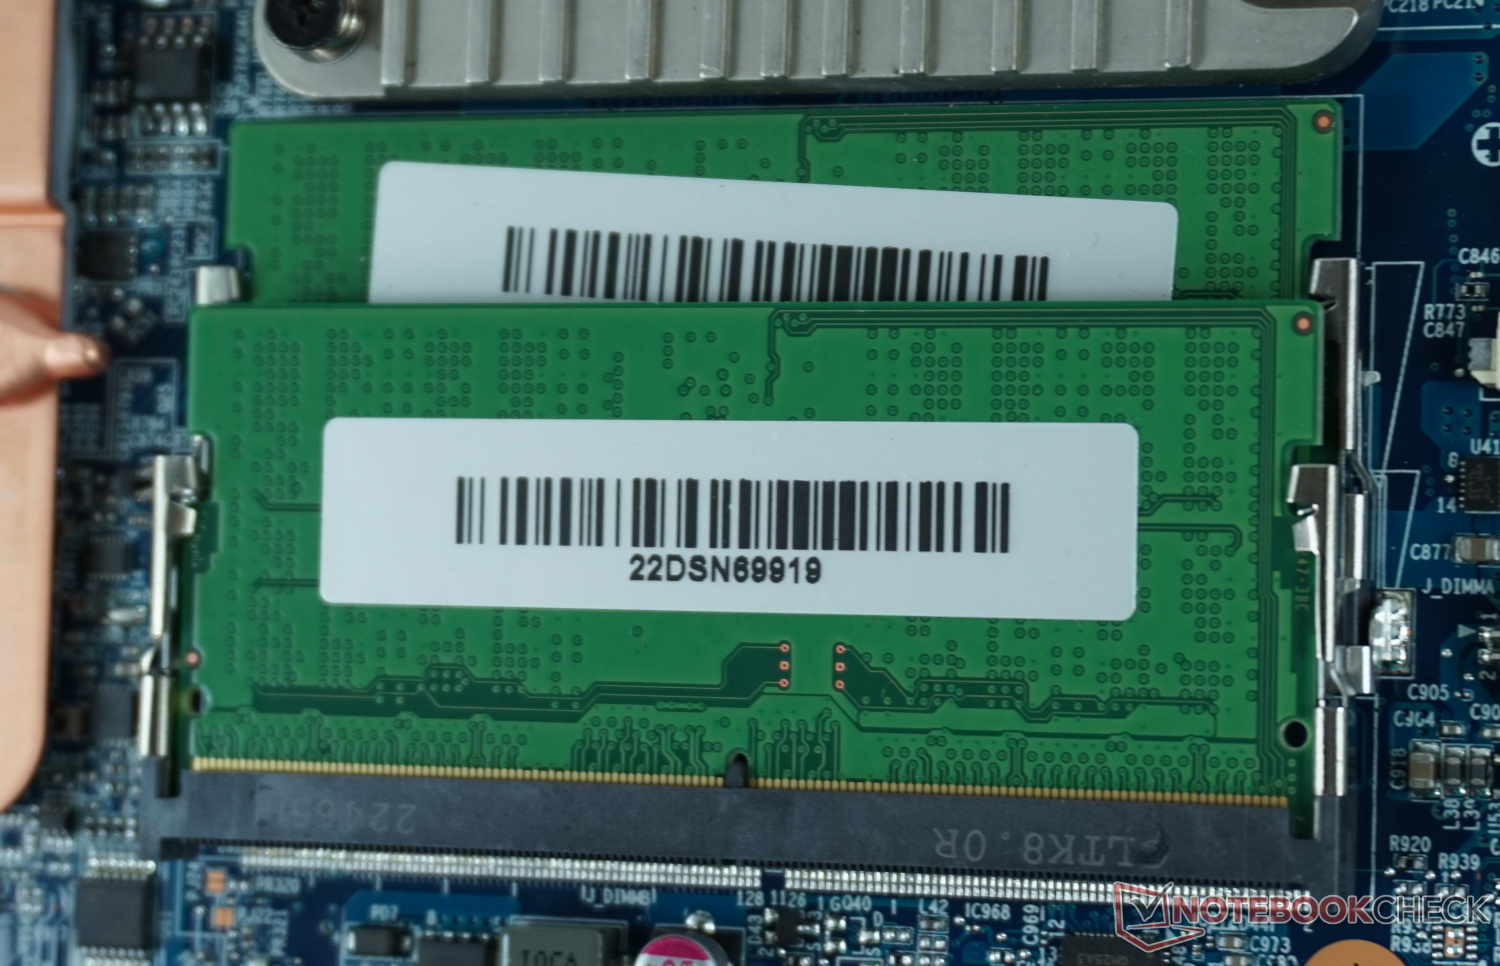
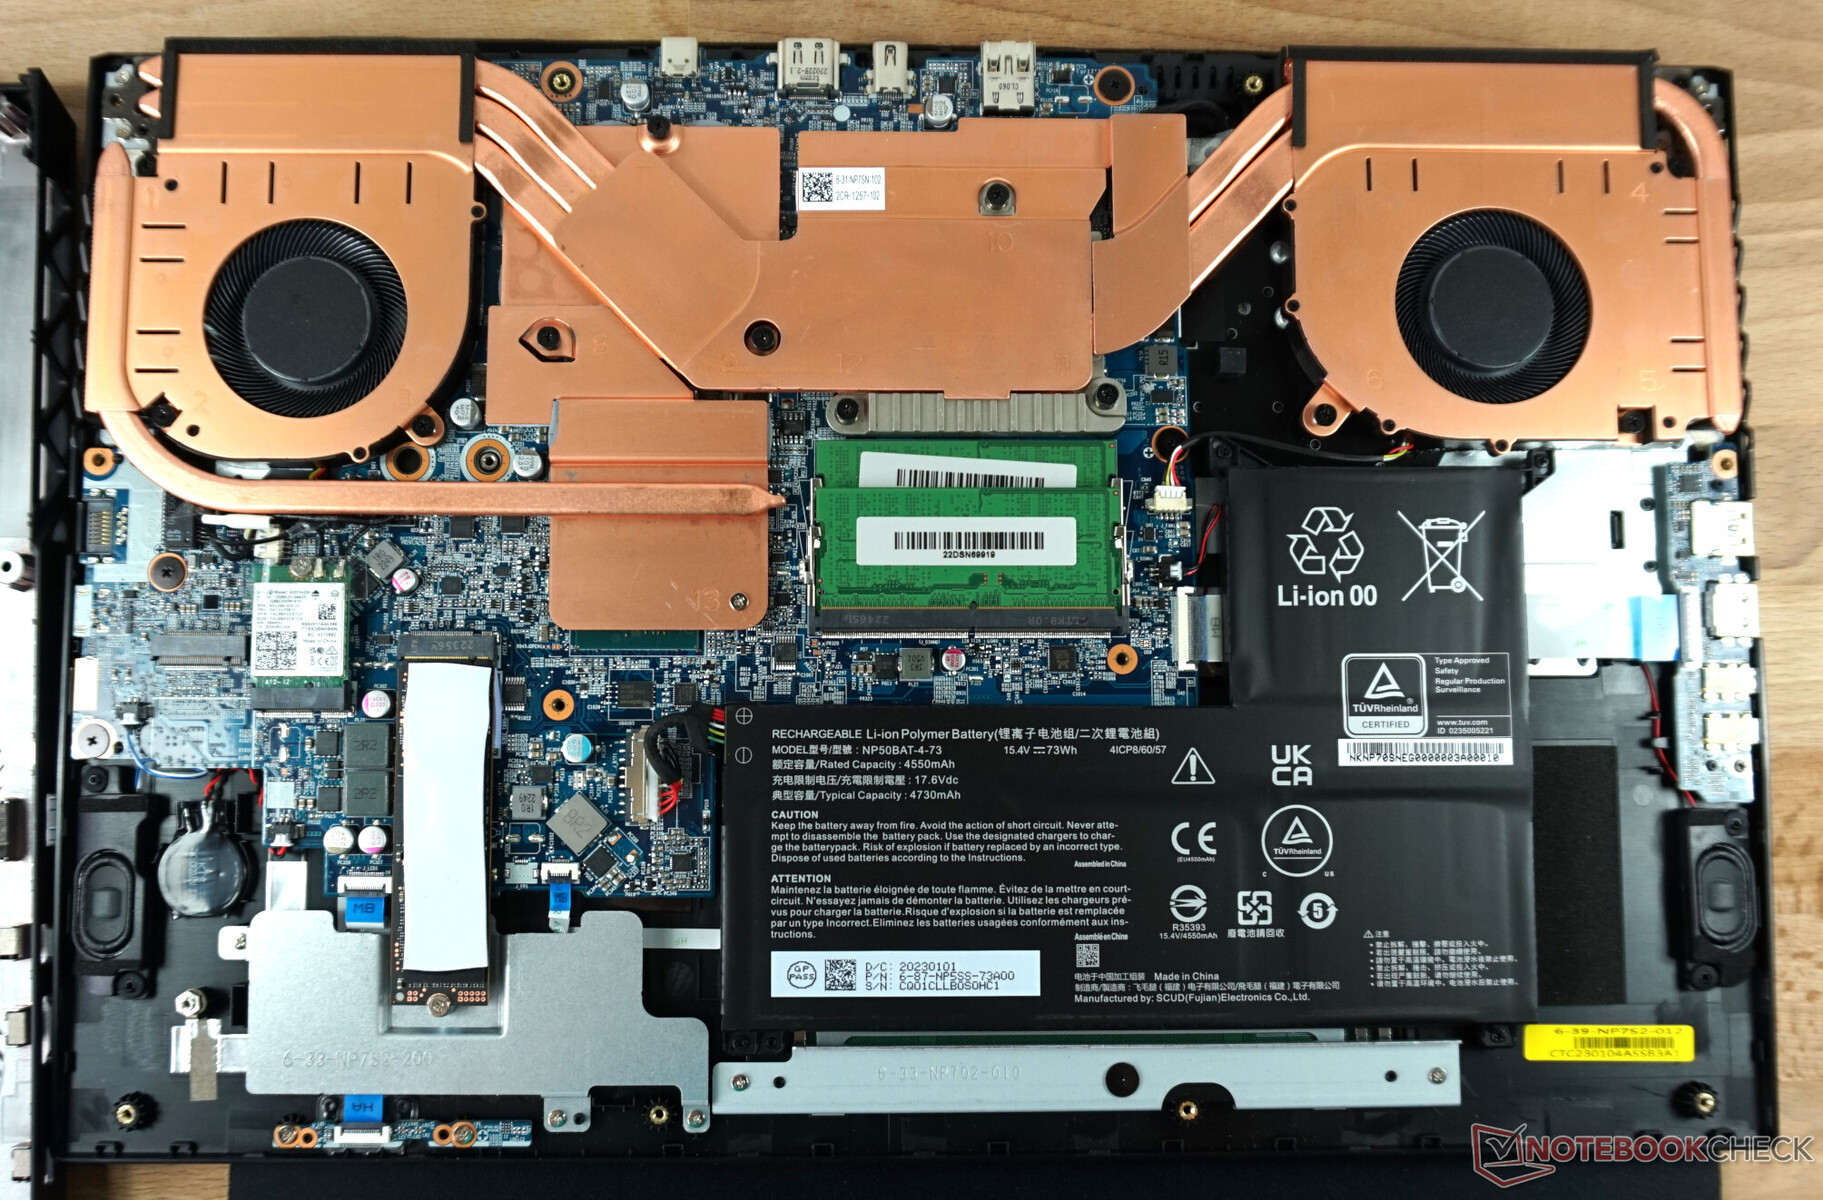
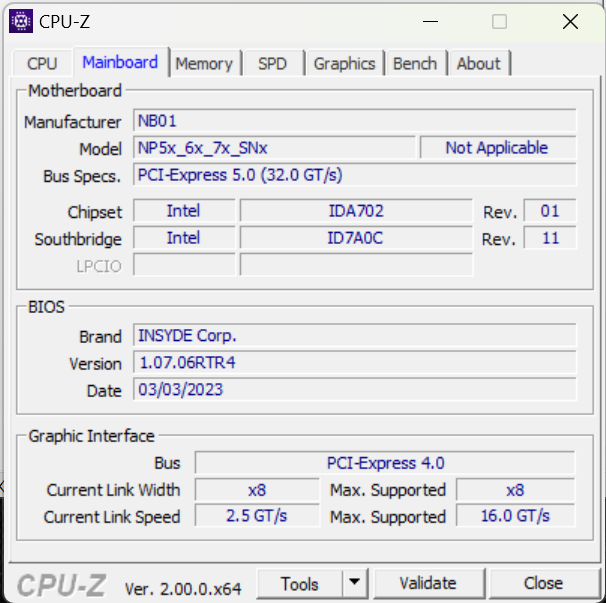
Manutenção
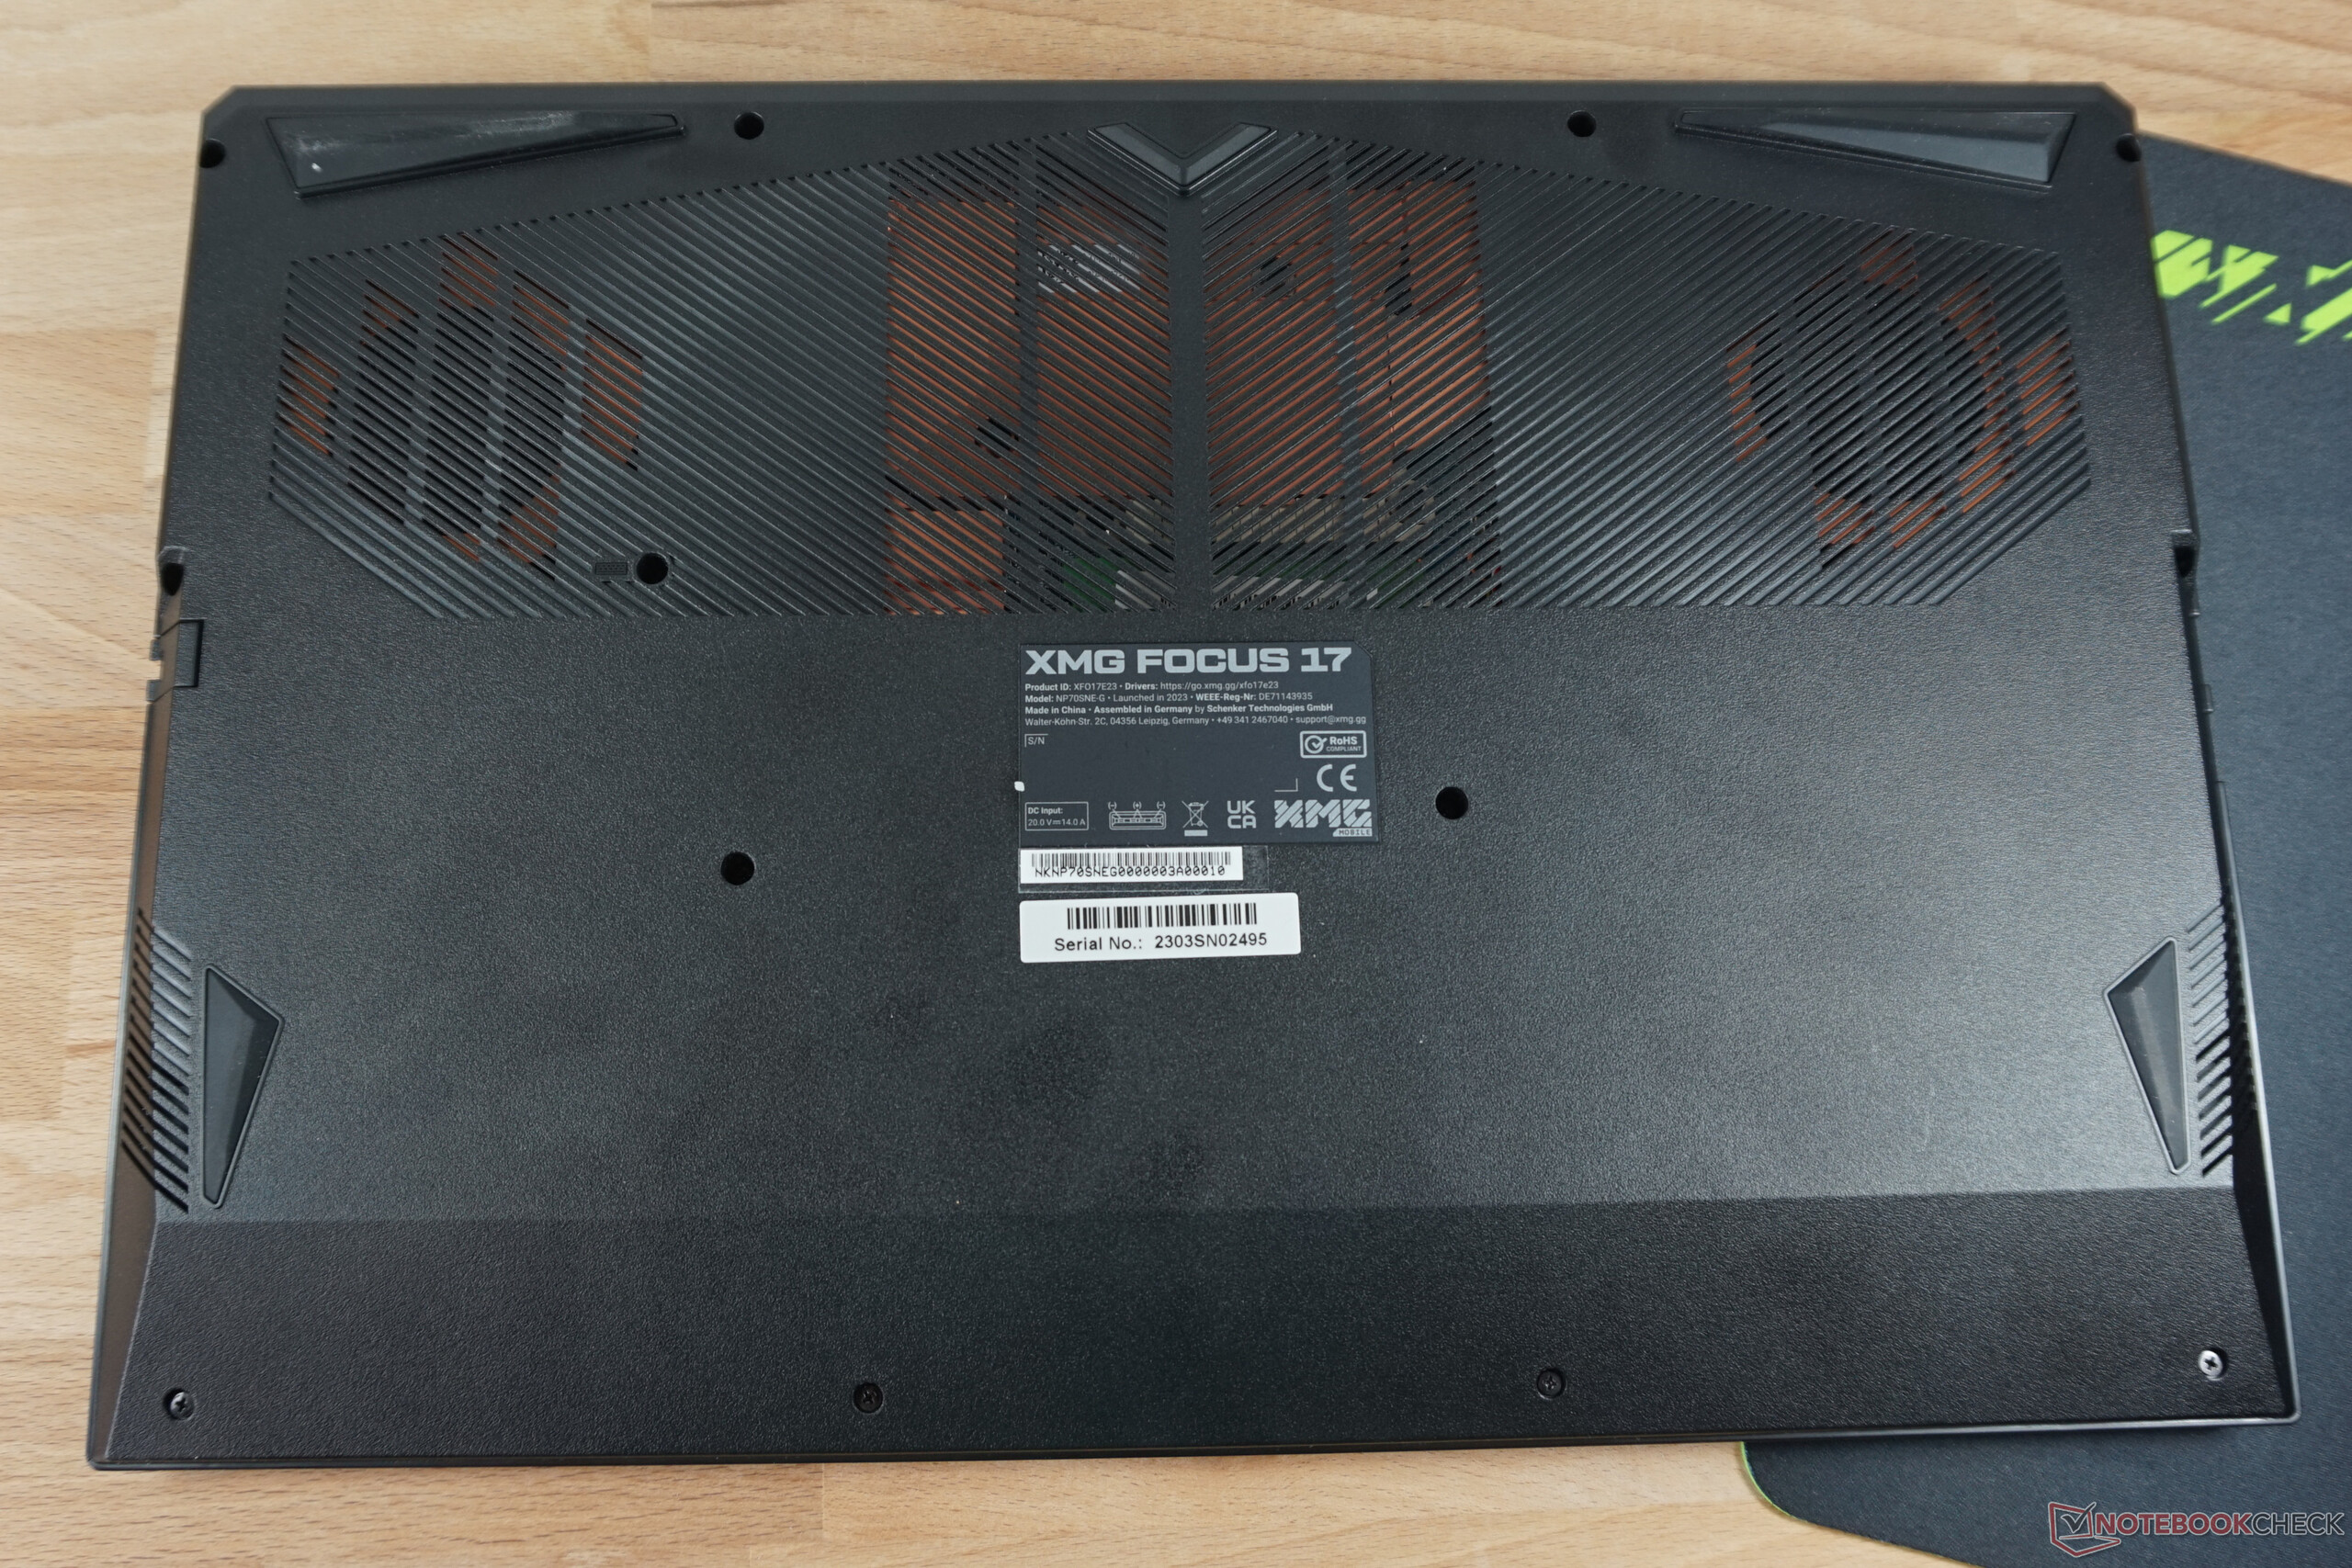
Mudanças consideráveis com vistas ao XMG Focus 17 a partir de 2021 foram feitas no interior. Todos os elementos de resfriamento agora são feitos de cobre e o ar pode sair para ambos os lados. A porta SATA desatualizada para um SSD de 2,5 polegadas desapareceu. Em vez disso, há um segundo slot para um SSD M.2 NVMe.
Como esperado da Schenker, o acesso aos componentes é fácil. Depois de soltar doze parafusos idênticos, a parte inferior pode ser retirada com pouco esforço, começando pelo resfriamento traseiro. A RAM, o SSD, o módulo WLAN e a bateria podem ser facilmente acessados e substituídos.
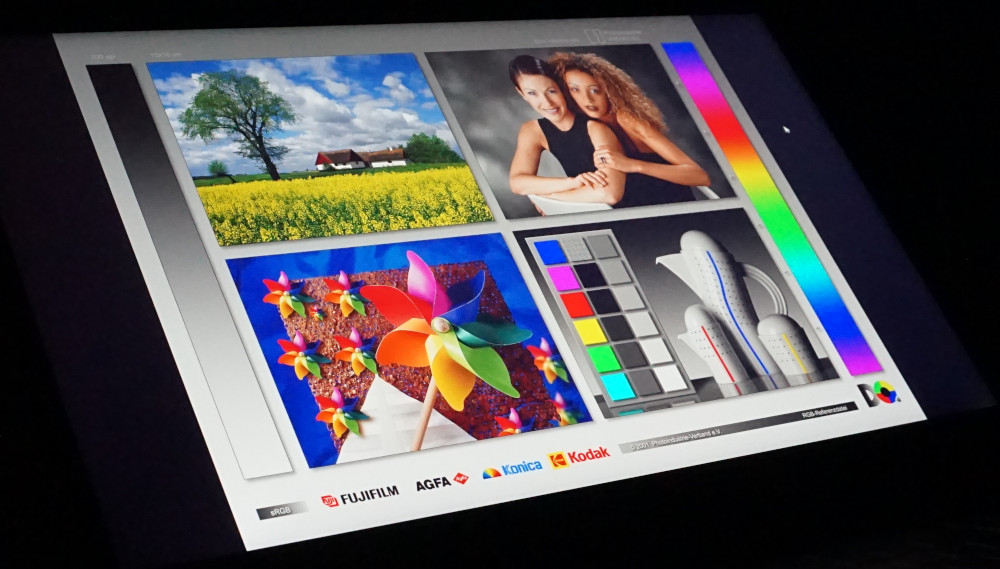
Tela - Cores fortes, contrastes escassos no notebook para jogos XMG

O painel IPS fosco do XMG Focus 17 atende às expectativas de um notebook para jogos sólido, mas não excepcional. A resolução QHD se destaca na grande diagonal de 17,3 polegadas/ Além disso, a taxa de atualização de 240 Hz garante baixas latências, mesmo quando a taxa de quadros não é atingida nos jogos.
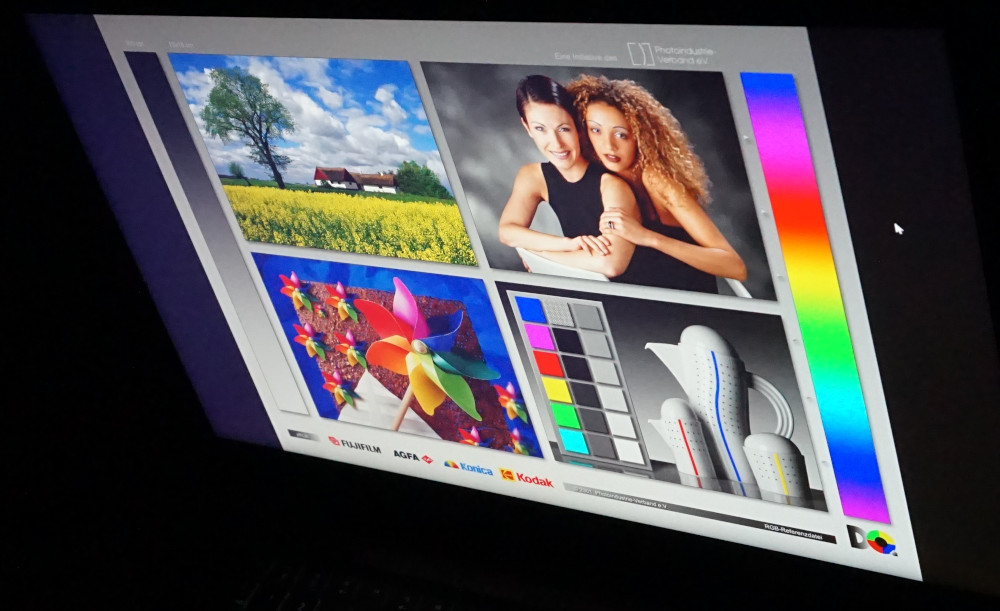
Os tempos de resposta, que não são ideais, com mais de 10 ms, não convencem muito, mas são aceitáveis. O nível de preto ruim impede um contraste melhor. Uma névoa cinza é visível em cenas muito escuras com iluminação mínima na sala. Com uma proporção de 623:1 medida por nós, o contraste aqui é apenas um pouco menos da metade do valor do Medion Erazer Defender P40 ou do HP Omen 17-ck. O sangramento da tela também é claramente visível.
A iluminação poderia ser um pouco mais uniforme e o brilho de 320 cd/m² um pouco mais alto. Portanto, as taxas de exibição estão abaixo da média em comparação com muitos modelos com preços semelhantes.
| |||||||||||||||||||||||||
iluminação: 82 %
iluminação com acumulador: 349 cd/m²
Contraste: 623:1 (Preto: 0.56 cd/m²)
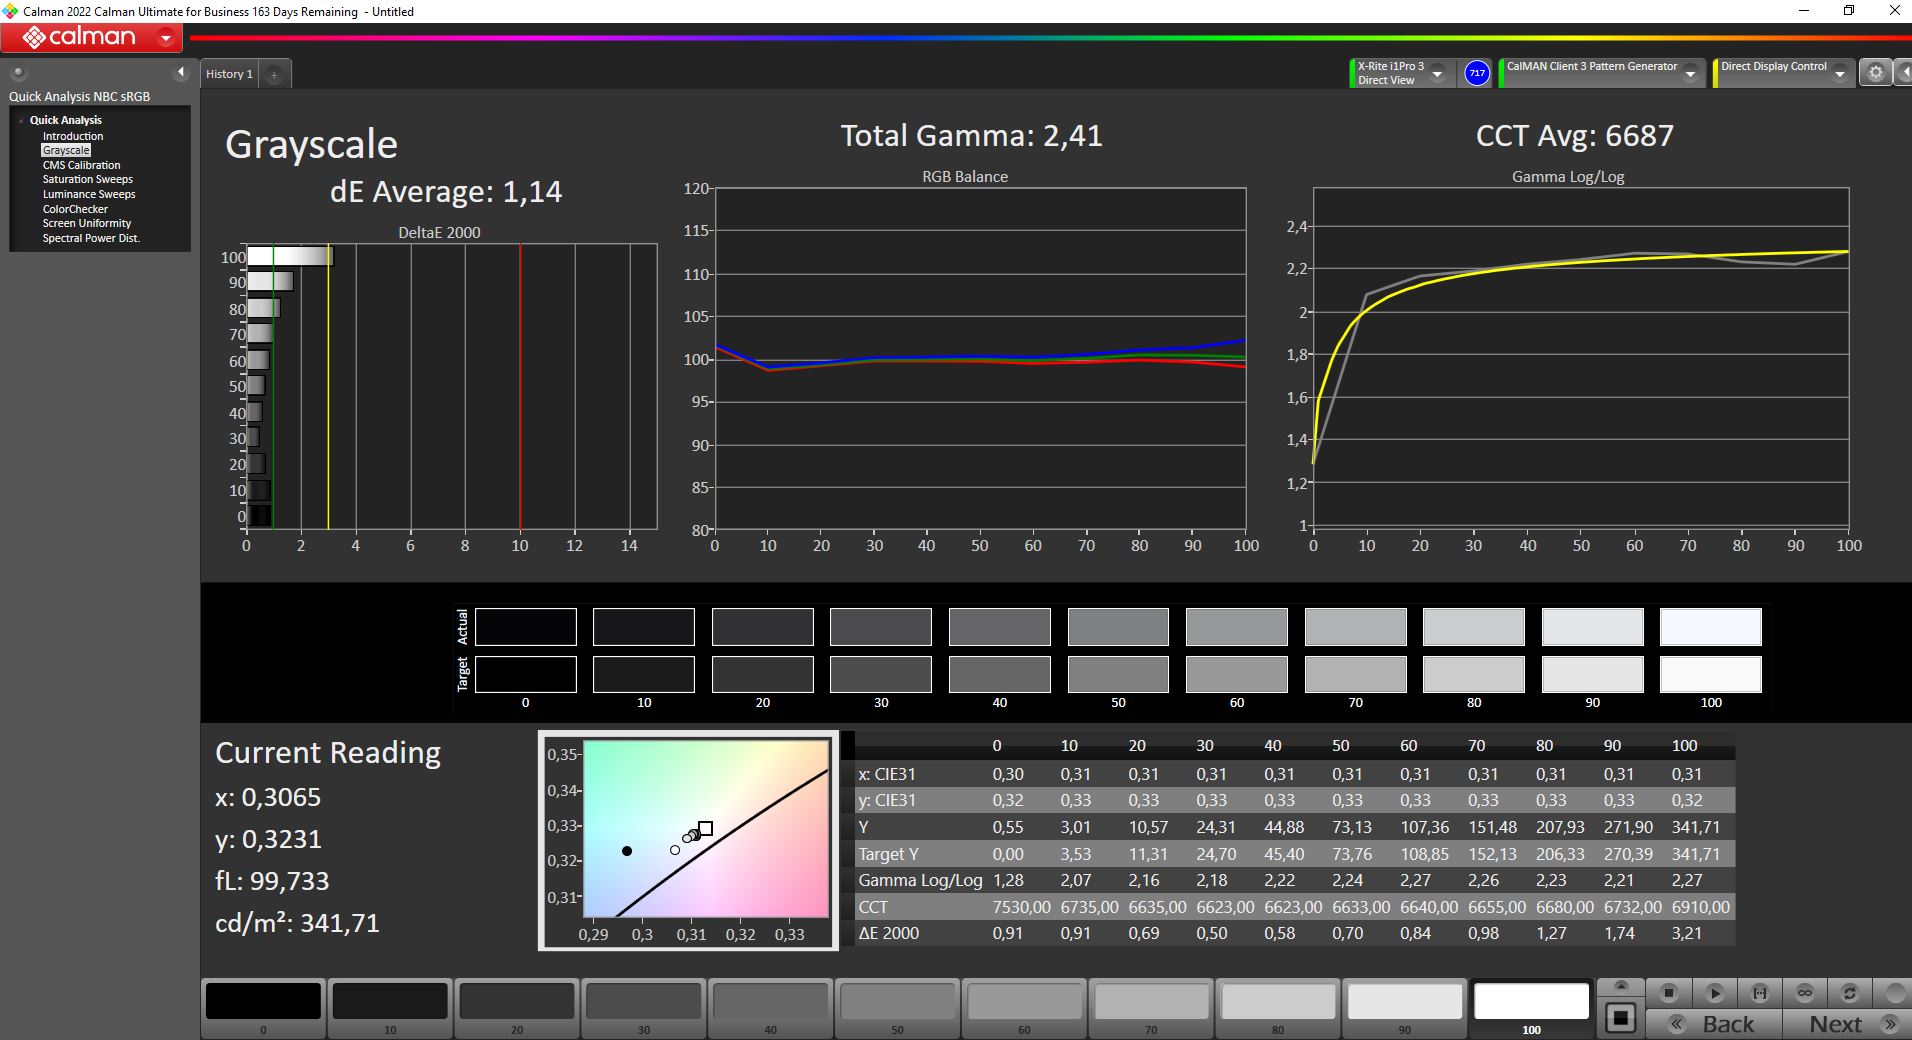
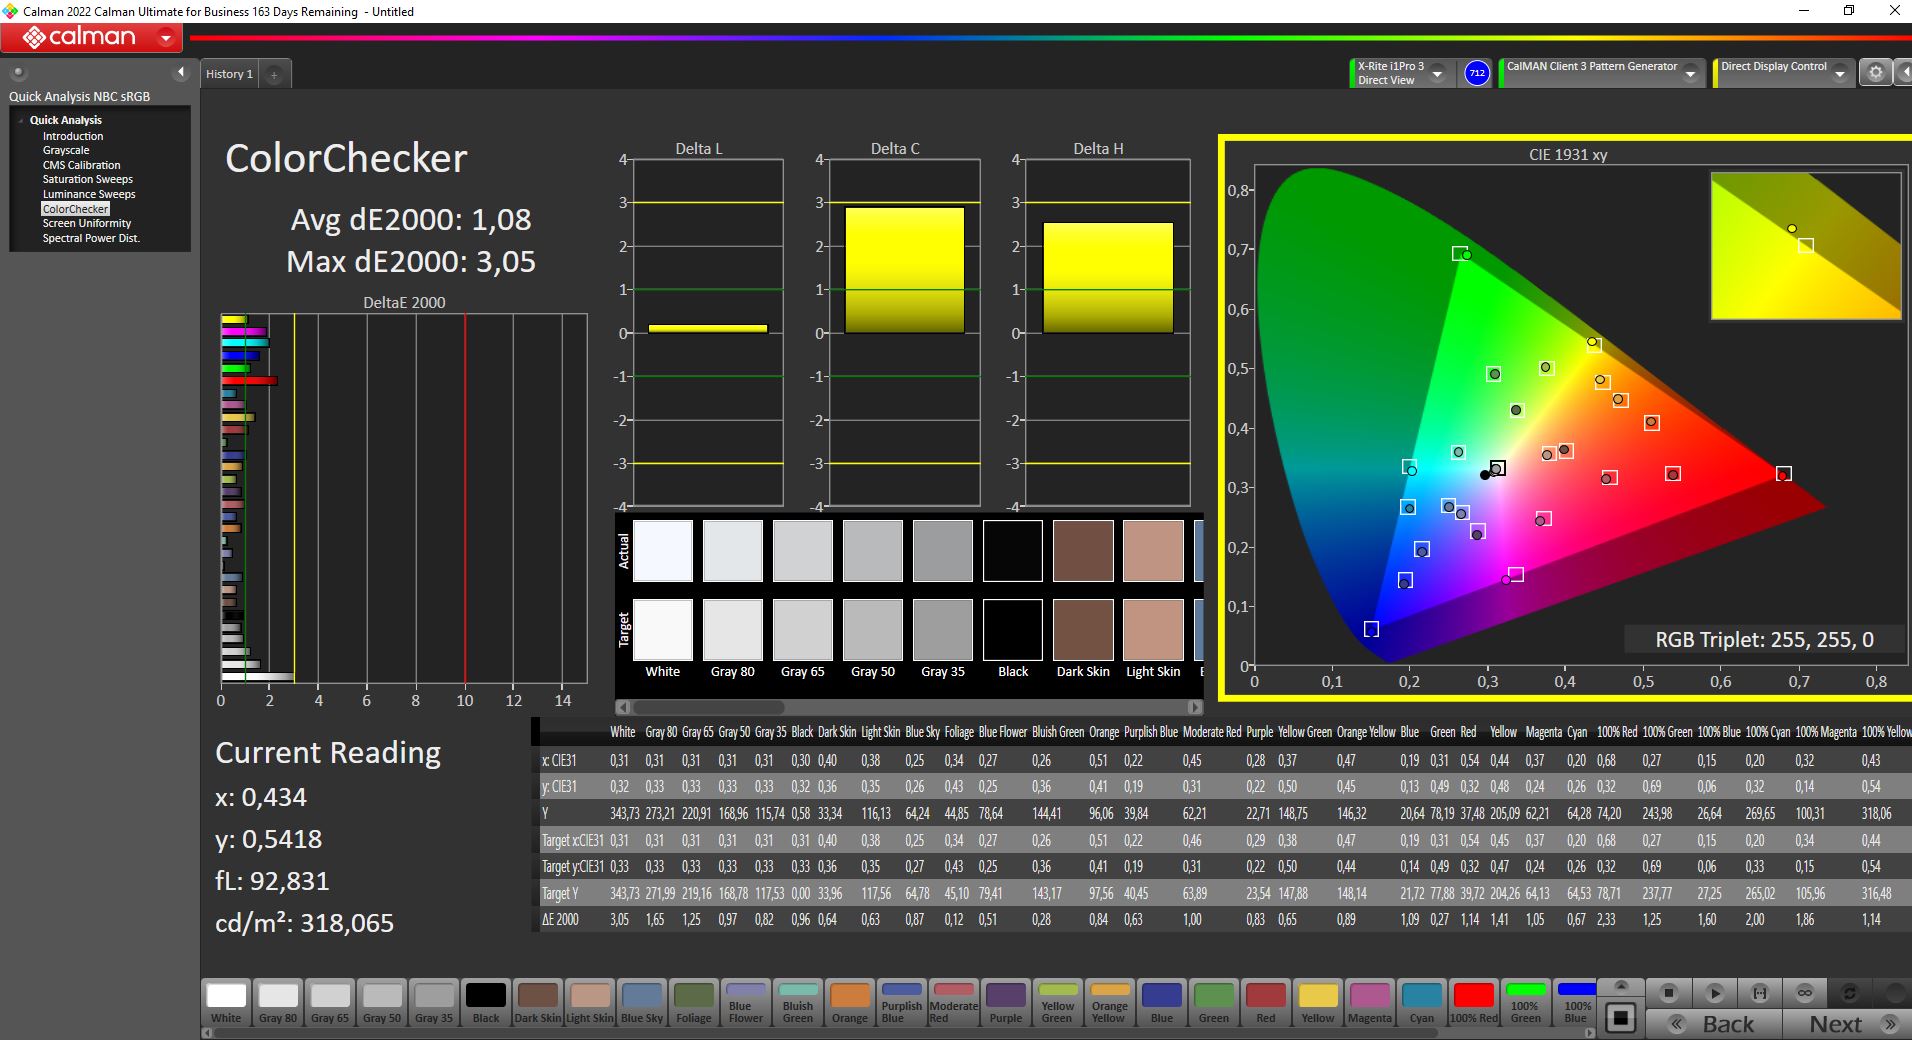
ΔE ColorChecker Calman: 1.08 | ∀{0.5-29.43 Ø4.71}
calibrated: 1.08
ΔE Greyscale Calman: 1.14 | ∀{0.09-98 Ø4.96}
84.5% AdobeRGB 1998 (Argyll 3D)
99.9% sRGB (Argyll 3D)
96.6% Display P3 (Argyll 3D)
Gamma: 2.41
CCT: 6687 K
| Schenker XMG Focus 17 (E23) BOE09F9 NE173QHM-NZ1, IPS, 2560x1440, 17.3" | Lenovo Legion Pro 5 16ARX8 CSOT T3 MNG007DA1-Q, IPS, 2560x1600, 16" | Medion Erazer Major X20 BOE CQ NE160QDM-NZ1, IPS, 2560x1600, 16" | Schenker XMG Neo 17 M22 BOE0A99, IPS, 2560x1600, 17" | HP Omen 17-ck2097ng BOE BOE09BF, IPS, 2560x1440, 17.3" | Medion Erazer Defender P40 BOE CQ NE173QHM-NZ3, IPS, 2560x1440, 17.3" | |
|---|---|---|---|---|---|---|
| Display | -14% | -15% | -16% | -17% | -16% | |
| Display P3 Coverage (%) | 96.6 | 70.4 -27% | 69.4 -28% | 69 -29% | 67.4 -30% | 68.3 -29% |
| sRGB Coverage (%) | 99.9 | 99.6 0% | 98 -2% | 99.8 0% | 97.6 -2% | 98.1 -2% |
| AdobeRGB 1998 Coverage (%) | 84.5 | 72.6 -14% | 70.9 -16% | 69.6 -18% | 69.6 -18% | 69.8 -17% |
| Response Times | 37% | 26% | 39% | 12% | 15% | |
| Response Time Grey 50% / Grey 80% * (ms) | 16.4 ? | 7 ? 57% | 13.1 ? 20% | 10.8 ? 34% | 15.6 ? 5% | 14.6 ? 11% |
| Response Time Black / White * (ms) | 10.8 ? | 9.1 ? 16% | 7.3 ? 32% | 6.1 ? 44% | 8.9 ? 18% | 8.7 ? 19% |
| PWM Frequency (Hz) | ||||||
| Screen | 21% | -23% | 9% | -7% | 11% | |
| Brightness middle (cd/m²) | 349 | 355.3 2% | 374 7% | 415 19% | 371 6% | 364 4% |
| Brightness (cd/m²) | 318 | 340 7% | 357 12% | 399 25% | 350 10% | 343 8% |
| Brightness Distribution (%) | 82 | 91 11% | 92 12% | 90 10% | 90 10% | 86 5% |
| Black Level * (cd/m²) | 0.56 | 0.32 43% | 0.33 41% | 0.43 23% | 0.32 43% | 0.28 50% |
| Contrast (:1) | 623 | 1110 78% | 1133 82% | 965 55% | 1159 86% | 1300 109% |
| Colorchecker dE 2000 * | 1.08 | 1.13 -5% | 2.43 -125% | 1.44 -33% | 1.74 -61% | 1.67 -55% |
| Colorchecker dE 2000 max. * | 3.05 | 2.78 9% | 3.97 -30% | 2.33 24% | 3.59 -18% | 2.78 9% |
| Colorchecker dE 2000 calibrated * | 1.08 | 0.32 70% | 1.4 -30% | 0.89 18% | 1.01 6% | 1.14 -6% |
| Greyscale dE 2000 * | 1.14 | 1.4 -23% | 3.1 -172% | 1.8 -58% | 2.8 -146% | 1.4 -23% |
| Gamma | 2.41 91% | 2.24 98% | 2.191 100% | 2.132 103% | 2.19 100% | 2.091 105% |
| CCT | 6687 97% | 6372 102% | 6194 105% | 6327 103% | 6474 100% | 6568 99% |
| Média Total (Programa/Configurações) | 15% /
16% | -4% /
-14% | 11% /
8% | -4% /
-7% | 3% /
6% |
* ... menor é melhor
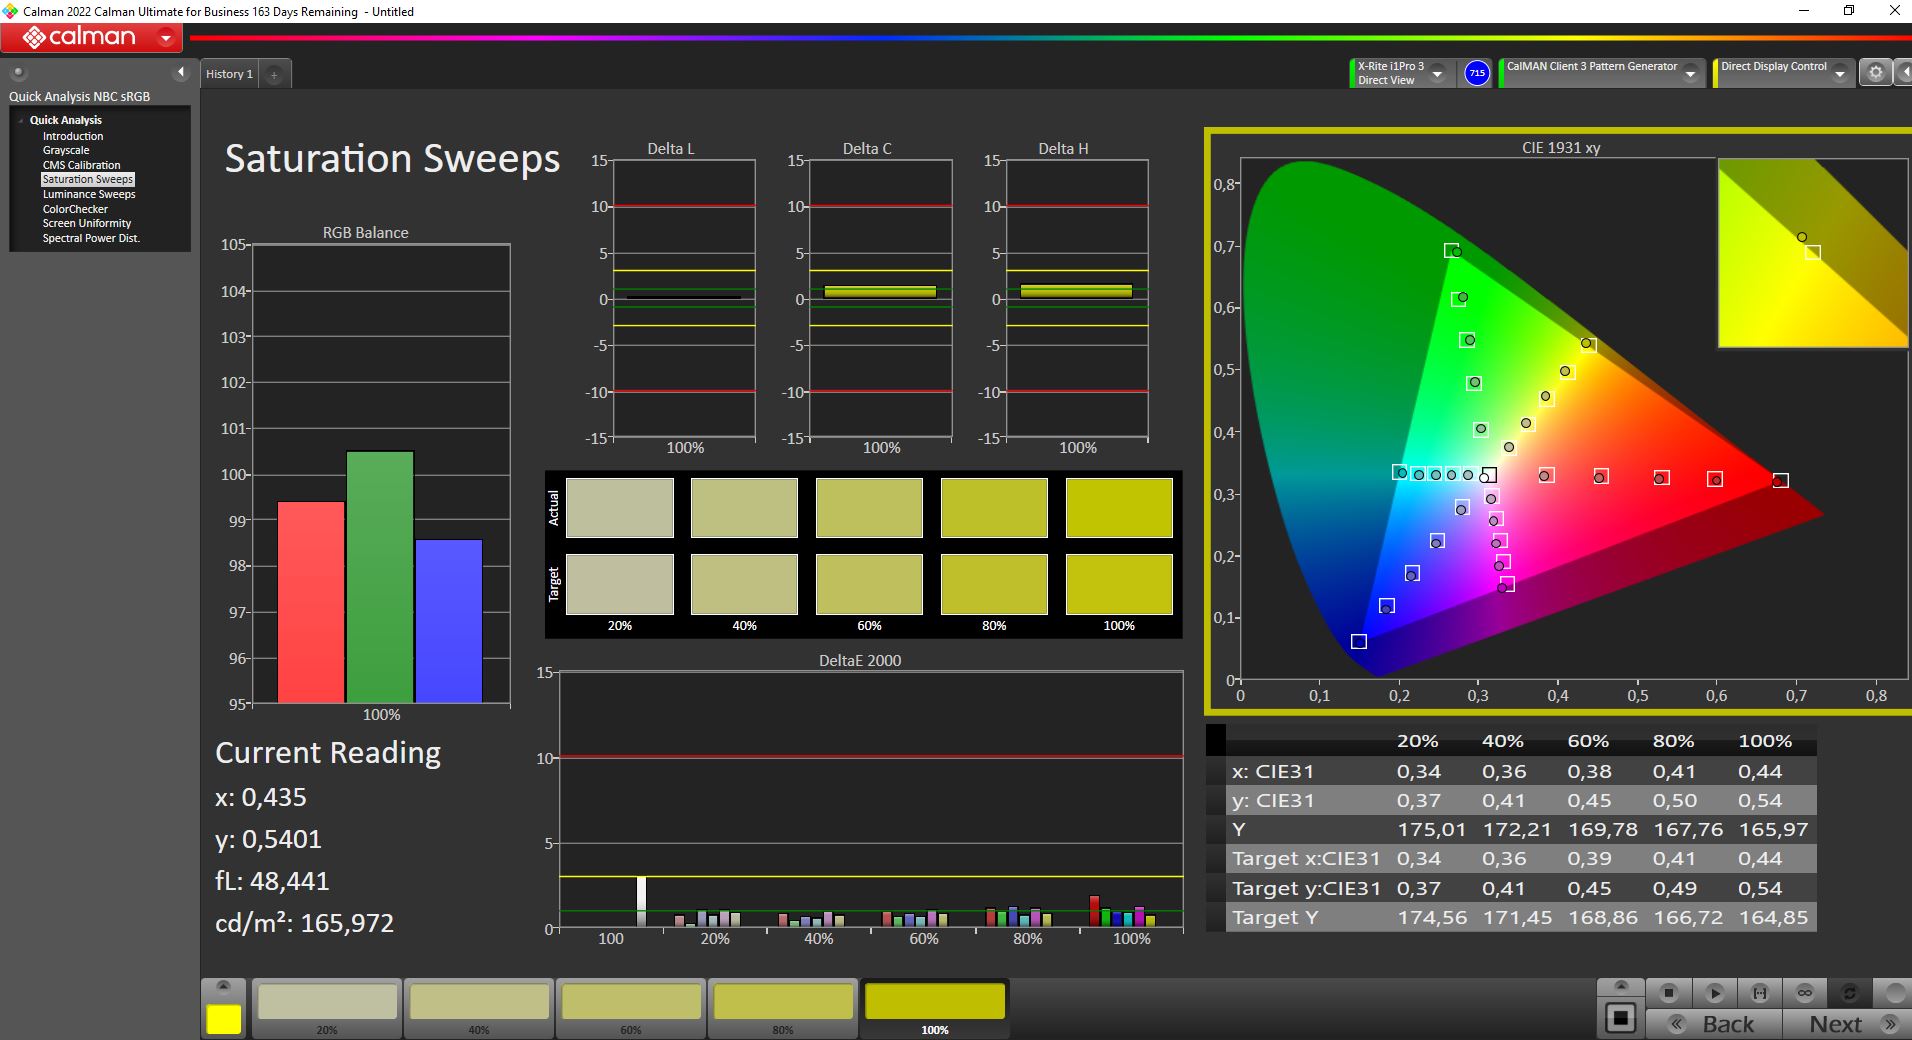
A reprodução de cores é muito boa. O espaço de cores sRGB usado para jogos e a maioria dos aplicativos não profissionais é basicamente coberto por completo. Até mesmo o DCI-P3 pode ser representado em grande parte. Portanto, a reprodução de cores está acima da média.
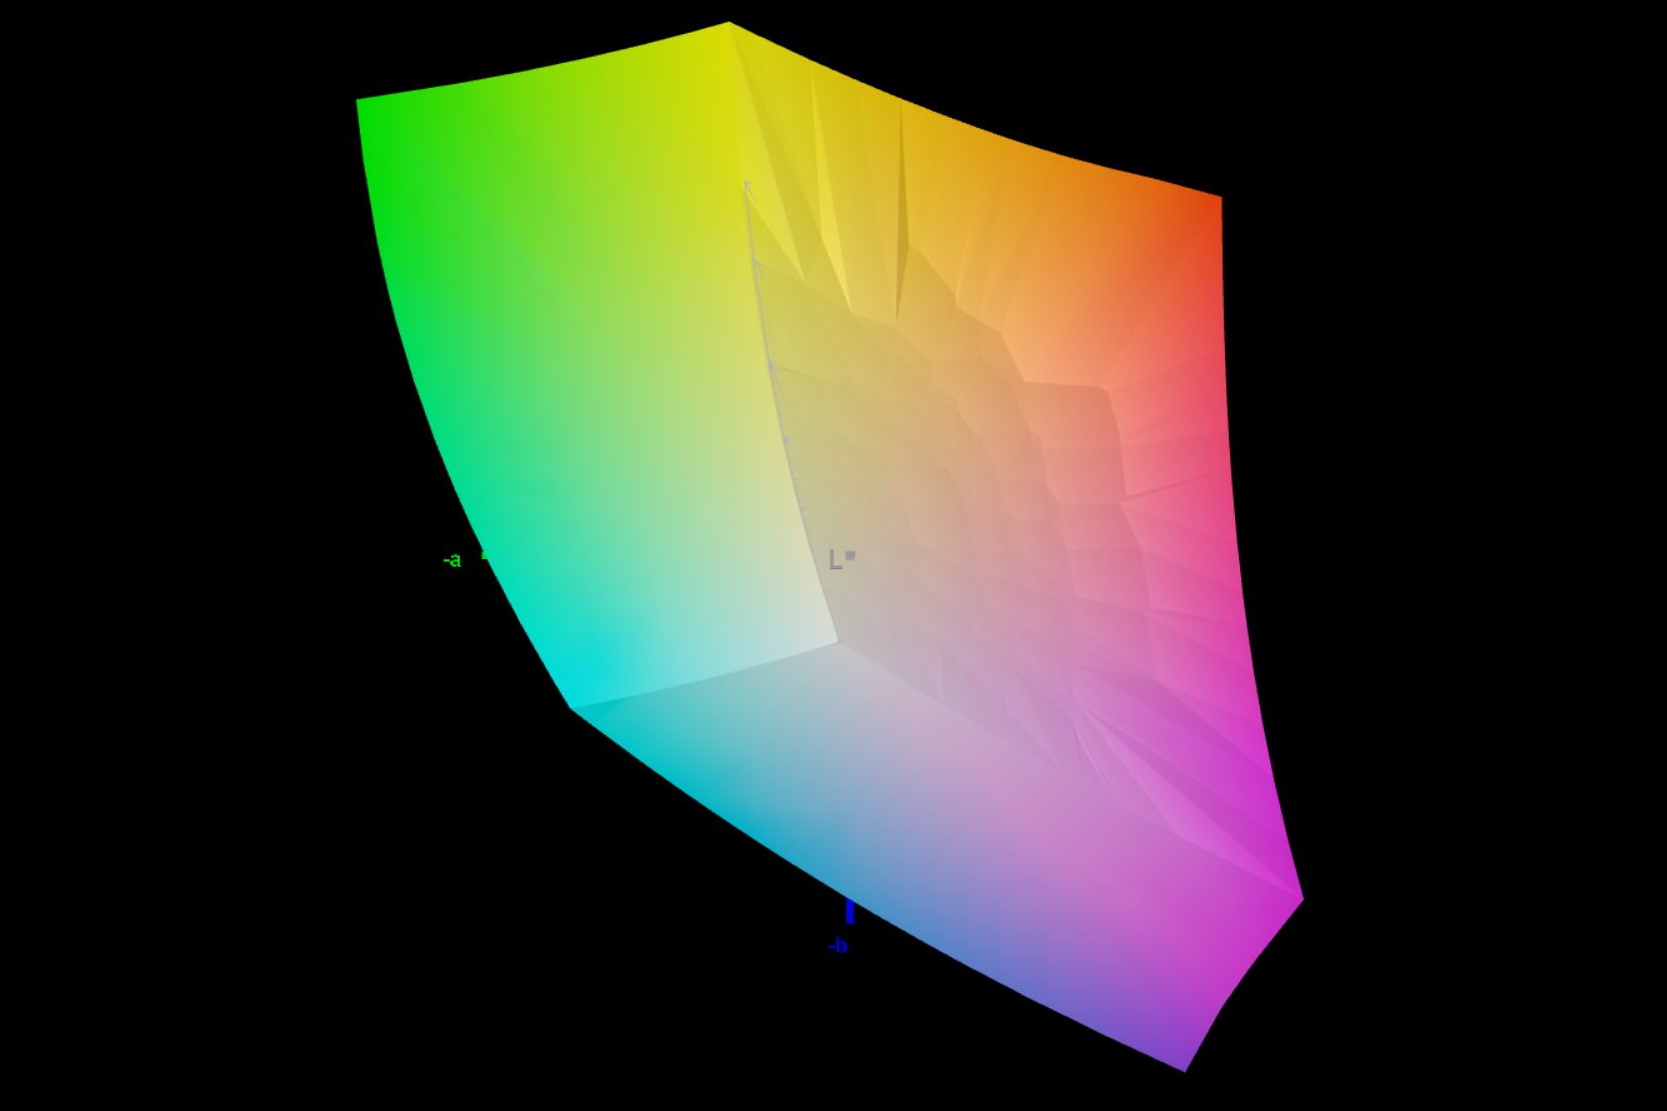
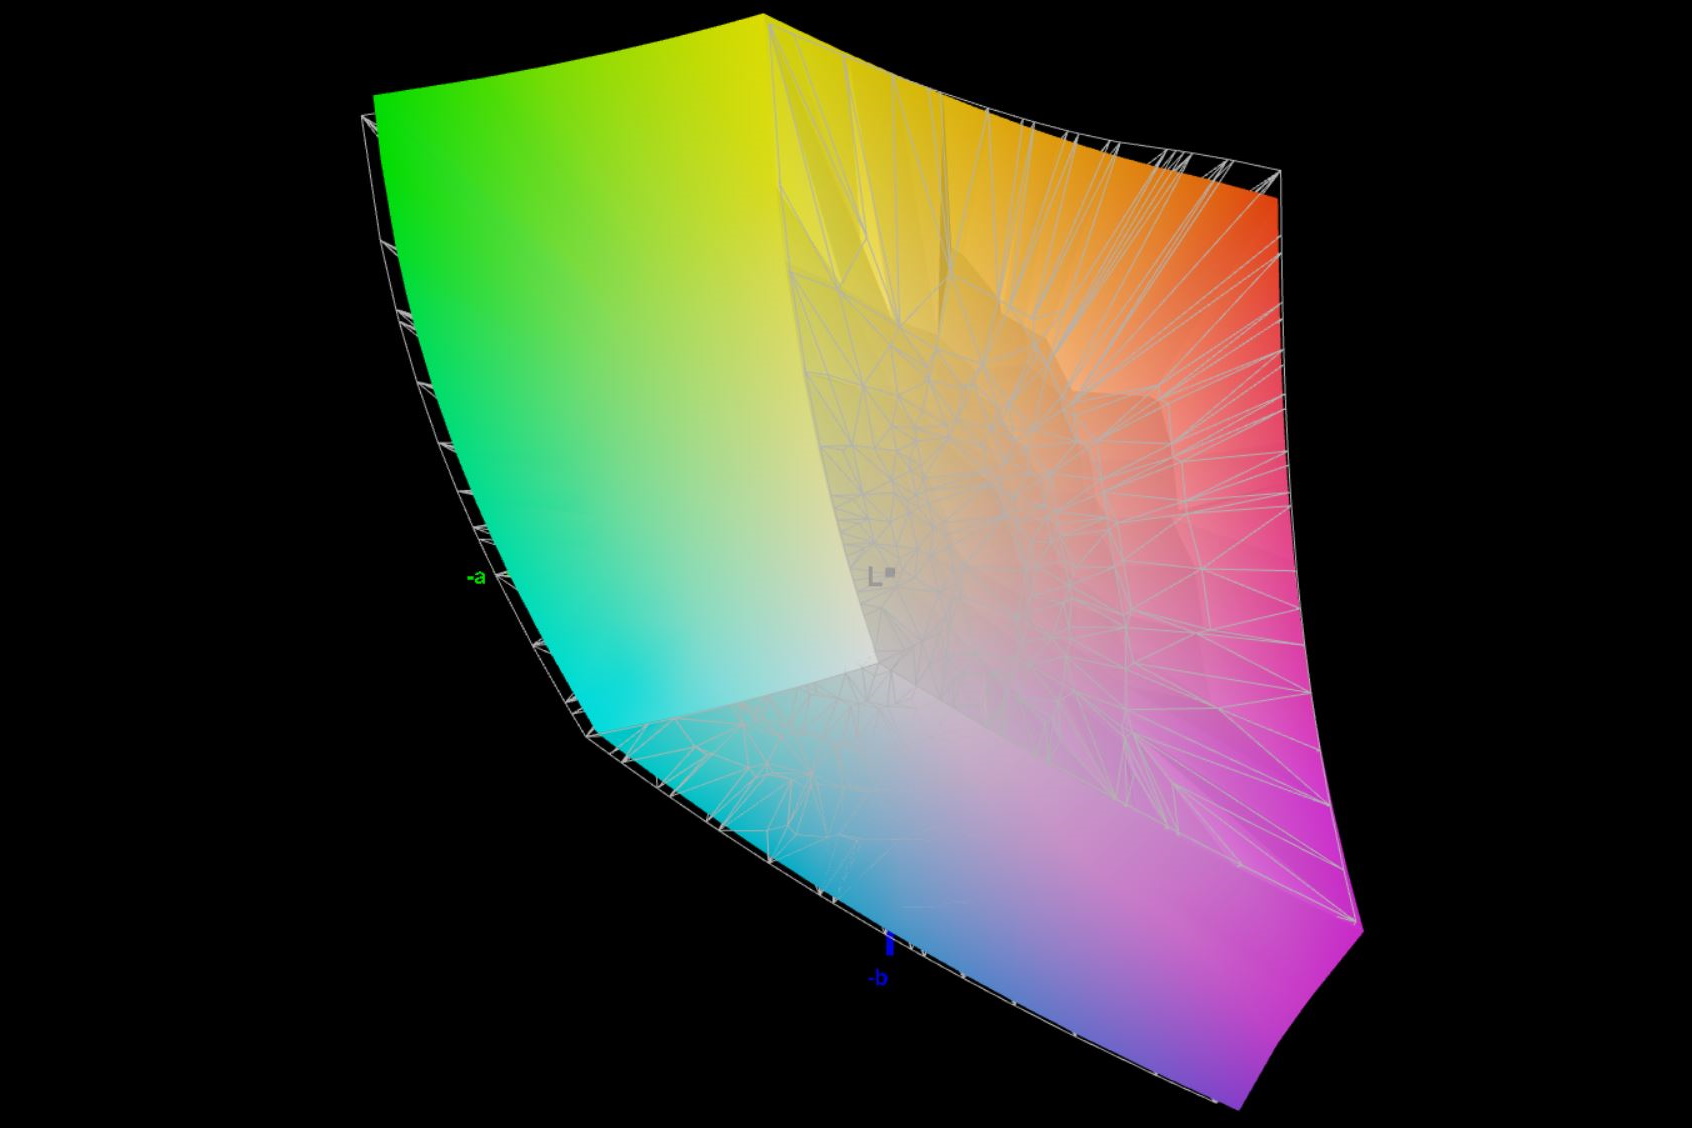
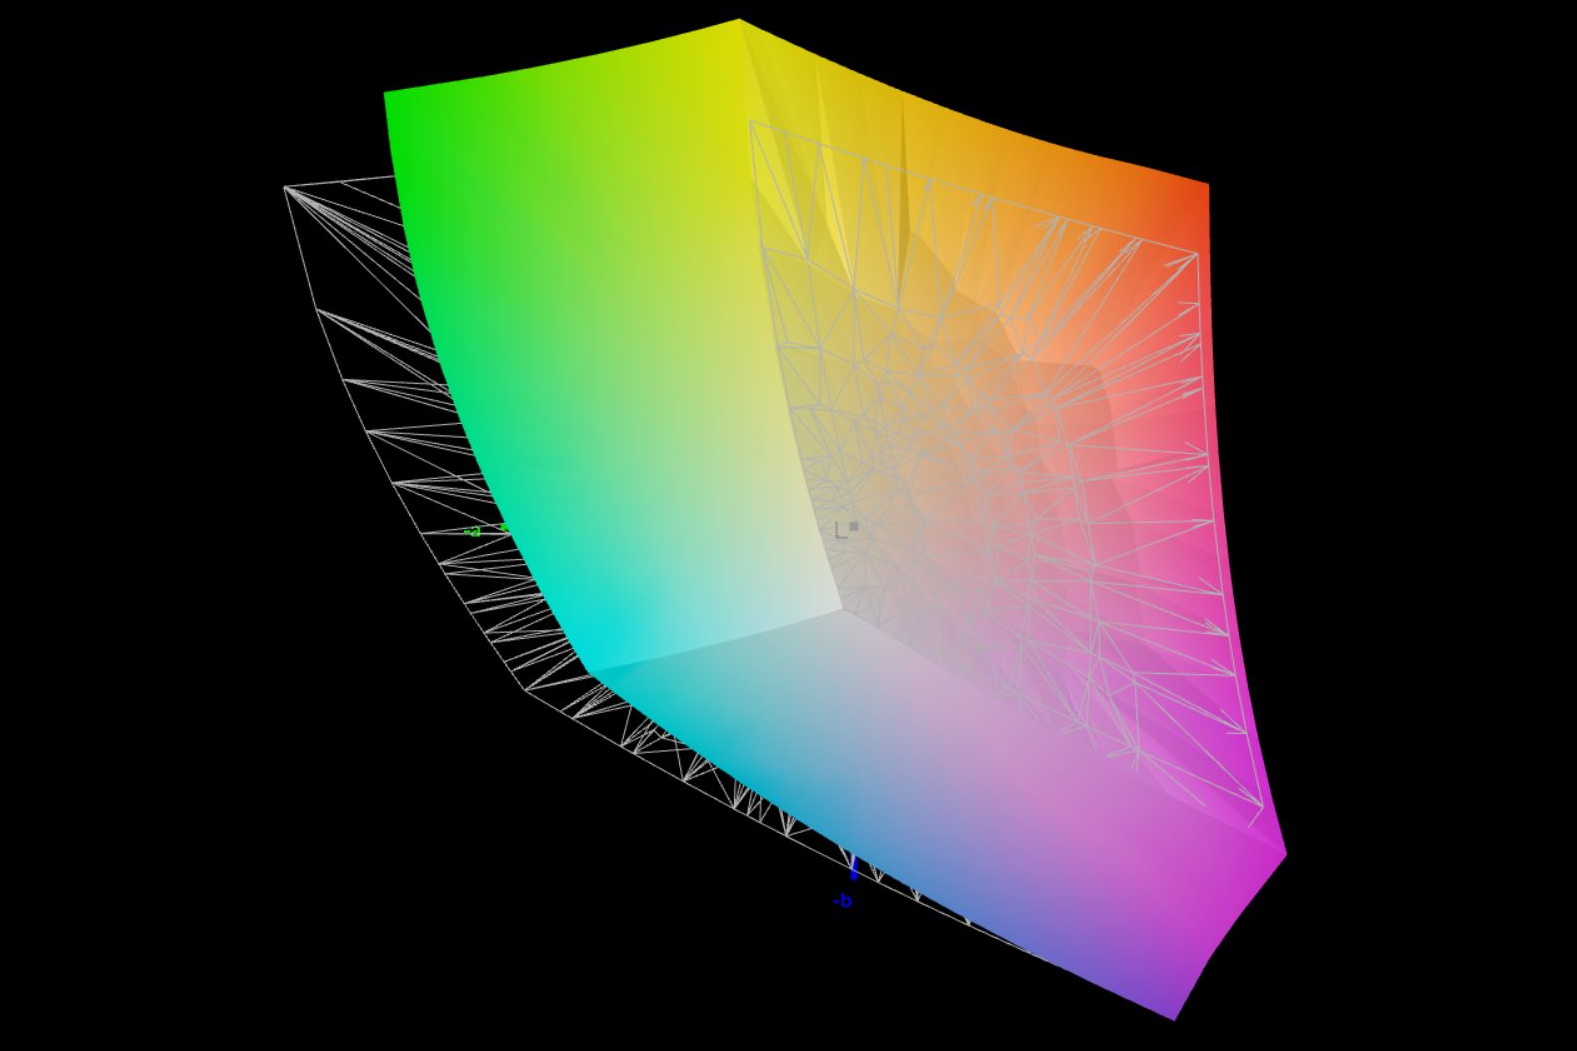
Os baixos desvios de cor medidos sem calibração prévia são notáveis. Mesmo o DeltaE máximo determinado de pouco menos de 3 significa que nenhuma diferença pode ser detectada a olho nu. Portanto, o monitor não precisa ser ajustado posteriormente para obter uma exibição ideal.
Exibir tempos de resposta
| ↔ Tempo de resposta preto para branco | ||
|---|---|---|
| 10.8 ms ... ascensão ↗ e queda ↘ combinadas | ↗ 4.6 ms ascensão | 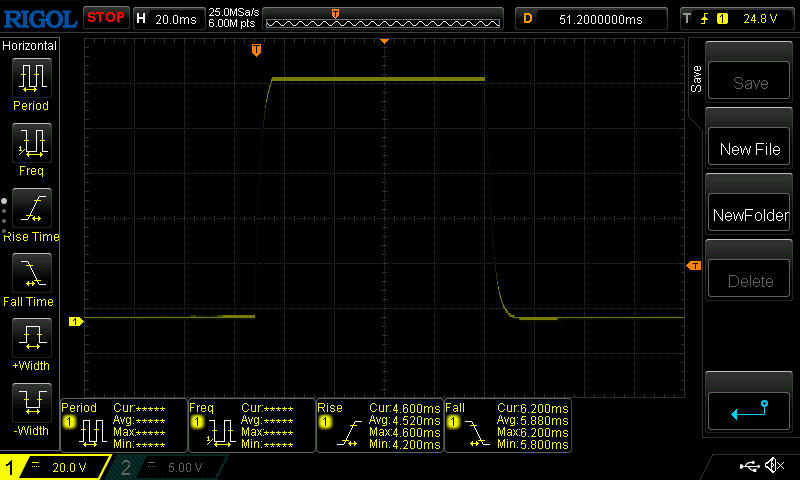 |
| ↘ 6.2 ms queda | ||
| A tela mostra boas taxas de resposta em nossos testes, mas pode ser muito lenta para jogadores competitivos. Em comparação, todos os dispositivos testados variam de 0.1 (mínimo) a 240 (máximo) ms. » 29 % de todos os dispositivos são melhores. Isso significa que o tempo de resposta medido é melhor que a média de todos os dispositivos testados (19.8 ms). | ||
| ↔ Tempo de resposta 50% cinza a 80% cinza | ||
| 16.4 ms ... ascensão ↗ e queda ↘ combinadas | ↗ 7.4 ms ascensão | 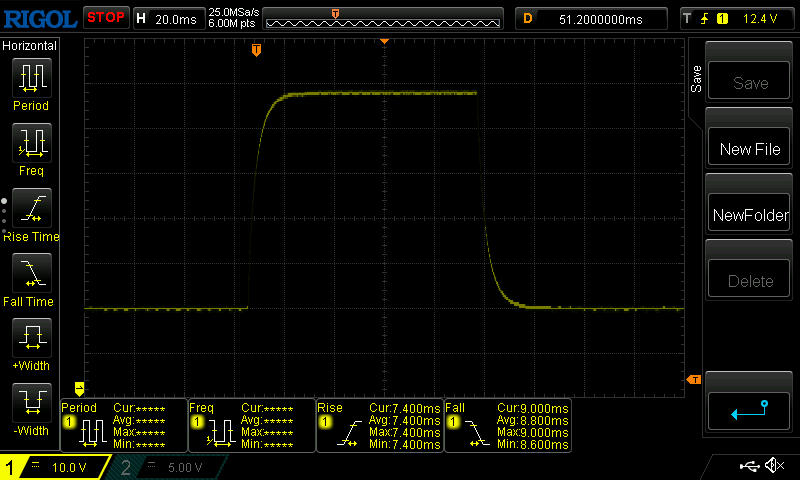 |
| ↘ 9 ms queda | ||
| A tela mostra boas taxas de resposta em nossos testes, mas pode ser muito lenta para jogadores competitivos. Em comparação, todos os dispositivos testados variam de 0.165 (mínimo) a 636 (máximo) ms. » 31 % de todos os dispositivos são melhores. Isso significa que o tempo de resposta medido é melhor que a média de todos os dispositivos testados (31 ms). | ||
Cintilação da tela / PWM (modulação por largura de pulso)
| Tela tremeluzindo / PWM não detectado | 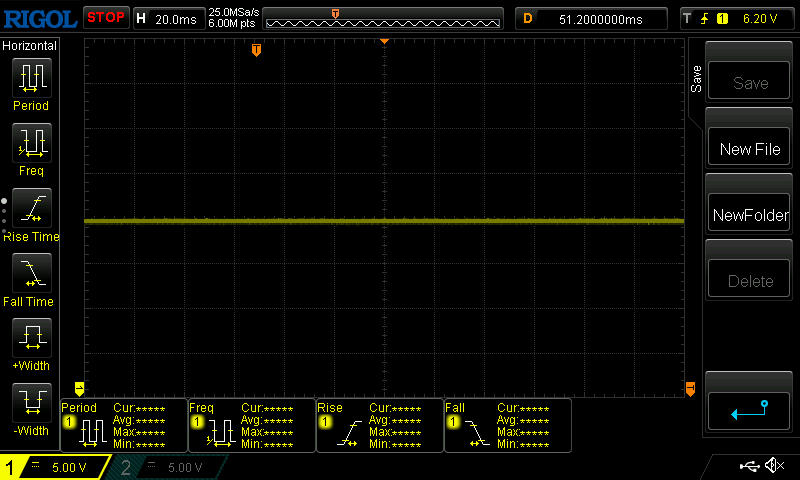 | ||
[pwm_comparison] Em comparação: 52 % de todos os dispositivos testados não usam PWM para escurecer a tela. Se PWM foi detectado, uma média de 7754 (mínimo: 5 - máximo: 343500) Hz foi medida. | |||
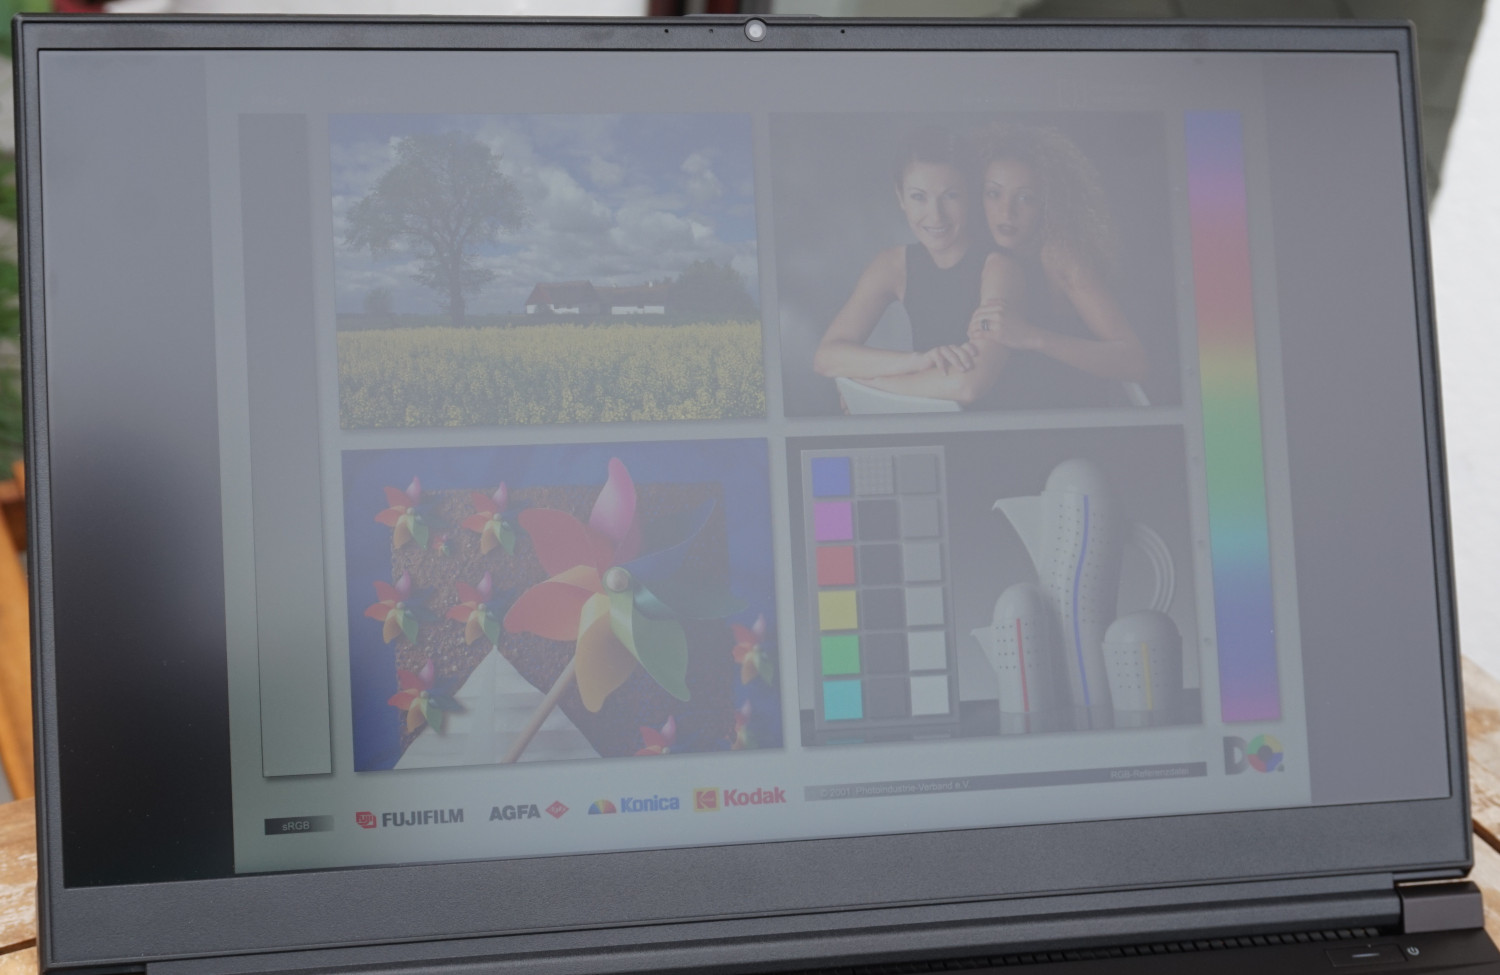
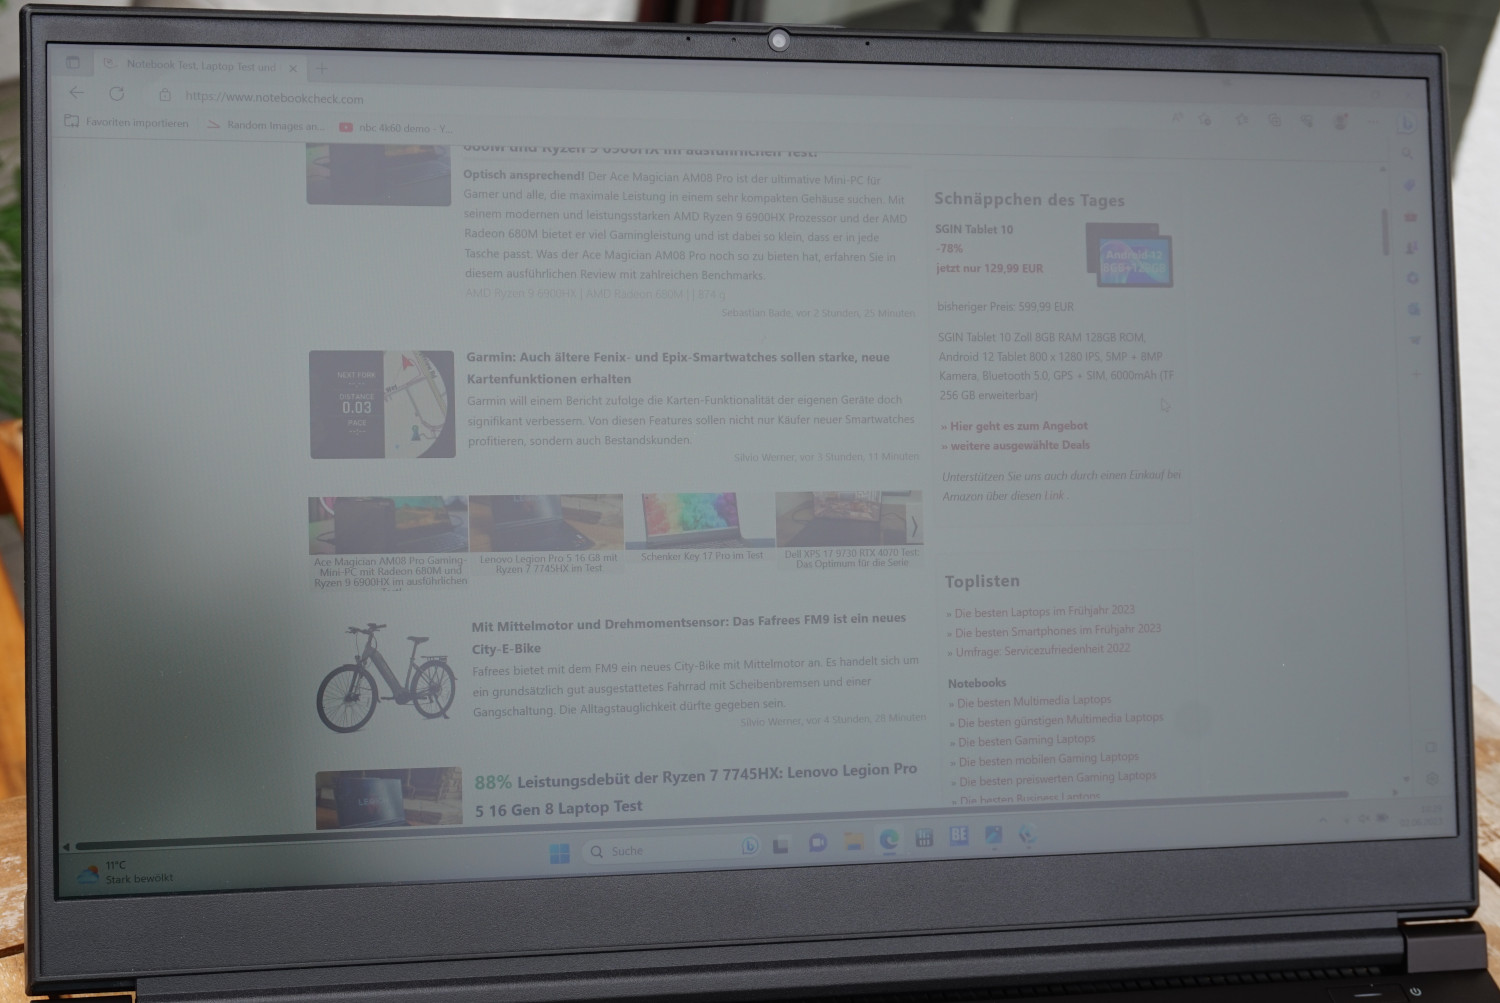
Com apenas 350 cd/m², a visibilidade em ambientes externos é significativamente prejudicada. As cores ainda podem ser reconhecidas bem em um local com sombra. No entanto, se um pouco mais de luz incidir sobre a tela, os textos poderão, no máximo, ser reconhecidos suficientemente bem. Isso também se aplica em um dia nublado.
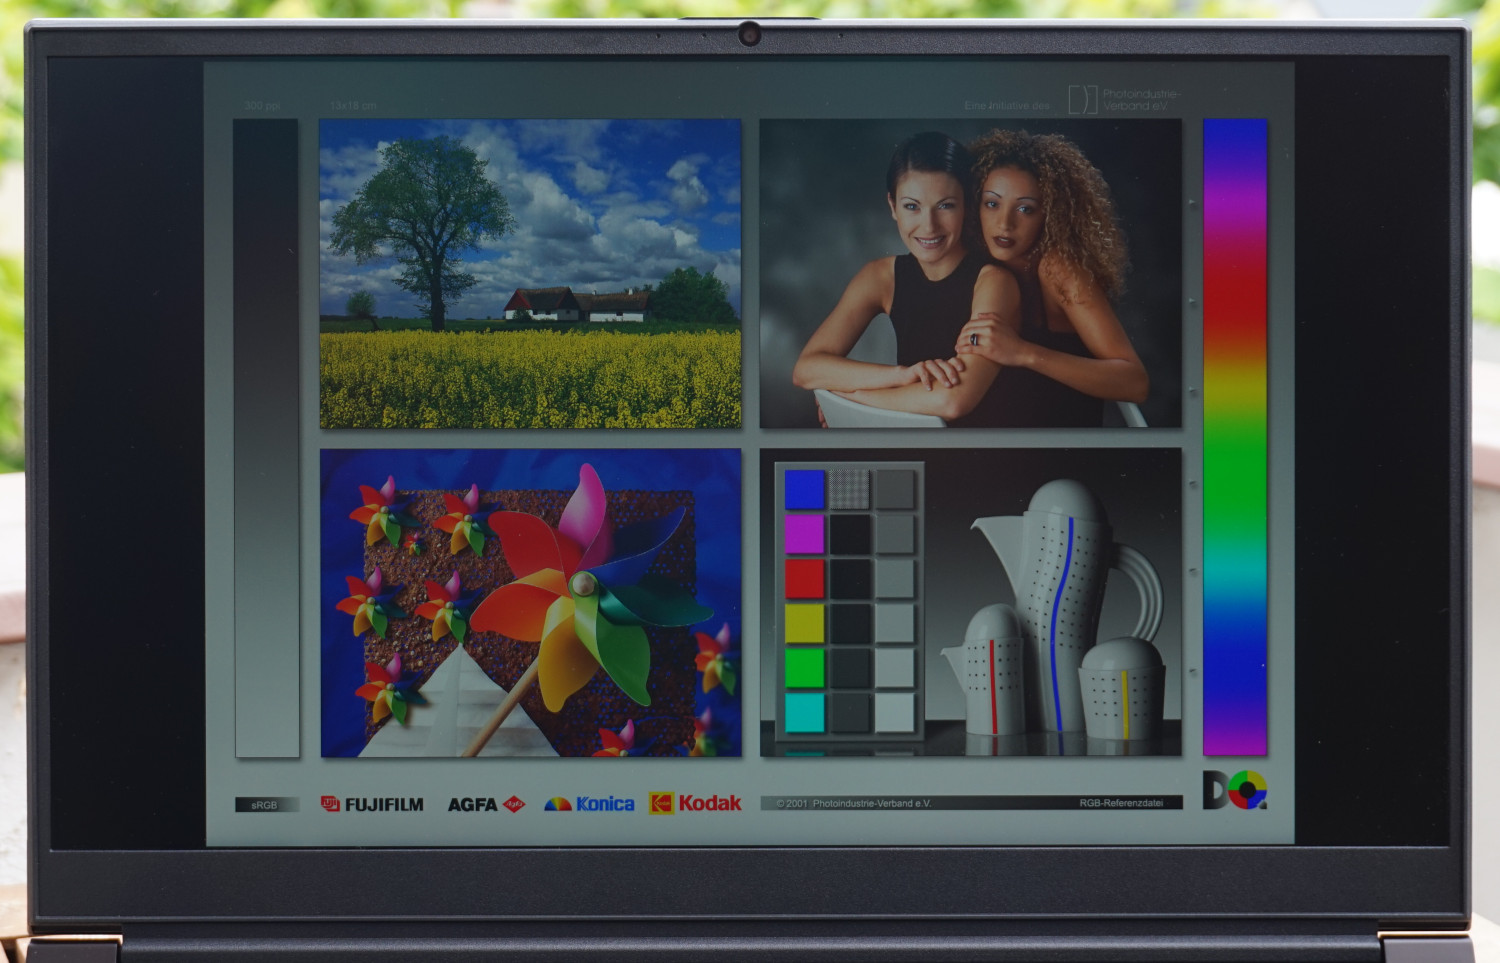
A reprodução de cores a partir de diferentes direções de visualização é esperadamente boa. O painel IPS não revela nenhuma mudança de cor e o brilho também permanece quase constante, mesmo em um ângulo agudo.

Desempenho - Jogos sólidos com o Focus 17
Especialmente a forte Nvidia Geforce RTX 4070 determina as possibilidades de aplicação do Focus 17 E23. A GPU oferece muito desempenho em conjunto com VRAM suficiente para os títulos atuais que podem ser jogados principalmente na resolução QHD nativa e quase todos os detalhes. Isso também deve se aplicar aos jogos que virão em um futuro próximo.
Ao mesmo tempo, uma boa velocidade de trabalho é garantida graças ao processador Intel Core i9-13900HX. Aplicativos complexos podem ser processados rapidamente. A multitarefa não representa um problema, mesmo em um grau elevado. No entanto, o desempenho da CPU é secundário, na melhor das hipóteses, em um notebook para jogos.
Condições de teste
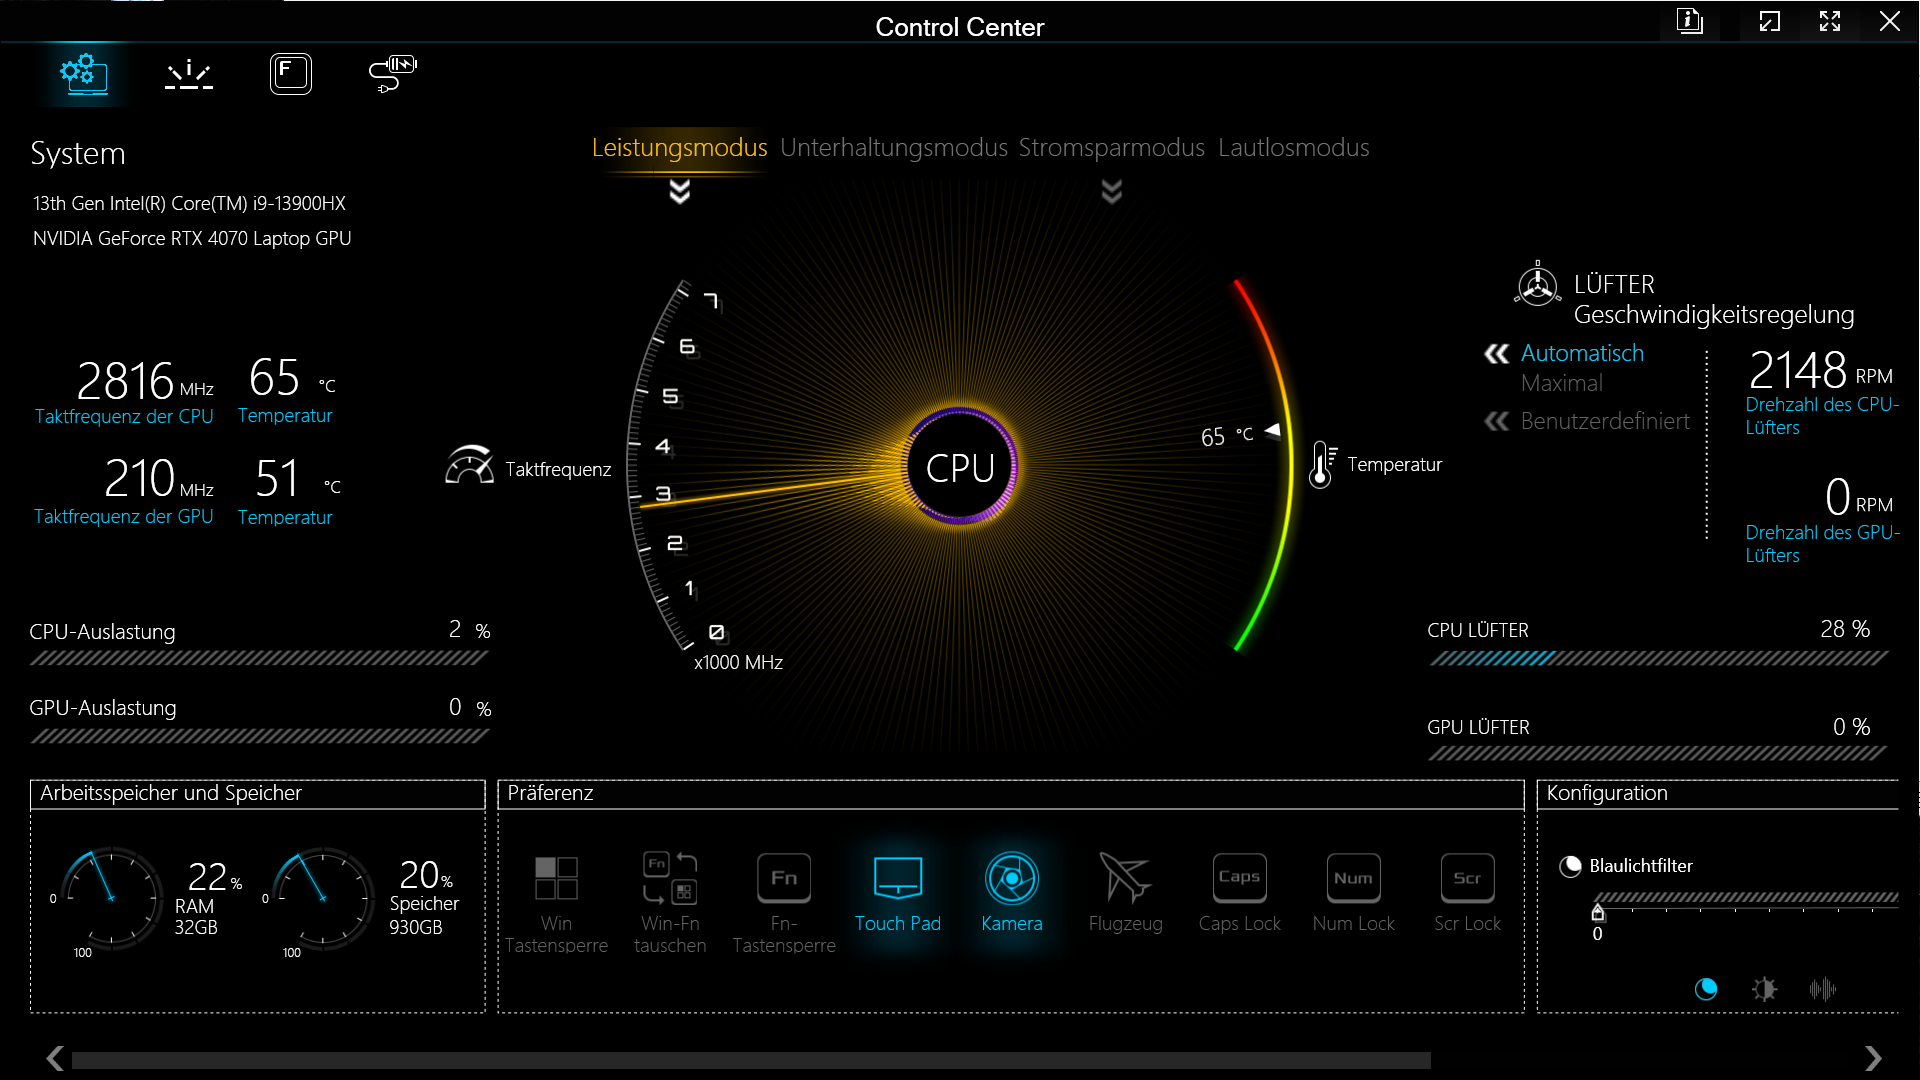
Quatro modos de desempenho predefinidos podem ser selecionados no ControlCenter pré-instalado. Sempre usamos o "Modo de desempenho" para nossos testes e benchmarks, o que garante as velocidades mais altas da ventoinha e o fornecimento máximo de energia para a GPU e a CPU.
Os valores são minimamente mais fracos no "Entertainment Mode". Apenas o desempenho da CPU é ligeiramente reduzido aqui, portanto, não se espera efeitos perceptíveis nos jogos. o "Modo silencioso", por outro lado, restringe consideravelmente o desempenho do sistema, mas o desenvolvimento do ruído fica em segundo plano, mesmo que não desapareça completamente. Os jogos menos exigentes permanecem jogáveis mesmo nesse modo. Entre outros, o Witcher 3 atinge mais de 60 fps nas configurações mais altas e em Full HD.
O "Modo de economia de energia" desativa completamente o chip gráfico dedicado e, de acordo com a situação atual, é obrigatório para atingir uma duração de bateria aceitável, pelo menos no sistema que testamos.
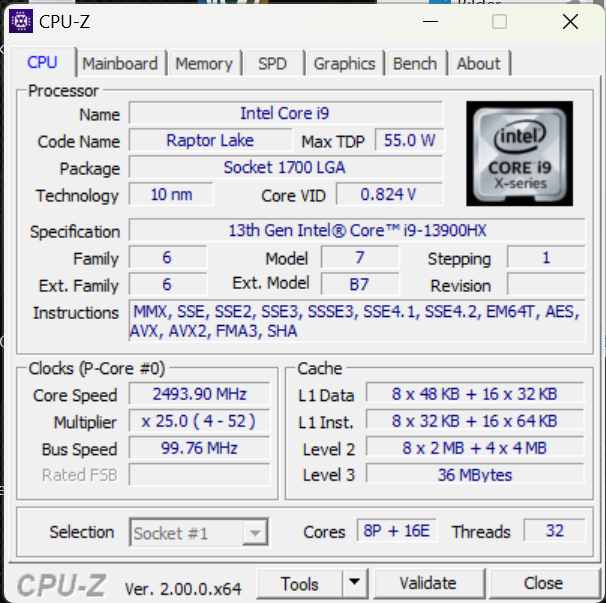
Processador
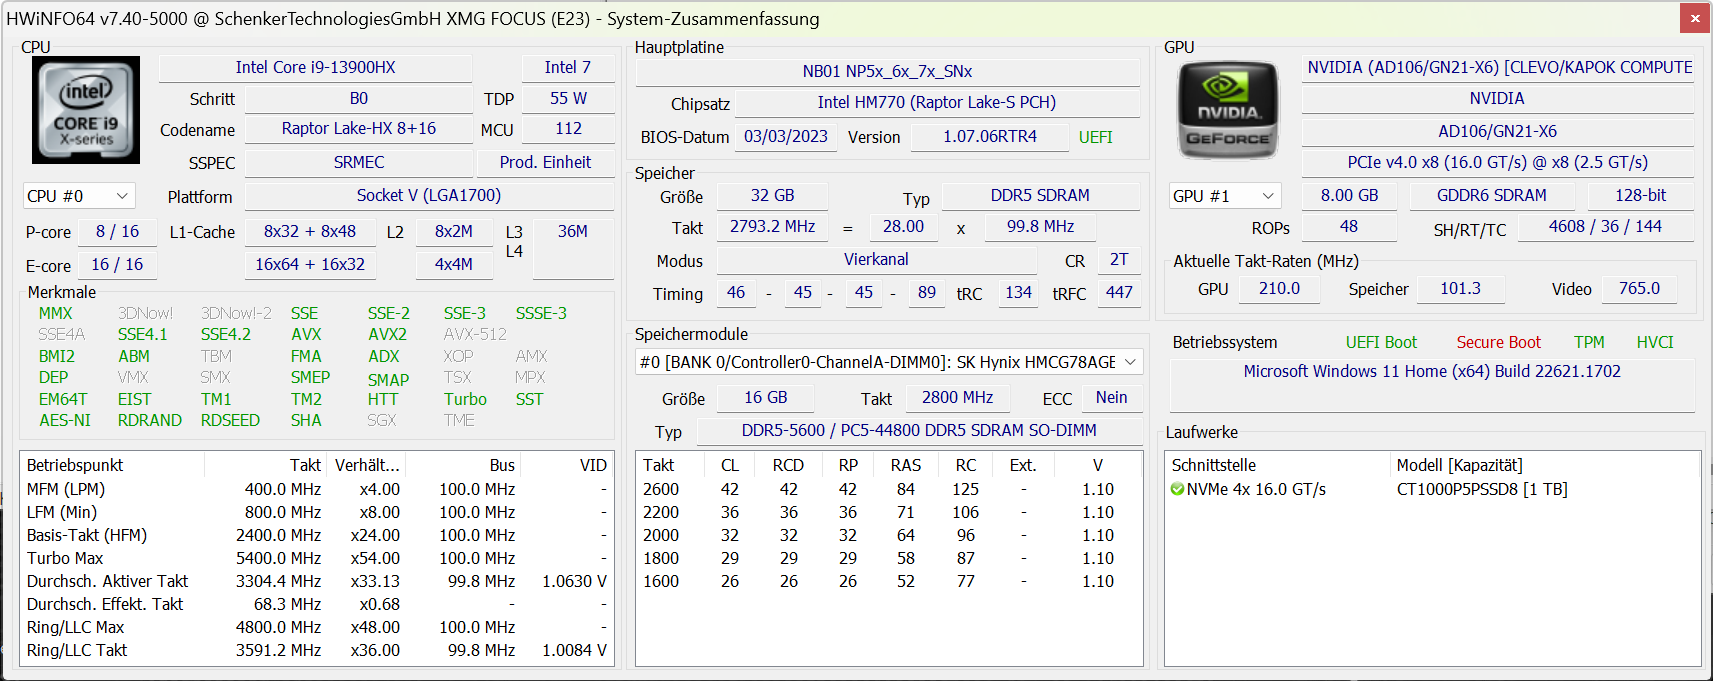
Um total de 32 threads e 36 MB de cache de nível 3, bem como a taxa de clock máxima de 5,4 GHz, indicam isso: O Intel Core i9-13900HX é atualmente uma das melhores CPUs móveis. Ele é usado de forma ideal para aplicativos multitarefa e de computação intensiva, deixando para trás o antecessor Intel Core i9-12900HX ou um AMD Ryzen 7 7745HX para trás.
No XMG Focus 17, a CPU recebe até 162 W por frações de segundo. Pelo menos 135 W podem ser alimentados por meio minuto. Infelizmente, o resfriamento não consegue lidar com o alto desenvolvimento de calor. No Medion Erazer Major X20, o processador idêntico permanece estável no desempenho máximo. No Focus 17, o desempenho cai em mais de 20% no teste Cinebench R15. No entanto, o i9 no Omen 17-ck2097ng da HP chega a perder 30%, portanto o comportamento geral parece aceitável.
O fato de que o processador é um pouco superdimensionado fica evidente quando olhamos para o "Modo de entretenimento". A ventoinha continua barulhenta aqui também, embora a fonte de alimentação tenha sido reduzida de 135 W para 55 W. Ao mesmo tempo, não medimos nenhuma redução séria de desempenho, especialmente em jogos. Isso ocorre porque a CPU só pode ser operada de forma suficientemente estável com esse consumo de energia em longo prazo. Dessa forma, o modo de energia só tem efeito durante cargas de curto prazo.
Apenas 15 W são concedidos nos modos silencioso e de economia de energia e 30 W por períodos curtos.
Mais medições, dados de comparação e informações podem ser encontrados em nossa Lista de benchmarks de CPU.
Cinebench R15 Multi loop
Cinebench R23: Multi Core | Single Core
Cinebench R20: CPU (Multi Core) | CPU (Single Core)
Cinebench R15: CPU Multi 64Bit | CPU Single 64Bit
Blender: v2.79 BMW27 CPU
7-Zip 18.03: 7z b 4 | 7z b 4 -mmt1
Geekbench 5.5: Multi-Core | Single-Core
HWBOT x265 Benchmark v2.2: 4k Preset
LibreOffice : 20 Documents To PDF
R Benchmark 2.5: Overall mean
| CPU Performance rating | |
| Média Intel Core i9-13900HX | |
| Medion Erazer Major X20 | |
| HP Omen 17-ck2097ng | |
| Schenker XMG Focus 17 (E23) | |
| Média da turma Gaming | |
| MSI Titan GT77 12UHS | |
| Lenovo Legion Pro 5 16ARX8 | |
| Medion Erazer Defender P40 | |
| Schenker XMG Neo 17 M22 | |
| Cinebench R23 / Multi Core | |
| Média Intel Core i9-13900HX (24270 - 32623, n=23) | |
| Medion Erazer Major X20 | |
| Schenker XMG Focus 17 (E23) | |
| HP Omen 17-ck2097ng | |
| Média da turma Gaming (10488 - 42661, n=107, últimos 2 anos) | |
| MSI Titan GT77 12UHS | |
| Medion Erazer Defender P40 | |
| Lenovo Legion Pro 5 16ARX8 | |
| Schenker XMG Neo 17 M22 | |
| Cinebench R23 / Single Core | |
| HP Omen 17-ck2097ng | |
| Média Intel Core i9-13900HX (1867 - 2105, n=20) | |
| Medion Erazer Major X20 | |
| Média da turma Gaming (1166 - 2415, n=107, últimos 2 anos) | |
| Schenker XMG Focus 17 (E23) | |
| MSI Titan GT77 12UHS | |
| Lenovo Legion Pro 5 16ARX8 | |
| Medion Erazer Defender P40 | |
| Schenker XMG Neo 17 M22 | |
| Cinebench R20 / CPU (Multi Core) | |
| Média Intel Core i9-13900HX (9152 - 12541, n=21) | |
| Medion Erazer Major X20 | |
| Média da turma Gaming (4029 - 16433, n=106, últimos 2 anos) | |
| Schenker XMG Focus 17 (E23) | |
| HP Omen 17-ck2097ng | |
| MSI Titan GT77 12UHS | |
| Medion Erazer Defender P40 | |
| Lenovo Legion Pro 5 16ARX8 | |
| Schenker XMG Neo 17 M22 | |
| Cinebench R20 / CPU (Single Core) | |
| HP Omen 17-ck2097ng | |
| Média Intel Core i9-13900HX (722 - 810, n=21) | |
| Média da turma Gaming (442 - 913, n=106, últimos 2 anos) | |
| Medion Erazer Major X20 | |
| Schenker XMG Focus 17 (E23) | |
| MSI Titan GT77 12UHS | |
| Lenovo Legion Pro 5 16ARX8 | |
| Medion Erazer Defender P40 | |
| Schenker XMG Neo 17 M22 | |
| Cinebench R15 / CPU Multi 64Bit | |
| Média Intel Core i9-13900HX (3913 - 4970, n=22) | |
| Schenker XMG Focus 17 (E23) | |
| Medion Erazer Major X20 | |
| HP Omen 17-ck2097ng | |
| Média da turma Gaming (1578 - 6330, n=105, últimos 2 anos) | |
| MSI Titan GT77 12UHS | |
| Medion Erazer Defender P40 | |
| Lenovo Legion Pro 5 16ARX8 | |
| Schenker XMG Neo 17 M22 | |
| Cinebench R15 / CPU Single 64Bit | |
| HP Omen 17-ck2097ng | |
| Medion Erazer Major X20 | |
| Média da turma Gaming (188.8 - 350, n=106, últimos 2 anos) | |
| Lenovo Legion Pro 5 16ARX8 | |
| Média Intel Core i9-13900HX (247 - 304, n=22) | |
| Schenker XMG Focus 17 (E23) | |
| MSI Titan GT77 12UHS | |
| Schenker XMG Neo 17 M22 | |
| Medion Erazer Defender P40 | |
| Blender / v2.79 BMW27 CPU | |
| Schenker XMG Neo 17 M22 | |
| Medion Erazer Defender P40 | |
| Lenovo Legion Pro 5 16ARX8 | |
| HP Omen 17-ck2097ng | |
| Média da turma Gaming (79 - 330, n=104, últimos 2 anos) | |
| MSI Titan GT77 12UHS | |
| Schenker XMG Focus 17 (E23) | |
| Média Intel Core i9-13900HX (101 - 153, n=22) | |
| Medion Erazer Major X20 | |
| 7-Zip 18.03 / 7z b 4 | |
| Medion Erazer Major X20 | |
| Média Intel Core i9-13900HX (90675 - 127283, n=21) | |
| Schenker XMG Focus 17 (E23) | |
| HP Omen 17-ck2097ng | |
| Média da turma Gaming (33491 - 148086, n=105, últimos 2 anos) | |
| MSI Titan GT77 12UHS | |
| Lenovo Legion Pro 5 16ARX8 | |
| Medion Erazer Defender P40 | |
| Schenker XMG Neo 17 M22 | |
| 7-Zip 18.03 / 7z b 4 -mmt1 | |
| Lenovo Legion Pro 5 16ARX8 | |
| HP Omen 17-ck2097ng | |
| Medion Erazer Major X20 | |
| Média Intel Core i9-13900HX (6340 - 7177, n=21) | |
| Schenker XMG Focus 17 (E23) | |
| Média da turma Gaming (4199 - 7436, n=105, últimos 2 anos) | |
| MSI Titan GT77 12UHS | |
| Schenker XMG Neo 17 M22 | |
| Medion Erazer Defender P40 | |
| Geekbench 5.5 / Multi-Core | |
| HP Omen 17-ck2097ng | |
| Média Intel Core i9-13900HX (17614 - 21075, n=22) | |
| Medion Erazer Major X20 | |
| Schenker XMG Focus 17 (E23) | |
| Média da turma Gaming (6460 - 28263, n=105, últimos 2 anos) | |
| MSI Titan GT77 12UHS | |
| Medion Erazer Defender P40 | |
| Lenovo Legion Pro 5 16ARX8 | |
| Schenker XMG Neo 17 M22 | |
| Geekbench 5.5 / Single-Core | |
| HP Omen 17-ck2097ng | |
| Média da turma Gaming (986 - 2474, n=105, últimos 2 anos) | |
| Lenovo Legion Pro 5 16ARX8 | |
| Medion Erazer Major X20 | |
| Média Intel Core i9-13900HX (1345 - 2093, n=22) | |
| Schenker XMG Focus 17 (E23) | |
| MSI Titan GT77 12UHS | |
| Medion Erazer Defender P40 | |
| Schenker XMG Neo 17 M22 | |
| HWBOT x265 Benchmark v2.2 / 4k Preset | |
| Média Intel Core i9-13900HX (23.5 - 34.4, n=22) | |
| Medion Erazer Major X20 | |
| Média da turma Gaming (11.5 - 44.4, n=105, últimos 2 anos) | |
| Schenker XMG Focus 17 (E23) | |
| MSI Titan GT77 12UHS | |
| HP Omen 17-ck2097ng | |
| Lenovo Legion Pro 5 16ARX8 | |
| Medion Erazer Defender P40 | |
| Schenker XMG Neo 17 M22 | |
| LibreOffice / 20 Documents To PDF | |
| Schenker XMG Neo 17 M22 | |
| Schenker XMG Focus 17 (E23) | |
| Medion Erazer Defender P40 | |
| Média da turma Gaming (33.2 - 88.8, n=105, últimos 2 anos) | |
| HP Omen 17-ck2097ng | |
| Média Intel Core i9-13900HX (32.8 - 51.1, n=21) | |
| Medion Erazer Major X20 | |
| MSI Titan GT77 12UHS | |
| Lenovo Legion Pro 5 16ARX8 | |
| R Benchmark 2.5 / Overall mean | |
| Medion Erazer Defender P40 | |
| Schenker XMG Neo 17 M22 | |
| Média da turma Gaming (0.3439 - 0.759, n=106, últimos 2 anos) | |
| Schenker XMG Focus 17 (E23) | |
| Lenovo Legion Pro 5 16ARX8 | |
| MSI Titan GT77 12UHS | |
| Média Intel Core i9-13900HX (0.375 - 0.4564, n=22) | |
| Medion Erazer Major X20 | |
| HP Omen 17-ck2097ng | |
* ... menor é melhor
AIDA64: FP32 Ray-Trace | FPU Julia | CPU SHA3 | CPU Queen | FPU SinJulia | FPU Mandel | CPU AES | CPU ZLib | FP64 Ray-Trace | CPU PhotoWorxx
| Performance rating | |
| Média da turma Gaming | |
| Média Intel Core i9-13900HX | |
| Medion Erazer Major X20 | |
| Schenker XMG Focus 17 (E23) | |
| Lenovo Legion Pro 5 16ARX8 | |
| HP Omen 17-ck2097ng | |
| Schenker XMG Neo 17 M22 | |
| Medion Erazer Defender P40 | |
| AIDA64 / FP32 Ray-Trace | |
| Média da turma Gaming (10227 - 85542, n=105, últimos 2 anos) | |
| Lenovo Legion Pro 5 16ARX8 | |
| Medion Erazer Major X20 | |
| Média Intel Core i9-13900HX (17589 - 27615, n=22) | |
| Schenker XMG Focus 17 (E23) | |
| HP Omen 17-ck2097ng | |
| Schenker XMG Neo 17 M22 | |
| Medion Erazer Defender P40 | |
| AIDA64 / FPU Julia | |
| Média da turma Gaming (51376 - 238426, n=105, últimos 2 anos) | |
| Medion Erazer Major X20 | |
| Média Intel Core i9-13900HX (88686 - 137015, n=22) | |
| Lenovo Legion Pro 5 16ARX8 | |
| Schenker XMG Focus 17 (E23) | |
| Schenker XMG Neo 17 M22 | |
| HP Omen 17-ck2097ng | |
| Medion Erazer Defender P40 | |
| AIDA64 / CPU SHA3 | |
| Média da turma Gaming (2180 - 10115, n=105, últimos 2 anos) | |
| Medion Erazer Major X20 | |
| Média Intel Core i9-13900HX (4362 - 7029, n=22) | |
| Schenker XMG Focus 17 (E23) | |
| Lenovo Legion Pro 5 16ARX8 | |
| HP Omen 17-ck2097ng | |
| Schenker XMG Neo 17 M22 | |
| Medion Erazer Defender P40 | |
| AIDA64 / CPU Queen | |
| Schenker XMG Focus 17 (E23) | |
| HP Omen 17-ck2097ng | |
| Medion Erazer Major X20 | |
| Média Intel Core i9-13900HX (125644 - 141385, n=22) | |
| Lenovo Legion Pro 5 16ARX8 | |
| Média da turma Gaming (49785 - 173351, n=90, últimos 2 anos) | |
| Medion Erazer Defender P40 | |
| Schenker XMG Neo 17 M22 | |
| AIDA64 / FPU SinJulia | |
| Lenovo Legion Pro 5 16ARX8 | |
| Medion Erazer Major X20 | |
| Média Intel Core i9-13900HX (12334 - 17179, n=22) | |
| Média da turma Gaming (4424 - 33636, n=105, últimos 2 anos) | |
| Schenker XMG Focus 17 (E23) | |
| Schenker XMG Neo 17 M22 | |
| HP Omen 17-ck2097ng | |
| Medion Erazer Defender P40 | |
| AIDA64 / FPU Mandel | |
| Média da turma Gaming (25115 - 128721, n=105, últimos 2 anos) | |
| Lenovo Legion Pro 5 16ARX8 | |
| Medion Erazer Major X20 | |
| Média Intel Core i9-13900HX (43850 - 69202, n=22) | |
| Schenker XMG Neo 17 M22 | |
| Schenker XMG Focus 17 (E23) | |
| HP Omen 17-ck2097ng | |
| Medion Erazer Defender P40 | |
| AIDA64 / CPU AES | |
| Média Intel Core i9-13900HX (89413 - 237881, n=22) | |
| Schenker XMG Neo 17 M22 | |
| Medion Erazer Major X20 | |
| Média da turma Gaming (39258 - 247074, n=105, últimos 2 anos) | |
| Schenker XMG Focus 17 (E23) | |
| HP Omen 17-ck2097ng | |
| Medion Erazer Defender P40 | |
| Lenovo Legion Pro 5 16ARX8 | |
| AIDA64 / CPU ZLib | |
| Medion Erazer Major X20 | |
| Média Intel Core i9-13900HX (1284 - 1958, n=22) | |
| Schenker XMG Focus 17 (E23) | |
| Média da turma Gaming (574 - 2531, n=105, últimos 2 anos) | |
| HP Omen 17-ck2097ng | |
| Lenovo Legion Pro 5 16ARX8 | |
| Medion Erazer Defender P40 | |
| Schenker XMG Neo 17 M22 | |
| AIDA64 / FP64 Ray-Trace | |
| Média da turma Gaming (5509 - 45446, n=105, últimos 2 anos) | |
| Lenovo Legion Pro 5 16ARX8 | |
| Medion Erazer Major X20 | |
| Média Intel Core i9-13900HX (9481 - 15279, n=22) | |
| Schenker XMG Focus 17 (E23) | |
| HP Omen 17-ck2097ng | |
| Schenker XMG Neo 17 M22 | |
| Medion Erazer Defender P40 | |
| AIDA64 / CPU PhotoWorxx | |
| HP Omen 17-ck2097ng | |
| Schenker XMG Focus 17 (E23) | |
| Média Intel Core i9-13900HX (42994 - 51994, n=22) | |
| Média da turma Gaming (12271 - 89891, n=105, últimos 2 anos) | |
| Medion Erazer Major X20 | |
| Medion Erazer Defender P40 | |
| Schenker XMG Neo 17 M22 | |
| Lenovo Legion Pro 5 16ARX8 | |
Desempenho do sistema
Muitos núcleos de processador, uma grande quantidade de RAM com acesso rápido e um SSD rápido impulsionam o sistema em todas as situações. Até mesmo um jogo pausado em segundo plano fica um pouco mais lento. De multitarefas extensas com software de edição de vídeo aberto a inúmeras guias do navegador, quase nada causa problemas sérios ao Focus 17.
Embora esteja relativamente distante dos rivais com hardware semelhante, ele consegue uma classificação mais do que sólida, que promete desempenho mais do que suficiente para tarefas exigentes.
CrossMark: Overall | Productivity | Creativity | Responsiveness
| PCMark 10 / Score | |
| Média da turma Gaming (5828 - 12414, n=93, últimos 2 anos) | |
| Lenovo Legion Pro 5 16ARX8 | |
| HP Omen 17-ck2097ng | |
| Medion Erazer Major X20 | |
| Média Intel Core i9-13900HX, NVIDIA GeForce RTX 4070 Laptop GPU (6956 - 8153, n=3) | |
| Schenker XMG Neo 17 M22 | |
| Schenker XMG Focus 17 (E23) | |
| Medion Erazer Defender P40 | |
| PCMark 10 / Essentials | |
| HP Omen 17-ck2097ng | |
| Medion Erazer Major X20 | |
| Lenovo Legion Pro 5 16ARX8 | |
| Média Intel Core i9-13900HX, NVIDIA GeForce RTX 4070 Laptop GPU (9865 - 11653, n=3) | |
| Média da turma Gaming (8810 - 11935, n=97, últimos 2 anos) | |
| Schenker XMG Focus 17 (E23) | |
| Medion Erazer Defender P40 | |
| Schenker XMG Neo 17 M22 | |
| PCMark 10 / Productivity | |
| Média da turma Gaming (6845 - 25323, n=95, últimos 2 anos) | |
| Lenovo Legion Pro 5 16ARX8 | |
| HP Omen 17-ck2097ng | |
| Medion Erazer Major X20 | |
| Medion Erazer Defender P40 | |
| Média Intel Core i9-13900HX, NVIDIA GeForce RTX 4070 Laptop GPU (9470 - 9850, n=3) | |
| Schenker XMG Neo 17 M22 | |
| Schenker XMG Focus 17 (E23) | |
| PCMark 10 / Digital Content Creation | |
| Média da turma Gaming (7602 - 19954, n=95, últimos 2 anos) | |
| Lenovo Legion Pro 5 16ARX8 | |
| Média Intel Core i9-13900HX, NVIDIA GeForce RTX 4070 Laptop GPU (9776 - 13370, n=3) | |
| Medion Erazer Major X20 | |
| HP Omen 17-ck2097ng | |
| Schenker XMG Neo 17 M22 | |
| Schenker XMG Focus 17 (E23) | |
| Medion Erazer Defender P40 | |
| CrossMark / Overall | |
| Schenker XMG Focus 17 (E23) | |
| Lenovo Legion Pro 5 16ARX8 | |
| HP Omen 17-ck2097ng | |
| Média da turma Gaming (1366 - 2409, n=94, últimos 2 anos) | |
| Média Intel Core i9-13900HX, NVIDIA GeForce RTX 4070 Laptop GPU (1842 - 2029, n=3) | |
| Medion Erazer Major X20 | |
| Medion Erazer Defender P40 | |
| Schenker XMG Neo 17 M22 | |
| CrossMark / Productivity | |
| Lenovo Legion Pro 5 16ARX8 | |
| Schenker XMG Focus 17 (E23) | |
| Média da turma Gaming (1386 - 2254, n=94, últimos 2 anos) | |
| HP Omen 17-ck2097ng | |
| Média Intel Core i9-13900HX, NVIDIA GeForce RTX 4070 Laptop GPU (1700 - 1872, n=3) | |
| Medion Erazer Major X20 | |
| Schenker XMG Neo 17 M22 | |
| Medion Erazer Defender P40 | |
| CrossMark / Creativity | |
| Schenker XMG Focus 17 (E23) | |
| Média da turma Gaming (1343 - 2786, n=94, últimos 2 anos) | |
| HP Omen 17-ck2097ng | |
| Média Intel Core i9-13900HX, NVIDIA GeForce RTX 4070 Laptop GPU (2088 - 2316, n=3) | |
| Lenovo Legion Pro 5 16ARX8 | |
| Medion Erazer Major X20 | |
| Medion Erazer Defender P40 | |
| Schenker XMG Neo 17 M22 | |
| CrossMark / Responsiveness | |
| HP Omen 17-ck2097ng | |
| Lenovo Legion Pro 5 16ARX8 | |
| Schenker XMG Focus 17 (E23) | |
| Média da turma Gaming (1226 - 2334, n=94, últimos 2 anos) | |
| Média Intel Core i9-13900HX, NVIDIA GeForce RTX 4070 Laptop GPU (1557 - 1752, n=3) | |
| Medion Erazer Major X20 | |
| Medion Erazer Defender P40 | |
| Schenker XMG Neo 17 M22 | |
| PCMark 10 Score | 6956 pontos | |
Ajuda | ||
| AIDA64 / Memory Copy | |
| HP Omen 17-ck2097ng | |
| Schenker XMG Focus 17 (E23) | |
| Média Intel Core i9-13900HX (67716 - 79193, n=22) | |
| Média da turma Gaming (21750 - 129946, n=105, últimos 2 anos) | |
| Medion Erazer Major X20 | |
| Medion Erazer Defender P40 | |
| Schenker XMG Neo 17 M22 | |
| Lenovo Legion Pro 5 16ARX8 | |
| AIDA64 / Memory Read | |
| HP Omen 17-ck2097ng | |
| Schenker XMG Focus 17 (E23) | |
| Média Intel Core i9-13900HX (73998 - 88462, n=22) | |
| Média da turma Gaming (22956 - 118858, n=105, últimos 2 anos) | |
| Medion Erazer Major X20 | |
| Medion Erazer Defender P40 | |
| Schenker XMG Neo 17 M22 | |
| Lenovo Legion Pro 5 16ARX8 | |
| AIDA64 / Memory Write | |
| HP Omen 17-ck2097ng | |
| Média da turma Gaming (22297 - 135096, n=105, últimos 2 anos) | |
| Schenker XMG Focus 17 (E23) | |
| Média Intel Core i9-13900HX (65472 - 77045, n=22) | |
| Medion Erazer Major X20 | |
| Medion Erazer Defender P40 | |
| Schenker XMG Neo 17 M22 | |
| Lenovo Legion Pro 5 16ARX8 | |
| AIDA64 / Memory Latency | |
| Média da turma Gaming (75.3 - 259, n=105, últimos 2 anos) | |
| Medion Erazer Defender P40 | |
| Schenker XMG Focus 17 (E23) | |
| Schenker XMG Neo 17 M22 | |
| Medion Erazer Major X20 | |
| Lenovo Legion Pro 5 16ARX8 | |
| Média Intel Core i9-13900HX (75.3 - 91.1, n=22) | |
| HP Omen 17-ck2097ng | |
* ... menor é melhor
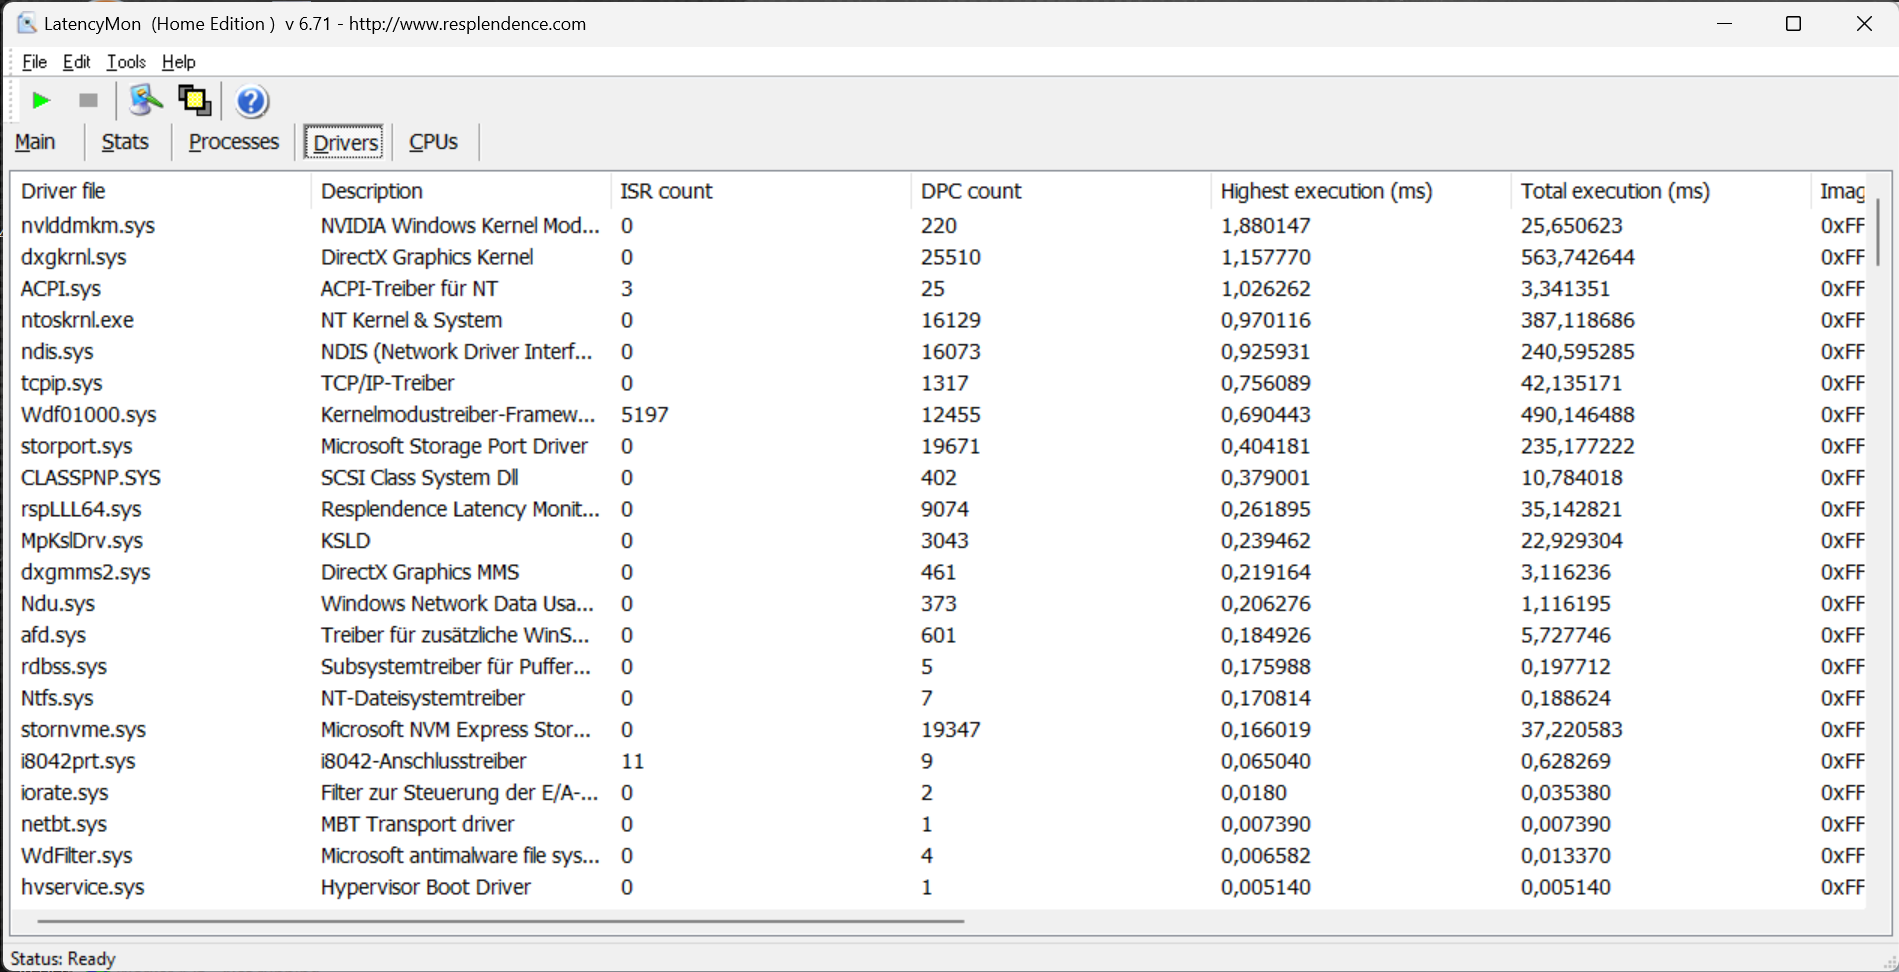
Latências de DPC
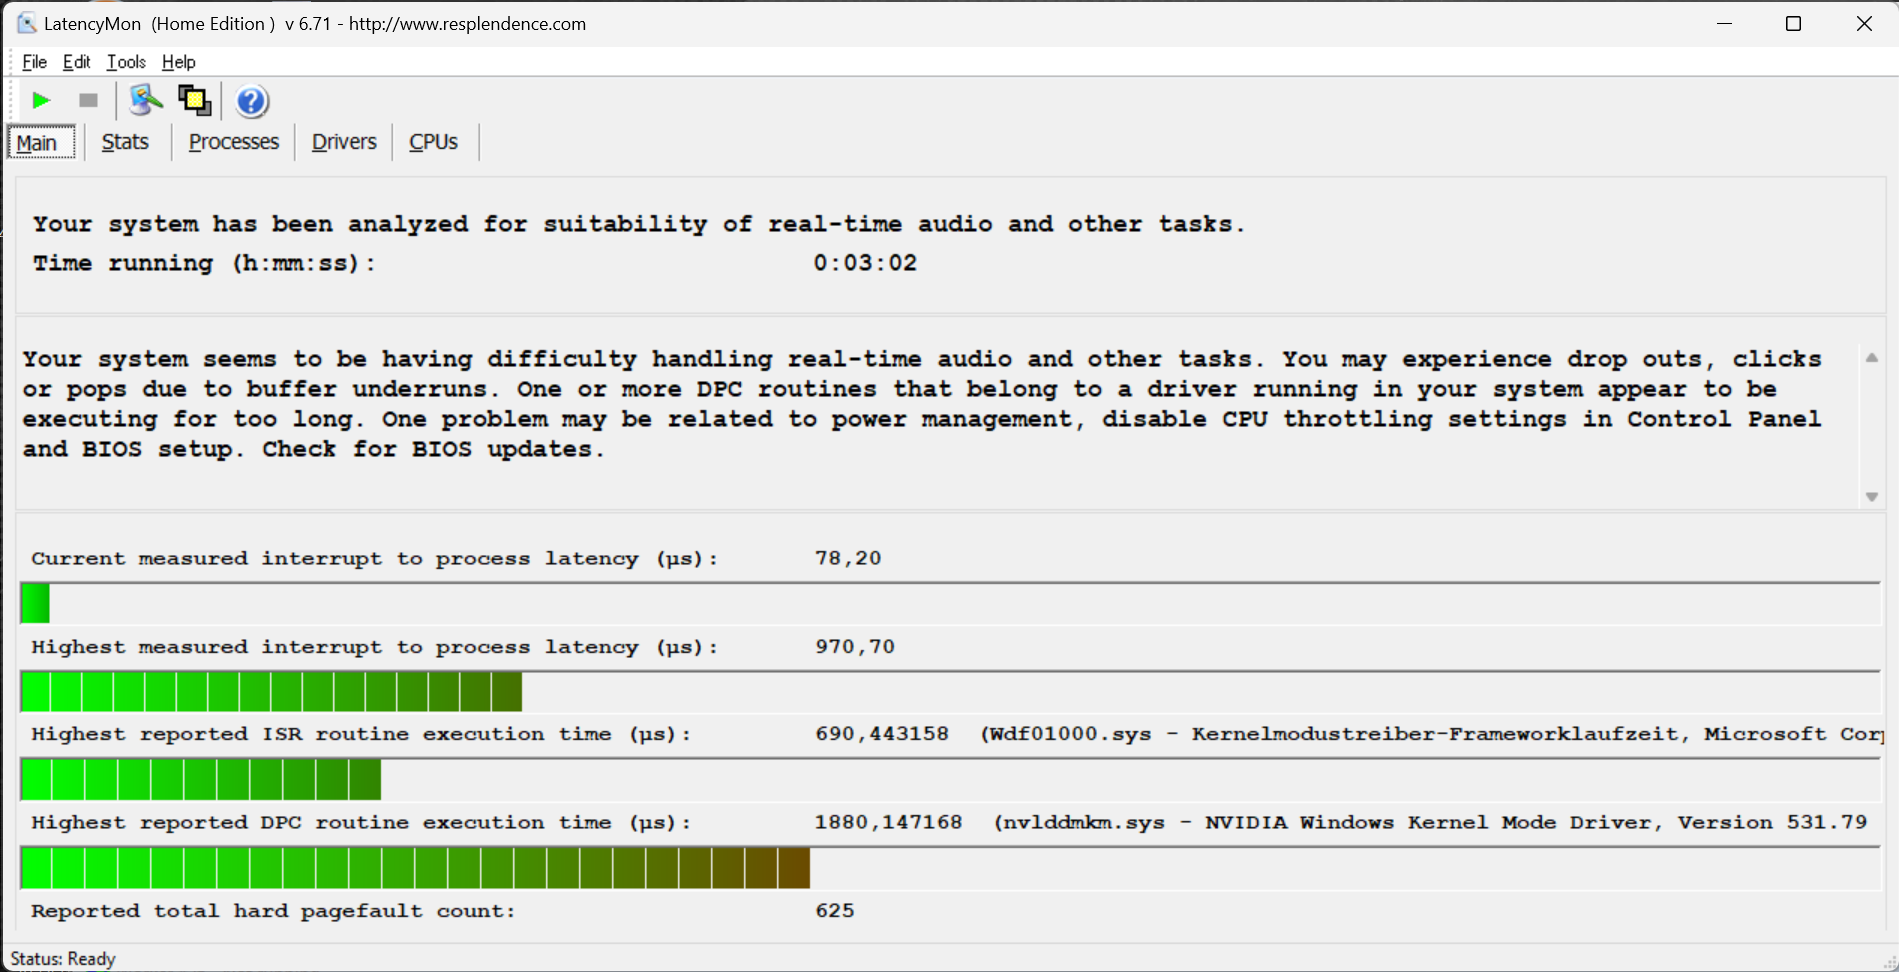
Outros notebooks para jogos com a mesma CPU têm desempenho muito pior do que o XMG Focus 17. Ele não atinge um resultado ideal, mas deve funcionar satisfatoriamente na maioria das tarefas em que é necessário um processo suave. Ela pode ser ainda melhor, mas isso deve ser de importância secundária para a maioria dos usuários.
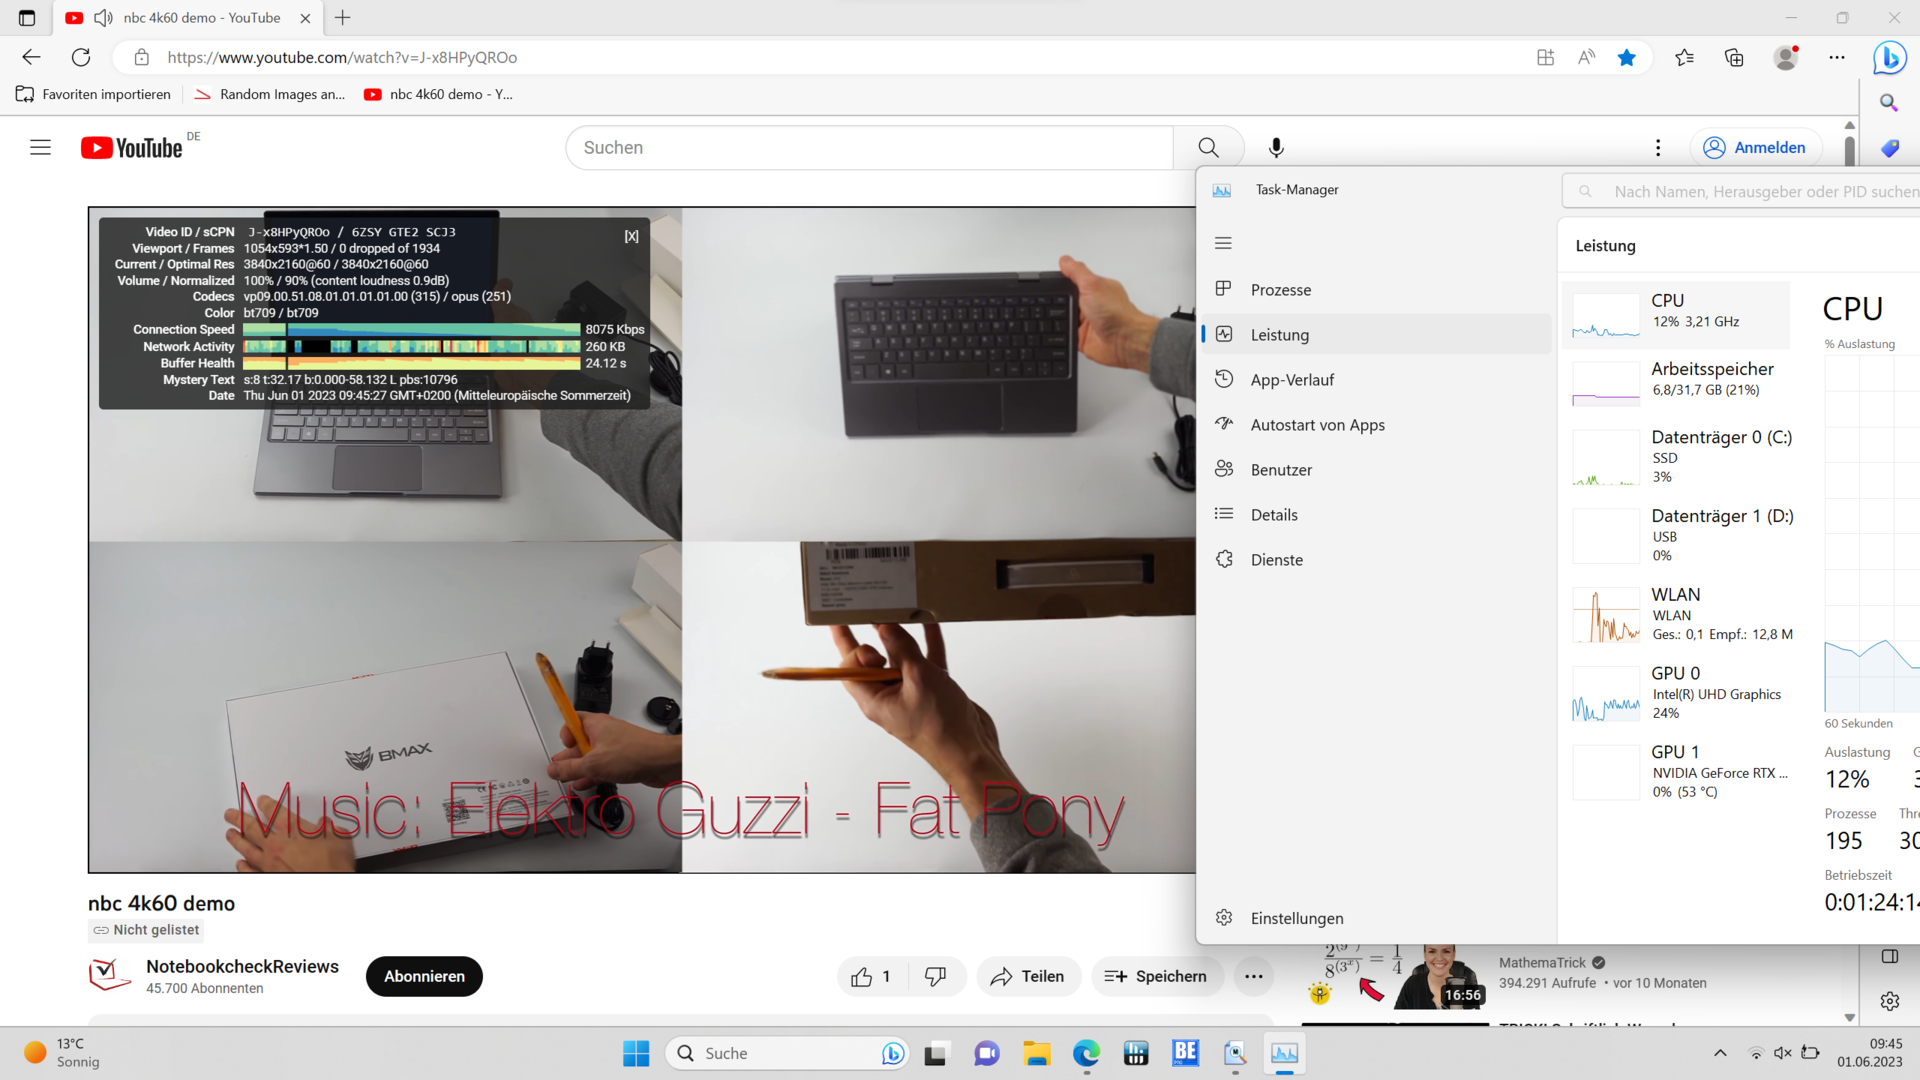
As maiores dificuldades são causadas pelo driver da placa de vídeo da Nvidia, que, espera-se, será aprimorado por meio de uma atualização no futuro. Também digno de elogio, e de forma alguma a norma, é a reprodução suave de vídeo em 4K sem queda de quadros. Portanto, a construção atual e o equipamento do driver parecem estar em harmonia.
| DPC Latencies / LatencyMon - interrupt to process latency (max), Web, Youtube, Prime95 | |
| Schenker XMG Neo 17 M22 | |
| Medion Erazer Defender P40 | |
| HP Omen 17-ck2097ng | |
| Medion Erazer Major X20 | |
| Schenker XMG Focus 17 (E23) | |
| Lenovo Legion Pro 5 16ARX8 | |
* ... menor é melhor
Armazenamento em massa
O SSD Crucial P5 Plus M.2 instalado não é um modelo premium. No entanto, ele atinge boas taxas de transferência via PCIe 4.0 e permanece muito estável no teste de longo prazo, o que se deve ao resfriamento adicional na placa de base do laptop para jogos.
Portanto, não se pode esperar obstruções ou atrasos durante o carregamento, a execução de programas, etc., do armazenamento em massa.

* ... menor é melhor
Continuous reading: DiskSpd Read Loop, Queue Depth 8
Placa de vídeo
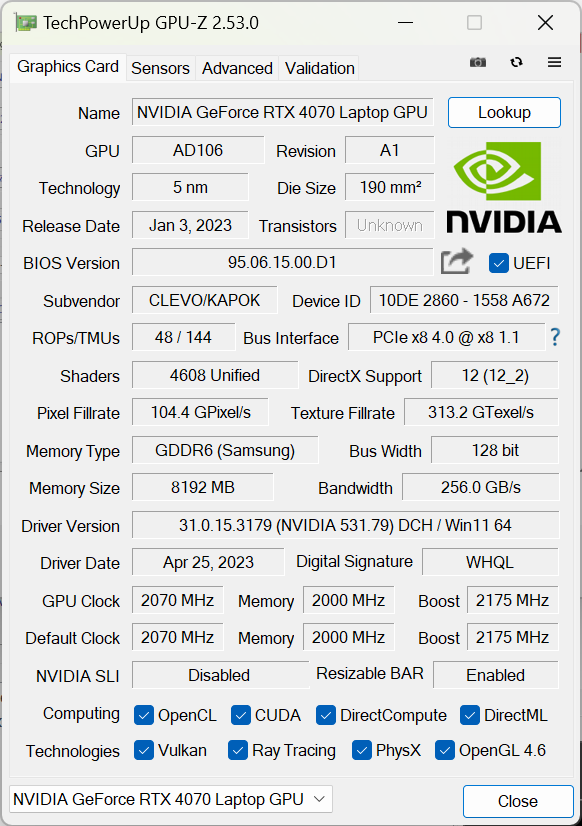
Apenas algumas GPUs são mais rápidas do que a Nvidia GeForce RTX 4070, que pode ser classificada corretamente na faixa intermediária superior. Ela oferece 4.608 shaders, 144 núcleos de tensor para Nvidia DLSS e 36 núcleos de traçado de raio. Isso é suficiente para tarefas exigentes e jogos complexos com o mais alto nível de detalhes. Apenas a VRAM é um pouco limitada, com 8 GB. No entanto, isso só deve causar problemas quando um monitor 4K estiver conectado. Em testes aleatórios individuais na resolução QHD nativa da tela, mais de 7 GB nunca foram ocupados nos jogos atuais
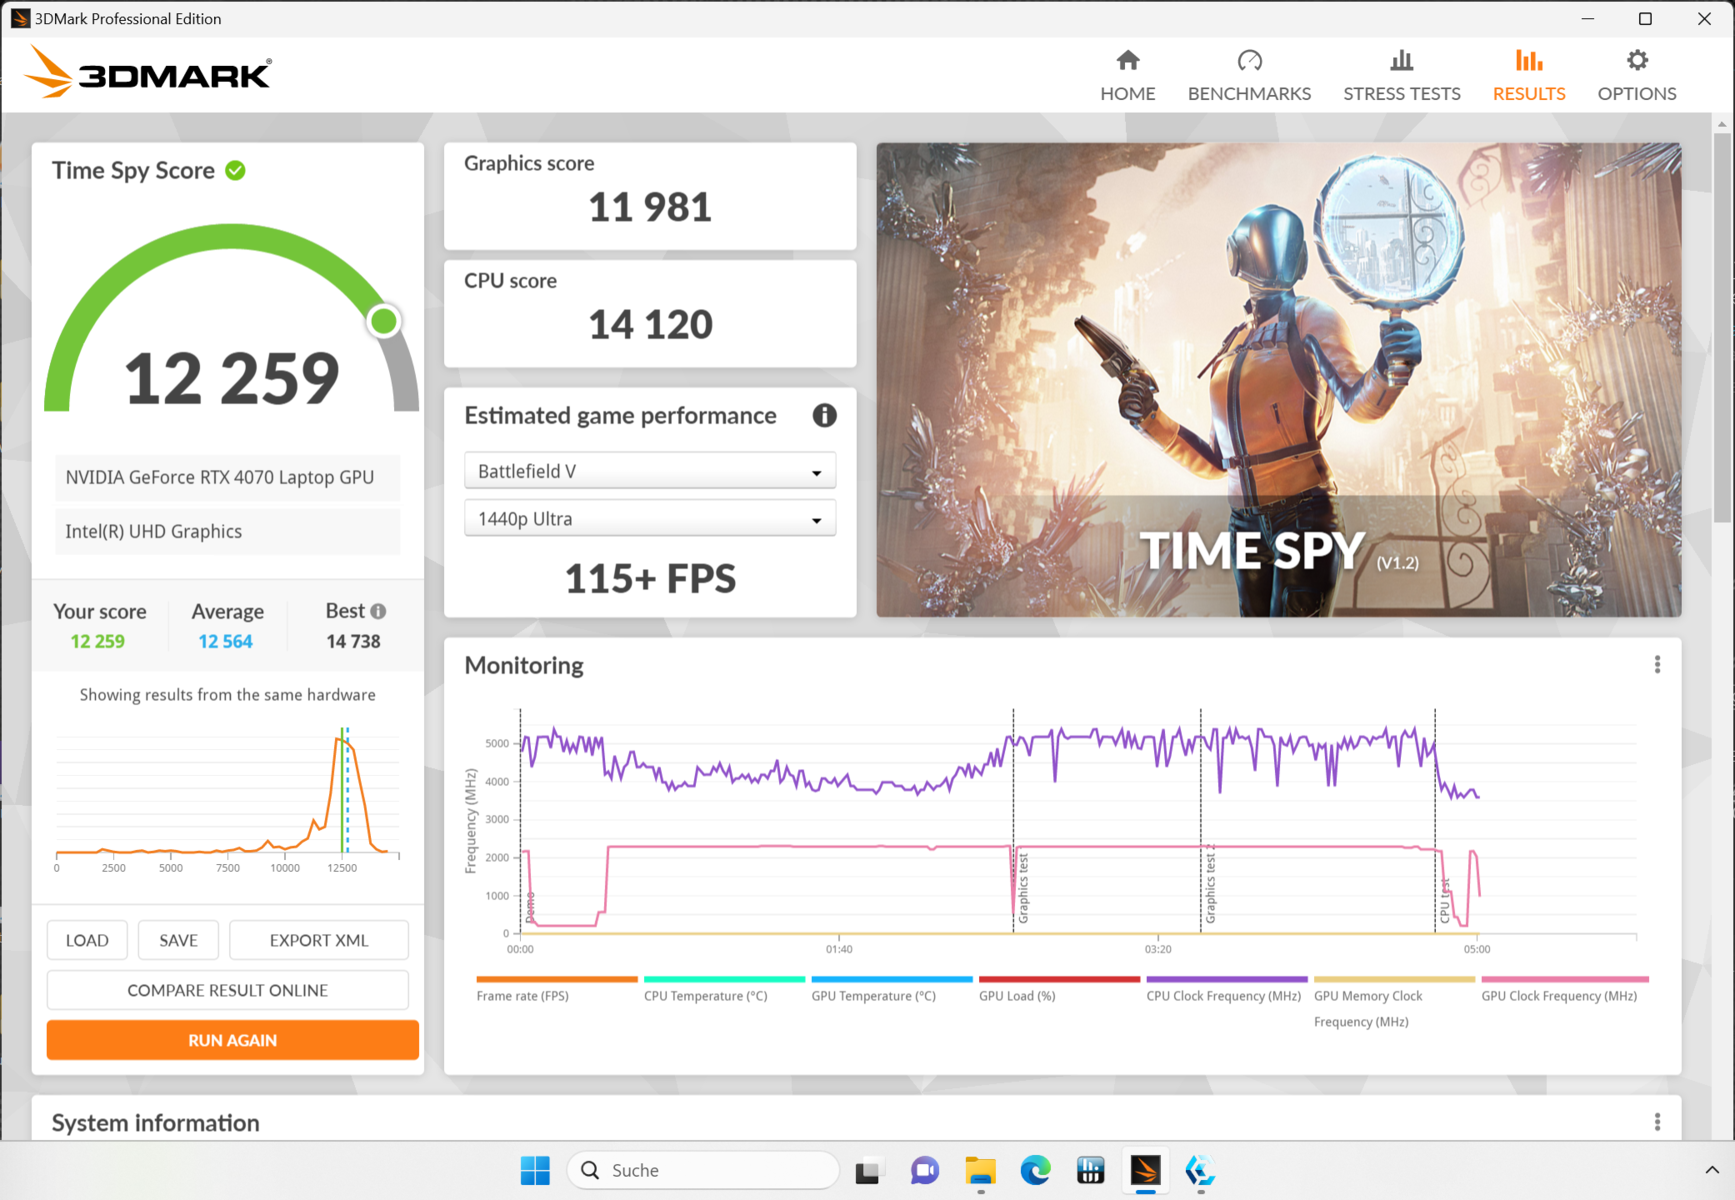
No Focus 17 E23, o chip gráfico pode consumir um máximo de 140 W, sendo que 25 W são desviados do processador como um aumento dinâmico. Isso corresponde às configurações típicas da RTX 4070 em um laptop para jogos. No entanto, os benchmarks sintéticos que realizamos ficaram um pouco aquém das expectativas porque o alto consumo de energia não pode ser mantido ao longo do tempo.
Nas pontuações do 3DMark, bem como nos jogos, o Focus 17 sempre fica atrás de um equipamento quase idêntico Medion Erazer Major X20 ou do Lenovo Legion Pro 5 com uma CPU diferente. Aparentemente, o grande i9-13900HX com os requisitos de resfriamento correspondentes também atrapalha em vez de ajudar nos aplicativos gráficos. Além do Legion Pro, o Asus ROG Strix G18 com o RTX 4070 mas com o i7-13650HX menor pode ser mencionado como exemplo, que atinge aproximadamente as mesmas taxas de desempenho.
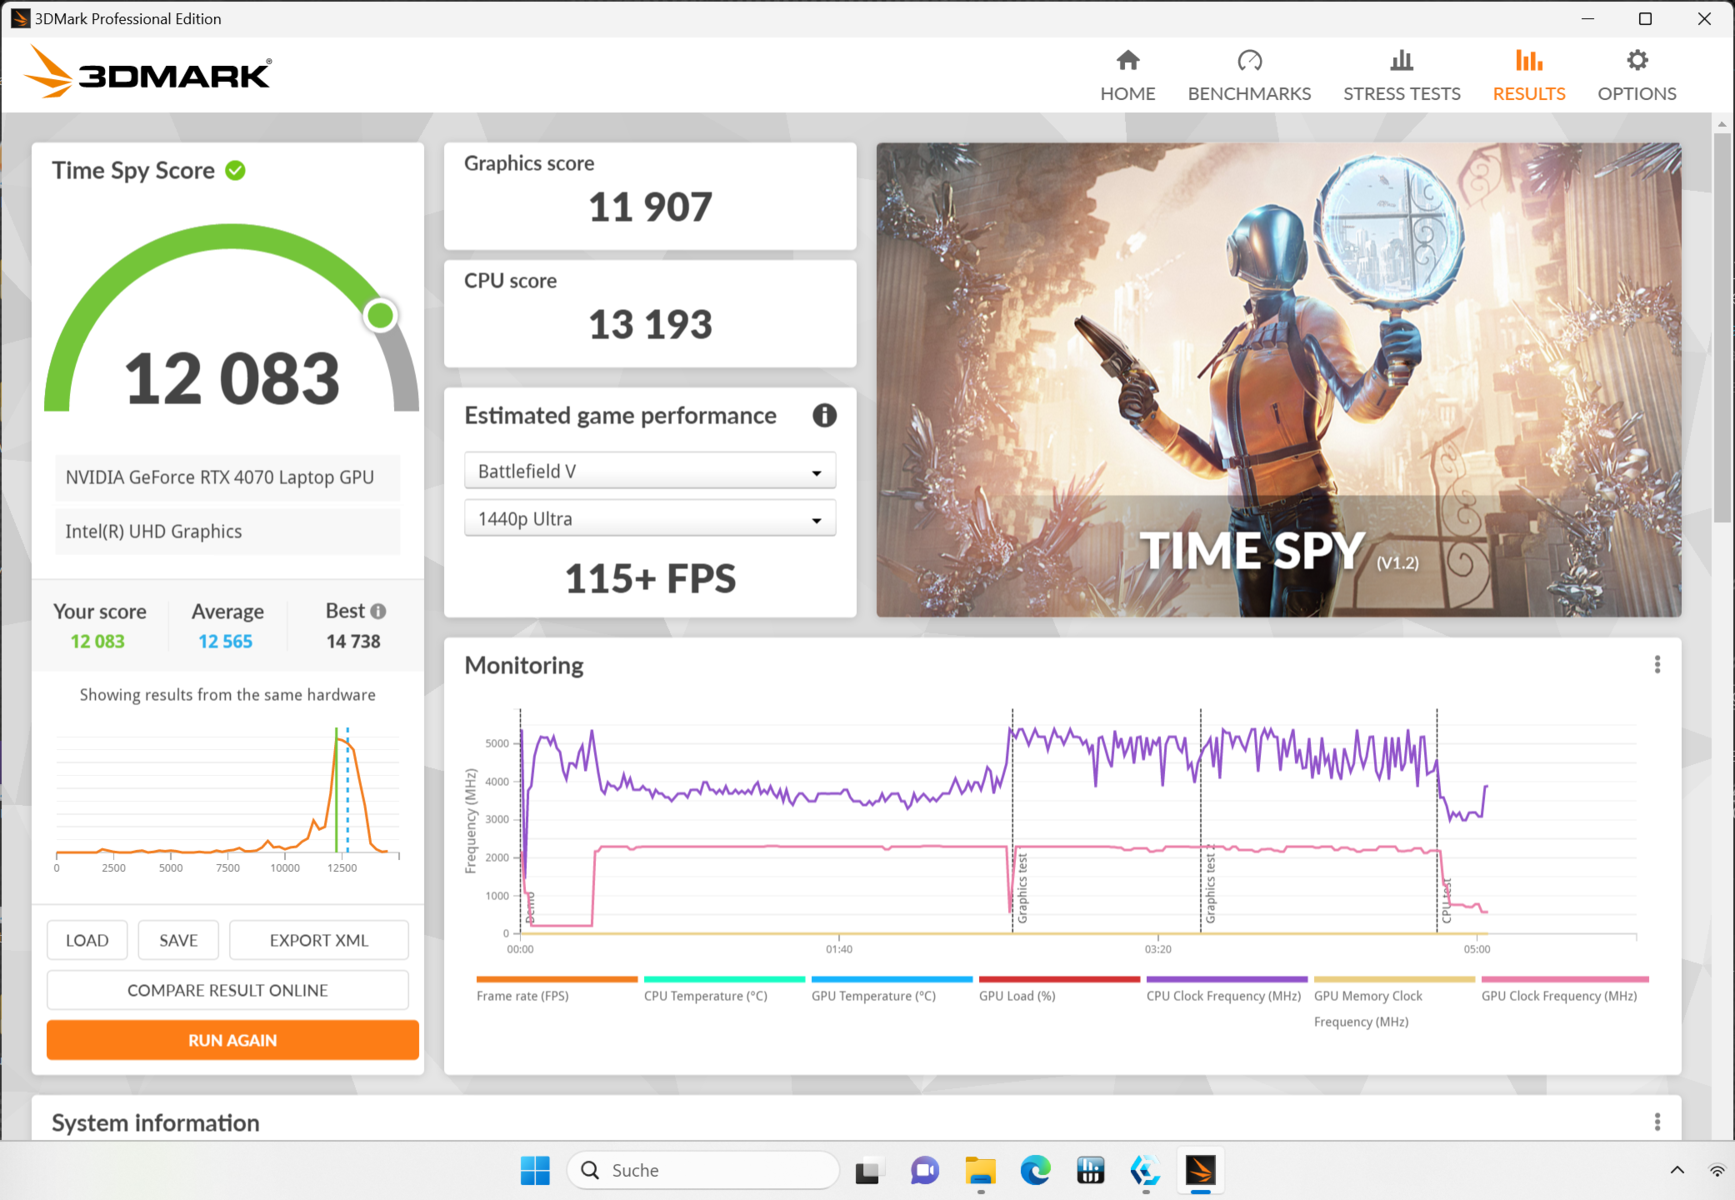
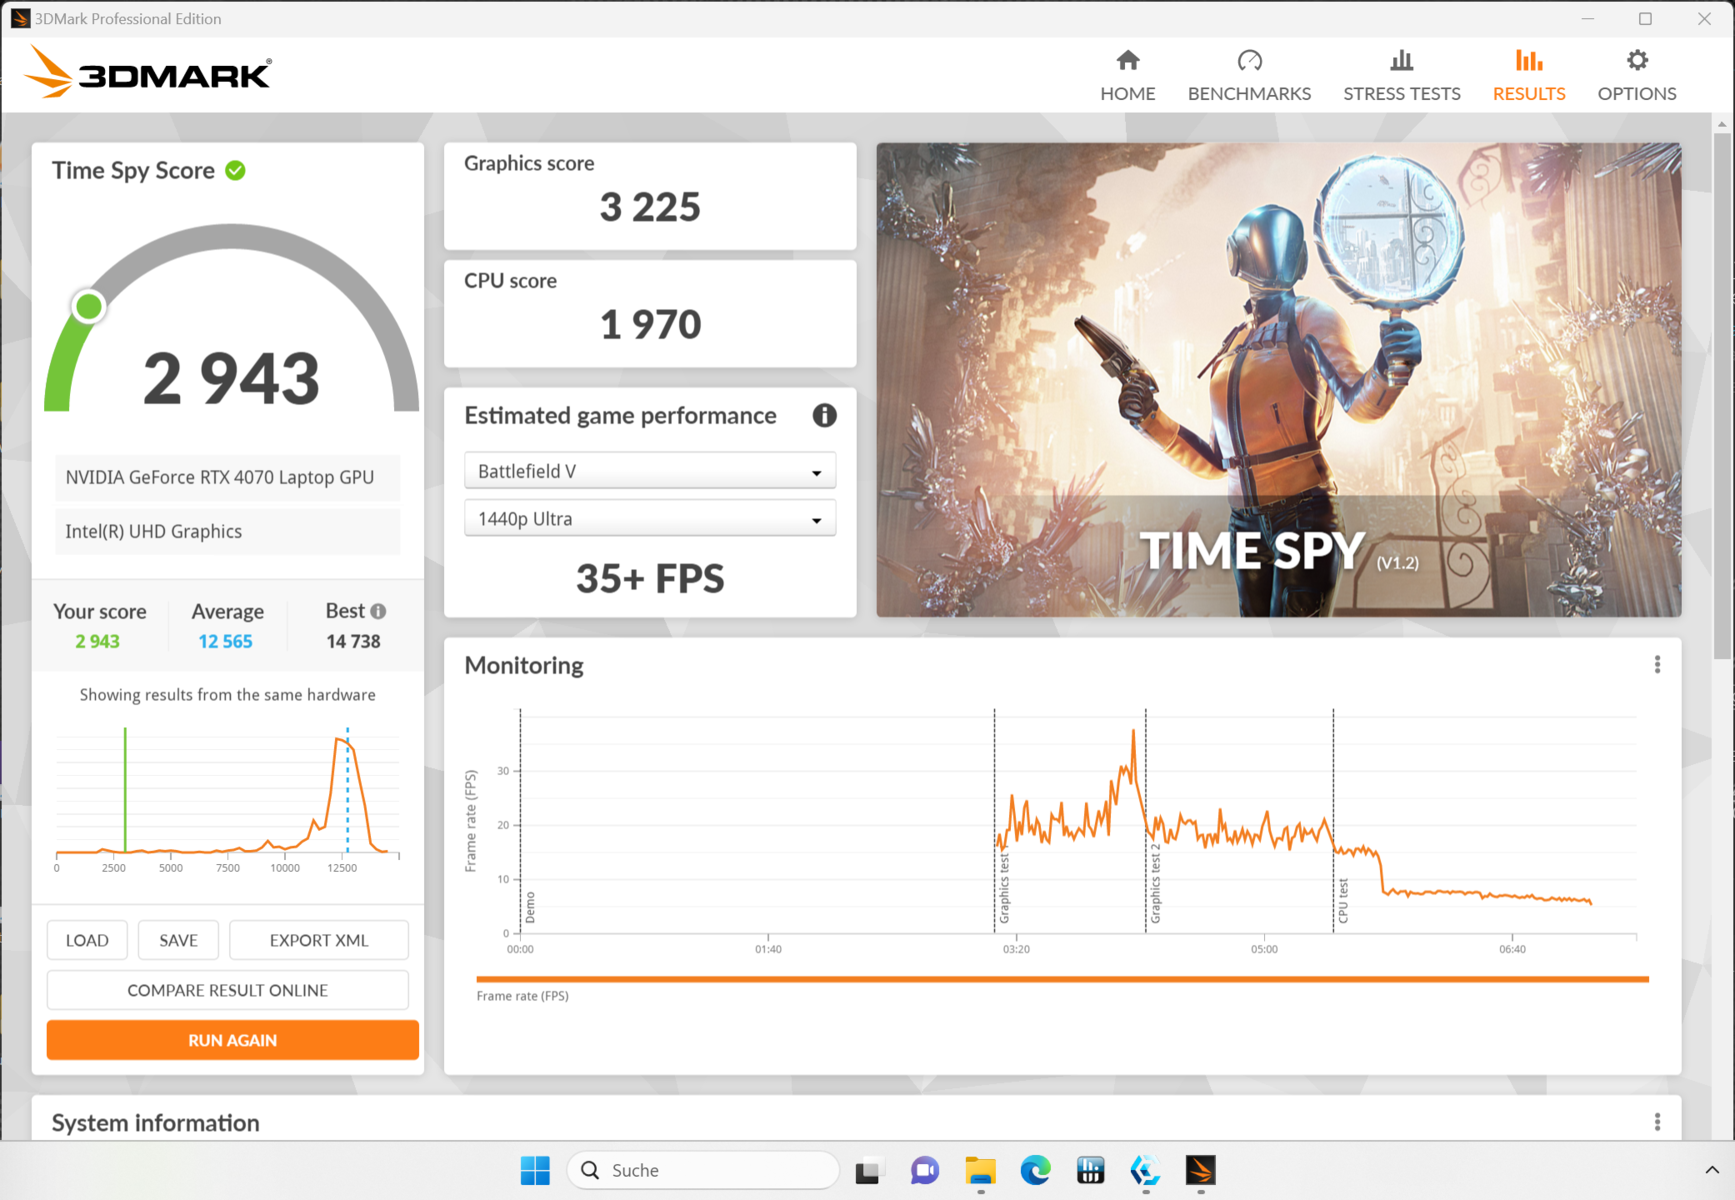
Além disso, os modos de desempenho ainda não parecem maduros. Comparando os resultados no benchmark Time Spy, os modos de desempenho e entretenimento estão quase no mesmo nível. Mesmo em jogos individuais que testamos, a diferença no FPS medido foi mínima. Por outro lado, o modo silencioso, que pelo menos funciona de forma muito silenciosa, apresenta uma queda muito significativa. Os 2.943 pontos alcançados também foram obtidos pelo AMD Radeon 780M, um chip gráfico integrado
Mais benchmarks e dados de desempenho podem ser encontrados em nossa lista de benchmarks de GPU Mobile Graphics Cards - Benchmark List .
| 3DMark 11 Performance | 33424 pontos | |
| 3DMark Cloud Gate Standard Score | 58621 pontos | |
| 3DMark Fire Strike Score | 25541 pontos | |
| 3DMark Time Spy Score | 12339 pontos | |
Ajuda | ||
* ... menor é melhor
Desempenho em jogos
Todos os jogos que testamos atingem taxas de quadros pelo menos satisfatórias. As taxas só ficam abaixo de 60 fps em jogos atuais e bastante exigentes com o mais alto nível de detalhes e resolução QHD. Portanto, o hardware deve ser suficiente para jogos futuros por um bom tempo. A maioria dos jogos é jogável com 100 fps ou mais quando você abre mão de alguns detalhes e usa a resolução Full HD
O XMG Focus 17 está classificado entre nossos rivais selecionados com GPUs idênticas nos jogos para os quais há taxas de comparação disponíveis. Ele também está praticamente no mesmo nível de um MSI Titan GT77 com uma RTX 3080 Ti, que era cerca de duas vezes mais caro quando foi lançado no ano passado. Os notebooks para jogos com a GPU antecessora RTX 3070 podem ser superados em mais de 10%, dependendo do modelo.
Como a CPU é menos estressada nos jogos do que em muitos outros benchmarks, o resfriamento um tanto fraco não importa muito. Somente a GPU precisa dissipar muito calor, enquanto o desempenho do processador pode ser reduzido sem perdas significativas na taxa de quadros. Portanto, o notebook XMG não mostra nenhuma fraqueza em jogos, embora alguns pontos percentuais a mais sob carga total pareçam realistas.
Entre outras coisas, o máximo possível de 140 W que a GPU pode consumir quase nunca é atingido. Conseguimos provocar um único pico de medição de 143 W em um cenário especial do nosso teste de estresse. Fora isso, o consumo médio de energia em jogos é de 100 W, o que, mais uma vez, está bem abaixo dos 115 W que o chip gráfico deveria consumir mesmo sem um aumento dinâmico.
Tudo indica que o sistema de resfriamento não consegue dissipar o calor residual com rapidez suficiente. A Schenker XMG já demonstrou várias vezes que uma ventoinha de notebook também pode suportar o consumo máximo de energia do chip gráfico em uma base permanente - veja, por exemplo, o XMG Neo 16 E23.
| Star Wars Jedi Survivor | |
| 1920x1080 Epic Preset | |
| Lenovo Legion Pro 5 16ARX8 | |
| Schenker XMG Focus 17 (E23) | |
| Média NVIDIA GeForce RTX 4070 Laptop GPU (61.5 - 80.1, n=8) | |
| Medion Erazer Defender P40 | |
| 2560x1440 Epic Preset | |
| Lenovo Legion Pro 5 16ARX8 | |
| Média NVIDIA GeForce RTX 4070 Laptop GPU (39.5 - 51.1, n=8) | |
| Schenker XMG Focus 17 (E23) | |
| Medion Erazer Defender P40 | |
O teste de resistência com Witcher 3 não traz nenhuma surpresa. Isso deve ser entendido como totalmente positivo. Não foi possível observar quedas de desempenho ou aceleração constante. As flutuações típicas podem ser explicadas pela mudança da hora do dia no jogo. Da mesma forma, não devem ser observadas taxas de quadros decrescentes em outros jogos ao longo do tempo.
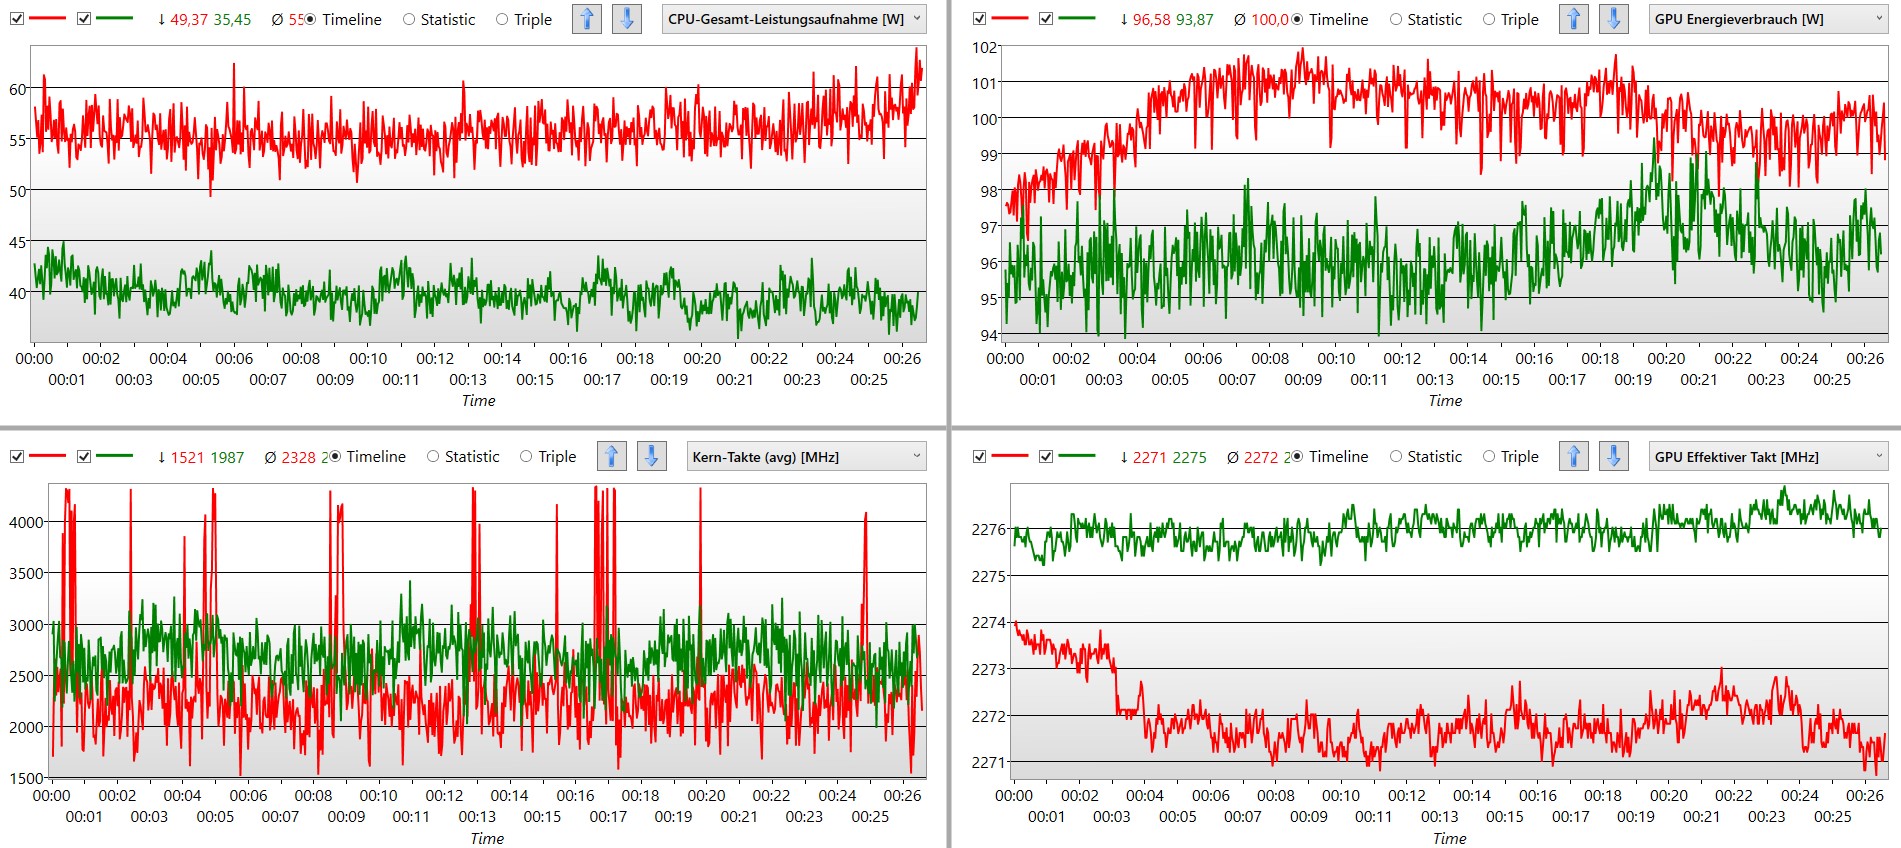
No teste de resistência do jogo, pudemos verificar mais uma vez como os modos de entretenimento e desempenho se comportam. No modo de entretenimento, o sistema requer quase 20 W a menos, enquanto a GPU tem uma taxa de clock mais alta do que no modo de desempenho. O comportamento da CPU parece mais regular e, normalmente, a taxa de clock (verde) também é um pouco mais alta em comparação com o modo de desempenho. Com menos consumo de energia e um desenvolvimento de ruído ligeiramente menor, também medimos a taxa de quadros idêntica.
Witcher 3 FPS chart
| baixo | média | alto | ultra | QHD | |
|---|---|---|---|---|---|
| GTA V (2015) | 180.8 | 117.4 | 88.5 | ||
| The Witcher 3 (2015) | 226 | 115 | |||
| Dota 2 Reborn (2015) | 177.3 | 164.5 | |||
| Final Fantasy XV Benchmark (2018) | 114.8 | 81.3 | |||
| X-Plane 11.11 (2018) | 123 | ||||
| Far Cry 5 (2018) | 145 | 136 | 112 | ||
| Strange Brigade (2018) | 247 | 211 | 135.2 | ||
| Cyberpunk 2077 1.6 (2022) | 100.7 | 102.3 | 63.9 | ||
| F1 22 (2022) | 211 | 77.8 | 49 | ||
| Hogwarts Legacy (2023) | 86 | 71 | 50 | ||
| Star Wars Jedi Survivor (2023) | 79 | 73 | 45 |
Emissões - O Focus 17 pode ser silencioso
Emissões de ruído
O Focus 17 é um dos representantes mais barulhentos de sua categoria. Ele é claramente audível com cerca de 58 dB, mesmo através de uma porta fechada. No entanto, oMedion Erazer Defender P40 demonstra que ele pode ser ainda mais barulhento. Apesar do chip gráfico menor, ele atinge claramente mais de 60 dB.
O aumento da velocidade da ventoinha durante o uso normal do laptop, longe da carga permanente, é evidente. O resfriamento é iniciado sem motivo aparente. Alguns segundos depois, a velocidade é reduzida novamente. Por outro lado, a velocidade permanece constante durante os jogos, portanto, um ruído permanente é audível, mas sem mudanças incômodas de velocidade.
Medimos alguns decibéis a menos em Witcher 3 no modo de entretenimento, o que é bastante perceptível. A propósito, os fps permanecem constantes. No "modo silencioso", são medidos 15 dB a menos, o que equivale a um terço do volume original. Nesse caso, o notebook é audível, mas não chega a incomodar, mesmo em um ambiente silencioso. Ainda medimos um pouco menos da metade da taxa de quadros em Witcher 3. O jogo ainda pode ser jogado a 60 fps nas configurações de detalhes mais altas, o que provavelmente é verdade para muitos títulos não muito exigentes ou um pouco mais antigos, que também podem ser jogados tão silenciosamente quanto um sussurro.
Barulho
| Ocioso |
| 24 / 24 / 26.47 dB |
| Carga |
| 55.72 / 57.94 dB |
 | ||
30 dB silencioso 40 dB(A) audível 50 dB(A) ruidosamente alto |
||
min: | ||
| Schenker XMG Focus 17 (E23) GeForce RTX 4070 Laptop GPU, i9-13900HX, Crucial P5 Plus 1TB CT1000P5PSSD8 | Lenovo Legion Pro 5 16ARX8 GeForce RTX 4070 Laptop GPU, R7 7745HX, Samsung PM9A1 MZVL21T0HCLR | Medion Erazer Major X20 GeForce RTX 4070 Laptop GPU, i9-13900HX, Phison E18-1TB-PHISON-SSD-B47R | Schenker XMG Neo 17 M22 GeForce RTX 3080 Ti Laptop GPU, R9 6900HX, Samsung SSD 980 Pro 1TB MZ-V8P1T0BW | HP Omen 17-ck2097ng GeForce RTX 4080 Laptop GPU, i9-13900HX, SK hynix PC801 HFS001TEJ9X101N | Medion Erazer Defender P40 GeForce RTX 4060 Laptop GPU, i7-13700HX, Phison PS5021-E21 1TB | |
|---|---|---|---|---|---|---|
| Noise | 11% | -3% | -8% | -5% | -7% | |
| desligado / ambiente * (dB) | 24 | 23.2 3% | 24 -0% | 26 -8% | 24 -0% | 25 -4% |
| Idle Minimum * (dB) | 24 | 23.2 3% | 25 -4% | 26 -8% | 31 -29% | 26 -8% |
| Idle Average * (dB) | 24 | 23.2 3% | 29 -21% | 29 -21% | 32 -33% | 27 -13% |
| Idle Maximum * (dB) | 26.47 | 26.2 1% | 31 -17% | 40 -51% | 33 -25% | 32 -21% |
| Load Average * (dB) | 55.72 | 31.4 44% | 50 10% | 47 16% | 45 19% | 53 5% |
| Witcher 3 ultra * (dB) | 57.94 | 48.4 16% | 53 9% | 52 10% | 45 22% | 56 3% |
| Load Maximum * (dB) | 57.94 | 53.8 7% | 57 2% | 54 7% | 50 14% | 64 -10% |
* ... menor é melhor
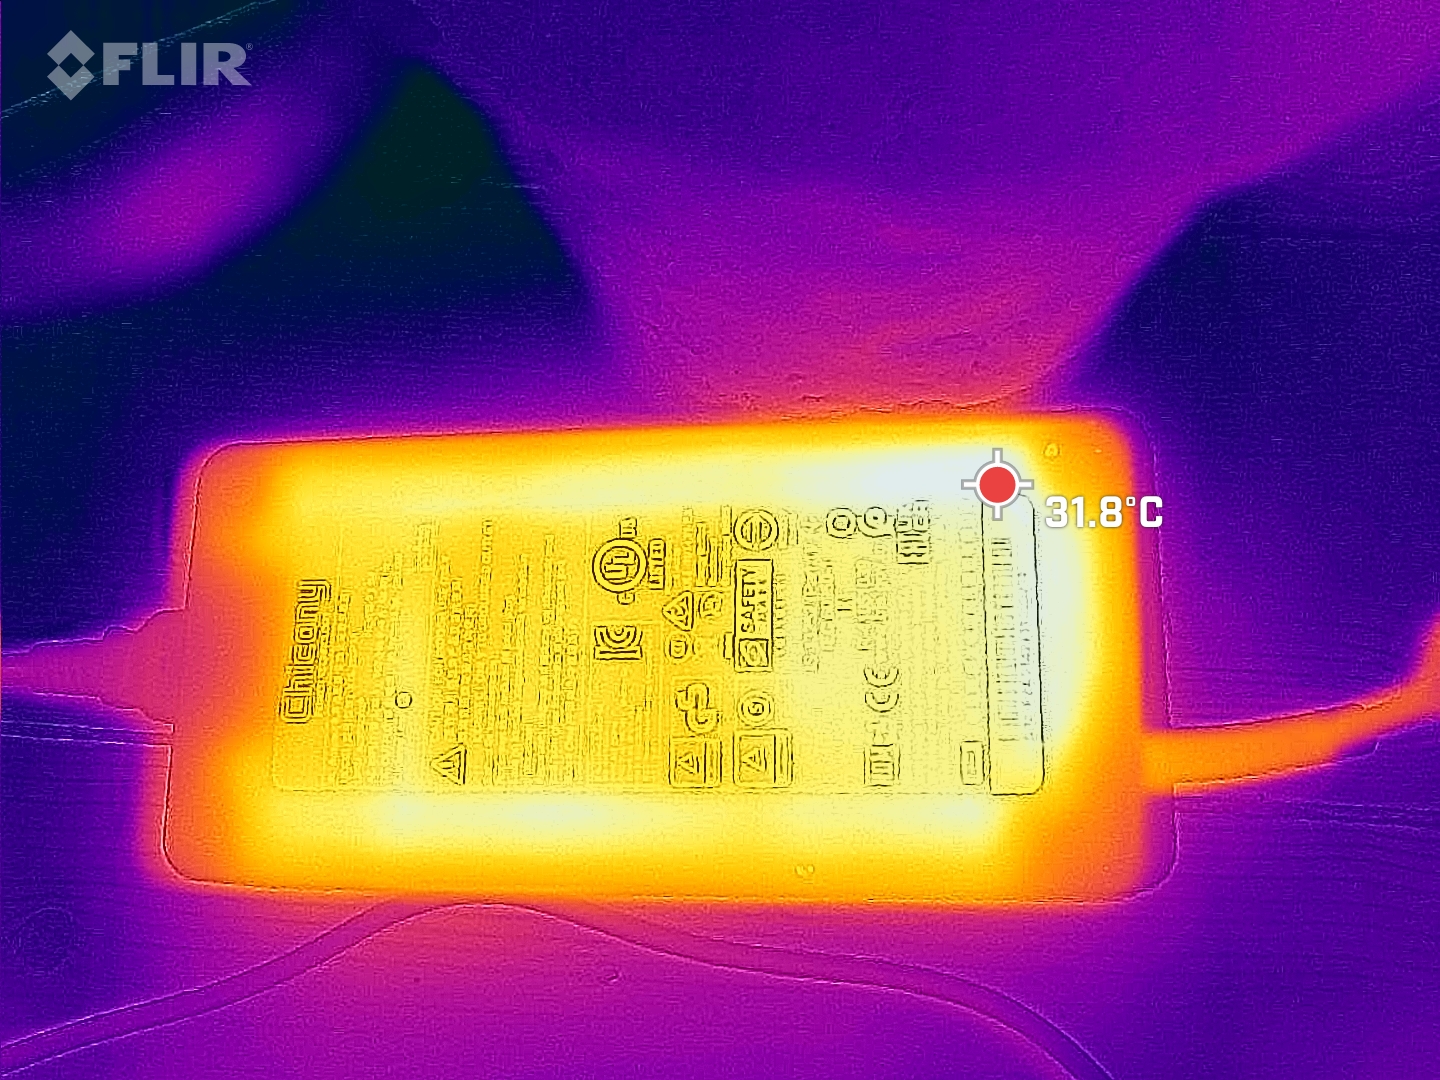
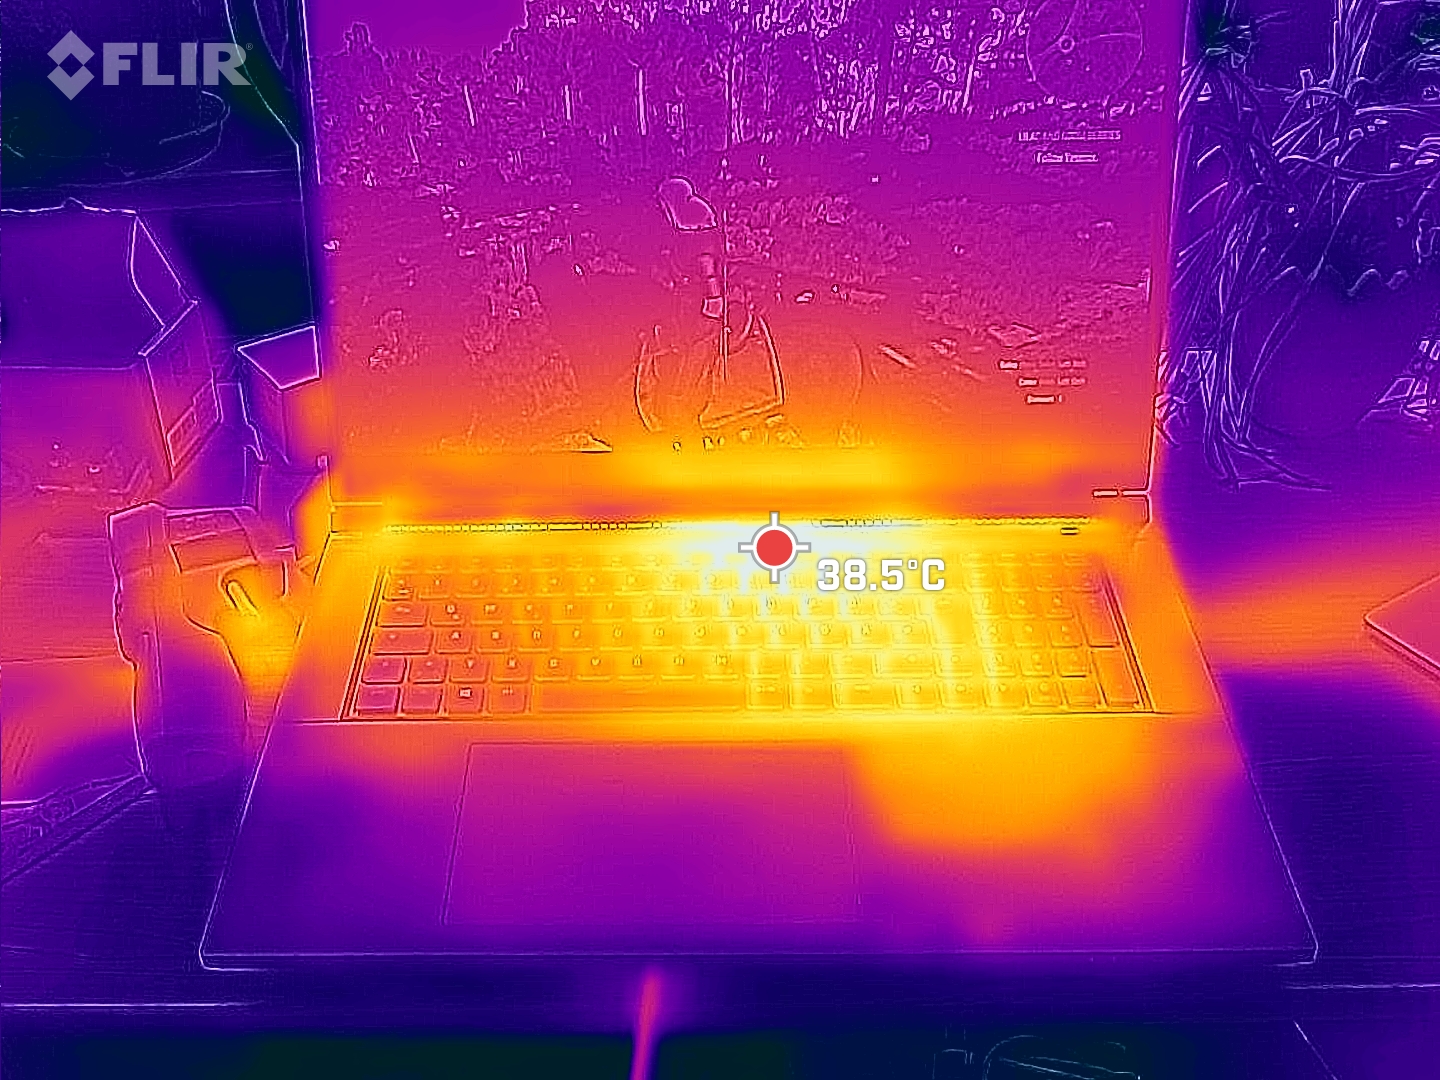
Temperatura
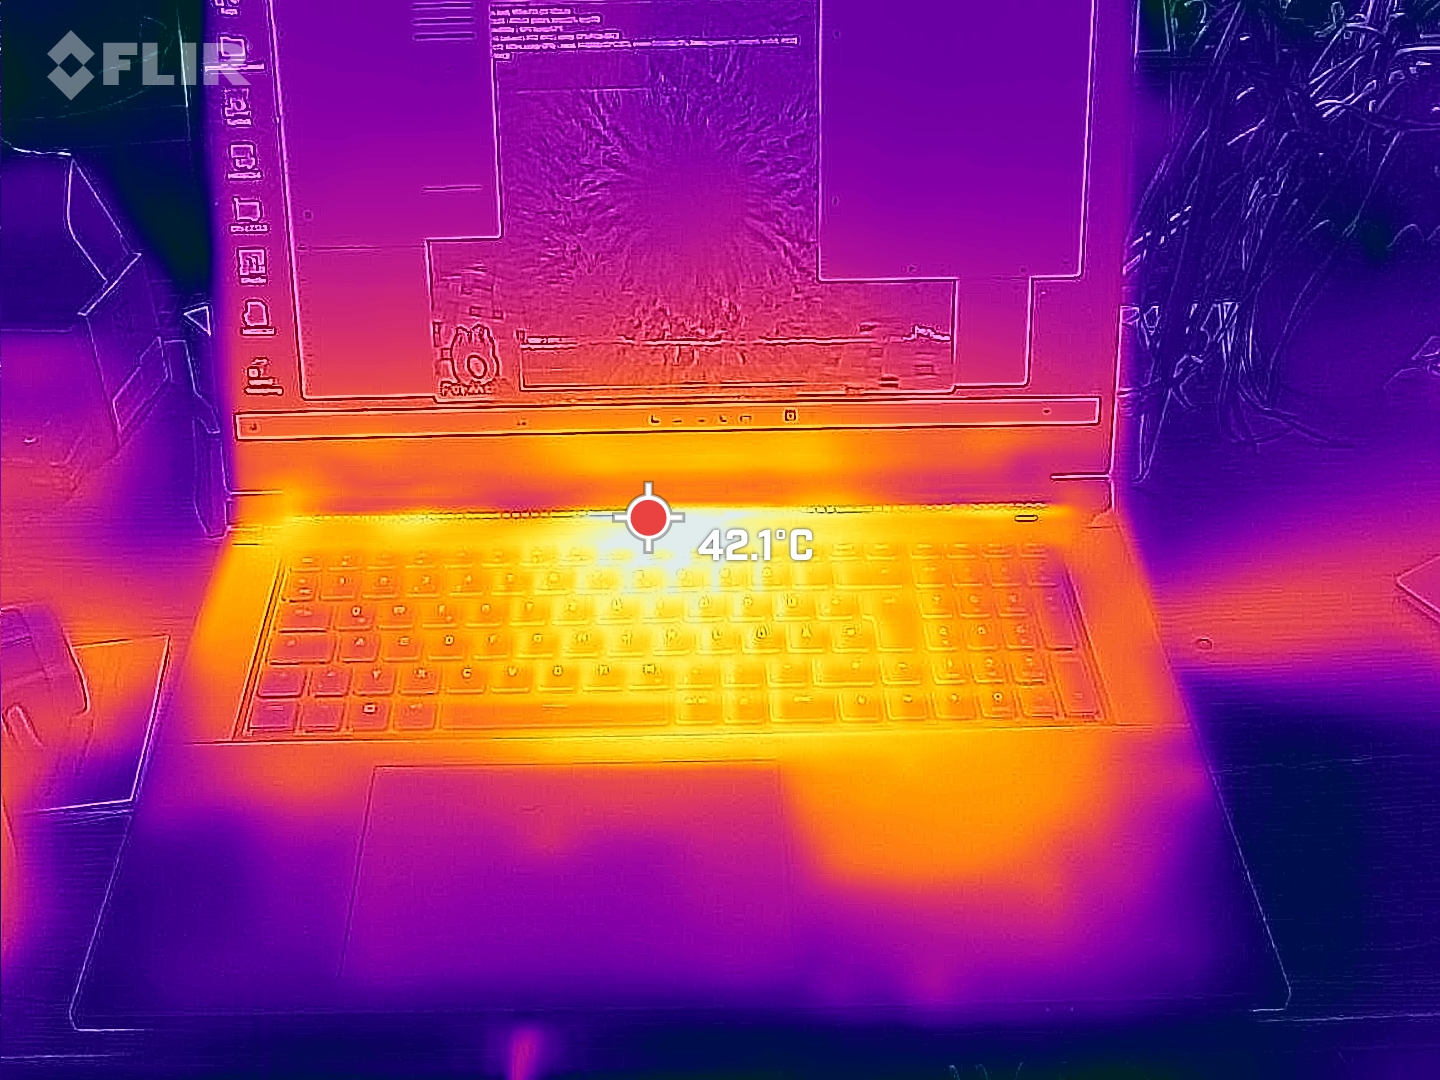
Os apoios para as mãos estão quentes, mas de forma alguma quentes (medimos um máximo de 36 °C). No entanto, a temperatura já está em 42 °C na área principal, e ainda está em 40 °C à direita do centro. À esquerda, o laptop para jogos permanece um pouco mais frio. Isso pode ser irritante, especialmente em dias quentes, quando se digita e joga.
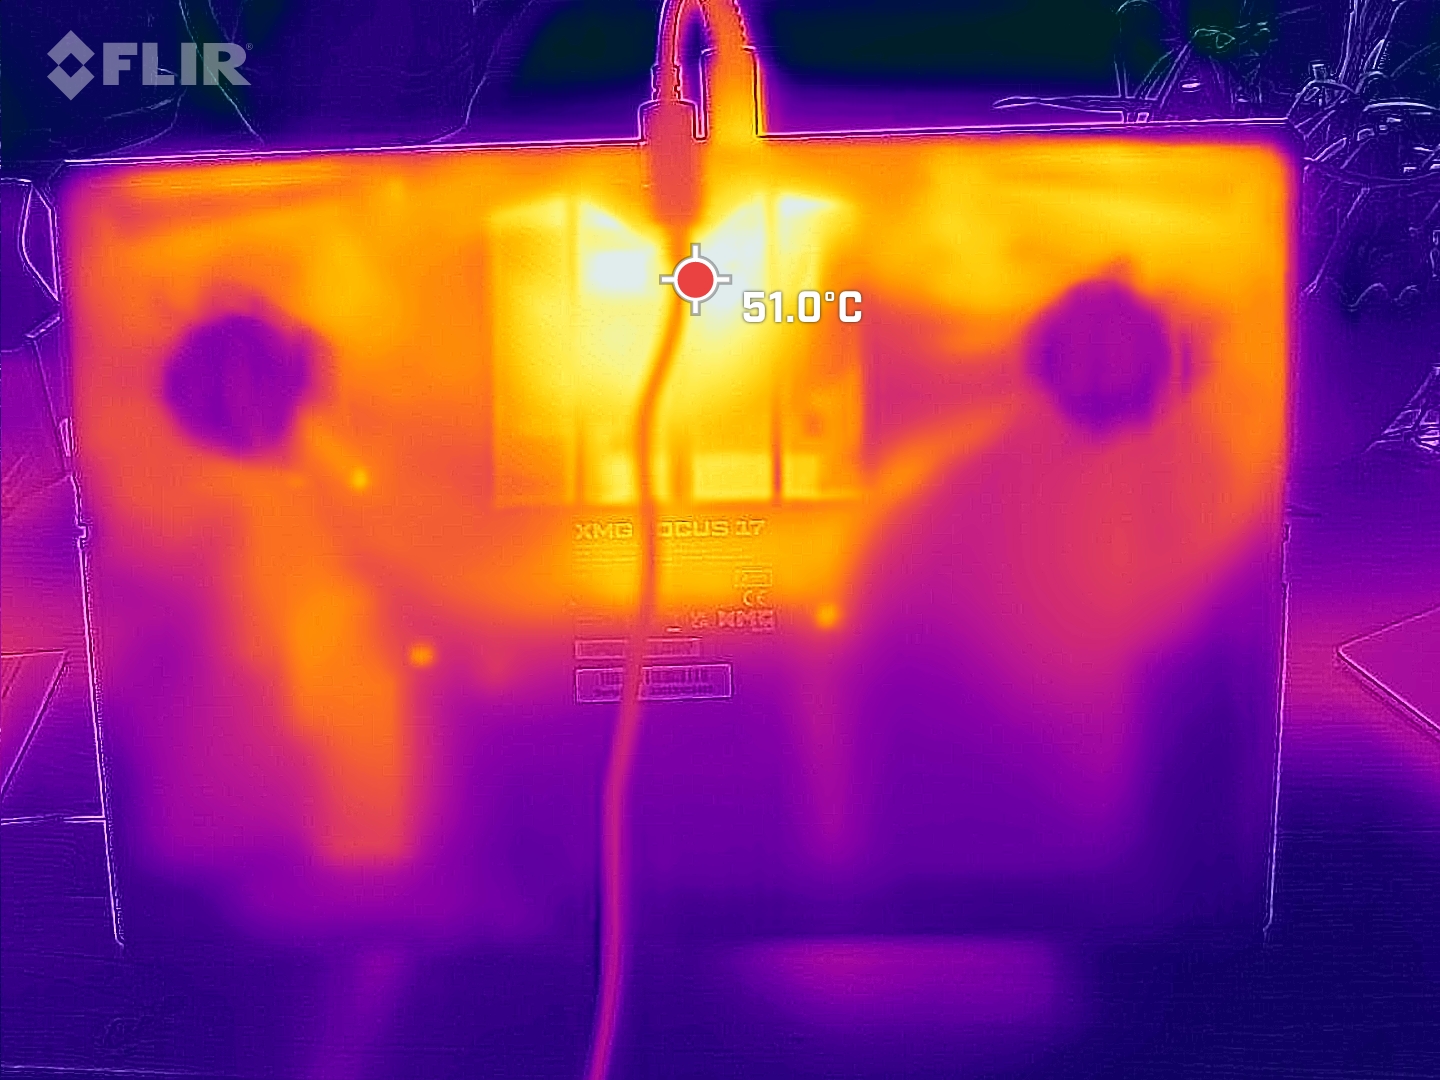
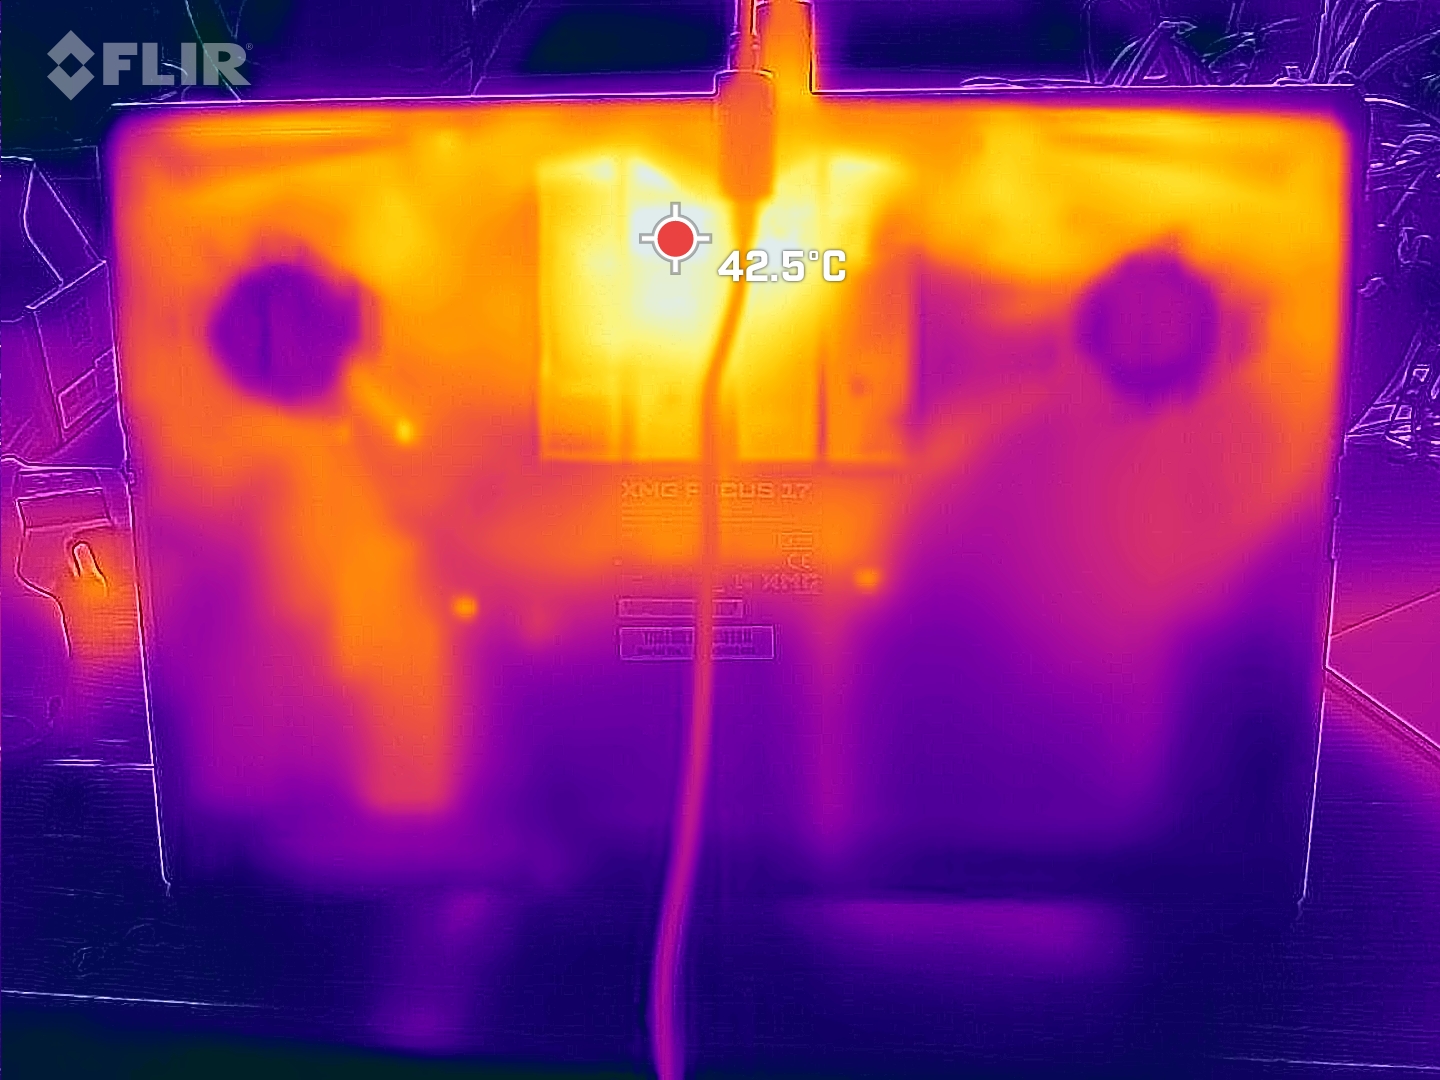
A parte inferior esquenta mesmo sem carga significativa, portanto o XMG Focus 17 E23 só deve ser usado em uma superfície plana e dura.
(-) A temperatura máxima no lado superior é 50 °C / 122 F, em comparação com a média de 40.4 °C / 105 F , variando de 21.2 a 68.8 °C para a classe Gaming.
(-) A parte inferior aquece até um máximo de 56 °C / 133 F, em comparação com a média de 43.2 °C / 110 F
(+) Em uso inativo, a temperatura média para o lado superior é 30.9 °C / 88 F, em comparação com a média do dispositivo de 33.9 °C / ### class_avg_f### F.
(±) Jogando The Witcher 3, a temperatura média para o lado superior é 36.8 °C / 98 F, em comparação com a média do dispositivo de 33.9 °C / ## #class_avg_f### F.
(±) Os apoios para as mãos e o touchpad podem ficar muito quentes ao toque, com um máximo de 37 °C / 98.6 F.
(-) A temperatura média da área do apoio para as mãos de dispositivos semelhantes foi 28.8 °C / 83.8 F (-8.2 °C / -14.8 F).
| Schenker XMG Focus 17 (E23) Intel Core i9-13900HX, NVIDIA GeForce RTX 4070 Laptop GPU | Lenovo Legion Pro 5 16ARX8 AMD Ryzen 7 7745HX, NVIDIA GeForce RTX 4070 Laptop GPU | Medion Erazer Major X20 Intel Core i9-13900HX, NVIDIA GeForce RTX 4070 Laptop GPU | Schenker XMG Neo 17 M22 AMD Ryzen 9 6900HX, NVIDIA GeForce RTX 3080 Ti Laptop GPU | HP Omen 17-ck2097ng Intel Core i9-13900HX, NVIDIA GeForce RTX 4080 Laptop GPU | Medion Erazer Defender P40 Intel Core i7-13700HX, NVIDIA GeForce RTX 4060 Laptop GPU | |
|---|---|---|---|---|---|---|
| Heat | 20% | 4% | 9% | 23% | 19% | |
| Maximum Upper Side * (°C) | 50 | 41.8 16% | 46 8% | 49 2% | 41 18% | 42 16% |
| Maximum Bottom * (°C) | 56 | 41.4 26% | 49 12% | 52 7% | 51 9% | 45 20% |
| Idle Upper Side * (°C) | 37 | 29 22% | 37 -0% | 30 19% | 24 35% | 28 24% |
| Idle Bottom * (°C) | 36 | 30.4 16% | 38 -6% | 33 8% | 25 31% | 30 17% |
* ... menor é melhor
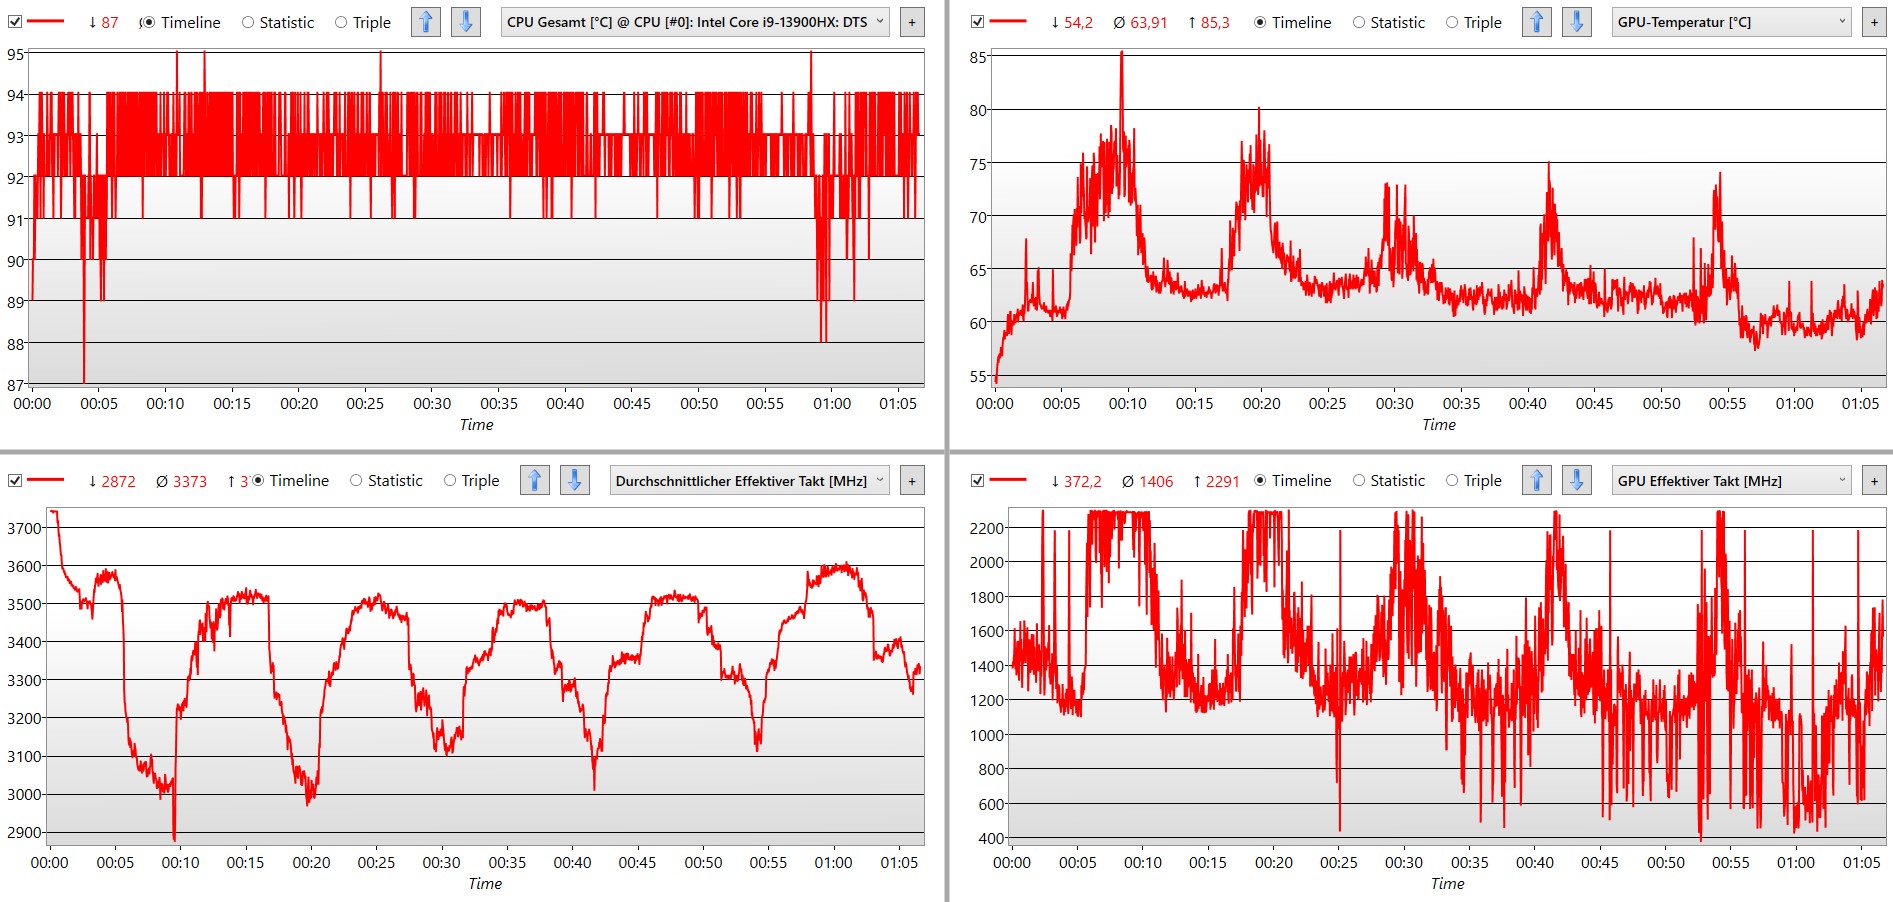
Teste de estresse
Em nosso teste de estresse com o Prime95 e o Furmark, a CPU atinge temperaturas superiores a 95 °C. A GPU, por outro lado, não é totalmente utilizada e oscila entre 60 e 75 °C. A fonte de alimentação é limitada nessa situação extrema e fica em torno de 200 W para a GPU e a CPU juntas, enquanto 240 W seriam teoricamente possíveis. Além disso, isso dura apenas alguns segundos antes que a fonte de alimentação e a taxa de clock sejam significativamente reduzidas.
O resfriamento não pode manter permanentemente o desempenho máximo, como é o caso, por exemplo, do XMG Neo 16 E23 é o caso.
Alto-falante
A reprodução do som é suficientemente potente para um notebook. Não há nada a reclamar, especialmente nas baixas frequências e nos agudos. A fala e os efeitos típicos de jogos com muita ação são bem reproduzidos.
Em música ou até mesmo em filmes, a falta de qualidade de som e a falta de médios e graves mais baixos, que é claramente perceptível em nossas medições, também pode ser ouvida. Para essas tarefas, não há como evitar o uso de alto-falantes externos ou fones de ouvido.
Schenker XMG Focus 17 (E23) análise de áudio
(±) | o volume do alto-falante é médio, mas bom (###valor### dB)
Graves 100 - 315Hz
(-) | quase nenhum baixo - em média 33.5% menor que a mediana
(+) | o baixo é linear (6.1% delta para a frequência anterior)
Médios 400 - 2.000 Hz
(±) | médios reduzidos - em média 7.2% menor que a mediana
(±) | a linearidade dos médios é média (9.5% delta para frequência anterior)
Altos 2 - 16 kHz
(+) | agudos equilibrados - apenas 4.4% longe da mediana
(+) | os máximos são lineares (5.2% delta da frequência anterior)
Geral 100 - 16.000 Hz
(±) | a linearidade do som geral é média (26.9% diferença em relação à mediana)
Comparado com a mesma classe
» 93% de todos os dispositivos testados nesta classe foram melhores, 2% semelhantes, 5% piores
» O melhor teve um delta de 6%, a média foi 18%, o pior foi 132%
Comparado com todos os dispositivos testados
» 82% de todos os dispositivos testados foram melhores, 4% semelhantes, 14% piores
» O melhor teve um delta de 4%, a média foi 23%, o pior foi 134%
Apple MacBook Pro 16 2021 M1 Pro análise de áudio
(+) | os alto-falantes podem tocar relativamente alto (###valor### dB)
Graves 100 - 315Hz
(+) | bons graves - apenas 3.8% longe da mediana
(+) | o baixo é linear (5.2% delta para a frequência anterior)
Médios 400 - 2.000 Hz
(+) | médios equilibrados - apenas 1.3% longe da mediana
(+) | médios são lineares (2.1% delta para frequência anterior)
Altos 2 - 16 kHz
(+) | agudos equilibrados - apenas 1.9% longe da mediana
(+) | os máximos são lineares (2.7% delta da frequência anterior)
Geral 100 - 16.000 Hz
(+) | o som geral é linear (4.6% diferença em relação à mediana)
Comparado com a mesma classe
» 0% de todos os dispositivos testados nesta classe foram melhores, 0% semelhantes, 100% piores
» O melhor teve um delta de 5%, a média foi 17%, o pior foi 45%
Comparado com todos os dispositivos testados
» 0% de todos os dispositivos testados foram melhores, 0% semelhantes, 100% piores
» O melhor teve um delta de 4%, a média foi 23%, o pior foi 134%
Gerenciamento de energia - A CPU potente do notebook para jogos consome muita energia
Consumo de energia
O consumo de energia é claramente muito alto quando nenhum processo está em execução. Especialmente os rivais com processadores AMD, como o XMG Neo 17 M22 conseguem usar menos da metade da energia.
O Focus 17 também não é econômico sob carga. Ele precisa de um terço a mais de energia para uma taxa de quadros idêntica em Witcher 3 do que o Lenovo Legion Pro 5. Isso não é eficiente e explica, em grande parte, por que o Legion é apenas metade do ruído.
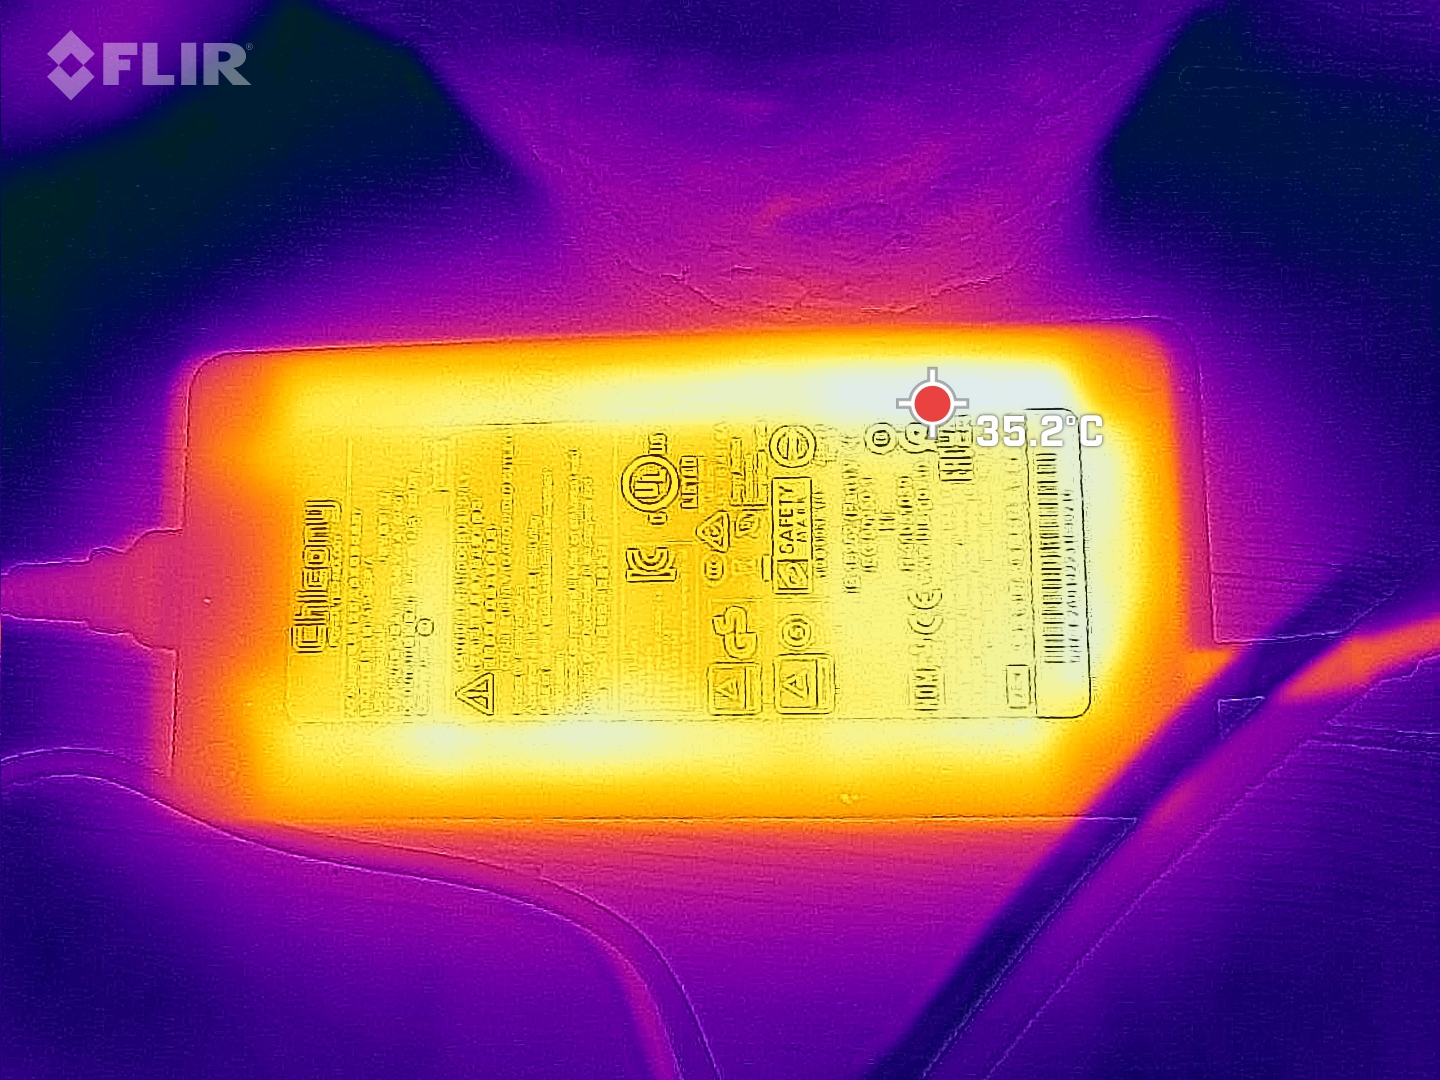
A fonte de alimentação de 280 watts é, pelo menos, suficientemente grande, nunca sobrecarregada e deve sempre fornecer energia suficiente para carregar a bateria.
| desligado | |
| Ocioso | |
| Carga |
|
Key:
min: | |
| Schenker XMG Focus 17 (E23) i9-13900HX, GeForce RTX 4070 Laptop GPU, Crucial P5 Plus 1TB CT1000P5PSSD8, IPS, 2560x1440, 17.3" | Lenovo Legion Pro 5 16ARX8 R7 7745HX, GeForce RTX 4070 Laptop GPU, Samsung PM9A1 MZVL21T0HCLR, IPS, 2560x1600, 16" | Schenker XMG Neo 17 M22 R9 6900HX, GeForce RTX 3080 Ti Laptop GPU, Samsung SSD 980 Pro 1TB MZ-V8P1T0BW, IPS, 2560x1600, 17" | HP Omen 17-ck2097ng i9-13900HX, GeForce RTX 4080 Laptop GPU, SK hynix PC801 HFS001TEJ9X101N, IPS, 2560x1440, 17.3" | Medion Erazer Defender P40 i7-13700HX, GeForce RTX 4060 Laptop GPU, Phison PS5021-E21 1TB, IPS, 2560x1440, 17.3" | MSI Titan GT77 12UHS i9-12900HX, GeForce RTX 3080 Ti Laptop GPU, Samsung PM9A1 MZVL21T0HCLR, IPS-Level, 1920x1080, 17.3" | Média NVIDIA GeForce RTX 4070 Laptop GPU | Média da turma Gaming | |
|---|---|---|---|---|---|---|---|---|
| Power Consumption | 17% | 31% | 5% | 31% | -29% | 18% | 13% | |
| Idle Minimum * (Watt) | 17 | 8.1 52% | 7 59% | 16 6% | 8 53% | 30.21 -78% | 13.2 ? 22% | 13 ? 24% |
| Idle Average * (Watt) | 18 | 15.9 12% | 11 39% | 20 -11% | 12 33% | 32.42 -80% | 18.2 ? -1% | 19 ? -6% |
| Idle Maximum * (Watt) | 25.8 | 37.2 -44% | 17 34% | 26 -1% | 18 30% | 33.7 -31% | 24.6 ? 5% | 24.6 ? 5% |
| Load Average * (Watt) | 178 | 90.9 49% | 92 48% | 135 24% | 101 43% | 125.09 30% | 97 ? 46% | 110.7 ? 38% |
| Witcher 3 ultra * (Watt) | 265 | 189.6 28% | 221 17% | 215 19% | 180.8 32% | 256 3% | ||
| Load Maximum * (Watt) | 275 | 263.5 4% | 306 -11% | 299 -9% | 284 -3% | 321.88 -17% | 221 ? 20% | 259 ? 6% |
* ... menor é melhor
Power consumption Witcher 3 / Stress test
Power consumption external monitor
Duração da bateria
O alto consumo de energia sem carga é acompanhado por tempos de execução fracos da bateria. Mesmo no modo de economia de energia, não é possível atingir 4 horas. Outros 20 minutos a mais são obtidos no modo silencioso, o que não era de se esperar em vista da dGPU ativada. Se o plugue for desligado no modo de desempenho e o Advanced Optimus estiver ativo, o tempo de execução não chega nem a 2 horas em nosso teste de WLAN com chamadas alternadas pela Internet.
O XMG relatou que o modo de economia de energia não está funcionando como desejado. Podemos confirmar isso com base em nossos resultados de teste. Uma atualização deve definitivamente remediar a situação.
| Schenker XMG Focus 17 (E23) i9-13900HX, GeForce RTX 4070 Laptop GPU, 73 Wh | Lenovo Legion Pro 5 16ARX8 R7 7745HX, GeForce RTX 4070 Laptop GPU, 80 Wh | Medion Erazer Major X20 i9-13900HX, GeForce RTX 4070 Laptop GPU, 62.3 Wh | Schenker XMG Neo 17 M22 R9 6900HX, GeForce RTX 3080 Ti Laptop GPU, 99 Wh | HP Omen 17-ck2097ng i9-13900HX, GeForce RTX 4080 Laptop GPU, 83 Wh | Medion Erazer Defender P40 i7-13700HX, GeForce RTX 4060 Laptop GPU, 73 Wh | Média da turma Gaming | |
|---|---|---|---|---|---|---|---|
| Duração da bateria | 3% | 18% | 122% | 6% | 72% | 125% | |
| H.264 (h) | 3.1 | 4.2 35% | 6.6 113% | 3.7 19% | 5.7 84% | 8.32 ? 168% | |
| WiFi v1.3 (h) | 3.9 | 4 3% | 3.9 0% | 9 131% | 3.6 -8% | 6.2 59% | 7.11 ? 82% |
| Witcher 3 ultra (h) | 1 |
Pro
Contra
Veredicto - O melhor para jogos, com algumas desvantagens
Não há dúvidas sobre o desempenho do sistema. O Focus 17 está classificado entre os concorrentes igualmente fortes. Somente o resfriamento não muito convincente impede uma pontuação melhor. Ele não parece ter sido ajustado precisamente para o Intel Core i9 em particular. No entanto, provavelmente não há nenhum jogo atual que seja muito exigente para a resolução QHD da tela com precisão de cores.
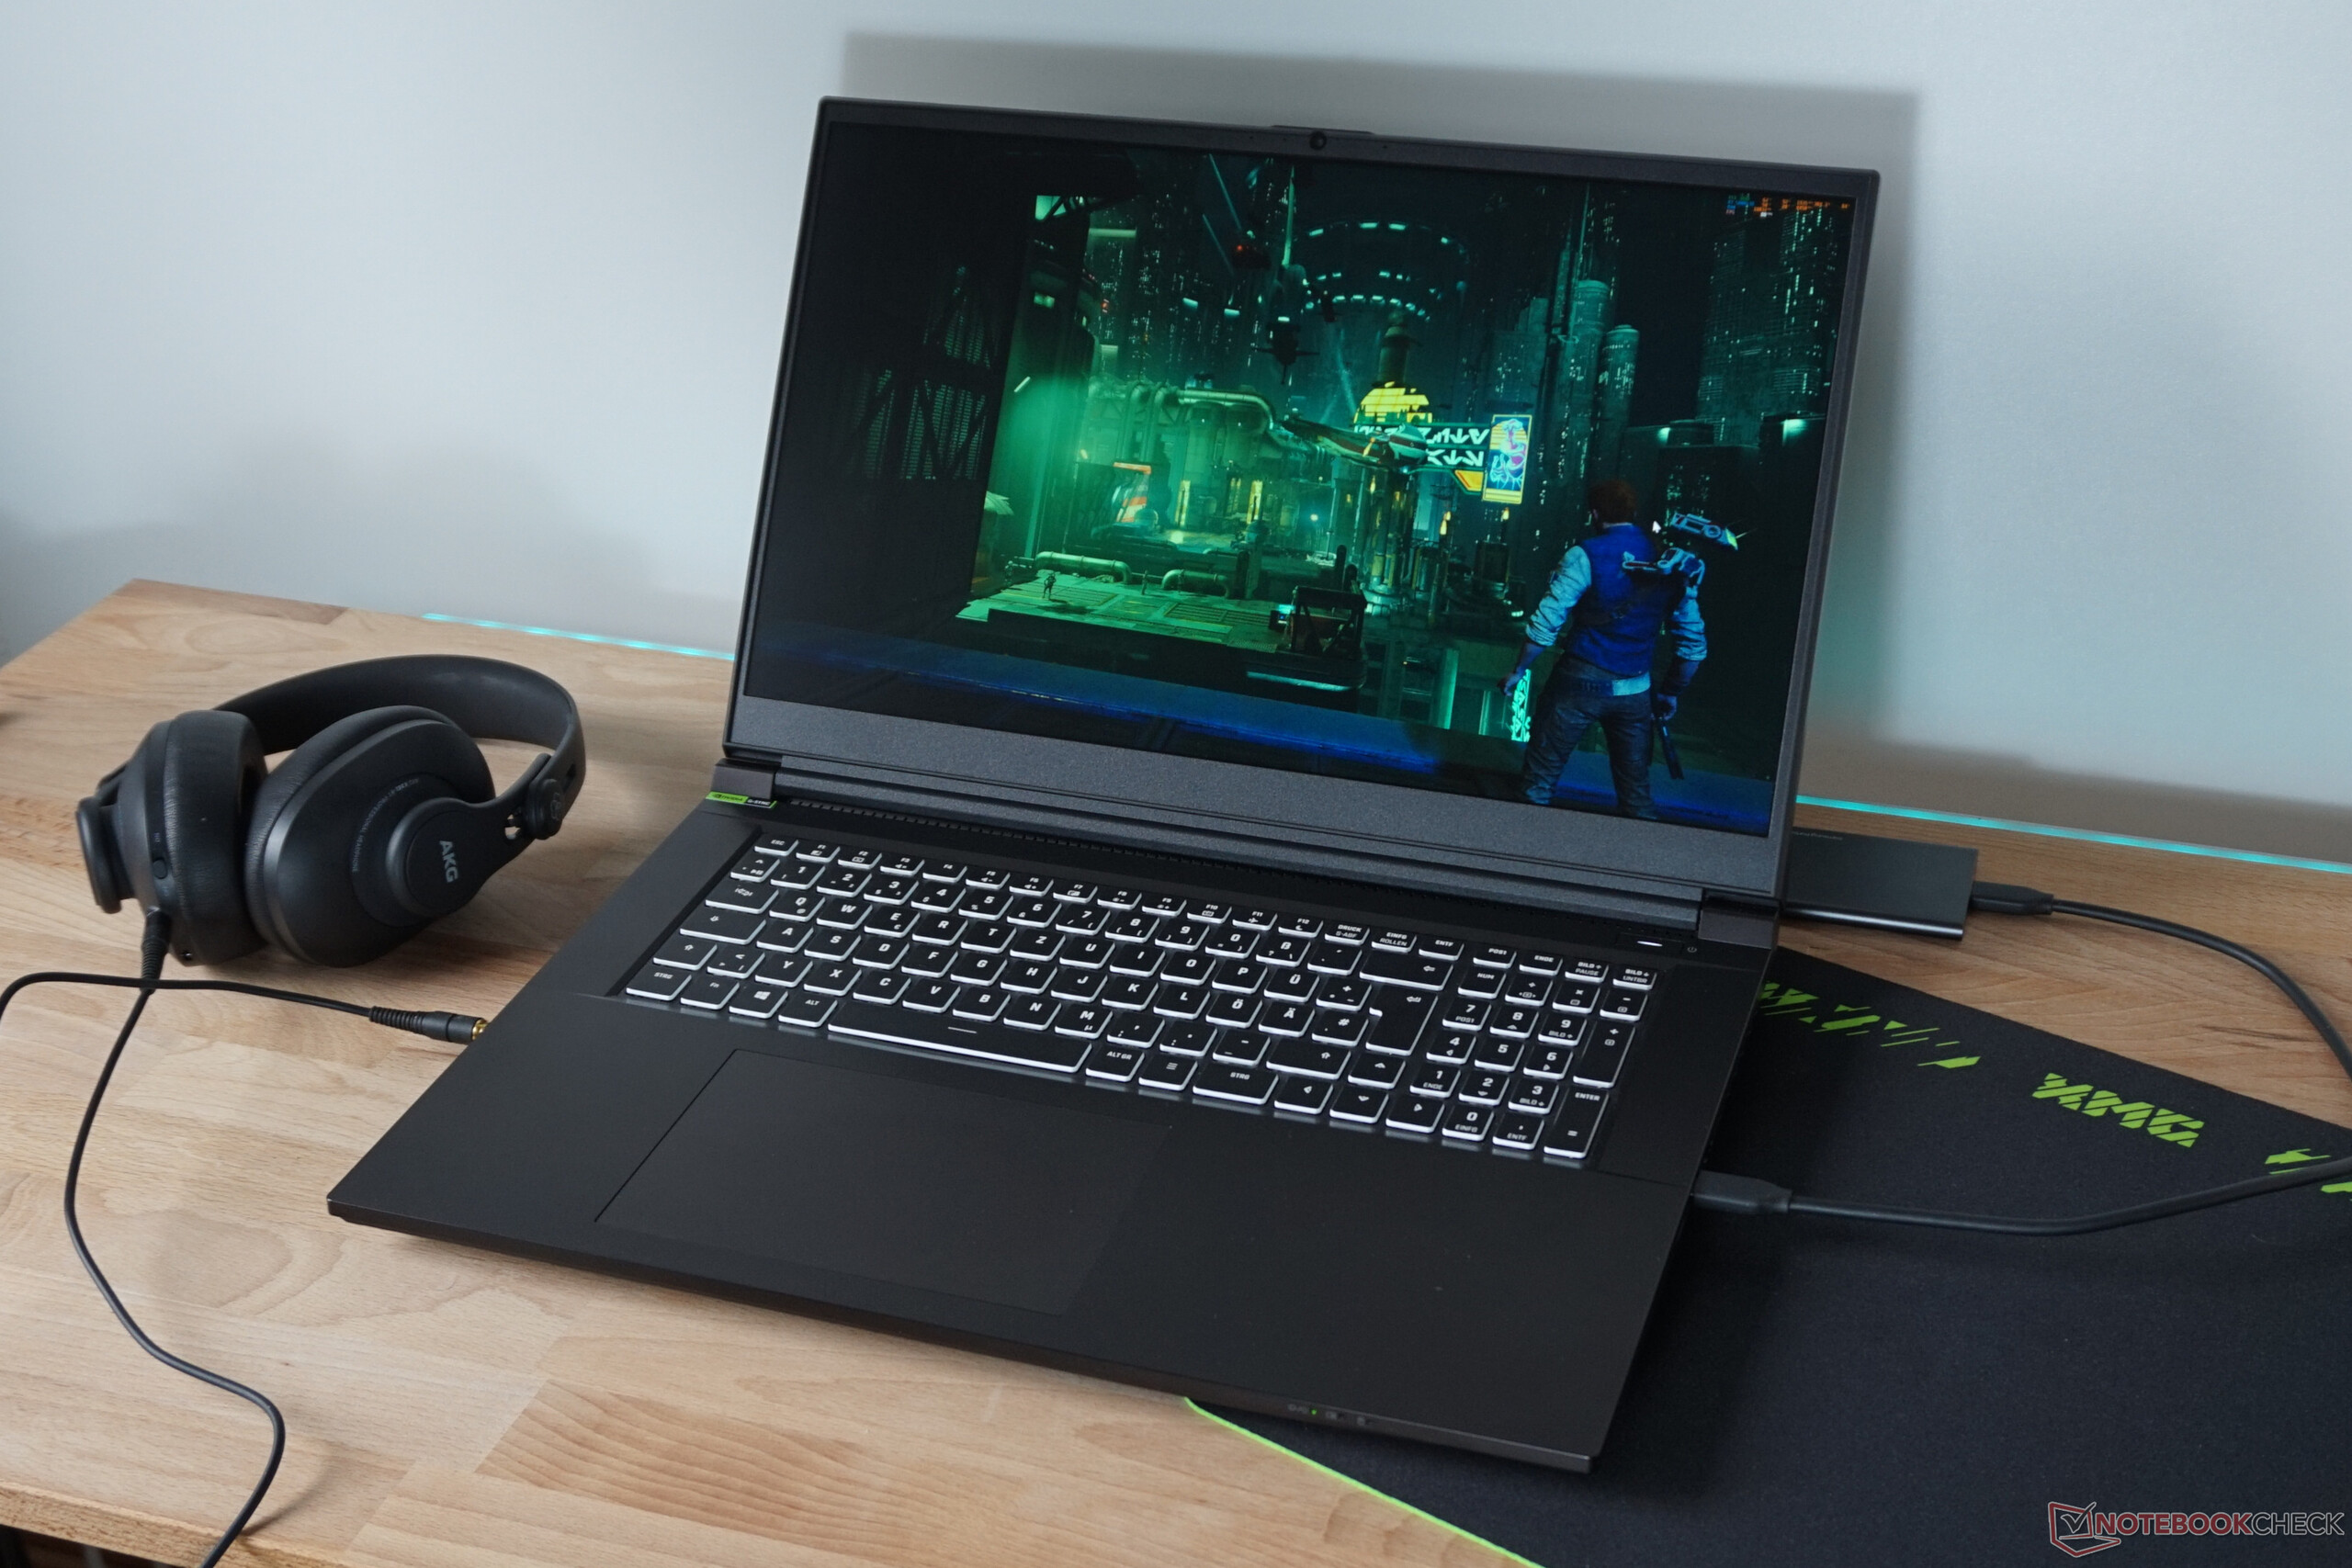
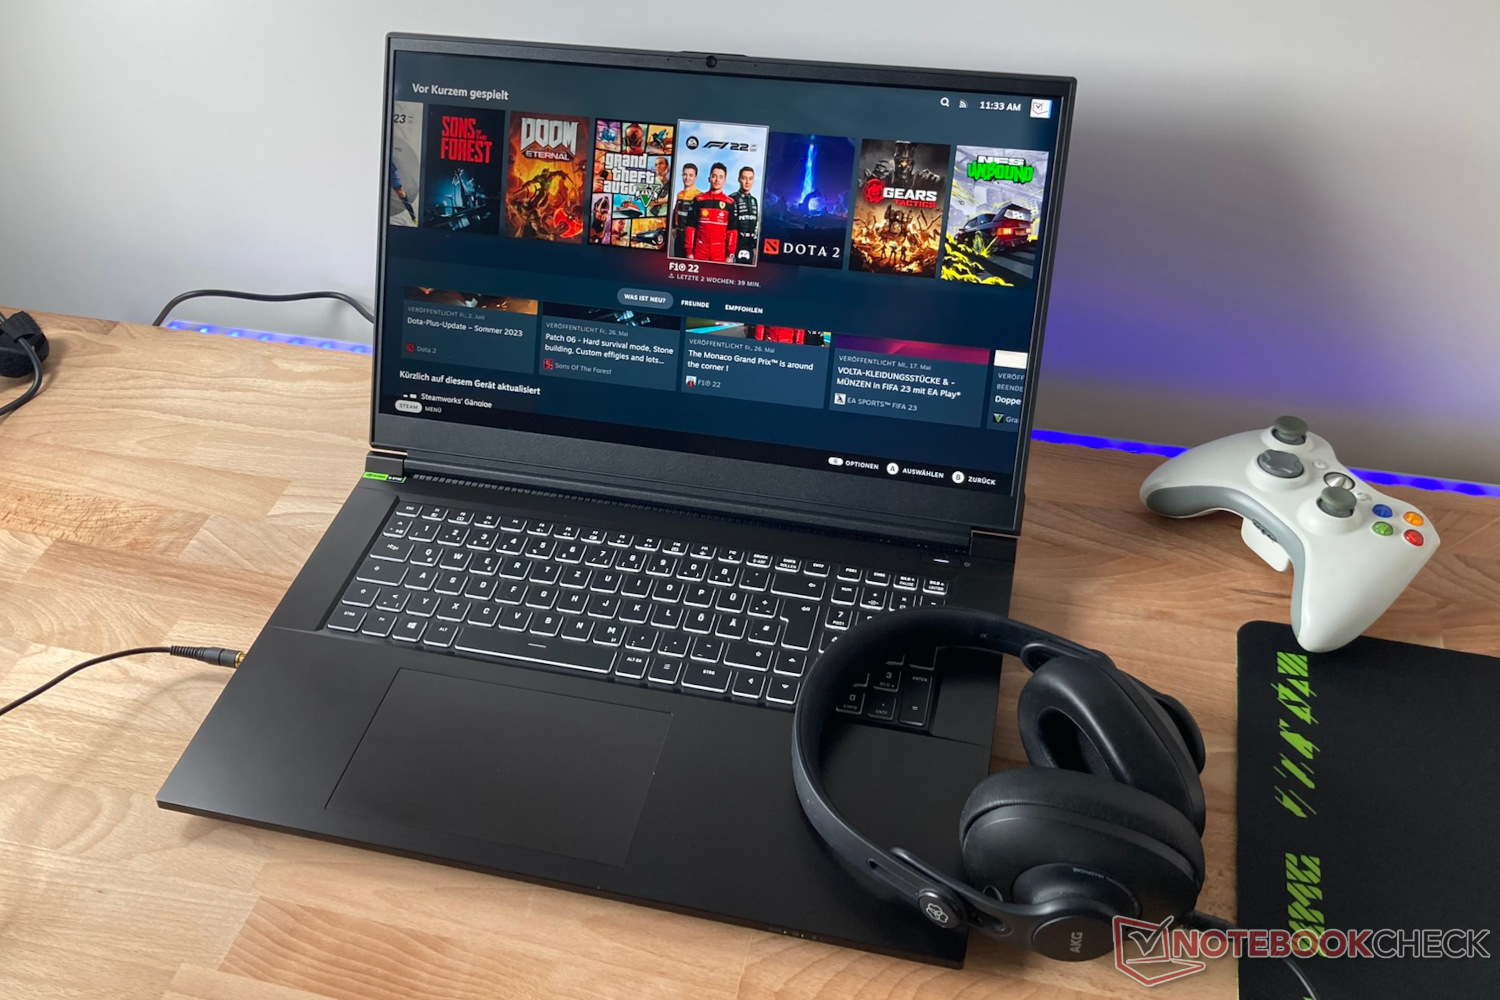
Foco no desempenho em jogos: O Focus 17 E23 possui um hardware forte com equipamento abaixo da média.
Se o laptop não tiver que ser capaz de mais, o XMG Focus se concentrará no desempenho em jogos, o que já está previsto no nome. Caso contrário, a classificação se mostra bastante fraca em comparação com a concorrência (quase universalmente mais cara).
O teclado oferece apenas algumas configurações de cores, sempre para todas as teclas. Como no antecessor, o touchpad não convence, mas dificilmente será usado para jogos. A duração da bateria é muito curta e só é aceitável até a metade no modo de economia de energia. O som dos alto-falantes é medíocre. Além disso, a ventilação é mais barulhenta do que a média, enquanto os componentes consomem energia demais para o desempenho verificado. Além disso, o USB 2.0 não parece mais atualizado e o Mini-DisplayPort pode ser encontrado em fones de ouvido VR, por exemplo, mas o USB-C com suporte a DP seria mais variável.
Em compensação, o preço é atraente. A relação preço-desempenho é boa. Se a Schenker também conseguir ajustar os modos de desempenho aparentemente inacabados por meio de uma atualização de software, algumas falhas, como a curta duração da bateria ou o comportamento ruim do ventilador, poderão ser atenuadas significativamente.
É possível obter mais desempenho de componentes comparáveis, por exemplo, com o XMG Neo 16 E23 (equipado com a RTX 4090). Aproximadamente tão rápido e mais silencioso que o XMG Focus 17 é o Lenovo Legion Pro 5 16 Gen8. No entanto, ambos os notebooks para jogos também são visivelmente mais caros com seus melhores equipamentos em geral.
Preço e disponibilidade
Schenker XMG Focus 17 (E23)
- 06/04/2023 v7 (old)
Mario Petzold
Transparência
A seleção dos dispositivos a serem analisados é feita pela nossa equipe editorial. A amostra de teste foi fornecida ao autor como empréstimo pelo fabricante ou varejista para fins desta revisão. O credor não teve influência nesta revisão, nem o fabricante recebeu uma cópia desta revisão antes da publicação. Não houve obrigação de publicar esta revisão. Como empresa de mídia independente, a Notebookcheck não está sujeita à autoridade de fabricantes, varejistas ou editores.
É assim que o Notebookcheck está testando
Todos os anos, o Notebookcheck analisa de forma independente centenas de laptops e smartphones usando procedimentos padronizados para garantir que todos os resultados sejam comparáveis. Desenvolvemos continuamente nossos métodos de teste há cerca de 20 anos e definimos padrões da indústria no processo. Em nossos laboratórios de teste, equipamentos de medição de alta qualidade são utilizados por técnicos e editores experientes. Esses testes envolvem um processo de validação em vários estágios. Nosso complexo sistema de classificação é baseado em centenas de medições e benchmarks bem fundamentados, o que mantém a objetividade.Price comparison
