Análise do Acer Predator Triton 14: Um laptop para jogos de 14 polegadas com uma tela brilhante e uma RTX 4050

O laptop compacto para jogos representa o estado atual da arte: Raptor Lake, Ada Lovelace, LPDDR5, PCIe 4, Thunderbolt 4. Estamos lidando aqui com o sucessor quase idêntico do já analisado Acer Predator Triton 300 SE. Os dispositivos concorrentes são o Razer Blade 14e oMSI Stealth 14 Studio A13Ve oGigabyte Aero 14 OLED BMF, oApple MacBook Pro 14 2023 M2 Pro Entrye oAsus ROG Zephyrus G14 GA402RJ.
Possíveis concorrentes em comparação
Avaliação | Data | Modelo | Peso | Altura | Size | Resolução | Preço |
|---|---|---|---|---|---|---|---|
| 87.3 % v7 (old) | 07/2023 | Acer Predator Triton 14 PT14-51 i7-13700H, GeForce RTX 4050 Laptop GPU | 1.7 kg | 19.81 mm | 14.00" | 2560x1600 | |
| 88.7 % v7 (old) | 06/2023 | Razer Blade 14 RTX 4070 R9 7940HS, GeForce RTX 4070 Laptop GPU | 1.8 kg | 17.99 mm | 14.00" | 2560x1600 | |
| 86.4 % v7 (old) | 10/2022 | Asus ROG Zephyrus G14 GA402RJ R7 6800HS, Radeon RX 6700S | 1.7 kg | 19.5 mm | 14.00" | 2560x1600 | |
| 85.4 % v7 (old) | 07/2023 | MSI Stealth 14 Studio A13V i7-13700H, GeForce RTX 4050 Laptop GPU | 1.7 kg | 19 mm | 14.00" | 2560x1600 | |
| 89.4 % v7 (old) | 05/2023 | Gigabyte Aero 14 OLED BMF i7-13700H, GeForce RTX 4050 Laptop GPU | 1.4 kg | 17 mm | 14.00" | 2880x1800 | |
| 93.4 % v7 (old) | 03/2023 | Apple MacBook Pro 14 2023 M2 Pro Entry M2 Pro 10-Core, M2 Pro 16-Core GPU | 1.6 kg | 15.5 mm | 14.20" | 3024x1964 |
Gabinete - A Acer equipou o Triton com um chassi de metal
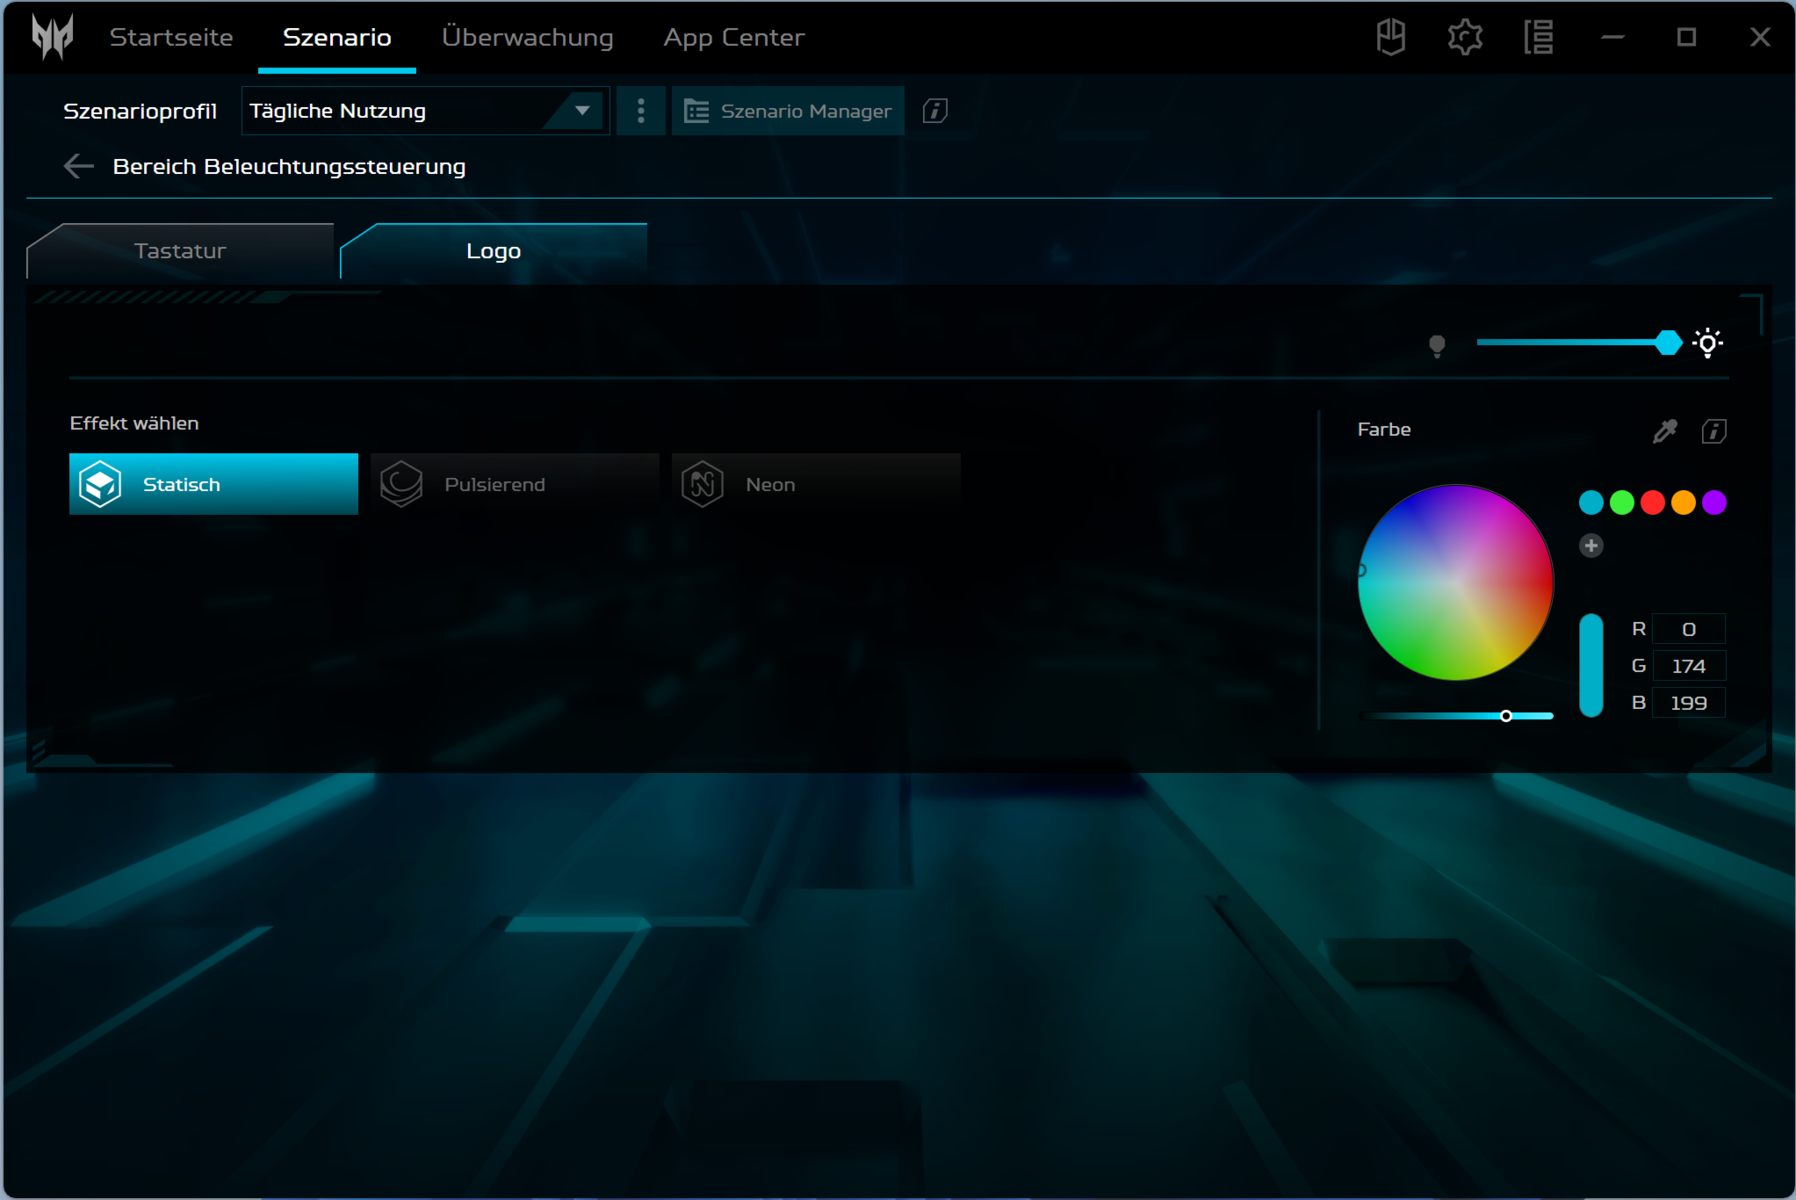
A tecnologia do laptop está alojada em um gabinete de metal cinza-prateado. A Acer optou por superfícies lisas e foscas. O computador compacto não oferece nenhum elemento de design atraente, o que significa que ele também pode ser considerado um laptop de escritório. Da mesma forma, as extravagantes barras de LED também estão ausentes. Além da iluminação das teclas, um pequeno logotipo iluminado do Predator no apoio para as mãos mistura as coisas em termos de cores.
O Triton não apresenta sinais de falhas de fabricação. As dimensões do espaço estão corretas e não há excesso de material saindo do dispositivo. A unidade de base e a tampa podem ser ligeiramente torcidas, mas tudo dentro de uma faixa aceitável. A pressão exercida na parte traseira da tampa não resulta em nenhuma distorção da imagem. As dobradiças mantêm a tampa firmemente no lugar, com o ângulo máximo de abertura em torno de 175 graus. É possível abrir o dispositivo com uma só mão.


Com relação às dimensões, não há muito o que escolher entre a maioria dos dispositivos concorrentes. OMSI Stealth 14 Studio A13Vé a exceção à regra: ele ocupa mais espaço do que os concorrentes. Quando se trata de peso, o laptop Acer se encontra no meio do grupo.
Recursos - O PT14 oferece Thunderbolt 4
A seleção de portas é bastante limitada: O PT14 pode chamar de suas duas portas USB-A (USB 3.2 Gen 2) e uma porta USB-C (Thunderbolt 4). A porta USB-C suporta Power Delivery e pode emitir um sinal Displayport. Há um total de duas saídas de vídeo (HDMI 2.1, DP). Um conector de áudio completa o pacote.


Leitor de cartão SD
O leitor de cartão de memória MicroSD (cartão de referência: AV PRO microSD 128 GB V60) pertence aos modelos mais lentos, com velocidades máximas de transferência de 19 MB/s (transferência de 250 arquivos de imagem jpg com cerca de 5 MB cada) e 26 MB/s (cópia de grandes blocos de dados).
| SD Card Reader | |
| average JPG Copy Test (av. of 3 runs) | |
| Gigabyte Aero 14 OLED BMF | |
| Asus ROG Zephyrus G14 GA402RJ (AV PRO microSD 128 GB V60) | |
| Média da turma Gaming (20.9 - 210, n=54, últimos 2 anos) | |
| Acer Predator Triton 14 PT14-51 (AV PRO microSD 128 GB V60) | |
| maximum AS SSD Seq Read Test (1GB) | |
| Gigabyte Aero 14 OLED BMF | |
| Asus ROG Zephyrus G14 GA402RJ (AV PRO microSD 128 GB V60) | |
| Média da turma Gaming (25.5 - 261, n=51, últimos 2 anos) | |
| Acer Predator Triton 14 PT14-51 (AV PRO microSD 128 GB V60) | |
Comunicação
Em condições ideais (nenhum dispositivo Wi-Fi por perto, uma distância curta entre o laptop e o PC do servidor), é possível obter velocidades de dados Wi-Fi excelentes. O laptop tem um chip Wi-Fi 6E (Killer AX1675i) integrado. Não há uma porta ethernet disponível.
Webcam
A webcam (2,1 MP, máx. 1.920 x 1.080 pixels) não vem com um obturador mecânico. Entretanto, em termos de qualidade, ela não consegue se destacar da concorrência. Ela falha na área de precisão de cores, com as cores se desviando de seu valor alvo.


Acessórios
Além dos documentos habituais (guia de início rápido e informações sobre garantia), nenhum acessório adicional está incluído no laptop.
Manutenção
Depois de remover todos os parafusos da base do dispositivo, a parte inferior do gabinete pode ser removida com a ajuda de um plectro. Consequentemente, isso ajuda a obter acesso ao SSD (PCIe 4, M.2 2280), à bateria do BIOS, ao módulo Wi-Fi, aos ventiladores, aos alto-falantes e à bateria.


Garantia
A Acer concedeu ao dispositivo de 14 polegadas uma garantia de dois anos. A extensão dessa garantia para três anos custa quase US$ 100.
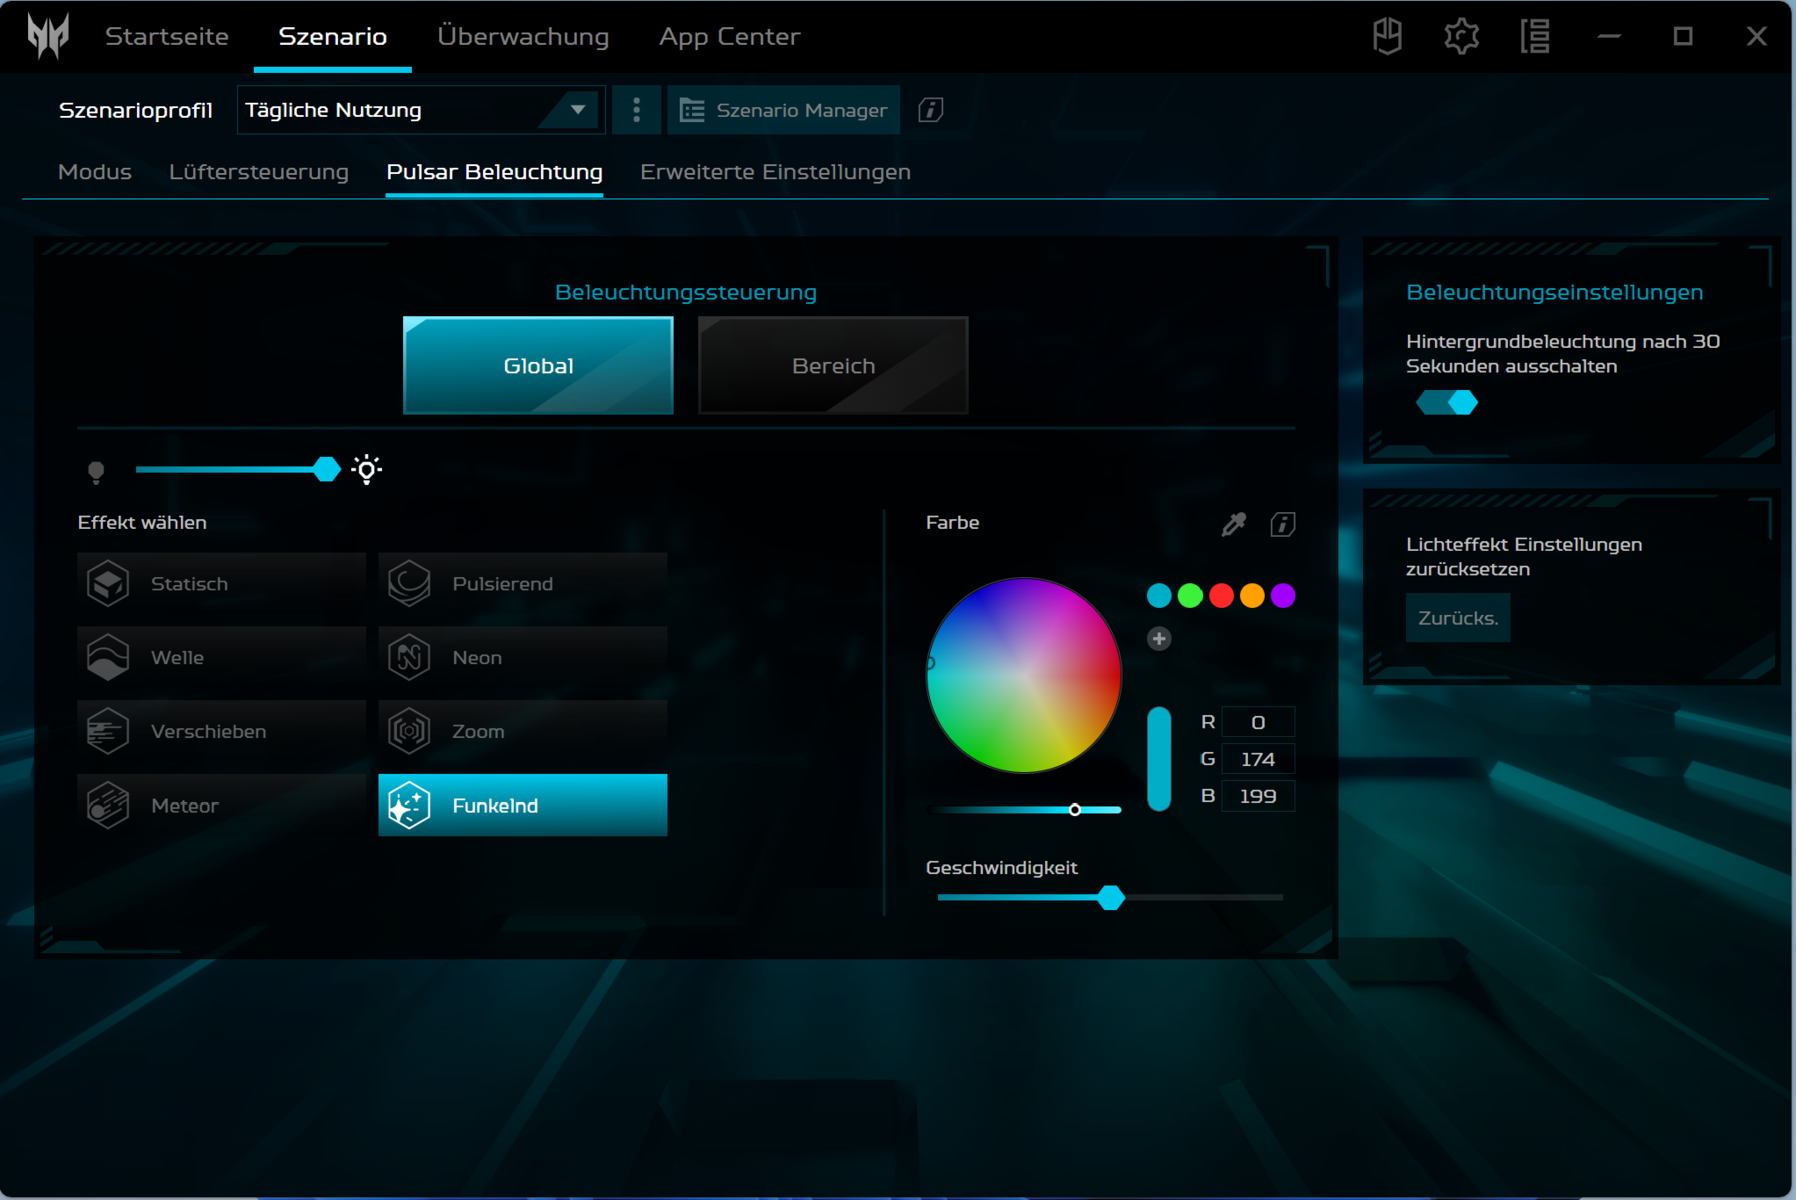
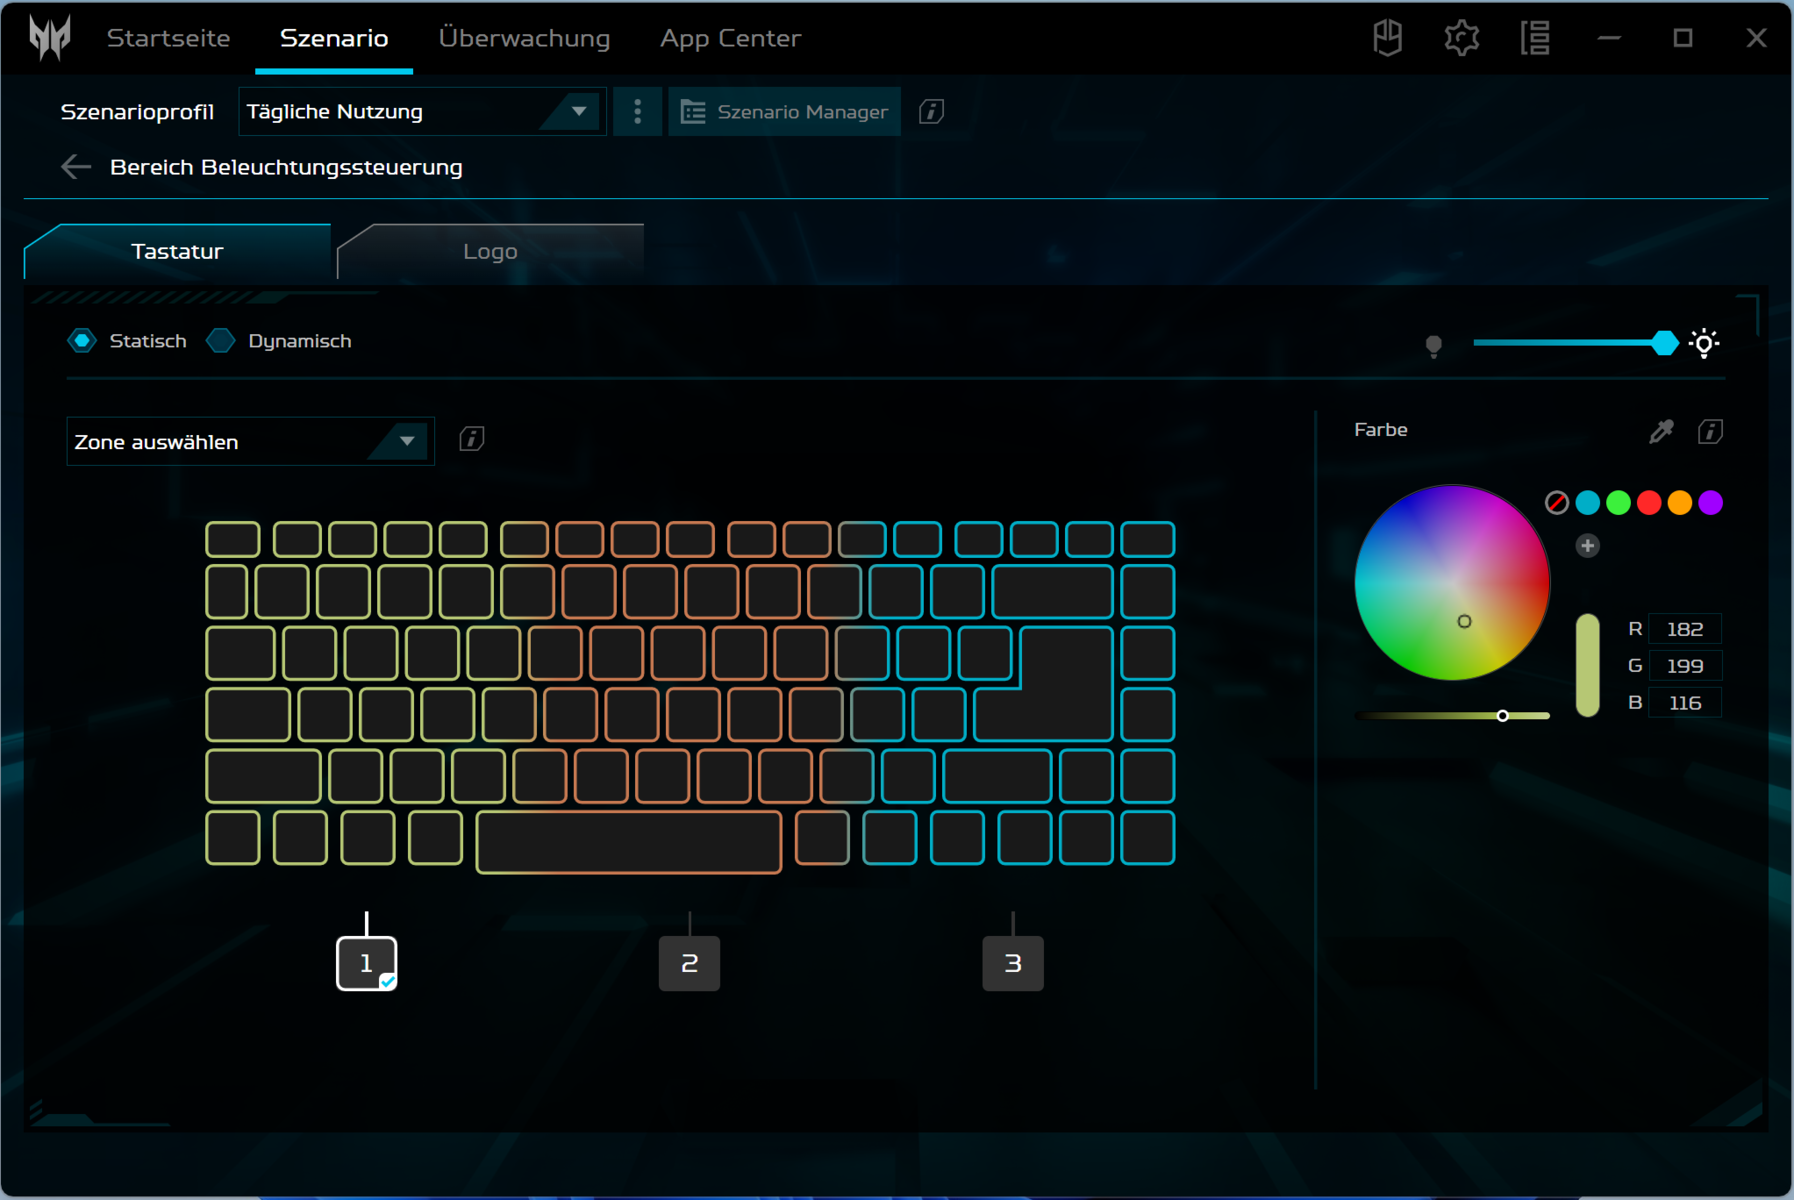
Dispositivos de entrada - O Acer Predator vem com iluminação RGB nas teclas
Teclado
As teclas planas e suaves do teclado chiclet (iluminação RGB) têm um curso curto, um ponto de pressão claramente definido e uma boa resistência das teclas. Ao digitar, o teclado não oscila. Bom: As quatro teclas de seta têm tamanho normal. No geral, a Acer forneceu um teclado adequado para o uso diário.
Touchpad
Um mouse alternativo vem na forma de um Clickpad com capacidade multitoque (cerca de 10,5 x 6,5 cm) pelo qual os dedos do usuário deslizam sem esforço. Ele tem um curso curto e um ponto de pressão claramente definido.

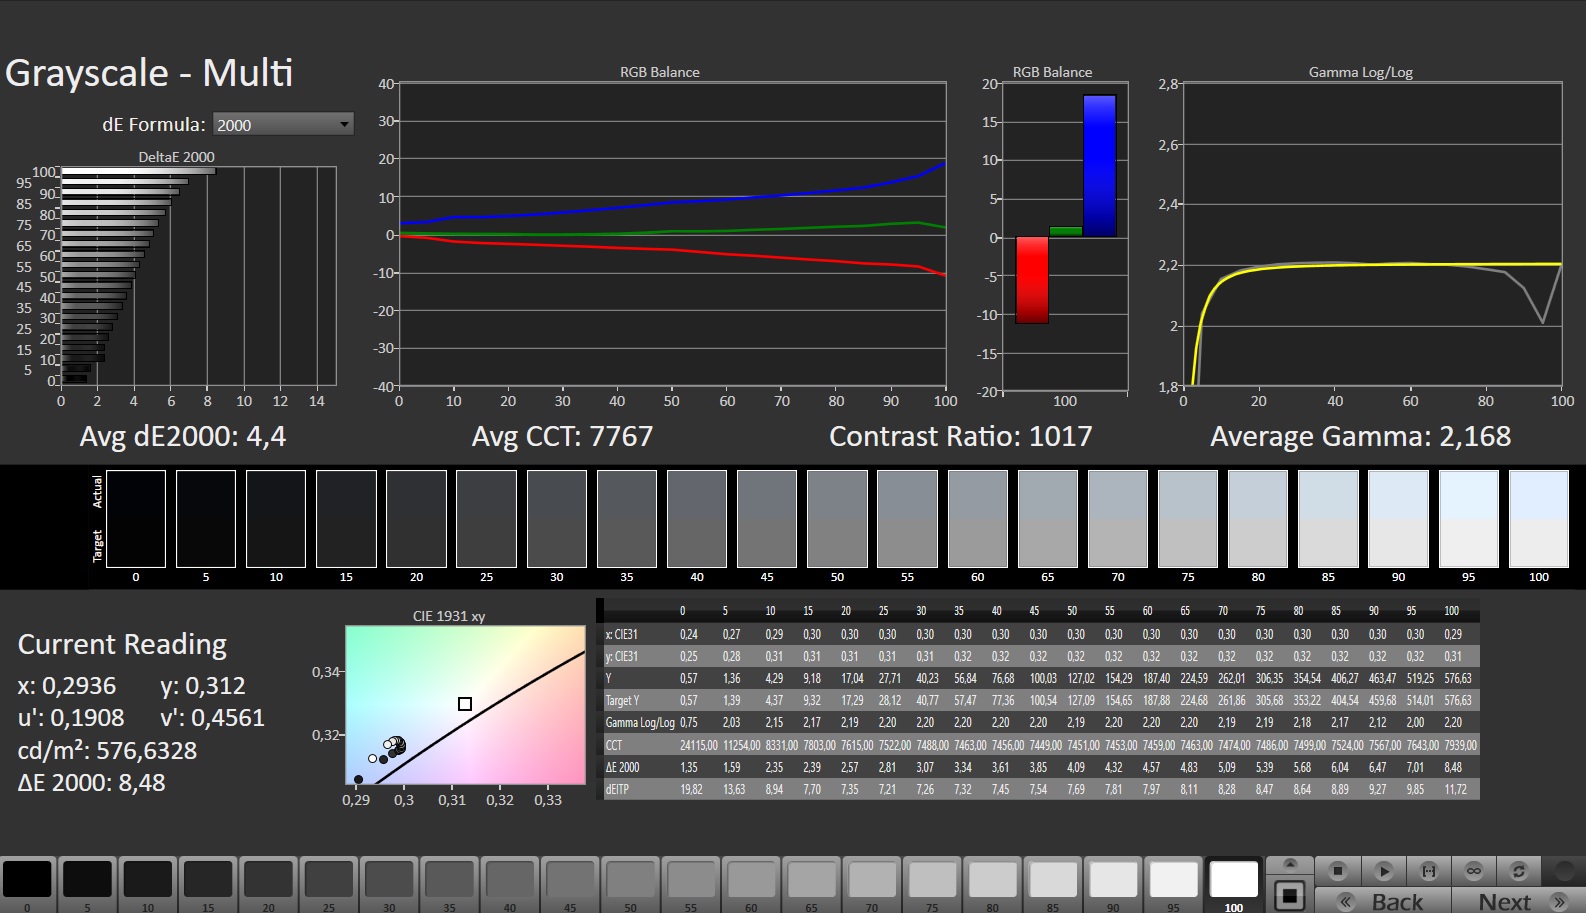
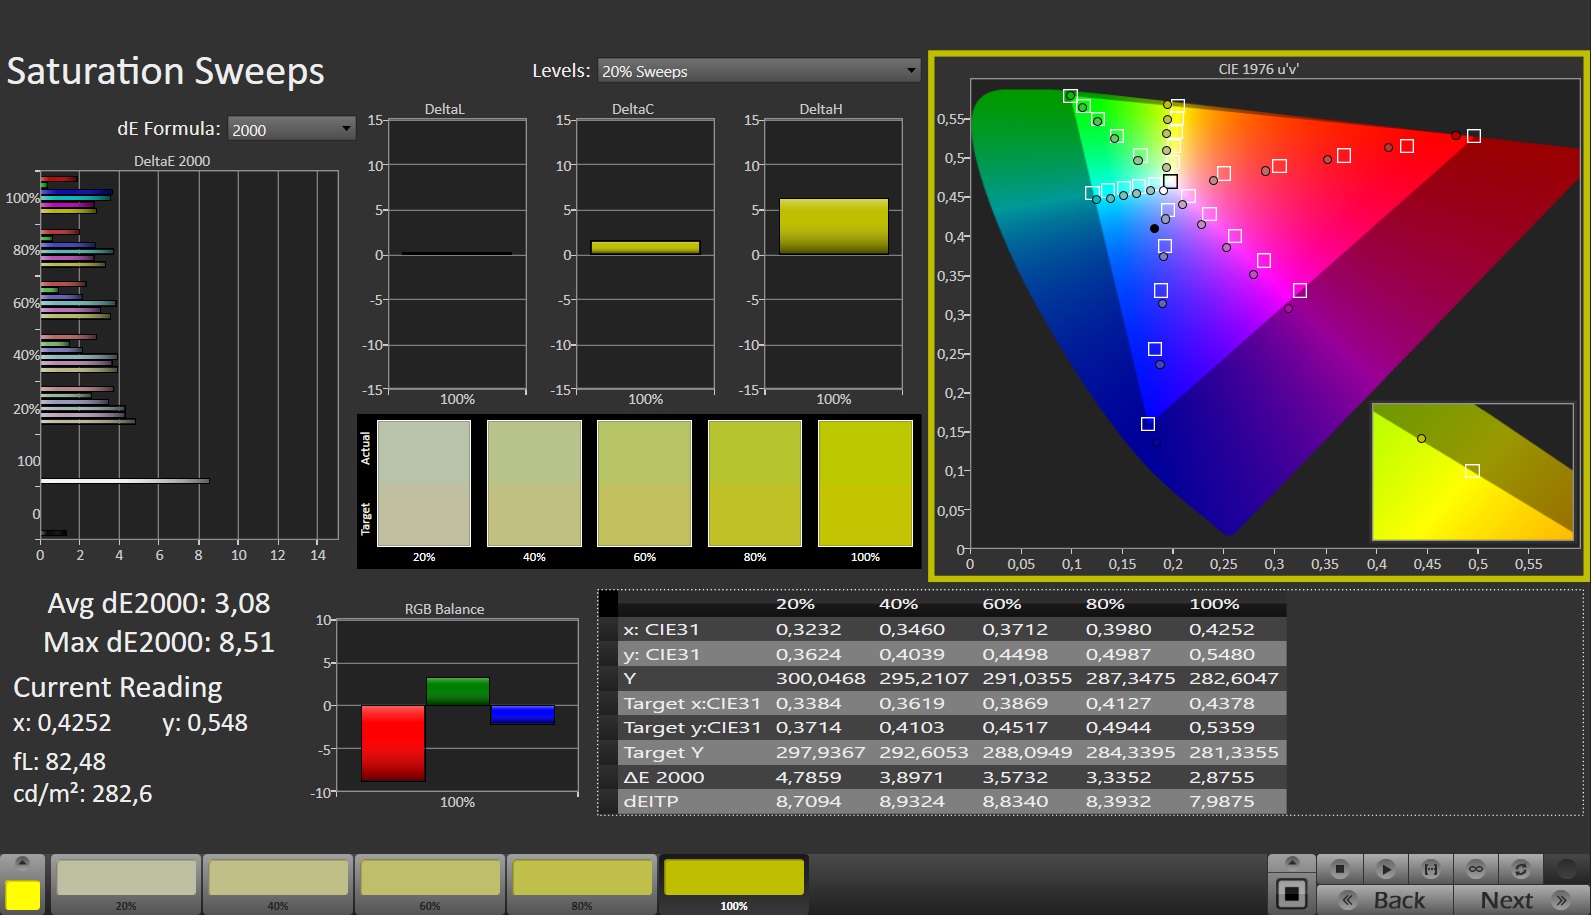
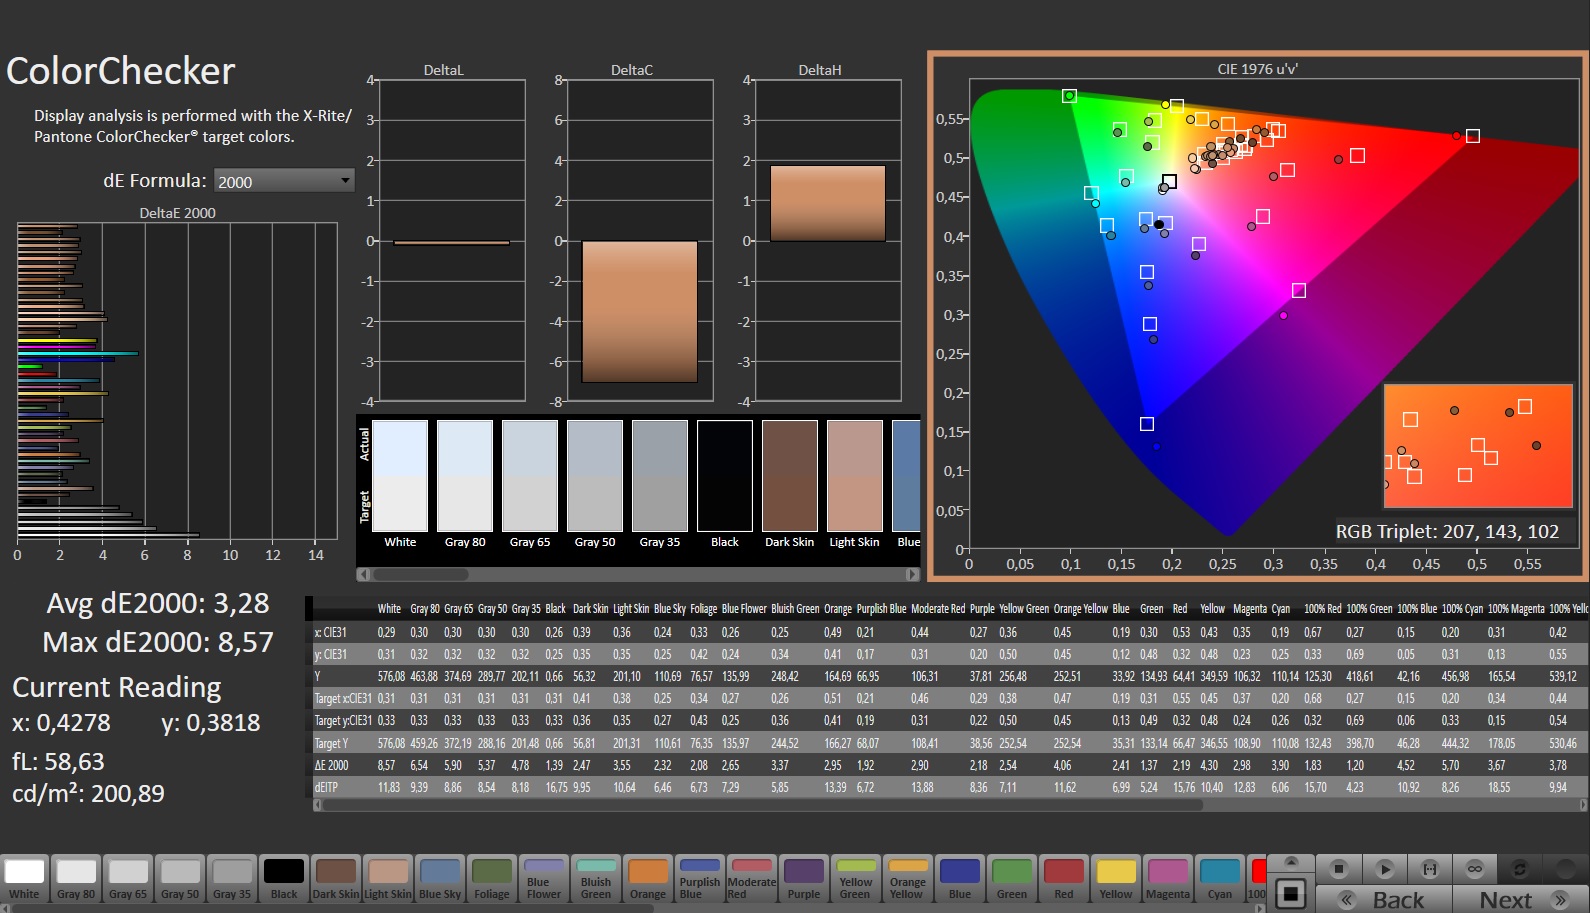
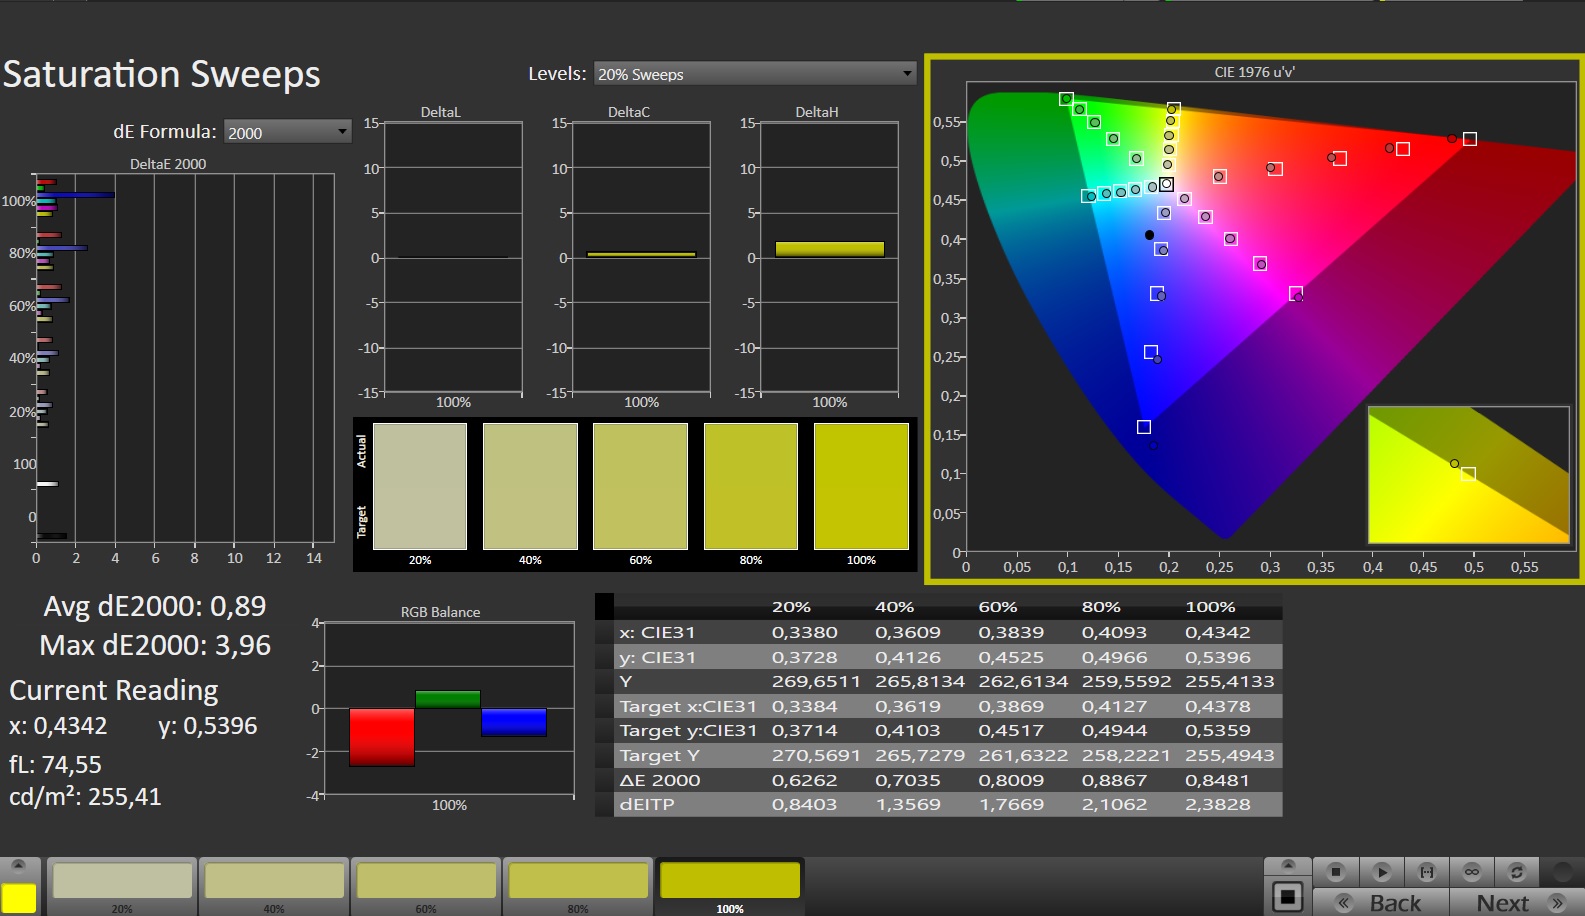
Tela - Muito brilhante com cobertura de cores DCI P3
A Acer equipou seu Predator com uma tela de 14 polegadas (2.560 x 1.600 pixels) em uma proporção de 16:10, ideal para o trabalho. No lado positivo, há o suporte G-Sync, a ausência de cintilação PWM, tempos de resposta curtos e um alto brilho de (516,2 cd/m²). A taxa de contraste (944:1) apenas não atinge seu valor alvo (> 1.000:1).
A tela mini-LED disponível como alternativa (2.560 x 1.600 pixels) deve ter um contraste significativamente maior e vem com uma certificação DisplayHDR 600.
| |||||||||||||||||||||||||
iluminação: 88 %
iluminação com acumulador: 547 cd/m²
Contraste: 977:1 (Preto: 0.56 cd/m²)
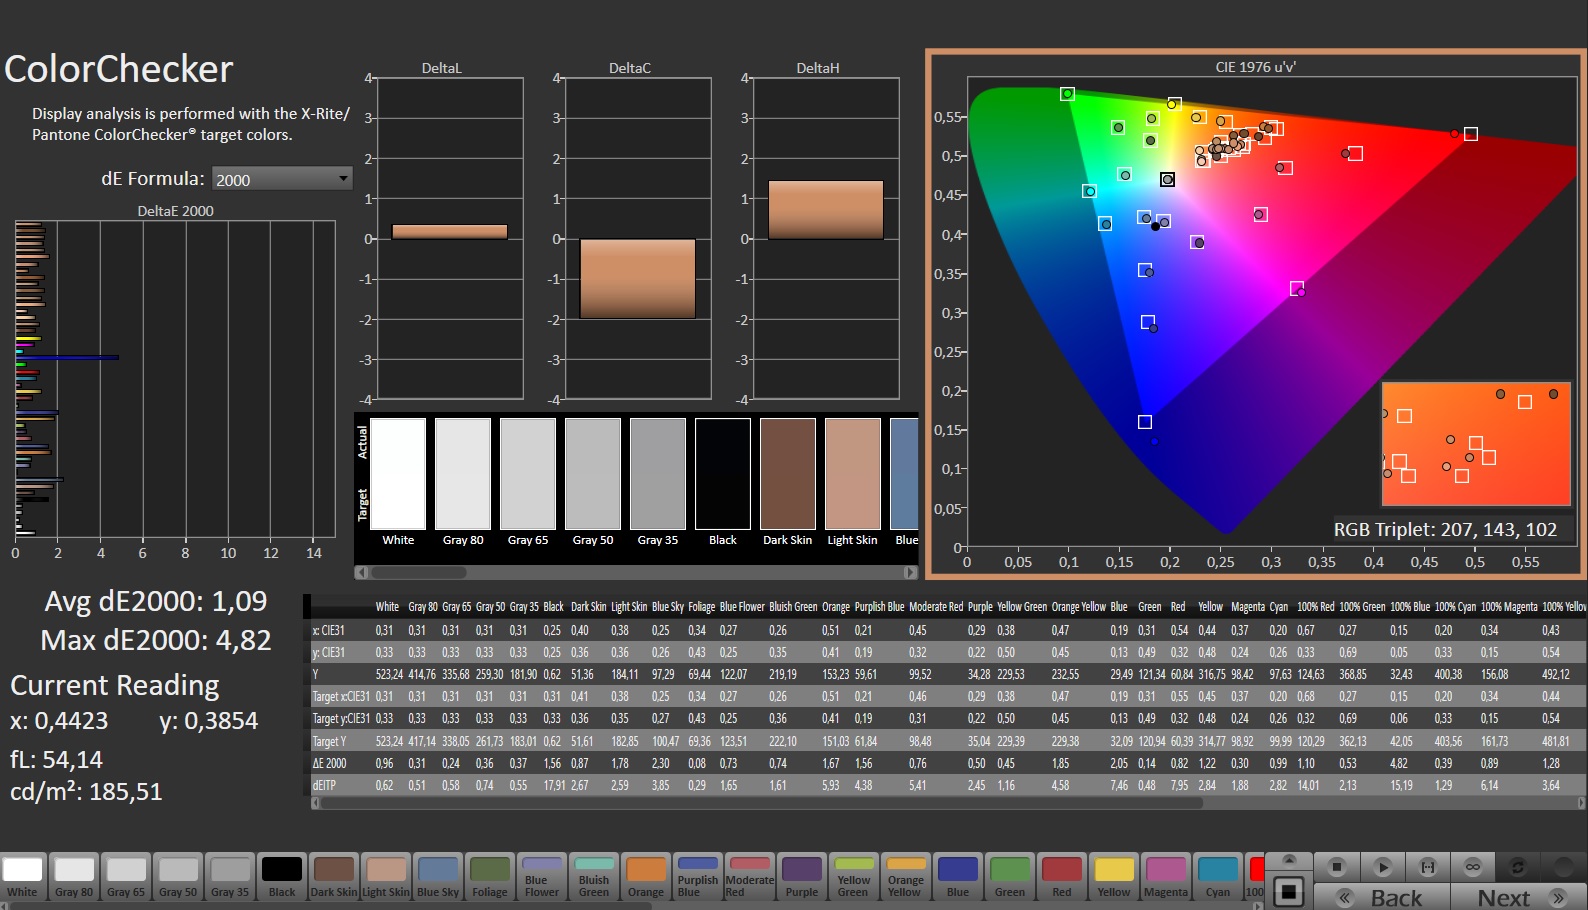
ΔE ColorChecker Calman: 3.28 | ∀{0.5-29.43 Ø4.71}
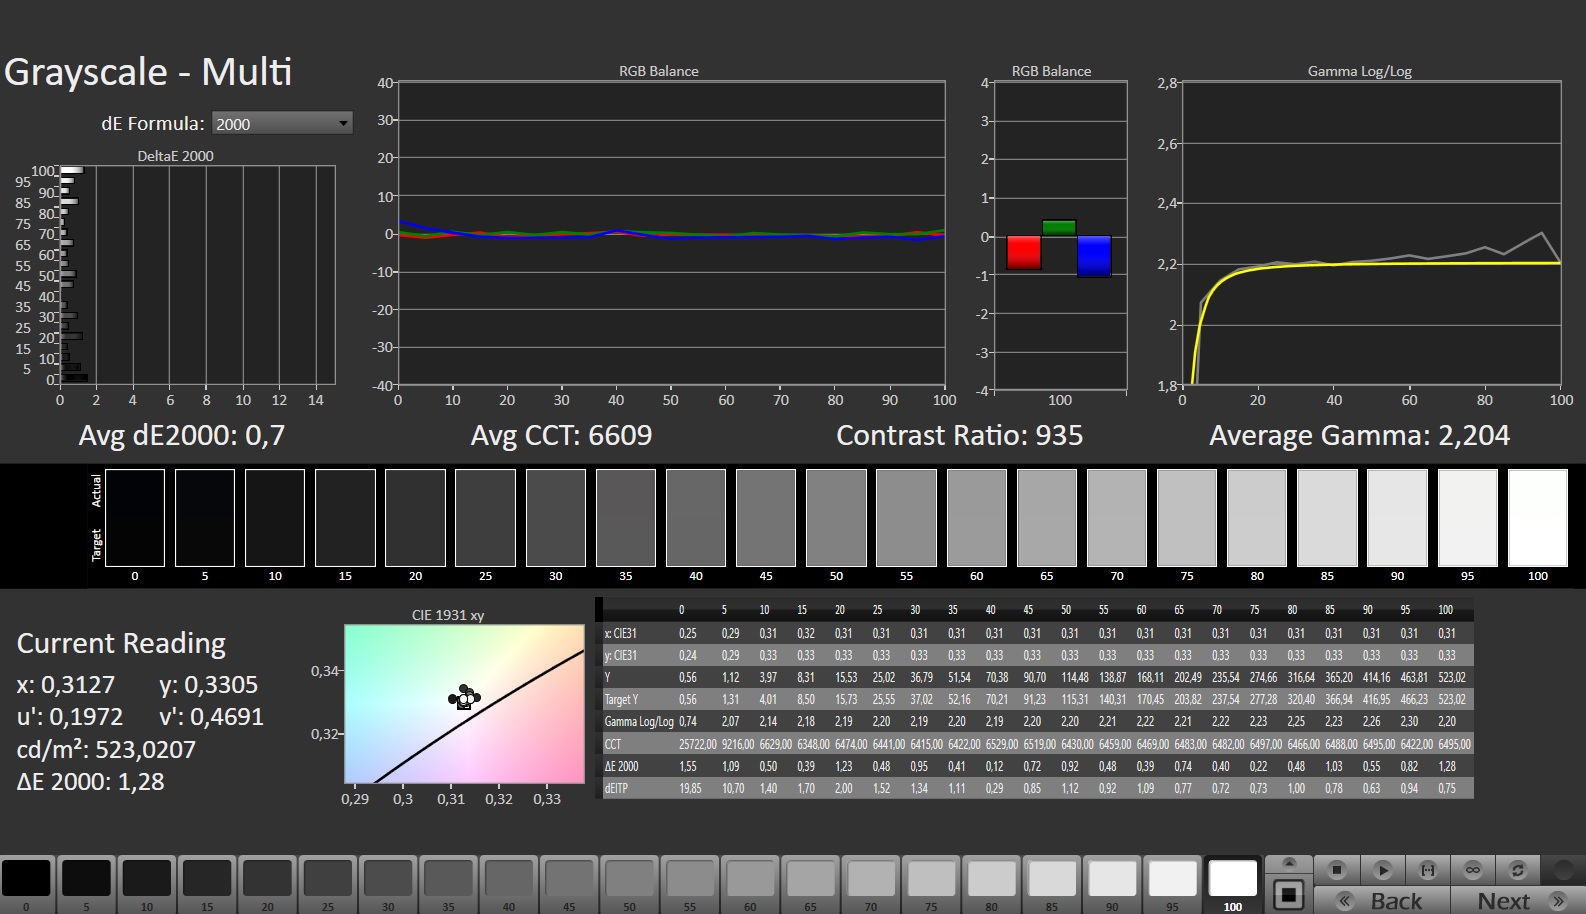
calibrated: 1.09
ΔE Greyscale Calman: 4.4 | ∀{0.09-98 Ø4.96}
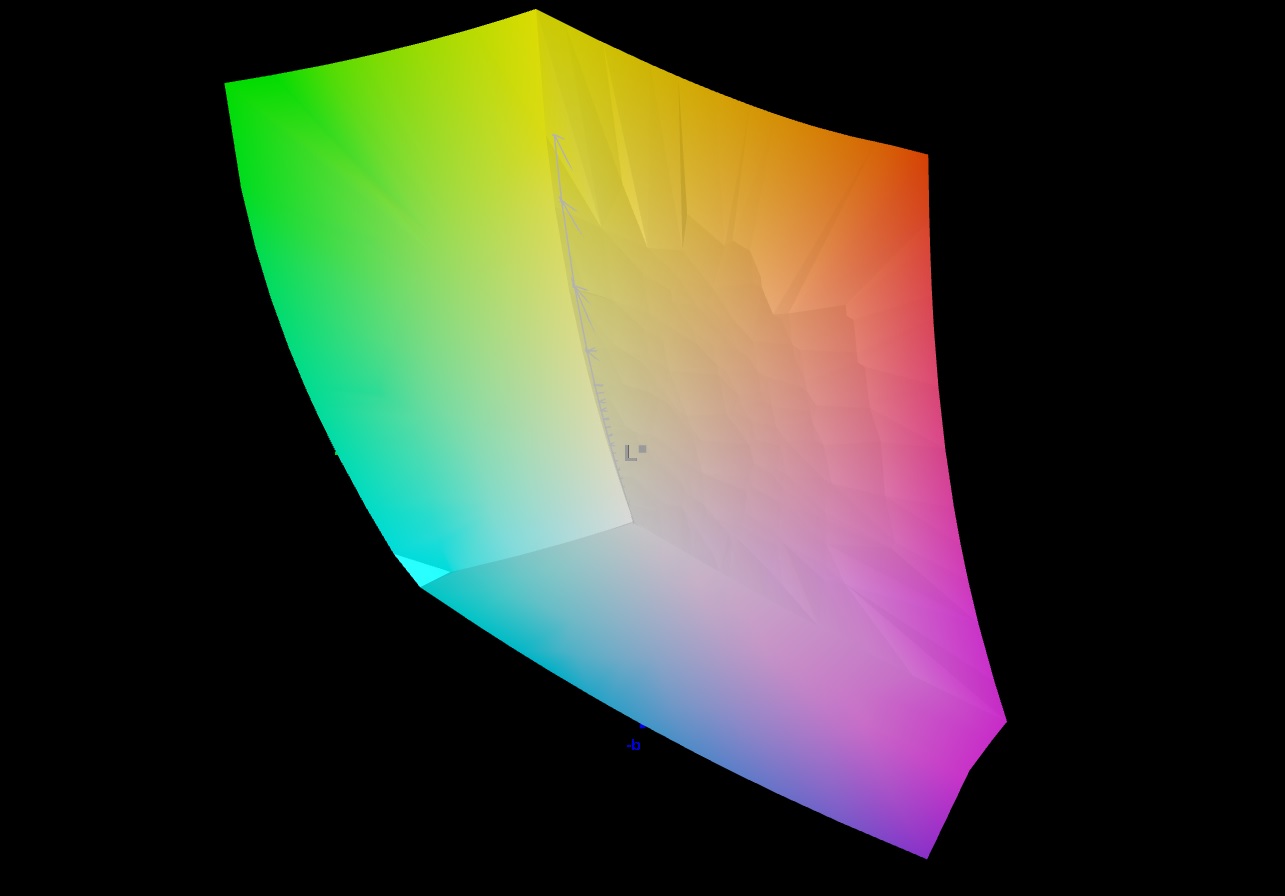
85.5% AdobeRGB 1998 (Argyll 3D)
99.9% sRGB (Argyll 3D)
96.9% Display P3 (Argyll 3D)
Gamma: 2.168
CCT: 7767 K
| Acer Predator Triton 14 PT14-51 BOE NE140QDM-NY1, IPS, 2560x1600, 14" | Razer Blade 14 RTX 4070 AU Optronics B140QAN06.U, IPS, 2560x1600, 14" | Asus ROG Zephyrus G14 GA402RJ BOEhydis NE140QDM-NX1, IPS, 2560x1600, 14" | MSI Stealth 14 Studio A13V B140QAN06.T, IPS, 2560x1600, 14" | Gigabyte Aero 14 OLED BMF Samsung SDC4192 (ATNA40YK14-0), OLED, 2880x1800, 14" | Apple MacBook Pro 14 2023 M2 Pro Entry Mini-LED, 3024x1964, 14.2" | |
|---|---|---|---|---|---|---|
| Display | 0% | 0% | -0% | 2% | ||
| Display P3 Coverage (%) | 96.9 | 97.3 0% | 97.6 1% | 96.2 -1% | 99.8 3% | |
| sRGB Coverage (%) | 99.9 | 99.8 0% | 99.9 0% | 99.6 0% | 100 0% | |
| AdobeRGB 1998 Coverage (%) | 85.5 | 85.3 0% | 85.6 0% | 85.3 0% | 88.7 4% | |
| Response Times | -9% | 21% | 32% | 72% | ||
| Response Time Grey 50% / Grey 80% * (ms) | 15.1 ? | 11.9 ? 21% | 8.3 ? 45% | 5.5 ? 64% | 2.4 ? 84% | |
| Response Time Black / White * (ms) | 5.8 ? | 8 ? -38% | 6 ? -3% | 5.8 ? -0% | 2.4 ? 59% | |
| PWM Frequency (Hz) | 26191 ? | 300 | ||||
| Screen | 3% | 12% | 9% | 70% | ||
| Brightness middle (cd/m²) | 547 | 559.3 2% | 500 -9% | 419 -23% | 423 -23% | |
| Brightness (cd/m²) | 516 | 560 9% | 470 -9% | 402 -22% | 427 -17% | |
| Brightness Distribution (%) | 88 | 88 0% | 85 -3% | 89 1% | 98 11% | |
| Black Level * (cd/m²) | 0.56 | 0.44 21% | 0.42 25% | 0.43 23% | 0.1 82% | |
| Contrast (:1) | 977 | 1271 30% | 1190 22% | 974 0% | 4230 333% | |
| Colorchecker dE 2000 * | 3.28 | 4.44 -35% | 2.45 25% | 2.3 30% | 0.55 83% | |
| Colorchecker dE 2000 max. * | 8.57 | 9.3 -9% | 5.34 38% | 5.8 32% | 1.15 87% | |
| Colorchecker dE 2000 calibrated * | 1.09 | 0.39 64% | 1.2 -10% | 0.9 17% | 1.15 -6% | |
| Greyscale dE 2000 * | 4.4 | 6.8 -55% | 3.1 30% | 3.3 25% | 0.69 84% | |
| Gamma | 2.168 101% | 2.3 96% | 2.213 99% | 2.14 103% | 2.42 91% | |
| CCT | 7767 84% | 6242 104% | 7251 90% | 6550 99% | 6479 100% | |
| Média Total (Programa/Configurações) | -2% /
1% | 11% /
11% | 14% /
10% | 48% /
56% |
* ... menor é melhor
A tela é uma reprodução de cores decente, pronta para uso: Com um desvio de cerca de 3,3, o valor-alvo (DeltaE < 3) não é atingido por pouco. Uma calibração reduz esse valor para 1,1 e garante escalas de cinza equilibradas. A precisão das cores é garantida: O painel reproduz completamente os espaços de cores sRGB e DCI P3 e o espaço AdobeRGB em 86%. As telas da concorrência contam a mesma história.
Criamos nosso próprio perfil de cores, que pode ser baixado e usado. Um link para isso pode ser encontrado na caixa de entrada "Tela".


Exibir tempos de resposta
| ↔ Tempo de resposta preto para branco | ||
|---|---|---|
| 5.8 ms ... ascensão ↗ e queda ↘ combinadas | ↗ 2.1 ms ascensão | 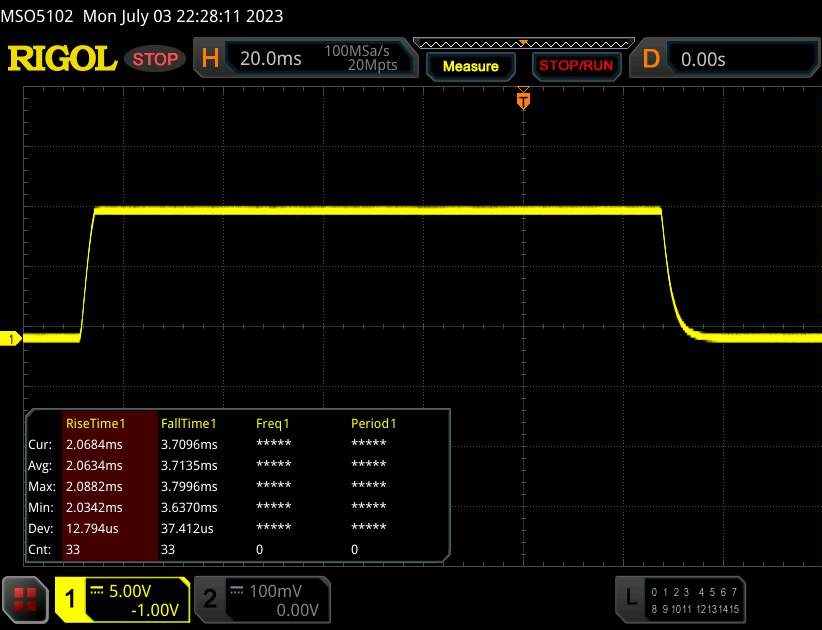 |
| ↘ 3.7 ms queda | ||
| A tela mostra taxas de resposta muito rápidas em nossos testes e deve ser muito adequada para jogos em ritmo acelerado. Em comparação, todos os dispositivos testados variam de 0.1 (mínimo) a 240 (máximo) ms. » 18 % de todos os dispositivos são melhores. Isso significa que o tempo de resposta medido é melhor que a média de todos os dispositivos testados (19.8 ms). | ||
| ↔ Tempo de resposta 50% cinza a 80% cinza | ||
| 15.1 ms ... ascensão ↗ e queda ↘ combinadas | ↗ 6.8 ms ascensão | 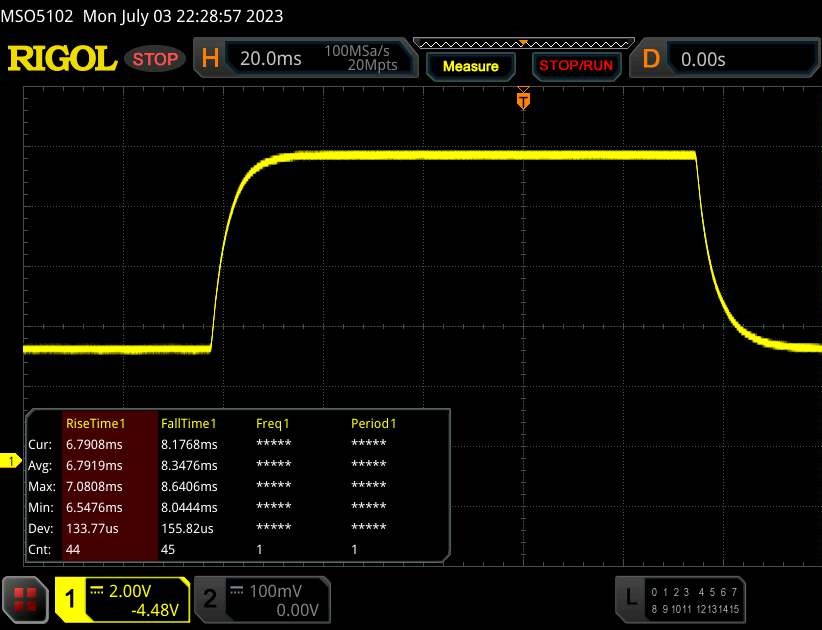 |
| ↘ 8.3 ms queda | ||
| A tela mostra boas taxas de resposta em nossos testes, mas pode ser muito lenta para jogadores competitivos. Em comparação, todos os dispositivos testados variam de 0.165 (mínimo) a 636 (máximo) ms. » 29 % de todos os dispositivos são melhores. Isso significa que o tempo de resposta medido é melhor que a média de todos os dispositivos testados (31 ms). | ||
Cintilação da tela / PWM (modulação por largura de pulso)
| Tela tremeluzindo / PWM não detectado | 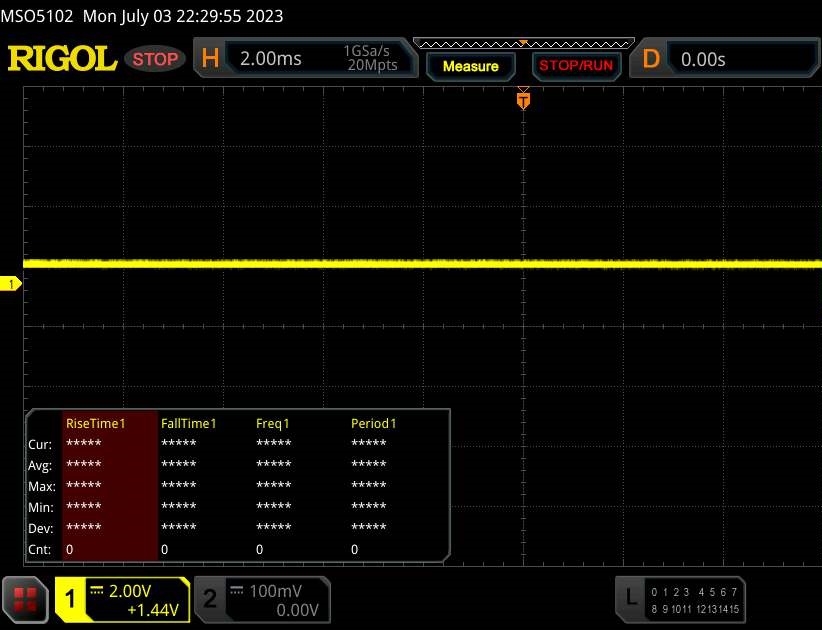 | ||
[pwm_comparison] Em comparação: 52 % de todos os dispositivos testados não usam PWM para escurecer a tela. Se PWM foi detectado, uma média de 7754 (mínimo: 5 - máximo: 343500) Hz foi medida. | |||
O painel IPS tem ângulos de visão estáveis e é legível em qualquer posição. Graças ao alto brilho do display, a tela também pode ser vista em ambientes externos.


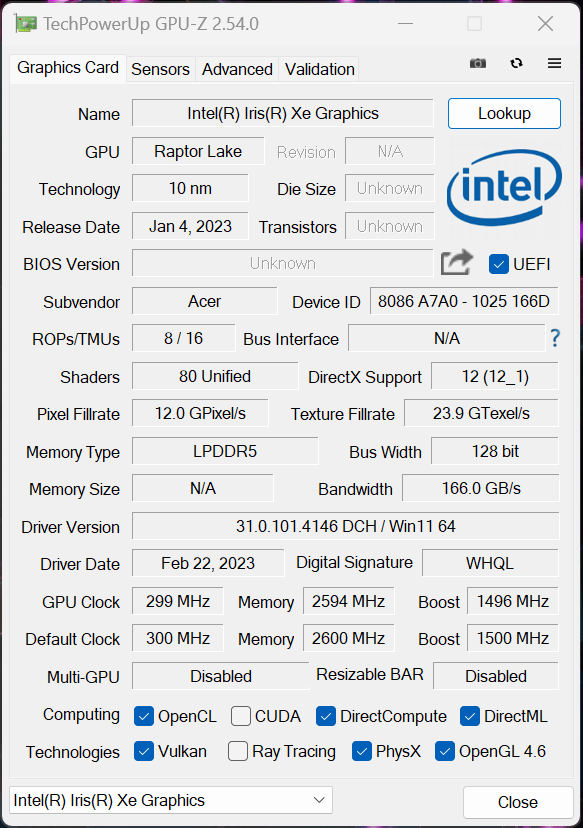
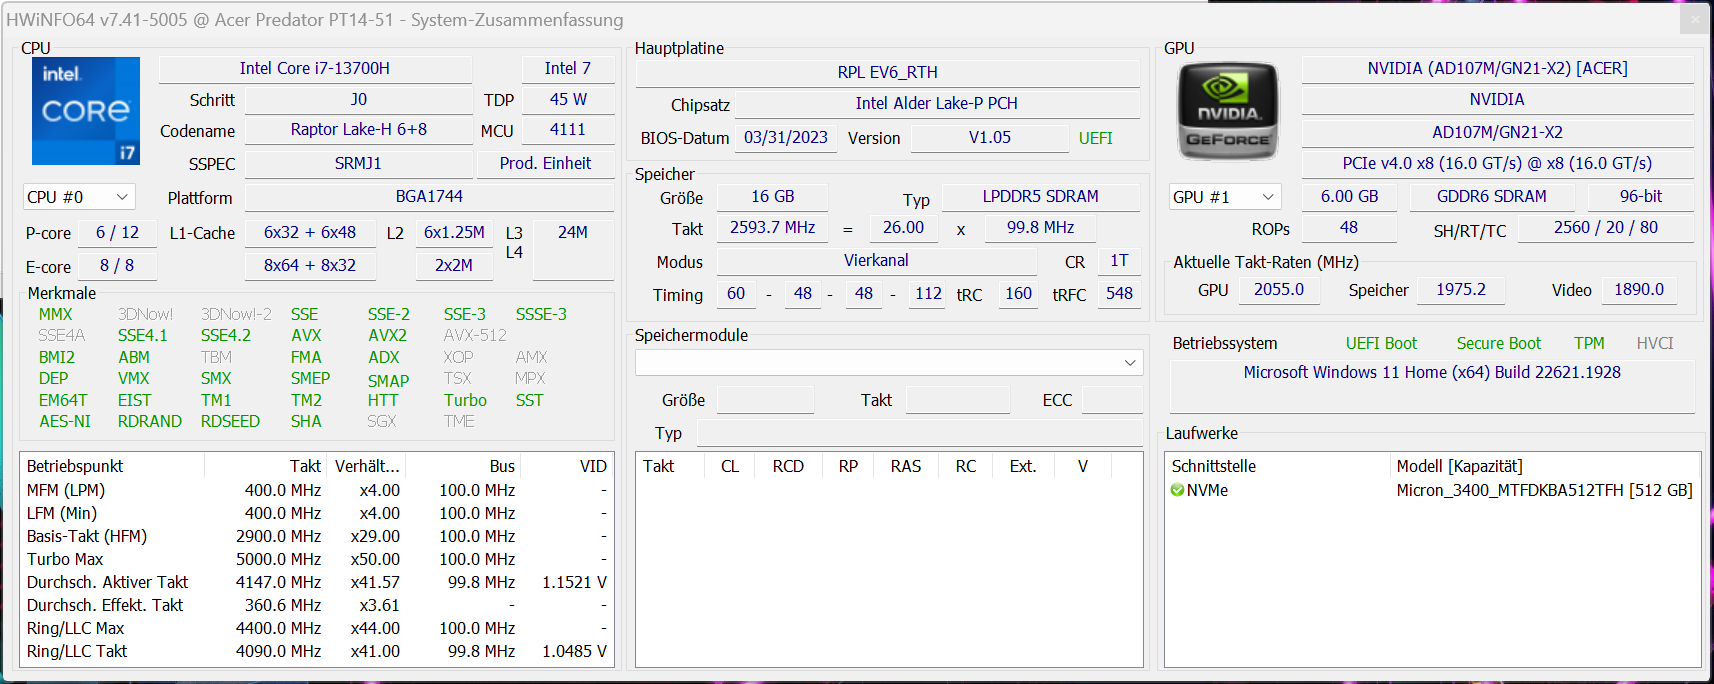
Desempenho - Raptor Lake e Ada Lovelace alimentam o laptop Acer
Com o Predator Triton 14, a Acer tem um laptop de 14 polegadas feito para jogos e renderização. O processadorCore i7-13700He GeForce RTX 4050fornecem a potência computacional necessária. As variantes de maior desempenho têm um GeForce RTX 4070a bordo.
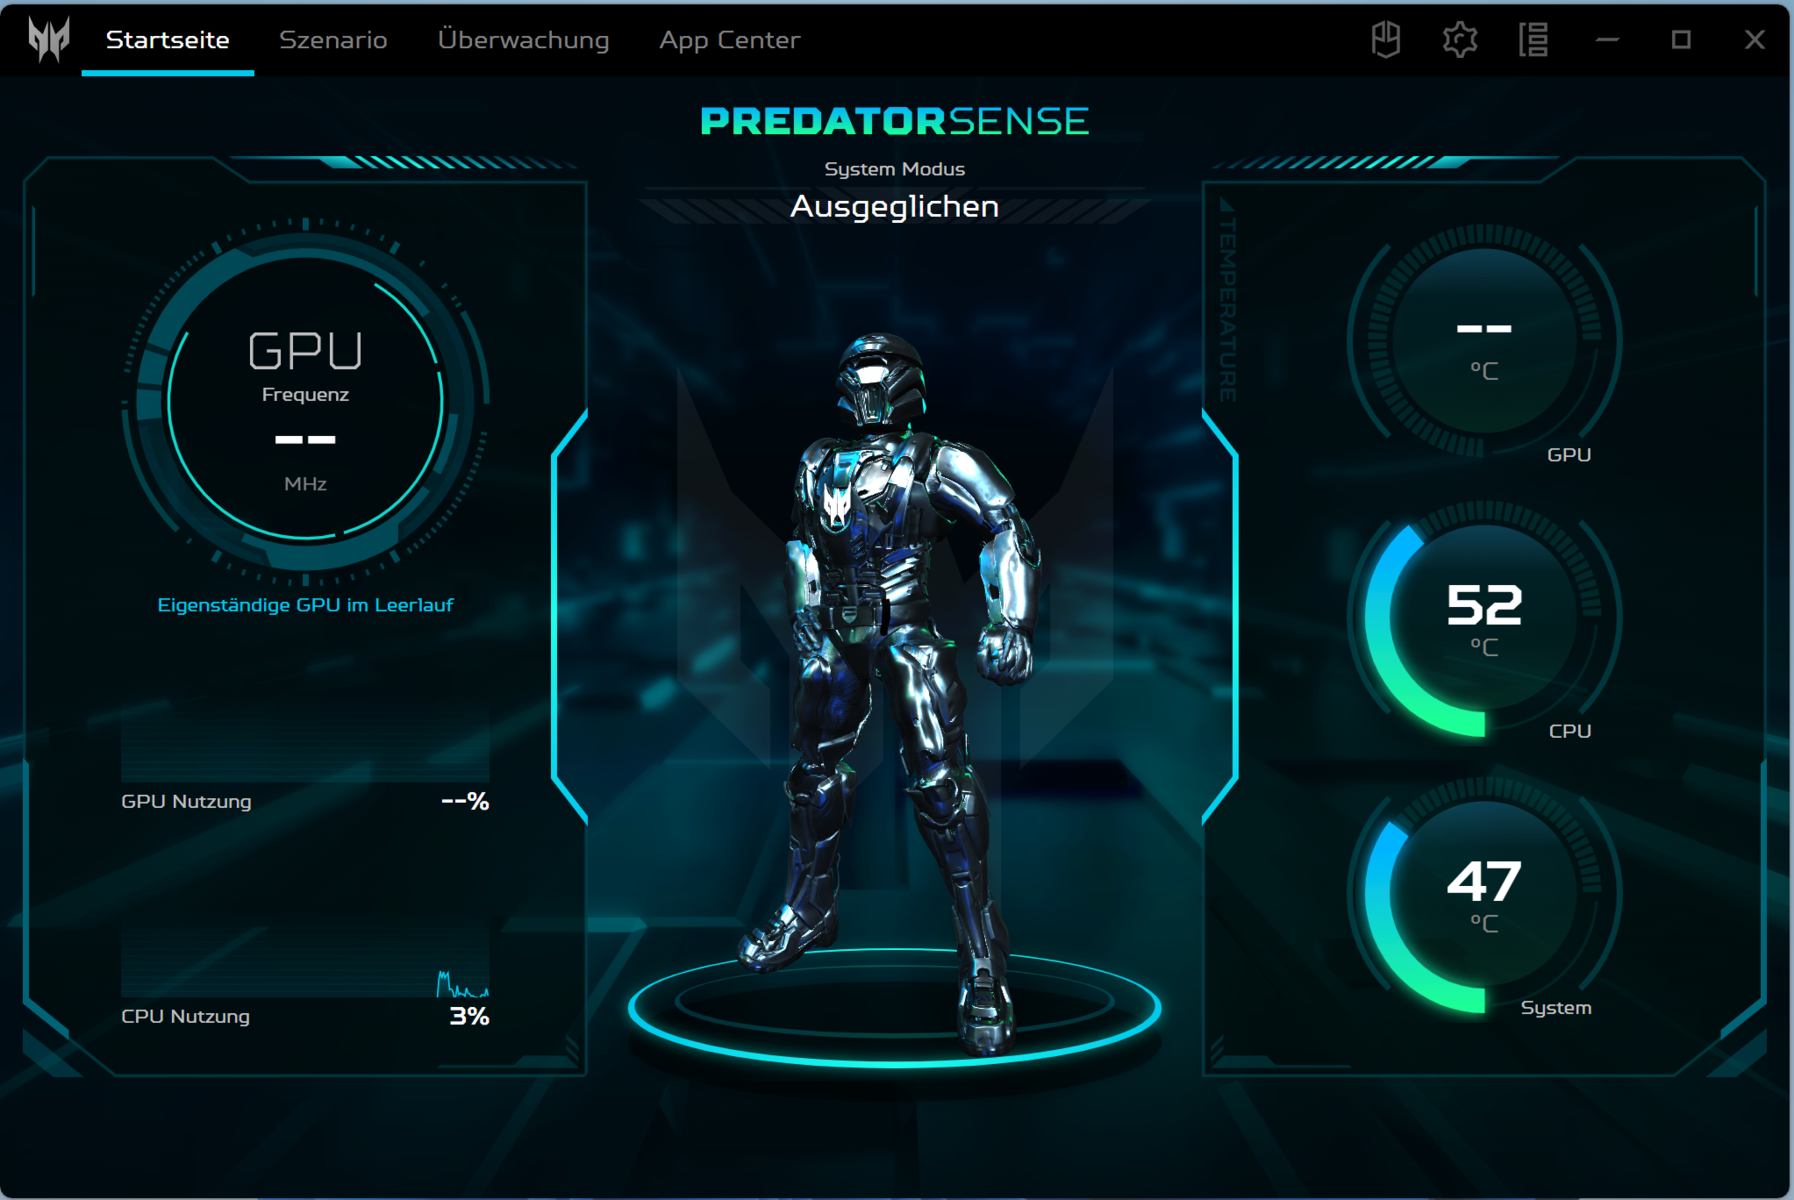
Condições de teste
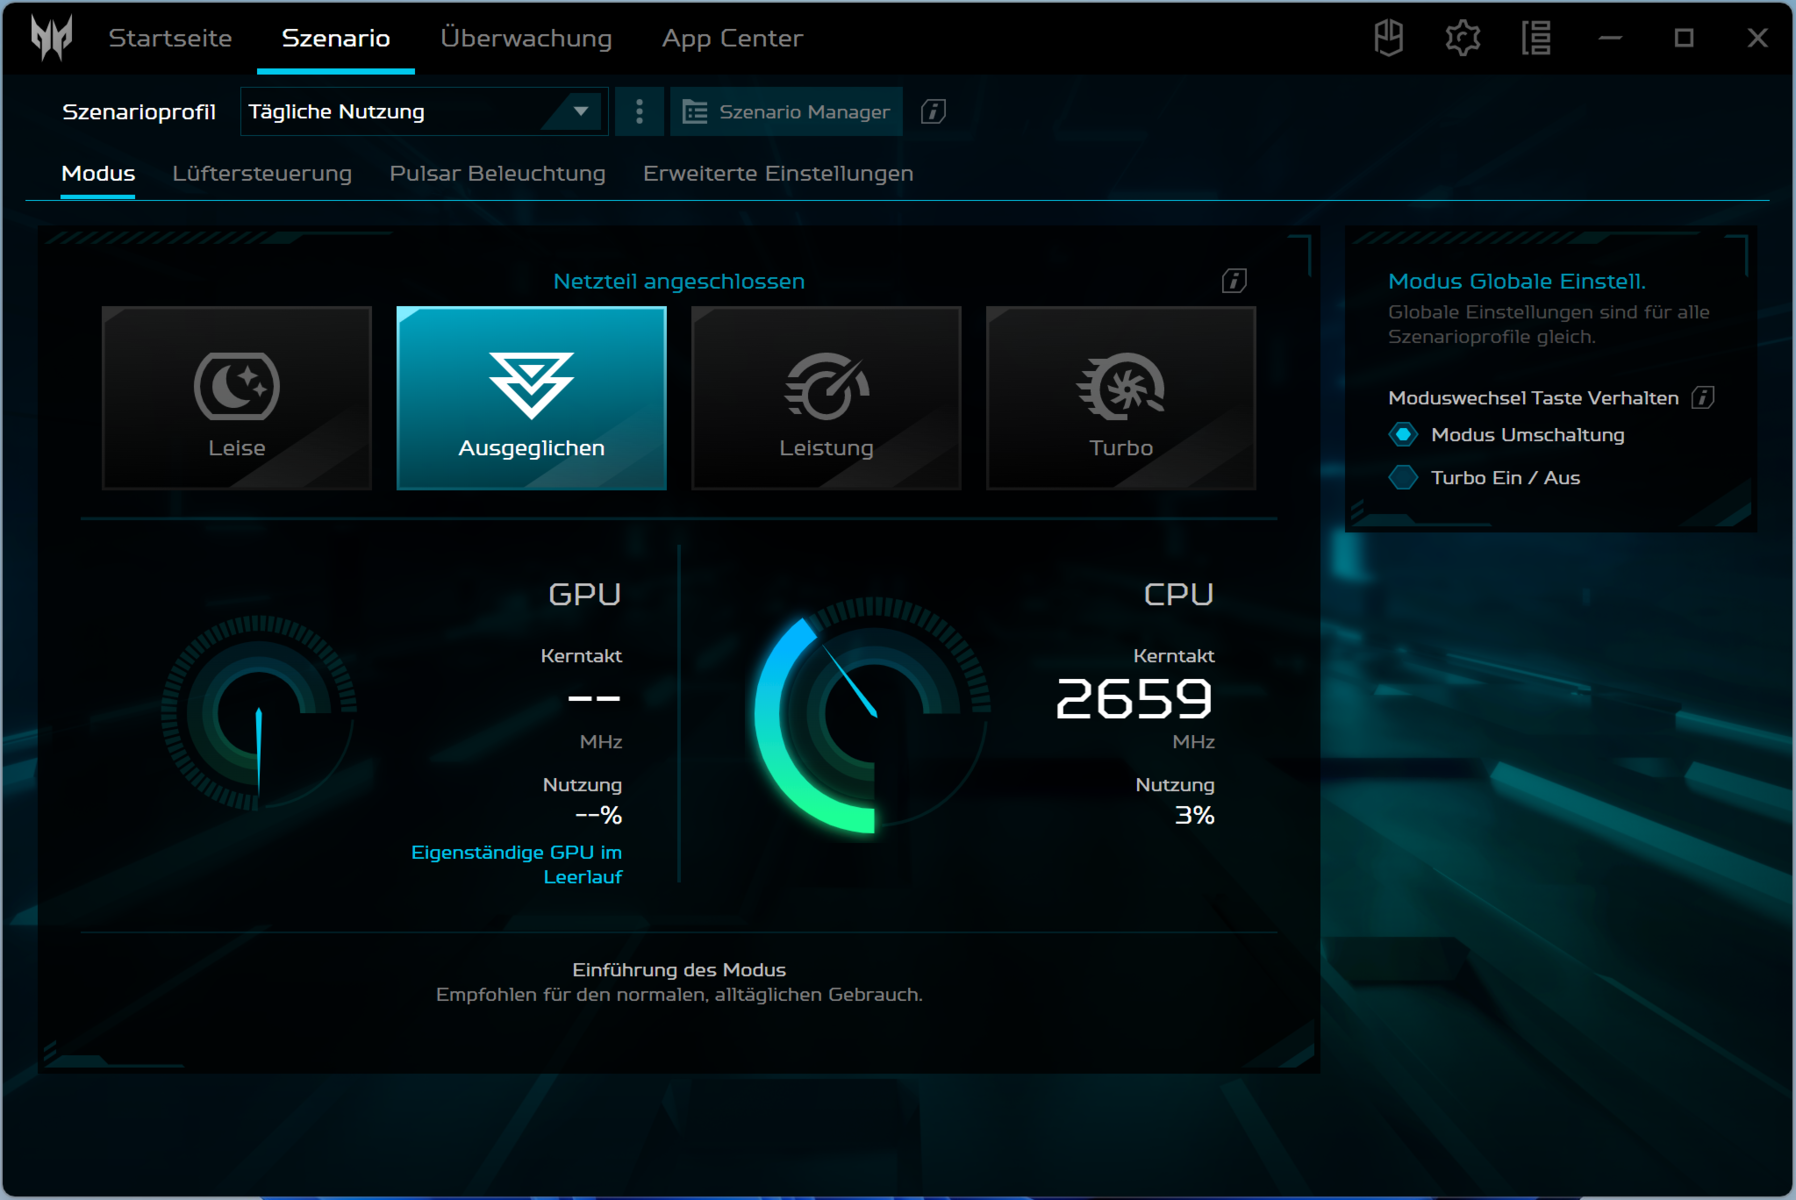
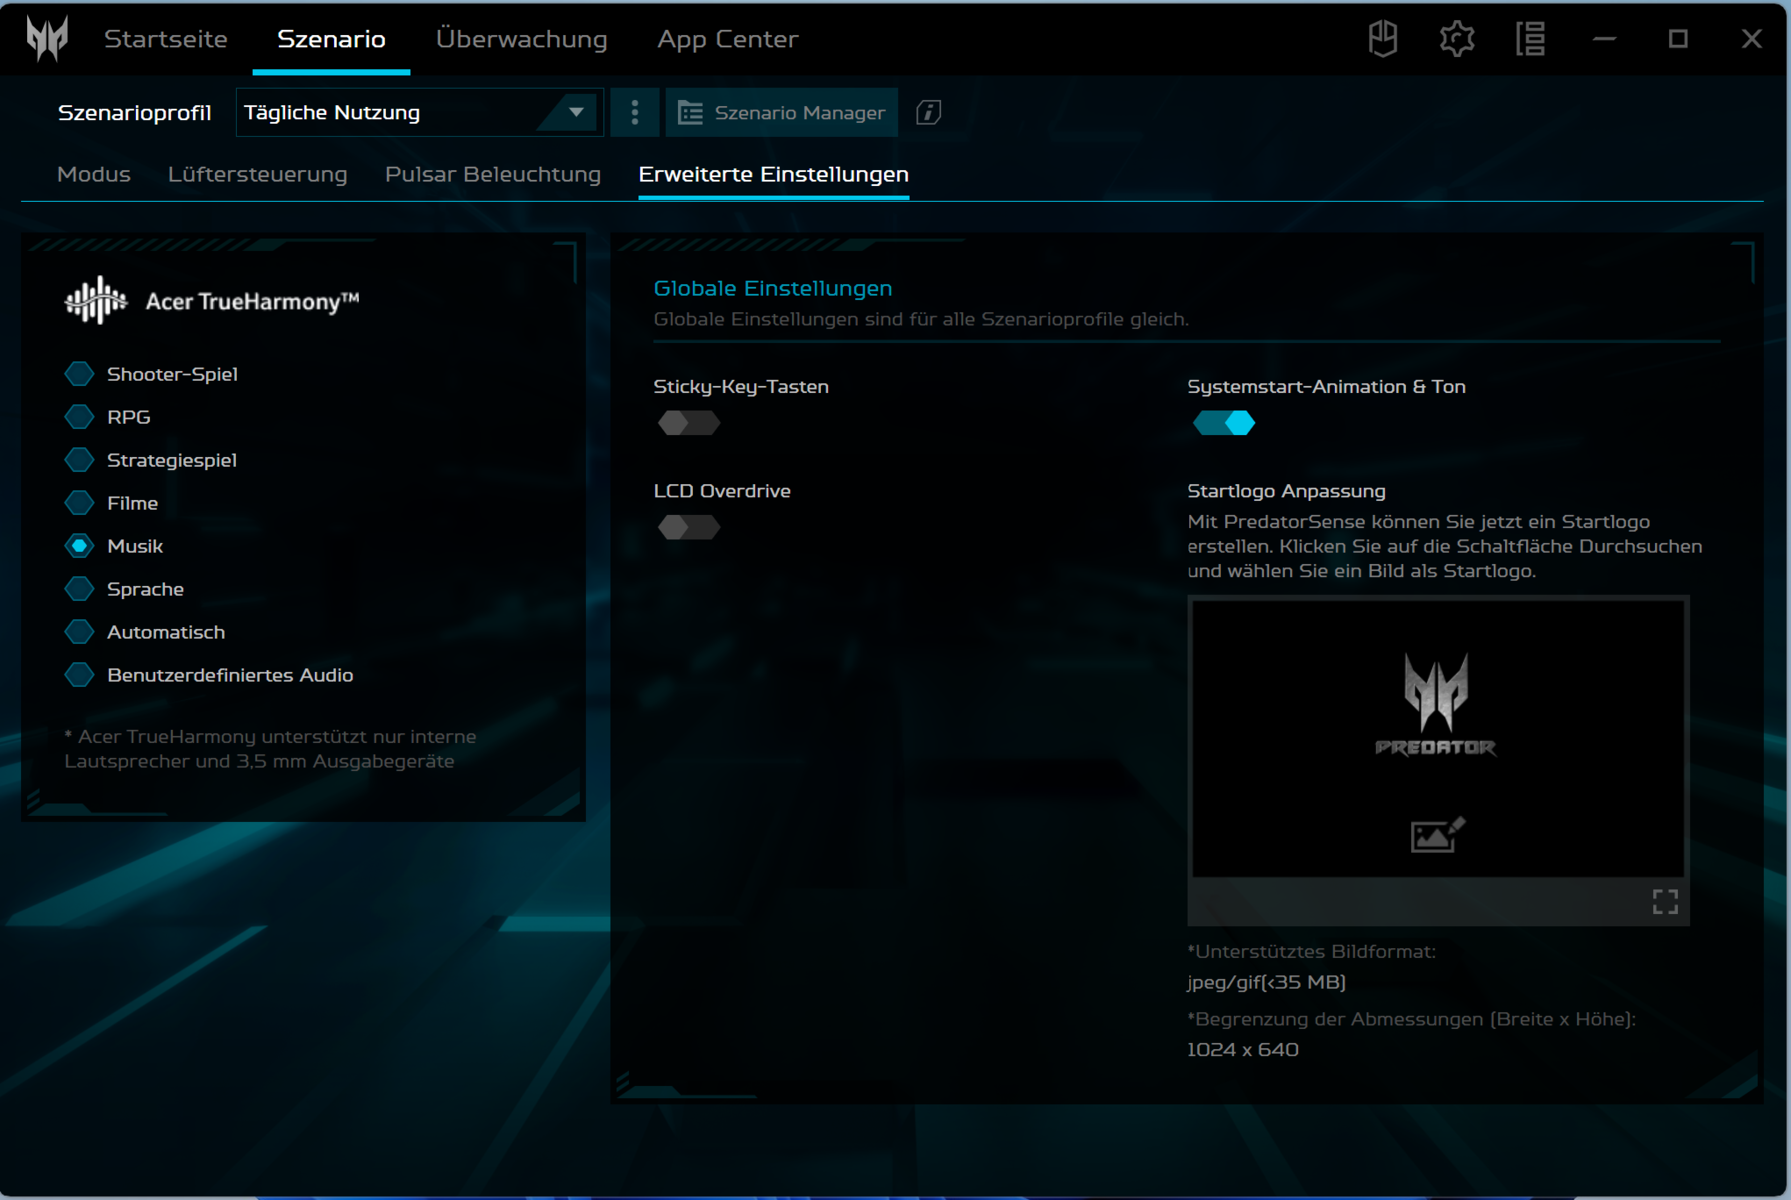
O laptop oferece seis modos de sistema específicos do fabricante - quatro em operação com a rede elétrica e dois em modo de bateria (consulte a tabela). Usamos os modos "Balanced" (benchmarks) e "Eco" (testes de bateria). os modos "Turbo" e "Performance" só estão disponíveis quando conectados à tomada (nível de bateria > 30%).
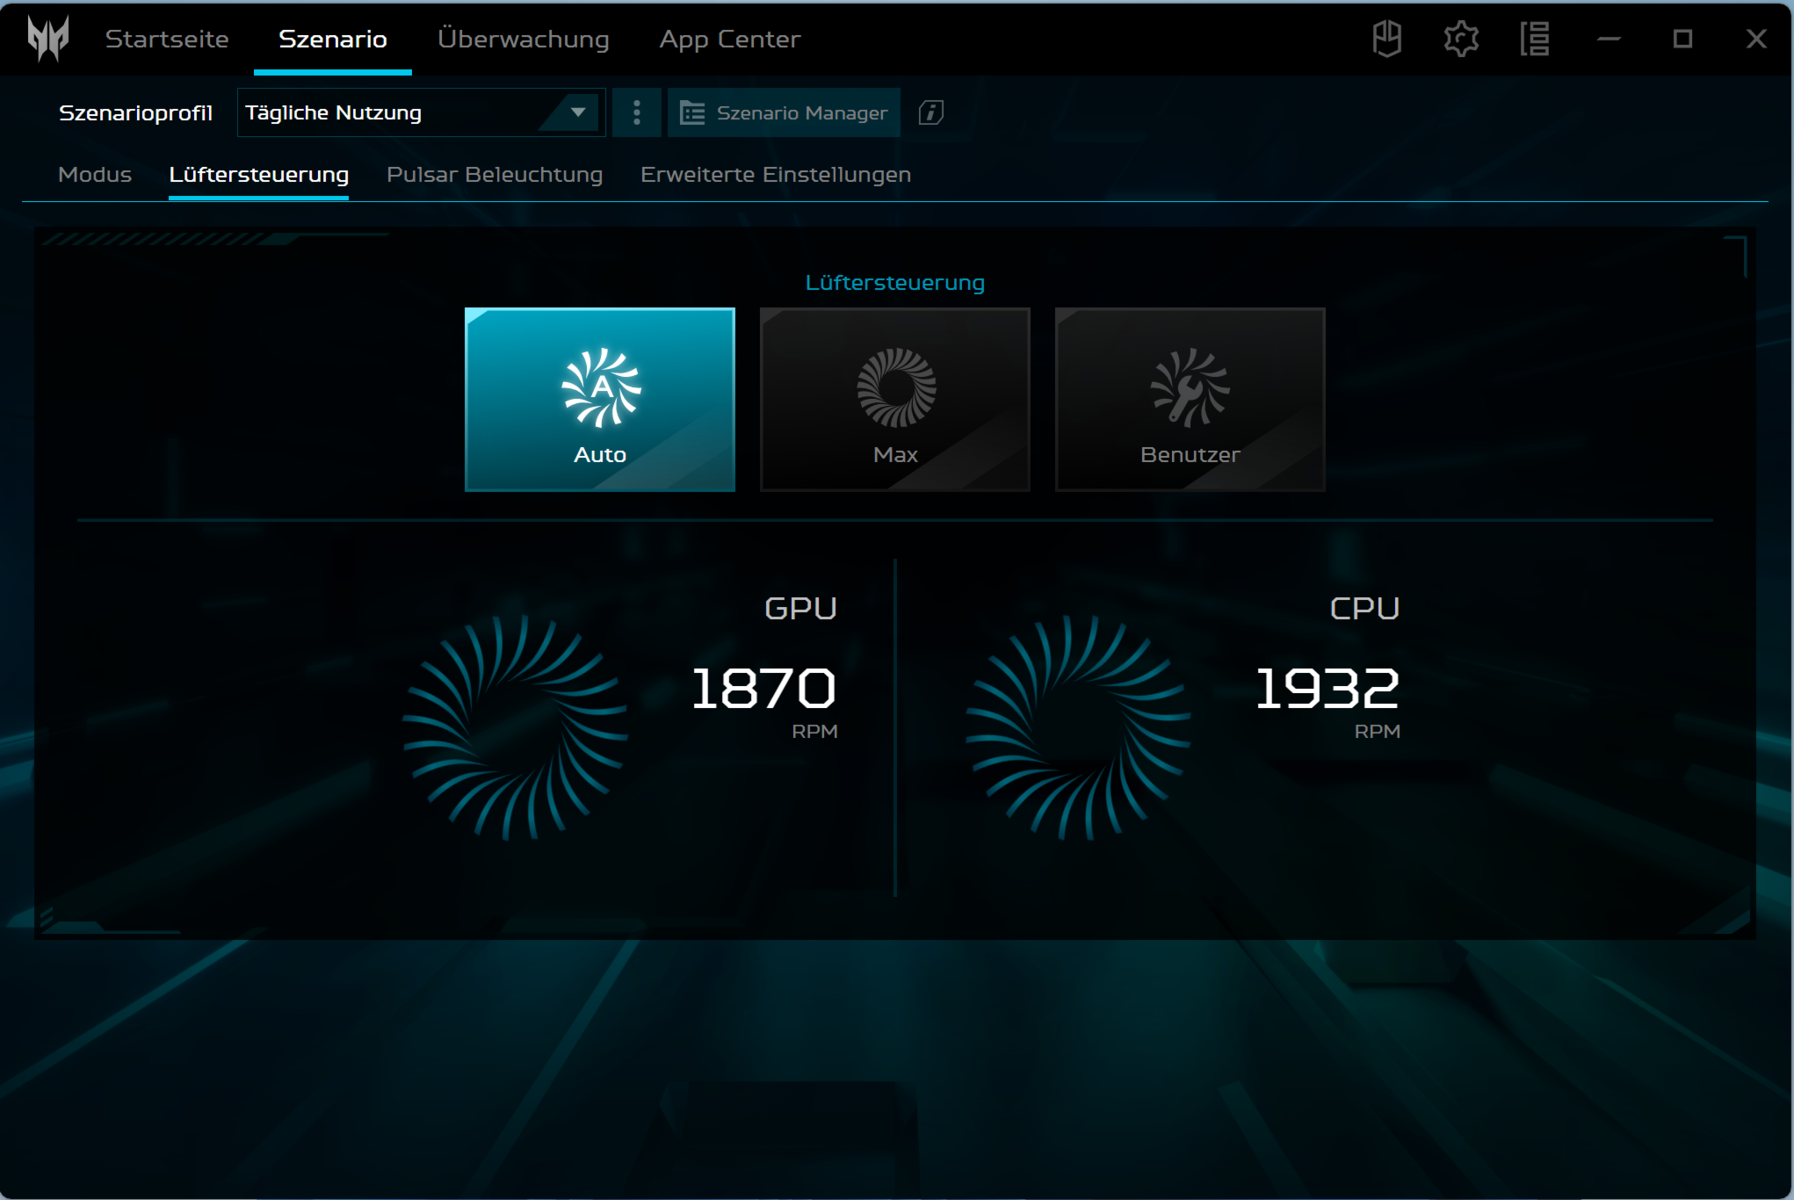
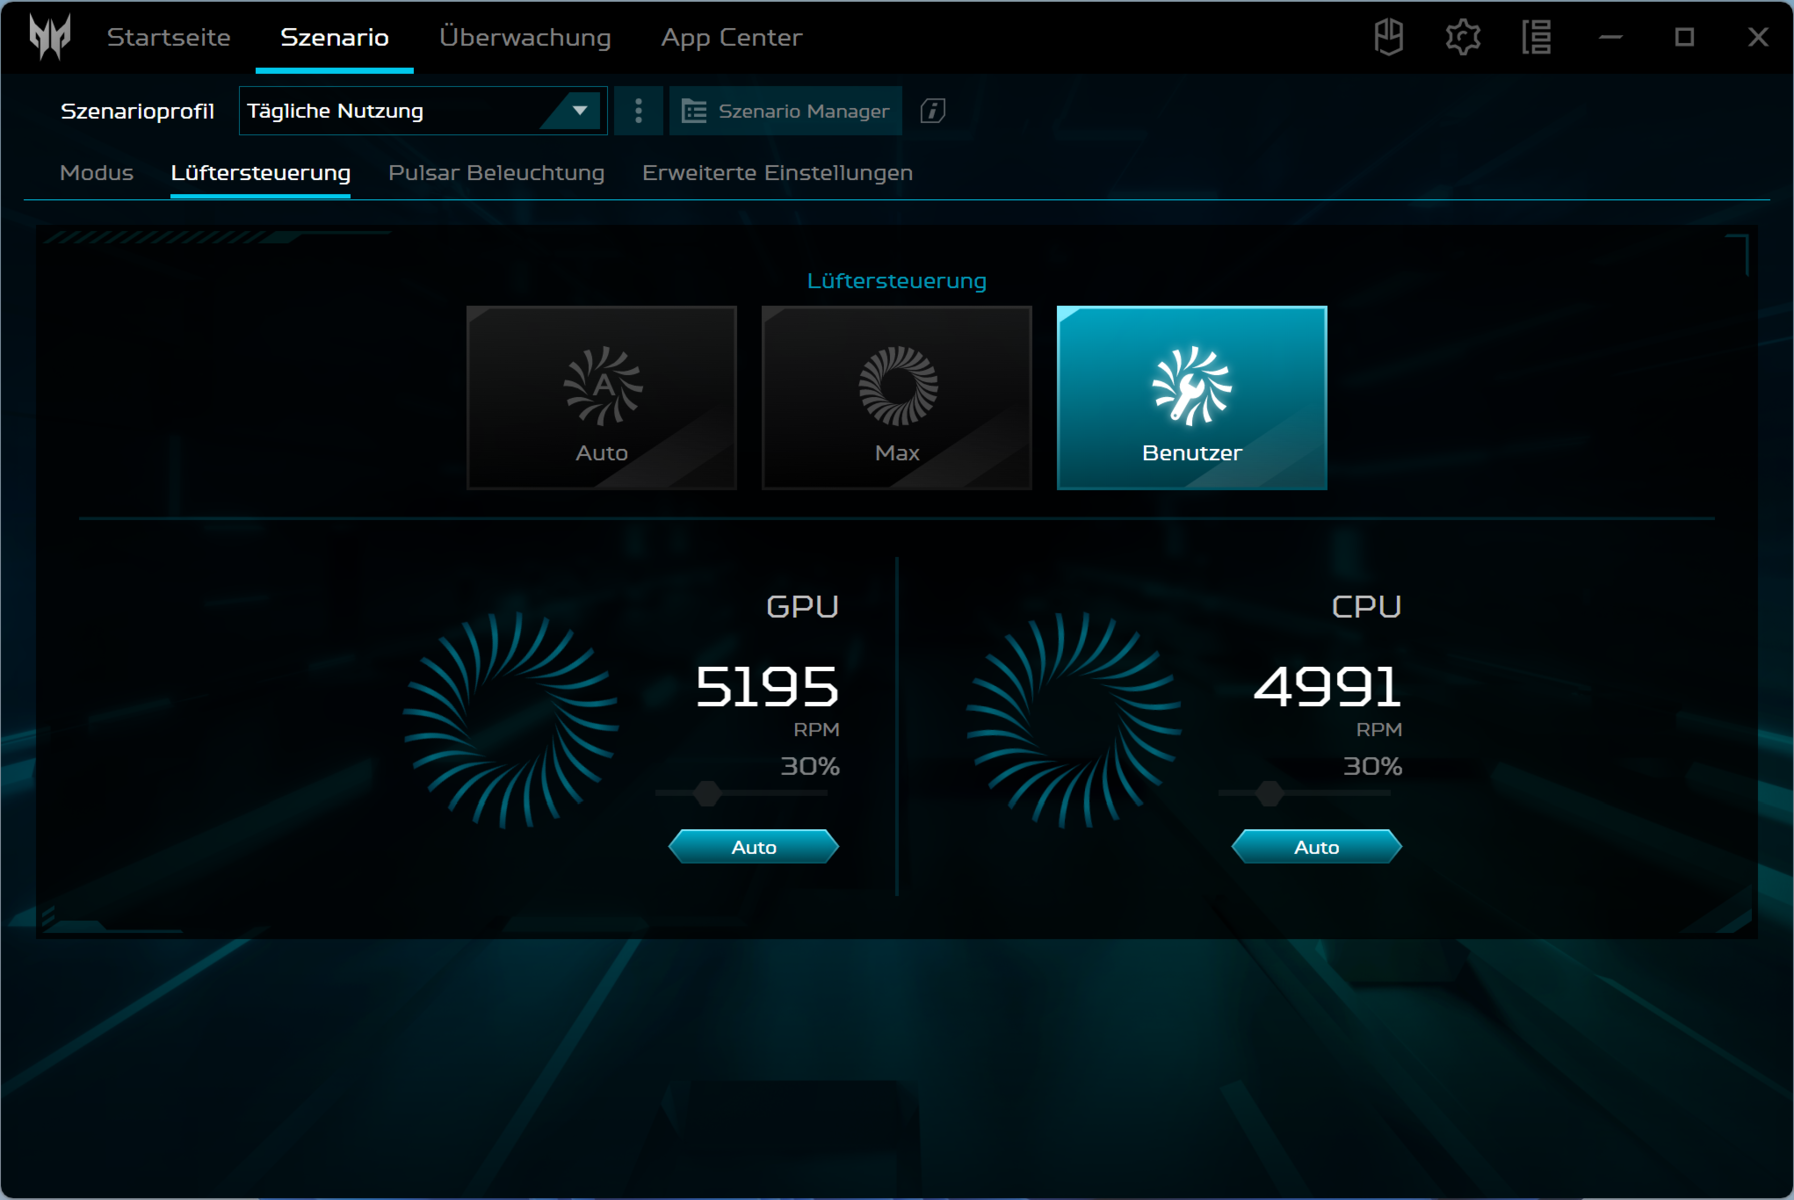
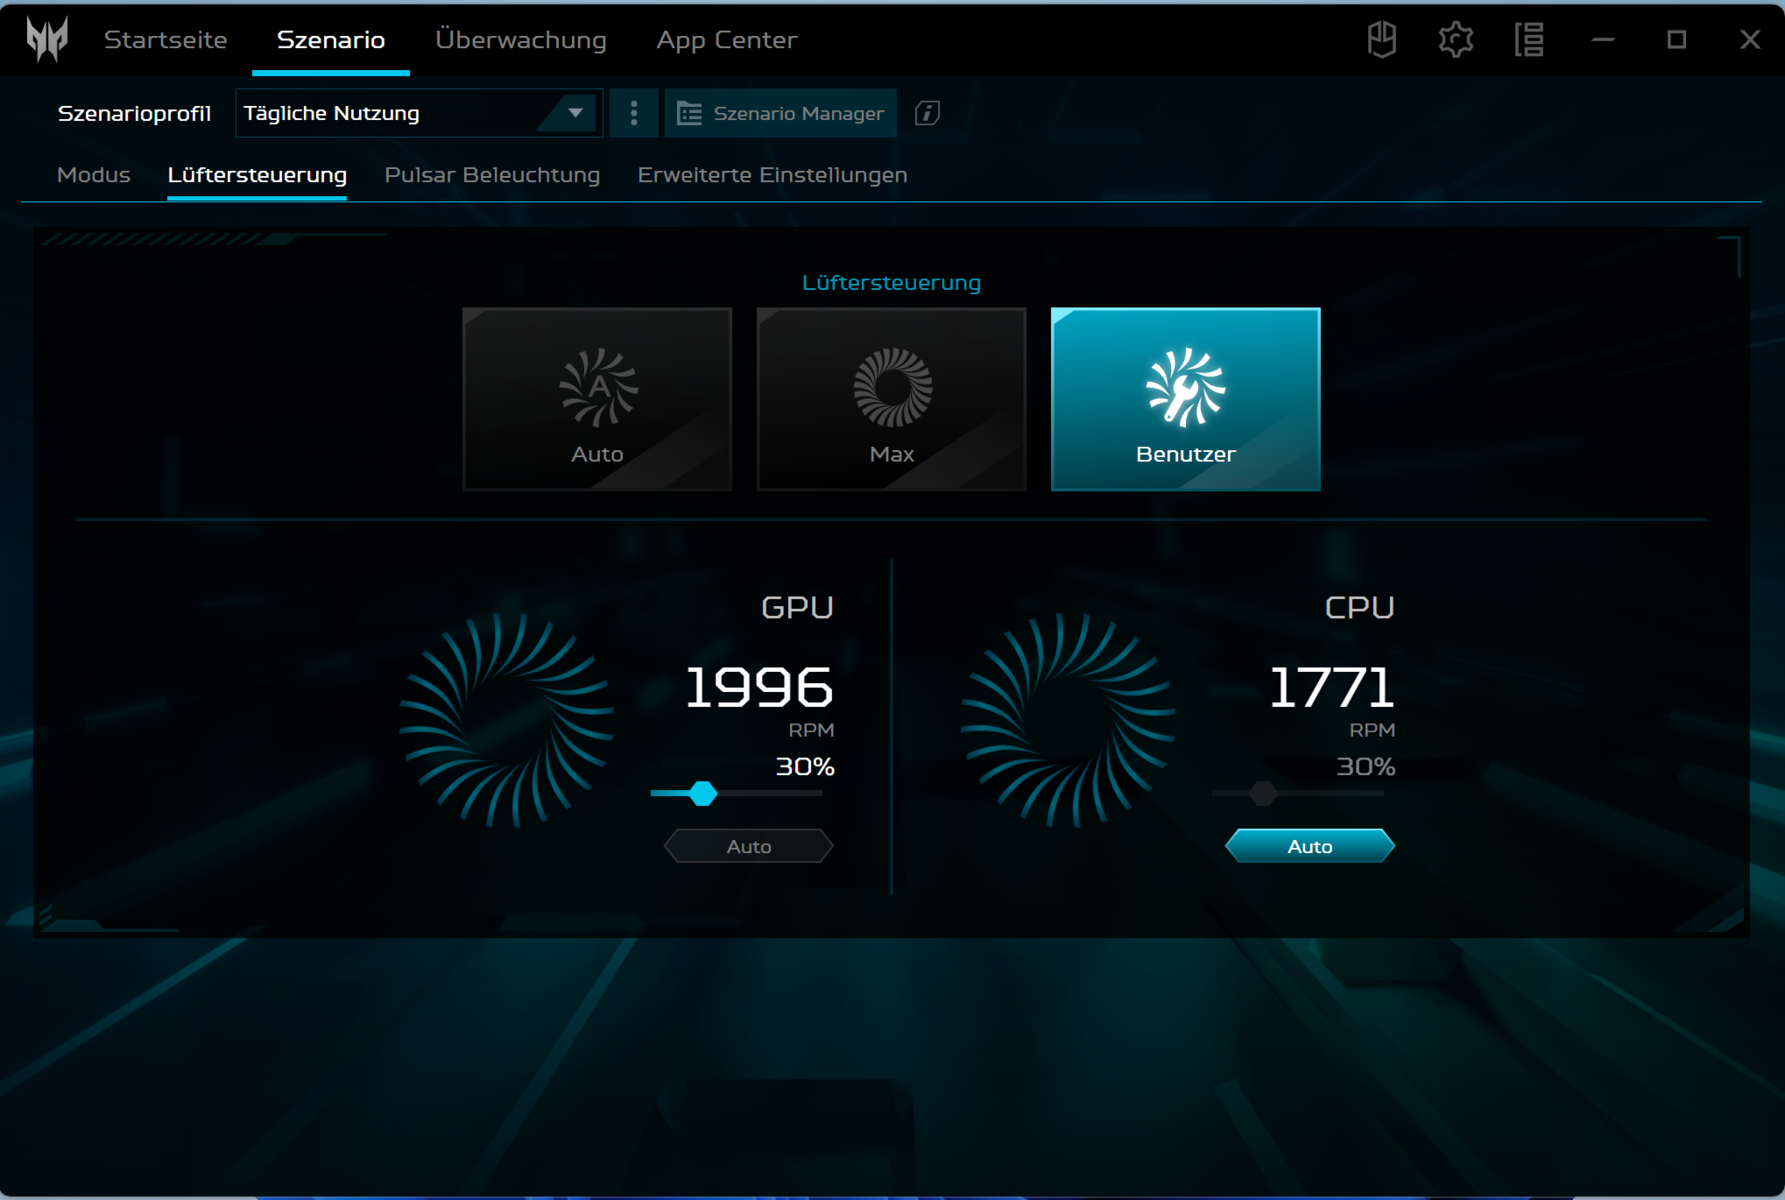
Uma tecla localizada acima do teclado é responsável pela alternância rápida entre os modos. Como alternativa, isso pode ser feito por meio do software PredatorSense (o centro de controle do laptop). Um LED exibe o modo ativo.
| Turbo | Desempenho | Balanceado | Silencioso | Balanceado (Bateria) | Eco (Bateria) | |
|---|---|---|---|---|---|---|
| Limite de potência 1 (HWInfo) | 80 watts | 75 watts | 60 watts | 50 watts | 60 watts | 25 watts |
| Limite de potência 2 (HWInfo) | 115 watts | 115 watts | 115 watts | 115 watts | 115 watts | 30 watts |
| Ruído (Witcher 3) | 56 dB(A) | 53 dB(A) | 43 dB(A) | 36 dB(A) | - | - |
| Desempenho (Witcher 3) | ~86 fps | ~83 fps | ~82 fps | ~58 fps | - | - |

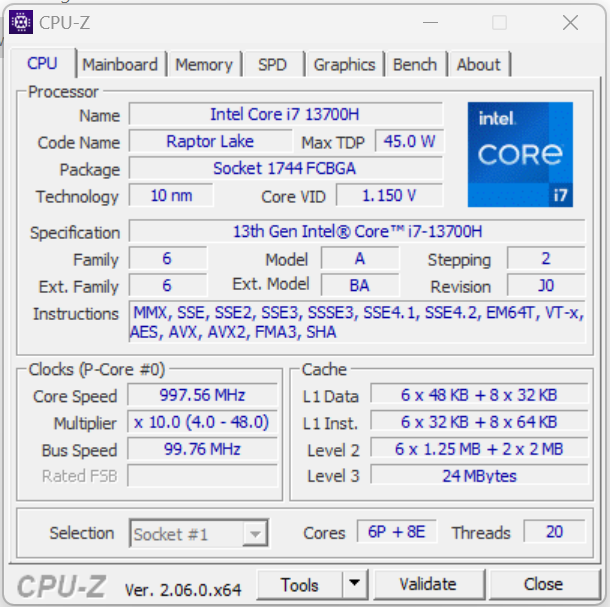
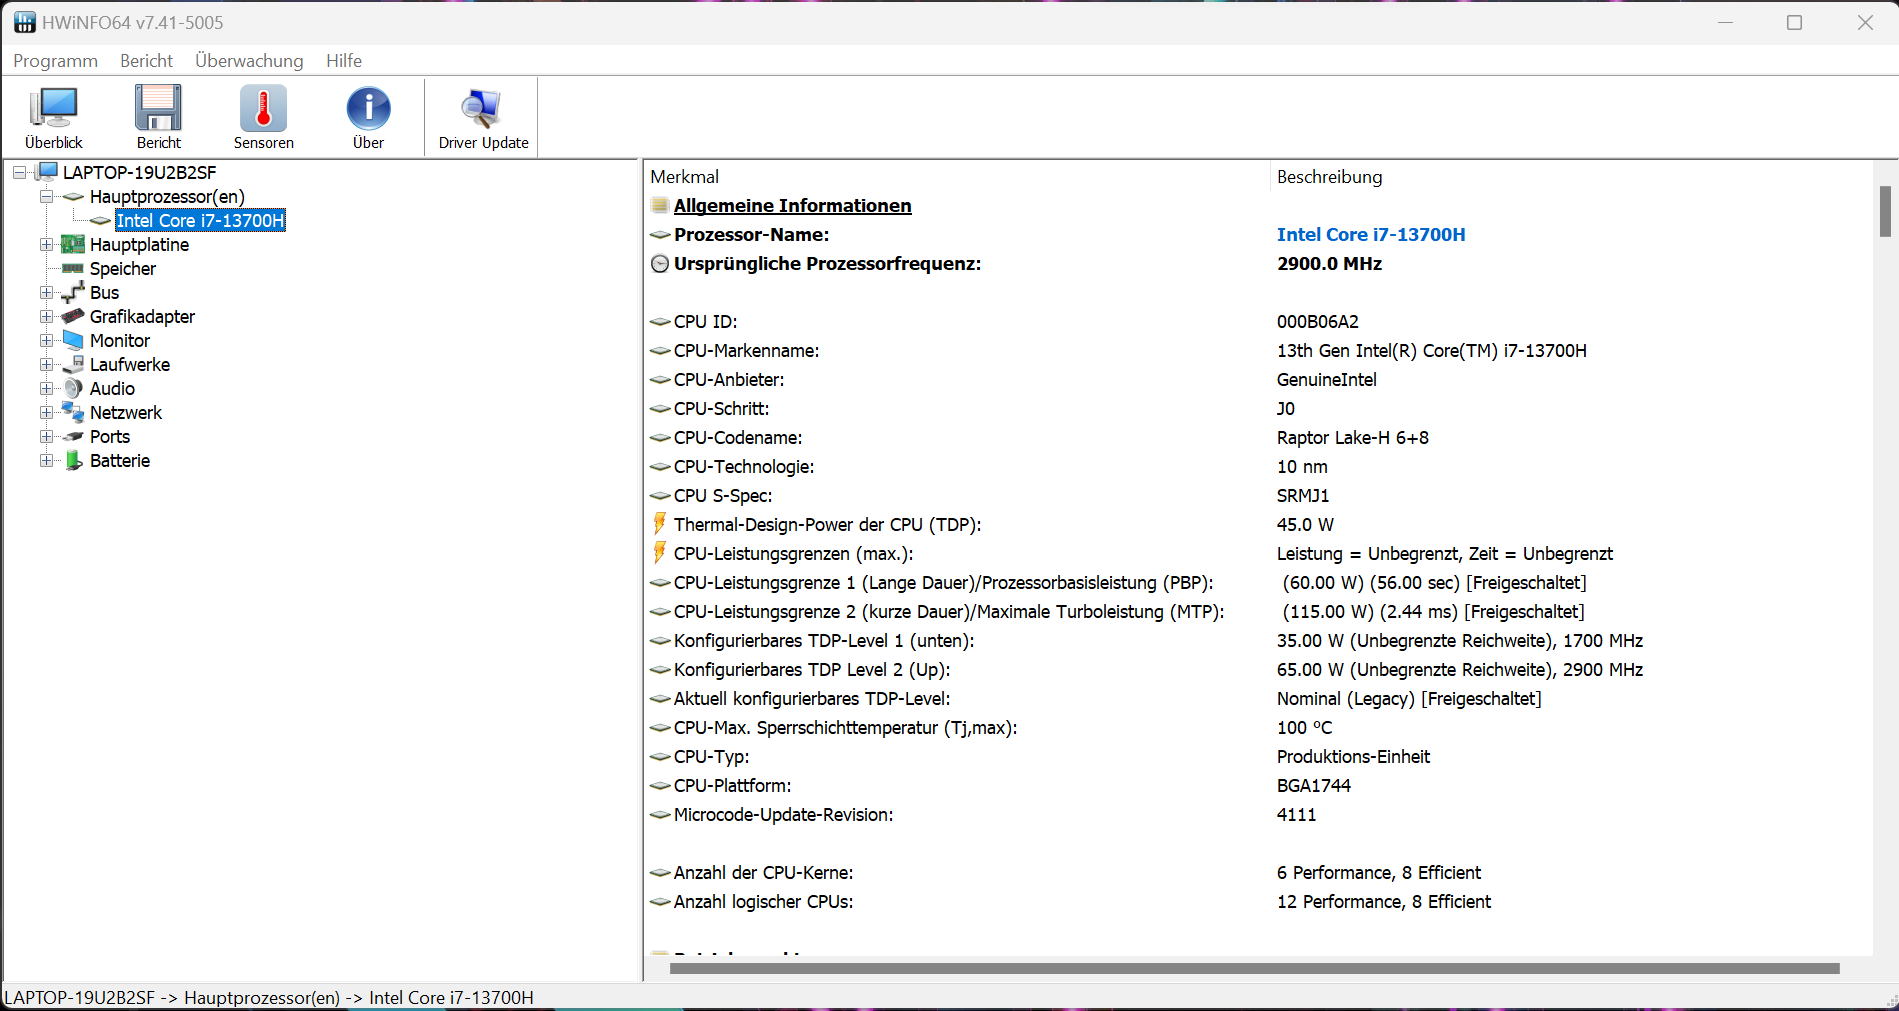
Processador
OCore-i7-13700H(Raptor Lake) consiste em oito núcleos de eficiência (sem hyperthreading, 1,8 a 3,7 GHz) e seis núcleos de desempenho (hyperthreading, 2,4 a 5 GHz). No total, isso representa um total de 20 núcleos lógicos de CPU.
Os resultados do benchmark estão acima da média típica da CPU, independentemente do modo de desempenho selecionado. O desempenho relevante de um único thread (179 pontos) cai menos no modo de bateria do que o desempenho de vários threads (992 pontos).
Sob carga contínua de vários threads (loop CB15), a velocidade do clock do turbo cai da primeira à terceira execução. Posteriormente, é mantido um nível consistente. O perfil "Turbo" garante resultados minimamente mais altos. Em geral, a diferença entre os modos é muito pequena.


Cinebench R15 Multi Continuous Test


* ... menor é melhor
AIDA64: FP32 Ray-Trace | FPU Julia | CPU SHA3 | CPU Queen | FPU SinJulia | FPU Mandel | CPU AES | CPU ZLib | FP64 Ray-Trace | CPU PhotoWorxx
| Performance rating | |
| Média da turma Gaming | |
| Razer Blade 14 RTX 4070 | |
| Acer Predator Triton 14 PT14-51 | |
| MSI Stealth 14 Studio A13V | |
| Asus ROG Zephyrus G14 GA402RJ | |
| Gigabyte Aero 14 OLED BMF | |
| Média Intel Core i7-13700H | |
| AIDA64 / FP32 Ray-Trace | |
| Média da turma Gaming (10227 - 85542, n=105, últimos 2 anos) | |
| Razer Blade 14 RTX 4070 | |
| MSI Stealth 14 Studio A13V | |
| Acer Predator Triton 14 PT14-51 | |
| Média Intel Core i7-13700H (4986 - 18908, n=29) | |
| Asus ROG Zephyrus G14 GA402RJ | |
| Gigabyte Aero 14 OLED BMF | |
| AIDA64 / FPU Julia | |
| Média da turma Gaming (51376 - 238426, n=105, últimos 2 anos) | |
| Razer Blade 14 RTX 4070 | |
| Asus ROG Zephyrus G14 GA402RJ | |
| Acer Predator Triton 14 PT14-51 | |
| MSI Stealth 14 Studio A13V | |
| Média Intel Core i7-13700H (25360 - 92359, n=29) | |
| Gigabyte Aero 14 OLED BMF | |
| AIDA64 / CPU SHA3 | |
| Média da turma Gaming (2180 - 10115, n=105, últimos 2 anos) | |
| Razer Blade 14 RTX 4070 | |
| Acer Predator Triton 14 PT14-51 | |
| MSI Stealth 14 Studio A13V | |
| Média Intel Core i7-13700H (1339 - 4224, n=29) | |
| Gigabyte Aero 14 OLED BMF | |
| Asus ROG Zephyrus G14 GA402RJ | |
| AIDA64 / CPU Queen | |
| Razer Blade 14 RTX 4070 | |
| Média da turma Gaming (49785 - 173351, n=90, últimos 2 anos) | |
| Gigabyte Aero 14 OLED BMF | |
| MSI Stealth 14 Studio A13V | |
| Asus ROG Zephyrus G14 GA402RJ | |
| Acer Predator Triton 14 PT14-51 | |
| Média Intel Core i7-13700H (59324 - 107159, n=29) | |
| AIDA64 / FPU SinJulia | |
| Razer Blade 14 RTX 4070 | |
| Média da turma Gaming (4424 - 33636, n=105, últimos 2 anos) | |
| Asus ROG Zephyrus G14 GA402RJ | |
| MSI Stealth 14 Studio A13V | |
| Acer Predator Triton 14 PT14-51 | |
| Média Intel Core i7-13700H (4800 - 11050, n=29) | |
| Gigabyte Aero 14 OLED BMF | |
| AIDA64 / FPU Mandel | |
| Média da turma Gaming (25115 - 128721, n=105, últimos 2 anos) | |
| Razer Blade 14 RTX 4070 | |
| Asus ROG Zephyrus G14 GA402RJ | |
| MSI Stealth 14 Studio A13V | |
| Acer Predator Triton 14 PT14-51 | |
| Média Intel Core i7-13700H (12321 - 45118, n=29) | |
| Gigabyte Aero 14 OLED BMF | |
| AIDA64 / CPU AES | |
| Acer Predator Triton 14 PT14-51 | |
| Asus ROG Zephyrus G14 GA402RJ | |
| Gigabyte Aero 14 OLED BMF | |
| Média da turma Gaming (39258 - 247074, n=105, últimos 2 anos) | |
| Razer Blade 14 RTX 4070 | |
| MSI Stealth 14 Studio A13V | |
| Média Intel Core i7-13700H (28769 - 151254, n=29) | |
| AIDA64 / CPU ZLib | |
| Média da turma Gaming (574 - 2531, n=105, últimos 2 anos) | |
| Acer Predator Triton 14 PT14-51 | |
| Razer Blade 14 RTX 4070 | |
| MSI Stealth 14 Studio A13V | |
| Média Intel Core i7-13700H (389 - 1215, n=29) | |
| Gigabyte Aero 14 OLED BMF | |
| Asus ROG Zephyrus G14 GA402RJ | |
| AIDA64 / FP64 Ray-Trace | |
| Média da turma Gaming (5509 - 45446, n=105, últimos 2 anos) | |
| Razer Blade 14 RTX 4070 | |
| MSI Stealth 14 Studio A13V | |
| Acer Predator Triton 14 PT14-51 | |
| Média Intel Core i7-13700H (2540 - 10135, n=29) | |
| Asus ROG Zephyrus G14 GA402RJ | |
| Gigabyte Aero 14 OLED BMF | |
| AIDA64 / CPU PhotoWorxx | |
| Gigabyte Aero 14 OLED BMF | |
| Acer Predator Triton 14 PT14-51 | |
| Média da turma Gaming (12271 - 89891, n=105, últimos 2 anos) | |
| Média Intel Core i7-13700H (12872 - 52727, n=29) | |
| MSI Stealth 14 Studio A13V | |
| Razer Blade 14 RTX 4070 | |
| Asus ROG Zephyrus G14 GA402RJ | |
Desempenho do sistema
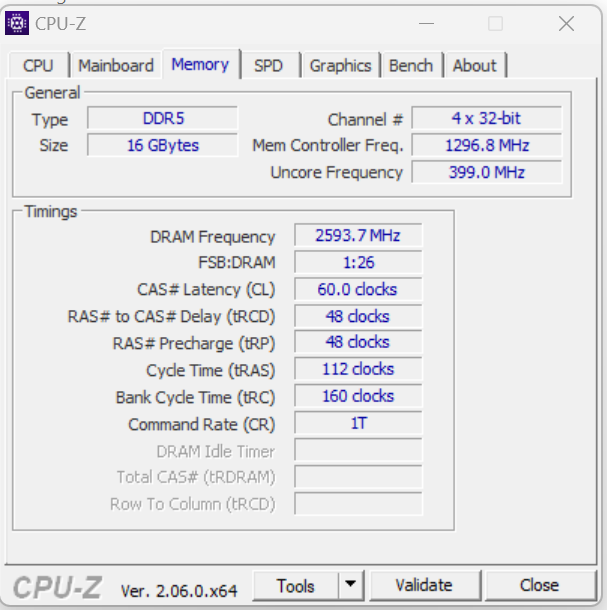
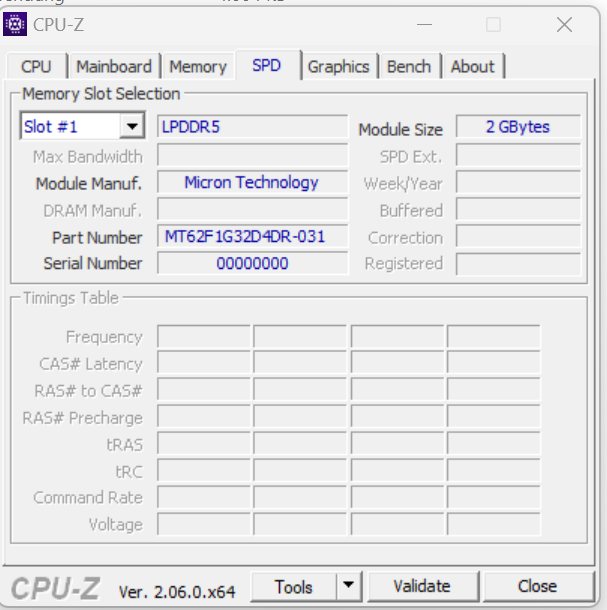
O sistema de funcionamento suave tem potência suficiente à sua disposição para aplicativos exigentes, como renderização e jogos - algo confirmado pelos bons resultados do PC Mark. As taxas de transferência da RAM estão dentro de uma faixa normal para a RAM LPDDR5 6000.
CrossMark: Overall | Productivity | Creativity | Responsiveness
| PCMark 10 / Score | |
| Média da turma Gaming (5828 - 12414, n=93, últimos 2 anos) | |
| Razer Blade 14 RTX 4070 | |
| Acer Predator Triton 14 PT14-51 | |
| Asus ROG Zephyrus G14 GA402RJ | |
| Gigabyte Aero 14 OLED BMF | |
| Média Intel Core i7-13700H, NVIDIA GeForce RTX 4050 Laptop GPU (6822 - 7556, n=7) | |
| MSI Stealth 14 Studio A13V | |
| PCMark 10 / Essentials | |
| Gigabyte Aero 14 OLED BMF | |
| Razer Blade 14 RTX 4070 | |
| Média Intel Core i7-13700H, NVIDIA GeForce RTX 4050 Laptop GPU (10283 - 11549, n=7) | |
| Média da turma Gaming (8810 - 11935, n=97, últimos 2 anos) | |
| Acer Predator Triton 14 PT14-51 | |
| MSI Stealth 14 Studio A13V | |
| Asus ROG Zephyrus G14 GA402RJ | |
| PCMark 10 / Productivity | |
| Média da turma Gaming (6845 - 25323, n=95, últimos 2 anos) | |
| Razer Blade 14 RTX 4070 | |
| Acer Predator Triton 14 PT14-51 | |
| Asus ROG Zephyrus G14 GA402RJ | |
| Gigabyte Aero 14 OLED BMF | |
| Média Intel Core i7-13700H, NVIDIA GeForce RTX 4050 Laptop GPU (8368 - 9836, n=7) | |
| MSI Stealth 14 Studio A13V | |
| PCMark 10 / Digital Content Creation | |
| Média da turma Gaming (7602 - 19954, n=95, últimos 2 anos) | |
| Razer Blade 14 RTX 4070 | |
| Asus ROG Zephyrus G14 GA402RJ | |
| Acer Predator Triton 14 PT14-51 | |
| MSI Stealth 14 Studio A13V | |
| Média Intel Core i7-13700H, NVIDIA GeForce RTX 4050 Laptop GPU (9527 - 10643, n=7) | |
| Gigabyte Aero 14 OLED BMF | |
| CrossMark / Overall | |
| Média da turma Gaming (1366 - 2409, n=94, últimos 2 anos) | |
| Acer Predator Triton 14 PT14-51 | |
| Gigabyte Aero 14 OLED BMF | |
| Razer Blade 14 RTX 4070 | |
| Apple MacBook Pro 14 2023 M2 Pro Entry | |
| MSI Stealth 14 Studio A13V | |
| Média Intel Core i7-13700H, NVIDIA GeForce RTX 4050 Laptop GPU (1205 - 1937, n=9) | |
| CrossMark / Productivity | |
| Média da turma Gaming (1386 - 2254, n=94, últimos 2 anos) | |
| Gigabyte Aero 14 OLED BMF | |
| Razer Blade 14 RTX 4070 | |
| Acer Predator Triton 14 PT14-51 | |
| Média Intel Core i7-13700H, NVIDIA GeForce RTX 4050 Laptop GPU (1158 - 1877, n=9) | |
| MSI Stealth 14 Studio A13V | |
| Apple MacBook Pro 14 2023 M2 Pro Entry | |
| CrossMark / Creativity | |
| Média da turma Gaming (1343 - 2786, n=94, últimos 2 anos) | |
| Apple MacBook Pro 14 2023 M2 Pro Entry | |
| Acer Predator Triton 14 PT14-51 | |
| Razer Blade 14 RTX 4070 | |
| Gigabyte Aero 14 OLED BMF | |
| MSI Stealth 14 Studio A13V | |
| Média Intel Core i7-13700H, NVIDIA GeForce RTX 4050 Laptop GPU (1293 - 2044, n=9) | |
| CrossMark / Responsiveness | |
| Acer Predator Triton 14 PT14-51 | |
| Gigabyte Aero 14 OLED BMF | |
| Média da turma Gaming (1226 - 2334, n=94, últimos 2 anos) | |
| Média Intel Core i7-13700H, NVIDIA GeForce RTX 4050 Laptop GPU (1097 - 1929, n=9) | |
| Razer Blade 14 RTX 4070 | |
| MSI Stealth 14 Studio A13V | |
| Apple MacBook Pro 14 2023 M2 Pro Entry | |
| PCMark 8 Home Score Accelerated v2 | 5120 pontos | |
| PCMark 8 Work Score Accelerated v2 | 5617 pontos | |
| PCMark 10 Score | 7402 pontos | |
Ajuda | ||
| AIDA64 / Memory Copy | |
| Gigabyte Aero 14 OLED BMF | |
| Acer Predator Triton 14 PT14-51 | |
| Média da turma Gaming (21750 - 129946, n=105, últimos 2 anos) | |
| Média Intel Core i7-13700H (24334 - 78081, n=29) | |
| Razer Blade 14 RTX 4070 | |
| MSI Stealth 14 Studio A13V | |
| Asus ROG Zephyrus G14 GA402RJ | |
| AIDA64 / Memory Read | |
| Gigabyte Aero 14 OLED BMF | |
| Média da turma Gaming (22956 - 118858, n=105, últimos 2 anos) | |
| MSI Stealth 14 Studio A13V | |
| Acer Predator Triton 14 PT14-51 | |
| Média Intel Core i7-13700H (23681 - 79656, n=29) | |
| Razer Blade 14 RTX 4070 | |
| Asus ROG Zephyrus G14 GA402RJ | |
| AIDA64 / Memory Write | |
| Gigabyte Aero 14 OLED BMF | |
| Acer Predator Triton 14 PT14-51 | |
| Razer Blade 14 RTX 4070 | |
| Média da turma Gaming (22297 - 135096, n=105, últimos 2 anos) | |
| Média Intel Core i7-13700H (22986 - 99898, n=29) | |
| Asus ROG Zephyrus G14 GA402RJ | |
| MSI Stealth 14 Studio A13V | |
| AIDA64 / Memory Latency | |
| Média da turma Gaming (75.3 - 259, n=105, últimos 2 anos) | |
| Acer Predator Triton 14 PT14-51 | |
| Média Intel Core i7-13700H (82.4 - 136.8, n=29) | |
| Gigabyte Aero 14 OLED BMF | |
| Asus ROG Zephyrus G14 GA402RJ | |
| Razer Blade 14 RTX 4070 | |
| MSI Stealth 14 Studio A13V | |
* ... menor é melhor
Latências de DPC
O teste padronizado do Latency Monitor (navegação na Internet, reprodução de vídeo 4k, Prime95 High Load) revelou anormalidades. O sistema não parece ser adequado para edição de vídeo e áudio em tempo real. Futuras atualizações de software poderão melhorar ou piorar a situação.


| DPC Latencies / LatencyMon - interrupt to process latency (max), Web, Youtube, Prime95 | |
| Gigabyte Aero 14 OLED BMF | |
| MSI Stealth 14 Studio A13V | |
| Acer Predator Triton 14 PT14-51 | |
| Asus ROG Zephyrus G14 GA402RJ | |
| Razer Blade 14 RTX 4070 | |
* ... menor é melhor
Armazenamento em massa
Armazenamento limitado na Acer: O SSD PCIe 4 instalado (M.2 2280) tem uma capacidade de apenas 512 GB, o que não é suficiente para um laptop para jogos, especialmente um nessa categoria de preço. O SSD Micron é muito bom, mas não tem velocidades de transferência excepcionais. Contras: no decorrer do loop do DiskSpd, há quedas de desempenho devido à limitação térmica. Não há espaço para uma mídia de armazenamento adicional.


* ... menor é melhor
Continuous Performance Read: DiskSpd Read Loop, Queue Depth 8
Placa de vídeo
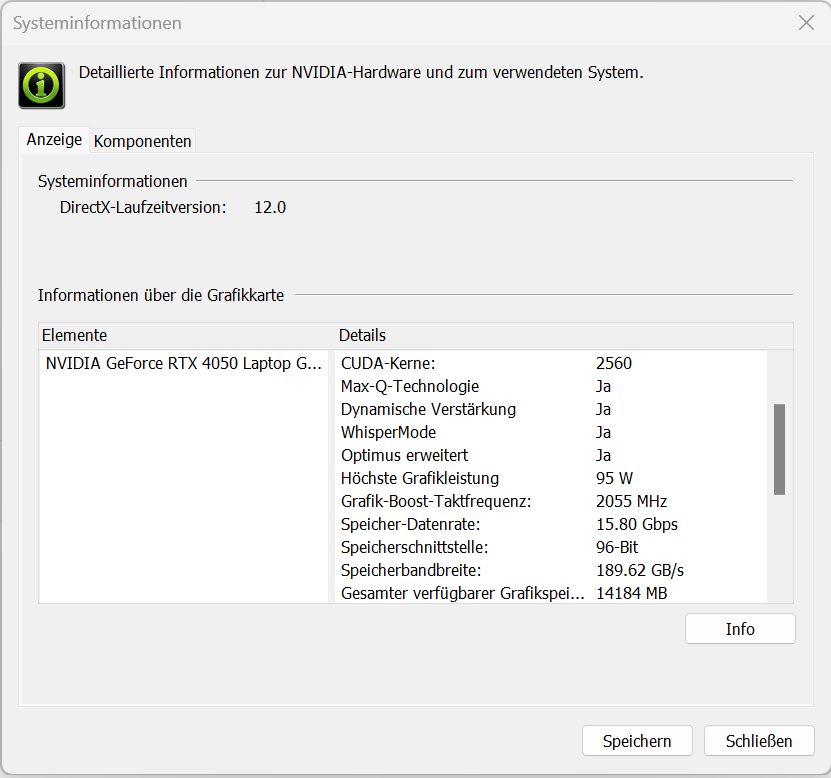
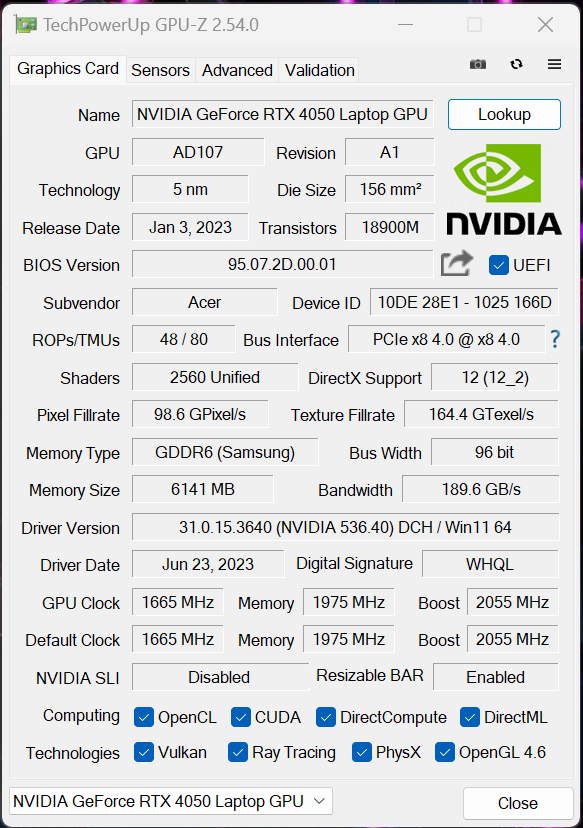
AGeForce RTX 4050para laptop oferece 2.560 shaders, um barramento de 96 bits de largura e uma rápida RAM GDDR6 (6.144 MB). A Acer definiu o TGP máximo para 95 watts. De acordo com o teste Witcher 3, o TGP não está no limite máximo.
Os resultados do benchmark estão acima da média da RTX 4050. No entanto, isso não se aplica ao usar o modo "Quiet". A saída direta de vídeo por meio da GPU GeForce não proporciona um aumento no desempenho e a alternância entre a dGPU e o Optimus não exige uma reinicialização - o Optimus avançado é compatível.

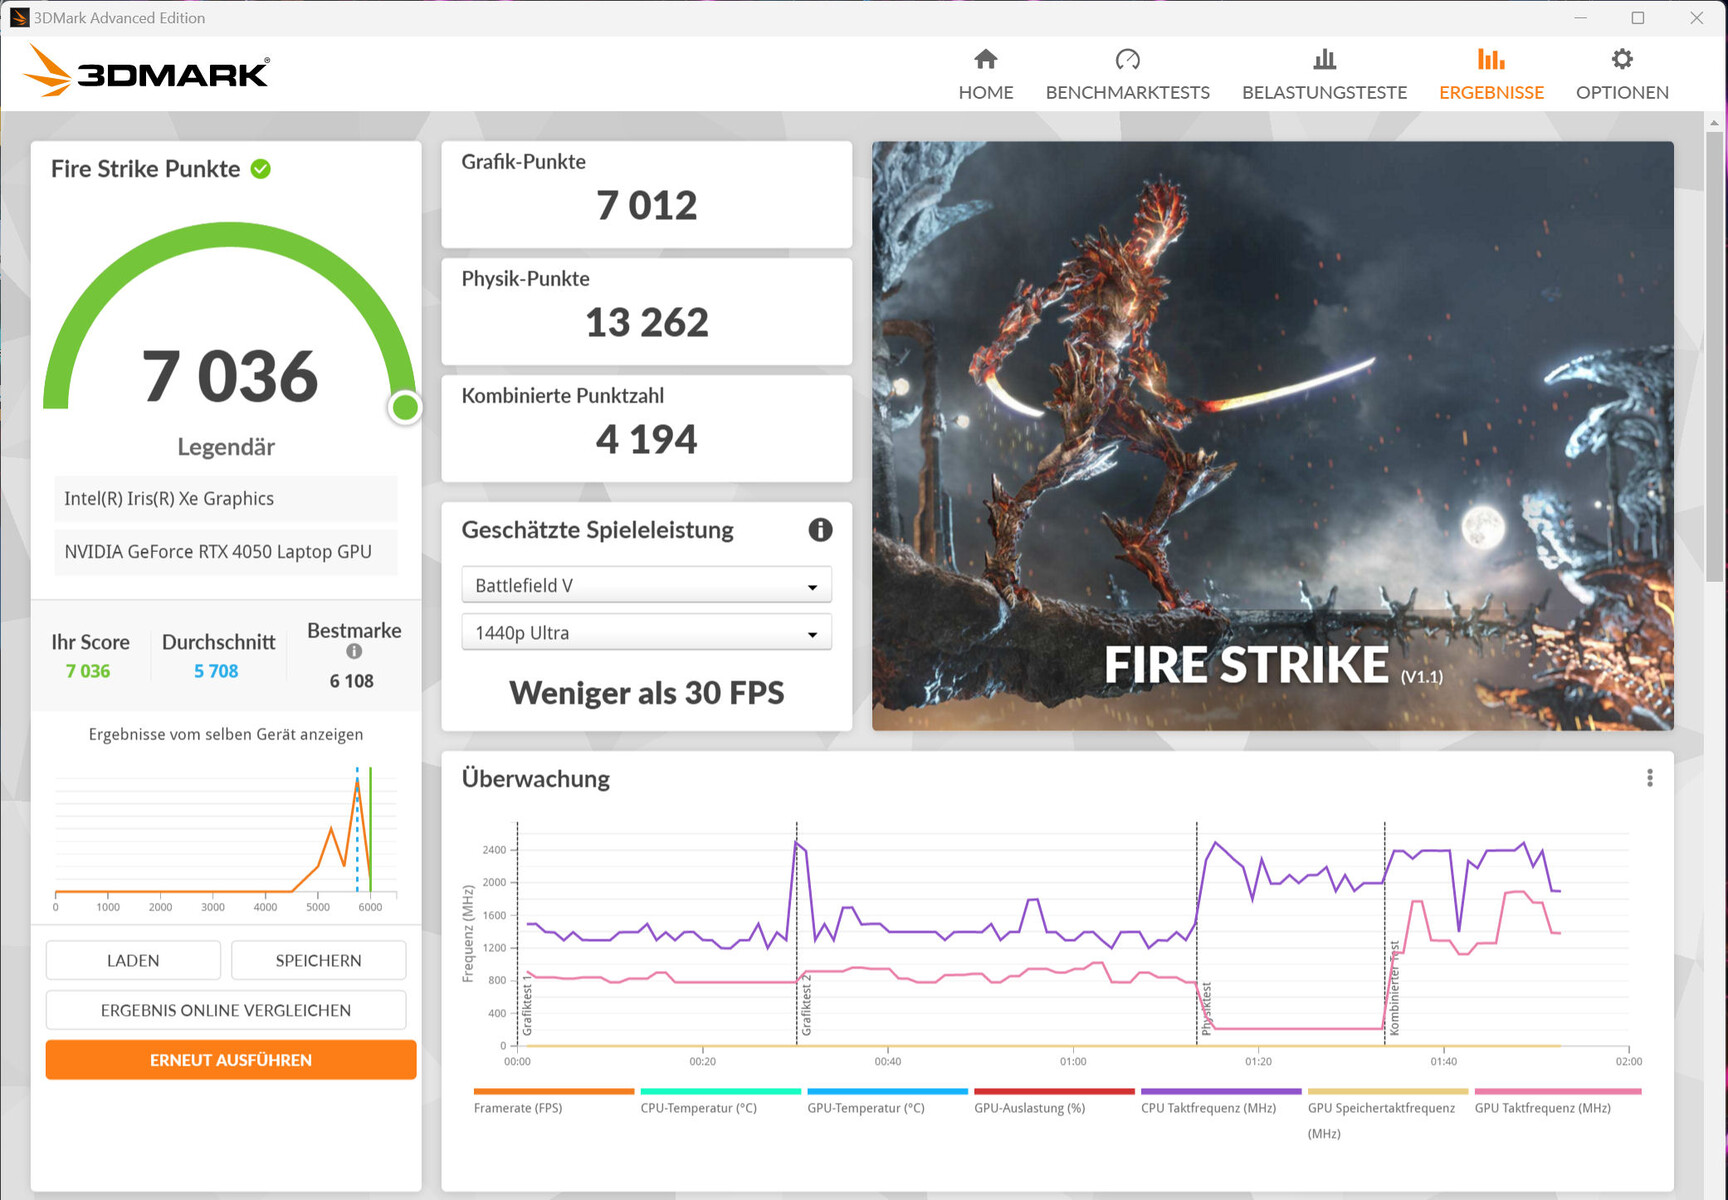


| 3DMark 06 Standard Score | 52667 pontos | |
| 3DMark 11 Performance | 27364 pontos | |
| 3DMark Cloud Gate Standard Score | 61034 pontos | |
| 3DMark Fire Strike Score | 19711 pontos | |
| 3DMark Time Spy Score | 8580 pontos | |
Ajuda | ||
| Geekbench 6.7 - GPU OpenCL | |
| Média da turma Gaming (67235 - 253130, n=103, últimos 2 anos) | |
| Acer Predator Triton 14 PT14-51 | |
| Média NVIDIA GeForce RTX 4050 Laptop GPU (60815 - 86892, n=21) | |
* ... menor é melhor
Desempenho em jogos
O hardware do Predator foi projetado para jogos em FHD em configurações altas ou máximas. No entanto, a resolução máxima da tela (2.560 x 1.600 pixels) pode ser aproveitada, às vezes com configurações mais baixas. Medimos taxas de quadros acima da média do RTX 4050.
| The Last of Us - 1920x1080 Ultra Preset | |
| Razer Blade 14 RTX 4070 | |
| Média NVIDIA GeForce RTX 4050 Laptop GPU (35.7 - 50.2, n=3) | |
| Acer Predator Triton 14 PT14-51 | |
| Gigabyte Aero 14 OLED BMF | |
| The Callisto Protocol | |
| 2560x1440 Ultra Preset (without FSR Upscaling) | |
| Acer Predator Triton 14 PT14-51 | |
| Média NVIDIA GeForce RTX 4050 Laptop GPU (29.5 - 46.7, n=3) | |
| 1920x1080 Ultra Preset (without FSR Upscaling) | |
| Acer Predator Triton 14 PT14-51 | |
| Média NVIDIA GeForce RTX 4050 Laptop GPU (41.4 - 63.1, n=3) | |
| 1920x1080 Ultra Preset (without FSR Upscaling) + Full Ray-Tracing | |
| Acer Predator Triton 14 PT14-51 | |
| Média NVIDIA GeForce RTX 4050 Laptop GPU (31 - 49.9, n=3) | |
| Star Wars Jedi Survivor | |
| 1920x1080 Epic Preset | |
| Média NVIDIA GeForce RTX 4050 Laptop GPU (48.4 - 56, n=7) | |
| Medion Erazer Scout E20 | |
| Acer Predator Triton 14 PT14-51 | |
| 2560x1440 Epic Preset | |
| Média NVIDIA GeForce RTX 4050 Laptop GPU (30.4 - 35, n=4) | |
| Acer Predator Triton 14 PT14-51 | |
| 1920x1080 Epic Preset + Ray Tracing | |
| Média NVIDIA GeForce RTX 4050 Laptop GPU (38.6 - 42, n=4) | |
| Medion Erazer Scout E20 | |
| Acer Predator Triton 14 PT14-51 | |
| F1 23 | |
| 1920x1080 Ultra High Preset AA:T AF:16x | |
| Média NVIDIA GeForce RTX 4050 Laptop GPU (25.7 - 60.8, n=14) | |
| Acer Predator Triton 14 PT14-51 | |
| 2560x1440 Ultra High Preset AA:T AF:16x | |
| Média NVIDIA GeForce RTX 4050 Laptop GPU (16.7 - 40.8, n=11) | |
| Acer Predator Triton 14 PT14-51 | |
| Dead Island 2 | |
| 2560x1440 Ultra Preset AA:High T | |
| Média NVIDIA GeForce RTX 4050 Laptop GPU (61.8 - 76.5, n=2) | |
| Acer Predator Triton 14 PT14-51 | |
| 1920x1080 Ultra Preset AA:High T | |
| Medion Erazer Scout E20 | |
| Média NVIDIA GeForce RTX 4050 Laptop GPU (90.9 - 133.5, n=3) | |
| Acer Predator Triton 14 PT14-51 | |
Para verificar se as taxas de quadros permanecem estáveis por um longo período de tempo, executamos o jogo Witcher 3 por cerca de 60 minutos com resolução FullHD e configurações de qualidade máxima. O personagem do jogo não foi movido e não detectamos nenhuma queda na taxa de quadros.
Witcher 3 FPS diagram


| baixo | média | alto | ultra | QHD | |
|---|---|---|---|---|---|
| The Witcher 3 (2015) | 393.7 | 253.3 | 149.7 | 80.1 | |
| Dota 2 Reborn (2015) | 159.4 | 141.8 | 132.6 | 127.2 | |
| Final Fantasy XV Benchmark (2018) | 183 | 110.5 | 79.2 | 58.2 | |
| X-Plane 11.11 (2018) | 138.1 | 128.6 | 100.2 | ||
| Far Cry 5 (2018) | 174 | 131 | 122 | 113 | 79 |
| Strange Brigade (2018) | 467 | 194.8 | 159.4 | 137 | 94.9 |
| F1 22 (2022) | 210 | 194.4 | 147.2 | 48.5 | 31 |
| The Callisto Protocol (2022) | 119 | 96 | 93.3 | 63.1 | 46.7 |
| The Last of Us (2023) | 82.2 | 67.4 | 56.2 | 42.8 | |
| Dead Island 2 (2023) | 201 | 171.8 | 125.9 | 90.9 | 61.8 |
| Star Wars Jedi Survivor (2023) | 60.6 | 54.6 | 51.6 | 48.4 | 30.4 |
| F1 23 (2023) | 197.9 | 194.8 | 139.8 | 40.5 | 31 |
Emissões - O laptop Acer pode funcionar silenciosamente
Emissões de ruído
No uso diário (escritório, Internet, ...), a Triton geralmente funciona silenciosamente, independentemente do modo selecionado. O nível de ruído pode aumentar para até 56 dB(A) ("Turbo") e 53 dB(A) ("Performance"), respectivamente. Usamos o modo "Balanced" e registramos um nível moderado de 43 dB(A). De modo geral, é possível obter uma produção de ruído menor aplicando o modo "Quiet" (Silencioso), com uma queda relativamente pequena no desempenho.
Barulho
| Ocioso |
| 27 / 29 / 31 dB |
| Carga |
| 42 / 45 dB |
 | ||
30 dB silencioso 40 dB(A) audível 50 dB(A) ruidosamente alto |
||
min: | ||
| Acer Predator Triton 14 PT14-51 i7-13700H, GeForce RTX 4050 Laptop GPU | Razer Blade 14 RTX 4070 R9 7940HS, GeForce RTX 4070 Laptop GPU | Asus ROG Zephyrus G14 GA402RJ R7 6800HS, Radeon RX 6700S | MSI Stealth 14 Studio A13V i7-13700H, GeForce RTX 4050 Laptop GPU | Gigabyte Aero 14 OLED BMF i7-13700H, GeForce RTX 4050 Laptop GPU | Apple MacBook Pro 14 2023 M2 Pro Entry M2 Pro 10-Core, M2 Pro 16-Core GPU | |
|---|---|---|---|---|---|---|
| Noise | 6% | 2% | -3% | 1% | 16% | |
| desligado / ambiente * (dB) | 25 | 22.7 9% | 25 -0% | 25.3 -1% | 24 4% | 23.6 6% |
| Idle Minimum * (dB) | 27 | 23.4 13% | 25 7% | 25.3 6% | 24 11% | 23.6 13% |
| Idle Average * (dB) | 29 | 23.4 19% | 26 10% | 25 14% | 24 17% | 23.6 19% |
| Idle Maximum * (dB) | 31 | 23.4 25% | 29 6% | 33.7 -9% | 35.71 -15% | 23.6 24% |
| Load Average * (dB) | 42 | 33 21% | 45 -7% | 42.2 -0% | 24.2 42% | |
| Witcher 3 ultra * (dB) | 43 | 51.8 -20% | 43 -0% | 51 -19% | 40.22 6% | |
| Load Maximum * (dB) | 45 | 55.6 -24% | 45 -0% | 51 -13% | 51.93 -15% | 47.5 -6% |
* ... menor é melhor
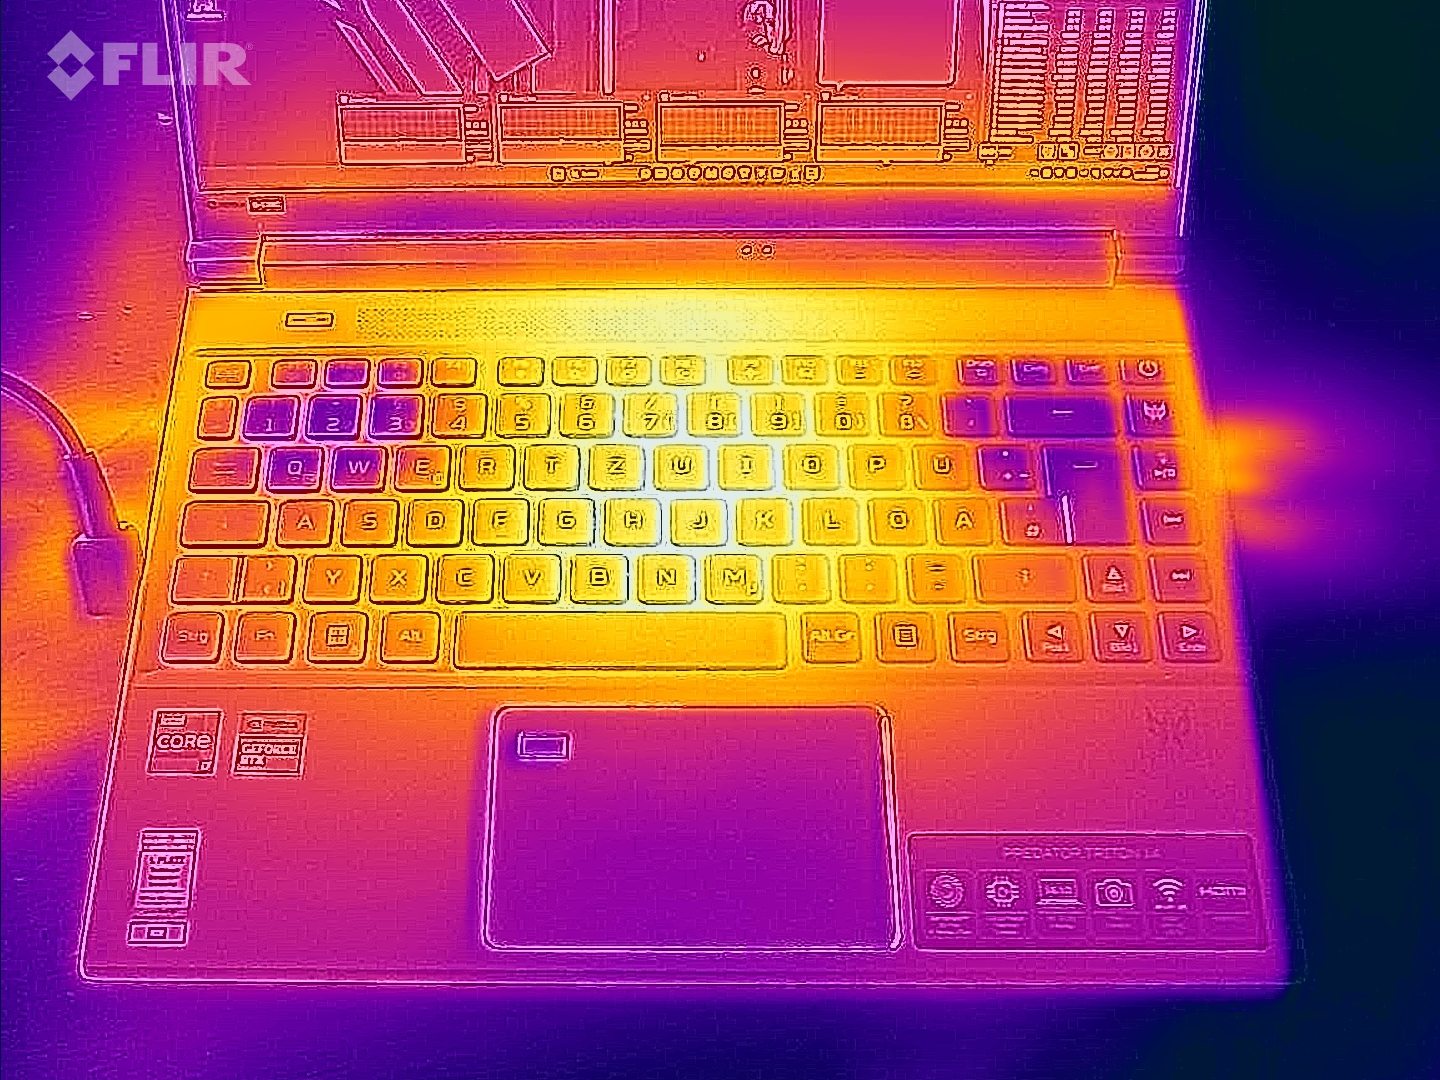
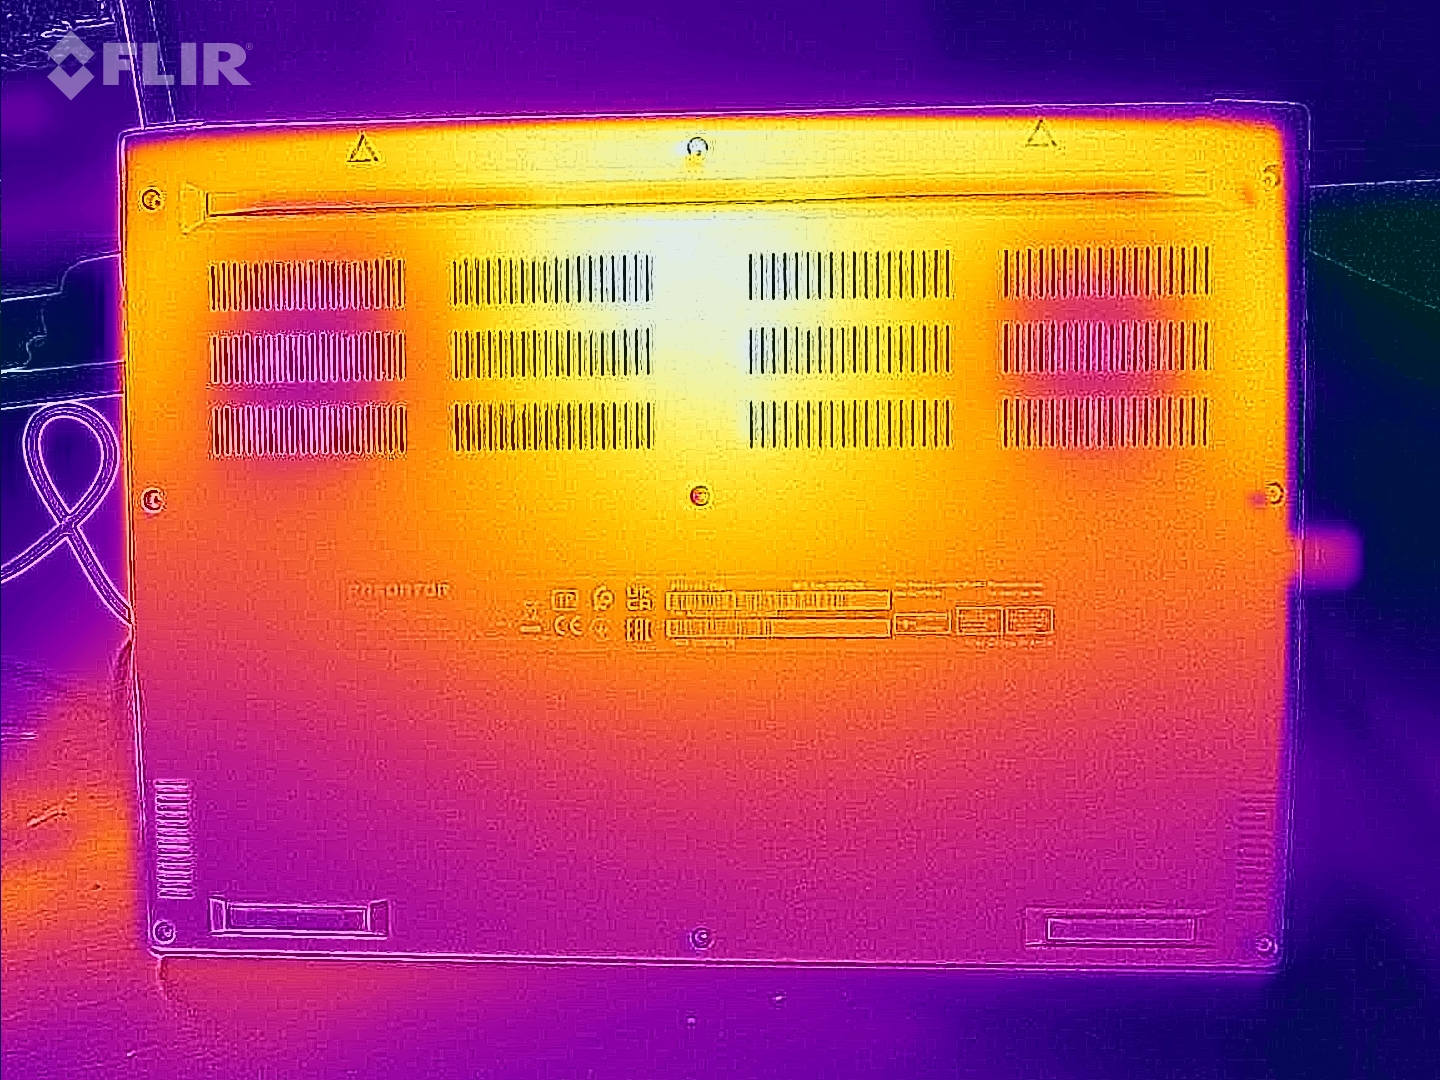
Temperatura
Sob carga, o laptop aquece visivelmente. Em vários pontos de medição, registramos temperaturas entre 50 e 56 °C. Quando se trata do uso diário, esses números estão na zona verde.
(-) A temperatura máxima no lado superior é 54 °C / 129 F, em comparação com a média de 40.4 °C / 105 F , variando de 21.2 a 68.8 °C para a classe Gaming.
(-) A parte inferior aquece até um máximo de 56 °C / 133 F, em comparação com a média de 43.2 °C / 110 F
(+) Em uso inativo, a temperatura média para o lado superior é 29.1 °C / 84 F, em comparação com a média do dispositivo de 33.9 °C / ### class_avg_f### F.
(-) Jogando The Witcher 3, a temperatura média para o lado superior é 46.7 °C / 116 F, em comparação com a média do dispositivo de 33.9 °C / ## #class_avg_f### F.
(-) Os apoios para as mãos e o touchpad podem ficar muito quentes ao toque, com um máximo de 41 °C / 105.8 F.
(-) A temperatura média da área do apoio para as mãos de dispositivos semelhantes foi 28.8 °C / 83.8 F (-12.2 °C / -22 F).
| Acer Predator Triton 14 PT14-51 Intel Core i7-13700H, NVIDIA GeForce RTX 4050 Laptop GPU | Razer Blade 14 RTX 4070 AMD Ryzen 9 7940HS, NVIDIA GeForce RTX 4070 Laptop GPU | Asus ROG Zephyrus G14 GA402RJ AMD Ryzen 7 6800HS, AMD Radeon RX 6700S | MSI Stealth 14 Studio A13V Intel Core i7-13700H, NVIDIA GeForce RTX 4050 Laptop GPU | Gigabyte Aero 14 OLED BMF Intel Core i7-13700H, NVIDIA GeForce RTX 4050 Laptop GPU | Apple MacBook Pro 14 2023 M2 Pro Entry Apple M2 Pro 10-Core, Apple M2 Pro 16-Core GPU | |
|---|---|---|---|---|---|---|
| Heat | 11% | -7% | -5% | 15% | 24% | |
| Maximum Upper Side * (°C) | 54 | 37.4 31% | 53 2% | 46.9 13% | 42 22% | 47 13% |
| Maximum Bottom * (°C) | 56 | 35.2 37% | 54 4% | 56.1 -0% | 52 7% | 42.8 24% |
| Idle Upper Side * (°C) | 31 | 33.2 -7% | 34 -10% | 33.8 -9% | 26 16% | 22.3 28% |
| Idle Bottom * (°C) | 31 | 36.2 -17% | 38 -23% | 37.9 -22% | 27 13% | 21.7 30% |
* ... menor é melhor
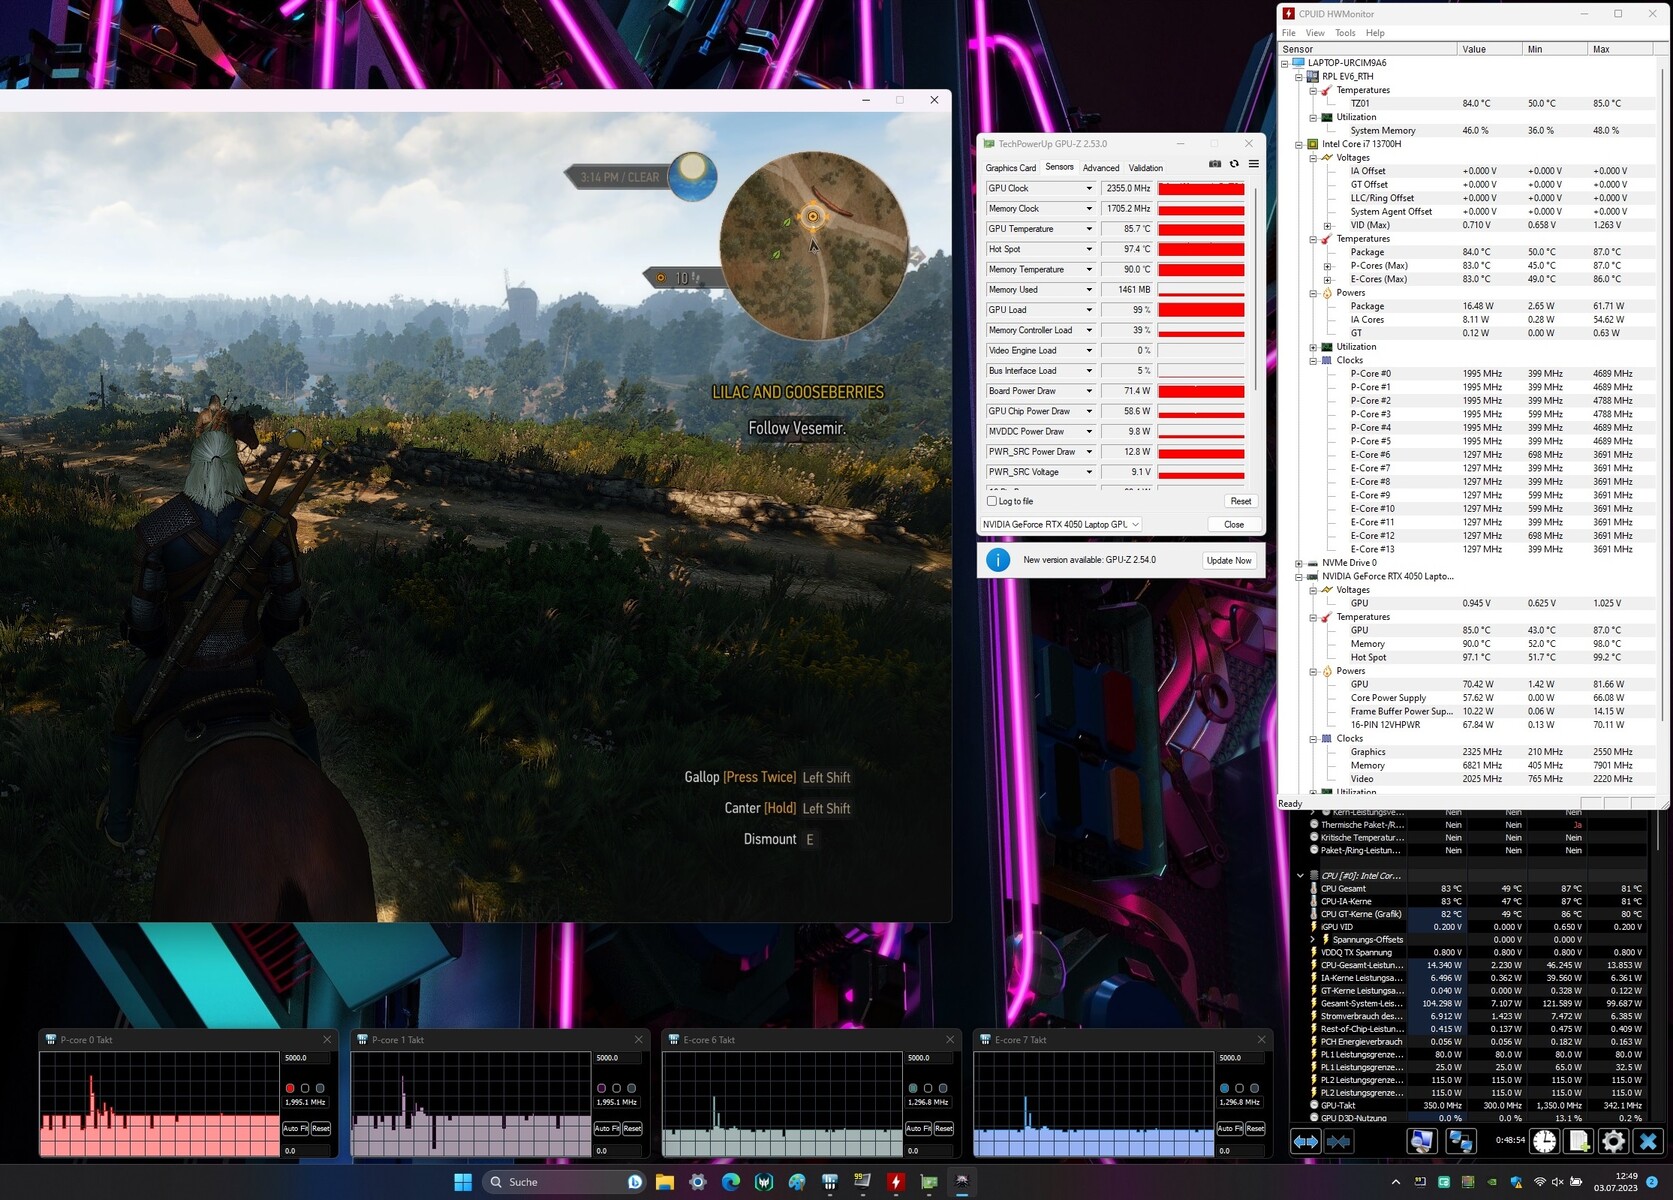
Teste de estresse
O teste de estresse (Prime95 e Furmark em operação contínua) é um cenário extremo que examina a estabilidade do sistema sob carga total. A velocidade do clock da CPU cai inicialmente de 4,4 para 4,5 GHz (P) e 3,1 GHz (E) e, em seguida, gradualmente de 2,1 para 2,2 GHz (P) e 1,3 GHz (E). A velocidade do clock da GPU se estabiliza em 1.750 a 1.800 MHz.

Alto-falantes
Os alto-falantes estéreo produzem um som decente que, na maioria das vezes, não tem graves. Uma experiência de áudio melhor pode ser obtida com o uso de fones de ouvido ou de um alto-falante externo.
Acer Predator Triton 14 PT14-51 análise de áudio
(±) | o volume do alto-falante é médio, mas bom (###valor### dB)
Graves 100 - 315Hz
(-) | quase nenhum baixo - em média 18% menor que a mediana
(±) | a linearidade dos graves é média (11.8% delta para a frequência anterior)
Médios 400 - 2.000 Hz
(+) | médios equilibrados - apenas 3.7% longe da mediana
(+) | médios são lineares (4% delta para frequência anterior)
Altos 2 - 16 kHz
(+) | agudos equilibrados - apenas 2.9% longe da mediana
(±) | a linearidade dos máximos é média (7.2% delta para frequência anterior)
Geral 100 - 16.000 Hz
(±) | a linearidade do som geral é média (15.4% diferença em relação à mediana)
Comparado com a mesma classe
» 34% de todos os dispositivos testados nesta classe foram melhores, 7% semelhantes, 59% piores
» O melhor teve um delta de 6%, a média foi 18%, o pior foi 132%
Comparado com todos os dispositivos testados
» 23% de todos os dispositivos testados foram melhores, 4% semelhantes, 73% piores
» O melhor teve um delta de 4%, a média foi 23%, o pior foi 134%
Razer Blade 14 RTX 4070 análise de áudio
(+) | os alto-falantes podem tocar relativamente alto (###valor### dB)
Graves 100 - 315Hz
(-) | quase nenhum baixo - em média 15.9% menor que a mediana
(±) | a linearidade dos graves é média (12.3% delta para a frequência anterior)
Médios 400 - 2.000 Hz
(+) | médios equilibrados - apenas 4.3% longe da mediana
(+) | médios são lineares (3.1% delta para frequência anterior)
Altos 2 - 16 kHz
(±) | máximos mais altos - em média 6.2% maior que a mediana
(+) | os máximos são lineares (5.5% delta da frequência anterior)
Geral 100 - 16.000 Hz
(±) | a linearidade do som geral é média (16.7% diferença em relação à mediana)
Comparado com a mesma classe
» 43% de todos os dispositivos testados nesta classe foram melhores, 10% semelhantes, 47% piores
» O melhor teve um delta de 6%, a média foi 18%, o pior foi 132%
Comparado com todos os dispositivos testados
» 29% de todos os dispositivos testados foram melhores, 7% semelhantes, 64% piores
» O melhor teve um delta de 4%, a média foi 23%, o pior foi 134%
Gerenciamento de energia - O computador Acer atinge níveis de resistência decentes
Consumo de energia
Não há nada de anormal a ser dito com relação ao consumo de energia do computador. Os resultados se encontram em uma faixa normal para o hardware instalado. O teste de estresse e o teste Witcher 3 foram executados com consumo de energia constante ou decrescente. A PSU (230 watts) tem um tamanho mais do que adequado.
| desligado | |
| Ocioso | |
| Carga |
|
Key:
min: | |
| Acer Predator Triton 14 PT14-51 i7-13700H, GeForce RTX 4050 Laptop GPU | Razer Blade 14 RTX 4070 R9 7940HS, GeForce RTX 4070 Laptop GPU | Asus ROG Zephyrus G14 GA402RJ R7 6800HS, Radeon RX 6700S | MSI Stealth 14 Studio A13V i7-13700H, GeForce RTX 4050 Laptop GPU | Gigabyte Aero 14 OLED BMF i7-13700H, GeForce RTX 4050 Laptop GPU | Apple MacBook Pro 14 2023 M2 Pro Entry M2 Pro 10-Core, M2 Pro 16-Core GPU | Média NVIDIA GeForce RTX 4050 Laptop GPU | Média da turma Gaming | |
|---|---|---|---|---|---|---|---|---|
| Power Consumption | -30% | -10% | -4% | 40% | 52% | 9% | -17% | |
| Idle Minimum * (Watt) | 12 | 19.5 -63% | 12 -0% | 10.4 13% | 7.4 38% | 2.5 79% | 9.95 ? 17% | 13 ? -8% |
| Idle Average * (Watt) | 14 | 24.7 -76% | 18 -29% | 19.1 -36% | 8.3 41% | 12.1 14% | 15.8 ? -13% | 19 ? -36% |
| Idle Maximum * (Watt) | 26 | 27 -4% | 26 -0% | 19.4 25% | 8.7 67% | 12.3 53% | 20.1 ? 23% | 24.6 ? 5% |
| Load Average * (Watt) | 88 | 83.2 5% | 88 -0% | 95.9 -9% | 76 14% | 49.8 43% | 88 ? -0% | 110.7 ? -26% |
| Witcher 3 ultra * (Watt) | 114.9 | 165.8 -44% | 157.7 -37% | 141.6 -23% | 70 39% | 46.6 59% | ||
| Load Maximum * (Watt) | 213 | 204.5 4% | 194 9% | 203 5% | 132 38% | 71.4 66% | 176.3 ? 17% | 259 ? -22% |
* ... menor é melhor
Power consumption Witcher 3 / stress test
Power consumption with an external monitor
Duração da bateria
No teste de Wi-Fi (carregamento de sites com a ajuda de um script) e no teste de vídeo (o curta-metragem Big Buck Bunny (codificação H.264, FHD) em um loop), o dispositivo de 14 polegadas alcançou tempos de execução de 5 horas e 2 minutos e 8 horas e 59 minutos, respectivamente. Durante os dois testes, as funções de economia de energia do laptop foram desativadas e o brilho da tela foi definido para cerca de 150 cd/m². Além disso, o teste de vídeo foi realizado com o módulo de rádio desligado.

| Acer Predator Triton 14 PT14-51 i7-13700H, GeForce RTX 4050 Laptop GPU, 76.3 Wh | Razer Blade 14 RTX 4070 R9 7940HS, GeForce RTX 4070 Laptop GPU, 68 Wh | Asus ROG Zephyrus G14 GA402RJ R7 6800HS, Radeon RX 6700S, 76 Wh | MSI Stealth 14 Studio A13V i7-13700H, GeForce RTX 4050 Laptop GPU, 72 Wh | Gigabyte Aero 14 OLED BMF i7-13700H, GeForce RTX 4050 Laptop GPU, 63 Wh | Apple MacBook Pro 14 2023 M2 Pro Entry M2 Pro 10-Core, M2 Pro 16-Core GPU, 70 Wh | Média da turma Gaming | |
|---|---|---|---|---|---|---|---|
| Duração da bateria | -14% | 104% | -11% | 12% | 120% | -2% | |
| Reader / Idle (h) | 11.2 | 8.6 -23% | 11.3 1% | 8.27 ? -26% | |||
| H.264 (h) | 9 | 6.6 -27% | 16.4 82% | 8.32 ? -8% | |||
| WiFi v1.3 (h) | 5 | 6.2 24% | 10.2 104% | 6.3 26% | 7.6 52% | 12.9 158% | 7.11 ? 42% |
| Load (h) | 1.8 | 1 -44% | 1.2 -33% | 1.5 -17% | 1.502 ? -17% |
Pro
Contra
Veredicto - Uma potência compacta

As principais aplicações do laptop de 14 polegadas devem ser nas áreas de renderização e jogos. O Core i7-13700H e o GeForce RTX 4050 fornecem a potência necessária com ambos os chips funcionando em uma velocidade de clock consistentemente alta. Se for necessário mais potência gráfica, a Acer também tem GeForce variantes RTX 4070 em oferta.
Uma tonelada de poder computacional em uma estrutura de 14 polegadas: Com o Predator Triton 14, a Acer entregou um laptop potente.
O laptop fica visivelmente quente e pode produzir uma quantidade considerável de ruído. Usamos principalmente o modo de sistema "Equilibrado" e ele garantiu apenas um ruído de fundo moderado com uma perda de desempenho relativamente pequena.
De modo geral, a tela 16:10 (2.560 x 1.600 pixels, IPS, 165 Hz, G-Sync) é impressionante. Os pontos de destaque incluem o alto brilho e a cobertura DCI P3. Além disso, a bateria tem uma duração real de 5 a 9 horas. Ponto positivo: A bateria pode ser carregada por meio do adaptador de rede USB-C (mín. 65 watts, 20 V). O Power Delivery é compatível. Isso significa que você não precisa estar acompanhado da PSU proprietária (230 watts) onde quer que vá.
Os pontos fracos do Predator estão principalmente em seu armazenamento: Uma capacidade de SSD reduzida (512 GB), nenhum espaço para SSDs adicionais, RAM soldada sem possibilidade de expansão e um leitor de cartão de memória de funcionamento muito lento. Em suma, é preciso esperar mais de um laptop nessa categoria de preço.
Uma alternativa poderia ser oMSI Stealth 14 Studio A13V. Ele é equipado com a mesma CPU e GPU, oferecendo um pouco mais de potência do que o Predator e ganha pontos extras por seus dois bancos de RAM. No entanto, com um preço de cerca de US$ 2.000, não é um dos dispositivos mais baratos.
Preço e disponibilidade
A variante de especificações de análise do laptop da Acer pode ser adquirida atualmente na Amazon por US$ 1.440.
Acer Predator Triton 14 PT14-51
- 07/24/2023 v7 (old)
Sascha Mölck
Transparência
A seleção dos dispositivos a serem analisados é feita pela nossa equipe editorial. A amostra de teste foi fornecida ao autor como empréstimo pelo fabricante ou varejista para fins desta revisão. O credor não teve influência nesta revisão, nem o fabricante recebeu uma cópia desta revisão antes da publicação. Não houve obrigação de publicar esta revisão. Como empresa de mídia independente, a Notebookcheck não está sujeita à autoridade de fabricantes, varejistas ou editores.
É assim que o Notebookcheck está testando
Todos os anos, o Notebookcheck analisa de forma independente centenas de laptops e smartphones usando procedimentos padronizados para garantir que todos os resultados sejam comparáveis. Desenvolvemos continuamente nossos métodos de teste há cerca de 20 anos e definimos padrões da indústria no processo. Em nossos laboratórios de teste, equipamentos de medição de alta qualidade são utilizados por técnicos e editores experientes. Esses testes envolvem um processo de validação em vários estágios. Nosso complexo sistema de classificação é baseado em centenas de medições e benchmarks bem fundamentados, o que mantém a objetividade.Price comparison

