Notebookcheck Logo

Revisão Acer Predator Triton 300 SE PT314: Resfriamento de metal líquido para um laptop de 14 polegadas
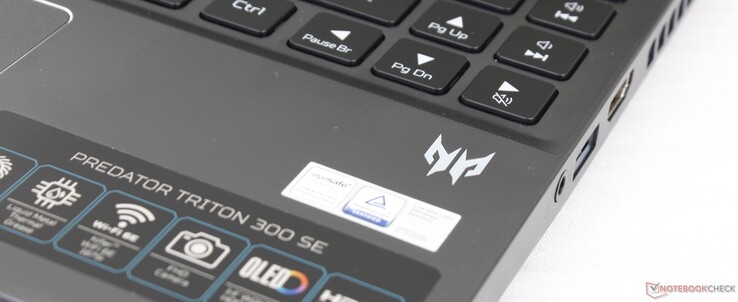
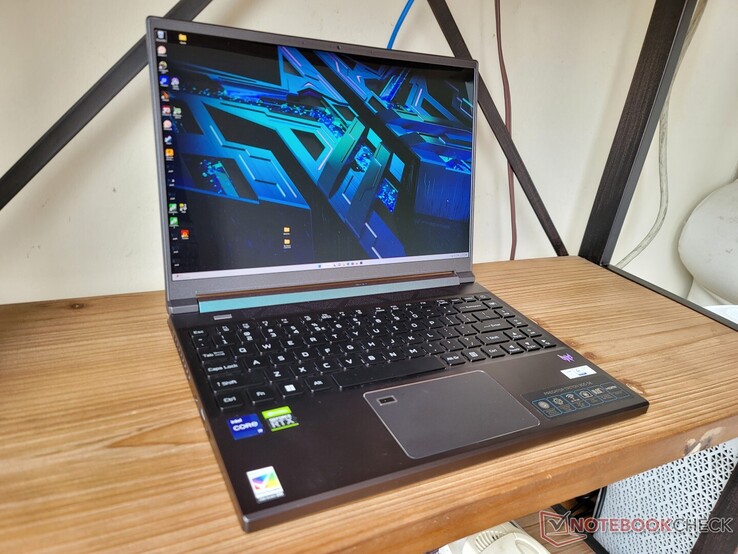
Talvez um pouco ambicioso demais. O Predator Triton 300 SE se une ao pequeno mas elite grupo de laptops de alto desempenho de 14 polegadas que consiste no Razer Blade 14, Asus Zephyrus G14, e Alienware x14. O modelo Acer tem suas vantagens, mas elas não são suficientes para se destacar da multidão.

Já se passaram dois anos desde que nós revisou pela última vez o Predator Triton 300. Este último modelo, chamado Predator Triton 300 SE, utiliza as CPUs Core H série H e Nvidia Ampere RTX GPUs do 12º gênero ao lado de um design de chassi menor de 14 polegadas. Ele compete assim com alguns dos menores laptops para jogos do mercado, incluindo o Lâmina Razer 14, Asus Zephyrus G14e o Alienware x14.

Nossa unidade de revisão é uma SKU mais alta com CPU Core i9-12900H e display OLED de 90 Hz 1800p por aproximadamente $1950 USD. Outra configuração está disponível com a CPU Core i7-12700H, display IPS 165 Hz 1200p, e metade da RAM e armazenamento por centenas de dólares a menos. Todas as opções no momento vêm com o mesmo 95 W GeForce RTX 3060 GPU

Está disponível uma versão maior de 16 polegadas que compartilha o mesmo nome Predator Triton 300 SE, mas com um número de modelo diferente (PT316 vs. PT314)

Mais revisões Acer:

Acer Predator Triton 300 SE (Predator Triton 300 Serie)
Processador
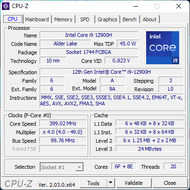
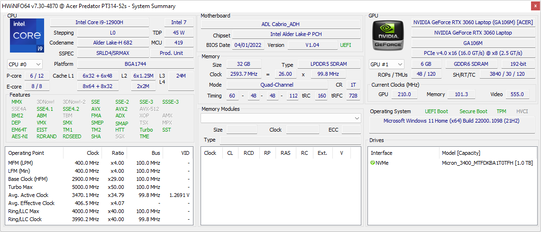
Intel Core i9-12900H 14 x 1.8 - 5 GHz, 109 W PL2 / Short Burst, 69 W PL1 / Sustained, Alder Lake-H
Placa gráfica
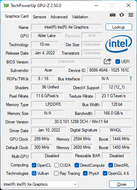
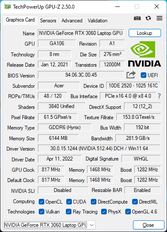
NVIDIA GeForce RTX 3060 Laptop GPU - 6 GB VRAM, Análises do: 1282 MHz, Memoría: 1468 MHz, 95 W TDP, GDDR6, 512.44, Optimus
Memória
32 GB 
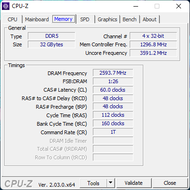
, LPDDR5, 2133 MHz, 60-48-48-112, Dual-Channel, Soldered
Pantalha
14.00 polegadas 16:10, 2880 x 1800 pixel 243 PPI, Samsung ATNA40YK07-0, OLED, SDC4171, 90 Hz
placa mãe
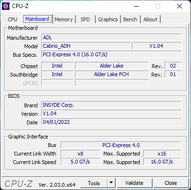
Intel Alder Lake-P PCH
Disco rígido
Micron 3400 1TB MTFDKBA1T0TFH, 1024 GB 
Placa de Som
Intel Alder Lake-P PCH - cAVS (Audio, Voice, Speech)
Conexões
3 USB 3.0, 1 USB 3.1 Gen2, 1 Thunderbolt, 1 HDMI, 1 DisplayPort, Conexões Audio: 3.5 mm headset, 1 Leitor de Impressões Digitais
Funcionamento em rede
Killer Wi-Fi 6E AX1675i 160MHz Wireless Network Adapter (a/b/g/n = Wi-Fi 4/ac = Wi-Fi 5/ax = Wi-Fi 6/), Bluetooth 5.2
Tamanho
altura x largura x profundidade (em mm): 19.8 x 313.4 x 227
Bateria
76 Wh Lítio-Polímero, 4-cell
Sistema Operativo
Microsoft Windows 11 Home
Camera
Webcam: 1080p30
Primary Camera: 2.1 MPix
Características adicionais
Alto falantes: Stereo, Teclado: Chiclet, Iluminação do Teclado: sim, Acer Jumpstart, PowerDirector, PhotoDirector, McAfee, PredatorSense, 12 Meses Garantia
peso
1.734 kg, Suprimento de energia: 529 g
Preço
1950 USD
Note: The manufacturer may use components from different suppliers including display panels, drives or memory sticks with similar specifications.


Possíveis concorrentes em comparação

Rating
Date
Model
Weight
Height
Size
Resolution
Best Price
86 %
11/2022
Acer Predator Triton 300 SE
i9-12900H, GeForce RTX 3060 Laptop GPU
1.7 kg19.8 mm14.00"2880x1800
86.4 %
10/2022
Asus ROG Zephyrus G14 GA402RJ
R7 6800HS, Radeon RX 6700S
1.7 kg19.5 mm14.00"2560x1600
89.4 %
05/2022
Razer Blade 14 Ryzen 9 6900HX
R9 6900HX, GeForce RTX 3070 Ti Laptop GPU
1.8 kg16.8 mm14.00"2560x1440
86.7 %
03/2022
Alienware x14 i7 RTX 3060
i7-12700H, GeForce RTX 3060 Laptop GPU
1.8 kg14.5 mm14.00"1920x1080
87.2 %
09/2022
Dell Inspiron 14 Plus 7420
i7-12700H, GeForce RTX 3050 4GB Laptop GPU
1.7 kg18.87 mm14.00"2240x1400
87.7 %
01/2022
SCHENKER Vision 14
i7-11370H, GeForce RTX 3050 Ti Laptop GPU
1.1 kg15.6 mm14.00"2880x1800

Estojo - Similar em tamanho a Zephyrus G14

A base metálica é forte com apenas sinais mínimos de torção ou deformação e sem rangidos ao aplicar pressão ao longo do centro ou cantos do teclado. Não é tão rígida como na Razer Blade 14, mas certamente também não se sente barata

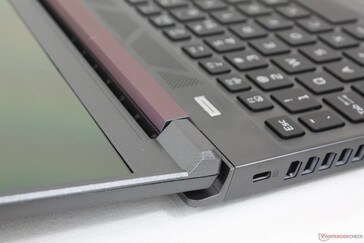
A área mais fraca do chassi é sua tela. Embora isto seja comum na maioria dos laptops, a tela do Acer é particularmente fina e notavelmente mais suscetível à deformação do que as telas do Zephyrus G14 ou Blade 14. Apreciamos que a tela pode abrir quase 180 graus ao contrário dos modelos Asus ou Razer acima mencionados, mas as dobradiças da Acer se sentem mais fracas e têm tendência a teeter mais em comparação.

Coincidentemente, tanto o peso quanto as dimensões são quase idênticos ao Asus Zephyrus G14. O Blade 14 e o Alienware x14 são notavelmente mais finos cada um, mas têm pegadas maiores para compensar. A maioria dos Ultrabooks comuns de 14 polegadas, como oSchenker Visão 14 pode ser significativamente mais leve em mais de meio quilograma, mas sem os benefícios de desempenho.

Chassi todo de metal, exceto a estrutura de plástico ABS ao redor das bordas do display
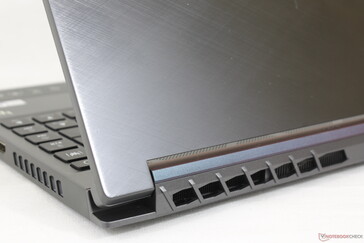
A tampa externa apresenta um aspecto de alumínio escovado com revestimento em cruz, enquanto sua seção superior é fosca. Este estilo é exclusivo para as configurações Best Buy
A tampa pode abrir até ~175 graus. A rigidez da dobradiça poderia ter sido mais rígida, especialmente em ângulos mais amplos, para reduzir a formação de tetas
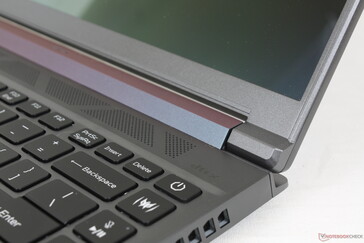
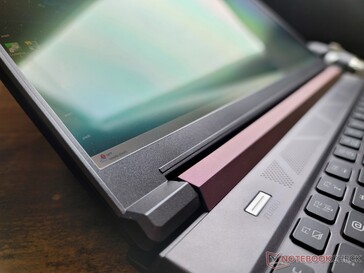
Botão dedicado Acer para o lançamento do software PredatorSense
A barra da dobradiça é colorida de forma diferente do resto do chassi, mas parece descolorida e quase fora do lugar na prática
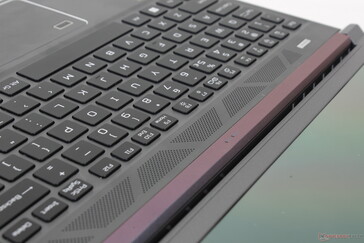
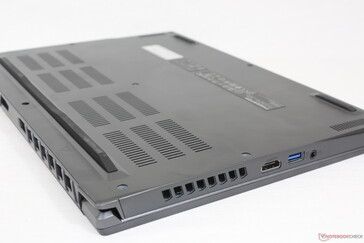
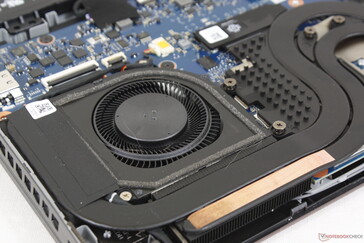
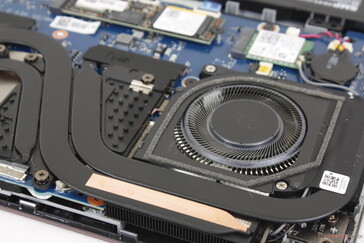
Muitas grelhas de ventilação ao redor do laptop

Comparação de tamanho

319.7 mm 220 mm 16.8 mm 1.8 kg321.5 mm 262.77 mm 14.5 mm 1.8 kg313.4 mm 227 mm 19.8 mm 1.7 kg314 mm 227.5 mm 18.87 mm 1.7 kg312 mm 227 mm 19.5 mm 1.7 kg308.8 mm 215 mm 15.6 mm 1.1 kg297 mm 210 mm 1 mm 5.7 g

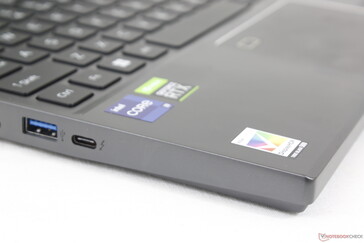
Conectividade - Suporte Thunderbolt 4

As opções de porta são mais limitadas do que na Asus Zephyrus G14 ou Razer Blade 14, pois cada alternativa integra uma porta USB-C a mais do que nossa Acer. O posicionamento das portas também é um pouco desfavorável porque as portas estão bem embaladas e relativamente próximas à borda frontal. É evidente que as grandes grelhas de ventilação ao redor do chassi estão retirando espaço valioso das portas.

Frente: Sem portas
Frente: Sem portas
Direita: fone de ouvido 3,5 mm, USB-A 3.2 Gen. 2, HDMI 2.1
Atrás: Sem portas
Atrás: Sem portas
Esquerda: Kensington lock, adaptador AC, USB-A 3.2 Gen. 2, USB-C c/ Thunderbolt 4 + DisplayPort 1.4

Comunicação

Um Intel AX1675i vem como padrão para conectividade Wi-Fi 6E e Bluetooth 5.2. Nós experimentamos taxas de transferência rápidas e estáveis quando emparelhadas com nossa rede de 6 GHz.

Módulo removível M.2 WLAN
Networking
iperf3 transmit AX12
Alienware x14 i7 RTX 3060
Intel Wi-Fi 6E AX211
1410 (1239min - 1603max) MBit/s
SCHENKER Vision 14
Intel Wi-Fi 6 AX201
1386 (1229min - 1460max) MBit/s
Razer Blade 14 Ryzen 9 6900HX
Qualcomm WCN685x
1049 (964min - 1093max) MBit/s
iperf3 receive AX12
SCHENKER Vision 14
Intel Wi-Fi 6 AX201
1617 (1531min - 1678max) MBit/s
Razer Blade 14 Ryzen 9 6900HX
Qualcomm WCN685x
1537 (1431min - 1625max) MBit/s
Alienware x14 i7 RTX 3060
Intel Wi-Fi 6E AX211
1371 (1221min - 1483max) MBit/s
iperf3 receive AXE11000 6GHz
Acer Predator Triton 300 SE
Killer Wi-Fi 6E AX1675i 160MHz Wireless Network Adapter
1454 (1377min - 1497max) MBit/s
Dell Inspiron 14 Plus 7420
Intel Wi-Fi 6E AX211
1423 (1154min - 1500max) MBit/s -2%
iperf3 receive AXE11000
Asus ROG Zephyrus G14 GA402RJ
MediaTek Wi-Fi 6E MT7922 160MHz Wireless LAN Card
1769 (1729min - 1795max) MBit/s
iperf3 transmit AXE11000 6GHz
Acer Predator Triton 300 SE
Killer Wi-Fi 6E AX1675i 160MHz Wireless Network Adapter
1482 (1273min - 1624max) MBit/s
Dell Inspiron 14 Plus 7420
Intel Wi-Fi 6E AX211
1305 (1032min - 1456max) MBit/s -12%
0501001502002503003504004505005506006507007508008509009501000105011001150120012501300135014001450150015501600Tooltip
Acer Predator Triton 300 SE; iperf3 transmit AXE11000 6GHz; iperf 3.1.3: Ø1482 (1273-1624)
Acer Predator Triton 300 SE; iperf3 receive AXE11000 6GHz; iperf 3.1.3: Ø1454 (1377-1497)

Webcam

Uma câmera de 2 MP vem como padrão para ser comparável a muitos Ultrabooks de médio alcance. Não há sensor IR ou mesmo um obturador de privacidade.
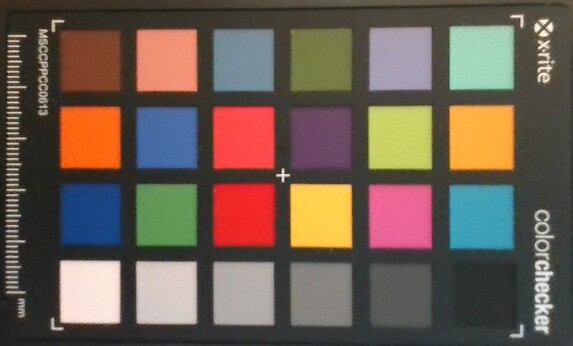
ColorChecker
8.5 ∆E
10.6 ∆E
11.5 ∆E
10.5 ∆E
14 ∆E
10.2 ∆E
10.6 ∆E
7.1 ∆E
13.1 ∆E
7.8 ∆E
8.5 ∆E
6.2 ∆E
7.3 ∆E
4.1 ∆E
14.3 ∆E
5.3 ∆E
11.9 ∆E
10.4 ∆E
9.4 ∆E
6.4 ∆E
5.2 ∆E
5.2 ∆E
3.1 ∆E
4.4 ∆E
ColorChecker Acer Predator Triton 300 SE: 8.56 ∆E min: 3.08 - max: 14.32 ∆E

Manutenção

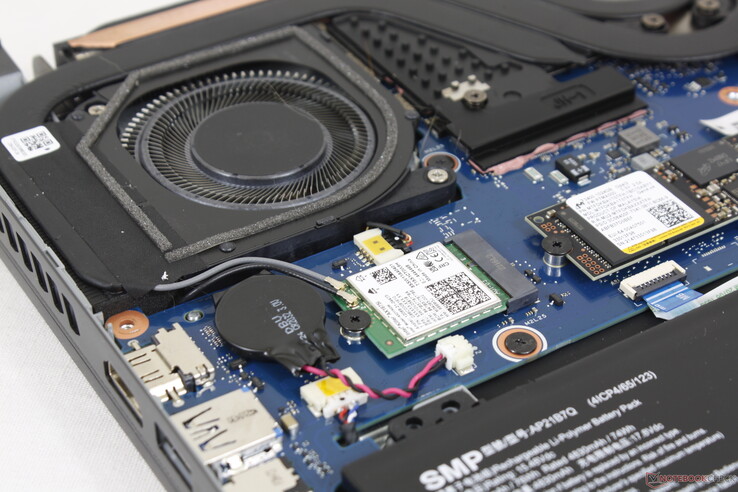
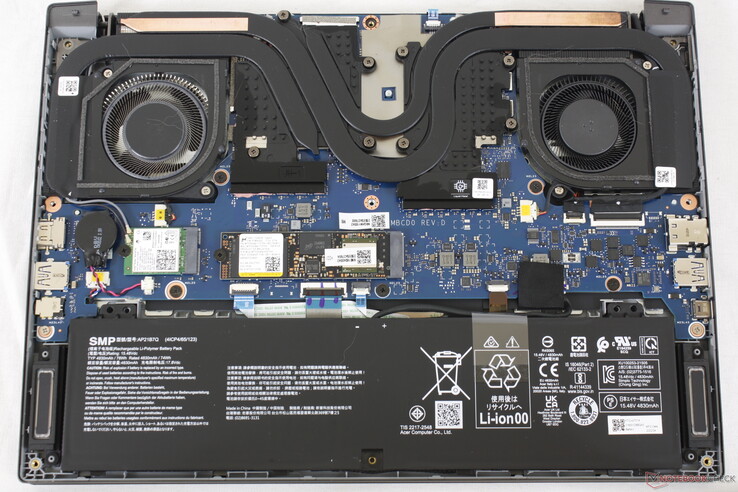
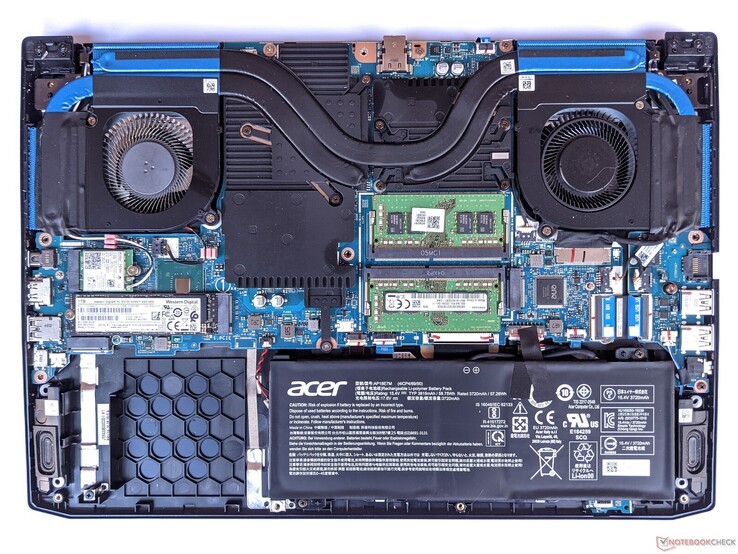
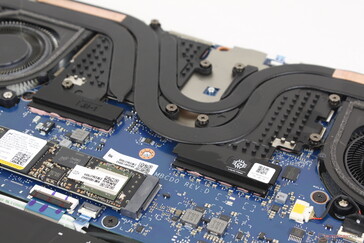
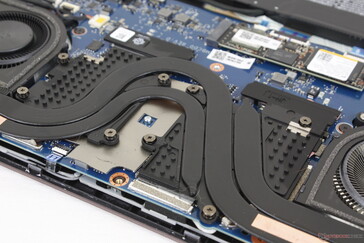
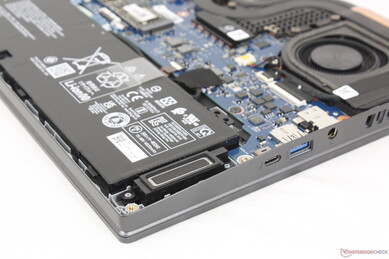
O painel inferior é fixado por nove parafusos Torx T6 para uma manutenção relativamente fácil. Os usuários só podem atualizar o SSD, o módulo WLAN e a bateria. Os módulos RAM são soldados, ao contrário do modelo da geração anterior.

2022 Predador Triton 300 SE
2020 Predator Triton 300 para comparação

Acessórios e Garantia

A caixa de varejo inclui um prático estojo de transporte, além do adaptador AC e a papelada. Outros fabricantes raramente incluem mais estojos de transporte sem custos adicionais. A habitual garantia limitada de um ano do fabricante se aplica se comprada nos EUA.

Dispositivos de entrada - Chaves suaves e silenciosas

Teclado

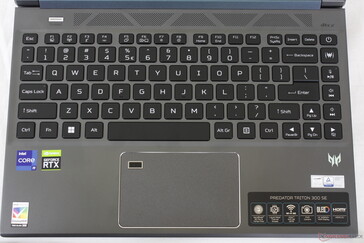
As chaves são rasas em viagens e têm feedback relativamente fraco, semelhante às chaves da Lâmina 14 e muitos Utlrabooks baratos como o Asus VivoBook S14. Se você já digitou antes em um Ultrabook, então você saberá o que esperar aqui. O feedback pode ser relativamente silencioso, mas não é tão firme quanto as chaves de um ThinkPad ou EliteBook centrado nos negócios

Uma luz de fundo RGB de três zonas vem de série, enquanto a Lâmina 14 inclui iluminação RGB por tecla. Todas as teclas e símbolos são retroiluminados.

Touchpad

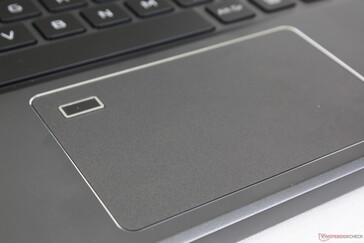
O clickpad é um pouco maior que o clickpad do Zephyrus G14 (10,5 x 6,5 cm vs. 10,5 x 6 cm). Entretanto, o leitor de impressão digital no canto reduz o espaço efetivo para o controle do cursor ou entradas multi-toque e assim o clickpad pode se sentir menor. A maioria dos outros laptops deslocou o leitor de impressão digital para áreas mais convenientes como o botão de alimentação ou teclado. O Predator Triton 300 SE pode se sentir como um projeto de chassi mais antigo a este respeito.

O feedback ao clicar no clickpad é suave e muito superficial para uma impressão fraca. Com certeza, você vai querer usar um mouse USB sempre que possível.

Não há nada de especial no teclado, pois o feedback das teclas é semelhante ao de um Ultrabook de médio porte
Touchpad liso com perímetro cromado e leitor de impressões digitais de canto
Teclas de seta em tamanho real às custas de uma tecla Shift mais curta
O ruído da chave é relativamente silencioso devido ao feedback superficial e suave. As chaves no Zephyrus G14 sentem-se um pouco mais profundas

Visor - Opções OLED e IPS

Faixa de subpixels OLED crocante com problemas mínimos de granulosidade

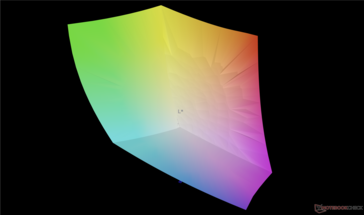
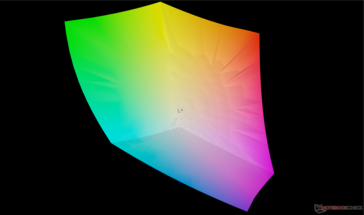
O Predator Triton 300 SE é um dos poucos laptops para jogos OLED que oferece tanto cores DCI-P3 completas quanto uma taxa de atualização relativamente rápida de 90 Hz. Certas alternativas IPS podem ter taxas de atualização ainda mais rápidas, como o painel no Lâmina 14mas eles normalmente prometem apenas cobertura sRGB.

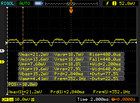
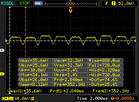
A falta de suporte de sincronização adaptativa é uma desvantagem notável para o Predator Triton 300 SE de 14 polegadas. Embora o fantasma possa ser quase inexistente, o painel OLED traz definitivamente seu próprio conjunto de desvantagens quando comparado ao IPS. Uma freqüência cintilante de cerca de 352 Hz, por exemplo, permanece presente em todos os níveis de brilho semelhante ao que registramos em outros laptops OLED de 14 polegadas, como o Asus VivoBook 14.

A Acer oferece uma SKU IPS 1200p de baixa resolução com suporte MUX e uma taxa de atualização mais rápida de 165 Hz. Se a cobertura total de cores P3 não for importante para suas tarefas, então a alternativa IPS pode valer a pena considerar especialmente para fins de jogos.

Sem suporte de tela sensível ao toque, apesar do painel brilhante
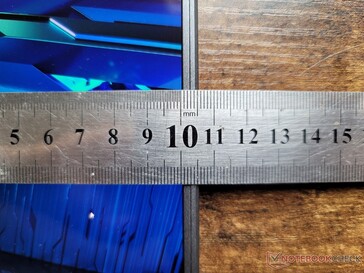
Luneis laterais estreitos. O vidro Gorila de borda a borda poderia ter melhorado a rigidez, mas também teria aumentado tanto o peso quanto a espessura
416.4
cd/m²
417.3
cd/m²
419.1
cd/m²
413.6
cd/m²
414.3
cd/m²
417.2
cd/m²
414.3
cd/m²
413.6
cd/m²
419.1
cd/m²
Distribuição do brilho
Samsung ATNA40YK07-0 tested with X-Rite i1Pro 2
Máximo: 419.1 cd/m² (Nits) Médio: 416.1 cd/m² Minimum: 22.53 cd/m²
iluminação: 99 %
iluminação com acumulador: 414.3 cd/m²
Contraste: ∞:1 (Preto: 0 cd/m²)
ΔE Color 4.68 | 0.5-29.43 Ø5
ΔE Greyscale 1.8 | 0.57-98 Ø5.3
99% AdobeRGB 1998 (Argyll 2.2.0 3D)
100% sRGB (Argyll 2.2.0 3D)
99.9% Display P3 (Argyll 2.2.0 3D)
Gamma: 2.22
Acer Predator Triton 300 SE
Samsung ATNA40YK07-0, OLED, 2880x1800, 14.00
Asus ROG Zephyrus G14 GA402RJ
BOEhydis NE140QDM-NX1, IPS, 2560x1600, 14.00
Razer Blade 14 Ryzen 9 6900HX
TL140BDXP02-0, IPS, 2560x1440, 14.00
Alienware x14 i7 RTX 3060
SHP154D, IPS, 1920x1080, 14.00
Dell Inspiron 14 Plus 7420
InfoVision 140NWHE, IPS, 2240x1400, 14.00
SCHENKER Vision 14
MNE007ZA1, IPS, 2880x1800, 14.00
Display
-5%
-5%
-4%
-21%
-17%
Display P3 Coverage
99.9
97.6
-2%
97.2
-3%
99.6
0%
68.8
-31%
74.3
-26%
sRGB Coverage
100
99.9
0%
99.9
0%
100
0%
99.3
-1%
97.6
-2%
AdobeRGB 1998 Coverage
99
85.6
-14%
85.7
-13%
87.6
-12%
69.5
-30%
75.7
-24%
Response Times
2058%
-1077%
-533%
-1944%
-2062%
Response Time Grey 50% / Grey 80% *
1.36 ?(0.68, 0.68)
8.3 ?(3.5, 4.8)
-510%
16.8 ?(8.4, 8.4)
-1135%
9.6 ?(4.4, 5.2)
-606%
32.8 ?(16, 16.8)
-2312%
40.4 ?(18.8, 21.6)
-2871%
Response Time Black / White *
1.36 ?(0.52, 0.84)
6 ?(1.8, 4.2)
-341%
15.2 ?(8.4, 6.8)
-1018%
7.6 ?(2.8, 4.8)
-459%
22.8 ?(12, 10.8)
-1576%
18.4 ?(6, 12.4)
-1253%
PWM Frequency
367.6 ?(100)
26191 ?(35)
7025%
Screen
5%
13%
-24%
-12%
5%
Brightness middle
414.3
500
21%
354
-15%
434
5%
331.1
-20%
407
-2%
Brightness
416
470
13%
328
-21%
411
-1%
326
-22%
407
-2%
Brightness Distribution
99
85
-14%
86
-13%
89
-10%
85
-14%
94
-5%
Black Level *
0.42
0.37
0.25
0.29
0.25
Colorchecker dE 2000 *
4.68
2.45
48%
1.66
65%
3
36%
2.23
52%
2.6
44%
Colorchecker dE 2000 max. *
7.78
5.34
31%
3.83
51%
7.1
9%
5.44
30%
4.4
43%
Greyscale dE 2000 *
1.8
3.1
-72%
1.6
11%
5.1
-183%
3.6
-100%
2.7
-50%
Gamma
2.22 99%
2.213 99%
2.23 99%
2.19 100%
2.21 100%
2.18 101%
CCT
6207 105%
7251 90%
6542 99%
6204 105%
6022 108%
6316 103%
Contrast
1190
957
1736
1142
1628
Colorchecker dE 2000 calibrated *
1.2
0.7
0.63
2
Total Average (Program / Settings)
686% / 515%
-356% / -190%
-187% / -111%
-659% / -366%
-691% / -377%

* ... smaller is better

vs. sRGB
vs. sRGB
vs. P3
vs. P3

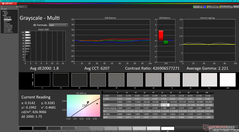
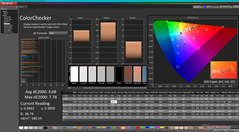
O painel é decentemente calibrado em relação ao padrão P3 com valores médios de escala de cinza e deltaE de apenas 1,8 e 4,68, respectivamente.

Escala de cinza (vs. P3)
Varreduras de saturação (vs. P3)
ColorChecker (vs. P3)

Display Response Times

Display response times show how fast the screen is able to change from one color to the next. Slow response times can lead to afterimages and can cause moving objects to appear blurry (ghosting). Gamers of fast-paced 3D titles should pay special attention to fast response times.
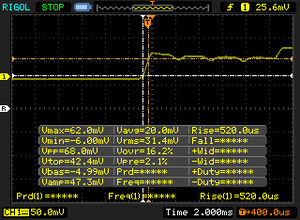
       Response Time Black to White
1.36 ms ... rise ↗ and fall ↘ combined↗ 0.52 ms rise
↘ 0.84 ms fall
The screen shows very fast response rates in our tests and should be very well suited for fast-paced gaming.
In comparison, all tested devices range from 0.1 (minimum) to 240 (maximum) ms. » 4 % of all devices are better.
This means that the measured response time is better than the average of all tested devices (21.5 ms).
       Response Time 50% Grey to 80% Grey
1.36 ms ... rise ↗ and fall ↘ combined↗ 0.68 ms rise
↘ 0.68 ms fall
The screen shows very fast response rates in our tests and should be very well suited for fast-paced gaming.
In comparison, all tested devices range from 0.2 (minimum) to 636 (maximum) ms. » 3 % of all devices are better.
This means that the measured response time is better than the average of all tested devices (33.7 ms).

Screen Flickering / PWM (Pulse-Width Modulation)

To dim the screen, some notebooks will simply cycle the backlight on and off in rapid succession - a method called Pulse Width Modulation (PWM) . This cycling frequency should ideally be undetectable to the human eye. If said frequency is too low, users with sensitive eyes may experience strain or headaches or even notice the flickering altogether.
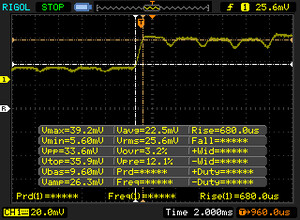
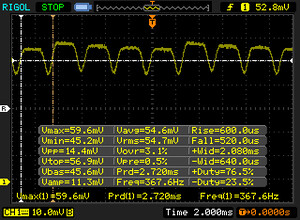
Screen flickering / PWM detected 367.6 Hz ≤ 100 % brightness setting

The display backlight flickers at 367.6 Hz (worst case, e.g., utilizing PWM) Flickering detected at a brightness setting of 100 % and below. There should be no flickering or PWM above this brightness setting.

The frequency of 367.6 Hz is relatively high, so most users sensitive to PWM should not notice any flickering. However, there are reports that some users are still sensitive to PWM at 500 Hz and above, so be aware.

In comparison: 53 % of all tested devices do not use PWM to dim the display. If PWM was detected, an average of 17924 (minimum: 5 - maximum: 3846000) Hz was measured.

0 por cento de brilho
25 por cento de brilho
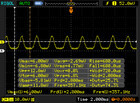
50 por cento de brilho
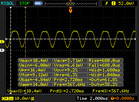
75 por cento de brilho
100 por cento de brilho

A visibilidade ao ar livre é decente se sob a sombra, devido aos níveis de preto profundo e às cores do painel OLED brilhante. No entanto, o brilho ainda é inevitável na maioria das condições. O visor mate no Zephyrus G14 é cerca de 100 lêndeas mais brilhante para facilitar um pouco a leitura.

Ao ar livre sob a luz do sol
Ao ar livre sob a sombra
Ao ar livre sob a luz do sol
Amplos ângulos de visão OLED. Um efeito arco-íris exclusivo do OLED torna-se perceptível se a visualização for feita de ângulos extremos

Desempenho - 12th Gen Core i9


Condições de teste

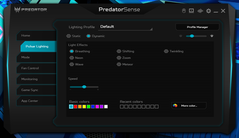
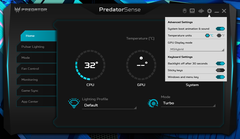
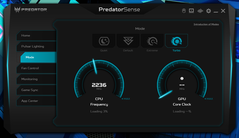
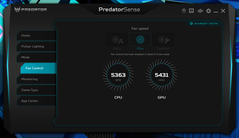
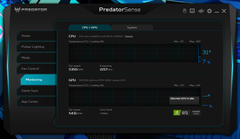
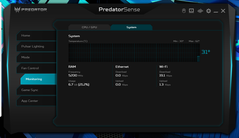
Ajustamos nossa unidade para o modo 'Melhor desempenho' via Windows e 'Turbo' via software PredatorSense pré-instalado antes de executar quaisquer benchmarks abaixo. Recomenda-se que os proprietários se familiarizem com o PredatorSense, pois ele é o principal centro de controle para ajustar a luz de fundo do teclado, ventiladores, configurações de inicialização e muito mais, conforme mostrado pelas telas abaixo

Infelizmente, o MUX só está disponível nos SKUs não refrigerados, conforme confirmado pela Acer. A tentativa de sair do modo MSHybrid através do PredatorSense iria travar nossa unidade.

Processador

O desempenho da CPU é um dos mais rápidos de qualquer laptop de 14 polegadas para jogos. Para qualquer coisa significativamente mais rápida, você teria que considerar modelos maiores como o MSI GE77 com oNúcleo i9-12900HX. Mesmo assim, o Núcleo i9-12900H em nossas 14 polegadas, a Acer é incapaz de manter taxas de relógio Turbo Boost muito altas por longos períodos, como mostrará nossa seção de Teste de Estresse abaixo

Downgrading to the Núcleo i7-12700H A SKU pode implicar um déficit de desempenho de apenas 1 a 2% com base em nosso tempo com o Alienware x14. Os potenciais compradores podem economizar algumas centenas de dólares desta forma e receber essencialmente o mesmo desempenho de processador que o mais caro Core i9-12900H.

Cinebench R15 Multi Loop

0130260390520650780910104011701300143015601690182019502080221023402470Tooltip
Acer Predator Triton 300 SE Intel Core i9-12900H: Ø2282 (2251.36-2406.88)
Asus ROG Zephyrus G14 GA402RJ AMD Ryzen 7 6800HS: Ø1945 (1933.96-1986.89)
Razer Blade 14 Ryzen 9 6900HX AMD Ryzen 9 6900HX: Ø2265 (2136.18-2287.68)
Alienware x14 i7 RTX 3060 Intel Core i7-12700H: Ø2194 (2063.56-2534.53)
Dell Inspiron 14 Plus 7420 Intel Core i7-12700H: Ø1900 (1853.65-2410.51)
Cinebench R20: CPU (Multi Core) | CPU (Single Core)
Cinebench R23: Multi Core | Single Core
Cinebench R15: CPU Multi 64Bit | CPU Single 64Bit
Blender: v2.79 BMW27 CPU
7-Zip 18.03: 7z b 4 | 7z b 4 -mmt1
Geekbench 5.5: Multi-Core | Single-Core
HWBOT x265 Benchmark v2.2: 4k Preset
LibreOffice : 20 Documents To PDF
R Benchmark 2.5: Overall mean
Cinebench R20 / CPU (Multi Core)
MSI Raider GE77 HX 12UHS
Intel Core i9-12900HX
8828 Points +45%
Acer Predator Triton 300 SE
Intel Core i9-12900H
6108 Points
Alienware x14 i7 RTX 3060
Intel Core i7-12700H
5967 Points -2%
Average Intel Core i9-12900H
  (2681 - 7471, n=25)
5761 Points -6%
Lenovo IdeaPad Gaming 3 15IAH7
Intel Core i5-12500H
5640 Points -8%
Razer Blade 14 Ryzen 9 6900HX
AMD Ryzen 9 6900HX
5461 Points -11%
Acer Nitro 5 AN515-46-R1A1
AMD Ryzen 7 6800H
5311 Points -13%
Razer Blade 14 Ryzen 9 RTX 3070
AMD Ryzen 9 5900HX
4876 Points -20%
Asus ROG Zephyrus G14 GA402RJ
AMD Ryzen 7 6800HS
4634 Points -24%
Asus ZenBook 14X UM5401QA-KN162
AMD Ryzen 7 5800H
4235 Points -31%
Lenovo Legion 5 Pro 16 ARH7H-82RG0047GE
AMD Ryzen 5 6600H
4141 Points -32%
SCHENKER Vision 14
Intel Core i7-11370H
2351 Points -62%
Cinebench R20 / CPU (Single Core)
MSI Raider GE77 HX 12UHS
Intel Core i9-12900HX
742 Points +1%
Acer Predator Triton 300 SE
Intel Core i9-12900H
733 Points
Average Intel Core i9-12900H
  (624 - 738, n=25)
705 Points -4%
Alienware x14 i7 RTX 3060
Intel Core i7-12700H
684 Points -7%
Lenovo IdeaPad Gaming 3 15IAH7
Intel Core i5-12500H
653 Points -11%
Acer Nitro 5 AN515-46-R1A1
AMD Ryzen 7 6800H
605 Points -17%
Razer Blade 14 Ryzen 9 6900HX
AMD Ryzen 9 6900HX
601 Points -18%
SCHENKER Vision 14
Intel Core i7-11370H
595 Points -19%
Lenovo Legion 5 Pro 16 ARH7H-82RG0047GE
AMD Ryzen 5 6600H
575 Points -22%
Asus ROG Zephyrus G14 GA402RJ
AMD Ryzen 7 6800HS
570 Points -22%
Asus ZenBook 14X UM5401QA-KN162
AMD Ryzen 7 5800H
550 Points -25%
Razer Blade 14 Ryzen 9 RTX 3070
AMD Ryzen 9 5900HX
471 Points -36%
Cinebench R23 / Multi Core
MSI Raider GE77 HX 12UHS
Intel Core i9-12900HX
23124 Points +45%
Acer Predator Triton 300 SE
Intel Core i9-12900H
15906 (14978min - 15906.4max) Points
Alienware x14 i7 RTX 3060
Intel Core i7-12700H
15783 Points -1%
Average Intel Core i9-12900H
  (7359 - 19648, n=25)
15301 Points -4%
Lenovo IdeaPad Gaming 3 15IAH7
Intel Core i5-12500H
14686 Points -8%
Razer Blade 14 Ryzen 9 6900HX
AMD Ryzen 9 6900HX
14120 (13823.2min - 14120max) Points -11%
Acer Nitro 5 AN515-46-R1A1
AMD Ryzen 7 6800H
13623 Points -14%
Razer Blade 14 Ryzen 9 RTX 3070
AMD Ryzen 9 5900HX
12652 (12516min - 12651.7max) Points -20%
Asus ROG Zephyrus G14 GA402RJ
AMD Ryzen 7 6800HS
11992 Points -25%
Asus ZenBook 14X UM5401QA-KN162
AMD Ryzen 7 5800H
10936 Points -31%
Lenovo Legion 5 Pro 16 ARH7H-82RG0047GE
AMD Ryzen 5 6600H
10717 Points -33%
SCHENKER Vision 14
Intel Core i7-11370H
5904 Points -63%
Cinebench R23 / Single Core
Acer Predator Triton 300 SE
Intel Core i9-12900H
1910 Points
MSI Raider GE77 HX 12UHS
Intel Core i9-12900HX
1907 Points 0%
Average Intel Core i9-12900H
  (1634 - 1921, n=25)
1822 Points -5%
Alienware x14 i7 RTX 3060
Intel Core i7-12700H
1763 Points -8%
Lenovo IdeaPad Gaming 3 15IAH7
Intel Core i5-12500H
1681 Points -12%
Acer Nitro 5 AN515-46-R1A1
AMD Ryzen 7 6800H
1542 Points -19%
Razer Blade 14 Ryzen 9 6900HX
AMD Ryzen 9 6900HX
1529 Points -20%
SCHENKER Vision 14
Intel Core i7-11370H
1467 Points -23%
Lenovo Legion 5 Pro 16 ARH7H-82RG0047GE
AMD Ryzen 5 6600H
1458 Points -24%
Asus ROG Zephyrus G14 GA402RJ
AMD Ryzen 7 6800HS
1455 Points -24%
Asus ZenBook 14X UM5401QA-KN162
AMD Ryzen 7 5800H
1413 Points -26%
Razer Blade 14 Ryzen 9 RTX 3070
AMD Ryzen 9 5900HX
1218 Points -36%
Cinebench R15 / CPU Multi 64Bit
MSI Raider GE77 HX 12UHS
Intel Core i9-12900HX
3562 Points +48%
Alienware x14 i7 RTX 3060
Intel Core i7-12700H
2535 (2063.56min - 2534.53max) Points +5%
Average Intel Core i9-12900H
  (1395 - 3077, n=25)
2482 Points +3%
Acer Predator Triton 300 SE
Intel Core i9-12900H
2407 (2251.36min - 2406.88max) Points
Razer Blade 14 Ryzen 9 6900HX
AMD Ryzen 9 6900HX
2288 (2136.18min - 2287.68max) Points -5%
Lenovo IdeaPad Gaming 3 15IAH7
Intel Core i5-12500H
2272 (2136.52min - 2272.47max) Points -6%
Acer Nitro 5 AN515-46-R1A1
AMD Ryzen 7 6800H
2206.17 Points -8%
Razer Blade 14 Ryzen 9 RTX 3070
AMD Ryzen 9 5900HX
2061 (2009.65min - 2060.79max) Points -14%
Asus ROG Zephyrus G14 GA402RJ
AMD Ryzen 7 6800HS
1987 (1933.96min - 1986.89max) Points -17%
Asus ZenBook 14X UM5401QA-KN162
AMD Ryzen 7 5800H
1768 Points -27%
Lenovo Legion 5 Pro 16 ARH7H-82RG0047GE
AMD Ryzen 5 6600H
1740 (1701.55min - 1739.81max) Points -28%
SCHENKER Vision 14
Intel Core i7-11370H
1070 (1030.18min - 1070.35max) Points -56%
SCHENKER Vision 14
Intel Core i7-11370H
877 (1030.18min - 1070.35max) Points -64%
Cinebench R15 / CPU Single 64Bit
MSI Raider GE77 HX 12UHS
Intel Core i9-12900HX
280 Points +3%
Acer Predator Triton 300 SE
Intel Core i9-12900H
271 Points
Average Intel Core i9-12900H
  (235 - 277, n=26)
262 Points -3%
Alienware x14 i7 RTX 3060
Intel Core i7-12700H
252 Points -7%
Acer Nitro 5 AN515-46-R1A1
AMD Ryzen 7 6800H
248 Points -8%
Lenovo IdeaPad Gaming 3 15IAH7
Intel Core i5-12500H
247 Points -9%
Razer Blade 14 Ryzen 9 6900HX
AMD Ryzen 9 6900HX
245 Points -10%
Lenovo Legion 5 Pro 16 ARH7H-82RG0047GE
AMD Ryzen 5 6600H
236 Points -13%
Asus ROG Zephyrus G14 GA402RJ
AMD Ryzen 7 6800HS
234 Points -14%
SCHENKER Vision 14
Intel Core i7-11370H
232 Points -14%
Asus ZenBook 14X UM5401QA-KN162
AMD Ryzen 7 5800H
220 Points -19%
Razer Blade 14 Ryzen 9 RTX 3070
AMD Ryzen 9 5900HX
197 Points -27%
Blender / v2.79 BMW27 CPU
SCHENKER Vision 14
Intel Core i7-11370H
451 Seconds * -124%
Lenovo Legion 5 Pro 16 ARH7H-82RG0047GE
AMD Ryzen 5 6600H
291 Seconds * -45%
Asus ZenBook 14X UM5401QA-KN162
AMD Ryzen 7 5800H
279 Seconds * -39%
Asus ROG Zephyrus G14 GA402RJ
AMD Ryzen 7 6800HS
258 Seconds * -28%
Razer Blade 14 Ryzen 9 RTX 3070
AMD Ryzen 9 5900HX
251 Seconds * -25%
Acer Nitro 5 AN515-46-R1A1
AMD Ryzen 7 6800H
234 Seconds * -16%
Average Intel Core i9-12900H
  (160 - 451, n=25)
229 Seconds * -14%
Alienware x14 i7 RTX 3060
Intel Core i7-12700H
223 Seconds * -11%
Lenovo IdeaPad Gaming 3 15IAH7
Intel Core i5-12500H
223 Seconds * -11%
Razer Blade 14 Ryzen 9 6900HX
AMD Ryzen 9 6900HX
222 Seconds * -10%
Acer Predator Triton 300 SE
Intel Core i9-12900H
201 Seconds *
MSI Raider GE77 HX 12UHS
Intel Core i9-12900HX
150.5 Seconds * +25%
7-Zip 18.03 / 7z b 4
MSI Raider GE77 HX 12UHS
Intel Core i9-12900HX
86541 MIPS +33%
Alienware x14 i7 RTX 3060
Intel Core i7-12700H
66498 MIPS +2%
Acer Predator Triton 300 SE
Intel Core i9-12900H
64899 MIPS
Razer Blade 14 Ryzen 9 6900HX
AMD Ryzen 9 6900HX
62123 MIPS -4%
Average Intel Core i9-12900H
  (34684 - 76677, n=25)
61535 MIPS -5%
Acer Nitro 5 AN515-46-R1A1
AMD Ryzen 7 6800H
61342 MIPS -5%
Asus ROG Zephyrus G14 GA402RJ
AMD Ryzen 7 6800HS
56170 MIPS -13%
Asus ZenBook 14X UM5401QA-KN162
AMD Ryzen 7 5800H
52732 MIPS -19%
Razer Blade 14 Ryzen 9 RTX 3070
AMD Ryzen 9 5900HX
52370 MIPS -19%
Lenovo Legion 5 Pro 16 ARH7H-82RG0047GE
AMD Ryzen 5 6600H
47836 MIPS -26%
Lenovo IdeaPad Gaming 3 15IAH7
Intel Core i5-12500H
44105 MIPS -32%
SCHENKER Vision 14
Intel Core i7-11370H
28410 MIPS -56%
7-Zip 18.03 / 7z b 4 -mmt1
MSI Raider GE77 HX 12UHS
Intel Core i9-12900HX
6357 MIPS +14%
Razer Blade 14 Ryzen 9 6900HX
AMD Ryzen 9 6900HX
5840 MIPS +4%
Average Intel Core i9-12900H
  (5302 - 6289, n=25)
5835 MIPS +4%
Acer Nitro 5 AN515-46-R1A1
AMD Ryzen 7 6800H
5720 MIPS +2%
Alienware x14 i7 RTX 3060
Intel Core i7-12700H
5605 MIPS 0%
Acer Predator Triton 300 SE
Intel Core i9-12900H
5590 MIPS
Lenovo Legion 5 Pro 16 ARH7H-82RG0047GE
AMD Ryzen 5 6600H
5553 MIPS -1%
SCHENKER Vision 14
Intel Core i7-11370H
5550 MIPS -1%
Asus ROG Zephyrus G14 GA402RJ
AMD Ryzen 7 6800HS
5495 MIPS -2%
Lenovo IdeaPad Gaming 3 15IAH7
Intel Core i5-12500H
5451 MIPS -2%
Asus ZenBook 14X UM5401QA-KN162
AMD Ryzen 7 5800H
5402 MIPS -3%
Razer Blade 14 Ryzen 9 RTX 3070
AMD Ryzen 9 5900HX
4791 MIPS -14%
Geekbench 5.5 / Multi-Core
MSI Raider GE77 HX 12UHS
Intel Core i9-12900HX
16448 Points +27%
Alienware x14 i7 RTX 3060
Intel Core i7-12700H
13400 Points +3%
Acer Predator Triton 300 SE
Intel Core i9-12900H
12963 Points
Average Intel Core i9-12900H
  (8519 - 14376, n=26)
12163 Points -6%
Razer Blade 14 Ryzen 9 6900HX
AMD Ryzen 9 6900HX
9647 Points -26%
Acer Nitro 5 AN515-46-R1A1
AMD Ryzen 7 6800H
9392 Points -28%
Asus ROG Zephyrus G14 GA402RJ
AMD Ryzen 7 6800HS
9298 Points -28%
Asus ZenBook 14X UM5401QA-KN162
AMD Ryzen 7 5800H
8053 Points -38%
Lenovo IdeaPad Gaming 3 15IAH7
Intel Core i5-12500H
7962 Points -39%
Lenovo Legion 5 Pro 16 ARH7H-82RG0047GE
AMD Ryzen 5 6600H
7729 Points -40%
SCHENKER Vision 14
Intel Core i7-11370H
5775 Points -55%
Geekbench 5.5 / Single-Core
MSI Raider GE77 HX 12UHS
Intel Core i9-12900HX
1949 Points +5%
Acer Predator Triton 300 SE
Intel Core i9-12900H
1854 Points
Average Intel Core i9-12900H
  (1631 - 1892, n=26)
1797 Points -3%
Alienware x14 i7 RTX 3060
Intel Core i7-12700H
1796 Points -3%
Lenovo IdeaPad Gaming 3 15IAH7
Intel Core i5-12500H
1624 Points -12%
SCHENKER Vision 14
Intel Core i7-11370H
1601 Points -14%
Razer Blade 14 Ryzen 9 6900HX
AMD Ryzen 9 6900HX
1558 Points -16%
Acer Nitro 5 AN515-46-R1A1
AMD Ryzen 7 6800H
1549 Points -16%
Asus ROG Zephyrus G14 GA402RJ
AMD Ryzen 7 6800HS
1492 Points -20%
Lenovo Legion 5 Pro 16 ARH7H-82RG0047GE
AMD Ryzen 5 6600H
1474 Points -20%
Asus ZenBook 14X UM5401QA-KN162
AMD Ryzen 7 5800H
1459 Points -21%
HWBOT x265 Benchmark v2.2 / 4k Preset
MSI Raider GE77 HX 12UHS
Intel Core i9-12900HX
26 fps +39%
Acer Predator Triton 300 SE
Intel Core i9-12900H
18.7 fps
Razer Blade 14 Ryzen 9 6900HX
AMD Ryzen 9 6900HX
17.8 fps -5%
Alienware x14 i7 RTX 3060
Intel Core i7-12700H
17.7 fps -5%
Average Intel Core i9-12900H
  (8.05 - 22.5, n=25)
17.3 fps -7%
Acer Nitro 5 AN515-46-R1A1
AMD Ryzen 7 6800H
16.7 fps -11%
Lenovo IdeaPad Gaming 3 15IAH7
Intel Core i5-12500H
15.5 fps -17%
Razer Blade 14 Ryzen 9 RTX 3070
AMD Ryzen 9 5900HX
15.3 fps -18%
Asus ROG Zephyrus G14 GA402RJ
AMD Ryzen 7 6800HS
15.1 fps -19%
Lenovo Legion 5 Pro 16 ARH7H-82RG0047GE
AMD Ryzen 5 6600H
14.2 fps -24%
Asus ZenBook 14X UM5401QA-KN162
AMD Ryzen 7 5800H
13.8 fps -26%
SCHENKER Vision 14
Intel Core i7-11370H
8.82 fps -53%
LibreOffice / 20 Documents To PDF
Lenovo Legion 5 Pro 16 ARH7H-82RG0047GE
AMD Ryzen 5 6600H
60 s * -46%
Razer Blade 14 Ryzen 9 RTX 3070
AMD Ryzen 9 5900HX
58.9 s * -43%
Asus ROG Zephyrus G14 GA402RJ
AMD Ryzen 7 6800HS
55 s * -33%
Asus ZenBook 14X UM5401QA-KN162
AMD Ryzen 7 5800H
53.3 s * -29%
Acer Nitro 5 AN515-46-R1A1
AMD Ryzen 7 6800H
50.6 s * -23%
Razer Blade 14 Ryzen 9 6900HX
AMD Ryzen 9 6900HX
50.1 s * -22%
Lenovo IdeaPad Gaming 3 15IAH7
Intel Core i5-12500H
48.9 s * -19%
SCHENKER Vision 14
Intel Core i7-11370H
47.9 s * -16%
Average Intel Core i9-12900H
  (36.8 - 59.8, n=25)
42.7 s * -4%
MSI Raider GE77 HX 12UHS
Intel Core i9-12900HX
42.4 s * -3%
Acer Predator Triton 300 SE
Intel Core i9-12900H
41.2 s *
Alienware x14 i7 RTX 3060
Intel Core i7-12700H
39.4 s * +4%
R Benchmark 2.5 / Overall mean
Razer Blade 14 Ryzen 9 RTX 3070
AMD Ryzen 9 5900HX
0.599 sec * -40%
SCHENKER Vision 14
Intel Core i7-11370H
0.544 sec * -27%
Asus ZenBook 14X UM5401QA-KN162
AMD Ryzen 7 5800H
0.524 sec * -22%
Asus ROG Zephyrus G14 GA402RJ
AMD Ryzen 7 6800HS
0.512 sec * -19%
Lenovo IdeaPad Gaming 3 15IAH7
Intel Core i5-12500H
0.508 sec * -18%
Lenovo Legion 5 Pro 16 ARH7H-82RG0047GE
AMD Ryzen 5 6600H
0.502 sec * -17%
Acer Nitro 5 AN515-46-R1A1
AMD Ryzen 7 6800H
0.4876 sec * -14%
Razer Blade 14 Ryzen 9 6900HX
AMD Ryzen 9 6900HX
0.4797 sec * -12%
Alienware x14 i7 RTX 3060
Intel Core i7-12700H
0.4564 sec * -6%
Average Intel Core i9-12900H
  (0.4218 - 0.506, n=25)
0.4547 sec * -6%
Acer Predator Triton 300 SE
Intel Core i9-12900H
0.4292 sec *
MSI Raider GE77 HX 12UHS
Intel Core i9-12900HX
0.4239 sec * +1%

* ... smaller is better

Cinebench R15 CPU Multi 64Bit
2407 Points
Cinebench R15 OpenGL 64Bit
216 fps
Cinebench R15 Ref. Match 64Bit
99.6 %
Cinebench R15 CPU Single 64Bit
271 Points
Ajuda
Performance Rating
Razer Blade 14 Ryzen 9 6900HX
AMD Ryzen 9 6900HX, GeForce RTX 3070 Ti Laptop GPU
93.1 pt
Acer Predator Triton 300 SE
Intel Core i9-12900H, GeForce RTX 3060 Laptop GPU
89.4 pt
Asus ROG Zephyrus G14 GA402RJ
AMD Ryzen 7 6800HS, Radeon RX 6700S
81.3 pt
Average Intel Core i9-12900H
 
71.5 pt
Dell Inspiron 14 Plus 7420
Intel Core i7-12700H, GeForce RTX 3050 4GB Laptop GPU
69.7 pt
Alienware x14 i7 RTX 3060
Intel Core i7-12700H, GeForce RTX 3060 Laptop GPU
68.4 pt
SCHENKER Vision 14
Intel Core i7-11370H, GeForce RTX 3050 Ti Laptop GPU
47.5 pt
AIDA64 / FP32 Ray-Trace
Razer Blade 14 Ryzen 9 6900HX
AMD Ryzen 9 6900HX, GeForce RTX 3070 Ti Laptop GPU
16379 KRay/s +8%
Acer Predator Triton 300 SE
Intel Core i9-12900H, GeForce RTX 3060 Laptop GPU
15140 KRay/s
Asus ROG Zephyrus G14 GA402RJ
AMD Ryzen 7 6800HS, Radeon RX 6700S
13411 KRay/s -11%
Dell Inspiron 14 Plus 7420
Intel Core i7-12700H, GeForce RTX 3050 4GB Laptop GPU
12199 KRay/s -19%
Average Intel Core i9-12900H
  (4074 - 18289, n=25)
11031 KRay/s -27%
SCHENKER Vision 14
Intel Core i7-11370H, GeForce RTX 3050 Ti Laptop GPU
8413 KRay/s -44%
Alienware x14 i7 RTX 3060
Intel Core i7-12700H, GeForce RTX 3060 Laptop GPU
8357 KRay/s -45%
AIDA64 / FPU Julia
Razer Blade 14 Ryzen 9 6900HX
AMD Ryzen 9 6900HX, GeForce RTX 3070 Ti Laptop GPU
102318 Points +36%
Asus ROG Zephyrus G14 GA402RJ
AMD Ryzen 7 6800HS, Radeon RX 6700S
86254 Points +15%
Acer Predator Triton 300 SE
Intel Core i9-12900H, GeForce RTX 3060 Laptop GPU
75181 Points
Dell Inspiron 14 Plus 7420
Intel Core i7-12700H, GeForce RTX 3050 4GB Laptop GPU
61302 Points -18%
Average Intel Core i9-12900H
  (22307 - 93236, n=25)
54480 Points -28%
Alienware x14 i7 RTX 3060
Intel Core i7-12700H, GeForce RTX 3060 Laptop GPU
38442 Points -49%
SCHENKER Vision 14
Intel Core i7-11370H, GeForce RTX 3050 Ti Laptop GPU
34020 Points -55%
AIDA64 / CPU SHA3
Acer Predator Triton 300 SE
Intel Core i9-12900H, GeForce RTX 3060 Laptop GPU
3676 MB/s
Razer Blade 14 Ryzen 9 6900HX
AMD Ryzen 9 6900HX, GeForce RTX 3070 Ti Laptop GPU
3499 MB/s -5%
Average Intel Core i9-12900H
  (1378 - 4215, n=25)
3063 MB/s -17%
Asus ROG Zephyrus G14 GA402RJ
AMD Ryzen 7 6800HS, Radeon RX 6700S
2953 MB/s -20%
Alienware x14 i7 RTX 3060
Intel Core i7-12700H, GeForce RTX 3060 Laptop GPU
2906 MB/s -21%
Dell Inspiron 14 Plus 7420
Intel Core i7-12700H, GeForce RTX 3050 4GB Laptop GPU
2795 MB/s -24%
SCHENKER Vision 14
Intel Core i7-11370H, GeForce RTX 3050 Ti Laptop GPU
2287 MB/s -38%
AIDA64 / CPU Queen
Acer Predator Triton 300 SE
Intel Core i9-12900H, GeForce RTX 3060 Laptop GPU
111168 Points
Razer Blade 14 Ryzen 9 6900HX
AMD Ryzen 9 6900HX, GeForce RTX 3070 Ti Laptop GPU
102463 Points -8%
Average Intel Core i9-12900H
  (78172 - 111241, n=25)
101523 Points -9%
Asus ROG Zephyrus G14 GA402RJ
AMD Ryzen 7 6800HS, Radeon RX 6700S
100537 Points -10%
Alienware x14 i7 RTX 3060
Intel Core i7-12700H, GeForce RTX 3060 Laptop GPU
99631 Points -10%
Dell Inspiron 14 Plus 7420
Intel Core i7-12700H, GeForce RTX 3050 4GB Laptop GPU
96156 Points -14%
SCHENKER Vision 14
Intel Core i7-11370H, GeForce RTX 3050 Ti Laptop GPU
52839 Points -52%
AIDA64 / FPU SinJulia
Razer Blade 14 Ryzen 9 6900HX
AMD Ryzen 9 6900HX, GeForce RTX 3070 Ti Laptop GPU
12861 Points +33%
Asus ROG Zephyrus G14 GA402RJ
AMD Ryzen 7 6800HS, Radeon RX 6700S
12044 Points +24%
Acer Predator Triton 300 SE
Intel Core i9-12900H, GeForce RTX 3060 Laptop GPU
9702 Points
Alienware x14 i7 RTX 3060
Intel Core i7-12700H, GeForce RTX 3060 Laptop GPU
9325 Points -4%
Average Intel Core i9-12900H
  (5709 - 10410, n=25)
9091 Points -6%
Dell Inspiron 14 Plus 7420
Intel Core i7-12700H, GeForce RTX 3050 4GB Laptop GPU
8198 Points -16%
SCHENKER Vision 14
Intel Core i7-11370H, GeForce RTX 3050 Ti Laptop GPU
5025 Points -48%
AIDA64 / FPU Mandel
Razer Blade 14 Ryzen 9 6900HX
AMD Ryzen 9 6900HX, GeForce RTX 3070 Ti Laptop GPU
56460 Points +53%
Asus ROG Zephyrus G14 GA402RJ
AMD Ryzen 7 6800HS, Radeon RX 6700S
47307 Points +28%
Acer Predator Triton 300 SE
Intel Core i9-12900H, GeForce RTX 3060 Laptop GPU
36920 Points
Dell Inspiron 14 Plus 7420
Intel Core i7-12700H, GeForce RTX 3050 4GB Laptop GPU
30775 Points -17%
Average Intel Core i9-12900H
  (11257 - 45581, n=25)
28345 Points -23%
Alienware x14 i7 RTX 3060
Intel Core i7-12700H, GeForce RTX 3060 Laptop GPU
22701 Points -39%
SCHENKER Vision 14
Intel Core i7-11370H, GeForce RTX 3050 Ti Laptop GPU
20417 Points -45%
AIDA64 / CPU AES
Razer Blade 14 Ryzen 9 6900HX
AMD Ryzen 9 6900HX, GeForce RTX 3070 Ti Laptop GPU
140049 MB/s +6%
Acer Predator Triton 300 SE
Intel Core i9-12900H, GeForce RTX 3060 Laptop GPU
132544 MB/s
Asus ROG Zephyrus G14 GA402RJ
AMD Ryzen 7 6800HS, Radeon RX 6700S
120077 MB/s -9%
Alienware x14 i7 RTX 3060
Intel Core i7-12700H, GeForce RTX 3060 Laptop GPU
92214 MB/s -30%
Average Intel Core i9-12900H
  (31935 - 151546, n=25)
85224 MB/s -36%
SCHENKER Vision 14
Intel Core i7-11370H, GeForce RTX 3050 Ti Laptop GPU
76839 MB/s -42%
Dell Inspiron 14 Plus 7420
Intel Core i7-12700H, GeForce RTX 3050 4GB Laptop GPU
59729 MB/s -55%
AIDA64 / CPU ZLib
Acer Predator Triton 300 SE
Intel Core i9-12900H, GeForce RTX 3060 Laptop GPU
1029 MB/s
Alienware x14 i7 RTX 3060
Intel Core i7-12700H, GeForce RTX 3060 Laptop GPU
991 MB/s -4%
Average Intel Core i9-12900H
  (449 - 1193, n=25)
941 MB/s -9%
Dell Inspiron 14 Plus 7420
Intel Core i7-12700H, GeForce RTX 3050 4GB Laptop GPU
932 MB/s -9%
Razer Blade 14 Ryzen 9 6900HX
AMD Ryzen 9 6900HX, GeForce RTX 3070 Ti Laptop GPU
881 MB/s -14%
Asus ROG Zephyrus G14 GA402RJ
AMD Ryzen 7 6800HS, Radeon RX 6700S
760 MB/s -26%
SCHENKER Vision 14
Intel Core i7-11370H, GeForce RTX 3050 Ti Laptop GPU
422 MB/s -59%
AIDA64 / FP64 Ray-Trace
Razer Blade 14 Ryzen 9 6900HX
AMD Ryzen 9 6900HX, GeForce RTX 3070 Ti Laptop GPU
8748 KRay/s +8%
Acer Predator Triton 300 SE
Intel Core i9-12900H, GeForce RTX 3060 Laptop GPU
8122 KRay/s
Asus ROG Zephyrus G14 GA402RJ
AMD Ryzen 7 6800HS, Radeon RX 6700S
7183 KRay/s -12%
Dell Inspiron 14 Plus 7420
Intel Core i7-12700H, GeForce RTX 3050 4GB Laptop GPU
6553 KRay/s -19%
Average Intel Core i9-12900H
  (2235 - 10511, n=25)
6131 KRay/s -25%
Alienware x14 i7 RTX 3060
Intel Core i7-12700H, GeForce RTX 3060 Laptop GPU
4806 KRay/s -41%
SCHENKER Vision 14
Intel Core i7-11370H, GeForce RTX 3050 Ti Laptop GPU
4551 KRay/s -44%
AIDA64 / CPU PhotoWorxx
Acer Predator Triton 300 SE
Intel Core i9-12900H, GeForce RTX 3060 Laptop GPU
48269 MPixel/s
Alienware x14 i7 RTX 3060
Intel Core i7-12700H, GeForce RTX 3060 Laptop GPU
46643 MPixel/s -3%
Average Intel Core i9-12900H
  (20960 - 48269, n=26)
36777 MPixel/s -24%
Dell Inspiron 14 Plus 7420
Intel Core i7-12700H, GeForce RTX 3050 4GB Laptop GPU
35362 MPixel/s -27%
Razer Blade 14 Ryzen 9 6900HX
AMD Ryzen 9 6900HX, GeForce RTX 3070 Ti Laptop GPU
28094 MPixel/s -42%
SCHENKER Vision 14
Intel Core i7-11370H, GeForce RTX 3050 Ti Laptop GPU
27992 MPixel/s -42%
Asus ROG Zephyrus G14 GA402RJ
AMD Ryzen 7 6800HS, Radeon RX 6700S
27474 MPixel/s -43%

Desempenho do sistema

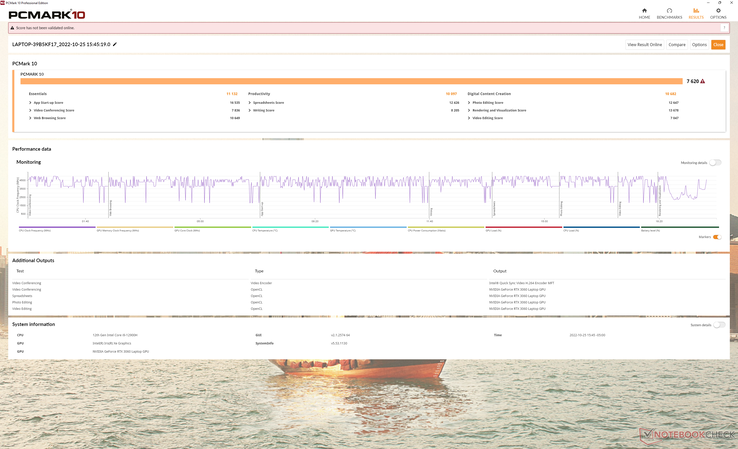
Os resultados do PCMark são quase 50% mais rápidos do que o Predator Triton 300 de 2020, uma vez que o modelo mais antigo tinha uma pontuação invulgarmente baixa na Criação de Conteúdo Digital. As pontuações estão agora onde deveriam estar em relação a outros laptops de jogos com o mais recente Core H CPUs Zen 3+ ou 12º gênero, como oDell G16.

PCMark 10 / Score
Acer Predator Triton 300 SE
GeForce RTX 3060 Laptop GPU, i9-12900H, Micron 3400 1TB MTFDKBA1T0TFH
7620 Points
Asus ROG Zephyrus G14 GA402RJ
Radeon RX 6700S, R7 6800HS, Micron 2450 1TB MTFDKBA1T0TFK
7345 Points -4%
Razer Blade 14 Ryzen 9 6900HX
GeForce RTX 3070 Ti Laptop GPU, R9 6900HX, Samsung PM9A1 MZVL21T0HCLR
7332 Points -4%
Alienware x14 i7 RTX 3060
GeForce RTX 3060 Laptop GPU, i7-12700H, WDC PC SN810 1TB
7170 Points -6%
Dell Inspiron 14 Plus 7420
GeForce RTX 3050 4GB Laptop GPU, i7-12700H, SK Hynix BC711 512GB HFM512GD3GX013N
6660 Points -13%
SCHENKER Vision 14
GeForce RTX 3050 Ti Laptop GPU, i7-11370H, Samsung SSD 980 Pro 1TB MZ-V8P1T0BW
5838 Points -23%
Acer Predator Triton 300 PT315-52-79LP
GeForce RTX 2060 Mobile, i7-10750H, WDC PC SN730 SDBQNTY-1T00
5193 Points -32%
PCMark 10 / Essentials
Acer Predator Triton 300 SE
GeForce RTX 3060 Laptop GPU, i9-12900H, Micron 3400 1TB MTFDKBA1T0TFH
11132 Points
Razer Blade 14 Ryzen 9 6900HX
GeForce RTX 3070 Ti Laptop GPU, R9 6900HX, Samsung PM9A1 MZVL21T0HCLR
10934 Points -2%
Alienware x14 i7 RTX 3060
GeForce RTX 3060 Laptop GPU, i7-12700H, WDC PC SN810 1TB
10294 Points -8%
Dell Inspiron 14 Plus 7420
GeForce RTX 3050 4GB Laptop GPU, i7-12700H, SK Hynix BC711 512GB HFM512GD3GX013N
10150 Points -9%
Asus ROG Zephyrus G14 GA402RJ
Radeon RX 6700S, R7 6800HS, Micron 2450 1TB MTFDKBA1T0TFK
10149 Points -9%
Acer Predator Triton 300 PT315-52-79LP
GeForce RTX 2060 Mobile, i7-10750H, WDC PC SN730 SDBQNTY-1T00
9763 Points -12%
SCHENKER Vision 14
GeForce RTX 3050 Ti Laptop GPU, i7-11370H, Samsung SSD 980 Pro 1TB MZ-V8P1T0BW
9234 Points -17%
PCMark 10 / Productivity
Acer Predator Triton 300 SE
GeForce RTX 3060 Laptop GPU, i9-12900H, Micron 3400 1TB MTFDKBA1T0TFH
10097 Points
Alienware x14 i7 RTX 3060
GeForce RTX 3060 Laptop GPU, i7-12700H, WDC PC SN810 1TB
9602 Points -5%
Asus ROG Zephyrus G14 GA402RJ
Radeon RX 6700S, R7 6800HS, Micron 2450 1TB MTFDKBA1T0TFK
9429 Points -7%
Razer Blade 14 Ryzen 9 6900HX
GeForce RTX 3070 Ti Laptop GPU, R9 6900HX, Samsung PM9A1 MZVL21T0HCLR
9043 Points -10%
Dell Inspiron 14 Plus 7420
GeForce RTX 3050 4GB Laptop GPU, i7-12700H, SK Hynix BC711 512GB HFM512GD3GX013N
8995 Points -11%
SCHENKER Vision 14
GeForce RTX 3050 Ti Laptop GPU, i7-11370H, Samsung SSD 980 Pro 1TB MZ-V8P1T0BW
8806 Points -13%
Acer Predator Triton 300 PT315-52-79LP
GeForce RTX 2060 Mobile, i7-10750H, WDC PC SN730 SDBQNTY-1T00
8008 Points -21%
PCMark 10 / Digital Content Creation
Asus ROG Zephyrus G14 GA402RJ
Radeon RX 6700S, R7 6800HS, Micron 2450 1TB MTFDKBA1T0TFK
11237 Points +5%
Razer Blade 14 Ryzen 9 6900HX
GeForce RTX 3070 Ti Laptop GPU, R9 6900HX, Samsung PM9A1 MZVL21T0HCLR
10817 Points +1%
Acer Predator Triton 300 SE
GeForce RTX 3060 Laptop GPU, i9-12900H, Micron 3400 1TB MTFDKBA1T0TFH
10682 Points
Alienware x14 i7 RTX 3060
GeForce RTX 3060 Laptop GPU, i7-12700H, WDC PC SN810 1TB
10118 Points -5%
Dell Inspiron 14 Plus 7420
GeForce RTX 3050 4GB Laptop GPU, i7-12700H, SK Hynix BC711 512GB HFM512GD3GX013N
8779 Points -18%
SCHENKER Vision 14
GeForce RTX 3050 Ti Laptop GPU, i7-11370H, Samsung SSD 980 Pro 1TB MZ-V8P1T0BW
6641 Points -38%
Acer Predator Triton 300 PT315-52-79LP
GeForce RTX 2060 Mobile, i7-10750H, WDC PC SN730 SDBQNTY-1T00
4861 Points -54%
CrossMark / Overall
Acer Predator Triton 300 SE
GeForce RTX 3060 Laptop GPU, i9-12900H, Micron 3400 1TB MTFDKBA1T0TFH
1971 Points
Alienware x14 i7 RTX 3060
GeForce RTX 3060 Laptop GPU, i7-12700H, WDC PC SN810 1TB
1910 Points -3%
Dell Inspiron 14 Plus 7420
GeForce RTX 3050 4GB Laptop GPU, i7-12700H, SK Hynix BC711 512GB HFM512GD3GX013N
1717 Points -13%
SCHENKER Vision 14
GeForce RTX 3050 Ti Laptop GPU, i7-11370H, Samsung SSD 980 Pro 1TB MZ-V8P1T0BW
1502 Points -24%
CrossMark / Productivity
Acer Predator Triton 300 SE
GeForce RTX 3060 Laptop GPU, i9-12900H, Micron 3400 1TB MTFDKBA1T0TFH
1877 Points
Alienware x14 i7 RTX 3060
GeForce RTX 3060 Laptop GPU, i7-12700H, WDC PC SN810 1TB
1797 Points -4%
Dell Inspiron 14 Plus 7420
GeForce RTX 3050 4GB Laptop GPU, i7-12700H, SK Hynix BC711 512GB HFM512GD3GX013N
1620 Points -14%
SCHENKER Vision 14
GeForce RTX 3050 Ti Laptop GPU, i7-11370H, Samsung SSD 980 Pro 1TB MZ-V8P1T0BW
1555 Points -17%
CrossMark / Creativity
Acer Predator Triton 300 SE
GeForce RTX 3060 Laptop GPU, i9-12900H, Micron 3400 1TB MTFDKBA1T0TFH
2107 Points
Alienware x14 i7 RTX 3060
GeForce RTX 3060 Laptop GPU, i7-12700H, WDC PC SN810 1TB
2072 Points -2%
Dell Inspiron 14 Plus 7420
GeForce RTX 3050 4GB Laptop GPU, i7-12700H, SK Hynix BC711 512GB HFM512GD3GX013N
1911 Points -9%
SCHENKER Vision 14
GeForce RTX 3050 Ti Laptop GPU, i7-11370H, Samsung SSD 980 Pro 1TB MZ-V8P1T0BW
1452 Points -31%
CrossMark / Responsiveness
Acer Predator Triton 300 SE
GeForce RTX 3060 Laptop GPU, i9-12900H, Micron 3400 1TB MTFDKBA1T0TFH
1869 Points
Alienware x14 i7 RTX 3060
GeForce RTX 3060 Laptop GPU, i7-12700H, WDC PC SN810 1TB
1798 Points -4%
SCHENKER Vision 14
GeForce RTX 3050 Ti Laptop GPU, i7-11370H, Samsung SSD 980 Pro 1TB MZ-V8P1T0BW
1501 Points -20%
Dell Inspiron 14 Plus 7420
GeForce RTX 3050 4GB Laptop GPU, i7-12700H, SK Hynix BC711 512GB HFM512GD3GX013N
1481 Points -21%
PCMark 10 Score
7620 pontos
Ajuda
AIDA64 / Memory Copy
Alienware x14 i7 RTX 3060
Intel Core i7-12700H, GeForce RTX 3060 Laptop GPU
77803 MB/s +6%
Acer Predator Triton 300 SE
Intel Core i9-12900H, GeForce RTX 3060 Laptop GPU
73354 MB/s
Average Intel Core i9-12900H
  (34438 - 74264, n=25)
59157 MB/s -19%
Dell Inspiron 14 Plus 7420
Intel Core i7-12700H, GeForce RTX 3050 4GB Laptop GPU
55064 MB/s -25%
Razer Blade 14 Ryzen 9 6900HX
AMD Ryzen 9 6900HX, GeForce RTX 3070 Ti Laptop GPU
48427 MB/s -34%
Asus ROG Zephyrus G14 GA402RJ
AMD Ryzen 7 6800HS, Radeon RX 6700S
48013 MB/s -35%
SCHENKER Vision 14
Intel Core i7-11370H, GeForce RTX 3050 Ti Laptop GPU
46072 MB/s -37%
AIDA64 / Memory Read
Alienware x14 i7 RTX 3060
Intel Core i7-12700H, GeForce RTX 3060 Laptop GPU
76185 MB/s +2%
Acer Predator Triton 300 SE
Intel Core i9-12900H, GeForce RTX 3060 Laptop GPU
74642 MB/s
Dell Inspiron 14 Plus 7420
Intel Core i7-12700H, GeForce RTX 3050 4GB Laptop GPU
63135 MB/s -15%
Average Intel Core i9-12900H
  (36365 - 74642, n=25)
61866 MB/s -17%
Razer Blade 14 Ryzen 9 6900HX
AMD Ryzen 9 6900HX, GeForce RTX 3070 Ti Laptop GPU
50457 MB/s -32%
Asus ROG Zephyrus G14 GA402RJ
AMD Ryzen 7 6800HS, Radeon RX 6700S
50377 MB/s -33%
SCHENKER Vision 14
Intel Core i7-11370H, GeForce RTX 3050 Ti Laptop GPU
47864 MB/s -36%
AIDA64 / Memory Write
Alienware x14 i7 RTX 3060
Intel Core i7-12700H, GeForce RTX 3060 Laptop GPU
64219 MB/s +1%
Acer Predator Triton 300 SE
Intel Core i9-12900H, GeForce RTX 3060 Laptop GPU
63565 MB/s
Average Intel Core i9-12900H
  (32276 - 67858, n=25)
59295 MB/s -7%
Dell Inspiron 14 Plus 7420
Intel Core i7-12700H, GeForce RTX 3050 4GB Laptop GPU
57985 MB/s -9%
Asus ROG Zephyrus G14 GA402RJ
AMD Ryzen 7 6800HS, Radeon RX 6700S
54997 MB/s -13%
Razer Blade 14 Ryzen 9 6900HX
AMD Ryzen 9 6900HX, GeForce RTX 3070 Ti Laptop GPU
54912 MB/s -14%
SCHENKER Vision 14
Intel Core i7-11370H, GeForce RTX 3050 Ti Laptop GPU
46199 MB/s -27%
AIDA64 / Memory Latency
Dell Inspiron 14 Plus 7420
Intel Core i7-12700H, GeForce RTX 3050 4GB Laptop GPU
133.9 ns * -32%
Alienware x14 i7 RTX 3060
Intel Core i7-12700H, GeForce RTX 3060 Laptop GPU
111 ns * -9%
Acer Predator Triton 300 SE
Intel Core i9-12900H, GeForce RTX 3060 Laptop GPU
101.7 ns *
Asus ROG Zephyrus G14 GA402RJ
AMD Ryzen 7 6800HS, Radeon RX 6700S
90.2 ns * +11%
Average Intel Core i9-12900H
  (88 - 118.1, n=24)
85.8 ns * +16%
Razer Blade 14 Ryzen 9 6900HX
AMD Ryzen 9 6900HX, GeForce RTX 3070 Ti Laptop GPU
83.4 ns * +18%
SCHENKER Vision 14
Intel Core i7-11370H, GeForce RTX 3050 Ti Laptop GPU
73.4 ns * +28%

* ... smaller is better

Latência do DPC

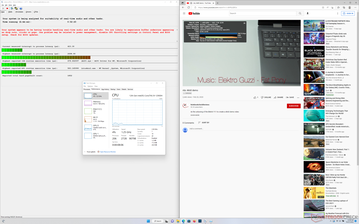
LatencyMon revela problemas de DPC ao abrir várias abas do navegador em nossa página inicial. O 2020 Predador Tritão Tritão 300 também sofreria de problemas similares de DPC e, portanto, é um pouco decepcionante ver isto não tratado. Além disso, não há grandes saltos de fotogramas quando se reproduz vídeos 4K60.

DPC Latencies / LatencyMon - interrupt to process latency (max), Web, Youtube, Prime95
Acer Predator Triton 300 SE
GeForce RTX 3060 Laptop GPU, i9-12900H, Micron 3400 1TB MTFDKBA1T0TFH
2698.9 μs *
Razer Blade 14 Ryzen 9 6900HX
GeForce RTX 3070 Ti Laptop GPU, R9 6900HX, Samsung PM9A1 MZVL21T0HCLR
1361.3 μs * +50%
Alienware x14 i7 RTX 3060
GeForce RTX 3060 Laptop GPU, i7-12700H, WDC PC SN810 1TB
1140 μs * +58%
Asus ROG Zephyrus G14 GA402RJ
Radeon RX 6700S, R7 6800HS, Micron 2450 1TB MTFDKBA1T0TFK
1111.5 μs * +59%
SCHENKER Vision 14
GeForce RTX 3050 Ti Laptop GPU, i7-11370H, Samsung SSD 980 Pro 1TB MZ-V8P1T0BW
1052 μs * +61%
Dell Inspiron 14 Plus 7420
GeForce RTX 3050 4GB Laptop GPU, i7-12700H, SK Hynix BC711 512GB HFM512GD3GX013N
529.6 μs * +80%

* ... smaller is better

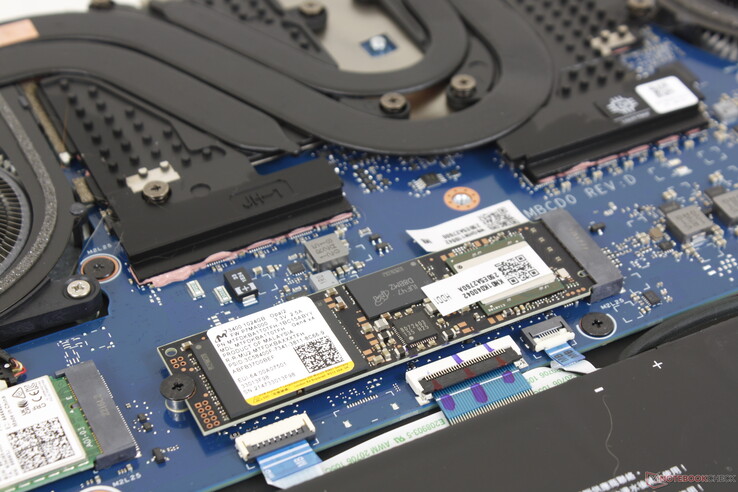
Dispositivos de armazenamento - Sem espátula de calor incluída

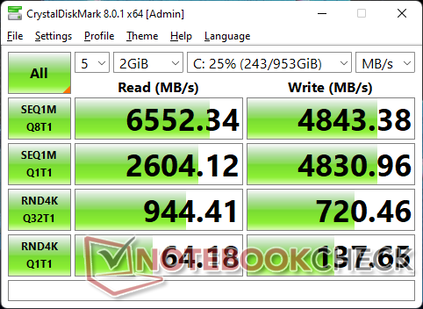
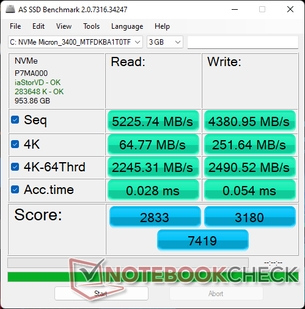
Nossa unidade de teste vem com um 1 TB Micron 3400 PCIe4 NVMe SSD para leitura e escrita seqüencial de até 6600 MB/s e 5000 MB/s, respectivamente. Infelizmente, a unidade é incapaz de manter velocidades tão rápidas por longos períodos, provavelmente devido à falta de um espalhador de calor. Nossos resultados do loop DiskSpd abaixo mostram taxas de leitura de até 6500 MB/s durante o início do teste antes de cair para apenas 1700 MB/s ou mesmo 400 MB/s ao longo do tempo. Concorrentes como a Lâmina Razer 14 são muito melhores em manter taxas de transferência SSD mais rápidas em comparação.

MDL 8
MDL 8
AS SSD
AS SSD
Suporta até um M.2 PCIe4 x4 NVMe SSD interno apenas
Micron 3400 1TB MTFDKBA1T0TFH
CDM 5/6 Read Seq Q32T1: 6573 MB/s
CDM 5/6 Write Seq Q32T1: 4884 MB/s
CDM 5/6 Read 4K Q32T1: 936.8 MB/s
CDM 5/6 Write 4K Q32T1: 742.9 MB/s
CDM 5 Read Seq: 3622 MB/s
CDM 5 Write Seq: 4863 MB/s
CDM 5/6 Read 4K: 73.95 MB/s
CDM 5/6 Write 4K: 136.1 MB/s
Drive Performance Rating - Percent
Razer Blade 14 Ryzen 9 6900HX
Samsung PM9A1 MZVL21T0HCLR
90.4 pt
SCHENKER Vision 14
Samsung SSD 980 Pro 1TB MZ-V8P1T0BW
79.5 pt
Acer Predator Triton 300 SE -11!
Micron 3400 1TB MTFDKBA1T0TFH
76 pt
Alienware x14 i7 RTX 3060
WDC PC SN810 1TB
71.2 pt
Asus ROG Zephyrus G14 GA402RJ
Micron 2450 1TB MTFDKBA1T0TFK
62.1 pt
Dell Inspiron 14 Plus 7420
SK Hynix BC711 512GB HFM512GD3GX013N
47 pt
DiskSpd
seq read
Razer Blade 14 Ryzen 9 6900HX
Samsung PM9A1 MZVL21T0HCLR
4352 (4339.56min - 4351.7max) MB/s +58%
SCHENKER Vision 14
Samsung SSD 980 Pro 1TB MZ-V8P1T0BW
4315 (4271.27min - 4314.68max) MB/s +56%
Alienware x14 i7 RTX 3060
WDC PC SN810 1TB
3922 (3902.75min - 3922.43max) MB/s +42%
Acer Predator Triton 300 SE
Micron 3400 1TB MTFDKBA1T0TFH
2762 (2451.7min - 2761.95max) MB/s
Dell Inspiron 14 Plus 7420
SK Hynix BC711 512GB HFM512GD3GX013N
2293 (2283.8min - 2292.84max) MB/s -17%
Asus ROG Zephyrus G14 GA402RJ
Micron 2450 1TB MTFDKBA1T0TFK
2083 (2073.03min - 2082.92max) MB/s -25%
seq write
SCHENKER Vision 14
Samsung SSD 980 Pro 1TB MZ-V8P1T0BW
4326 (4303.78min - 4326.21max) MB/s +32%
Razer Blade 14 Ryzen 9 6900HX
Samsung PM9A1 MZVL21T0HCLR
4240 (4228.84min - 4239.93max) MB/s +30%
Alienware x14 i7 RTX 3060
WDC PC SN810 1TB
3931 (3911.33min - 3931.01max) MB/s +20%
Acer Predator Triton 300 SE
Micron 3400 1TB MTFDKBA1T0TFH
3266 (1415.26min - 3266.31max) MB/s
Asus ROG Zephyrus G14 GA402RJ
Micron 2450 1TB MTFDKBA1T0TFK
3237 (949.8min - 3236.98max) MB/s -1%
Dell Inspiron 14 Plus 7420
SK Hynix BC711 512GB HFM512GD3GX013N
2045 (1925.53min - 2044.83max) MB/s -37%
seq q8 t1 read
Alienware x14 i7 RTX 3060
WDC PC SN810 1TB
6858 (6042.6min - 6858.23max) MB/s +6%
SCHENKER Vision 14
Samsung SSD 980 Pro 1TB MZ-V8P1T0BW
6701 (6057.41min - 6701.03max) MB/s +4%
Razer Blade 14 Ryzen 9 6900HX
Samsung PM9A1 MZVL21T0HCLR
6670 (6396.73min - 6670.28max) MB/s +3%
Acer Predator Triton 300 SE
Micron 3400 1TB MTFDKBA1T0TFH
6449 (5531.66min - 6449.16max) MB/s
Asus ROG Zephyrus G14 GA402RJ
Micron 2450 1TB MTFDKBA1T0TFK
3563 (3320.84min - 3562.65max) MB/s -45%
Dell Inspiron 14 Plus 7420
SK Hynix BC711 512GB HFM512GD3GX013N
3552 (3135.24min - 3552.16max) MB/s -45%
seq q8 t1 write
Alienware x14 i7 RTX 3060
WDC PC SN810 1TB
5168 (5037.36min - 5167.53max) MB/s +12%
Razer Blade 14 Ryzen 9 6900HX
Samsung PM9A1 MZVL21T0HCLR
4995 (4991.1min - 4995.28max) MB/s +8%
SCHENKER Vision 14
Samsung SSD 980 Pro 1TB MZ-V8P1T0BW
4955 (4937.74min - 4955.15max) MB/s +8%
Acer Predator Triton 300 SE
Micron 3400 1TB MTFDKBA1T0TFH
4606 (4445.88min - 4605.99max) MB/s
Asus ROG Zephyrus G14 GA402RJ
Micron 2450 1TB MTFDKBA1T0TFK
3287 (3261.26min - 3287.42max) MB/s -29%
Dell Inspiron 14 Plus 7420
SK Hynix BC711 512GB HFM512GD3GX013N
2450 (2198.24min - 2449.82max) MB/s -47%
4k q1 t1 read
SCHENKER Vision 14
Samsung SSD 980 Pro 1TB MZ-V8P1T0BW
94.2 (93.47min - 94.2max) MB/s +34%
Razer Blade 14 Ryzen 9 6900HX
Samsung PM9A1 MZVL21T0HCLR
79.8 (78.65min - 79.84max) MB/s +13%
Alienware x14 i7 RTX 3060
WDC PC SN810 1TB
79.3 (77.62min - 79.29max) MB/s +12%
Acer Predator Triton 300 SE
Micron 3400 1TB MTFDKBA1T0TFH
70.5 (68.62min - 70.48max) MB/s
Dell Inspiron 14 Plus 7420
SK Hynix BC711 512GB HFM512GD3GX013N
63 (62.21min - 62.95max) MB/s -11%
Asus ROG Zephyrus G14 GA402RJ
Micron 2450 1TB MTFDKBA1T0TFK
59.7 (59.49min - 59.72max) MB/s -15%
4k q1 t1 write
Acer Predator Triton 300 SE
Micron 3400 1TB MTFDKBA1T0TFH
259 (255.34min - 258.92max) MB/s
SCHENKER Vision 14
Samsung SSD 980 Pro 1TB MZ-V8P1T0BW
247 (244.59min - 247.11max) MB/s -5%
Asus ROG Zephyrus G14 GA402RJ
Micron 2450 1TB MTFDKBA1T0TFK
225 (223.07min - 224.58max) MB/s -13%
Alienware x14 i7 RTX 3060
WDC PC SN810 1TB
222 (216.3min - 221.72max) MB/s -14%
Razer Blade 14 Ryzen 9 6900HX
Samsung PM9A1 MZVL21T0HCLR
196.8 (195.15min - 196.78max) MB/s -24%
Dell Inspiron 14 Plus 7420
SK Hynix BC711 512GB HFM512GD3GX013N
157.9 (153.98min - 157.89max) MB/s -39%
4k q32 t16 read
Razer Blade 14 Ryzen 9 6900HX
Samsung PM9A1 MZVL21T0HCLR
4174 (4158.12min - 4174.4max) MB/s +48%
SCHENKER Vision 14
Samsung SSD 980 Pro 1TB MZ-V8P1T0BW
3297 (3266.49min - 3297.01max) MB/s +17%
Acer Predator Triton 300 SE
Micron 3400 1TB MTFDKBA1T0TFH
2816 (2326.5min - 2816.32max) MB/s
Asus ROG Zephyrus G14 GA402RJ
Micron 2450 1TB MTFDKBA1T0TFK
1846 (1840.32min - 1845.53max) MB/s -34%
Alienware x14 i7 RTX 3060
WDC PC SN810 1TB
839 (826.17min - 839.11max) MB/s -70%
Dell Inspiron 14 Plus 7420
SK Hynix BC711 512GB HFM512GD3GX013N
663 (638.34min - 663.33max) MB/s -76%
4k q32 t16 write
Razer Blade 14 Ryzen 9 6900HX
Samsung PM9A1 MZVL21T0HCLR
3559 (3530.12min - 3559.13max) MB/s +129%
Asus ROG Zephyrus G14 GA402RJ
Micron 2450 1TB MTFDKBA1T0TFK
2074 (162.35min - 2073.69max) MB/s +33%
Acer Predator Triton 300 SE
Micron 3400 1TB MTFDKBA1T0TFH
1556 (1408.86min - 1555.81max) MB/s
SCHENKER Vision 14
Samsung SSD 980 Pro 1TB MZ-V8P1T0BW
964 (961.85min - 964.1max) MB/s -38%
Alienware x14 i7 RTX 3060
WDC PC SN810 1TB
573 (461.98min - 572.89max) MB/s -63%
Dell Inspiron 14 Plus 7420
SK Hynix BC711 512GB HFM512GD3GX013N
435 (416.67min - 434.59max) MB/s -72%
AS SSD
Score Total
Razer Blade 14 Ryzen 9 6900HX
Samsung PM9A1 MZVL21T0HCLR
9147 Points
Asus ROG Zephyrus G14 GA402RJ
Micron 2450 1TB MTFDKBA1T0TFK
7311 Points
SCHENKER Vision 14
Samsung SSD 980 Pro 1TB MZ-V8P1T0BW
5763 Points
Alienware x14 i7 RTX 3060
WDC PC SN810 1TB
4984 Points
Dell Inspiron 14 Plus 7420
SK Hynix BC711 512GB HFM512GD3GX013N
3898 Points
Score Read
Razer Blade 14 Ryzen 9 6900HX
Samsung PM9A1 MZVL21T0HCLR
3439 Points
SCHENKER Vision 14
Samsung SSD 980 Pro 1TB MZ-V8P1T0BW
2920 Points
Asus ROG Zephyrus G14 GA402RJ
Micron 2450 1TB MTFDKBA1T0TFK
2687 Points
Alienware x14 i7 RTX 3060
WDC PC SN810 1TB
1631 Points
Dell Inspiron 14 Plus 7420
SK Hynix BC711 512GB HFM512GD3GX013N
1205 Points
Score Write
Razer Blade 14 Ryzen 9 6900HX
Samsung PM9A1 MZVL21T0HCLR
4026 Points
Asus ROG Zephyrus G14 GA402RJ
Micron 2450 1TB MTFDKBA1T0TFK
3248 Points
Alienware x14 i7 RTX 3060
WDC PC SN810 1TB
2658 Points
Dell Inspiron 14 Plus 7420
SK Hynix BC711 512GB HFM512GD3GX013N
2122 Points
SCHENKER Vision 14
Samsung SSD 980 Pro 1TB MZ-V8P1T0BW
1412 Points
Seq Read
Razer Blade 14 Ryzen 9 6900HX
Samsung PM9A1 MZVL21T0HCLR
5482.07 MB/s
Alienware x14 i7 RTX 3060
WDC PC SN810 1TB
5404 MB/s
SCHENKER Vision 14
Samsung SSD 980 Pro 1TB MZ-V8P1T0BW
5367 MB/s
Asus ROG Zephyrus G14 GA402RJ
Micron 2450 1TB MTFDKBA1T0TFK
2999.71 MB/s
Dell Inspiron 14 Plus 7420
SK Hynix BC711 512GB HFM512GD3GX013N
2892.47 MB/s
Seq Write
Razer Blade 14 Ryzen 9 6900HX
Samsung PM9A1 MZVL21T0HCLR
4007.19 MB/s
SCHENKER Vision 14
Samsung SSD 980 Pro 1TB MZ-V8P1T0BW
3955 MB/s
Asus ROG Zephyrus G14 GA402RJ
Micron 2450 1TB MTFDKBA1T0TFK
2927.58 MB/s
Alienware x14 i7 RTX 3060
WDC PC SN810 1TB
2236 MB/s
Dell Inspiron 14 Plus 7420
SK Hynix BC711 512GB HFM512GD3GX013N
1670.44 MB/s
4K Read
SCHENKER Vision 14
Samsung SSD 980 Pro 1TB MZ-V8P1T0BW
83.6 MB/s
Alienware x14 i7 RTX 3060
WDC PC SN810 1TB
76.3 MB/s
Razer Blade 14 Ryzen 9 6900HX
Samsung PM9A1 MZVL21T0HCLR
73.78 MB/s
Asus ROG Zephyrus G14 GA402RJ
Micron 2450 1TB MTFDKBA1T0TFK
73.57 MB/s
Dell Inspiron 14 Plus 7420
SK Hynix BC711 512GB HFM512GD3GX013N
60.79 MB/s
4K Write
Alienware x14 i7 RTX 3060
WDC PC SN810 1TB
272.6 MB/s
SCHENKER Vision 14
Samsung SSD 980 Pro 1TB MZ-V8P1T0BW
205.3 MB/s
Asus ROG Zephyrus G14 GA402RJ
Micron 2450 1TB MTFDKBA1T0TFK
194.83 MB/s
Dell Inspiron 14 Plus 7420
SK Hynix BC711 512GB HFM512GD3GX013N
182.28 MB/s
Razer Blade 14 Ryzen 9 6900HX
Samsung PM9A1 MZVL21T0HCLR
174.19 MB/s
4K-64 Read
Razer Blade 14 Ryzen 9 6900HX
Samsung PM9A1 MZVL21T0HCLR
2816.7 MB/s
Asus ROG Zephyrus G14 GA402RJ
Micron 2450 1TB MTFDKBA1T0TFK
2313.48 MB/s
SCHENKER Vision 14
Samsung SSD 980 Pro 1TB MZ-V8P1T0BW
2300 MB/s
Alienware x14 i7 RTX 3060
WDC PC SN810 1TB
1014 MB/s
Dell Inspiron 14 Plus 7420
SK Hynix BC711 512GB HFM512GD3GX013N
854.69 MB/s
4K-64 Write
Razer Blade 14 Ryzen 9 6900HX
Samsung PM9A1 MZVL21T0HCLR
3450.87 MB/s
Asus ROG Zephyrus G14 GA402RJ
Micron 2450 1TB MTFDKBA1T0TFK
2760.09 MB/s
Alienware x14 i7 RTX 3060
WDC PC SN810 1TB
2161 MB/s
Dell Inspiron 14 Plus 7420
SK Hynix BC711 512GB HFM512GD3GX013N
1772.46 MB/s
SCHENKER Vision 14
Samsung SSD 980 Pro 1TB MZ-V8P1T0BW
811 MB/s
Access Time Read
Asus ROG Zephyrus G14 GA402RJ
Micron 2450 1TB MTFDKBA1T0TFK
0.075 ms *
Dell Inspiron 14 Plus 7420
SK Hynix BC711 512GB HFM512GD3GX013N
0.042 ms *
Razer Blade 14 Ryzen 9 6900HX
Samsung PM9A1 MZVL21T0HCLR
0.035 ms *
Alienware x14 i7 RTX 3060
WDC PC SN810 1TB
0.029 ms *
SCHENKER Vision 14
Samsung SSD 980 Pro 1TB MZ-V8P1T0BW
0.024 ms *
Access Time Write
Asus ROG Zephyrus G14 GA402RJ
Micron 2450 1TB MTFDKBA1T0TFK
0.169 ms *
Dell Inspiron 14 Plus 7420
SK Hynix BC711 512GB HFM512GD3GX013N
0.087 ms *
Razer Blade 14 Ryzen 9 6900HX
Samsung PM9A1 MZVL21T0HCLR
0.07 ms *
SCHENKER Vision 14
Samsung SSD 980 Pro 1TB MZ-V8P1T0BW
0.02 ms *
Alienware x14 i7 RTX 3060
WDC PC SN810 1TB
0.013 ms *

* ... smaller is better

Disk Throttling: DiskSpd Read Loop, Queue Depth 8

03256509751300162519502275260029253250357539004225455048755200552558506175Tooltip
Acer Predator Triton 300 SE: Ø2189 (453.55-6466.22)

GPU Performance - TGP 95 W

O desempenho gráfico está dentro de 1 a 2% da média do laptop em nosso banco de dados equipado com o mesmo GeForce RTX 3060 GPU mesmo quando funcionando no modo Turbo. Se o modo Turbo estiver desligado, o desempenho diminuiria em cerca de 5% a 6% para ser mais lento do que a média. Assim, os usuários devem rodar o Predator Triton 300 SE em sua configuração mais alta se quiserem obter o máximo do laptop quando estiverem jogando.

O desempenho geral ainda é mais rápido do que os mais antigos RTX 2060 no 2020 Predador Tritão Tritão 300 em cerca de 25 a 30 por cento. A maioria dos jogos é estável a 1080p máximo, exceto para os títulos mais exigentes, como o Cyberpunk 2077. O desempenho começa a se dobrar com a resolução nativa de 1800p e infelizmente não há suporte G-Sync aqui para aliviar o ritmo irregular do frame pacing. Achamos que o 1800p em configurações de média a média-alta é o ponto ideal para esta máquina.

3DMark 11
3DMark 11
Cloud Gate
Cloud Gate
Time Spy (Turbo on)
Time Spy (Turbo on)
Fire Strike Ultra
Fire Strike Ultra
Fire Strike (Turbo desligado)
Fire Strike (Turbo on)
3DMark
1920x1080 Fire Strike Graphics
Razer Blade 14 Ryzen 9 6900HX
NVIDIA GeForce RTX 3070 Ti Laptop GPU, AMD Ryzen 9 6900HX
26398 Points +29%
Asus ROG Zephyrus G14 GA402RJ
AMD Radeon RX 6700S, AMD Ryzen 7 6800HS
24135 Points +18%
Lenovo Legion 7 15IMH05-81YT001VGE
NVIDIA GeForce RTX 2080 Super Max-Q, Intel Core i9-10980HK
22630 Points +11%
Average NVIDIA GeForce RTX 3060 Laptop GPU
  (16354 - 23109, n=49)
20436 Points 0%
Acer Predator Triton 300 SE
NVIDIA GeForce RTX 3060 Laptop GPU, Intel Core i9-12900H
20405 Points
Asus ROG Zephyrus M15 GU502LU-BI7N4
NVIDIA GeForce GTX 1660 Ti Mobile, Intel Core i7-10750H
16488 Points -19%
Acer Predator Triton 300 PT315-52-79LP
NVIDIA GeForce RTX 2060 Mobile, Intel Core i7-10750H
16355 Points -20%
Dell Inspiron 14 Plus 7420
NVIDIA GeForce RTX 3050 4GB Laptop GPU, Intel Core i7-12700H
12125 Points -41%
SCHENKER Vision 14
NVIDIA GeForce RTX 3050 Ti Laptop GPU, Intel Core i7-11370H
11055 Points -46%
2560x1440 Time Spy Graphics
Razer Blade 14 Ryzen 9 6900HX
NVIDIA GeForce RTX 3070 Ti Laptop GPU, AMD Ryzen 9 6900HX
9753 Points +26%
Lenovo Legion 7 15IMH05-81YT001VGE
NVIDIA GeForce RTX 2080 Super Max-Q, Intel Core i9-10980HK
8526 Points +10%
Asus ROG Zephyrus G14 GA402RJ
AMD Radeon RX 6700S, AMD Ryzen 7 6800HS
8316 Points +7%
Average NVIDIA GeForce RTX 3060 Laptop GPU
  (6285 - 9235, n=49)
8057 Points +4%
Acer Predator Triton 300 SE
NVIDIA GeForce RTX 3060 Laptop GPU, Intel Core i9-12900H
7763 Points
Asus ROG Zephyrus M15 GU502LU-BI7N4
NVIDIA GeForce GTX 1660 Ti Mobile, Intel Core i7-10750H
6123 Points -21%
Acer Predator Triton 300 PT315-52-79LP
NVIDIA GeForce RTX 2060 Mobile, Intel Core i7-10750H
6012 Points -23%
SCHENKER Vision 14
NVIDIA GeForce RTX 3050 Ti Laptop GPU, Intel Core i7-11370H
4721 Points -39%
Dell Inspiron 14 Plus 7420
NVIDIA GeForce RTX 3050 4GB Laptop GPU, Intel Core i7-12700H
4503 Points -42%
2560x1440 Time Spy Score
Razer Blade 14 Ryzen 9 6900HX
NVIDIA GeForce RTX 3070 Ti Laptop GPU, AMD Ryzen 9 6900HX
9638 Points +16%
Lenovo Legion 7 15IMH05-81YT001VGE
NVIDIA GeForce RTX 2080 Super Max-Q, Intel Core i9-10980HK
8621 Points +4%
Asus ROG Zephyrus G14 GA402RJ
AMD Radeon RX 6700S, AMD Ryzen 7 6800HS
8547 Points +3%
Acer Predator Triton 300 SE
NVIDIA GeForce RTX 3060 Laptop GPU, Intel Core i9-12900H
8281 Points
Average NVIDIA GeForce RTX 3060 Laptop GPU
  (6473 - 9677, n=50)
8214 Points -1%
Asus ROG Zephyrus M15 GU502LU-BI7N4
NVIDIA GeForce GTX 1660 Ti Mobile, Intel Core i7-10750H
6261 Points -24%
Acer Predator Triton 300 PT315-52-79LP
NVIDIA GeForce RTX 2060 Mobile, Intel Core i7-10750H
6124 Points -26%
Dell Inspiron 14 Plus 7420
NVIDIA GeForce RTX 3050 4GB Laptop GPU, Intel Core i7-12700H
4964 Points -40%
SCHENKER Vision 14
NVIDIA GeForce RTX 3050 Ti Laptop GPU, Intel Core i7-11370H
4842 Points -42%
3DMark 11 - 1280x720 Performance GPU
Razer Blade 14 Ryzen 9 6900HX
NVIDIA GeForce RTX 3070 Ti Laptop GPU, AMD Ryzen 9 6900HX
34206 Points +28%
Asus ROG Zephyrus G14 GA402RJ
AMD Radeon RX 6700S, AMD Ryzen 7 6800HS
32662 Points +22%
Lenovo Legion 7 15IMH05-81YT001VGE
NVIDIA GeForce RTX 2080 Super Max-Q, Intel Core i9-10980HK
31156 Points +17%
Average NVIDIA GeForce RTX 3060 Laptop GPU
  (13799 - 30772, n=43)
26816 Points 0%
Acer Predator Triton 300 SE
NVIDIA GeForce RTX 3060 Laptop GPU, Intel Core i9-12900H
26724 Points
Asus ROG Zephyrus M15 GU502LU-BI7N4
NVIDIA GeForce GTX 1660 Ti Mobile, Intel Core i7-10750H
22670 Points -15%
Acer Predator Triton 300 PT315-52-79LP
NVIDIA GeForce RTX 2060 Mobile, Intel Core i7-10750H
21338 Points -20%
SCHENKER Vision 14
NVIDIA GeForce RTX 3050 Ti Laptop GPU, Intel Core i7-11370H
16128 Points -40%
Dell Inspiron 14 Plus 7420
NVIDIA GeForce RTX 3050 4GB Laptop GPU, Intel Core i7-12700H
15994 Points -40%
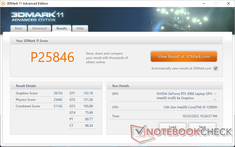
3DMark 11 Performance
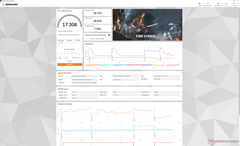
25846 pontos
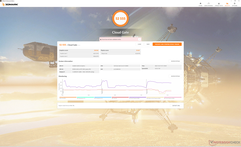
3DMark Cloud Gate Standard Score
52555 pontos
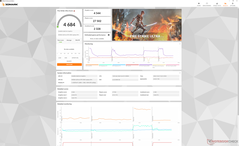
3DMark Fire Strike Score
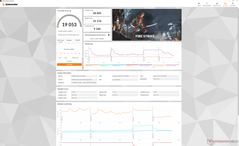
19053 pontos
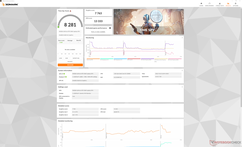
3DMark Time Spy Score
8281 pontos
Ajuda
Blender
v3.3 Classroom OPTIX/RTX
Dell Inspiron 14 Plus 7420
NVIDIA GeForce RTX 3050 4GB Laptop GPU, Intel Core i7-12700H
58 Seconds * -66%
Acer Predator Triton 300 SE
NVIDIA GeForce RTX 3060 Laptop GPU, Intel Core i9-12900H
35 Seconds *
Average NVIDIA GeForce RTX 3060 Laptop GPU
  (30 - 56, n=15)
34.2 Seconds * +2%
v3.3 Classroom CUDA
Dell Inspiron 14 Plus 7420
NVIDIA GeForce RTX 3050 4GB Laptop GPU, Intel Core i7-12700H
107 Seconds * -75%
Acer Predator Triton 300 SE
NVIDIA GeForce RTX 3060 Laptop GPU, Intel Core i9-12900H
61 Seconds *
Average NVIDIA GeForce RTX 3060 Laptop GPU
  (51 - 89, n=15)
57.6 Seconds * +6%
v3.3 Classroom CPU
Dell Inspiron 14 Plus 7420
NVIDIA GeForce RTX 3050 4GB Laptop GPU, Intel Core i7-12700H
456 Seconds * -31%
Average NVIDIA GeForce RTX 3060 Laptop GPU
  (291 - 508, n=15)
375 Seconds * -8%
Acer Predator Triton 300 SE
NVIDIA GeForce RTX 3060 Laptop GPU, Intel Core i9-12900H
348 Seconds *

* ... smaller is better

Final Fantasy XV Benchmark
1280x720 Lite Quality
Razer Blade 14 Ryzen 9 6900HX
AMD Ryzen 9 6900HX, NVIDIA GeForce RTX 3070 Ti Laptop GPU
177.1 fps 0%
Acer Predator Triton 300 SE
Intel Core i9-12900H, NVIDIA GeForce RTX 3060 Laptop GPU
176.4 fps
Average NVIDIA GeForce RTX 3060 Laptop GPU
  (122.5 - 214, n=33)
157 fps -11%
Asus ROG Zephyrus M15 GU502LU-BI7N4
Intel Core i7-10750H, NVIDIA GeForce GTX 1660 Ti Mobile
137 fps -22%
Dell Inspiron 14 Plus 7420
Intel Core i7-12700H, NVIDIA GeForce RTX 3050 4GB Laptop GPU
113.5 fps -36%
SCHENKER Vision 14
Intel Core i7-11370H, NVIDIA GeForce RTX 3050 Ti Laptop GPU
110 fps -38%
1920x1080 Standard Quality
Razer Blade 14 Ryzen 9 6900HX
AMD Ryzen 9 6900HX, NVIDIA GeForce RTX 3070 Ti Laptop GPU
128.9 fps +23%
Asus ROG Zephyrus G14 GA402RJ
AMD Ryzen 7 6800HS, AMD Radeon RX 6700S
106.7 fps +2%
Average NVIDIA GeForce RTX 3060 Laptop GPU
  (70.4 - 133.5, n=37)
105.6 fps 0%
Acer Predator Triton 300 SE
Intel Core i9-12900H, NVIDIA GeForce RTX 3060 Laptop GPU
105.1 fps
Asus ROG Zephyrus M15 GU502LU-BI7N4
Intel Core i7-10750H, NVIDIA GeForce GTX 1660 Ti Mobile
87.6 fps -17%
Dell Inspiron 14 Plus 7420
Intel Core i7-12700H, NVIDIA GeForce RTX 3050 4GB Laptop GPU
66.1 fps -37%
SCHENKER Vision 14
Intel Core i7-11370H, NVIDIA GeForce RTX 3050 Ti Laptop GPU
58.3 fps -45%
1920x1080 High Quality
Razer Blade 14 Ryzen 9 6900HX
AMD Ryzen 9 6900HX, NVIDIA GeForce RTX 3070 Ti Laptop GPU
98.1 fps +24%
Average NVIDIA GeForce RTX 3060 Laptop GPU
  (55 - 100.9, n=42)
79.4 fps 0%
Acer Predator Triton 300 SE
Intel Core i9-12900H, NVIDIA GeForce RTX 3060 Laptop GPU
79.1 fps
Asus ROG Zephyrus G14 GA402RJ
AMD Ryzen 7 6800HS, AMD Radeon RX 6700S
78.6 fps -1%
Asus ROG Zephyrus M15 GU502LU-BI7N4
Intel Core i7-10750H, NVIDIA GeForce GTX 1660 Ti Mobile
63.9 fps -19%
Dell Inspiron 14 Plus 7420
Intel Core i7-12700H, NVIDIA GeForce RTX 3050 4GB Laptop GPU
47.4 fps -40%
SCHENKER Vision 14
Intel Core i7-11370H, NVIDIA GeForce RTX 3050 Ti Laptop GPU
40.8 fps -48%
2560x1440 High Quality
Razer Blade 14 Ryzen 9 6900HX
AMD Ryzen 9 6900HX, NVIDIA GeForce RTX 3070 Ti Laptop GPU
74.1 fps +22%
Acer Predator Triton 300 SE
Intel Core i9-12900H, NVIDIA GeForce RTX 3060 Laptop GPU
60.5 fps
Average NVIDIA GeForce RTX 3060 Laptop GPU
  (41.1 - 73.7, n=25)
59.5 fps -2%
SCHENKER Vision 14
Intel Core i7-11370H, NVIDIA GeForce RTX 3050 Ti Laptop GPU
29 fps -52%
The Witcher 3
1024x768 Low Graphics & Postprocessing
Razer Blade 14 Ryzen 9 6900HX
AMD Ryzen 9 6900HX, NVIDIA GeForce RTX 3070 Ti Laptop GPU
386.2 (364min) fps +13%
Lenovo Legion 7 15IMH05-81YT001VGE
Intel Core i9-10980HK, NVIDIA GeForce RTX 2080 Super Max-Q
345 (268min) fps +1%
Acer Predator Triton 300 SE
Intel Core i9-12900H, NVIDIA GeForce RTX 3060 Laptop GPU
341.1 (325min) fps
Average NVIDIA GeForce RTX 3060 Laptop GPU
  (221 - 449, n=35)
324 fps -5%
Asus ROG Zephyrus M15 GU502LU-BI7N4
Intel Core i7-10750H, NVIDIA GeForce GTX 1660 Ti Mobile
288.3 (254min) fps -15%
Dell Inspiron 14 Plus 7420
Intel Core i7-12700H, NVIDIA GeForce RTX 3050 4GB Laptop GPU
222.2 (198min) fps -35%
SCHENKER Vision 14
Intel Core i7-11370H, NVIDIA GeForce RTX 3050 Ti Laptop GPU
205 fps -40%
1366x768 Medium Graphics & Postprocessing
Razer Blade 14 Ryzen 9 6900HX
AMD Ryzen 9 6900HX, NVIDIA GeForce RTX 3070 Ti Laptop GPU
300.4 (282min) fps +31%
Asus ROG Zephyrus G14 GA402RJ
AMD Ryzen 7 6800HS, AMD Radeon RX 6700S
246 (195min) fps +7%
Lenovo Legion 7 15IMH05-81YT001VGE
Intel Core i9-10980HK, NVIDIA GeForce RTX 2080 Super Max-Q
245 (191min) fps +7%
Average NVIDIA GeForce RTX 3060 Laptop GPU
  (204 - 296, n=33)
237 fps +3%
Acer Predator Triton 300 SE
Intel Core i9-12900H, NVIDIA GeForce RTX 3060 Laptop GPU
230 (205min) fps
Asus ROG Zephyrus M15 GU502LU-BI7N4
Intel Core i7-10750H, NVIDIA GeForce GTX 1660 Ti Mobile
193.2 (176min) fps -16%
Dell Inspiron 14 Plus 7420
Intel Core i7-12700H, NVIDIA GeForce RTX 3050 4GB Laptop GPU
150.4 (141min) fps -35%
SCHENKER Vision 14
Intel Core i7-11370H, NVIDIA GeForce RTX 3050 Ti Laptop GPU
112 fps -51%
1920x1080 High Graphics & Postprocessing (Nvidia HairWorks Off)
Razer Blade 14 Ryzen 9 6900HX
AMD Ryzen 9 6900HX, NVIDIA GeForce RTX 3070 Ti Laptop GPU
187.5 (175min) fps +29%
Lenovo Legion 7 15IMH05-81YT001VGE
Intel Core i9-10980HK, NVIDIA GeForce RTX 2080 Super Max-Q
160 (127min) fps +10%
Acer Predator Triton 300 SE
Intel Core i9-12900H, NVIDIA GeForce RTX 3060 Laptop GPU
145.6 (133min) fps
Average NVIDIA GeForce RTX 3060 Laptop GPU
  (81 - 186.8, n=41)
144.8 fps -1%
Asus ROG Zephyrus G14 GA402RJ
AMD Ryzen 7 6800HS, AMD Radeon RX 6700S
144 (124min) fps -1%
Asus ROG Zephyrus M15 GU502LU-BI7N4
Intel Core i7-10750H, NVIDIA GeForce GTX 1660 Ti Mobile
117.6 (107min) fps -19%
Dell Inspiron 14 Plus 7420
Intel Core i7-12700H, NVIDIA GeForce RTX 3050 4GB Laptop GPU
83.5 (77min) fps -43%
SCHENKER Vision 14
Intel Core i7-11370H, NVIDIA GeForce RTX 3050 Ti Laptop GPU
73 fps -50%
1920x1080 Ultra Graphics & Postprocessing (HBAO+)
Razer Blade 14 Ryzen 9 6900HX
AMD Ryzen 9 6900HX, NVIDIA GeForce RTX 3070 Ti Laptop GPU
95.2 (90min) fps +27%
Lenovo Legion 7 15IMH05-81YT001VGE
Intel Core i9-10980HK, NVIDIA GeForce RTX 2080 Super Max-Q
88.8 (73min, 83P1) fps +18%
Asus ROG Zephyrus G14 GA402RJ
AMD Ryzen 7 6800HS, AMD Radeon RX 6700S
84.3 (69min) fps +12%
Average NVIDIA GeForce RTX 3060 Laptop GPU
  (58.2 - 91.5, n=48)
76.9 fps +3%
Acer Predator Triton 300 SE
Intel Core i9-12900H, NVIDIA GeForce RTX 3060 Laptop GPU
75 (69min) fps
Asus ROG Zephyrus M15 GU502LU-BI7N4
Intel Core i7-10750H, NVIDIA GeForce GTX 1660 Ti Mobile
65.1 (62min) fps -13%
Dell Inspiron 14 Plus 7420
Intel Core i7-12700H, NVIDIA GeForce RTX 3050 4GB Laptop GPU
46 (43min) fps -39%
SCHENKER Vision 14
Intel Core i7-11370H, NVIDIA GeForce RTX 3050 Ti Laptop GPU
41.4 (39min, 40P1) fps -45%
X-Plane 11.11
1280x720 low (fps_test=1)
Acer Predator Triton 300 SE
Intel Core i9-12900H, NVIDIA GeForce RTX 3060 Laptop GPU
141.8 fps
Dell Inspiron 14 Plus 7420
Intel Core i7-12700H, NVIDIA GeForce RTX 3050 4GB Laptop GPU
137.8 fps -3%
Average NVIDIA GeForce RTX 3060 Laptop GPU
  (83.6 - 157.1, n=48)
115.1 fps -19%
Razer Blade 14 Ryzen 9 6900HX
AMD Ryzen 9 6900HX, NVIDIA GeForce RTX 3070 Ti Laptop GPU
114.9 fps -19%
Lenovo Legion 7 15IMH05-81YT001VGE
Intel Core i9-10980HK, NVIDIA GeForce RTX 2080 Super Max-Q
114 fps -20%
Asus ROG Zephyrus M15 GU502LU-BI7N4
Intel Core i7-10750H, NVIDIA GeForce GTX 1660 Ti Mobile
101 fps -29%
SCHENKER Vision 14
Intel Core i7-11370H, NVIDIA GeForce RTX 3050 Ti Laptop GPU
98.3 fps -31%
Asus ROG Zephyrus G14 GA402RJ
AMD Ryzen 7 6800HS, AMD Radeon RX 6700S
65.4 fps -54%
1920x1080 med (fps_test=2)
Acer Predator Triton 300 SE
Intel Core i9-12900H, NVIDIA GeForce RTX 3060 Laptop GPU
126.1 fps
Dell Inspiron 14 Plus 7420
Intel Core i7-12700H, NVIDIA GeForce RTX 3050 4GB Laptop GPU
117.2 fps -7%
Lenovo Legion 7 15IMH05-81YT001VGE
Intel Core i9-10980HK, NVIDIA GeForce RTX 2080 Super Max-Q
104 fps -18%
Average NVIDIA GeForce RTX 3060 Laptop GPU
  (73 - 138.3, n=48)
100.9 fps -20%
Razer Blade 14 Ryzen 9 6900HX
AMD Ryzen 9 6900HX, NVIDIA GeForce RTX 3070 Ti Laptop GPU
100.8 fps -20%
Asus ROG Zephyrus M15 GU502LU-BI7N4
Intel Core i7-10750H, NVIDIA GeForce GTX 1660 Ti Mobile
89 fps -29%
SCHENKER Vision 14
Intel Core i7-11370H, NVIDIA GeForce RTX 3050 Ti Laptop GPU
88.3 fps -30%
Asus ROG Zephyrus G14 GA402RJ
AMD Ryzen 7 6800HS, AMD Radeon RX 6700S
51.7 fps -59%
1920x1080 high (fps_test=3)
Acer Predator Triton 300 SE
Intel Core i9-12900H, NVIDIA GeForce RTX 3060 Laptop GPU
101 fps
Dell Inspiron 14 Plus 7420
Intel Core i7-12700H, NVIDIA GeForce RTX 3050 4GB Laptop GPU
94.4 fps -7%
Lenovo Legion 7 15IMH05-81YT001VGE
Intel Core i9-10980HK, NVIDIA GeForce RTX 2080 Super Max-Q
87.6 fps -13%
Average NVIDIA GeForce RTX 3060 Laptop GPU
  (61.9 - 109.3, n=48)
82 fps -19%
Razer Blade 14 Ryzen 9 6900HX
AMD Ryzen 9 6900HX, NVIDIA GeForce RTX 3070 Ti Laptop GPU
81.7 fps -19%
SCHENKER Vision 14
Intel Core i7-11370H, NVIDIA GeForce RTX 3050 Ti Laptop GPU
75.7 fps -25%
Asus ROG Zephyrus M15 GU502LU-BI7N4
Intel Core i7-10750H, NVIDIA GeForce GTX 1660 Ti Mobile
75.2 fps -26%
Asus ROG Zephyrus G14 GA402RJ
AMD Ryzen 7 6800HS, AMD Radeon RX 6700S
45.2 fps -55%
Dota 2 Reborn
1280x720 min (0/3) fastest
Acer Predator Triton 300 SE
Intel Core i9-12900H, NVIDIA GeForce RTX 3060 Laptop GPU
185 (165min) fps
Dell Inspiron 14 Plus 7420
Intel Core i7-12700H, NVIDIA GeForce RTX 3050 4GB Laptop GPU
174.4 (154.2min) fps -6%
Lenovo Legion 7 15IMH05-81YT001VGE
Intel Core i9-10980HK, NVIDIA GeForce RTX 2080 Super Max-Q
156 (136min) fps -16%
Average NVIDIA GeForce RTX 3060 Laptop GPU
  (112.5 - 204, n=49)
155.6 fps -16%
Asus ROG Zephyrus M15 GU502LU-BI7N4
Intel Core i7-10750H, NVIDIA GeForce GTX 1660 Ti Mobile
150 (131.2min) fps -19%
SCHENKER Vision 14
Intel Core i7-11370H, NVIDIA GeForce RTX 3050 Ti Laptop GPU
148 (130.9min) fps -20%
Razer Blade 14 Ryzen 9 6900HX
AMD Ryzen 9 6900HX, NVIDIA GeForce RTX 3070 Ti Laptop GPU
145.6 (128.3min) fps -21%
Asus ROG Zephyrus G14 GA402RJ
AMD Ryzen 7 6800HS, AMD Radeon RX 6700S
145.1 (116.2min) fps -22%
1366x768 med (1/3)
Acer Predator Triton 300 SE
Intel Core i9-12900H, NVIDIA GeForce RTX 3060 Laptop GPU
169.2 (149.1min) fps
Dell Inspiron 14 Plus 7420
Intel Core i7-12700H, NVIDIA GeForce RTX 3050 4GB Laptop GPU
158.7 (141min) fps -6%
Average NVIDIA GeForce RTX 3060 Laptop GPU
  (106 - 177.4, n=49)
142.6 fps -16%
Lenovo Legion 7 15IMH05-81YT001VGE
Intel Core i9-10980HK, NVIDIA GeForce RTX 2080 Super Max-Q
141 (124min) fps -17%
Asus ROG Zephyrus M15 GU502LU-BI7N4
Intel Core i7-10750H, NVIDIA GeForce GTX 1660 Ti Mobile
135 (117.8min) fps -20%
SCHENKER Vision 14
Intel Core i7-11370H, NVIDIA GeForce RTX 3050 Ti Laptop GPU
132 (105.8min) fps -22%
Razer Blade 14 Ryzen 9 6900HX
AMD Ryzen 9 6900HX, NVIDIA GeForce RTX 3070 Ti Laptop GPU
131.1 (116.7min) fps -23%
1920x1080 high (2/3)
Acer Predator Triton 300 SE
Intel Core i9-12900H, NVIDIA GeForce RTX 3060 Laptop GPU
162.1 (142.2min) fps
Dell Inspiron 14 Plus 7420
Intel Core i7-12700H, NVIDIA GeForce RTX 3050 4GB Laptop GPU
145 (127.5min) fps -11%
Lenovo Legion 7 15IMH05-81YT001VGE
Intel Core i9-10980HK, NVIDIA GeForce RTX 2080 Super Max-Q
134 (116.8min) fps -17%
Average NVIDIA GeForce RTX 3060 Laptop GPU
  (98.9 - 169.2, n=49)
133.6 fps -18%
Razer Blade 14 Ryzen 9 6900HX
AMD Ryzen 9 6900HX, NVIDIA GeForce RTX 3070 Ti Laptop GPU
126 (112min) fps -22%
Asus ROG Zephyrus M15 GU502LU-BI7N4
Intel Core i7-10750H, NVIDIA GeForce GTX 1660 Ti Mobile
124 (107.1min) fps -24%
SCHENKER Vision 14
Intel Core i7-11370H, NVIDIA GeForce RTX 3050 Ti Laptop GPU
117 (101.4min) fps -28%
Asus ROG Zephyrus G14 GA402RJ
AMD Ryzen 7 6800HS, AMD Radeon RX 6700S
114.7 (96.5min) fps -29%
1920x1080 ultra (3/3) best looking
Acer Predator Triton 300 SE
Intel Core i9-12900H, NVIDIA GeForce RTX 3060 Laptop GPU
153.6 (134.8min) fps
Dell Inspiron 14 Plus 7420
Intel Core i7-12700H, NVIDIA GeForce RTX 3050 4GB Laptop GPU
134.4 (116.2min) fps -12%
Lenovo Legion 7 15IMH05-81YT001VGE
Intel Core i9-10980HK, NVIDIA GeForce RTX 2080 Super Max-Q
128 (111.6min) fps -17%
Average NVIDIA GeForce RTX 3060 Laptop GPU
  (90.7 - 154.8, n=49)
125.9 fps -18%
Razer Blade 14 Ryzen 9 6900HX
AMD Ryzen 9 6900HX, NVIDIA GeForce RTX 3070 Ti Laptop GPU
120.5 (107.7min) fps -22%
Asus ROG Zephyrus M15 GU502LU-BI7N4
Intel Core i7-10750H, NVIDIA GeForce GTX 1660 Ti Mobile
118 (100.3min) fps -23%
SCHENKER Vision 14
Intel Core i7-11370H, NVIDIA GeForce RTX 3050 Ti Laptop GPU
113 (95.5min) fps -26%
Asus ROG Zephyrus G14 GA402RJ
AMD Ryzen 7 6800HS, AMD Radeon RX 6700S
103 (86.9min) fps -33%
Cyberpunk 2077 1.6
1920x1080 Low Preset
Razer Blade 14 Ryzen 9 6900HX
AMD Ryzen 9 6900HX, NVIDIA GeForce RTX 3070 Ti Laptop GPU
129.3 (51.2min) fps +18%
Acer Predator Triton 300 SE
Intel Core i9-12900H, NVIDIA GeForce RTX 3060 Laptop GPU
109.8 (15min) fps
Average NVIDIA GeForce RTX 3060 Laptop GPU
  (80 - 135.7, n=14)
105.4 fps -4%
Dell Inspiron 14 Plus 7420
Intel Core i7-12700H, NVIDIA GeForce RTX 3050 4GB Laptop GPU
68.6 (26.2min) fps -38%
1920x1080 Medium Preset
Razer Blade 14 Ryzen 9 6900HX
AMD Ryzen 9 6900HX, NVIDIA GeForce RTX 3070 Ti Laptop GPU
108.6 (53.3min) fps +51%
Asus ROG Zephyrus G14 GA402RJ
AMD Ryzen 7 6800HS, AMD Radeon RX 6700S
99.1 (58min) fps +38%
Average NVIDIA GeForce RTX 3060 Laptop GPU
  (68 - 118, n=14)
89.3 fps +24%
Acer Predator Triton 300 SE
Intel Core i9-12900H, NVIDIA GeForce RTX 3060 Laptop GPU
71.9 (21min) fps
Dell Inspiron 14 Plus 7420
Intel Core i7-12700H, NVIDIA GeForce RTX 3050 4GB Laptop GPU
55 (19min) fps -24%
1920x1080 High Preset
Razer Blade 14 Ryzen 9 6900HX
AMD Ryzen 9 6900HX, NVIDIA GeForce RTX 3070 Ti Laptop GPU
86 (57.8min) fps +22%
Asus ROG Zephyrus G14 GA402RJ
AMD Ryzen 7 6800HS, AMD Radeon RX 6700S
74 (46min) fps +5%
Acer Predator Triton 300 SE
Intel Core i9-12900H, NVIDIA GeForce RTX 3060 Laptop GPU
70.4 (26min) fps
Average NVIDIA GeForce RTX 3060 Laptop GPU
  (42.2 - 87.7, n=14)
68 fps -3%
Dell Inspiron 14 Plus 7420
Intel Core i7-12700H, NVIDIA GeForce RTX 3050 4GB Laptop GPU
41 (11.4min) fps -42%
1920x1080 Ultra Preset
Razer Blade 14 Ryzen 9 6900HX
AMD Ryzen 9 6900HX, NVIDIA GeForce RTX 3070 Ti Laptop GPU
86 (32.5min) fps +49%
Average NVIDIA GeForce RTX 3060 Laptop GPU
  (40 - 78.8, n=16)
61.1 fps +6%
Asus ROG Zephyrus G14 GA402RJ
AMD Ryzen 7 6800HS, AMD Radeon RX 6700S
59.7 (40min) fps +3%
Acer Predator Triton 300 SE
Intel Core i9-12900H, NVIDIA GeForce RTX 3060 Laptop GPU
57.7 (29min) fps
Dell Inspiron 14 Plus 7420
Intel Core i7-12700H, NVIDIA GeForce RTX 3050 4GB Laptop GPU
33.8 (12min) fps -41%
2560x1440 Ultra Preset
Razer Blade 14 Ryzen 9 6900HX
AMD Ryzen 9 6900HX, NVIDIA GeForce RTX 3070 Ti Laptop GPU
45.2 (30.3min) fps +26%
Average NVIDIA GeForce RTX 3060 Laptop GPU
  (23 - 45.8, n=9)
36.5 fps +1%
Acer Predator Triton 300 SE
Intel Core i9-12900H, NVIDIA GeForce RTX 3060 Laptop GPU
36 (24min) fps
Asus ROG Zephyrus G14 GA402RJ
AMD Ryzen 7 6800HS, AMD Radeon RX 6700S
31.2 (21min) fps -13%
GTA V
1024x768 Lowest Settings possible
Acer Predator Triton 300 SE
Intel Core i9-12900H, NVIDIA GeForce RTX 3060 Laptop GPU
185.9 (2.23min, 142.9P1) fps
Dell Inspiron 14 Plus 7420
Intel Core i7-12700H, NVIDIA GeForce RTX 3050 4GB Laptop GPU
181.8 (2.74min, 125P1) fps -2%
Average NVIDIA GeForce RTX 3060 Laptop GPU
  (164 - 186.8, n=38)
179.5 fps -3%
Razer Blade 14 Ryzen 9 6900HX
AMD Ryzen 9 6900HX, NVIDIA GeForce RTX 3070 Ti Laptop GPU
178.4 (3.25min, 125P1) fps -4%
Asus ROG Zephyrus M15 GU502LU-BI7N4
Intel Core i7-10750H, NVIDIA GeForce GTX 1660 Ti Mobile
178 (3.93min, 111P1) fps -4%
SCHENKER Vision 14
Intel Core i7-11370H, NVIDIA GeForce RTX 3050 Ti Laptop GPU
163 (5.05min, 90.9P1) fps -12%
1920x1080 Lowest Settings possible
Acer Predator Triton 300 SE
Intel Core i9-12900H, NVIDIA GeForce RTX 3060 Laptop GPU
183.8 (2.32min, 125P1) fps
Razer Blade 14 Ryzen 9 6900HX
AMD Ryzen 9 6900HX, NVIDIA GeForce RTX 3070 Ti Laptop GPU
178.9 (3.48min, 125P1) fps -3%
Average NVIDIA GeForce RTX 3060 Laptop GPU
  (156 - 186.6, n=32)
175.6 fps -4%
Asus ROG Zephyrus M15 GU502LU-BI7N4
Intel Core i7-10750H, NVIDIA GeForce GTX 1660 Ti Mobile
175 (3.43min, 125P1) fps -5%
Dell Inspiron 14 Plus 7420
Intel Core i7-12700H, NVIDIA GeForce RTX 3050 4GB Laptop GPU
171.3 (3.89min, 100P1) fps -7%
1366x768 Normal/Off AF:4x
Acer Predator Triton 300 SE
Intel Core i9-12900H, NVIDIA GeForce RTX 3060 Laptop GPU
181.8 (3.11min, 142.9P1) fps
Average NVIDIA GeForce RTX 3060 Laptop GPU
  (152 - 183.4, n=36)
174.1 fps -4%
Razer Blade 14 Ryzen 9 6900HX
AMD Ryzen 9 6900HX, NVIDIA GeForce RTX 3070 Ti Laptop GPU
173.1 (3.24min, 125P1) fps -5%
Asus ROG Zephyrus M15 GU502LU-BI7N4
Intel Core i7-10750H, NVIDIA GeForce GTX 1660 Ti Mobile
171 (5.11min, 125P1) fps -6%
Asus ROG Zephyrus G14 GA402RJ
AMD Ryzen 7 6800HS, AMD Radeon RX 6700S
170.9 (3.38min, 111.1P1) fps -6%
Dell Inspiron 14 Plus 7420
Intel Core i7-12700H, NVIDIA GeForce RTX 3050 4GB Laptop GPU
161.4 (4.39min, 66.7P1) fps -11%
SCHENKER Vision 14
Intel Core i7-11370H, NVIDIA GeForce RTX 3050 Ti Laptop GPU
154 (4.56min, 83.3P1) fps -15%
1920x1080 Normal/Off AF:4x
Acer Predator Triton 300 SE
Intel Core i9-12900H, NVIDIA GeForce RTX 3060 Laptop GPU
179.9 (4.09min, 142.9P1) fps
Razer Blade 14 Ryzen 9 6900HX
AMD Ryzen 9 6900HX, NVIDIA GeForce RTX 3070 Ti Laptop GPU
172.6 (3.75min, 125P1) fps -4%
Asus ROG Zephyrus G14 GA402RJ
AMD Ryzen 7 6800HS, AMD Radeon RX 6700S
170.6 (2.92min, 125P1) fps -5%
Average NVIDIA GeForce RTX 3060 Laptop GPU
  (146 - 183.7, n=33)
170.2 fps -5%
Asus ROG Zephyrus M15 GU502LU-BI7N4
Intel Core i7-10750H, NVIDIA GeForce GTX 1660 Ti Mobile
169 (4.81min, 111P1) fps -6%
Dell Inspiron 14 Plus 7420
Intel Core i7-12700H, NVIDIA GeForce RTX 3050 4GB Laptop GPU
166.2 (4.67min, 83.3P1) fps -8%
1920x1080 High/On (Advanced Graphics Off) AA:2xMSAA + FX AF:8x
Acer Predator Triton 300 SE
Intel Core i9-12900H, NVIDIA GeForce RTX 3060 Laptop GPU
172.3 (2.91min, 125P1) fps
Razer Blade 14 Ryzen 9 6900HX
AMD Ryzen 9 6900HX, NVIDIA GeForce RTX 3070 Ti Laptop GPU
158.4 (3.72min, 90.9P1) fps -8%
Asus ROG Zephyrus G14 GA402RJ
AMD Ryzen 7 6800HS, AMD Radeon RX 6700S
154.7 (4.36min, 90.9P1) fps -10%
Average NVIDIA GeForce RTX 3060 Laptop GPU
  (120 - 179.4, n=42)
154 fps -11%
Asus ROG Zephyrus M15 GU502LU-BI7N4
Intel Core i7-10750H, NVIDIA GeForce GTX 1660 Ti Mobile
140 (3.44min, 90.9P1) fps -19%
Dell Inspiron 14 Plus 7420
Intel Core i7-12700H, NVIDIA GeForce RTX 3050 4GB Laptop GPU
111.5 (15min, 58.8P1) fps -35%
SCHENKER Vision 14
Intel Core i7-11370H, NVIDIA GeForce RTX 3050 Ti Laptop GPU
104 (8.49min, 71.4P1) fps -40%
1920x1080 Highest Settings possible AA:4xMSAA + FX AF:16x
Acer Predator Triton 300 SE
Intel Core i9-12900H, NVIDIA GeForce RTX 3060 Laptop GPU
99.6 (5.85min, 66.7P1) fps
Razer Blade 14 Ryzen 9 6900HX
AMD Ryzen 9 6900HX, NVIDIA GeForce RTX 3070 Ti Laptop GPU
93 (10.3min, 62.5P1) fps -7%
Average NVIDIA GeForce RTX 3060 Laptop GPU
  (69.2 - 109.8, n=46)
89.7 fps -10%
Asus ROG Zephyrus G14 GA402RJ
AMD Ryzen 7 6800HS, AMD Radeon RX 6700S
81.3 (9.16min, 55.6P1) fps -18%
Asus ROG Zephyrus M15 GU502LU-BI7N4
Intel Core i7-10750H, NVIDIA GeForce GTX 1660 Ti Mobile
76 (7.66min, 45.5P1) fps -24%
Dell Inspiron 14 Plus 7420
Intel Core i7-12700H, NVIDIA GeForce RTX 3050 4GB Laptop GPU
61.8 (7.41min, 37P1) fps -38%
SCHENKER Vision 14
Intel Core i7-11370H, NVIDIA GeForce RTX 3050 Ti Laptop GPU
52.2 (9.58min, 29.4P1) fps -48%
2560x1440 Highest Settings possible AA:4xMSAA + FX AF:16x
Razer Blade 14 Ryzen 9 6900HX
AMD Ryzen 9 6900HX, NVIDIA GeForce RTX 3070 Ti Laptop GPU
89.5 (4.25min, 62.5P1) fps +19%
Acer Predator Triton 300 SE
Intel Core i9-12900H, NVIDIA GeForce RTX 3060 Laptop GPU
75.2 (7.64min, 50P1) fps
Average NVIDIA GeForce RTX 3060 Laptop GPU
  (52 - 86.5, n=23)
74.3 fps -1%
SCHENKER Vision 14
Intel Core i7-11370H, NVIDIA GeForce RTX 3050 Ti Laptop GPU
35.7 (18.9min, 22.2P1) fps -53%
Strange Brigade
1280x720 lowest AF:1
Razer Blade 14 Ryzen 9 6900HX
AMD Ryzen 9 6900HX, NVIDIA GeForce RTX 3070 Ti Laptop GPU
393 (225min, 293P1) fps +1%
Acer Predator Triton 300 SE
Intel Core i9-12900H, NVIDIA GeForce RTX 3060 Laptop GPU
389 (197.4min, 293P1) fps
Average NVIDIA GeForce RTX 3060 Laptop GPU
  (253 - 471, n=37)
347 fps -11%
Asus ROG Zephyrus M15 GU502LU-BI7N4
Intel Core i7-10750H, NVIDIA GeForce GTX 1660 Ti Mobile
311 (91.4min, 250P1) fps -20%
Dell Inspiron 14 Plus 7420
Intel Core i7-12700H, NVIDIA GeForce RTX 3050 4GB Laptop GPU
263 (75.2min, 209P1) fps -32%
SCHENKER Vision 14
Intel Core i7-11370H, NVIDIA GeForce RTX 3050 Ti Laptop GPU
232 (80.1min, 181P1) fps -40%
1920x1080 medium AA:medium AF:4
Razer Blade 14 Ryzen 9 6900HX
AMD Ryzen 9 6900HX, NVIDIA GeForce RTX 3070 Ti Laptop GPU
254 (162.5min, 218P1) fps +29%
Asus ROG Zephyrus G14 GA402RJ
AMD Ryzen 7 6800HS, AMD Radeon RX 6700S
227 (143.8min, 195.2P1) fps +15%
Acer Predator Triton 300 SE
Intel Core i9-12900H, NVIDIA GeForce RTX 3060 Laptop GPU
196.7 (46.4min, 157.5P1) fps
Average NVIDIA GeForce RTX 3060 Laptop GPU
  (154.9 - 242, n=38)
193.8 fps -1%
Asus ROG Zephyrus M15 GU502LU-BI7N4
Intel Core i7-10750H, NVIDIA GeForce GTX 1660 Ti Mobile
150 (47.9min, 126P1) fps -24%
Dell Inspiron 14 Plus 7420
Intel Core i7-12700H, NVIDIA GeForce RTX 3050 4GB Laptop GPU
118.2 (73min, 102.5P1) fps -40%
SCHENKER Vision 14
Intel Core i7-11370H, NVIDIA GeForce RTX 3050 Ti Laptop GPU
110 (45.7min, 91.5P1) fps -44%
1920x1080 high AA:high AF:8
Razer Blade 14 Ryzen 9 6900HX
AMD Ryzen 9 6900HX, NVIDIA GeForce RTX 3070 Ti Laptop GPU
202 (135min, 150.8P1) fps +28%
Asus ROG Zephyrus G14 GA402RJ
AMD Ryzen 7 6800HS, AMD Radeon RX 6700S
182.7 (120.8min, 132.5P1) fps +16%
Acer Predator Triton 300 SE
Intel Core i9-12900H, NVIDIA GeForce RTX 3060 Laptop GPU
157.8 (47min, 117.6P1) fps
Average NVIDIA GeForce RTX 3060 Laptop GPU
  (115.6 - 192.1, n=41)
157 fps -1%
Asus ROG Zephyrus M15 GU502LU-BI7N4
Intel Core i7-10750H, NVIDIA GeForce GTX 1660 Ti Mobile
122 (68.9min, 95.9P1) fps -23%
Dell Inspiron 14 Plus 7420
Intel Core i7-12700H, NVIDIA GeForce RTX 3050 4GB Laptop GPU
94.7 (65.8min, 72.2P1) fps -40%
SCHENKER Vision 14
Intel Core i7-11370H, NVIDIA GeForce RTX 3050 Ti Laptop GPU
89.4 (64.6min, 67.3P1) fps -43%
1920x1080 ultra AA:ultra AF:16
Razer Blade 14 Ryzen 9 6900HX
AMD Ryzen 9 6900HX, NVIDIA GeForce RTX 3070 Ti Laptop GPU
177.4 (104.5min, 133.9P1) fps +28%
Asus ROG Zephyrus G14 GA402RJ
AMD Ryzen 7 6800HS, AMD Radeon RX 6700S
157.3 (108.2min, 113.2P1) fps +13%
Acer Predator Triton 300 SE
Intel Core i9-12900H, NVIDIA GeForce RTX 3060 Laptop GPU
138.6 (37.8min, 106P1) fps
Average NVIDIA GeForce RTX 3060 Laptop GPU
  (102.2 - 166.3, n=43)
137.6 fps -1%
Asus ROG Zephyrus M15 GU502LU-BI7N4
Intel Core i7-10750H, NVIDIA GeForce GTX 1660 Ti Mobile
104 (63.4min, 82.8P1) fps -25%
Dell Inspiron 14 Plus 7420
Intel Core i7-12700H, NVIDIA GeForce RTX 3050 4GB Laptop GPU
82.4 (29.6min, 63.4P1) fps -41%
SCHENKER Vision 14
Intel Core i7-11370H, NVIDIA GeForce RTX 3050 Ti Laptop GPU
76.7 (54min, 57.9P1) fps -45%
2560x1440 ultra AA:ultra AF:16
Razer Blade 14 Ryzen 9 6900HX
AMD Ryzen 9 6900HX, NVIDIA GeForce RTX 3070 Ti Laptop GPU
130 (99.1min, 103.2P1) fps +29%
Acer Predator Triton 300 SE
Intel Core i9-12900H, NVIDIA GeForce RTX 3060 Laptop GPU
100.8 (38.2min, 79.2P1) fps
Average NVIDIA GeForce RTX 3060 Laptop GPU
  (75.4 - 118.4, n=17)
99.7 fps -1%
SCHENKER Vision 14
Intel Core i7-11370H, NVIDIA GeForce RTX 3050 Ti Laptop GPU
57.2 (43.1min, 45.4P1) fps -43%

Witcher 3 FPS Chart

0510152025303540455055606570Tooltip
Acer Predator Triton 300 SE i9-12900H, GeForce RTX 3060 Laptop GPU: Ø70.8 (61-75)
baixo média alto ultraQHD
GTA V (2015) 185.9 181.8 172.3 99.6 75.2
The Witcher 3 (2015) 341.1 230 145.6 75
Dota 2 Reborn (2015) 185 169.2 162.1 153.6
Final Fantasy XV Benchmark (2018) 176.4 105.1 79.1 60.5
X-Plane 11.11 (2018) 141.8 126.1 101
Strange Brigade (2018) 389 196.7 157.8 138.6 100.8
Cyberpunk 2077 1.6 (2022) 109.8 71.9 70.4 57.7 36

Emissões - Alto quando se joga

Ruído do sistema

Os modos de ventilador PredatorSense incluem Quiet, Default, e Turbo. Os ventiladores pulsam freqüentemente se configurados para Default ou superior e por isso é recomendado configurar o sistema para Quiet se a navegação na web ou streaming de vídeo. Caso contrário, o ruído do ventilador pode chegar a 34 dB(A) contra um fundo silencioso de 24 dB(A) quando se está executando cargas não exigidas.

Há uma enorme diferença no ruído do ventilador entre as configurações de modo Default e Turbo. O ruído do ventilador ao rodar Witcher 3 no modo Default atinge 47 dB(A) em comparação com 60 dB(A) se estiver no modo Turbo. 60 dB(A) é significativamente mais alto do que a maioria dos outros laptops, independentemente do tamanho, como mostra nossa tabela abaixo. Como foi dito anteriormente, a habilitação do modo Turbo é obrigatória para explorar totalmente a GPU TGP 95 W. No entanto, os usuários podem querer considerar a possibilidade de jogar no modo Default em vez do ruído mais silencioso do ventilador, mesmo que isso implique uma queda de performance de 5 a 6%.

A solução de resfriamento consiste em ventiladores duplos de ~60 mm com três tubos de calor entre eles
Acer anuncia um resfriamento 10% melhor do que o projeto da geração anterior
Resfriamento de metal líquido somente para a CPU. Não podemos notar nenhum grande ruído eletrônico ou problemas com a bobina em nossa unidade
Os tubos de calor de cobre são espessos em relação ao pequeno fator de forma de 14 polegadas
Perfil de ruído do ventilador (Branco: Fundo, Vermelho: Sistema ocioso, Azul: 3DMark 06, Verde: Prime95+FurMark ou Witcher 3 stress)

Barulho

Ocioso
23.8 / 23.8 / 30.6 dB
Carga
44.2 / 60 dB
  red to green bar
 
 
30 dB
silencioso
40 dB(A)
audível
50 dB(A)
ruidosamente alto
 
min: dark, med: mid, max: light   Earthworks M23R, Arta (15 cm de distância)   environment noise: 23.8 dB(A)
dB(A) 0102030405060708090Deep BassMiddle BassHigh BassLower RangeMidsHigher MidsLower HighsMid HighsUpper HighsSuper Highs2036.733.535.539.3332528.926.932.829.629.23125.32827.528.624.44026.325.527.728.425.4502626.424.52827.36331.430.722.923.628.68027.227.225.826.726.710027.223.421.524.227.512527.623.118.920.828.116029.623.116.516.129.520032.524.115.115.832.325034.624.514.115.433.931536.927.317.118.737.340039.428.81516.439.25004029.412.313.439.963042.730.110.711.942.380045.7349.910.245.3100048.936.89.99.648.9125048.433.79.79.748.1160048.733.39.89.948.8200049.433.210.210.149.4250047.83110.710.347.7315048.231.71110.748400049.933.411.911.149.7500049.732.41211.249.6630048.827.812.411.448.7800048.823.813.112.548.41000045.621.713.111.845.51250042.620.112.211.642.51600038.520.811.210.838.5SPL60.144.223.823.860N13.84.60.50.513.7median 45.6median 28.8median 12.2median 11.6median 45.3Delta6.84.92.32.86.7hearing rangehide median Fan NoiseAcer Predator Triton 300 SE
Acer Predator Triton 300 SE
GeForce RTX 3060 Laptop GPU, i9-12900H, Micron 3400 1TB MTFDKBA1T0TFH
Asus ROG Zephyrus G14 GA402RJ
Radeon RX 6700S, R7 6800HS, Micron 2450 1TB MTFDKBA1T0TFK
Razer Blade 14 Ryzen 9 6900HX
GeForce RTX 3070 Ti Laptop GPU, R9 6900HX, Samsung PM9A1 MZVL21T0HCLR
Alienware x14 i7 RTX 3060
GeForce RTX 3060 Laptop GPU, i7-12700H, WDC PC SN810 1TB
Dell Inspiron 14 Plus 7420
GeForce RTX 3050 4GB Laptop GPU, i7-12700H, SK Hynix BC711 512GB HFM512GD3GX013N
SCHENKER Vision 14
GeForce RTX 3050 Ti Laptop GPU, i7-11370H, Samsung SSD 980 Pro 1TB MZ-V8P1T0BW
Noise
5%
16%
4%
8%
8%
off / environment *
23.8
25
-5%
23.3
2%
24.7
-4%
23.2
3%
24.3
-2%
Idle Minimum *
23.8
25
-5%
23.3
2%
24.7
-4%
23.2
3%
24.3
-2%
Idle Average *
23.8
26
-9%
23.3
2%
24.7
-4%
23.2
3%
24.3
-2%
Idle Maximum *
30.6
29
5%
23.3
24%
30.9
-1%
23.2
24%
25.9
15%
Load Average *
44.2
45
-2%
34.7
21%
40
10%
47.5
-7%
43.3
2%
Witcher 3 ultra *
60.1
43
28%
42.1
30%
51.5
14%
51.7
14%
44.6
26%
Load Maximum *
60
45
25%
42.1
30%
51.5
14%
51.7
14%
49.5
17%

* ... smaller is better

Temperatura

Os pontos quentes podem atingir até 43 C e 46 C na parte superior e inferior, respectivamente, em direção à parte traseira do chassi, como mostram os mapas de calor abaixo. As temperaturas gerais da superfície são visivelmente mais frias do que as que registramos no Zephyrus G14 ou Alienware x14 onde os pontos quentes podem facilmente alcançar mais de 50 C quando em condições similares

Quase metade do chassi é dedicada à ventilação, incluindo as bordas, traseira, inferior e laterais do teclado. Certifique-se de não bloquear acidentalmente nenhuma nas grelhas de ventilação para preservar o resfriamento ideal.

Quatro conjuntos de aberturas de exaustão ao longo da lateral e traseira
O adaptador AC pode alcançar mais de 45 C quando se joga por longos períodos
 39 °C43 °C37.4 °C 
 36.8 °C41.2 °C39 °C 
 29.2 °C26.8 °C28.4 °C 
Máximo: 43 °C
Médio: 35.6 °C
38.6 °C46.4 °C37.6 °C
32 °C38.8 °C32.6 °C
29 °C31.4 °C30.8 °C
Máximo: 46.4 °C
Médio: 35.2 °C
alimentação elétrica  51.6 °C | Temperatura do quarto 20 °C | Fluke 62 Mini IR Thermometer
(±) The average temperature for the upper side under maximal load is 35.6 °C / 96 F, compared to the average of 33.8 °C / 93 F for the devices in the class Gaming.
(±) The maximum temperature on the upper side is 43 °C / 109 F, compared to the average of 40.4 °C / 105 F, ranging from 21.2 to 68.8 °C for the class Gaming.
(-) The bottom heats up to a maximum of 46.4 °C / 116 F, compared to the average of 43.2 °C / 110 F
(+) In idle usage, the average temperature for the upper side is 26 °C / 79 F, compared to the device average of 33.8 °C / 93 F.
(±) Playing The Witcher 3, the average temperature for the upper side is 37.1 °C / 99 F, compared to the device average of 33.8 °C / 93 F.
(+) The palmrests and touchpad are reaching skin temperature as a maximum (32 °C / 89.6 F) and are therefore not hot.
(-) The average temperature of the palmrest area of similar devices was 28.9 °C / 84 F (-3.1 °C / -5.6 F).
Sistema ocioso (topo)
Sistema ocioso (fundo)
Witcher 3 tensão (topo)
Witcher 3 tensão (inferior)
Prime95+FurMark stress (topo)
Prime95+FurMark stress (fundo)
Acer Predator Triton 300 SE
Intel Core i9-12900H, NVIDIA GeForce RTX 3060 Laptop GPU
Asus ROG Zephyrus G14 GA402RJ
AMD Ryzen 7 6800HS, AMD Radeon RX 6700S
Razer Blade 14 Ryzen 9 6900HX
AMD Ryzen 9 6900HX, NVIDIA GeForce RTX 3070 Ti Laptop GPU
Alienware x14 i7 RTX 3060
Intel Core i7-12700H, NVIDIA GeForce RTX 3060 Laptop GPU
Dell Inspiron 14 Plus 7420
Intel Core i7-12700H, NVIDIA GeForce RTX 3050 4GB Laptop GPU
SCHENKER Vision 14
Intel Core i7-11370H, NVIDIA GeForce RTX 3050 Ti Laptop GPU
Heat
-24%
-13%
-1%
8%
-12%
Maximum Upper Side *
43
53
-23%
40.6
6%
51.3
-19%
40
7%
49.7
-16%
Maximum Bottom *
46.4
54
-16%
42.6
8%
44.4
4%
36.4
22%
56
-21%
Idle Upper Side *
28.2
34
-21%
38
-35%
27.2
4%
27
4%
28.8
-2%
Idle Bottom *
28.4
38
-34%
37
-30%
26.6
6%
29.2
-3%
30.6
-8%

* ... smaller is better

Teste de estresse

Sistema ocioso
Sistema ocioso

As taxas de clock da CPU, temperatura e consumo de energia da placa aumentariam para 3,7 GHz, 100 C e 108 W, respectivamente, ao iniciar a tensão Prime95. Após apenas alguns segundos, no entanto, a taxa de clock e o consumo de energia começariam a cair antes de estabilizarem em apenas 3,0 GHz e 69 W, respectivamente, mantendo uma temperatura central de 100 C. Muito poucas CPUs de laptop estabilizariam em faixas de temperatura acima de 90 C e, portanto, isto é um pouco alarmante de se ver na Acer. A Dell Precision 5470 com a mesma CPU Core i9-12900H, por exemplo, estabilizaria em até 2,4 GHz e 80 C quando sob condições similares. É claro que o sistema Acer está empurrando a CPU Core i9 até onde a solução de resfriamento pode permitir.

Rodando Witcher 3 no modo Turbo faz com que a GPU Nvidia se estabilize em 1830 MHz, 70 C e 93 W. Se o modo Turbo for desativado, as taxas de clock e o consumo de energia da placa cairiam para 1605 MHz e 80 W, respectivamente, enquanto a temperatura subiria ligeiramente para 73 C por causa do teto inferior do ventilador. Assim, os usuários devem habilitar o modo Turbo se desejarem explorar plenamente a GPU TGP de 95 W.

Funcionando com bateria limita o desempenho, especialmente porque o modo Turbo requer rede elétrica. Um teste Fire Strike em baterias retornaria pontuações Física e Gráfica de 14166 e 11131 pontos, respectivamente, em comparação com 31176 e 20405 pontos quando em rede elétrica.

Prime95 stress (Turbo on)
Prime95+FurMark stress (Turbo on)
Witcher 3 stress (Turbo desligado)
Witcher 3 tensão (Turbo on)
Relógio CPU (GHz) Relógio GPU (MHz) Temperatura média da CPU (°C) Temperatura média da GPU (°C)
System Idle -- -- 37 40
Prime95 Stress 3.0 - 3.1 -- 100 59
Prime95 + FurMark Stress 2.5 ~1050 85 69
Witcher 3 Stress (Turbo off) ~0.8 1605 69 73
Witcher 3 Stress (Turbo on) ~0.8 1830 63 70

Oradores

Alto-falantes estereofônicos para baixo perto dos cantos da frente
Ruído rosa no volume máximo. Os alto-falantes internos não são nada de especial, se não ligeiramente abaixo do esperado
dB(A) 0102030405060708090Deep BassMiddle BassHigh BassLower RangeMidsHigher MidsLower HighsMid HighsUpper HighsSuper Highs2036.635.536.62528.432.828.43123.827.523.84027.427.727.4502624.5266326.122.926.18032.725.832.710038.121.538.112543.918.943.916050.316.550.320053.815.153.825056.314.156.331560.917.160.940060.11560.150058.612.358.66306010.76080062.49.962.4100064.79.964.7125069.99.769.9160071.29.871.2200072.210.272.2250066.510.766.5315069.81169.8400065.211.965.2500066.11266.1630068.712.468.7800066.113.166.11000059.913.159.91250057.212.257.21600055.211.255.2SPL79.923.879.9N45.90.545.9median 60.9median 12.2median 60.9Delta5.52.35.526.325.821.422.12624.925.127.622.532.523.448.72655.818.860.922.167.2267019.372.317.674.217.774.319.575.31571.711.871.311.27410.574.21072.710.17210.67210.97511.374.811.671.71269.71269.612.371.112.669.61270.111.269.824.784.70.666.6median 12median 71.73.42.2hearing rangehide median Pink NoiseAcer Predator Triton 300 SEApple MacBook Pro 16 2021 M1 Pro
Frequency diagram (checkboxes can be checked and unchecked to compare devices)
Acer Predator Triton 300 SE audio analysis

(±) | speaker loudness is average but good (79.9 dB)
Bass 100 - 315 Hz
(±) | reduced bass - on average 10.3% lower than median
(±) | linearity of bass is average (9.7% delta to prev. frequency)
Mids 400 - 2000 Hz
(±) | higher mids - on average 5% higher than median
(+) | mids are linear (4% delta to prev. frequency)
Highs 2 - 16 kHz
(±) | higher highs - on average 5.5% higher than median
(±) | linearity of highs is average (7.6% delta to prev. frequency)
Overall 100 - 16.000 Hz
(±) | linearity of overall sound is average (15.1% difference to median)
Compared to same class
» 29% of all tested devices in this class were better, 6% similar, 64% worse
» The best had a delta of 6%, average was 18%, worst was 132%
Compared to all devices tested
» 17% of all tested devices were better, 4% similar, 79% worse
» The best had a delta of 4%, average was 25%, worst was 134%

Apple MacBook Pro 16 2021 M1 Pro audio analysis

(+) | speakers can play relatively loud (84.7 dB)
Bass 100 - 315 Hz
(+) | good bass - only 3.8% away from median
(+) | bass is linear (5.2% delta to prev. frequency)
Mids 400 - 2000 Hz
(+) | balanced mids - only 1.3% away from median
(+) | mids are linear (2.1% delta to prev. frequency)
Highs 2 - 16 kHz
(+) | balanced highs - only 1.9% away from median
(+) | highs are linear (2.7% delta to prev. frequency)
Overall 100 - 16.000 Hz
(+) | overall sound is linear (4.6% difference to median)
Compared to same class
» 0% of all tested devices in this class were better, 0% similar, 100% worse
» The best had a delta of 5%, average was 18%, worst was 45%
Compared to all devices tested
» 0% of all tested devices were better, 0% similar, 100% worse
» The best had a delta of 4%, average was 25%, worst was 134%

Gestão de energia

Consumo de energia - Modelo mais eficiente que o da última geração

O consumo geral é bastante semelhante ao Alienware x14 que é enviada com opções similares de CPU e GPU. O consumo de energia no desktop no modo de economia de energia e no ajuste de brilho mais baixo consumiria apenas 8 W, enquanto o modo de desempenho mais alto e os ajustes de brilho consumiriam cerca de 18 W. Note que o consumo de energia e, portanto, a vida útil da bateria são sensíveis às cores na tela, ao contrário dos painéis IPS, como mostram nossas medidas de consumo de energia OLED aqui.

Rodando Witcher 3para representar a carga de jogos consome cerca de 14% menos energia do que no 2020 Predador Tritão Tritão 300 enquanto proporciona um desempenho gráfico até 30% mais rápido para um aumento significativo no desempenho por watt. A CPU da 12ª geração, entretanto, está agora ainda mais ávida de energia do que antes.

Somos capazes de registrar um consumo máximo temporário de 246 W a partir do adaptador AC de tamanho médio (~15,1 x 7,2 x 2,3 cm) 200 W quando a CPU e a GPU estão cada uma com 100% de utilização. Esta taxa cairia rapidamente e se estabilizaria a um nível mais seguro de 150 W, como mostra nosso gráfico abaixo, devido a preocupações térmicas. O sistema ainda pode recarregar a uma taxa razoável enquanto estiver jogando.

3DMark 06 consumo de energia
Witcher 3 1080p Ultra consumo de energia
O consumo saltaria para 178 W ao iniciar Prime95 stress antes de cair rapidamente e se estabilizar em 103 W devido a limitações térmicas
Prime95+ FurMark stress iniciado na marca dos 10s. O sistema pode extrair até 247 W do adaptador AC de 200 W
Consumo de energia
desligadodarklight 0.1 / 0.19 Watt
Ociosodarkmidlight 7.6 / 12.3 / 17.6 Watt
Carga midlight 111 / 245.8 Watt
 color bar
Key: min: dark, med: mid, max: light        Metrahit Energy
Currently we use the Metrahit Energy, a professional single phase power quality and energy measurement digital multimeter, for our measurements. Find out more about it here. All of our test methods can be found here.
Acer Predator Triton 300 SE
i9-12900H, GeForce RTX 3060 Laptop GPU, Micron 3400 1TB MTFDKBA1T0TFH, OLED, 2880x1800, 14.00
Asus ROG Zephyrus G14 GA402RJ
R7 6800HS, Radeon RX 6700S, Micron 2450 1TB MTFDKBA1T0TFK, IPS, 2560x1600, 14.00
Razer Blade 14 Ryzen 9 6900HX
R9 6900HX, GeForce RTX 3070 Ti Laptop GPU, Samsung PM9A1 MZVL21T0HCLR, IPS, 2560x1440, 14.00
Alienware x14 i7 RTX 3060
i7-12700H, GeForce RTX 3060 Laptop GPU, WDC PC SN810 1TB, IPS, 1920x1080, 14.00
SCHENKER Vision 14
i7-11370H, GeForce RTX 3050 Ti Laptop GPU, Samsung SSD 980 Pro 1TB MZ-V8P1T0BW, IPS, 2880x1800, 14.00
Acer Predator Triton 300 PT315-52-79LP
i7-10750H, GeForce RTX 2060 Mobile, WDC PC SN730 SDBQNTY-1T00, IPS, 1920x1080, 15.60
Power Consumption
-24%
-34%
15%
22%
12%
Idle Minimum *
7.6
12
-58%
10.2
-34%
7.9
-4%
6.7
12%
4
47%
Idle Average *
12.3
18
-46%
26
-111%
11.1
10%
12.6
-2%
10
19%
Idle Maximum *
17.6
26
-48%
26.7
-52%
11.8
33%
15.4
12%
19
-8%
Load Average *
111
88
21%
89.3
20%
107.4
3%
85.7
23%
96
14%
Witcher 3 ultra *
117.1
157.7
-35%
158.7
-36%
111
5%
83
29%
136
-16%
Load Maximum *
245.8
194
21%
227.5
7%
140.4
43%
110.9
55%
214
13%

* ... smaller is better

Power Consumption Witcher 3 / Stresstest

0153045607590105120135150165180195210225240Tooltip
Acer Predator Triton 300 SE i9-12900H, GeForce RTX 3060 Laptop GPU; Witcher 3 ultra: Ø117.1 (113-121.8)
Razer Blade 14 Ryzen 9 RTX 3070 R9 5900HX, GeForce RTX 3070 Laptop GPU; Witcher 3 ultra: Ø154.3 (152-161)
Acer Predator Triton 300 SE i9-12900H, GeForce RTX 3060 Laptop GPU; 1280x720 Prime95 28.10 and Furmark 1.25: Ø163.3 (149-247)
Razer Blade 14 Ryzen 9 RTX 3070 R9 5900HX, GeForce RTX 3070 Laptop GPU; 1280x720 Prime95 28.10 and Furmark 1.25: Ø178.3 (172-188)
Acer Predator Triton 300 SE i9-12900H, GeForce RTX 3060 Laptop GPU; Idle 150cd/m2: Ø7.99 (5.64-13.9)

Power Consumption external Monitor

0102030405060708090100110120130140150160170Tooltip
Acer Predator Triton 300 SE i9-12900H, GeForce RTX 3060 Laptop GPU; Prime95 V2810 Stress (external Monitor): Ø107.2 (99.8-177.8)
Razer Blade 14 Ryzen 9 RTX 3070 R9 5900HX, GeForce RTX 3070 Laptop GPU; Prime95 V2810 Stress (external Monitor): Ø114.6 (111-119)
Acer Predator Triton 300 SE i9-12900H, GeForce RTX 3060 Laptop GPU; Cinebench R15 Multi (external Monitor): Ø134.5 (120.6-177.5)
Acer Predator Triton 300 SE i9-12900H, GeForce RTX 3060 Laptop GPU; 1280x720 FurMark 1.19 GPU Stress Test (external Monitor): Ø112.6 (107.4-122.8)
Razer Blade 14 Ryzen 9 RTX 3070 R9 5900HX, GeForce RTX 3070 Laptop GPU; 1280x720 FurMark 1.19 GPU Stress Test (external Monitor): Ø136.1 (129-154)
Acer Predator Triton 300 SE i9-12900H, GeForce RTX 3060 Laptop GPU; 1920x1080 The Witcher 3 ultra (external Monitor): Ø118 (115.7-130.6)
Razer Blade 14 Ryzen 9 RTX 3070 R9 5900HX, GeForce RTX 3070 Laptop GPU; 1920x1080 The Witcher 3 ultra (external Monitor): Ø152.3 (151-155)
Acer Predator Triton 300 SE i9-12900H, GeForce RTX 3060 Laptop GPU; Idle 1min (external Monitor): Ø4.05 (1.492-10.8)

Vida útil da bateria - Nada mal para o tamanho e a potência

Os tempos de execução são em média de pouco mais de 6 horas de navegação WLAN no mundo real no perfil de potência Balanceado. No entanto, a maioria dos outros laptops de 14 polegadas pode durar ainda mais, incluindo o Asus ROG Zephyrus G14 ou o Razer Blade 14 por várias horas cada um. A CPU Intel e o painel OLED, mais ávidos de energia, são provavelmente responsáveis pela menor duração da bateria.

A carga de capacidade vazia a plena é relativamente lenta às 2 horas. Além disso, o sistema não pode ser recarregado via USB-C.

Tempo de Execução da Bateria
Ocioso (sem WLAN, min brilho)
8h 06min
WiFi Websurfing
6h 14min
Carga (máximo brilho)
1h 17min
Acer Predator Triton 300 SE
i9-12900H, GeForce RTX 3060 Laptop GPU, 76 Wh
Asus ROG Zephyrus G14 GA402RJ
R7 6800HS, Radeon RX 6700S, 76 Wh
Razer Blade 14 Ryzen 9 6900HX
R9 6900HX, GeForce RTX 3070 Ti Laptop GPU, 62 Wh
Alienware x14 i7 RTX 3060
i7-12700H, GeForce RTX 3060 Laptop GPU, 80 Wh
Dell Inspiron 14 Plus 7420
i7-12700H, GeForce RTX 3050 4GB Laptop GPU, 64 Wh
SCHENKER Vision 14
i7-11370H, GeForce RTX 3050 Ti Laptop GPU, 53 Wh
Battery Runtime
64%
42%
1%
11%
-1%
Reader / Idle
486
732
51%
712
47%
WiFi v1.3
374
612
64%
571
53%
535
43%
432
16%
327
-13%
Load
77
93
21%
45
-42%
54
-30%
86
12%
H.264
561
405
Witcher 3 ultra
45

Pro

+ visor OLED de 90 Hz com cores P3 completas
+ temperaturas de superfície razoáveis
+ design compacto e portátil
+ alto desempenho da CPU
+ Suporte Thunderbolt 4

Contra

- sem persiana de privacidade USB-C PD ou webcam
- mais alto que muitos outros laptops para jogos
- sem MUX ou RAM atualizável
- Estrangulamento do desempenho de SSD
- altas temperaturas centrais

Veredicto - Bom, mas não o suficiente

Em revisão: Acer Predator Triton 300 SE PT314. Unidade de teste fornecida pela Acer

O Predador Triton 300 SE de 14 polegadas enfrenta uma dura competição contra o Asus Zephyrus G14, Lâmina Razer 14e Alienware x14. Quando comparado com o Zephyrus G14, o laptop Asus é frequentemente em venda por centenas de dólares a menos, oferecendo o mesmo nível de desempenho gráfico e peso e dimensões quase idênticos. Quando comparado com o Blade 14, o laptop da Razer é indiscutivelmente mais elegante com seu design mais fino e iluminação RGB por chave. E por último, o Alienware x14 integra teclas de teclado mais firmes e um perfil ainda mais fino. Todas estas máquinas têm melhor desempenho SSD do que a Acer também.

O Acer Predator Triton 300 SE é um laptop para jogos especialmente poderoso, independentemente do tamanho. No entanto, outros laptops para jogos de 14 polegadas o têm mais rápido quando se trata de ruído de ventoinha e desempenho SSD.

O sistema Acer também é mais ruidoso do que as três alternativas mencionadas acima quando se trata de jogos. Entendemos que o modo Turbo vai ser mais barulhento, não importa o quê, mas o fato de ser muito mais barulhento do que a concorrência coloca uma mossa no sistema. O modo Turbo deve ser habilitado para explorar totalmente a GPU na Acer.

Existem algumas qualidades redentoras como o painel OLED 16:10 90 Hz, CPU Core i9 rápida, e suporte para Thunderbolt 4, todas indisponíveis nos modelos Razer Blade 14 e na maioria dos modelos Asus Zephyrus G14. Na verdade, o Predator Triton 300 SE é um dos únicos laptops 16:10 na categoria de 14 polegadas no momento. Entretanto, se tais características únicas não são uma prioridade, então o Zephyrus G14, Blade 14 ou Alienware x14 vale a pena considerar.

Preço e Disponibilidade

O Predador Triton 300 SE de 14 polegadas está agora amplamente disponível através de varejistas como Amazon, Melhor compra, e Newegg por cerca de US$ 2.000,00, se configurado como nossa unidade de revisão. SKUs menorescom a CPU Core i7 estão disponíveis por $1600 USD.

Acer Predator Triton 300 SE - 11/02/2022 v7
Allen Ngo
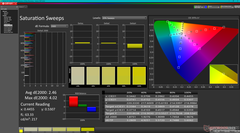
Acabamento
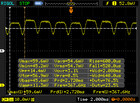
79 / 98 → 80%
Teclado
77%
Mouse
81%
Conectividade
62 / 80 → 77%
Peso
66 / 10-66 → 100%
Bateria
70 / 95 → 74%
Pantalha
91%
Desempenho do jogos
96%
Desempenho da aplicação
97%
Temperatura
88 / 95 → 93%
Ruído
72 / 90 → 79%
Audio
76%
Camera
44 / 85 → 51%
Médio
77%
86%
Gaming - Médio equilibrado

Pricecompare

Please share our article, every link counts!
> Análises e revisões de portáteis e celulares > Análises > Análises > Revisão Acer Predator Triton 300 SE PT314: Resfriamento de metal líquido para um laptop de 14 polegadas
Allen Ngo, 2022-11- 3 (Update: 2022-11- 3)