Análise do Asus ProArt Studiobook 16 OLED: Laptop multimídia com desempenho extremo da CPU
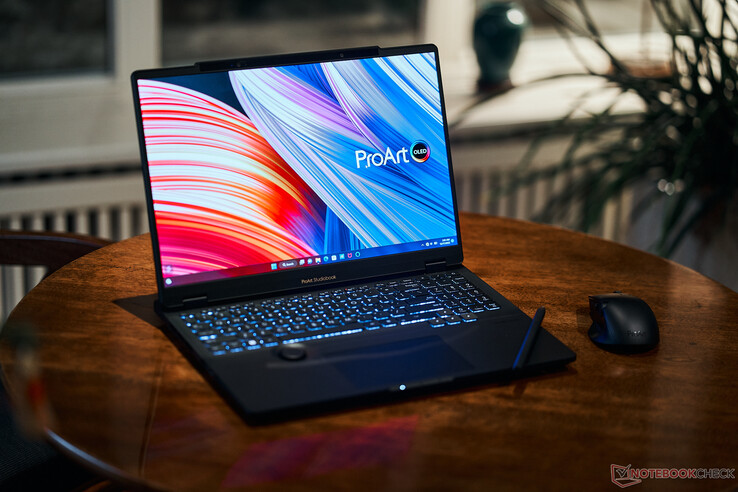
A Asus tem como alvo principal os usuários criativos com o ProArt Studiobook 16 e oferece um recurso de entrada adicional no DialPad. O atual Studiobook 16 OLED 2023 usa o processador móvel mais rápido da Intel, oCore i9-13980HXem combinação com o novo laptop GeForce Laptop RTX 4070.a tela também mudou, pois o OLED 4K foi trocado por um modelo de tela sensível ao toque 3K com 120 Hz. Nosso dispositivo de teste é o modelo de ponta com 64 GB de RAM e um SSD PCIe de 4 TB por 3999 euros (US$ 4380). Como alternativa, há também uma variante com o laptop RTX 4070, 32 GB de RAM e um SSD de 2 TB por 3499 euros (US$ 3.800) ou um laptop Laptop RTX 4060com 32 GB de RAM e um SSD de 1 TB por 2.999 euros (US$ 3300).
Possíveis concorrentes em comparação
Avaliação | Data | Modelo | Peso | Altura | Size | Resolução | Preço |
|---|---|---|---|---|---|---|---|
| 86.1 % v7 (old) | 06/2023 | Asus ProArt Studiobook 16 OLED H7604 i9-13980HX, GeForce RTX 4070 Laptop GPU | 2.4 kg | 23.9 mm | 16.00" | 3200x2000 | |
| 86.2 % v7 (old) | 03/2023 | Gigabyte AERO 16 OLED BSF i9-13900H, GeForce RTX 4070 Laptop GPU | 2.1 kg | 18 mm | 16.00" | 3840x2400 | |
| 89.4 % v7 (old) | 04/2023 | Samsung Galaxy Book3 Ultra 16 i7-13700H, GeForce RTX 4050 Laptop GPU | 1.8 kg | 16.5 mm | 16.00" | 2880x1800 | |
| 89.2 % v7 (old) | 04/2023 | MSI Stealth 17 Studio A13VH-014 i9-13900H, GeForce RTX 4080 Laptop GPU | 3 kg | 21.3 mm | 17.30" | 3840x2160 | |
| 93.7 % v7 (old) | 03/2023 | Apple MacBook Pro 16 2023 M2 Max M2 Max, M2 Max 38-Core GPU | 2.2 kg | 16.8 mm | 16.20" | 3456x2234 | |
| 88 % v7 (old) | 04/2023 | Asus Zephyrus Duo 16 GX650PY-NM006W R9 7945HX, GeForce RTX 4090 Laptop GPU | 2.7 kg | 29.7 mm | 16.00" | 2560x1600 |
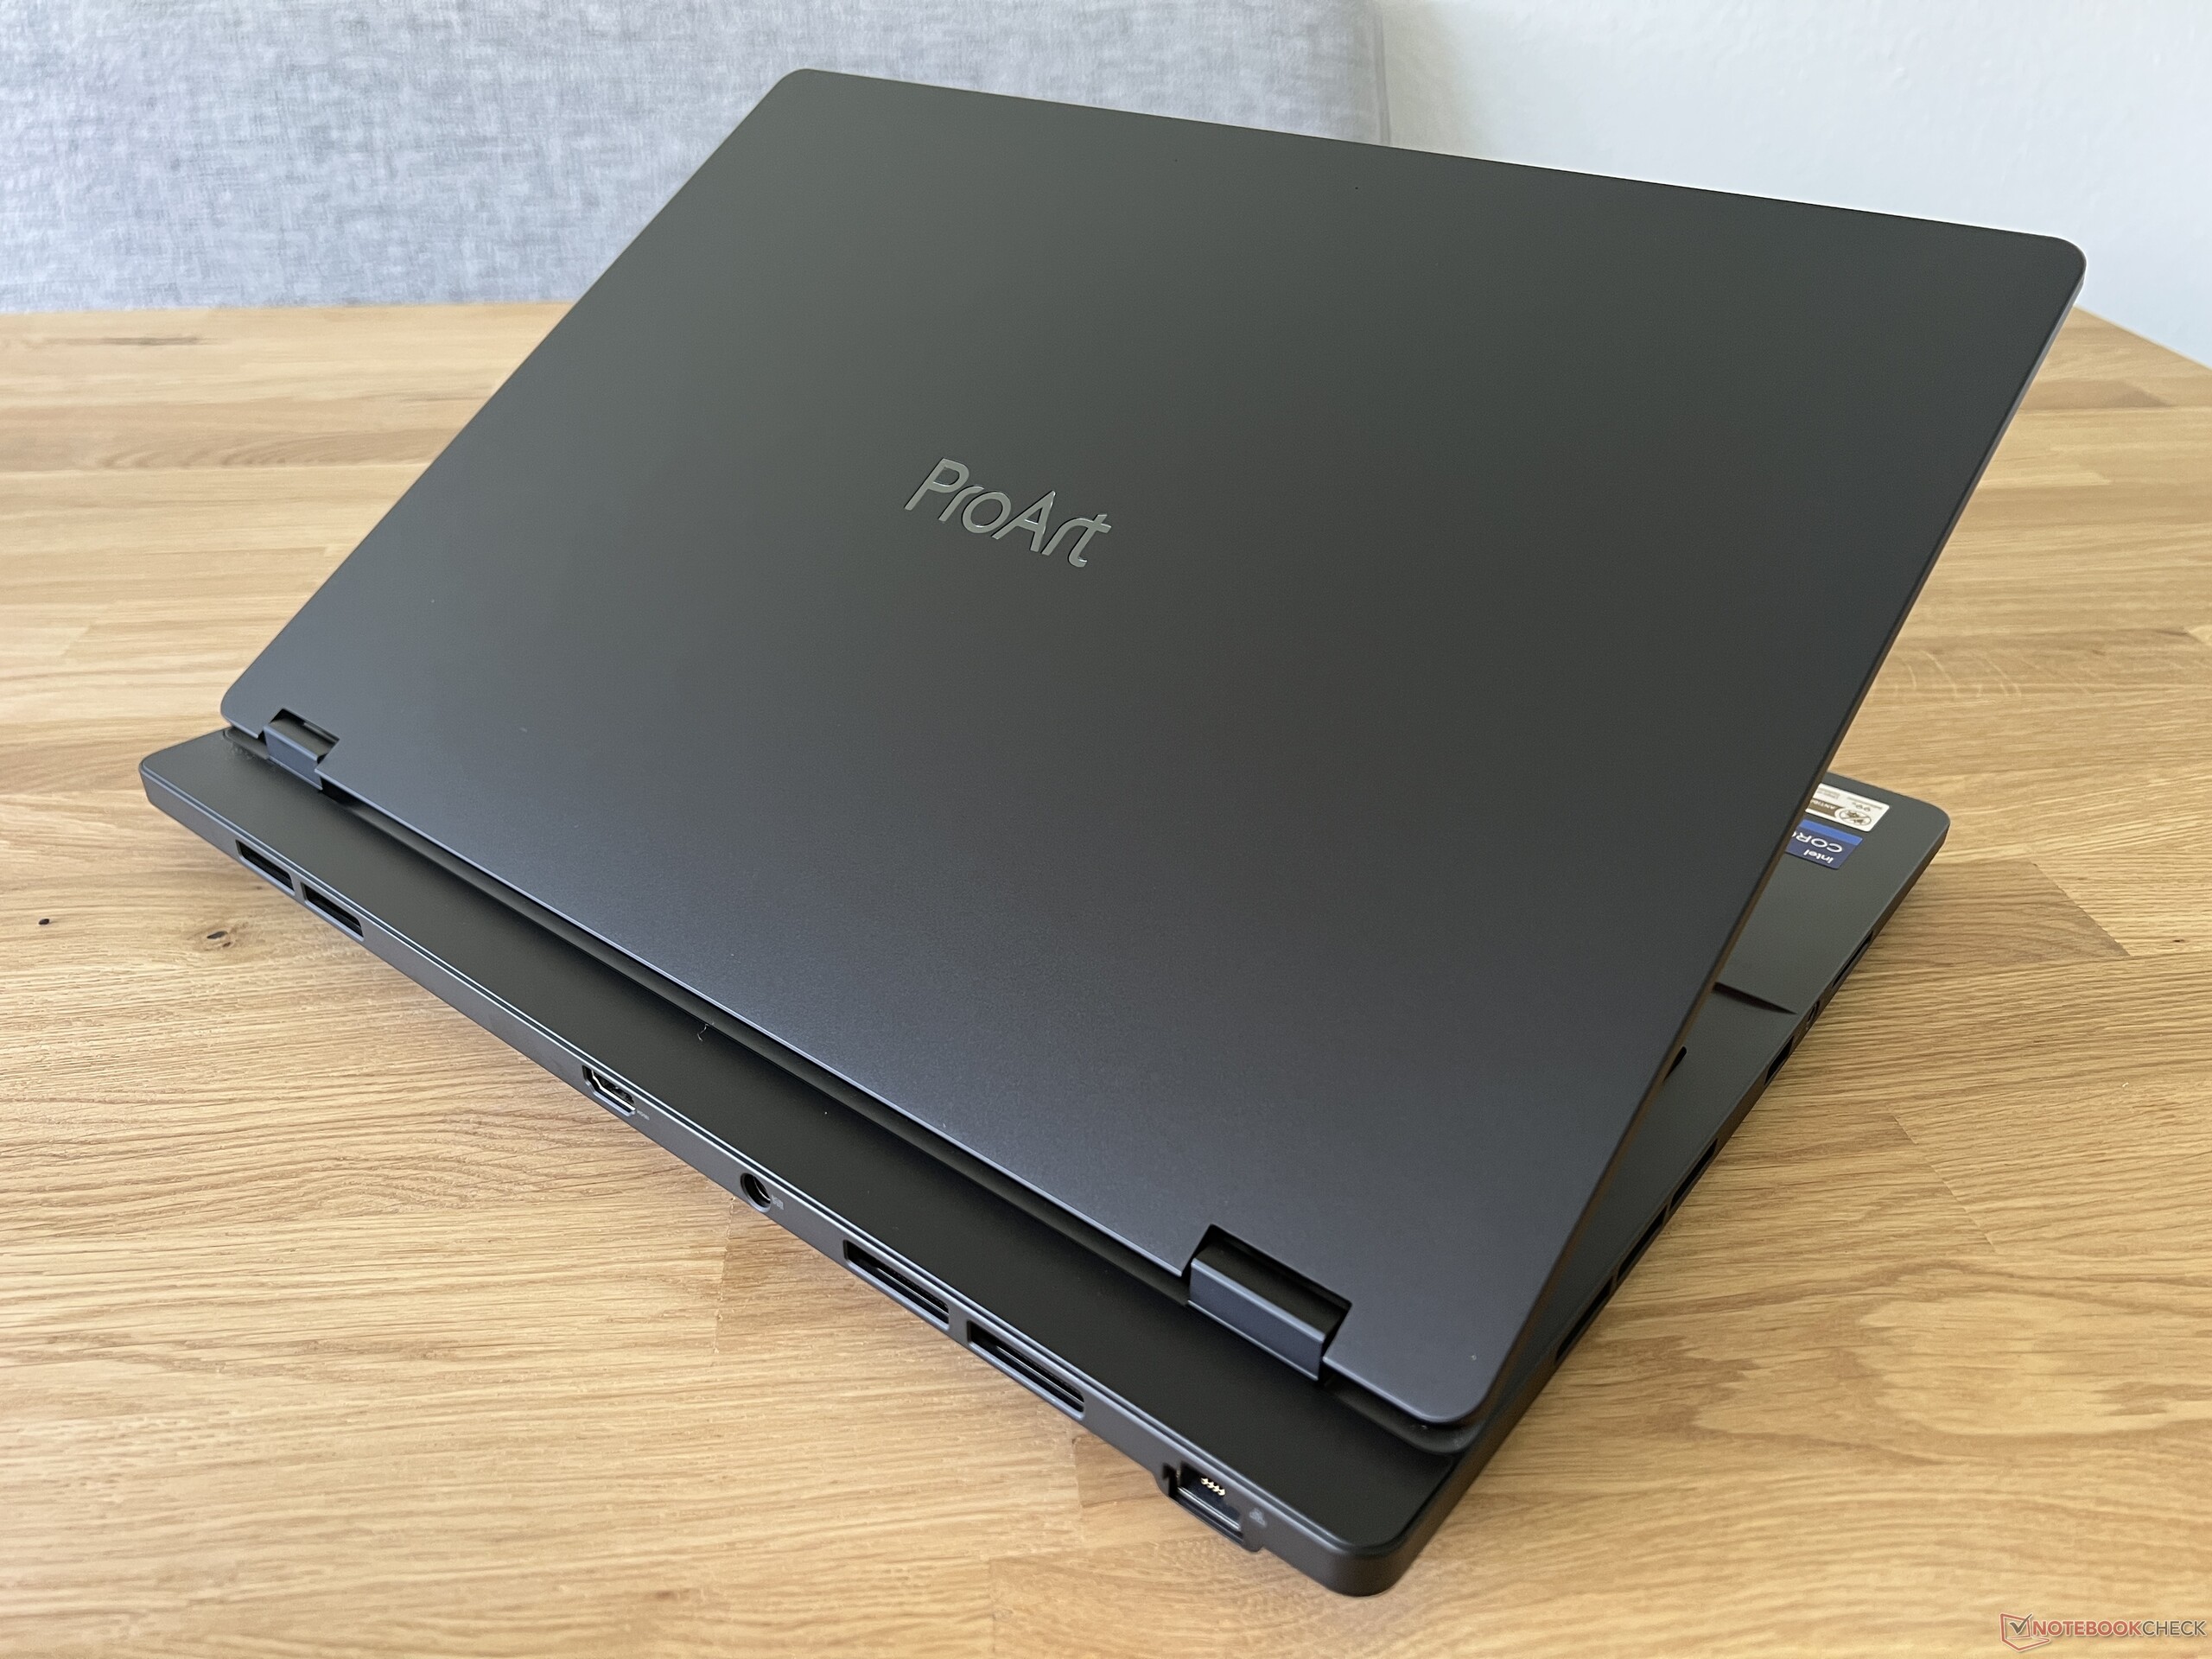
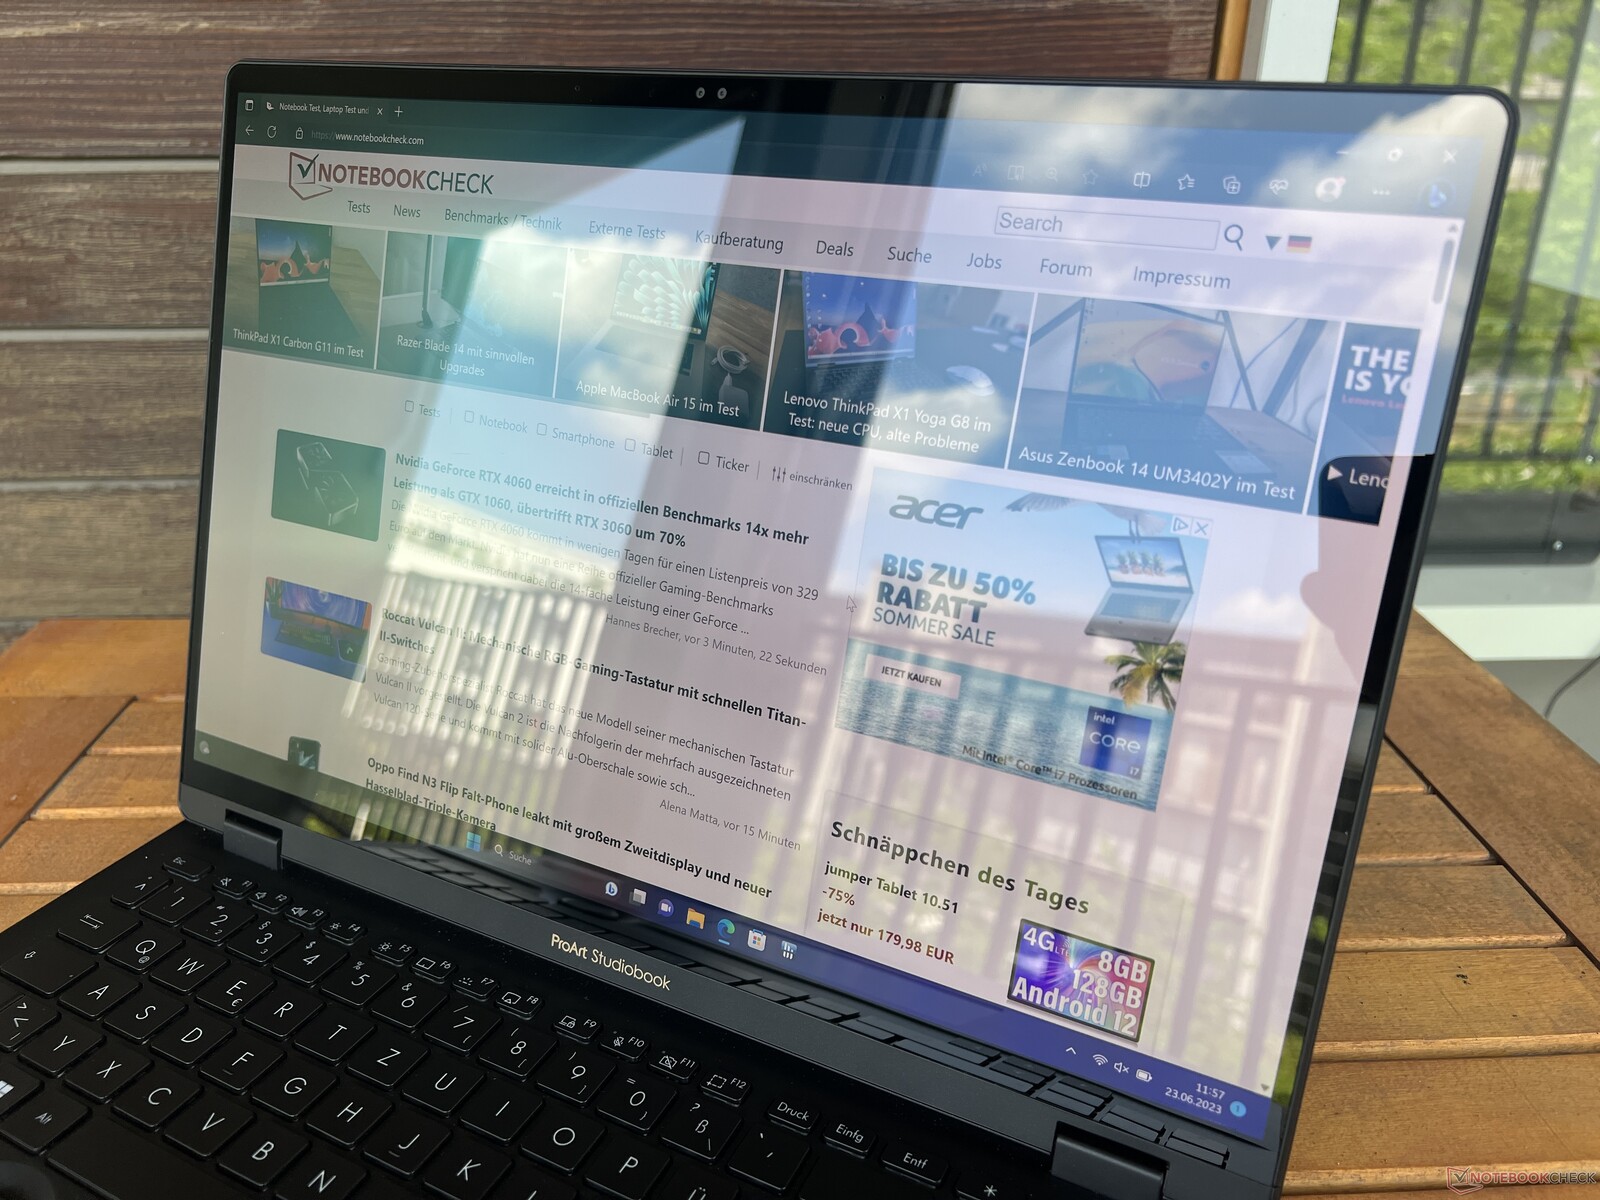
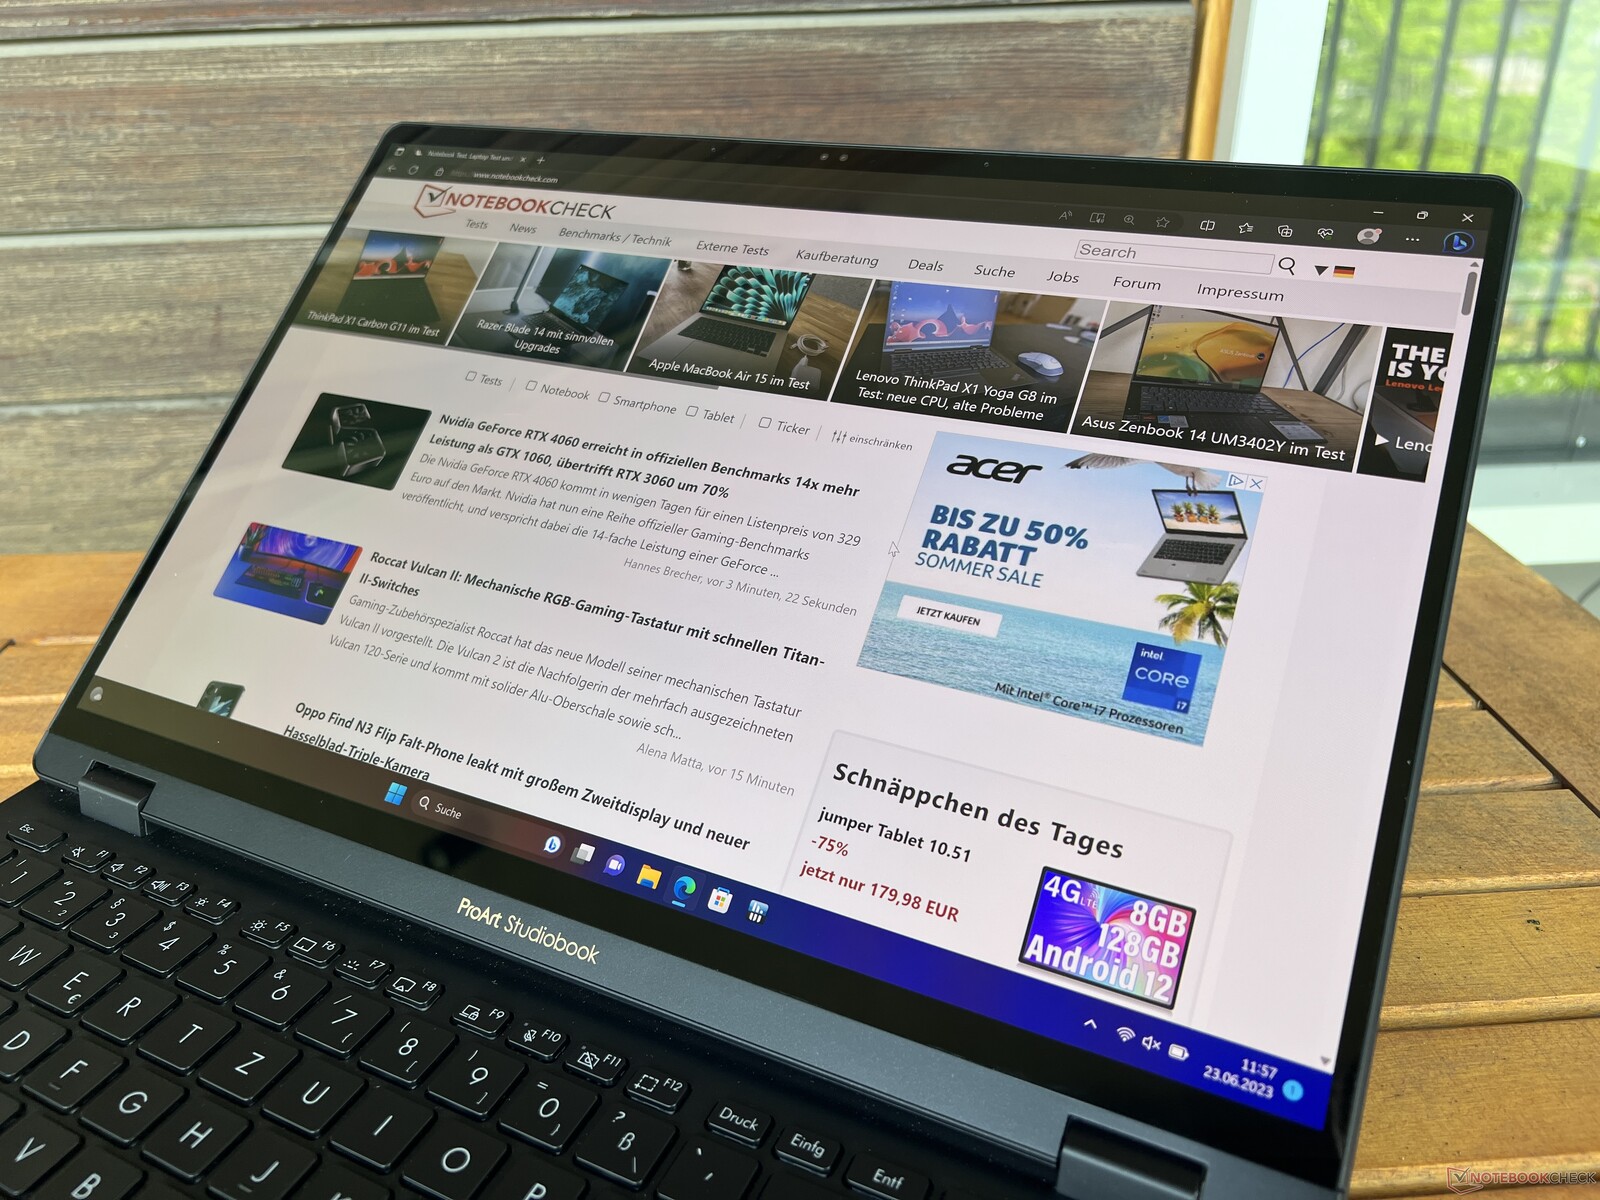
Caso - ProArt é restringida
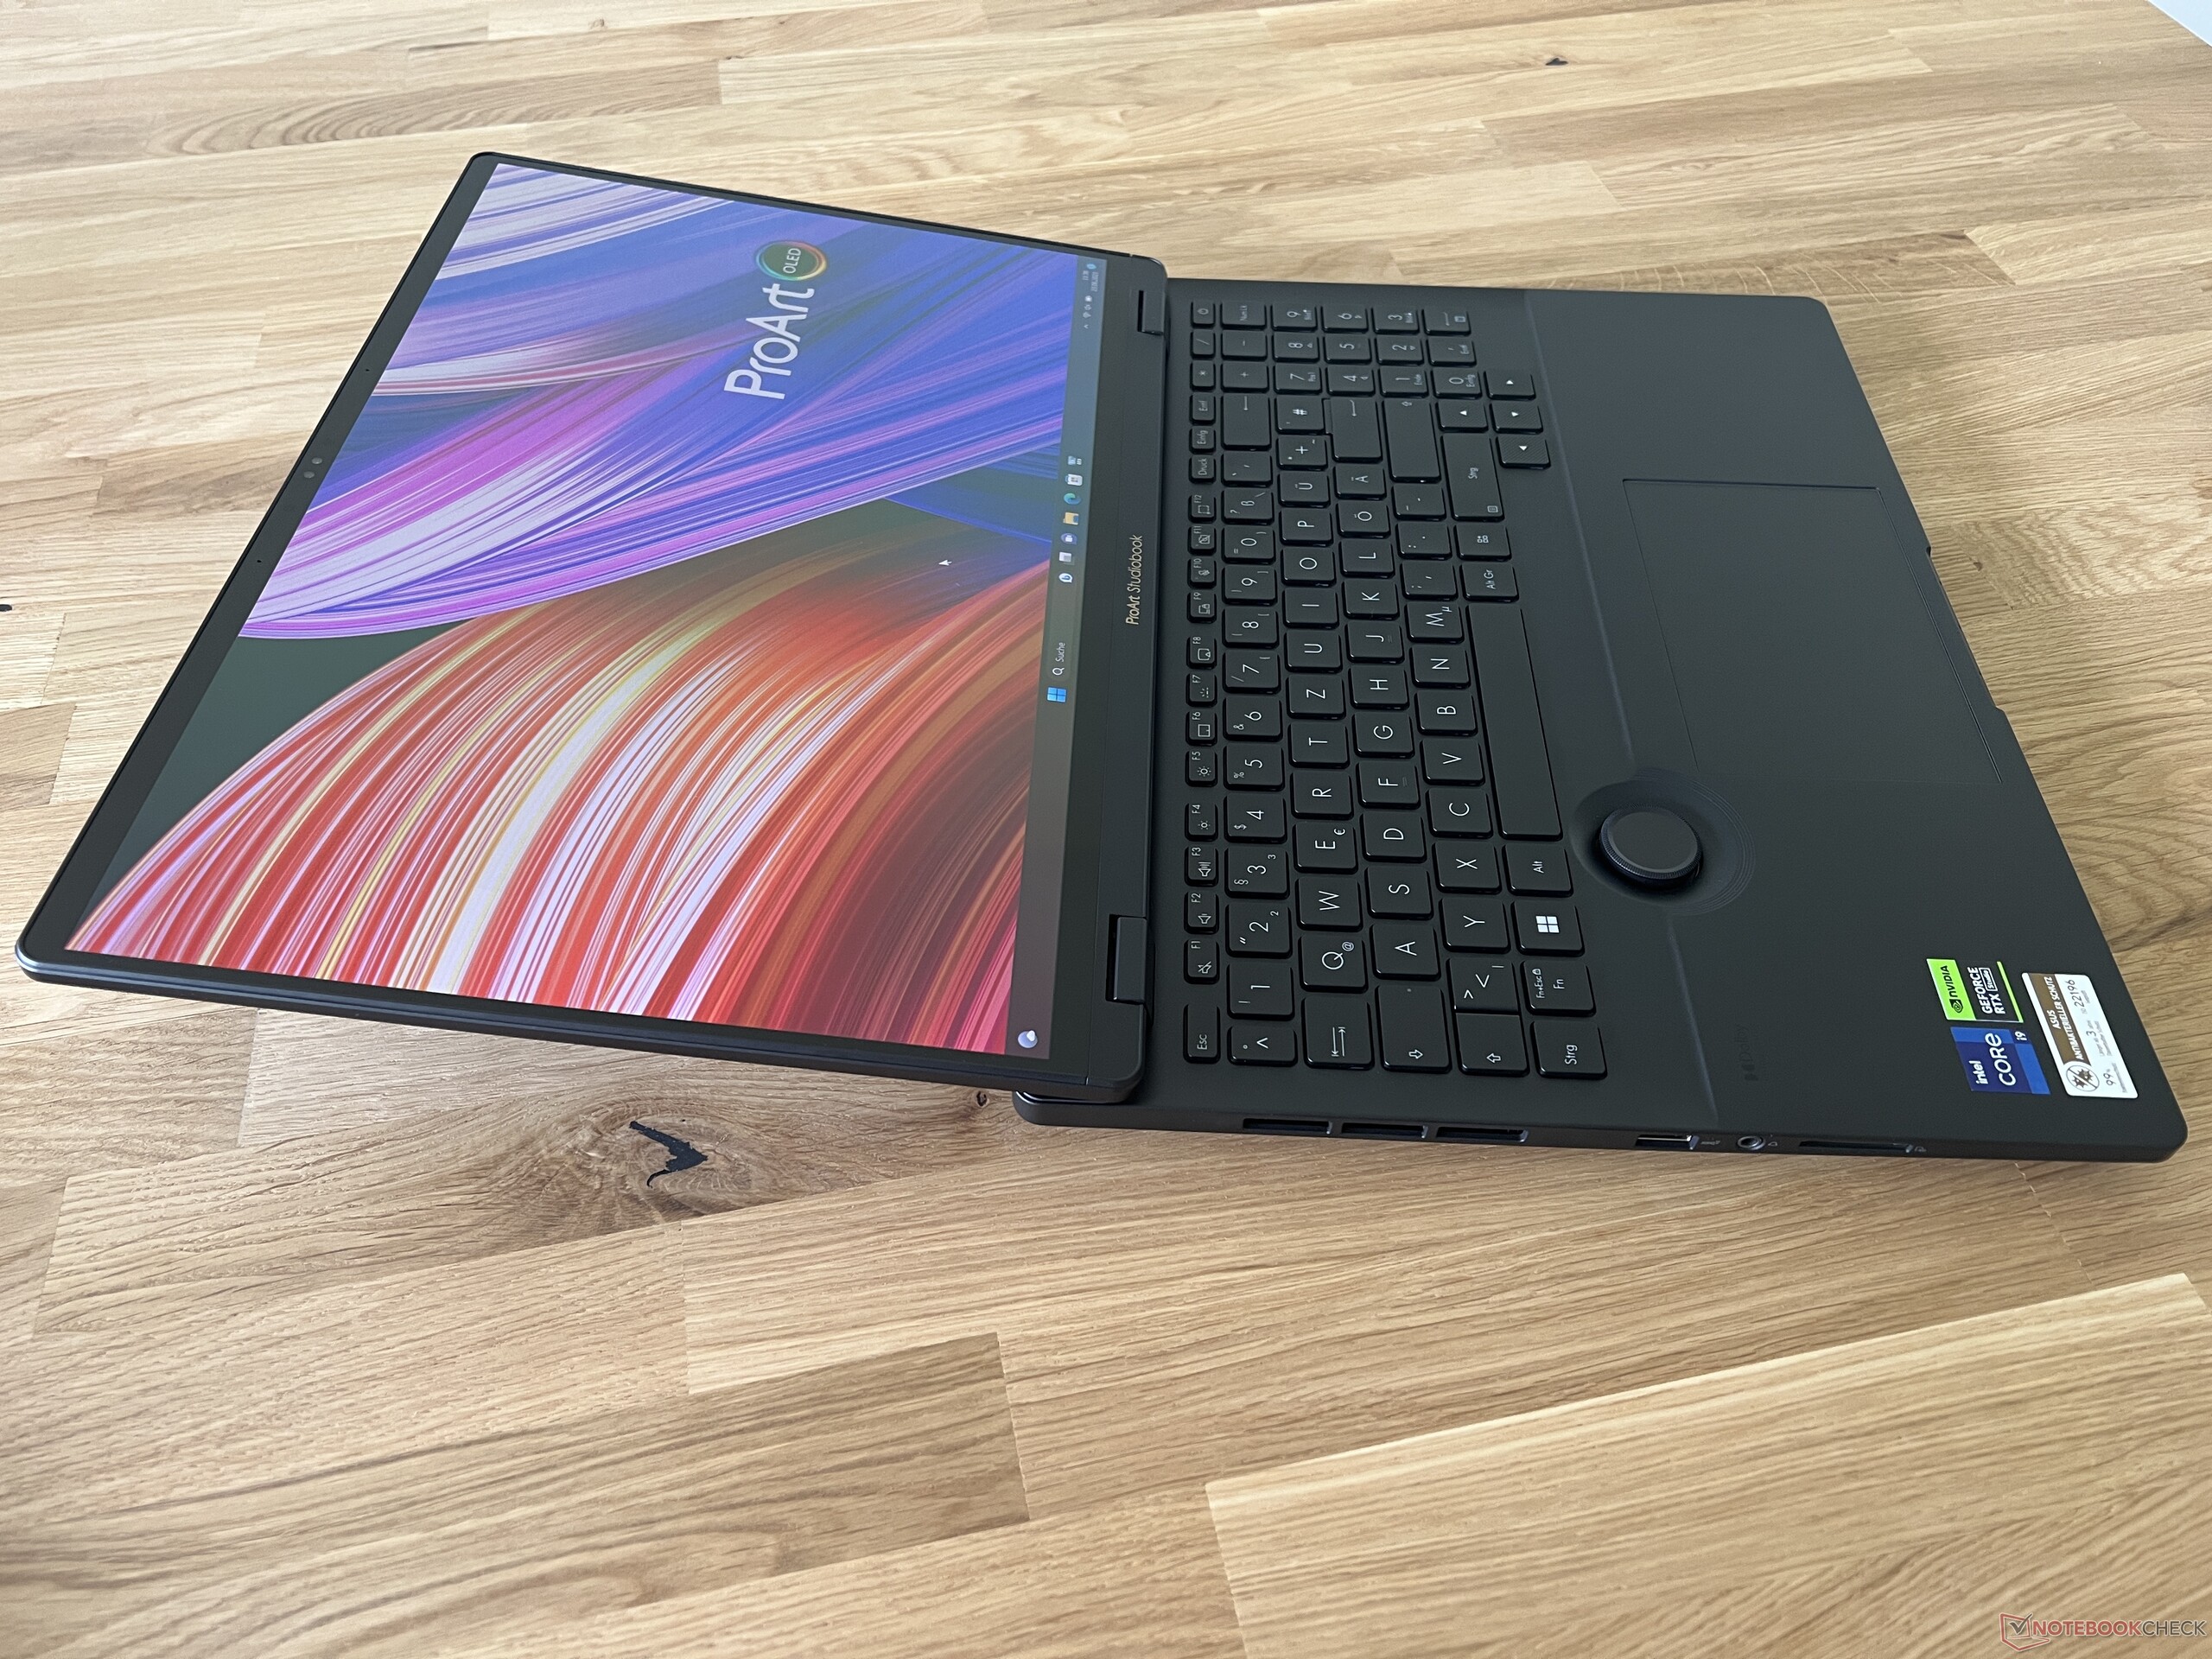
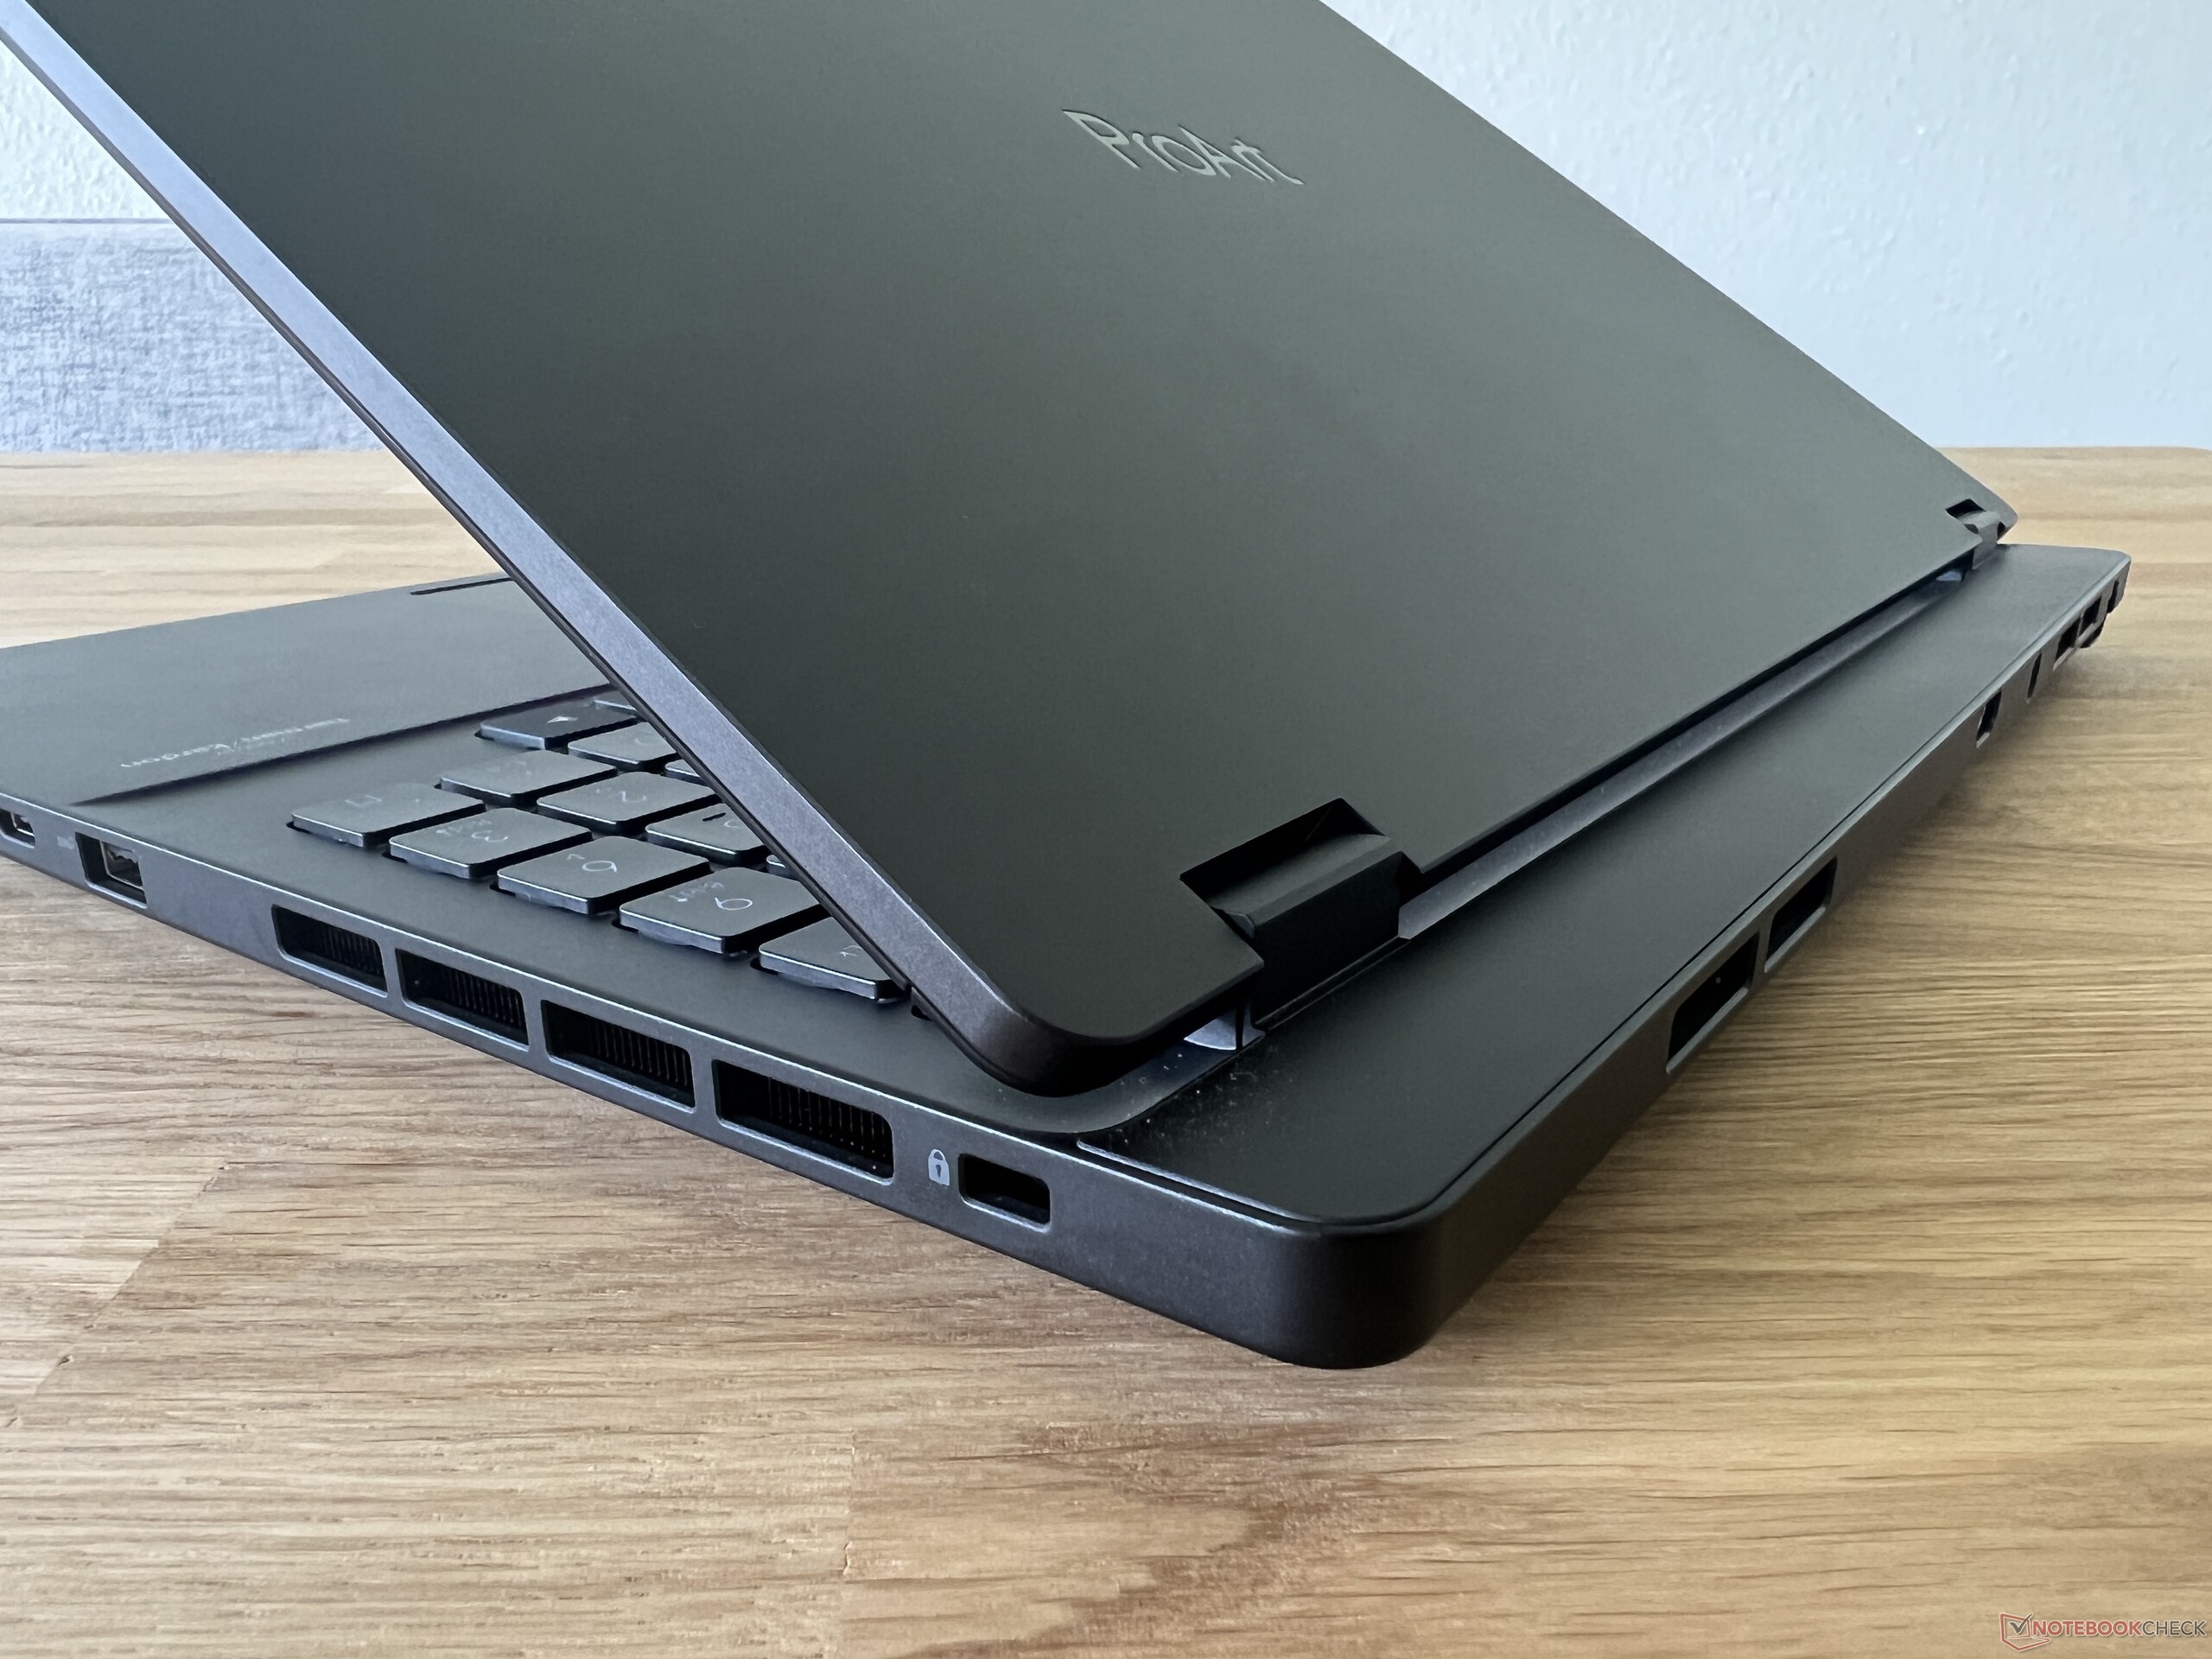
A Asus utiliza plástico preto para o ProArt Studiobook 16, que parece ser de alta qualidade. O único problema são as superfícies lisas, que são muito suscetíveis a impressões digitais. No geral, o design é muito discreto e, além do logotipo da ProArt na tampa, não há outros detalhes visuais. Assim que você abre a tampa, o DialPad grande sob o teclado chama imediatamente sua atenção. A tampa fica um pouco à frente da unidade base, mas isso também permite um ângulo máximo de abertura de quase 180 graus
A estabilidade é excelente, tanto da unidade base quanto da tampa. Nenhum ruído de rangido é emitido sob estresse de torção e nada pode ser amassado. As dobradiças são bem ajustadas: elas evitam efetivamente a oscilação e mantêm a tela firmemente no lugar. Somente em ângulos muito pequenos (menos de 20 graus) é que a tampa se fecha sozinha devido ao peso.
Com pouco menos de 2,5 kg, o Studiobook não é leve e, devido ao seu tamanho, também não é particularmente portátil. O notebook ainda cabe em mochilas grandes, mas naturalmente ocupa muito espaço por ser um notebook de 16 polegadas. Ele também é o maior notebook de 16 polegadas do grupo de comparação e não é muito menor do que os dispositivos de 17 polegadas. O laptop também é bastante espesso, com cerca de 2,5 cm, e só é superado peloZephyrus Duocom sua segunda tela. Para a fonte de alimentação de 240 watts, você terá que levar em conta 740 gramas adicionais para o transporte.
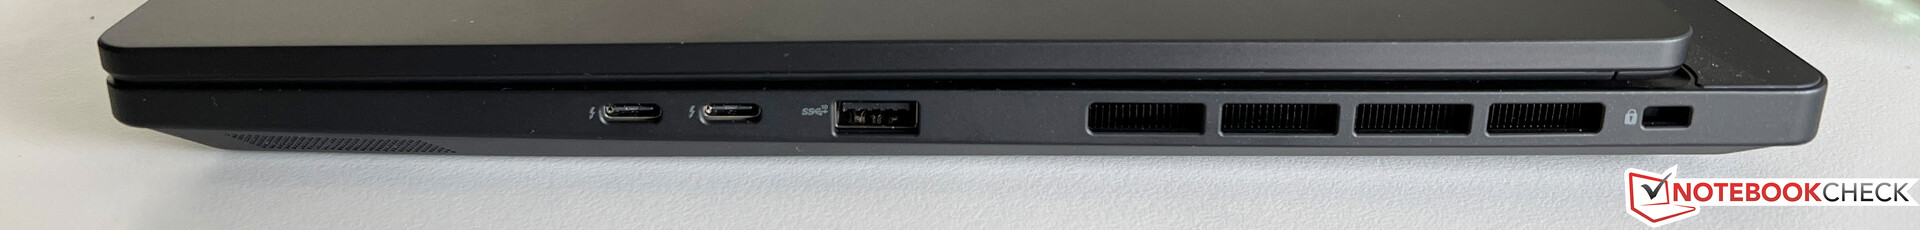
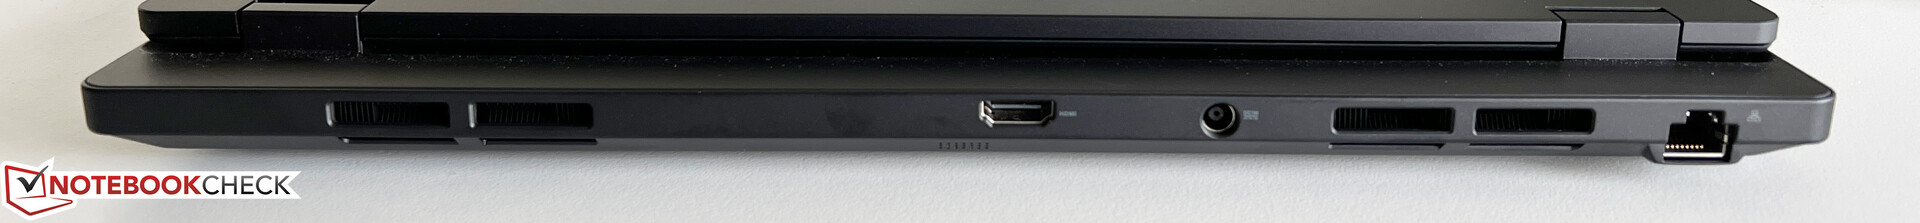
Equipamento - Thunderbolt 4 e HDMI 2.1
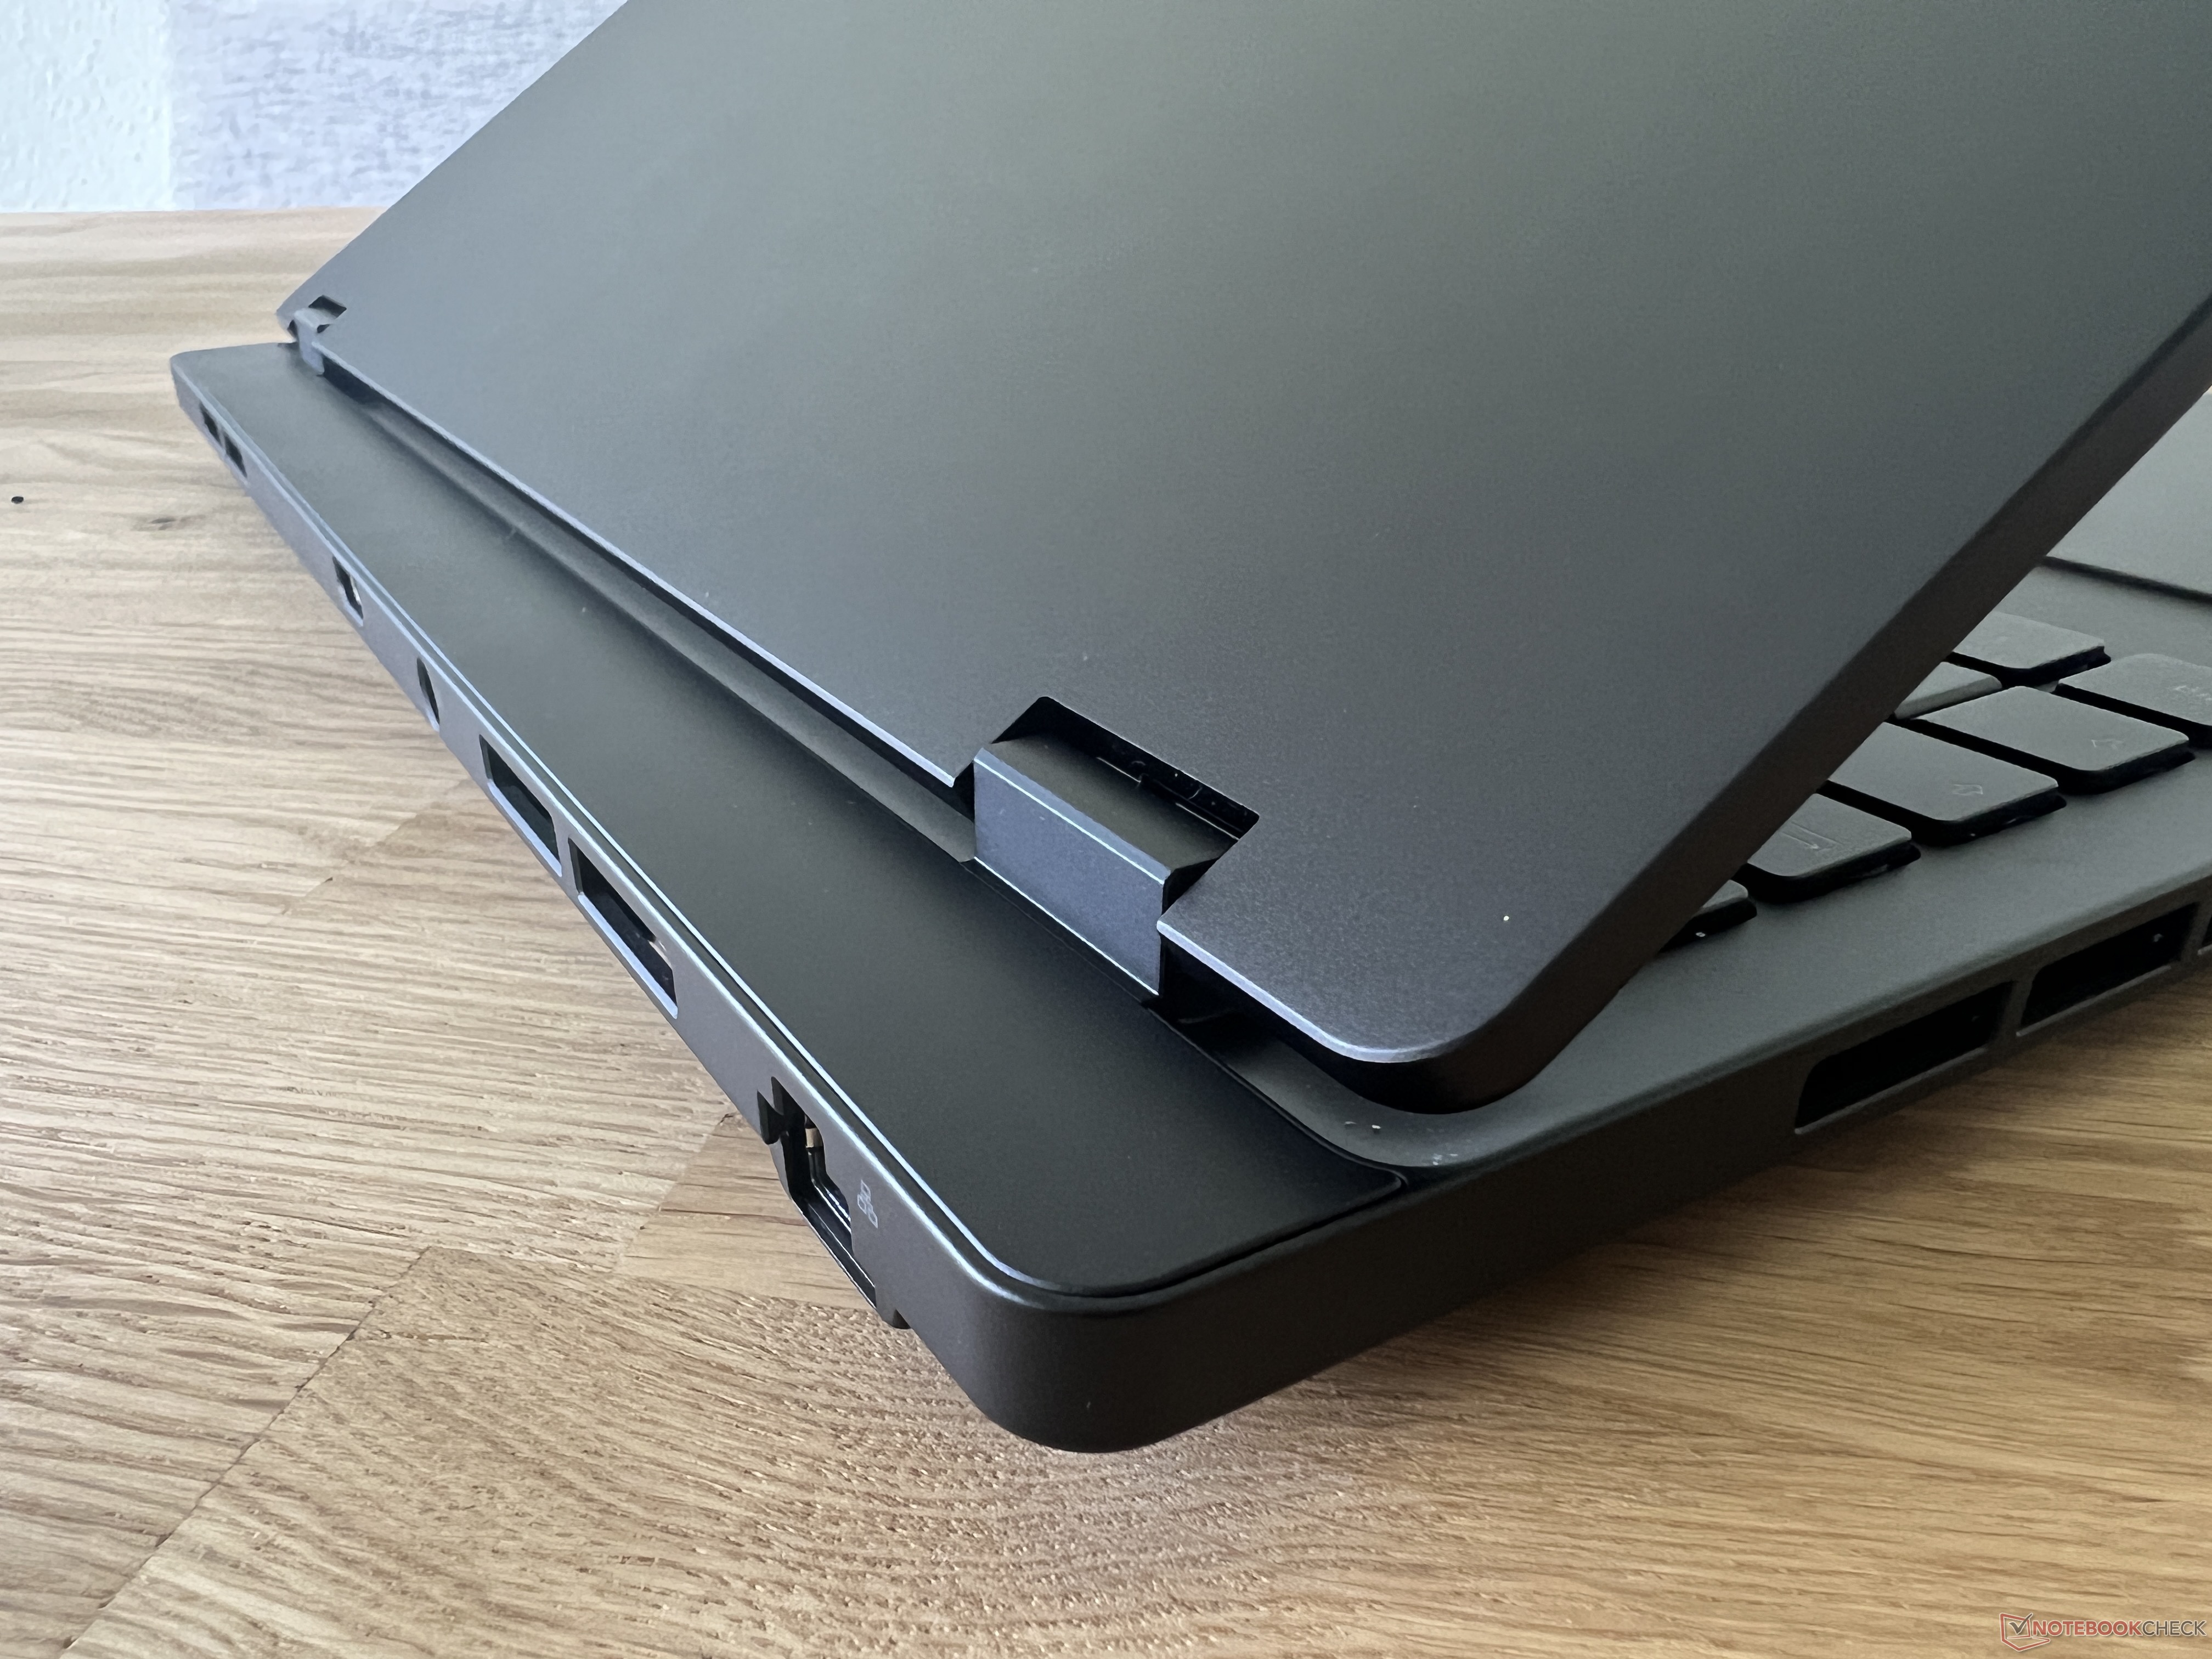
As portas estão distribuídas nas áreas frontais de ambos os lados e na parte traseira. A maioria das portas USB está na parte frontal direita, que pode ficar lotada quando totalmente ocupada. Por outro lado, a Asus colocou o conector de energia, a porta Ethernet e a saída HDMI na parte traseira, onde não atrapalham.
Leitor de cartão SD
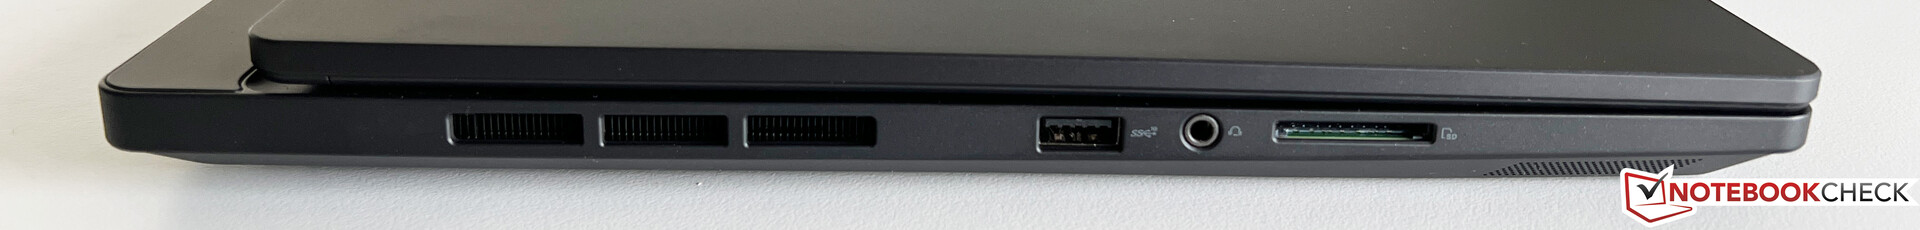
No lado esquerdo está o leitor de cartão SD completo, que atinge apenas taxas de transferência médias por meio do nosso cartão de referência (Angelbird AV Pro V60). É possível fazer muito mais aqui, como mostra a concorrência.
| SD Card Reader | |
| average JPG Copy Test (av. of 3 runs) | |
| Apple MacBook Pro 16 2023 M2 Max (Angelbird AV Pro V60) | |
| Asus Zephyrus Duo 16 GX650PY-NM006W (Angelbird AV Pro V60) | |
| Gigabyte AERO 16 OLED BSF | |
| Média da turma Multimedia (23 - 531, n=39, últimos 2 anos) | |
| Samsung Galaxy Book3 Ultra 16 (AV PRO microSD 128 GB V60) | |
| Asus ProArt Studiobook 16 OLED H7604 (Angelibird AV Pro V60) | |
| MSI Stealth 17 Studio A13VH-014 | |
| maximum AS SSD Seq Read Test (1GB) | |
| Asus Zephyrus Duo 16 GX650PY-NM006W (Angelbird AV Pro V60) | |
| Apple MacBook Pro 16 2023 M2 Max (Angelbird AV Pro V60) | |
| Média da turma Multimedia (37.3 - 1455, n=38, últimos 2 anos) | |
| Gigabyte AERO 16 OLED BSF | |
| Asus ProArt Studiobook 16 OLED H7604 (Angelibird AV Pro V60) | |
| Samsung Galaxy Book3 Ultra 16 (AV PRO microSD 128 GB V60) | |
| MSI Stealth 17 Studio A13VH-014 | |
Comunicação
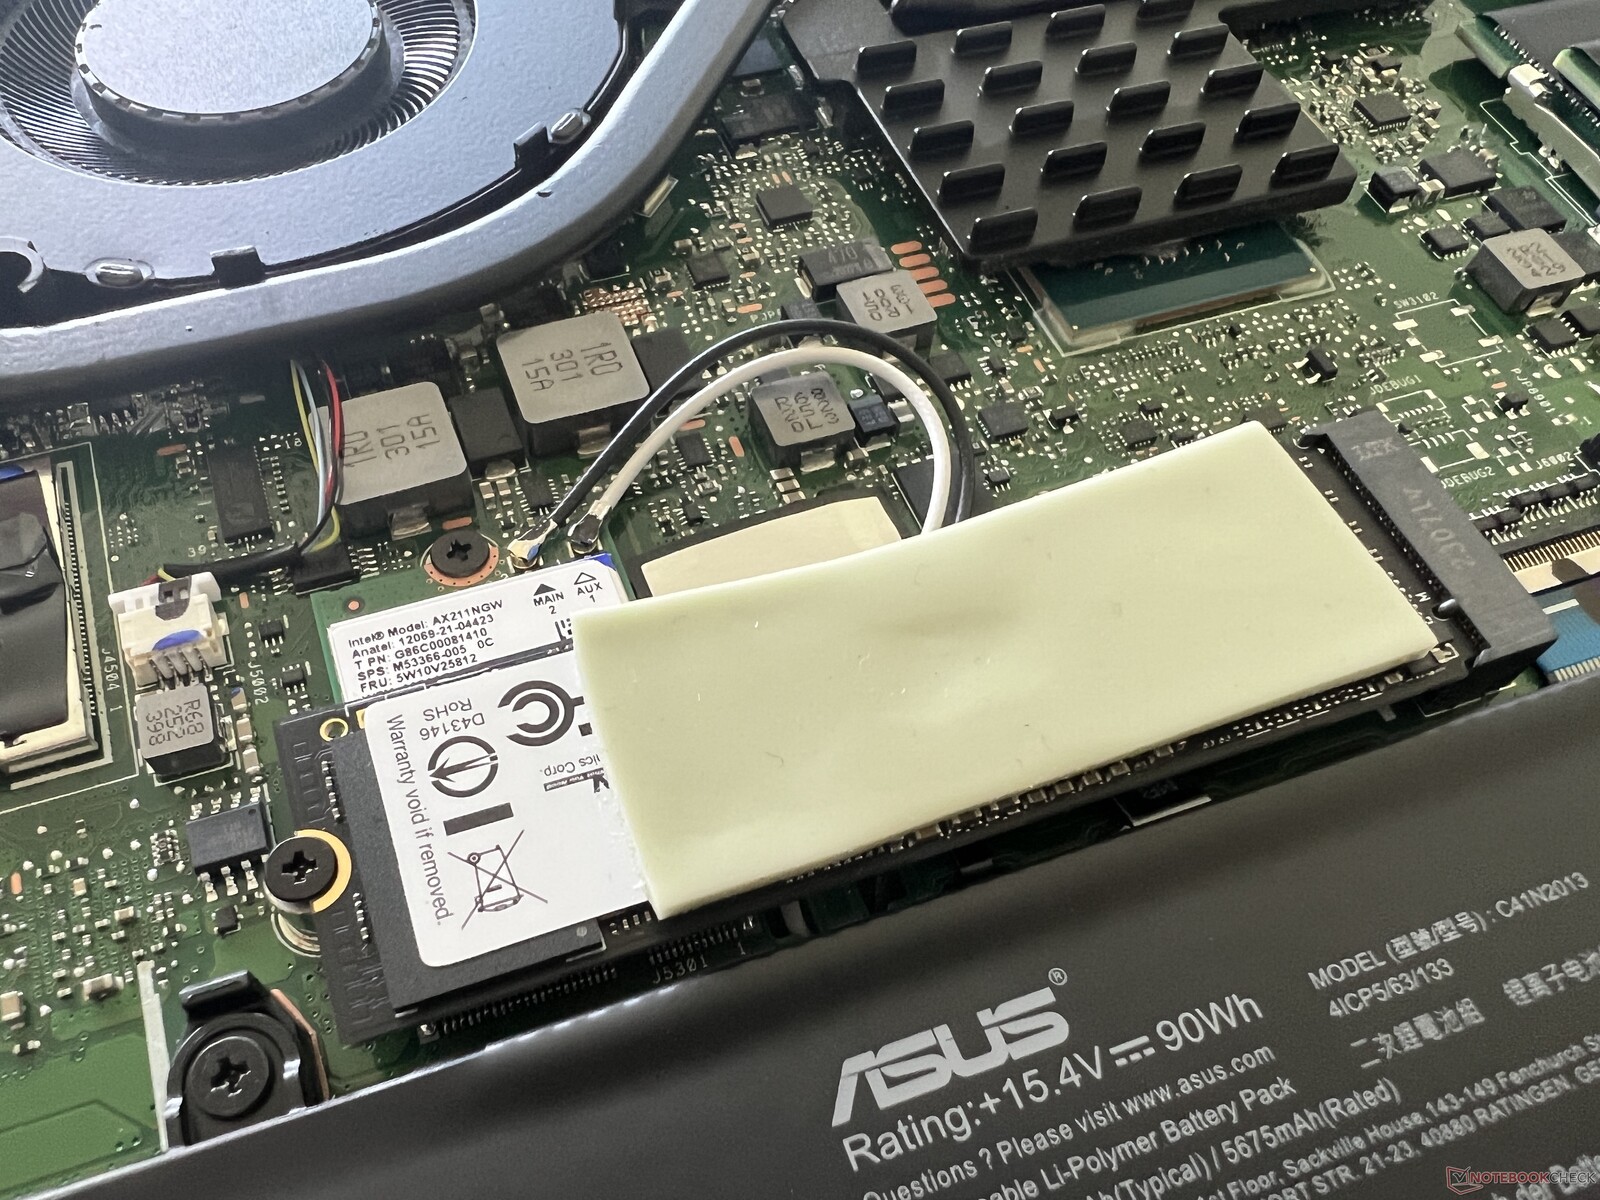
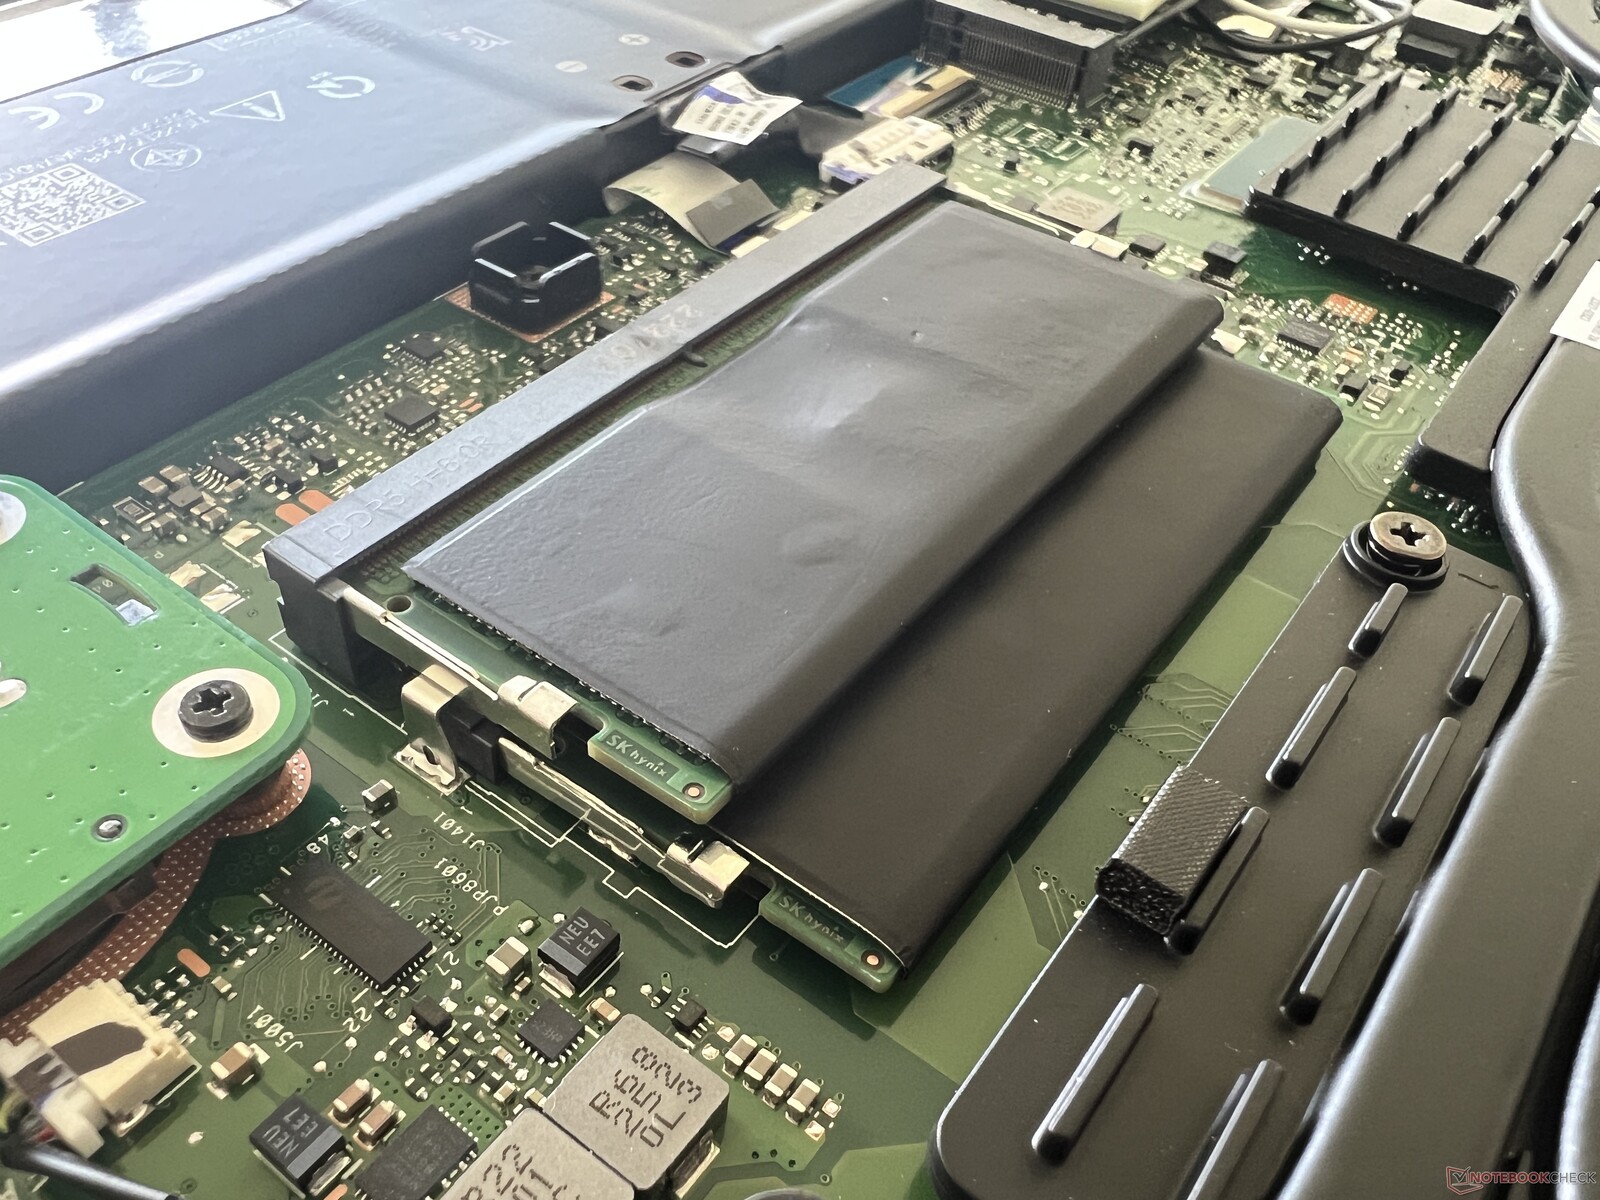
A Asus instala o moderno módulo WLAN AX211 da Intel, que está localizado abaixo do SSD primário e pode ser substituído. Em conjunto com nosso roteador de referência da Asus, as taxas de transferência são muito altas e estáveis. Não tivemos nenhum problema de estabilidade da WLAN durante nossa análise. Uma porta Ethernet de 2,5 Gbit/s para redes com fio também está disponível na parte traseira.
| Networking | |
| Asus ProArt Studiobook 16 OLED H7604 | |
| iperf3 transmit AXE11000 | |
| iperf3 receive AXE11000 | |
| Gigabyte AERO 16 OLED BSF | |
| iperf3 transmit AXE11000 6GHz | |
| iperf3 receive AXE11000 6GHz | |
| Samsung Galaxy Book3 Ultra 16 | |
| iperf3 transmit AXE11000 | |
| iperf3 receive AXE11000 | |
| MSI Stealth 17 Studio A13VH-014 | |
| iperf3 transmit AXE11000 | |
| iperf3 receive AXE11000 | |
| iperf3 transmit AXE11000 6GHz | |
| iperf3 receive AXE11000 6GHz | |
| Apple MacBook Pro 16 2023 M2 Max | |
| iperf3 transmit AXE11000 6GHz | |
| iperf3 receive AXE11000 6GHz | |
| Asus Zephyrus Duo 16 GX650PY-NM006W | |
| iperf3 transmit AXE11000 6GHz | |
| iperf3 receive AXE11000 6GHz | |
Webcam
A webcam de 1080p tira fotos decentes em boas condições de iluminação, mas elas também ficam um pouco distorcidas. Um módulo de infravermelho também está instalado, com suporte para reconhecimento facial via Windows Hello.


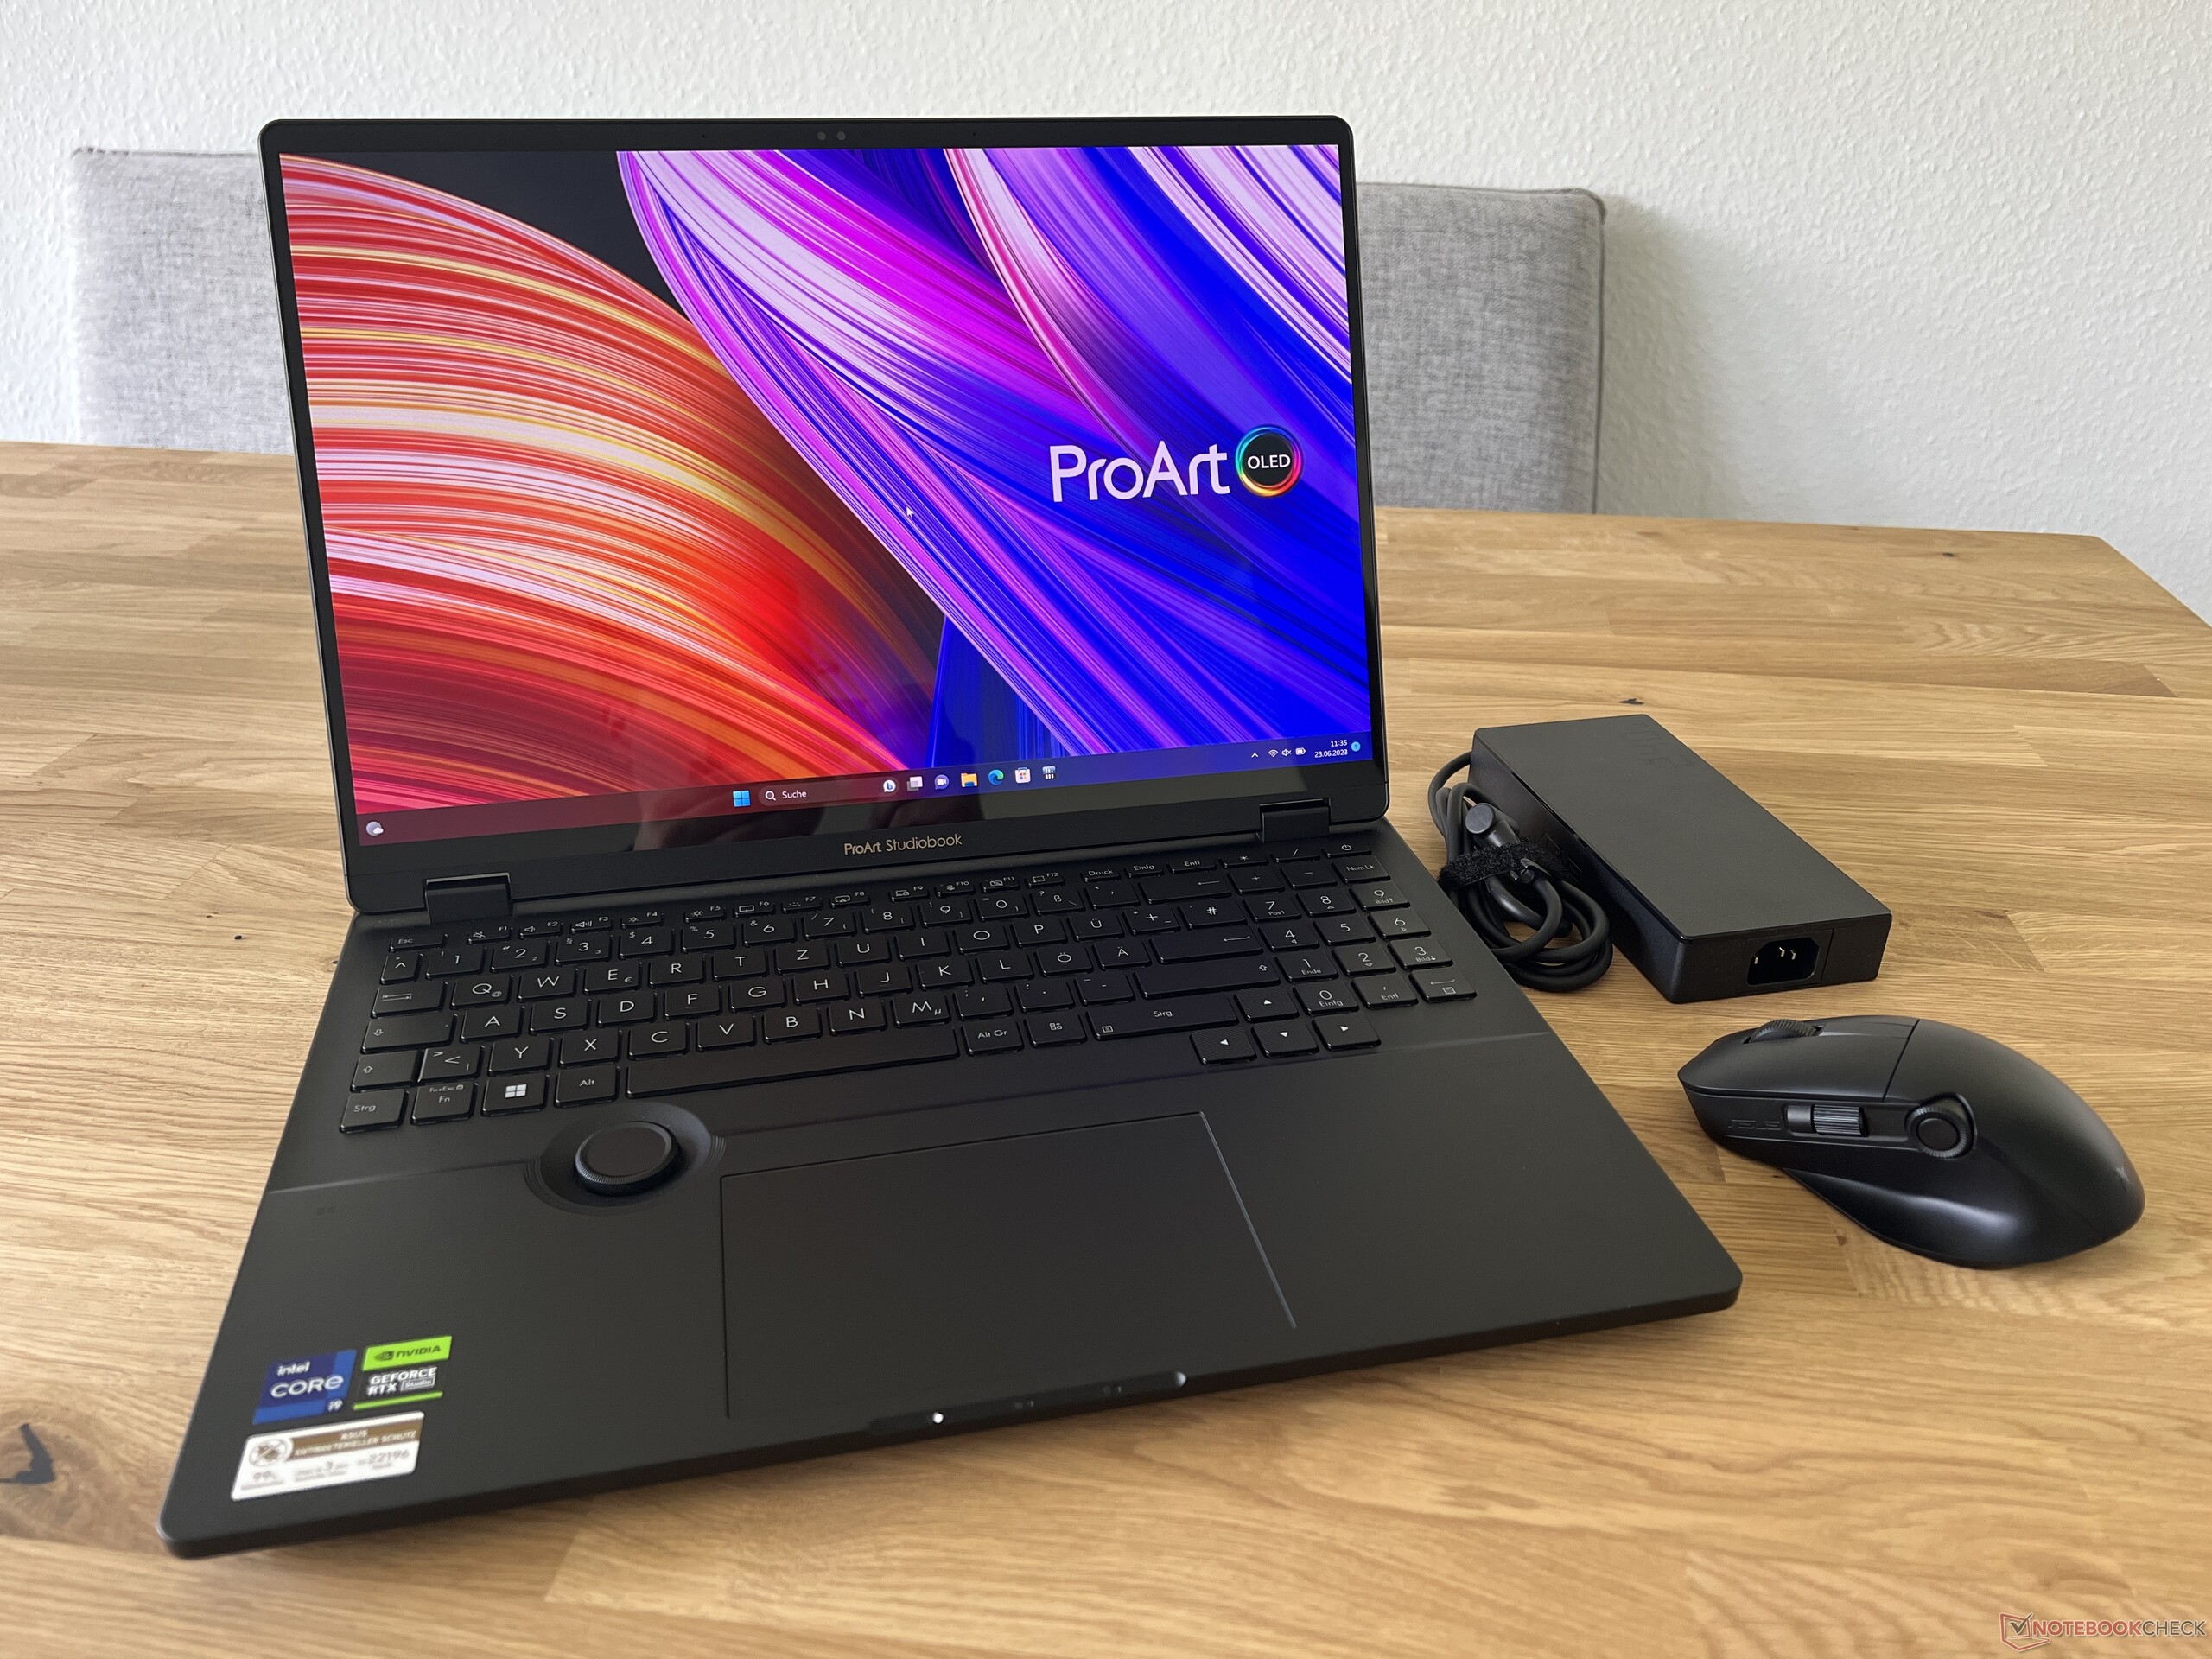
Acessórios
Nosso dispositivo de teste foi enviado com a Asus Pen 2.0 e com o mouse sem fio ProArt MD300, cujo preço sugerido é de US$ 180. Assim como o próprio laptop, o mouse tem um pequeno DialPad instalado na lateral. A possibilidade de usá-lo de forma significativa depende do software em uso. É um pouco irritante ter que instalar o ArmoryCrate para ajustar as configurações do mouse e não poder fazer isso no ProArt Creator Hub. Nos testes, o mouse funcionou perfeitamente e os cliques foram muito precisos, mas também altos. Os botões silenciosos dos mouses da Logitech, por exemplo, são muito mais silenciosos.
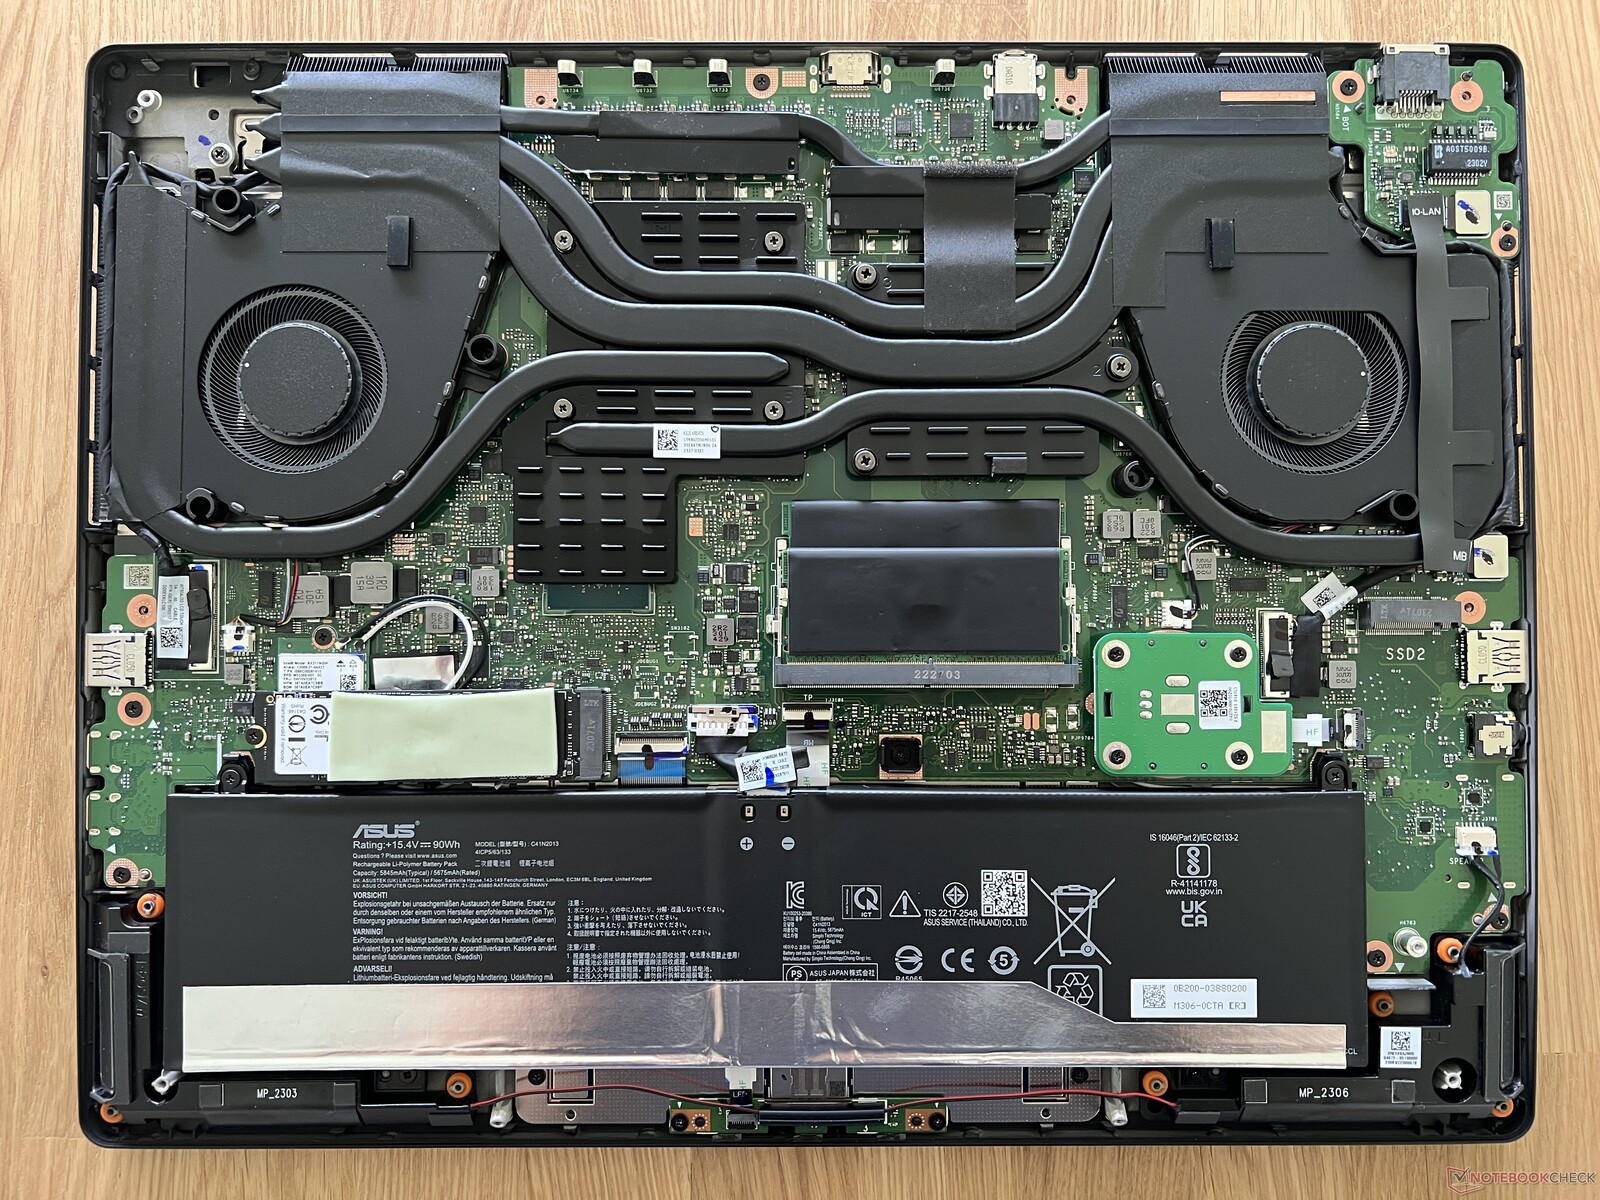
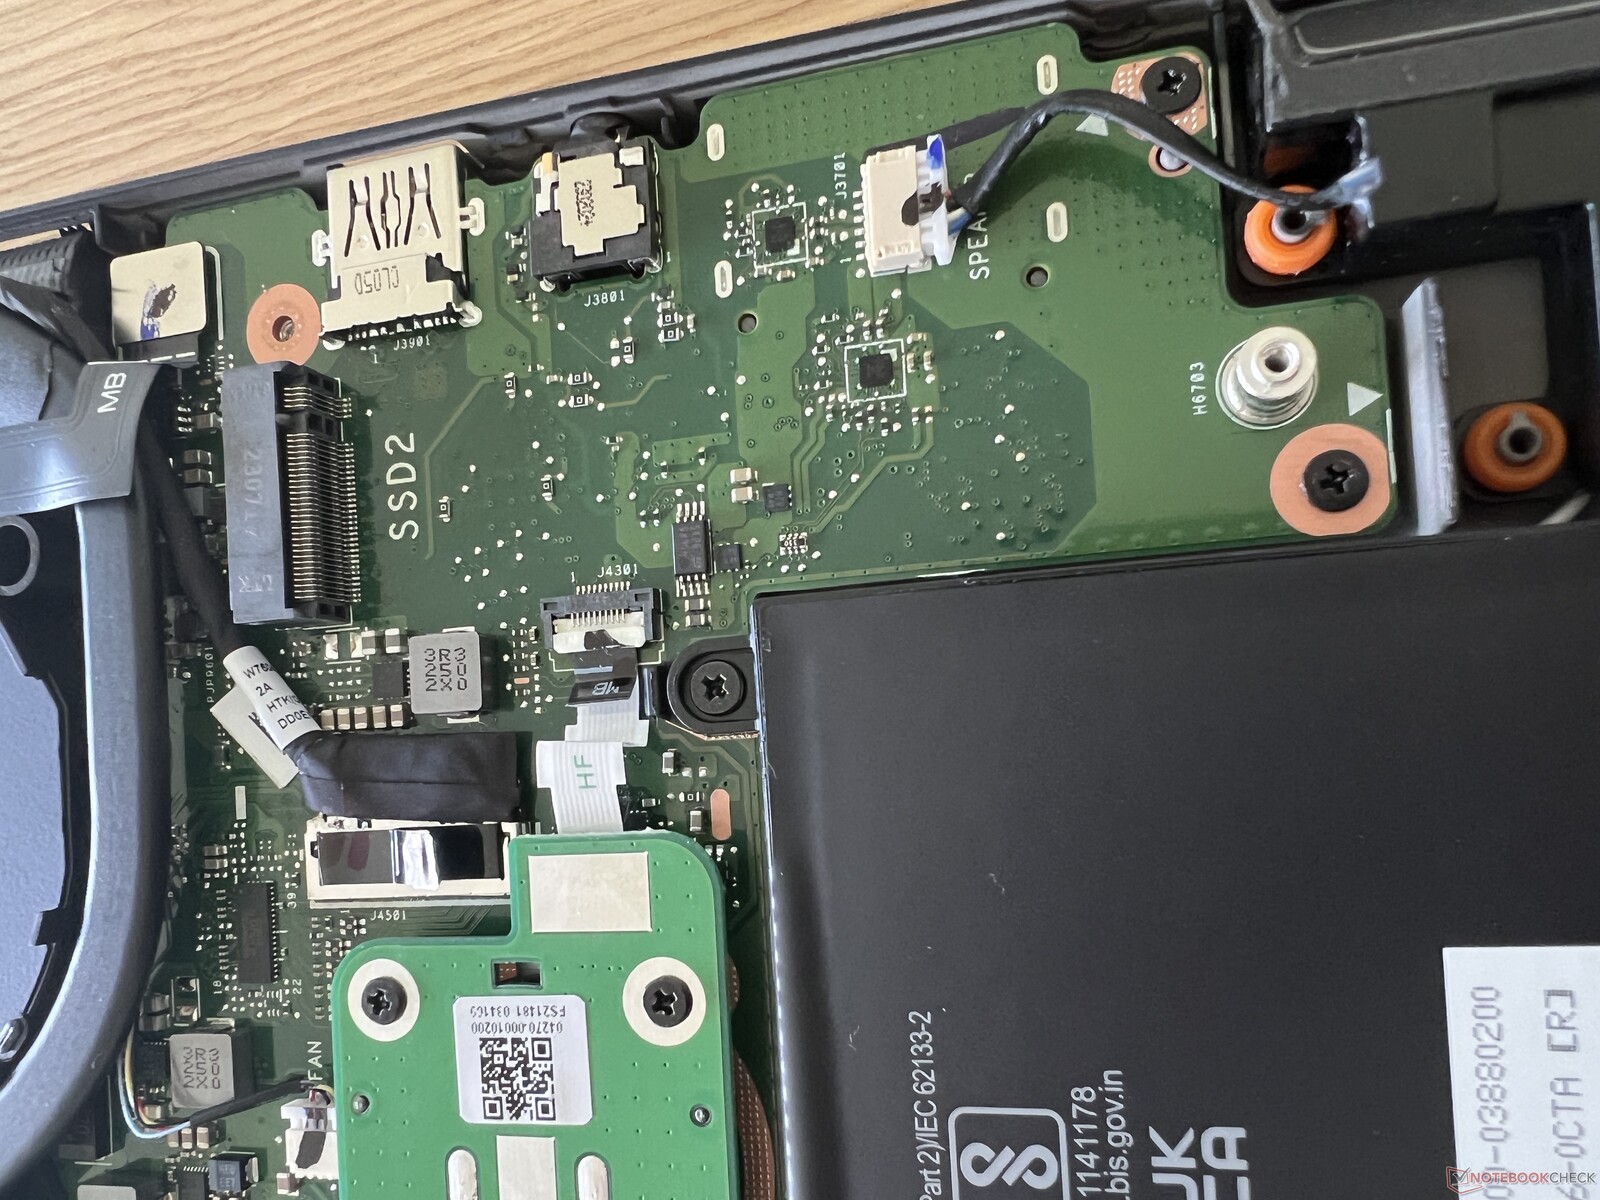
Manutenção
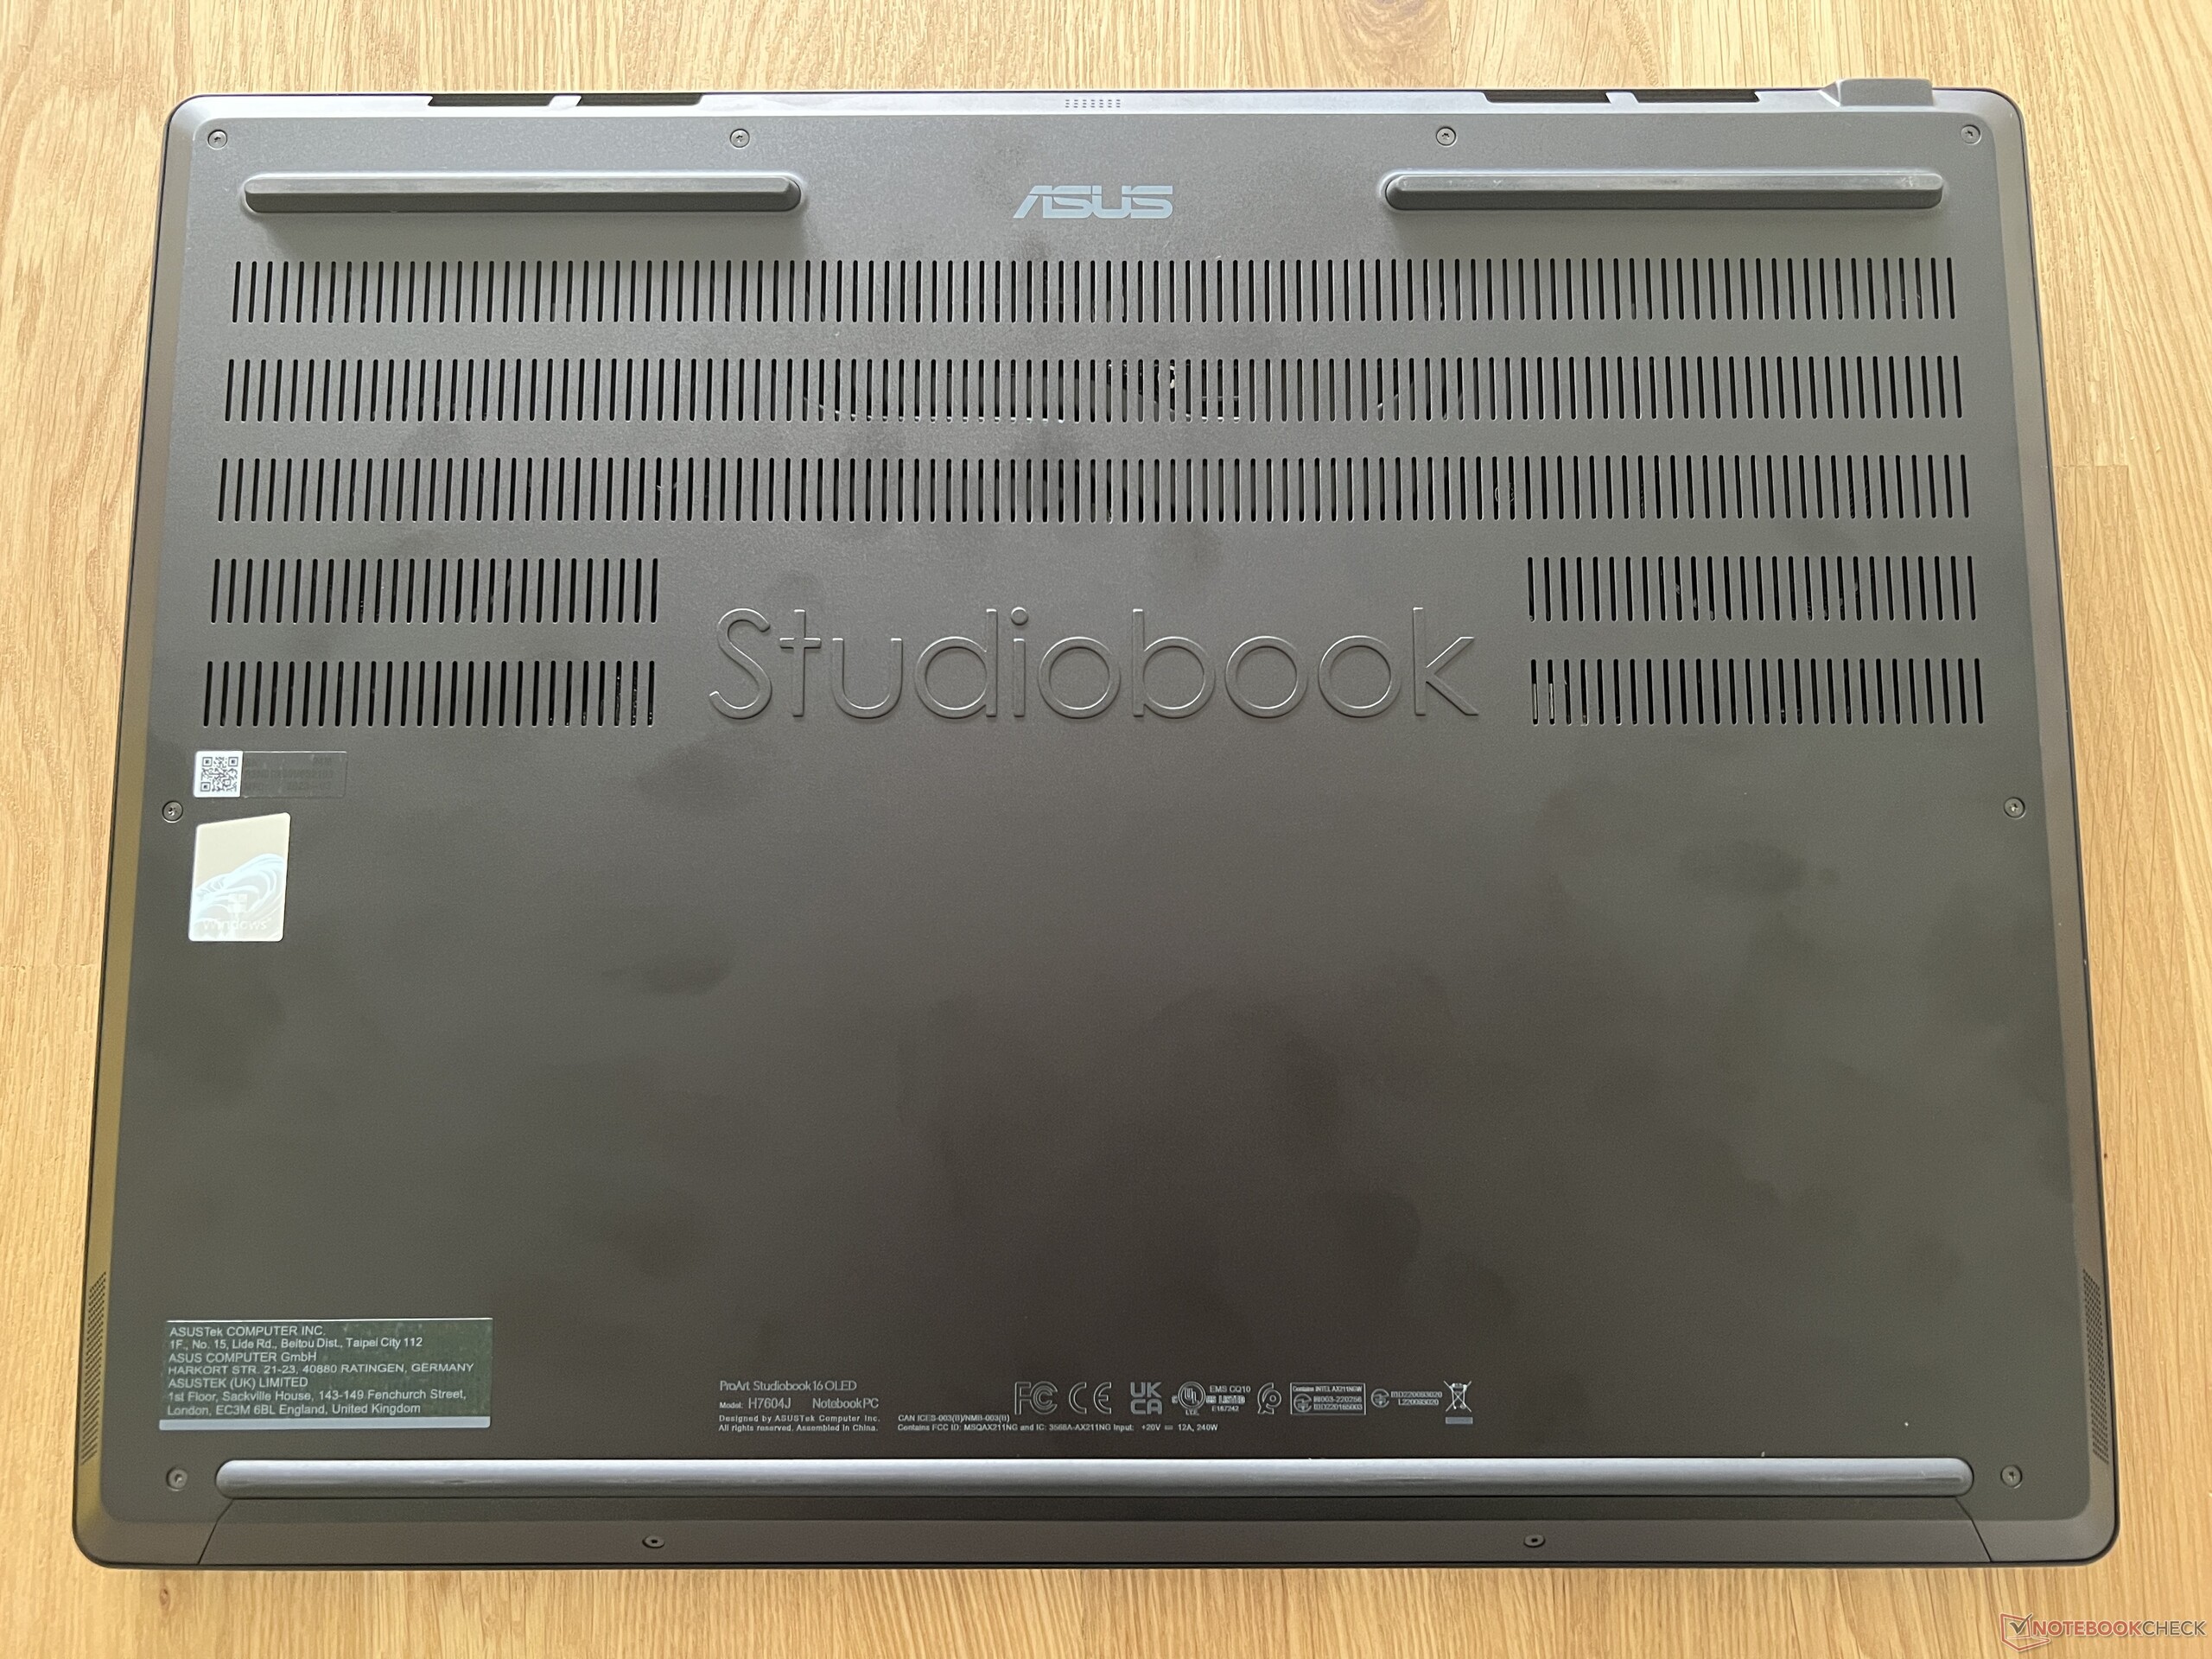
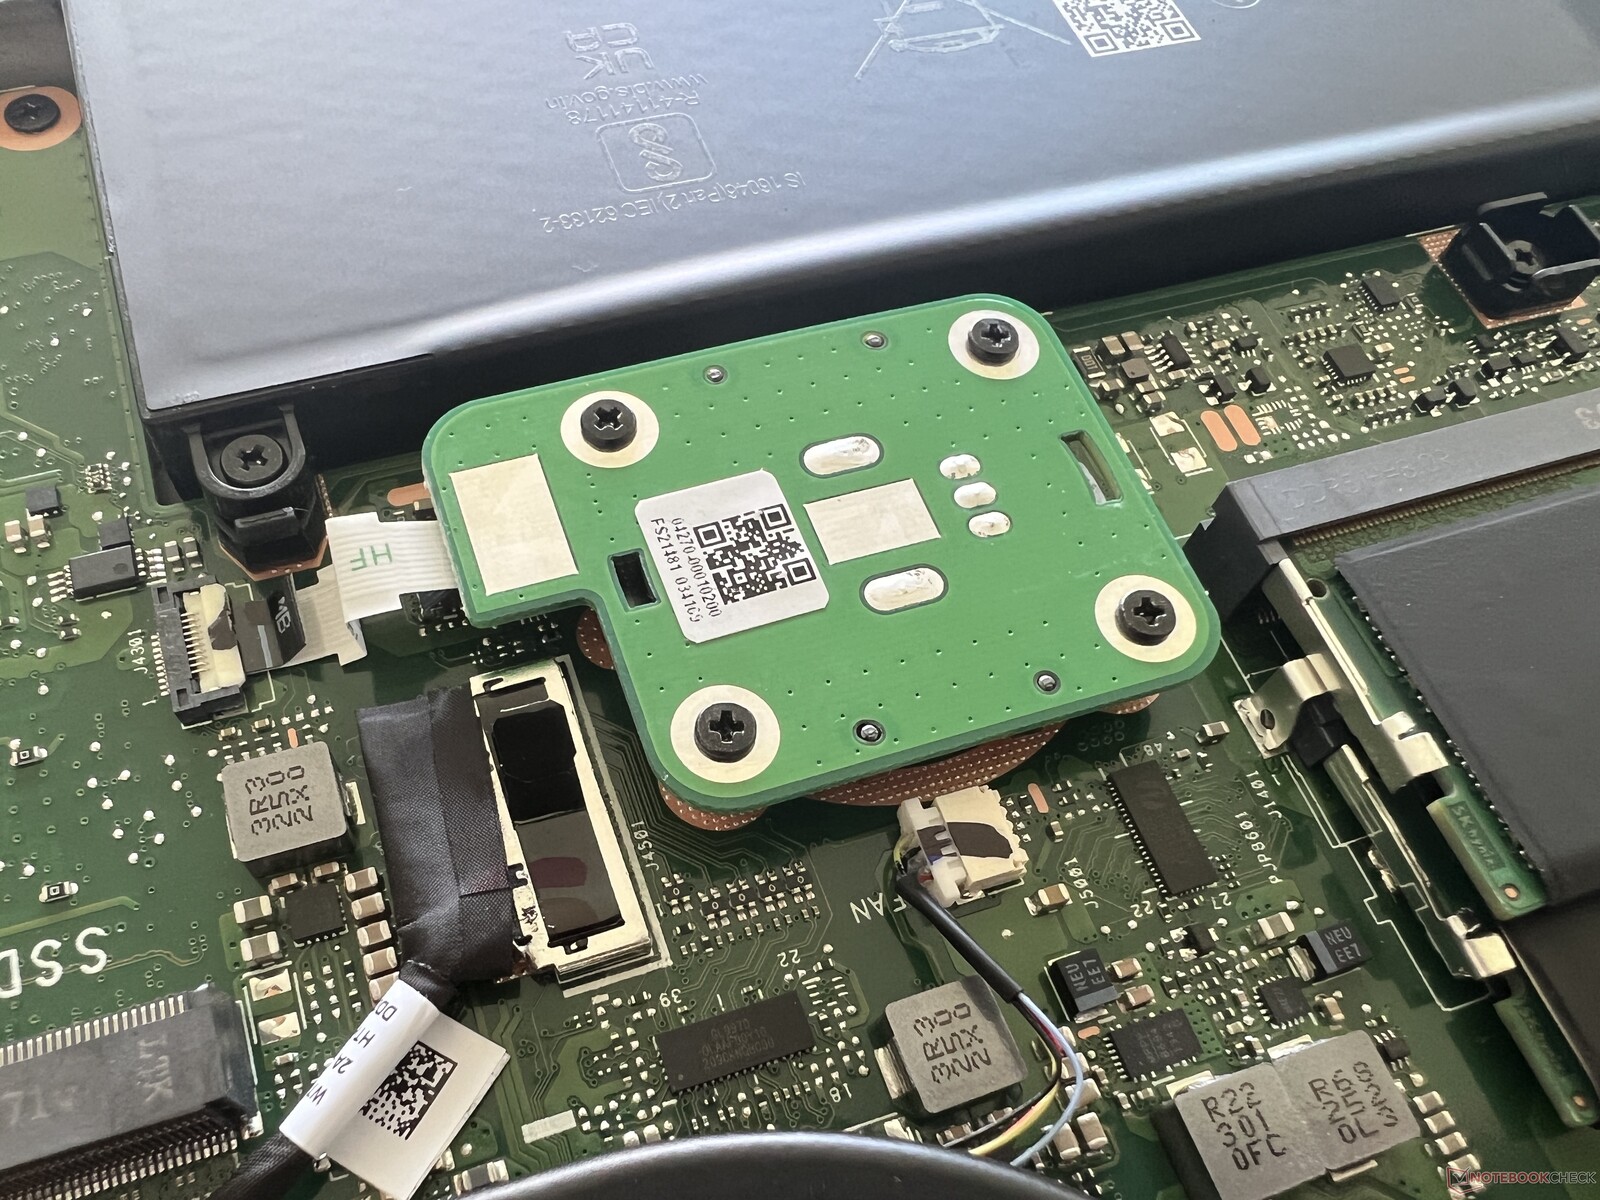
A tampa inferior do gabinete é fixada com 10 parafusos Torx (T5) e ainda está muito apertada depois que esses parafusos são removidos. A maneira mais fácil de abrir a tampa é pelas saídas do ventilador traseiro. No interior, o grande sistema de resfriamento domina e as opções de manutenção também são muito boas, desde o módulo WLAN (abaixo do SSD primário), dois slots SO DIMM até os dois slots M.2 2280 para SSDs. O que também chama a atenção aqui é a quantidade de espaço que o DialPad adicional ocupa
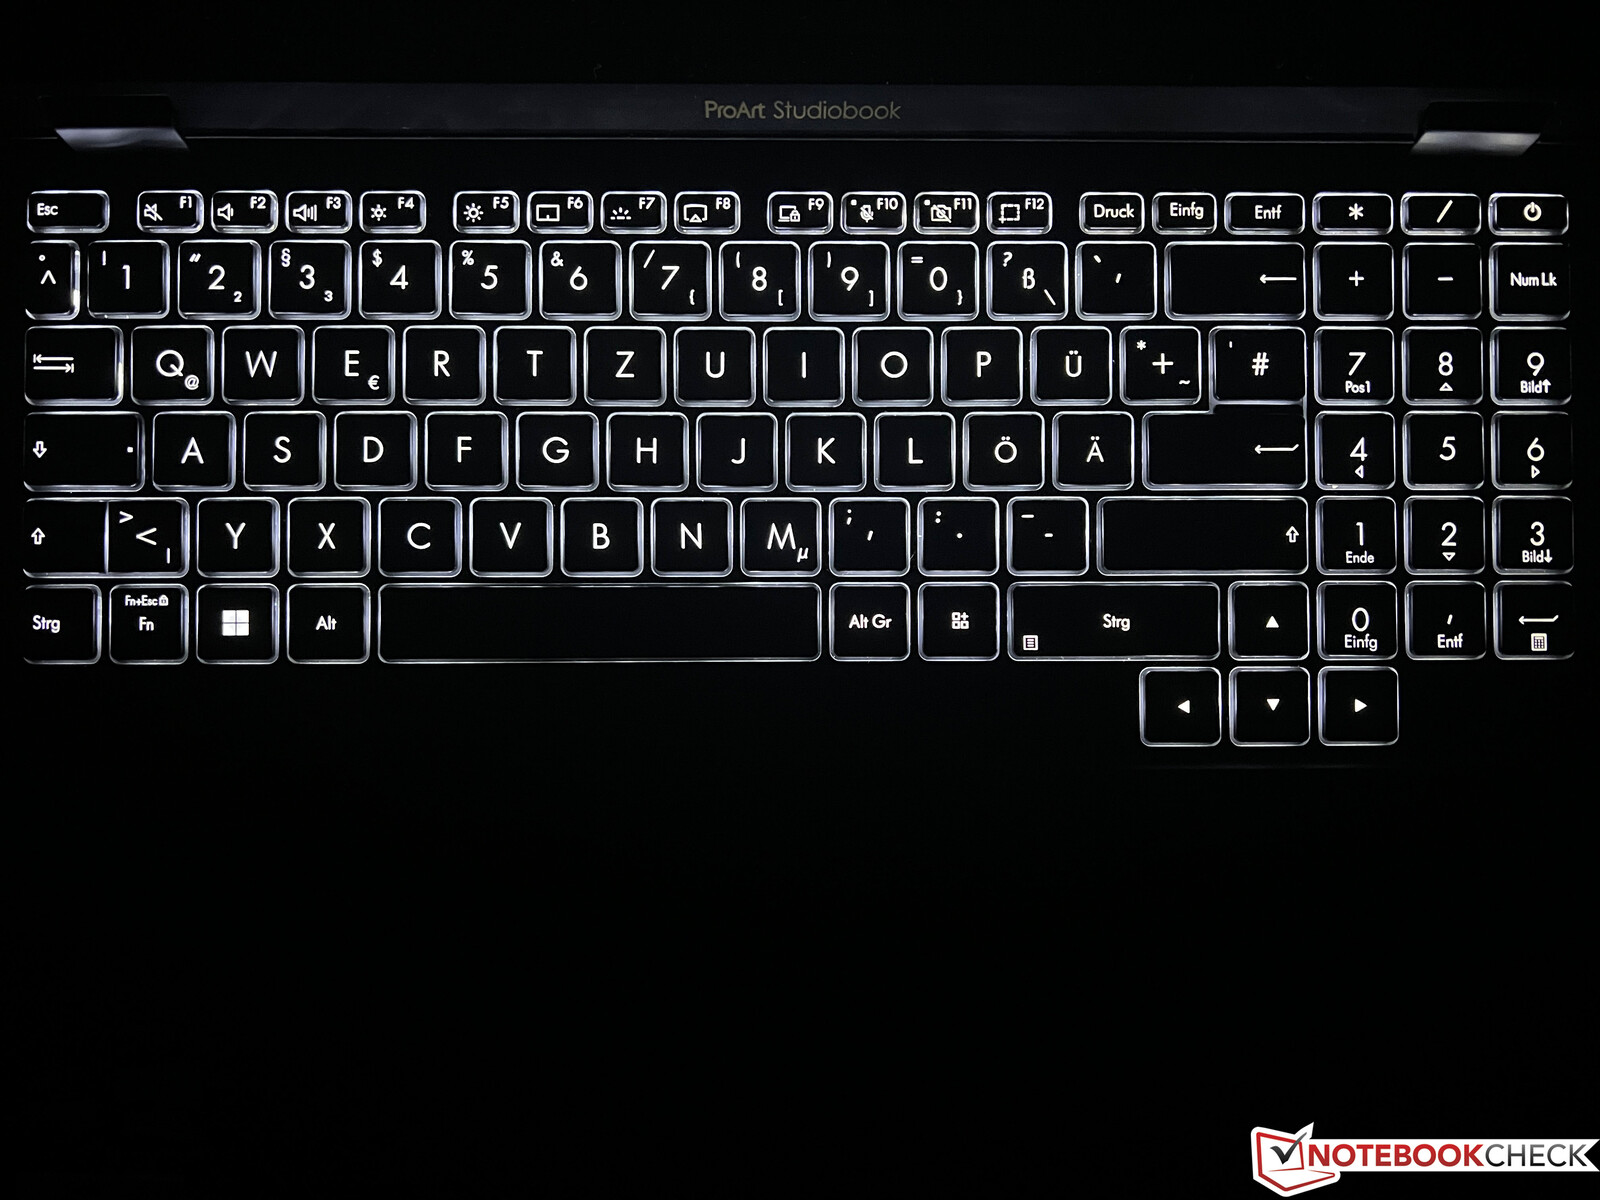
Dispositivos de entrada - DialPad e teclado numérico
Teclado
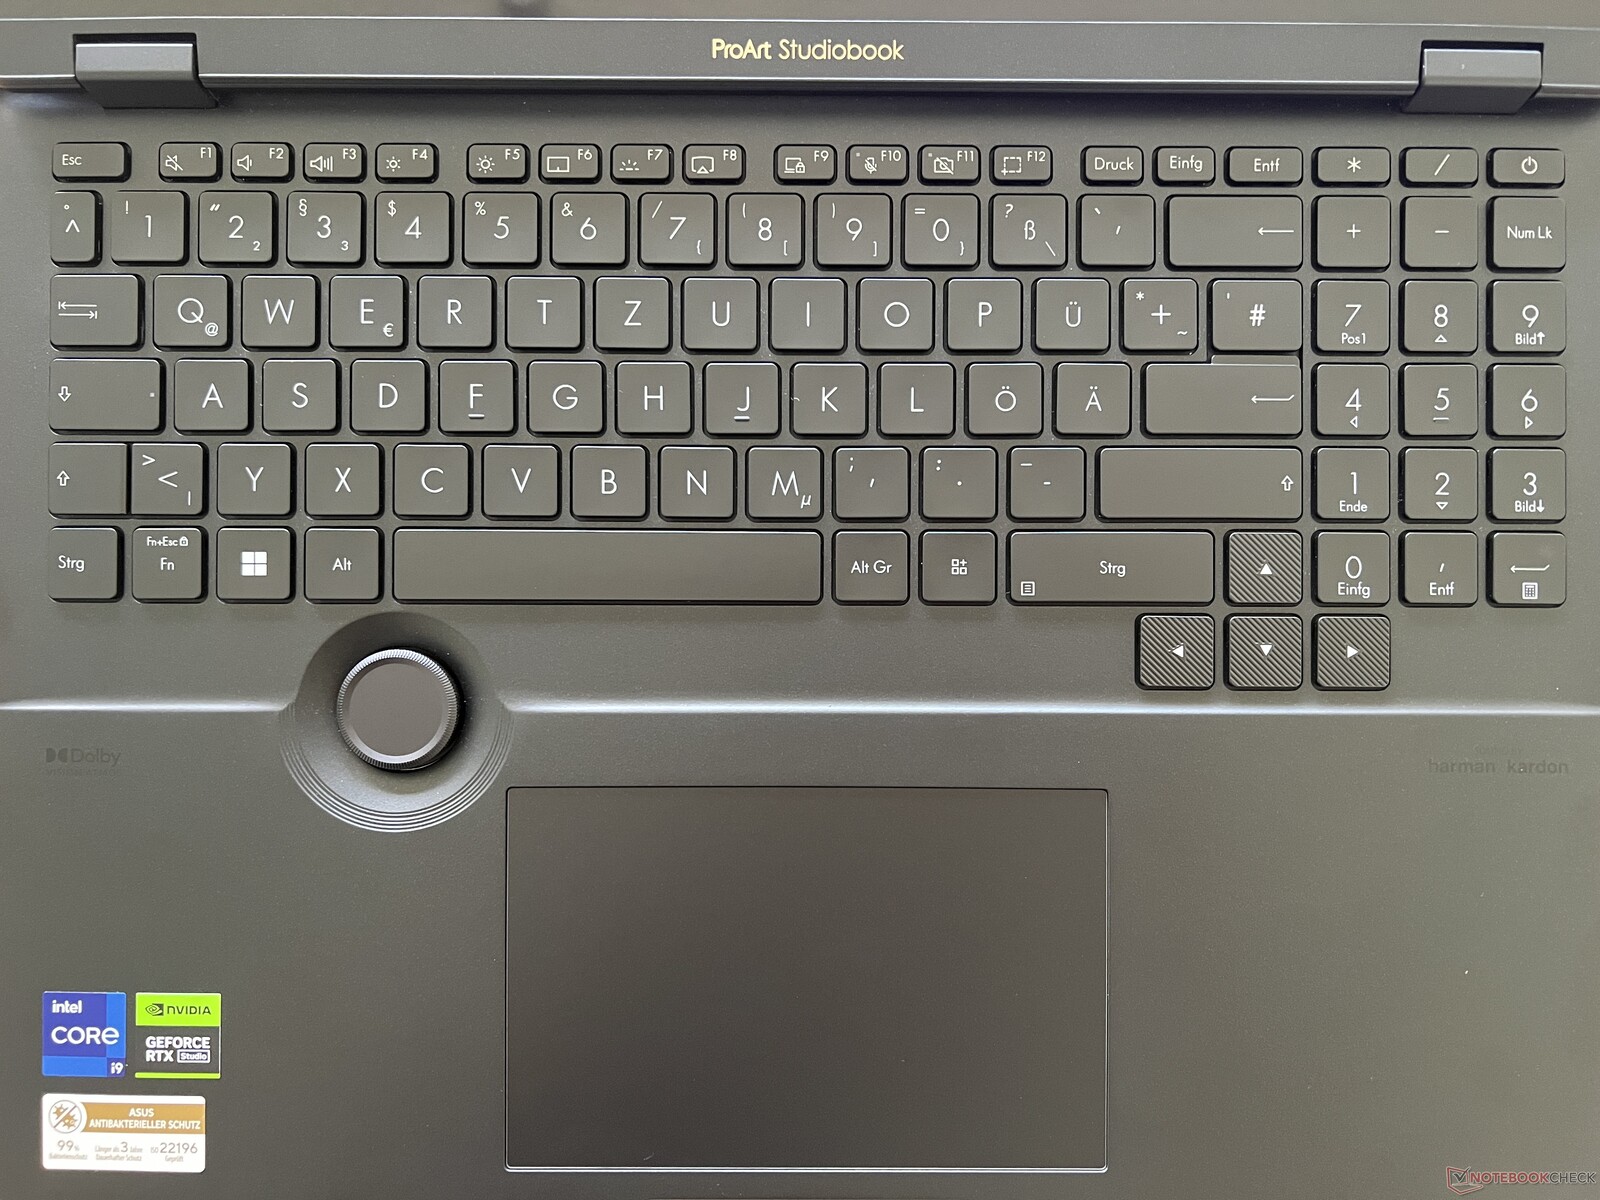
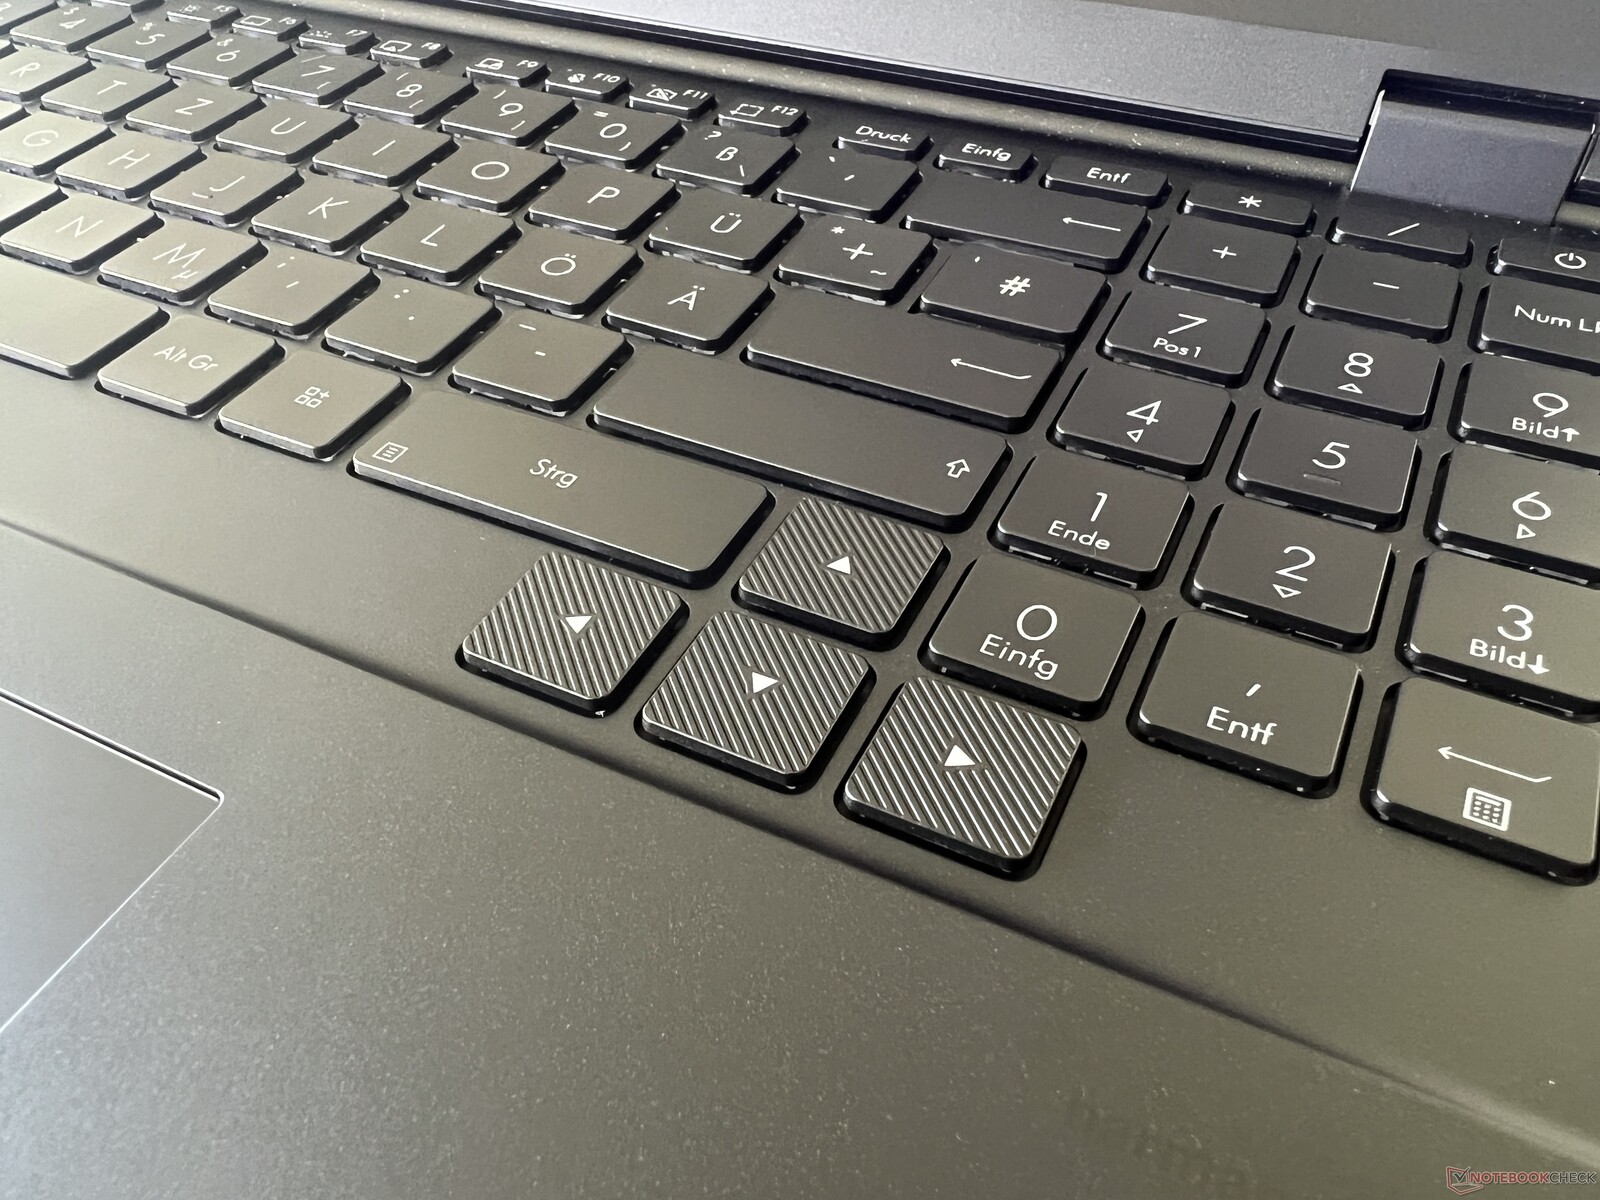
O teclado tem um deslocamento de 1,4 mm e um teclado numérico dedicado. A sensação de digitação é boa, mas as teclas não são as mais silenciosas e a barra de espaço, em particular, é bastante barulhenta. Também é preciso se acostumar um pouco com o layout, pois as teclas de seta são grandes, mas foram deslocadas para baixo. A tecla Enter de uma única linha também não é perfeita. Há uma iluminação branca de três estágios, mas ela não é ativada automaticamente pelo sensor.
Touchpad
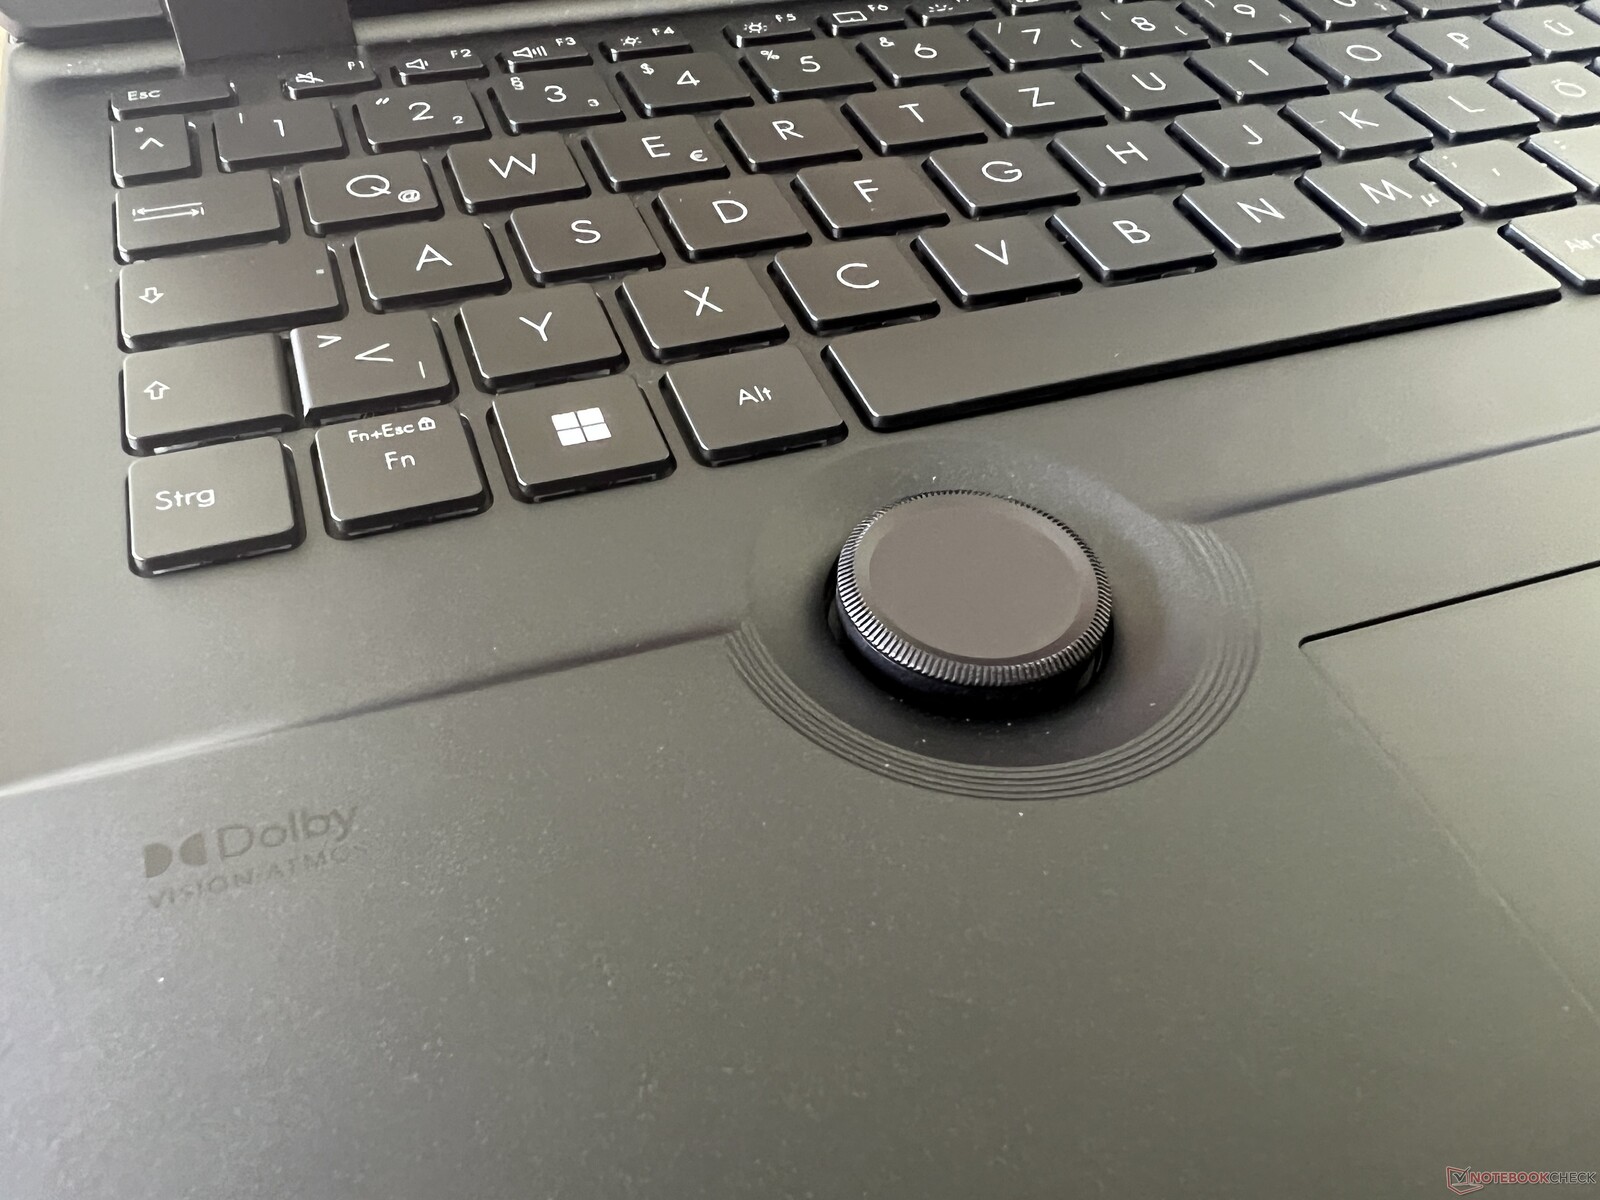
O touchpad grande funciona de forma excelente e pode ser clicado em qualquer lugar, o que se caracteriza por um ruído de clique rico e silencioso. O recurso especial é o DialPad, um grande botão giratório entre o touchpad e o teclado. A implementação com os aplicativos da Adobe funciona bem, mas a combinação de mouse e teclas geralmente é mais rápida. No uso normal do desktop, o brilho e o volume também podem ser ajustados por meio do DialPad, mas isso é muito mais rápido por meio das teclas especiais normais ou das teclas F.
Tela - painel OLED a 120 Hz
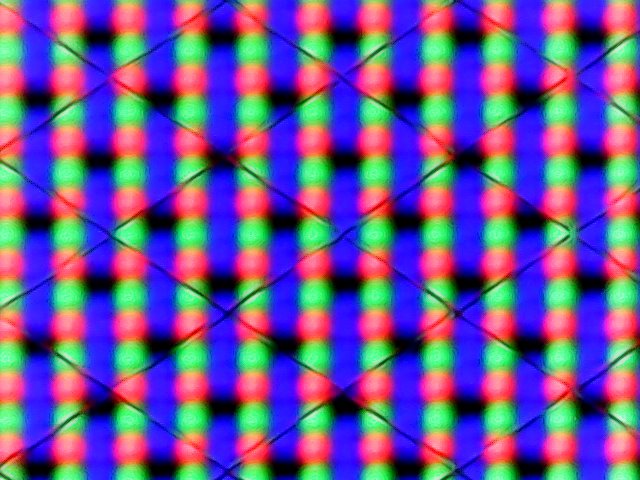
Atualmente, a Asus está totalmente comprometida com as telas OLED e o Studiobook não é exceção. Em contraste com o antecessor com sua tela OLED 4K, aqui é usada uma tela touchscreen OLED com 3.200 x 2.000 pixels e uma frequência mais alta de 120 Hz. A qualidade subjetiva da imagem é muito boa, mas, como no ZenBook Pro 14 analisado recentemente, as áreas brilhantes parecem um pouco granuladas após uma inspeção mais detalhada, o que se deve à camada de toque. O brilho não se ajusta automaticamente à luz ambiente.
Determinamos um brilho médio de 350 cd/m² no modo SDR normal, mas graças ao valor de preto extremamente baixo dos painéis OLED, a taxa de contraste é muito alta. No modo HDR, o máximo é de quase 580 cd/m² em uma pequena seção de imagem e cerca de 480 cd/m² em uma imagem quase totalmente branca. No entanto, o modo HDR precisa ser ativado manualmente nas configurações do Windows primeiro, depois disso os perfis de cores não podem mais ser usados. Não há halos nos painéis OLED.
| |||||||||||||||||||||||||
iluminação: 95 %
iluminação com acumulador: 346 cd/m²
Contraste: 17450:1 (Preto: 0.02 cd/m²)
ΔE ColorChecker Calman: 2.1 | ∀{0.5-29.43 Ø4.71}
calibrated: 2.1
ΔE Greyscale Calman: 1.2 | ∀{0.09-98 Ø4.96}
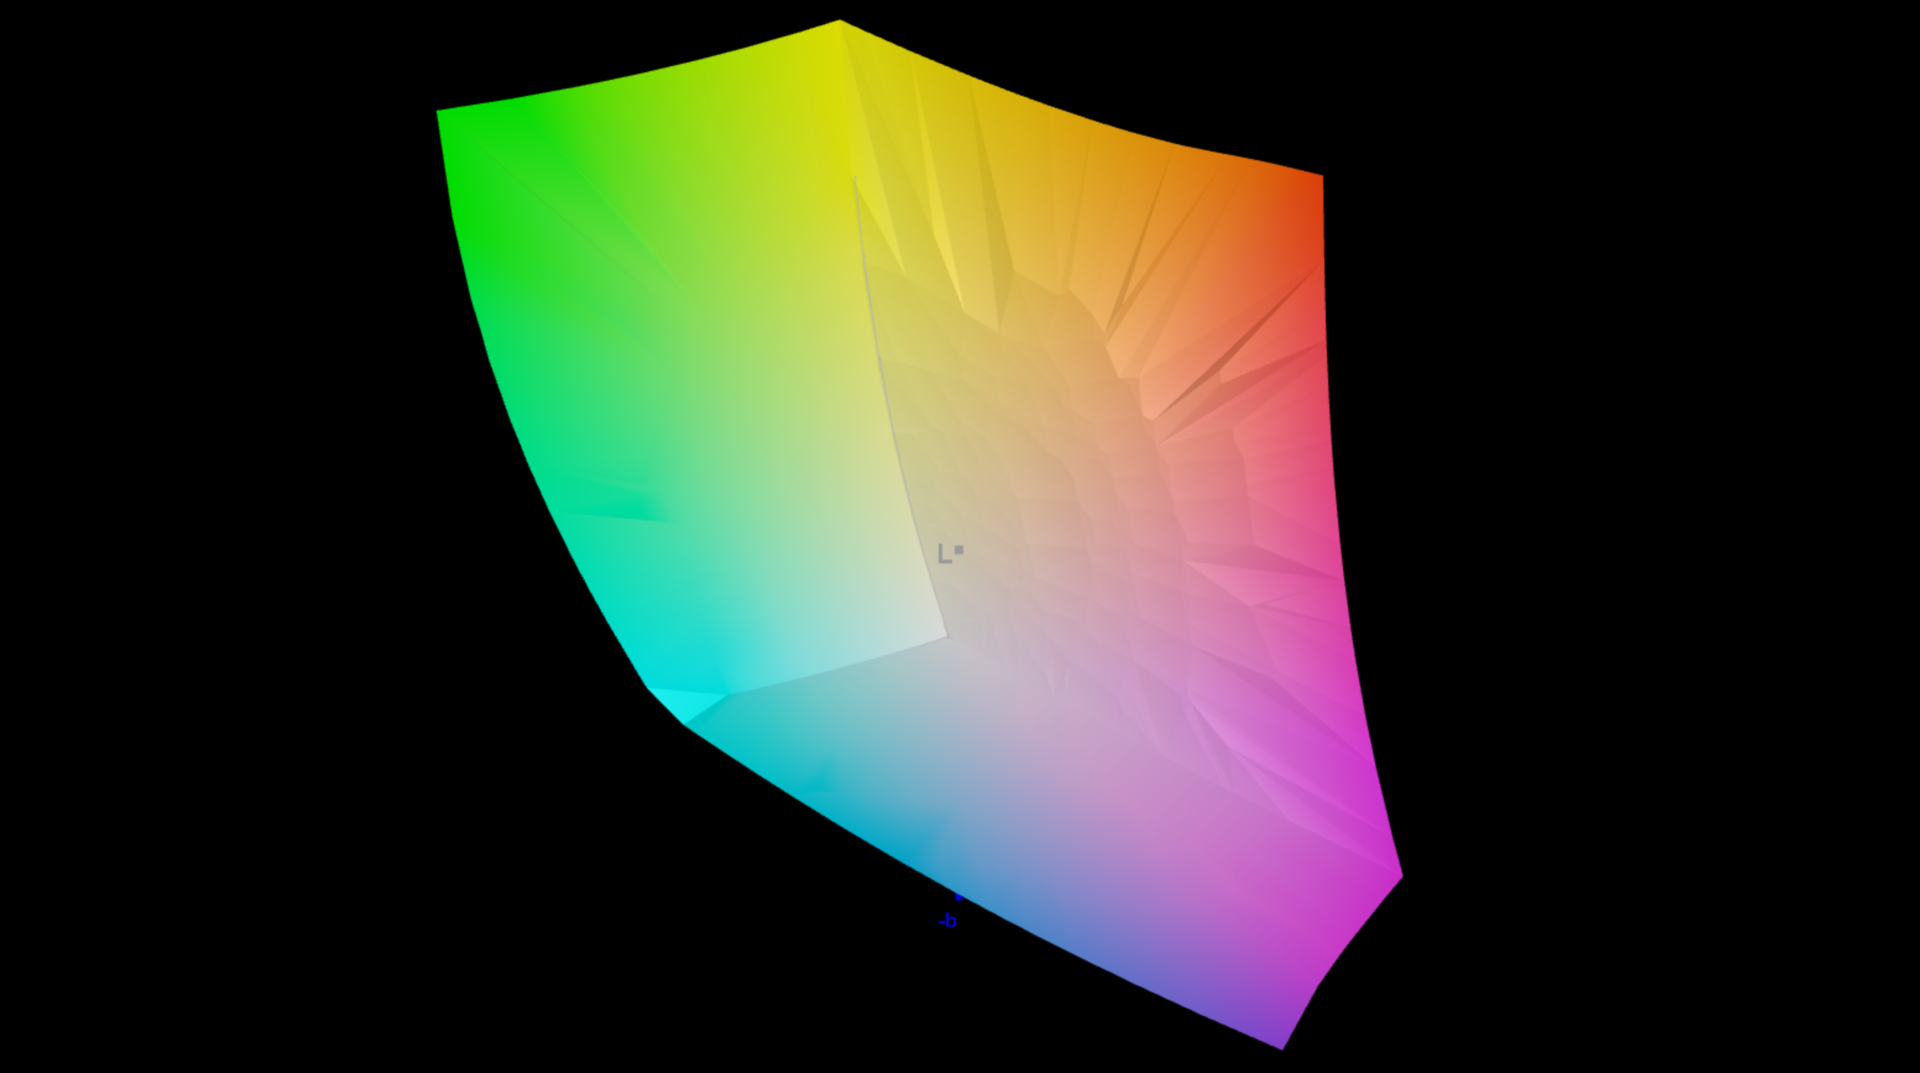
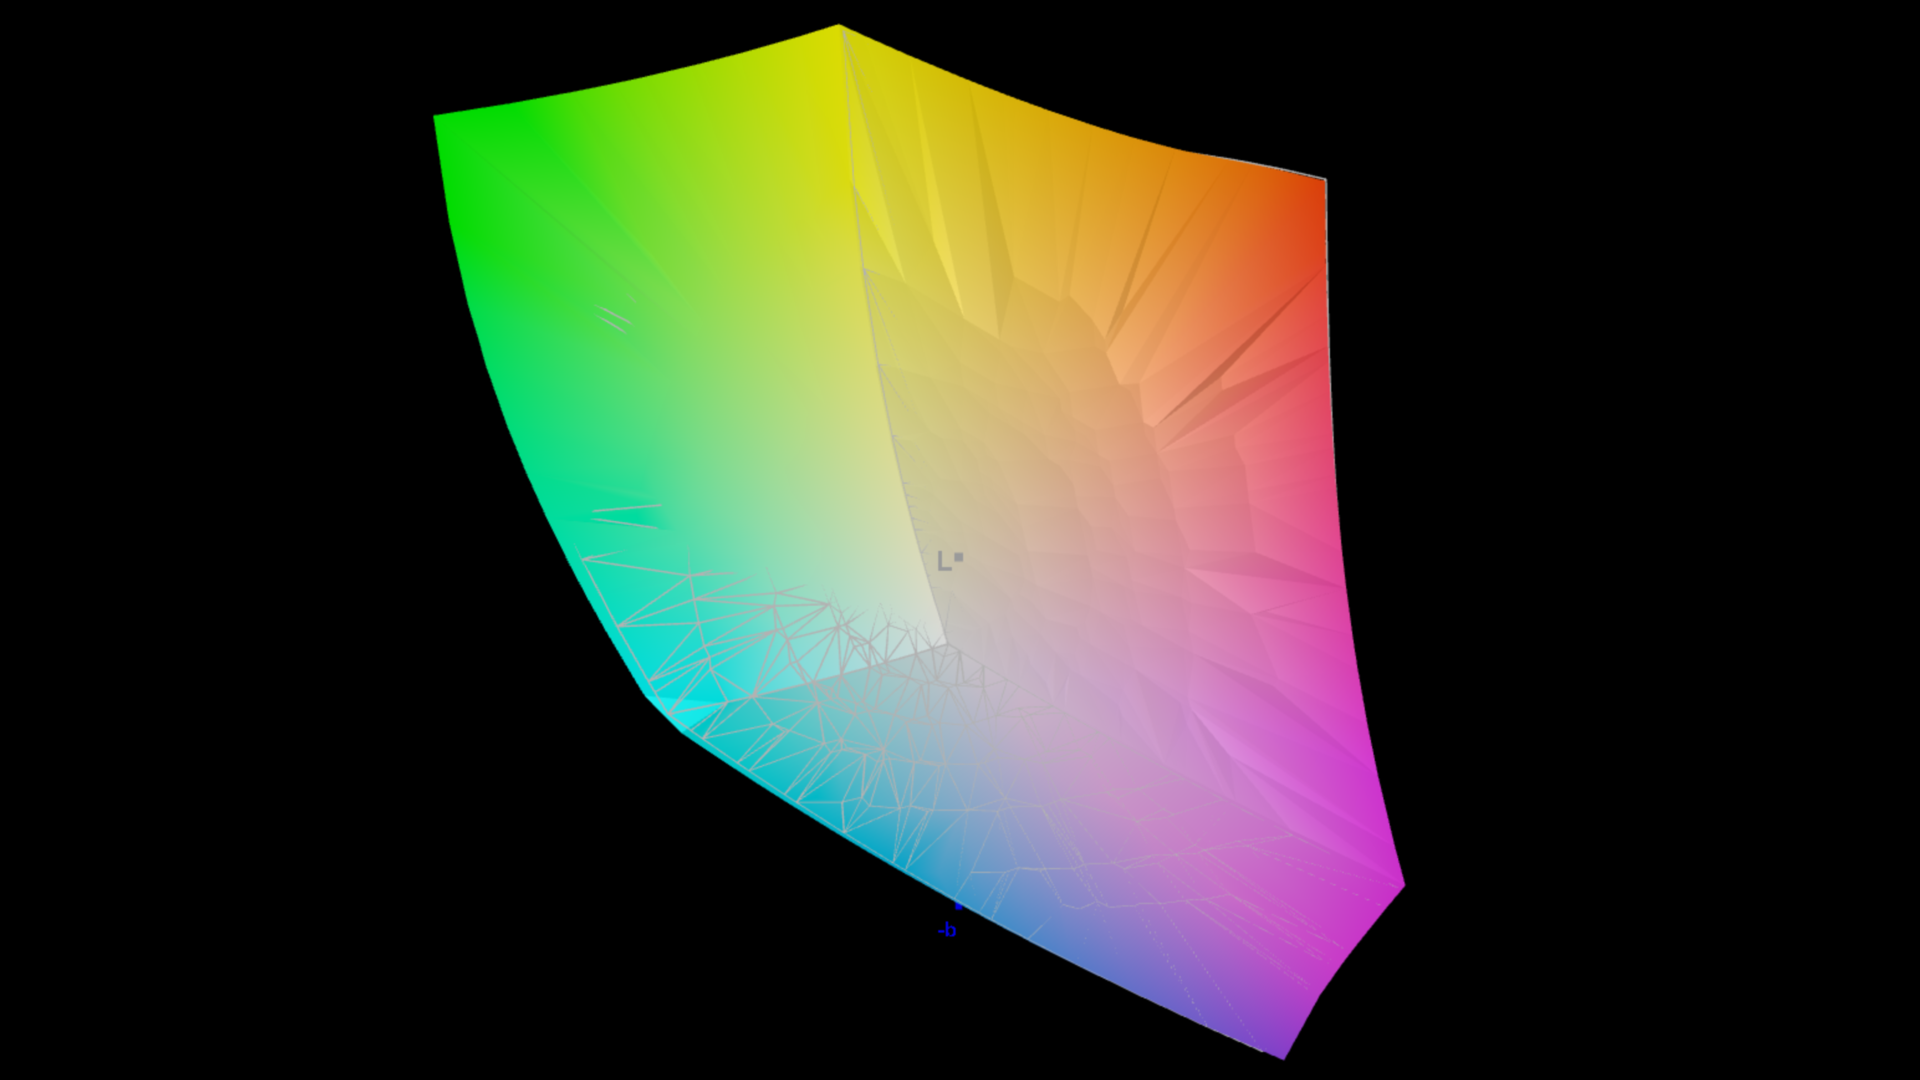
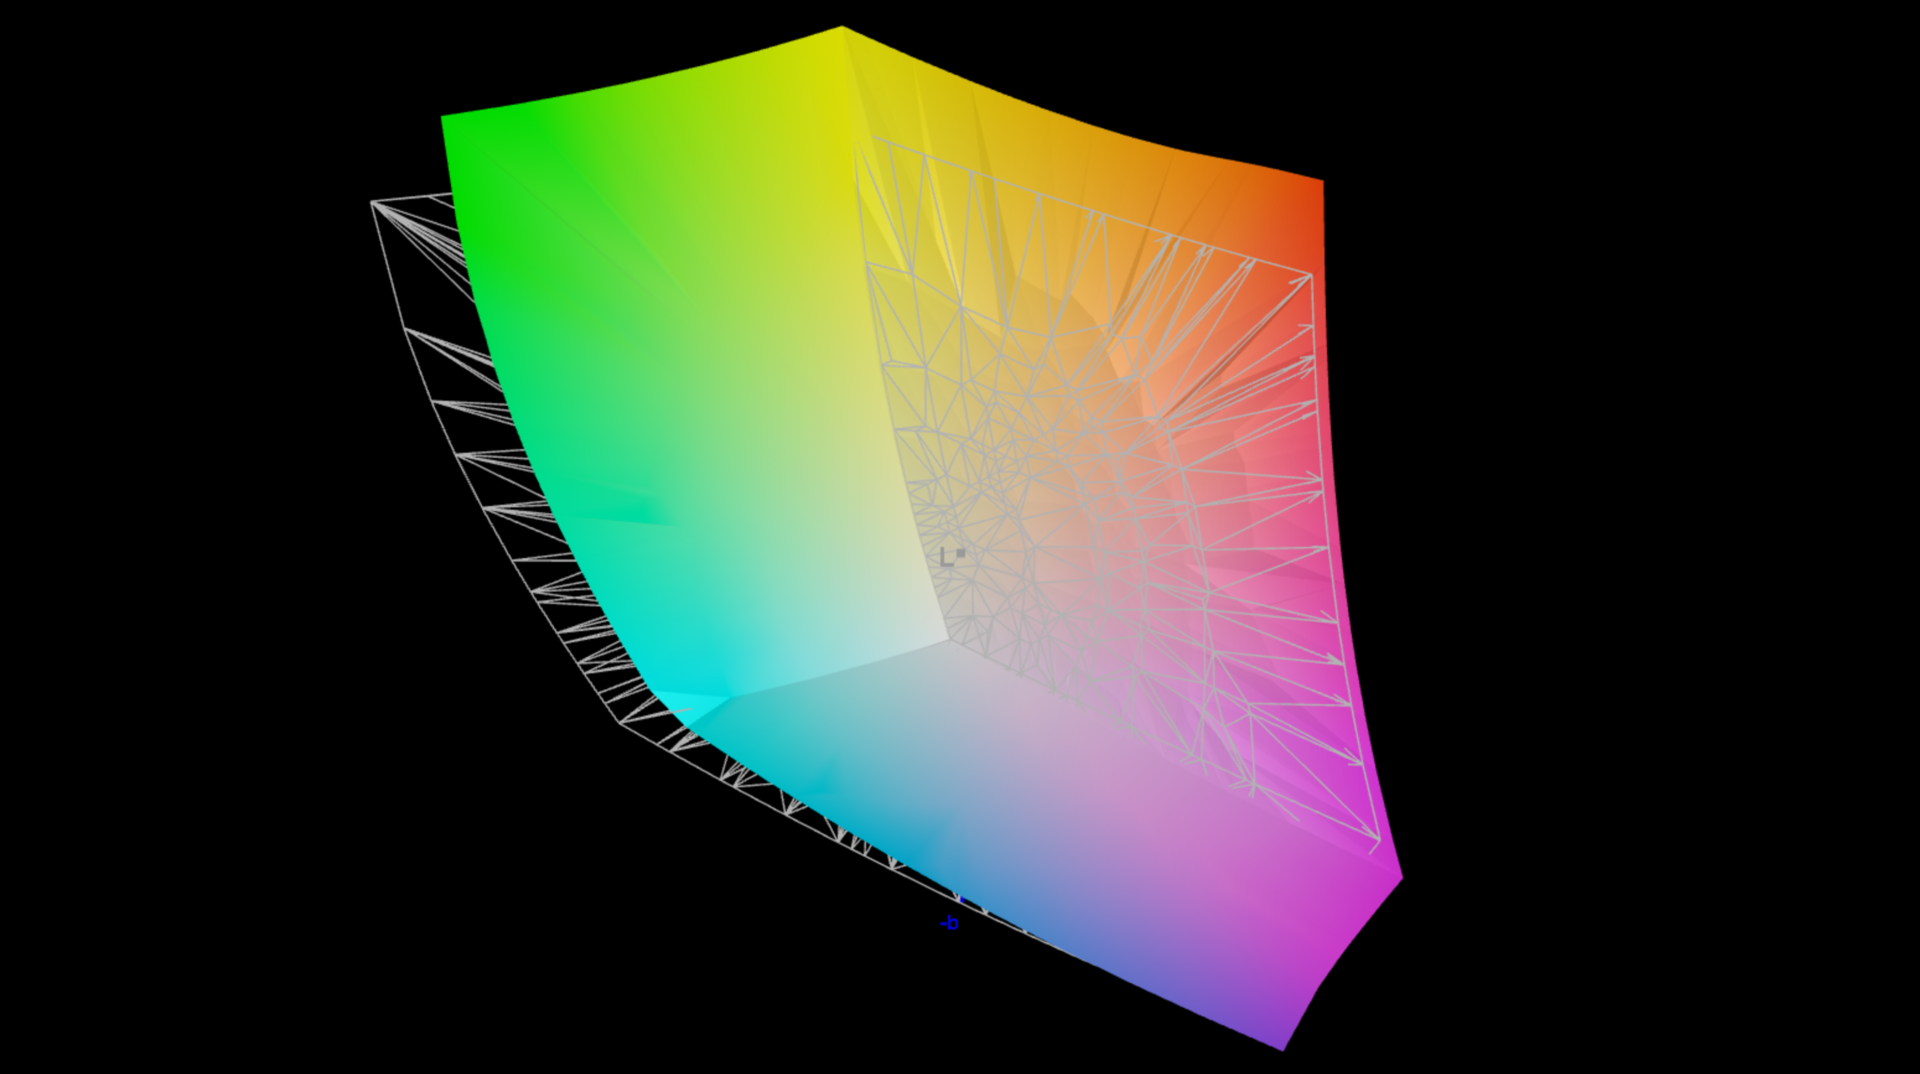
89.4% AdobeRGB 1998 (Argyll 3D)
100% sRGB (Argyll 3D)
99.6% Display P3 (Argyll 3D)
Gamma: 2.19
CCT: 6545 K
| Asus ProArt Studiobook 16 OLED H7604 ATNA60BX01-1, OLED, 3200x2000, 16" | Gigabyte AERO 16 OLED BSF Samsung SDC4191 (ATNA60YV09-0, OLED, 3840x2400, 16" | Samsung Galaxy Book3 Ultra 16 Samsung ATNA60CL03-0, AMOLED, 2880x1800, 16" | MSI Stealth 17 Studio A13VH-014 AUO41A2 B173ZAN06.C, Mini LED, 3840x2160, 17.3" | Apple MacBook Pro 16 2023 M2 Max Mini-LED, 3456x2234, 16.2" | Asus Zephyrus Duo 16 GX650PY-NM006W NE160QDM-NM4, MiniLED, 2560x1600, 16" | |
|---|---|---|---|---|---|---|
| Display | 3% | 3% | -1% | -1% | 1% | |
| Display P3 Coverage (%) | 99.6 | 99.9 0% | 99.9 0% | 92 -8% | 99 -1% | 99.4 0% |
| sRGB Coverage (%) | 100 | 100 0% | 100 0% | 99.1 -1% | 100 0% | 100 0% |
| AdobeRGB 1998 Coverage (%) | 89.4 | 96.4 8% | 96.3 8% | 94.07 5% | 88.5 -1% | 90.8 2% |
| Response Times | -195% | 18% | -3871% | -9710% | -2391% | |
| Response Time Grey 50% / Grey 80% * (ms) | 0.59 ? | 2 ? -239% | 0.49 ? 17% | 46.4 ? -7764% | 80.5 ? -13544% | 15.2 ? -2476% |
| Response Time Black / White * (ms) | 0.79 ? | 1.98 ? -151% | 0.65 ? 18% | 0.62 ? 22% | 47.2 ? -5875% | 19 ? -2305% |
| PWM Frequency (Hz) | 240 ? | 60 | 240 ? | 2400 | 14880 ? | 12000 ? |
| Screen | -9% | -15% | -12% | 370% | -15% | |
| Brightness middle (cd/m²) | 349 | 389.97 12% | 400 15% | 397.29 14% | 504 44% | 712 104% |
| Brightness (cd/m²) | 350 | 395 13% | 399 14% | 392 12% | 487 39% | 703 101% |
| Brightness Distribution (%) | 95 | 97 2% | 93 -2% | 93 -2% | 94 -1% | 95 0% |
| Black Level * (cd/m²) | 0.02 | 0.03 -50% | 0.03 -50% | 0.02 -0% | 0.001 95% | 0.07 -250% |
| Contrast (:1) | 17450 | 12999 -26% | 13333 -24% | 19865 14% | 504000 2788% | 10171 -42% |
| Colorchecker dE 2000 * | 2.1 | 2 5% | 2.3 -10% | 2.52 -20% | 1.5 29% | 1.7 19% |
| Colorchecker dE 2000 max. * | 5.5 | 4.1 25% | 4.15 25% | 3.91 29% | 3.3 40% | 4 27% |
| Colorchecker dE 2000 calibrated * | 2.1 | 1.68 20% | 1.66 21% | 2.52 -20% | 1.2 43% | |
| Greyscale dE 2000 * | 1.2 | 2.23 -86% | 2.7 -125% | 2.78 -132% | 2.1 -75% | 2.8 -133% |
| Gamma | 2.19 100% | 2.41 91% | 2.266 97% | 2.63 84% | 2.25 98% | 2.21 100% |
| CCT | 6545 99% | 6323 103% | 7047 92% | 6412 101% | 6882 94% | 6978 93% |
| Média Total (Programa/Configurações) | -67% /
-33% | 2% /
-7% | -1295% /
-561% | -3114% /
-1266% | -802% /
-351% |
* ... menor é melhor
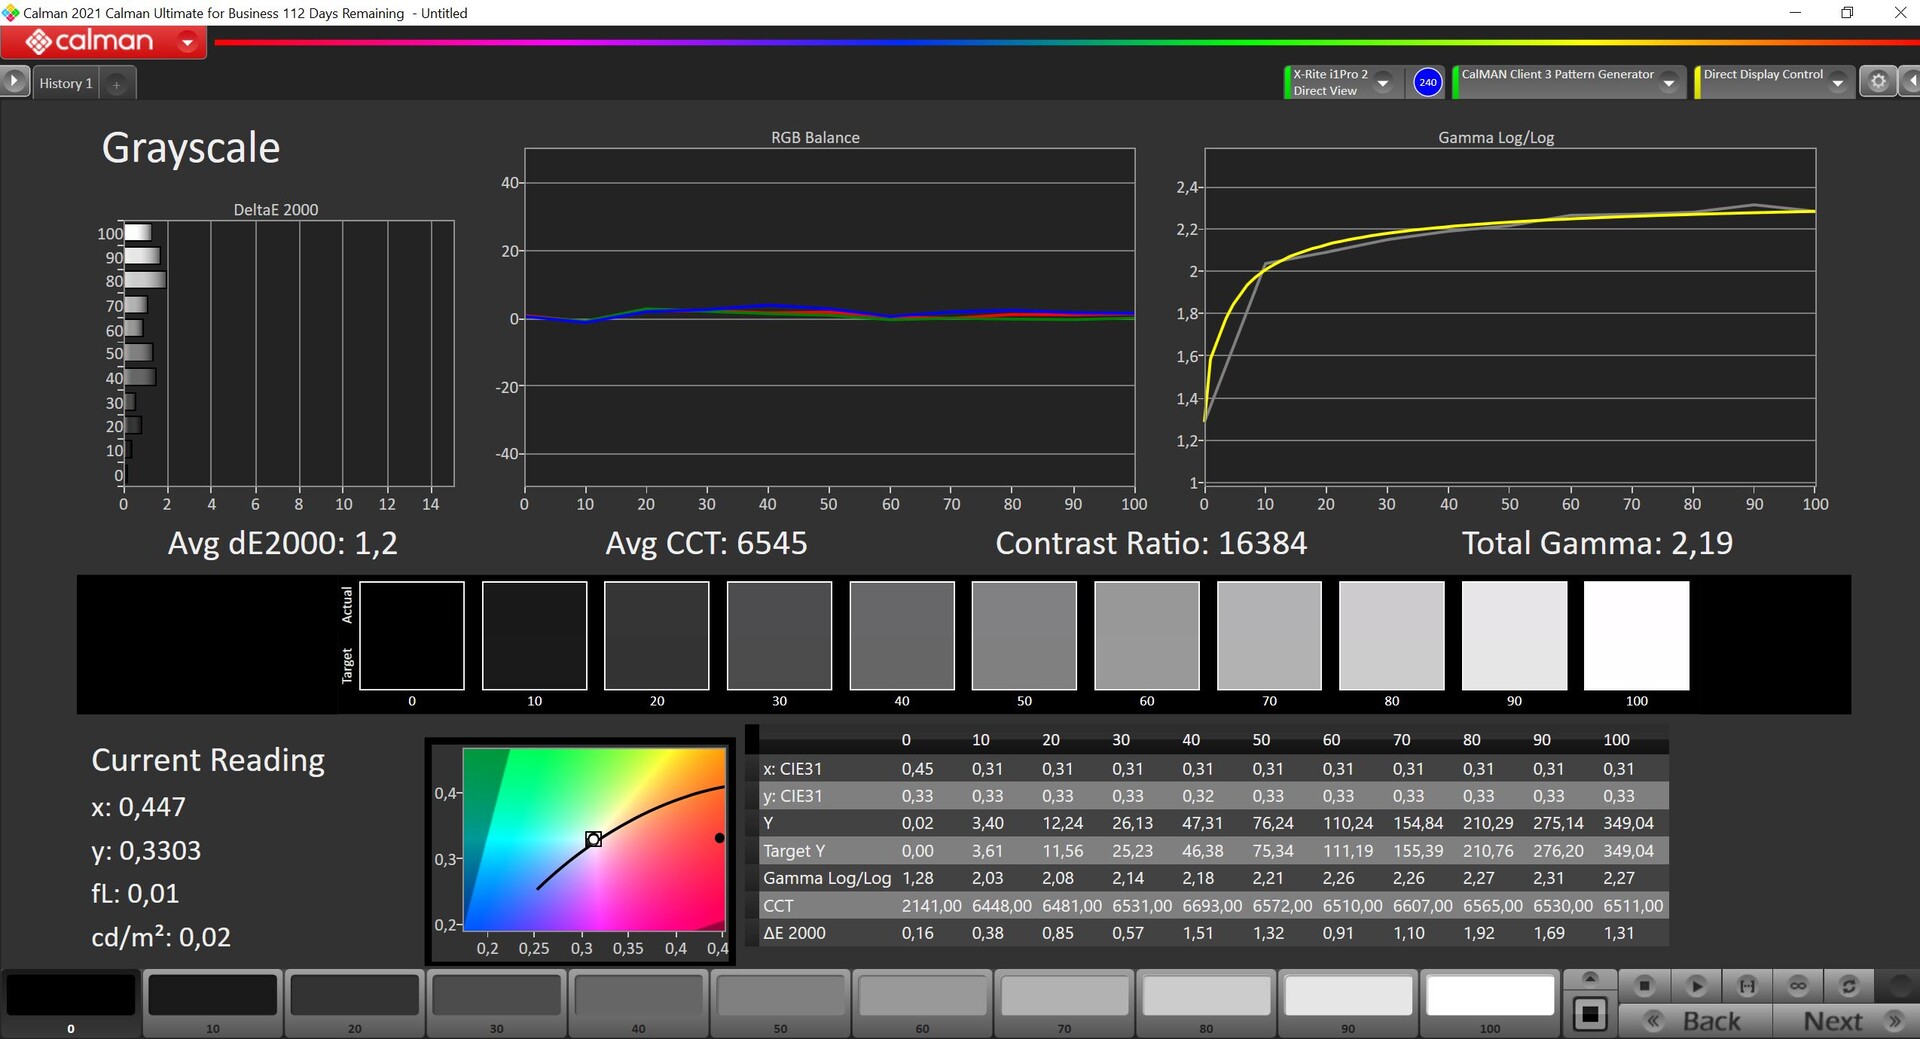
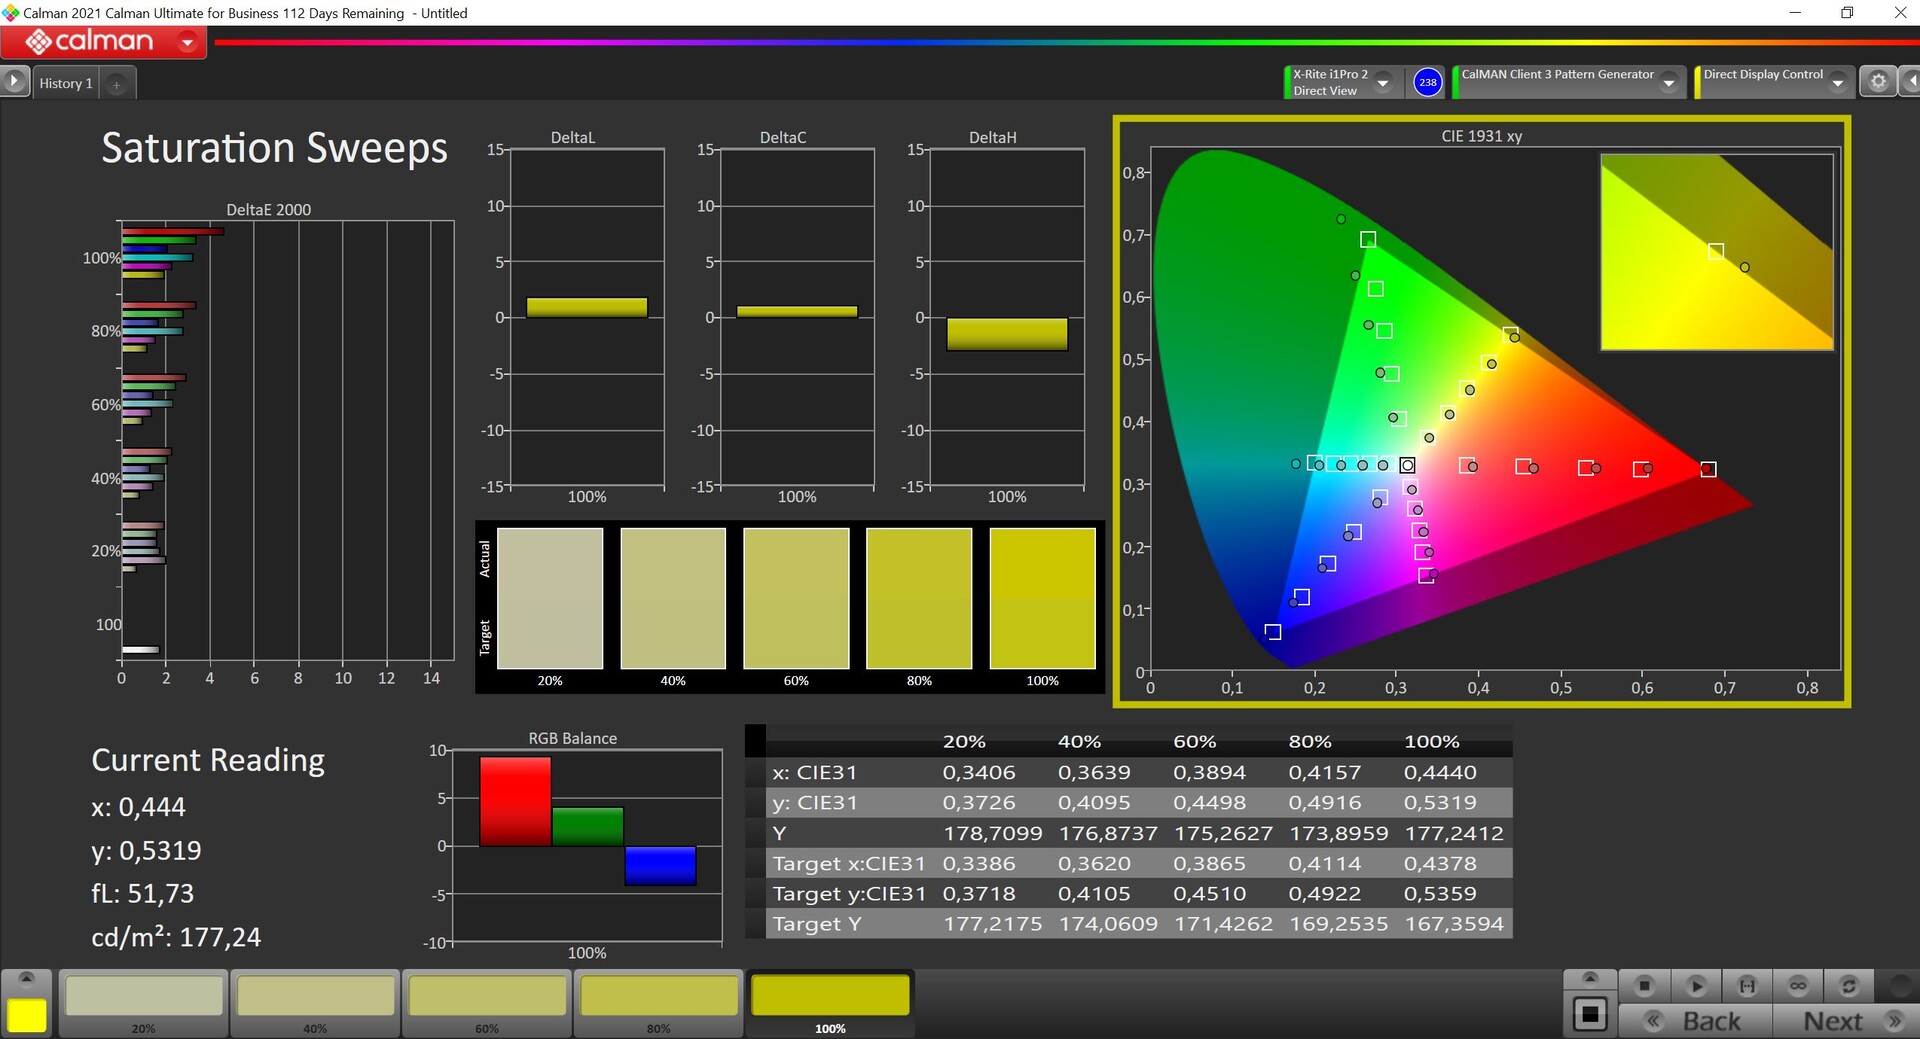
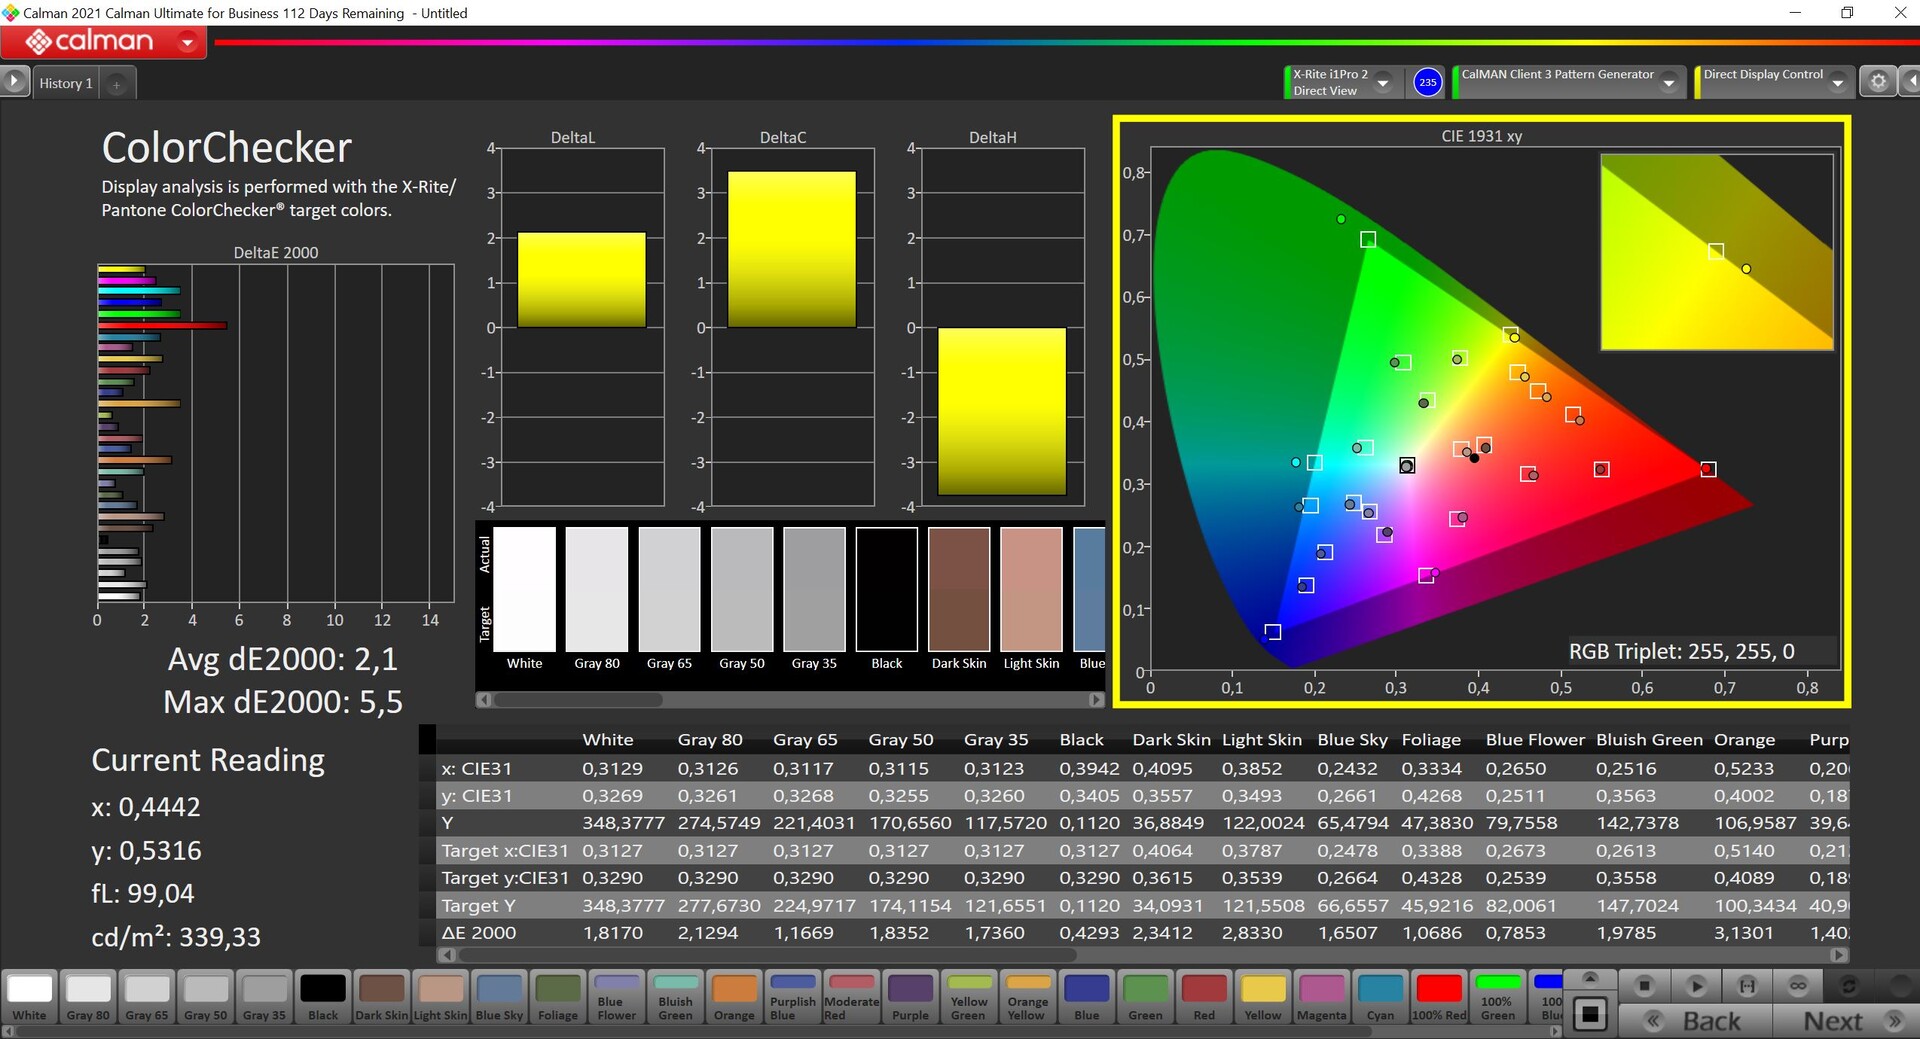
Como de costume, há vários perfis de cores no software MyAsus, onde "Nativo" é predefinido por padrão. Aqui, as cores são um pouco supersaturadas, o que deve resultar em uma imagem um pouco mais poderosa na prática. O perfil mais preciso é o DisplayP3, que também usamos para nossas medições com o software profissional CalMAN (X-Rite i1 Pro 2). Basicamente, os resultados já são muito bons e não há problemas em termos de projeção de cor ou temperatura de cor, embora algumas cores individuais estejam acima do importante desvio de 3. Não foi possível corrigir isso com nossa própria calibração, e é por isso que não fornecemos um perfil para download nesse caso específico. O espaço de cores P3 é totalmente coberto.
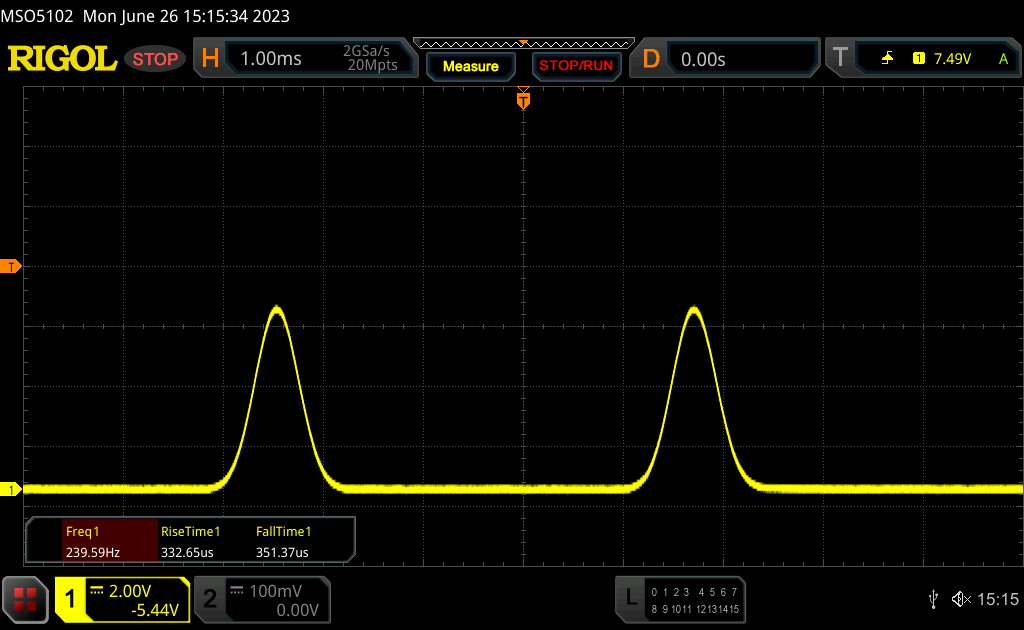
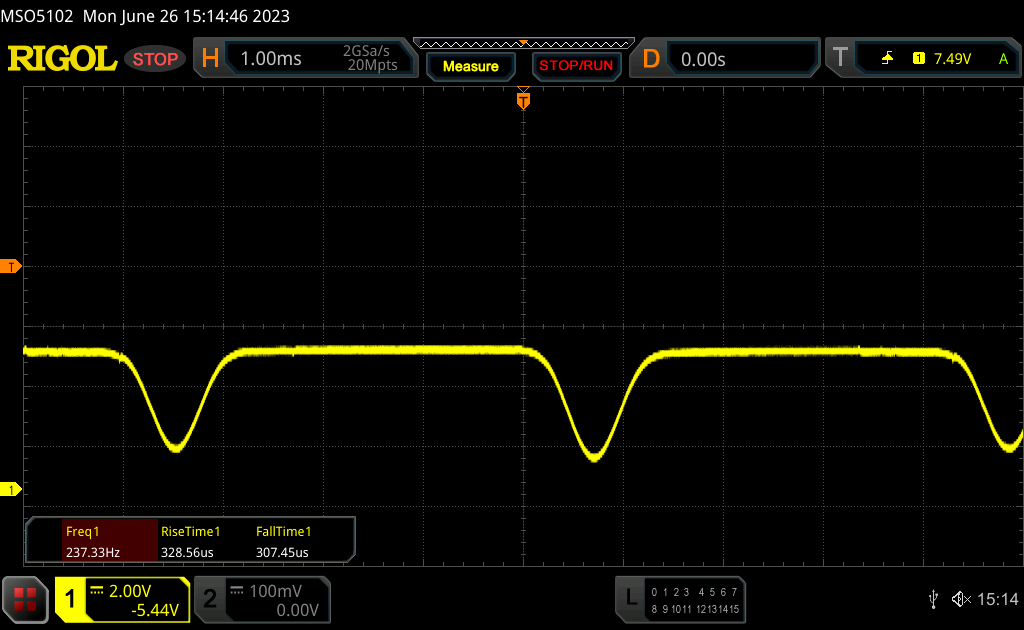
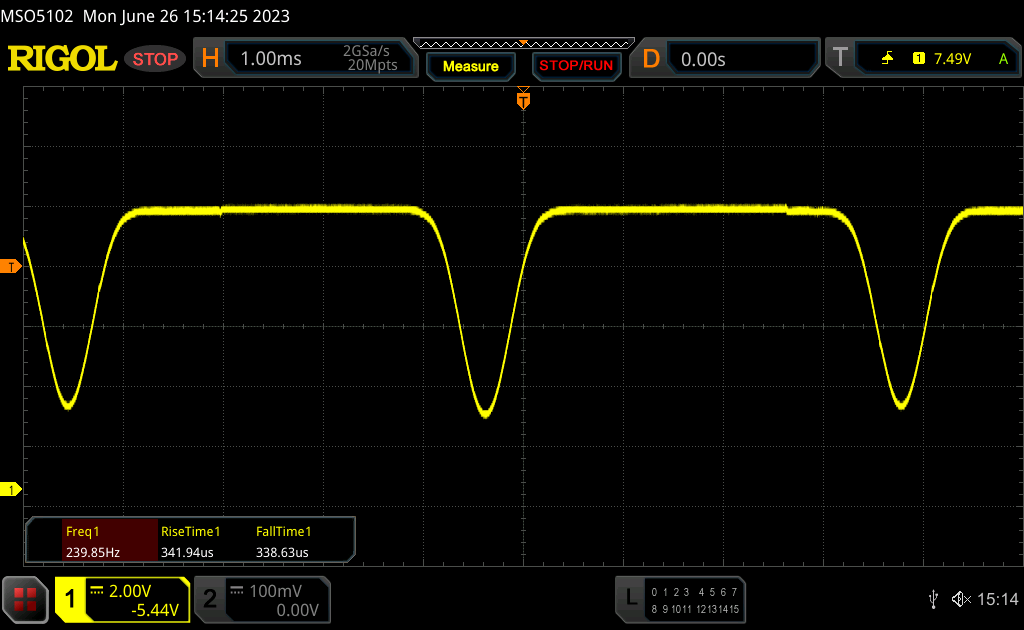
Exibir tempos de resposta
| ↔ Tempo de resposta preto para branco | ||
|---|---|---|
| 0.79 ms ... ascensão ↗ e queda ↘ combinadas | ↗ 0.34 ms ascensão | 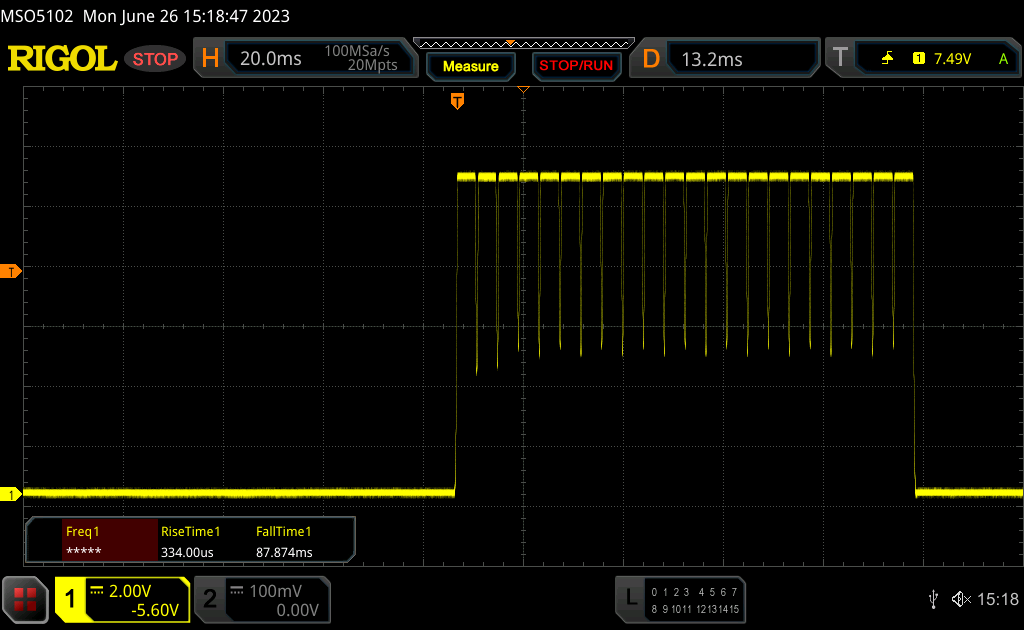 |
| ↘ 0.45 ms queda | ||
| A tela mostra taxas de resposta muito rápidas em nossos testes e deve ser muito adequada para jogos em ritmo acelerado. Em comparação, todos os dispositivos testados variam de 0.1 (mínimo) a 240 (máximo) ms. » 2 % de todos os dispositivos são melhores. Isso significa que o tempo de resposta medido é melhor que a média de todos os dispositivos testados (19.8 ms). | ||
| ↔ Tempo de resposta 50% cinza a 80% cinza | ||
| 0.59 ms ... ascensão ↗ e queda ↘ combinadas | ↗ 0.29 ms ascensão | 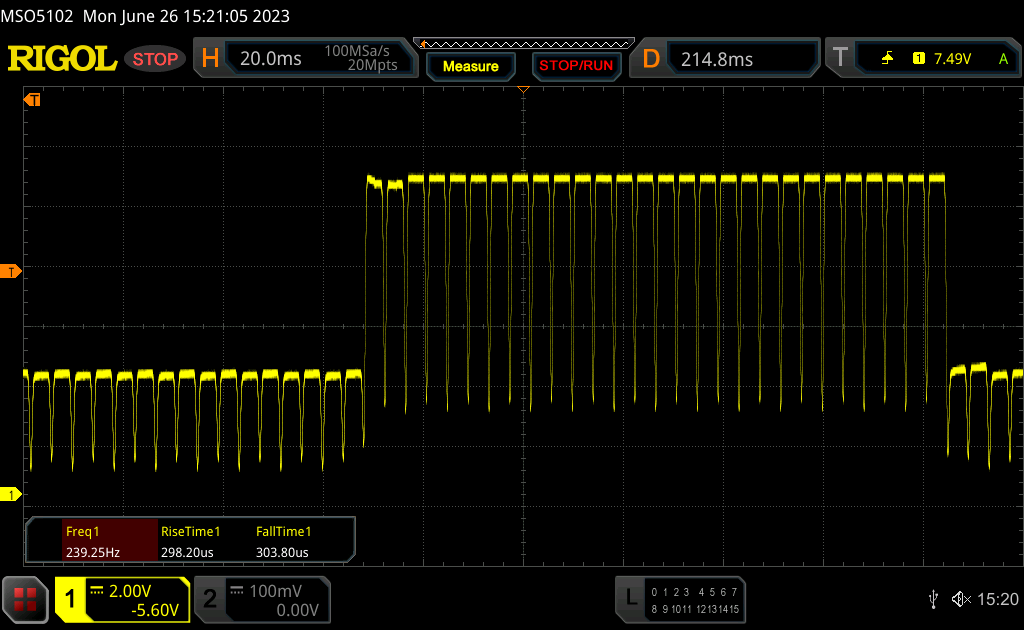 |
| ↘ 0.3 ms queda | ||
| A tela mostra taxas de resposta muito rápidas em nossos testes e deve ser muito adequada para jogos em ritmo acelerado. Em comparação, todos os dispositivos testados variam de 0.165 (mínimo) a 636 (máximo) ms. » 1 % de todos os dispositivos são melhores. Isso significa que o tempo de resposta medido é melhor que a média de todos os dispositivos testados (31 ms). | ||
Cintilação da tela / PWM (modulação por largura de pulso)
| Tela tremeluzindo/PWM detectado | 240 Hz | ≤ 100 % configuração de brilho | 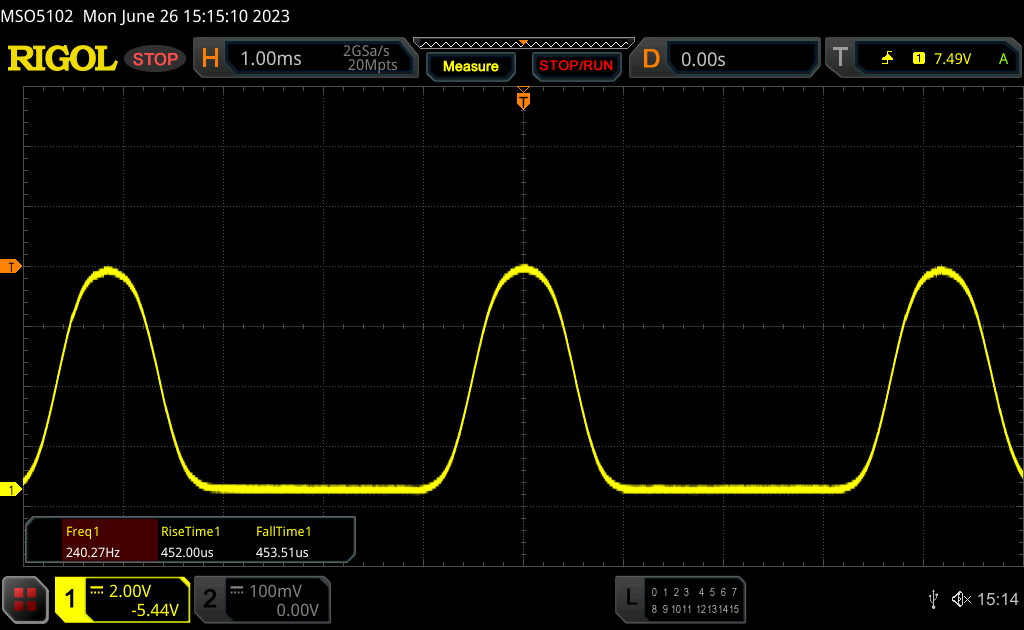 |
A luz de fundo da tela pisca em 240 Hz (pior caso, por exemplo, utilizando PWM) Cintilação detectada em uma configuração de brilho de 100 % e abaixo. Não deve haver cintilação ou PWM acima desta configuração de brilho. A frequência de 240 Hz é relativamente baixa, portanto, usuários sensíveis provavelmente notarão cintilação e sentirão fadiga ocular na configuração de brilho indicada e abaixo. [pwm_comparison] Em comparação: 52 % de todos os dispositivos testados não usam PWM para escurecer a tela. Se PWM foi detectado, uma média de 7757 (mínimo: 5 - máximo: 343500) Hz foi medida. | |||
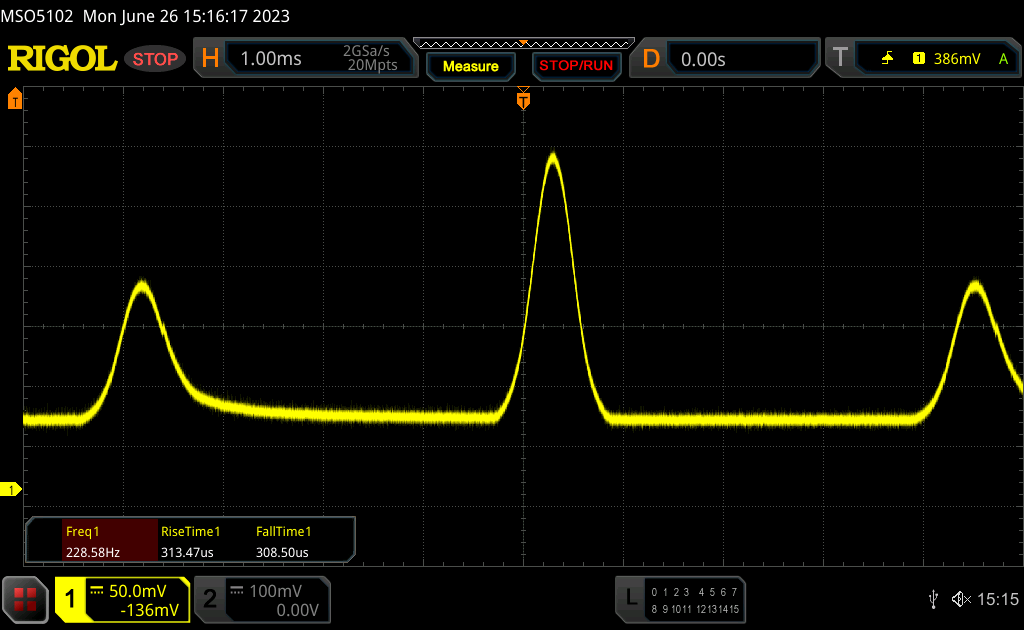
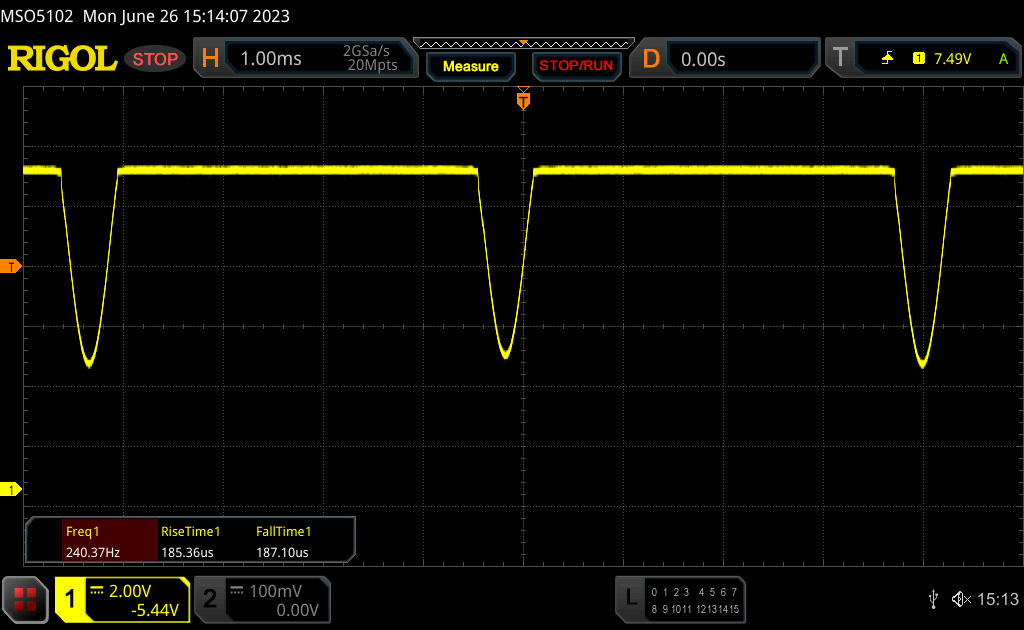
O escurecimento de CC é usado na faixa de brilho de 100 a 60%, e a oscilação clássica de PWM a 240 Hz abaixo disso. Assim que o brilho cai abaixo de 60%, aparece um aviso de que o escurecimento DC não está mais disponível. Como alternativa, o chamado escurecimento OLED sem cintilação está disponível no software MyAsus, que examinamos em nossa análise do Zenbook S 13 OLED. De fato, é uma adição útil, mas também é incômodo ter que passar pelo software o tempo todo.
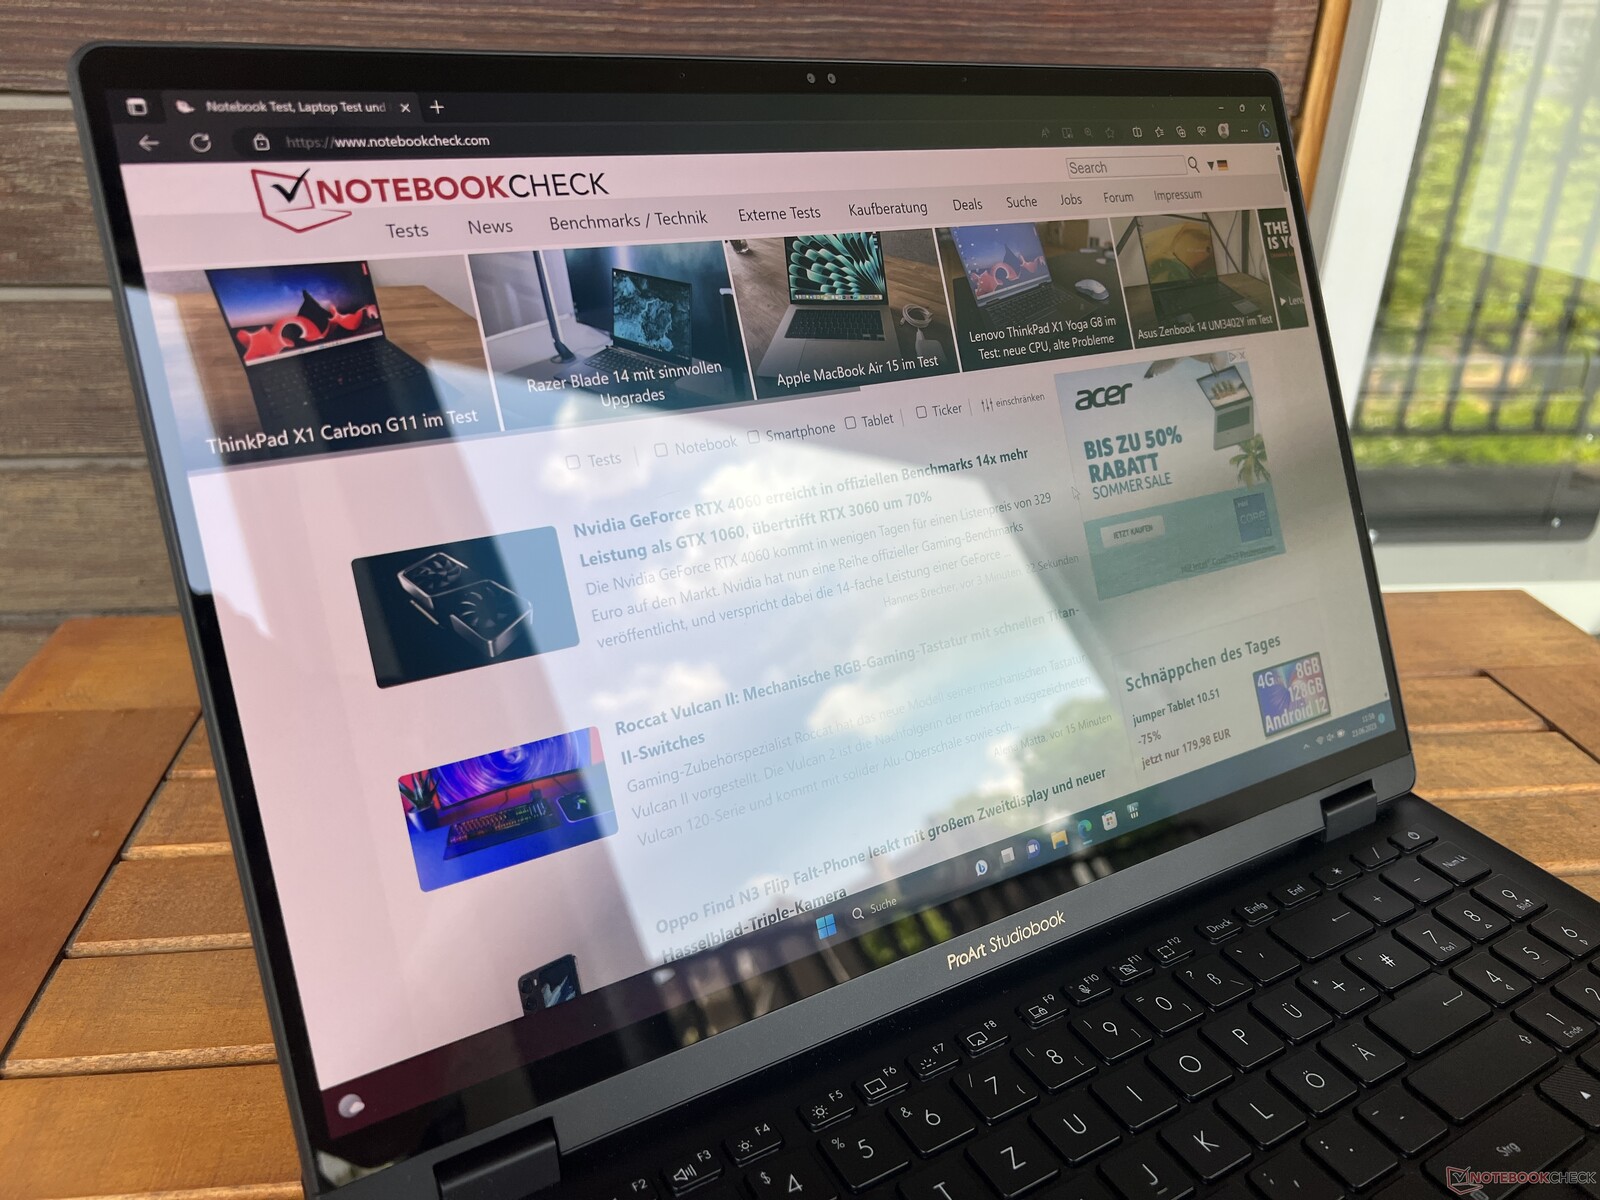
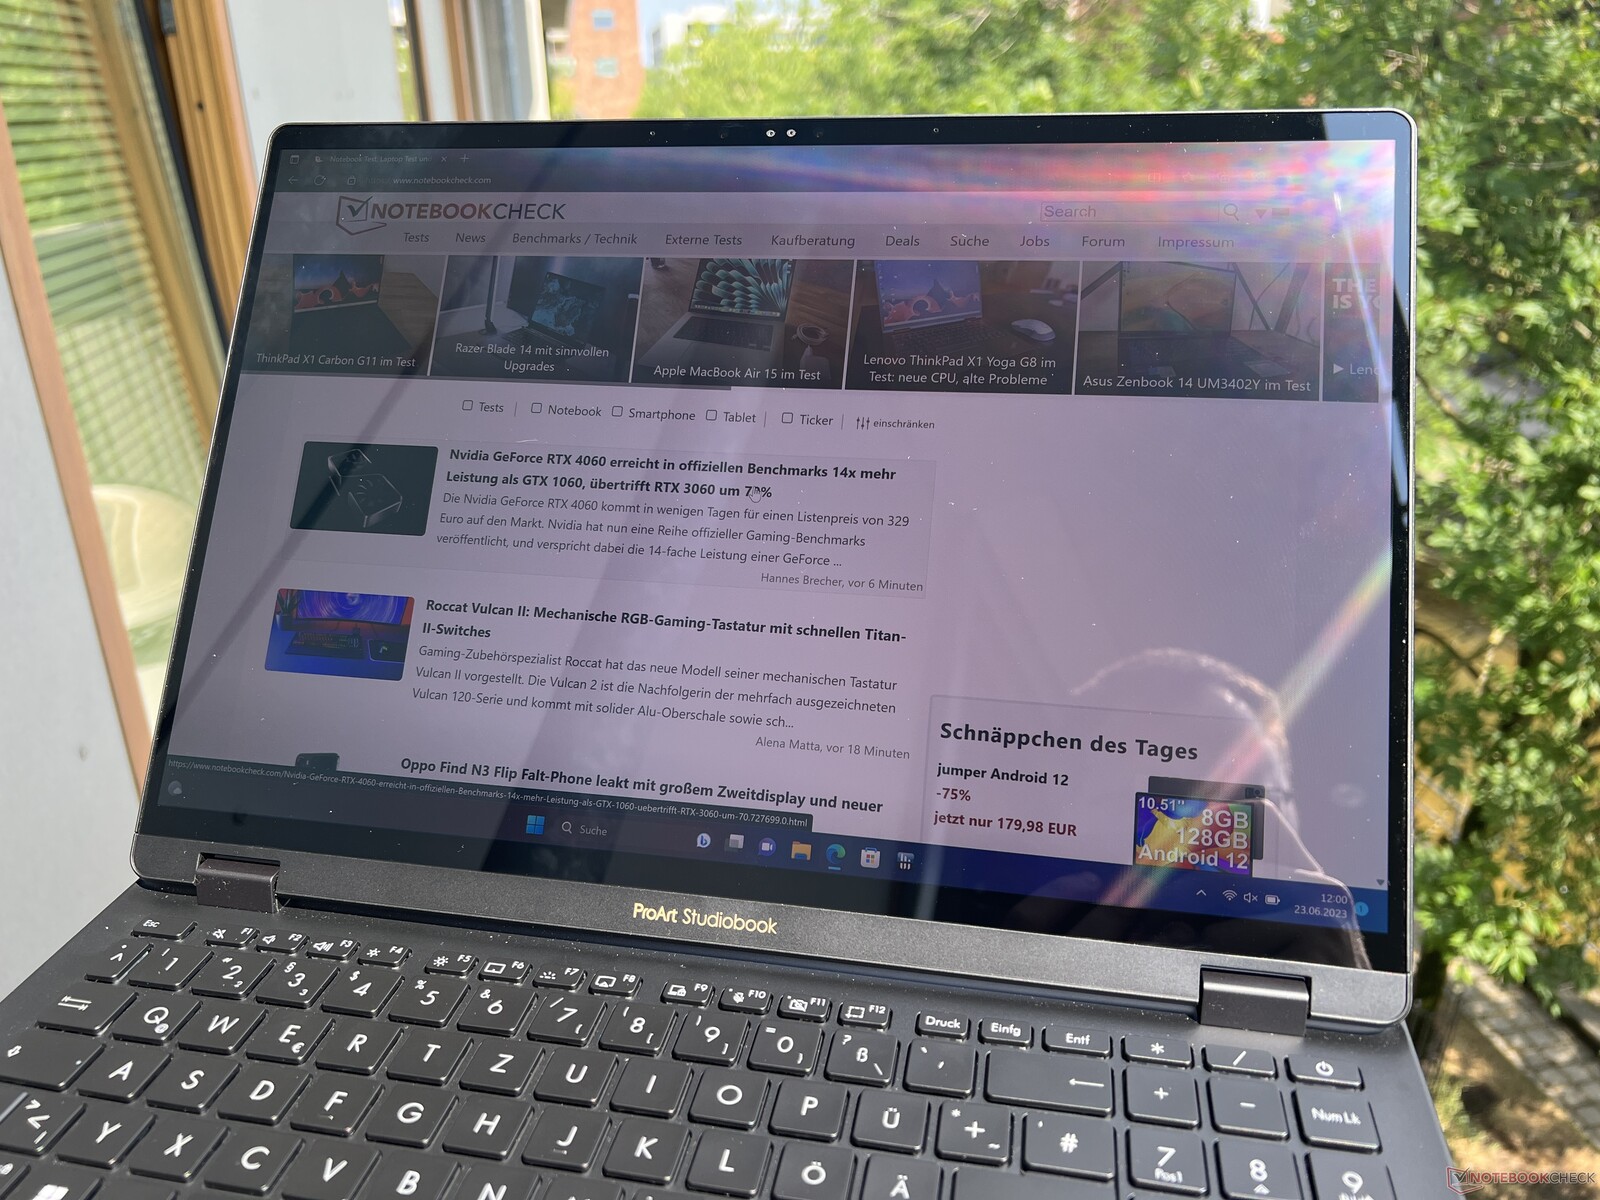
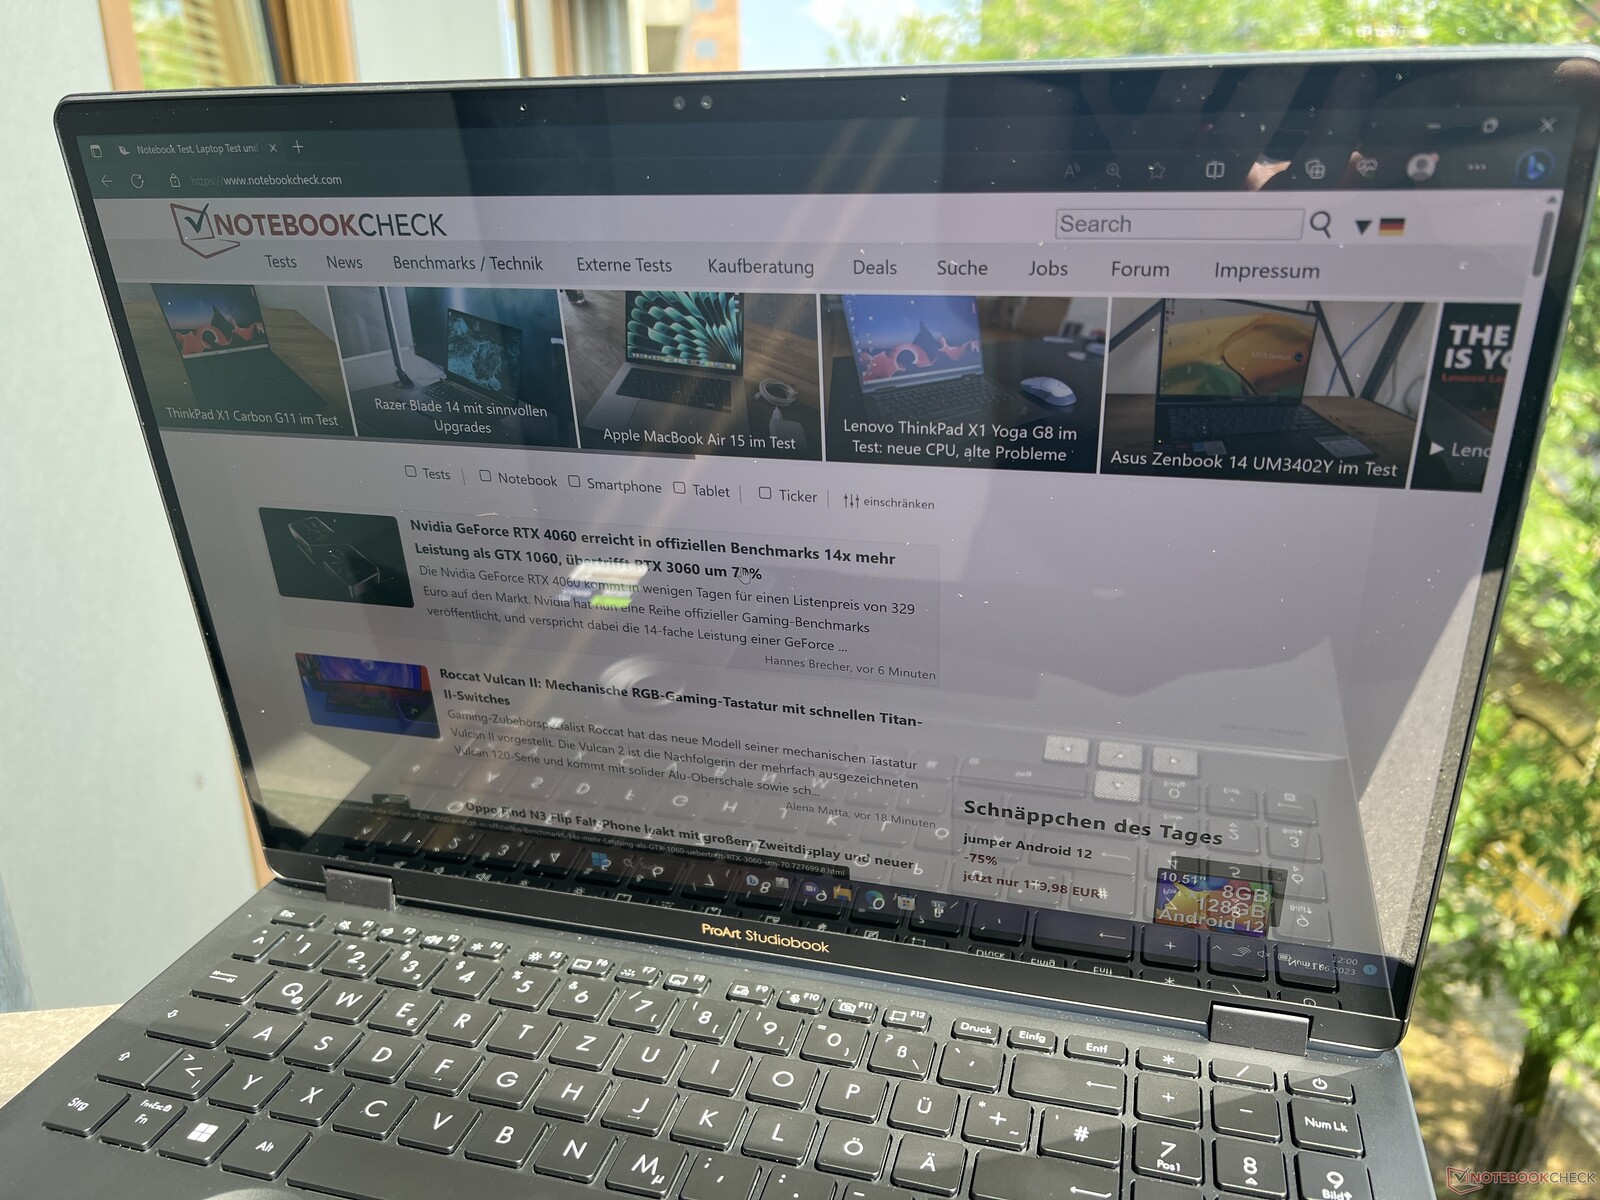
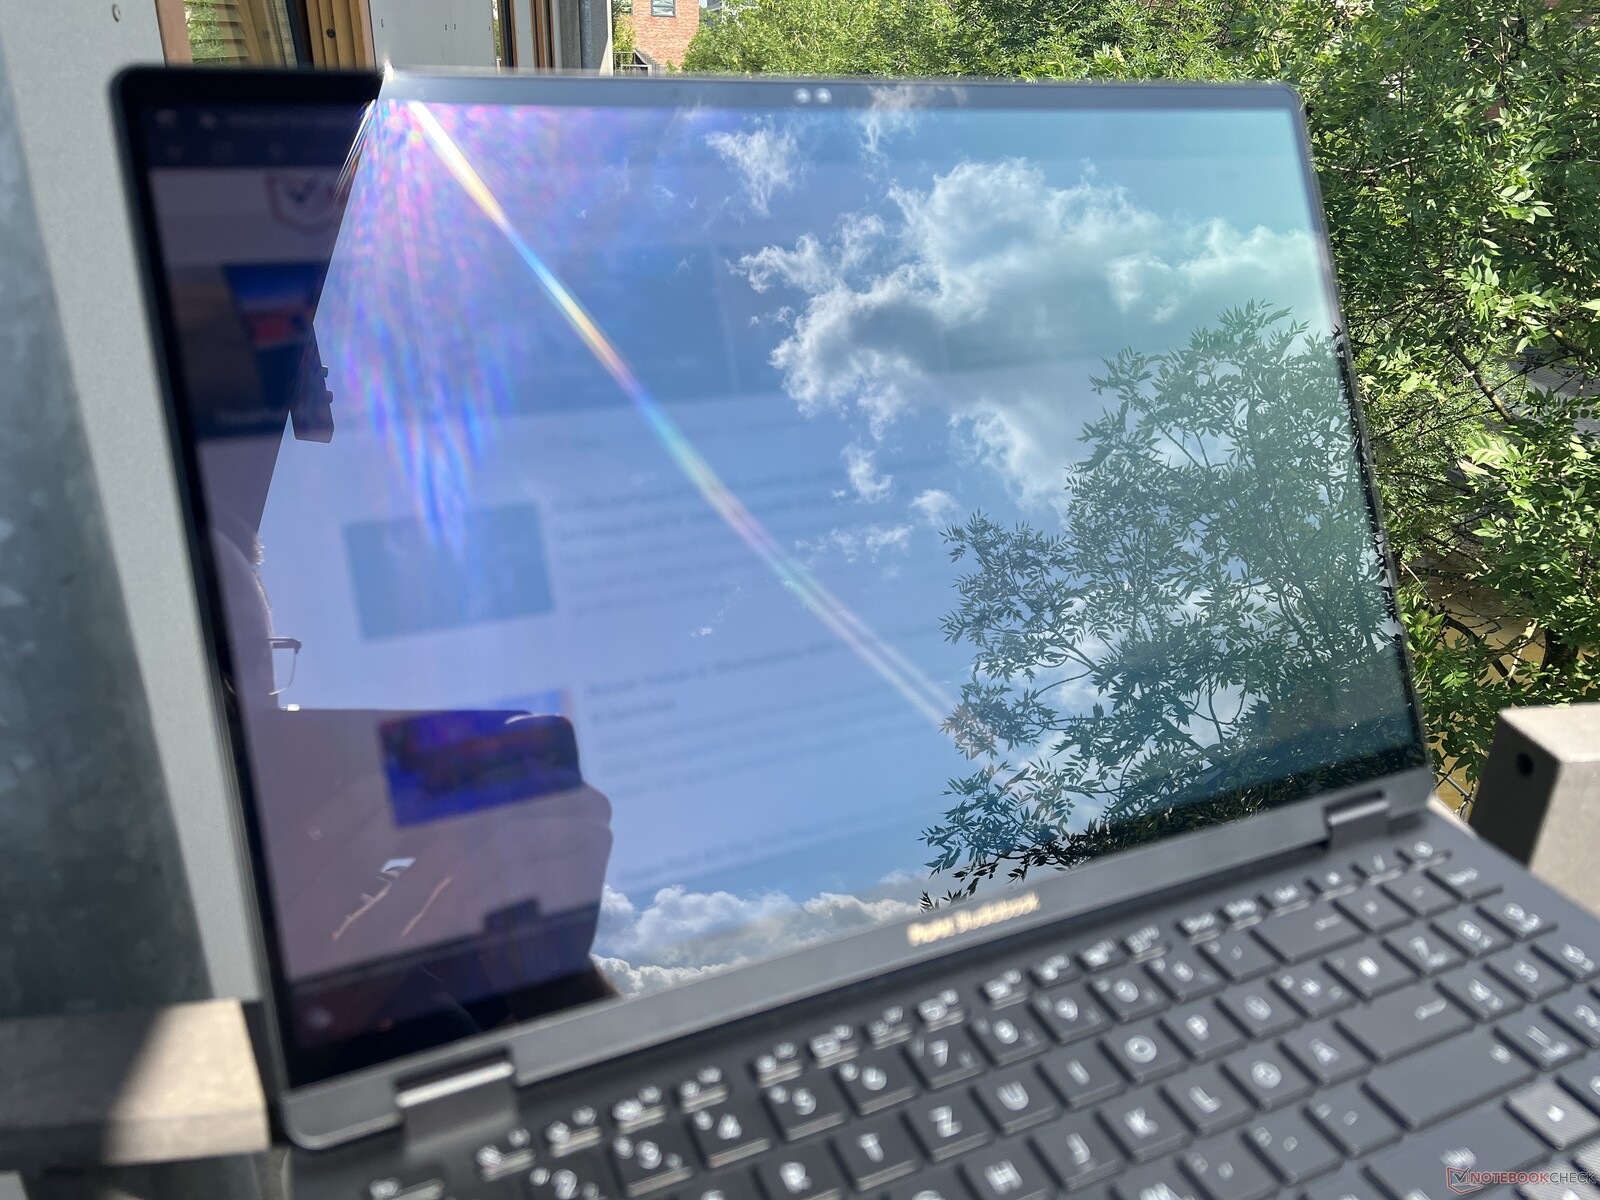
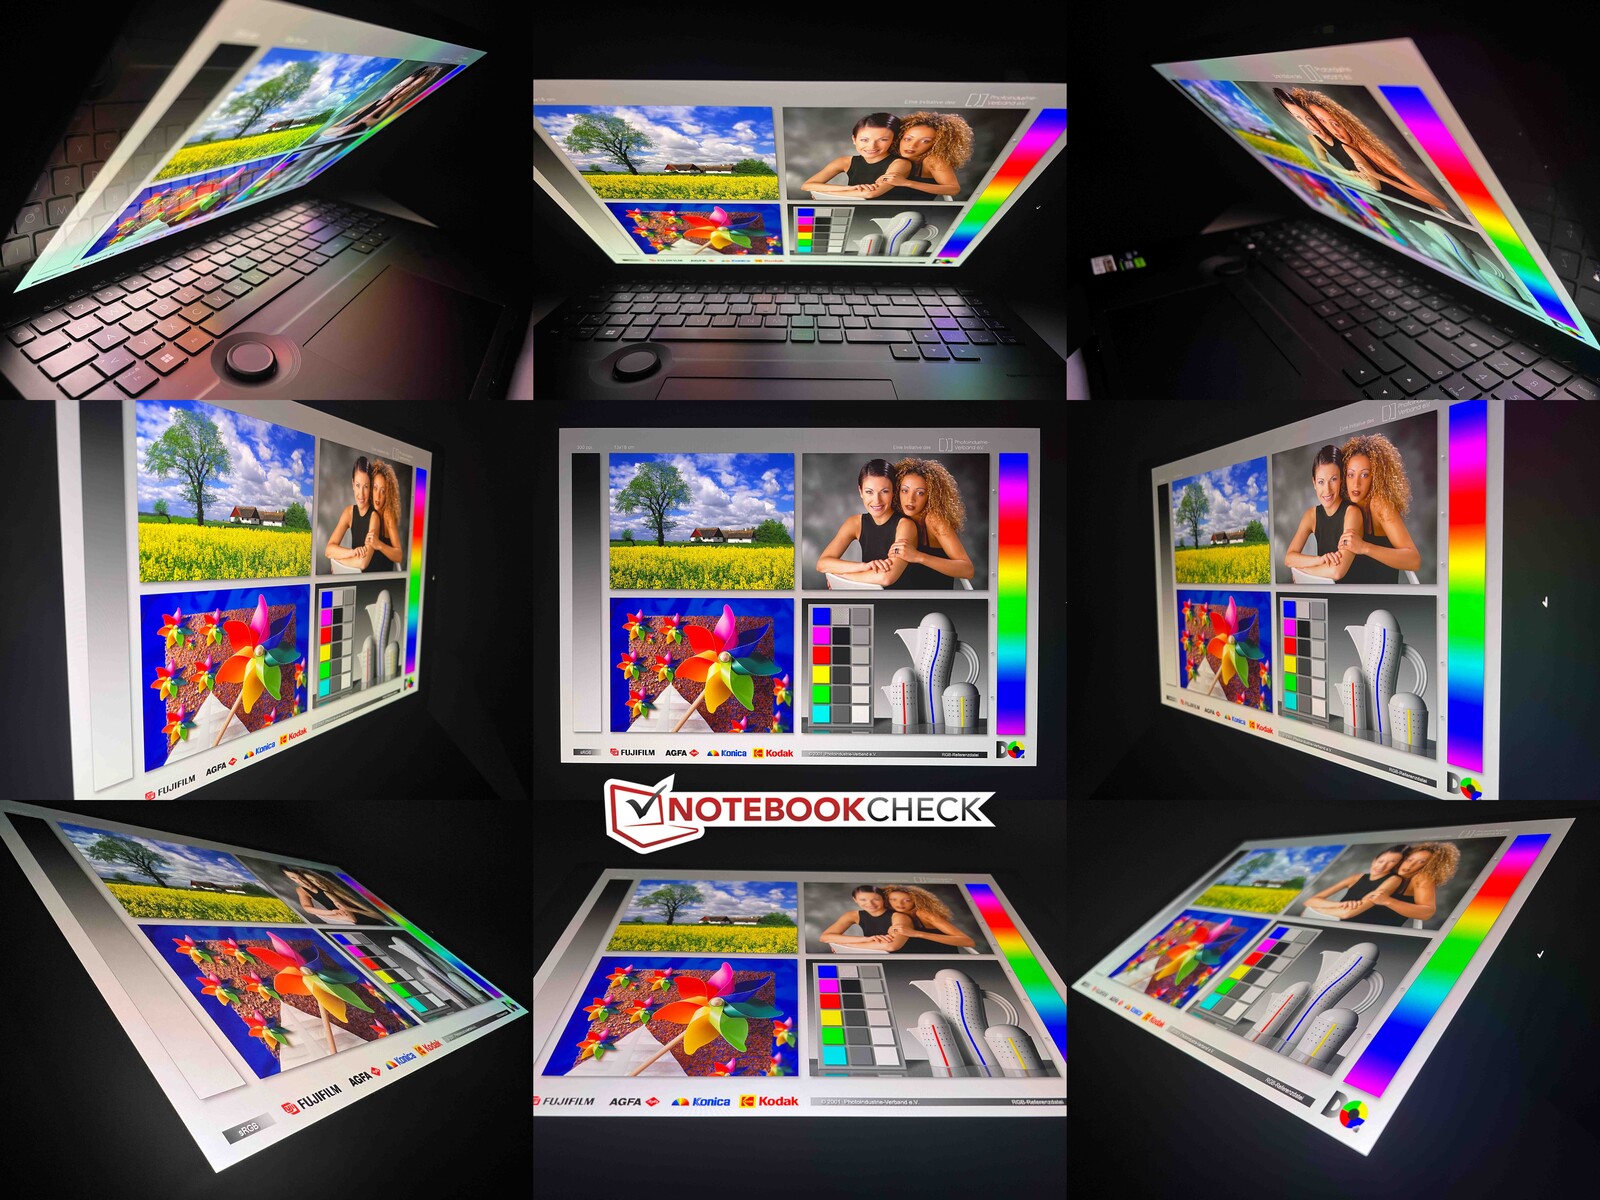
A tela sensível ao toque é muito reflexiva em ambientes externos, portanto, você deve evitar reflexos de janelas ou fontes de luz, tanto em ambientes internos quanto externos. Isso não é fácil, especialmente quando o sol está brilhando. A estabilidade do ângulo de visão é muito boa no geral. Somente em ângulos muito extremos aparece a típica projeção azulada do OLED.
Desempenho - Raptor Lake-HX e Ada Lovelace
Condições de teste
Vários perfis de energia estão disponíveis no ProArt Creator Hub pré-instalado, que listamos na tabela abaixo. Realizamos as medições e os benchmarks principalmente no modo Desempenho , mas também analisamos os efeitos dos outros dois modos em algumas seções.
| Perfil de energia | Carga da CPU | Carga da GPU | Teste de estresse | Volume máximo do ventilador |
|---|---|---|---|---|
| Padrão | 157/80 watts | 90 watts | CPU: 30 watts GPU: 80 watts |
47,6 dB(A) |
| Desempenho | 170/130 watts | 130 watts | CPU: 55 watts GPU: 105 watts |
56,7 dB(A) |
| Velocidade máxima | 170/130 watts | 130 watts | CPU: 64 watts 95 watts |
58,9 dB(A) |
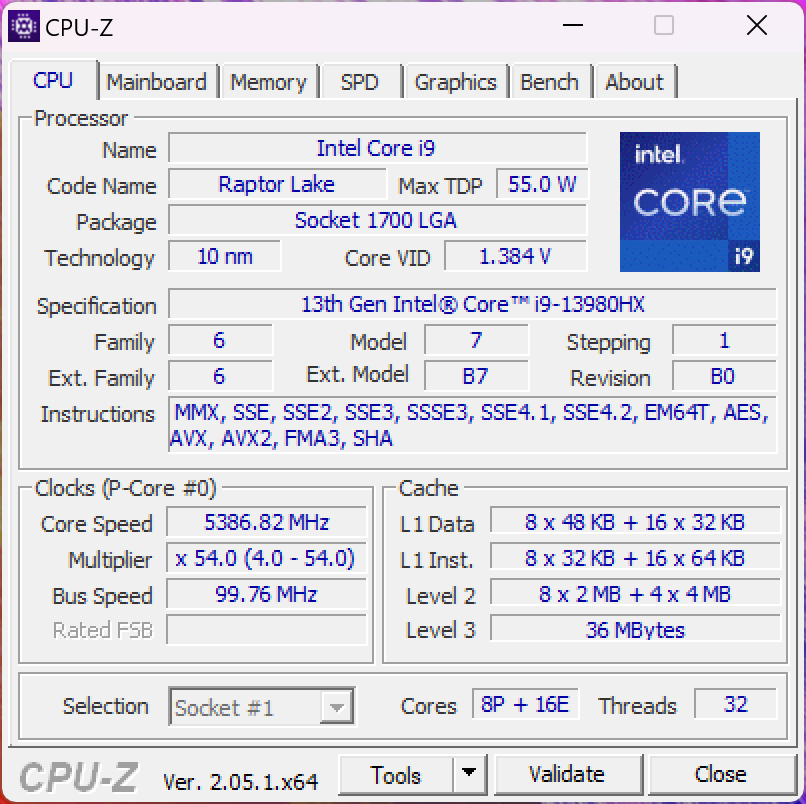
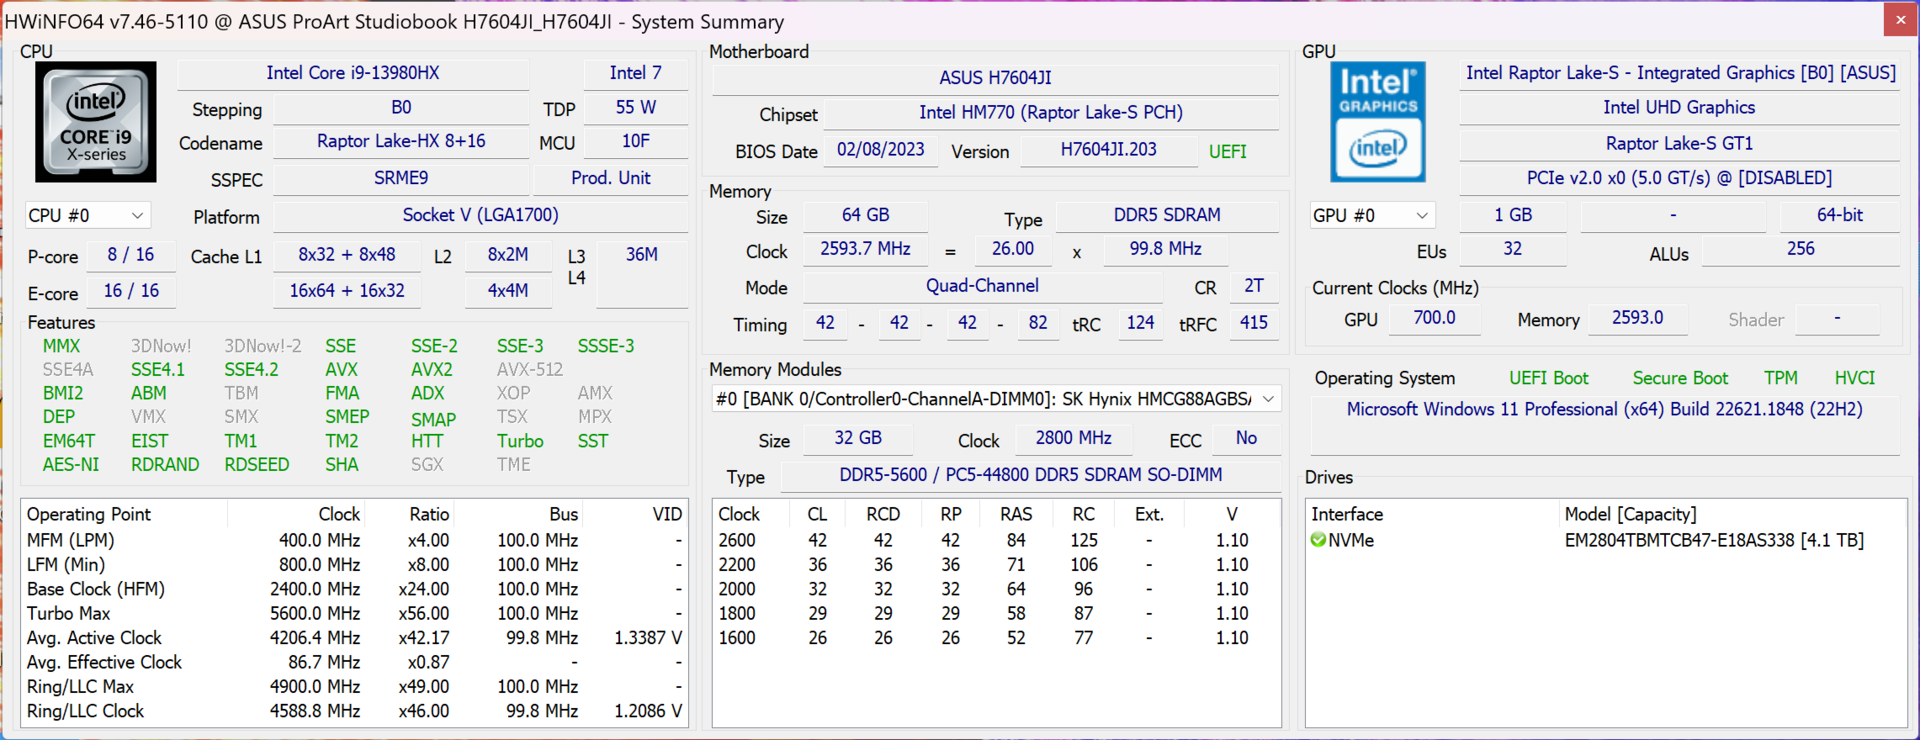
Processador - Core i9-13980HX
O atual modelo topo de linha da série Raptor Lake da Intel para notebooks, o Core i9-13980HX, é usado como processador. Ele oferece 8 núcleos de desempenho rápido e 16 núcleos de eficiência, razão pela qual o chip é capaz de processar um total de 32 threads simultaneamente. No Studiobook, o processador consome até ~170 watts e se estabiliza em 130 watts após alguns minutos de carga contínua. Em notebooks grandes para jogos, a CPU opera um pouco mais rápido, mas em comparação com o grupo de comparação com CPUs Intel normais ou com o Apple M2 Max, o Studiobook tem uma grande vantagem. Em termos de desempenho de núcleo único, o Core i9 também está à frente do novo AMD Ryzen 9 7945HX, mas este último oferece ainda mais desempenho nos testes de vários núcleos, além de trabalhar com mais eficiência.
Longe do soquete, não há muito o que se ver sobre os recursos de desempenho do laptop, pois a CPU só pode consumir 34/26 watts. No multiteste CB R23, ele marca apenas 11.576 pontos, o que corresponde a um déficit de 63%. Portanto, o StudioBook é mais lento com relação à energia da bateria do que oMacBook Pro 16 com seu M2 Maxonde não há redução de desempenho com a energia da bateria. Mais benchmarks de CPU estão disponíveis em nossa seção de tecnologia.
Cinebench R15 Multi Sustained Load
Cinebench R23: Multi Core | Single Core
Cinebench R20: CPU (Multi Core) | CPU (Single Core)
Cinebench R15: CPU Multi 64Bit | CPU Single 64Bit
Blender: v2.79 BMW27 CPU
7-Zip 18.03: 7z b 4 | 7z b 4 -mmt1
Geekbench 5.5: Multi-Core | Single-Core
HWBOT x265 Benchmark v2.2: 4k Preset
LibreOffice : 20 Documents To PDF
R Benchmark 2.5: Overall mean
| CPU Performance rating | |
| Asus Zephyrus Duo 16 GX650PY-NM006W | |
| Asus ProArt Studiobook 16 OLED H7604 | |
| Média Intel Core i9-13980HX | |
| Apple MacBook Pro 16 2023 M2 Max -6! | |
| MSI Stealth 17 Studio A13VH-014 | |
| Gigabyte AERO 16 OLED BSF | |
| Média da turma Multimedia | |
| Samsung Galaxy Book3 Ultra 16 | |
| Cinebench R23 / Multi Core | |
| Asus Zephyrus Duo 16 GX650PY-NM006W | |
| Asus ProArt Studiobook 16 OLED H7604 | |
| Média Intel Core i9-13980HX (28301 - 33052, n=11) | |
| MSI Stealth 17 Studio A13VH-014 | |
| Gigabyte AERO 16 OLED BSF | |
| Média da turma Multimedia (4861 - 33362, n=75, últimos 2 anos) | |
| Samsung Galaxy Book3 Ultra 16 | |
| Apple MacBook Pro 16 2023 M2 Max | |
| Cinebench R23 / Single Core | |
| Asus ProArt Studiobook 16 OLED H7604 | |
| Média Intel Core i9-13980HX (1825 - 2169, n=9) | |
| Asus Zephyrus Duo 16 GX650PY-NM006W | |
| Média da turma Multimedia (1128 - 2459, n=67, últimos 2 anos) | |
| Gigabyte AERO 16 OLED BSF | |
| MSI Stealth 17 Studio A13VH-014 | |
| Samsung Galaxy Book3 Ultra 16 | |
| Apple MacBook Pro 16 2023 M2 Max | |
| Cinebench R20 / CPU (Multi Core) | |
| Asus Zephyrus Duo 16 GX650PY-NM006W | |
| Asus ProArt Studiobook 16 OLED H7604 | |
| Média Intel Core i9-13980HX (10353 - 12437, n=10) | |
| MSI Stealth 17 Studio A13VH-014 | |
| Gigabyte AERO 16 OLED BSF | |
| Média da turma Multimedia (1887 - 12912, n=58, últimos 2 anos) | |
| Samsung Galaxy Book3 Ultra 16 | |
| Apple MacBook Pro 16 2023 M2 Max | |
| Cinebench R20 / CPU (Single Core) | |
| Asus ProArt Studiobook 16 OLED H7604 | |
| Média Intel Core i9-13980HX (717 - 825, n=10) | |
| Asus Zephyrus Duo 16 GX650PY-NM006W | |
| Média da turma Multimedia (425 - 853, n=58, últimos 2 anos) | |
| MSI Stealth 17 Studio A13VH-014 | |
| Samsung Galaxy Book3 Ultra 16 | |
| Gigabyte AERO 16 OLED BSF | |
| Apple MacBook Pro 16 2023 M2 Max | |
| Cinebench R15 / CPU Multi 64Bit | |
| Asus Zephyrus Duo 16 GX650PY-NM006W | |
| Média Intel Core i9-13980HX (4358 - 5172, n=11) | |
| Asus ProArt Studiobook 16 OLED H7604 | |
| MSI Stealth 17 Studio A13VH-014 | |
| Gigabyte AERO 16 OLED BSF | |
| Média da turma Multimedia (856 - 5224, n=62, últimos 2 anos) | |
| Samsung Galaxy Book3 Ultra 16 | |
| Apple MacBook Pro 16 2023 M2 Max | |
| Cinebench R15 / CPU Single 64Bit | |
| Asus ProArt Studiobook 16 OLED H7604 | |
| Asus Zephyrus Duo 16 GX650PY-NM006W | |
| Média Intel Core i9-13980HX (289 - 312, n=11) | |
| MSI Stealth 17 Studio A13VH-014 | |
| Média da turma Multimedia (184.8 - 326, n=60, últimos 2 anos) | |
| Samsung Galaxy Book3 Ultra 16 | |
| Gigabyte AERO 16 OLED BSF | |
| Apple MacBook Pro 16 2023 M2 Max | |
| Blender / v2.79 BMW27 CPU | |
| Média da turma Multimedia (100 - 557, n=59, últimos 2 anos) | |
| Samsung Galaxy Book3 Ultra 16 | |
| Gigabyte AERO 16 OLED BSF | |
| MSI Stealth 17 Studio A13VH-014 | |
| Média Intel Core i9-13980HX (97 - 136, n=10) | |
| Asus ProArt Studiobook 16 OLED H7604 | |
| Asus Zephyrus Duo 16 GX650PY-NM006W | |
| 7-Zip 18.03 / 7z b 4 | |
| Asus Zephyrus Duo 16 GX650PY-NM006W | |
| Asus ProArt Studiobook 16 OLED H7604 | |
| Média Intel Core i9-13980HX (104616 - 129804, n=10) | |
| MSI Stealth 17 Studio A13VH-014 | |
| Gigabyte AERO 16 OLED BSF | |
| Samsung Galaxy Book3 Ultra 16 | |
| Média da turma Multimedia (26062 - 130368, n=56, últimos 2 anos) | |
| 7-Zip 18.03 / 7z b 4 -mmt1 | |
| Asus Zephyrus Duo 16 GX650PY-NM006W | |
| Asus ProArt Studiobook 16 OLED H7604 | |
| Média Intel Core i9-13980HX (6230 - 7163, n=10) | |
| MSI Stealth 17 Studio A13VH-014 | |
| Média da turma Multimedia (3666 - 7545, n=57, últimos 2 anos) | |
| Gigabyte AERO 16 OLED BSF | |
| Samsung Galaxy Book3 Ultra 16 | |
| Geekbench 5.5 / Multi-Core | |
| Média Intel Core i9-13980HX (18475 - 22200, n=10) | |
| Asus ProArt Studiobook 16 OLED H7604 | |
| Asus Zephyrus Duo 16 GX650PY-NM006W | |
| Apple MacBook Pro 16 2023 M2 Max | |
| Gigabyte AERO 16 OLED BSF | |
| MSI Stealth 17 Studio A13VH-014 | |
| Média da turma Multimedia (4652 - 20422, n=57, últimos 2 anos) | |
| Samsung Galaxy Book3 Ultra 16 | |
| Geekbench 5.5 / Single-Core | |
| Asus ProArt Studiobook 16 OLED H7604 | |
| Asus Zephyrus Duo 16 GX650PY-NM006W | |
| Média Intel Core i9-13980HX (1796 - 2139, n=10) | |
| MSI Stealth 17 Studio A13VH-014 | |
| Apple MacBook Pro 16 2023 M2 Max | |
| Média da turma Multimedia (805 - 2974, n=57, últimos 2 anos) | |
| Gigabyte AERO 16 OLED BSF | |
| Samsung Galaxy Book3 Ultra 16 | |
| HWBOT x265 Benchmark v2.2 / 4k Preset | |
| Asus Zephyrus Duo 16 GX650PY-NM006W | |
| Média Intel Core i9-13980HX (27 - 33.4, n=9) | |
| Asus ProArt Studiobook 16 OLED H7604 | |
| MSI Stealth 17 Studio A13VH-014 | |
| Gigabyte AERO 16 OLED BSF | |
| Média da turma Multimedia (5.26 - 36.1, n=57, últimos 2 anos) | |
| Samsung Galaxy Book3 Ultra 16 | |
| LibreOffice / 20 Documents To PDF | |
| Asus Zephyrus Duo 16 GX650PY-NM006W | |
| Gigabyte AERO 16 OLED BSF | |
| MSI Stealth 17 Studio A13VH-014 | |
| Média da turma Multimedia (23.9 - 146.7, n=58, últimos 2 anos) | |
| Samsung Galaxy Book3 Ultra 16 | |
| Asus ProArt Studiobook 16 OLED H7604 | |
| Média Intel Core i9-13980HX (35 - 51.4, n=10) | |
| R Benchmark 2.5 / Overall mean | |
| Gigabyte AERO 16 OLED BSF | |
| Samsung Galaxy Book3 Ultra 16 | |
| Média da turma Multimedia (0.3604 - 0.947, n=57, últimos 2 anos) | |
| MSI Stealth 17 Studio A13VH-014 | |
| Asus Zephyrus Duo 16 GX650PY-NM006W | |
| Média Intel Core i9-13980HX (0.3793 - 0.4462, n=10) | |
| Asus ProArt Studiobook 16 OLED H7604 | |
* ... menor é melhor
AIDA64: FP32 Ray-Trace | FPU Julia | CPU SHA3 | CPU Queen | FPU SinJulia | FPU Mandel | CPU AES | CPU ZLib | FP64 Ray-Trace | CPU PhotoWorxx
| Performance rating | |
| Asus ProArt Studiobook 16 OLED H7604 | |
| Média Intel Core i9-13980HX | |
| Gigabyte AERO 16 OLED BSF | |
| MSI Stealth 17 Studio A13VH-014 | |
| Média da turma Multimedia | |
| Samsung Galaxy Book3 Ultra 16 | |
| AIDA64 / FP32 Ray-Trace | |
| Asus ProArt Studiobook 16 OLED H7604 | |
| Média Intel Core i9-13980HX (21332 - 29553, n=9) | |
| MSI Stealth 17 Studio A13VH-014 | |
| Gigabyte AERO 16 OLED BSF | |
| Média da turma Multimedia (2214 - 50388, n=54, últimos 2 anos) | |
| Samsung Galaxy Book3 Ultra 16 | |
| AIDA64 / FPU Julia | |
| Asus ProArt Studiobook 16 OLED H7604 | |
| Média Intel Core i9-13980HX (108001 - 148168, n=9) | |
| MSI Stealth 17 Studio A13VH-014 | |
| Gigabyte AERO 16 OLED BSF | |
| Média da turma Multimedia (12867 - 201874, n=55, últimos 2 anos) | |
| Samsung Galaxy Book3 Ultra 16 | |
| AIDA64 / CPU SHA3 | |
| Asus ProArt Studiobook 16 OLED H7604 | |
| Média Intel Core i9-13980HX (5264 - 7142, n=9) | |
| MSI Stealth 17 Studio A13VH-014 | |
| Gigabyte AERO 16 OLED BSF | |
| Média da turma Multimedia (626 - 8623, n=55, últimos 2 anos) | |
| Samsung Galaxy Book3 Ultra 16 | |
| AIDA64 / CPU Queen | |
| Média Intel Core i9-13980HX (126758 - 143409, n=9) | |
| Asus ProArt Studiobook 16 OLED H7604 | |
| Samsung Galaxy Book3 Ultra 16 | |
| MSI Stealth 17 Studio A13VH-014 | |
| Gigabyte AERO 16 OLED BSF | |
| Média da turma Multimedia (13483 - 181505, n=42, últimos 2 anos) | |
| AIDA64 / FPU SinJulia | |
| Média Intel Core i9-13980HX (13785 - 17117, n=9) | |
| Asus ProArt Studiobook 16 OLED H7604 | |
| MSI Stealth 17 Studio A13VH-014 | |
| Gigabyte AERO 16 OLED BSF | |
| Samsung Galaxy Book3 Ultra 16 | |
| Média da turma Multimedia (886 - 28794, n=55, últimos 2 anos) | |
| AIDA64 / FPU Mandel | |
| Asus ProArt Studiobook 16 OLED H7604 | |
| Média Intel Core i9-13980HX (53398 - 73758, n=9) | |
| MSI Stealth 17 Studio A13VH-014 | |
| Gigabyte AERO 16 OLED BSF | |
| Média da turma Multimedia (6395 - 105740, n=54, últimos 2 anos) | |
| Samsung Galaxy Book3 Ultra 16 | |
| AIDA64 / CPU AES | |
| Gigabyte AERO 16 OLED BSF | |
| Asus ProArt Studiobook 16 OLED H7604 | |
| Média Intel Core i9-13980HX (105169 - 136520, n=9) | |
| MSI Stealth 17 Studio A13VH-014 | |
| Samsung Galaxy Book3 Ultra 16 | |
| Média da turma Multimedia (8171 - 126790, n=55, últimos 2 anos) | |
| AIDA64 / CPU ZLib | |
| Asus ProArt Studiobook 16 OLED H7604 | |
| Média Intel Core i9-13980HX (1513 - 2039, n=9) | |
| MSI Stealth 17 Studio A13VH-014 | |
| Gigabyte AERO 16 OLED BSF | |
| Samsung Galaxy Book3 Ultra 16 | |
| Média da turma Multimedia (143.8 - 2022, n=55, últimos 2 anos) | |
| AIDA64 / FP64 Ray-Trace | |
| Média Intel Core i9-13980HX (11431 - 16325, n=9) | |
| Asus ProArt Studiobook 16 OLED H7604 | |
| MSI Stealth 17 Studio A13VH-014 | |
| Gigabyte AERO 16 OLED BSF | |
| Média da turma Multimedia (1014 - 26875, n=55, últimos 2 anos) | |
| Samsung Galaxy Book3 Ultra 16 | |
| AIDA64 / CPU PhotoWorxx | |
| MSI Stealth 17 Studio A13VH-014 | |
| Média da turma Multimedia (8187 - 88154, n=55, últimos 2 anos) | |
| Asus ProArt Studiobook 16 OLED H7604 | |
| Samsung Galaxy Book3 Ultra 16 | |
| Média Intel Core i9-13980HX (37069 - 52949, n=9) | |
| Gigabyte AERO 16 OLED BSF | |
Desempenho do sistema
O desempenho do sistema é excelente, tanto nos benchmarks sintéticos quanto na prática. Também não foram encontrados problemas durante os testes.
CrossMark: Overall | Productivity | Creativity | Responsiveness
| PCMark 10 / Score | |
| Asus Zephyrus Duo 16 GX650PY-NM006W | |
| Gigabyte AERO 16 OLED BSF | |
| Média da turma Multimedia (4325 - 10386, n=53, últimos 2 anos) | |
| Asus ProArt Studiobook 16 OLED H7604 | |
| Média Intel Core i9-13980HX, NVIDIA GeForce RTX 4070 Laptop GPU (n=1) | |
| MSI Stealth 17 Studio A13VH-014 | |
| Samsung Galaxy Book3 Ultra 16 | |
| PCMark 10 / Essentials | |
| Asus Zephyrus Duo 16 GX650PY-NM006W | |
| Gigabyte AERO 16 OLED BSF | |
| Asus ProArt Studiobook 16 OLED H7604 | |
| Média Intel Core i9-13980HX, NVIDIA GeForce RTX 4070 Laptop GPU (n=1) | |
| Samsung Galaxy Book3 Ultra 16 | |
| Média da turma Multimedia (8025 - 11664, n=52, últimos 2 anos) | |
| MSI Stealth 17 Studio A13VH-014 | |
| PCMark 10 / Productivity | |
| Asus Zephyrus Duo 16 GX650PY-NM006W | |
| Média da turma Multimedia (7323 - 18233, n=52, últimos 2 anos) | |
| MSI Stealth 17 Studio A13VH-014 | |
| Asus ProArt Studiobook 16 OLED H7604 | |
| Média Intel Core i9-13980HX, NVIDIA GeForce RTX 4070 Laptop GPU (n=1) | |
| Gigabyte AERO 16 OLED BSF | |
| Samsung Galaxy Book3 Ultra 16 | |
| PCMark 10 / Digital Content Creation | |
| Asus Zephyrus Duo 16 GX650PY-NM006W | |
| Gigabyte AERO 16 OLED BSF | |
| MSI Stealth 17 Studio A13VH-014 | |
| Asus ProArt Studiobook 16 OLED H7604 | |
| Média Intel Core i9-13980HX, NVIDIA GeForce RTX 4070 Laptop GPU (n=1) | |
| Média da turma Multimedia (3651 - 16240, n=52, últimos 2 anos) | |
| Samsung Galaxy Book3 Ultra 16 | |
| CrossMark / Overall | |
| Asus ProArt Studiobook 16 OLED H7604 | |
| Média Intel Core i9-13980HX, NVIDIA GeForce RTX 4070 Laptop GPU (n=1) | |
| Asus Zephyrus Duo 16 GX650PY-NM006W | |
| Apple MacBook Pro 16 2023 M2 Max | |
| Gigabyte AERO 16 OLED BSF | |
| Média da turma Multimedia (866 - 2728, n=61, últimos 2 anos) | |
| MSI Stealth 17 Studio A13VH-014 | |
| Samsung Galaxy Book3 Ultra 16 | |
| CrossMark / Productivity | |
| Asus ProArt Studiobook 16 OLED H7604 | |
| Média Intel Core i9-13980HX, NVIDIA GeForce RTX 4070 Laptop GPU (n=1) | |
| Asus Zephyrus Duo 16 GX650PY-NM006W | |
| Gigabyte AERO 16 OLED BSF | |
| Média da turma Multimedia (931 - 2489, n=61, últimos 2 anos) | |
| MSI Stealth 17 Studio A13VH-014 | |
| Apple MacBook Pro 16 2023 M2 Max | |
| Samsung Galaxy Book3 Ultra 16 | |
| CrossMark / Creativity | |
| Apple MacBook Pro 16 2023 M2 Max | |
| Asus ProArt Studiobook 16 OLED H7604 | |
| Média Intel Core i9-13980HX, NVIDIA GeForce RTX 4070 Laptop GPU (n=1) | |
| Asus Zephyrus Duo 16 GX650PY-NM006W | |
| Média da turma Multimedia (907 - 3465, n=61, últimos 2 anos) | |
| Gigabyte AERO 16 OLED BSF | |
| MSI Stealth 17 Studio A13VH-014 | |
| Samsung Galaxy Book3 Ultra 16 | |
| CrossMark / Responsiveness | |
| Gigabyte AERO 16 OLED BSF | |
| Asus ProArt Studiobook 16 OLED H7604 | |
| Média Intel Core i9-13980HX, NVIDIA GeForce RTX 4070 Laptop GPU (n=1) | |
| Asus Zephyrus Duo 16 GX650PY-NM006W | |
| MSI Stealth 17 Studio A13VH-014 | |
| Média da turma Multimedia (605 - 2024, n=61, últimos 2 anos) | |
| Samsung Galaxy Book3 Ultra 16 | |
| Apple MacBook Pro 16 2023 M2 Max | |
| PCMark 10 Score | 7491 pontos | |
Ajuda | ||
| AIDA64 / Memory Copy | |
| Média da turma Multimedia (11299 - 132135, n=55, últimos 2 anos) | |
| Asus ProArt Studiobook 16 OLED H7604 | |
| MSI Stealth 17 Studio A13VH-014 | |
| Samsung Galaxy Book3 Ultra 16 | |
| Média Intel Core i9-13980HX (62189 - 80776, n=9) | |
| Gigabyte AERO 16 OLED BSF | |
| AIDA64 / Memory Read | |
| Média da turma Multimedia (11624 - 174586, n=55, últimos 2 anos) | |
| Asus ProArt Studiobook 16 OLED H7604 | |
| Média Intel Core i9-13980HX (62624 - 89096, n=9) | |
| MSI Stealth 17 Studio A13VH-014 | |
| Samsung Galaxy Book3 Ultra 16 | |
| Gigabyte AERO 16 OLED BSF | |
| AIDA64 / Memory Write | |
| Samsung Galaxy Book3 Ultra 16 | |
| Média da turma Multimedia (11755 - 134998, n=55, últimos 2 anos) | |
| MSI Stealth 17 Studio A13VH-014 | |
| Asus ProArt Studiobook 16 OLED H7604 | |
| Média Intel Core i9-13980HX (59912 - 79917, n=9) | |
| Gigabyte AERO 16 OLED BSF | |
| AIDA64 / Memory Latency | |
| Média da turma Multimedia (7 - 535, n=54, últimos 2 anos) | |
| Samsung Galaxy Book3 Ultra 16 | |
| Gigabyte AERO 16 OLED BSF | |
| MSI Stealth 17 Studio A13VH-014 | |
| Média Intel Core i9-13980HX (79.4 - 93.2, n=9) | |
| Asus ProArt Studiobook 16 OLED H7604 | |
* ... menor é melhor
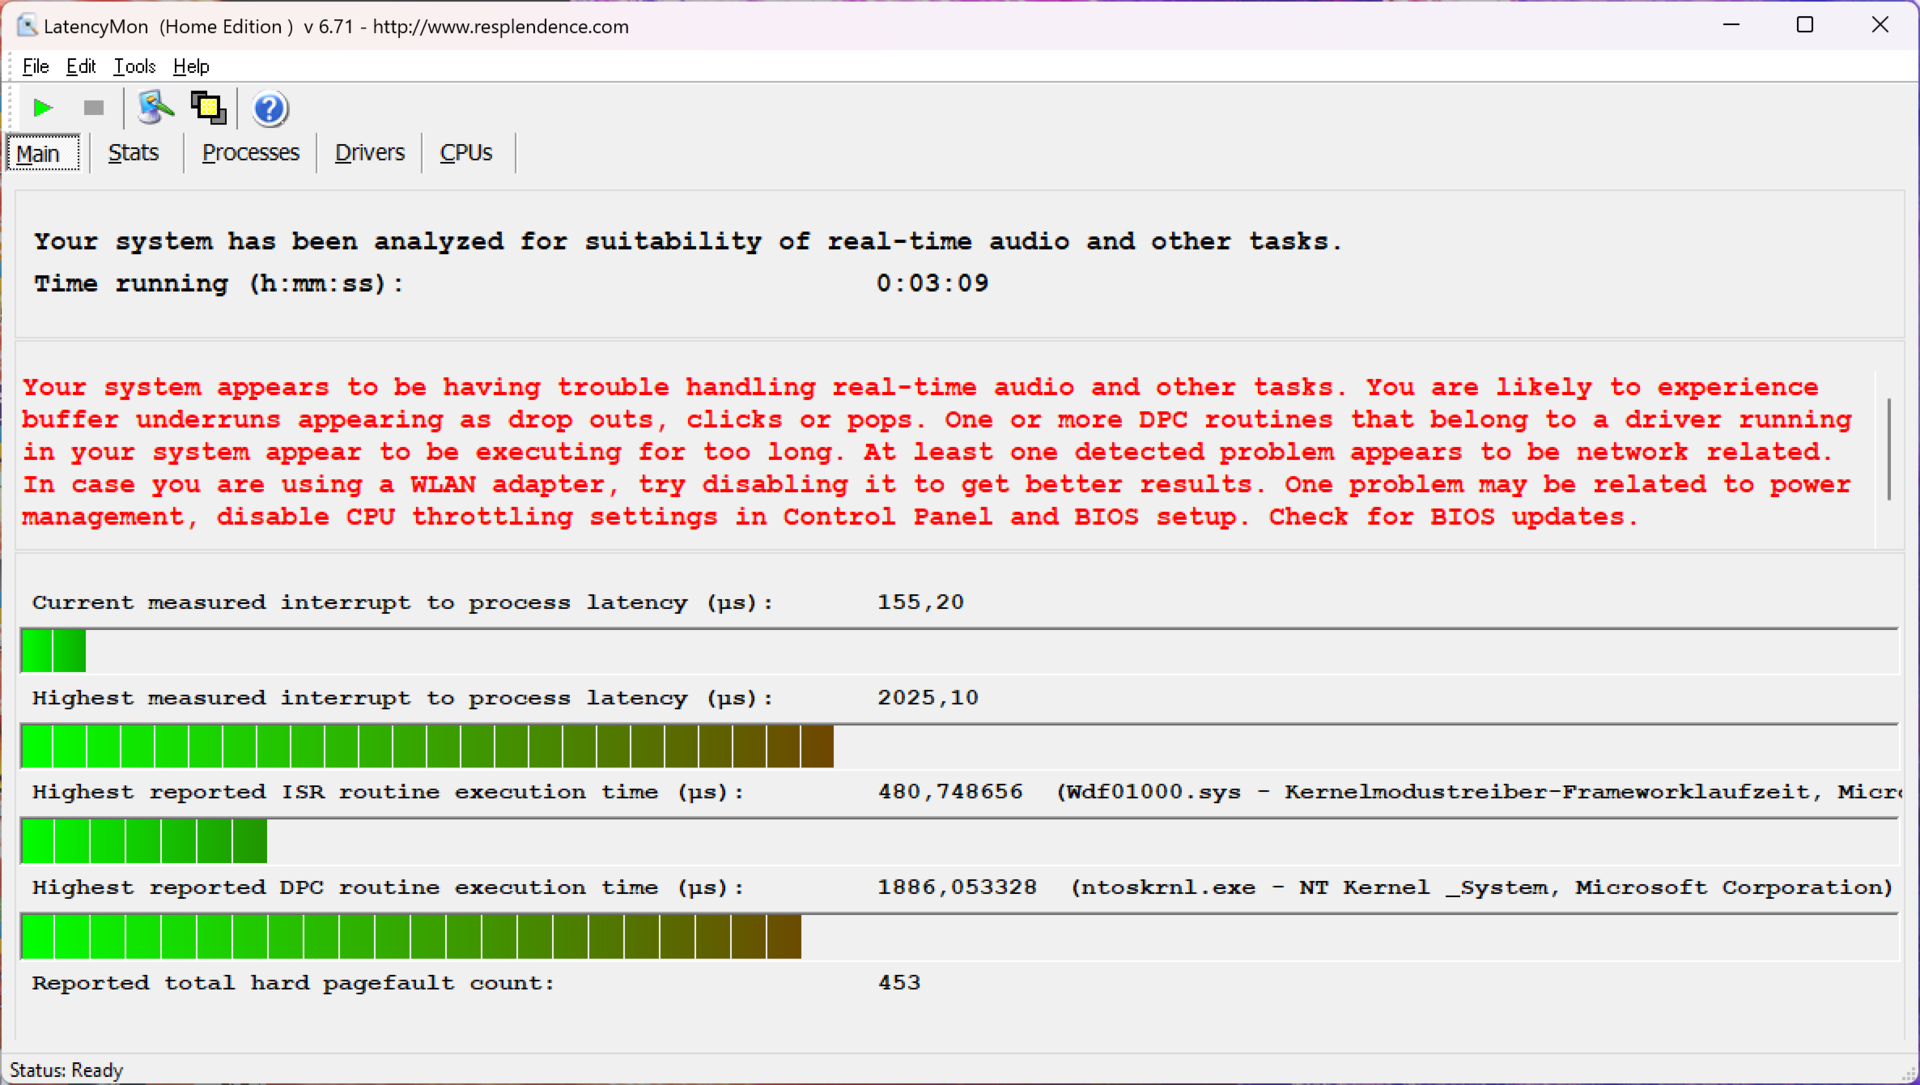
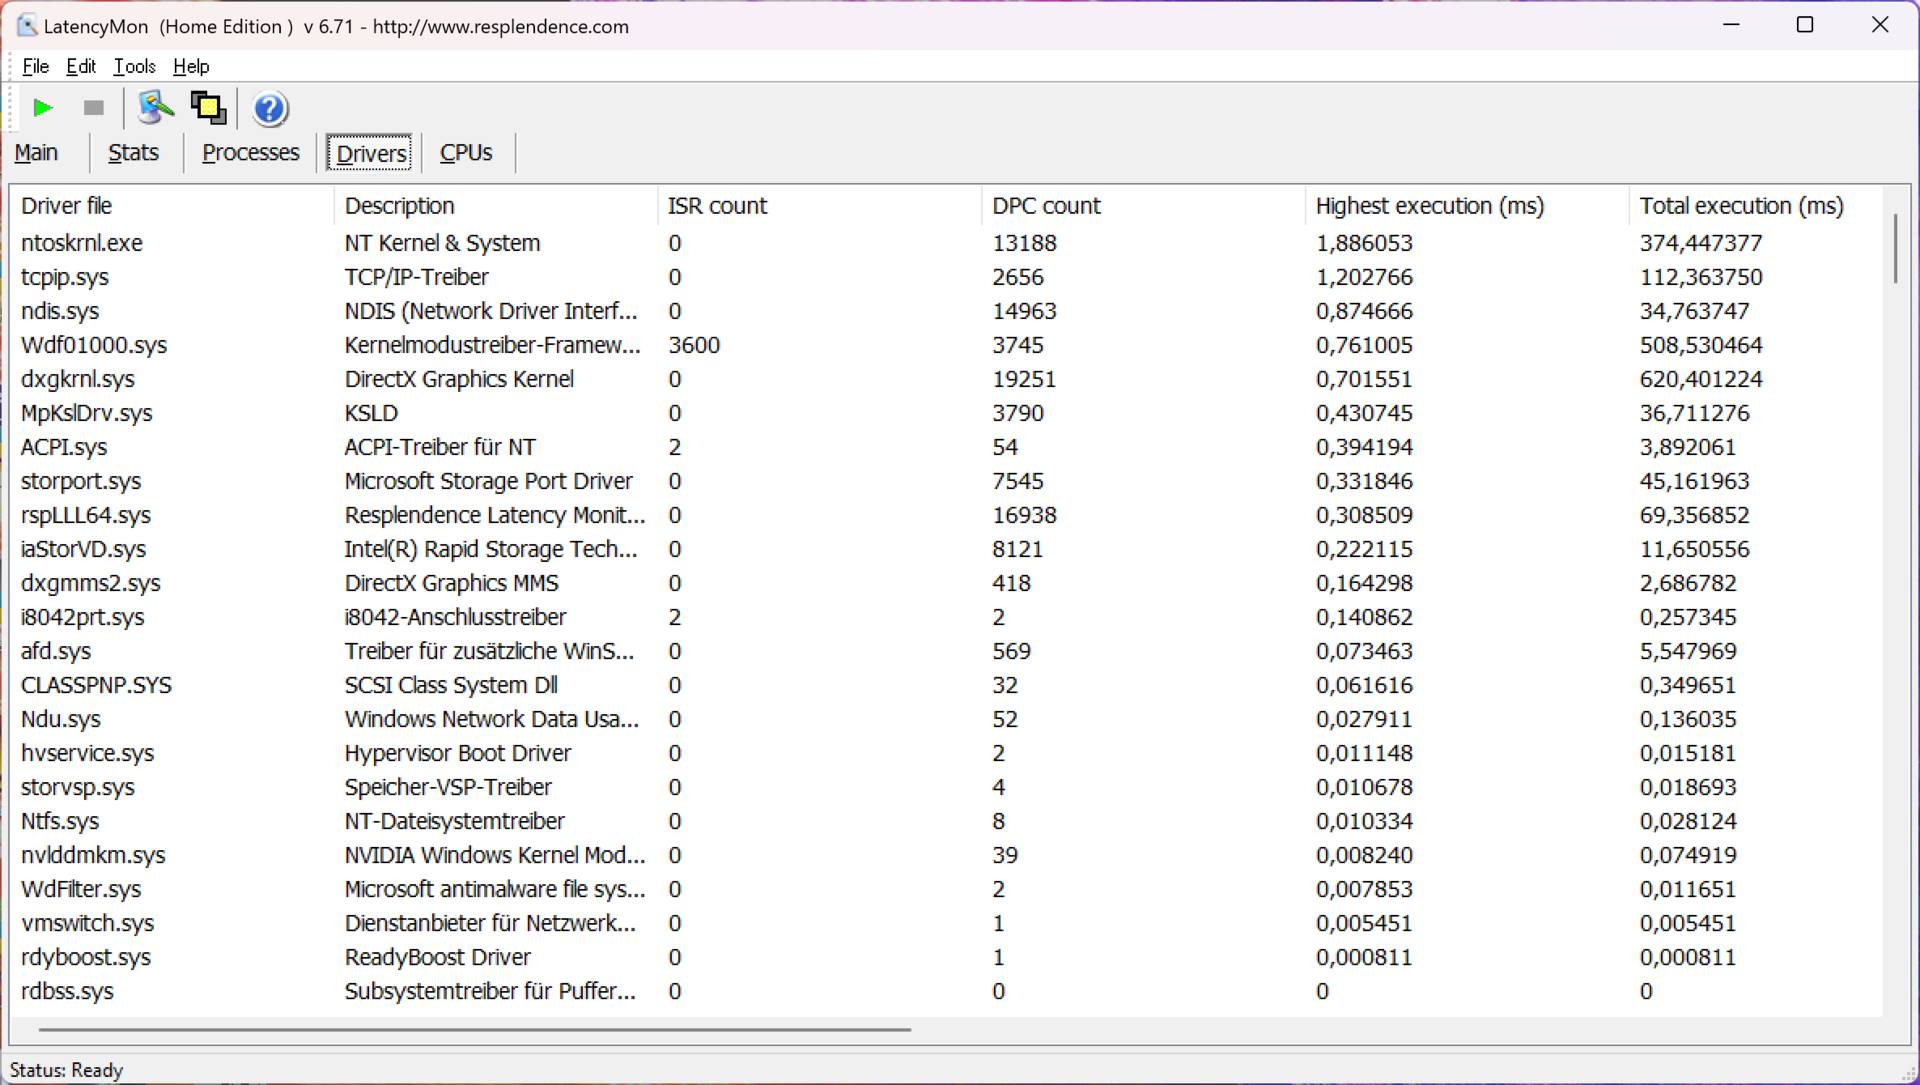
Latência DPC
O Studiobook não é particularmente adequado para aplicativos de áudio em tempo real. Ocorreram altas latências com a versão atual do BIOS em nosso teste de latência padronizado.
| DPC Latencies / LatencyMon - interrupt to process latency (max), Web, Youtube, Prime95 | |
| Asus Zephyrus Duo 16 GX650PY-NM006W | |
| Samsung Galaxy Book3 Ultra 16 | |
| MSI Stealth 17 Studio A13VH-014 | |
| Asus ProArt Studiobook 16 OLED H7604 | |
| Gigabyte AERO 16 OLED BSF | |
* ... menor é melhor
Dispositivos de armazenamento
Um SSD PCIe 4.0 rápido da Phison é usado em nosso dispositivo de teste, que oferece uma enorme capacidade de armazenamento de 4 TB. Desse total, 3,63 TB ainda estão disponíveis após a primeira inicialização. A unidade é muito rápida, com taxas de transferência de mais de 7 GB/s e, acima de tudo, o desempenho pode ser mantido constantemente, mesmo sob carga permanente. Isso não é, de forma alguma, um padrão. Além disso, o Studiobook 16 oferece outro slot M.2 2280, que também é conectado por meio da rápida interface PCIe 4.0. Mais benchmarks de SSD estão listadosaqui.

* ... menor é melhor
Sustained Read Performance: DiskSpd Read Loop, Queue Depth 8
Gráficos
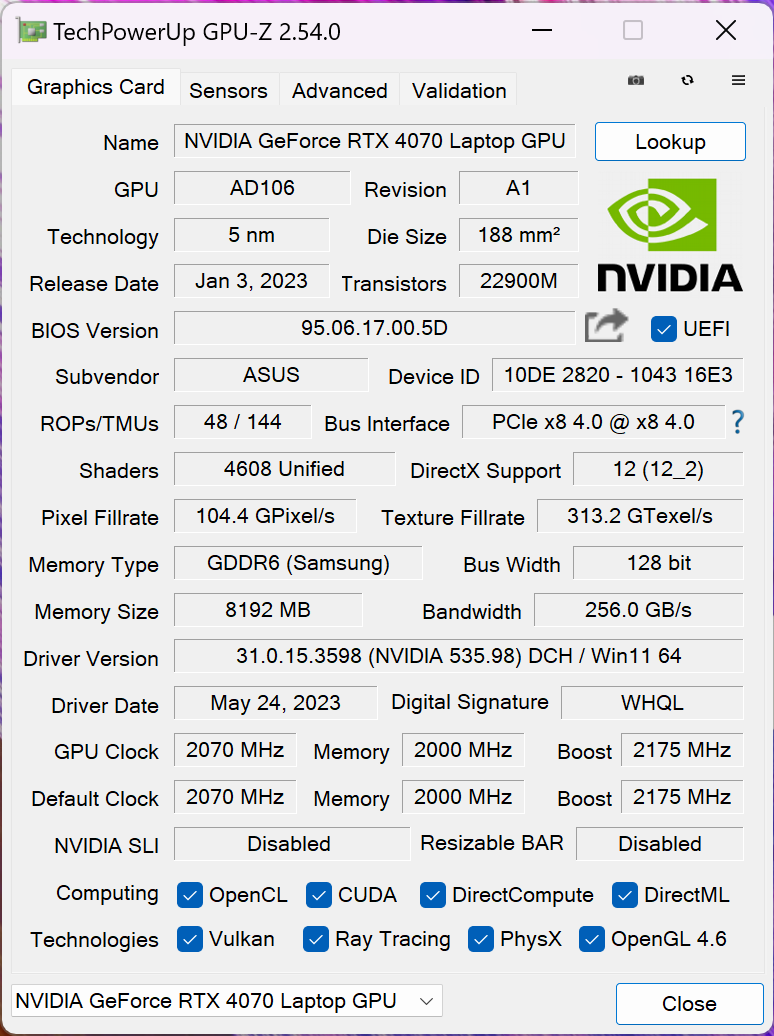
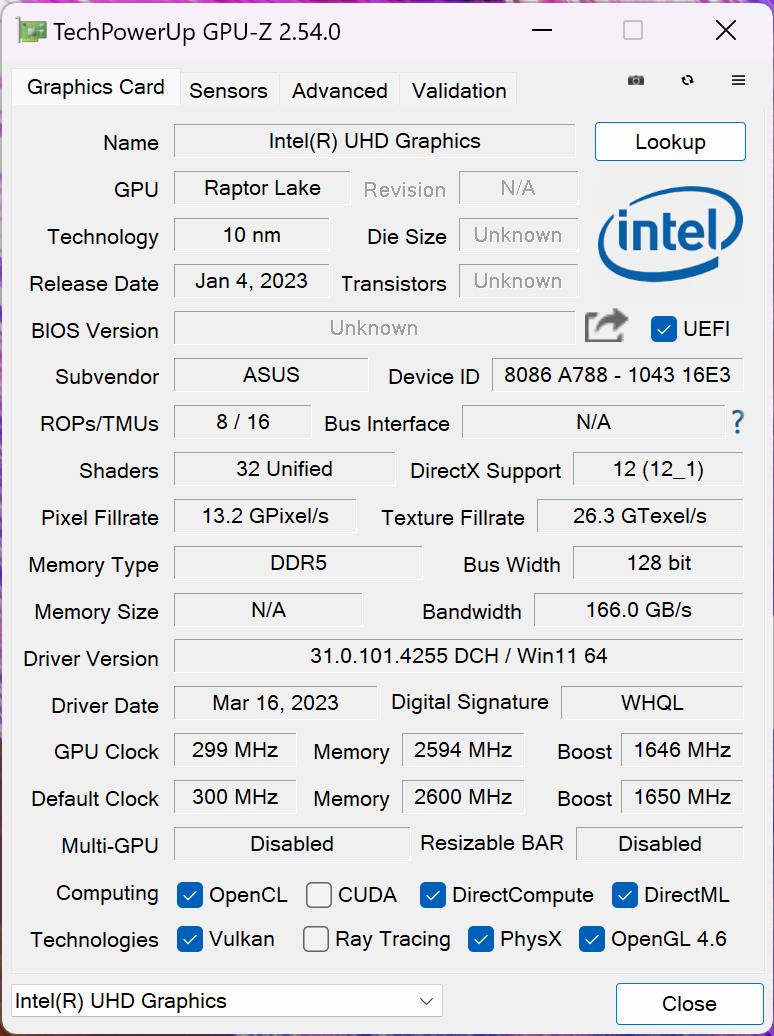
Além da GPU integrada do processador (UHD Graphics), o rápido laptop Nvidia GeForce RTX 4070 também está instalado. A comutação de gráficos é feita por meio do Optimus, mas não há Optimus avançado ou um switch MUX. Com um TGP máximo de 130 watts, esse é um dos modelos de laptop 4070 mais rápidos, mas esse número é um pouco enganador. Como vimos em nossa primeira análise das novas GPUs móveis, esse valor pode ser alcançado em testes sintéticos, como o FurMark, mas os jogos são limitados a cerca de 105-110 watts porque a GPU atinge seu clock máximo aqui
Nos benchmarks, a RTX 4070 está no nível esperado, atrás daLaptop RTX 4080 e do laptop 4090em comparação com o antigo Studiobook 16 com seu RTX 3070 Ti,a vantagem de 7-15% não é tão grande, portanto, uma atualização não vale a pena aqui. O desempenho da GPU permanece estável sob carga permanente, mas o desempenho é cerca de 40% menor no modo de bateria (TGP máximo de 40 watts). Mais benchmarks de GPU estão disponíveis em aqui.
| 3DMark 11 Performance | 35000 pontos | |
| 3DMark Fire Strike Score | 25949 pontos | |
| 3DMark Time Spy Score | 12384 pontos | |
Ajuda | ||
| Blender / v3.3 Classroom OPTIX/RTX | |
| Média da turma Multimedia (12 - 105, n=22, últimos 2 anos) | |
| Samsung Galaxy Book3 Ultra 16 | |
| Asus ProArt StudioBook 16 H7600ZW | |
| Schenker XMG Pro 15 (E23) | |
| Asus ProArt Studiobook 16 OLED H7604 | |
| Média NVIDIA GeForce RTX 4070 Laptop GPU (18 - 30, n=68) | |
| Gigabyte AERO 16 OLED BSF | |
| MSI Stealth 17 Studio A13VH-014 | |
| Asus Zephyrus Duo 16 GX650PY-NM006W | |
| Blender / v3.3 Classroom CUDA | |
| Média da turma Multimedia (20 - 186, n=22, últimos 2 anos) | |
| Samsung Galaxy Book3 Ultra 16 | |
| Asus ProArt StudioBook 16 H7600ZW | |
| Schenker XMG Pro 15 (E23) | |
| Asus ProArt Studiobook 16 OLED H7604 | |
| Média NVIDIA GeForce RTX 4070 Laptop GPU (32 - 50, n=67) | |
| Gigabyte AERO 16 OLED BSF | |
| MSI Stealth 17 Studio A13VH-014 | |
| Asus Zephyrus Duo 16 GX650PY-NM006W | |
| Blender / v3.3 Classroom METAL | |
| Apple MacBook Pro 16 2023 M2 Max | |
| Média da turma Multimedia (17.8 - 68, n=5, últimos 2 anos) | |
| Blender / v3.3 Classroom CPU | |
| Média da turma Multimedia (134.5 - 1042, n=63, últimos 2 anos) | |
| Samsung Galaxy Book3 Ultra 16 | |
| Apple MacBook Pro 16 2023 M2 Max | |
| Gigabyte AERO 16 OLED BSF | |
| Média NVIDIA GeForce RTX 4070 Laptop GPU (158 - 440, n=67) | |
| Asus ProArt StudioBook 16 H7600ZW | |
| MSI Stealth 17 Studio A13VH-014 | |
| Schenker XMG Pro 15 (E23) | |
| Asus ProArt Studiobook 16 OLED H7604 | |
| Asus Zephyrus Duo 16 GX650PY-NM006W | |
* ... menor é melhor
Desempenho em jogos
O desempenho do Studiobook 16 em jogos é muito bom e até mesmo os títulos modernos podem ser reproduzidos em resolução QHD sem problemas. Apenas o Ray Tracing geralmente requer um aumento de escala para que a reprodução ocorra sem problemas. Um bom exemplo é o Cyberpunk 2077, em que apenas 26 FPS são possíveis com a predefinição Ray Tracing Ultra, mas isso se torna 84 FPS com DLSS (incluindo Frame Generation). É claro que o aumento de velocidade pode variar dependendo do título, e Cyberpunk é um título emblemático para o DLSS. O desempenho em jogos permanece estável durante sessões mais longas, mas a vantagem geral sobre o antigo studio book com sua RTX 3070 Ti é mínima.
Witcher 3 FPS Chart
| baixo | média | alto | ultra | QHD | |
|---|---|---|---|---|---|
| GTA V (2015) | 183.4 | 179 | 123 | 94.5 | |
| The Witcher 3 (2015) | 249 | 107.1 | |||
| Dota 2 Reborn (2015) | 215 | 192.8 | 184.4 | 171.6 | |
| Final Fantasy XV Benchmark (2018) | 162.4 | 114.7 | 85.2 | ||
| X-Plane 11.11 (2018) | 181.6 | 164.3 | 131.1 | ||
| Far Cry 5 (2018) | 187 | 162 | 154 | 145 | 117 |
| Strange Brigade (2018) | 315 | 162.1 | 150.6 | 142.7 | 95.3 |
| Shadow of the Tomb Raider (2018) | 153 | 103 | |||
| F1 2021 (2021) | 441 | 336 | 264 | 149.8 | 110.9 |
| Cyberpunk 2077 1.6 (2022) | 129 | 113 | 96 | 87 | 54 |
| F1 22 (2022) | 138.5 | 133.8 | 111.2 | 59.4 | 42.4 |
| Call of Duty Modern Warfare 2 2022 (2022) | 102 | 72 |
Emissões - Loud, Louder, Studiobook
Ruído
Em geral, as duas ventoinhas permanecem silenciosas durante as tarefas diárias, mas rapidamente se tornam barulhentas assim que a CPU ou a GPU ficam sob estresse. Listamos os valores na tabela abaixo, mas geralmente recomendamos fones de ouvido ou headsets para jogos. Você pode ignorar o modo Full Speed aqui, pois ele só aumenta o volume e não há vantagem de desempenho. Não foram detectados outros ruídos eletrônicos, como o ruído da bobina
| Perfil de energia | 3DMark 06 | Witcher 3 | Cyberpoint 2077 | Teste de estresse |
|---|---|---|---|---|
| Padrão | 43,6dB(A) | 43,6dB(A) | 47,6dB(A) | 47,6dB(A) |
| Desempenho | 43,6dB(A) | 43,6dB(A) | 47,6dB(A) | 47,6dB(A) |
| Velocidade máxima | 58,9dB(A) | 58,9dB(A) | 58,9dB(A) | 58,9dB(A) |
Barulho
| Ocioso |
| 24.5 / 24.5 / 24.5 dB |
| Carga |
| 47.6 / 56.7 dB |
 | ||
30 dB silencioso 40 dB(A) audível 50 dB(A) ruidosamente alto |
||
min: | ||
| Asus ProArt Studiobook 16 OLED H7604 GeForce RTX 4070 Laptop GPU, i9-13980HX, Phison EM2804TBMTCB47 | Gigabyte AERO 16 OLED BSF GeForce RTX 4070 Laptop GPU, i9-13900H, Gigabyte AG470S1TB-SI B10 | Samsung Galaxy Book3 Ultra 16 GeForce RTX 4050 Laptop GPU, i7-13700H, Samsung PM9A1 MZVL2512HCJQ | MSI Stealth 17 Studio A13VH-014 GeForce RTX 4080 Laptop GPU, i9-13900H, Samsung PM9A1 MZVL22T0HBLB | Apple MacBook Pro 16 2023 M2 Max M2 Max 38-Core GPU, M2 Max, Apple SSD AP2048Z | Asus Zephyrus Duo 16 GX650PY-NM006W GeForce RTX 4090 Laptop GPU, R9 7945HX, SK hynix PC801 HFS002TEJ9X101N | |
|---|---|---|---|---|---|---|
| Noise | -3% | 6% | 9% | 13% | -9% | |
| desligado / ambiente * (dB) | 24.5 | 23 6% | 25 -2% | 24 2% | 23.9 2% | 23.9 2% |
| Idle Minimum * (dB) | 24.5 | 23 6% | 26 -6% | 24 2% | 23.9 2% | 23.9 2% |
| Idle Average * (dB) | 24.5 | 23 6% | 27 -10% | 24 2% | 23.9 2% | 32.9 -34% |
| Idle Maximum * (dB) | 24.5 | 33.64 -37% | 28 -14% | 24 2% | 23.9 2% | 36.5 -49% |
| Load Average * (dB) | 47.6 | 51.49 -8% | 40 16% | 34.49 28% | 36.6 23% | 42.9 10% |
| Witcher 3 ultra * (dB) | 55.9 | 55.27 1% | 39 30% | 48.29 14% | 35.1 37% | 51.2 8% |
| Load Maximum * (dB) | 56.7 | 55.24 3% | 41 28% | 49.66 12% | 43.2 24% | 56 1% |
* ... menor é melhor
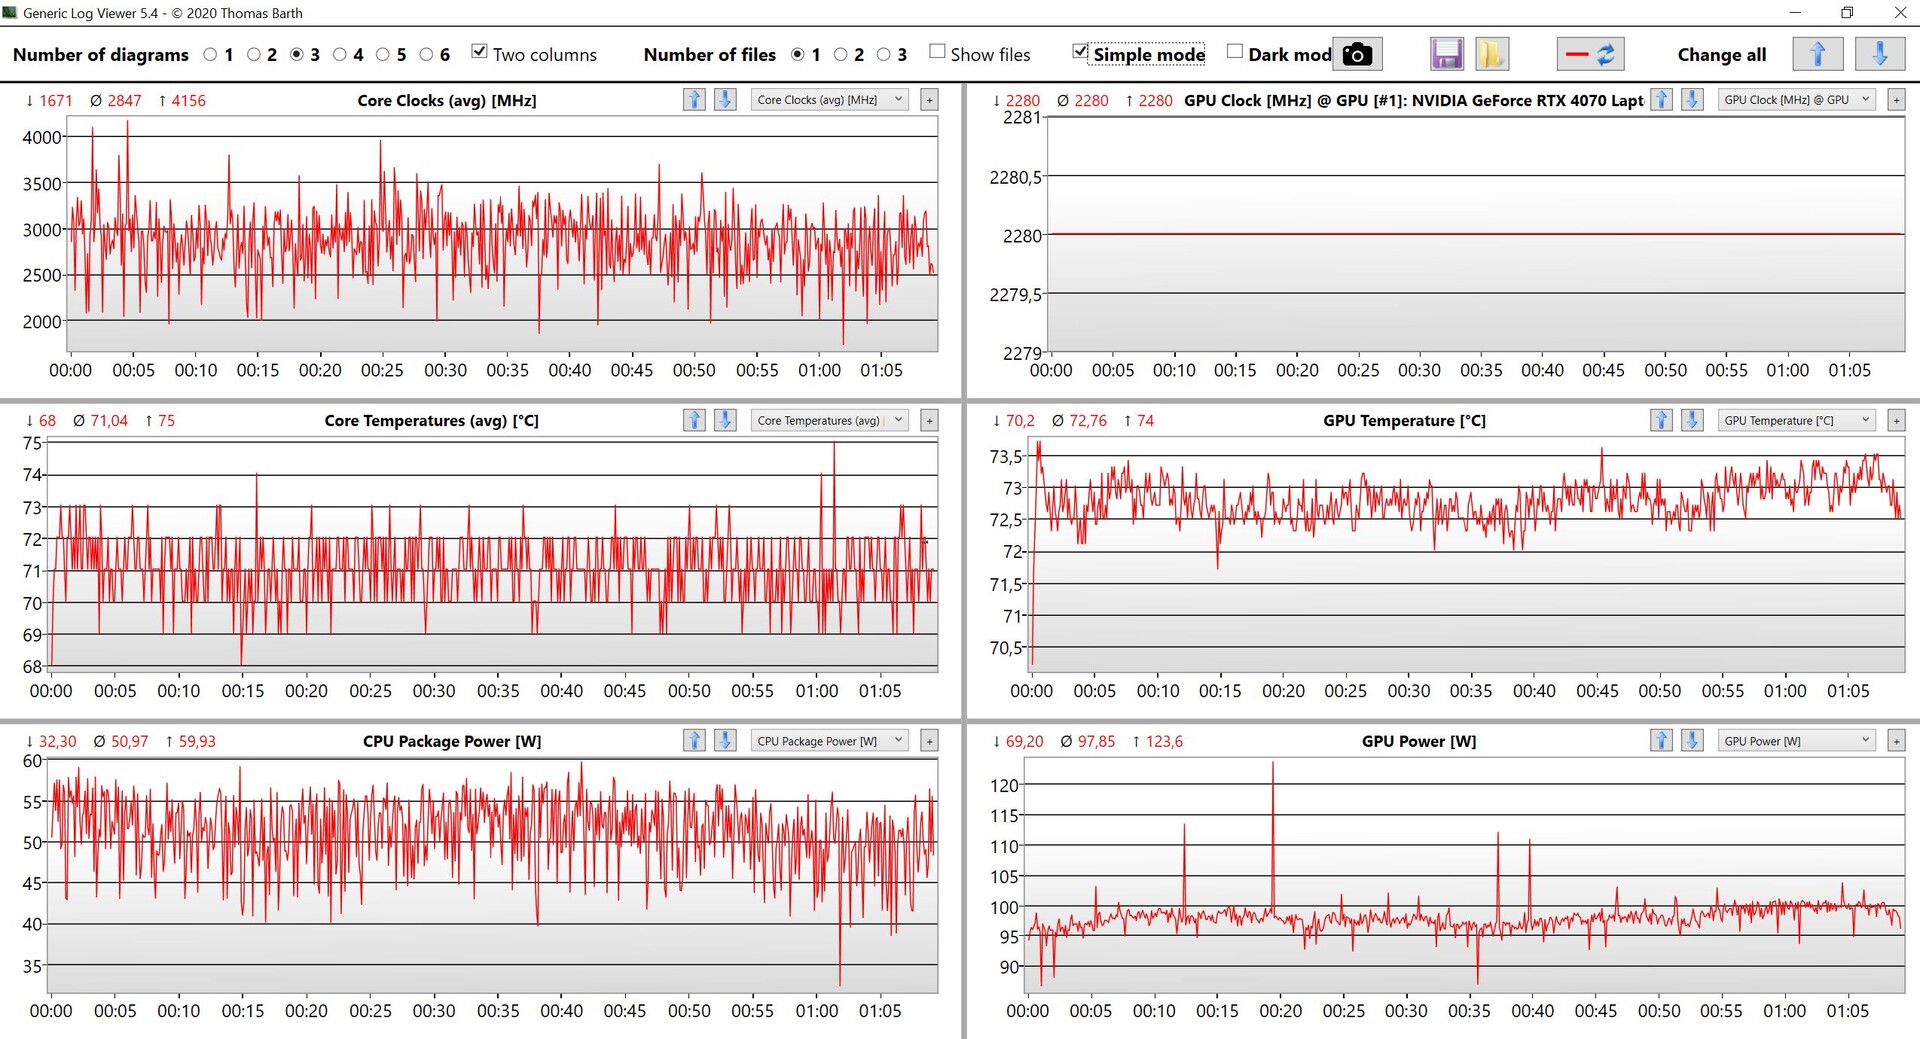
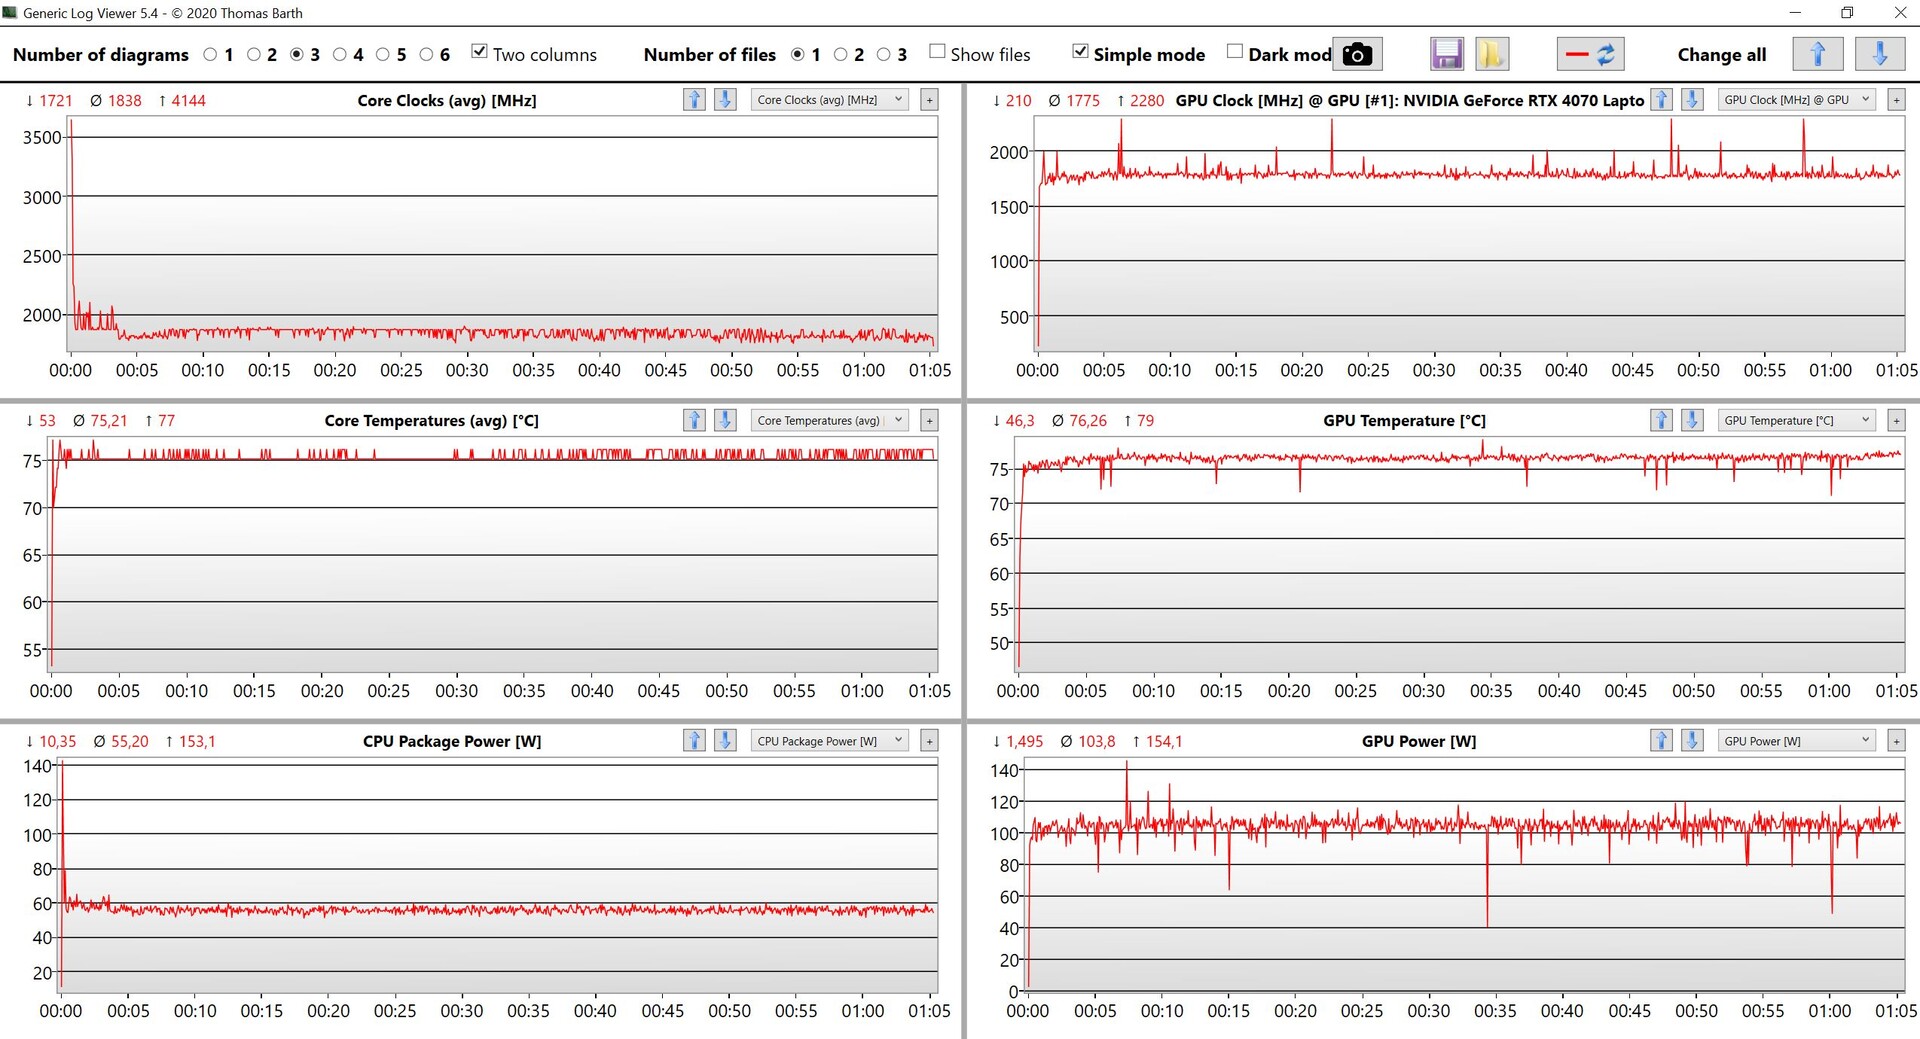
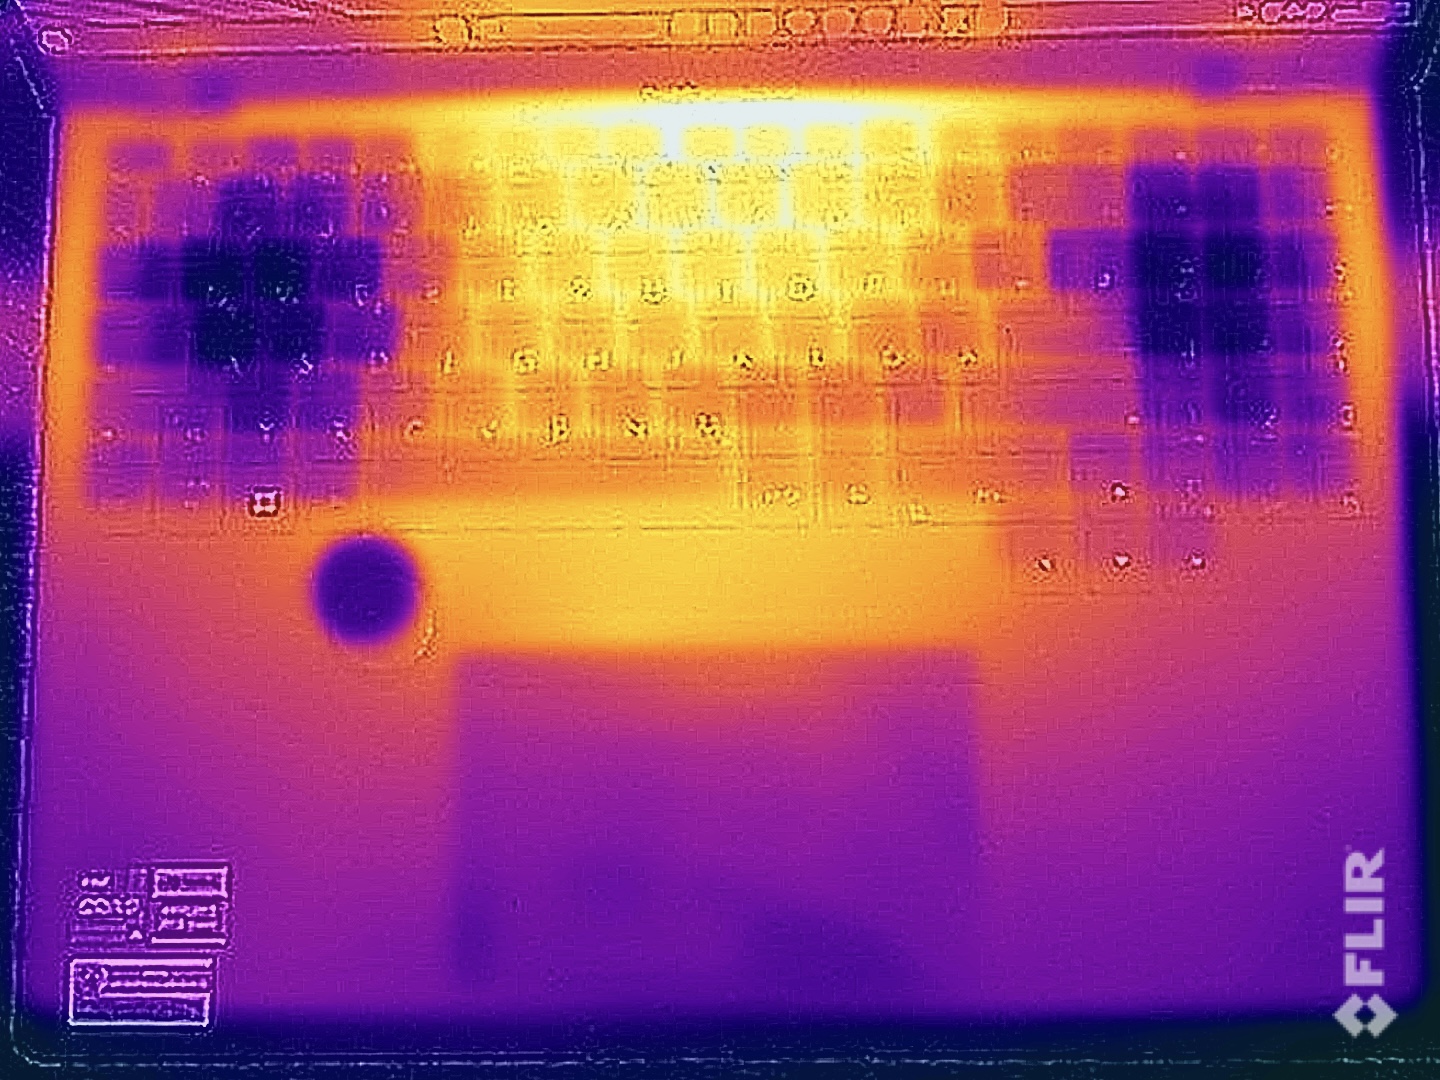
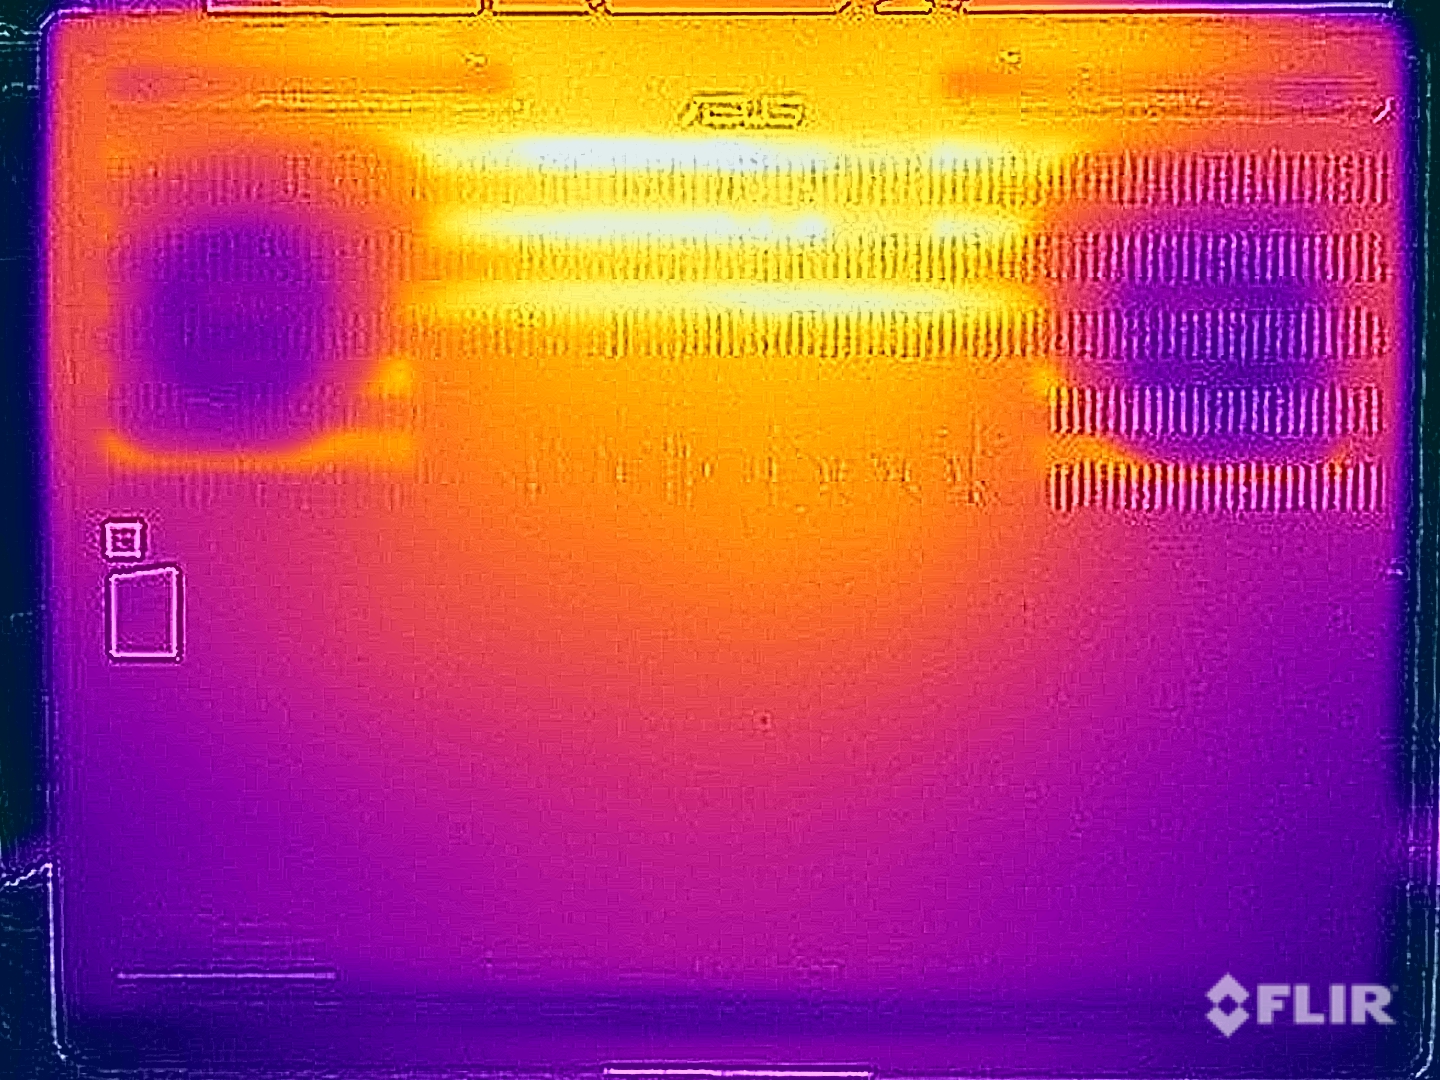
Temperatura
As temperaturas da superfície não são problemáticas em geral, mas os componentes fortes do laptop se fazem sentir rapidamente, mesmo quando ociosos. Como os ventiladores não estão funcionando aqui, medimos mais de 30 °C. Sob carga, a parte superior da unidade base permanece bastante confortável, com um máximo de 45 °C, e não há restrições ao digitar. O lado inferior atinge um máximo de pouco menos de 48 °C no centro, razão pela qual, teoricamente, é possível colocar o dispositivo no colo (mas isso é improvável devido ao tamanho).
Os dois componentes se estabilizam rapidamente no teste de estresse, em que a placa de vídeo é a preferida pelo sistema e trabalha com cerca de 105 watts, enquanto o processador ainda tem cerca de 55 watts. Não foi registrada nenhuma redução de desempenho logo após o teste de estresse.
(±) A temperatura máxima no lado superior é 44.1 °C / 111 F, em comparação com a média de 36.8 °C / 98 F , variando de 21 a 71 °C para a classe Multimedia.
(-) A parte inferior aquece até um máximo de 48 °C / 118 F, em comparação com a média de 39.1 °C / 102 F
(+) Em uso inativo, a temperatura média para o lado superior é 31 °C / 88 F, em comparação com a média do dispositivo de 31.3 °C / ### class_avg_f### F.
(±) Jogando The Witcher 3, a temperatura média para o lado superior é 34.9 °C / 95 F, em comparação com a média do dispositivo de 31.3 °C / ## #class_avg_f### F.
(+) Os apoios para as mãos e o touchpad estão atingindo a temperatura máxima da pele (32.3 °C / 90.1 F) e, portanto, não estão quentes.
(-) A temperatura média da área do apoio para as mãos de dispositivos semelhantes foi 28.7 °C / 83.7 F (-3.6 °C / -6.4 F).
| Asus ProArt Studiobook 16 OLED H7604 Intel Core i9-13980HX, NVIDIA GeForce RTX 4070 Laptop GPU | Gigabyte AERO 16 OLED BSF Intel Core i9-13900H, NVIDIA GeForce RTX 4070 Laptop GPU | Samsung Galaxy Book3 Ultra 16 Intel Core i7-13700H, NVIDIA GeForce RTX 4050 Laptop GPU | MSI Stealth 17 Studio A13VH-014 Intel Core i9-13900H, NVIDIA GeForce RTX 4080 Laptop GPU | Apple MacBook Pro 16 2023 M2 Max Apple M2 Max, Apple M2 Max 38-Core GPU | Asus Zephyrus Duo 16 GX650PY-NM006W AMD Ryzen 9 7945HX, NVIDIA GeForce RTX 4090 Laptop GPU | |
|---|---|---|---|---|---|---|
| Heat | 18% | 18% | -1% | 20% | 7% | |
| Maximum Upper Side * (°C) | 44.1 | 41 7% | 41 7% | 47 -7% | 44.2 -0% | 44.2 -0% |
| Maximum Bottom * (°C) | 48 | 47 2% | 44 8% | 54 -13% | 42.9 11% | 46.8 2% |
| Idle Upper Side * (°C) | 32.7 | 23 30% | 23 30% | 30 8% | 22.4 31% | 29.2 11% |
| Idle Bottom * (°C) | 34.9 | 23 34% | 26 26% | 32 8% | 22.3 36% | 30.2 13% |
* ... menor é melhor
Alto-falantes
O sistema de som é composto por quatro alto-falantes que oferecem boa qualidade de som. Embora não seja o suficiente para competir com o MacBook Pro 16já que ainda falta um pouco de pressão, ela é satisfatória no geral. O desempenho é suficiente para vídeos e algumas músicas de fundo e, de qualquer forma, não é possível ouvir muito dos alto-falantes durante os jogos devido aos ventiladores barulhentos.
Asus ProArt Studiobook 16 OLED H7604 análise de áudio
(+) | os alto-falantes podem tocar relativamente alto (###valor### dB)
Graves 100 - 315Hz
(±) | graves reduzidos - em média 14.1% menor que a mediana
(±) | a linearidade dos graves é média (9.5% delta para a frequência anterior)
Médios 400 - 2.000 Hz
(+) | médios equilibrados - apenas 1.9% longe da mediana
(+) | médios são lineares (3.8% delta para frequência anterior)
Altos 2 - 16 kHz
(+) | agudos equilibrados - apenas 4.2% longe da mediana
(+) | os máximos são lineares (3.9% delta da frequência anterior)
Geral 100 - 16.000 Hz
(+) | o som geral é linear (11.2% diferença em relação à mediana)
Comparado com a mesma classe
» 17% de todos os dispositivos testados nesta classe foram melhores, 4% semelhantes, 80% piores
» O melhor teve um delta de 5%, a média foi 17%, o pior foi 45%
Comparado com todos os dispositivos testados
» 7% de todos os dispositivos testados foram melhores, 2% semelhantes, 91% piores
» O melhor teve um delta de 4%, a média foi 23%, o pior foi 134%
Apple MacBook Pro 16 2023 M2 Max análise de áudio
(+) | os alto-falantes podem tocar relativamente alto (###valor### dB)
Graves 100 - 315Hz
(+) | bons graves - apenas 3.9% longe da mediana
(+) | o baixo é linear (5.7% delta para a frequência anterior)
Médios 400 - 2.000 Hz
(+) | médios equilibrados - apenas 1.2% longe da mediana
(+) | médios são lineares (1.5% delta para frequência anterior)
Altos 2 - 16 kHz
(+) | agudos equilibrados - apenas 2.5% longe da mediana
(+) | os máximos são lineares (1.7% delta da frequência anterior)
Geral 100 - 16.000 Hz
(+) | o som geral é linear (4.9% diferença em relação à mediana)
Comparado com a mesma classe
» 0% de todos os dispositivos testados nesta classe foram melhores, 0% semelhantes, 99% piores
» O melhor teve um delta de 5%, a média foi 17%, o pior foi 45%
Comparado com todos os dispositivos testados
» 0% de todos os dispositivos testados foram melhores, 0% semelhantes, 100% piores
» O melhor teve um delta de 4%, a média foi 23%, o pior foi 134%
Gerenciamento de energia - StudioBook com bateria de curta duração
Consumo de energia
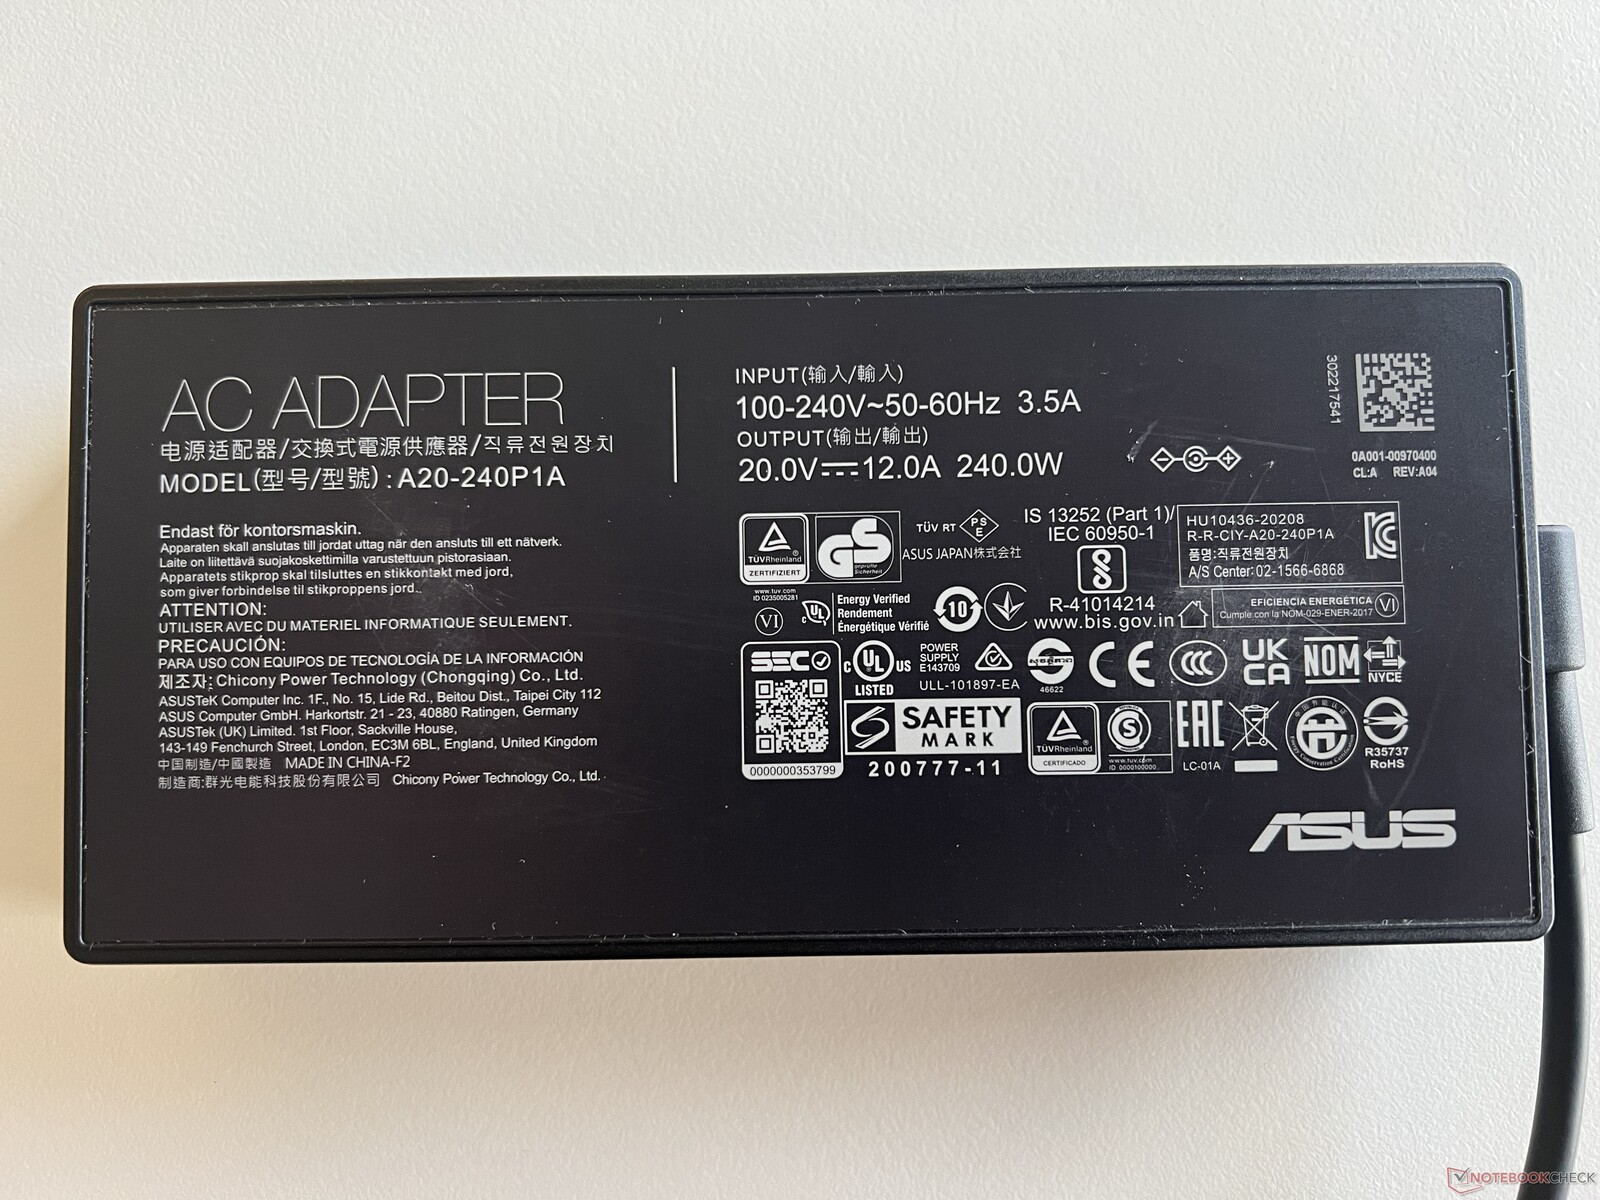
Devido ao grande painel OLED e ao processador HX, a eficiência do Studiobook 16 não é particularmente boa. Medimos entre 12 e 21 watts em modo inativo, dependendo do brilho, embora ocasionalmente atinja até 36 watts no modo HDR. Sob carga, não há surpresas: ele sobe para cerca de 200 watts durante os jogos e se estabiliza em cerca de 210 watts após os ~247 watts iniciais no teste de estresse. A fonte de alimentação de 240 watts incluída é, portanto, de tamanho suficiente.
| desligado | |
| Ocioso | |
| Carga |
|
Key:
min: | |
| Asus ProArt Studiobook 16 OLED H7604 i9-13980HX, GeForce RTX 4070 Laptop GPU, Phison EM2804TBMTCB47, OLED, 3200x2000, 16" | Gigabyte AERO 16 OLED BSF i9-13900H, GeForce RTX 4070 Laptop GPU, Gigabyte AG470S1TB-SI B10, OLED, 3840x2400, 16" | Samsung Galaxy Book3 Ultra 16 i7-13700H, GeForce RTX 4050 Laptop GPU, Samsung PM9A1 MZVL2512HCJQ, AMOLED, 2880x1800, 16" | MSI Stealth 17 Studio A13VH-014 i9-13900H, GeForce RTX 4080 Laptop GPU, Samsung PM9A1 MZVL22T0HBLB, Mini LED, 3840x2160, 17.3" | Apple MacBook Pro 16 2023 M2 Max M2 Max, M2 Max 38-Core GPU, Apple SSD AP2048Z, Mini-LED, 3456x2234, 16.2" | Asus Zephyrus Duo 16 GX650PY-NM006W R9 7945HX, GeForce RTX 4090 Laptop GPU, SK hynix PC801 HFS002TEJ9X101N, MiniLED, 2560x1600, 16" | Média NVIDIA GeForce RTX 4070 Laptop GPU | Média da turma Multimedia | |
|---|---|---|---|---|---|---|---|---|
| Power Consumption | 18% | 61% | 10% | 34% | -35% | 4% | 49% | |
| Idle Minimum * (Watt) | 12.8 | 11.8 8% | 3 77% | 13.9 -9% | 5.2 59% | 19.2 -50% | 13.2 ? -3% | 5.69 ? 56% |
| Idle Average * (Watt) | 19.9 | 16.1 19% | 5 75% | 20 -1% | 16.5 17% | 29.7 -49% | 18.2 ? 9% | 10.2 ? 49% |
| Idle Maximum * (Watt) | 20.3 | 17 16% | 11 46% | 20.6 -1% | 16.8 17% | 30.8 -52% | 24.6 ? -21% | 12.5 ? 38% |
| Load Average * (Watt) | 131.4 | 100.6 23% | 72 45% | 77 41% | 113 14% | 126 4% | 97 ? 26% | 65.4 ? 50% |
| Witcher 3 ultra * (Watt) | 196.5 | 158 20% | 69.7 65% | 162 18% | 92 53% | 258 -31% | ||
| Load Maximum * (Watt) | 246.8 | 192 22% | 108 56% | 216 12% | 145 41% | 330 -34% | 221 ? 10% | 112.9 ? 54% |
* ... menor é melhor
Power consumption Witcher 3 / Stress test
Power consumption with an external monitor
Duração da bateria
Em vista das taxas de consumo, não é de surpreender que a duração da bateria não seja particularmente boa, apesar da bateria de 90 Wh. Por padrão, o laptop muda para o modo 60Hz assim que você o desconecta da tomada. Apesar disso, registramos apenas 5,5 horas no teste WLAN a 150 cd/m² (120 Hz: 5 horas) e cerca de 4,5 horas com brilho total (120 Hz: ~3,5 horas). O teste de vídeo dura pouco menos de 6 horas. Um vídeo HDR com brilho total esgota a bateria após ~2:40 horas e cerca de uma hora sob carga, apesar do desempenho reduzido.
| Asus ProArt Studiobook 16 OLED H7604 i9-13980HX, GeForce RTX 4070 Laptop GPU, 90 Wh | Gigabyte AERO 16 OLED BSF i9-13900H, GeForce RTX 4070 Laptop GPU, 88 Wh | Samsung Galaxy Book3 Ultra 16 i7-13700H, GeForce RTX 4050 Laptop GPU, 76 Wh | MSI Stealth 17 Studio A13VH-014 i9-13900H, GeForce RTX 4080 Laptop GPU, 99 Wh | Apple MacBook Pro 16 2023 M2 Max M2 Max, M2 Max 38-Core GPU, 99.6 Wh | Asus Zephyrus Duo 16 GX650PY-NM006W R9 7945HX, GeForce RTX 4090 Laptop GPU, 90 Wh | Média da turma Multimedia | |
|---|---|---|---|---|---|---|---|
| Duração da bateria | 49% | 86% | 13% | 125% | -25% | 118% | |
| H.264 (h) | 6 | 7.4 23% | 13.4 123% | 5.6 -7% | 18.7 212% | 3.8 -37% | 16.8 ? 180% |
| WiFi v1.3 (h) | 5.6 | 7.5 34% | 9.6 71% | 5.6 0% | 14.8 164% | 4 -29% | 12.2 ? 118% |
| Load (h) | 1.1 | 2.1 91% | 1.8 64% | 1.6 45% | 1.1 0% | 1 -9% | 1.7 ? 55% |
| Witcher 3 ultra (h) | 2.6 |
Pro
Contra
Veredicto - Studiobook 16 com pontos fracos nos detalhes

O novo 2023 ProArt Studiobook 16 OLED oferece muito desempenho e é um bom laptop para usuários criativos em geral, embora haja alguns pontos fracos nos detalhes. Em primeiro lugar, o processador Core i9-13980HXcomo o processador móvel mais rápido da Intel, oferece muita potência de CPU, mas ainda fica atrás do AMD Ryzen 9 7945HX em termos de desempenho e eficiência de vários núcleos. Em comparação com o Core i9-12900H do modelo antigo, por outro lado, ele oferece um desempenho consideravelmente maior. No entanto, isso não se aplica à placa de vídeo, pois o Laptop RTX 4070 é apenas um pouco mais rápido do que a RTX 3070 Tiportanto, o upgrade não vale a pena aqui. Outros pontos de crítica incluem o resfriamento convencional e o ruído do ventilador em particular, pois o dispositivo rapidamente se torna muito barulhento. Pelo menos as temperaturas permanecem dentro dos limites.
A tela OLED mudou do painel 4K com 60 Hz para uma tela sensível ao toque de 120 Hz com uma resolução um pouco menor. A qualidade da imagem é fundamentalmente muito boa, mas, como em outras telas sensíveis ao toque OLED da Asus, as áreas claras parecem um pouco granuladas. Há também pequenos desvios de cor que não conseguimos corrigir com nossa própria calibração. A tela OLED também tem um impacto negativo na duração da bateria. O recurso de software contra a oscilação de PWM é bom, mas os ajustes devem ser feitos sempre por meio do software, o que é incômodo.
Muita potência, mas também ventoinhas barulhentas: O ProArt Studiobook 16 é, sem dúvida, um dispositivo rápido e o DialPad pode agregar valor para usuários criativos. Entretanto, o OLED de 120 Hz não é totalmente convincente.
Além da tela sensível ao toque, o Studiobook 16 oferece novamente o DialPad adicional, que funciona particularmente bem com os aplicativos da Adobe e também pode oferecer valor agregado aqui. Os recursos HDR ainda são limitados, mas isso se deve ao Windows. O HDR precisa ser ativado manualmente e os perfis de cores não estão mais disponíveis. Além disso, os painéis mini LED têm uma vantagem quando se trata de brilho máximo. Embora o MacBook Pro 16 ofereça um desempenho significativamente menor da CPU (pelo menos em operação na rede elétrica), ele ainda é uma opção muito boa para usuários criativos e oferece uma duração de bateria significativamente maior no uso diário. O desempenho ainda maior é oferecido pelo ROG Zephyrus Duo 16que está listado como um gamer, mas também é interessante para criadores de conteúdo graças à segunda tela.
Preço e disponibilidade
Uma variante do Asus ProArt Studiobook 16 OLED (CPU Intel Core i9-13980HX, GPU Nvidia Geforce RTX 4070, 32GB DDR5 SO-DIMM RAM, 1TB SSD) está disponível na Amazon EUA por US$ 2.499,99.
Os preços são válidos a partir de 29.06.23 e estão sujeitos a alterações.
Asus ProArt Studiobook 16 OLED H7604
- 06/27/2023 v7 (old)
Andreas Osthoff
Transparência
A seleção dos dispositivos a serem analisados é feita pela nossa equipe editorial. A amostra de teste foi fornecida ao autor como empréstimo pelo fabricante ou varejista para fins desta revisão. O credor não teve influência nesta revisão, nem o fabricante recebeu uma cópia desta revisão antes da publicação. Não houve obrigação de publicar esta revisão. Como empresa de mídia independente, a Notebookcheck não está sujeita à autoridade de fabricantes, varejistas ou editores.
É assim que o Notebookcheck está testando
Todos os anos, o Notebookcheck analisa de forma independente centenas de laptops e smartphones usando procedimentos padronizados para garantir que todos os resultados sejam comparáveis. Desenvolvemos continuamente nossos métodos de teste há cerca de 20 anos e definimos padrões da indústria no processo. Em nossos laboratórios de teste, equipamentos de medição de alta qualidade são utilizados por técnicos e editores experientes. Esses testes envolvem um processo de validação em vários estágios. Nosso complexo sistema de classificação é baseado em centenas de medições e benchmarks bem fundamentados, o que mantém a objetividade.Price comparison

