Revisão do MSI Stealth 17 Studio: Um laptop com um silencioso RTX 4080 para quase todas as ocasiões
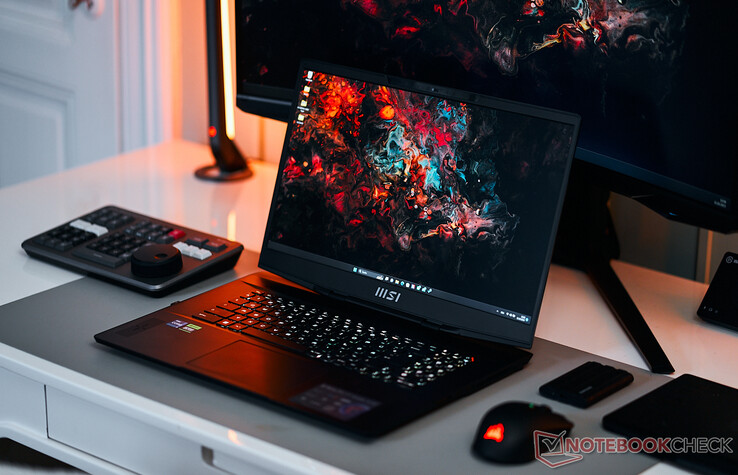
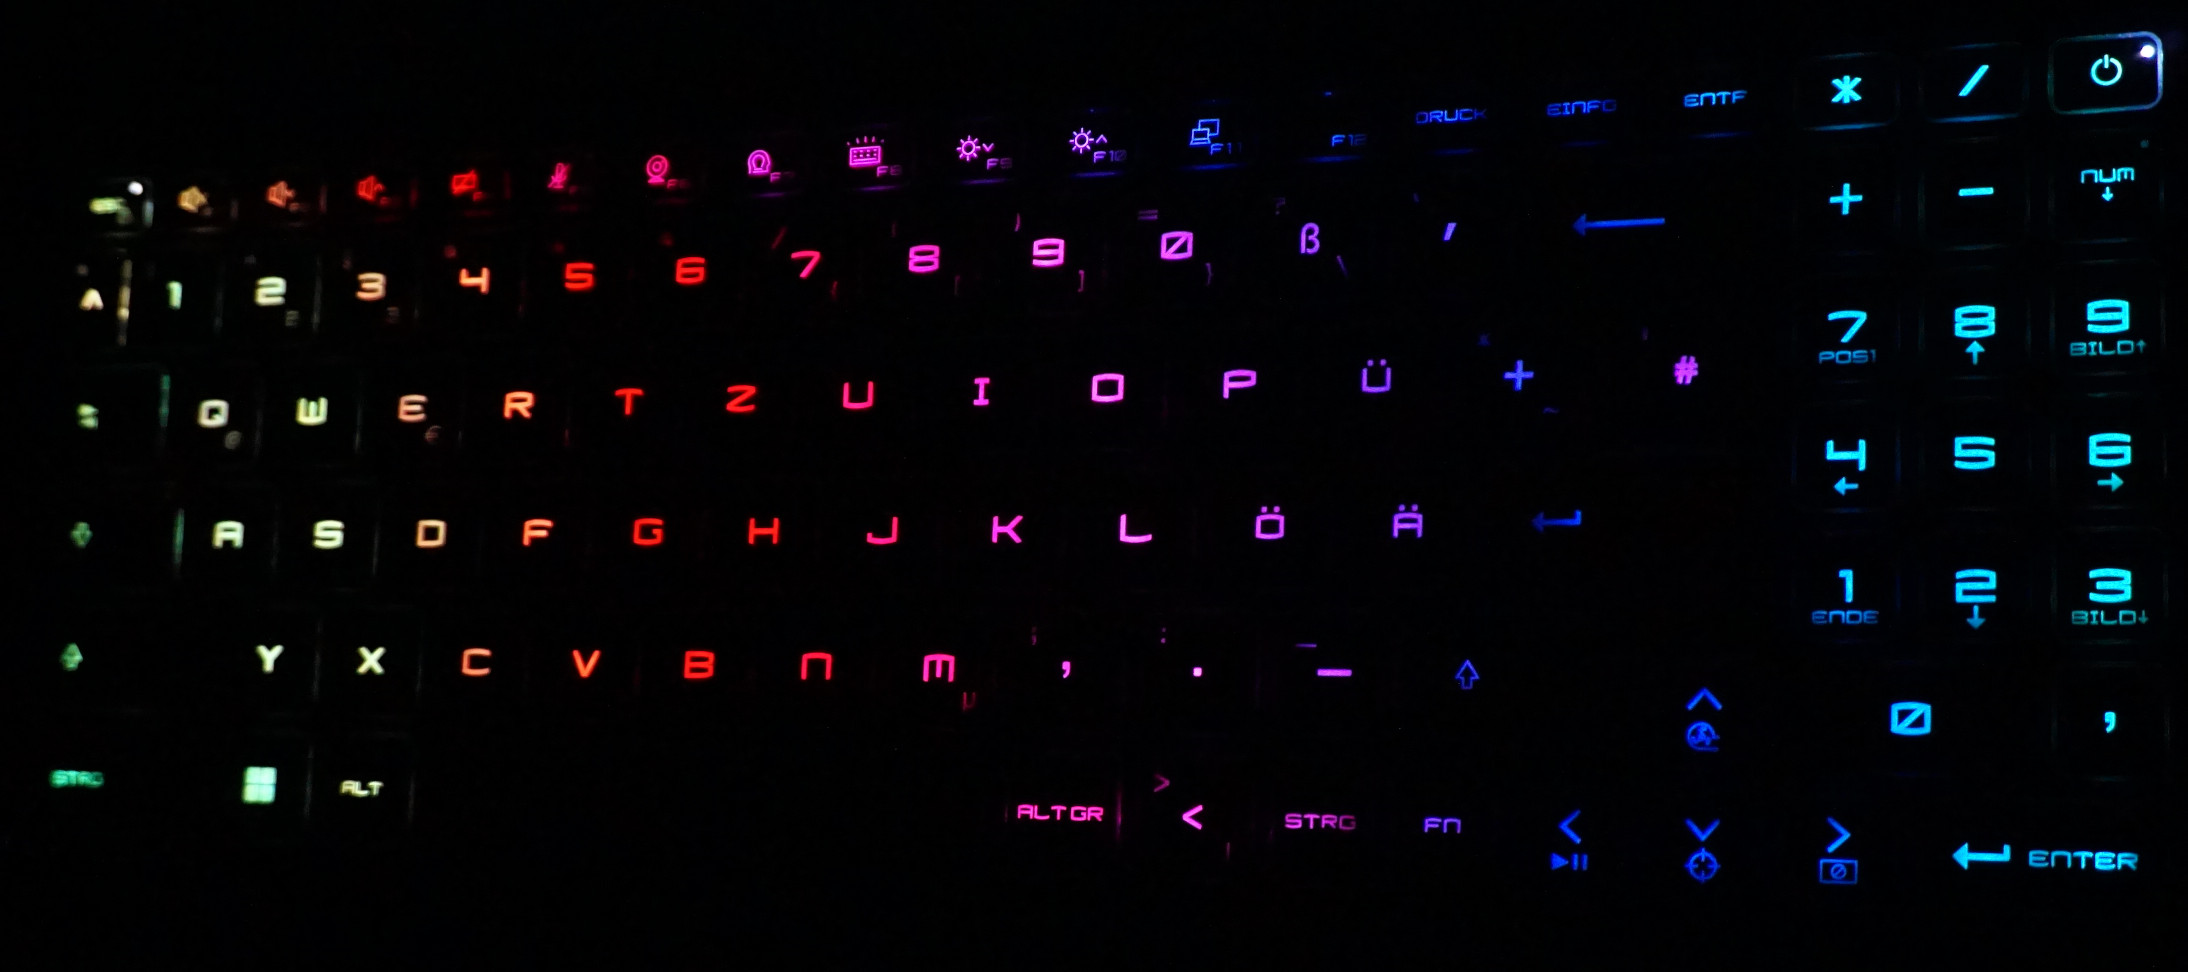
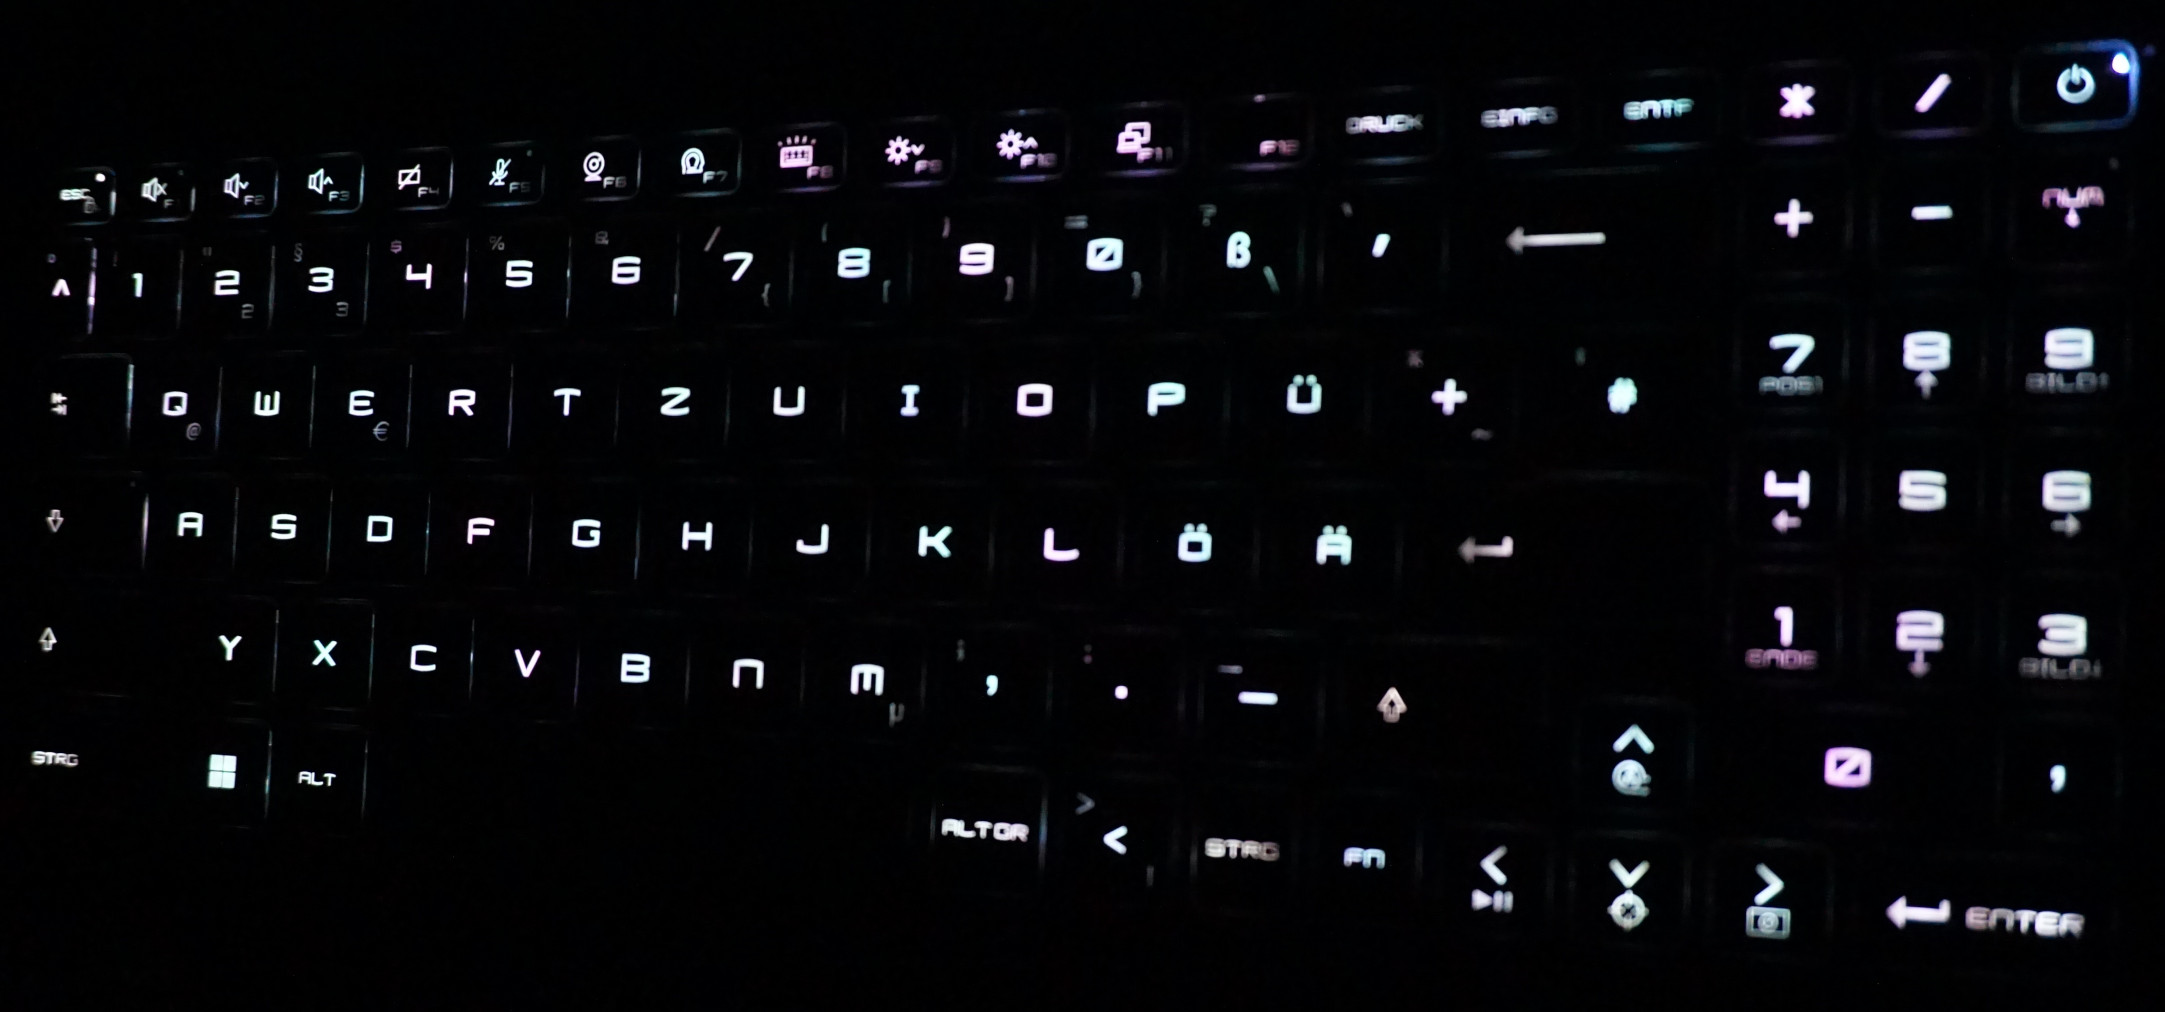
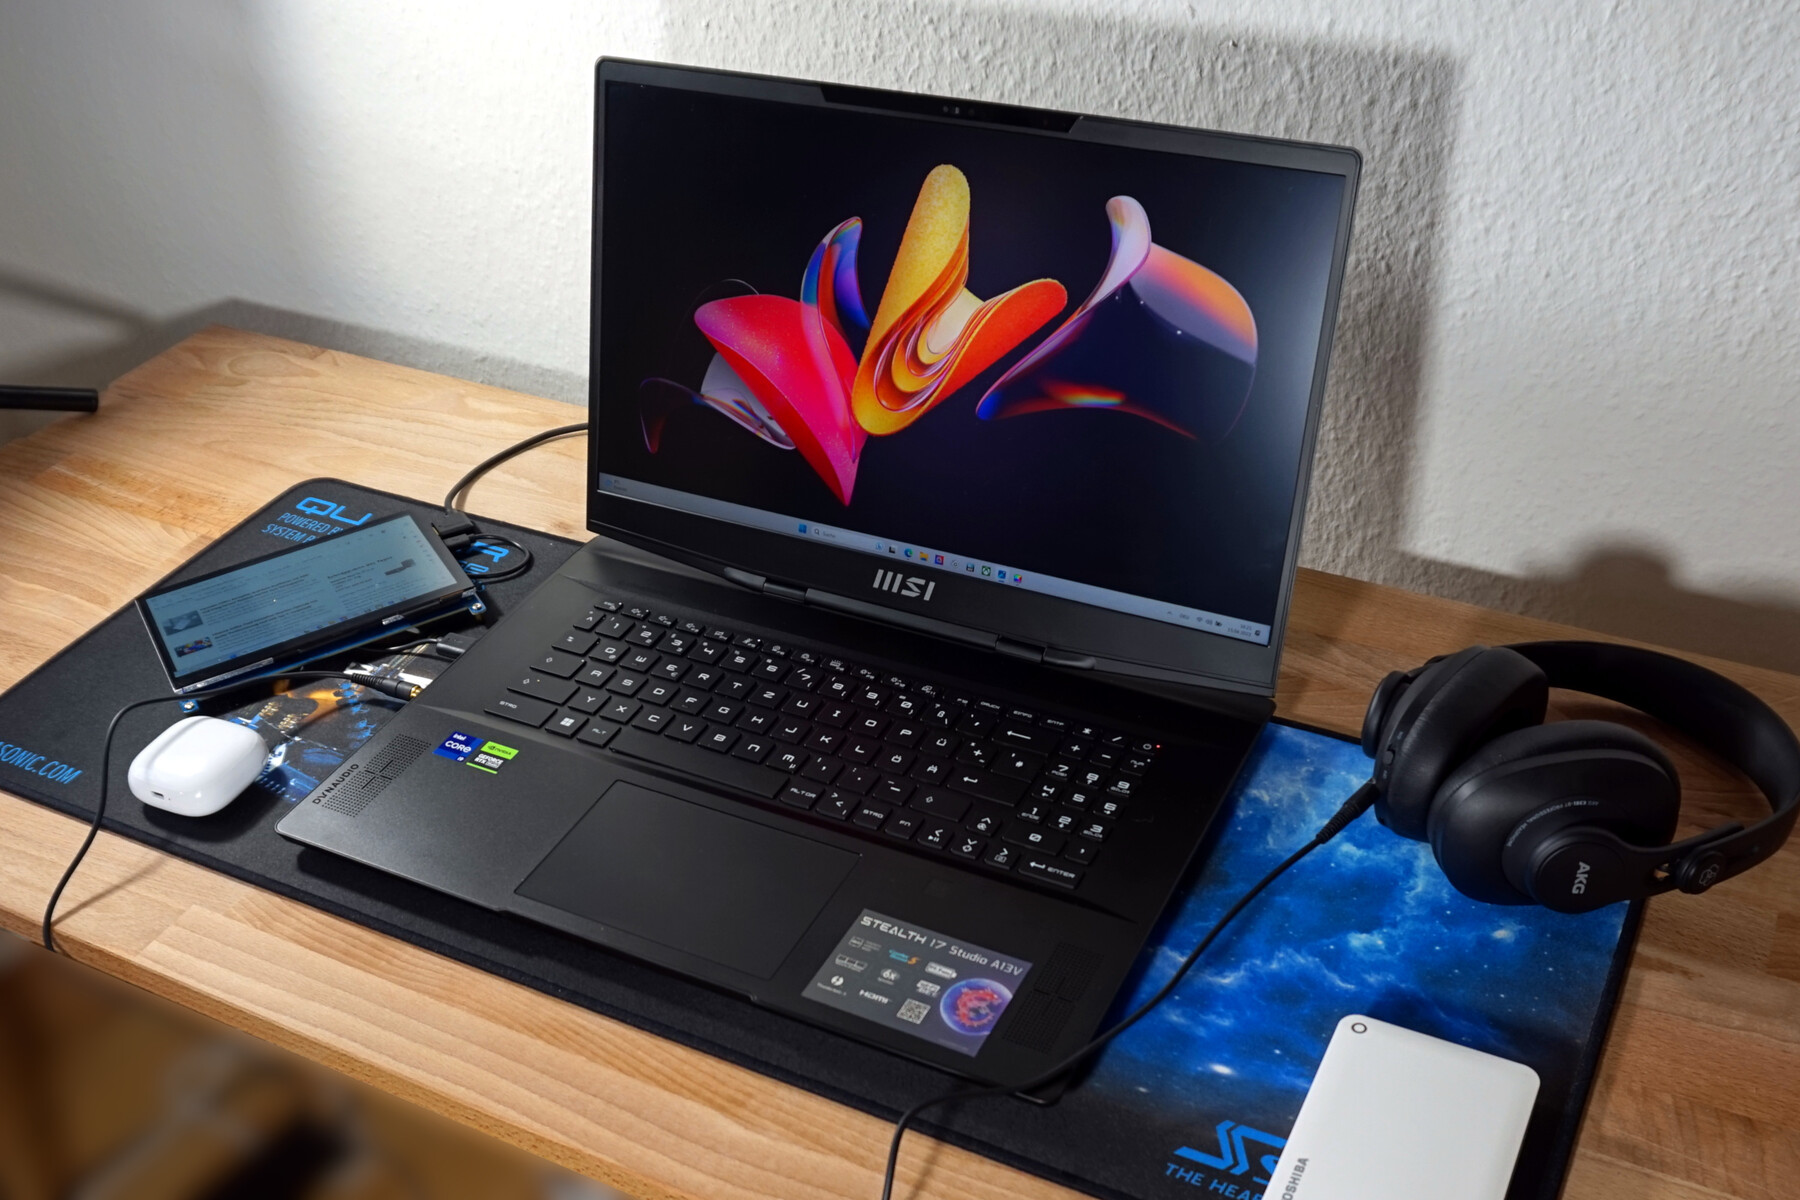
O MSI Stealth 17 Studio pisa uma linha fina. De dia, é um dispositivo de trabalho comparativamente sóbrio: design plano, retroiluminação branca do teclado e ruído de resfriamento dificilmente audível, apesar dos amplos recursos de hardware e bolsas de energia. À noite, ele se transforma em uma potente máquina de jogos: A iluminação das teclas muda para um efeito arco-íris, os ventiladores entram em ação e até mesmo jogos exigentes atingem quase 100fps.
Basicamente, tudo isso parece lógico. Um laptop para criadores que oferece muito poder gráfico para processamento rápido, de alto nível, de imagem e vídeo. Este poder também deve estar à mão durante os momentos de lazer. Portanto, a MSI só tinha que combinar a aparência discreta do dispositivo e o design mais fino possível para trabalhos móveis com um sistema de resfriamento suficientemente potente e alguns efeitos de luz. No final das contas, um brilhante mini display LED se adapta perfeitamente a ambos os mundos. Nossa revisão revela o sucesso e o silêncio do sistema, mesmo quando se trata de imagens de movimento rápido.
Não é tão fácil encontrar concorrentes, pois a maioria dos computadores portáteis é projetada tanto para jogos quanto para a criação de conteúdo. Com umIntel Core i9-13900H e umNvidia GeForce RTX 4080tem que ser capaz de competir com um HP Omen 17-ck2097ng ou Lâmina Razer 16. Também não há mal nenhum em dar uma olhada em um laptop multimídia do segmento high-end do ano passado, como oGigabyte Aero 16 YE5.
Além disso, você pode encontrar um vídeo sobre o MSI Stealth 17 Studio em nosso canal no YouTube:
Possíveis concorrentes em comparação
Avaliação | Data | Modelo | Peso | Altura | Size | Resolução | Preço |
|---|---|---|---|---|---|---|---|
| 89.2 % v7 (old) | 04/2023 | MSI Stealth 17 Studio A13VH-014 i9-13900H, GeForce RTX 4080 Laptop GPU | 3 kg | 21.3 mm | 17.30" | 3840x2160 | |
| 91.2 % v7 (old) | 02/2023 | Razer Blade 16 Early 2023 i9-13950HX, GeForce RTX 4080 Laptop GPU | 2.4 kg | 21.99 mm | 16.00" | 2560x1600 | |
| 88.4 % v7 (old) | 04/2023 | Asus ROG Strix G17 G713PI R9 7945HX, GeForce RTX 4070 Laptop GPU | 2.8 kg | 30.7 mm | 17.30" | 2560x1440 | |
| 86 % v7 (old) | 04/2023 | Aorus 17X AZF i9-13900HX, GeForce RTX 4090 Laptop GPU | 2.9 kg | 21.8 mm | 17.30" | 2560x1440 | |
| 85.4 % v7 (old) | 03/2023 | HP Omen 17-ck2097ng i9-13900HX, GeForce RTX 4080 Laptop GPU | 2.8 kg | 27 mm | 17.30" | 2560x1440 | |
| 84.7 % v7 (old) | 03/2022 | Gigabyte Aero 16 YE5 i9-12900HK, GeForce RTX 3080 Ti Laptop GPU | 2.3 kg | 22.4 mm | 16.00" | 3840x2400 |
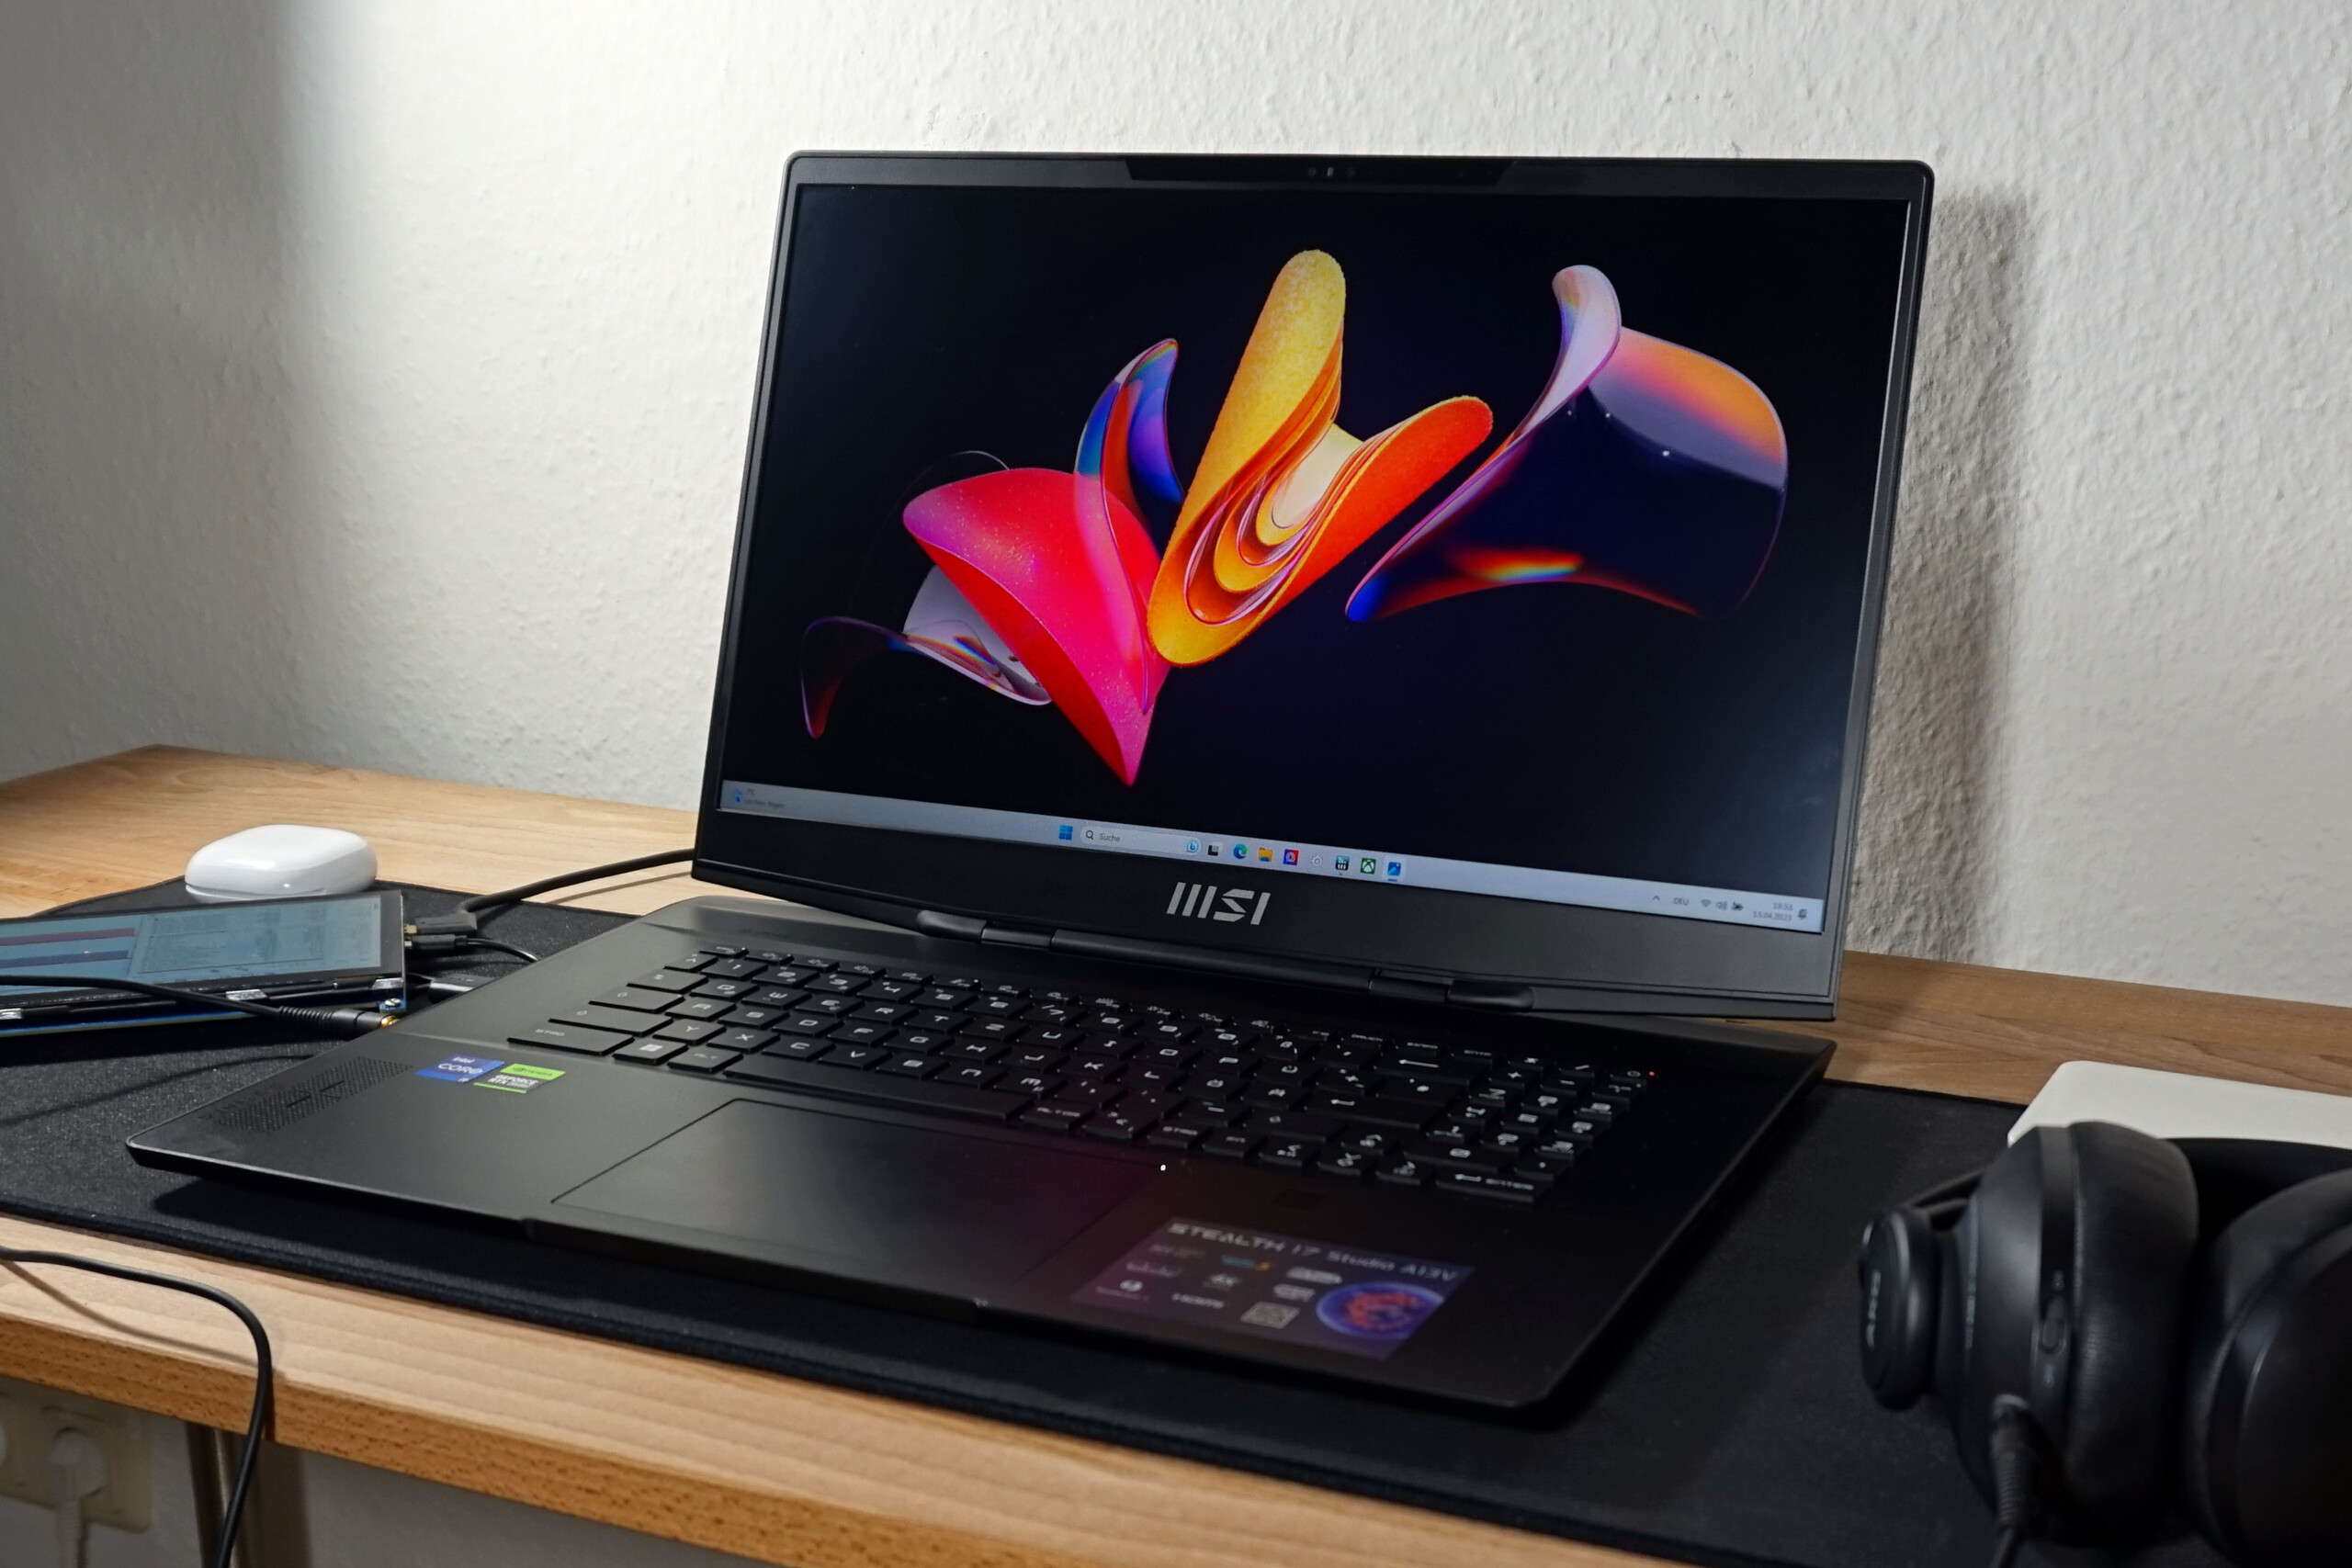
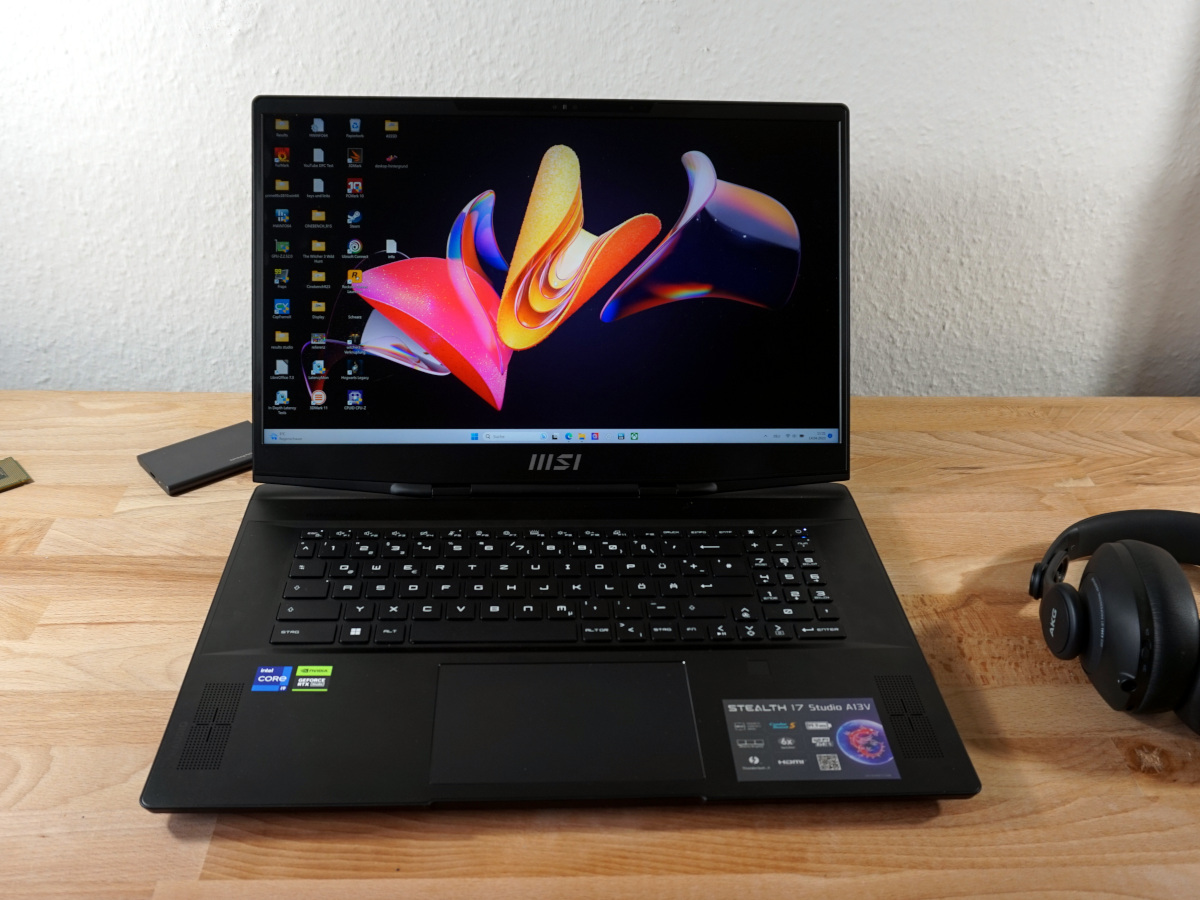
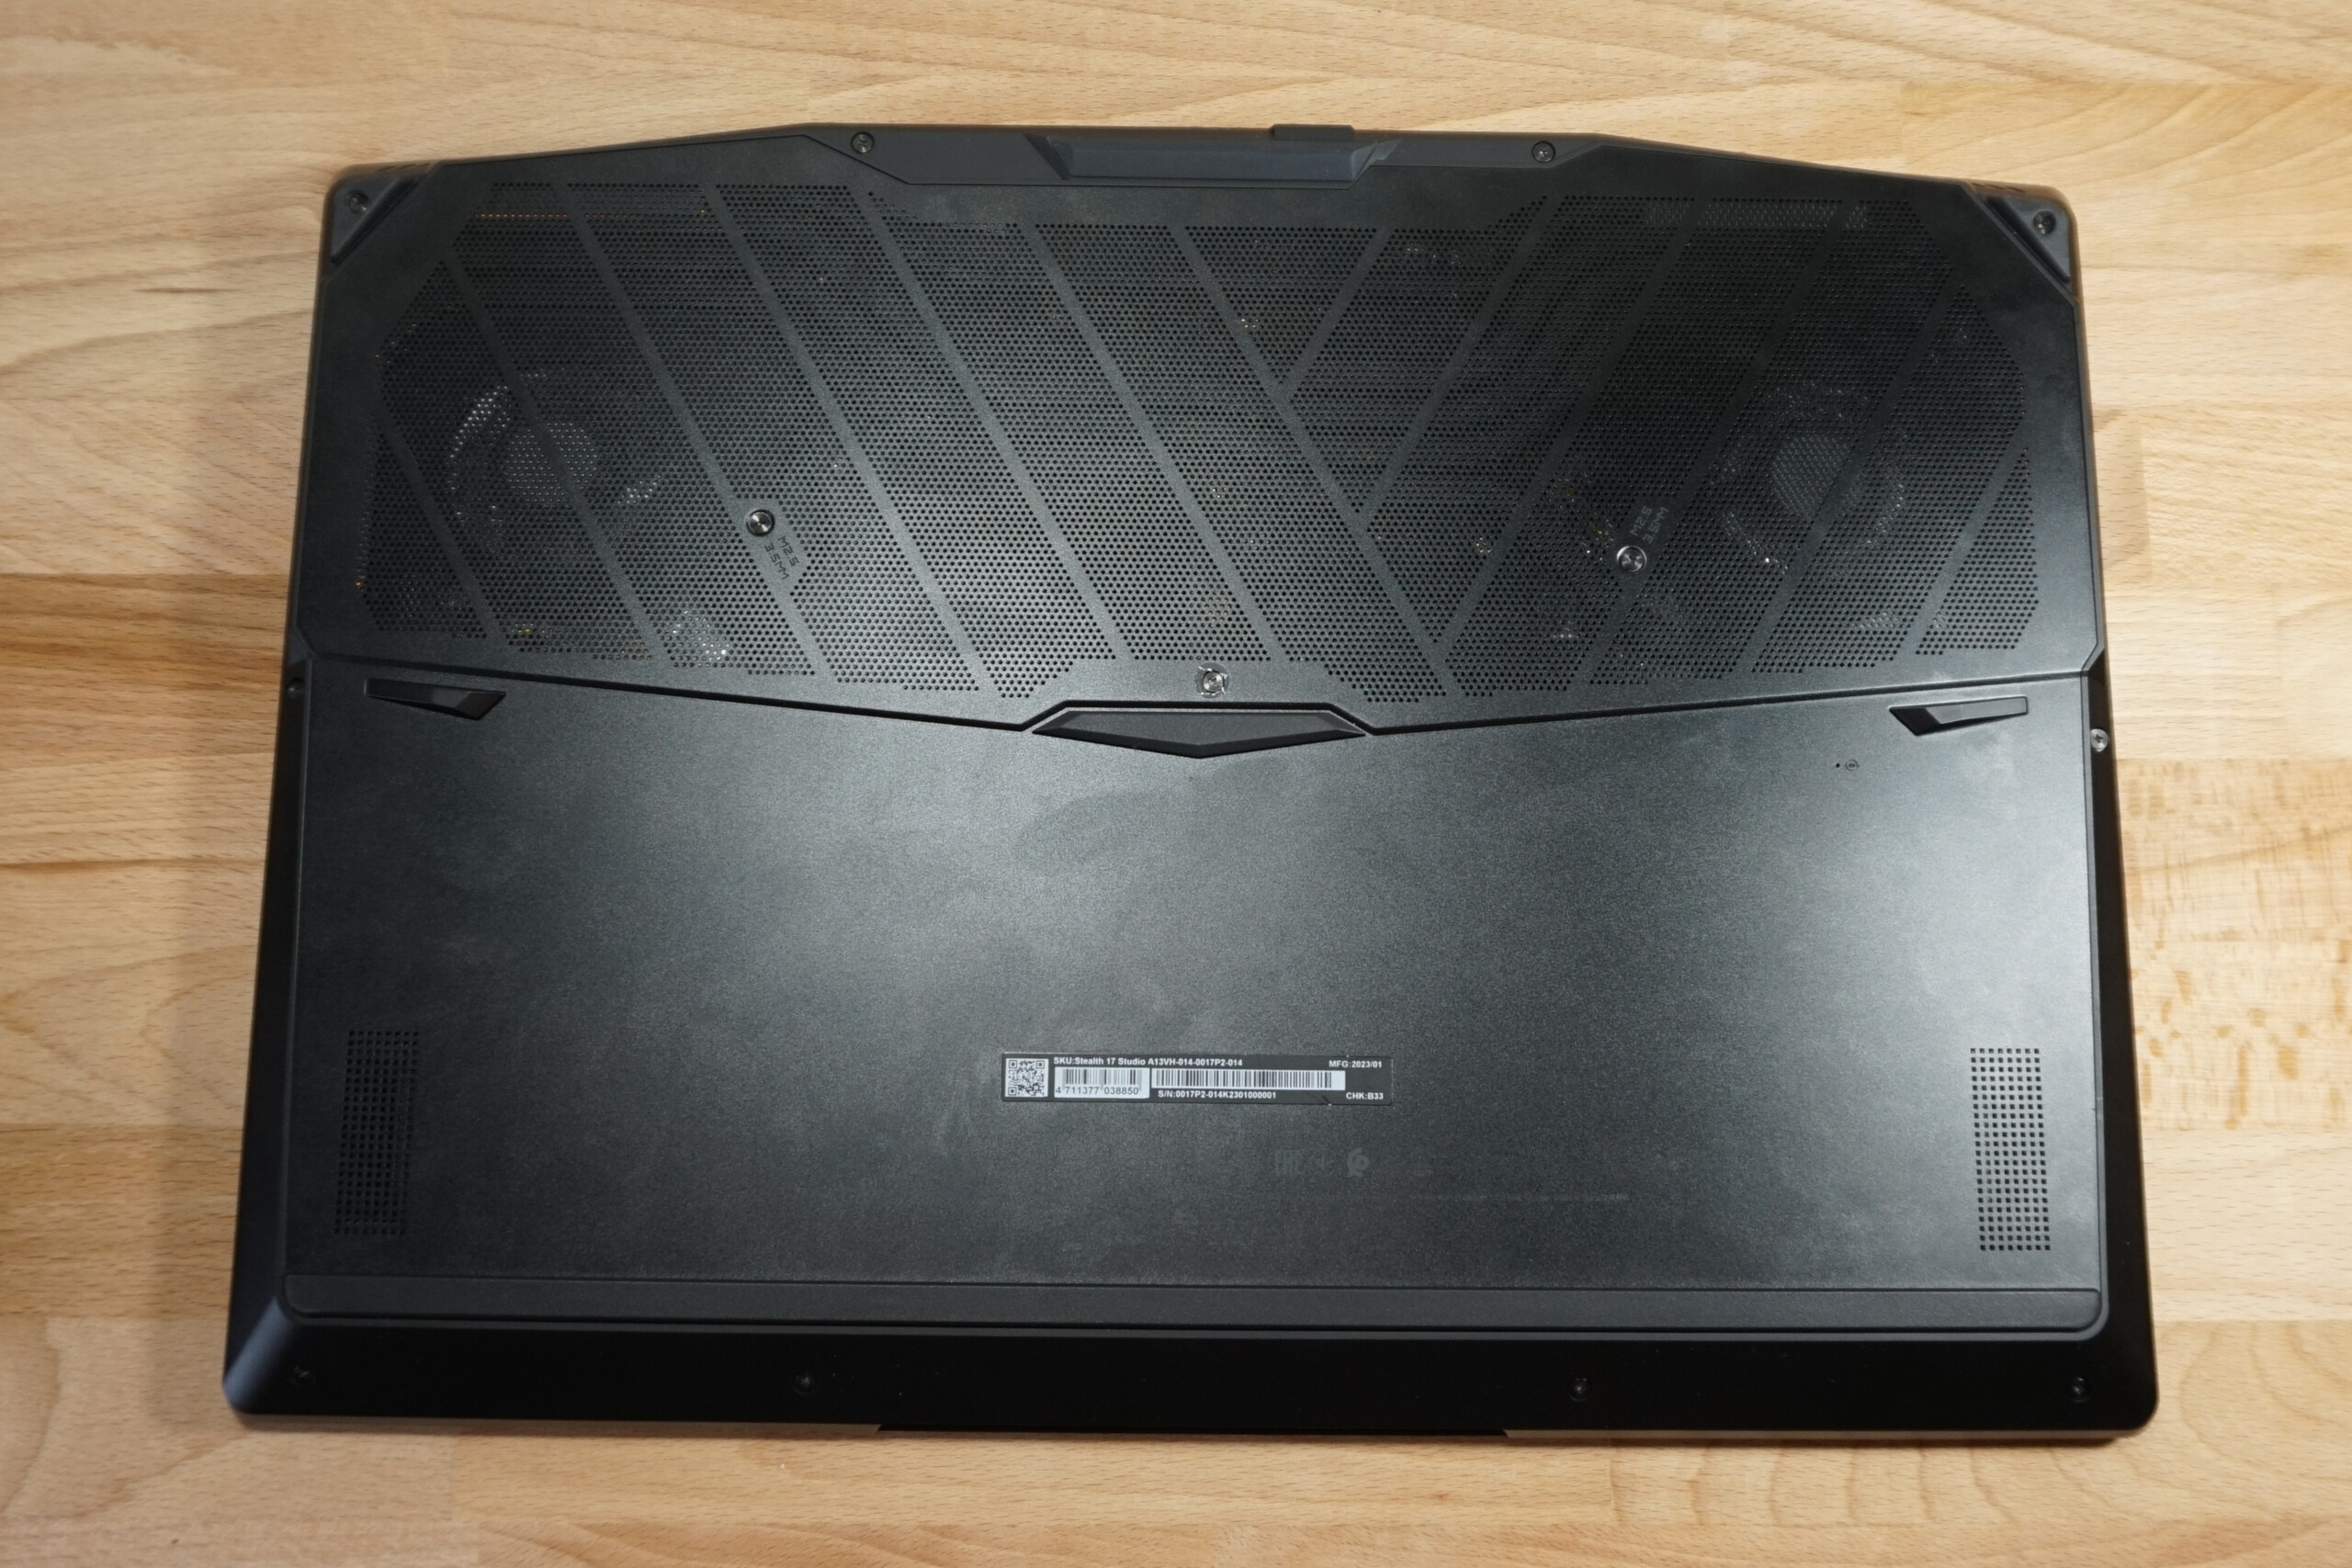
Estojo - Um MSI Stealth 17 elegante e esguio
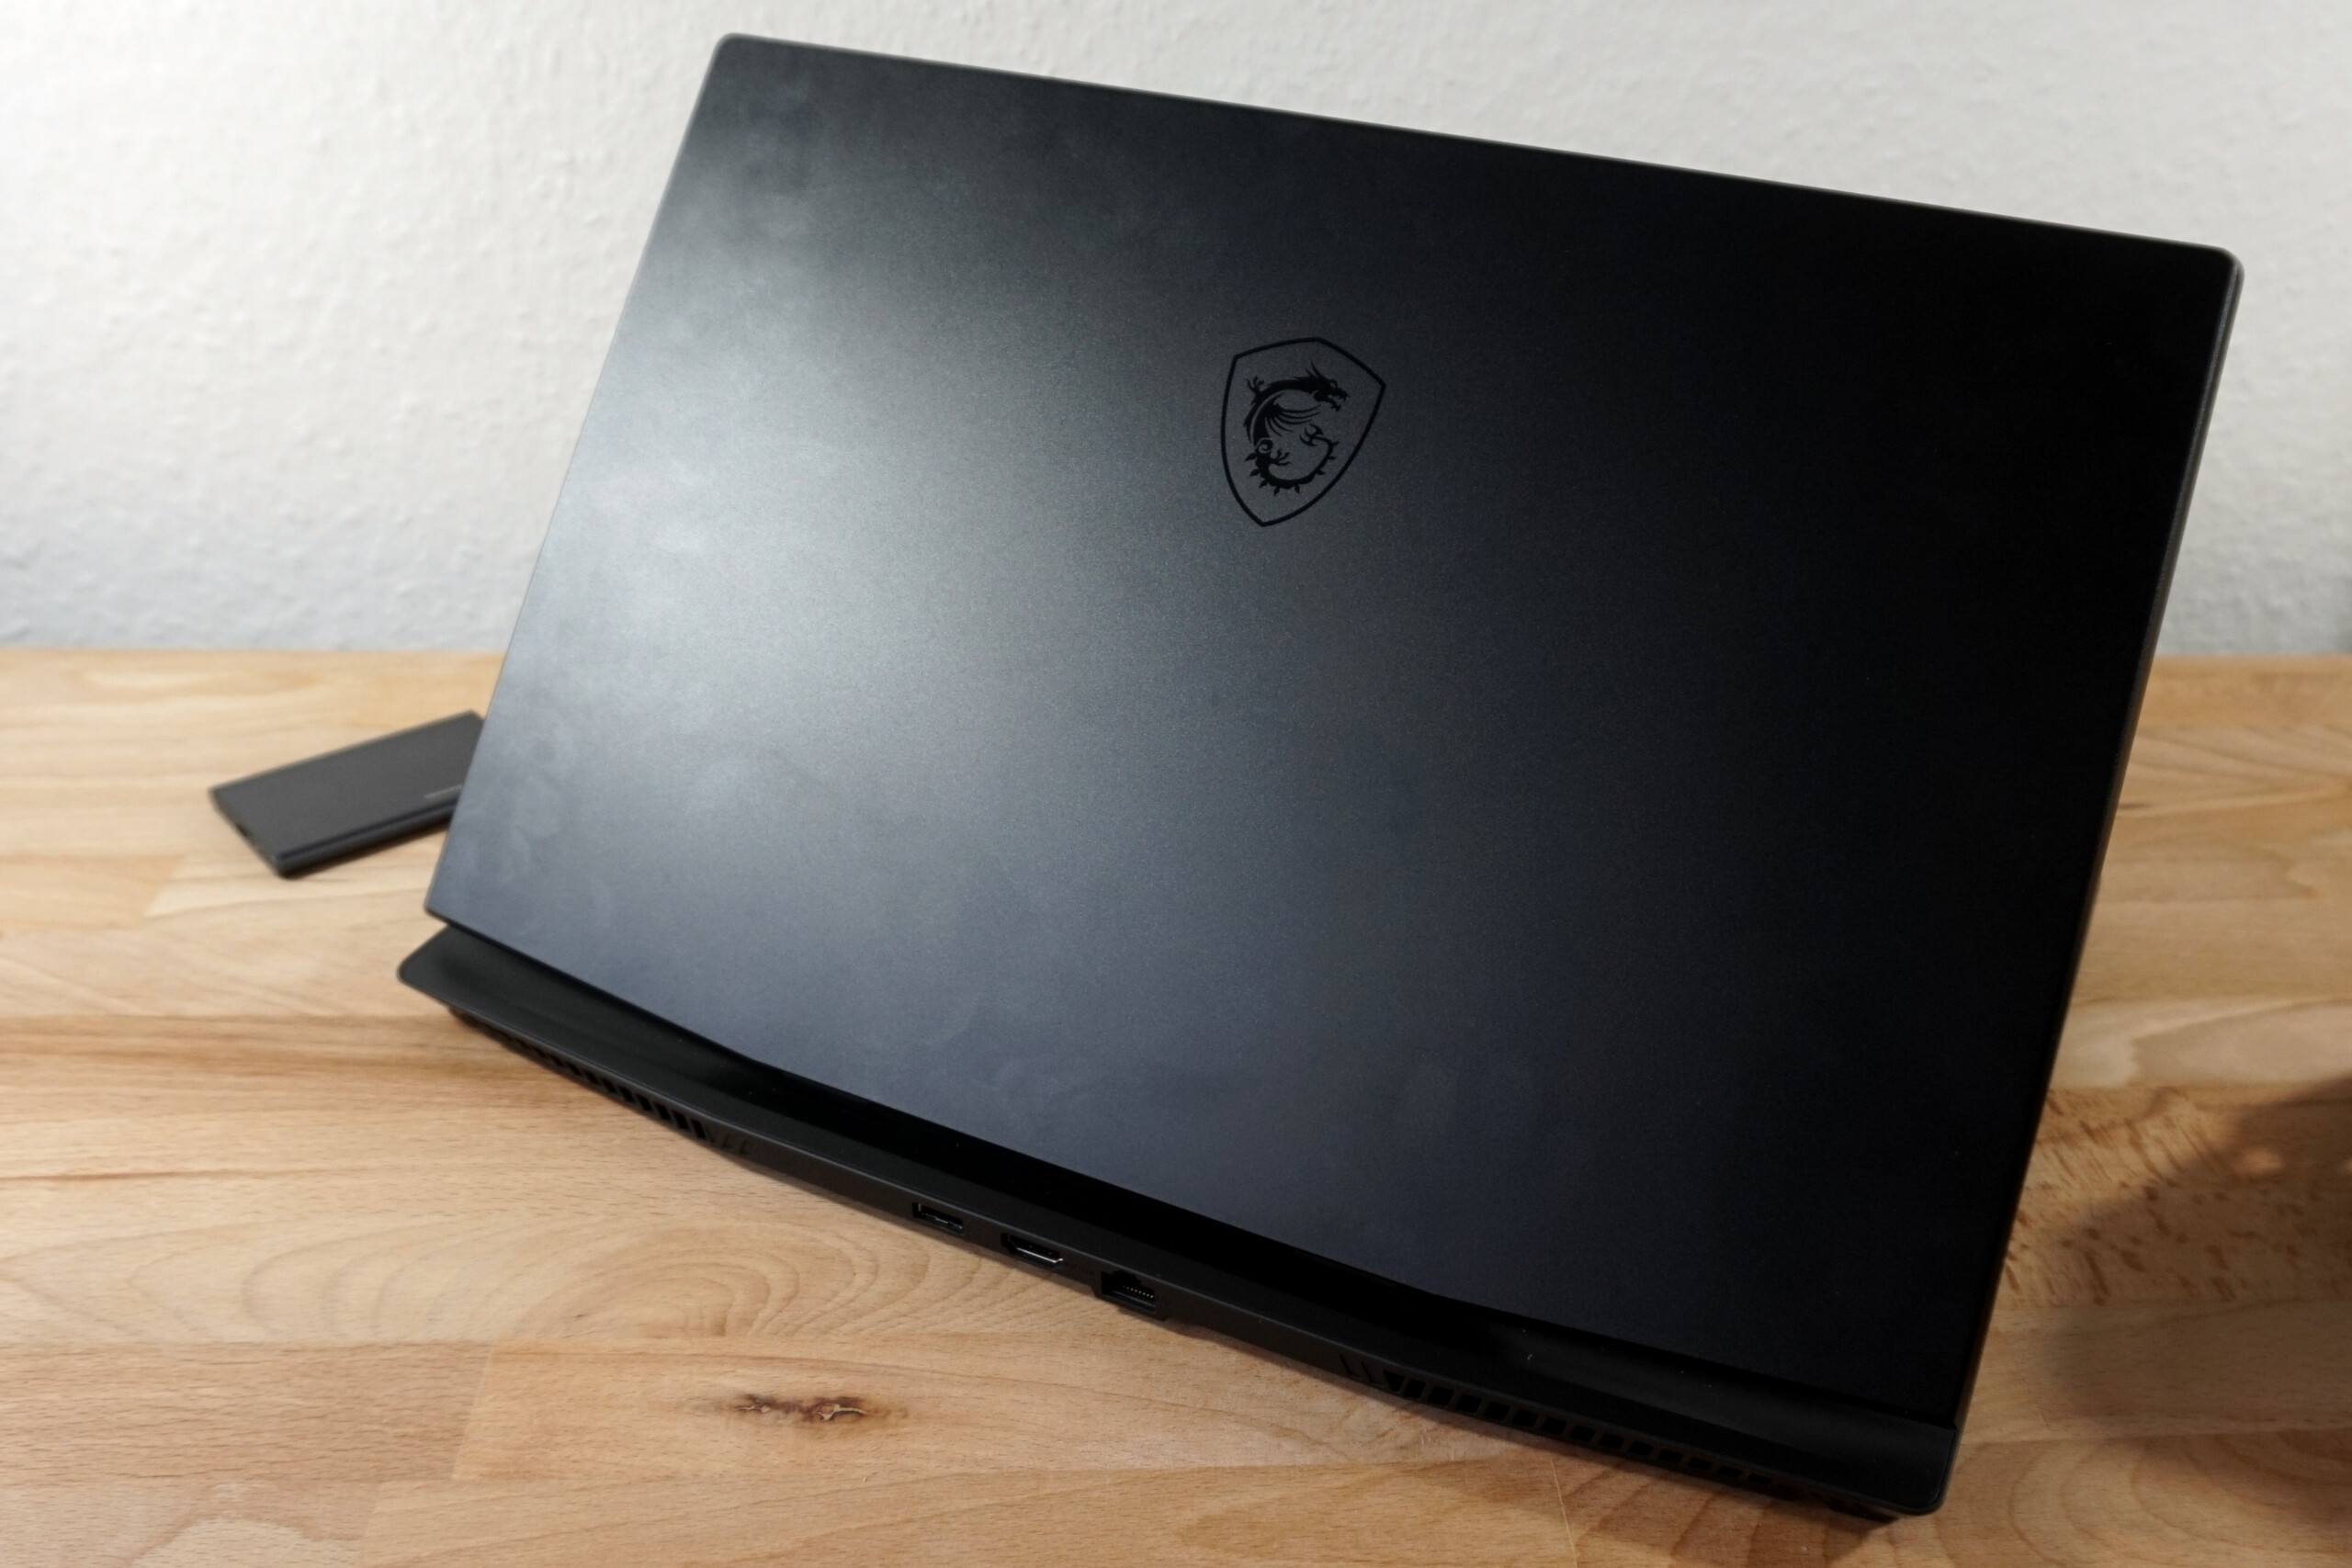
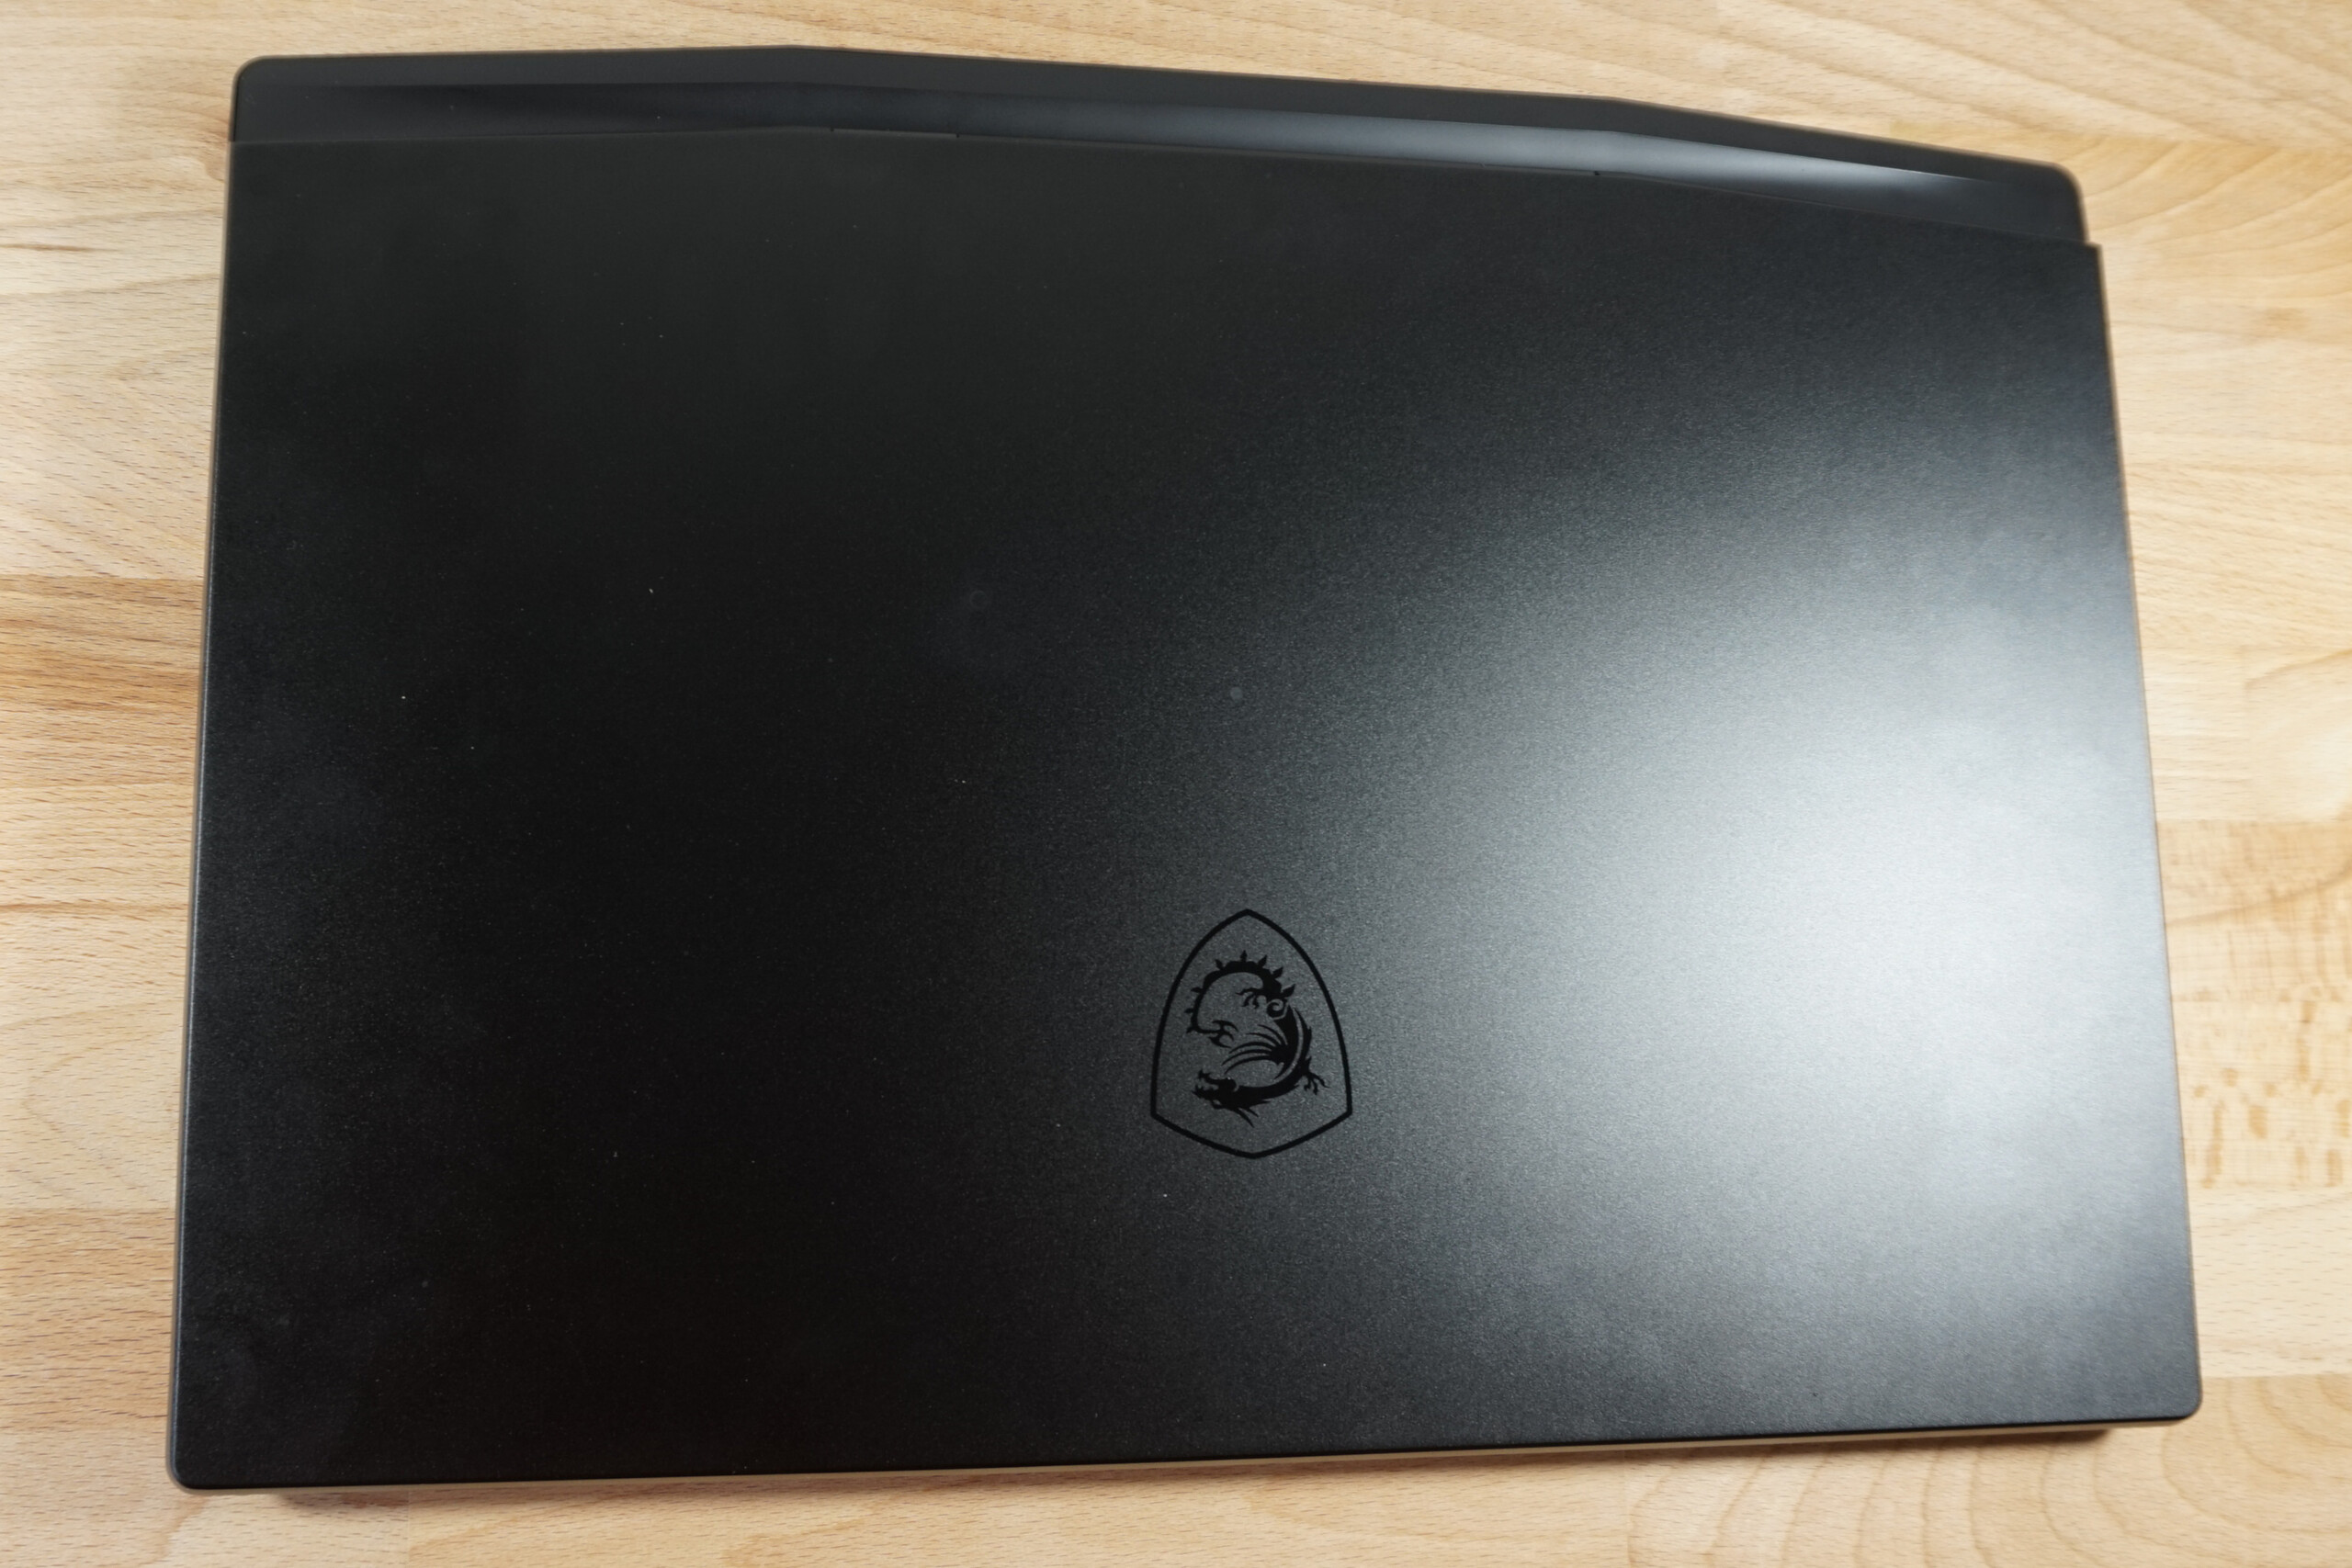
A caixa preta do laptop MSI é largamente livre de sotaques, destacando-se apenas o logotipo do fabricante da tampa metálica da tela devido à textura da superfície diferente.
A estrutura do teclado e a base também são de metal. Componentes adicionais como as partes laterais, a estrutura do display e a tampa de ventilação atrás do display são feitos de plástico. Tudo parece consistente e, acima de tudo, construído de forma sólida. Realizado no canto frontal da base, a torção é mínima. O pesado display de 4K se comporta de forma semelhante. Aqui também, a construção estável restringe os movimentos indesejados.
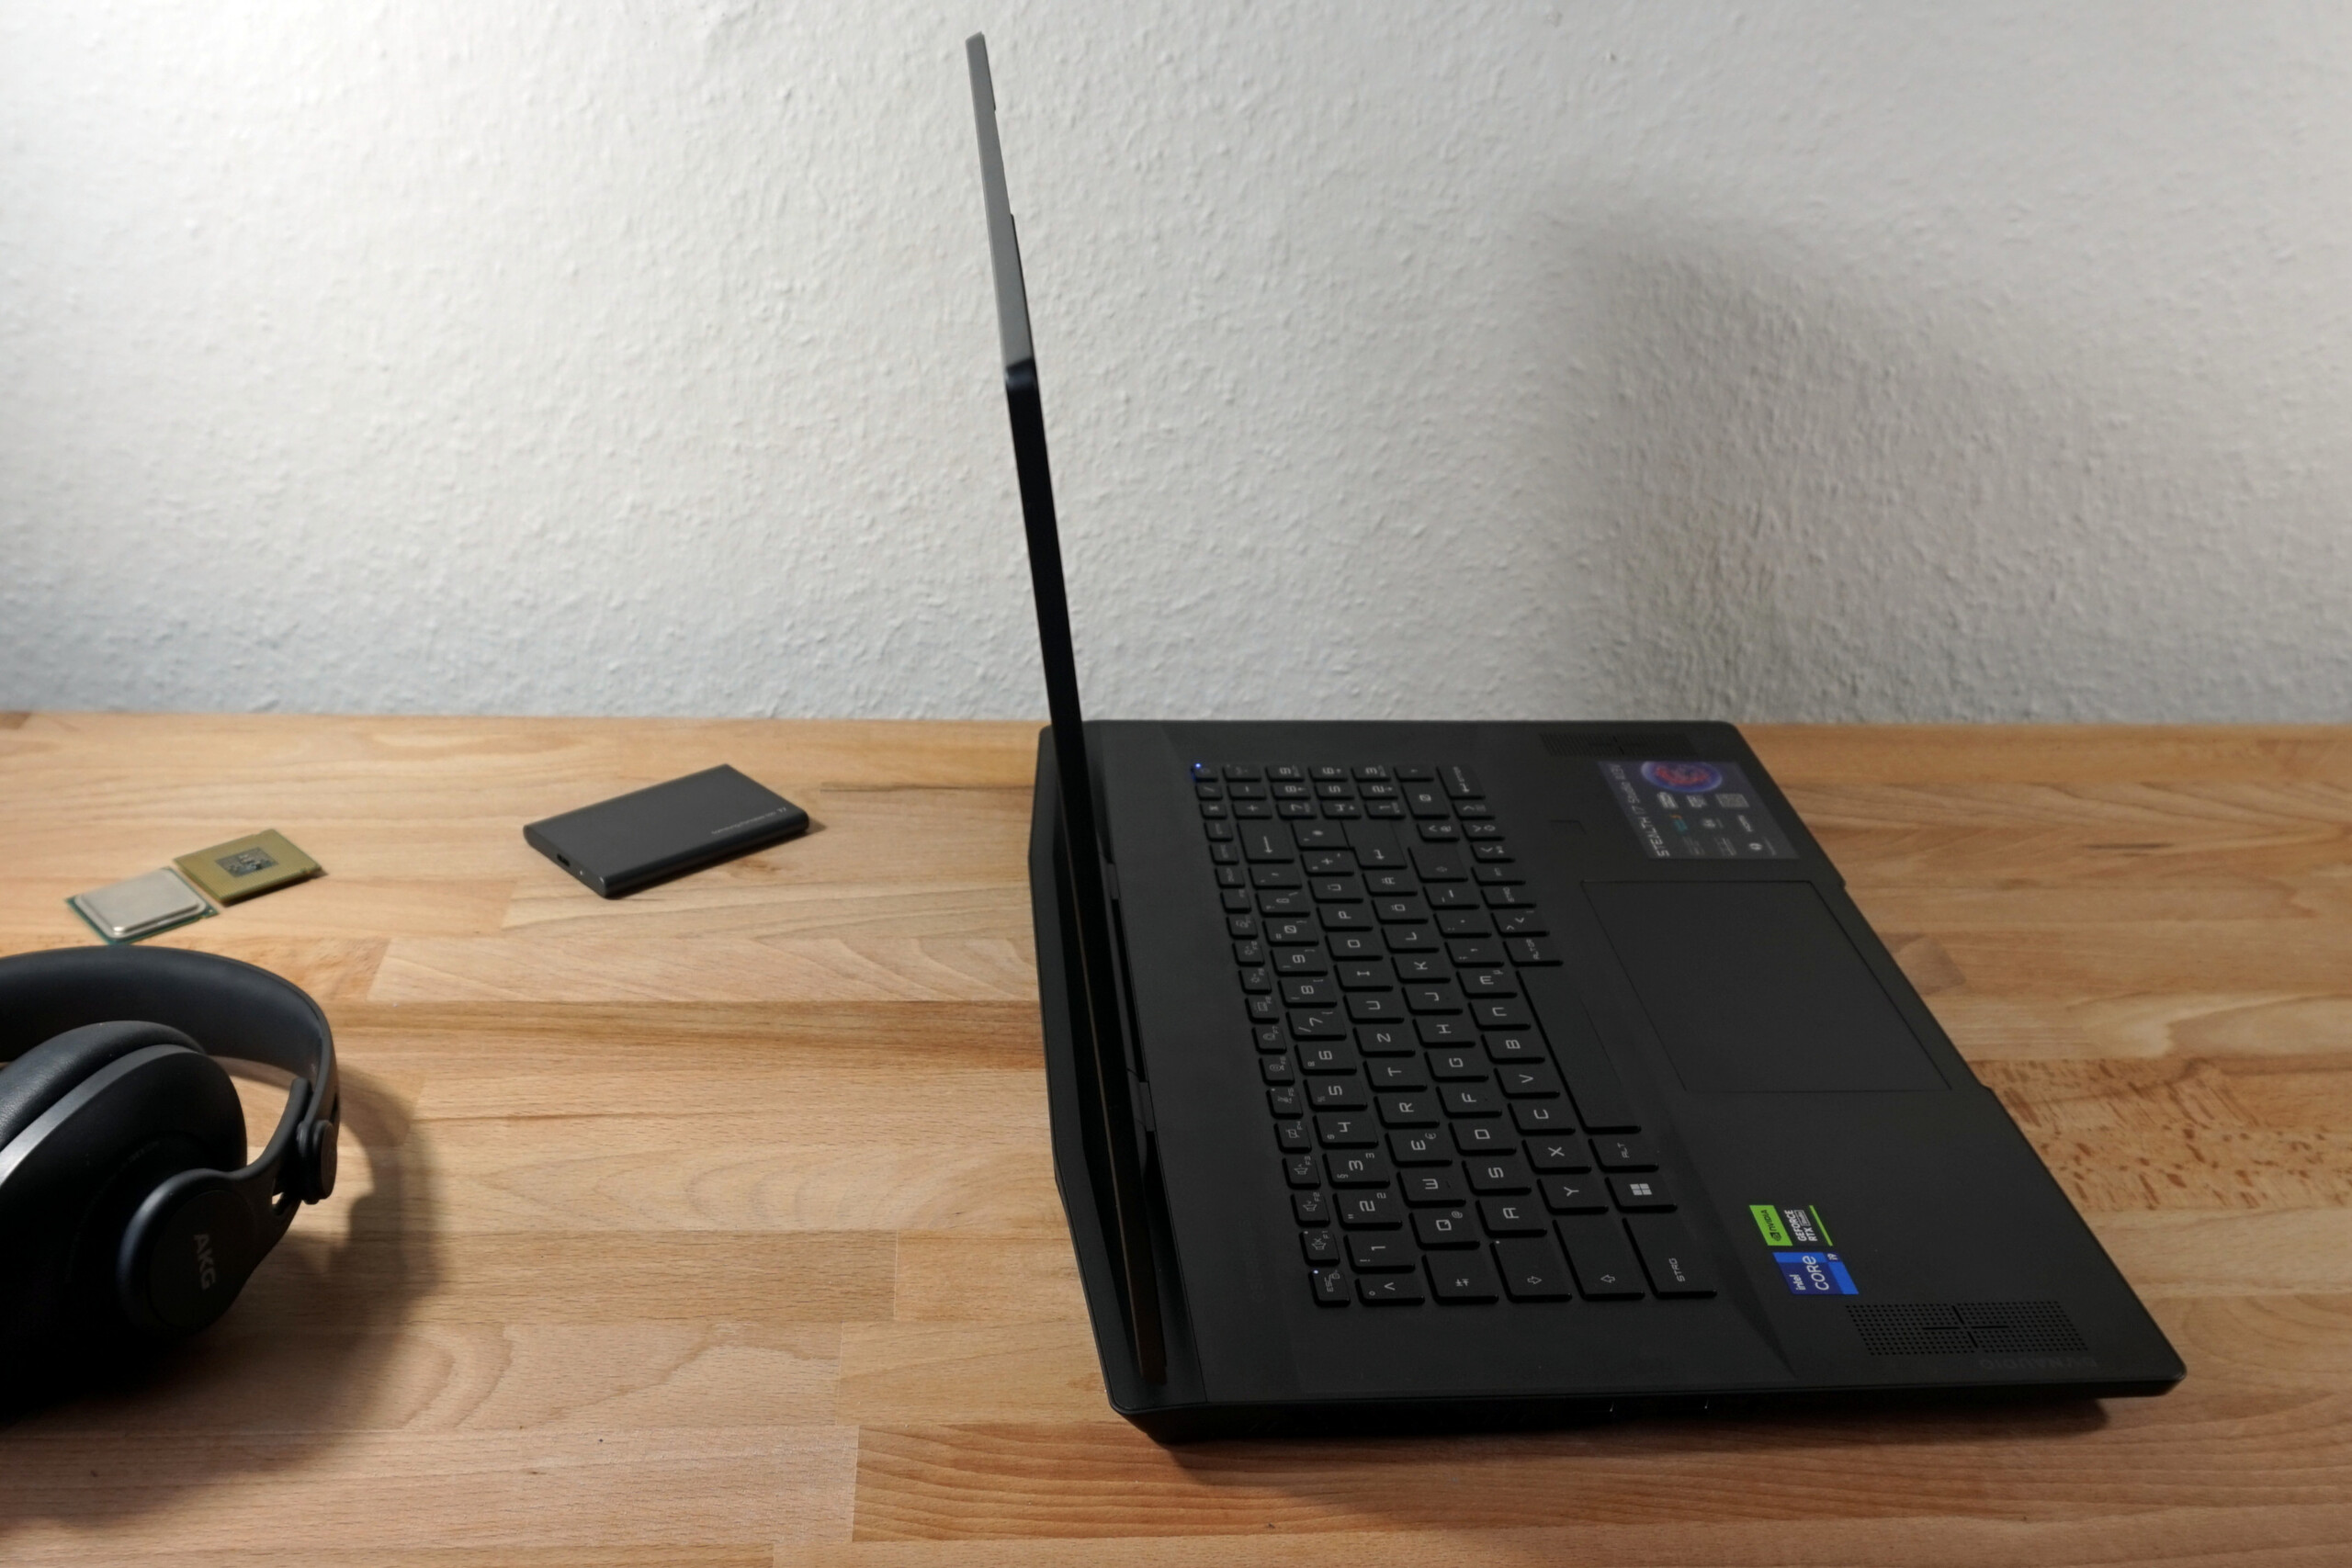
Entretanto, as dobradiças da tela causam uma impressão negativa, pois foram claramente construídas muito pequenas e fracas. Com um ângulo de cerca de 30 graus, o laptop fecha por si só. Além disso, a tela quase sempre se dobra em sua posição final de 130 graus, por exemplo, ao levantar o Stealth 17 da mesa.
Mesmo comparado a outros dispositivos de 17 polegadas, a caixa é grande e pesada. Em termos de profundidade, somente laptops de jogos puros com soluções de resfriamento maiores o superam. Em comparação, o sistema de resfriamento encontrado no Stealth 17 Studio é compacto.
Por outro lado, a espessura do dispositivo dificilmente pode ser superada. Com 21 mm, este é excepcionalmente plano para esta categoria de desempenho. Apenas para comparação: O equipamento similarAsus ROG Strix G17 é 50 % mais espesso.
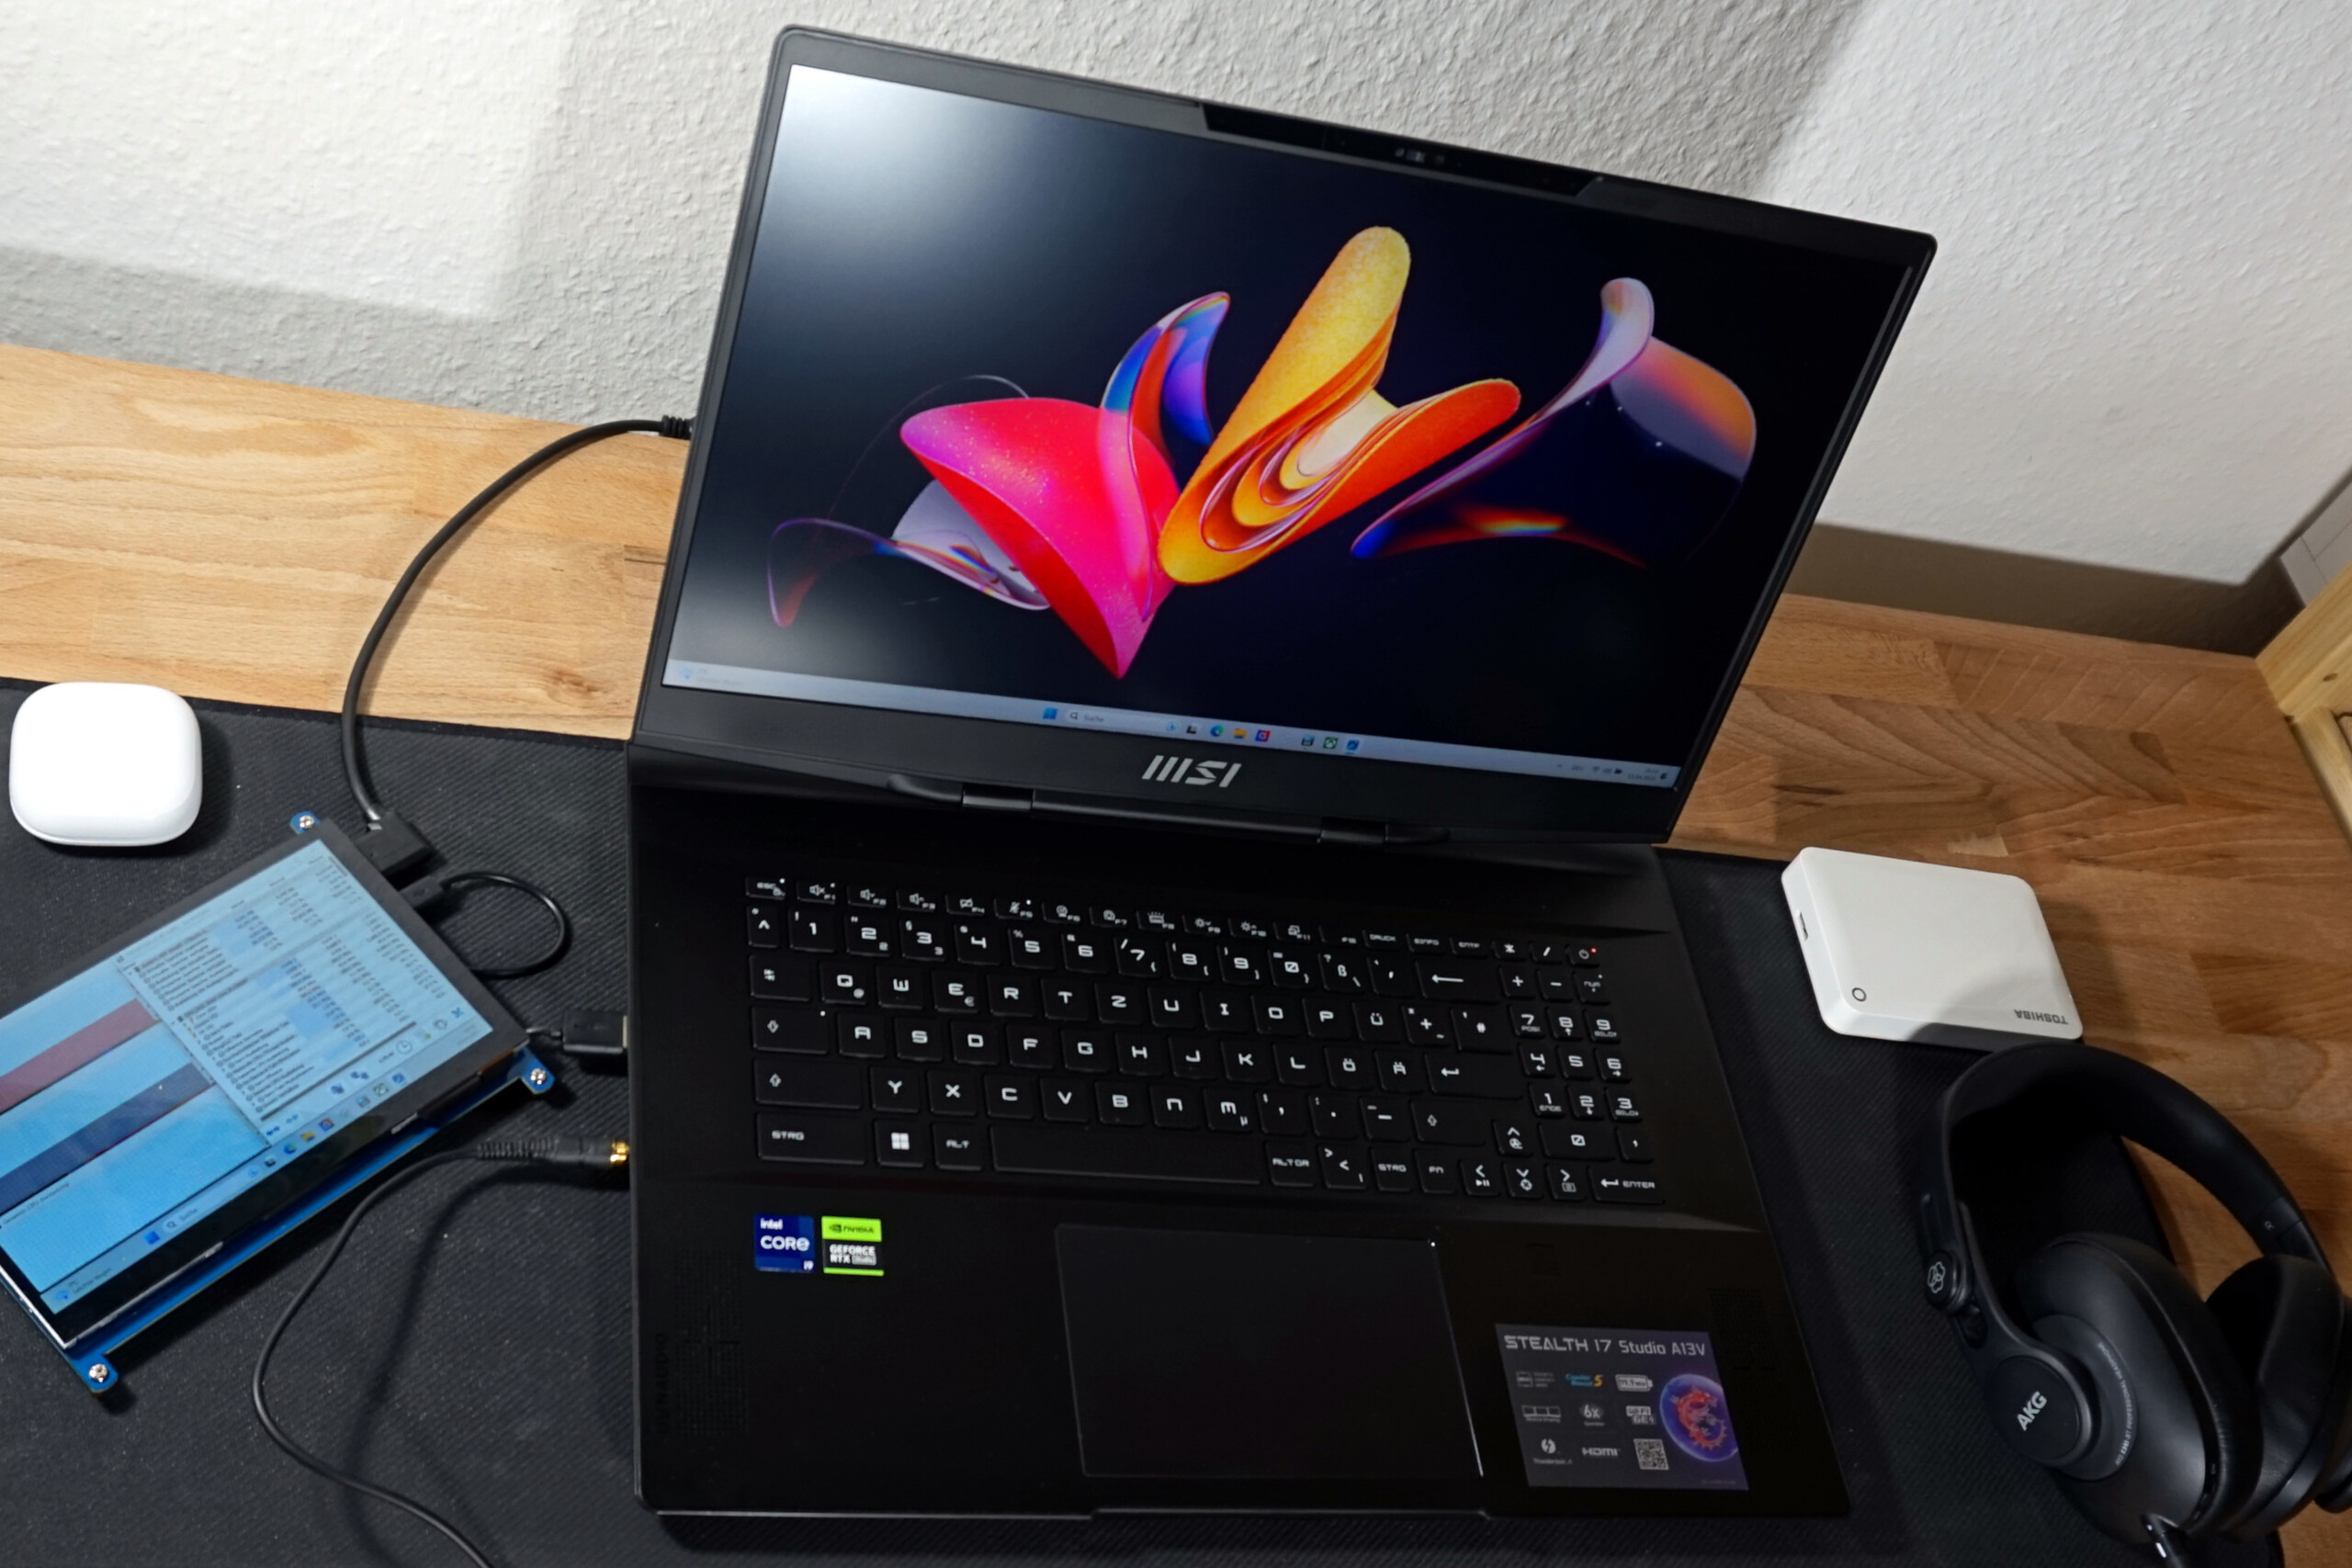
Características - Tudo o que você precisa para um laptop de um criador, e jogos da mesma forma
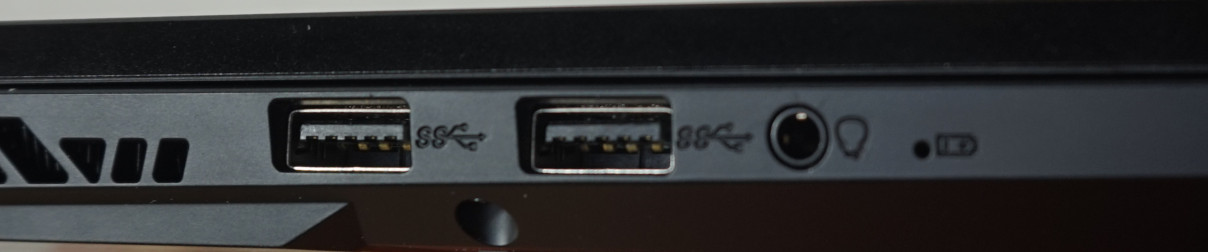
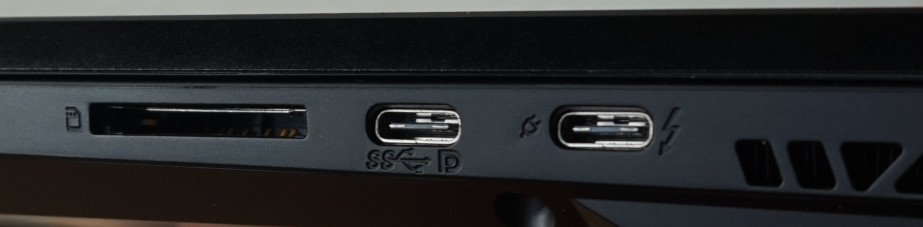
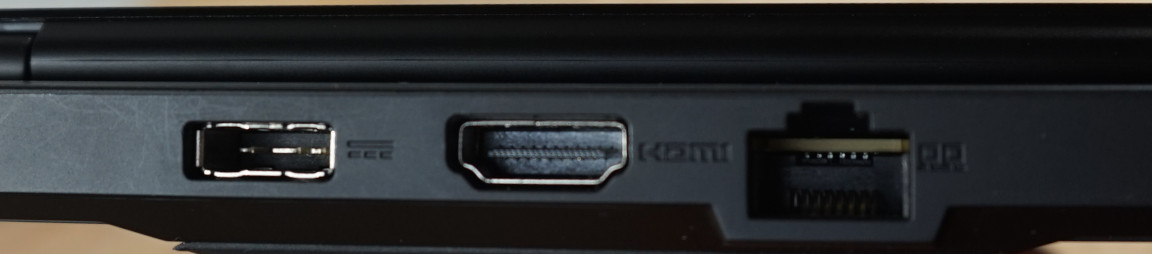
O laptop vem com uma seleção completa de portos. Enquanto alguns laptops para jogos não possuem um leitor de cartões, alguns laptops multimídia não possuem a porta LAN.
Em contraste, o MSI Stealth 17 Studio atende a todos os requisitos: Com um total de três saídas de vídeo, quatro portas USB, incluindo Thunderbolt 4, um leitor de cartões para cartões SD normais e 2,5 Gbit LAN, o básico para jogos, transferência rápida de dados e conexões variáveis a outros dispositivos, monitores e acessórios de streaming, estão todos cobertos.
Considerando o alto nível auto-proclamado ao qual a Stealth pertence, as portas USB-A e USB-C seriam mais práticas à esquerda e à direita. Além disso, o fabricante poderia ter optado por uma tomada de fone de ouvido dedicada, bem como o conector de fone de ouvido embutido.
Leitor de cartões SD
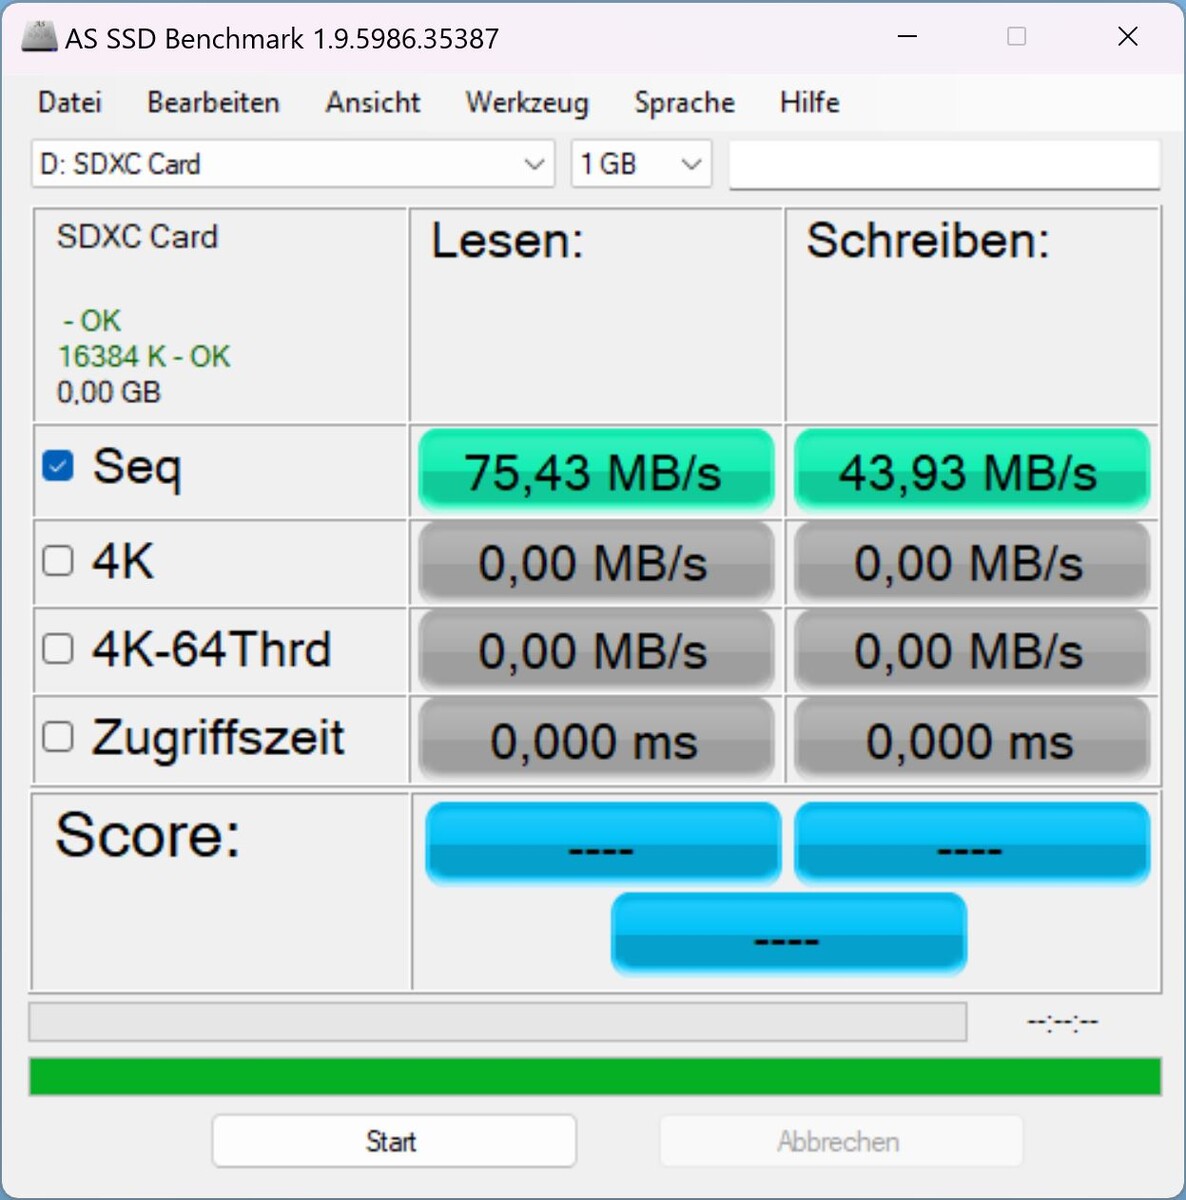
O leitor de cartões teve uma pontuação decepcionante quando medido com nosso cartão de referência AV PRO microSD 128 GB V60. Ao ler arquivos de imagem, o Stealth 17 só conseguiu administrar um pouco menos da metade da velocidade de transferência do Lâmina Razer 16 Início de 2023em nosso teste.
No entanto, o tempo de espera para 30 GB de dados de imagem é de cerca de 10 minutos e está dentro dos limites.
| SD Card Reader | |
| average JPG Copy Test (av. of 3 runs) | |
| Média da turma Gaming (20.9 - 210, n=54, últimos 2 anos) | |
| Razer Blade 16 Early 2023 (AV PRO microSD 128 GB V60) | |
| HP Omen 17-ck2097ng (AV PRO microSD 128 GB V60) | |
| MSI Stealth 17 Studio A13VH-014 | |
| maximum AS SSD Seq Read Test (1GB) | |
| Razer Blade 16 Early 2023 (AV PRO microSD 128 GB V60) | |
| Média da turma Gaming (25.5 - 261, n=51, últimos 2 anos) | |
| HP Omen 17-ck2097ng (AV PRO microSD 128 GB V60) | |
| MSI Stealth 17 Studio A13VH-014 | |
Comunicação
A conexão LAN funciona quase sem demora com taxas de dados estáveis a 2.500 Mbit/s, fornecendo a arquitetura de rede adicional que pode acompanhar.
Pelo menos na proximidade, o módulo WiFi está ao par. A exigência é uma distância curta até o roteador e nenhuma interferência de outras redes de rádio. Isto é demonstrado por nossa comparação entre as medidas de 5 GHz a menos de 1.000 Mbit/s e 6 GHz quase se aproximando de 1.600 Mbit/s. Na faixa de 5 GHz, um grande número de redes sem fio próximas pode reduzir notavelmente a taxa de transferência. O passo até 6 GHz e bandas de freqüência mais amplas, efetivamente evitam isto.
No total, o Stealth 17 conseguiu nos impressionar com suas conexões de rede com e sem fio.
Webcam
A webcam de resolução Full HD funciona decentemente, mas não de forma excepcional. Ela se adapta rapidamente e sem artefatos visuais, especialmente quando se trata de condições de iluminação ruins ou mutáveis. O que não é tão fácil aos olhos é o ruído permanente e visivelmente perceptível da imagem. No geral, para um laptop, a câmera é muito boa. A resolução Full HD garante chamadas de vídeo de qualidade decente em movimento com apenas uma largura de banda moderada e fornece imagens atraentes sob boas condições de iluminação.
Em termos das outras características de hardware, não pode haver reclamações sobre a cobertura mecânica e a câmera infravermelha adicional para o log in via reconhecimento facial.
O microfone soa muito bem. Independentemente da distância, o nível de volume permanece o mesmo e a fala proveniente de diferentes direções também não apresenta problemas reais. Além disso, as vozes soam naturalmente com apenas um subtil tom de baixo.


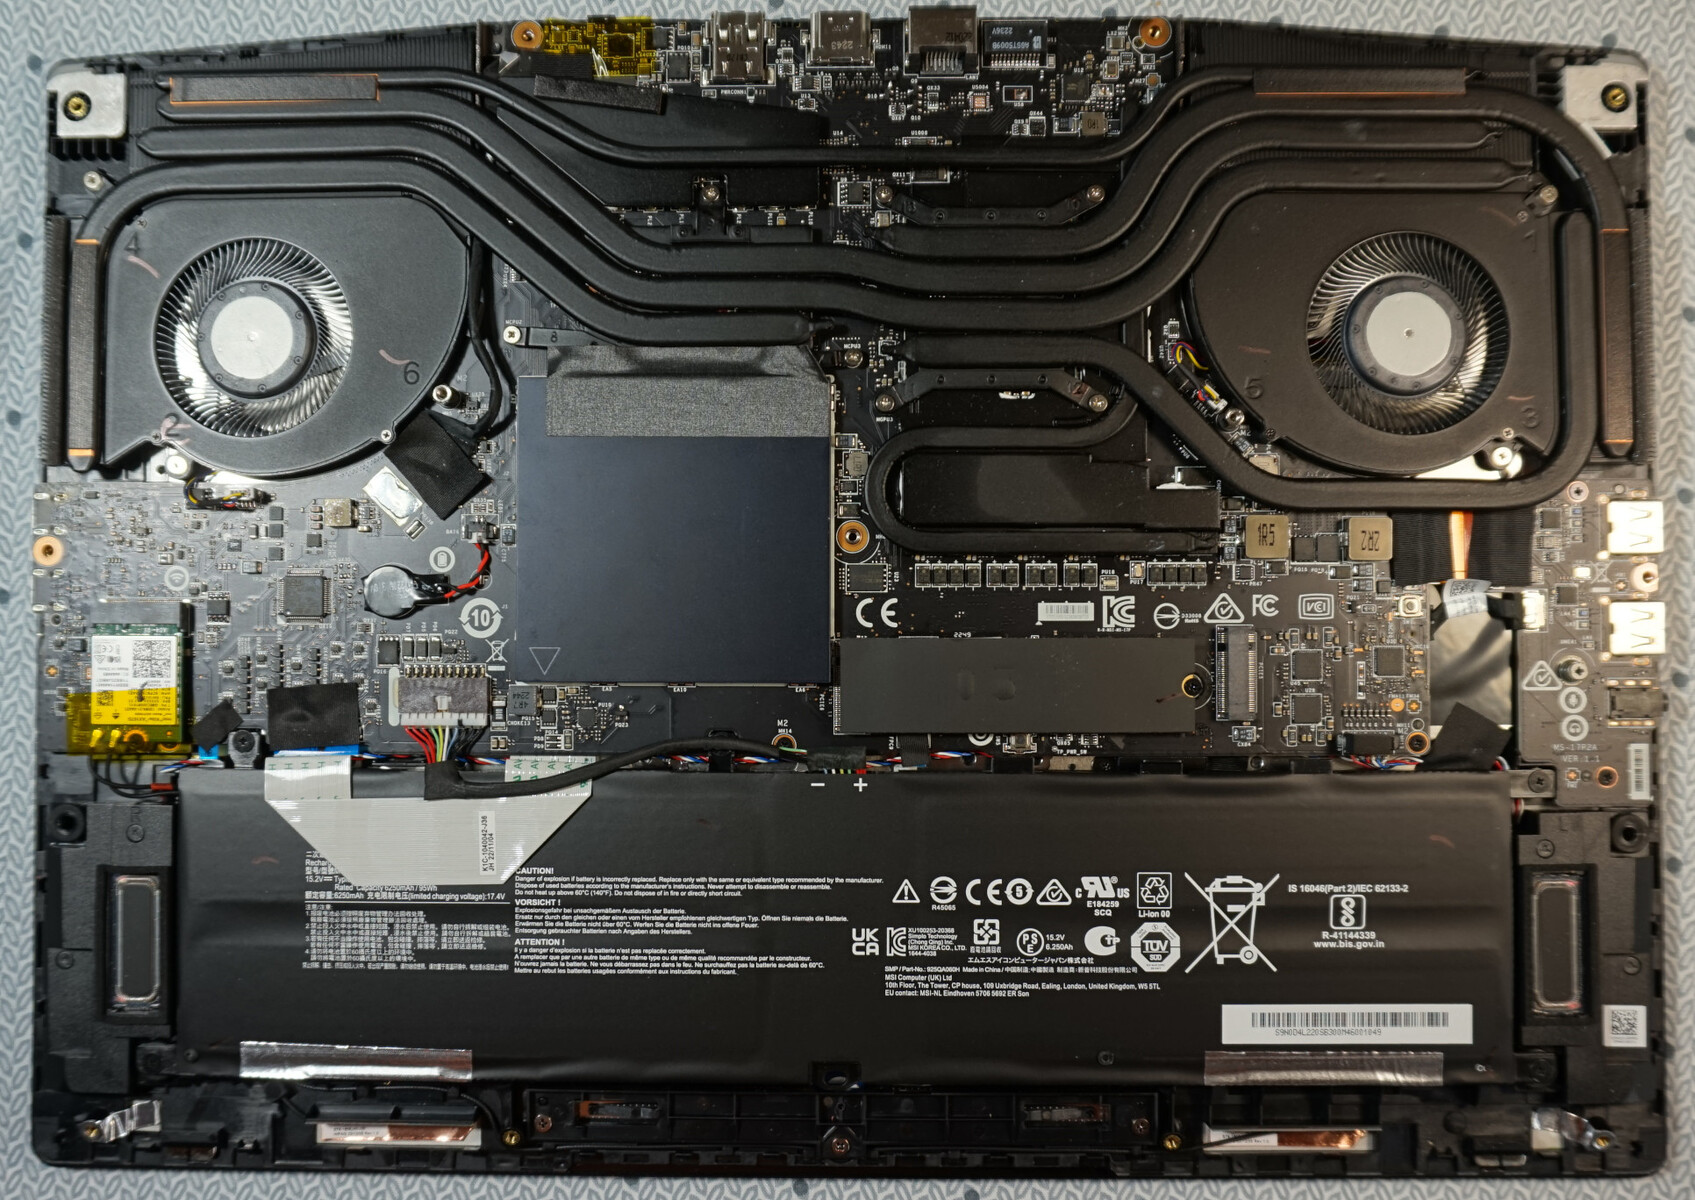
Manutenção
Se você não for desencorajado pelo selo que cobre o parafuso do meio, a abertura do dispositivo é descomplicada - os três comprimentos diferentes do parafuso não obstante. Na área das aberturas laterais de refrigeração, a caixa pode ser facilmente aberta e é algo para o qual é necessário um toque delicado em vez de força bruta.
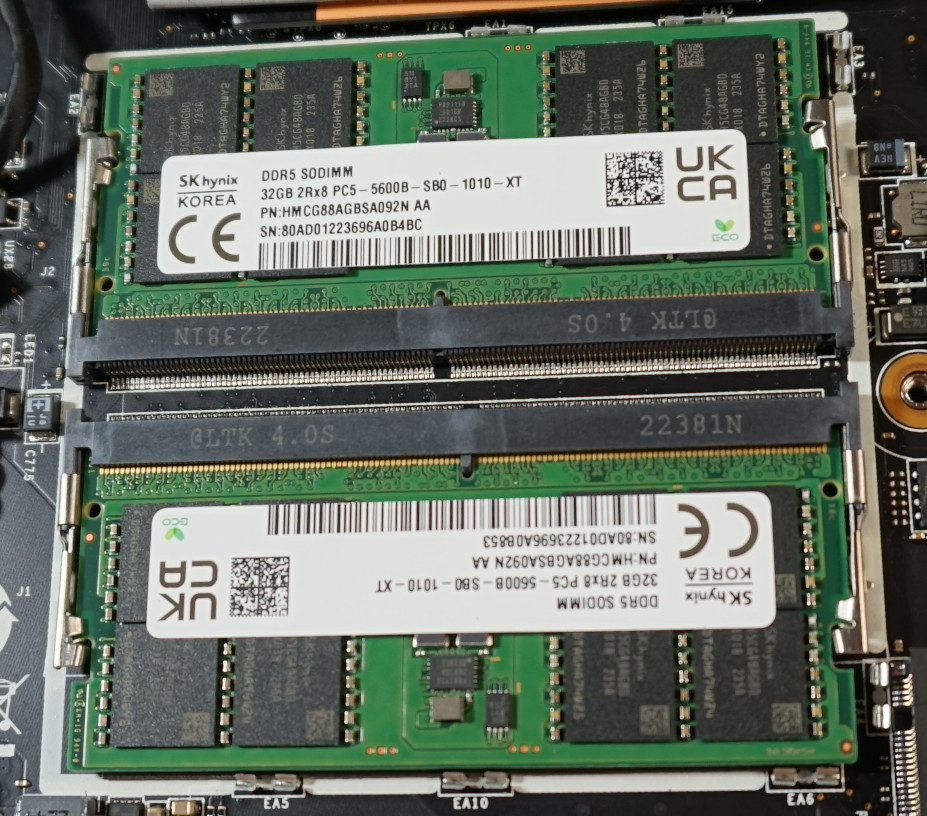
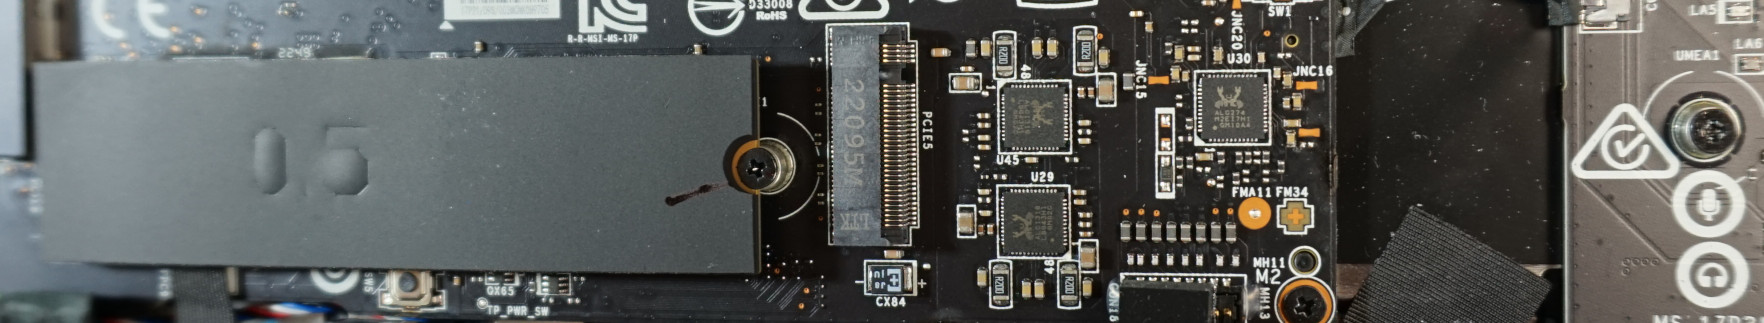
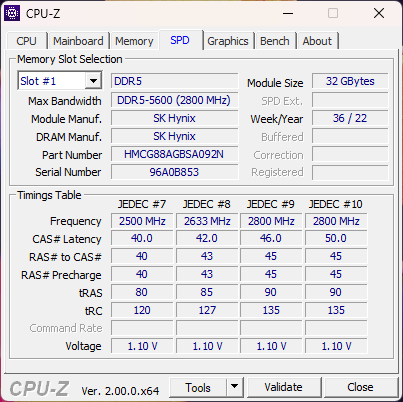
Posteriormente, os ventiladores, a bateria e todos os componentes substituíveis podem ser facilmente acessados. O módulo WiFi pode ser trocado. Dois slots de RAM permitem a instalação de um máximo de 64 GB de RAM DDR5 e este já estava equipado ao máximo em nosso dispositivo de revisão Stealth 17. Além disso, há um slot gratuito para um SSD M.2.
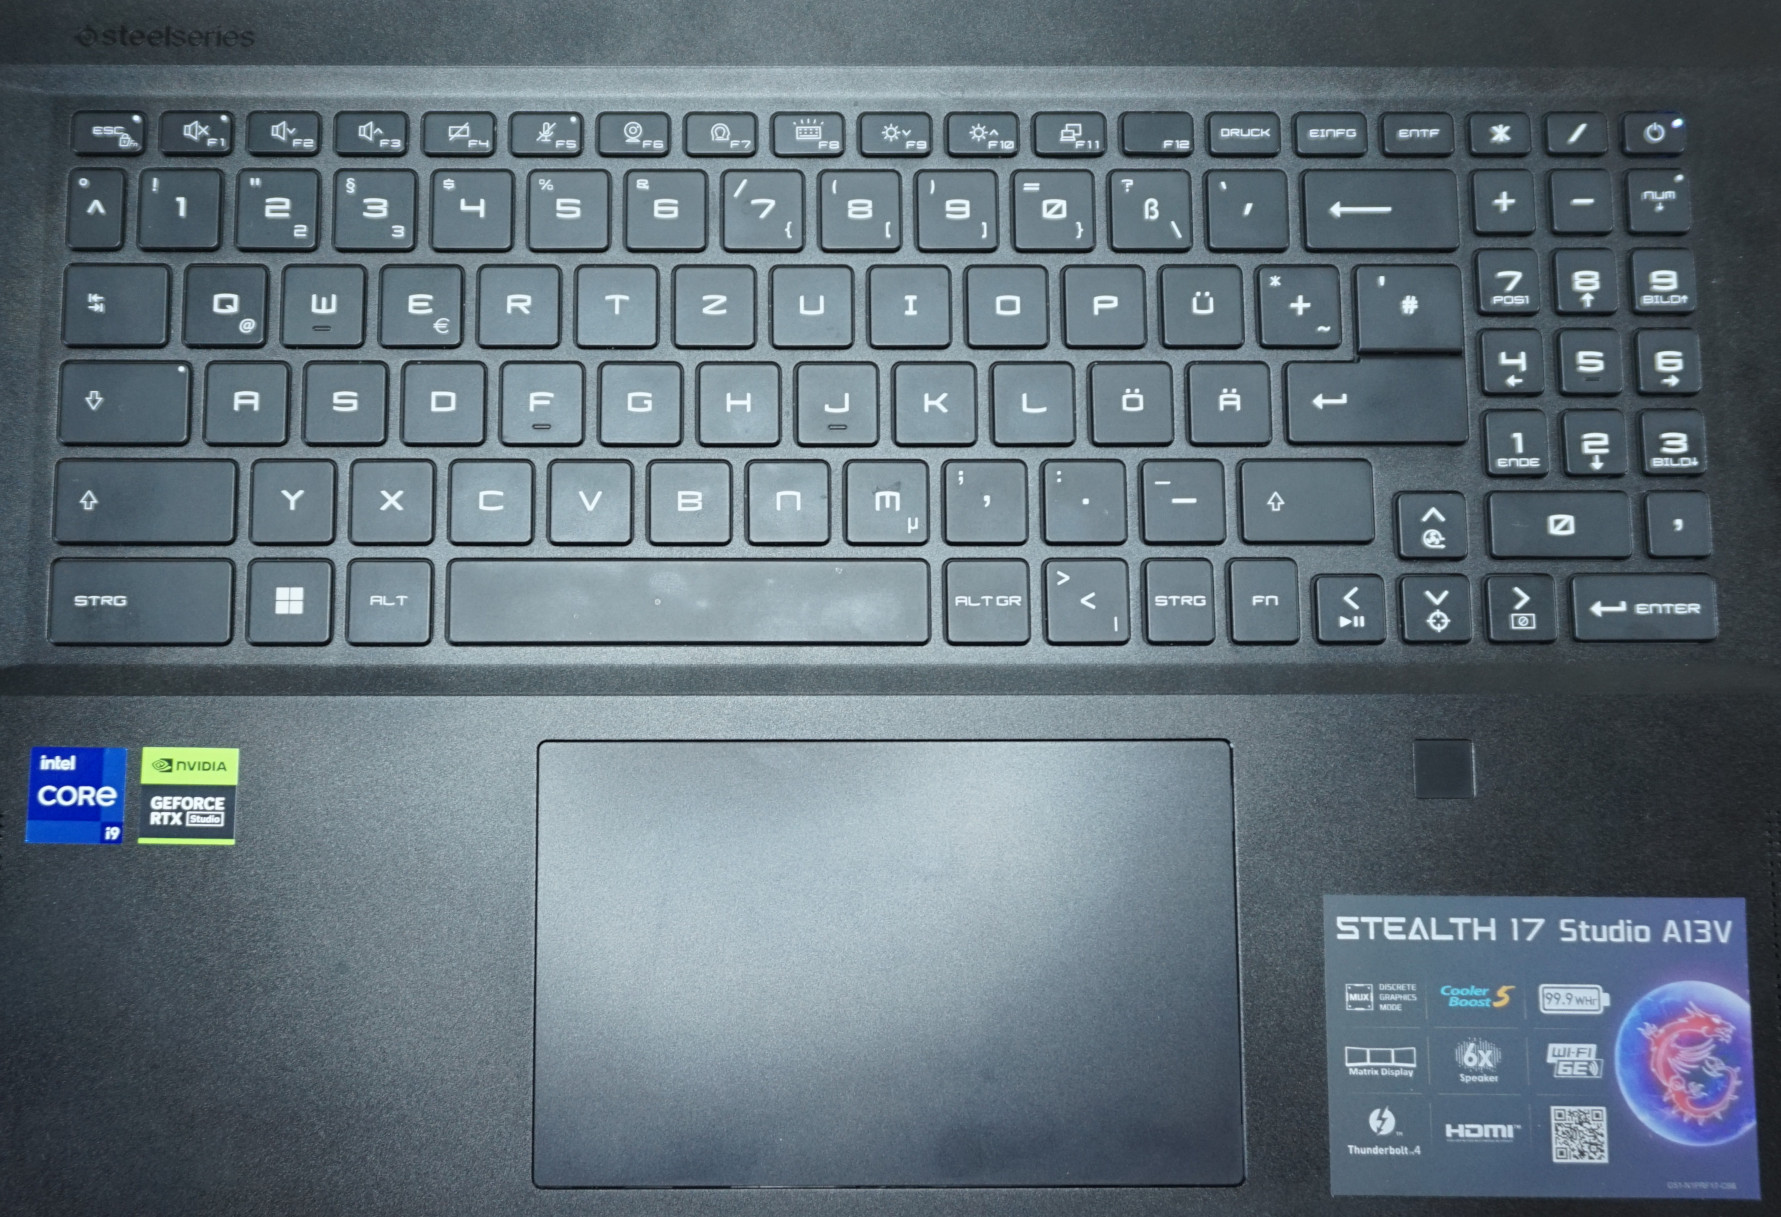
Dispositivos de entrada - Muita média em um laptop premium, do criador
O ruído de digitação mal audível se encaixa bem com a imagem geral de um dispositivo de trabalho silencioso. Além disso, o curso da chave ligeiramente acima da média de 1,7 mm é tangível e garante uma experiência de digitação rápida e fácil. O teclado não é melhor, mas também não é pior do que o tipo encontrado na maioria dos laptops comerciais. O teclado numérico parece um pouco apertado demais, o que é um ponto negativo quando se muda freqüentemente para a área de trabalho.
Além disso, cada tecla pode ser retroiluminada individualmente e também mudar de cor. Além disso, com a ajuda do software cliente SteelSeries GG, todas as teclas podem ser atribuídas a novas funções ou funções adicionais.
Infelizmente, a combinação de cores de comutação e valores de sensores não funciona. O que poderia ser mais irritante é o relâmpago irregular. Se sua preferência for iluminação de fundo unicolor, as diferenças entre as chaves são perceptíveis, especialmente com cores mais claras.
Da mesma forma, o touchpad não combina com o caráter premium do Stealth 17, embora suas funções sejam basicamente boas. As teclas físicas na área inferior parecem pastosas e imprecisas. Embora em situações normais, poderíamos ver um mouse mais provável de ser usado.
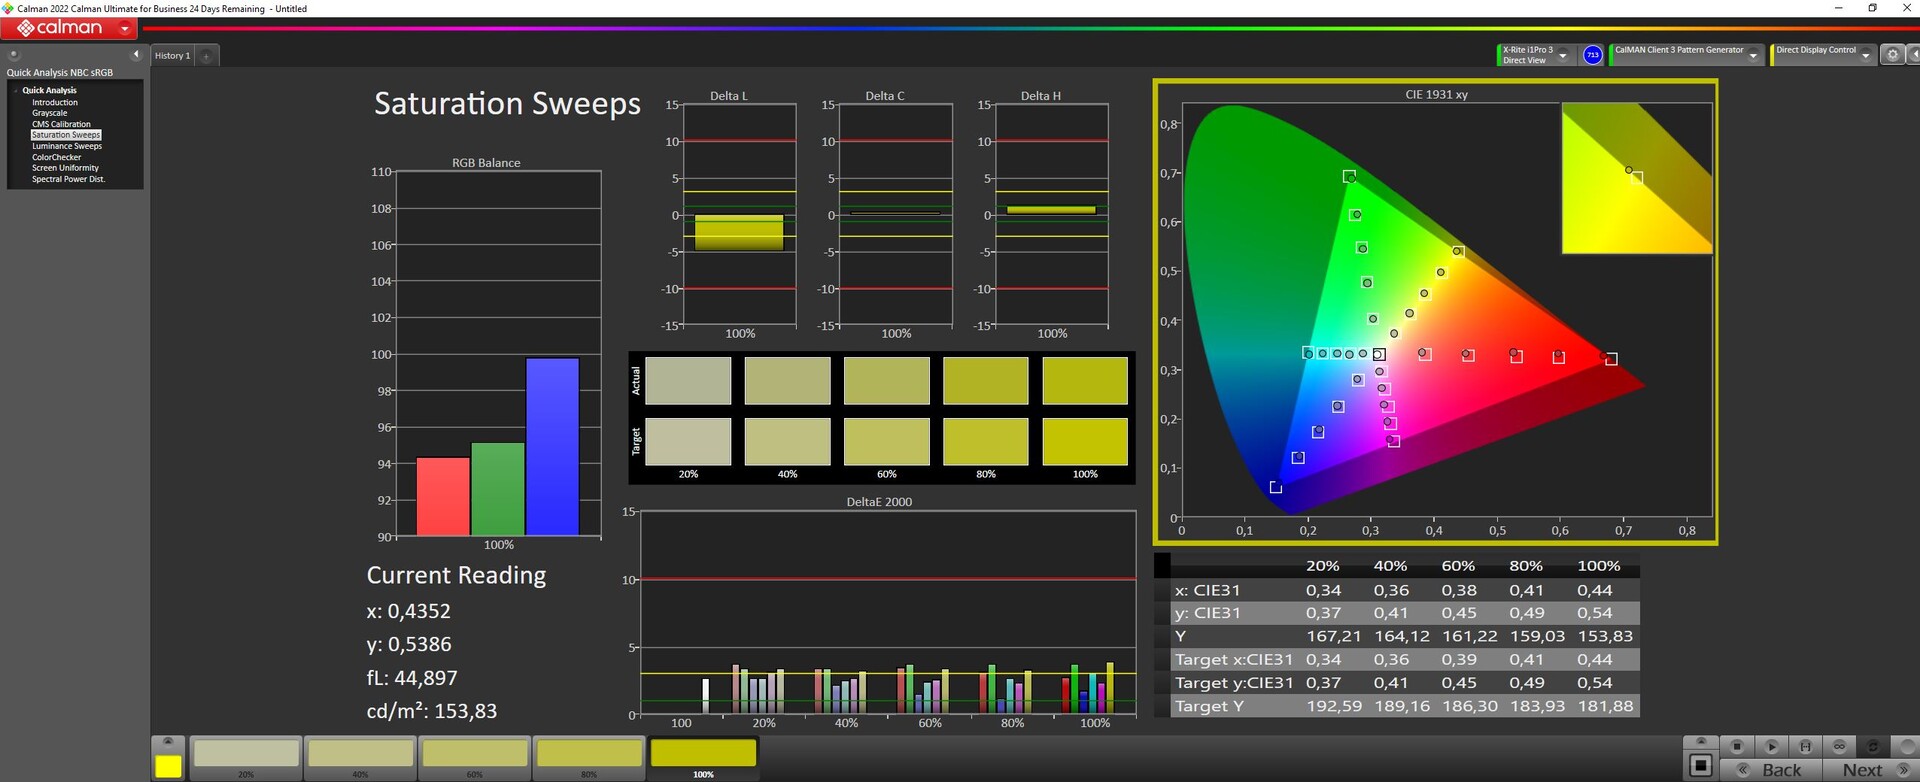
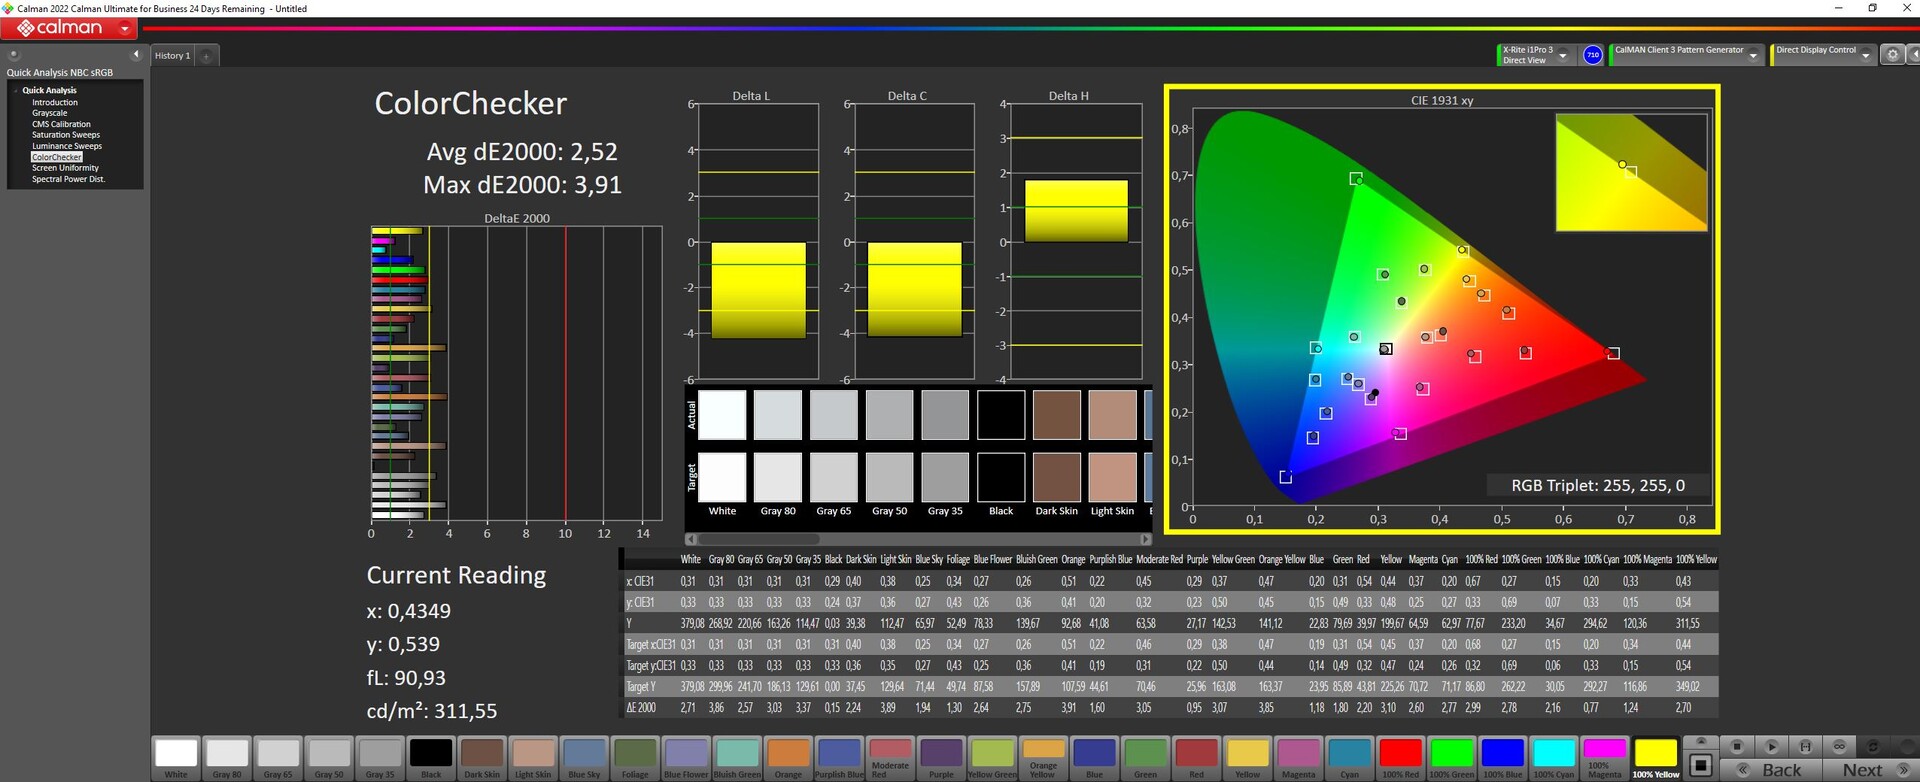
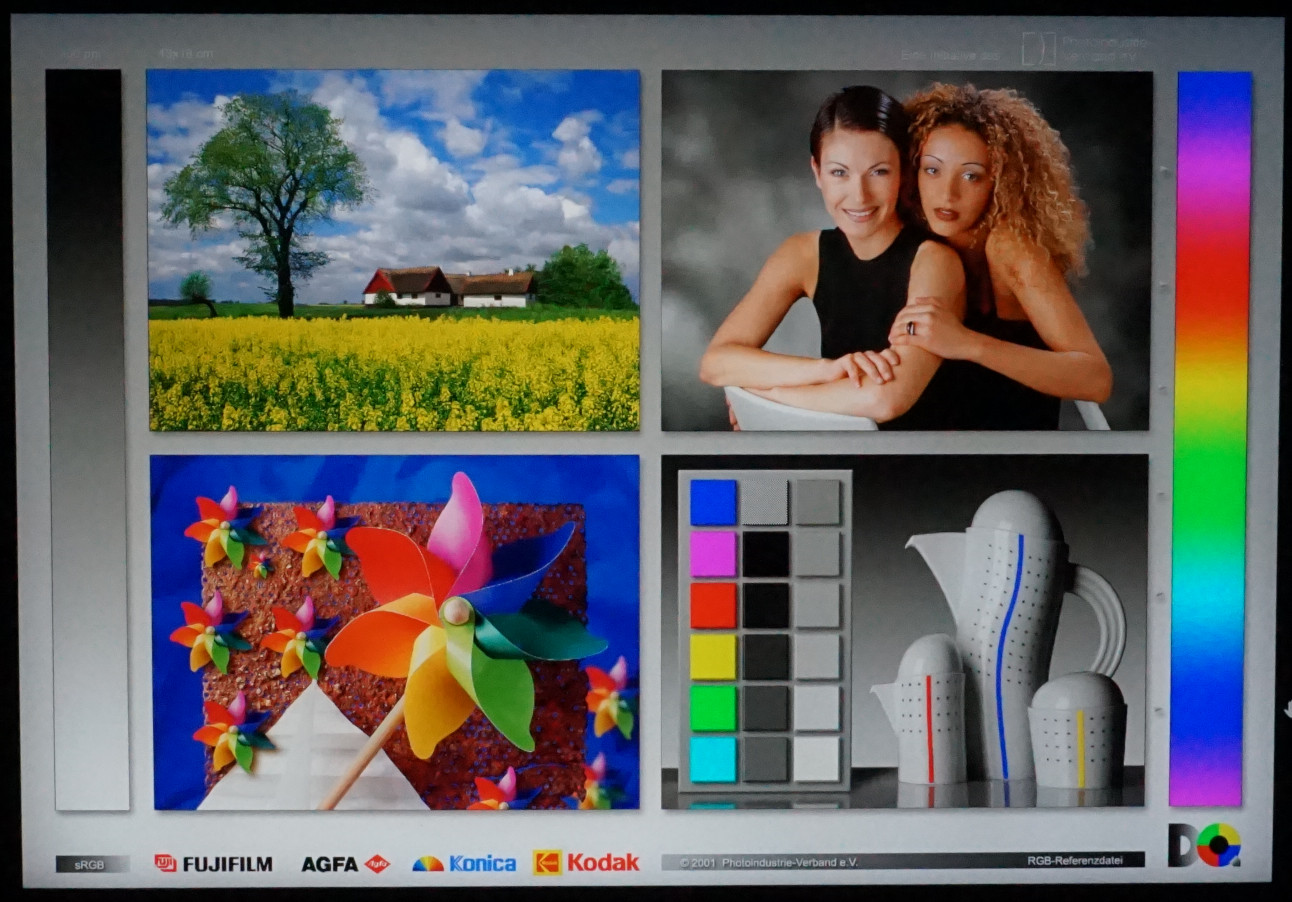
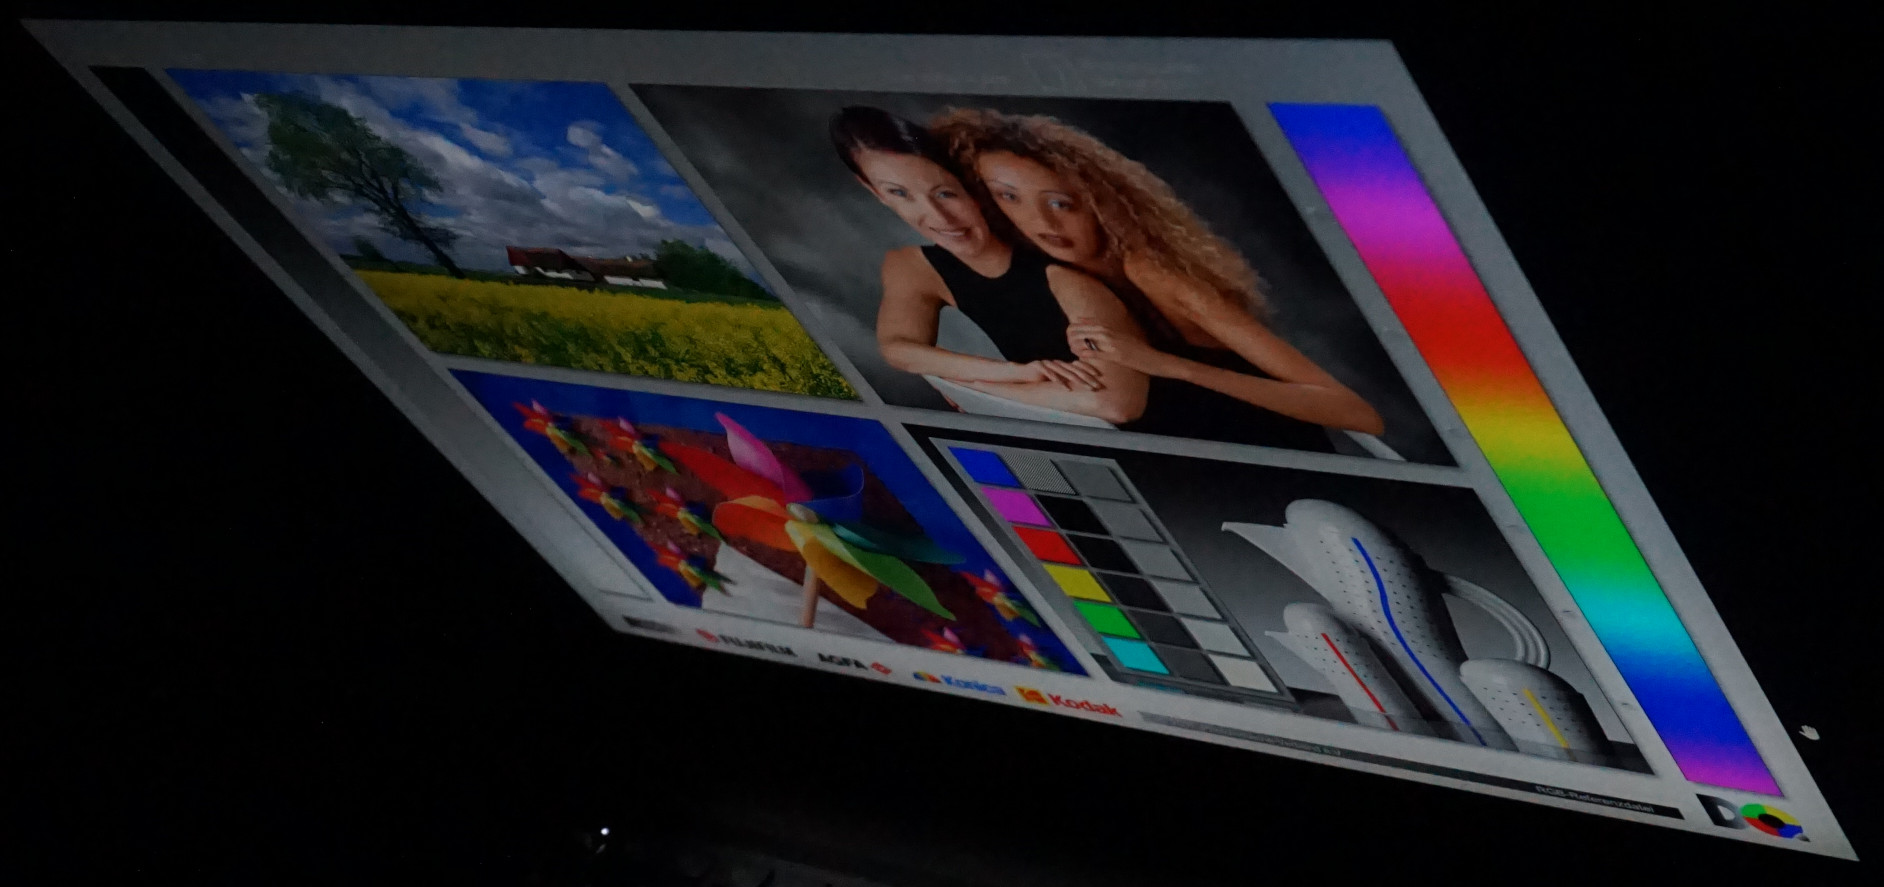
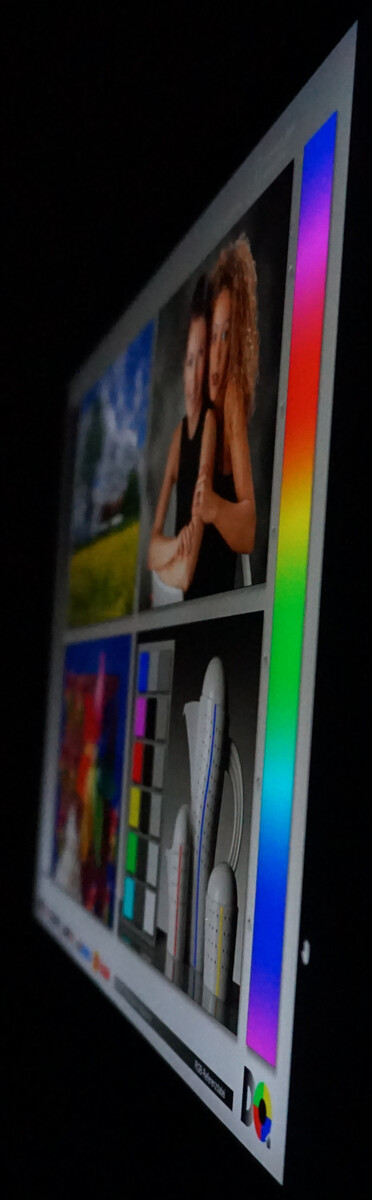
Mostrador - Valores de imagem impressionantes para o Stealth 17
Com sua resolução de 4K e (pelo menos em papel) quase 100% de cobertura de espaço de cor DCI-P3 e a certificação VESA DisplayHDR 1000, a tela é destinada a aplicações profissionais. Em particular, a edição de vídeo de alto nível exige tais atributos de exibição. Além disso, há a taxa de quadros de 144 Hz que tem seus benefícios nos jogos. As imagens com movimento suave e baixa latência são os resultados.
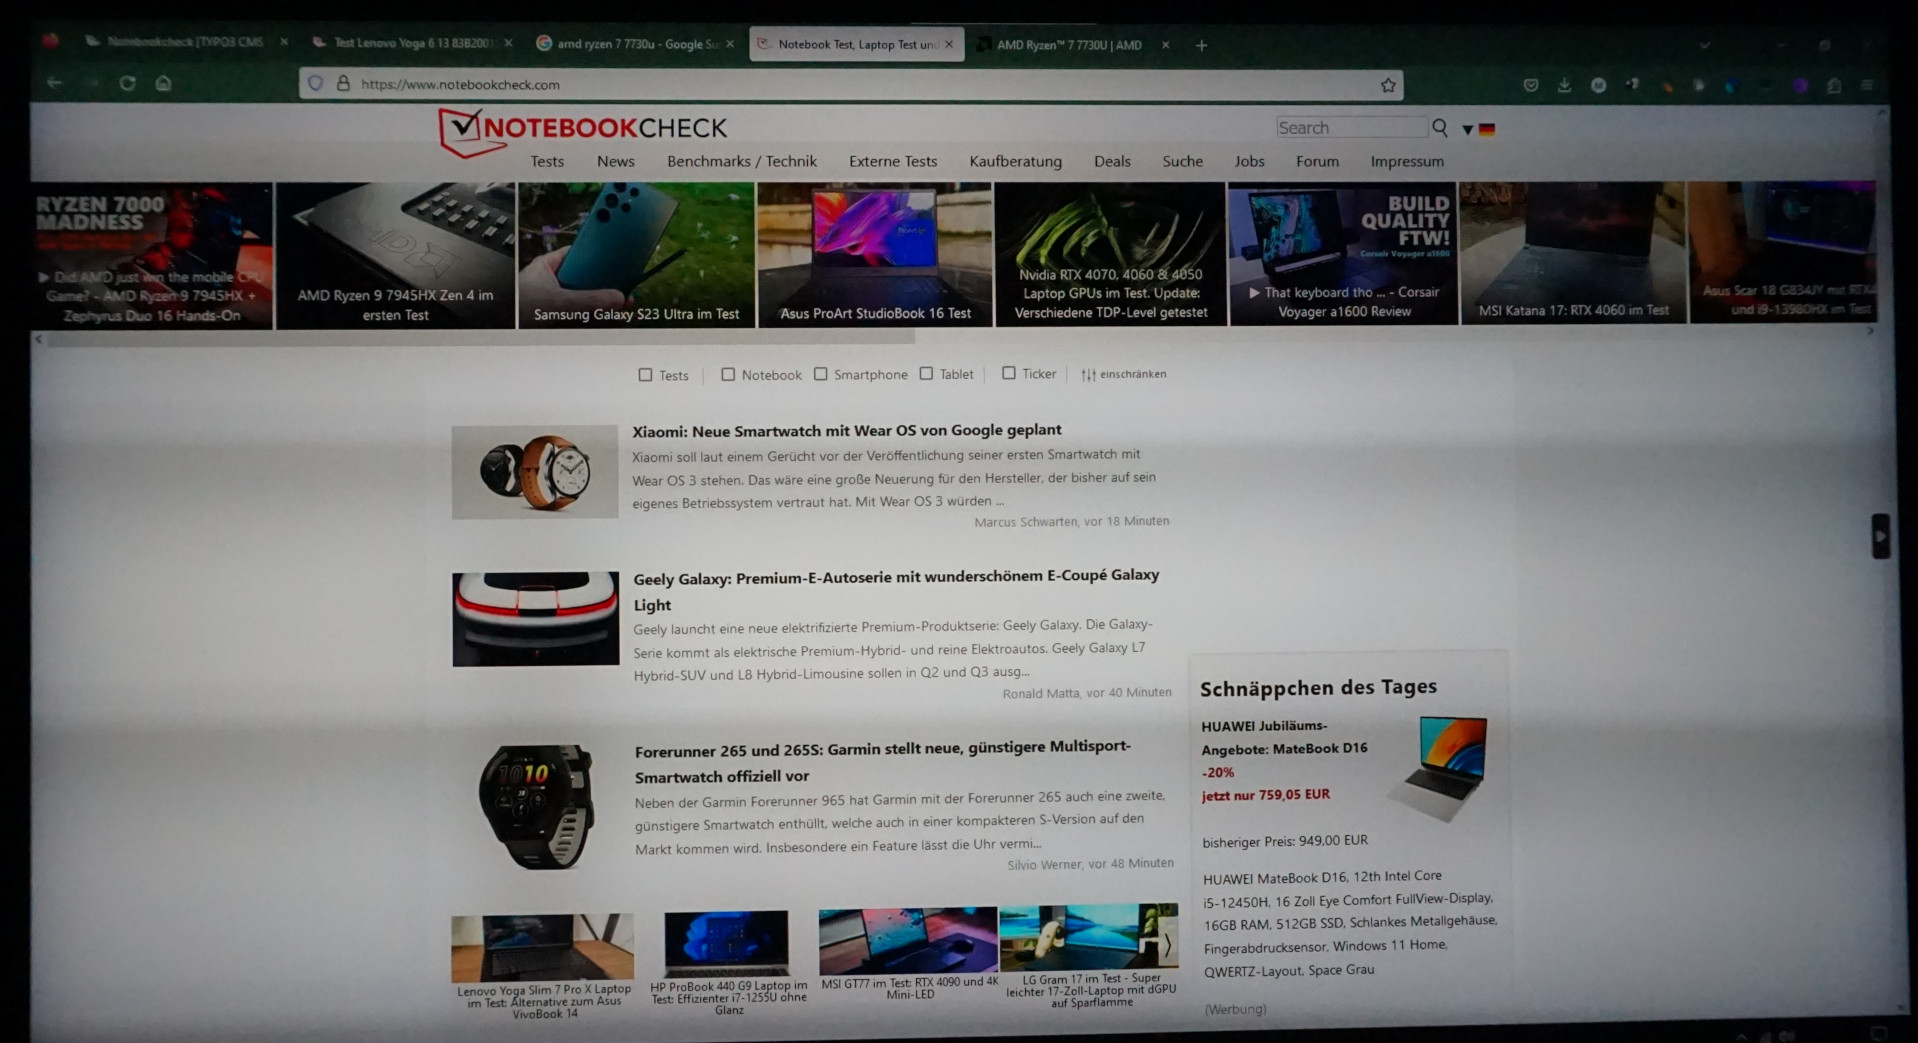
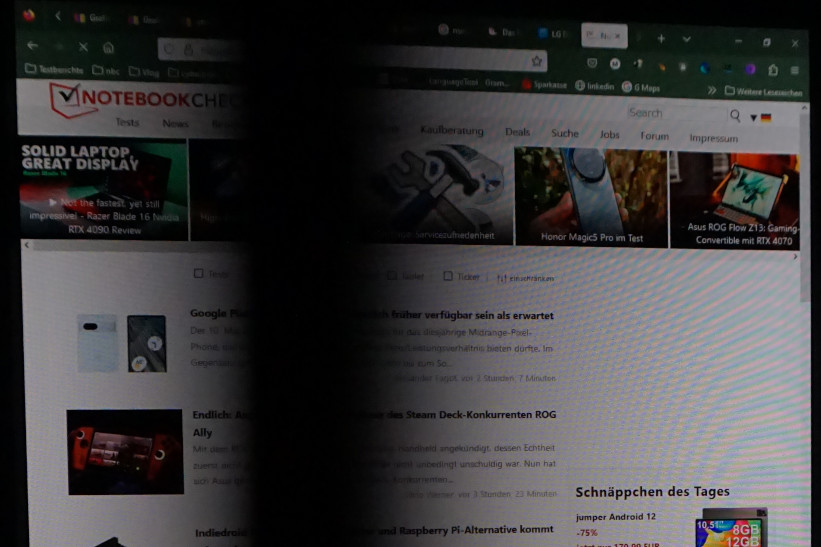
Graças aos níveis quase perfeitos de preto, o contraste é alto, mas nunca pode estar em zero devido aos reflexos de luz residual. Quando se trata de reprodução de vídeo e jogos, a diferença para a iluminação clássica de fundo é claramente visível. A imagem se assemelha àquela encontrada em um visor OLED. Isso é mostrado por nossa captura de imagem, cujo objetivo é revelar qualquer sangramento na tela. Nem um único traço disto pode ser visto na longa exposição.
Para muitas tarefas, uma resolução de 4K em um dispositivo de 17 polegadas é demais. O Windows 11 ajusta automaticamente o fator de ampliação para 250 %. Entretanto, 200 % deve ser suficiente para que se possa reconhecer texto e gráficos. Dito isto, não recomendamos menos do que isso. Em contraste, em termos de edição de imagem, a alta densidade de pixels é uma vantagem.
Medimos 400 cd/m² sem nenhum agravamento no modo de bateria. Isto ainda resulta em imagens maravilhosas dentro de casa que, no entanto, nunca parecem deslumbrantemente brilhantes. Quanto ao conteúdo HDR, o brilho de pico poderia ser maior.
| |||||||||||||||||||||||||
iluminação: 93 %
iluminação com acumulador: 408.46 cd/m²
Contraste: 19865:1 (Preto: 0.02 cd/m²)
ΔE ColorChecker Calman: 2.52 | ∀{0.5-29.43 Ø4.71}
calibrated: 2.52
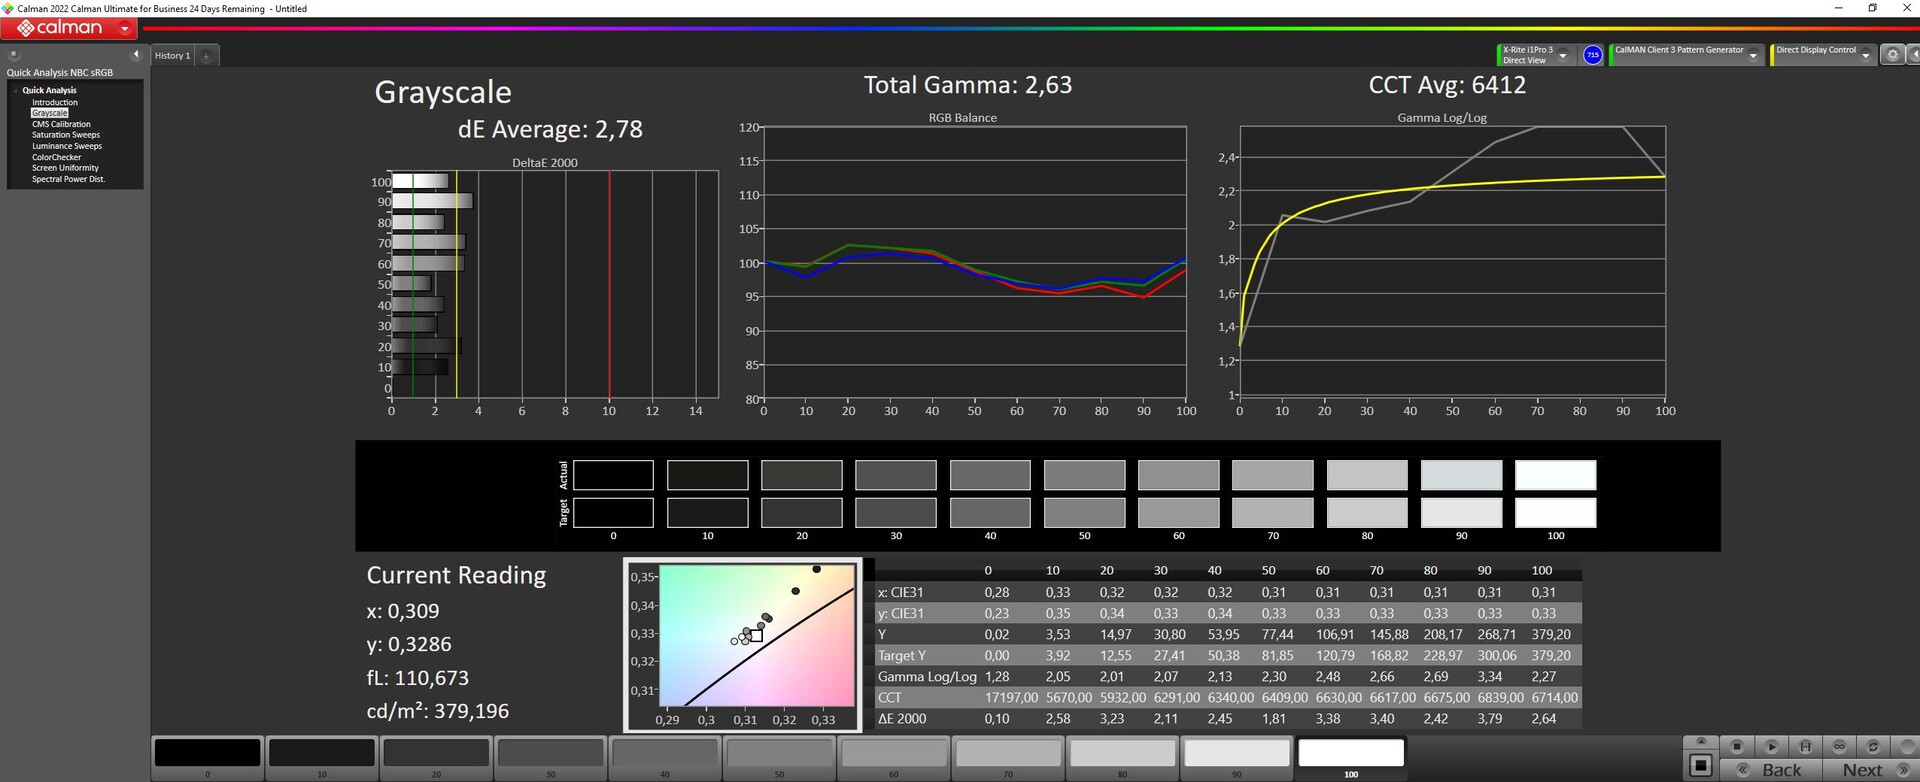
ΔE Greyscale Calman: 2.78 | ∀{0.09-98 Ø4.96}
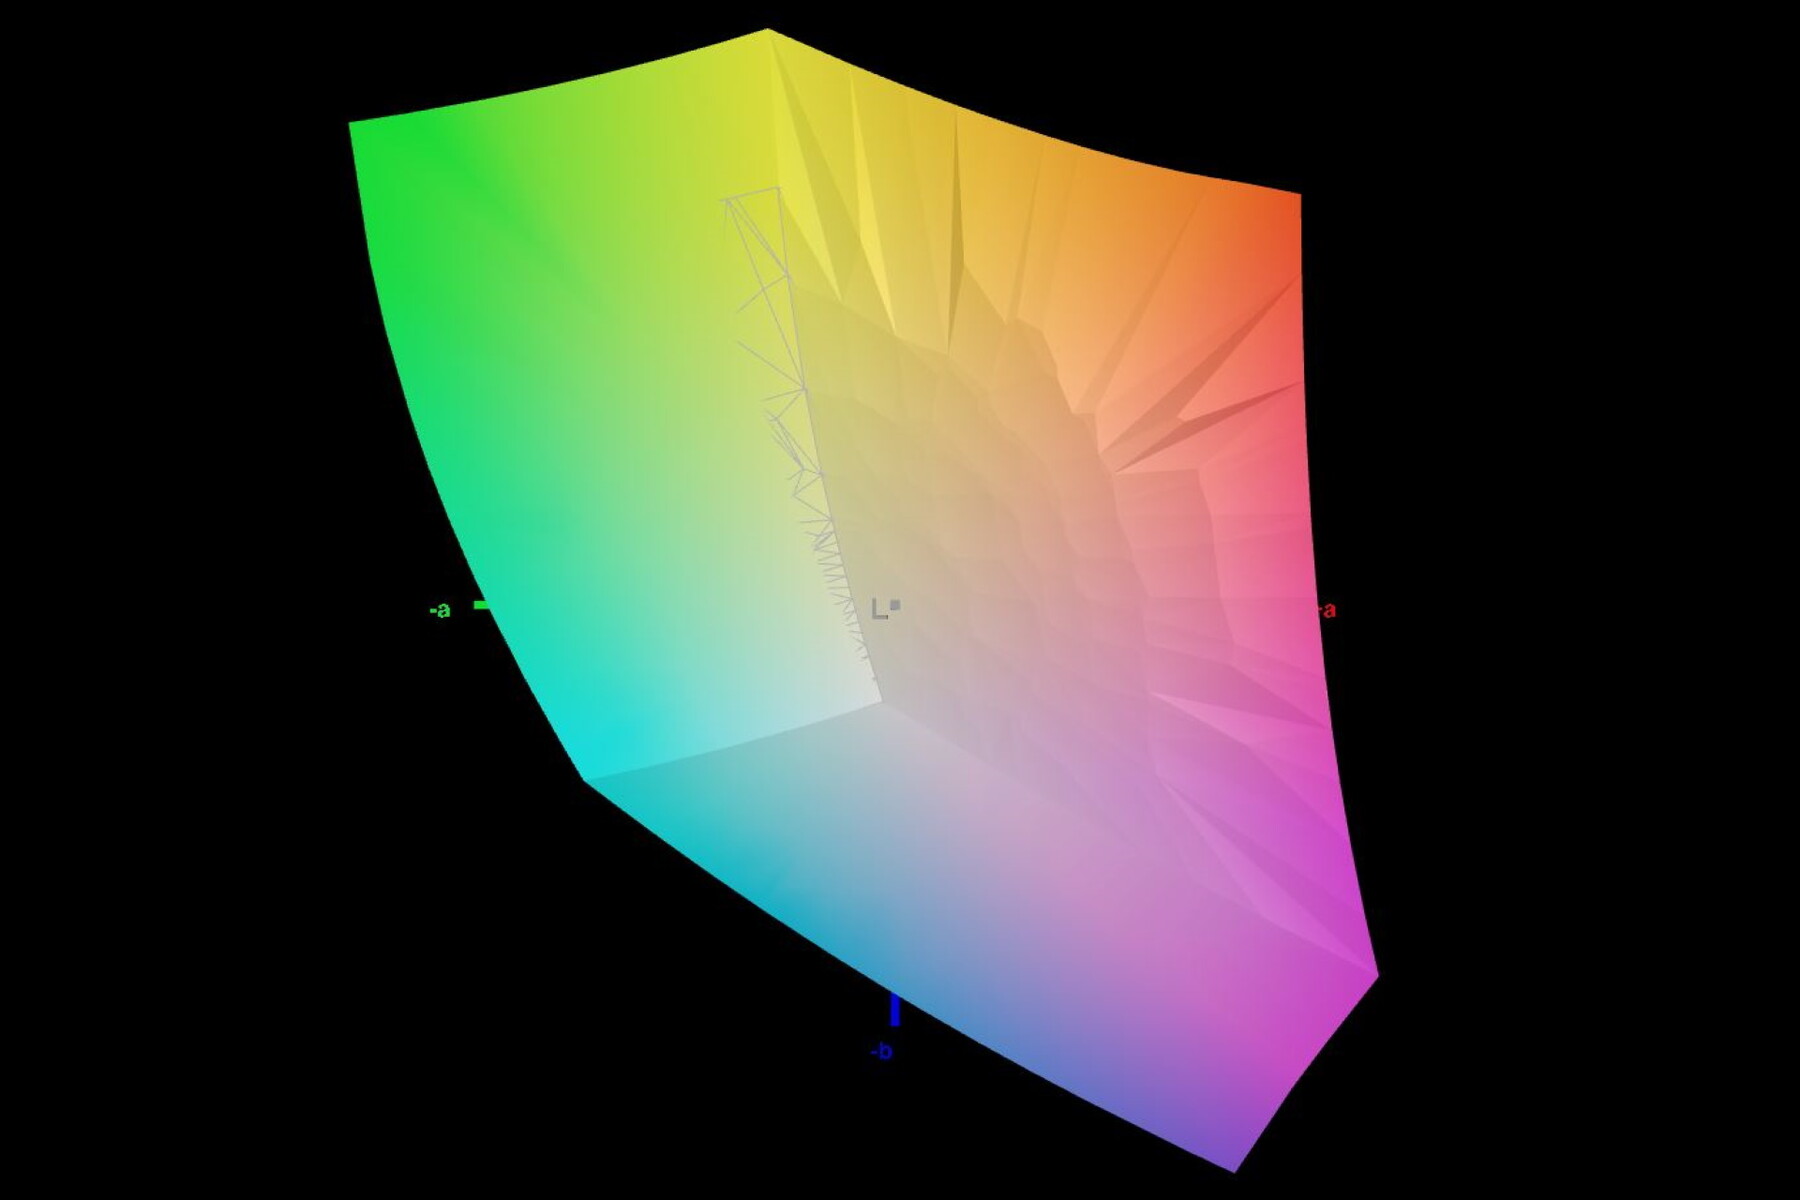
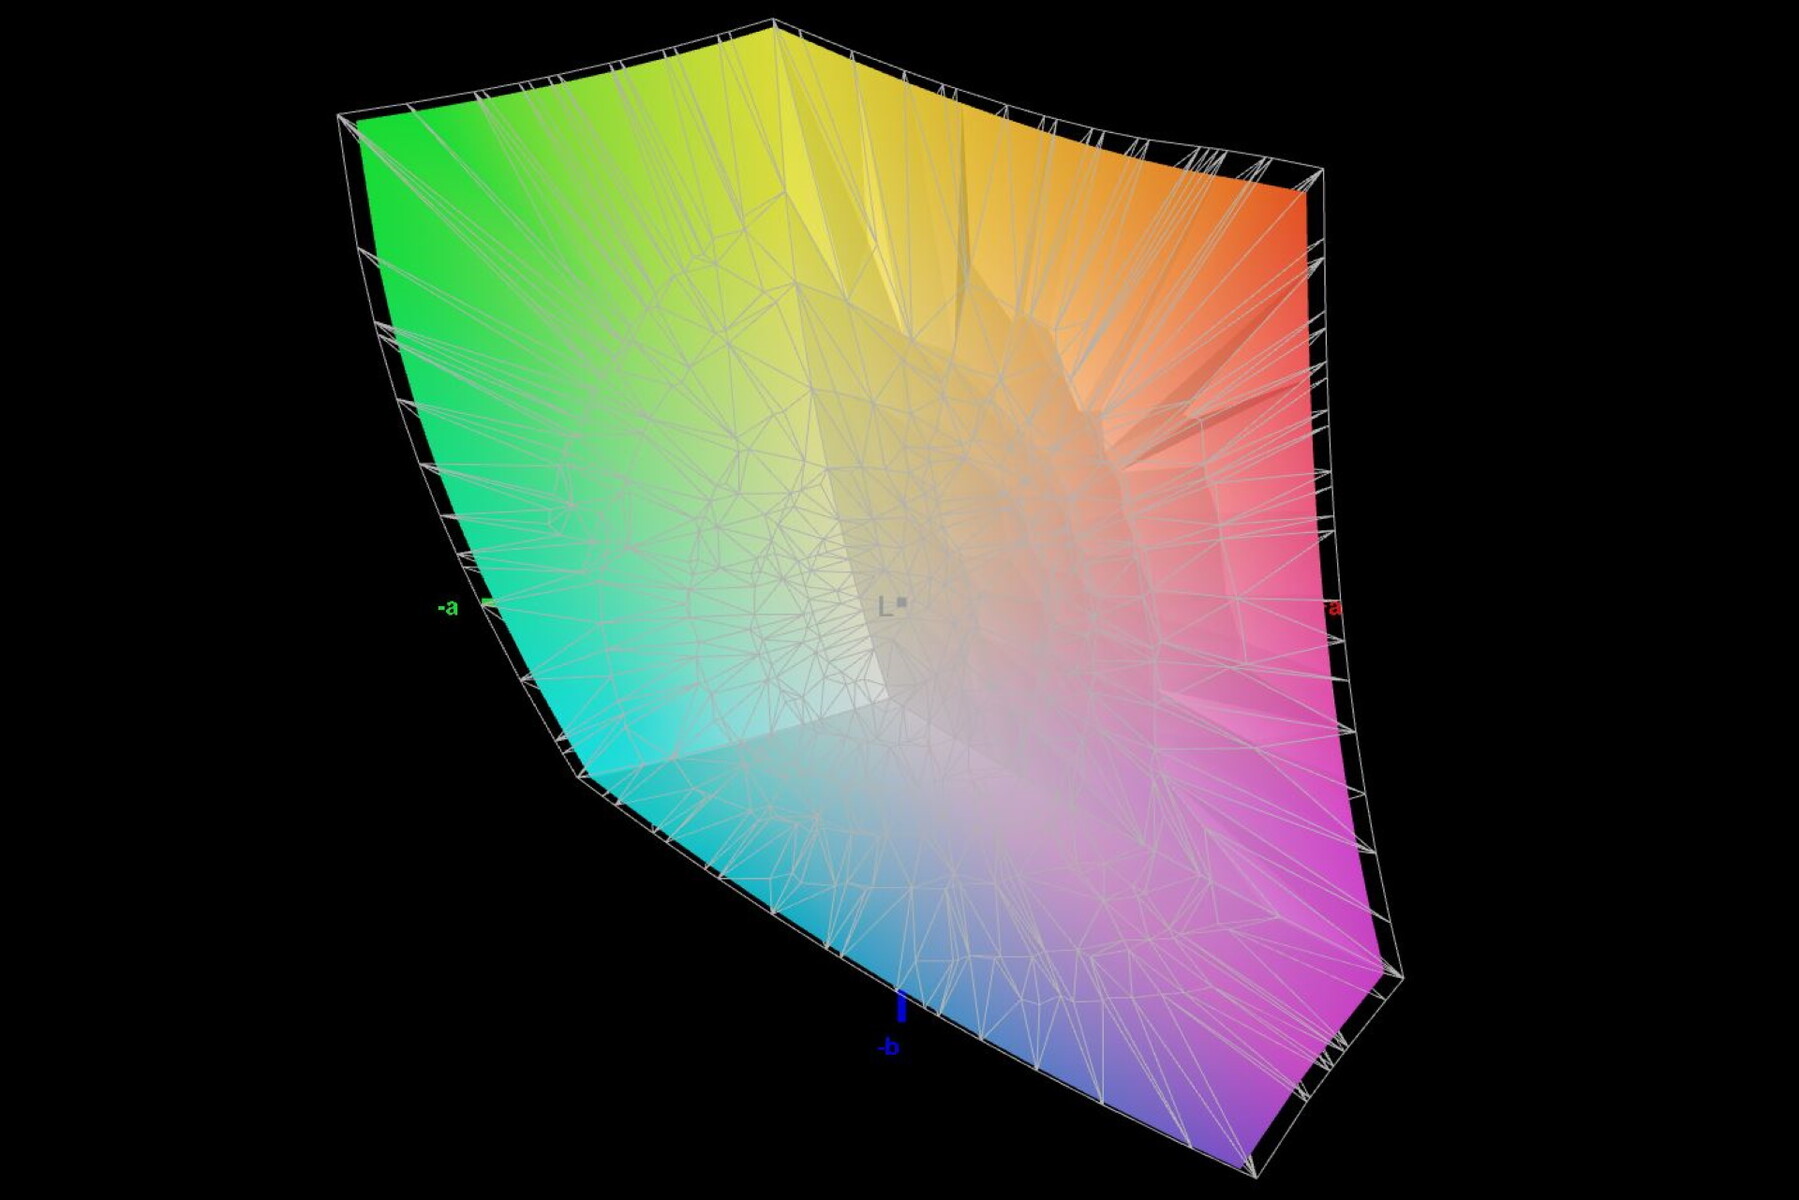
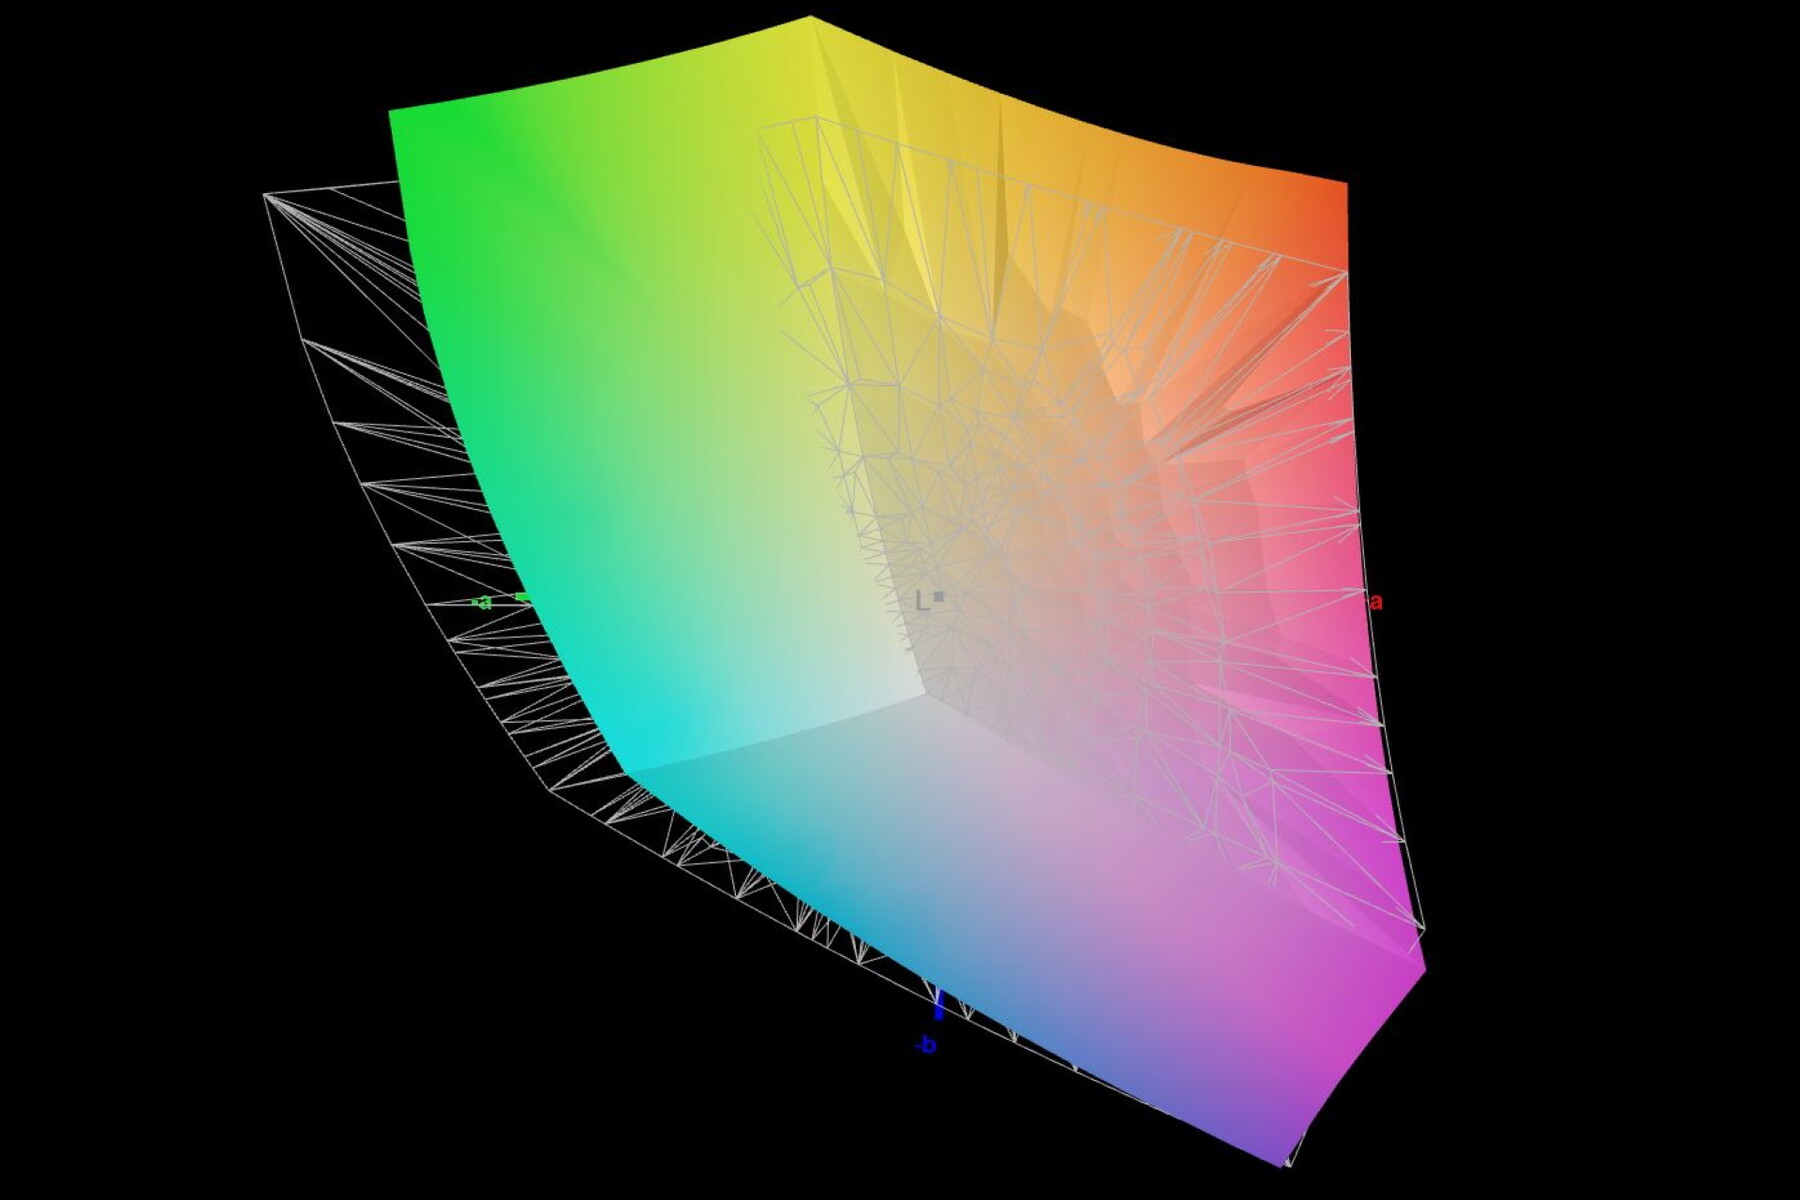
94.07% AdobeRGB 1998 (Argyll 3D)
99.1% sRGB (Argyll 3D)
92% Display P3 (Argyll 3D)
Gamma: 2.63
CCT: 6412 K
| MSI Stealth 17 Studio A13VH-014 AUO41A2 B173ZAN06.C, Mini LED, 3840x2160, 17.3" | Gigabyte Aero 16 YE5 Samsung SDC416B, AMOLED, 3840x2400, 16" | HP Omen 17-ck2097ng BOE BOE09BF, IPS, 2560x1440, 17.3" | Razer Blade 16 Early 2023 CSOT T3 MNG007DA4-1, IPS, 2560x1600, 16" | Aorus 17X AZF BOE09F9, IPS, 2560x1440, 17.3" | Asus ROG Strix G17 G713PI BOE0B69, IPS, 2560x1440, 17.3" | |
|---|---|---|---|---|---|---|
| Display | -18% | 1% | -1% | -0% | ||
| Display P3 Coverage (%) | 92 | 67.4 -27% | 98.5 7% | 96.7 5% | 98.3 7% | |
| sRGB Coverage (%) | 99.1 | 97.6 -2% | 100 1% | 99.9 1% | 100 1% | |
| AdobeRGB 1998 Coverage (%) | 94.07 | 69.6 -26% | 89.7 -5% | 84.5 -10% | 85.9 -9% | |
| Response Times | -64% | -635% | -875% | -730% | -599% | |
| Response Time Grey 50% / Grey 80% * (ms) | 46.4 ? | 2.4 ? 95% | 15.6 ? 66% | 6.6 ? 86% | 14 ? 70% | 5.3 ? 89% |
| Response Time Black / White * (ms) | 0.62 ? | 2 ? -223% | 8.9 ? -1335% | 12 ? -1835% | 10.1 ? -1529% | 8.6 ? -1287% |
| PWM Frequency (Hz) | 2400 | 60 ? | ||||
| Screen | 24% | -169% | -195% | -163% | -195% | |
| Brightness middle (cd/m²) | 397.29 | 368 -7% | 371 -7% | 456.8 15% | 294 -26% | 327 -18% |
| Brightness (cd/m²) | 392 | 368 -6% | 350 -11% | 437 11% | 276 -30% | 320 -18% |
| Brightness Distribution (%) | 93 | 93 0% | 90 -3% | 83 -11% | 90 -3% | 89 -4% |
| Black Level * (cd/m²) | 0.02 | 0.01 50% | 0.32 -1500% | 0.35 -1650% | 0.28 -1300% | 0.38 -1800% |
| Contrast (:1) | 19865 | 36800 85% | 1159 -94% | 1305 -93% | 1050 -95% | 861 -96% |
| Colorchecker dE 2000 * | 2.52 | 2.33 8% | 1.74 31% | 3.7 -47% | 2.81 -12% | 1.01 60% |
| Colorchecker dE 2000 max. * | 3.91 | 4.34 -11% | 3.59 8% | 6.42 -64% | 5.7 -46% | 4.01 -3% |
| Colorchecker dE 2000 calibrated * | 2.52 | 1.01 60% | 0.66 74% | 0.86 66% | 0.41 84% | |
| Greyscale dE 2000 * | 2.78 | 0.8 71% | 2.8 -1% | 2.6 6% | 3.4 -22% | 1.6 42% |
| Gamma | 2.63 84% | 2.119 104% | 2.19 100% | 2.3 96% | 2.301 96% | 2.168 101% |
| CCT | 6412 101% | 6569 99% | 6474 100% | 6108 106% | 7389 88% | 6659 98% |
| Média Total (Programa/Configurações) | -20% /
6% | -274% /
-203% | -356% /
-250% | -298% /
-209% | -265% /
-211% |
* ... menor é melhor
A cobertura típica do espaço de cores não parece muito perfeita. Em particular, o DCI-P3 carece de um pouco de brilho. O fato de a tela pertencer à categoria premium é demonstrado por 94 por cento de cobertura de espaço frio AdobeRGB. A maioria dos painéis IPS da concorrência está um pouco atrasada.
A partir de agora, a precisão da reprodução de cores é boa. Em 2,5, o valor medido do DeltaE fica abaixo do nível de perceptibilidade. Mesmo o desvio máximo detectado de alguns tons marrons deve ser imperceptível para a maioria das pessoas. A calibração subseqüente não resultou em melhorias.
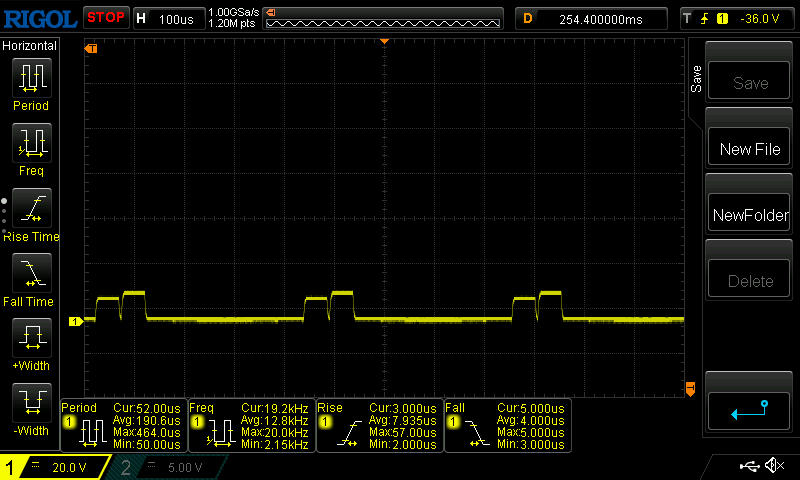
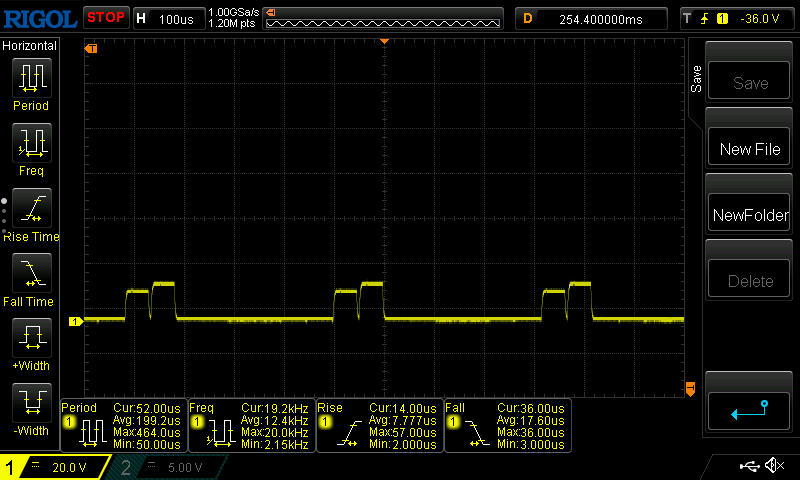
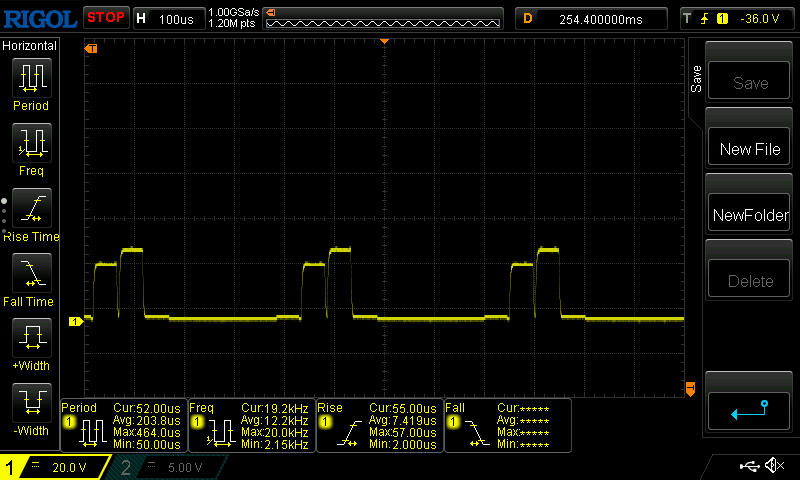
Conseguimos detectar a cintilação relacionada a PWM com uma freqüência de 2,4 kHz. Entretanto, a sua intensidade é dificilmente comparável a um visor LED típico. Graças ao fino rastering da mini-LED, áreas muito limitadas são momentaneamente desligadas. Isso não significa necessariamente que os usuários de disposição sensível não irão notar.
Através de todos os níveis de brilho e com curtos tempos de exposição, uma densa variedade de faixas ligeiramente escuras pode ser vista para percorrer a imagem. Parece que a iluminação de fundo não se apaga completamente. Isto é devido a apenas uma pequena área LED sendo desativada enquanto os mini-LEDs ao redor parecem iluminar a parte desligada. Como resultado, o escurecimento parece significativamente menos intenso.
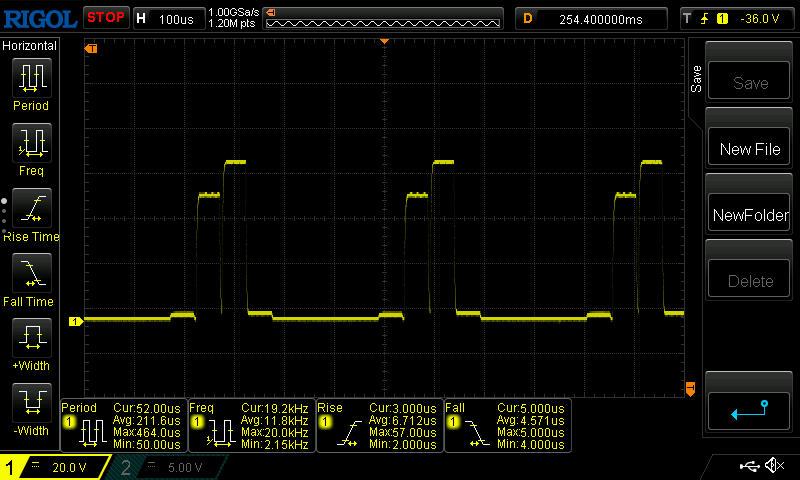
Com um tempo de exposição de 1/500 de segundo, isto pode ser visto claramente. Isto é visto nas imagens sob os dados de análise: Com os mini-LEDs, algumas áreas são ligeiramente escurecidas. Em contraste, com iluminação de fundo LED normal, uma grande área permanece completamente escura por algumas frações de segundo, já que uma área maior é desligada.
O tempo de resposta cinza a cinza não é impressionante - como em outros painéis mini-LED. Por outro lado, a chave da luz para o escuro está em um nível muito bom.

Exibir tempos de resposta
| ↔ Tempo de resposta preto para branco | ||
|---|---|---|
| 0.62 ms ... ascensão ↗ e queda ↘ combinadas | ↗ 0.42 ms ascensão | 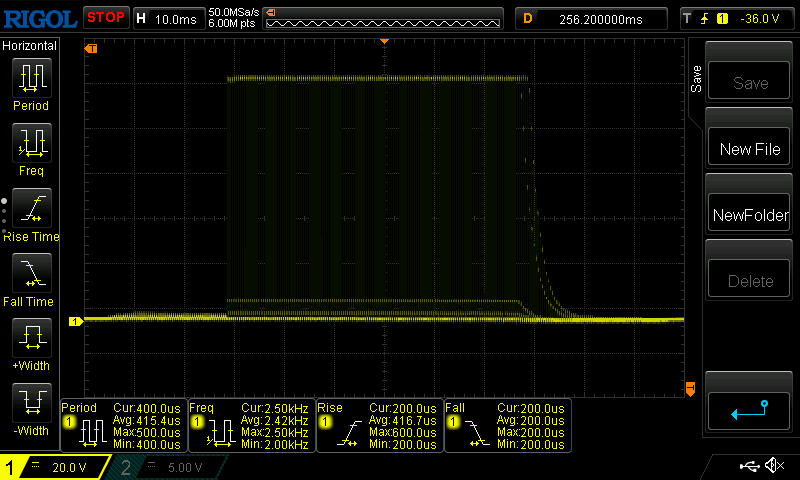 |
| ↘ 0.2 ms queda | ||
| A tela mostra taxas de resposta muito rápidas em nossos testes e deve ser muito adequada para jogos em ritmo acelerado. Em comparação, todos os dispositivos testados variam de 0.1 (mínimo) a 240 (máximo) ms. » 1 % de todos os dispositivos são melhores. Isso significa que o tempo de resposta medido é melhor que a média de todos os dispositivos testados (19.8 ms). | ||
| ↔ Tempo de resposta 50% cinza a 80% cinza | ||
| 46.4 ms ... ascensão ↗ e queda ↘ combinadas | ↗ 24 ms ascensão | 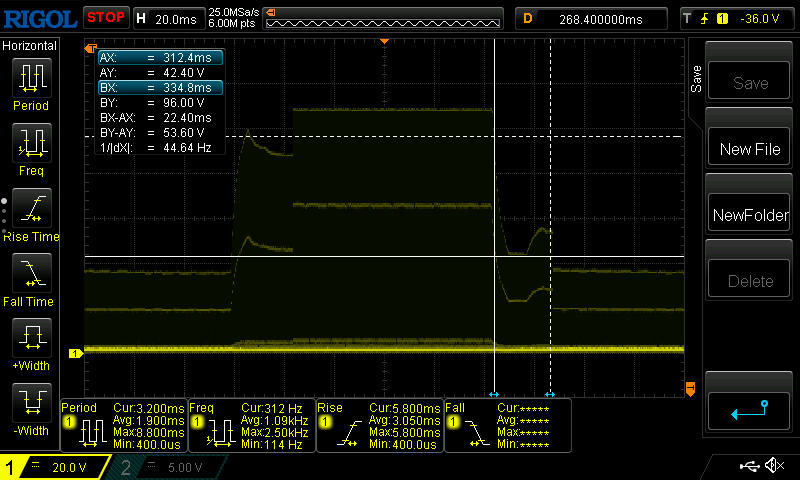 |
| ↘ 22.4 ms queda | ||
| A tela mostra taxas de resposta lentas em nossos testes e será insatisfatória para os jogadores. Em comparação, todos os dispositivos testados variam de 0.165 (mínimo) a 636 (máximo) ms. » 80 % de todos os dispositivos são melhores. Isso significa que o tempo de resposta medido é pior que a média de todos os dispositivos testados (31 ms). | ||
Cintilação da tela / PWM (modulação por largura de pulso)
| Tela tremeluzindo/PWM detectado | 2400 Hz | 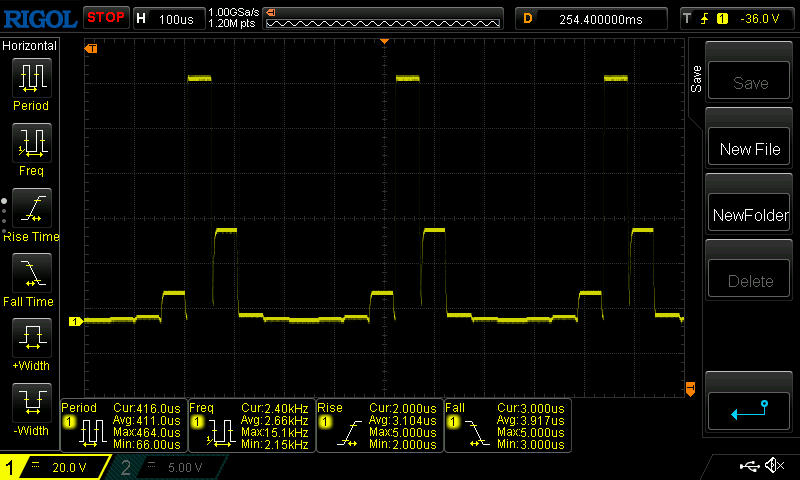 | |
A luz de fundo da tela pisca em 2400 Hz (pior caso, por exemplo, utilizando PWM) . A frequência de 2400 Hz é bastante alta, então a maioria dos usuários sensíveis ao PWM não deve notar nenhuma oscilação. [pwm_comparison] Em comparação: 52 % de todos os dispositivos testados não usam PWM para escurecer a tela. Se PWM foi detectado, uma média de 7754 (mínimo: 5 - máximo: 343500) Hz foi medida. | |||
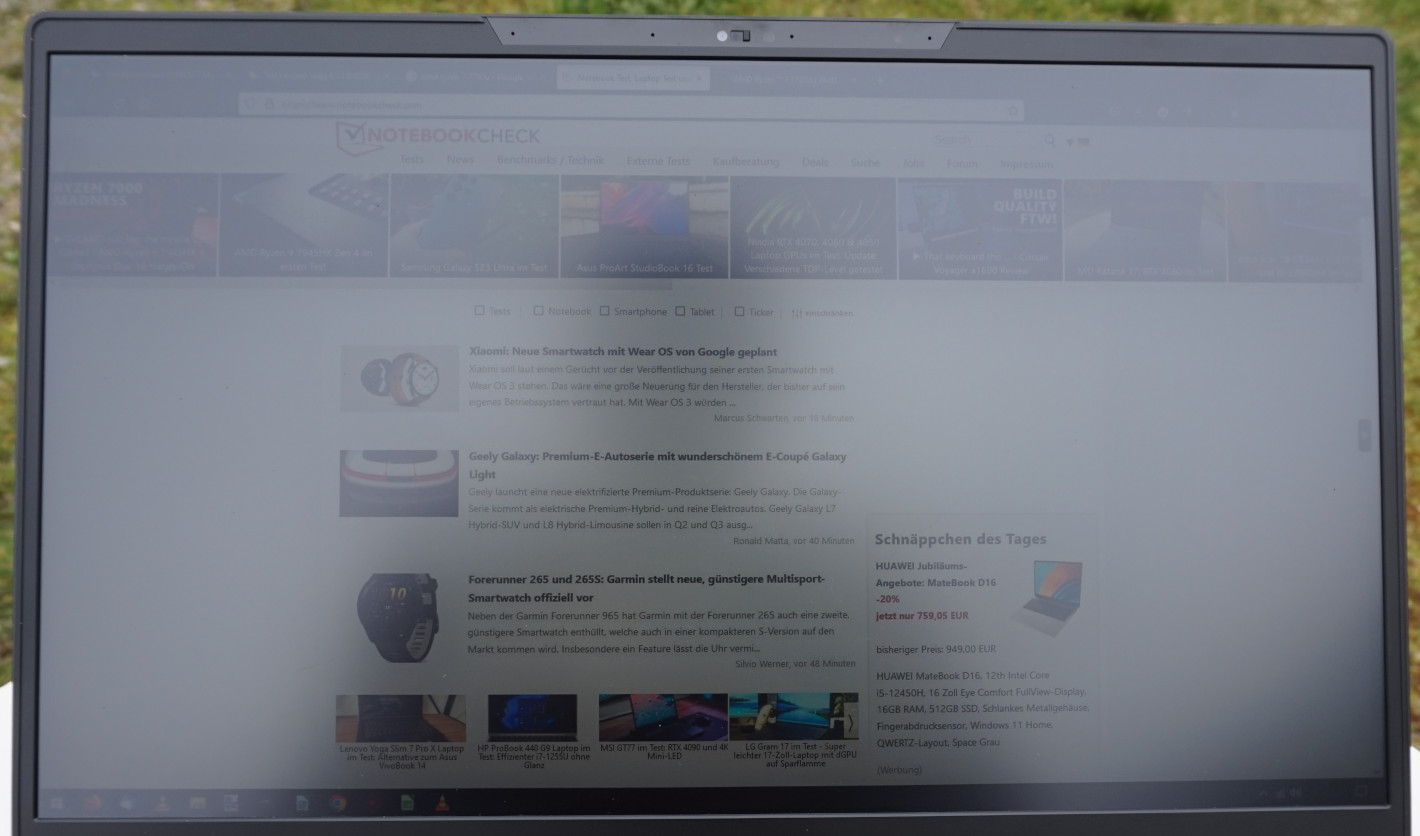
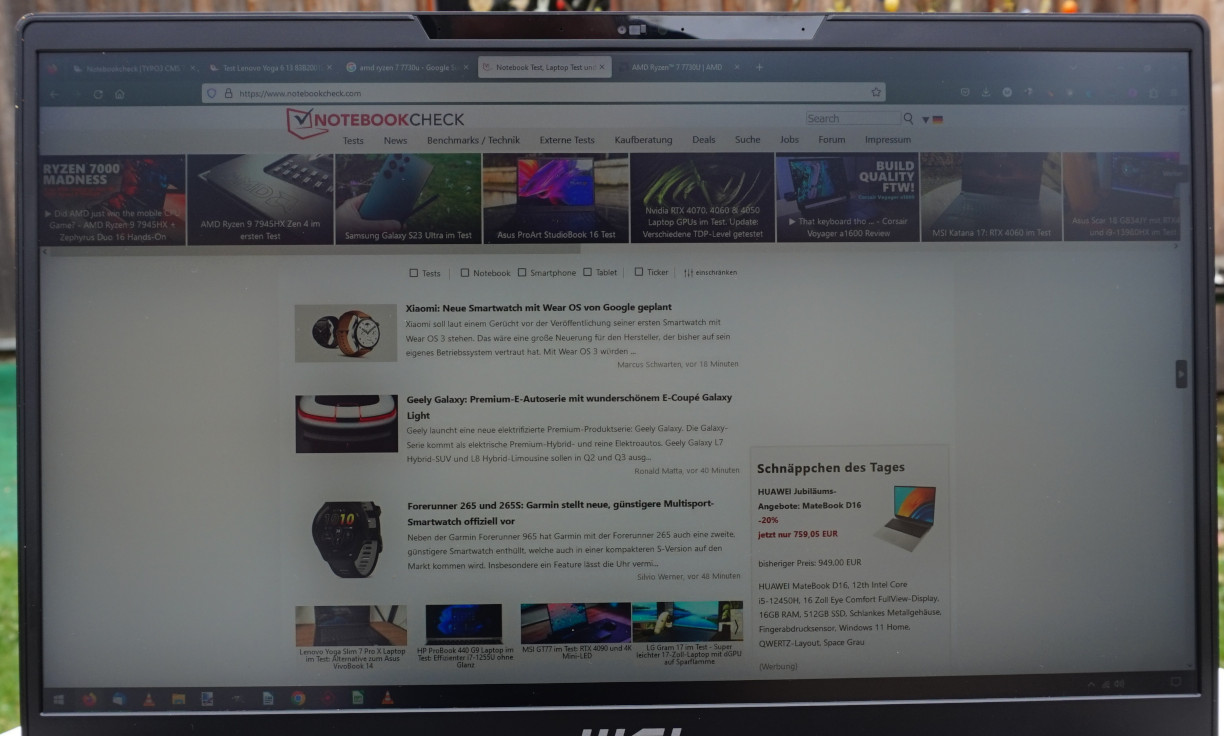
Apesar dos bons valores de contraste, a tela tem problemas ao ar livre. Mesmo quando apenas ligeiramente nublado, a luz do sol lançada diretamente sobre a tela deve ser evitada, pois a tela se torna ilegível. Apontado para longe da luz, o texto permanece legível e as imagens também são suficientemente reconhecíveis.
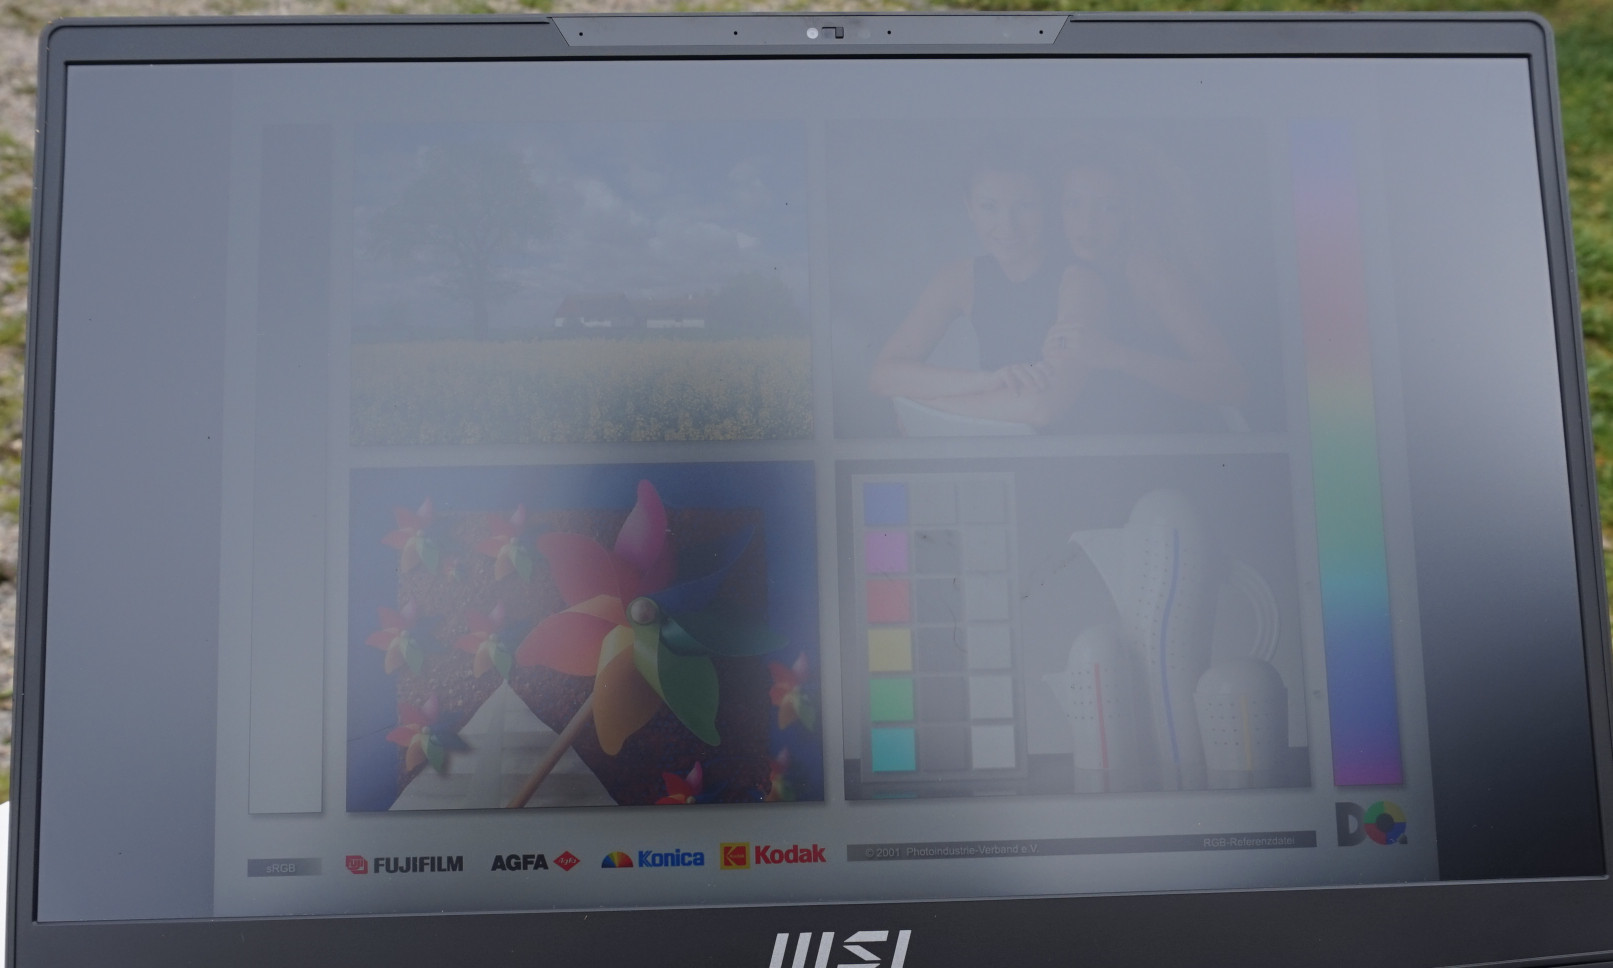
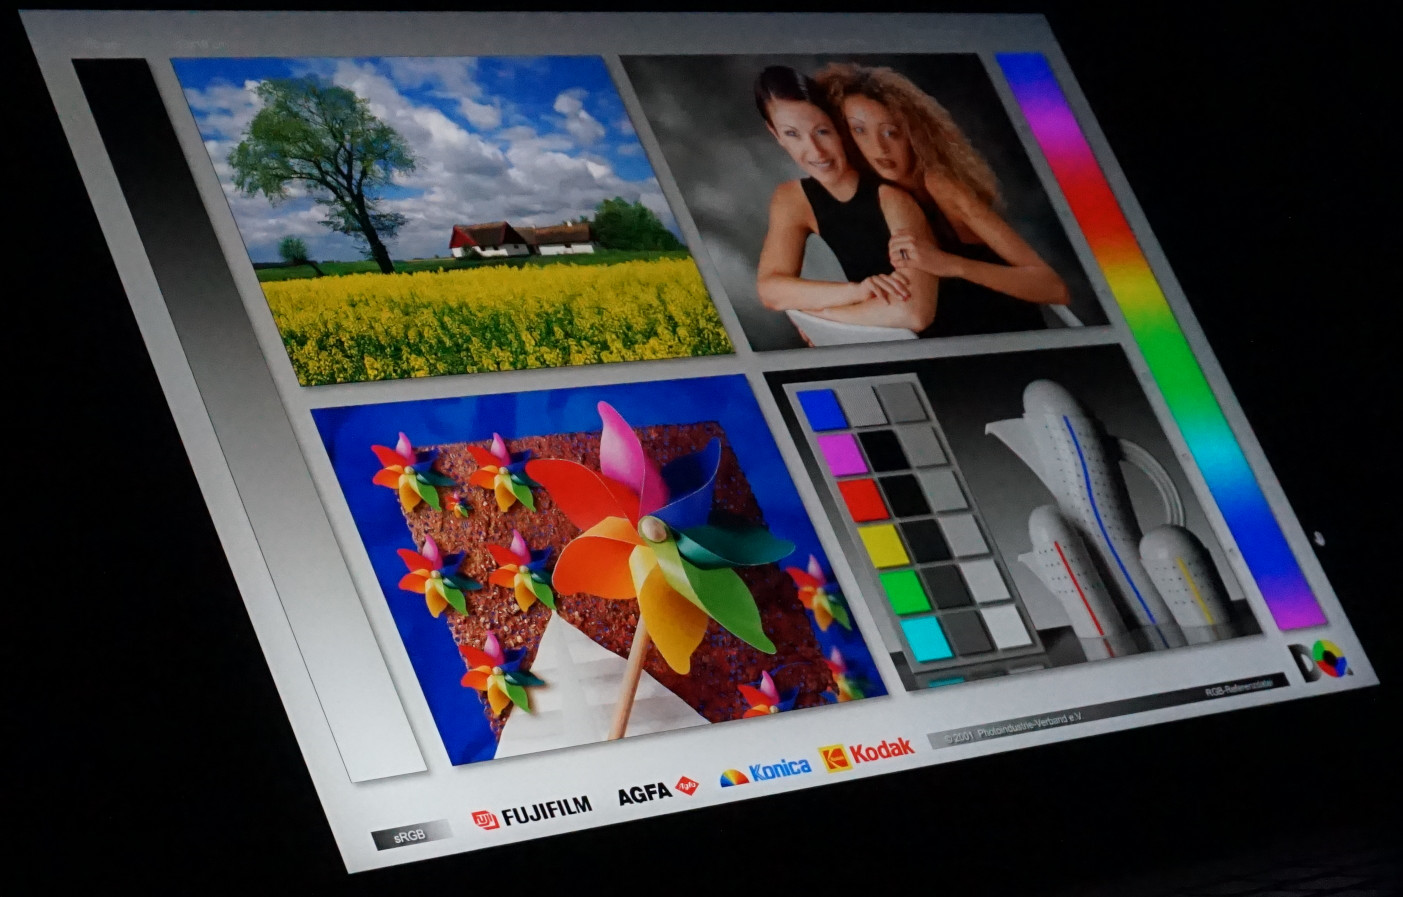
A estabilidade dos ângulos de visão é excepcional. Mesmo quando visto de um ângulo muito inclinado e amplo, as cores e o brilho permanecem inalterados.
Desempenho - As restrições de hardware são práticas
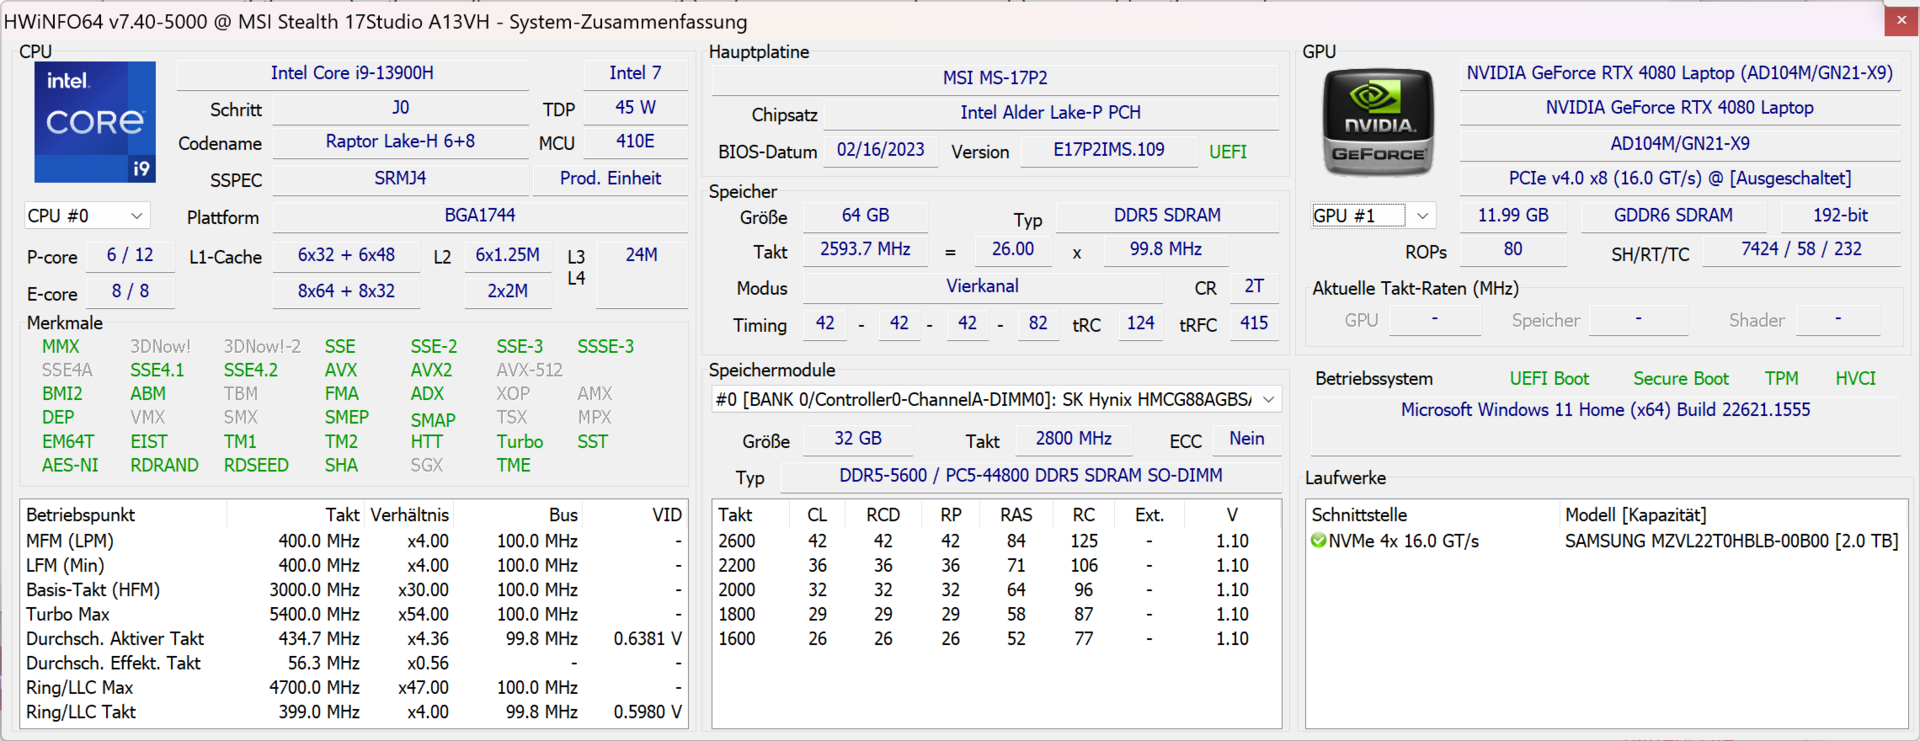
Não há quase nada que deva colocar problemas para aIntel Core i9-13900H e oNvidia GeForce RTX 4080. Graças ao alto poder computacional, numerosos núcleos computacionais e gráficos poderosos, vários tipos de aplicações, bem como jogos exigentes, podem ser tratados sem esforço. Há também os 64 GB de RAM que se tornam próprios quando se trata de multitarefa ou edição de imagens complexas. Independentemente da tarefa, seja instalando software ou programas de inicialização, a alta velocidade operacional da máquina é tangível.
Condições de teste
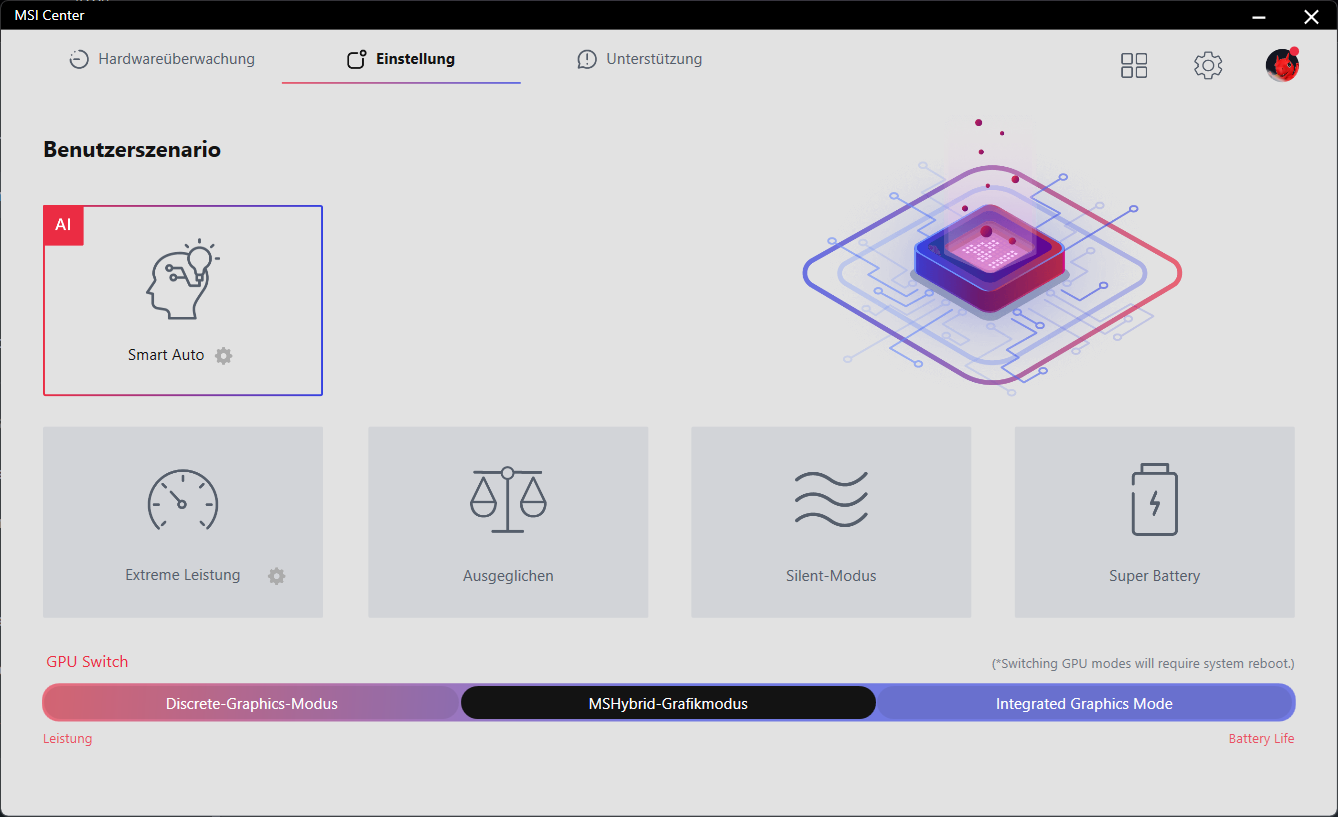
Para cada teste e benchmark, usamos o modo de desempenho "Automático Inteligente". Este modo é suposto ser capaz de determinar independentemente a mistura necessária de gráficos e potência de computação, bem como as configurações do ventilador, com a ajuda da inteligência artificial.
O Stealth 17 Studio permanece moderadamente alto e raramente resulta na ativação dos ventiladores. Em contraste, o modo "Extreme Performance" nos lembrou significativamente mais do tipo de comportamento associado a um laptop para jogos. Entretanto, como o objetivo aqui é uma mistura bem sucedida de jogos e trabalho, o modo mais silencioso é preferível. Também podemos ver abaixo que o "Extreme Performance" não resulta automaticamente em um melhor desempenho. Por outro lado, durante todo o teste, a configuração automática foi impressionante.
Vale a pena notar: Durante todo o período de testes, duas atualizações da BIOS foram necessárias. A primeira resultou em uma vida útil aceitável da bateria, que anteriormente era apenas metade do tempo de vida útil. Após a segunda, desapareceram as telas azuis que anteriormente tinham sido acionadas de forma confiável por vários testes de hardware.
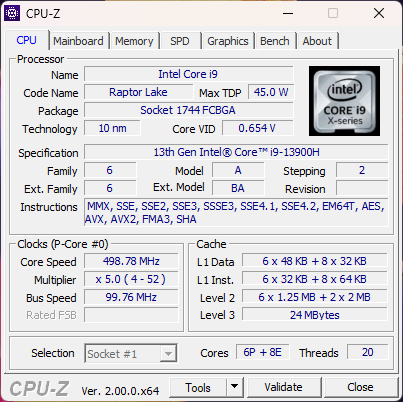
Processador
Um total de 14 núcleos, 20 fios e uma velocidade de relógio superior de 5,4 GHz alimentam oIntel Core i9-13900H. Isto a coloca no topo da classificação das CPUs móveis. Há núcleos mais rápidos, tais como oAMD Ryzen 9 7945HX ou oIntel Core i9-13950HX. Entretanto, a lacuna atrás de seu predecessor, o Intel Core i9-12900Ha taxa de crescimento de 10% ou mais em vários testes.
Mas mesmo oIntel Core i9-13900HXa Cinebench R15, que também promete mais potência, estava em um nível semelhante ao 13900H (encontrado em modelos concorrentes) depois de apenas algumas corridas em nosso teste contínuo Cinebench R15. Isto fala a favor de bons ajustes de resfriamento e fornecimento de energia no MSI Stealth 17 Studio. O laptop apresentou apenas flutuações moderadas entre as execuções de teste individuais
O consumo de 115 watts de energia - que é permitido por um período mais longo - foi atingido regularmente. Além disso, foram permitidos 135 watts para frações de um segundo. Somente no modo "Silencioso" era permitido o consumo de energia limitado a 30 watts enquanto que no modo de bateria eram permitidos até 45 watts.
Outros valores de referência e comparação podem ser encontrados em nosso Lista de referência de CPU.
Cinebench R15 Multi Continuous Test
Cinebench R23: Multi Core | Single Core
Cinebench R20: CPU (Multi Core) | CPU (Single Core)
Cinebench R15: CPU Multi 64Bit | CPU Single 64Bit
Blender: v2.79 BMW27 CPU
7-Zip 18.03: 7z b 4 | 7z b 4 -mmt1
Geekbench 5.5: Multi-Core | Single-Core
HWBOT x265 Benchmark v2.2: 4k Preset
LibreOffice : 20 Documents To PDF
R Benchmark 2.5: Overall mean
| CPU Performance rating | |
| Lenovo Legion Pro 7 16IRX8H | |
| Schenker XMG Neo 16 Raptor Lake | |
| Razer Blade 16 Early 2023 | |
| Média da turma Gaming | |
| Asus ROG Zephyrus M16 GU604VY-NM042X | |
| MSI Stealth 17 Studio A13VH-014 | |
| Alienware x17 R2 P48E | |
| Média Intel Core i9-13900H | |
| MSI Creator Z17 A12UGST-054 | |
| Gigabyte AERO 16 OLED BSF | |
| Razer Blade 17 Early 2022 | |
| Cinebench R23 / Single Core | |
| Schenker XMG Neo 16 Raptor Lake | |
| Lenovo Legion Pro 7 16IRX8H | |
| Razer Blade 16 Early 2023 | |
| Média da turma Gaming (1166 - 2415, n=107, últimos 2 anos) | |
| Asus ROG Zephyrus M16 GU604VY-NM042X | |
| Razer Blade 17 Early 2022 | |
| Alienware x17 R2 P48E | |
| Média Intel Core i9-13900H (1297 - 2054, n=26) | |
| MSI Creator Z17 A12UGST-054 | |
| Gigabyte AERO 16 OLED BSF | |
| MSI Stealth 17 Studio A13VH-014 | |
| Cinebench R20 / CPU (Multi Core) | |
| Lenovo Legion Pro 7 16IRX8H | |
| Schenker XMG Neo 16 Raptor Lake | |
| Média da turma Gaming (4029 - 16433, n=106, últimos 2 anos) | |
| Razer Blade 16 Early 2023 | |
| MSI Stealth 17 Studio A13VH-014 | |
| Asus ROG Zephyrus M16 GU604VY-NM042X | |
| Gigabyte AERO 16 OLED BSF | |
| Alienware x17 R2 P48E | |
| Média Intel Core i9-13900H (4935 - 7716, n=25) | |
| MSI Creator Z17 A12UGST-054 | |
| Razer Blade 17 Early 2022 | |
| Cinebench R20 / CPU (Single Core) | |
| Lenovo Legion Pro 7 16IRX8H | |
| Média da turma Gaming (442 - 913, n=106, últimos 2 anos) | |
| Schenker XMG Neo 16 Raptor Lake | |
| Asus ROG Zephyrus M16 GU604VY-NM042X | |
| Razer Blade 16 Early 2023 | |
| Alienware x17 R2 P48E | |
| Média Intel Core i9-13900H (428 - 792, n=25) | |
| MSI Creator Z17 A12UGST-054 | |
| Razer Blade 17 Early 2022 | |
| MSI Stealth 17 Studio A13VH-014 | |
| Gigabyte AERO 16 OLED BSF | |
| Cinebench R15 / CPU Multi 64Bit | |
| Schenker XMG Neo 16 Raptor Lake | |
| Schenker XMG Neo 16 Raptor Lake | |
| Lenovo Legion Pro 7 16IRX8H | |
| Razer Blade 16 Early 2023 | |
| Média da turma Gaming (1578 - 6330, n=105, últimos 2 anos) | |
| Asus ROG Zephyrus M16 GU604VY-NM042X | |
| MSI Stealth 17 Studio A13VH-014 | |
| Gigabyte AERO 16 OLED BSF | |
| Alienware x17 R2 P48E | |
| Média Intel Core i9-13900H (2061 - 3100, n=26) | |
| MSI Creator Z17 A12UGST-054 | |
| Razer Blade 17 Early 2022 | |
| Cinebench R15 / CPU Single 64Bit | |
| Lenovo Legion Pro 7 16IRX8H | |
| Média da turma Gaming (188.8 - 350, n=106, últimos 2 anos) | |
| Schenker XMG Neo 16 Raptor Lake | |
| Schenker XMG Neo 16 Raptor Lake | |
| Asus ROG Zephyrus M16 GU604VY-NM042X | |
| MSI Stealth 17 Studio A13VH-014 | |
| Razer Blade 16 Early 2023 | |
| Alienware x17 R2 P48E | |
| Média Intel Core i9-13900H (211 - 297, n=26) | |
| MSI Creator Z17 A12UGST-054 | |
| Razer Blade 17 Early 2022 | |
| Gigabyte AERO 16 OLED BSF | |
| Blender / v2.79 BMW27 CPU | |
| Razer Blade 17 Early 2022 | |
| MSI Creator Z17 A12UGST-054 | |
| Média Intel Core i9-13900H (166 - 268, n=24) | |
| Alienware x17 R2 P48E | |
| Gigabyte AERO 16 OLED BSF | |
| Asus ROG Zephyrus M16 GU604VY-NM042X | |
| MSI Stealth 17 Studio A13VH-014 | |
| Média da turma Gaming (79 - 330, n=104, últimos 2 anos) | |
| Razer Blade 16 Early 2023 | |
| Schenker XMG Neo 16 Raptor Lake | |
| Lenovo Legion Pro 7 16IRX8H | |
| 7-Zip 18.03 / 7z b 4 -mmt1 | |
| Lenovo Legion Pro 7 16IRX8H | |
| Schenker XMG Neo 16 Raptor Lake | |
| Razer Blade 16 Early 2023 | |
| Média da turma Gaming (4199 - 7436, n=105, últimos 2 anos) | |
| Asus ROG Zephyrus M16 GU604VY-NM042X | |
| MSI Stealth 17 Studio A13VH-014 | |
| Média Intel Core i9-13900H (3665 - 6600, n=25) | |
| Razer Blade 17 Early 2022 | |
| MSI Creator Z17 A12UGST-054 | |
| Alienware x17 R2 P48E | |
| Gigabyte AERO 16 OLED BSF | |
| Geekbench 5.5 / Multi-Core | |
| Lenovo Legion Pro 7 16IRX8H | |
| Schenker XMG Neo 16 Raptor Lake | |
| Razer Blade 16 Early 2023 | |
| Média da turma Gaming (6460 - 28263, n=105, últimos 2 anos) | |
| Asus ROG Zephyrus M16 GU604VY-NM042X | |
| Gigabyte AERO 16 OLED BSF | |
| MSI Stealth 17 Studio A13VH-014 | |
| Alienware x17 R2 P48E | |
| MSI Creator Z17 A12UGST-054 | |
| Média Intel Core i9-13900H (9094 - 15410, n=26) | |
| Razer Blade 17 Early 2022 | |
| Geekbench 5.5 / Single-Core | |
| Média da turma Gaming (986 - 2474, n=105, últimos 2 anos) | |
| MSI Stealth 17 Studio A13VH-014 | |
| Lenovo Legion Pro 7 16IRX8H | |
| Schenker XMG Neo 16 Raptor Lake | |
| Asus ROG Zephyrus M16 GU604VY-NM042X | |
| Média Intel Core i9-13900H (1140 - 2043, n=26) | |
| Alienware x17 R2 P48E | |
| MSI Creator Z17 A12UGST-054 | |
| Razer Blade 16 Early 2023 | |
| Razer Blade 17 Early 2022 | |
| Gigabyte AERO 16 OLED BSF | |
| HWBOT x265 Benchmark v2.2 / 4k Preset | |
| Lenovo Legion Pro 7 16IRX8H | |
| Schenker XMG Neo 16 Raptor Lake | |
| Média da turma Gaming (11.5 - 44.4, n=105, últimos 2 anos) | |
| Razer Blade 16 Early 2023 | |
| MSI Stealth 17 Studio A13VH-014 | |
| Asus ROG Zephyrus M16 GU604VY-NM042X | |
| Alienware x17 R2 P48E | |
| Gigabyte AERO 16 OLED BSF | |
| Média Intel Core i9-13900H (14.1 - 22.3, n=25) | |
| MSI Creator Z17 A12UGST-054 | |
| Razer Blade 17 Early 2022 | |
| LibreOffice / 20 Documents To PDF | |
| Gigabyte AERO 16 OLED BSF | |
| MSI Stealth 17 Studio A13VH-014 | |
| Asus ROG Zephyrus M16 GU604VY-NM042X | |
| Média da turma Gaming (33.2 - 88.8, n=105, últimos 2 anos) | |
| Média Intel Core i9-13900H (34.4 - 82.8, n=25) | |
| Razer Blade 16 Early 2023 | |
| Schenker XMG Neo 16 Raptor Lake | |
| Lenovo Legion Pro 7 16IRX8H | |
| Alienware x17 R2 P48E | |
| MSI Creator Z17 A12UGST-054 | |
| Razer Blade 17 Early 2022 | |
| R Benchmark 2.5 / Overall mean | |
| Gigabyte AERO 16 OLED BSF | |
| MSI Creator Z17 A12UGST-054 | |
| Média Intel Core i9-13900H (0.4052 - 0.723, n=25) | |
| Razer Blade 17 Early 2022 | |
| Alienware x17 R2 P48E | |
| MSI Stealth 17 Studio A13VH-014 | |
| Média da turma Gaming (0.3439 - 0.759, n=106, últimos 2 anos) | |
| Razer Blade 16 Early 2023 | |
| Asus ROG Zephyrus M16 GU604VY-NM042X | |
| Lenovo Legion Pro 7 16IRX8H | |
| Schenker XMG Neo 16 Raptor Lake | |
* ... menor é melhor
AIDA64: FP32 Ray-Trace | FPU Julia | CPU SHA3 | CPU Queen | FPU SinJulia | FPU Mandel | CPU AES | CPU ZLib | FP64 Ray-Trace | CPU PhotoWorxx
| Performance rating | |
| Asus ROG Strix G17 G713PI | |
| Média da turma Gaming | |
| Razer Blade 16 Early 2023 | |
| Aorus 17X AZF | |
| HP Omen 17-ck2097ng | |
| MSI Stealth 17 Studio A13VH-014 | |
| Média Intel Core i9-13900H | |
| Gigabyte Aero 16 YE5 | |
| AIDA64 / FP32 Ray-Trace | |
| Asus ROG Strix G17 G713PI | |
| Média da turma Gaming (10227 - 85542, n=105, últimos 2 anos) | |
| Razer Blade 16 Early 2023 | |
| Razer Blade 16 Early 2023 | |
| Razer Blade 16 Early 2023 | |
| MSI Stealth 17 Studio A13VH-014 | |
| Aorus 17X AZF | |
| HP Omen 17-ck2097ng | |
| Média Intel Core i9-13900H (6788 - 19557, n=25) | |
| Gigabyte Aero 16 YE5 | |
| AIDA64 / FPU Julia | |
| Asus ROG Strix G17 G713PI | |
| Média da turma Gaming (51376 - 238426, n=105, últimos 2 anos) | |
| Razer Blade 16 Early 2023 | |
| Razer Blade 16 Early 2023 | |
| Razer Blade 16 Early 2023 | |
| MSI Stealth 17 Studio A13VH-014 | |
| Aorus 17X AZF | |
| HP Omen 17-ck2097ng | |
| Média Intel Core i9-13900H (22551 - 95579, n=25) | |
| Gigabyte Aero 16 YE5 | |
| AIDA64 / CPU SHA3 | |
| Asus ROG Strix G17 G713PI | |
| Média da turma Gaming (2180 - 10115, n=105, últimos 2 anos) | |
| Razer Blade 16 Early 2023 | |
| Razer Blade 16 Early 2023 | |
| Razer Blade 16 Early 2023 | |
| Aorus 17X AZF | |
| HP Omen 17-ck2097ng | |
| MSI Stealth 17 Studio A13VH-014 | |
| Média Intel Core i9-13900H (2491 - 4270, n=25) | |
| Gigabyte Aero 16 YE5 | |
| AIDA64 / CPU Queen | |
| Asus ROG Strix G17 G713PI | |
| Razer Blade 16 Early 2023 | |
| Razer Blade 16 Early 2023 | |
| HP Omen 17-ck2097ng | |
| Aorus 17X AZF | |
| Média da turma Gaming (49785 - 173351, n=90, últimos 2 anos) | |
| Gigabyte Aero 16 YE5 | |
| Média Intel Core i9-13900H (65121 - 120936, n=25) | |
| MSI Stealth 17 Studio A13VH-014 | |
| AIDA64 / FPU SinJulia | |
| Asus ROG Strix G17 G713PI | |
| Razer Blade 16 Early 2023 | |
| Razer Blade 16 Early 2023 | |
| Razer Blade 16 Early 2023 | |
| Média da turma Gaming (4424 - 33636, n=105, últimos 2 anos) | |
| Aorus 17X AZF | |
| HP Omen 17-ck2097ng | |
| MSI Stealth 17 Studio A13VH-014 | |
| Média Intel Core i9-13900H (6108 - 11631, n=25) | |
| Gigabyte Aero 16 YE5 | |
| AIDA64 / FPU Mandel | |
| Asus ROG Strix G17 G713PI | |
| Média da turma Gaming (25115 - 128721, n=105, últimos 2 anos) | |
| Razer Blade 16 Early 2023 | |
| Razer Blade 16 Early 2023 | |
| Razer Blade 16 Early 2023 | |
| MSI Stealth 17 Studio A13VH-014 | |
| Aorus 17X AZF | |
| HP Omen 17-ck2097ng | |
| Média Intel Core i9-13900H (11283 - 48474, n=25) | |
| Gigabyte Aero 16 YE5 | |
| AIDA64 / CPU AES | |
| Aorus 17X AZF | |
| Asus ROG Strix G17 G713PI | |
| Razer Blade 16 Early 2023 | |
| Razer Blade 16 Early 2023 | |
| Razer Blade 16 Early 2023 | |
| Média da turma Gaming (39258 - 247074, n=105, últimos 2 anos) | |
| Gigabyte Aero 16 YE5 | |
| HP Omen 17-ck2097ng | |
| Média Intel Core i9-13900H (3691 - 149377, n=25) | |
| MSI Stealth 17 Studio A13VH-014 | |
| AIDA64 / CPU ZLib | |
| Asus ROG Strix G17 G713PI | |
| Razer Blade 16 Early 2023 | |
| Razer Blade 16 Early 2023 | |
| Razer Blade 16 Early 2023 | |
| Média da turma Gaming (574 - 2531, n=105, últimos 2 anos) | |
| Aorus 17X AZF | |
| HP Omen 17-ck2097ng | |
| MSI Stealth 17 Studio A13VH-014 | |
| Média Intel Core i9-13900H (789 - 1254, n=25) | |
| Gigabyte Aero 16 YE5 | |
| AIDA64 / FP64 Ray-Trace | |
| Asus ROG Strix G17 G713PI | |
| Média da turma Gaming (5509 - 45446, n=105, últimos 2 anos) | |
| Razer Blade 16 Early 2023 | |
| Razer Blade 16 Early 2023 | |
| Razer Blade 16 Early 2023 | |
| MSI Stealth 17 Studio A13VH-014 | |
| Aorus 17X AZF | |
| HP Omen 17-ck2097ng | |
| Média Intel Core i9-13900H (3655 - 10716, n=25) | |
| Gigabyte Aero 16 YE5 | |
| AIDA64 / CPU PhotoWorxx | |
| Razer Blade 16 Early 2023 | |
| Razer Blade 16 Early 2023 | |
| Razer Blade 16 Early 2023 | |
| HP Omen 17-ck2097ng | |
| MSI Stealth 17 Studio A13VH-014 | |
| Aorus 17X AZF | |
| Média da turma Gaming (12271 - 89891, n=105, últimos 2 anos) | |
| Média Intel Core i9-13900H (10871 - 50488, n=25) | |
| Gigabyte Aero 16 YE5 | |
| Asus ROG Strix G17 G713PI | |
Desempenho do sistema
Os valores medidos para PCMark 10 estão em um nível elevado. Entretanto, o Stealth 17 Studio não consegue acompanhar os melhores modelos e carece do consumo de energia extremamente alto que a concorrência é capaz de oferecer brevemente. No entanto, seu poder de computação é suficiente para multitarefas complexas e, em particular, para momentos em que são necessários longos períodos de desempenho de alto nível.
CrossMark: Overall | Productivity | Creativity | Responsiveness
| PCMark 10 / Score | |
| Média da turma Gaming (5828 - 12414, n=93, últimos 2 anos) | |
| Asus ROG Zephyrus M16 GU604VY-NM042X | |
| Alienware x17 R2 P48E | |
| Gigabyte AERO 16 OLED BSF | |
| Razer Blade 16 Early 2023 | |
| Lenovo Legion Pro 7 16IRX8H | |
| MSI Stealth 17 Studio A13VH-014 | |
| Média Intel Core i9-13900H, NVIDIA GeForce RTX 4080 Laptop GPU (n=1) | |
| Razer Blade 17 Early 2022 | |
| MSI Creator Z17 A12UGST-054 | |
| PCMark 10 / Essentials | |
| Lenovo Legion Pro 7 16IRX8H | |
| Asus ROG Zephyrus M16 GU604VY-NM042X | |
| Gigabyte AERO 16 OLED BSF | |
| Alienware x17 R2 P48E | |
| Razer Blade 16 Early 2023 | |
| Média da turma Gaming (8810 - 11935, n=97, últimos 2 anos) | |
| MSI Creator Z17 A12UGST-054 | |
| Razer Blade 17 Early 2022 | |
| MSI Stealth 17 Studio A13VH-014 | |
| Média Intel Core i9-13900H, NVIDIA GeForce RTX 4080 Laptop GPU (n=1) | |
| PCMark 10 / Productivity | |
| Média da turma Gaming (6845 - 25323, n=95, últimos 2 anos) | |
| Asus ROG Zephyrus M16 GU604VY-NM042X | |
| Lenovo Legion Pro 7 16IRX8H | |
| Alienware x17 R2 P48E | |
| MSI Stealth 17 Studio A13VH-014 | |
| Média Intel Core i9-13900H, NVIDIA GeForce RTX 4080 Laptop GPU (n=1) | |
| MSI Creator Z17 A12UGST-054 | |
| Gigabyte AERO 16 OLED BSF | |
| Razer Blade 17 Early 2022 | |
| Razer Blade 16 Early 2023 | |
| PCMark 10 / Digital Content Creation | |
| Razer Blade 16 Early 2023 | |
| Média da turma Gaming (7602 - 19954, n=95, últimos 2 anos) | |
| Gigabyte AERO 16 OLED BSF | |
| Alienware x17 R2 P48E | |
| Asus ROG Zephyrus M16 GU604VY-NM042X | |
| MSI Stealth 17 Studio A13VH-014 | |
| Média Intel Core i9-13900H, NVIDIA GeForce RTX 4080 Laptop GPU (n=1) | |
| Razer Blade 17 Early 2022 | |
| Lenovo Legion Pro 7 16IRX8H | |
| MSI Creator Z17 A12UGST-054 | |
| CrossMark / Overall | |
| MSI Creator Z17 A12UGST-054 | |
| Média da turma Gaming (1366 - 2409, n=94, últimos 2 anos) | |
| Asus ROG Zephyrus M16 GU604VY-NM042X | |
| Alienware x17 R2 P48E | |
| Gigabyte AERO 16 OLED BSF | |
| Razer Blade 17 Early 2022 | |
| MSI Stealth 17 Studio A13VH-014 | |
| Média Intel Core i9-13900H, NVIDIA GeForce RTX 4080 Laptop GPU (n=1) | |
| Razer Blade 16 Early 2023 | |
| CrossMark / Productivity | |
| MSI Creator Z17 A12UGST-054 | |
| Média da turma Gaming (1386 - 2254, n=94, últimos 2 anos) | |
| Asus ROG Zephyrus M16 GU604VY-NM042X | |
| Alienware x17 R2 P48E | |
| Gigabyte AERO 16 OLED BSF | |
| Razer Blade 17 Early 2022 | |
| MSI Stealth 17 Studio A13VH-014 | |
| Média Intel Core i9-13900H, NVIDIA GeForce RTX 4080 Laptop GPU (n=1) | |
| Razer Blade 16 Early 2023 | |
| CrossMark / Creativity | |
| Média da turma Gaming (1343 - 2786, n=94, últimos 2 anos) | |
| Asus ROG Zephyrus M16 GU604VY-NM042X | |
| MSI Creator Z17 A12UGST-054 | |
| Alienware x17 R2 P48E | |
| Gigabyte AERO 16 OLED BSF | |
| MSI Stealth 17 Studio A13VH-014 | |
| Média Intel Core i9-13900H, NVIDIA GeForce RTX 4080 Laptop GPU (n=1) | |
| Razer Blade 17 Early 2022 | |
| Razer Blade 16 Early 2023 | |
| CrossMark / Responsiveness | |
| Gigabyte AERO 16 OLED BSF | |
| MSI Creator Z17 A12UGST-054 | |
| Média da turma Gaming (1226 - 2334, n=94, últimos 2 anos) | |
| Alienware x17 R2 P48E | |
| Asus ROG Zephyrus M16 GU604VY-NM042X | |
| Razer Blade 17 Early 2022 | |
| MSI Stealth 17 Studio A13VH-014 | |
| Média Intel Core i9-13900H, NVIDIA GeForce RTX 4080 Laptop GPU (n=1) | |
| Razer Blade 16 Early 2023 | |
| PCMark 10 Score | 7486 pontos | |
Ajuda | ||
| AIDA64 / Memory Copy | |
| Razer Blade 16 Early 2023 | |
| Razer Blade 16 Early 2023 | |
| Razer Blade 16 Early 2023 | |
| Aorus 17X AZF | |
| HP Omen 17-ck2097ng | |
| MSI Stealth 17 Studio A13VH-014 | |
| Média da turma Gaming (21750 - 129946, n=105, últimos 2 anos) | |
| Gigabyte Aero 16 YE5 | |
| Média Intel Core i9-13900H (37448 - 74486, n=25) | |
| Asus ROG Strix G17 G713PI | |
| AIDA64 / Memory Read | |
| Aorus 17X AZF | |
| Razer Blade 16 Early 2023 | |
| Razer Blade 16 Early 2023 | |
| Razer Blade 16 Early 2023 | |
| HP Omen 17-ck2097ng | |
| MSI Stealth 17 Studio A13VH-014 | |
| Média da turma Gaming (22956 - 118858, n=105, últimos 2 anos) | |
| Gigabyte Aero 16 YE5 | |
| Média Intel Core i9-13900H (41599 - 75433, n=25) | |
| Asus ROG Strix G17 G713PI | |
| AIDA64 / Memory Write | |
| Razer Blade 16 Early 2023 | |
| Razer Blade 16 Early 2023 | |
| Razer Blade 16 Early 2023 | |
| HP Omen 17-ck2097ng | |
| Aorus 17X AZF | |
| Média da turma Gaming (22297 - 135096, n=105, últimos 2 anos) | |
| MSI Stealth 17 Studio A13VH-014 | |
| Média Intel Core i9-13900H (36152 - 88505, n=25) | |
| Gigabyte Aero 16 YE5 | |
| Asus ROG Strix G17 G713PI | |
| AIDA64 / Memory Latency | |
| Média da turma Gaming (75.3 - 259, n=105, últimos 2 anos) | |
| Razer Blade 16 Early 2023 | |
| Razer Blade 16 Early 2023 | |
| Razer Blade 16 Early 2023 | |
| MSI Stealth 17 Studio A13VH-014 | |
| Gigabyte Aero 16 YE5 | |
| Média Intel Core i9-13900H (75.8 - 102.3, n=25) | |
| Asus ROG Strix G17 G713PI | |
| HP Omen 17-ck2097ng | |
| Aorus 17X AZF | |
* ... menor é melhor
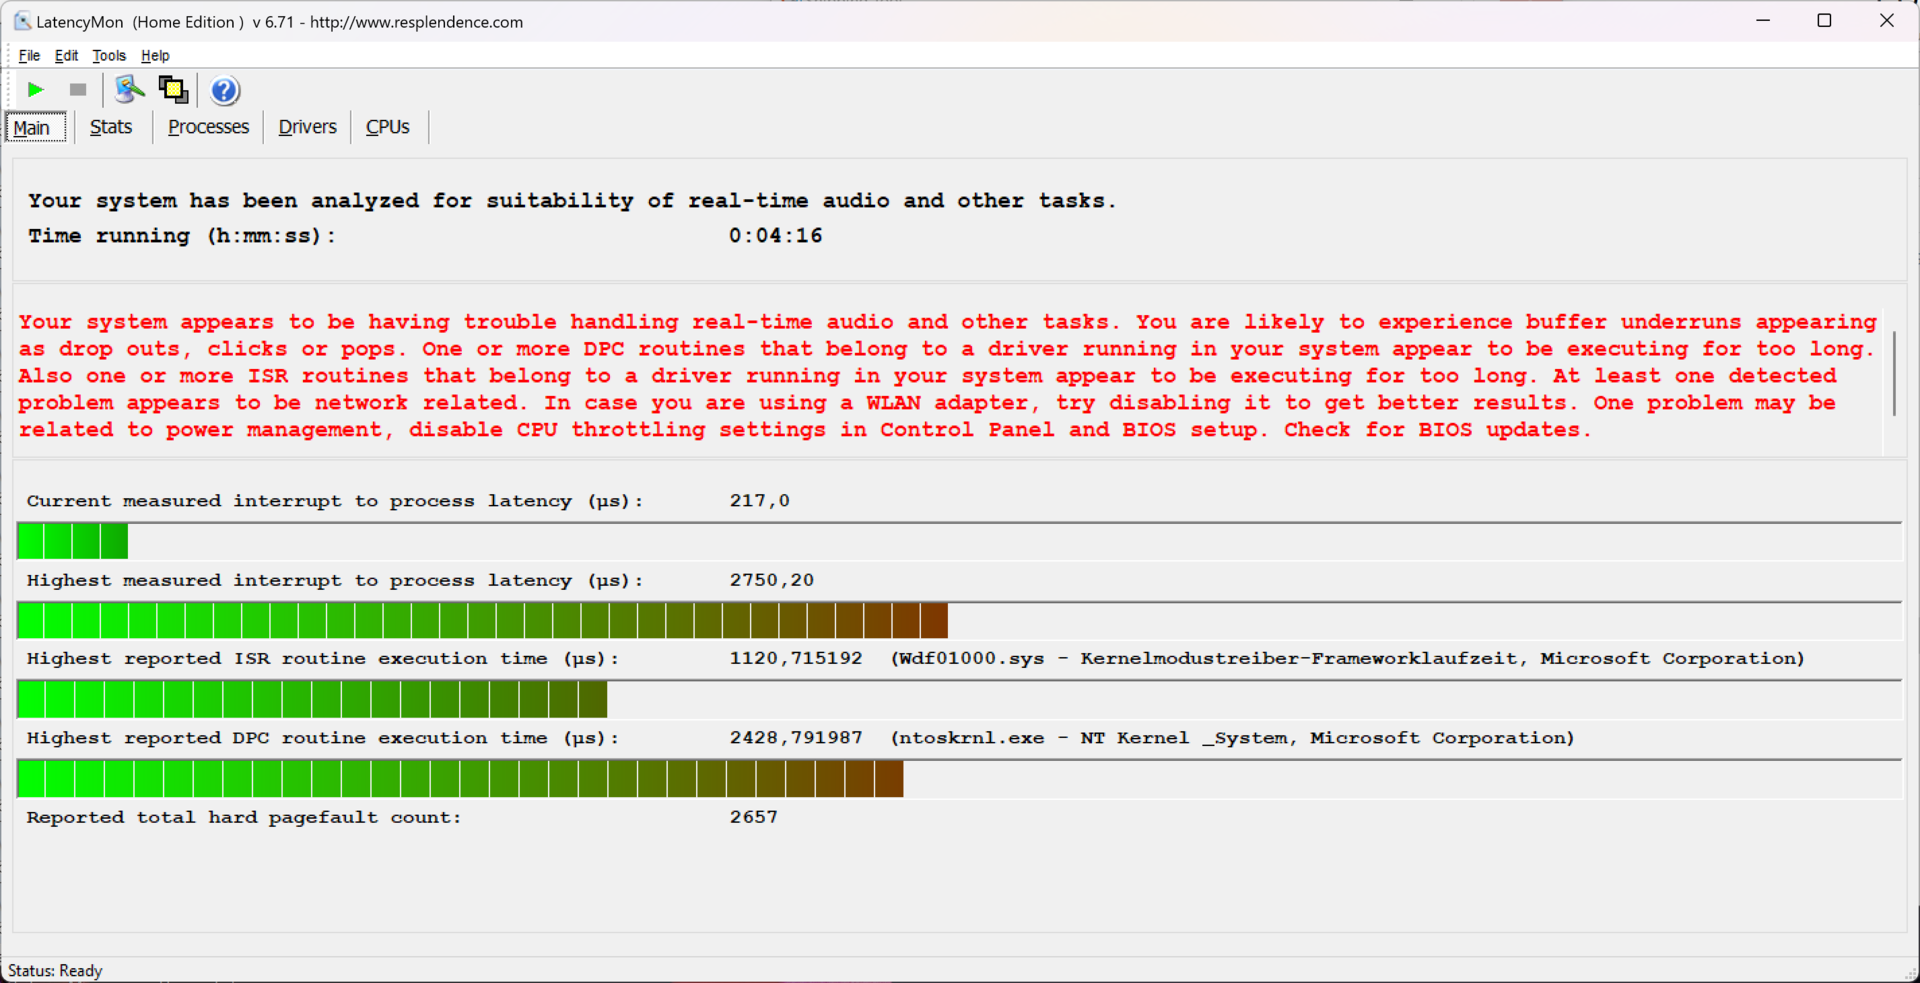
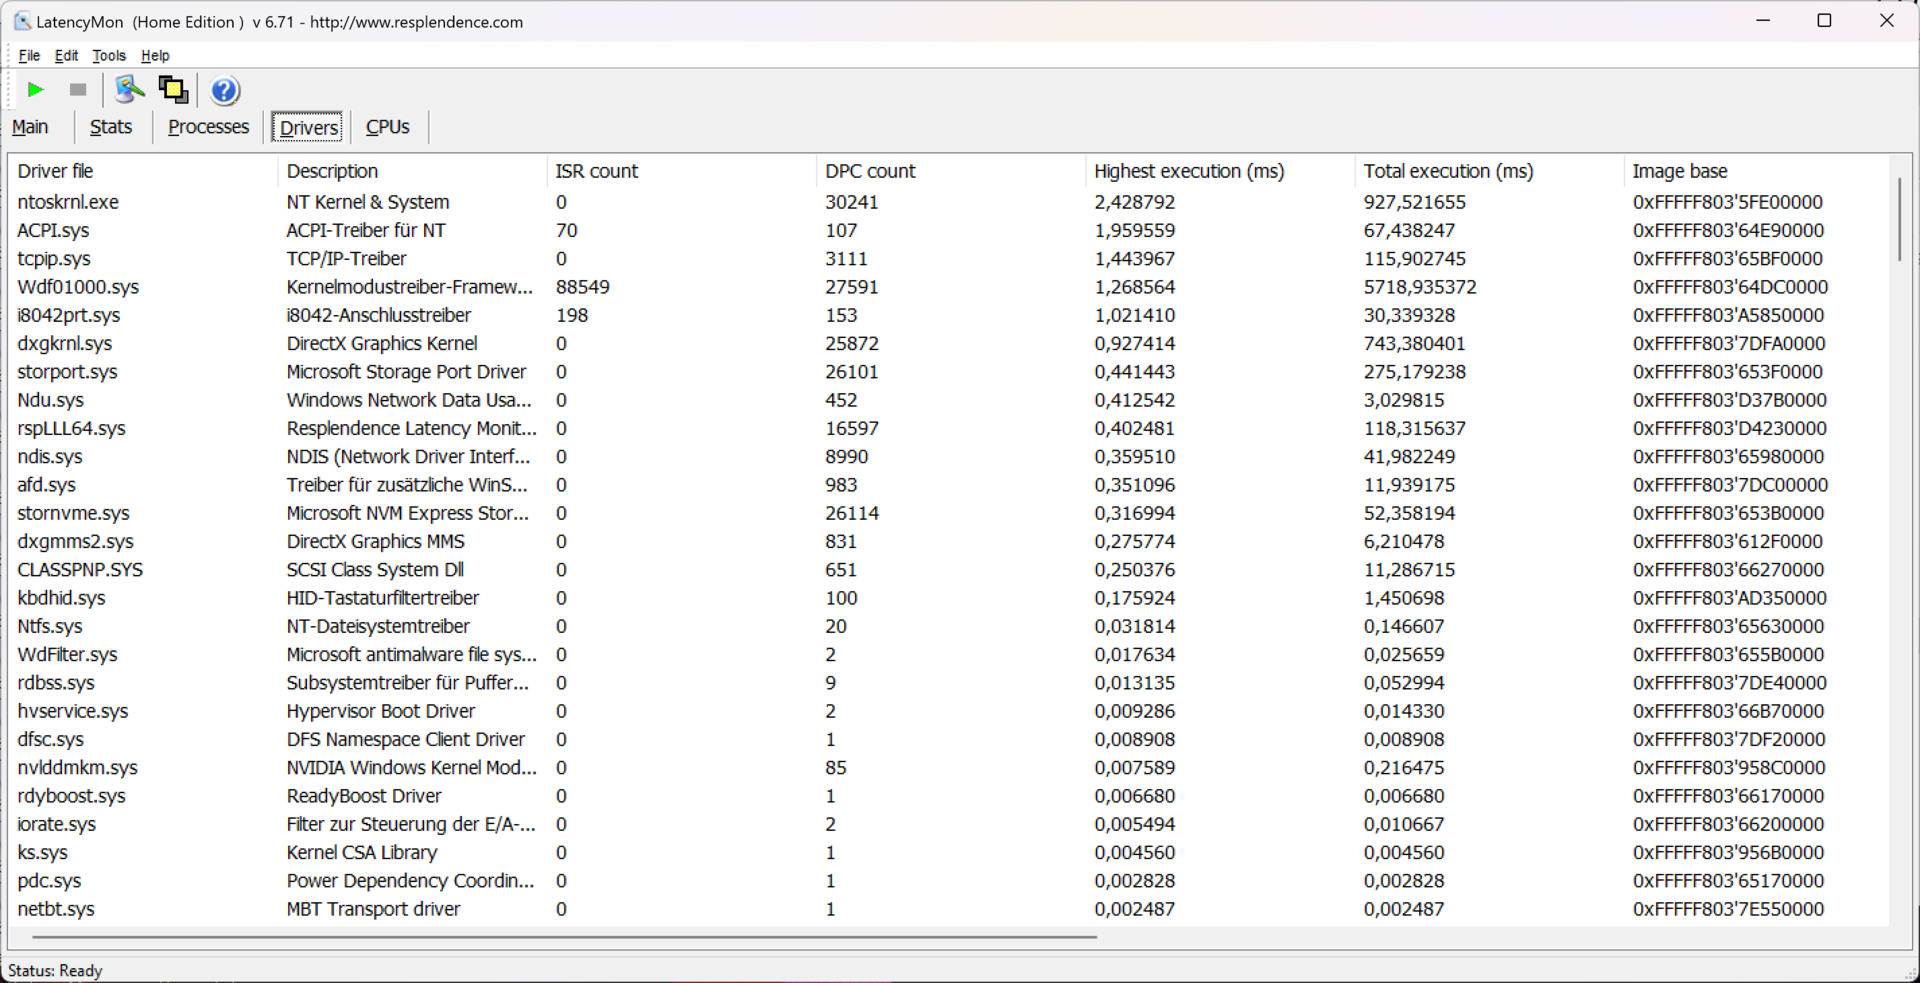
Latências DPC
Mesmo navegando com múltiplas abas, a latência era muito alta para tarefas adequadamente exigentes, tais como processamento de áudio em tempo real. Com várias atualizações de drivers, é possível que este desempenho possa mudar tanto em direções positivas quanto negativas. Como geralmente encontramos alguns processos imaturos, é de se esperar que o desempenho nesta área melhore. A alta latência dos drivers das placas gráficas anteriores da série RTX 4000 parece já ter sido resolvida. OGigabyte Aero 16 YE5é um exemplo de que os laptops multimídia podem claramente fazer melhor.
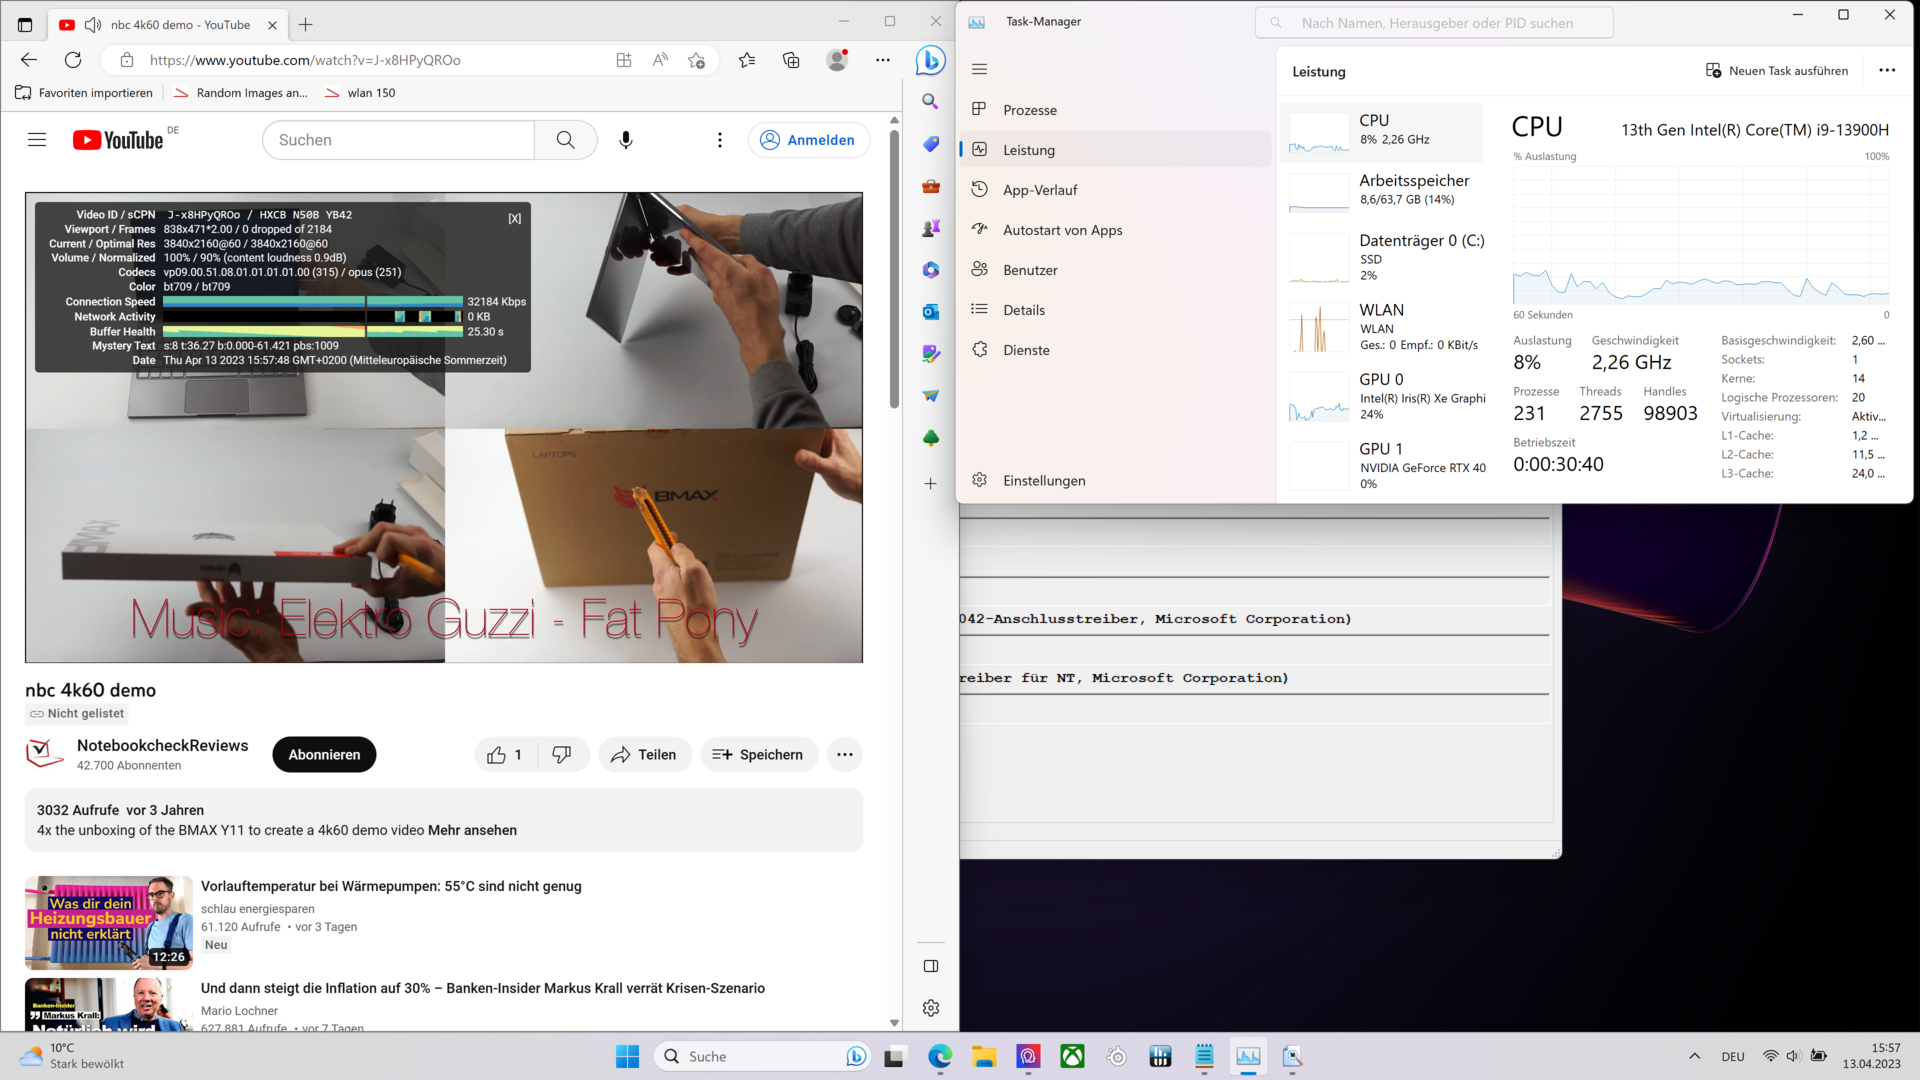
A transmissão de vídeo em 4K não apresentou nenhum problema. Não havia quadros saltados e, com pouco mais de 20%, a carga do iGPU não era muito alta.
| DPC Latencies / LatencyMon - interrupt to process latency (max), Web, Youtube, Prime95 | |
| Aorus 17X AZF | |
| MSI Stealth 17 Studio A13VH-014 | |
| Razer Blade 16 Early 2023 | |
| HP Omen 17-ck2097ng | |
| Asus ROG Strix G17 G713PI | |
| Gigabyte Aero 16 YE5 | |
* ... menor é melhor
Armazenamento em massa
Com seus 2 TB de armazenamento, o NVMe SSD Samsung PM9A convence a todos e ganha uma alta colocação em nosso ranking.
O teste contínuo enquanto realizávamos a escrita sequencial chamou nossa atenção. Quando o "Extreme Performance" foi definido (linha vermelha), a velocidade caiu após um curto período de tempo devido às altas temperaturas. A taxa de transferência permaneceu em seu nível mais alto usando o modo "Automático Inteligente" ou AI (linha azul).

* ... menor é melhor
Continuous performance read: DiskSpd Read Loop, Queue Depth 8
Placa gráfica
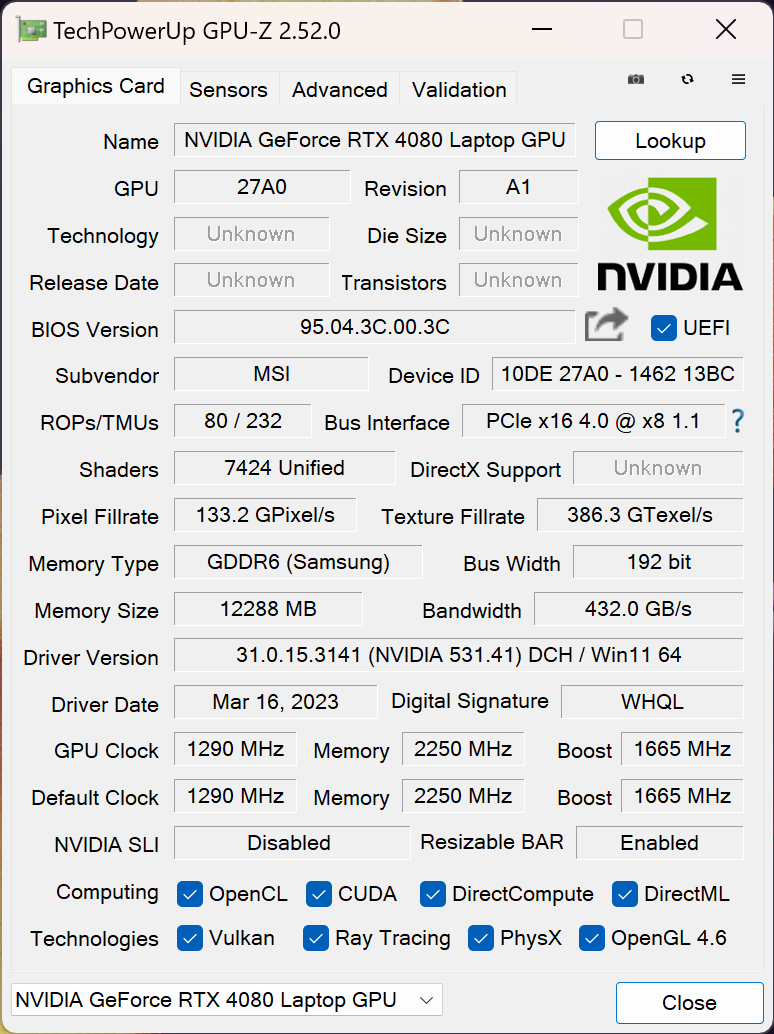
O MSI Stealth 17 Studio A13V pode ser equipado com todas as placas gráficas RTX 4000 atualmente disponíveis. O modelo A13VH-014 em mãos vem com umRTX 4080e 12 GB de VRAM. Entretanto, em comparação com o modelo de referência, outros valores de desempenho são de certa forma limitados.
A velocidade do relógio de impulso fica em 1.665 ao invés de 2.280 MHz e em vez de consumir o máximo permitido de 150 watts, ele consome apenas 105 watts de eletricidade. Isto explica a clara lacuna em nossos valores médios para o RTX 4080. Em comparação com os laptops para jogos equipados com um Nvidia GeForce RTX 3080 Ti ou o RTX 4070, é claramente até 20% mais eficiente, apesar destas limitações.
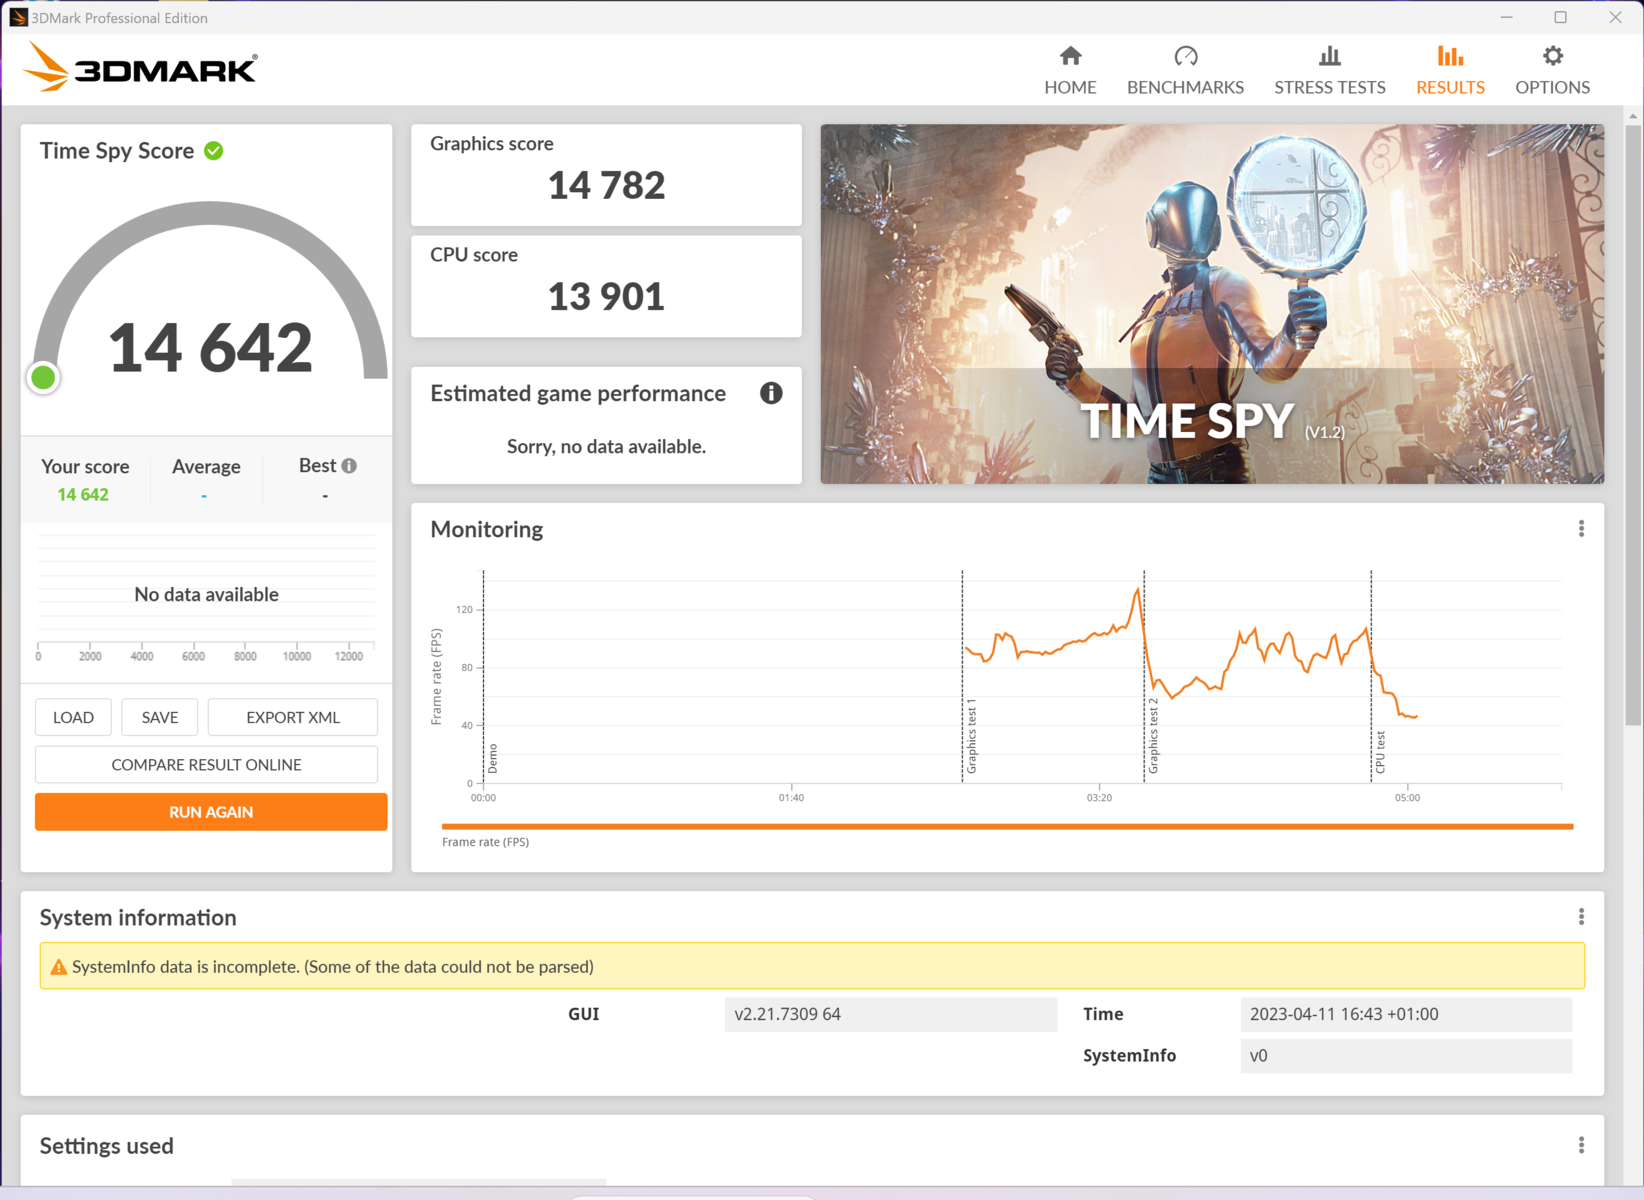
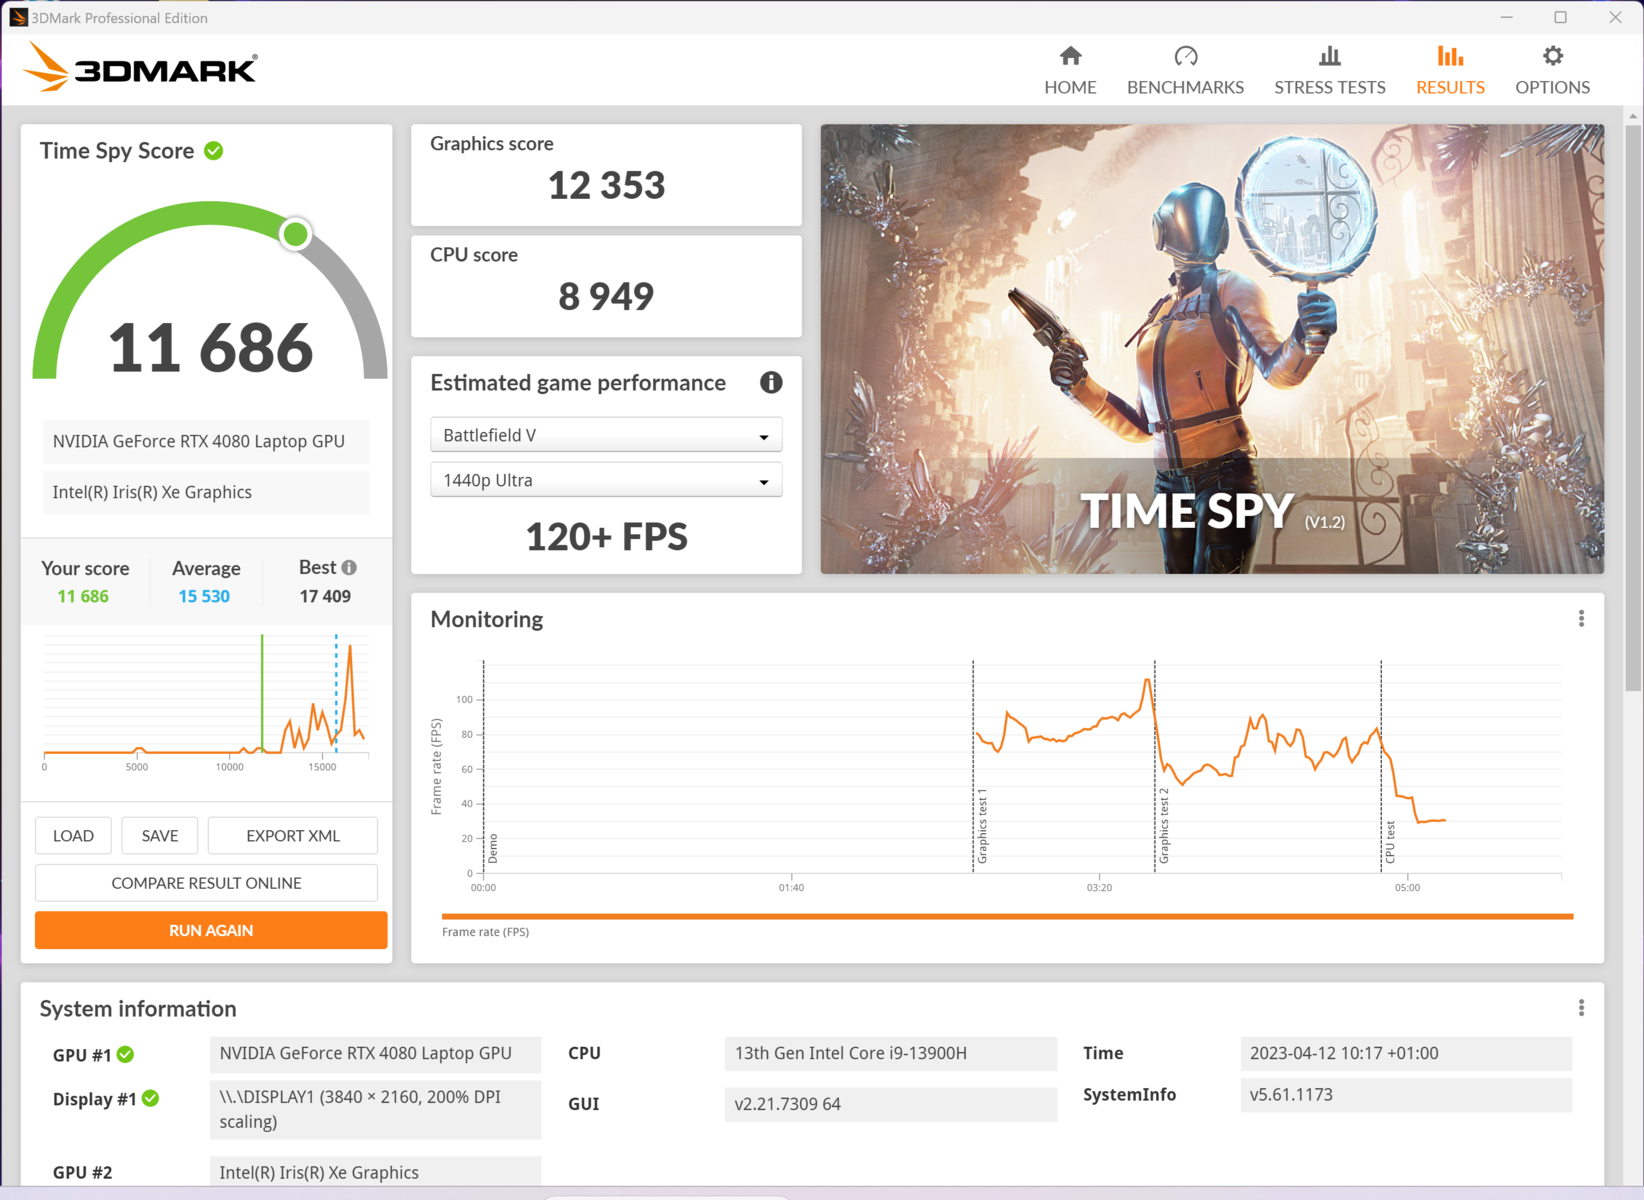
Vale notar que no exigente teste 3DMark Time Spy, observamos quase nenhuma diferença entre "Smart Auto" e "Extreme", embora o ruído do ventilador fosse visivelmente diferente. No modo de comutação inteligente, a placa gráfica recebeu um pouco mais de potência e o processador um pouco menos. Ao mesmo tempo, isto permite uma dissipação de calor ligeiramente maior. Na maioria dos jogos, conseguimos melhores valores de taxa de quadros no modo AI do que no modo "Extremo".
Os resultados com a redução do ruído do ventilador também são notáveis. o modo "Silencioso" garante uma operação muito silenciosa, mas permite, na maioria dos jogos atuais, uma renderização suave em configurações de alta qualidade. Para fins de teste, fomos capazes de jogar usando 10% do volume disponível do alto-falante sem que os ventiladores interferissem com a fala ou efeitos sonoros.
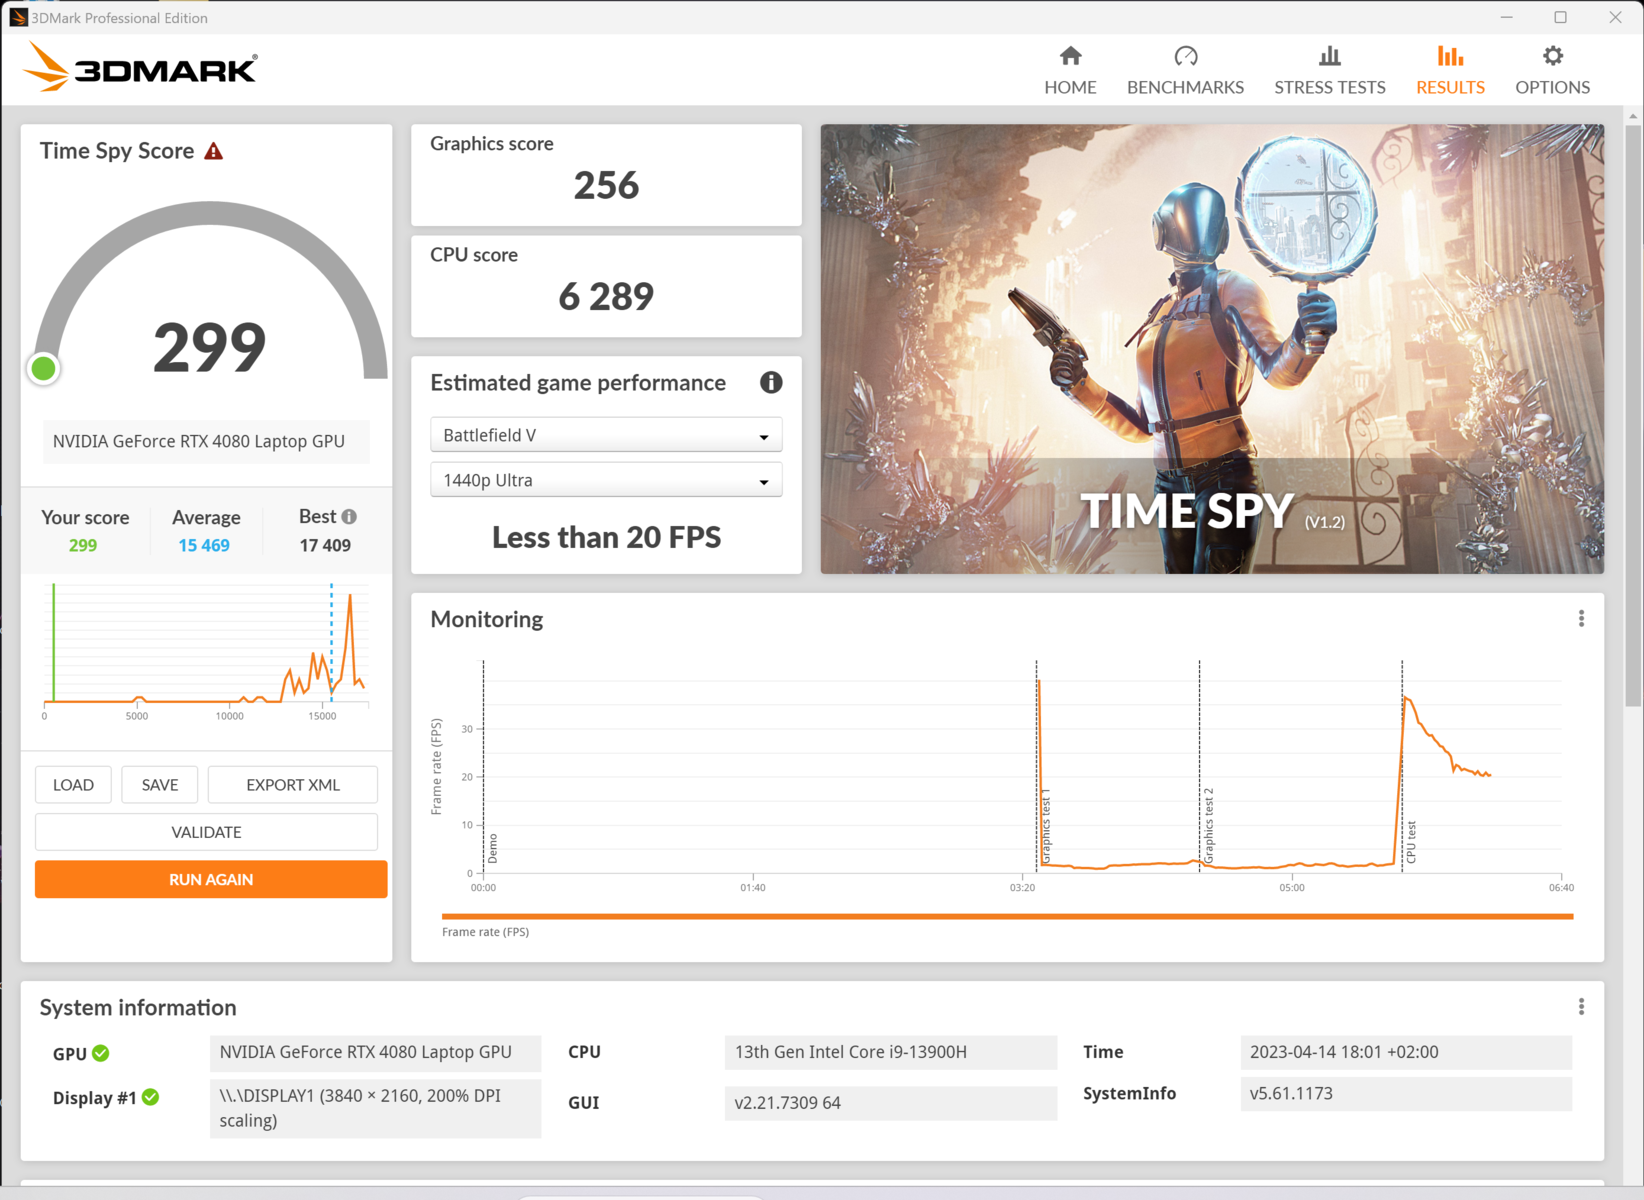
No entanto, desaconselhamos totalmente o uso do dispositivo no modo de bateria. Nossos resultados gravados foram ainda piores do que os laptops do segmento de escritório de nível básico. Sem uma conexão à rede elétrica, o jogo Witcher 3 gerenciava apenas 3fps em Full HD e Ultra. Presumimos que isto tenha algo a ver com um erro de configuração, infelizmente, muitos dos quais observamos durante os testes.

| 3DMark 11 Performance | 33542 pontos | |
| 3DMark Cloud Gate Standard Score | 51999 pontos | |
| 3DMark Fire Strike Score | 30028 pontos | |
| 3DMark Fire Strike Extreme Score | 16371 pontos | |
| 3DMark Time Spy Score | 14775 pontos | |
Ajuda | ||
* ... menor é melhor
| Photoshop PugetBench - Overall Score | |
| MSI Titan GT77 HX 13VI | |
| Asus Zephyrus Duo 16 GX650PY-NM006W | |
| MSI Stealth 17 Studio A13VH-014 | |
| Asus ROG Strix Scar 18 2023 G834JY-N6005W | |
| Premiere Pro PugetBench - Overall Score 0.9 | |
| MSI Stealth 17 Studio A13VH-014 | |
| Asus Zephyrus Duo 16 GX650PY-NM006W | |
| MSI Titan GT77 HX 13VI | |
Desempenho nos jogos
Apesar de ter um poder que não pode ser totalmente acessado, o Nvidia GeForce RTX 4080 demonstrou taxas de quadros muito boas em vários jogos, ajustes de qualidade e resoluções. Mesmo um título atual como "Hogwarts Legacy" é jogável em configurações máximas e em 4K, apesar de 43fps ser muito modesto.
O Stealth 17 Studio é particularmente impressionante em resoluções de QHD um pouco mais baixas e muitas vezes se senta acima de 100fps - marque você, nas configurações mais detalhadas.
Comparado com outros laptops puramente voltados para jogos, o dispositivo da MSI consegue funcionar como um Alienware x17 R2. Essa máquina usa o mais antigoRTX 3080 Ti mas é sempre significativamente mais alto e consome consideravelmente mais energia.
Análises de jogo adicionais, dados comparativos e muito mais podem ser encontrados em nosso Lista de referência da GPU.
| The Witcher 3 | |
| 1920x1080 High Graphics & Postprocessing (Nvidia HairWorks Off) | |
| Aorus 17X AZF | |
| Média da turma Gaming (341 - 404, n=2, últimos 2 anos) | |
| Razer Blade 16 Early 2023 | |
| Média NVIDIA GeForce RTX 4080 Laptop GPU (246 - 385, n=14) | |
| HP Omen 17-ck2097ng | |
| MSI Stealth 17 Studio A13VH-014 | |
| Asus ROG Strix G17 G713PI | |
| Gigabyte Aero 16 YE5 | |
| 1920x1080 Ultra Graphics & Postprocessing (HBAO+) | |
| Aorus 17X AZF | |
| Média da turma Gaming (104.7 - 240, n=7, últimos 2 anos) | |
| Razer Blade 16 Early 2023 | |
| Média NVIDIA GeForce RTX 4080 Laptop GPU (130.4 - 186.1, n=20) | |
| HP Omen 17-ck2097ng | |
| MSI Stealth 17 Studio A13VH-014 | |
| Asus ROG Strix G17 G713PI | |
| Gigabyte Aero 16 YE5 | |
| Far Cry 6 | |
| 1920x1080 Ultra Graphics Quality + HD Textures AA:T | |
| Média da turma Gaming (n=1últimos 2 anos) | |
| Média NVIDIA GeForce RTX 4080 Laptop GPU (118 - 156, n=5) | |
| Aorus 17X AZF | |
| Razer Blade 16 Early 2023 | |
| MSI Stealth 17 Studio A13VH-014 | |
| 2560x1440 Ultra Graphics Quality + HD Textures AA:T | |
| Média da turma Gaming (n=1últimos 2 anos) | |
| Média NVIDIA GeForce RTX 4080 Laptop GPU (100 - 141, n=5) | |
| Aorus 17X AZF | |
| Razer Blade 16 Early 2023 | |
| MSI Stealth 17 Studio A13VH-014 | |
| 3840x2160 Ultra Graphics Quality + HD Textures AA:T | |
| Aorus 17X AZF | |
| Razer Blade 16 Early 2023 | |
| Média NVIDIA GeForce RTX 4080 Laptop GPU (61 - 73, n=4) | |
| MSI Stealth 17 Studio A13VH-014 | |
| F1 22 | |
| 1920x1080 Ultra High Preset AA:T AF:16x | |
| Aorus 17X AZF | |
| Média NVIDIA GeForce RTX 4080 Laptop GPU (72.3 - 124.2, n=15) | |
| HP Omen 17-ck2097ng | |
| MSI Stealth 17 Studio A13VH-014 | |
| Asus ROG Strix G17 G713PI | |
| Média da turma Gaming (40.1 - 121.2, n=4, últimos 2 anos) | |
| 2560x1440 Ultra High Preset AA:T AF:16x | |
| Aorus 17X AZF | |
| Média NVIDIA GeForce RTX 4080 Laptop GPU (55.4 - 79, n=13) | |
| HP Omen 17-ck2097ng | |
| MSI Stealth 17 Studio A13VH-014 | |
| Média da turma Gaming (42 - 77.8, n=3, últimos 2 anos) | |
| Asus ROG Strix G17 G713PI | |
| 3840x2160 Ultra High Preset AA:T AF:16x | |
| Aorus 17X AZF | |
| Média da turma Gaming (n=1últimos 2 anos) | |
| Média NVIDIA GeForce RTX 4080 Laptop GPU (25.8 - 39.8, n=10) | |
| MSI Stealth 17 Studio A13VH-014 | |
| Hogwarts Legacy | |
| 1920x1080 Ultra Preset AA:High T | |
| Média NVIDIA GeForce RTX 4080 Laptop GPU (108 - 131, n=3) | |
| MSI Stealth 17 Studio A13VH-014 | |
| Média da turma Gaming (n=1últimos 2 anos) | |
| Asus ROG Strix G17 G713PI | |
| Aorus 17X AZF | |
| 2560x1440 Ultra Preset AA:High T | |
| Média da turma Gaming (n=1últimos 2 anos) | |
| Média NVIDIA GeForce RTX 4080 Laptop GPU (76 - 102, n=3) | |
| Aorus 17X AZF | |
| MSI Stealth 17 Studio A13VH-014 | |
| Asus ROG Strix G17 G713PI | |
| 3840x2160 Ultra Preset AA:High T | |
| Média da turma Gaming (n=1últimos 2 anos) | |
| Aorus 17X AZF | |
| MSI Stealth 17 Studio A13VH-014 | |
| Média NVIDIA GeForce RTX 4080 Laptop GPU (n=1) | |
Por um curto período, a taxa de quadros em Witcher 3 está quase no mesmo nível de um RTX 4080, mas cai rapidamente para um ainda impressionante 120fps. Isto corresponde praticamente exatamente a umAsus ROG Strix G17com um RTX 4070 e uma CPU significativamente mais potente, mas este também é um laptop de construção consideravelmente mais generosa e puro para jogos. O laptop multimídia e o laptop do criador, oGigabyte Aero 16 com um RTX 3080 Ti, fica bem atrás.
Considerando o consumo de energia ligeiramente restrito e a velocidade do relógio, assim como o comportamento moderado do ventilador, este foi um excelente resultado no teste contínuo.
Para uma melhor classificação do ruído dos ventiladores e do desempenho dos jogos, aqui estão as taxas de quadros e os valores de ruído do MSI laptop:
| Modo | AI | Extremo | Equilibrado | Silencioso |
| Fps (FHD, Ultra) | 127 | 135 | 134 | 114 |
| P0.1 | 48 | 50 | 52 | 61 |
| Ruído do ventilador (dB) | 48 | 53 | 48 | 36 |
As taxas de quadros ainda decentes com ventiladores quase não audíveis são notáveis. Em comparação com "Extremo", "Silencioso" aparece menos da metade como barulhento. Além disso, o limite de desempenho da CPU parece garantir um desempenho mais estável porque o valor P0,1 (99,9% de todos os quadros acima deste valor) é o melhor e vem com o mínimo de emissões de ruído.
Witcher 3fps diagram
| baixo | média | alto | ultra | QHD | 4K DLSS | 4K | |
|---|---|---|---|---|---|---|---|
| GTA V (2015) | 168.4 | 122.7 | 105.9 | 123.9 | |||
| The Witcher 3 (2015) | 274 | 145 | 66 | ||||
| Dota 2 Reborn (2015) | 140 | 136.2 | 116.7 | ||||
| Final Fantasy XV Benchmark (2018) | 134 | 105.8 | 60.8 | ||||
| X-Plane 11.11 (2018) | 106.1 | 90 | |||||
| Far Cry 5 (2018) | 158 | 136 | 116 | 75 | |||
| Strange Brigade (2018) | 301 | 269 | 192.2 | 100.9 | |||
| Horizon Zero Dawn (2020) | 113 | 106 | 86 | 62 | |||
| Assassin´s Creed Valhalla (2020) | 118 | 93 | 55 | ||||
| Far Cry 6 (2021) | 118 | 100 | 61 | ||||
| Cyberpunk 2077 1.6 (2022) | 105.2 | 94.9 | 63.39 | 29 | |||
| Tiny Tina's Wonderlands (2022) | 112.86 | 89.27 | 47.85 | ||||
| F1 22 (2022) | 203 | 91.1 | 60.4 | 25.8 | |||
| Call of Duty Modern Warfare 2 2022 (2022) | 126 | 93 | 55 | ||||
| Hogwarts Legacy (2023) | 137 | 116 | 76 | 43 |
Emissões - O poderoso mas silencioso MSI Stealth
Emissões sonoras
O laptop deste criador fica barulhento quando a potência máxima é necessária para jogos, com os valores do ventilador um pouco ao norte de 50 dB. Isto é alto, mas é facilmente ultrapassado por alguns laptops de top-model para jogos. No modo "Extreme", os ventiladores logo começam a girar, mas rapidamente retornam ao mínimo se não forem necessários.
O modo AI funciona de forma muito mais convincente. O gerenciamento inteligente garante que o resfriamento seja relativamente consistente e, a pouco menos de 50 dB, não seja muito barulhento. Ao fazer isso, o laptop pode ser mantido frio, apesar de seu formato estreito, sem criar imediatamente um ruído excessivo.
Em algumas situações, o modo "Silencioso" parece extremamente útil. Os 36 dB medidos são melhorados por alguns laptops de escritório. Este nível de ruído permite um trabalho focalizado, seja no escritório ou trabalhando remotamente. Quando se joga, quase 20% do desempenho máximo tem que ser sacrificado, mas isto não é de forma alguma gritante considerando os pontos de referência. Isto significa que você pode realmente jogar sem fones de ouvido em um ambiente silencioso onde os poderosos alto-falantes do dispositivo também podem ser usados para o som dentro do jogo.
Witcher 3 Para comparação, aqui estão os níveis de volume que medimos em Full HD e Ultra:
| Witcher 3 Ultra | Modo AI | Extremo | Equilibrado | Silencioso |
| Volume (dB) | 48 | 53 | 48 | 36 |
Barulho
| Ocioso |
| 24 / 24 / 24 dB |
| Carga |
| 34.49 / 49.66 dB |
 | ||
30 dB silencioso 40 dB(A) audível 50 dB(A) ruidosamente alto |
||
min: | ||
| MSI Stealth 17 Studio A13VH-014 GeForce RTX 4080 Laptop GPU, i9-13900H, Samsung PM9A1 MZVL22T0HBLB | Gigabyte Aero 16 YE5 GeForce RTX 3080 Ti Laptop GPU, i9-12900HK, Phison ESR01TBMFCT | HP Omen 17-ck2097ng GeForce RTX 4080 Laptop GPU, i9-13900HX, SK hynix PC801 HFS001TEJ9X101N | Razer Blade 16 Early 2023 GeForce RTX 4080 Laptop GPU, i9-13950HX, SSSTC CA6-8D1024 | Aorus 17X AZF GeForce RTX 4090 Laptop GPU, i9-13900HX, Gigabyte AG470S1TB-SI B10 | Asus ROG Strix G17 G713PI GeForce RTX 4070 Laptop GPU, R9 7945HX, WD PC SN560 SDDPNQE-1T00 | |
|---|---|---|---|---|---|---|
| Noise | -20% | -18% | -1% | -23% | -12% | |
| desligado / ambiente * (dB) | 24 | 25 -4% | 24 -0% | 23 4% | 25 -4% | 25 -4% |
| Idle Minimum * (dB) | 24 | 30 -25% | 31 -29% | 23 4% | 28 -17% | 26 -8% |
| Idle Average * (dB) | 24 | 32 -33% | 32 -33% | 23 4% | 29 -21% | 29 -21% |
| Idle Maximum * (dB) | 24 | 33 -38% | 33 -38% | 23.6 2% | 34 -42% | 30 -25% |
| Load Average * (dB) | 34.49 | 45 -30% | 45 -30% | 39 -13% | 51 -48% | 46 -33% |
| Witcher 3 ultra * (dB) | 48.29 | 50 -4% | 45 7% | 51.6 -7% | 57 -18% | 46 5% |
| Load Maximum * (dB) | 49.66 | 52 -5% | 50 -1% | 51.3 -3% | 54 -9% | 47 5% |
* ... menor é melhor
Temperatura
O preço do resfriamento muito restrito pode ser sentido em um aumento sempre perceptível da temperatura. Mesmo ao realizar tarefas simples como visualizar imagens ou navegar na internet, a base da unidade fica tão quente que o uso do laptop se torna desconfortável.
Com o uso intensivo, especialmente durante longas sessões de jogos, a área do teclado e ainda mais, a parte inferior traseira onde operam os tubos de calor e os ventiladores, fica muito quente. Isso pode ser sentido de forma clara e desagradável em todas as teclas. Entretanto, também não pode ser considerado realmente quente. Em dias quentes, você não gostaria realmente de usar um teclado como este, tornando difícil evitar o uso de um teclado separado.
Tubos de calor maiores poderiam evitar isso, mas também ir contra o design fino do laptop.
(-) A temperatura máxima no lado superior é 47 °C / 117 F, em comparação com a média de 40.4 °C / 105 F , variando de 21.2 a 68.8 °C para a classe Gaming.
(-) A parte inferior aquece até um máximo de 54 °C / 129 F, em comparação com a média de 43.2 °C / 110 F
(+) Em uso inativo, a temperatura média para o lado superior é 27.1 °C / 81 F, em comparação com a média do dispositivo de 33.9 °C / ### class_avg_f### F.
(-) Jogando The Witcher 3, a temperatura média para o lado superior é 40.3 °C / 105 F, em comparação com a média do dispositivo de 33.9 °C / ## #class_avg_f### F.
(+) Os apoios para as mãos e o touchpad são mais frios que a temperatura da pele, com um máximo de 31 °C / 87.8 F e, portanto, são frios ao toque.
(-) A temperatura média da área do apoio para as mãos de dispositivos semelhantes foi 28.8 °C / 83.8 F (-2.2 °C / -4 F).
| MSI Stealth 17 Studio A13VH-014 Intel Core i9-13900H, NVIDIA GeForce RTX 4080 Laptop GPU | Gigabyte Aero 16 YE5 Intel Core i9-12900HK, NVIDIA GeForce RTX 3080 Ti Laptop GPU | HP Omen 17-ck2097ng Intel Core i9-13900HX, NVIDIA GeForce RTX 4080 Laptop GPU | Razer Blade 16 Early 2023 Intel Core i9-13950HX, NVIDIA GeForce RTX 4080 Laptop GPU | Aorus 17X AZF Intel Core i9-13900HX, NVIDIA GeForce RTX 4090 Laptop GPU | Asus ROG Strix G17 G713PI AMD Ryzen 9 7945HX, NVIDIA GeForce RTX 4070 Laptop GPU | |
|---|---|---|---|---|---|---|
| Heat | -5% | 15% | 10% | 2% | 5% | |
| Maximum Upper Side * (°C) | 47 | 49 -4% | 41 13% | 40 15% | 47 -0% | 42 11% |
| Maximum Bottom * (°C) | 54 | 55 -2% | 51 6% | 37.6 30% | 51 6% | 41 24% |
| Idle Upper Side * (°C) | 30 | 33 -10% | 24 20% | 32.4 -8% | 30 -0% | 33 -10% |
| Idle Bottom * (°C) | 32 | 33 -3% | 25 22% | 31.4 2% | 31 3% | 34 -6% |
* ... menor é melhor
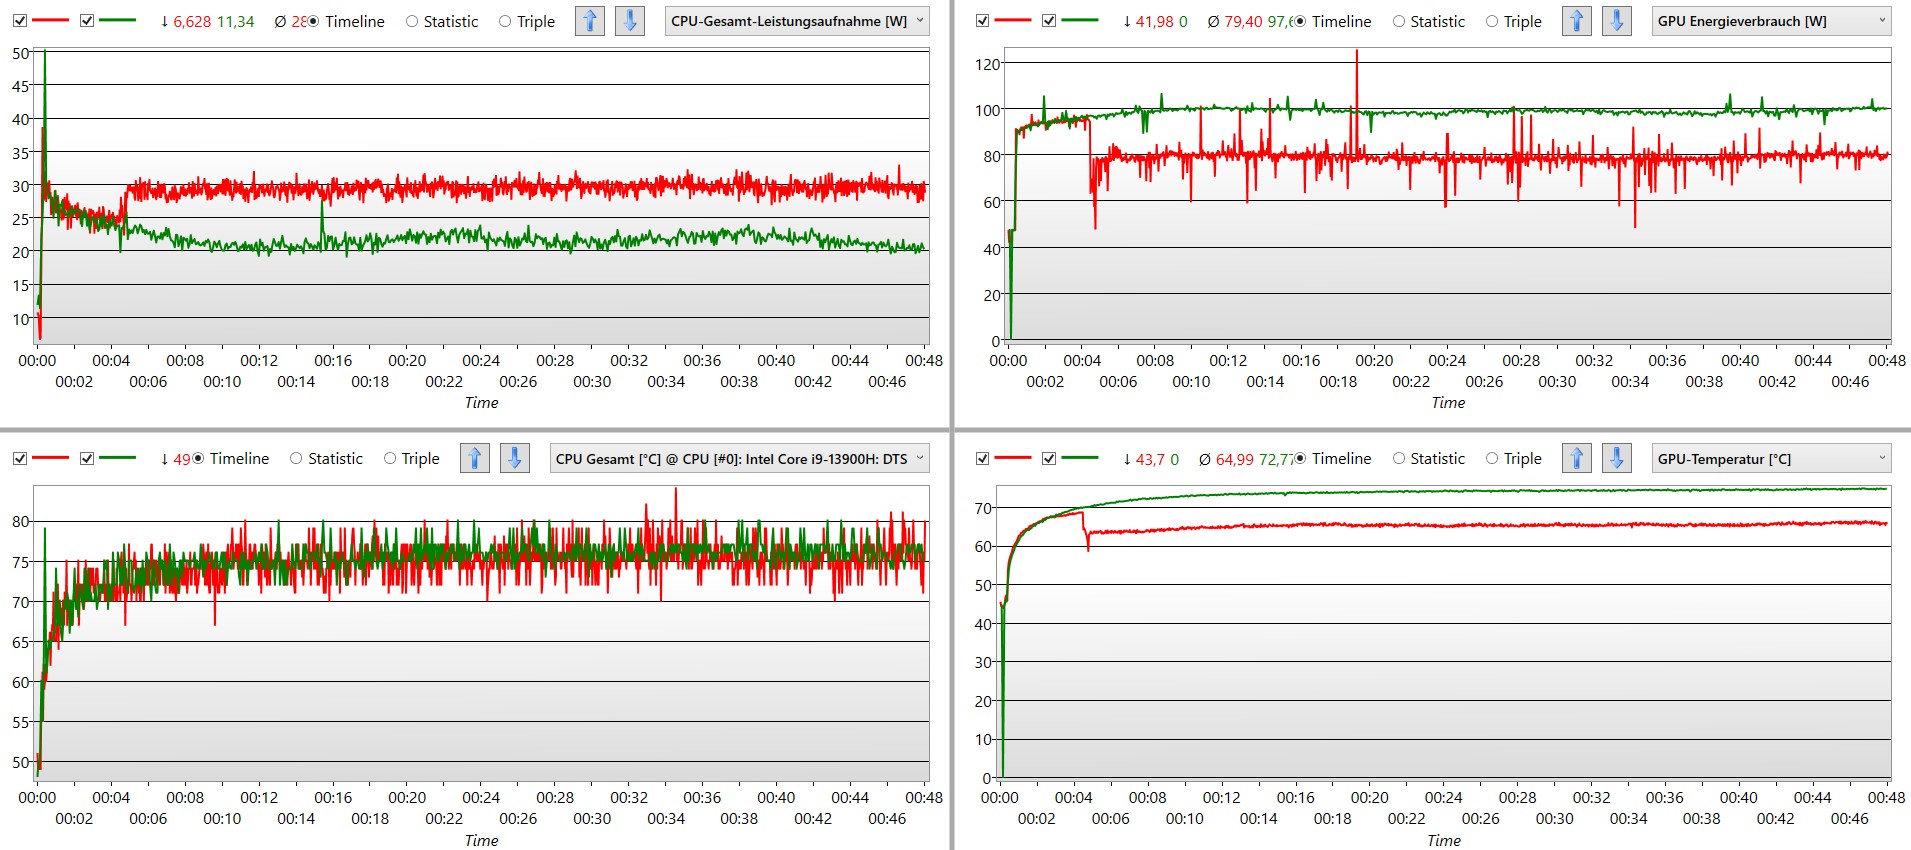
Teste de estresse
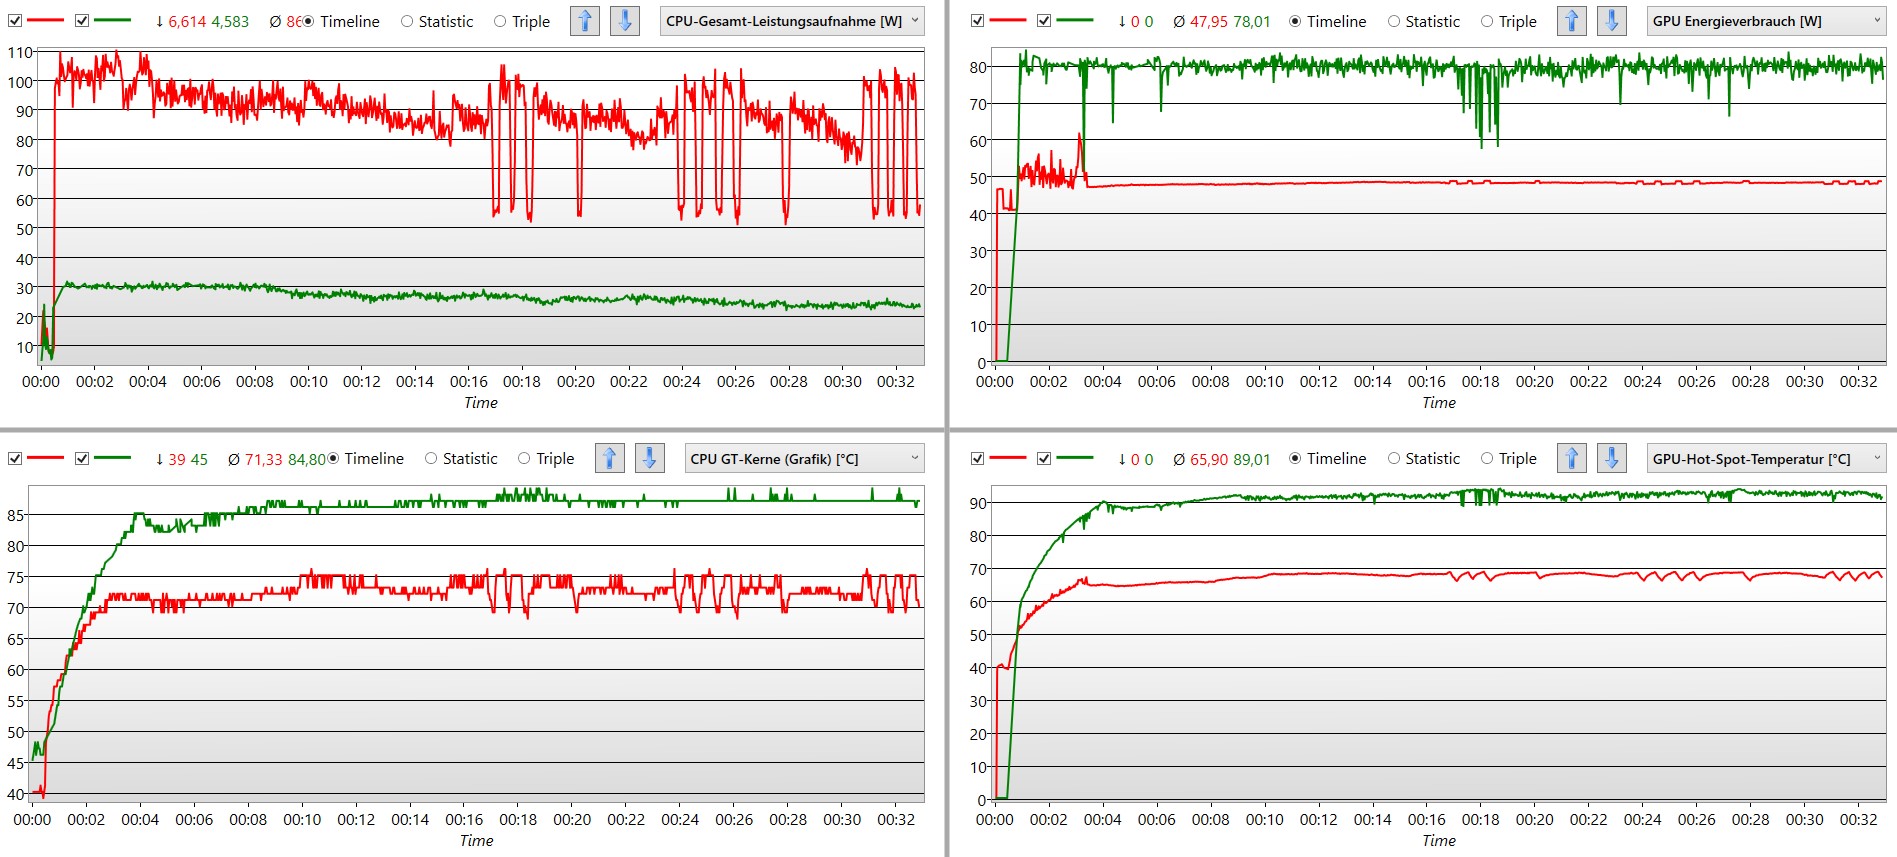
Sob carga constante, a CPU pode ser fornecida com 90 watts ou mais por quase 15 minutos. Posteriormente, este valor tem que ser novamente engolido para 50 watts, uma e outra vez. Em seguida, 100 watts ou mais são atingidos mais uma vez, por um breve momento. A freqüência do relógio então também aumenta para mais de 4.000 MHz e nunca cai abaixo de 2.500 MHz.
Em paralelo, a GPU funciona quase constantemente a 48 watts, após alguns minutos e depois a 60 watts e não mostra quedas ou estrangulamentos. A temperatura do componente permanece constantemente abaixo de 80 °C.
o modo "silencioso" faz jus ao seu nome mesmo nestas condições, mesmo que os ventiladores estejam funcionando e não ocorra estrangulamento. O desempenho gráfico é maior do que nos outros modos. Em troca, a CPU só é permitida em torno de 25 watts e o laptop fica muito quente.
Oradores
Os alto-falantes estéreo estão consideravelmente melhor equipados do que se espera dos drivers típicos de laptops. Além de seus alto-falantes de banda larga, o laptop da MSI também usa dois woofers à esquerda e à direita
Isto significa que estamos lidando com um sistema bidirecional, embora de forma compacta. E ele certamente sabe como se fazer ouvir. Baixos muito profundos são claramente audíveis e também relativamente barulhentos. As vozes e os instrumentos soam com precisão. Em cima do som dos videogames, até mesmo ouvir música é possível e agradável nesta configuração.
Somente os baixos altos e médios inferiores poderiam suportar um pouco mais de potência. É exatamente nesta lacuna que os woofers não podem mais operar e, como resultado, falta uma sensação de presença, por exemplo, na bateria e no baixo. Caso contrário, os alto-falantes do Stealth 17 quase parecem excelentes para um laptop.
MSI Stealth 17 Studio A13VH-014 análise de áudio
(+) | os alto-falantes podem tocar relativamente alto (###valor### dB)
Graves 100 - 315Hz
(±) | graves reduzidos - em média 8% menor que a mediana
(±) | a linearidade dos graves é média (8.8% delta para a frequência anterior)
Médios 400 - 2.000 Hz
(±) | médios mais altos - em média 8.2% maior que a mediana
(+) | médios são lineares (6.8% delta para frequência anterior)
Altos 2 - 16 kHz
(+) | agudos equilibrados - apenas 1% longe da mediana
(+) | os máximos são lineares (4% delta da frequência anterior)
Geral 100 - 16.000 Hz
(+) | o som geral é linear (11.6% diferença em relação à mediana)
Comparado com a mesma classe
» 10% de todos os dispositivos testados nesta classe foram melhores, 3% semelhantes, 87% piores
» O melhor teve um delta de 6%, a média foi 18%, o pior foi 132%
Comparado com todos os dispositivos testados
» 8% de todos os dispositivos testados foram melhores, 2% semelhantes, 90% piores
» O melhor teve um delta de 4%, a média foi 23%, o pior foi 134%
Apple MacBook Pro 16 2021 M1 Pro análise de áudio
(+) | os alto-falantes podem tocar relativamente alto (###valor### dB)
Graves 100 - 315Hz
(+) | bons graves - apenas 3.8% longe da mediana
(+) | o baixo é linear (5.2% delta para a frequência anterior)
Médios 400 - 2.000 Hz
(+) | médios equilibrados - apenas 1.3% longe da mediana
(+) | médios são lineares (2.1% delta para frequência anterior)
Altos 2 - 16 kHz
(+) | agudos equilibrados - apenas 1.9% longe da mediana
(+) | os máximos são lineares (2.7% delta da frequência anterior)
Geral 100 - 16.000 Hz
(+) | o som geral é linear (4.6% diferença em relação à mediana)
Comparado com a mesma classe
» 0% de todos os dispositivos testados nesta classe foram melhores, 0% semelhantes, 100% piores
» O melhor teve um delta de 5%, a média foi 17%, o pior foi 45%
Comparado com todos os dispositivos testados
» 0% de todos os dispositivos testados foram melhores, 0% semelhantes, 100% piores
» O melhor teve um delta de 4%, a média foi 23%, o pior foi 134%
Gerenciamento de energia - Econômico e portátil, para um laptop para jogos
Consumo de energia
Tendo em vista o hardware potente, um consumo mínimo de 14 watts pode ser considerado um valor muito bom. Especialmente porque o MSI Stealth estará usando a maior parte dele para sua complexa tela mini-LED. Ao realizar tarefas simples, isto aumenta para quase 20 watts. O Gigabyte Aero 16 YE5, com a CPU da geração anterior, funcionaria seco com tão pouca energia, embora tenha que alimentar uma tela OLED.
Nossa medição de pico era de 210 watts, o que significa que a unidade de alimentação de 240 watts é o tamanho ideal para carregar a bateria em todas as situações. O HP Omen 17, com sua variante HX da CPU e chip gráfico idêntico, fica a 300 watts. Quase independentemente da situação, o Stealth 17 Studio prova ser econômico para a energia oferecida.
| desligado | |
| Ocioso | |
| Carga |
|
Key:
min: | |
| MSI Stealth 17 Studio A13VH-014 i9-13900H, GeForce RTX 4080 Laptop GPU, Samsung PM9A1 MZVL22T0HBLB, Mini LED, 3840x2160, 17.3" | Gigabyte Aero 16 YE5 i9-12900HK, GeForce RTX 3080 Ti Laptop GPU, Phison ESR01TBMFCT, AMOLED, 3840x2400, 16" | HP Omen 17-ck2097ng i9-13900HX, GeForce RTX 4080 Laptop GPU, SK hynix PC801 HFS001TEJ9X101N, IPS, 2560x1440, 17.3" | Razer Blade 16 Early 2023 i9-13950HX, GeForce RTX 4080 Laptop GPU, SSSTC CA6-8D1024, IPS, 2560x1600, 16" | Aorus 17X AZF i9-13900HX, GeForce RTX 4090 Laptop GPU, Gigabyte AG470S1TB-SI B10, IPS, 2560x1440, 17.3" | Asus ROG Strix G17 G713PI R9 7945HX, GeForce RTX 4070 Laptop GPU, WD PC SN560 SDDPNQE-1T00, IPS, 2560x1440, 17.3" | Média NVIDIA GeForce RTX 4080 Laptop GPU | Média da turma Gaming | |
|---|---|---|---|---|---|---|---|---|
| Power Consumption | -50% | -31% | -50% | -34% | -22% | -38% | -14% | |
| Idle Minimum * (Watt) | 13.9 | 26 -87% | 16 -15% | 15.2 -9% | 11 21% | 15 -8% | 16.9 ? -22% | 13 ? 6% |
| Idle Average * (Watt) | 20 | 30 -50% | 20 -0% | 22.8 -14% | 17 15% | 20 -0% | 22 ? -10% | 19 ? 5% |
| Idle Maximum * (Watt) | 20.6 | 37 -80% | 26 -26% | 49.8 -142% | 29 -41% | 29 -41% | 34.1 ? -66% | 24.6 ? -19% |
| Load Average * (Watt) | 77 | 127 -65% | 135 -75% | 121.2 -57% | 134 -74% | 121 -57% | 117.9 ? -53% | 110.7 ? -44% |
| Witcher 3 ultra * (Watt) | 162 | 176 -9% | 215 -33% | 242 -49% | 278 -72% | 179.8 -11% | ||
| Load Maximum * (Watt) | 216 | 236 -9% | 299 -38% | 273.7 -27% | 334 -55% | 246 -14% | 297 ? -38% | 259 ? -20% |
* ... menor é melhor
Power consumption Witcher 3 / stress test
Power consumption with an external monitor
Duração da bateria
Antes da primeira atualização da BIOS, determinamos que a duração da bateria seria um pouco mais de três horas no teste WiFi com brilho reduzido do visor.
Posteriormente, o MSI Stealth 17 mostrou então que também pode ser econômico no modo de bateria. Apesar da potência computacional ainda decente, medimos consideravelmente mais de cinco horas com reprodução de vídeo Full HD e um teste WiFi, onde os sites foram trocados a cada minuto, apesar da potência computacional ainda decente. Pelo menos a este nível de desempenho, isto pode ser considerado um resultado muito bom.
Nos testes de bateria, a competição foi deixada para trás em Witcher 3. No entanto, isso não é um feito insignificante considerando o desempenho gráfico completamente minimizado e 3fps. Por esta razão, aconselhamos não jogar jogos ou editar imagens ou vídeos em modo de bateria.
o modo "Super Bateria" foi decepcionante. Parece super, mas não conseguimos nem cinco horas no teste WiFi. Talvez atualizações adicionais venham a melhorar a situação.
| MSI Stealth 17 Studio A13VH-014 i9-13900H, GeForce RTX 4080 Laptop GPU, 99 Wh | Gigabyte AERO 16 OLED BSF i9-13900H, GeForce RTX 4070 Laptop GPU, 88 Wh | Asus ROG Zephyrus M16 GU604VY-NM042X i9-13900H, GeForce RTX 4090 Laptop GPU, 90 Wh | MSI Creator Z17 A12UGST-054 i9-12900H, GeForce RTX 3070 Ti Laptop GPU, 90 Wh | Razer Blade 17 Early 2022 i9-12900H, GeForce RTX 3080 Ti Laptop GPU, 82 Wh | Alienware x17 R2 P48E i9-12900HK, GeForce RTX 3080 Ti Laptop GPU, 87 Wh | Lenovo Legion Pro 7 16IRX8H i9-13900HX, GeForce RTX 4080 Laptop GPU, 99.9 Wh | Razer Blade 16 Early 2023 i9-13950HX, GeForce RTX 4080 Laptop GPU, 95.2 Wh | Média da turma Gaming | |
|---|---|---|---|---|---|---|---|---|---|
| Duração da bateria | 32% | 15% | 11% | -13% | -57% | 11% | -2% | 23% | |
| H.264 (h) | 5.6 | 7.4 32% | 4.8 -14% | 5.5 -2% | 4.8 -14% | 8.32 ? 49% | |||
| WiFi v1.3 (h) | 5.6 | 7.5 34% | 4.3 -23% | 5.5 -2% | 3.8 -32% | 2 -64% | 5.1 -9% | 6.1 9% | 7.11 ? 27% |
| Witcher 3 ultra (h) | 2.6 | ||||||||
| Load (h) | 1.6 | 2.1 31% | 2.9 81% | 2.2 38% | 1.7 6% | 0.8 -50% | 2.1 31% | 1.4 -13% | 1.502 ? -6% |
Pro
Contra
Veredicto - Forte, não perfeito
O MSI Stealth 17 Studio é igualmente capaz de processar mídia de alto nível e jogar jogos atuais. Ele permanece agradavelmente silencioso, mesmo que alguns pontos percentuais de poder tenham tido que ser sacrificados no processo. Enquanto a CPU consegue atingir seu potencial máximo, aRTX 4080tem sido um pouco acorrentado ao nível de um RTX 4070.
É exatamente este truque que garante uma enorme melhoria na eficiência para que jogos de alto nível (se não o mais alto nível) sejam possíveis sem nenhuma geração de ruído exagerado. Da mesma forma, isto se aplica ao trabalho no escritório. Especialmente no modo "Silencioso", o Stealth é perfeitamente contido, mesmo que fique muito quente.
Não é bem perfeito: Em certa medida, o Stealth 17 é bem pensado. Ele embala toneladas de potência gráfica e componentes high-end em um estojo fino. O sistema de refrigeração do laptop pode ser ajustado de tal forma que, em termos de ruído, ele não atinge nem mesmo um volume baixo. No entanto, pequenas falhas nublam impressões excepcionalmente positivas.
Além disso, há características excepcionais na forma de 64 GB de RAM, o grande M.2 SSD mais opções de expansibilidade e um display de 144 Hz, 4K mini-LED. Isto é complementado por alto-falantes de som realmente bom e um teclado RGB com numerosas opções de personalização.
Mas: O modelo Stealth 17 Studio top model (RTX 4090) custa a soma principesca de $3.999. E por esse preço, a lista de falhas parece um pouco longa demais. As duas atualizações da BIOS são as mais fáceis de perdoar. As dobradiças fracas, por outro lado, parecem ser uma falha de design. Especialmente porque o visor de mini LED anexado a elas certamente possui uma qualidade de imagem boa, mas de forma alguma superlativa, e não consegue impressionar nem nas áreas de brilho nem no espaço de cor prometido.
Há também alguns pequenos detalhes adicionais. O touchpad, que deve ser usado apenas ocasionalmente, parece impreciso. A retroiluminação do teclado é desigual, e o cabo de alimentação do laptop é muito curto, o que significa que a PSU deve inevitavelmente sentar-se na mesa.
O bom conceito básico não é afetado, mas as melhorias parecem inevitáveis. A versão do Stealth 17 Studio A13V, que é melhor em muitas situações, provavelmente será a próxima variante menor. Este dispositivo faz sem Mini LED e 4K, em vez disso, vai para IPS, resolução QHD, um i7 e o RTX 4070 - e tudo por US$1.300 a menos. Se os jogos são o foco principal, oAsus ROG Strix G17o computador portátil, por exemplo, oferece consideravelmente mais energia por cerca de US$ 2.300 e é reconhecível como um laptop de jogos de longe - ao contrário do Stealth.
Preço e disponibilidade
O MSI Stealth 17 Studio (32 GB de RAM) com um Nvidia GeForce RTX 4080 pode ser obtido em Amazon por $2.669. Uma variante com um RTX 4090 e 64 GB de RAM também está disponível em por $3.999.
MSI Stealth 17 Studio A13VH-014
- 04/18/2023 v7 (old)
Mario Petzold
Transparência
A seleção dos dispositivos a serem analisados é feita pela nossa equipe editorial. A amostra de teste foi fornecida ao autor como empréstimo pelo fabricante ou varejista para fins desta revisão. O credor não teve influência nesta revisão, nem o fabricante recebeu uma cópia desta revisão antes da publicação. Não houve obrigação de publicar esta revisão. Como empresa de mídia independente, a Notebookcheck não está sujeita à autoridade de fabricantes, varejistas ou editores.
É assim que o Notebookcheck está testando
Todos os anos, o Notebookcheck analisa de forma independente centenas de laptops e smartphones usando procedimentos padronizados para garantir que todos os resultados sejam comparáveis. Desenvolvemos continuamente nossos métodos de teste há cerca de 20 anos e definimos padrões da indústria no processo. Em nossos laboratórios de teste, equipamentos de medição de alta qualidade são utilizados por técnicos e editores experientes. Esses testes envolvem um processo de validação em vários estágios. Nosso complexo sistema de classificação é baseado em centenas de medições e benchmarks bem fundamentados, o que mantém a objetividade.Price comparison

