Asus ROG Zephyrus Duo 16 Revisão do Notebook: Monstro multitarefa com AMD Zen4, RTX 4090 & Mini-LED
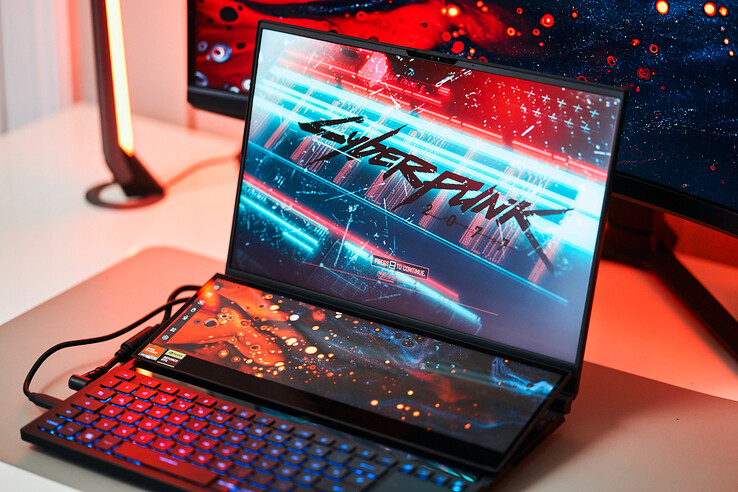
Asus continua o conceito do ROG Zephyrus Duo 16 com suas duas telas em 2023 e utiliza as melhores tecnologias que você pode obter atualmente para laptops. Além das novíssimas placas gráficas móveis da Nvidia, aGeForce Computador portátil RTX 4080eGeForce Computador portátil RTX 4090o Asus mais uma vez usa o processador HX da AMD. Na verdade, é um dos primeiros laptops em nosso escritório editorial com o novo processadorAMD Ryzen 9 7945HXque oferece 16 núcleos Zen4 contra as CPUs Raptor Lake HX da Intel. Asus também atualizou a tela: A resolução cai de 4K para WQHD, mas é um painel Mini-LED mate com uma taxa de atualização de 240 Hz e tempos de resposta rápidos.
A classificação do laptop na verdade não é tão simples, porque o Zephyrus Duo poderia ser um laptop para jogos, uma máquina para criação de conteúdo ou mesmo uma estação de trabalho móvel. No entanto, o conceito com duas telas não é definitivamente interessante para cada usuário. Existem atualmente quatro configurações diferentes e nossa unidade de revisão com o laptop RTX 4090, 32 GB de RAM e 2 TB de armazenamento SSD para varejo por 4999 euros. A SKU com o SSD menor de 1 TB, bem como o SSD GeForce RTX 4080 Laptop estará disponível em breve por 4299 euros.
Possíveis concorrentes em comparação
Avaliação | Data | Modelo | Peso | Altura | Size | Resolução | Preço |
|---|---|---|---|---|---|---|---|
| 88 % v7 (old) | 04/2023 | Asus Zephyrus Duo 16 GX650PY-NM006W R9 7945HX, GeForce RTX 4090 Laptop GPU | 2.7 kg | 29.7 mm | 16.00" | 2560x1600 | |
| 89 % v7 (old) | 02/2023 | MSI Titan GT77 HX 13VI i9-13950HX, GeForce RTX 4090 Laptop GPU | 3.5 kg | 23 mm | 17.30" | 3840x2160 | |
v (old) | 02/2023 | Schenker XMG Neo 16 Raptor Lake i9-13900HX, GeForce RTX 4090 Laptop GPU | 16.00" | 2560x1600 | |||
| 89.4 % v7 (old) | 02/2023 | Lenovo Legion Pro 7 16IRX8H i9-13900HX, GeForce RTX 4080 Laptop GPU | 2.7 kg | 26 mm | 16.00" | 2560x1600 | |
| 91.2 % v7 (old) | 02/2023 | Razer Blade 16 Early 2023 i9-13950HX, GeForce RTX 4080 Laptop GPU | 2.4 kg | 21.99 mm | 16.00" | 2560x1600 | |
| 88.2 % v7 (old) | 05/2022 | Asus ROG Zephyrus Duo 16 GX650RX R9 6900HX, GeForce RTX 3080 Ti Laptop GPU | 2.6 kg | 20.5 mm | 16.00" | 3840x2400 | |
| 93.7 % v7 (old) | 03/2023 | Apple MacBook Pro 16 2023 M2 Max M2 Max, M2 Max 38-Core GPU | 2.2 kg | 16.8 mm | 16.20" | 3456x2234 |
Estojo - Asus com chassis de metal familiar
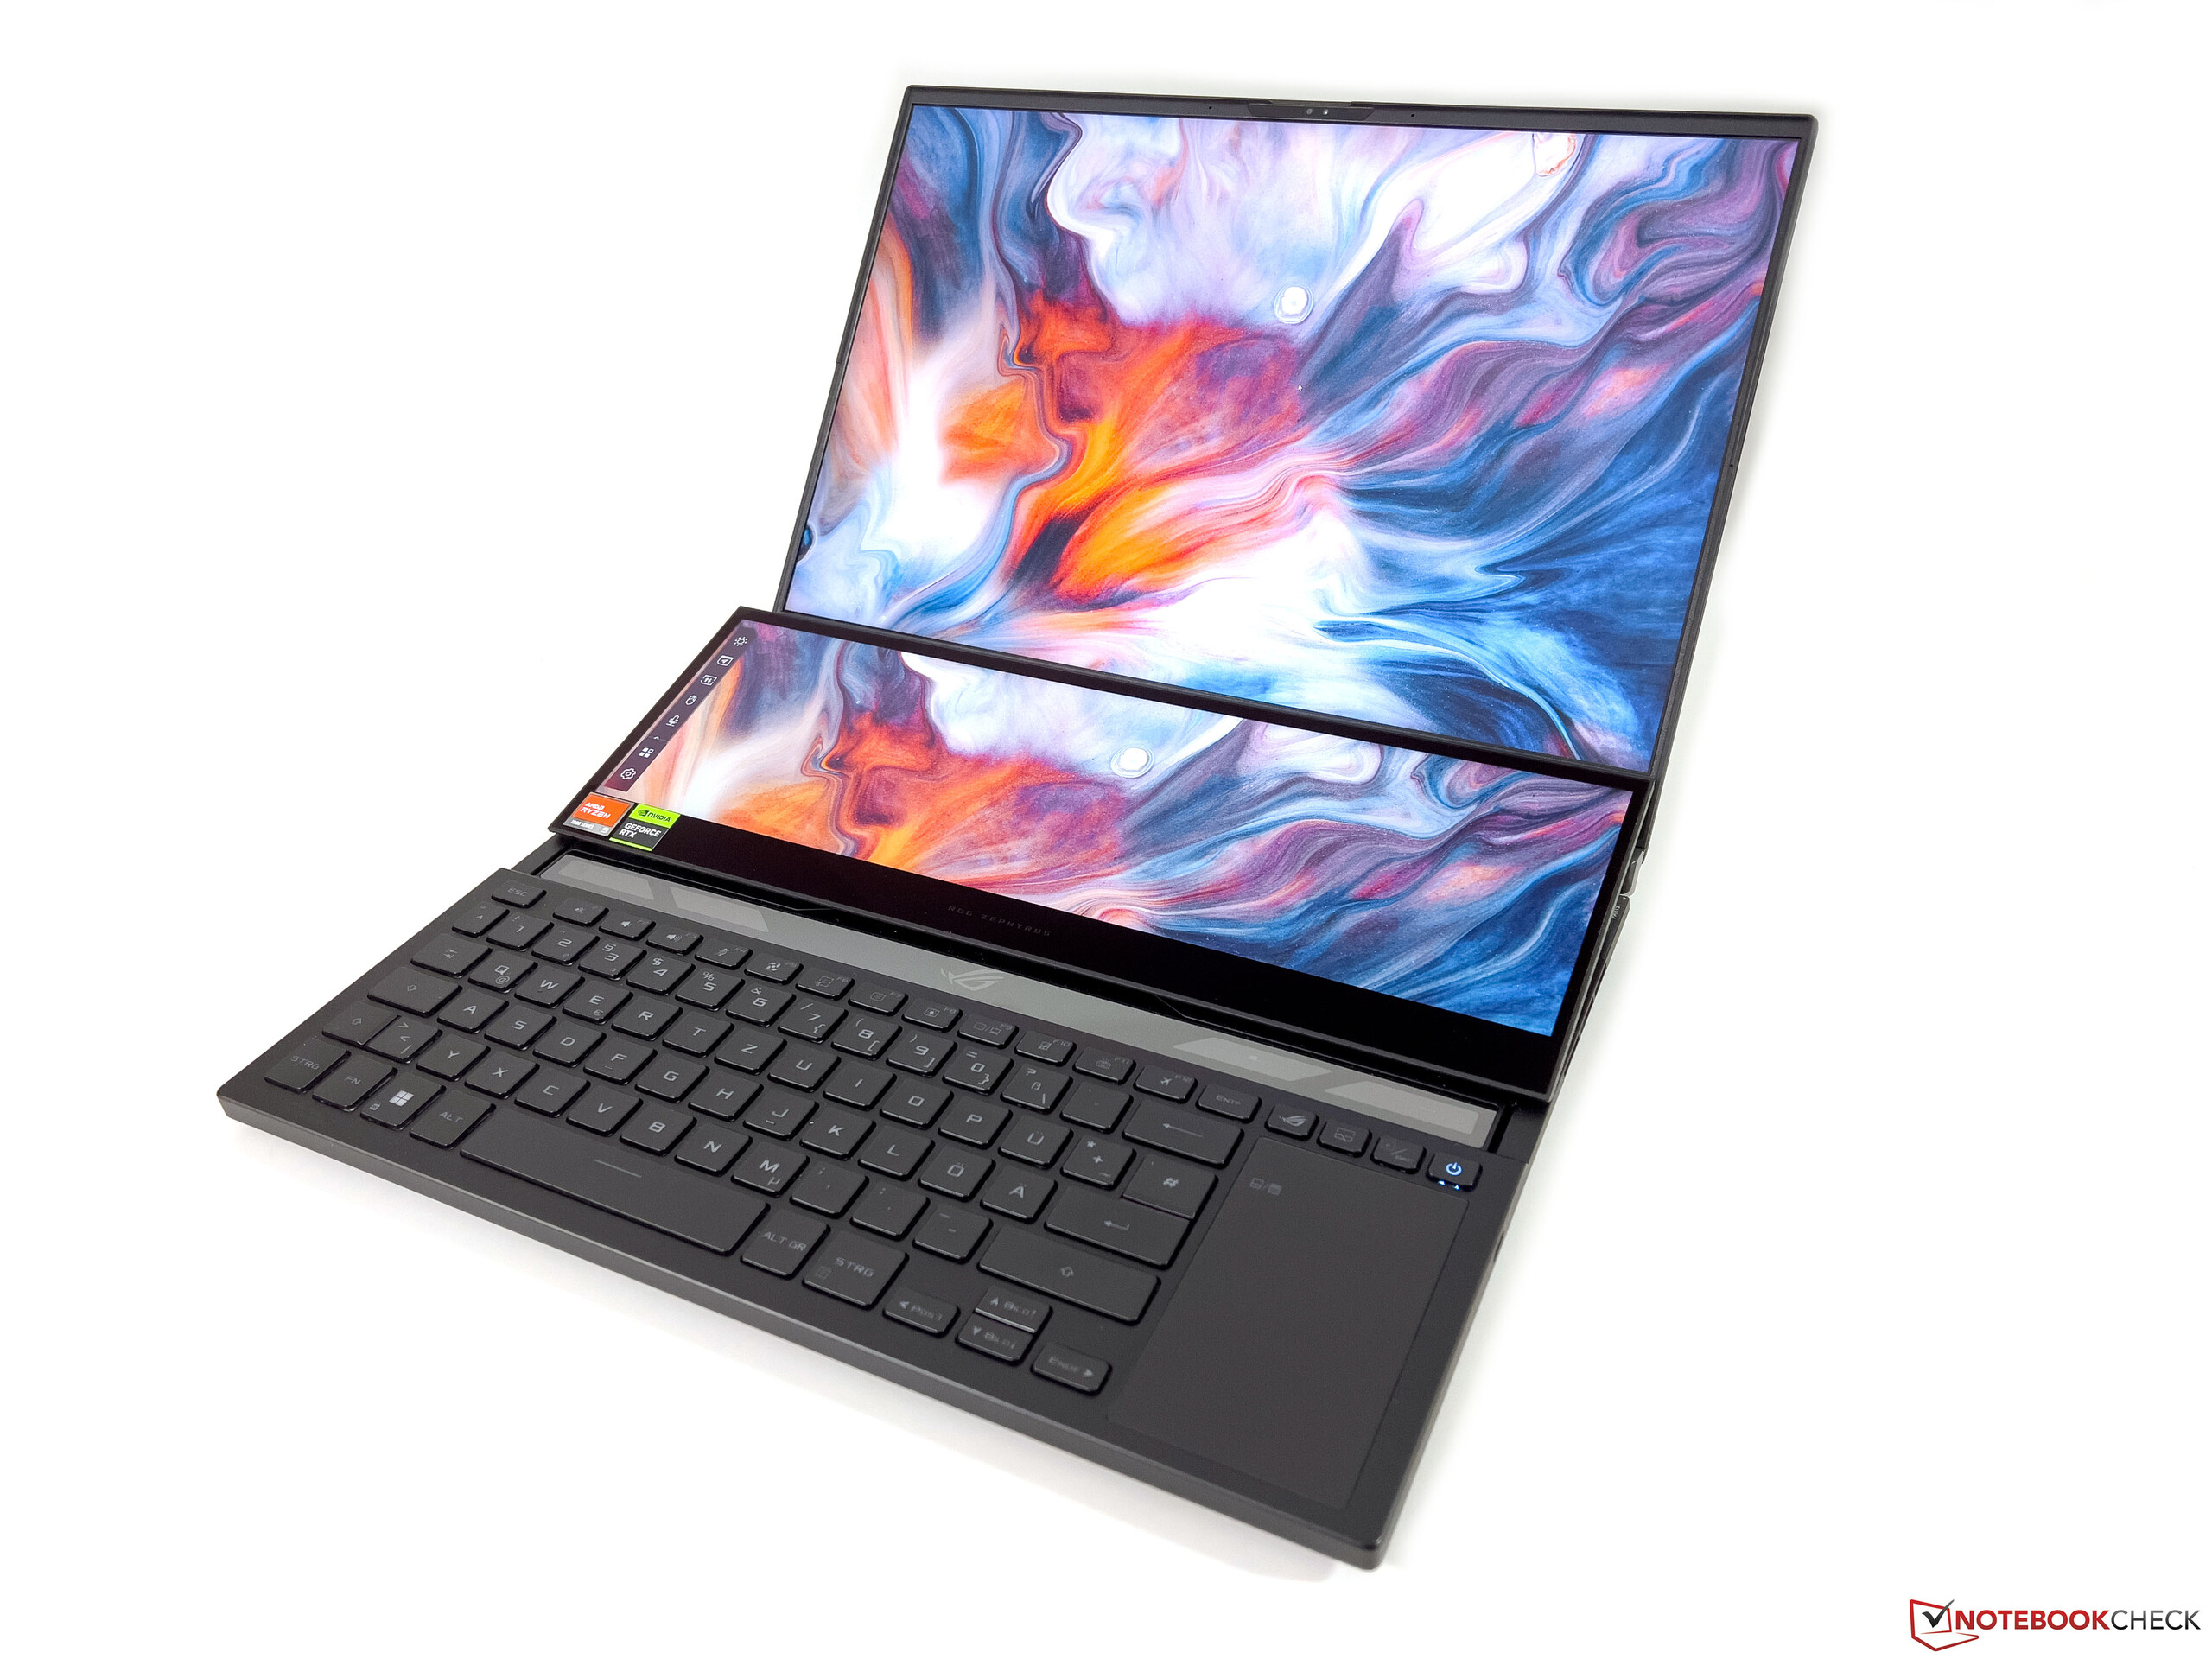
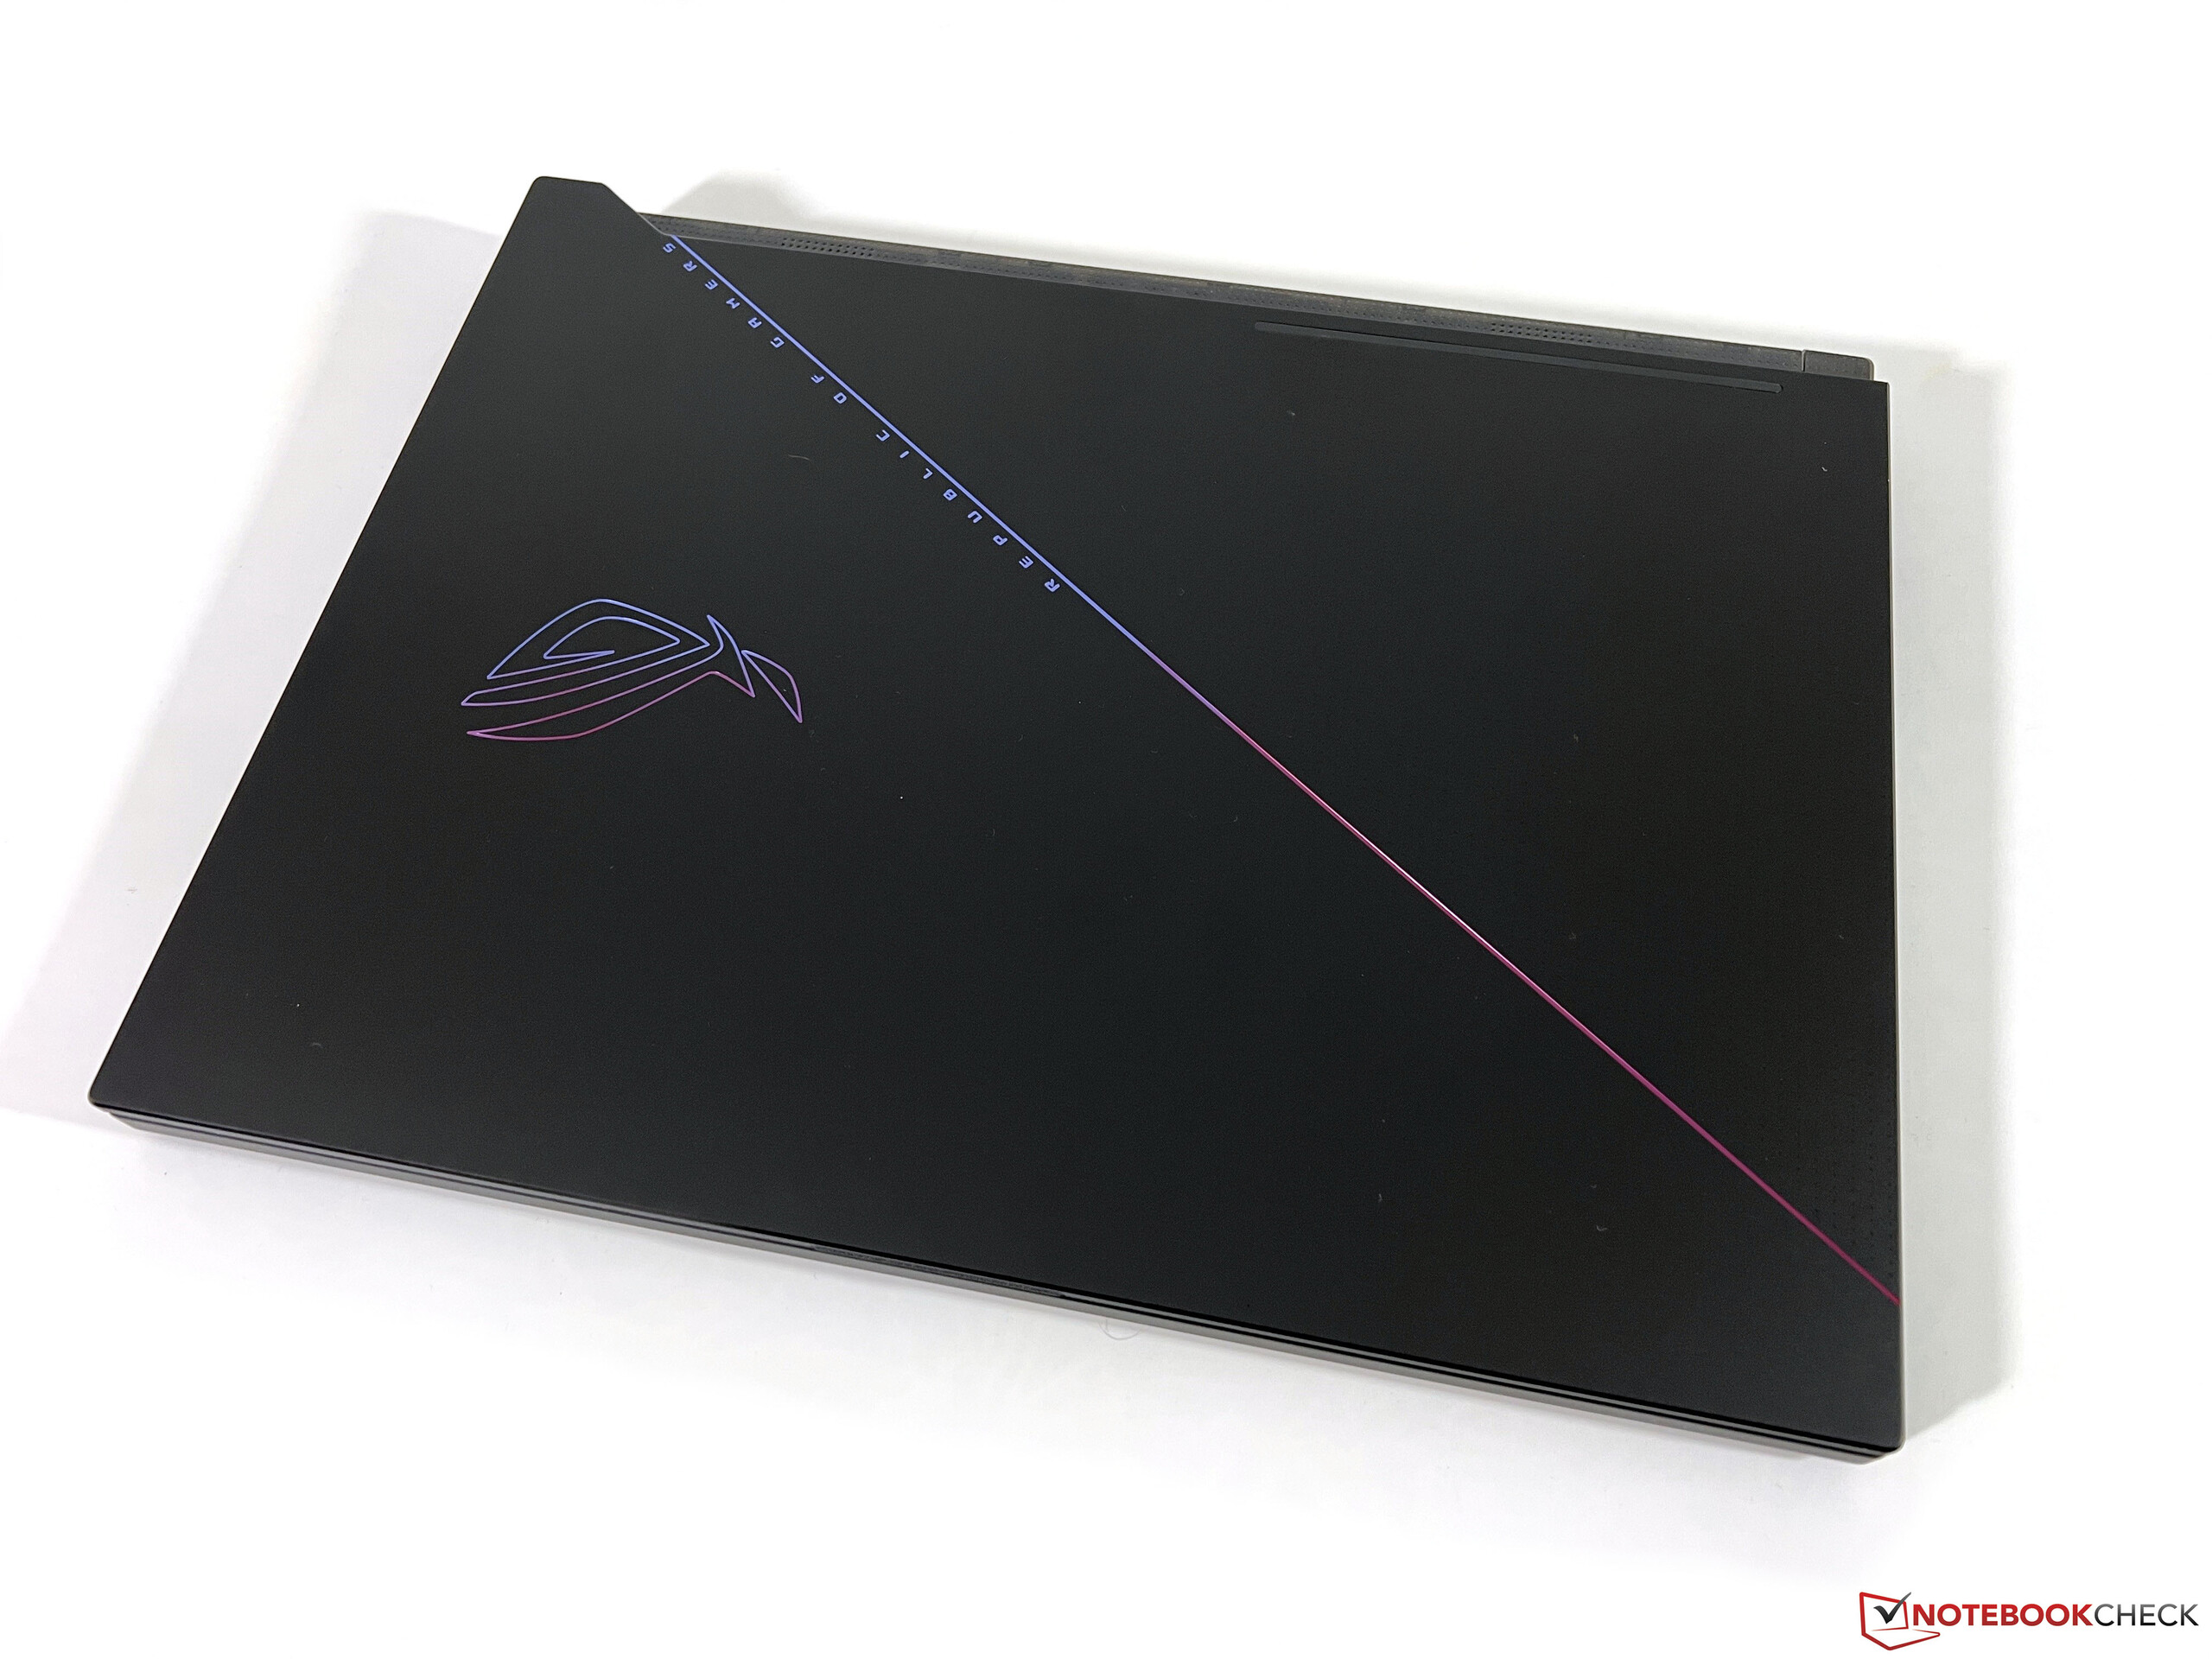
O projeto do chassi não mudou em comparação com o modelo anterior. O laptop é na verdade bastante sutil quando a tampa está fechada e somente o logotipo ROG é colorido em comparação com o acabamento em preto fosco. Também não há iluminação louca do chassi. A qualidade do laptop deixa uma boa impressão, apenas a tampa inferior de plástico fica um pouco curta.
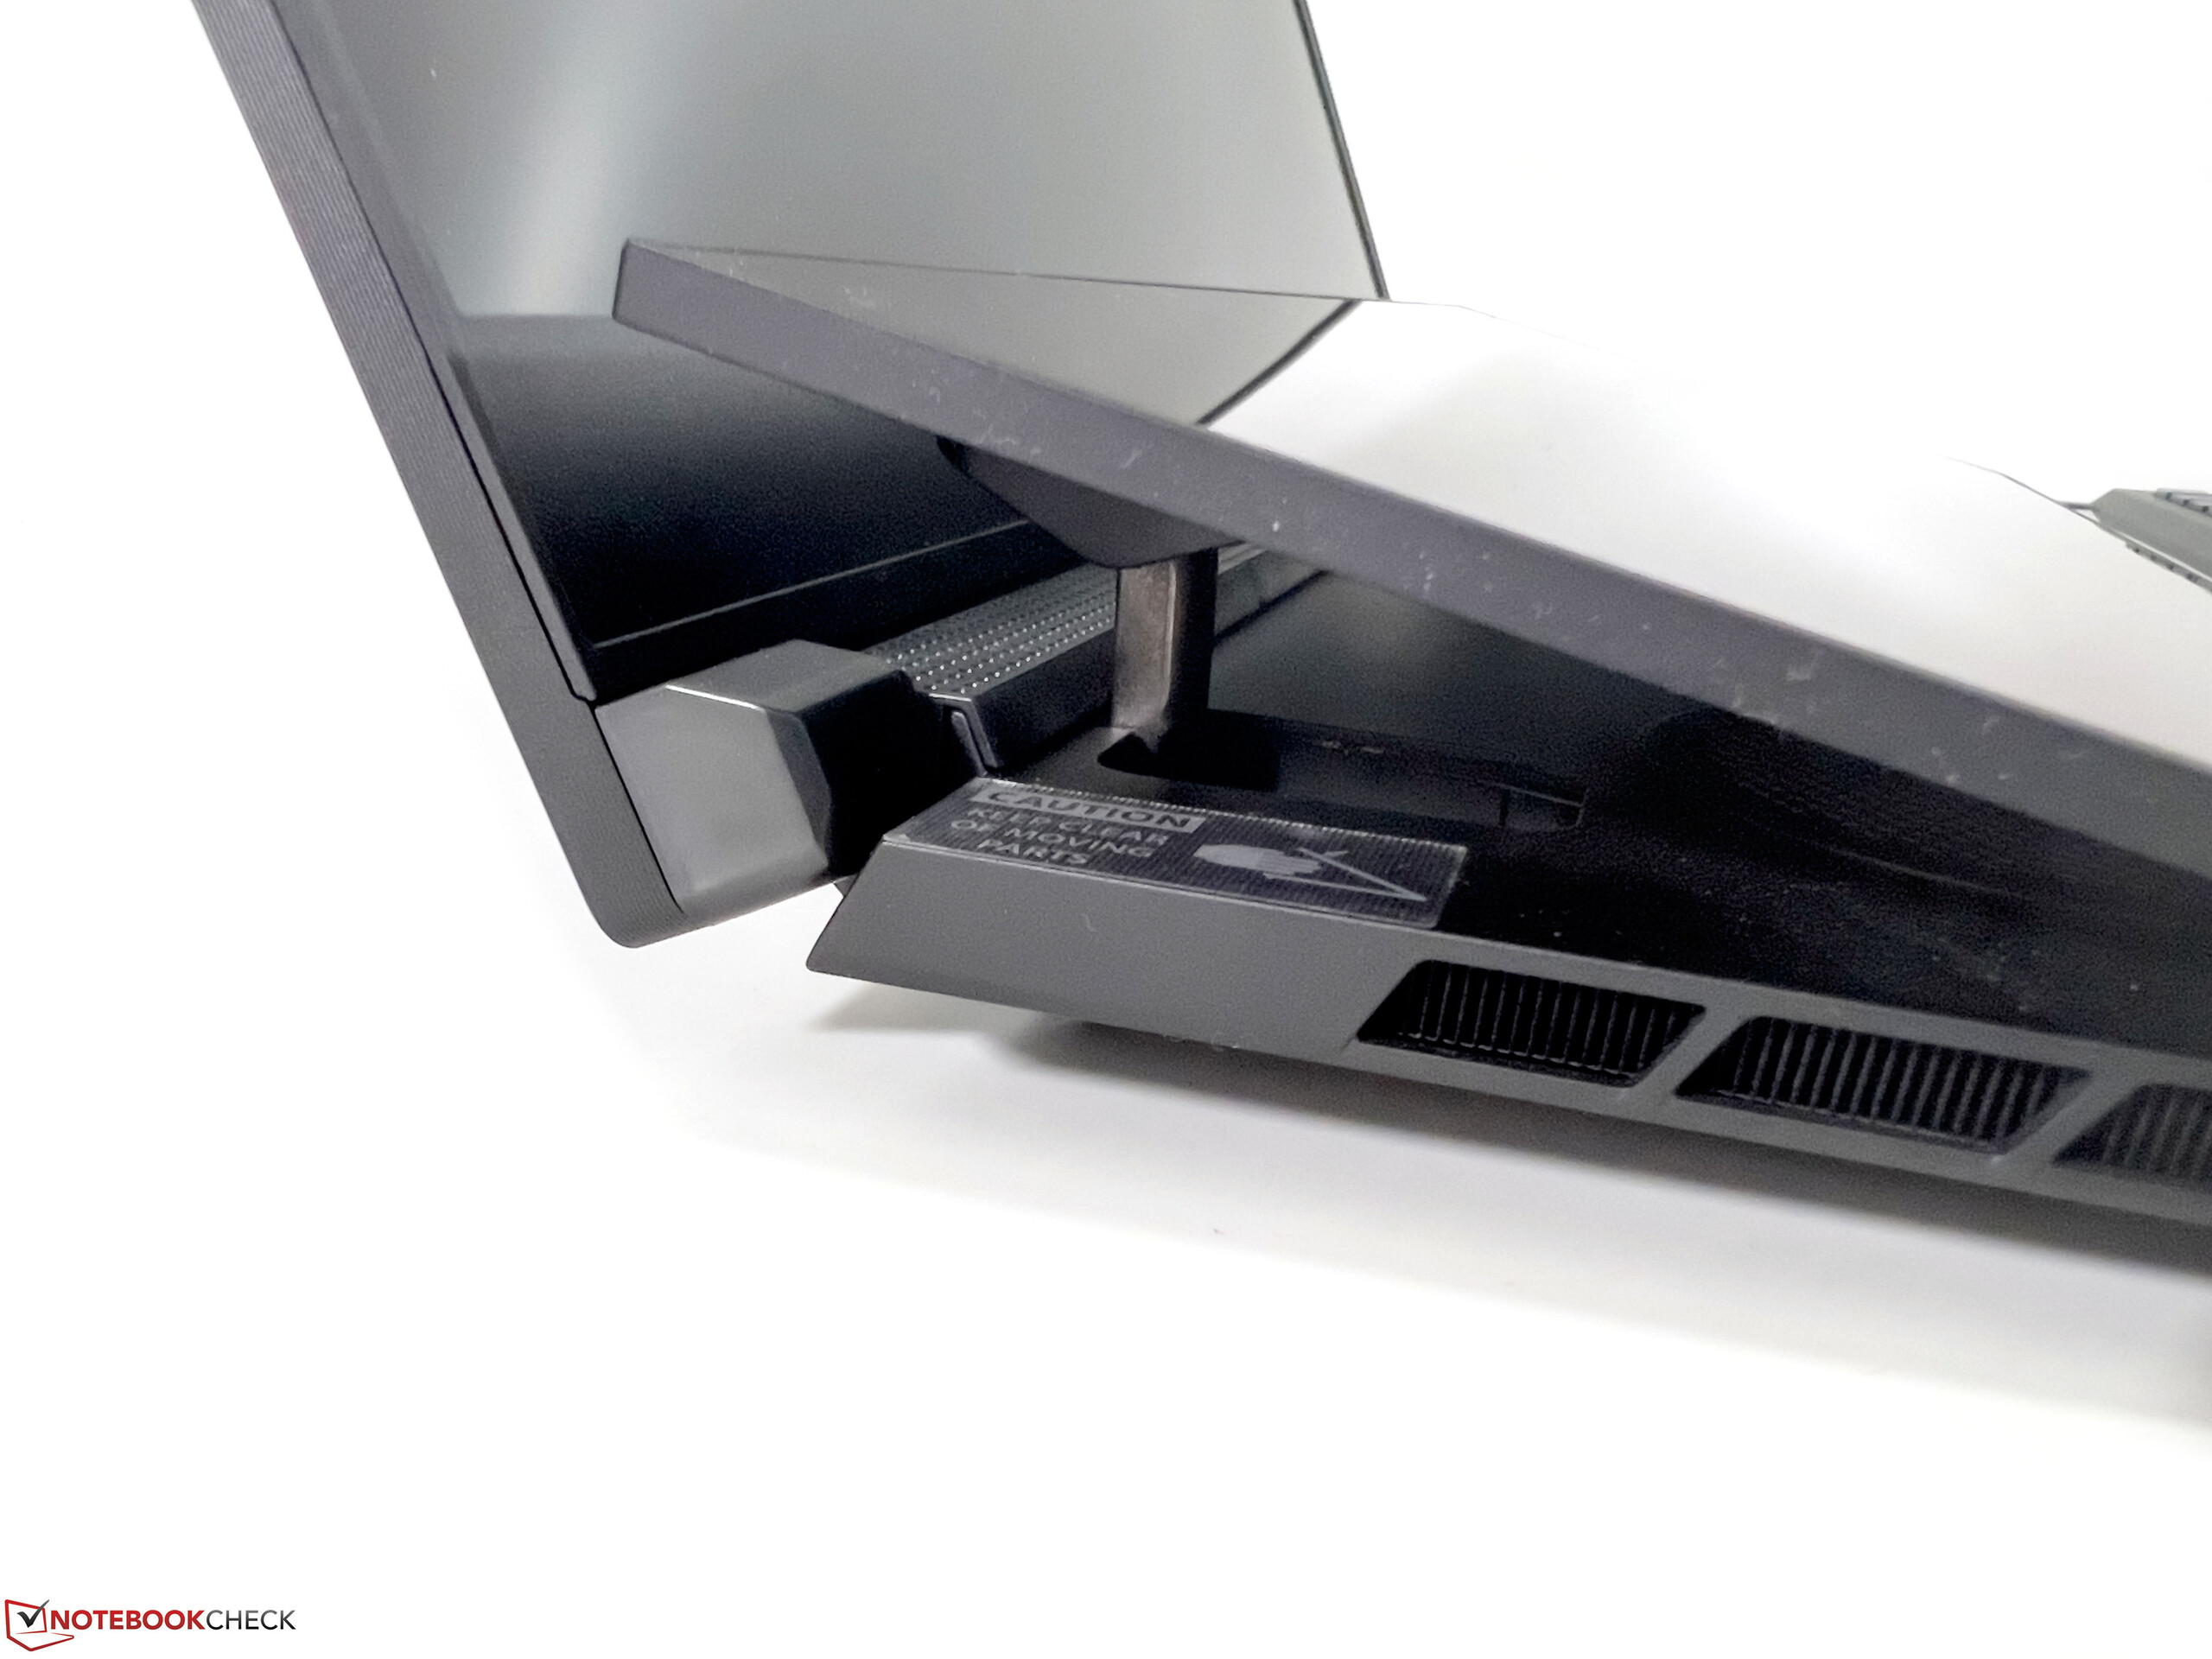
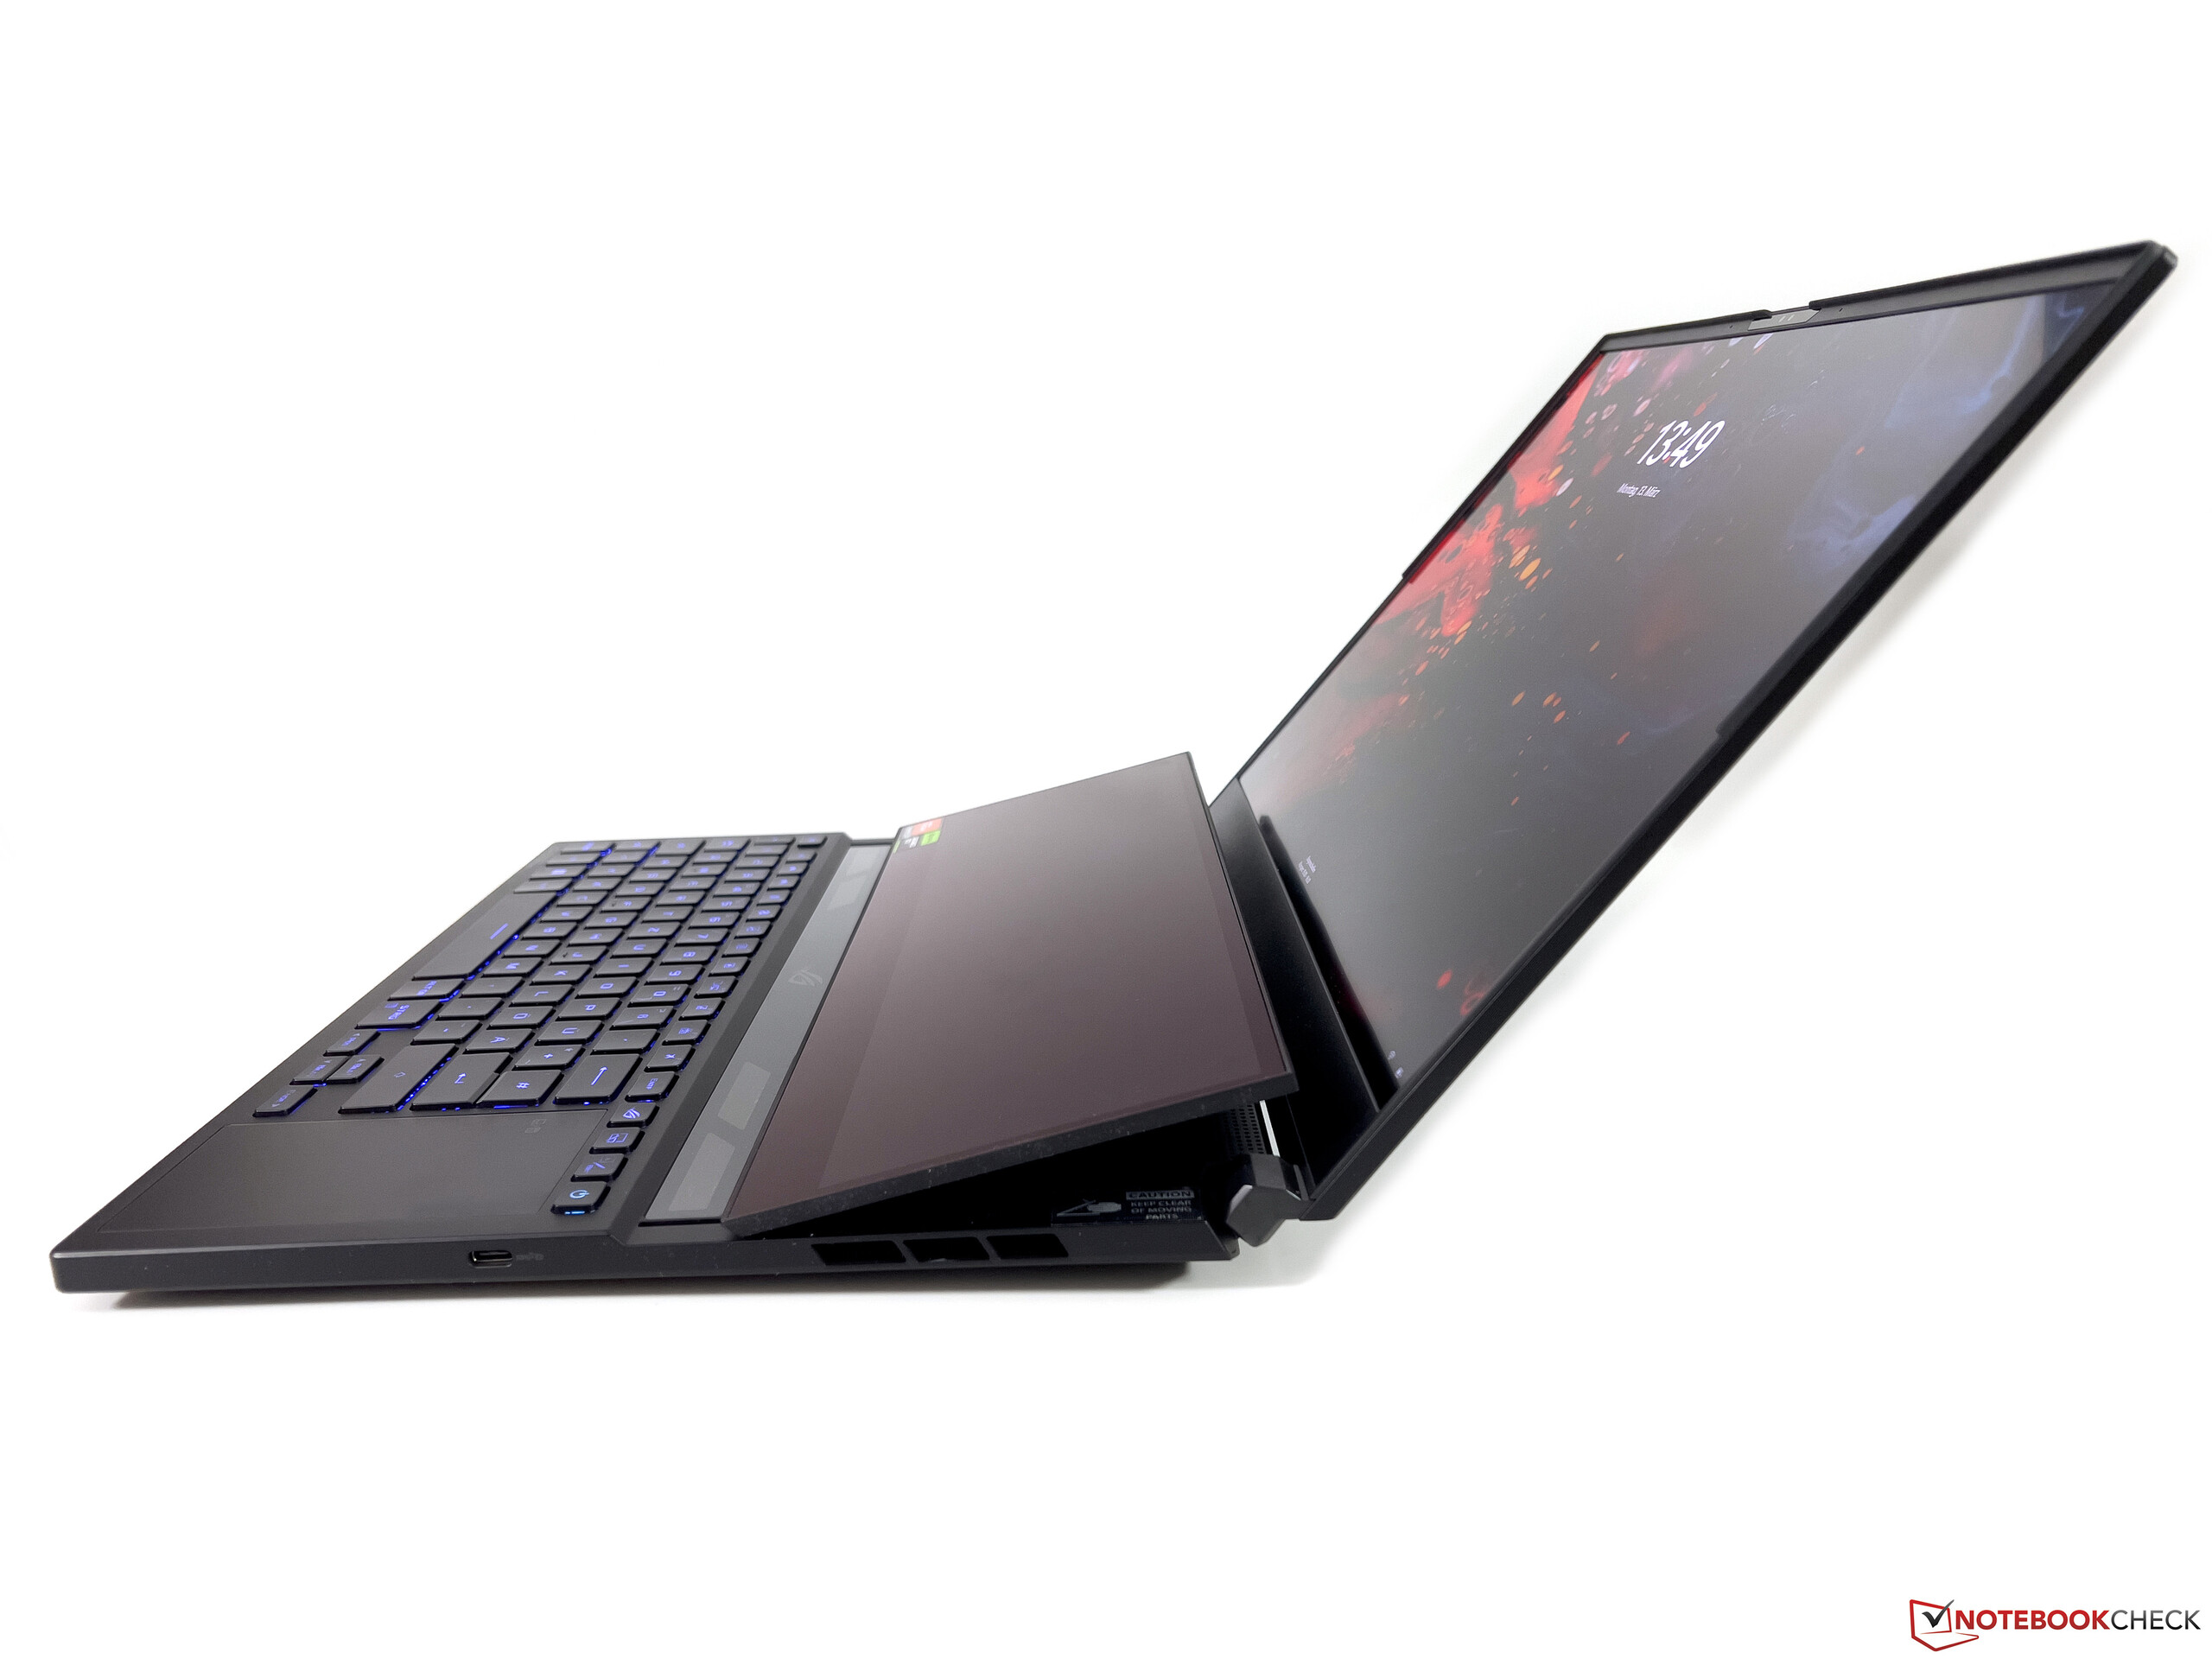
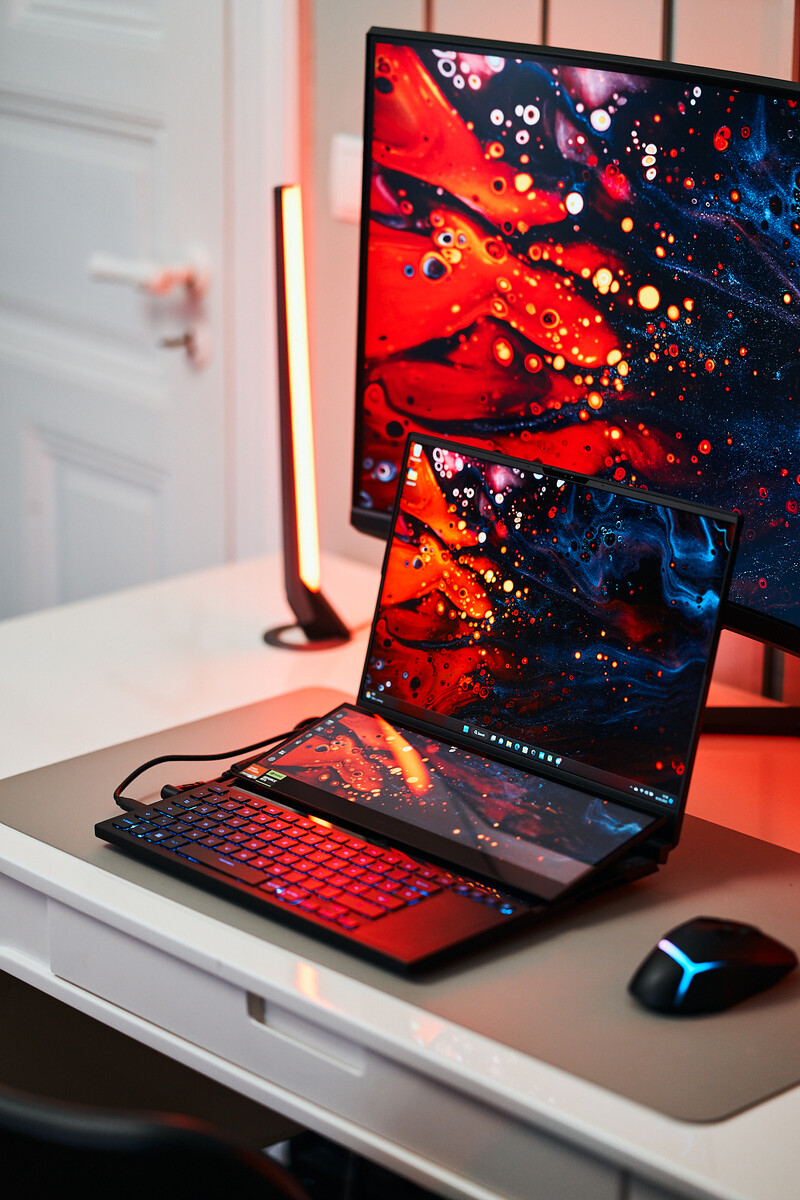
Uma vez aberta a tampa, porém, você verá imediatamente que este não é um laptop comum. Dependendo do ângulo de abertura da tela principal, a tela secundária é levemente elevada (até ~15 graus) e deslocada para trás, o que descobre uma tampa transparente acima do teclado onde se pode até vislumbrar o interior do chassi nos cantos. O ângulo da tela secundária não pode ser alterado, mas funciona bem na prática. O mecanismo de elevação também é muito robusto e não há movimentos. A estabilidade é muito boa em geral, apenas o ângulo máximo de abertura da tampa é um pouco limitado a ~130 graus.
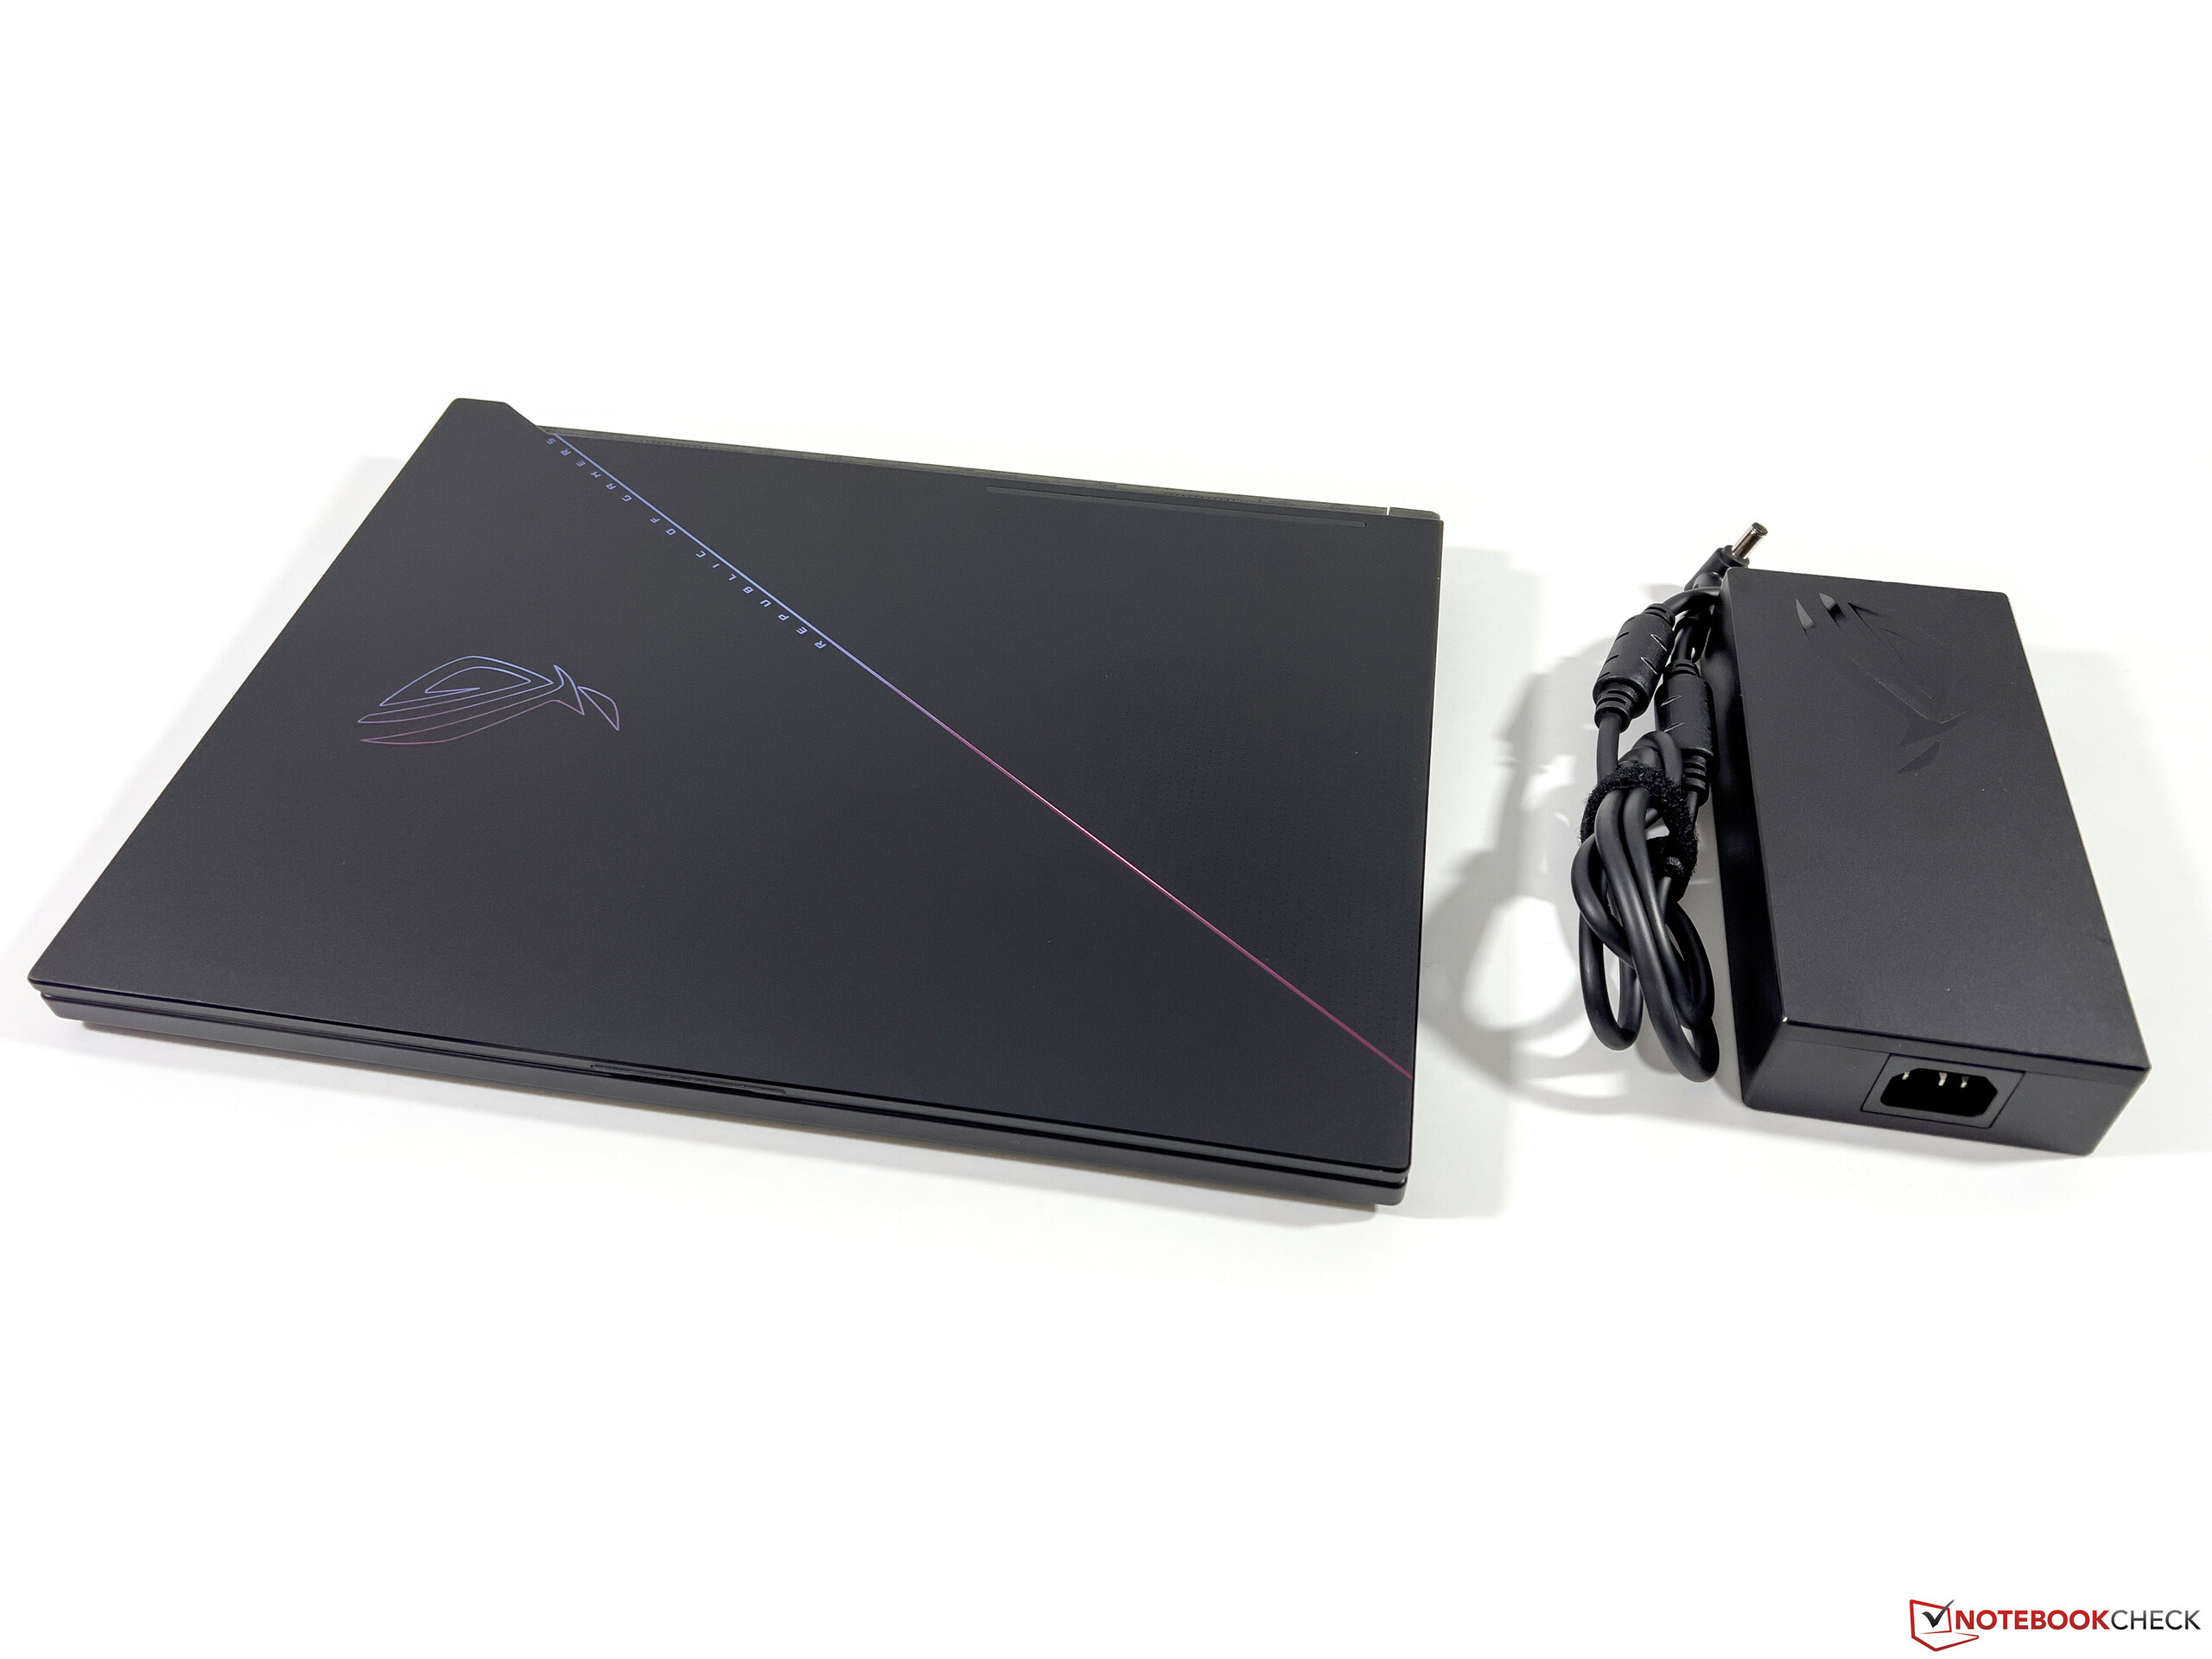
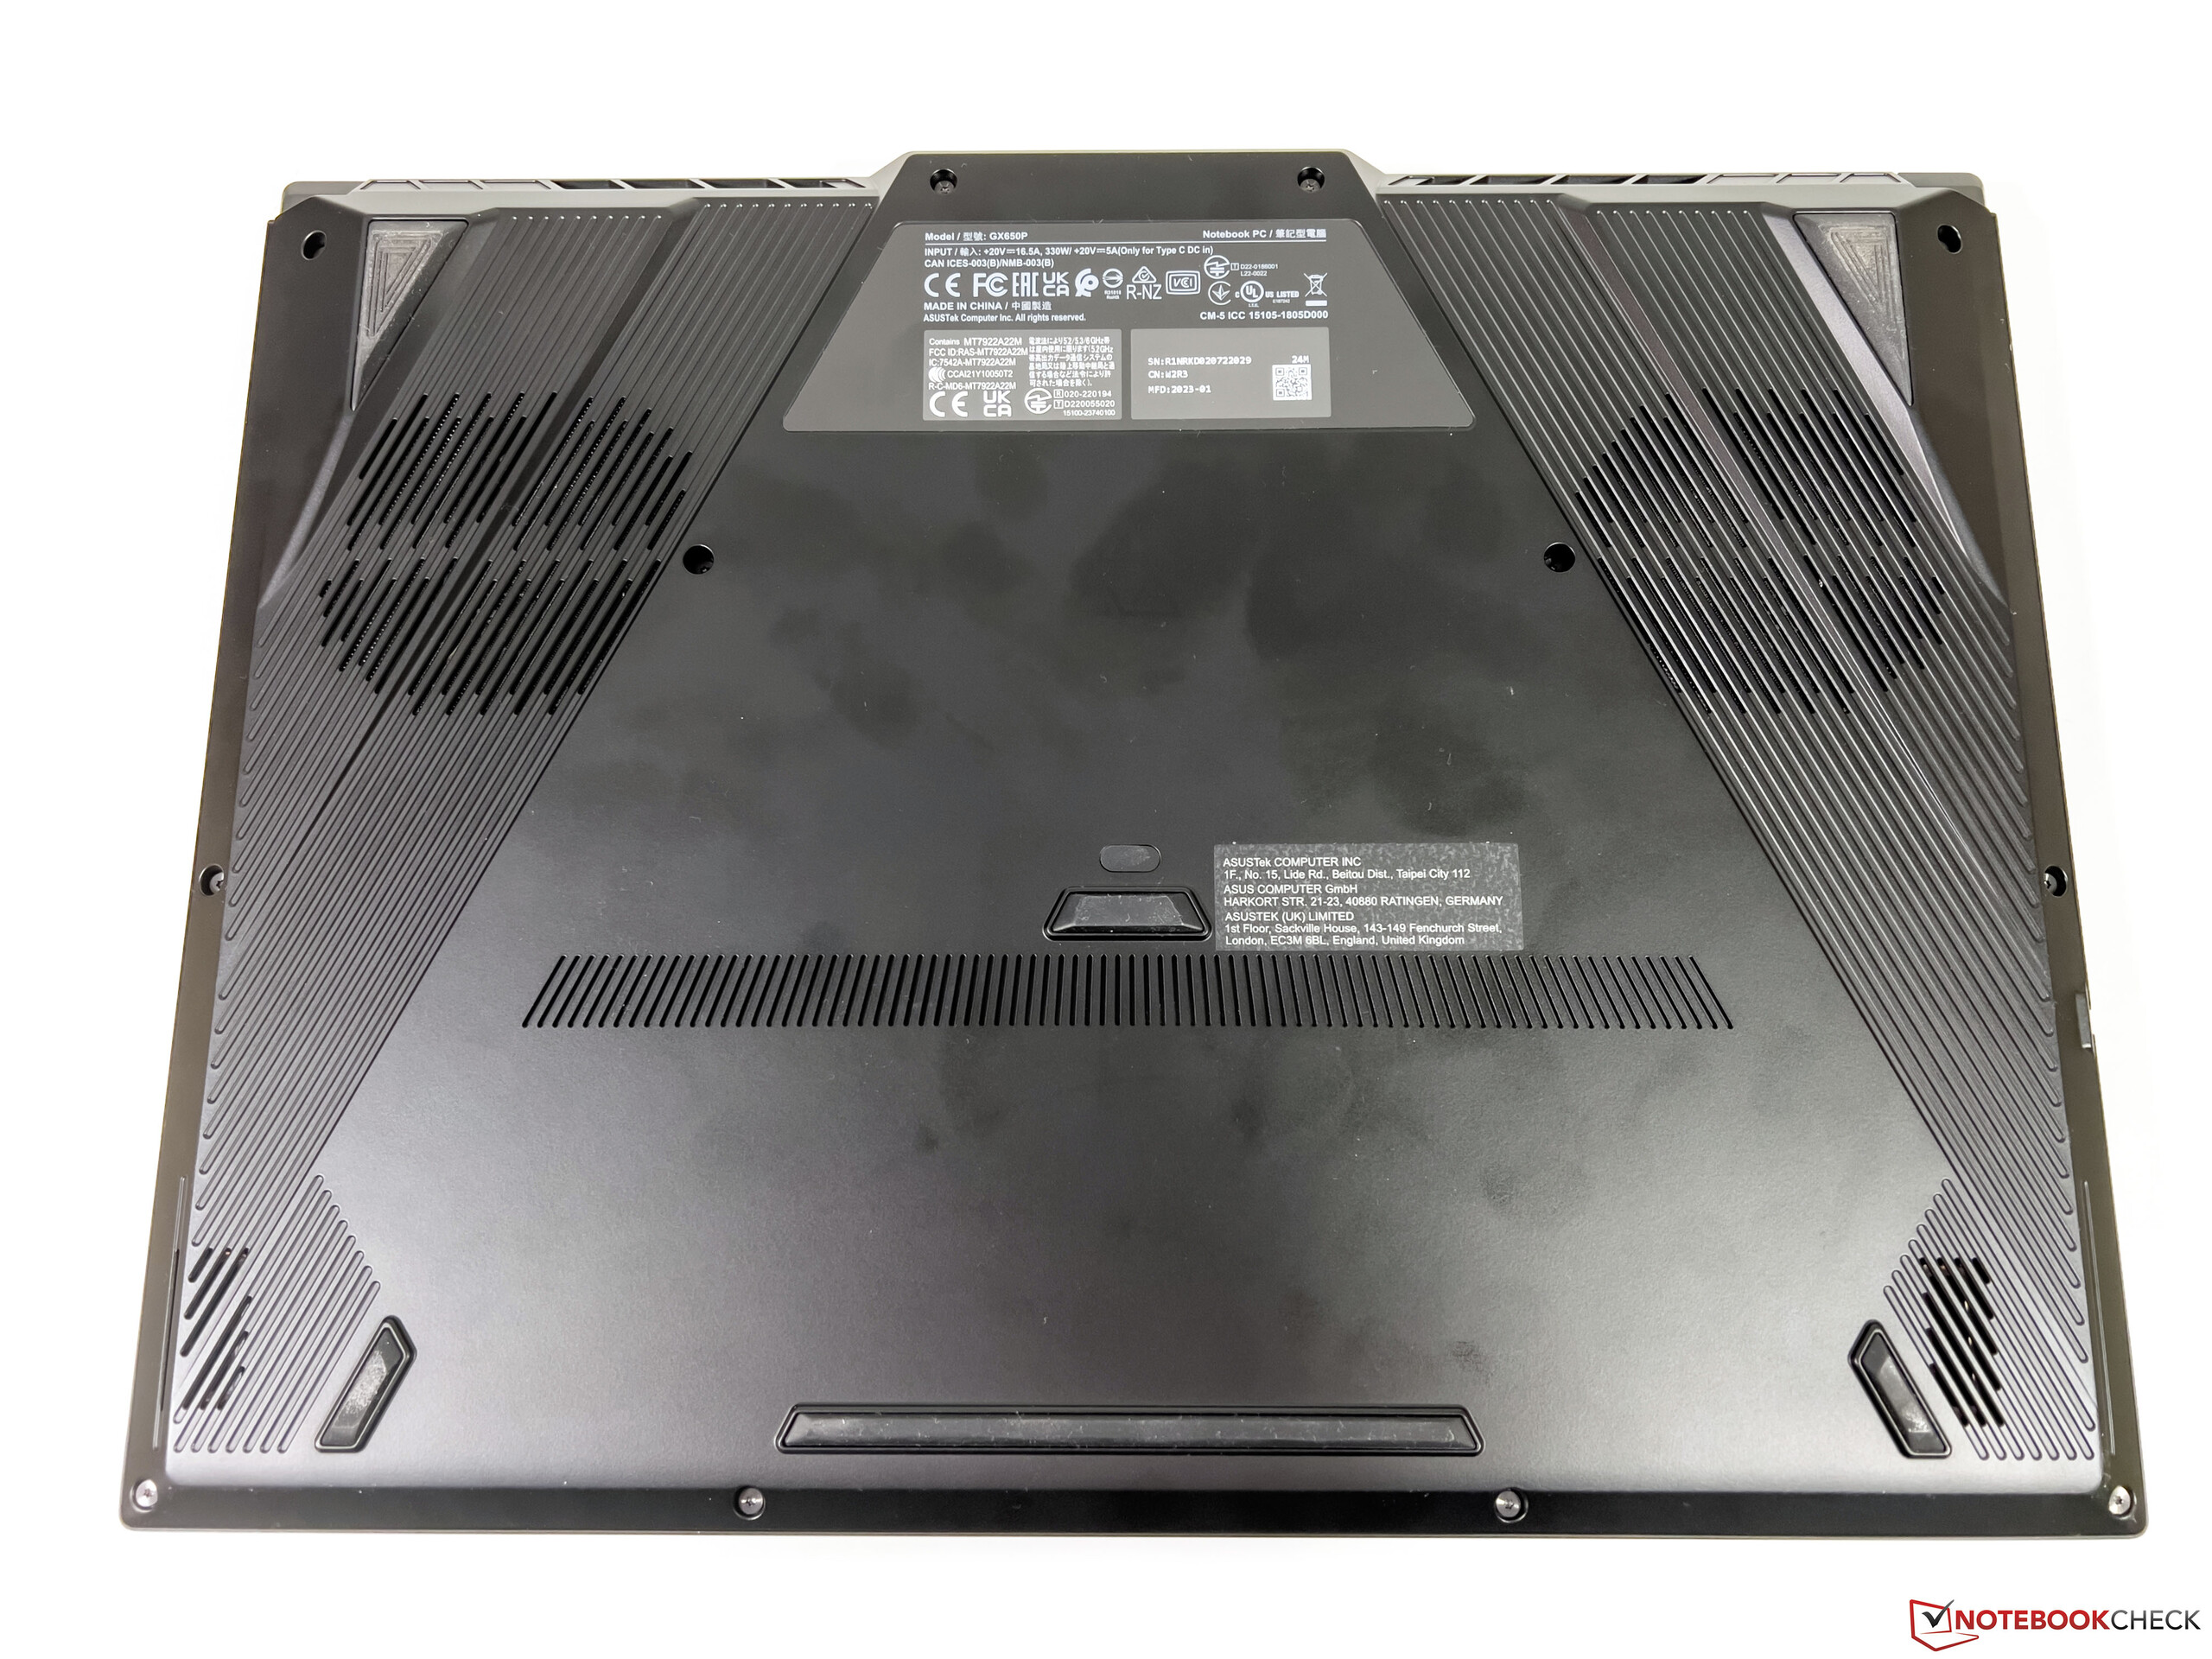
Nossa comparação de tamanho mostra que a linha de 17 polegadasMSI Titan GT77tem uma pegada muito maior, mas também mostra que o ROG Zephyrus Duo 16 é de longe o dispositivo mais grosso em nosso pequeno grupo de comparação. Isto é obviamente causado pela tela secundária, que requer espaço adicional. É também um dos modelos mais pesados de 16 polegadas com quase 2,7 kg e você também tem que considerar a volumosa fonte de alimentação de 330W, que dá uma ponta na balança de mais de 1,1 kg.
Conectividade - Leitor de cartões, mas sem USB 4.0
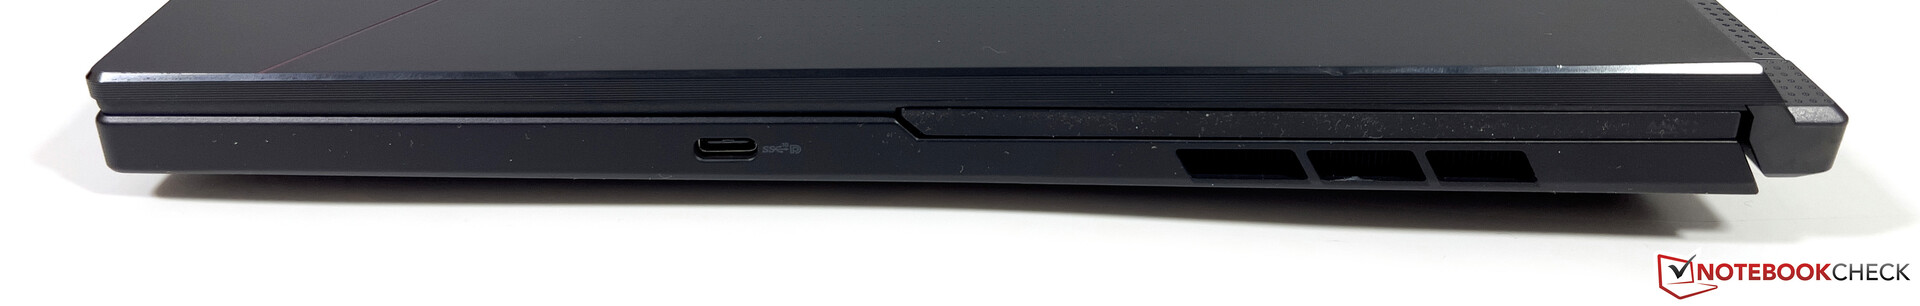
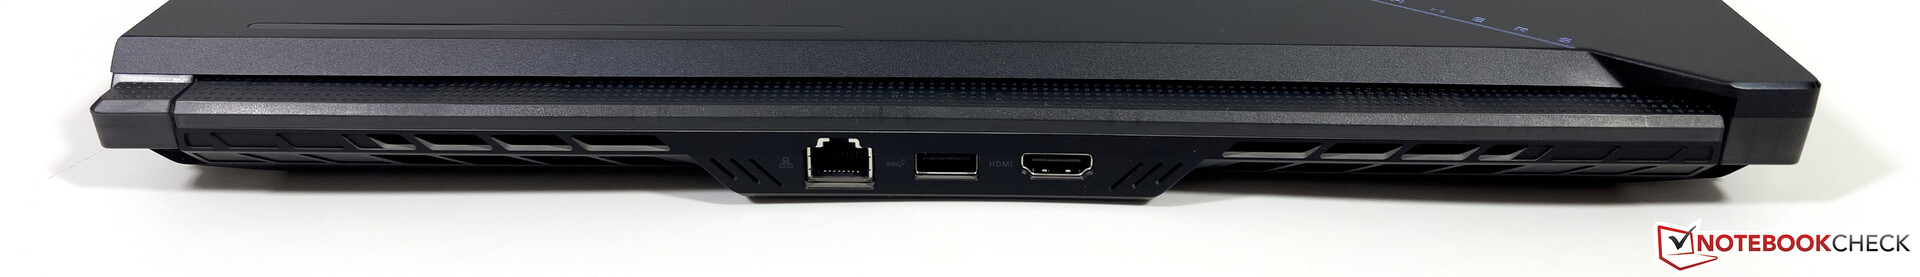
A área traseira da unidade base é quase completamente ocupada pelo resfriamento, razão pela qual existem apenas três portas (Ethernet, HDMI, USB-A) no centro da parte traseira. A maioria das portas restantes está localizada na parte frontal do lado esquerdo, o que também é o caso do conector de alimentação angular. O cabo da PSU é bastante curto, portanto o cabo de alimentação pode bloquear a porta USB-A dependendo da orientação. Há mais uma porta USB-C no lado esquerdo.
Além da disposição um tanto inconveniente da porta, estamos surpresos que o Asus não tenha incluído o suporte para USB 4. O processador AMD suporta USB 4 em geral, mas requer um controlador USB adicional, e parece que o Asus não queria gastar o dinheiro.
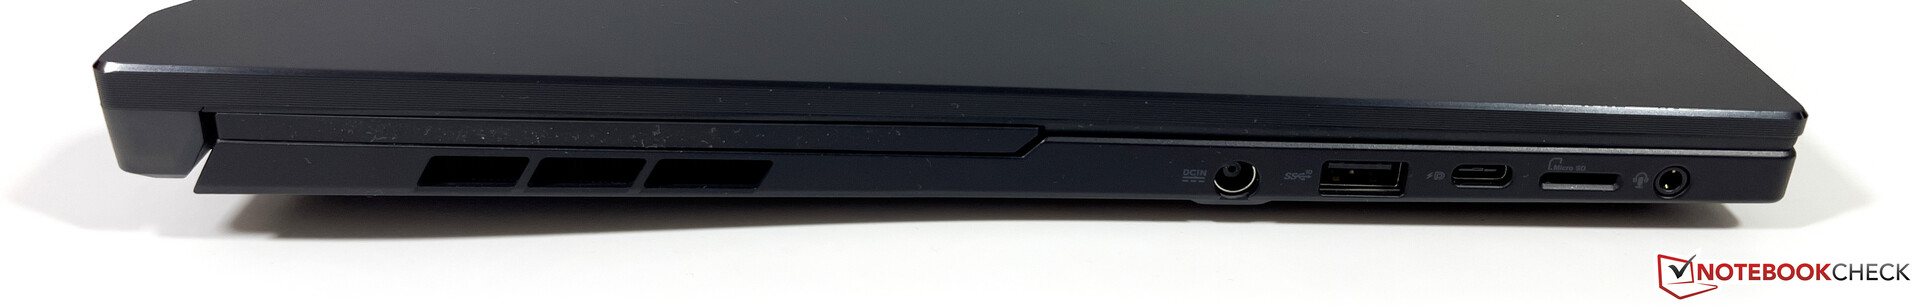
Leitor de cartões SD
Há um leitor de cartões microSD no lado esquerdo e os cartões SD estão nivelados com o chassi. As taxas de transferência em combinação com nosso cartão de referência (Angelbird AV Pro V60 128 GB) são excelentes e medimos até 270 MB/s e mais de 180 MB/s quando copiamos arquivos de imagem jpeg.
| SD Card Reader | |
| average JPG Copy Test (av. of 3 runs) | |
| Apple MacBook Pro 16 2023 M2 Max (Angelbird AV Pro V60) | |
| Asus Zephyrus Duo 16 GX650PY-NM006W (Angelbird AV Pro V60) | |
| Asus ROG Zephyrus Duo 16 GX650RX (AV PRO microSD 128 GB V60) | |
| Média da turma Gaming (20.9 - 210, n=54, últimos 2 anos) | |
| Razer Blade 16 Early 2023 (AV PRO microSD 128 GB V60) | |
| MSI Titan GT77 HX 13VI (Angelibird AV Pro V60) | |
| maximum AS SSD Seq Read Test (1GB) | |
| Asus Zephyrus Duo 16 GX650PY-NM006W (Angelbird AV Pro V60) | |
| Apple MacBook Pro 16 2023 M2 Max (Angelbird AV Pro V60) | |
| Razer Blade 16 Early 2023 (AV PRO microSD 128 GB V60) | |
| Asus ROG Zephyrus Duo 16 GX650RX (AV PRO microSD 128 GB V60) | |
| Média da turma Gaming (25.5 - 261, n=51, últimos 2 anos) | |
| MSI Titan GT77 HX 13VI (Angelibird AV Pro V60) | |
Comunicação
Você obtém uma tomada Ethernet de 2,5 Gbps na parte traseira e o módulo Wi-Fi (RZ616) também suporta o moderno padrão Wi-Fi 6E para redes de 6 GHz. Não tivemos problemas para usar a rede Wi-Fi de 6 GHz correspondente com nosso roteador de referência da Asus e as taxas de transferência eram ambas muito altas e estáveis. O Bluetooth 5.2 também é suportado.
| Networking | |
| Asus Zephyrus Duo 16 GX650PY-NM006W | |
| iperf3 transmit AXE11000 6GHz | |
| iperf3 receive AXE11000 6GHz | |
| MSI Titan GT77 HX 13VI | |
| iperf3 transmit AXE11000 | |
| iperf3 receive AXE11000 | |
| Lenovo Legion Pro 7 16IRX8H | |
| iperf3 transmit AXE11000 | |
| iperf3 receive AXE11000 | |
| Razer Blade 16 Early 2023 | |
| iperf3 transmit AXE11000 | |
| iperf3 receive AXE11000 | |
| iperf3 transmit AXE11000 6GHz | |
| iperf3 receive AXE11000 6GHz | |
| Asus ROG Zephyrus Duo 16 GX650RX | |
| iperf3 transmit AXE11000 | |
| iperf3 receive AXE11000 | |
| Apple MacBook Pro 16 2023 M2 Max | |
| iperf3 transmit AXE11000 6GHz | |
| iperf3 receive AXE11000 6GHz | |
Webcam
Asus atualizou a webcam e agora usa um sensor de 1080p. Isto tem um efeito positivo sobre a nitidez das imagens em comparação com o modelo anterior, mas a precisão da cor ainda não é muito boa. O ROG Zephyrus Duo 16 não oferece um obturador mecânico.


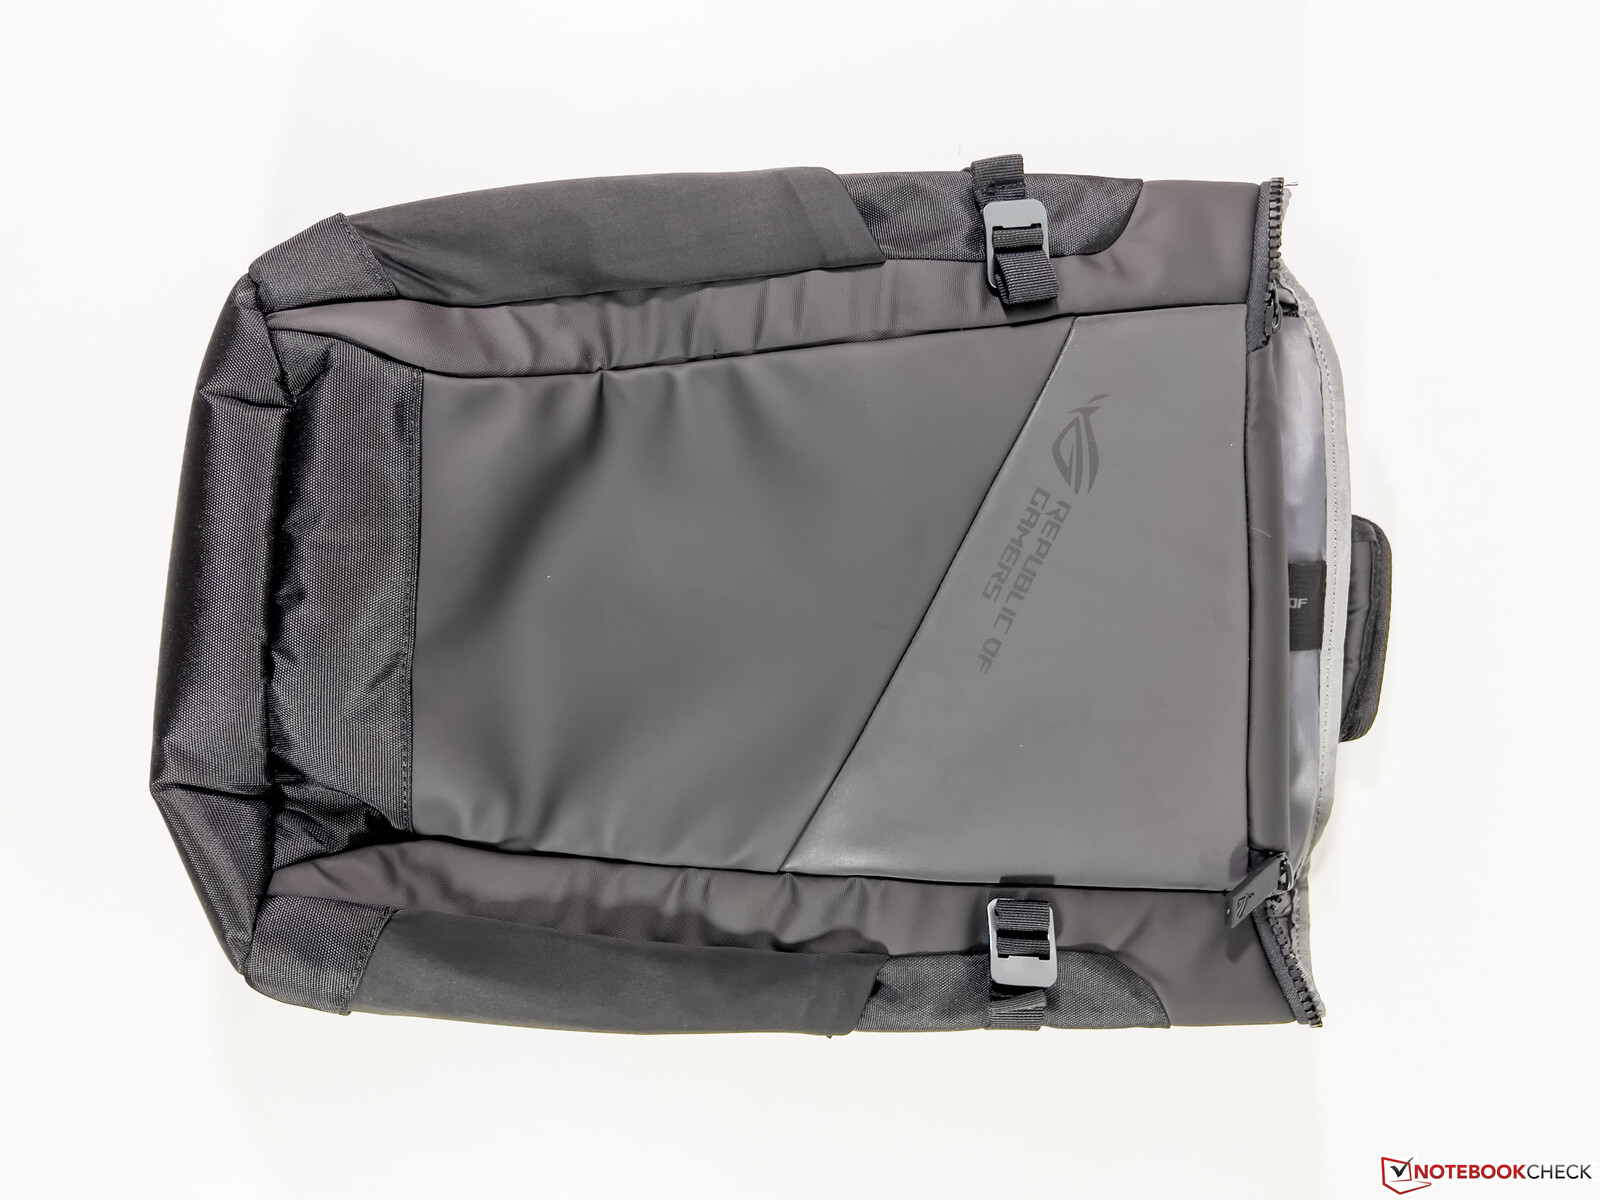
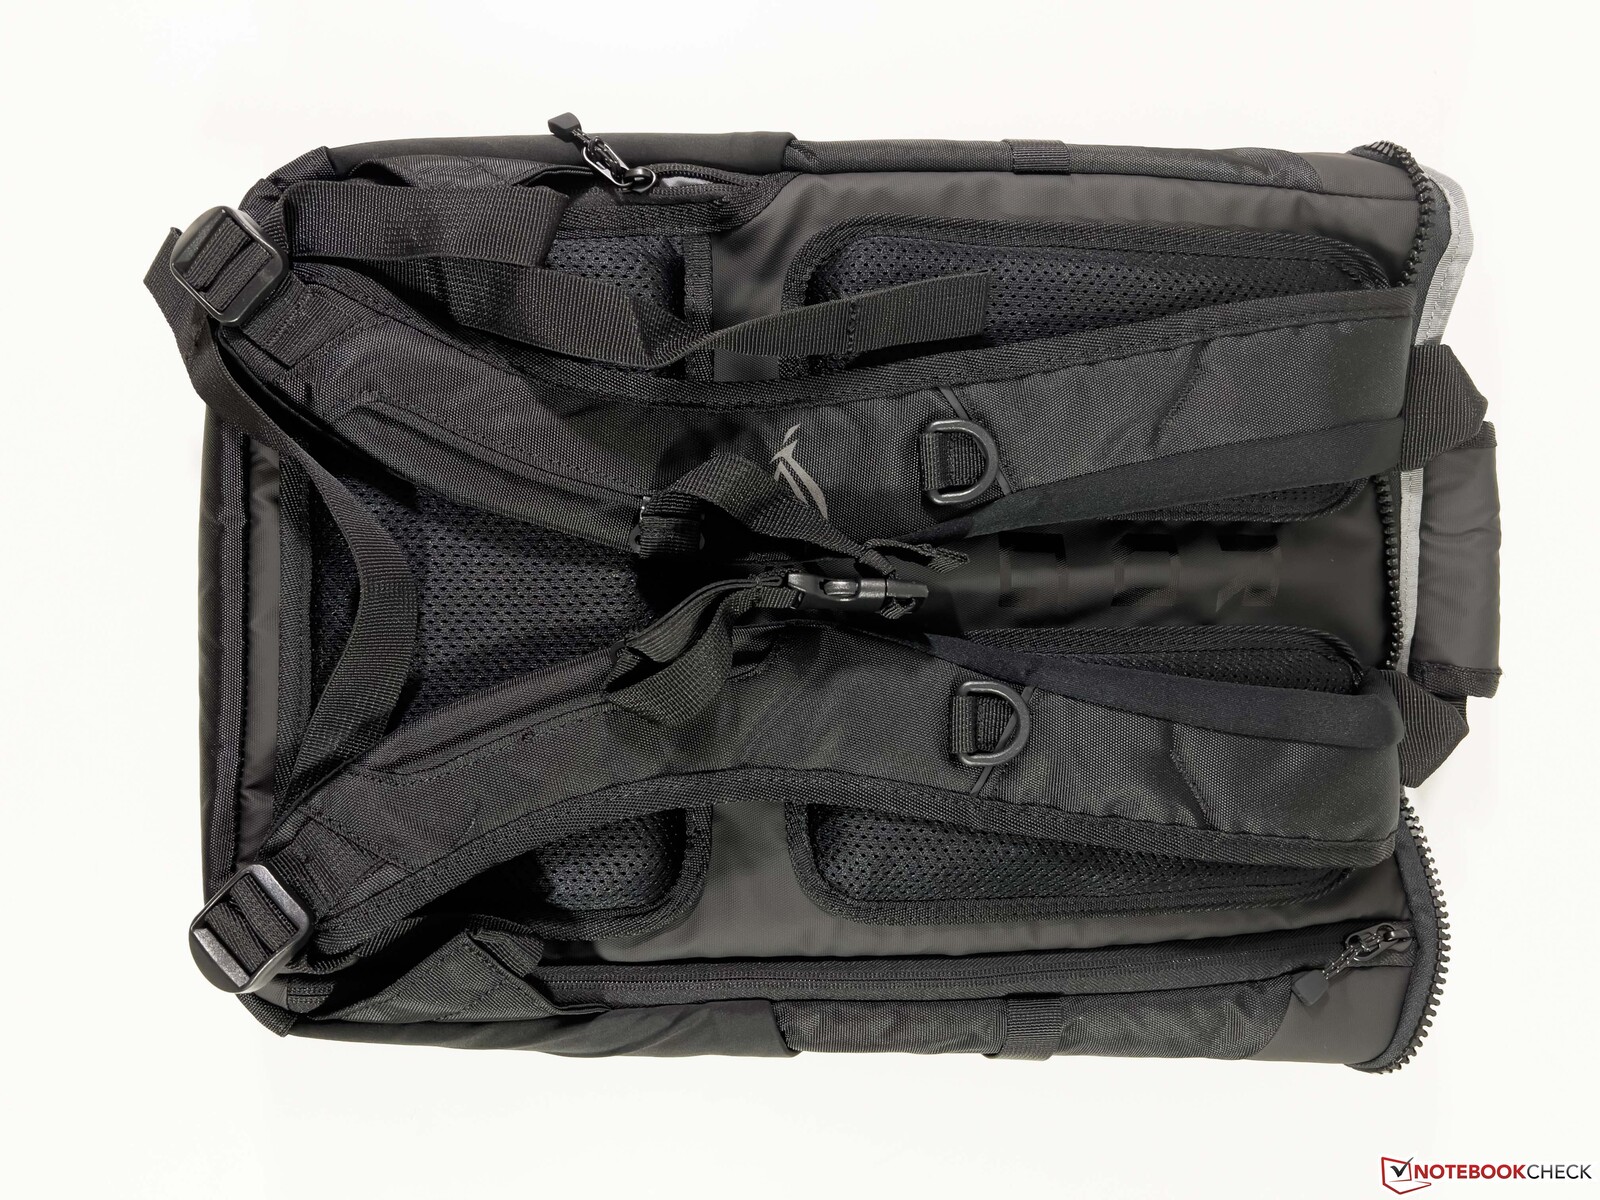
Acessórios
Cada versão do ROG Zephyrus Duo 16 é enviada com um apoio de palma emborrachado, bem como uma mochila ROG escura, o que deixa uma impressão de qualidade muito boa. As unidades mais caras com Windows 11 Pro, 64 GB de RAM e armazenamento SSD de 2 ou 4 TB também incluem o headset ROG Fusion II 300, bem como o mouse para jogos ROG Gladius III Mouse P514.
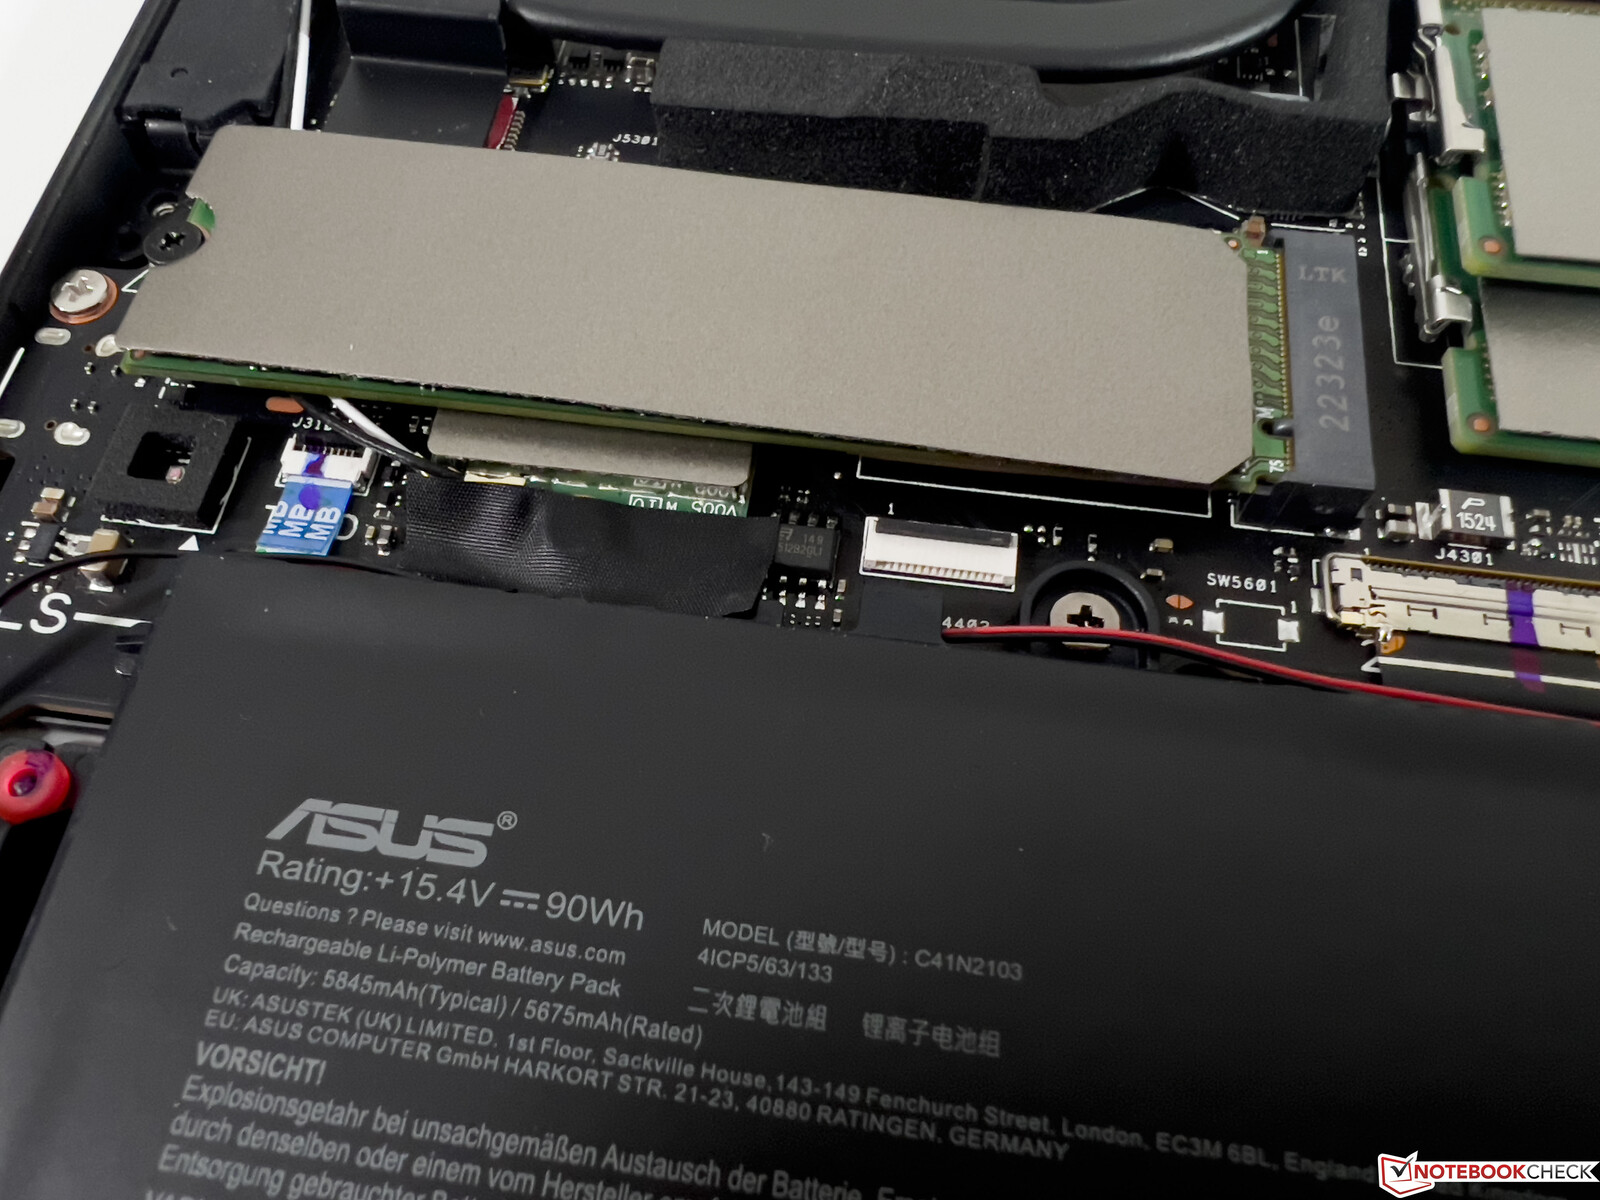
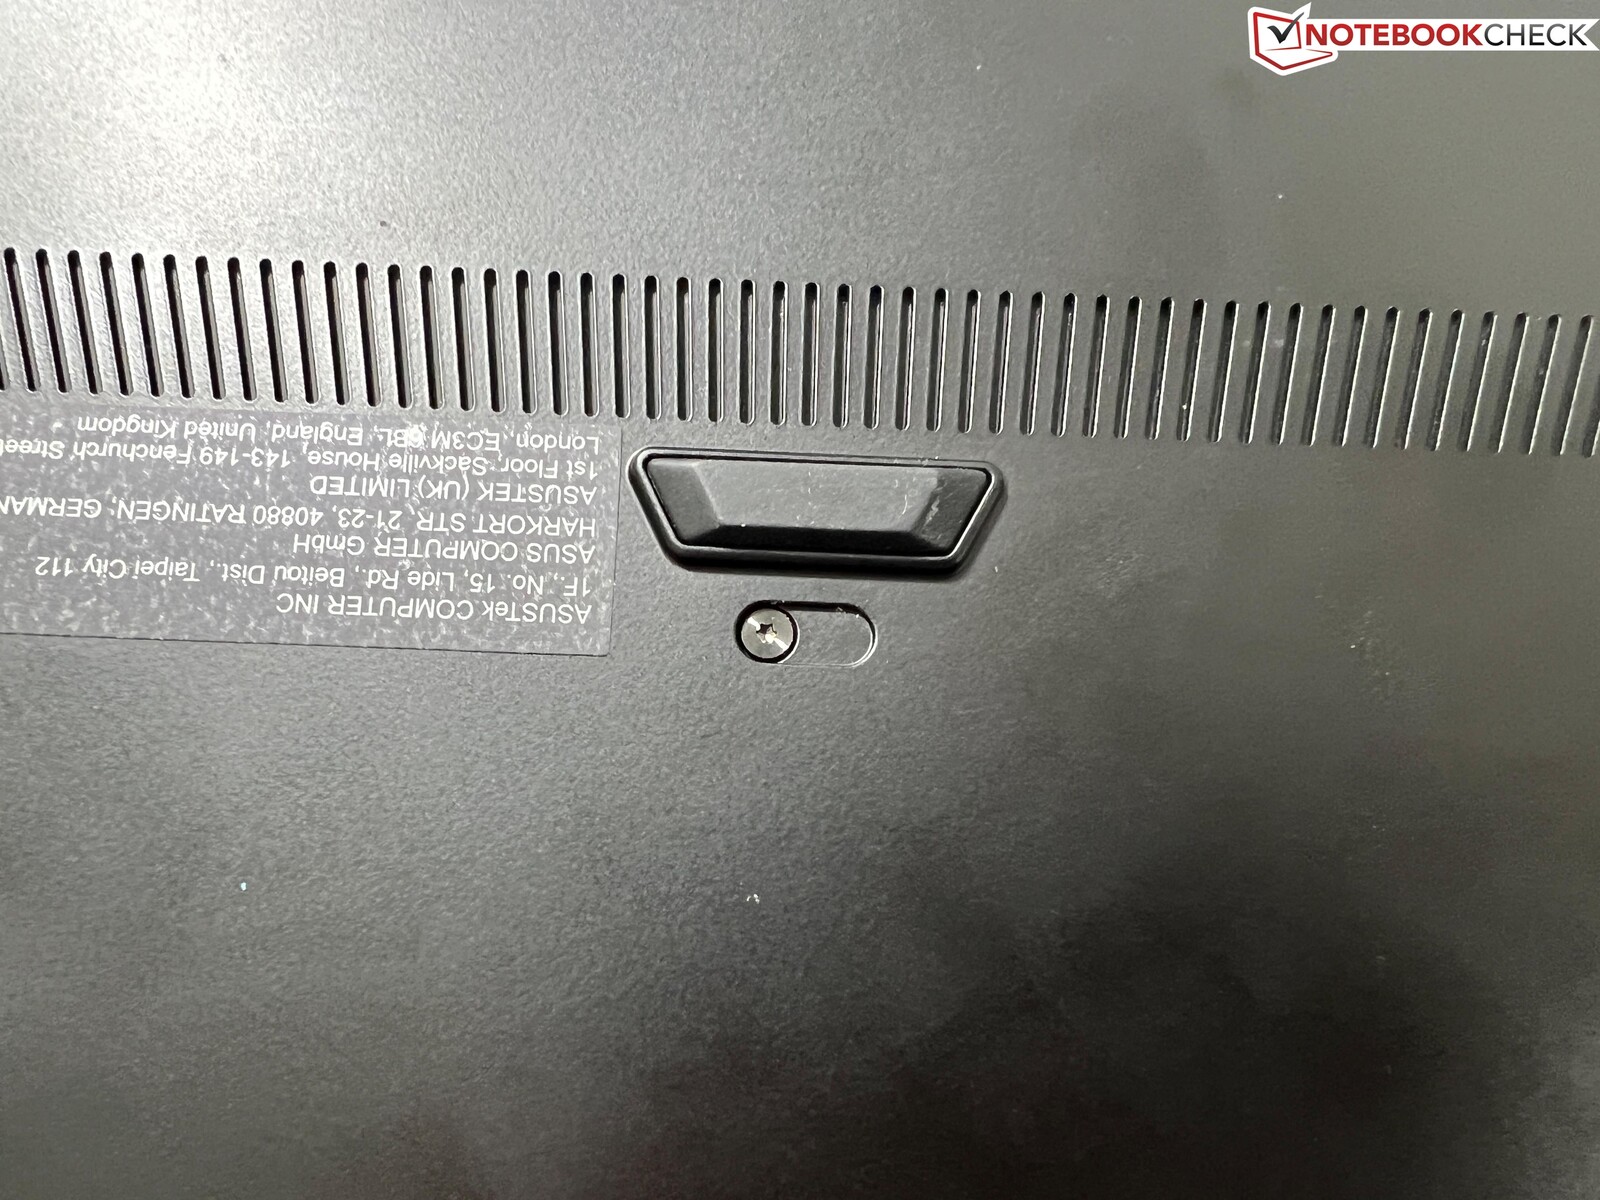
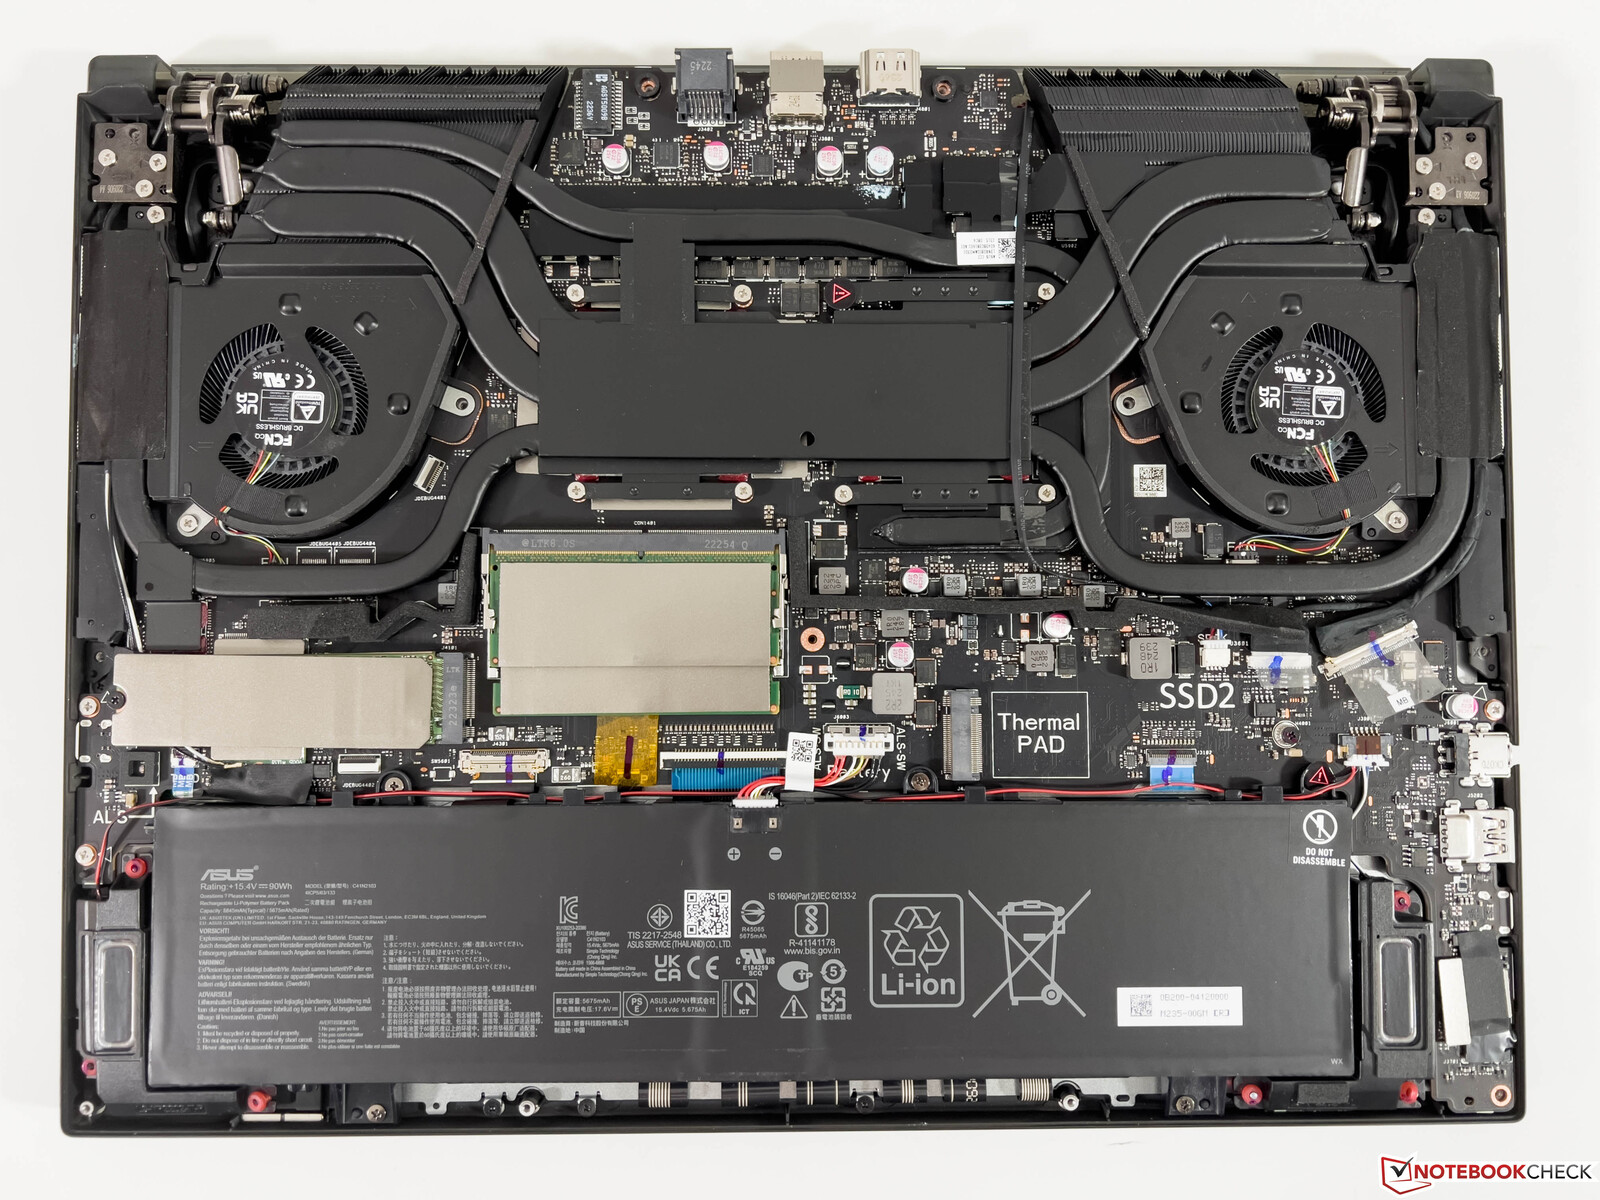
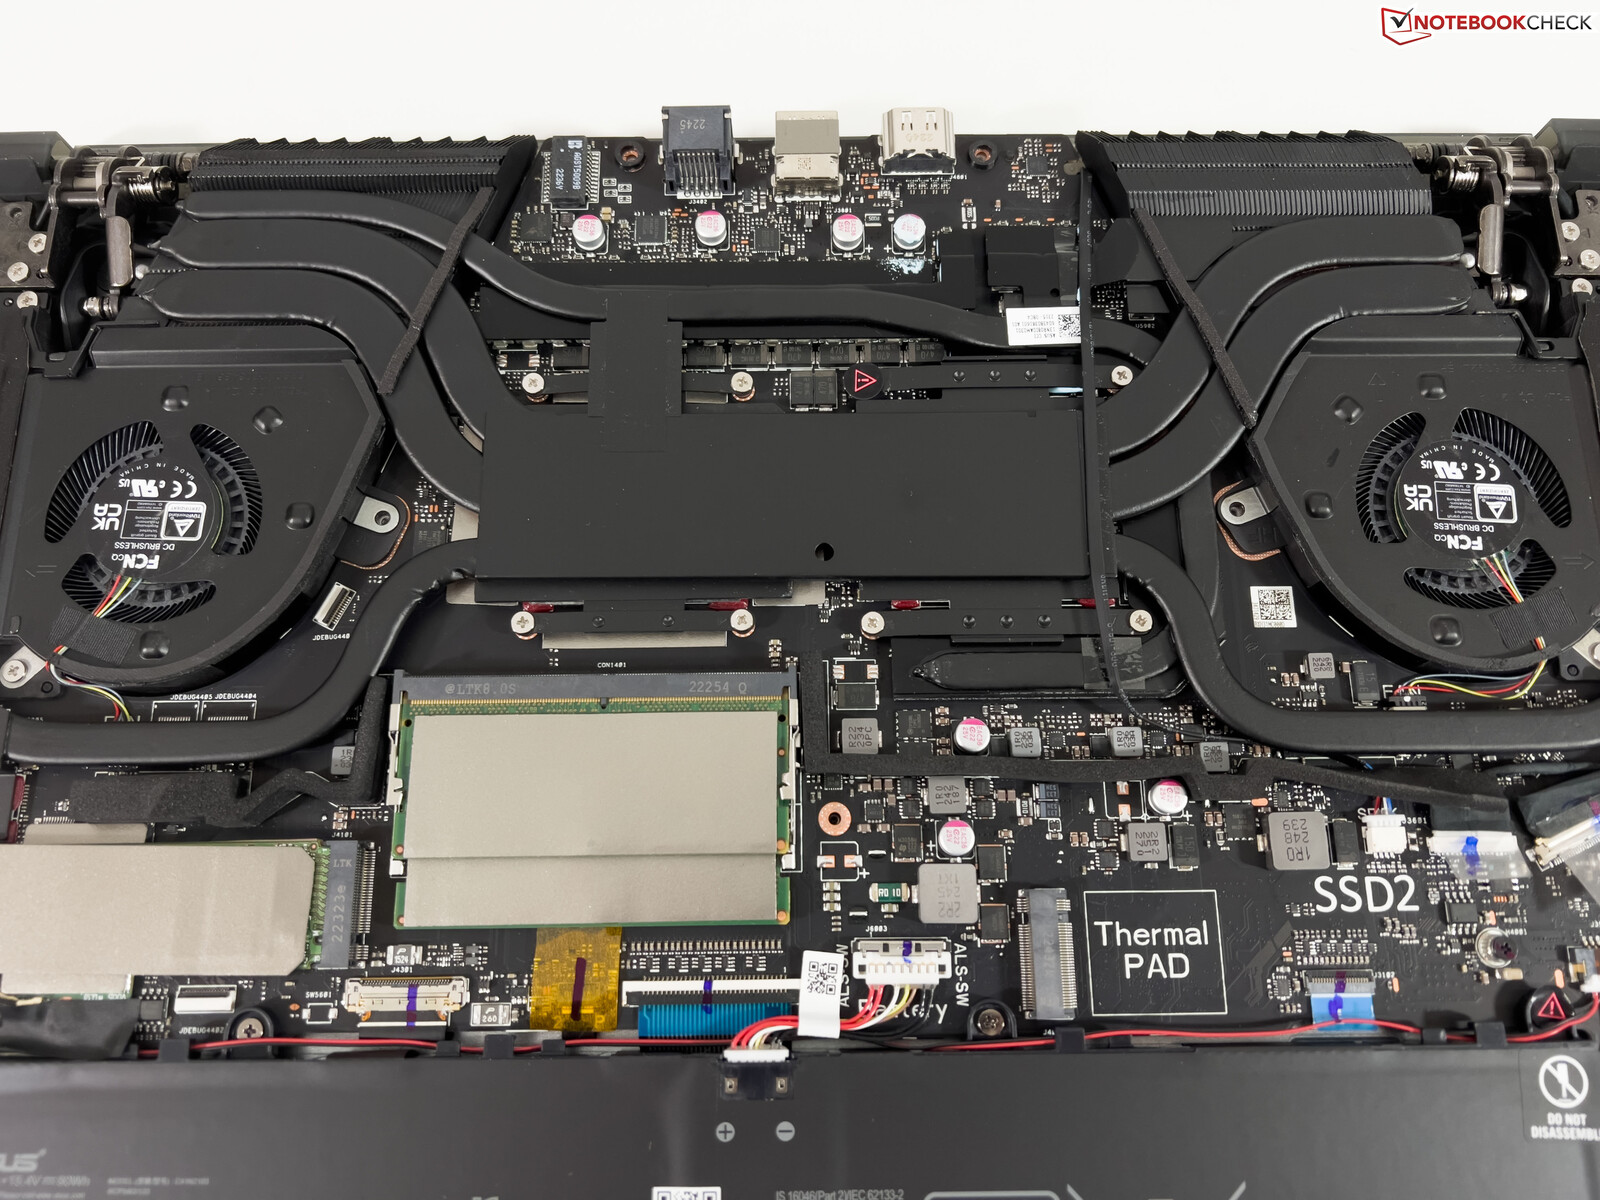
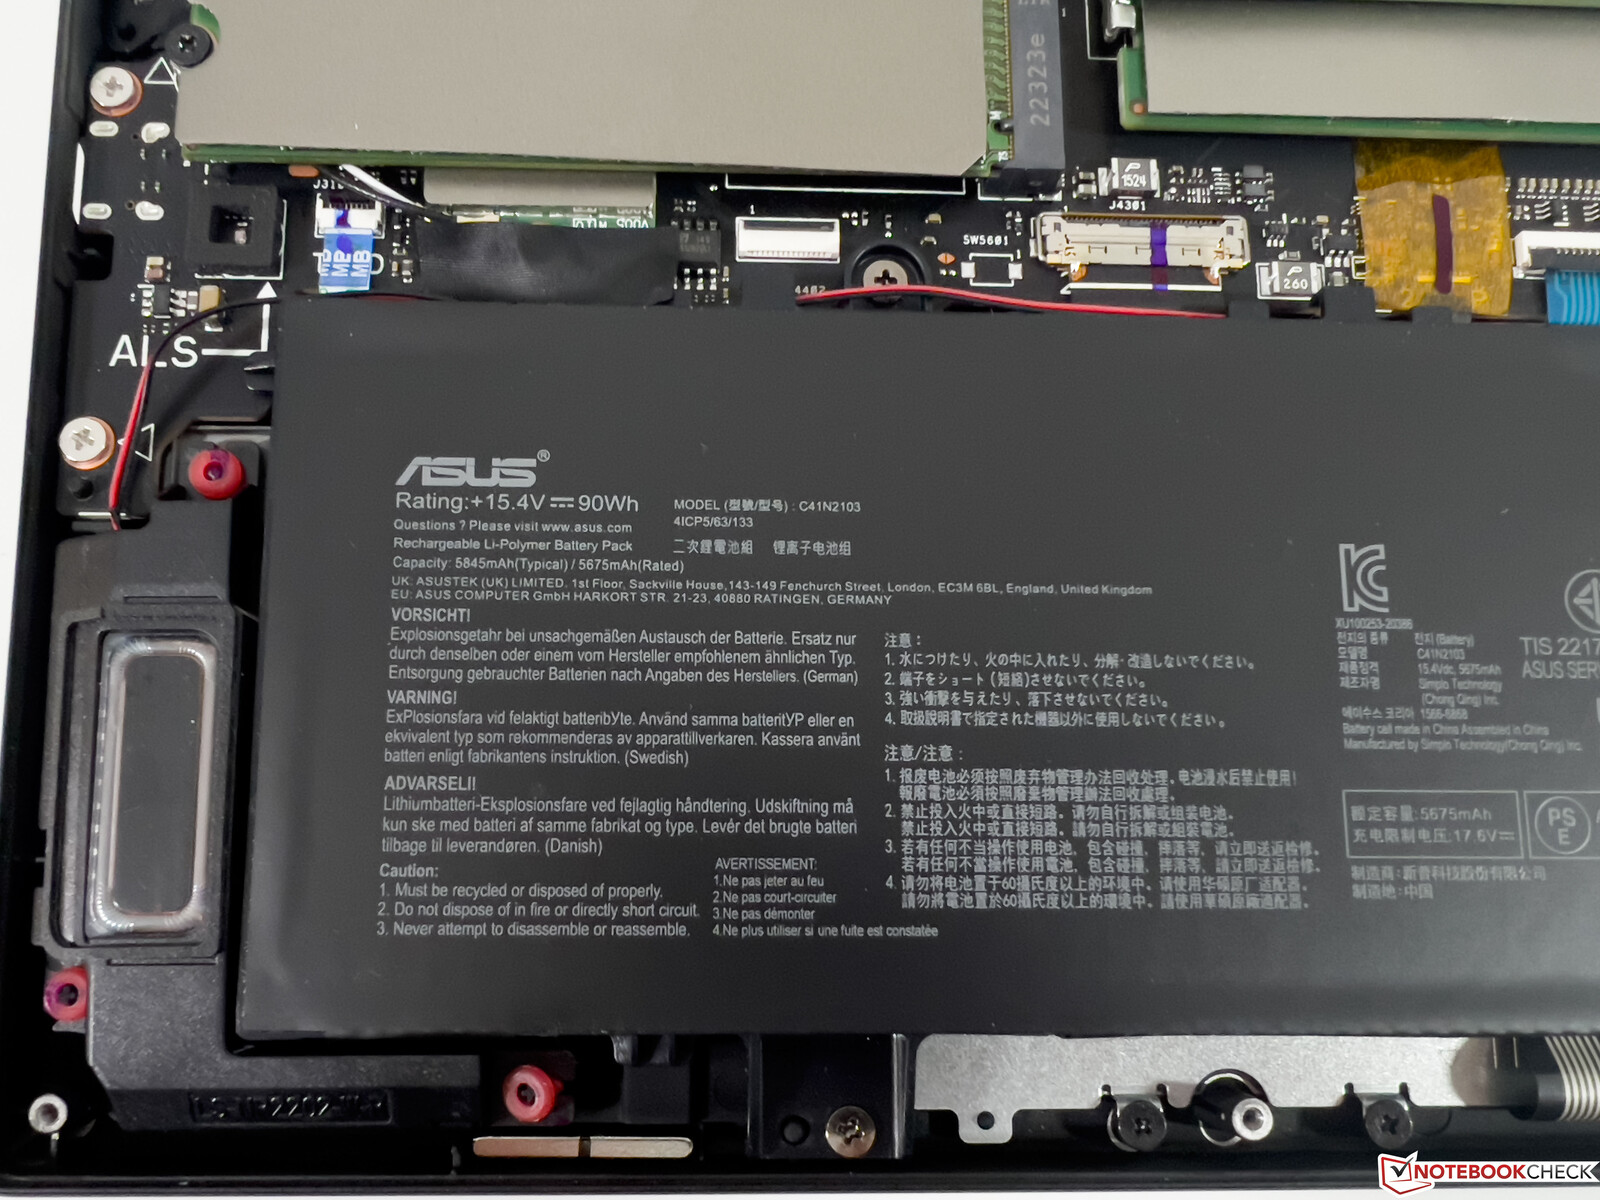
Manutenção
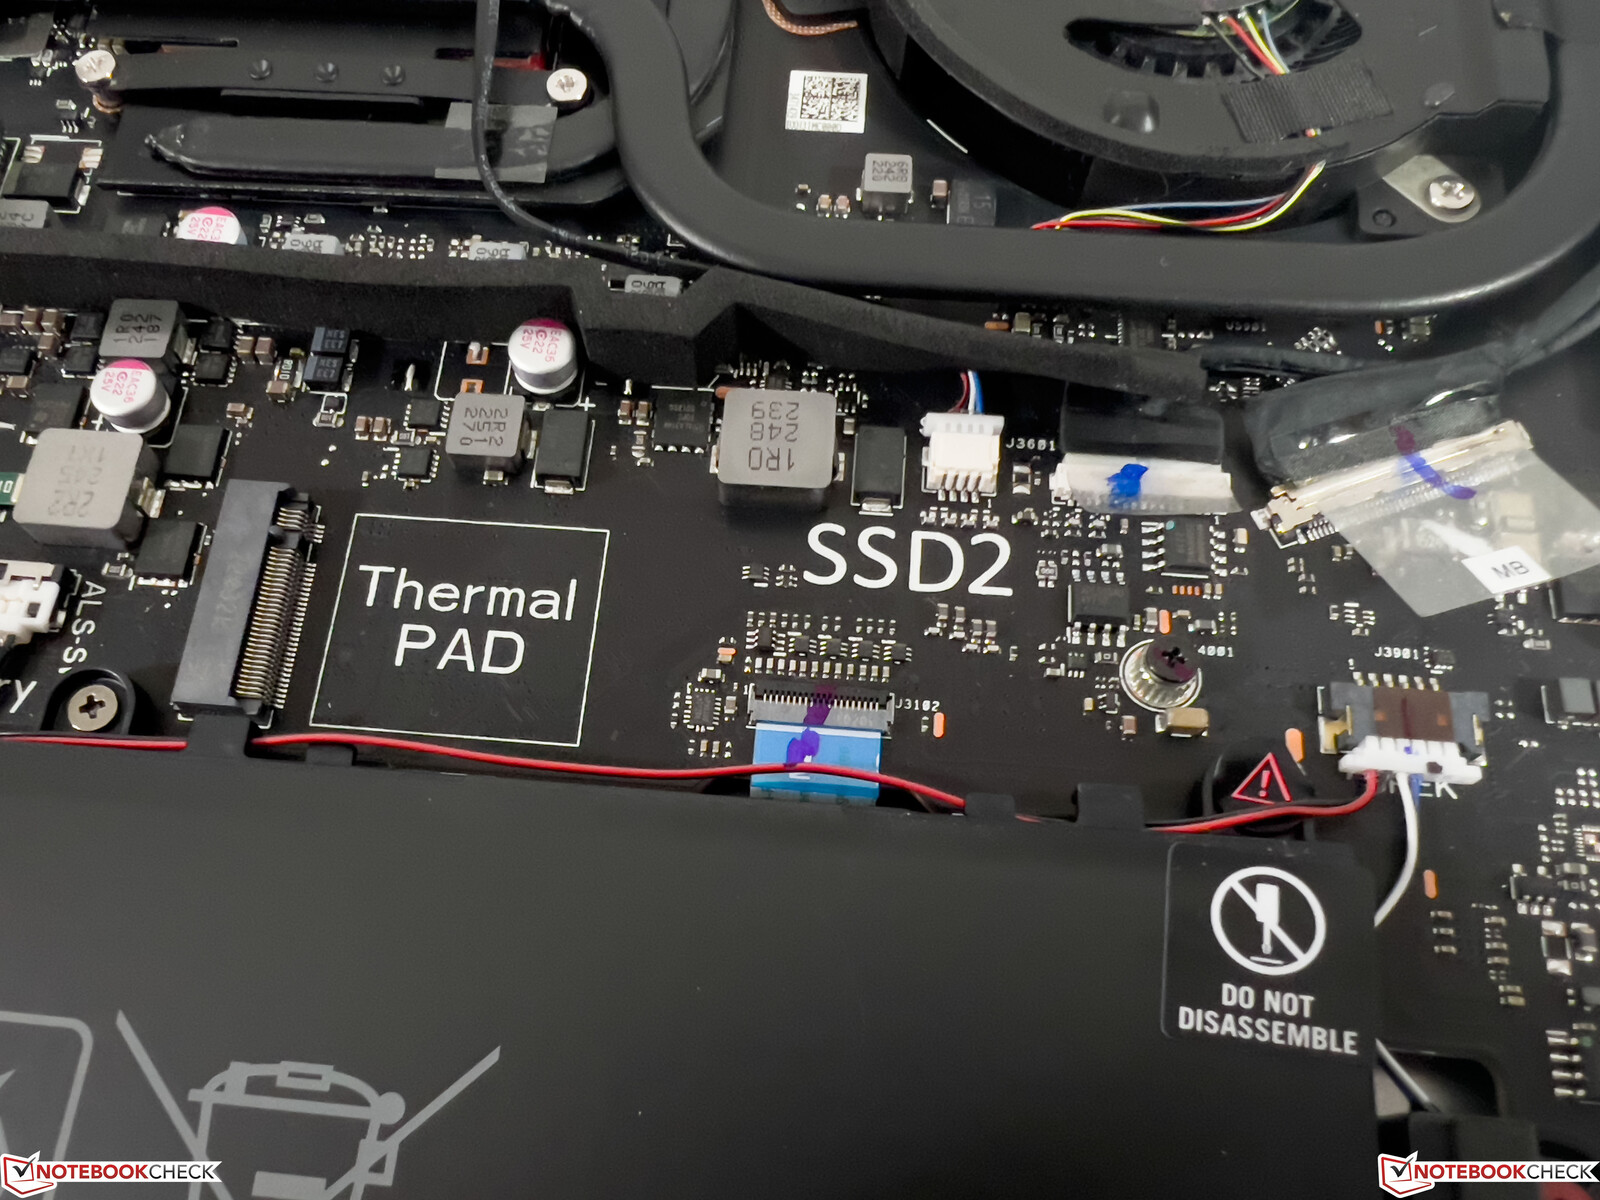
A tampa inferior é fixada por vários parafusos Torx (TR6), mas também há um parafuso adicional escondido no centro sob uma almofada de borracha colada, o que torna o acesso ao interior desnecessariamente complicado. No interior, você obtém dois slots SO-DIMM, bem como dois slots M.2-2280 para SSDs. Também é possível substituir o módulo Wi-Fi, mas você terá que remover o SSD primeiro.
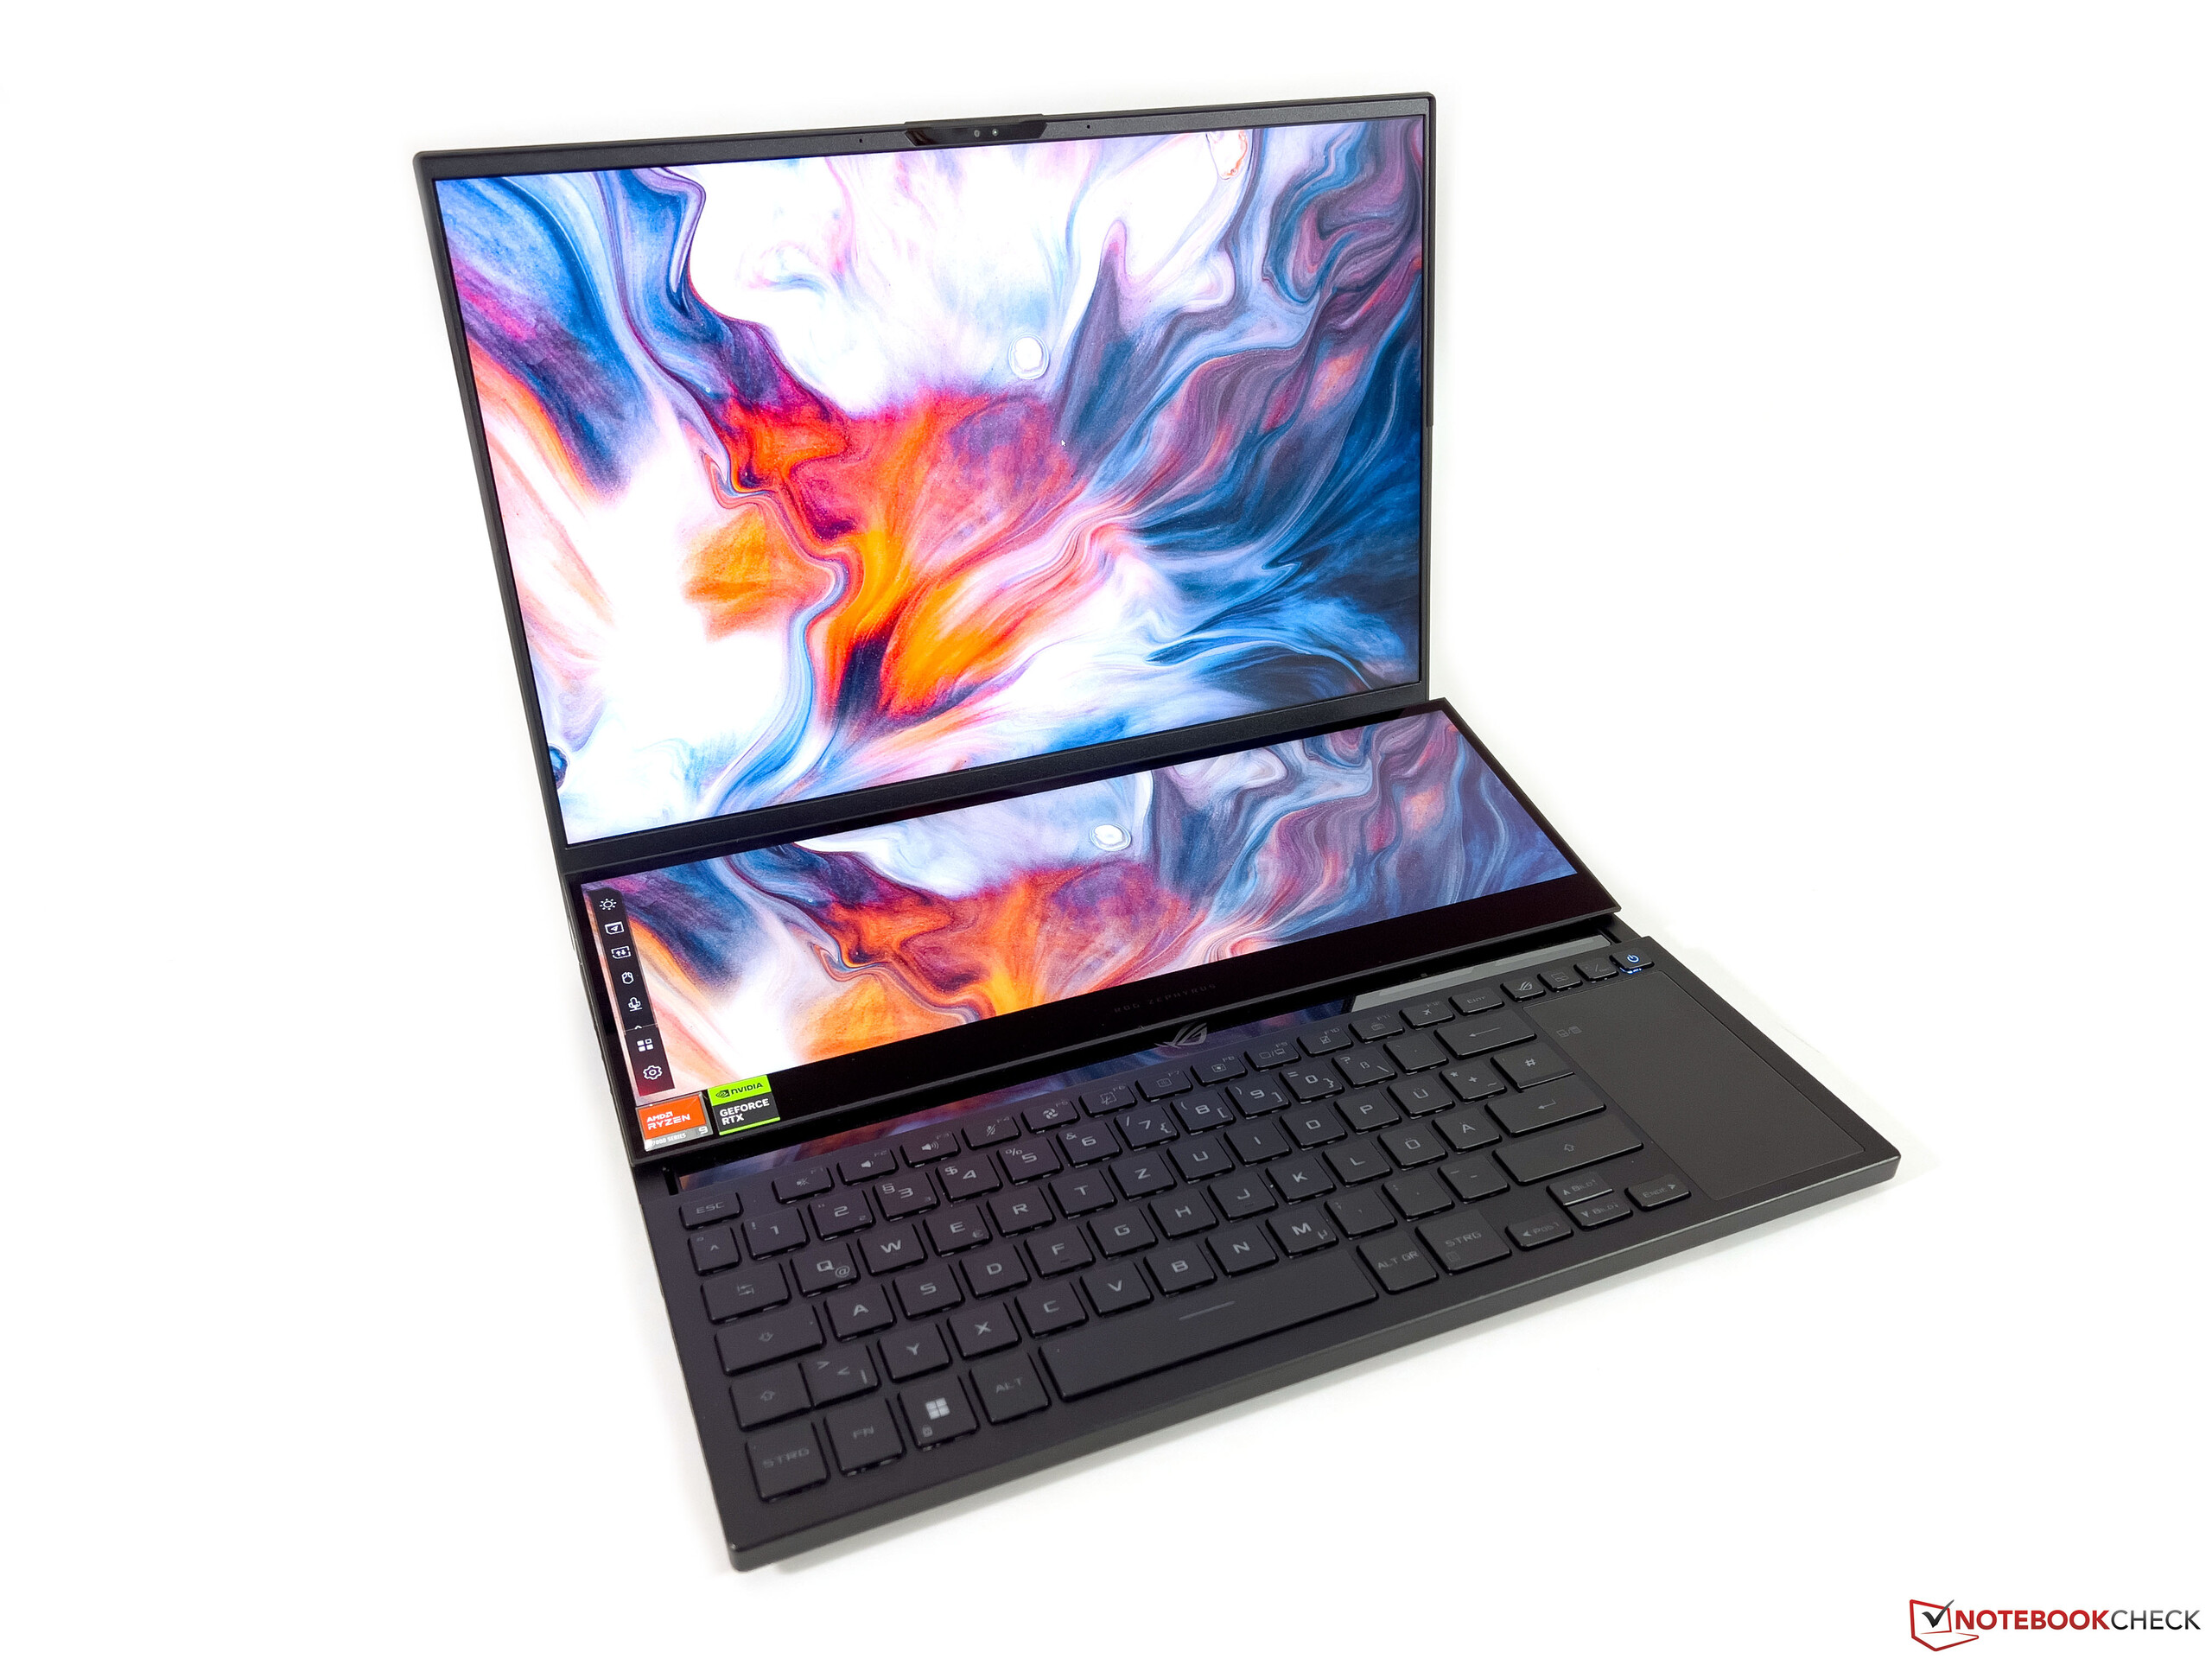
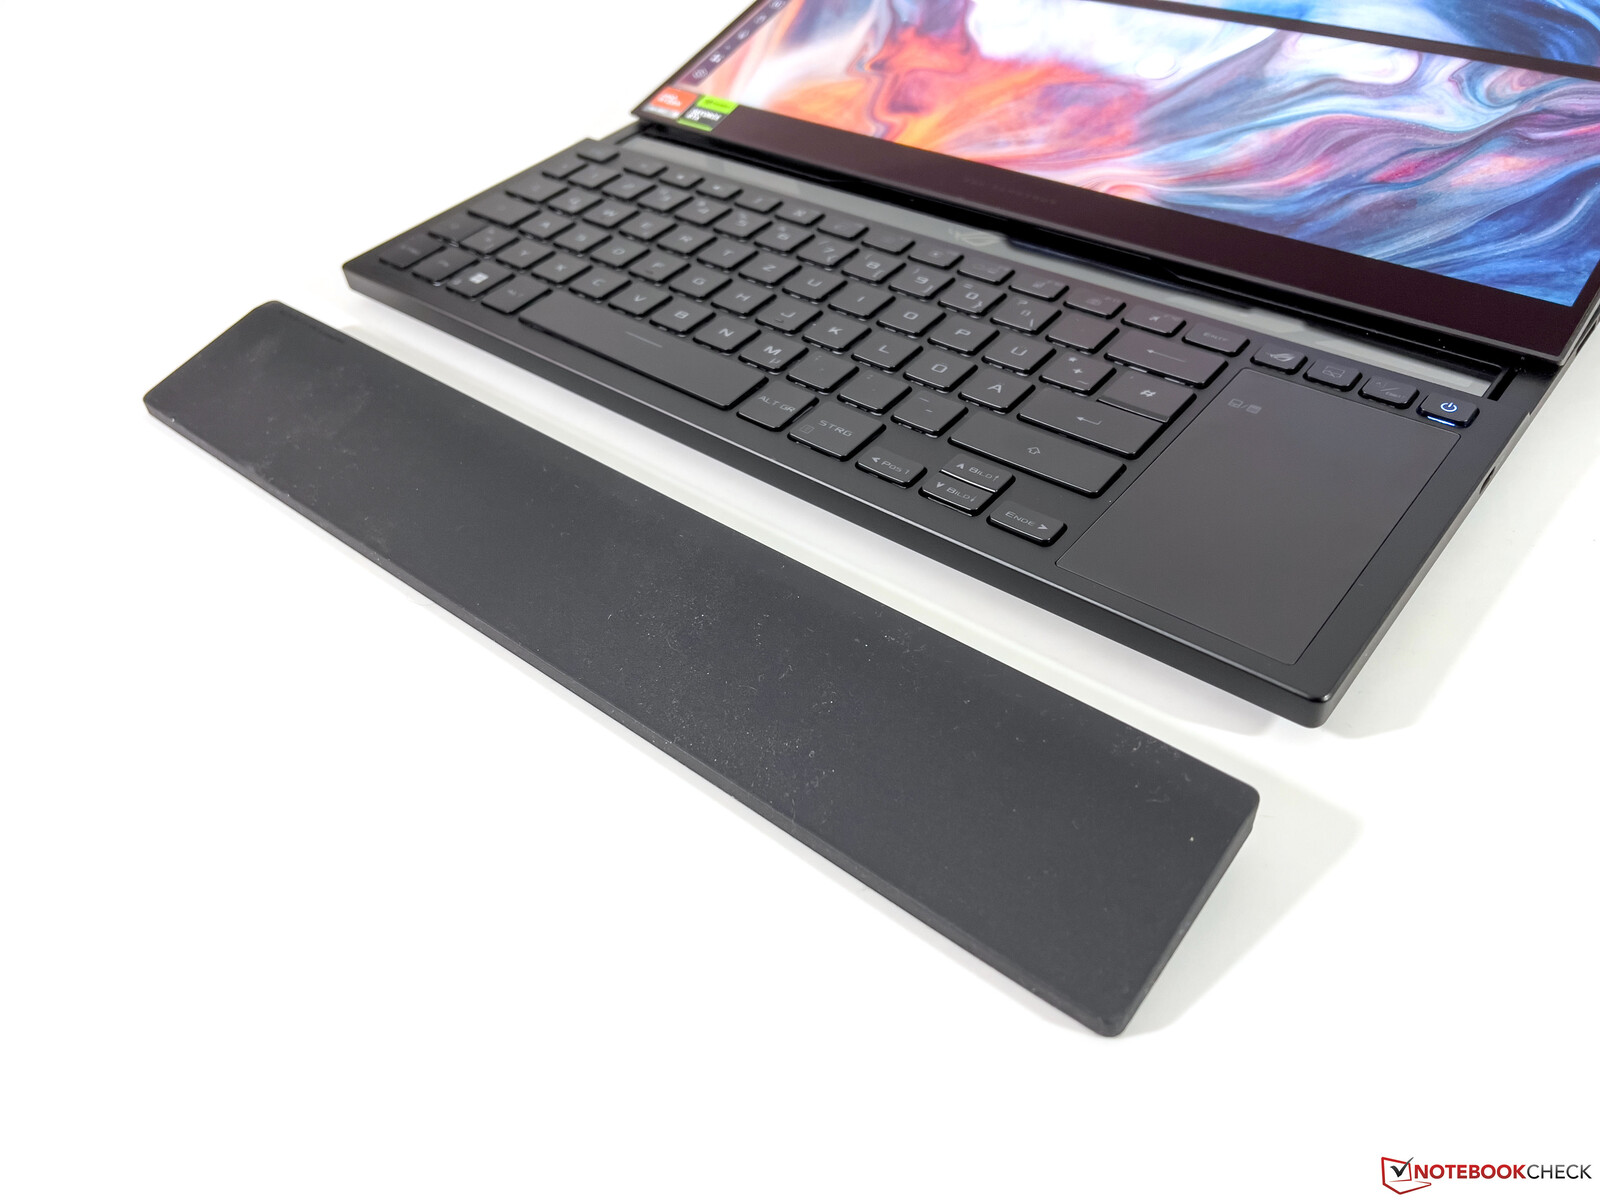
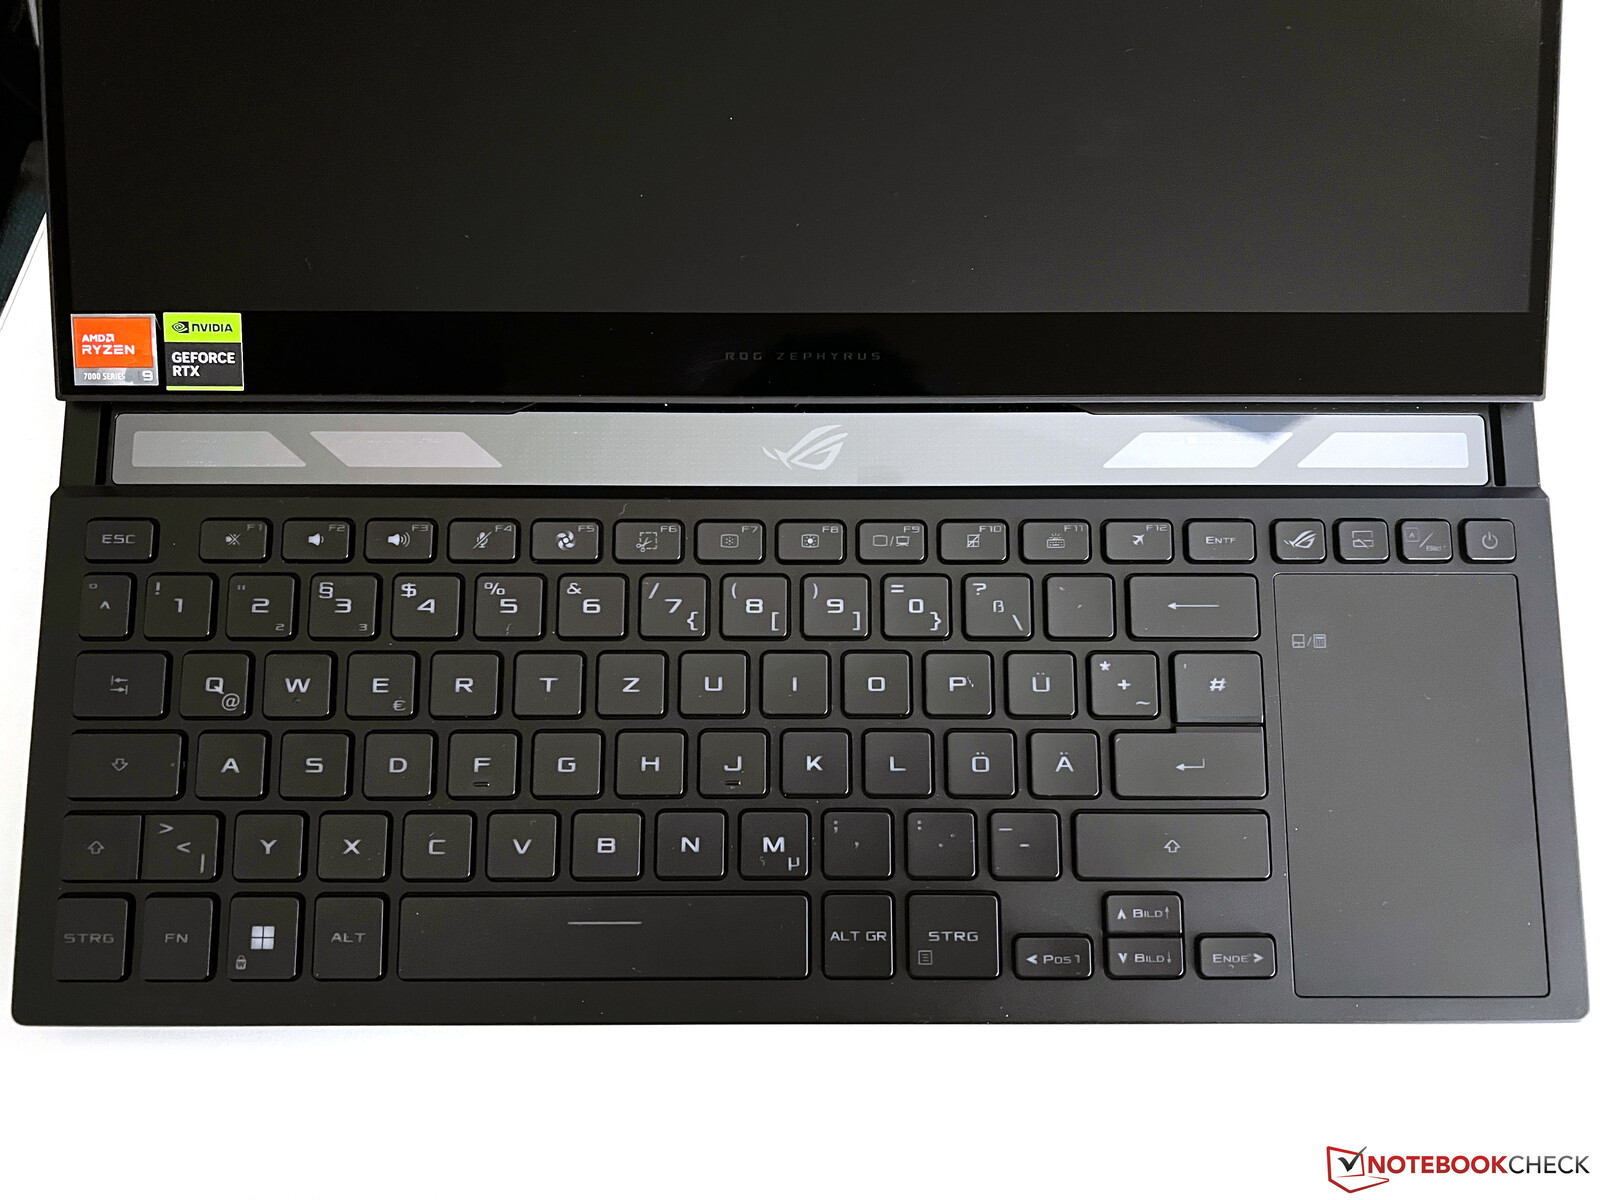
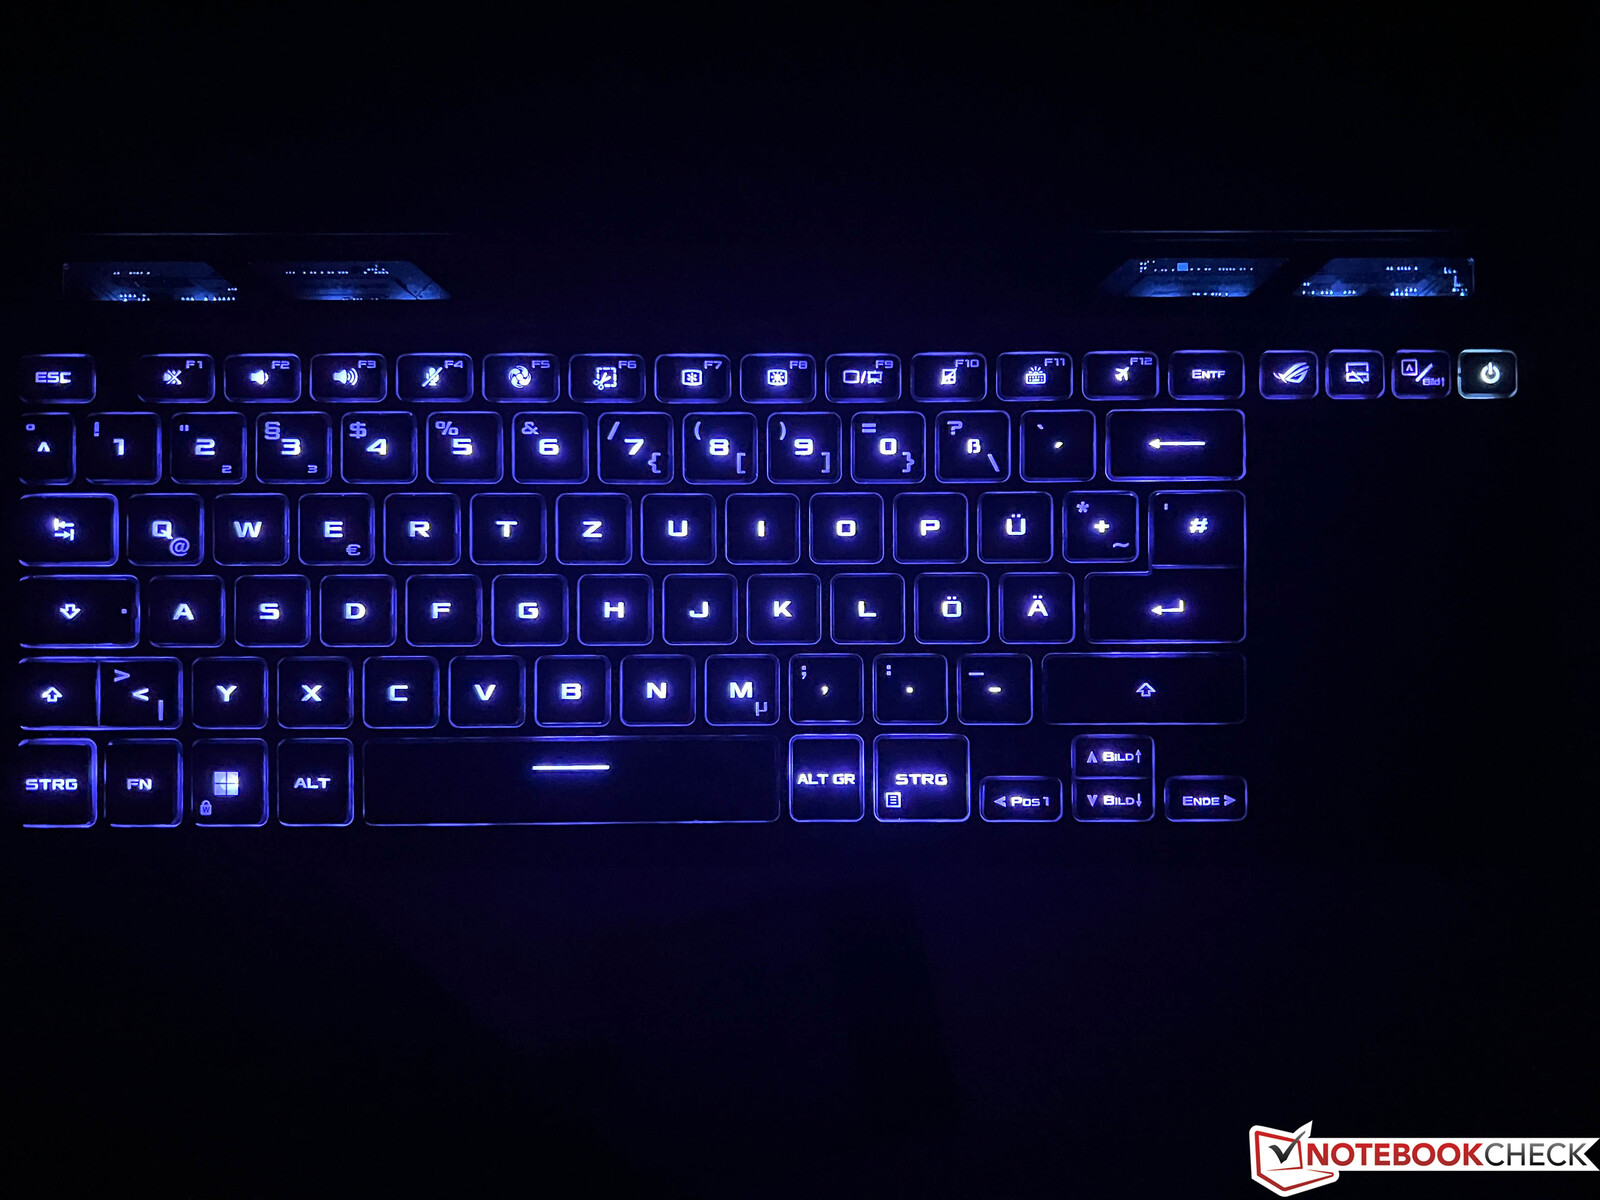
Dispositivos de entrada - O teclado não é ergonômico
A tela adicional requer uma mudança para a frente da unidade base do teclado, o que obviamente não é ideal para a ergonomia. O Asus também sabe disso e envia cada unidade com um apoio de palma emborrachado. Funciona bem em sua mesa de trabalho em casa, mas não é uma ajuda quando você está na estrada. O teclado em si oferece uma confortável experiência de digitação com uma viagem com teclas rasas, mas também silenciosas. O teclado é iluminado e você pode usar o software Armoury Crate para definir a cor para cada chave individualmente (se quiser).
O touchpad na orientação de retrato está sentado bem ao lado do teclado e até mesmo os movimentos padrão do cursor podem ser desafiadores e exigir múltiplas tentativas devido ao fator de forma estreita. Você também pode usar o touchpad como um teclado numérico (ativado por toque no canto superior esquerdo), que funciona bem.
Mostrador - 240 Hz Mini-LED
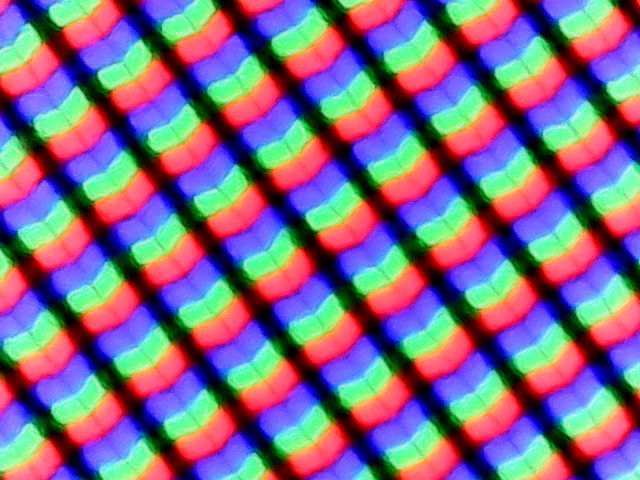
O painel Mini-LED de 16 polegadas é uma grande atualização em relação ao modelo anterior. Ele oferece a resolução WQHD (2560 x 2600 pixels, 16:10) e uma taxa de atualização de 240 Hz. O painel mate oferece uma qualidade de imagem excepcional com conteúdo afiado e cores ricas. Asus anuncia um brilho de até 1100 lêndeas, mas você tem que diferenciar entre o conteúdo SDR e HDR.
Os resultados dos testes são muito bons e enquanto o painel Mini-LED doMacBook Pro 16atinge apenas 500 lêndeas para o conteúdo de DSE, wen pode medir até 700 lêndeas para a unidade de revisão. Ela até administra quase 1400 lêndeas com conteúdo HDR, e não importa se você tem apenas uma pequena área ou uma imagem completa. A implementação do HDR do Windows, por outro lado, ainda é incômoda e requer uma mudança manual de configurações.
O valor do preto é extremamente baixo e resulta em uma excelente relação de contraste. Os painéis Mini-LED também não têm nenhum problema com turvação ou sangramento de luz de fundo.
| |||||||||||||||||||||||||
iluminação: 95 %
iluminação com acumulador: 713 cd/m²
Contraste: 10171:1 (Preto: 0.07 cd/m²)
ΔE ColorChecker Calman: 1.7 | ∀{0.5-29.43 Ø4.72}
calibrated: 1.2
ΔE Greyscale Calman: 2.8 | ∀{0.09-98 Ø4.97}
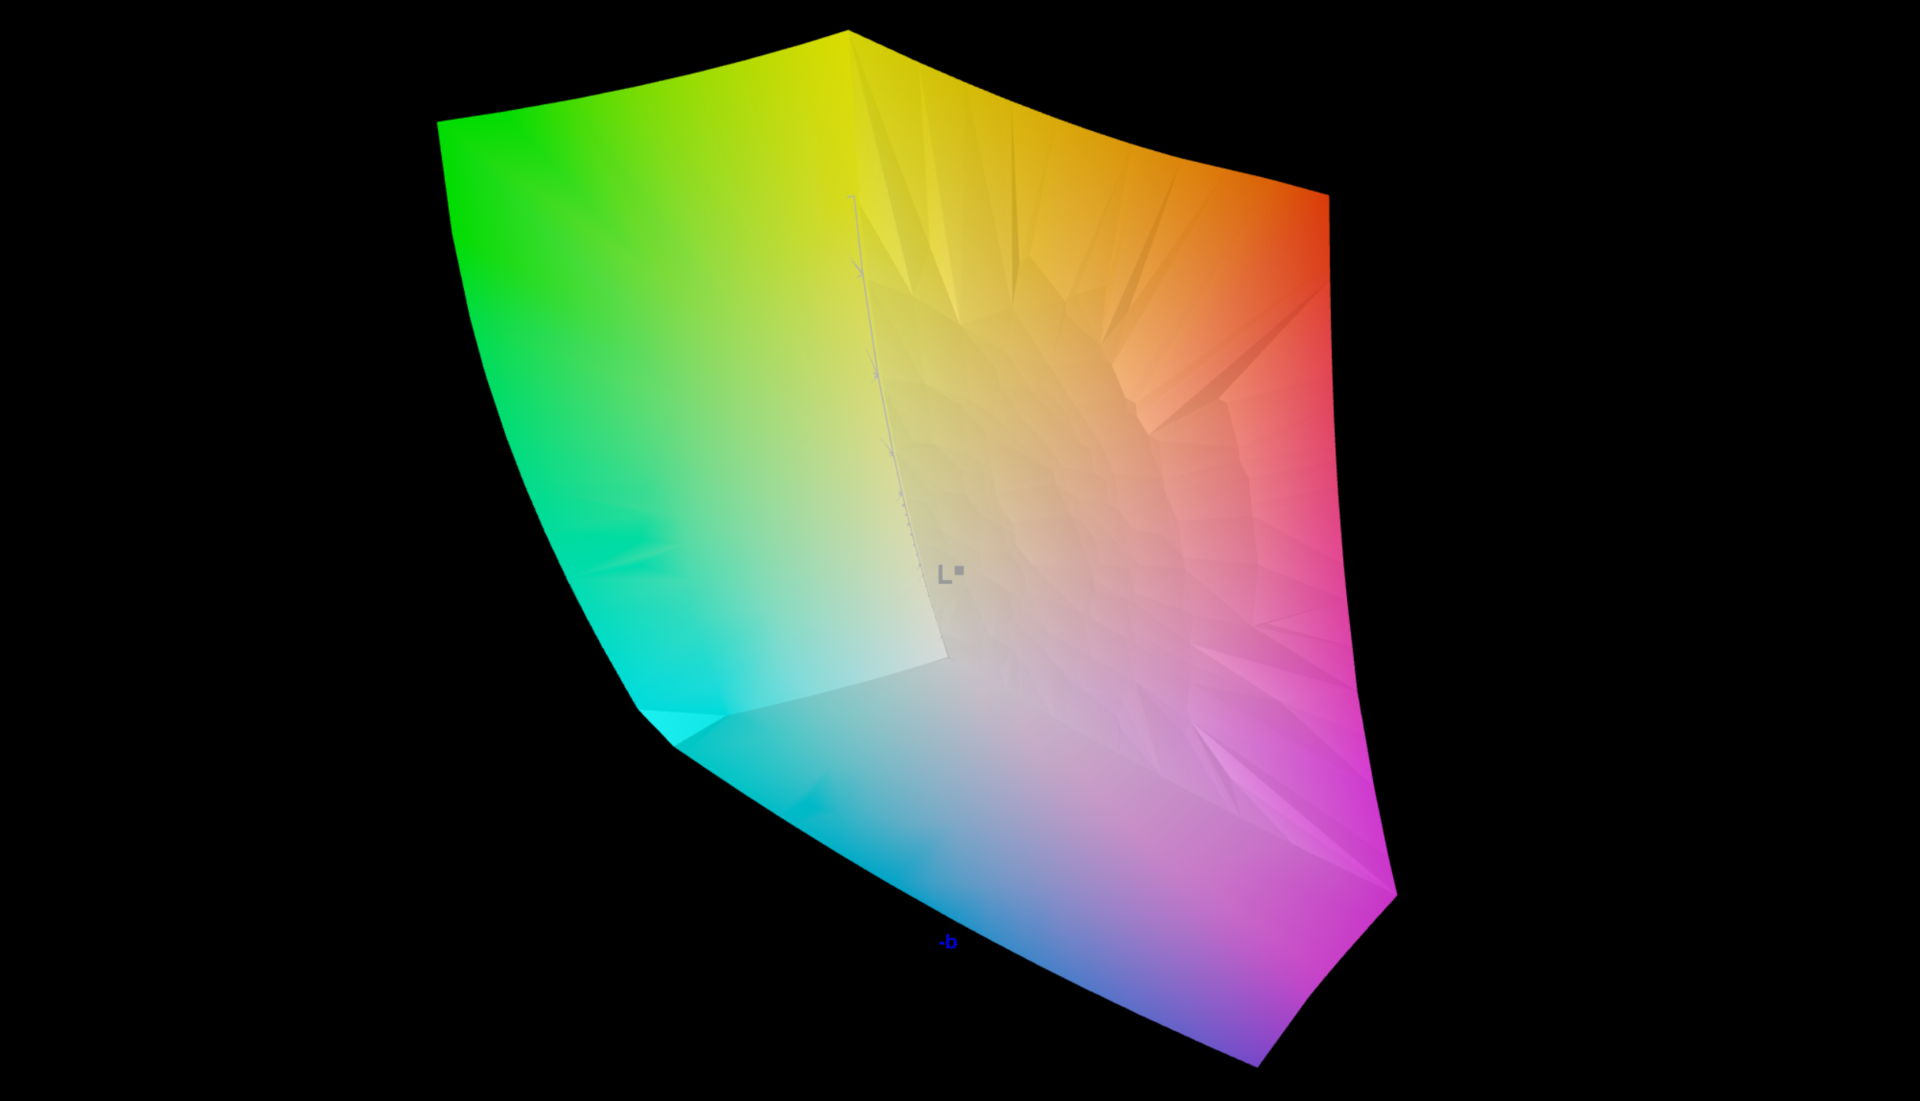
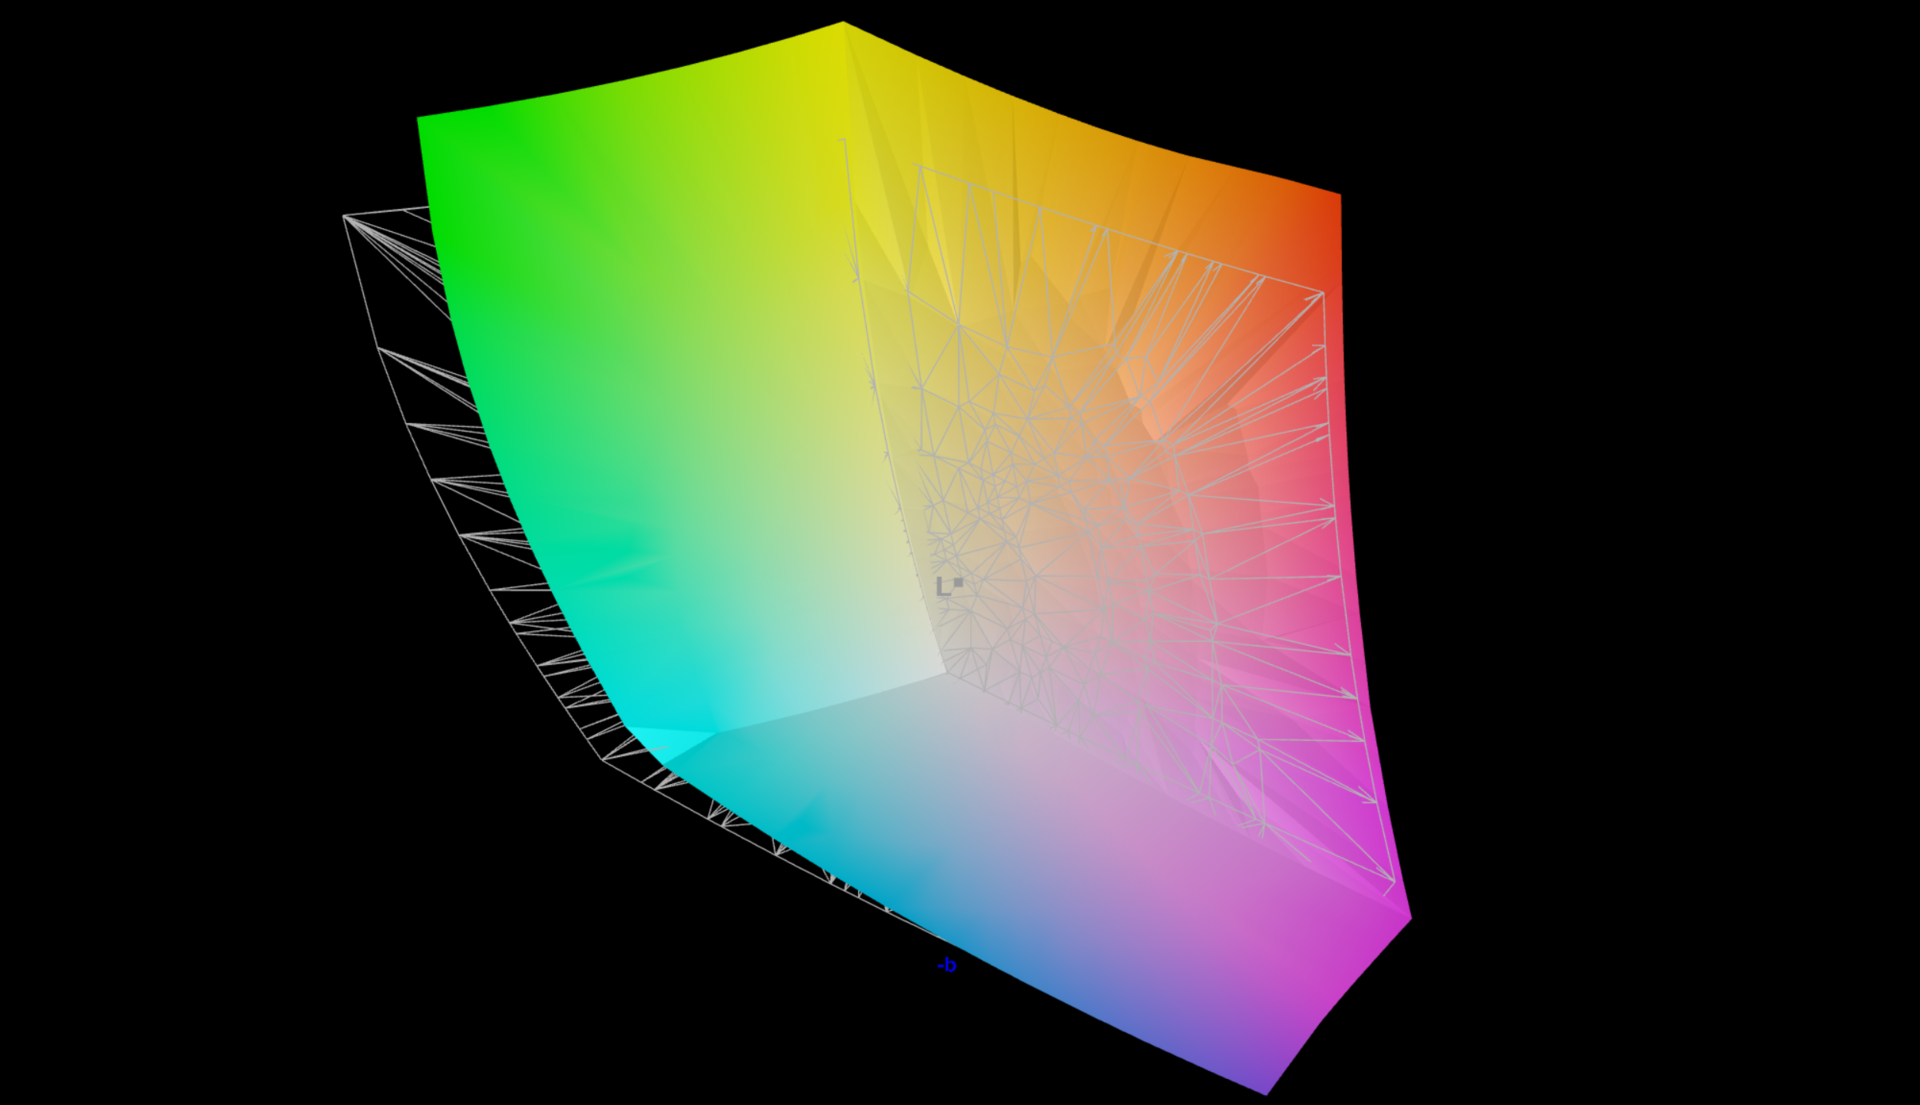
90.8% AdobeRGB 1998 (Argyll 3D)
100% sRGB (Argyll 3D)
99.4% Display P3 (Argyll 3D)
Gamma: 2.21
CCT: 6978 K
| Asus Zephyrus Duo 16 GX650PY-NM006W NE160QDM-NM4, MiniLED, 2560x1600, 16" | MSI Titan GT77 HX 13VI B173ZAN06.C, Mini-LED, 3840x2160, 17.3" | Schenker XMG Neo 16 Raptor Lake 2560x1600, 16" | Lenovo Legion Pro 7 16IRX8H MNG007DA2-3 (CSO1628), IPS, 2560x1600, 16" | Razer Blade 16 Early 2023 CSOT T3 MNG007DA4-1, IPS, 2560x1600, 16" | Asus ROG Zephyrus Duo 16 GX650RX BOE NE160QAM-NX1, IPS-Level, 3840x2400, 16" | Apple MacBook Pro 16 2023 M2 Max Mini-LED, 3456x2234, 16.2" | |
|---|---|---|---|---|---|---|---|
| Display | -1% | -20% | -17% | -1% | -2% | -1% | |
| Display P3 Coverage (%) | 99.4 | 94.9 -5% | 67.44 -32% | 69.1 -30% | 98.5 -1% | 98 -1% | 99 0% |
| sRGB Coverage (%) | 100 | 99.9 0% | 96.89 -3% | 99.7 0% | 100 0% | 99.9 0% | 100 0% |
| AdobeRGB 1998 Coverage (%) | 90.8 | 92.4 2% | 68.93 -24% | 71.2 -22% | 89.7 -1% | 86.3 -5% | 88.5 -3% |
| Response Times | -97% | 44% | 47% | 38% | -289% | ||
| Response Time Grey 50% / Grey 80% * (ms) | 15.2 ? | 38.4 ? -153% | 12.3 ? 19% | 6.6 ? 57% | 14.6 ? 4% | 80.5 ? -430% | |
| Response Time Black / White * (ms) | 19 ? | 26.6 ? -40% | 5.9 ? 69% | 12 ? 37% | 5.6 ? 71% | 47.2 ? -148% | |
| PWM Frequency (Hz) | 12000 ? | 2380 ? | 14880 ? | ||||
| Screen | 6565% | -152% | -48% | -78% | -104% | 618% | |
| Brightness middle (cd/m²) | 712 | 606 -15% | 377.62 -47% | 511 -28% | 456.8 -36% | 459 -36% | 504 -29% |
| Brightness (cd/m²) | 703 | 602 -14% | 469 -33% | 437 -38% | 434 -38% | 487 -31% | |
| Brightness Distribution (%) | 95 | 93 -2% | 86 -9% | 83 -13% | 88 -7% | 94 -1% | |
| Black Level * (cd/m²) | 0.07 | 0.0001 100% | 0.47 -571% | 0.4 -471% | 0.35 -400% | 0.44 -529% | 0.001 99% |
| Contrast (:1) | 10171 | 6060000 59481% | 803 -92% | 1278 -87% | 1305 -87% | 1043 -90% | 504000 4855% |
| Colorchecker dE 2000 * | 1.7 | 4.8 -182% | 3.2 -88% | 0.95 44% | 3.7 -118% | 2.97 -75% | 1.5 12% |
| Colorchecker dE 2000 max. * | 4 | 8.2 -105% | 6.9 -73% | 2.07 48% | 6.42 -61% | 8.13 -103% | 3.3 17% |
| Colorchecker dE 2000 calibrated * | 1.2 | 1.8 -50% | 0.91 24% | 0.66 45% | 1.03 14% | ||
| Greyscale dE 2000 * | 2.8 | 6.5 -132% | 3.9 -39% | 0.6 79% | 2.6 7% | 4.9 -75% | 2.1 25% |
| Gamma | 2.21 100% | 2.63 84% | 2.176 101% | 2.3 96% | 2.235 98% | 2.25 98% | |
| CCT | 6978 93% | 6596 99% | 6545 99% | 6108 106% | 6775 96% | 6882 94% | |
| Média Total (Programa/Configurações) | 2156% /
4206% | -86% /
-108% | -7% /
-28% | -11% /
-44% | -23% /
-62% | 109% /
336% |
* ... menor é melhor
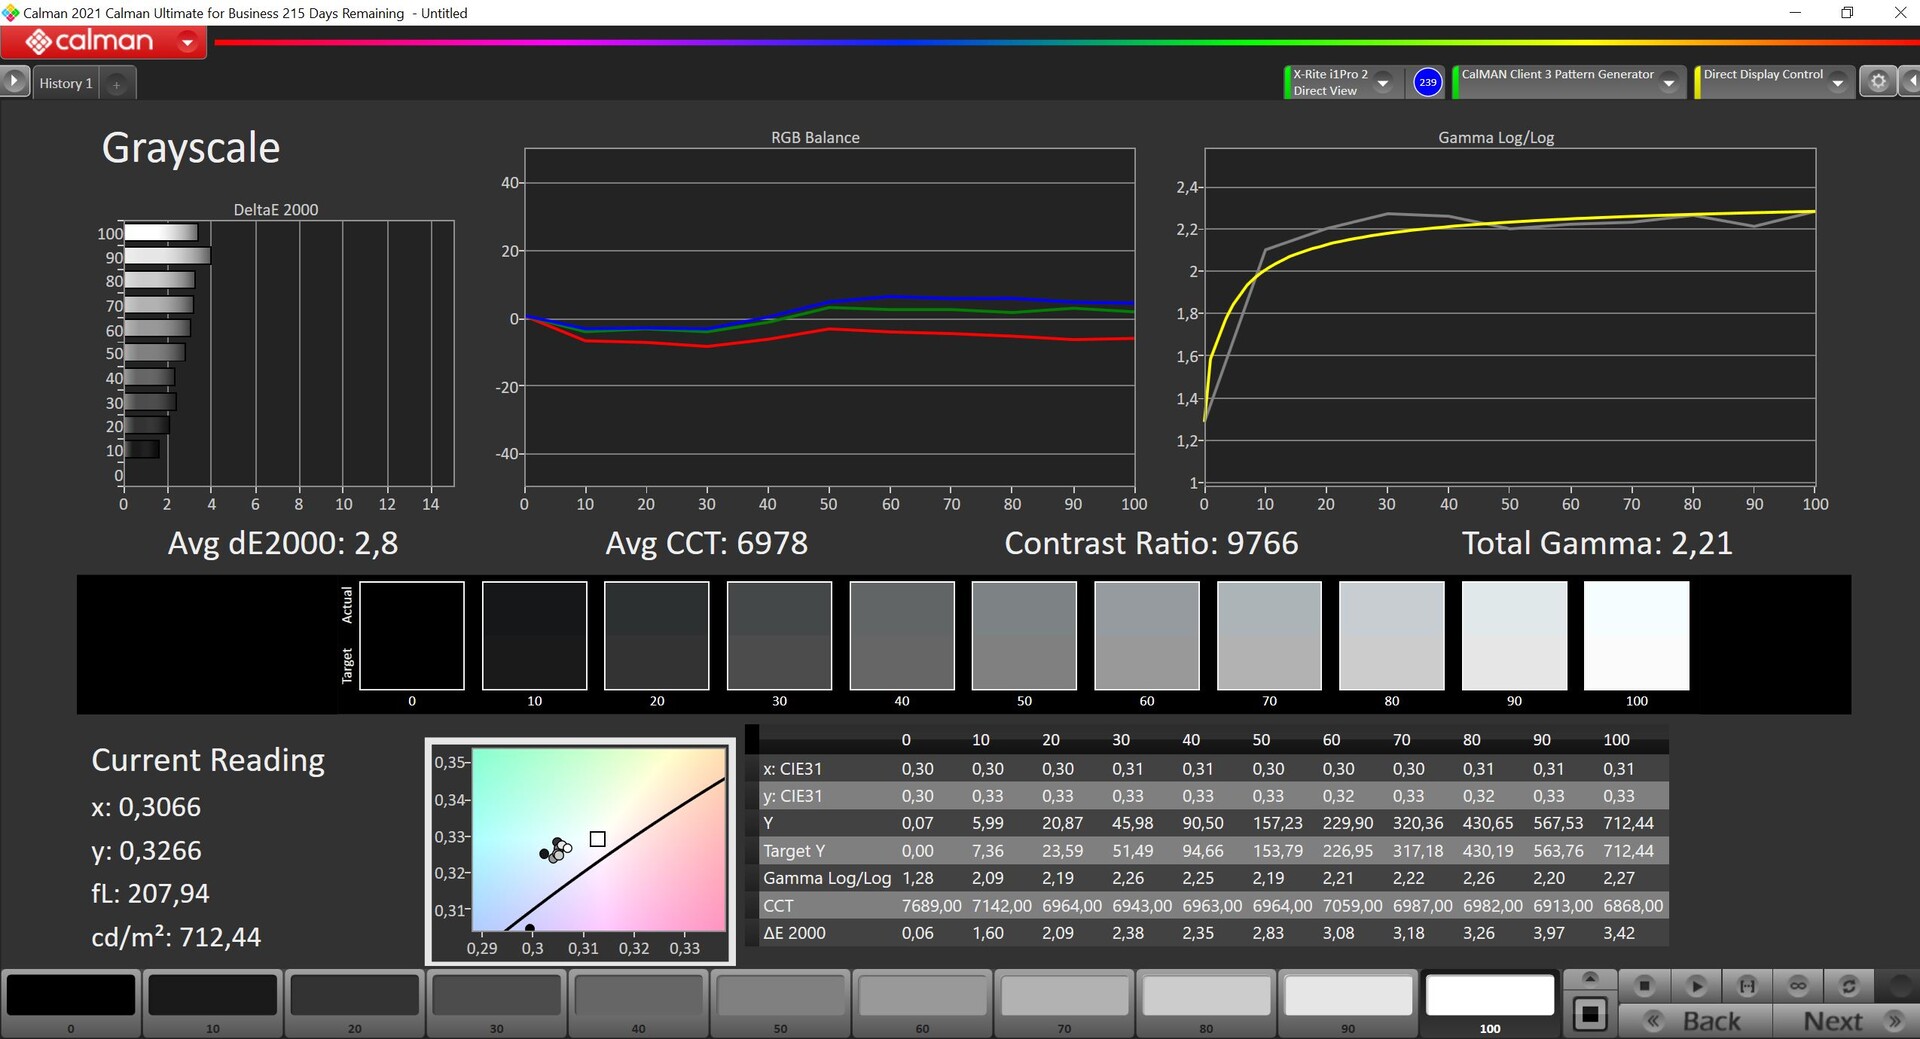
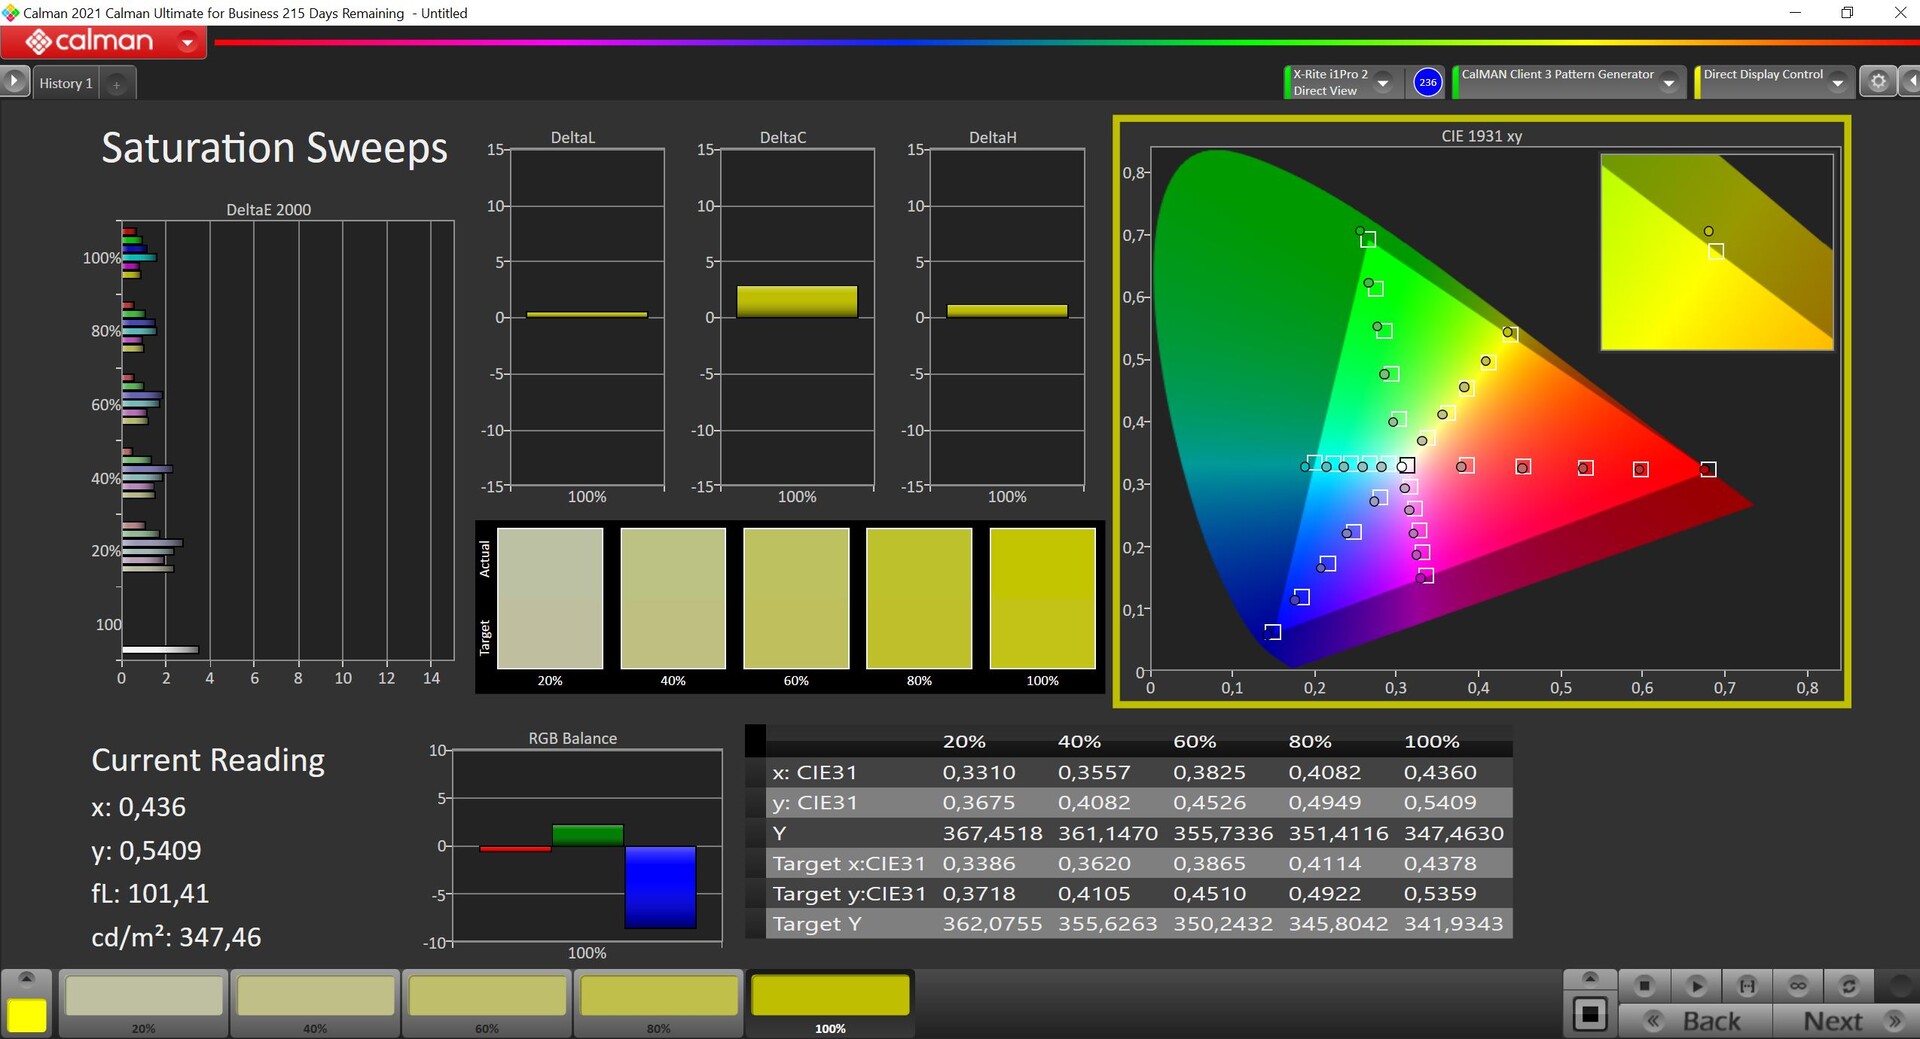
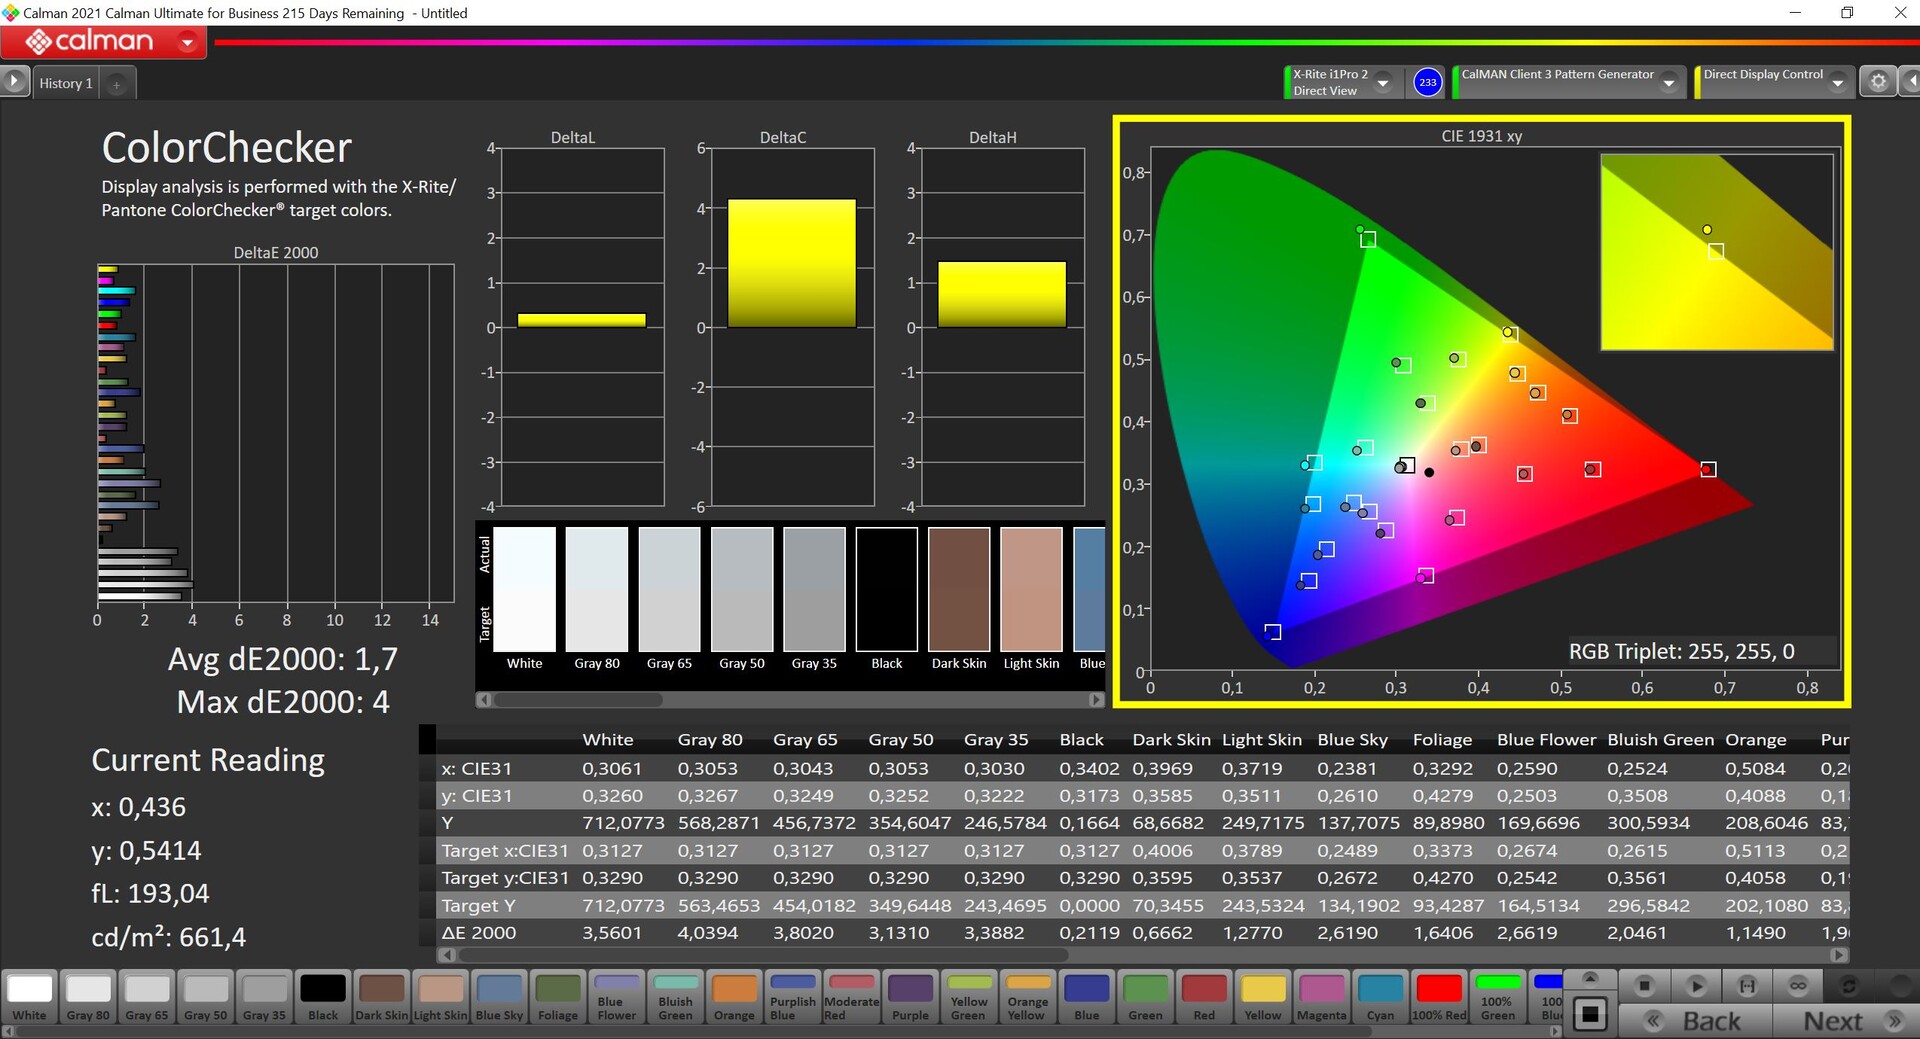
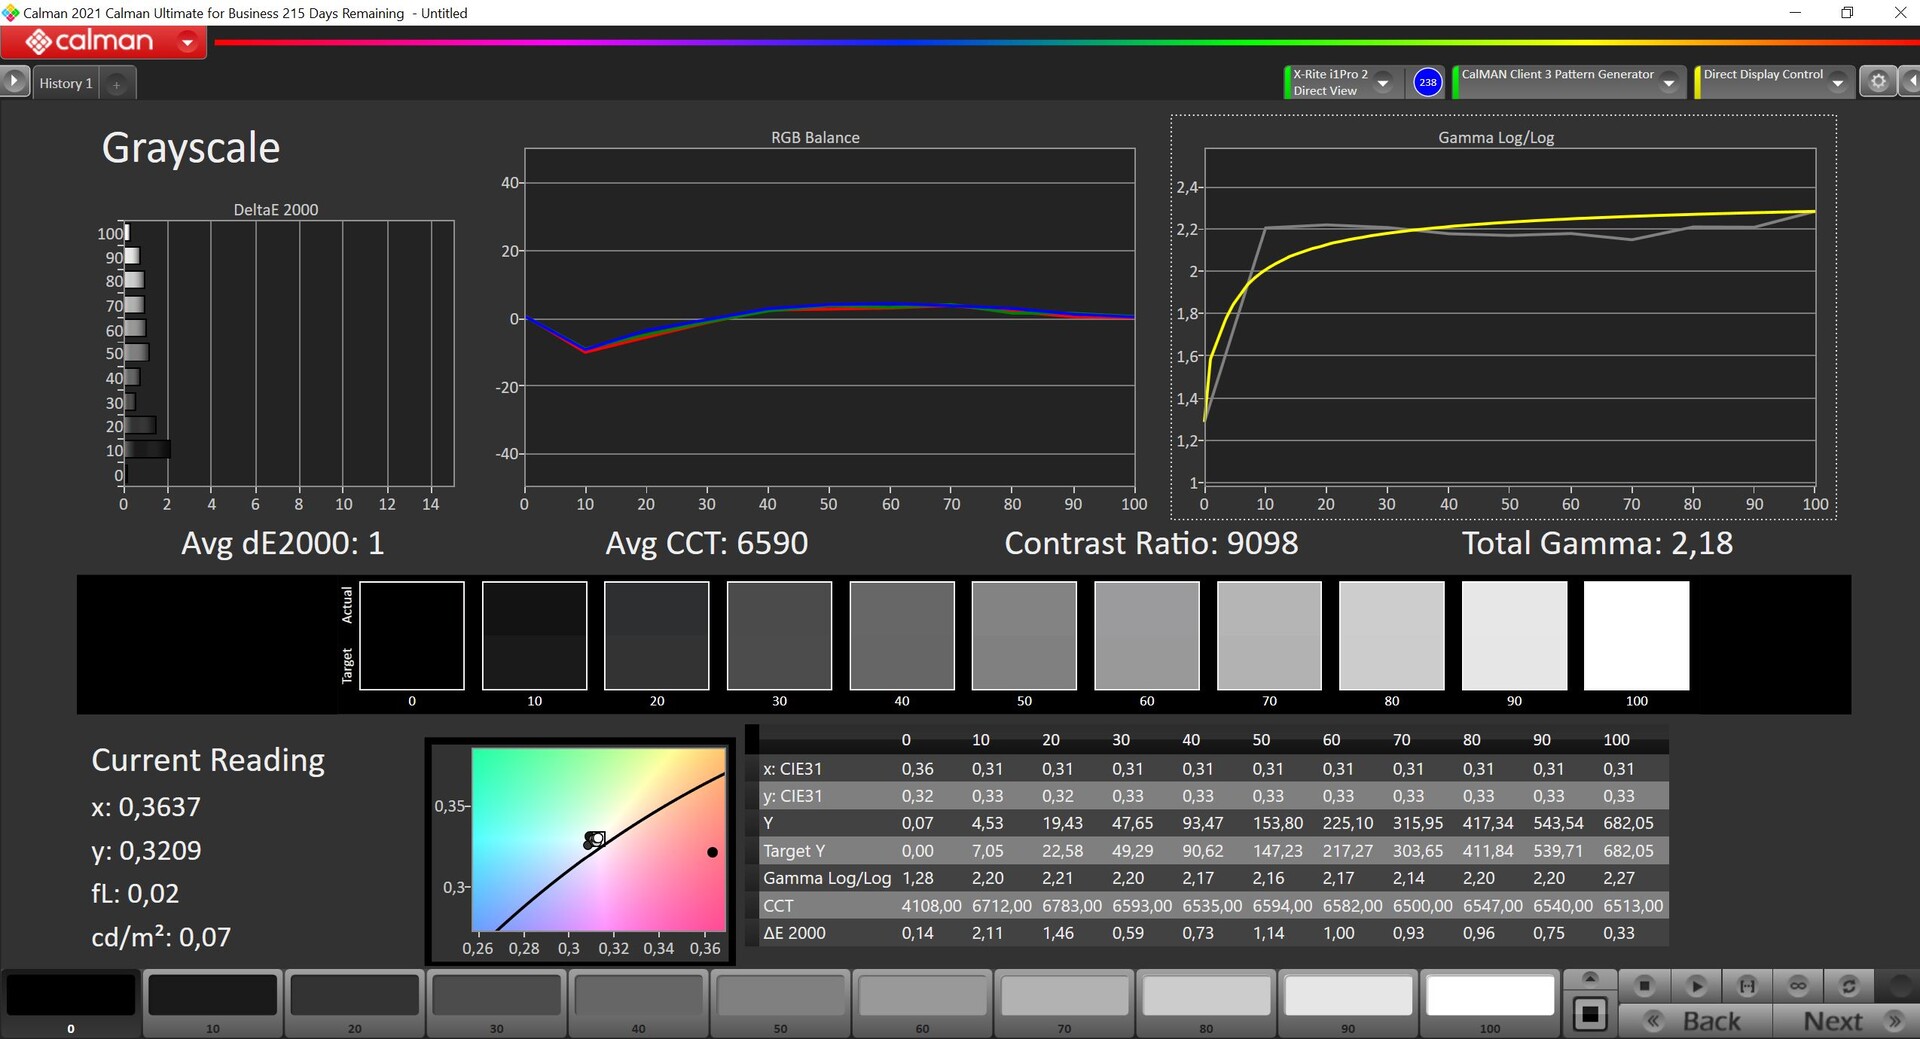

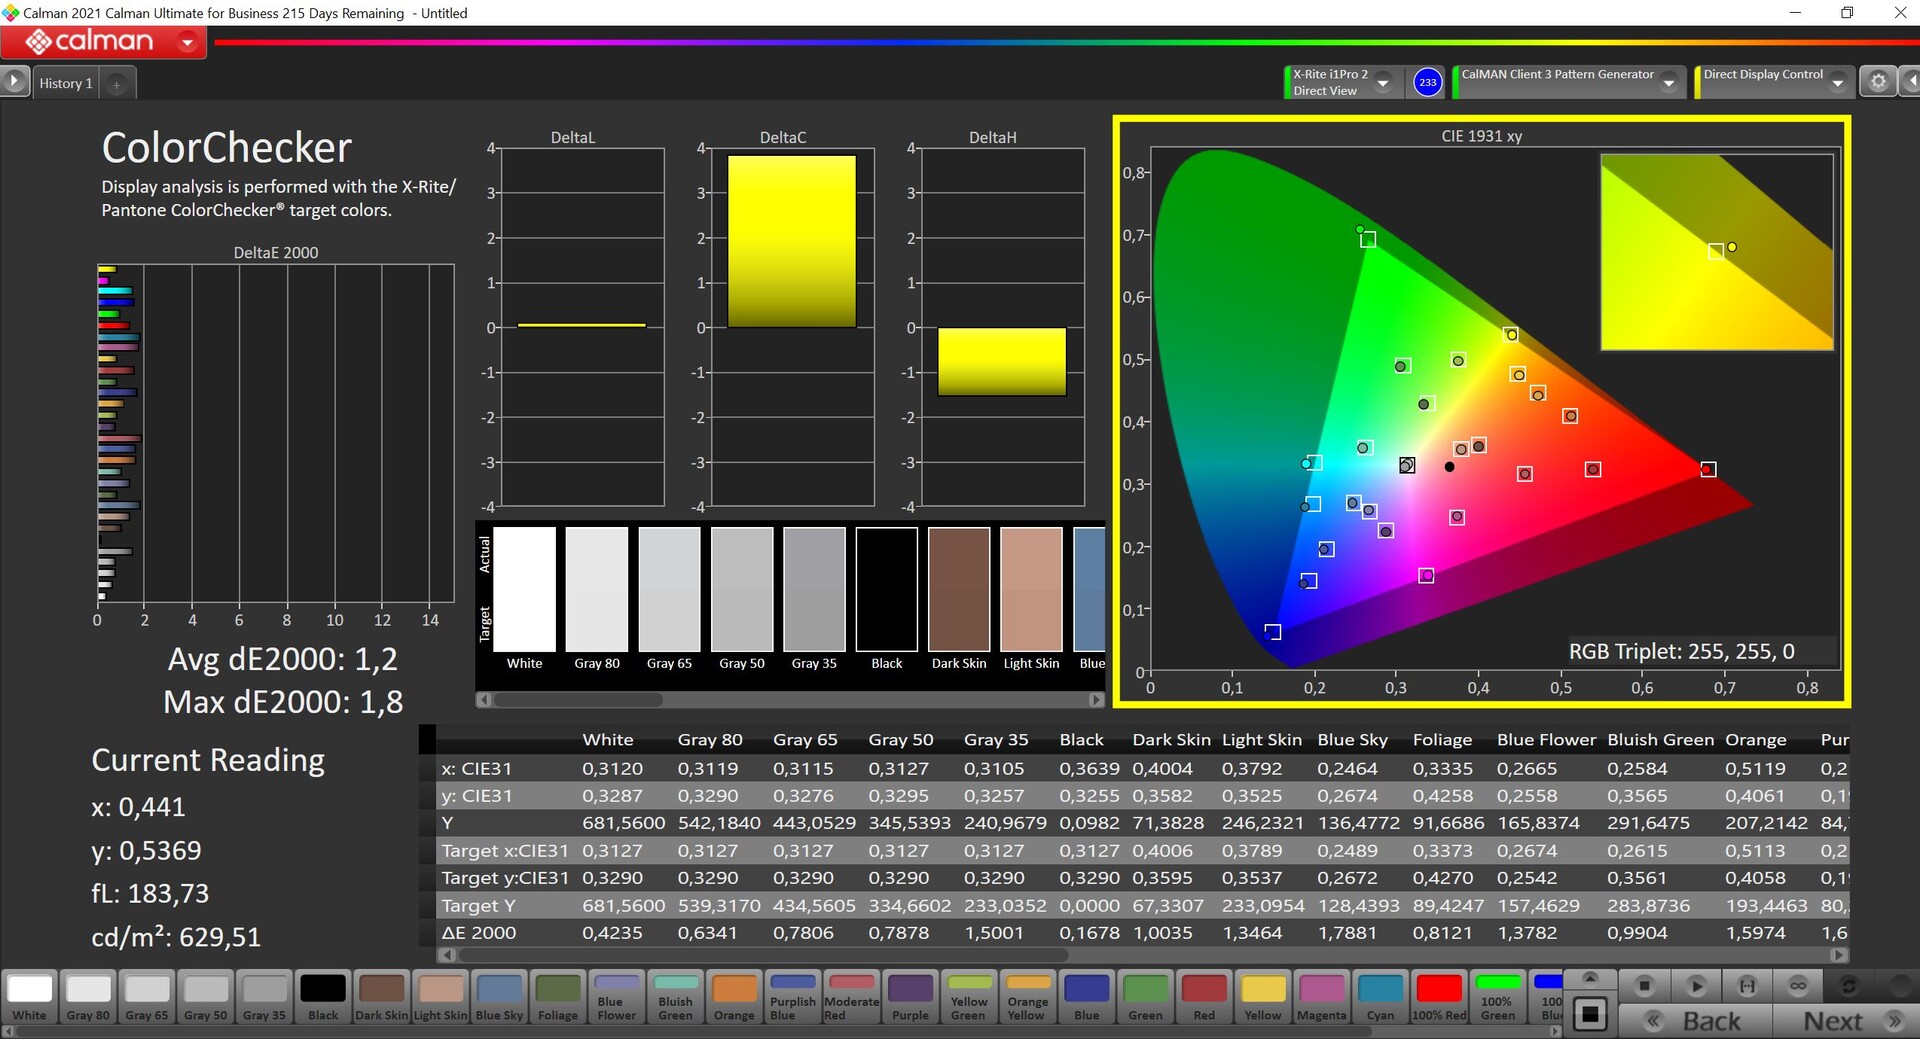
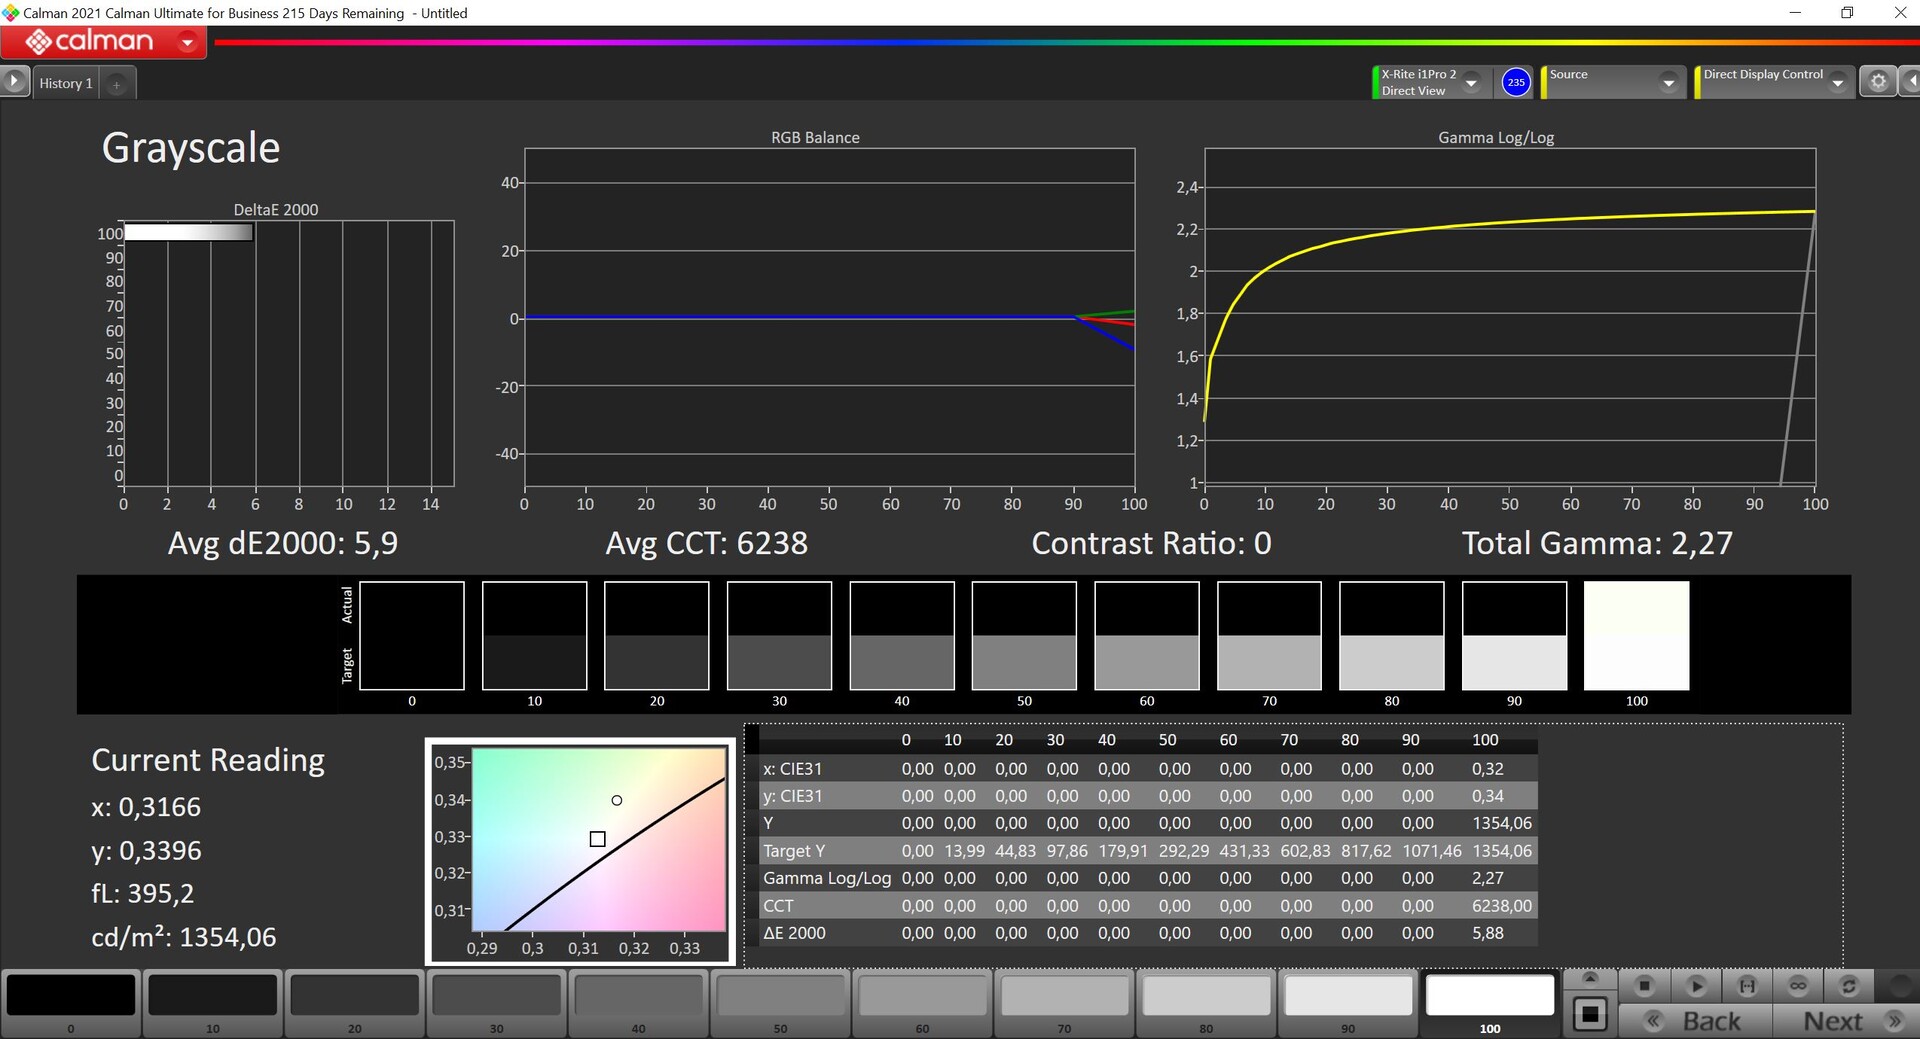
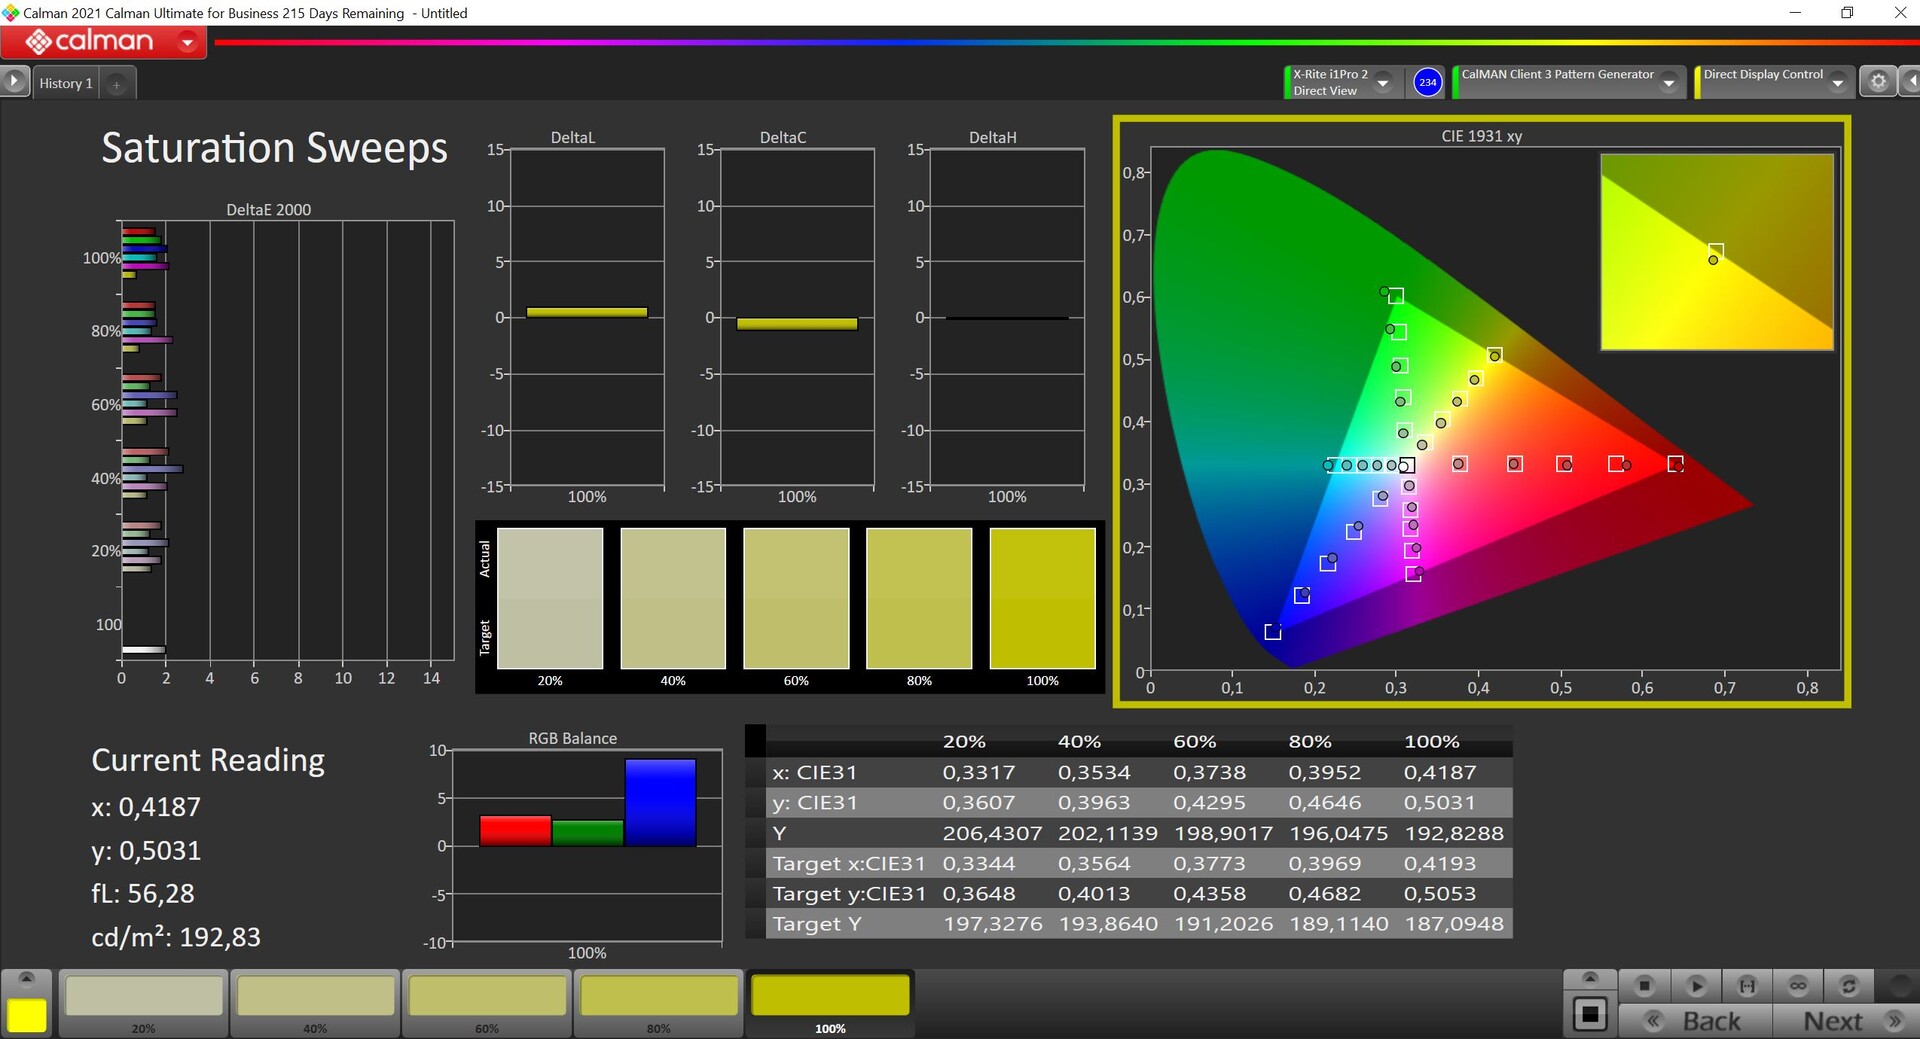
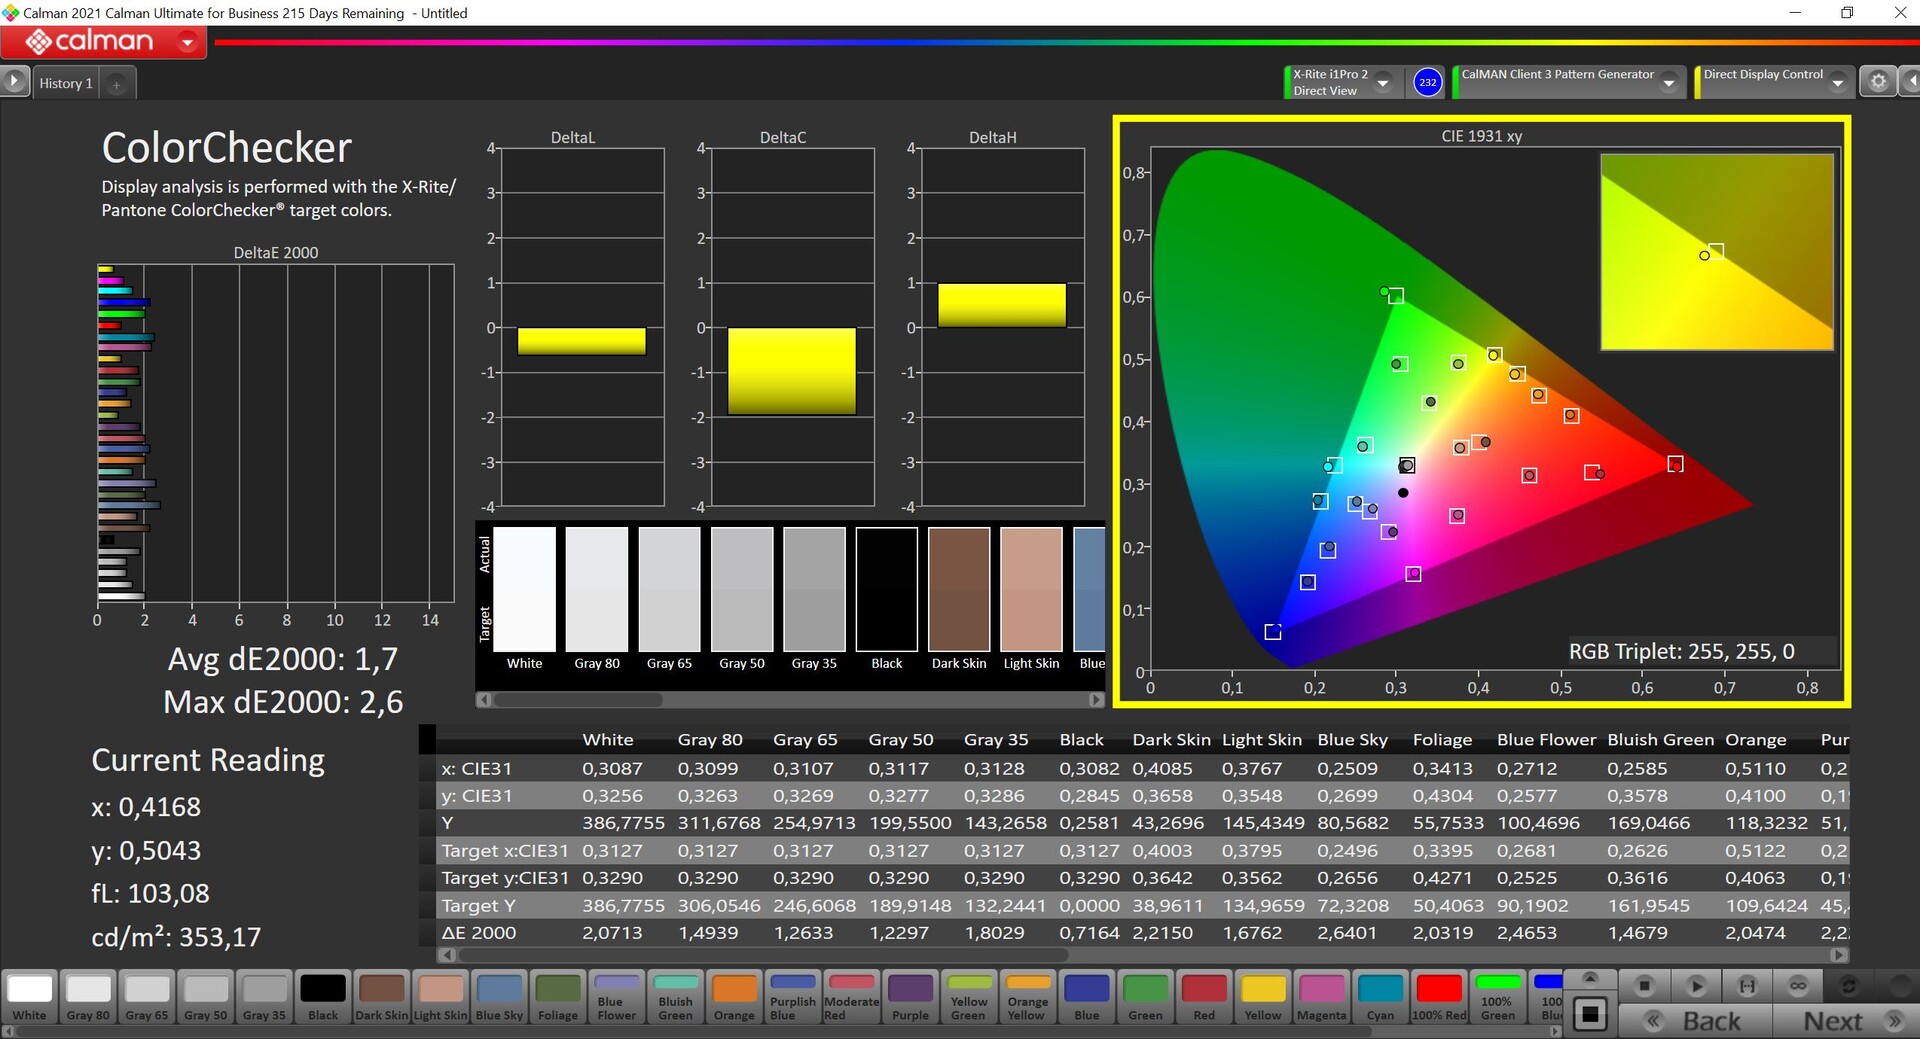
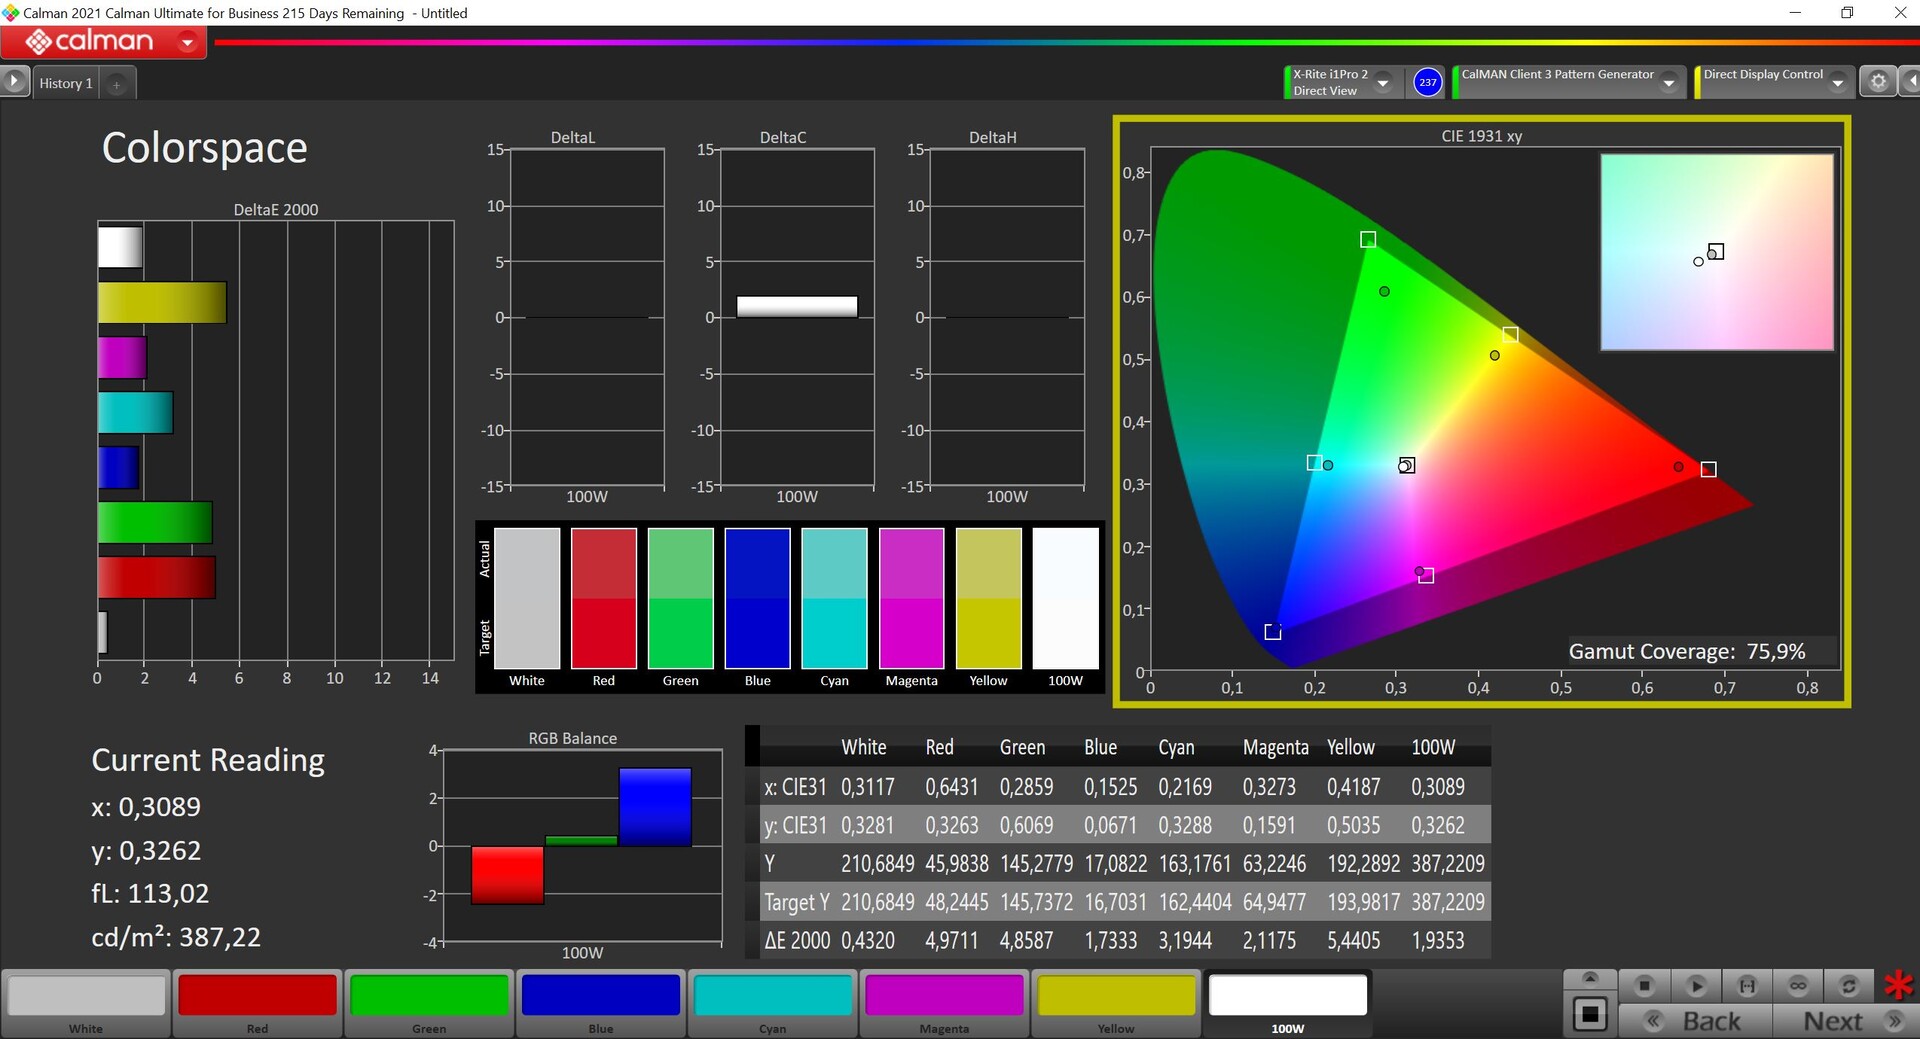
A qualidade da imagem já é muito boa fora da caixa. Analisamos o painel com o software profissional CalMAN (X-Rite i1 Pro 2) e tanto o desempenho da escala de cinza quanto o do verificador de cores mostram apenas pequenos desvios em comparação com o espaço de cores de referência P3. No entanto, há um pequeno gesso azul e a temperatura da cor também está um pouco no lado frio. Nossa própria calibração (o perfil pode ser baixado gratuitamente na caixa acima) melhora ainda mais o desempenho, portanto o painel também é adequado para edição de imagem/vídeo. É um pouco lamentável que o Asus não inclua uma opção para mudar para a gama sRGB menor.
Atualização: Há um perfil sRGB dedicado disponível no software Armoury Crate.

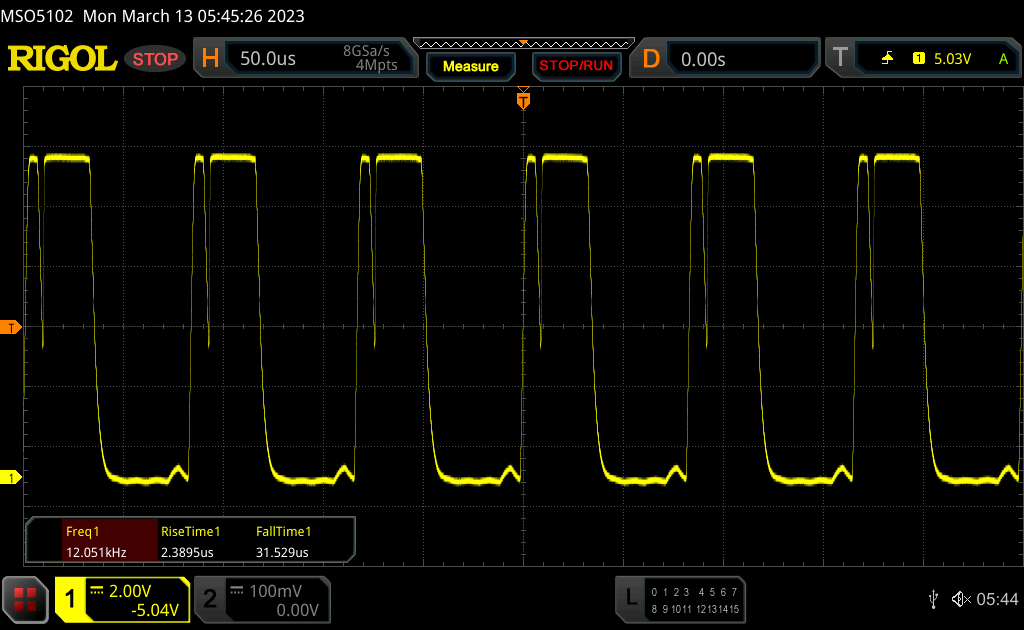
Exibir tempos de resposta
| ↔ Tempo de resposta preto para branco | ||
|---|---|---|
| 19 ms ... ascensão ↗ e queda ↘ combinadas | ↗ 10.6 ms ascensão | 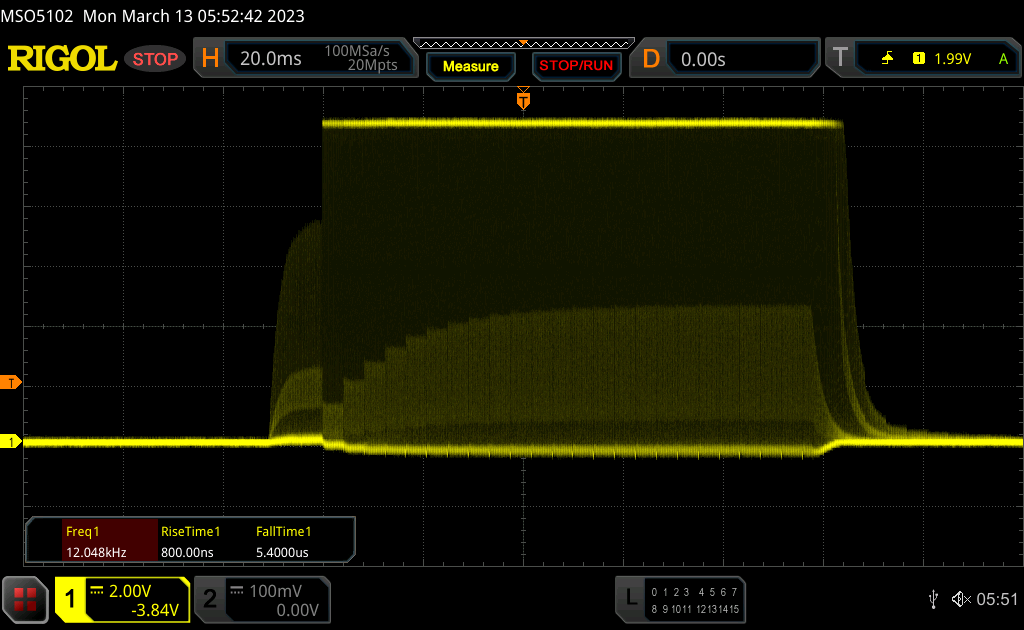 |
| ↘ 8.4 ms queda | ||
| A tela mostra boas taxas de resposta em nossos testes, mas pode ser muito lenta para jogadores competitivos. Em comparação, todos os dispositivos testados variam de 0.1 (mínimo) a 240 (máximo) ms. » 42 % de todos os dispositivos são melhores. Isso significa que o tempo de resposta medido é semelhante à média de todos os dispositivos testados (19.8 ms). | ||
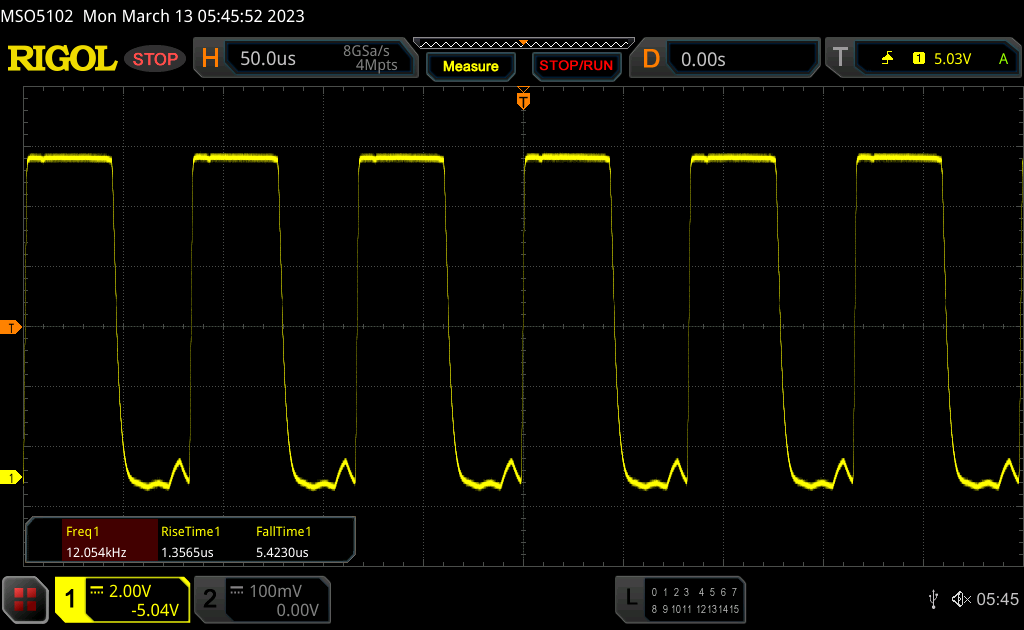
| ↔ Tempo de resposta 50% cinza a 80% cinza | ||
| 15.2 ms ... ascensão ↗ e queda ↘ combinadas | ↗ 11.2 ms ascensão | 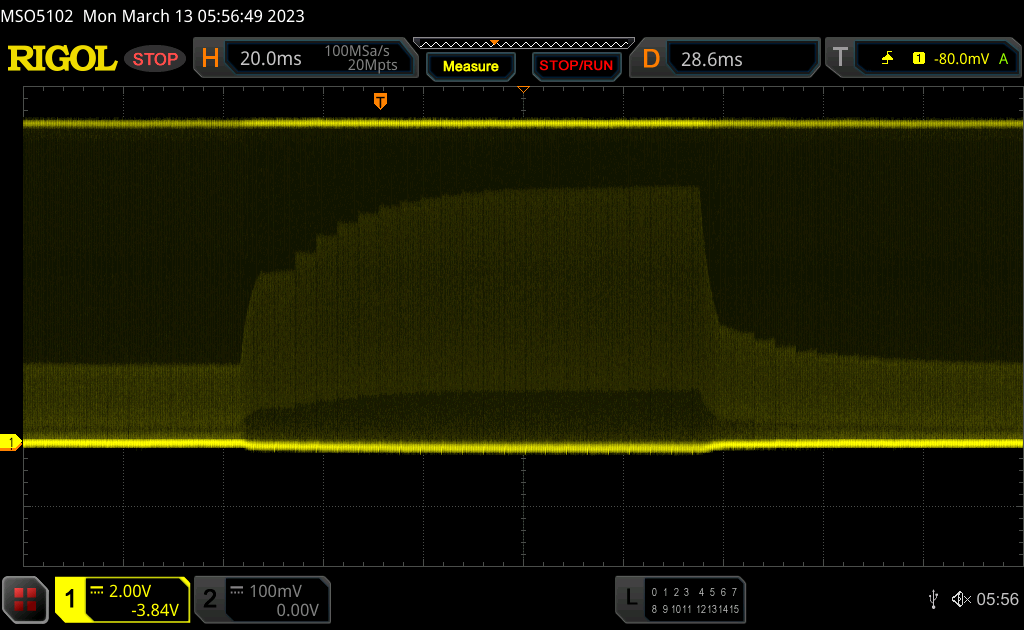 |
| ↘ 4 ms queda | ||
| A tela mostra boas taxas de resposta em nossos testes, mas pode ser muito lenta para jogadores competitivos. Em comparação, todos os dispositivos testados variam de 0.165 (mínimo) a 636 (máximo) ms. » 29 % de todos os dispositivos são melhores. Isso significa que o tempo de resposta medido é melhor que a média de todos os dispositivos testados (31 ms). | ||
Cintilação da tela / PWM (modulação por largura de pulso)
| Tela tremeluzindo/PWM detectado | 12000 Hz | ≤ 100 % configuração de brilho | 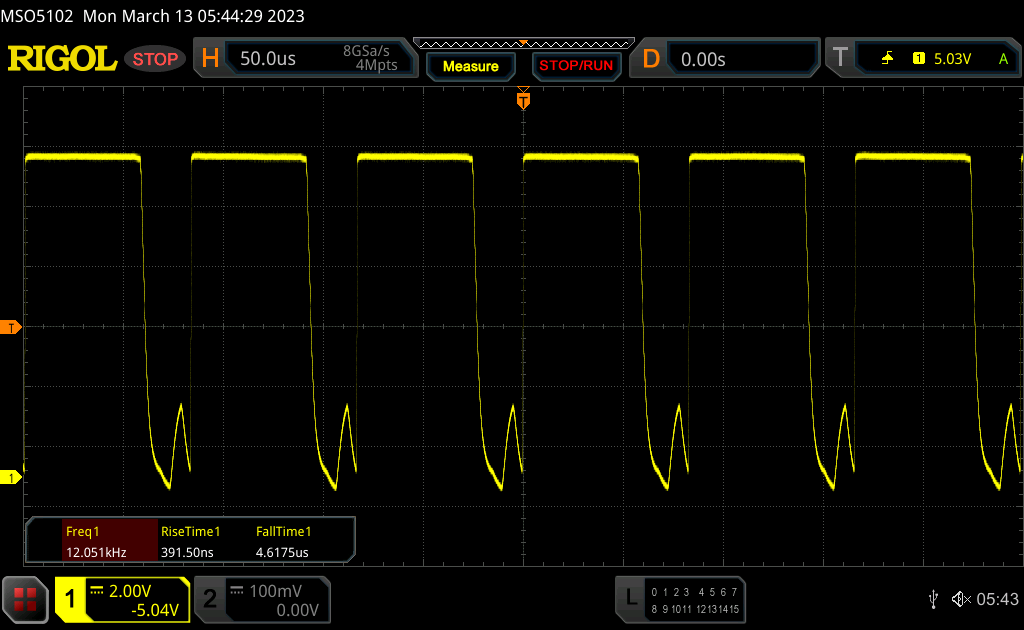 |
A luz de fundo da tela pisca em 12000 Hz (pior caso, por exemplo, utilizando PWM) Cintilação detectada em uma configuração de brilho de 100 % e abaixo. Não deve haver cintilação ou PWM acima desta configuração de brilho. A frequência de 12000 Hz é bastante alta, então a maioria dos usuários sensíveis ao PWM não deve notar nenhuma oscilação. [pwm_comparison] Em comparação: 52 % de todos os dispositivos testados não usam PWM para escurecer a tela. Se PWM foi detectado, uma média de 7781 (mínimo: 5 - máximo: 343500) Hz foi medida. | |||
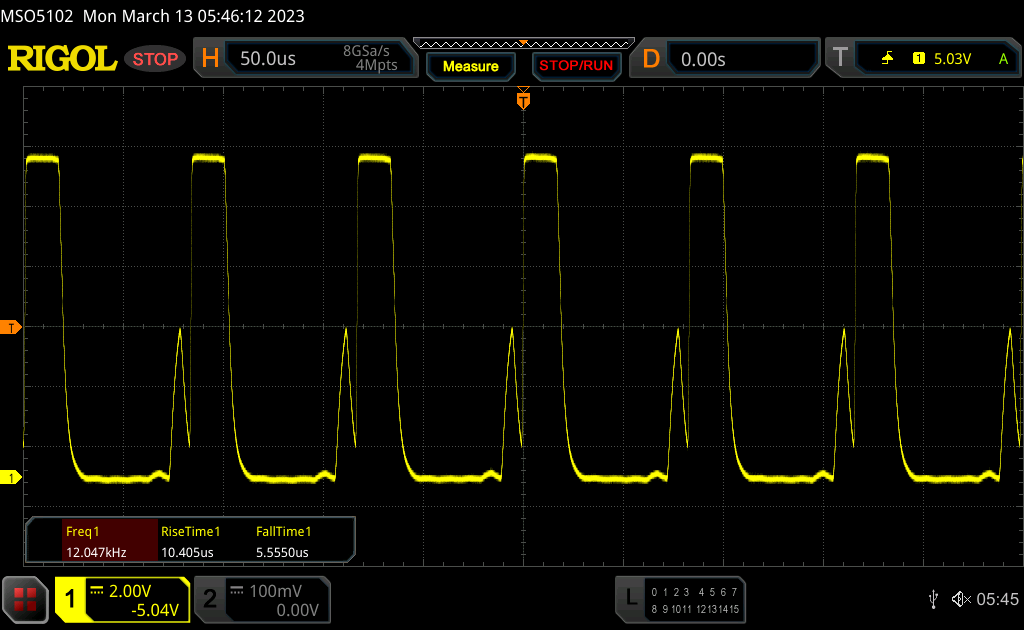
O painel usou PWM em todos os níveis de brilho, mas a freqüência de 12 kHz é muito alta e não deve causar nenhum problema. Entretanto, a constante cintilação do PWM torna muito difícil medir com precisão os tempos de resposta. Nossos resultados são bastante médios, mas o Asus anuncia um tempo de resposta de 3 ms. Não notamos nenhum fantasma durante nossos testes e o painel é ótimo para jogos.
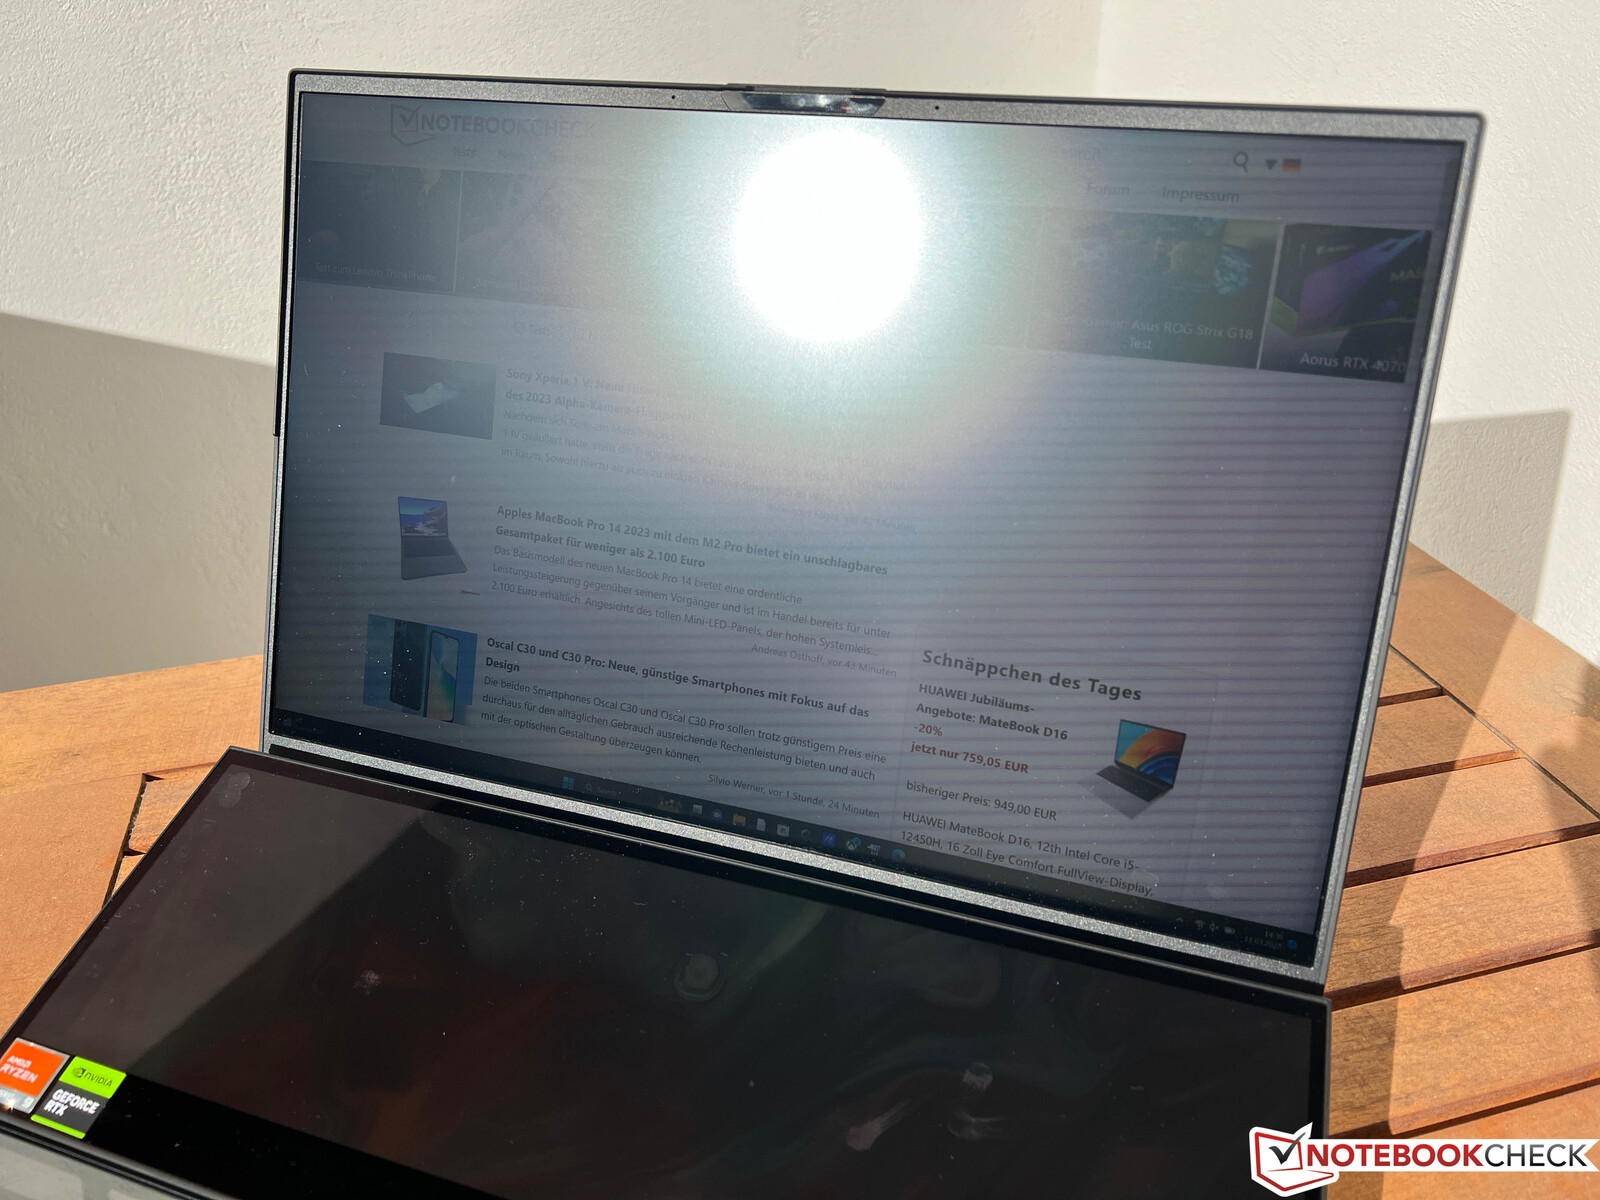
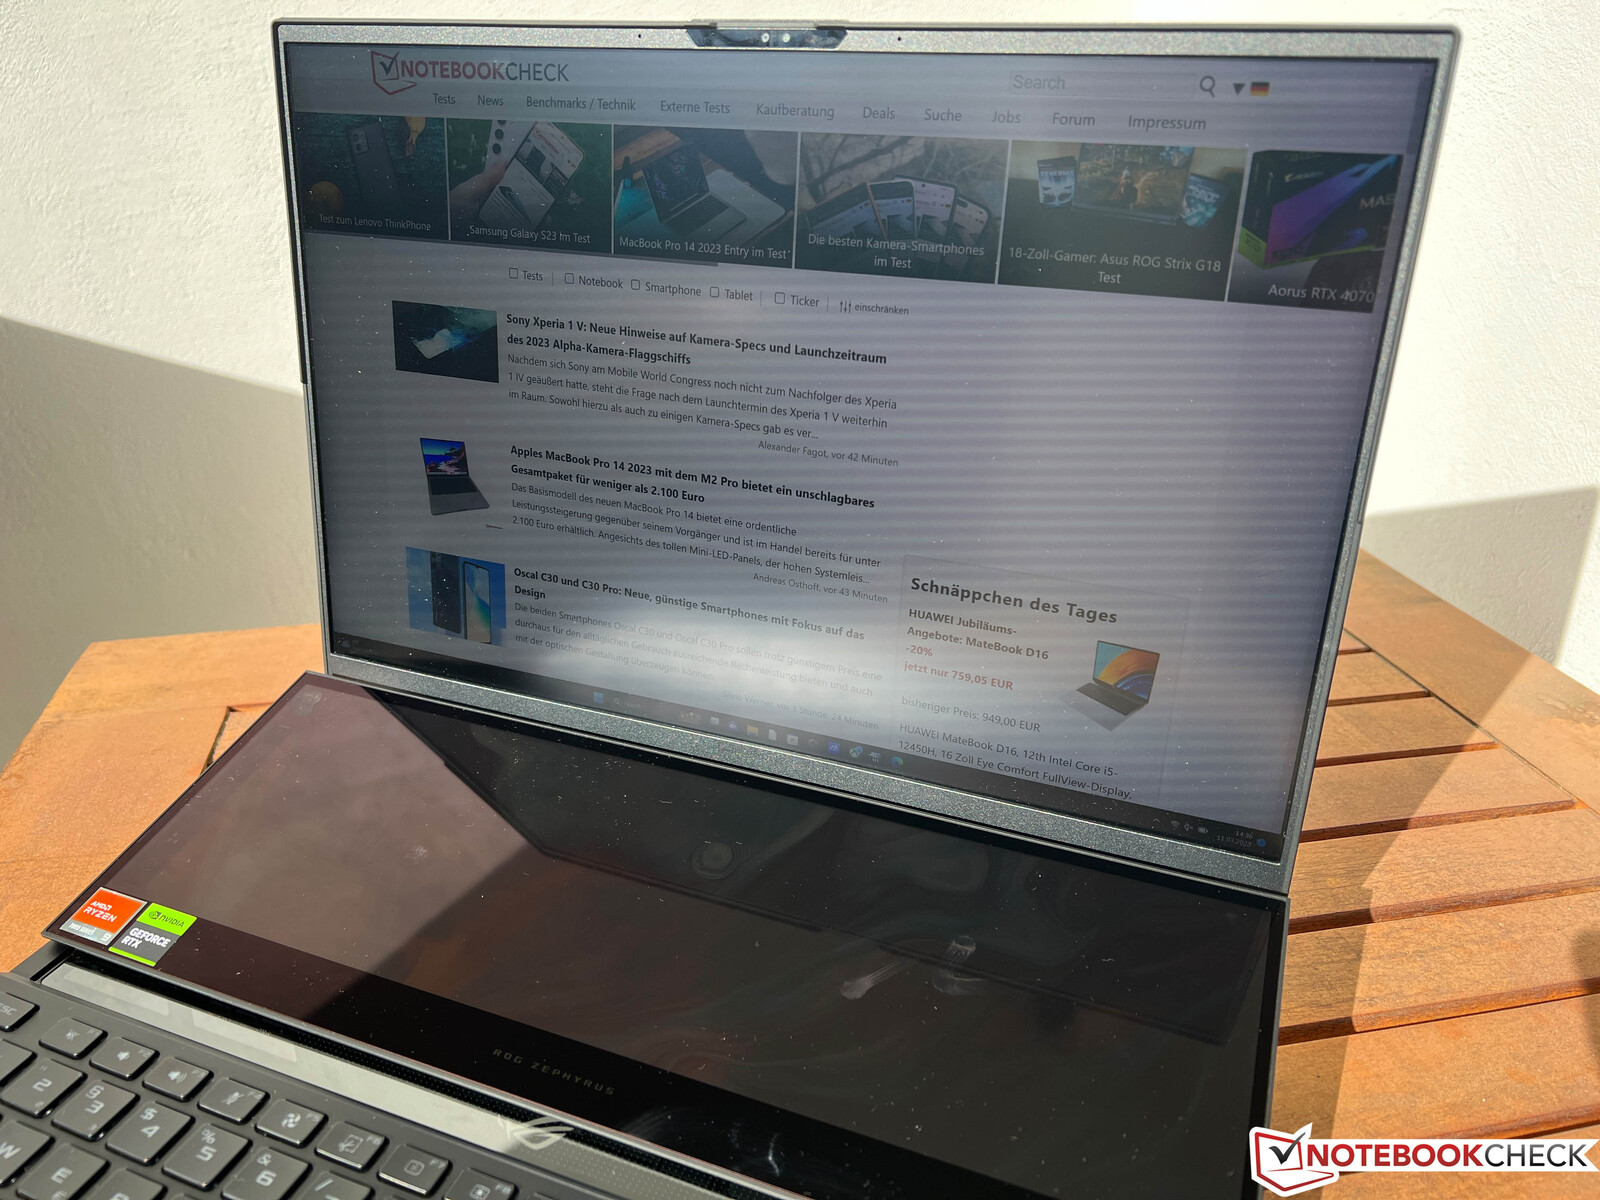
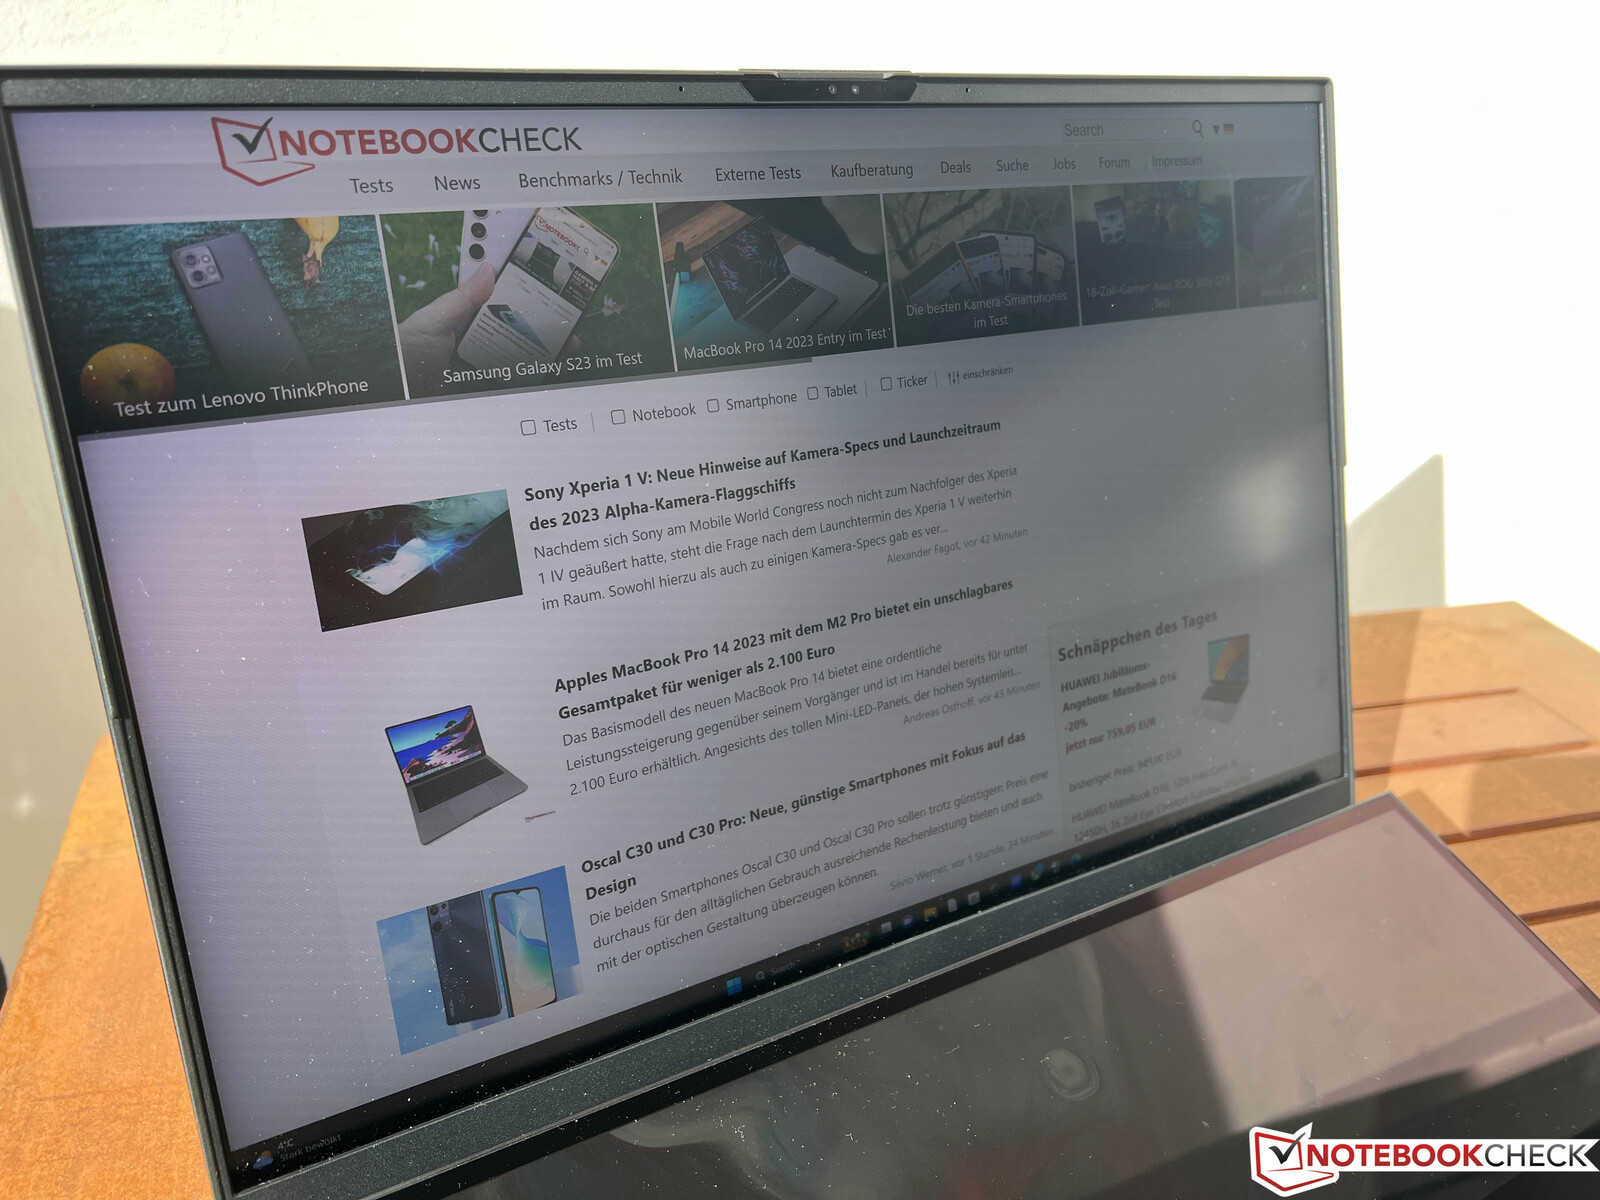
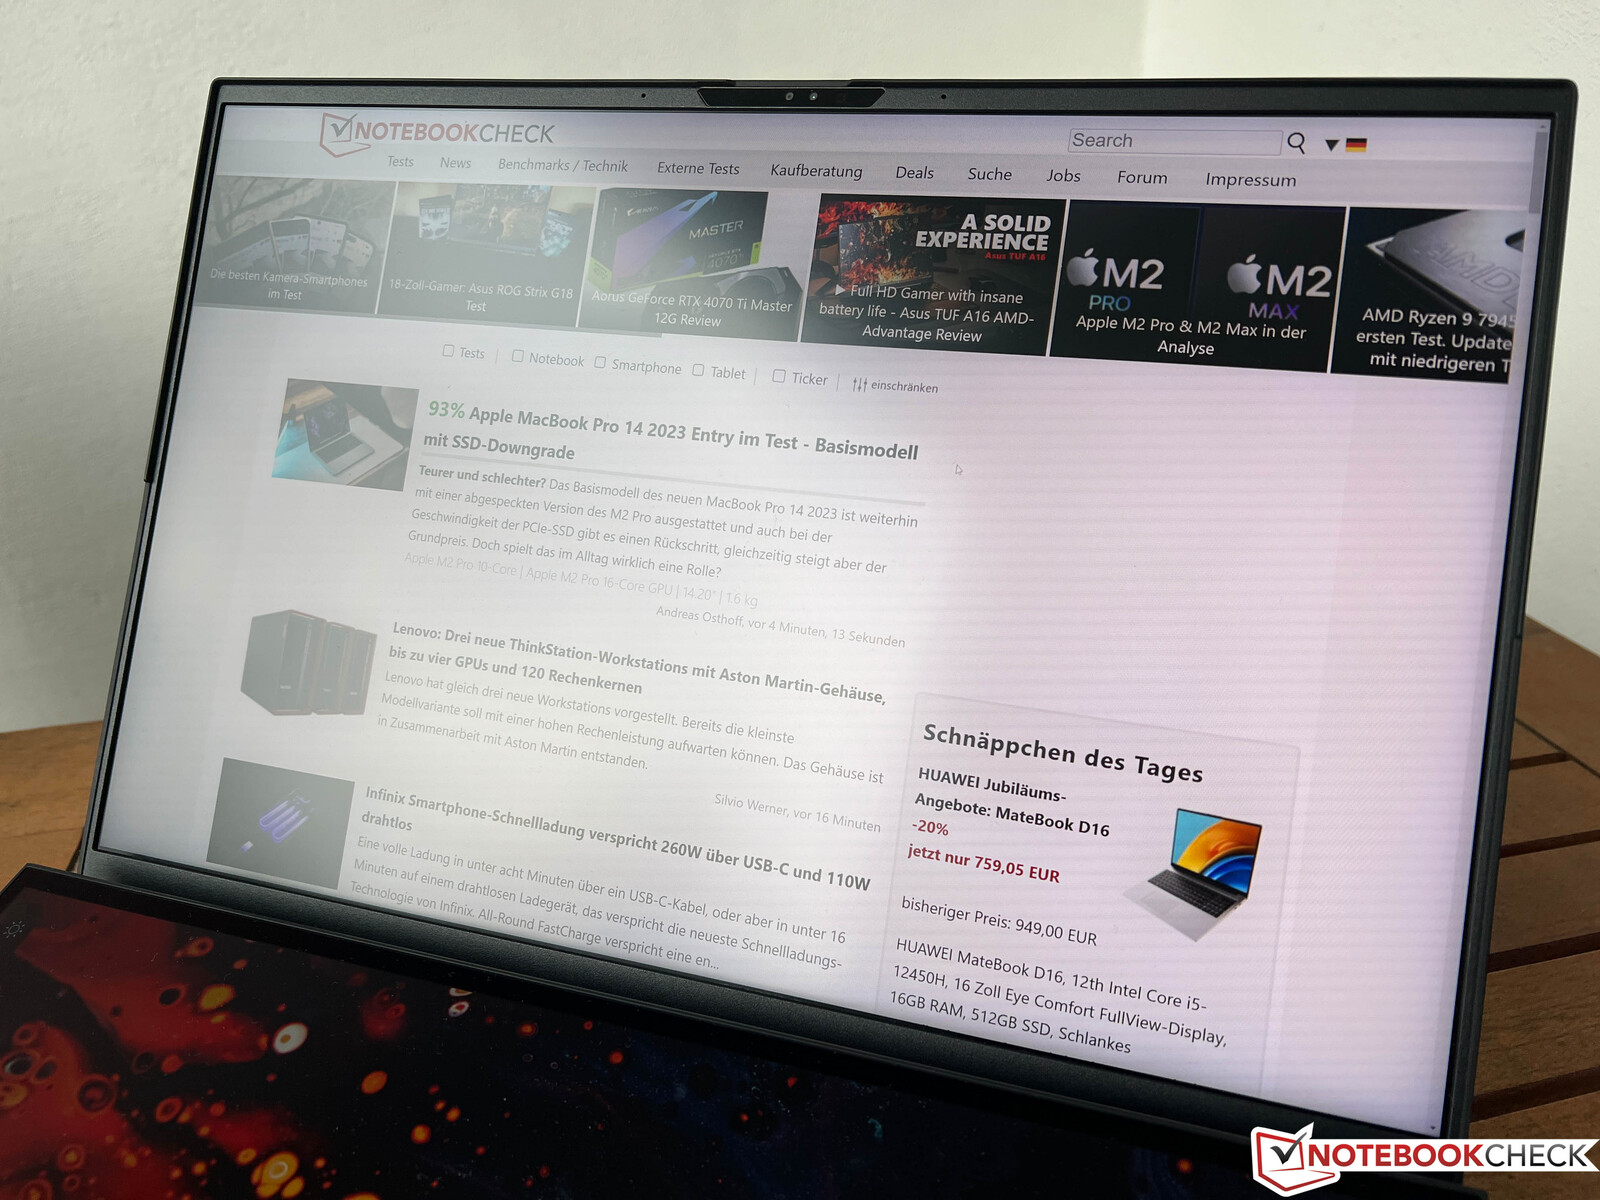
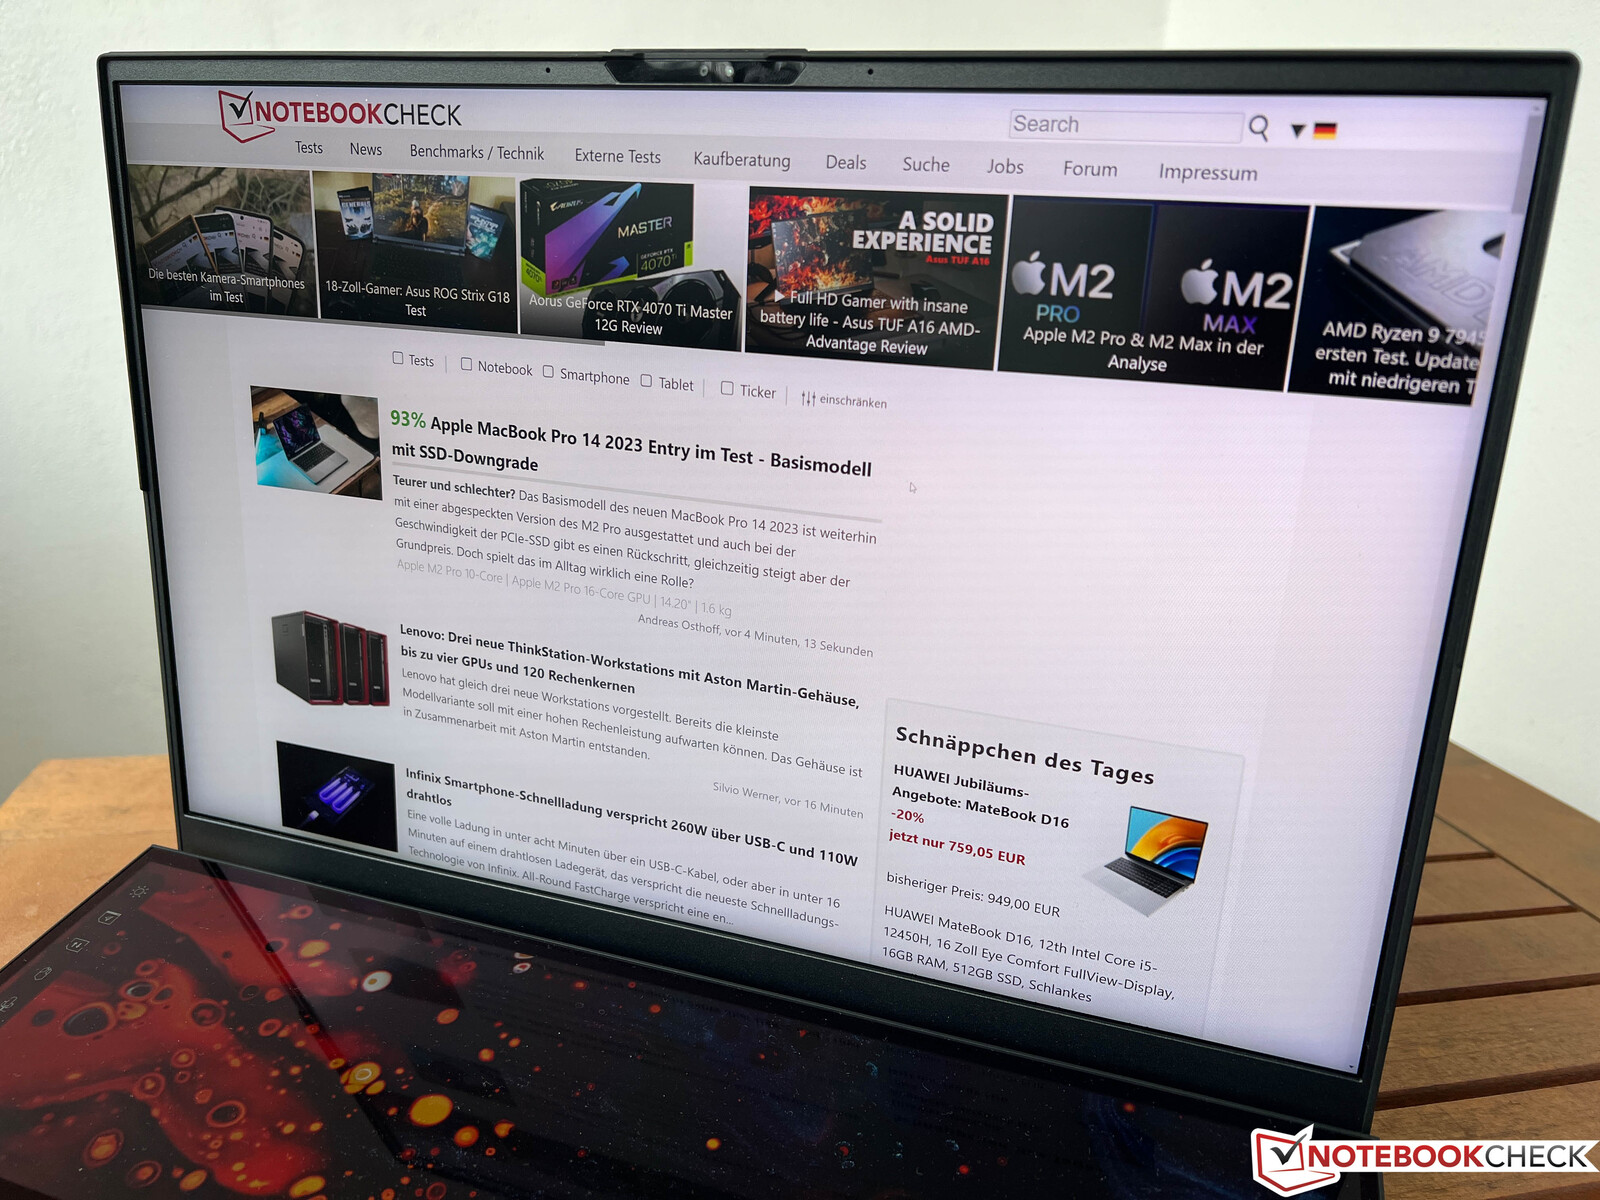
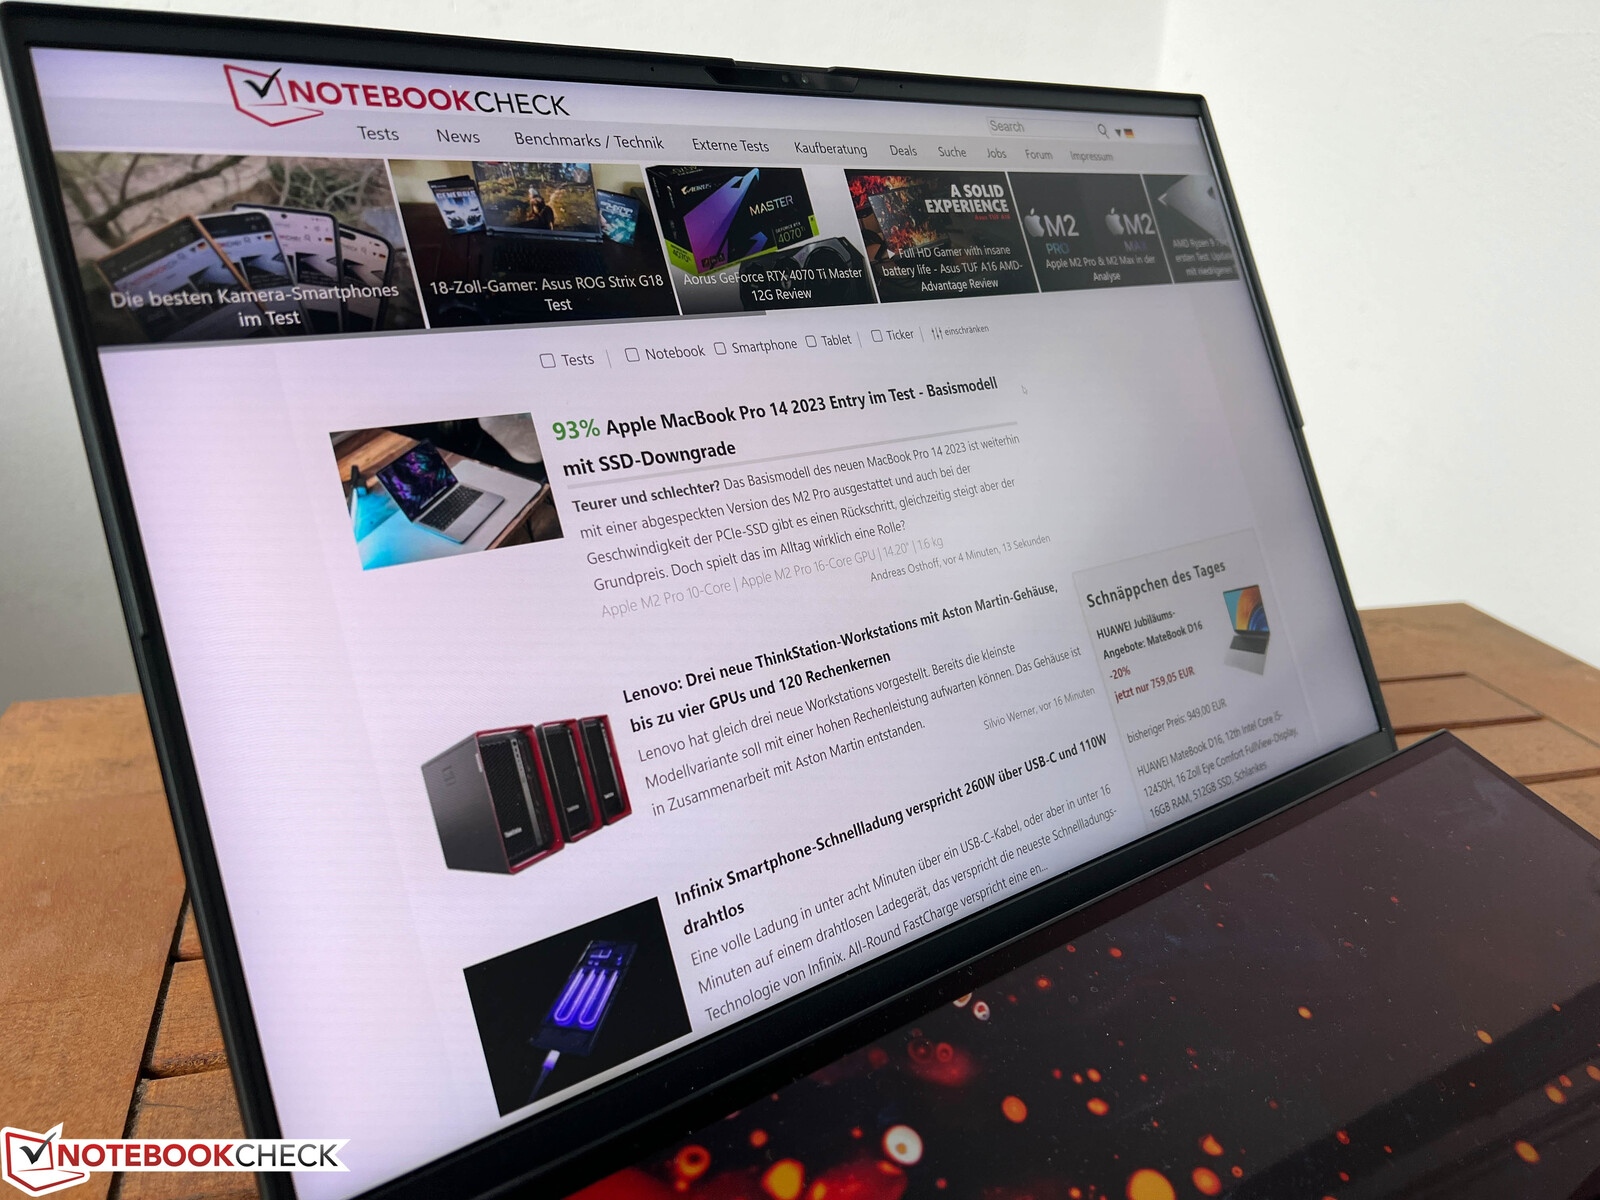
O painel Matte Mini-LED também funciona muito bem ao ar livre, o que é confirmado por nossas fotos ao ar livre. Você deve obviamente evitar reflexos de fontes de luz direta, mas você ainda pode ver o conteúdo muito confortável em dias de sol, enquanto você não pode ver nada na tela secundária brilhante (~400 lêndeas). A estabilidade do ângulo de visão também não causa nenhuma crítica.

ScreenPad Plus - Tela sensível ao toque IPS 4K
Como modelo do ano passadoa tela secundária tem uma resolução de 3840 x 1100 pixels (14 polegadas) e agora é brilhante. As entradas de toque são bem executadas e o Asus evita o problema de resoluções horizontais diferentes ajustando o fator de escala, o que significa que a largura das janelas não muda quando você as muda de uma tela para outra. Isto funciona razoavelmente bem na prática, mas pode haver problemas quando os aplicativos executados em modo tela cheia (como jogos), onde aplicativos ou janelas na segunda tela podem se mover.
O brilho é de quase 400 lêndeas e as outras medidas também são boas, mas a qualidade da imagem não consegue acompanhar a tela principal. O painel adicional também está limitado à gama sRGB menor, mas não detectamos nenhuma cintilação de PWM.
| |||||||||||||||||||||||||
iluminação: 90 %
iluminação com acumulador: 386 cd/m²
Contraste: 1838:1 (Preto: 0.21 cd/m²)
ΔE ColorChecker Calman: 1.7 | ∀{0.5-29.43 Ø4.72}
ΔE Greyscale Calman: 1.5 | ∀{0.09-98 Ø4.97}
Gamma: 2.11
CCT: 6476 K


Exibir tempos de resposta
| ↔ Tempo de resposta preto para branco | ||
|---|---|---|
| 17.2 ms ... ascensão ↗ e queda ↘ combinadas | ↗ 7.7 ms ascensão | 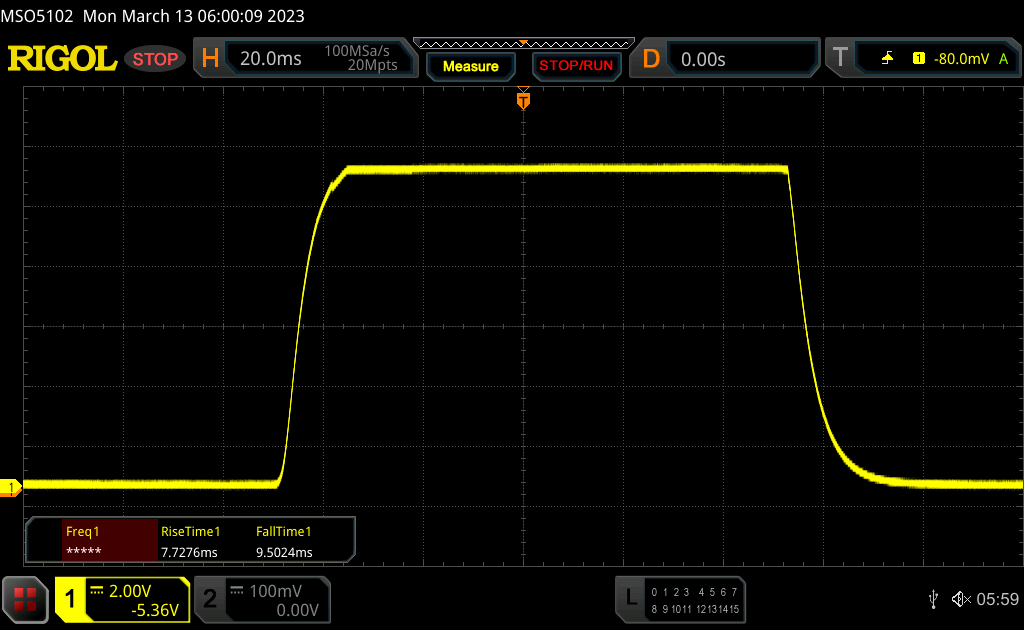 |
| ↘ 9.5 ms queda | ||
| A tela mostra boas taxas de resposta em nossos testes, mas pode ser muito lenta para jogadores competitivos. Em comparação, todos os dispositivos testados variam de 0.1 (mínimo) a 240 (máximo) ms. » 39 % de todos os dispositivos são melhores. Isso significa que o tempo de resposta medido é melhor que a média de todos os dispositivos testados (19.8 ms). | ||
| ↔ Tempo de resposta 50% cinza a 80% cinza | ||
| 32.1 ms ... ascensão ↗ e queda ↘ combinadas | ↗ 15.4 ms ascensão | 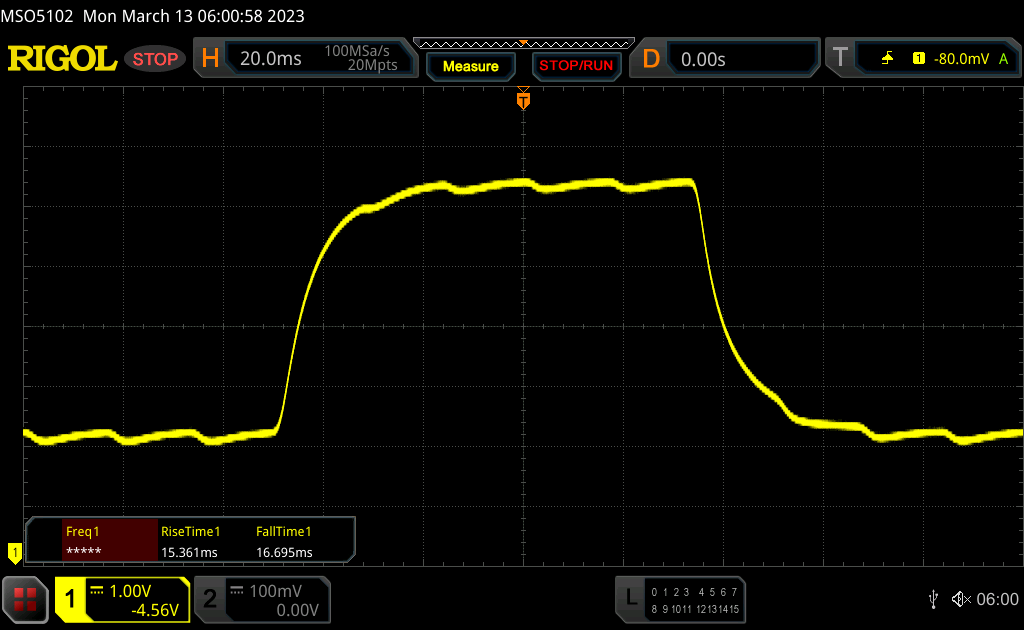 |
| ↘ 16.7 ms queda | ||
| A tela mostra taxas de resposta lentas em nossos testes e será insatisfatória para os jogadores. Em comparação, todos os dispositivos testados variam de 0.165 (mínimo) a 636 (máximo) ms. » 44 % de todos os dispositivos são melhores. Isso significa que o tempo de resposta medido é semelhante à média de todos os dispositivos testados (31 ms). | ||
Cintilação da tela / PWM (modulação por largura de pulso)
| Tela tremeluzindo / PWM não detectado | 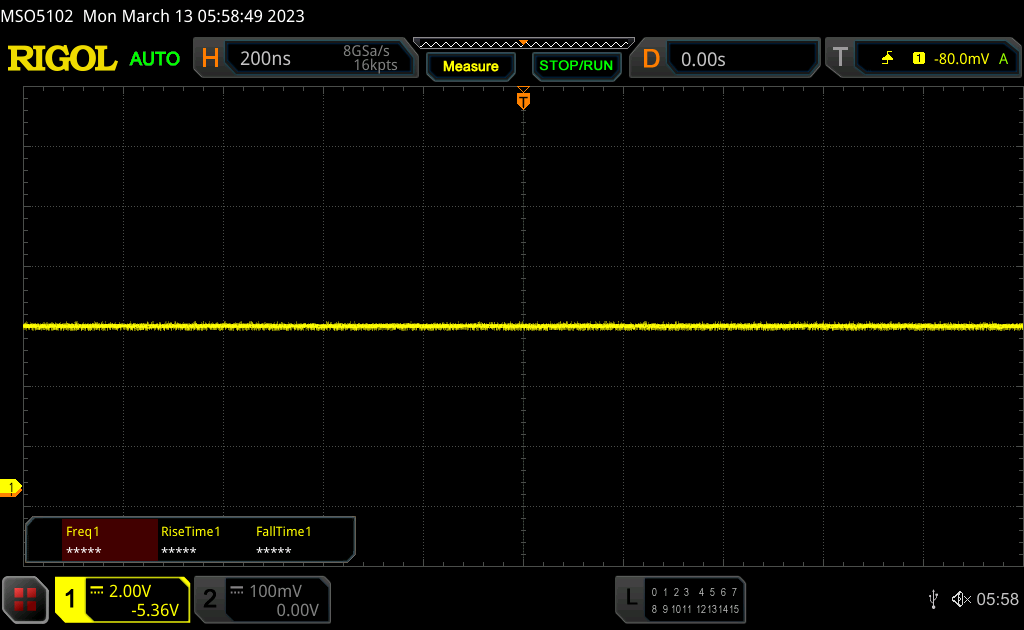 | ||
[pwm_comparison] Em comparação: 52 % de todos os dispositivos testados não usam PWM para escurecer a tela. Se PWM foi detectado, uma média de 7781 (mínimo: 5 - máximo: 343500) Hz foi medida. | |||
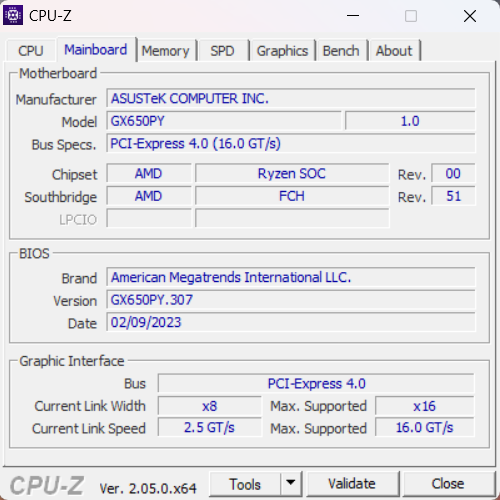
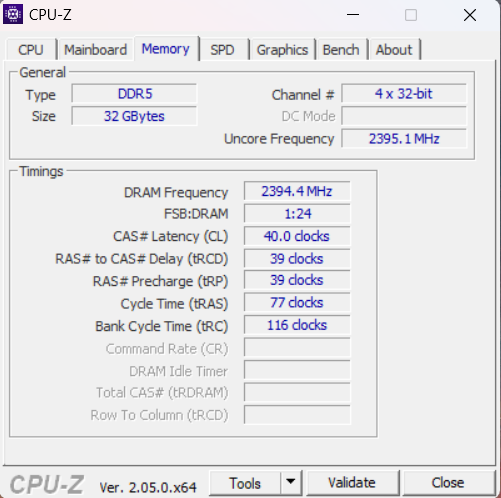
Desempenho - Laptop Ryzen 9 e RTX 4090
Todos os modelos do ROG Zephyrus Duo são equipados com o poderosoAMD Ryzen 9 7945HXmas o Asus não usa RAM rápida e ainda usa DDR5-4800. Também enfrentamos alguns bugs durante nossa revisão e tivemos até algumas telas azuis quando lançamos os benchmarks AIDA64, por exemplo. Você também tem que saber que os gráficos são tratados pela GPU dedicada GeForce quando você usa uma tela externa. Isto é causado pela tela secundária, e a GPU GeForce também está funcionando mesmo quando ambas as telas integradas estão desligadas, o que obviamente aumentará o consumo de energia.
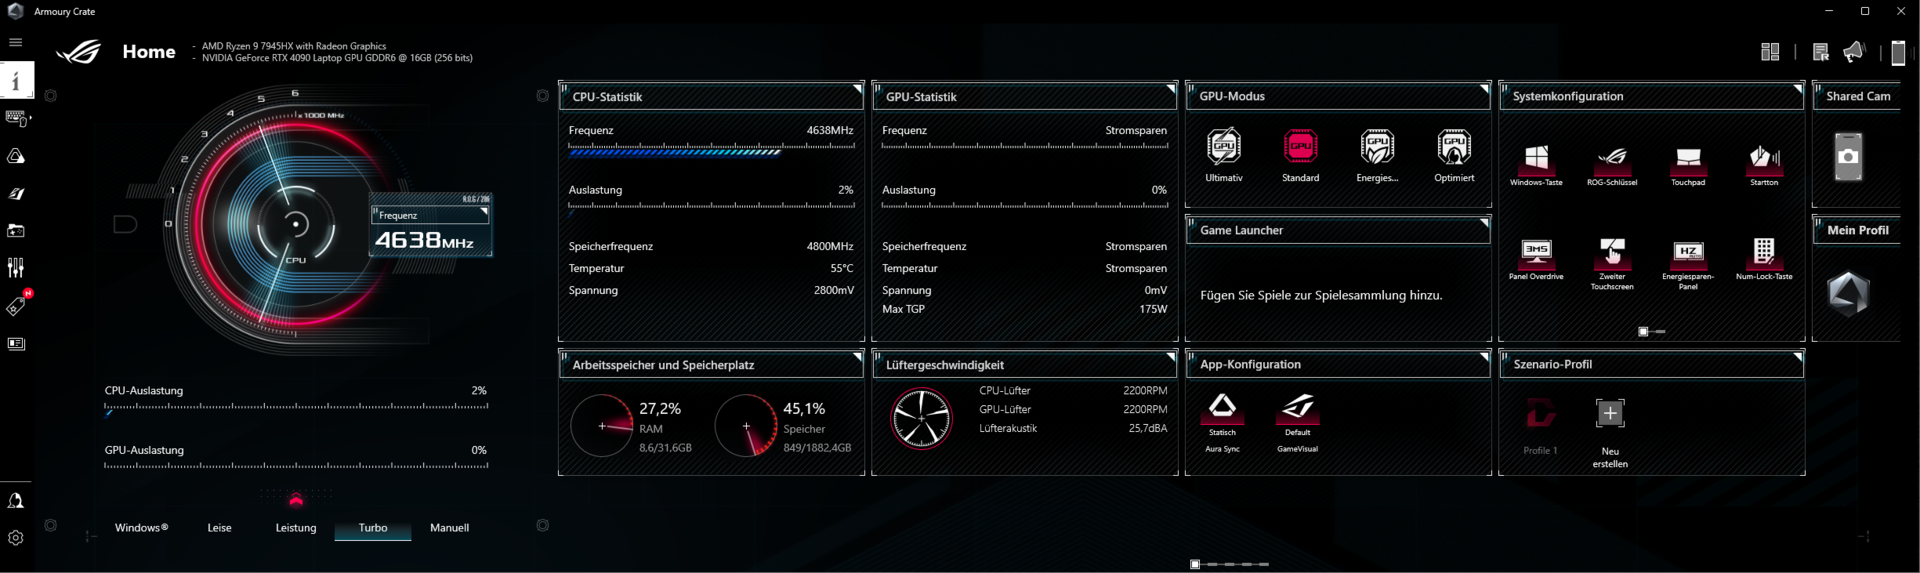
Configurações de revisão
O software Armoury Crate pré-carregado oferece vários perfis de potência para o ROG Zephyrus Duo 16. Também é possível ajustar as configurações da GPU, além dos perfis básicos. Obtivemos os melhores resultados gerais com o perfil Turbo, bem como a configuração padrão da GPU (MSHybrid).
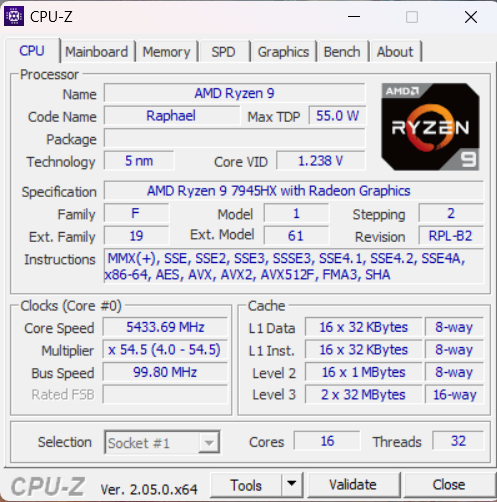
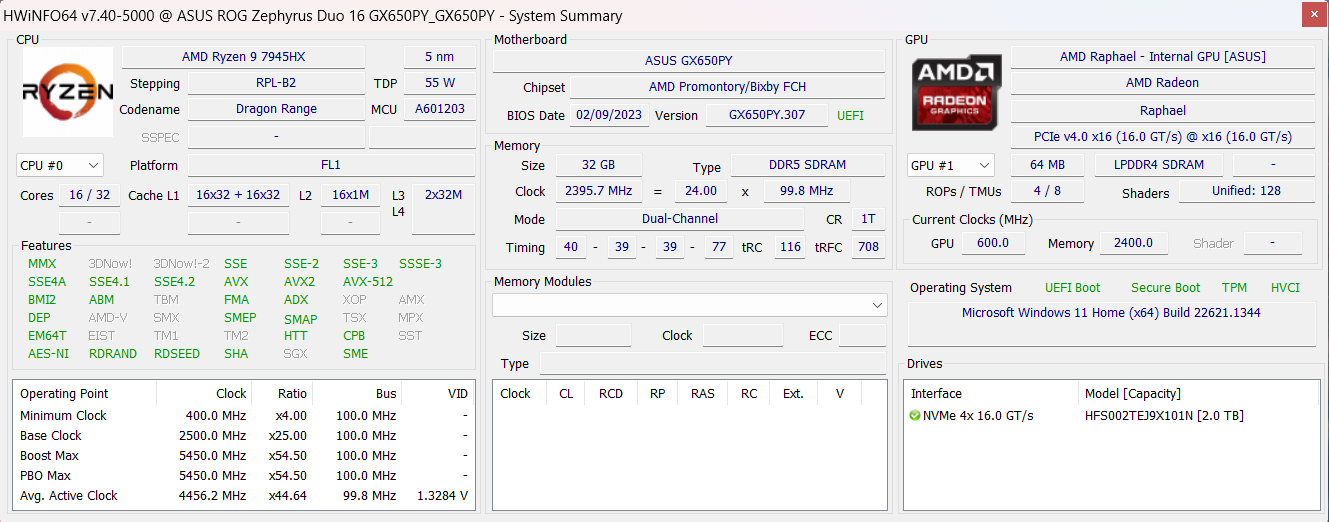
Processador
O novoAMD Ryzen 9 7945HX (Gama Dragon)utiliza 16 núcleos Zen4 (32 fios) e é fabricado em um processo de 5 nm. É a nova CPU móvel principal da AMD e é um rival direto dos atuais chips Raptor Lake HX da Intel. A AMD anuncia um TDP típico de 55 Watts, mas o processador no ROH Zephyrus Duo 16 pode consumir até 130 Watts e 120 Watts para cargas de trabalho sustentadas. Isto significa que é muito mais eficiente do que os últimos modelos da Intel, como oNúcleo i9-13980HXque pode consumir mais de 200 Watts em cenários de pico de carga.
O desempenho multi-core, em particular, é muito impressionante e o Ryzen 9 7945HX pode ocupar o primeiro lugar em quase todas as referências. As CPUs atuais da Intel têm apenas uma ligeira vantagem em testes de núcleo único, mas também consomem mais energia nestes cenários. Ofereceremos uma comparação detalhada do desempenho e eficiência entre as novas CPUs AMD Ryzen 9 7945HX e as CPUs Raptor Lake HX em um artigo de comparação separado.
Cinebench R15 Multi Loop
O desempenho da CPU é quase completamente estável sob cargas de trabalho sustentadas, mas você tem que esperar um déficit de desempenho de cerca de 50% em testes de múltiplos núcleos executados com bateria (o desempenho de um único núcleo não é afetado). Em comparação com oRyzen 9 6900HXno antigoZephyrus Duo 16o desempenho da CPU aumentou em 68% em todos os benchmarks de CPU. Mais resultados de referência estão disponíveis em nossa seção técnica.
Cinebench R23: Multi Core | Single Core
Cinebench R20: CPU (Multi Core) | CPU (Single Core)
Cinebench R15: CPU Multi 64Bit | CPU Single 64Bit
Blender: v2.79 BMW27 CPU
7-Zip 18.03: 7z b 4 | 7z b 4 -mmt1
Geekbench 5.5: Multi-Core | Single-Core
HWBOT x265 Benchmark v2.2: 4k Preset
LibreOffice : 20 Documents To PDF
R Benchmark 2.5: Overall mean
| CPU Performance rating | |
| MSI Titan GT77 HX 13VI | |
| Média AMD Ryzen 9 7945HX | |
| Asus Zephyrus Duo 16 GX650PY-NM006W | |
| MSI Titan GT77 HX 13VI | |
| Lenovo Legion Pro 7 16IRX8H | |
| Schenker XMG Neo 16 Raptor Lake | |
| Razer Blade 16 Early 2023 | |
| Média da turma Gaming | |
| MSI Titan GT77 12UHS | |
| Apple MacBook Pro 16 2023 M2 Max -6! | |
| Asus ROG Zephyrus Duo 16 GX650RX | |
| Cinebench R23 / Multi Core | |
| Asus Zephyrus Duo 16 GX650PY-NM006W | |
| MSI Titan GT77 HX 13VI | |
| Média AMD Ryzen 9 7945HX (30783 - 34613, n=9) | |
| MSI Titan GT77 HX 13VI | |
| Lenovo Legion Pro 7 16IRX8H | |
| Schenker XMG Neo 16 Raptor Lake | |
| Schenker XMG Neo 16 Raptor Lake | |
| Schenker XMG Neo 16 Raptor Lake | |
| Razer Blade 16 Early 2023 | |
| Média da turma Gaming (10488 - 40970, n=110, últimos 2 anos) | |
| MSI Titan GT77 12UHS | |
| Apple MacBook Pro 16 2023 M2 Max | |
| Asus ROG Zephyrus Duo 16 GX650RX | |
| Cinebench R23 / Single Core | |
| MSI Titan GT77 HX 13VI | |
| MSI Titan GT77 HX 13VI | |
| Schenker XMG Neo 16 Raptor Lake | |
| Lenovo Legion Pro 7 16IRX8H | |
| Razer Blade 16 Early 2023 | |
| Média da turma Gaming (1166 - 2356, n=110, últimos 2 anos) | |
| Asus Zephyrus Duo 16 GX650PY-NM006W | |
| Média AMD Ryzen 9 7945HX (1861 - 1957, n=9) | |
| MSI Titan GT77 12UHS | |
| Apple MacBook Pro 16 2023 M2 Max | |
| Asus ROG Zephyrus Duo 16 GX650RX | |
| Cinebench R20 / CPU (Multi Core) | |
| Asus Zephyrus Duo 16 GX650PY-NM006W | |
| Média AMD Ryzen 9 7945HX (10025 - 13769, n=9) | |
| MSI Titan GT77 HX 13VI | |
| MSI Titan GT77 HX 13VI | |
| Lenovo Legion Pro 7 16IRX8H | |
| Schenker XMG Neo 16 Raptor Lake | |
| Média da turma Gaming (4029 - 16108, n=109, últimos 2 anos) | |
| Razer Blade 16 Early 2023 | |
| MSI Titan GT77 12UHS | |
| Asus ROG Zephyrus Duo 16 GX650RX | |
| Apple MacBook Pro 16 2023 M2 Max | |
| Cinebench R20 / CPU (Single Core) | |
| MSI Titan GT77 HX 13VI | |
| MSI Titan GT77 HX 13VI | |
| Lenovo Legion Pro 7 16IRX8H | |
| Média da turma Gaming (442 - 895, n=109, últimos 2 anos) | |
| Schenker XMG Neo 16 Raptor Lake | |
| Asus Zephyrus Duo 16 GX650PY-NM006W | |
| Razer Blade 16 Early 2023 | |
| Média AMD Ryzen 9 7945HX (712 - 760, n=9) | |
| MSI Titan GT77 12UHS | |
| Asus ROG Zephyrus Duo 16 GX650RX | |
| Apple MacBook Pro 16 2023 M2 Max | |
| Cinebench R15 / CPU Multi 64Bit | |
| Asus Zephyrus Duo 16 GX650PY-NM006W | |
| Média AMD Ryzen 9 7945HX (4998 - 5663, n=10) | |
| MSI Titan GT77 HX 13VI | |
| MSI Titan GT77 HX 13VI | |
| Schenker XMG Neo 16 Raptor Lake | |
| Schenker XMG Neo 16 Raptor Lake | |
| Lenovo Legion Pro 7 16IRX8H | |
| Razer Blade 16 Early 2023 | |
| Média da turma Gaming (1578 - 6271, n=109, últimos 2 anos) | |
| MSI Titan GT77 12UHS | |
| Asus ROG Zephyrus Duo 16 GX650RX | |
| Apple MacBook Pro 16 2023 M2 Max | |
| Cinebench R15 / CPU Single 64Bit | |
| MSI Titan GT77 HX 13VI | |
| Asus Zephyrus Duo 16 GX650PY-NM006W | |
| Média AMD Ryzen 9 7945HX (290 - 311, n=10) | |
| Lenovo Legion Pro 7 16IRX8H | |
| MSI Titan GT77 HX 13VI | |
| Média da turma Gaming (188.8 - 343, n=109, últimos 2 anos) | |
| Schenker XMG Neo 16 Raptor Lake | |
| Schenker XMG Neo 16 Raptor Lake | |
| MSI Titan GT77 12UHS | |
| Razer Blade 16 Early 2023 | |
| Asus ROG Zephyrus Duo 16 GX650RX | |
| Apple MacBook Pro 16 2023 M2 Max | |
| Blender / v2.79 BMW27 CPU | |
| Asus ROG Zephyrus Duo 16 GX650RX | |
| Média da turma Gaming (80 - 330, n=107, últimos 2 anos) | |
| MSI Titan GT77 12UHS | |
| Razer Blade 16 Early 2023 | |
| Schenker XMG Neo 16 Raptor Lake | |
| Lenovo Legion Pro 7 16IRX8H | |
| MSI Titan GT77 HX 13VI | |
| MSI Titan GT77 HX 13VI | |
| Média AMD Ryzen 9 7945HX (87 - 100, n=9) | |
| Asus Zephyrus Duo 16 GX650PY-NM006W | |
| 7-Zip 18.03 / 7z b 4 | |
| Asus Zephyrus Duo 16 GX650PY-NM006W | |
| Média AMD Ryzen 9 7945HX (123364 - 140932, n=9) | |
| MSI Titan GT77 HX 13VI | |
| MSI Titan GT77 HX 13VI | |
| Lenovo Legion Pro 7 16IRX8H | |
| Schenker XMG Neo 16 Raptor Lake | |
| Razer Blade 16 Early 2023 | |
| Média da turma Gaming (33491 - 148086, n=108, últimos 2 anos) | |
| MSI Titan GT77 12UHS | |
| Asus ROG Zephyrus Duo 16 GX650RX | |
| 7-Zip 18.03 / 7z b 4 -mmt1 | |
| Média AMD Ryzen 9 7945HX (7319 - 7711, n=9) | |
| Asus Zephyrus Duo 16 GX650PY-NM006W | |
| Lenovo Legion Pro 7 16IRX8H | |
| MSI Titan GT77 HX 13VI | |
| MSI Titan GT77 HX 13VI | |
| Schenker XMG Neo 16 Raptor Lake | |
| Razer Blade 16 Early 2023 | |
| Média da turma Gaming (4199 - 7436, n=108, últimos 2 anos) | |
| MSI Titan GT77 12UHS | |
| Asus ROG Zephyrus Duo 16 GX650RX | |
| Geekbench 5.5 / Multi-Core | |
| Lenovo Legion Pro 7 16IRX8H | |
| Schenker XMG Neo 16 Raptor Lake | |
| MSI Titan GT77 HX 13VI | |
| MSI Titan GT77 HX 13VI | |
| Média AMD Ryzen 9 7945HX (18372 - 20394, n=9) | |
| Asus Zephyrus Duo 16 GX650PY-NM006W | |
| Razer Blade 16 Early 2023 | |
| Média da turma Gaming (6460 - 27010, n=108, últimos 2 anos) | |
| MSI Titan GT77 12UHS | |
| Apple MacBook Pro 16 2023 M2 Max | |
| Asus ROG Zephyrus Duo 16 GX650RX | |
| Geekbench 5.5 / Single-Core | |
| MSI Titan GT77 HX 13VI | |
| Asus Zephyrus Duo 16 GX650PY-NM006W | |
| Média AMD Ryzen 9 7945HX (1960 - 2158, n=9) | |
| Média da turma Gaming (986 - 2474, n=108, últimos 2 anos) | |
| MSI Titan GT77 HX 13VI | |
| Lenovo Legion Pro 7 16IRX8H | |
| Schenker XMG Neo 16 Raptor Lake | |
| Apple MacBook Pro 16 2023 M2 Max | |
| MSI Titan GT77 12UHS | |
| Razer Blade 16 Early 2023 | |
| Asus ROG Zephyrus Duo 16 GX650RX | |
| HWBOT x265 Benchmark v2.2 / 4k Preset | |
| Média AMD Ryzen 9 7945HX (33.8 - 37.6, n=8) | |
| Asus Zephyrus Duo 16 GX650PY-NM006W | |
| MSI Titan GT77 HX 13VI | |
| MSI Titan GT77 HX 13VI | |
| Lenovo Legion Pro 7 16IRX8H | |
| Schenker XMG Neo 16 Raptor Lake | |
| Razer Blade 16 Early 2023 | |
| Média da turma Gaming (11.5 - 44.3, n=108, últimos 2 anos) | |
| MSI Titan GT77 12UHS | |
| Asus ROG Zephyrus Duo 16 GX650RX | |
| LibreOffice / 20 Documents To PDF | |
| Asus Zephyrus Duo 16 GX650PY-NM006W | |
| Média da turma Gaming (19 - 88.8, n=108, últimos 2 anos) | |
| Razer Blade 16 Early 2023 | |
| MSI Titan GT77 HX 13VI | |
| Schenker XMG Neo 16 Raptor Lake | |
| Asus ROG Zephyrus Duo 16 GX650RX | |
| Média AMD Ryzen 9 7945HX (35.5 - 60.4, n=8) | |
| Lenovo Legion Pro 7 16IRX8H | |
| MSI Titan GT77 12UHS | |
| MSI Titan GT77 HX 13VI | |
| R Benchmark 2.5 / Overall mean | |
| Asus ROG Zephyrus Duo 16 GX650RX | |
| Média da turma Gaming (0.3439 - 0.759, n=109, últimos 2 anos) | |
| MSI Titan GT77 12UHS | |
| Razer Blade 16 Early 2023 | |
| Média AMD Ryzen 9 7945HX (0.3884 - 0.4159, n=8) | |
| MSI Titan GT77 HX 13VI | |
| MSI Titan GT77 HX 13VI | |
| Asus Zephyrus Duo 16 GX650PY-NM006W | |
| Lenovo Legion Pro 7 16IRX8H | |
| Schenker XMG Neo 16 Raptor Lake | |
* ... menor é melhor
Desempenho do sistema
Com exceção das telas azuis mencionadas anteriormente, também notamos alguns bugs de software durante nosso período de revisão. Houve problemas com a conexão Bluetooth (ocasionalmente tivemos que abrir o menu Bluetooth antes de nosso mouse funcionar) e o YouTube às vezes não reproduzia nenhum vídeo, o que foi resolvido por um reinício. Atualmente não temos certeza se estes são problemas de software causados pelo Asus ou problemas iniciais com a nova plataforma AMD.
Se tudo funcionar como projetado (que é o caso na maioria das vezes), o desempenho é realmente bom. Não há gagueira e todas as entradas são executadas sem atrasos. Os resultados nos benchmarks sintéticos também são excelentes e o sistema AMD pode vencer a maioria dos rivais da Intel.
CrossMark: Overall | Productivity | Creativity | Responsiveness
| PCMark 10 / Score | |
| Asus Zephyrus Duo 16 GX650PY-NM006W | |
| Média AMD Ryzen 9 7945HX, NVIDIA GeForce RTX 4090 Laptop GPU (8733 - 9151, n=2) | |
| MSI Titan GT77 HX 13VI | |
| Média da turma Gaming (5828 - 11574, n=95, últimos 2 anos) | |
| Razer Blade 16 Early 2023 | |
| Lenovo Legion Pro 7 16IRX8H | |
| Asus ROG Zephyrus Duo 16 GX650RX | |
| PCMark 10 / Essentials | |
| Asus Zephyrus Duo 16 GX650PY-NM006W | |
| MSI Titan GT77 HX 13VI | |
| Lenovo Legion Pro 7 16IRX8H | |
| Média AMD Ryzen 9 7945HX, NVIDIA GeForce RTX 4090 Laptop GPU (11165 - 12176, n=2) | |
| Razer Blade 16 Early 2023 | |
| Média da turma Gaming (8810 - 12600, n=99, últimos 2 anos) | |
| Asus ROG Zephyrus Duo 16 GX650RX | |
| PCMark 10 / Productivity | |
| Asus Zephyrus Duo 16 GX650PY-NM006W | |
| Média AMD Ryzen 9 7945HX, NVIDIA GeForce RTX 4090 Laptop GPU (10266 - 11833, n=2) | |
| Lenovo Legion Pro 7 16IRX8H | |
| Média da turma Gaming (6845 - 18766, n=97, últimos 2 anos) | |
| MSI Titan GT77 HX 13VI | |
| Razer Blade 16 Early 2023 | |
| Asus ROG Zephyrus Duo 16 GX650RX | |
| PCMark 10 / Digital Content Creation | |
| MSI Titan GT77 HX 13VI | |
| Média AMD Ryzen 9 7945HX, NVIDIA GeForce RTX 4090 Laptop GPU (14432 - 15768, n=2) | |
| Razer Blade 16 Early 2023 | |
| Asus Zephyrus Duo 16 GX650PY-NM006W | |
| Média da turma Gaming (7602 - 19657, n=97, últimos 2 anos) | |
| Lenovo Legion Pro 7 16IRX8H | |
| Asus ROG Zephyrus Duo 16 GX650RX | |
| CrossMark / Overall | |
| MSI Titan GT77 HX 13VI | |
| Asus Zephyrus Duo 16 GX650PY-NM006W | |
| Média AMD Ryzen 9 7945HX, NVIDIA GeForce RTX 4090 Laptop GPU (1993 - 2078, n=2) | |
| Schenker XMG Neo 16 Raptor Lake | |
| Média da turma Gaming (1366 - 2409, n=96, últimos 2 anos) | |
| Apple MacBook Pro 16 2023 M2 Max | |
| Asus ROG Zephyrus Duo 16 GX650RX | |
| Razer Blade 16 Early 2023 | |
| CrossMark / Productivity | |
| MSI Titan GT77 HX 13VI | |
| Asus Zephyrus Duo 16 GX650PY-NM006W | |
| Média AMD Ryzen 9 7945HX, NVIDIA GeForce RTX 4090 Laptop GPU (1838 - 1946, n=2) | |
| Média da turma Gaming (1386 - 2254, n=96, últimos 2 anos) | |
| Schenker XMG Neo 16 Raptor Lake | |
| Asus ROG Zephyrus Duo 16 GX650RX | |
| Apple MacBook Pro 16 2023 M2 Max | |
| Razer Blade 16 Early 2023 | |
| CrossMark / Creativity | |
| Apple MacBook Pro 16 2023 M2 Max | |
| MSI Titan GT77 HX 13VI | |
| Schenker XMG Neo 16 Raptor Lake | |
| Asus Zephyrus Duo 16 GX650PY-NM006W | |
| Média AMD Ryzen 9 7945HX, NVIDIA GeForce RTX 4090 Laptop GPU (2334 - 2377, n=2) | |
| Média da turma Gaming (1343 - 2729, n=96, últimos 2 anos) | |
| Razer Blade 16 Early 2023 | |
| Asus ROG Zephyrus Duo 16 GX650RX | |
| CrossMark / Responsiveness | |
| MSI Titan GT77 HX 13VI | |
| Asus ROG Zephyrus Duo 16 GX650RX | |
| Média da turma Gaming (1226 - 2334, n=96, últimos 2 anos) | |
| Asus Zephyrus Duo 16 GX650PY-NM006W | |
| Média AMD Ryzen 9 7945HX, NVIDIA GeForce RTX 4090 Laptop GPU (1584 - 1689, n=2) | |
| Schenker XMG Neo 16 Raptor Lake | |
| Apple MacBook Pro 16 2023 M2 Max | |
| Razer Blade 16 Early 2023 | |
| PCMark 10 Score | 9151 pontos | |
Ajuda | ||
Latência do DPC
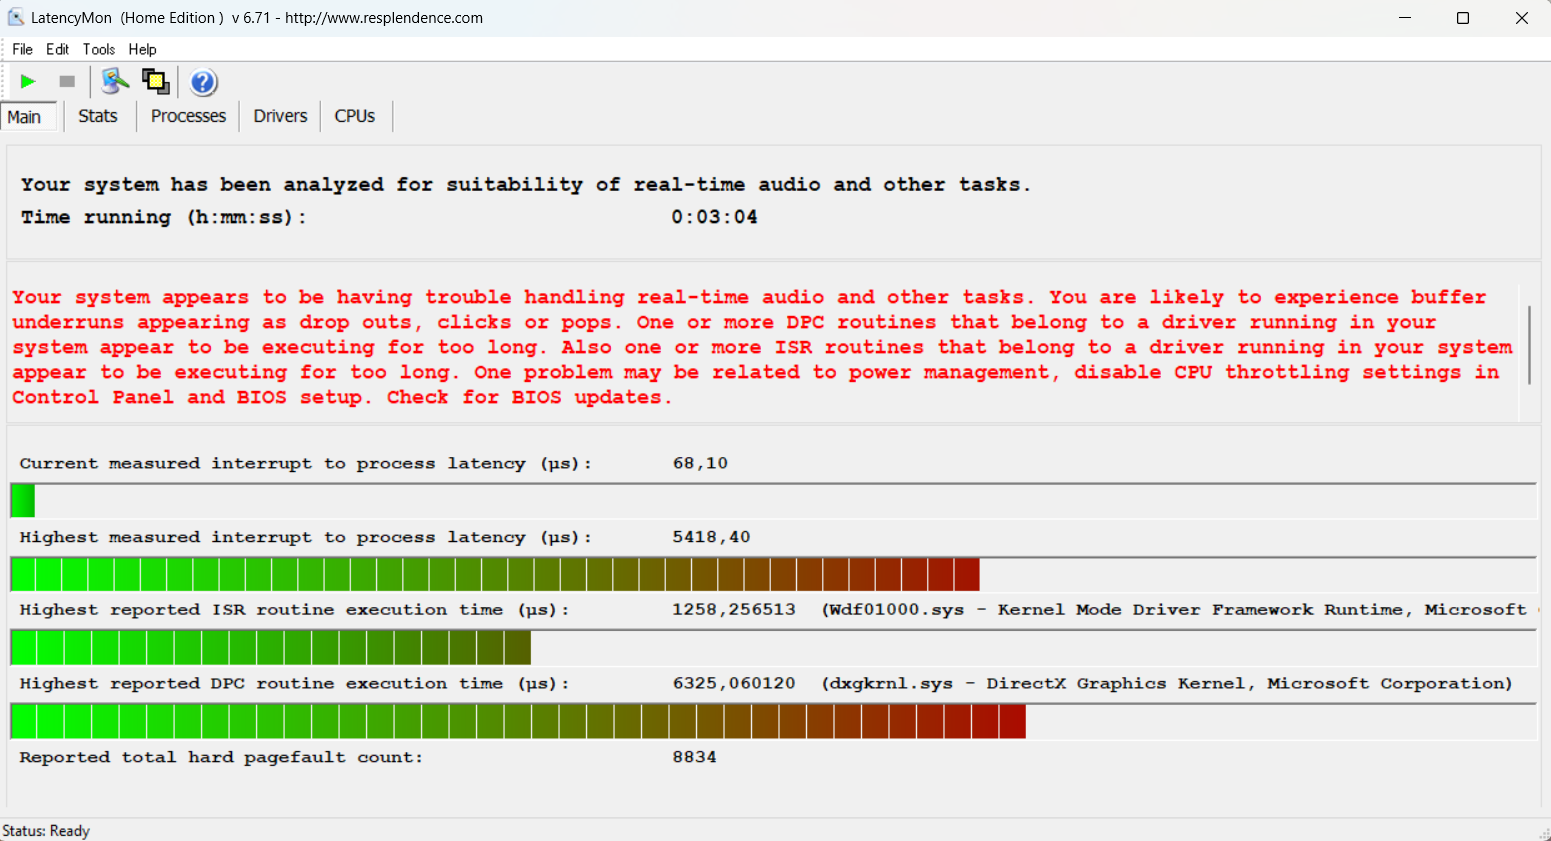
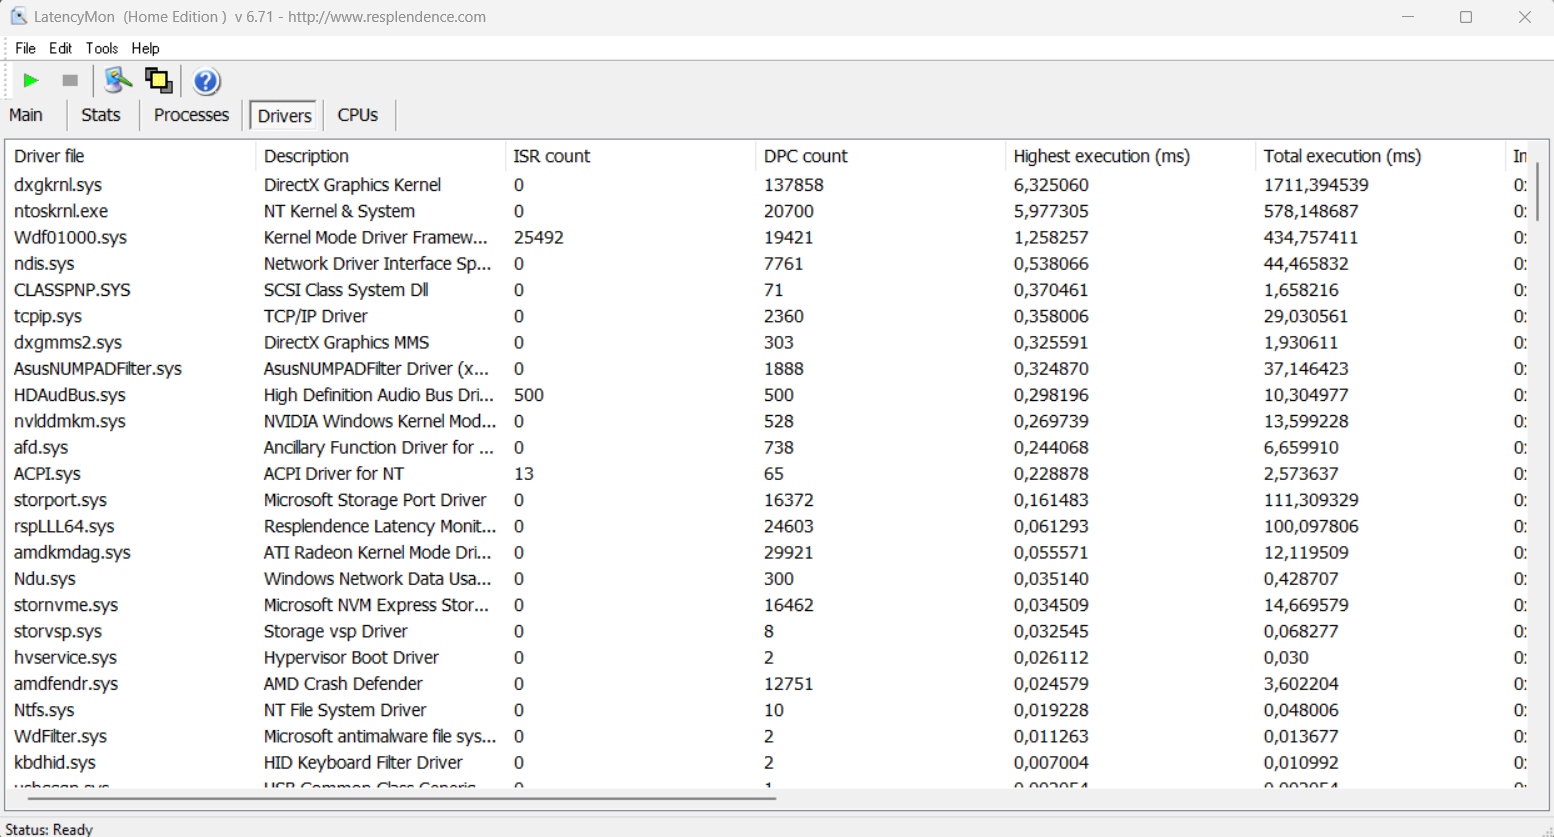
Nosso teste de latência padronizado (navegação na web, reprodução YouTube 4K, carga de CPU) mostra limitações significativas para a unidade de teste com a versão atual da BIOS, por isso não é adequado para aplicações de áudio em tempo real.
| DPC Latencies / LatencyMon - interrupt to process latency (max), Web, Youtube, Prime95 | |
| Asus Zephyrus Duo 16 GX650PY-NM006W | |
| MSI Titan GT77 HX 13VI | |
| Razer Blade 16 Early 2023 | |
| Asus ROG Zephyrus Duo 16 GX650RX | |
| Lenovo Legion Pro 7 16IRX8H | |
* ... menor é melhor
Dispositivos de armazenamento
Nossa unidade de revisão é equipada com um SSD rápido de 2 TB da SK Hynix (PC801), que é acoplado via PCIe 4.0. O desempenho da unidade NVMe é excelente e nós transferimos taxas de mais de 7 GB/s. O desempenho também é estável sob cargas de trabalho sustentadas, o que é um problema para muitos laptops high-end no momento. Mais benchmarks de SSD são listados aqui.

* ... menor é melhor
Disk Throttling: DiskSpd Read Loop, Queue Depth 8
Desempenho da GPU
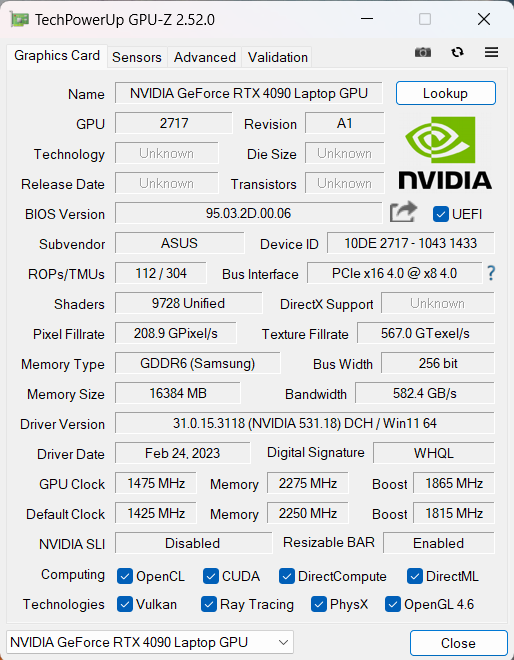
A Asus oferece o novo ROG Zephyrus Duo 16 com o Nvidia GeForce RTX 4080 Laptop ou o GeForce RTX 4090 Laptop como em nossa unidade de revisão agora mesmo. Em teoria, é a versão mais rápida da GPU, mas o TGP máximo de 175 Watts (150W TGP + 25W Dynamic Boost) é reservado para o perfil de potência manual. O perfil Turbo, que foi usado para todas as referências, é limitado a 155 Watts (140W TGP + 15W Dynamic Boost).
Isto significa que oComputador portátil RTX 4090no Zephyrus Duo 16 no modo Turbo não consegue acompanhar os rivais mais rápidos como o Titan GT77 e normalmente é apenas alguns pontos percentuais mais rápido do que o GeForce RTX 4080 Laptop. O é mais rápido do que o Titan GT77.RTX 3080 Tino anterior Zephyrus Duo 16 é claramente batido em todos os testes (55-78 % mais rápido). O desempenho do computador também é muito bom e o laptop RTX 4090 também pode rivalizar com GPU móvel profissional em alguns testes SPECviewperf. Por favor, veja nosso análise abrangente do laptop RTX 4090 e do laptop RTX 4080 para mais resultados de testes.
O desempenho da GPU é estável sob cargas de trabalho sustentadas e o teste de estresse Time Spy é aprovado em 97,8%. Entretanto, o consumo de energia da GPU é limitado a 55W na potência da bateria, o que resulta em um déficit de desempenho de mais de 50% (Time Spy Gráficos: 9575 pontos).
| 3DMark 11 Performance | 46207 pontos | |
| 3DMark Fire Strike Score | 40149 pontos | |
| 3DMark Time Spy Score | 18602 pontos | |
Ajuda | ||
| Blender / v3.3 Classroom OPTIX/RTX | |
| MSI Titan GT77 12UHS | |
| Média da turma Gaming (9 - 32, n=109, últimos 2 anos) | |
| Razer Blade 16 Early 2023 | |
| Lenovo Legion Pro 7 16IRX8H | |
| Asus Zephyrus Duo 16 GX650PY-NM006W | |
| Média NVIDIA GeForce RTX 4090 Laptop GPU (9 - 19, n=39) | |
| MSI Titan GT77 HX 13VI | |
| Schenker XMG Neo 16 Raptor Lake | |
| Blender / v3.3 Classroom CUDA | |
| Média da turma Gaming (15 - 228, n=109, últimos 2 anos) | |
| MSI Titan GT77 12UHS | |
| Lenovo Legion Pro 7 16IRX8H | |
| Razer Blade 16 Early 2023 | |
| Asus Zephyrus Duo 16 GX650PY-NM006W | |
| Média NVIDIA GeForce RTX 4090 Laptop GPU (16 - 24, n=39) | |
| Schenker XMG Neo 16 Raptor Lake | |
| MSI Titan GT77 HX 13VI | |
| Blender / v3.3 Classroom CPU | |
| Apple MacBook Pro 16 2023 M2 Max | |
| MSI Titan GT77 12UHS | |
| Média da turma Gaming (122 - 565, n=105, últimos 2 anos) | |
| Razer Blade 16 Early 2023 | |
| Schenker XMG Neo 16 Raptor Lake | |
| Média NVIDIA GeForce RTX 4090 Laptop GPU (144 - 305, n=39) | |
| Lenovo Legion Pro 7 16IRX8H | |
| MSI Titan GT77 HX 13VI | |
| Asus Zephyrus Duo 16 GX650PY-NM006W | |
| Blender / v3.3 Classroom METAL | |
| Apple MacBook Pro 16 2023 M2 Max | |
* ... menor é melhor
Desempenho nos jogos
O desempenho de jogo do ROG Zephyrus Duo 16 é excelente, mas um pouco inferior em comparação com os dispositivos mais rápidos devido à versão ligeiramente mais lenta do laptop RTX 4090. O processador AMD deixa uma boa impressão durante os jogos e não tem que se esconder atrás de seus equivalentes Intel HX. Também não notamos nenhum problema durante nossos benchmarks de jogos. Entretanto, considerando a resolução nativa WQHD, recomendamos que você guarde o dinheiro para oComputador portátil RTX 4090sKU e obtenha oComputador portátil RTX 4080ao invés disso.
| The Witcher 3 - 1920x1080 Ultra Graphics & Postprocessing (HBAO+) | |
| Schenker XMG Neo 16 Raptor Lake | |
| MSI Titan GT77 HX 13VI | |
| Asus Zephyrus Duo 16 GX650PY-NM006W | |
| Lenovo Legion Pro 7 16IRX8H | |
| Razer Blade 16 Early 2023 | |
| Média da turma Gaming (95 - 240, n=8, últimos 2 anos) | |
| MSI Titan GT77 12UHS | |
| Asus ROG Zephyrus Duo 16 GX650RX | |
| The Witcher 3 v4 - 1920x1080 Ultra Preset / On AA:FX | |
| MSI Titan GT77 HX 13VI | |
| Média NVIDIA GeForce RTX 4090 Laptop GPU (120.4 - 217, n=7) | |
| Schenker XMG Neo 16 Raptor Lake | |
| Asus Zephyrus Duo 16 GX650PY-NM006W | |
| Lenovo Legion Pro 7 16IRX8H | |
| Shadow of the Tomb Raider - 1920x1080 Highest Preset AA:T | |
| MSI Titan GT77 HX 13VI | |
| Asus Zephyrus Duo 16 GX650PY-NM006W | |
| Schenker XMG Neo 16 Raptor Lake | |
| Média NVIDIA GeForce RTX 4090 Laptop GPU (143.7 - 271, n=14) | |
| Razer Blade 16 Early 2023 | |
| Média da turma Gaming (96 - 116, n=2, últimos 2 anos) | |
Witcher 3 FPS Chart
| baixo | média | alto | ultra | QHD | |
|---|---|---|---|---|---|
| GTA V (2015) | 186.7 | 182.4 | 134 | 123.8 | |
| The Witcher 3 (2015) | 361 | 178.6 | |||
| Dota 2 Reborn (2015) | 227 | 207 | 196.1 | 179.7 | |
| Final Fantasy XV Benchmark (2018) | 210 | 169.6 | 142.1 | ||
| X-Plane 11.11 (2018) | 177.5 | 155.7 | 117.8 | ||
| Strange Brigade (2018) | 518 | 400 | 370 | 333 | 257 |
| Shadow of the Tomb Raider (2018) | 208 | 175 | |||
| Assassin´s Creed Valhalla (2020) | 161 | 126 | |||
| F1 2021 (2021) | 476 | 391 | 312 | 182.4 | 159.7 |
| Far Cry 6 (2021) | 117 | 110 | |||
| Cyberpunk 2077 1.6 (2022) | 136 | 130.6 | 86 | ||
| Tiny Tina's Wonderlands (2022) | 171.5 | 120 | |||
| F1 22 (2022) | 303 | 286 | 265 | 114.3 | 80.3 |
| Call of Duty Modern Warfare 2 2022 (2022) | 170 | 125 | |||
| The Witcher 3 v4 (2023) | 174 | 158 | 133.9 | 88 |
Emissões - O Duo 16 faz muito barulho no modo Turbo
Ruído do sistema
O Zephyrus Duo é normalmente audível em situações cotidianas e você deve usar o perfil de potência Silencioso quando não precisa do desempenho total. O modo Turbo normalmente resulta em mais de 30 dB(A), mesmo quando ocioso. Cenários de jogos e carga alta resultam rapidamente em mais de 50 dB(A) e até 56 dB(A), o que será irritante por períodos mais longos. Você também pode notar os ventiladores relativamente pequenos da solução de resfriamento. Não há como contornar o ruído quando você precisa do máximo desempenho, mas recomendamos verificar os outros perfis de potência do software Armoury Crate quando você joga jogos. Nós o testamos com três jogos diferentes:
| Título | Silencioso | Desempenho | Turbo |
|---|---|---|---|
| Witcher 3 | 40.2 dB(A) | 48,6 dB(A) | 51,2 dB(A) |
| Witcher 3 v4,00 | 40,2 dB(A) | 48,6 dB(A) | 56 dB(A) |
| Cyberpunkt 2077 v1.5 | 40,2 dB(A) | 48,6 dB(A) | 56 dB(A) |
Os títulos modernos normalmente funcionam bem com o modo Performance, onde o número de fps é apenas um pouco menor comparado com o modo Turbo, mas o ruído do ventilador é muito mais conveniente a ~49 dB(A). O modo Quiet é mais adequado para títulos mais antigos, pois o desempenho cairá notavelmente. Também notamos alguns sons eletrônicos em alguns benchmarks/jogos.
Barulho
| Ocioso |
| 23.9 / 32.9 / 36.5 dB |
| Carga |
| 42.9 / 56 dB |
 | ||
30 dB silencioso 40 dB(A) audível 50 dB(A) ruidosamente alto |
||
min: | ||
| Asus Zephyrus Duo 16 GX650PY-NM006W GeForce RTX 4090 Laptop GPU, R9 7945HX, SK hynix PC801 HFS002TEJ9X101N | MSI Titan GT77 HX 13VI GeForce RTX 4090 Laptop GPU, i9-13950HX, Samsung PM9A1 MZVL22T0HBLB | Lenovo Legion Pro 7 16IRX8H GeForce RTX 4080 Laptop GPU, i9-13900HX, Samsung PM9A1 MZVL21T0HCLR | Razer Blade 16 Early 2023 GeForce RTX 4080 Laptop GPU, i9-13950HX, SSSTC CA6-8D1024 | Asus ROG Zephyrus Duo 16 GX650RX GeForce RTX 3080 Ti Laptop GPU, R9 6900HX, 2x Samsung SSD 980 Pro 2TB MZ-V8P2T0 (RAID 0) | Apple MacBook Pro 16 2023 M2 Max M2 Max 38-Core GPU, M2 Max, Apple SSD AP2048Z | |
|---|---|---|---|---|---|---|
| Noise | -4% | -1% | 13% | 6% | 19% | |
| desligado / ambiente * (dB) | 23.9 | 24.6 -3% | 24 -0% | 23 4% | 26 -9% | 23.9 -0% |
| Idle Minimum * (dB) | 23.9 | 29.2 -22% | 26 -9% | 23 4% | 26 -9% | 23.9 -0% |
| Idle Average * (dB) | 32.9 | 29.2 11% | 28 15% | 23 30% | 27 18% | 23.9 27% |
| Idle Maximum * (dB) | 36.5 | 29.2 20% | 34 7% | 23.6 35% | 29 21% | 23.9 35% |
| Load Average * (dB) | 42.9 | 50.7 -18% | 47 -10% | 39 9% | 41 4% | 36.6 15% |
| Witcher 3 ultra * (dB) | 51.2 | 53.3 -4% | 55 -7% | 51.6 -1% | 48 6% | 35.1 31% |
| Load Maximum * (dB) | 56 | 61 -9% | 56 -0% | 51.3 8% | 50 11% | 43.2 23% |
* ... menor é melhor
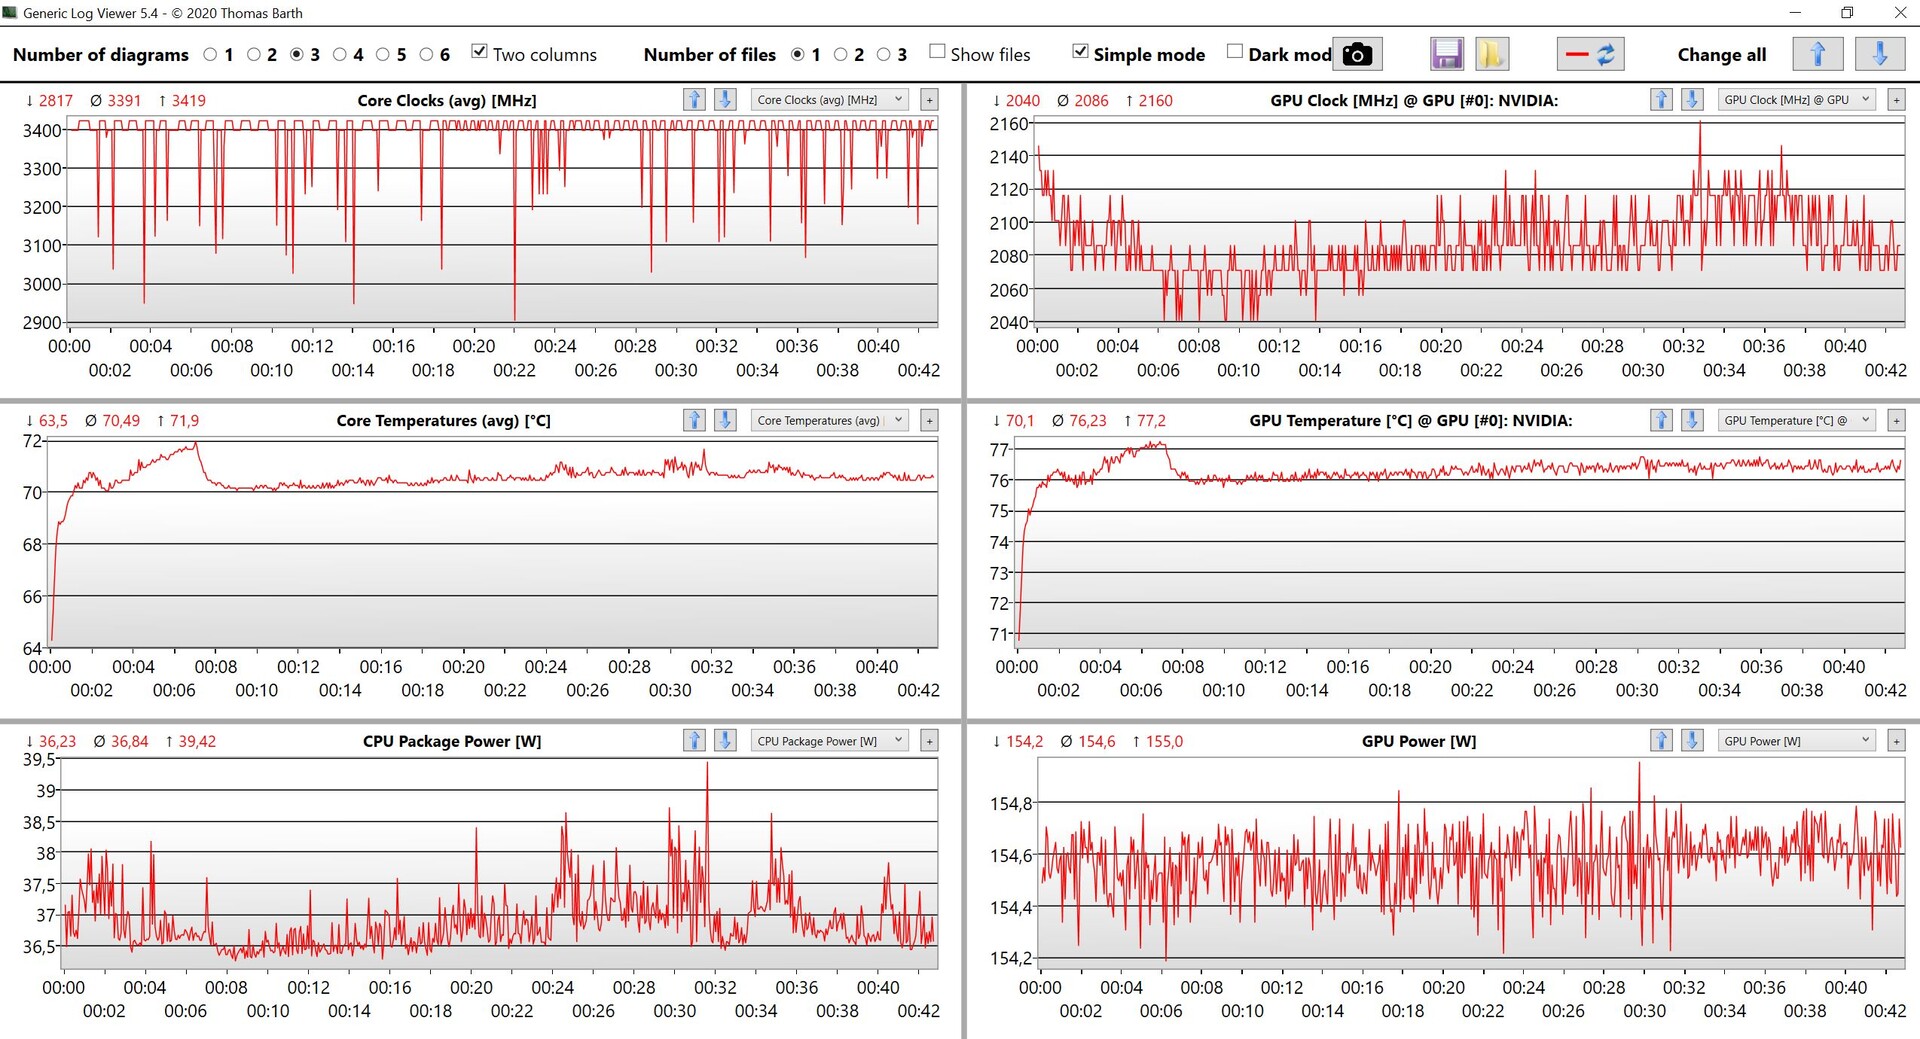
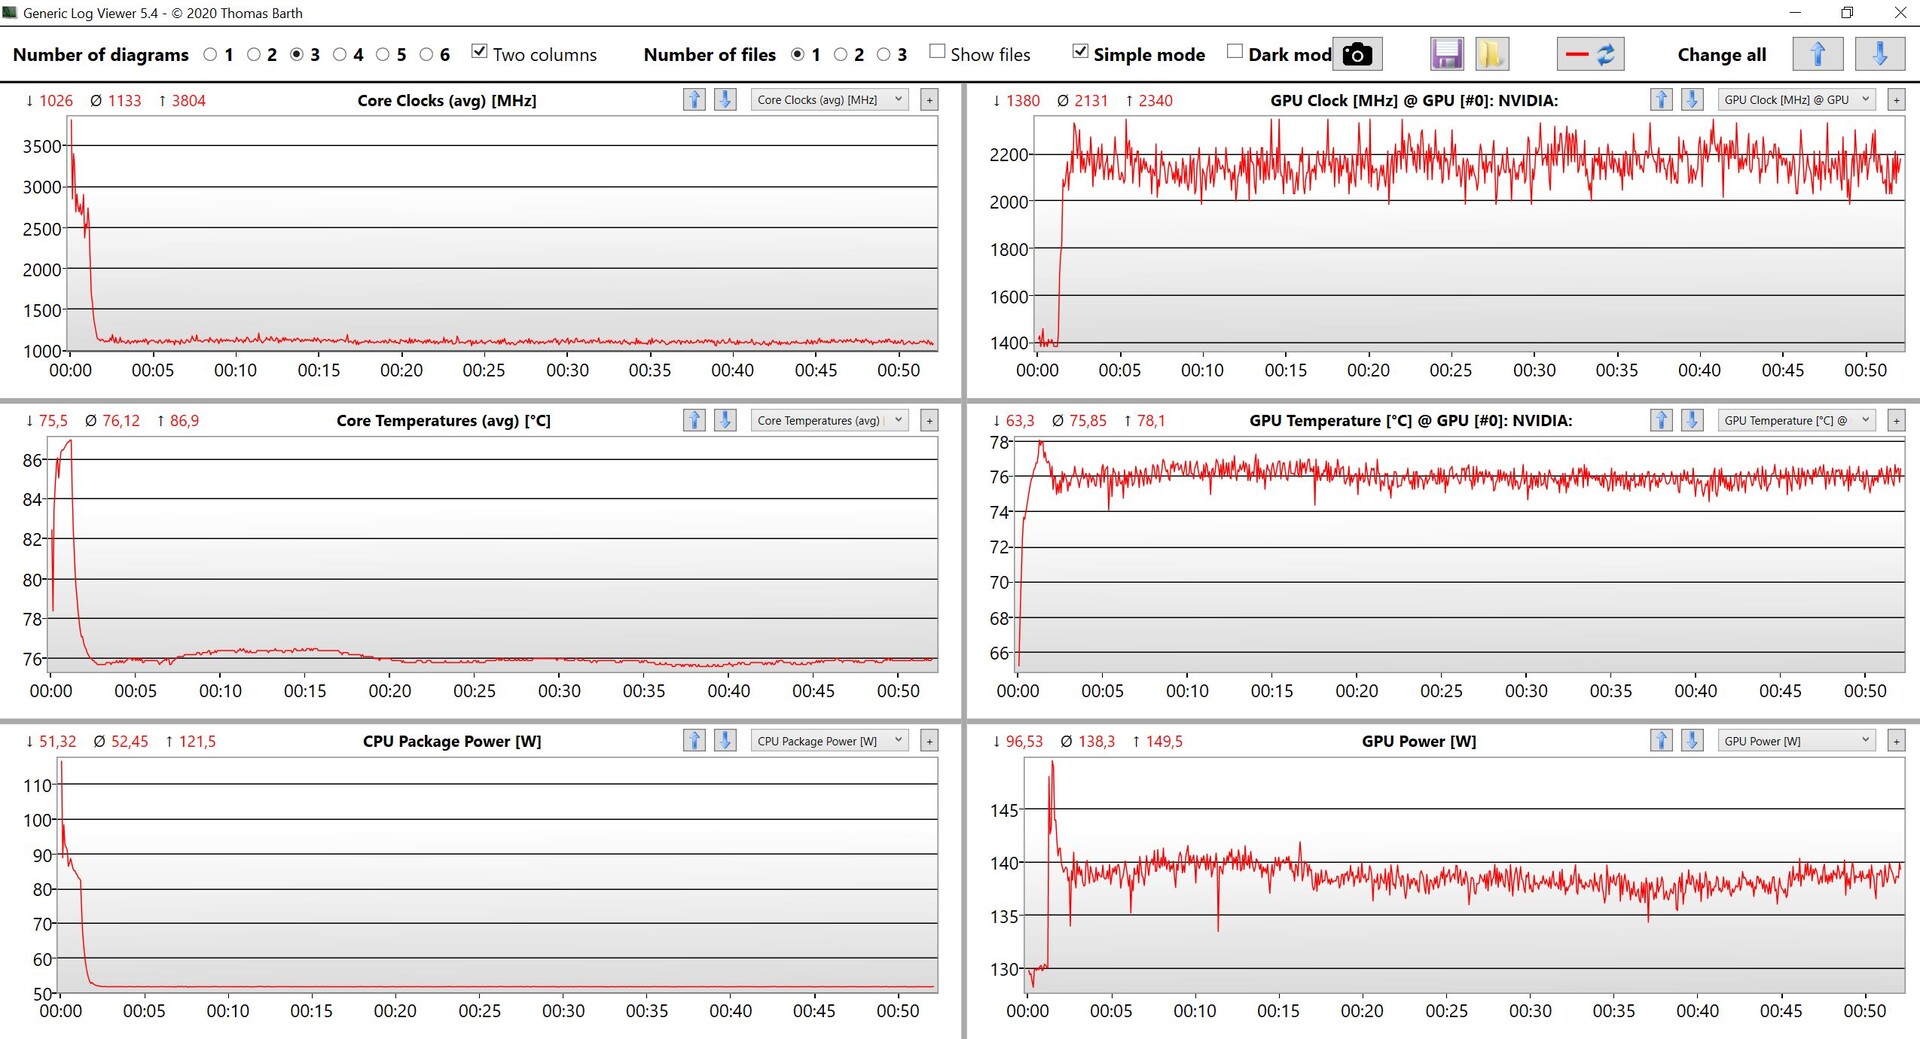
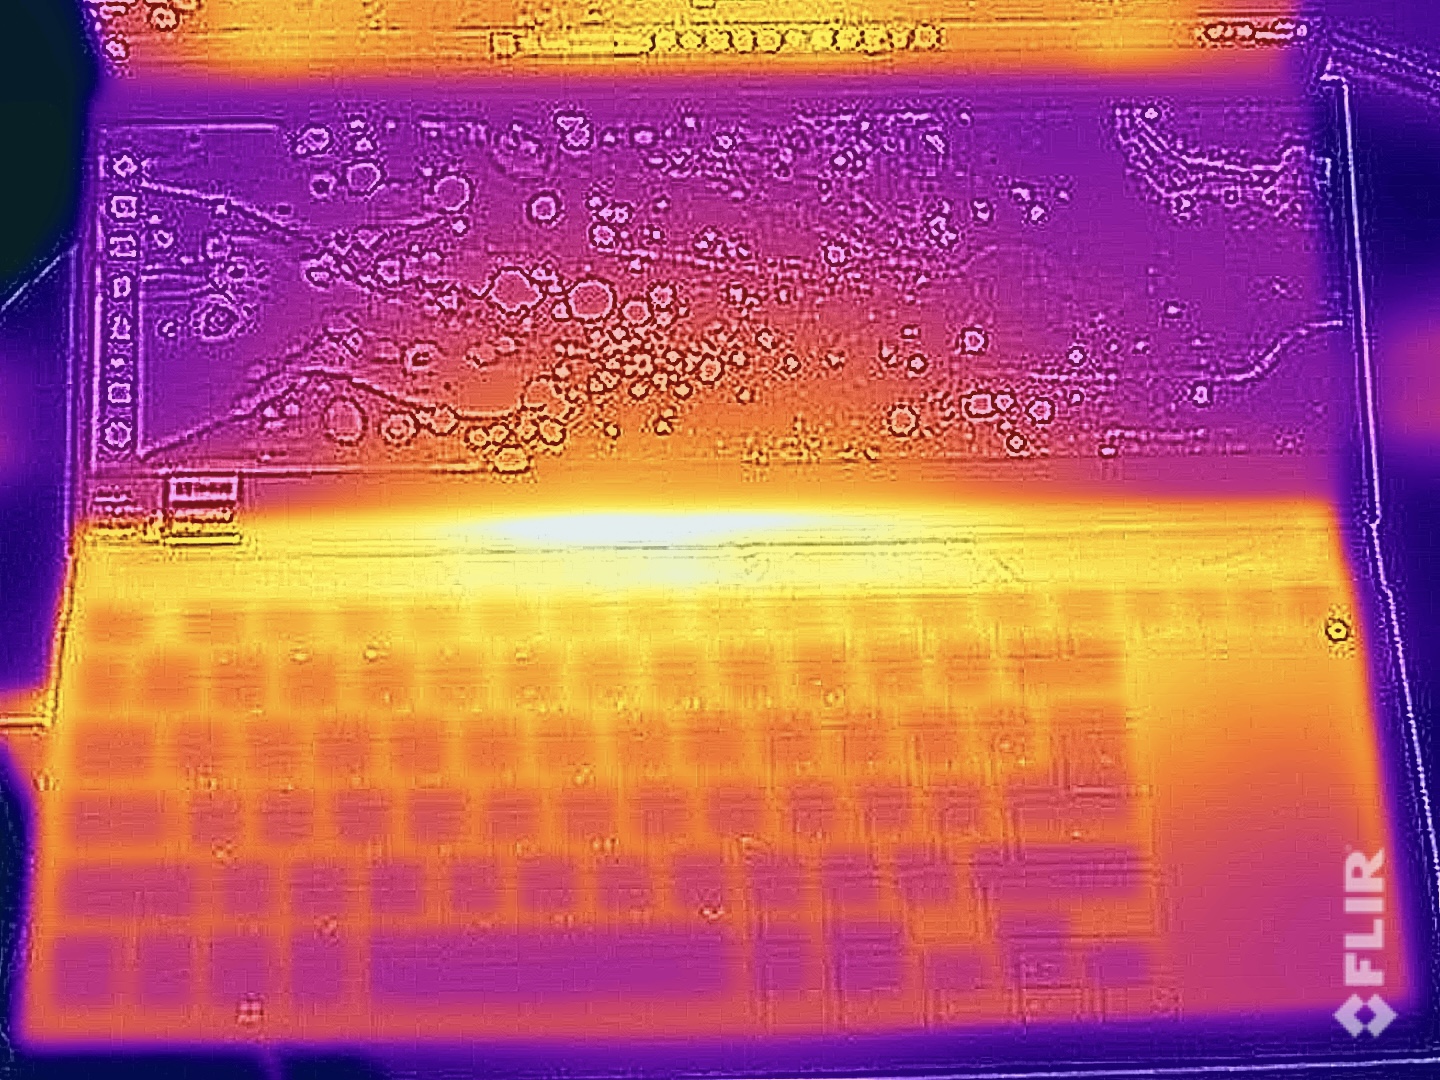
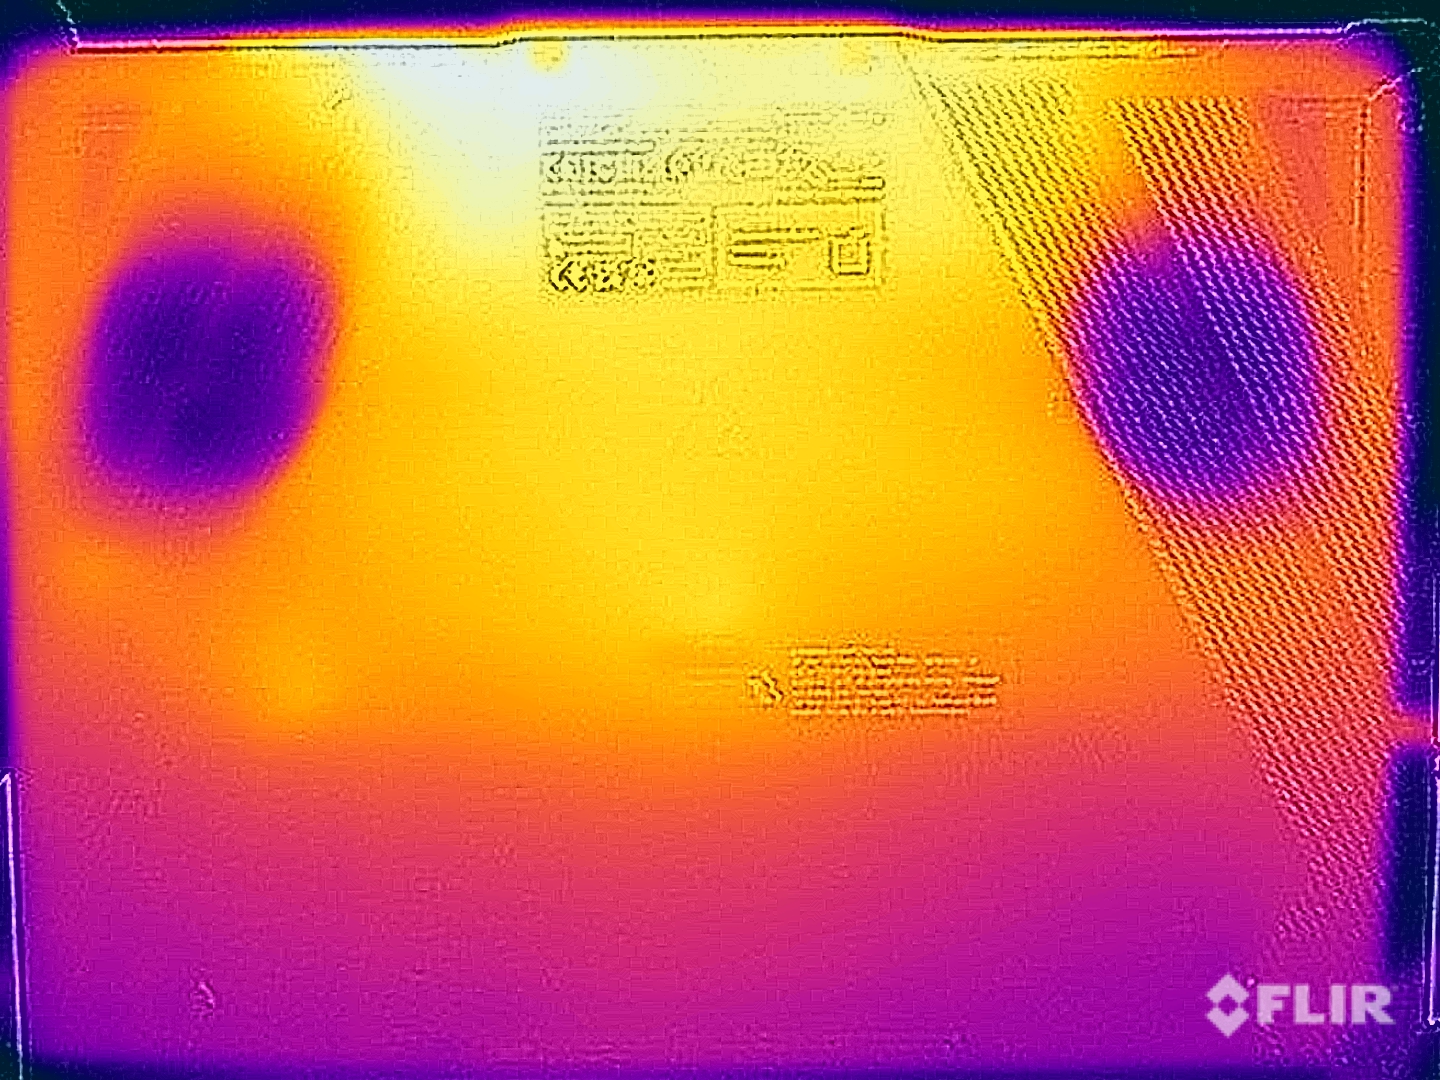
Temperatura
As temperaturas dos chassis são muito confortáveis durante cargas leves de trabalho. A posição do teclado é benéfica para jogos/subcarga, pois ele só aquece na região superior e as teclas freqüentemente usadas geralmente permanecem muito frias. Entretanto, a área entre o teclado e o secundário é um ponto quente. Medimos até 47 °C na parte inferior, portanto, não se deve colocar o dispositivo no colo sob carga. O desenvolvimento geral da temperatura é bom.
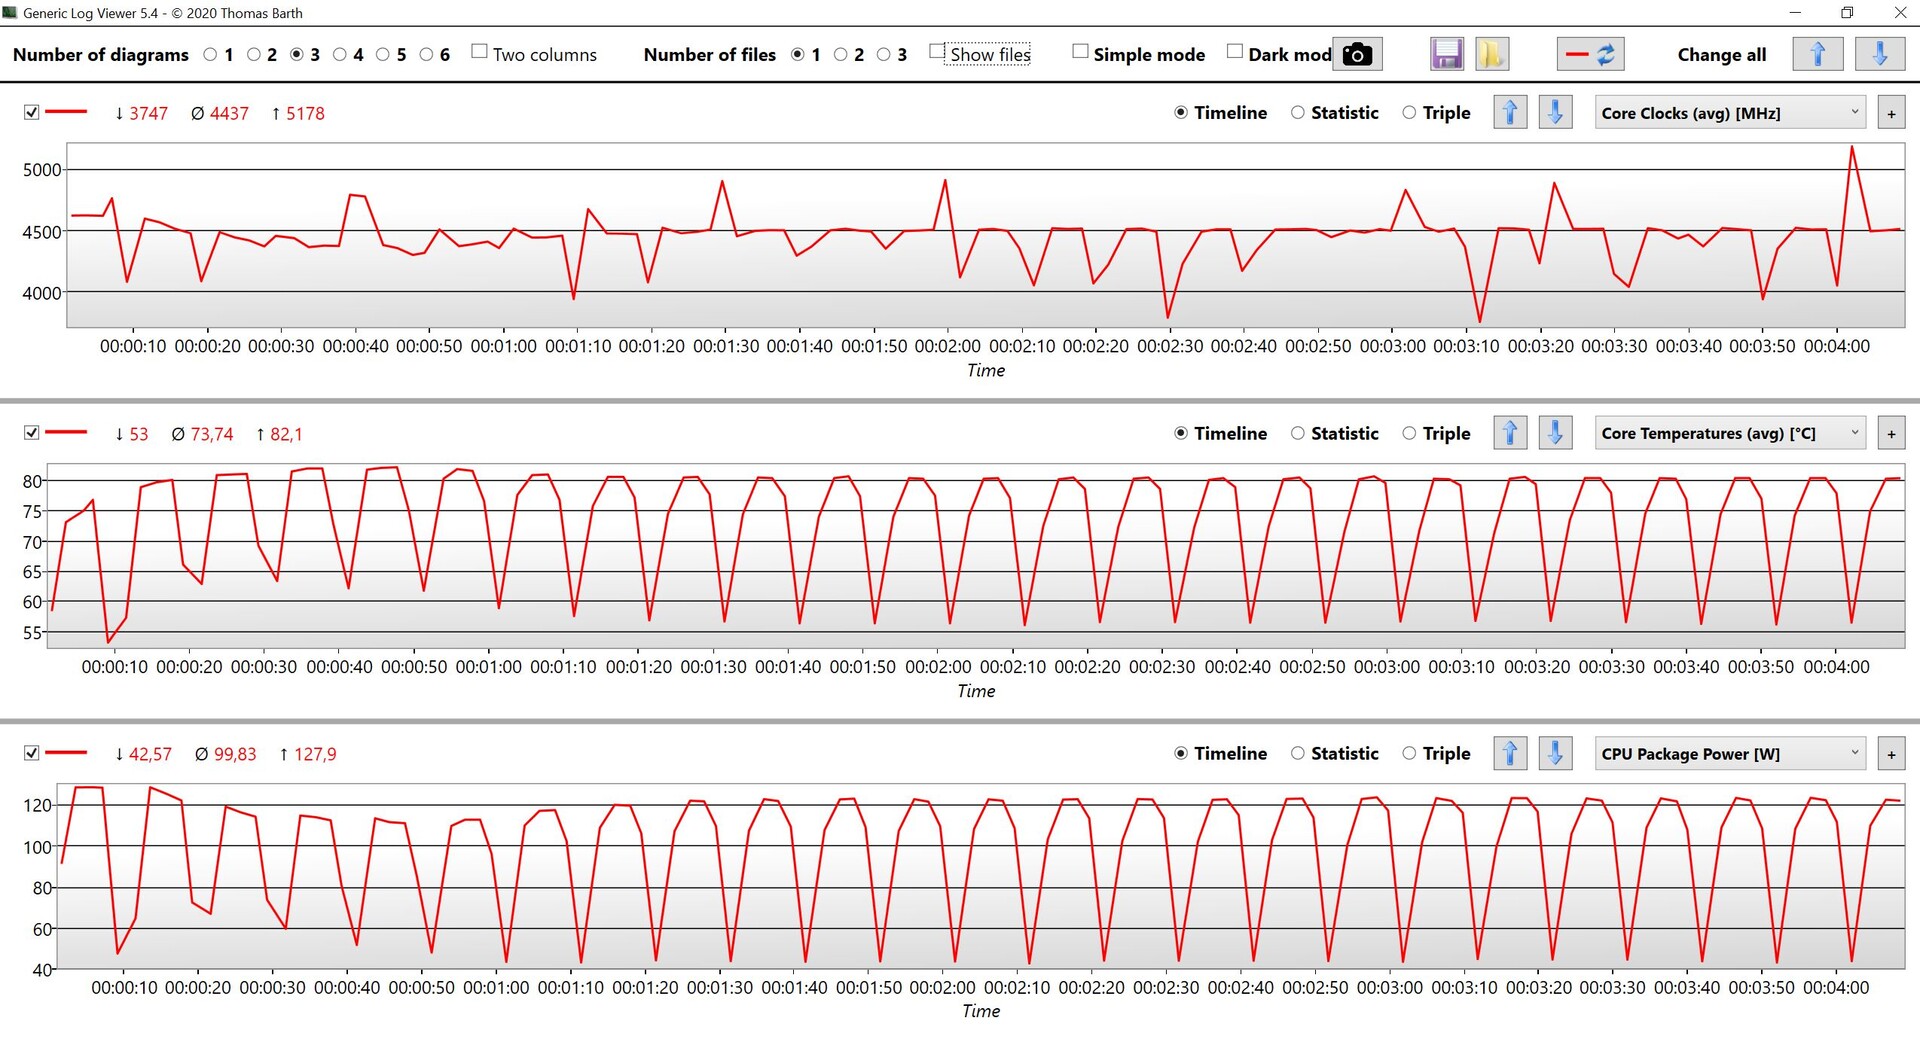
Nosso teste de estresse favorece a placa gráfica dedicada, O processador se nivelará em 50 Watts após alguns minutos, enquanto o consumo da GPU aumenta de 130 para ~140 Watts (que é o valor especificado para o perfil de potência do Turbo) e permanece neste nível. Este é um resultado decente e não vimos uma queda de desempenho imediatamente após o teste de estresse. As cargas de trabalho combinadas CPU/GPU na energia da bateria resultam em um consumo de CPU de ~43 Watts e ~33 Watts para a GPU.
(±) A temperatura máxima no lado superior é 44.2 °C / 112 F, em comparação com a média de 40.4 °C / 105 F , variando de 21.2 a 68.8 °C para a classe Gaming.
(-) A parte inferior aquece até um máximo de 46.8 °C / 116 F, em comparação com a média de 43.2 °C / 110 F
(+) Em uso inativo, a temperatura média para o lado superior é 26.2 °C / 79 F, em comparação com a média do dispositivo de 33.9 °C / ### class_avg_f### F.
(±) Jogando The Witcher 3, a temperatura média para o lado superior é 36.5 °C / 98 F, em comparação com a média do dispositivo de 33.9 °C / ## #class_avg_f### F.
(+) Os apoios para as mãos e o touchpad estão atingindo a temperatura máxima da pele (35.7 °C / 96.3 F) e, portanto, não estão quentes.
(-) A temperatura média da área do apoio para as mãos de dispositivos semelhantes foi 28.8 °C / 83.8 F (-6.9 °C / -12.5 F).

| Asus Zephyrus Duo 16 GX650PY-NM006W AMD Ryzen 9 7945HX, NVIDIA GeForce RTX 4090 Laptop GPU | MSI Titan GT77 HX 13VI Intel Core i9-13950HX, NVIDIA GeForce RTX 4090 Laptop GPU | Lenovo Legion Pro 7 16IRX8H Intel Core i9-13900HX, NVIDIA GeForce RTX 4080 Laptop GPU | Razer Blade 16 Early 2023 Intel Core i9-13950HX, NVIDIA GeForce RTX 4080 Laptop GPU | Asus ROG Zephyrus Duo 16 GX650RX AMD Ryzen 9 6900HX, NVIDIA GeForce RTX 3080 Ti Laptop GPU | Apple MacBook Pro 16 2023 M2 Max Apple M2 Max, Apple M2 Max 38-Core GPU | |
|---|---|---|---|---|---|---|
| Heat | 8% | -15% | 4% | -8% | 14% | |
| Maximum Upper Side * (°C) | 44.2 | 40.6 8% | 48 -9% | 40 10% | 45 -2% | 44.2 -0% |
| Maximum Bottom * (°C) | 46.8 | 41.1 12% | 49 -5% | 37.6 20% | 50 -7% | 42.9 8% |
| Idle Upper Side * (°C) | 29.2 | 26.2 10% | 40 -37% | 32.4 -11% | 33 -13% | 22.4 23% |
| Idle Bottom * (°C) | 30.2 | 30.3 -0% | 33 -9% | 31.4 -4% | 33 -9% | 22.3 26% |
* ... menor é melhor
Oradores
O Asus utiliza um sistema de alto-falantes composto por 6 módulos e o resultado é muito bom em geral. O fabricante também melhorou o desempenho do som em comparação com o modelo anterior, apenas o desempenho dos graves poderia ser melhor. O resultado é definitivamente suficiente para a reprodução ocasional de vídeo/movie, mas os alto-falantes são normalmente rivalizados pelo ruído dos ventiladores enquanto jogam.
Asus Zephyrus Duo 16 GX650PY-NM006W análise de áudio
(+) | os alto-falantes podem tocar relativamente alto (###valor### dB)
Graves 100 - 315Hz
(±) | graves reduzidos - em média 9.5% menor que a mediana
(±) | a linearidade dos graves é média (10.6% delta para a frequência anterior)
Médios 400 - 2.000 Hz
(±) | médios mais altos - em média 5.4% maior que a mediana
(+) | médios são lineares (3.3% delta para frequência anterior)
Altos 2 - 16 kHz
(+) | agudos equilibrados - apenas 2.7% longe da mediana
(+) | os máximos são lineares (2.3% delta da frequência anterior)
Geral 100 - 16.000 Hz
(+) | o som geral é linear (12% diferença em relação à mediana)
Comparado com a mesma classe
» 12% de todos os dispositivos testados nesta classe foram melhores, 4% semelhantes, 84% piores
» O melhor teve um delta de 6%, a média foi 18%, o pior foi 132%
Comparado com todos os dispositivos testados
» 9% de todos os dispositivos testados foram melhores, 2% semelhantes, 88% piores
» O melhor teve um delta de 4%, a média foi 24%, o pior foi 134%
Apple MacBook Pro 16 2023 M2 Max análise de áudio
(+) | os alto-falantes podem tocar relativamente alto (###valor### dB)
Graves 100 - 315Hz
(+) | bons graves - apenas 3.9% longe da mediana
(+) | o baixo é linear (5.7% delta para a frequência anterior)
Médios 400 - 2.000 Hz
(+) | médios equilibrados - apenas 1.2% longe da mediana
(+) | médios são lineares (1.5% delta para frequência anterior)
Altos 2 - 16 kHz
(+) | agudos equilibrados - apenas 2.5% longe da mediana
(+) | os máximos são lineares (1.7% delta da frequência anterior)
Geral 100 - 16.000 Hz
(+) | o som geral é linear (4.9% diferença em relação à mediana)
Comparado com a mesma classe
» 0% de todos os dispositivos testados nesta classe foram melhores, 0% semelhantes, 99% piores
» O melhor teve um delta de 5%, a média foi 17%, o pior foi 45%
Comparado com todos os dispositivos testados
» 0% de todos os dispositivos testados foram melhores, 0% semelhantes, 100% piores
» O melhor teve um delta de 4%, a média foi 24%, o pior foi 134%
Gestão de energia - Zephyrus com resistência limitada
Consumo de energia
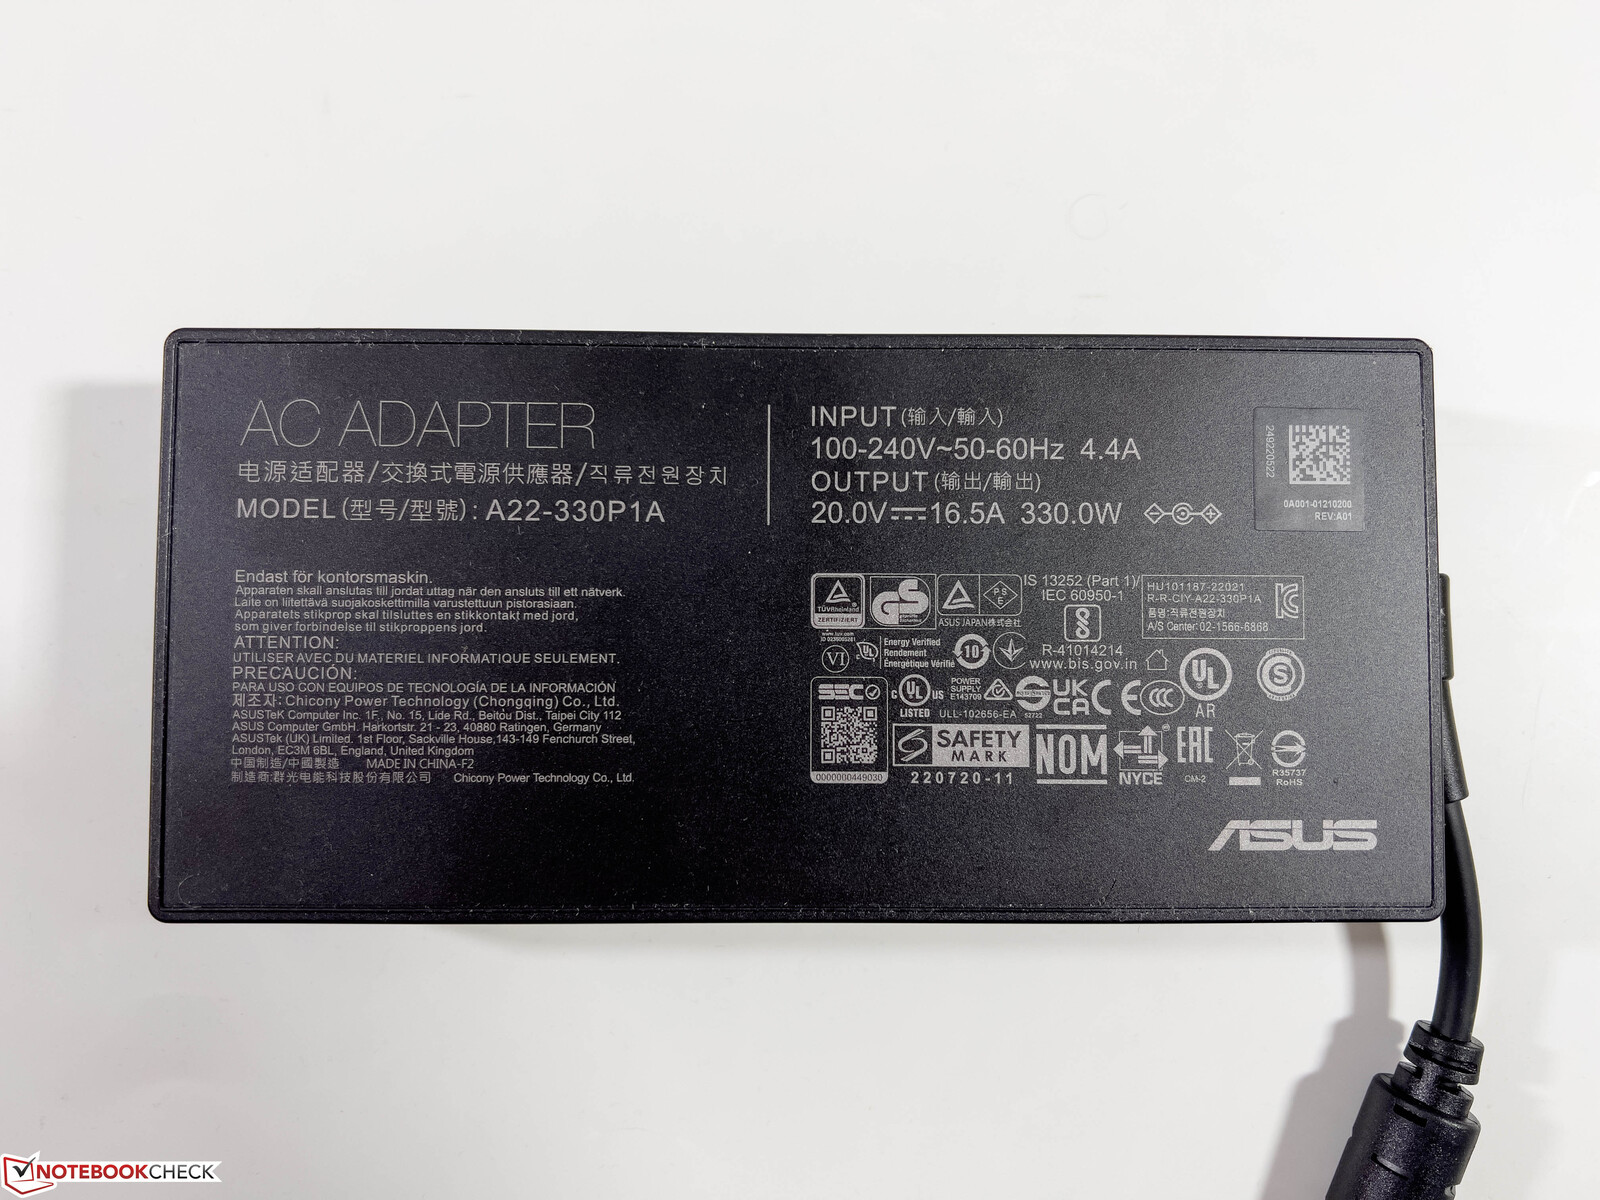
O ROG Zephyrus Duo 16 não é um dispositivo particularmente eficiente com um consumo mínimo de energia de 19 Watts e mais de 30 Watts na máxima luminosidade (tela secundária desligada). A tela secundária aumentará o consumo de energia em 4-7 Watts dependendo da luminosidade. Medimos cerca de 260 Watts durante o jogo e até 330 Watts durante nosso teste de estresse, mas o valor rapidamente se estabiliza em ~270 Watts. Isto significa que a PSU de 330W é completamente suficiente.
Queremos mais uma vez mencionar que a GPU dedicada GeForce está lidando com todas as tarefas gráficas quando você usa uma tela externa, o que significa que as seguintes medidas da CPU com uma tela externa não oferecem resultados comparáveis.
| desligado | |
| Ocioso | |
| Carga |
|
Key:
min: | |
| Asus Zephyrus Duo 16 GX650PY-NM006W R9 7945HX, GeForce RTX 4090 Laptop GPU, SK hynix PC801 HFS002TEJ9X101N, MiniLED, 2560x1600, 16" | MSI Titan GT77 HX 13VI i9-13950HX, GeForce RTX 4090 Laptop GPU, Samsung PM9A1 MZVL22T0HBLB, Mini-LED, 3840x2160, 17.3" | Lenovo Legion Pro 7 16IRX8H i9-13900HX, GeForce RTX 4080 Laptop GPU, Samsung PM9A1 MZVL21T0HCLR, IPS, 2560x1600, 16" | Razer Blade 16 Early 2023 i9-13950HX, GeForce RTX 4080 Laptop GPU, SSSTC CA6-8D1024, IPS, 2560x1600, 16" | Asus ROG Zephyrus Duo 16 GX650RX R9 6900HX, GeForce RTX 3080 Ti Laptop GPU, 2x Samsung SSD 980 Pro 2TB MZ-V8P2T0 (RAID 0), IPS-Level, 3840x2400, 16" | Apple MacBook Pro 16 2023 M2 Max M2 Max, M2 Max 38-Core GPU, Apple SSD AP2048Z, Mini-LED, 3456x2234, 16.2" | Média NVIDIA GeForce RTX 4090 Laptop GPU | Média da turma Gaming | |
|---|---|---|---|---|---|---|---|---|
| Power Consumption | 8% | 3% | 2% | 14% | 49% | 5% | 25% | |
| Idle Minimum * (Watt) | 19.2 | 14 27% | 18 6% | 15.2 21% | 19 1% | 5.2 73% | 16.2 ? 16% | 13.2 ? 31% |
| Idle Average * (Watt) | 29.7 | 21.6 27% | 24 19% | 22.8 23% | 24 19% | 16.5 44% | 23.1 ? 22% | 18.9 ? 36% |
| Idle Maximum * (Watt) | 30.8 | 24.8 19% | 32 -4% | 49.8 -62% | 31 -1% | 16.8 45% | 34.2 ? -11% | 24.3 ? 21% |
| Load Average * (Watt) | 126 | 122.5 3% | 130 -3% | 121.2 4% | 104 17% | 113 10% | 130.5 ? -4% | 108.3 ? 14% |
| Witcher 3 ultra * (Watt) | 258 | 265 -3% | 260 -1% | 242 6% | 186.5 28% | 92 64% | ||
| Load Maximum * (Watt) | 330 | 418 -27% | 320 3% | 273.7 17% | 256 22% | 145 56% | 324 ? 2% | 254 ? 23% |
* ... menor é melhor
Power consumption Witcher 3 / Stress test
Power consumption external screen
Tempo de uso da bateria
O tempo de funcionamento da bateria é consideravelmente pior em comparação com o modelo anterior, apesar da mesma bateria de 90 Wh. Neste momento, não temos certeza se isto é causado apenas pelo novo painel Mini-LED ou por problemas com a nova plataforma AMD. Mesmo com 150 lêndeas e sem a tela secundária, conseguimos apenas cerca de 4 horas de reprodução de vídeo e tempo de execução Wi-Fi, que caiu para apenas 2,5 horas com o brilho máximo do painel. Estes são maus resultados e o tempo de execução da carga é inferior a uma hora. Uma recarga completa da bateria leva 108 minutos quando o laptop é ligado.
| Asus Zephyrus Duo 16 GX650PY-NM006W R9 7945HX, GeForce RTX 4090 Laptop GPU, 90 Wh | MSI Titan GT77 HX 13VI i9-13950HX, GeForce RTX 4090 Laptop GPU, 99.9 Wh | Lenovo Legion Pro 7 16IRX8H i9-13900HX, GeForce RTX 4080 Laptop GPU, 99.9 Wh | Razer Blade 16 Early 2023 i9-13950HX, GeForce RTX 4080 Laptop GPU, 95.2 Wh | Asus ROG Zephyrus Duo 16 GX650RX R9 6900HX, GeForce RTX 3080 Ti Laptop GPU, 90 Wh | Apple MacBook Pro 16 2023 M2 Max M2 Max, M2 Max 38-Core GPU, 99.6 Wh | Média da turma Gaming | |
|---|---|---|---|---|---|---|---|
| Duração da bateria | 44% | 69% | 47% | 80% | 224% | 80% | |
| H.264 (h) | 3.8 | 6 58% | 9.3 145% | 18.7 392% | 8.26 ? 117% | ||
| WiFi v1.3 (h) | 4 | 5.3 33% | 5.1 27% | 6.1 53% | 7.8 95% | 14.8 270% | 7.04 ? 76% |
| Load (h) | 1 | 1.4 40% | 2.1 110% | 1.4 40% | 1 0% | 1.1 10% | 1.47 ? 47% |
Pro
Contra
Veredicto - Conceito interessante com inconvenientes
O novo ROG Zephyrus Duo 16 é mais uma vez um conceito interessante com sua tela secundária, mas também requer compromissos. O laptop é significativamente mais espesso que a concorrência e, embora a qualidade da tela secundária seja muito boa, ele simplesmente não consegue igualar a excelente qualidade de imagem da nova tela Mini-LED de 240 Hz. O manuseio da tela dupla também nem sempre é ideal na prática, mas esta é uma questão geral do Windows. A tela secundária é anexada via iGPU, o que significa que a GPU Nvidia cuida de todos os cálculos gráficos quando se usa uma tela externa (4K por exemplo), o que aumentará o consumo de energia. A posição do teclado na frente do laptop é outro problema, que pode ser resolvido com o apoio de mãos incluído em sua mesa de trabalho em casa, mas ainda é um problema na estrada. Será que a tela secundária faz muito sentido? Bem, isso depende de seu cenário de uso.
A Asus melhorou o laptop em áreas chave, começando com a nova tela Matte 240 Hz Mini-LED e a resolução WQHD. A qualidade da imagem é surpreendente e já é muito brilhante para conteúdos SDR a 700 nits (quase 1400 nits para conteúdos HDR). As cores já são muito precisas fora da caixa e não tivemos problemas para calibrar a tela.
A novaGeForce Computador portátil RTX 4090é a GPU mais poderosa para notebooks no momento e a vantagem de desempenho em relação ao antigo RTX 3080 Ti é enorme. Entretanto, é apenas a versão mais rápida (175W) em modo manual, mas recomendamos aComputador portátil RTX 4080sKU, no entanto, considerando a resolução nativa WQHD.
O novo Asus ROG Zephyrus Duo 16 convence com a excelente tela Mini-LED, bem como a poderosa combinação de hardware que consiste no novo AMD Ryzen 9 7945HX e no GeForce RTX 4090 Laptop, que não tem problemas com a resolução nativa WQHD. Mas ainda existem alguns bugs e os ventiladores são muito ruidosos quando se utiliza todo o potencial de desempenho.
O novo processador Zen4 da AMD, o Ryzen 9 7945HXé provavelmente a atualização mais interessante no momento. Graças aos 16 núcleos Zen4, ela rouba a coroa de desempenho multi-core do Intel Core i9-13980HX e até consome menos energia. Devido aos problemas mencionados anteriormente com a GPU dedicada Nvidia quando telas externas são anexadas, não podemos oferecer números precisos de eficiência neste ponto, mas cobriremos isso em um artigo separado.
Há também algumas questões que precisamos conversar, e nossa unidade de teste tinha alguns bugs. O consumo de energia ociosa também é muito alto, o que obviamente afeta também o tempo de funcionamento da bateria. Se este é um problema de software da Asus ou um problema inicial da nova plataforma AMD não está claro neste momento. O preço alto é outro problema, mas este é o caso de todos os computadores portáteis RTX 4090 neste momento. Considerando o preço, também temos que criticar a falta de USB 4, bem como o uso de DDR5-4800 RAM.
No total, o novo ROG Zephyrus Duo 16 é um bom dispositivo com bastante potência e a tela secundária pode ser uma vantagem real para alguns usuários. Se você não precisa da segunda tela (gamer ou criador de conteúdo) em seu notebook, no entanto, você está melhor com um laptop comum, o que também significa menos comprometimento em algumas áreas.
Preço e Disponibilidade
O ROG Zephyrus Duo 16 2023 só pode ser pré-encomendado agora mesmo e deve estar disponível nas próximas semanas.
Asus Zephyrus Duo 16 GX650PY-NM006W
- 03/14/2023 v7 (old)
Andreas Osthoff
Transparência
A seleção dos dispositivos a serem analisados é feita pela nossa equipe editorial. A amostra de teste foi fornecida ao autor como empréstimo pelo fabricante ou varejista para fins desta revisão. O credor não teve influência nesta revisão, nem o fabricante recebeu uma cópia desta revisão antes da publicação. Não houve obrigação de publicar esta revisão. Como empresa de mídia independente, a Notebookcheck não está sujeita à autoridade de fabricantes, varejistas ou editores.
É assim que o Notebookcheck está testando
Todos os anos, o Notebookcheck analisa de forma independente centenas de laptops e smartphones usando procedimentos padronizados para garantir que todos os resultados sejam comparáveis. Desenvolvemos continuamente nossos métodos de teste há cerca de 20 anos e definimos padrões da indústria no processo. Em nossos laboratórios de teste, equipamentos de medição de alta qualidade são utilizados por técnicos e editores experientes. Esses testes envolvem um processo de validação em vários estágios. Nosso complexo sistema de classificação é baseado em centenas de medições e benchmarks bem fundamentados, o que mantém a objetividade.Price comparison

