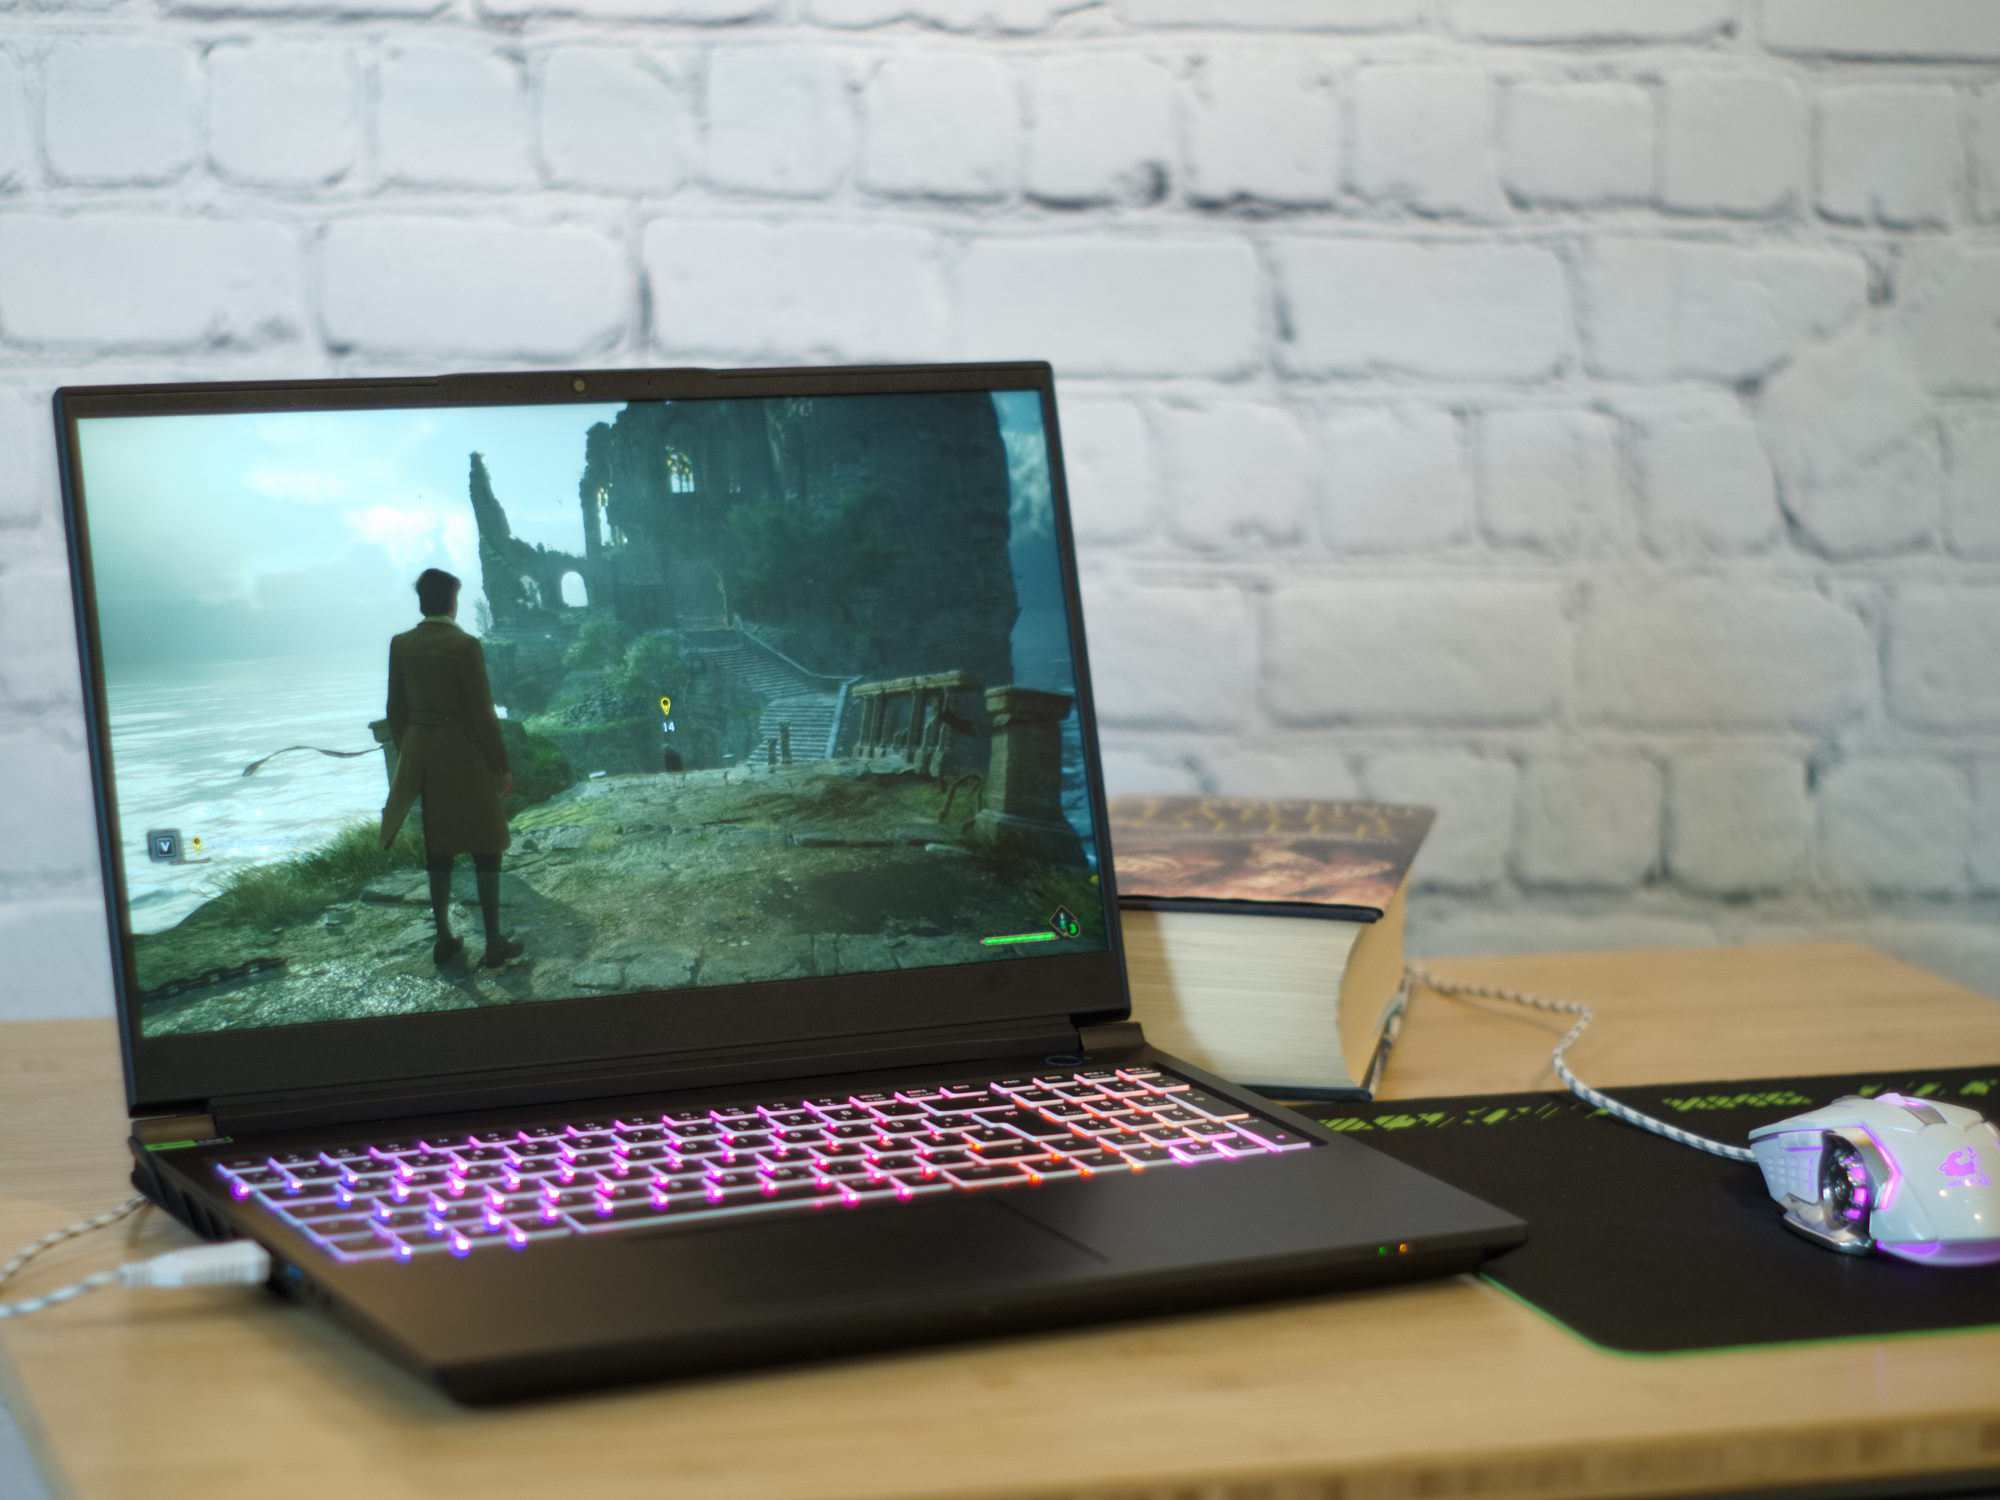
Análise do laptop para jogos Schenker XMG Pro 15 E23 (PD50SND-G): Um brinde ao equilíbrio entre trabalho e diversão!

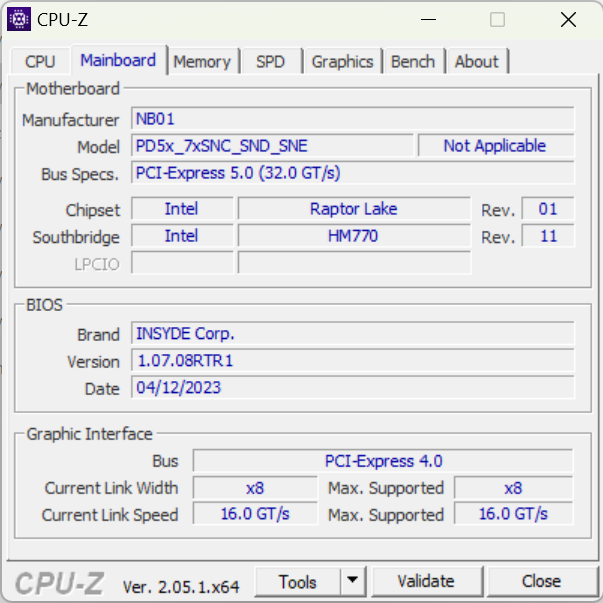
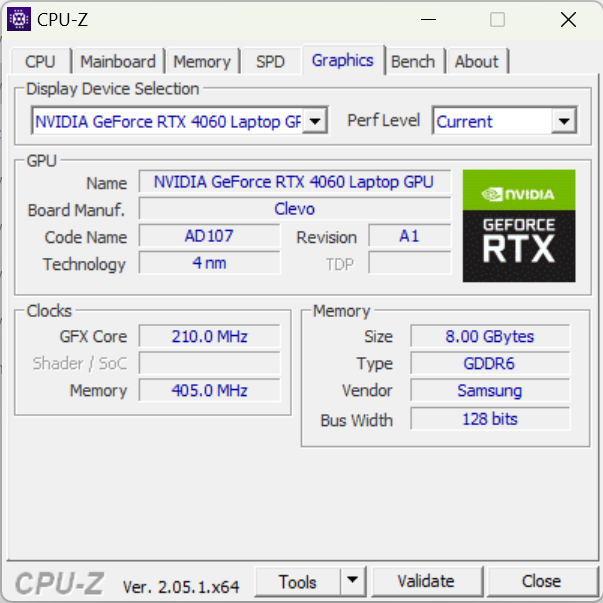
Os notebooks Schenker são atualizados regularmente e, no ano passado, analisamos dois dos antecessores do XMG Pro 15. Um com umaTiger Lake CPUe outro com Alder Lakee ambos com uma RTX 3080. Em termos de processador, nosso dispositivo de análise está equipado com a mais recente geração Raptor Lake e optou por umaNvidia GeForce RTX 4060. No entanto, o laptop não recebeu apenas ajustes internos, pois o design também passou por uma pequena reforma. O dispositivo agora é baseado no barebone Clevo PD50SND-G.
Uma comparação com o antecessor é interessante porque, embora a placa de vídeo agora seja originária da mais nova geração Ada Lovelace da Nvidia, sua classe foi reduzida de 80 para 60. Outra opção de configuração é fornecida na forma da placa de vídeoRTX 4070. Ambas as placas de vídeo funcionam com 140 a 150 watts. O Pro 15 E23 conseguiu apresentar um desempenho impressionante e se destaca bem em comparação com laptops para jogos, como o Dell G15 5530 ou oAorus 15X ASF. Um pouco além desse nível está oAsus ZenBook Pro 14 Duo. No entanto, o laptop multimídia também apresenta altas contagens de fps em muitos títulos atuais.
Possíveis concorrentes em comparação
Avaliação | Data | Modelo | Peso | Altura | Size | Resolução | Preço |
|---|---|---|---|---|---|---|---|
| 86.2 % v7 (old) | 07/2023 | Schenker XMG Pro 15 (E23) i9-13900HX, GeForce RTX 4060 Laptop GPU | 2.4 kg | 24.9 mm | 15.60" | 2560x1440 | |
| 86.9 % v7 (old) | 07/2022 | Schenker XMG Pro 15 (i7-12700H, RTX 3080 Ti) i7-12700H, GeForce RTX 3080 Ti Laptop GPU | 2.4 kg | 25 mm | 15.60" | 2560x1440 | |
| 84.2 % v7 (old) | 06/2023 | Dell G15 5530 i7-13650HX, GeForce RTX 4060 Laptop GPU | 3 kg | 26.95 mm | 15.60" | 1920x1080 | |
| 86.3 % v7 (old) | 06/2023 | Asus TUF A15 FA507 R7 7735HS, GeForce RTX 4050 Laptop GPU | 2.2 kg | 24.9 mm | 15.60" | 1920x1080 | |
| 86.2 % v7 (old) | 04/2023 | Aorus 15X ASF i7-13700HX, GeForce RTX 4070 Laptop GPU | 2.3 kg | 19.7 mm | 15.60" | 2560x1440 | |
| 87 % v7 (old) | 06/2023 | Asus ZenBook Pro 14 Duo UX8402VV-P1021W i9-13900H, GeForce RTX 4060 Laptop GPU | 1.8 kg | 21 mm | 14.50" | 2880x1800 | |
| 82.4 % v7 (old) | 04/2023 | MSI Cyborg 15 A12VF i7-12650H, GeForce RTX 4060 Laptop GPU | 2 kg | 22.9 mm | 15.60" | 1920x1080 | |
| 88.4 % v7 (old) | 06/2023 | Alienware x16 R1 i9-13900HK, GeForce RTX 4080 Laptop GPU | 2.6 kg | 18.57 mm | 16.00" | 2560x1600 |
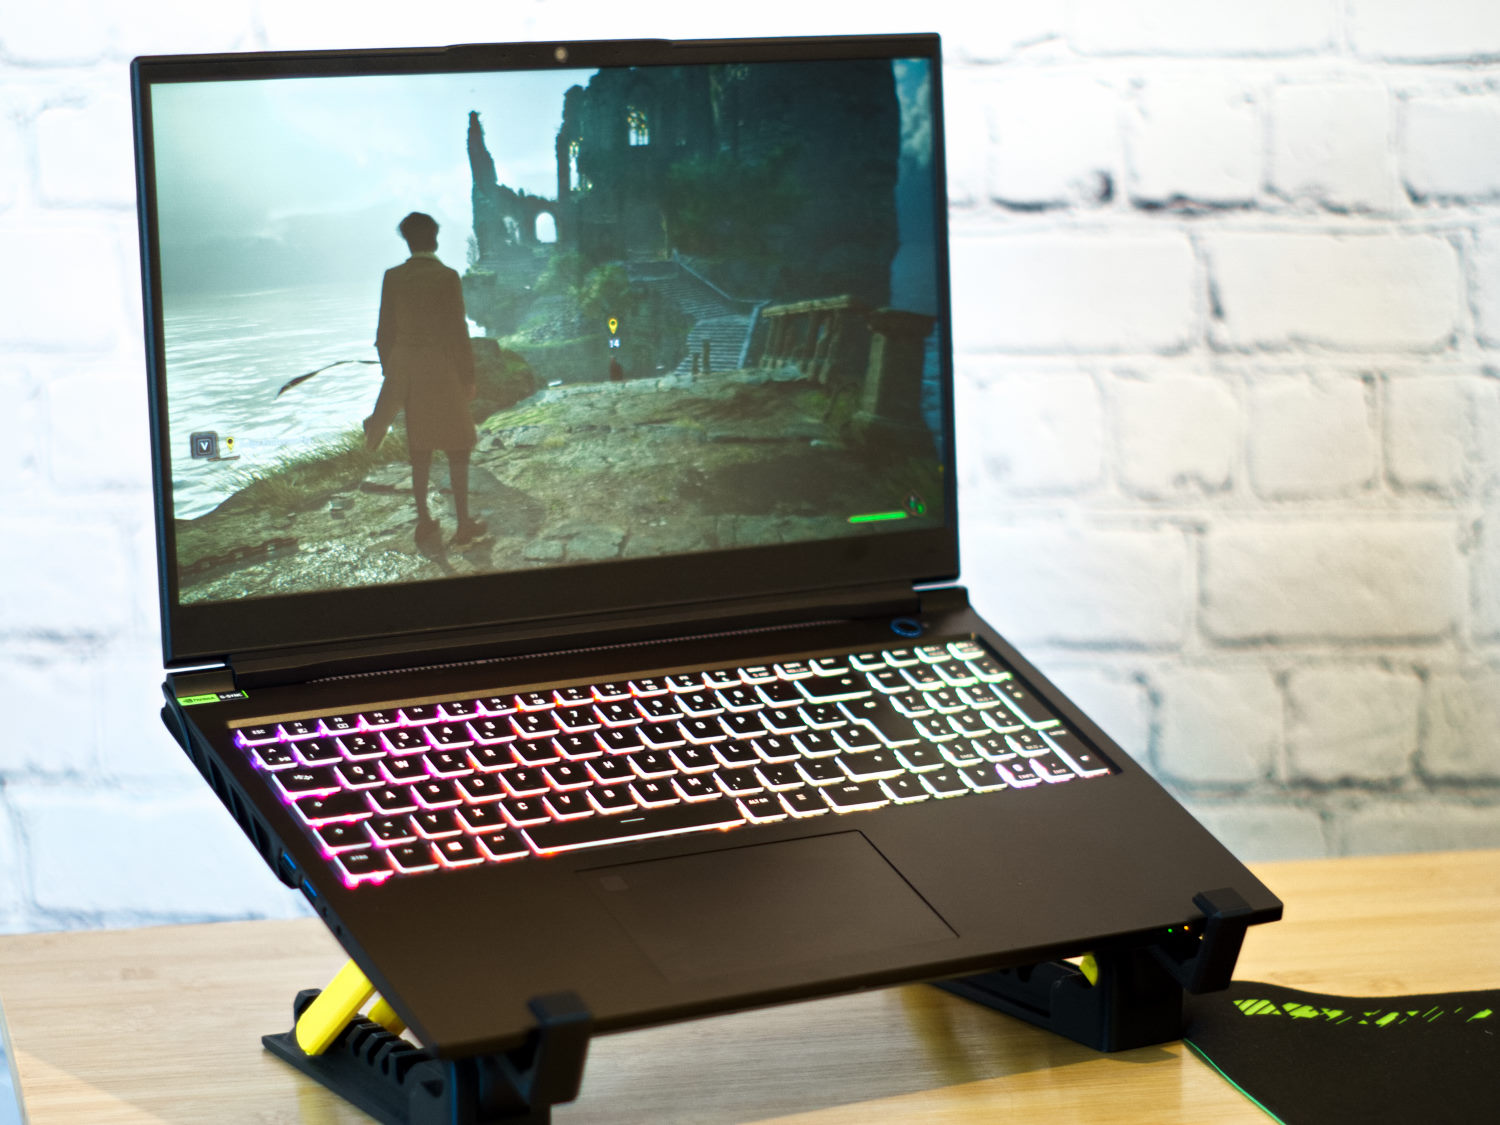
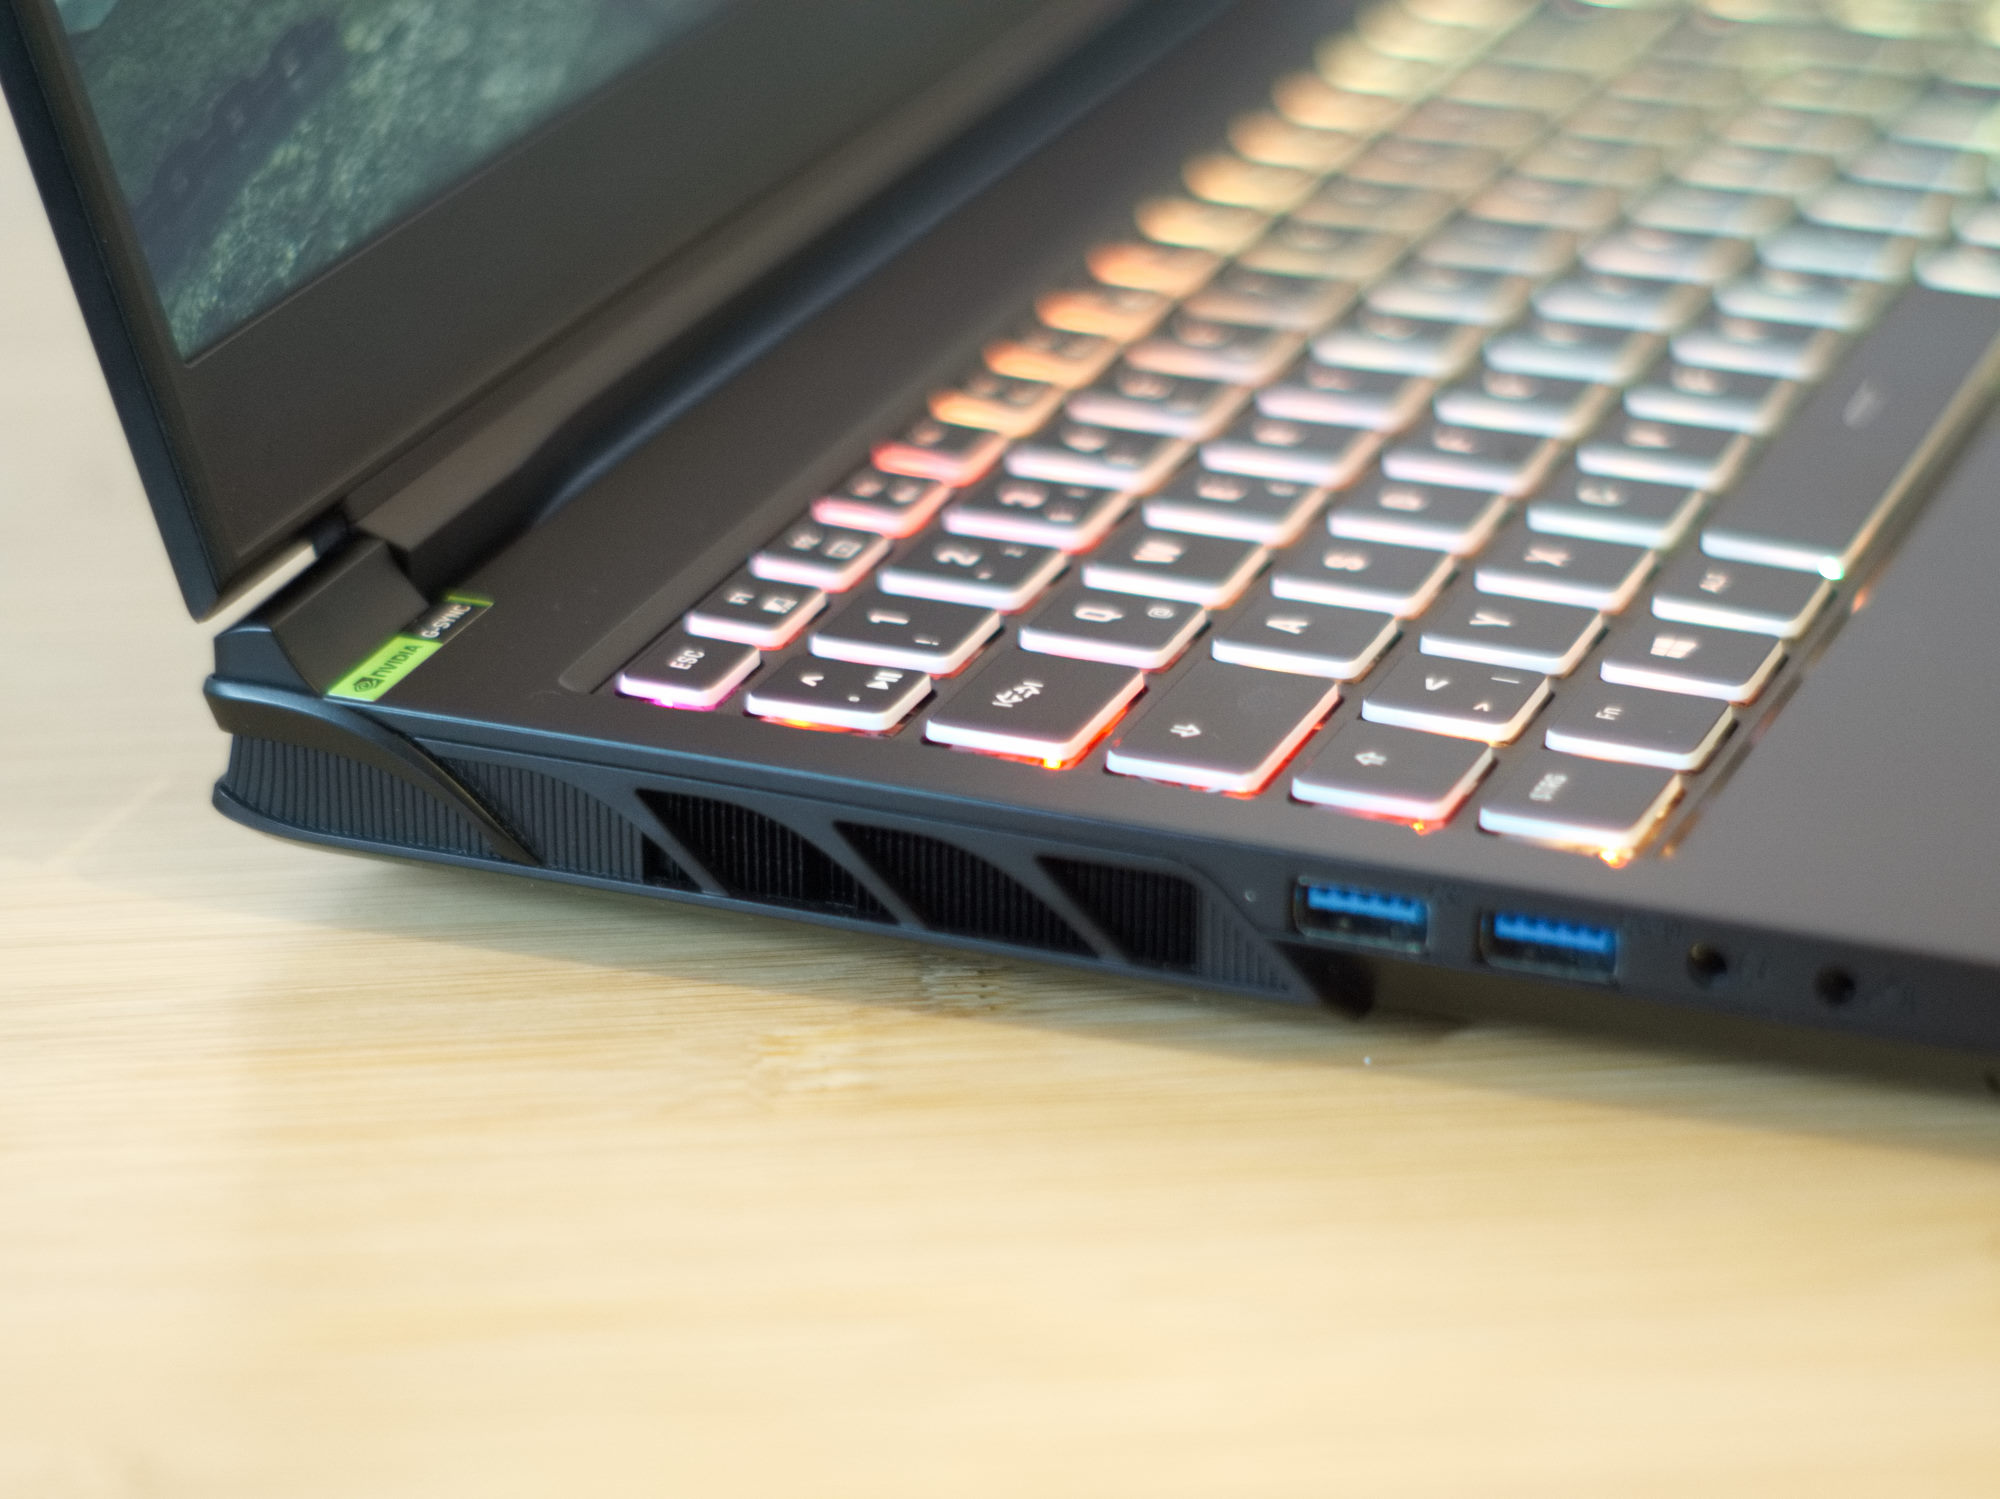
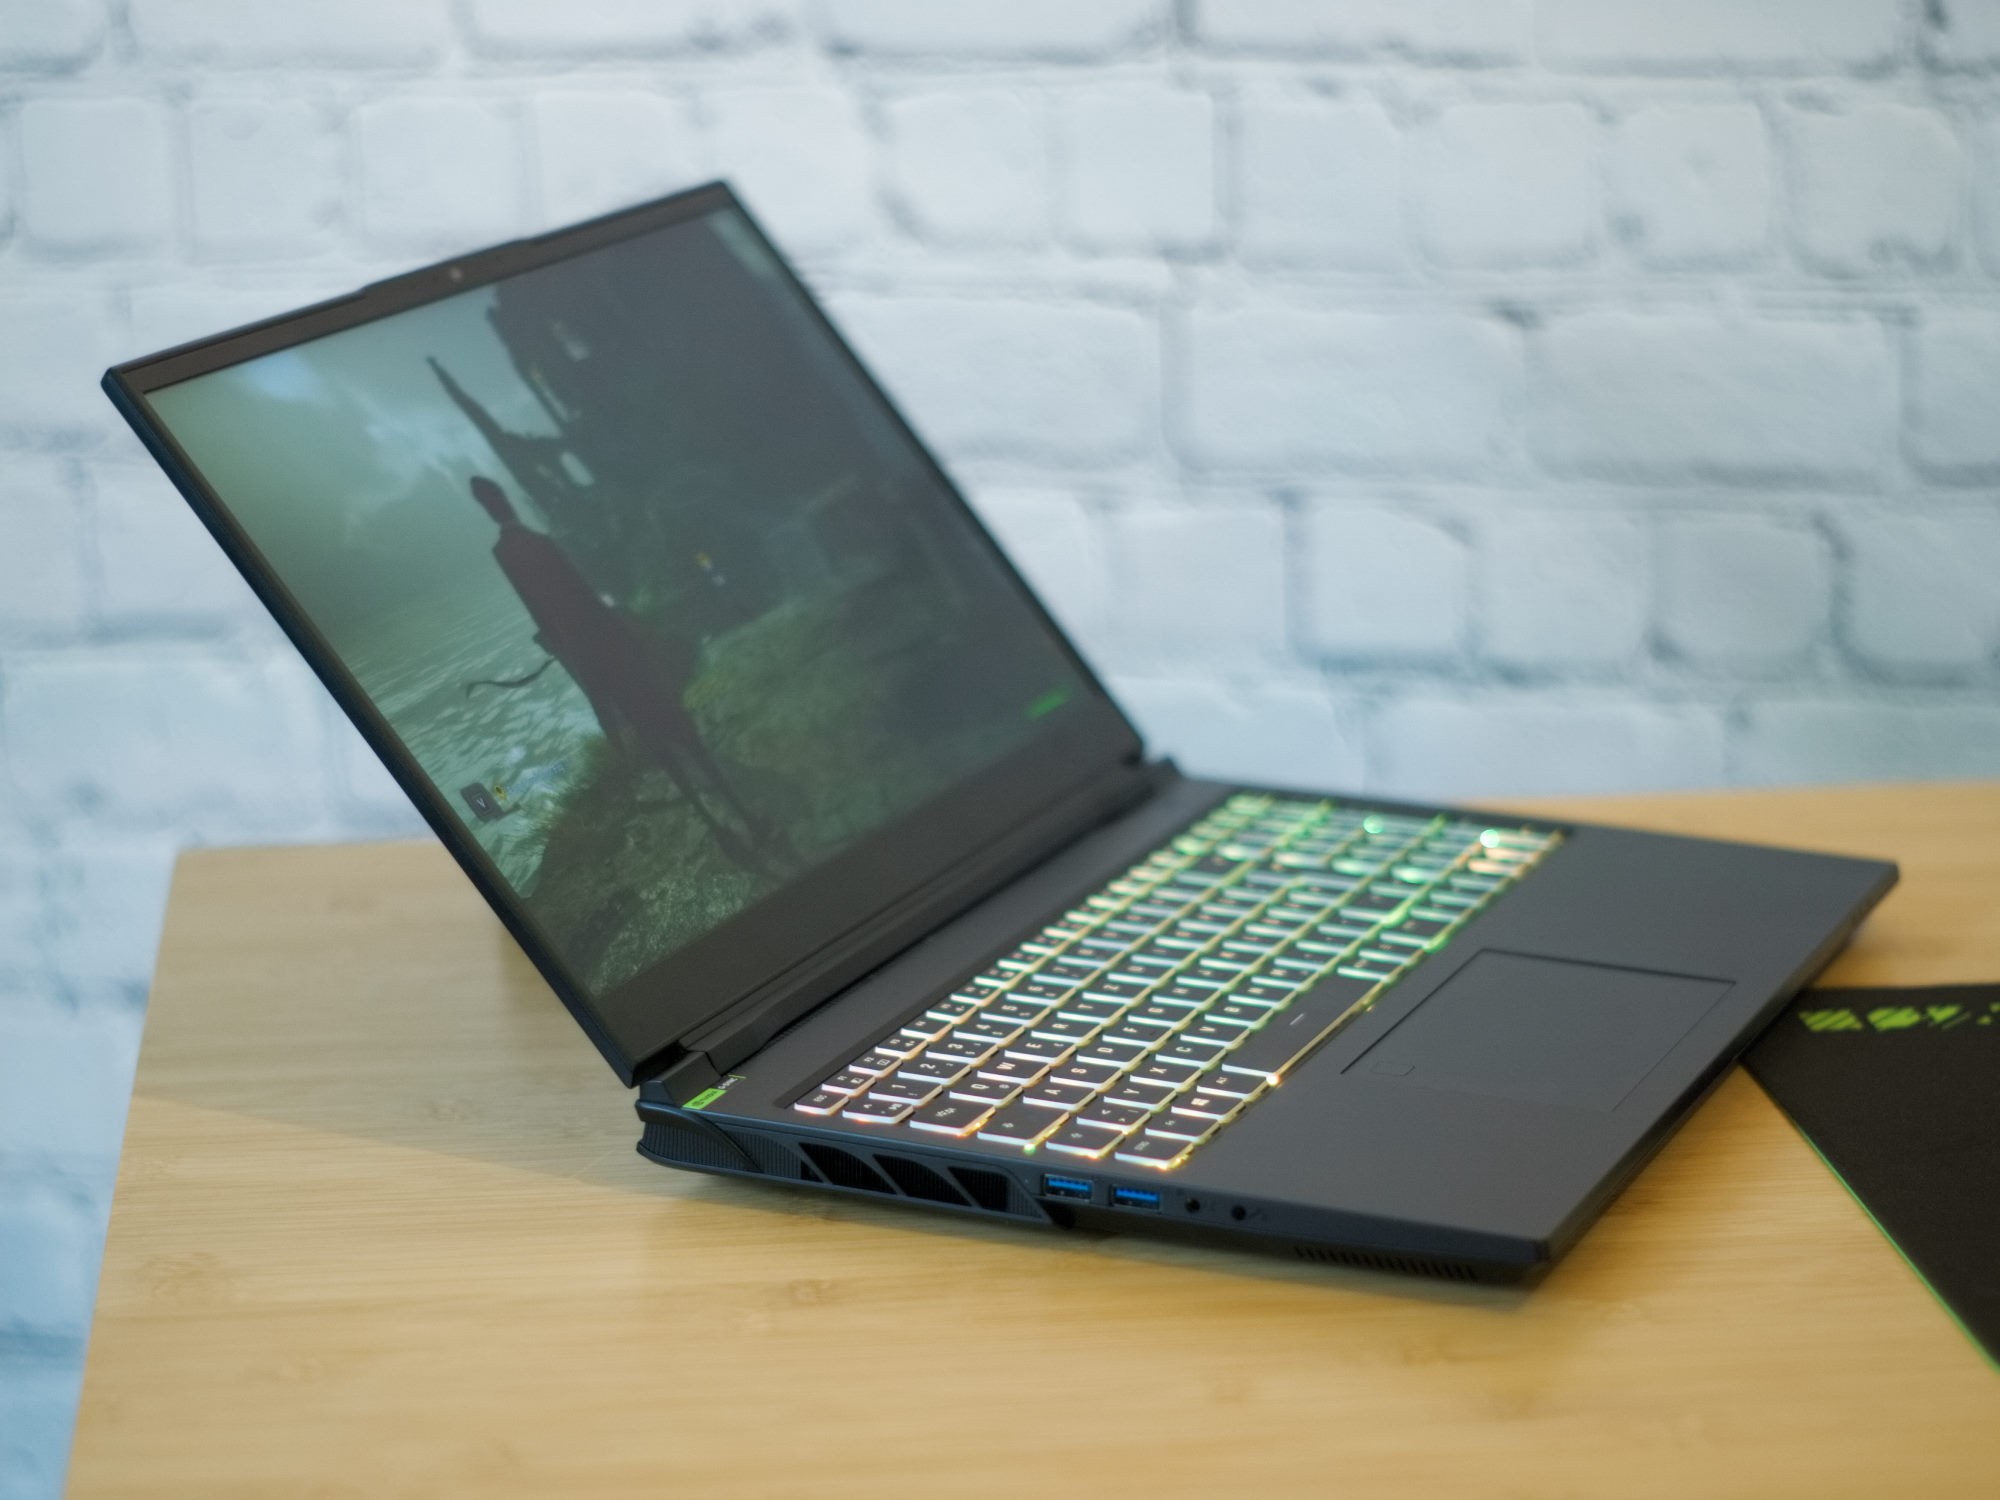
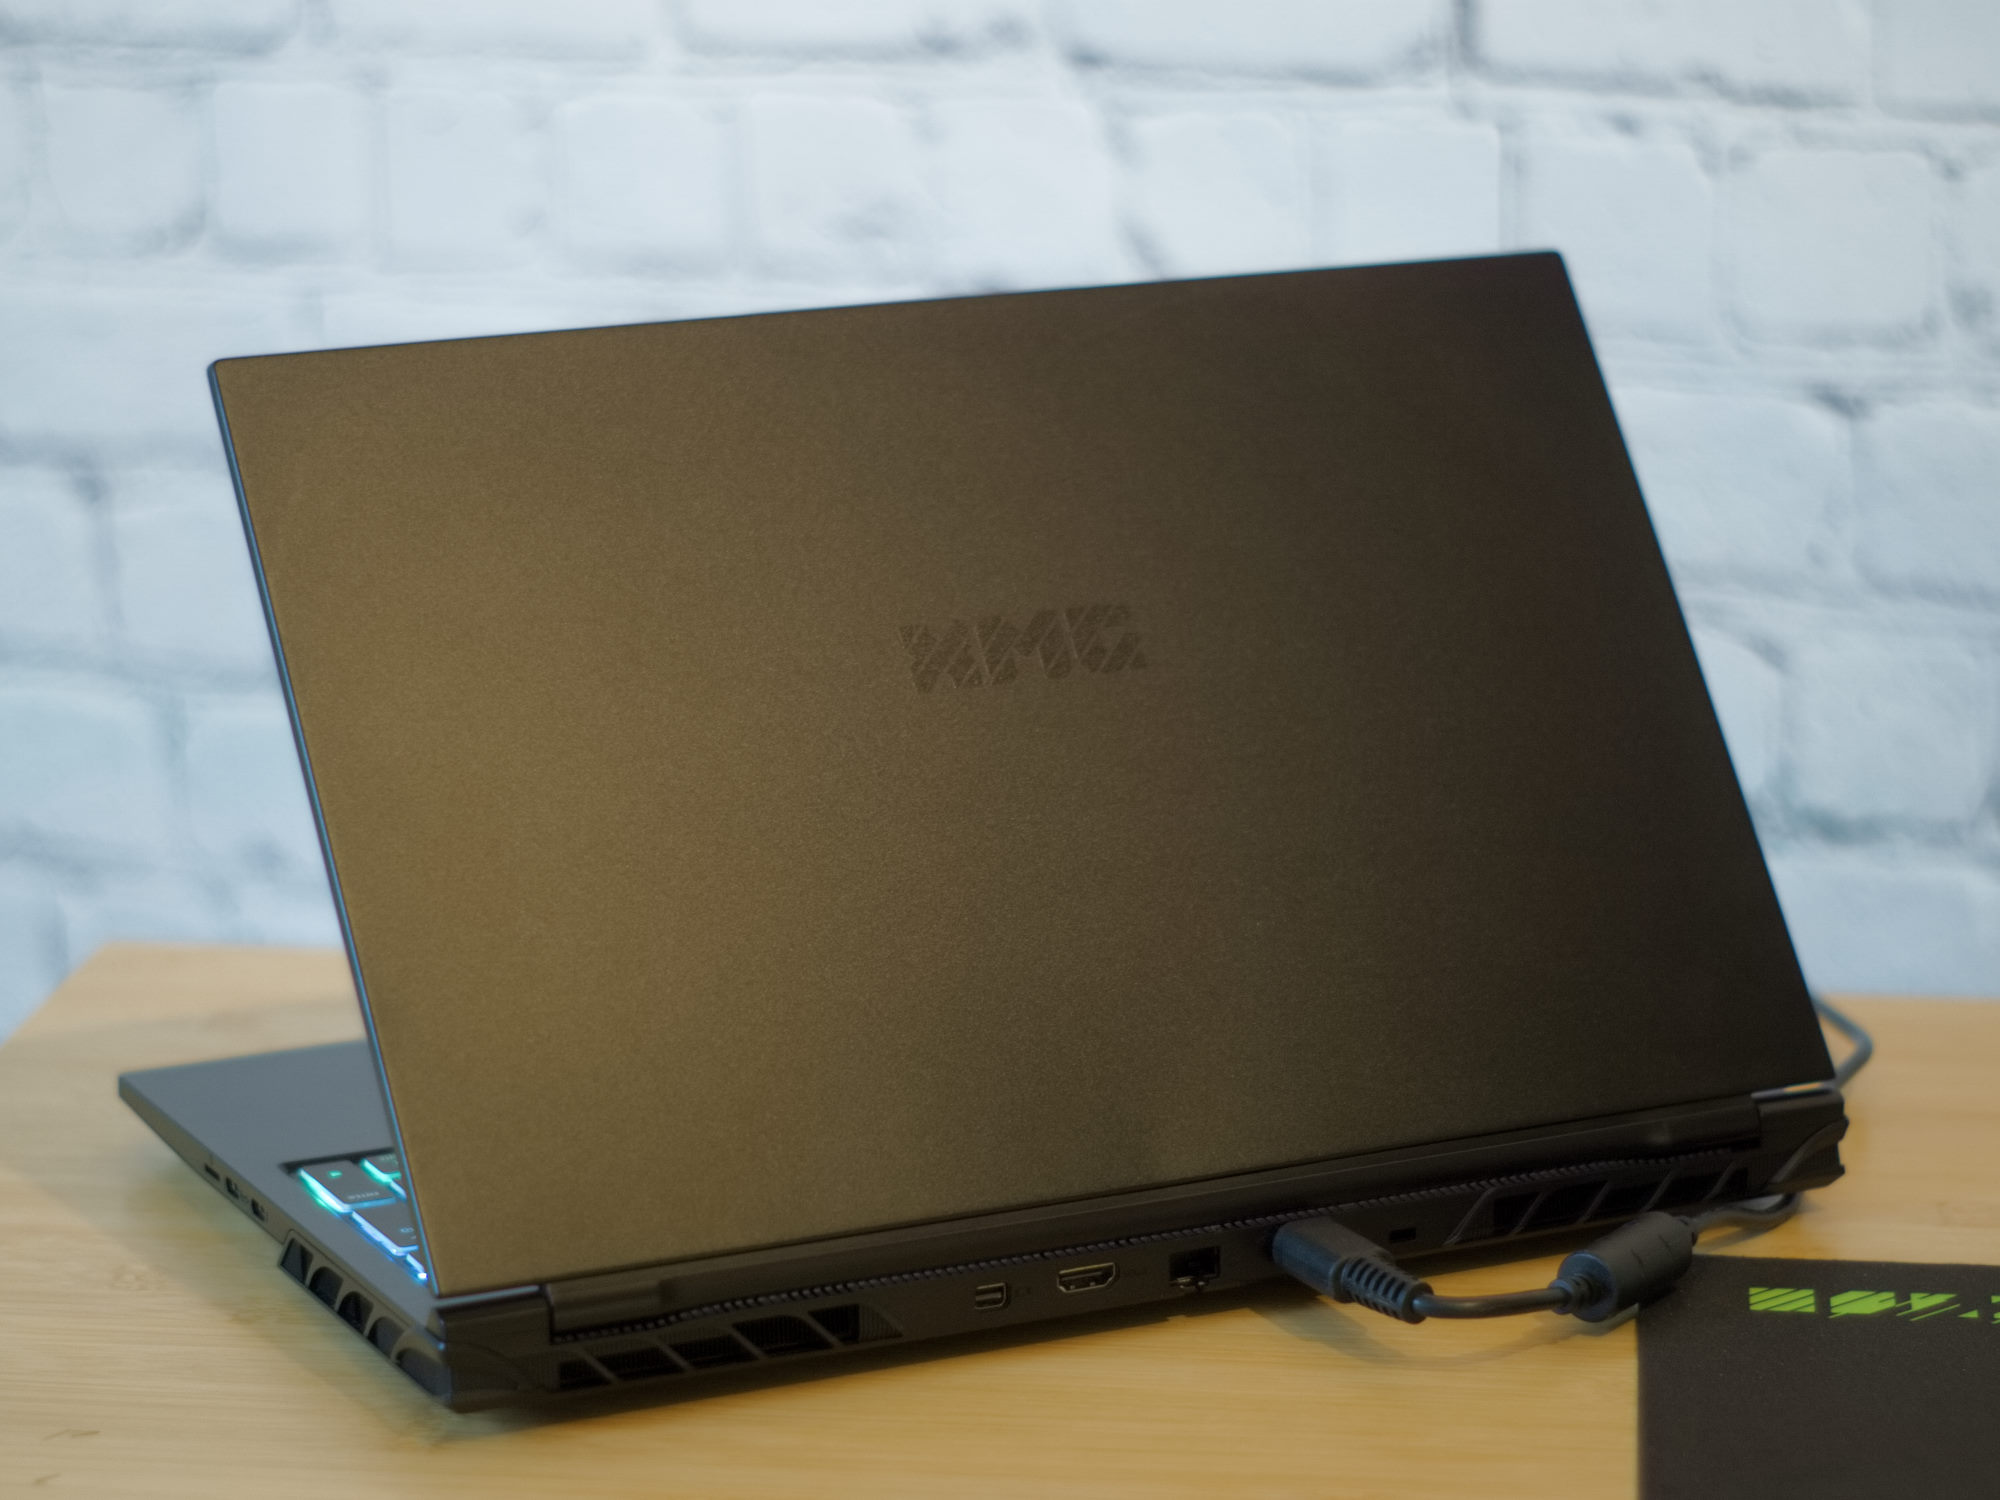
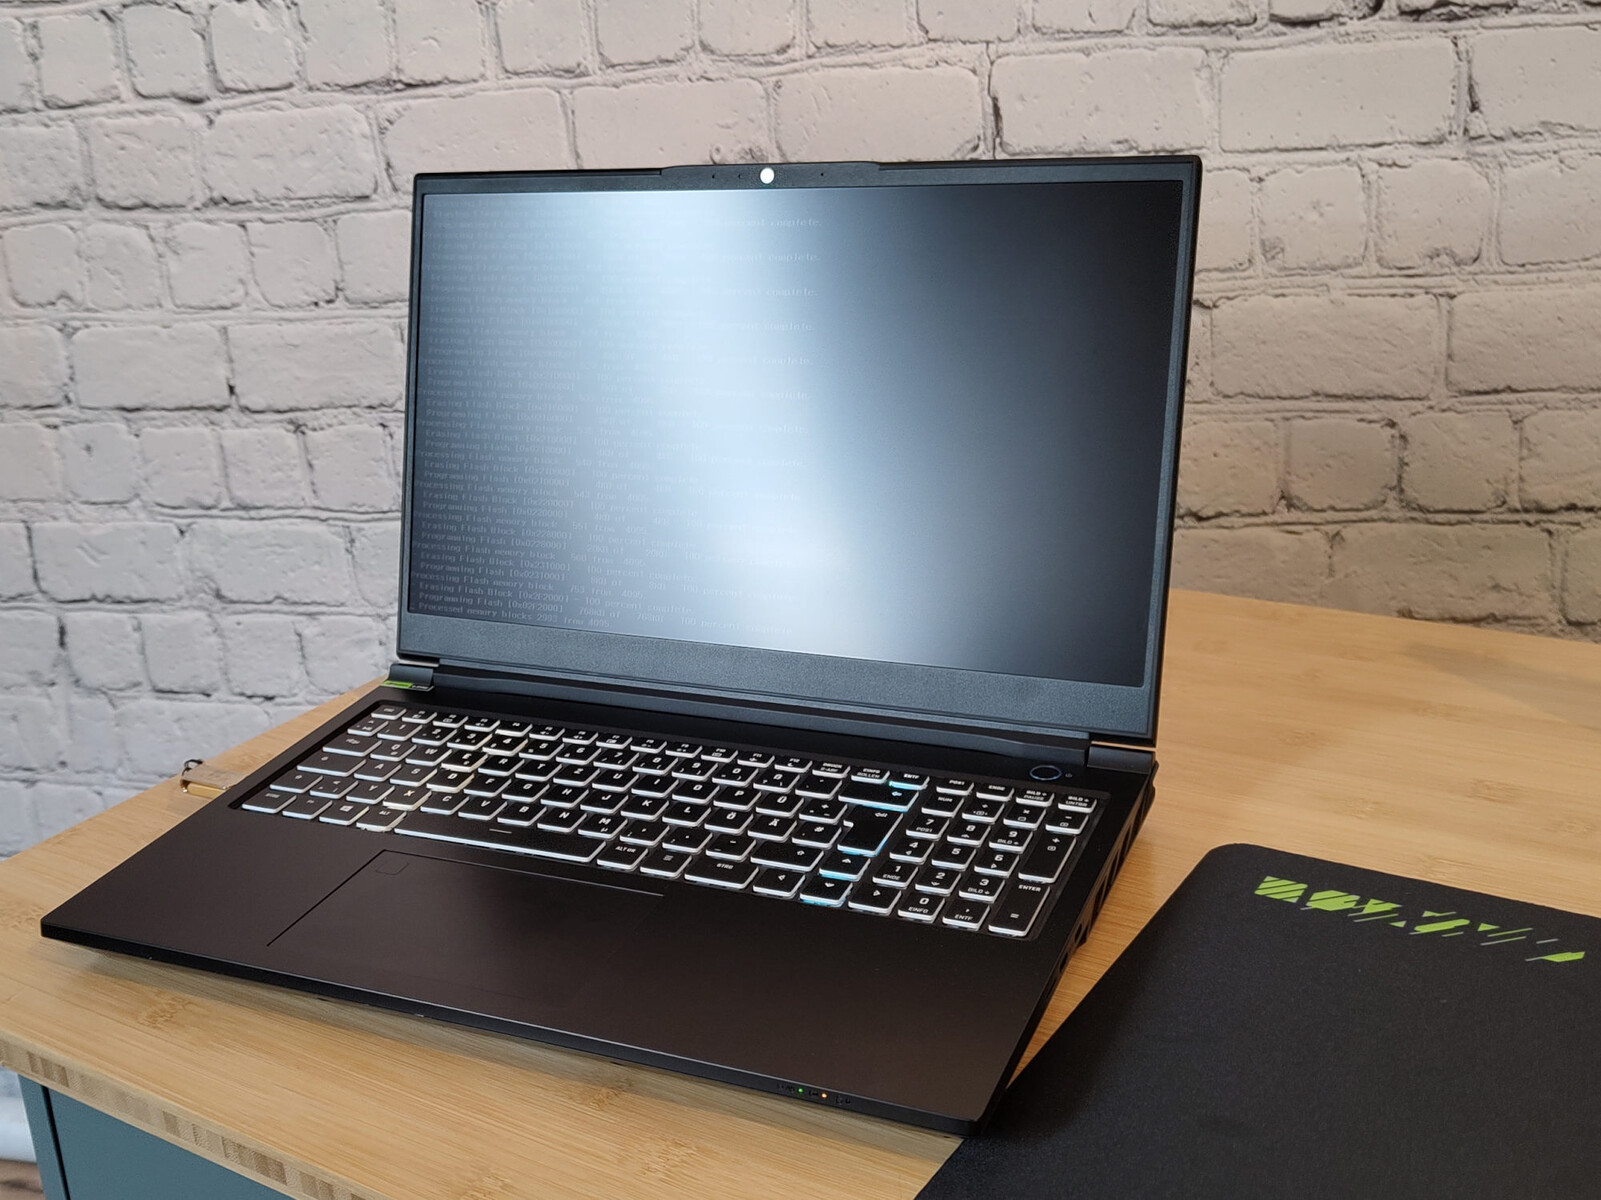
Estojo e recursos - Alto teor de metal
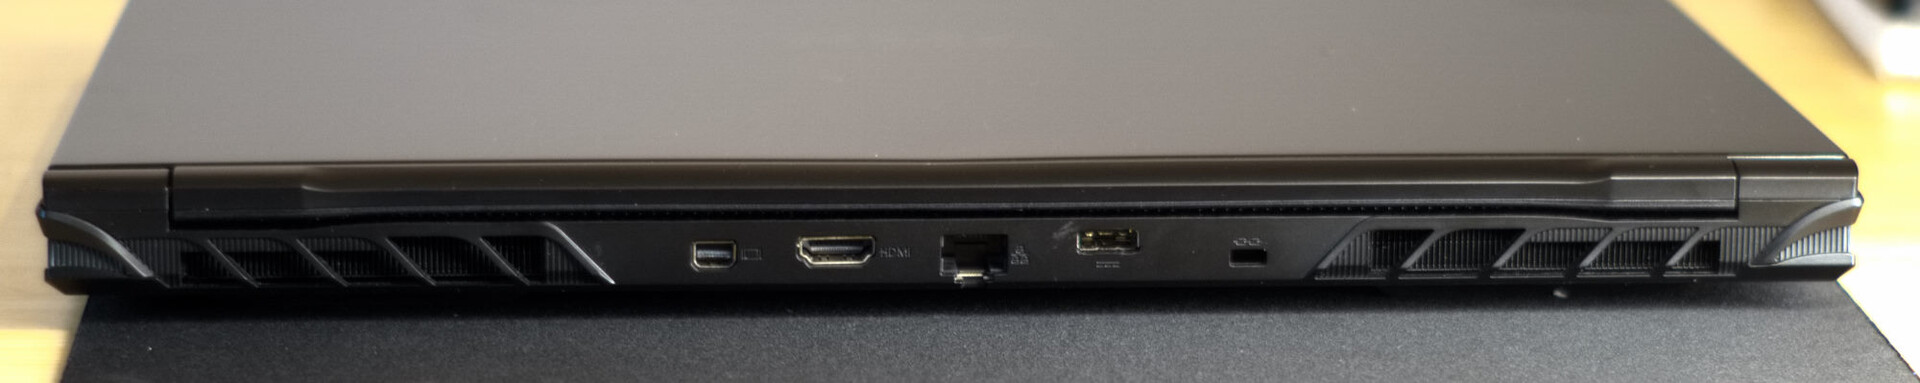
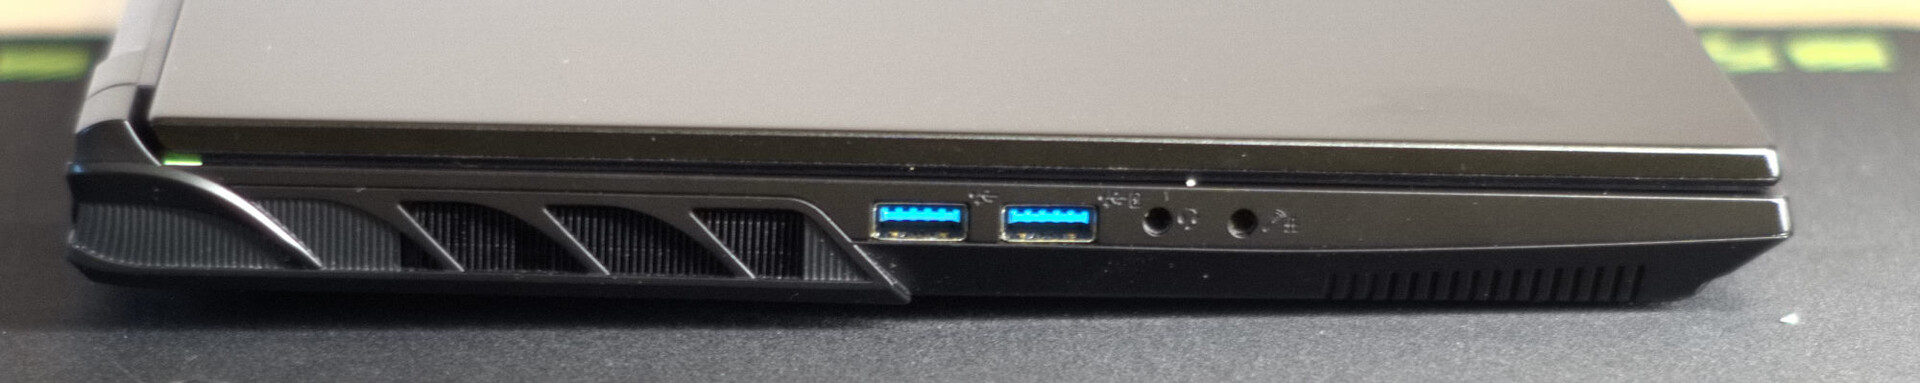
Em comparação com seu antecessor, o Pro 15 E23 recebeu alguns pequenos ajustes de detalhes. Os afetados são essencialmente as aberturas nas laterais do laptop e uma troca de posição do slot RJ45 e um slot USB-C. Agora, todas as portas USB podem ser encontradas nas laterais do dispositivo.
O design permanece discreto, preto e praticamente sem marcas. Tanto o tamanho quanto o peso do laptop são praticamente idênticos aos de seu antecessor. A tampa da tela do laptop e a parte inferior da estrutura continuam a ser feitas de alumínio, enquanto a parte superior da estrutura é feita de plástico. A tela é emoldurada por uma borda de plástico de aparência ampla, com apenas 5 mm de espessura nas laterais, um centímetro na parte superior e dois centímetros na parte inferior. É possível obter um pequeno ruído de rangido da tela e da base torcendo-as. Mas, para conseguir isso, é preciso fazer um esforço considerável, pois todas as peças do laptop são muito bem construídas e sólidas. O teclado e a tampa da tela só se flexionam um pouco quando é aplicada muita pressão e as dobradiças mantêm o monitor com segurança em todas as posições possíveis entre 0° e 135°.

Leitor de cartão SD, Wi-Fi e webcam

O Das Pro 15 possui, pelo menos em comparação com muitos outros laptops para jogos, um leitor de cartão microSD. Combinado com o nosso microSD AV Pro (V60), registramos boas velocidades de transferência na faixa de 80 a 90 MB/s.
Na rede de 6 GHz, o Intel Wi-Fi 6E AX211 do laptop demonstrou velocidades de dados excelentes, mas na rede de 5 GHz, ele apresentou números abaixo da média quando se trata de velocidades de transferência.
Para streamers, a qualidade da webcam Full HD integrada provavelmente será insuficiente, especialmente em condições de iluminação ruins. Entretanto, ela pode ser usada para chamadas de vídeo ocasionais.
| SD Card Reader | |
| average JPG Copy Test (av. of 3 runs) | |
| Média da turma Gaming (20.9 - 210, n=53, últimos 2 anos) | |
| Schenker XMG Pro 15 (E23) | |
| Schenker XMG Pro 15 (i7-12700H, RTX 3080 Ti) | |
| Asus ZenBook Pro 14 Duo UX8402VV-P1021W (AV Pro SD microSD 128 GB V60) | |
| Alienware x16 R1 (AV PRO microSD 128 GB V60) | |
| maximum AS SSD Seq Read Test (1GB) | |
| Alienware x16 R1 (AV PRO microSD 128 GB V60) | |
| Média da turma Gaming (25.5 - 261, n=50, últimos 2 anos) | |
| Schenker XMG Pro 15 (i7-12700H, RTX 3080 Ti) | |
| Schenker XMG Pro 15 (E23) | |
| Asus ZenBook Pro 14 Duo UX8402VV-P1021W (AV Pro SD microSD 128 GB V60) | |

 GeForce RTX 4060 Laptop GPU, i9-13900HX, Crucial P5 Plus 1TB CT1000P5PSSD8")
 GeForce RTX 4060 Laptop GPU, i9-13900HX, Crucial P5 Plus 1TB CT1000P5PSSD8")
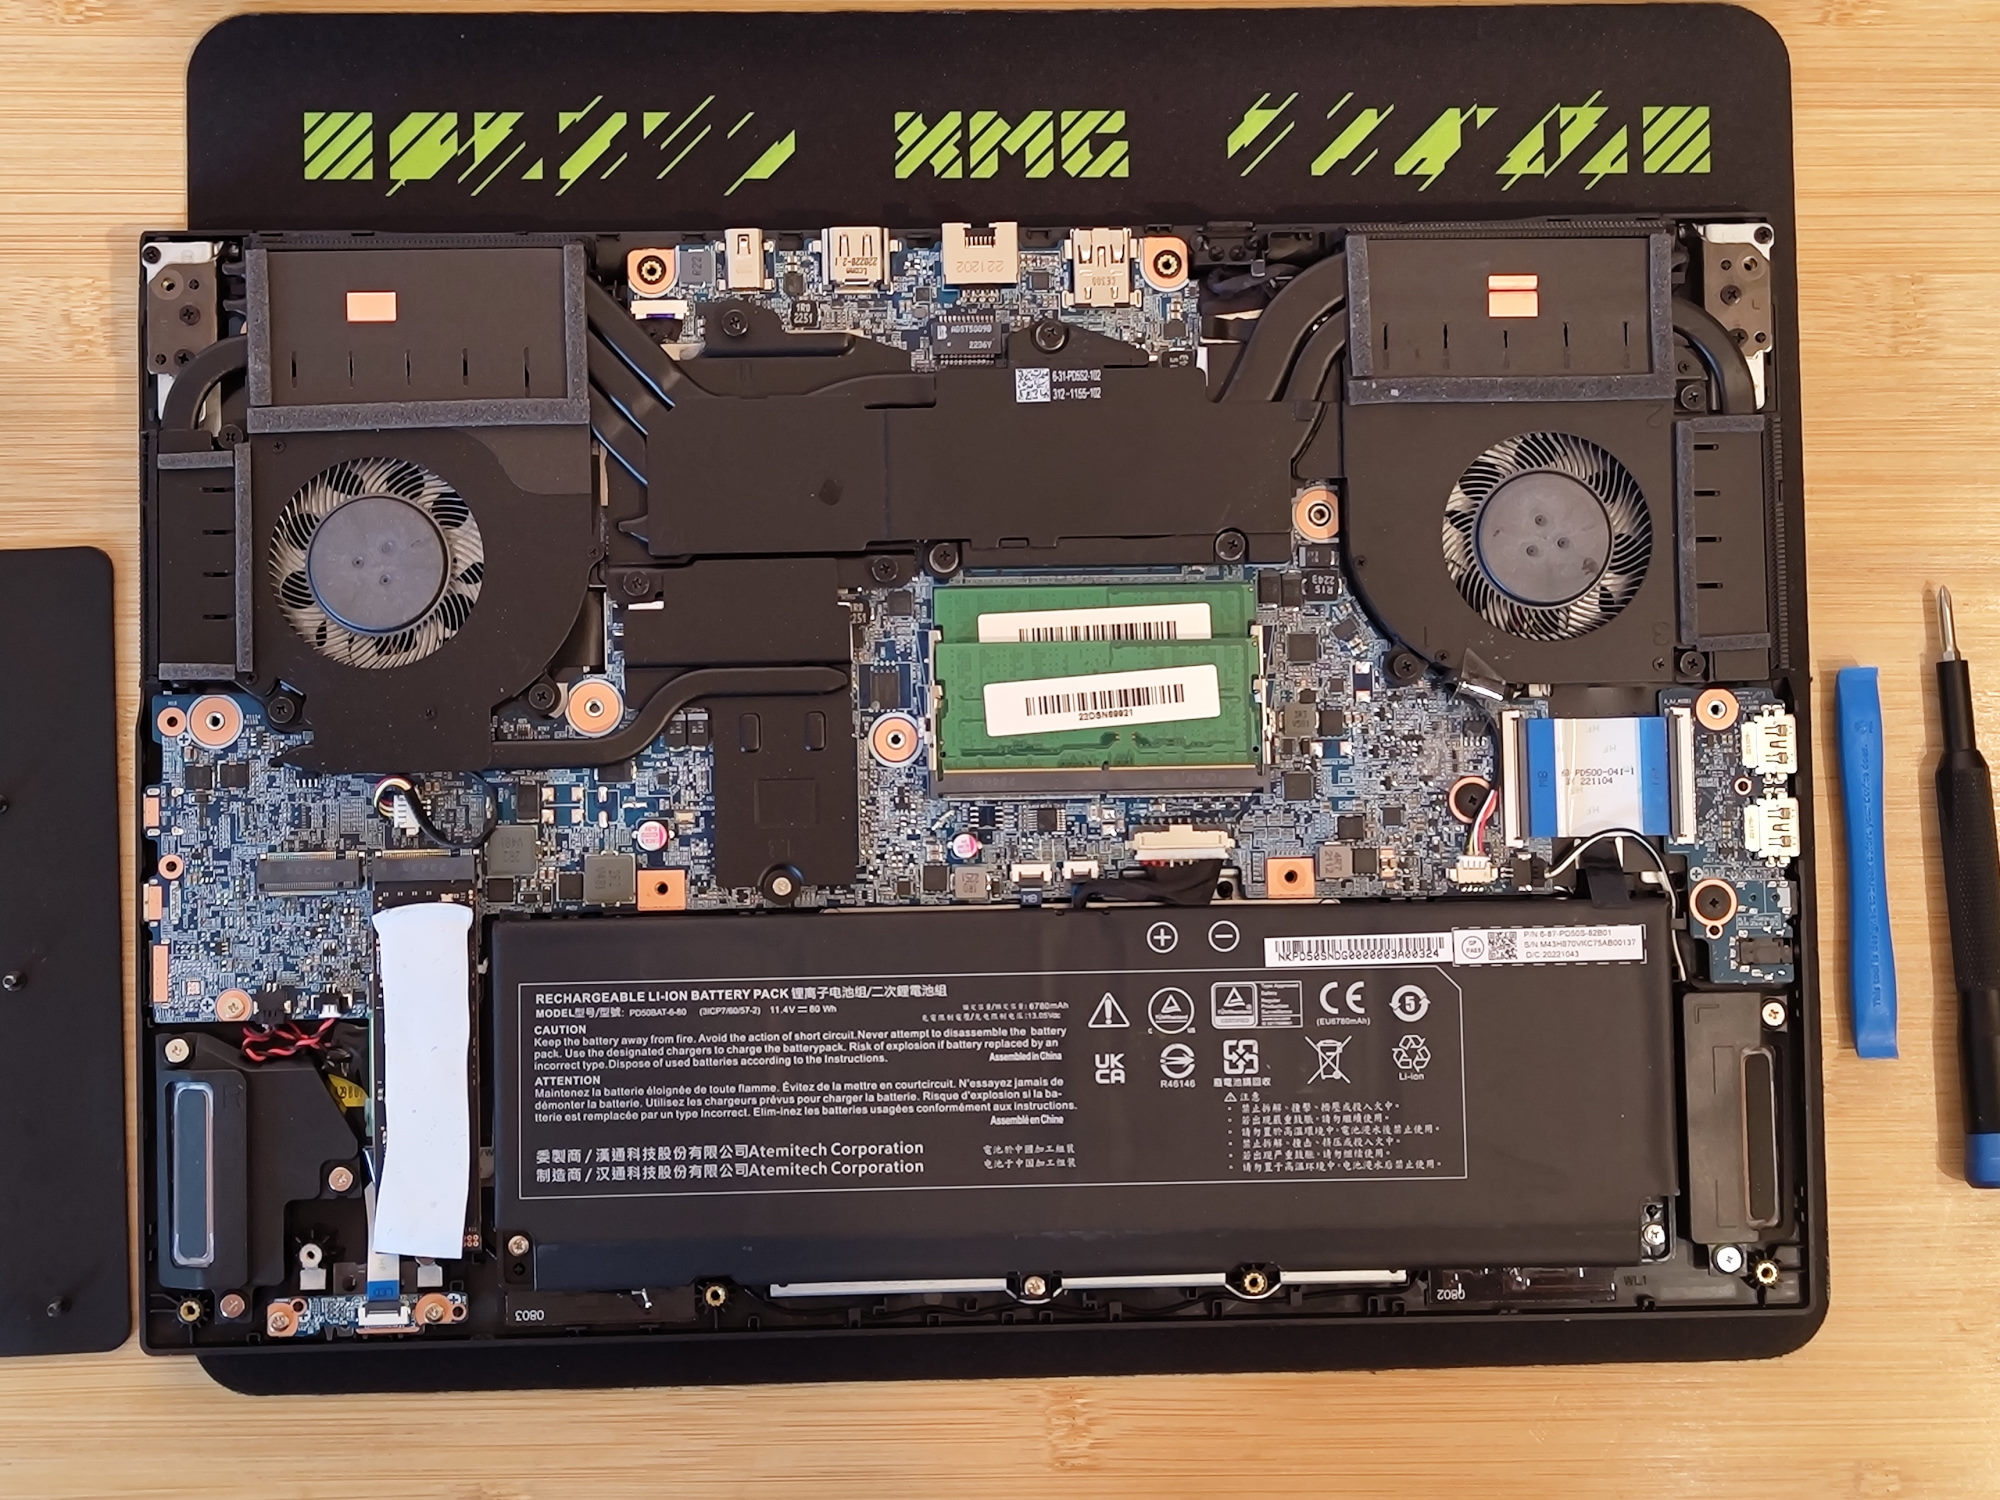
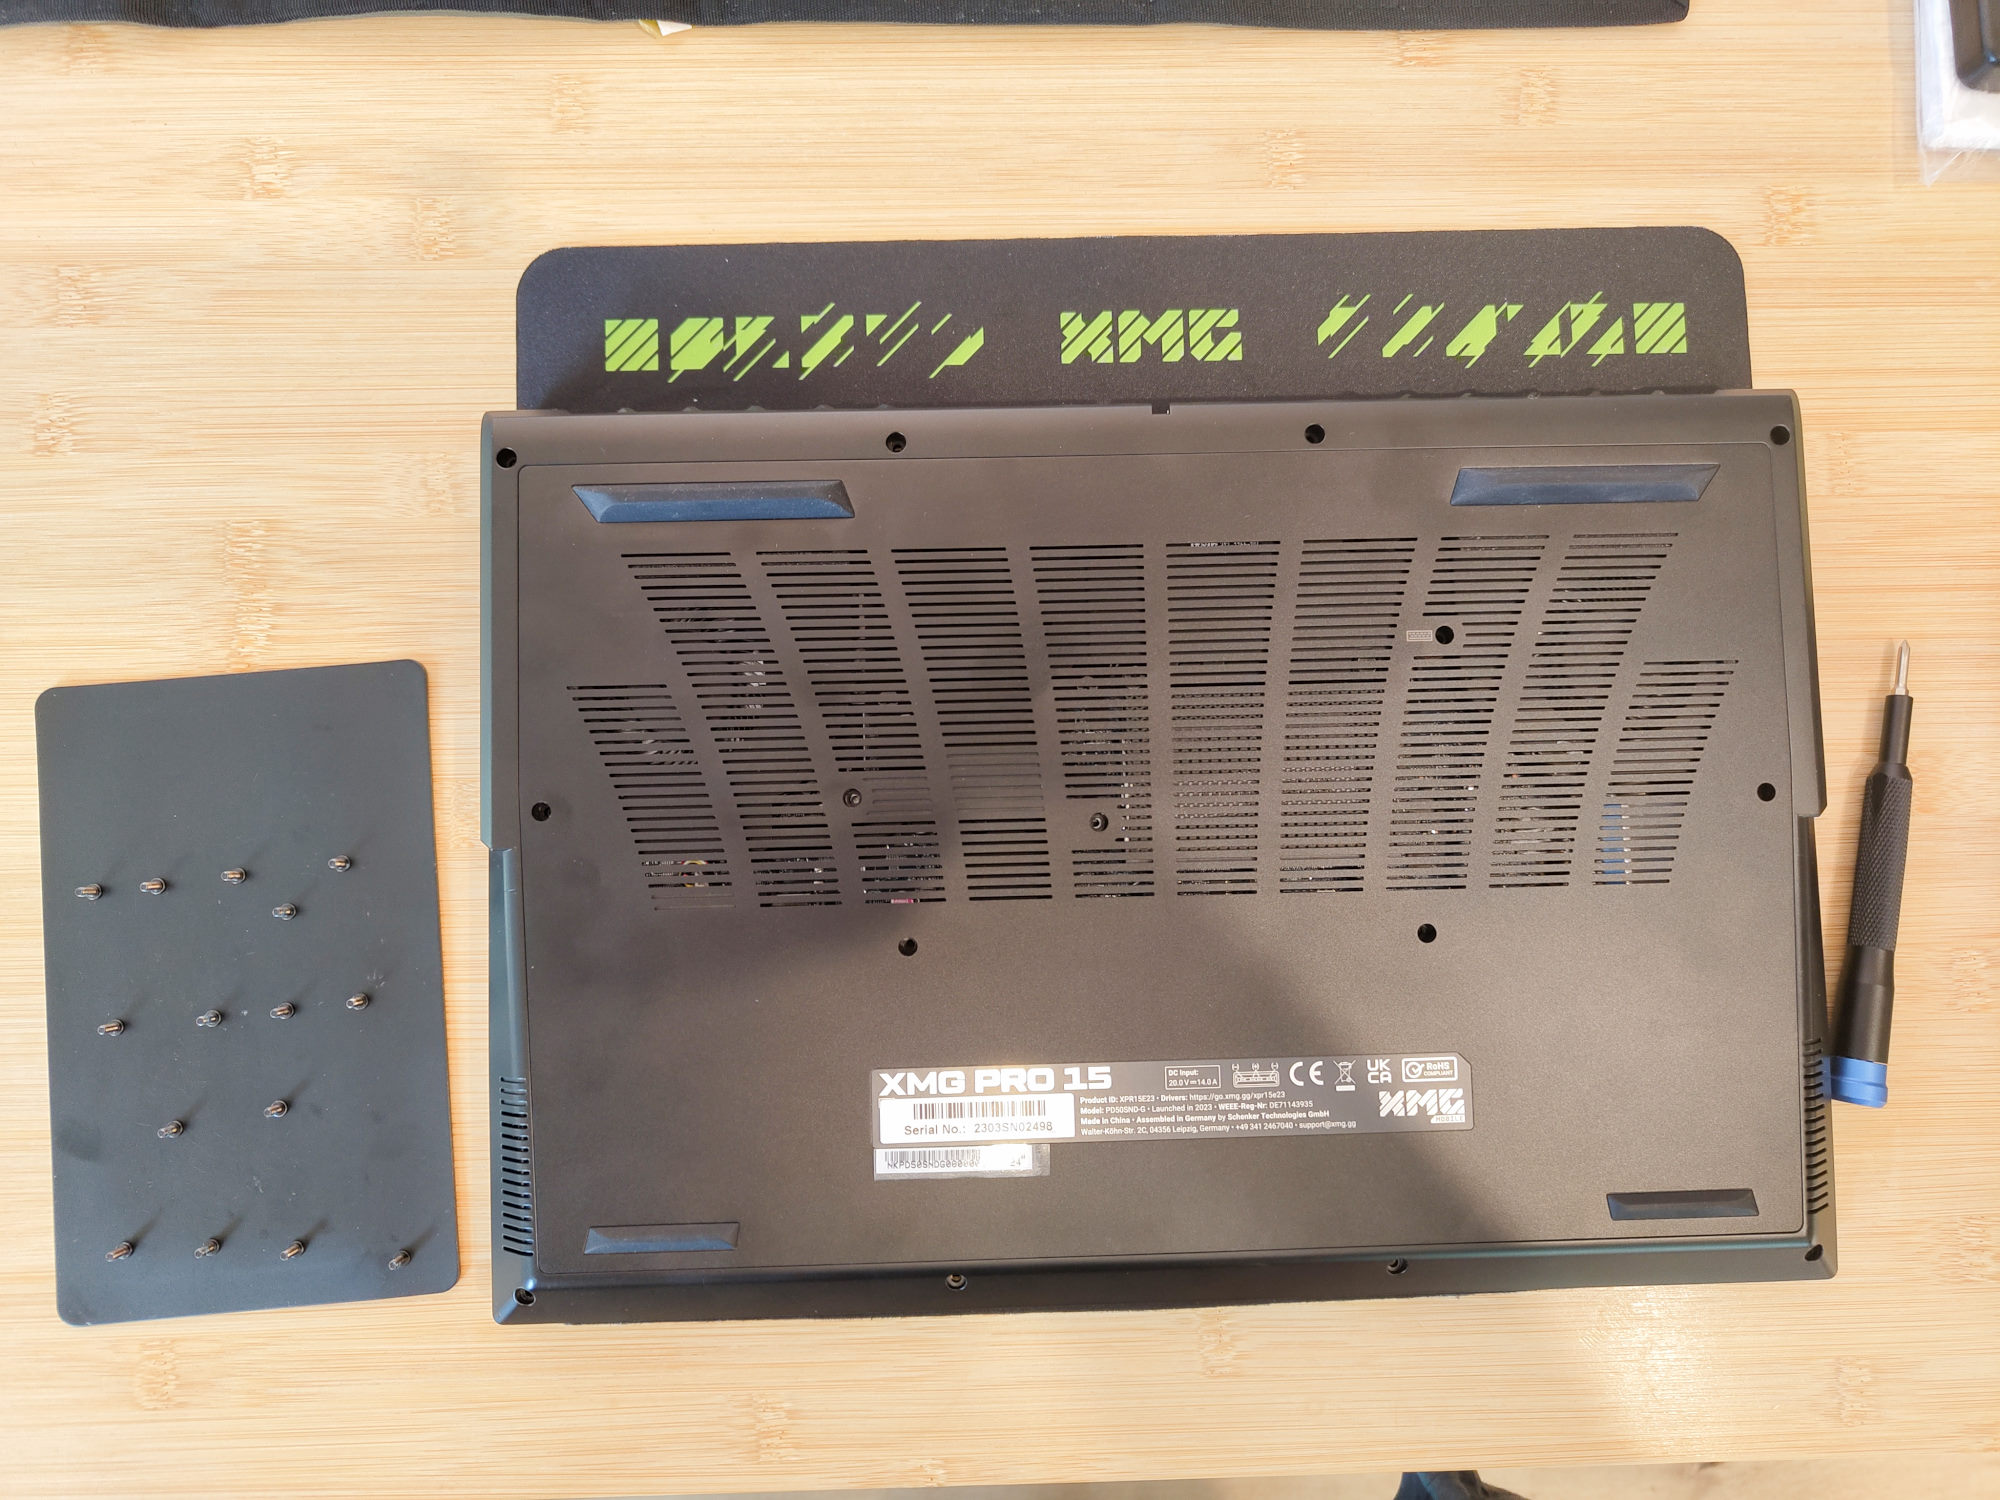
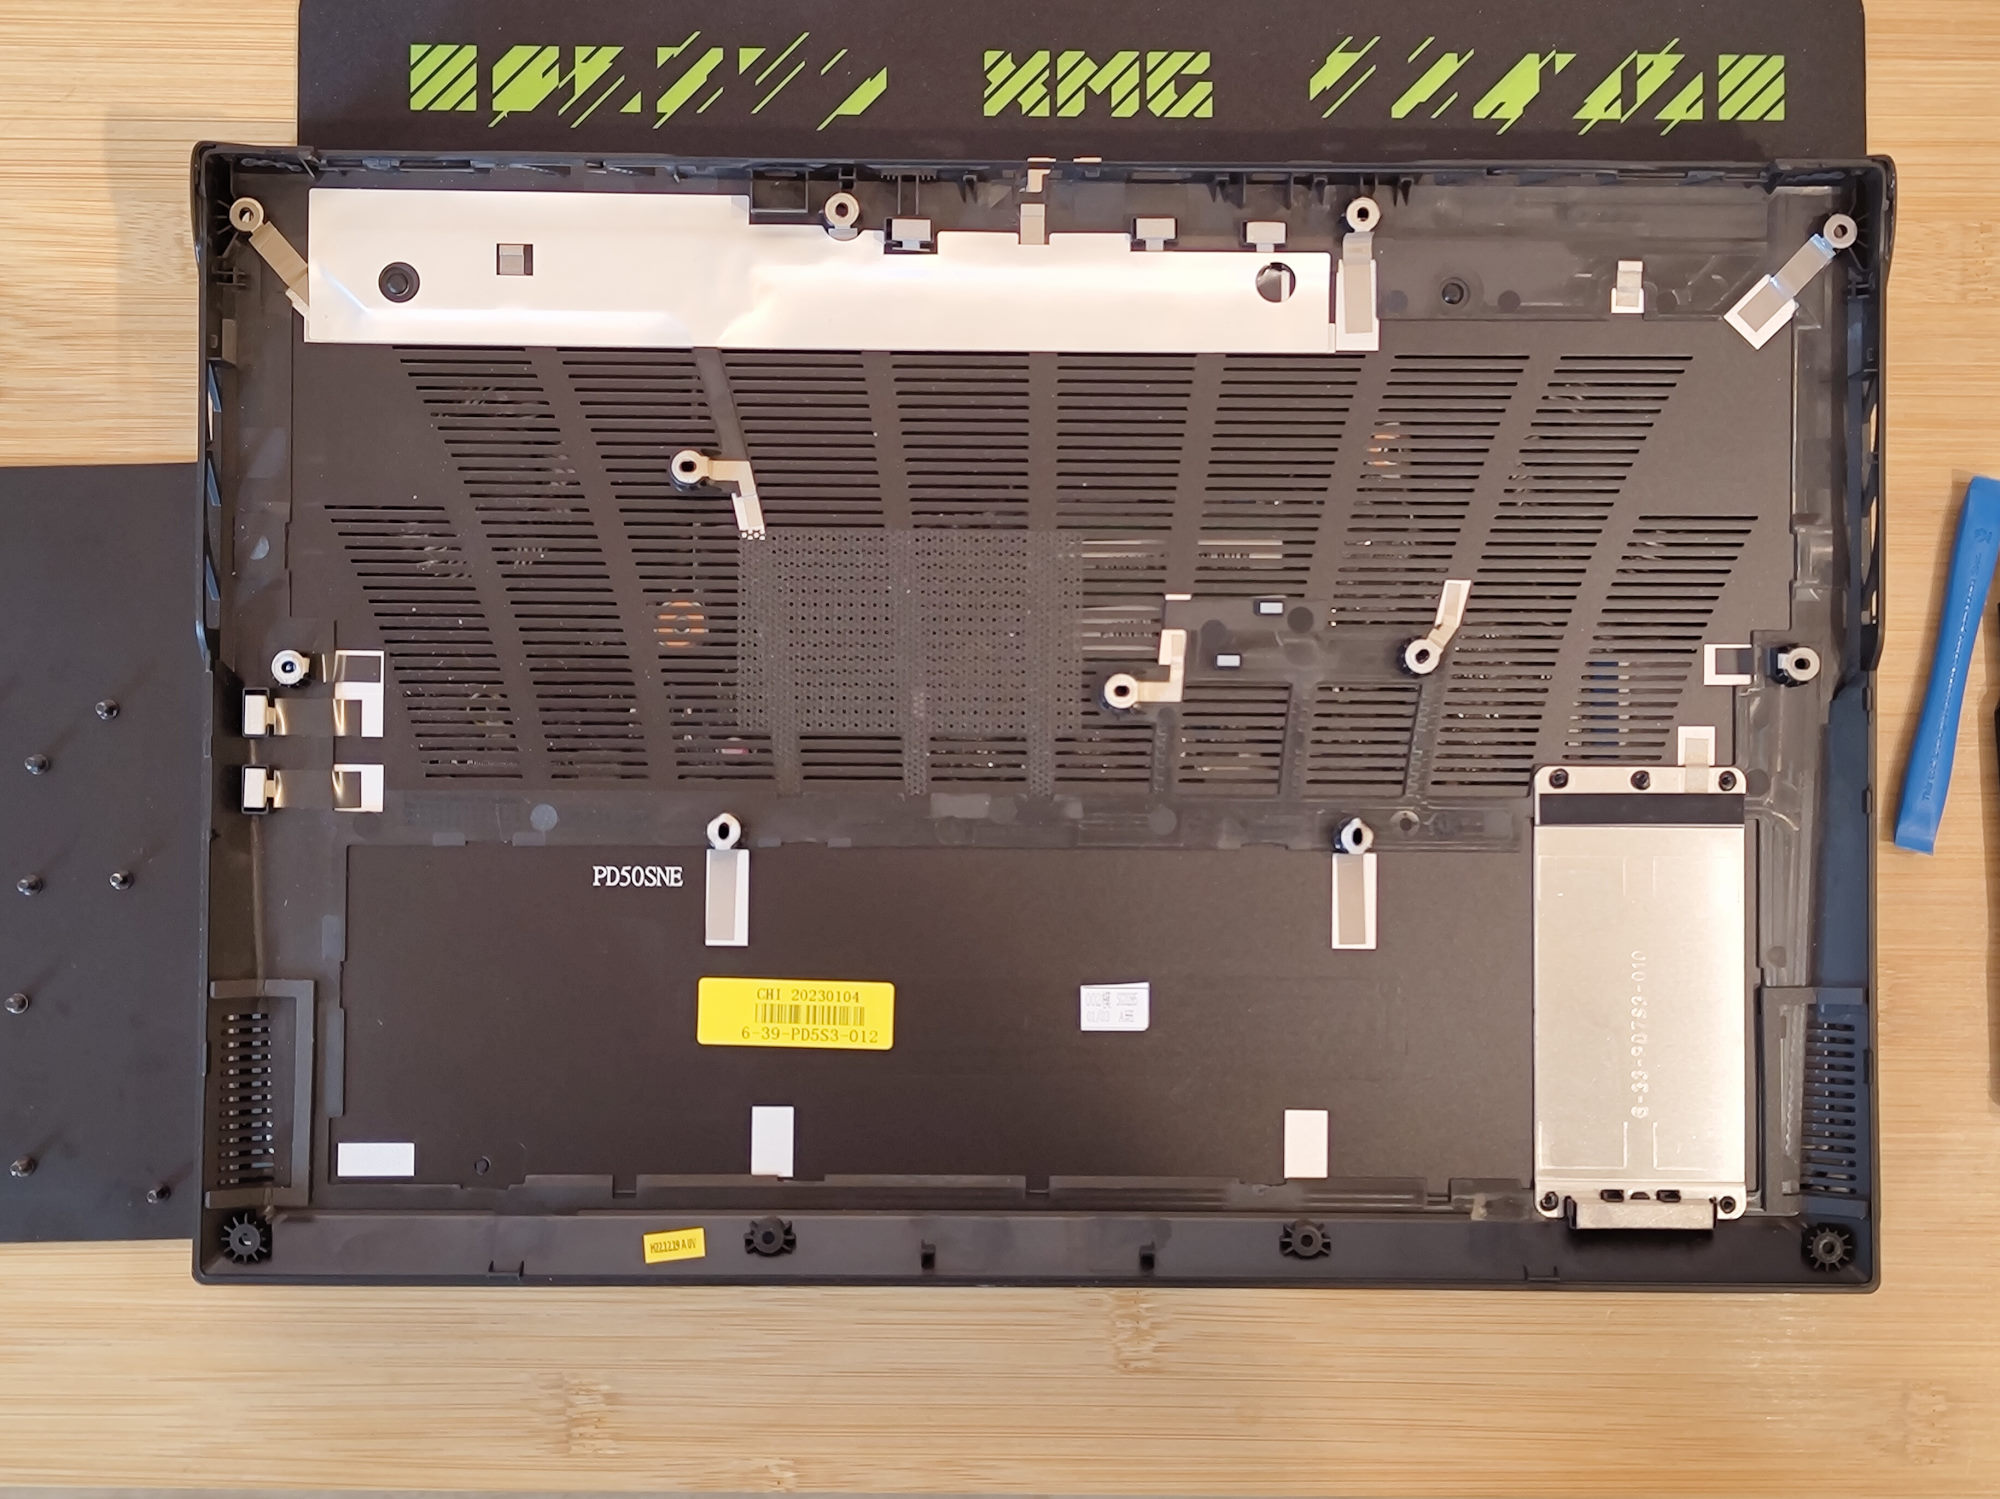
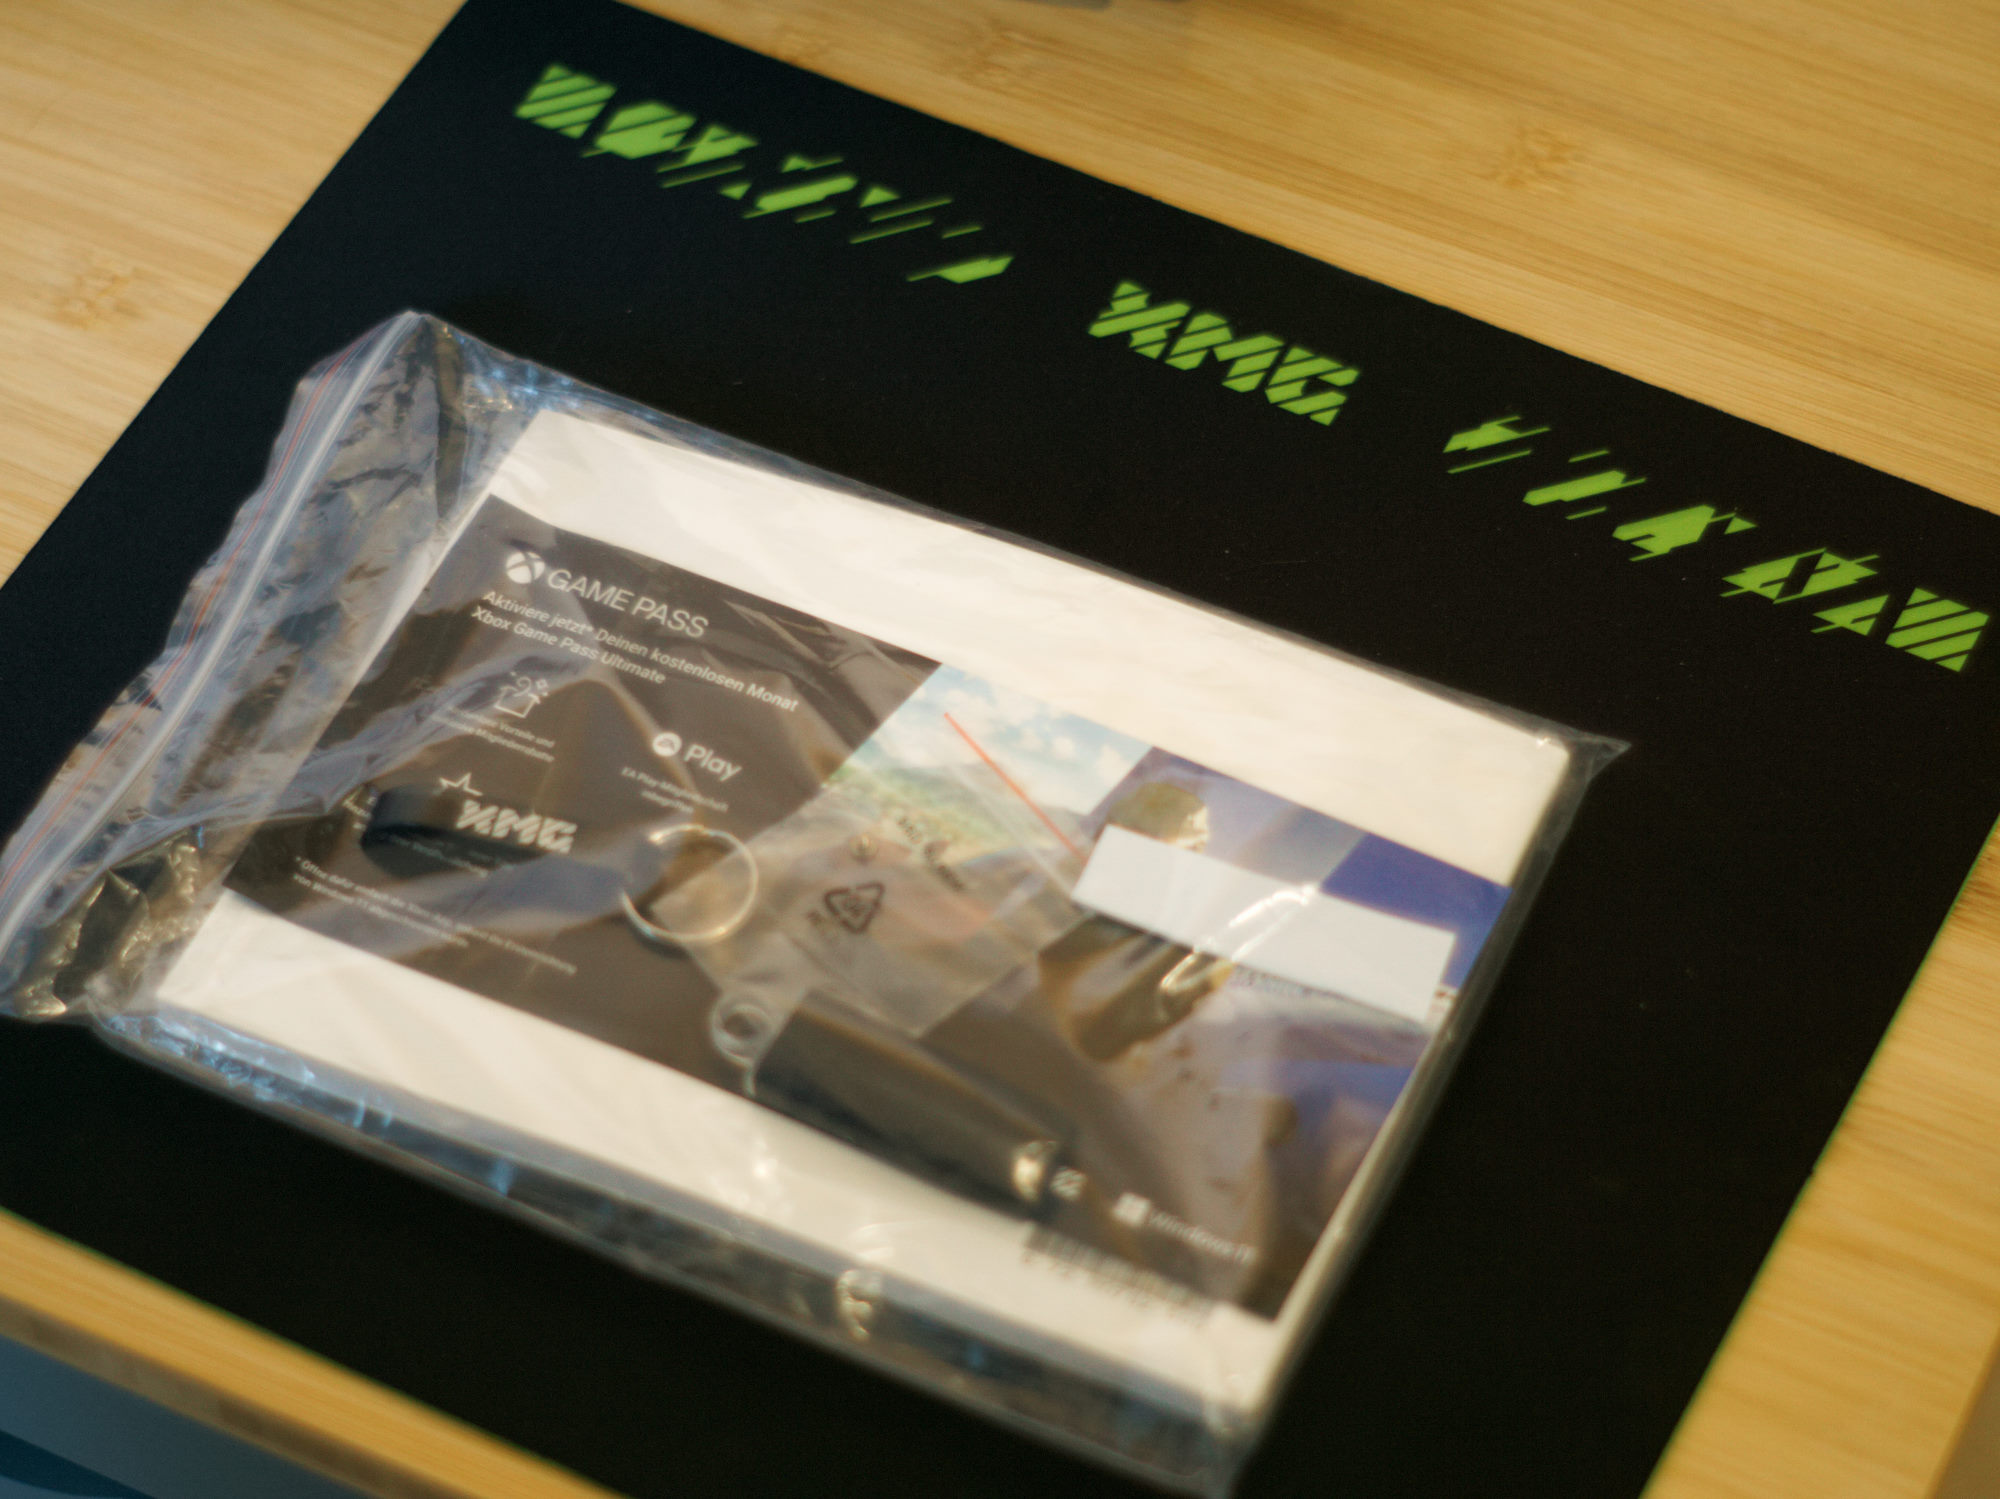
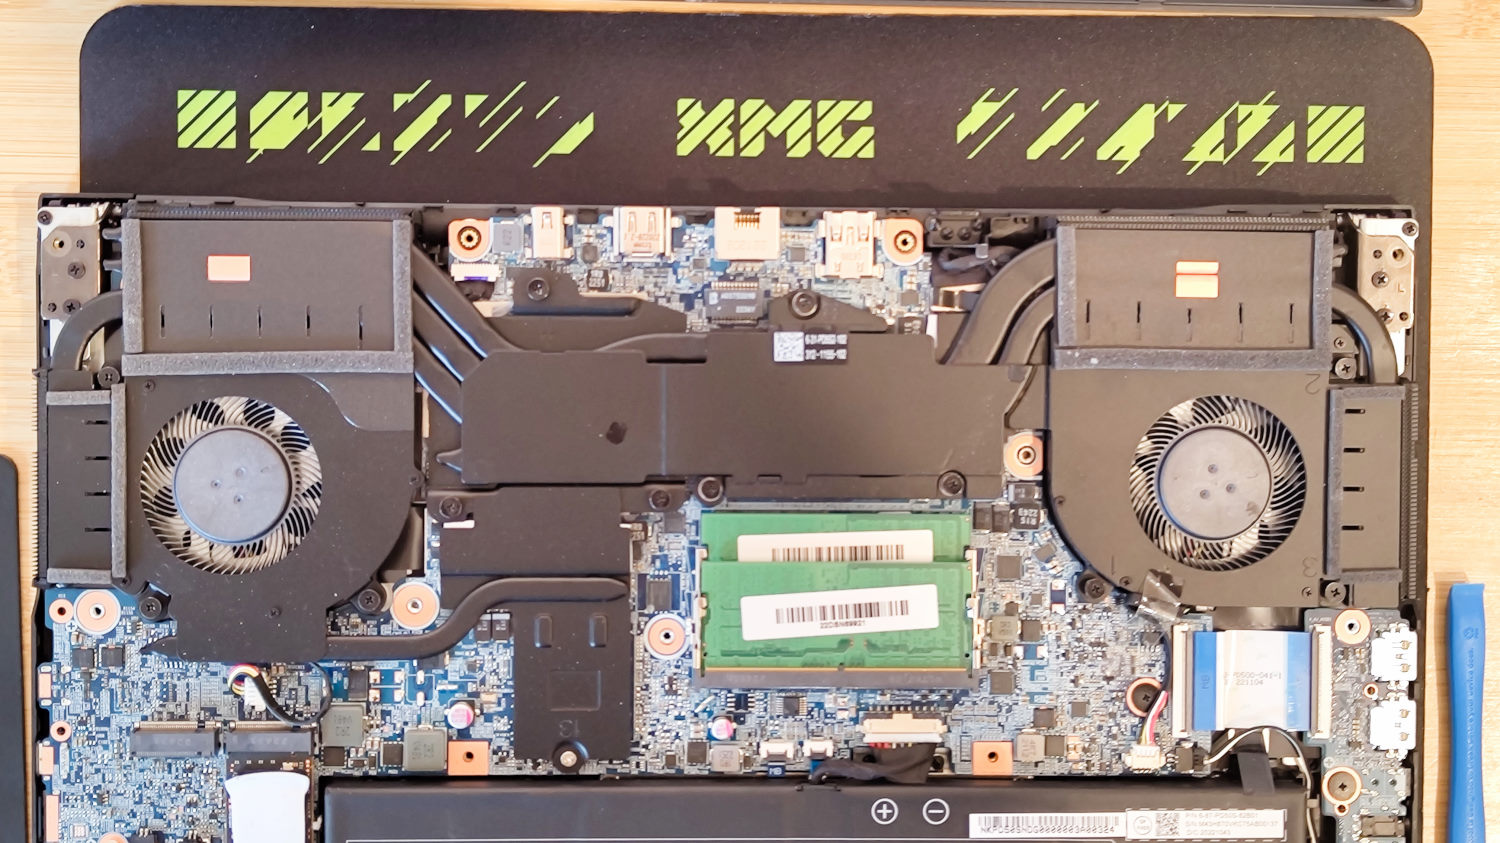
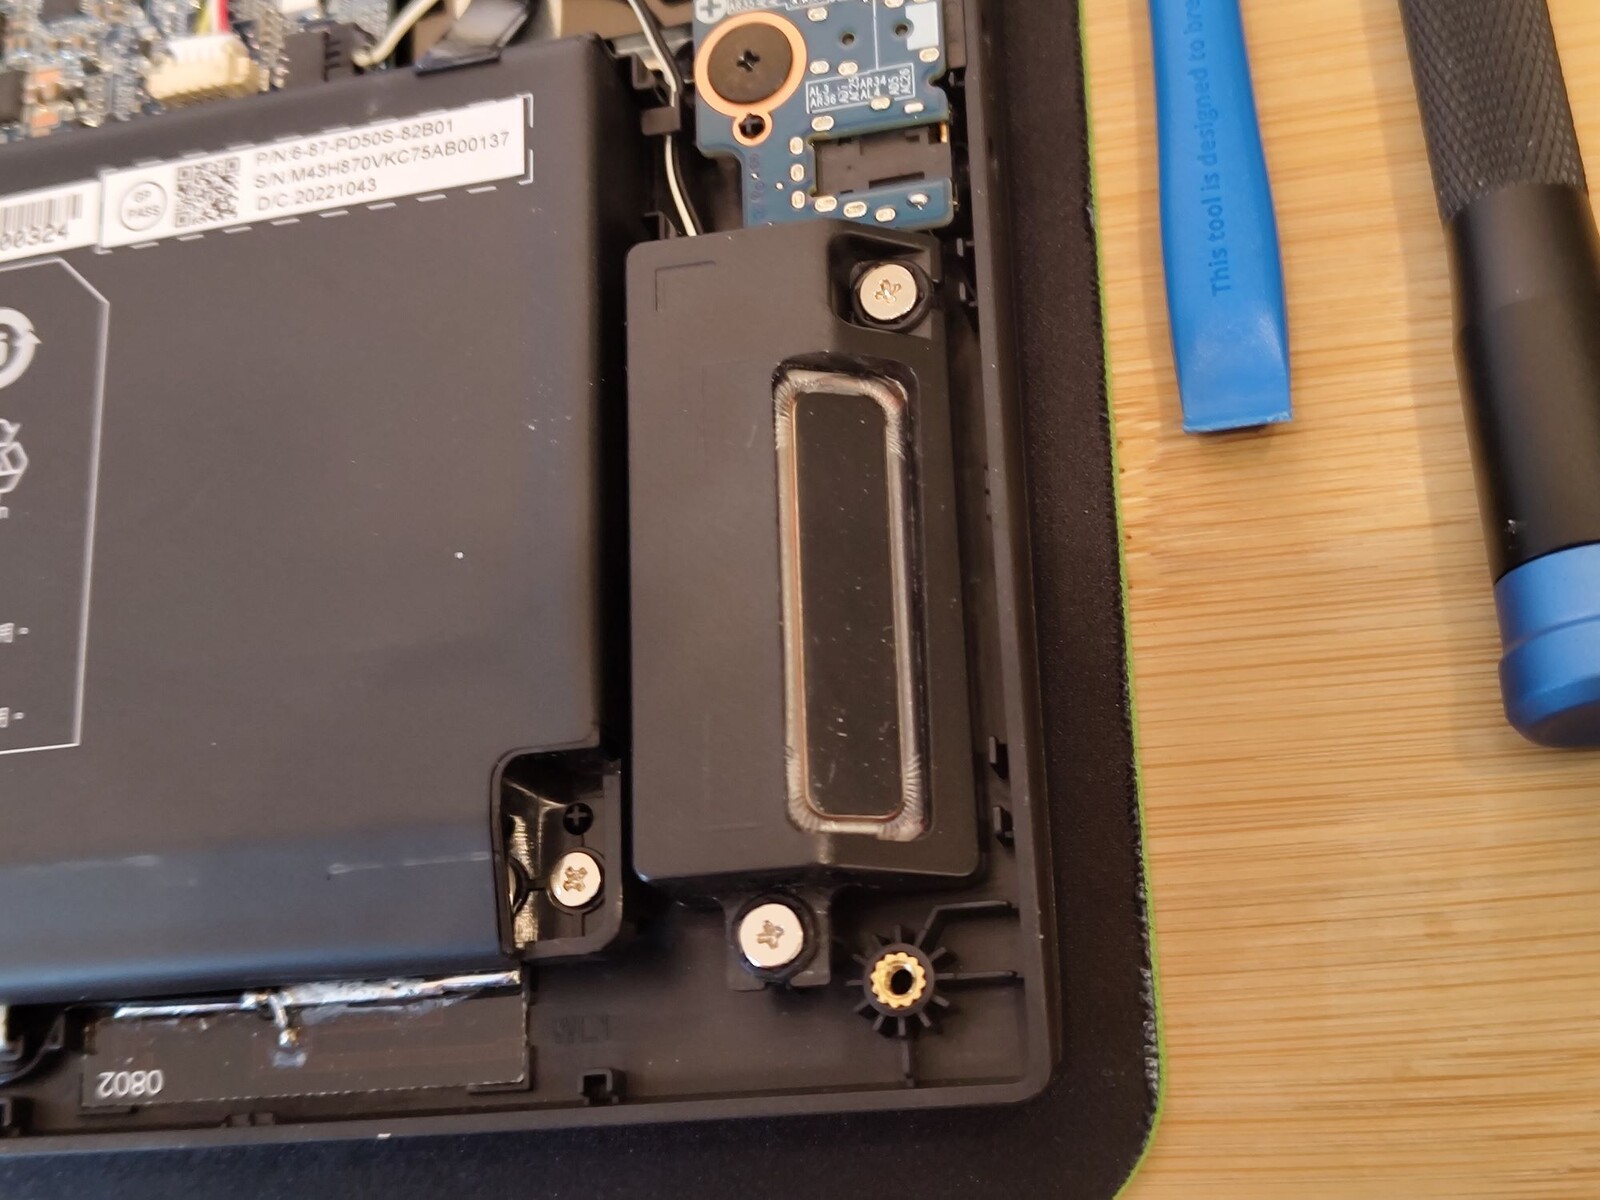
Acessórios e manutenção
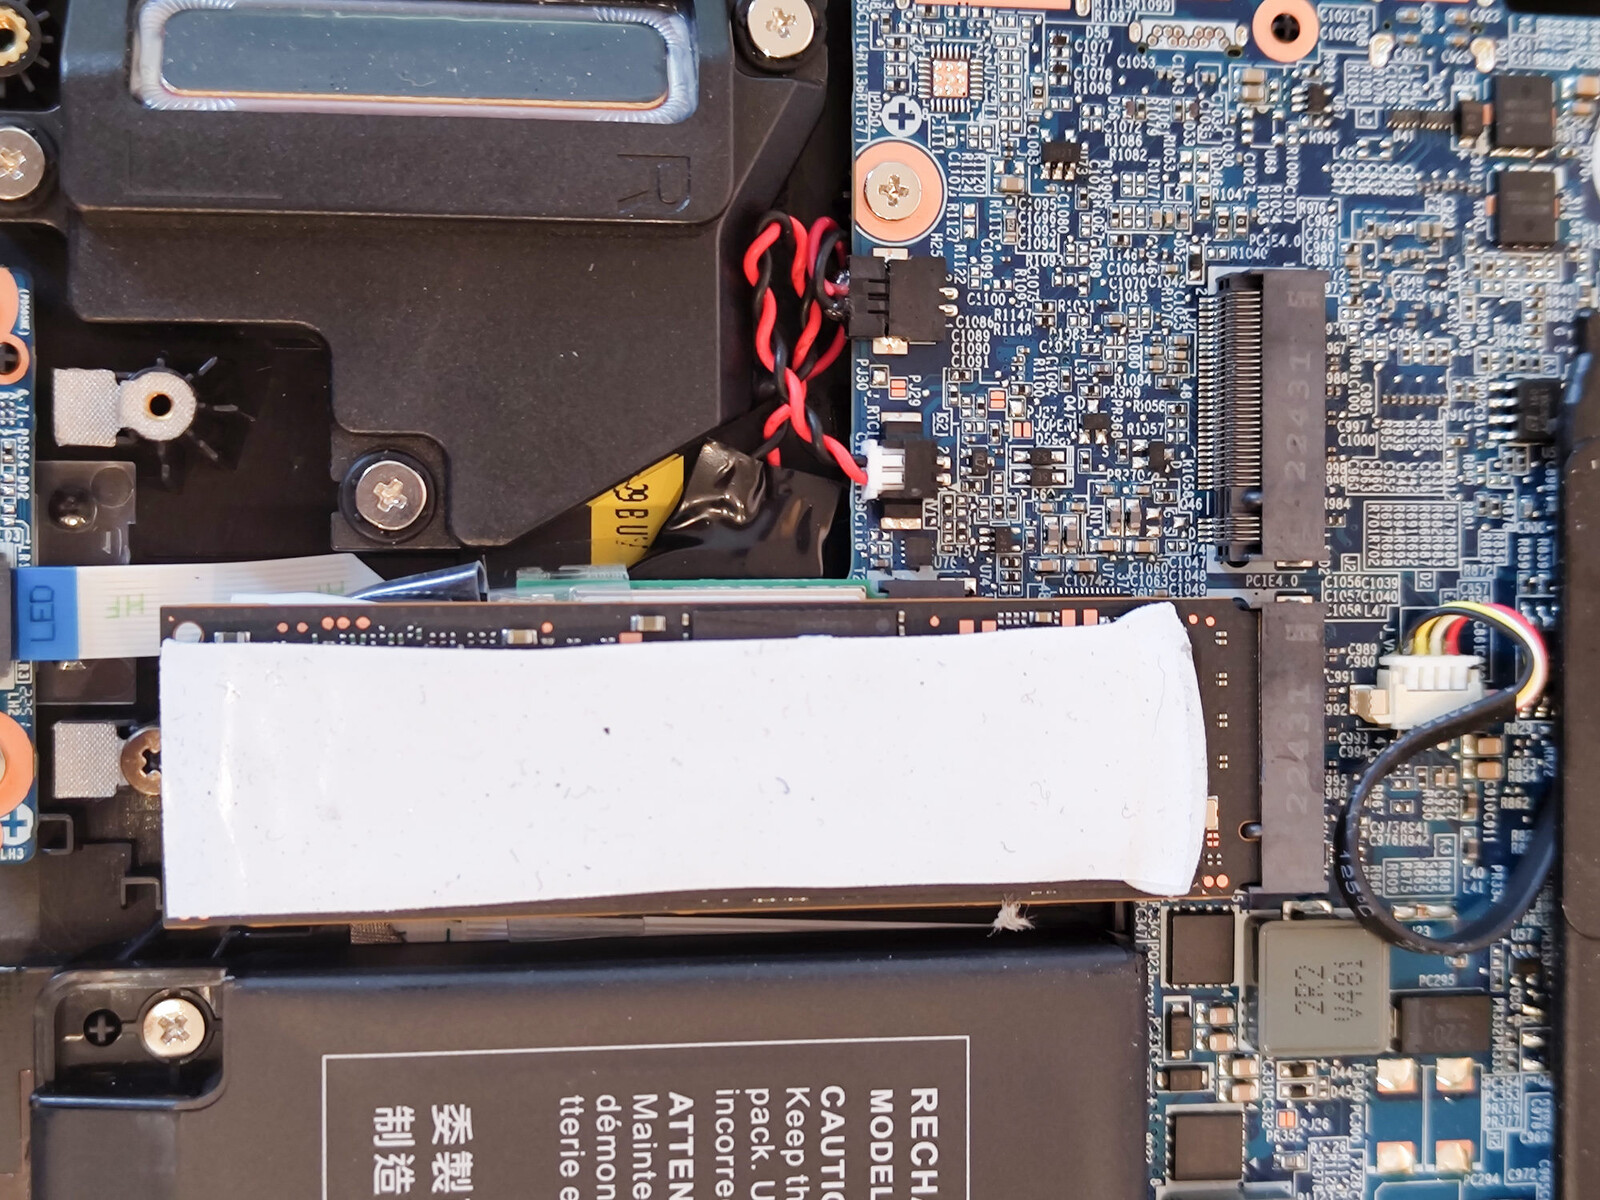
A tampa da base é fixada por 15 parafusos. Ao desparafusá-los, a tampa pode ser facilmente aberta pela frente com a ajuda de uma ferramenta de abertura de plástico. Abaixo dela, você encontrará uma RAM intercambiável e um slot M.2 livre para um SSD adicional. A almofada térmica apropriada está incluída no laptop, assim como um CD com drivers, um pendrive USB com o mesmo conteúdo, um mouse pad grande e um abridor de garrafas.
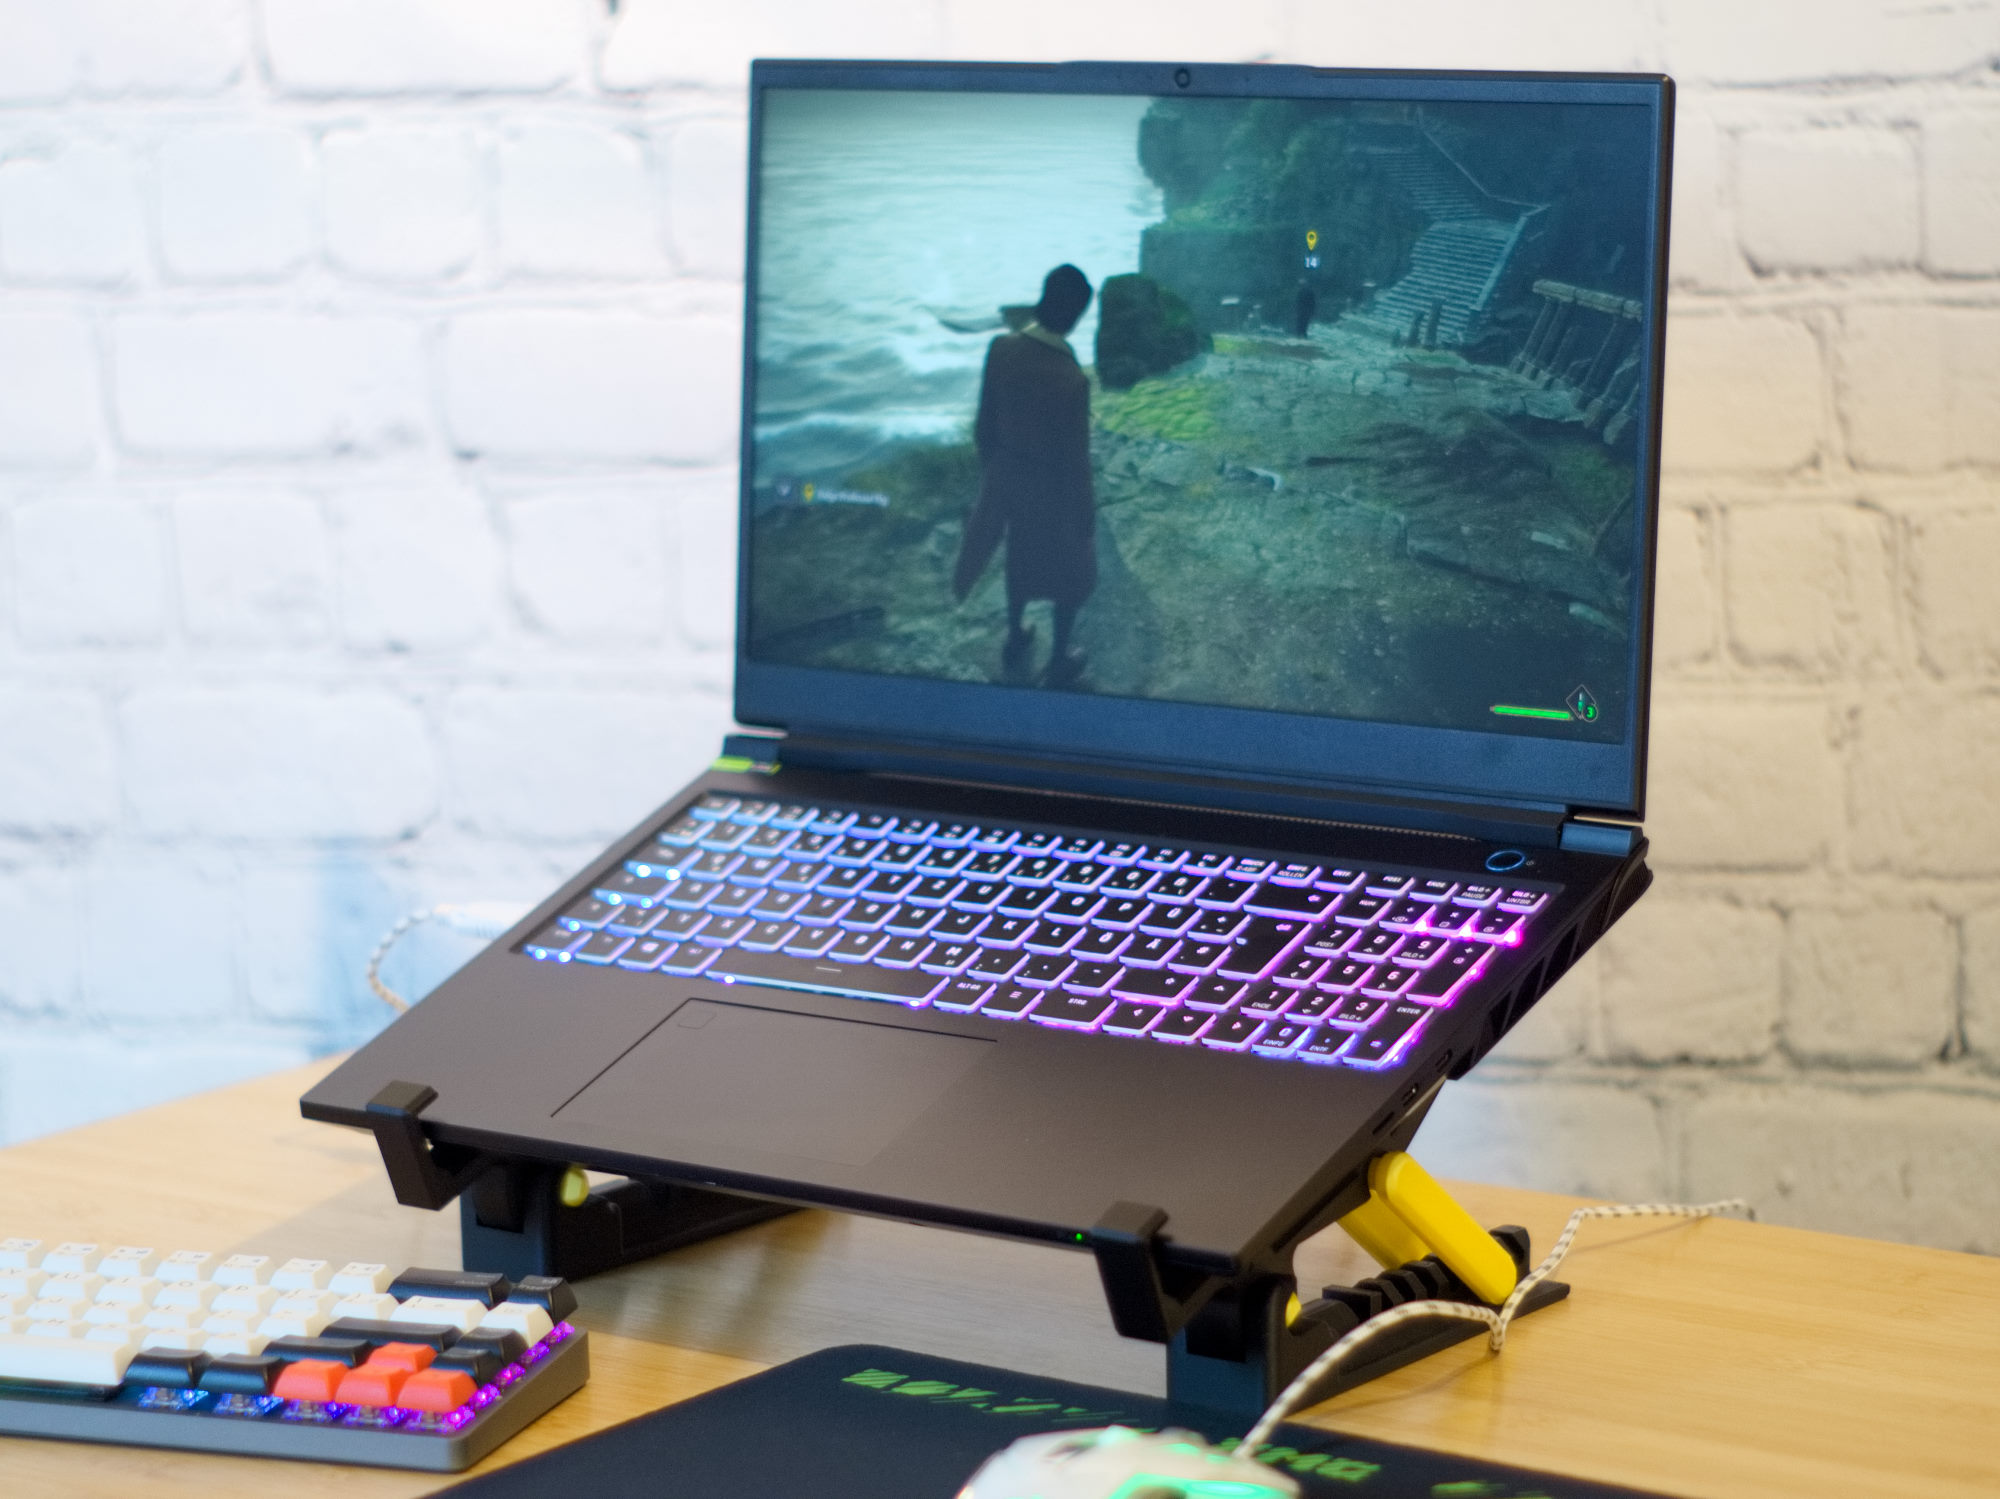
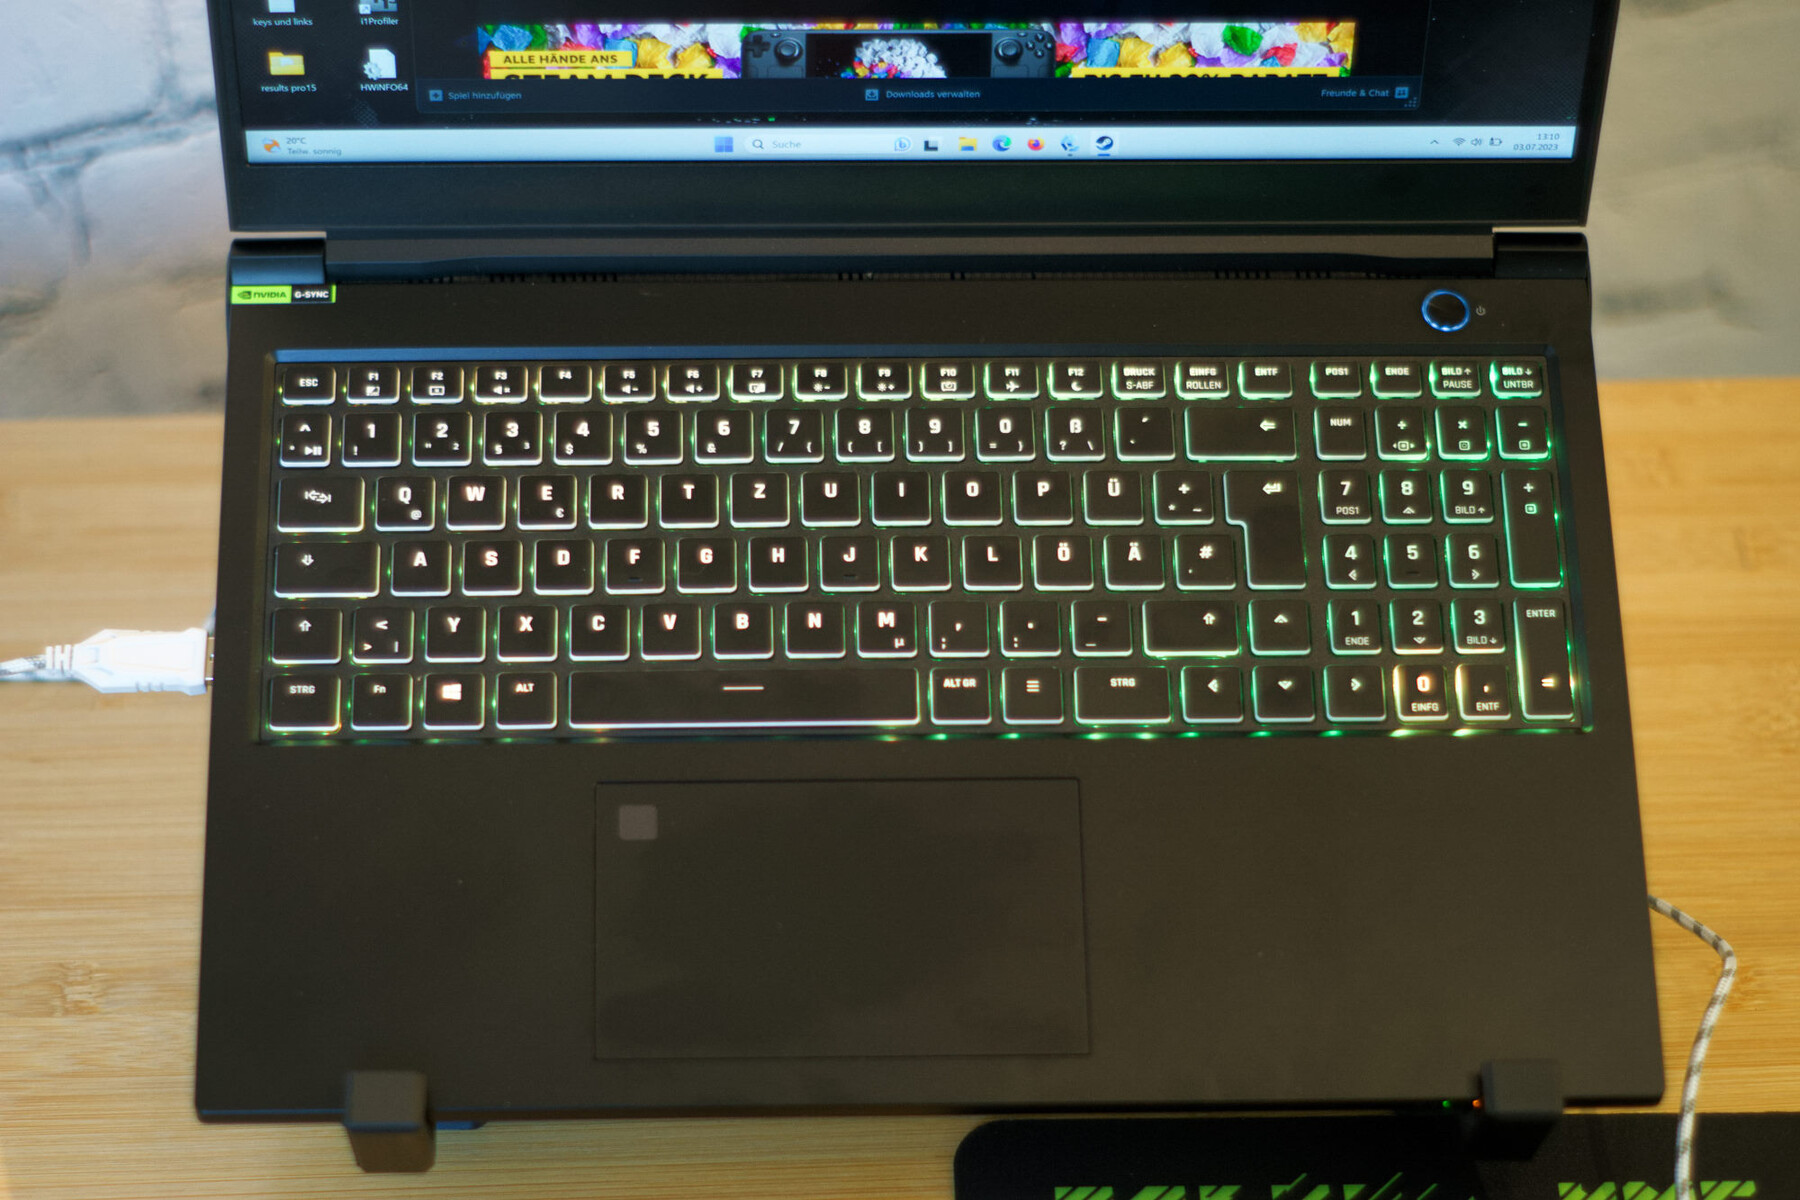
Dispositivos de entrada - Um teclado RGB de tamanho normal
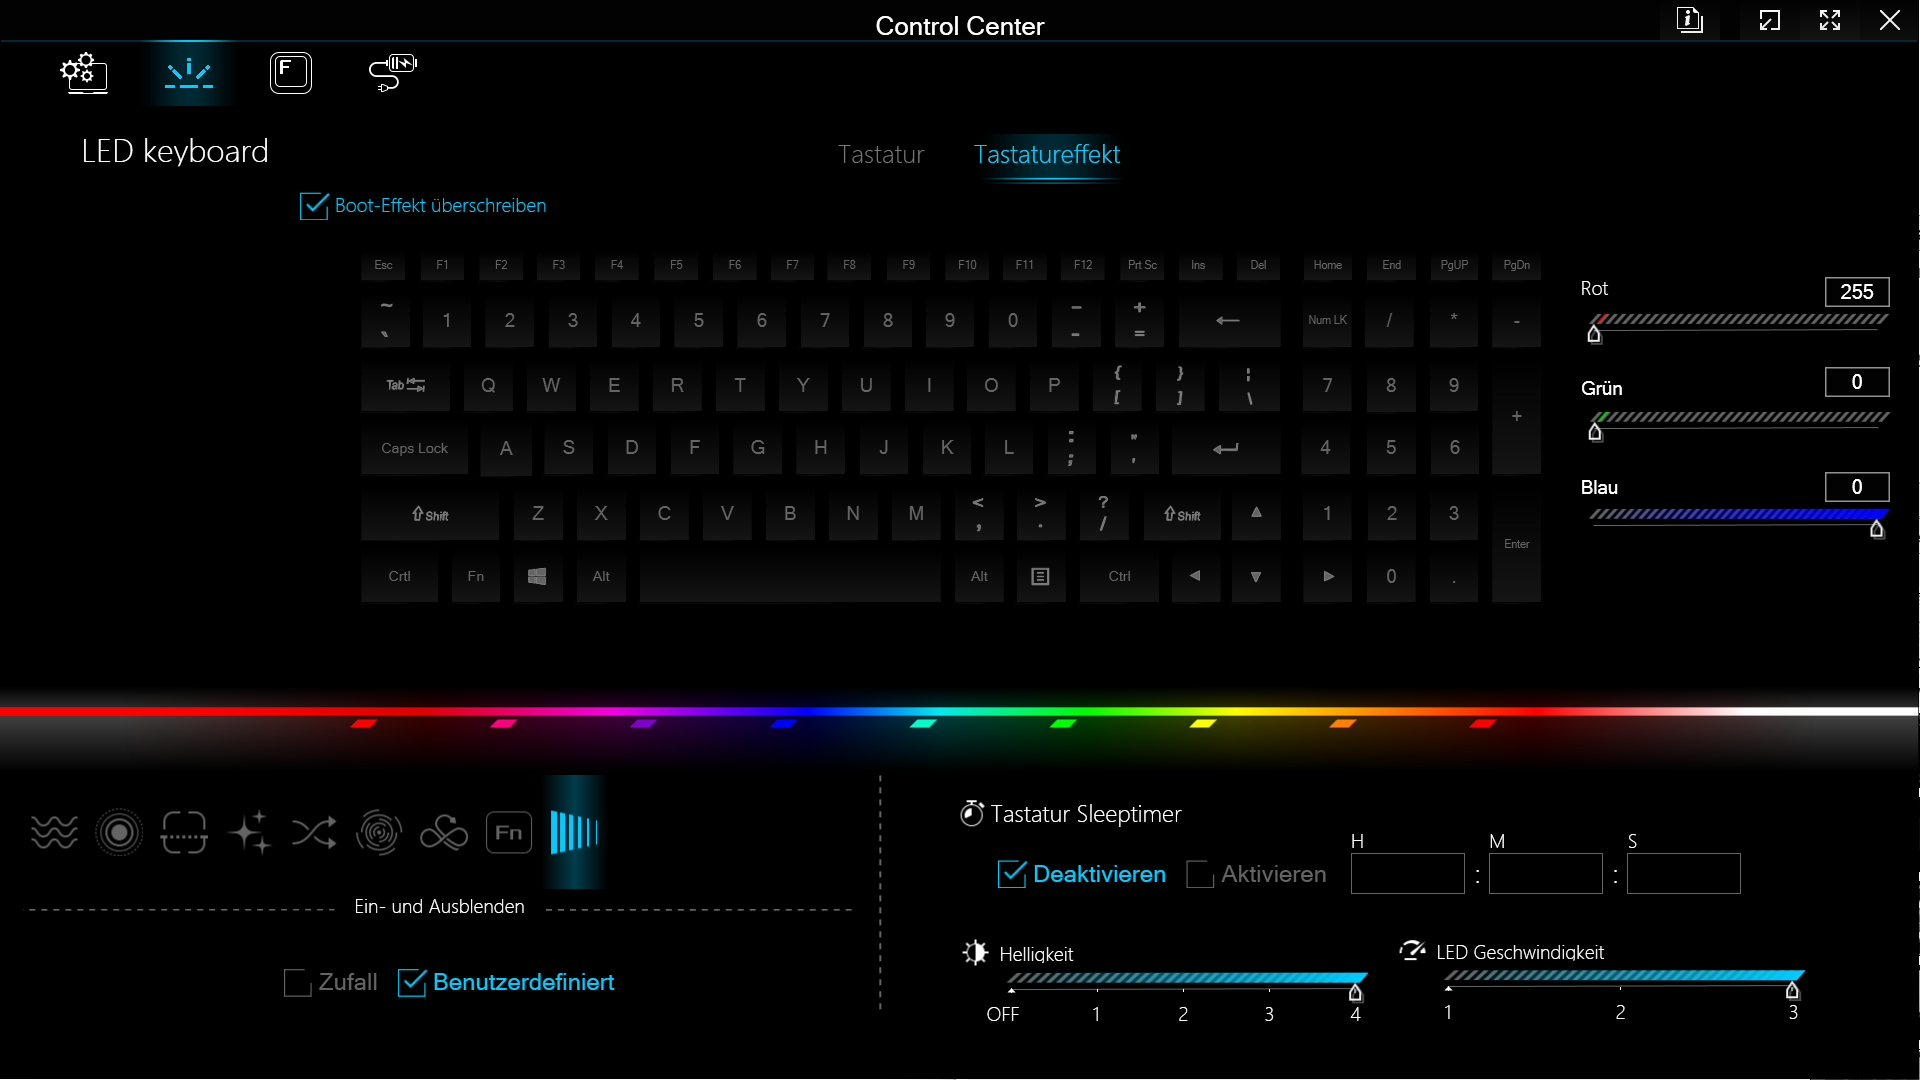
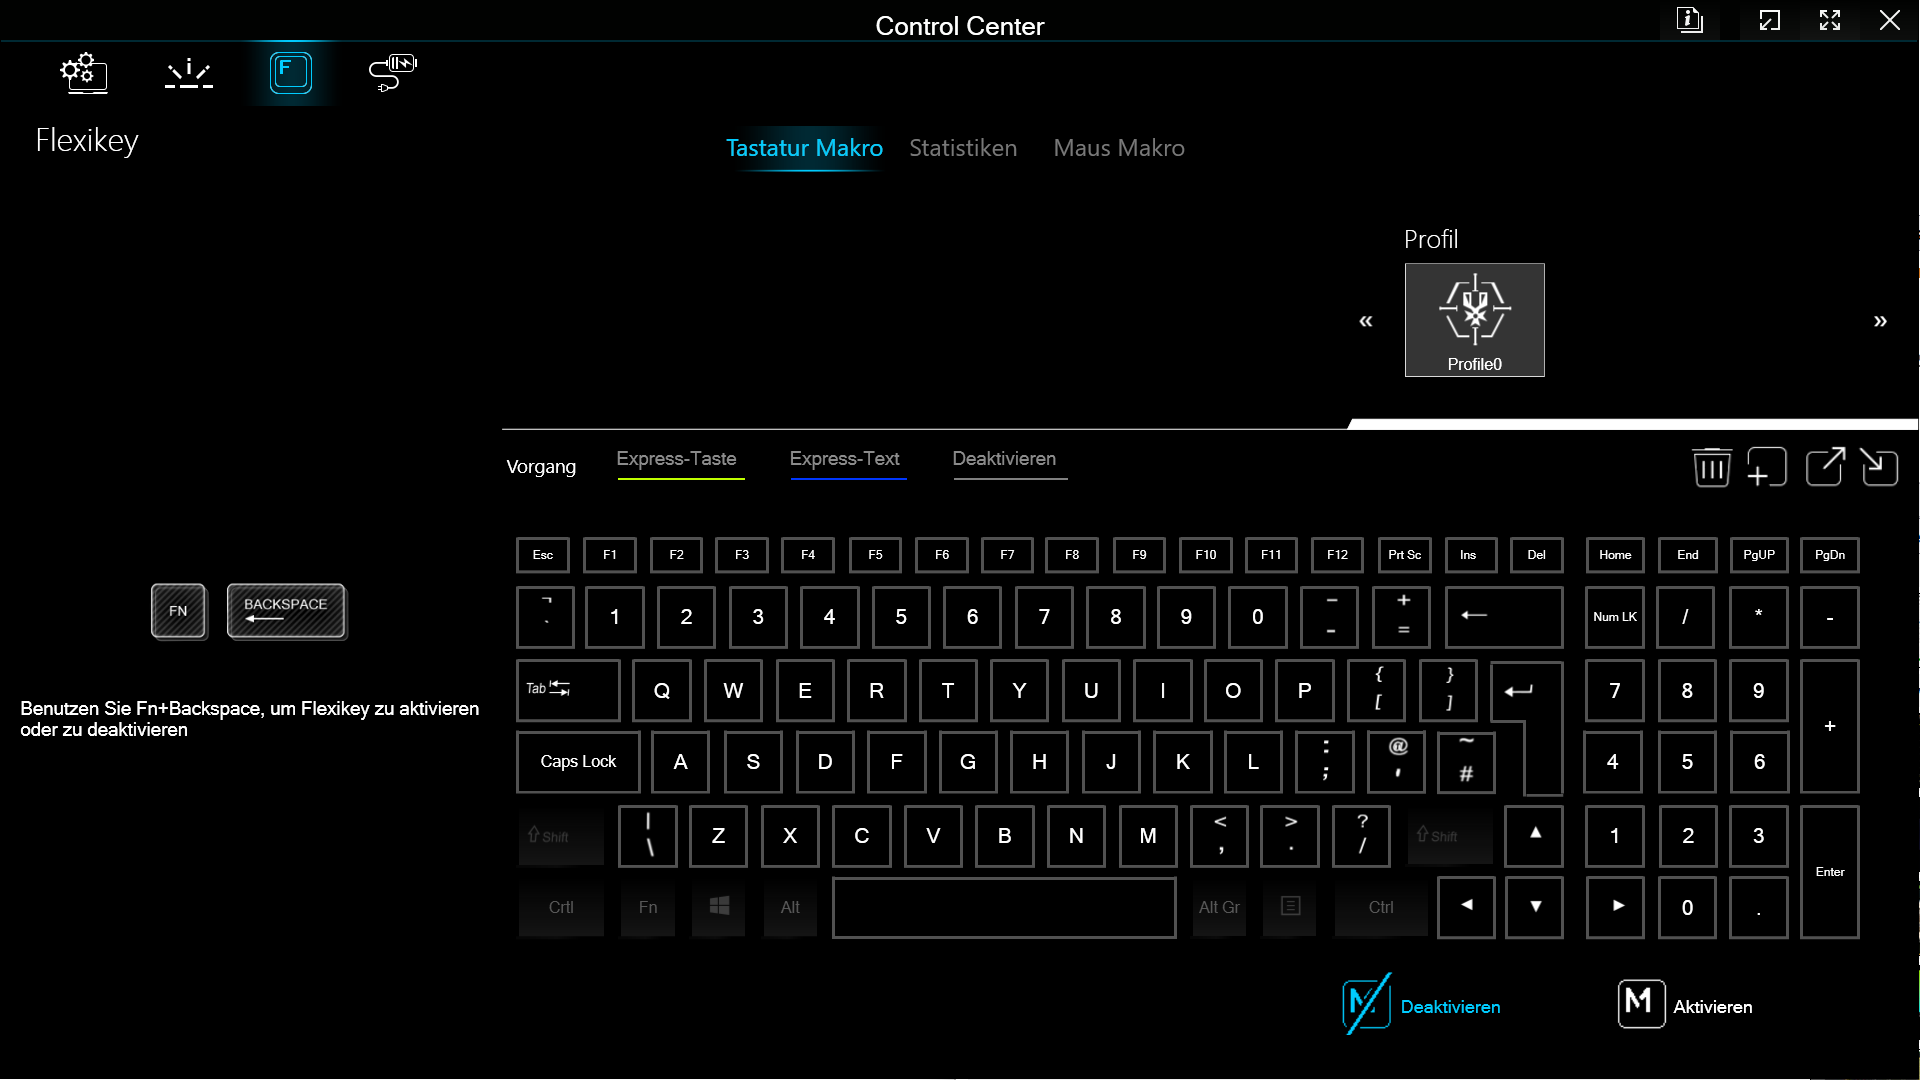
Um Clickpad de 12 × 7 cm com scanner de impressão digital e um teclado de tamanho normal com teclado numérico compõem os dispositivos de entrada do XMG Pro 15. Ambos têm uma sensação tátil agradável e um ponto de pressão tangível. Com relação ao teclado, o deslocamento das teclas é de cerca de 1,5 mm. Todas as teclas podem ser iluminadas individualmente com iluminação RGB.
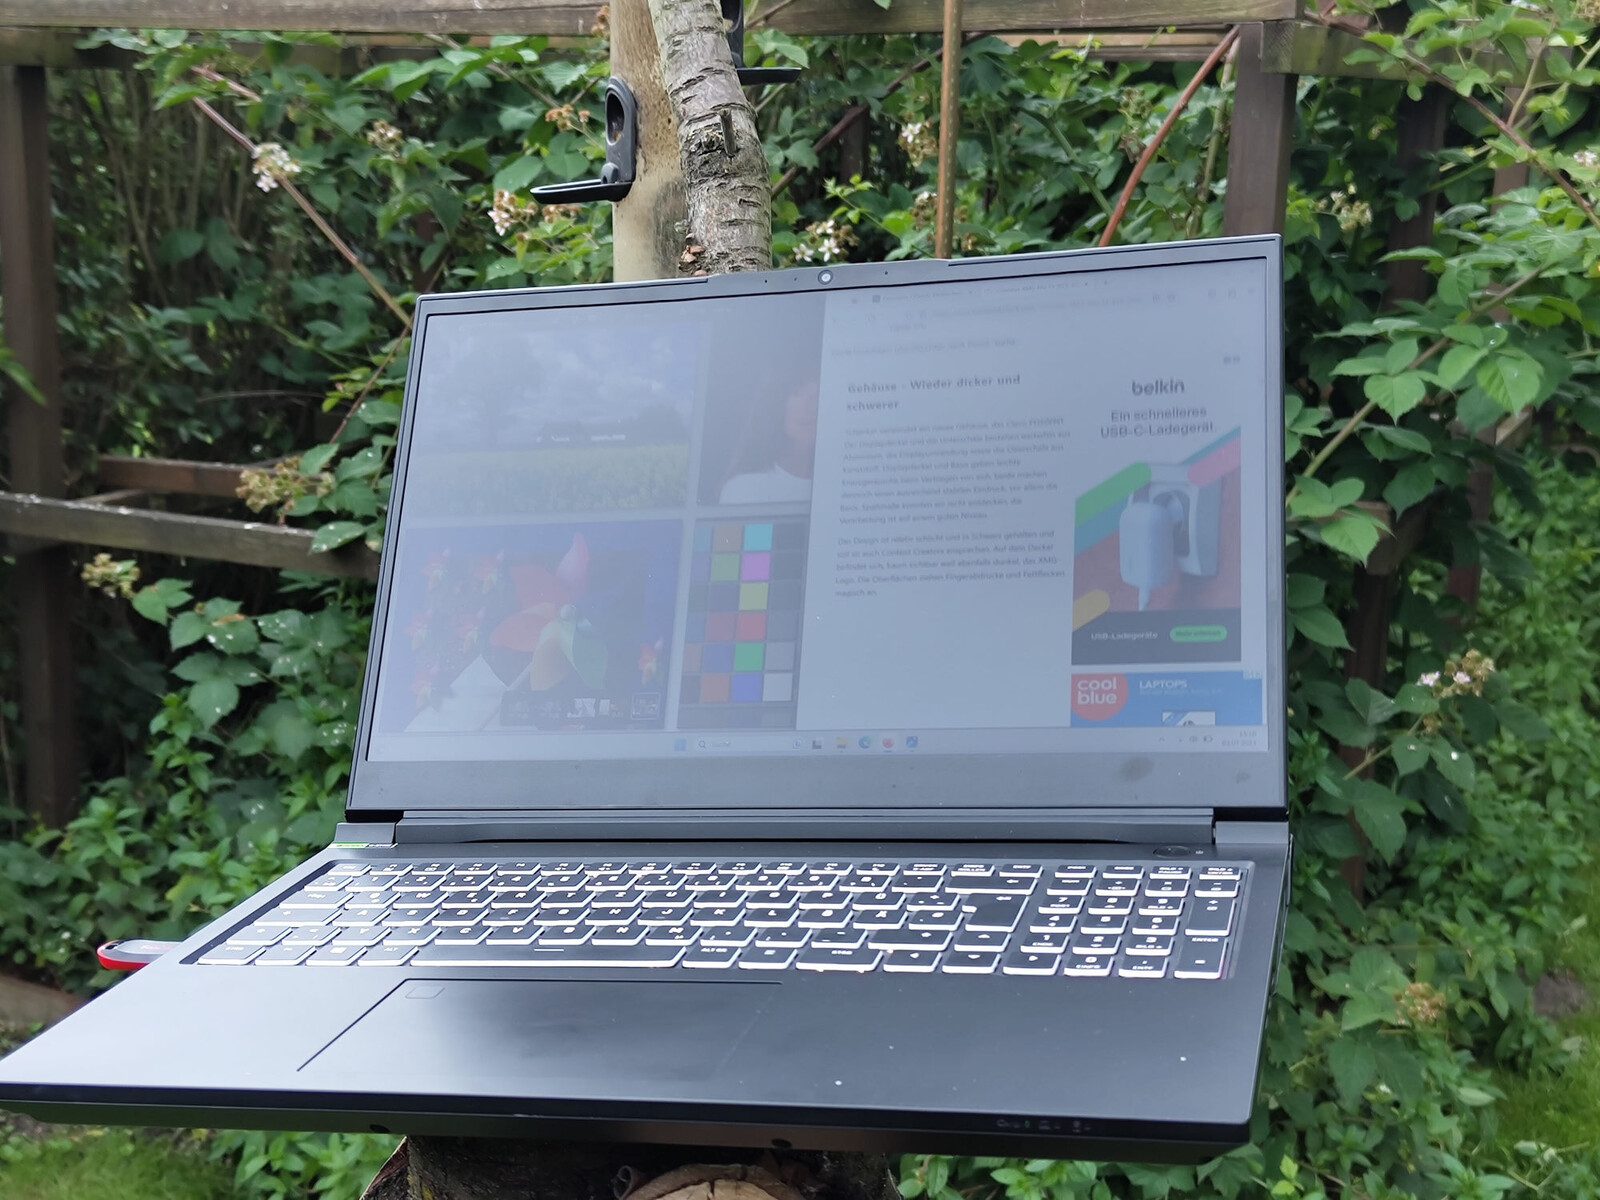
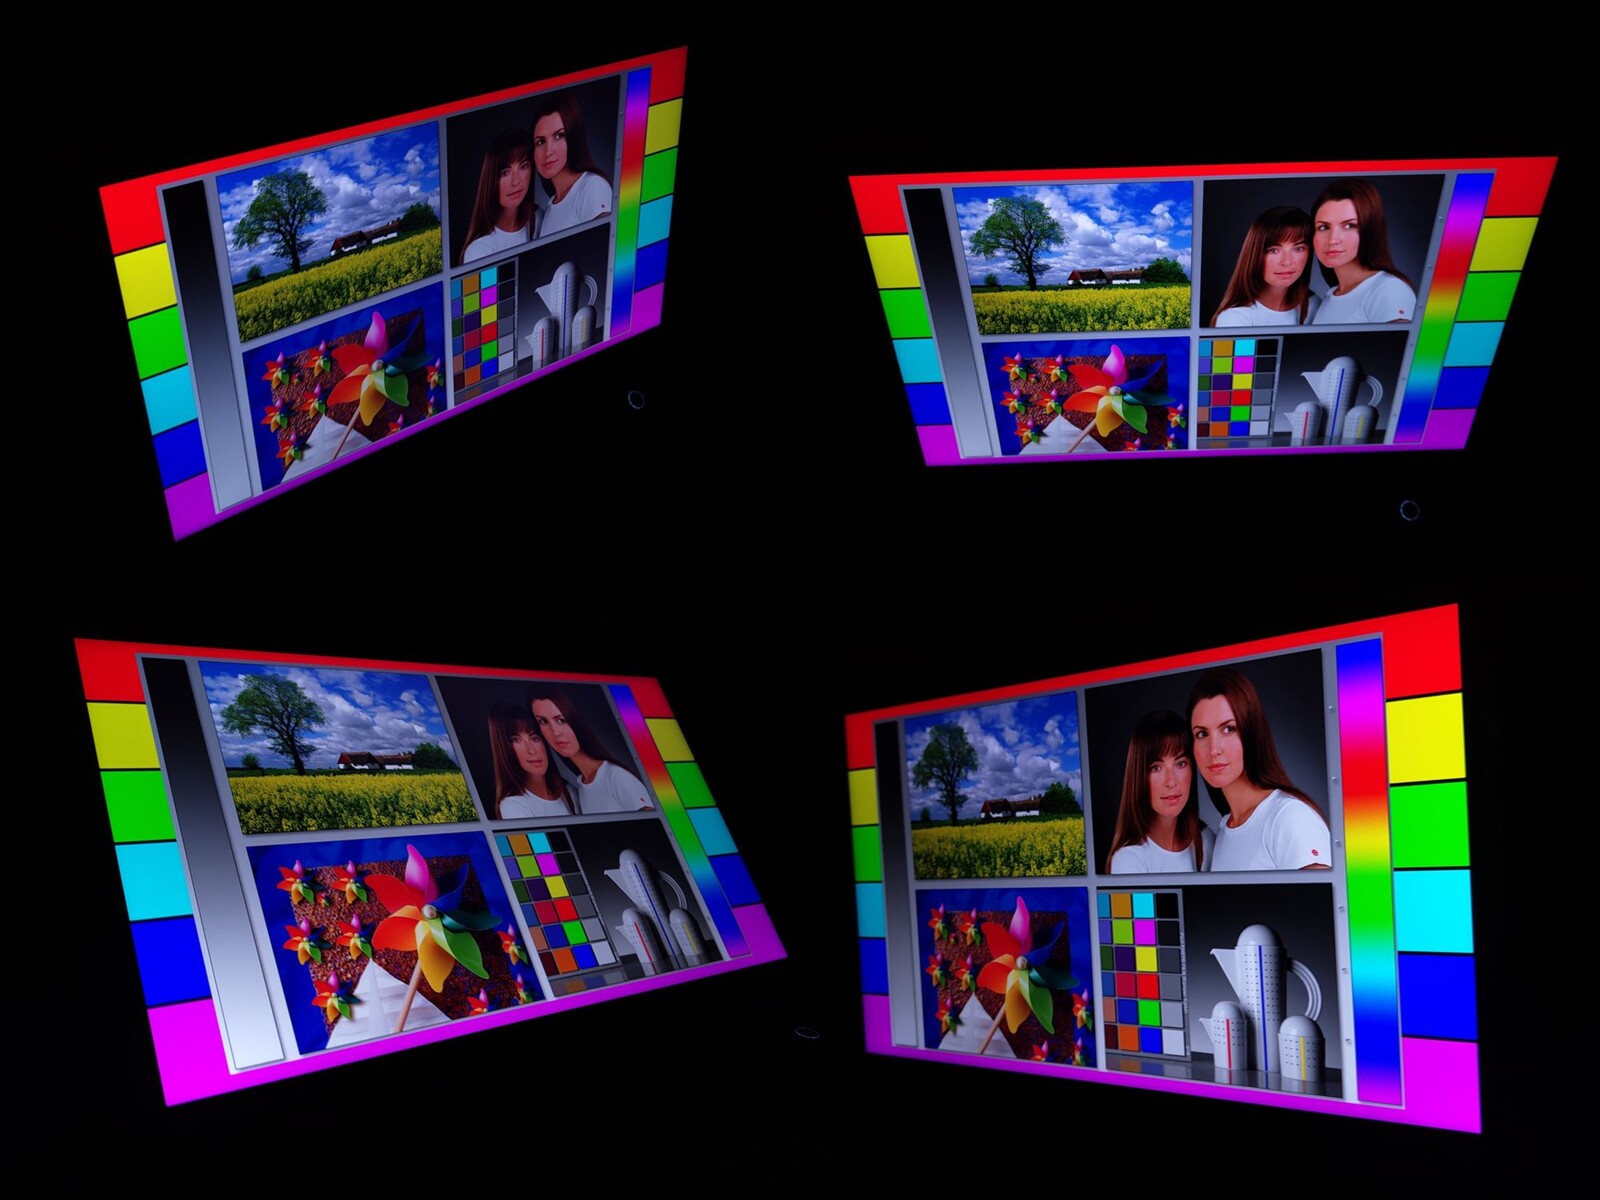
Tela - Uma QHD de 240 Hz e DisplayP3
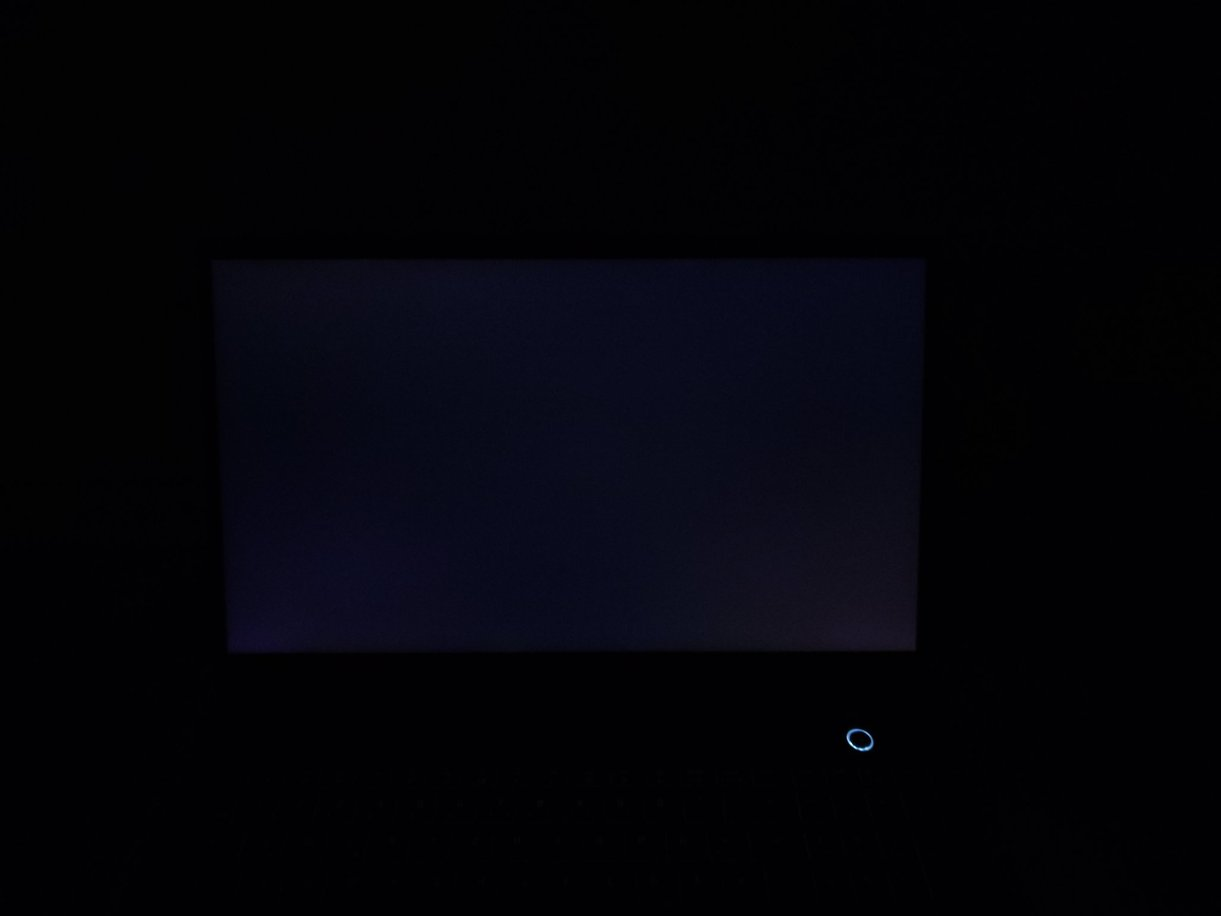
Embora não seja um OLED, o XMG Pro 15 possui uma boa tela IPS com G-Sync. A 240 Hz e 2.560 × 1.660 pixels, os espaços de cores sRGB e DisplayP3 são quase completamente cobertos. No brilho total, no entanto, é ligeiramente perceptível que a tela de 300 cd/m² é iluminada visivelmente mais no meio da tela do que nas bordas. Entretanto, ao contrário do antecessor, isso não se manifesta em sangramento de tela claramente visível.
Em comparação com o modelo de última geração, os tempos de resposta da tela permanecem praticamente inalterados. A taxa de quadros foi atualizada de 165 Hz para 240 Hz. Não detectamos nenhuma oscilação na tela.
| |||||||||||||||||||||||||
iluminação: 85 %
Contraste: 894:1 (Preto: 0.36 cd/m²)
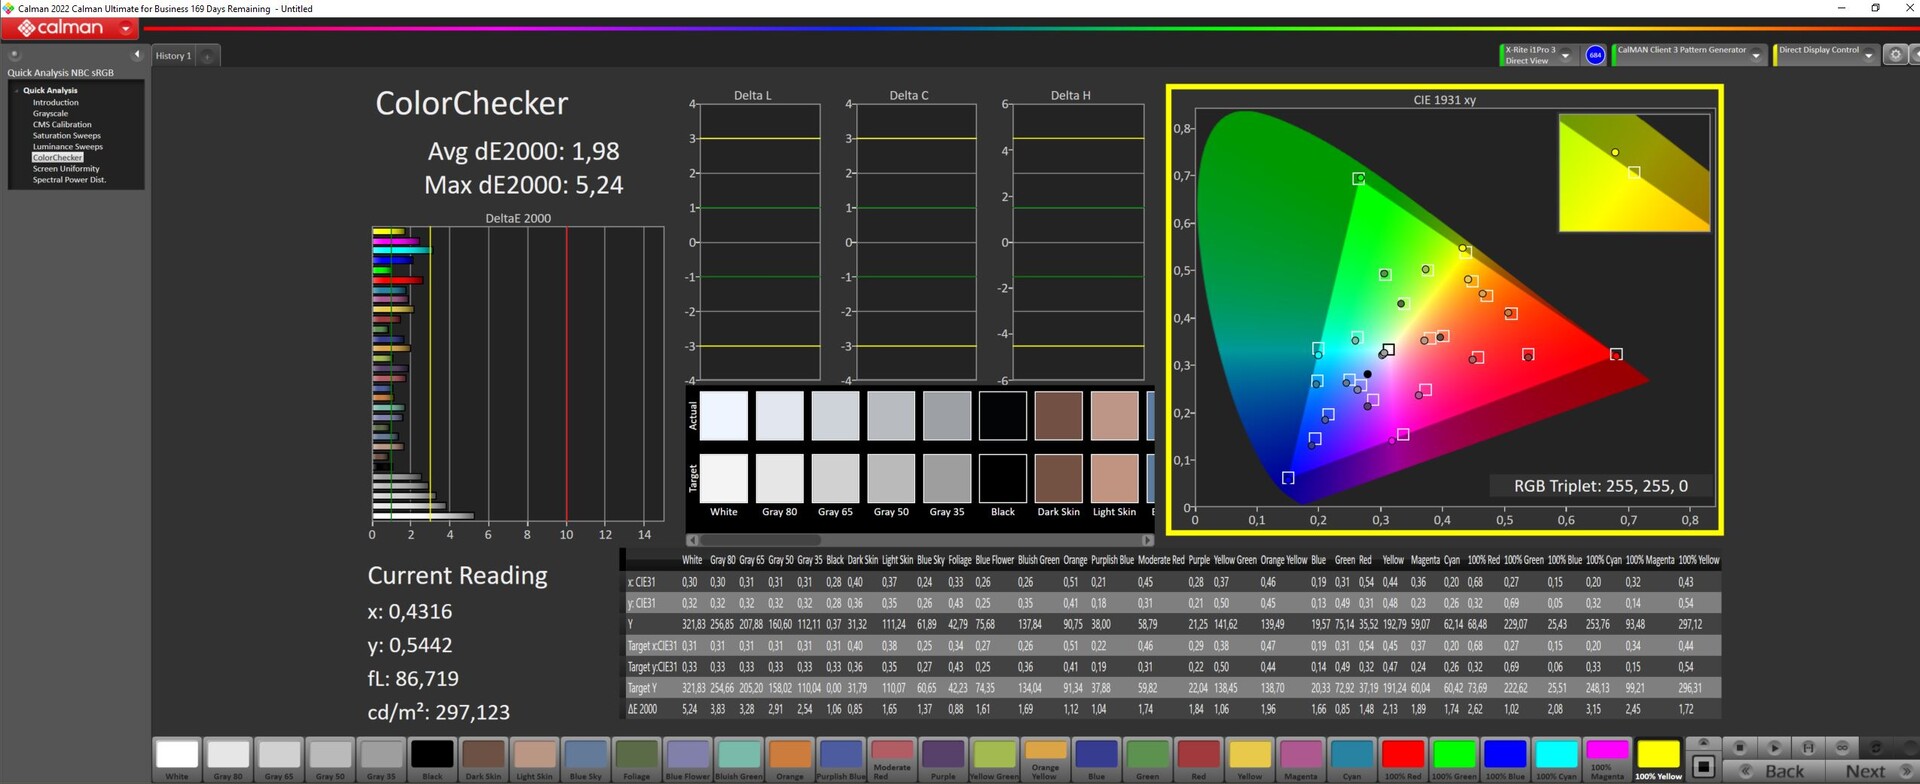
ΔE ColorChecker Calman: 1.98 | ∀{0.5-29.43 Ø4.72}
calibrated: 1.98
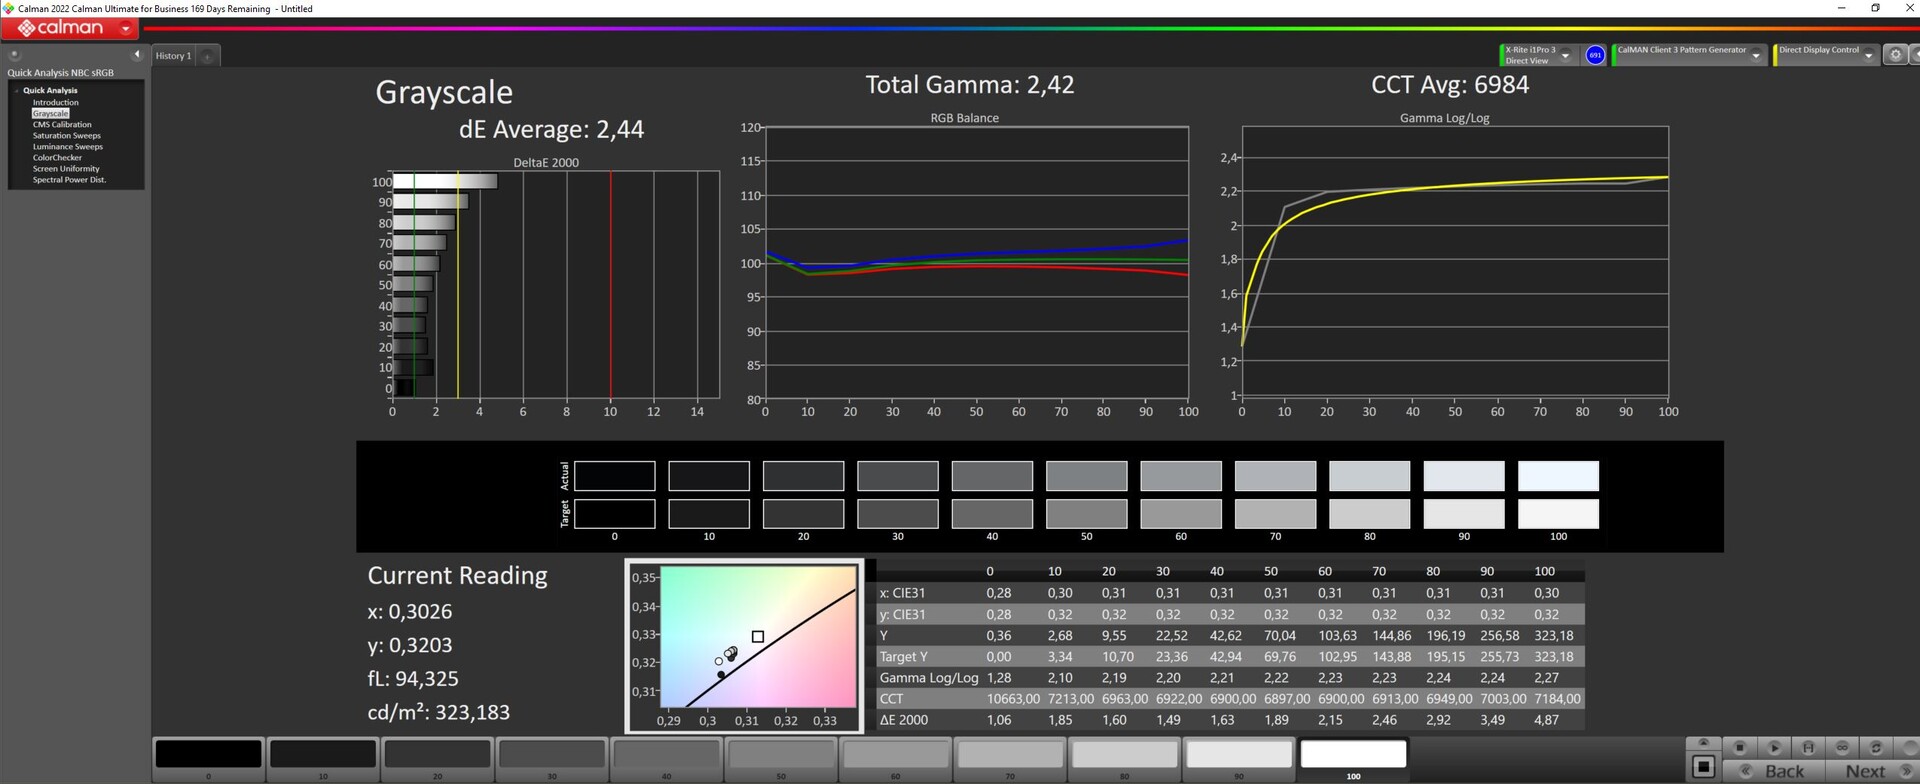
ΔE Greyscale Calman: 2.44 | ∀{0.09-98 Ø4.97}
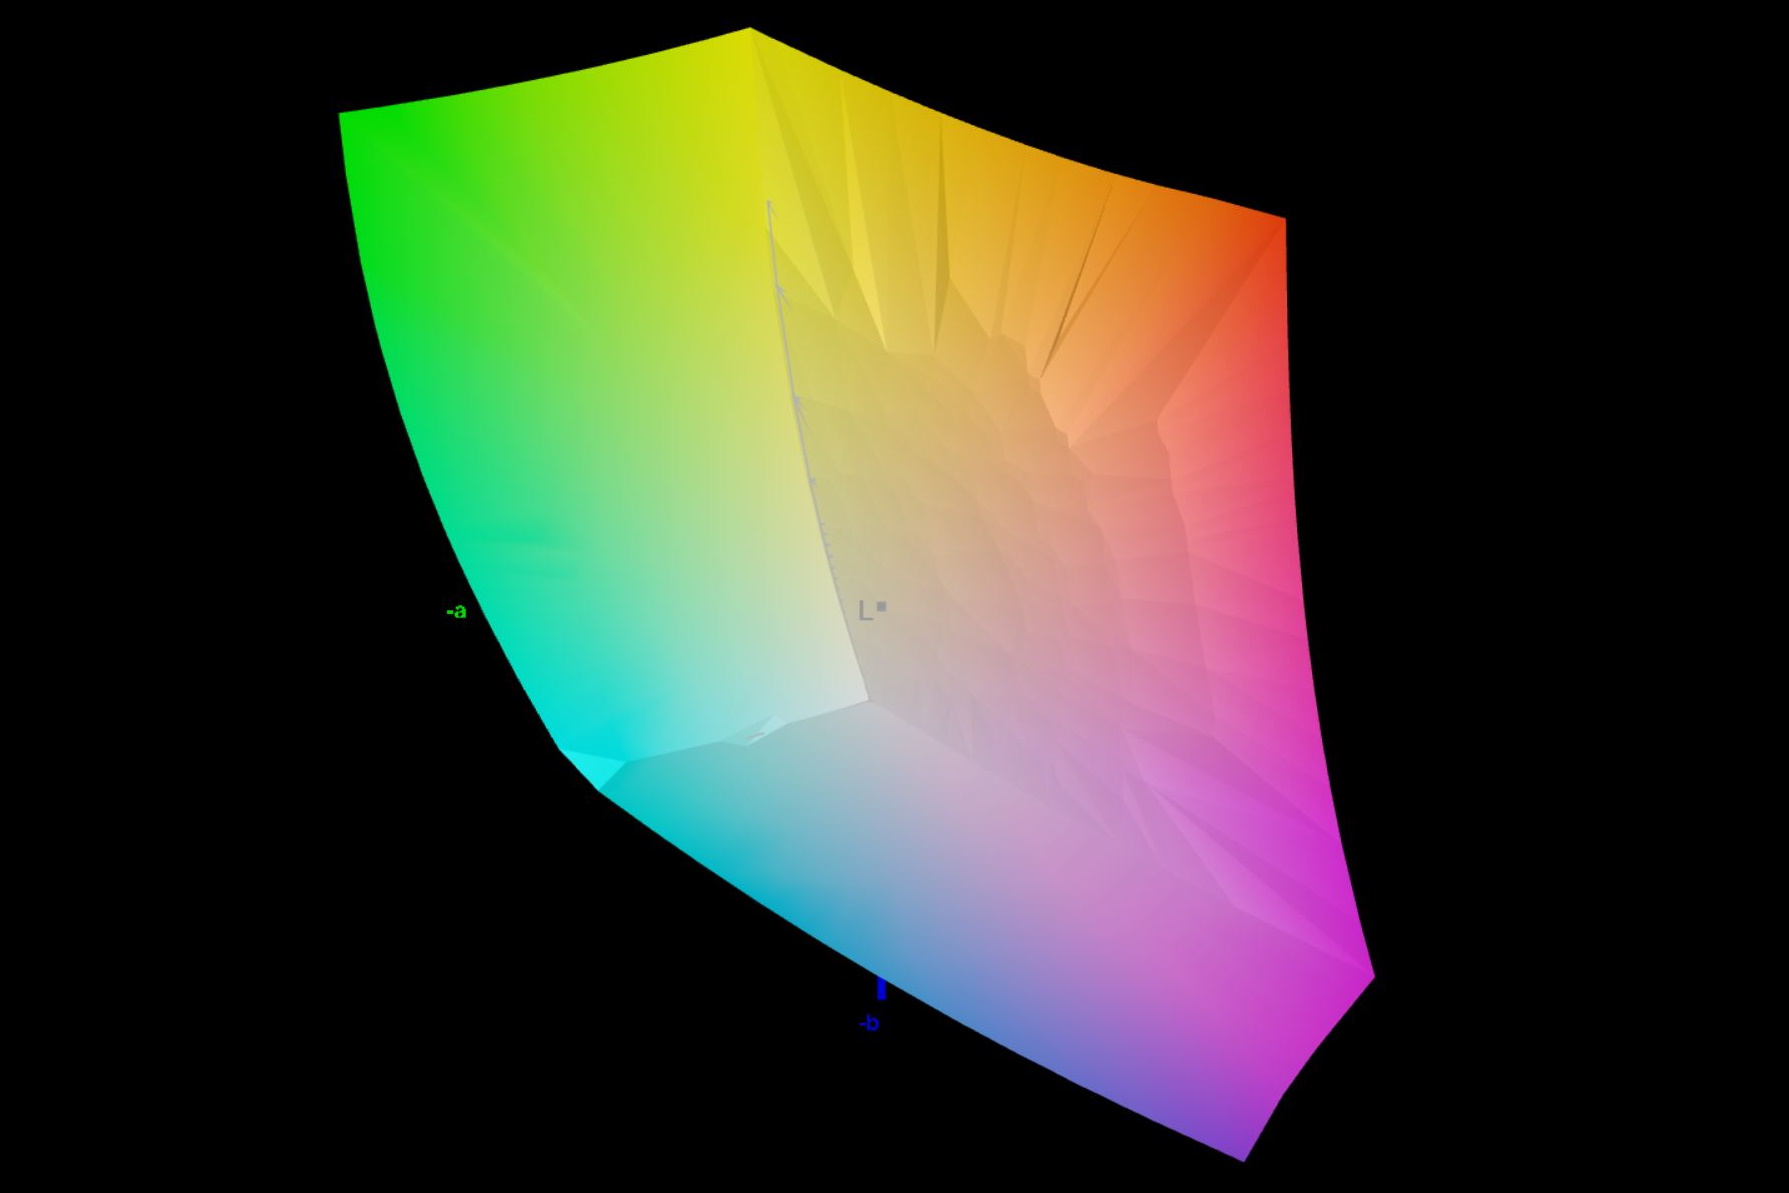
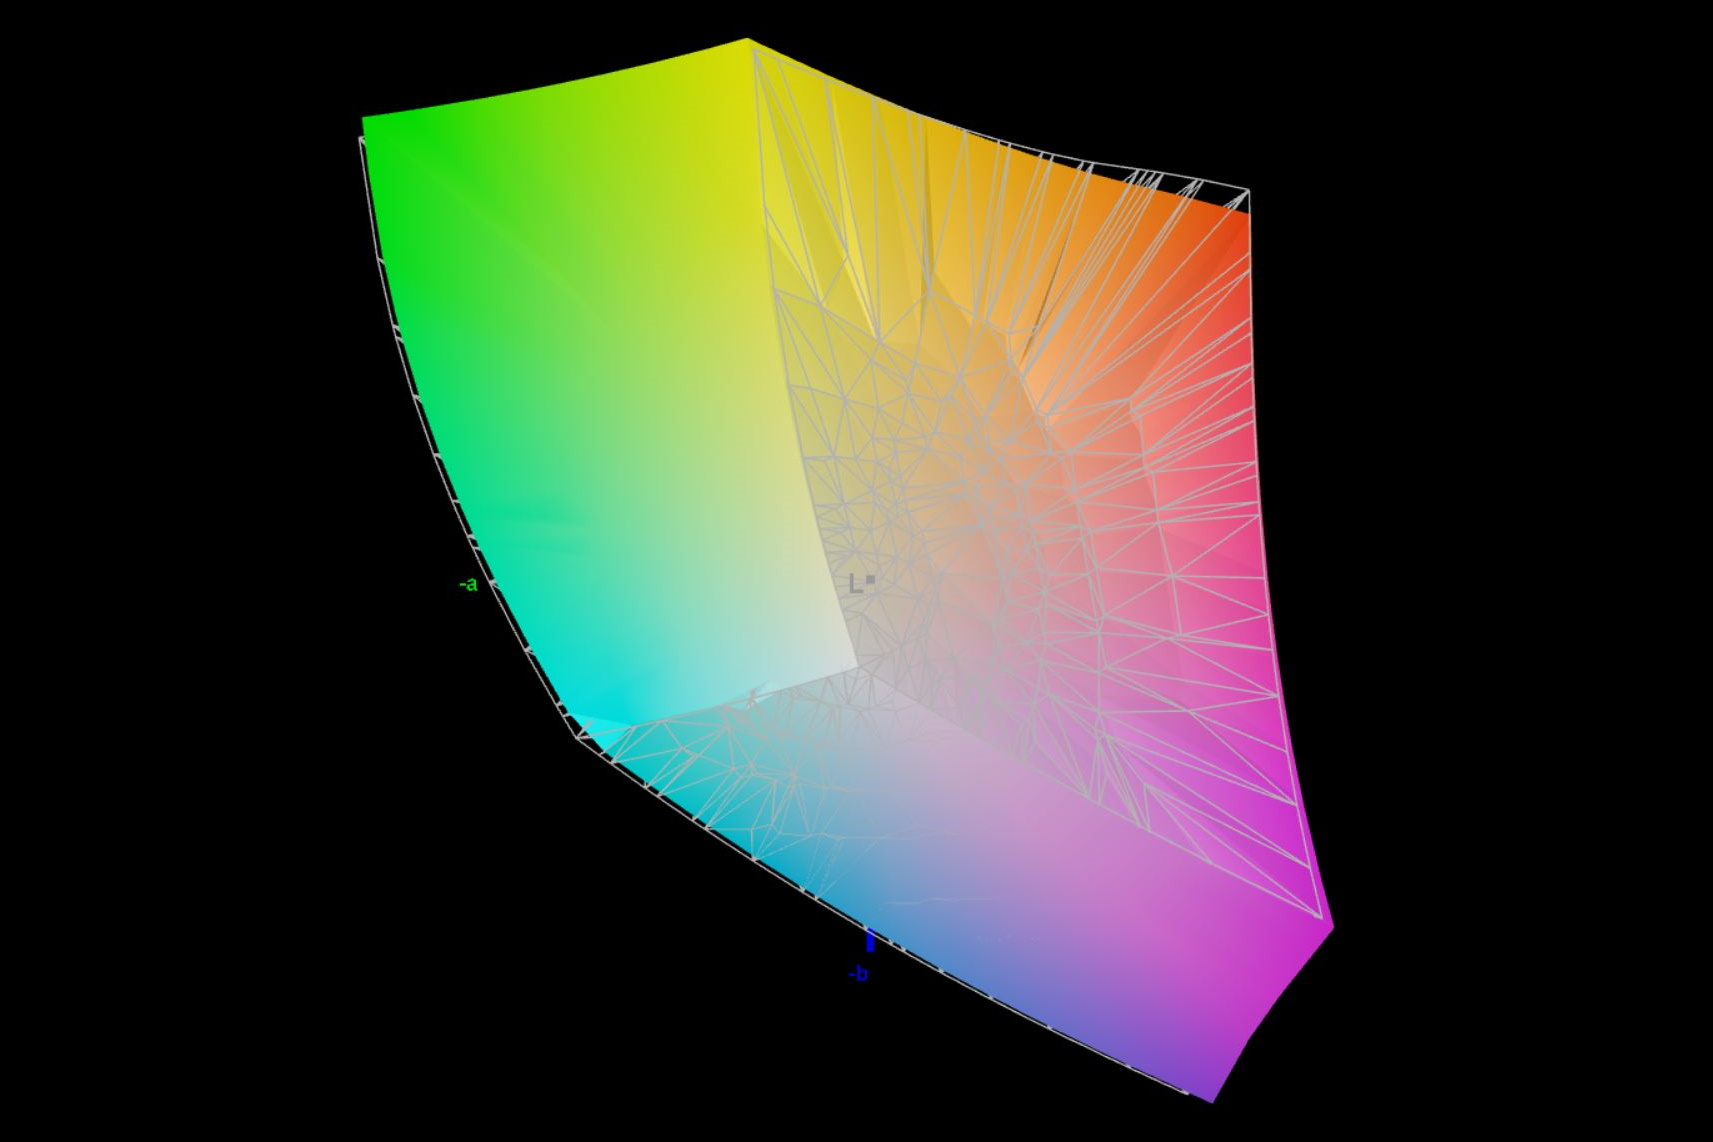
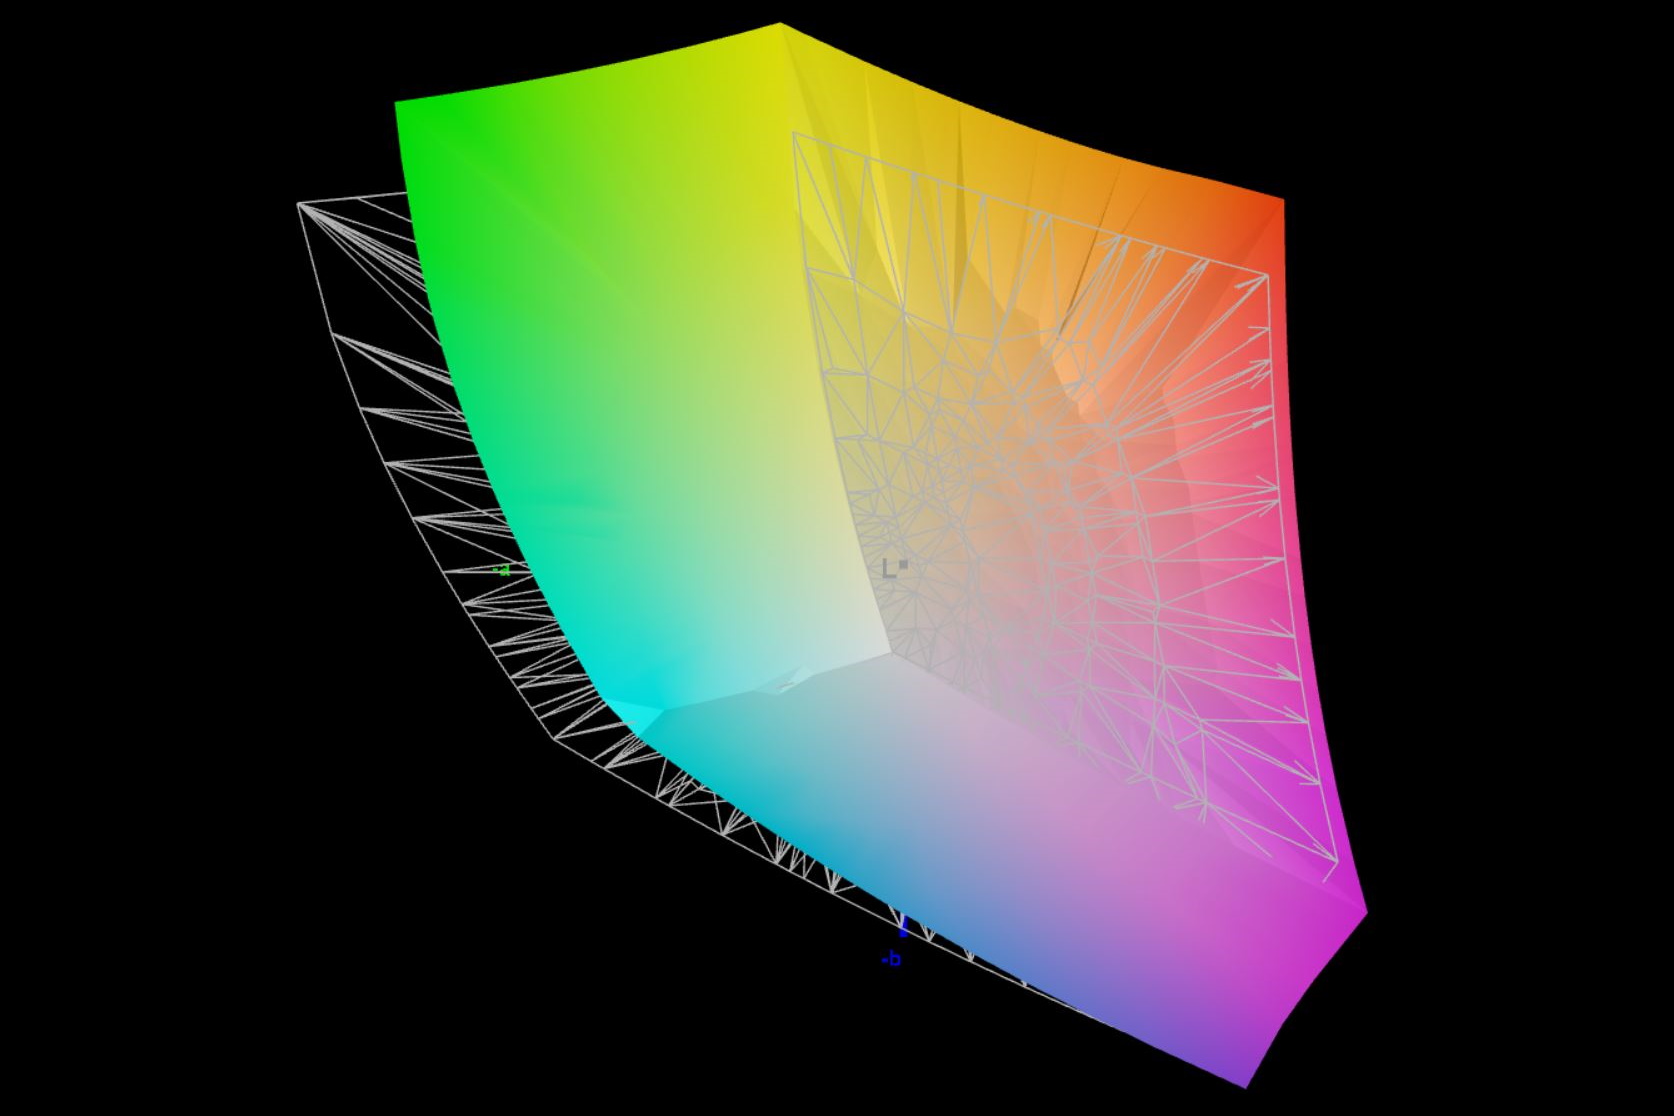
85.4% AdobeRGB 1998 (Argyll 3D)
99.9% sRGB (Argyll 3D)
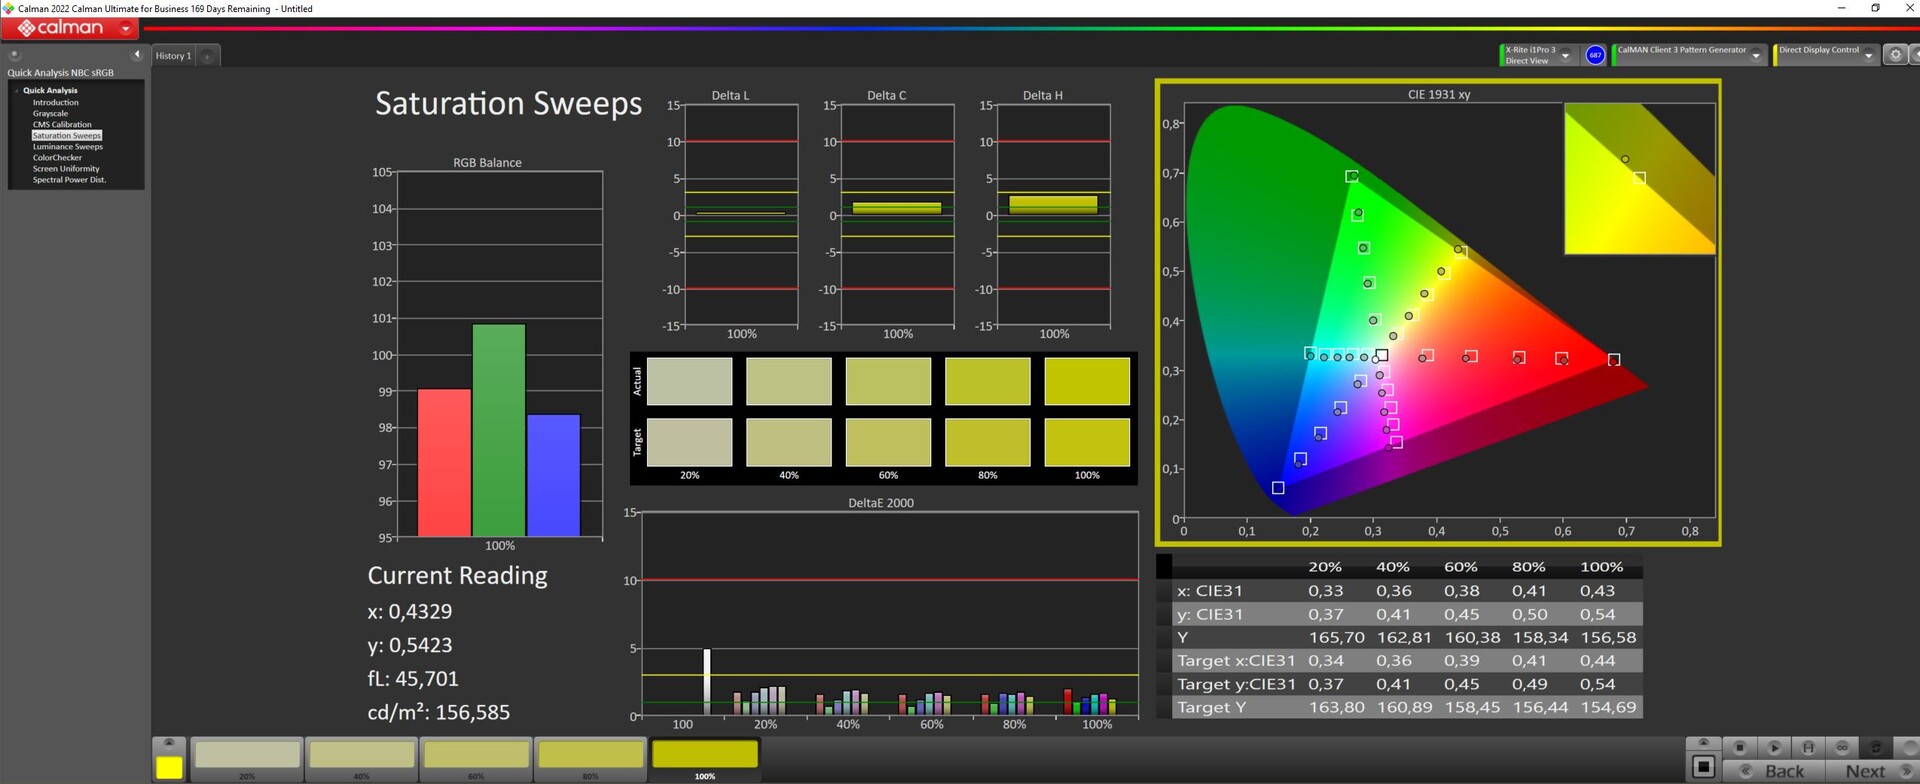
97.8% Display P3 (Argyll 3D)
Gamma: 2.42
CCT: 6984 K
| Schenker XMG Pro 15 (E23) BOE0AD1, IPS, 2560x1440, 15.6" | Schenker XMG Pro 15 (i7-12700H, RTX 3080 Ti) BOE09C2 (BOE CQ NE156QHM-NY1), IPS, 2560x1440, 15.6" | Dell G15 5530 AUO B156HAN, IPS, 1920x1080, 15.6" | Aorus 15X ASF BOE CQ NE156QHM-NZ1, IPS, 2560x1440, 15.6" | MSI Cyborg 15 A12VF AU Optronics B156HAN15.1, IPS, 1920x1080, 15.6" | Alienware x16 R1 BOE NE16NZ4, IPS, 2560x1600, 16" | |
|---|---|---|---|---|---|---|
| Display | 0% | -13% | -16% | -48% | 2% | |
| Display P3 Coverage (%) | 97.8 | 97.5 0% | 73.1 -25% | 69.3 -29% | 42.3 -57% | 99.2 1% |
| sRGB Coverage (%) | 99.9 | 99.9 0% | 98.4 -2% | 98.2 -2% | 62.6 -37% | 100 0% |
| AdobeRGB 1998 Coverage (%) | 85.4 | 85.2 0% | 74.4 -13% | 70.5 -17% | 43.7 -49% | 88.6 4% |
| Response Times | 7% | 60% | 7% | -52% | 29% | |
| Response Time Grey 50% / Grey 80% * (ms) | 14 ? | 13.2 ? 6% | 3.39 ? 76% | 12.4 ? 11% | 22 ? -57% | 5.1 ? 64% |
| Response Time Black / White * (ms) | 9.6 ? | 8.8 ? 8% | 5.35 ? 44% | 9.4 ? 2% | 14 ? -46% | 10.3 ? -7% |
| PWM Frequency (Hz) | 21620 ? | |||||
| Screen | -33% | -25% | 24% | -22% | 14% | |
| Brightness middle (cd/m²) | 322 | 317 -2% | 320 -1% | 316 -2% | 247 -23% | 302.2 -6% |
| Brightness (cd/m²) | 301 | 294 -2% | 316 5% | 301 0% | 234 -22% | 285 -5% |
| Brightness Distribution (%) | 85 | 83 -2% | 94 11% | 90 6% | 89 5% | 89 5% |
| Black Level * (cd/m²) | 0.36 | 0.32 11% | 0.21 42% | 0.28 22% | 0.25 31% | 0.26 28% |
| Contrast (:1) | 894 | 991 11% | 1524 70% | 1129 26% | 988 11% | 1162 30% |
| Colorchecker dE 2000 * | 1.98 | 4.22 -113% | 4.55 -130% | 1.54 22% | 3.78 -91% | 1.63 18% |
| Colorchecker dE 2000 max. * | 5.24 | 5.97 -14% | 9.83 -88% | 2.46 53% | 6.42 -23% | 4.13 21% |
| Colorchecker dE 2000 calibrated * | 1.98 | 4.09 -107% | 1.51 24% | 1.21 39% | 3.94 -99% | 1.17 41% |
| Greyscale dE 2000 * | 2.44 | 4.41 -81% | 6.2 -154% | 1.3 47% | 2.16 11% | 2.5 -2% |
| Gamma | 2.42 91% | 2.29 96% | 2.07 106% | 2.307 95% | 2.33 94% | 2.23 99% |
| CCT | 6984 93% | 6733 97% | 6479 100% | 6456 101% | 6906 94% | 6590 99% |
| Média Total (Programa/Configurações) | -9% /
-20% | 7% /
-10% | 5% /
13% | -41% /
-32% | 15% /
14% |
* ... menor é melhor
Com as cores e as escalas de cinza no Calman ColorChecker, em ΔΕ 1,98 e ΔΕ 2,44, respectivamente, o XMG Pro 15 está claramente dentro da faixa-alvo de ΔΕ < 3. Nosso próprio perfil ICC (download na caixa de informações) deve ser capaz de reduzir um pouco o azul excessivamente enfatizado e melhorar significativamente as escalas de cinza e a reprodução de cores. Juntamente com o espaço de cores DisplayP3 quase totalmente coberto, estamos lidando com uma tela que parece ser adequada para edição de vídeo profissional.
Exibir tempos de resposta
| ↔ Tempo de resposta preto para branco | ||
|---|---|---|
| 9.6 ms ... ascensão ↗ e queda ↘ combinadas | ↗ 4.2 ms ascensão | 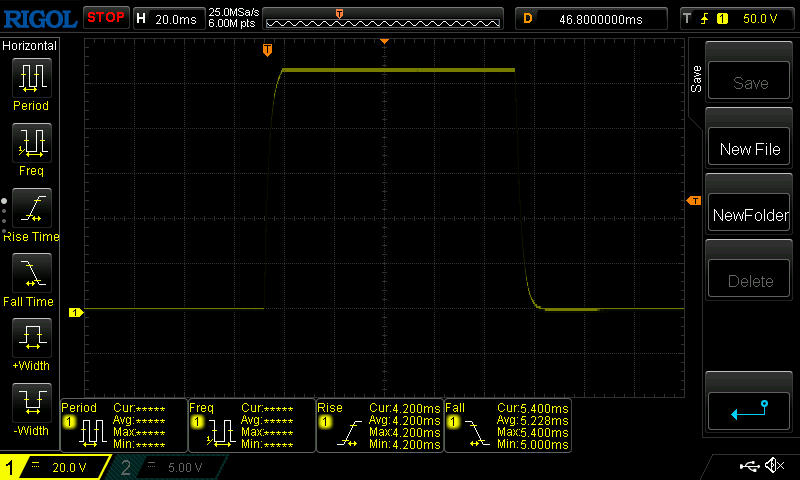 |
| ↘ 5.4 ms queda | ||
| A tela mostra taxas de resposta rápidas em nossos testes e deve ser adequada para jogos. Em comparação, todos os dispositivos testados variam de 0.1 (mínimo) a 240 (máximo) ms. » 26 % de todos os dispositivos são melhores. Isso significa que o tempo de resposta medido é melhor que a média de todos os dispositivos testados (19.8 ms). | ||
| ↔ Tempo de resposta 50% cinza a 80% cinza | ||
| 14 ms ... ascensão ↗ e queda ↘ combinadas | ↗ 6.6 ms ascensão | 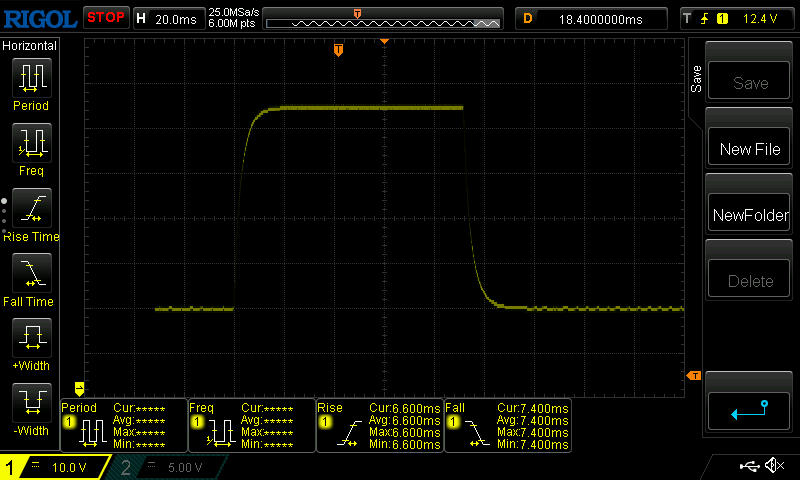 |
| ↘ 7.4 ms queda | ||
| A tela mostra boas taxas de resposta em nossos testes, mas pode ser muito lenta para jogadores competitivos. Em comparação, todos os dispositivos testados variam de 0.165 (mínimo) a 636 (máximo) ms. » 28 % de todos os dispositivos são melhores. Isso significa que o tempo de resposta medido é melhor que a média de todos os dispositivos testados (31 ms). | ||
Cintilação da tela / PWM (modulação por largura de pulso)
| Tela tremeluzindo / PWM não detectado | 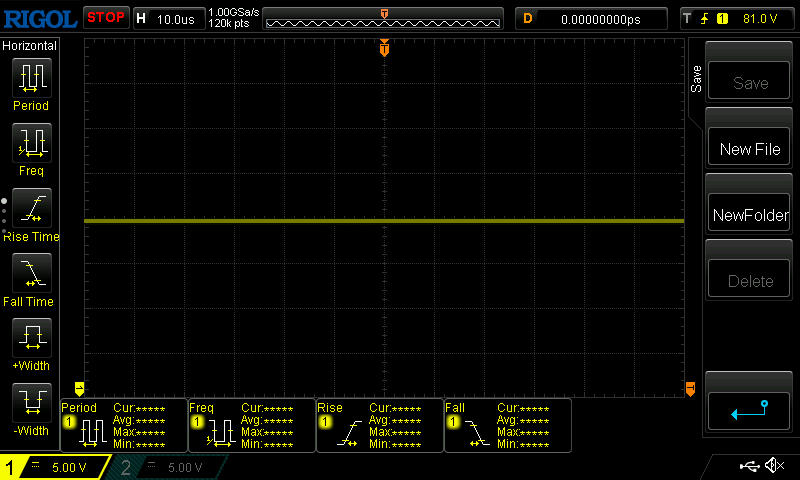 | ||
[pwm_comparison] Em comparação: 52 % de todos os dispositivos testados não usam PWM para escurecer a tela. Se PWM foi detectado, uma média de 7753 (mínimo: 5 - máximo: 343500) Hz foi medida. | |||
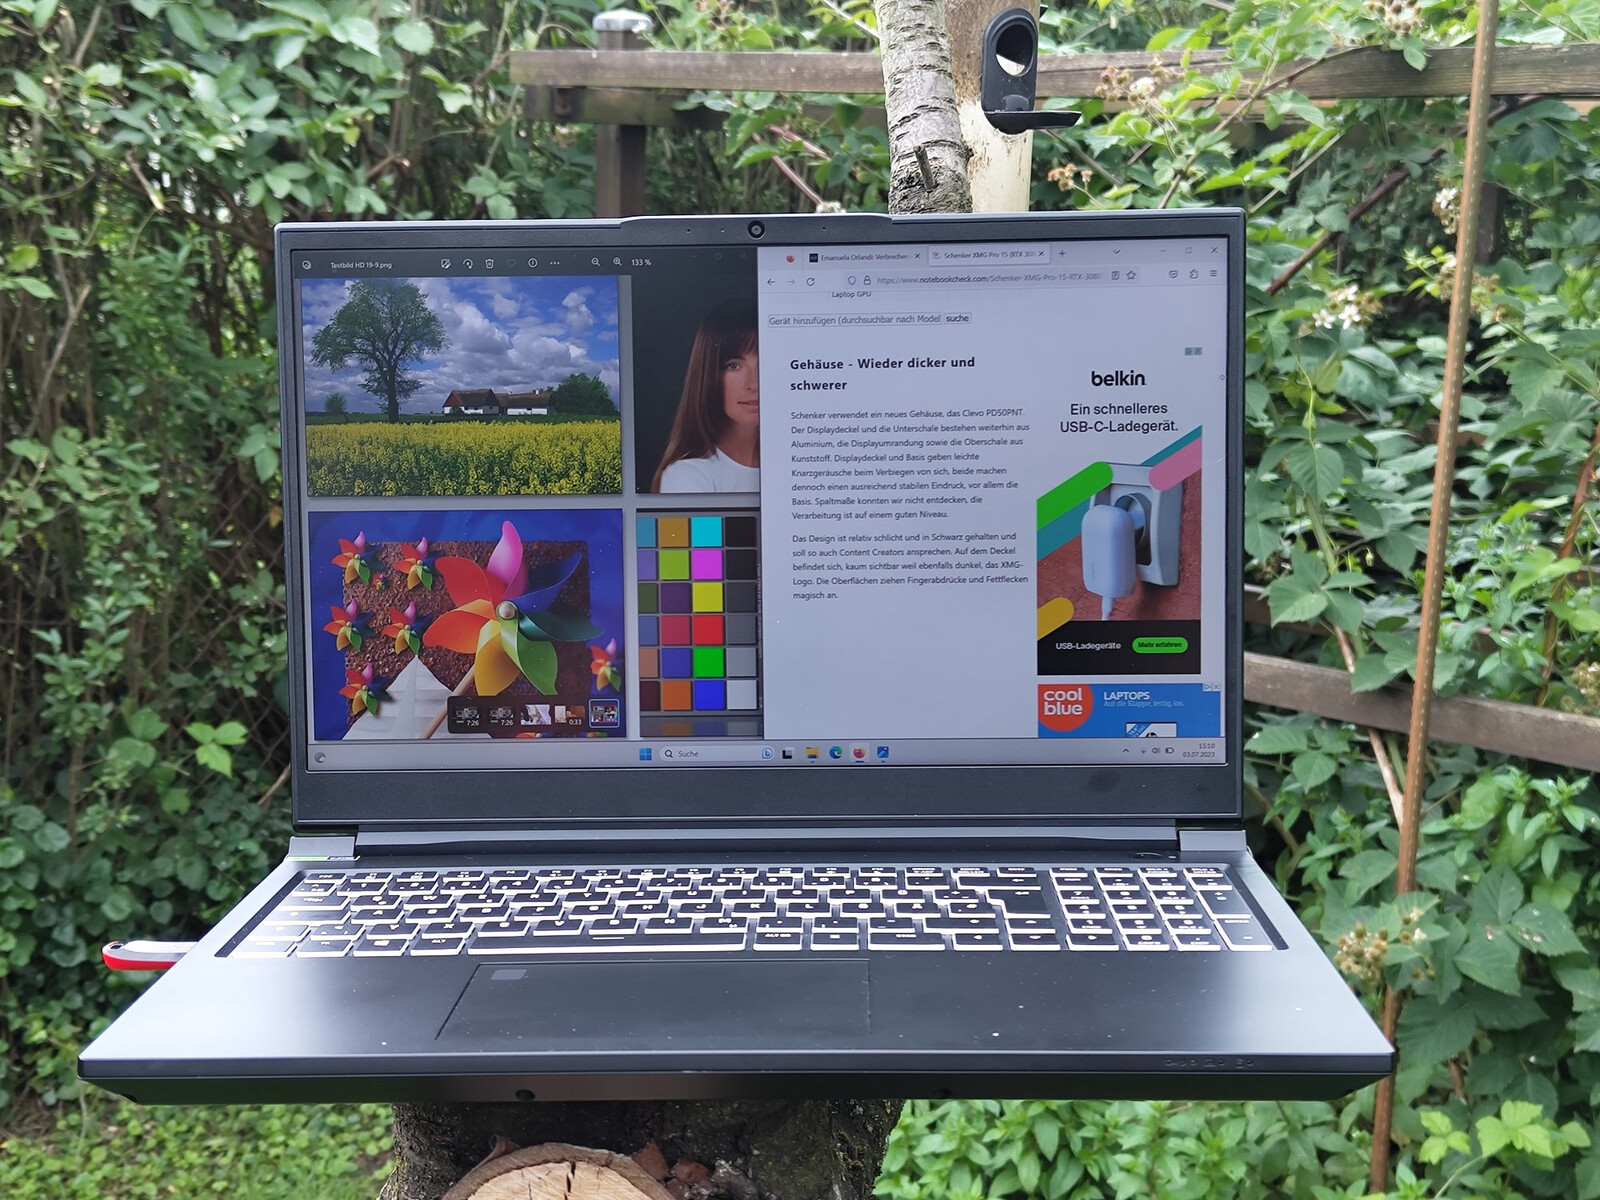
Também é possível usar o laptop de 15 polegadas em ambientes externos, graças à tela fosca e relativamente brilhante. Dependendo do local, é necessário escolher o ângulo de visão apropriado para obter a menor quantidade possível de reflexos. Felizmente, o painel IPS possui ângulos de visão muito estáveis.
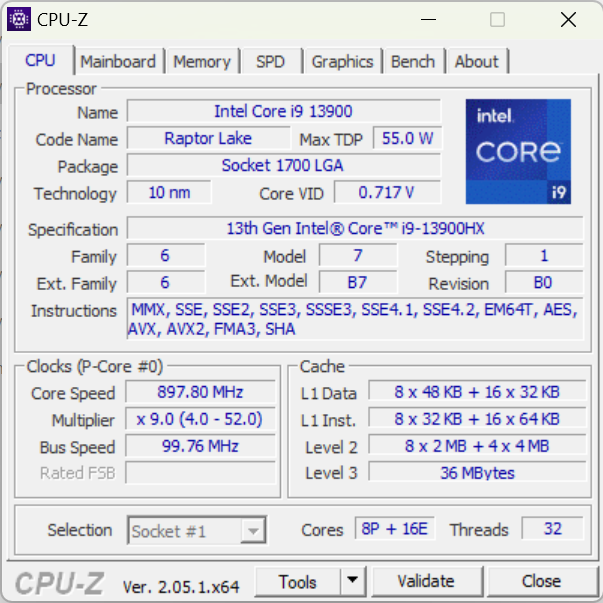
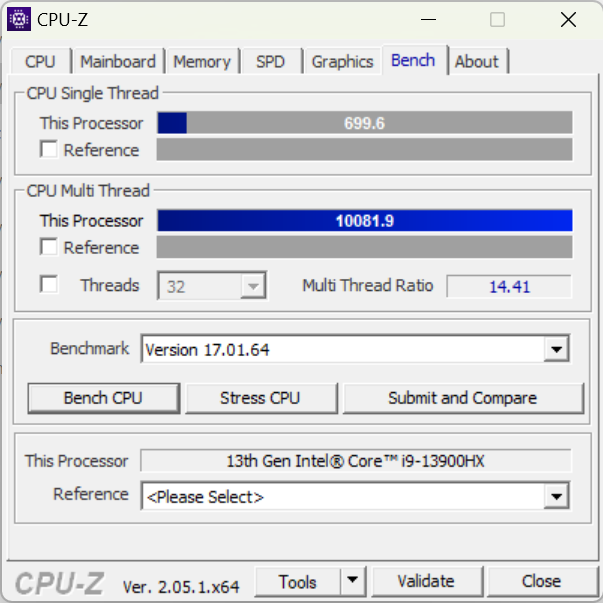
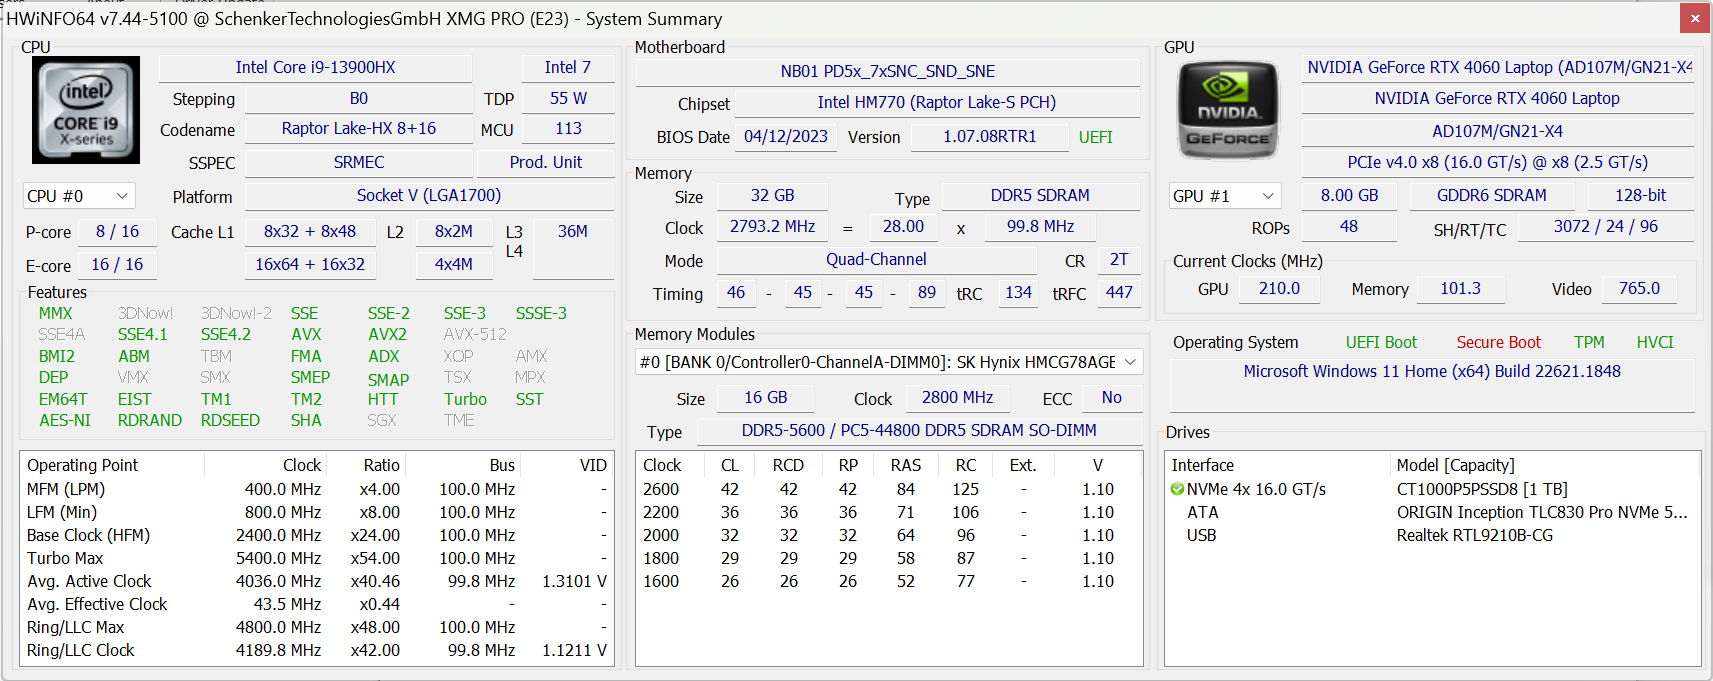
Desempenho - O Intel Core i9 e a Nvidia GeForce RTX 4060 têm poder de permanência
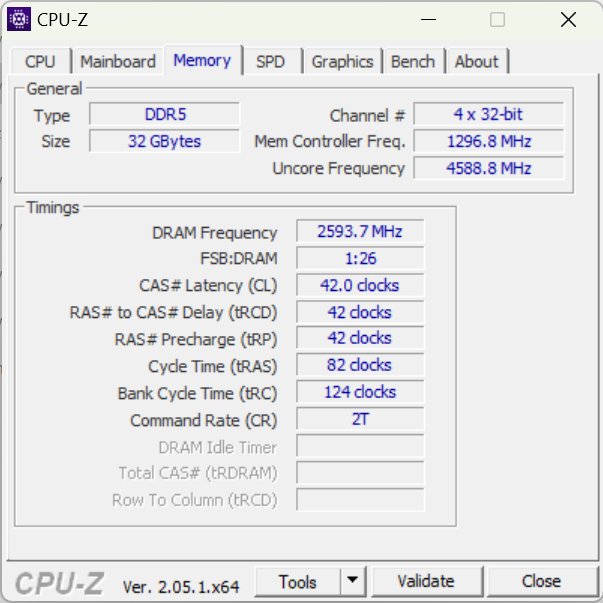
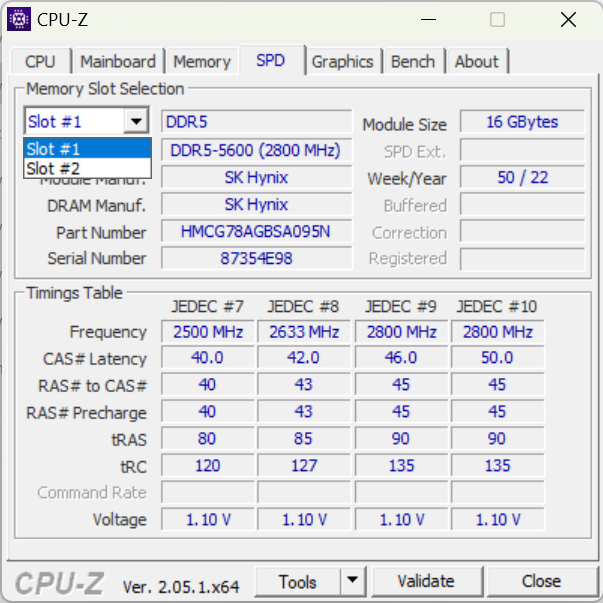
Em nosso dispositivo de análise, um poderosoIntel Core i9-13900HX e o processadorNvidia GeForce RTX 4060 são responsáveis pela potência suficiente para lidar com jogos e a maioria das tarefas criativas. O laptop pode ser configurado com 8 a 64 GB de RAM DDR5. Nossa amostra de análise está equipada com 32 GB. Como é típico da Schenker, muitas opções diferentes podem ser escolhidas como parte do processo de pedido da Bestware. Além do RTX 4060, um RTX 4070 também pode ser configurado. Quando se trata de SSDs e opções de WiFi, uma ampla seleção também está disponível.
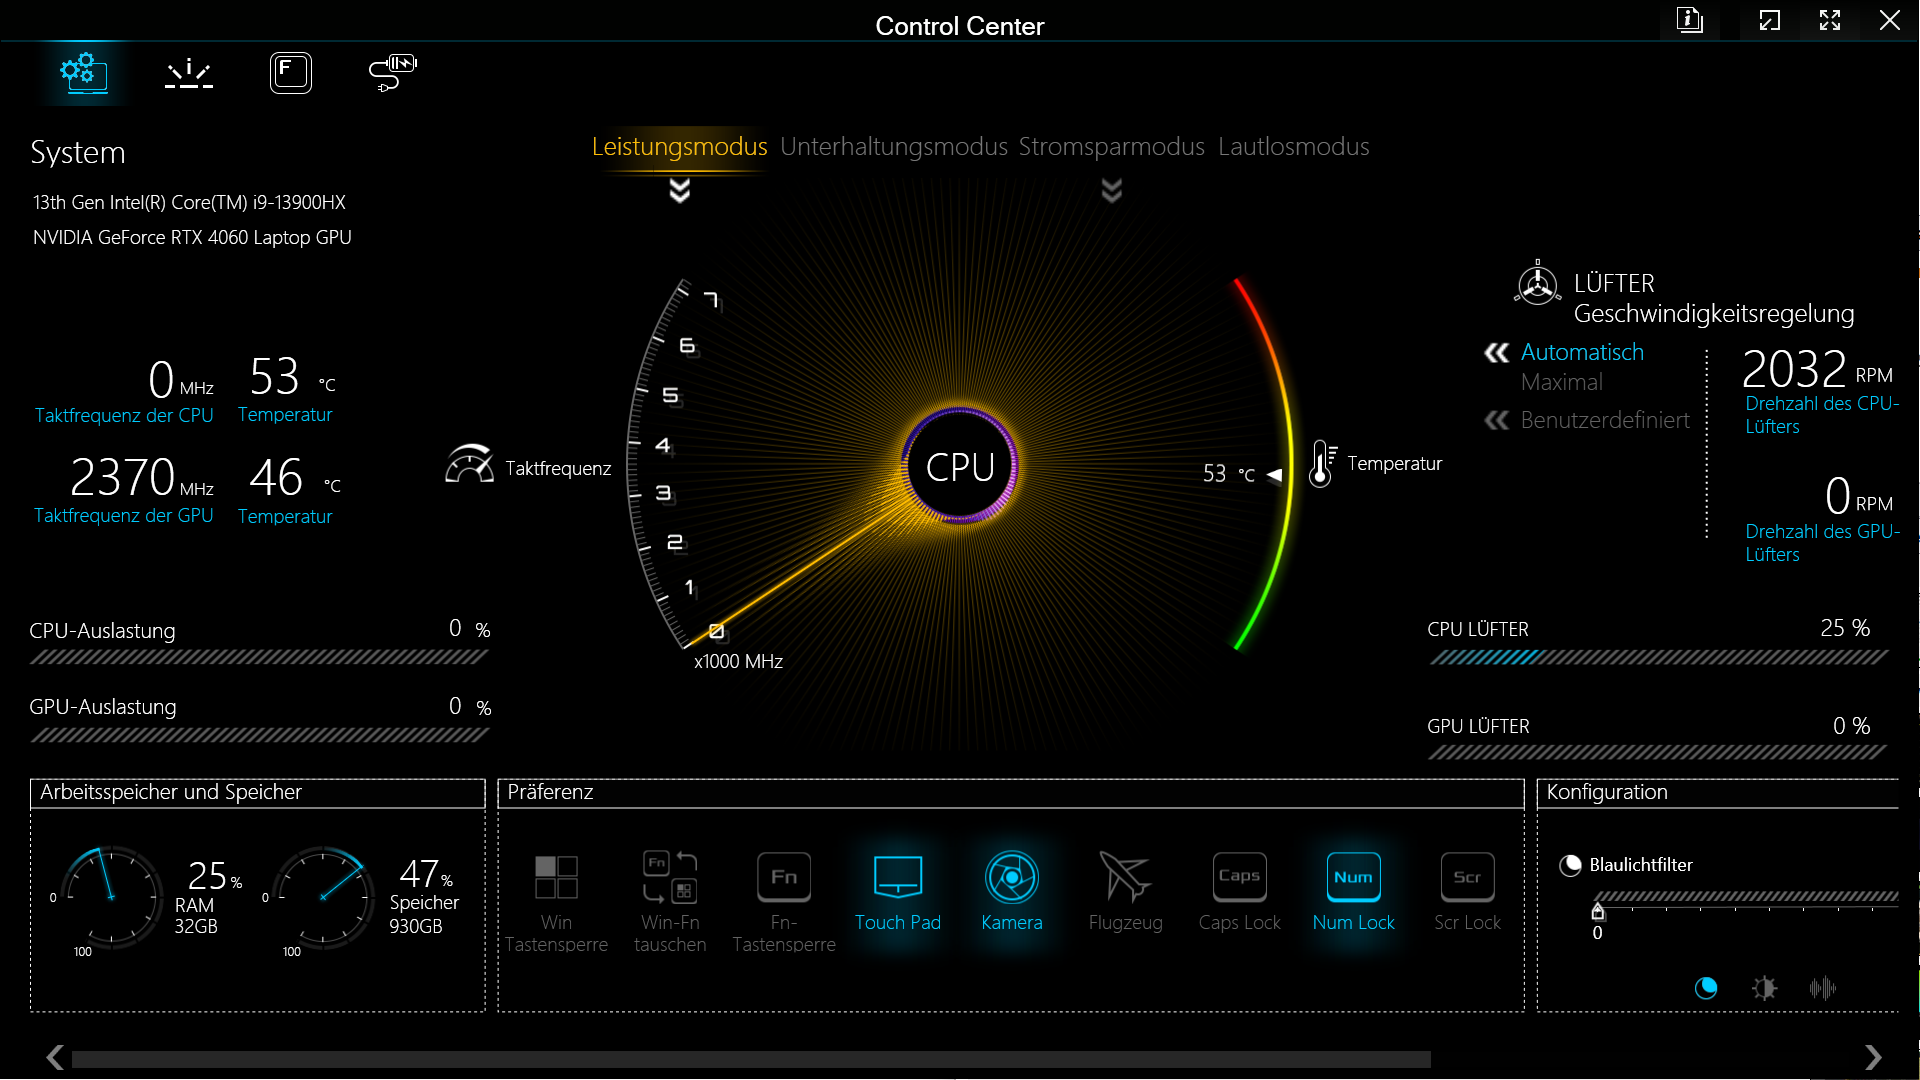
Condições de teste
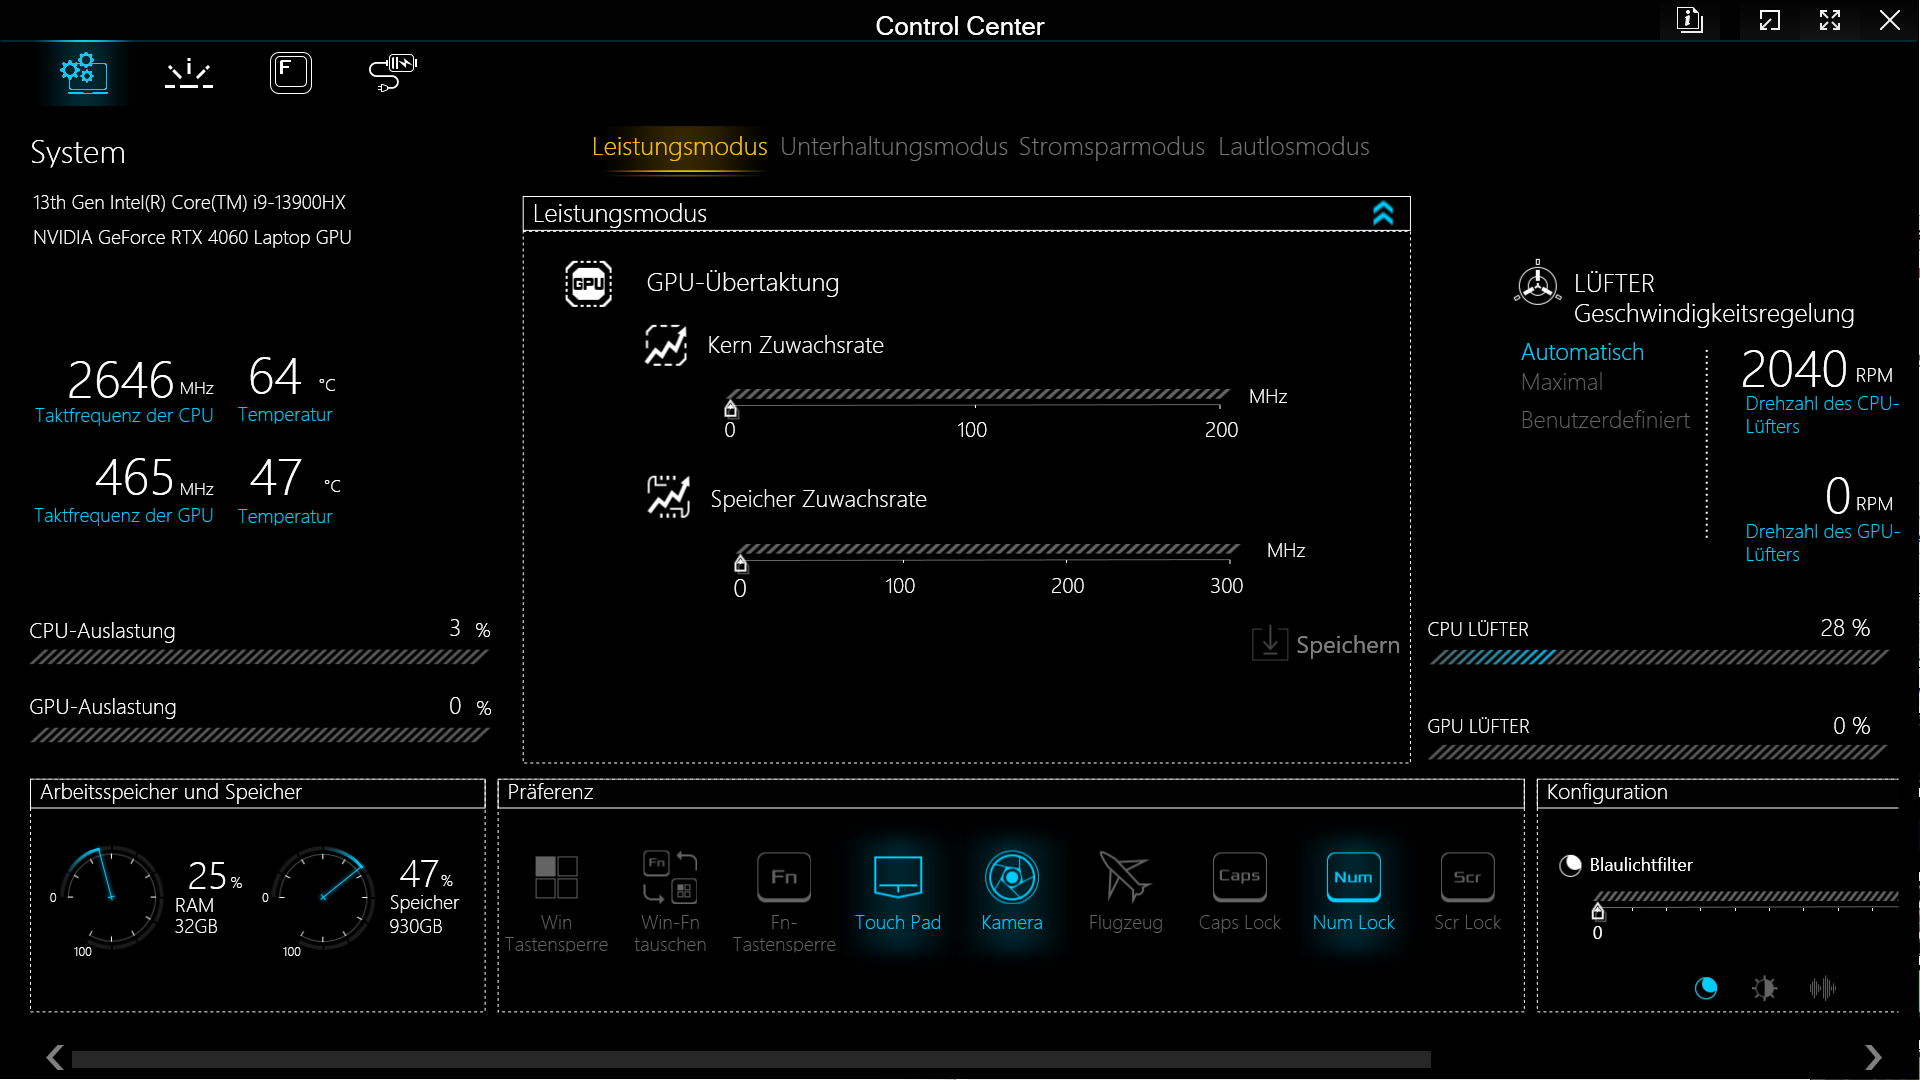
Os vários níveis de desempenho - modo de desempenho, modo de entretenimento, modo de economia de energia e modo silencioso - podem ser selecionados por meio do Control Center. Além disso, no modo de desempenho, há opções disponíveis para fazer um leve overclock da GPU e da memória gráfica. O Intel Core i9 é fornecido com um máximo de 135 watts e o GeForce RTX 4060 com 140 watts, se 25 watts forem transferidos do processador para a placa de vídeo. Os seguintes valores-alvo se aplicam aos modos individuais de economia de energia:
| Modus: | Modo de desempenho | Modo de entretenimento | Modo de economia de energia | Modo silencioso |
|---|---|---|---|---|
| CPU PL1 | 135 W | 65 W | 55 W | 45 W |
| CPU PL2 | 162 W | 115 W | 115 W | 115 W |
| Temperatura alvo CPU | 93 °C | 87 °C | 85 °C | 85 °C |
| GPU TGP + Dynamic Boost | 115 W + 25 W | 115 W + 0 W | 115 W + 0 W | 115 W + 0 W |
| Temperatura alvo GPU | 87 °C | 87 °C | 87 °C | 87 °C |
Os registros que compilamos mostram que o laptop para jogos pode suportar um aumento de desempenho muito alto por até 90 segundos nos modos de entretenimento e desempenho. Schenker sugere a realização de tarefas cotidianas no modo de entretenimento. No entanto, decidimos realizar todos os benchmarks no modo de desempenho.
Processador
OIntel Core i9-13900HX é o processador de laptop mais potente da atual geração Raptor Lake. Essa CPU é capaz de processar simultaneamente 32 threads distribuídos em 8 núcleos P e 16 núcleos E. Graças a seus altos valores de PL1 e PL2, o i9 realmente mostra o potencial que possui, com o XMG Pro 15 superando todos os outros dispositivos nos benchmarks de processador.
Cinebench R15 Multi Continuous Test
Cinebench R23: Multi Core | Single Core
Cinebench R20: CPU (Multi Core) | CPU (Single Core)
Cinebench R15: CPU Multi 64Bit | CPU Single 64Bit
Blender: v2.79 BMW27 CPU
7-Zip 18.03: 7z b 4 | 7z b 4 -mmt1
Geekbench 5.5: Multi-Core | Single-Core
HWBOT x265 Benchmark v2.2: 4k Preset
LibreOffice : 20 Documents To PDF
R Benchmark 2.5: Overall mean
| CPU Performance rating | |
| Média Intel Core i9-13900HX | |
| Média da turma Gaming | |
| Schenker XMG Pro 15 (E23) | |
| Alienware x16 R1 -1! | |
| Aorus 15X ASF | |
| Dell G15 5530 | |
| Asus ZenBook Pro 14 Duo UX8402VV-P1021W | |
| Schenker XMG Pro 15 (i7-12700H, RTX 3080 Ti) | |
| MSI Cyborg 15 A12VF | |
| Asus TUF A15 FA507 | |
| Cinebench R23 / Multi Core | |
| Média Intel Core i9-13900HX (24270 - 32623, n=23) | |
| Média da turma Gaming (10488 - 40970, n=108, últimos 2 anos) | |
| Schenker XMG Pro 15 (E23) | |
| Dell G15 5530 | |
| Aorus 15X ASF | |
| Alienware x16 R1 | |
| Asus ZenBook Pro 14 Duo UX8402VV-P1021W | |
| Schenker XMG Pro 15 (i7-12700H, RTX 3080 Ti) | |
| MSI Cyborg 15 A12VF | |
| Asus TUF A15 FA507 | |
| Cinebench R23 / Single Core | |
| Média Intel Core i9-13900HX (1867 - 2105, n=20) | |
| Média da turma Gaming (1166 - 2356, n=108, últimos 2 anos) | |
| Asus ZenBook Pro 14 Duo UX8402VV-P1021W | |
| Alienware x16 R1 | |
| Aorus 15X ASF | |
| Schenker XMG Pro 15 (E23) | |
| Dell G15 5530 | |
| Schenker XMG Pro 15 (i7-12700H, RTX 3080 Ti) | |
| MSI Cyborg 15 A12VF | |
| Asus TUF A15 FA507 | |
| Cinebench R20 / CPU (Multi Core) | |
| Média Intel Core i9-13900HX (9152 - 12541, n=21) | |
| Média da turma Gaming (4029 - 16108, n=107, últimos 2 anos) | |
| Schenker XMG Pro 15 (E23) | |
| Dell G15 5530 | |
| Aorus 15X ASF | |
| Alienware x16 R1 | |
| Asus ZenBook Pro 14 Duo UX8402VV-P1021W | |
| Schenker XMG Pro 15 (i7-12700H, RTX 3080 Ti) | |
| MSI Cyborg 15 A12VF | |
| Asus TUF A15 FA507 | |
| Cinebench R20 / CPU (Single Core) | |
| Média Intel Core i9-13900HX (722 - 810, n=21) | |
| Média da turma Gaming (442 - 895, n=107, últimos 2 anos) | |
| Asus ZenBook Pro 14 Duo UX8402VV-P1021W | |
| Alienware x16 R1 | |
| Aorus 15X ASF | |
| Schenker XMG Pro 15 (E23) | |
| Dell G15 5530 | |
| Schenker XMG Pro 15 (i7-12700H, RTX 3080 Ti) | |
| MSI Cyborg 15 A12VF | |
| Asus TUF A15 FA507 | |
| Cinebench R15 / CPU Multi 64Bit | |
| Média Intel Core i9-13900HX (3913 - 4970, n=22) | |
| Média da turma Gaming (1578 - 6271, n=106, últimos 2 anos) | |
| Schenker XMG Pro 15 (E23) | |
| Aorus 15X ASF | |
| Dell G15 5530 | |
| Alienware x16 R1 | |
| Asus ZenBook Pro 14 Duo UX8402VV-P1021W | |
| Schenker XMG Pro 15 (i7-12700H, RTX 3080 Ti) | |
| Asus TUF A15 FA507 | |
| MSI Cyborg 15 A12VF | |
| Cinebench R15 / CPU Single 64Bit | |
| Média da turma Gaming (188.8 - 343, n=107, últimos 2 anos) | |
| Média Intel Core i9-13900HX (247 - 304, n=22) | |
| Asus ZenBook Pro 14 Duo UX8402VV-P1021W | |
| Alienware x16 R1 | |
| Aorus 15X ASF | |
| Dell G15 5530 | |
| Schenker XMG Pro 15 (i7-12700H, RTX 3080 Ti) | |
| Asus TUF A15 FA507 | |
| Schenker XMG Pro 15 (E23) | |
| MSI Cyborg 15 A12VF | |
| Blender / v2.79 BMW27 CPU | |
| MSI Cyborg 15 A12VF | |
| Asus TUF A15 FA507 | |
| Schenker XMG Pro 15 (i7-12700H, RTX 3080 Ti) | |
| Asus ZenBook Pro 14 Duo UX8402VV-P1021W | |
| Aorus 15X ASF | |
| Dell G15 5530 | |
| Média da turma Gaming (80 - 330, n=105, últimos 2 anos) | |
| Schenker XMG Pro 15 (E23) | |
| Média Intel Core i9-13900HX (101 - 153, n=22) | |
| 7-Zip 18.03 / 7z b 4 | |
| Média Intel Core i9-13900HX (90675 - 127283, n=21) | |
| Schenker XMG Pro 15 (E23) | |
| Média da turma Gaming (33491 - 148086, n=106, últimos 2 anos) | |
| Dell G15 5530 | |
| Alienware x16 R1 | |
| Aorus 15X ASF | |
| Asus ZenBook Pro 14 Duo UX8402VV-P1021W | |
| Schenker XMG Pro 15 (i7-12700H, RTX 3080 Ti) | |
| Asus TUF A15 FA507 | |
| MSI Cyborg 15 A12VF | |
| 7-Zip 18.03 / 7z b 4 -mmt1 | |
| Média Intel Core i9-13900HX (6340 - 7177, n=21) | |
| Aorus 15X ASF | |
| Média da turma Gaming (4199 - 7436, n=106, últimos 2 anos) | |
| Schenker XMG Pro 15 (E23) | |
| Asus ZenBook Pro 14 Duo UX8402VV-P1021W | |
| Alienware x16 R1 | |
| Dell G15 5530 | |
| Asus TUF A15 FA507 | |
| Schenker XMG Pro 15 (i7-12700H, RTX 3080 Ti) | |
| MSI Cyborg 15 A12VF | |
| Geekbench 5.5 / Multi-Core | |
| Média Intel Core i9-13900HX (17614 - 21075, n=22) | |
| Schenker XMG Pro 15 (E23) | |
| Média da turma Gaming (6460 - 27010, n=106, últimos 2 anos) | |
| Aorus 15X ASF | |
| Alienware x16 R1 | |
| Dell G15 5530 | |
| Asus ZenBook Pro 14 Duo UX8402VV-P1021W | |
| Schenker XMG Pro 15 (i7-12700H, RTX 3080 Ti) | |
| MSI Cyborg 15 A12VF | |
| Asus TUF A15 FA507 | |
| Geekbench 5.5 / Single-Core | |
| Média da turma Gaming (986 - 2474, n=106, últimos 2 anos) | |
| Média Intel Core i9-13900HX (1345 - 2093, n=22) | |
| Alienware x16 R1 | |
| Asus ZenBook Pro 14 Duo UX8402VV-P1021W | |
| Aorus 15X ASF | |
| Dell G15 5530 | |
| Schenker XMG Pro 15 (E23) | |
| MSI Cyborg 15 A12VF | |
| Schenker XMG Pro 15 (i7-12700H, RTX 3080 Ti) | |
| Asus TUF A15 FA507 | |
| HWBOT x265 Benchmark v2.2 / 4k Preset | |
| Média Intel Core i9-13900HX (23.5 - 34.4, n=22) | |
| Média da turma Gaming (11.5 - 44.3, n=106, últimos 2 anos) | |
| Schenker XMG Pro 15 (E23) | |
| Dell G15 5530 | |
| Alienware x16 R1 | |
| Aorus 15X ASF | |
| Schenker XMG Pro 15 (i7-12700H, RTX 3080 Ti) | |
| Asus ZenBook Pro 14 Duo UX8402VV-P1021W | |
| Asus TUF A15 FA507 | |
| MSI Cyborg 15 A12VF | |
| MSI Cyborg 15 A12VF | |
| LibreOffice / 20 Documents To PDF | |
| Schenker XMG Pro 15 (E23) | |
| Asus TUF A15 FA507 | |
| Média da turma Gaming (33.2 - 88.8, n=106, últimos 2 anos) | |
| Schenker XMG Pro 15 (i7-12700H, RTX 3080 Ti) | |
| Dell G15 5530 | |
| Alienware x16 R1 | |
| Aorus 15X ASF | |
| Média Intel Core i9-13900HX (32.8 - 51.1, n=21) | |
| Asus ZenBook Pro 14 Duo UX8402VV-P1021W | |
| MSI Cyborg 15 A12VF | |
| R Benchmark 2.5 / Overall mean | |
| Asus TUF A15 FA507 | |
| MSI Cyborg 15 A12VF | |
| Schenker XMG Pro 15 (E23) | |
| Schenker XMG Pro 15 (i7-12700H, RTX 3080 Ti) | |
| Aorus 15X ASF | |
| Asus ZenBook Pro 14 Duo UX8402VV-P1021W | |
| Média da turma Gaming (0.3439 - 0.759, n=107, últimos 2 anos) | |
| Alienware x16 R1 | |
| Dell G15 5530 | |
| Média Intel Core i9-13900HX (0.375 - 0.4564, n=22) | |
* ... menor é melhor
AIDA64: FP32 Ray-Trace | FPU Julia | CPU SHA3 | CPU Queen | FPU SinJulia | FPU Mandel | CPU AES | CPU ZLib | FP64 Ray-Trace | CPU PhotoWorxx
| Performance rating | |
| Média da turma Gaming | |
| Média Intel Core i9-13900HX | |
| Schenker XMG Pro 15 (E23) | |
| Alienware x16 R1 | |
| Aorus 15X ASF | |
| Dell G15 5530 | |
| Asus TUF A15 FA507 | |
| Asus ZenBook Pro 14 Duo UX8402VV-P1021W | |
| MSI Cyborg 15 A12VF | |
| Schenker XMG Pro 15 (i7-12700H, RTX 3080 Ti) | |
| AIDA64 / FP32 Ray-Trace | |
| Média da turma Gaming (10227 - 85542, n=105, últimos 2 anos) | |
| Média Intel Core i9-13900HX (17589 - 27615, n=22) | |
| Alienware x16 R1 | |
| Dell G15 5530 | |
| Schenker XMG Pro 15 (E23) | |
| Aorus 15X ASF | |
| Asus TUF A15 FA507 | |
| Asus ZenBook Pro 14 Duo UX8402VV-P1021W | |
| MSI Cyborg 15 A12VF | |
| Schenker XMG Pro 15 (i7-12700H, RTX 3080 Ti) | |
| AIDA64 / FPU Julia | |
| Média da turma Gaming (51376 - 238426, n=105, últimos 2 anos) | |
| Média Intel Core i9-13900HX (88686 - 137015, n=22) | |
| Asus TUF A15 FA507 | |
| Schenker XMG Pro 15 (E23) | |
| Alienware x16 R1 | |
| Dell G15 5530 | |
| Aorus 15X ASF | |
| Asus ZenBook Pro 14 Duo UX8402VV-P1021W | |
| MSI Cyborg 15 A12VF | |
| Schenker XMG Pro 15 (i7-12700H, RTX 3080 Ti) | |
| AIDA64 / CPU SHA3 | |
| Média da turma Gaming (2180 - 9817, n=105, últimos 2 anos) | |
| Média Intel Core i9-13900HX (4362 - 7029, n=22) | |
| Schenker XMG Pro 15 (E23) | |
| Dell G15 5530 | |
| Alienware x16 R1 | |
| Aorus 15X ASF | |
| Asus TUF A15 FA507 | |
| Asus ZenBook Pro 14 Duo UX8402VV-P1021W | |
| MSI Cyborg 15 A12VF | |
| Schenker XMG Pro 15 (i7-12700H, RTX 3080 Ti) | |
| AIDA64 / CPU Queen | |
| Média Intel Core i9-13900HX (125644 - 141385, n=22) | |
| Schenker XMG Pro 15 (E23) | |
| Alienware x16 R1 | |
| Média da turma Gaming (49785 - 173351, n=92, últimos 2 anos) | |
| Aorus 15X ASF | |
| Asus ZenBook Pro 14 Duo UX8402VV-P1021W | |
| Dell G15 5530 | |
| Asus TUF A15 FA507 | |
| Schenker XMG Pro 15 (i7-12700H, RTX 3080 Ti) | |
| MSI Cyborg 15 A12VF | |
| AIDA64 / FPU SinJulia | |
| Média Intel Core i9-13900HX (12334 - 17179, n=22) | |
| Média da turma Gaming (4424 - 33636, n=105, últimos 2 anos) | |
| Asus TUF A15 FA507 | |
| Schenker XMG Pro 15 (E23) | |
| Aorus 15X ASF | |
| Alienware x16 R1 | |
| Dell G15 5530 | |
| Schenker XMG Pro 15 (i7-12700H, RTX 3080 Ti) | |
| Asus ZenBook Pro 14 Duo UX8402VV-P1021W | |
| MSI Cyborg 15 A12VF | |
| AIDA64 / FPU Mandel | |
| Média da turma Gaming (25115 - 128721, n=105, últimos 2 anos) | |
| Média Intel Core i9-13900HX (43850 - 69202, n=22) | |
| Asus TUF A15 FA507 | |
| Alienware x16 R1 | |
| Schenker XMG Pro 15 (E23) | |
| Dell G15 5530 | |
| Aorus 15X ASF | |
| Asus ZenBook Pro 14 Duo UX8402VV-P1021W | |
| MSI Cyborg 15 A12VF | |
| Schenker XMG Pro 15 (i7-12700H, RTX 3080 Ti) | |
| AIDA64 / CPU AES | |
| Aorus 15X ASF | |
| Média Intel Core i9-13900HX (89413 - 237881, n=22) | |
| Média da turma Gaming (39258 - 247074, n=105, últimos 2 anos) | |
| Schenker XMG Pro 15 (E23) | |
| Dell G15 5530 | |
| Alienware x16 R1 | |
| Asus TUF A15 FA507 | |
| MSI Cyborg 15 A12VF | |
| Asus ZenBook Pro 14 Duo UX8402VV-P1021W | |
| Schenker XMG Pro 15 (i7-12700H, RTX 3080 Ti) | |
| AIDA64 / CPU ZLib | |
| Média Intel Core i9-13900HX (1284 - 1958, n=22) | |
| Média da turma Gaming (574 - 2531, n=105, últimos 2 anos) | |
| Schenker XMG Pro 15 (E23) | |
| Dell G15 5530 | |
| Alienware x16 R1 | |
| Aorus 15X ASF | |
| Schenker XMG Pro 15 (i7-12700H, RTX 3080 Ti) | |
| MSI Cyborg 15 A12VF | |
| Asus ZenBook Pro 14 Duo UX8402VV-P1021W | |
| Asus TUF A15 FA507 | |
| AIDA64 / FP64 Ray-Trace | |
| Média da turma Gaming (5509 - 45446, n=105, últimos 2 anos) | |
| Média Intel Core i9-13900HX (9481 - 15279, n=22) | |
| Alienware x16 R1 | |
| Dell G15 5530 | |
| Schenker XMG Pro 15 (E23) | |
| Aorus 15X ASF | |
| Asus TUF A15 FA507 | |
| Asus ZenBook Pro 14 Duo UX8402VV-P1021W | |
| MSI Cyborg 15 A12VF | |
| Schenker XMG Pro 15 (i7-12700H, RTX 3080 Ti) | |
| AIDA64 / CPU PhotoWorxx | |
| Schenker XMG Pro 15 (E23) | |
| Alienware x16 R1 | |
| Média Intel Core i9-13900HX (42994 - 51994, n=22) | |
| Média da turma Gaming (12271 - 89891, n=105, últimos 2 anos) | |
| Asus ZenBook Pro 14 Duo UX8402VV-P1021W | |
| Dell G15 5530 | |
| MSI Cyborg 15 A12VF | |
| Aorus 15X ASF | |
| Schenker XMG Pro 15 (i7-12700H, RTX 3080 Ti) | |
| Asus TUF A15 FA507 | |
Desempenho do sistema
Na área de desempenho do sistema, o dispositivo analisado também apresentou números fortes e até superou o desempenho da Aorus 15X ASFapesar de compartilhar valores semelhantes de TDP e TGP. No PCMark 10, o XMG Pro 15 está apenas alguns pontos atrás do fino Asus ZenBook Pro 14 Duo o que mostra que um notebook potente para jogos nem sempre precisa ser um notebook pesado para jogos.
CrossMark: Overall | Productivity | Creativity | Responsiveness
| PCMark 10 / Score | |
| Média da turma Gaming (5828 - 11574, n=94, últimos 2 anos) | |
| Alienware x16 R1 | |
| Asus ZenBook Pro 14 Duo UX8402VV-P1021W | |
| Schenker XMG Pro 15 (E23) | |
| Média Intel Core i9-13900HX, NVIDIA GeForce RTX 4060 Laptop GPU (n=1) | |
| Asus TUF A15 FA507 | |
| Aorus 15X ASF | |
| MSI Cyborg 15 A12VF | |
| Dell G15 5530 | |
| Schenker XMG Pro 15 (i7-12700H, RTX 3080 Ti) | |
| PCMark 10 / Essentials | |
| Schenker XMG Pro 15 (E23) | |
| Média Intel Core i9-13900HX, NVIDIA GeForce RTX 4060 Laptop GPU (n=1) | |
| Asus ZenBook Pro 14 Duo UX8402VV-P1021W | |
| Alienware x16 R1 | |
| Dell G15 5530 | |
| Schenker XMG Pro 15 (i7-12700H, RTX 3080 Ti) | |
| Aorus 15X ASF | |
| MSI Cyborg 15 A12VF | |
| Média da turma Gaming (8810 - 11935, n=98, últimos 2 anos) | |
| Asus TUF A15 FA507 | |
| PCMark 10 / Productivity | |
| Média da turma Gaming (6845 - 21327, n=96, últimos 2 anos) | |
| Schenker XMG Pro 15 (E23) | |
| Média Intel Core i9-13900HX, NVIDIA GeForce RTX 4060 Laptop GPU (n=1) | |
| Dell G15 5530 | |
| MSI Cyborg 15 A12VF | |
| Alienware x16 R1 | |
| Asus ZenBook Pro 14 Duo UX8402VV-P1021W | |
| Aorus 15X ASF | |
| Asus TUF A15 FA507 | |
| Schenker XMG Pro 15 (i7-12700H, RTX 3080 Ti) | |
| PCMark 10 / Digital Content Creation | |
| Alienware x16 R1 | |
| Média da turma Gaming (7602 - 19657, n=96, últimos 2 anos) | |
| Asus ZenBook Pro 14 Duo UX8402VV-P1021W | |
| Asus TUF A15 FA507 | |
| Aorus 15X ASF | |
| Schenker XMG Pro 15 (E23) | |
| Média Intel Core i9-13900HX, NVIDIA GeForce RTX 4060 Laptop GPU (n=1) | |
| MSI Cyborg 15 A12VF | |
| Schenker XMG Pro 15 (i7-12700H, RTX 3080 Ti) | |
| Dell G15 5530 | |
| CrossMark / Overall | |
| Aorus 15X ASF | |
| Média da turma Gaming (1366 - 2409, n=94, últimos 2 anos) | |
| Schenker XMG Pro 15 (E23) | |
| Média Intel Core i9-13900HX, NVIDIA GeForce RTX 4060 Laptop GPU (n=1) | |
| Alienware x16 R1 | |
| Asus ZenBook Pro 14 Duo UX8402VV-P1021W | |
| Dell G15 5530 | |
| MSI Cyborg 15 A12VF | |
| Asus TUF A15 FA507 | |
| CrossMark / Productivity | |
| Aorus 15X ASF | |
| Média da turma Gaming (1386 - 2254, n=94, últimos 2 anos) | |
| Alienware x16 R1 | |
| Schenker XMG Pro 15 (E23) | |
| Média Intel Core i9-13900HX, NVIDIA GeForce RTX 4060 Laptop GPU (n=1) | |
| Asus ZenBook Pro 14 Duo UX8402VV-P1021W | |
| Dell G15 5530 | |
| MSI Cyborg 15 A12VF | |
| Asus TUF A15 FA507 | |
| CrossMark / Creativity | |
| Média da turma Gaming (1343 - 2729, n=94, últimos 2 anos) | |
| Schenker XMG Pro 15 (E23) | |
| Média Intel Core i9-13900HX, NVIDIA GeForce RTX 4060 Laptop GPU (n=1) | |
| Aorus 15X ASF | |
| Asus ZenBook Pro 14 Duo UX8402VV-P1021W | |
| Dell G15 5530 | |
| Alienware x16 R1 | |
| MSI Cyborg 15 A12VF | |
| Asus TUF A15 FA507 | |
| CrossMark / Responsiveness | |
| Aorus 15X ASF | |
| Alienware x16 R1 | |
| Schenker XMG Pro 15 (E23) | |
| Média Intel Core i9-13900HX, NVIDIA GeForce RTX 4060 Laptop GPU (n=1) | |
| Média da turma Gaming (1226 - 2334, n=94, últimos 2 anos) | |
| MSI Cyborg 15 A12VF | |
| Asus ZenBook Pro 14 Duo UX8402VV-P1021W | |
| Dell G15 5530 | |
| Asus TUF A15 FA507 | |
| PCMark 10 Score | 7521 pontos | |
Ajuda | ||
| AIDA64 / Memory Copy | |
| Schenker XMG Pro 15 (E23) | |
| Média Intel Core i9-13900HX (67716 - 79193, n=22) | |
| Alienware x16 R1 | |
| Média da turma Gaming (21750 - 129946, n=105, últimos 2 anos) | |
| Asus ZenBook Pro 14 Duo UX8402VV-P1021W | |
| Dell G15 5530 | |
| Aorus 15X ASF | |
| MSI Cyborg 15 A12VF | |
| Asus TUF A15 FA507 | |
| Schenker XMG Pro 15 (i7-12700H, RTX 3080 Ti) | |
| AIDA64 / Memory Read | |
| Schenker XMG Pro 15 (E23) | |
| Média Intel Core i9-13900HX (73998 - 88462, n=22) | |
| Média da turma Gaming (22956 - 118858, n=105, últimos 2 anos) | |
| Dell G15 5530 | |
| Alienware x16 R1 | |
| Aorus 15X ASF | |
| MSI Cyborg 15 A12VF | |
| Asus ZenBook Pro 14 Duo UX8402VV-P1021W | |
| Asus TUF A15 FA507 | |
| Schenker XMG Pro 15 (i7-12700H, RTX 3080 Ti) | |
| AIDA64 / Memory Write | |
| Alienware x16 R1 | |
| Média da turma Gaming (22297 - 135096, n=105, últimos 2 anos) | |
| Schenker XMG Pro 15 (E23) | |
| Média Intel Core i9-13900HX (65472 - 77045, n=22) | |
| Asus ZenBook Pro 14 Duo UX8402VV-P1021W | |
| Dell G15 5530 | |
| MSI Cyborg 15 A12VF | |
| Aorus 15X ASF | |
| Asus TUF A15 FA507 | |
| Schenker XMG Pro 15 (i7-12700H, RTX 3080 Ti) | |
| AIDA64 / Memory Latency | |
| Média da turma Gaming (75.3 - 259, n=105, últimos 2 anos) | |
| Alienware x16 R1 | |
| Asus ZenBook Pro 14 Duo UX8402VV-P1021W | |
| MSI Cyborg 15 A12VF | |
| Dell G15 5530 | |
| Aorus 15X ASF | |
| Média Intel Core i9-13900HX (75.3 - 91.1, n=22) | |
| Schenker XMG Pro 15 (E23) | |
| Asus TUF A15 FA507 | |
* ... menor é melhor
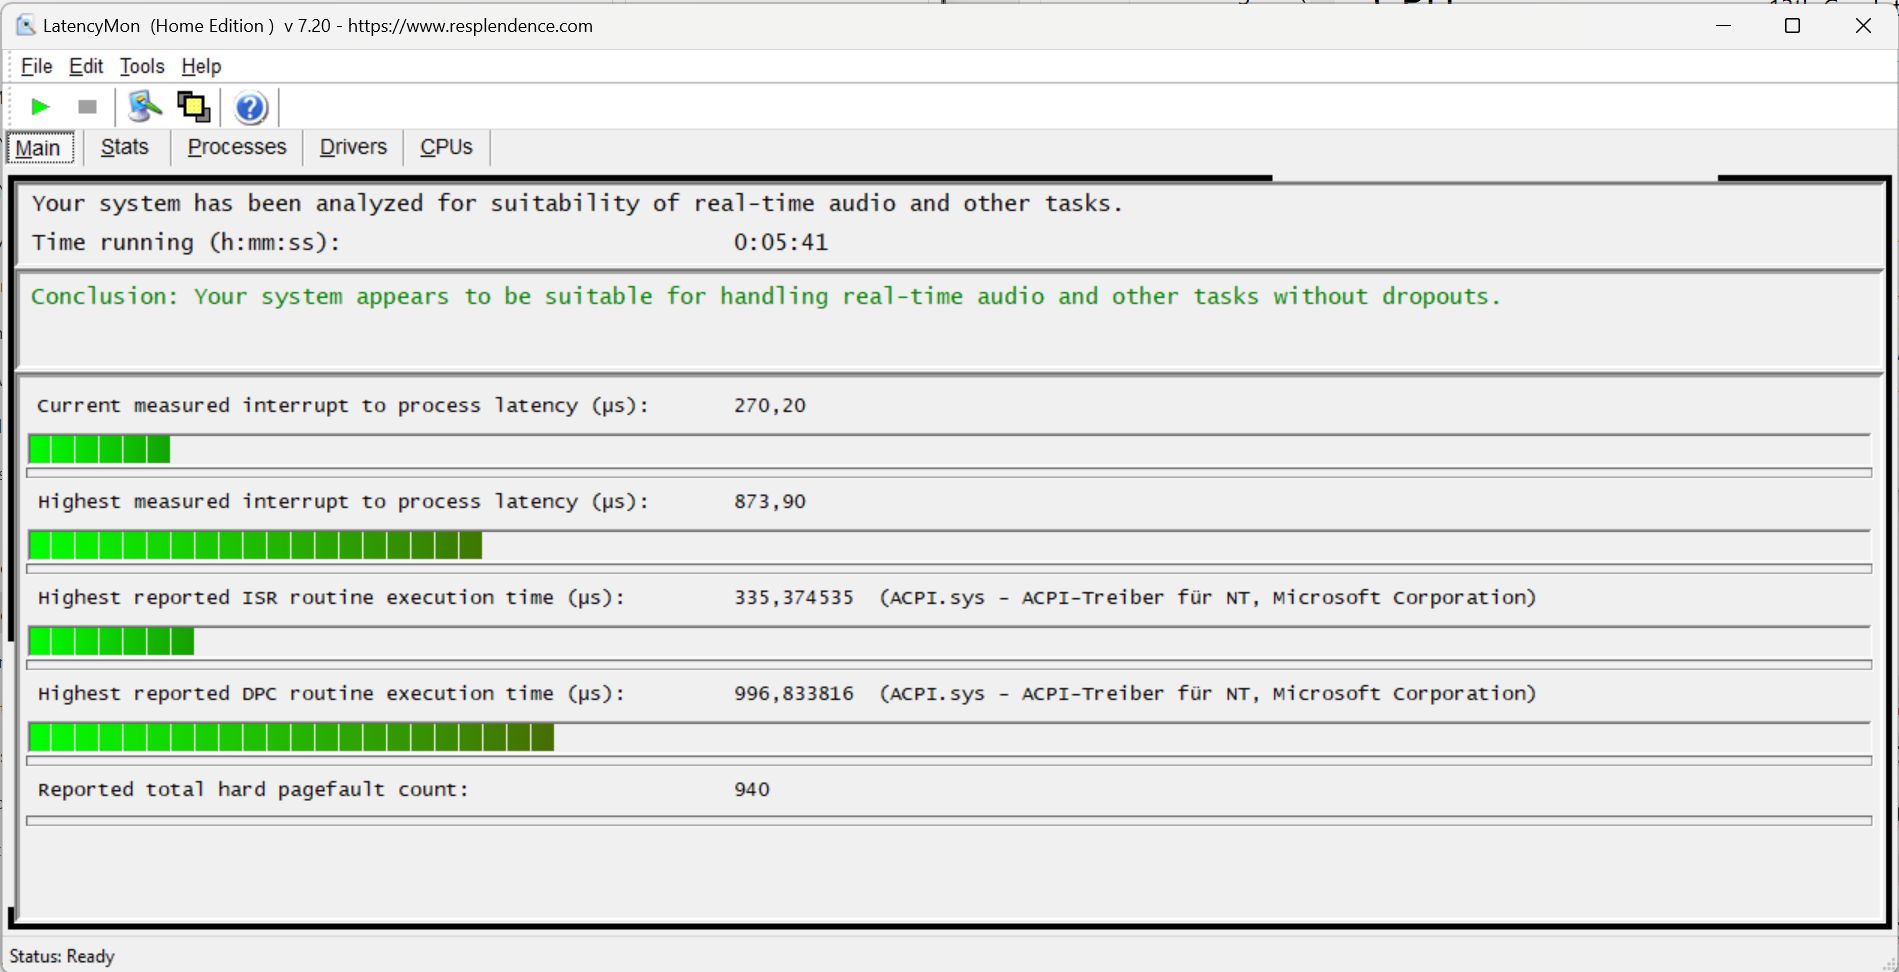
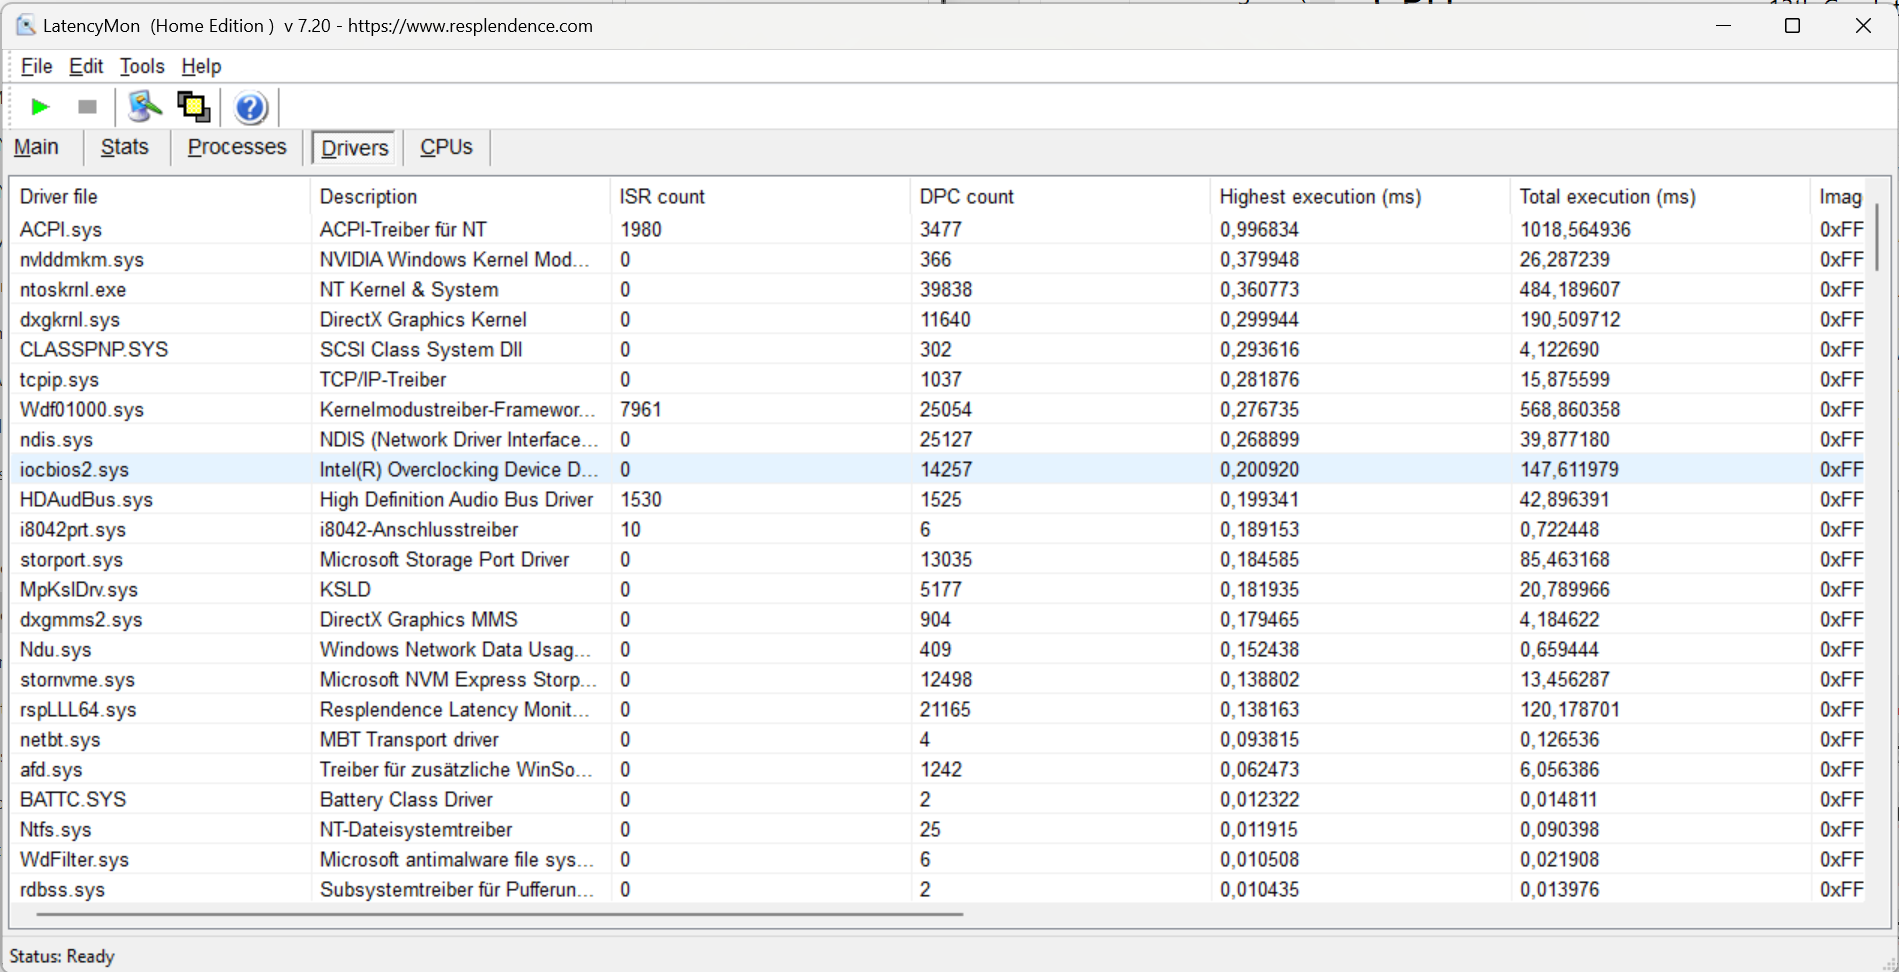
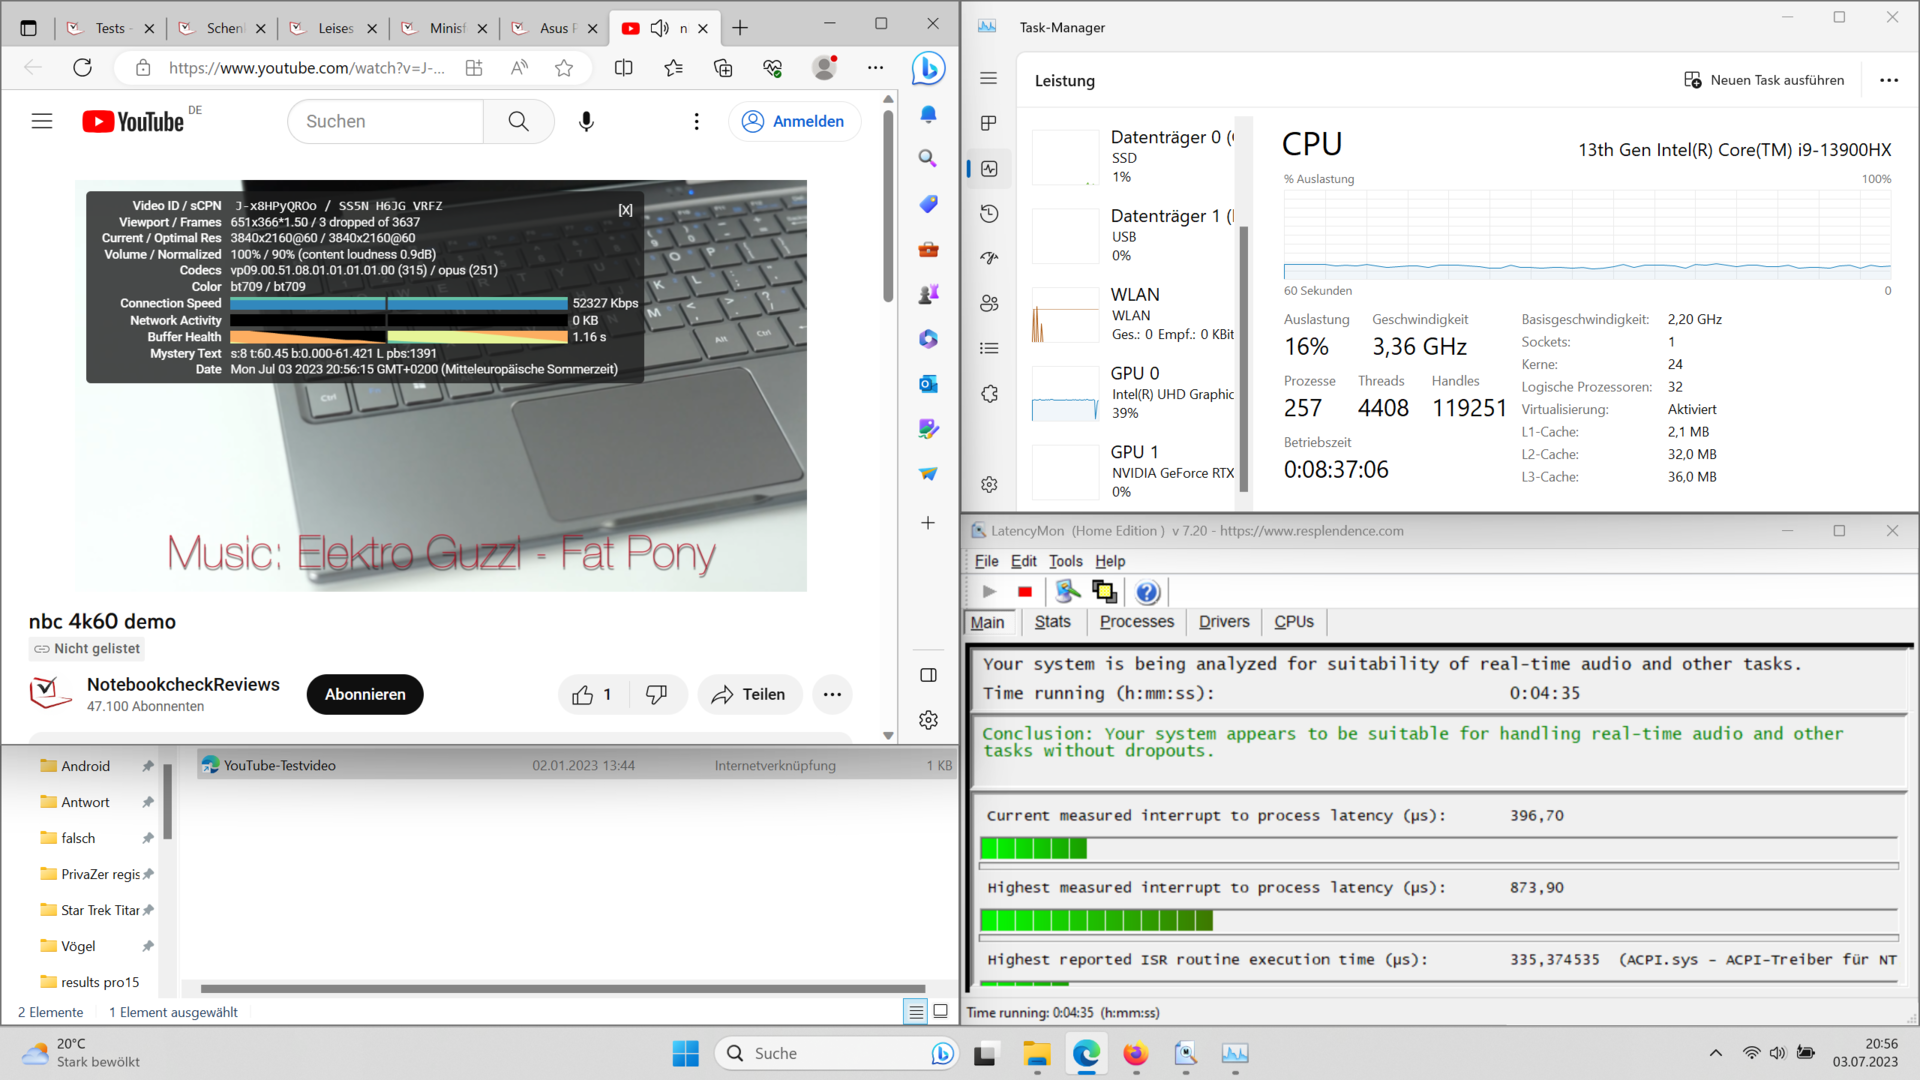
Latências de DPC
Nessa área, é perceptível que os problemas de interação entre os drivers da Nvidia e outros drivers foram, nesse meio tempo, superados. Nesse laptop, no momento do teste, as latências de DPC estão em um nível baixo com os drivers e o firmware atuais.
| DPC Latencies / LatencyMon - interrupt to process latency (max), Web, Youtube, Prime95 | |
| Dell G15 5530 | |
| Aorus 15X ASF | |
| Schenker XMG Pro 15 (i7-12700H, RTX 3080 Ti) | |
| Alienware x16 R1 | |
| MSI Cyborg 15 A12VF | |
| Asus ZenBook Pro 14 Duo UX8402VV-P1021W | |
| Schenker XMG Pro 15 (E23) | |
* ... menor é melhor
Armazenamento em massa
De todos os SSDs NVMe que a Schenker oferece para o XMG Pro 15, o Crucial P5 Plus provavelmente não é a opção mais rápida. No entanto, nos testes, ele apresentou bons valores que foram mantidos por períodos mais longos. No loop do DiskSpd, observamos apenas uma aceleração mínima após algumas execuções.

* ... menor é melhor
Continuous Performance Read: DiskSpd Read Loop, Queue Depth 8
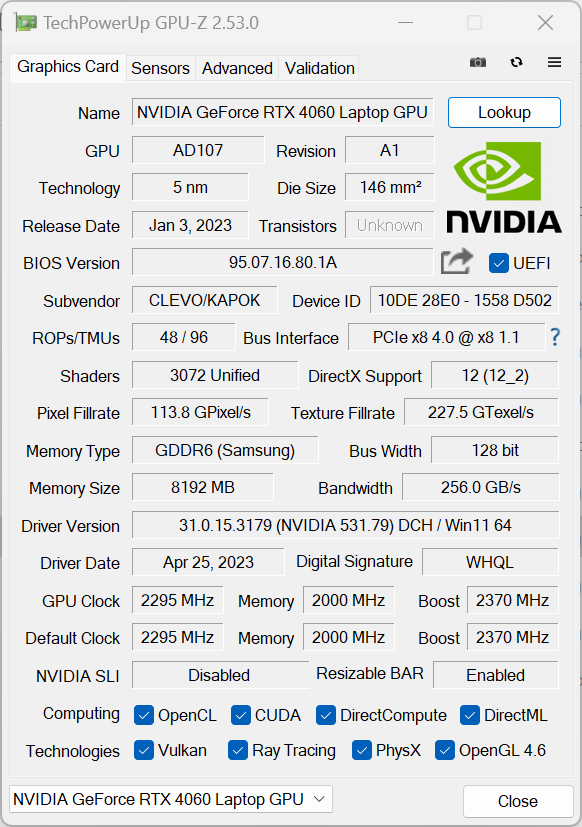
Placa de vídeo
Agora chegamos à questão central de nossa análise. ANvidia GeForce RTX 4060 em nosso dispositivo de análise consegue acompanhar o desempenho do antecessorRTX 3080 Ti? A resposta honesta a essa pergunta é um claro sim e não. Dependendo do benchmark, você terá que contar com um desempenho de 10% a 20% menor. Nos jogos, a diferença de desempenho entre o XMG Pro 15 atual e o antecessor depende do jogo. Enquanto algo como The Witcher 3 se beneficia da velocidade de clock mais alta da 4060 e atinge taxas de quadros mais altas, no GTA V, o Pro 15 E23 fica um pouco atrás de seu antecessor. No entanto, o XMG Pro 15 também pode ser configurado com umaRTX 4070. OAorus 15X ASFmostra que a diferença de desempenho entre uma RTX 3080 Ti e uma RTX 4070 é muito baixa - em todas as situações. Como o Aorus e o XMG Pro 15 operam com valores de TDP e TGP quase idênticos, isso indica o possível desempenho esperado no XMG Pro 15 com uma RTX 4070.
| 3DMark 11 Performance | 29518 pontos | |
| 3DMark Ice Storm Standard Score | 146918 pontos | |
| 3DMark Cloud Gate Standard Score | 54429 pontos | |
| 3DMark Fire Strike Score | 23131 pontos | |
| 3DMark Time Spy Score | 10776 pontos | |
Ajuda | ||
* ... menor é melhor
| The Witcher 3 - 1920x1080 Ultra Graphics & Postprocessing (HBAO+) | |
| Média da turma Gaming (95 - 240, n=7, últimos 2 anos) | |
| Alienware x16 R1 | |
| Schenker XMG Pro 15 (E23) | |
| Asus ZenBook Pro 14 Duo UX8402VV-P1021W | |
| Schenker XMG Pro 15 (i7-12700H, RTX 3080 Ti) | |
| Aorus 15X ASF | |
| Dell G15 5530 | |
| Asus TUF A15 FA507 | |
| MSI Cyborg 15 A12VF | |
| Final Fantasy XV Benchmark - 1920x1080 High Quality | |
| Alienware x16 R1 | |
| Média da turma Gaming (41 - 215, n=96, últimos 2 anos) | |
| Aorus 15X ASF | |
| Schenker XMG Pro 15 (i7-12700H, RTX 3080 Ti) | |
| Dell G15 5530 | |
| Asus ZenBook Pro 14 Duo UX8402VV-P1021W | |
| Asus TUF A15 FA507 | |
| MSI Cyborg 15 A12VF | |
| Hogwarts Legacy | |
| 2560x1440 Ultra Preset AA:High T | |
| Média da turma Gaming (n=1últimos 2 anos) | |
| Schenker XMG Pro 15 (E23) | |
| Média NVIDIA GeForce RTX 4060 Laptop GPU (42.8 - 45, n=4) | |
| 1920x1080 Ultra Preset AA:High T | |
| Média da turma Gaming (n=1últimos 2 anos) | |
| Média NVIDIA GeForce RTX 4060 Laptop GPU (61.9 - 91.9, n=6) | |
| Schenker XMG Pro 15 (E23) | |
| MSI Cyborg 15 A12VF | |
| Asus TUF A15 FA507 | |
| 1920x1080 High Preset AA:High T | |
| Asus TUF A15 FA507 | |
| Média NVIDIA GeForce RTX 4060 Laptop GPU (70.8 - 107.7, n=6) | |
| MSI Cyborg 15 A12VF | |
| Schenker XMG Pro 15 (E23) | |
| baixo | média | alto | ultra | QHD | 4K | |
|---|---|---|---|---|---|---|
| GTA V (2015) | 184.5 | 178.9 | 170.6 | 107.2 | 87 | |
| The Witcher 3 (2015) | 112 | 159.7 | ||||
| Dota 2 Reborn (2015) | 210 | 182.9 | 176.1 | 154.3 | 126.4 | |
| X-Plane 11.11 (2018) | 154.9 | 135.9 | 111 | 102 | ||
| Strange Brigade (2018) | 377 | 267 | 213 | 183.3 | 127.5 | |
| Shadow of the Tomb Raider (2018) | 142 | 94 | ||||
| Cyberpunk 2077 1.6 (2022) | 80.6 | 48.56 | ||||
| Tiny Tina's Wonderlands (2022) | 89.29 | 60.01 | ||||
| F1 22 (2022) | 245 | 235 | 179.8 | 66.4 | 43 | |
| Call of Duty Modern Warfare 2 2022 (2022) | 91 | 66 | ||||
| Hogwarts Legacy (2023) | 90.4 | 70.8 | 64 | 44.4 |
Emissões e energia - alto-falantes silenciosos e ventiladores barulhentos
Emissões de ruído
Infelizmente, nos testes, o XMG Pro 15 provou ser muito barulhento. Usando o modo de desempenho ativado sob carga total e a uma distância de 15 centímetros, medimos 53 dB(A) no Prime95 e no Furmark. No entanto, os ventiladores têm outros truques na manga. Nossa experiência mostra que o modo de entretenimento também oferece desempenho suficiente para muitos jogos. Isso reduz significativamente o nível de ruído emitido pelo laptop. Em uso normal, sem aplicativos 3D, você pode até esperar uma operação muito silenciosa ou silenciosa. Isso, pelo menos, ajuda o notebook a ficar um pouco à frente em comparação com o antecessor.
Barulho
| Ocioso |
| 24 / 24 / 24 dB |
| Carga |
| 53.65 / 53.65 dB |
 | ||
30 dB silencioso 40 dB(A) audível 50 dB(A) ruidosamente alto |
||
min: | ||
| Schenker XMG Pro 15 (E23) GeForce RTX 4060 Laptop GPU, i9-13900HX, Crucial P5 Plus 1TB CT1000P5PSSD8 | Schenker XMG Pro 15 (i7-12700H, RTX 3080 Ti) GeForce RTX 3080 Ti Laptop GPU, i7-12700H, Samsung SSD 980 Pro 1TB MZ-V8P1T0BW | Dell G15 5530 GeForce RTX 4060 Laptop GPU, i7-13650HX, SSTC CL4-3D512-Q11 | Asus TUF A15 FA507 GeForce RTX 4050 Laptop GPU, R7 7735HS, Micron 2400 MTFDKBA512QFM | Aorus 15X ASF GeForce RTX 4070 Laptop GPU, i7-13700HX, Gigabyte AG470S1TB-SI B10 | Asus ZenBook Pro 14 Duo UX8402VV-P1021W GeForce RTX 4060 Laptop GPU, i9-13900H, Samsung PM9A1 MZVL22T0HBLB | MSI Cyborg 15 A12VF GeForce RTX 4060 Laptop GPU, i7-12650H, Samsung PM9B1 1024GB MZVL41T0HBLB | Alienware x16 R1 GeForce RTX 4080 Laptop GPU, i9-13900HK, SK hynix PC801 HFS001TEJ9X101N | |
|---|---|---|---|---|---|---|---|---|
| Noise | -11% | 7% | 14% | -13% | -13% | -25% | 4% | |
| desligado / ambiente * (dB) | 24 | 23 4% | 20.41 15% | 23.3 3% | 25 -4% | 25.2 -5% | 27 -13% | 22.7 5% |
| Idle Minimum * (dB) | 24 | 23 4% | 26.85 -12% | 23.3 3% | 28 -17% | 25.2 -5% | 27 -13% | 23.1 4% |
| Idle Average * (dB) | 24 | 31.22 -30% | 26.85 -12% | 23.3 3% | 29 -21% | 25.2 -5% | 37.5 -56% | 25.8 -8% |
| Idle Maximum * (dB) | 24 | 33.09 -38% | 26.85 -12% | 23.3 3% | 36 -50% | 32.5 -35% | 38 -58% | 25.8 -8% |
| Load Average * (dB) | 53.65 | 56.35 -5% | 27.65 48% | 29.6 45% | 50 7% | 59.7 -11% | 56.3 -5% | 39.3 27% |
| Witcher 3 ultra * (dB) | 53.53 | 56.89 -6% | 47.9 11% | 43 20% | 54 -1% | 49.9 7% | ||
| Load Maximum * (dB) | 53.65 | 56.89 -6% | 47.86 11% | 43 20% | 58 -8% | 60.9 -14% | 56.3 -5% | 54.8 -2% |
* ... menor é melhor
Temperatura
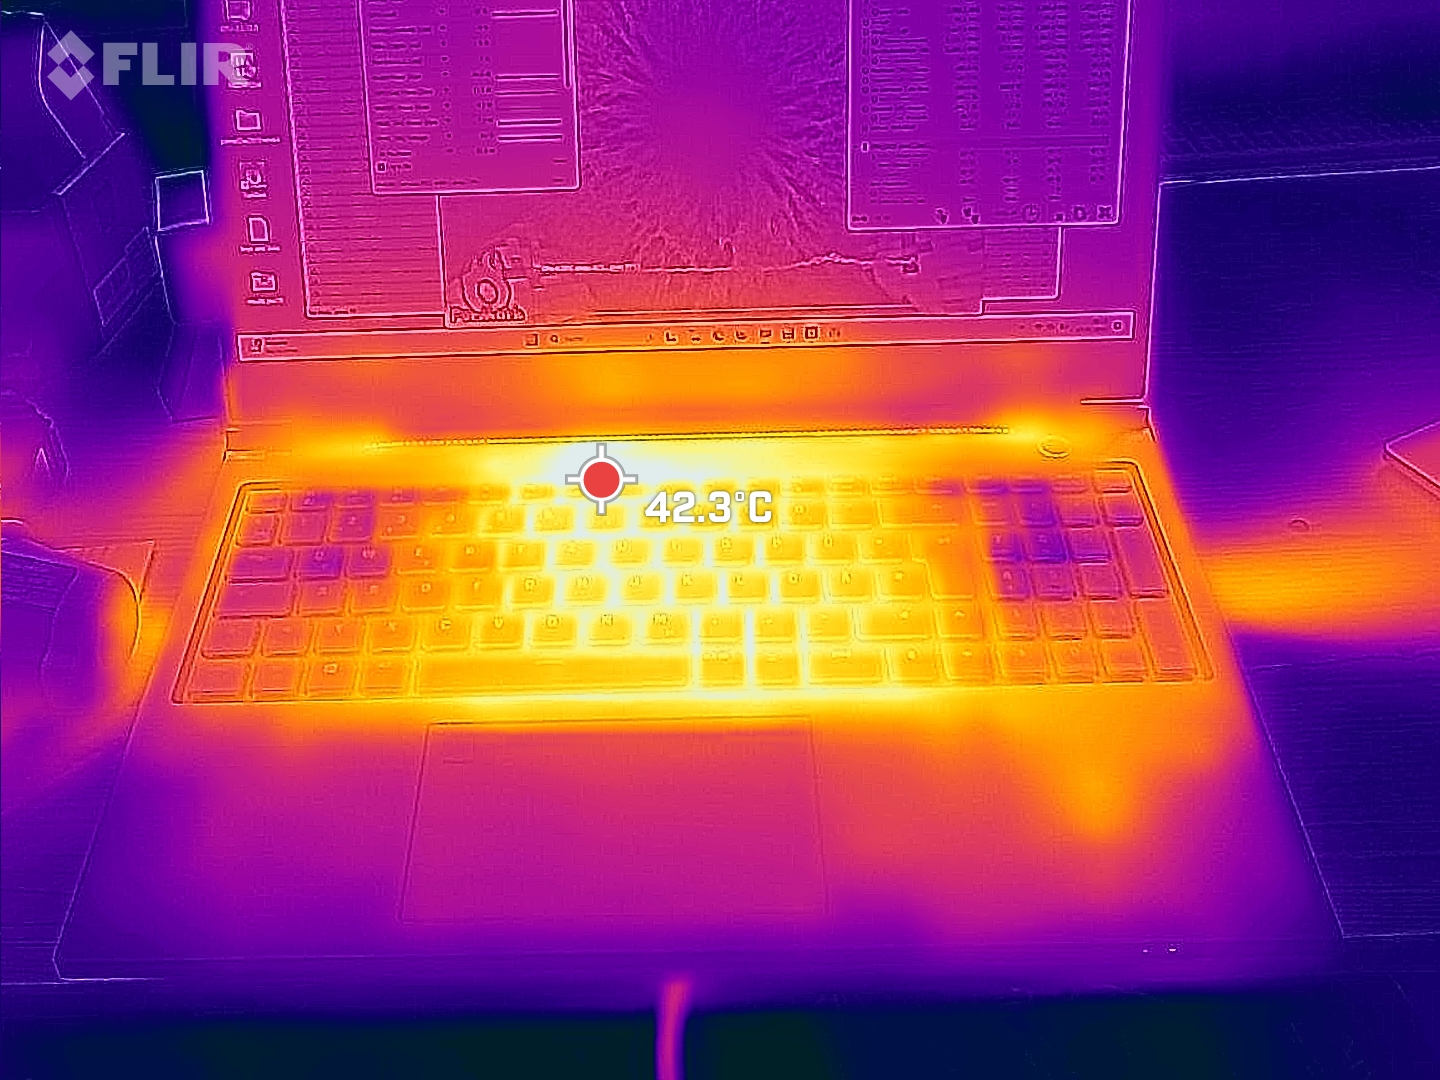
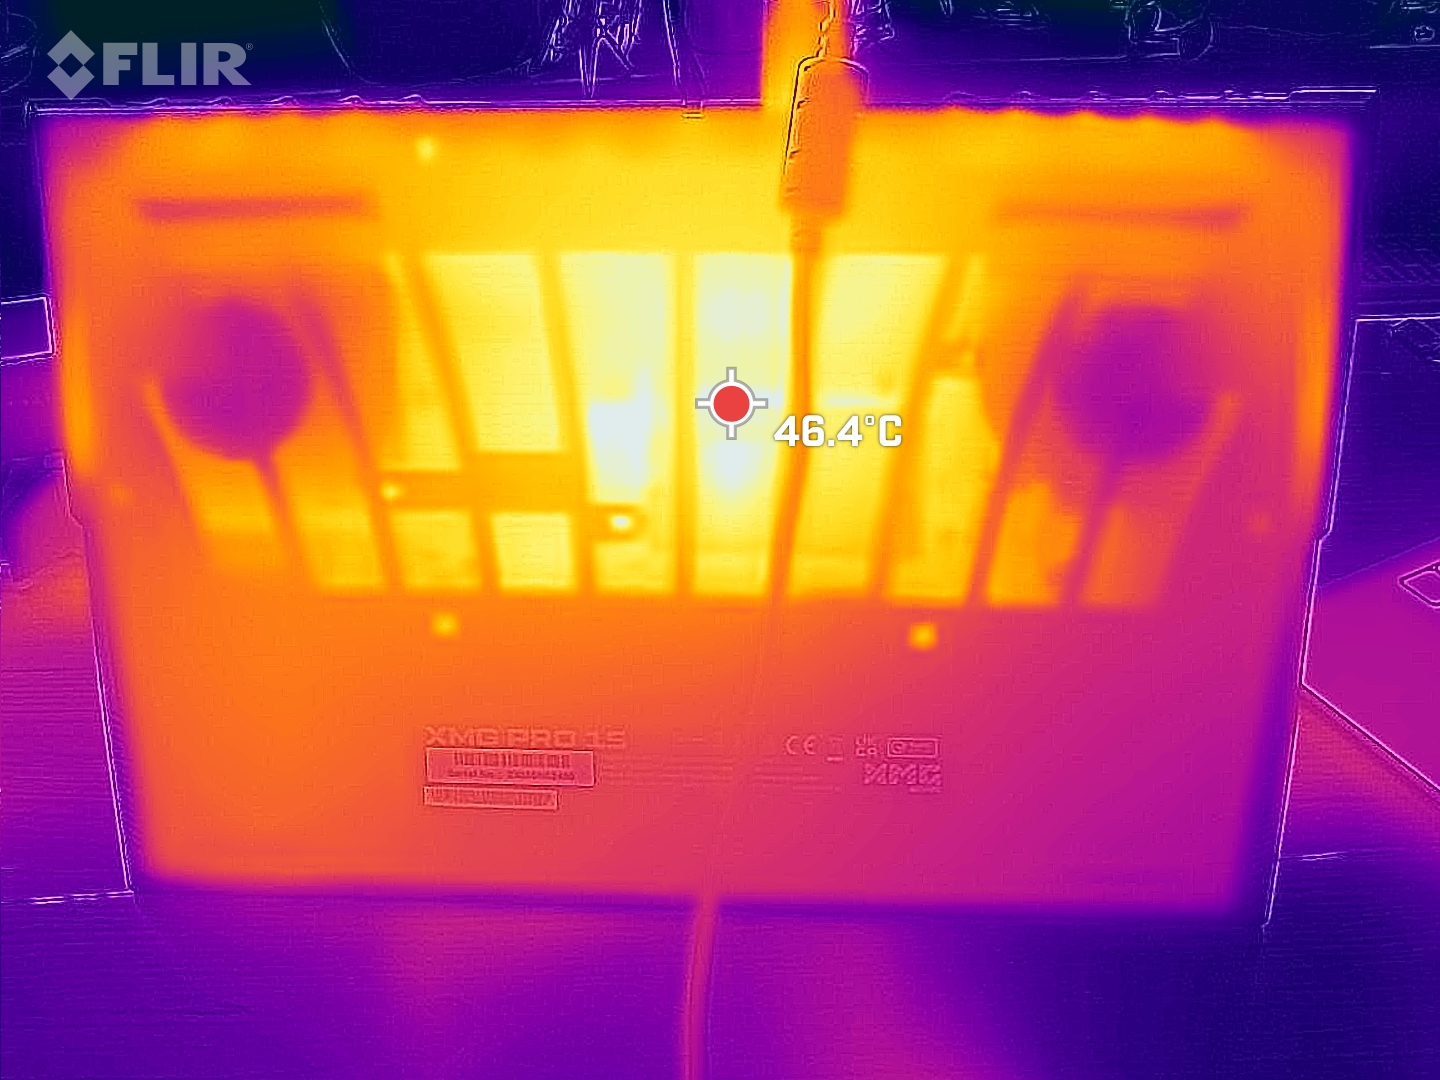
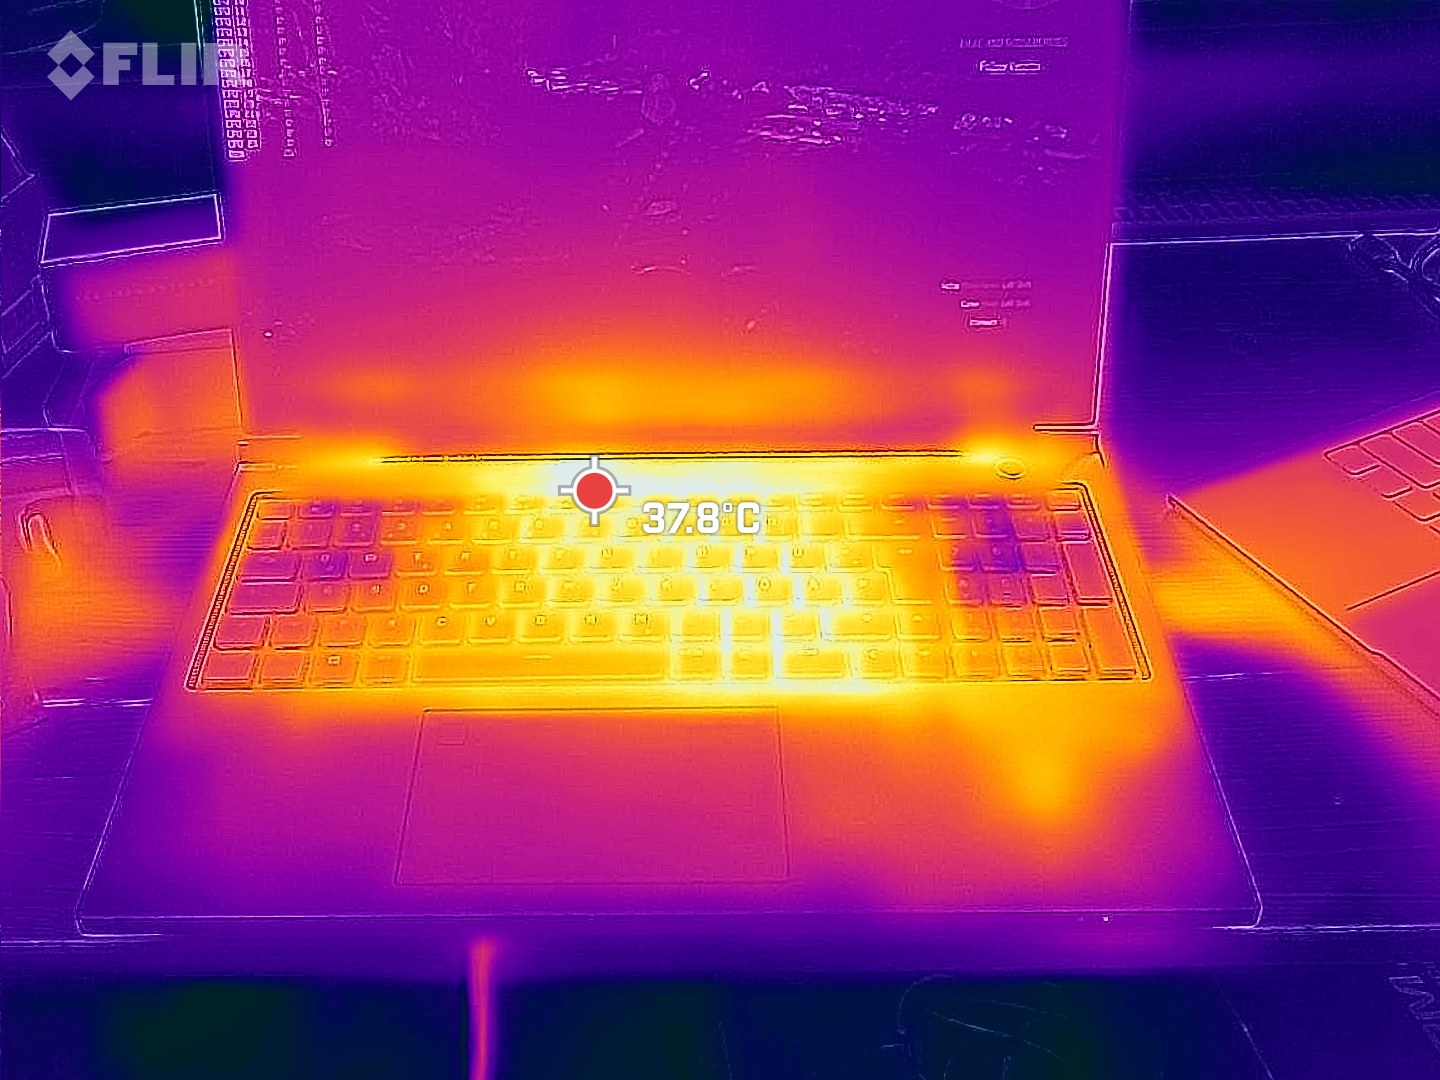
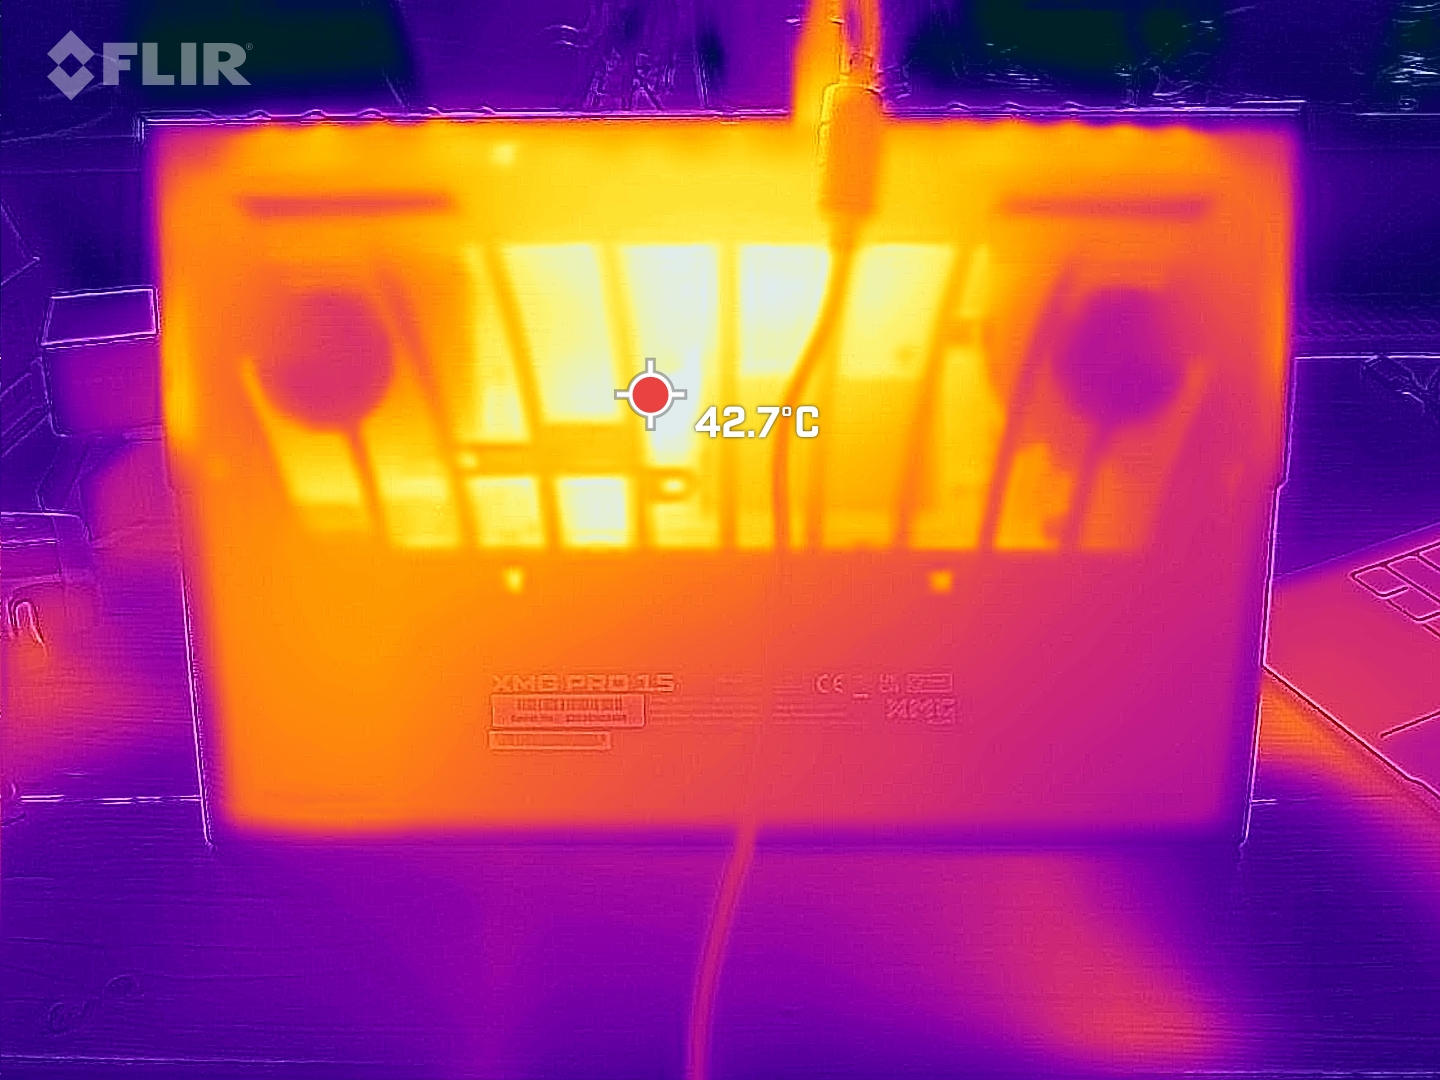
Com temperaturas de superfície de até 50 °C no teste de estresse, o XMG Pro 15 é consideravelmente mais quente do que muitos de seus concorrentes. Entretanto, por um lado, estamos falando apenas de pontos de acesso relativamente pequenos e, por outro, a superfície da unidade base é feita de plástico. Em contato, isso faz com que as altas temperaturas pareçam significativamente mais baixas. Ao jogar, seria errado descrever o teclado como frio, mas ele não parece desagradavelmente quente. O desempenho do laptop também não é prejudicado com o passar do tempo.
(-) A temperatura máxima no lado superior é 50 °C / 122 F, em comparação com a média de 40.4 °C / 105 F , variando de 21.2 a 68.8 °C para a classe Gaming.
(-) A parte inferior aquece até um máximo de 50 °C / 122 F, em comparação com a média de 43.2 °C / 110 F
(+) Em uso inativo, a temperatura média para o lado superior é 28.7 °C / 84 F, em comparação com a média do dispositivo de 33.9 °C / ### class_avg_f### F.
(±) Jogando The Witcher 3, a temperatura média para o lado superior é 35.6 °C / 96 F, em comparação com a média do dispositivo de 33.9 °C / ## #class_avg_f### F.
(+) Os apoios para as mãos e o touchpad estão atingindo a temperatura máxima da pele (34 °C / 93.2 F) e, portanto, não estão quentes.
(-) A temperatura média da área do apoio para as mãos de dispositivos semelhantes foi 28.8 °C / 83.8 F (-5.2 °C / -9.4 F).
| Schenker XMG Pro 15 (E23) Intel Core i9-13900HX, NVIDIA GeForce RTX 4060 Laptop GPU | Schenker XMG Pro 15 (i7-12700H, RTX 3080 Ti) Intel Core i7-12700H, NVIDIA GeForce RTX 3080 Ti Laptop GPU | Dell G15 5530 Intel Core i7-13650HX, NVIDIA GeForce RTX 4060 Laptop GPU | Asus TUF A15 FA507 AMD Ryzen 7 7735HS, NVIDIA GeForce RTX 4050 Laptop GPU | Aorus 15X ASF Intel Core i7-13700HX, NVIDIA GeForce RTX 4070 Laptop GPU | Asus ZenBook Pro 14 Duo UX8402VV-P1021W Intel Core i9-13900H, NVIDIA GeForce RTX 4060 Laptop GPU | MSI Cyborg 15 A12VF Intel Core i7-12650H, NVIDIA GeForce RTX 4060 Laptop GPU | Alienware x16 R1 Intel Core i9-13900HK, NVIDIA GeForce RTX 4080 Laptop GPU | |
|---|---|---|---|---|---|---|---|---|
| Heat | -5% | -9% | 11% | 13% | 9% | 15% | -4% | |
| Maximum Upper Side * (°C) | 50 | 57 -14% | 54 -8% | 48.9 2% | 42 16% | 37.1 26% | 47.5 5% | 47.2 6% |
| Maximum Bottom * (°C) | 50 | 52 -4% | 62.2 -24% | 44.6 11% | 51 -2% | 49.4 1% | 35.5 29% | 47.8 4% |
| Idle Upper Side * (°C) | 33 | 32 3% | 33.4 -1% | 27.1 18% | 27 18% | 30 9% | 27.7 16% | 36.8 -12% |
| Idle Bottom * (°C) | 32 | 34 -6% | 33.4 -4% | 27.5 14% | 26 19% | 32.4 -1% | 29.5 8% | 35.8 -12% |
* ... menor é melhor
Alto-falantes
O volume médio percebido dos dois alto-falantes do XMG Pro 15 é de apenas 72,5 dB(A). Muitas faixas de frequência estão significativamente abaixo do volume do ventilador sob carga. Como resultado, ao jogar, é necessário usar um headset ou alto-falantes externos. Eles podem ser conectados por meio do conector de fone de ouvido de 3,5 mm, Bluetooth ou S/PDIF óptico por meio do conector de 3,5 mm. Usando esse método, também é possível conectar um sistema de som surround diretamente ao computador.
Schenker XMG Pro 15 (E23) análise de áudio
(±) | o volume do alto-falante é médio, mas bom (###valor### dB)
Graves 100 - 315Hz
(±) | graves reduzidos - em média 12.9% menor que a mediana
(±) | a linearidade dos graves é média (7.2% delta para a frequência anterior)
Médios 400 - 2.000 Hz
(±) | médios mais altos - em média 6.2% maior que a mediana
(±) | a linearidade dos médios é média (7.8% delta para frequência anterior)
Altos 2 - 16 kHz
(+) | agudos equilibrados - apenas 2.5% longe da mediana
(+) | os máximos são lineares (4.6% delta da frequência anterior)
Geral 100 - 16.000 Hz
(±) | a linearidade do som geral é média (18% diferença em relação à mediana)
Comparado com a mesma classe
» 55% de todos os dispositivos testados nesta classe foram melhores, 9% semelhantes, 36% piores
» O melhor teve um delta de 6%, a média foi 18%, o pior foi 132%
Comparado com todos os dispositivos testados
» 38% de todos os dispositivos testados foram melhores, 8% semelhantes, 54% piores
» O melhor teve um delta de 4%, a média foi 23%, o pior foi 134%
Asus ZenBook Pro 14 Duo UX8402VV-P1021W análise de áudio
(+) | os alto-falantes podem tocar relativamente alto (###valor### dB)
Graves 100 - 315Hz
(-) | quase nenhum baixo - em média 19.9% menor que a mediana
(±) | a linearidade dos graves é média (11.9% delta para a frequência anterior)
Médios 400 - 2.000 Hz
(+) | médios equilibrados - apenas 1.2% longe da mediana
(+) | médios são lineares (4.7% delta para frequência anterior)
Altos 2 - 16 kHz
(±) | máximos mais altos - em média 5.5% maior que a mediana
(+) | os máximos são lineares (5.9% delta da frequência anterior)
Geral 100 - 16.000 Hz
(±) | a linearidade do som geral é média (16.1% diferença em relação à mediana)
Comparado com a mesma classe
» 41% de todos os dispositivos testados nesta classe foram melhores, 6% semelhantes, 53% piores
» O melhor teve um delta de 5%, a média foi 17%, o pior foi 45%
Comparado com todos os dispositivos testados
» 26% de todos os dispositivos testados foram melhores, 5% semelhantes, 69% piores
» O melhor teve um delta de 4%, a média foi 23%, o pior foi 134%
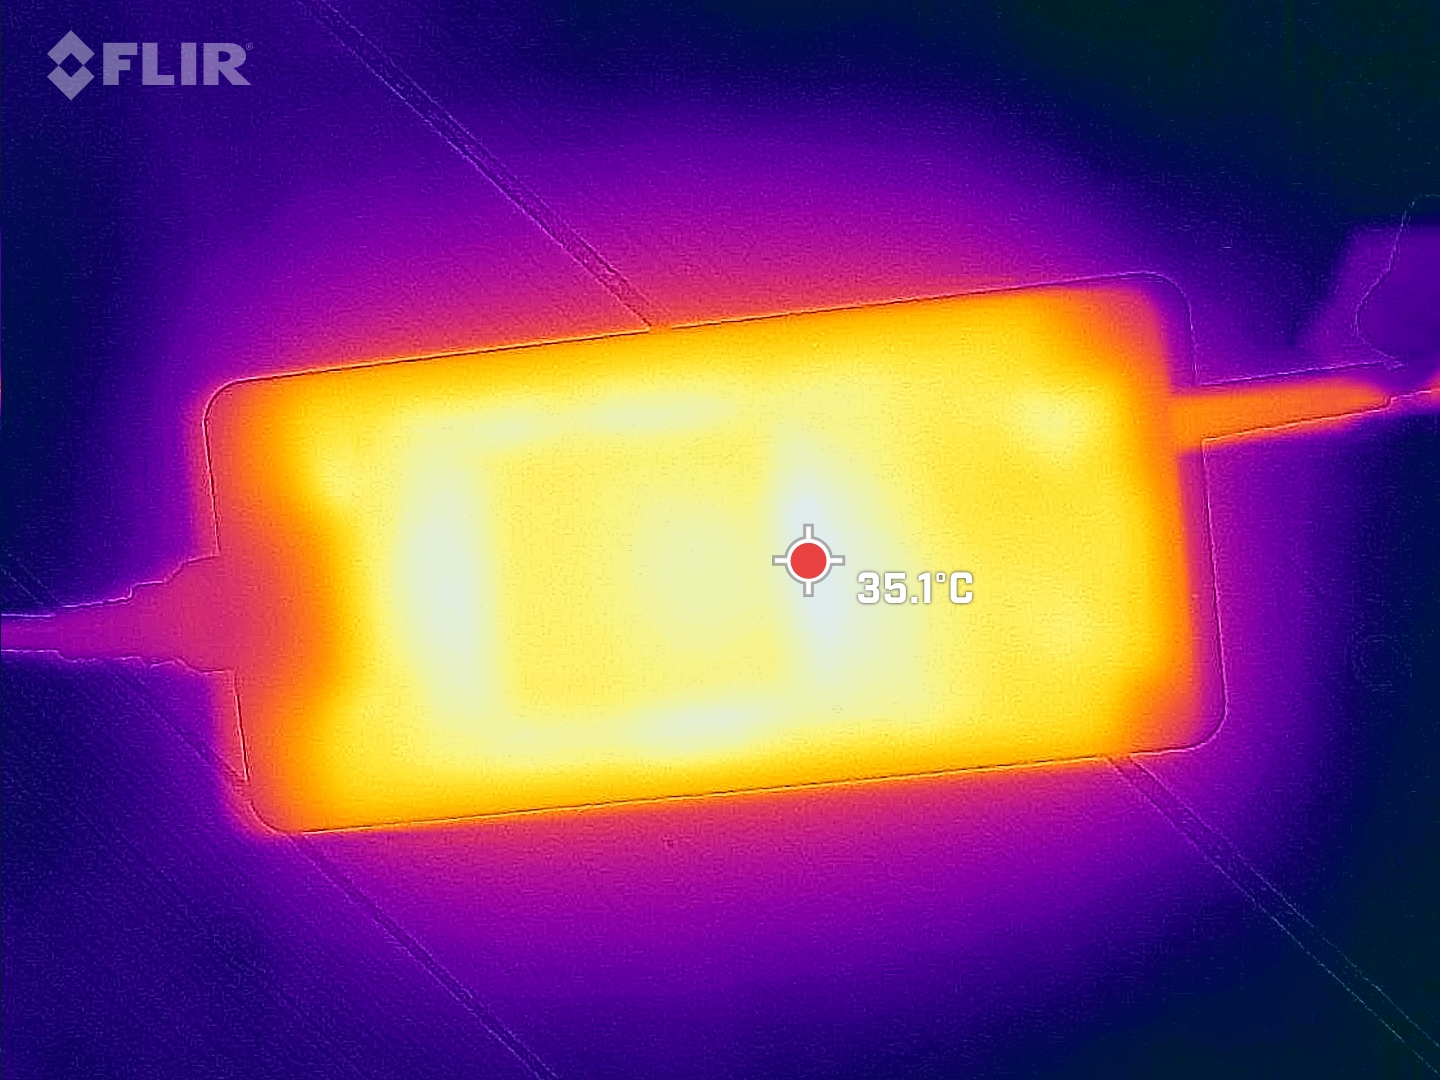
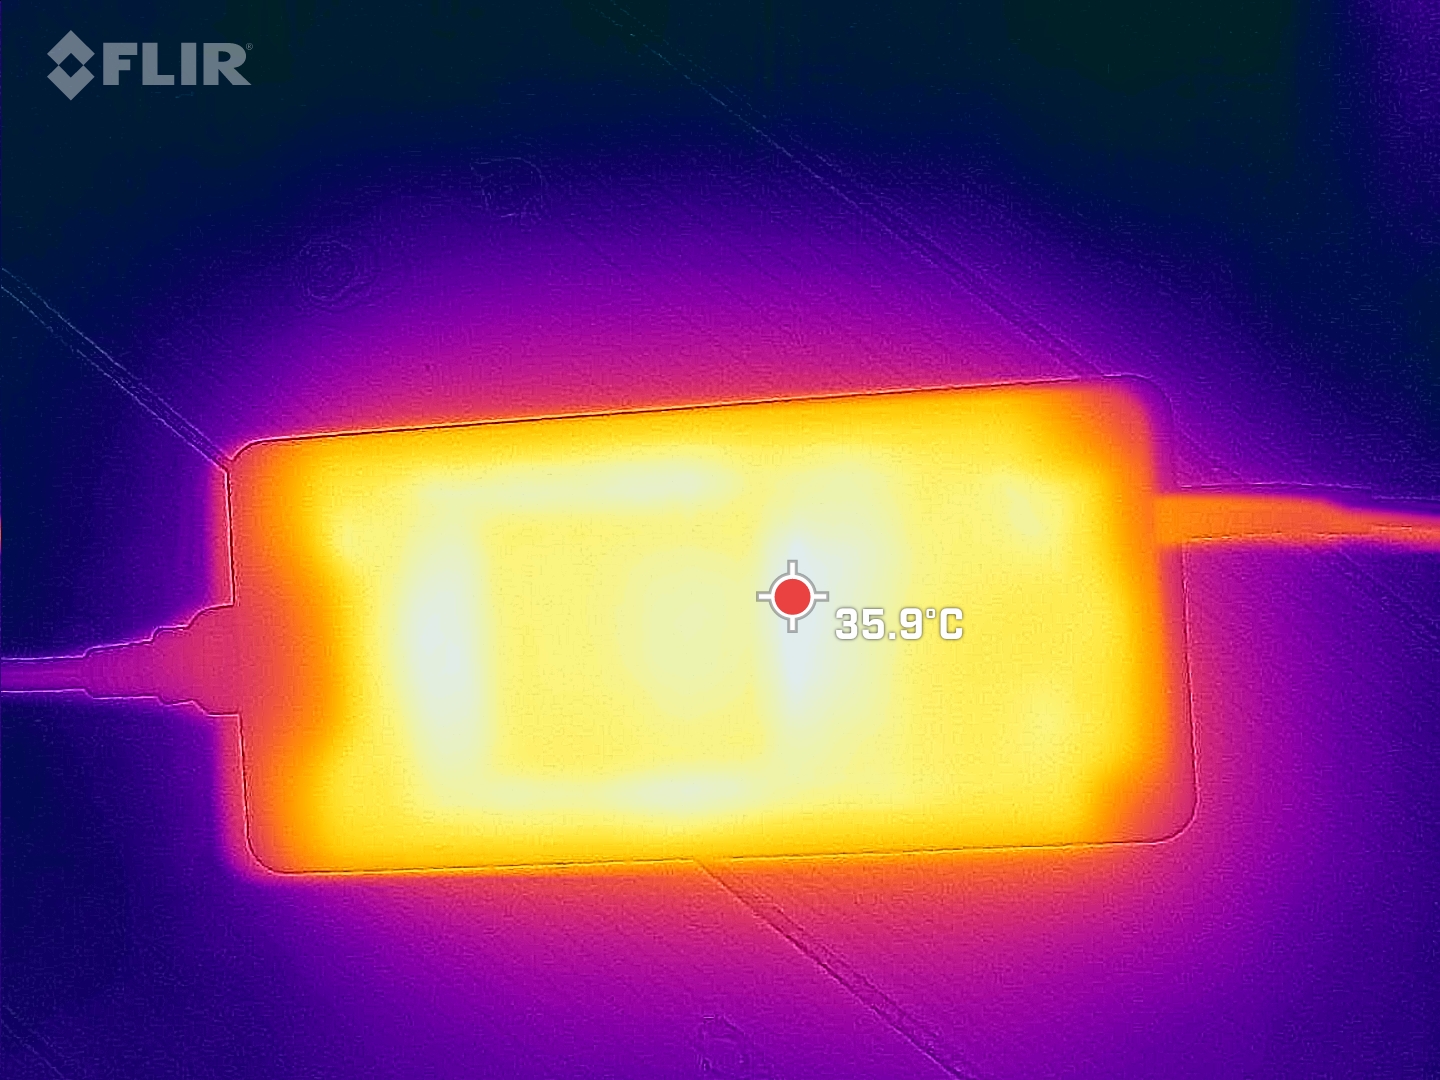
Consumo de energia
De acordo com sua categoria, o Schenker XMG Pro 15 não é um milagre de economia de energia. Uma PSU grande está incluída e pode fornecer até 280 watts. Quando usado com o laptop para jogos, isso significa que ele ainda tem um pouco de reserva. No teste de estresse Prime95 e no Furmark, ela consumiu um máximo de 269 watts, mas, em média, ficou em torno de 215 watts.
| desligado | |
| Ocioso | |
| Carga |
|
Key:
min: | |
Power consumption Witcher 3 / stress test
Power consumption with an external monitor
Duração da bateria
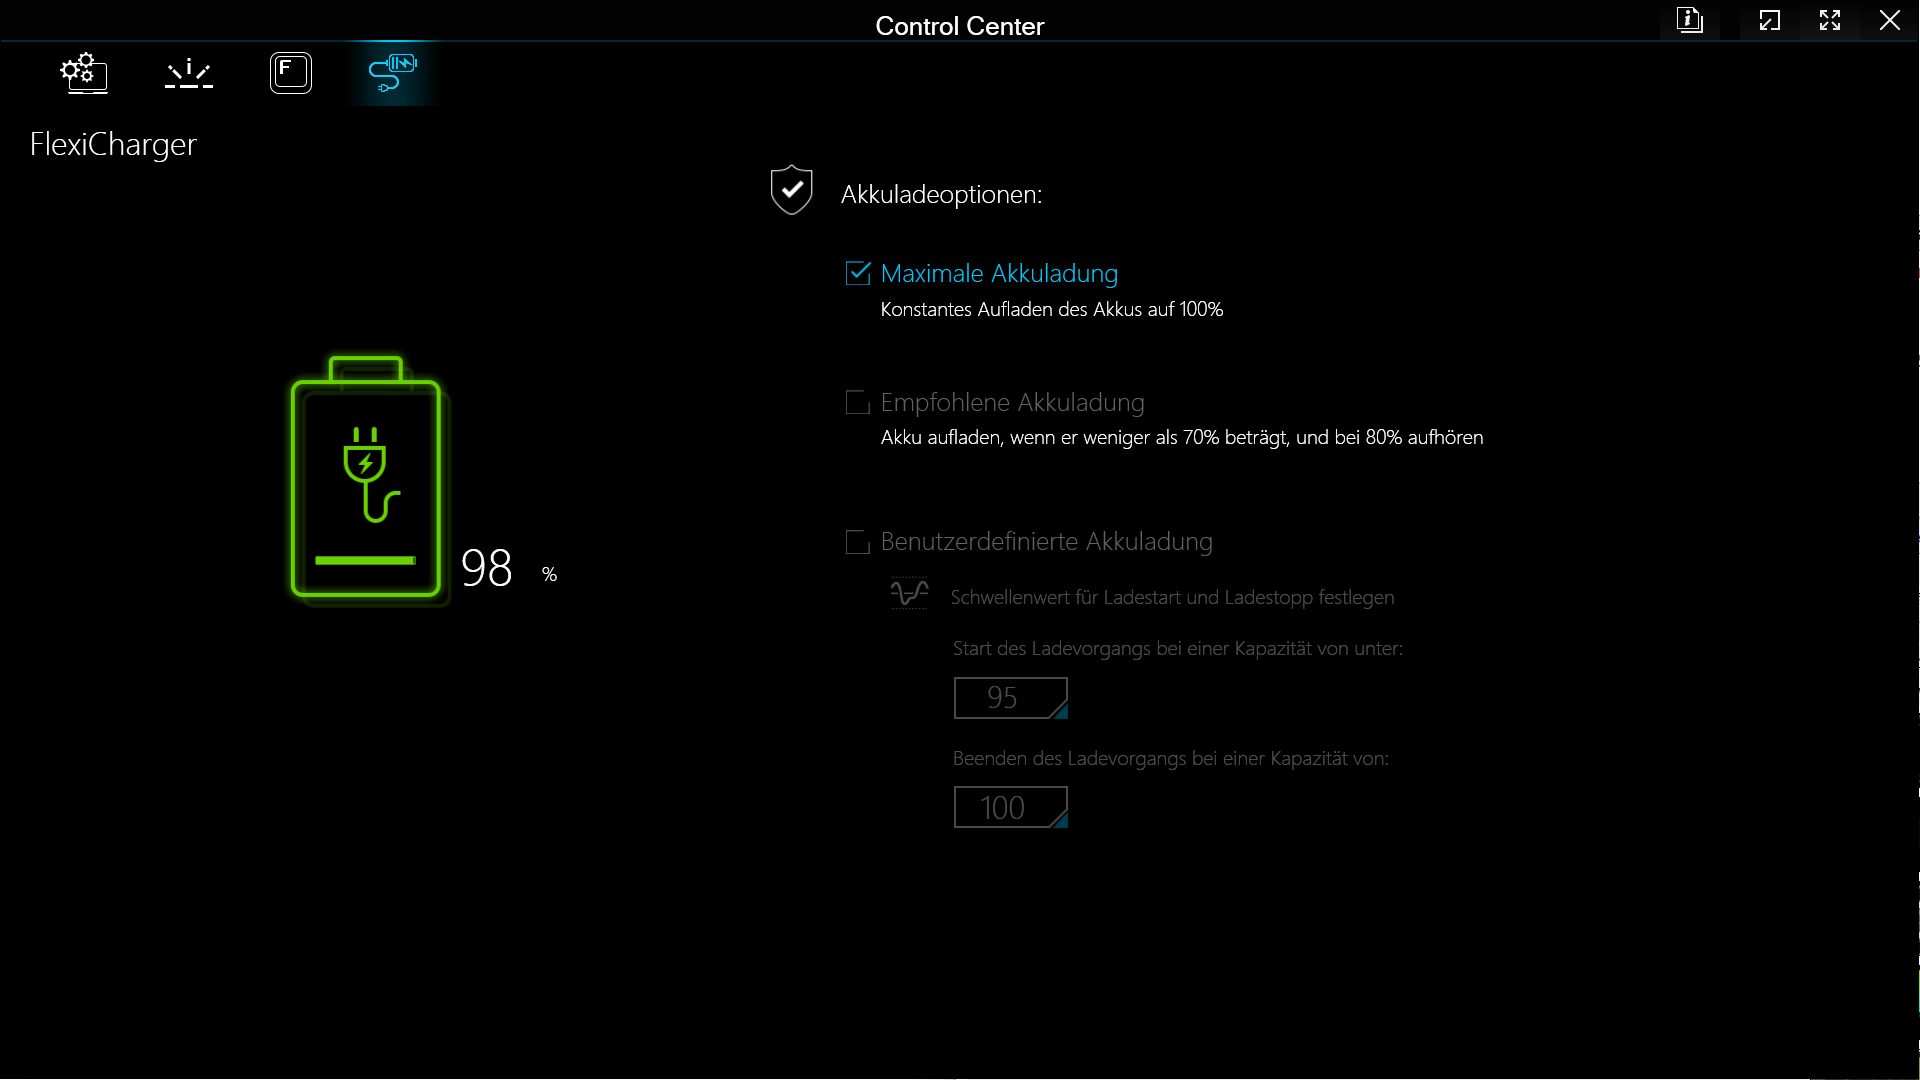
Em nosso teste de navegação na Internet por Wi-Fi, o XMG Pro 15 E23 não conseguiu mais do que seis horas. No entanto, não se pode esperar muito mais de uma bateria de 80 Wh. Dito isso, o dispositivo analisado tem um pequeno problema quando se trata do modo de suspensão da dGPU, que nem sempre é ativado de forma confiável, mas a Schenker está ciente do problema e está trabalhando em uma solução.
| Schenker XMG Pro 15 (E23) i9-13900HX, GeForce RTX 4060 Laptop GPU, 80 Wh | Schenker XMG Pro 15 (i7-12700H, RTX 3080 Ti) i7-12700H, GeForce RTX 3080 Ti Laptop GPU, 80 Wh | Dell G15 5530 i7-13650HX, GeForce RTX 4060 Laptop GPU, 86 Wh | Asus TUF A15 FA507 R7 7735HS, GeForce RTX 4050 Laptop GPU, 90 Wh | Aorus 15X ASF i7-13700HX, GeForce RTX 4070 Laptop GPU, 99 Wh | Asus ZenBook Pro 14 Duo UX8402VV-P1021W i9-13900H, GeForce RTX 4060 Laptop GPU, 76 Wh | MSI Cyborg 15 A12VF i7-12650H, GeForce RTX 4060 Laptop GPU, 53.5 Wh | Alienware x16 R1 i9-13900HK, GeForce RTX 4080 Laptop GPU, 90 Wh | Média da turma Gaming | |
|---|---|---|---|---|---|---|---|---|---|
| Duração da bateria | -2% | -22% | 29% | 25% | 71% | 27% | -60% | 2% | |
| WiFi v1.3 (h) | 5.7 | 5.8 2% | 6.5 14% | 11.7 105% | 8.2 44% | 9 58% | 7.5 32% | 2.5 -56% | 7.08 ? 24% |
| Load (h) | 1.9 | 1.8 -5% | 0.8 -58% | 1 -47% | 2 5% | 3.5 84% | 2.3 21% | 0.7 -63% | 1.51 ? -21% |
| H.264 (h) | 5.3 | 6.8 | 12.5 | 7.9 | 8 | 8.9 ? | |||
| Witcher 3 ultra (h) | 0.8 | ||||||||
| Reader / Idle (h) | 11.3 | 13.6 | 7.3 | 8.71 ? |
Pro
Contra
Veredicto - perfeito para o equilíbrio entre trabalho e lazer

O XMG Pro 15 E23 é anunciado como uma estação de trabalho para jogos. Em nossa análise, ele atende a todos os requisitos de um bom laptop de médio porte para jogos, mas também a muitos aspectos que o tornam um laptop decente para trabalhos com vídeos e filmes. O design discreto não reflete de forma alguma o desempenho estrondoso do dispositivo de 15,6 polegadas. Ao sair da caixa, a Schenker refinou um barebone sólido que vem com bons dispositivos de entrada e uma forte seleção de portas, além de componentes premium.
Algumas das desvantagens do antecessor foram significativamente reduzidas ou completamente eliminadas. Agora o SSD funciona de forma estável em altas velocidades, a tela é mais brilhante e o volume foi ligeiramente ajustado. O laptop para jogos pode ainda não ser silencioso, mas agora ele sabe os momentos certos para se comportar adequadamente.
Algumas das bordas irregulares do XMG Pro 15 E23 foram suavizadas, o que significa que o laptop para jogos agora só apresenta alguns pequenos incômodos.
Não há pontos negativos evidentes que se destaquem. A falta de uma porta USB traseira é bastante lamentável, o que significa que somente uma configuração de mouse e teclado sem fio resultará em uma área de trabalho sem cabos. Quem não quiser levar o laptop permanentemente aos seus limites de desempenho gostará de usar o modo de entretenimento silencioso. A maioria dos jogos também funciona bem. Apenas os tempos de resposta lentos da tela QHD de 240 Hz nos incomodam. Enquanto isso, a diferença em relação aos concorrentes, como oAorus 15X ASF ou MSI Cyborg 15 só pode ser encontrada nos detalhes. Qualquer pessoa que esteja de olho em um laptop para jogos mais empolgante seria melhor dar uma olhada noAlienware x16 R1 ou oAsus ROG Strix G16- mas você não será recompensado com muito mais potência.
Preço e disponibilidade
O XMG Pro 15 pode ser configurado na Bestware. Sem o Windows, um SSD e a quantidade mínima de RAM, o laptop custa a partir de 1.893 euros. Nosso dispositivo de análise sem o Windows 11 custa 2.150 euros. Para um Windows 11 Home ativado, a Bestware está pedindo um adicional de 100 euros. A Schenker claramente não está seguindo a espiral ascendente de preços. No ano passado, o Pro 15 E22com uma RTX 3070 Ti, 32 GB de RAM e um SSD de 1 TB custava 2.510 euros. Para o E23 com uma RTX 4070, 32 GB de RAM e um SSD de 1 TB, a Bestware tem um preço pedido de 2.400 euros.
Schenker XMG Pro 15 (E23)
- 07/04/2023 v7 (old)
Marc Herter
Transparência
A seleção dos dispositivos a serem analisados é feita pela nossa equipe editorial. A amostra de teste foi fornecida ao autor como empréstimo pelo fabricante ou varejista para fins desta revisão. O credor não teve influência nesta revisão, nem o fabricante recebeu uma cópia desta revisão antes da publicação. Não houve obrigação de publicar esta revisão. Como empresa de mídia independente, a Notebookcheck não está sujeita à autoridade de fabricantes, varejistas ou editores.
É assim que o Notebookcheck está testando
Todos os anos, o Notebookcheck analisa de forma independente centenas de laptops e smartphones usando procedimentos padronizados para garantir que todos os resultados sejam comparáveis. Desenvolvemos continuamente nossos métodos de teste há cerca de 20 anos e definimos padrões da indústria no processo. Em nossos laboratórios de teste, equipamentos de medição de alta qualidade são utilizados por técnicos e editores experientes. Esses testes envolvem um processo de validação em vários estágios. Nosso complexo sistema de classificação é baseado em centenas de medições e benchmarks bem fundamentados, o que mantém a objetividade.Price comparison

