Análise do Dell XPS 16 9640 - O laptop multimídia com OLED 4K e uma barra de toque irritante
A Dell substituiu seu conhecido laptop multimídia, o XPS 15, por dois novos modelos: Em primeiro lugar, o mais compacto XPS 14, que já testamos exaustivamente-e seu conceito revelou algumas questões para nós. Hoje, vamos dar uma olhada no modelo maior, de 16 polegadas, ou seja, o XPS 16. Em geral, sua receita é idêntica e, além dos novos processadores Meteor Lake da Intel, ele usa placas de vídeo dedicadas da Nvidia, mas desta vez também os modelos mais potentes, até o laptop RTX 4070. Há algumas diferenças adicionais, que discutiremos em mais detalhes no decorrer desta análise.
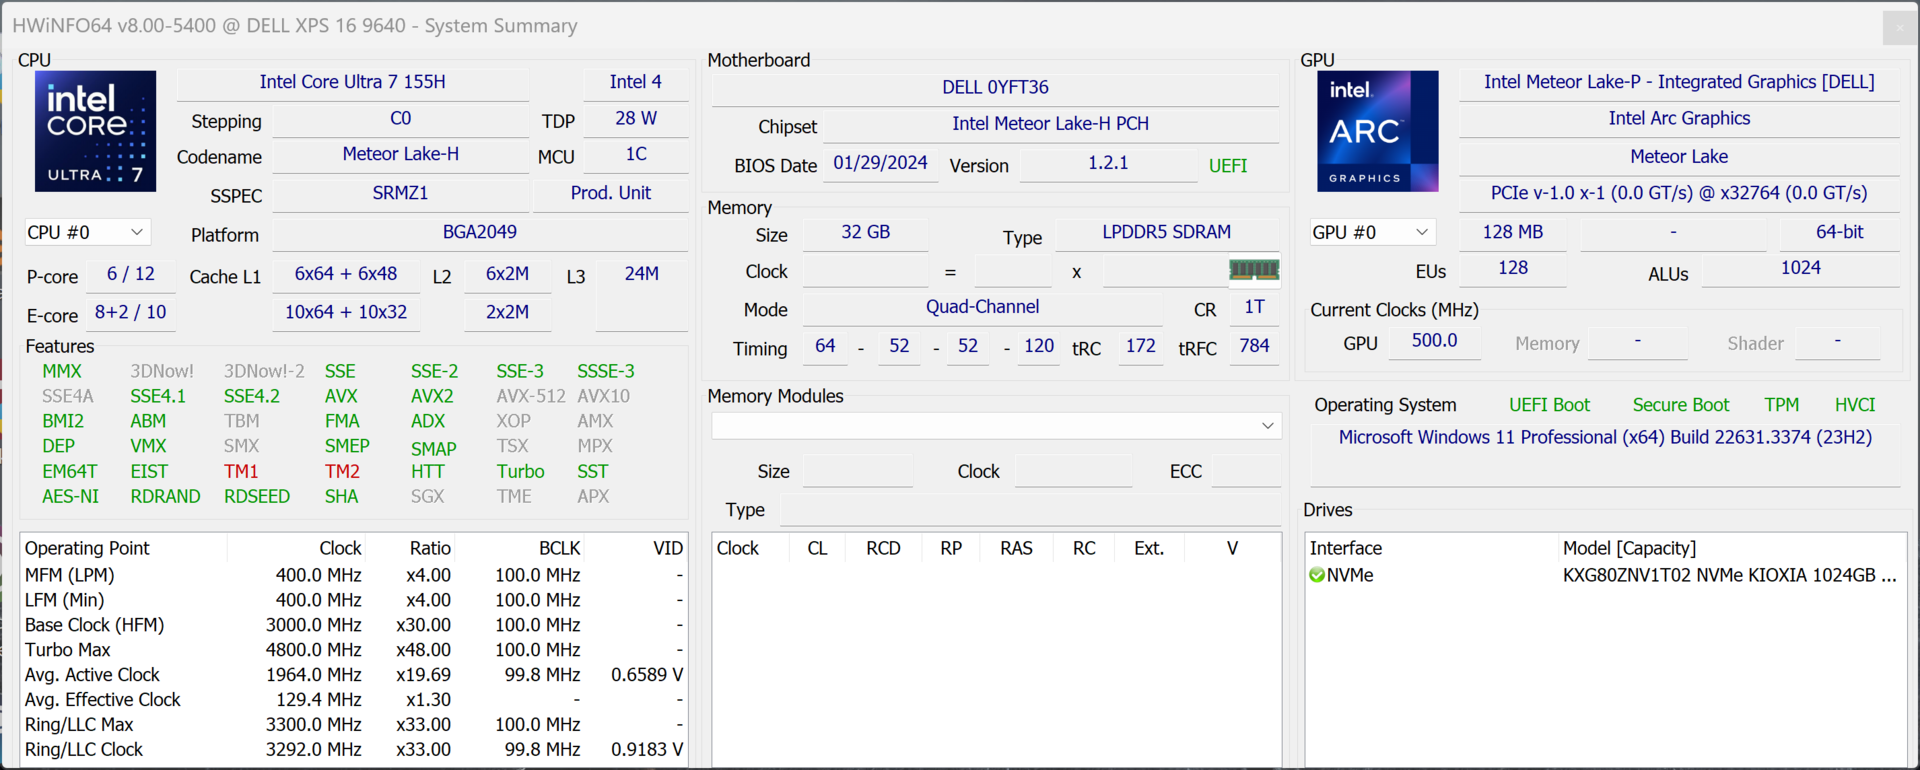
Nosso dispositivo de teste é uma configuração bem equipada com o Core Ultra 7 155H, o RTX 4070 Laptop, 32 GB de RAM, um SSD de 1 TB, bem como uma tela sensível ao toque OLED de alta resolução por US$ 2.899. Como resultado, o XPS 16 concorre com outros notebooks multimídia de alta qualidade e híbridos para jogos/multimídia, como o ROG Zephyrus G16.
Possíveis concorrentes em comparação
Avaliação | Data | Modelo | Peso | Altura | Size | Resolução | Preço |
|---|---|---|---|---|---|---|---|
| 88.6 % v7 (old) | 04/2024 | Dell XPS 16 9640 Ultra 7 155H, GeForce RTX 4070 Laptop GPU | 2.3 kg | 18.7 mm | 16.30" | 3840x2400 | |
| 90.4 % v7 (old) | 03/2024 | Samsung Galaxy Book4 Ultra Ultra 7 155H, GeForce RTX 4050 Laptop GPU | 1.8 kg | 17 mm | 16.00" | 2880x1800 | |
| 90 % v7 (old) | 03/2024 | Honor MagicBook Pro 16 2024 Ultra 7 155H, GeForce RTX 4060 Laptop GPU | 1.9 kg | 17.9 mm | 16.00" | 3072x1920 | |
| 92.3 % v7 (old) | 02/2024 | Asus ROG Zephyrus G16 2024 GU605M Ultra 7 155H, GeForce RTX 4070 Laptop GPU | 1.8 kg | 16.4 mm | 16.00" | 2560x1600 | |
| 88.4 % v7 (old) | 08/2023 | Lenovo Yoga Pro 9 16-IRP G8 i7-13705H, GeForce RTX 4060 Laptop GPU | 2.2 kg | 18.2 mm | 16.00" | 3200x2000 | |
| 88.6 % v7 (old) | 07/2023 | Schenker VISION 16 Pro (M23) i7-13700H, GeForce RTX 4070 Laptop GPU | 1.6 kg | 17.1 mm | 16.00" | 2560x1600 | |
| 90.3 % v7 (old) | 04/2023 | Dell XPS 15 9530 RTX 4070 i7-13700H, GeForce RTX 4070 Laptop GPU | 1.9 kg | 18 mm | 15.60" | 3456x2160 |
Estojo - Estojo de alumínio estável
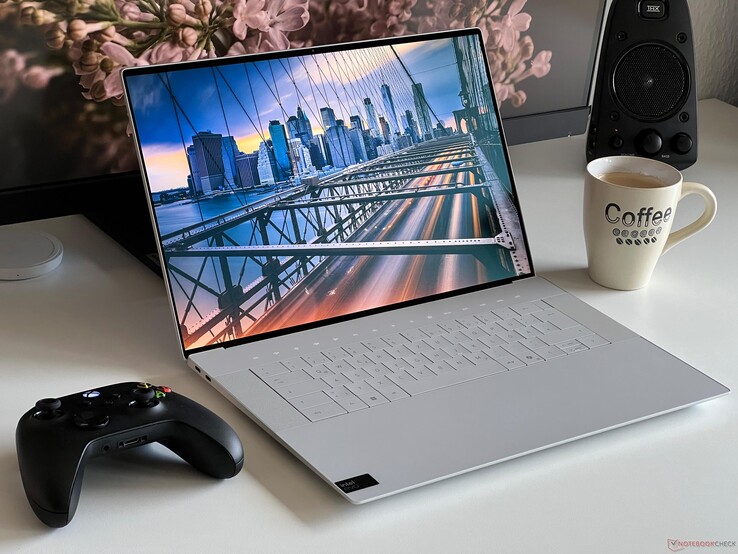
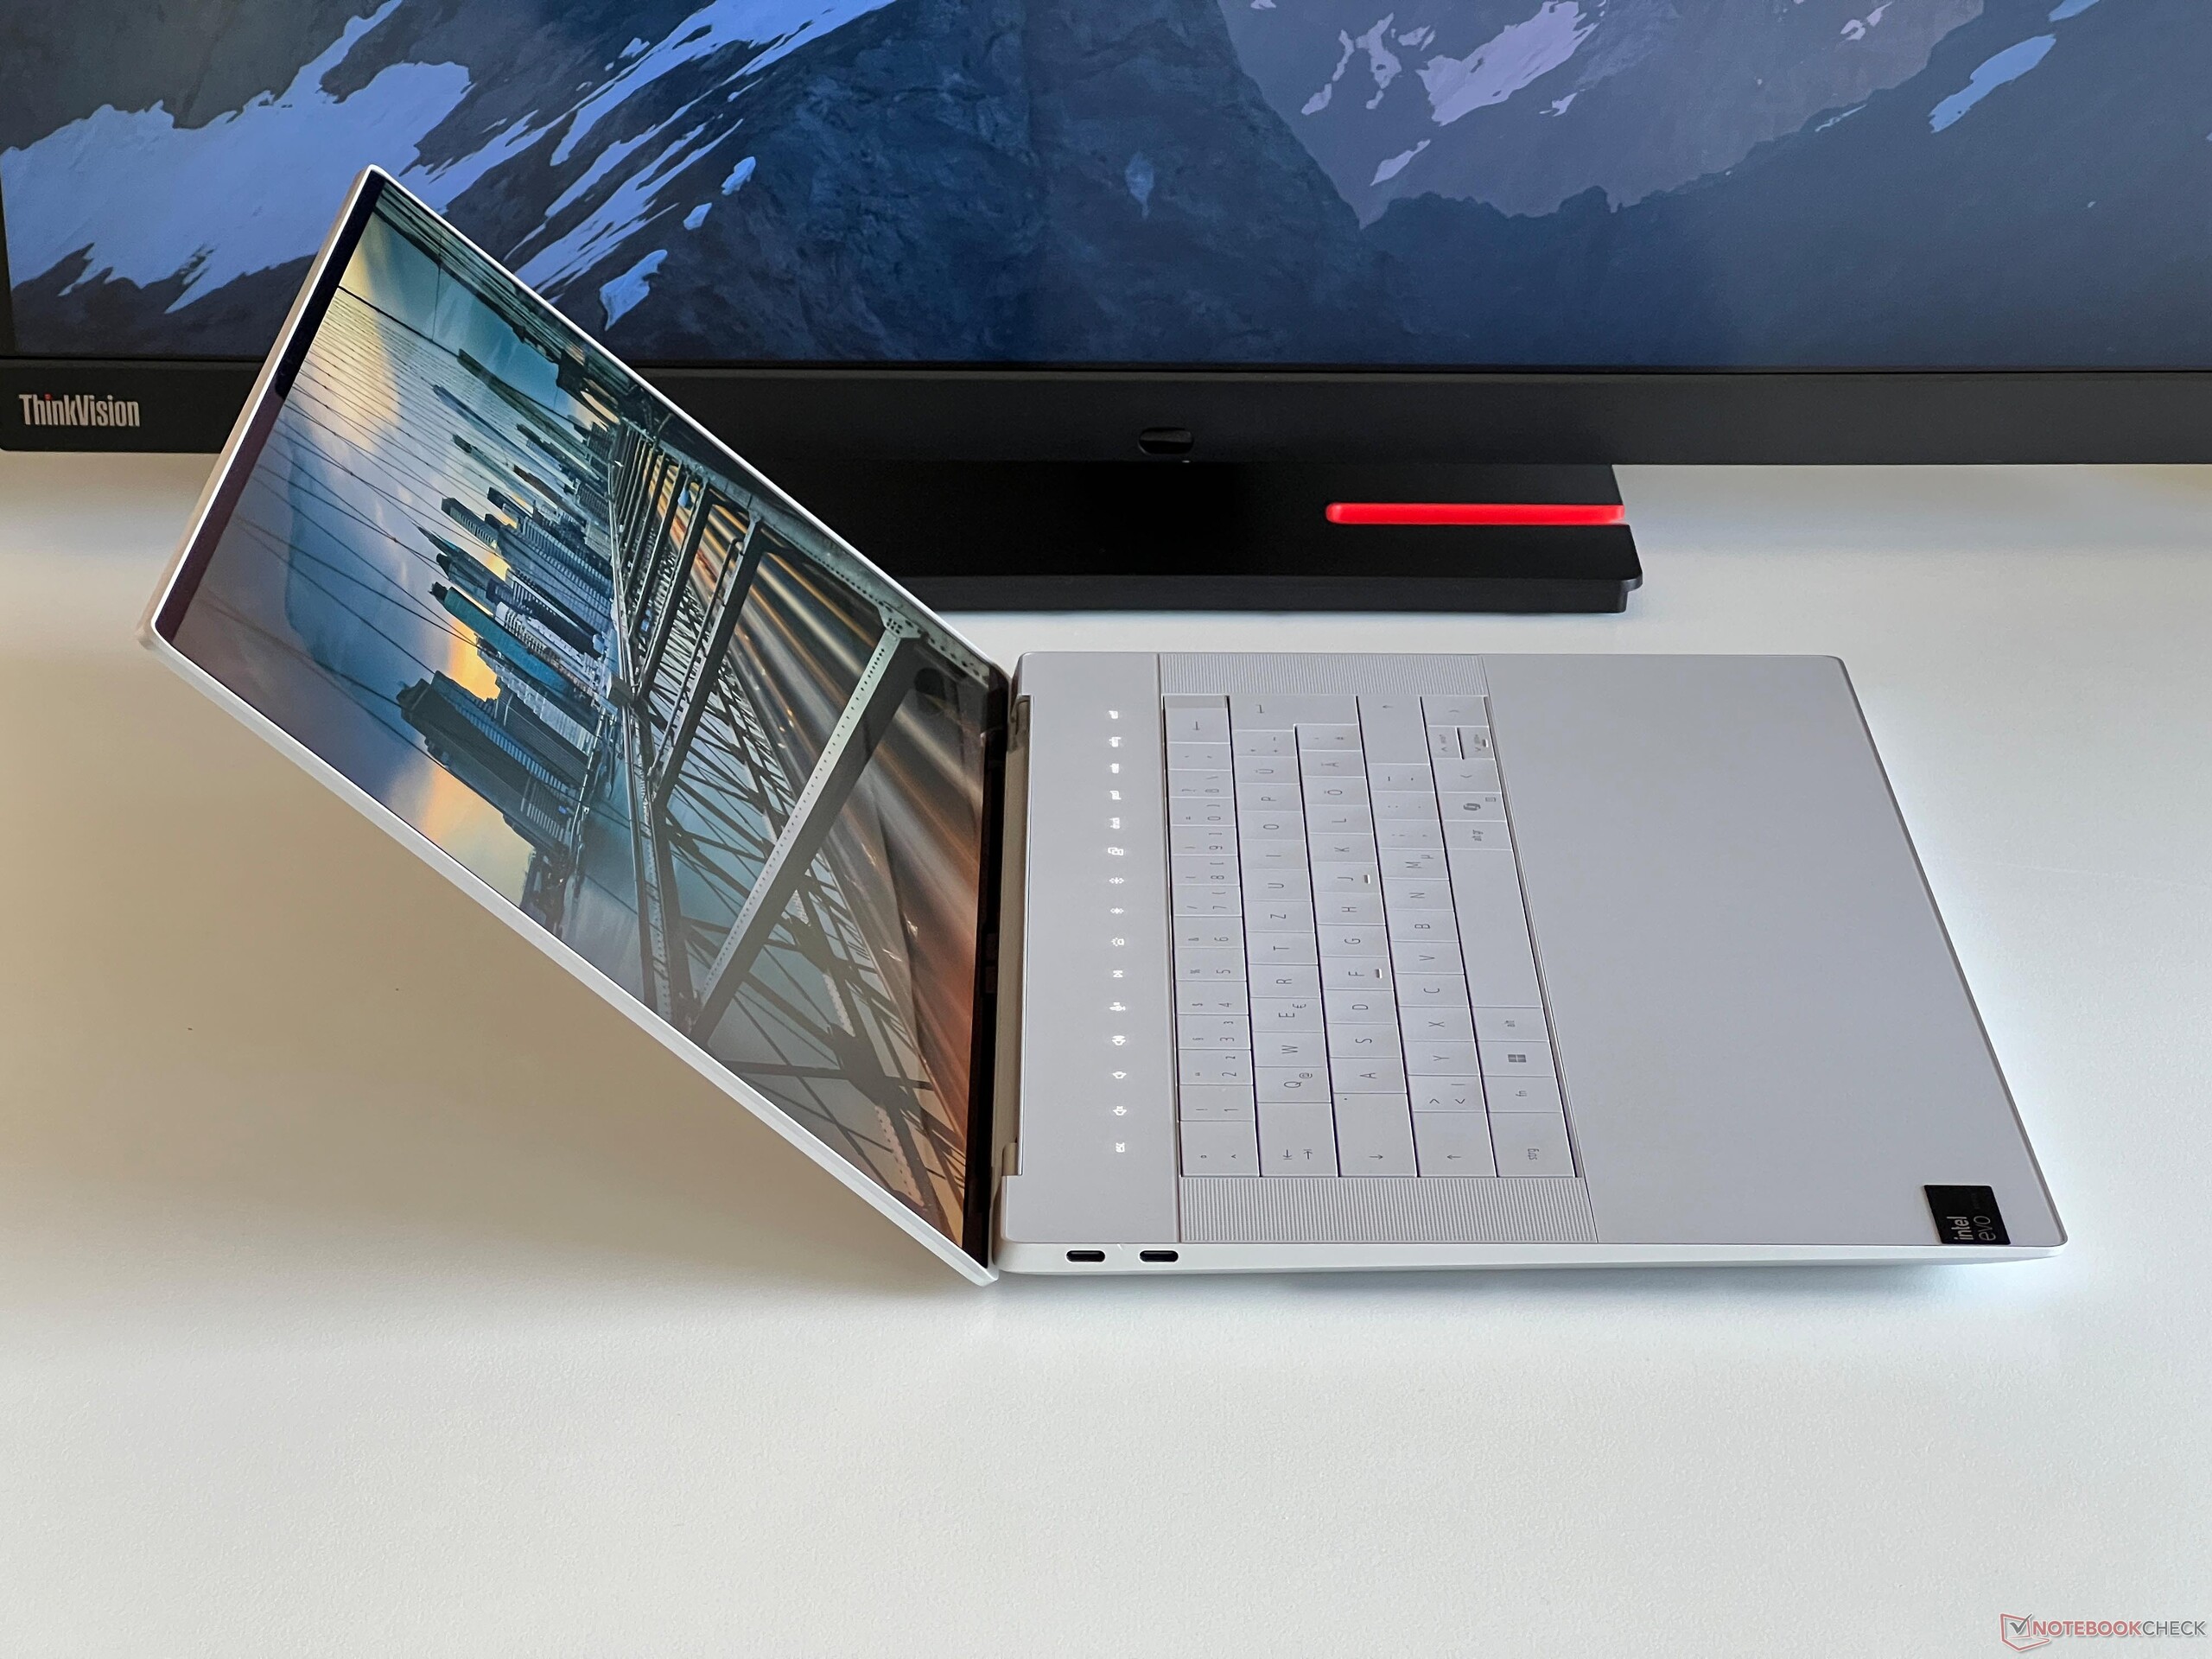
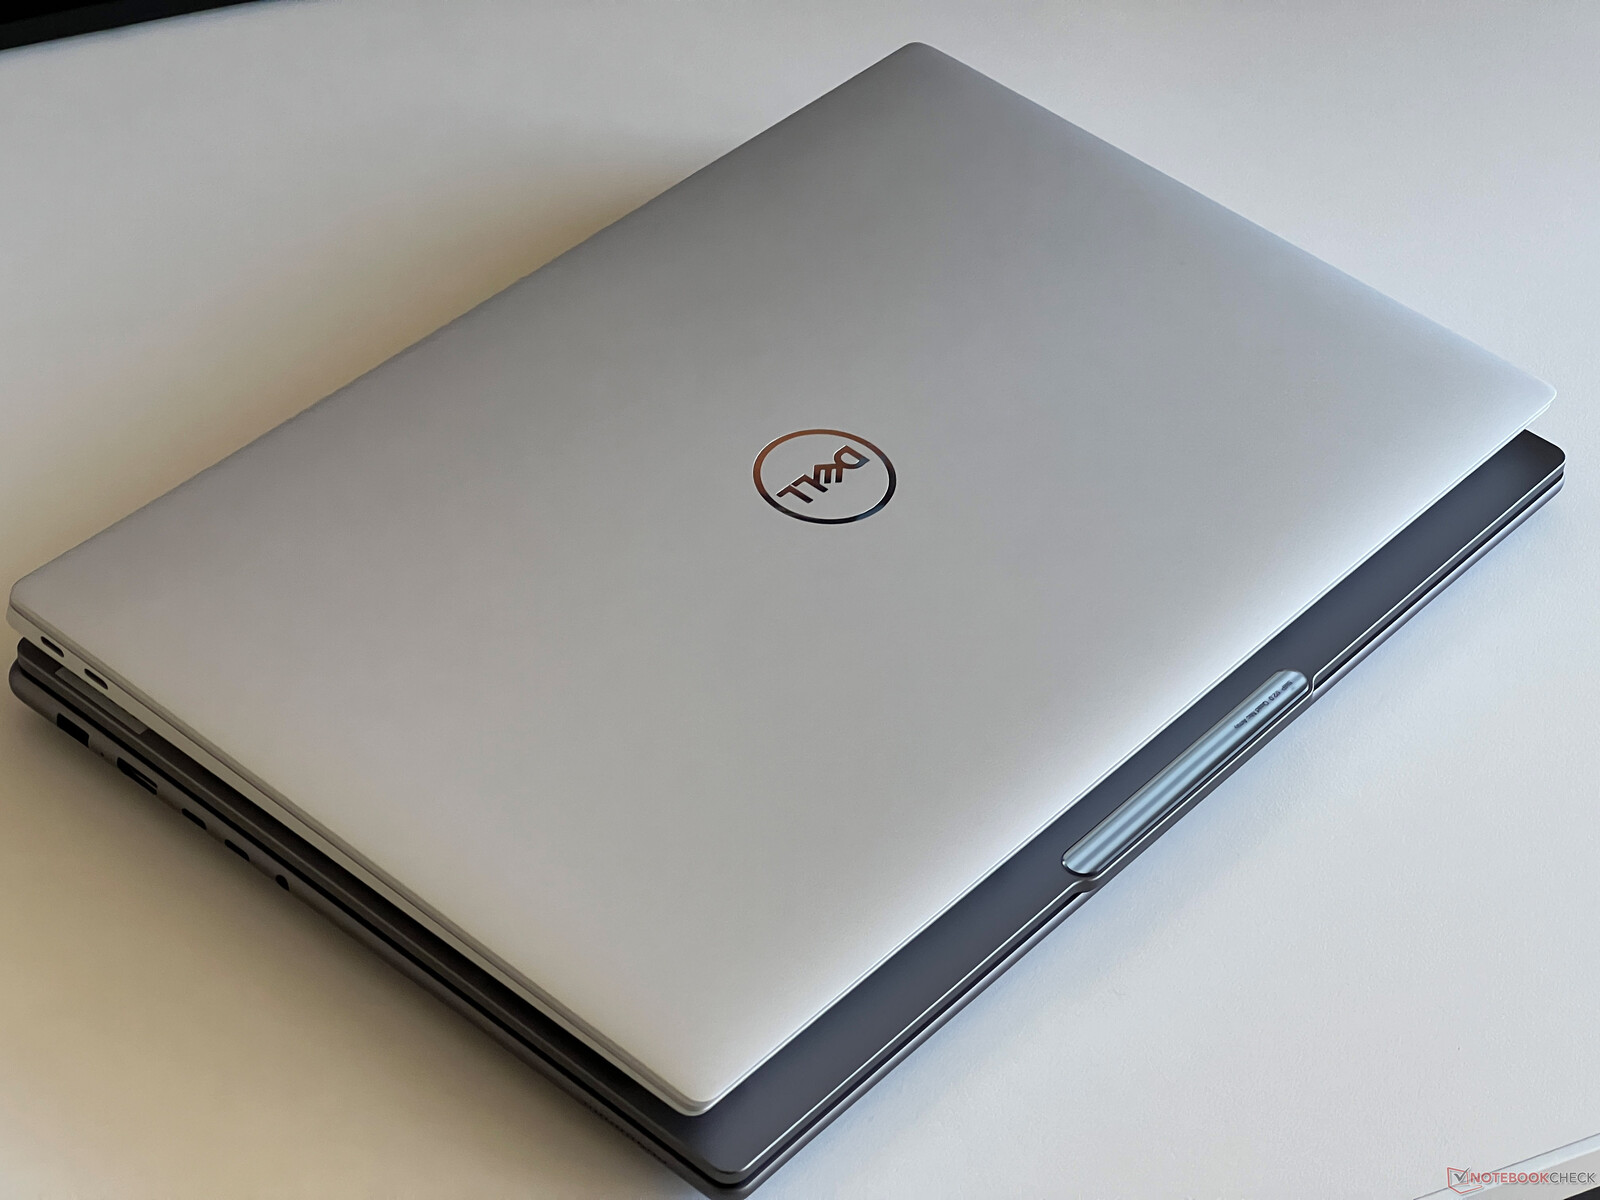
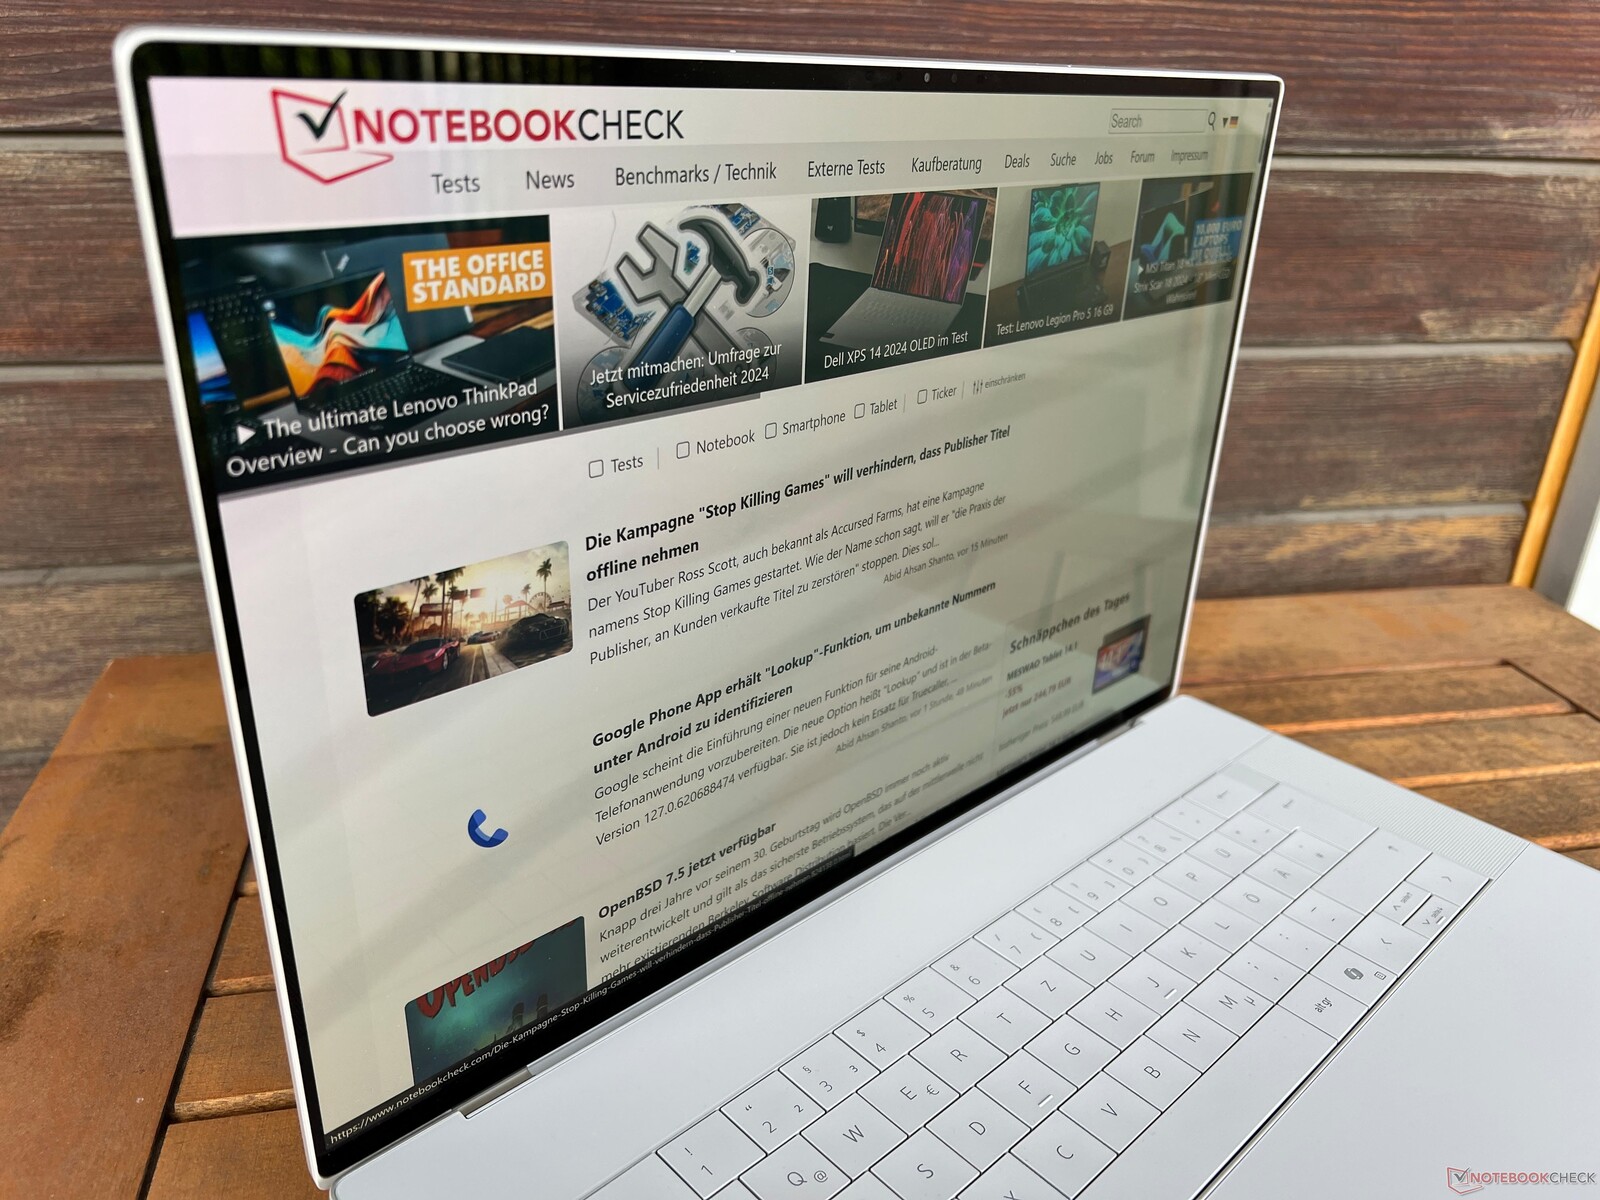
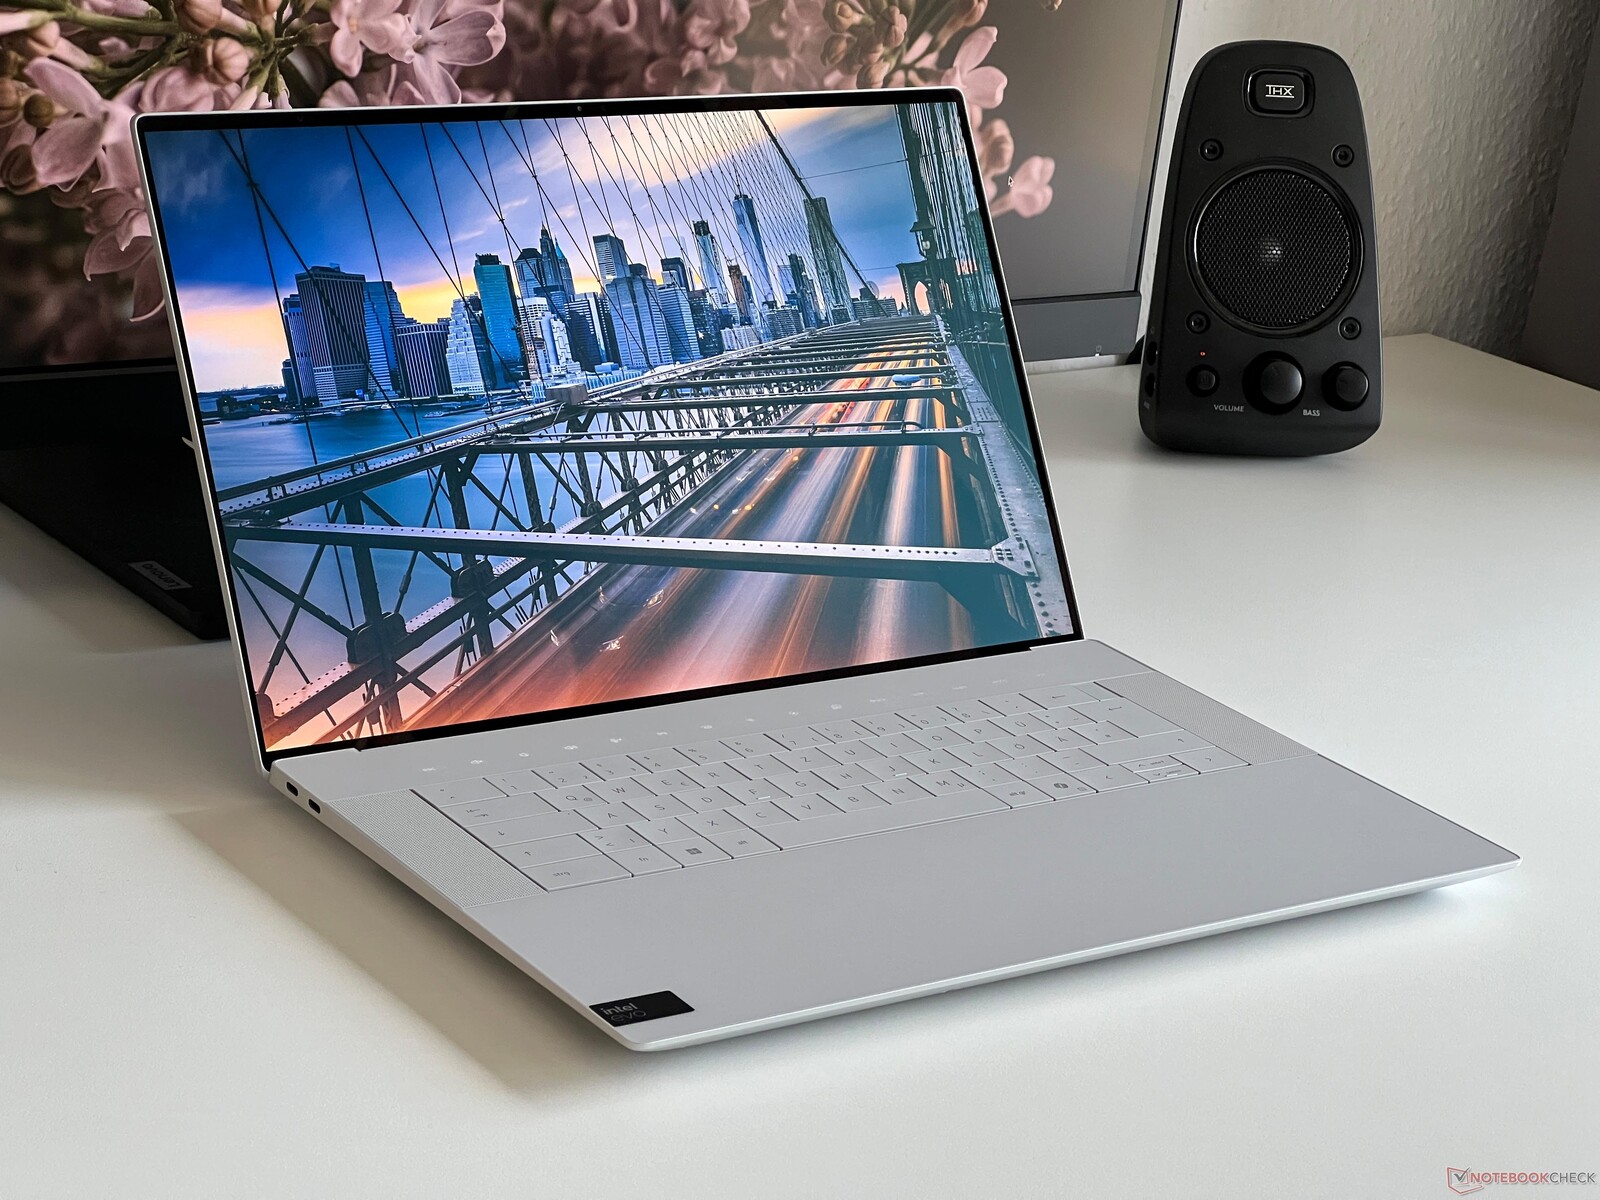
A Dell usou o mesmo design básico para todas as três variantes da atual série XPS, inspirando-se no XPS 13 Plus e seu grande apoio para as mãos de vidro contínuo e seu teclado incomum que inclui uma barra de toque. O design é atraente e, além de nossa versão clara, a Dell também oferece uma versão do portátil em cinza escuro. Suas bordas são finas em todos os quatro lados, resultando em uma aparência moderna. Devido ao seu tamanho maior, o XPS 16 não parece tão volumoso quanto o menor XPS 14.
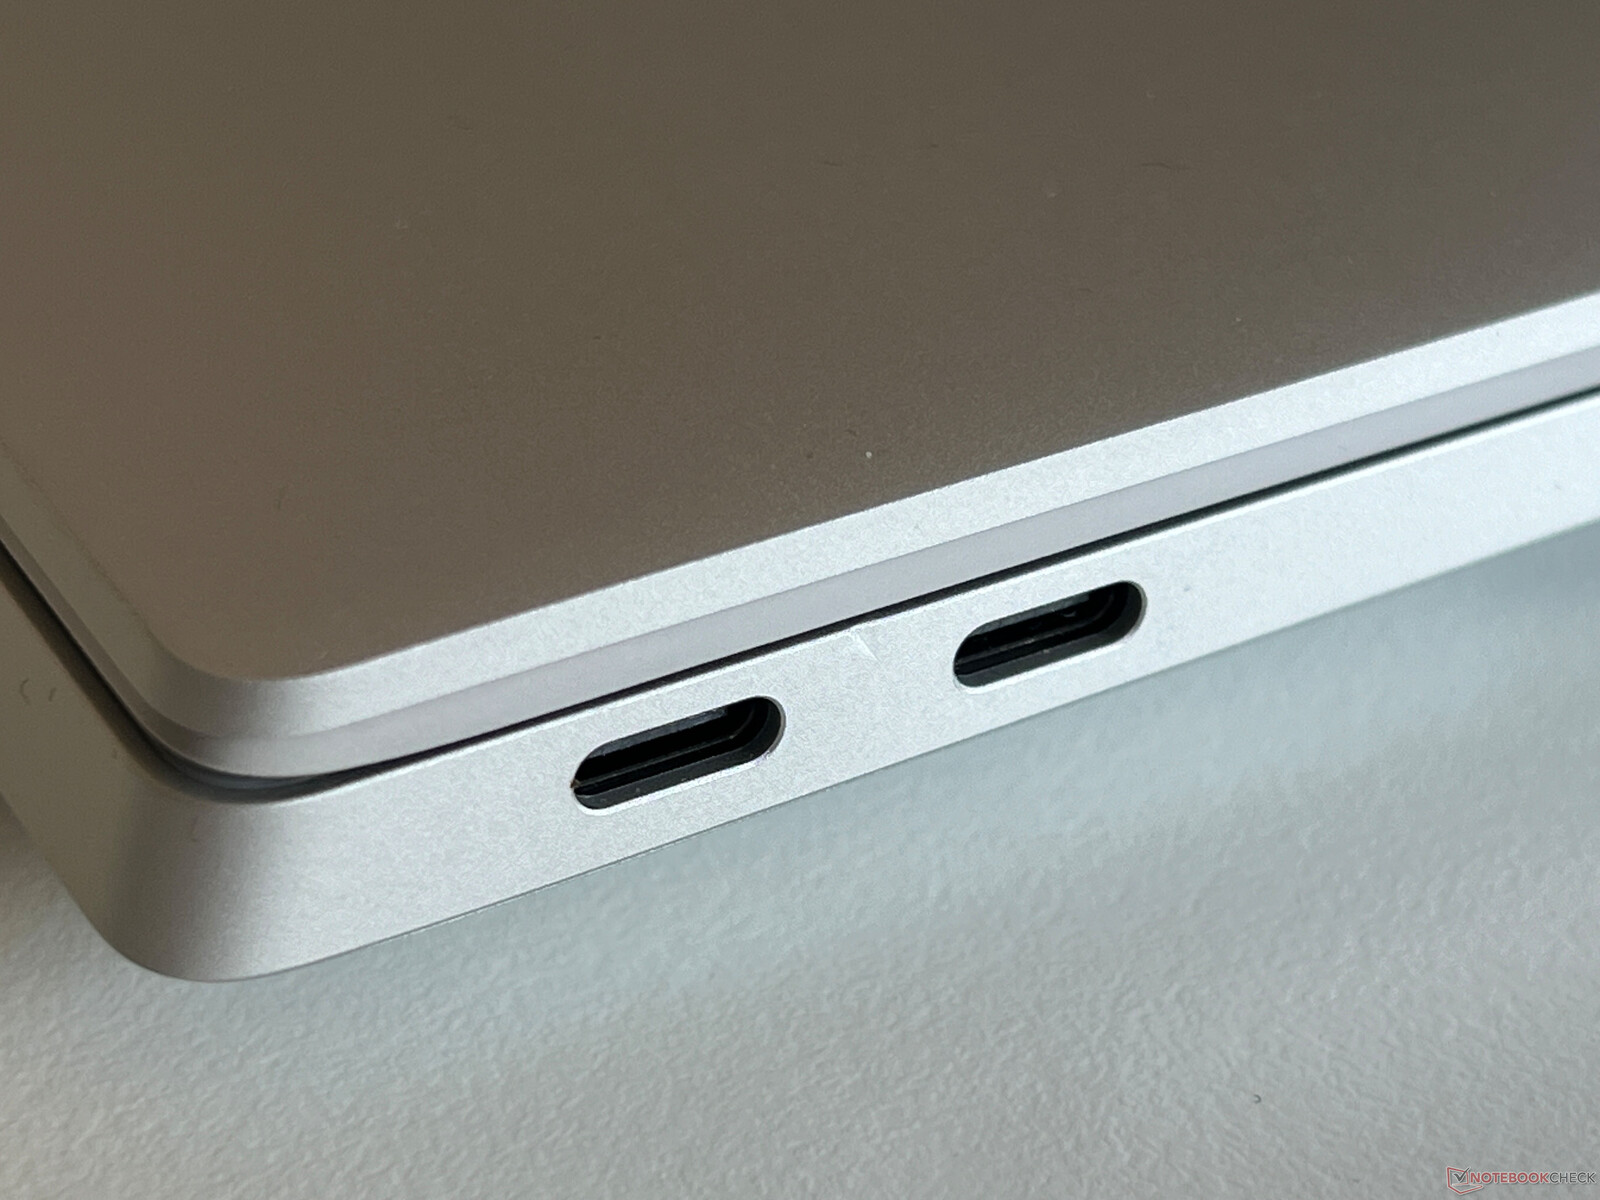
O case é muito resistente e, em geral, muito bem construído; no entanto, notamos um pequeno defeito entre as duas portas USB-C no lado esquerdo do nosso dispositivo de teste. A tela também é muito estável e a tampa só balança um pouco quando o ângulo de abertura é ajustado (máximo de 135 graus). No entanto, devido ao formato da borda frontal, é difícil abrir a tampa com apenas uma mão.
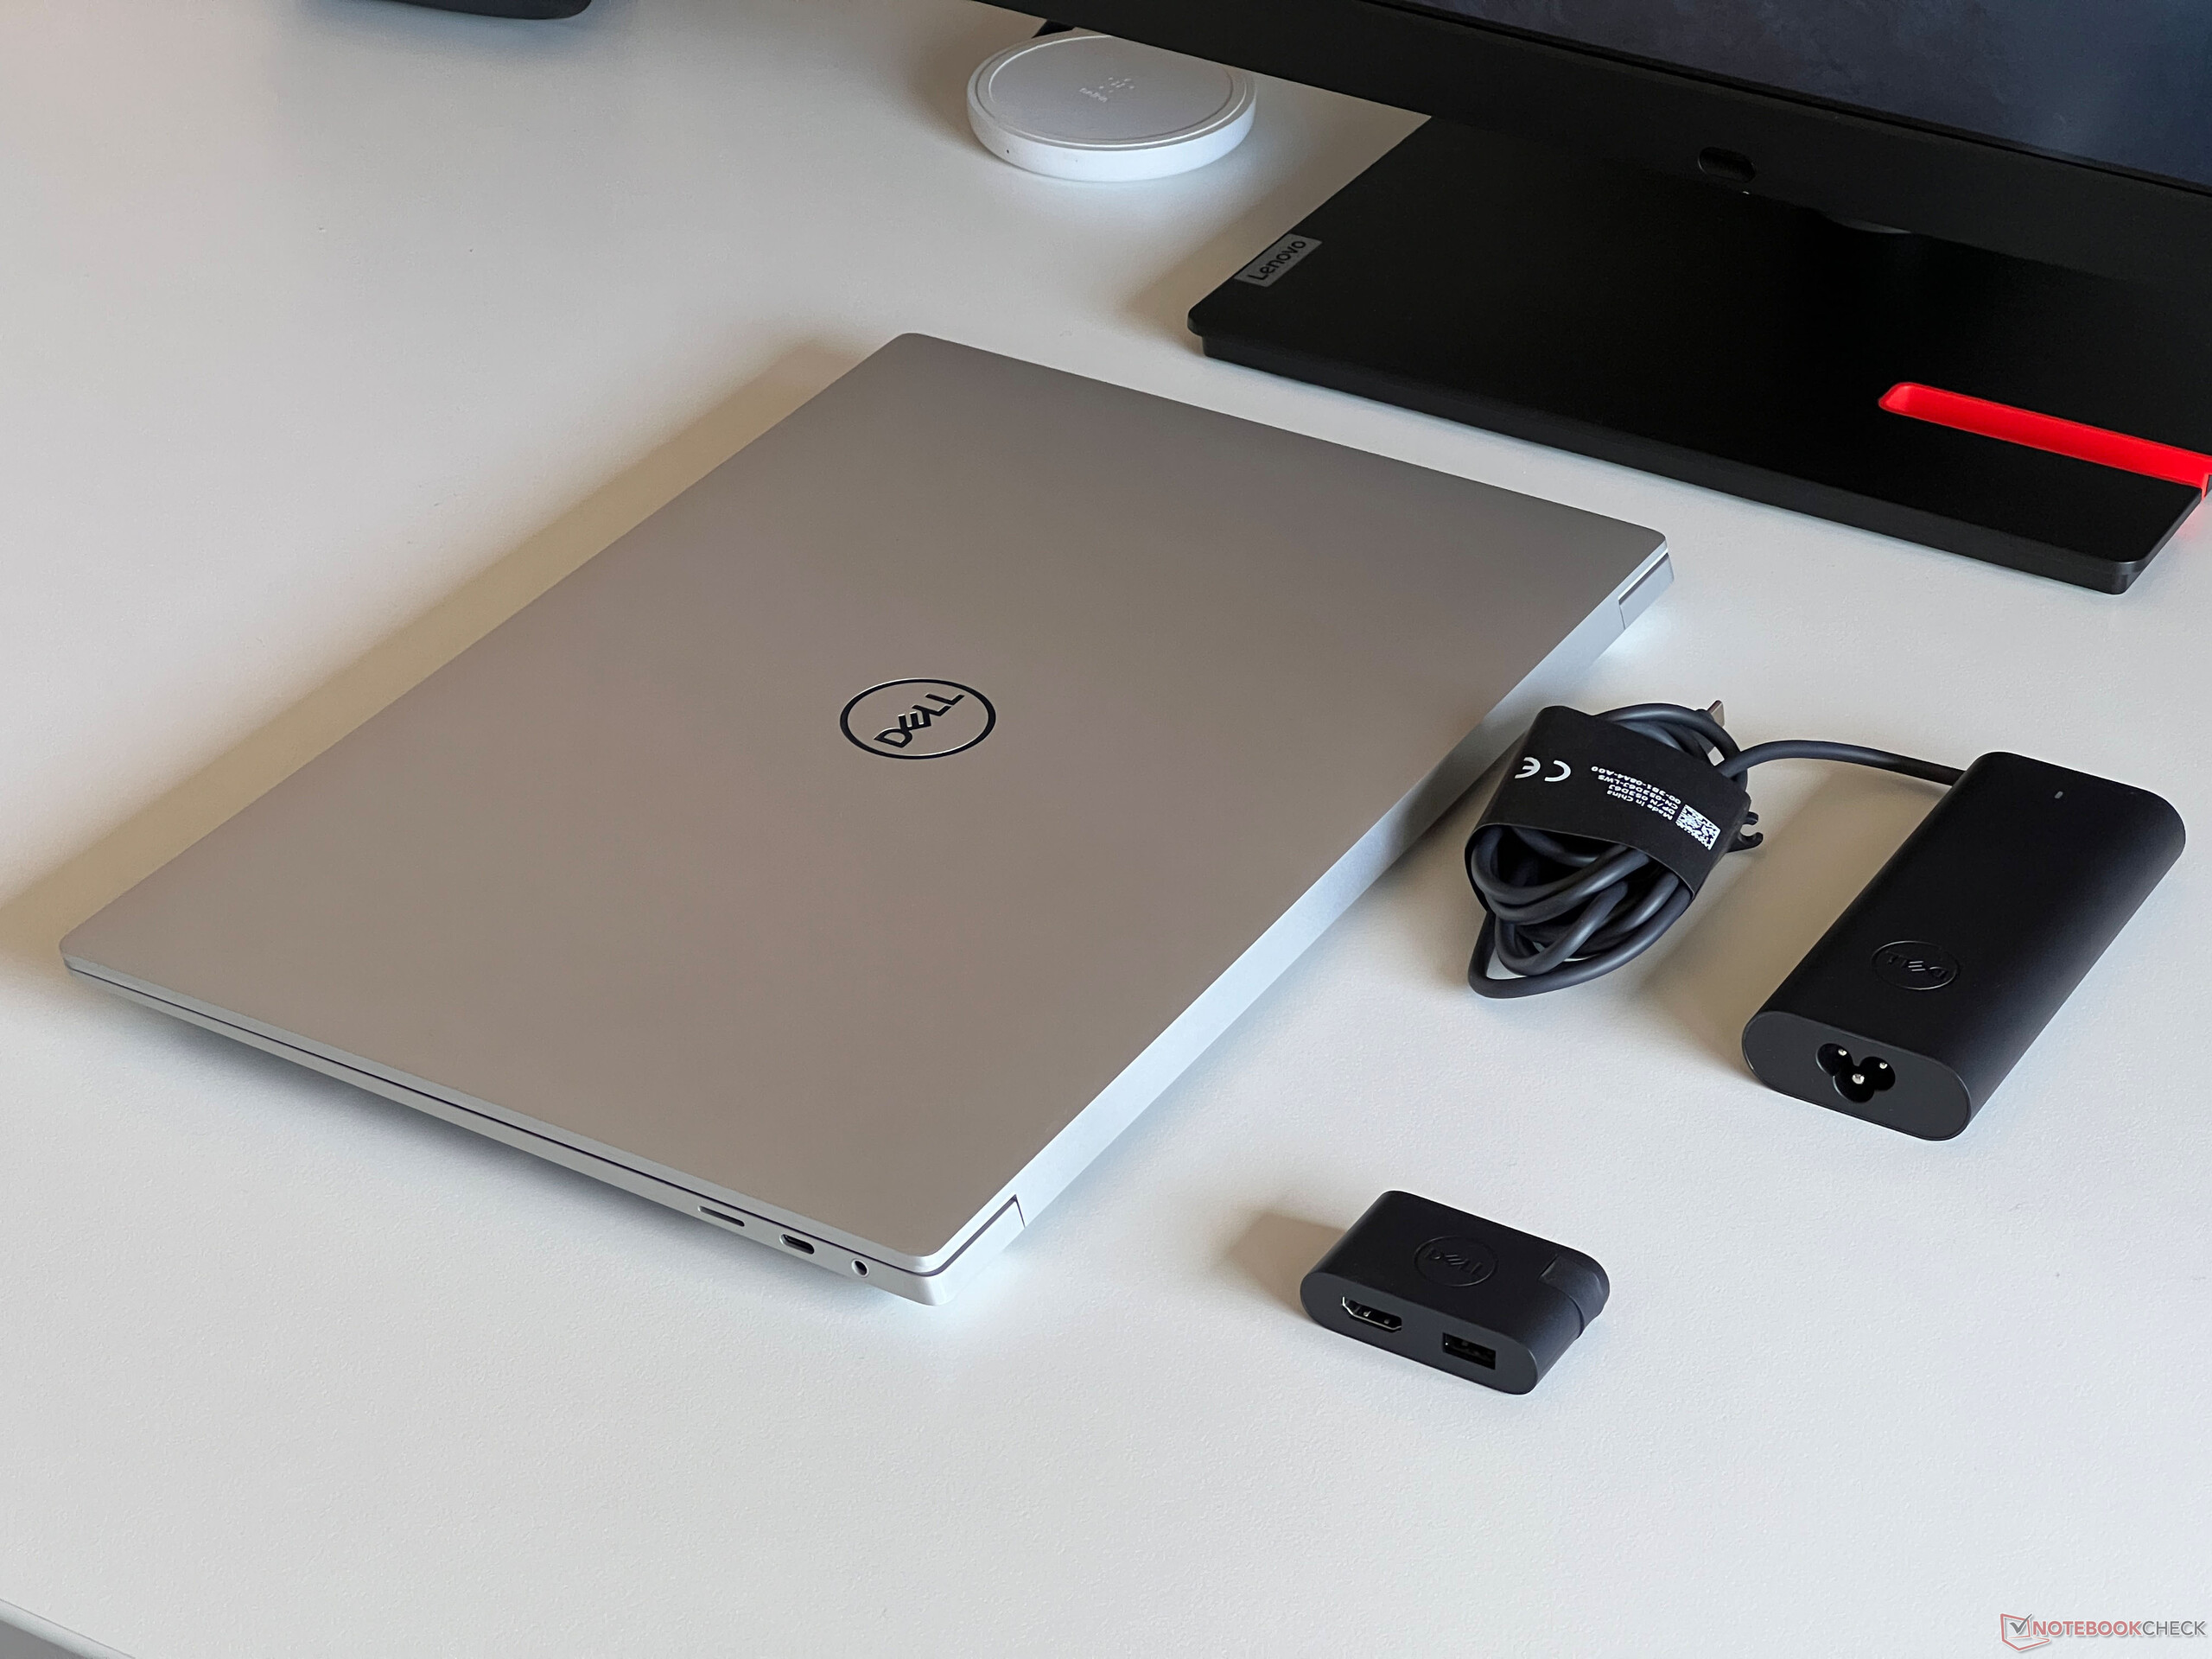
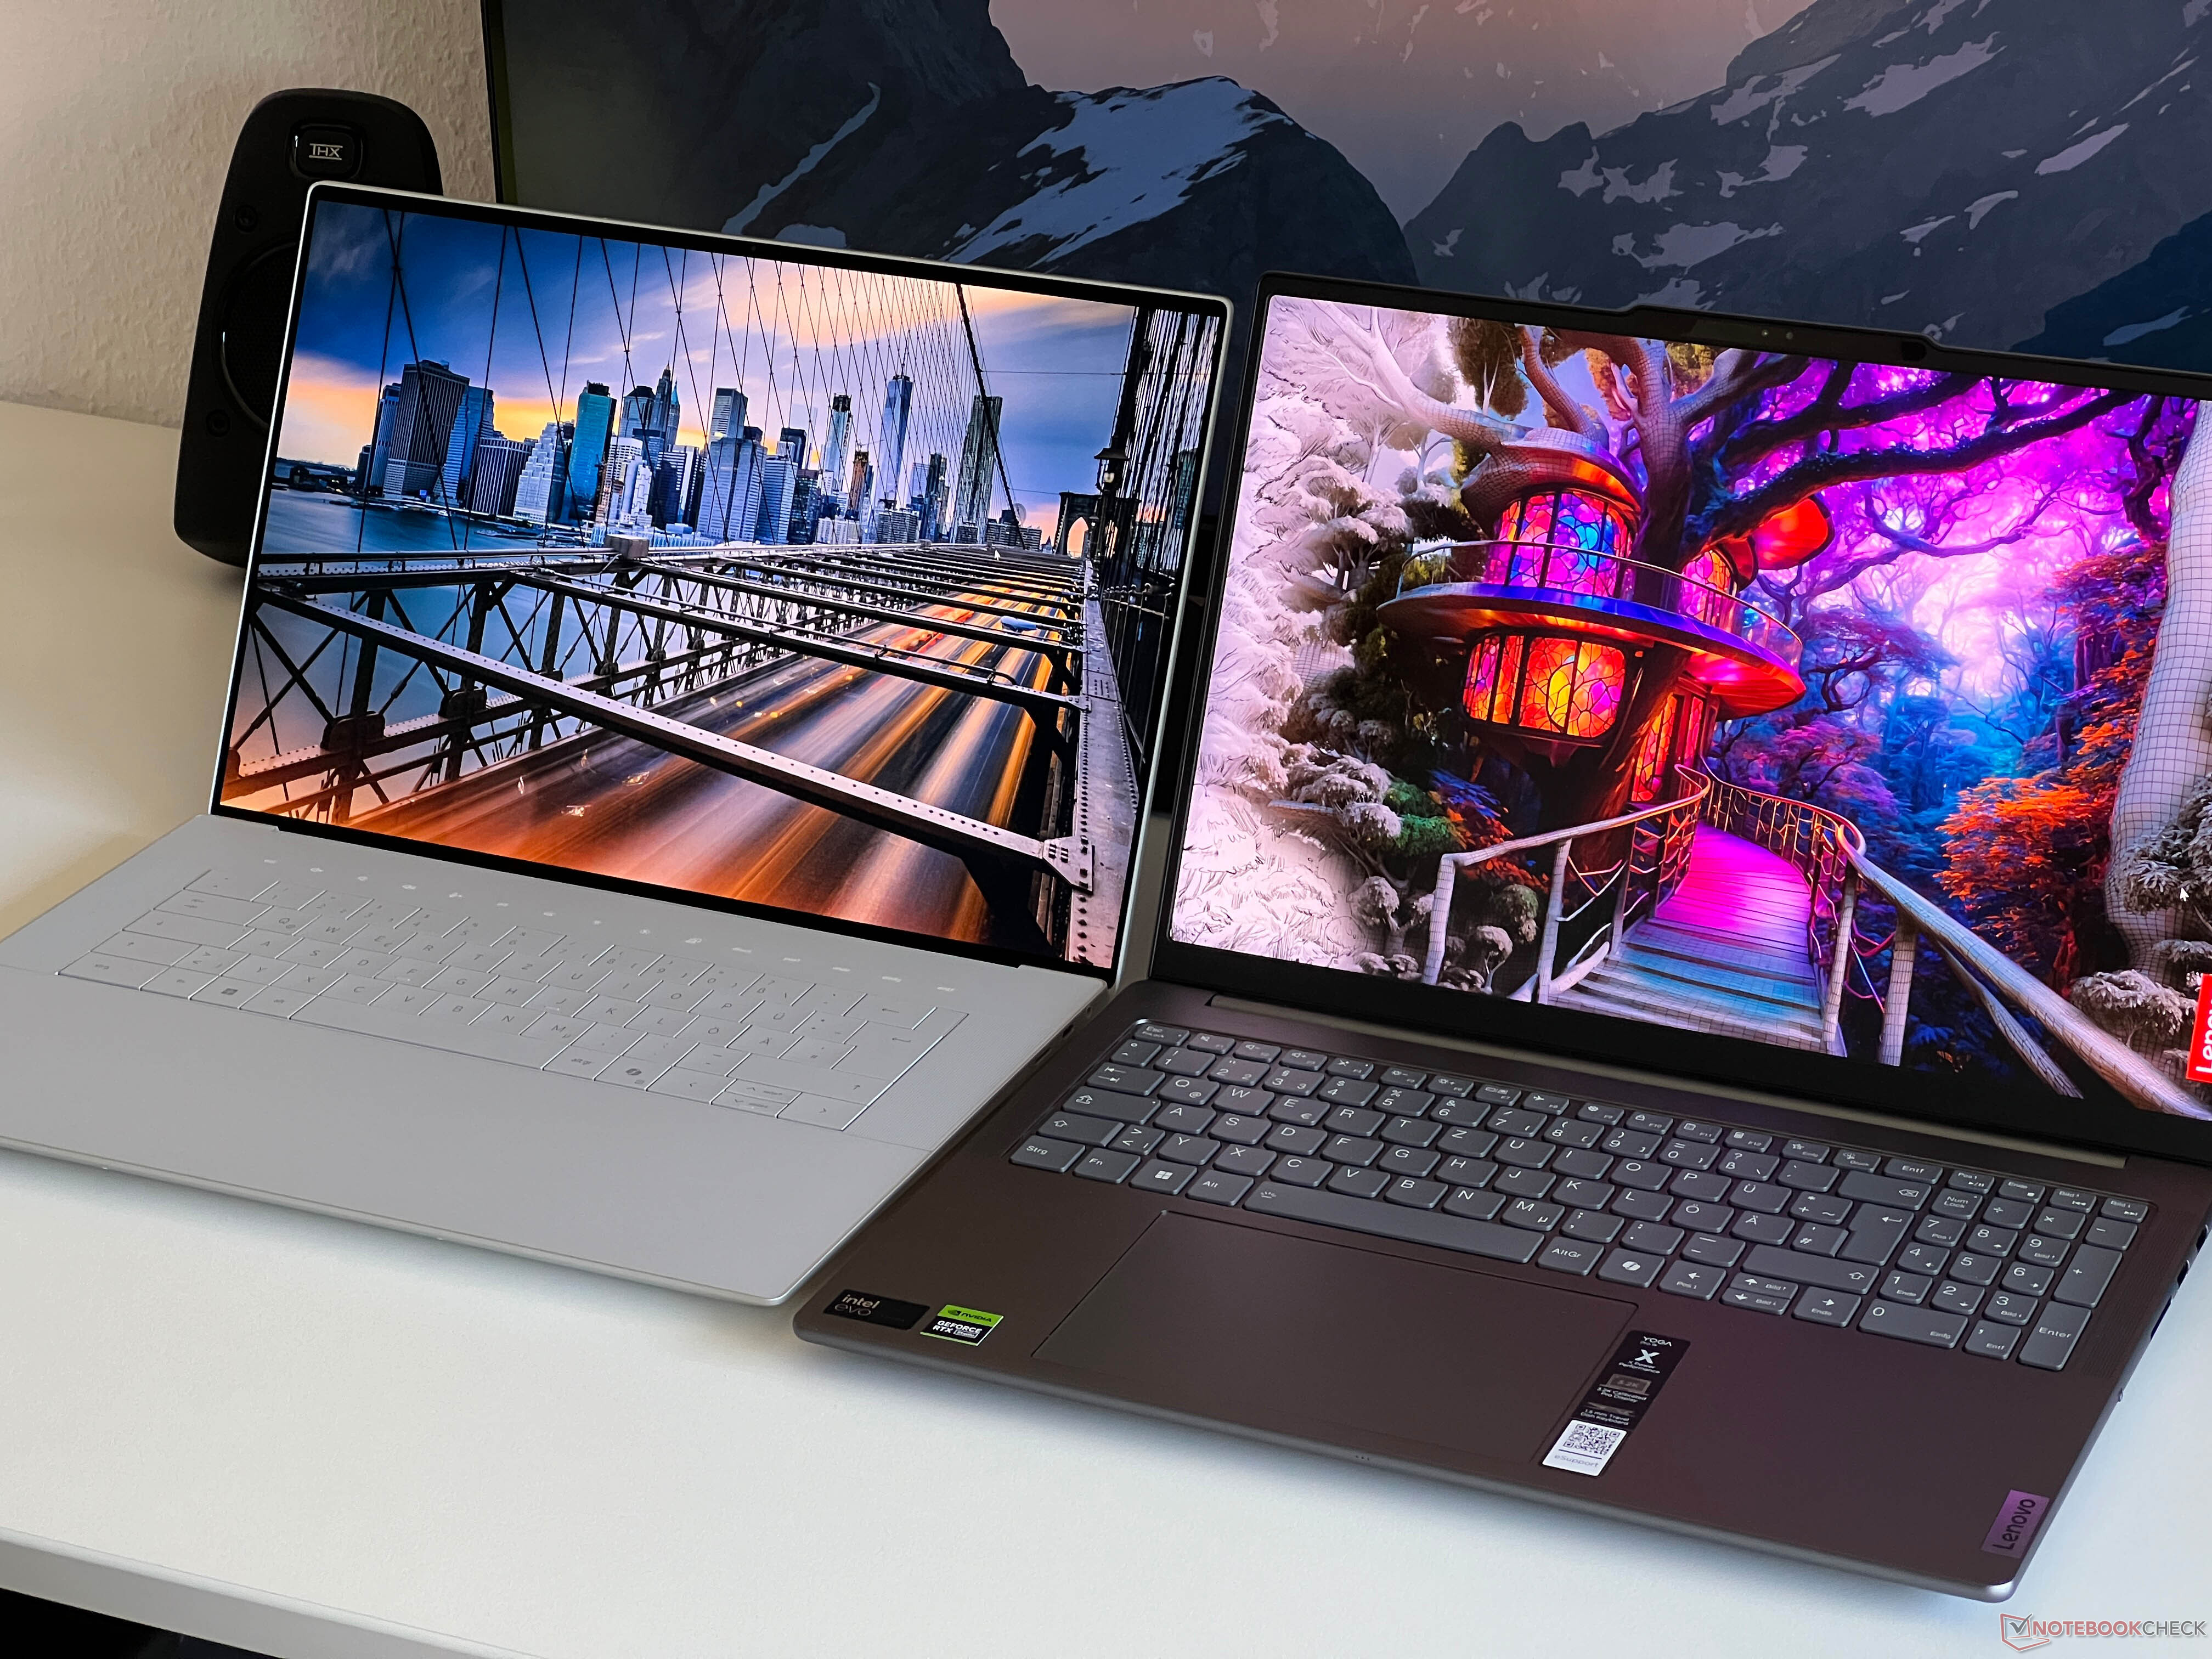
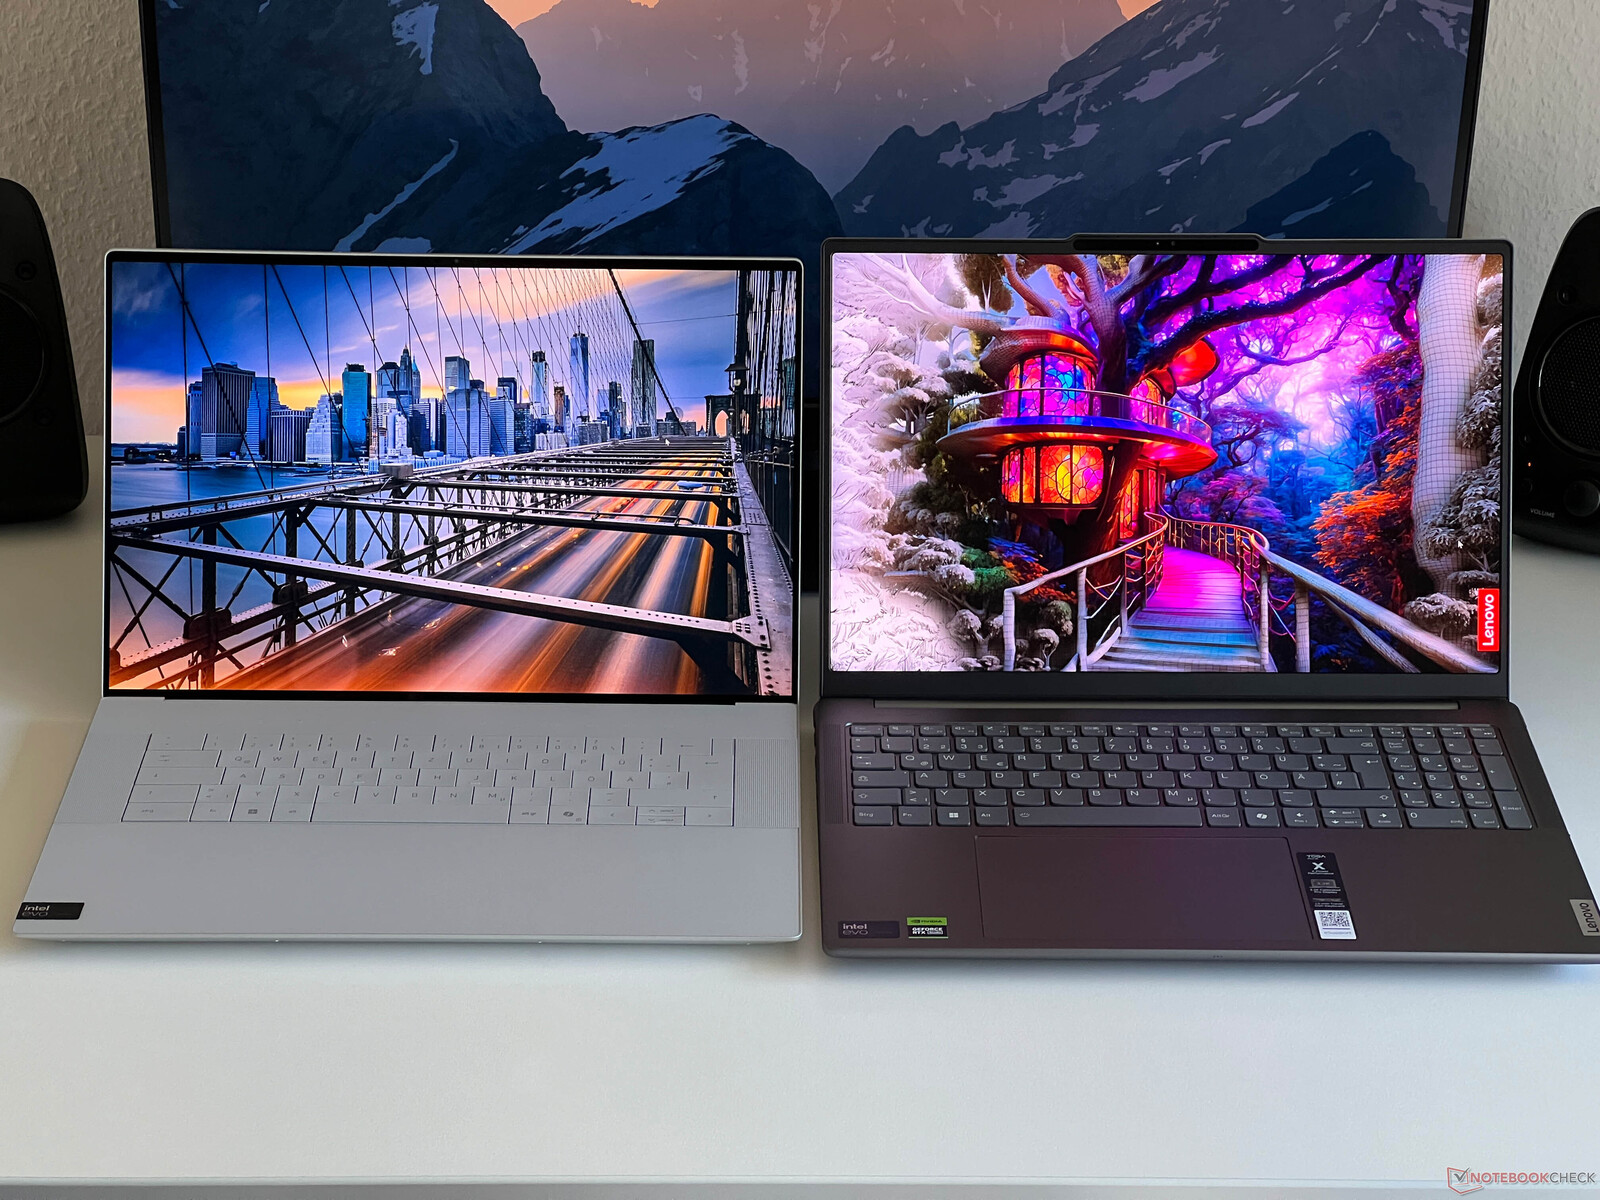
Como já foi mencionado, o novo design do modelo de 16 polegadas parece mais agradável do que o XPS 14 e não há grandes diferenças em relação à concorrência, especialmente em termos de tamanho e espessura do gabinete. Em comparação com o atual Yoga Pro 9 16 2024 (veja as imagens de comparação abaixo), o XPS se beneficia de molduras mais finas. Entretanto, com 2,313 kg, o XPS 16 ainda é o dispositivo mais pesado do nosso grupo de comparação.
Conectividade - O XPS 16 mais rápido somente com 2x Thunderbolt 4
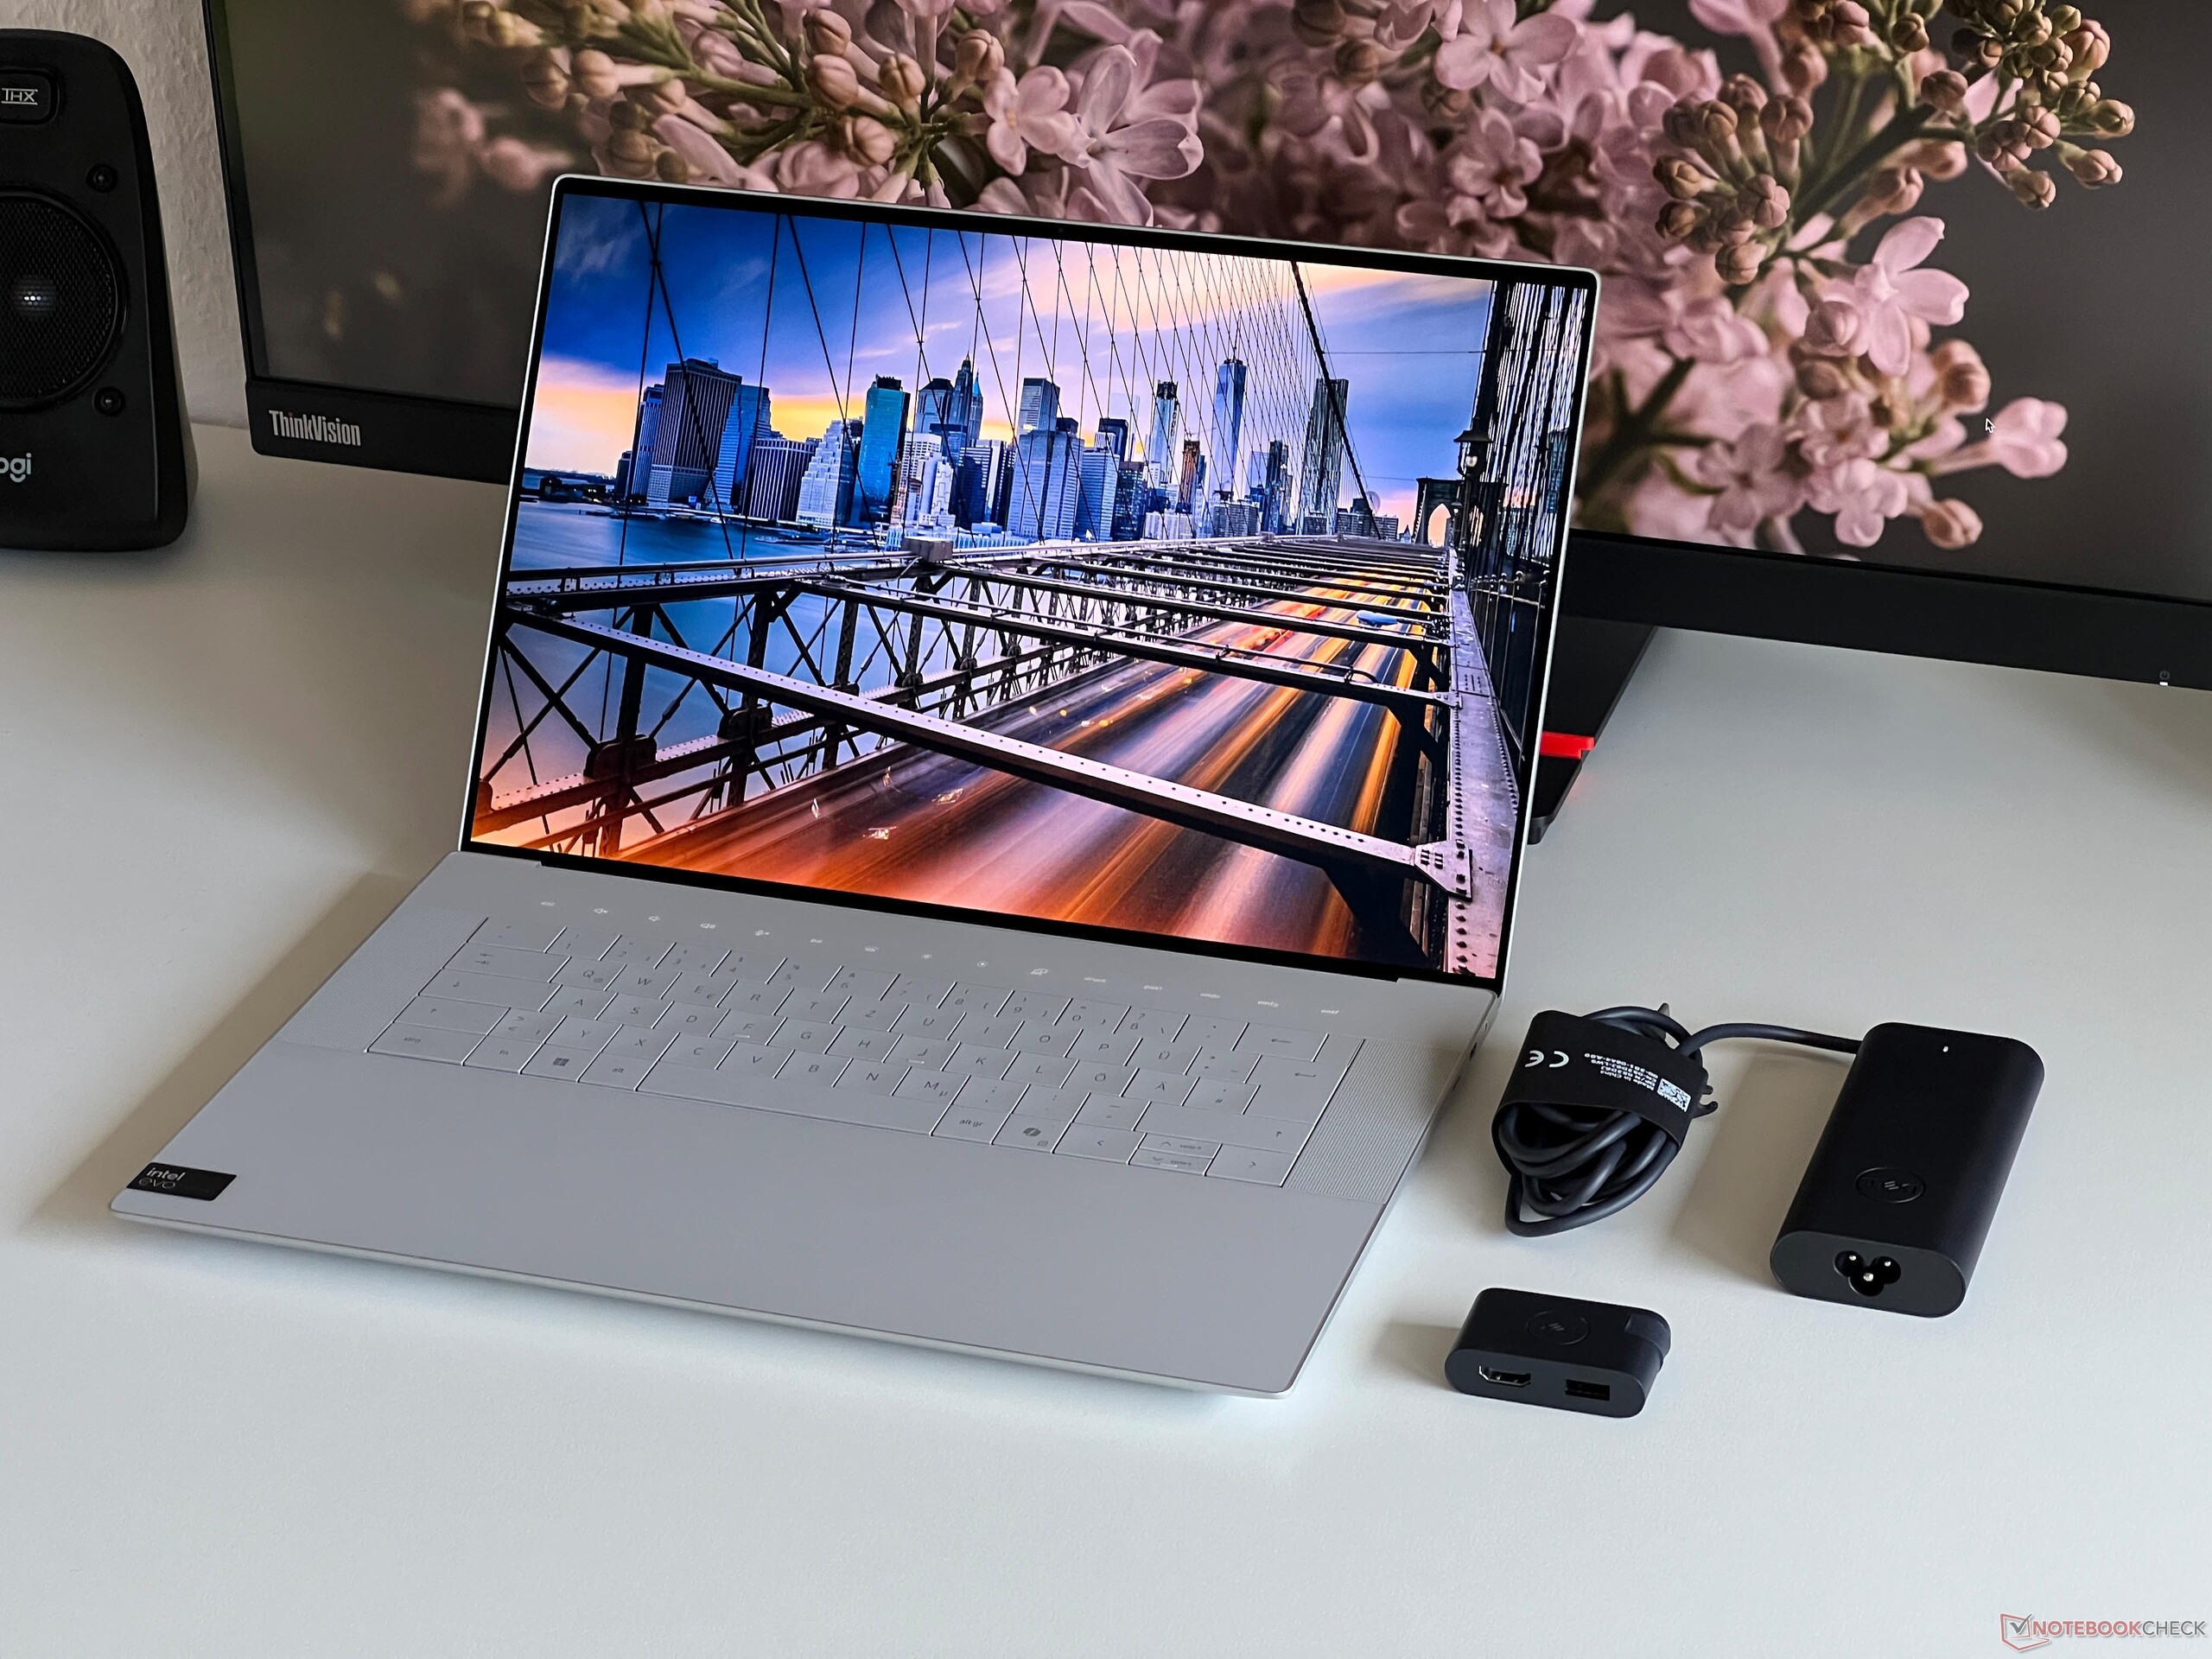
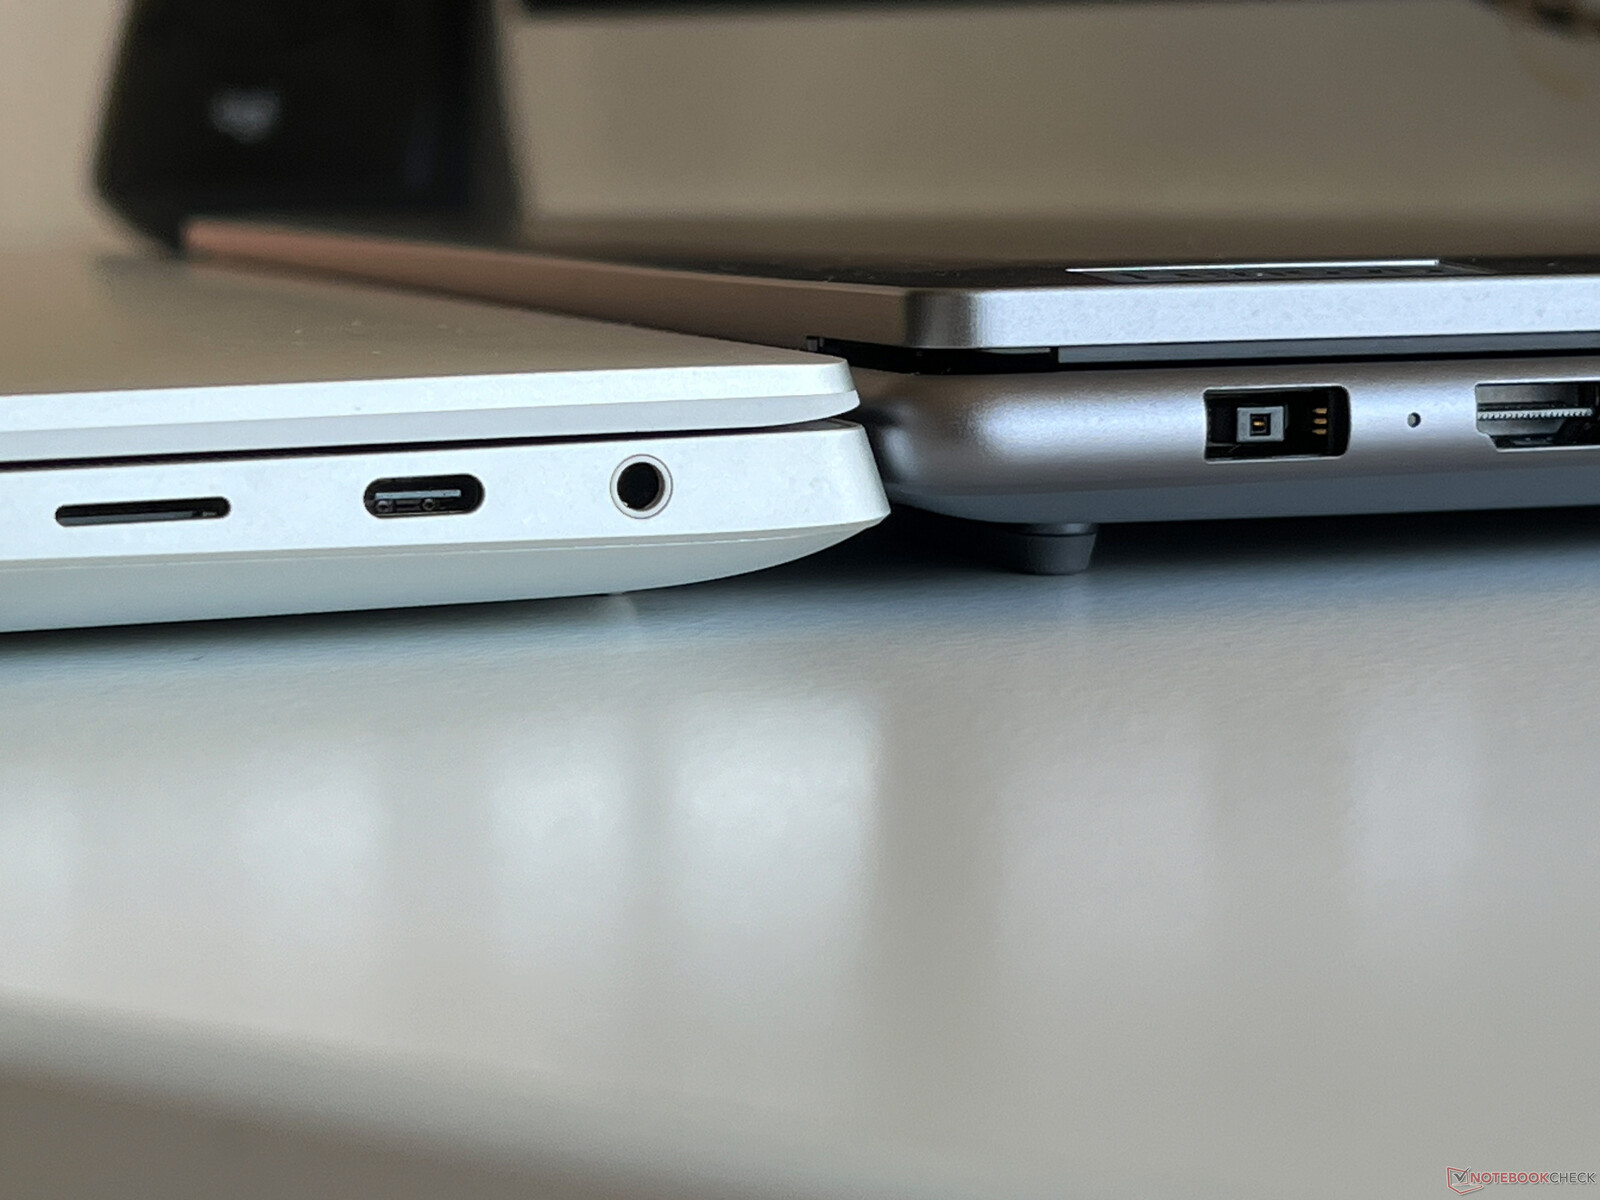
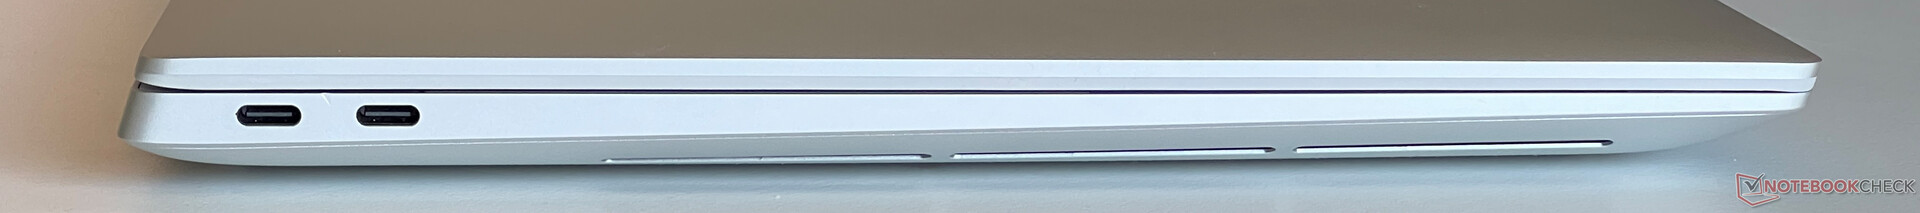
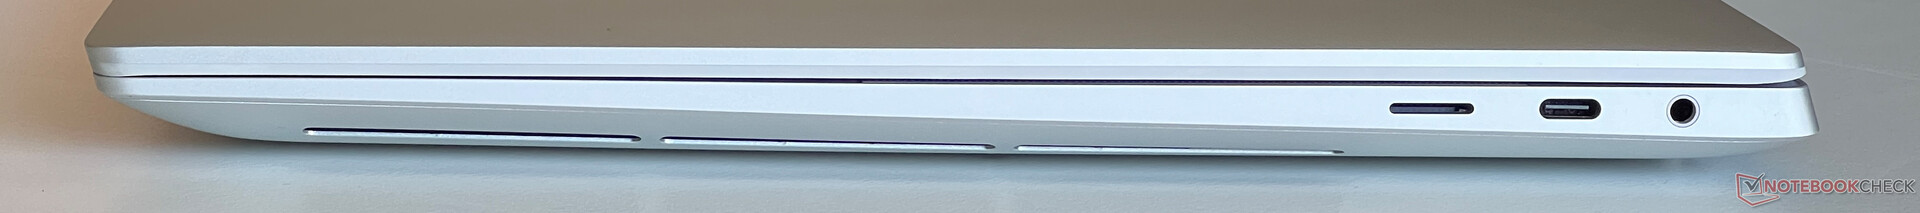
O XPS 16 apresenta as mesmas opções de conectividade que o menor XPS 14menor, com a Dell deixando o espaço adicional sem uso. Há um total de três portas USB-C e um leitor de cartão - e é isso. Para piorar a situação, apenas as duas portas do lado esquerdo dos modelos que apresentam o rápido laptop RTX 4070 suportam Thunderbolt 4, enquanto apenas USB-C 3.2 Gen 2 é suportado no lado direito. Em contrapartida, todas as três portas nas variantes mais lentas são compatíveis com Thunderbolt 4. Além disso, todas as saídas USB-C são conectadas por meio da iGPU. O escopo da entrega também inclui uma pequena estação de acoplamento com uma porta USB-A e uma saída HDMI.
Leitor de cartão SD
O leitor de cartão microSD (mecanismo de mola) está localizado no lado direito do dispositivo e aceita os cartões de memória compactos quase completamente. Em conjunto com nosso cartão de referência (Angelbird AV Pro V60), suas taxas de transferência atingiram um máximo de cerca de 204 MB/s e, ao copiar arquivos de imagem, medimos bons 148 MB/s.
| SD Card Reader | |
| average JPG Copy Test (av. of 3 runs) | |
| Dell XPS 15 9530 RTX 4070 (Toshiba Exceria Pro SDXC 64 GB UHS-II) | |
| Dell XPS 16 9640 (Angelbird AV Pro V60) | |
| Média da turma Multimedia (23 - 531, n=40, últimos 2 anos) | |
| Samsung Galaxy Book4 Ultra (Angelbird AV Pro V60) | |
| Asus ROG Zephyrus G16 2024 GU605M | |
| Lenovo Yoga Pro 9 16-IRP G8 (Angelibird AV Pro V60) | |
| Schenker VISION 16 Pro (M23) (Angelbird AV Pro V60) | |
| maximum AS SSD Seq Read Test (1GB) | |
| Dell XPS 16 9640 (Angelbird AV Pro V60) | |
| Média da turma Multimedia (37.3 - 1455, n=39, últimos 2 anos) | |
| Dell XPS 15 9530 RTX 4070 (Toshiba Exceria Pro SDXC 64 GB UHS-II) | |
| Asus ROG Zephyrus G16 2024 GU605M | |
| Samsung Galaxy Book4 Ultra (Angelbird AV Pro V60) | |
| Lenovo Yoga Pro 9 16-IRP G8 (Angelibird AV Pro V60) | |
| Schenker VISION 16 Pro (M23) (Angelbird AV Pro V60) | |
Comunicação
Em contraste com o menor XPS 14a Dell instalou um módulo Wi-Fi-7 da Intel no XPS 16. Ele também suporta Bluetooth 5.4. Ainda não podemos testar seu desempenho Wi-Fi 7, mas em combinação com nosso roteador de referência da Asus, seu desempenho foi um pouco pior que, por exemplo, o XPS 14 com seu módulo Wi-Fi 6E. Mesmo assim, o senhor não deve notar nenhuma limitação e, durante o curso do nosso teste, não notamos nenhum problema de conexão.
| Networking | |
| Dell XPS 16 9640 | |
| iperf3 transmit AXE11000 | |
| iperf3 receive AXE11000 | |
| Samsung Galaxy Book4 Ultra | |
| iperf3 transmit AXE11000 | |
| iperf3 receive AXE11000 | |
| Honor MagicBook Pro 16 2024 | |
| iperf3 transmit AXE11000 | |
| iperf3 receive AXE11000 | |
| Asus ROG Zephyrus G16 2024 GU605M | |
| iperf3 transmit AXE11000 | |
| iperf3 receive AXE11000 | |
| Lenovo Yoga Pro 9 16-IRP G8 | |
| iperf3 transmit AXE11000 | |
| iperf3 receive AXE11000 | |
| Schenker VISION 16 Pro (M23) | |
| iperf3 transmit AXE11000 | |
| iperf3 receive AXE11000 | |
| Dell XPS 15 9530 RTX 4070 | |
| iperf3 transmit AXE11000 | |
| iperf3 receive AXE11000 | |
Webcam
A Dell instalou uma webcam de 1080p na parte superior da tela, além de uma câmera IR para reconhecimento facial via Windows Hello. A qualidade da webcam é boa em boas condições de iluminação. Além disso, a câmera suporta efeitos de estúdio (foco suave de fundo, rastreamento de olhos, enquadramento automático) como parte do sistema operacional, o que significa que ela funciona independentemente do aplicativo que estiver sendo usado no momento.


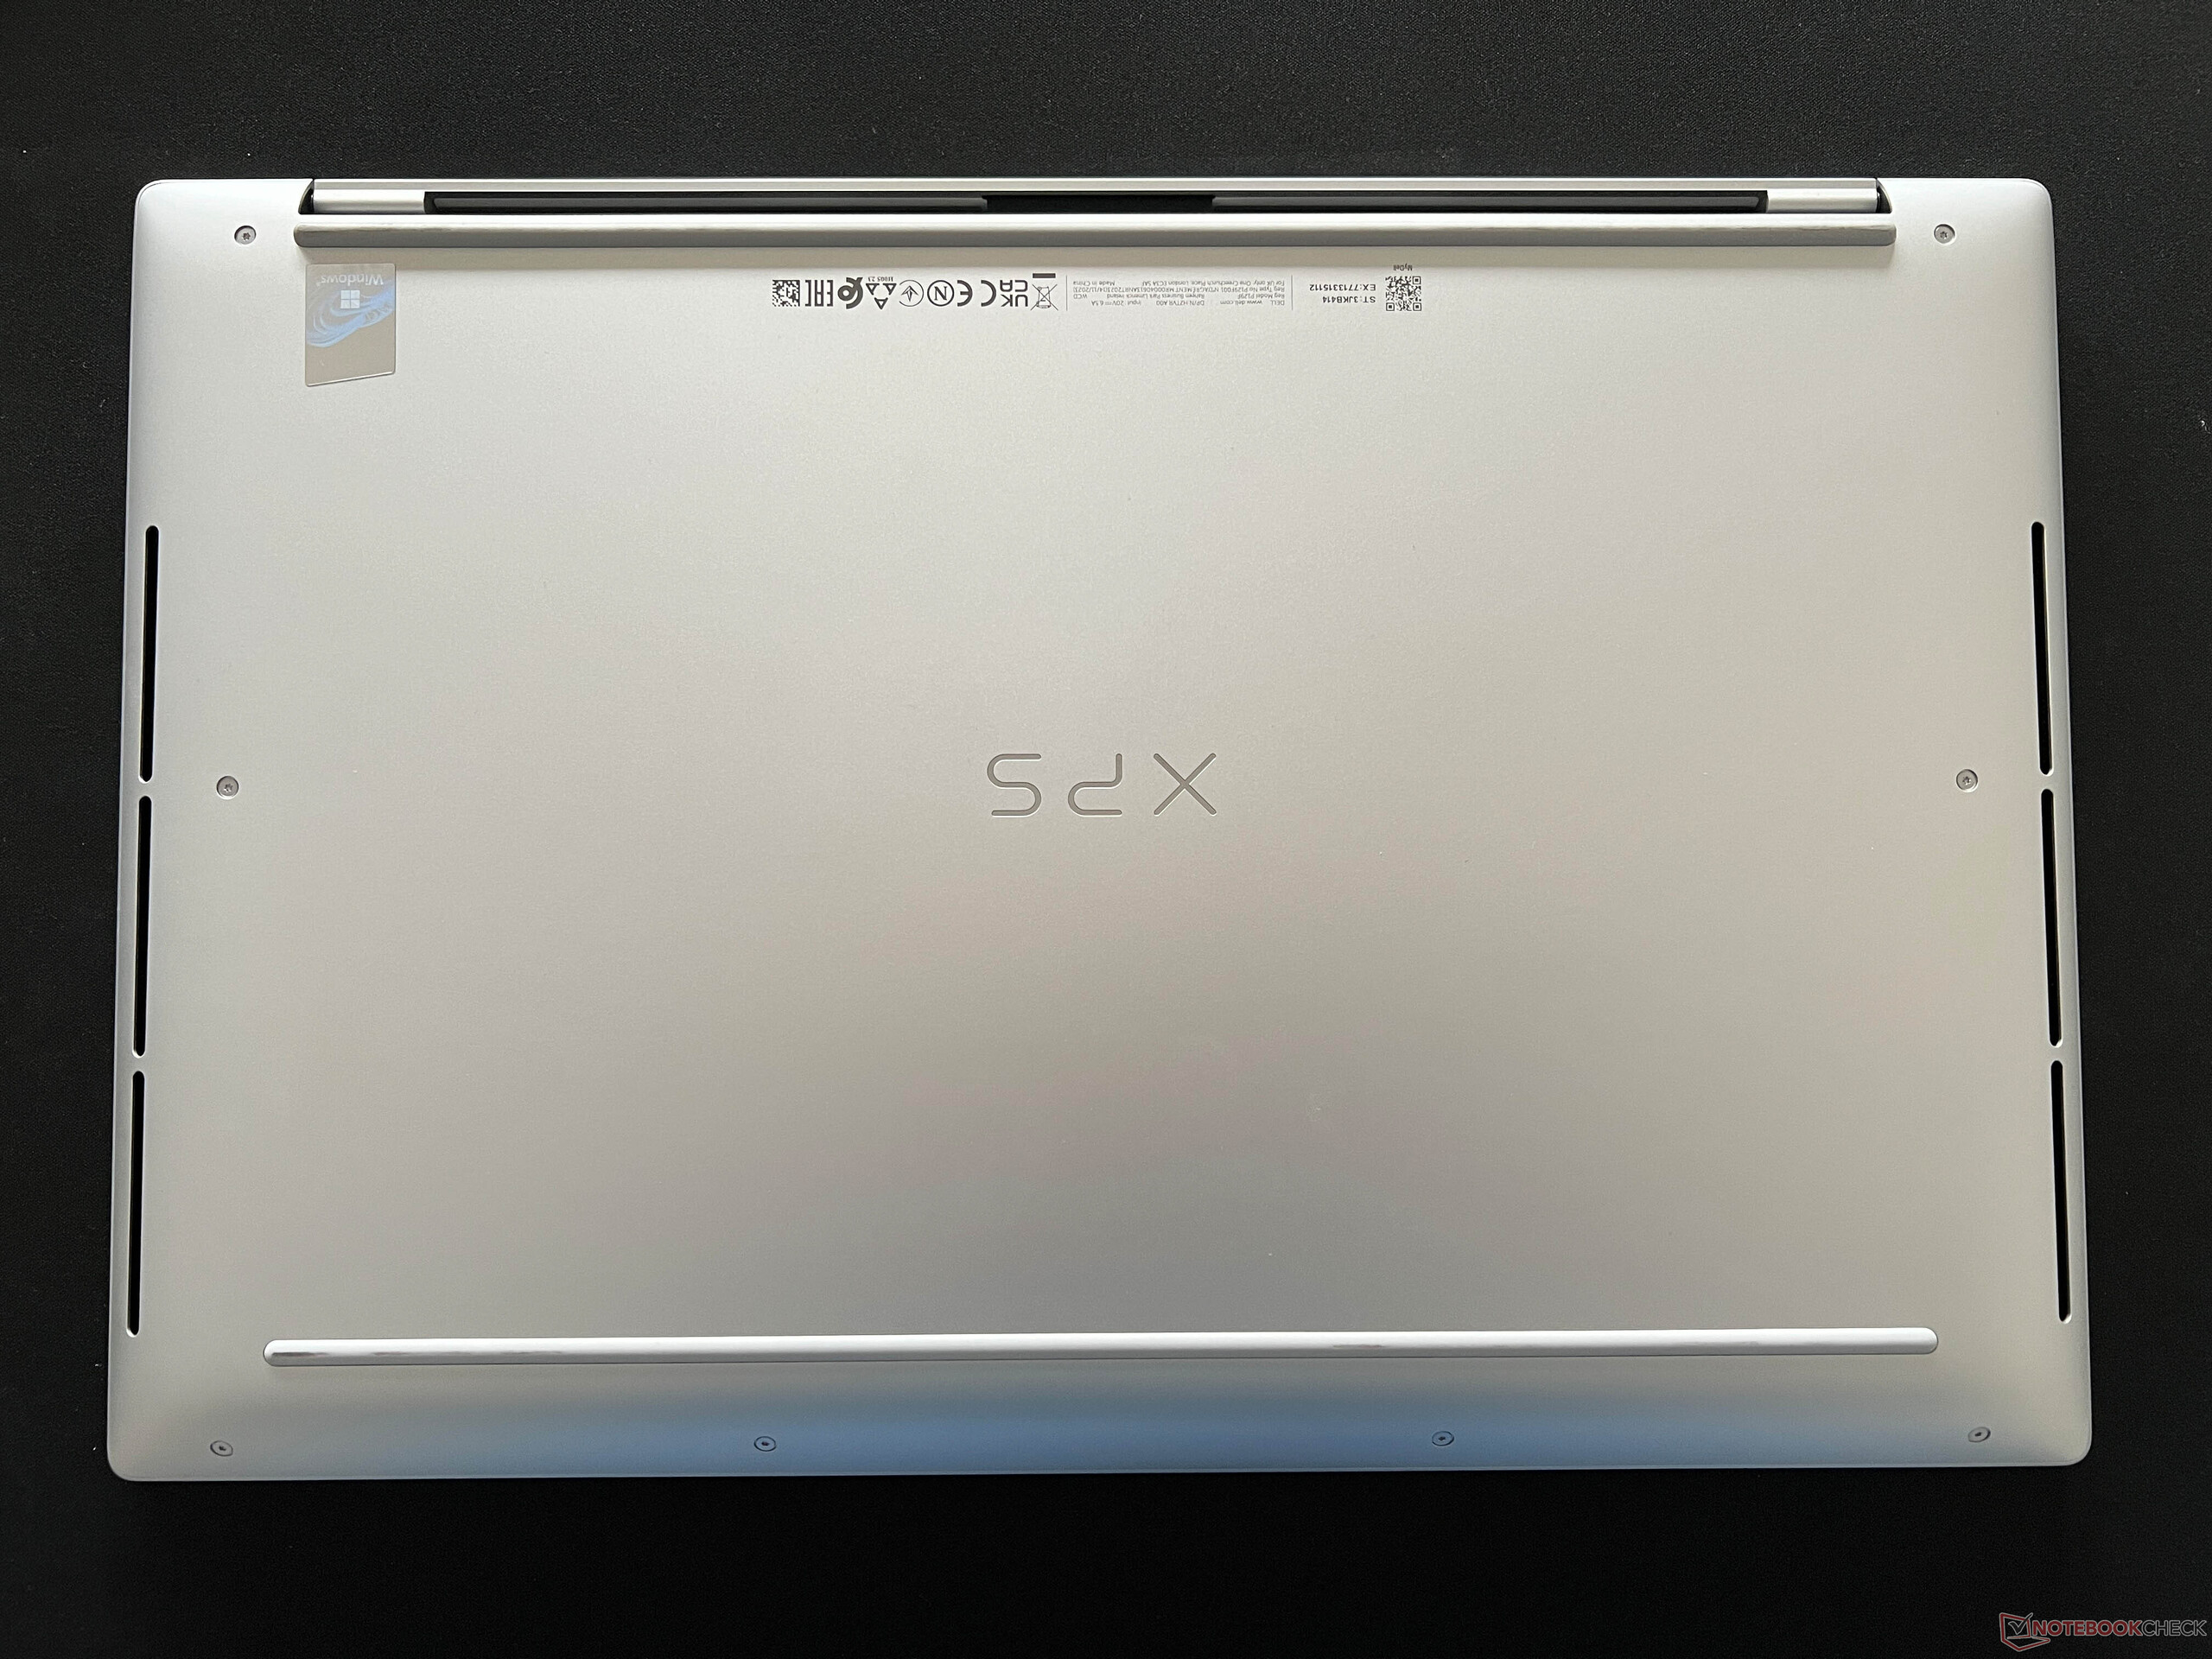
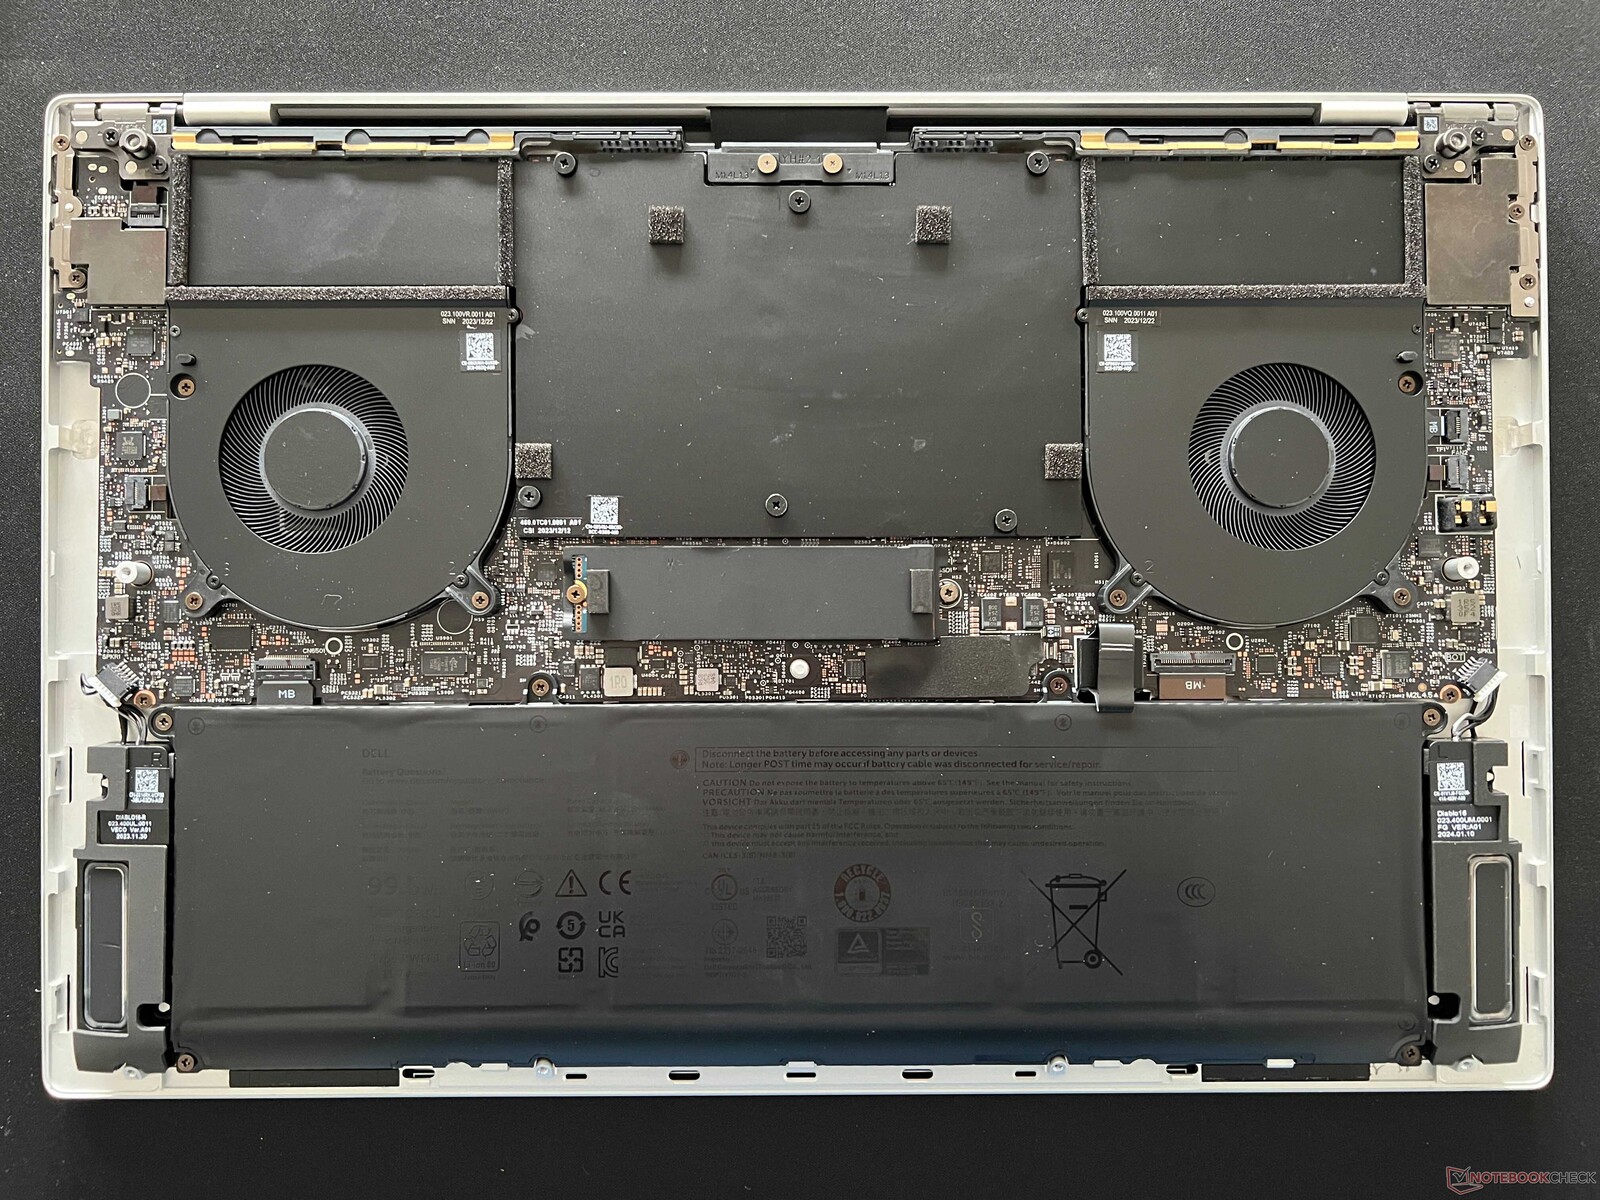
Manutenção
A tampa inferior do gabinete é fixada por parafusos Torx (T5) e pode ser removida facilmente. A estrutura interna é dominada pela unidade de resfriamento e pela bateria. Só é possível realizar a manutenção do SSD M.2-2280 e limpar as ventoinhas do notebook - além disso, o senhor pode trocar a bateria, se necessário. Todos os outros componentes, inclusive o módulo WLAN e a RAM, são soldados.
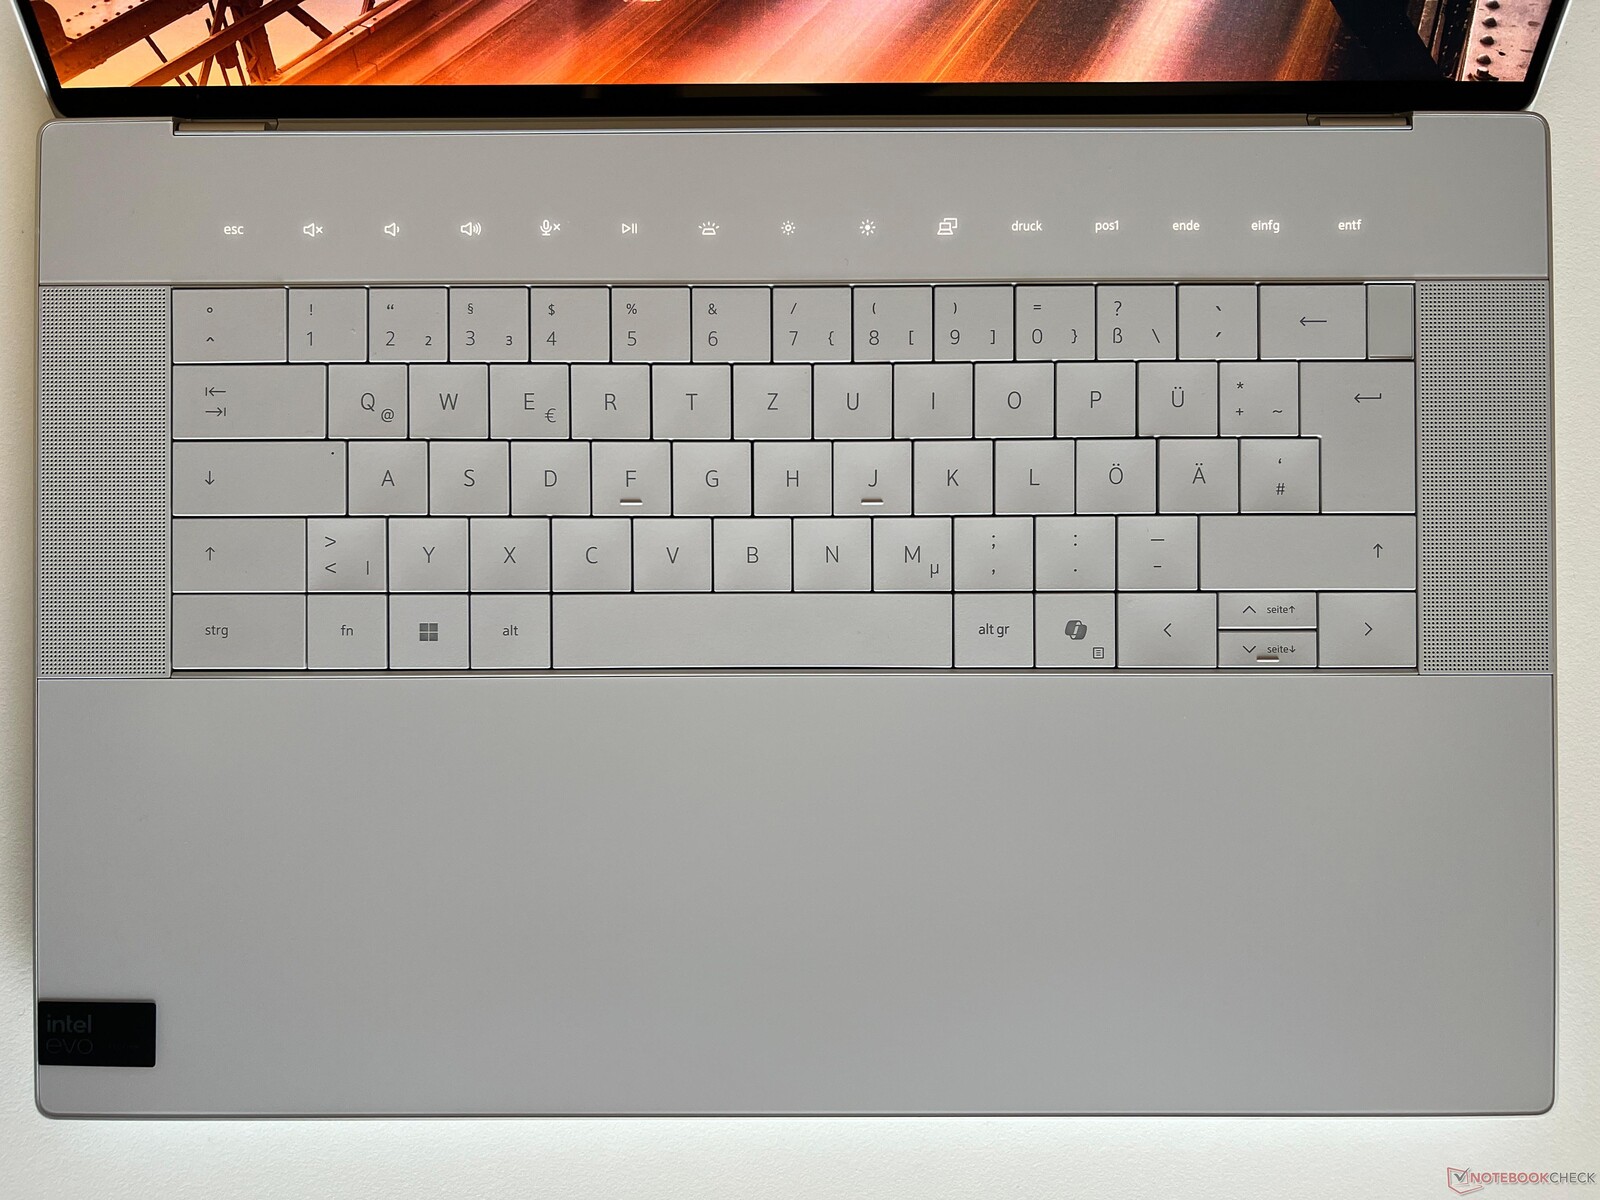
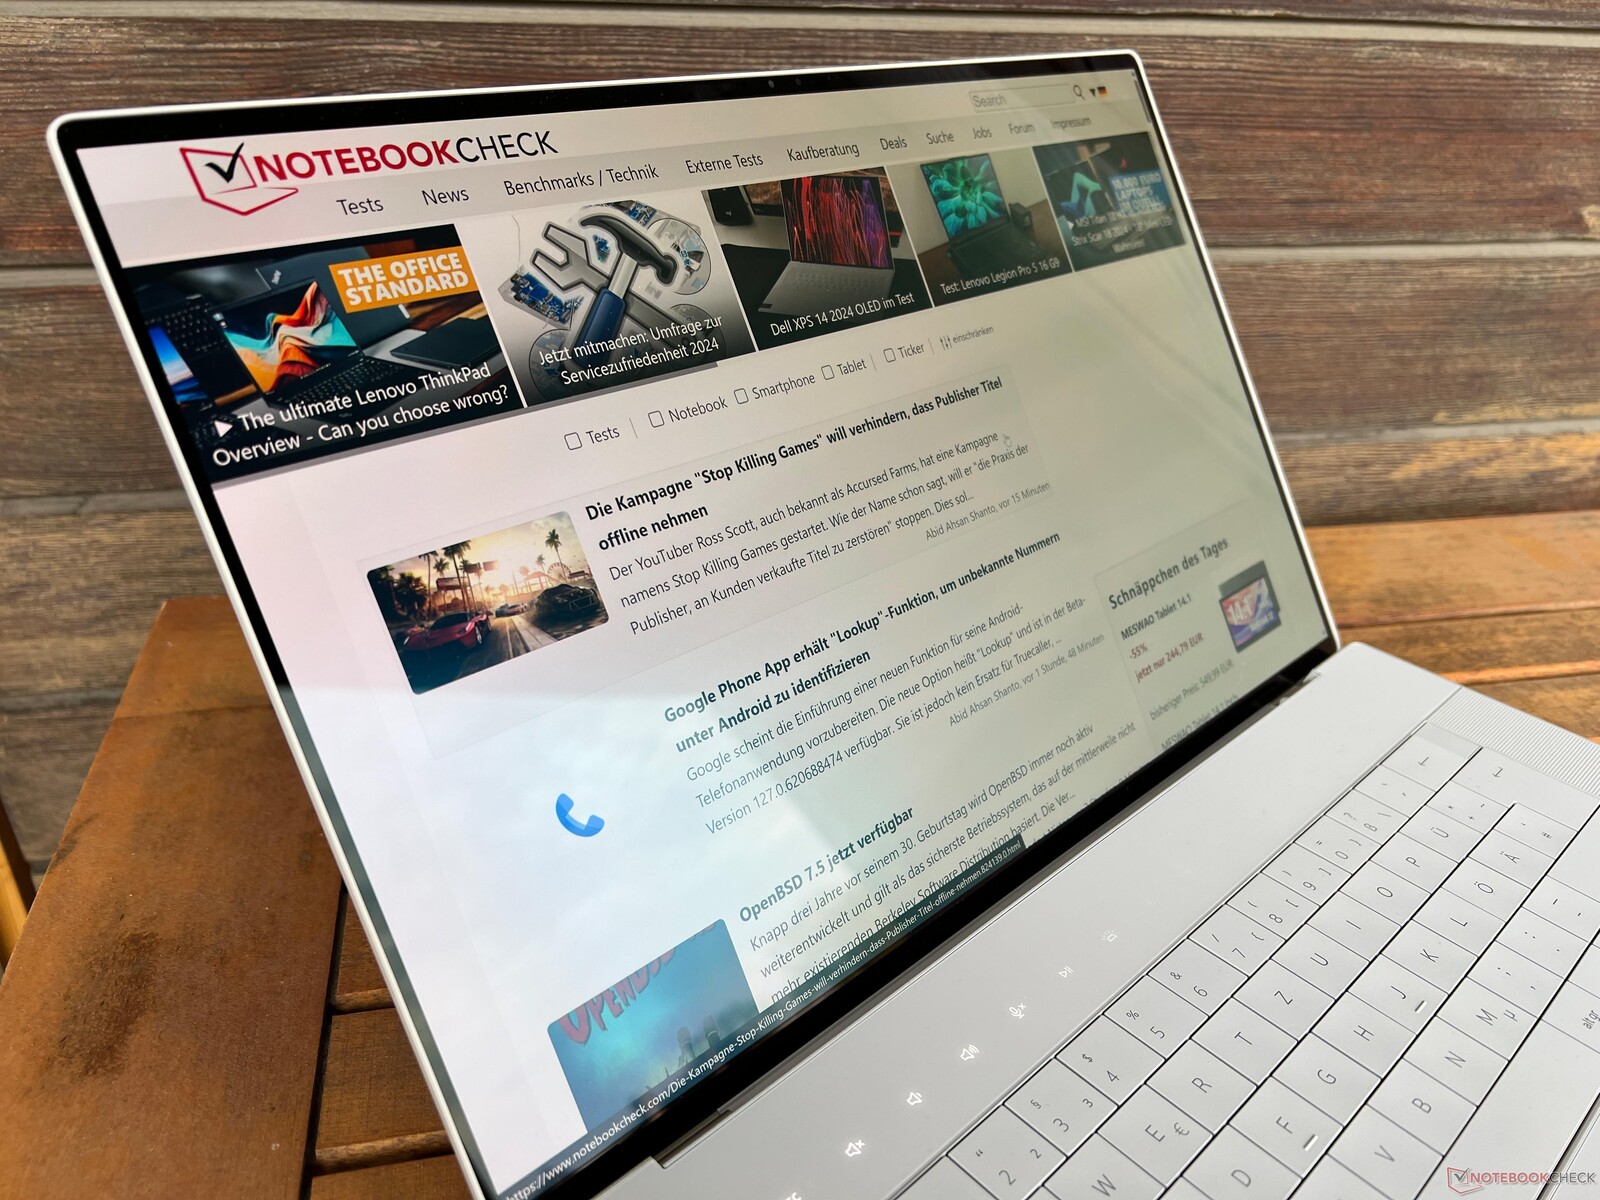
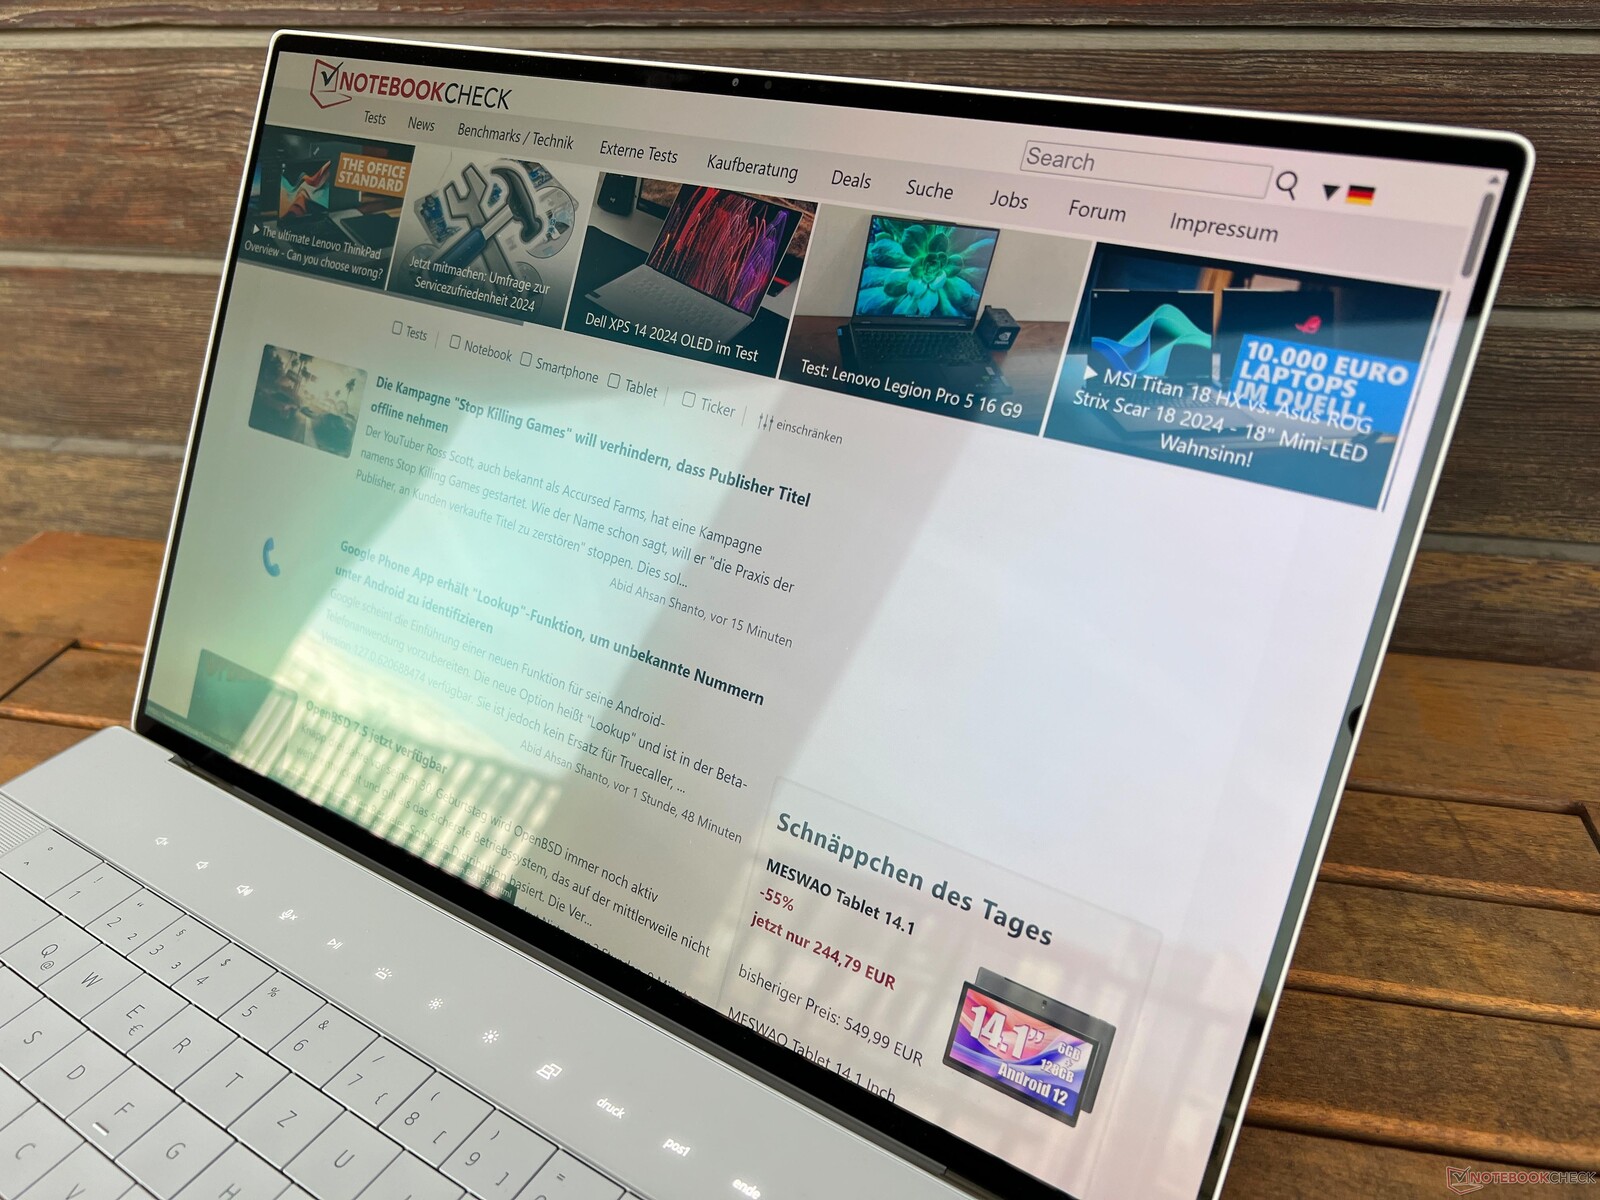
Dispositivos de entrada - O teclado leva algum tempo para se acostumar e as teclas de função são irritantes
Como já observado no XPS 14a Dell também usa o mesmo design de teclado do antigo XPS 13 Plus para seu modelo maior XPS 16, que não apresenta espaços entre as teclas individuais. Ele não tem um teclado numérico - em vez disso, o espaço ao lado do teclado é usado para os alto-falantes do laptop. As próprias teclas são ligeiramente côncavas e é muito confortável digitá-las, pois as teclas são precisas. No entanto, notamos um problema ocasional, pois muitas vezes pressionamos a tecla errada por acidente, portanto, o senhor definitivamente precisa de algum tempo para se acostumar com esse teclado. Também achamos que as minúsculas teclas de seta verticais são incômodas de serem pressionadas com dedos maiores, e o ruído das teclas maiores é muito mais alto (barra de espaço, tecla Enter). O botão liga/desliga fica no canto superior direito (incluindo um scanner de impressões digitais), onde normalmente se espera que esteja a tecla delete - isso nos leva ao próximo problema.
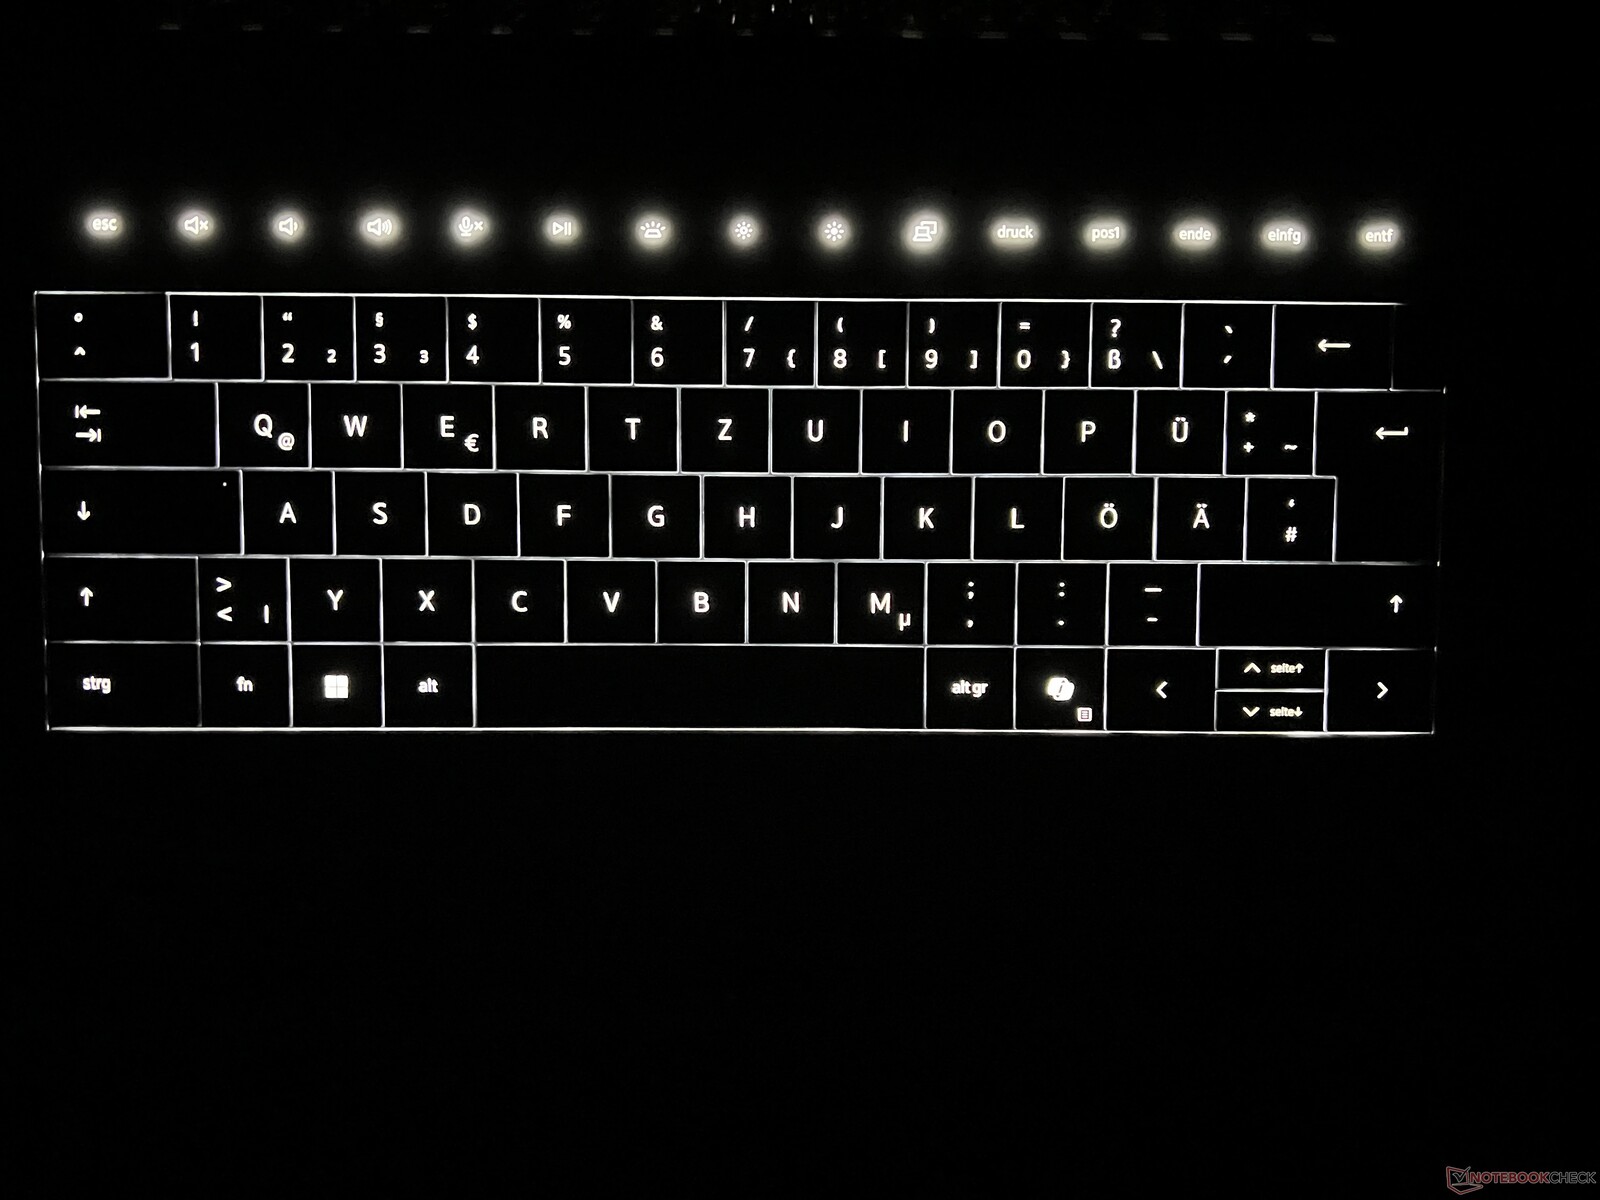
As teclas de função estão instaladas como uma barra de toque que não só não agrega nenhum valor adicional ao dispositivo para os usuários, como também é bastante irritante. Como resultado, o usuário não consegue nem mesmo pressionar a tecla Delete às cegas e sempre precisa olhar para as teclas. A luz de fundo também é um incômodo, pois se desliga durante períodos de inatividade, mas não quando se assiste a vídeos por horas a fio - mesmo que o usuário não toque em uma única tecla. Além disso, quando a luz de fundo é desativada, o usuário não sabe onde deve pressionar, o que significa que pode pressionar as teclas erradas até que a iluminação seja reativada. A própria luz de fundo branca é adaptada constantemente por meio de um sensor e o usuário não pode influenciar a intensidade de forma alguma - ou pelo menos não conseguimos encontrar a opção. O sensor também não está interessado em saber se o senhor desativou a luz de fundo manualmente e, assim que as condições de iluminação mudam, ela é reativada.
O touchpad é totalmente integrado ao apoio para as mãos e não há limites visíveis. O touchpad usa toda a altura do apoio para as mãos e sua largura se estende do centro da tecla Fn esquerda até o centro da tecla de seta esquerda. Em geral, ele funciona bem e é agradável e suave, com um clique uniforme, mas ocasionalmente encontramos alguns problemas se o usuário saísse da área ou iniciasse movimentos um pouco fora da área real do touchpad. Em contraste com a barra de toque, no entanto, esse é apenas um pequeno ponto de crítica. O painel OLED opcional também é equipado com uma tela sensível ao toque capacitiva e funciona perfeitamente.
Tela - OLED 4K de 90 Hz
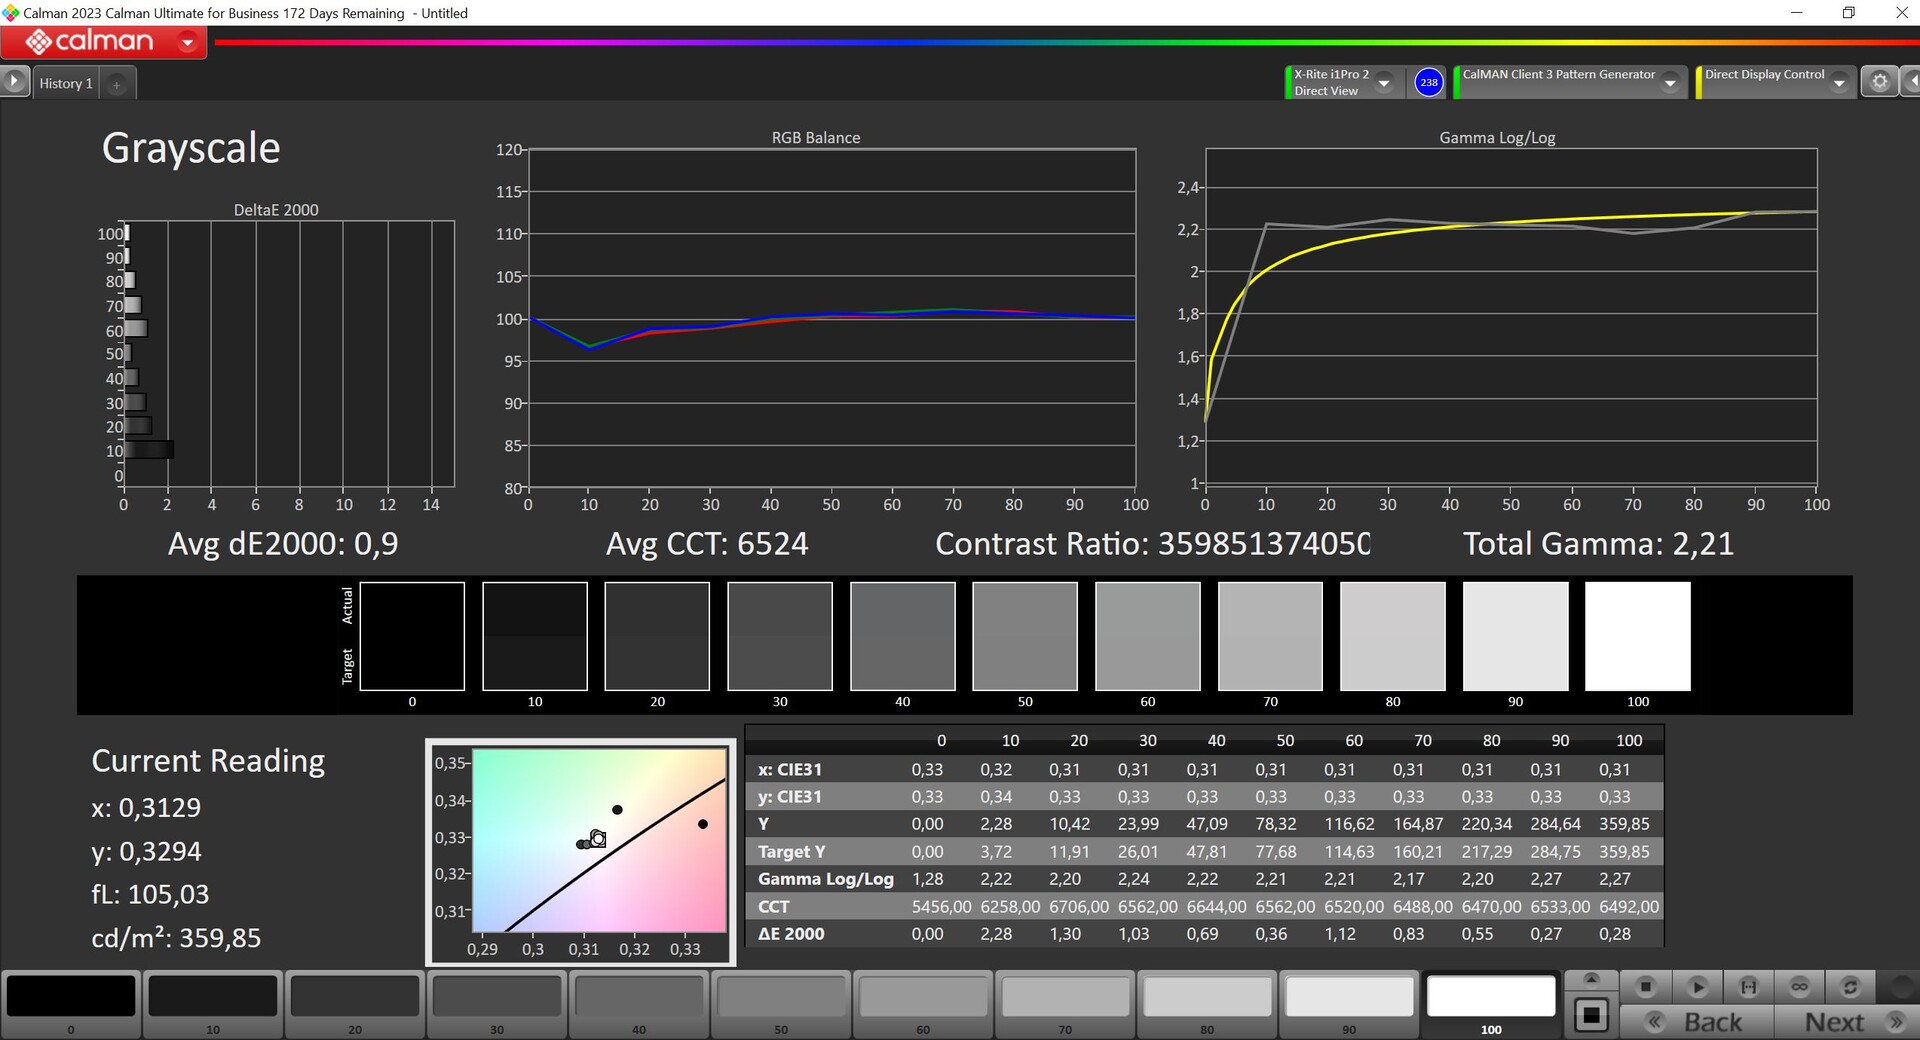
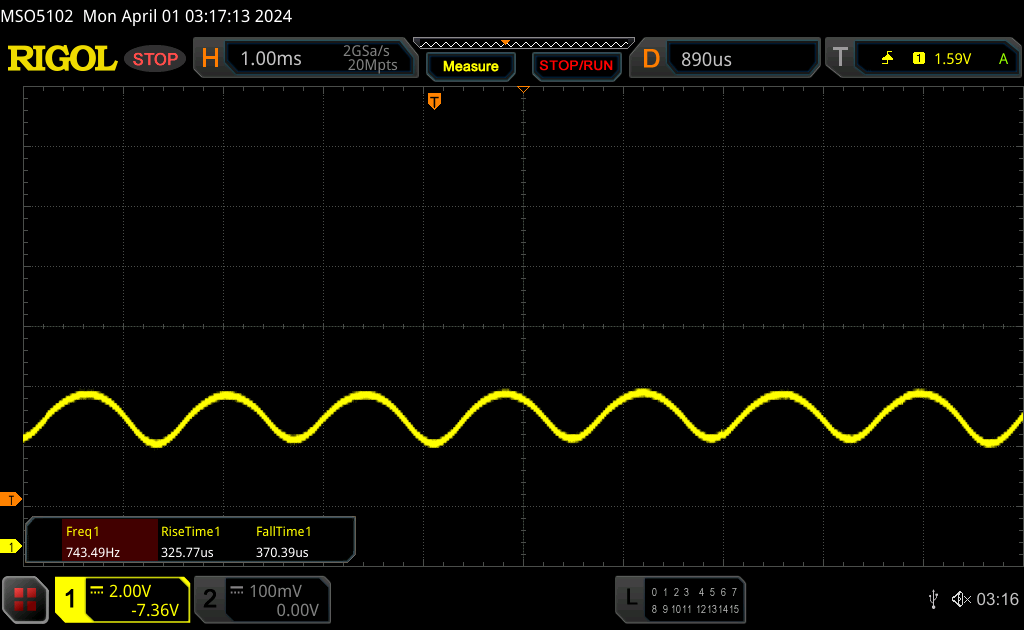
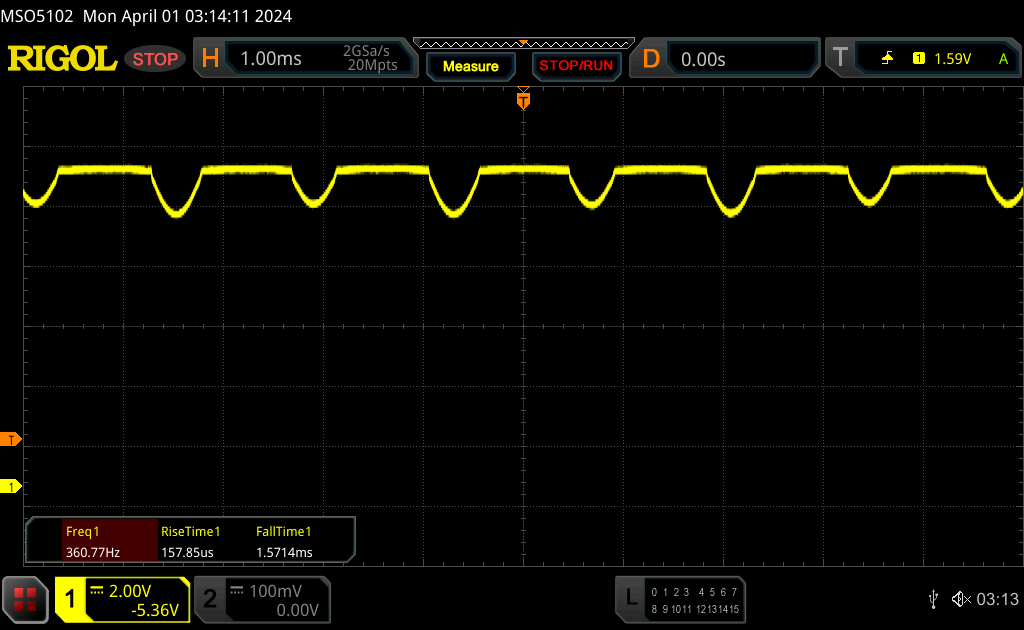
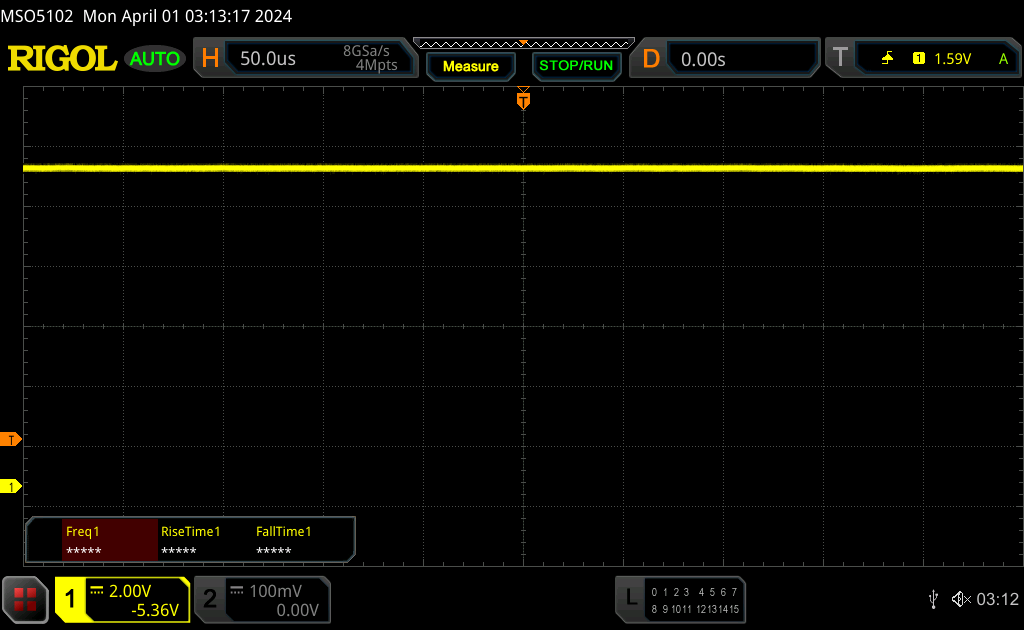
A Dell oferece dois painéis diferentes de 16,3 polegadas com uma superfície reflexiva para seu novo XPS 16. Um modelo de 1080p (500 cd/m²) sem tela táctil está instalado como padrão, mas por um adicional de US$300, o senhor pode obter uma tela táctil OLED da Samsung com uma resolução de 3.840 x 2.400 pixels, que também é a que está instalada em nosso equipamento de teste. Apesar da boa qualidade subjetiva da imagem, o painel do XPS 16 apresenta algumas desvantagens em comparação com a última geração OLED da Samsung (que está instalada no Galaxy Book4 Ultra, por exemplo), apesar de sua resolução mais alta. Em primeiro lugar, sua taxa de atualização é de apenas 90 Hz, em vez de 120 Hz, e um efeito de rasterização pode ser visto em uma inspeção mais próxima quando o conteúdo brilhante é exibido. O Dell XPS 16 também fica um pouco atrás quando se trata de seu brilho SDR máximo com uma média de ~367 cd/m². Seu valor de preto é 0, o que leva a uma taxa de contraste extremamente alta. Observamos um máximo de 580 cd/m² no modo HDR (que precisa ser ativado manualmente). Conseguimos detectar PWM com uma frequência de 360 Hz em todos os níveis de brilho, de 0 a 90%.
| |||||||||||||||||||||||||
iluminação: 96 %
iluminação com acumulador: 366 cd/m²
Contraste: ∞:1 (Preto: 0 cd/m²)
ΔE ColorChecker Calman: 1.3 | ∀{0.5-29.43 Ø4.71}
calibrated: 1
ΔE Greyscale Calman: 2.2 | ∀{0.09-98 Ø4.96}
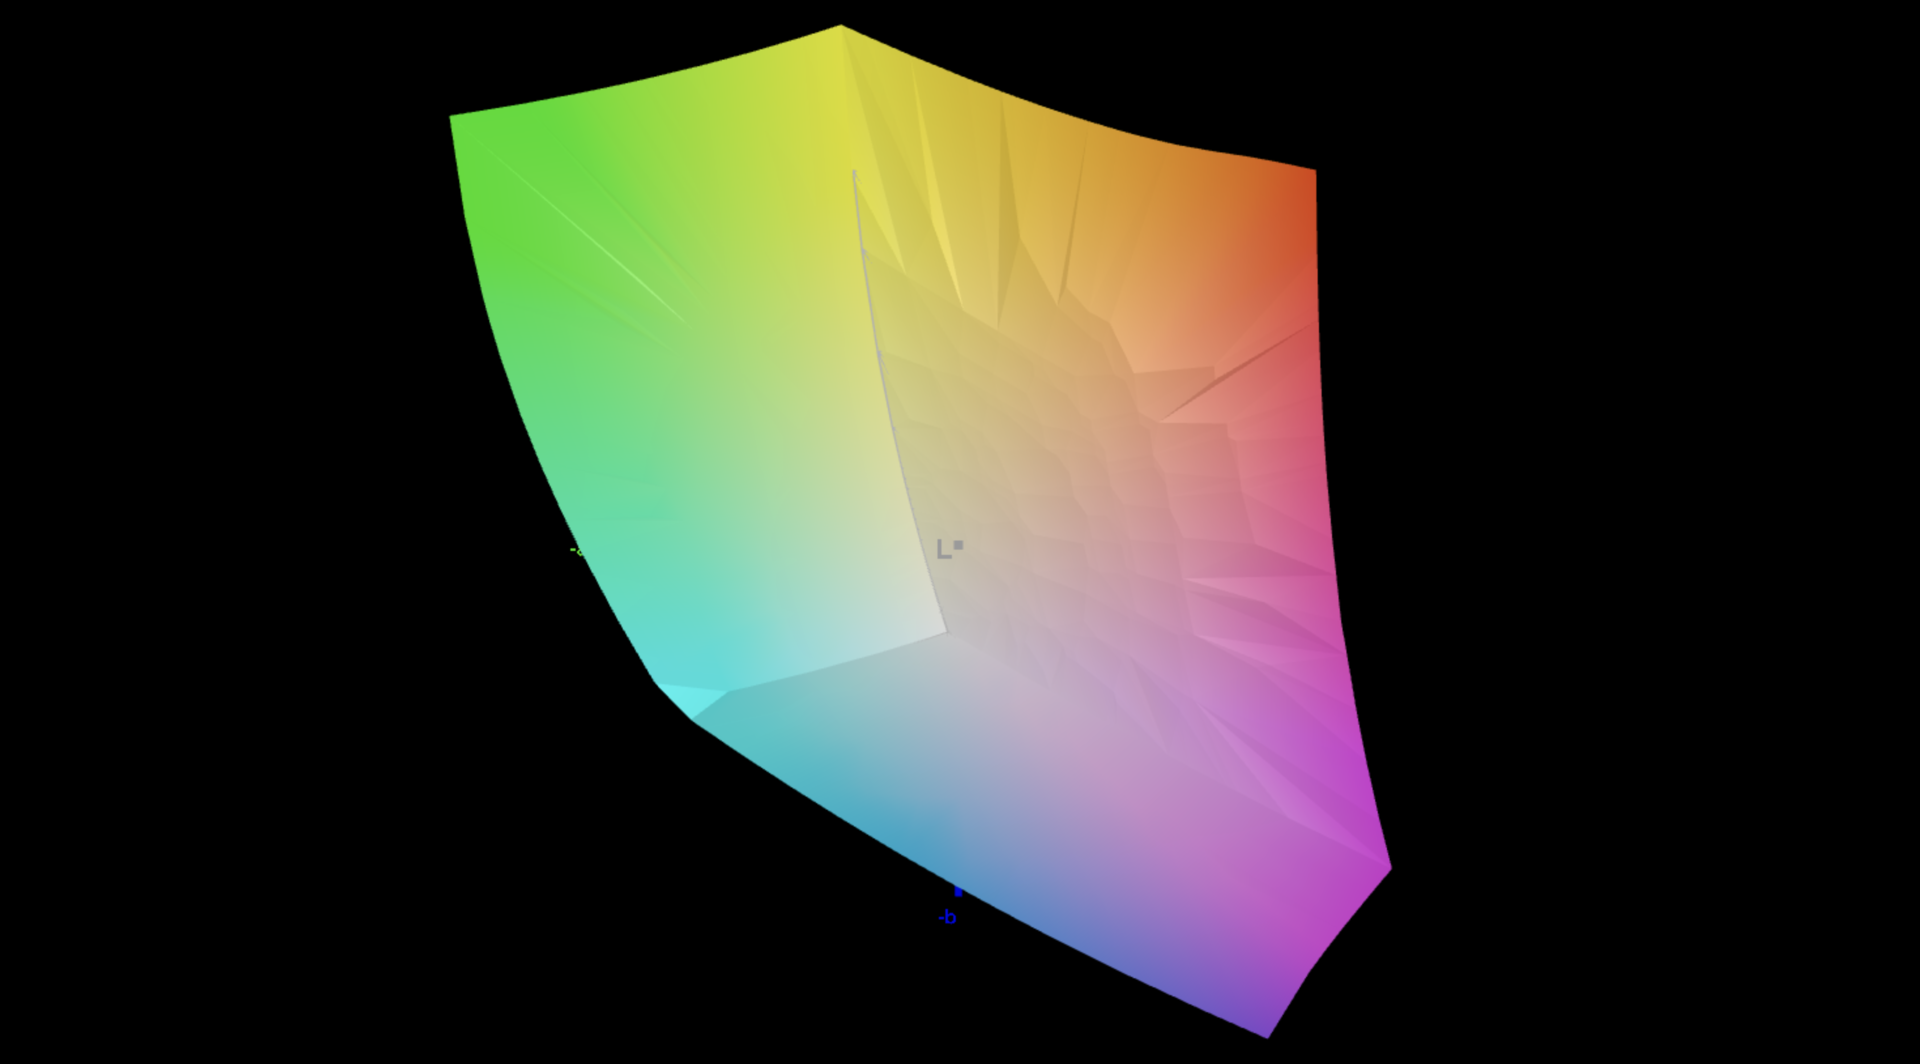
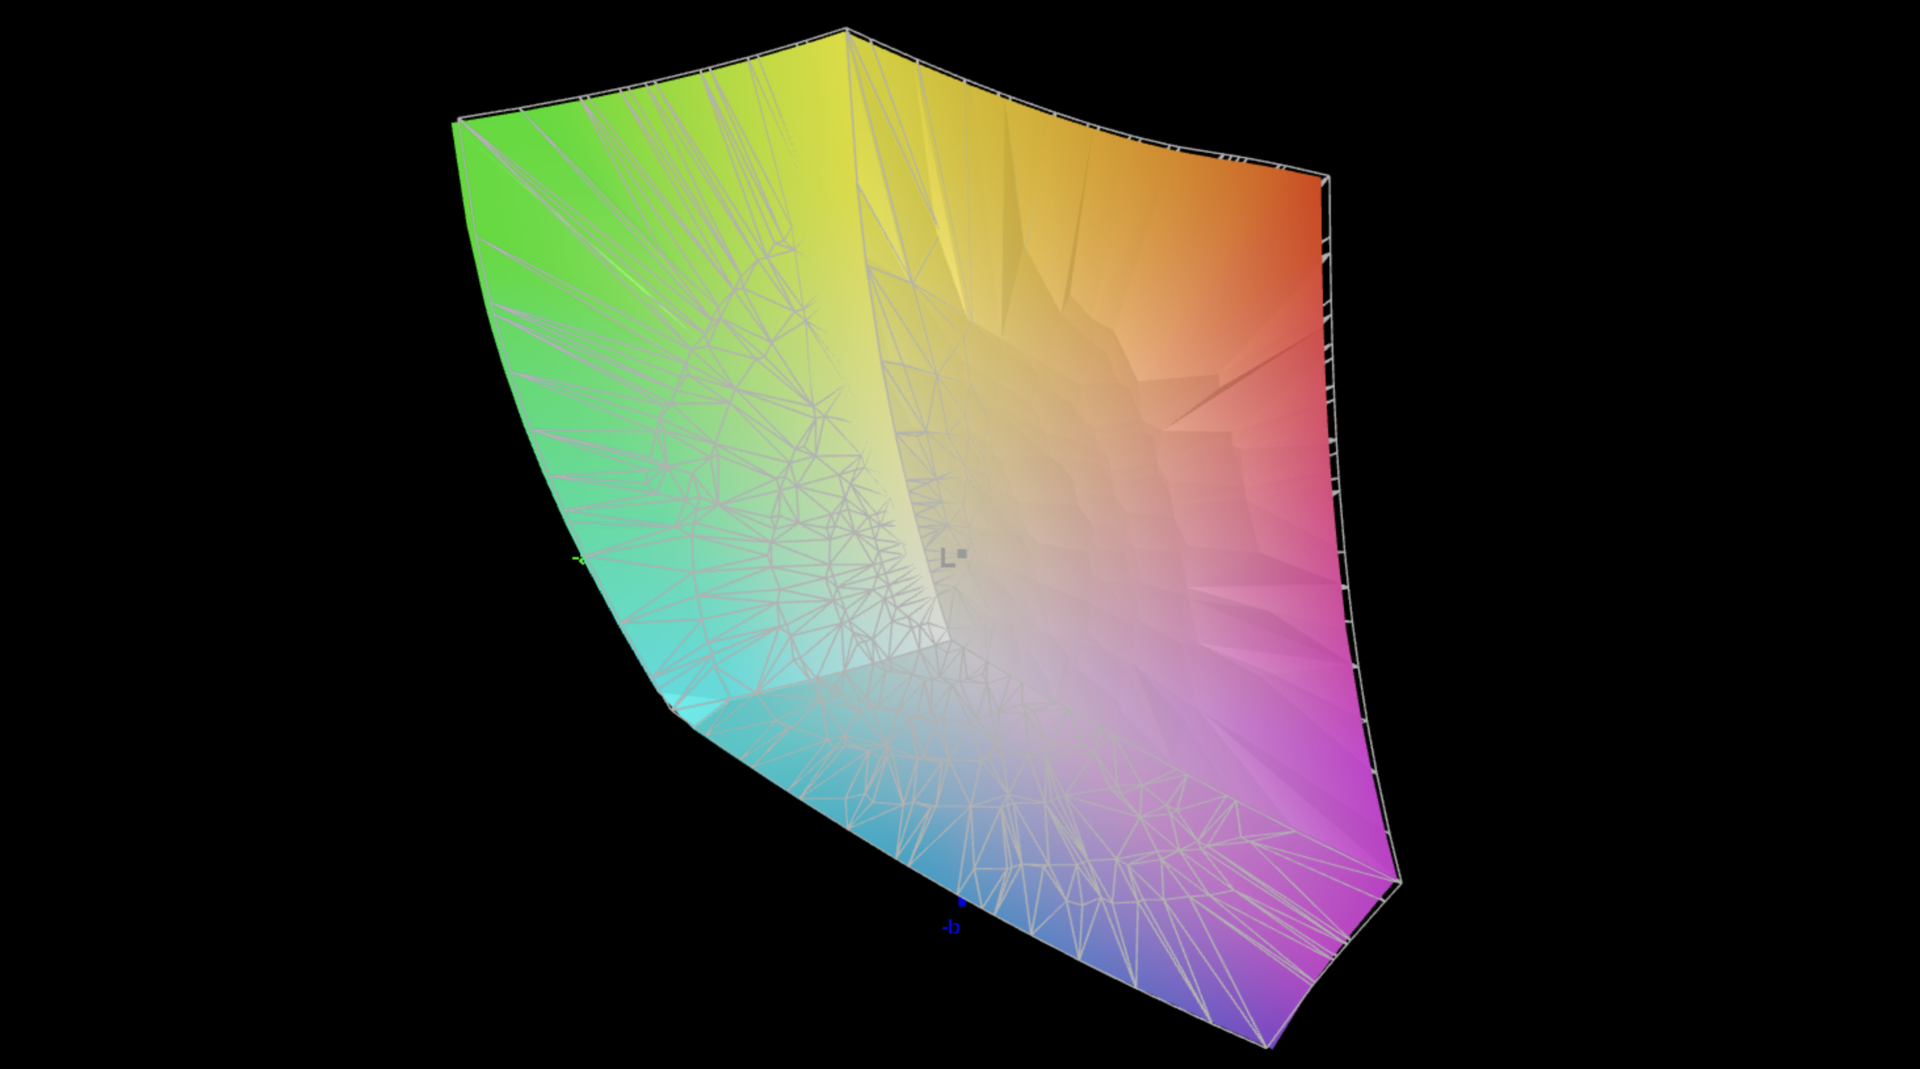
87.8% AdobeRGB 1998 (Argyll 3D)
100% sRGB (Argyll 3D)
98.3% Display P3 (Argyll 3D)
Gamma: 2.14
CCT: 6680 K
| Dell XPS 16 9640 SDC4196, OLED, 3840x2400, 16.3" | Samsung Galaxy Book4 Ultra ATNA60CL07-0, OLED, 2880x1800, 16" | Honor MagicBook Pro 16 2024 TL160MDMP01, IPS, 3072x1920, 16" | Asus ROG Zephyrus G16 2024 GU605M ATNA60DL01-0, OLED, 2560x1600, 16" | Lenovo Yoga Pro 9 16-IRP G8 LEN160-3.2K, Mini-LED, 3200x2000, 16" | Schenker VISION 16 Pro (M23) NE160QDM-NZ1, IPS, 2560x1600, 16" | Dell XPS 15 9530 RTX 4070 Samsung 156XG01, OLED, 3456x2160, 15.6" | |
|---|---|---|---|---|---|---|---|
| Display | 0% | 1% | 4% | 2% | -17% | 5% | |
| Display P3 Coverage (%) | 98.3 | 98.6 0% | 98.8 1% | 99.9 2% | 97 -1% | 68.8 -30% | 99.8 2% |
| sRGB Coverage (%) | 100 | 99.9 0% | 100 0% | 100 0% | 99.8 0% | 98.8 -1% | 100 0% |
| AdobeRGB 1998 Coverage (%) | 87.8 | 88.5 1% | 89.1 1% | 96.9 10% | 95.1 8% | 70 -20% | 98.4 12% |
| Response Times | 27% | -614% | 72% | -1295% | -1212% | -117% | |
| Response Time Grey 50% / Grey 80% * (ms) | 0.82 ? | 0.54 ? 34% | 6.3 ? -668% | 0.22 ? 73% | 14 ? -1607% | 13.7 ? -1571% | 1.68 ? -105% |
| Response Time Black / White * (ms) | 0.85 ? | 0.69 ? 19% | 5.6 ? -559% | 0.25 ? 71% | 9.2 ? -982% | 8.1 ? -853% | 1.94 ? -128% |
| PWM Frequency (Hz) | 360 ? | 240 ? | 960 ? | 5800 ? | 239 | ||
| Screen | 6% | 5% | 4% | 22% | -58% | -64% | |
| Brightness middle (cd/m²) | 366 | 390 7% | 551 51% | 416 14% | 539 47% | 384 5% | 389.5 6% |
| Brightness (cd/m²) | 367 | 393 7% | 524 43% | 418 14% | 546 49% | 371 1% | 392 7% |
| Brightness Distribution (%) | 96 | 98 2% | 91 -5% | 96 0% | 96 0% | 88 -8% | 98 2% |
| Black Level * (cd/m²) | 0.52 | 0.18 | 0.3 | ||||
| Colorchecker dE 2000 * | 1.3 | 1.4 -8% | 1.7 -31% | 1.6 -23% | 1.4 -8% | 3.4 -162% | 4.95 -281% |
| Colorchecker dE 2000 max. * | 3.6 | 2.7 25% | 4.1 -14% | 2.1 42% | 2.1 42% | 9.2 -156% | 8.65 -140% |
| Colorchecker dE 2000 calibrated * | 1 | 1 -0% | 1.3 -30% | 1.53 -53% | |||
| Greyscale dE 2000 * | 2.2 | 2.1 5% | 2.4 -9% | 2.7 -23% | 2.2 -0% | 3.4 -55% | 2 9% |
| Gamma | 2.14 103% | 2.27 97% | 2.2 100% | 2.16 102% | 2.19 100% | 2.16 102% | 2.27 97% |
| CCT | 6680 97% | 6431 101% | 6842 95% | 6331 103% | 6479 100% | 7462 87% | 6265 104% |
| Contrast (:1) | 1060 | 2994 | 1280 | ||||
| Média Total (Programa/Configurações) | 11% /
8% | -203% /
-99% | 27% /
16% | -424% /
-223% | -429% /
-240% | -59% /
-56% |
* ... menor é melhor

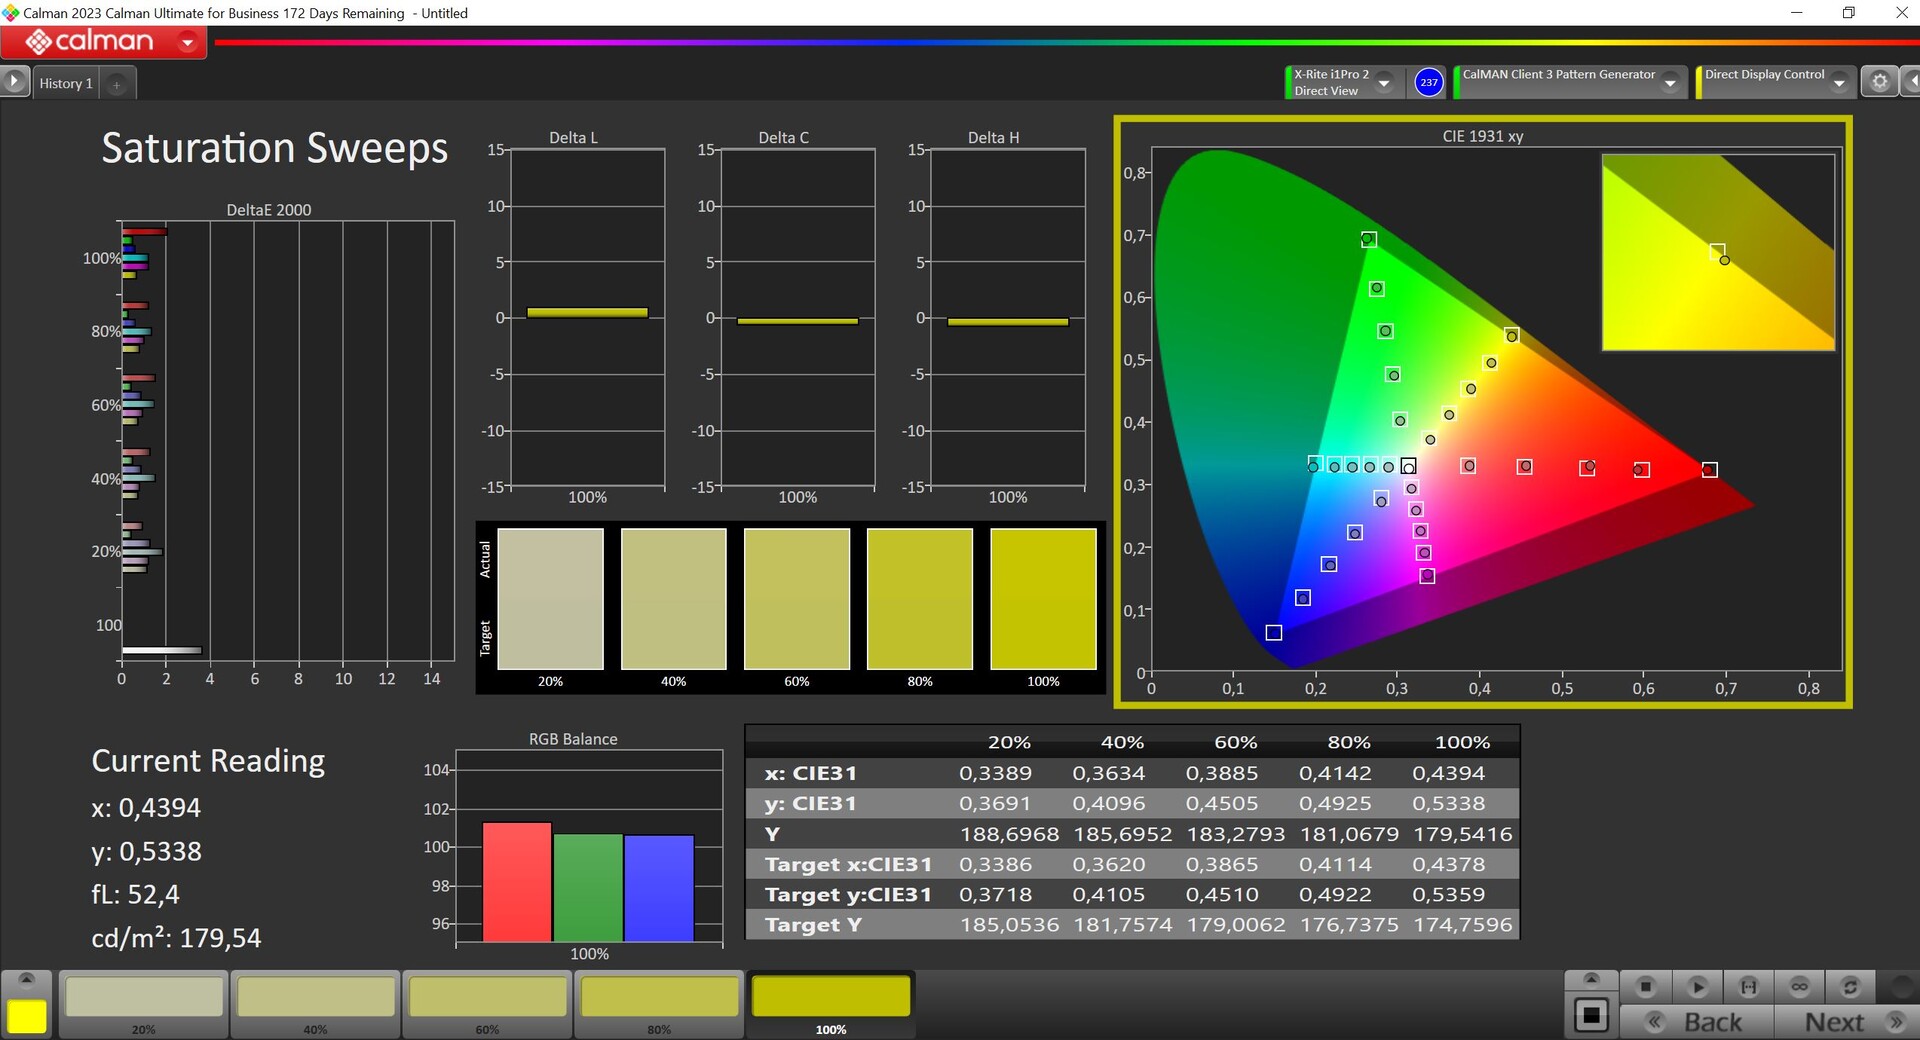

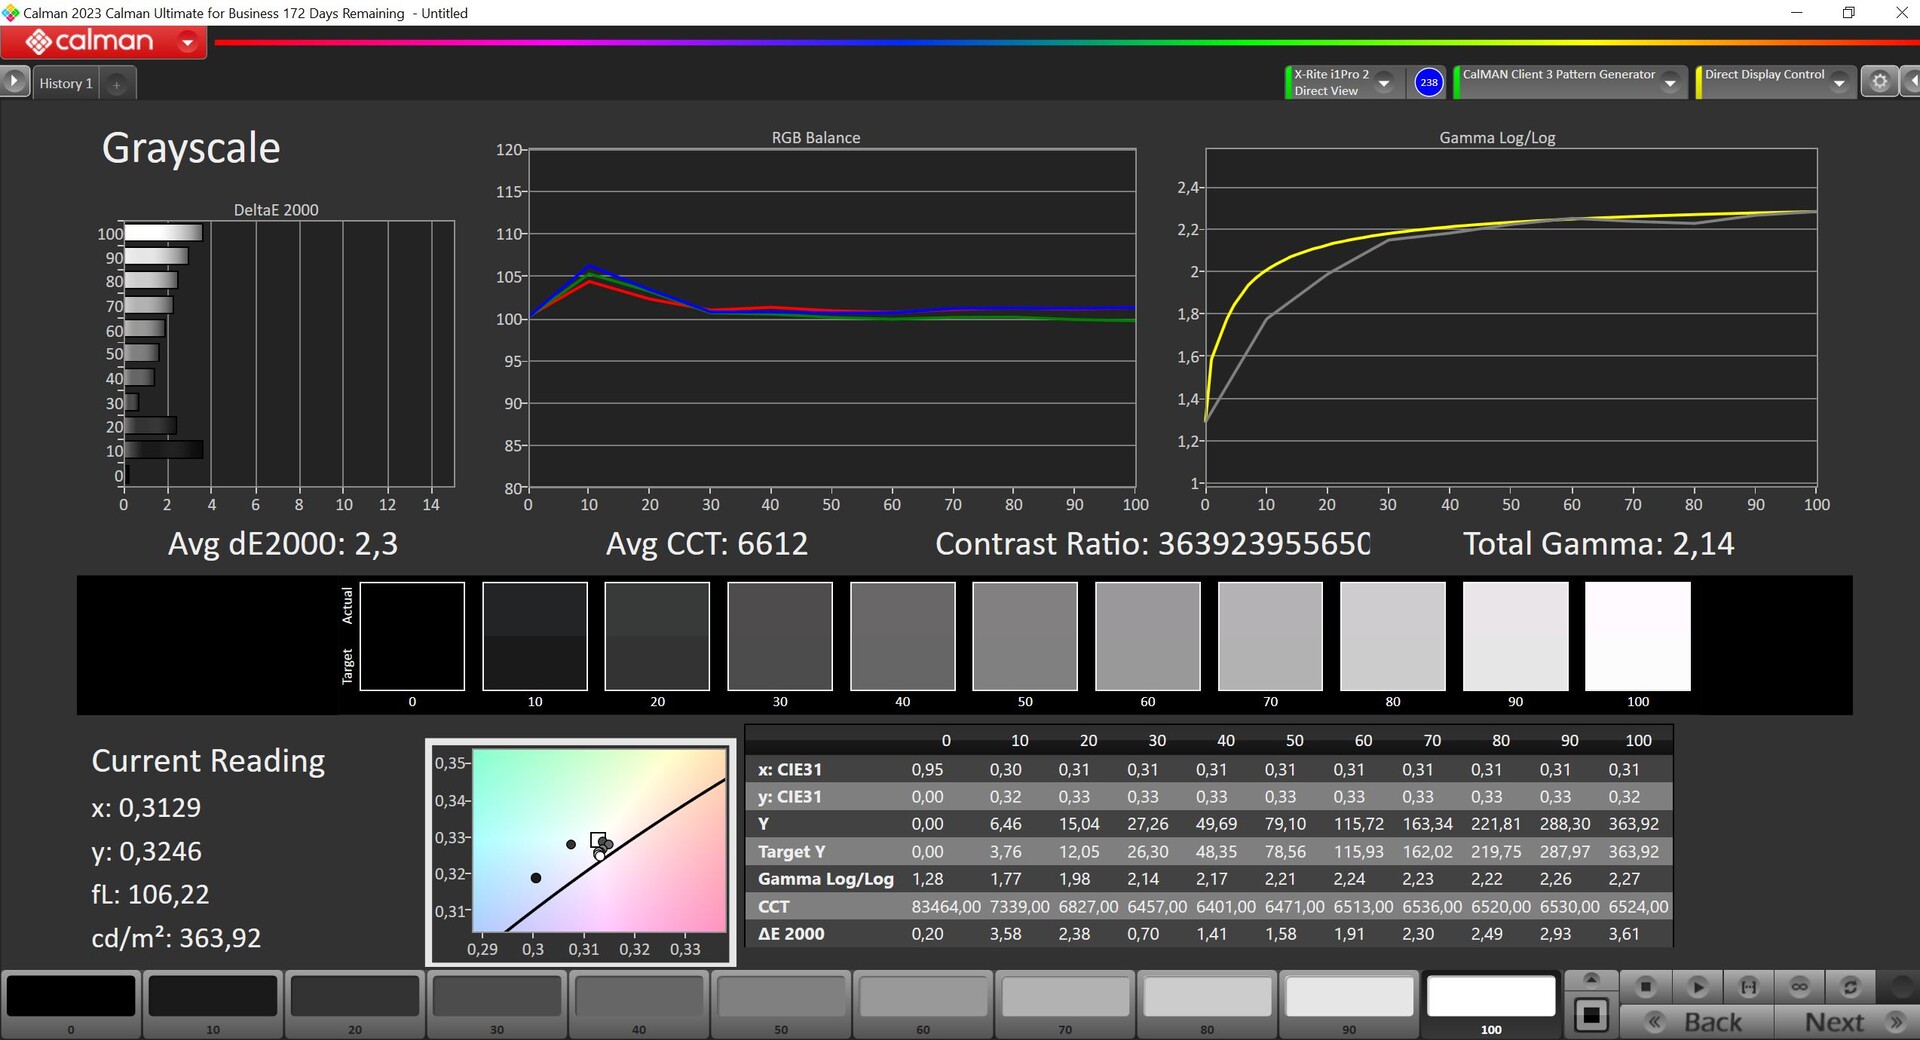
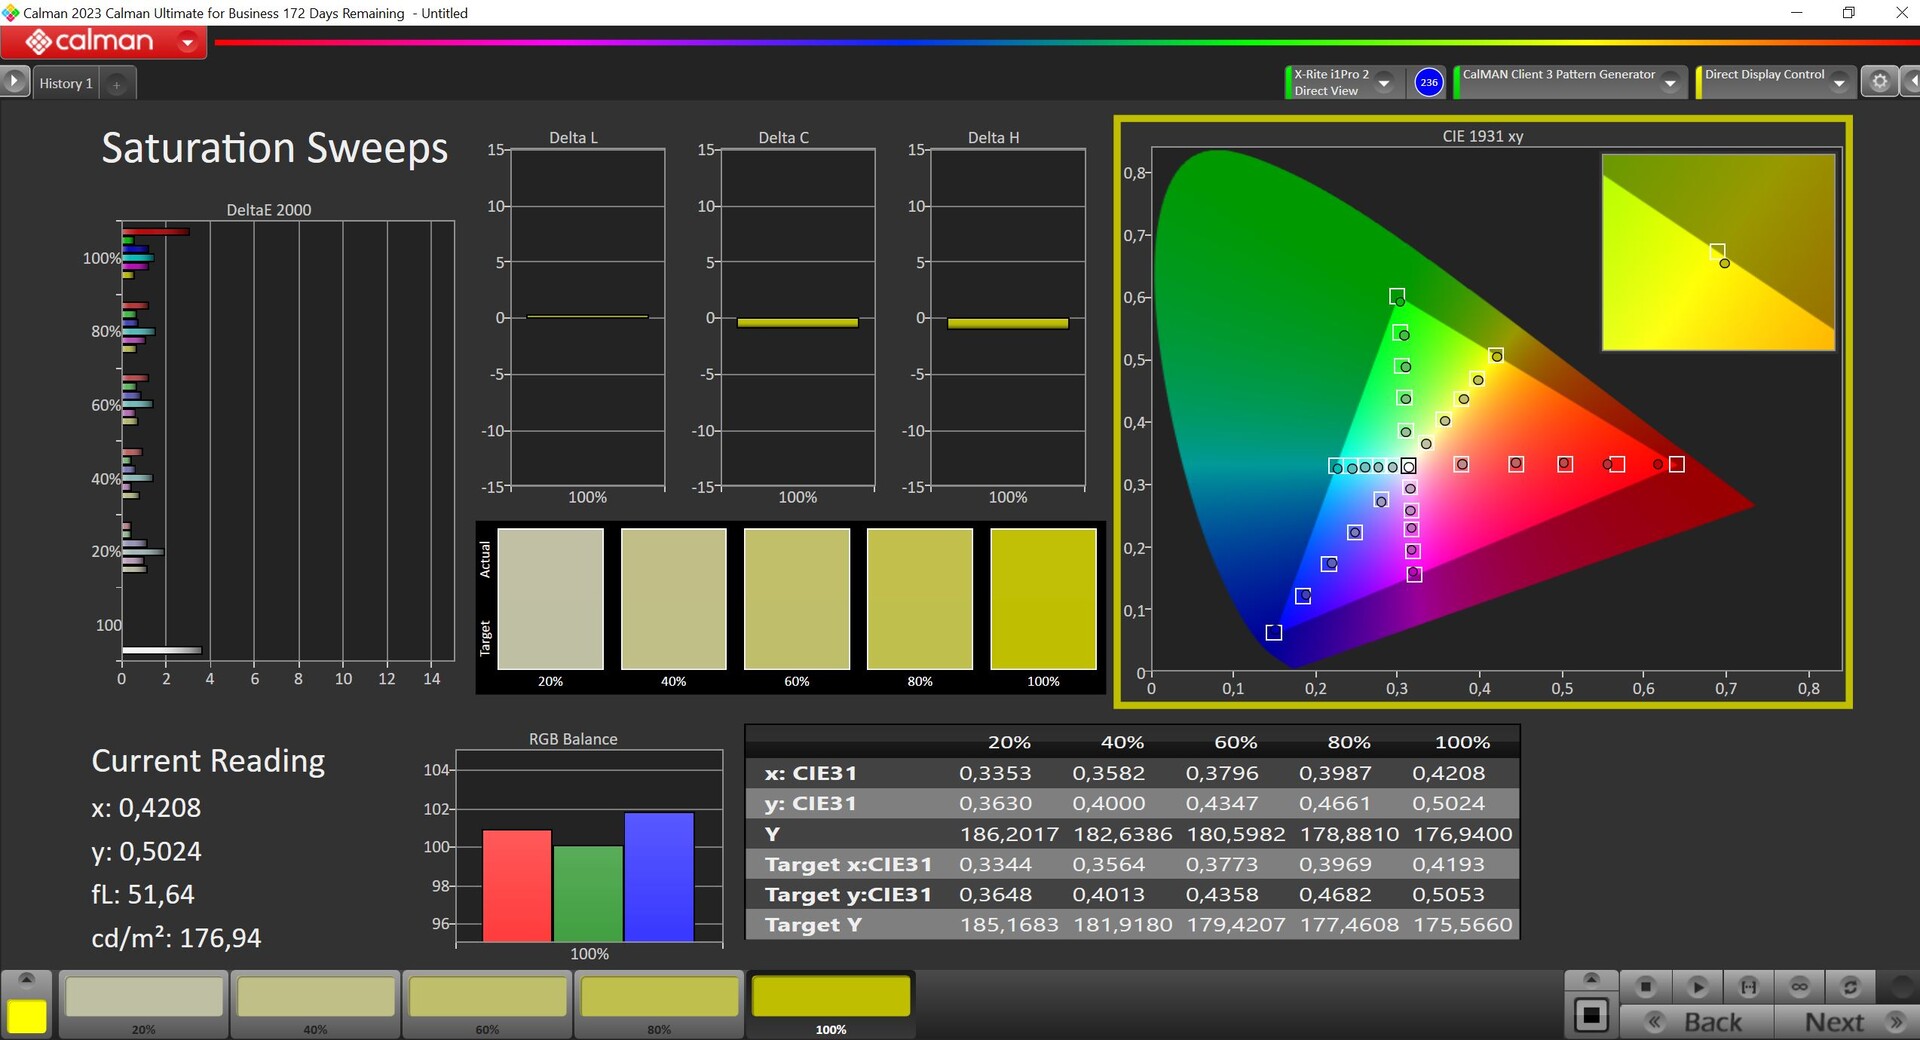

Analisamos o painel usando o software profissional CalMAN (X-Rite i1 Pro 2). A Dell oferece diferentes perfis de cores e o perfil pré-selecionado Vivid já oferece cores muito precisas - apenas os tons de cinza ainda mostram alguns pequenos desvios. Usando nossa própria calibração (o senhor pode baixar o perfil correspondente gratuitamente acima), conseguimos melhorar ainda mais a representação. Se o senhor gosta de editar fotos, vai gostar do perfil preciso Internet, que limita o espaço de cores a sRGB.


Exibir tempos de resposta
| ↔ Tempo de resposta preto para branco | ||
|---|---|---|
| 0.85 ms ... ascensão ↗ e queda ↘ combinadas | ↗ 0.46 ms ascensão | 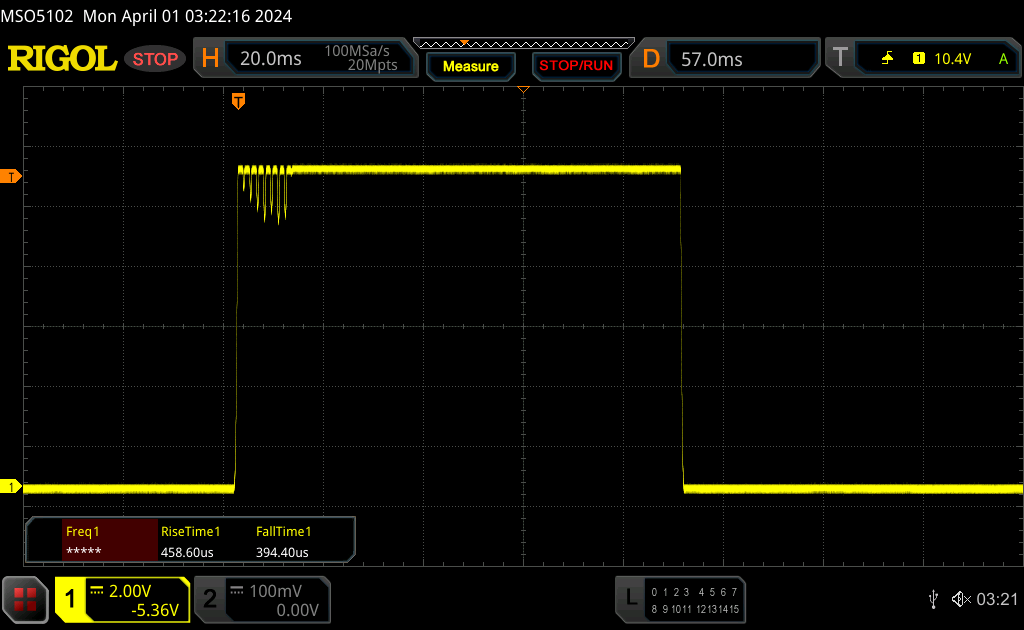 |
| ↘ 0.39 ms queda | ||
| A tela mostra taxas de resposta muito rápidas em nossos testes e deve ser muito adequada para jogos em ritmo acelerado. Em comparação, todos os dispositivos testados variam de 0.1 (mínimo) a 240 (máximo) ms. » 3 % de todos os dispositivos são melhores. Isso significa que o tempo de resposta medido é melhor que a média de todos os dispositivos testados (19.8 ms). | ||
| ↔ Tempo de resposta 50% cinza a 80% cinza | ||
| 0.82 ms ... ascensão ↗ e queda ↘ combinadas | ↗ 0.43 ms ascensão | 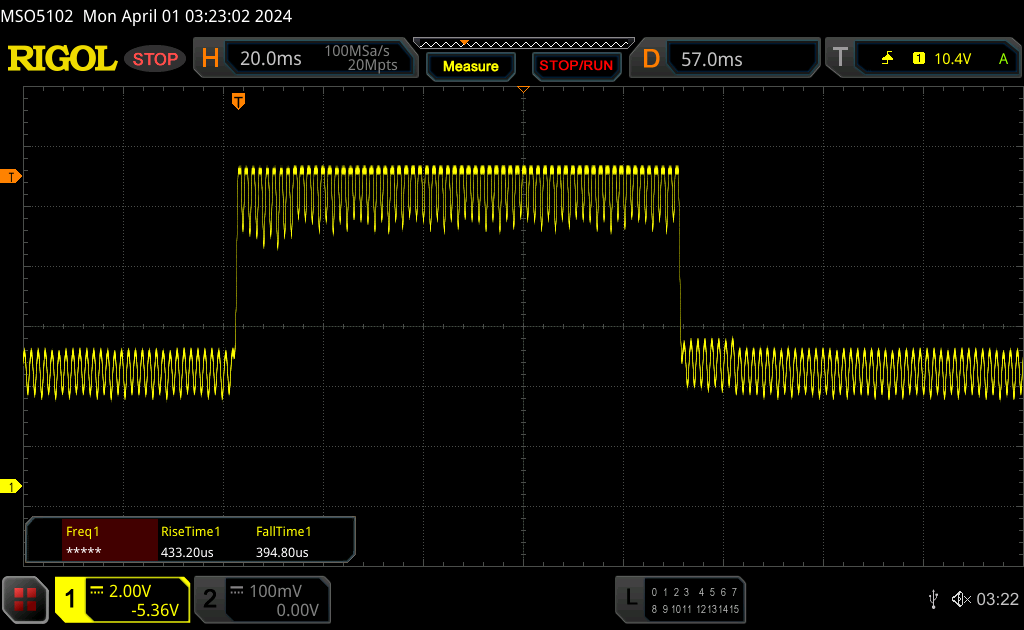 |
| ↘ 0.39 ms queda | ||
| A tela mostra taxas de resposta muito rápidas em nossos testes e deve ser muito adequada para jogos em ritmo acelerado. Em comparação, todos os dispositivos testados variam de 0.165 (mínimo) a 636 (máximo) ms. » 3 % de todos os dispositivos são melhores. Isso significa que o tempo de resposta medido é melhor que a média de todos os dispositivos testados (31 ms). | ||
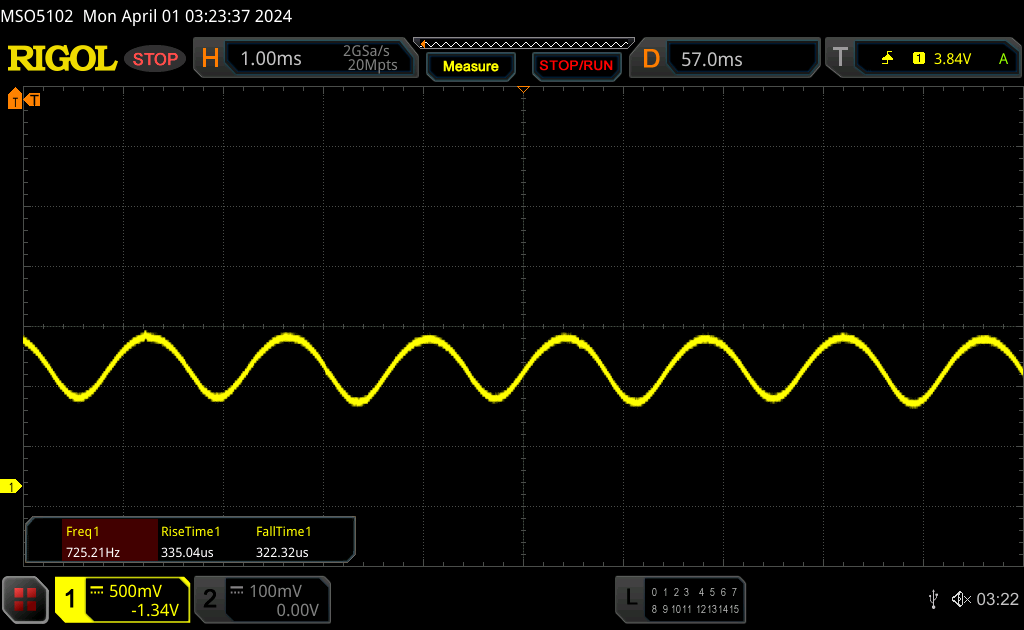
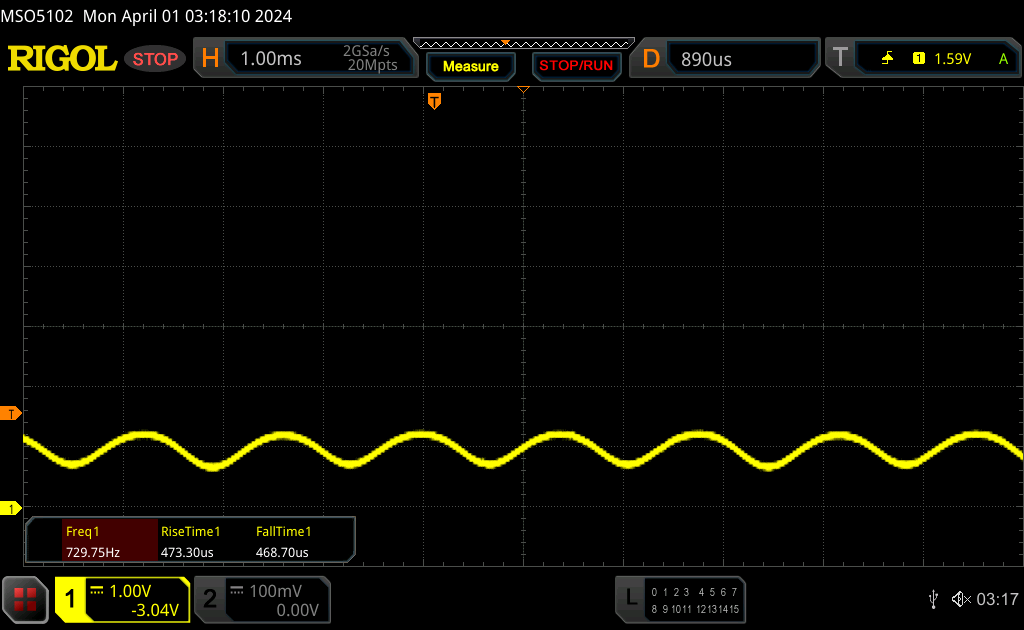
Cintilação da tela / PWM (modulação por largura de pulso)
| Tela tremeluzindo/PWM detectado | 360 Hz | ≤ 90 % configuração de brilho | 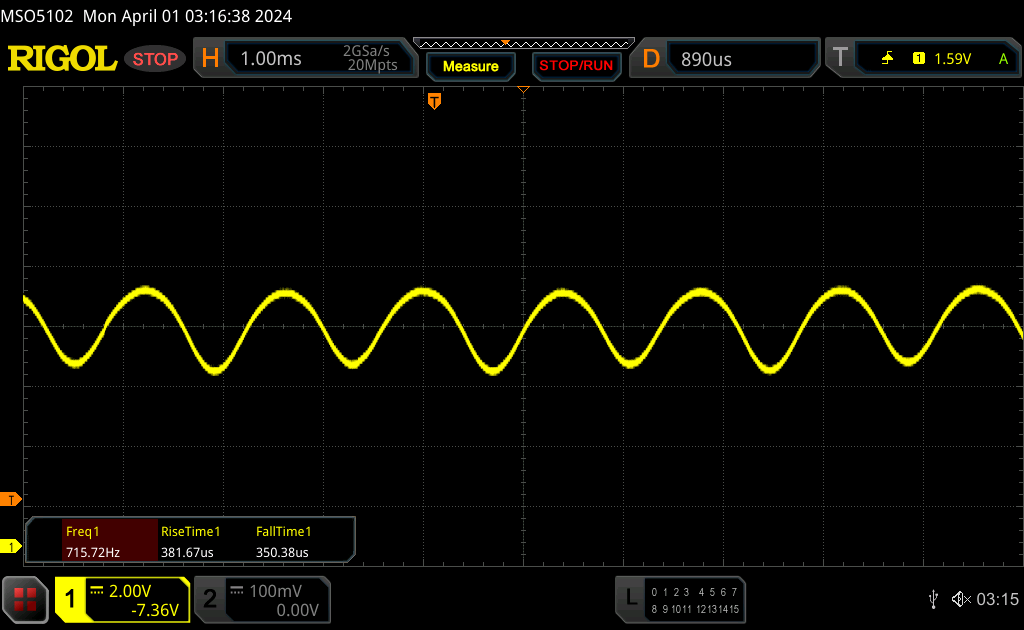 |
A luz de fundo da tela pisca em 360 Hz (pior caso, por exemplo, utilizando PWM) Cintilação detectada em uma configuração de brilho de 90 % e abaixo. Não deve haver cintilação ou PWM acima desta configuração de brilho. A frequência de 360 Hz é relativamente alta, portanto, a maioria dos usuários sensíveis ao PWM não deve notar nenhuma oscilação. No entanto, há relatos de que alguns usuários ainda são sensíveis ao PWM em 500 Hz e acima, portanto, esteja atento. [pwm_comparison] Em comparação: 52 % de todos os dispositivos testados não usam PWM para escurecer a tela. Se PWM foi detectado, uma média de 7757 (mínimo: 5 - máximo: 343500) Hz foi medida. | |||

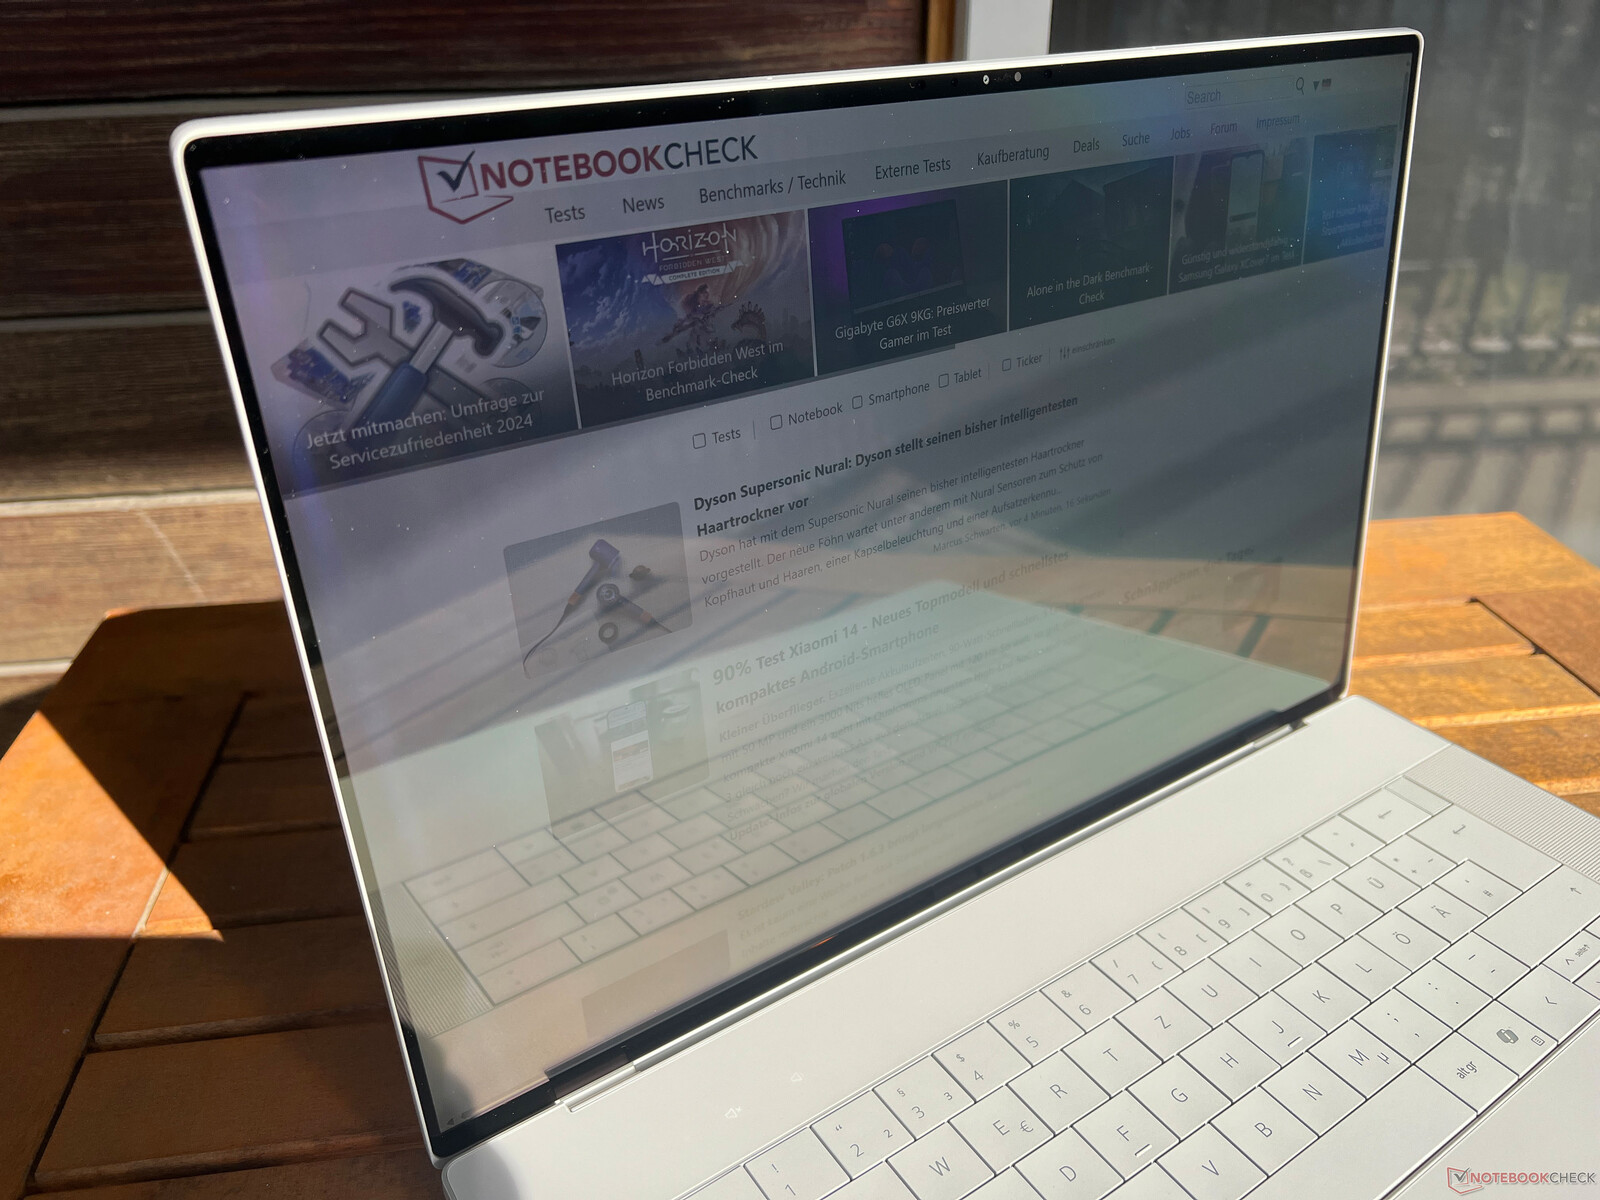
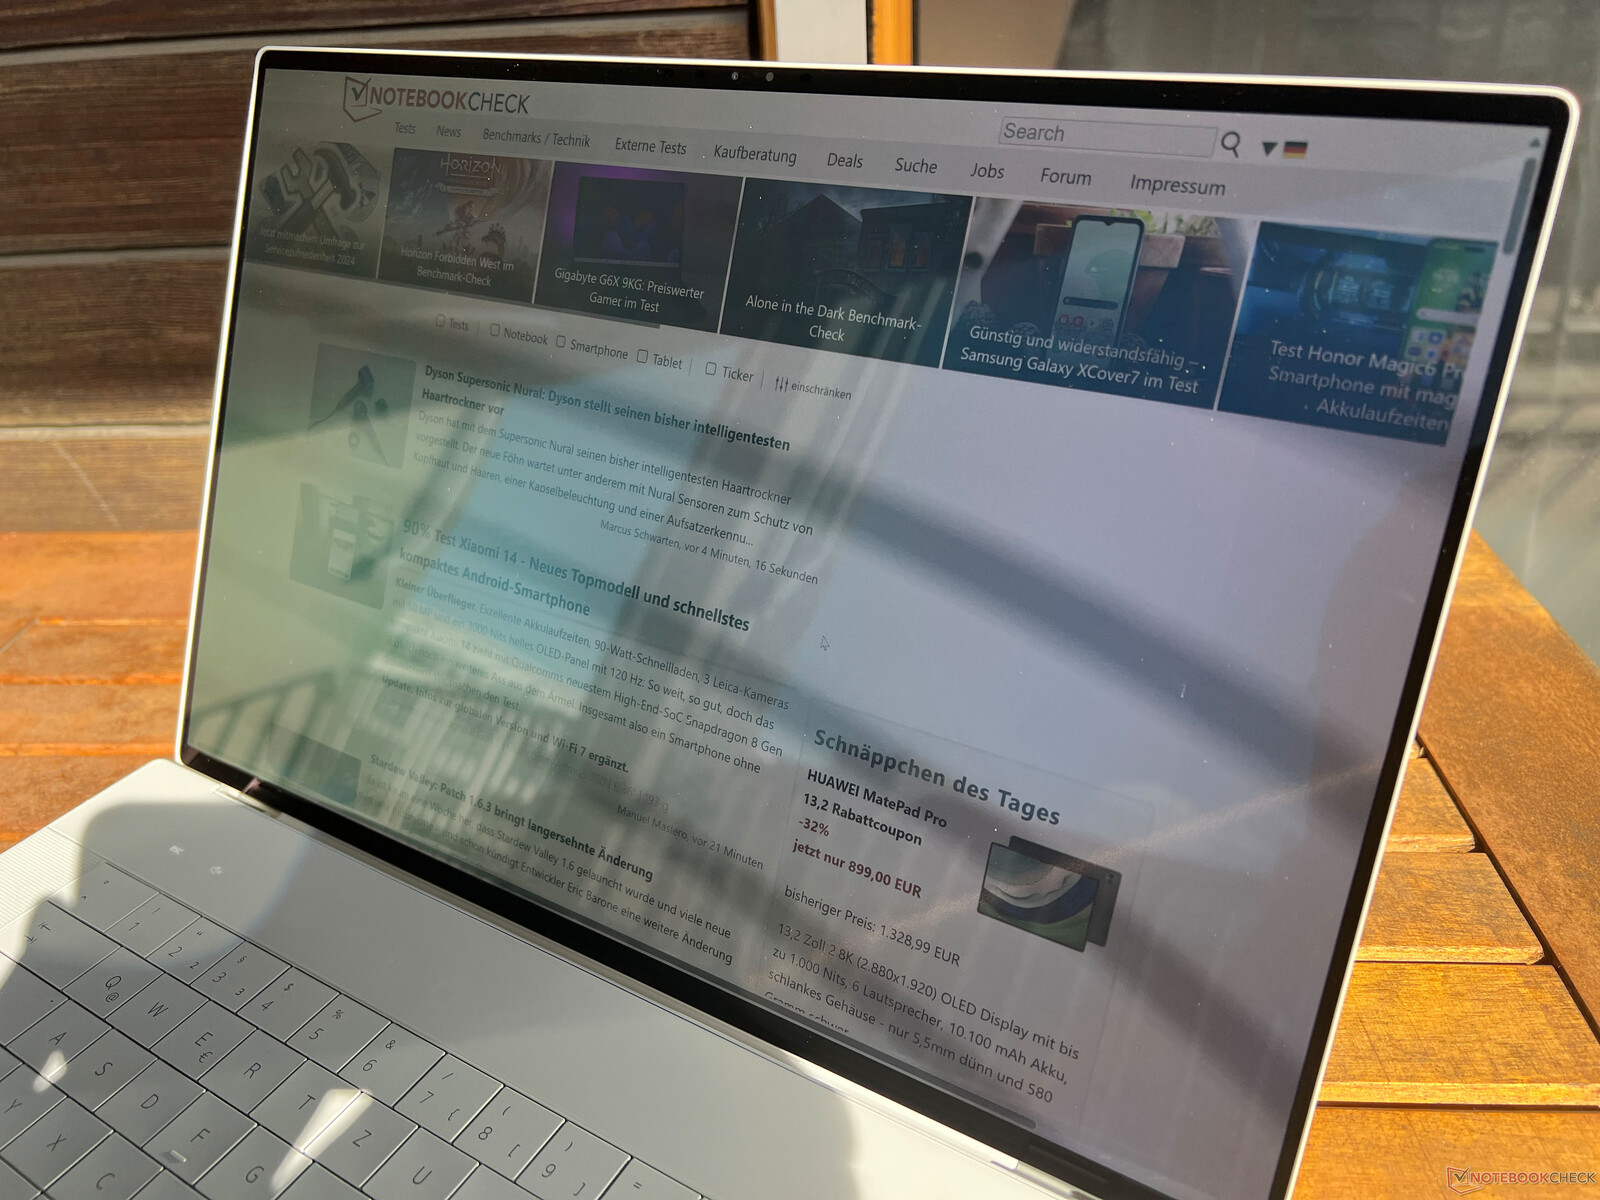
A tela sensível ao toque é muito reflexiva e os reflexos também podem ser um problema em ambientes internos. Em ambientes externos, o senhor também terá que tentar evitar reflexos de fontes de luz ou superfícies brilhantes. É possível usar o laptop em dias nublados, mas pode ser problemático em dias claros com muita luz solar. A estabilidade do ângulo de visão é geralmente muito boa, mas se houver grandes desvios do centro da tela, o típico brilho azul do OLED poderá ser visto.

Desempenho - O XPS 16 com Advanced Optimus e até 64 GB de RAM
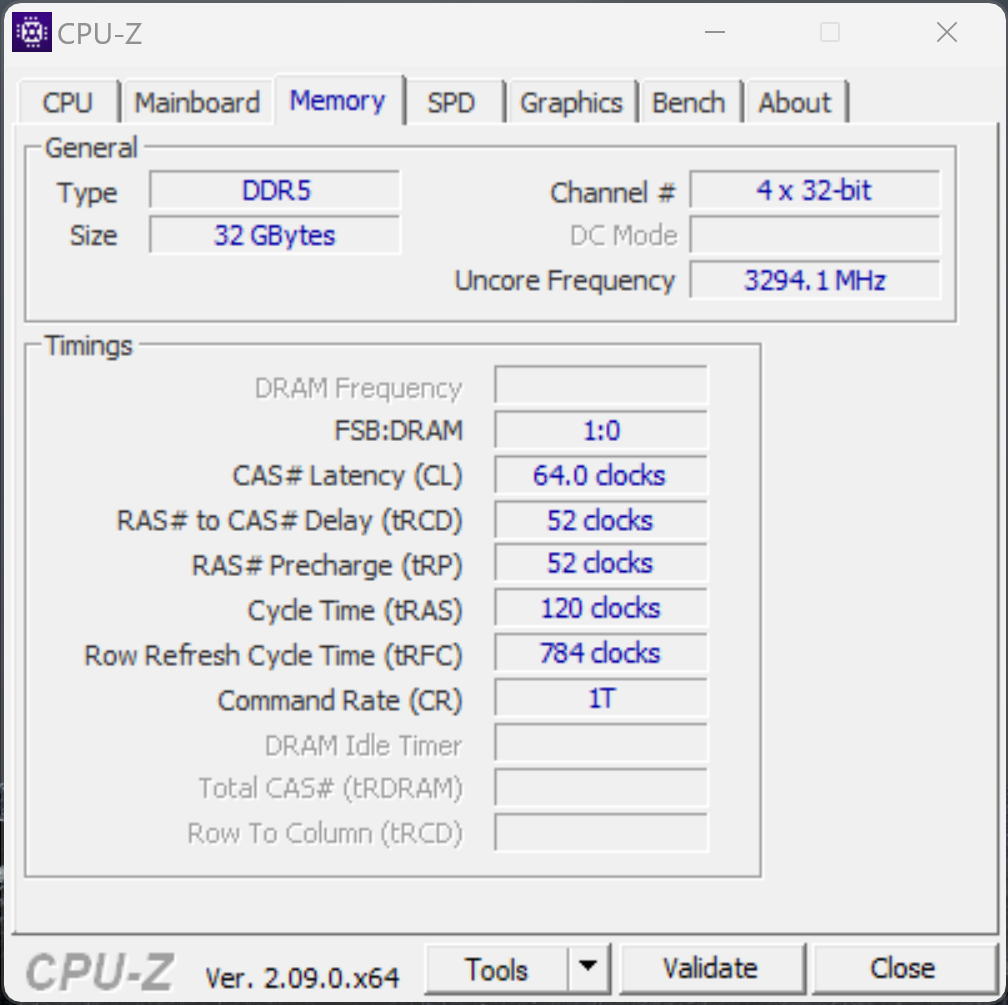
Assim como o menor XPS 14menor, o novo XPS 16 pode ser configurado sem uma placa de vídeo dedicada, mas somente em conjunto com 16 GB de RAM (LPDDR5x-6400). a RAM de 32 GB só está disponível em conjunto com GPUs dedicadas, e a RAM LPDDR5x-7467 mais rápida só pode ser selecionada em conjunto com a Laptop RTX 4070. Se quiser 64 GB de RAM, o senhor também terá que escolher o Core Ultra 9 185H e, no mínimo, o Laptop RTX 4060. O XPS 16 é equipado com um switch MUX e comutação gráfica Advanced Optimus.
Condições de teste
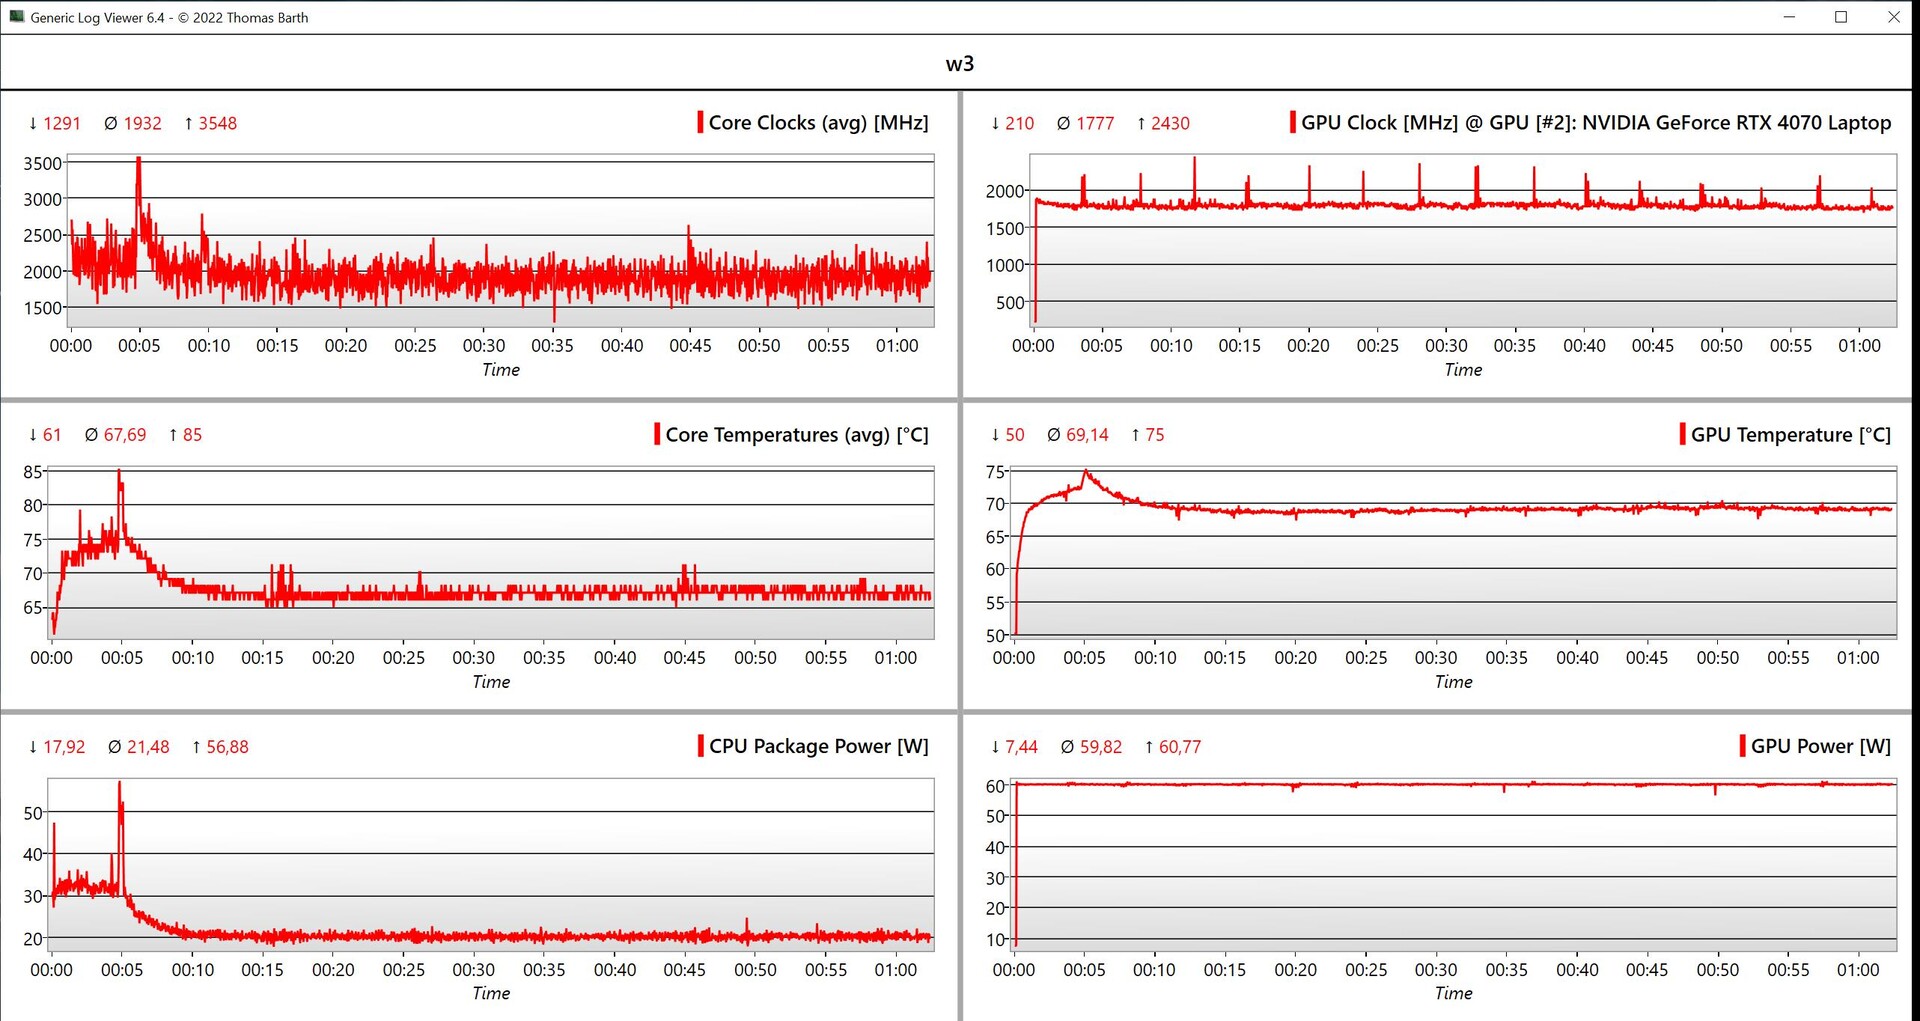
A Dell permite que os usuários selecionem vários perfis de energia que também podem ser combinados com as configurações de desempenho do Windows. O perfil padrão é Otimizado, mas o desempenho total da placa de vídeo só está disponível no modo Ultra Performance. Como as emissões de ruído da ventoinha são muito semelhantes com esses dois perfis, selecionamos o modo Ultra Performance para nossos benchmarks e medições.
| Perfil de energia | Carga da CPU | CB R23 Multi | Carga da GPU | Time Spy gráficos | Cyberpunk 2077 QHD Ultra |
emissões máximas de ruído do ventilador |
|---|---|---|---|---|---|---|
| Silencioso | 80 -> 75 watts | 18.296 pontos | 50 watts | 8.186 pontos | 30.8fps | 43.3 dB(A) |
| Otimizado | 80 -> 75 watts | 18.248 pontos | 50 watts | 8.532 pontos | 37,4fps | 48,1 dB(A) |
| Ultra Performance | 100 -> 85 watts | 18,518 pontos | 60 watts | 9,638 pontos | 39.6fps | 49.7 dB(A) |
Durante nosso teste, encontramos um bug durante o processo de troca de gráficos, pois o V-Sync estava sempre ativo no modo de tela cheia. No modo de janela e ao selecionar manualmente a GPU Nvidia no driver gráfico, o problema não ocorreu. Ao conectar um monitor externo, a comutação normal do Optimus está ativa (já que todas as portas Thunderbolt são executadas por meio da GPU Intel) e o problema também pode ser encontrado aqui.
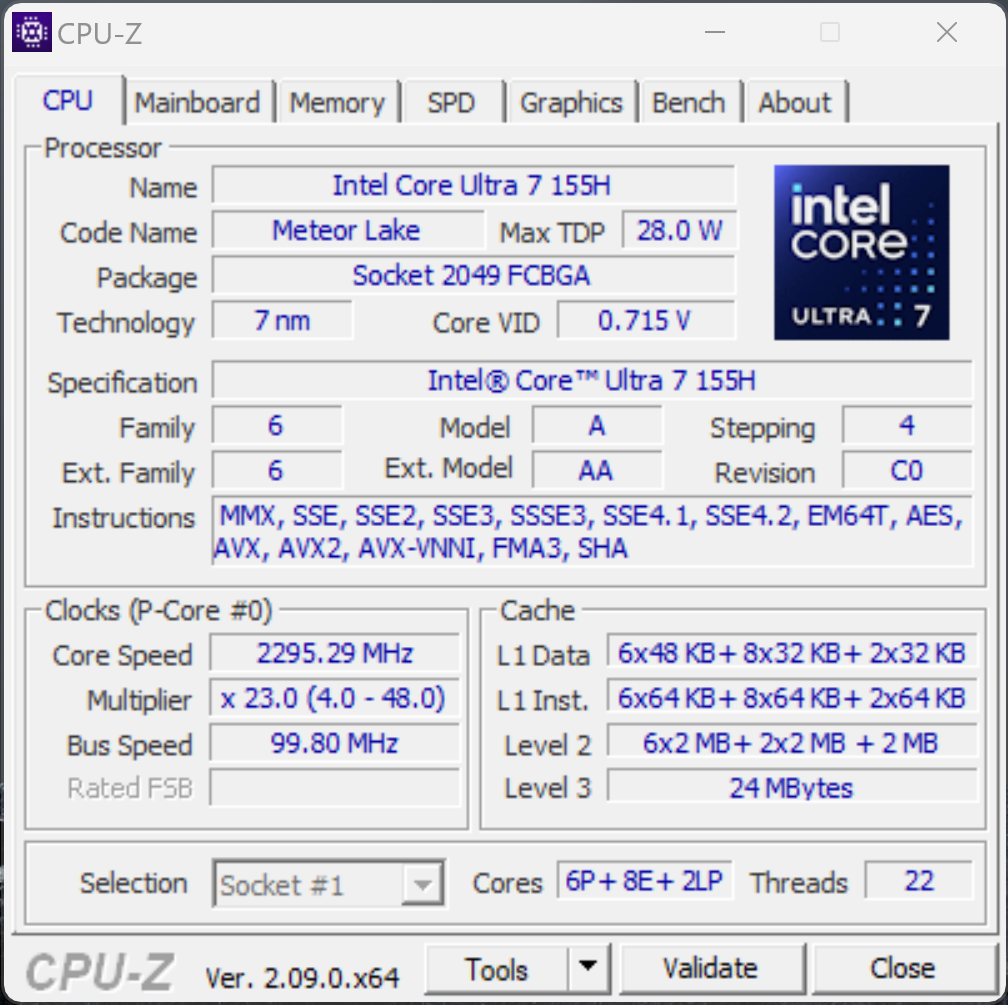
Processador - Core Ultra 7 155H
O Core Ultra 7 155H faz parte da atual geração Meteor Lake da Intel, substituindo o antigo Core i7-13700H. Ele tem 16 núcleos (22 threads) e atinge uma taxa máxima de clock do núcleo de 4,8 GHz. Além disso, seu desempenho geral de vários núcleos também é excelente, graças aos seus limites de alta potência (100/85 watts). No entanto, praticamente não há vantagem de desempenho em relação aos antigos chips Raptor Lake e as diferenças entre os dispositivos individuais são resultado de diferentes limites de energia. Por outro lado, quando se trata de desempenho de núcleo único, os novos chips Meteor Lake têm uma pequena desvantagem em relação aos antigos modelos Raptor Lake, como o 13700H. No uso da bateria, o processador pode consumir 75/45 watts (sendo que os 75 watts podem ser mantidos por um bom tempo) e seu desempenho de vários núcleos cai apenas cerca de 4%. Por sua vez, as diferenças são maiores em períodos mais longos de carga. Outros benchmarks de CPU podem ser encontrados em nossa seção de tecnologia.
Cinebench R15 Multi continuous test
Cinebench R23: Multi Core | Single Core
Cinebench R20: CPU (Multi Core) | CPU (Single Core)
Cinebench R15: CPU Multi 64Bit | CPU Single 64Bit
Blender: v2.79 BMW27 CPU
7-Zip 18.03: 7z b 4 | 7z b 4 -mmt1
Geekbench 6.7: Multi-Core | Single-Core
Geekbench 5.5: Multi-Core | Single-Core
HWBOT x265 Benchmark v2.2: 4k Preset
LibreOffice : 20 Documents To PDF
R Benchmark 2.5: Overall mean
| CPU Performance rating | |
| Lenovo Yoga Pro 9 16-IRP G8 | |
| Honor MagicBook Pro 16 2024 | |
| Dell XPS 16 9640 | |
| Média da turma Multimedia | |
| Asus ROG Zephyrus G16 2024 GU605M | |
| Dell XPS 15 9530 RTX 4070 -2! | |
| Samsung Galaxy Book4 Ultra | |
| Schenker VISION 16 Pro (M23) -2! | |
| Média Intel Core Ultra 7 155H | |
| Cinebench R23 / Multi Core | |
| Lenovo Yoga Pro 9 16-IRP G8 | |
| Honor MagicBook Pro 16 2024 | |
| Dell XPS 16 9640 | |
| Asus ROG Zephyrus G16 2024 GU605M | |
| Média da turma Multimedia (4861 - 33362, n=76, últimos 2 anos) | |
| Samsung Galaxy Book4 Ultra | |
| Dell XPS 15 9530 RTX 4070 | |
| Média Intel Core Ultra 7 155H (9769 - 19007, n=52) | |
| Schenker VISION 16 Pro (M23) | |
| Cinebench R23 / Single Core | |
| Média da turma Multimedia (1128 - 2459, n=68, últimos 2 anos) | |
| Schenker VISION 16 Pro (M23) | |
| Lenovo Yoga Pro 9 16-IRP G8 | |
| Dell XPS 15 9530 RTX 4070 | |
| Dell XPS 16 9640 | |
| Samsung Galaxy Book4 Ultra | |
| Honor MagicBook Pro 16 2024 | |
| Média Intel Core Ultra 7 155H (1496 - 1815, n=52) | |
| Asus ROG Zephyrus G16 2024 GU605M | |
| Cinebench R20 / CPU (Multi Core) | |
| Lenovo Yoga Pro 9 16-IRP G8 | |
| Honor MagicBook Pro 16 2024 | |
| Dell XPS 16 9640 | |
| Asus ROG Zephyrus G16 2024 GU605M | |
| Média da turma Multimedia (1887 - 12912, n=59, últimos 2 anos) | |
| Samsung Galaxy Book4 Ultra | |
| Dell XPS 15 9530 RTX 4070 | |
| Média Intel Core Ultra 7 155H (3798 - 7409, n=50) | |
| Schenker VISION 16 Pro (M23) | |
| Cinebench R20 / CPU (Single Core) | |
| Lenovo Yoga Pro 9 16-IRP G8 | |
| Média da turma Multimedia (425 - 853, n=59, últimos 2 anos) | |
| Schenker VISION 16 Pro (M23) | |
| Dell XPS 15 9530 RTX 4070 | |
| Asus ROG Zephyrus G16 2024 GU605M | |
| Samsung Galaxy Book4 Ultra | |
| Honor MagicBook Pro 16 2024 | |
| Dell XPS 16 9640 | |
| Média Intel Core Ultra 7 155H (601 - 696, n=50) | |
| Cinebench R15 / CPU Multi 64Bit | |
| Lenovo Yoga Pro 9 16-IRP G8 | |
| Honor MagicBook Pro 16 2024 | |
| Dell XPS 16 9640 | |
| Asus ROG Zephyrus G16 2024 GU605M | |
| Dell XPS 15 9530 RTX 4070 | |
| Média da turma Multimedia (856 - 5224, n=63, últimos 2 anos) | |
| Samsung Galaxy Book4 Ultra | |
| Média Intel Core Ultra 7 155H (1932 - 2880, n=56) | |
| Schenker VISION 16 Pro (M23) | |
| Cinebench R15 / CPU Single 64Bit | |
| Média da turma Multimedia (184.8 - 326, n=61, últimos 2 anos) | |
| Schenker VISION 16 Pro (M23) | |
| Lenovo Yoga Pro 9 16-IRP G8 | |
| Dell XPS 15 9530 RTX 4070 | |
| Honor MagicBook Pro 16 2024 | |
| Asus ROG Zephyrus G16 2024 GU605M | |
| Dell XPS 16 9640 | |
| Samsung Galaxy Book4 Ultra | |
| Média Intel Core Ultra 7 155H (99.6 - 268, n=52) | |
| Blender / v2.79 BMW27 CPU | |
| Média da turma Multimedia (100 - 557, n=60, últimos 2 anos) | |
| Média Intel Core Ultra 7 155H (175 - 381, n=47) | |
| Schenker VISION 16 Pro (M23) | |
| Samsung Galaxy Book4 Ultra | |
| Dell XPS 15 9530 RTX 4070 | |
| Asus ROG Zephyrus G16 2024 GU605M | |
| Honor MagicBook Pro 16 2024 | |
| Dell XPS 16 9640 | |
| Lenovo Yoga Pro 9 16-IRP G8 | |
| 7-Zip 18.03 / 7z b 4 | |
| Lenovo Yoga Pro 9 16-IRP G8 | |
| Dell XPS 16 9640 | |
| Honor MagicBook Pro 16 2024 | |
| Asus ROG Zephyrus G16 2024 GU605M | |
| Samsung Galaxy Book4 Ultra | |
| Schenker VISION 16 Pro (M23) | |
| Dell XPS 15 9530 RTX 4070 | |
| Média Intel Core Ultra 7 155H (41739 - 70254, n=50) | |
| Média da turma Multimedia (26062 - 130368, n=57, últimos 2 anos) | |
| 7-Zip 18.03 / 7z b 4 -mmt1 | |
| Schenker VISION 16 Pro (M23) | |
| Dell XPS 15 9530 RTX 4070 | |
| Lenovo Yoga Pro 9 16-IRP G8 | |
| Média da turma Multimedia (3666 - 7545, n=58, últimos 2 anos) | |
| Samsung Galaxy Book4 Ultra | |
| Honor MagicBook Pro 16 2024 | |
| Dell XPS 16 9640 | |
| Asus ROG Zephyrus G16 2024 GU605M | |
| Média Intel Core Ultra 7 155H (4594 - 5621, n=50) | |
| Geekbench 6.7 / Multi-Core | |
| Média da turma Multimedia (4983 - 29415, n=71, últimos 2 anos) | |
| Lenovo Yoga Pro 9 16-IRP G8 | |
| Dell XPS 16 9640 | |
| Asus ROG Zephyrus G16 2024 GU605M | |
| Honor MagicBook Pro 16 2024 | |
| Samsung Galaxy Book4 Ultra | |
| Média Intel Core Ultra 7 155H (7732 - 13656, n=55) | |
| Geekbench 6.7 / Single-Core | |
| Média da turma Multimedia (1534 - 4335, n=70, últimos 2 anos) | |
| Lenovo Yoga Pro 9 16-IRP G8 | |
| Honor MagicBook Pro 16 2024 | |
| Samsung Galaxy Book4 Ultra | |
| Dell XPS 16 9640 | |
| Asus ROG Zephyrus G16 2024 GU605M | |
| Média Intel Core Ultra 7 155H (1901 - 2473, n=52) | |
| Geekbench 5.5 / Multi-Core | |
| Lenovo Yoga Pro 9 16-IRP G8 | |
| Dell XPS 16 9640 | |
| Dell XPS 15 9530 RTX 4070 | |
| Honor MagicBook Pro 16 2024 | |
| Média da turma Multimedia (4652 - 20422, n=58, últimos 2 anos) | |
| Asus ROG Zephyrus G16 2024 GU605M | |
| Samsung Galaxy Book4 Ultra | |
| Média Intel Core Ultra 7 155H (10017 - 13556, n=52) | |
| Schenker VISION 16 Pro (M23) | |
| Geekbench 5.5 / Single-Core | |
| Média da turma Multimedia (805 - 2974, n=58, últimos 2 anos) | |
| Dell XPS 15 9530 RTX 4070 | |
| Schenker VISION 16 Pro (M23) | |
| Samsung Galaxy Book4 Ultra | |
| Honor MagicBook Pro 16 2024 | |
| Lenovo Yoga Pro 9 16-IRP G8 | |
| Dell XPS 16 9640 | |
| Asus ROG Zephyrus G16 2024 GU605M | |
| Média Intel Core Ultra 7 155H (1462 - 1824, n=52) | |
| HWBOT x265 Benchmark v2.2 / 4k Preset | |
| Lenovo Yoga Pro 9 16-IRP G8 | |
| Dell XPS 16 9640 | |
| Honor MagicBook Pro 16 2024 | |
| Asus ROG Zephyrus G16 2024 GU605M | |
| Média da turma Multimedia (5.26 - 36.1, n=58, últimos 2 anos) | |
| Dell XPS 15 9530 RTX 4070 | |
| Samsung Galaxy Book4 Ultra | |
| Schenker VISION 16 Pro (M23) | |
| Média Intel Core Ultra 7 155H (9.93 - 21.2, n=50) | |
| LibreOffice / 20 Documents To PDF | |
| Média da turma Multimedia (23.9 - 146.7, n=59, últimos 2 anos) | |
| Asus ROG Zephyrus G16 2024 GU605M | |
| Média Intel Core Ultra 7 155H (37.5 - 79.2, n=49) | |
| Lenovo Yoga Pro 9 16-IRP G8 | |
| Schenker VISION 16 Pro (M23) | |
| Honor MagicBook Pro 16 2024 | |
| Samsung Galaxy Book4 Ultra | |
| Dell XPS 16 9640 | |
| Dell XPS 15 9530 RTX 4070 | |
| R Benchmark 2.5 / Overall mean | |
| Dell XPS 16 9640 | |
| Média Intel Core Ultra 7 155H (0.4457 - 0.53, n=49) | |
| Samsung Galaxy Book4 Ultra | |
| Asus ROG Zephyrus G16 2024 GU605M | |
| Média da turma Multimedia (0.3604 - 0.947, n=58, últimos 2 anos) | |
| Honor MagicBook Pro 16 2024 | |
| Lenovo Yoga Pro 9 16-IRP G8 | |
| Dell XPS 15 9530 RTX 4070 | |
| Schenker VISION 16 Pro (M23) | |
* ... menor é melhor
AIDA64: FP32 Ray-Trace | FPU Julia | CPU SHA3 | CPU Queen | FPU SinJulia | FPU Mandel | CPU AES | CPU ZLib | FP64 Ray-Trace | CPU PhotoWorxx
| Performance rating | |
| Honor MagicBook Pro 16 2024 | |
| Lenovo Yoga Pro 9 16-IRP G8 | |
| Dell XPS 16 9640 | |
| Asus ROG Zephyrus G16 2024 GU605M | |
| Média da turma Multimedia | |
| Samsung Galaxy Book4 Ultra | |
| Schenker VISION 16 Pro (M23) | |
| Dell XPS 15 9530 RTX 4070 | |
| Média Intel Core Ultra 7 155H | |
| AIDA64 / FP32 Ray-Trace | |
| Média da turma Multimedia (2214 - 50388, n=55, últimos 2 anos) | |
| Lenovo Yoga Pro 9 16-IRP G8 | |
| Honor MagicBook Pro 16 2024 | |
| Dell XPS 16 9640 | |
| Asus ROG Zephyrus G16 2024 GU605M | |
| Dell XPS 15 9530 RTX 4070 | |
| Samsung Galaxy Book4 Ultra | |
| Schenker VISION 16 Pro (M23) | |
| Média Intel Core Ultra 7 155H (6670 - 18470, n=50) | |
| AIDA64 / FPU Julia | |
| Honor MagicBook Pro 16 2024 | |
| Lenovo Yoga Pro 9 16-IRP G8 | |
| Dell XPS 16 9640 | |
| Asus ROG Zephyrus G16 2024 GU605M | |
| Média da turma Multimedia (12867 - 201874, n=56, últimos 2 anos) | |
| Samsung Galaxy Book4 Ultra | |
| Schenker VISION 16 Pro (M23) | |
| Média Intel Core Ultra 7 155H (40905 - 93181, n=50) | |
| Dell XPS 15 9530 RTX 4070 | |
| AIDA64 / CPU SHA3 | |
| Honor MagicBook Pro 16 2024 | |
| Lenovo Yoga Pro 9 16-IRP G8 | |
| Dell XPS 16 9640 | |
| Média da turma Multimedia (626 - 8623, n=56, últimos 2 anos) | |
| Asus ROG Zephyrus G16 2024 GU605M | |
| Samsung Galaxy Book4 Ultra | |
| Média Intel Core Ultra 7 155H (1940 - 4436, n=50) | |
| Schenker VISION 16 Pro (M23) | |
| Dell XPS 15 9530 RTX 4070 | |
| AIDA64 / CPU Queen | |
| Lenovo Yoga Pro 9 16-IRP G8 | |
| Dell XPS 15 9530 RTX 4070 | |
| Schenker VISION 16 Pro (M23) | |
| Asus ROG Zephyrus G16 2024 GU605M | |
| Dell XPS 16 9640 | |
| Samsung Galaxy Book4 Ultra | |
| Honor MagicBook Pro 16 2024 | |
| Média Intel Core Ultra 7 155H (64698 - 94181, n=50) | |
| Média da turma Multimedia (13483 - 181505, n=43, últimos 2 anos) | |
| AIDA64 / FPU SinJulia | |
| Lenovo Yoga Pro 9 16-IRP G8 | |
| Asus ROG Zephyrus G16 2024 GU605M | |
| Honor MagicBook Pro 16 2024 | |
| Dell XPS 16 9640 | |
| Samsung Galaxy Book4 Ultra | |
| Média Intel Core Ultra 7 155H (5639 - 10647, n=50) | |
| Schenker VISION 16 Pro (M23) | |
| Média da turma Multimedia (886 - 28794, n=56, últimos 2 anos) | |
| Dell XPS 15 9530 RTX 4070 | |
| AIDA64 / FPU Mandel | |
| Dell XPS 16 9640 | |
| Honor MagicBook Pro 16 2024 | |
| Média da turma Multimedia (6395 - 105740, n=55, últimos 2 anos) | |
| Lenovo Yoga Pro 9 16-IRP G8 | |
| Asus ROG Zephyrus G16 2024 GU605M | |
| Samsung Galaxy Book4 Ultra | |
| Média Intel Core Ultra 7 155H (18236 - 47685, n=50) | |
| Dell XPS 15 9530 RTX 4070 | |
| Schenker VISION 16 Pro (M23) | |
| AIDA64 / CPU AES | |
| Honor MagicBook Pro 16 2024 | |
| Lenovo Yoga Pro 9 16-IRP G8 | |
| Dell XPS 16 9640 | |
| Asus ROG Zephyrus G16 2024 GU605M | |
| Média Intel Core Ultra 7 155H (45713 - 152179, n=50) | |
| Samsung Galaxy Book4 Ultra | |
| Schenker VISION 16 Pro (M23) | |
| Média da turma Multimedia (8171 - 126790, n=56, últimos 2 anos) | |
| Dell XPS 15 9530 RTX 4070 | |
| AIDA64 / CPU ZLib | |
| Honor MagicBook Pro 16 2024 | |
| Lenovo Yoga Pro 9 16-IRP G8 | |
| Dell XPS 16 9640 | |
| Asus ROG Zephyrus G16 2024 GU605M | |
| Média da turma Multimedia (143.8 - 2022, n=56, últimos 2 anos) | |
| Samsung Galaxy Book4 Ultra | |
| Média Intel Core Ultra 7 155H (557 - 1250, n=50) | |
| Schenker VISION 16 Pro (M23) | |
| Dell XPS 15 9530 RTX 4070 | |
| AIDA64 / FP64 Ray-Trace | |
| Média da turma Multimedia (1014 - 26875, n=56, últimos 2 anos) | |
| Lenovo Yoga Pro 9 16-IRP G8 | |
| Dell XPS 16 9640 | |
| Honor MagicBook Pro 16 2024 | |
| Asus ROG Zephyrus G16 2024 GU605M | |
| Dell XPS 15 9530 RTX 4070 | |
| Schenker VISION 16 Pro (M23) | |
| Samsung Galaxy Book4 Ultra | |
| Média Intel Core Ultra 7 155H (3569 - 9802, n=50) | |
| AIDA64 / CPU PhotoWorxx | |
| Lenovo Yoga Pro 9 16-IRP G8 | |
| Dell XPS 16 9640 | |
| Samsung Galaxy Book4 Ultra | |
| Média da turma Multimedia (8187 - 88154, n=56, últimos 2 anos) | |
| Asus ROG Zephyrus G16 2024 GU605M | |
| Média Intel Core Ultra 7 155H (32719 - 54223, n=50) | |
| Honor MagicBook Pro 16 2024 | |
| Schenker VISION 16 Pro (M23) | |
| Dell XPS 15 9530 RTX 4070 | |
Desempenho do sistema
No uso diário, o novo XPS 16 9640 é um dispositivo muito ágil e também não notamos nenhuma anormalidade nos benchmarks sintéticos. Não tivemos problemas com o laptop durante nosso teste.
CrossMark: Overall | Productivity | Creativity | Responsiveness
WebXPRT 3: Overall
WebXPRT 4: Overall
Mozilla Kraken 1.1: Total
| PCMark 10 / Score | |
| Média da turma Multimedia (4325 - 10386, n=54, últimos 2 anos) | |
| Média Intel Core Ultra 7 155H, NVIDIA GeForce RTX 4070 Laptop GPU (7084 - 7761, n=4) | |
| Schenker VISION 16 Pro (M23) | |
| Lenovo Yoga Pro 9 16-IRP G8 | |
| Dell XPS 15 9530 RTX 4070 | |
| Asus ROG Zephyrus G16 2024 GU605M | |
| Dell XPS 16 9640 | |
| Samsung Galaxy Book4 Ultra | |
| Honor MagicBook Pro 16 2024 | |
| PCMark 10 / Essentials | |
| Dell XPS 15 9530 RTX 4070 | |
| Lenovo Yoga Pro 9 16-IRP G8 | |
| Schenker VISION 16 Pro (M23) | |
| Média da turma Multimedia (8025 - 11664, n=53, últimos 2 anos) | |
| Samsung Galaxy Book4 Ultra | |
| Dell XPS 16 9640 | |
| Média Intel Core Ultra 7 155H, NVIDIA GeForce RTX 4070 Laptop GPU (10038 - 10393, n=4) | |
| Asus ROG Zephyrus G16 2024 GU605M | |
| Honor MagicBook Pro 16 2024 | |
| PCMark 10 / Productivity | |
| Média da turma Multimedia (7323 - 18233, n=53, últimos 2 anos) | |
| Schenker VISION 16 Pro (M23) | |
| Média Intel Core Ultra 7 155H, NVIDIA GeForce RTX 4070 Laptop GPU (9192 - 9518, n=4) | |
| Asus ROG Zephyrus G16 2024 GU605M | |
| Dell XPS 16 9640 | |
| Samsung Galaxy Book4 Ultra | |
| Lenovo Yoga Pro 9 16-IRP G8 | |
| Dell XPS 15 9530 RTX 4070 | |
| Honor MagicBook Pro 16 2024 | |
| PCMark 10 / Digital Content Creation | |
| Média Intel Core Ultra 7 155H, NVIDIA GeForce RTX 4070 Laptop GPU (10100 - 13035, n=4) | |
| Lenovo Yoga Pro 9 16-IRP G8 | |
| Schenker VISION 16 Pro (M23) | |
| Honor MagicBook Pro 16 2024 | |
| Dell XPS 15 9530 RTX 4070 | |
| Asus ROG Zephyrus G16 2024 GU605M | |
| Média da turma Multimedia (3651 - 16240, n=53, últimos 2 anos) | |
| Dell XPS 16 9640 | |
| Samsung Galaxy Book4 Ultra | |
| CrossMark / Overall | |
| Schenker VISION 16 Pro (M23) | |
| Dell XPS 15 9530 RTX 4070 | |
| Média da turma Multimedia (866 - 2728, n=62, últimos 2 anos) | |
| Dell XPS 16 9640 | |
| Lenovo Yoga Pro 9 16-IRP G8 | |
| Média Intel Core Ultra 7 155H, NVIDIA GeForce RTX 4070 Laptop GPU (1687 - 1848, n=4) | |
| Samsung Galaxy Book4 Ultra | |
| Honor MagicBook Pro 16 2024 | |
| Asus ROG Zephyrus G16 2024 GU605M | |
| CrossMark / Productivity | |
| Schenker VISION 16 Pro (M23) | |
| Média da turma Multimedia (931 - 2489, n=62, últimos 2 anos) | |
| Dell XPS 15 9530 RTX 4070 | |
| Dell XPS 16 9640 | |
| Lenovo Yoga Pro 9 16-IRP G8 | |
| Honor MagicBook Pro 16 2024 | |
| Média Intel Core Ultra 7 155H, NVIDIA GeForce RTX 4070 Laptop GPU (1589 - 1750, n=4) | |
| Samsung Galaxy Book4 Ultra | |
| Asus ROG Zephyrus G16 2024 GU605M | |
| CrossMark / Creativity | |
| Média da turma Multimedia (907 - 3465, n=62, últimos 2 anos) | |
| Dell XPS 15 9530 RTX 4070 | |
| Lenovo Yoga Pro 9 16-IRP G8 | |
| Dell XPS 16 9640 | |
| Schenker VISION 16 Pro (M23) | |
| Asus ROG Zephyrus G16 2024 GU605M | |
| Média Intel Core Ultra 7 155H, NVIDIA GeForce RTX 4070 Laptop GPU (1860 - 2014, n=4) | |
| Samsung Galaxy Book4 Ultra | |
| Honor MagicBook Pro 16 2024 | |
| CrossMark / Responsiveness | |
| Schenker VISION 16 Pro (M23) | |
| Dell XPS 16 9640 | |
| Dell XPS 15 9530 RTX 4070 | |
| Honor MagicBook Pro 16 2024 | |
| Média Intel Core Ultra 7 155H, NVIDIA GeForce RTX 4070 Laptop GPU (1424 - 1683, n=4) | |
| Lenovo Yoga Pro 9 16-IRP G8 | |
| Média da turma Multimedia (605 - 2024, n=62, últimos 2 anos) | |
| Samsung Galaxy Book4 Ultra | |
| Asus ROG Zephyrus G16 2024 GU605M | |
| WebXPRT 3 / Overall | |
| Média da turma Multimedia (136.4 - 596, n=65, últimos 2 anos) | |
| Dell XPS 15 9530 RTX 4070 | |
| Schenker VISION 16 Pro (M23) | |
| Lenovo Yoga Pro 9 16-IRP G8 | |
| Honor MagicBook Pro 16 2024 | |
| Asus ROG Zephyrus G16 2024 GU605M | |
| Dell XPS 16 9640 | |
| Samsung Galaxy Book4 Ultra | |
| Média Intel Core Ultra 7 155H, NVIDIA GeForce RTX 4070 Laptop GPU (264 - 294, n=4) | |
| WebXPRT 4 / Overall | |
| Média da turma Multimedia (167.3 - 402, n=67, últimos 2 anos) | |
| Dell XPS 15 9530 RTX 4070 | |
| Schenker VISION 16 Pro (M23) | |
| Lenovo Yoga Pro 9 16-IRP G8 | |
| Honor MagicBook Pro 16 2024 | |
| Samsung Galaxy Book4 Ultra | |
| Asus ROG Zephyrus G16 2024 GU605M | |
| Dell XPS 16 9640 | |
| Média Intel Core Ultra 7 155H, NVIDIA GeForce RTX 4070 Laptop GPU (247 - 257, n=4) | |
| Mozilla Kraken 1.1 / Total | |
| Média Intel Core Ultra 7 155H, NVIDIA GeForce RTX 4070 Laptop GPU (546 - 568, n=3) | |
| Asus ROG Zephyrus G16 2024 GU605M | |
| Honor MagicBook Pro 16 2024 | |
| Lenovo Yoga Pro 9 16-IRP G8 | |
| Dell XPS 15 9530 RTX 4070 | |
| Schenker VISION 16 Pro (M23) | |
| Média da turma Multimedia (228 - 835, n=68, últimos 2 anos) | |
| Samsung Galaxy Book4 Ultra | |
* ... menor é melhor
| PCMark 10 Score | 7084 pontos | |
Ajuda | ||
| AIDA64 / Memory Copy | |
| Dell XPS 16 9640 | |
| Samsung Galaxy Book4 Ultra | |
| Asus ROG Zephyrus G16 2024 GU605M | |
| Honor MagicBook Pro 16 2024 | |
| Média Intel Core Ultra 7 155H (62397 - 96791, n=50) | |
| Média da turma Multimedia (11299 - 132135, n=56, últimos 2 anos) | |
| Lenovo Yoga Pro 9 16-IRP G8 | |
| Dell XPS 15 9530 RTX 4070 | |
| Schenker VISION 16 Pro (M23) | |
| AIDA64 / Memory Read | |
| Samsung Galaxy Book4 Ultra | |
| Asus ROG Zephyrus G16 2024 GU605M | |
| Dell XPS 16 9640 | |
| Média da turma Multimedia (11624 - 174586, n=56, últimos 2 anos) | |
| Média Intel Core Ultra 7 155H (60544 - 90647, n=50) | |
| Lenovo Yoga Pro 9 16-IRP G8 | |
| Honor MagicBook Pro 16 2024 | |
| Schenker VISION 16 Pro (M23) | |
| Dell XPS 15 9530 RTX 4070 | |
| AIDA64 / Memory Write | |
| Lenovo Yoga Pro 9 16-IRP G8 | |
| Média da turma Multimedia (11755 - 134998, n=56, últimos 2 anos) | |
| Honor MagicBook Pro 16 2024 | |
| Samsung Galaxy Book4 Ultra | |
| Dell XPS 16 9640 | |
| Asus ROG Zephyrus G16 2024 GU605M | |
| Média Intel Core Ultra 7 155H (58692 - 93451, n=50) | |
| Dell XPS 15 9530 RTX 4070 | |
| Schenker VISION 16 Pro (M23) | |
| AIDA64 / Memory Latency | |
| Média Intel Core Ultra 7 155H (116.2 - 233, n=50) | |
| Honor MagicBook Pro 16 2024 | |
| Samsung Galaxy Book4 Ultra | |
| Asus ROG Zephyrus G16 2024 GU605M | |
| Dell XPS 16 9640 | |
| Média da turma Multimedia (7 - 535, n=55, últimos 2 anos) | |
| Lenovo Yoga Pro 9 16-IRP G8 | |
| Dell XPS 15 9530 RTX 4070 | |
| Schenker VISION 16 Pro (M23) | |
* ... menor é melhor
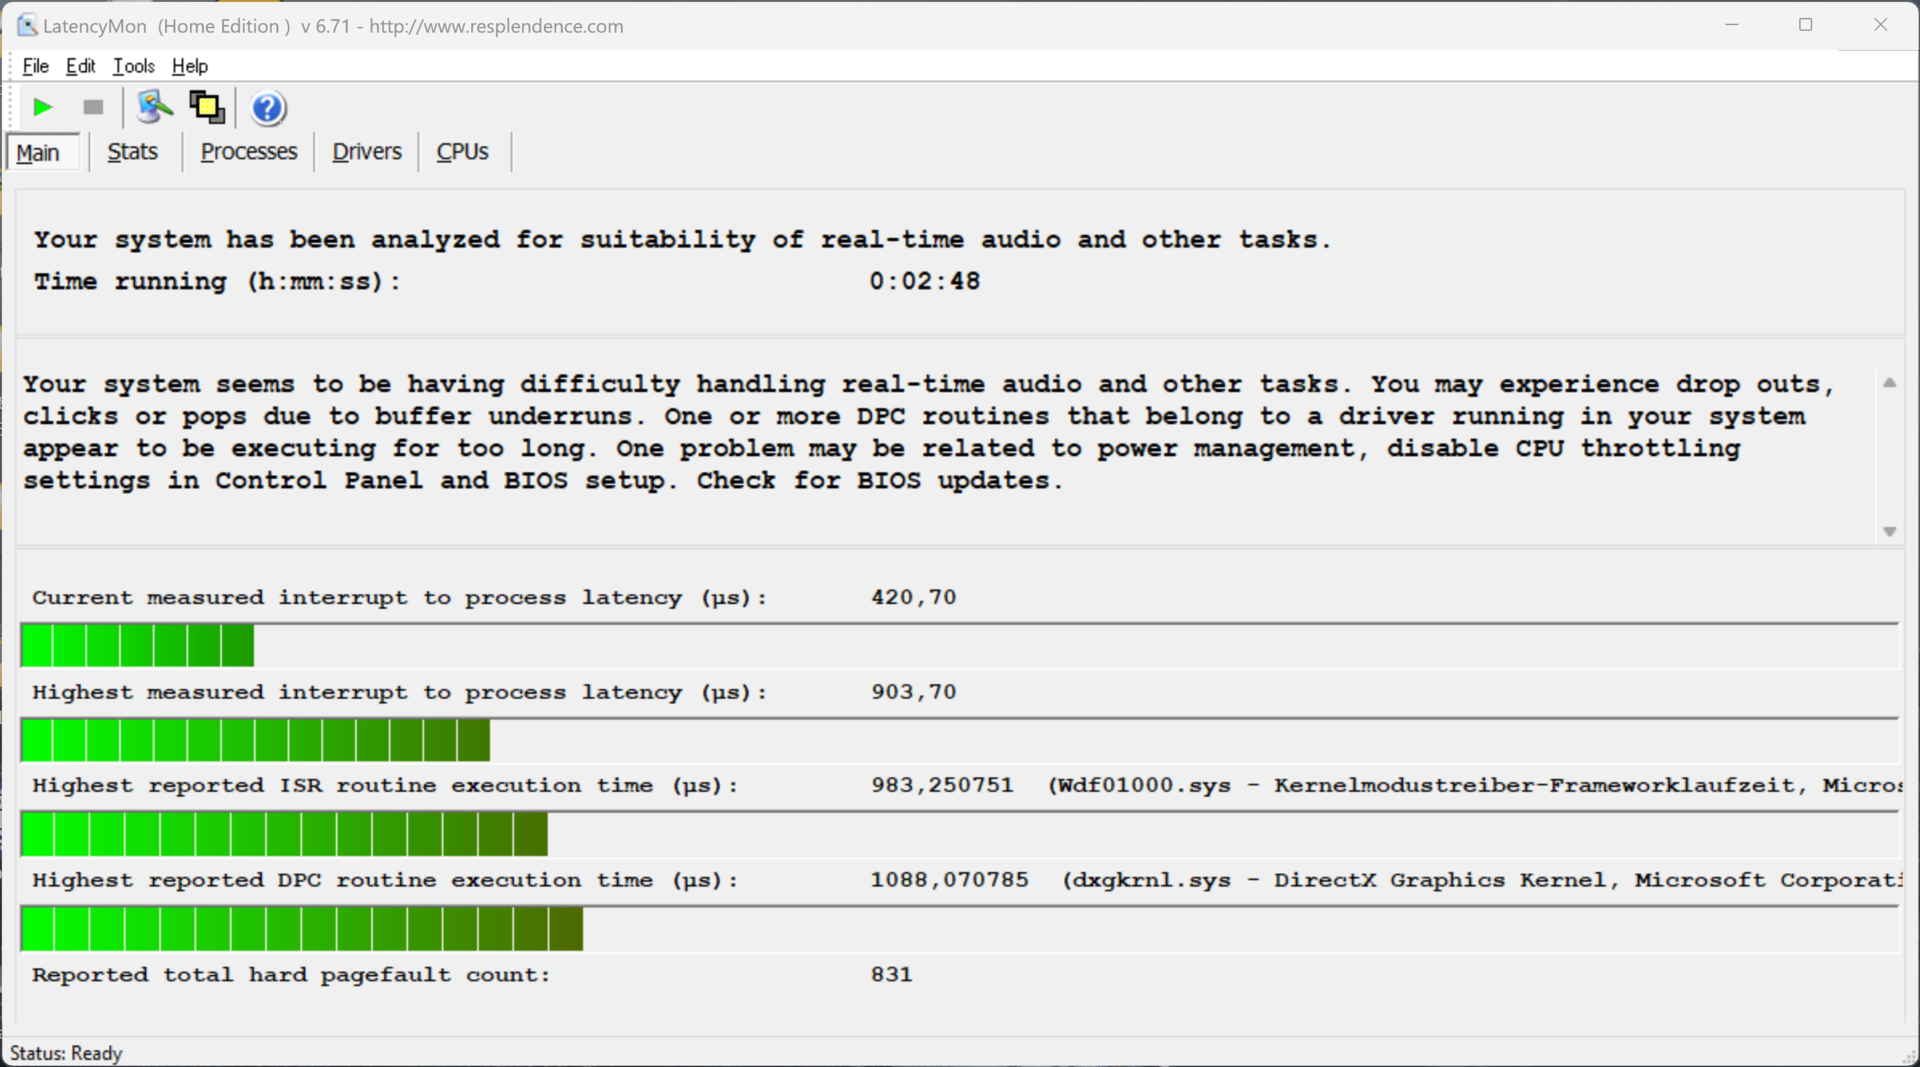
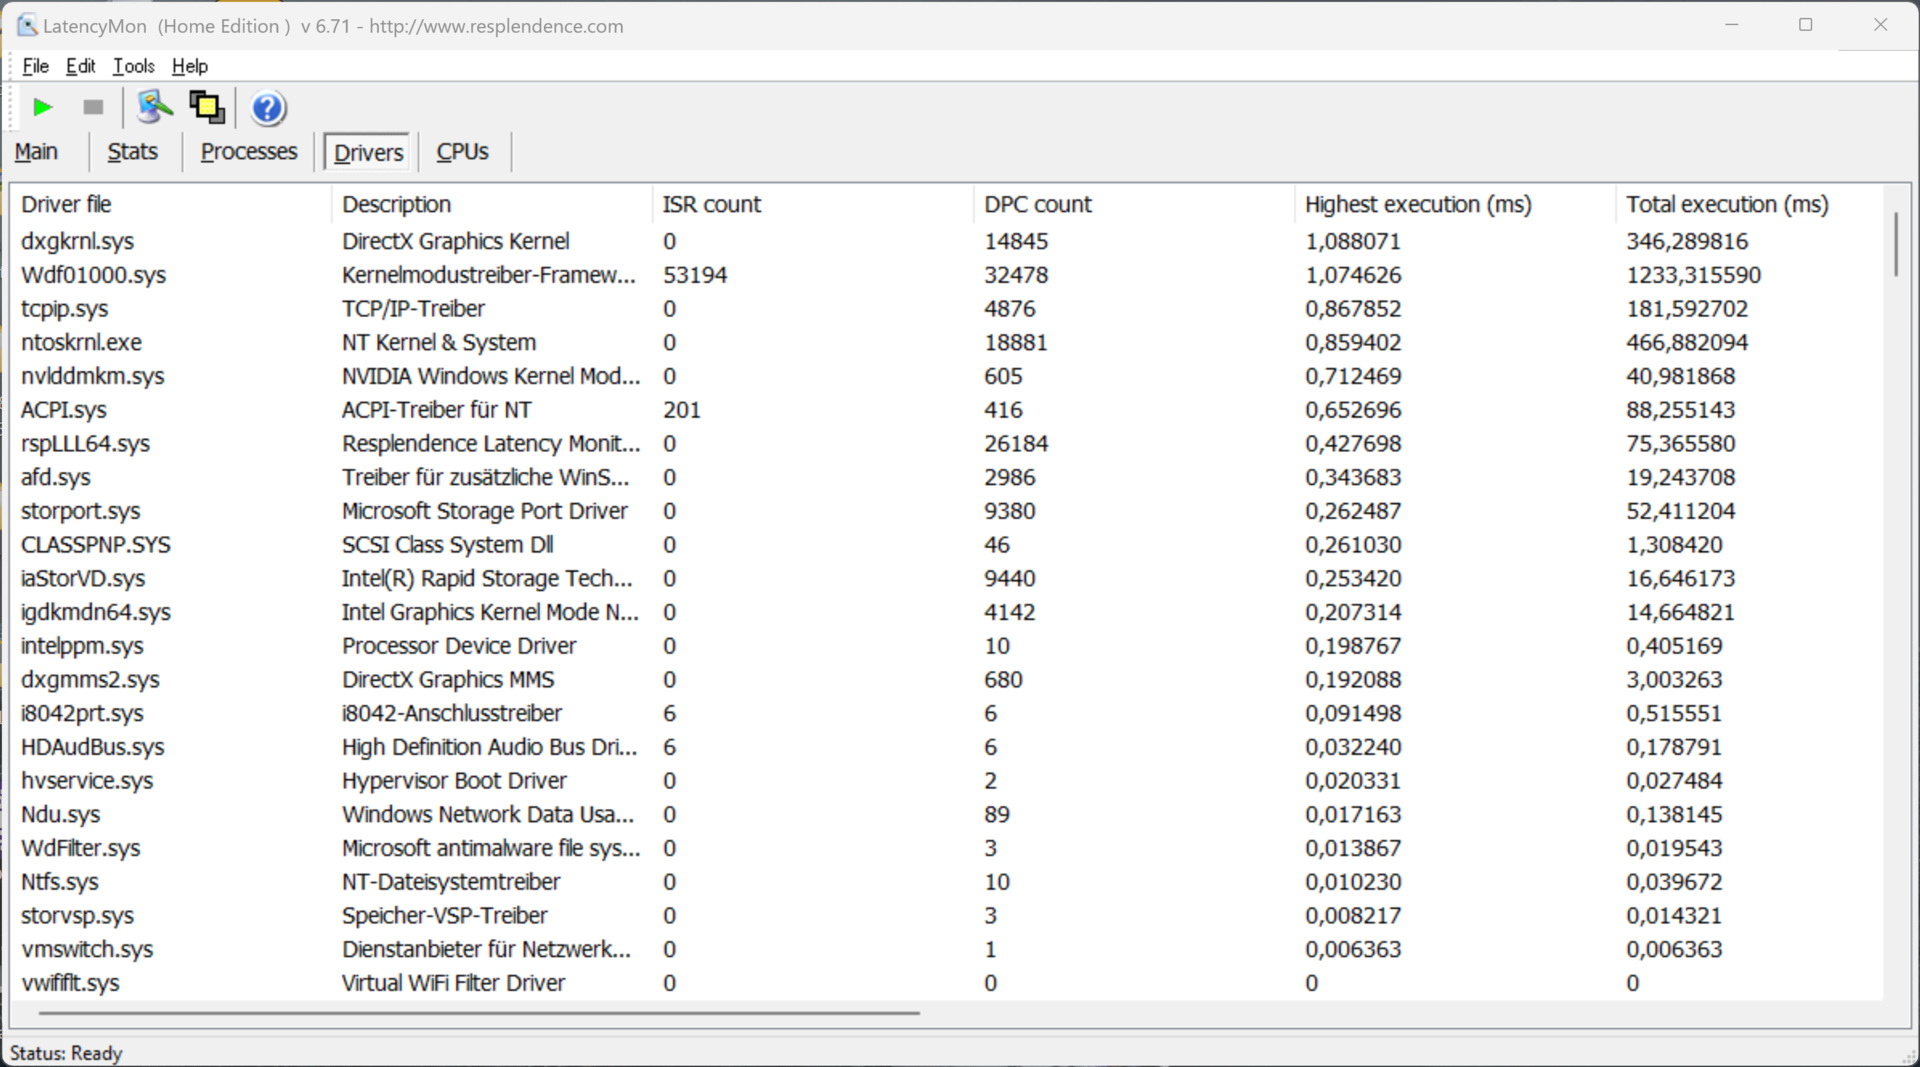
Latência DPC
Em nosso teste de latência padronizado (navegação na Web, reprodução em 4K no YouTube, carga da CPU), nosso dispositivo de teste com a versão atual do BIOS apresentou apenas pequenas limitações ao usar aplicativos de áudio em tempo real.
| DPC Latencies / LatencyMon - interrupt to process latency (max), Web, Youtube, Prime95 | |
| Lenovo Yoga Pro 9 16-IRP G8 | |
| Asus ROG Zephyrus G16 2024 GU605M | |
| Honor MagicBook Pro 16 2024 | |
| Dell XPS 15 9530 RTX 4070 | |
| Dell XPS 16 9640 | |
| Schenker VISION 16 Pro (M23) | |
| Samsung Galaxy Book4 Ultra | |
* ... menor é melhor
Dispositivo de armazenamento
Uma versão de 1 TB do Kioxia XG8 foi instalada em nosso dispositivo de teste, com 834 GB disponíveis para os usuários após a primeira inicialização do laptop. O desempenho do SSD PCIe-4.0 é muito bom e, acima de tudo, muito estável. Não há slot para um SSD adicional. Outros benchmarks de SSD estão listados aqui.

* ... menor é melhor
Reading continuous performance: DiskSpd Read Loop, Queue Depth 8
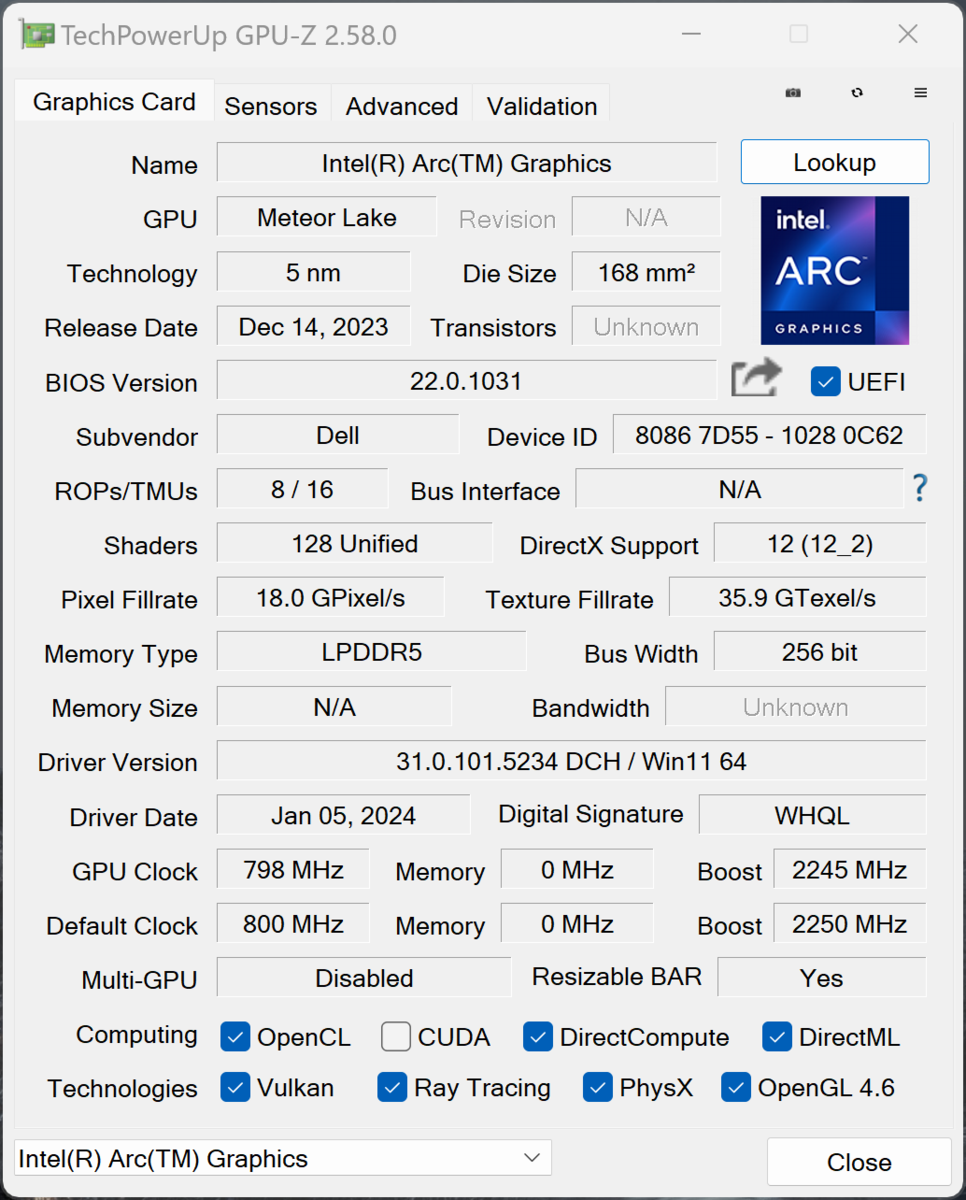
Placa de vídeo
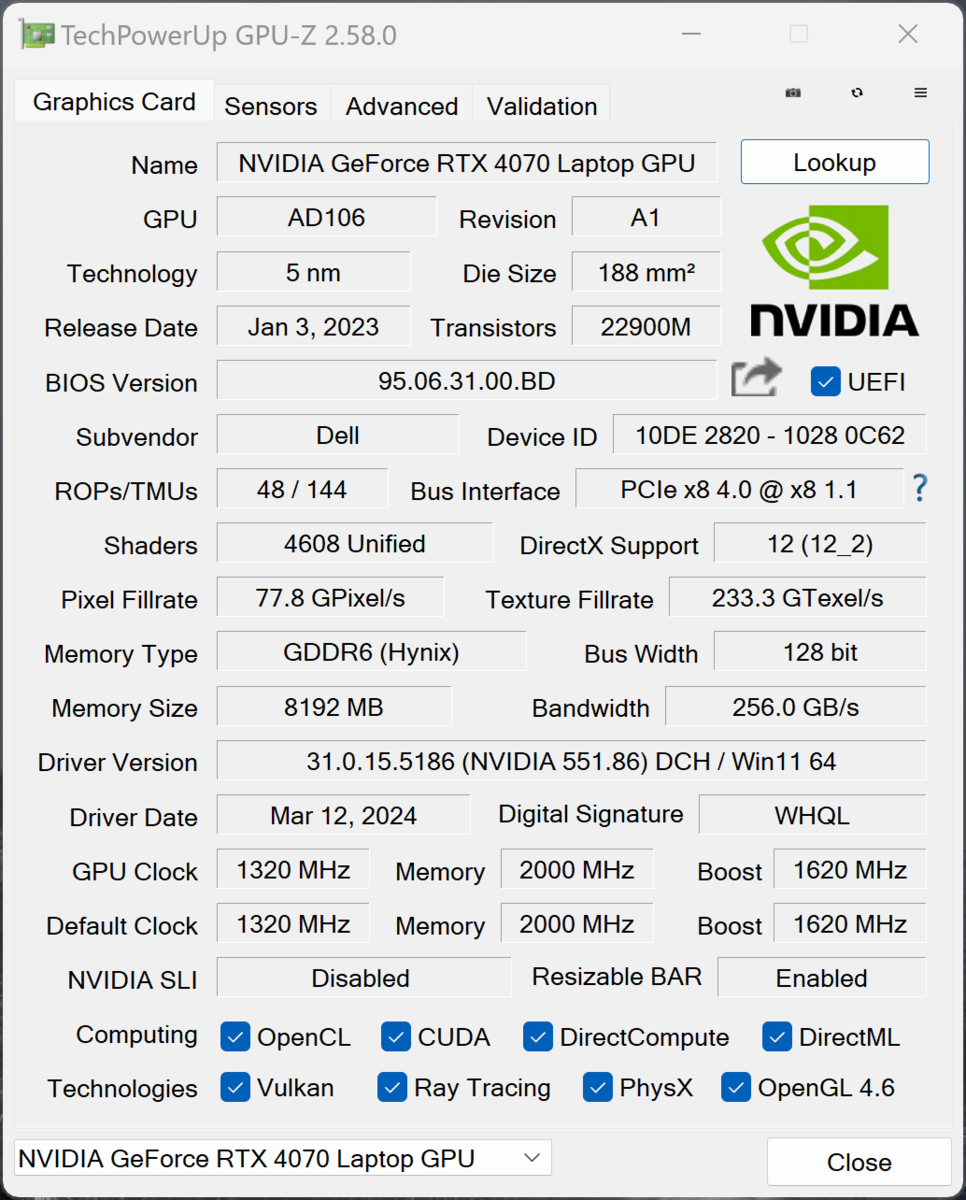
Nosso dispositivo de teste está equipado com a GeForce Laptop RTX 4070 com 8 GB de VRAM, sendo que seu TGP é de 50 a 60 watts, dependendo do perfil de energia selecionado. O XPS 16 tem um comutador MUX e oferece suporte à comutação de gráficos por meio do Advanced Optimus - os cálculos gráficos simples são feitos pelo processador gráfico Intel Arc Graphics integrado Intel Arc Graphics integrada.
Como resultado, seu desempenho é melhor do que o do antigo XPS 15 com a versão de 50 watts do laptop RTX 4070, mas os concorrentes desse segmento oferecem modelos mais rápidos e, como resultado, também mais desempenho de GPU. O Yoga Pro 9 16 do ano passado, com a versão de 100 watts do Laptop RTX 4060do ano passado, por exemplo, não é muito mais lento. Nesse aspecto, muito mais poderia ter sido possível.
Seu desempenho gráfico permanece estável sob carga contínua, mas a GPU pode consumir no máximo 50 watts no modo de bateria, o que leva a uma redução de desempenho de pouco menos de 10%. Outros benchmarks de GPU podem ser encontrados aqui.
| 3DMark 11 Performance | 29315 pontos | |
| 3DMark Fire Strike Score | 21848 pontos | |
| 3DMark Time Spy Score | 9774 pontos | |
Ajuda | ||
| Blender / v3.3 Classroom OPTIX/RTX | |
| Média da turma Multimedia (12 - 105, n=23, últimos 2 anos) | |
| Samsung Galaxy Book4 Ultra | |
| Dell XPS 15 9530 RTX 4070 | |
| Lenovo Yoga Pro 9 16-IRP G8 | |
| Schenker VISION 16 Pro (M23) | |
| Honor MagicBook Pro 16 2024 | |
| Asus ROG Zephyrus G16 2024 GU605M | |
| Média NVIDIA GeForce RTX 4070 Laptop GPU (18 - 30, n=68) | |
| Dell XPS 16 9640 | |
| Blender / v3.3 Classroom CUDA | |
| Média da turma Multimedia (20 - 186, n=23, últimos 2 anos) | |
| Samsung Galaxy Book4 Ultra | |
| Dell XPS 15 9530 RTX 4070 | |
| Lenovo Yoga Pro 9 16-IRP G8 | |
| Honor MagicBook Pro 16 2024 | |
| Dell XPS 16 9640 | |
| Schenker VISION 16 Pro (M23) | |
| Média NVIDIA GeForce RTX 4070 Laptop GPU (32 - 50, n=67) | |
| Asus ROG Zephyrus G16 2024 GU605M | |
| Blender / v3.3 Classroom CPU | |
| Média da turma Multimedia (134.5 - 1042, n=63, últimos 2 anos) | |
| Schenker VISION 16 Pro (M23) | |
| Samsung Galaxy Book4 Ultra | |
| Dell XPS 15 9530 RTX 4070 | |
| Asus ROG Zephyrus G16 2024 GU605M | |
| Honor MagicBook Pro 16 2024 | |
| Lenovo Yoga Pro 9 16-IRP G8 | |
| Dell XPS 16 9640 | |
| Média NVIDIA GeForce RTX 4070 Laptop GPU (158 - 440, n=67) | |
* ... menor é melhor
Desempenho em jogos
Com o laptop RTX 4070, o desempenho do XPS 16 9640 para jogos não é tão ruim - todos os jogos que testamos puderam ser jogados sem problemas em resolução QHD com o máximo de detalhes. Para a resolução nativa da tela de 3.840 x 2.400 pixels, no entanto, é preciso reduzir os detalhes ou usar tecnologias de aumento de escala, como a DLSS da Nvidia. Em comparação com a concorrência, o XPS é mais uma vez inferior aos modelos equipados com o laptop RTX 4070 e as versões rápidas do laptop RTX 4060 (Honor MagicBook Pro, Lenovo Yoga Pro 9 16). Seu desempenho em jogos permanece estável mesmo durante sessões mais longas.
| The Witcher 3 - 1920x1080 Ultra Graphics & Postprocessing (HBAO+) | |
| Schenker VISION 16 Pro (M23) | |
| Asus ROG Zephyrus G16 2024 GU605M | |
| Lenovo Yoga Pro 9 16-IRP G8 | |
| Dell XPS 16 9640 | |
| Honor MagicBook Pro 16 2024 | |
| Dell XPS 15 9530 RTX 4070 | |
| Média da turma Multimedia (11 - 121, n=10, últimos 2 anos) | |
| Samsung Galaxy Book4 Ultra | |
| Baldur's Gate 3 | |
| 1920x1080 Ultra Preset AA:T | |
| Média NVIDIA GeForce RTX 4070 Laptop GPU (66.7 - 128.5, n=30) | |
| Dell XPS 16 9640 | |
| Média da turma Multimedia (7.8 - 158.7, n=67, últimos 2 anos) | |
| 2560x1440 Ultra Preset AA:T | |
| Média NVIDIA GeForce RTX 4070 Laptop GPU (54.4 - 89.6, n=25) | |
| Média da turma Multimedia (28.7 - 121, n=25, últimos 2 anos) | |
| Dell XPS 16 9640 | |
| Horizon Forbidden West | |
| 1920x1080 Very High Preset AA:T | |
| Média NVIDIA GeForce RTX 4070 Laptop GPU (53.2 - 76.7, n=10) | |
| Dell XPS 16 9640 | |
| Média da turma Multimedia (12.4 - 64.4, n=3, últimos 2 anos) | |
| 2560x1440 Very High Preset AA:T | |
| Média NVIDIA GeForce RTX 4070 Laptop GPU (40.3 - 59.1, n=9) | |
| Média da turma Multimedia (n=1últimos 2 anos) | |
| Dell XPS 16 9640 | |
Witcher 3 FPS diagram
| baixo | média | alto | ultra | QHD | 4K | |
|---|---|---|---|---|---|---|
| GTA V (2015) | 177 | 170.7 | 103.6 | 81.3 | ||
| The Witcher 3 (2015) | 399 | 327 | 195 | 87.8 | 73 | |
| Dota 2 Reborn (2015) | 89.8 | 89.6 | 89.5 | 89.7 | 115.7 | |
| Final Fantasy XV Benchmark (2018) | 150.2 | 123.2 | 93.1 | 70 | ||
| X-Plane 11.11 (2018) | 125.1 | 108.5 | 84.7 | 68.9 | ||
| Far Cry 5 (2018) | 140 | 126 | 122 | 115 | 94 | |
| Strange Brigade (2018) | 423 | 258 | 202 | 175 | 116 | |
| F1 23 (2023) | 214 | 189.7 | 175.1 | 55.5 | 35.2 | |
| Baldur's Gate 3 (2023) | 135.7 | 107.1 | 93.5 | 91.8 | 63.8 | |
| Cyberpunk 2077 (2023) | 112 | 87.6 | 74.7 | 64.3 | 39.6 | |
| Horizon Forbidden West (2024) | 96.6 | 83.7 | 58.5 | 53.2 | 40.3 |
Emissões - A Dell instalou uma câmara de vapor no XPS 16
Emissões de ruído
Em contraste com o xPS 14 menora Dell instalou uma unidade de resfriamento Vapor Chamber com duas ventoinhas no XPS 16 maior. Especialmente sob carga baixa, os ventiladores geralmente permanecem desativados ou simplesmente muito silenciosos, mas sob carga mais alta, ainda assim o ruído aumenta rapidamente. Ficamos particularmente surpresos com a pequena diferença entre os perfis Otimizado (máx. 48,1 dB(A)) e Ultra Desempenho (máx. 49,7 dB(A)), sendo que ambos são muito altos para poder jogar sem a necessidade de fones de ouvido. Com um máximo de 43,3 dB(A), o perfil Quiet não é realmente muito silencioso. Alguns concorrentes, como o MagicBook Pro ou o Zephyrus G16oferecem melhor desempenho com menos emissões de ruído. Não notamos nenhum ruído eletrônico adicional vindo da nossa amostra de teste.
Barulho
| Ocioso |
| 24.5 / 24.5 / 27.5 dB |
| Carga |
| 39.6 / 49.7 dB |
 | ||
30 dB silencioso 40 dB(A) audível 50 dB(A) ruidosamente alto |
||
min: | ||
| Dell XPS 16 9640 GeForce RTX 4070 Laptop GPU, Ultra 7 155H, Kioxia XG8 KXG80ZNV1T02 | Samsung Galaxy Book4 Ultra GeForce RTX 4050 Laptop GPU, Ultra 7 155H, Samsung PM9A1 MZVL2512HCJQ | Honor MagicBook Pro 16 2024 GeForce RTX 4060 Laptop GPU, Ultra 7 155H, WD PC SN740 SDDPNQD-1T00 | Asus ROG Zephyrus G16 2024 GU605M GeForce RTX 4070 Laptop GPU, Ultra 7 155H, WD PC SN560 SDDPNQE-1T00 | Lenovo Yoga Pro 9 16-IRP G8 GeForce RTX 4060 Laptop GPU, i7-13705H, Samsung PM9A1 MZVL21T0HCLR | Schenker VISION 16 Pro (M23) GeForce RTX 4070 Laptop GPU, i7-13700H, Samsung 990 Pro 1 TB | Dell XPS 15 9530 RTX 4070 GeForce RTX 4070 Laptop GPU, i7-13700H, SK hynix PC801 HFS001TEJ9X101N | |
|---|---|---|---|---|---|---|---|
| Noise | 7% | 8% | 1% | -3% | -10% | 13% | |
| desligado / ambiente * (dB) | 24.5 | 24.2 1% | 24 2% | 23.9 2% | 24.7 -1% | 25.9 -6% | 23.1 6% |
| Idle Minimum * (dB) | 24.5 | 24.2 1% | 24 2% | 23.9 2% | 24.7 -1% | 25.9 -6% | 23.1 6% |
| Idle Average * (dB) | 24.5 | 24.2 1% | 24 2% | 27.8 -13% | 26.2 -7% | 25.9 -6% | 23.1 6% |
| Idle Maximum * (dB) | 27.5 | 24.2 12% | 27.2 1% | 30.1 -9% | 26.2 5% | 32 -16% | 24.2 12% |
| Load Average * (dB) | 39.6 | 37.9 4% | 29 27% | 34.2 14% | 39.7 -0% | 47.2 -19% | 27.1 32% |
| Witcher 3 ultra * (dB) | 49.7 | 41.7 16% | 42.1 15% | 46.4 7% | 53.2 -7% | 53.1 -7% | 40.1 19% |
| Load Maximum * (dB) | 49.7 | 41.7 16% | 45 9% | 46.4 7% | 53.2 -7% | 53.1 -7% | 44.6 10% |
* ... menor é melhor
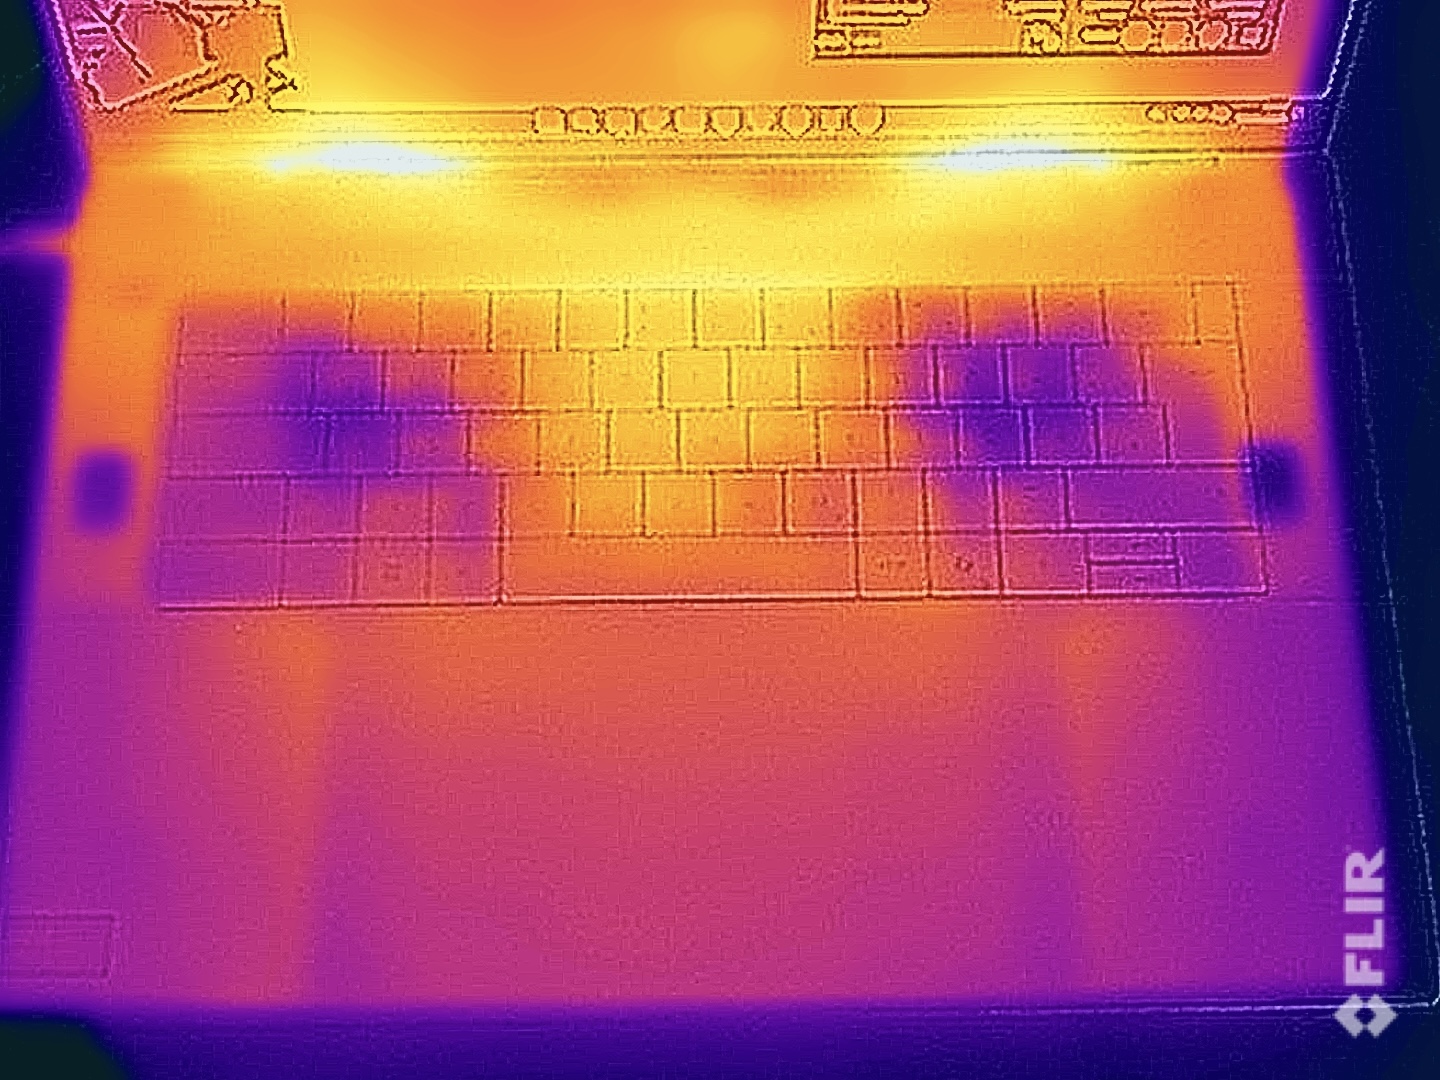
Temperatura
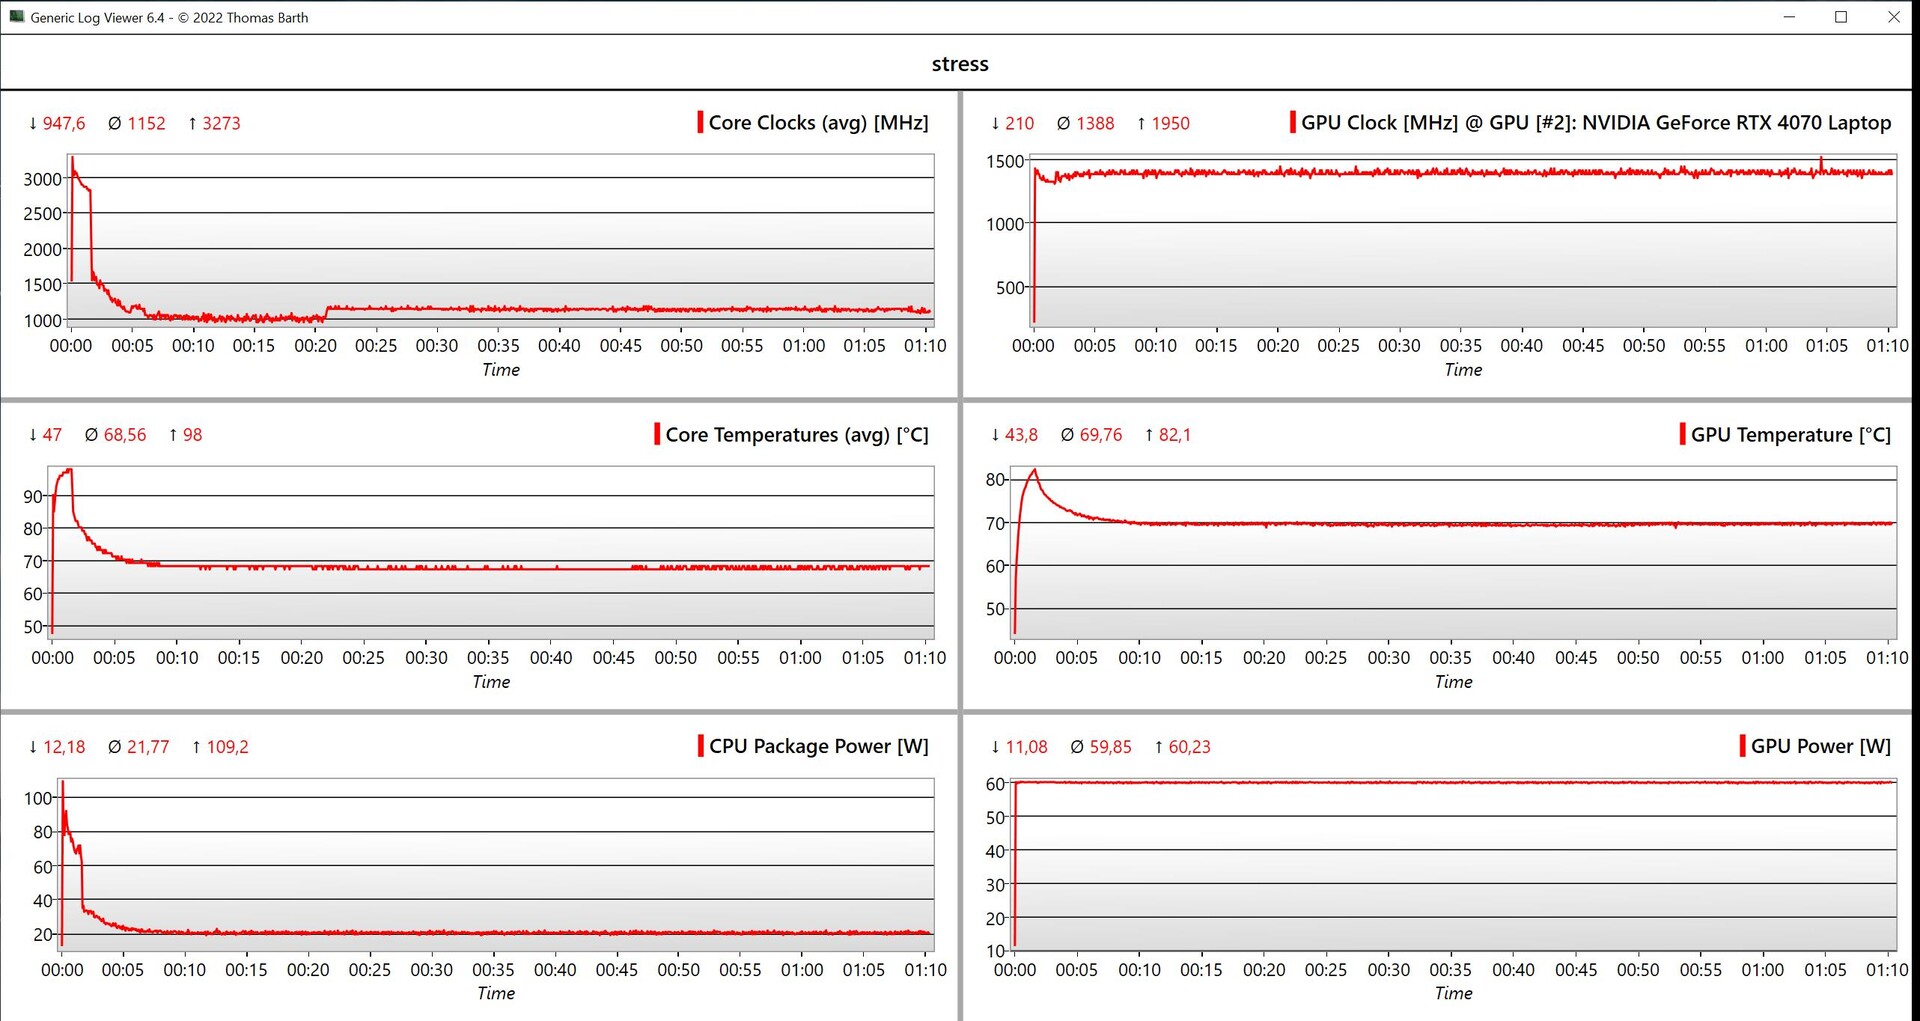
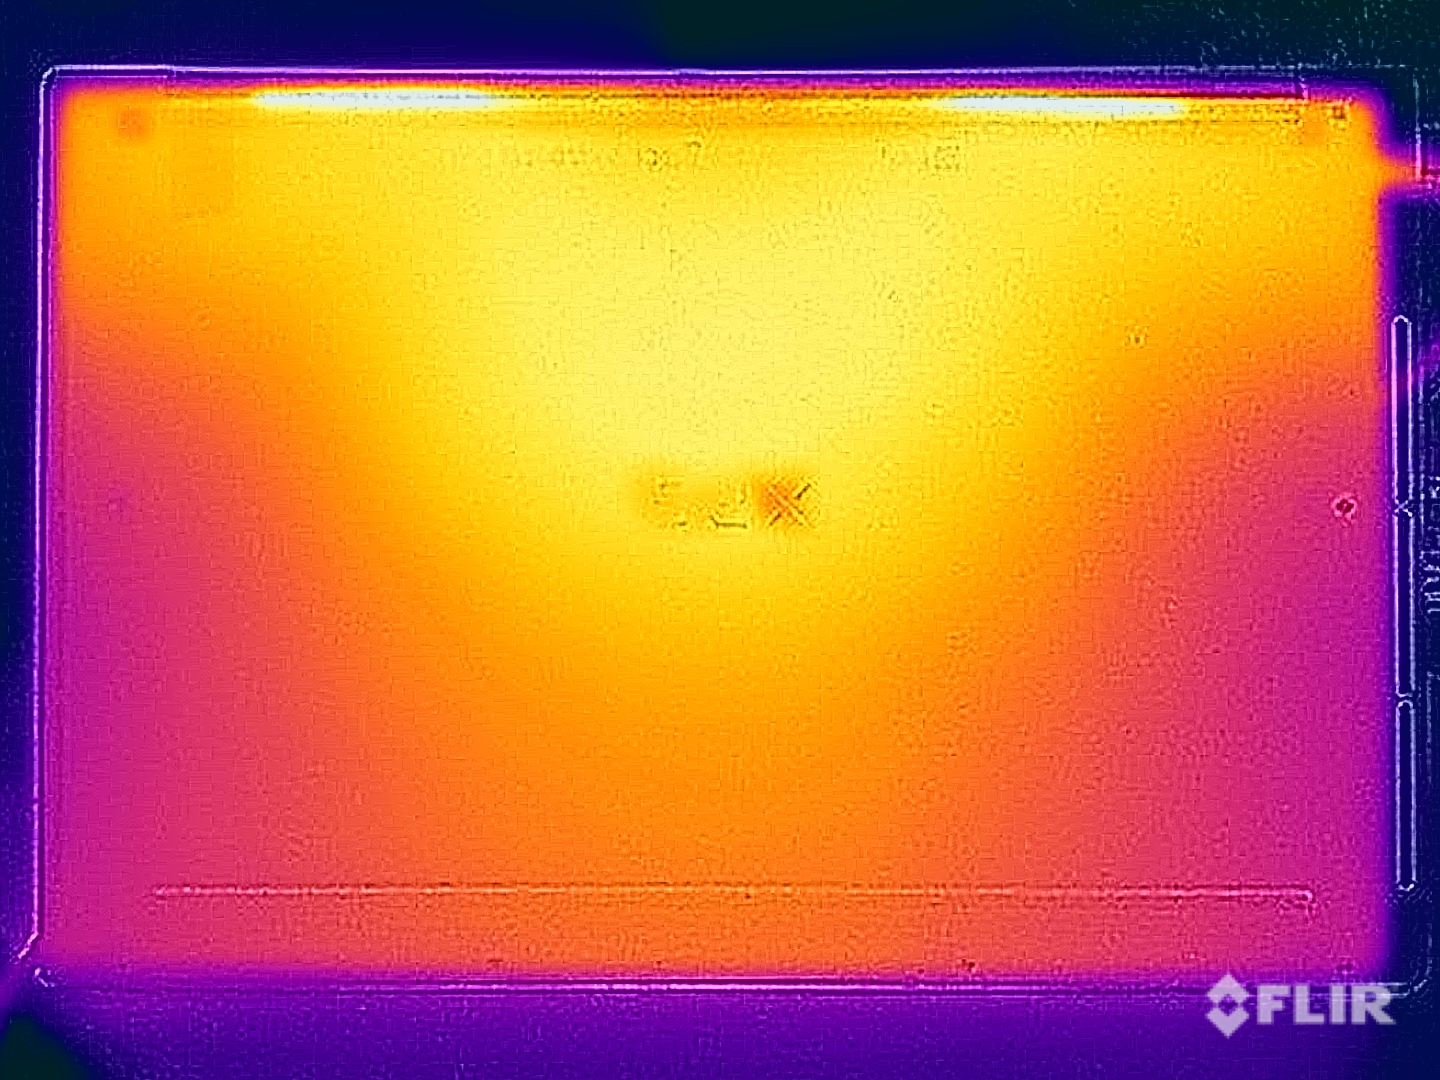
As temperaturas da superfície do laptop mostram que a Dell poderia aumentar o desempenho dos componentes ou reduzir a velocidade dos ventiladores, pois mesmo durante o teste de estresse, nunca medimos mais de 40 °C. O gabinete de alumínio quase não esquenta durante as tarefas simples e quando está ocioso. No teste de estresse usando a carga combinada de CPU/GPU, a placa gráfica permaneceu estável em 60 watts, enquanto o processador teve que se contentar com apenas 20 watts.
(+) A temperatura máxima no lado superior é 39.4 °C / 103 F, em comparação com a média de 36.8 °C / 98 F , variando de 21 a 71 °C para a classe Multimedia.
(+) A parte inferior aquece até um máximo de 36.9 °C / 98 F, em comparação com a média de 39.1 °C / 102 F
(+) Em uso inativo, a temperatura média para o lado superior é 26.3 °C / 79 F, em comparação com a média do dispositivo de 31.3 °C / ### class_avg_f### F.
(±) Jogando The Witcher 3, a temperatura média para o lado superior é 34 °C / 93 F, em comparação com a média do dispositivo de 31.3 °C / ## #class_avg_f### F.
(+) Os apoios para as mãos e o touchpad são mais frios que a temperatura da pele, com um máximo de 30.2 °C / 86.4 F e, portanto, são frios ao toque.
(±) A temperatura média da área do apoio para as mãos de dispositivos semelhantes foi 28.7 °C / 83.7 F (-1.5 °C / -2.7 F).
| Dell XPS 16 9640 Intel Core Ultra 7 155H, NVIDIA GeForce RTX 4070 Laptop GPU | Samsung Galaxy Book4 Ultra Intel Core Ultra 7 155H, NVIDIA GeForce RTX 4050 Laptop GPU | Honor MagicBook Pro 16 2024 Intel Core Ultra 7 155H, NVIDIA GeForce RTX 4060 Laptop GPU | Asus ROG Zephyrus G16 2024 GU605M Intel Core Ultra 7 155H, NVIDIA GeForce RTX 4070 Laptop GPU | Lenovo Yoga Pro 9 16-IRP G8 Intel Core i7-13705H, NVIDIA GeForce RTX 4060 Laptop GPU | Schenker VISION 16 Pro (M23) Intel Core i7-13700H, NVIDIA GeForce RTX 4070 Laptop GPU | Dell XPS 15 9530 RTX 4070 Intel Core i7-13700H, NVIDIA GeForce RTX 4070 Laptop GPU | |
|---|---|---|---|---|---|---|---|
| Heat | 5% | 3% | -17% | -10% | -15% | -18% | |
| Maximum Upper Side * (°C) | 39.4 | 38.5 2% | 39.7 -1% | 50.3 -28% | 41.6 -6% | 46.7 -19% | 45.6 -16% |
| Maximum Bottom * (°C) | 36.9 | 41.2 -12% | 42.9 -16% | 48 -30% | 50 -36% | 54.1 -47% | 42 -14% |
| Idle Upper Side * (°C) | 28.2 | 23.5 17% | 23.7 16% | 28.8 -2% | 26.8 5% | 26.5 6% | 34.4 -22% |
| Idle Bottom * (°C) | 27.4 | 24.1 12% | 23.5 14% | 29.8 -9% | 27.9 -2% | 26.8 2% | 33.2 -21% |
* ... menor é melhor
Alto-falantes
O sistema de som do XPS 16 é composto por quatro alto-falantes com uma potência total de 10 watts. O som resultante é bom e o senhor dificilmente ficará desapontado, mas concorrentes como o ROG Zephyrus G16 mostram que ele poderia ser ainda melhor. De acordo com nossa análise, o novo XPS 16 também fica um pouco atrás do antigo XPS 15.
Dell XPS 16 9640 análise de áudio
(+) | os alto-falantes podem tocar relativamente alto (###valor### dB)
Graves 100 - 315Hz
(±) | graves reduzidos - em média 11.2% menor que a mediana
(±) | a linearidade dos graves é média (8.9% delta para a frequência anterior)
Médios 400 - 2.000 Hz
(+) | médios equilibrados - apenas 4.5% longe da mediana
(+) | médios são lineares (3% delta para frequência anterior)
Altos 2 - 16 kHz
(+) | agudos equilibrados - apenas 1.4% longe da mediana
(+) | os máximos são lineares (2% delta da frequência anterior)
Geral 100 - 16.000 Hz
(+) | o som geral é linear (10% diferença em relação à mediana)
Comparado com a mesma classe
» 13% de todos os dispositivos testados nesta classe foram melhores, 2% semelhantes, 84% piores
» O melhor teve um delta de 5%, a média foi 17%, o pior foi 45%
Comparado com todos os dispositivos testados
» 4% de todos os dispositivos testados foram melhores, 1% semelhantes, 94% piores
» O melhor teve um delta de 4%, a média foi 23%, o pior foi 134%
Asus ROG Zephyrus G16 2024 GU605M análise de áudio
(+) | os alto-falantes podem tocar relativamente alto (###valor### dB)
Graves 100 - 315Hz
(+) | bons graves - apenas 3.8% longe da mediana
(±) | a linearidade dos graves é média (8.1% delta para a frequência anterior)
Médios 400 - 2.000 Hz
(+) | médios equilibrados - apenas 3.5% longe da mediana
(+) | médios são lineares (2.4% delta para frequência anterior)
Altos 2 - 16 kHz
(+) | agudos equilibrados - apenas 2.2% longe da mediana
(+) | os máximos são lineares (3.7% delta da frequência anterior)
Geral 100 - 16.000 Hz
(+) | o som geral é linear (7.3% diferença em relação à mediana)
Comparado com a mesma classe
» 1% de todos os dispositivos testados nesta classe foram melhores, 0% semelhantes, 99% piores
» O melhor teve um delta de 6%, a média foi 18%, o pior foi 132%
Comparado com todos os dispositivos testados
» 1% de todos os dispositivos testados foram melhores, 0% semelhantes, 99% piores
» O melhor teve um delta de 4%, a média foi 23%, o pior foi 134%
Lenovo Yoga Pro 9 16-IRP G8 análise de áudio
(±) | o volume do alto-falante é médio, mas bom (###valor### dB)
Graves 100 - 315Hz
(+) | bons graves - apenas 4.9% longe da mediana
(±) | a linearidade dos graves é média (9.1% delta para a frequência anterior)
Médios 400 - 2.000 Hz
(+) | médios equilibrados - apenas 3.2% longe da mediana
(+) | médios são lineares (6.5% delta para frequência anterior)
Altos 2 - 16 kHz
(+) | agudos equilibrados - apenas 2.9% longe da mediana
(+) | os máximos são lineares (3% delta da frequência anterior)
Geral 100 - 16.000 Hz
(+) | o som geral é linear (8.4% diferença em relação à mediana)
Comparado com a mesma classe
» 9% de todos os dispositivos testados nesta classe foram melhores, 2% semelhantes, 89% piores
» O melhor teve um delta de 5%, a média foi 17%, o pior foi 45%
Comparado com todos os dispositivos testados
» 2% de todos os dispositivos testados foram melhores, 1% semelhantes, 97% piores
» O melhor teve um delta de 4%, a média foi 23%, o pior foi 134%
Dell XPS 15 9530 RTX 4070 análise de áudio
(+) | os alto-falantes podem tocar relativamente alto (###valor### dB)
Graves 100 - 315Hz
(+) | bons graves - apenas 3.9% longe da mediana
(+) | o baixo é linear (6.8% delta para a frequência anterior)
Médios 400 - 2.000 Hz
(+) | médios equilibrados - apenas 4.4% longe da mediana
(+) | médios são lineares (4.1% delta para frequência anterior)
Altos 2 - 16 kHz
(+) | agudos equilibrados - apenas 1.1% longe da mediana
(+) | os máximos são lineares (3.3% delta da frequência anterior)
Geral 100 - 16.000 Hz
(+) | o som geral é linear (6.4% diferença em relação à mediana)
Comparado com a mesma classe
» 4% de todos os dispositivos testados nesta classe foram melhores, 1% semelhantes, 95% piores
» O melhor teve um delta de 5%, a média foi 17%, o pior foi 45%
Comparado com todos os dispositivos testados
» 1% de todos os dispositivos testados foram melhores, 0% semelhantes, 99% piores
» O melhor teve um delta de 4%, a média foi 23%, o pior foi 134%
Gerenciamento de energia - Muita resistência graças a uma bateria de 99,5 Wh
Consumo de energia
Em nossas medições de consumo, a tela sensível ao toque OLED de alta resolução provou ser surpreendentemente econômica, pois, apesar da imagem de fundo padrão escura, o consumo máximo de 10,6 watts não é muito para uma tela de 16,3 polegadas. Não notamos nenhuma surpresa sob carga. Durante o teste de estresse, o consumo atingiu brevemente cerca de 138 watts, mas depois se estabilizou em 125 watts após 1,5 minutos e, mais tarde, em 115 watts. Pode não haver muita margem de manobra, mas, de modo geral, a fonte de alimentação compacta de 130 watts tem tamanho suficiente.
| desligado | |
| Ocioso | |
| Carga |
|
Key:
min: | |
| Dell XPS 16 9640 Ultra 7 155H, GeForce RTX 4070 Laptop GPU, Kioxia XG8 KXG80ZNV1T02, OLED, 3840x2400, 16.3" | Samsung Galaxy Book4 Ultra Ultra 7 155H, GeForce RTX 4050 Laptop GPU, Samsung PM9A1 MZVL2512HCJQ, OLED, 2880x1800, 16" | Honor MagicBook Pro 16 2024 Ultra 7 155H, GeForce RTX 4060 Laptop GPU, WD PC SN740 SDDPNQD-1T00, IPS, 3072x1920, 16" | Asus ROG Zephyrus G16 2024 GU605M Ultra 7 155H, GeForce RTX 4070 Laptop GPU, WD PC SN560 SDDPNQE-1T00, OLED, 2560x1600, 16" | Lenovo Yoga Pro 9 16-IRP G8 i7-13705H, GeForce RTX 4060 Laptop GPU, Samsung PM9A1 MZVL21T0HCLR, Mini-LED, 3200x2000, 16" | Schenker VISION 16 Pro (M23) i7-13700H, GeForce RTX 4070 Laptop GPU, Samsung 990 Pro 1 TB, IPS, 2560x1600, 16" | Dell XPS 15 9530 RTX 4070 i7-13700H, GeForce RTX 4070 Laptop GPU, SK hynix PC801 HFS001TEJ9X101N, OLED, 3456x2160, 15.6" | Média NVIDIA GeForce RTX 4070 Laptop GPU | Média da turma Multimedia | |
|---|---|---|---|---|---|---|---|---|---|
| Power Consumption | 22% | -20% | -11% | -58% | -16% | -57% | -73% | 8% | |
| Idle Minimum * (Watt) | 7.7 | 4.8 38% | 5.2 32% | 8.3 -8% | 10.9 -42% | 8.6 -12% | 20 -160% | 13.2 ? -71% | 5.72 ? 26% |
| Idle Average * (Watt) | 10.3 | 7.5 27% | 14.4 -40% | 12.5 -21% | 22.6 -119% | 12 -17% | 20.7 -101% | 18.2 ? -77% | 10.2 ? 1% |
| Idle Maximum * (Watt) | 10.6 | 7.9 25% | 15.4 -45% | 12.8 -21% | 23.5 -122% | 12.4 -17% | 22.4 -111% | 24.6 ? -132% | 12.4 ? -17% |
| Load Average * (Watt) | 76.5 | 79.3 -4% | 105.4 -38% | 71.3 7% | 84.6 -11% | 80 -5% | 77.1 -1% | 97 ? -27% | 65.5 ? 14% |
| Witcher 3 ultra * (Watt) | 126.4 | 79.2 37% | 107.6 15% | 127.5 -1% | 159.5 -26% | 147.7 -17% | 95.4 25% | ||
| Load Maximum * (Watt) | 138.5 | 125 10% | 195.2 -41% | 169.1 -22% | 177.3 -28% | 173.1 -25% | 133.4 4% | 221 ? -60% | 114 ? 18% |
* ... menor é melhor
Power consumption Witcher 3 / stress test
Power consumption with external monitor
Tempos de execução
A Dell instalou a maior bateria possível no novo XPS 16, que tem uma capacidade de 99,5 Wh e, no total, seus tempos de funcionamento são muito bons. Em nosso teste WLAN a 150 cd/m² (corresponde a 57% do brilho SDR máximo do dispositivo de teste), medimos 10:29 horas a 60 Hz (09:56 horas a 90 Hz) e pouco mais de 8 horas com brilho total e 60 Hz (~07:20 horas a 90 Hz). Durante o teste de vídeo a 150 cd/m², observamos uma excelente duração de 16,5 horas e, aqui, o processador Meteor Lake se beneficia de seus dois núcleos de baixa eficiência energética. Um vídeo HDR com brilho total pôde ser reproduzido por pouco mais de 6,5 horas e, sob carga total, o teste terminou após pouco menos de 1,5 horas.
O XPS 16 oferece duas velocidades de carregamento: No modo normal, são necessários 151 minutos (80% após 93 minutos) para que a bateria esteja totalmente carregada quando o dispositivo é ligado; no modo expresso, são necessários 97 minutos (80% após 50 minutos).
| Dell XPS 16 9640 Ultra 7 155H, GeForce RTX 4070 Laptop GPU, 99.5 Wh | Samsung Galaxy Book4 Ultra Ultra 7 155H, GeForce RTX 4050 Laptop GPU, 76 Wh | Honor MagicBook Pro 16 2024 Ultra 7 155H, GeForce RTX 4060 Laptop GPU, 75 Wh | Asus ROG Zephyrus G16 2024 GU605M Ultra 7 155H, GeForce RTX 4070 Laptop GPU, 90 Wh | Lenovo Yoga Pro 9 16-IRP G8 i7-13705H, GeForce RTX 4060 Laptop GPU, 75 Wh | Schenker VISION 16 Pro (M23) i7-13700H, GeForce RTX 4070 Laptop GPU, 80 Wh | Dell XPS 15 9530 RTX 4070 i7-13700H, GeForce RTX 4070 Laptop GPU, 86 Wh | Média da turma Multimedia | |
|---|---|---|---|---|---|---|---|---|
| Duração da bateria | -0% | -13% | -27% | -49% | -31% | -12% | 9% | |
| H.264 (h) | 16.5 | 17.9 8% | 13.1 -21% | 11.2 -32% | 7.5 -55% | 7.8 -53% | 16.4 ? -1% | |
| WiFi v1.3 (h) | 10.5 | 10.9 4% | 12.2 16% | 7.3 -30% | 6.4 -39% | 7.8 -26% | 8 -24% | 12.2 ? 16% |
| Load (h) | 1.5 | 1.3 -13% | 1 -33% | 1.2 -20% | 0.7 -53% | 1.3 -13% | 1.5 0% | 1.668 ? 11% |
Pro
Contra
Veredicto - O novo design do XPS funciona melhor como um dispositivo de 16 polegadas
No total, o novo Dell XPS 16 causa uma impressão melhor do que o modelo menor de 14 polegadas. Apesar de seu peso, o design do laptop não parece terrivelmente volumoso e sua pegada se beneficia em comparação com a concorrência graças às bordas finas. Mesmo assim, é preciso observar que esse modelo também coloca o design em primeiro plano, o que leva, em particular, ao laptop RTX 4070 de 60 watts RTX 4070 Laptopde 60 watts seja apenas mediano. Por sua vez, o desempenho da CPU é bom, mesmo que os processadores Meteor Lake não ofereçam nenhuma vantagem sobre os antigos modelos Raptor-Lake.
A tela touchscreen OLED 4K do dispositivo apresenta boa qualidade de imagem com cores precisas, mas, em comparação com os painéis OLED mais atuais, é possível notar um claro efeito de rasterização ao visualizar conteúdo leve - além disso, sua taxa de atualização de 90 Hz não está mais totalmente atualizada. Seus novos dispositivos de entrada também não são os melhores, pois o teclado leva algum tempo para se acostumar e a barra de toque, em particular, é um pouco inconveniente no uso diário. Quando se trata de conectividade, o senhor terá que se contentar com três portas USB-C - como no XPS 14 menor - enquanto o XPS 16 mais caro com o laptop RTX 4070 parece ter apenas 2 portas Thunderbolt e ambos os modelos mais fracos apresentam 3 portas Thunderbolt 4.
O Dell XPS 16 se concentra no design e, ao mesmo tempo, oferece um bom desempenho da CPU; no entanto, a ergonomia do dispositivo de entrada e o desempenho da GPU sofrem com isso. Além disso, por US$2.899, ele é extremamente caro.
Não temos nada negativo a dizer sobre os alto-falantes e os tempos de execução do laptop e, em geral, a estabilidade da estrutura e do gabinete é boa, embora nossa amostra de teste tenha apresentado uma pequena falha de estrutura entre as duas portas USB-C. As temperaturas da superfície permanecem muito baixas, mesmo sob carga, no entanto, as ventoinhas são muito barulhentas e não notamos grandes diferenças entre todos os perfis de energia. As opções de configuração mostram algumas limitações, especialmente quando se trata de RAM. O senhor pode selecionar um máximo de 64 GB de RAM, mas somente em combinação com o Core Ultra 9 185H.
É preciso deixar claro que o desempenho não é o ponto de venda exclusivo do XPS 16 - a concorrência oferece muito mais desempenho, especialmente no que diz respeito às GPUs. Ao mesmo tempo, por US$ 2.899, o preço do Dell XPS 16 é extremamente alto e muitos de seus concorrentes oferecem uma melhor relação preço/desempenho.
Preço e disponibilidade
Atualmente, o novo XPS 16 9640 pode ser encomendado diretamente da Dell, com preços a partir de US$ 1.699.
Dell XPS 16 9640
- 04/09/2024 v7 (old)
Andreas Osthoff
Transparência
A seleção dos dispositivos a serem analisados é feita pela nossa equipe editorial. A amostra de teste foi fornecida ao autor como empréstimo pelo fabricante ou varejista para fins desta revisão. O credor não teve influência nesta revisão, nem o fabricante recebeu uma cópia desta revisão antes da publicação. Não houve obrigação de publicar esta revisão. Como empresa de mídia independente, a Notebookcheck não está sujeita à autoridade de fabricantes, varejistas ou editores.
É assim que o Notebookcheck está testando
Todos os anos, o Notebookcheck analisa de forma independente centenas de laptops e smartphones usando procedimentos padronizados para garantir que todos os resultados sejam comparáveis. Desenvolvemos continuamente nossos métodos de teste há cerca de 20 anos e definimos padrões da indústria no processo. Em nossos laboratórios de teste, equipamentos de medição de alta qualidade são utilizados por técnicos e editores experientes. Esses testes envolvem um processo de validação em vários estágios. Nosso complexo sistema de classificação é baseado em centenas de medições e benchmarks bem fundamentados, o que mantém a objetividade.Price comparison

