Análise do laptop Lenovo Yoga Pro 9i 16: Ótimo painel mini-LED, mas medidas desnecessárias de economia de custos
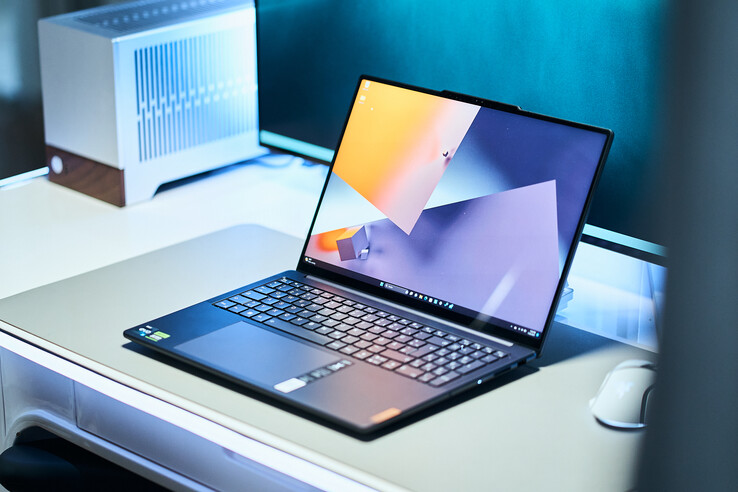
Depois de analisarmos de perto a versão de 14 polegadas do novo Lenovo Yoga Pro 9i, agora vamos dar uma olhada na versão de 16 polegadas. As especificações técnicas (além do tamanho) são fundamentalmente idênticas, pois uma tela sensível ao toque mini-LED de 3,2K com 165 Hz e cobertura AdobeRGB também é usada aqui. Sob o capô estão as mais recentes CPUs Raptor Lake H da Intel e GPUs da Nvidia que vão da RTX 4050 à RTX 4070. Em detalhes, no entanto, há algumas diferenças que também analisamos.
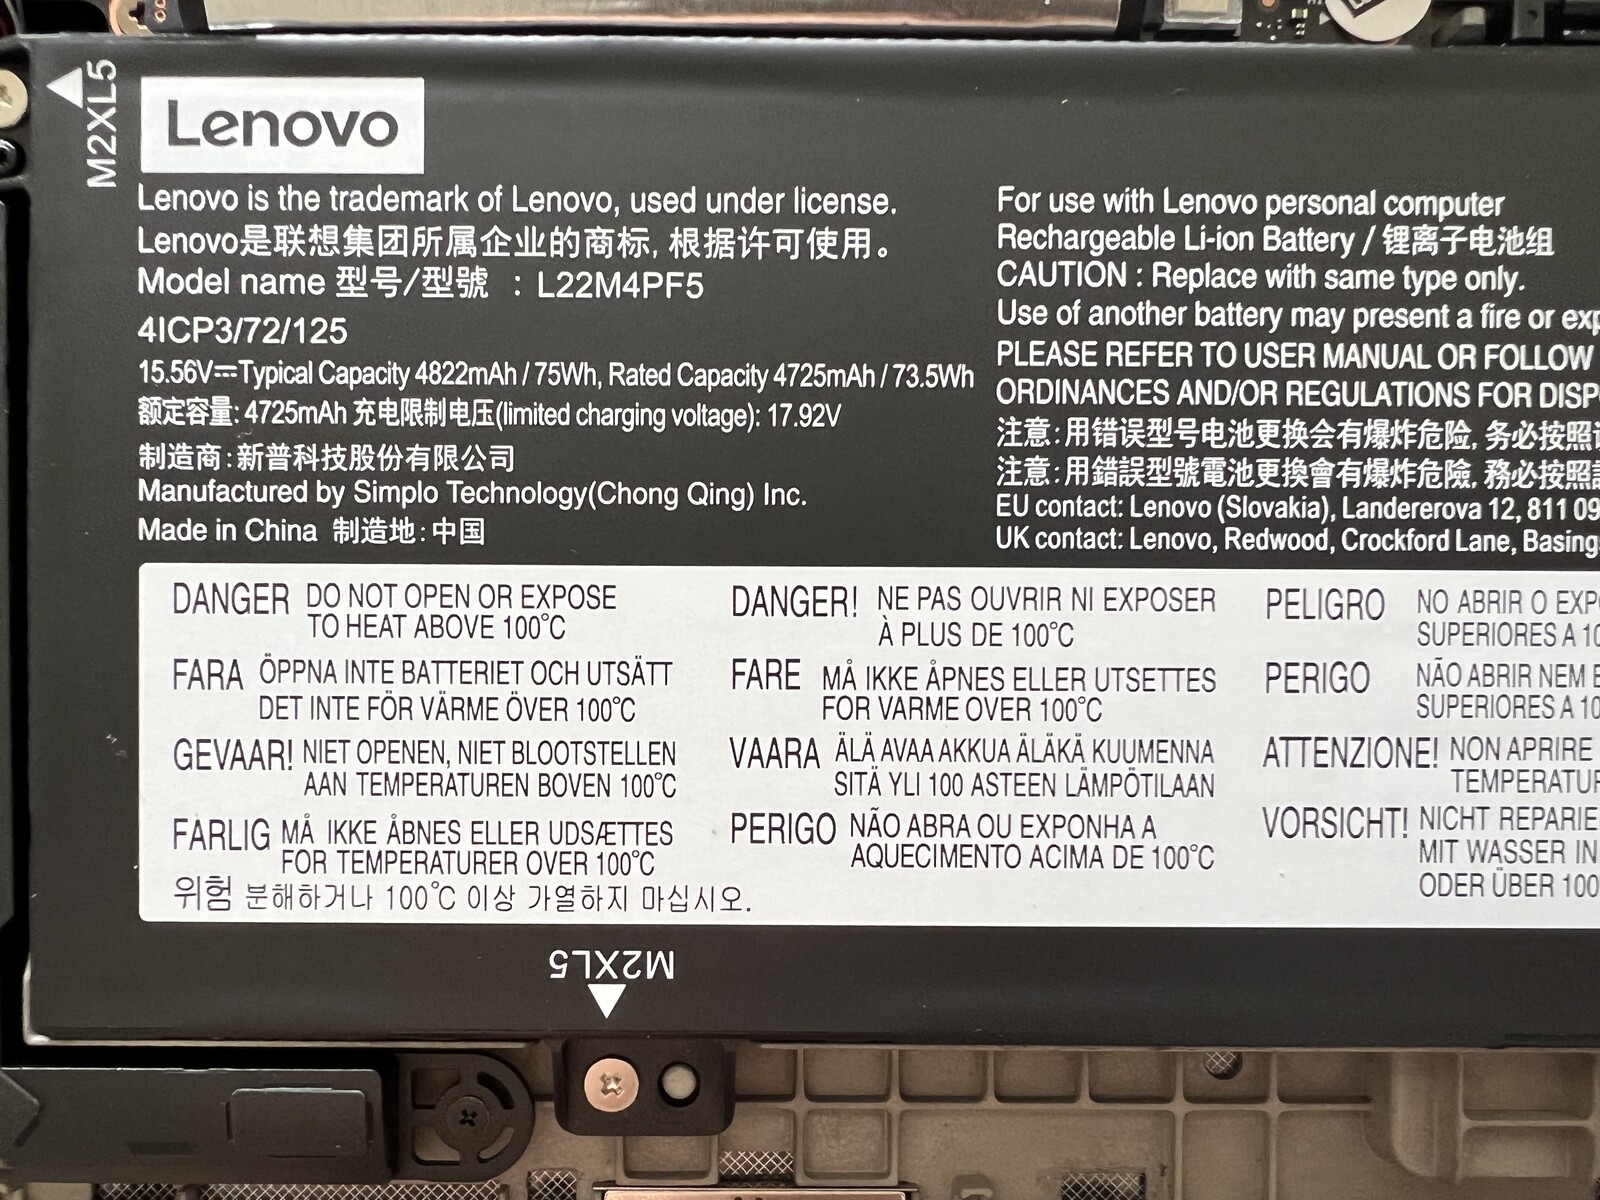
Nosso dispositivo de teste é o modelo 83BY0016GE e custa 2.399 euros(Nota do tradutor: os modelos nos EUA são consideravelmente mais baratos - consulte "Preço e disponibilidade" no final desta análise) com um mini painel LED de 3,2K (165 Hz), um processador Core i7, umaGeForce RTX 406016 GB de RAM LPDDR5X 6400 e um SSD PCIe 4.0 de 1 TB. Também foi possível executar alguns benchmarks em uma configuração mais potente (Core i9, laptop RTX 4070, 64 GB de RAM).
Possíveis concorrentes em comparação
Avaliação | Data | Modelo | Peso | Altura | Size | Resolução | Preço |
|---|---|---|---|---|---|---|---|
| 88.4 % v7 (old) | 08/2023 | Lenovo Yoga Pro 9 16-IRP G8 i7-13705H, GeForce RTX 4060 Laptop GPU | 2.2 kg | 18.2 mm | 16.00" | 3200x2000 | |
| 88.6 % v7 (old) | 07/2023 | Schenker VISION 16 Pro (M23) i7-13700H, GeForce RTX 4070 Laptop GPU | 1.6 kg | 17.1 mm | 16.00" | 2560x1600 | |
| 86.2 % v7 (old) | 07/2023 | Asus Vivobook Pro 16X K6604JV-MX016W i9-13980HX, GeForce RTX 4060 Laptop GPU | 2.1 kg | 22.8 mm | 16.00" | 3200x2000 | |
| 86.1 % v7 (old) | 06/2023 | Asus ProArt Studiobook 16 OLED H7604 i9-13980HX, GeForce RTX 4070 Laptop GPU | 2.4 kg | 23.9 mm | 16.00" | 3200x2000 | |
| 88.8 % v7 (old) | 07/2023 | MSI Stealth 16 Studio A13VG i7-13700H, GeForce RTX 4070 Laptop GPU | 2 kg | 19.95 mm | 16.00" | 2560x1600 | |
| 93.7 % v7 (old) | 03/2023 | Apple MacBook Pro 16 2023 M2 Max M2 Max, M2 Max 38-Core GPU | 2.2 kg | 16.8 mm | 16.20" | 3456x2234 |
Caixa - Caixa de alumínio com uma placa de base que range
O design do gabinete é o mesmo do menor Yoga Pro 9i 14ou seja, é usada uma estrutura de alumínio. No entanto, o modelo de 16 polegadas tem um ponto fraco: a placa de base é muito fina e emite ruídos desagradáveis de rangidos quando manuseada, o que não é nada adequado para um dispositivo premium. O problema também estava presente (embora menos pronunciado) no segundo dispositivo de teste, portanto, esse pode ser um problema geral. É uma pena, pois não há nenhum outro defeito em termos de acabamento ou estabilidade. A unidade base só pode ser pressionada minimamente na área central, mas praticamente não pode ser torcida. A tampa é um pouco mais flexível do que a do modelo menor de 14 polegadas, mas também não apresenta problemas. As duas dobradiças estão bem ajustadas (apenas uma oscilação mínima) e mantêm a tela firmemente no lugar, mesmo em pequenos ângulos de abertura. Ao mesmo tempo, é possível abrir a tela com uma só mão e o ângulo máximo de abertura é de 180 graus.
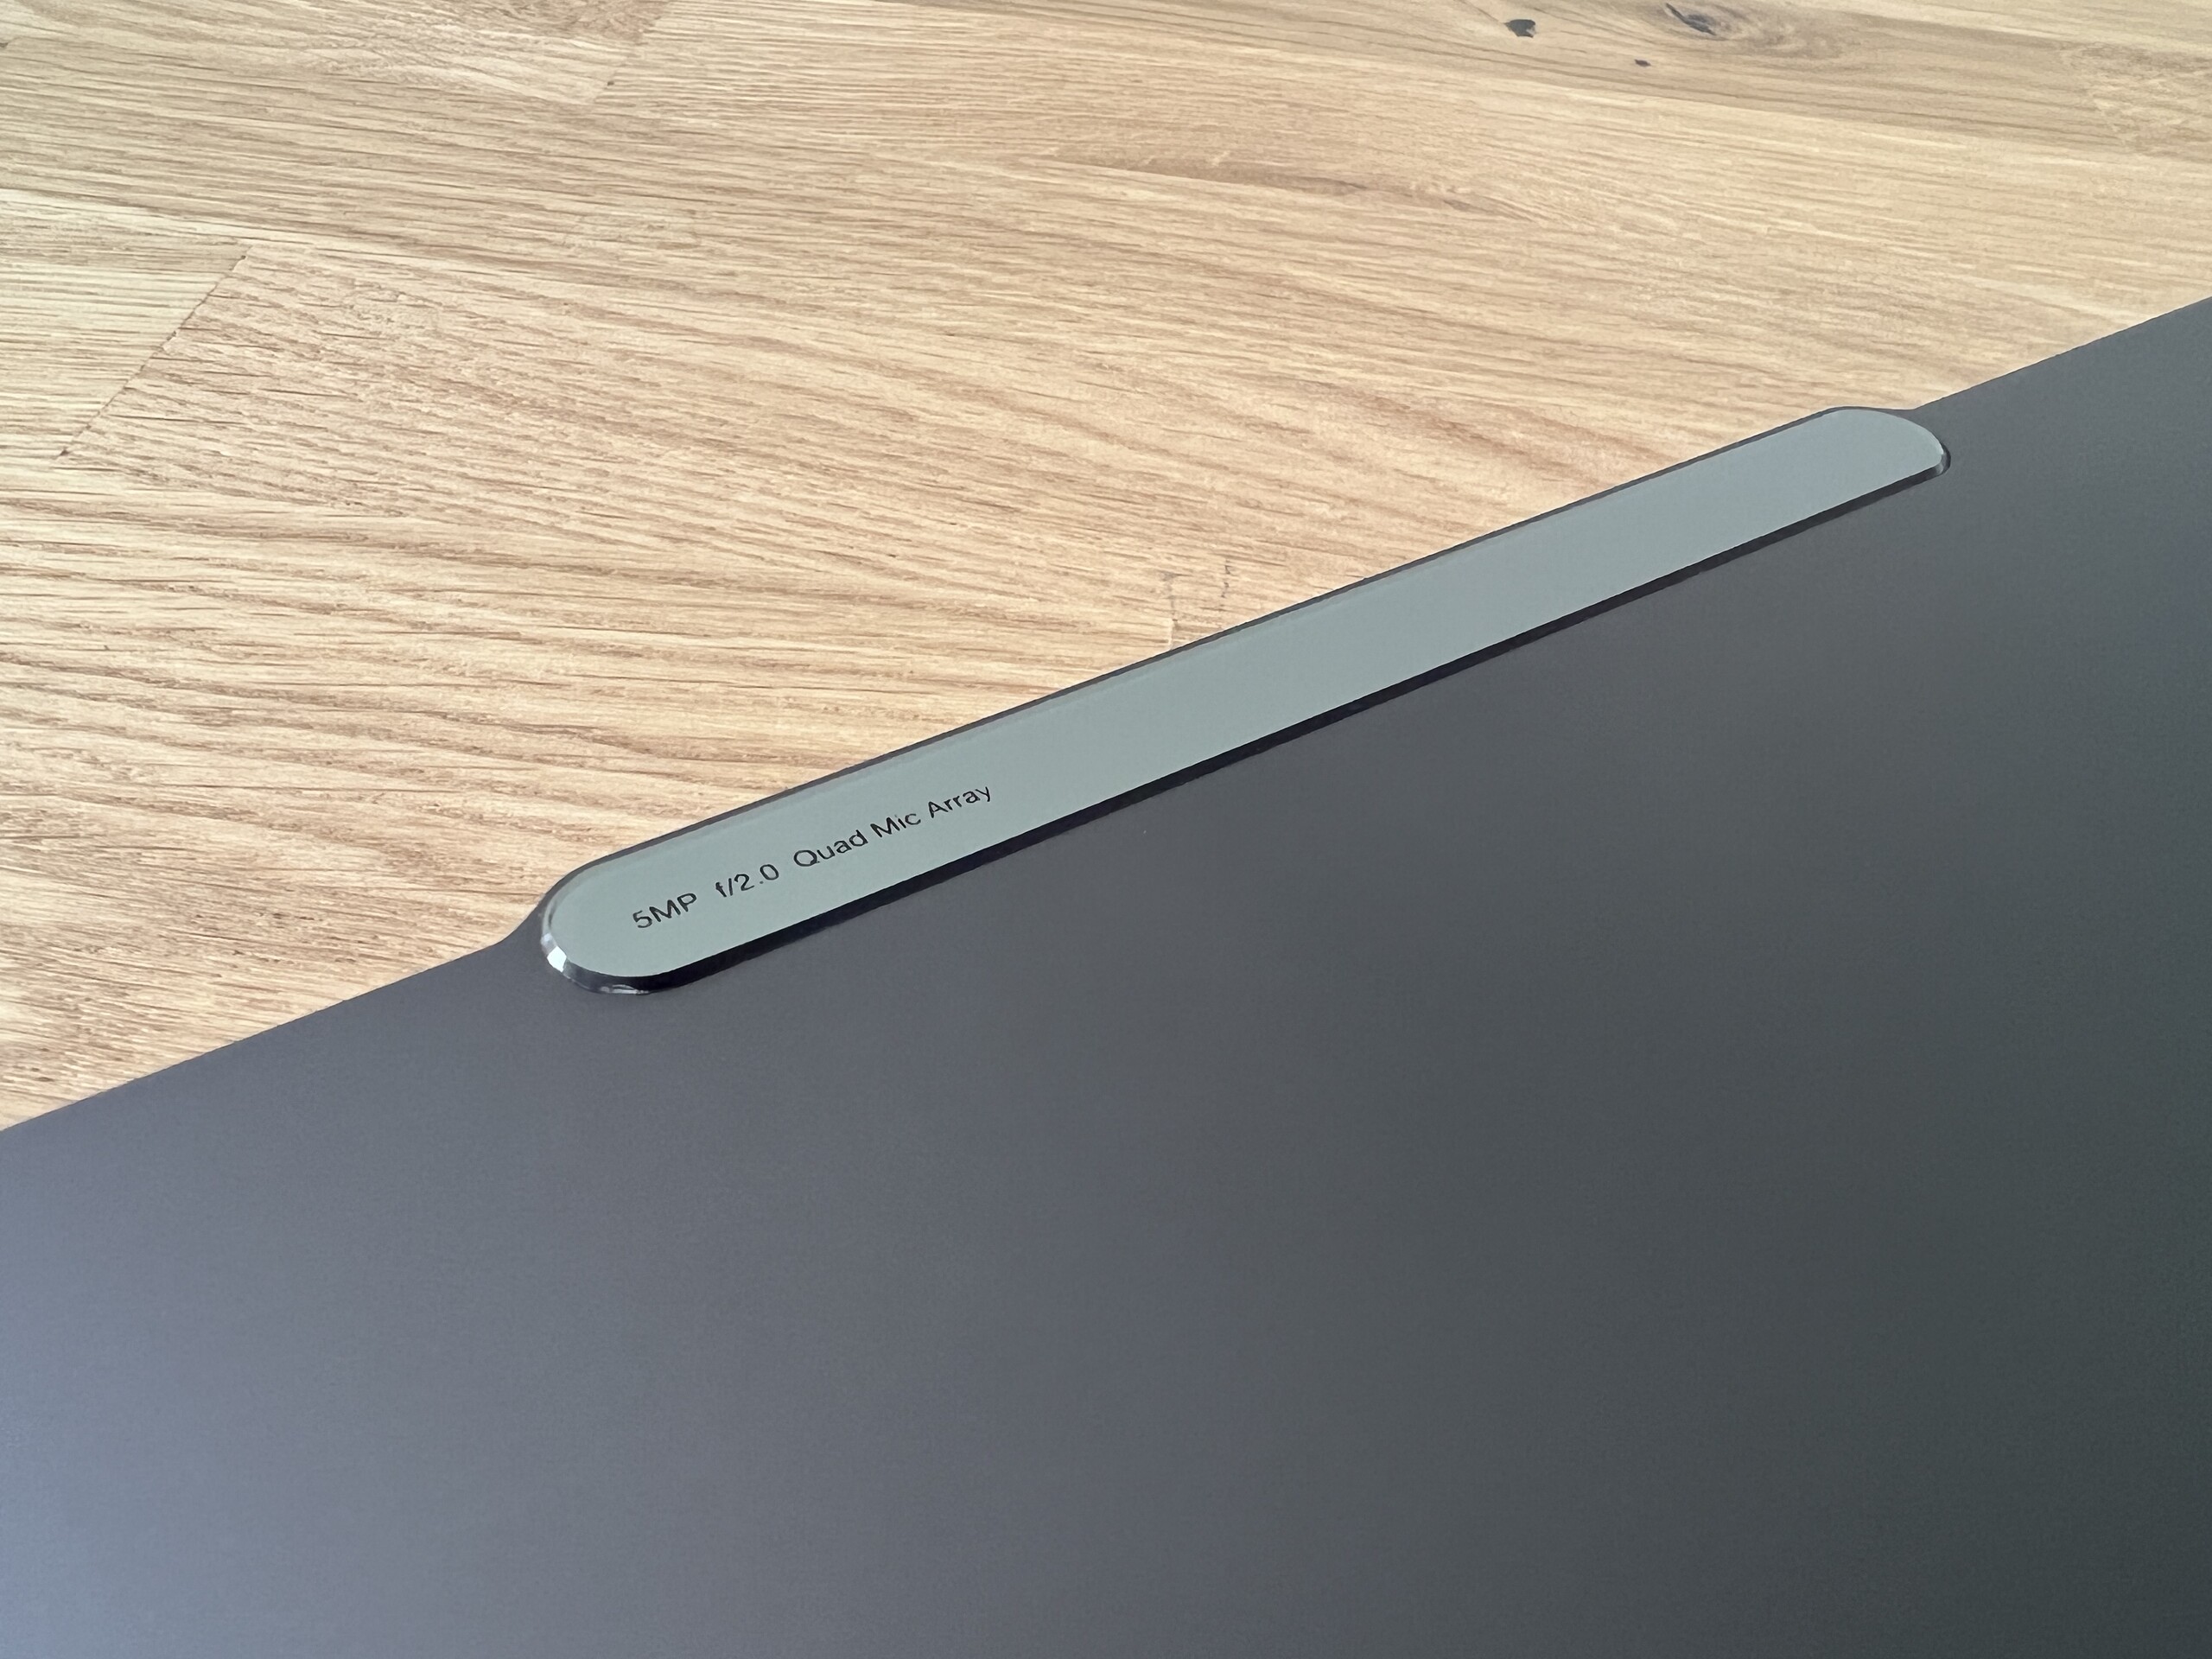
Nossa unidade de teste é a variante Strom Grey , que é muito discreta e se encaixa perfeitamente no escritório sem chamar a atenção. Aqueles que gostam de cores mais chamativas podem optar pela variante Tidal Teal (verde turquesa). No geral, o design parece muito moderno e as bordas da tela são bem estreitas, mas a saliência da câmera é um pouco irritante porque fica um pouco mais profunda do que o resto da tampa da tela.
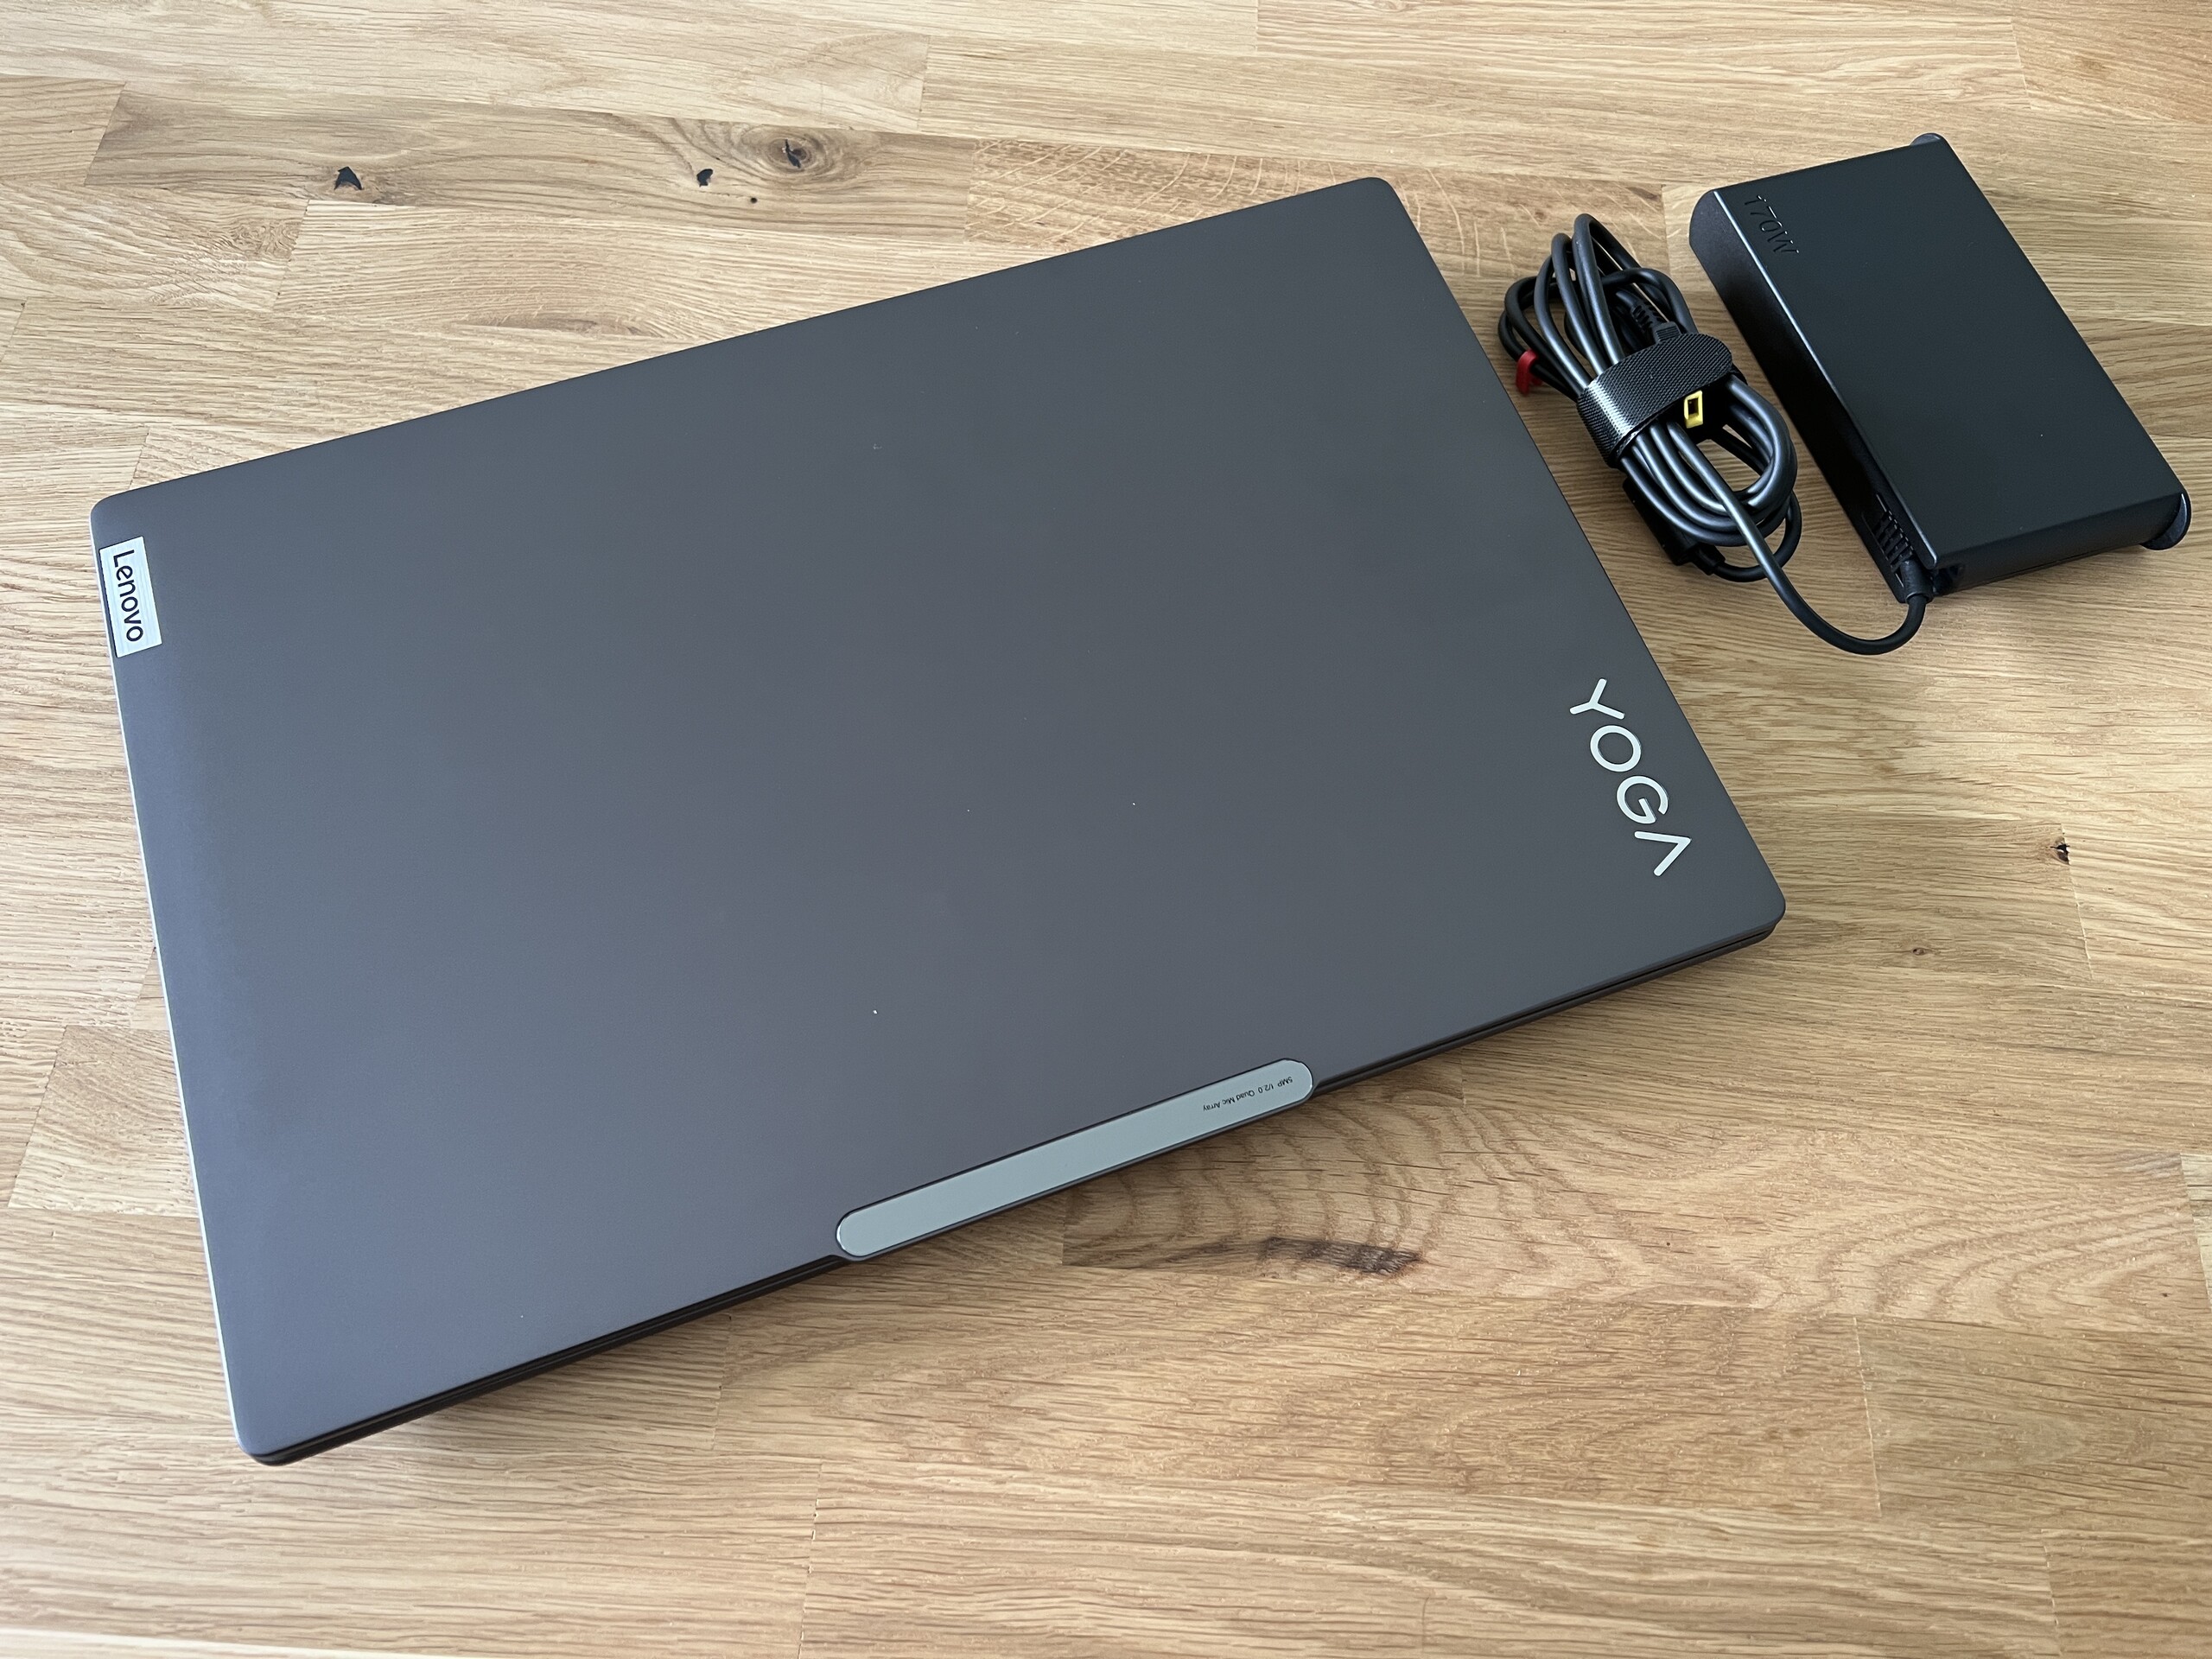
Juntamente com o Schenker Vision 16 Pro e oApple MacBook Pro 16o Yoga Pro 9i 16 tem o menor tamanho no campo de comparação, mas também é um dos modelos mais pesados, com pouco mais de 2,2 kg, embora as diferenças não sejam enormes. A única exceção é o Vision 16 Pro com apenas 1,6 kg. O adaptador de energia de 170 watts incluído pesa cerca de 570 gramas.
Equipamento - Yoga Pro de 16 polegadas somente com HDMI 1.4b
As diferenças em relação ao modelo menor podem ser encontradas nas portas. Apenas uma porta USB-C está instalada aqui, que pelo menos também suporta Thunderbolt 4 e pode ser usada para carregamento, se necessário (isso funcionou sem problemas com uma fonte de alimentação de 65 watts). Como há uma fonte de alimentação dedicada (SlimTip) aqui, a falta de uma segunda porta USB pode ser ignorada, mas não entendemos por que a saída HMDI da versão de 16 polegadas suporta apenas o padrão 1.4b, razão pela qual o 4K só pode ser reproduzido a 30 Hz.
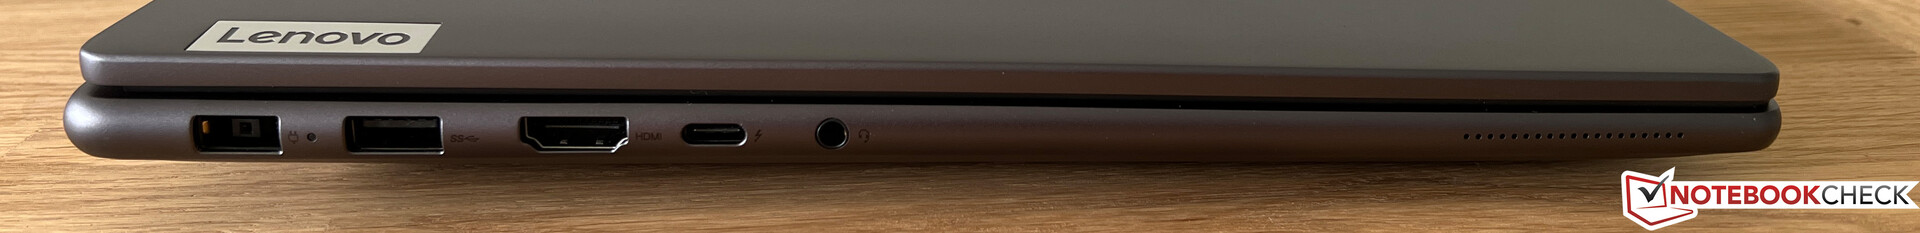
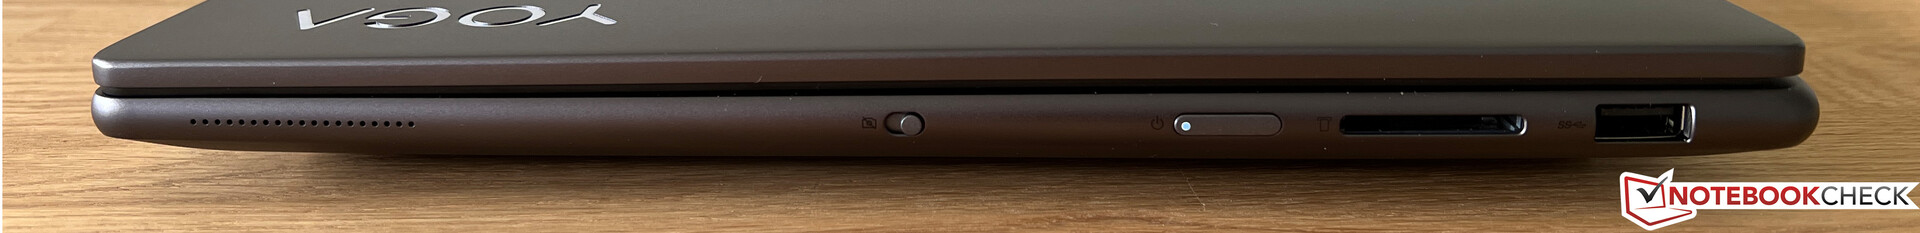
Leitor de cartão SD
O leitor de cartões à direita aceita cartões SD comuns, que se projetam cerca de 2 cm do dispositivo. As taxas de transferência em conjunto com nosso cartão de referência Angelbird AV Pro V60 são de cerca de 80 MB/s. Esse é um valor médio que é claramente superado por alguns concorrentes.
| SD Card Reader | |
| average JPG Copy Test (av. of 3 runs) | |
| Apple MacBook Pro 16 2023 M2 Max (Angelbird AV Pro V60) | |
| MSI Stealth 16 Studio A13VG | |
| Média da turma Multimedia (23 - 531, n=39, últimos 2 anos) | |
| Asus Vivobook Pro 16X K6604JV-MX016W | |
| Lenovo Yoga Pro 9 16-IRP G8 (Angelibird AV Pro V60) | |
| Asus ProArt Studiobook 16 OLED H7604 (Angelibird AV Pro V60) | |
| Schenker VISION 16 Pro (M23) (Angelbird AV Pro V60) | |
| maximum AS SSD Seq Read Test (1GB) | |
| Apple MacBook Pro 16 2023 M2 Max (Angelbird AV Pro V60) | |
| Média da turma Multimedia (37.3 - 1455, n=38, últimos 2 anos) | |
| MSI Stealth 16 Studio A13VG | |
| Asus Vivobook Pro 16X K6604JV-MX016W | |
| Asus ProArt Studiobook 16 OLED H7604 (Angelibird AV Pro V60) | |
| Lenovo Yoga Pro 9 16-IRP G8 (Angelibird AV Pro V60) | |
| Schenker VISION 16 Pro (M23) (Angelbird AV Pro V60) | |
Comunicação
Não está disponível uma porta para conexões de rede com fio, mas isso pode ser implementado por meio de um adaptador USB opcional. O módulo AX211 da Intel, que também suporta o atual padrão Wi-Fi 6E, é responsável pelas conexões sem fio. Medimos taxas de transferência altas e estáveis com nosso roteador de referência da Asus. Também não houve problemas na prática, nem em transferências de dados grandes nem em downloads.
| Networking | |
| Lenovo Yoga Pro 9 16-IRP G8 | |
| iperf3 transmit AXE11000 | |
| iperf3 receive AXE11000 | |
| Schenker VISION 16 Pro (M23) | |
| iperf3 transmit AXE11000 | |
| iperf3 receive AXE11000 | |
| Asus Vivobook Pro 16X K6604JV-MX016W | |
| iperf3 transmit AXE11000 | |
| iperf3 receive AXE11000 | |
| iperf3 transmit AXE11000 6GHz | |
| iperf3 receive AXE11000 6GHz | |
| Asus ProArt Studiobook 16 OLED H7604 | |
| iperf3 transmit AXE11000 | |
| iperf3 receive AXE11000 | |
| MSI Stealth 16 Studio A13VG | |
| iperf3 transmit AXE11000 | |
| iperf3 receive AXE11000 | |
| iperf3 transmit AXE11000 6GHz | |
| iperf3 receive AXE11000 6GHz | |
| Apple MacBook Pro 16 2023 M2 Max | |
| iperf3 transmit AXE11000 6GHz | |
| iperf3 receive AXE11000 6GHz | |
Webcam
A parte ligeiramente mais grossa da câmera abriga uma câmera de 5 MP que oferece boa qualidade de imagem, tanto para fotos quanto para vídeos. Isso elimina a necessidade de uma webcam externa, especialmente para videoconferências. Um sensor IR também está instalado, o que permite o reconhecimento facial via Windows Hello. A câmera pode ser desativada por meio de um pequeno controle deslizante no lado direito do gabinete (e-shutter).


Manutenção
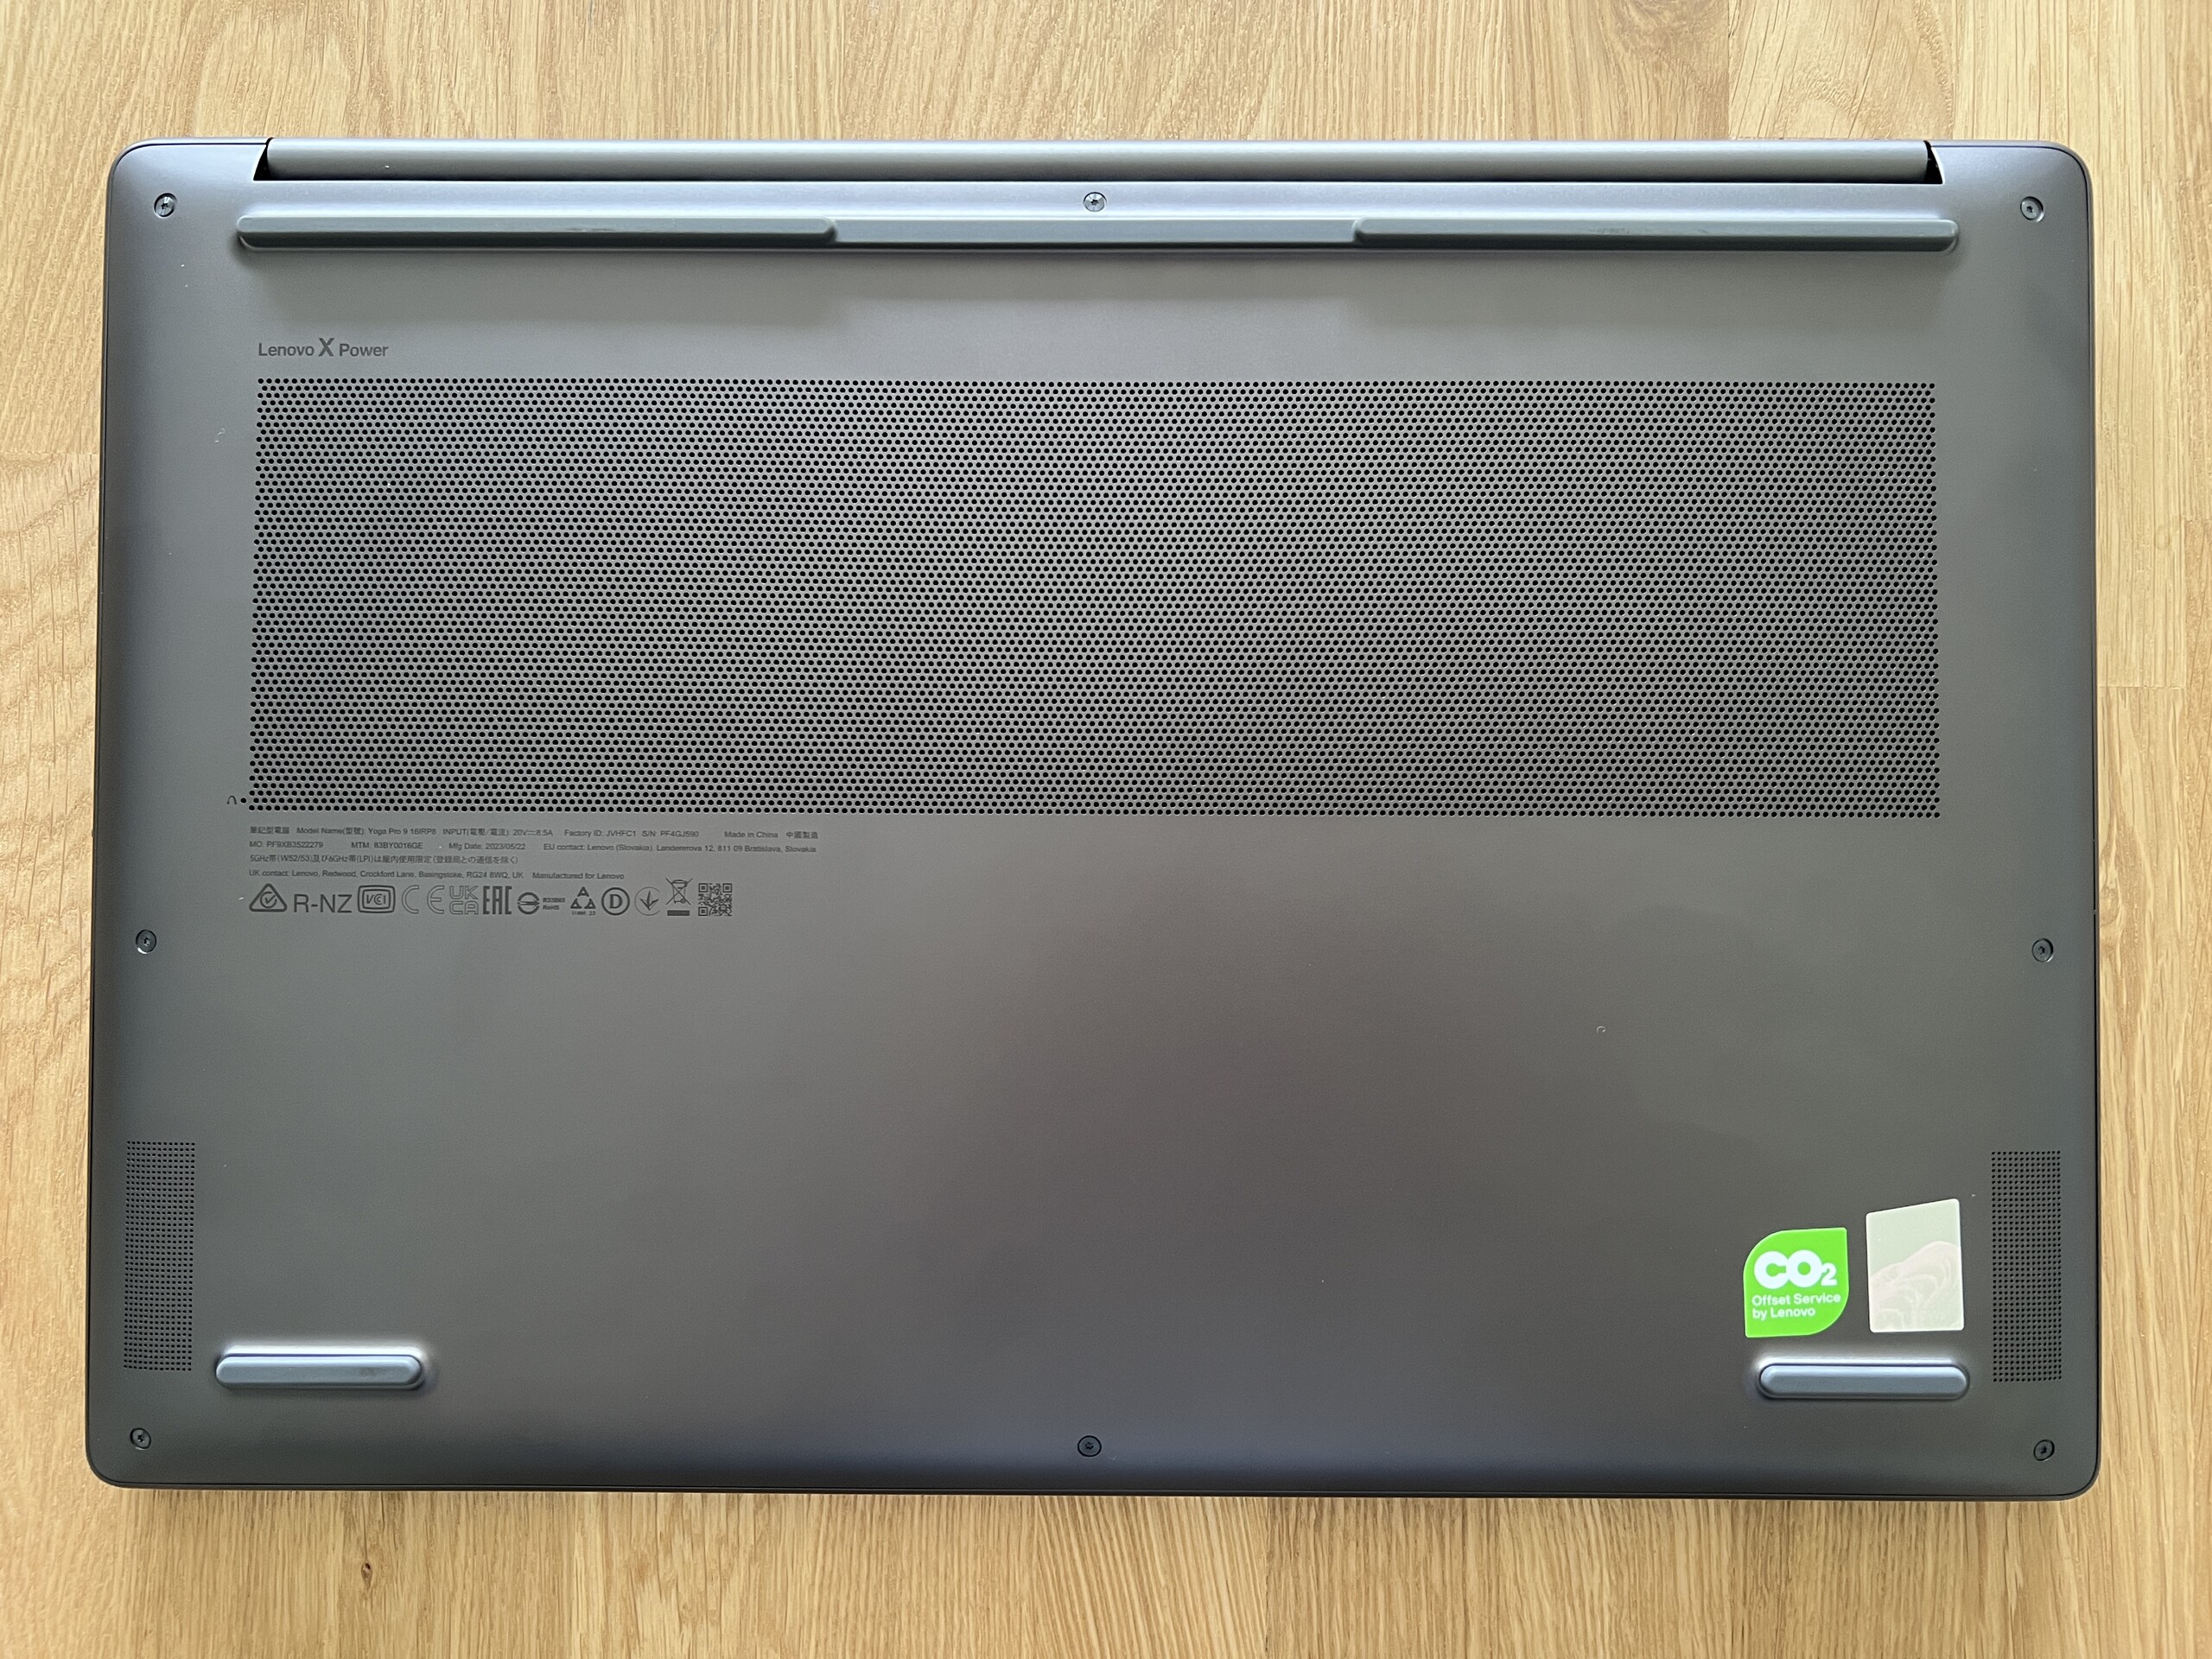
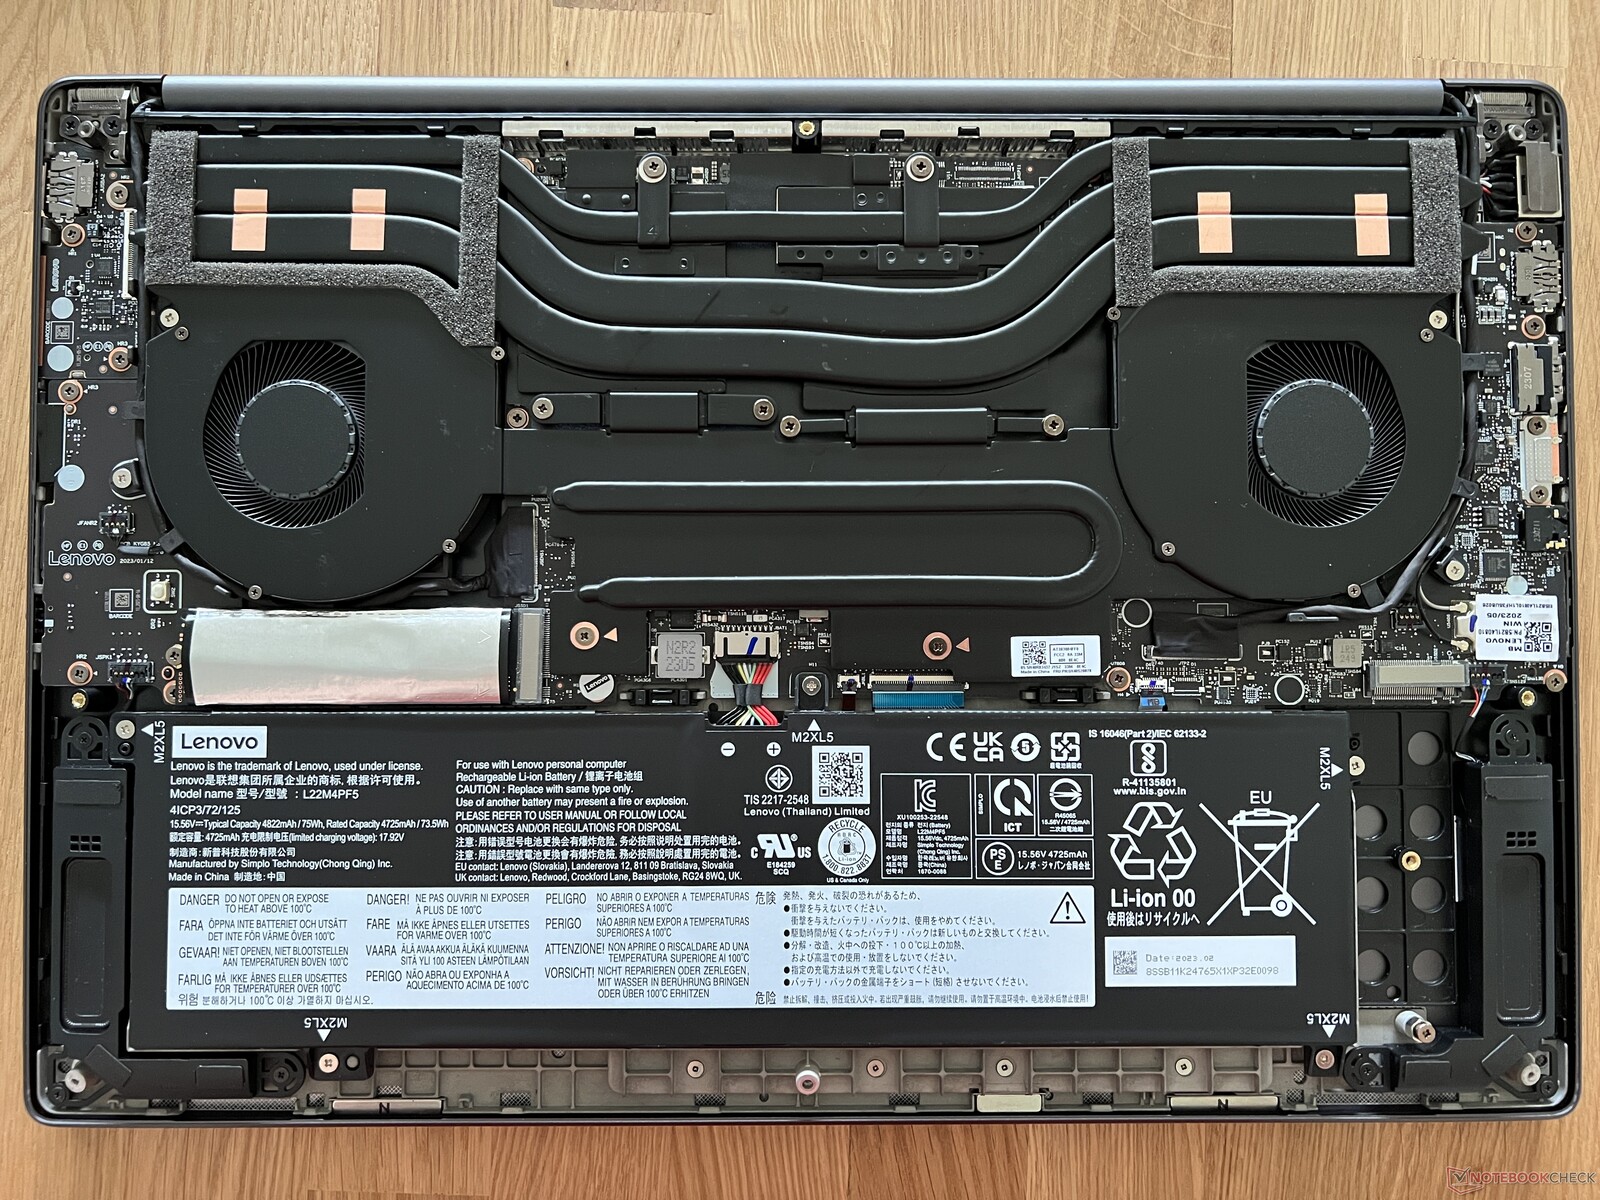
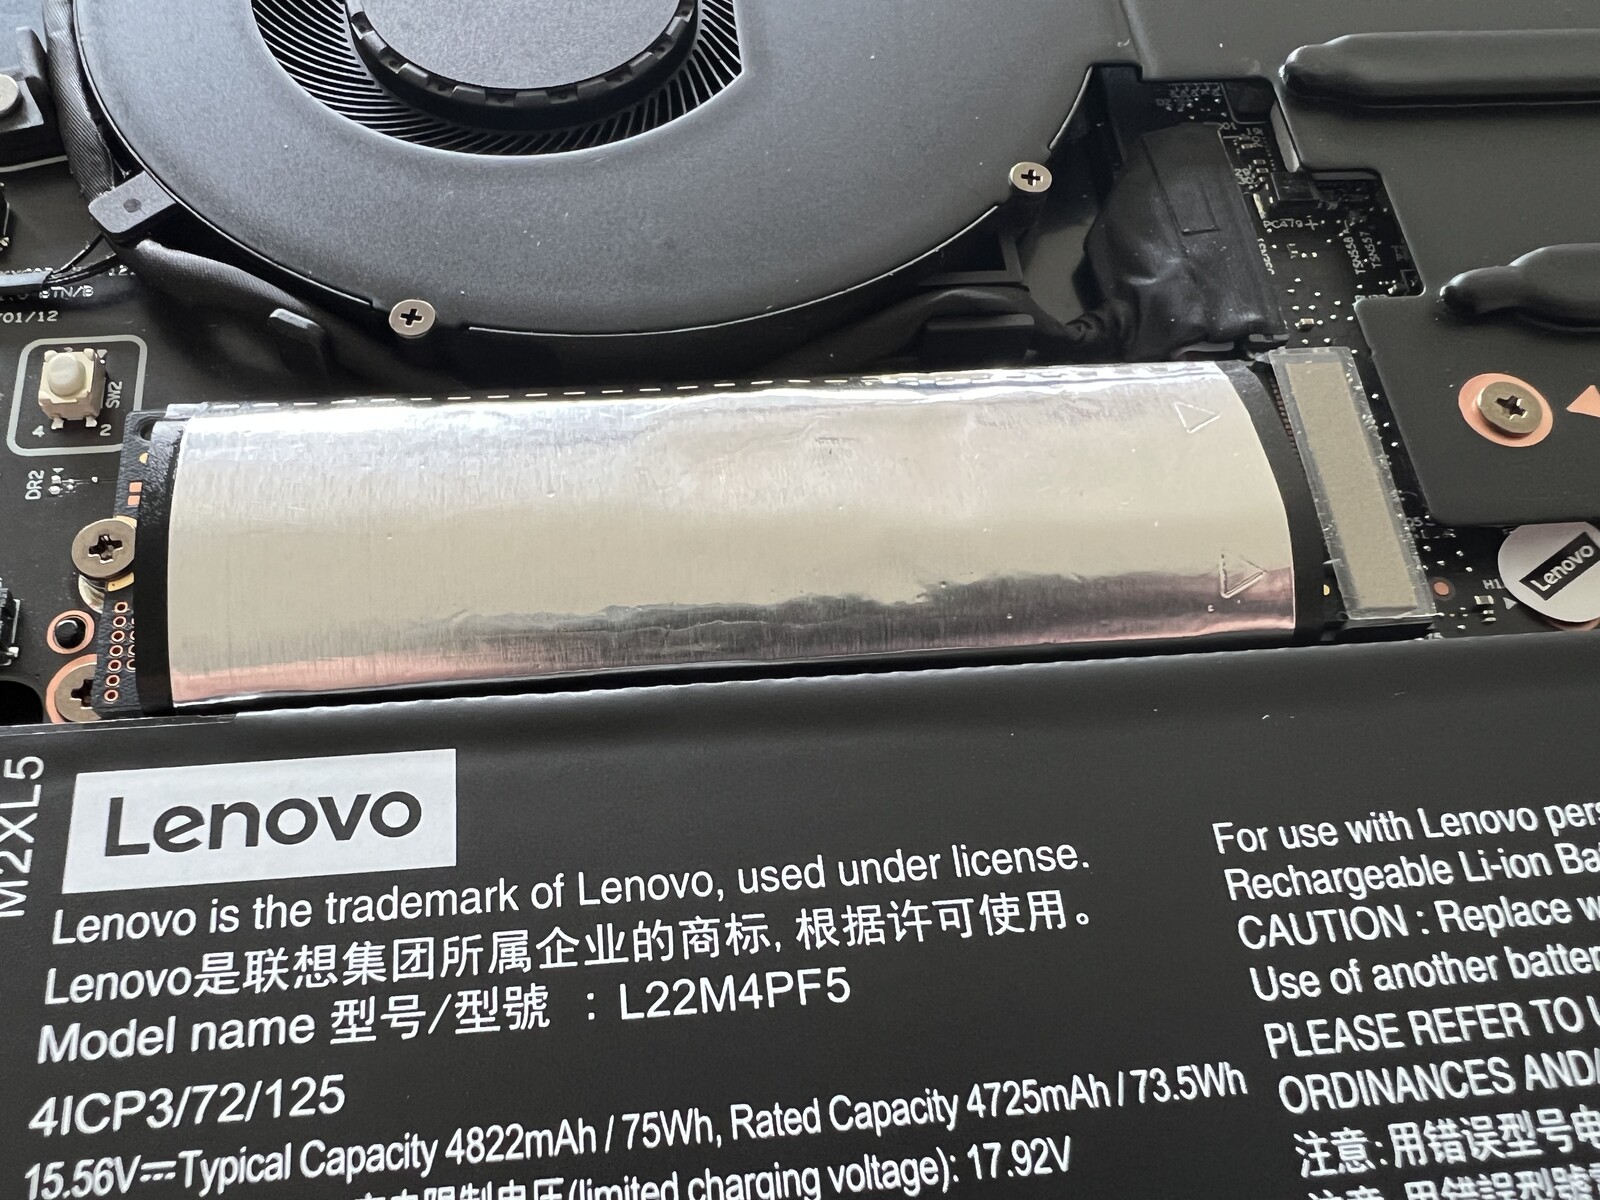
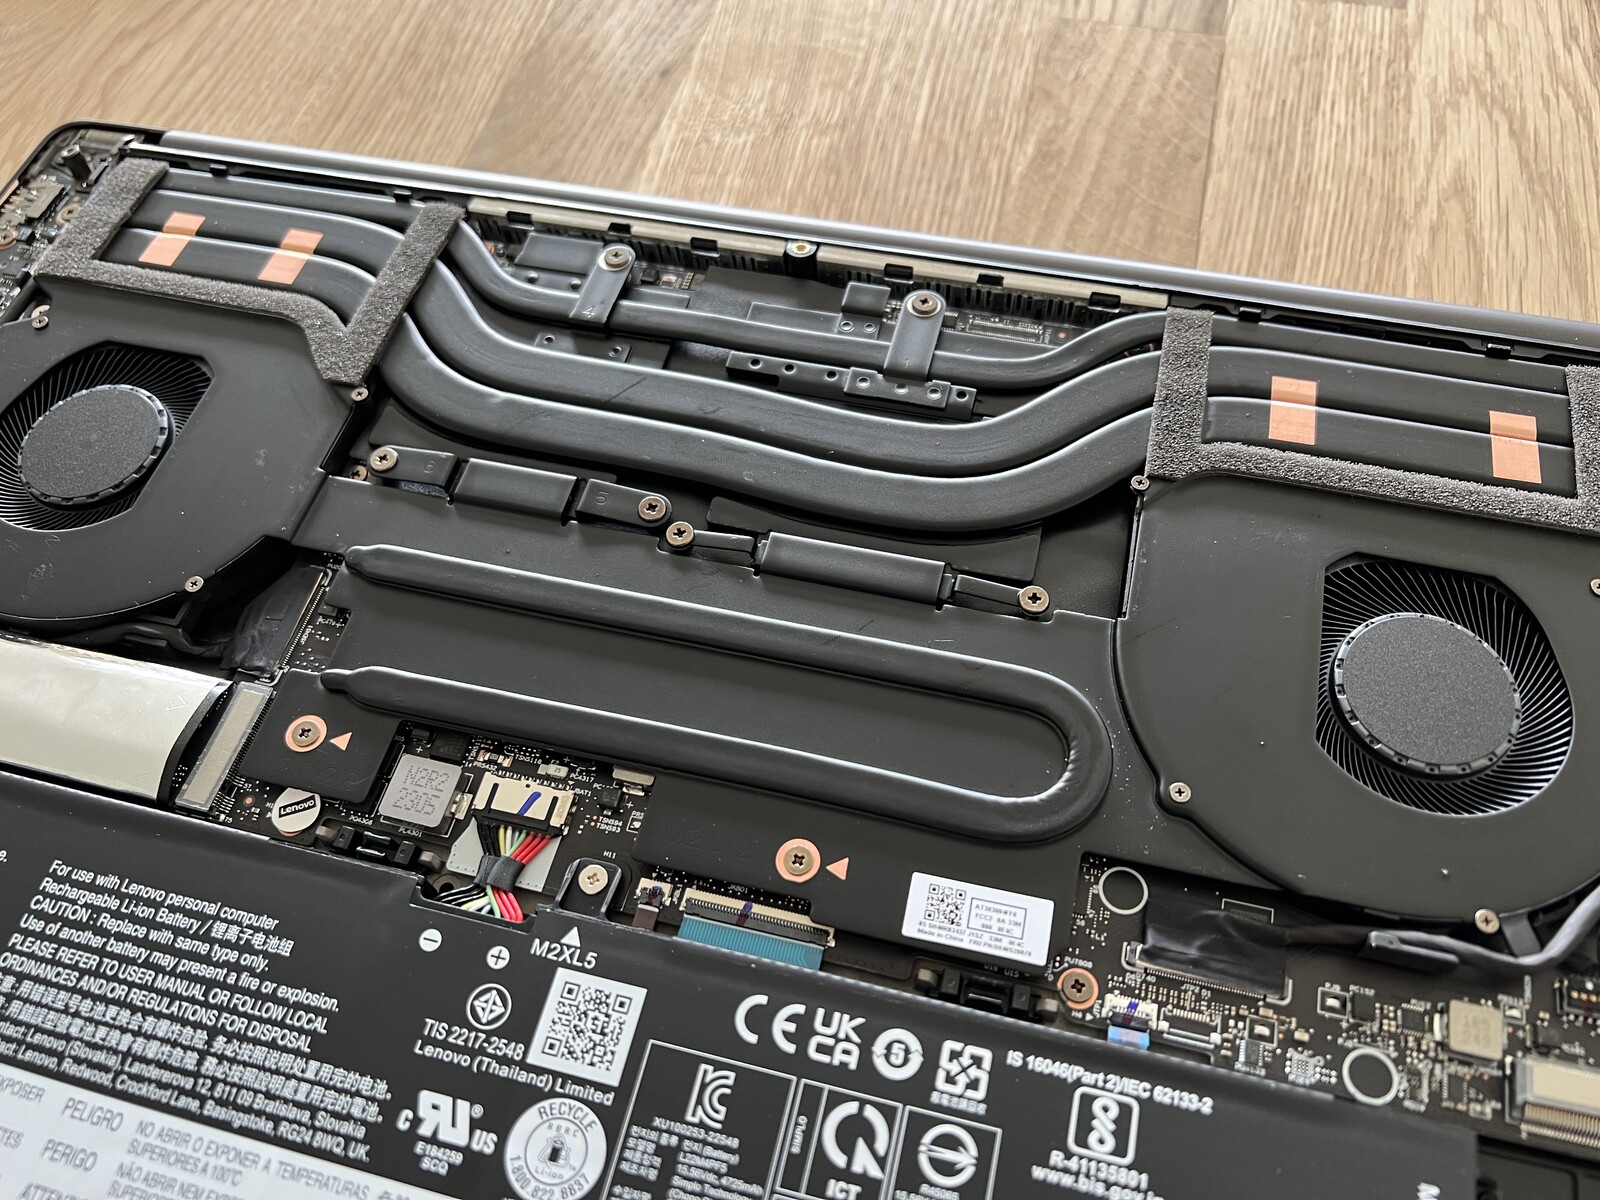
A placa de base é fixada com alguns parafusos Torx (T5) e é facilmente removida. Assim, você tem acesso às duas ventoinhas, à bateria e aos dois slots para os SSDs M.2-2280. No entanto, a RAM e o módulo WLAN são soldados.
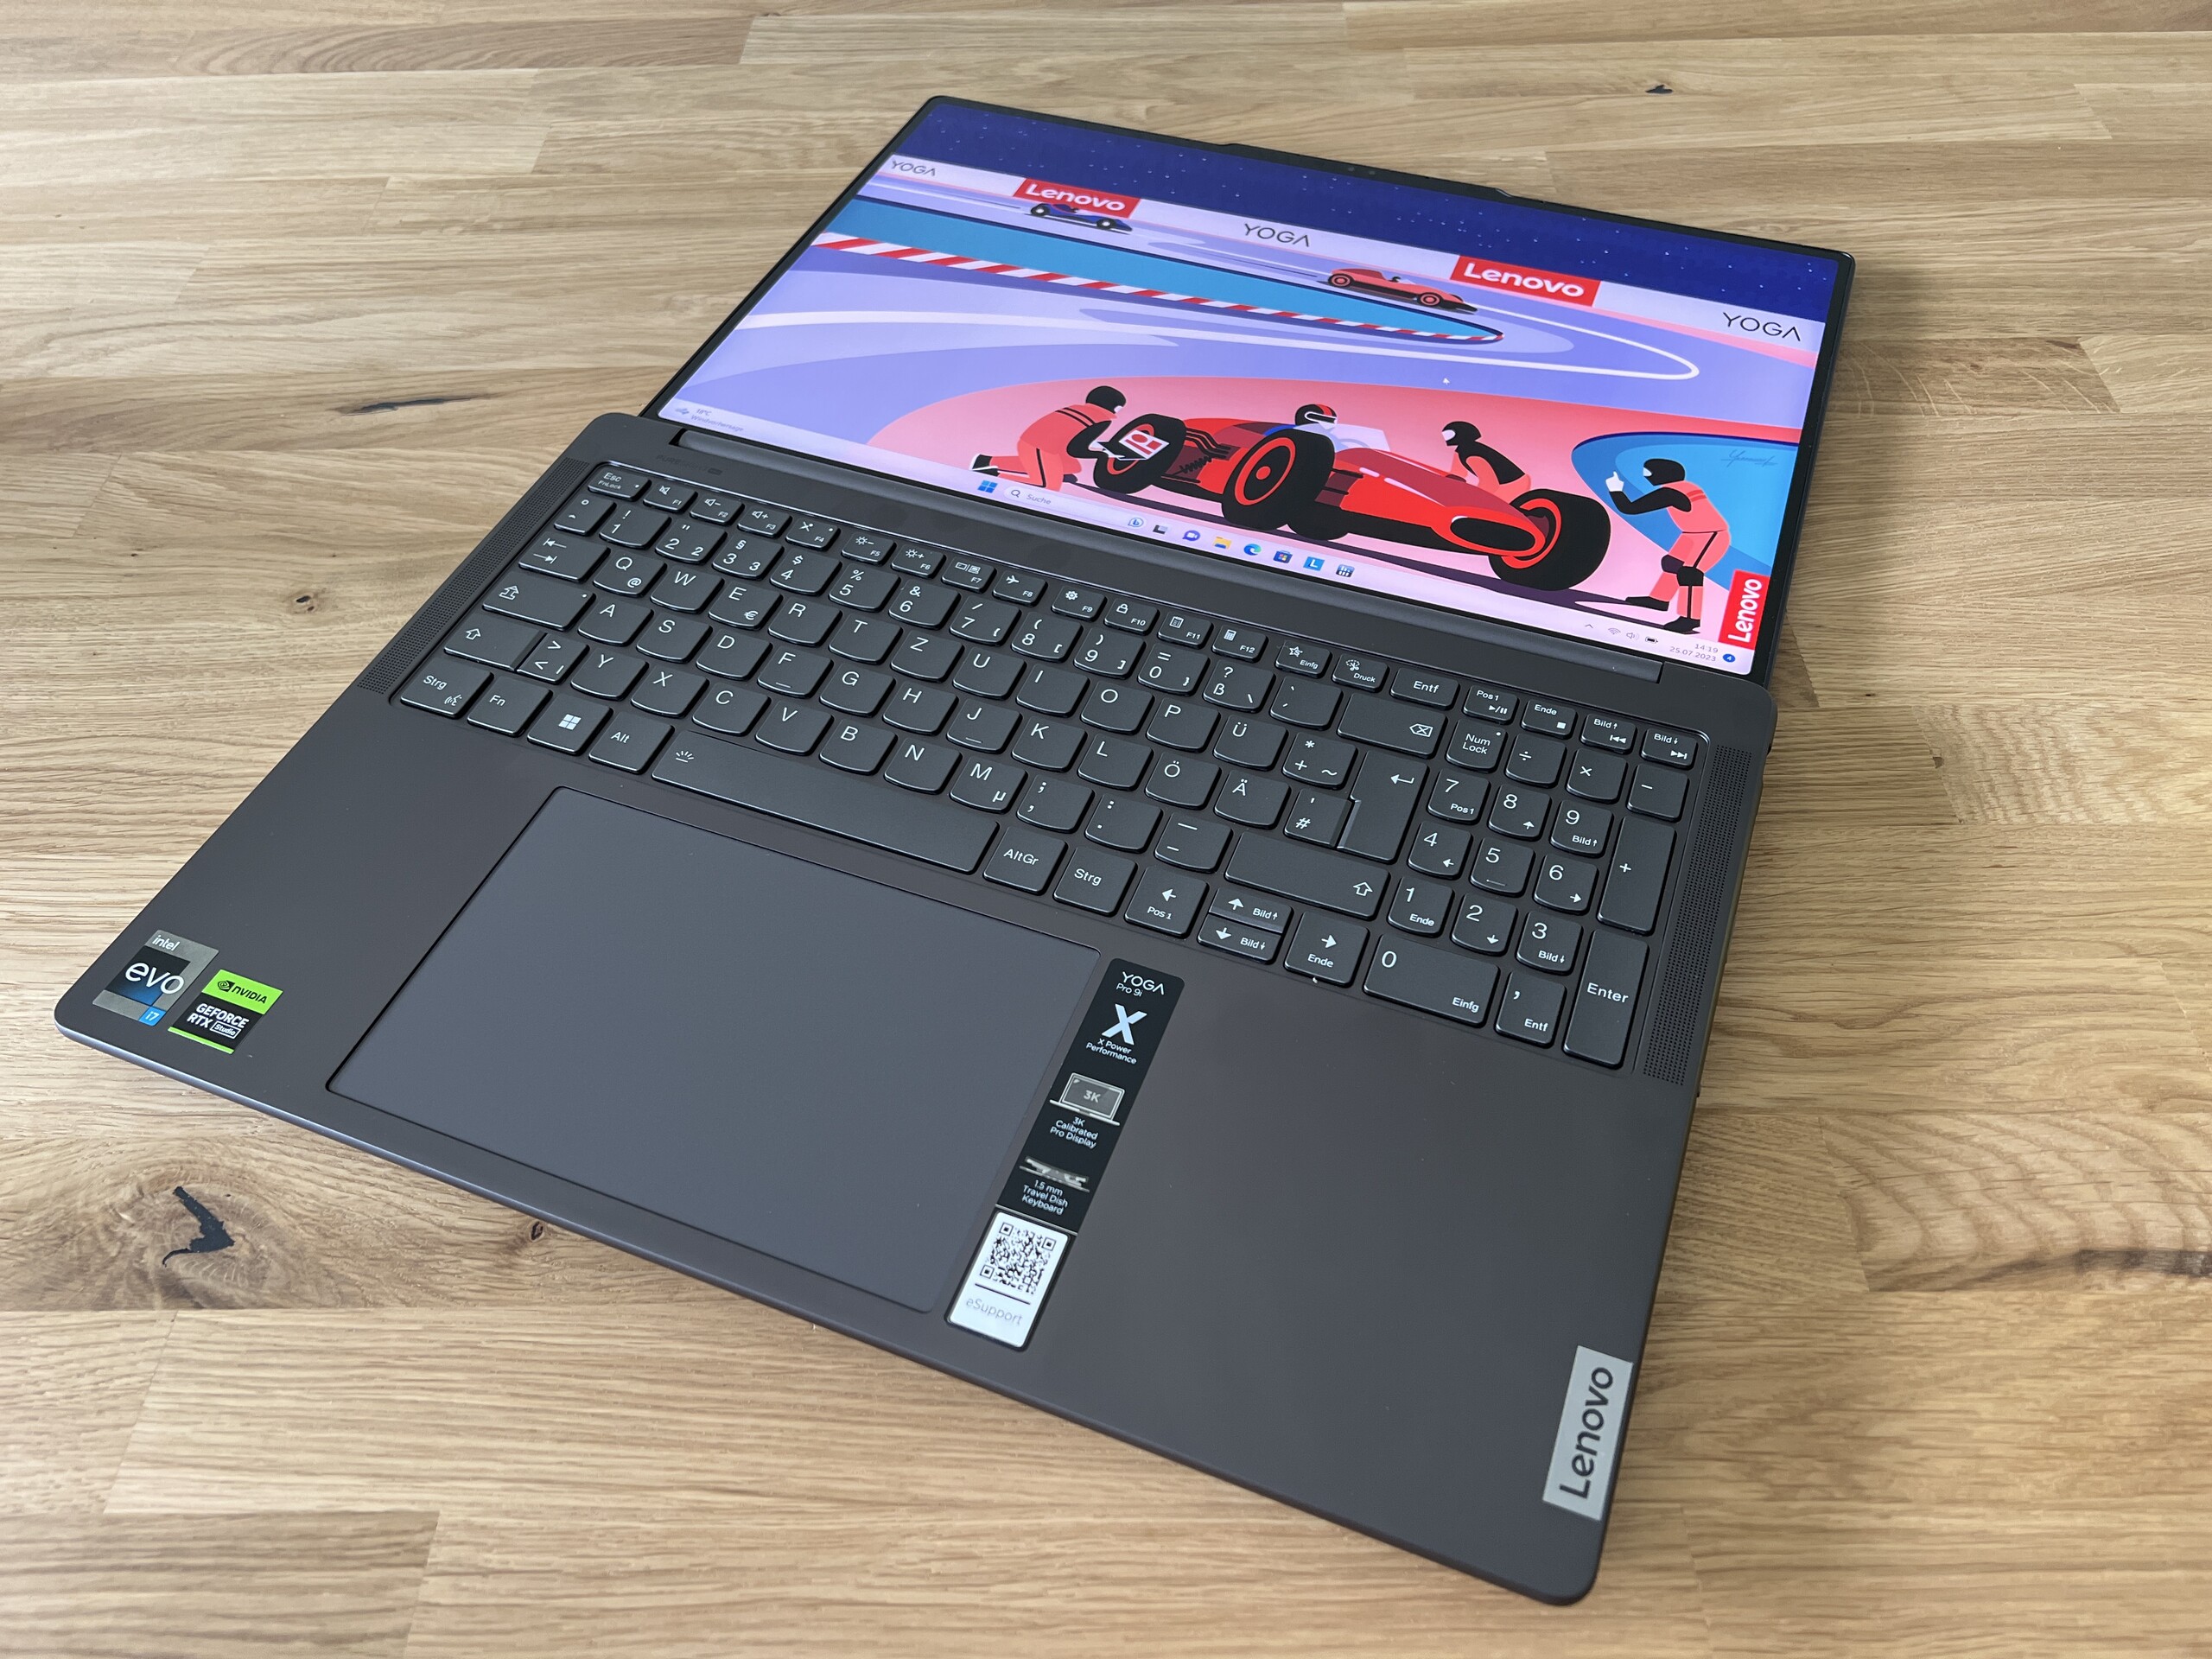
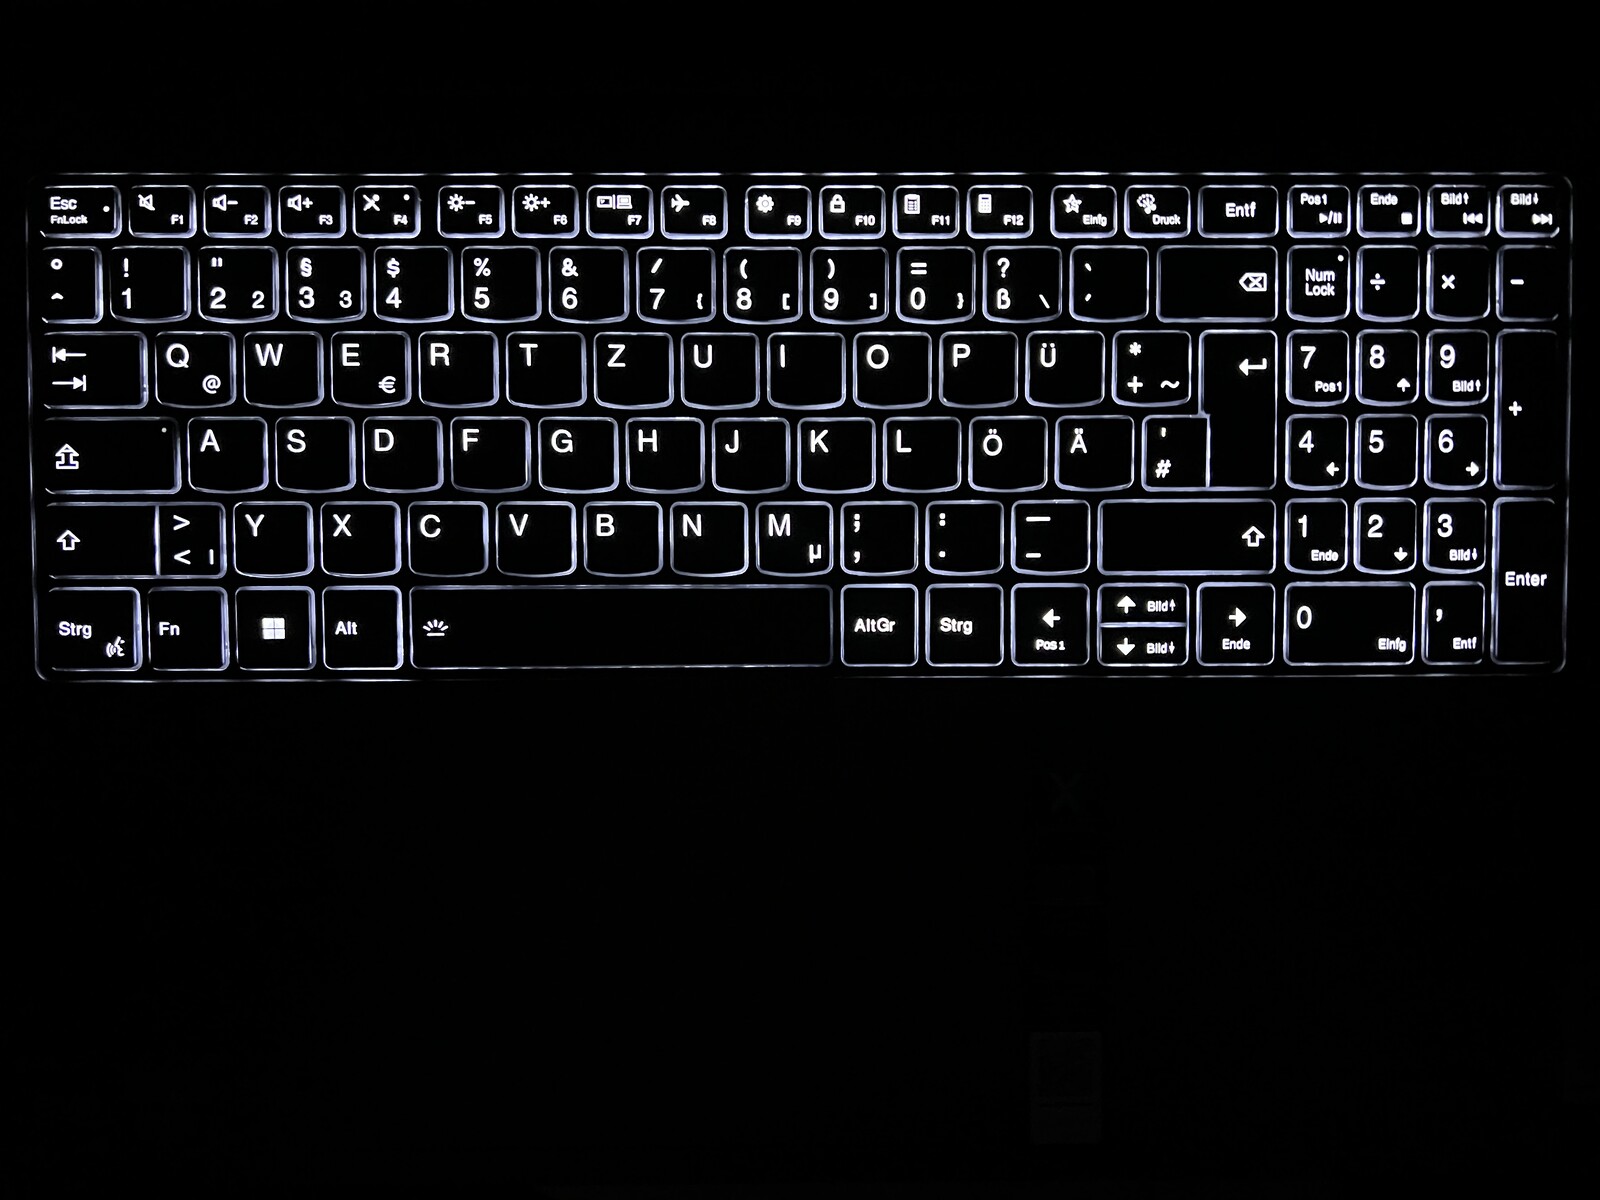
Dispositivos de entrada - A Lenovo instala um bom teclado com numpad
A Lenovo não deixa a largura extra do gabinete sem uso e adiciona um teclado numérico dedicado ao teclado. Como no menor Yoga Pro 9i 14menor, o fabricante instala um teclado confortável e preciso que também oferece um deslocamento suficiente das teclas de 1,5 mm. Textos mais longos também podem ser digitados sem esforço. Uma luz de fundo branca de dois estágios que pode ser ativada automaticamente por meio de um sensor ajuda em ambientes escuros.
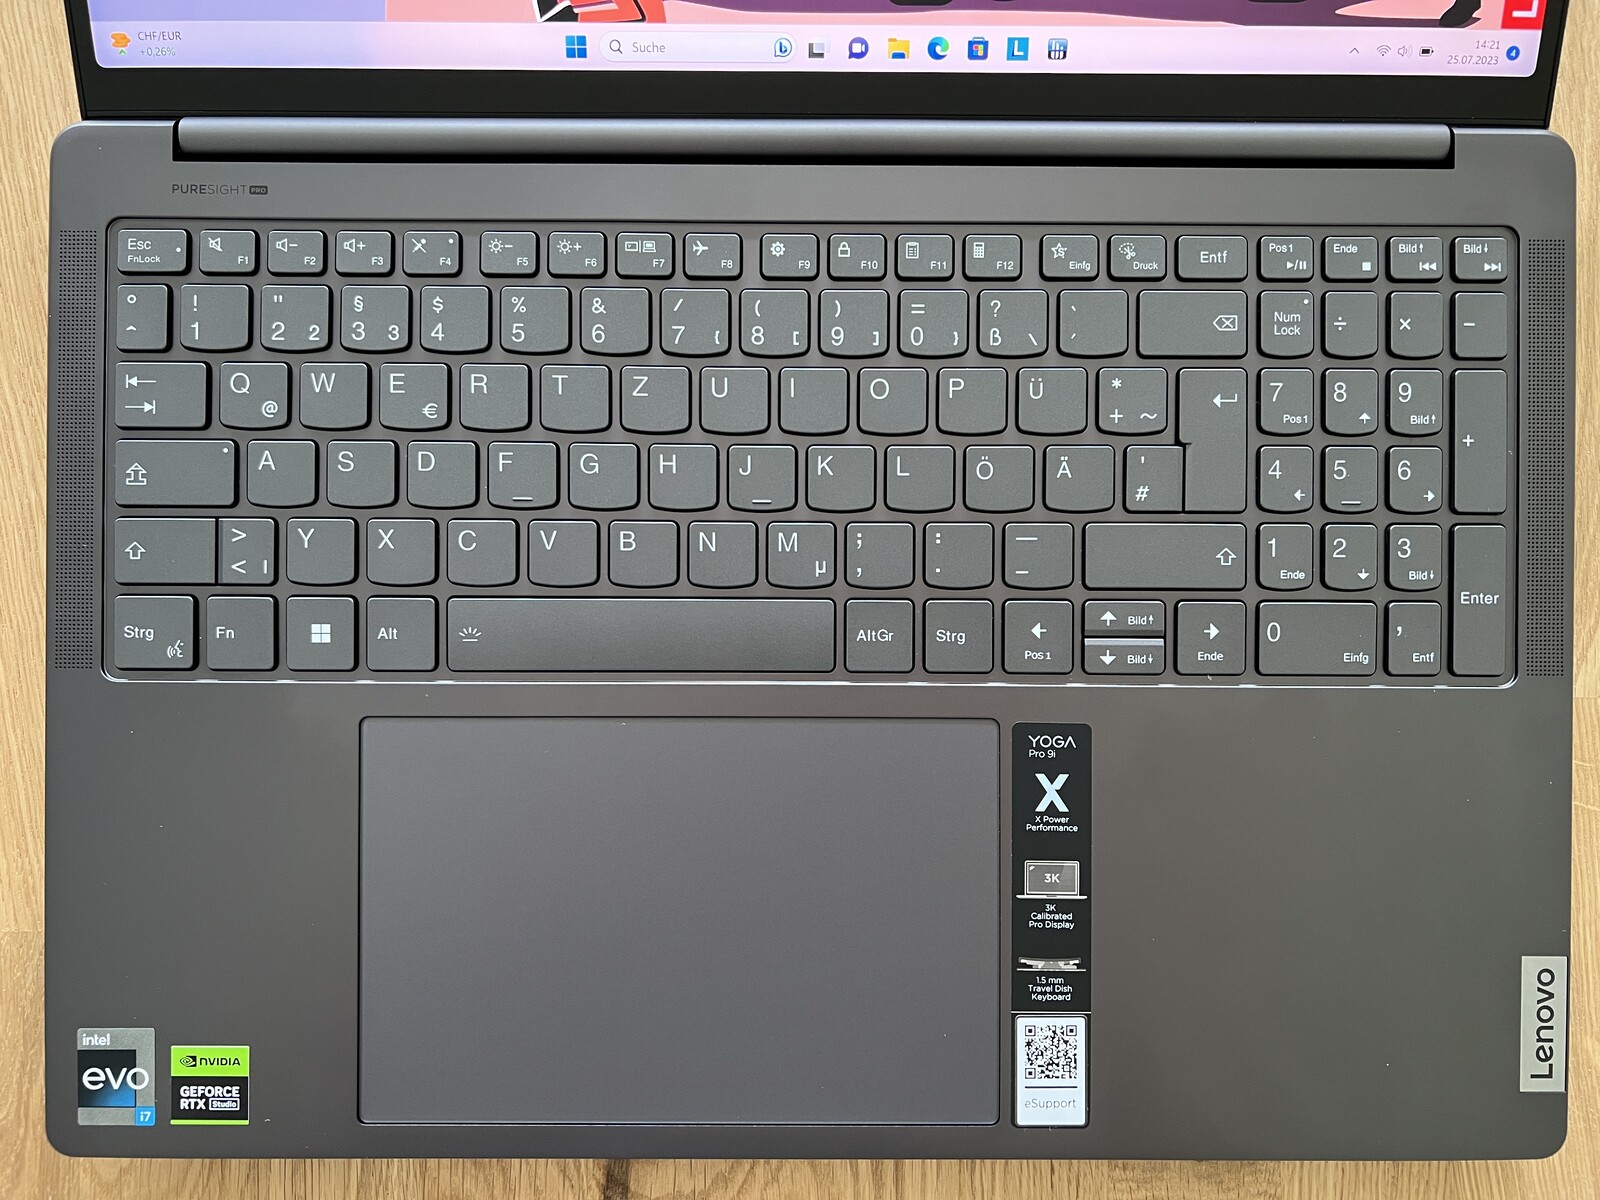
O touchpad do Yoga de 16 polegadas é ainda maior e, com 15 x 9,5 cm, oferece muito espaço para o controle do ponteiro e gestos de até quatro dedos, que também funcionam muito bem e de forma confiável graças às boas propriedades de deslizamento. A metade inferior também pode ser pressionada, o que se caracteriza por um ruído de clique muito alto e barato. Recomendamos apenas tocar o pad para fazer a entrada aqui. Em contraste com o modelo menor de 14 polegadas, o touchpad não está no meio do gabinete, mas está ligeiramente deslocado para a esquerda.
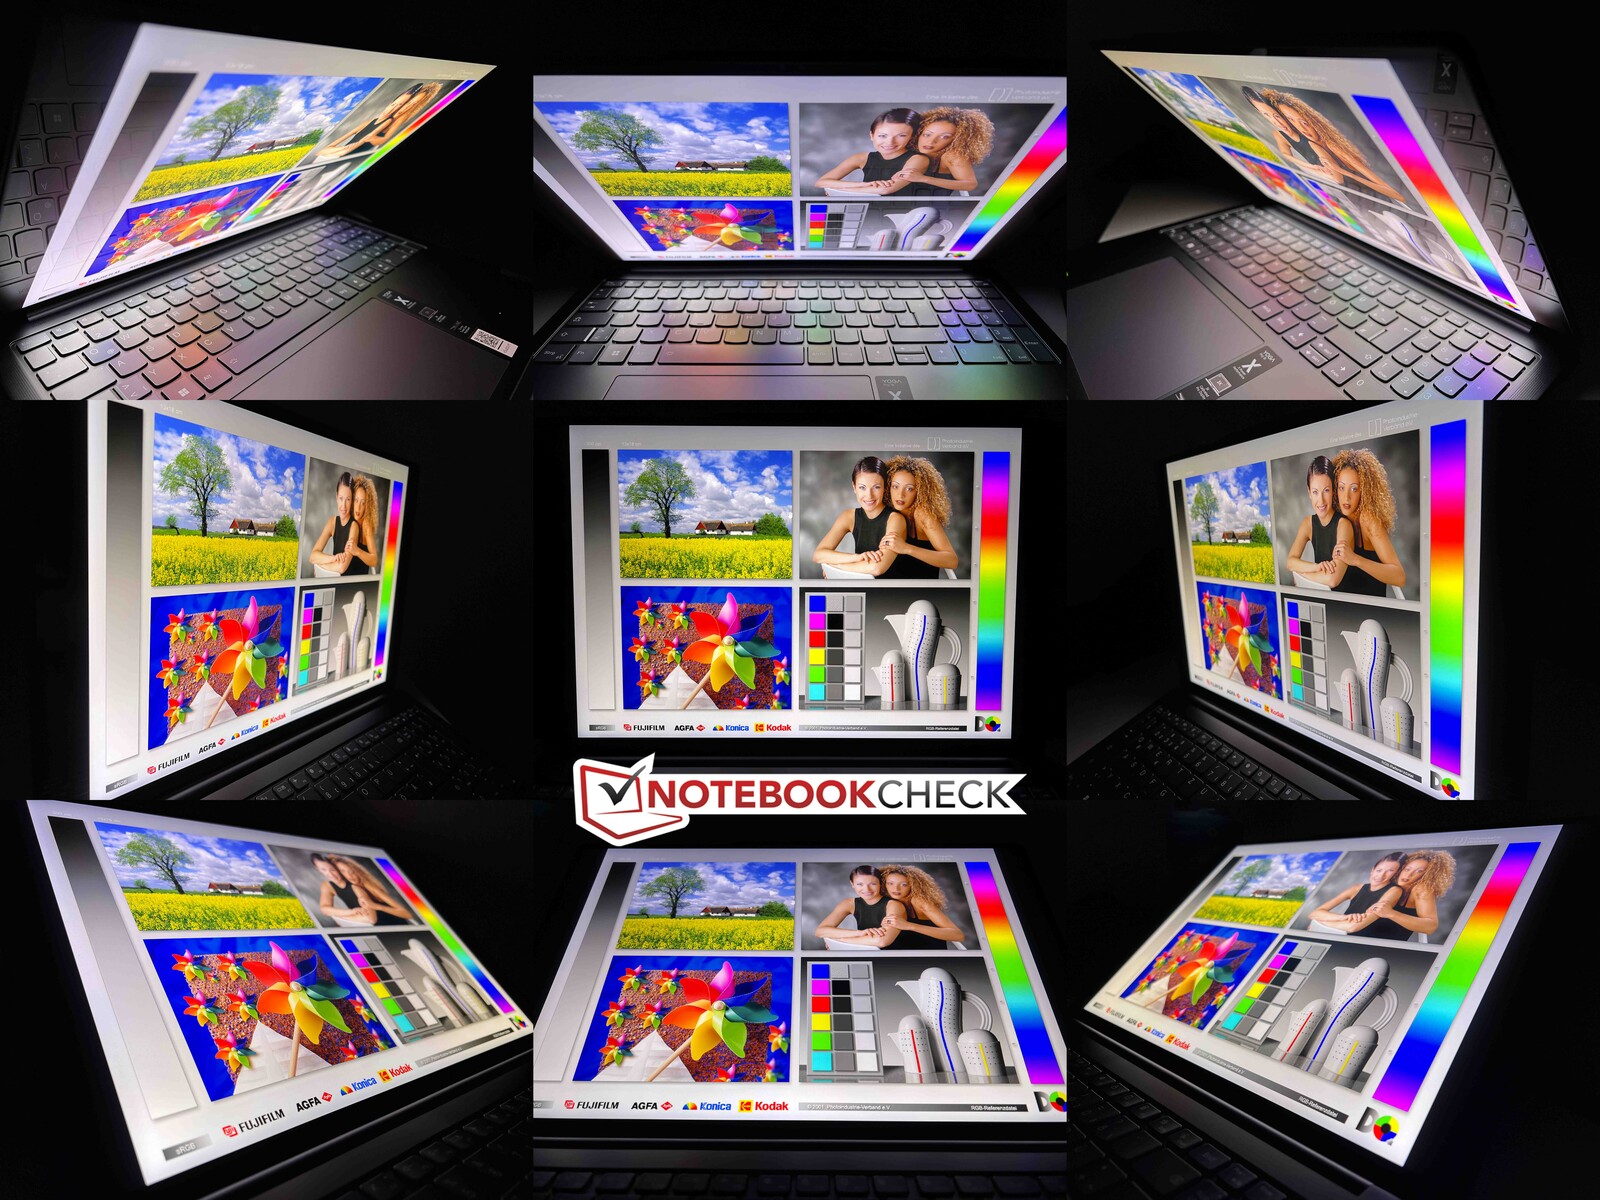
Tela - Mini LED a 165 Hz
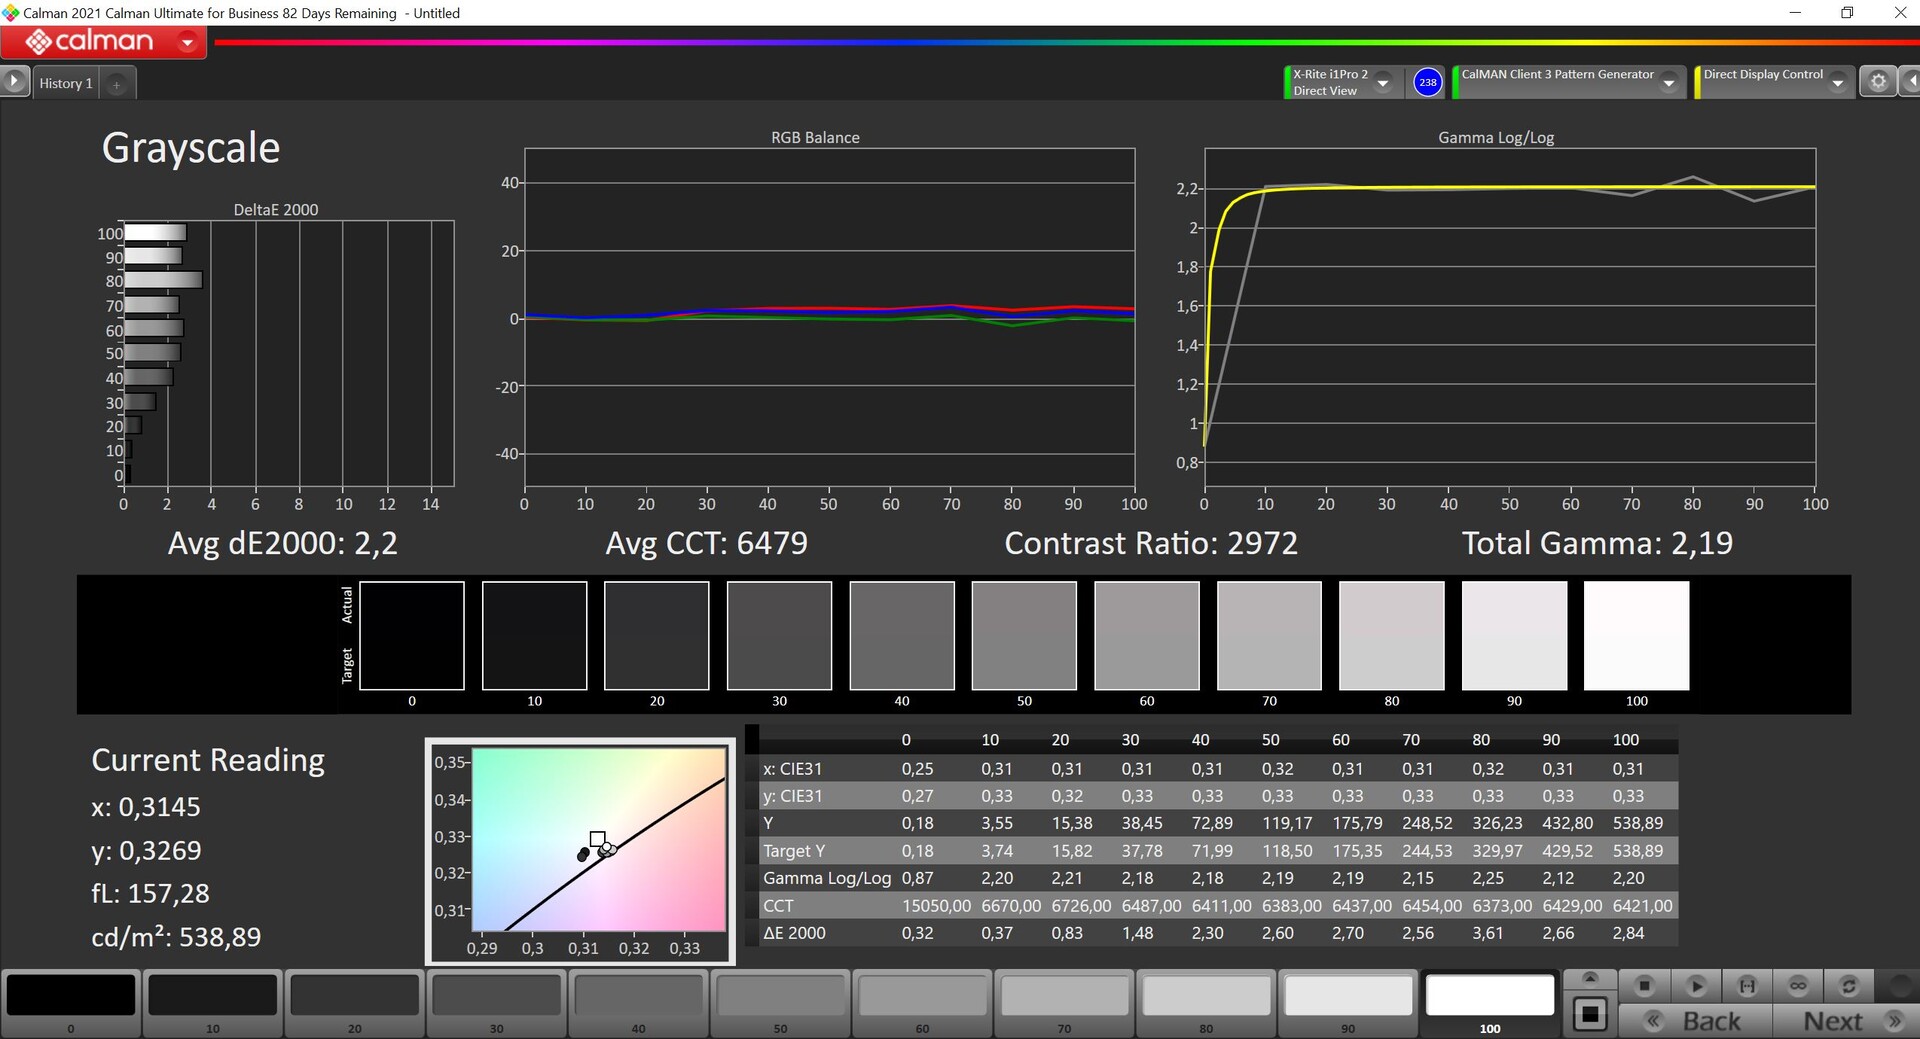
As especificações da tela diferem de seu irmão menor apenas na diagonal da tela, pois o Yoga Pro 9i 16 também usa uma tela mini LED com resolução de 3.200 x 2.000 (16:10) e frequência de 165 Hz. O painel brilhante também suporta entrada por toque. A impressão subjetiva da imagem é excelente, especialmente com conteúdo HDR. Além da tela mini-LED, a Lenovo também oferece um painel IPS regular (3200x2000 pixels, 165 Hz, sRGB).
Há novamente uma grande diferença entre os modos SDR e HDR: no modo SDR normal, a luz de fundo do mini-LED não está ativa e o painel se comporta como um modelo IPS normal. Portanto, o conteúdo preto não é totalmente preto e halos leves também são visíveis. No entanto, ao contrário do modelo de 14 polegadas, o controle PWM é diferente e, por isso, não foi possível determinar com exatidão os tempos de resposta. A oscilação de 5,8 kHz ocorre em todos os níveis de brilho, mas não deve ser um problema para a grande maioria dos usuários.
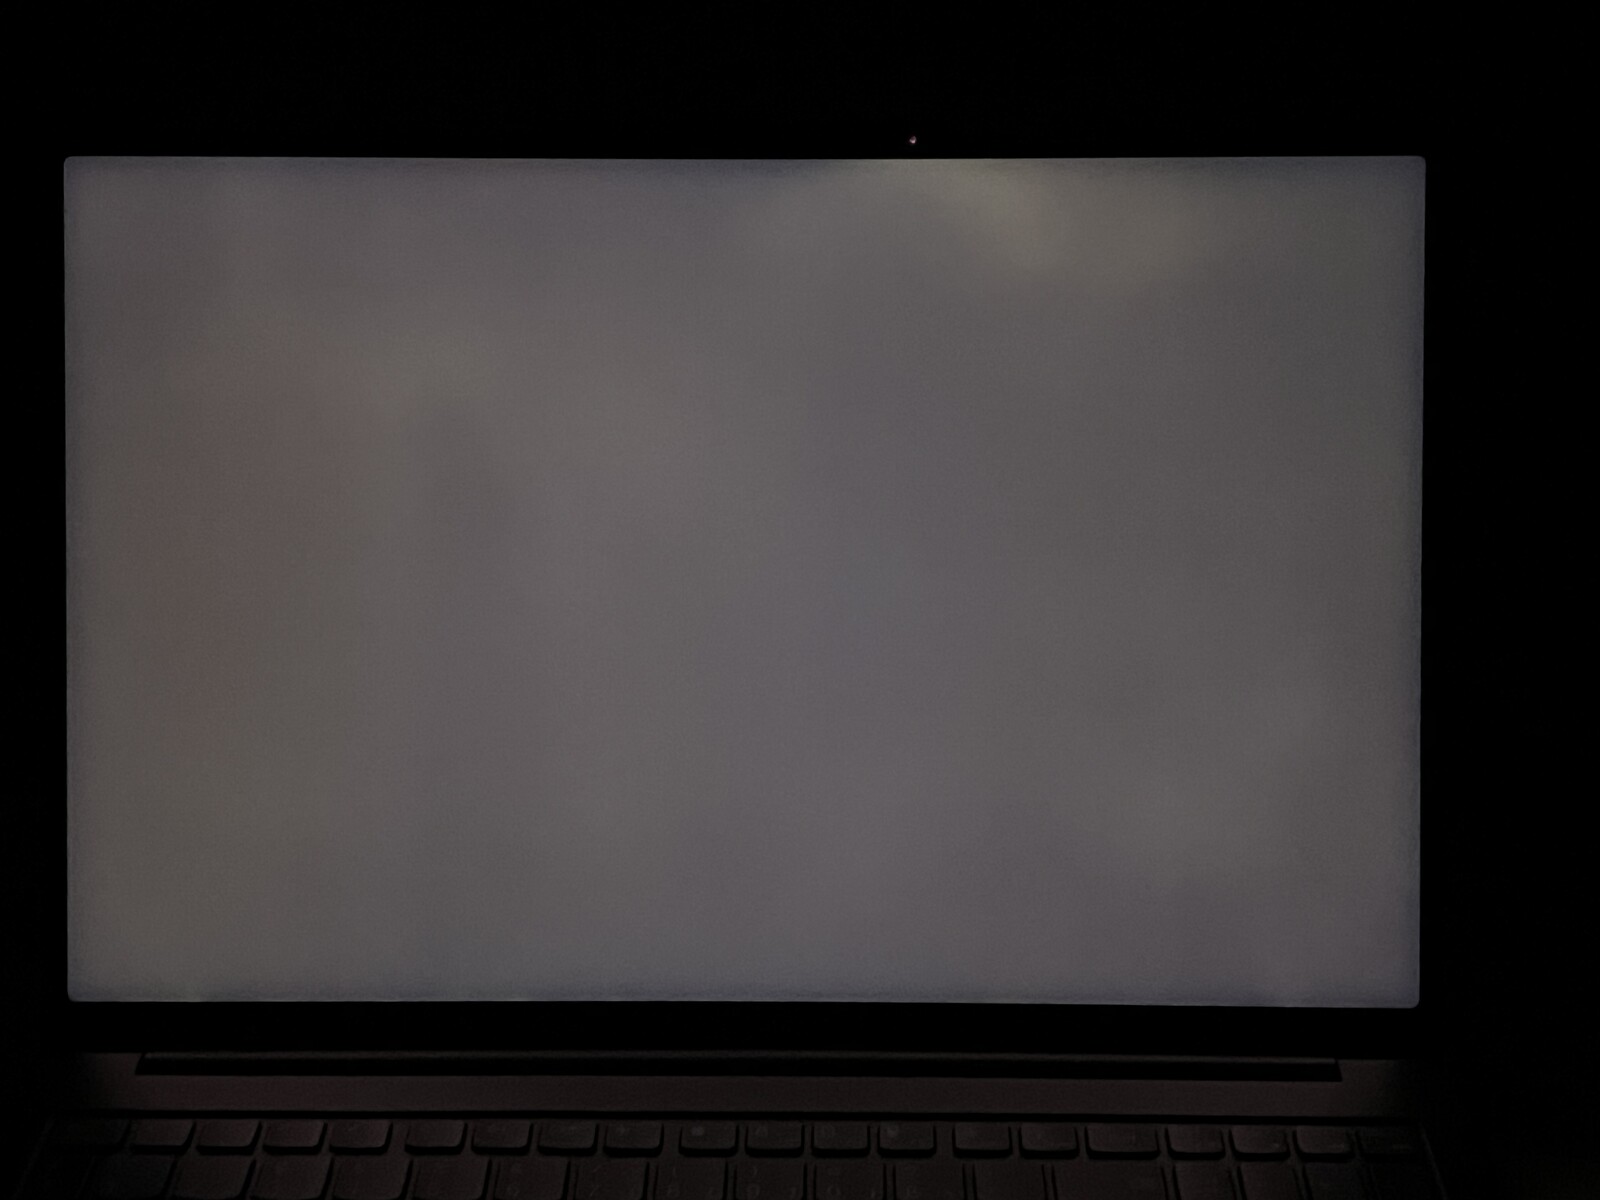
No modo SDR, a tela mini-LED de 16 polegadas atinge um brilho mais baixo, de cerca de 550 cd/m² (~700 cd/m² para o painel de 14 polegadas), o que é praticamente igual ao doMacBook Pro de 16 polegadaso valor de preto é de 0,18 cd/m² no modo SDR, razão pela qual a taxa de contraste é de "apenas" ~3.000:1. Isso é baixo em comparação com outros painéis mini-LED ou OLED, mas ainda é muito bom em comparação com telas IPS normais.
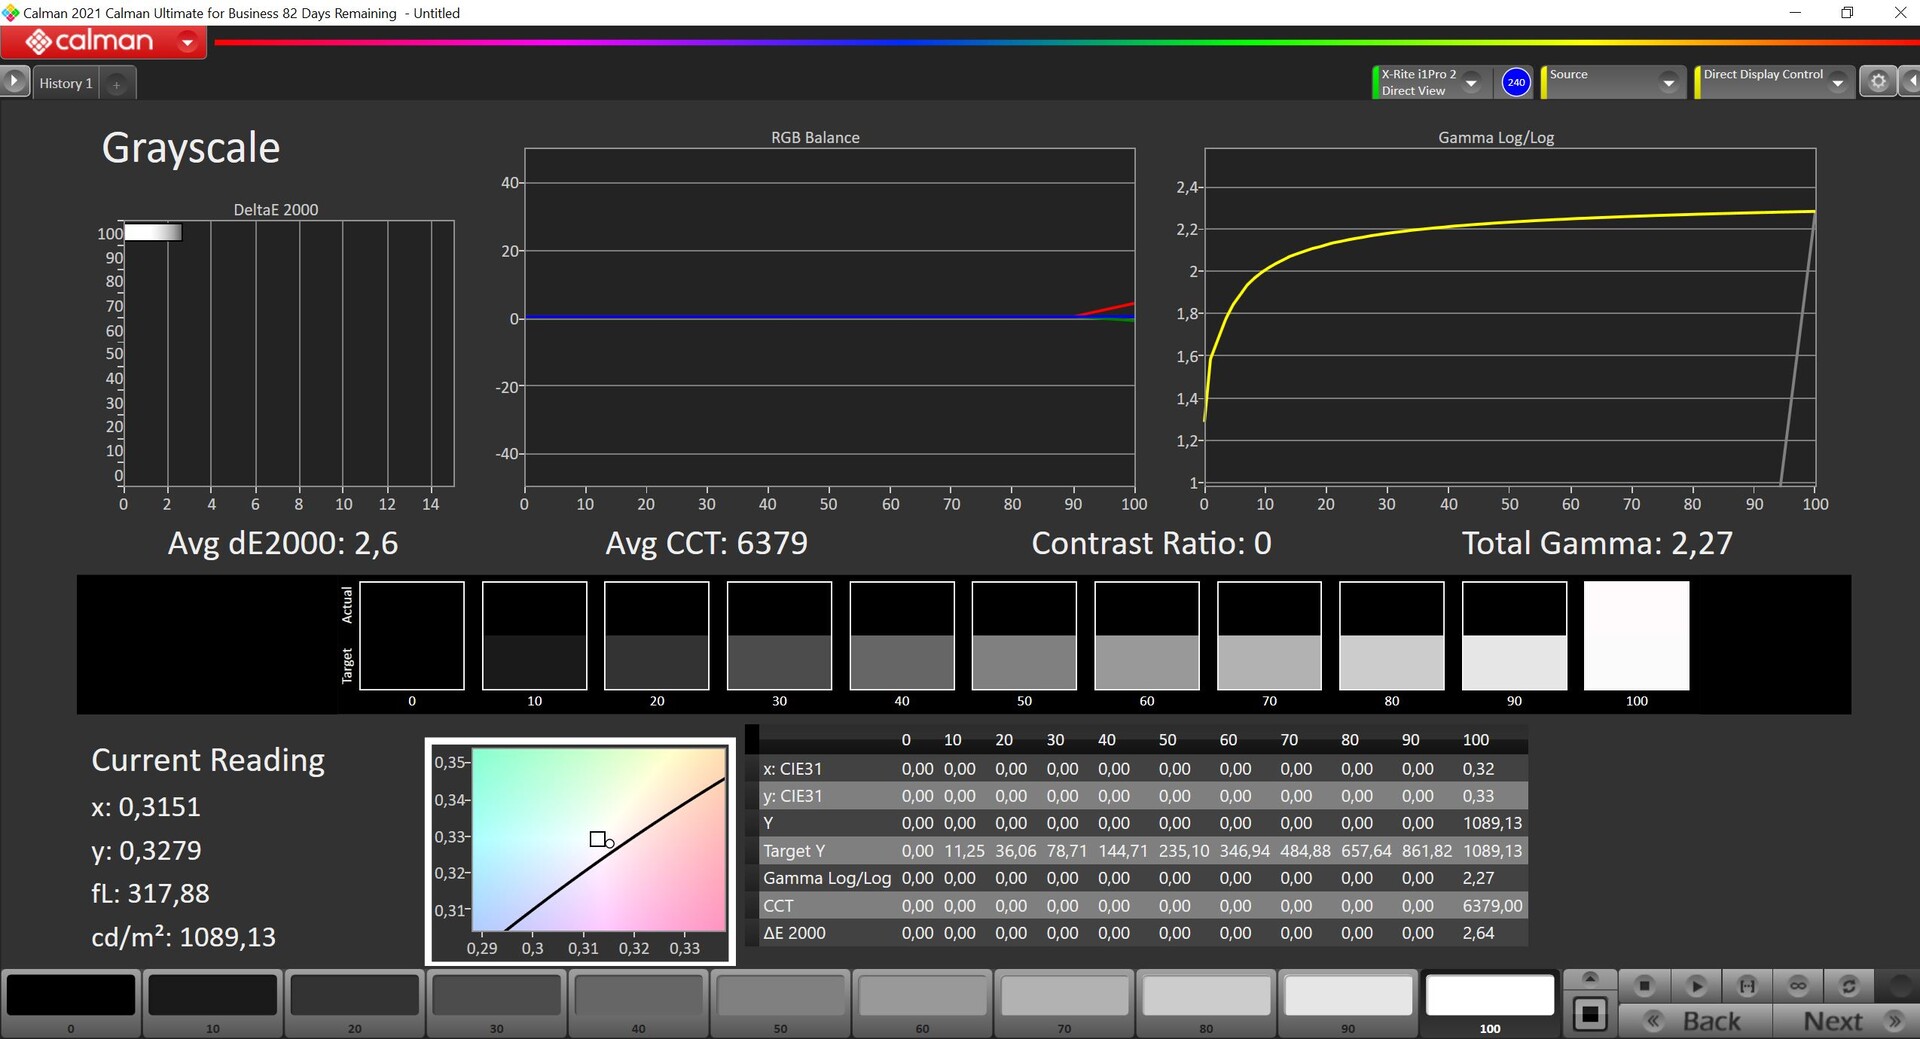
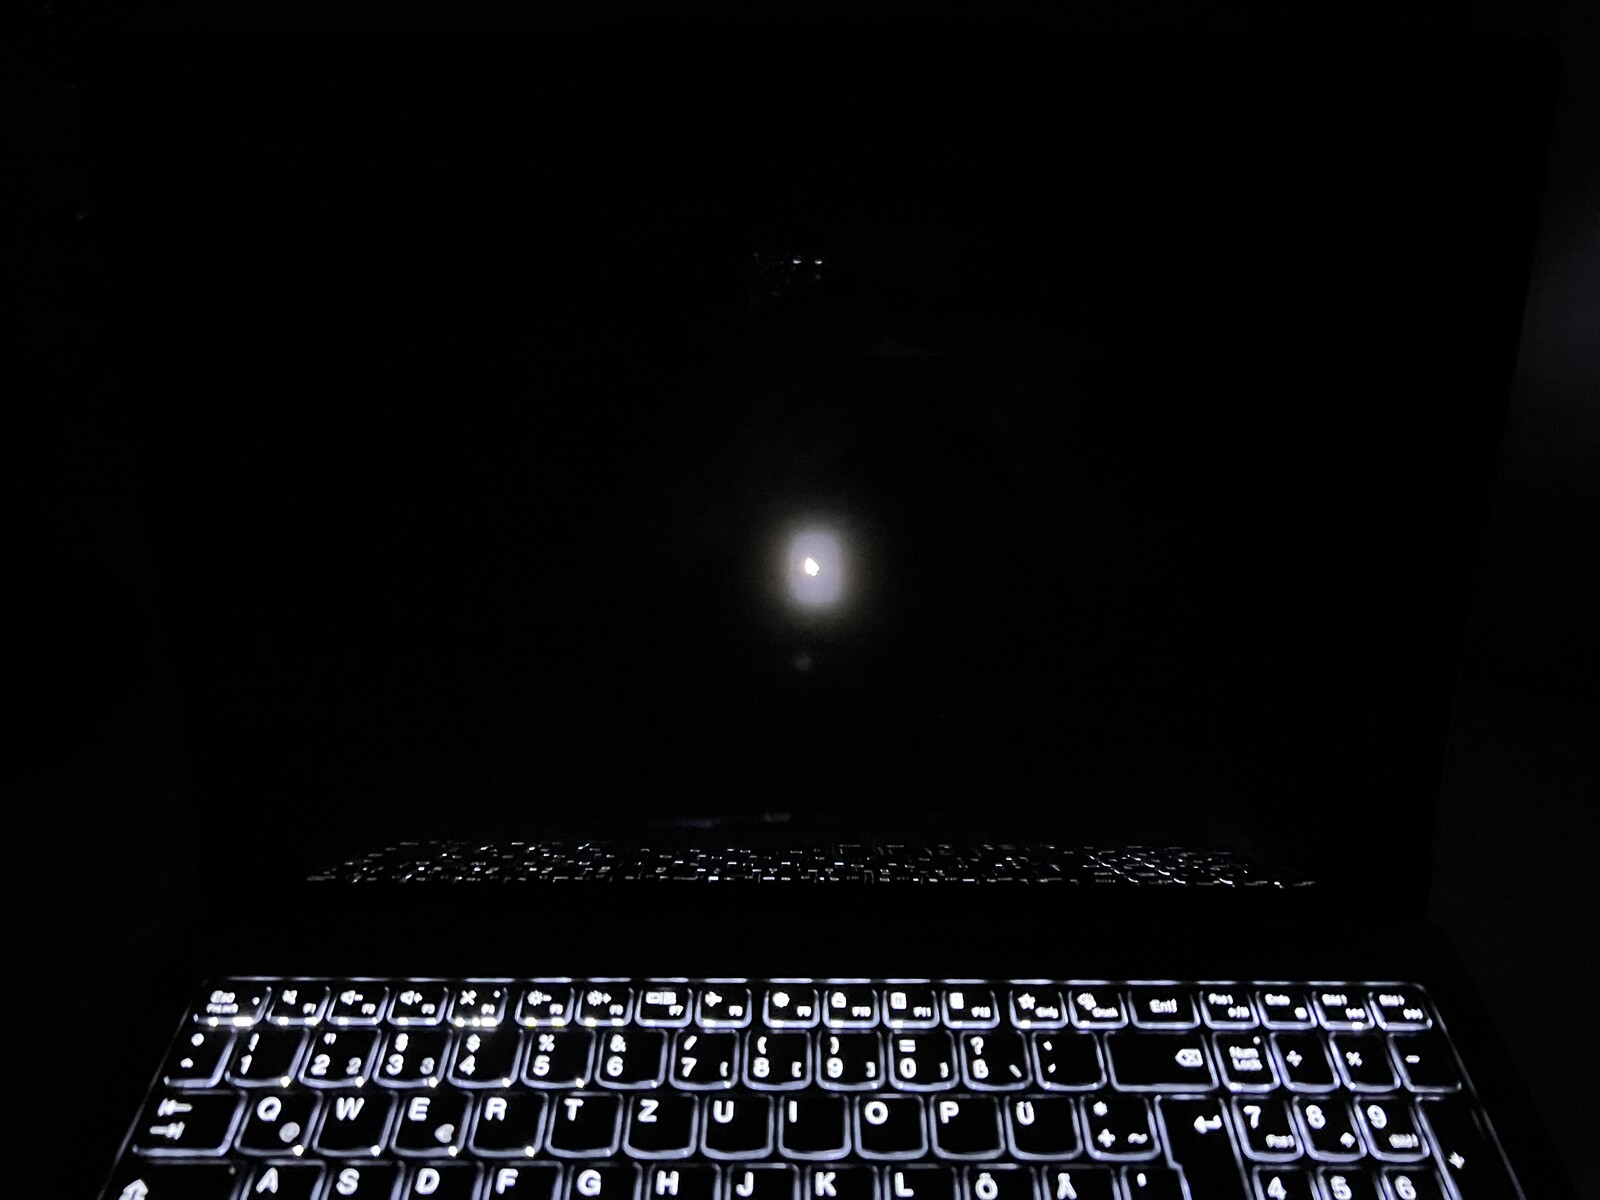
O valor de preto é apenas 0 no modo HDR, e é por isso que a taxa de contraste também é extremamente alta. O conteúdo preto é realmente preto aqui e você pode ver a diferença claramente nas duas imagens de comparação acima. Com o conteúdo HDR, o brilho máximo fica abaixo de 1.100 cd/m², o que é significativamente menor do que o do Yoga de 14 polegadas e também menor do que a especificação do fabricante de 1.200 cd/m². O modo HDR também resulta em um efeito visível de florescimento devido às zonas de mini-LED, embora o efeito não seja particularmente pronunciado aqui.
Infelizmente, a implementação do HDR do Windows ainda deixa muito a desejar, pois o modo HDR precisa ser ativado manualmente primeiro. Isso, por sua vez, significa que o Windows não oferece mais nenhum perfil de cor e o modo HDR está efetivamente limitado ao espaço de cores sRGB.
| |||||||||||||||||||||||||
iluminação: 96 %
iluminação com acumulador: 545 cd/m²
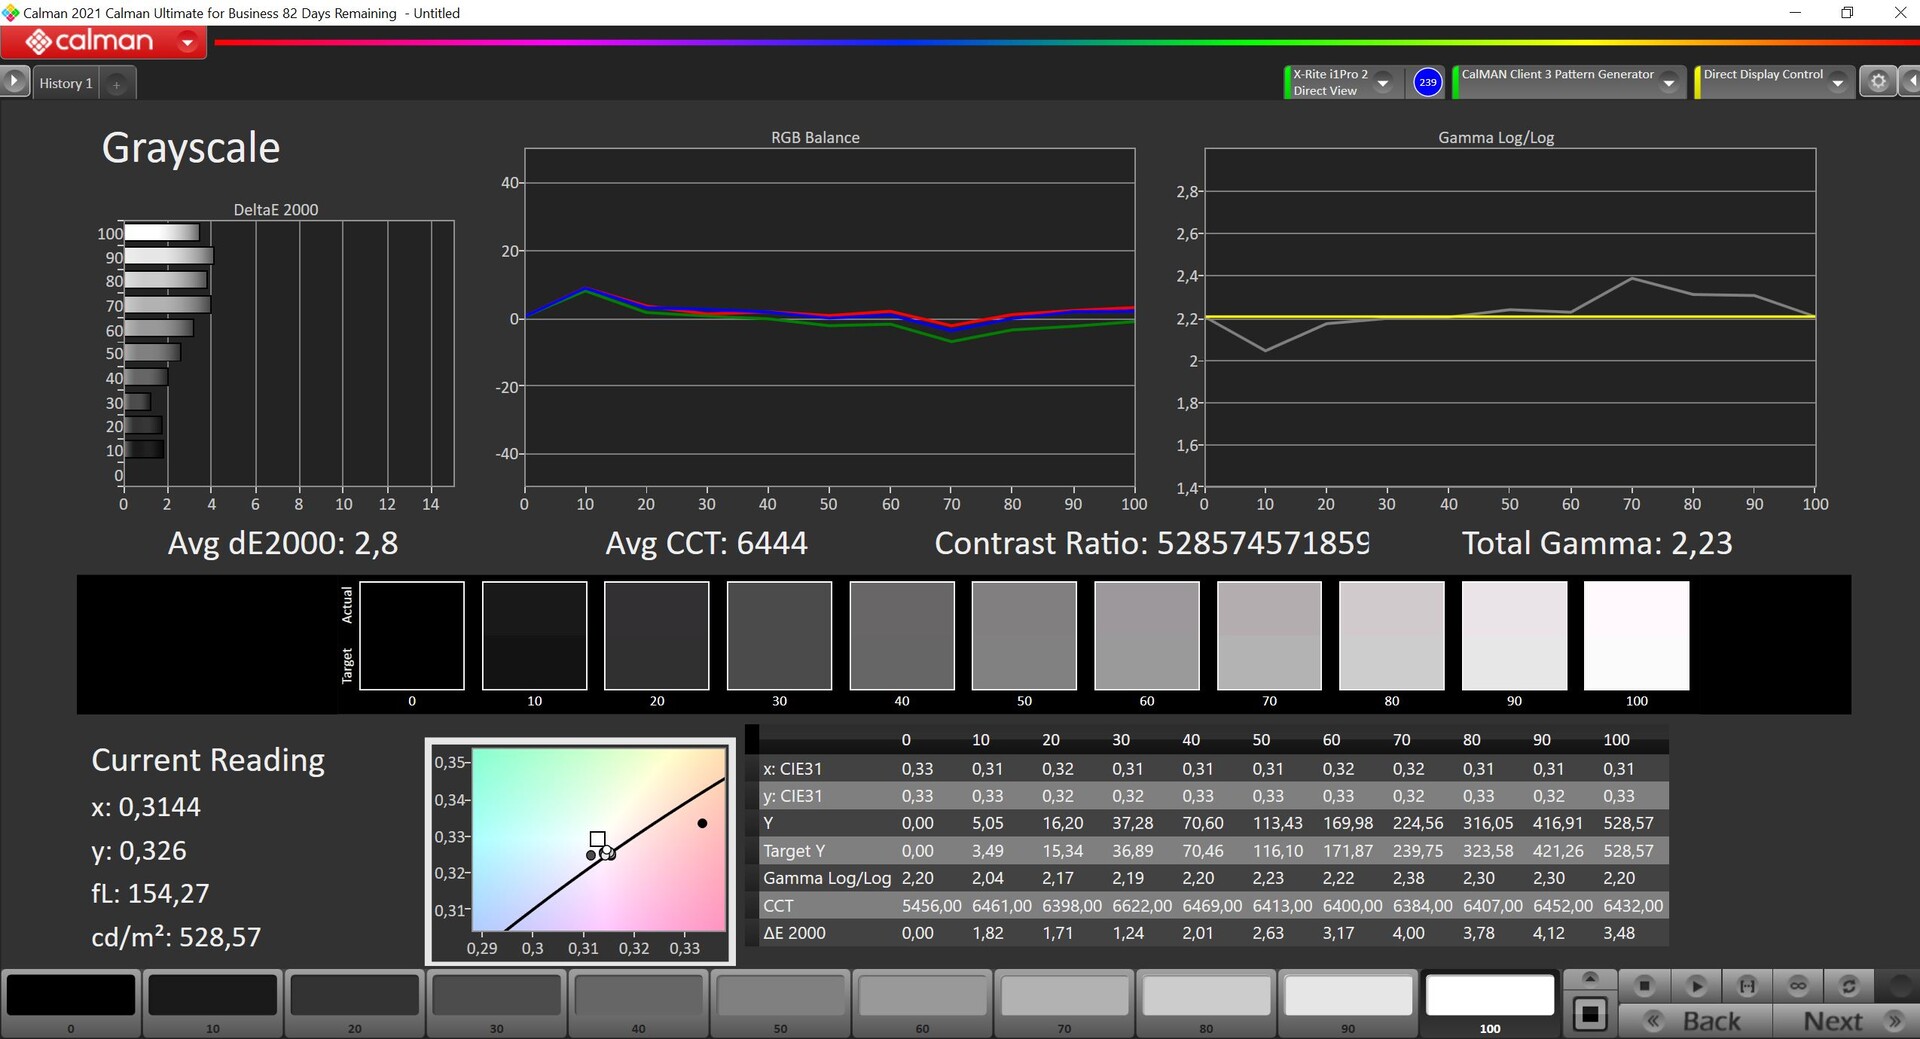
Contraste: 2994:1 (Preto: 0.18 cd/m²)
ΔE ColorChecker Calman: 1.4 | ∀{0.5-29.43 Ø4.71}
ΔE Greyscale Calman: 2.2 | ∀{0.09-98 Ø4.96}
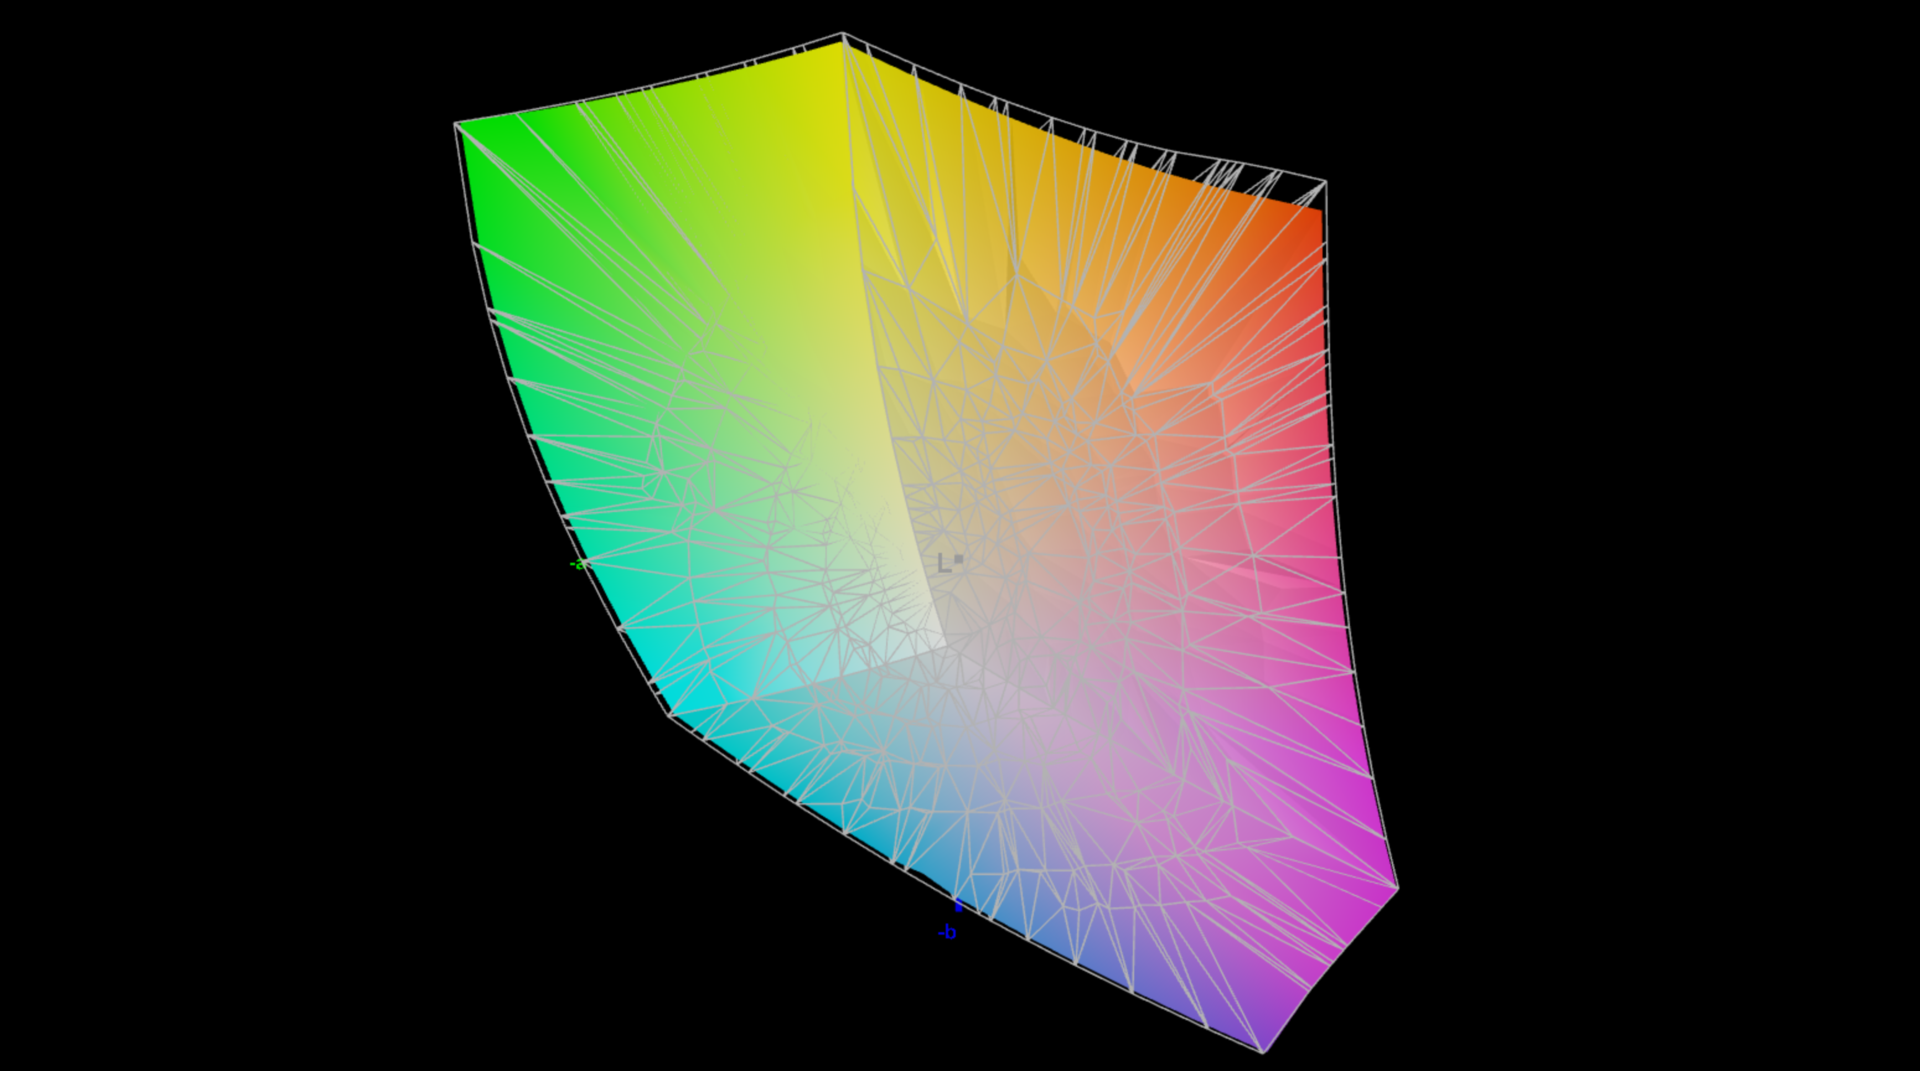
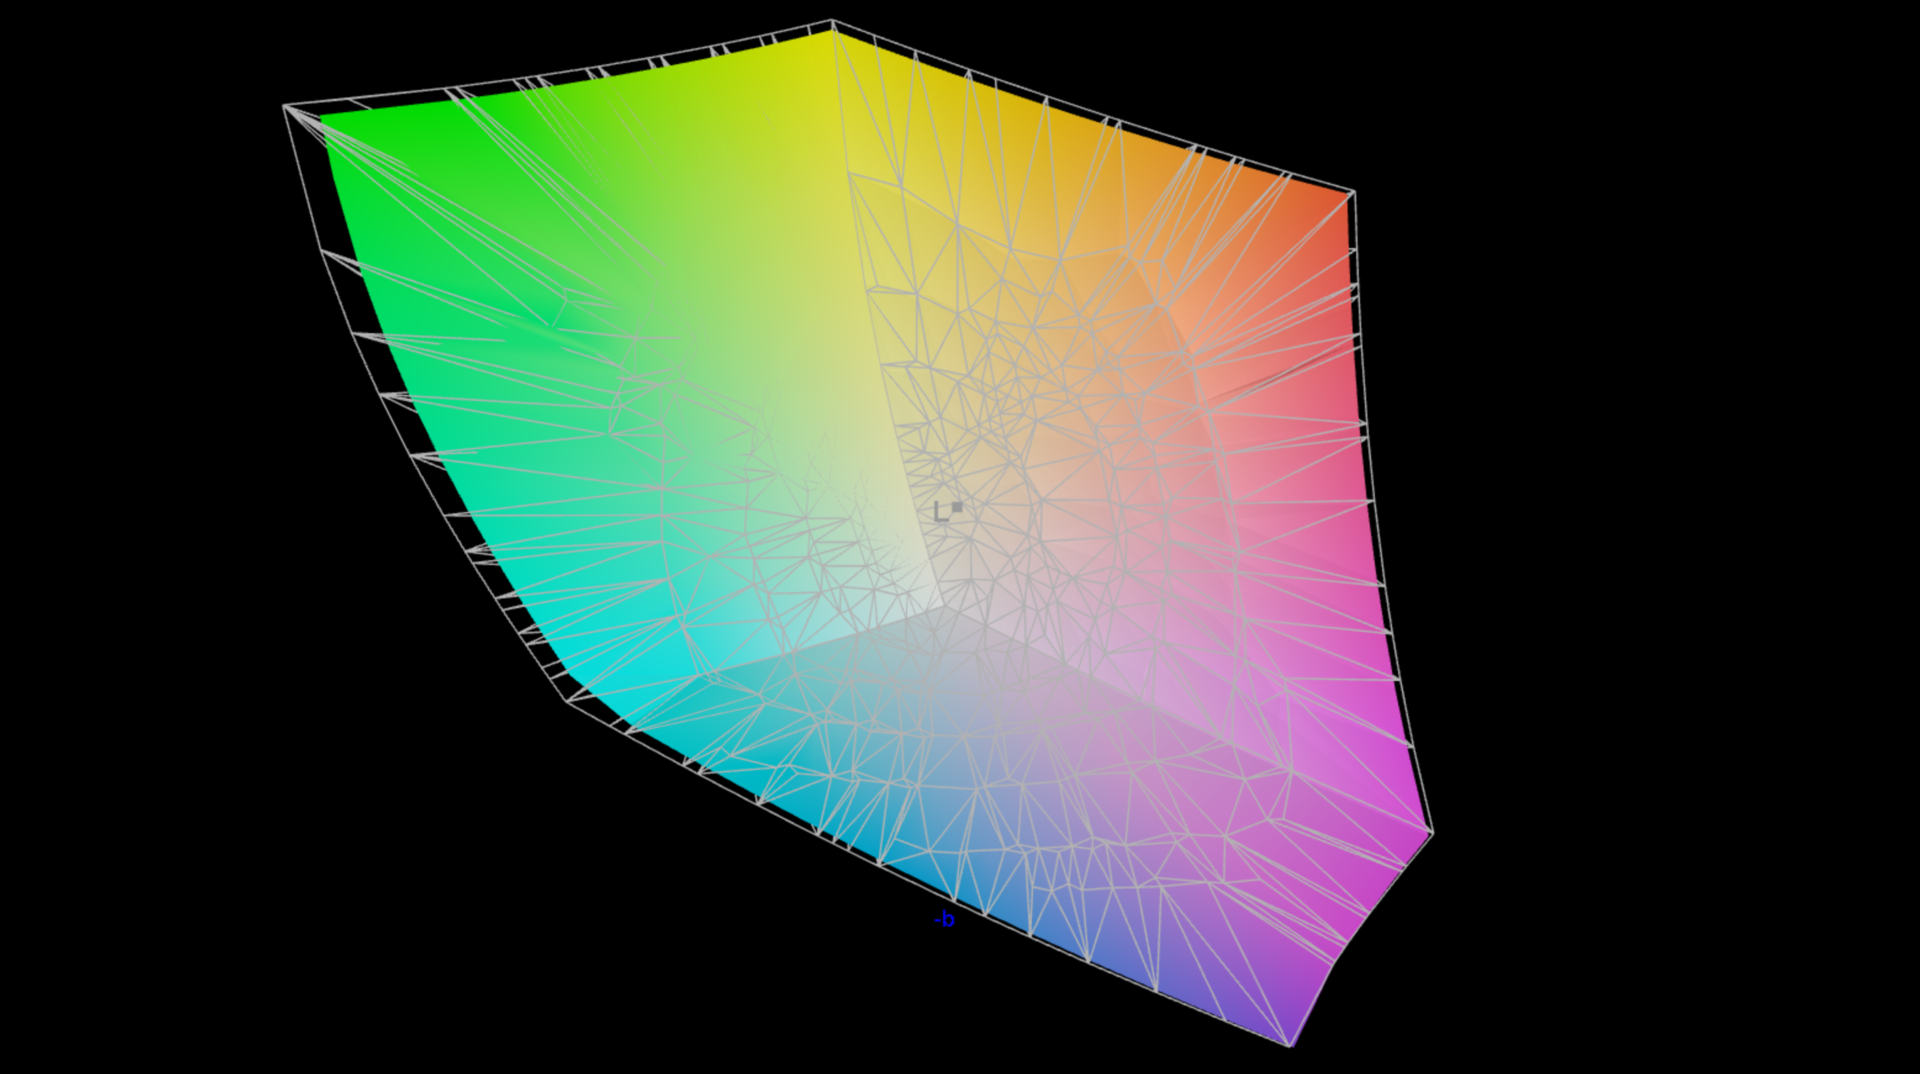
95.1% AdobeRGB 1998 (Argyll 3D)
99.8% sRGB (Argyll 3D)
97% Display P3 (Argyll 3D)
Gamma: 2.19
CCT: 6479 K
| Lenovo Yoga Pro 9 16-IRP G8 LEN160-3.2K, Mini-LED, 3200x2000, 16" | Schenker VISION 16 Pro (M23) NE160QDM-NZ1, IPS, 2560x1600, 16" | Asus Vivobook Pro 16X K6604JV-MX016W Samsung SDC4178 ATNA60BX01-1, OLED, 3200x2000, 16" | Asus ProArt Studiobook 16 OLED H7604 ATNA60BX01-1, OLED, 3200x2000, 16" | MSI Stealth 16 Studio A13VG AUO26A9, IPS, 2560x1600, 16" | Apple MacBook Pro 16 2023 M2 Max Mini-LED, 3456x2234, 16.2" | |
|---|---|---|---|---|---|---|
| Display | -19% | 1% | -1% | -4% | -2% | |
| Display P3 Coverage (%) | 97 | 68.8 -29% | 98.4 1% | 99.6 3% | 96.4 -1% | 99 2% |
| sRGB Coverage (%) | 99.8 | 98.8 -1% | 99.7 0% | 100 0% | 99.7 0% | 100 0% |
| AdobeRGB 1998 Coverage (%) | 95.1 | 70 -26% | 95.8 1% | 89.4 -6% | 84.8 -11% | 88.5 -7% |
| Response Times | 7% | 87% | 94% | 54% | -444% | |
| Response Time Grey 50% / Grey 80% * (ms) | 14 ? | 13.7 ? 2% | 1.6 ? 89% | 0.59 ? 96% | 4.4 ? 69% | 80.5 ? -475% |
| Response Time Black / White * (ms) | 9.2 ? | 8.1 ? 12% | 1.4 ? 85% | 0.79 ? 91% | 5.6 ? 39% | 47.2 ? -413% |
| PWM Frequency (Hz) | 5800 ? | 120 ? | 240 ? | 14880 ? | ||
| Screen | -91% | 4% | 42% | -87% | 2094% | |
| Brightness middle (cd/m²) | 539 | 384 -29% | 347 -36% | 349 -35% | 424 -21% | 504 -6% |
| Brightness (cd/m²) | 546 | 371 -32% | 346 -37% | 350 -36% | 411 -25% | 487 -11% |
| Brightness Distribution (%) | 96 | 88 -8% | 97 1% | 95 -1% | 88 -8% | 94 -2% |
| Black Level * (cd/m²) | 0.18 | 0.3 -67% | 0.06 67% | 0.02 89% | 0.37 -106% | 0.001 99% |
| Contrast (:1) | 2994 | 1280 -57% | 5783 93% | 17450 483% | 1146 -62% | 504000 16734% |
| Colorchecker dE 2000 * | 1.4 | 3.4 -143% | 1.89 -35% | 2.1 -50% | 3.04 -117% | 1.5 -7% |
| Colorchecker dE 2000 max. * | 2.1 | 9.2 -338% | 3.26 -55% | 5.5 -162% | 7.5 -257% | 3.3 -57% |
| Greyscale dE 2000 * | 2.2 | 3.4 -55% | 1.55 30% | 1.2 45% | 4.34 -97% | 2.1 5% |
| Gamma | 2.19 100% | 2.16 102% | 2.39 92% | 2.19 100% | 2.32 95% | 2.25 98% |
| CCT | 6479 100% | 7462 87% | 6458 101% | 6545 99% | 6952 93% | 6882 94% |
| Colorchecker dE 2000 calibrated * | 1.3 | 1.97 | 2.1 | 3.04 | ||
| Média Total (Programa/Configurações) | -34% /
-59% | 31% /
16% | 45% /
40% | -12% /
-46% | 549% /
1220% |
* ... menor é melhor
Medimos o painel usando o software profissional CalMAN. No software Lenovo Vantage pré-instalado, você pode escolher entre os perfis de cores sRGB, Display P3 e AdobeRGB. Como a Lenovo anuncia a cobertura total do AdobeRGB, também usamos esse perfil em nossas medições.
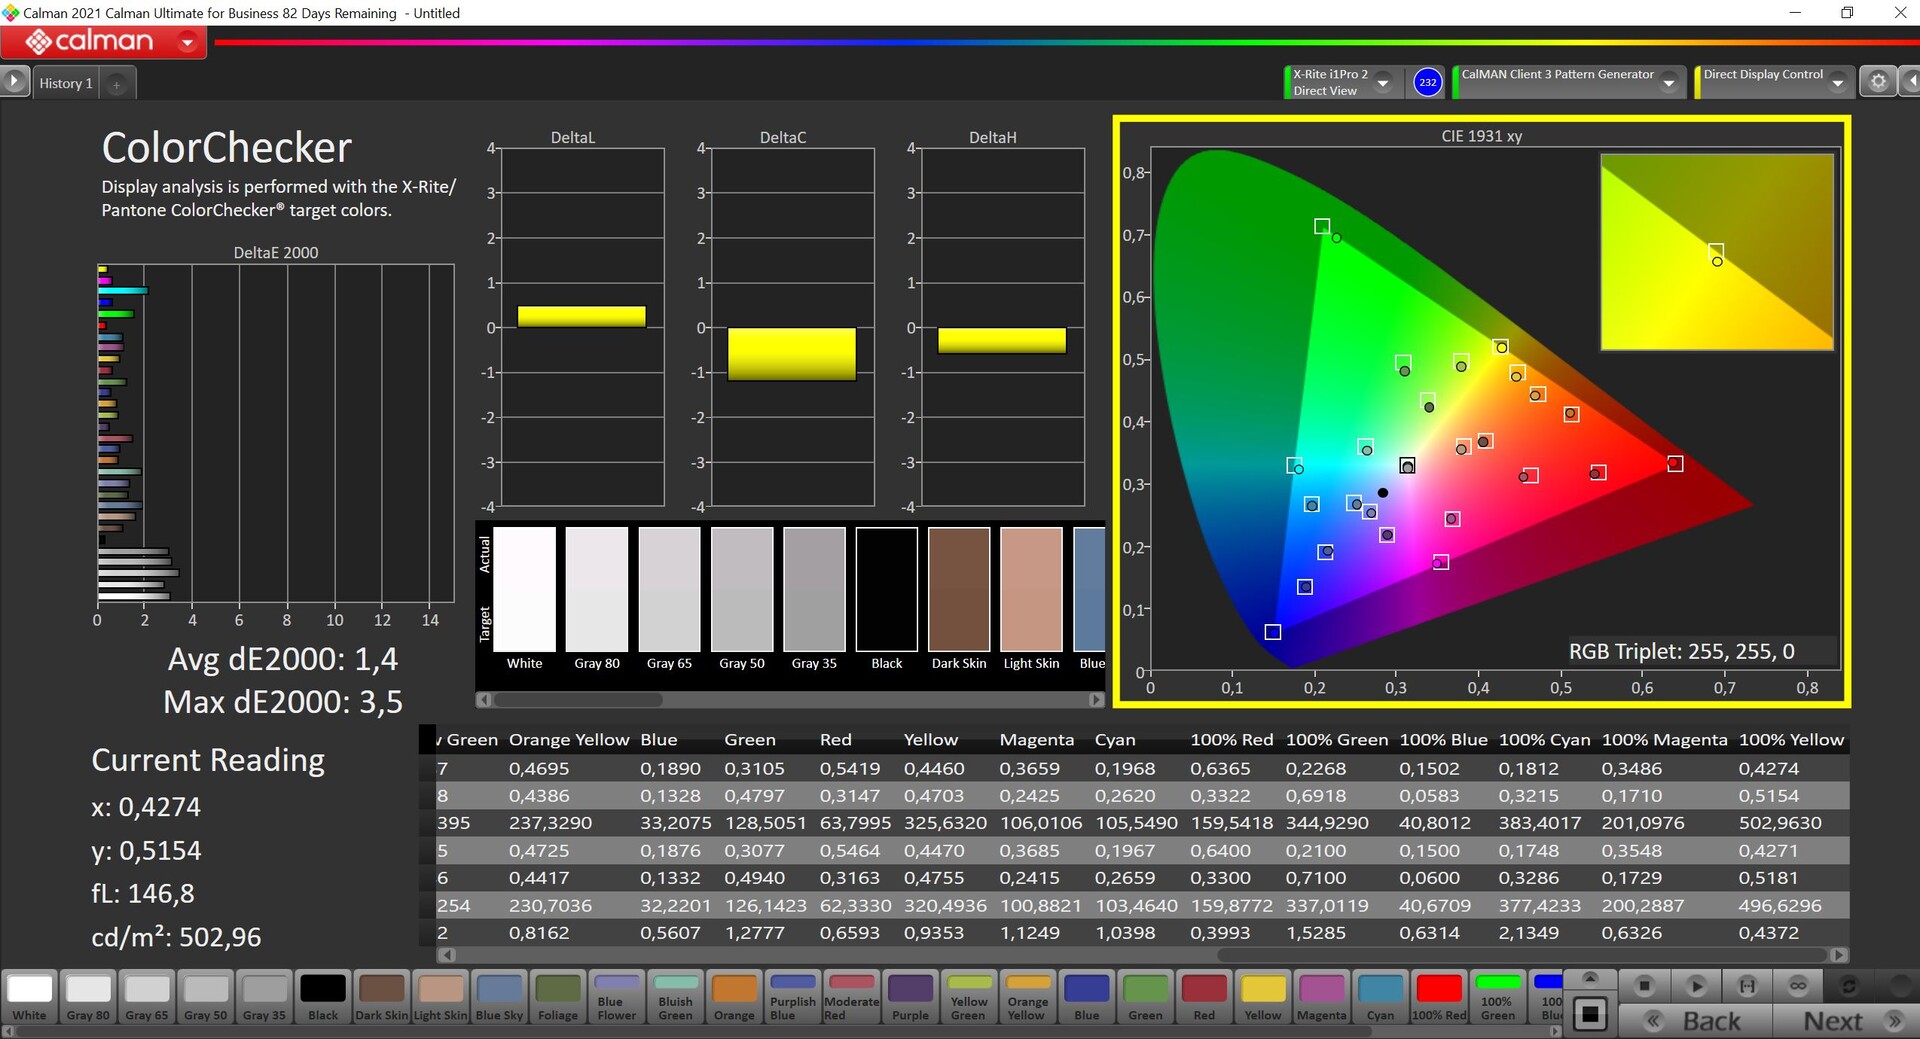
A calibração padrão do painel é muito melhor do que a do modelo de 14 polegadas e o desvio médio do DeltaE-2000 já está abaixo de 3, tanto para tons de cinza quanto para cores (também não há exceções aqui). Não foi possível confirmar o valor DeltaE anunciado de <1, mas uma calibração subsequente não é realmente necessária aqui e não conseguimos melhorar a tela com nossa própria calibração, razão pela qual não oferecemos um perfil de cores para download neste momento. O painel cobre quase completamente os espaços de cores P3 e AdobeRGB.
Exibir tempos de resposta
| ↔ Tempo de resposta preto para branco | ||
|---|---|---|
| 9.2 ms ... ascensão ↗ e queda ↘ combinadas | ↗ 2.2 ms ascensão | 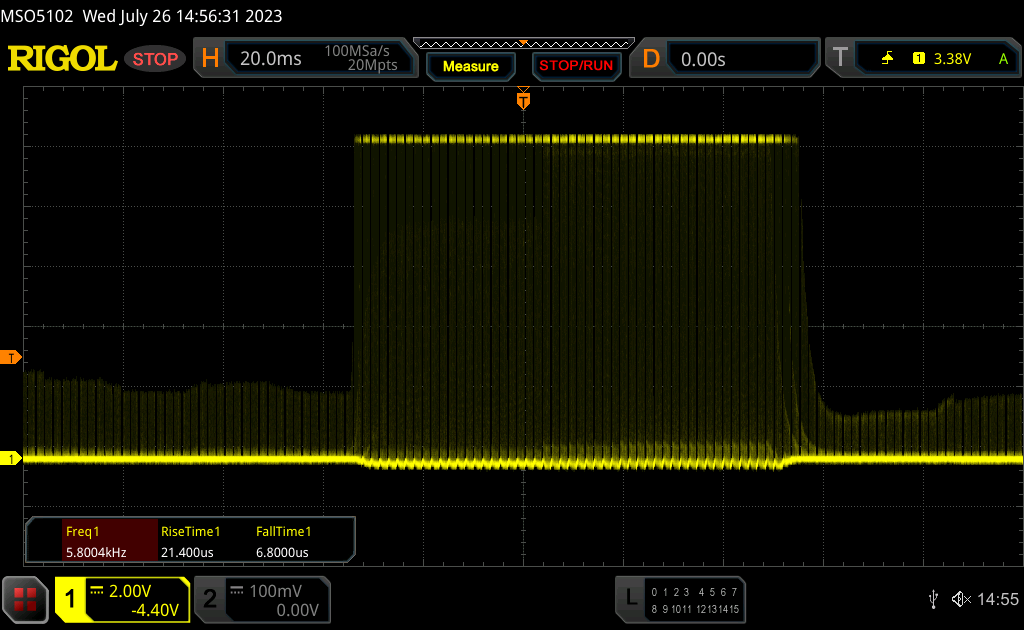 |
| ↘ 7 ms queda | ||
| A tela mostra taxas de resposta rápidas em nossos testes e deve ser adequada para jogos. Em comparação, todos os dispositivos testados variam de 0.1 (mínimo) a 240 (máximo) ms. » 26 % de todos os dispositivos são melhores. Isso significa que o tempo de resposta medido é melhor que a média de todos os dispositivos testados (19.8 ms). | ||
| ↔ Tempo de resposta 50% cinza a 80% cinza | ||
| 14 ms ... ascensão ↗ e queda ↘ combinadas | ↗ 7.5 ms ascensão | 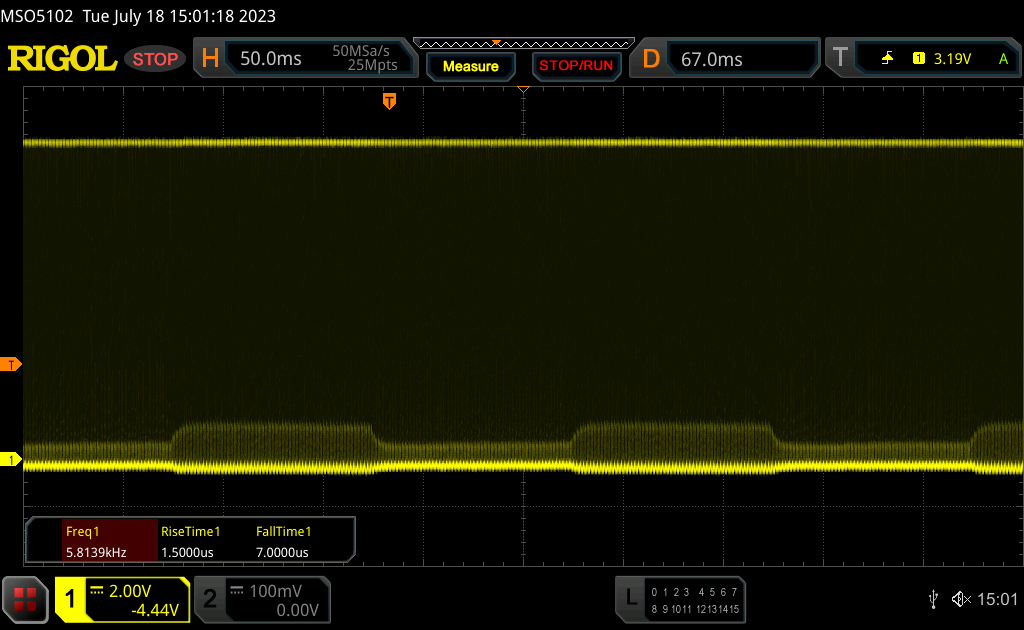 |
| ↘ 6.5 ms queda | ||
| A tela mostra boas taxas de resposta em nossos testes, mas pode ser muito lenta para jogadores competitivos. Em comparação, todos os dispositivos testados variam de 0.165 (mínimo) a 636 (máximo) ms. » 28 % de todos os dispositivos são melhores. Isso significa que o tempo de resposta medido é melhor que a média de todos os dispositivos testados (31 ms). | ||
Cintilação da tela / PWM (modulação por largura de pulso)
| Tela tremeluzindo/PWM detectado | 5800 Hz | ≤ 100 % configuração de brilho | 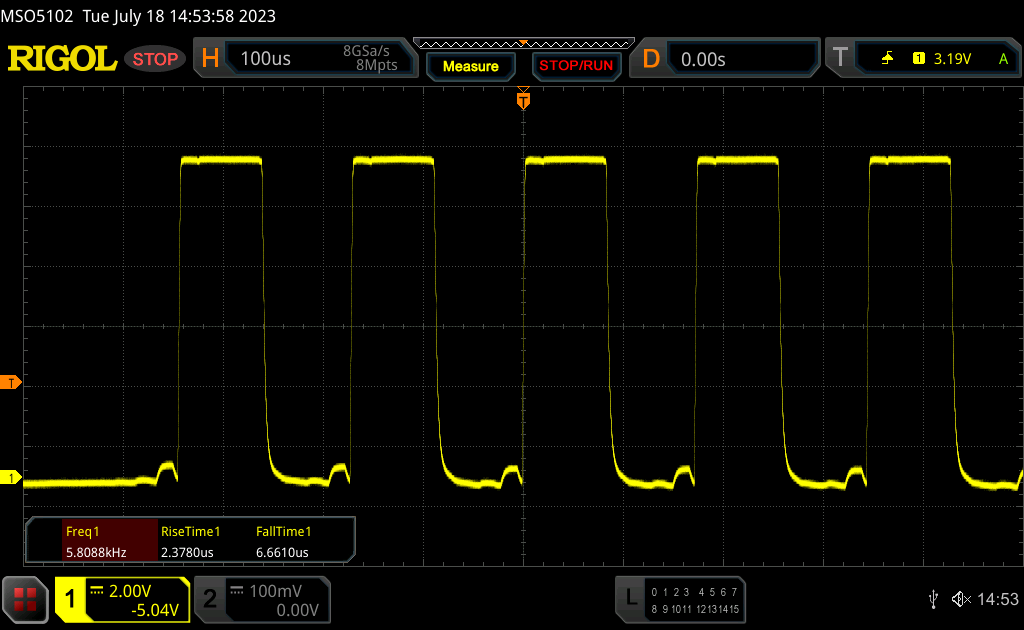 |
A luz de fundo da tela pisca em 5800 Hz (pior caso, por exemplo, utilizando PWM) Cintilação detectada em uma configuração de brilho de 100 % e abaixo. Não deve haver cintilação ou PWM acima desta configuração de brilho. A frequência de 5800 Hz é bastante alta, então a maioria dos usuários sensíveis ao PWM não deve notar nenhuma oscilação. [pwm_comparison] Em comparação: 52 % de todos os dispositivos testados não usam PWM para escurecer a tela. Se PWM foi detectado, uma média de 7757 (mínimo: 5 - máximo: 343500) Hz foi medida. | |||
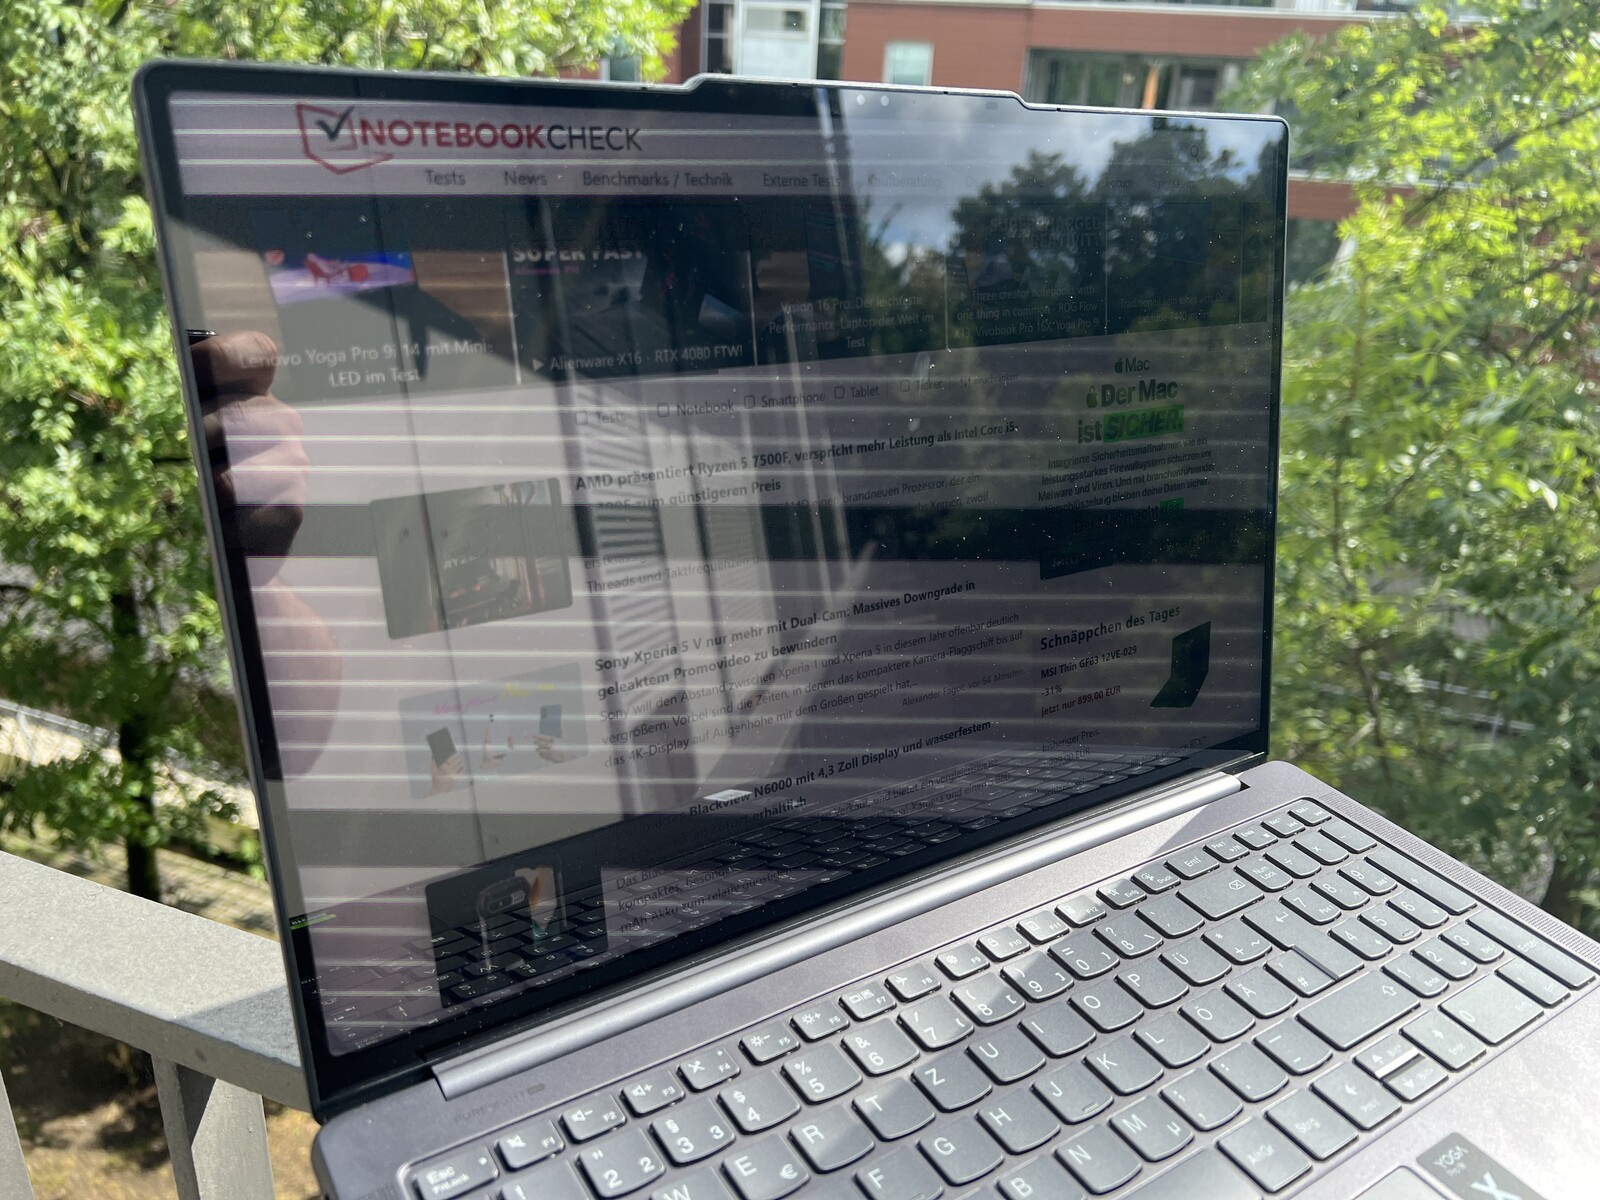
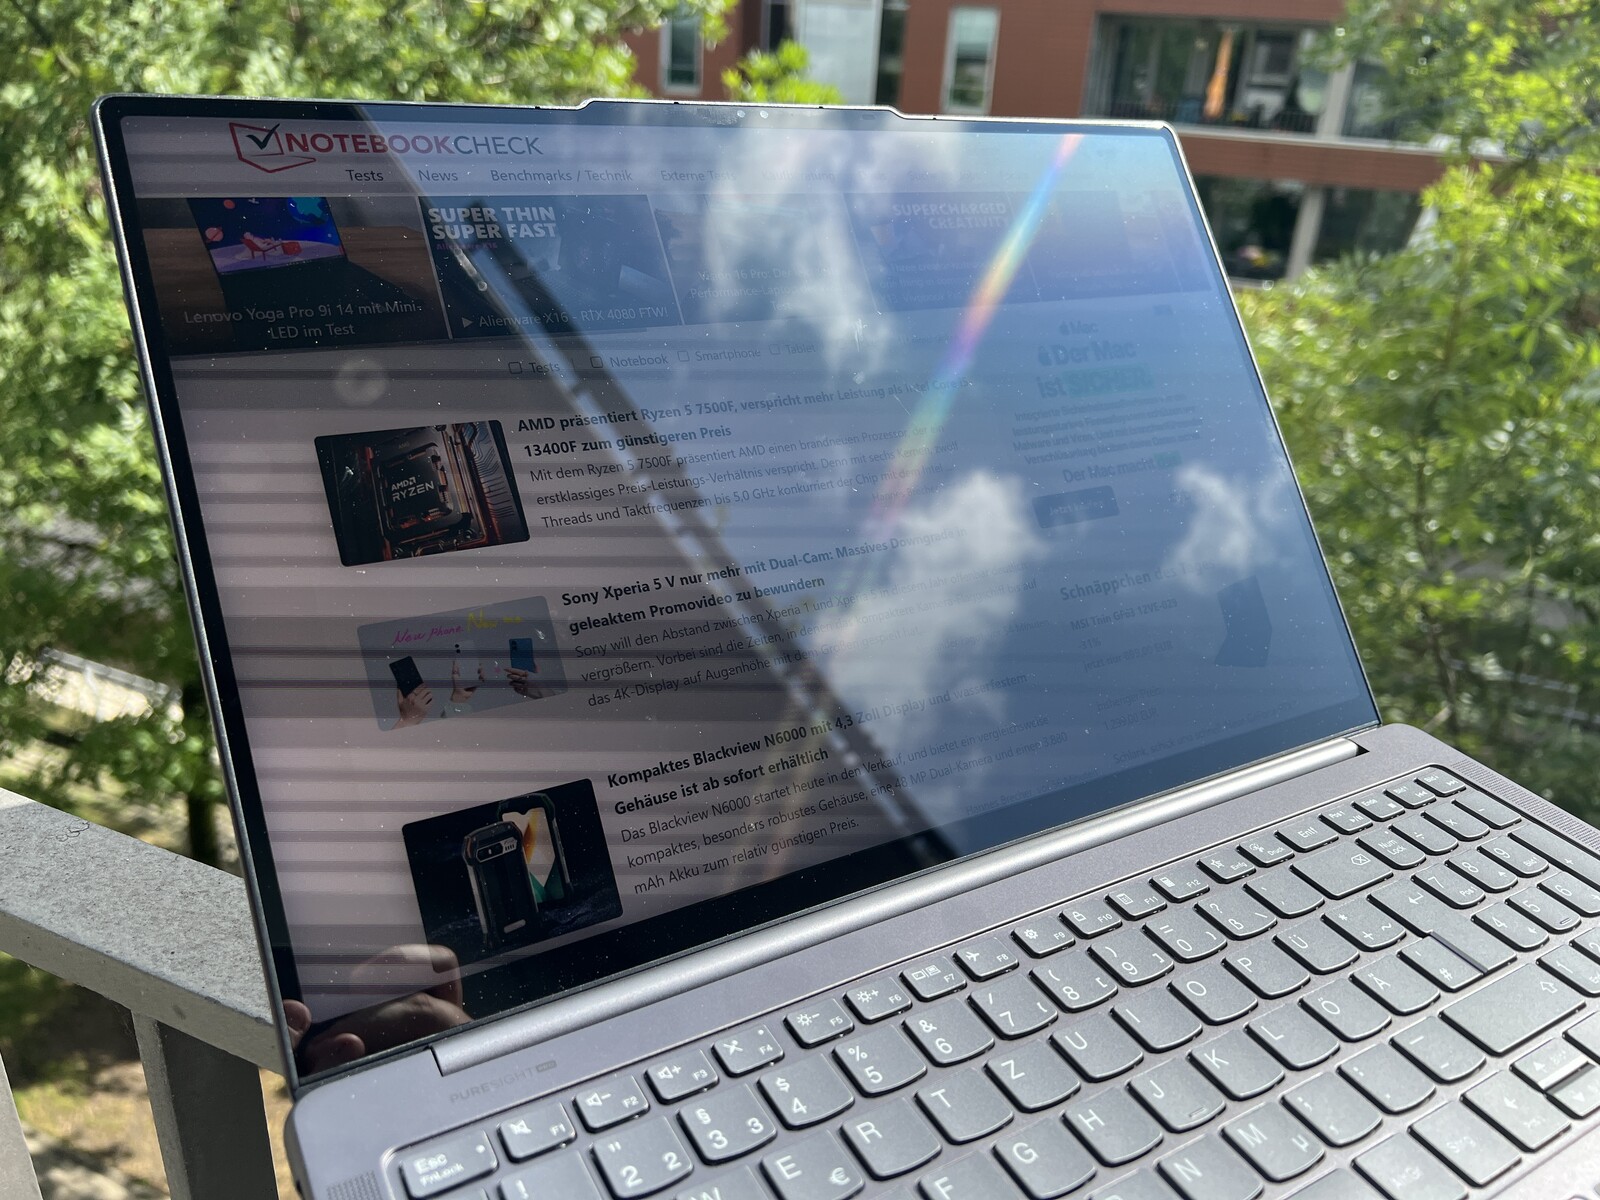
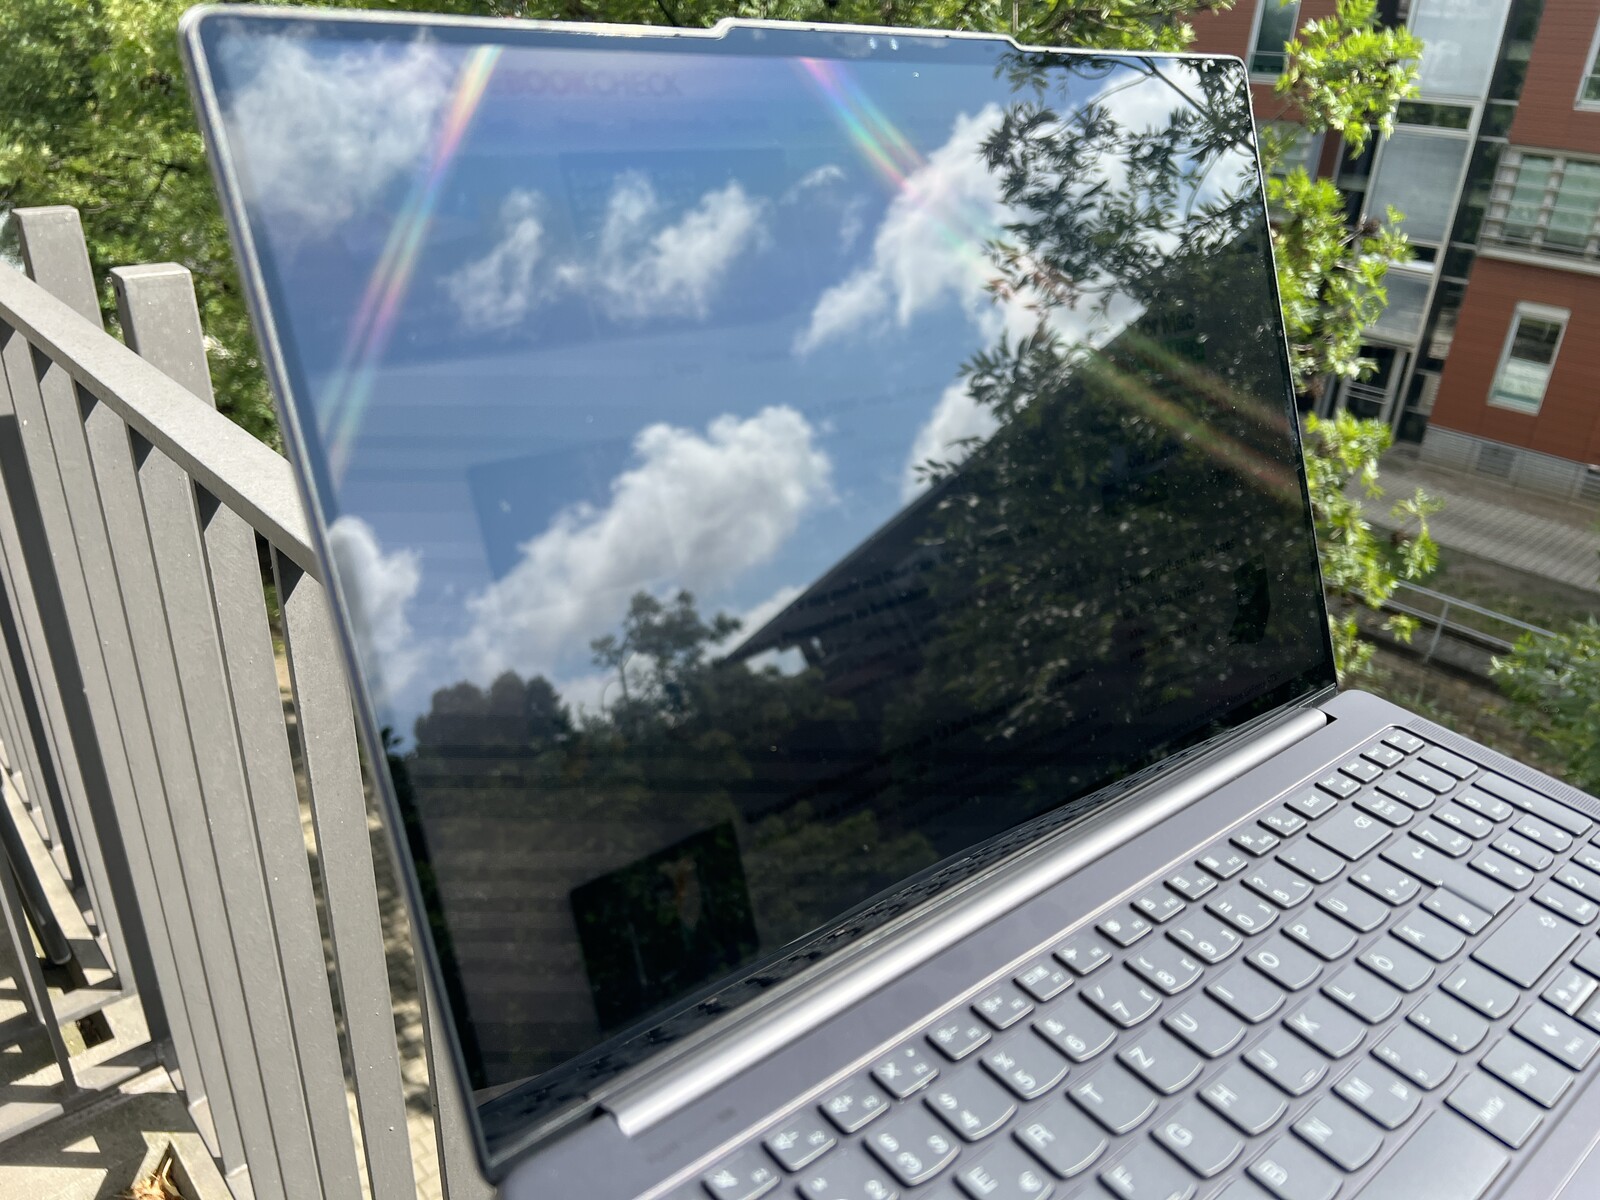
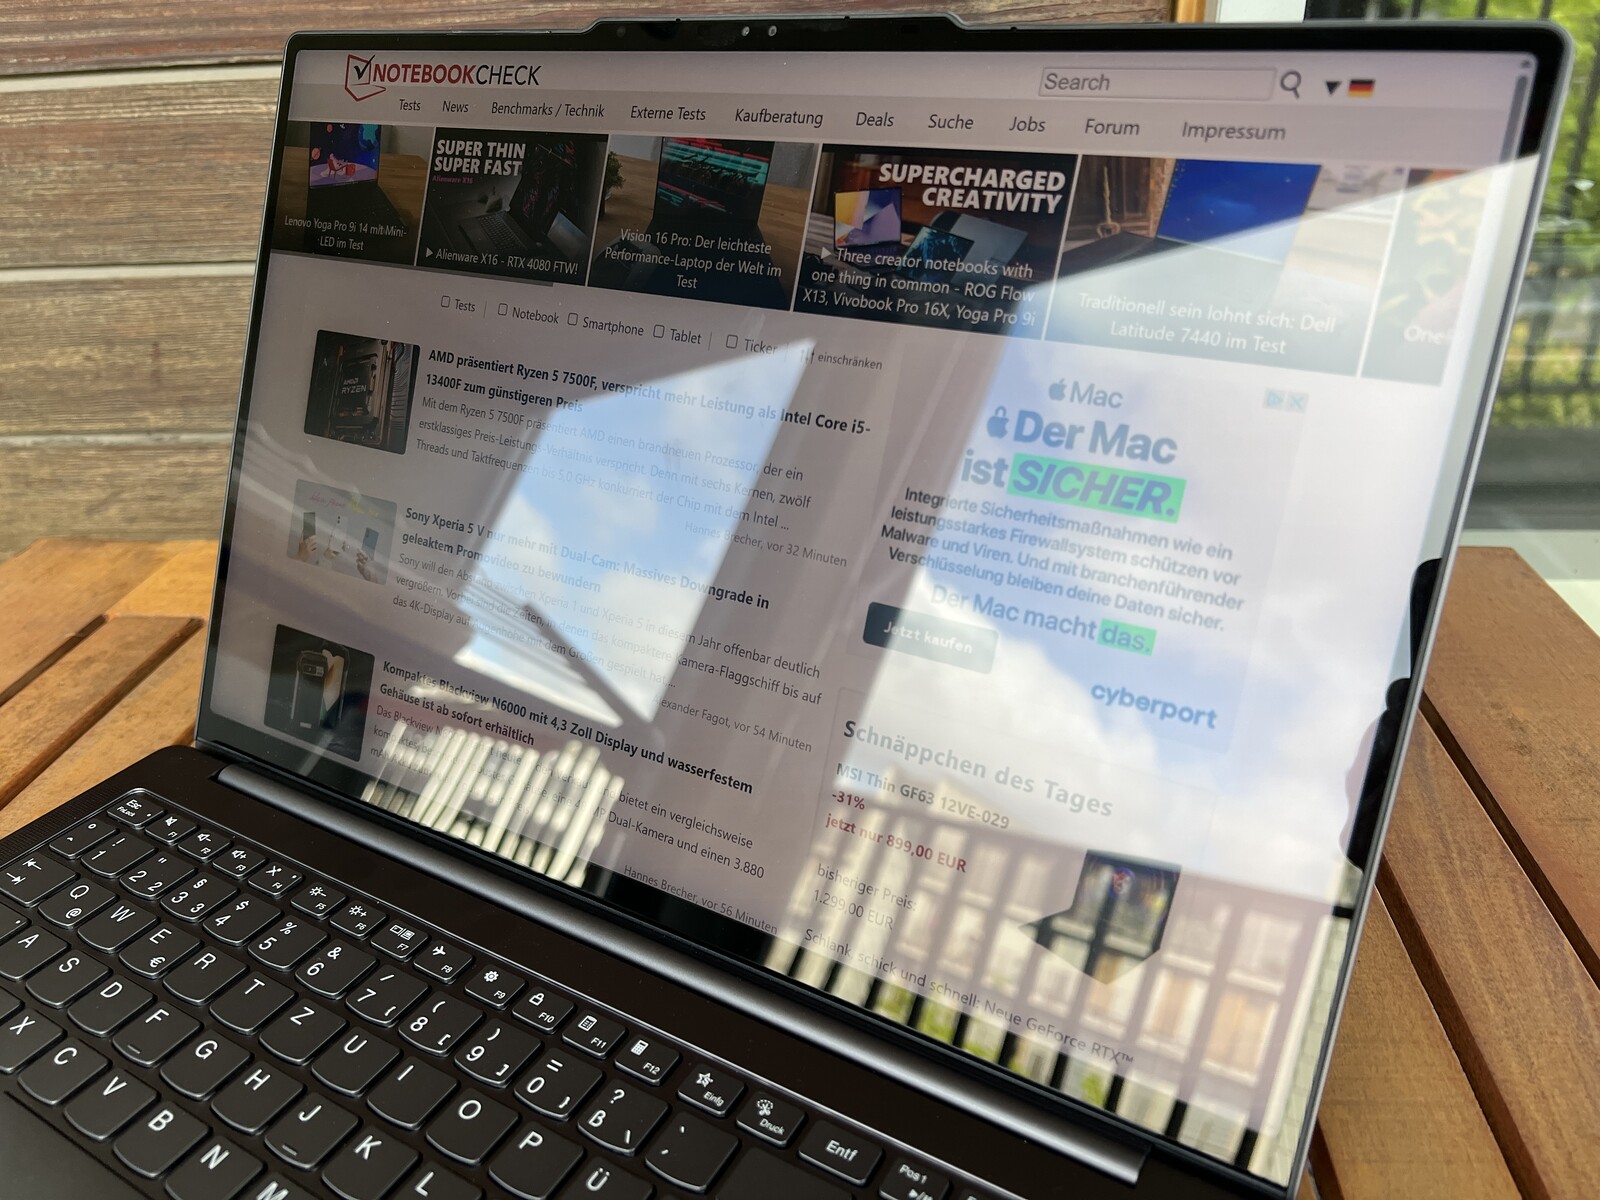
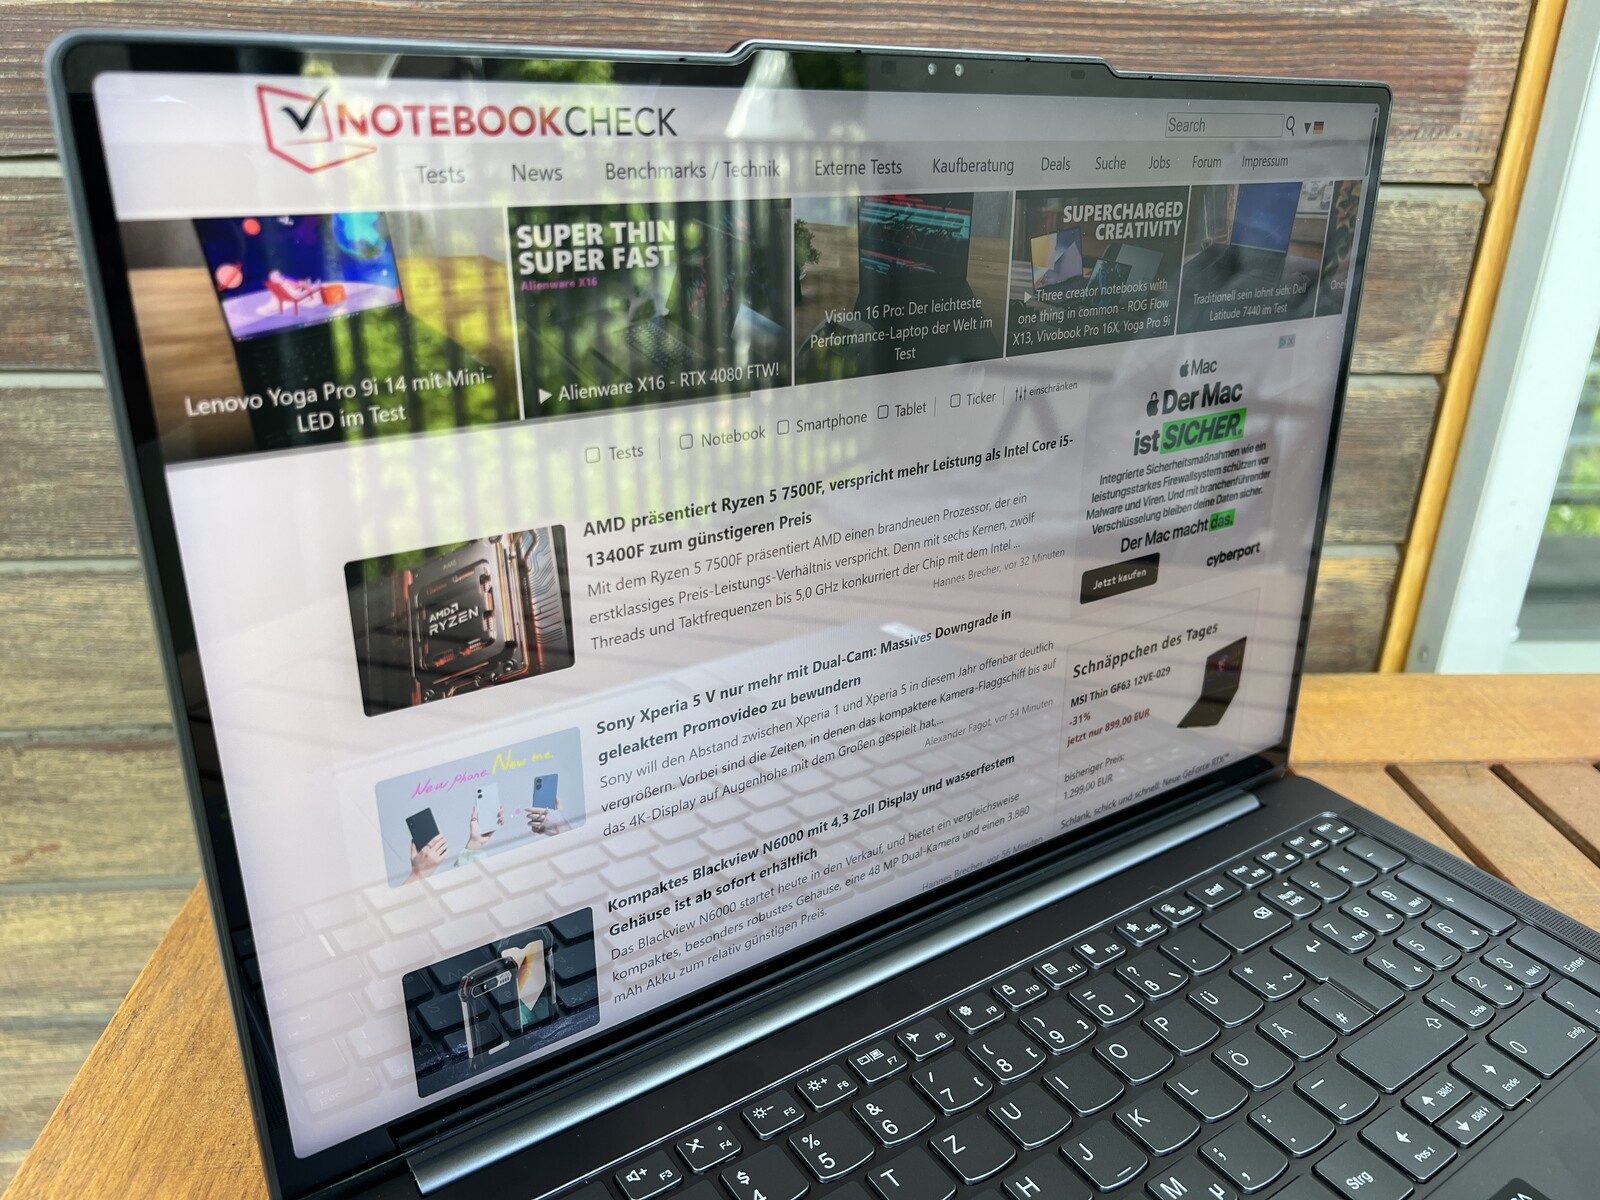
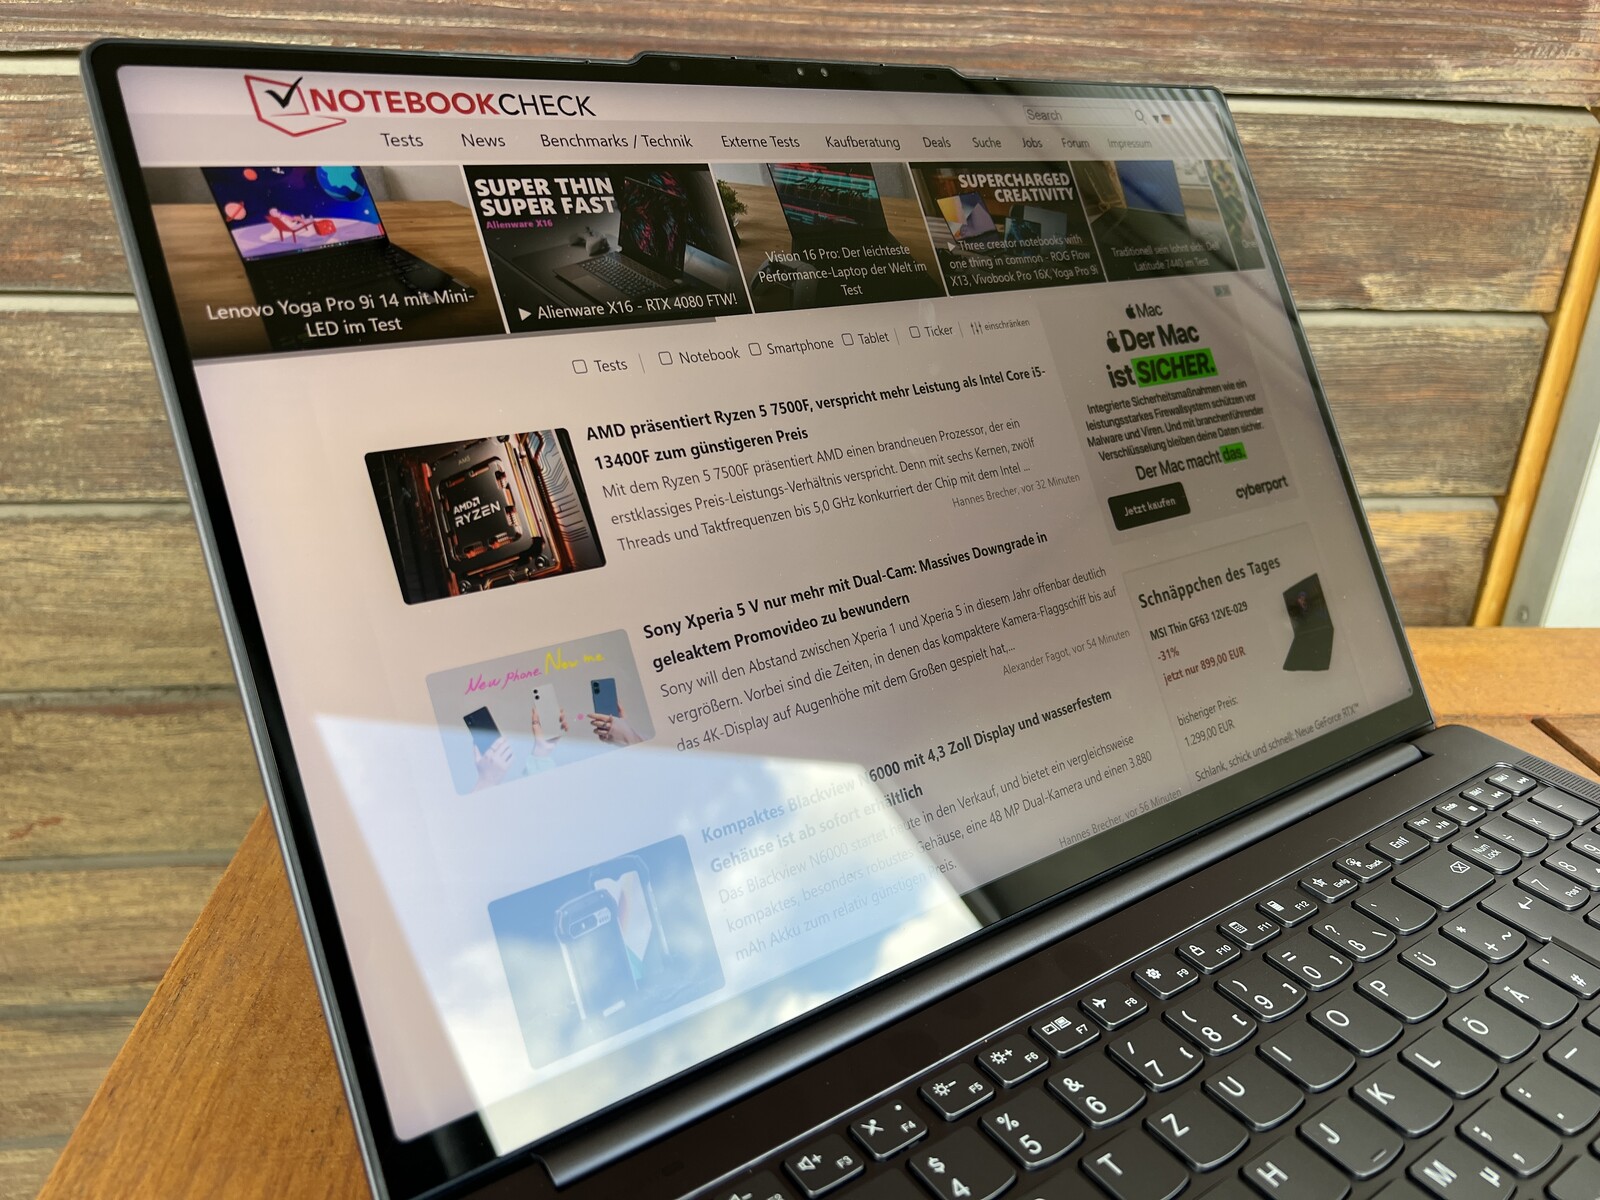
A tela sensível ao toque é muito reflexiva e ocorrem reflexos incômodos mesmo em ambientes internos. Em dias ensolarados, não é fácil encontrar uma posição adequada para poder reconhecer corretamente o conteúdo da tela. A estabilidade do ângulo de visão é muito boa.
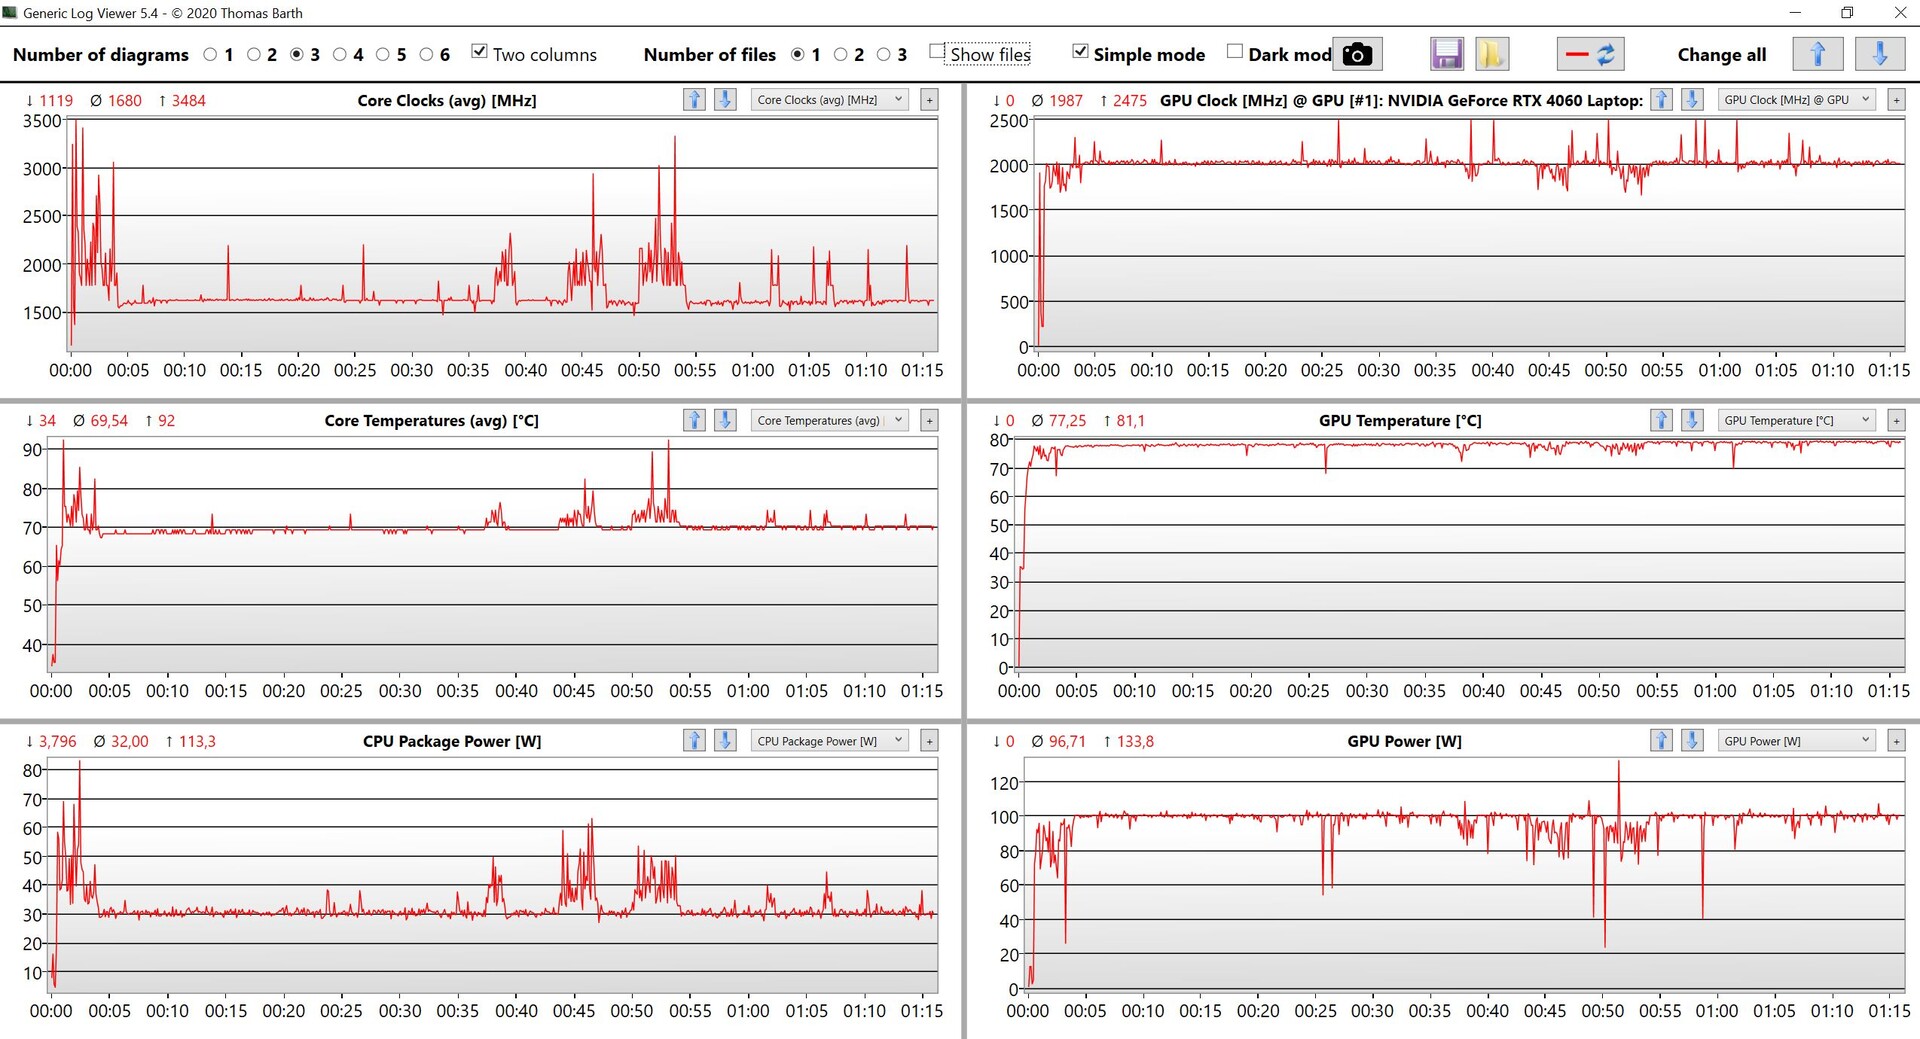
Desempenho - RTX 4060 com 100 watts
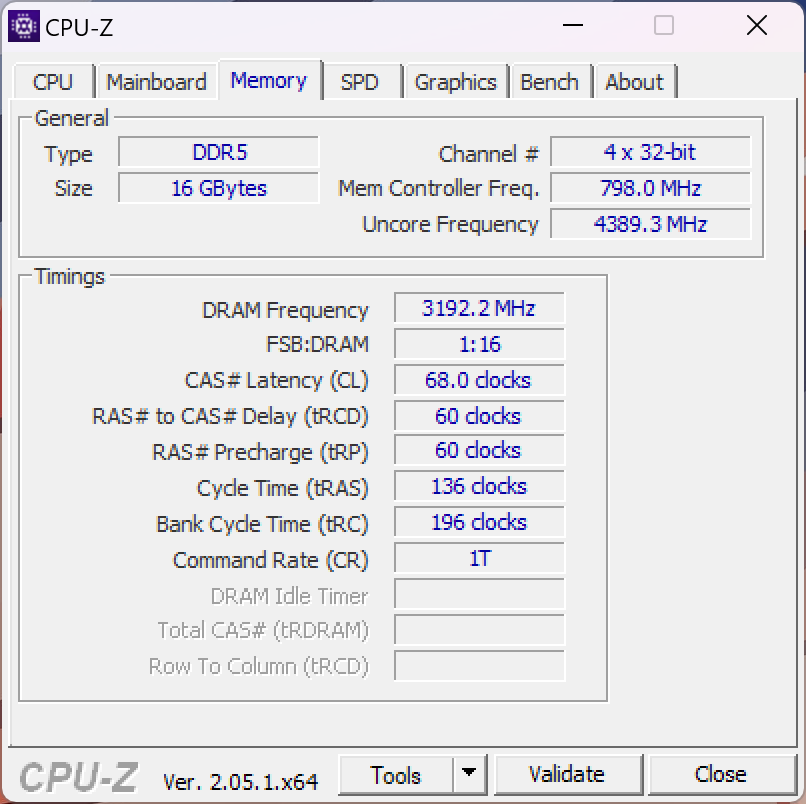
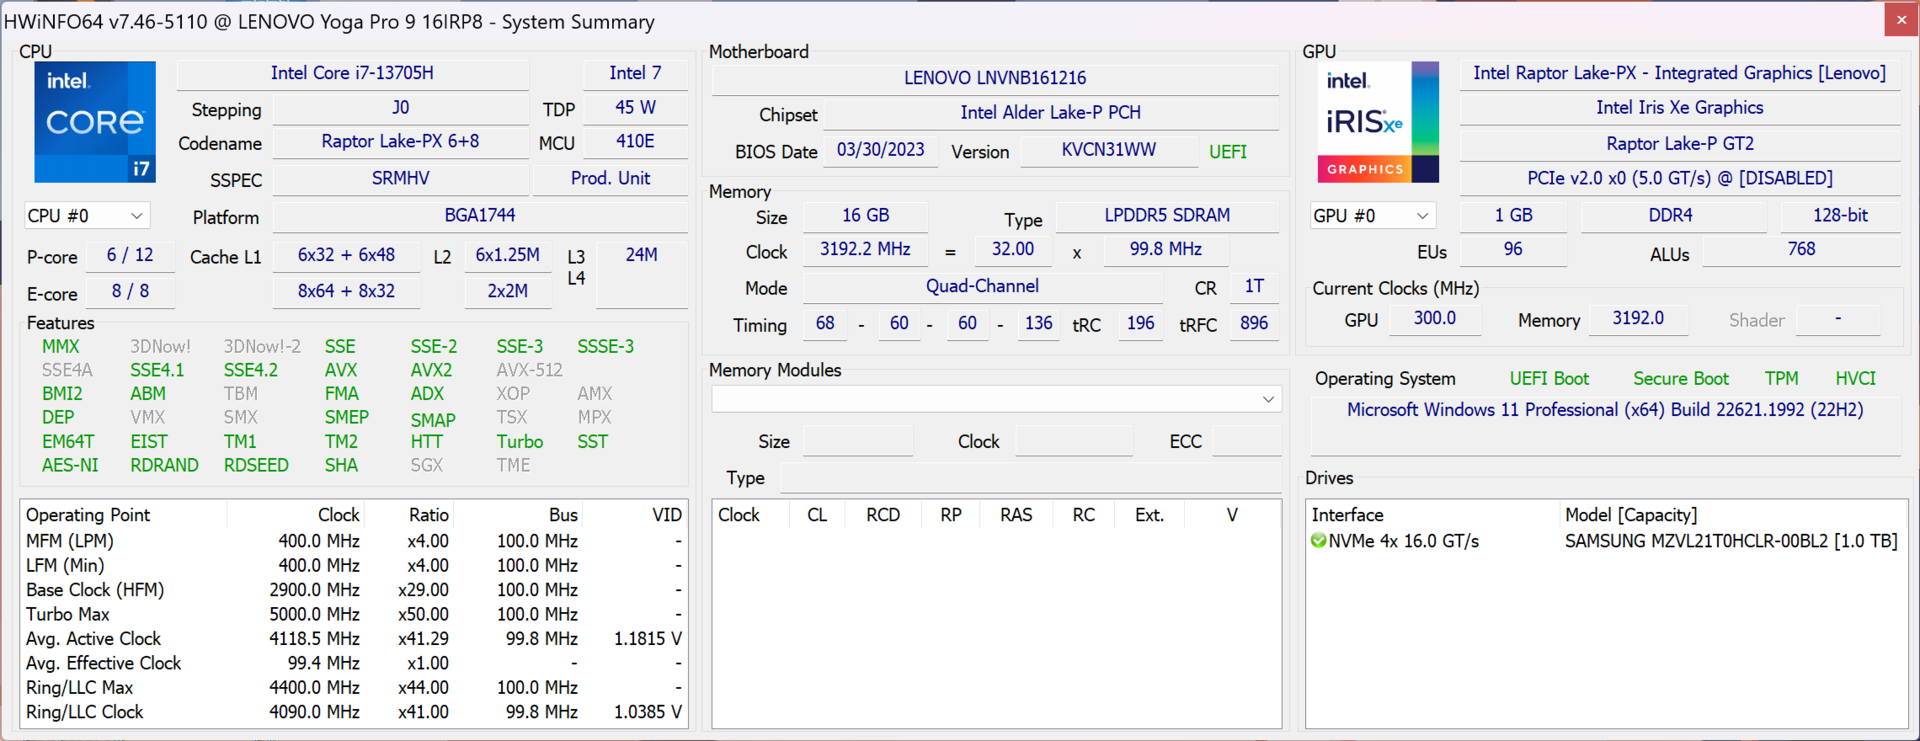
Como mencionado anteriormente, o Yoga Pro 9i 16 vem com um processador Core i7 ou Core i9, bem como com a GeForce RTX 4050,RTX 4060 ou RTX 4070 (100 watts TGP em cada caso). A memória de trabalho consiste em uma RAM LPDDR5X-6400 mais rápida, mas ela é soldada e não pode ser expandida.
Condições de teste
O aplicativo Lenovo Vantage pré-instalado oferece três perfis de desempenho diferentes que podem ser convenientemente alternados por meio da combinação de teclas Fn+Q a qualquer momento. Listamos os respectivos valores de TDP/TGP na tabela abaixo. Usamos o modo de alto desempenho como padrão para nossos benchmarks e medições.
| Modo | Carga da CPU | Carga da GPU | Teste de estresse | Volume máximo do ventilador |
|---|---|---|---|---|
| Bateria | 40 -> 25 watts | 22 watts | CPU: 25 watts GPU: 22 watts |
31,4 dB(A) |
| Resfriamento inteligente | 75 -> 65 watts | 55 watts | CPU: 30 watts GPU: 45 watts |
44,5 dB(A) |
| Alto desempenho | 125 -> 80 watts | 100 watts | CPU: 30 watts GPU: 100 watts |
53,2 dB(A) |
Processador
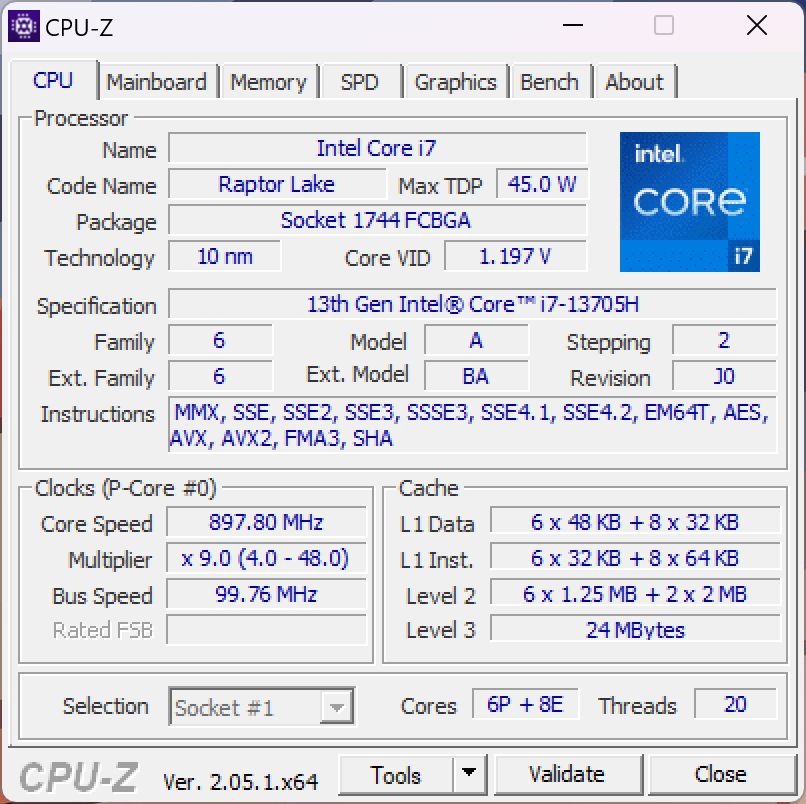
O modelo de 16 polegadas do Yoga Pro 9i também usa o Core i7-13705Hque é o mesmo que o Core i7-13700H no modo de alto desempenho, o processador é capaz de consumir até 125 watts por curtos períodos de tempo e 80 watts permanentemente, o que traz resultados muito bons. É interessante notar que o Core i9-13905H opcional tem um desempenho um pouco pior, portanto, o upgrade não vale a pena. Em nosso grupo de comparação, o Yoga só tem que admitir a derrota para os concorrentes com processadores HX significativamente mais rápidos.
O processador é capaz de consumir no máximo 85 watts no modo de bateria, o que leva a uma redução de desempenho de cerca de 20% nos testes de vários núcleos. Mais benchmarks de CPU estão disponíveis em nossa seção de tecnologia.
Cinebench R15 Multi Sustained Load
Cinebench R23: Multi Core | Single Core
Cinebench R20: CPU (Multi Core) | CPU (Single Core)
Cinebench R15: CPU Multi 64Bit | CPU Single 64Bit
Blender: v2.79 BMW27 CPU
7-Zip 18.03: 7z b 4 | 7z b 4 -mmt1
Geekbench 5.5: Multi-Core | Single-Core
HWBOT x265 Benchmark v2.2: 4k Preset
LibreOffice : 20 Documents To PDF
R Benchmark 2.5: Overall mean
| CPU Performance rating | |
| Asus ProArt Studiobook 16 OLED H7604 | |
| Asus Vivobook Pro 16X K6604JV-MX016W | |
| Apple MacBook Pro 16 2023 M2 Max -6! | |
| Lenovo Yoga Pro 9 16-IRP G8 | |
| Média Intel Core i7-13705H | |
| MSI Stealth 16 Studio A13VG | |
| Média da turma Multimedia | |
| Schenker VISION 16 Pro (M23) | |
| Cinebench R23 / Multi Core | |
| Asus ProArt Studiobook 16 OLED H7604 | |
| Asus Vivobook Pro 16X K6604JV-MX016W | |
| MSI Stealth 16 Studio A13VG | |
| Lenovo Yoga Pro 9 16-IRP G8 | |
| Média Intel Core i7-13705H (17855 - 19675, n=2) | |
| Média da turma Multimedia (4861 - 33362, n=75, últimos 2 anos) | |
| Apple MacBook Pro 16 2023 M2 Max | |
| Schenker VISION 16 Pro (M23) | |
| Cinebench R23 / Single Core | |
| Asus ProArt Studiobook 16 OLED H7604 | |
| Média da turma Multimedia (1128 - 2459, n=67, últimos 2 anos) | |
| Schenker VISION 16 Pro (M23) | |
| Lenovo Yoga Pro 9 16-IRP G8 | |
| Média Intel Core i7-13705H (1869 - 1879, n=2) | |
| MSI Stealth 16 Studio A13VG | |
| Asus Vivobook Pro 16X K6604JV-MX016W | |
| Apple MacBook Pro 16 2023 M2 Max | |
| Cinebench R20 / CPU (Multi Core) | |
| Asus ProArt Studiobook 16 OLED H7604 | |
| Asus Vivobook Pro 16X K6604JV-MX016W | |
| MSI Stealth 16 Studio A13VG | |
| Lenovo Yoga Pro 9 16-IRP G8 | |
| Média Intel Core i7-13705H (6868 - 7529, n=2) | |
| Média da turma Multimedia (1887 - 12912, n=58, últimos 2 anos) | |
| Schenker VISION 16 Pro (M23) | |
| Apple MacBook Pro 16 2023 M2 Max | |
| Cinebench R20 / CPU (Single Core) | |
| Asus ProArt Studiobook 16 OLED H7604 | |
| Lenovo Yoga Pro 9 16-IRP G8 | |
| Schenker VISION 16 Pro (M23) | |
| Média da turma Multimedia (425 - 853, n=58, últimos 2 anos) | |
| Média Intel Core i7-13705H (723 - 732, n=2) | |
| MSI Stealth 16 Studio A13VG | |
| Asus Vivobook Pro 16X K6604JV-MX016W | |
| Apple MacBook Pro 16 2023 M2 Max | |
| Cinebench R15 / CPU Multi 64Bit | |
| Asus Vivobook Pro 16X K6604JV-MX016W | |
| Asus ProArt Studiobook 16 OLED H7604 | |
| Lenovo Yoga Pro 9 16-IRP G8 | |
| Média Intel Core i7-13705H (2750 - 2987, n=2) | |
| MSI Stealth 16 Studio A13VG | |
| Média da turma Multimedia (856 - 5224, n=62, últimos 2 anos) | |
| Schenker VISION 16 Pro (M23) | |
| Apple MacBook Pro 16 2023 M2 Max | |
| Cinebench R15 / CPU Single 64Bit | |
| Asus ProArt Studiobook 16 OLED H7604 | |
| Asus Vivobook Pro 16X K6604JV-MX016W | |
| Média da turma Multimedia (184.8 - 326, n=60, últimos 2 anos) | |
| Schenker VISION 16 Pro (M23) | |
| Lenovo Yoga Pro 9 16-IRP G8 | |
| Média Intel Core i7-13705H (273 - 274, n=2) | |
| MSI Stealth 16 Studio A13VG | |
| Apple MacBook Pro 16 2023 M2 Max | |
| Blender / v2.79 BMW27 CPU | |
| Média da turma Multimedia (100 - 557, n=59, últimos 2 anos) | |
| Schenker VISION 16 Pro (M23) | |
| Média Intel Core i7-13705H (172 - 190, n=2) | |
| Lenovo Yoga Pro 9 16-IRP G8 | |
| MSI Stealth 16 Studio A13VG | |
| Asus Vivobook Pro 16X K6604JV-MX016W | |
| Asus ProArt Studiobook 16 OLED H7604 | |
| 7-Zip 18.03 / 7z b 4 | |
| Asus ProArt Studiobook 16 OLED H7604 | |
| Asus Vivobook Pro 16X K6604JV-MX016W | |
| Lenovo Yoga Pro 9 16-IRP G8 | |
| MSI Stealth 16 Studio A13VG | |
| Média Intel Core i7-13705H (71884 - 78446, n=2) | |
| Schenker VISION 16 Pro (M23) | |
| Média da turma Multimedia (26062 - 130368, n=56, últimos 2 anos) | |
| 7-Zip 18.03 / 7z b 4 -mmt1 | |
| Asus ProArt Studiobook 16 OLED H7604 | |
| Asus Vivobook Pro 16X K6604JV-MX016W | |
| Schenker VISION 16 Pro (M23) | |
| MSI Stealth 16 Studio A13VG | |
| Média Intel Core i7-13705H (5924 - 6075, n=2) | |
| Lenovo Yoga Pro 9 16-IRP G8 | |
| Média da turma Multimedia (3666 - 7545, n=57, últimos 2 anos) | |
| Geekbench 5.5 / Multi-Core | |
| Asus ProArt Studiobook 16 OLED H7604 | |
| Asus Vivobook Pro 16X K6604JV-MX016W | |
| Apple MacBook Pro 16 2023 M2 Max | |
| Lenovo Yoga Pro 9 16-IRP G8 | |
| Média Intel Core i7-13705H (14124 - 14521, n=2) | |
| MSI Stealth 16 Studio A13VG | |
| Média da turma Multimedia (4652 - 20422, n=57, últimos 2 anos) | |
| Schenker VISION 16 Pro (M23) | |
| Geekbench 5.5 / Single-Core | |
| Asus ProArt Studiobook 16 OLED H7604 | |
| Asus Vivobook Pro 16X K6604JV-MX016W | |
| Apple MacBook Pro 16 2023 M2 Max | |
| Média da turma Multimedia (805 - 2974, n=57, últimos 2 anos) | |
| Schenker VISION 16 Pro (M23) | |
| Média Intel Core i7-13705H (1791 - 1891, n=2) | |
| MSI Stealth 16 Studio A13VG | |
| Lenovo Yoga Pro 9 16-IRP G8 | |
| HWBOT x265 Benchmark v2.2 / 4k Preset | |
| Asus ProArt Studiobook 16 OLED H7604 | |
| Asus Vivobook Pro 16X K6604JV-MX016W | |
| Lenovo Yoga Pro 9 16-IRP G8 | |
| Média Intel Core i7-13705H (18.9 - 21.3, n=2) | |
| MSI Stealth 16 Studio A13VG | |
| Média da turma Multimedia (5.26 - 36.1, n=57, últimos 2 anos) | |
| Schenker VISION 16 Pro (M23) | |
| LibreOffice / 20 Documents To PDF | |
| MSI Stealth 16 Studio A13VG | |
| Asus Vivobook Pro 16X K6604JV-MX016W | |
| Média da turma Multimedia (23.9 - 146.7, n=58, últimos 2 anos) | |
| Lenovo Yoga Pro 9 16-IRP G8 | |
| Schenker VISION 16 Pro (M23) | |
| Média Intel Core i7-13705H (47.4 - 47.7, n=2) | |
| Asus ProArt Studiobook 16 OLED H7604 | |
| R Benchmark 2.5 / Overall mean | |
| Média da turma Multimedia (0.3604 - 0.947, n=57, últimos 2 anos) | |
| Lenovo Yoga Pro 9 16-IRP G8 | |
| MSI Stealth 16 Studio A13VG | |
| Média Intel Core i7-13705H (0.4305 - 0.4571, n=2) | |
| Schenker VISION 16 Pro (M23) | |
| Asus Vivobook Pro 16X K6604JV-MX016W | |
| Asus ProArt Studiobook 16 OLED H7604 | |
* ... menor é melhor
AIDA64: FP32 Ray-Trace | FPU Julia | CPU SHA3 | CPU Queen | FPU SinJulia | FPU Mandel | CPU AES | CPU ZLib | FP64 Ray-Trace | CPU PhotoWorxx
| Performance rating | |
| Asus ProArt Studiobook 16 OLED H7604 | |
| Asus Vivobook Pro 16X K6604JV-MX016W | |
| Lenovo Yoga Pro 9 16-IRP G8 | |
| Média Intel Core i7-13705H | |
| MSI Stealth 16 Studio A13VG | |
| Média da turma Multimedia | |
| Schenker VISION 16 Pro (M23) | |
| AIDA64 / FP32 Ray-Trace | |
| Asus ProArt Studiobook 16 OLED H7604 | |
| Asus Vivobook Pro 16X K6604JV-MX016W | |
| MSI Stealth 16 Studio A13VG | |
| Lenovo Yoga Pro 9 16-IRP G8 | |
| Média da turma Multimedia (2214 - 50388, n=54, últimos 2 anos) | |
| Média Intel Core i7-13705H (16297 - 17568, n=2) | |
| Schenker VISION 16 Pro (M23) | |
| AIDA64 / FPU Julia | |
| Asus ProArt Studiobook 16 OLED H7604 | |
| Asus Vivobook Pro 16X K6604JV-MX016W | |
| Lenovo Yoga Pro 9 16-IRP G8 | |
| Média Intel Core i7-13705H (80950 - 92250, n=2) | |
| Média da turma Multimedia (12867 - 201874, n=55, últimos 2 anos) | |
| MSI Stealth 16 Studio A13VG | |
| Schenker VISION 16 Pro (M23) | |
| AIDA64 / CPU SHA3 | |
| Asus ProArt Studiobook 16 OLED H7604 | |
| Asus Vivobook Pro 16X K6604JV-MX016W | |
| Lenovo Yoga Pro 9 16-IRP G8 | |
| MSI Stealth 16 Studio A13VG | |
| Média Intel Core i7-13705H (3673 - 4189, n=2) | |
| Média da turma Multimedia (626 - 8623, n=55, últimos 2 anos) | |
| Schenker VISION 16 Pro (M23) | |
| AIDA64 / CPU Queen | |
| Asus ProArt Studiobook 16 OLED H7604 | |
| Asus Vivobook Pro 16X K6604JV-MX016W | |
| Lenovo Yoga Pro 9 16-IRP G8 | |
| Média Intel Core i7-13705H (106151 - 106736, n=2) | |
| MSI Stealth 16 Studio A13VG | |
| Schenker VISION 16 Pro (M23) | |
| Média da turma Multimedia (13483 - 181505, n=42, últimos 2 anos) | |
| AIDA64 / FPU SinJulia | |
| Asus ProArt Studiobook 16 OLED H7604 | |
| Asus Vivobook Pro 16X K6604JV-MX016W | |
| Lenovo Yoga Pro 9 16-IRP G8 | |
| MSI Stealth 16 Studio A13VG | |
| Média Intel Core i7-13705H (10635 - 11077, n=2) | |
| Schenker VISION 16 Pro (M23) | |
| Média da turma Multimedia (886 - 28794, n=55, últimos 2 anos) | |
| AIDA64 / FPU Mandel | |
| Asus ProArt Studiobook 16 OLED H7604 | |
| Asus Vivobook Pro 16X K6604JV-MX016W | |
| MSI Stealth 16 Studio A13VG | |
| Lenovo Yoga Pro 9 16-IRP G8 | |
| Média da turma Multimedia (6395 - 105740, n=54, últimos 2 anos) | |
| Média Intel Core i7-13705H (40508 - 42686, n=2) | |
| Schenker VISION 16 Pro (M23) | |
| AIDA64 / CPU AES | |
| Asus ProArt Studiobook 16 OLED H7604 | |
| Asus Vivobook Pro 16X K6604JV-MX016W | |
| Lenovo Yoga Pro 9 16-IRP G8 | |
| MSI Stealth 16 Studio A13VG | |
| Média Intel Core i7-13705H (75651 - 85118, n=2) | |
| Schenker VISION 16 Pro (M23) | |
| Média da turma Multimedia (8171 - 126790, n=55, últimos 2 anos) | |
| AIDA64 / CPU ZLib | |
| Asus ProArt Studiobook 16 OLED H7604 | |
| Asus Vivobook Pro 16X K6604JV-MX016W | |
| Lenovo Yoga Pro 9 16-IRP G8 | |
| Média Intel Core i7-13705H (1126 - 1226, n=2) | |
| MSI Stealth 16 Studio A13VG | |
| Média da turma Multimedia (143.8 - 2022, n=55, últimos 2 anos) | |
| Schenker VISION 16 Pro (M23) | |
| AIDA64 / FP64 Ray-Trace | |
| Asus ProArt Studiobook 16 OLED H7604 | |
| Asus Vivobook Pro 16X K6604JV-MX016W | |
| MSI Stealth 16 Studio A13VG | |
| Média da turma Multimedia (1014 - 26875, n=55, últimos 2 anos) | |
| Lenovo Yoga Pro 9 16-IRP G8 | |
| Média Intel Core i7-13705H (8846 - 9166, n=2) | |
| Schenker VISION 16 Pro (M23) | |
| AIDA64 / CPU PhotoWorxx | |
| Lenovo Yoga Pro 9 16-IRP G8 | |
| Média Intel Core i7-13705H (51796 - 52257, n=2) | |
| Média da turma Multimedia (8187 - 88154, n=55, últimos 2 anos) | |
| Asus ProArt Studiobook 16 OLED H7604 | |
| MSI Stealth 16 Studio A13VG | |
| Schenker VISION 16 Pro (M23) | |
| Asus Vivobook Pro 16X K6604JV-MX016W | |
Desempenho do sistema
Os valores de desempenho nos benchmarks sintéticos são muito bons, embora os notebooks concorrentes também estejam em um nível geral muito semelhante. No uso diário, o laptop é sempre suave e responsivo. Também não houve problemas durante os testes.
CrossMark: Overall | Productivity | Creativity | Responsiveness
| PCMark 10 / Score | |
| Média da turma Multimedia (4325 - 10386, n=53, últimos 2 anos) | |
| Asus ProArt Studiobook 16 OLED H7604 | |
| Schenker VISION 16 Pro (M23) | |
| MSI Stealth 16 Studio A13VG | |
| Lenovo Yoga Pro 9 16-IRP G8 | |
| Média Intel Core i7-13705H, NVIDIA GeForce RTX 4060 Laptop GPU (n=1) | |
| Asus Vivobook Pro 16X K6604JV-MX016W | |
| PCMark 10 / Essentials | |
| Lenovo Yoga Pro 9 16-IRP G8 | |
| Média Intel Core i7-13705H, NVIDIA GeForce RTX 4060 Laptop GPU (n=1) | |
| Asus ProArt Studiobook 16 OLED H7604 | |
| Schenker VISION 16 Pro (M23) | |
| Asus Vivobook Pro 16X K6604JV-MX016W | |
| Média da turma Multimedia (8025 - 11664, n=52, últimos 2 anos) | |
| MSI Stealth 16 Studio A13VG | |
| PCMark 10 / Productivity | |
| Média da turma Multimedia (7323 - 18233, n=52, últimos 2 anos) | |
| Asus ProArt Studiobook 16 OLED H7604 | |
| Schenker VISION 16 Pro (M23) | |
| MSI Stealth 16 Studio A13VG | |
| Asus Vivobook Pro 16X K6604JV-MX016W | |
| Lenovo Yoga Pro 9 16-IRP G8 | |
| Média Intel Core i7-13705H, NVIDIA GeForce RTX 4060 Laptop GPU (n=1) | |
| PCMark 10 / Digital Content Creation | |
| MSI Stealth 16 Studio A13VG | |
| Lenovo Yoga Pro 9 16-IRP G8 | |
| Média Intel Core i7-13705H, NVIDIA GeForce RTX 4060 Laptop GPU (n=1) | |
| Schenker VISION 16 Pro (M23) | |
| Asus ProArt Studiobook 16 OLED H7604 | |
| Média da turma Multimedia (3651 - 16240, n=52, últimos 2 anos) | |
| Asus Vivobook Pro 16X K6604JV-MX016W | |
| CrossMark / Overall | |
| Asus ProArt Studiobook 16 OLED H7604 | |
| Asus Vivobook Pro 16X K6604JV-MX016W | |
| Apple MacBook Pro 16 2023 M2 Max | |
| Schenker VISION 16 Pro (M23) | |
| Média da turma Multimedia (866 - 2728, n=61, últimos 2 anos) | |
| Lenovo Yoga Pro 9 16-IRP G8 | |
| Média Intel Core i7-13705H, NVIDIA GeForce RTX 4060 Laptop GPU (n=1) | |
| MSI Stealth 16 Studio A13VG | |
| CrossMark / Productivity | |
| Asus ProArt Studiobook 16 OLED H7604 | |
| Asus Vivobook Pro 16X K6604JV-MX016W | |
| Schenker VISION 16 Pro (M23) | |
| Média da turma Multimedia (931 - 2489, n=61, últimos 2 anos) | |
| MSI Stealth 16 Studio A13VG | |
| Lenovo Yoga Pro 9 16-IRP G8 | |
| Média Intel Core i7-13705H, NVIDIA GeForce RTX 4060 Laptop GPU (n=1) | |
| Apple MacBook Pro 16 2023 M2 Max | |
| CrossMark / Creativity | |
| Apple MacBook Pro 16 2023 M2 Max | |
| Asus ProArt Studiobook 16 OLED H7604 | |
| Asus Vivobook Pro 16X K6604JV-MX016W | |
| Média da turma Multimedia (907 - 3465, n=61, últimos 2 anos) | |
| Lenovo Yoga Pro 9 16-IRP G8 | |
| Média Intel Core i7-13705H, NVIDIA GeForce RTX 4060 Laptop GPU (n=1) | |
| Schenker VISION 16 Pro (M23) | |
| MSI Stealth 16 Studio A13VG | |
| CrossMark / Responsiveness | |
| Asus ProArt Studiobook 16 OLED H7604 | |
| Schenker VISION 16 Pro (M23) | |
| Asus Vivobook Pro 16X K6604JV-MX016W | |
| MSI Stealth 16 Studio A13VG | |
| Lenovo Yoga Pro 9 16-IRP G8 | |
| Média Intel Core i7-13705H, NVIDIA GeForce RTX 4060 Laptop GPU (n=1) | |
| Média da turma Multimedia (605 - 2024, n=61, últimos 2 anos) | |
| Apple MacBook Pro 16 2023 M2 Max | |
| PCMark 10 Score | 7301 pontos | |
Ajuda | ||
| AIDA64 / Memory Copy | |
| Média da turma Multimedia (11299 - 132135, n=55, últimos 2 anos) | |
| Média Intel Core i7-13705H (78047 - 79495, n=2) | |
| Lenovo Yoga Pro 9 16-IRP G8 | |
| Asus ProArt Studiobook 16 OLED H7604 | |
| MSI Stealth 16 Studio A13VG | |
| Asus Vivobook Pro 16X K6604JV-MX016W | |
| Schenker VISION 16 Pro (M23) | |
| AIDA64 / Memory Read | |
| Média da turma Multimedia (11624 - 174586, n=55, últimos 2 anos) | |
| Lenovo Yoga Pro 9 16-IRP G8 | |
| Asus ProArt Studiobook 16 OLED H7604 | |
| Asus Vivobook Pro 16X K6604JV-MX016W | |
| Média Intel Core i7-13705H (72741 - 77976, n=2) | |
| MSI Stealth 16 Studio A13VG | |
| Schenker VISION 16 Pro (M23) | |
| AIDA64 / Memory Write | |
| Lenovo Yoga Pro 9 16-IRP G8 | |
| Média Intel Core i7-13705H (90999 - 95196, n=2) | |
| Média da turma Multimedia (11755 - 134998, n=55, últimos 2 anos) | |
| Asus ProArt Studiobook 16 OLED H7604 | |
| MSI Stealth 16 Studio A13VG | |
| Asus Vivobook Pro 16X K6604JV-MX016W | |
| Schenker VISION 16 Pro (M23) | |
| AIDA64 / Memory Latency | |
| Média da turma Multimedia (7 - 535, n=54, últimos 2 anos) | |
| Lenovo Yoga Pro 9 16-IRP G8 | |
| Média Intel Core i7-13705H (93.9 - 115, n=2) | |
| Asus Vivobook Pro 16X K6604JV-MX016W | |
| MSI Stealth 16 Studio A13VG | |
| Asus ProArt Studiobook 16 OLED H7604 | |
| Schenker VISION 16 Pro (M23) | |
* ... menor é melhor
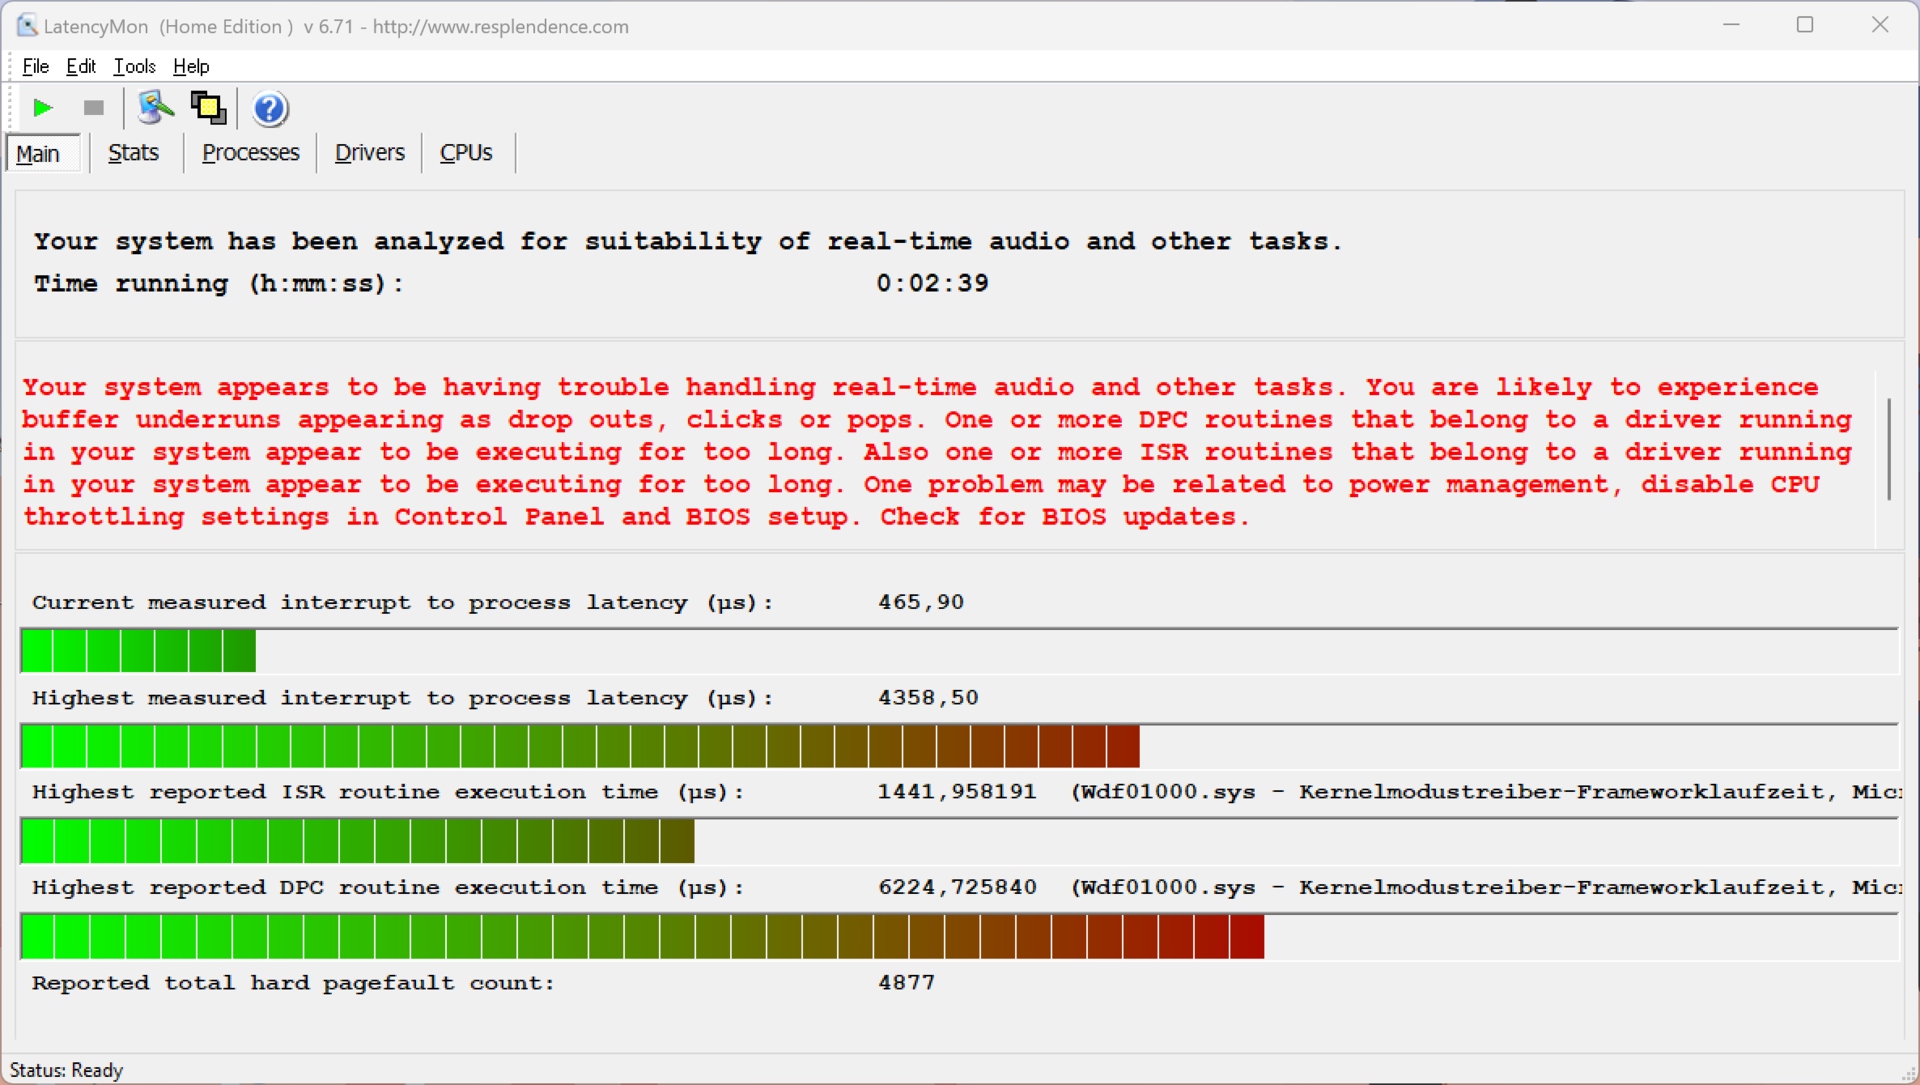
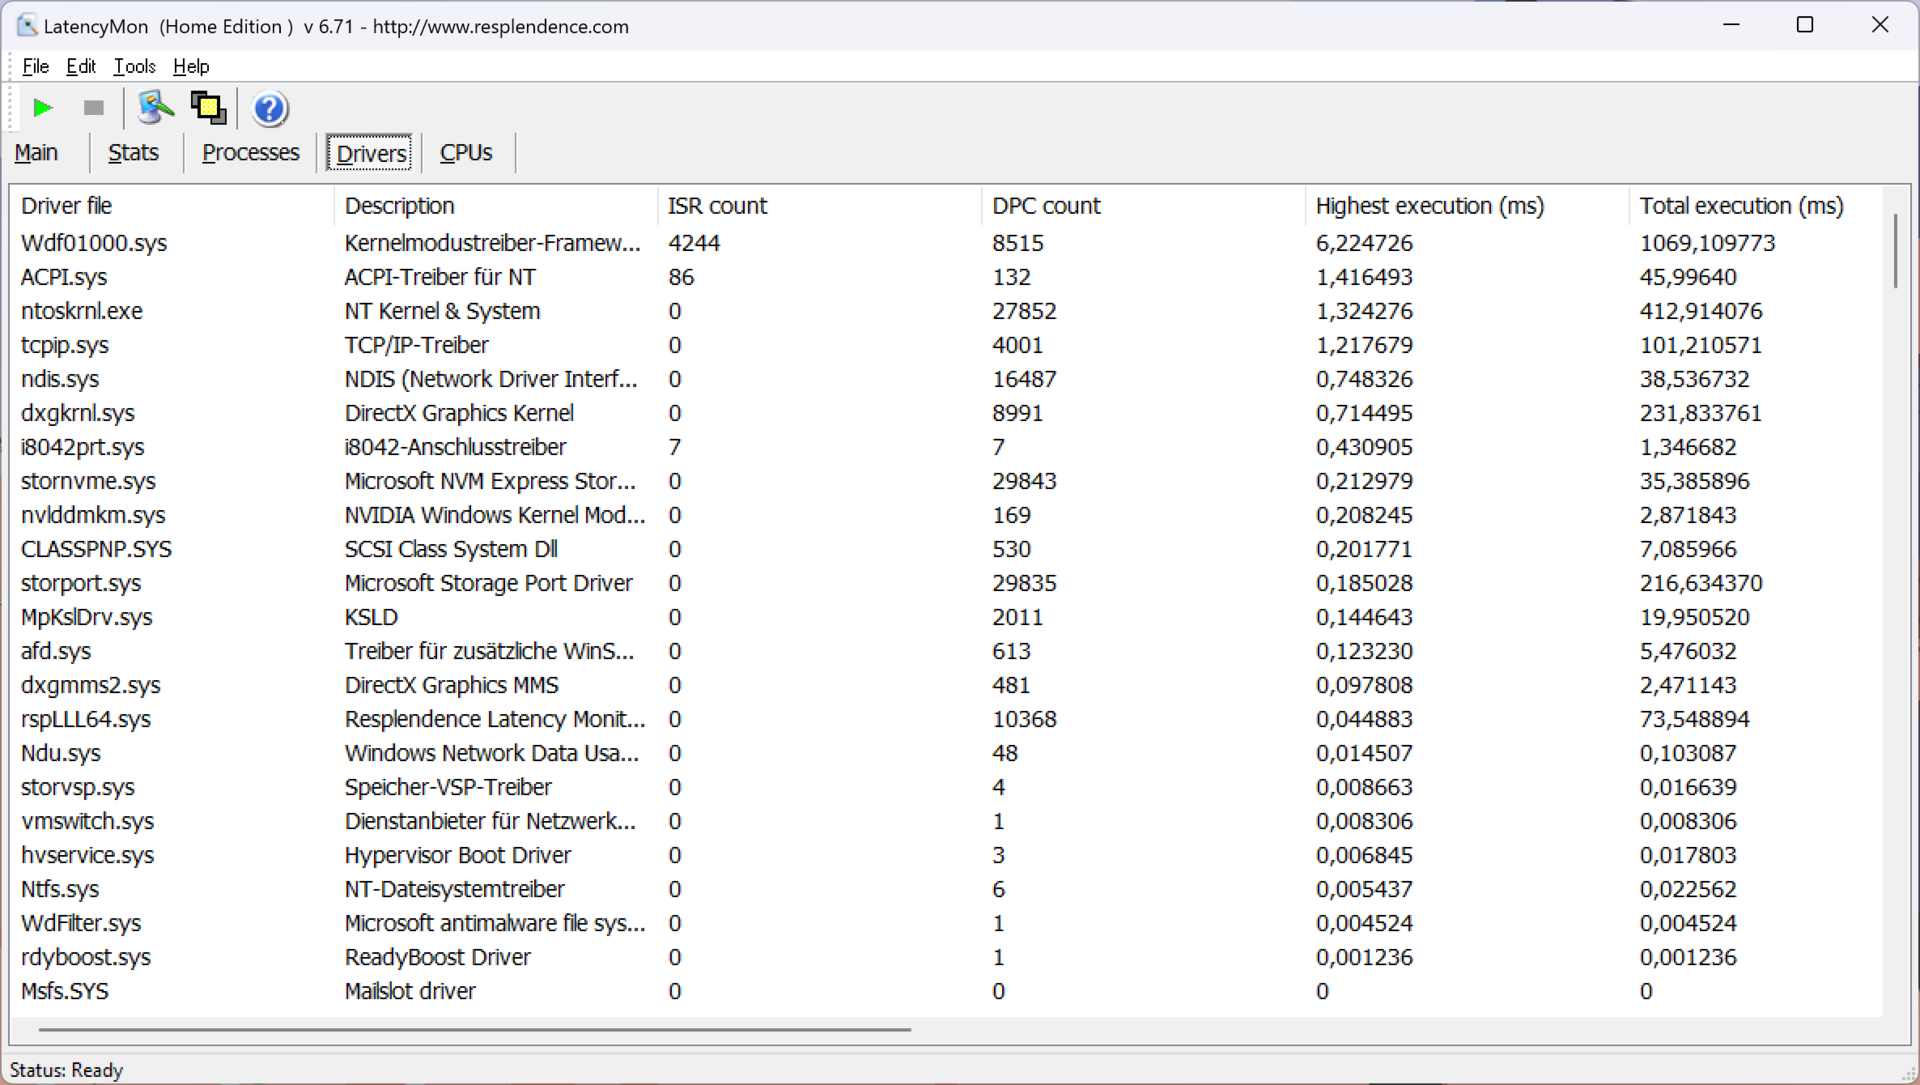
Latência DPC
Nossa unidade de teste revelou restrições significativas em nosso teste de latência padronizado (navegação na Web, reprodução em 4K no YouTube, carga da CPU) com a versão atual do BIOS e, portanto, não é adequada para aplicativos de áudio em tempo real.
| DPC Latencies / LatencyMon - interrupt to process latency (max), Web, Youtube, Prime95 | |
| MSI Stealth 16 Studio A13VG | |
| Lenovo Yoga Pro 9 16-IRP G8 | |
| Asus Vivobook Pro 16X K6604JV-MX016W | |
| Asus ProArt Studiobook 16 OLED H7604 | |
| Schenker VISION 16 Pro (M23) | |
* ... menor é melhor
Dispositivos de armazenamento
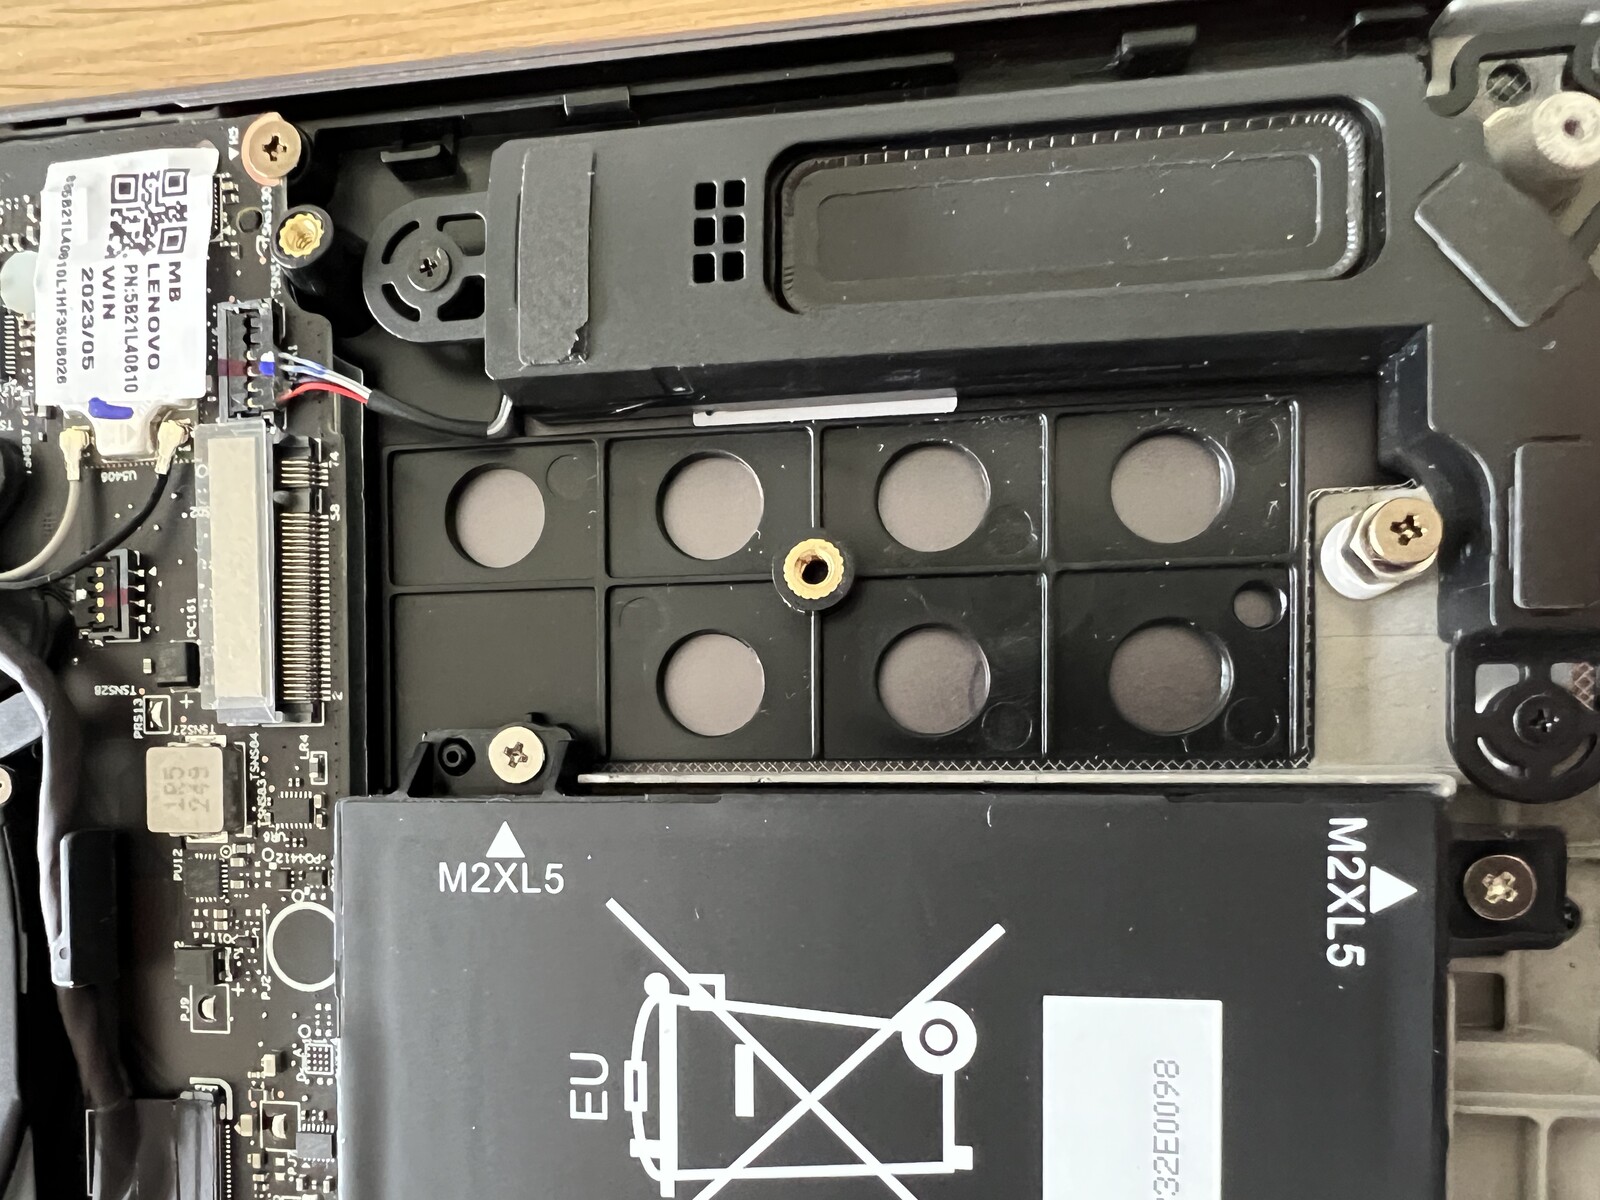
A Lenovo usa o espaço extra do chassi de 16 polegadas para um segundo slot M.2, que, no entanto, suporta apenas PCIe 3.0 x4. O slot principal é conectado via PCIe-4.0, e a versão de 1 TB do Samsung PM9A1 (versão OEM do 980 Pro) está instalada em nosso dispositivo de teste. Após a primeira inicialização, o usuário tem 891 GB disponíveis. As taxas de transferência são muito boas no geral e o desempenho permanece estável sob carga prolongada, o que nem sempre é garantido com as unidades modernas. No entanto, o sucessor do 990 Pro (consulteSchenker Vision 16 Pro) mais uma vez oferece vantagens significativas em acessos aleatórios. Mais benchmarks de SSD estão disponíveis aqui.

* ... menor é melhor
Sustained Read Performance: DiskSpd Read Loop, Queue Depth 8
Placa gráfica
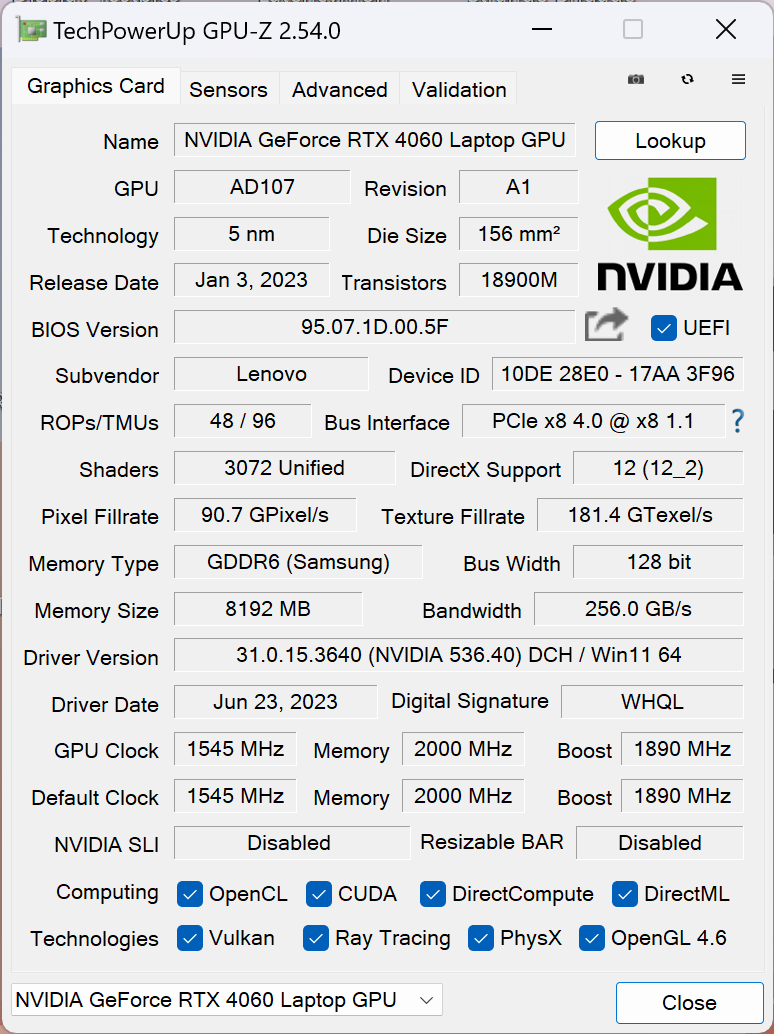
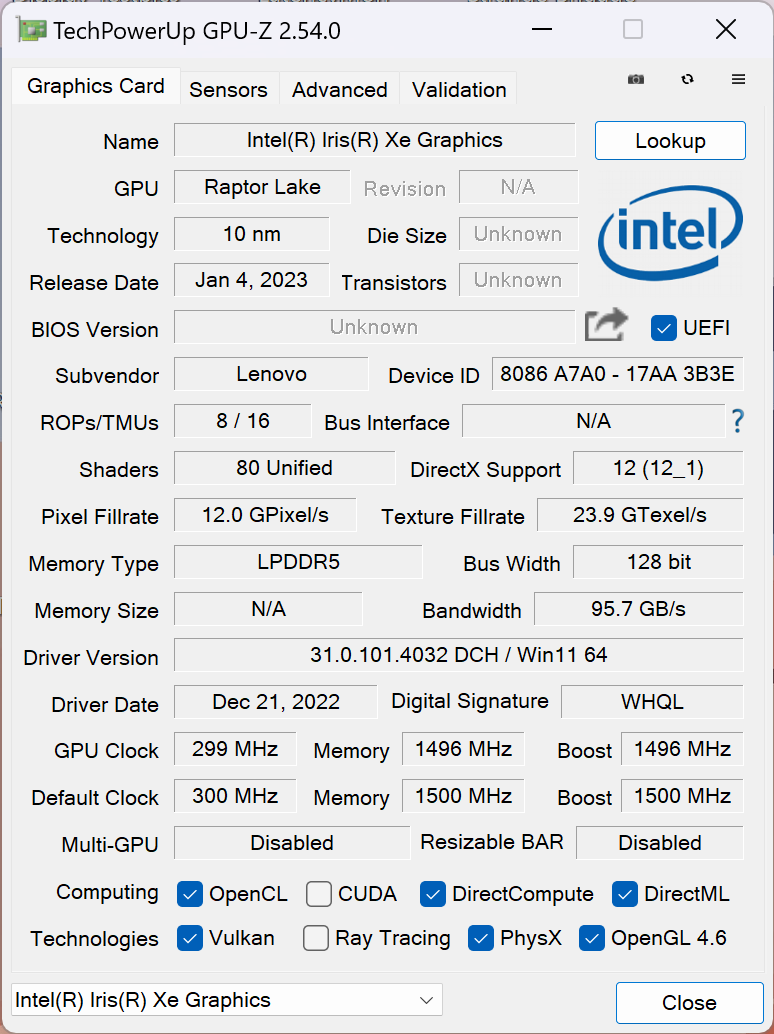
A placa de vídeo integrada do processadorIris Xe Graphics G7do processador lida com o processamento gráfico para tarefas simples, e a GPU dedicada GeForce só assume o controle em tarefas mais exigentes (por exemplo, jogos). Em contraste com o Yoga Pro 9i 14a Lenovo não usa o Advanced Optimus aqui e não há nenhum interruptor MUX para ignorar completamente a iGPU. Isso não é incomum para um portátil multimídia, mas estamos surpresos com a diferença em comparação com seu irmão menor, que está melhor equipado nesse aspecto.
Nossa unidade de teste está equipada com aGeForce RTX 4060que é a versão de 100 watts. Teoricamente, existem modelos muito mais rápidos, mas é preciso ter cuidado, pois, de acordo com nosso teste, a 4060 só consome no máximo 105 watts durante os jogos. Somente em testes sintéticos, como o Furmark, o consumo é maior. Portanto, uma RTX 4060 com um TGP de 140 watts não traz realmente nenhuma vantagem sobre a versão de 100 watts do Yoga Pro 9i para jogos, por exemplo, nem a RTX 4070.
No geral, os resultados são muito bons e o Yoga também está um pouco à frente dos resultados médios da RTX 4060 em nosso banco de dados. A GPU pode até ser submetida a overclock no aplicativo Vantage. Aqueles que optarem pelo Yoga com a RTX 4070 podem esperar um aumento de desempenho de cerca de 15 a 20%. Sob carga contínua, o desempenho da GPU permanece estável. Quando desconectado (TGP máximo de 68 watts), o desempenho é cerca de 18% menor. Mais benchmarks de GPU estão listados aqui.
| Geekbench 6.7 - GPU OpenCL | |
| Média NVIDIA GeForce RTX 4060 Laptop GPU (76525 - 100831, n=39) | |
| Lenovo Yoga Pro 9 16-IRP G8 | |
| Média da turma Multimedia (9994 - 187922, n=68, últimos 2 anos) | |
| 3DMark 11 Performance | 30821 pontos | |
| 3DMark Fire Strike Score | 23225 pontos | |
| 3DMark Time Spy Score | 10393 pontos | |
Ajuda | ||
| Blender / v3.3 Classroom OPTIX/RTX | |
| Média da turma Multimedia (12 - 105, n=22, últimos 2 anos) | |
| Asus Vivobook Pro 16X K6604JV-MX016W | |
| Lenovo Yoga Pro 9 16-IRP G8 | |
| MSI Stealth 16 Studio A13VG | |
| Schenker VISION 16 Pro (M23) | |
| Média NVIDIA GeForce RTX 4060 Laptop GPU (19 - 28, n=53) | |
| Asus ProArt Studiobook 16 OLED H7604 | |
| Lenovo Yoga Pro 9i RTX4070 | |
| Blender / v3.3 Classroom CUDA | |
| Média da turma Multimedia (20 - 186, n=22, últimos 2 anos) | |
| Asus Vivobook Pro 16X K6604JV-MX016W | |
| Lenovo Yoga Pro 9 16-IRP G8 | |
| Média NVIDIA GeForce RTX 4060 Laptop GPU (39 - 53, n=53) | |
| MSI Stealth 16 Studio A13VG | |
| Asus ProArt Studiobook 16 OLED H7604 | |
| Schenker VISION 16 Pro (M23) | |
| Blender / v3.3 Classroom METAL | |
| Apple MacBook Pro 16 2023 M2 Max | |
| Média da turma Multimedia (17.8 - 68, n=5, últimos 2 anos) | |
| Blender / v3.3 Classroom CPU | |
| Média da turma Multimedia (134.5 - 1042, n=63, últimos 2 anos) | |
| Schenker VISION 16 Pro (M23) | |
| Apple MacBook Pro 16 2023 M2 Max | |
| Média NVIDIA GeForce RTX 4060 Laptop GPU (189 - 452, n=53) | |
| Lenovo Yoga Pro 9 16-IRP G8 | |
| Lenovo Yoga Pro 9i RTX4070 | |
| MSI Stealth 16 Studio A13VG | |
| Asus Vivobook Pro 16X K6604JV-MX016W | |
| Asus ProArt Studiobook 16 OLED H7604 | |
* ... menor é melhor
Desempenho em jogos
O desempenho em jogos está praticamente de acordo com nossas expectativas, de modo que o Yoga Pro 9i 16 é capaz de executar títulos modernos muito bem e, normalmente, você pode selecionar a resolução QHD com o máximo de detalhes. Somente títulos muito exigentes, como Star Wars Jedi Survivor ou F1 2023 (em que o traçado de raios já está ativo), fazem com que o notebook tenha dificuldades. Nesse caso, é necessário reduzir os detalhes ou usar o upsampling (por exemplo, DLSS) para aumentar a taxa de quadros. O desempenho permanece completamente estável durante longas sessões de jogos.
| The Witcher 3 - 1920x1080 Ultra Graphics & Postprocessing (HBAO+) | |
| Lenovo Yoga Pro 9i RTX4070 | |
| MSI Stealth 16 Studio A13VG | |
| Asus ProArt Studiobook 16 OLED H7604 | |
| Schenker VISION 16 Pro (M23) | |
| Asus Vivobook Pro 16X K6604JV-MX016W | |
| Lenovo Yoga Pro 9 16-IRP G8 | |
| Média da turma Multimedia (11 - 121, n=8, últimos 2 anos) | |
Witcher 3 FPS chart
| baixo | média | alto | ultra | QHD | |
|---|---|---|---|---|---|
| GTA V (2015) | 175.9 | 169.4 | 107.4 | 84.1 | |
| The Witcher 3 (2015) | 203 | 90.8 | |||
| Dota 2 Reborn (2015) | 170.8 | 156.4 | 148.5 | 142.3 | |
| Final Fantasy XV Benchmark (2018) | 186 | 134.6 | 95.7 | 70.6 | |
| X-Plane 11.11 (2018) | 145.9 | 127.4 | 98.3 | ||
| Far Cry 5 (2018) | 166 | 146 | 136 | 127 | 97 |
| Strange Brigade (2018) | 265 | 214 | 184.1 | 123.7 | |
| F1 2021 (2021) | 274 | 221 | 123.2 | 92.4 | |
| Cyberpunk 2077 1.6 (2022) | 114 | 94 | 82 | 75 | 54 |
| F1 22 (2022) | 220 | 218 | 160 | 62.7 | 40 |
| Star Wars Jedi Survivor (2023) | 75 | 68 | 62 | 60 | 38 |
| F1 23 (2023) | 227 | 225 | 172.7 | 54.1 | 34.2 |
Emissões - Excelentes alto-falantes no Yoga Pro 9i 16
Ruído
O volume dos dois ventiladores depende muito do modo de desempenho escolhido. Sempre recomendamos o uso do modo de economia de bateria para tarefas cotidianas, pois as ventoinhas geralmente são desativadas nesse modo. Os ventiladores iniciam muito rapidamente, especialmente no modo de alto desempenho, o que pode ser irritante no uso diário. Ele também fica alto rapidamente sob carga e medimos entre 44,5 dB(A) (Smart Cooling) e 53,2 dB(A) (High Performance) durante os jogos, o que é claramente audível. Em ambos os modos, os fones de ouvido são certamente a opção preferível, embora outros concorrentes do Windows também não se saiam melhor aqui. Pelo menos as ventoinhas não pulsam desnecessariamente e não foram detectados outros ruídos eletrônicos.
| Cenário | Bateria | Resfriamento inteligente | Alto desempenho |
|---|---|---|---|
| 3DMark 06 | 31.4dB(A) | 35.4dB(A) | 39.7dB(A) |
| Witcher 3 | 31.4dB(A) | 44,5dB(A) | 53,2dB(A) |
| Teste de estresse | 31,4 dB(A) | 35,4 dB(A) | 53,2 dB(A) |
Barulho
| Ocioso |
| 24.7 / 26.2 / 26.2 dB |
| Carga |
| 39.7 / 53.2 dB |
 | ||
30 dB silencioso 40 dB(A) audível 50 dB(A) ruidosamente alto |
||
min: | ||
| Lenovo Yoga Pro 9 16-IRP G8 GeForce RTX 4060 Laptop GPU, i7-13705H, Samsung PM9A1 MZVL21T0HCLR | Schenker VISION 16 Pro (M23) GeForce RTX 4070 Laptop GPU, i7-13700H, Samsung 990 Pro 1 TB | Asus Vivobook Pro 16X K6604JV-MX016W GeForce RTX 4060 Laptop GPU, i9-13980HX, Solidigm P41 Plus SSDPFKNU010TZ | Asus ProArt Studiobook 16 OLED H7604 GeForce RTX 4070 Laptop GPU, i9-13980HX, Phison EM2804TBMTCB47 | MSI Stealth 16 Studio A13VG GeForce RTX 4070 Laptop GPU, i7-13700H, Micron 3400 2TB MTFDKBA2T0TFH | Apple MacBook Pro 16 2023 M2 Max M2 Max 38-Core GPU, M2 Max, Apple SSD AP2048Z | |
|---|---|---|---|---|---|---|
| Noise | -7% | -11% | -3% | 8% | 12% | |
| desligado / ambiente * (dB) | 24.7 | 25.9 -5% | 25.2 -2% | 24.5 1% | 24 3% | 23.9 3% |
| Idle Minimum * (dB) | 24.7 | 25.9 -5% | 26.6 -8% | 24.5 1% | 24 3% | 23.9 3% |
| Idle Average * (dB) | 26.2 | 25.9 1% | 26.6 -2% | 24.5 6% | 24 8% | 23.9 9% |
| Idle Maximum * (dB) | 26.2 | 32 -22% | 29.2 -11% | 24.5 6% | 24 8% | 23.9 9% |
| Load Average * (dB) | 39.7 | 47.2 -19% | 53.4 -35% | 47.6 -20% | 34.81 12% | 36.6 8% |
| Witcher 3 ultra * (dB) | 53.2 | 53.1 -0% | 55.9 -5% | 44.05 17% | 35.1 34% | |
| Load Maximum * (dB) | 53.2 | 53.1 -0% | 56.9 -7% | 56.7 -7% | 51.57 3% | 43.2 19% |
* ... menor é melhor
Temperatura
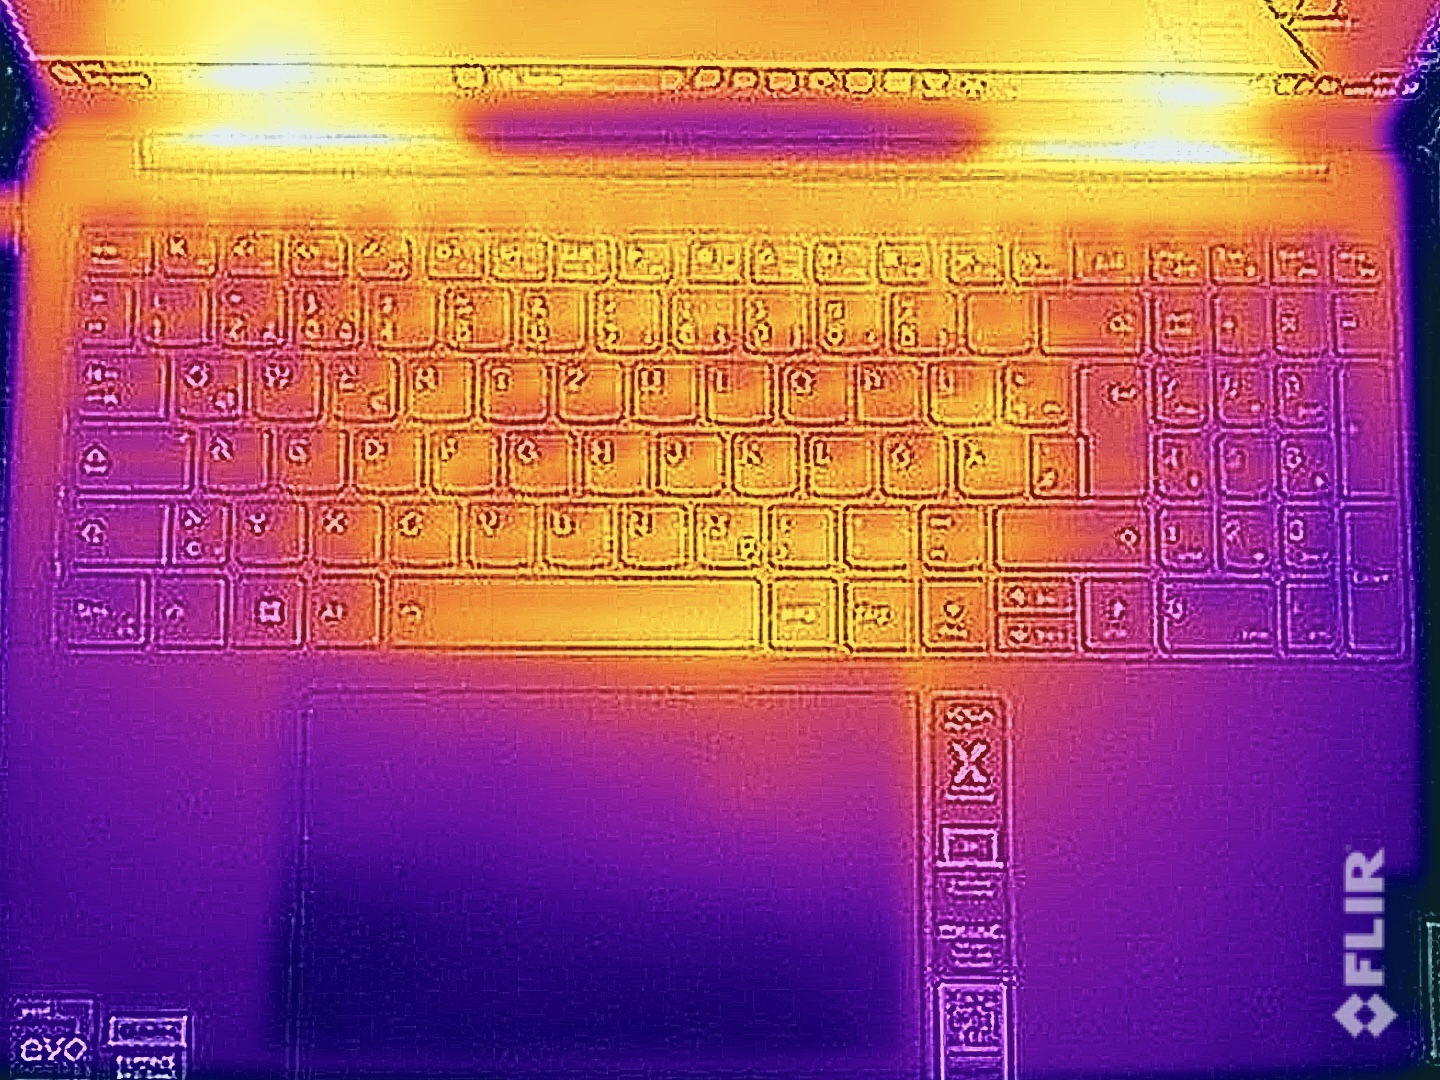
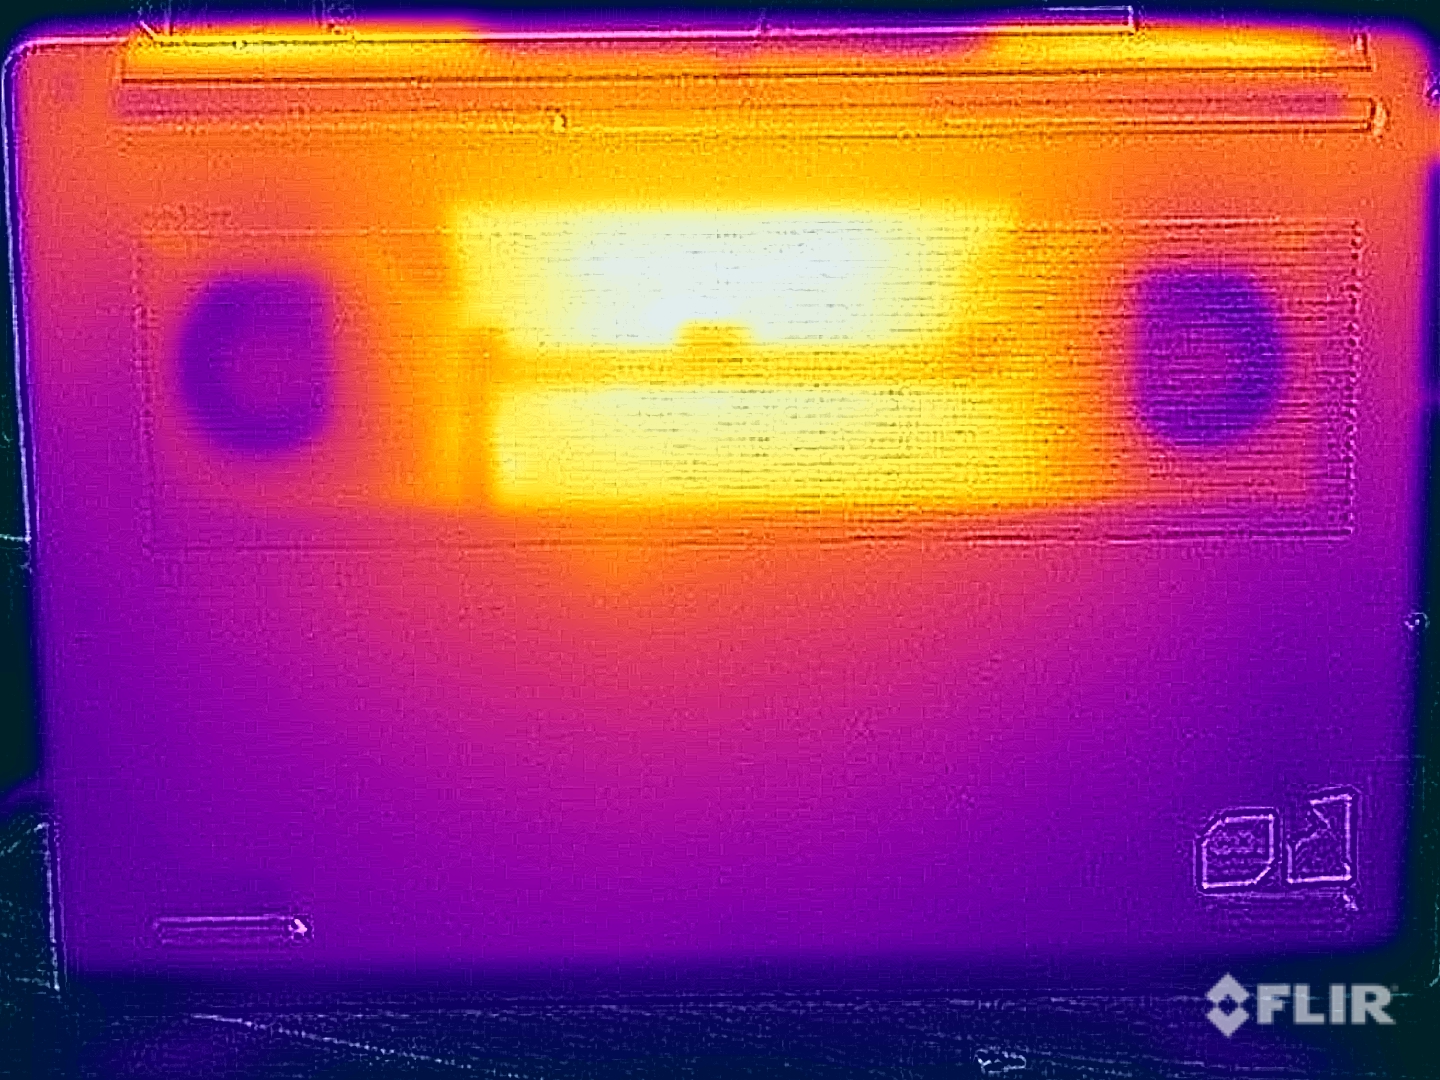
Não há nenhum problema com as temperaturas da superfície no uso diário, mas você não deve colocar o dispositivo no colo sob carga ou enquanto estiver jogando. Medimos até 50 °C na parte inferior, o que pode ser desagradável se entrar em contato com a pele. No entanto, os resultados não são de forma alguma críticos e, em geral, o modelo de 16 polegadas tem um desempenho melhor aqui do que o Yoga Pro 9i 14 menor e a maioria dos concorrentes com Windows. O teclado ainda permanece significativamente mais frio a 35-40 °C, portanto, não há restrições de uso aqui.
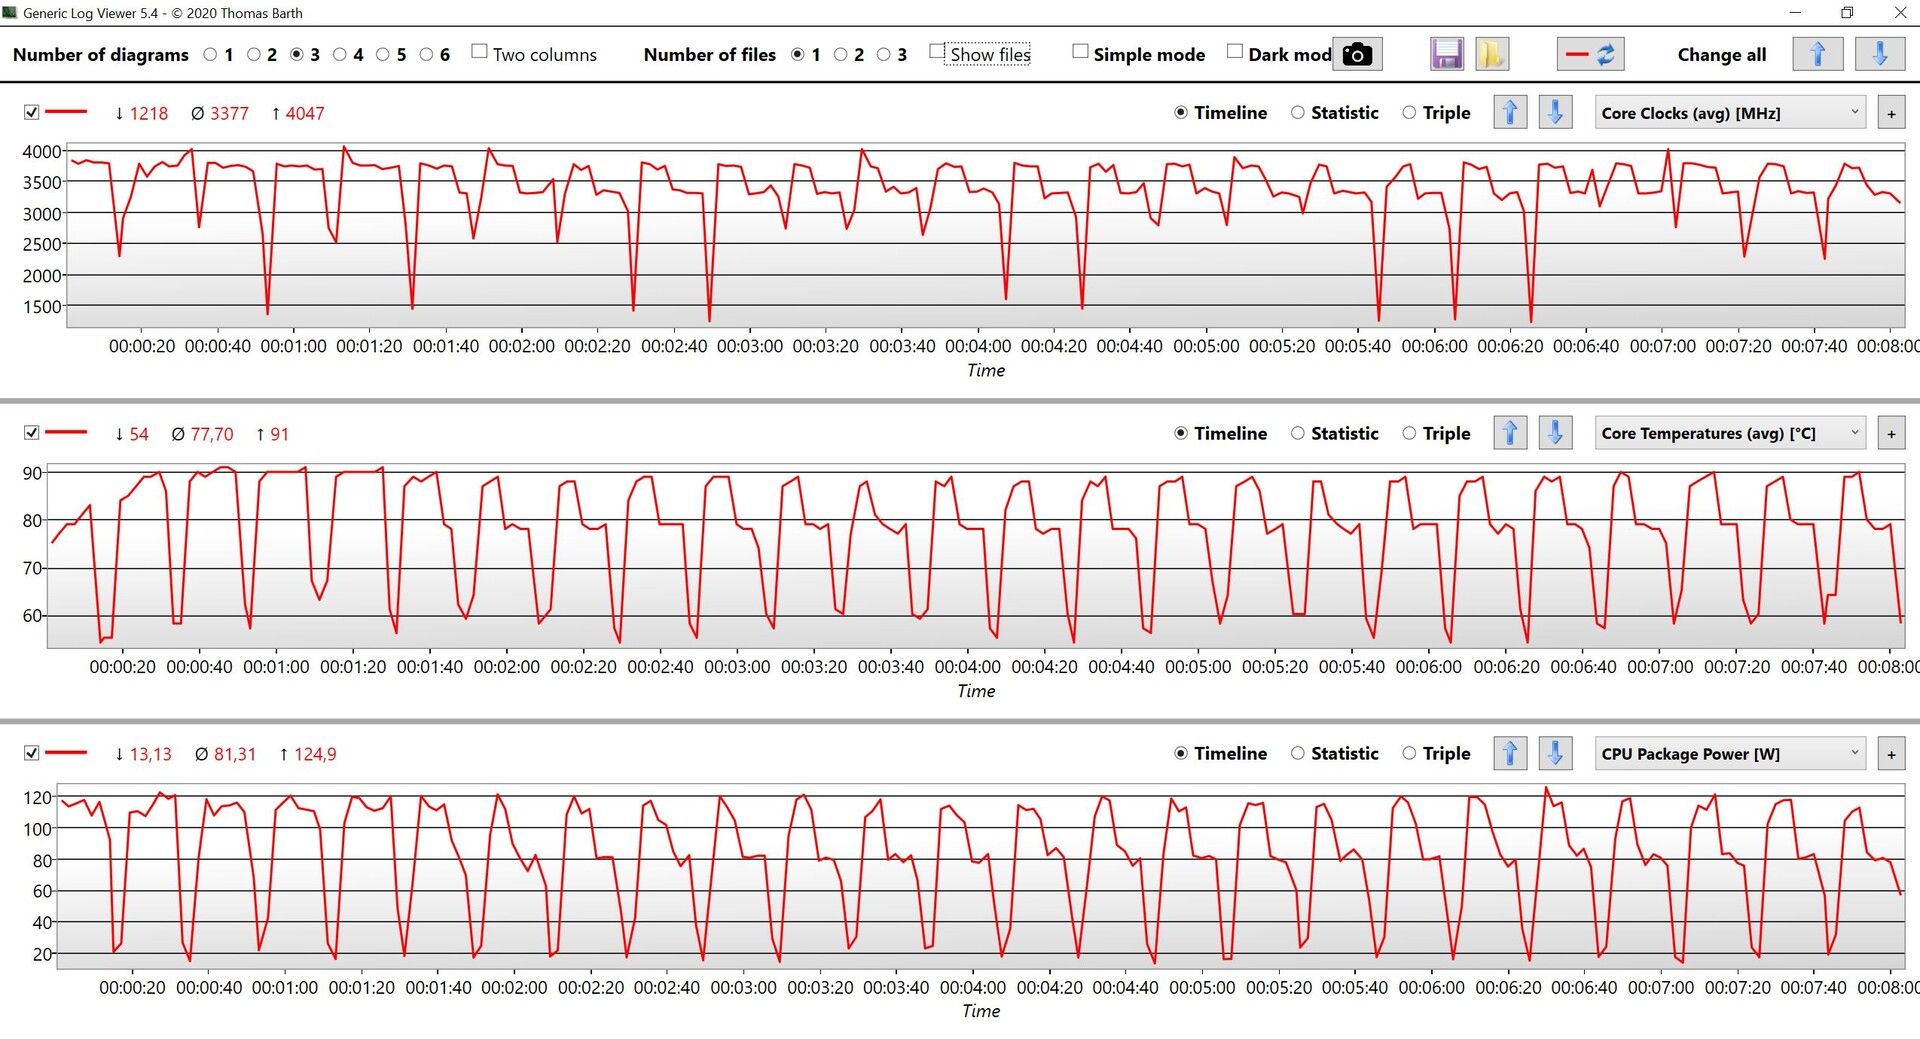
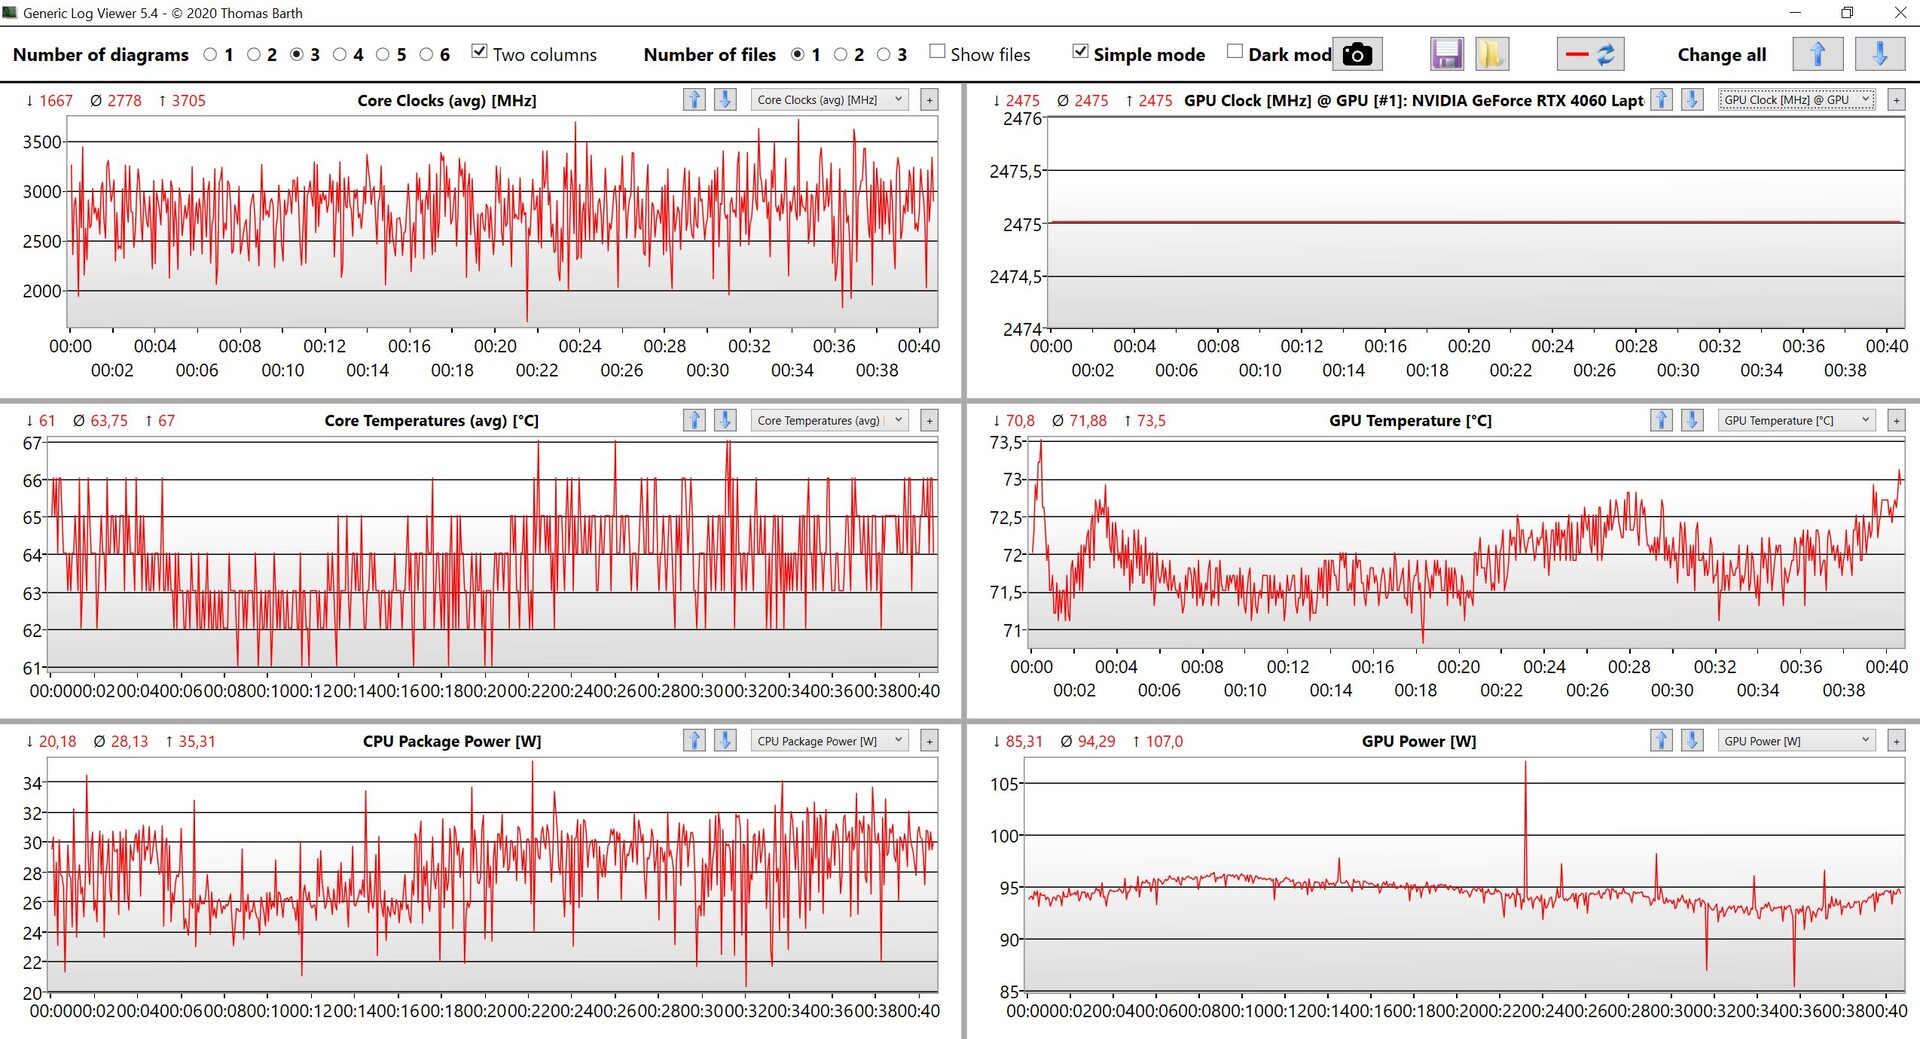
No teste de estresse, a GPU é claramente priorizada pelo sistema e funciona consistentemente com 100 watts, enquanto o processador rapidamente se estabiliza em 30 watts.
(±) A temperatura máxima no lado superior é 41.6 °C / 107 F, em comparação com a média de 36.8 °C / 98 F , variando de 21 a 71 °C para a classe Multimedia.
(-) A parte inferior aquece até um máximo de 50 °C / 122 F, em comparação com a média de 39.1 °C / 102 F
(+) Em uso inativo, a temperatura média para o lado superior é 26.4 °C / 80 F, em comparação com a média do dispositivo de 31.3 °C / ### class_avg_f### F.
(±) Jogando The Witcher 3, a temperatura média para o lado superior é 35.6 °C / 96 F, em comparação com a média do dispositivo de 31.3 °C / ## #class_avg_f### F.
(+) Os apoios para as mãos e o touchpad estão atingindo a temperatura máxima da pele (34.9 °C / 94.8 F) e, portanto, não estão quentes.
(-) A temperatura média da área do apoio para as mãos de dispositivos semelhantes foi 28.7 °C / 83.7 F (-6.2 °C / -11.1 F).
| Lenovo Yoga Pro 9 16-IRP G8 Intel Core i7-13705H, NVIDIA GeForce RTX 4060 Laptop GPU | Schenker VISION 16 Pro (M23) Intel Core i7-13700H, NVIDIA GeForce RTX 4070 Laptop GPU | Asus Vivobook Pro 16X K6604JV-MX016W Intel Core i9-13980HX, NVIDIA GeForce RTX 4060 Laptop GPU | Asus ProArt Studiobook 16 OLED H7604 Intel Core i9-13980HX, NVIDIA GeForce RTX 4070 Laptop GPU | MSI Stealth 16 Studio A13VG Intel Core i7-13700H, NVIDIA GeForce RTX 4070 Laptop GPU | Apple MacBook Pro 16 2023 M2 Max Apple M2 Max, Apple M2 Max 38-Core GPU | |
|---|---|---|---|---|---|---|
| Heat | -4% | -14% | -12% | -36% | 11% | |
| Maximum Upper Side * (°C) | 41.6 | 46.7 -12% | 39.7 5% | 44.1 -6% | 60 -44% | 44.2 -6% |
| Maximum Bottom * (°C) | 50 | 54.1 -8% | 60 -20% | 48 4% | 61 -22% | 42.9 14% |
| Idle Upper Side * (°C) | 26.8 | 26.5 1% | 30.9 -15% | 32.7 -22% | 38.2 -43% | 22.4 16% |
| Idle Bottom * (°C) | 27.9 | 26.8 4% | 34.7 -24% | 34.9 -25% | 37.7 -35% | 22.3 20% |
* ... menor é melhor
Alto-falantes
A variante de 16 polegadas do Yoga Pro 9i é equipada com seis alto-falantes (4 woofers + 2 tweeters, 6 watts cada) e é capaz de melhorar o desempenho já sólido do modelo de 14 polegadas, mesmo que o volume máximo seja um pouco menor. No geral, o som é muito bom e a diferença para oApple MacBook Pro 16(também com 6 alto-falantes) também não é grande. Em suma, os alto-falantes fazem seu trabalho muito bem.
Lenovo Yoga Pro 9 16-IRP G8 análise de áudio
(±) | o volume do alto-falante é médio, mas bom (###valor### dB)
Graves 100 - 315Hz
(+) | bons graves - apenas 4.9% longe da mediana
(±) | a linearidade dos graves é média (9.1% delta para a frequência anterior)
Médios 400 - 2.000 Hz
(+) | médios equilibrados - apenas 3.2% longe da mediana
(+) | médios são lineares (6.5% delta para frequência anterior)
Altos 2 - 16 kHz
(+) | agudos equilibrados - apenas 2.9% longe da mediana
(+) | os máximos são lineares (3% delta da frequência anterior)
Geral 100 - 16.000 Hz
(+) | o som geral é linear (8.4% diferença em relação à mediana)
Comparado com a mesma classe
» 9% de todos os dispositivos testados nesta classe foram melhores, 2% semelhantes, 89% piores
» O melhor teve um delta de 5%, a média foi 17%, o pior foi 45%
Comparado com todos os dispositivos testados
» 2% de todos os dispositivos testados foram melhores, 1% semelhantes, 97% piores
» O melhor teve um delta de 4%, a média foi 23%, o pior foi 134%
Apple MacBook Pro 16 2023 M2 Max análise de áudio
(+) | os alto-falantes podem tocar relativamente alto (###valor### dB)
Graves 100 - 315Hz
(+) | bons graves - apenas 3.9% longe da mediana
(+) | o baixo é linear (5.7% delta para a frequência anterior)
Médios 400 - 2.000 Hz
(+) | médios equilibrados - apenas 1.2% longe da mediana
(+) | médios são lineares (1.5% delta para frequência anterior)
Altos 2 - 16 kHz
(+) | agudos equilibrados - apenas 2.5% longe da mediana
(+) | os máximos são lineares (1.7% delta da frequência anterior)
Geral 100 - 16.000 Hz
(+) | o som geral é linear (4.9% diferença em relação à mediana)
Comparado com a mesma classe
» 0% de todos os dispositivos testados nesta classe foram melhores, 0% semelhantes, 99% piores
» O melhor teve um delta de 5%, a média foi 17%, o pior foi 45%
Comparado com todos os dispositivos testados
» 0% de todos os dispositivos testados foram melhores, 0% semelhantes, 100% piores
» O melhor teve um delta de 4%, a média foi 23%, o pior foi 134%
Gerenciamento de energia - Bateria de curta duração
Consumo de energia
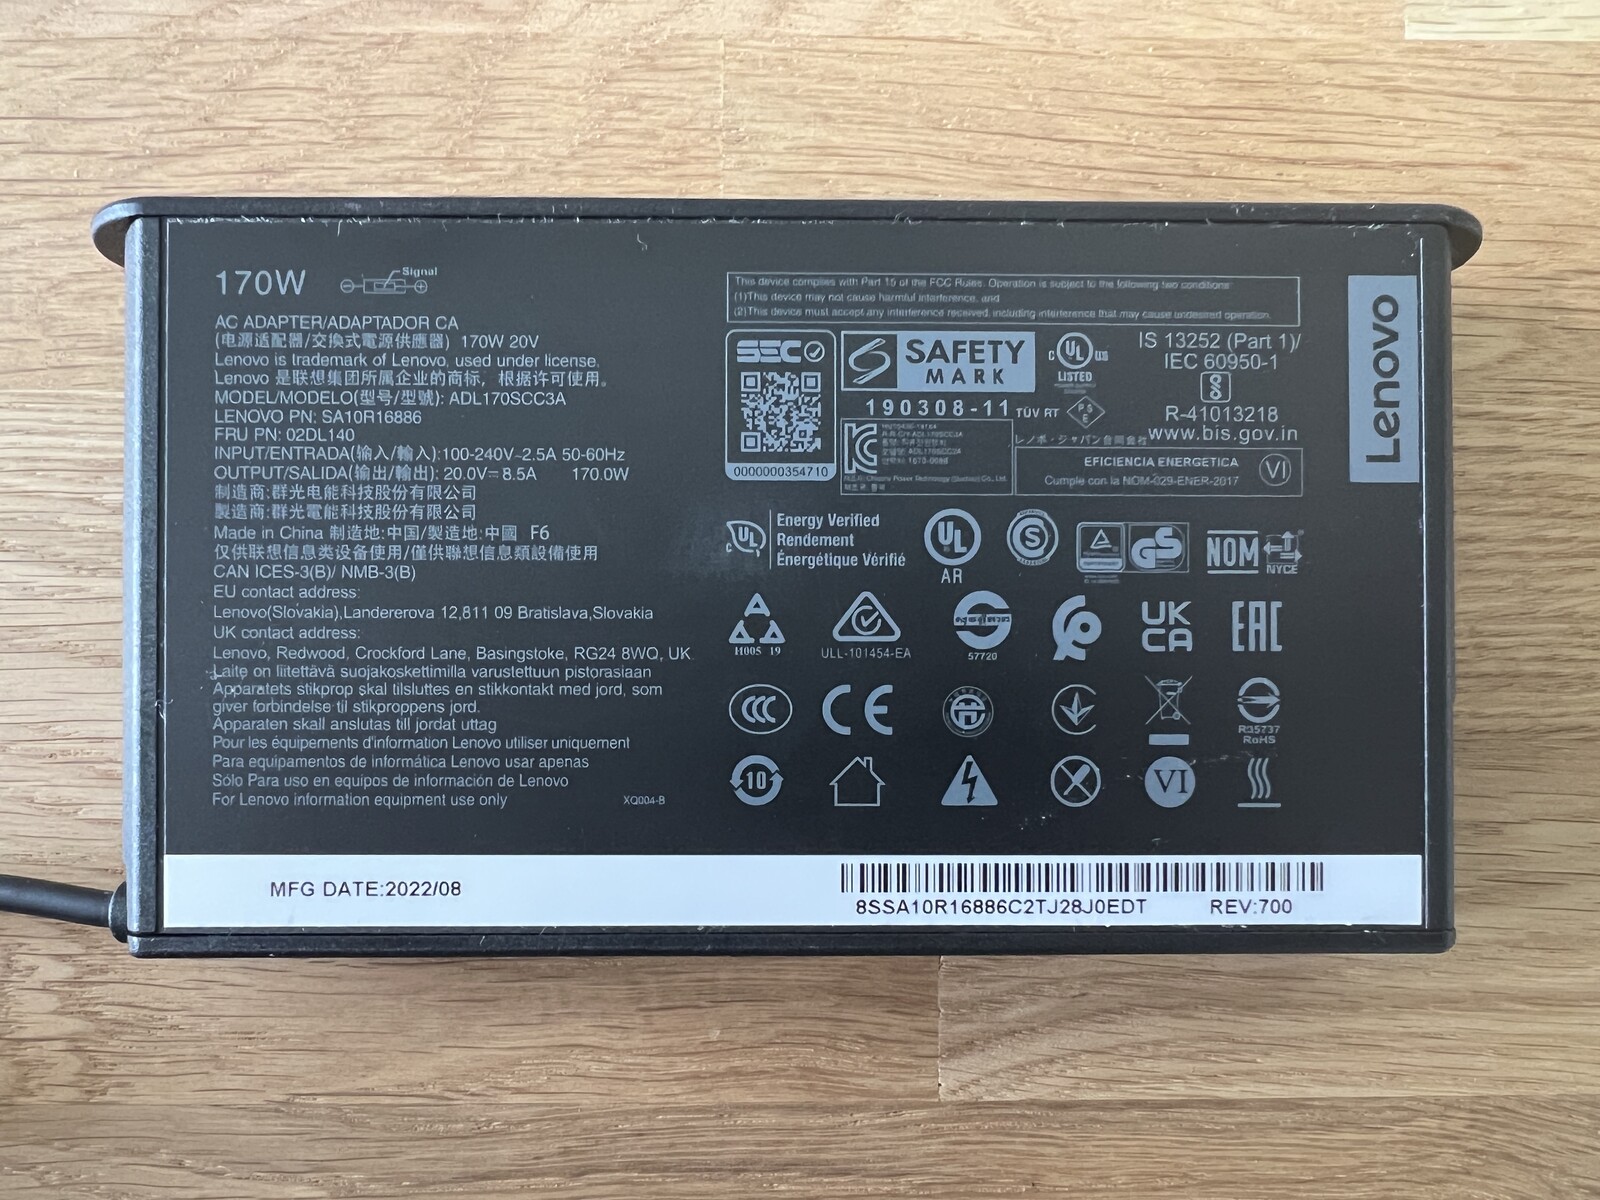
A tela grande de 16 polegadas é a principal responsável pelo consumo de energia no uso diário e medimos até 24 watts em modo inativo com o brilho máximo do SDR. Em comparação, o modelo menor, de 14 polegadas, consome 20 watts, apesar do brilho maior. No modo HDR, é possível atingir até 40 watts. Sob carga, vemos brevemente cerca de 177 watts, mas isso se estabiliza rapidamente em torno de 170 watts (~160-170 watts durante os jogos). Portanto, o adaptador de energia de 170 watts é suficiente, mas não há espaço para carregar a bateria em tais situações. Um modelo com 200 ou 230 watts teria sido a melhor opção nesse caso.
| desligado | |
| Ocioso | |
| Carga |
|
Key:
min: | |
| Lenovo Yoga Pro 9 16-IRP G8 i7-13705H, GeForce RTX 4060 Laptop GPU, Samsung PM9A1 MZVL21T0HCLR, Mini-LED, 3200x2000, 16" | Schenker VISION 16 Pro (M23) i7-13700H, GeForce RTX 4070 Laptop GPU, Samsung 990 Pro 1 TB, IPS, 2560x1600, 16" | Asus Vivobook Pro 16X K6604JV-MX016W i9-13980HX, GeForce RTX 4060 Laptop GPU, Solidigm P41 Plus SSDPFKNU010TZ, OLED, 3200x2000, 16" | Asus ProArt Studiobook 16 OLED H7604 i9-13980HX, GeForce RTX 4070 Laptop GPU, Phison EM2804TBMTCB47, OLED, 3200x2000, 16" | MSI Stealth 16 Studio A13VG i7-13700H, GeForce RTX 4070 Laptop GPU, Micron 3400 2TB MTFDKBA2T0TFH, IPS, 2560x1600, 16" | Apple MacBook Pro 16 2023 M2 Max M2 Max, M2 Max 38-Core GPU, Apple SSD AP2048Z, Mini-LED, 3456x2234, 16.2" | Média NVIDIA GeForce RTX 4060 Laptop GPU | Média da turma Multimedia | |
|---|---|---|---|---|---|---|---|---|
| Power Consumption | 22% | -14% | -18% | 3% | 22% | 2% | 42% | |
| Idle Minimum * (Watt) | 10.9 | 8.6 21% | 13.8 -27% | 12.8 -17% | 11 -1% | 5.2 52% | 11.5 ? -6% | 5.69 ? 48% |
| Idle Average * (Watt) | 22.6 | 12 47% | 16 29% | 19.9 12% | 18 20% | 16.5 27% | 16 ? 29% | 10.2 ? 55% |
| Idle Maximum * (Watt) | 23.5 | 12.4 47% | 19 19% | 20.3 14% | 19 19% | 16.8 29% | 20.3 ? 14% | 12.5 ? 47% |
| Load Average * (Watt) | 84.6 | 80 5% | 147 -74% | 131.4 -55% | 91 -8% | 113 -34% | 92.9 ? -10% | 65.4 ? 23% |
| Witcher 3 ultra * (Watt) | 159.5 | 147.7 7% | 147.8 7% | 196.5 -23% | 130 18% | 92 42% | ||
| Load Maximum * (Watt) | 177.3 | 173.1 2% | 244 -38% | 246.8 -39% | 228 -29% | 145 18% | 210 ? -18% | 112.9 ? 36% |
* ... menor é melhor
Power consumption Witcher 3 / Stress test
Power consumption with an external monitor
Duração da bateria
A Lenovo também equipa o Yoga Pro 9i 16 com uma bateria de 75 Wh. Em vista das taxas de consumo mais altas, podemos ser perdoados por já supor que a duração da bateria será ainda pior do que no modelo de 14 polegadas. Com 150 cd/m² (correspondente a 50% do brilho máximo do SDR) e 60 Hz, os resultados ainda são bons, com 6,5 horas no teste de WLAN (165 Hz: ~5,5 horas) e 7,5 horas no teste de vídeo. Mas assim que você usa o brilho alto e/ou a frequência mais alta de 165 Hz, isso se torna problemático. Com o brilho total do SDR, nosso teste de Wi-Fi dura apenas um pouco mais de 3,5 horas a 60 Hz e 15 minutos a menos a 165 Hz. Um vídeo HDR com brilho total esgota a bateria completamente em apenas 133 minutos.
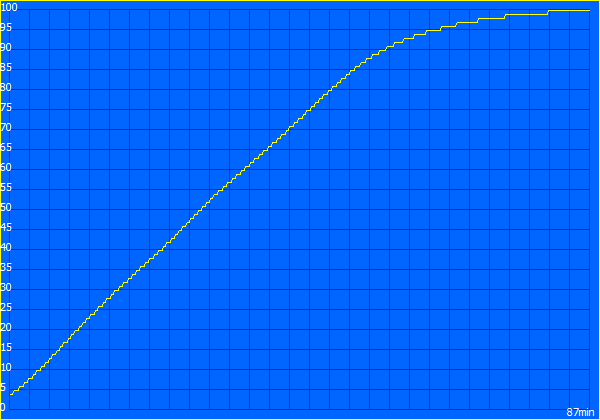
Em vista desses resultados, a Lenovo deveria ter instalado uma bateria maior em vez do segundo slot M.2 ou, pelo menos, ter dado ao cliente essa opção. O processo de carregamento é muito linear até 80% e leva 48 minutos para chegar lá. O processo de carregamento completo leva 87 minutos quando o dispositivo é ligado.
| Lenovo Yoga Pro 9 16-IRP G8 i7-13705H, GeForce RTX 4060 Laptop GPU, 75 Wh | Schenker VISION 16 Pro (M23) i7-13700H, GeForce RTX 4070 Laptop GPU, 80 Wh | Asus Vivobook Pro 16X K6604JV-MX016W i9-13980HX, GeForce RTX 4060 Laptop GPU, 90 Wh | Asus ProArt Studiobook 16 OLED H7604 i9-13980HX, GeForce RTX 4070 Laptop GPU, 90 Wh | MSI Stealth 16 Studio A13VG i7-13700H, GeForce RTX 4070 Laptop GPU, 99.9 Wh | Apple MacBook Pro 16 2023 M2 Max M2 Max, M2 Max 38-Core GPU, 99.6 Wh | Média da turma Multimedia | |
|---|---|---|---|---|---|---|---|
| Duração da bateria | 37% | 29% | 8% | 89% | 112% | 119% | |
| H.264 (h) | 7.5 | 7.8 4% | 5.3 -29% | 6 -20% | 7.7 3% | 18.7 149% | 16.8 ? 124% |
| WiFi v1.3 (h) | 6.4 | 7.8 22% | 6.5 2% | 5.6 -13% | 7.8 22% | 14.8 131% | 12.2 ? 91% |
| Load (h) | 0.7 | 1.3 86% | 1.5 114% | 1.1 57% | 2.4 243% | 1.1 57% | 1.7 ? 143% |
Pro
Contra
Veredicto - O Yoga Pro 9i tem problemas principalmente com a duração da bateria

O Yoga Pro 9i 16 é supostamente o notebook multimídia mais poderoso e melhor da Lenovo. Em comparação com o menor Yoga Pro 9i 14menor, no entanto, tem-se a impressão de que o fabricante fez cortes em várias áreas no modelo de 16 polegadas. Mas, antes de mais nada, o desempenho é, em geral, muito bom e ambos os componentes principais, ou seja, a CPU e a GPU, são mais rápidos do que no modelo de 14 polegadas. Então, nos perguntamos por que o Yoga Pro 9i 16 não oferece o Advanced Optimus e por que a porta HDMI suporta apenas o padrão 1.4b. Consequentemente, as telas 4K só podem ser executadas a 30 Hz, o que não está de acordo com o nível atual de tecnologia e não condiz com o alto preço. Também é problemática a decisão de soldar a RAM. Com relação ao gabinete, outra coisa que nos incomoda é o rangido da placa de base.
O painel mini-LED brilhante tem uma aparência fantástica, especialmente com conteúdo HDR, e também oferece reprodução precisa de cores, além de cobertura AdobeRGB completa. Infelizmente, as medidas são piores aqui do que no modelo de 14 polegadas; o fabricante parece ter trabalhado menos aqui, já que o modelo grande de 16 polegadas pisca em todos os níveis de brilho. A tela grande também tem altas taxas de consumo de energia, por isso não conseguimos entender por que a Lenovo não instalou uma bateria maior.
O Lenovo Yoga Pro 9i 16, em seus próprios termos, é um notebook multimídia muito bom com um ótimo painel mini-LED, alto desempenho, bom teclado e alto-falantes fantásticos. No entanto, a Lenovo fez cortes em várias áreas e há certas desvantagens em comparação com o modelo menor de 14 polegadas, o que é incompreensível.
É claro que há muitos aspectos positivos. Já mencionamos os sólidos valores de desempenho, juntamente com o bom teclado, o teclado numérico e os excelentes alto-falantes. Excluindo o rangido do painel da base, o gabinete é muito bom e a qualidade de construção é muito estável. Por fim, o modelo de 16 polegadas também oferece um segundo slot para SSD.
A duração da bateria é muito ruim no geral e, sem dúvida, um ponto fraco. O Apple MacBook Pro 16 tem uma grande vantagem aqui, apesar de seu excelente e brilhante painel mini-LED. Os rivais equipados com Windows e telas OLED, como o Asus Vivobook Pro 16X ou Asus Studiobook 16 OLED não se saem melhor aqui e estão claramente atrás em relação ao brilho da tela. Rivais IPS Schenker Vision 16 Pro e o MSI Stealth 16 Studio têm vantagens como telas foscas e sem cintilação de PWN, mas não suportam HDR.
Preço e disponibilidade
Na loja da Lenovo nos EUA, uma variante com o Core i9-13905H, RTX 4060 e 32 GB de RAM está atualmente disponível por US$ 2.199,99.
Os preços são de 02.08.2023 e estão sujeitos a alterações.
Lenovo Yoga Pro 9 16-IRP G8
- 07/31/2023 v7 (old)
Andreas Osthoff
Transparência
A seleção dos dispositivos a serem analisados é feita pela nossa equipe editorial. A amostra de teste foi fornecida ao autor como empréstimo pelo fabricante ou varejista para fins desta revisão. O credor não teve influência nesta revisão, nem o fabricante recebeu uma cópia desta revisão antes da publicação. Não houve obrigação de publicar esta revisão. Como empresa de mídia independente, a Notebookcheck não está sujeita à autoridade de fabricantes, varejistas ou editores.
É assim que o Notebookcheck está testando
Todos os anos, o Notebookcheck analisa de forma independente centenas de laptops e smartphones usando procedimentos padronizados para garantir que todos os resultados sejam comparáveis. Desenvolvemos continuamente nossos métodos de teste há cerca de 20 anos e definimos padrões da indústria no processo. Em nossos laboratórios de teste, equipamentos de medição de alta qualidade são utilizados por técnicos e editores experientes. Esses testes envolvem um processo de validação em vários estágios. Nosso complexo sistema de classificação é baseado em centenas de medições e benchmarks bem fundamentados, o que mantém a objetividade.Price comparison

