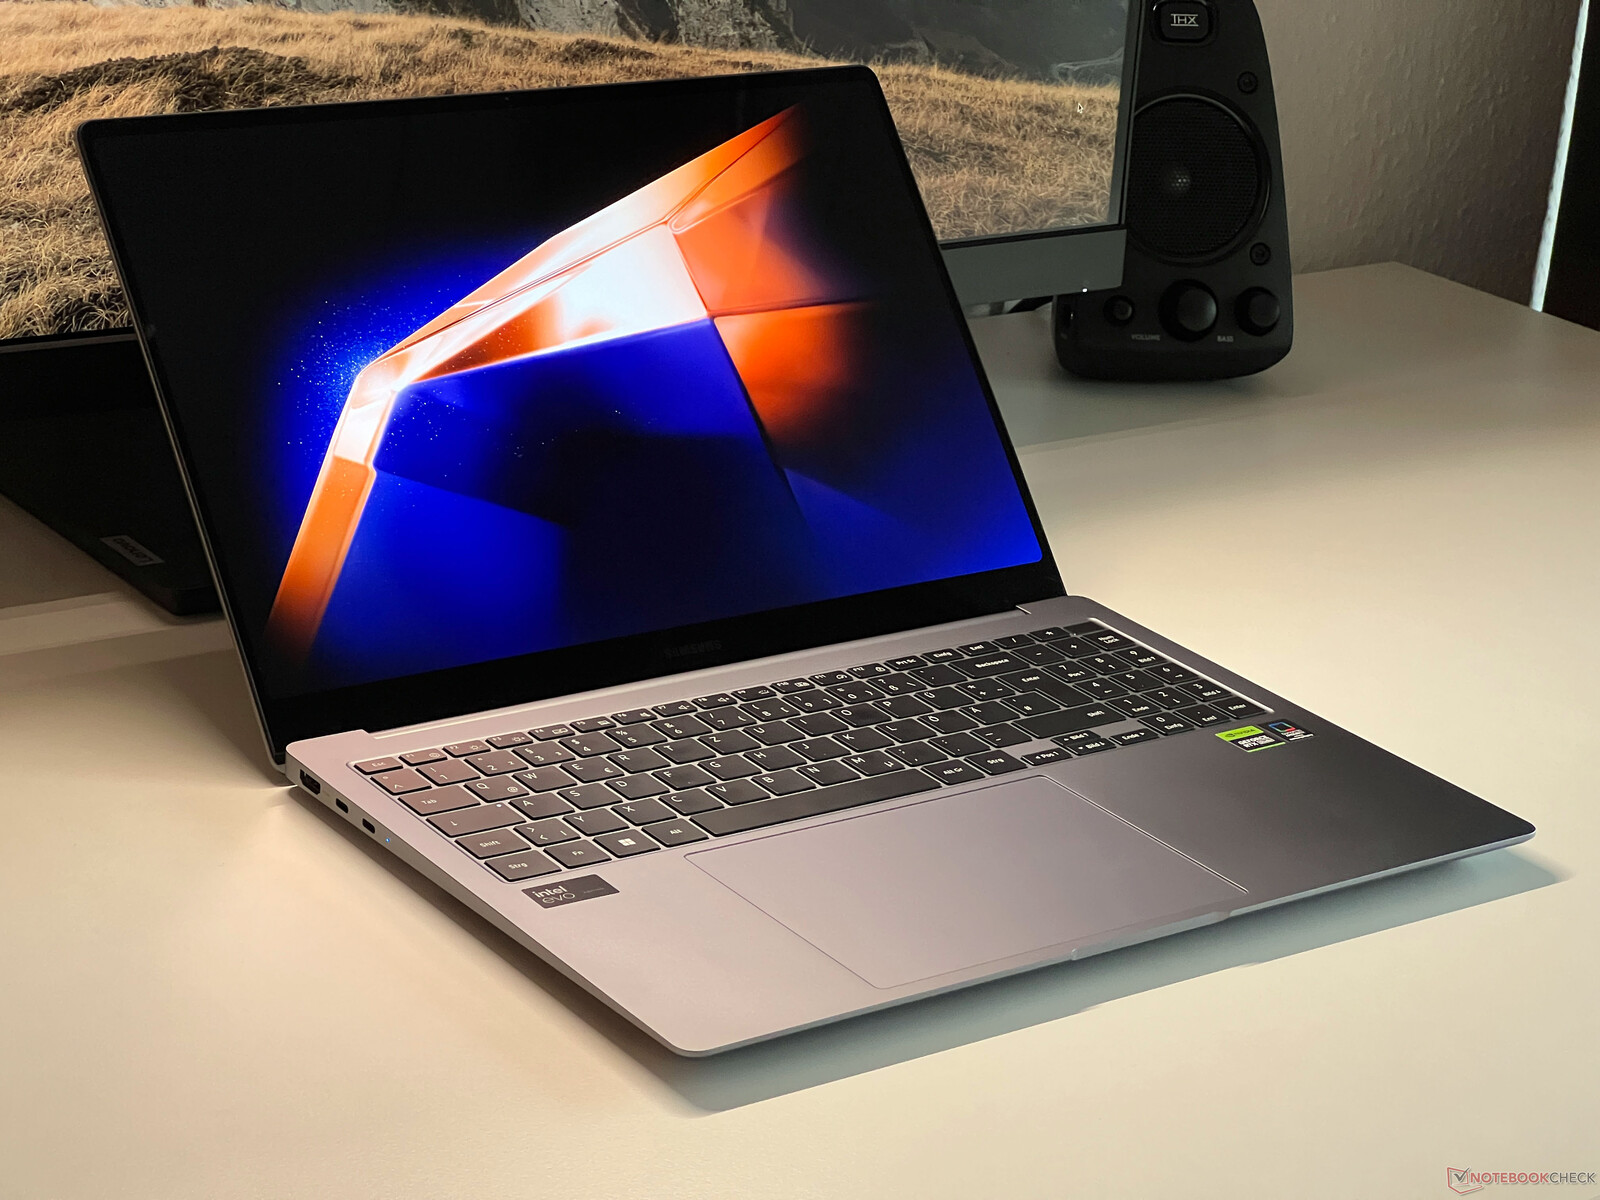
Análise do Samsung Galaxy Book4 Ultra - Um laptop multimídia com OLED de 120 Hz e RTX 4050
A Samsung está atualizando sua série Galaxy Book para a quarta geração e, com o Galaxy Book 4 Ultra, a Samsung gostaria de competir diretamente com o MacBook Pro 16 da Apple. Em comparação com o modelo do ano anterior, não houve muitas mudanças, apenas o Core i7-13700H foi substituído pelo chip Meteor Lake Core Ultra 7 155H.
Nada mudou também no que diz respeito ao preço, com o modelo básico e seu laptop Core Ultra 7 155H e GeForce RTX 4050 custando US$ 2.399. Isso continua sendo muito ambicioso, especialmente considerando as especificações de armazenamento escassas (16 GB de RAM, SSD de 512 GB). Por US$ 2.999, o senhor pode obter a variante superior com o Core Ultra 9 185He o laptop GeForce Laptop RTX 4070 além de mais memória e armazenamento (32 GB de RAM, SSD de 1 TB).
Possíveis concorrentes em comparação
Avaliação | Data | Modelo | Peso | Altura | Size | Resolução | Preço |
|---|---|---|---|---|---|---|---|
| 90.4 % v7 (old) | 03/2024 | Samsung Galaxy Book4 Ultra Ultra 7 155H, GeForce RTX 4050 Laptop GPU | 1.8 kg | 17 mm | 16.00" | 2880x1800 | |
| 88.6 % v7 (old) | 12/2023 | Lenovo ThinkPad Z16 Gen 2 R9 PRO 7940HS, Radeon RX 6550M | 1.8 kg | 15.8 mm | 16.00" | 3840x2400 | |
| 93.7 % v7 (old) | 11/2023 | Apple MacBook Pro 16 2023 M3 Pro Apple M3 Pro 12-Core, M3 Pro 18-Core GPU | 2.1 kg | 16.9 mm | 16.20" | 3456x2234 | |
| 88 % v7 (old) | 08/2023 | Lenovo Slim Pro 9i 16IRP8 i9-13905H, GeForce RTX 4050 Laptop GPU | 2.2 kg | 18.2 mm | 16.00" | 3200x2000 | |
| 91.1 % v7 (old) | 03/2024 | HP Spectre x360 16 RTX 4050 Ultra 7 155H, GeForce RTX 4050 Laptop GPU | 2 kg | 19.8 mm | 16.00" | 2880x1800 | |
| 88.6 % v7 (old) | 07/2023 | Schenker VISION 16 Pro (M23) i7-13700H, GeForce RTX 4070 Laptop GPU | 1.6 kg | 17.1 mm | 16.00" | 2560x1600 | |
| 89.4 % v7 (old) | 04/2023 | Samsung Galaxy Book3 Ultra 16 i7-13700H, GeForce RTX 4050 Laptop GPU | 1.8 kg | 16.5 mm | 16.00" | 2880x1800 |
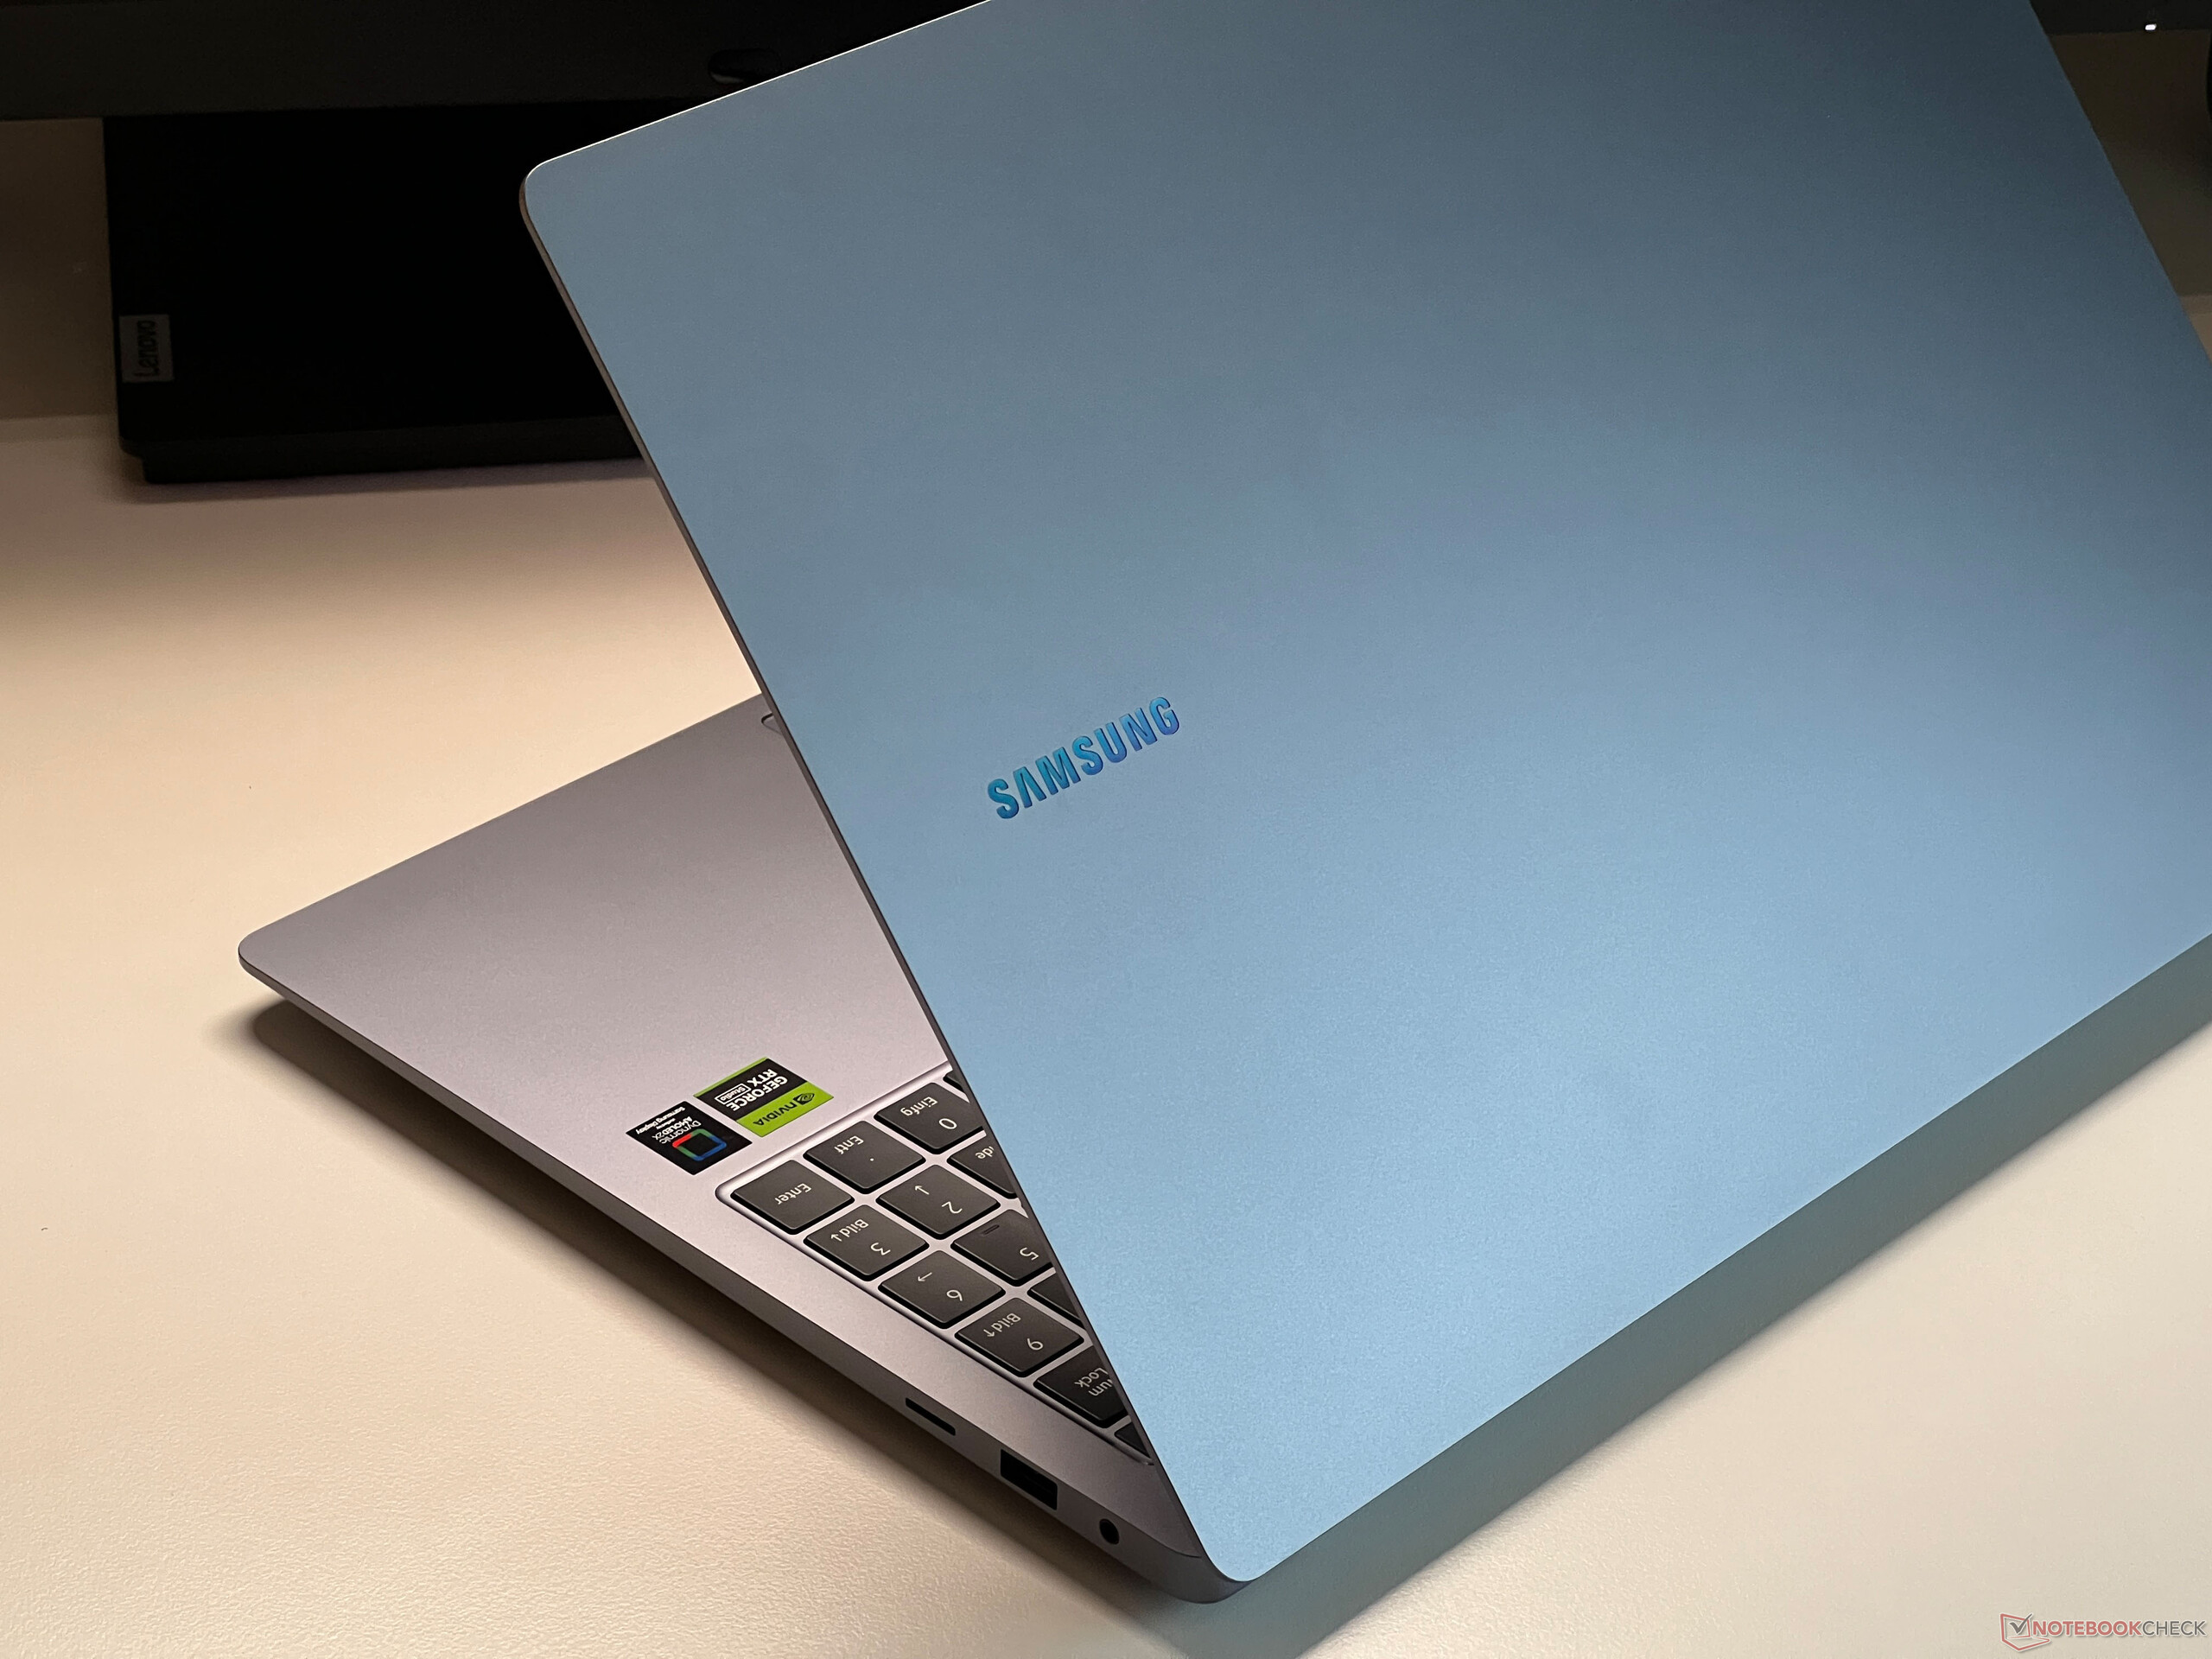
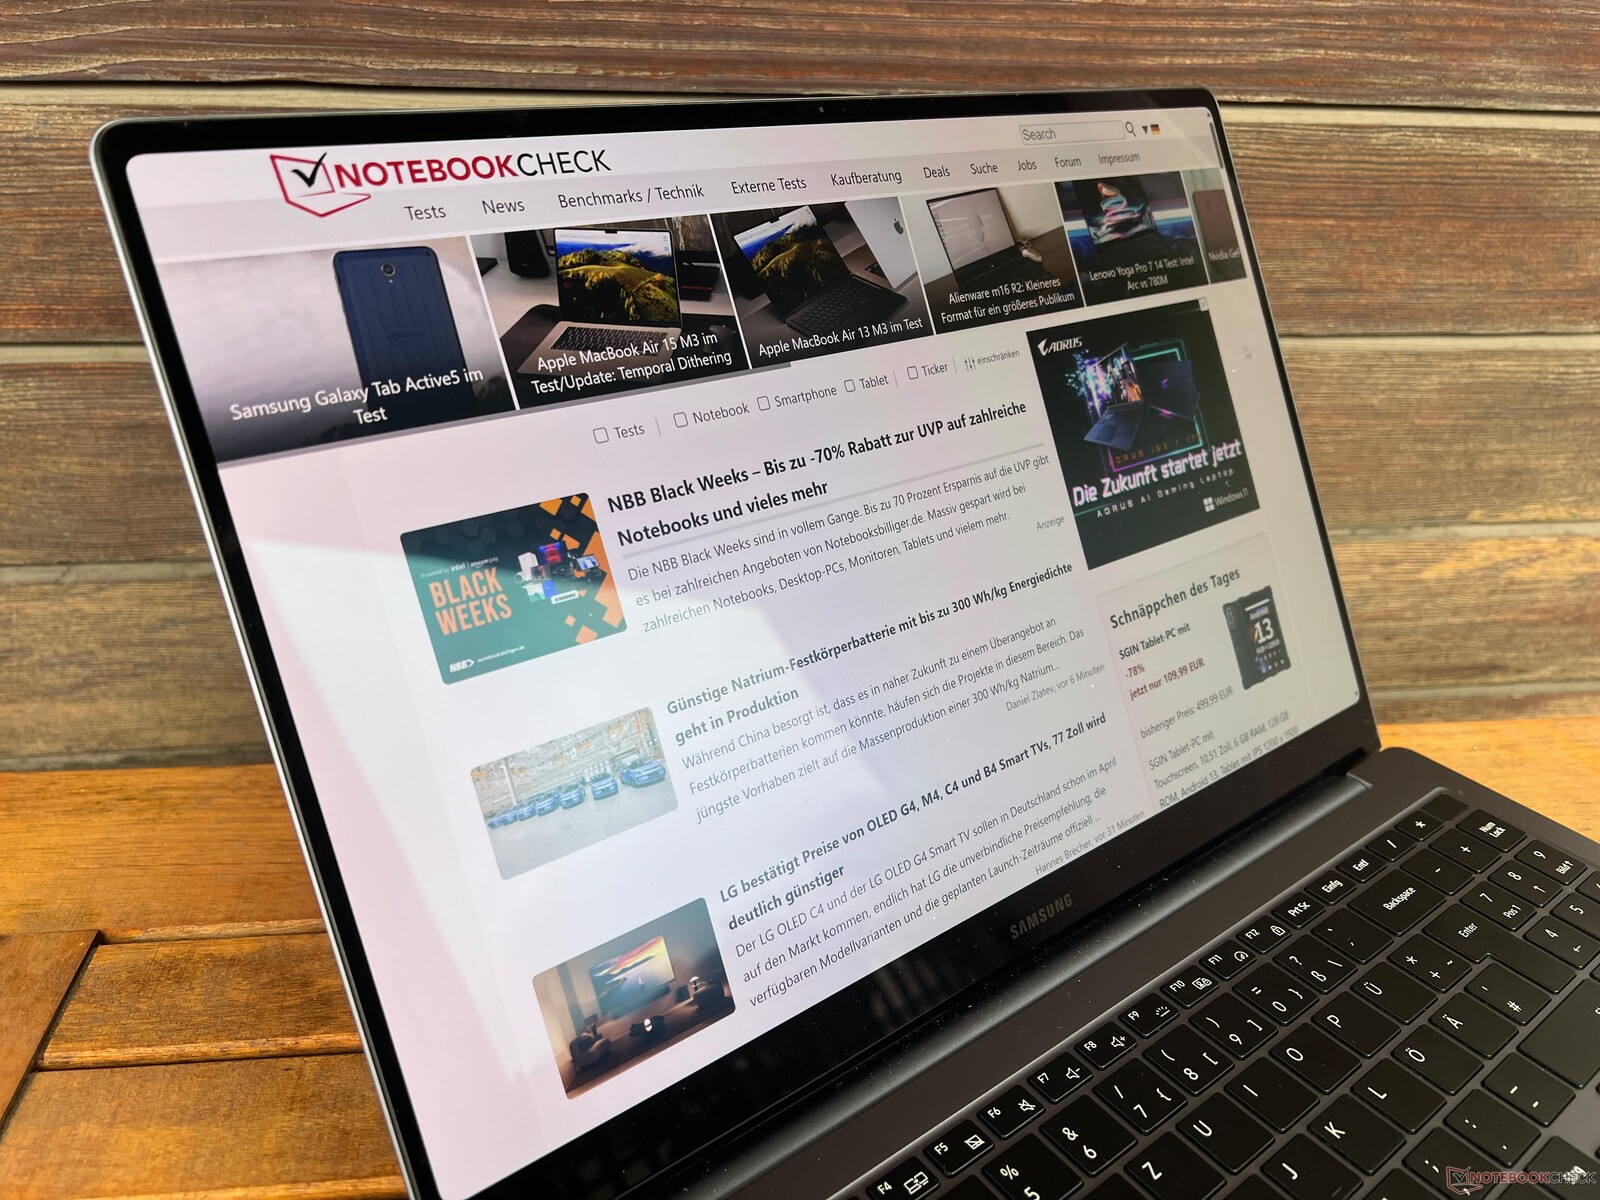
Estojo - O Galaxy Book vem com um estojo de metal
O design da caixa não foi alterado em comparação com o modelo antigo. A caixa de alumínio cinza escuro (Moonstone Gray) é muito premium e as superfícies não apenas proporcionam um feedback agradável, mas também não são sensíveis a impressões digitais e podem ser facilmente limpas. No entanto, a moldura inferior grossa da tela é perceptível (1,7 cm) e prejudica um pouco a aparência geral.
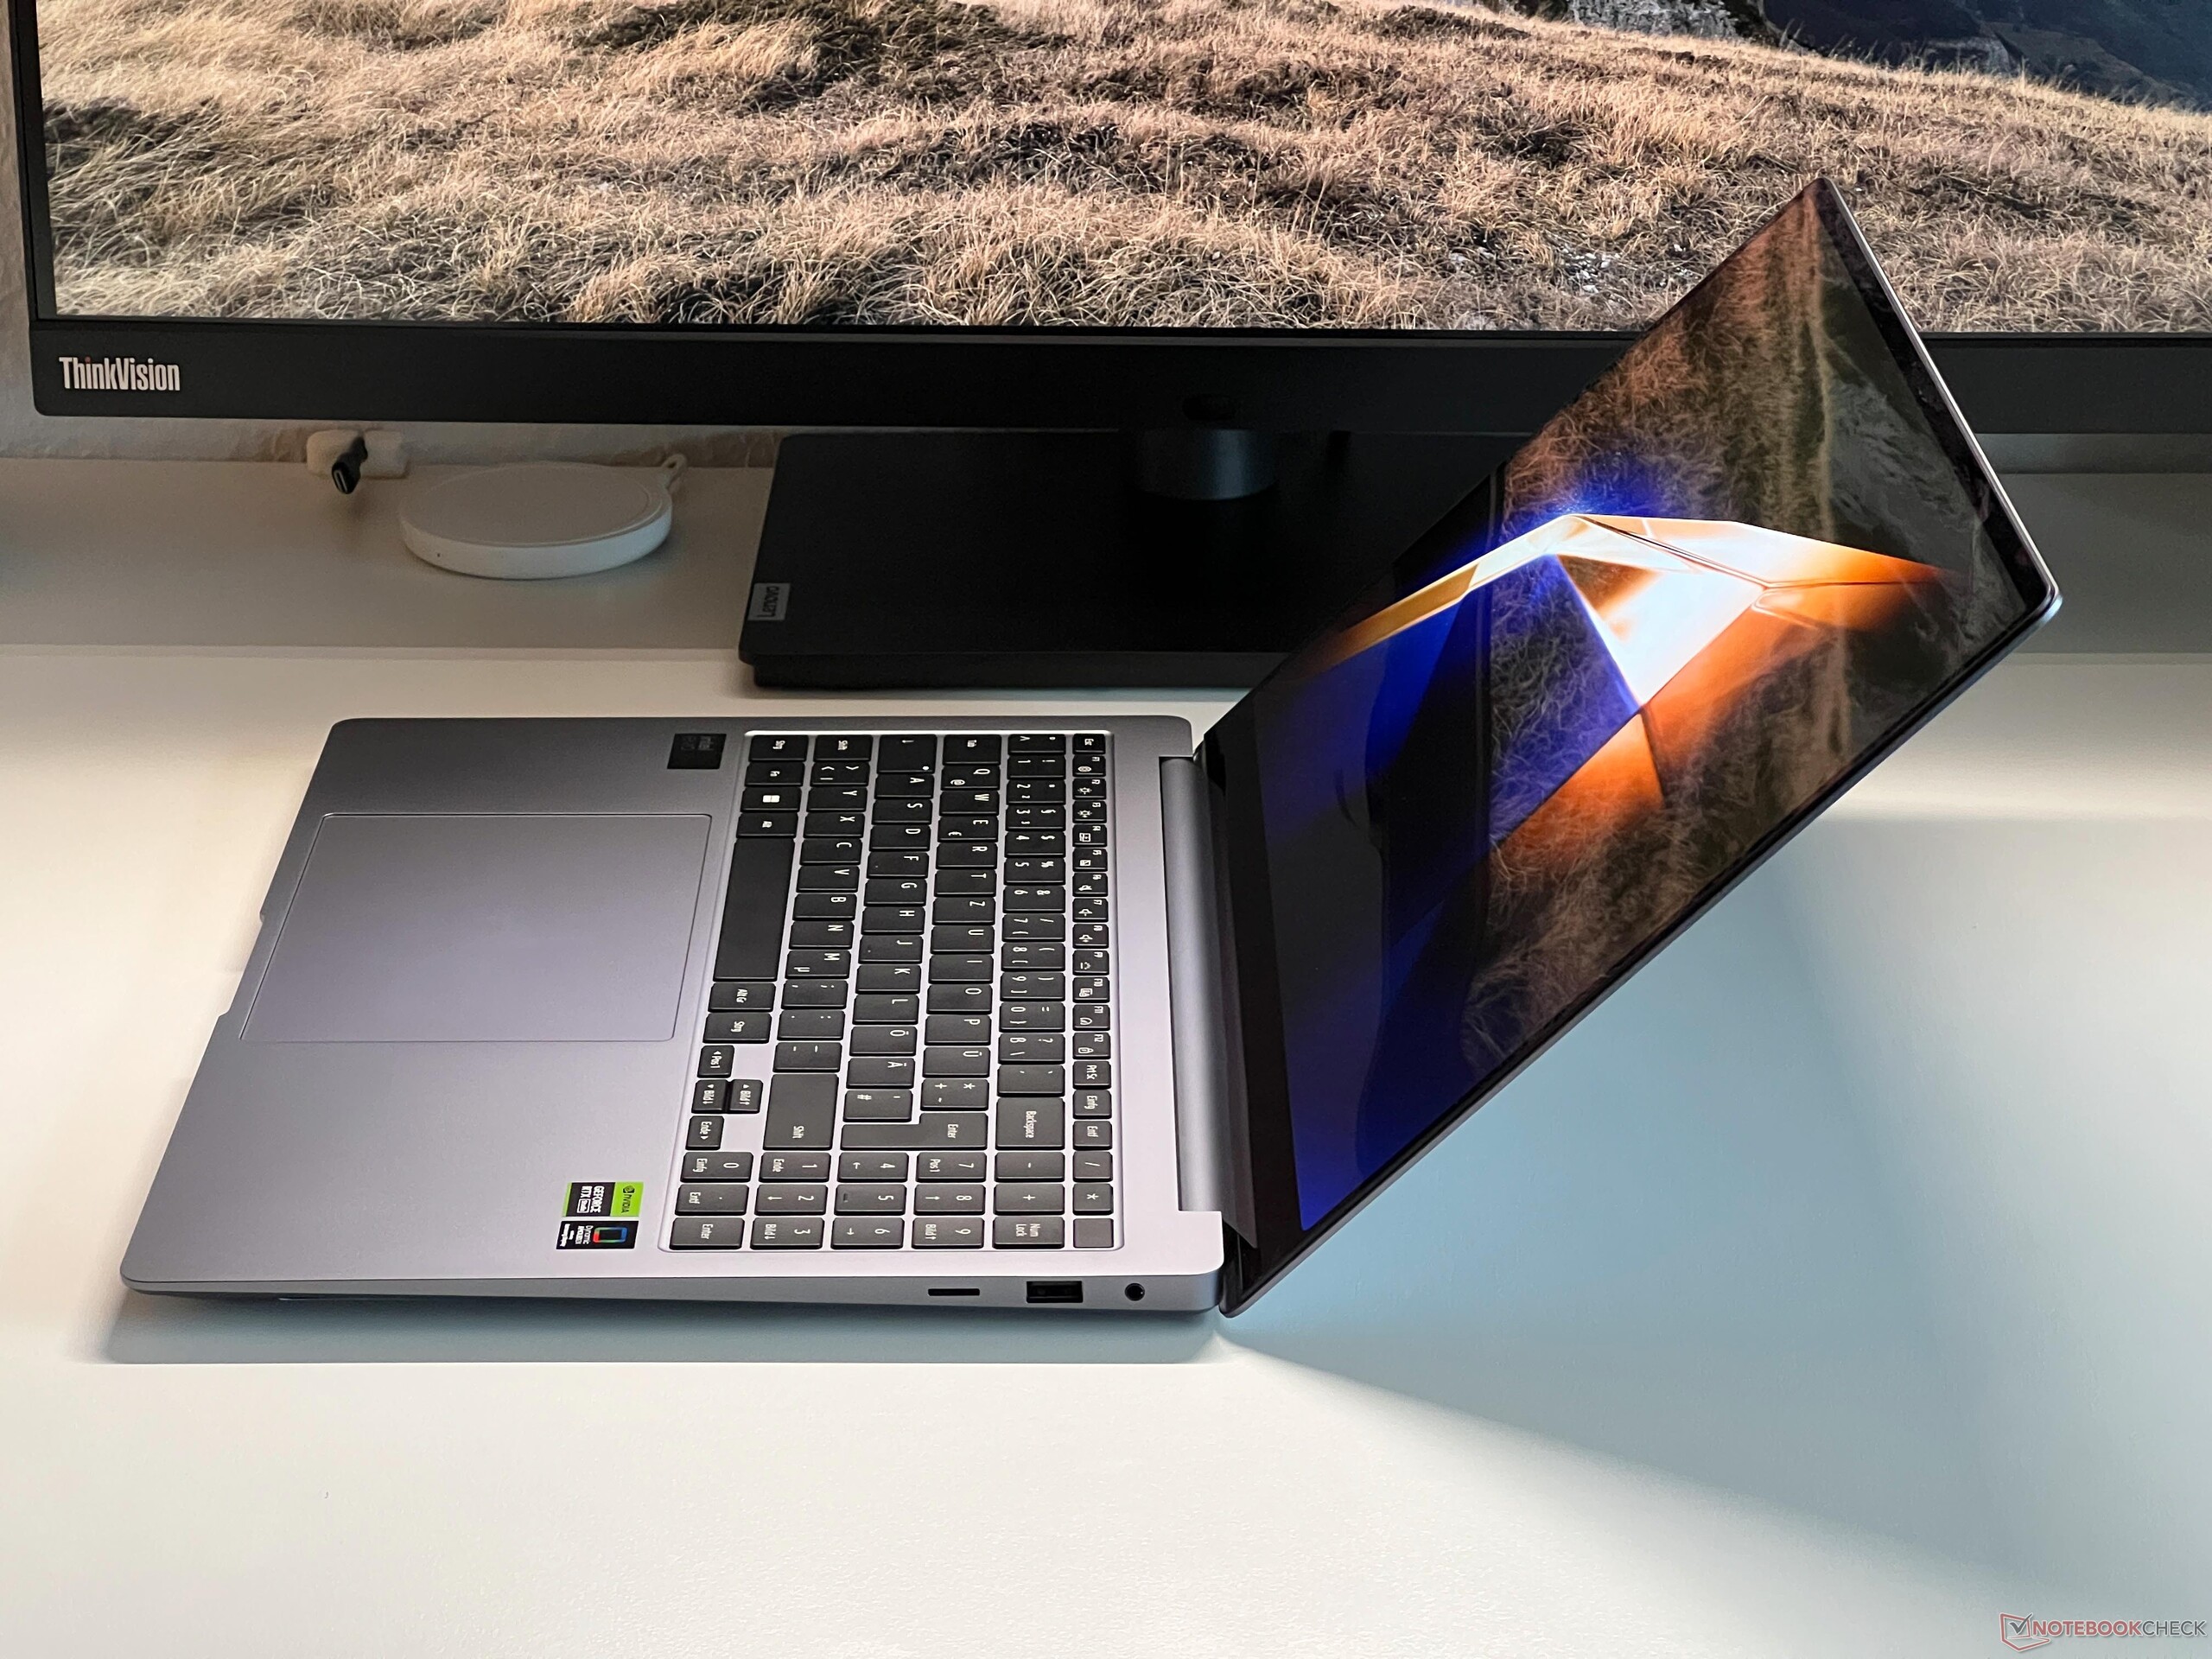
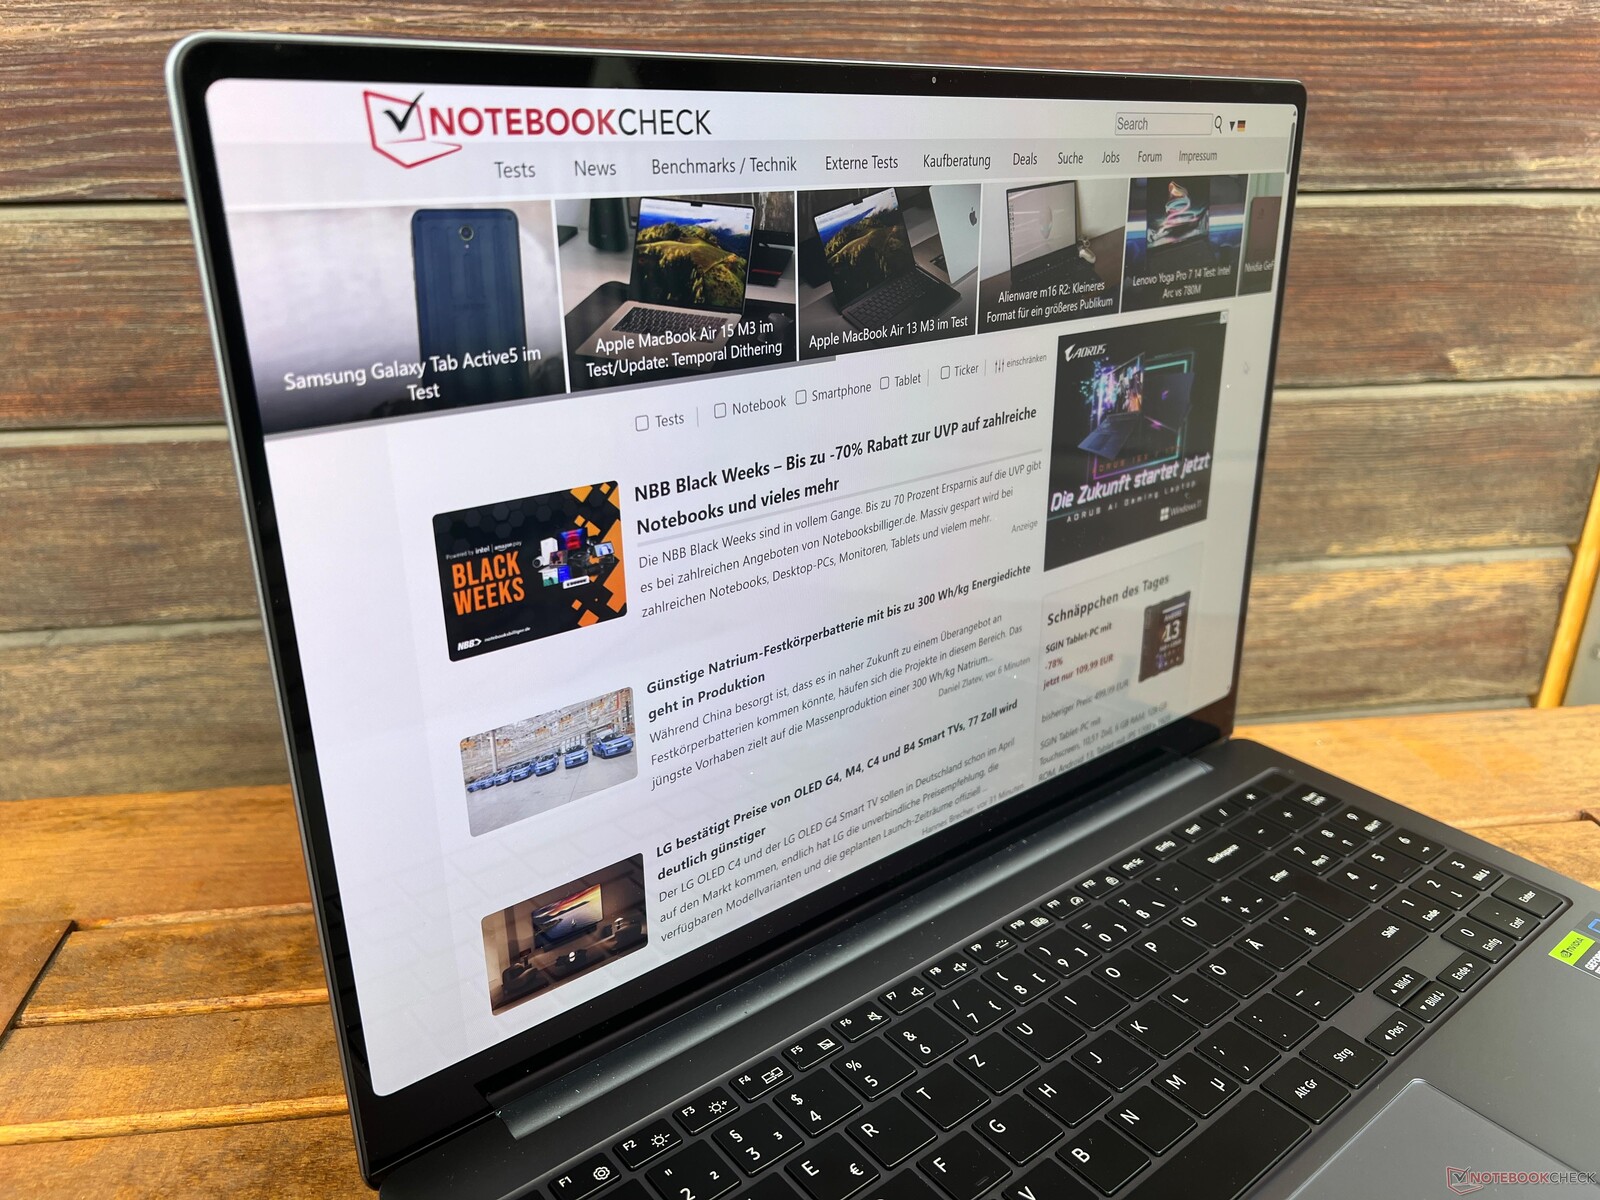
O Galaxy Book4 Ultra causa uma boa impressão tanto em termos de qualidade de construção quanto de estabilidade. A área do teclado cede apenas um pouco e toda a unidade de base é resistente à torção. Além disso, não há ruídos de rangidos. A própria tampa da tela é significativamente mais fina e, da mesma forma, muito estável. As dobradiças são bem ajustadas e, em sua maioria, ajudam a evitar qualquer oscilação e a tampa também pode ser aberta confortavelmente com uma mão. O ângulo máximo de abertura é de 135 graus.
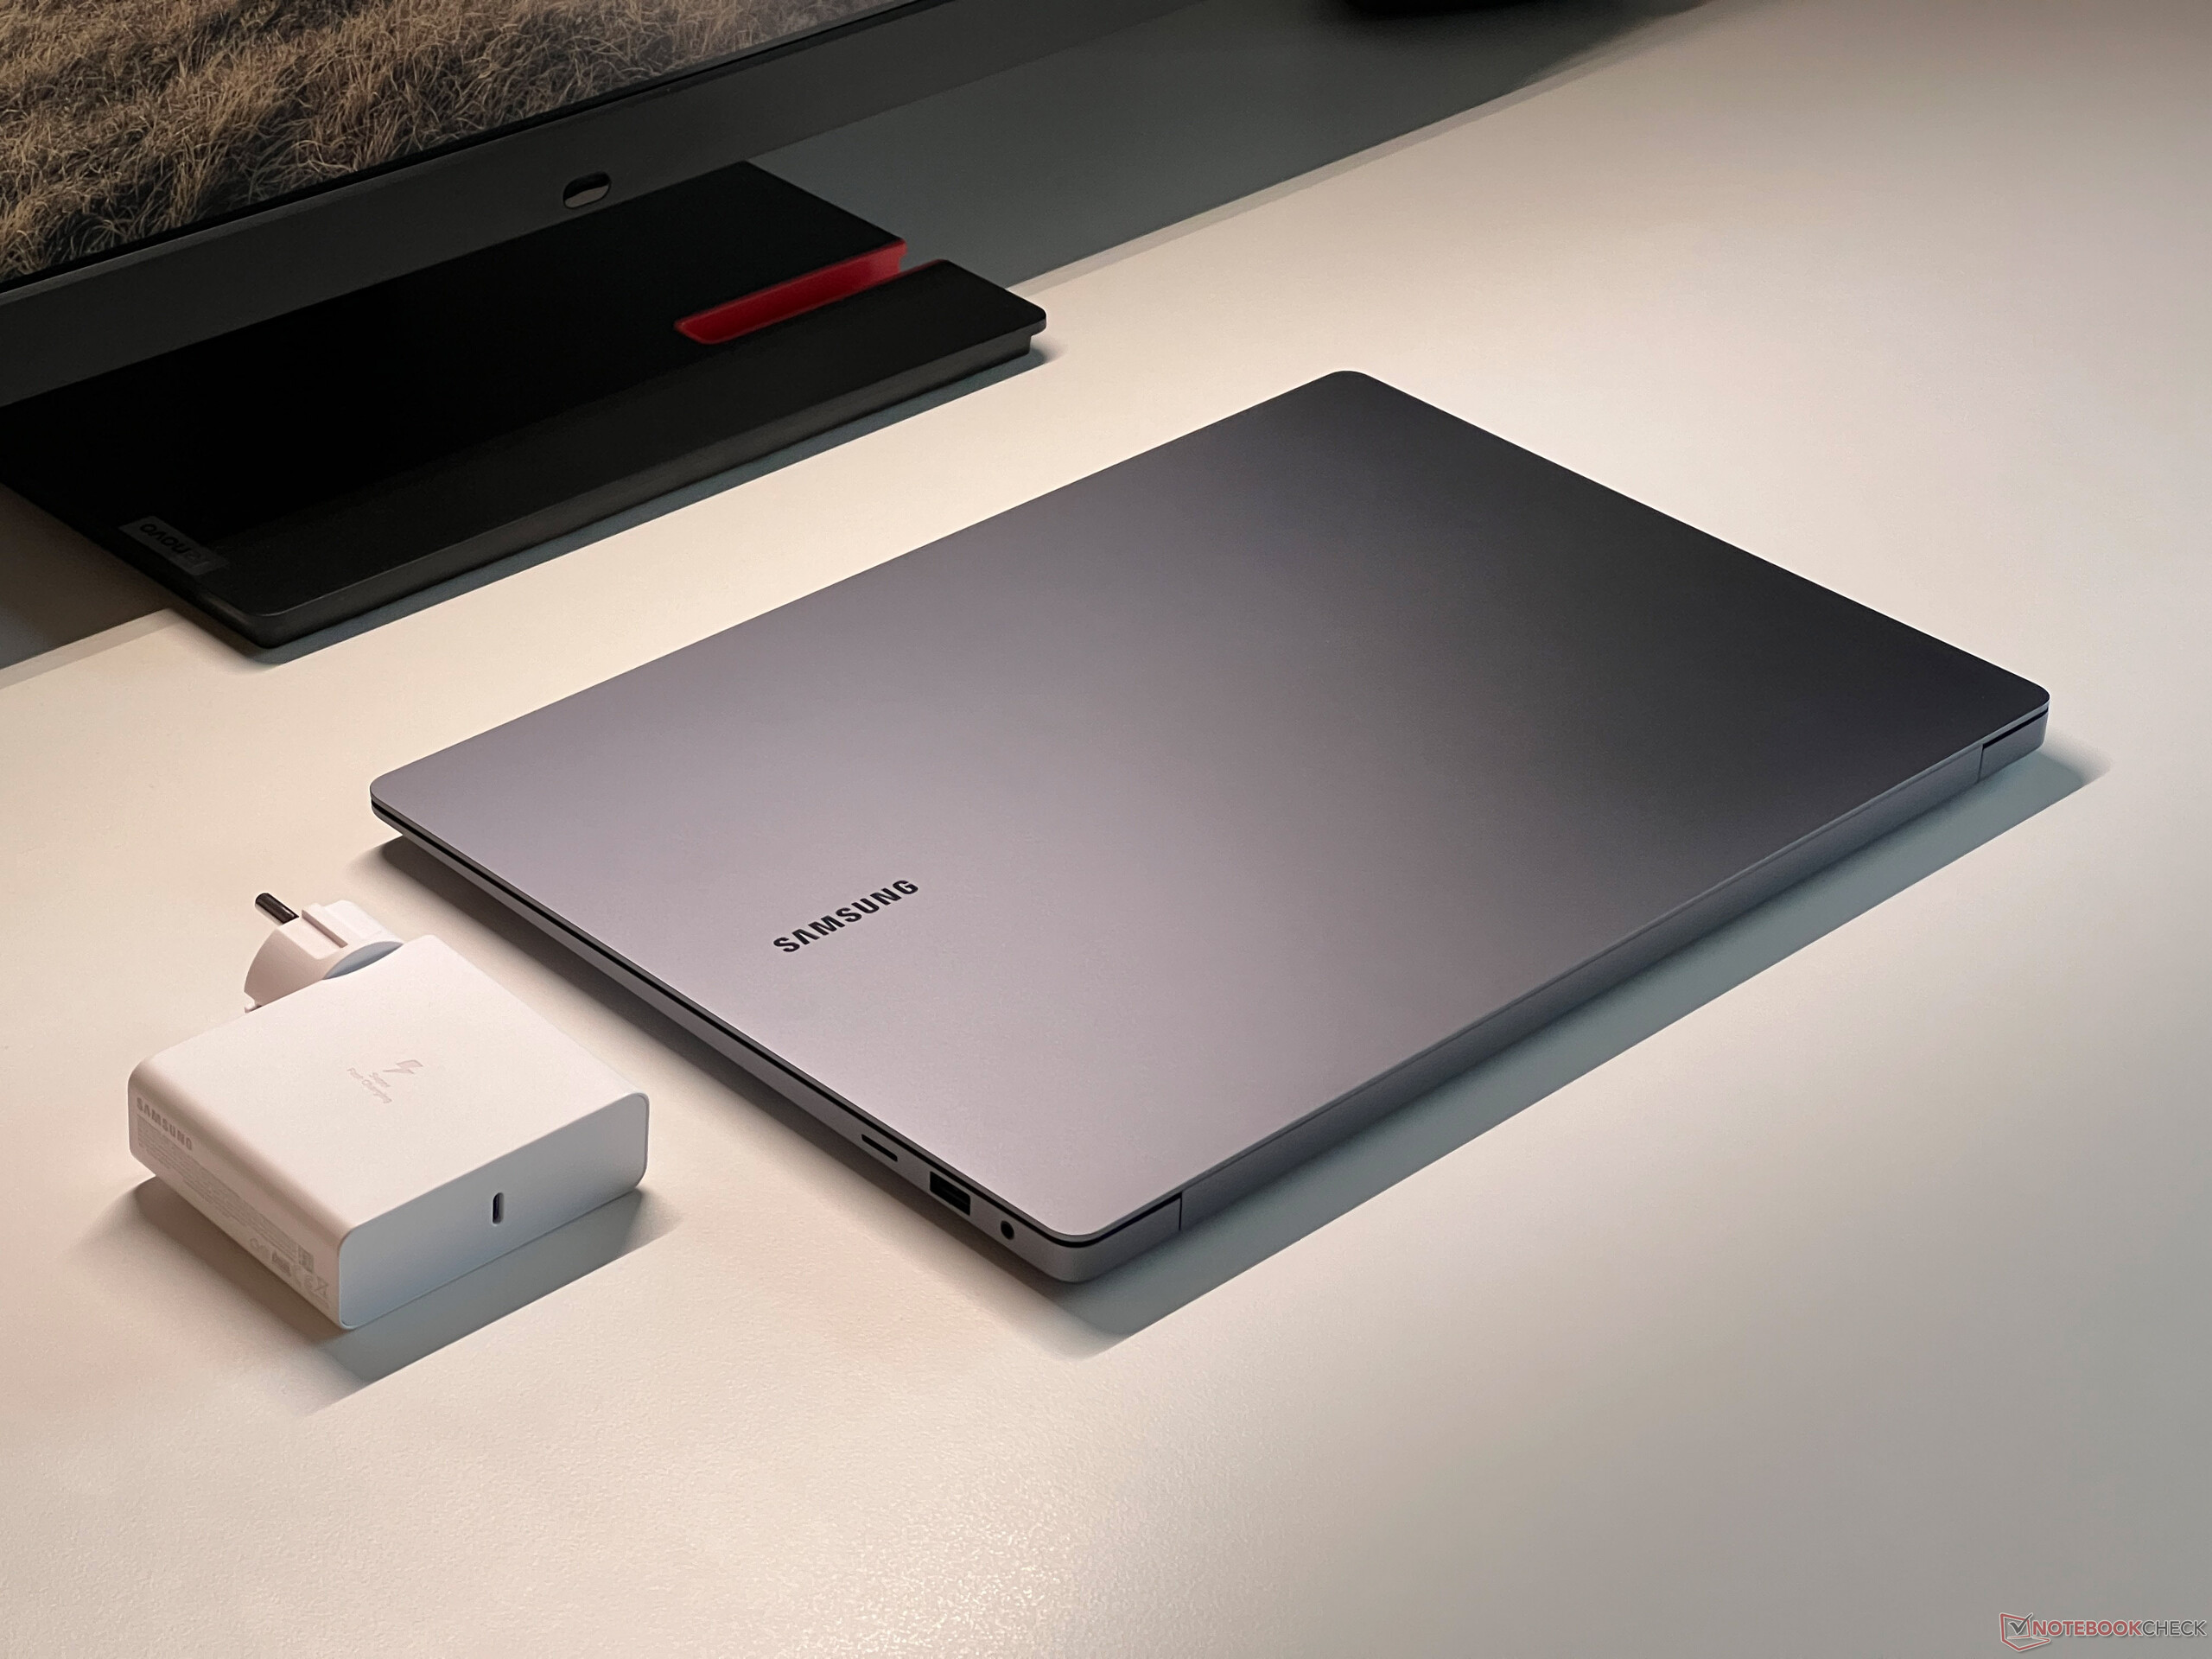
A moldura grossa da tela também é perceptível em termos de espessura do dispositivo, sendo que o Book4 Ultra é o que ocupa mais espaço em comparação com seus pares. Com uma altura de 16,5 mm e um peso de 1,82 kg, o dispositivo da análise fica no meio do pacote. A PSU de 140 watts fornecida traz mais 351 gramas para a balança.
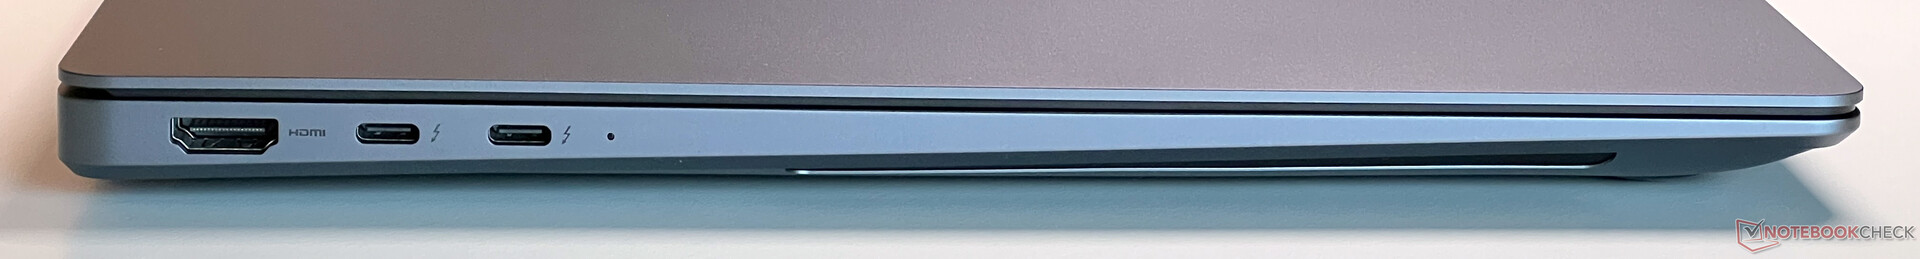
Recursos - Thunderbolt 4 e HDMI 2.1
Além das modernas interfaces USB-C, que incluem Thunderbolt 4, o Galaxy Book4 Ultra também oferece uma porta USB-A comum, bem como HDMI 2.1. Entretanto, uma das interfaces USB também pode ser usada para a PSU. Não há reclamações quanto à localização das portas em ambas as partes traseiras do dispositivo. O conector HDMI é conectado diretamente à GPU da Nvidia, mas não às duas portas USB-C. Ao usar um monitor externo, a dGPU nem sempre opera automaticamente de forma simultânea.
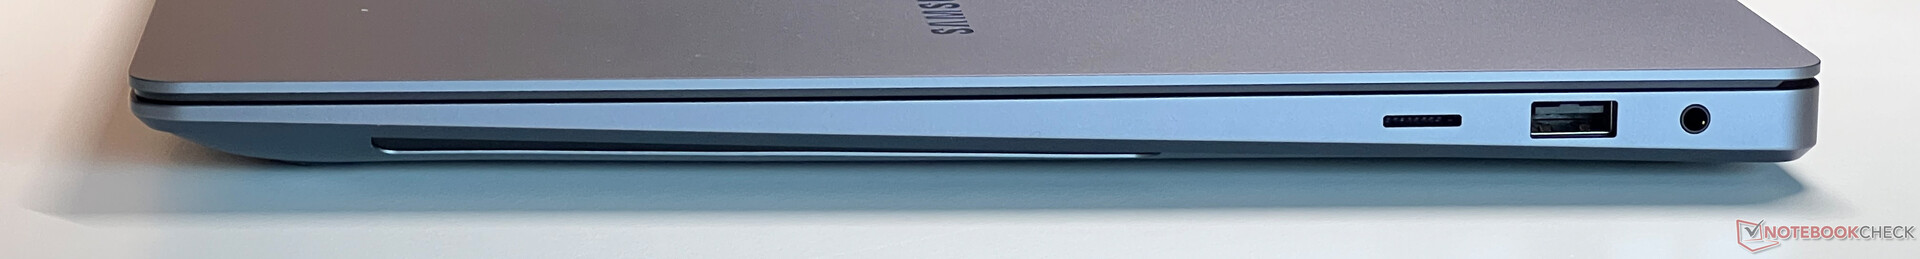
Leitor de cartão SD
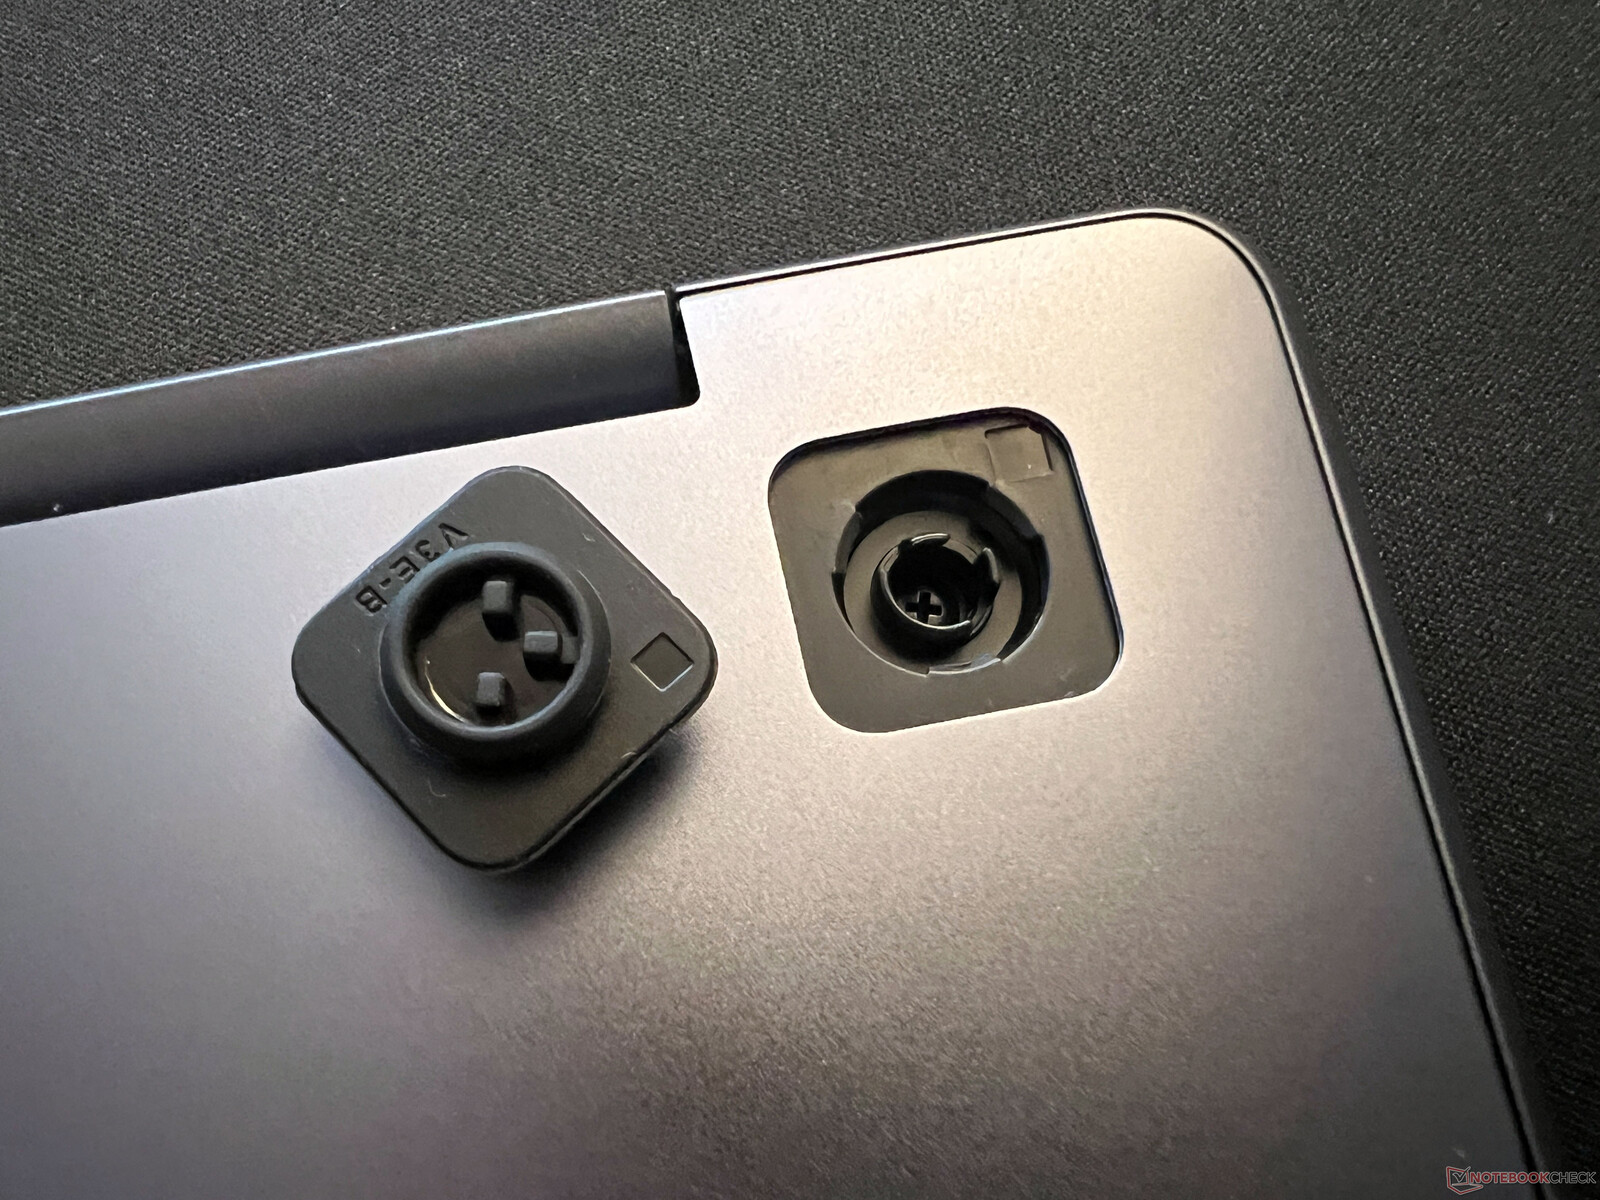
Em nosso teste, o leitor de cartão microSD do lado direito atingiu velocidades médias de ~80 a 90 MB/s emparelhado com nosso cartão de referência, o Angelbird AV Pro V60. No entanto, o leitor em si é problemático (mecanismo de mola) porque o ponto de conexão fica muito profundo dentro do gabinete, o que dificulta a instalação ou a remoção fácil do cartão sem a ajuda de uma ferramenta/auxiliar.
| SD Card Reader | |
| average JPG Copy Test (av. of 3 runs) | |
| Lenovo ThinkPad Z16 Gen 2 (Toshiba Exceria Pro SDXC 64 GB UHS-II) | |
| Média da turma Multimedia (23 - 531, n=40, últimos 2 anos) | |
| Samsung Galaxy Book4 Ultra (Angelbird AV Pro V60) | |
| Lenovo Slim Pro 9i 16IRP8 (PNY EliteX-Pro60 V60 256 GB) | |
| Samsung Galaxy Book3 Ultra 16 (AV PRO microSD 128 GB V60) | |
| Schenker VISION 16 Pro (M23) (Angelbird AV Pro V60) | |
| maximum AS SSD Seq Read Test (1GB) | |
| Lenovo ThinkPad Z16 Gen 2 (Toshiba Exceria Pro SDXC 64 GB UHS-II) | |
| Média da turma Multimedia (37.3 - 1455, n=39, últimos 2 anos) | |
| Samsung Galaxy Book4 Ultra (Angelbird AV Pro V60) | |
| Lenovo Slim Pro 9i 16IRP8 (PNY EliteX-Pro60 V60 256 GB) | |
| Samsung Galaxy Book3 Ultra 16 (AV PRO microSD 128 GB V60) | |
| Schenker VISION 16 Pro (M23) (Angelbird AV Pro V60) | |
Comunicação
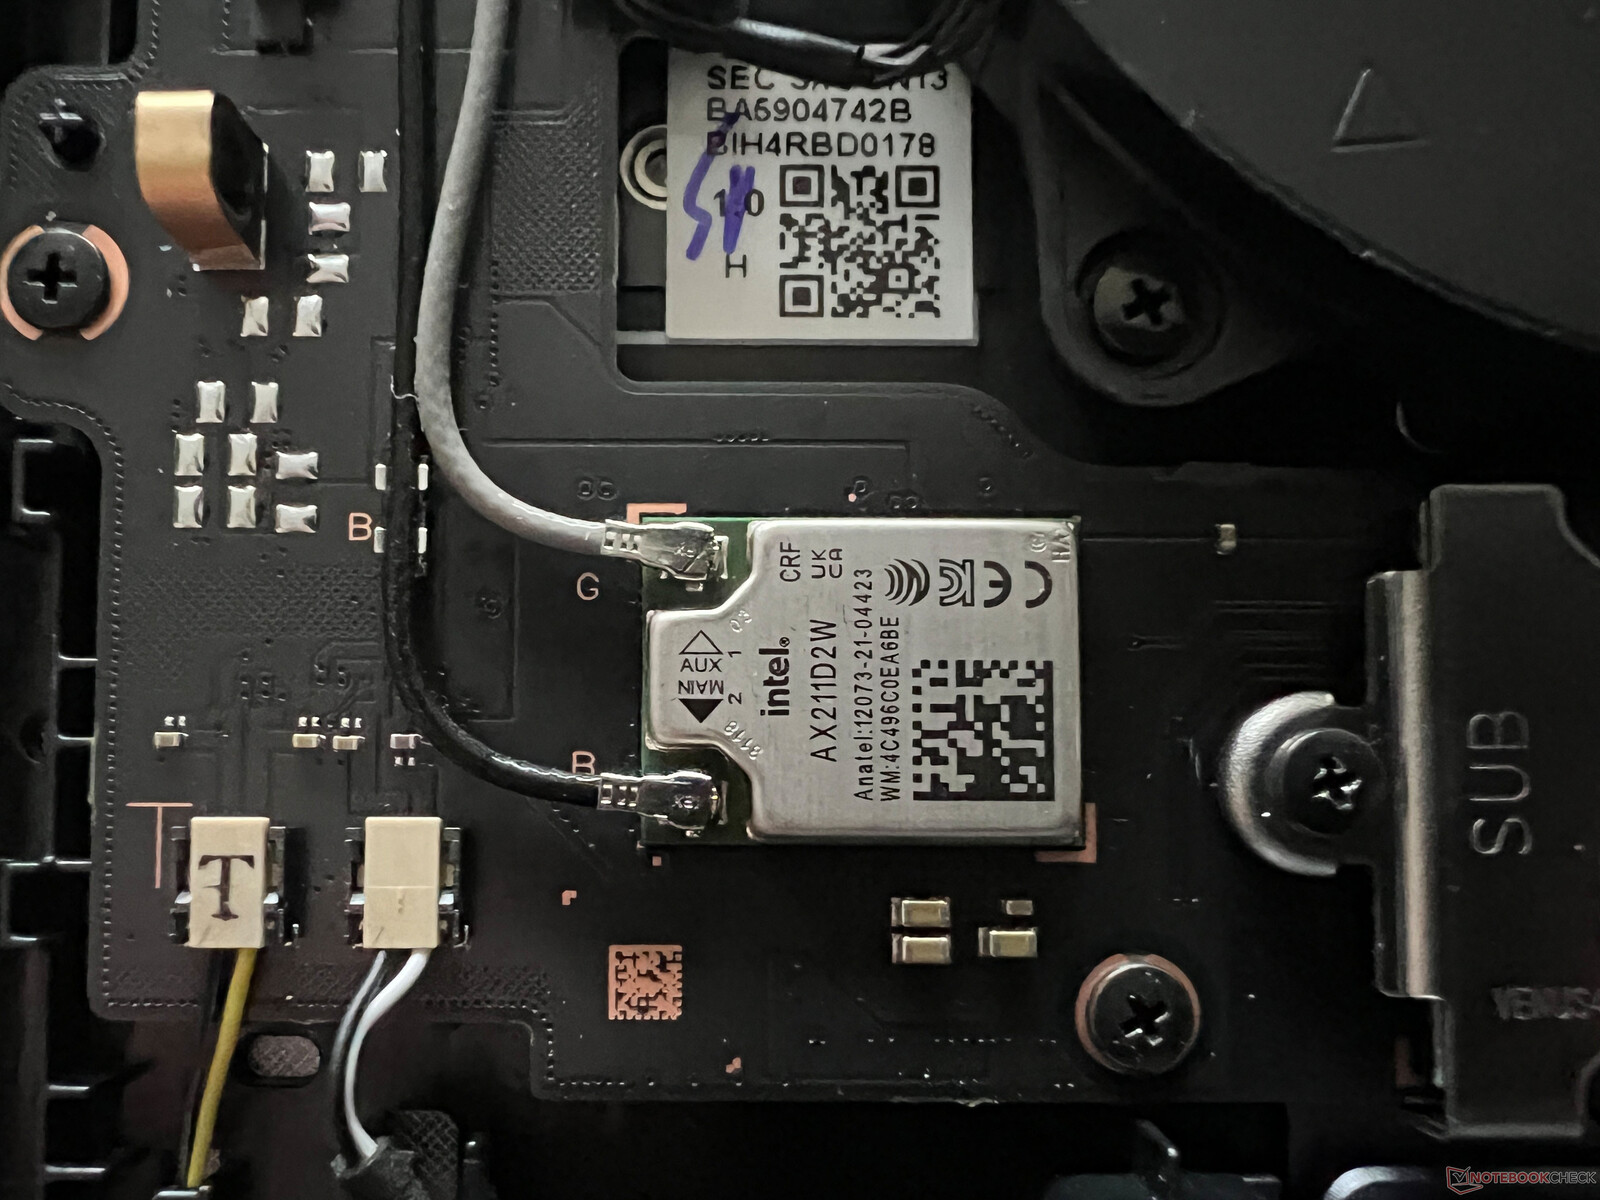
A Samsung usa o conhecido módulo Intel AX211 que suporta o padrão Wi-Fi 6E em redes de 6 GHz, bem como o Bluetooth 5.3. Trabalhando em conjunto com nosso roteador de referência da Asus, as velocidades de transferência são muito boas e estáveis. Apesar disso, o novo Galaxy Book4 Ultra não é compatível com o Wi-Fi 7.
| Networking | |
| Samsung Galaxy Book4 Ultra | |
| iperf3 transmit AXE11000 | |
| iperf3 receive AXE11000 | |
| Lenovo ThinkPad Z16 Gen 2 | |
| iperf3 transmit AXE11000 | |
| iperf3 receive AXE11000 | |
| iperf3 transmit AXE11000 6GHz | |
| iperf3 receive AXE11000 6GHz | |
| Lenovo Slim Pro 9i 16IRP8 | |
| iperf3 transmit AXE11000 | |
| iperf3 receive AXE11000 | |
| iperf3 transmit AXE11000 6GHz | |
| iperf3 receive AXE11000 6GHz | |
| Schenker VISION 16 Pro (M23) | |
| iperf3 transmit AXE11000 | |
| iperf3 receive AXE11000 | |
| Samsung Galaxy Book3 Ultra 16 | |
| iperf3 transmit AXE11000 | |
| iperf3 receive AXE11000 | |
| Apple MacBook Pro 16 2023 M3 Max | |
| iperf3 transmit AXE11000 | |
| iperf3 receive AXE11000 | |
| HP Spectre x360 16 RTX 4050 | |
| iperf3 transmit AXE11000 | |
| iperf3 receive AXE11000 | |
| iperf3 transmit AXE11000 6GHz | |
| iperf3 receive AXE11000 6GHz | |
Webcam
No que diz respeito à webcam de 1080p, não há alterações e a qualidade permanece mediana. O dispositivo não tem um obturador mecânico nem um módulo IR para reconhecimento facial. Graças à nova NPU do chip Meteor Lake, o Studio Effects (desfoque de fundo, contato visual, rastreamento de cabeça) para a webcam é compatível diretamente com o sistema operacional, independentemente do aplicativo usado.


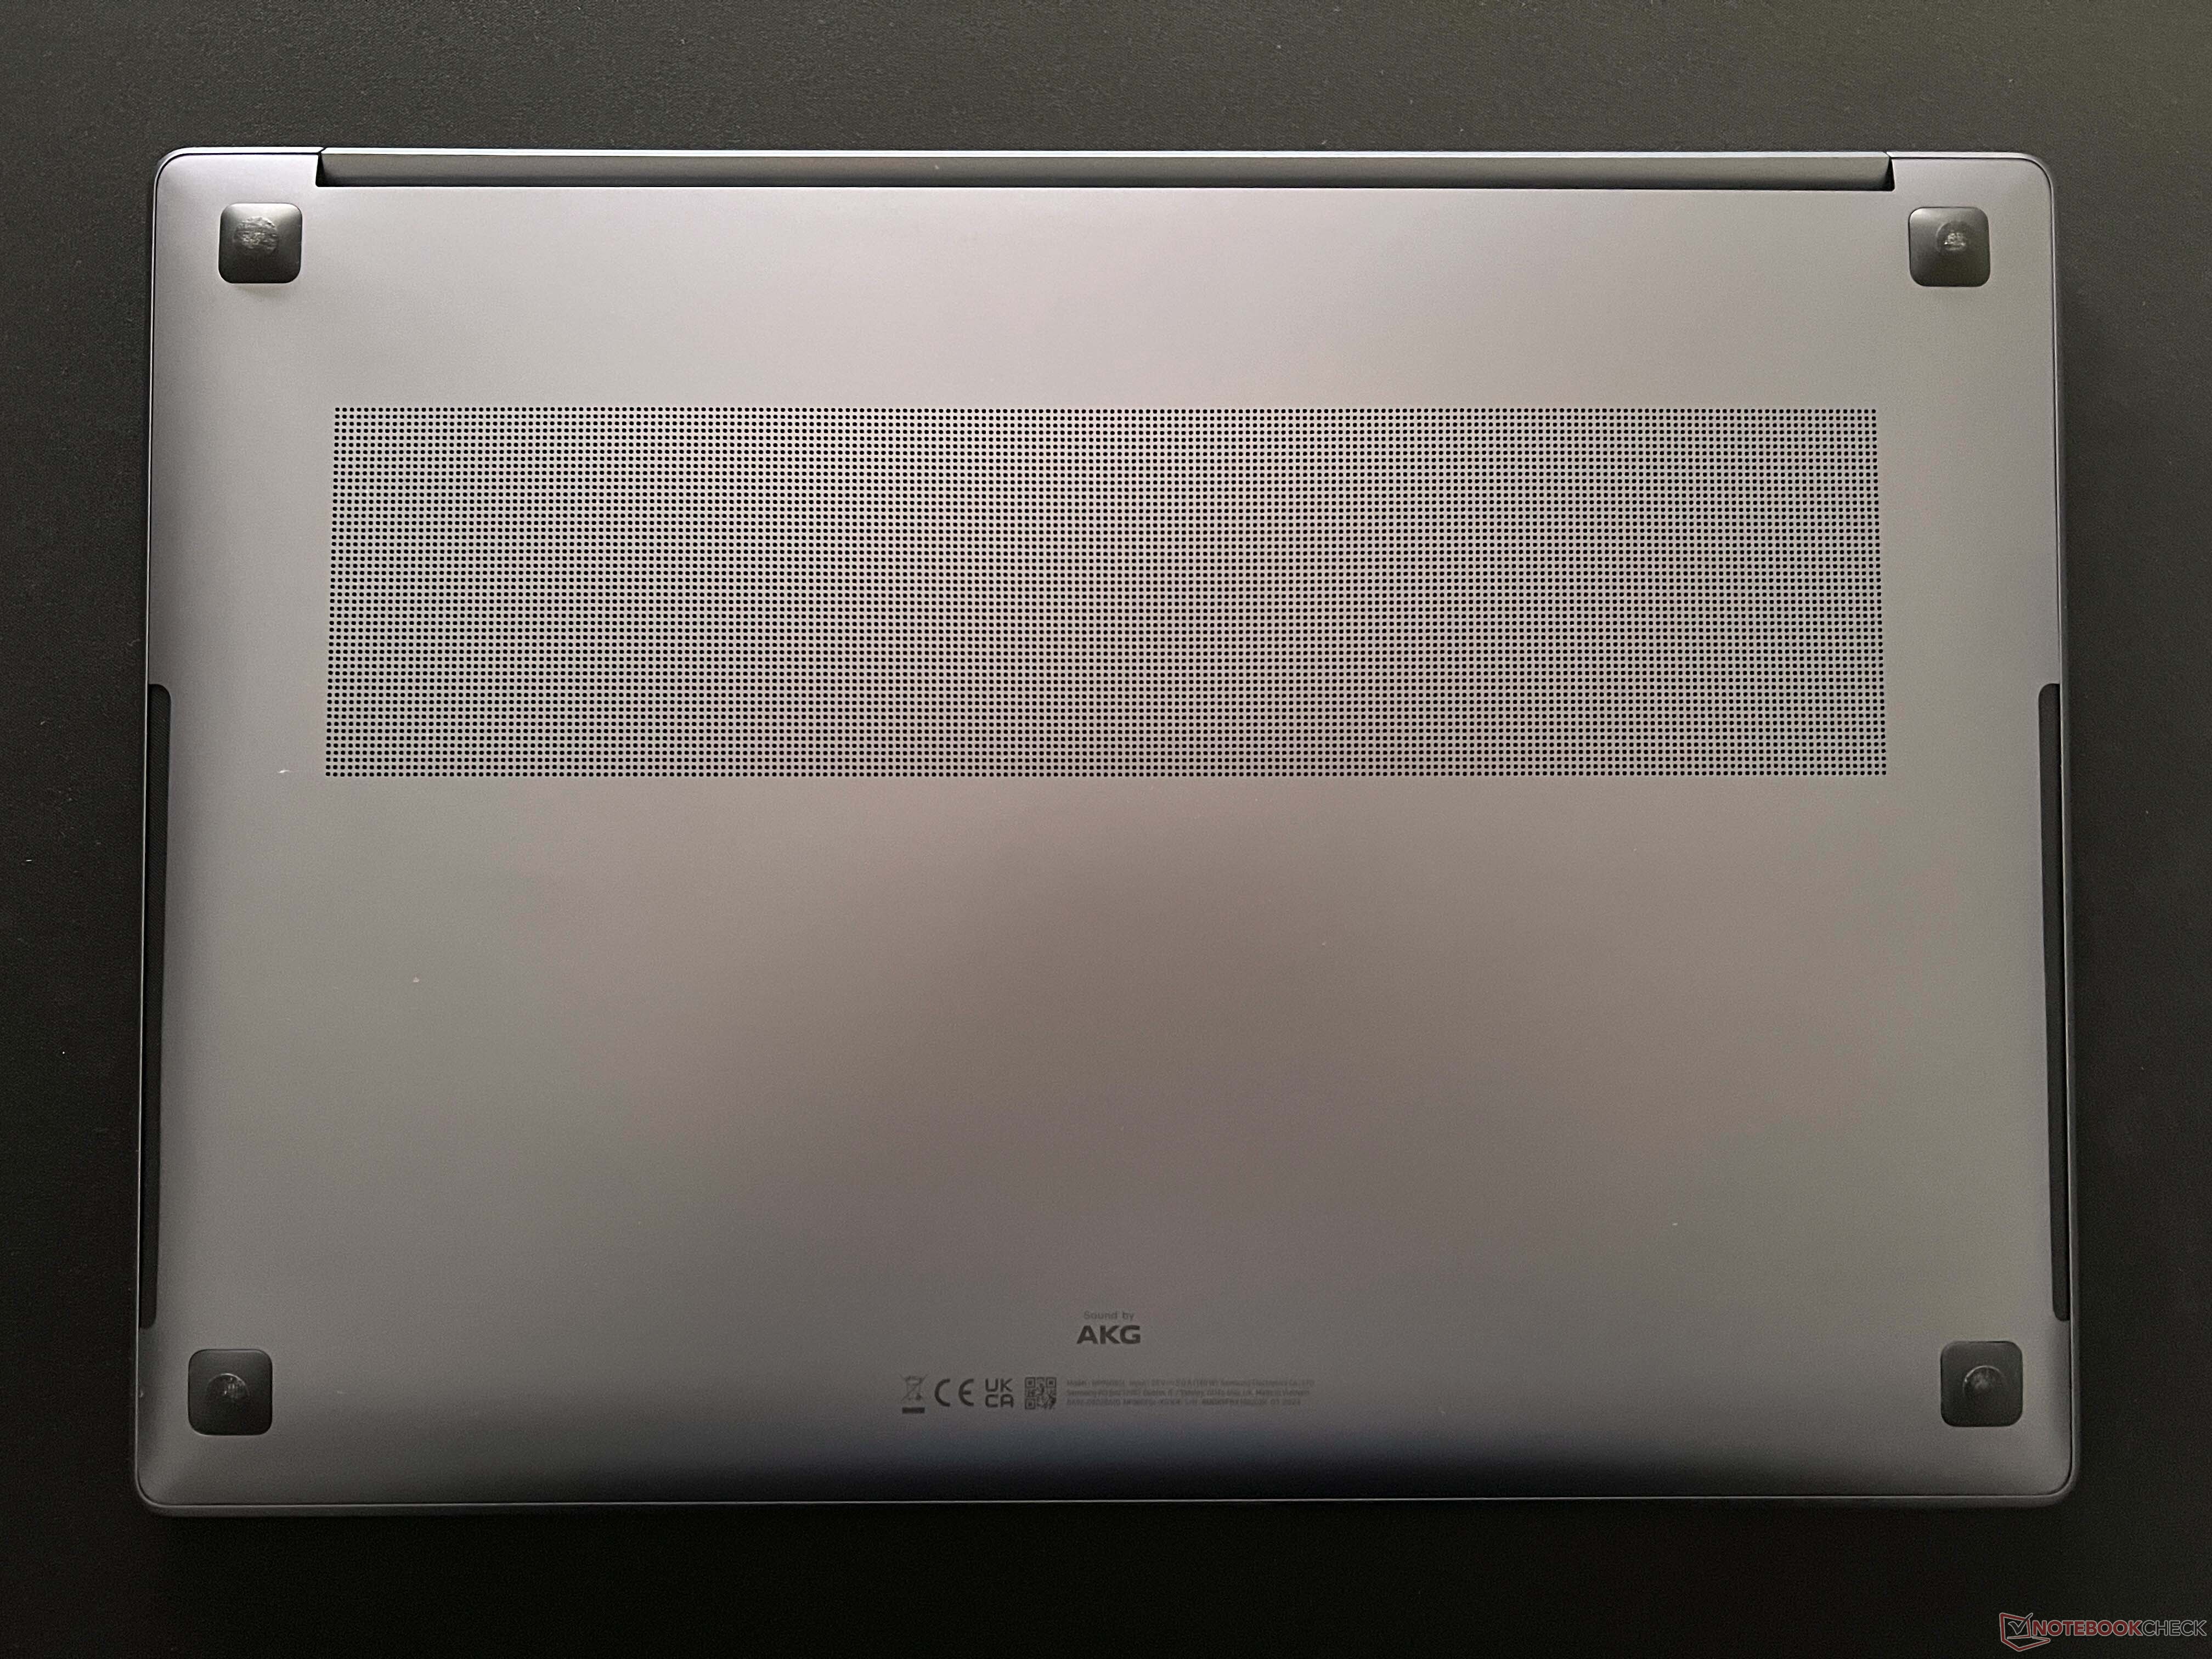
Manutenção
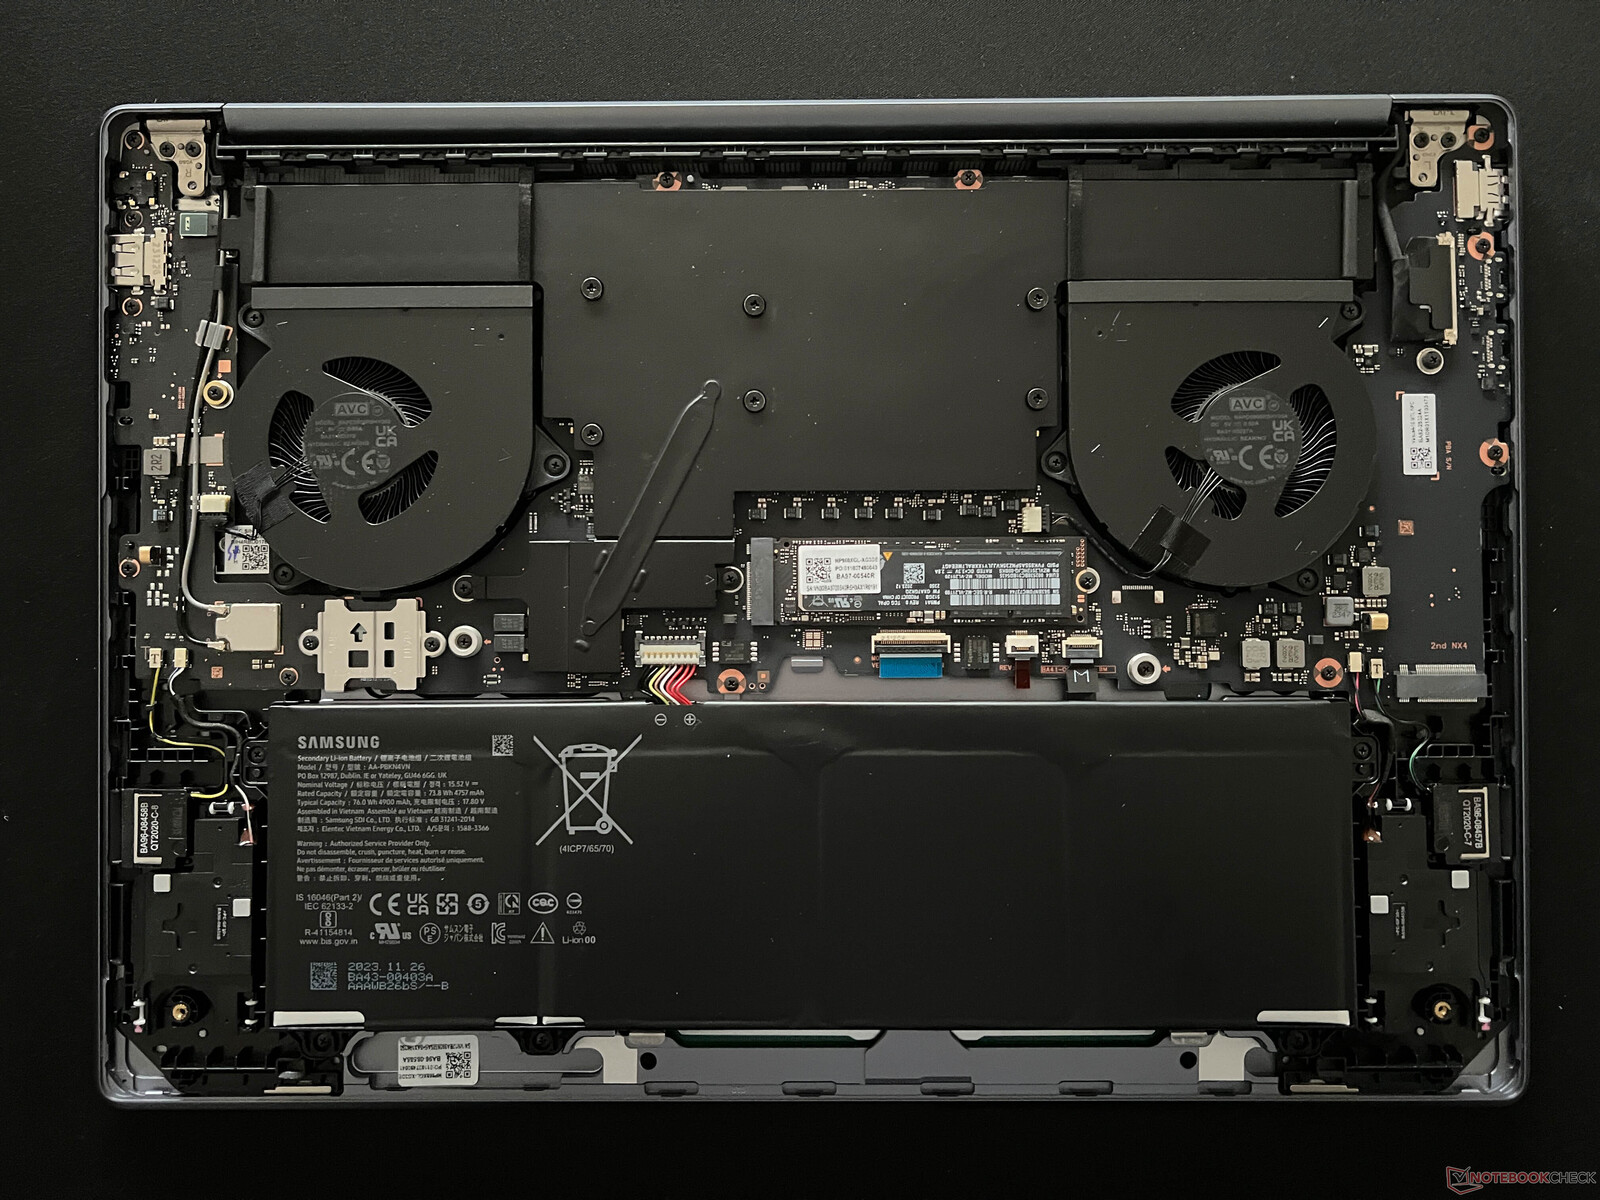
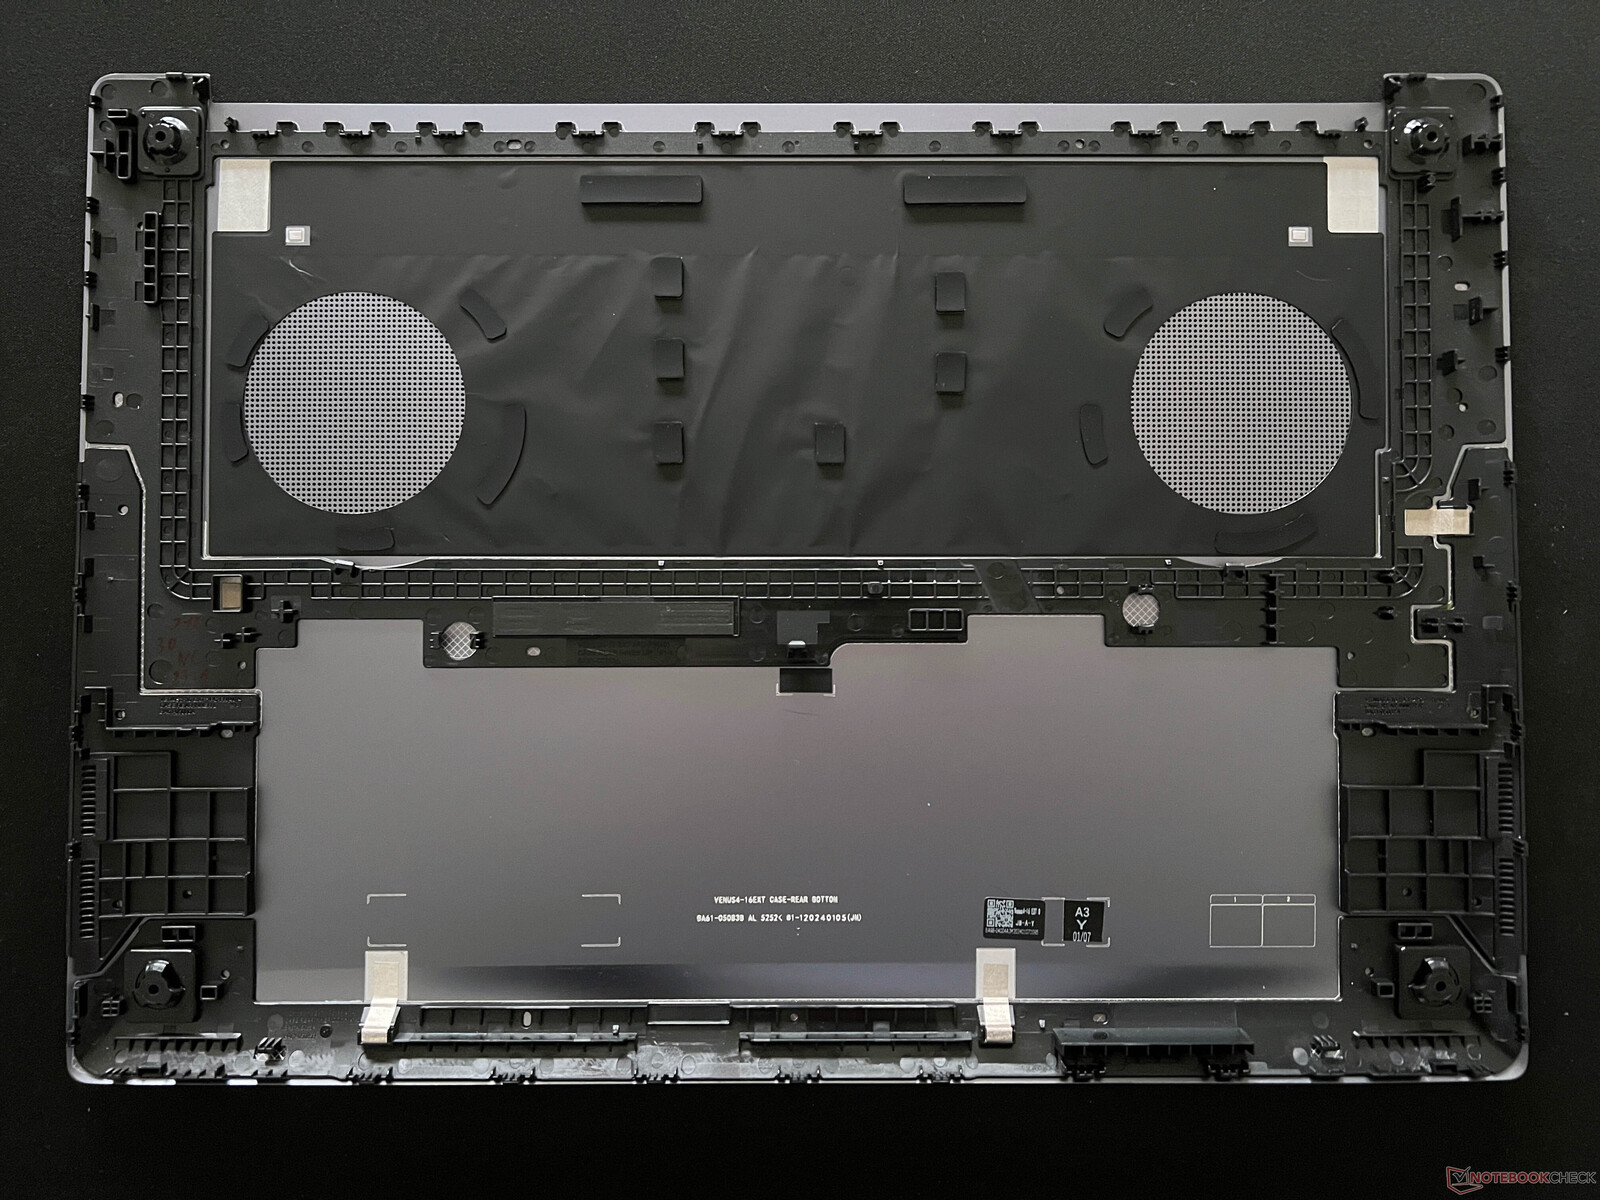
Na base da unidade, quatro parafusos estão escondidos sob os pés de borracha instalados. Mas, mesmo sem os parafusos, a tampa da base é presa com muita firmeza, pois há clipes de fixação adicionais no meio. Dentro do dispositivo, o senhor se depara com as duas ventoinhas e a grande câmara de vapor. Há dois slots para SSDs M.2 2280 e, embora a bateria aparafusada possa ser substituída, todos os outros componentes são soldados.
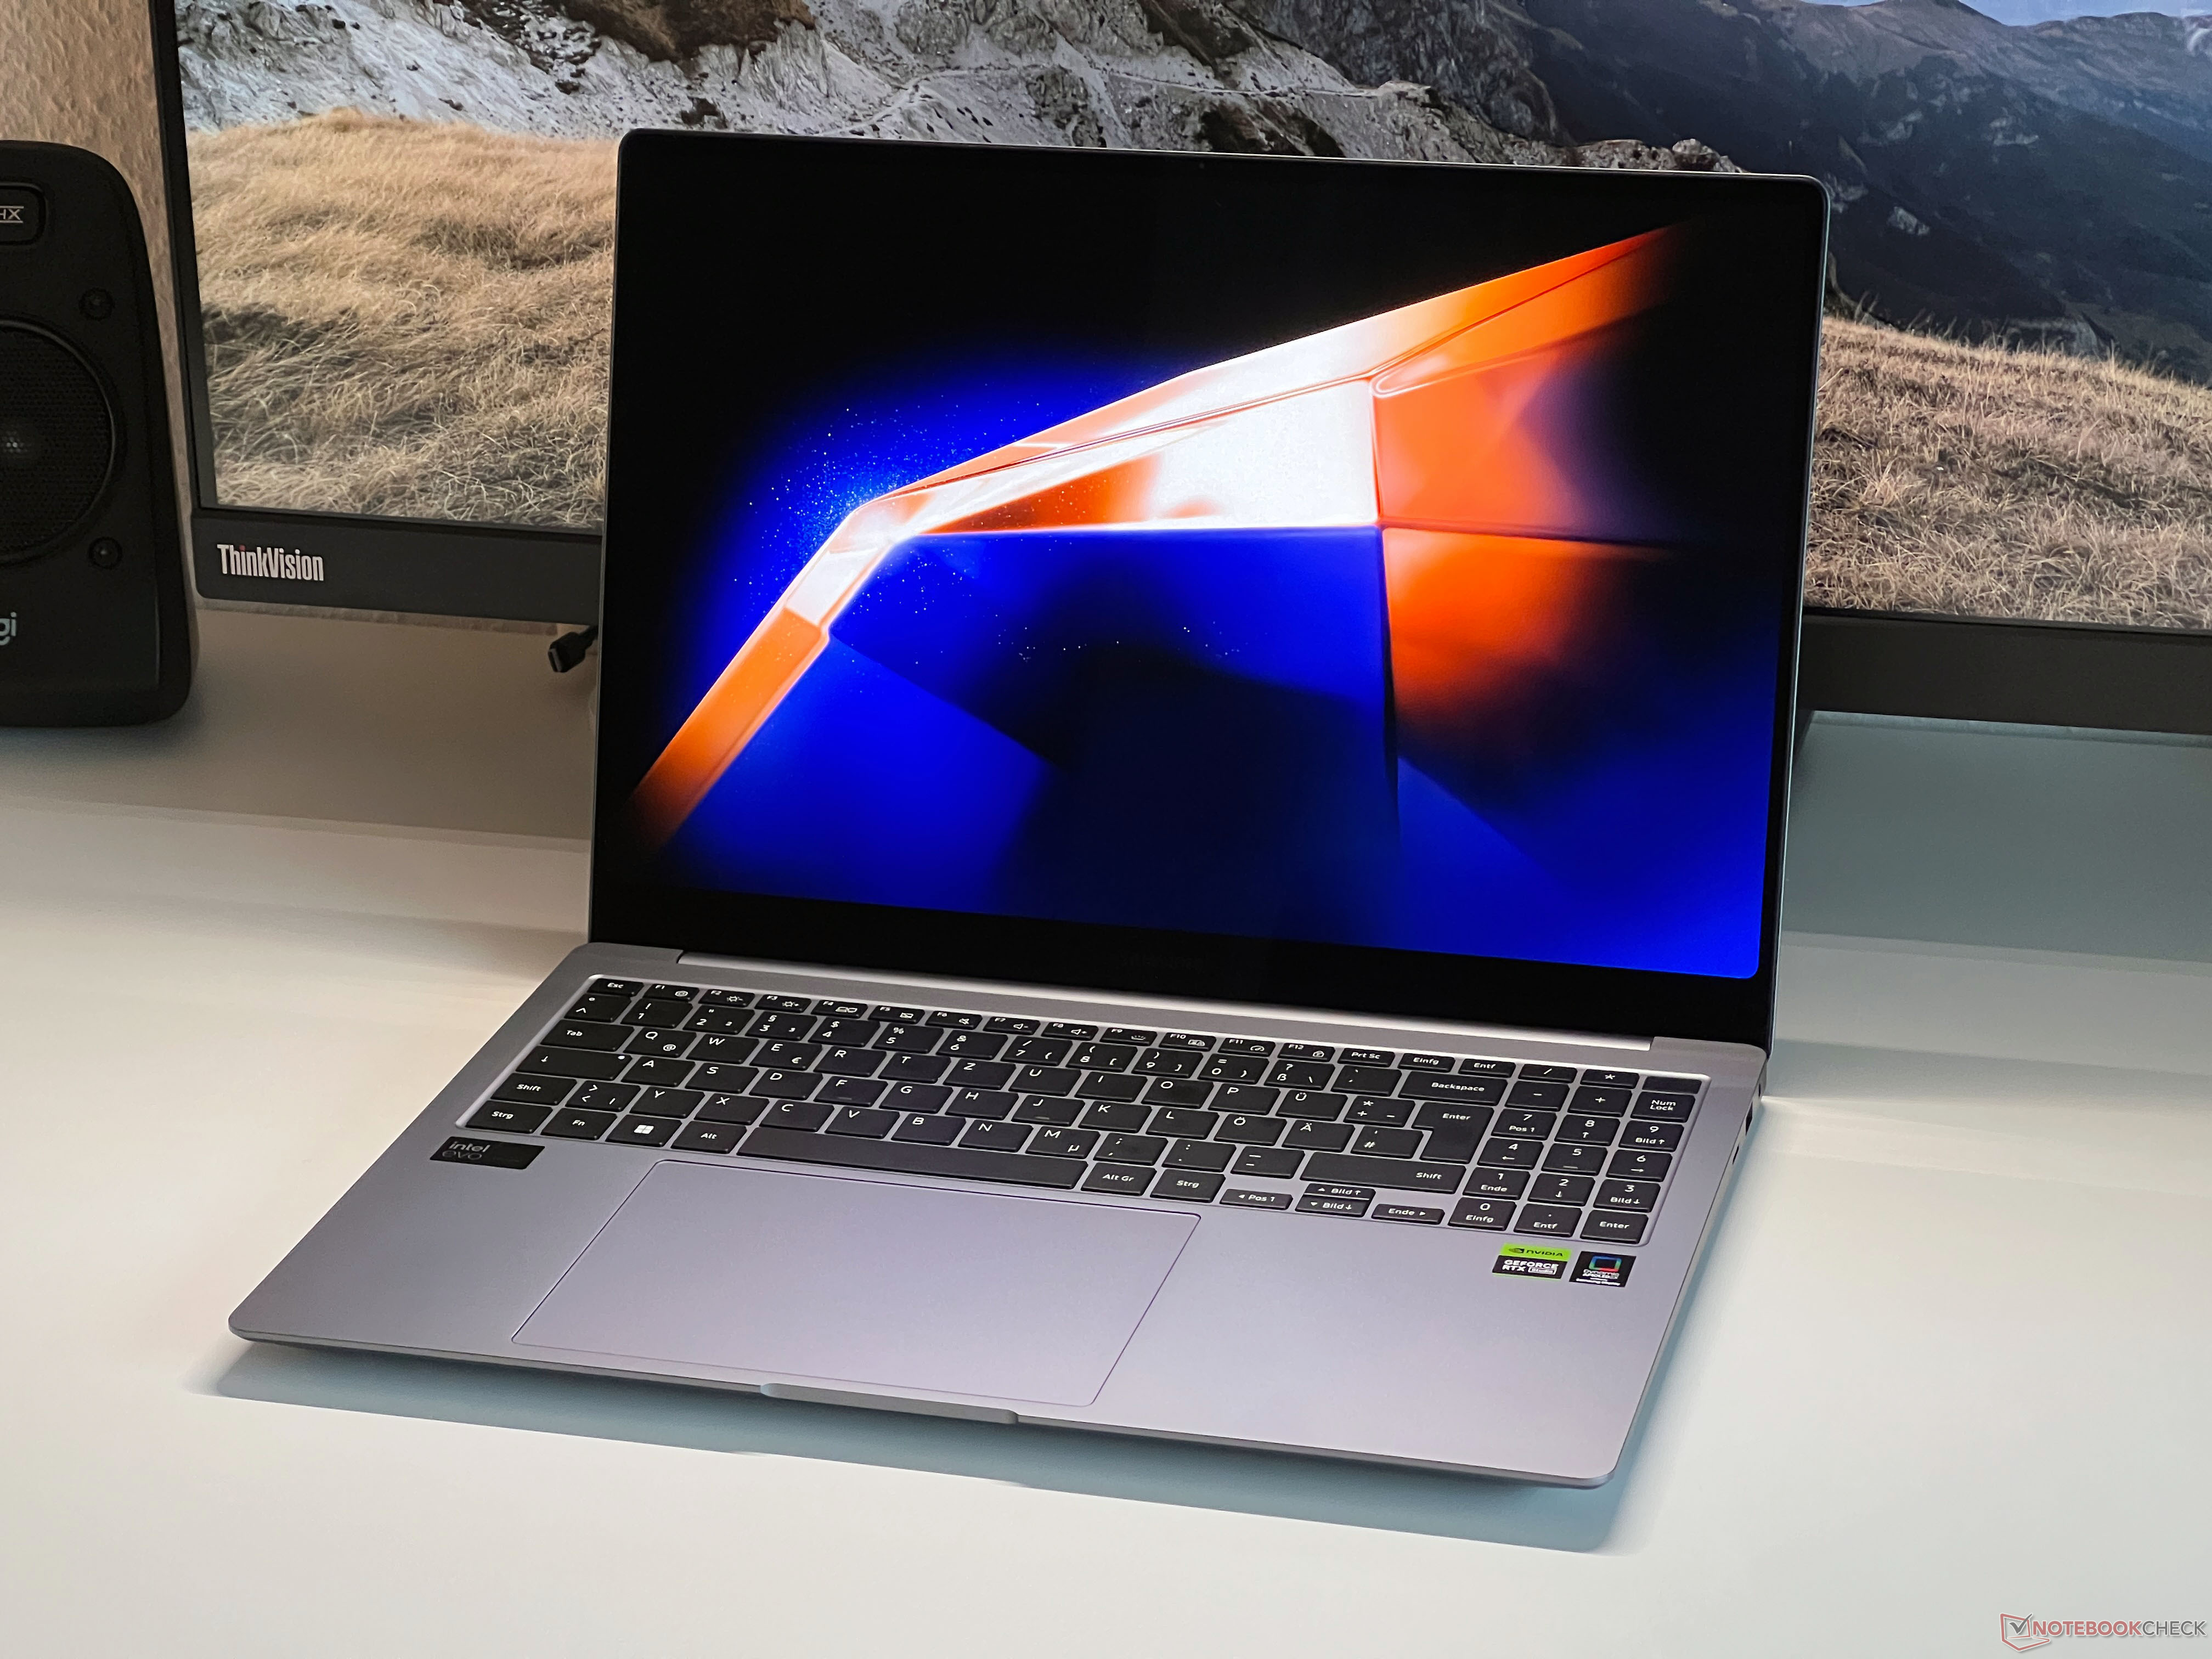
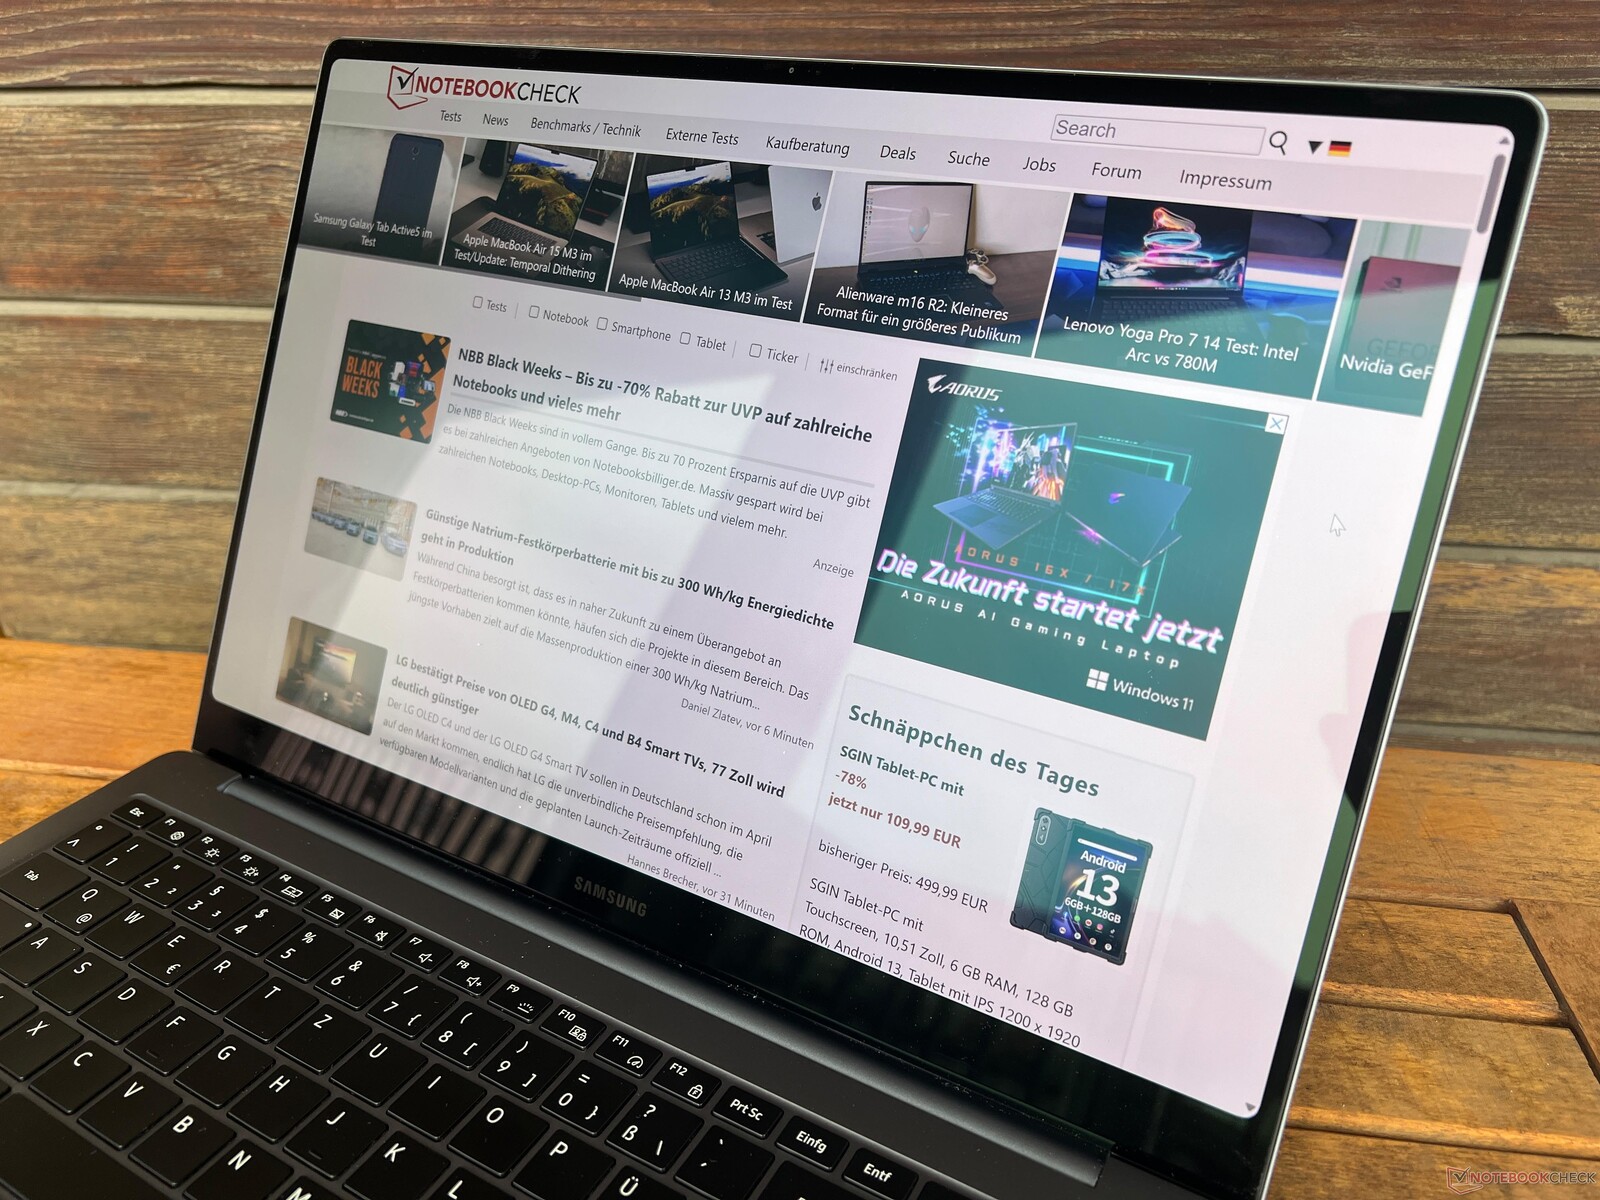
Dispositivos de entrada - Touchpad enorme, teclado mediano
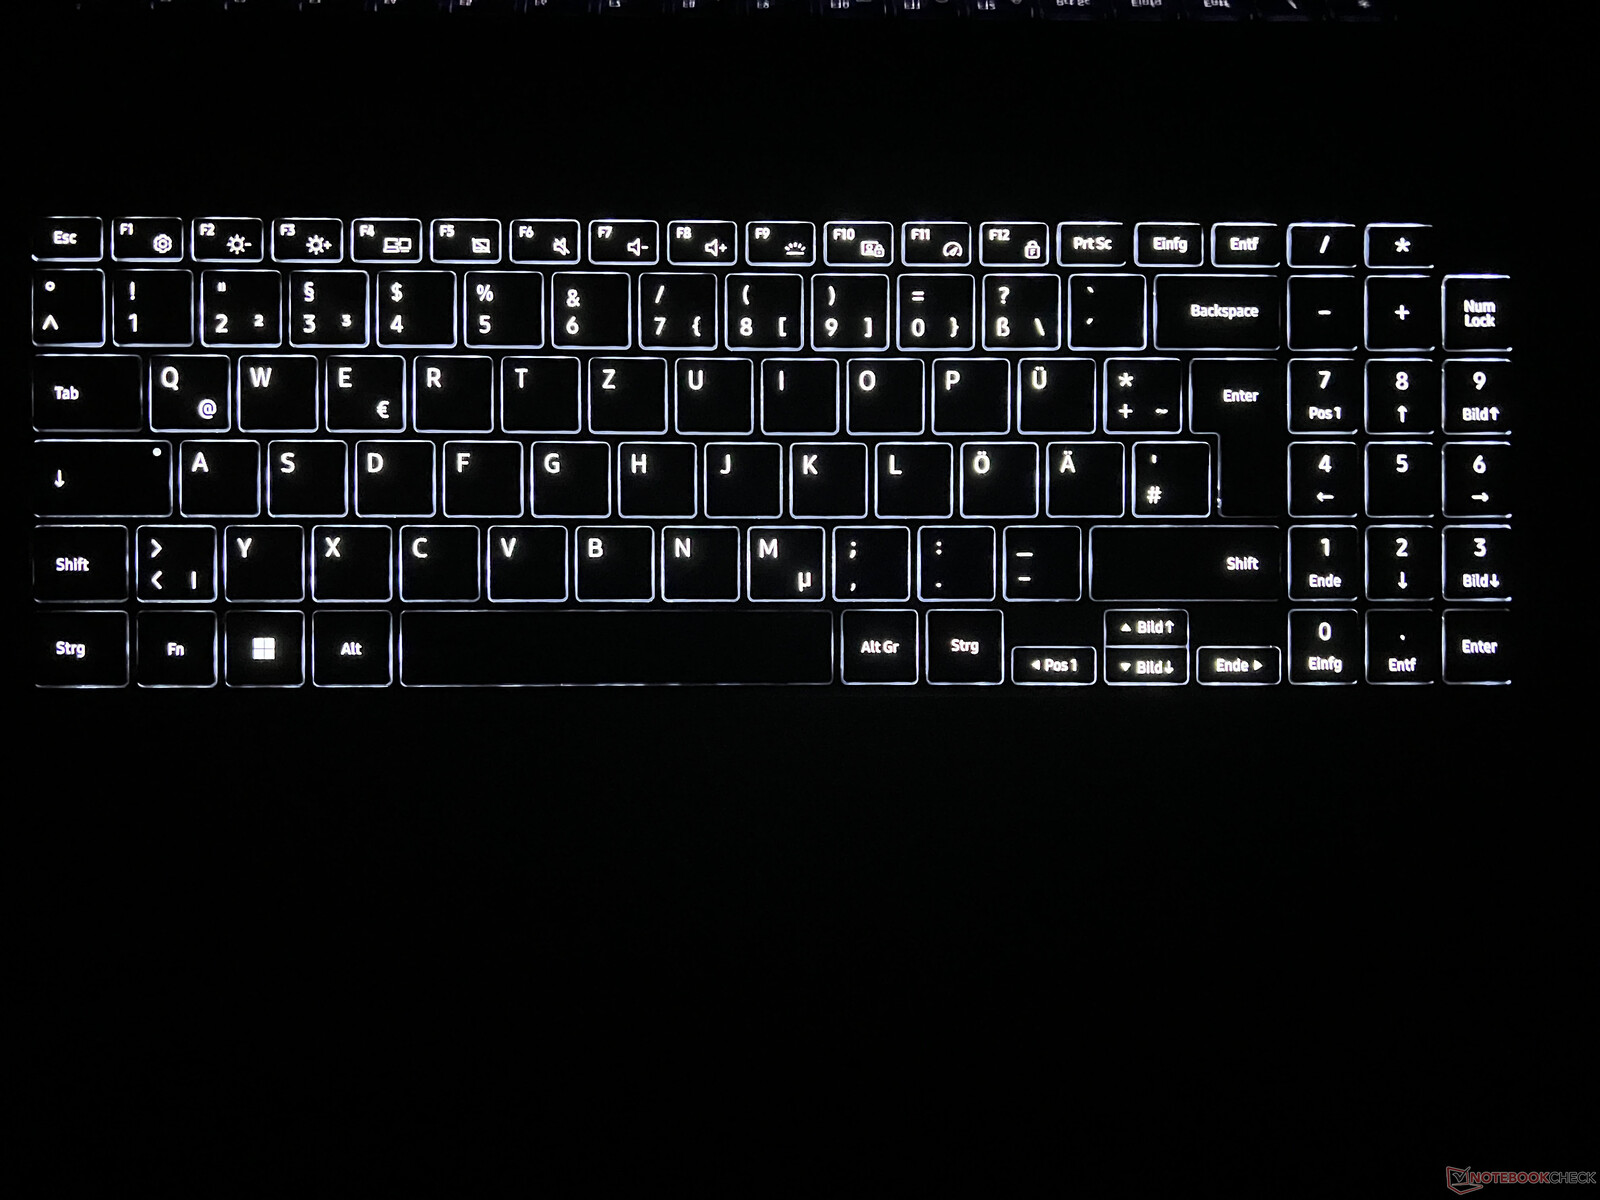
A Samsung equipou o Galaxy Book4 Ultra com um teclado e um teclado numérico. A experiência de digitação sofre um pouco com o deslocamento das teclas, que é muito raso, bem como com um ruído audível de pressionamento de tecla e, em comparação direta com o Galaxy Book4 Pro regular, os golpes não são tão precisos. Nesse quesito, o laptop da Samsung também fica atrás da concorrência. Qualquer pessoa que digite muito deve experimentar o teclado com antecedência. O botão liga/desliga localizado no canto superior direito também funciona como um sensor de impressão digital. A luz de fundo branca oferece três níveis de intensidade e pode ser ativada automaticamente.
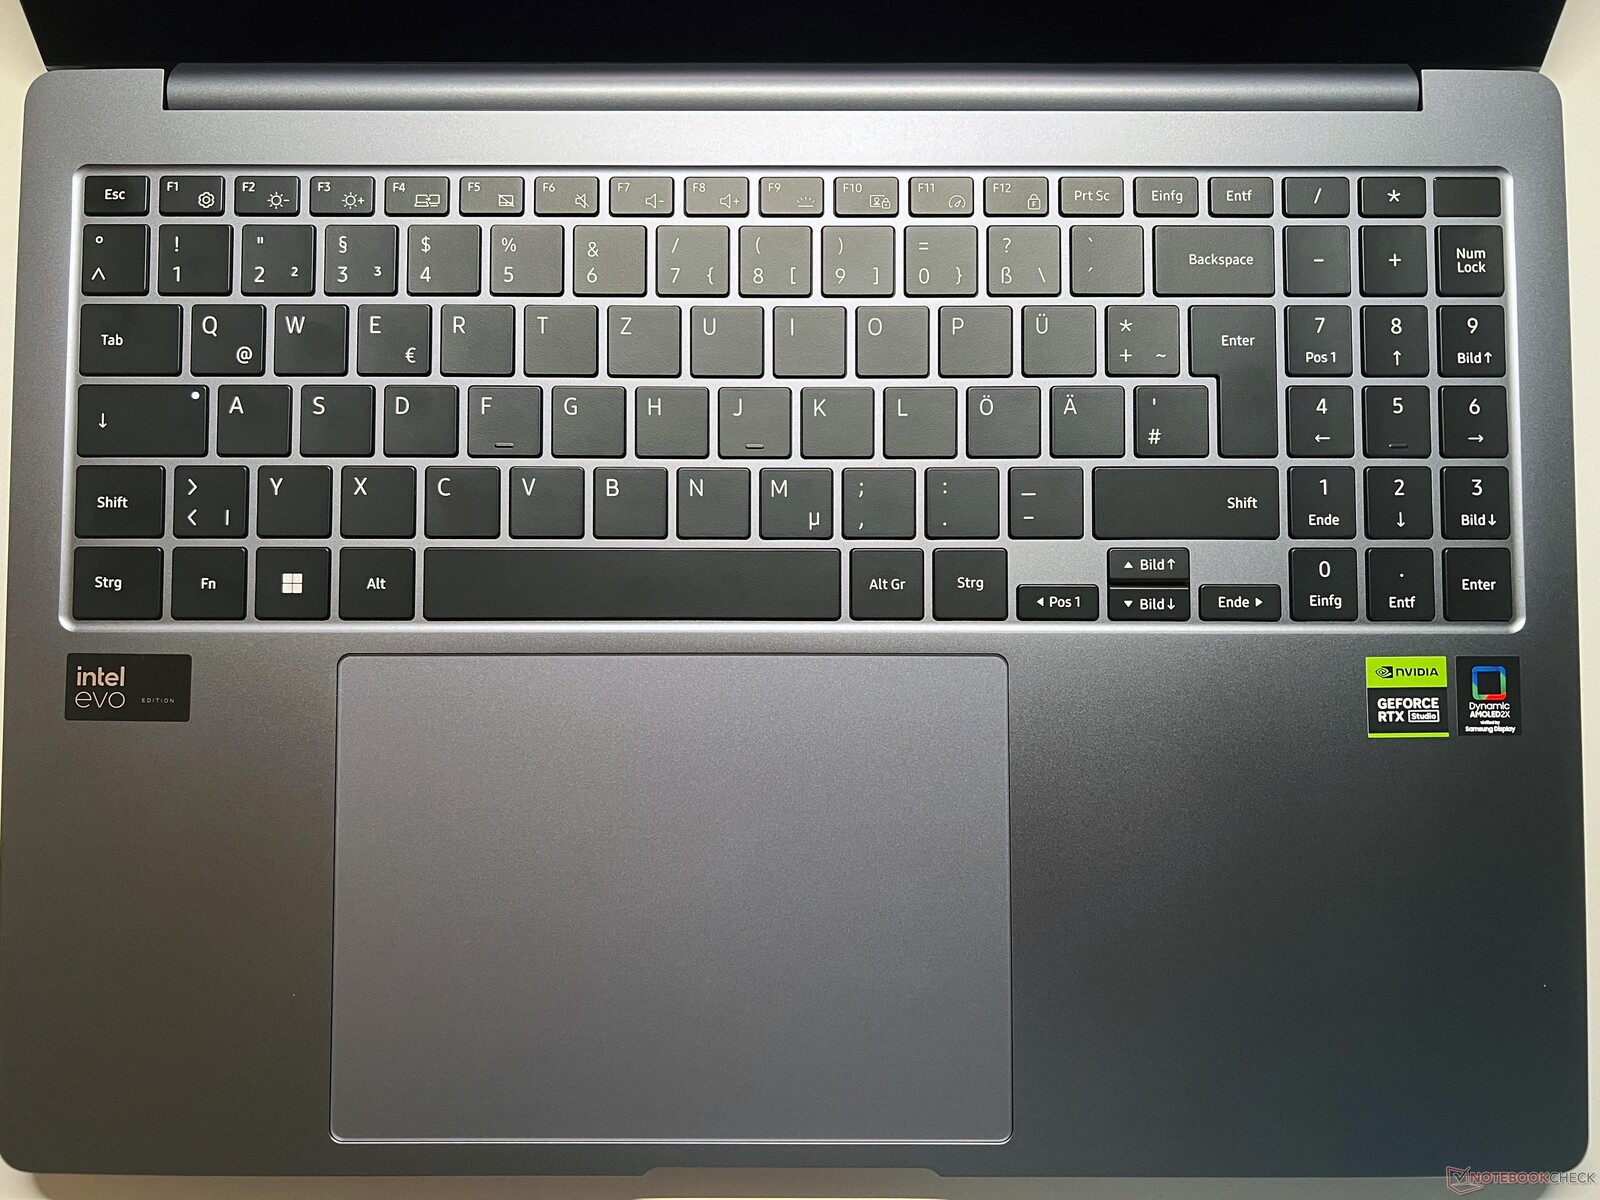
Os gestos de deslizamento feitos no enorme clickpad (15,1 x 10,8 cm) são muito bons, apesar de ele estar um pouco à esquerda do centro. Quando se trata de digitação, a bola da mão esquerda está quase sempre sobre o touchpad, mas isso não se mostrou um problema durante os testes. A parte inferior do touchpad pode ser clicada, mas isso tem o custo de um ruído relativamente alto e barato.
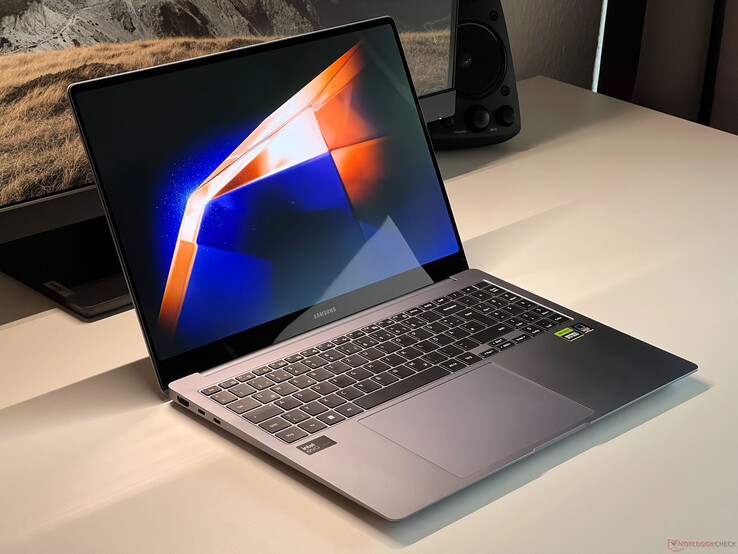
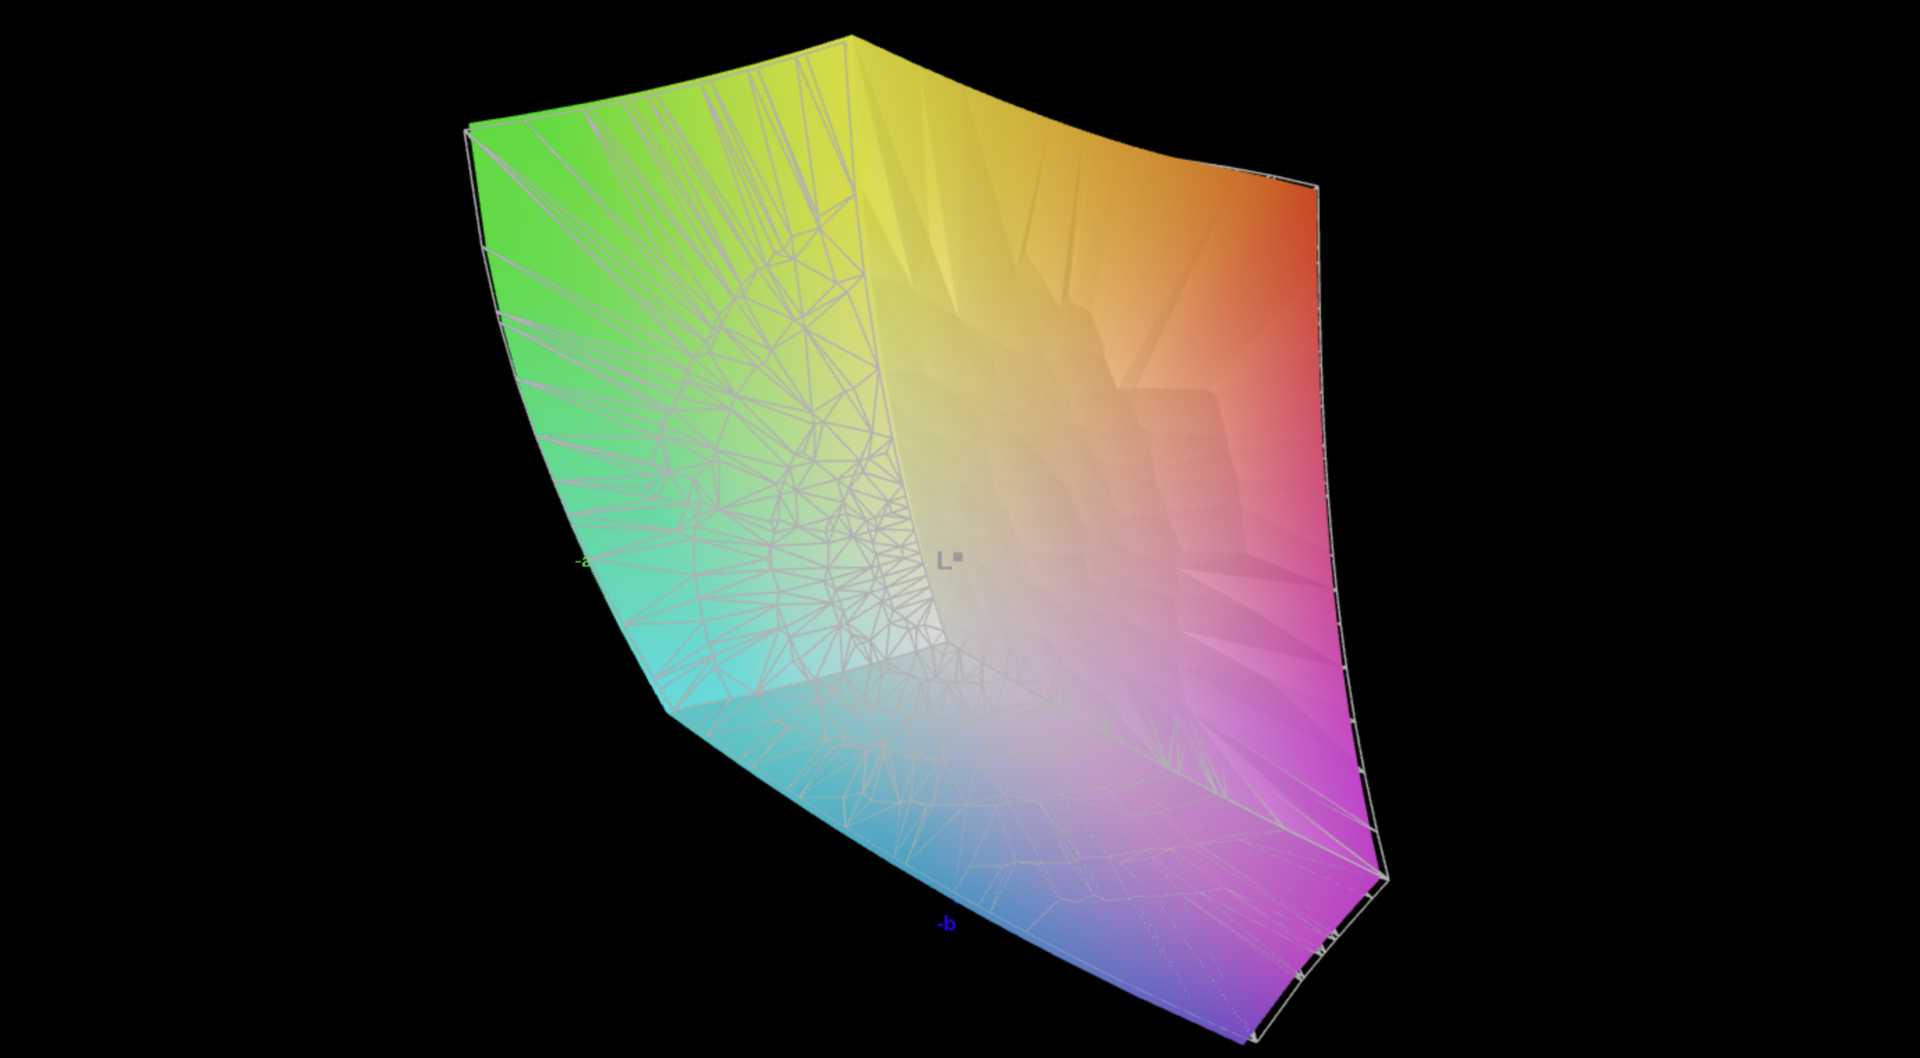
Tela - AMOLED de 120 Hz
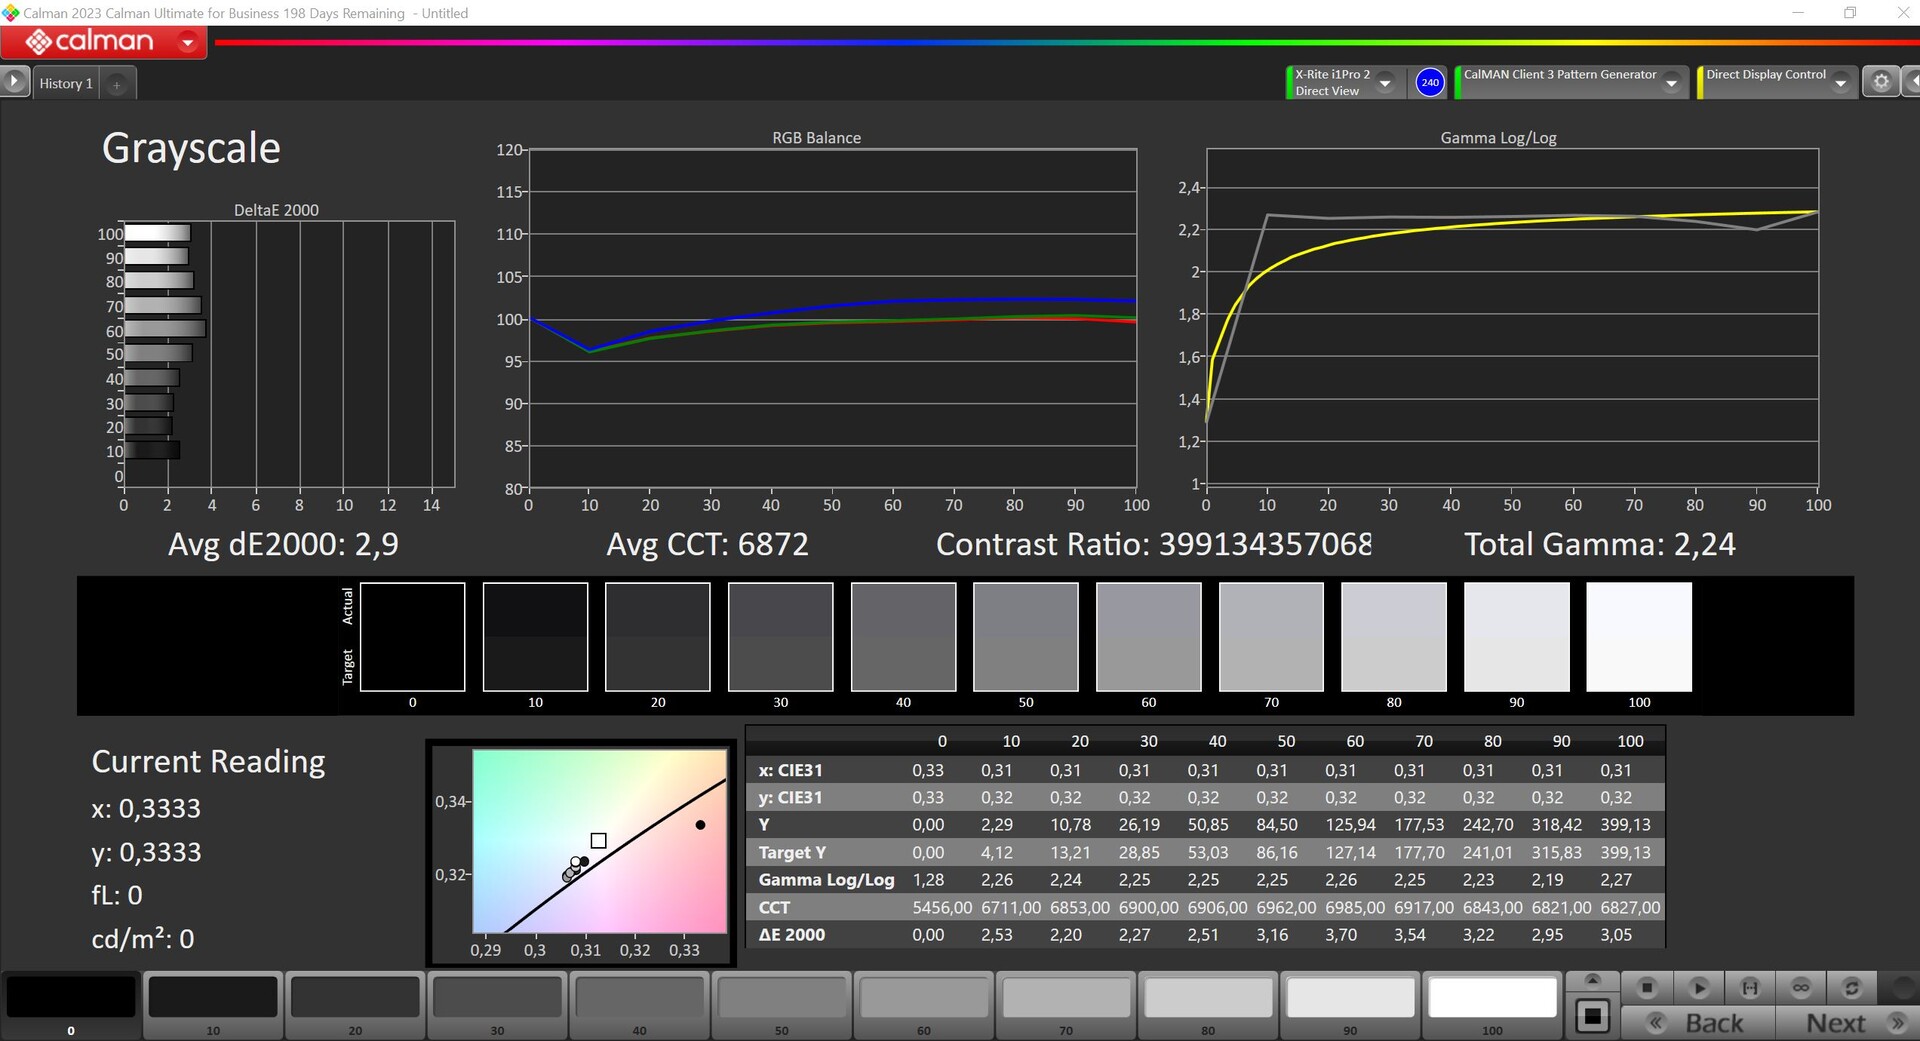
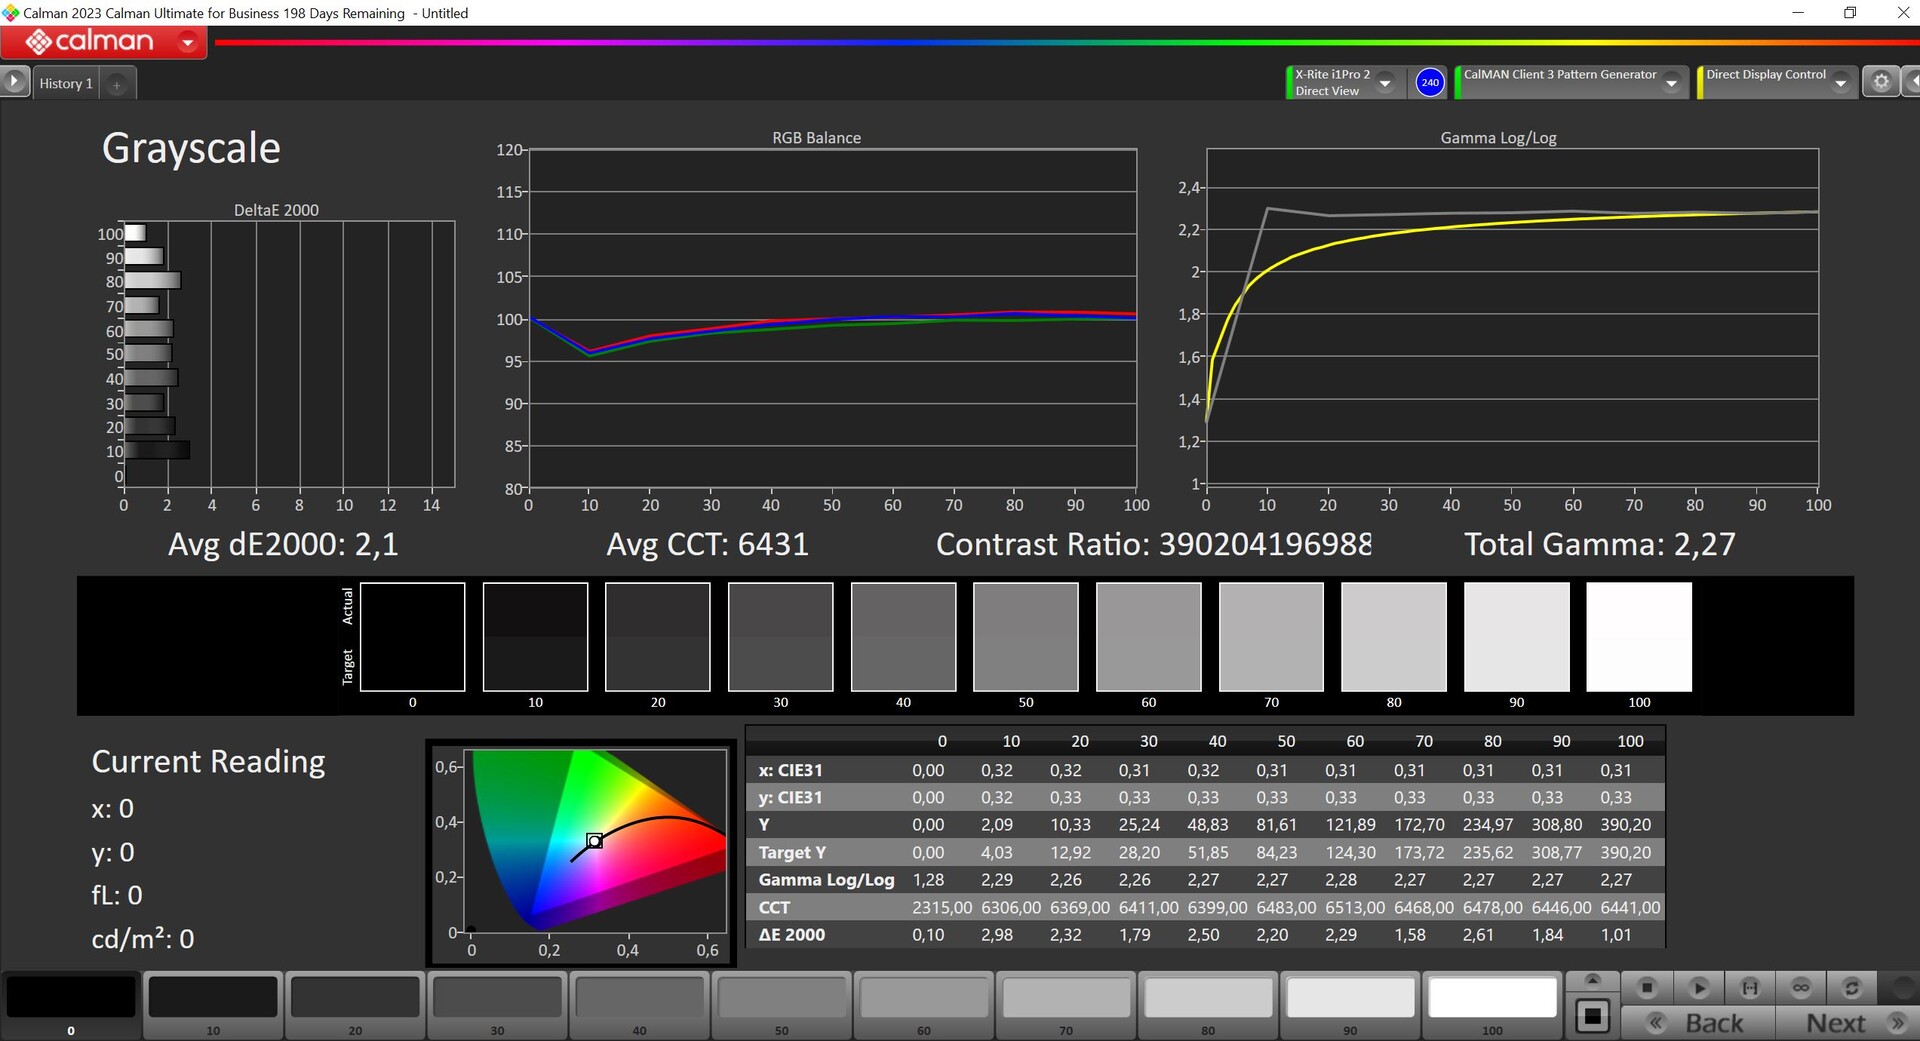
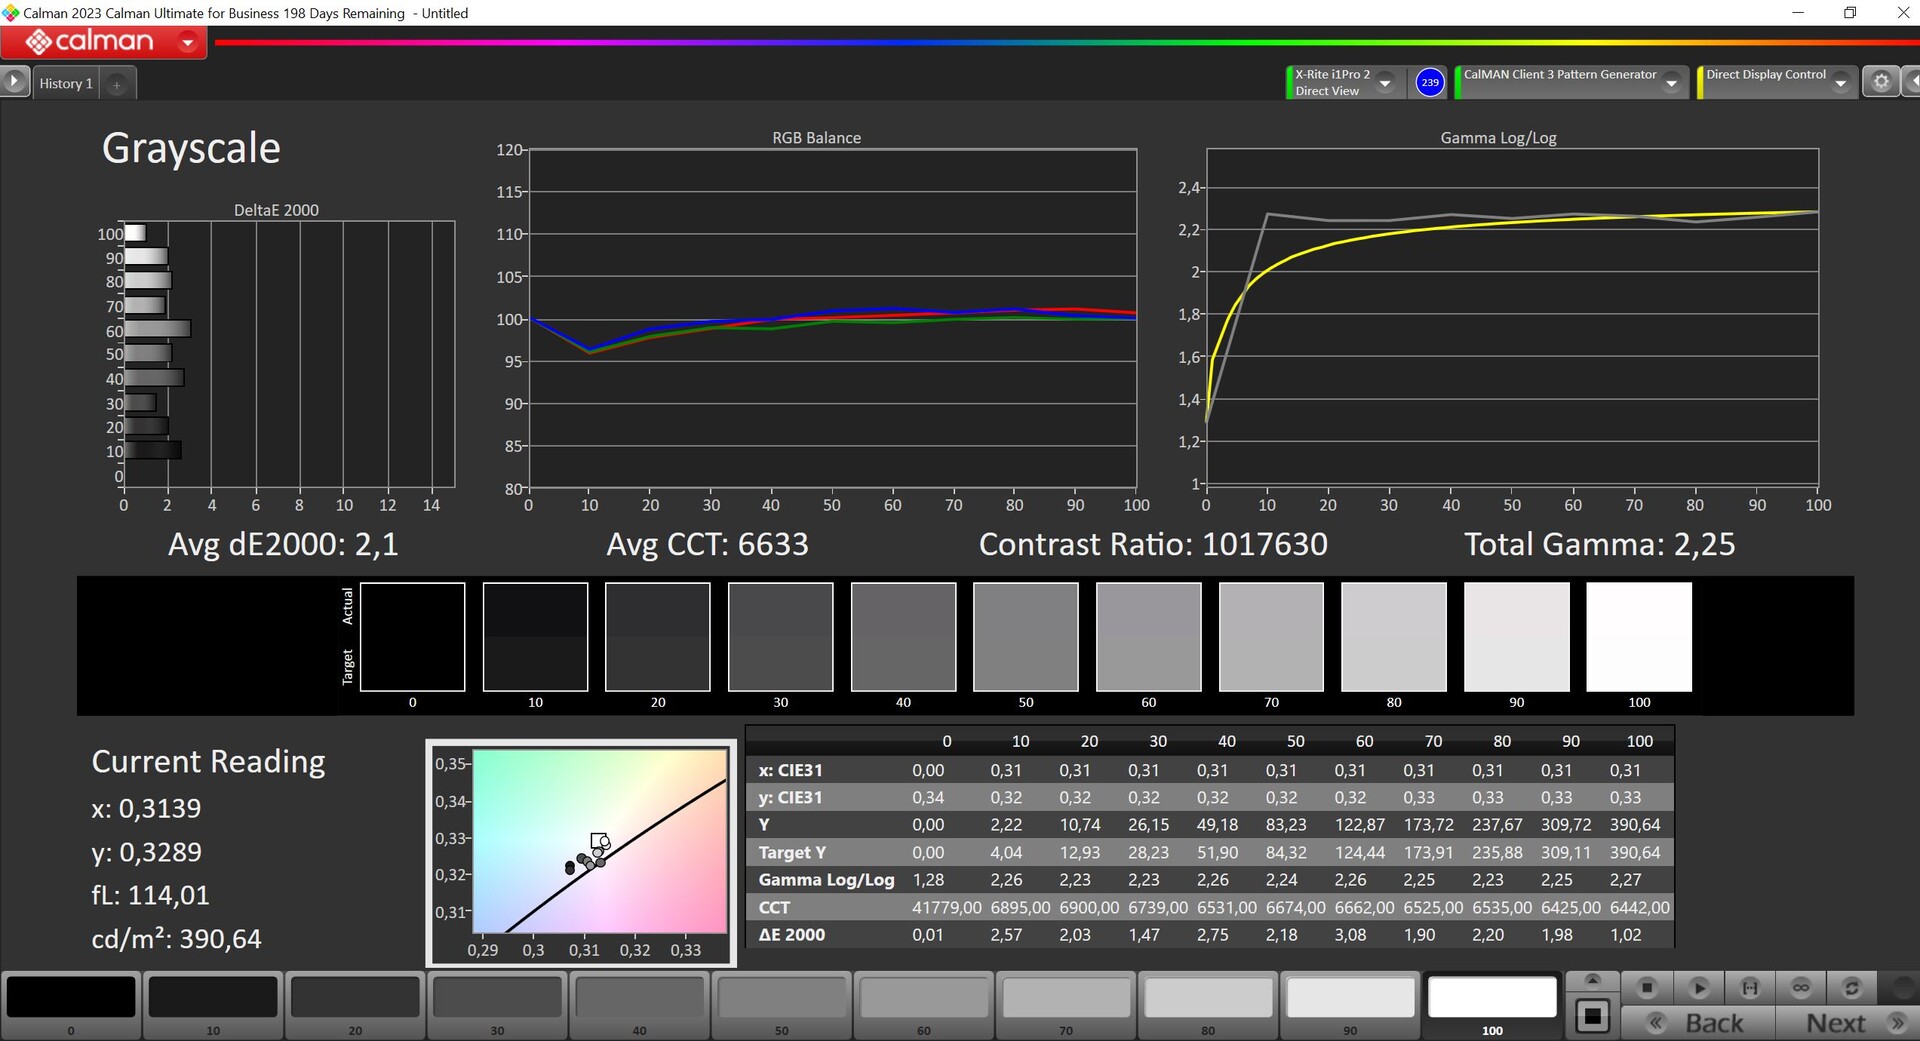
A Samsung só vende o Galaxy Book4 Ultra com uma tela touchscreen OLED de 16 polegadas (2.880 x 1.800 pixels, 16:10). A qualidade subjetiva da imagem impressiona com cores vivas e pretos profundos. Os tempos de resposta são extremamente rápidos e há suporte para conteúdo HDR. Além disso, o movimento é muito suave graças à taxa de atualização de 120 Hz. Como em todos os dispositivos Windows, o modo HDR pode ser ativado manualmente, mas o gerenciamento de cores não está mais disponível. Tanto o brilho quanto a temperatura da cor podem ser ajustados automaticamente pelo sensor.
O brilho máximo do modo SDR fica em uma média de 393 cd/m² e o valor de preto é de 0 cd/m², o que resulta em uma taxa de contraste muito alta. Medimos um brilho HDR de 564 cd/m² para seções de imagem ou 540 cd/m² com uma imagem quase totalmente branca. Isso significa que os recursos de HDR são significativamente mais limitados em comparação com os minipainéis de LED e, juntamente com o melhor manuseio do macOS, o MacBook Pro 16 é consideravelmente superior quando se trata da área de HDR.
| |||||||||||||||||||||||||
iluminação: 98 %
iluminação com acumulador: 389 cd/m²
Contraste: ∞:1 (Preto: 0 cd/m²)
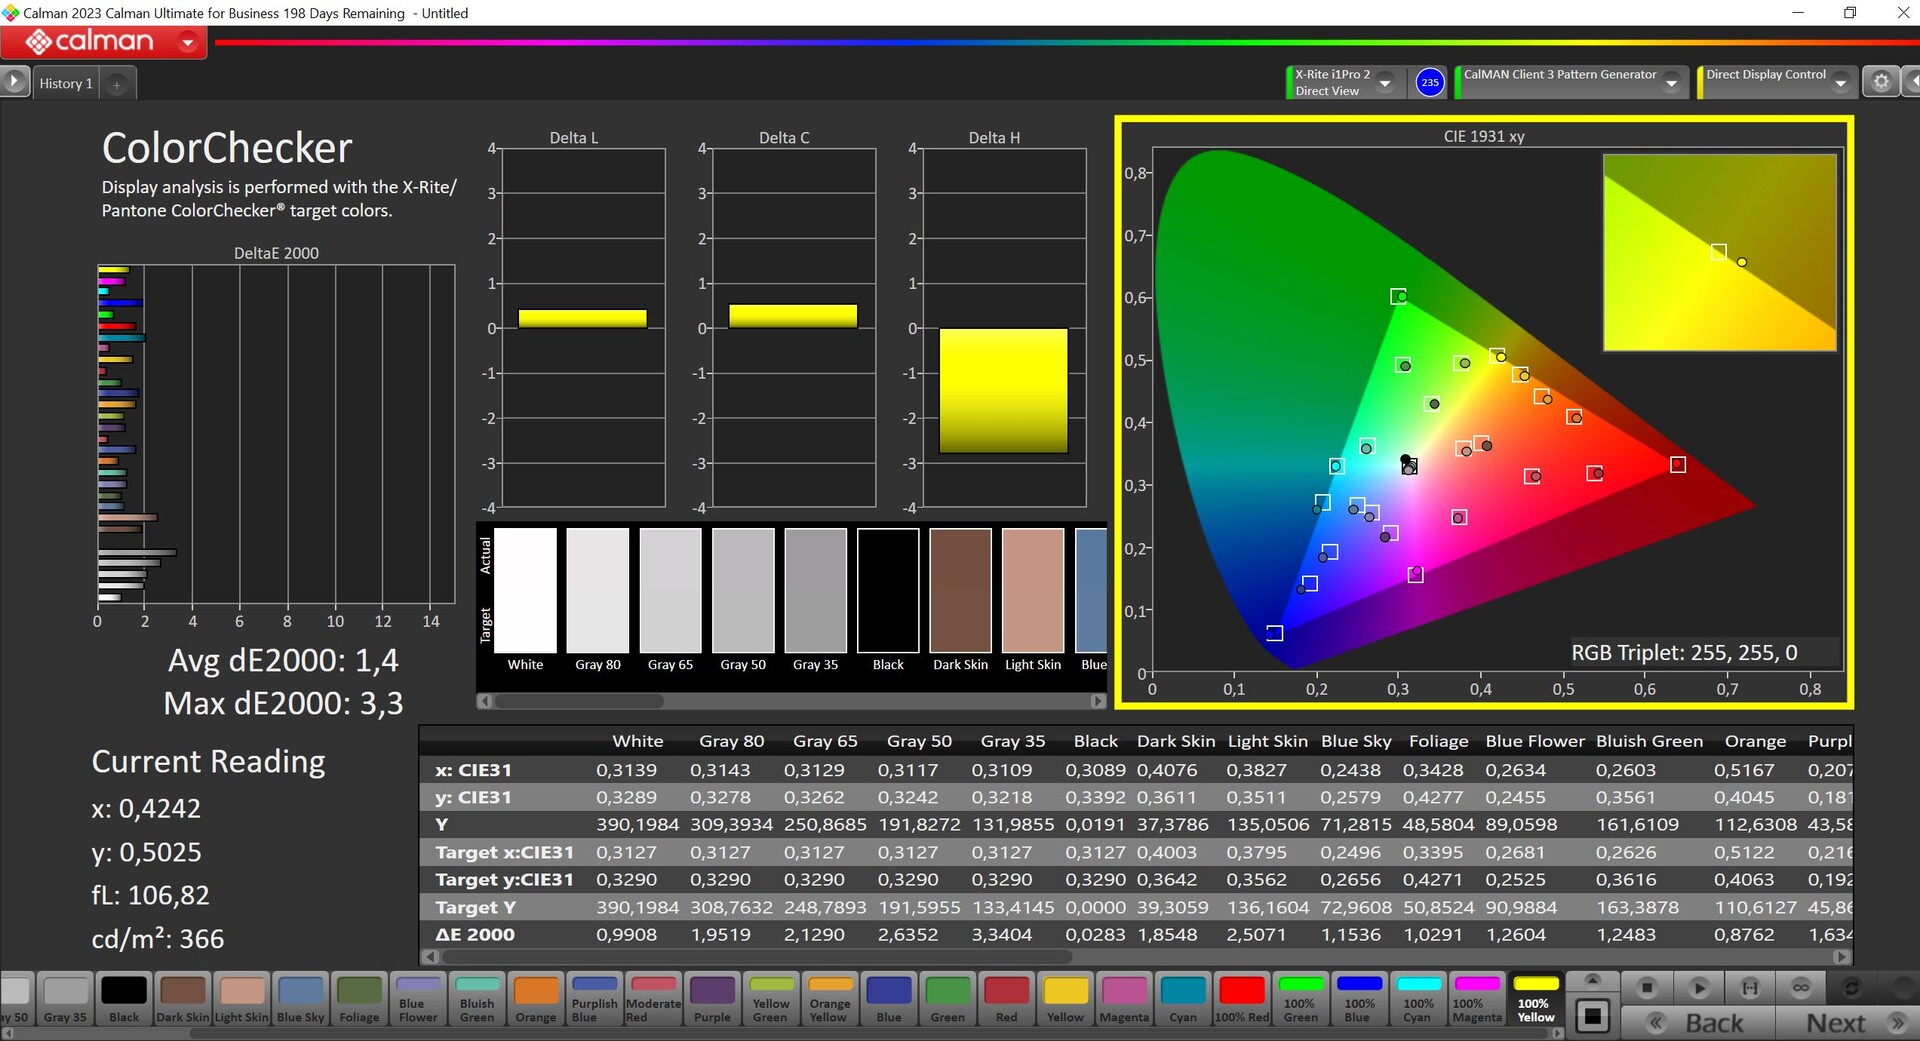
ΔE ColorChecker Calman: 1.4 | ∀{0.5-29.43 Ø4.71}
ΔE Greyscale Calman: 2.1 | ∀{0.09-98 Ø4.96}
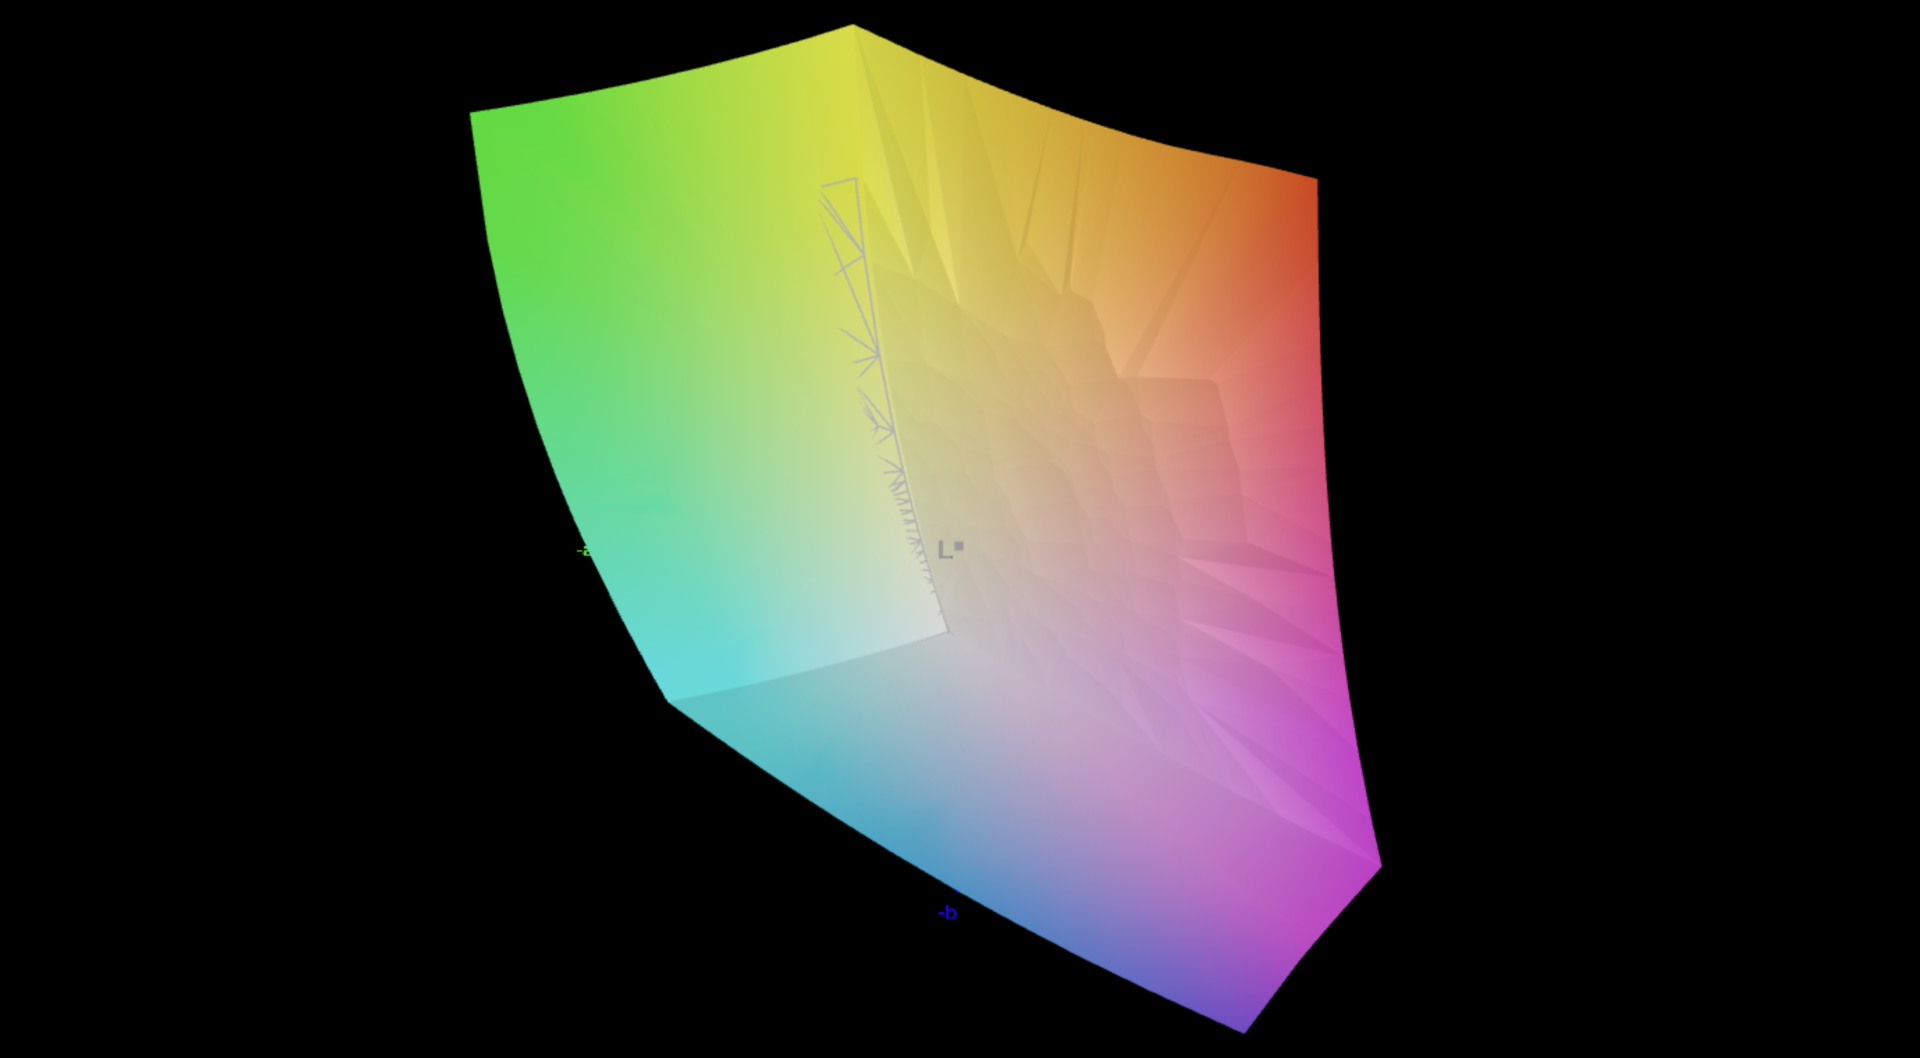
88.5% AdobeRGB 1998 (Argyll 3D)
99.9% sRGB (Argyll 3D)
98.6% Display P3 (Argyll 3D)
Gamma: 2.27
CCT: 6431 K
| Samsung Galaxy Book4 Ultra ATNA60CL07-0, OLED, 2880x1800, 16" | Lenovo ThinkPad Z16 Gen 2 Samsung ATNA60YV04-0, OLED, 3840x2400, 16" | Lenovo Slim Pro 9i 16IRP8 LEN160-3.2K, Mini-LED, 3200x2000, 16" | Schenker VISION 16 Pro (M23) NE160QDM-NZ1, IPS, 2560x1600, 16" | Samsung Galaxy Book3 Ultra 16 Samsung ATNA60CL03-0, AMOLED, 2880x1800, 16" | Apple MacBook Pro 16 2023 M3 Max Mini-LED, 3456x2234, 16" | HP Spectre x360 16 RTX 4050 Samsung SDC41A6, OLED, 2880x1800, 16" | |
|---|---|---|---|---|---|---|---|
| Display | 3% | -3% | -17% | 3% | 1% | 3% | |
| Display P3 Coverage (%) | 98.6 | 99.7 1% | 95.1 -4% | 68.8 -30% | 99.9 1% | 99.2 1% | 99.6 1% |
| sRGB Coverage (%) | 99.9 | 100 0% | 99.9 0% | 98.8 -1% | 100 0% | 100 0% | |
| AdobeRGB 1998 Coverage (%) | 88.5 | 96.7 9% | 84.6 -4% | 70 -21% | 96.3 9% | 96.7 9% | |
| Response Times | -209% | -1863% | -1756% | 8% | -9254% | -35% | |
| Response Time Grey 50% / Grey 80% * (ms) | 0.54 ? | 1.86 ? -244% | 14 ? -2493% | 13.7 ? -2437% | 0.49 ? 9% | 66.9 ? -12289% | 0.78 ? -44% |
| Response Time Black / White * (ms) | 0.69 ? | 1.89 ? -174% | 9.2 ? -1233% | 8.1 ? -1074% | 0.65 ? 6% | 43.6 ? -6219% | 0.86 ? -25% |
| PWM Frequency (Hz) | 240 ? | 60 ? | 5784 ? | 240 ? | 14877 | 480 ? | |
| Screen | -4% | -117% | -77% | -25% | 22% | -16% | |
| Brightness middle (cd/m²) | 390 | 390.1 0% | 627.4 61% | 384 -2% | 400 3% | 630 62% | 385.2 -1% |
| Brightness (cd/m²) | 393 | 393 0% | 618 57% | 371 -6% | 399 2% | 604 54% | 387 -2% |
| Brightness Distribution (%) | 98 | 97 -1% | 95 -3% | 88 -10% | 93 -5% | 94 -4% | 99 1% |
| Black Level * (cd/m²) | 0.19 | 0.3 | 0.03 | ||||
| Colorchecker dE 2000 * | 1.4 | 1.41 -1% | 5.84 -317% | 3.4 -143% | 2.3 -64% | 1.2 14% | 1.73 -24% |
| Colorchecker dE 2000 max. * | 2.7 | 3.43 -27% | 10.22 -279% | 9.2 -241% | 4.15 -54% | 2.8 -4% | 3.95 -46% |
| Greyscale dE 2000 * | 2.1 | 2 5% | 6.7 -219% | 3.4 -62% | 2.7 -29% | 1.9 10% | 2.6 -24% |
| Gamma | 2.27 97% | 2.22 99% | 2.77 79% | 2.16 102% | 2.266 97% | 2.29 96% | 2.17 101% |
| CCT | 6431 101% | 6324 103% | 5795 112% | 7462 87% | 7047 92% | 6812 95% | 6133 106% |
| Contrast (:1) | 3302 | 1280 | 13333 | ||||
| Colorchecker dE 2000 calibrated * | 4.45 | 1.3 | 1.66 | ||||
| Média Total (Programa/Configurações) | -70% /
-39% | -661% /
-403% | -617% /
-366% | -5% /
-11% | -3077% /
-2042% | -16% /
-14% |
* ... menor é melhor

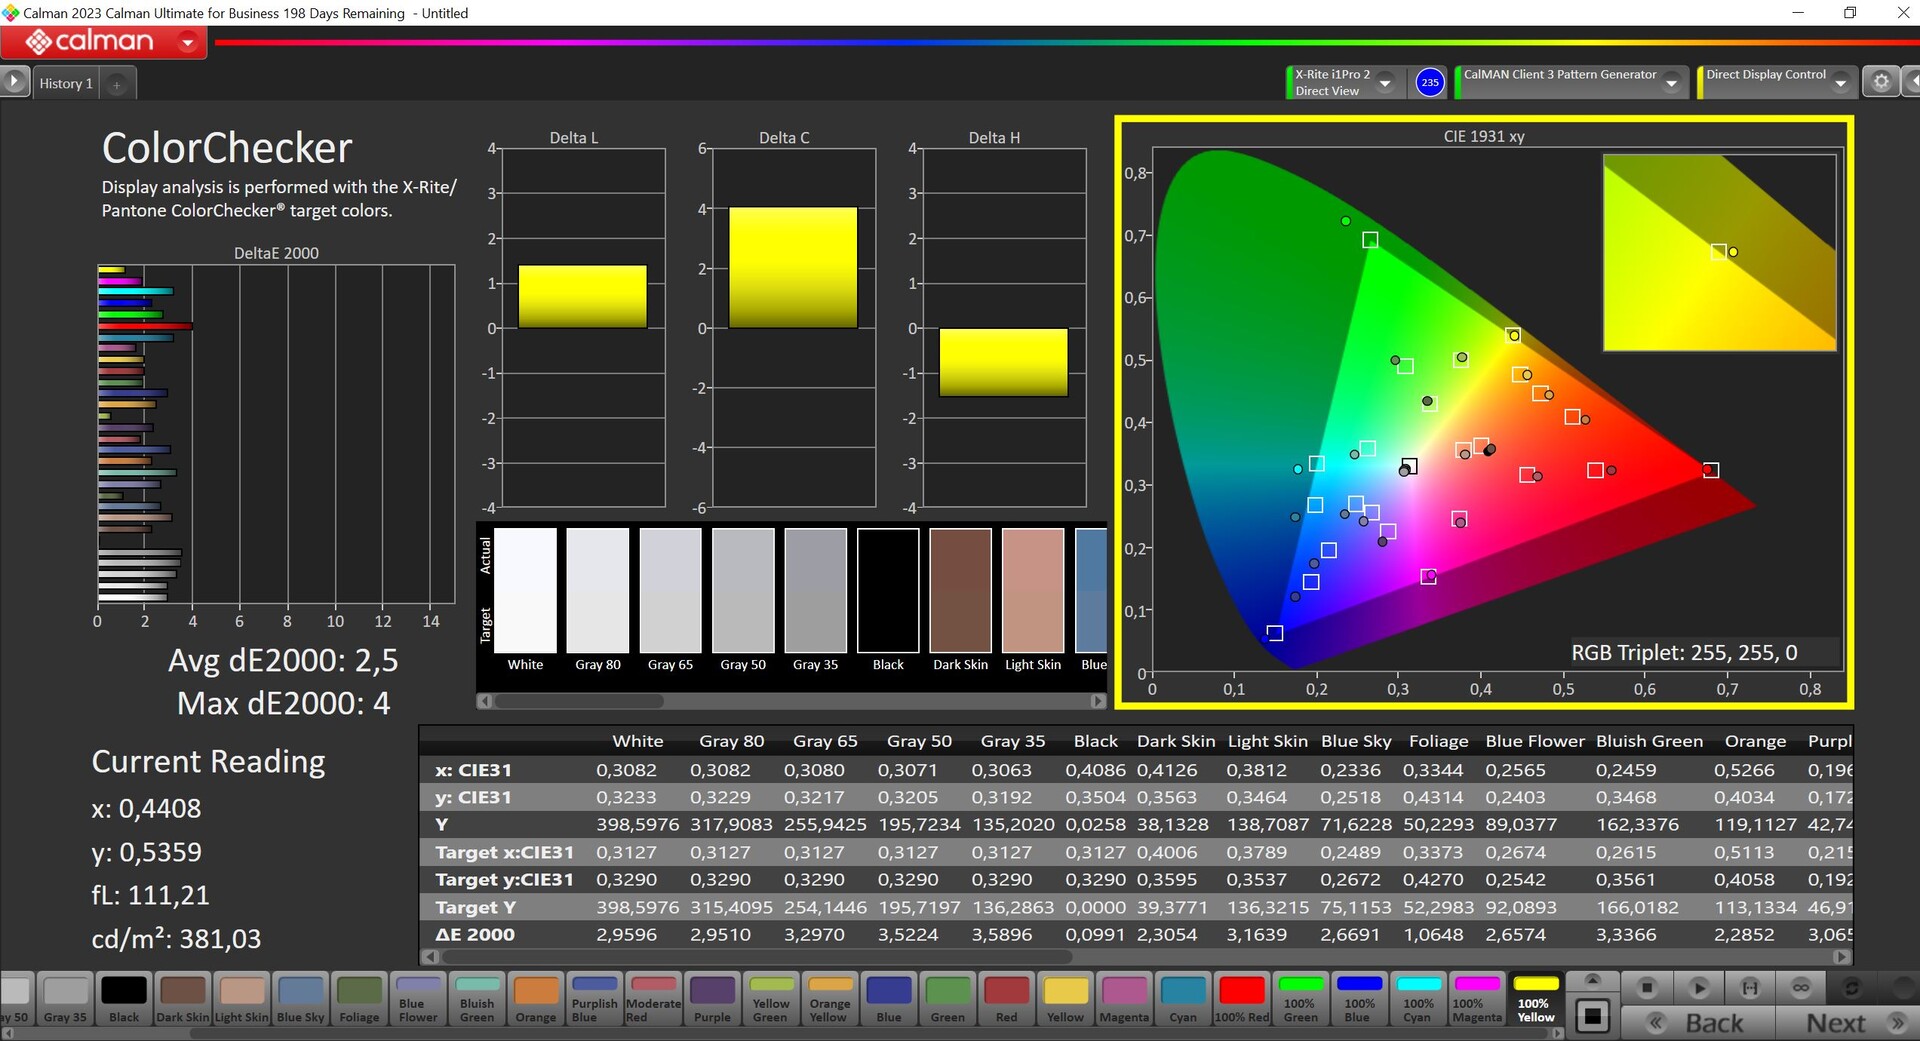
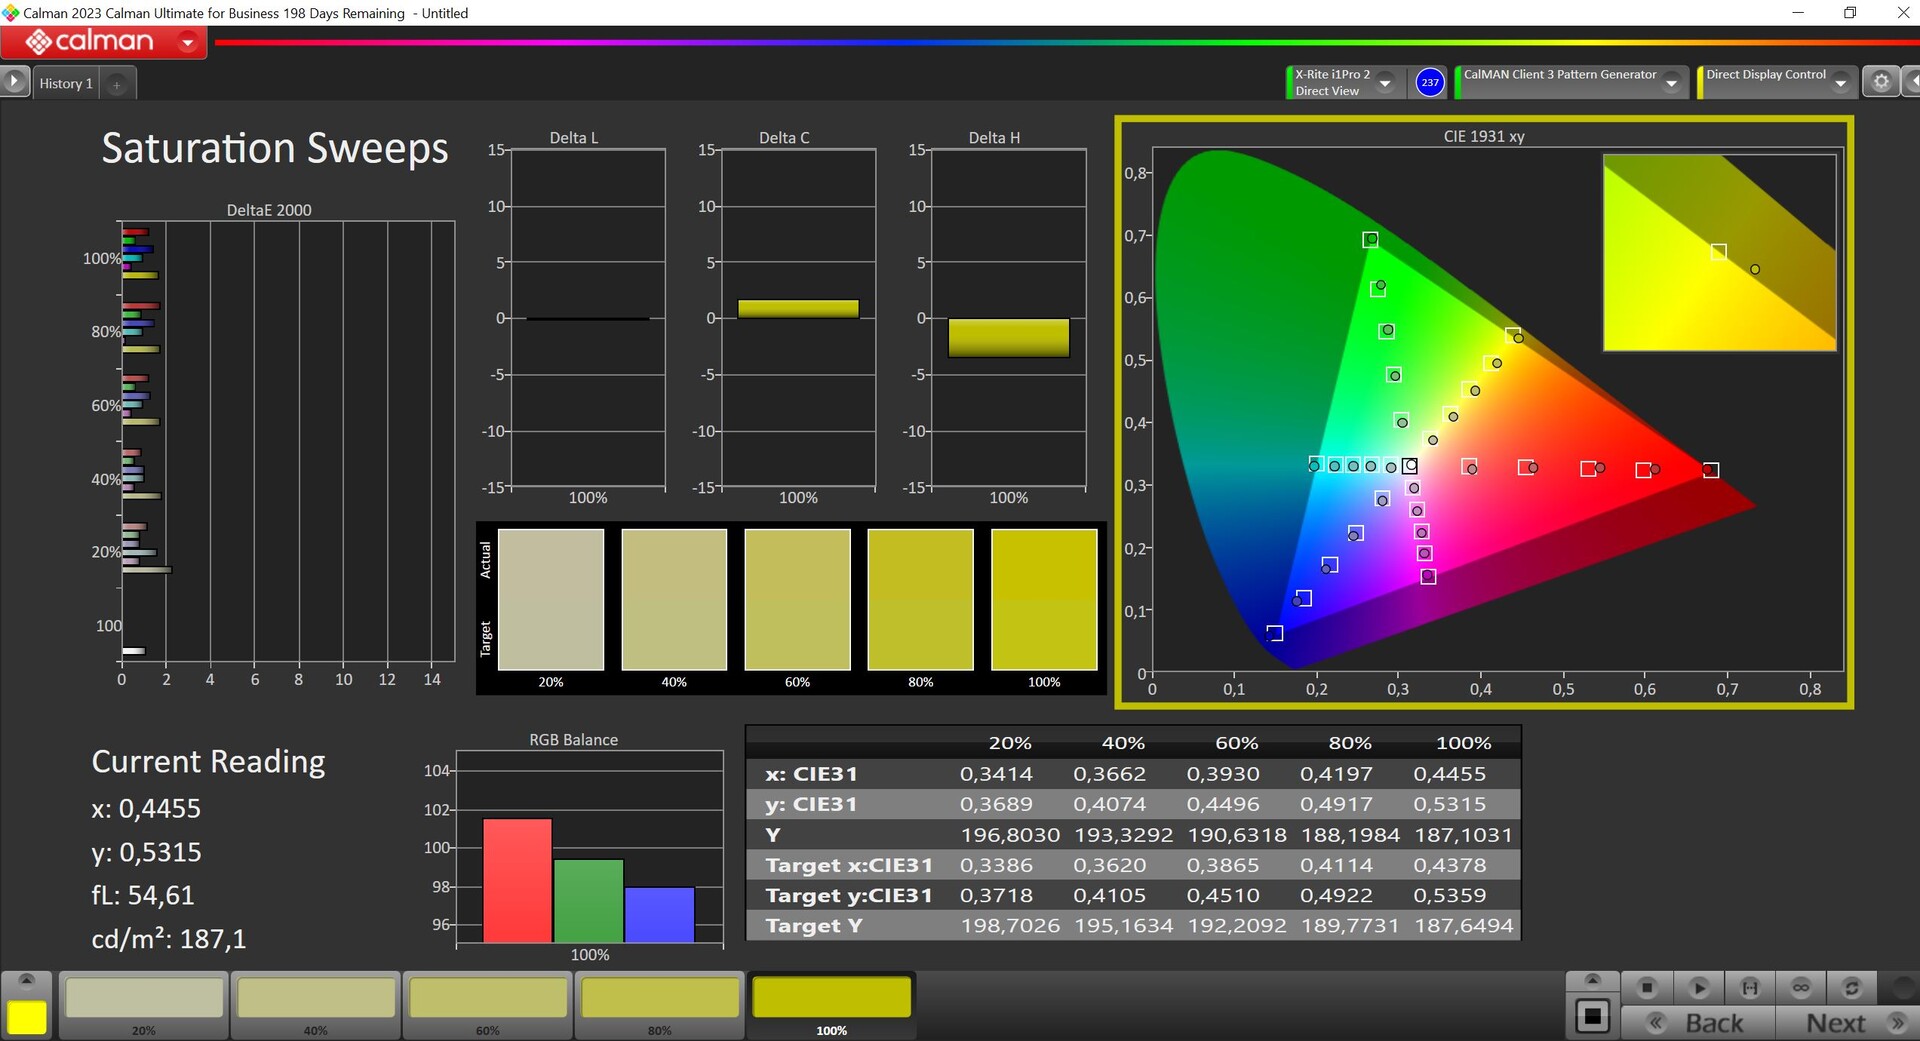
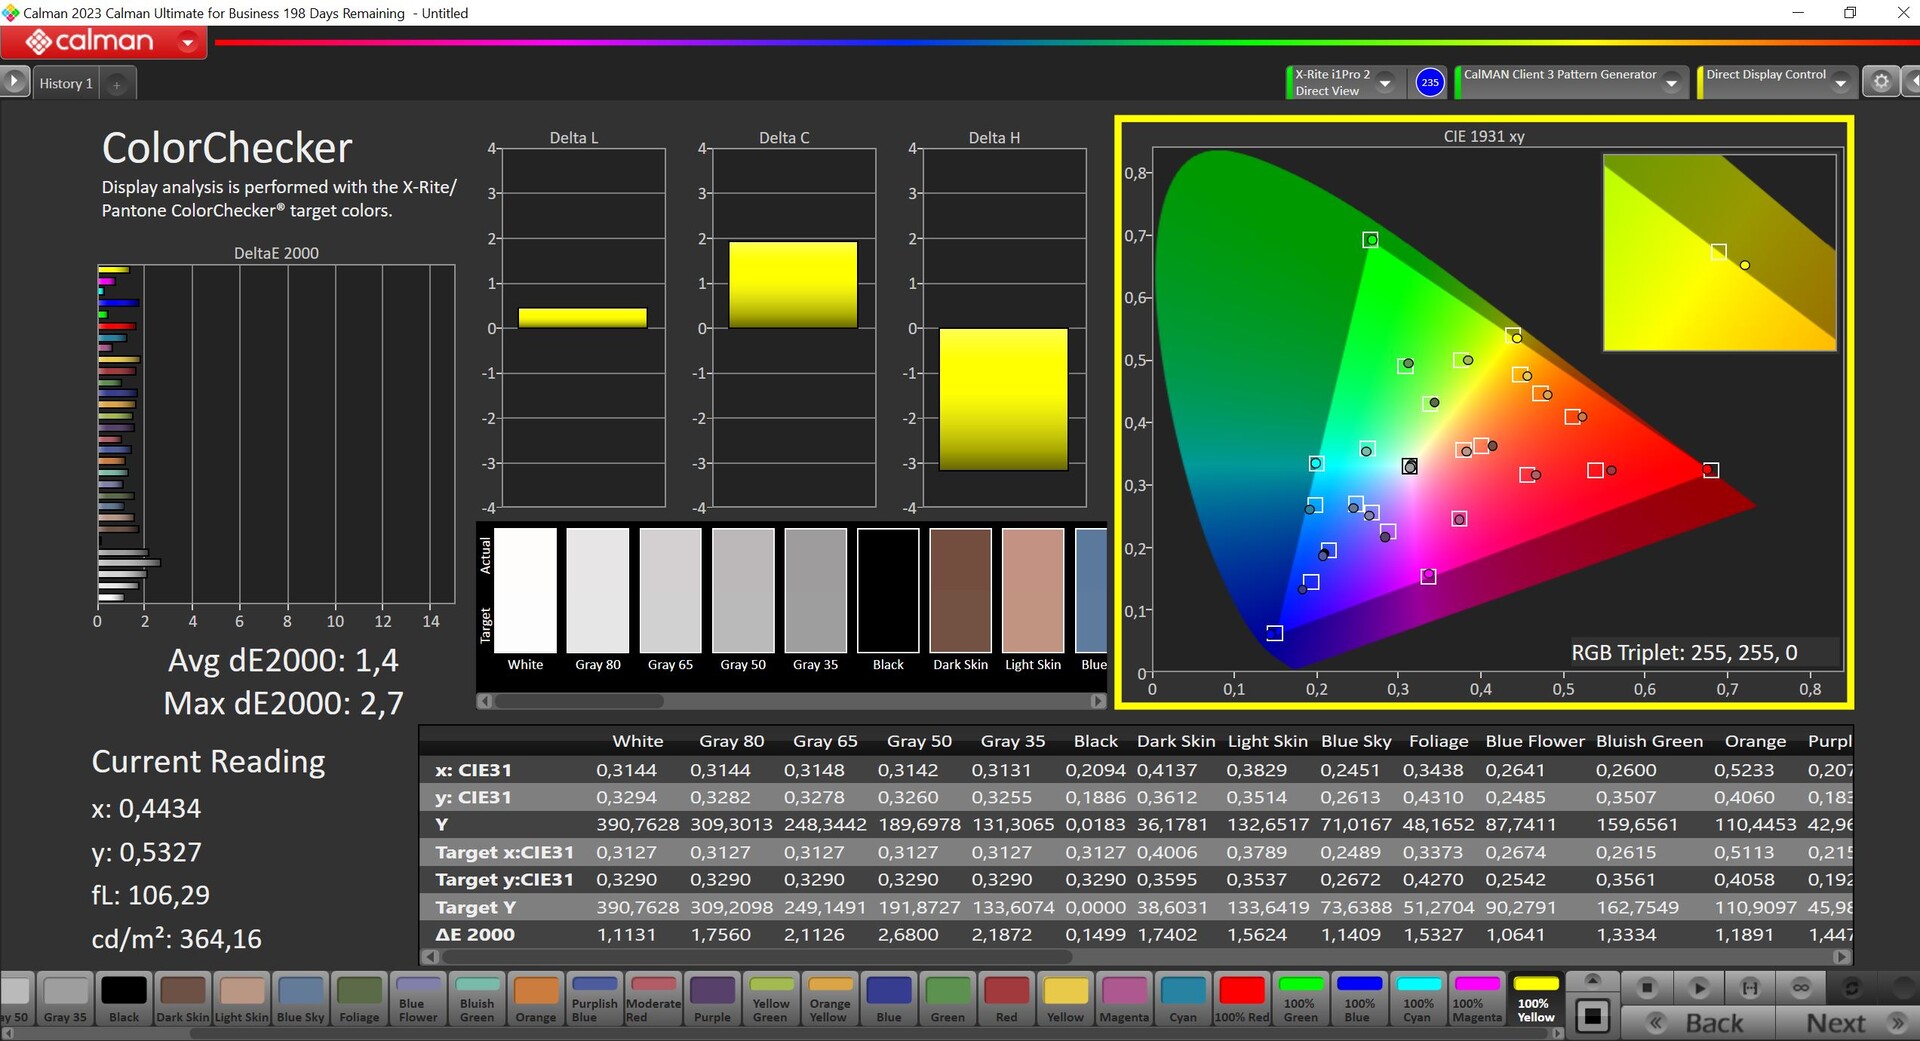
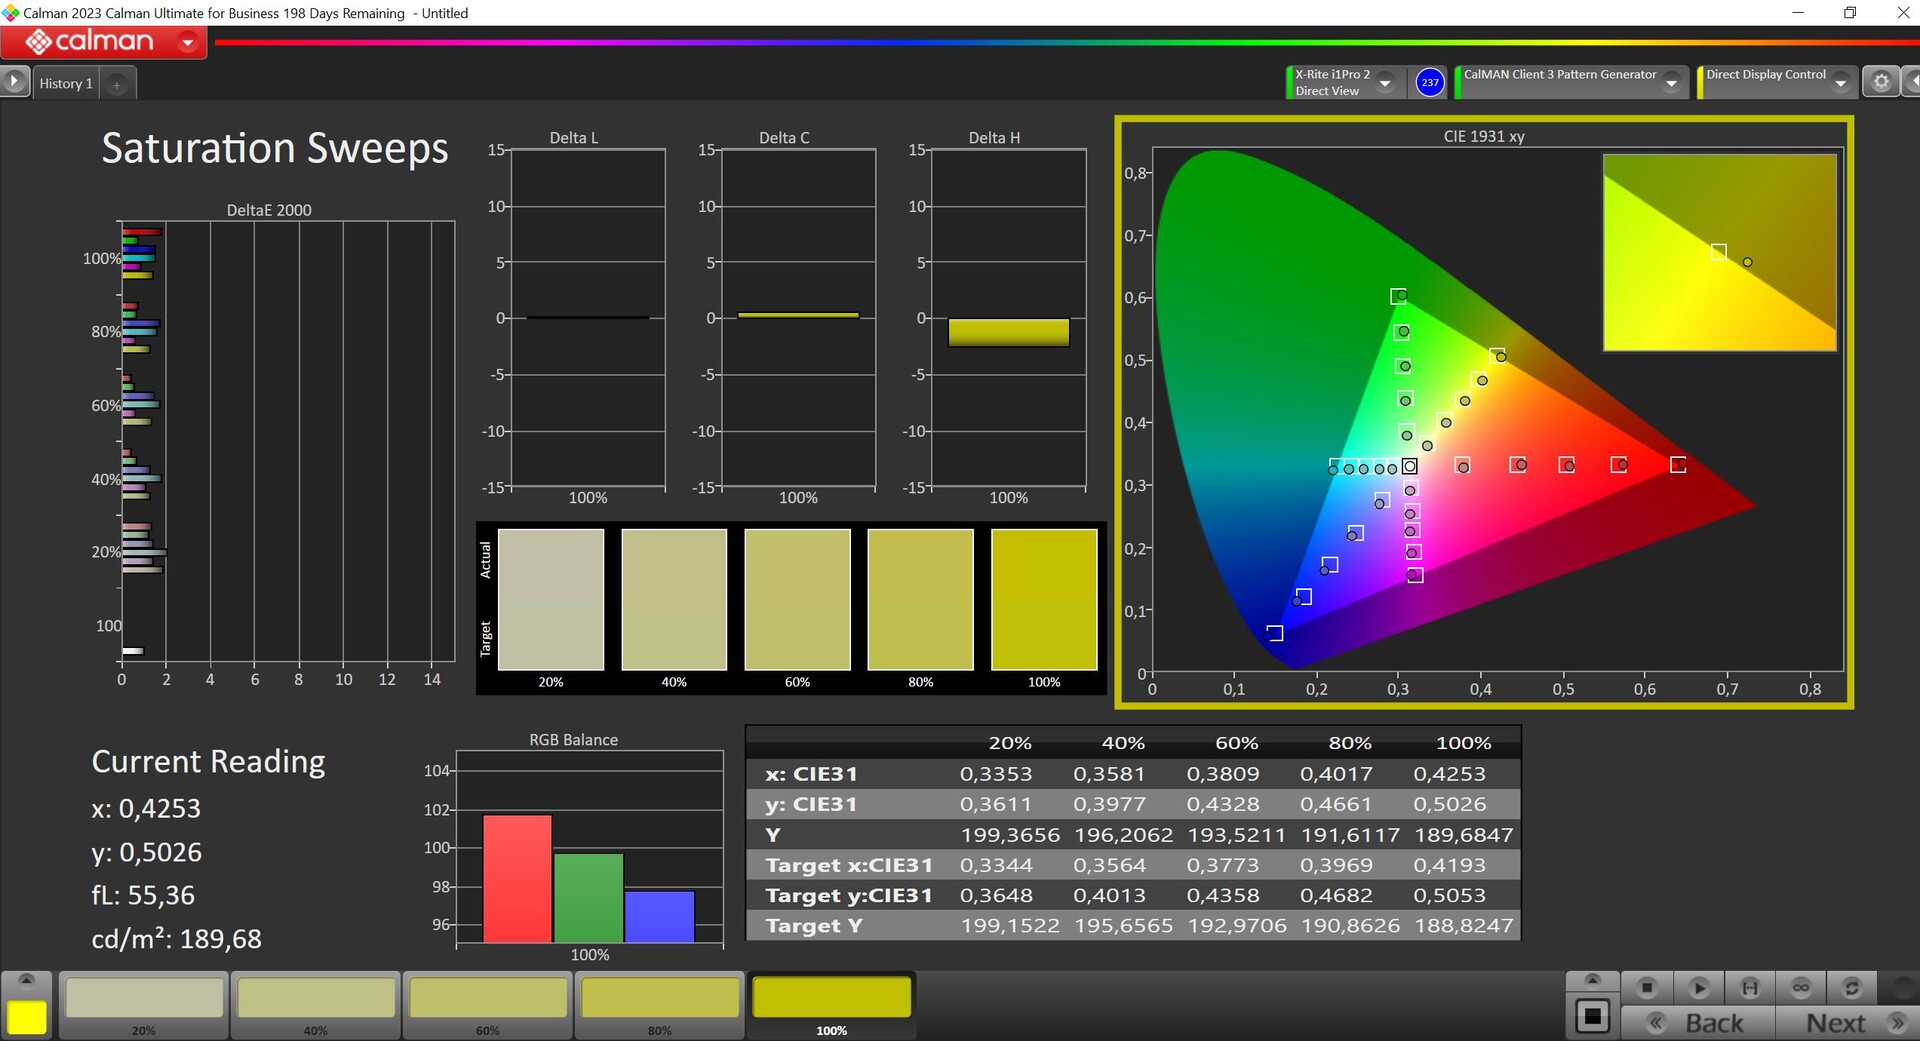
No aplicativo de configurações da Samsung, há vários perfis de cores, sendo que o padrão ativo é "Vivid". Como de costume, as cores aqui são um pouco supersaturadas e isso faz com que as imagens pareçam mais vibrantes. No entanto, o modo P3 também vem pronto para uso e oferece cores precisas, e foi esse que usamos em nossas medições. Usando nossa própria calibração, não foi possível melhorar ainda mais esse desempenho. O painel abrange completamente os espaços de cores sRGB e P3 e qualquer pessoa que goste de editar imagens ficará satisfeita com o modo sRGB de precisão semelhante.

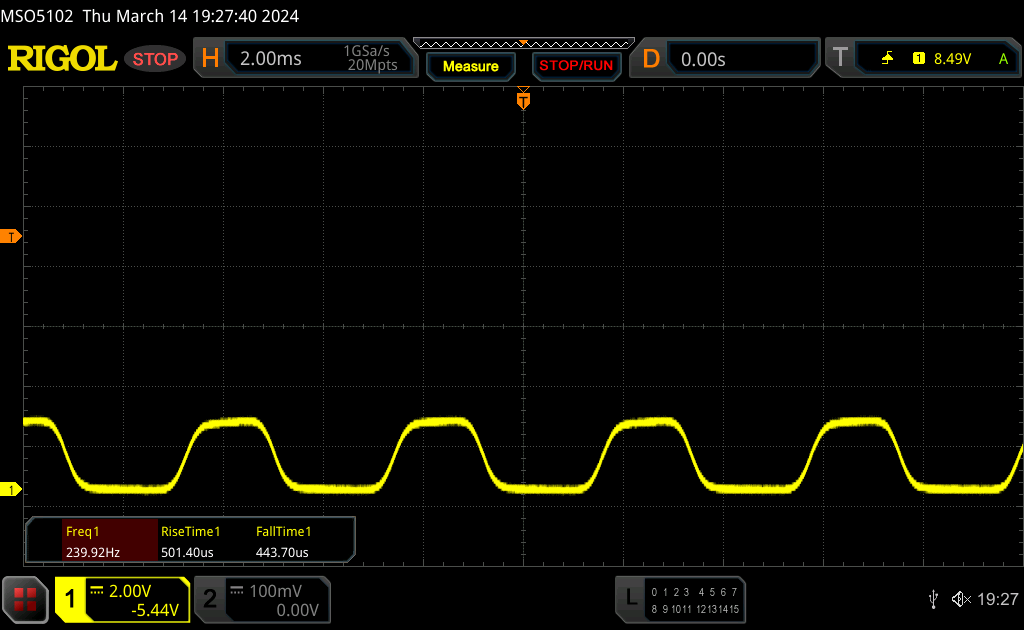
Exibir tempos de resposta
| ↔ Tempo de resposta preto para branco | ||
|---|---|---|
| 0.69 ms ... ascensão ↗ e queda ↘ combinadas | ↗ 0.39 ms ascensão | 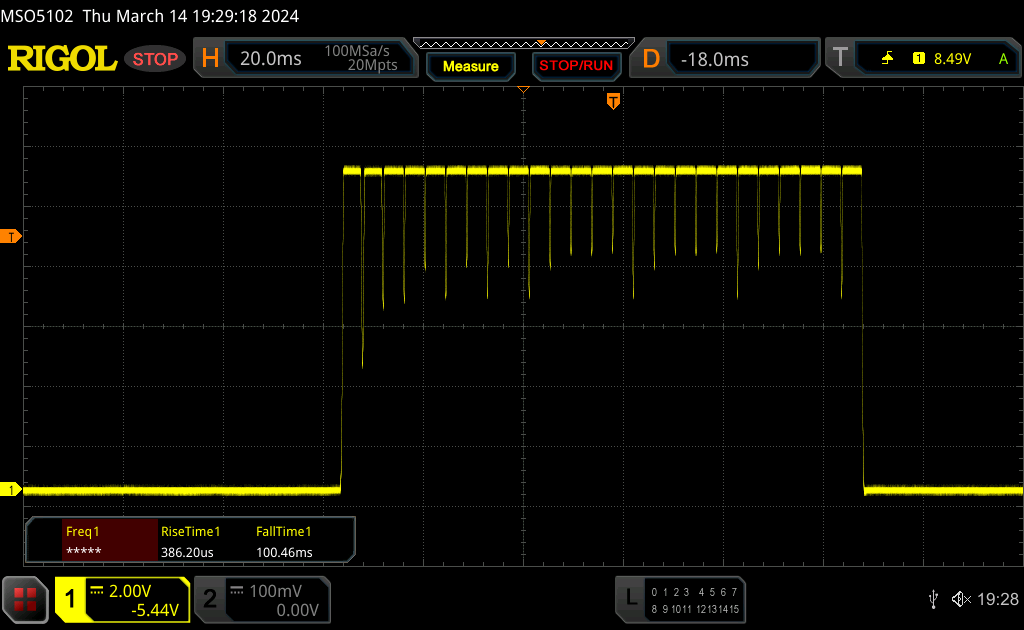 |
| ↘ 0.3 ms queda | ||
| A tela mostra taxas de resposta muito rápidas em nossos testes e deve ser muito adequada para jogos em ritmo acelerado. Em comparação, todos os dispositivos testados variam de 0.1 (mínimo) a 240 (máximo) ms. » 2 % de todos os dispositivos são melhores. Isso significa que o tempo de resposta medido é melhor que a média de todos os dispositivos testados (19.8 ms). | ||
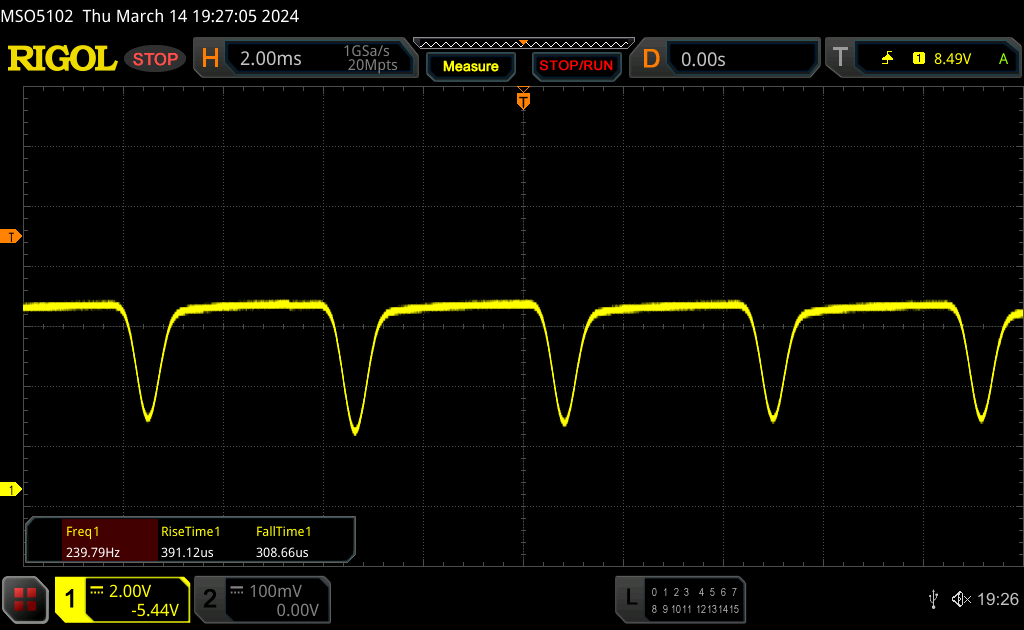
| ↔ Tempo de resposta 50% cinza a 80% cinza | ||
| 0.54 ms ... ascensão ↗ e queda ↘ combinadas | ↗ 0.29 ms ascensão | 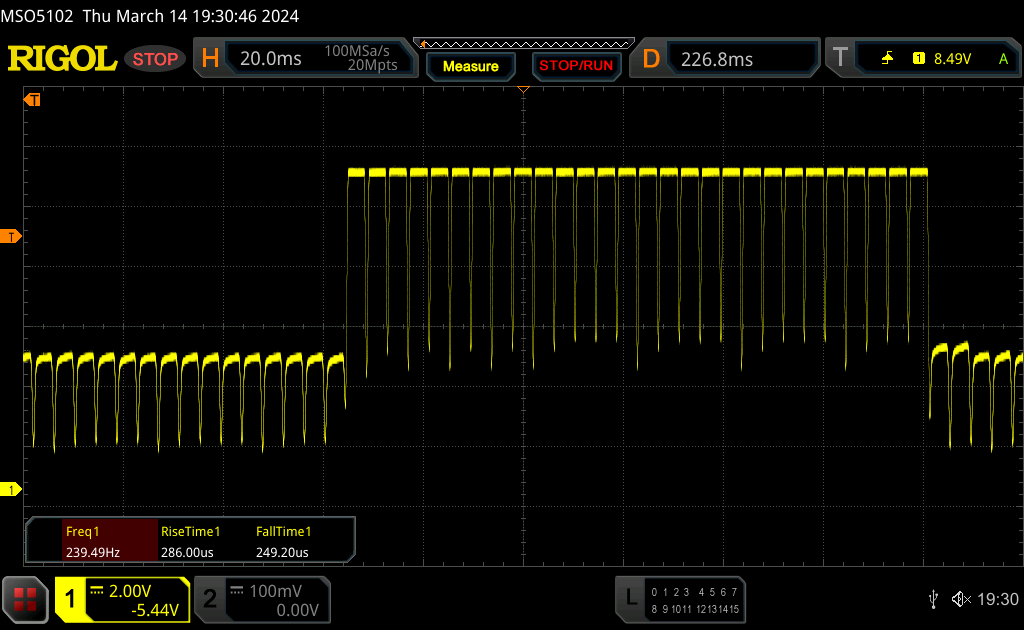 |
| ↘ 0.25 ms queda | ||
| A tela mostra taxas de resposta muito rápidas em nossos testes e deve ser muito adequada para jogos em ritmo acelerado. Em comparação, todos os dispositivos testados variam de 0.165 (mínimo) a 636 (máximo) ms. » 1 % de todos os dispositivos são melhores. Isso significa que o tempo de resposta medido é melhor que a média de todos os dispositivos testados (31 ms). | ||
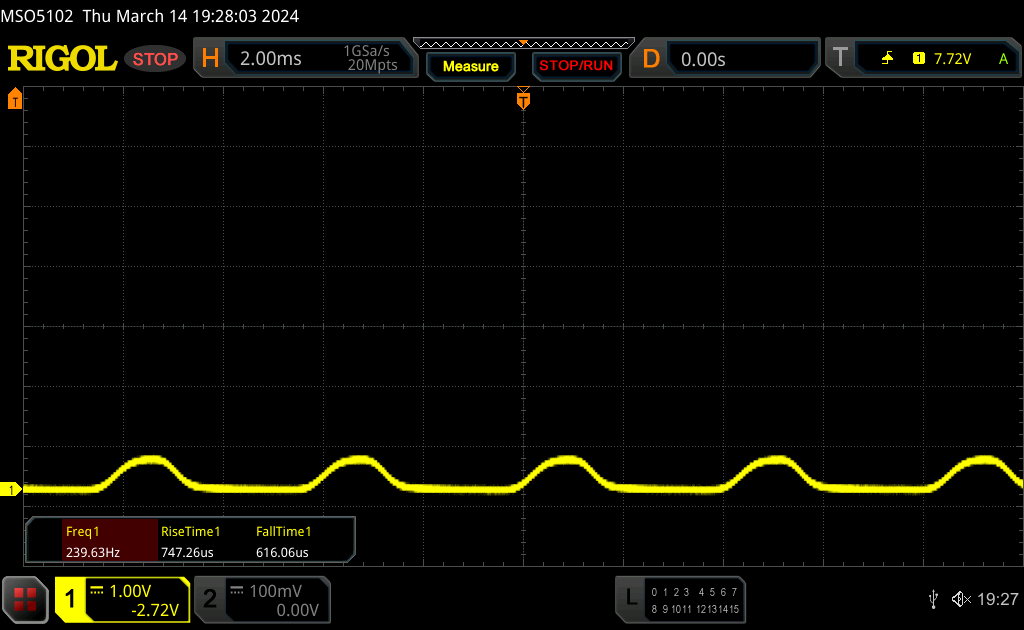
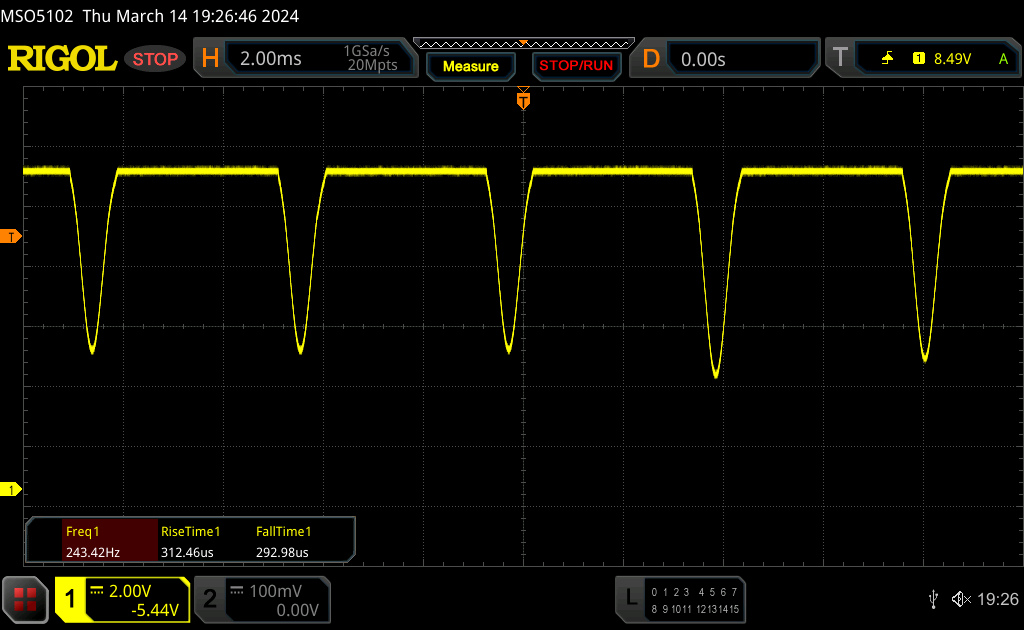
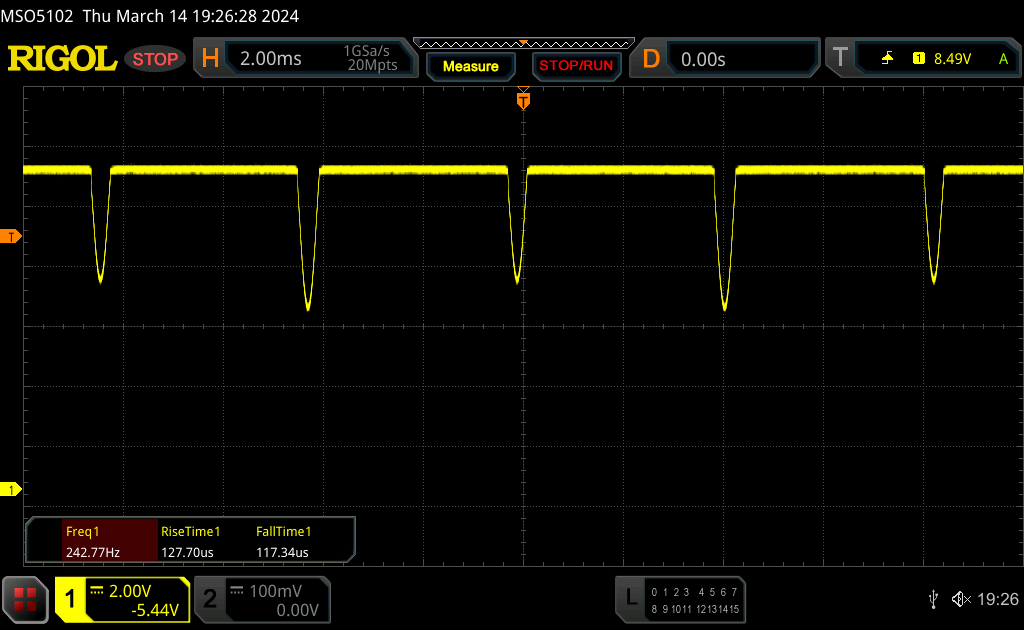
Cintilação da tela / PWM (modulação por largura de pulso)
| Tela tremeluzindo/PWM detectado | 240 Hz | ≤ 100 % configuração de brilho | 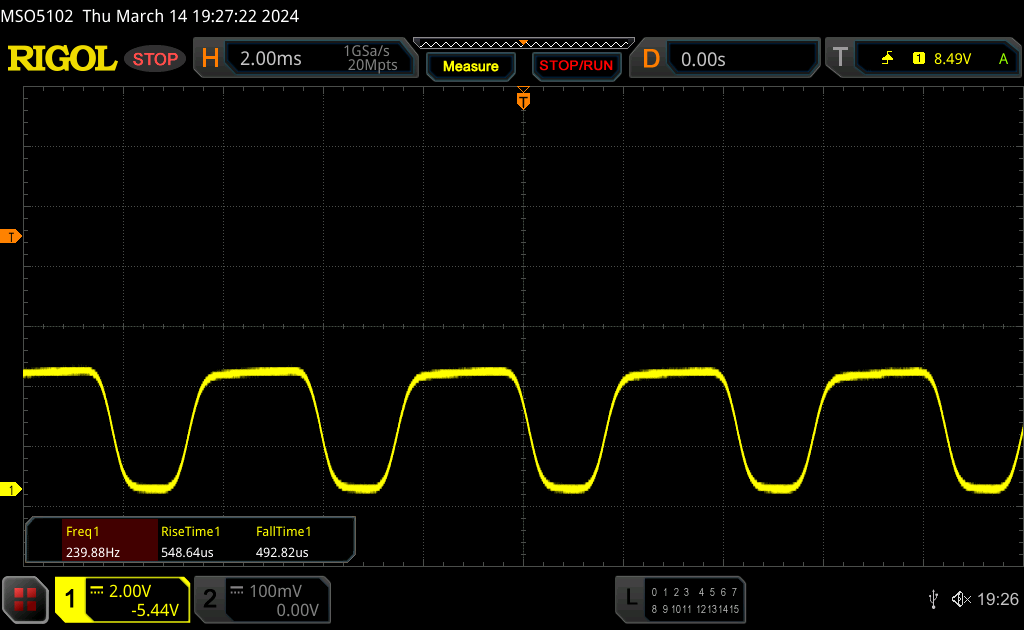 |
A luz de fundo da tela pisca em 240 Hz (pior caso, por exemplo, utilizando PWM) Cintilação detectada em uma configuração de brilho de 100 % e abaixo. Não deve haver cintilação ou PWM acima desta configuração de brilho. A frequência de 240 Hz é relativamente baixa, portanto, usuários sensíveis provavelmente notarão cintilação e sentirão fadiga ocular na configuração de brilho indicada e abaixo. [pwm_comparison] Em comparação: 52 % de todos os dispositivos testados não usam PWM para escurecer a tela. Se PWM foi detectado, uma média de 7747 (mínimo: 5 - máximo: 343500) Hz foi medida. | |||
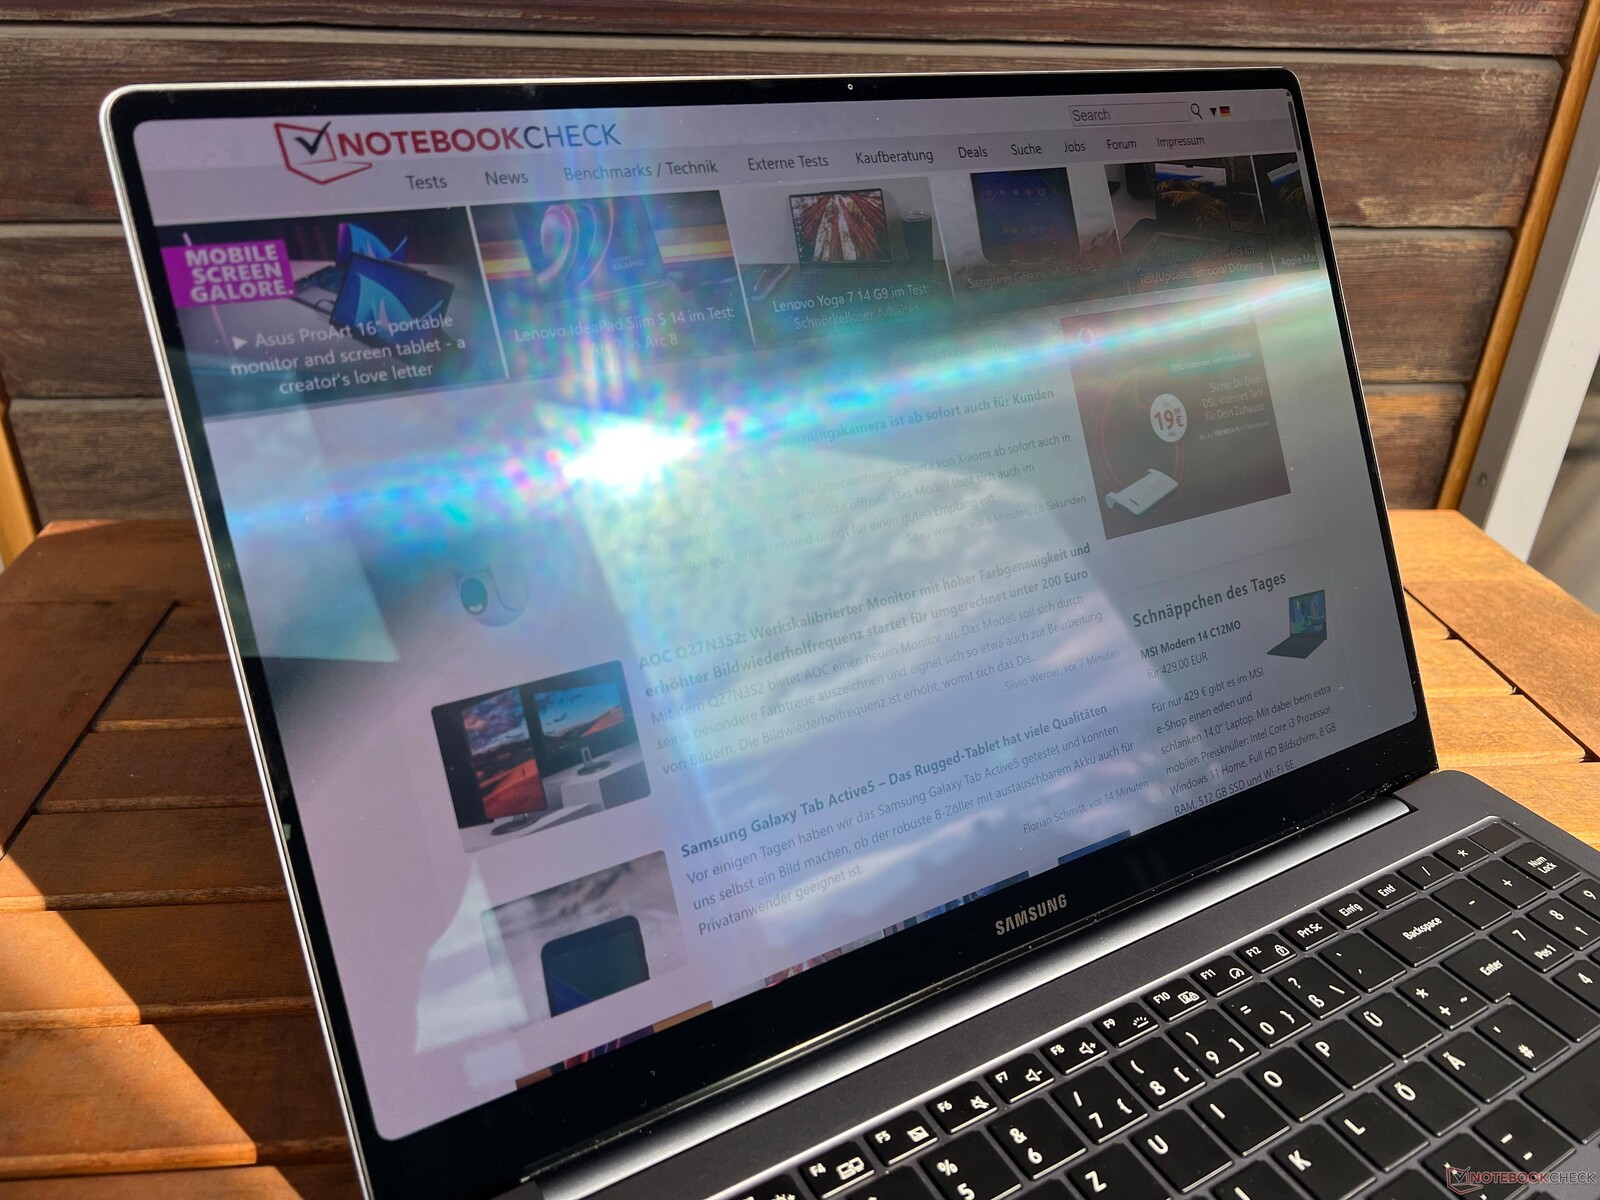
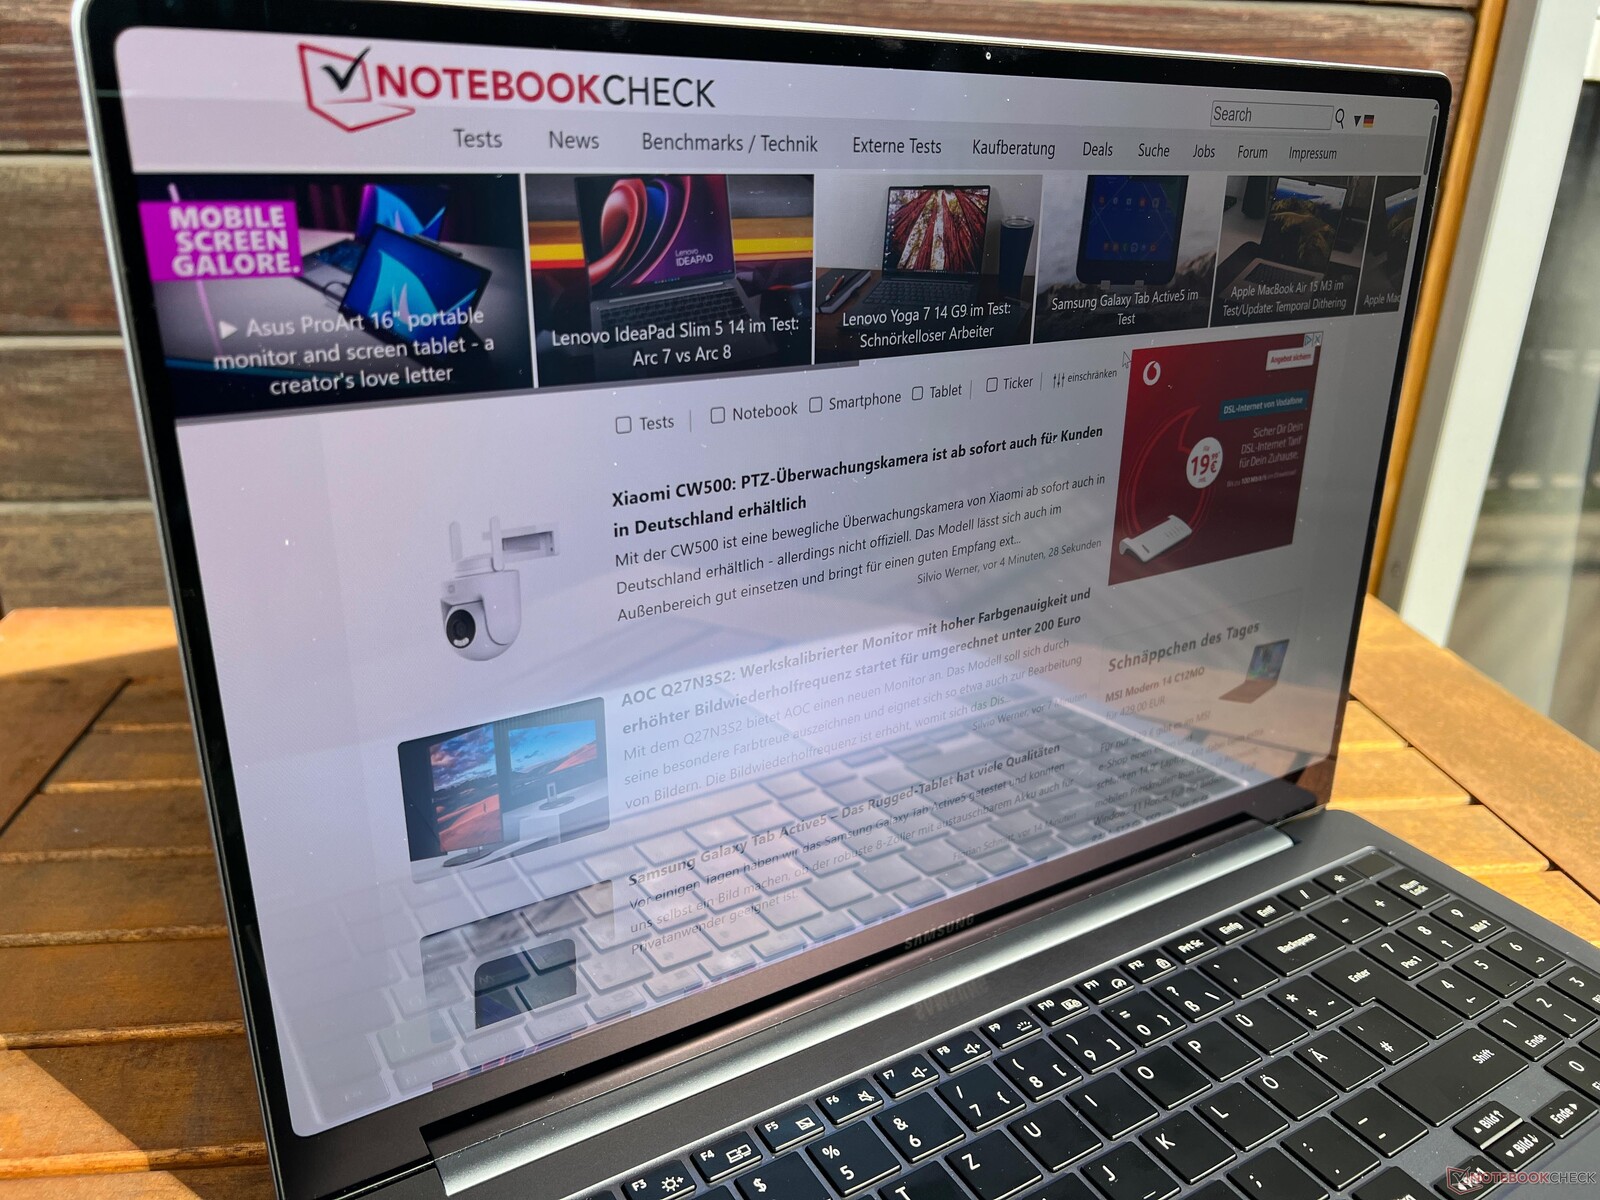
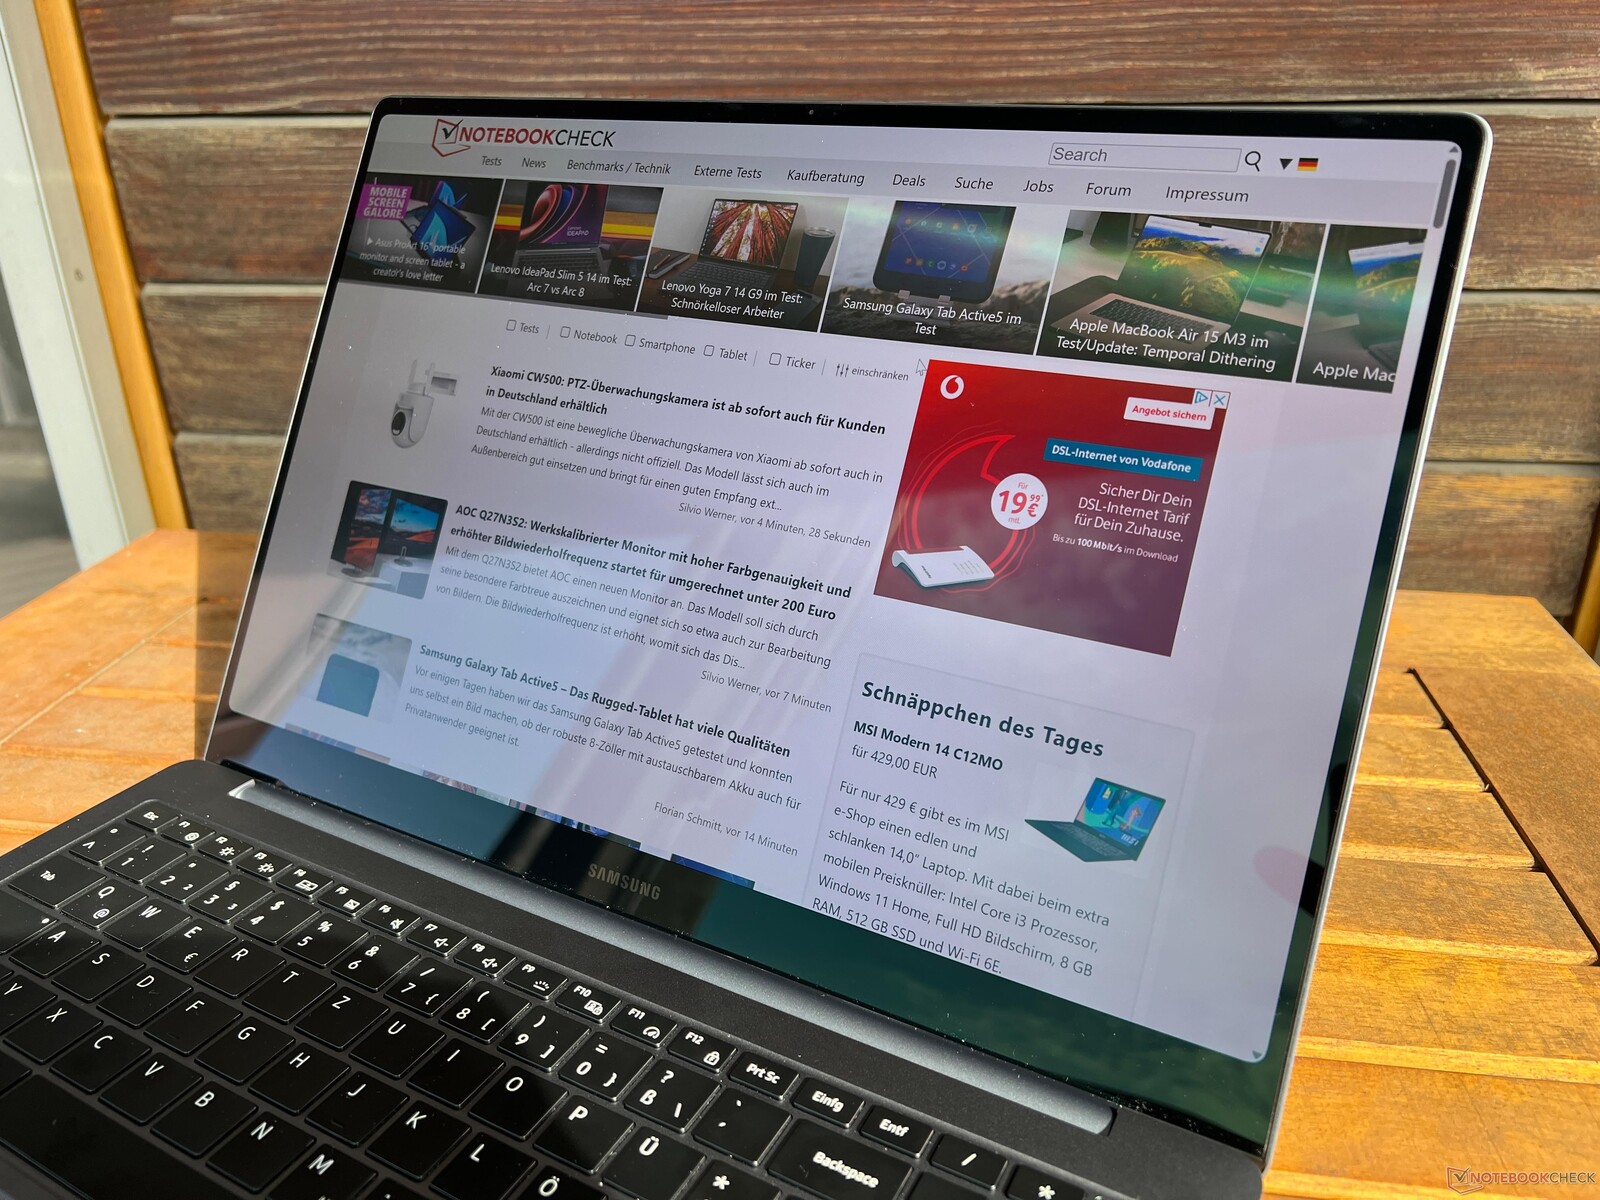
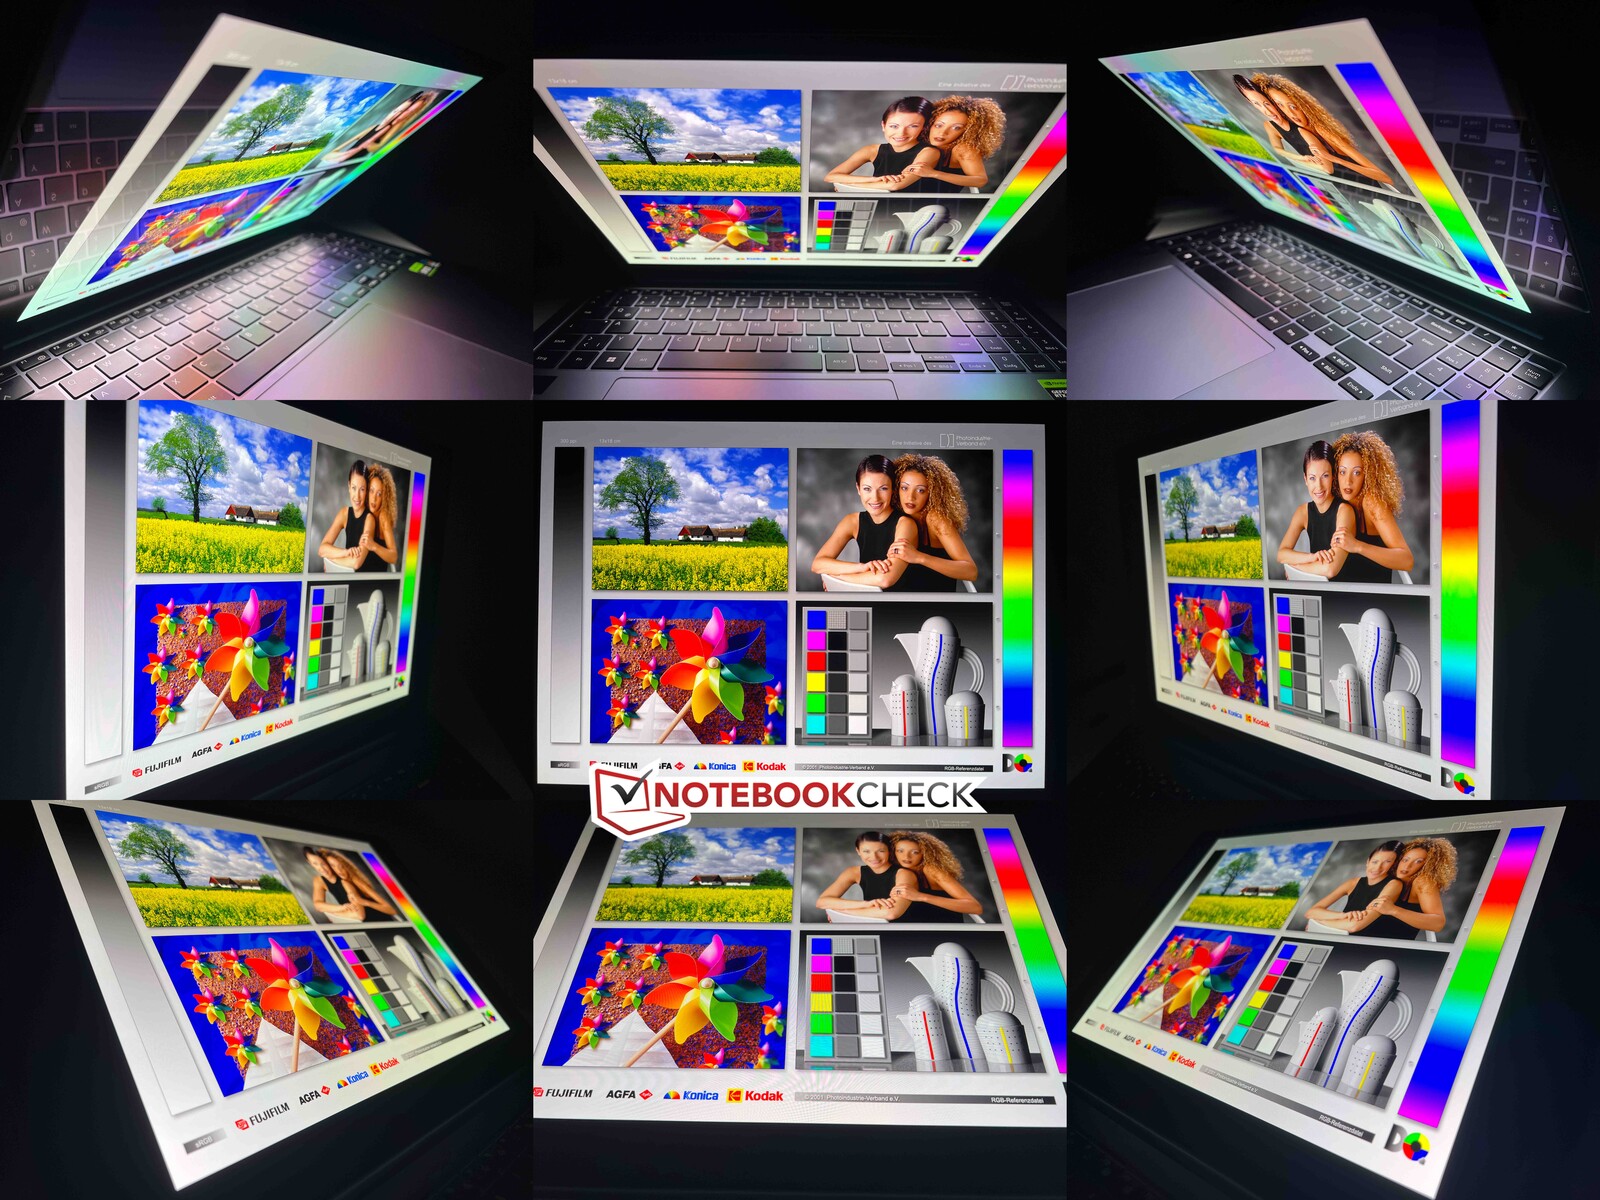
A tela sensível ao toque OLED é basicamente reflexiva, mas, graças à implementação do Corning Gorilla Glass DX, o nível de reflexo é menor em comparação com outros painéis brilhantes e, nesse aspecto, a Samsung está no mesmo nível dos MacBooks da Apple. Em princípio, o senhor também pode usar o dispositivo ao ar livre em dias claros, desde que evite reflexos de fontes de luz. A estabilidade do ângulo de visão é muito boa, mas, com grandes desvios, o senhor encontrará o típico brilho azul do OLED.
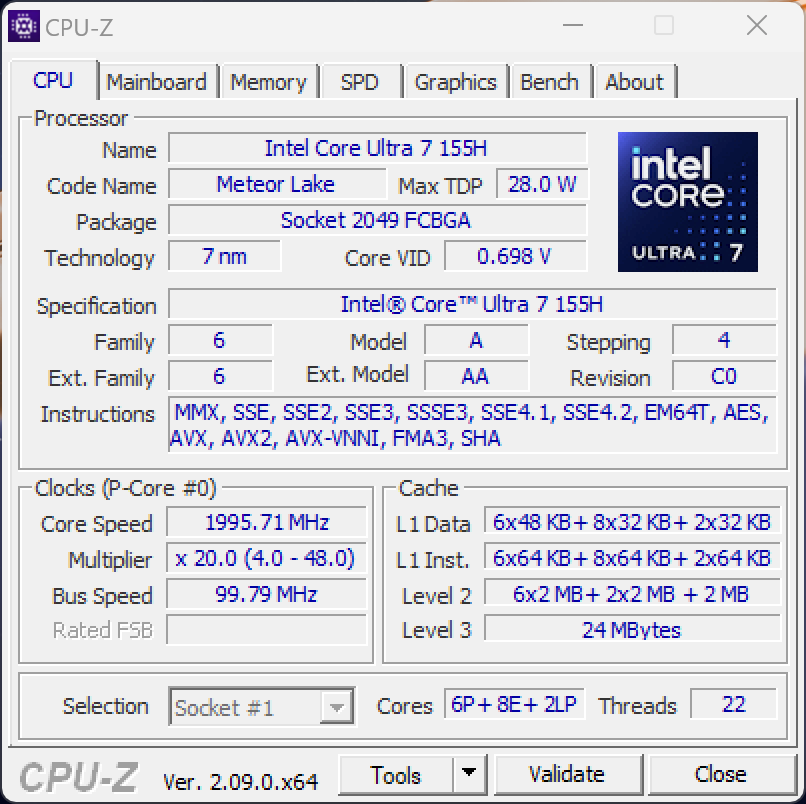
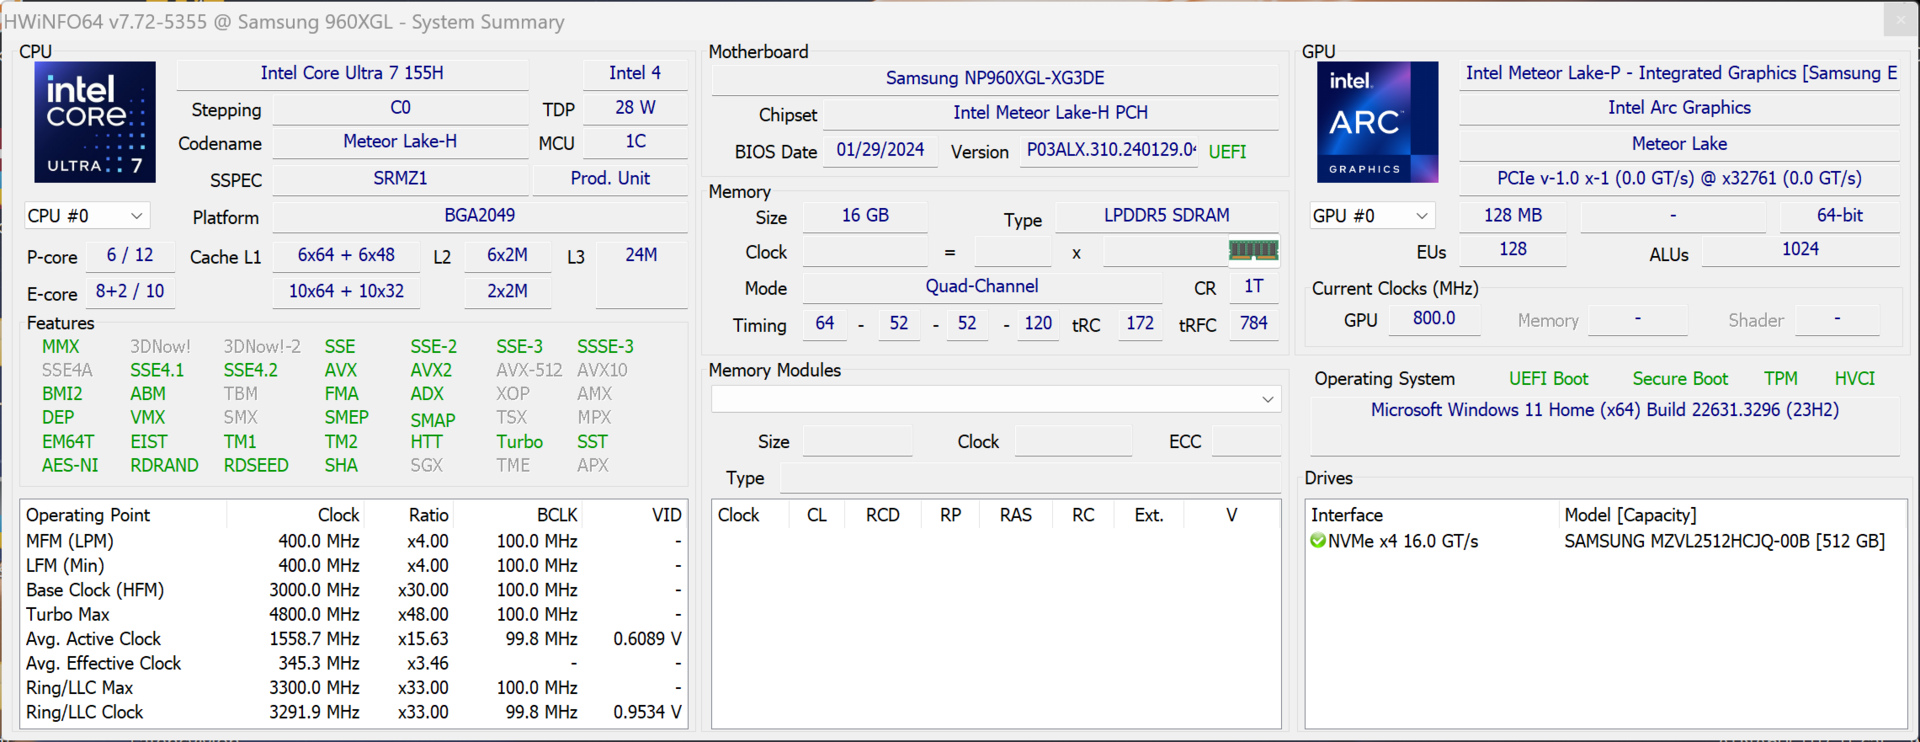
Desempenho - O Meteor Lake substitui o Raptor Lake
A Samsung substituiu os antigos chips Intel Raptor Lake pelos novos processadores Meteor Lake e os senhores podem adquirir o Core Ultra 7 155H ou o Core Ultra 9 185H. Independentemente do processador, o senhor também terá 16 ou 32 GB de RAM soldada e, em termos de GPUs, poderá escolher entre a GeForce RTX 4050 para laptop ou a mais rápida RTX 4070.
Condições de teste
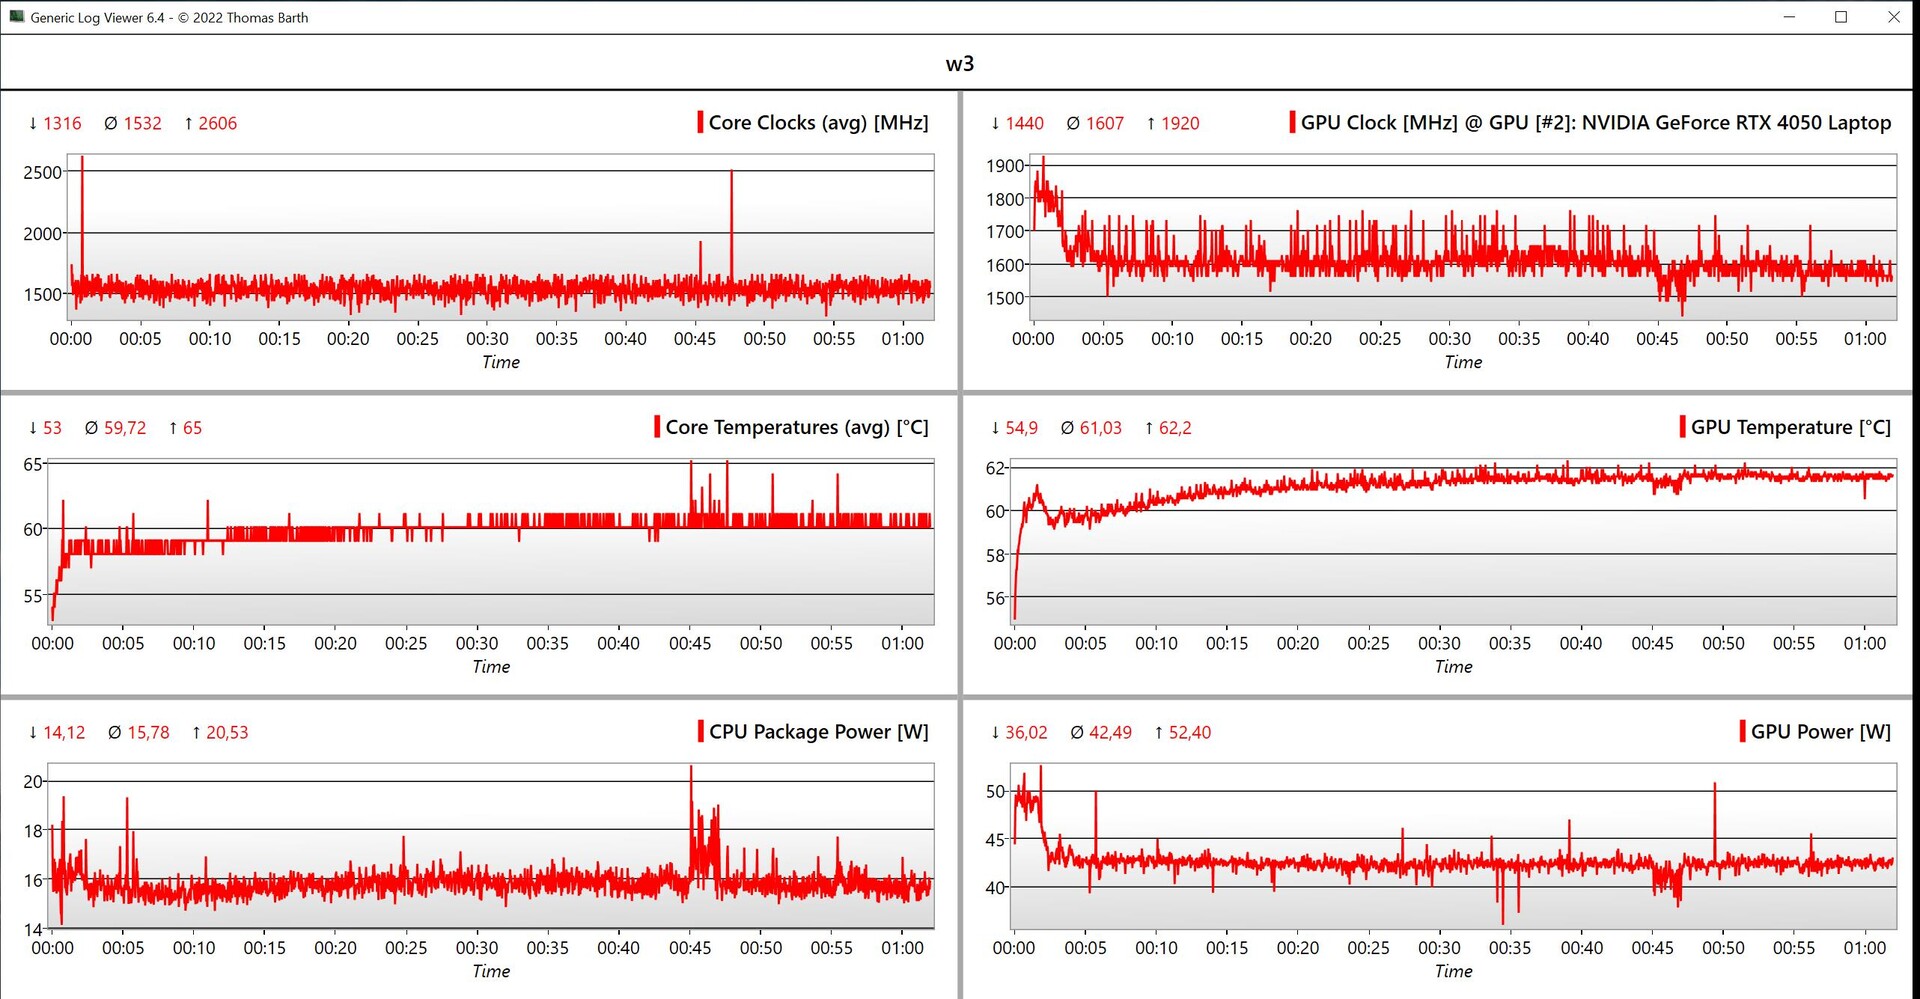
No aplicativo de configurações da Samsung, há vários perfis de energia, mas a seleção padrão é o modo Otimizado. Também usamos esse modo para os seguintes benchmarks e medições. Opcionalmente, o senhor também pode escolher entre Silencioso e Alto desempenho. Resumimos os valores de TDP/TGP correspondentes na tabela a seguir.
| Perfil de energia | CPU TDP | R23 Multi | GPU TGP | Time Spy Gráficos | Teste de estresse | Cyberpunk 2077 1080p Ultra |
força máxima da ventoinha |
|---|---|---|---|---|---|---|---|
| Silencioso | 35/25 watts | 11.327 pontos | 55 watts | 1.529 pontos | CPU: 20 watts GPU: 20 watts |
12fps | 32 dB(A) |
| Otimizado | 65/40 watts | 15.342 pontos | 55 watts | 6.073 pontos | CPU: 25 watts GPU: 33 watts |
39,4 fps | 41,7 dB(A) |
| Alto desempenho | 80/70 watts | 17.088 pontos | 80 watts | 7.849 pontos | CPU: 30 watts GPU: 80 watts |
55,4 fps | 51,3 dB(A) |
Processador
O Core Ultra 7 155H é o sucessor do bem-amado Core i7-13700H e oferece um total de 16 núcleos/22 threads (desempenho 6x, eficiência 10x). Com limites de potência de 65/40 watts, o processador oferece um desempenho decente, mesmo que não haja praticamente nenhuma diferença em comparação com a antiga geração Raptor Lake. Isso significa que não é uma atualização que valha a pena. Com o Ryzen 9 Pro 7940HSa AMD está um pouco à frente. O normal M3 Pro normal também se encontra nesse nível e desfruta de uma vantagem quando se trata de testes de núcleo único. Sob carga contínua, o desempenho de vários núcleos cai em cerca de 15%. No modo de bateria, o processador pode consumir um máximo de 45 watts, o que leva a um pequeno déficit de 7%. Outros benchmarks de CPU podem ser encontrados em nossa seção de tecnologia.
Cinebench R15 Multi Continuous Test
Cinebench R23: Multi Core | Single Core
Cinebench R20: CPU (Multi Core) | CPU (Single Core)
Cinebench R15: CPU Multi 64Bit | CPU Single 64Bit
Blender: v2.79 BMW27 CPU
7-Zip 18.03: 7z b 4 | 7z b 4 -mmt1
Geekbench 6.7: Multi-Core | Single-Core
Geekbench 5.5: Multi-Core | Single-Core
HWBOT x265 Benchmark v2.2: 4k Preset
LibreOffice : 20 Documents To PDF
R Benchmark 2.5: Overall mean
| CPU Performance rating | |
| Lenovo Slim Pro 9i 16IRP8 -2! | |
| Apple MacBook Pro 16 2023 M3 Pro -8! | |
| Lenovo ThinkPad Z16 Gen 2 | |
| Média da turma Multimedia | |
| Samsung Galaxy Book4 Ultra | |
| Schenker VISION 16 Pro (M23) -2! | |
| HP Spectre x360 16 RTX 4050 -1! | |
| Média Intel Core Ultra 7 155H | |
| Samsung Galaxy Book3 Ultra 16 -2! | |
| Cinebench R23 / Multi Core | |
| Lenovo Slim Pro 9i 16IRP8 | |
| Lenovo ThinkPad Z16 Gen 2 | |
| Média da turma Multimedia (4861 - 33362, n=76, últimos 2 anos) | |
| Samsung Galaxy Book4 Ultra | |
| Samsung Galaxy Book3 Ultra 16 | |
| HP Spectre x360 16 RTX 4050 | |
| Apple MacBook Pro 16 2023 M3 Pro | |
| Média Intel Core Ultra 7 155H (9769 - 19007, n=52) | |
| Schenker VISION 16 Pro (M23) | |
| Cinebench R23 / Single Core | |
| Lenovo Slim Pro 9i 16IRP8 | |
| Apple MacBook Pro 16 2023 M3 Pro | |
| Média da turma Multimedia (1128 - 2459, n=68, últimos 2 anos) | |
| Schenker VISION 16 Pro (M23) | |
| Lenovo ThinkPad Z16 Gen 2 | |
| Samsung Galaxy Book4 Ultra | |
| Média Intel Core Ultra 7 155H (1496 - 1815, n=52) | |
| HP Spectre x360 16 RTX 4050 | |
| Samsung Galaxy Book3 Ultra 16 | |
| Cinebench R20 / CPU (Multi Core) | |
| Lenovo Slim Pro 9i 16IRP8 | |
| Lenovo ThinkPad Z16 Gen 2 | |
| Média da turma Multimedia (1887 - 12912, n=59, últimos 2 anos) | |
| Samsung Galaxy Book4 Ultra | |
| Samsung Galaxy Book3 Ultra 16 | |
| Média Intel Core Ultra 7 155H (3798 - 7409, n=50) | |
| Schenker VISION 16 Pro (M23) | |
| HP Spectre x360 16 RTX 4050 | |
| Cinebench R20 / CPU (Single Core) | |
| Lenovo Slim Pro 9i 16IRP8 | |
| Média da turma Multimedia (425 - 853, n=59, últimos 2 anos) | |
| Schenker VISION 16 Pro (M23) | |
| Lenovo ThinkPad Z16 Gen 2 | |
| Samsung Galaxy Book4 Ultra | |
| Média Intel Core Ultra 7 155H (601 - 696, n=50) | |
| HP Spectre x360 16 RTX 4050 | |
| Samsung Galaxy Book3 Ultra 16 | |
| Cinebench R15 / CPU Multi 64Bit | |
| Lenovo Slim Pro 9i 16IRP8 | |
| Lenovo ThinkPad Z16 Gen 2 | |
| Média da turma Multimedia (856 - 5224, n=63, últimos 2 anos) | |
| Samsung Galaxy Book4 Ultra | |
| Samsung Galaxy Book3 Ultra 16 | |
| Média Intel Core Ultra 7 155H (1932 - 2880, n=56) | |
| HP Spectre x360 16 RTX 4050 | |
| Schenker VISION 16 Pro (M23) | |
| Apple MacBook Pro 16 2023 M3 Pro | |
| Cinebench R15 / CPU Single 64Bit | |
| Lenovo Slim Pro 9i 16IRP8 | |
| Média da turma Multimedia (184.8 - 326, n=61, últimos 2 anos) | |
| Lenovo ThinkPad Z16 Gen 2 | |
| Schenker VISION 16 Pro (M23) | |
| Samsung Galaxy Book4 Ultra | |
| HP Spectre x360 16 RTX 4050 | |
| Média Intel Core Ultra 7 155H (99.6 - 268, n=52) | |
| Samsung Galaxy Book3 Ultra 16 | |
| Blender / v2.79 BMW27 CPU | |
| Apple MacBook Pro 16 2023 M3 Pro | |
| Média da turma Multimedia (100 - 557, n=60, últimos 2 anos) | |
| Média Intel Core Ultra 7 155H (175 - 381, n=47) | |
| Schenker VISION 16 Pro (M23) | |
| Samsung Galaxy Book3 Ultra 16 | |
| Samsung Galaxy Book4 Ultra | |
| Lenovo ThinkPad Z16 Gen 2 | |
| Lenovo Slim Pro 9i 16IRP8 | |
| 7-Zip 18.03 / 7z b 4 | |
| Lenovo Slim Pro 9i 16IRP8 | |
| Lenovo ThinkPad Z16 Gen 2 | |
| Samsung Galaxy Book4 Ultra | |
| Schenker VISION 16 Pro (M23) | |
| Samsung Galaxy Book3 Ultra 16 | |
| HP Spectre x360 16 RTX 4050 | |
| Média Intel Core Ultra 7 155H (41739 - 70254, n=50) | |
| Média da turma Multimedia (26062 - 130368, n=57, últimos 2 anos) | |
| 7-Zip 18.03 / 7z b 4 -mmt1 | |
| Schenker VISION 16 Pro (M23) | |
| Lenovo ThinkPad Z16 Gen 2 | |
| Lenovo Slim Pro 9i 16IRP8 | |
| Média da turma Multimedia (3666 - 7545, n=58, últimos 2 anos) | |
| Samsung Galaxy Book4 Ultra | |
| Samsung Galaxy Book3 Ultra 16 | |
| Média Intel Core Ultra 7 155H (4594 - 5621, n=50) | |
| HP Spectre x360 16 RTX 4050 | |
| Geekbench 6.7 / Multi-Core | |
| Apple MacBook Pro 16 2023 M3 Pro | |
| Média da turma Multimedia (4983 - 29415, n=71, últimos 2 anos) | |
| Lenovo ThinkPad Z16 Gen 2 | |
| Samsung Galaxy Book4 Ultra | |
| Média Intel Core Ultra 7 155H (7732 - 13656, n=55) | |
| HP Spectre x360 16 RTX 4050 | |
| Geekbench 6.7 / Single-Core | |
| Apple MacBook Pro 16 2023 M3 Pro | |
| Média da turma Multimedia (1534 - 4335, n=70, últimos 2 anos) | |
| Lenovo ThinkPad Z16 Gen 2 | |
| Samsung Galaxy Book4 Ultra | |
| Média Intel Core Ultra 7 155H (1901 - 2473, n=52) | |
| HP Spectre x360 16 RTX 4050 | |
| Geekbench 5.5 / Multi-Core | |
| Apple MacBook Pro 16 2023 M3 Pro | |
| Lenovo Slim Pro 9i 16IRP8 | |
| Média da turma Multimedia (4652 - 20422, n=58, últimos 2 anos) | |
| Samsung Galaxy Book4 Ultra | |
| HP Spectre x360 16 RTX 4050 | |
| Lenovo ThinkPad Z16 Gen 2 | |
| Média Intel Core Ultra 7 155H (10017 - 13556, n=52) | |
| Schenker VISION 16 Pro (M23) | |
| Samsung Galaxy Book3 Ultra 16 | |
| Geekbench 5.5 / Single-Core | |
| Apple MacBook Pro 16 2023 M3 Pro | |
| Média da turma Multimedia (805 - 2974, n=58, últimos 2 anos) | |
| Lenovo Slim Pro 9i 16IRP8 | |
| Lenovo ThinkPad Z16 Gen 2 | |
| Schenker VISION 16 Pro (M23) | |
| Samsung Galaxy Book4 Ultra | |
| Média Intel Core Ultra 7 155H (1462 - 1824, n=52) | |
| HP Spectre x360 16 RTX 4050 | |
| Samsung Galaxy Book3 Ultra 16 | |
| HWBOT x265 Benchmark v2.2 / 4k Preset | |
| Lenovo Slim Pro 9i 16IRP8 | |
| Lenovo ThinkPad Z16 Gen 2 | |
| Média da turma Multimedia (5.26 - 36.1, n=58, últimos 2 anos) | |
| Samsung Galaxy Book4 Ultra | |
| Samsung Galaxy Book3 Ultra 16 | |
| Schenker VISION 16 Pro (M23) | |
| Média Intel Core Ultra 7 155H (9.93 - 21.2, n=50) | |
| HP Spectre x360 16 RTX 4050 | |
| LibreOffice / 20 Documents To PDF | |
| Média da turma Multimedia (23.9 - 146.7, n=59, últimos 2 anos) | |
| Samsung Galaxy Book3 Ultra 16 | |
| Média Intel Core Ultra 7 155H (37.5 - 79.2, n=49) | |
| Schenker VISION 16 Pro (M23) | |
| Samsung Galaxy Book4 Ultra | |
| Lenovo ThinkPad Z16 Gen 2 | |
| HP Spectre x360 16 RTX 4050 | |
| Lenovo Slim Pro 9i 16IRP8 | |
| R Benchmark 2.5 / Overall mean | |
| HP Spectre x360 16 RTX 4050 | |
| Samsung Galaxy Book3 Ultra 16 | |
| Média Intel Core Ultra 7 155H (0.4457 - 0.53, n=49) | |
| Samsung Galaxy Book4 Ultra | |
| Média da turma Multimedia (0.3604 - 0.947, n=58, últimos 2 anos) | |
| Lenovo ThinkPad Z16 Gen 2 | |
| Schenker VISION 16 Pro (M23) | |
| Lenovo Slim Pro 9i 16IRP8 | |
* ... menor é melhor
AIDA64: FP32 Ray-Trace | FPU Julia | CPU SHA3 | CPU Queen | FPU SinJulia | FPU Mandel | CPU AES | CPU ZLib | FP64 Ray-Trace | CPU PhotoWorxx
| Performance rating | |
| Lenovo ThinkPad Z16 Gen 2 | |
| Lenovo Slim Pro 9i 16IRP8 | |
| Média da turma Multimedia | |
| Samsung Galaxy Book3 Ultra 16 | |
| HP Spectre x360 16 RTX 4050 | |
| Samsung Galaxy Book4 Ultra | |
| Média Intel Core Ultra 7 155H | |
| Schenker VISION 16 Pro (M23) | |
| AIDA64 / FP32 Ray-Trace | |
| Lenovo ThinkPad Z16 Gen 2 | |
| Lenovo Slim Pro 9i 16IRP8 | |
| Média da turma Multimedia (2214 - 50388, n=55, últimos 2 anos) | |
| Samsung Galaxy Book3 Ultra 16 | |
| HP Spectre x360 16 RTX 4050 | |
| Samsung Galaxy Book4 Ultra | |
| Schenker VISION 16 Pro (M23) | |
| Média Intel Core Ultra 7 155H (6670 - 18470, n=50) | |
| AIDA64 / FPU Julia | |
| Lenovo ThinkPad Z16 Gen 2 | |
| Lenovo Slim Pro 9i 16IRP8 | |
| Média da turma Multimedia (12867 - 201874, n=56, últimos 2 anos) | |
| HP Spectre x360 16 RTX 4050 | |
| Samsung Galaxy Book4 Ultra | |
| Schenker VISION 16 Pro (M23) | |
| Média Intel Core Ultra 7 155H (40905 - 93181, n=50) | |
| Samsung Galaxy Book3 Ultra 16 | |
| AIDA64 / CPU SHA3 | |
| Lenovo ThinkPad Z16 Gen 2 | |
| Lenovo Slim Pro 9i 16IRP8 | |
| Média da turma Multimedia (626 - 8623, n=56, últimos 2 anos) | |
| HP Spectre x360 16 RTX 4050 | |
| Samsung Galaxy Book4 Ultra | |
| Média Intel Core Ultra 7 155H (1940 - 4436, n=50) | |
| Samsung Galaxy Book3 Ultra 16 | |
| Schenker VISION 16 Pro (M23) | |
| AIDA64 / CPU Queen | |
| Lenovo ThinkPad Z16 Gen 2 | |
| Lenovo Slim Pro 9i 16IRP8 | |
| Samsung Galaxy Book3 Ultra 16 | |
| Schenker VISION 16 Pro (M23) | |
| Samsung Galaxy Book4 Ultra | |
| Média Intel Core Ultra 7 155H (64698 - 94181, n=50) | |
| HP Spectre x360 16 RTX 4050 | |
| Média da turma Multimedia (13483 - 181505, n=43, últimos 2 anos) | |
| AIDA64 / FPU SinJulia | |
| Lenovo ThinkPad Z16 Gen 2 | |
| Lenovo Slim Pro 9i 16IRP8 | |
| Samsung Galaxy Book4 Ultra | |
| HP Spectre x360 16 RTX 4050 | |
| Média Intel Core Ultra 7 155H (5639 - 10647, n=50) | |
| Samsung Galaxy Book3 Ultra 16 | |
| Schenker VISION 16 Pro (M23) | |
| Média da turma Multimedia (886 - 28794, n=56, últimos 2 anos) | |
| AIDA64 / FPU Mandel | |
| Lenovo ThinkPad Z16 Gen 2 | |
| Lenovo Slim Pro 9i 16IRP8 | |
| Média da turma Multimedia (6395 - 105740, n=55, últimos 2 anos) | |
| HP Spectre x360 16 RTX 4050 | |
| Samsung Galaxy Book4 Ultra | |
| Samsung Galaxy Book3 Ultra 16 | |
| Média Intel Core Ultra 7 155H (18236 - 47685, n=50) | |
| Schenker VISION 16 Pro (M23) | |
| AIDA64 / CPU AES | |
| Lenovo ThinkPad Z16 Gen 2 | |
| Lenovo Slim Pro 9i 16IRP8 | |
| Média Intel Core Ultra 7 155H (45713 - 152179, n=50) | |
| HP Spectre x360 16 RTX 4050 | |
| Samsung Galaxy Book4 Ultra | |
| Samsung Galaxy Book3 Ultra 16 | |
| Schenker VISION 16 Pro (M23) | |
| Média da turma Multimedia (8171 - 126790, n=56, últimos 2 anos) | |
| AIDA64 / CPU ZLib | |
| Lenovo Slim Pro 9i 16IRP8 | |
| Lenovo ThinkPad Z16 Gen 2 | |
| Samsung Galaxy Book3 Ultra 16 | |
| HP Spectre x360 16 RTX 4050 | |
| Média da turma Multimedia (143.8 - 2022, n=56, últimos 2 anos) | |
| Samsung Galaxy Book4 Ultra | |
| Média Intel Core Ultra 7 155H (557 - 1250, n=50) | |
| Schenker VISION 16 Pro (M23) | |
| AIDA64 / FP64 Ray-Trace | |
| Lenovo ThinkPad Z16 Gen 2 | |
| Lenovo Slim Pro 9i 16IRP8 | |
| Média da turma Multimedia (1014 - 26875, n=56, últimos 2 anos) | |
| Samsung Galaxy Book3 Ultra 16 | |
| HP Spectre x360 16 RTX 4050 | |
| Schenker VISION 16 Pro (M23) | |
| Samsung Galaxy Book4 Ultra | |
| Média Intel Core Ultra 7 155H (3569 - 9802, n=50) | |
| AIDA64 / CPU PhotoWorxx | |
| Lenovo Slim Pro 9i 16IRP8 | |
| Samsung Galaxy Book4 Ultra | |
| Média da turma Multimedia (8187 - 88154, n=56, últimos 2 anos) | |
| HP Spectre x360 16 RTX 4050 | |
| Samsung Galaxy Book3 Ultra 16 | |
| Média Intel Core Ultra 7 155H (32719 - 54223, n=50) | |
| Schenker VISION 16 Pro (M23) | |
| Lenovo ThinkPad Z16 Gen 2 | |
Desempenho do sistema
Nos benchmarks sintéticos, o Galaxy Book4 Ultra obteve bons resultados e estamos lidando com um computador rápido e responsivo. Não detectamos nenhum tipo de problema durante nosso teste.
CrossMark: Overall | Productivity | Creativity | Responsiveness
WebXPRT 3: Overall
WebXPRT 4: Overall
Mozilla Kraken 1.1: Total
| PCMark 10 / Score | |
| Lenovo ThinkPad Z16 Gen 2 | |
| Média da turma Multimedia (4325 - 10386, n=54, últimos 2 anos) | |
| Lenovo Slim Pro 9i 16IRP8 | |
| Schenker VISION 16 Pro (M23) | |
| Samsung Galaxy Book4 Ultra | |
| Média Intel Core Ultra 7 155H, NVIDIA GeForce RTX 4050 Laptop GPU (6537 - 6973, n=5) | |
| Samsung Galaxy Book3 Ultra 16 | |
| HP Spectre x360 16 RTX 4050 | |
| PCMark 10 / Essentials | |
| Lenovo ThinkPad Z16 Gen 2 | |
| Lenovo Slim Pro 9i 16IRP8 | |
| Schenker VISION 16 Pro (M23) | |
| Samsung Galaxy Book3 Ultra 16 | |
| Média da turma Multimedia (8025 - 11664, n=53, últimos 2 anos) | |
| Samsung Galaxy Book4 Ultra | |
| HP Spectre x360 16 RTX 4050 | |
| Média Intel Core Ultra 7 155H, NVIDIA GeForce RTX 4050 Laptop GPU (9463 - 10446, n=5) | |
| PCMark 10 / Productivity | |
| Média da turma Multimedia (7323 - 18233, n=53, últimos 2 anos) | |
| Lenovo ThinkPad Z16 Gen 2 | |
| Lenovo Slim Pro 9i 16IRP8 | |
| Schenker VISION 16 Pro (M23) | |
| HP Spectre x360 16 RTX 4050 | |
| Samsung Galaxy Book4 Ultra | |
| Média Intel Core Ultra 7 155H, NVIDIA GeForce RTX 4050 Laptop GPU (8769 - 9272, n=5) | |
| Samsung Galaxy Book3 Ultra 16 | |
| PCMark 10 / Digital Content Creation | |
| Lenovo Slim Pro 9i 16IRP8 | |
| Lenovo ThinkPad Z16 Gen 2 | |
| Schenker VISION 16 Pro (M23) | |
| Média da turma Multimedia (3651 - 16240, n=53, últimos 2 anos) | |
| Samsung Galaxy Book4 Ultra | |
| Samsung Galaxy Book3 Ultra 16 | |
| Média Intel Core Ultra 7 155H, NVIDIA GeForce RTX 4050 Laptop GPU (8602 - 10622, n=5) | |
| HP Spectre x360 16 RTX 4050 | |
| CrossMark / Overall | |
| Apple MacBook Pro 16 2023 M3 Pro | |
| Schenker VISION 16 Pro (M23) | |
| Média da turma Multimedia (866 - 2728, n=62, últimos 2 anos) | |
| Lenovo Slim Pro 9i 16IRP8 | |
| Samsung Galaxy Book4 Ultra | |
| Média Intel Core Ultra 7 155H, NVIDIA GeForce RTX 4050 Laptop GPU (1552 - 1740, n=5) | |
| HP Spectre x360 16 RTX 4050 | |
| Samsung Galaxy Book3 Ultra 16 | |
| Lenovo ThinkPad Z16 Gen 2 | |
| CrossMark / Productivity | |
| Schenker VISION 16 Pro (M23) | |
| Apple MacBook Pro 16 2023 M3 Pro | |
| Média da turma Multimedia (931 - 2489, n=62, últimos 2 anos) | |
| Samsung Galaxy Book4 Ultra | |
| Lenovo Slim Pro 9i 16IRP8 | |
| Média Intel Core Ultra 7 155H, NVIDIA GeForce RTX 4050 Laptop GPU (1459 - 1659, n=5) | |
| HP Spectre x360 16 RTX 4050 | |
| Lenovo ThinkPad Z16 Gen 2 | |
| Samsung Galaxy Book3 Ultra 16 | |
| CrossMark / Creativity | |
| Apple MacBook Pro 16 2023 M3 Pro | |
| Média da turma Multimedia (907 - 3465, n=62, últimos 2 anos) | |
| Lenovo Slim Pro 9i 16IRP8 | |
| Schenker VISION 16 Pro (M23) | |
| Samsung Galaxy Book4 Ultra | |
| Média Intel Core Ultra 7 155H, NVIDIA GeForce RTX 4050 Laptop GPU (1811 - 1943, n=5) | |
| HP Spectre x360 16 RTX 4050 | |
| Lenovo ThinkPad Z16 Gen 2 | |
| Samsung Galaxy Book3 Ultra 16 | |
| CrossMark / Responsiveness | |
| Schenker VISION 16 Pro (M23) | |
| Média da turma Multimedia (605 - 2024, n=62, últimos 2 anos) | |
| Samsung Galaxy Book3 Ultra 16 | |
| Samsung Galaxy Book4 Ultra | |
| Apple MacBook Pro 16 2023 M3 Pro | |
| Lenovo Slim Pro 9i 16IRP8 | |
| Lenovo ThinkPad Z16 Gen 2 | |
| Média Intel Core Ultra 7 155H, NVIDIA GeForce RTX 4050 Laptop GPU (1167 - 1467, n=5) | |
| HP Spectre x360 16 RTX 4050 | |
| WebXPRT 3 / Overall | |
| Apple MacBook Pro 16 2023 M3 Pro | |
| Média da turma Multimedia (136.4 - 596, n=65, últimos 2 anos) | |
| Lenovo Slim Pro 9i 16IRP8 | |
| Lenovo ThinkPad Z16 Gen 2 | |
| Schenker VISION 16 Pro (M23) | |
| Samsung Galaxy Book4 Ultra | |
| HP Spectre x360 16 RTX 4050 | |
| Média Intel Core Ultra 7 155H, NVIDIA GeForce RTX 4050 Laptop GPU (262 - 285, n=5) | |
| Samsung Galaxy Book3 Ultra 16 | |
| WebXPRT 4 / Overall | |
| Média da turma Multimedia (167.3 - 402, n=67, últimos 2 anos) | |
| Lenovo Slim Pro 9i 16IRP8 | |
| Schenker VISION 16 Pro (M23) | |
| Samsung Galaxy Book4 Ultra | |
| Lenovo ThinkPad Z16 Gen 2 | |
| HP Spectre x360 16 RTX 4050 | |
| Média Intel Core Ultra 7 155H, NVIDIA GeForce RTX 4050 Laptop GPU (247 - 260, n=5) | |
| Samsung Galaxy Book3 Ultra 16 | |
| Mozilla Kraken 1.1 / Total | |
| Samsung Galaxy Book3 Ultra 16 | |
| Lenovo ThinkPad Z16 Gen 2 | |
| HP Spectre x360 16 RTX 4050 | |
| Média Intel Core Ultra 7 155H, NVIDIA GeForce RTX 4050 Laptop GPU (416 - 561, n=5) | |
| Schenker VISION 16 Pro (M23) | |
| Lenovo Slim Pro 9i 16IRP8 | |
| Média da turma Multimedia (228 - 835, n=68, últimos 2 anos) | |
| Samsung Galaxy Book4 Ultra | |
| Apple MacBook Pro 16 2023 M3 Pro | |
* ... menor é melhor
| PCMark 10 Score | 6973 pontos | |
Ajuda | ||
| AIDA64 / Memory Copy | |
| Samsung Galaxy Book4 Ultra | |
| HP Spectre x360 16 RTX 4050 | |
| Média Intel Core Ultra 7 155H (62397 - 96791, n=50) | |
| Média da turma Multimedia (11299 - 132135, n=56, últimos 2 anos) | |
| Lenovo Slim Pro 9i 16IRP8 | |
| Samsung Galaxy Book3 Ultra 16 | |
| Lenovo ThinkPad Z16 Gen 2 | |
| Schenker VISION 16 Pro (M23) | |
| AIDA64 / Memory Read | |
| Samsung Galaxy Book4 Ultra | |
| HP Spectre x360 16 RTX 4050 | |
| Média da turma Multimedia (11624 - 174586, n=56, últimos 2 anos) | |
| Média Intel Core Ultra 7 155H (60544 - 90647, n=50) | |
| Lenovo Slim Pro 9i 16IRP8 | |
| Schenker VISION 16 Pro (M23) | |
| Samsung Galaxy Book3 Ultra 16 | |
| Lenovo ThinkPad Z16 Gen 2 | |
| AIDA64 / Memory Write | |
| HP Spectre x360 16 RTX 4050 | |
| Lenovo ThinkPad Z16 Gen 2 | |
| Lenovo Slim Pro 9i 16IRP8 | |
| Samsung Galaxy Book3 Ultra 16 | |
| Média da turma Multimedia (11755 - 134998, n=56, últimos 2 anos) | |
| Samsung Galaxy Book4 Ultra | |
| Média Intel Core Ultra 7 155H (58692 - 93451, n=50) | |
| Schenker VISION 16 Pro (M23) | |
| AIDA64 / Memory Latency | |
| Média Intel Core Ultra 7 155H (116.2 - 233, n=50) | |
| Samsung Galaxy Book4 Ultra | |
| HP Spectre x360 16 RTX 4050 | |
| Média da turma Multimedia (7 - 535, n=55, últimos 2 anos) | |
| Lenovo ThinkPad Z16 Gen 2 | |
| Lenovo Slim Pro 9i 16IRP8 | |
| Samsung Galaxy Book3 Ultra 16 | |
| Schenker VISION 16 Pro (M23) | |
* ... menor é melhor
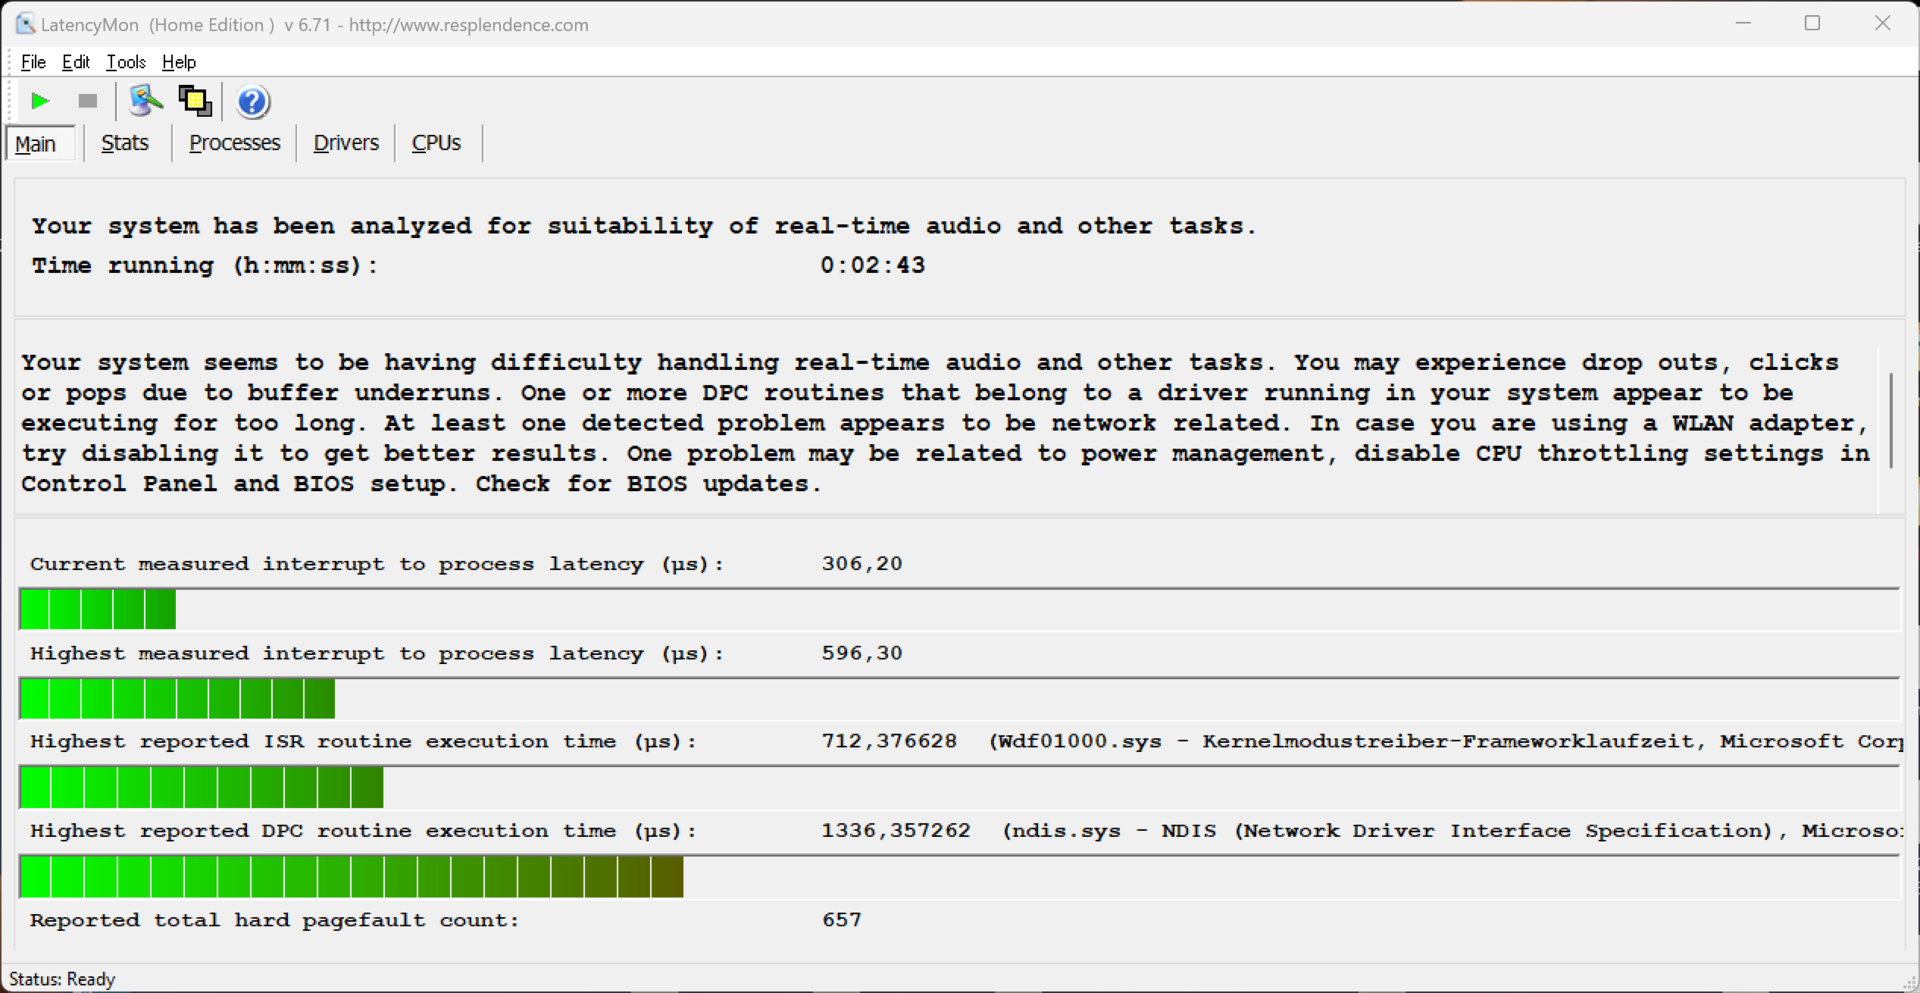
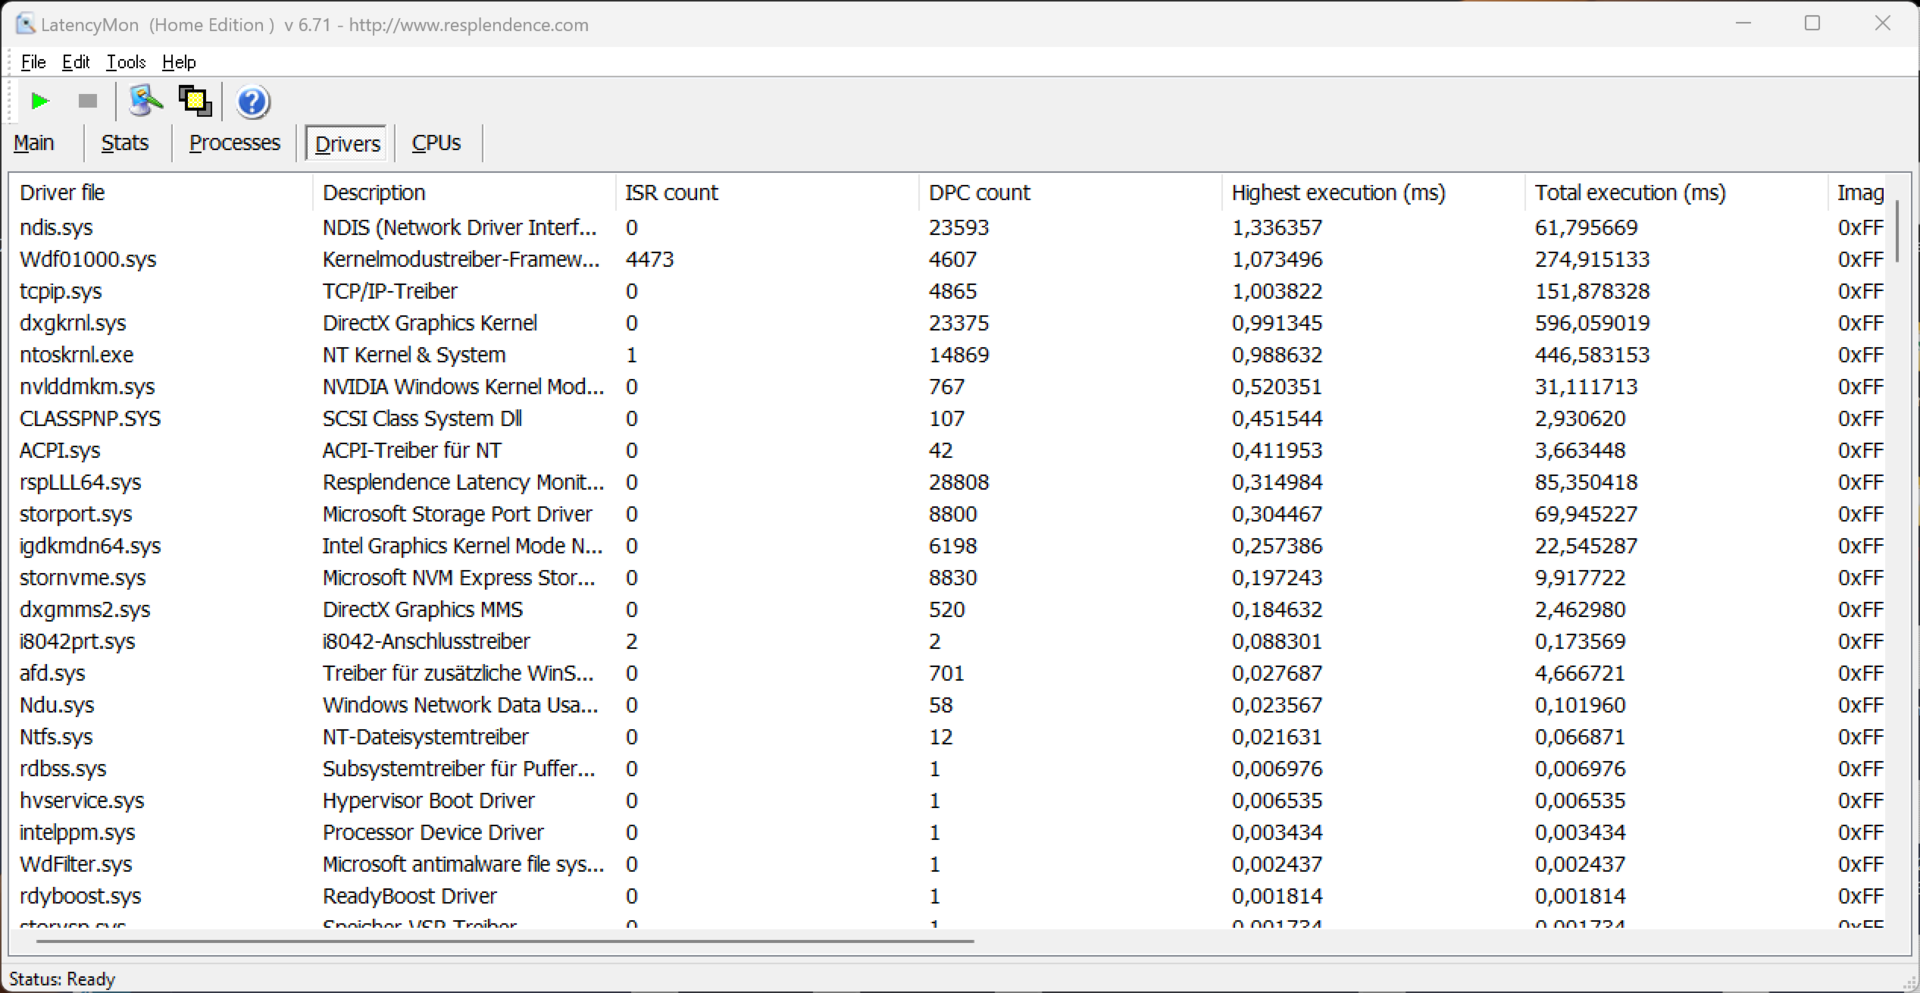
Latências de DPC
Em nosso teste de latência padronizado (navegação na Internet, reprodução em 4K no YouTube, carga da CPU), o dispositivo analisado e sua versão atual do BIOS tiveram um desempenho muito bom. Um driver apresentou um pico, mas o importante valor de "latência de interrupção para processamento" foi muito baixo.
| DPC Latencies / LatencyMon - interrupt to process latency (max), Web, Youtube, Prime95 | |
| HP Spectre x360 16 RTX 4050 | |
| Samsung Galaxy Book3 Ultra 16 | |
| Lenovo Slim Pro 9i 16IRP8 | |
| Lenovo ThinkPad Z16 Gen 2 | |
| Schenker VISION 16 Pro (M23) | |
| Samsung Galaxy Book4 Ultra | |
* ... menor é melhor
Armazenamento em massa
Não é de surpreender que a Samsung tenha instalado um de seus próprios SSDs (PM9A1), no entanto, ele tem apenas 512 GB de capacidade. Após a primeira instalação, o usuário tem 403 GB à sua disposição. Pelo menos a capacidade de armazenamento pode ser expandida de forma fácil e econômica graças ao segundo slot M.2 2280. Não há motivo para críticas com relação ao desempenho da SSD e, mesmo sob longos períodos de carga, não há quedas no desempenho. Outros benchmarks de SSDs estão listados aqui.

* ... menor é melhor
Continuous Performance Read : DiskSpd Read Loop, Queue Depth 8
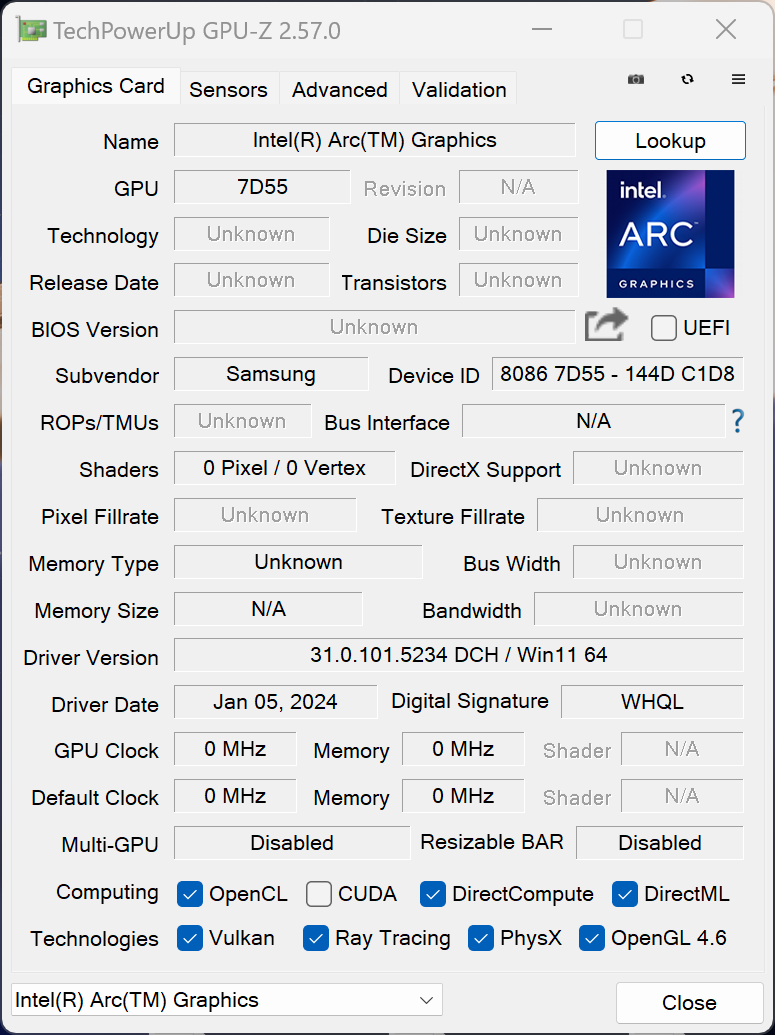
Placa de vídeo
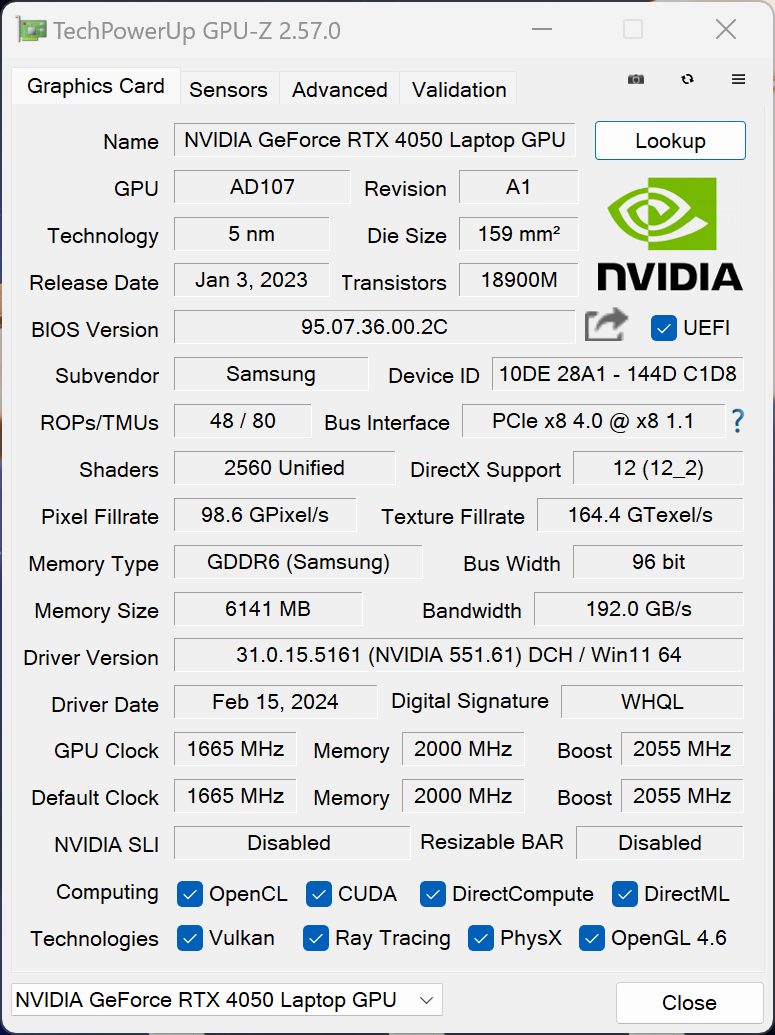
Em situações cotidianas, a GPU Arc integrada cuida dos cálculos gráficos e, para aplicativos exigentes, a GPU Nvidia é ativada automaticamente. O switch gráfico Optimus regular é usado, mas não há um switch MUX nem o Advanced Optimus disponíveis. O laptop Laptop RTX 4050 alojado no Galaxy Book4 Ultra, consome no máximo 80 watts no modo de alto desempenho e 55 watts no modo otimizado.
Os resultados de benchmark estão no mesmo nível do antigo Galaxy Book3 Ultra que também usava um laptop RTX 4050 com 55 watts. Isso supera a Radeon RX 6550M mas a GPU M3 Pro às vezes é mais rápida. Para um laptop multimídia, o laptop RTX 4050 continua a ser uma boa opção. No entanto, o Galaxy Book4 Ultra falhou no teste de estresse do 3DMark (Time Spy) com quedas no desempenho de 7% sob carga sustentada.
No modo de bateria, a GPU da Nvidia consome um máximo de 35 watts, razão pela qual o desempenho da GPU é cerca de 13% menor. Outros benchmarks de GPU estão disponíveis aqui.
| 3DMark 11 Performance | 21479 pontos | |
| 3DMark Fire Strike Score | 14587 pontos | |
| 3DMark Time Spy Score | 6449 pontos | |
Ajuda | ||
| Blender / v3.3 Classroom OPTIX/RTX | |
| Média da turma Multimedia (12 - 105, n=23, últimos 2 anos) | |
| Samsung Galaxy Book3 Ultra 16 | |
| Samsung Galaxy Book4 Ultra | |
| HP Spectre x360 16 RTX 4050 | |
| Média NVIDIA GeForce RTX 4050 Laptop GPU (25 - 37, n=40) | |
| Lenovo Slim Pro 9i 16IRP8 | |
| Schenker VISION 16 Pro (M23) | |
| Blender / v3.3 Classroom CUDA | |
| Samsung Galaxy Book3 Ultra 16 | |
| Média da turma Multimedia (20 - 186, n=23, últimos 2 anos) | |
| Samsung Galaxy Book4 Ultra | |
| HP Spectre x360 16 RTX 4050 | |
| Média NVIDIA GeForce RTX 4050 Laptop GPU (47 - 68, n=39) | |
| Lenovo Slim Pro 9i 16IRP8 | |
| Schenker VISION 16 Pro (M23) | |
| Blender / v3.3 Classroom METAL | |
| Apple MacBook Pro 16 2023 M3 Pro | |
| Média da turma Multimedia (17.8 - 68, n=5, últimos 2 anos) | |
| Blender / v3.3 Classroom CPU | |
| Média da turma Multimedia (134.5 - 1042, n=63, últimos 2 anos) | |
| HP Spectre x360 16 RTX 4050 | |
| Média NVIDIA GeForce RTX 4050 Laptop GPU (243 - 907, n=40) | |
| Schenker VISION 16 Pro (M23) | |
| Samsung Galaxy Book3 Ultra 16 | |
| Samsung Galaxy Book4 Ultra | |
| Apple MacBook Pro 16 2023 M3 Pro | |
| Lenovo Slim Pro 9i 16IRP8 | |
| Lenovo ThinkPad Z16 Gen 2 | |
* ... menor é melhor
Desempenho em jogos
Os jogos ficam maravilhosos na tela OLED do Galaxy Book4 Ultra e até mesmo os jogos de tiro em ritmo acelerado são um prazer graças aos tempos de resposta extremamente curtos. Por outro lado, em termos de desempenho em jogos, o senhor precisa aceitar compromissos com o laptop RTX 4050 e os títulos atuais dificilmente podem ser reproduzidos na resolução nativa do dispositivo. O ponto ideal é a resolução Full HD, com a qual o senhor geralmente deseja jogar com o máximo de detalhes. Com jogos muito exigentes ou ray tracing, o senhor não pode evitar o uso de tecnologias de upscaling, como a DLSS.
| The Witcher 3 - 1920x1080 Ultra Graphics & Postprocessing (HBAO+) | |
| Schenker VISION 16 Pro (M23) | |
| Lenovo Slim Pro 9i 16IRP8 | |
| HP Spectre x360 16 RTX 4050 | |
| Samsung Galaxy Book3 Ultra 16 | |
| Média da turma Multimedia (11 - 121, n=10, últimos 2 anos) | |
| Samsung Galaxy Book4 Ultra | |
| Lenovo ThinkPad Z16 Gen 2 | |
| GTA V - 1920x1080 Highest AA:4xMSAA + FX AF:16x | |
| Lenovo Slim Pro 9i 16IRP8 | |
| Schenker VISION 16 Pro (M23) | |
| HP Spectre x360 16 RTX 4050 | |
| Samsung Galaxy Book4 Ultra | |
| Samsung Galaxy Book3 Ultra 16 | |
| Média da turma Multimedia (7.92 - 141.6, n=58, últimos 2 anos) | |
| Final Fantasy XV Benchmark - 1920x1080 High Quality | |
| Schenker VISION 16 Pro (M23) | |
| Lenovo Slim Pro 9i 16IRP8 | |
| HP Spectre x360 16 RTX 4050 | |
| Samsung Galaxy Book3 Ultra 16 | |
| Samsung Galaxy Book4 Ultra | |
| Média da turma Multimedia (7.61 - 144.4, n=60, últimos 2 anos) | |
| Lenovo ThinkPad Z16 Gen 2 | |
| F1 23 - 1920x1080 Ultra High Preset AA:T AF:16x | |
| Média NVIDIA GeForce RTX 4050 Laptop GPU (25.7 - 60.8, n=14) | |
| Média da turma Multimedia (11 - 70.3, n=4, últimos 2 anos) | |
| Samsung Galaxy Book4 Ultra | |
Witcher 3 FPS diagram
| baixo | média | alto | ultra | QHD | |
|---|---|---|---|---|---|
| GTA V (2015) | 142.8 | 67.6 | 48.1 | ||
| The Witcher 3 (2015) | 121 | 54.5 | 46 | ||
| Dota 2 Reborn (2015) | 162.2 | 147.6 | 141.3 | 126.8 | |
| Final Fantasy XV Benchmark (2018) | 130.2 | 77.8 | 56.7 | 40.7 | |
| X-Plane 11.11 (2018) | 122.4 | 104.2 | 81.5 | ||
| Far Cry 5 (2018) | 132 | 93 | 88 | 80 | 58 |
| Strange Brigade (2018) | 321 | 158 | 127 | 113 | 77 |
| F1 23 (2023) | 145.5 | 137 | 93.7 | 25.7 | 16.7 |
| Cyberpunk 2077 (2023) | 74.2 | 54.3 | 45.7 | 39.4 | 23.3 |
Emissões - Câmara de vapor em todos os modelos
Emissões de ruído
A Samsung instalou o resfriamento por câmara de vapor com duas ventoinhas em ambos os modelos do Galaxy Book4 Ultra e, de modo geral, é muito impressionante. Durante tarefas simples, as ventoinhas geralmente permanecem completamente desativadas e picos de carga curtos são atingidos sem que as ventoinhas entrem em ação. Sob carga, as coisas ficam significativamente mais barulhentas, no entanto, com um máximo de 41,7 dB(A), o laptop é tolerável mesmo sem fones de ouvido. Por outro lado, a 51 dB(A) no modo de alto desempenho, ele é consideravelmente mais alto. Nenhum outro ruído eletrônico estava presente no dispositivo analisado
| Perfil de energia | 3DMark 06 | Witcher 3 | Cyberpunk 2077 | teste de estresse |
|---|---|---|---|---|
| Silencioso | 36,2 dB(A) | 36,2 dB(A) | 36,2 dB(A) | 32 dB(A) |
| Otimizado | 37,9 dB(A) | 41,7 dB(A) | 41,7 dB(A) | 41,7 dB(A) |
| Alto desempenho | 41,7 dB(A) | 50,5 dB(A) | 51,3 dB(A) | 51,3 dB(A) |
Barulho
| Ocioso |
| 24.2 / 24.2 / 24.2 dB |
| Carga |
| 37.9 / 41.7 dB |
 | ||
30 dB silencioso 40 dB(A) audível 50 dB(A) ruidosamente alto |
||
min: | ||
| Samsung Galaxy Book4 Ultra GeForce RTX 4050 Laptop GPU, Ultra 7 155H, Samsung PM9A1 MZVL2512HCJQ | Lenovo ThinkPad Z16 Gen 2 Radeon RX 6550M, R9 PRO 7940HS, Kioxia XG8 KXG8AZNV1T02 | Apple MacBook Pro 16 2023 M3 Pro M3 Pro 18-Core GPU, Apple M3 Pro 12-Core, Apple SSD AP0512Z | Lenovo Slim Pro 9i 16IRP8 GeForce RTX 4050 Laptop GPU, i9-13905H, Samsung PM9A1 MZVL21T0HCLR | HP Spectre x360 16 RTX 4050 GeForce RTX 4050 Laptop GPU, Ultra 7 155H, SK hynix PC801 HFS001TEJ9X101N | Schenker VISION 16 Pro (M23) GeForce RTX 4070 Laptop GPU, i7-13700H, Samsung 990 Pro 1 TB | Samsung Galaxy Book3 Ultra 16 GeForce RTX 4050 Laptop GPU, i7-13700H, Samsung PM9A1 MZVL2512HCJQ | |
|---|---|---|---|---|---|---|---|
| Noise | -8% | 6% | -3% | 11% | -19% | -5% | |
| desligado / ambiente * (dB) | 24.2 | 22.6 7% | 24.4 -1% | 22.7 6% | 23.3 4% | 25.9 -7% | 25 -3% |
| Idle Minimum * (dB) | 24.2 | 22.9 5% | 24.4 -1% | 22.7 6% | 23.6 2% | 25.9 -7% | 26 -7% |
| Idle Average * (dB) | 24.2 | 29.4 -21% | 24.4 -1% | 22.7 6% | 23.6 2% | 25.9 -7% | 27 -12% |
| Idle Maximum * (dB) | 24.2 | 29.4 -21% | 24.4 -1% | 27.5 -14% | 23.6 2% | 32 -32% | 28 -16% |
| Load Average * (dB) | 37.9 | 29.5 22% | 26.9 29% | 28.9 24% | 29.2 23% | 47.2 -25% | 40 -6% |
| Witcher 3 ultra * (dB) | 41.7 | 52 -25% | 25.1 40% | 52.6 -26% | 32.1 23% | 53.1 -27% | 39 6% |
| Load Maximum * (dB) | 41.7 | 52 -25% | 50.4 -21% | 52.5 -26% | 32.1 23% | 53.1 -27% | 41 2% |
* ... menor é melhor
Temperatura
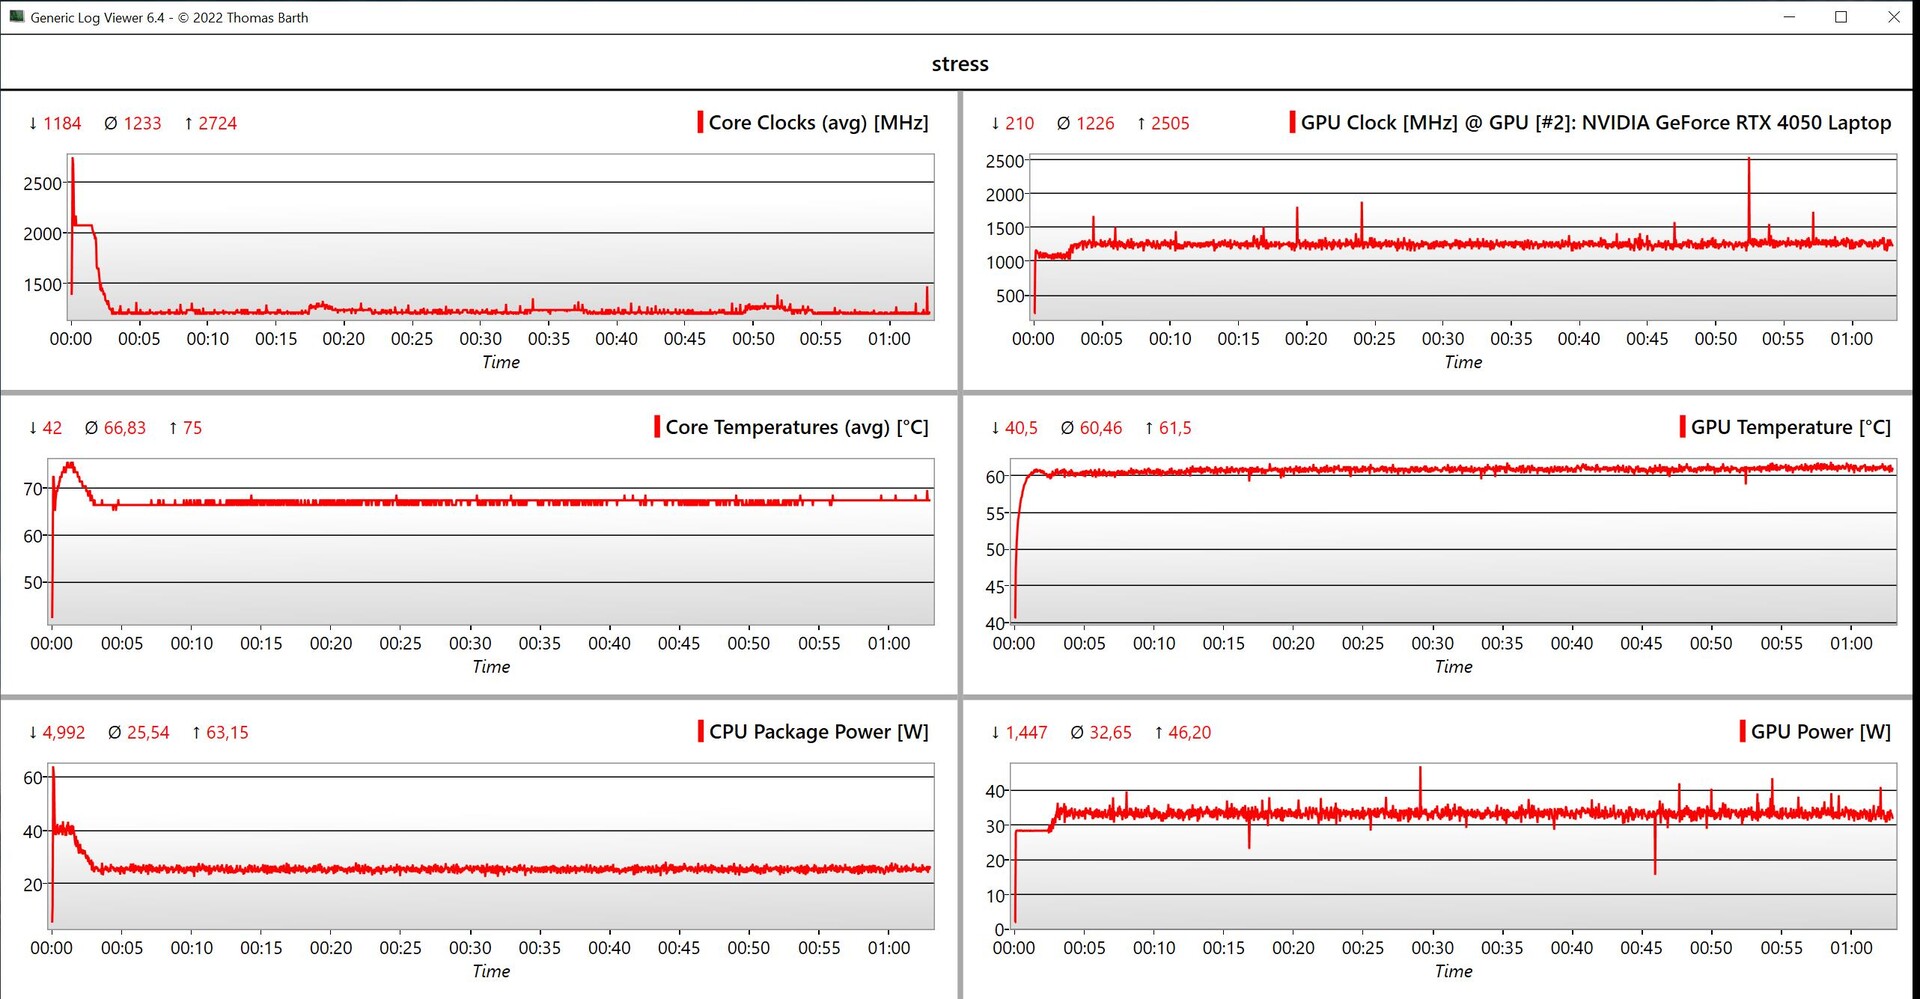
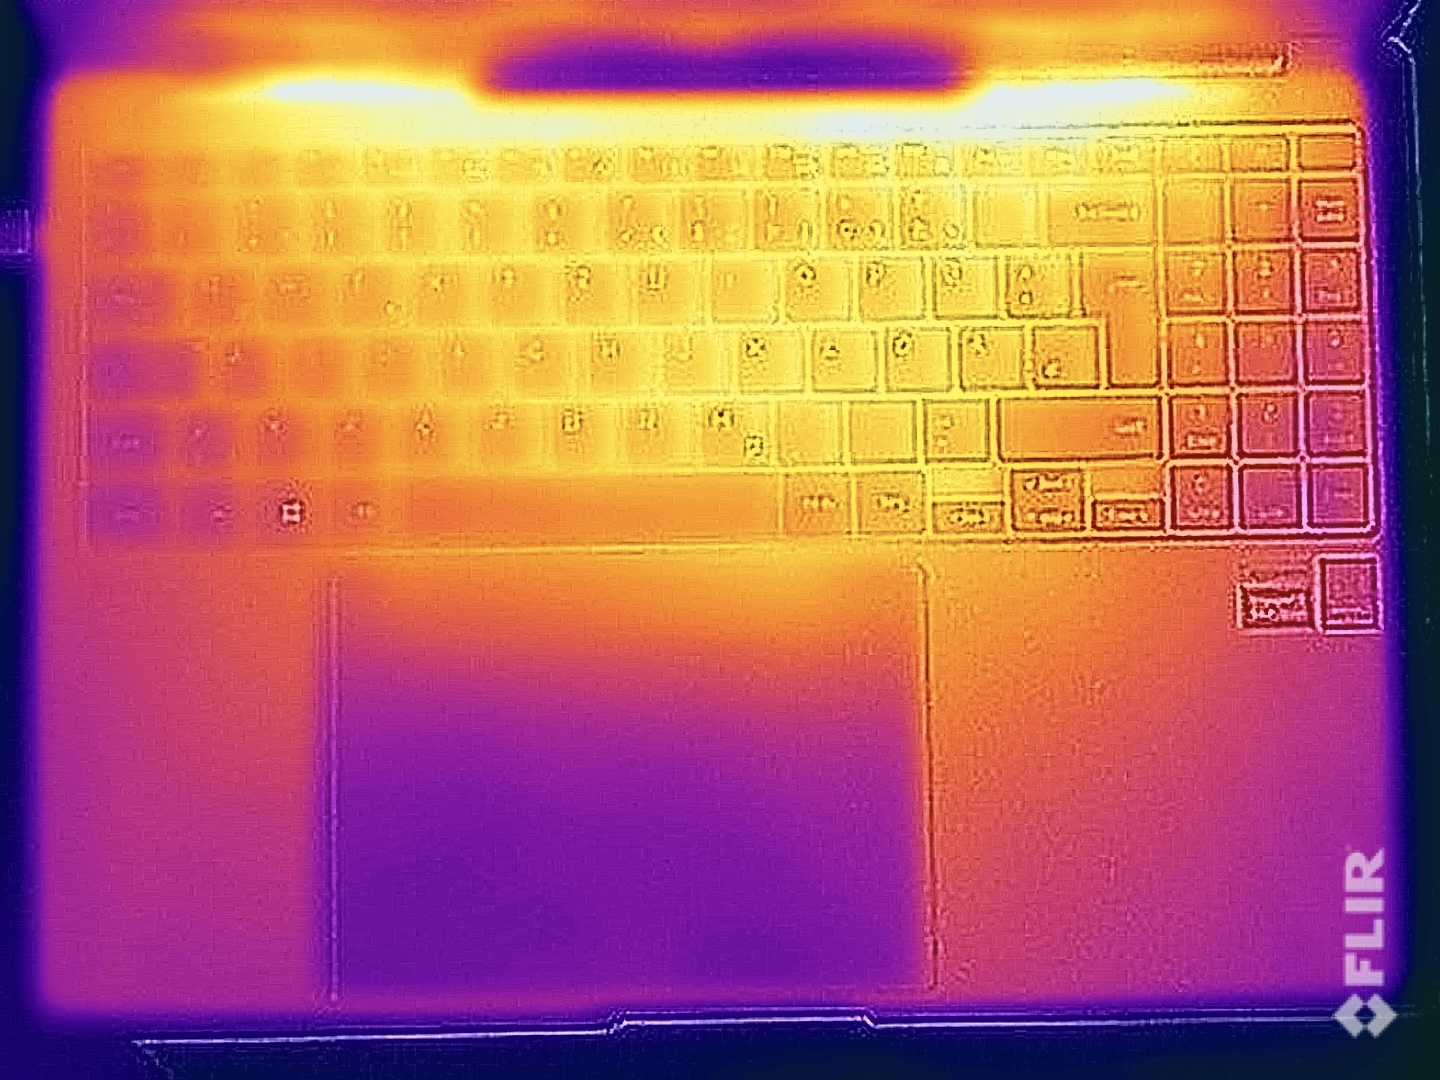
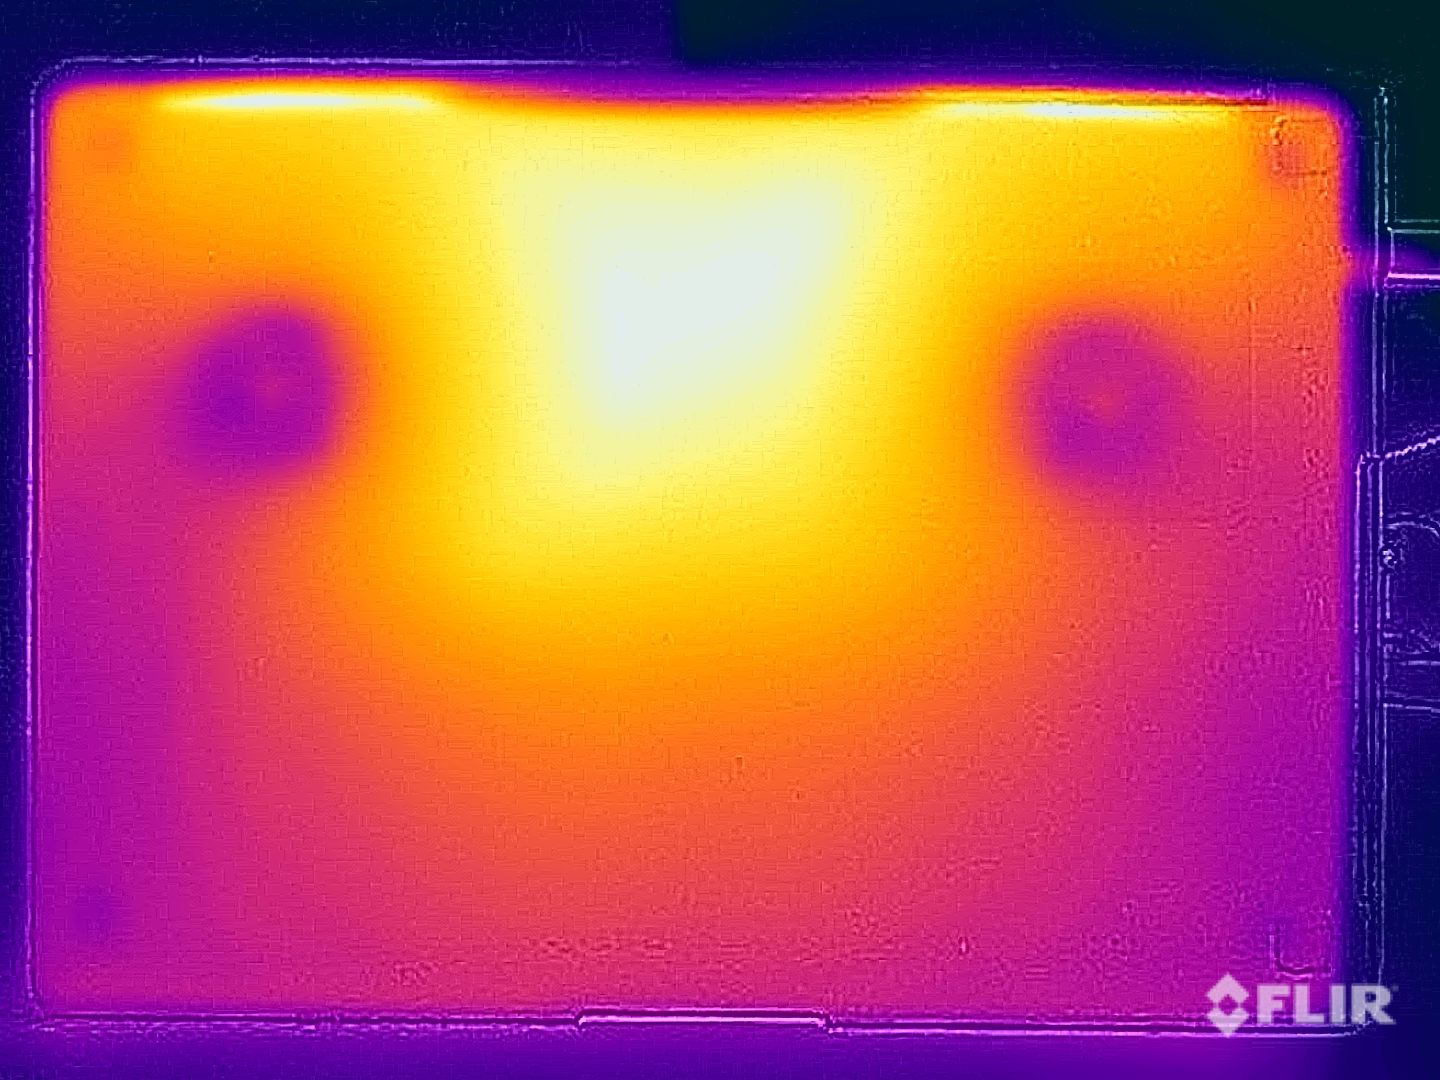
O gabinete de metal do Galaxy Book4 Ultra quase não esquenta durante o uso ocioso ou ao executar tarefas simples. Mesmo no teste de estresse, as temperaturas da superfície permanecem totalmente dentro dos limites, pois medimos apenas 39 °C na parte superior da unidade base e um máximo de 41,2 °C na parte inferior, no meio da área traseira. Isso significa que o senhor pode usar o dispositivo sem restrições. No teste de estresse, o processador e a placa de vídeo rapidamente atingiram valores de 25/33 watts.
(+) A temperatura máxima no lado superior é 38.5 °C / 101 F, em comparação com a média de 36.8 °C / 98 F , variando de 21 a 71 °C para a classe Multimedia.
(±) A parte inferior aquece até um máximo de 41.2 °C / 106 F, em comparação com a média de 39.1 °C / 102 F
(+) Em uso inativo, a temperatura média para o lado superior é 23.2 °C / 74 F, em comparação com a média do dispositivo de 31.3 °C / ### class_avg_f### F.
(±) Jogando The Witcher 3, a temperatura média para o lado superior é 35 °C / 95 F, em comparação com a média do dispositivo de 31.3 °C / ## #class_avg_f### F.
(+) Os apoios para as mãos e o touchpad são mais frios que a temperatura da pele, com um máximo de 31.9 °C / 89.4 F e, portanto, são frios ao toque.
(-) A temperatura média da área do apoio para as mãos de dispositivos semelhantes foi 28.7 °C / 83.7 F (-3.2 °C / -5.7 F).
| Samsung Galaxy Book4 Ultra Intel Core Ultra 7 155H, NVIDIA GeForce RTX 4050 Laptop GPU | Lenovo ThinkPad Z16 Gen 2 AMD Ryzen 9 PRO 7940HS, AMD Radeon RX 6550M | Apple MacBook Pro 16 2023 M3 Pro Apple M3 Pro 12-Core, Apple M3 Pro 18-Core GPU | Lenovo Slim Pro 9i 16IRP8 Intel Core i9-13905H, NVIDIA GeForce RTX 4050 Laptop GPU | HP Spectre x360 16 RTX 4050 Intel Core Ultra 7 155H, NVIDIA GeForce RTX 4050 Laptop GPU | Schenker VISION 16 Pro (M23) Intel Core i7-13700H, NVIDIA GeForce RTX 4070 Laptop GPU | Samsung Galaxy Book3 Ultra 16 Intel Core i7-13700H, NVIDIA GeForce RTX 4050 Laptop GPU | |
|---|---|---|---|---|---|---|---|
| Heat | 2% | 2% | -17% | -13% | -19% | -5% | |
| Maximum Upper Side * (°C) | 38.5 | 43 -12% | 38.1 1% | 37.8 2% | 39.6 -3% | 46.7 -21% | 41 -6% |
| Maximum Bottom * (°C) | 41.2 | 41.6 -1% | 37 10% | 44.8 -9% | 39.2 5% | 54.1 -31% | 44 -7% |
| Idle Upper Side * (°C) | 23.5 | 21.2 10% | 24.2 -3% | 30.6 -30% | 29 -23% | 26.5 -13% | 23 2% |
| Idle Bottom * (°C) | 24.1 | 21.4 11% | 24.6 -2% | 31 -29% | 31.6 -31% | 26.8 -11% | 26 -8% |
* ... menor é melhor
Alto-falantes
A Samsung instalou um sistema de alto-falantes com 4 módulos e, embora, no geral, a qualidade seja boa, o Galaxy Book4 Ultra não consegue acompanhar o ritmo dos melhores laptops multimídia de 16 polegadas, como o MacBook Pro, Yoga Pro 9i ou HP Spectre x360 16. Em particular, na comparação direta, os módulos poderiam ser um pouco mais enfáticos.
Samsung Galaxy Book4 Ultra análise de áudio
(+) | os alto-falantes podem tocar relativamente alto (###valor### dB)
Graves 100 - 315Hz
(±) | graves reduzidos - em média 14.4% menor que a mediana
(±) | a linearidade dos graves é média (11.3% delta para a frequência anterior)
Médios 400 - 2.000 Hz
(+) | médios equilibrados - apenas 3.4% longe da mediana
(+) | médios são lineares (3.4% delta para frequência anterior)
Altos 2 - 16 kHz
(+) | agudos equilibrados - apenas 3% longe da mediana
(+) | os máximos são lineares (5.6% delta da frequência anterior)
Geral 100 - 16.000 Hz
(+) | o som geral é linear (11.5% diferença em relação à mediana)
Comparado com a mesma classe
» 18% de todos os dispositivos testados nesta classe foram melhores, 4% semelhantes, 78% piores
» O melhor teve um delta de 5%, a média foi 17%, o pior foi 45%
Comparado com todos os dispositivos testados
» 8% de todos os dispositivos testados foram melhores, 2% semelhantes, 90% piores
» O melhor teve um delta de 4%, a média foi 23%, o pior foi 134%
Lenovo Slim Pro 9i 16IRP8 análise de áudio
(±) | o volume do alto-falante é médio, mas bom (###valor### dB)
Graves 100 - 315Hz
(+) | bons graves - apenas 2.8% longe da mediana
(±) | a linearidade dos graves é média (8.9% delta para a frequência anterior)
Médios 400 - 2.000 Hz
(+) | médios equilibrados - apenas 2.4% longe da mediana
(+) | médios são lineares (4.9% delta para frequência anterior)
Altos 2 - 16 kHz
(+) | agudos equilibrados - apenas 3.6% longe da mediana
(+) | os máximos são lineares (4.3% delta da frequência anterior)
Geral 100 - 16.000 Hz
(+) | o som geral é linear (7.3% diferença em relação à mediana)
Comparado com a mesma classe
» 6% de todos os dispositivos testados nesta classe foram melhores, 1% semelhantes, 94% piores
» O melhor teve um delta de 5%, a média foi 17%, o pior foi 45%
Comparado com todos os dispositivos testados
» 1% de todos os dispositivos testados foram melhores, 0% semelhantes, 99% piores
» O melhor teve um delta de 4%, a média foi 23%, o pior foi 134%
Apple MacBook Pro 16 2023 M3 Max análise de áudio
(+) | os alto-falantes podem tocar relativamente alto (###valor### dB)
Graves 100 - 315Hz
(±) | graves reduzidos - em média 5% menor que a mediana
(+) | o baixo é linear (5.6% delta para a frequência anterior)
Médios 400 - 2.000 Hz
(+) | médios equilibrados - apenas 1.2% longe da mediana
(+) | médios são lineares (3.1% delta para frequência anterior)
Altos 2 - 16 kHz
(+) | agudos equilibrados - apenas 2.4% longe da mediana
(+) | os máximos são lineares (2.4% delta da frequência anterior)
Geral 100 - 16.000 Hz
(+) | o som geral é linear (5.3% diferença em relação à mediana)
Comparado com a mesma classe
» 1% de todos os dispositivos testados nesta classe foram melhores, 1% semelhantes, 98% piores
» O melhor teve um delta de 5%, a média foi 17%, o pior foi 45%
Comparado com todos os dispositivos testados
» 0% de todos os dispositivos testados foram melhores, 0% semelhantes, 100% piores
» O melhor teve um delta de 4%, a média foi 23%, o pior foi 134%
HP Spectre x360 16 RTX 4050 análise de áudio
(+) | os alto-falantes podem tocar relativamente alto (###valor### dB)
Graves 100 - 315Hz
(±) | graves reduzidos - em média 13.2% menor que a mediana
(±) | a linearidade dos graves é média (7.9% delta para a frequência anterior)
Médios 400 - 2.000 Hz
(+) | médios equilibrados - apenas 3.2% longe da mediana
(+) | médios são lineares (3% delta para frequência anterior)
Altos 2 - 16 kHz
(+) | agudos equilibrados - apenas 1.6% longe da mediana
(+) | os máximos são lineares (3.5% delta da frequência anterior)
Geral 100 - 16.000 Hz
(+) | o som geral é linear (9.2% diferença em relação à mediana)
Comparado com a mesma classe
» 4% de todos os dispositivos testados nesta classe foram melhores, 1% semelhantes, 95% piores
» O melhor teve um delta de 6%, a média foi 20%, o pior foi 57%
Comparado com todos os dispositivos testados
» 3% de todos os dispositivos testados foram melhores, 1% semelhantes, 96% piores
» O melhor teve um delta de 4%, a média foi 23%, o pior foi 134%
Gerenciamento de energia - Melhoria da resistência
Consumo de energia
Em modo inativo, a tela OLED se mostra muito econômica, mas o papel de parede escuro e padrão da Samsung ajuda. Ao jogar, e dependendo do título, o senhor pode esperar cerca de 80 a 90 watts e, no teste de estresse, o consumo foi brevemente de 125 watts antes que esse valor também se estabilizasse rapidamente em 90 watts. No modo de alto desempenho, o consumo máximo foi de 141,6 watts e, posteriormente, de 128 watts. Isso significa que a PSU de 140 watts fornecida tem o tamanho adequado.
| desligado | |
| Ocioso | |
| Carga |
|
Key:
min: | |
| Samsung Galaxy Book4 Ultra Ultra 7 155H, GeForce RTX 4050 Laptop GPU, Samsung PM9A1 MZVL2512HCJQ, OLED, 2880x1800, 16" | Lenovo ThinkPad Z16 Gen 2 R9 PRO 7940HS, Radeon RX 6550M, Kioxia XG8 KXG8AZNV1T02, OLED, 3840x2400, 16" | Apple MacBook Pro 16 2023 M3 Pro Apple M3 Pro 12-Core, M3 Pro 18-Core GPU, Apple SSD AP0512Z, Mini-LED, 3456x2234, 16.2" | Lenovo Slim Pro 9i 16IRP8 i9-13905H, GeForce RTX 4050 Laptop GPU, Samsung PM9A1 MZVL21T0HCLR, Mini-LED, 3200x2000, 16" | Schenker VISION 16 Pro (M23) i7-13700H, GeForce RTX 4070 Laptop GPU, Samsung 990 Pro 1 TB, IPS, 2560x1600, 16" | Samsung Galaxy Book3 Ultra 16 i7-13700H, GeForce RTX 4050 Laptop GPU, Samsung PM9A1 MZVL2512HCJQ, AMOLED, 2880x1800, 16" | Média NVIDIA GeForce RTX 4050 Laptop GPU | Média da turma Multimedia | |
|---|---|---|---|---|---|---|---|---|
| Power Consumption | -40% | -25% | -160% | -54% | 11% | -85% | -17% | |
| Idle Minimum * (Watt) | 4.8 | 7.5 -56% | 4.5 6% | 16 -233% | 8.6 -79% | 3 37% | 9.95 ? -107% | 5.72 ? -19% |
| Idle Average * (Watt) | 7.5 | 9.6 -28% | 16.5 -120% | 30 -300% | 12 -60% | 5 33% | 15.8 ? -111% | 10.2 ? -36% |
| Idle Maximum * (Watt) | 7.9 | 18.5 -134% | 16.7 -111% | 30.4 -285% | 12.4 -57% | 11 -39% | 20.1 ? -154% | 12.4 ? -57% |
| Load Average * (Watt) | 79.3 | 57.1 28% | 60.4 24% | 78.9 1% | 80 -1% | 72 9% | 88 ? -11% | 65.5 ? 17% |
| Witcher 3 ultra * (Watt) | 79.2 | 115.8 -46% | 52.1 34% | 155.3 -96% | 147.7 -86% | 69.7 12% | ||
| Load Maximum * (Watt) | 125 | 131.7 -5% | 102.9 18% | 180.4 -44% | 173.1 -38% | 108 14% | 176.3 ? -41% | 114 ? 9% |
* ... menor é melhor
Power consumption Witcher 3 / stress test
Power consumption with an external monitor
Duração da bateria
Com 76 Wh, a capacidade da bateria permanece inalterada, mas, graças ao novo processador Meteor Lake, a duração da bateria é melhor. A propósito, só conseguimos realizar o teste de bateria a 120 Hz porque, apesar de selecionar 60 Hz no modo de sinal ativo, ele permaneceu em 120 Hz. Esse é um problema que também descobrimos nos outros modelos da série Galaxy Book4.
No teste de Wi-Fi a 150 cd/m² (que representa 66% do brilho SDR máximo do dispositivo analisado), registramos quase 11 horas, ou seja, quase 1,5 hora a mais do que o antecessor. Com brilho total, o teste de Wi-Fi durou um pouco mais de 7 horas. O tempo de execução do teste de vídeo (da mesma forma, 150 cd/m²) aumentou de aproximadamente 13,5 horas para quase 18 horas. É aqui que o novo processador Meteor Lake e seus núcleos de baixa eficiência energética compensam.
Sob carga, é possível esgotar a bateria após cerca de 80 minutos e um vídeo HDR com brilho total será reproduzido por aproximadamente 5,5 horas. Um ciclo de carregamento com a PSU de 140 watts leva cerca de 2,5 horas e não há função de carregamento rápido.
| Samsung Galaxy Book4 Ultra Ultra 7 155H, GeForce RTX 4050 Laptop GPU, 76 Wh | Lenovo ThinkPad Z16 Gen 2 R9 PRO 7940HS, Radeon RX 6550M, 72 Wh | Apple MacBook Pro 16 2023 M3 Pro Apple M3 Pro 12-Core, M3 Pro 18-Core GPU, 99.6 Wh | Lenovo Slim Pro 9i 16IRP8 i9-13905H, GeForce RTX 4050 Laptop GPU, 75 Wh | HP Spectre x360 16 RTX 4050 Ultra 7 155H, GeForce RTX 4050 Laptop GPU, 83 Wh | Schenker VISION 16 Pro (M23) i7-13700H, GeForce RTX 4070 Laptop GPU, 80 Wh | Samsung Galaxy Book3 Ultra 16 i7-13700H, GeForce RTX 4050 Laptop GPU, 76 Wh | Média da turma Multimedia | |
|---|---|---|---|---|---|---|---|---|
| Duração da bateria | -7% | 43% | -39% | 1% | -28% | 0% | 11% | |
| H.264 (h) | 17.9 | 24.7 38% | 7.8 -56% | 13.4 -25% | 16.4 ? -8% | |||
| WiFi v1.3 (h) | 10.9 | 6 -45% | 20.1 84% | 6.6 -39% | 11 1% | 7.8 -28% | 9.6 -12% | 12.2 ? 12% |
| Load (h) | 1.3 | 1.7 31% | 1.4 8% | 1.3 0% | 1.8 38% | 1.668 ? 28% | ||
| Reader / Idle (h) | 10.2 | 18.2 | 24.9 ? |
Pro
Contra
Veredicto - O Galaxy Book4 Ultra tem apenas pequenas melhorias
Fundamentalmente, a Samsung facilitou sua vida com seu atual Galaxy Book4 Ultra porque o computador multimídia de 16 polegadas recebeu um novo processador Meteor Lake, mas, fora isso, está como o senhor estava. Há duas configurações diferentes e o Core Ultra 7 155H e GeForce Laptop RTX 4050 é adequada como uma máquina multimídia. O desempenho dos componentes é decente e os vários perfis de energia também são bem equilibrados. Além disso, o novo processador Meteor Lake melhora a duração da bateria.
Com 120 Hz, a tela também oferece uma qualidade de imagem muito boa com vários perfis de cores que incluem perfis muito precisos para os espaços de cores P3 e sRGB. Apesar disso, há problemas como a oscilação constante do PWM de 240 Hz e os recursos HDR do dispositivo também são bastante limitados, especialmente quando comparados aos concorrentes mini LED, como o Lenovo Yoga Pro 9i ou o Apple MacBook Pro 16.
O Galaxy Book4 Ultra é um computador multimídia muito bom que combina uma tela AMOLED com um gabinete premium que abriga uma câmara de vapor eficaz, desempenho decente e bateria de longa duração. Infelizmente, a Samsung cortou custos quando se trata de memória e armazenamento. Por US$ 2.399, o senhor só tem 16 GB de RAM e um SSD de 512 GB.
O gabinete é impressionantemente estável e bem acabado, no entanto, também há desvantagens, como a moldura inferior larga e a RAM soldada. Em particular, os 16 GB em nossa configuração de análise não são especialmente generosos. O senhor também recebe apenas um teclado mediano, o que se deve principalmente ao deslocamento limitado das teclas.
Mas o maior problema é o preço, pois a Samsung está pedindo um alto valor de US$ 2.399 pelo nosso modelo de análise com 16 GB de RAM e SSD de 512 GB. Até mesmo o MacBook Pro 16 com o M3 Pro e recursos HDR significativamente melhores é cerca de US$ 200 mais barato nas lojas. A concorrência do Windows também é mais barata e vem com outros benefícios. O Lenovo Yoga Pro 9i oferece um teclado melhor, um mini painel de LED mais brilhante e alto-falantes melhores. Com o Vision 16 Pro, a Schenker ainda oferece um dispositivo de 16 polegadas muito portátil com o RTX 4070 mais rápido e um painel IPS sem PWM. O Galaxy Book4 Ultra não é de forma alguma uma máquina ruim, mas sua relação preço-desempenho não é particularmente boa, considerando a força dos dispositivos concorrentes nesse segmento e, em breve, ele terá outro concorrente no mercado na forma do novo Dell XPS 16.
Preço e disponibilidade
O GalaxyBook4 Ultra pode ser encomendado diretamente da Samsung a partir de US$ 2.399.
Samsung Galaxy Book4 Ultra
- 03/16/2024 v7 (old)
Andreas Osthoff
Transparência
A seleção dos dispositivos a serem analisados é feita pela nossa equipe editorial. A amostra de teste foi fornecida ao autor como empréstimo pelo fabricante ou varejista para fins desta revisão. O credor não teve influência nesta revisão, nem o fabricante recebeu uma cópia desta revisão antes da publicação. Não houve obrigação de publicar esta revisão. Como empresa de mídia independente, a Notebookcheck não está sujeita à autoridade de fabricantes, varejistas ou editores.
É assim que o Notebookcheck está testando
Todos os anos, o Notebookcheck analisa de forma independente centenas de laptops e smartphones usando procedimentos padronizados para garantir que todos os resultados sejam comparáveis. Desenvolvemos continuamente nossos métodos de teste há cerca de 20 anos e definimos padrões da indústria no processo. Em nossos laboratórios de teste, equipamentos de medição de alta qualidade são utilizados por técnicos e editores experientes. Esses testes envolvem um processo de validação em vários estágios. Nosso complexo sistema de classificação é baseado em centenas de medições e benchmarks bem fundamentados, o que mantém a objetividade.Price comparison

