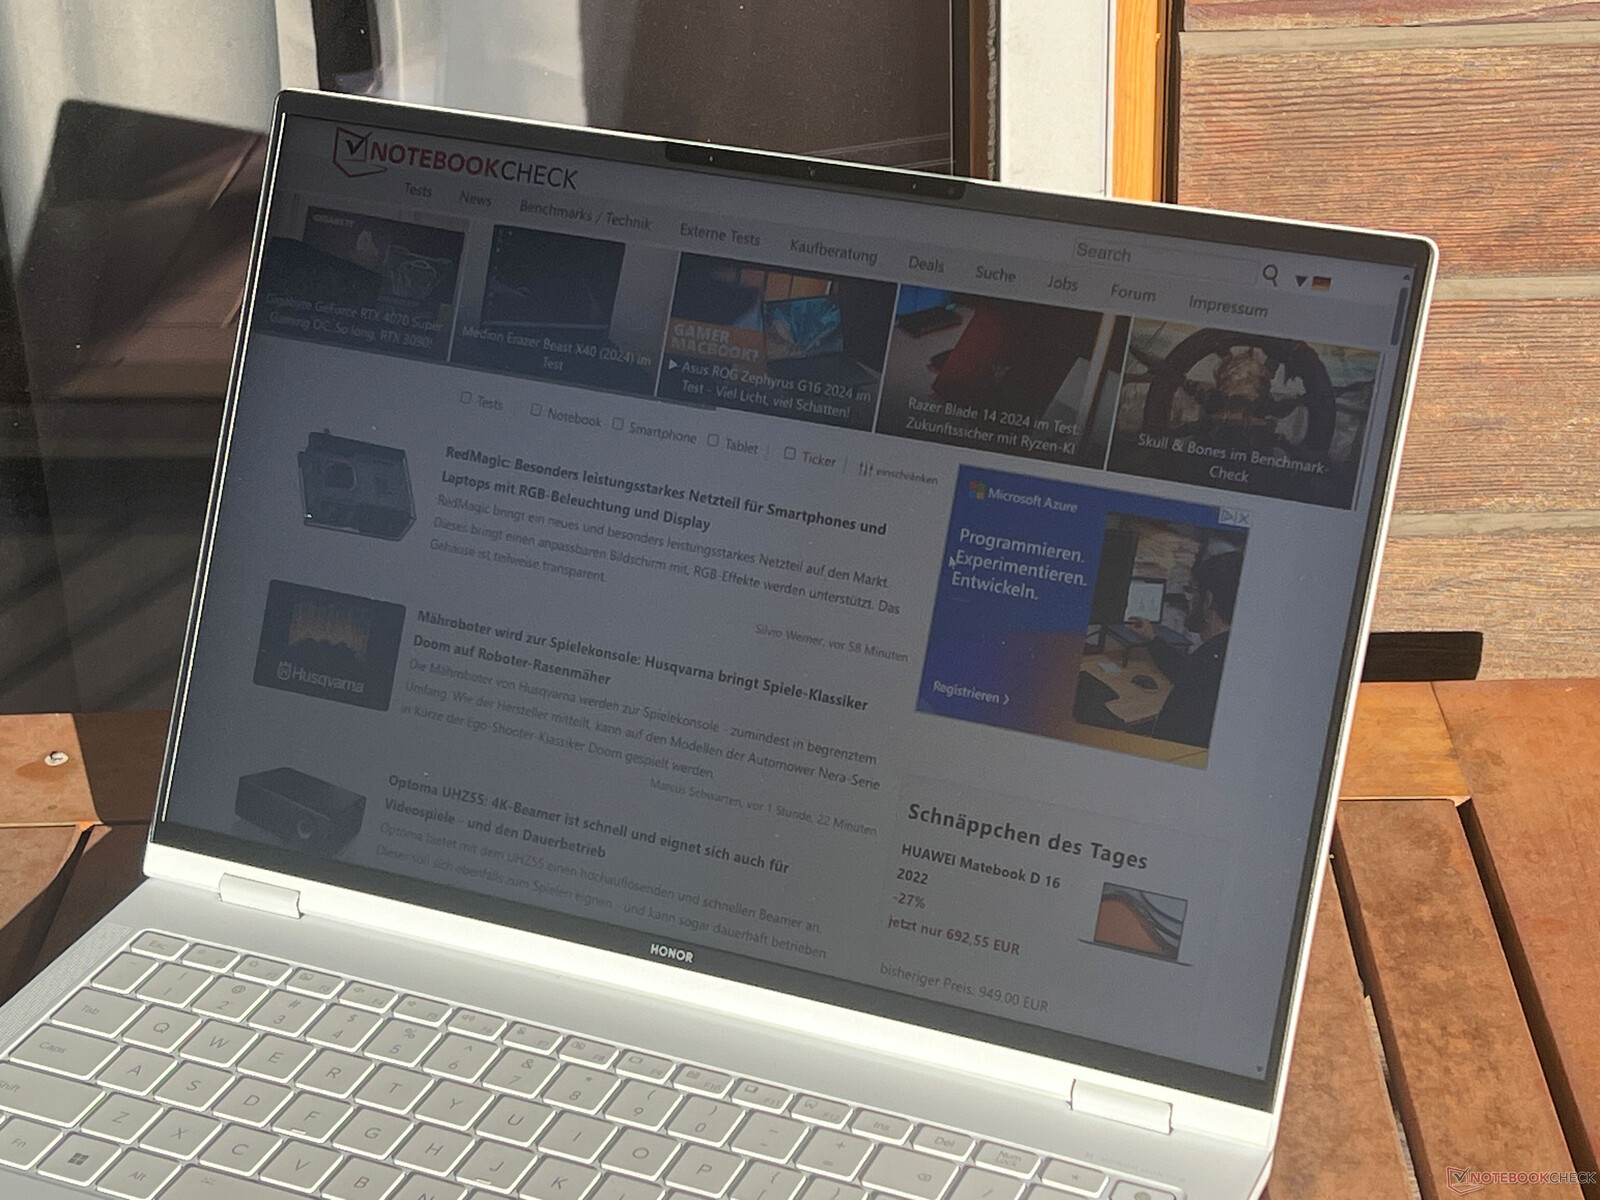
Honor MagicBook Pro 16 2024 - Um laptop multimídia com painel IPS de 165 Hz e RTX 4060
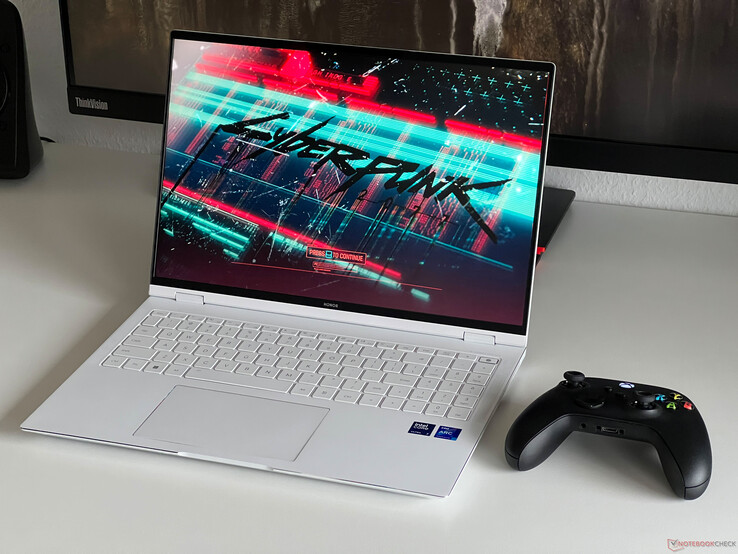
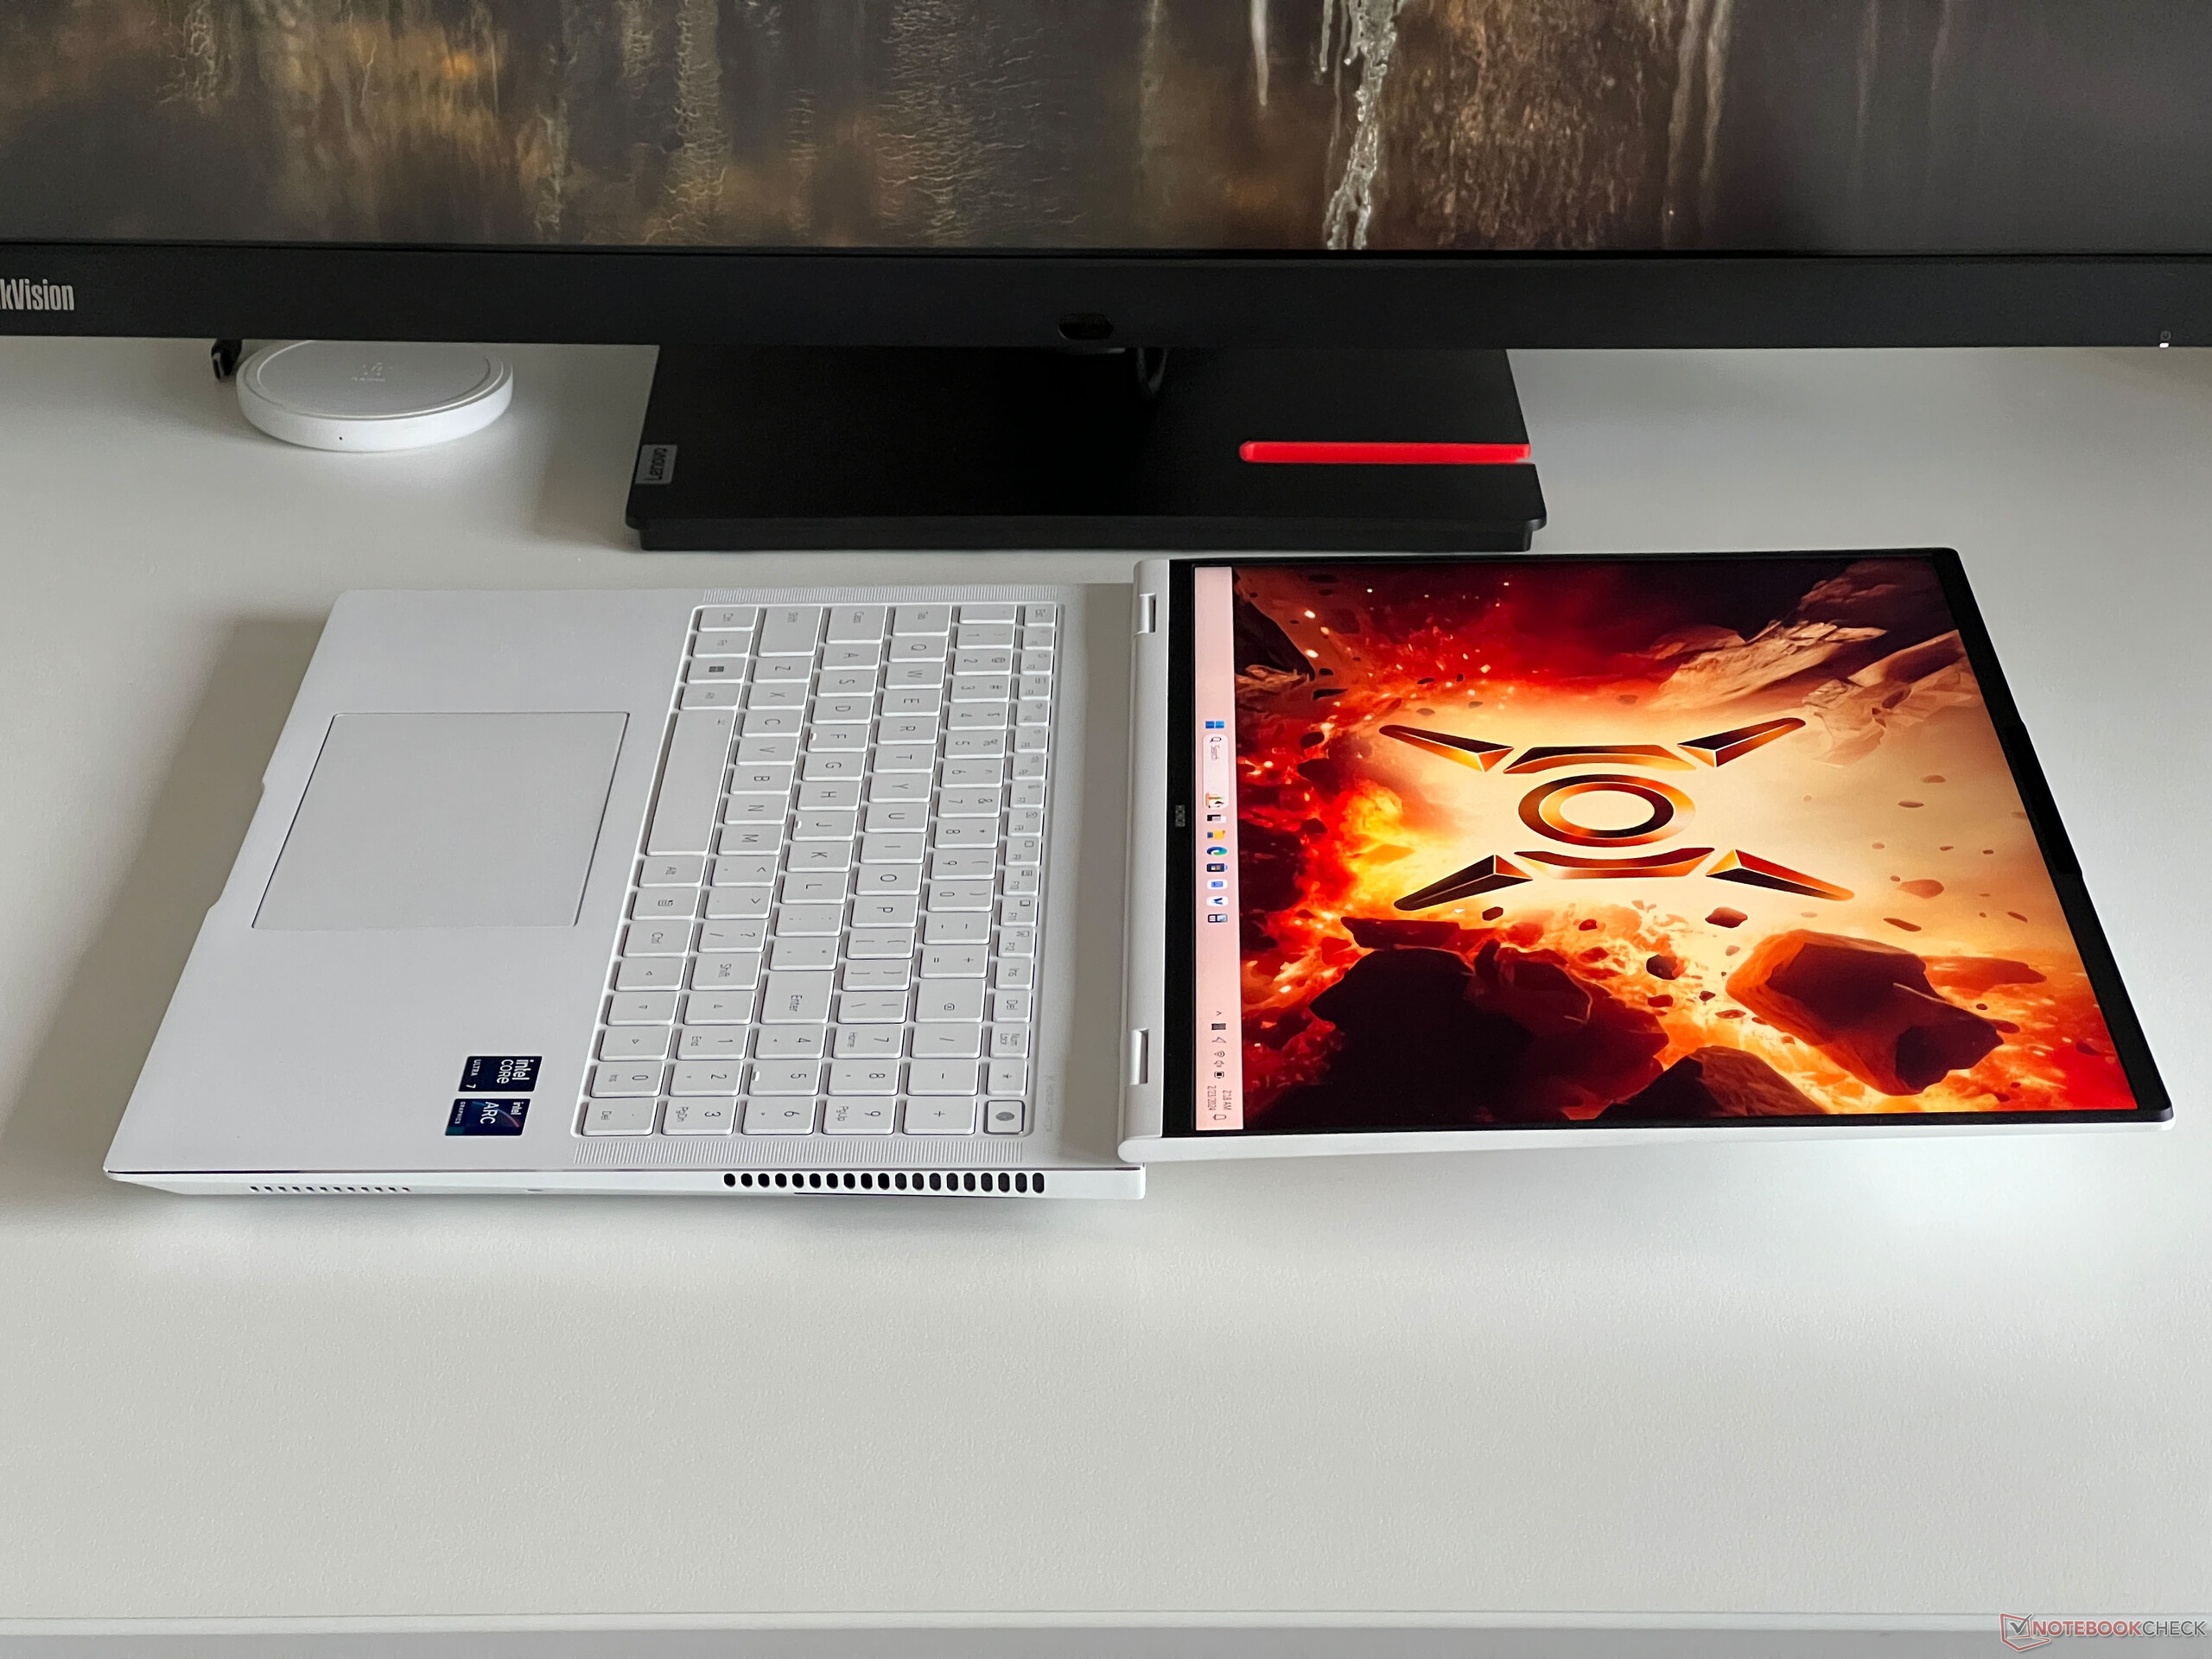
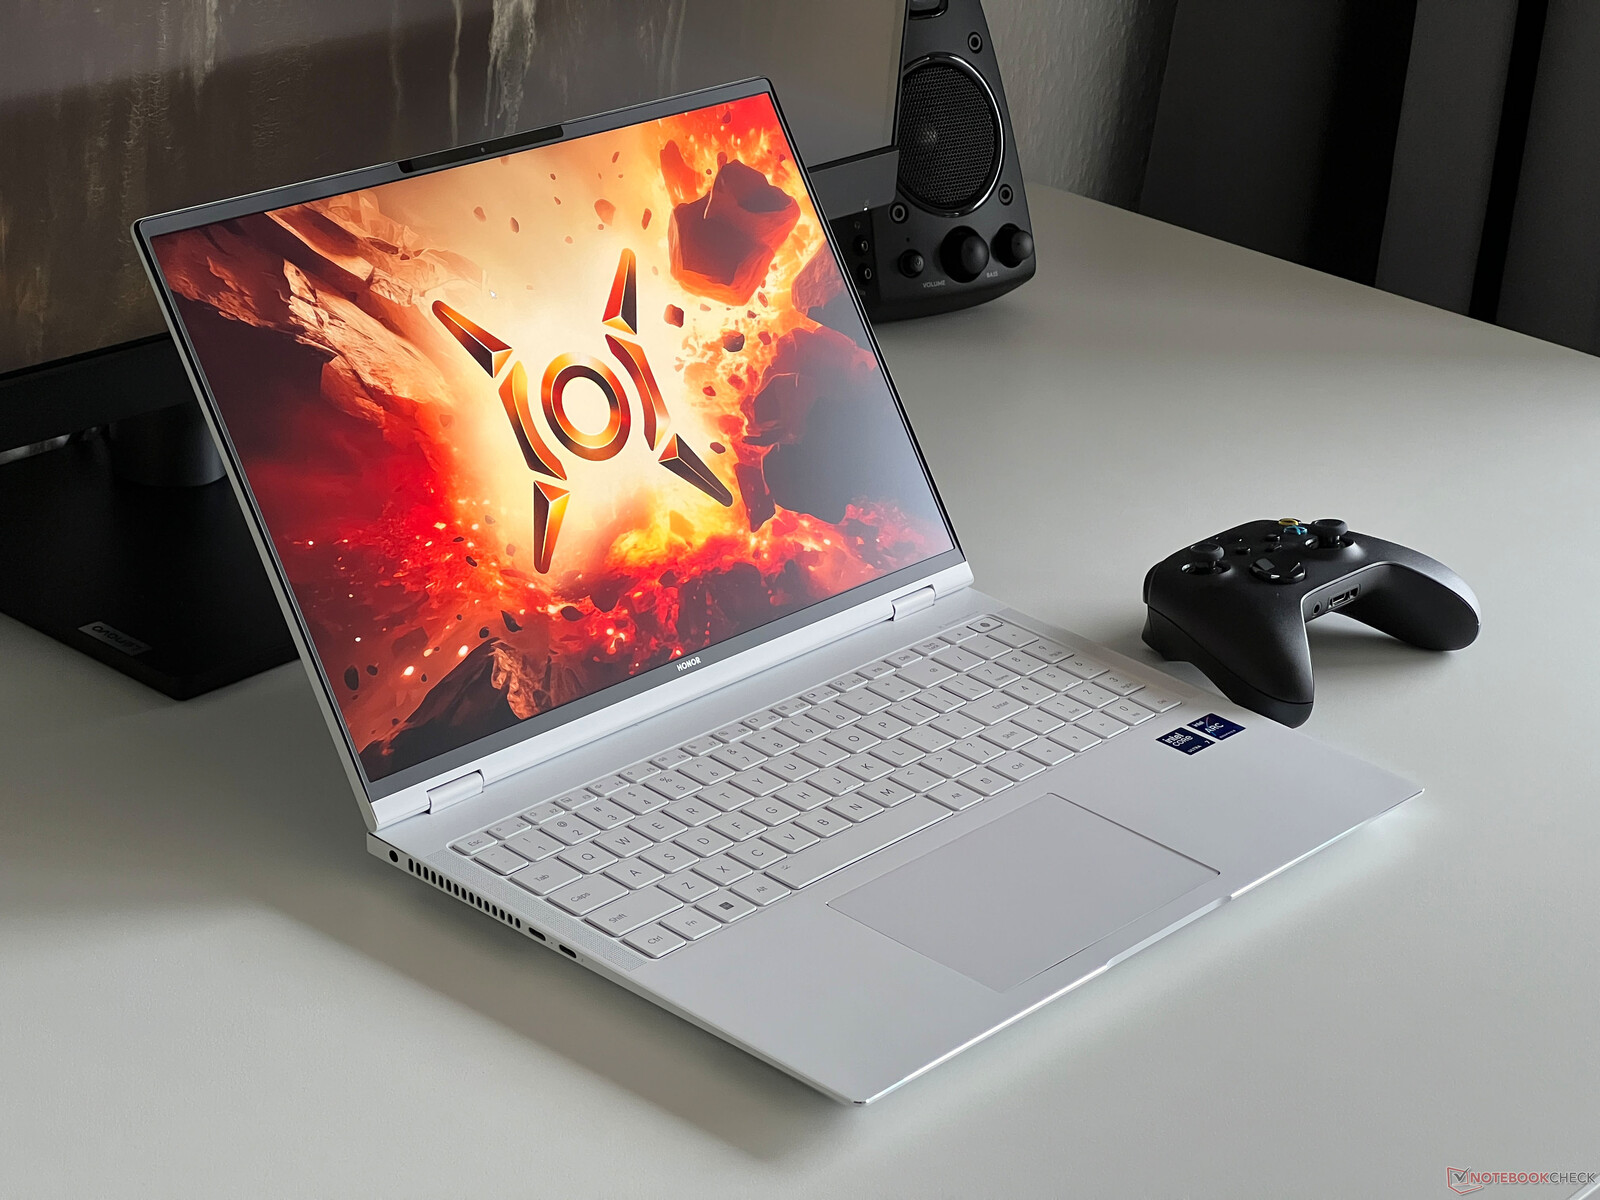
O nome MagicBook Pro 16 evoca imediatamente a ideia de um laptop multimídia com uma boa relação preço-desempenho. No entanto, com o modelo 2024, a Honor está adotando uma nova abordagem ao nos apresentar um laptop multimídia que vem com um processador Intel Meteor Lake atualizado, bem como a versão para laptop do Nvidia GeForce RTX 4060. Tivemos a sorte de poder fazer uma análise completa do novo MagicBook Pro 16 antes de ele chegar oficialmente às ruas. Além do processador Core Ultra 7 155H e o laptop GeForce Laptop RTX 4060temos 32 GB de RAM, um SSD de 1 TB e uma tela IPS fosca de 500 cd/m², 165 Hz e cobertura P3. No momento do teste, não podemos indicar um preço para essa configuração.
Possíveis concorrentes em comparação
Avaliação | Data | Modelo | Peso | Altura | Size | Resolução | Preço |
|---|---|---|---|---|---|---|---|
| 90 % v7 (old) | 03/2024 | Honor MagicBook Pro 16 2024 Ultra 7 155H, GeForce RTX 4060 Laptop GPU | 1.9 kg | 17.9 mm | 16.00" | 3072x1920 | |
| 89.6 % v7 (old) | 01/2024 | Framework Laptop 16 R9 7940HS, Radeon RX 7700S | 2.4 kg | 20.95 mm | 16.00" | 2560x1600 | |
| 88.6 % v7 (old) | 12/2023 | Lenovo ThinkPad Z16 Gen 2 R9 PRO 7940HS, Radeon RX 6550M | 1.8 kg | 15.8 mm | 16.00" | 3840x2400 | |
| 87.1 % v7 (old) | 08/2023 | Dell Inspiron 16 Plus 7630 i7-13700H, GeForce RTX 4060 Laptop GPU | 2.2 kg | 19.95 mm | 16.00" | 2560x1600 | |
| 88.4 % v7 (old) | 08/2023 | Lenovo Yoga Pro 9 16-IRP G8 i7-13705H, GeForce RTX 4060 Laptop GPU | 2.2 kg | 18.2 mm | 16.00" | 3200x2000 | |
| 88.6 % v7 (old) | 07/2023 | Schenker VISION 16 Pro (M23) i7-13700H, GeForce RTX 4070 Laptop GPU | 1.6 kg | 17.1 mm | 16.00" | 2560x1600 | |
| 86.2 % v7 (old) | 07/2023 | Asus Vivobook Pro 16X K6604JV-MX016W i9-13980HX, GeForce RTX 4060 Laptop GPU | 2.1 kg | 22.8 mm | 16.00" | 3200x2000 |
Estojo - O MagicBook Pro vem com um estojo de plástico
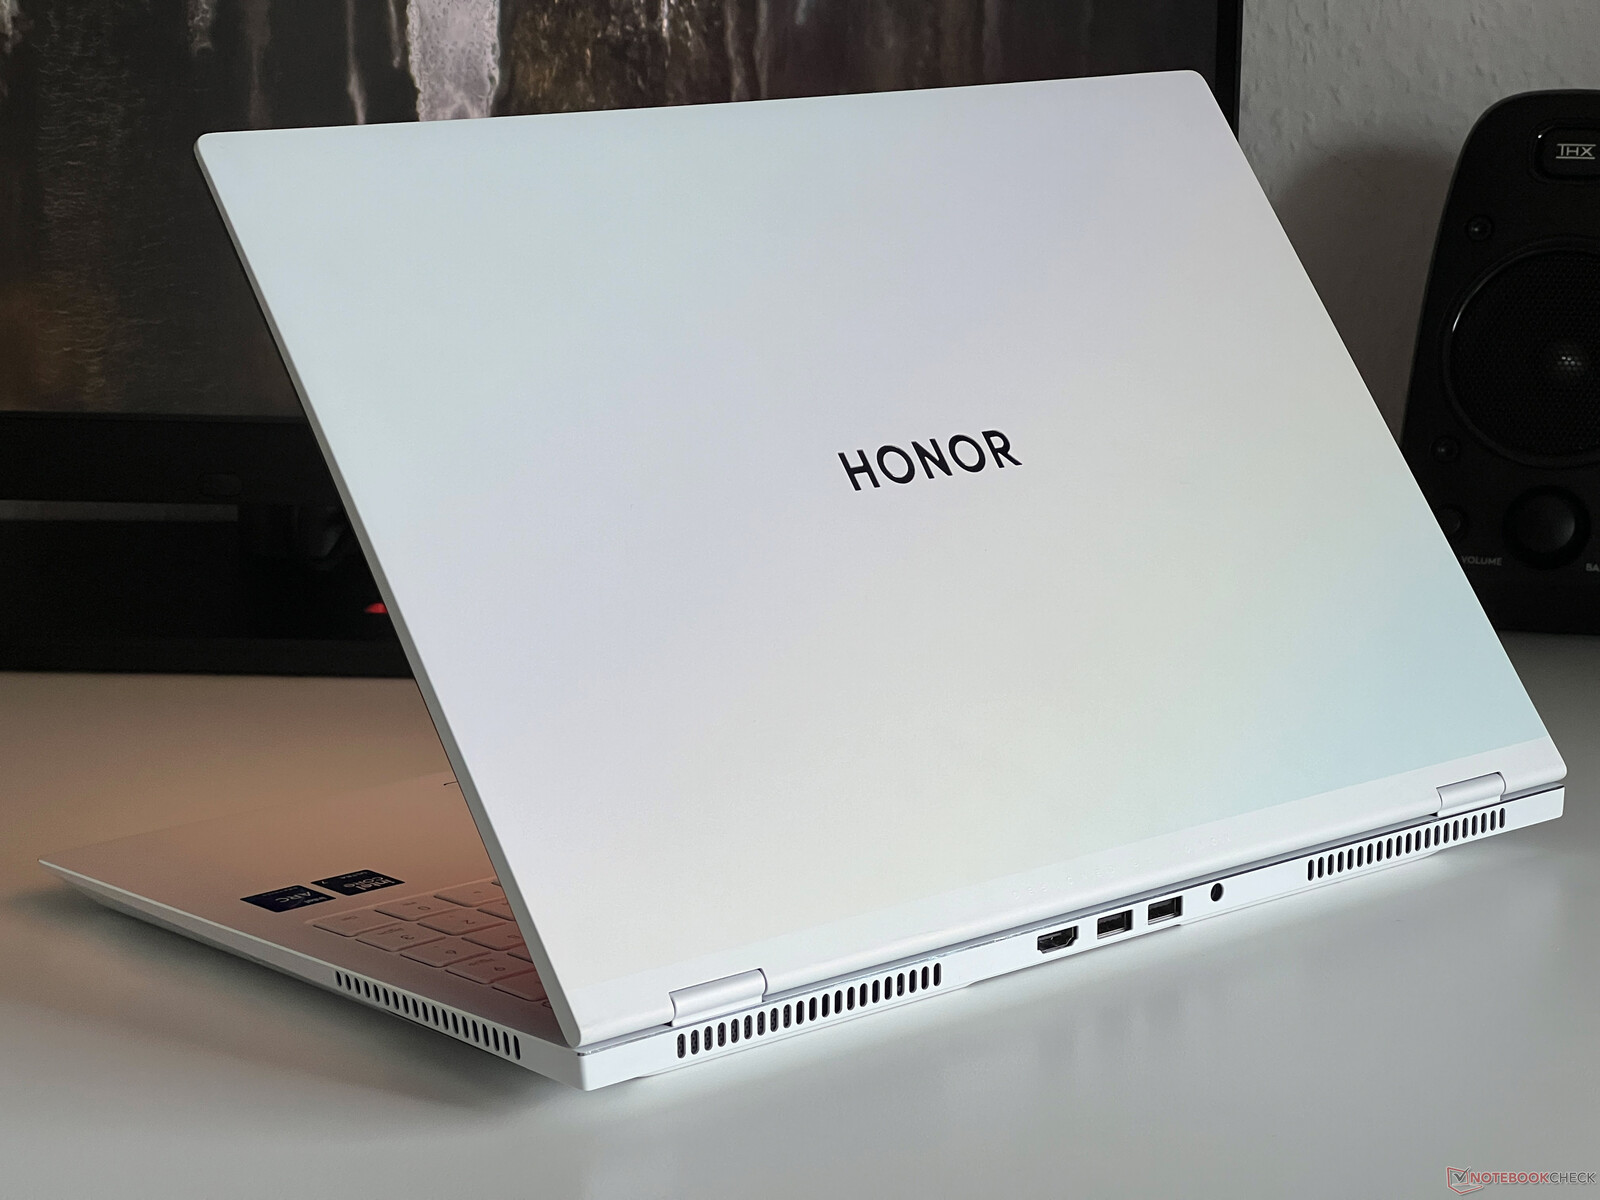
O MagicBook Pro 16 está disponível em branco ou roxo, embora uma cor metálica tenha sido aplicada às tampas da tela. Fora isso, o dispositivo é muito discreto e, além do acabamento ao redor da unidade de base, duas entradas de ar pretas e a moldura preta da tela, não há elementos de design.
O gabinete é totalmente feito de plástico e, embora o acabamento seja muito bom, nosso dispositivo de análise apresentou indícios de leves ruídos de rangidos quando manuseado. A estabilidade parece ser muito boa, com a área central do teclado permanecendo sólida mesmo quando a pressão é aplicada. Isso também se aplica à fina tampa da tela, pois não conseguimos provocar nenhuma distorção na imagem. As dobradiças permitem um ângulo máximo de abertura de 180 graus e a tampa pode ser aberta com uma mão, embora, ao fazer isso, a própria tampa tenda a oscilar um pouco.
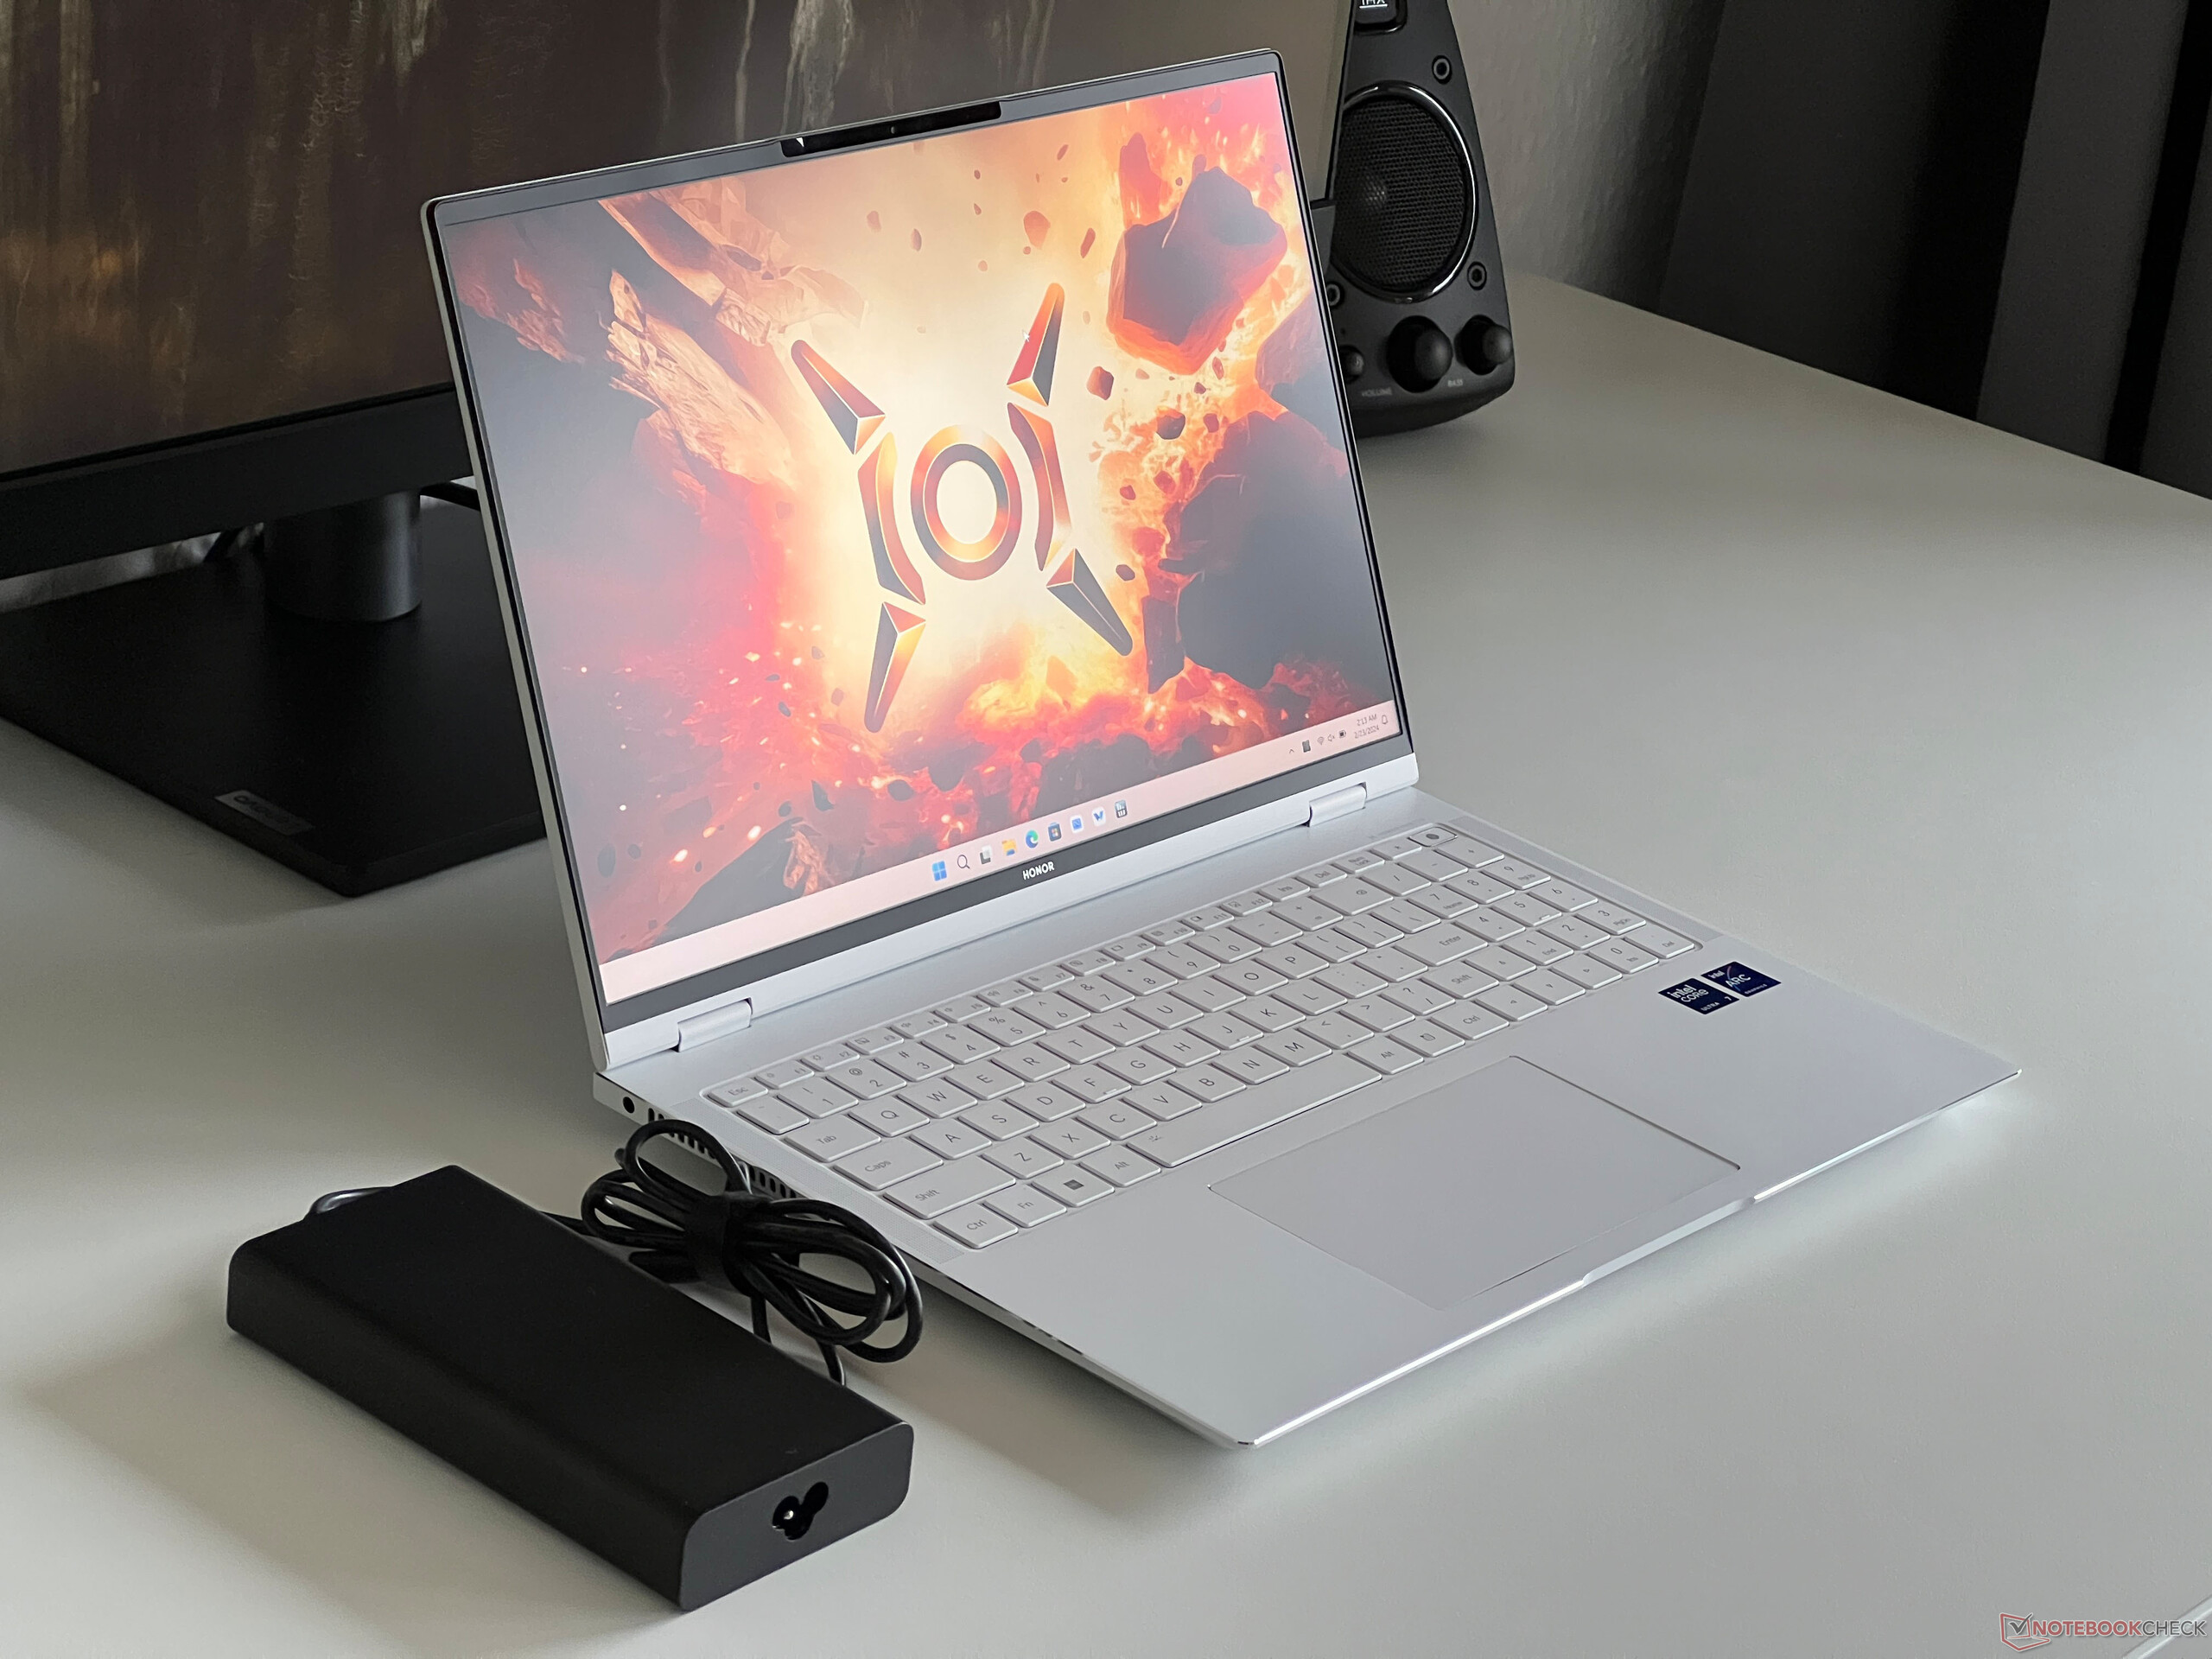
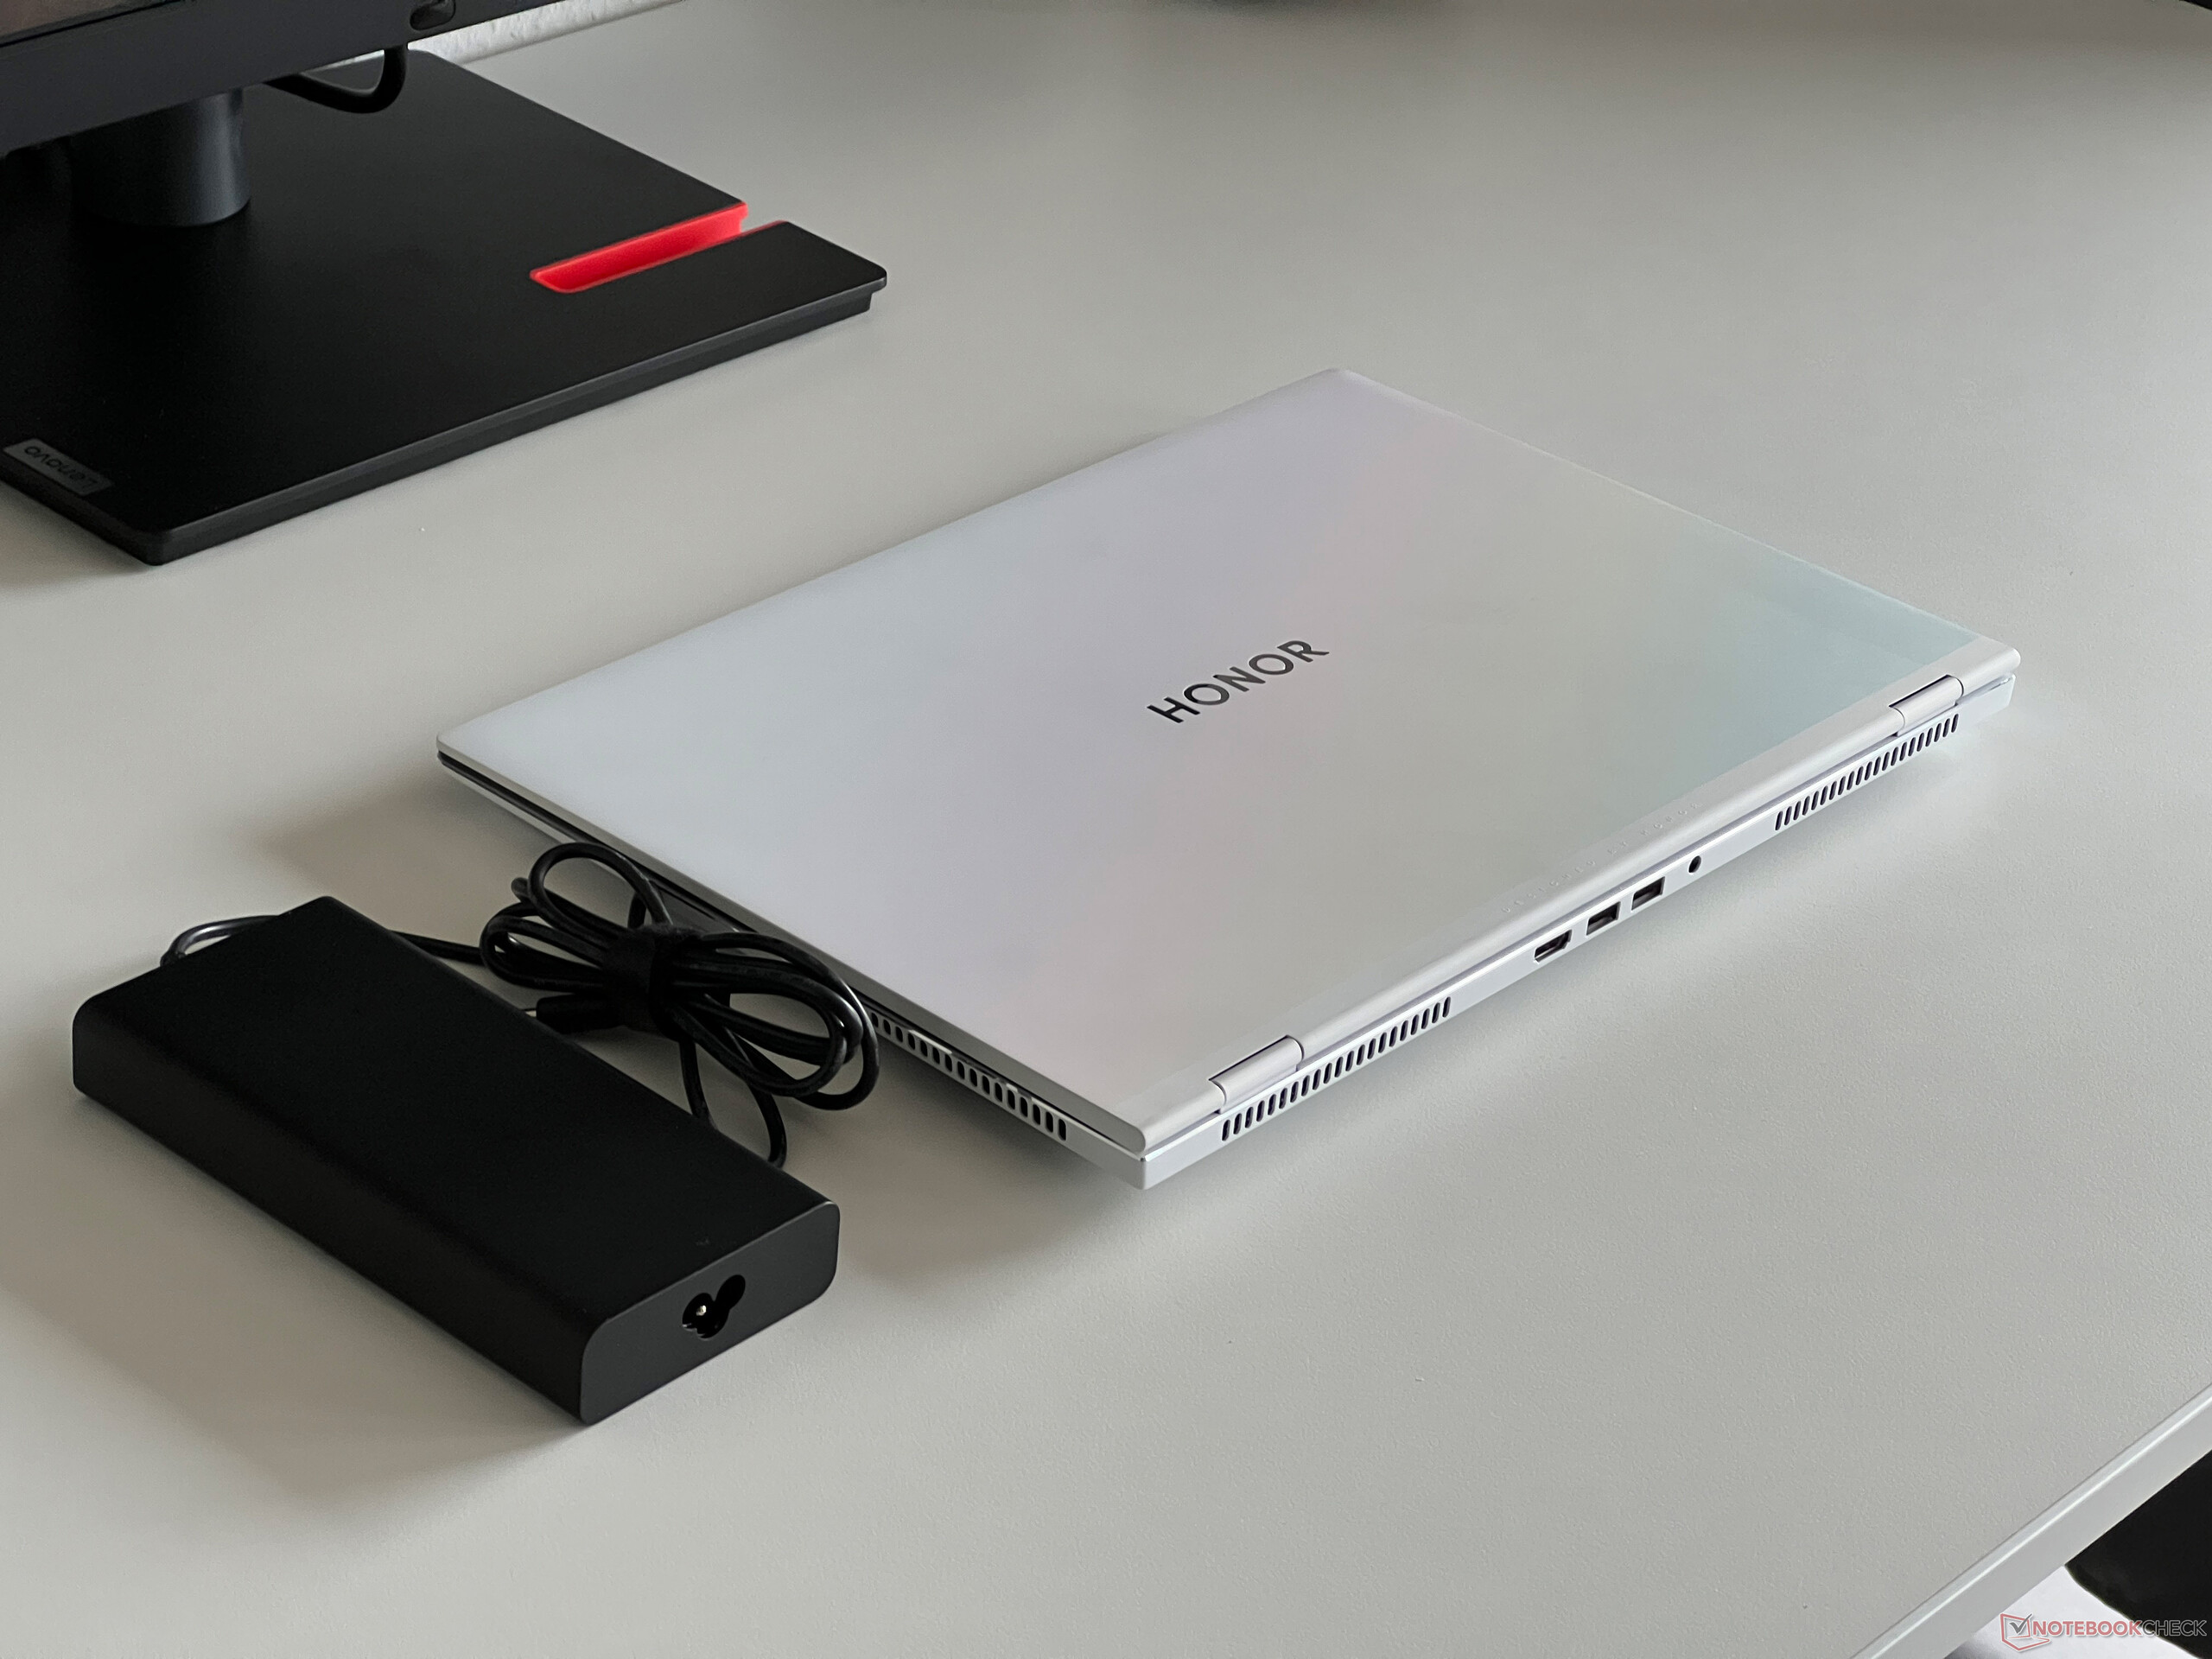
Dentro do campo de comparação de dispositivos, o MagicBook Pro 16 pertence às máquinas mais compactas e, com quase 1,8 cm, também é o mais fino. O laptop de 1,9 kg e a fonte de alimentação de 200 watts trazem mais 719 gramas para a balança.
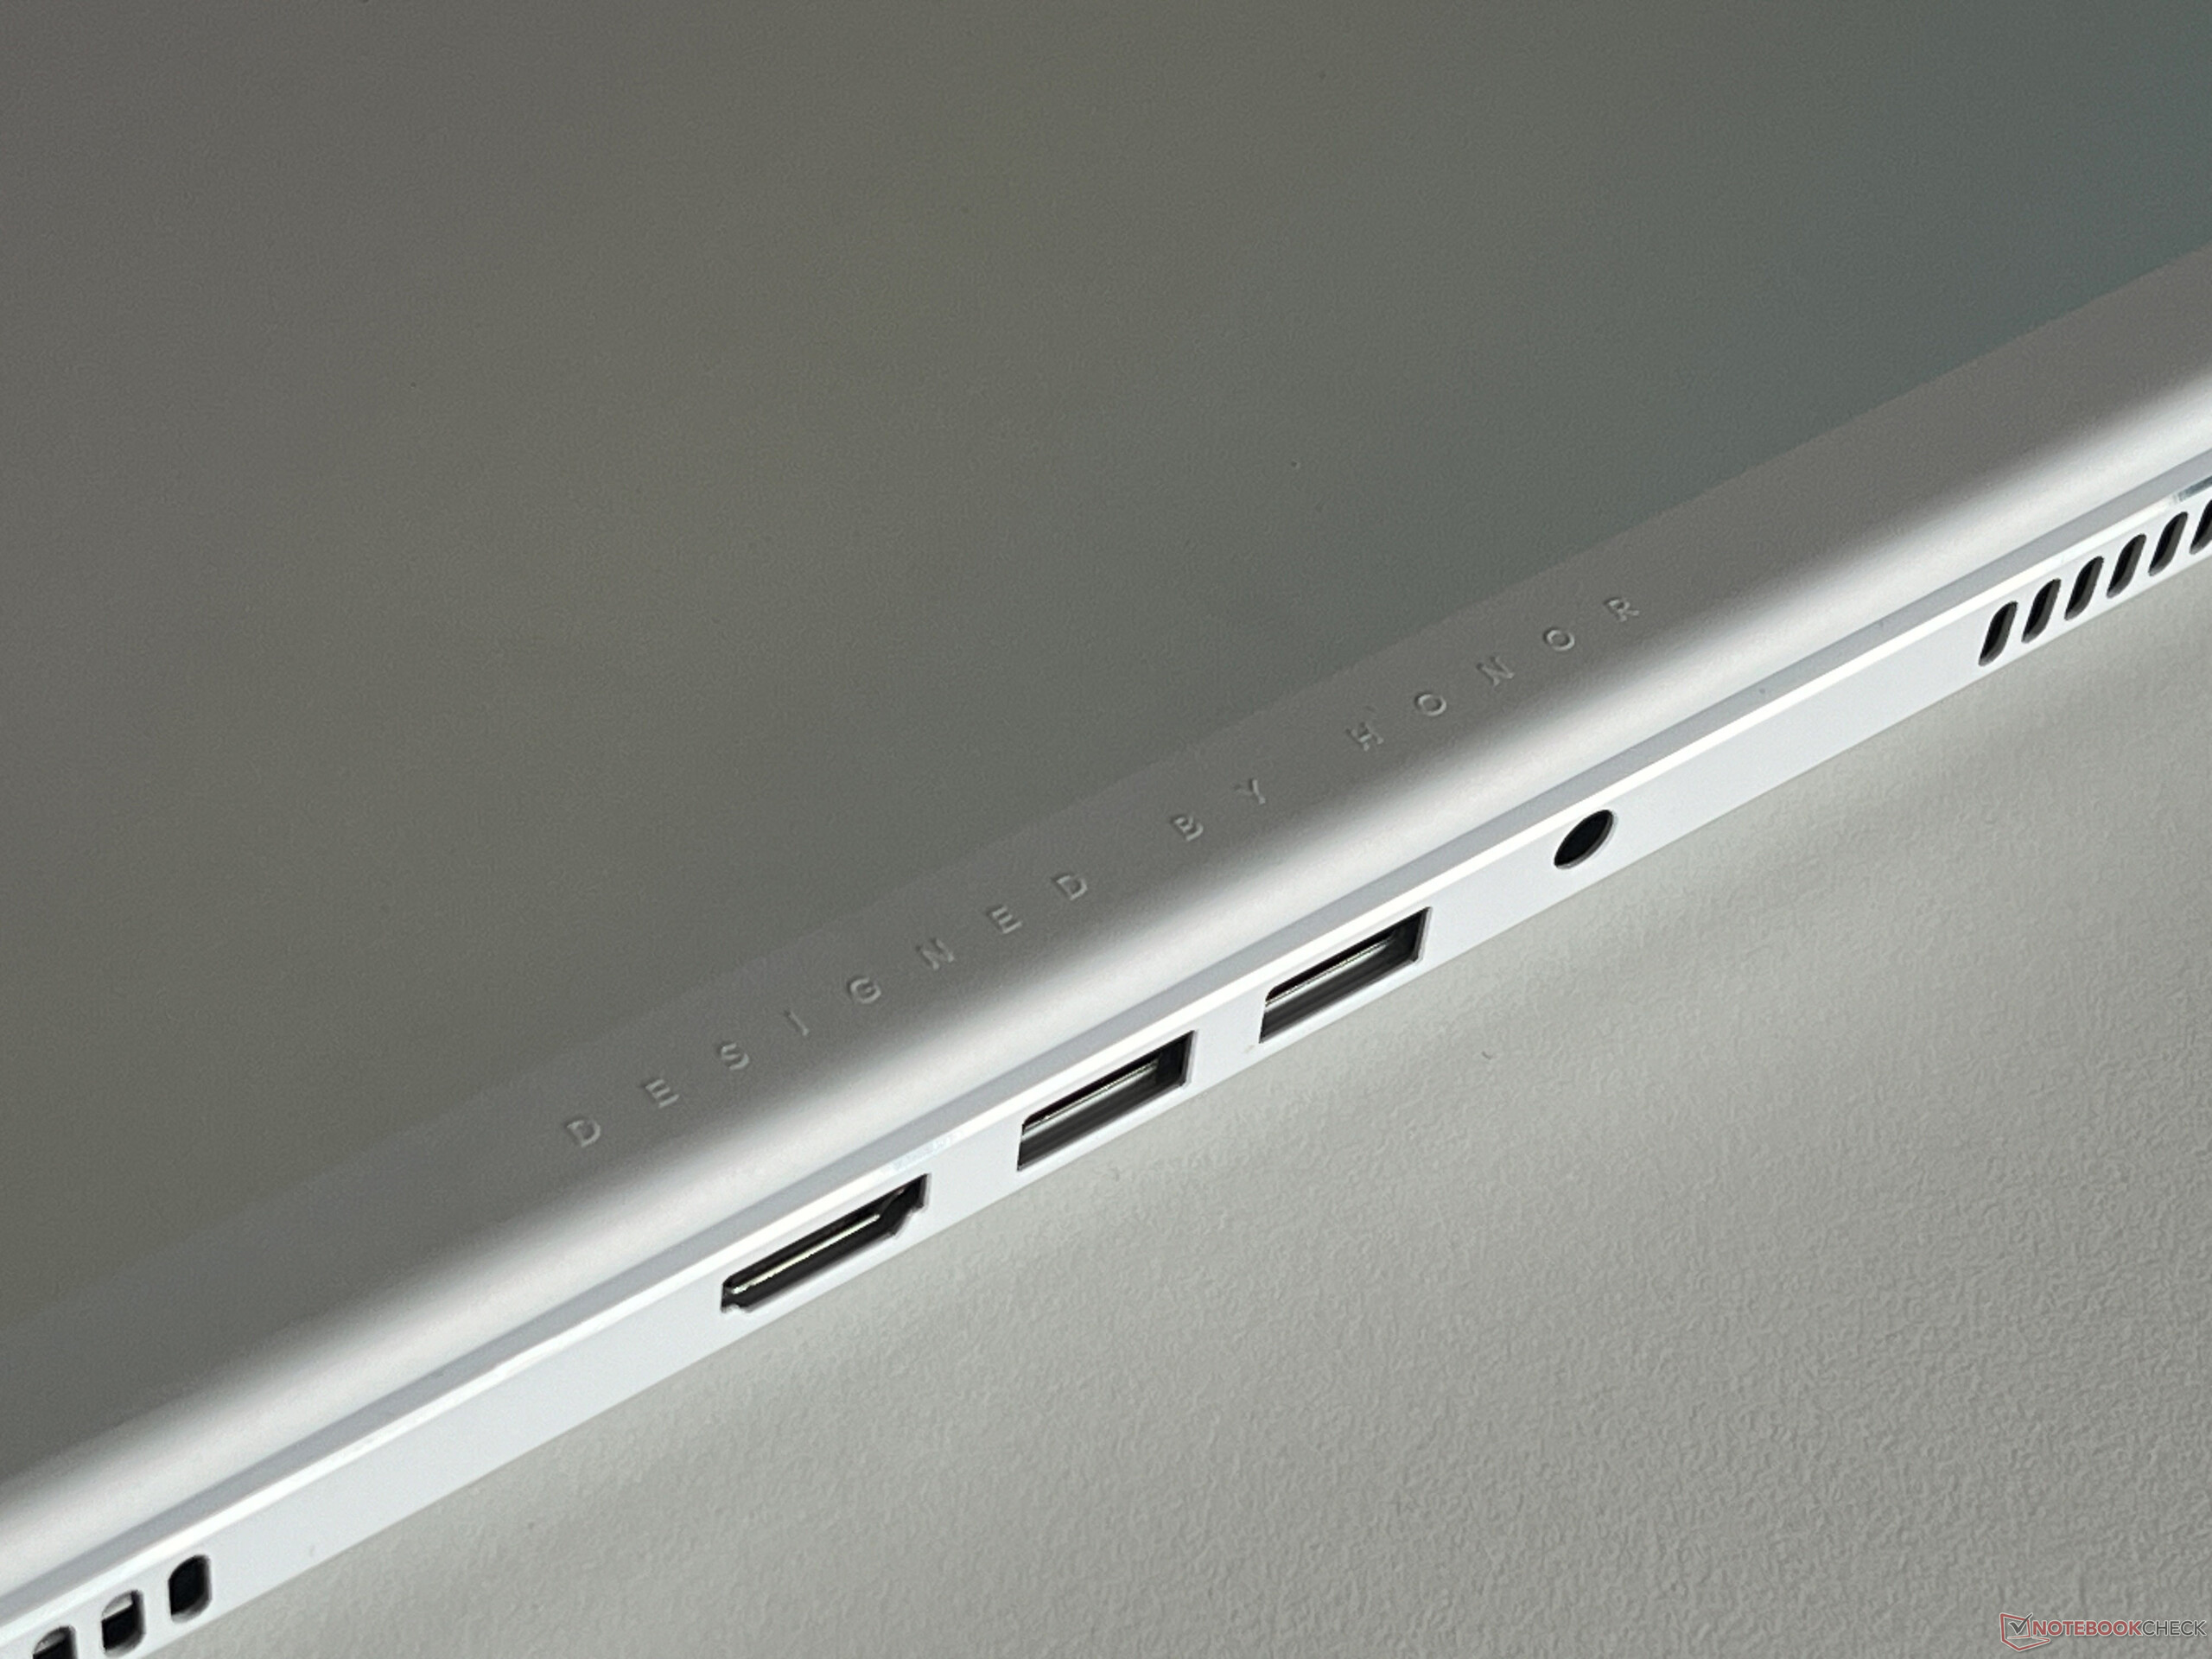
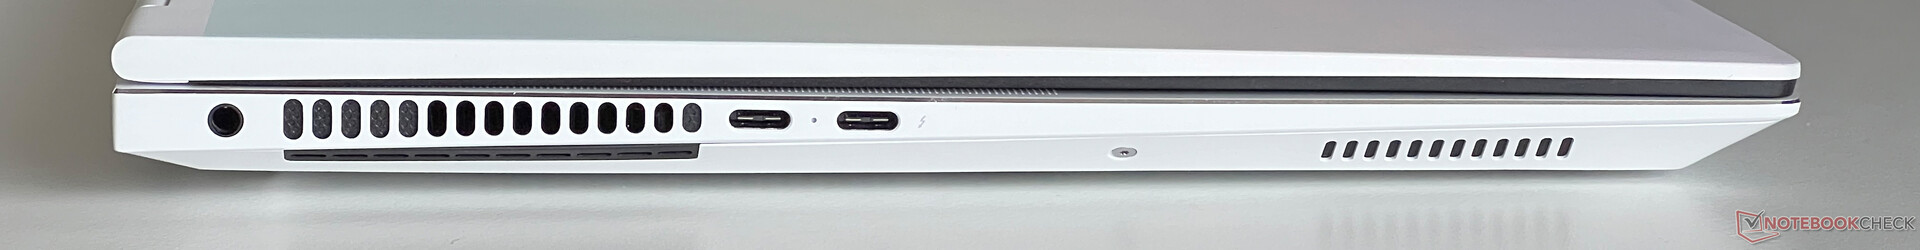
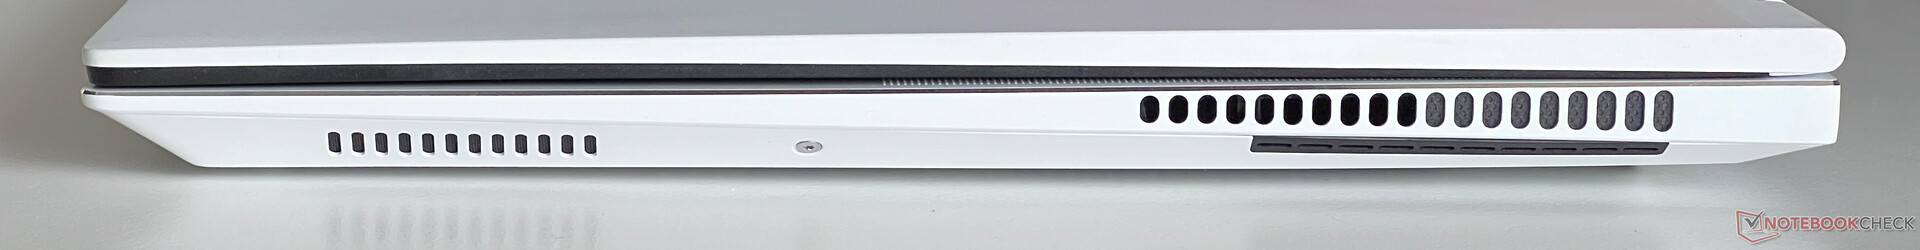
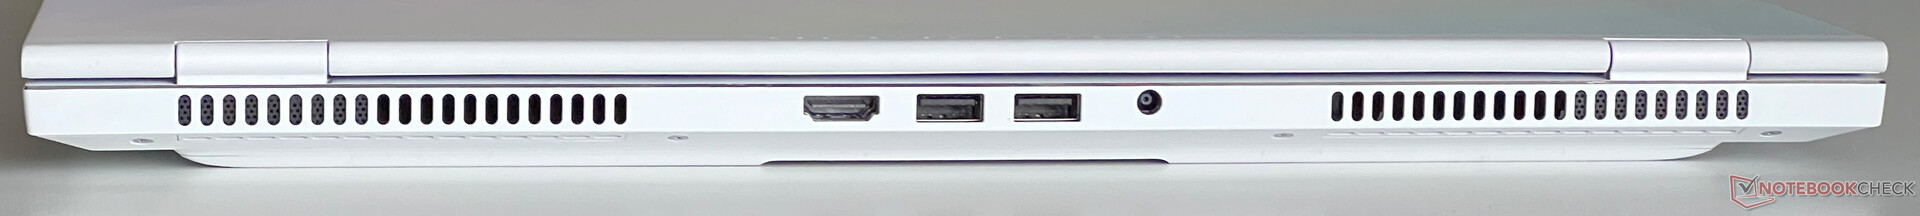
Recursos - O site Honor instalou o Thunderbolt 4
A posição das portas é incomum. Além das duas portas USB-C (1x Thunderbolt 4) no lado esquerdo, todas as outras portas podem ser encontradas no meio da parte traseira do dispositivo. Teríamos preferido que as duas portas USB-A estivessem no lado direito do dispositivo. A saída HDMI e os dois conectores USB-C são conectados por meio da iGPU, o que significa que, quando o senhor usa um monitor externo, a GPU da Nvidia não está necessariamente em execução. A saída HDMI suporta saída 4K a 60 Hz, mas sem frequências mais altas e também sem G-Sync.
Comunicação
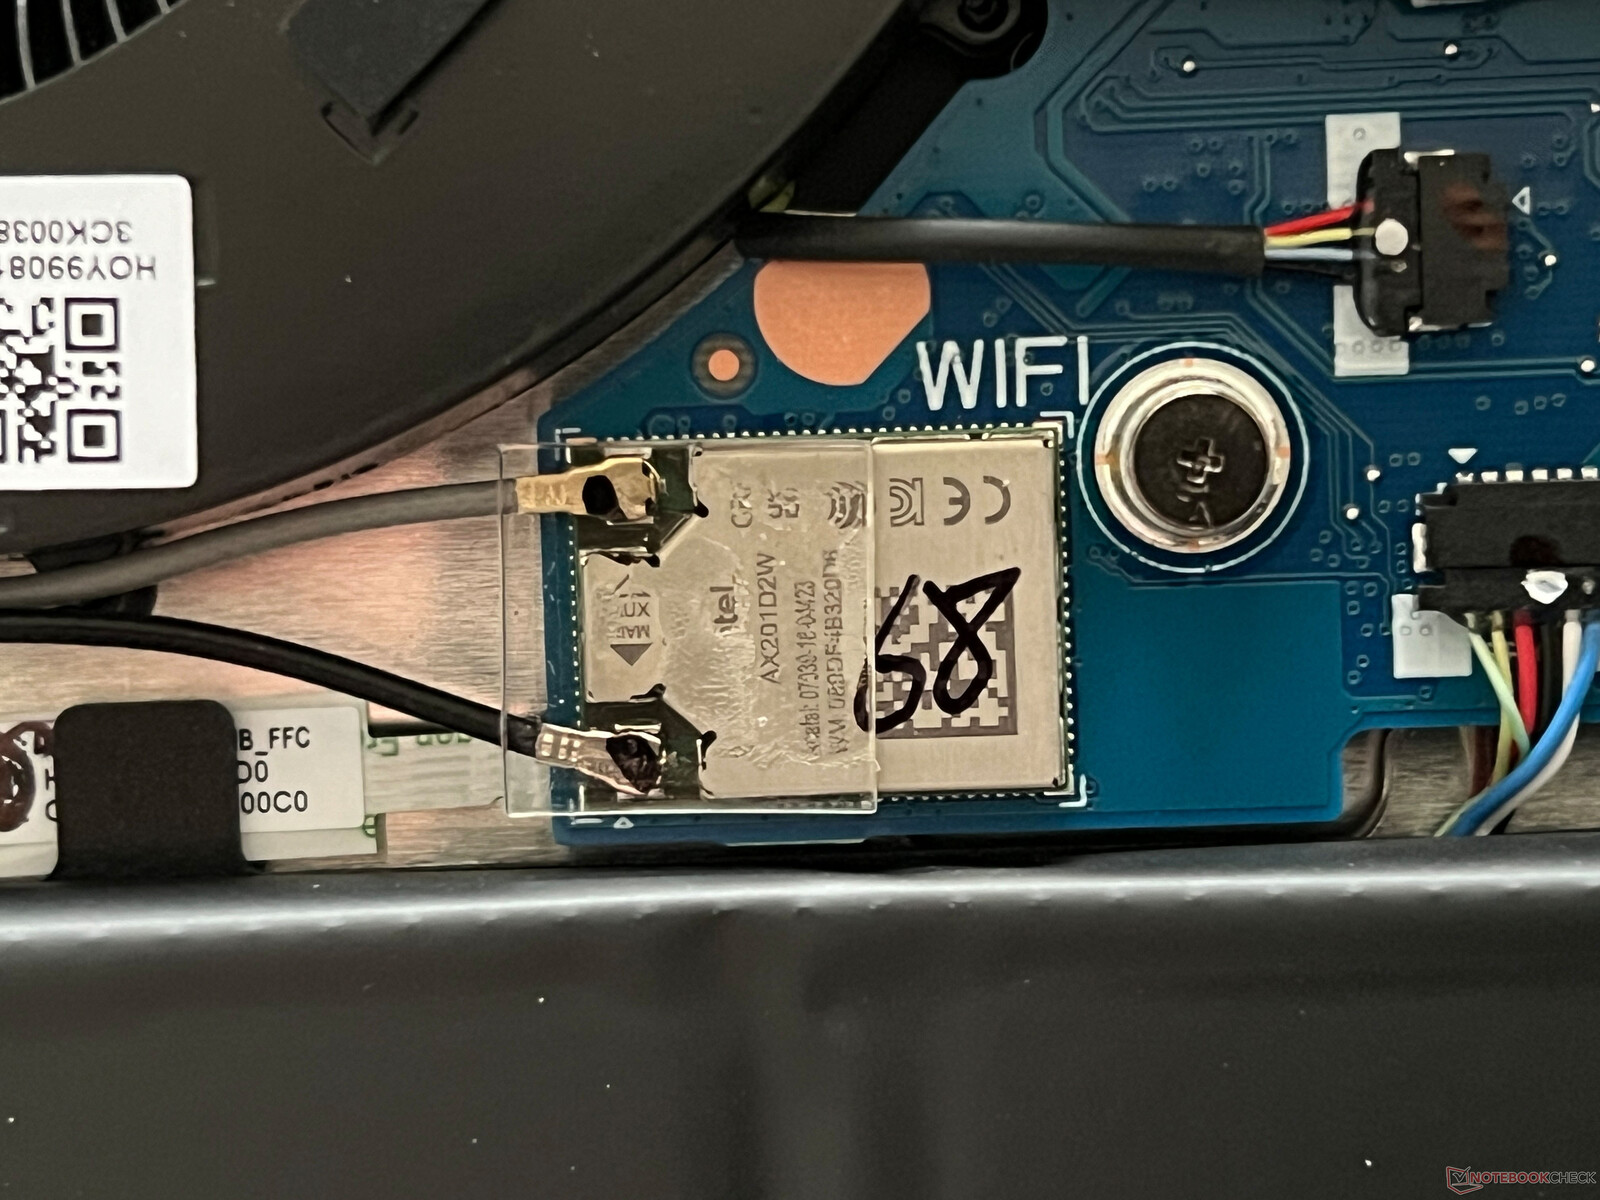
O módulo Wi-Fi é o conhecido Intel AX201, o que significa que o MagicBook Pro não suporta nem o Wi-Fi 6E nem o Wi-Fi 7. No entanto, atualmente não há grandes limitações e as velocidades de transferência em nosso teste com o roteador de referência da Asus são muito altas e estáveis. Qualquer pessoa que use dispositivos Honor adicionais também pode enviar arquivos facilmente entre os dois dispositivos ou, por exemplo, exibir o conteúdo do smartphone no PC.
| Networking | |
| Honor MagicBook Pro 16 2024 | |
| iperf3 transmit AXE11000 | |
| iperf3 receive AXE11000 | |
| Framework Laptop 16 | |
| iperf3 transmit AXE11000 | |
| iperf3 receive AXE11000 | |
| iperf3 transmit AXE11000 6GHz | |
| iperf3 receive AXE11000 6GHz | |
| Lenovo ThinkPad Z16 Gen 2 | |
| iperf3 transmit AXE11000 | |
| iperf3 receive AXE11000 | |
| iperf3 transmit AXE11000 6GHz | |
| iperf3 receive AXE11000 6GHz | |
| Dell Inspiron 16 Plus 7630 | |
| iperf3 transmit AXE11000 | |
| iperf3 receive AXE11000 | |
| iperf3 transmit AXE11000 6GHz | |
| iperf3 receive AXE11000 6GHz | |
| Lenovo Yoga Pro 9 16-IRP G8 | |
| iperf3 transmit AXE11000 | |
| iperf3 receive AXE11000 | |
| Schenker VISION 16 Pro (M23) | |
| iperf3 transmit AXE11000 | |
| iperf3 receive AXE11000 | |
| Asus Vivobook Pro 16X K6604JV-MX016W | |
| iperf3 transmit AXE11000 | |
| iperf3 receive AXE11000 | |
| iperf3 transmit AXE11000 6GHz | |
| iperf3 receive AXE11000 6GHz | |
Webcam
A webcam de 1080p suporta efeitos de estúdio do Windows (foco suave, contato visual, rastreamento da cabeça) e a qualidade da câmera pode ser descrita como média.


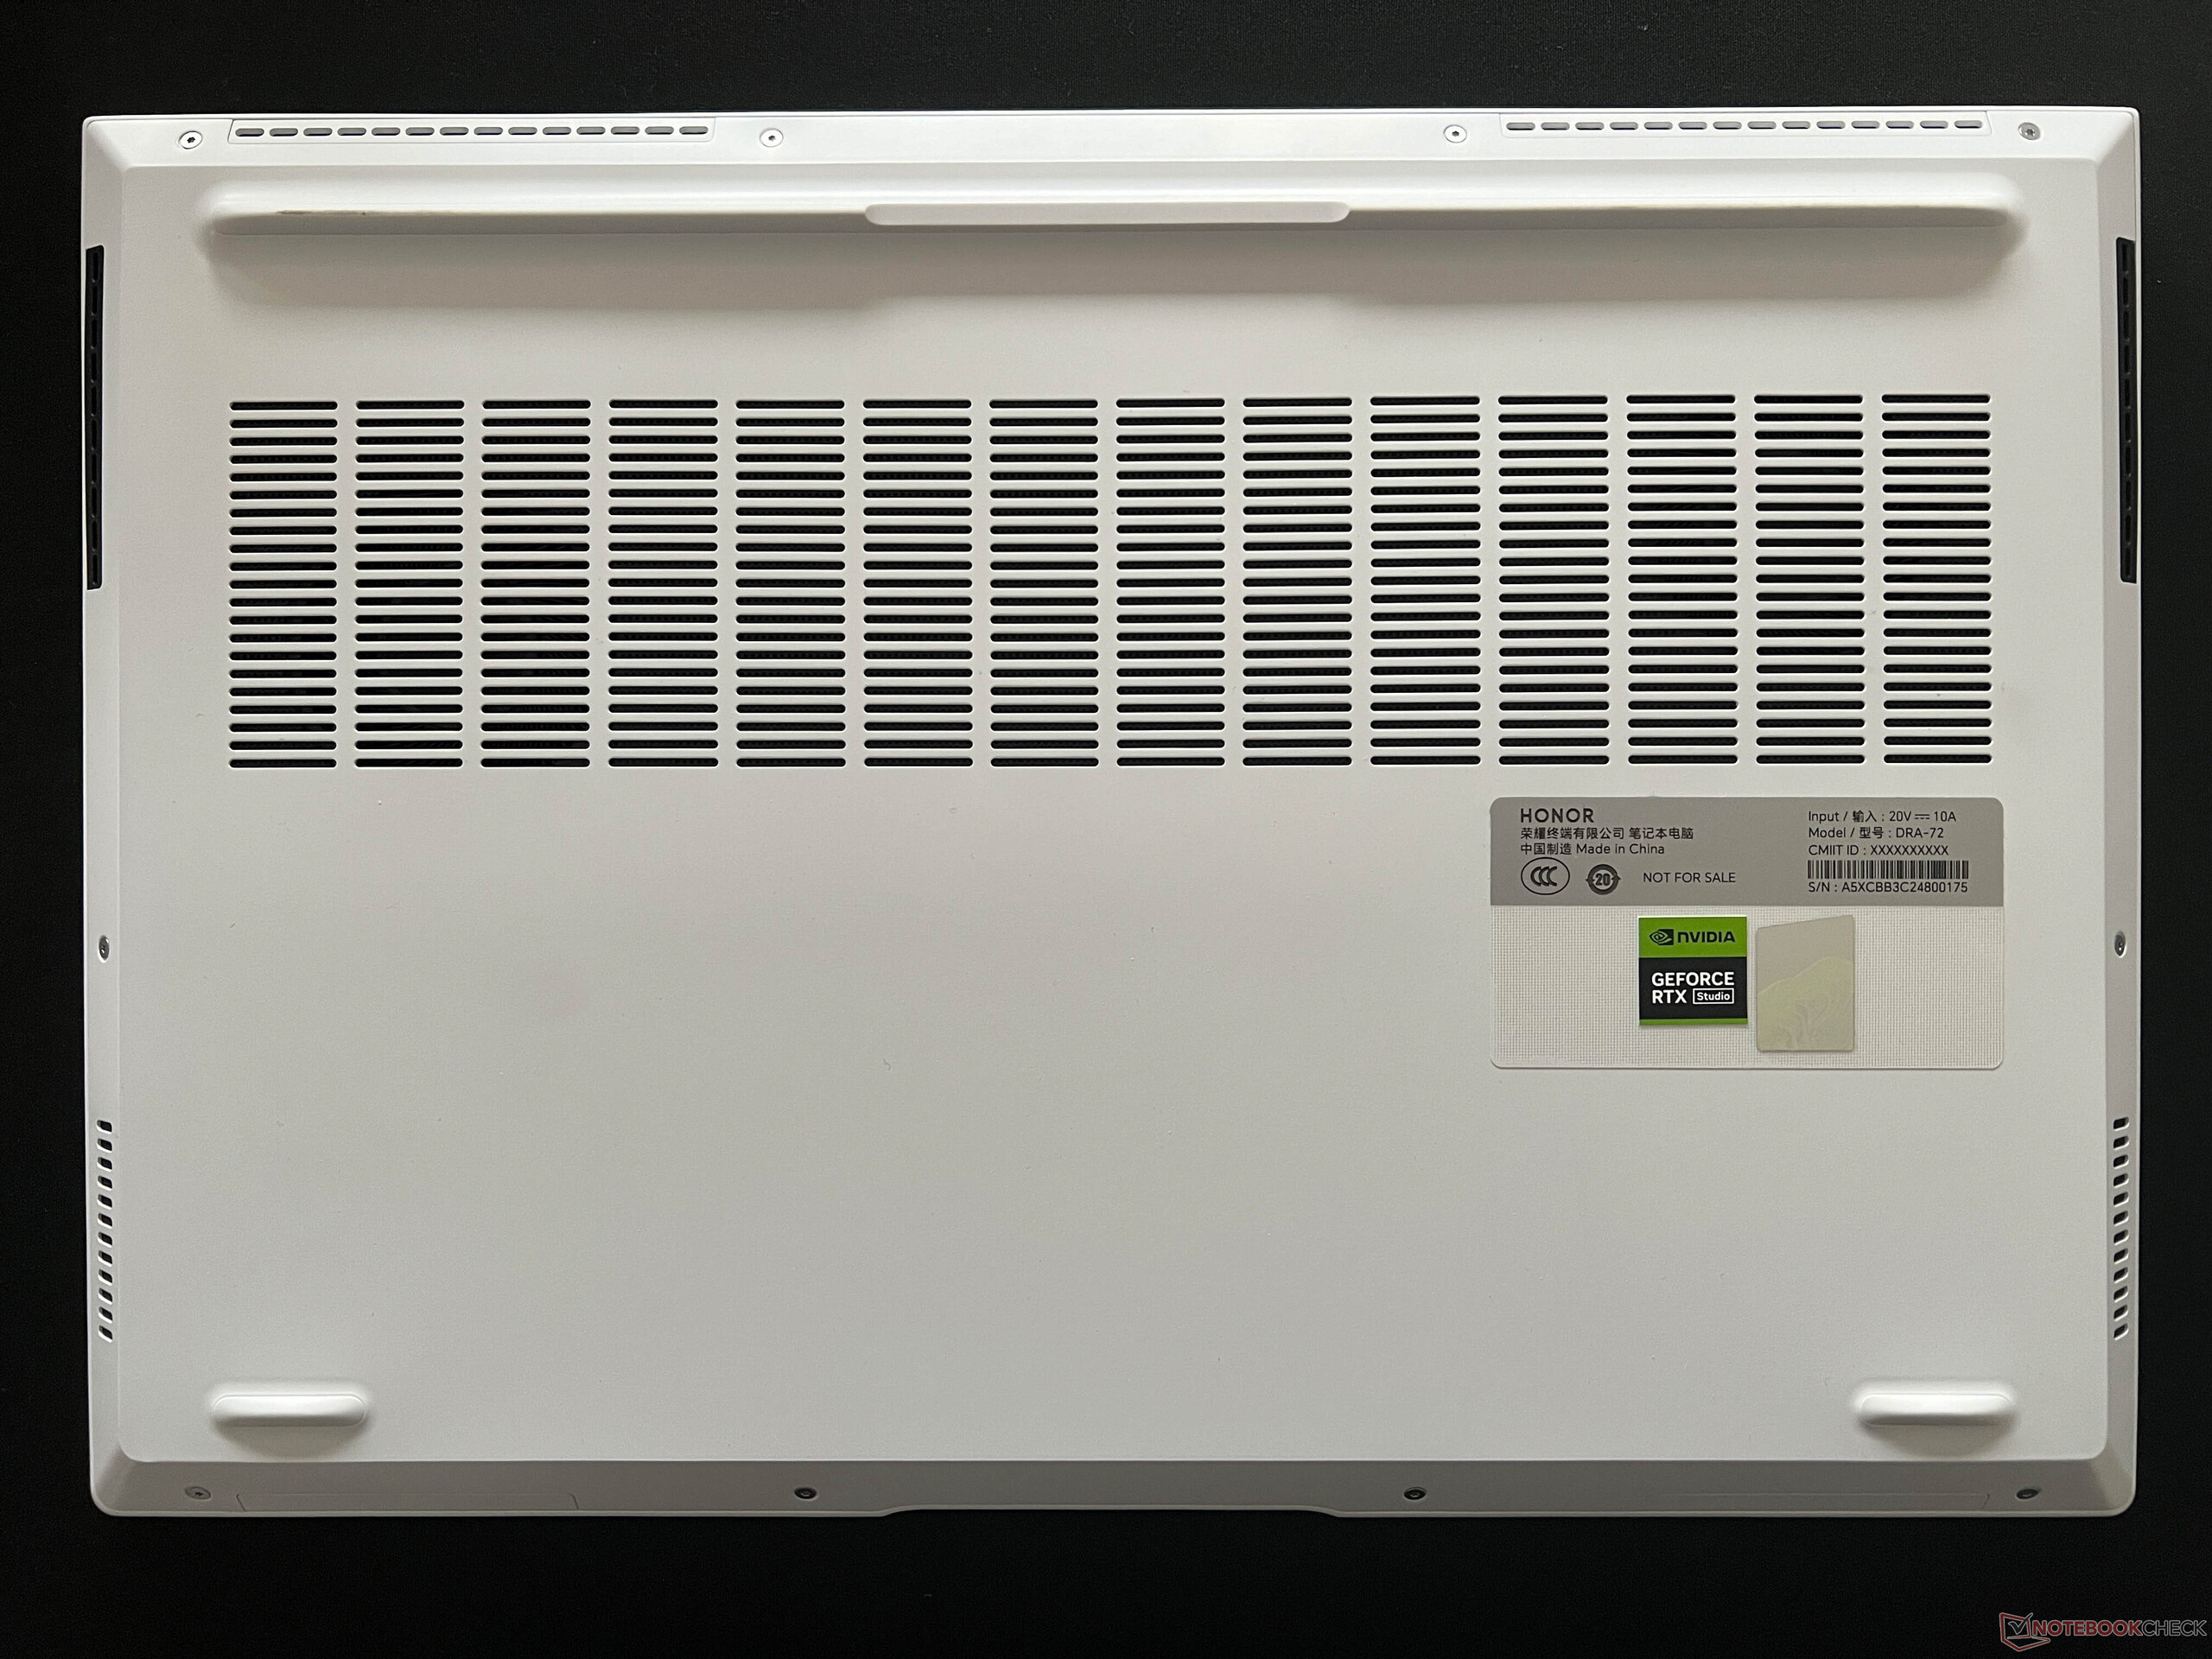
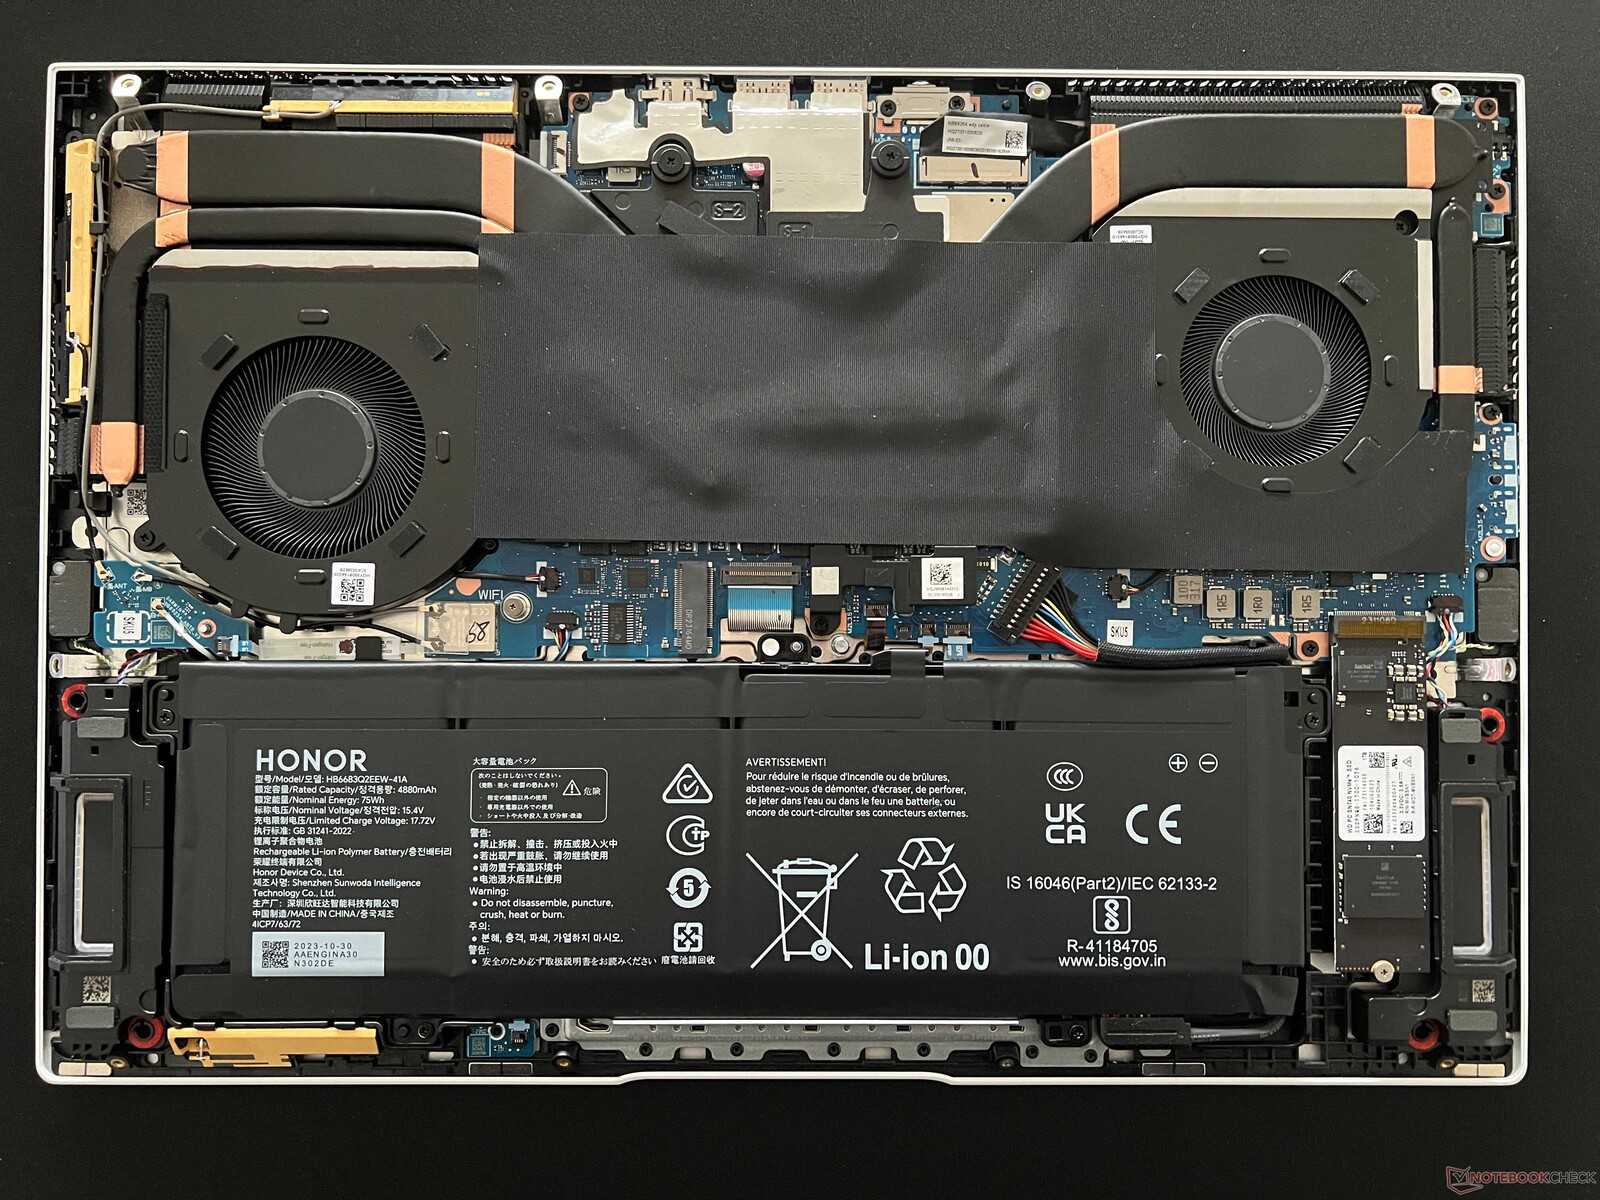
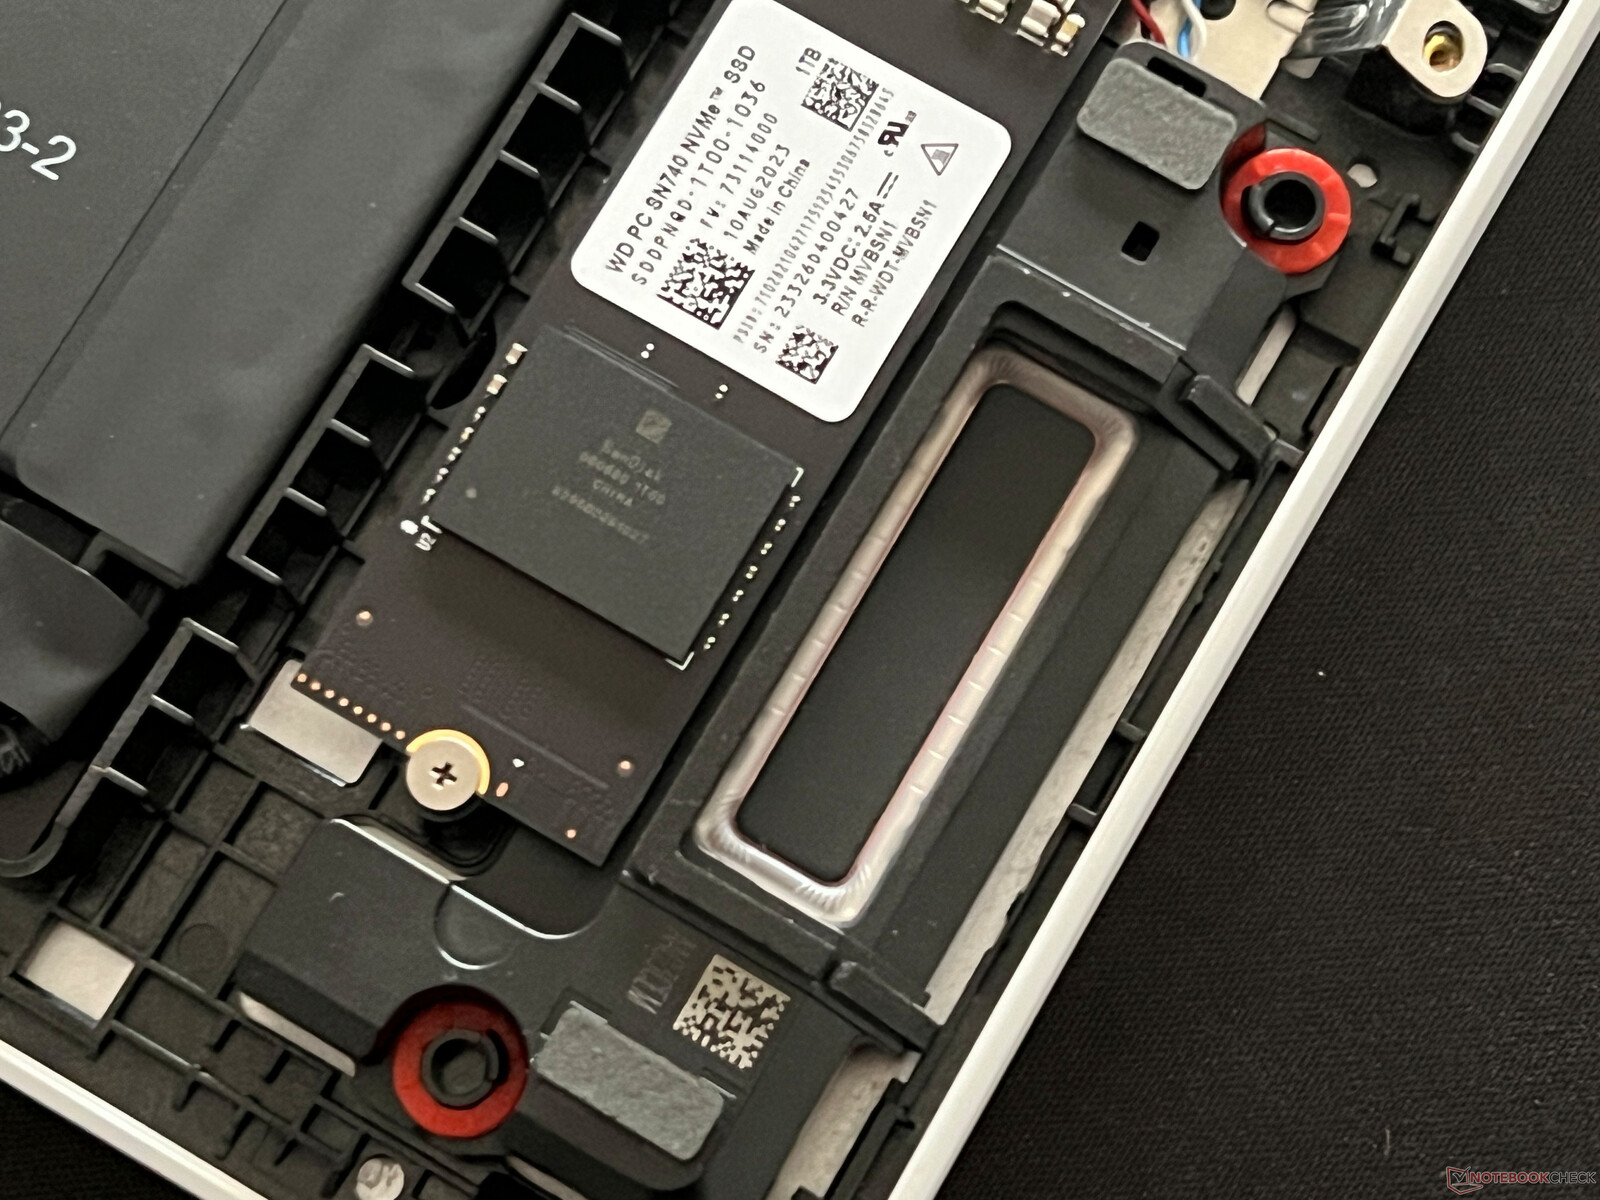
Manutenção
A tampa inferior do gabinete é fixada com alguns parafusos Torx (T6) e pode ser removida facilmente. Dentro do dispositivo, as duas ventoinhas podem ser limpas e a bateria e o SSD podem ser substituídos. No entanto, todos os outros componentes, inclusive a RAM e o módulo Wi-Fi, são soldados.
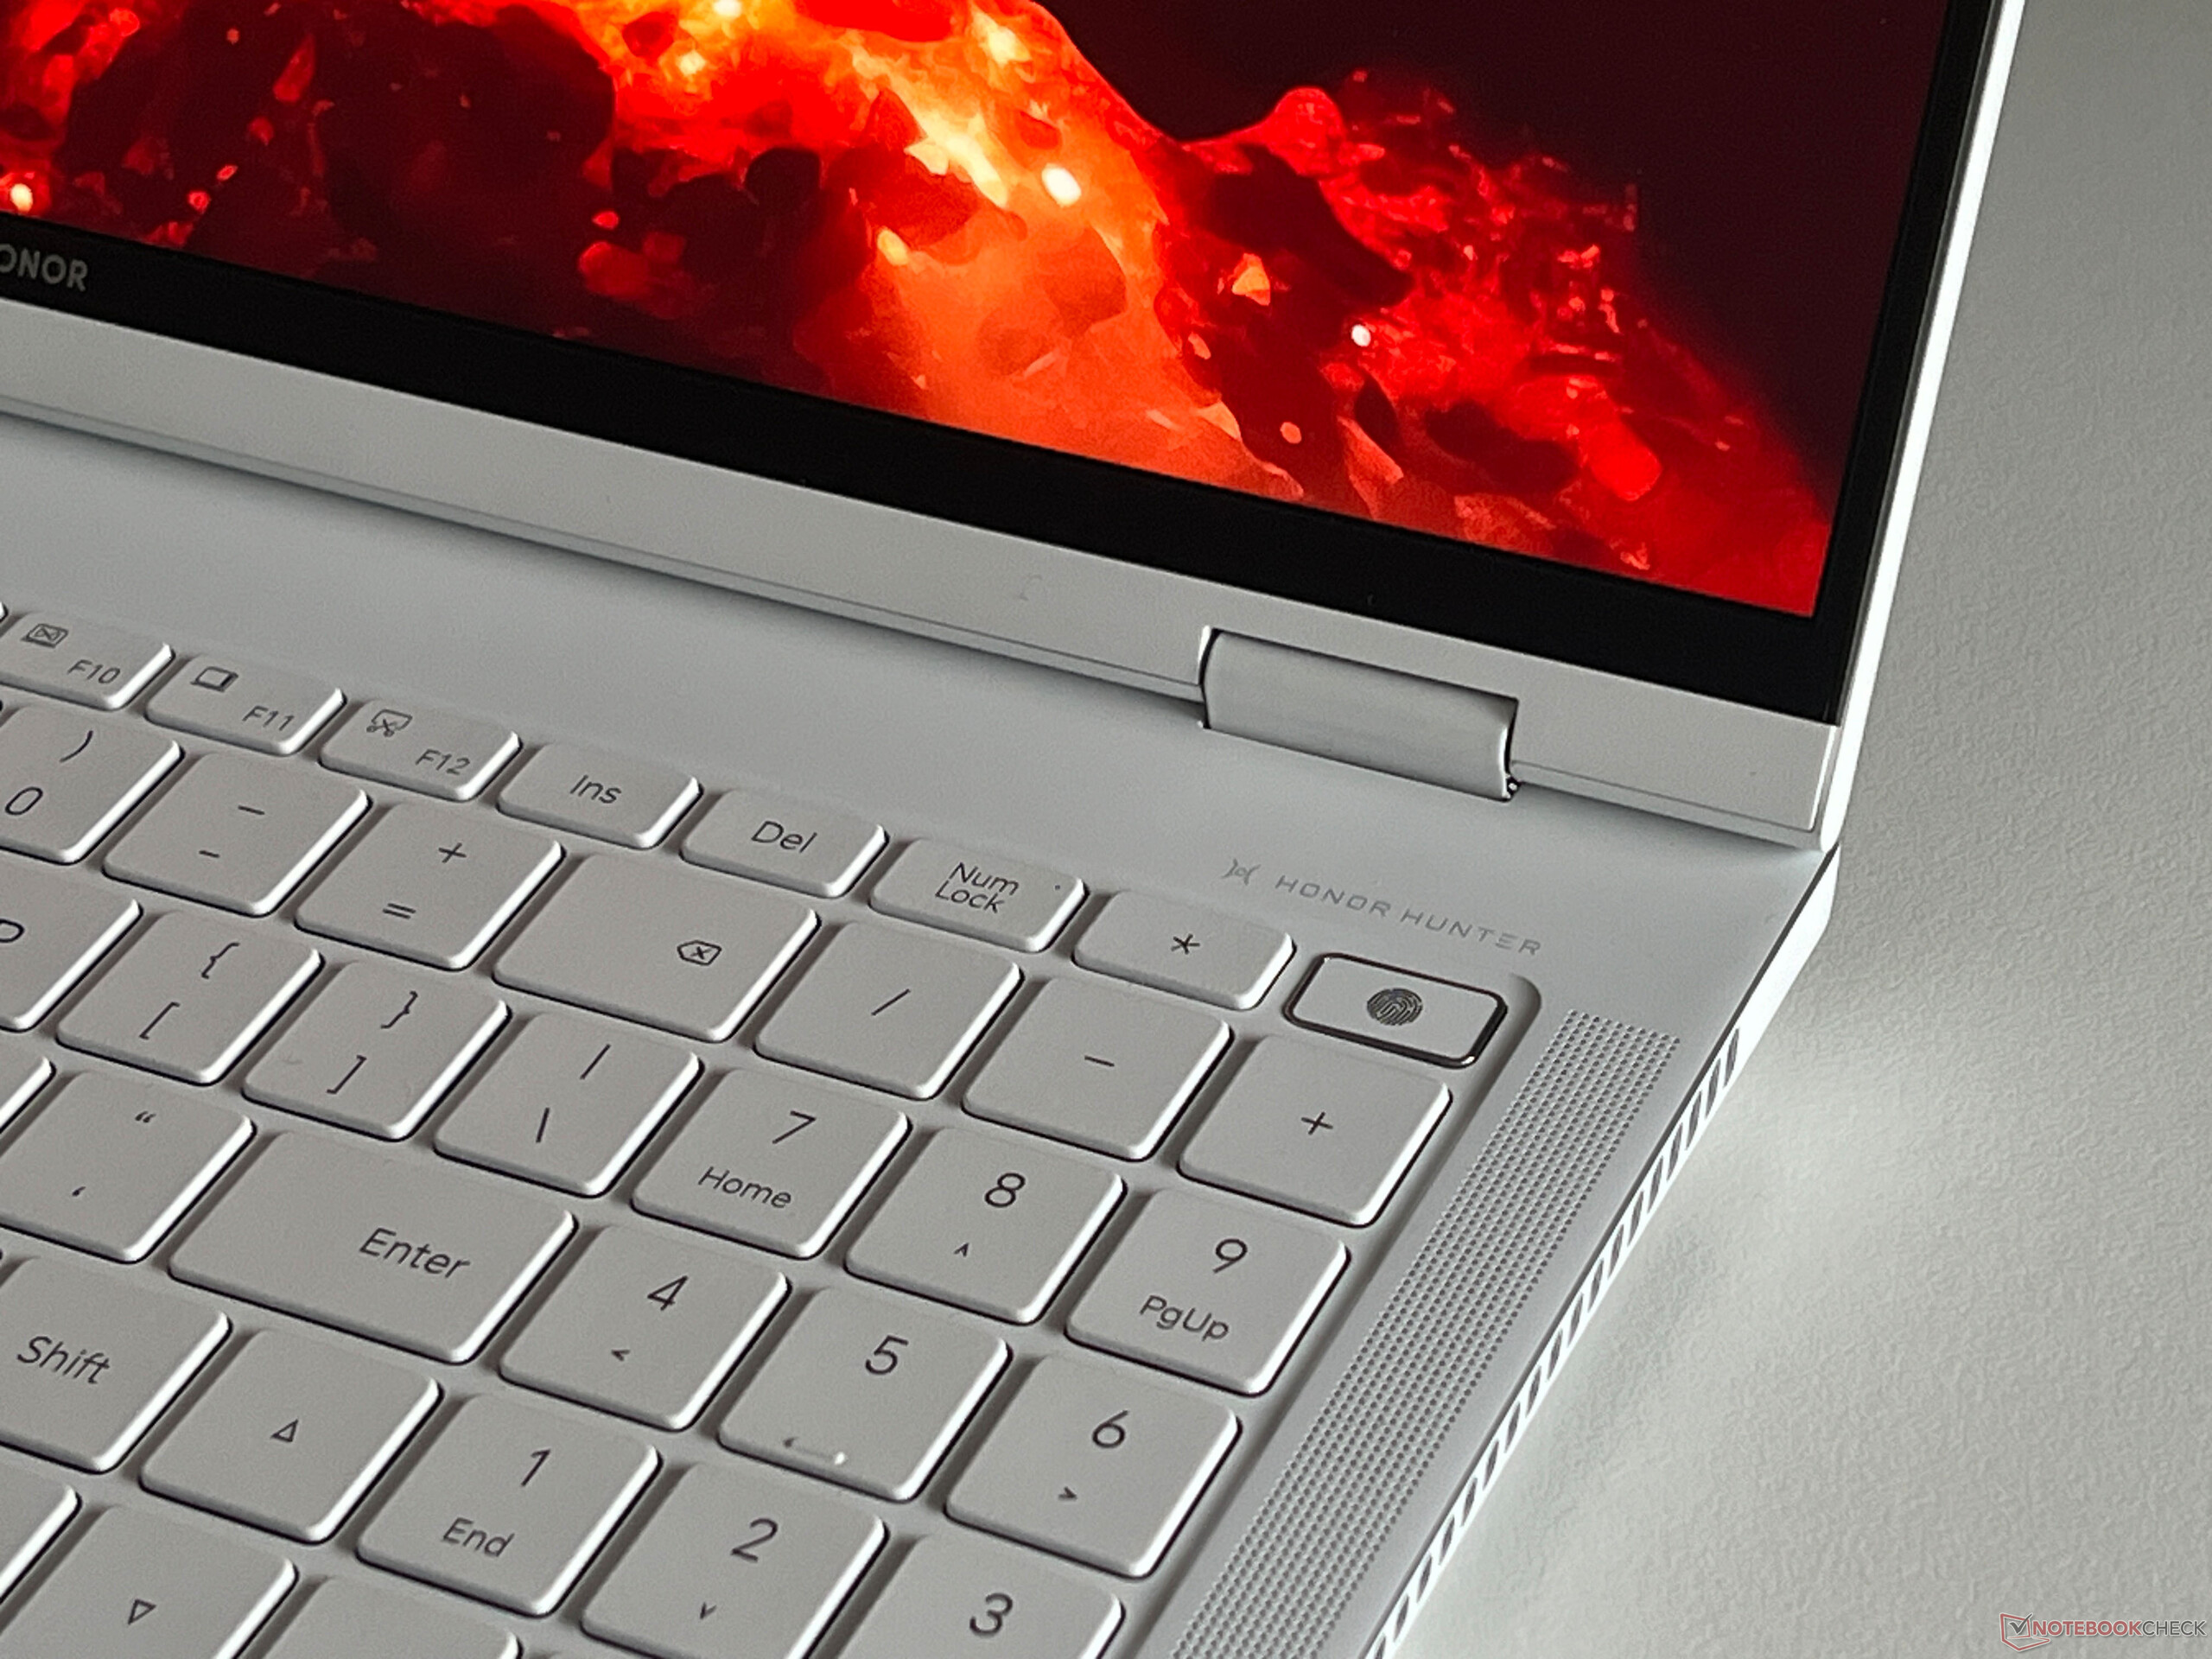
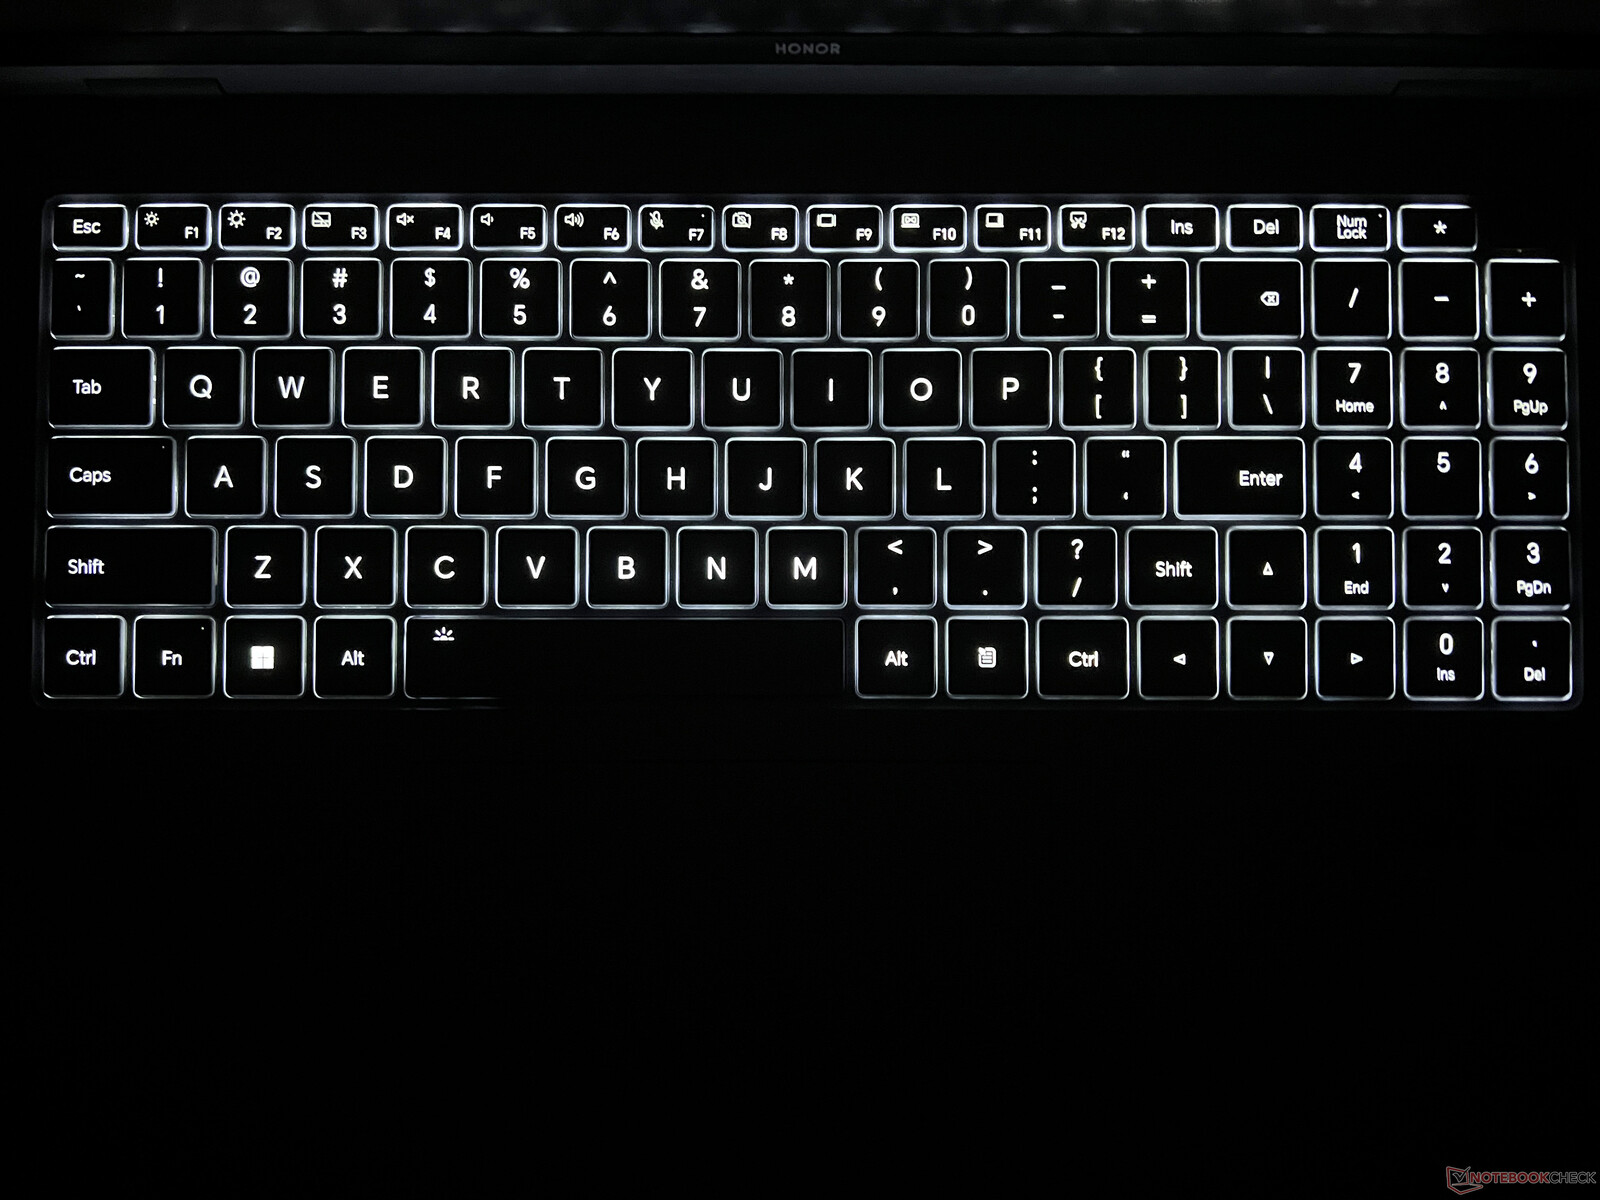
Dispositivos de entrada - Um teclado numérico e um clickpad de difícil manuseio
O MagicBook Pro 16 oferece um teclado grande com teclado numérico e luz de fundo branca. Isso pode ser ativado automaticamente, mas o contraste entre as teclas brancas e a iluminação é muito baixo, o que significa que sua visibilidade em condições de pouca luz pode ser ainda pior. Mas esse é um problema geral encontrado em teclados de cores claras. Fora isso, a experiência de digitação é muito confortável e facilita até mesmo textos mais longos. O botão liga/desliga fica no canto superior direito e, além de estar integrado ao teclado, abriga o scanner de impressões digitais.
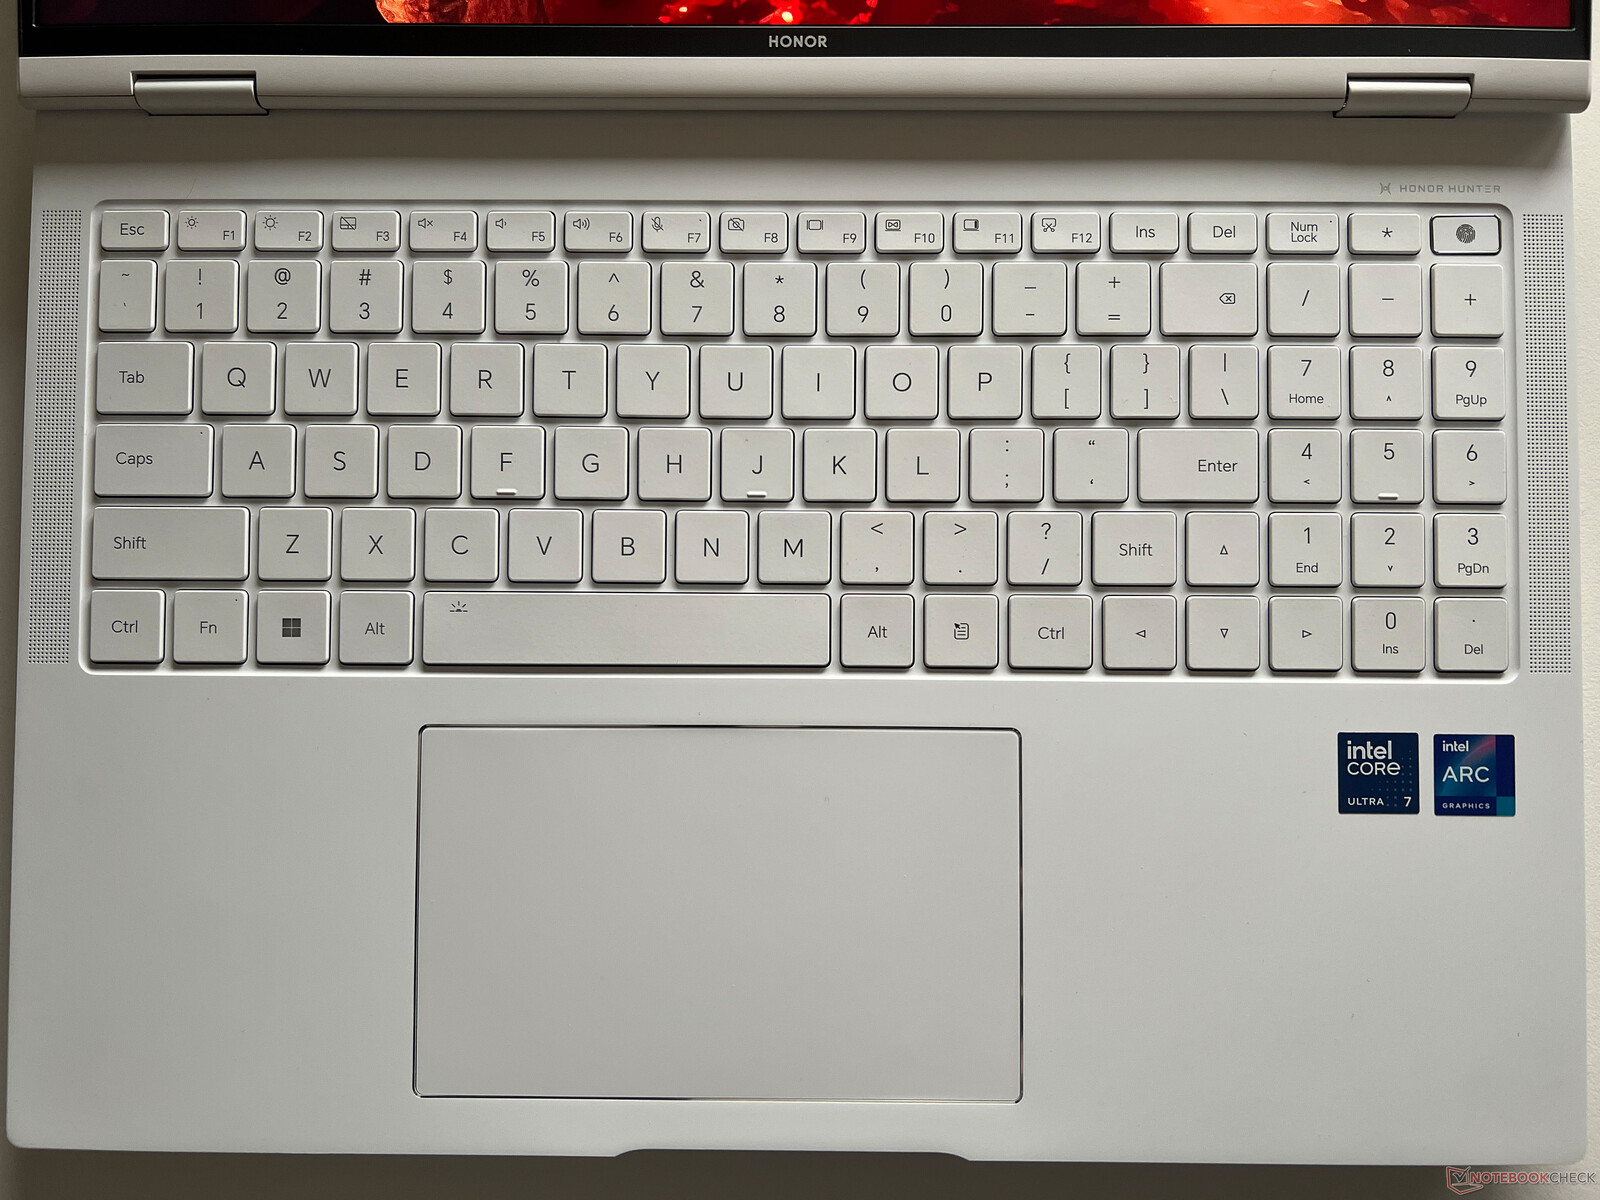
Com 13,5 x 8,2 cm, o grande clickpad oferece espaço suficiente para o movimento do mouse e gestos com até quatro dedos, mas a experiência de deslizar sobre a superfície plástica não é perfeita. Durante os testes, também tivemos problemas ocasionais com o pad, pois as entradas só eram registradas após um pequeno atraso. Isso foi muito irritante, mas, como só acontecia de vez em quando, achamos que é apenas um problema de driver. Na área inferior, o pad pode ser pressionado fisicamente, mas isso provoca ruídos altos de cliques.
Tela - IPS a 165 Hz
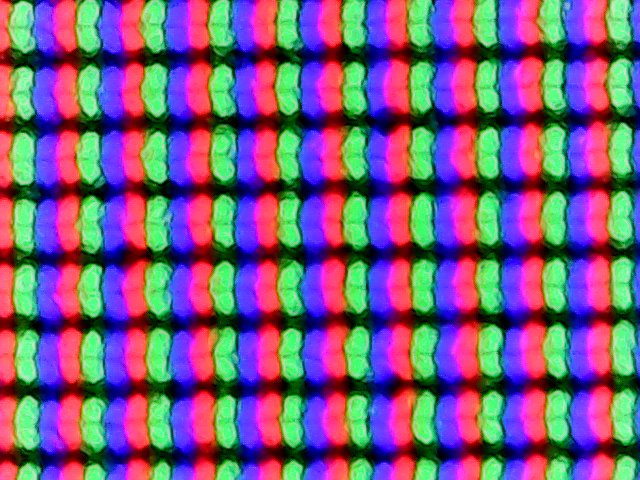
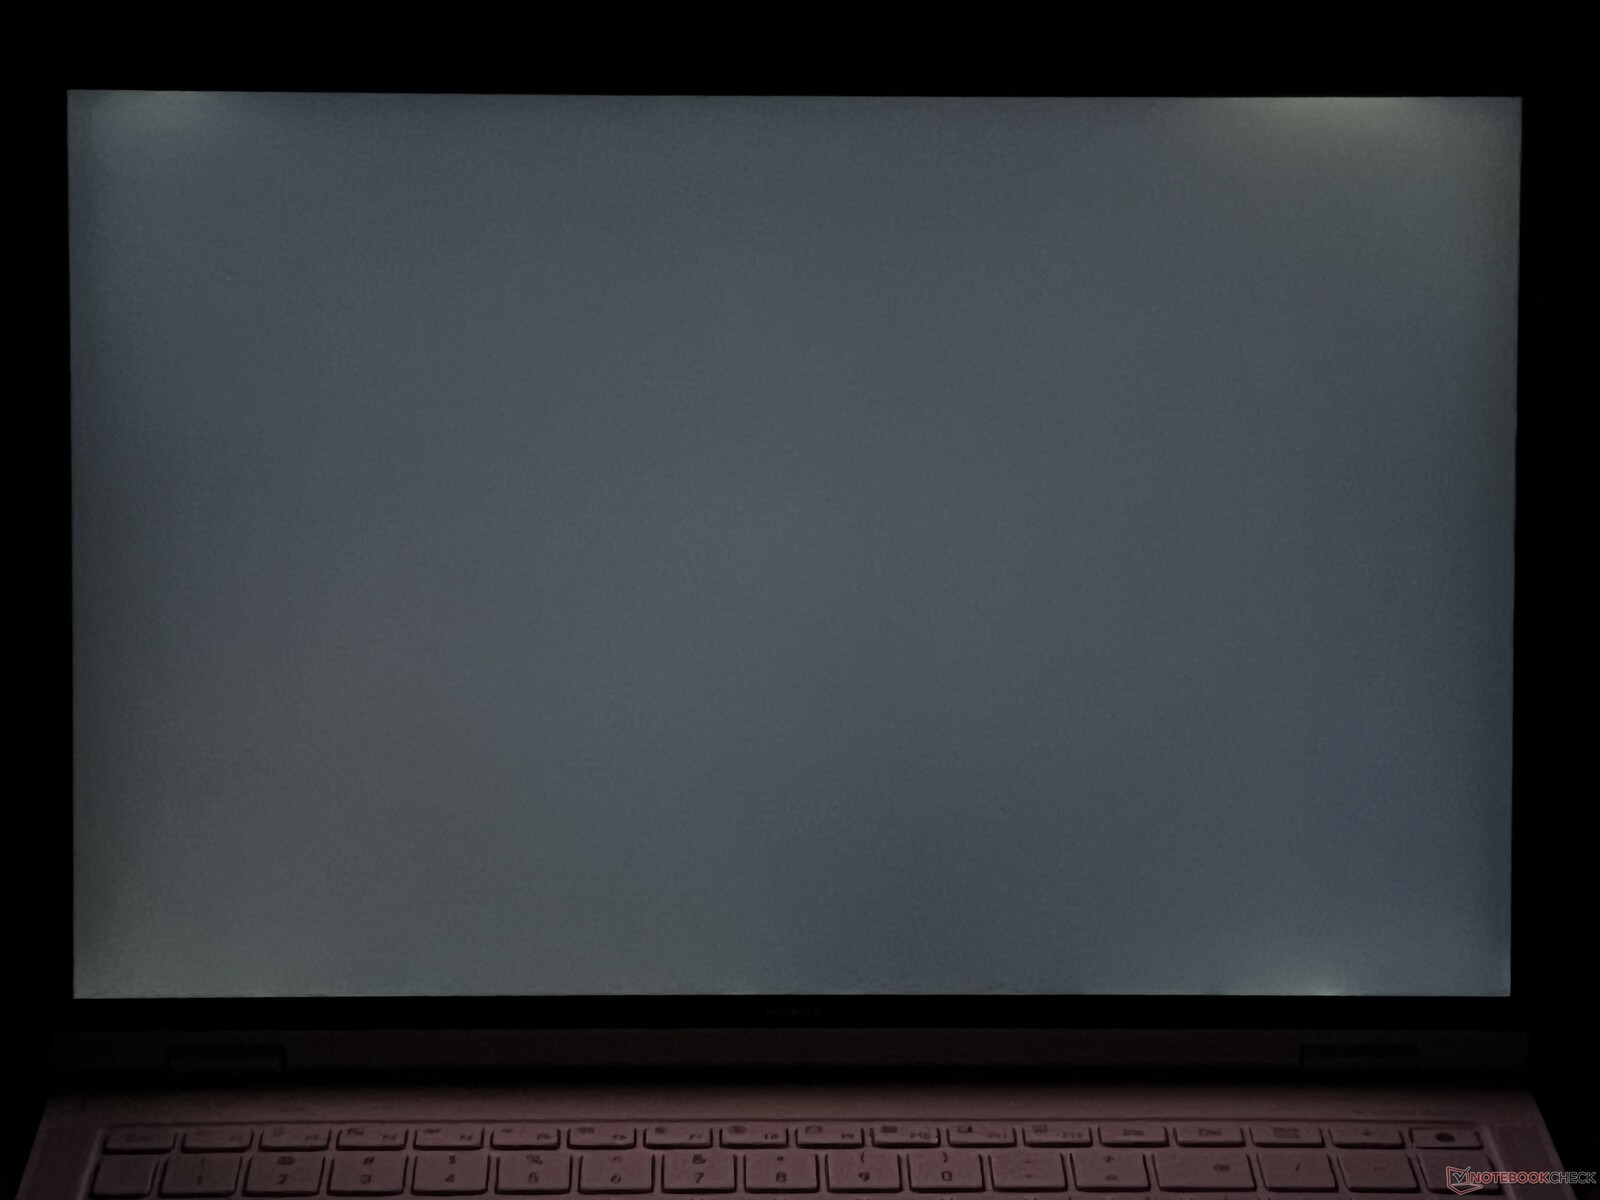
A tela é um painel IPS fosco, 16:10, com resolução de 3.072 x 1.920 pixels. A qualidade subjetiva da imagem é muito boa, mas as cores não são tão vibrantes quanto as encontradas nos painéis OLED. Apesar de sua superfície fosca, as áreas claras não parecem granuladas e não há PWM. Em cenas escuras, é possível ver um leve sangramento de luz nas bordas, mas isso não é irritante no uso diário. Os tempos de resposta são agradavelmente rápidos e não há problemas quando se trata de jogos.
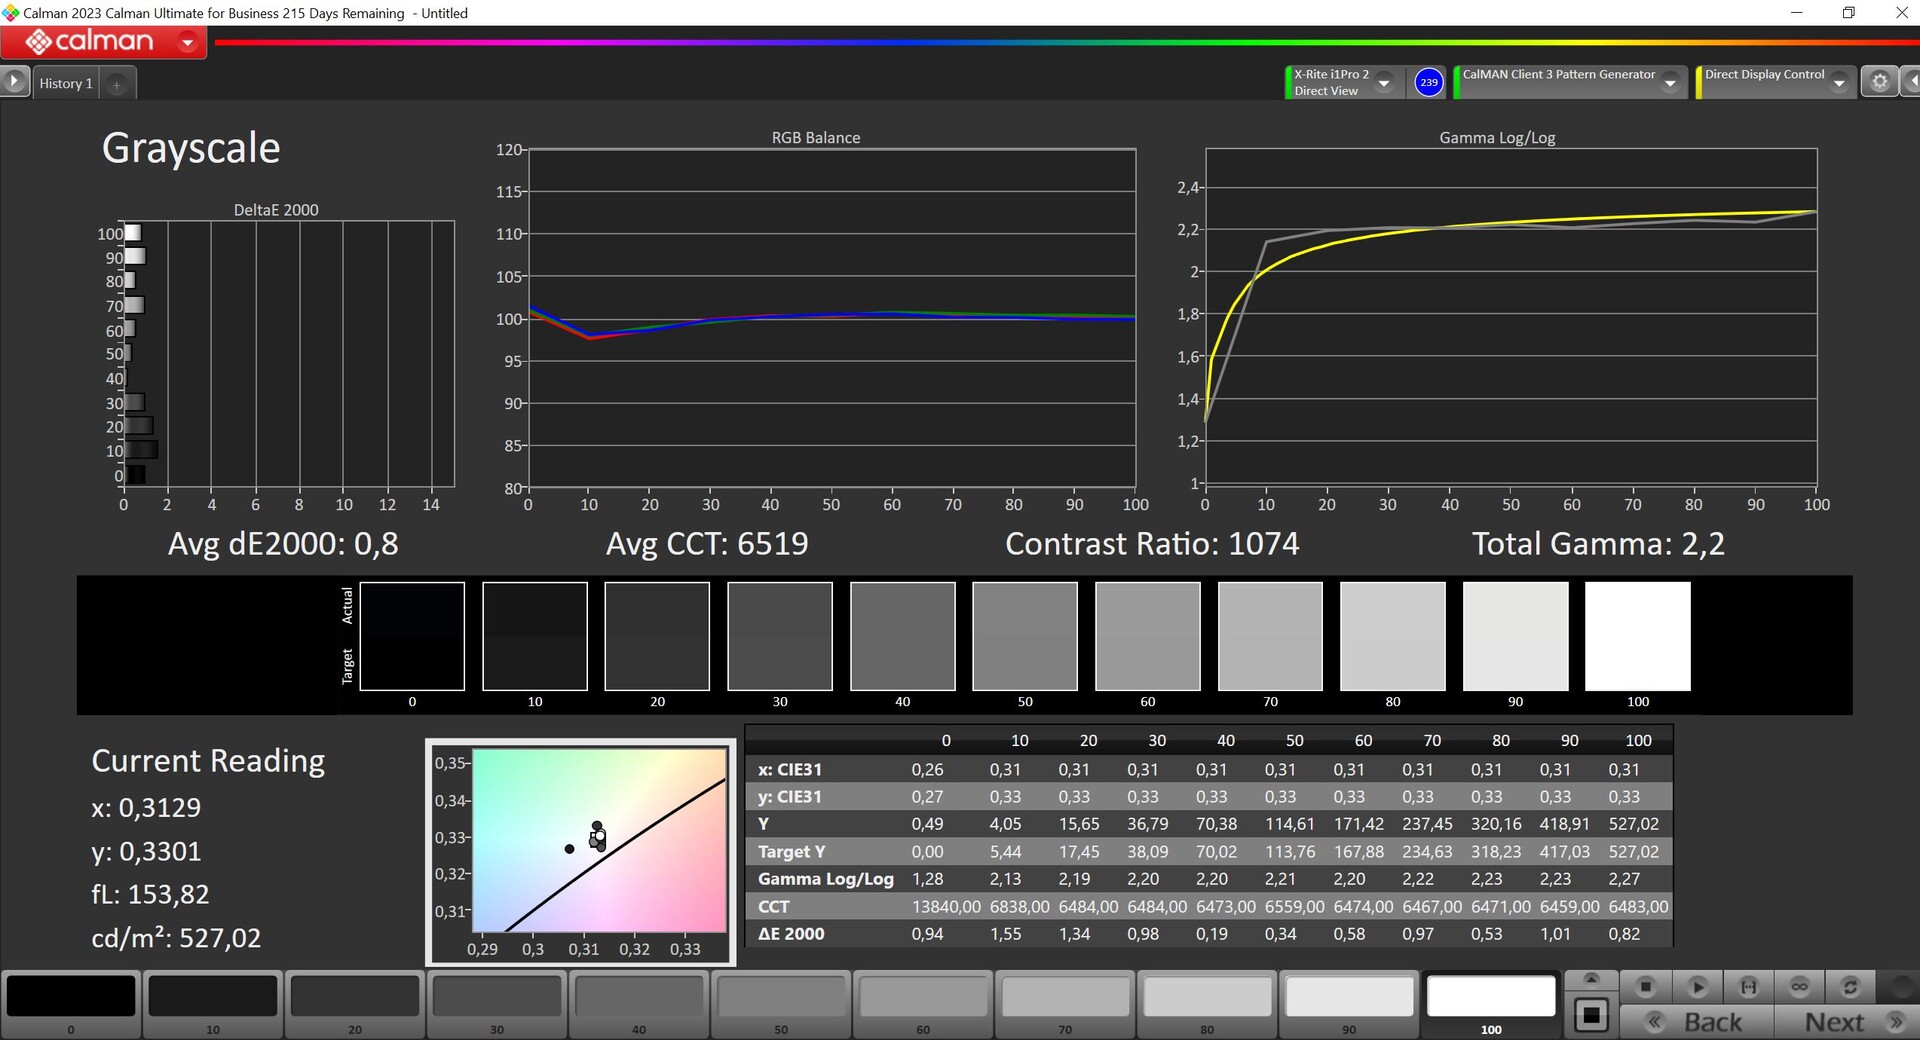
Medimos um brilho máximo de mais de 550 cd/m² (uma média de 524cd/m²) e a vantagem em comparação com os painéis OLED atuais (~360-400 cd/m² em operação SDR) é que o senhor sempre tem acesso a esse brilho. No entanto, a grande desvantagem é o aumento do nível de preto de 0,52 cd/m², o que significa que o conteúdo preto está mais para cinza escuro do que para preto. Isso também afeta o contraste máximo, que fica em pouco mais de 1.000:1.
| |||||||||||||||||||||||||
iluminação: 91 %
iluminação com acumulador: 550 cd/m²
Contraste: 1060:1 (Preto: 0.52 cd/m²)
ΔE ColorChecker Calman: 1.7 | ∀{0.5-29.43 Ø4.71}
calibrated: 1
ΔE Greyscale Calman: 2.4 | ∀{0.09-98 Ø4.96}
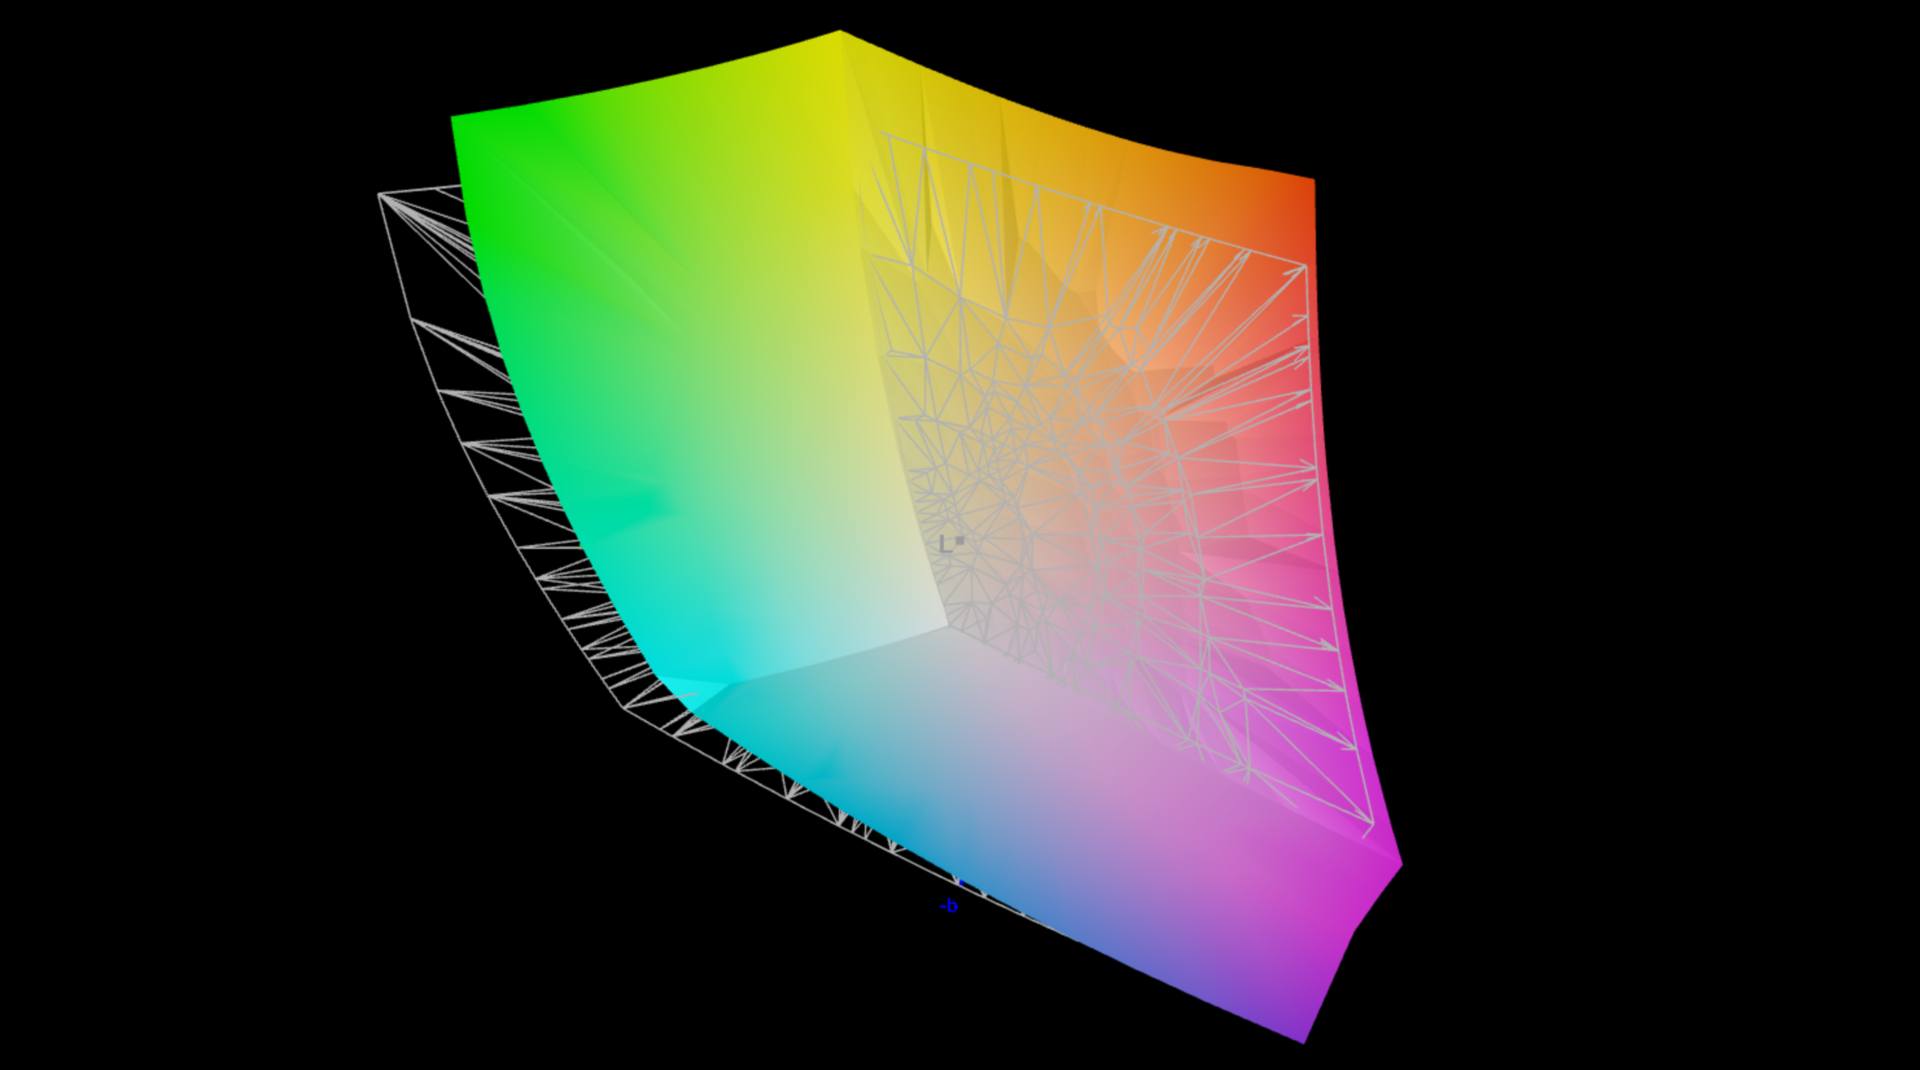
89.1% AdobeRGB 1998 (Argyll 3D)
100% sRGB (Argyll 3D)
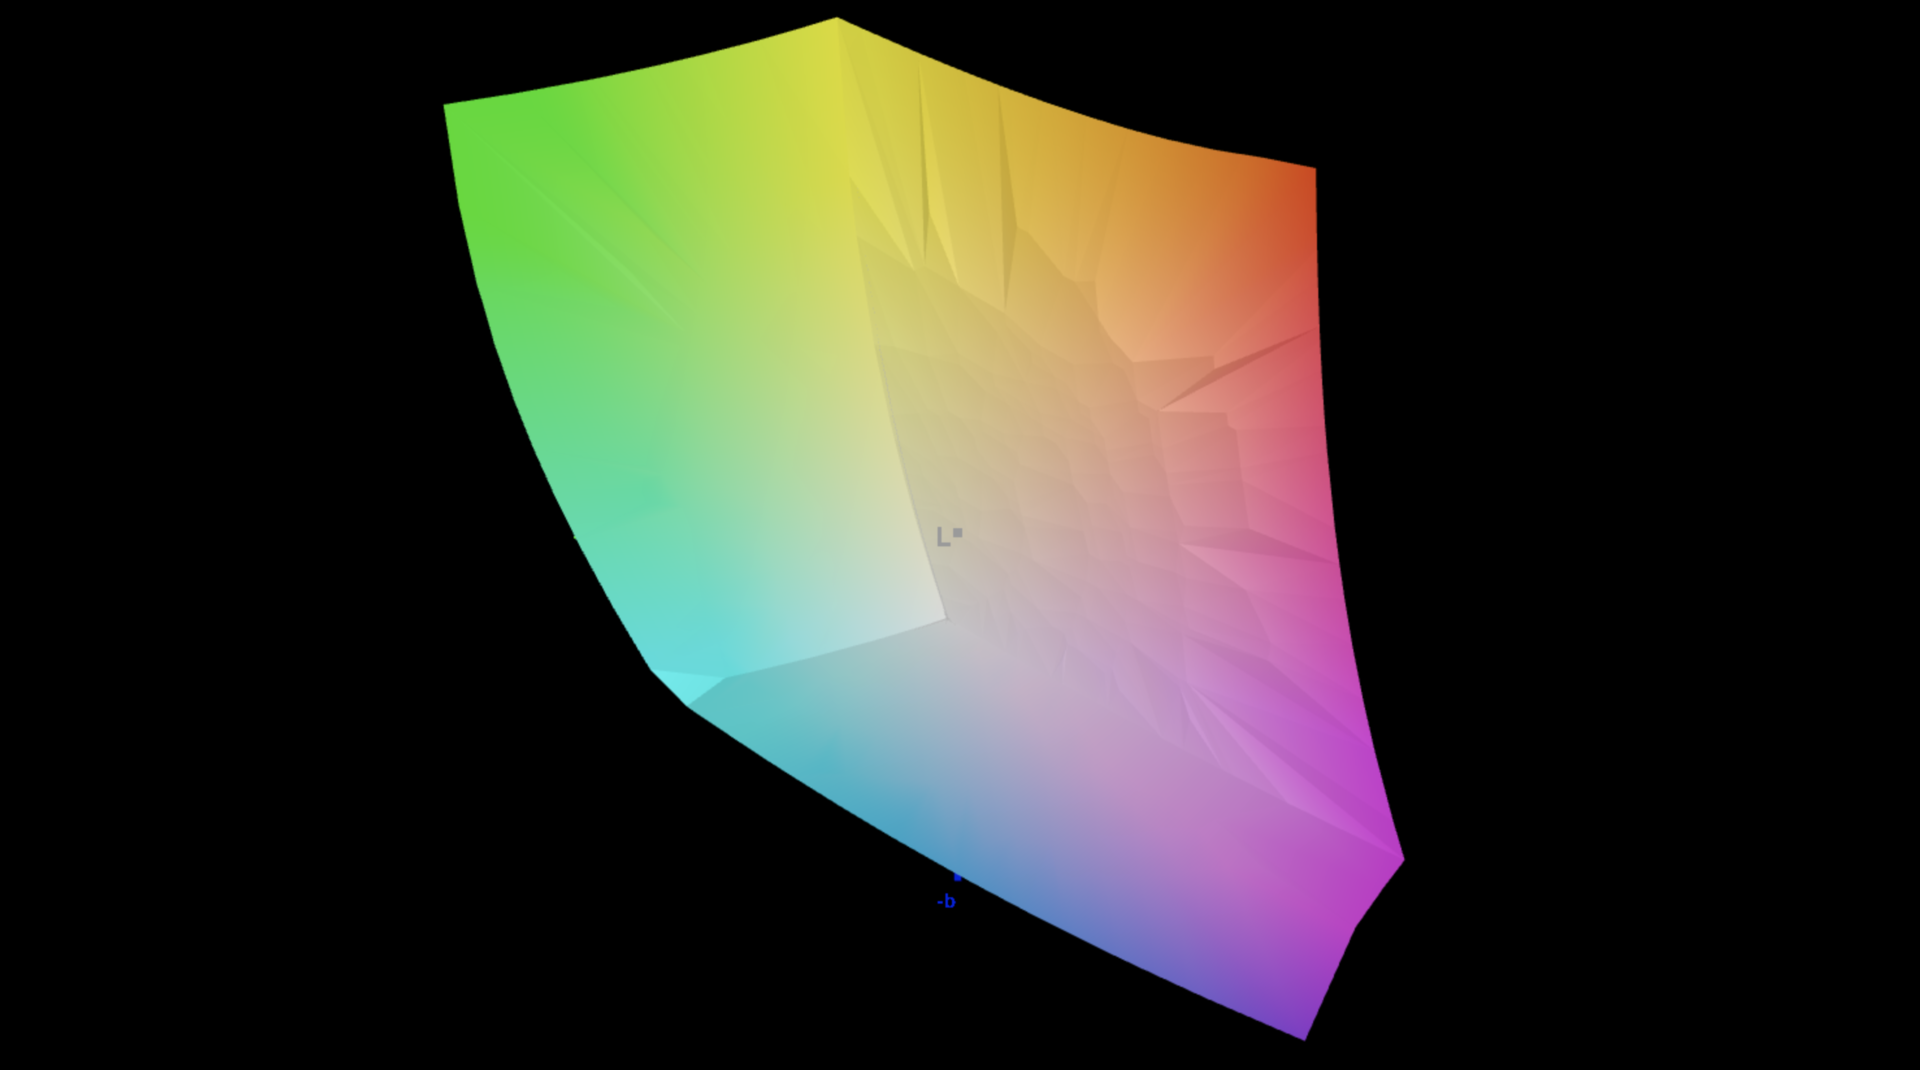
98.8% Display P3 (Argyll 3D)
Gamma: 2.2
CCT: 6842 K
| Honor MagicBook Pro 16 2024 TL160MDMP01, IPS, 3072x1920, 16" | Framework Laptop 16 2560x1600, 16" | Lenovo ThinkPad Z16 Gen 2 Samsung ATNA60YV04-0, OLED, 3840x2400, 16" | Dell Inspiron 16 Plus 7630 LG Philips 160WQ2, IPS, 2560x1600, 16" | Lenovo Yoga Pro 9 16-IRP G8 LEN160-3.2K, Mini-LED, 3200x2000, 16" | Schenker VISION 16 Pro (M23) NE160QDM-NZ1, IPS, 2560x1600, 16" | Asus Vivobook Pro 16X K6604JV-MX016W Samsung SDC4178 ATNA60BX01-1, OLED, 3200x2000, 16" | |
|---|---|---|---|---|---|---|---|
| Display | -1% | 3% | -16% | 2% | -17% | 3% | |
| Display P3 Coverage (%) | 98.8 | 97.7 -1% | 99.7 1% | 70.1 -29% | 97 -2% | 68.8 -30% | 98.4 0% |
| sRGB Coverage (%) | 100 | 99.7 0% | 100 0% | 99.6 0% | 99.8 0% | 98.8 -1% | 99.7 0% |
| AdobeRGB 1998 Coverage (%) | 89.1 | 87 -2% | 96.7 9% | 72.3 -19% | 95.1 7% | 70 -21% | 95.8 8% |
| Response Times | -117% | 68% | -394% | -93% | -81% | 75% | |
| Response Time Grey 50% / Grey 80% * (ms) | 6.3 ? | 14.6 ? -132% | 1.86 ? 70% | 35 ? -456% | 14 ? -122% | 13.7 ? -117% | 1.6 ? 75% |
| Response Time Black / White * (ms) | 5.6 ? | 11.3 ? -102% | 1.89 ? 66% | 24.2 ? -332% | 9.2 ? -64% | 8.1 ? -45% | 1.4 ? 75% |
| PWM Frequency (Hz) | 60 ? | 5800 ? | 120 ? | ||||
| Screen | 7% | 1% | -32% | 41% | -33% | 46% | |
| Brightness middle (cd/m²) | 551 | 504.8 -8% | 390.1 -29% | 299.4 -46% | 539 -2% | 384 -30% | 347 -37% |
| Brightness (cd/m²) | 524 | 490 -6% | 393 -25% | 290 -45% | 546 4% | 371 -29% | 346 -34% |
| Brightness Distribution (%) | 91 | 84 -8% | 97 7% | 92 1% | 96 5% | 88 -3% | 97 7% |
| Black Level * (cd/m²) | 0.52 | 0.41 21% | 0.21 60% | 0.18 65% | 0.3 42% | 0.06 88% | |
| Contrast (:1) | 1060 | 1231 16% | 1426 35% | 2994 182% | 1280 21% | 5783 446% | |
| Colorchecker dE 2000 * | 1.7 | 1.23 28% | 1.41 17% | 4.25 -150% | 1.4 18% | 3.4 -100% | 1.89 -11% |
| Colorchecker dE 2000 max. * | 4.1 | 3.74 9% | 3.43 16% | 6.71 -64% | 2.1 49% | 9.2 -124% | 3.26 20% |
| Colorchecker dE 2000 calibrated * | 1 | 1.1 -10% | 0.52 48% | 1.3 -30% | 1.97 -97% | ||
| Greyscale dE 2000 * | 2.4 | 2 17% | 2 17% | 5.5 -129% | 2.2 8% | 3.4 -42% | 1.55 35% |
| Gamma | 2.2 100% | 2.22 99% | 2.22 99% | 2.35 94% | 2.19 100% | 2.16 102% | 2.39 92% |
| CCT | 6842 95% | 6670 97% | 6324 103% | 6368 102% | 6479 100% | 7462 87% | 6458 101% |
| Média Total (Programa/Configurações) | -37% /
-13% | 24% /
14% | -147% /
-80% | -17% /
11% | -44% /
-36% | 41% /
41% |
* ... menor é melhor
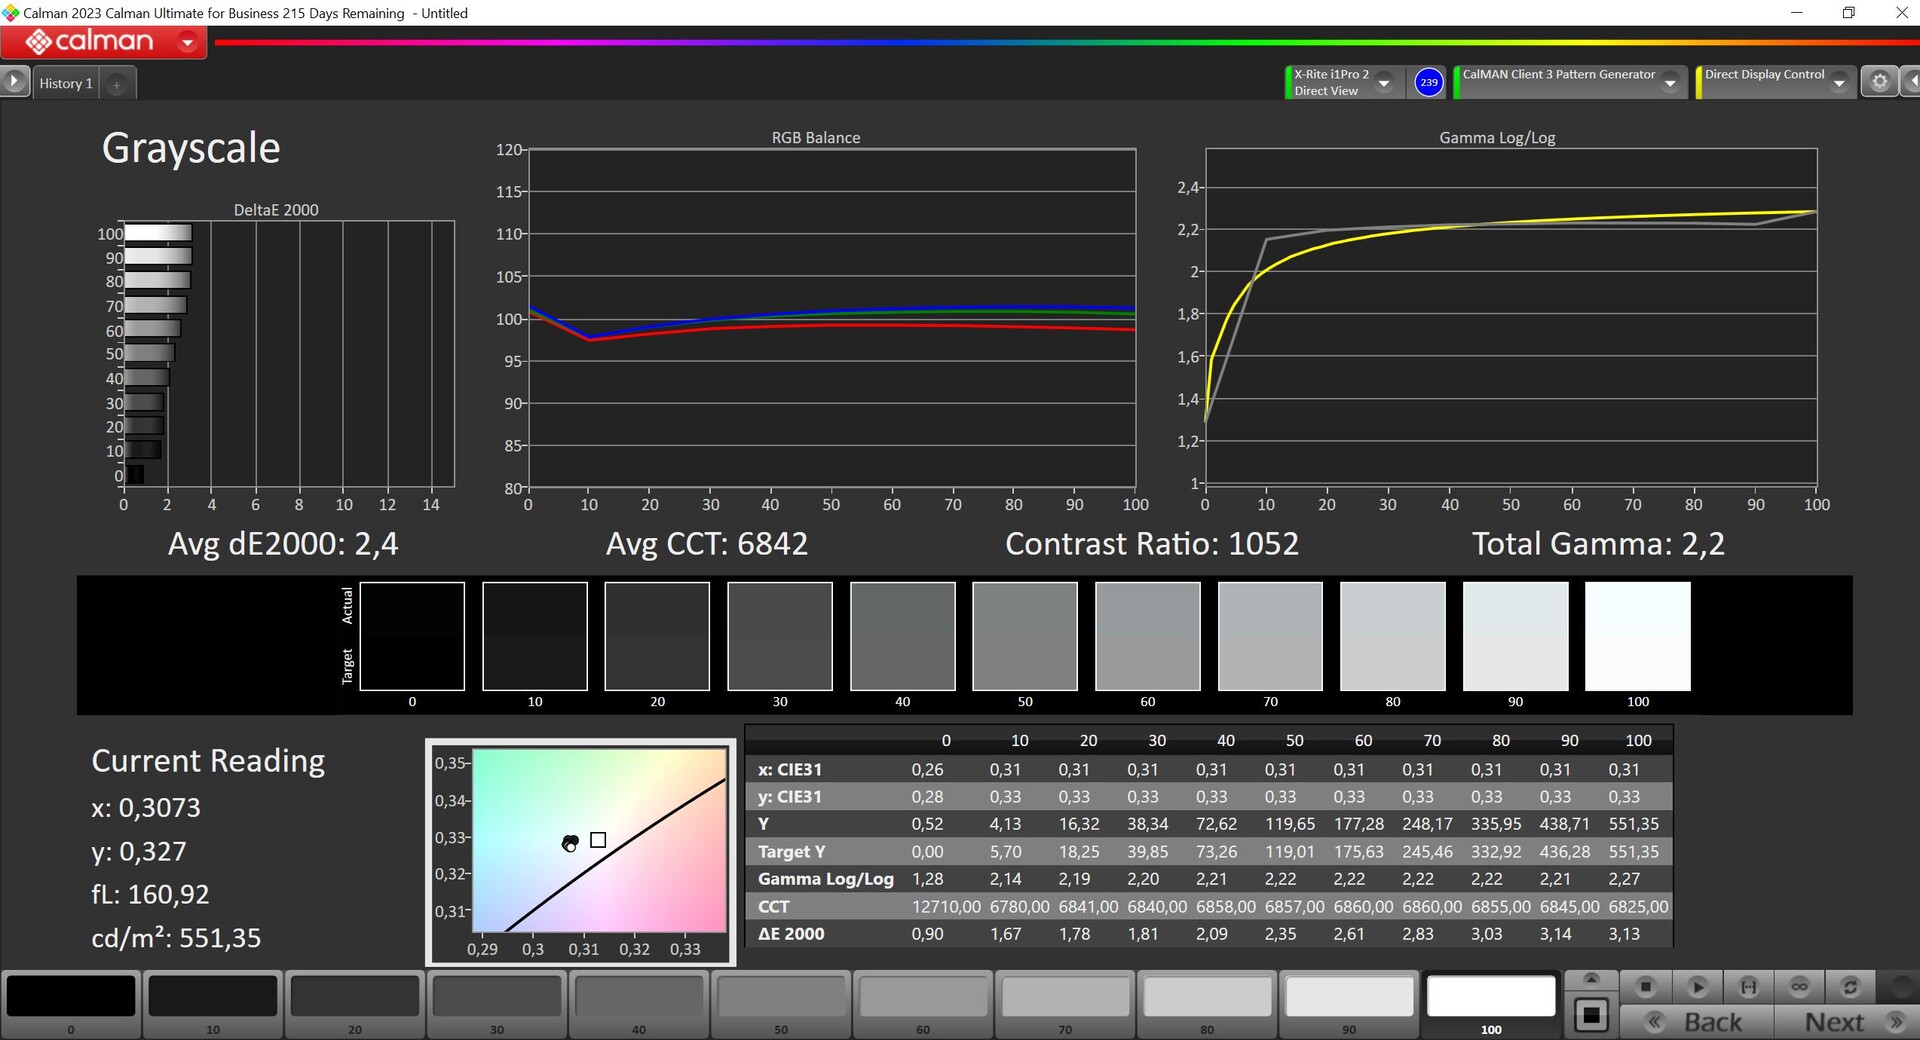
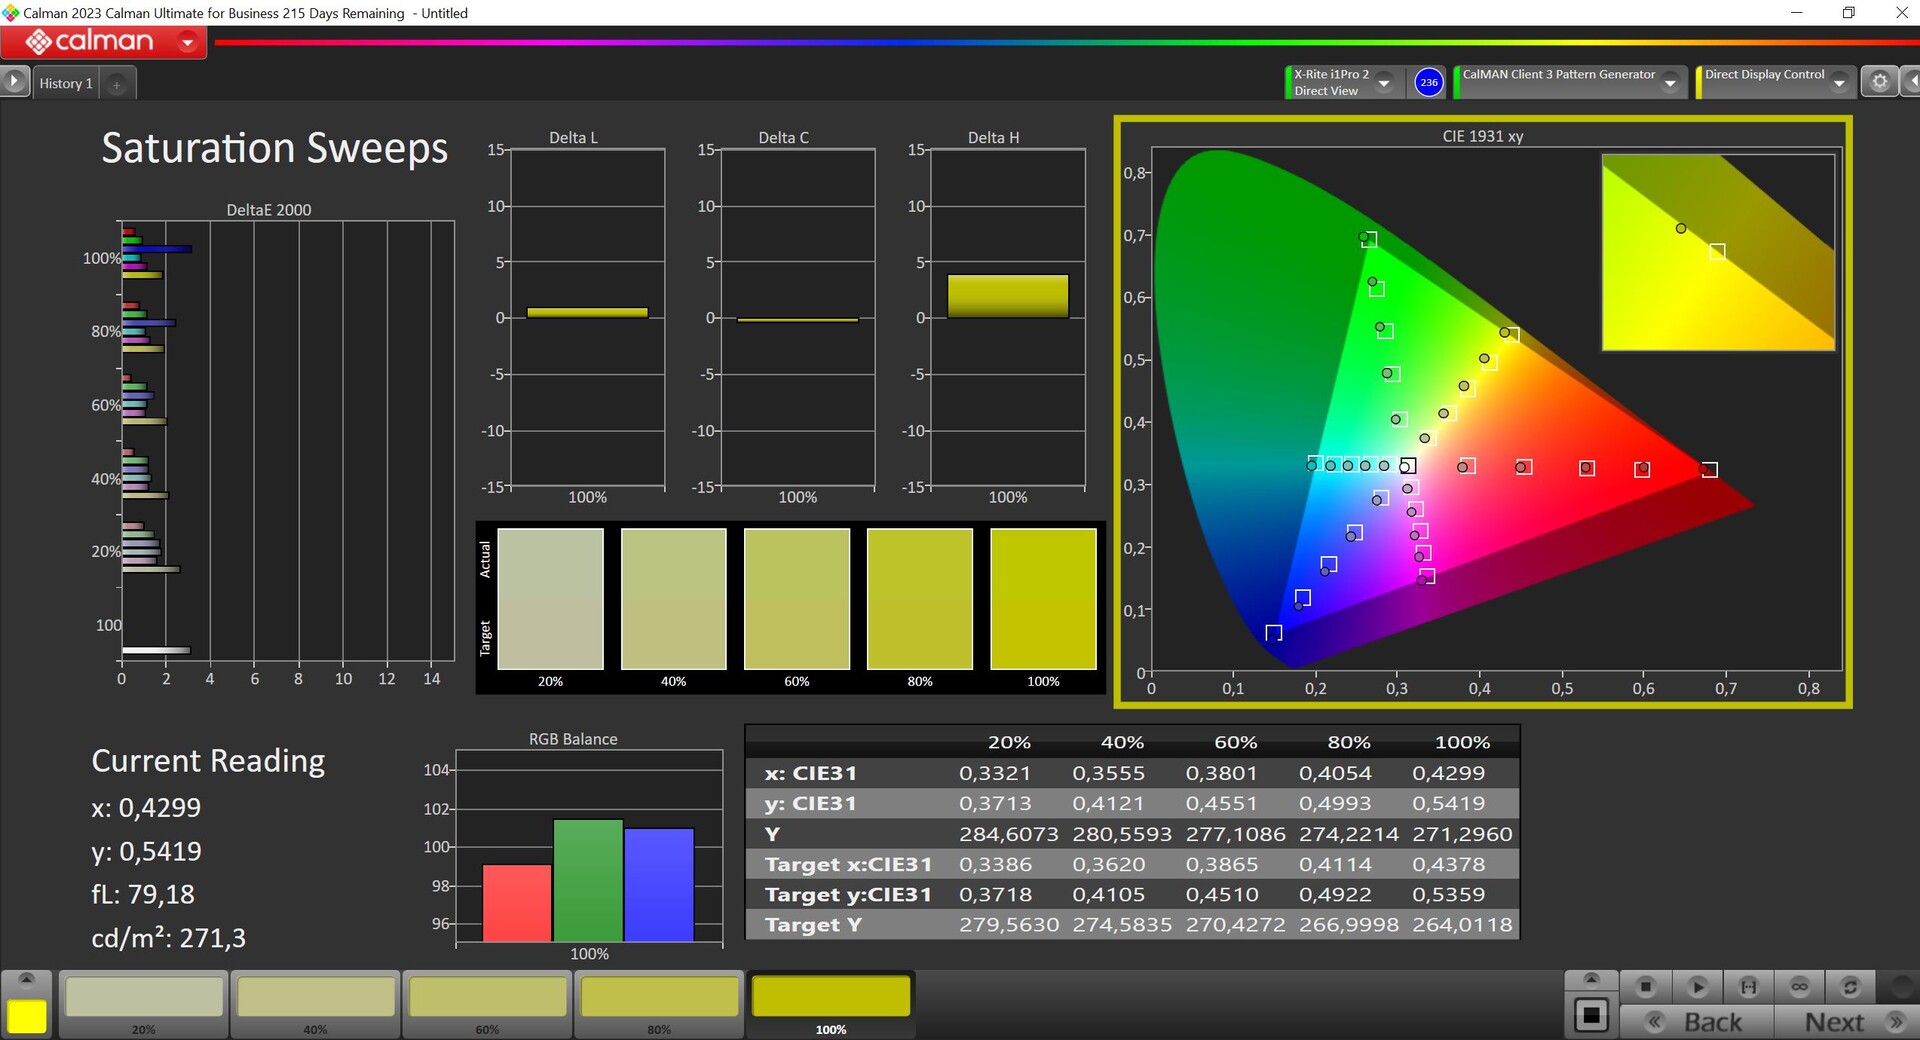
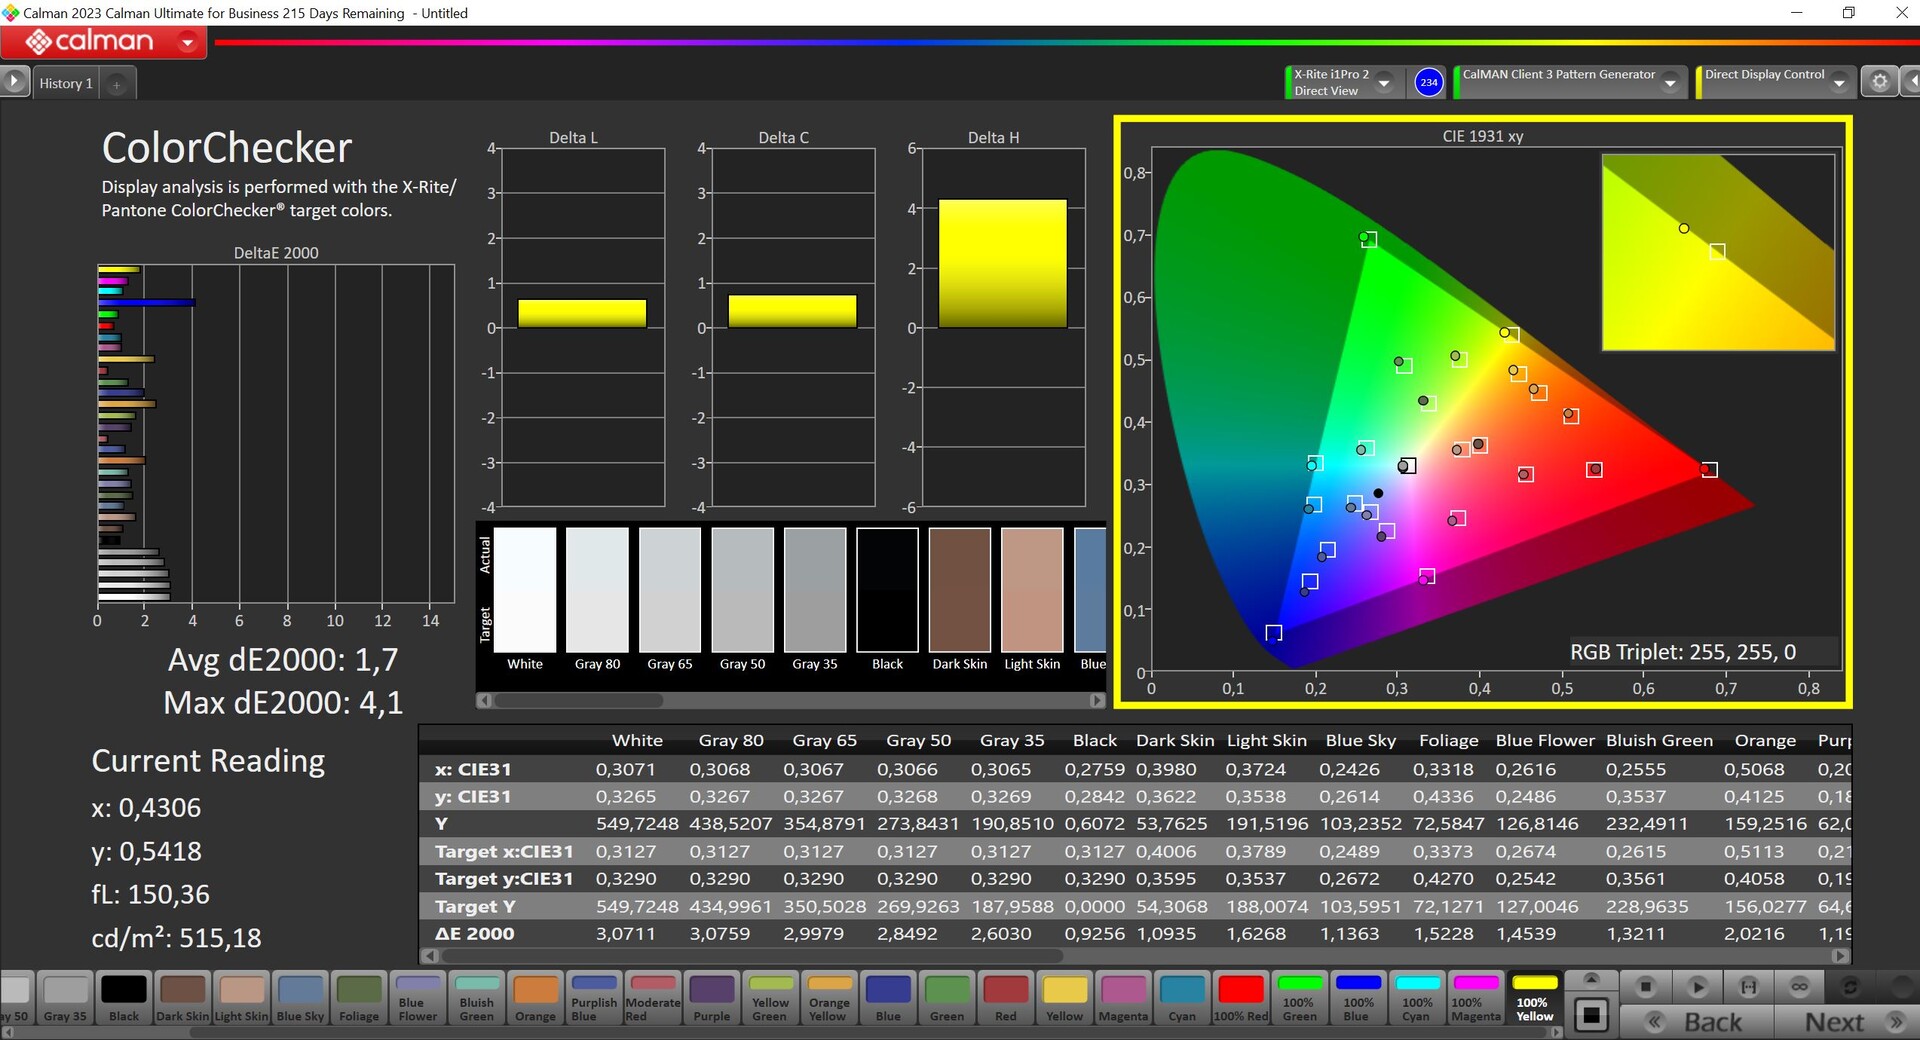
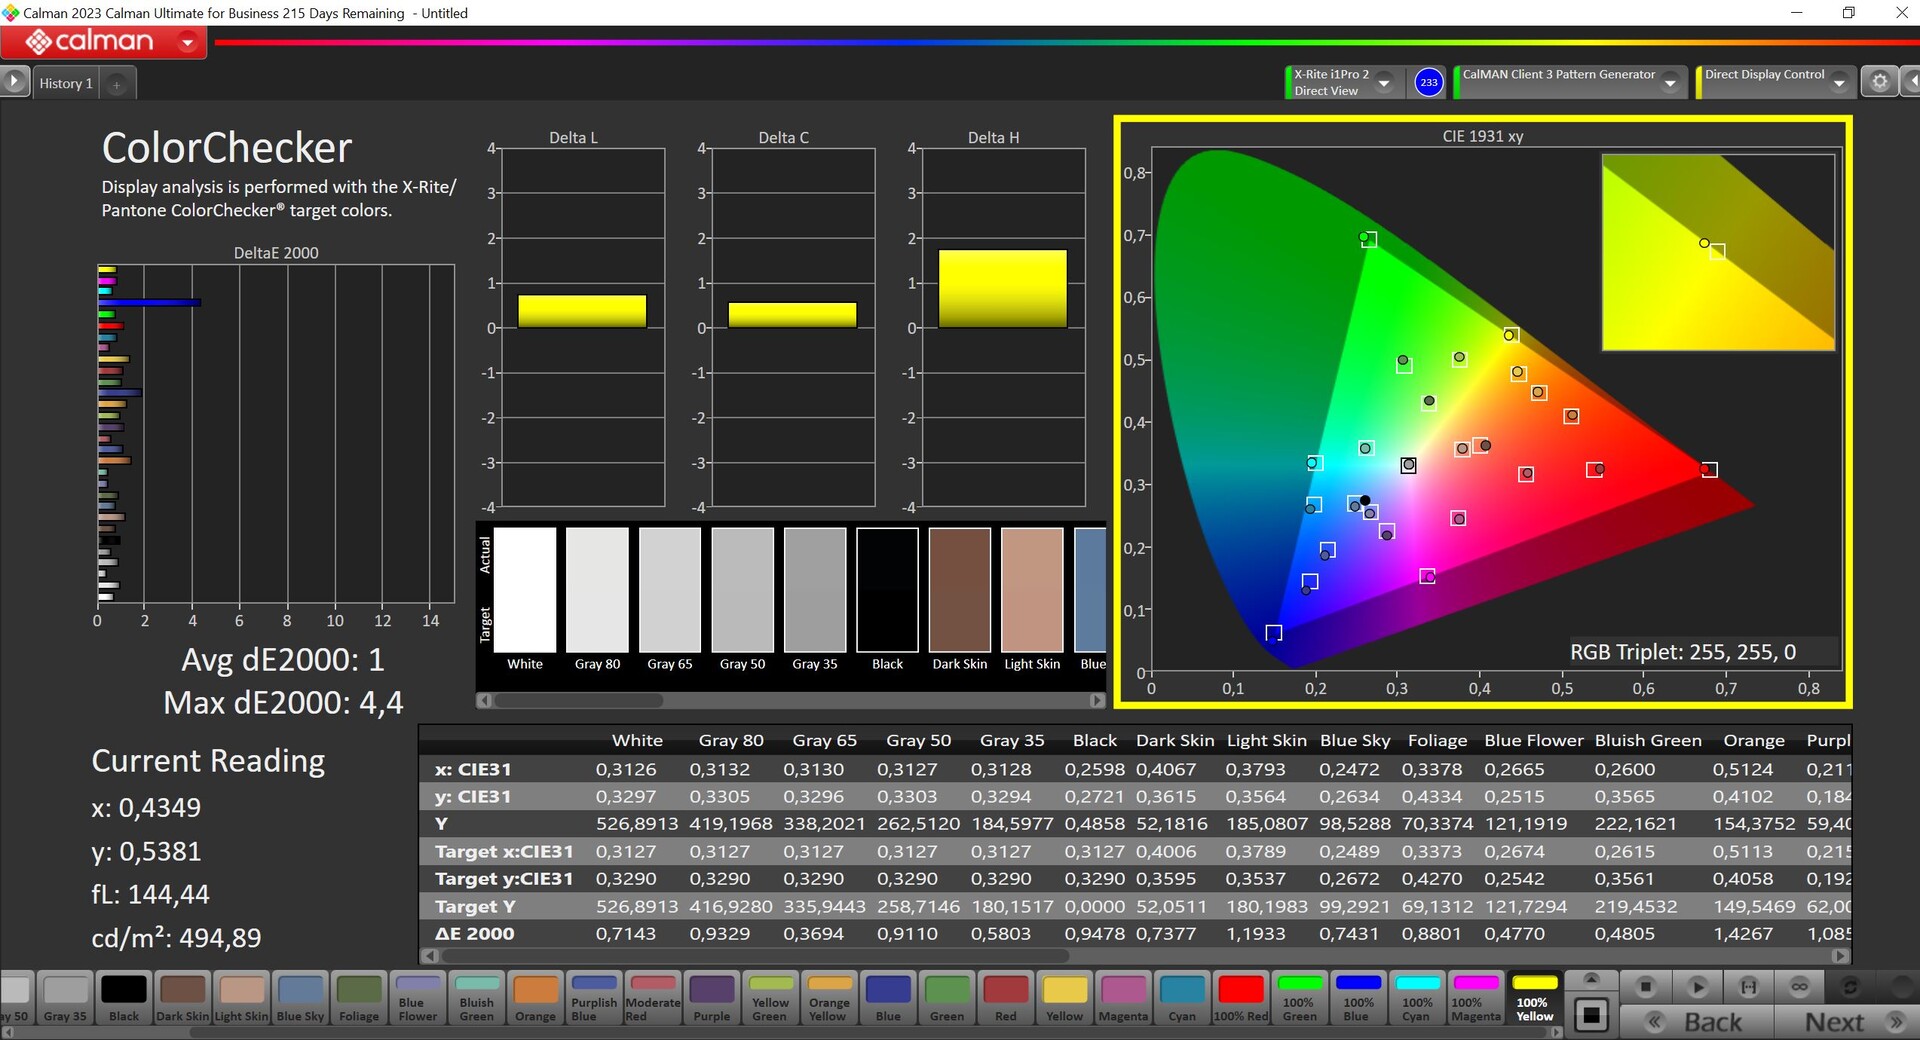
Honor não oferece nenhum perfil de cores, o que significa que também não há opção de restringir o espaço de cores de P3 para sRGB. Analisamos o painel usando o software profissional CalMAN e os desvios da escala de cinza são muito baixos. No entanto, há uma leve tonalidade azul combinada com uma temperatura de cor que é um pouco fria, mas isso não é particularmente problemático. Em termos de cores, somente o azul está um pouco acima do valor-alvo de 3 e isso pode ser considerado um desempenho sólido. Com a nossa calibração (o perfil gratuito correspondente, que pode ser baixado, pode ser encontrado acima), conseguimos controlar a tonalidade e a temperatura da cor e os desvios médios de cor resultantes são menores, sendo que o único problema ainda é a cor azul.


Exibir tempos de resposta
| ↔ Tempo de resposta preto para branco | ||
|---|---|---|
| 5.6 ms ... ascensão ↗ e queda ↘ combinadas | ↗ 1.6 ms ascensão | 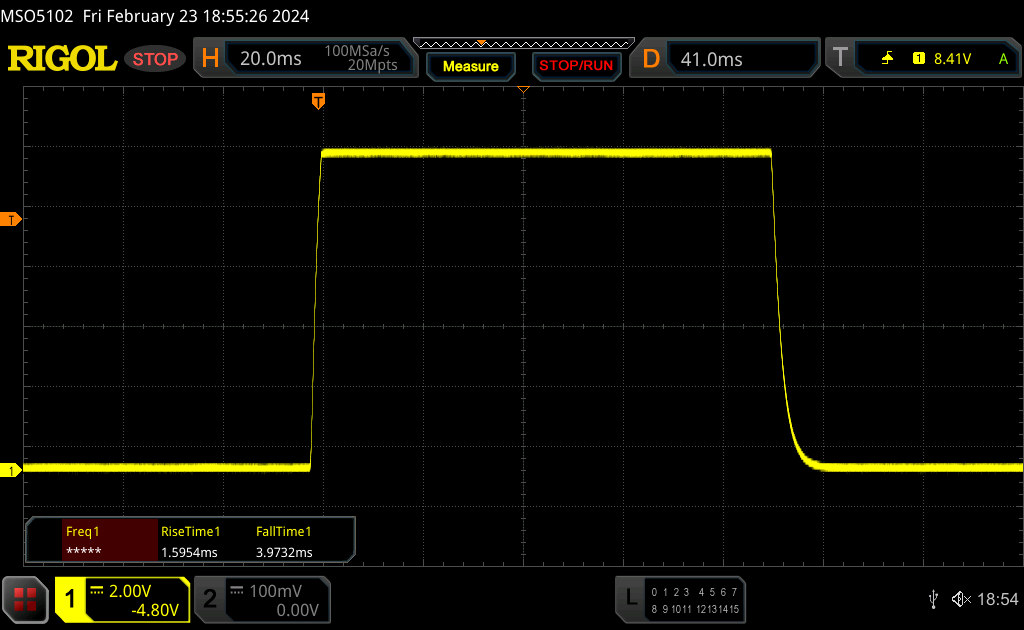 |
| ↘ 4 ms queda | ||
| A tela mostra taxas de resposta muito rápidas em nossos testes e deve ser muito adequada para jogos em ritmo acelerado. Em comparação, todos os dispositivos testados variam de 0.1 (mínimo) a 240 (máximo) ms. » 18 % de todos os dispositivos são melhores. Isso significa que o tempo de resposta medido é melhor que a média de todos os dispositivos testados (19.8 ms). | ||
| ↔ Tempo de resposta 50% cinza a 80% cinza | ||
| 6.3 ms ... ascensão ↗ e queda ↘ combinadas | ↗ 2.5 ms ascensão | 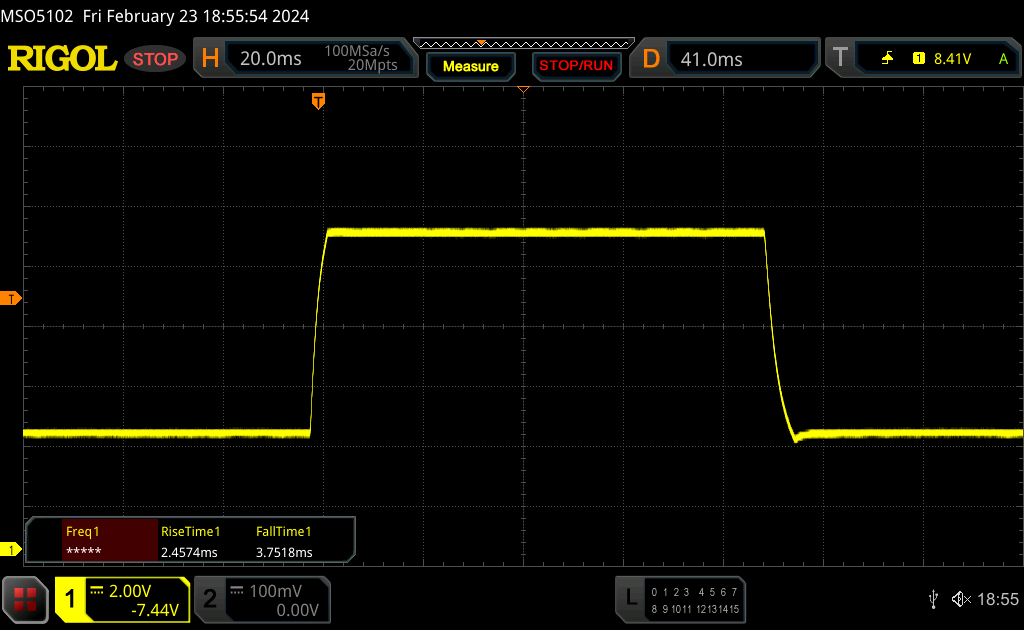 |
| ↘ 3.8 ms queda | ||
| A tela mostra taxas de resposta muito rápidas em nossos testes e deve ser muito adequada para jogos em ritmo acelerado. Em comparação, todos os dispositivos testados variam de 0.165 (mínimo) a 636 (máximo) ms. » 19 % de todos os dispositivos são melhores. Isso significa que o tempo de resposta medido é melhor que a média de todos os dispositivos testados (31 ms). | ||
Cintilação da tela / PWM (modulação por largura de pulso)
| Tela tremeluzindo / PWM não detectado | 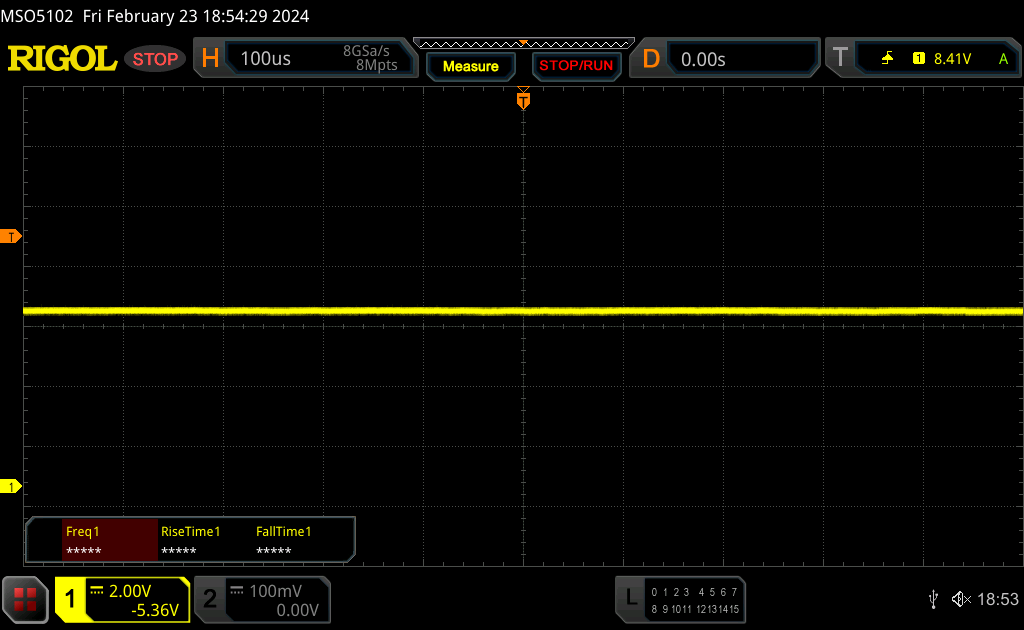 | ||
[pwm_comparison] Em comparação: 52 % de todos os dispositivos testados não usam PWM para escurecer a tela. Se PWM foi detectado, uma média de 7757 (mínimo: 5 - máximo: 343500) Hz foi medida. | |||
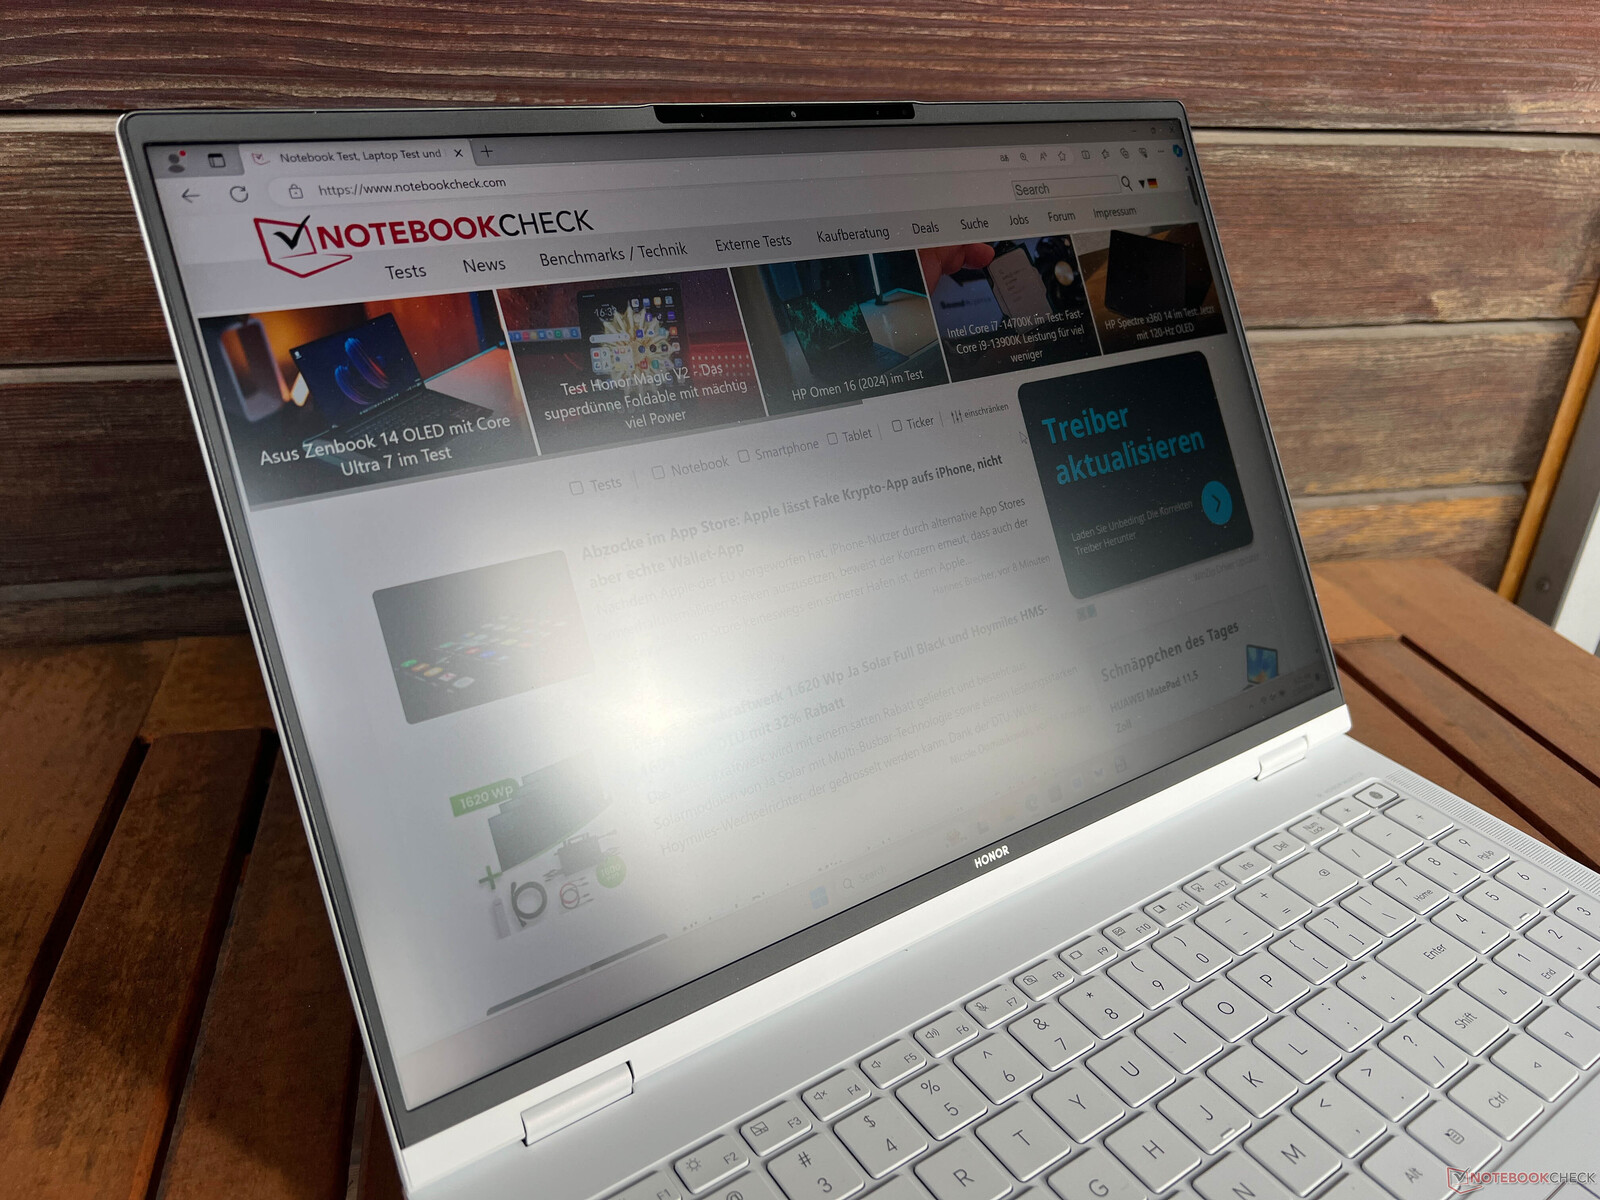
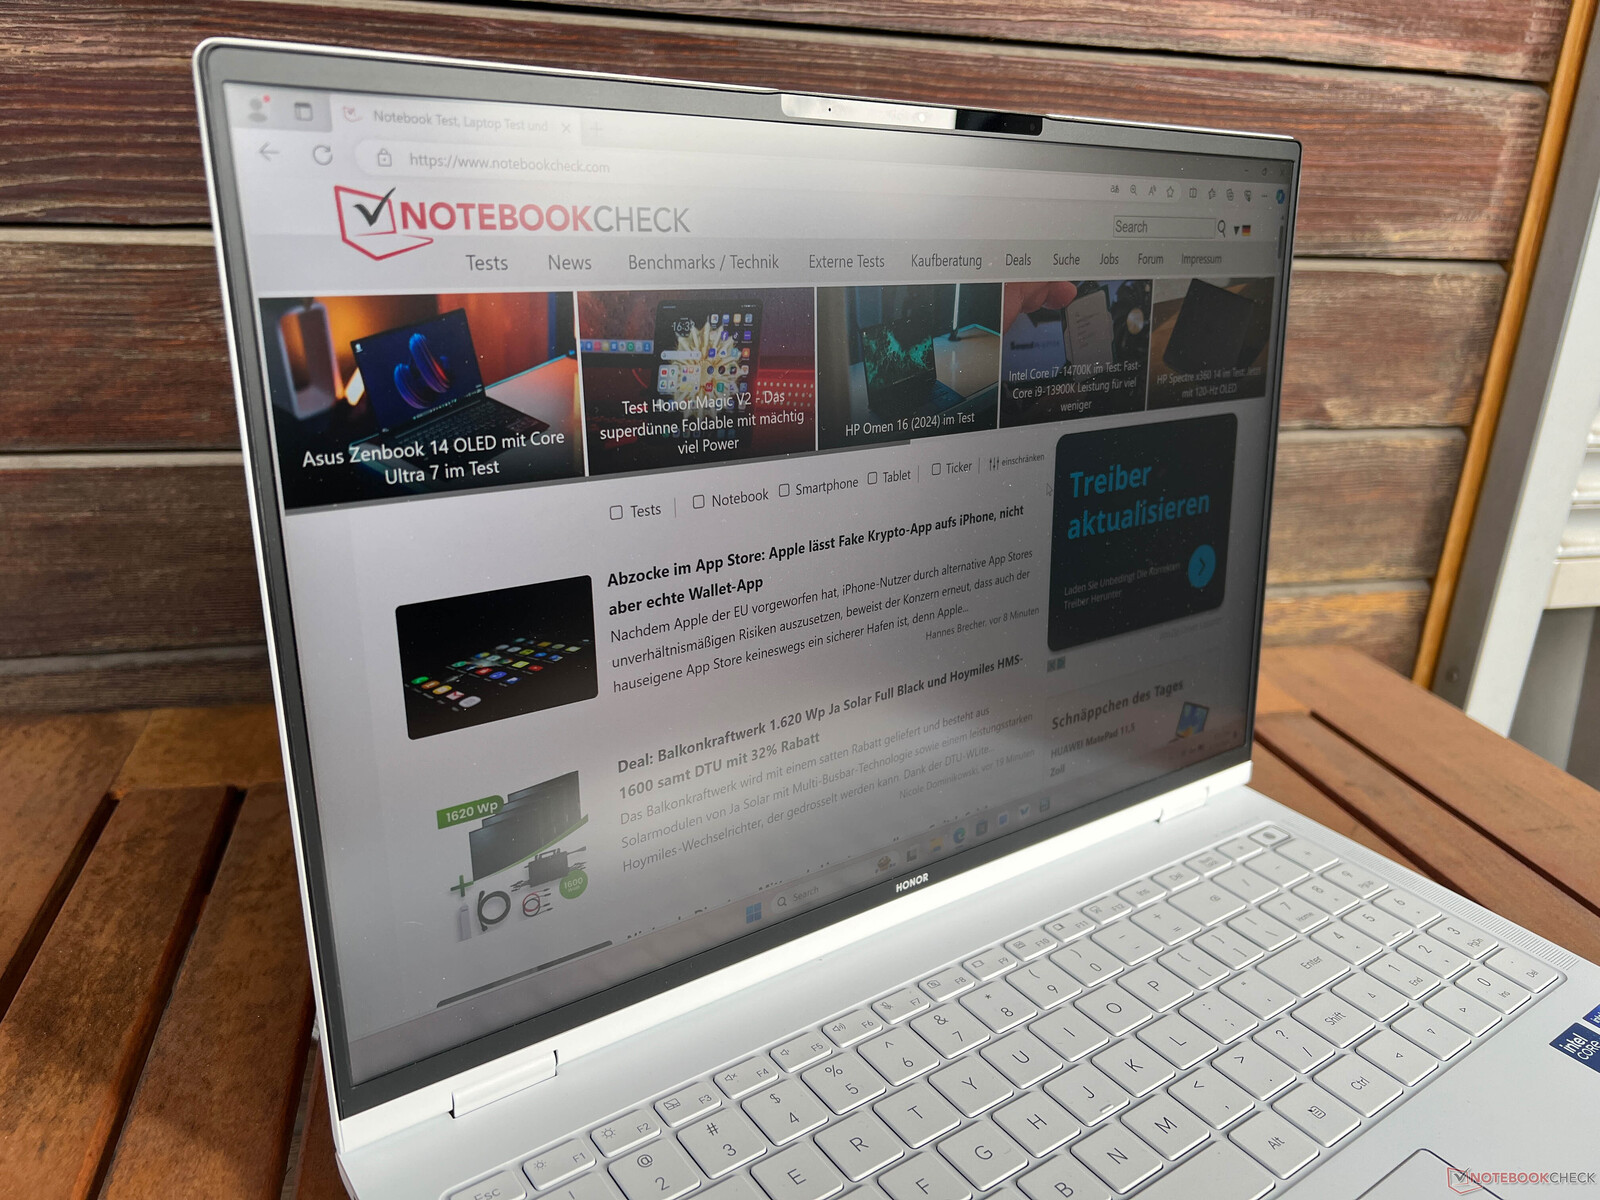
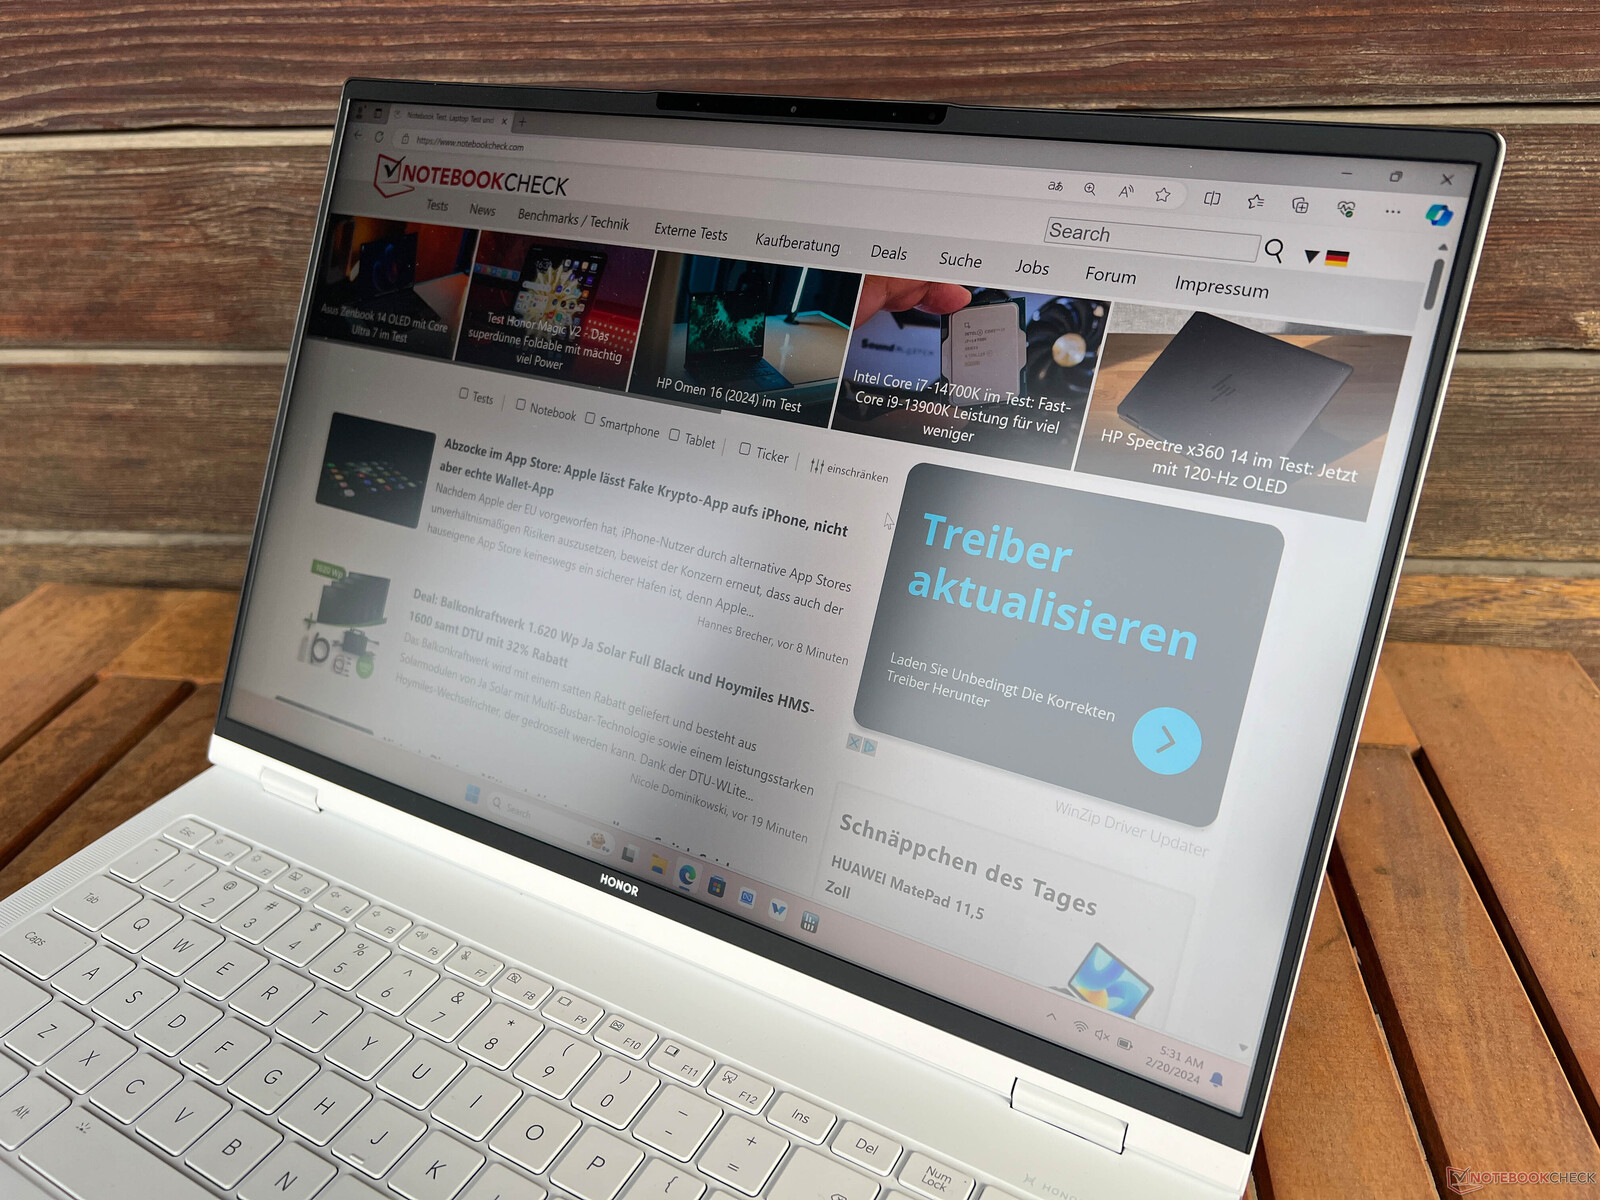
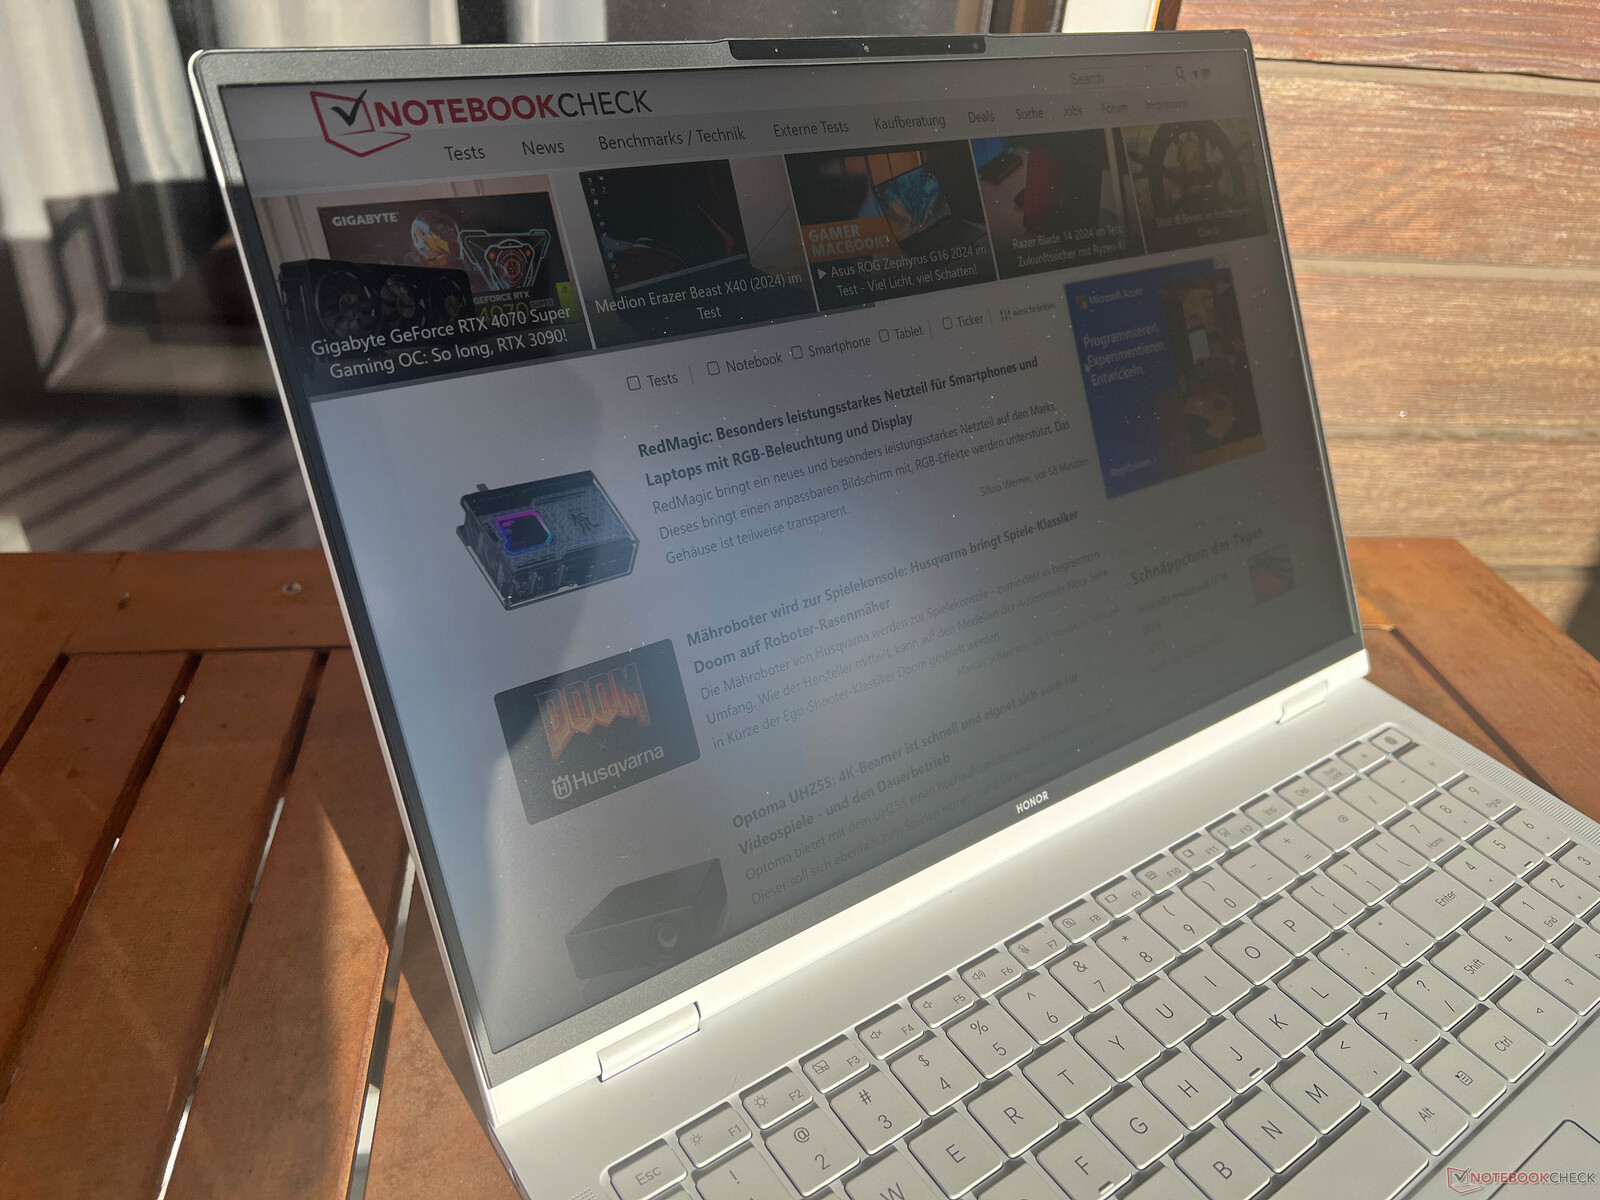
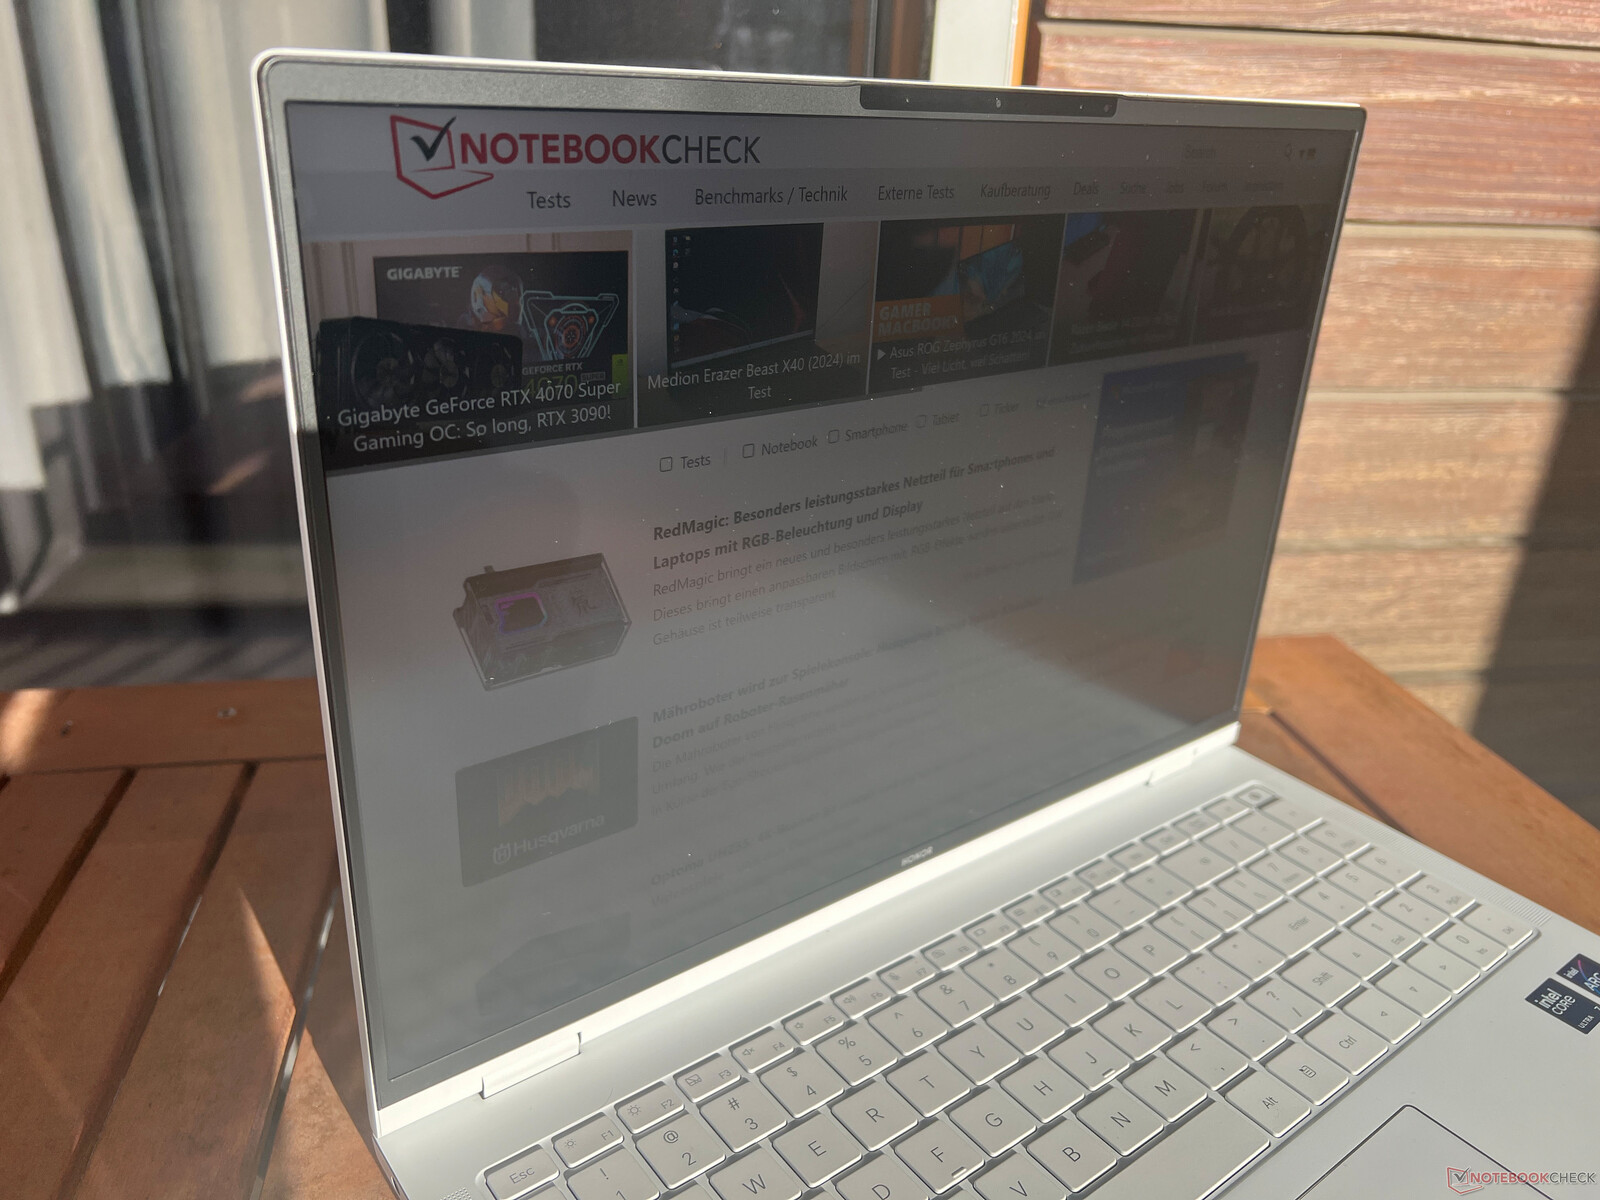
A combinação de um painel fosco e seu alto brilho é, obviamente, uma vantagem em ambientes externos. Isso significa até mesmo que o uso em ambientes externos em dias ensolarados é possível, desde que o senhor evite a luz solar direta. A estabilidade do ângulo de visão é boa, com apenas um leve brilho na imagem quando a tela é vista de cima em um ângulo.

Desempenho - laptop Meteor Lake e RTX 4060
Condições de teste
Honor oferece dois perfis de energia: Inteligente e de alto desempenho. Como é o padrão, o modo inteligente está ativo e o modo de alto desempenho só está disponível quando conectado à tomada. Na tabela a seguir, listamos os respectivos valores de TDP/TGP. Realizamos as seguintes medições usando o modo inteligente.
| Perfil de energia | Carga da CPU | CB R23 Multi | Carga da GPU | Time Spy Gráficos | Cyberpunk 2077 QHD Ultra | Volume máximo do ventilador |
|---|---|---|---|---|---|---|
| Inteligente | 90->60 watts | 19.007 pontos | 65 watts | 9.026 pontos | 36,5 fps | 45 dB(A) |
| Alto desempenho | 90->78 watts | 19,112 pontos | 115 watts | 11,153 pontos | 46.3fps | 53.2 dB(A) |
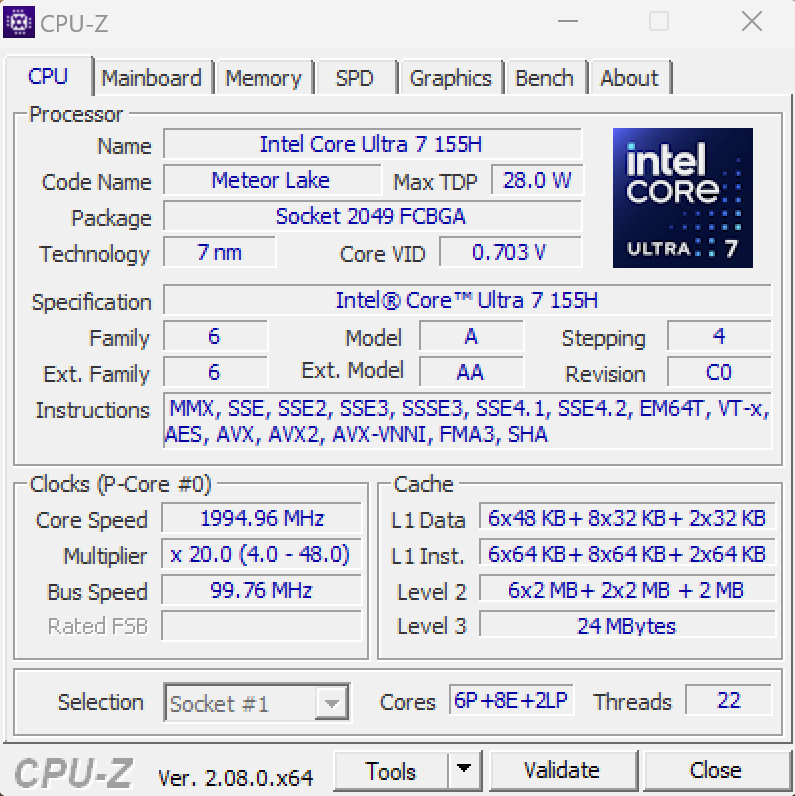
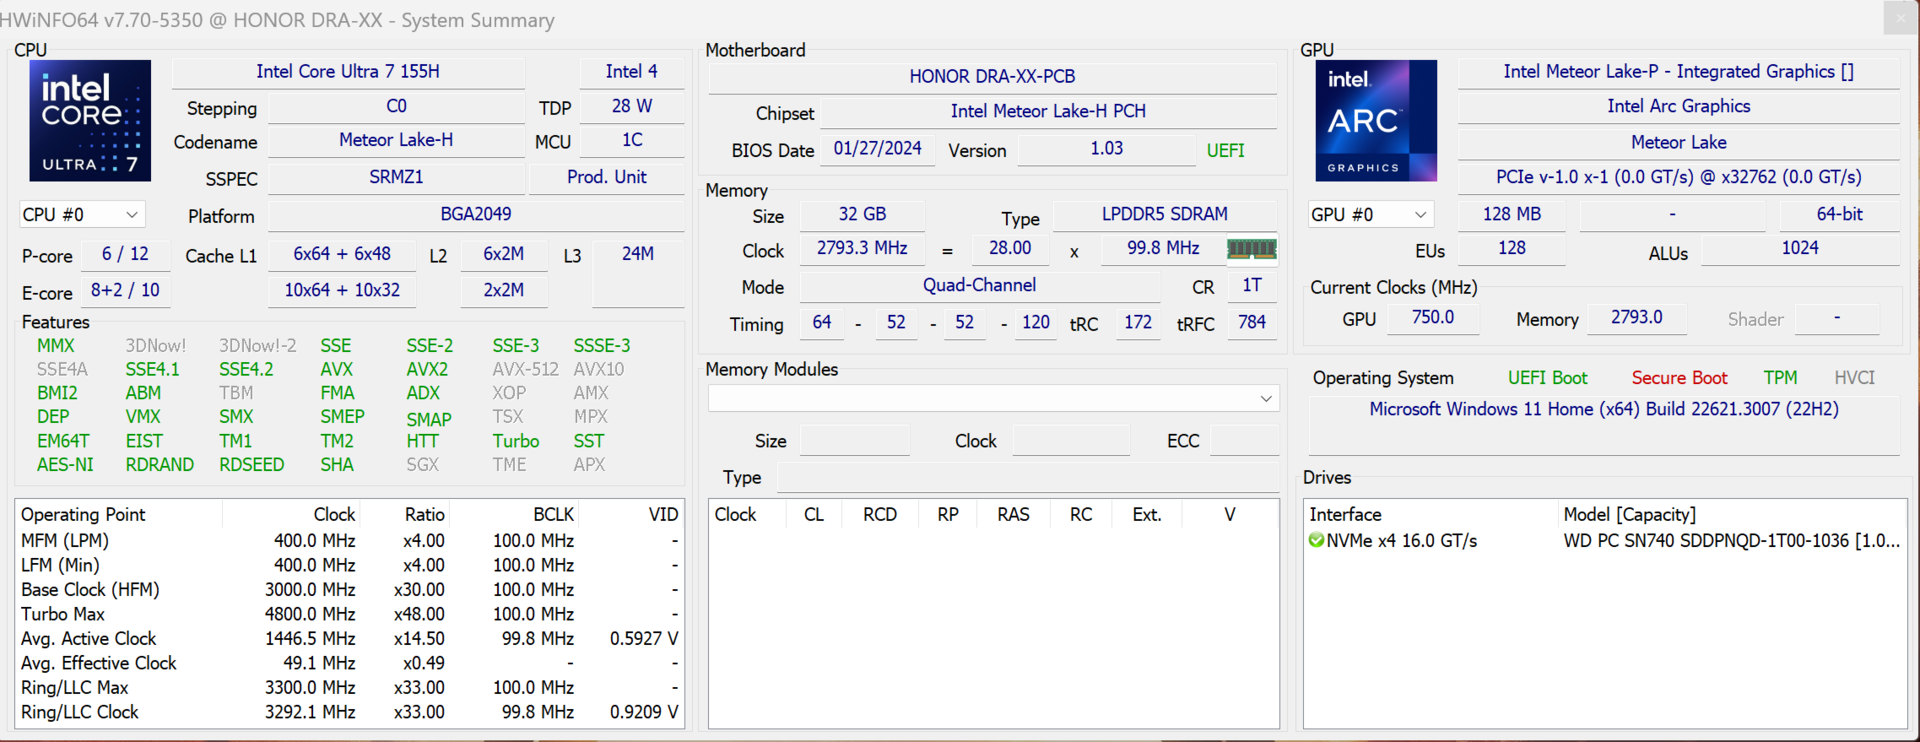
Processador - Core Ultra 7 155H
O novo Core Ultra 7 155H oferece 16 núcleos (22 threads) e é o sucessor do Core i7-13700H. No caso do MagicBook Pro, o processador pode consumir um máximo de 90 watts, caindo posteriormente para 60 watts. Isso significa que o desempenho geral está no mesmo nível do antigo Core i7-13705H encontrado no Lenovo Yoga Pro 9 16 bem como o Ryzen 9 7940HS.
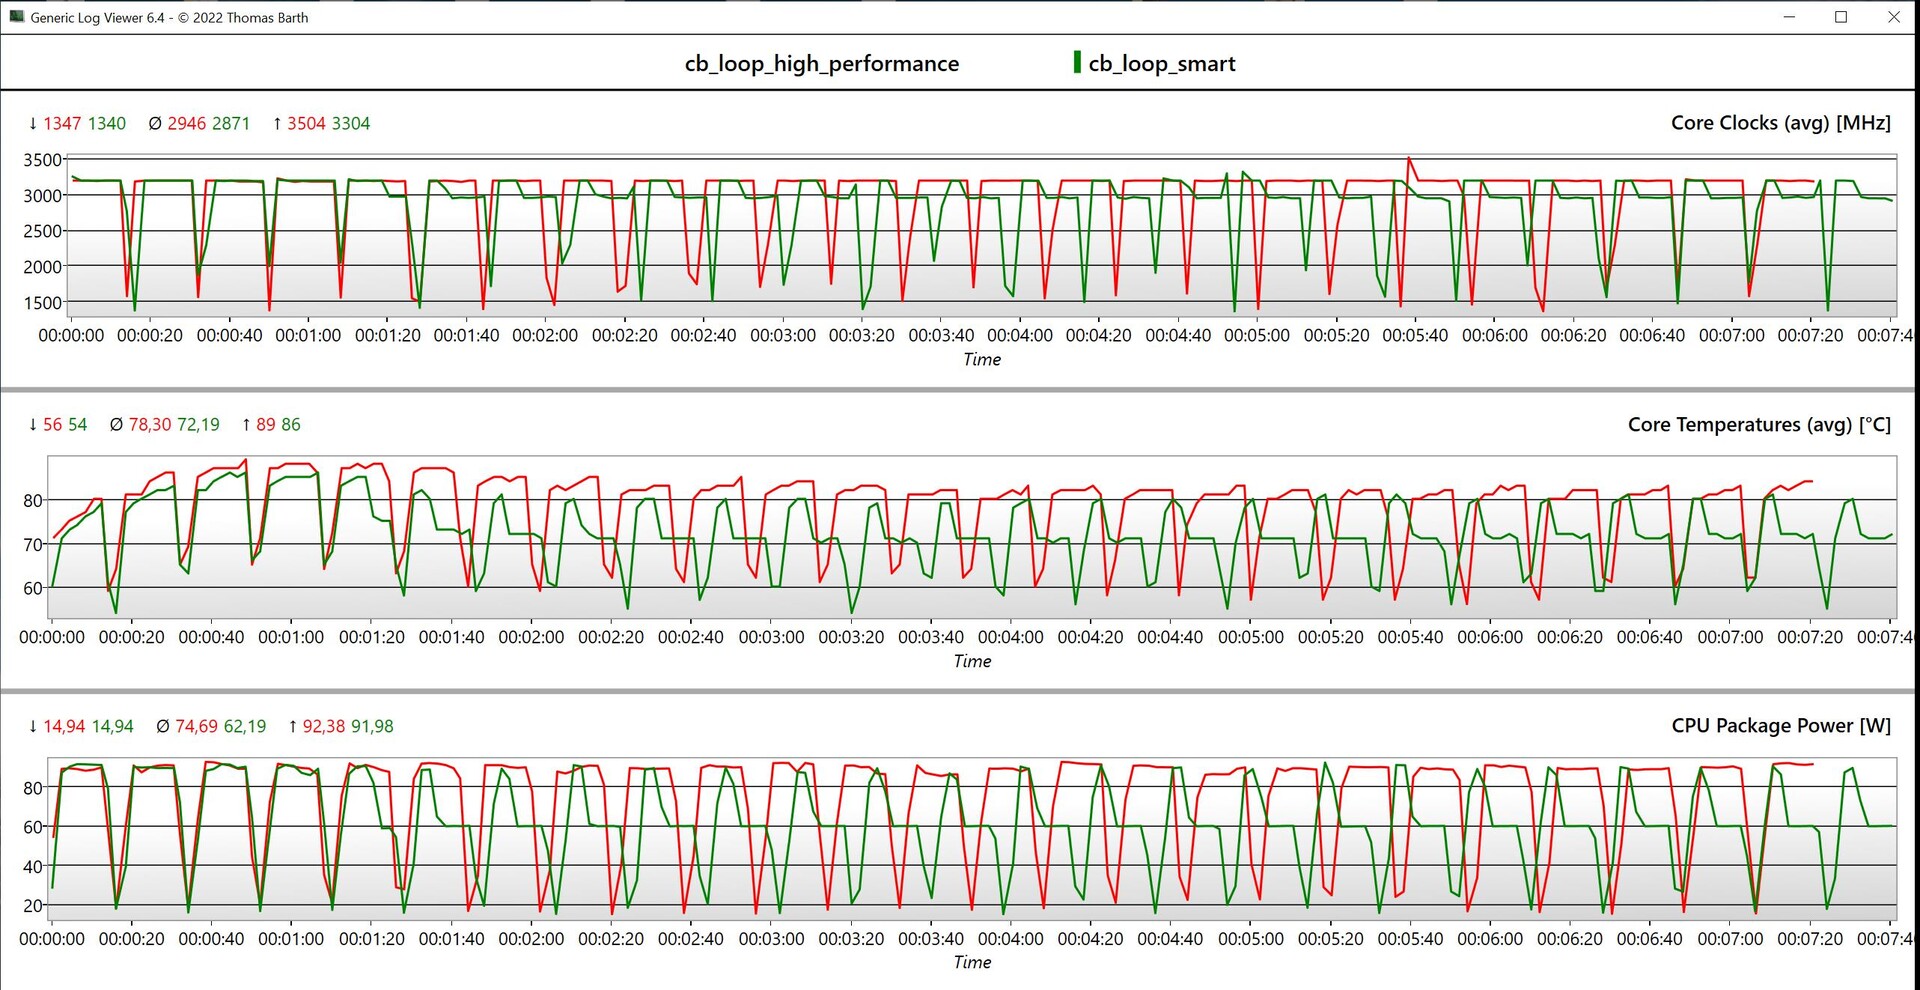
Cinebench R15 multi continuous test
Além disso, em nosso loop múltiplo CB R15, o desempenho também se mostrou estável, mesmo quando colocado sob carga por períodos mais longos. Com o modo de alto desempenho, o desempenho máximo permanece o mesmo e, com períodos mais longos de carga, os resultados são um pouco mais altos. No modo de bateria, o consumo máximo fica brevemente em 60 watts e depois cai rapidamente para 45 watts. É por isso que o desempenho de vários núcleos é cerca de 20% menor nessa área. Outros benchmarks de CPU estão disponíveis em nossa seção de tecnologia.
Cinebench R23: Multi Core | Single Core
Cinebench R20: CPU (Multi Core) | CPU (Single Core)
Cinebench R15: CPU Multi 64Bit | CPU Single 64Bit
Blender: v2.79 BMW27 CPU
7-Zip 18.03: 7z b 4 | 7z b 4 -mmt1
Geekbench 6.7: Multi-Core | Single-Core
Geekbench 5.5: Multi-Core | Single-Core
HWBOT x265 Benchmark v2.2: 4k Preset
LibreOffice : 20 Documents To PDF
R Benchmark 2.5: Overall mean
| CPU Performance rating | |
| Asus Vivobook Pro 16X K6604JV-MX016W -2! | |
| Lenovo Yoga Pro 9 16-IRP G8 | |
| Framework Laptop 16 | |
| Lenovo ThinkPad Z16 Gen 2 | |
| Honor MagicBook Pro 16 2024 | |
| Média da turma Multimedia | |
| Dell Inspiron 16 Plus 7630 | |
| Schenker VISION 16 Pro (M23) -2! | |
| Média Intel Core Ultra 7 155H | |
| Cinebench R23 / Multi Core | |
| Asus Vivobook Pro 16X K6604JV-MX016W | |
| Lenovo Yoga Pro 9 16-IRP G8 | |
| Honor MagicBook Pro 16 2024 | |
| Lenovo ThinkPad Z16 Gen 2 | |
| Média da turma Multimedia (4861 - 33362, n=75, últimos 2 anos) | |
| Framework Laptop 16 | |
| Dell Inspiron 16 Plus 7630 | |
| Média Intel Core Ultra 7 155H (9769 - 19007, n=52) | |
| Schenker VISION 16 Pro (M23) | |
| Cinebench R23 / Single Core | |
| Média da turma Multimedia (1128 - 2459, n=67, últimos 2 anos) | |
| Schenker VISION 16 Pro (M23) | |
| Lenovo Yoga Pro 9 16-IRP G8 | |
| Dell Inspiron 16 Plus 7630 | |
| Asus Vivobook Pro 16X K6604JV-MX016W | |
| Lenovo ThinkPad Z16 Gen 2 | |
| Honor MagicBook Pro 16 2024 | |
| Framework Laptop 16 | |
| Média Intel Core Ultra 7 155H (1496 - 1815, n=52) | |
| Cinebench R20 / CPU (Multi Core) | |
| Asus Vivobook Pro 16X K6604JV-MX016W | |
| Lenovo Yoga Pro 9 16-IRP G8 | |
| Honor MagicBook Pro 16 2024 | |
| Lenovo ThinkPad Z16 Gen 2 | |
| Framework Laptop 16 | |
| Média da turma Multimedia (1887 - 12912, n=58, últimos 2 anos) | |
| Dell Inspiron 16 Plus 7630 | |
| Média Intel Core Ultra 7 155H (3798 - 7409, n=50) | |
| Schenker VISION 16 Pro (M23) | |
| Cinebench R20 / CPU (Single Core) | |
| Lenovo Yoga Pro 9 16-IRP G8 | |
| Schenker VISION 16 Pro (M23) | |
| Média da turma Multimedia (425 - 853, n=58, últimos 2 anos) | |
| Dell Inspiron 16 Plus 7630 | |
| Asus Vivobook Pro 16X K6604JV-MX016W | |
| Lenovo ThinkPad Z16 Gen 2 | |
| Honor MagicBook Pro 16 2024 | |
| Framework Laptop 16 | |
| Média Intel Core Ultra 7 155H (601 - 696, n=50) | |
| Cinebench R15 / CPU Multi 64Bit | |
| Asus Vivobook Pro 16X K6604JV-MX016W | |
| Lenovo Yoga Pro 9 16-IRP G8 | |
| Honor MagicBook Pro 16 2024 | |
| Lenovo ThinkPad Z16 Gen 2 | |
| Framework Laptop 16 | |
| Média da turma Multimedia (856 - 5224, n=62, últimos 2 anos) | |
| Média Intel Core Ultra 7 155H (1932 - 2880, n=56) | |
| Dell Inspiron 16 Plus 7630 | |
| Schenker VISION 16 Pro (M23) | |
| Cinebench R15 / CPU Single 64Bit | |
| Asus Vivobook Pro 16X K6604JV-MX016W | |
| Média da turma Multimedia (184.8 - 326, n=60, últimos 2 anos) | |
| Lenovo ThinkPad Z16 Gen 2 | |
| Framework Laptop 16 | |
| Schenker VISION 16 Pro (M23) | |
| Lenovo Yoga Pro 9 16-IRP G8 | |
| Honor MagicBook Pro 16 2024 | |
| Dell Inspiron 16 Plus 7630 | |
| Média Intel Core Ultra 7 155H (99.6 - 268, n=52) | |
| Blender / v2.79 BMW27 CPU | |
| Média da turma Multimedia (100 - 557, n=59, últimos 2 anos) | |
| Média Intel Core Ultra 7 155H (175 - 381, n=47) | |
| Schenker VISION 16 Pro (M23) | |
| Dell Inspiron 16 Plus 7630 | |
| Framework Laptop 16 | |
| Lenovo ThinkPad Z16 Gen 2 | |
| Honor MagicBook Pro 16 2024 | |
| Lenovo Yoga Pro 9 16-IRP G8 | |
| Asus Vivobook Pro 16X K6604JV-MX016W | |
| 7-Zip 18.03 / 7z b 4 | |
| Asus Vivobook Pro 16X K6604JV-MX016W | |
| Lenovo Yoga Pro 9 16-IRP G8 | |
| Framework Laptop 16 | |
| Honor MagicBook Pro 16 2024 | |
| Lenovo ThinkPad Z16 Gen 2 | |
| Schenker VISION 16 Pro (M23) | |
| Dell Inspiron 16 Plus 7630 | |
| Média Intel Core Ultra 7 155H (41739 - 70254, n=50) | |
| Média da turma Multimedia (26062 - 130368, n=56, últimos 2 anos) | |
| 7-Zip 18.03 / 7z b 4 -mmt1 | |
| Asus Vivobook Pro 16X K6604JV-MX016W | |
| Framework Laptop 16 | |
| Schenker VISION 16 Pro (M23) | |
| Lenovo ThinkPad Z16 Gen 2 | |
| Lenovo Yoga Pro 9 16-IRP G8 | |
| Média da turma Multimedia (3666 - 7545, n=57, últimos 2 anos) | |
| Dell Inspiron 16 Plus 7630 | |
| Honor MagicBook Pro 16 2024 | |
| Média Intel Core Ultra 7 155H (4594 - 5621, n=50) | |
| Geekbench 6.7 / Multi-Core | |
| Média da turma Multimedia (4983 - 29415, n=70, últimos 2 anos) | |
| Lenovo Yoga Pro 9 16-IRP G8 | |
| Dell Inspiron 16 Plus 7630 | |
| Framework Laptop 16 | |
| Honor MagicBook Pro 16 2024 | |
| Lenovo ThinkPad Z16 Gen 2 | |
| Média Intel Core Ultra 7 155H (7732 - 13656, n=55) | |
| Geekbench 6.7 / Single-Core | |
| Média da turma Multimedia (1534 - 4335, n=69, últimos 2 anos) | |
| Dell Inspiron 16 Plus 7630 | |
| Framework Laptop 16 | |
| Lenovo ThinkPad Z16 Gen 2 | |
| Lenovo Yoga Pro 9 16-IRP G8 | |
| Honor MagicBook Pro 16 2024 | |
| Média Intel Core Ultra 7 155H (1901 - 2473, n=52) | |
| Geekbench 5.5 / Multi-Core | |
| Asus Vivobook Pro 16X K6604JV-MX016W | |
| Lenovo Yoga Pro 9 16-IRP G8 | |
| Honor MagicBook Pro 16 2024 | |
| Média da turma Multimedia (4652 - 20422, n=57, últimos 2 anos) | |
| Dell Inspiron 16 Plus 7630 | |
| Framework Laptop 16 | |
| Lenovo ThinkPad Z16 Gen 2 | |
| Média Intel Core Ultra 7 155H (10017 - 13556, n=52) | |
| Schenker VISION 16 Pro (M23) | |
| Geekbench 5.5 / Single-Core | |
| Asus Vivobook Pro 16X K6604JV-MX016W | |
| Média da turma Multimedia (805 - 2974, n=57, últimos 2 anos) | |
| Framework Laptop 16 | |
| Lenovo ThinkPad Z16 Gen 2 | |
| Dell Inspiron 16 Plus 7630 | |
| Schenker VISION 16 Pro (M23) | |
| Honor MagicBook Pro 16 2024 | |
| Lenovo Yoga Pro 9 16-IRP G8 | |
| Média Intel Core Ultra 7 155H (1462 - 1824, n=52) | |
| HWBOT x265 Benchmark v2.2 / 4k Preset | |
| Asus Vivobook Pro 16X K6604JV-MX016W | |
| Lenovo Yoga Pro 9 16-IRP G8 | |
| Framework Laptop 16 | |
| Honor MagicBook Pro 16 2024 | |
| Lenovo ThinkPad Z16 Gen 2 | |
| Média da turma Multimedia (5.26 - 36.1, n=57, últimos 2 anos) | |
| Schenker VISION 16 Pro (M23) | |
| Média Intel Core Ultra 7 155H (9.93 - 21.2, n=50) | |
| Dell Inspiron 16 Plus 7630 | |
| LibreOffice / 20 Documents To PDF | |
| Asus Vivobook Pro 16X K6604JV-MX016W | |
| Média da turma Multimedia (23.9 - 146.7, n=58, últimos 2 anos) | |
| Média Intel Core Ultra 7 155H (37.5 - 79.2, n=49) | |
| Lenovo Yoga Pro 9 16-IRP G8 | |
| Schenker VISION 16 Pro (M23) | |
| Honor MagicBook Pro 16 2024 | |
| Lenovo ThinkPad Z16 Gen 2 | |
| Dell Inspiron 16 Plus 7630 | |
| Framework Laptop 16 | |
| R Benchmark 2.5 / Overall mean | |
| Média Intel Core Ultra 7 155H (0.4457 - 0.53, n=49) | |
| Média da turma Multimedia (0.3604 - 0.947, n=57, últimos 2 anos) | |
| Honor MagicBook Pro 16 2024 | |
| Lenovo Yoga Pro 9 16-IRP G8 | |
| Lenovo ThinkPad Z16 Gen 2 | |
| Framework Laptop 16 | |
| Schenker VISION 16 Pro (M23) | |
| Dell Inspiron 16 Plus 7630 | |
| Asus Vivobook Pro 16X K6604JV-MX016W | |
* ... menor é melhor
AIDA64: FP32 Ray-Trace | FPU Julia | CPU SHA3 | CPU Queen | FPU SinJulia | FPU Mandel | CPU AES | CPU ZLib | FP64 Ray-Trace | CPU PhotoWorxx
| Performance rating | |
| Framework Laptop 16 | |
| Lenovo ThinkPad Z16 Gen 2 | |
| Asus Vivobook Pro 16X K6604JV-MX016W | |
| Honor MagicBook Pro 16 2024 | |
| Lenovo Yoga Pro 9 16-IRP G8 | |
| Média da turma Multimedia | |
| Schenker VISION 16 Pro (M23) | |
| Média Intel Core Ultra 7 155H | |
| Dell Inspiron 16 Plus 7630 | |
| AIDA64 / FP32 Ray-Trace | |
| Lenovo ThinkPad Z16 Gen 2 | |
| Framework Laptop 16 | |
| Asus Vivobook Pro 16X K6604JV-MX016W | |
| Lenovo Yoga Pro 9 16-IRP G8 | |
| Média da turma Multimedia (2214 - 50388, n=54, últimos 2 anos) | |
| Honor MagicBook Pro 16 2024 | |
| Dell Inspiron 16 Plus 7630 | |
| Schenker VISION 16 Pro (M23) | |
| Média Intel Core Ultra 7 155H (6670 - 18470, n=50) | |
| AIDA64 / FPU Julia | |
| Lenovo ThinkPad Z16 Gen 2 | |
| Framework Laptop 16 | |
| Asus Vivobook Pro 16X K6604JV-MX016W | |
| Honor MagicBook Pro 16 2024 | |
| Lenovo Yoga Pro 9 16-IRP G8 | |
| Média da turma Multimedia (12867 - 201874, n=55, últimos 2 anos) | |
| Schenker VISION 16 Pro (M23) | |
| Média Intel Core Ultra 7 155H (40905 - 93181, n=50) | |
| Dell Inspiron 16 Plus 7630 | |
| AIDA64 / CPU SHA3 | |
| Asus Vivobook Pro 16X K6604JV-MX016W | |
| Lenovo ThinkPad Z16 Gen 2 | |
| Framework Laptop 16 | |
| Honor MagicBook Pro 16 2024 | |
| Lenovo Yoga Pro 9 16-IRP G8 | |
| Média da turma Multimedia (626 - 8623, n=55, últimos 2 anos) | |
| Média Intel Core Ultra 7 155H (1940 - 4436, n=50) | |
| Schenker VISION 16 Pro (M23) | |
| Dell Inspiron 16 Plus 7630 | |
| AIDA64 / CPU Queen | |
| Asus Vivobook Pro 16X K6604JV-MX016W | |
| Lenovo ThinkPad Z16 Gen 2 | |
| Framework Laptop 16 | |
| Lenovo Yoga Pro 9 16-IRP G8 | |
| Dell Inspiron 16 Plus 7630 | |
| Schenker VISION 16 Pro (M23) | |
| Honor MagicBook Pro 16 2024 | |
| Média Intel Core Ultra 7 155H (64698 - 94181, n=50) | |
| Média da turma Multimedia (13483 - 181505, n=42, últimos 2 anos) | |
| AIDA64 / FPU SinJulia | |
| Lenovo ThinkPad Z16 Gen 2 | |
| Framework Laptop 16 | |
| Asus Vivobook Pro 16X K6604JV-MX016W | |
| Lenovo Yoga Pro 9 16-IRP G8 | |
| Honor MagicBook Pro 16 2024 | |
| Média Intel Core Ultra 7 155H (5639 - 10647, n=50) | |
| Schenker VISION 16 Pro (M23) | |
| Dell Inspiron 16 Plus 7630 | |
| Média da turma Multimedia (886 - 28794, n=55, últimos 2 anos) | |
| AIDA64 / FPU Mandel | |
| Lenovo ThinkPad Z16 Gen 2 | |
| Framework Laptop 16 | |
| Asus Vivobook Pro 16X K6604JV-MX016W | |
| Honor MagicBook Pro 16 2024 | |
| Lenovo Yoga Pro 9 16-IRP G8 | |
| Média da turma Multimedia (6395 - 105740, n=54, últimos 2 anos) | |
| Média Intel Core Ultra 7 155H (18236 - 47685, n=50) | |
| Dell Inspiron 16 Plus 7630 | |
| Schenker VISION 16 Pro (M23) | |
| AIDA64 / CPU AES | |
| Framework Laptop 16 | |
| Honor MagicBook Pro 16 2024 | |
| Asus Vivobook Pro 16X K6604JV-MX016W | |
| Lenovo ThinkPad Z16 Gen 2 | |
| Lenovo Yoga Pro 9 16-IRP G8 | |
| Média Intel Core Ultra 7 155H (45713 - 152179, n=50) | |
| Schenker VISION 16 Pro (M23) | |
| Média da turma Multimedia (8171 - 126790, n=55, últimos 2 anos) | |
| Dell Inspiron 16 Plus 7630 | |
| AIDA64 / CPU ZLib | |
| Asus Vivobook Pro 16X K6604JV-MX016W | |
| Honor MagicBook Pro 16 2024 | |
| Lenovo Yoga Pro 9 16-IRP G8 | |
| Lenovo ThinkPad Z16 Gen 2 | |
| Média da turma Multimedia (143.8 - 2022, n=55, últimos 2 anos) | |
| Média Intel Core Ultra 7 155H (557 - 1250, n=50) | |
| Schenker VISION 16 Pro (M23) | |
| Framework Laptop 16 | |
| Dell Inspiron 16 Plus 7630 | |
| AIDA64 / FP64 Ray-Trace | |
| Lenovo ThinkPad Z16 Gen 2 | |
| Framework Laptop 16 | |
| Asus Vivobook Pro 16X K6604JV-MX016W | |
| Média da turma Multimedia (1014 - 26875, n=55, últimos 2 anos) | |
| Lenovo Yoga Pro 9 16-IRP G8 | |
| Honor MagicBook Pro 16 2024 | |
| Dell Inspiron 16 Plus 7630 | |
| Schenker VISION 16 Pro (M23) | |
| Média Intel Core Ultra 7 155H (3569 - 9802, n=50) | |
| AIDA64 / CPU PhotoWorxx | |
| Lenovo Yoga Pro 9 16-IRP G8 | |
| Média da turma Multimedia (8187 - 88154, n=55, últimos 2 anos) | |
| Média Intel Core Ultra 7 155H (32719 - 54223, n=50) | |
| Honor MagicBook Pro 16 2024 | |
| Schenker VISION 16 Pro (M23) | |
| Asus Vivobook Pro 16X K6604JV-MX016W | |
| Framework Laptop 16 | |
| Dell Inspiron 16 Plus 7630 | |
| Lenovo ThinkPad Z16 Gen 2 | |
Desempenho do sistema
Embora os resultados sintéticos de benchmark sejam medianos, no uso diário, o MagicBook Pro 16 é um notebook muito responsivo que pode implementar entradas sem atrasos perceptíveis. Só tivemos um breve atraso ao alternar para a GPU da Nvidia (por exemplo, ao inicializar um jogo) e isso é normal ao alternar para o Advanced Optimus. Quem se incomodar com isso pode ativar a opção Optimus normal nos drivers da Nvidia.
CrossMark: Overall | Productivity | Creativity | Responsiveness
WebXPRT 3: Overall
WebXPRT 4: Overall
Mozilla Kraken 1.1: Total
| PCMark 10 / Score | |
| Framework Laptop 16 | |
| Lenovo ThinkPad Z16 Gen 2 | |
| Média da turma Multimedia (4325 - 10386, n=53, últimos 2 anos) | |
| Dell Inspiron 16 Plus 7630 | |
| Schenker VISION 16 Pro (M23) | |
| Lenovo Yoga Pro 9 16-IRP G8 | |
| Média Intel Core Ultra 7 155H, NVIDIA GeForce RTX 4060 Laptop GPU (6751 - 7370, n=5) | |
| Asus Vivobook Pro 16X K6604JV-MX016W | |
| Honor MagicBook Pro 16 2024 | |
| PCMark 10 / Essentials | |
| Framework Laptop 16 | |
| Lenovo ThinkPad Z16 Gen 2 | |
| Dell Inspiron 16 Plus 7630 | |
| Lenovo Yoga Pro 9 16-IRP G8 | |
| Schenker VISION 16 Pro (M23) | |
| Asus Vivobook Pro 16X K6604JV-MX016W | |
| Média da turma Multimedia (8025 - 11664, n=52, últimos 2 anos) | |
| Média Intel Core Ultra 7 155H, NVIDIA GeForce RTX 4060 Laptop GPU (9476 - 10446, n=5) | |
| Honor MagicBook Pro 16 2024 | |
| PCMark 10 / Productivity | |
| Média da turma Multimedia (7323 - 18233, n=52, últimos 2 anos) | |
| Framework Laptop 16 | |
| Lenovo ThinkPad Z16 Gen 2 | |
| Schenker VISION 16 Pro (M23) | |
| Dell Inspiron 16 Plus 7630 | |
| Asus Vivobook Pro 16X K6604JV-MX016W | |
| Lenovo Yoga Pro 9 16-IRP G8 | |
| Média Intel Core Ultra 7 155H, NVIDIA GeForce RTX 4060 Laptop GPU (8079 - 9477, n=5) | |
| Honor MagicBook Pro 16 2024 | |
| PCMark 10 / Digital Content Creation | |
| Framework Laptop 16 | |
| Dell Inspiron 16 Plus 7630 | |
| Lenovo ThinkPad Z16 Gen 2 | |
| Lenovo Yoga Pro 9 16-IRP G8 | |
| Schenker VISION 16 Pro (M23) | |
| Média Intel Core Ultra 7 155H, NVIDIA GeForce RTX 4060 Laptop GPU (9811 - 11620, n=5) | |
| Honor MagicBook Pro 16 2024 | |
| Média da turma Multimedia (3651 - 16240, n=52, últimos 2 anos) | |
| Asus Vivobook Pro 16X K6604JV-MX016W | |
| CrossMark / Overall | |
| Asus Vivobook Pro 16X K6604JV-MX016W | |
| Schenker VISION 16 Pro (M23) | |
| Média da turma Multimedia (866 - 2728, n=61, últimos 2 anos) | |
| Dell Inspiron 16 Plus 7630 | |
| Lenovo Yoga Pro 9 16-IRP G8 | |
| Honor MagicBook Pro 16 2024 | |
| Média Intel Core Ultra 7 155H, NVIDIA GeForce RTX 4060 Laptop GPU (1540 - 1746, n=5) | |
| Framework Laptop 16 | |
| Lenovo ThinkPad Z16 Gen 2 | |
| CrossMark / Productivity | |
| Asus Vivobook Pro 16X K6604JV-MX016W | |
| Schenker VISION 16 Pro (M23) | |
| Média da turma Multimedia (931 - 2489, n=61, últimos 2 anos) | |
| Dell Inspiron 16 Plus 7630 | |
| Lenovo Yoga Pro 9 16-IRP G8 | |
| Honor MagicBook Pro 16 2024 | |
| Média Intel Core Ultra 7 155H, NVIDIA GeForce RTX 4060 Laptop GPU (1436 - 1684, n=5) | |
| Framework Laptop 16 | |
| Lenovo ThinkPad Z16 Gen 2 | |
| CrossMark / Creativity | |
| Asus Vivobook Pro 16X K6604JV-MX016W | |
| Média da turma Multimedia (907 - 3465, n=61, últimos 2 anos) | |
| Lenovo Yoga Pro 9 16-IRP G8 | |
| Dell Inspiron 16 Plus 7630 | |
| Schenker VISION 16 Pro (M23) | |
| Framework Laptop 16 | |
| Média Intel Core Ultra 7 155H, NVIDIA GeForce RTX 4060 Laptop GPU (1811 - 1929, n=5) | |
| Honor MagicBook Pro 16 2024 | |
| Lenovo ThinkPad Z16 Gen 2 | |
| CrossMark / Responsiveness | |
| Schenker VISION 16 Pro (M23) | |
| Asus Vivobook Pro 16X K6604JV-MX016W | |
| Honor MagicBook Pro 16 2024 | |
| Dell Inspiron 16 Plus 7630 | |
| Lenovo Yoga Pro 9 16-IRP G8 | |
| Média da turma Multimedia (605 - 2024, n=61, últimos 2 anos) | |
| Média Intel Core Ultra 7 155H, NVIDIA GeForce RTX 4060 Laptop GPU (1165 - 1631, n=5) | |
| Framework Laptop 16 | |
| Lenovo ThinkPad Z16 Gen 2 | |
| WebXPRT 3 / Overall | |
| Framework Laptop 16 | |
| Média da turma Multimedia (136.4 - 596, n=64, últimos 2 anos) | |
| Lenovo ThinkPad Z16 Gen 2 | |
| Dell Inspiron 16 Plus 7630 | |
| Schenker VISION 16 Pro (M23) | |
| Lenovo Yoga Pro 9 16-IRP G8 | |
| Honor MagicBook Pro 16 2024 | |
| Média Intel Core Ultra 7 155H, NVIDIA GeForce RTX 4060 Laptop GPU (274 - 290, n=5) | |
| Asus Vivobook Pro 16X K6604JV-MX016W | |
| WebXPRT 4 / Overall | |
| Média da turma Multimedia (167.3 - 402, n=66, últimos 2 anos) | |
| Schenker VISION 16 Pro (M23) | |
| Dell Inspiron 16 Plus 7630 | |
| Framework Laptop 16 | |
| Lenovo Yoga Pro 9 16-IRP G8 | |
| Honor MagicBook Pro 16 2024 | |
| Lenovo ThinkPad Z16 Gen 2 | |
| Asus Vivobook Pro 16X K6604JV-MX016W | |
| Média Intel Core Ultra 7 155H, NVIDIA GeForce RTX 4060 Laptop GPU (236 - 262, n=5) | |
| Mozilla Kraken 1.1 / Total | |
| Média Intel Core Ultra 7 155H, NVIDIA GeForce RTX 4060 Laptop GPU (519 - 585, n=5) | |
| Lenovo ThinkPad Z16 Gen 2 | |
| Honor MagicBook Pro 16 2024 | |
| Asus Vivobook Pro 16X K6604JV-MX016W | |
| Lenovo Yoga Pro 9 16-IRP G8 | |
| Dell Inspiron 16 Plus 7630 | |
| Schenker VISION 16 Pro (M23) | |
| Framework Laptop 16 | |
| Média da turma Multimedia (228 - 835, n=67, últimos 2 anos) | |
* ... menor é melhor
| PCMark 10 Score | 6800 pontos | |
Ajuda | ||
| AIDA64 / Memory Copy | |
| Honor MagicBook Pro 16 2024 | |
| Média Intel Core Ultra 7 155H (62397 - 96791, n=50) | |
| Média da turma Multimedia (11299 - 132135, n=55, últimos 2 anos) | |
| Framework Laptop 16 | |
| Lenovo Yoga Pro 9 16-IRP G8 | |
| Asus Vivobook Pro 16X K6604JV-MX016W | |
| Lenovo ThinkPad Z16 Gen 2 | |
| Schenker VISION 16 Pro (M23) | |
| Dell Inspiron 16 Plus 7630 | |
| AIDA64 / Memory Read | |
| Média da turma Multimedia (11624 - 174586, n=55, últimos 2 anos) | |
| Média Intel Core Ultra 7 155H (60544 - 90647, n=50) | |
| Lenovo Yoga Pro 9 16-IRP G8 | |
| Honor MagicBook Pro 16 2024 | |
| Asus Vivobook Pro 16X K6604JV-MX016W | |
| Schenker VISION 16 Pro (M23) | |
| Dell Inspiron 16 Plus 7630 | |
| Framework Laptop 16 | |
| Lenovo ThinkPad Z16 Gen 2 | |
| AIDA64 / Memory Write | |
| Lenovo Yoga Pro 9 16-IRP G8 | |
| Lenovo ThinkPad Z16 Gen 2 | |
| Framework Laptop 16 | |
| Média da turma Multimedia (11755 - 134998, n=55, últimos 2 anos) | |
| Honor MagicBook Pro 16 2024 | |
| Média Intel Core Ultra 7 155H (58692 - 93451, n=50) | |
| Asus Vivobook Pro 16X K6604JV-MX016W | |
| Schenker VISION 16 Pro (M23) | |
| Dell Inspiron 16 Plus 7630 | |
| AIDA64 / Memory Latency | |
| Média Intel Core Ultra 7 155H (116.2 - 233, n=50) | |
| Honor MagicBook Pro 16 2024 | |
| Média da turma Multimedia (7 - 535, n=54, últimos 2 anos) | |
| Lenovo ThinkPad Z16 Gen 2 | |
| Lenovo Yoga Pro 9 16-IRP G8 | |
| Dell Inspiron 16 Plus 7630 | |
| Framework Laptop 16 | |
| Asus Vivobook Pro 16X K6604JV-MX016W | |
| Schenker VISION 16 Pro (M23) | |
* ... menor é melhor
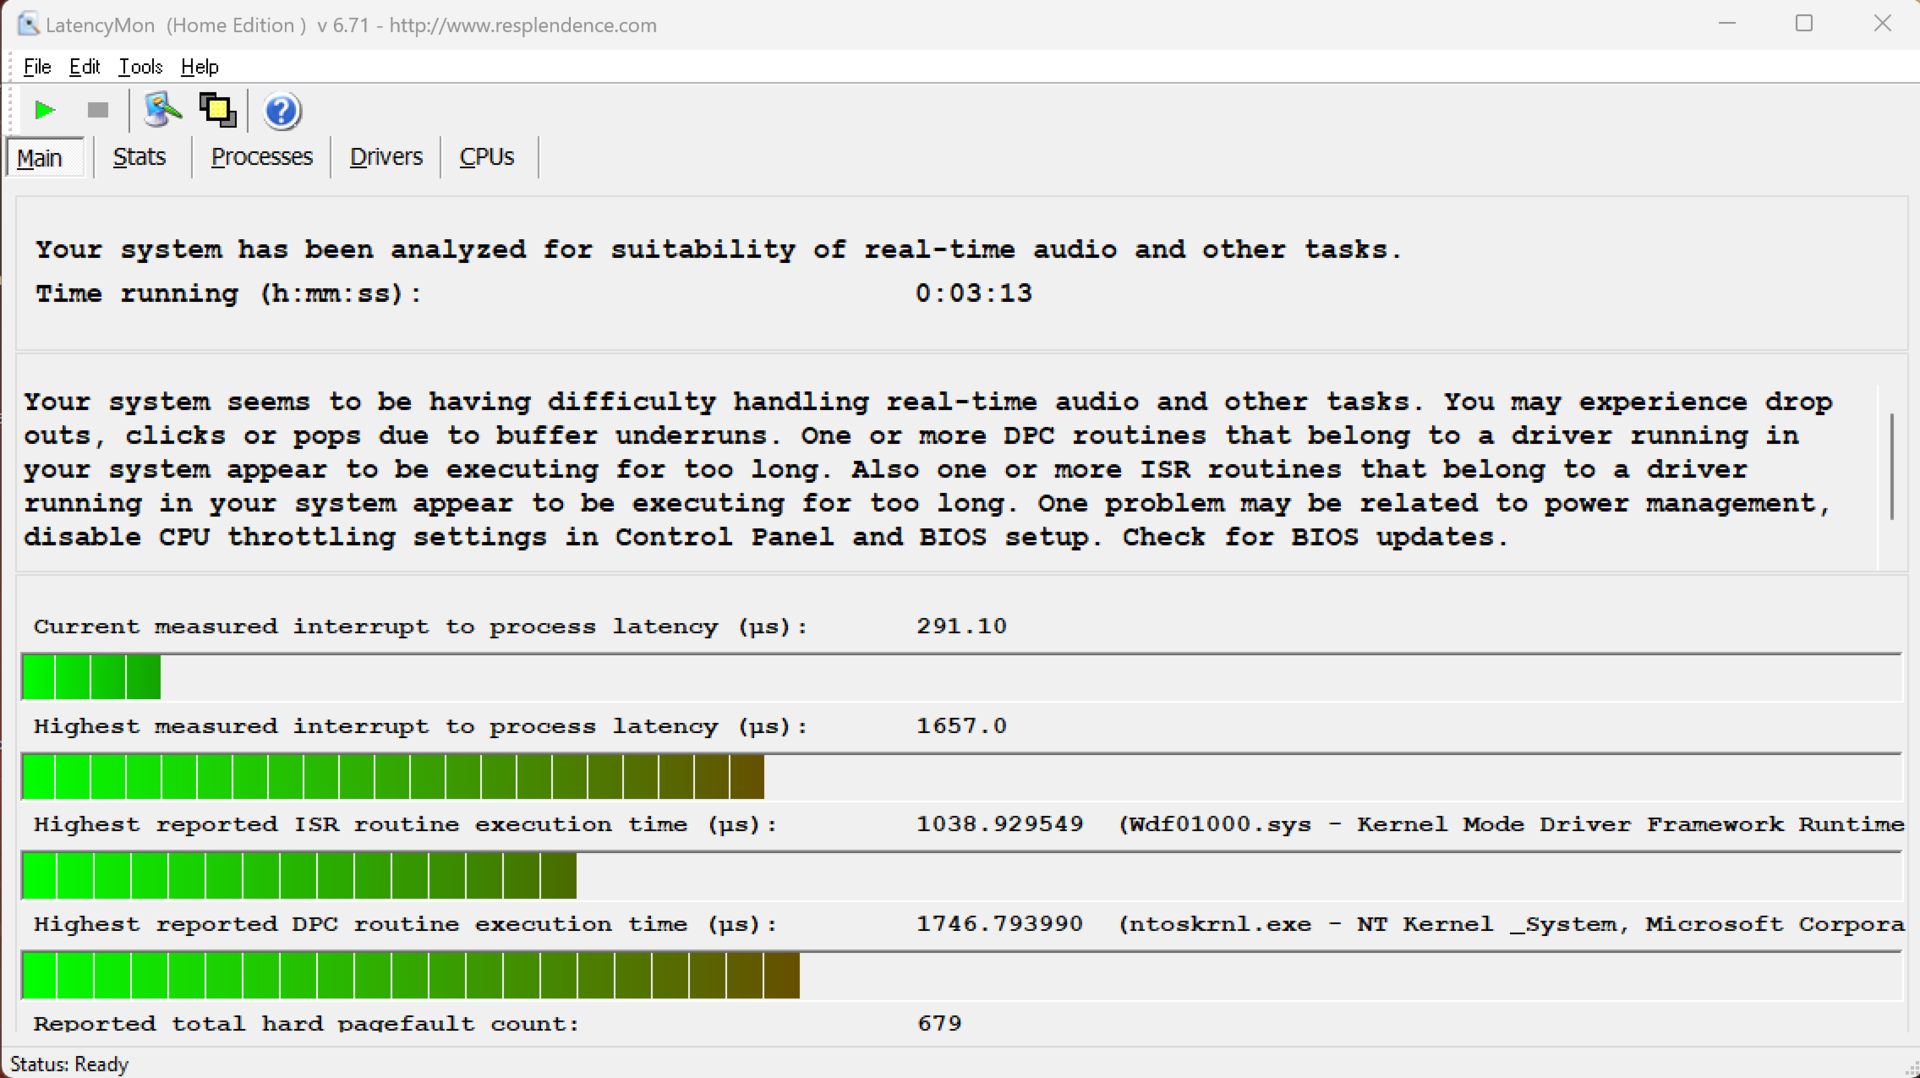
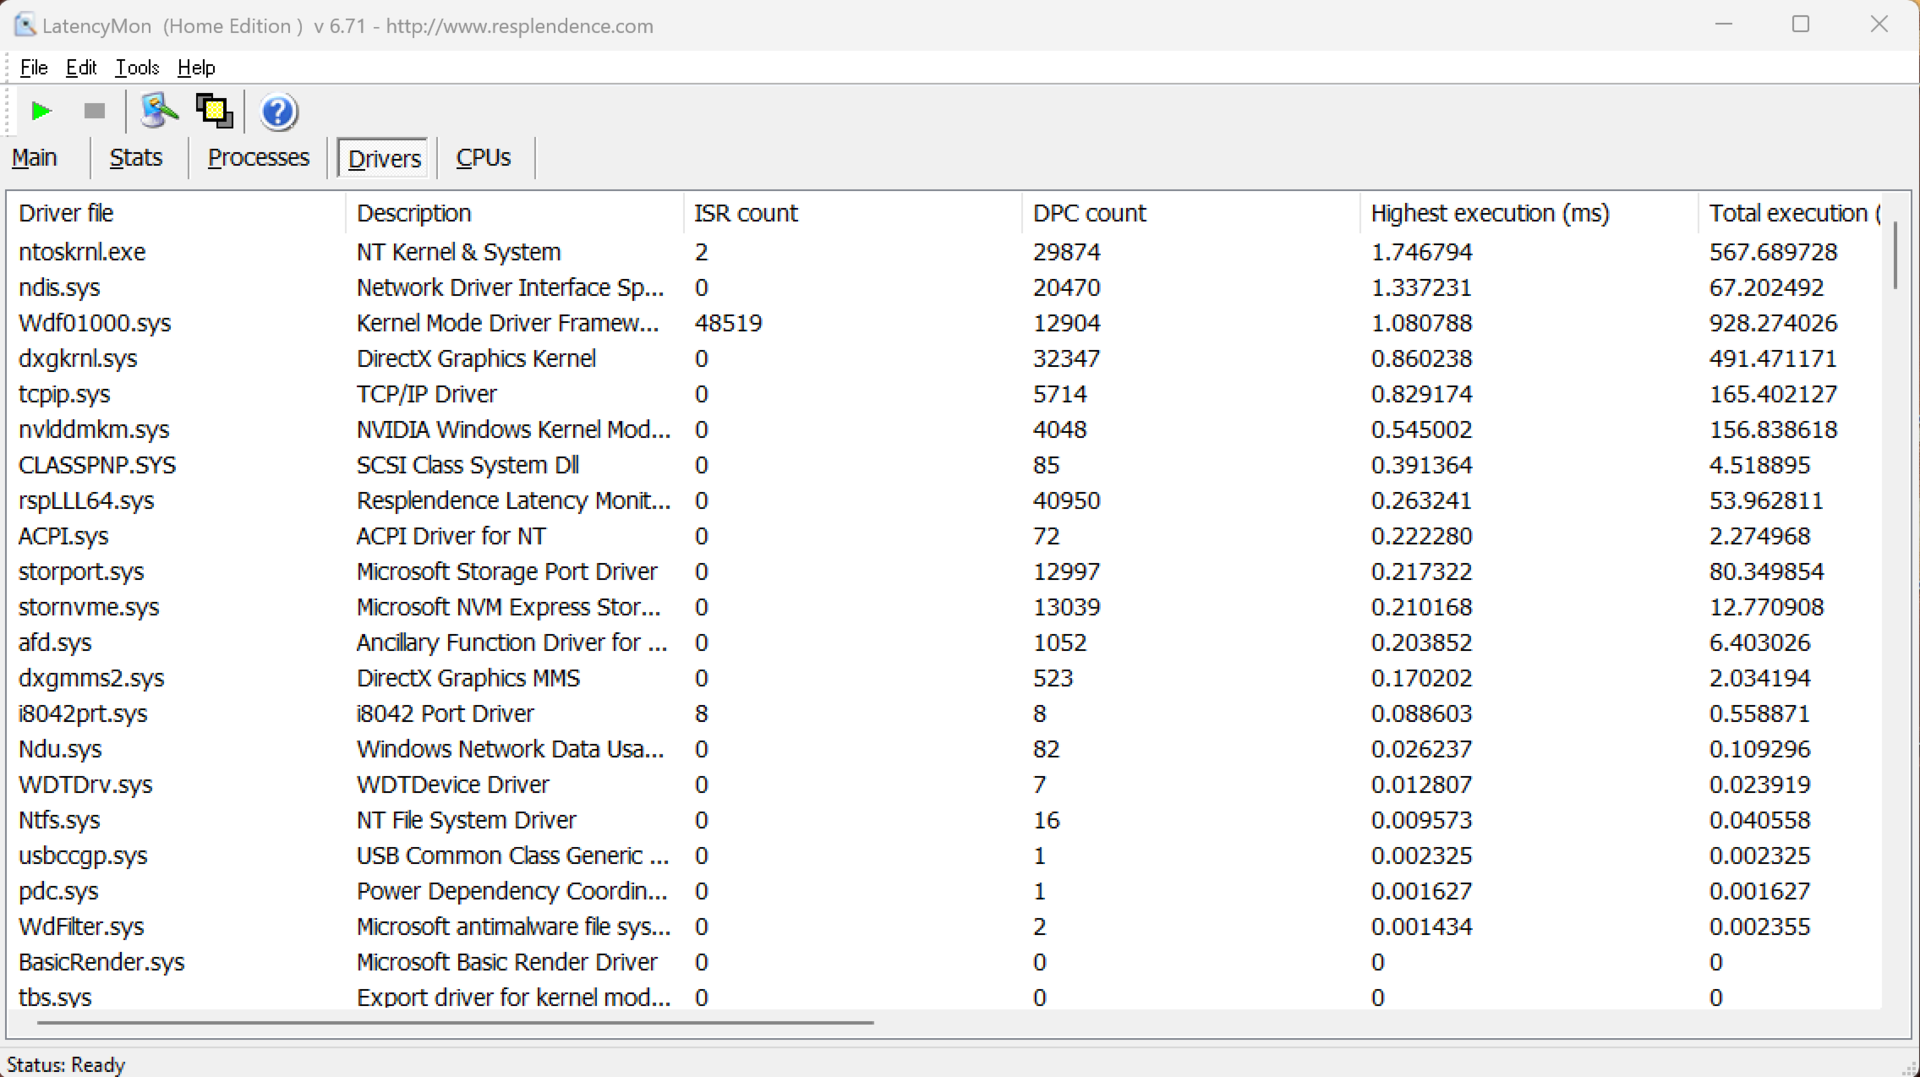
Latências de DPC
Em nosso teste de latência padronizado (navegação na Internet, reprodução em 4K no YouTube, carga da CPU), o dispositivo de análise mostrou pequenas limitações quando se tratava de usar aplicativos de áudio em tempo real com a versão atual do BIOS.
| DPC Latencies / LatencyMon - interrupt to process latency (max), Web, Youtube, Prime95 | |
| Lenovo Yoga Pro 9 16-IRP G8 | |
| Asus Vivobook Pro 16X K6604JV-MX016W | |
| Honor MagicBook Pro 16 2024 | |
| Lenovo ThinkPad Z16 Gen 2 | |
| Framework Laptop 16 | |
| Dell Inspiron 16 Plus 7630 | |
| Schenker VISION 16 Pro (M23) | |
* ... menor é melhor
Armazenamento em massa
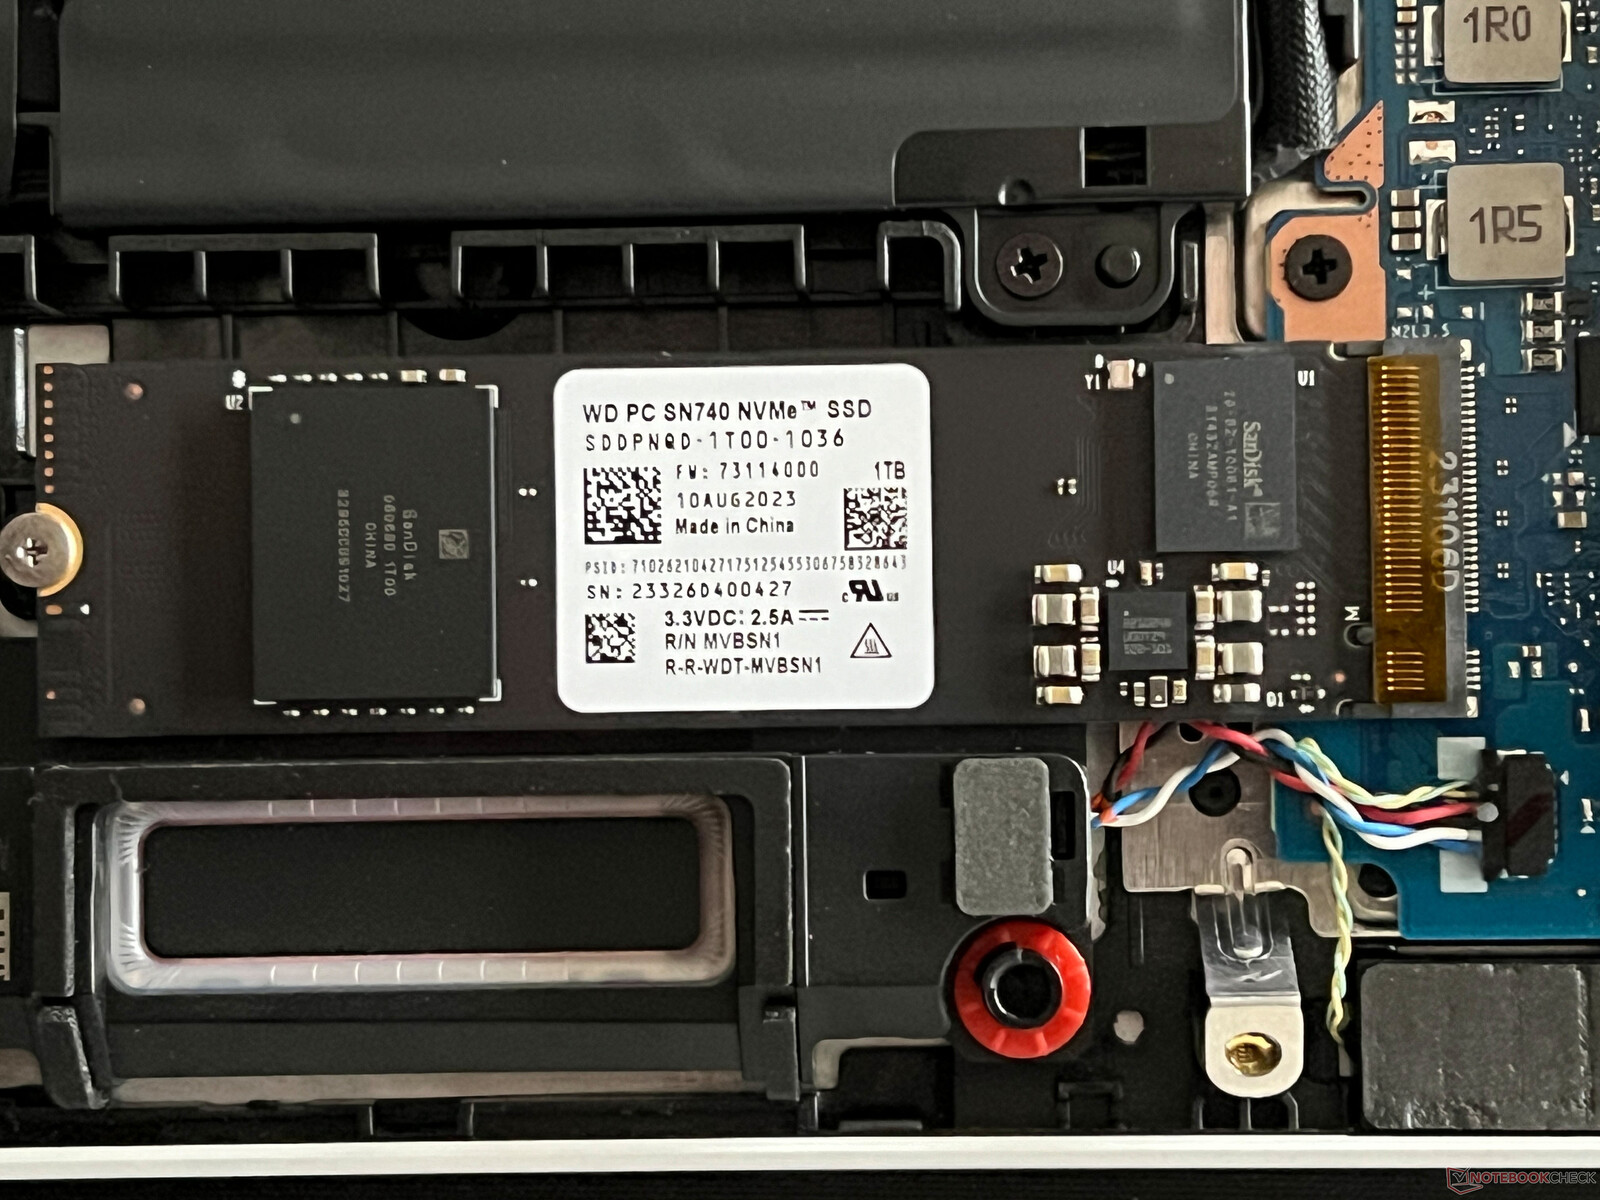
O SSD PCIe 4.0 encontrado em nosso dispositivo de análise é originário da Western Digital (SN740) e oferece 1 GB de capacidade de armazenamento, embora o usuário só tenha acesso a 847 GB na primeira inicialização. Entretanto, assim como nos dispositivos anteriores do Honor, o SSD é particionado e 221 GB estão disponíveis na unidade do sistema, com os 626 GB restantes disponíveis na unidade D. Isso é desnecessário e pode levar rapidamente a problemas ao instalar jogos se o senhor não tomar cuidado com o diretório de destino. O desempenho da SSD é muito bom, mas não é totalmente estável sob carga contínua. Outros benchmarks de SSD estão listados aqui.

* ... menor é melhor
Continuous Performance: DiskSpd Read Loop, Queue Depth 8
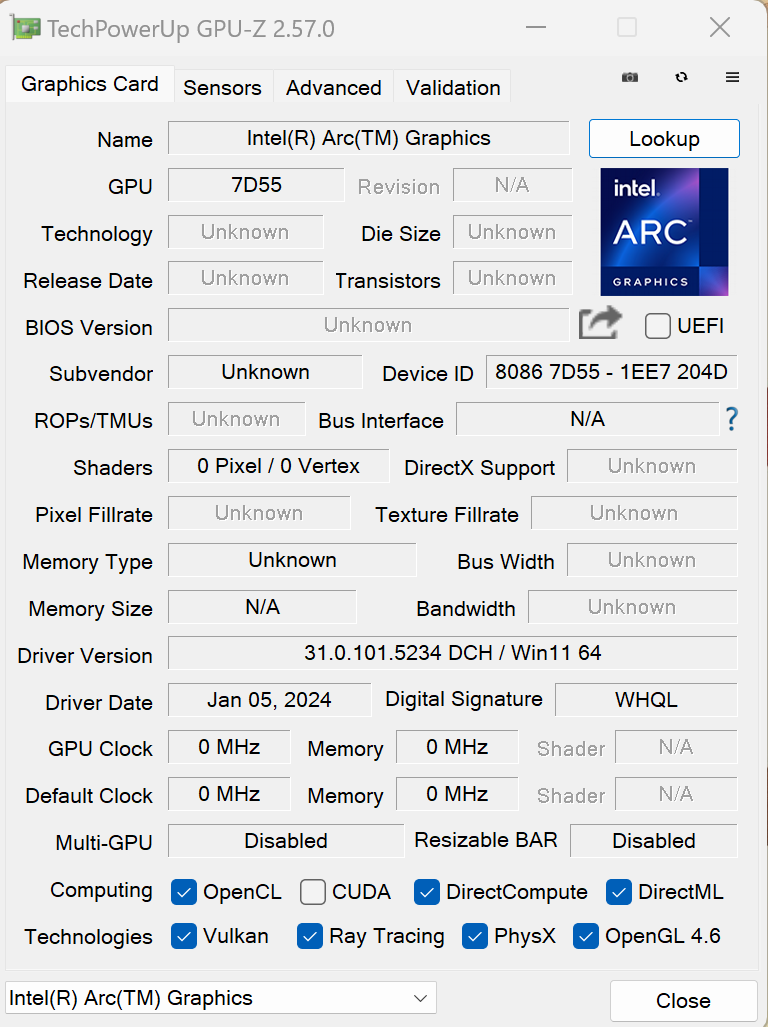
Placa de vídeo
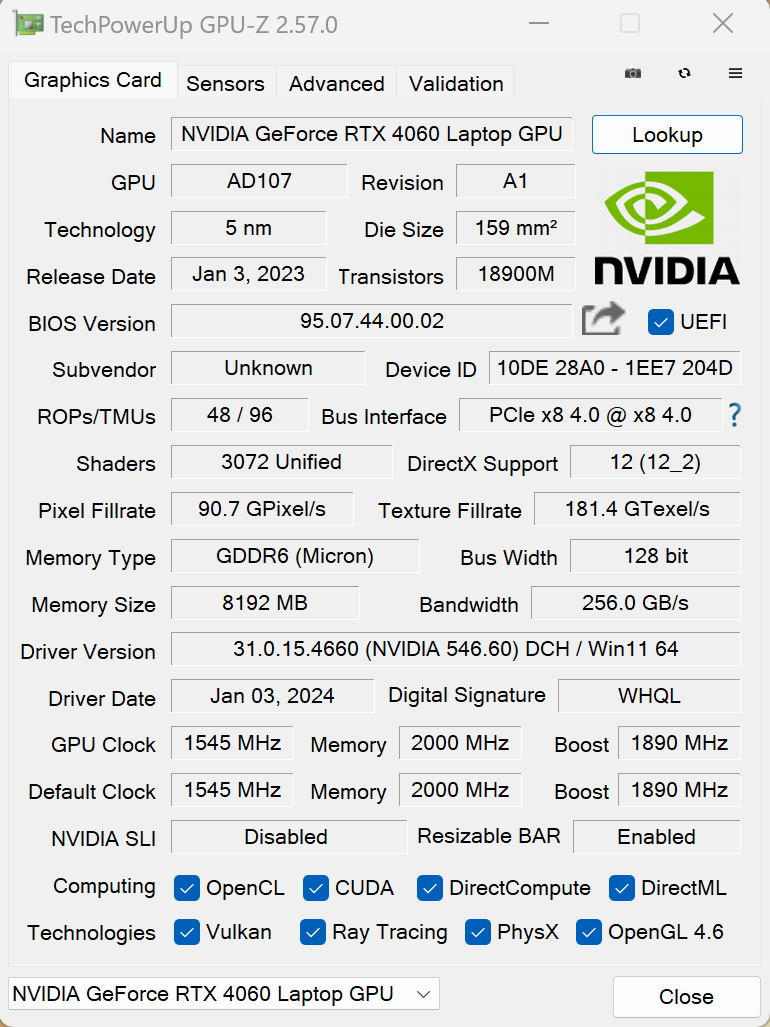
A unidade integrada Arc iGPU integrada cuida dos aplicativos do dia a dia, incluindo a reprodução de vídeos de alta resolução e, além disso, o dispositivo muda automaticamente para a GeForce Laptop RTX 4060 ao executar aplicativos exigentes (Advanced Optimus). Basicamente, estamos lidando com uma variante muito rápida do laptop RTX 4060 com 115 watts, embora apenas no modo de alto desempenho. São 65 watts no modo inteligente e, da mesma forma, isso é suficiente para bons valores de desempenho. No modo de alto desempenho, o dispositivo chega à frente dos dispositivos concorrentes e isso pode ser visto no resultado do site Time Spy. Nessa área, o MagicBook consegue acompanhar a concorrência, que está equipada com a variante mais fraca do laptop Laptop RTX 4070.
O desempenho da GPU permanece completamente estável, mesmo sob períodos mais longos de carga (com ambos os perfis de energia) e passa facilmente no teste de estresse Time Spy (99,1 %). No modo de bateria, a GPU pode consumir no máximo 50 watts, razão pela qual o desempenho da GPU é 15% menor nessa área (em comparação com o modo inteligente). Outros benchmarks de GPU estão disponíveis aqui.
| 3DMark 11 Performance | 28416 pontos | |
| 3DMark Fire Strike Score | 21094 pontos | |
| 3DMark Time Spy Score | 9230 pontos | |
Ajuda | ||
| Blender / v3.3 Classroom OPTIX/RTX | |
| Média da turma Multimedia (12 - 105, n=22, últimos 2 anos) | |
| Dell Inspiron 16 Plus 7630 | |
| Asus Vivobook Pro 16X K6604JV-MX016W | |
| Lenovo Yoga Pro 9 16-IRP G8 | |
| Schenker VISION 16 Pro (M23) | |
| Honor MagicBook Pro 16 2024 | |
| Média NVIDIA GeForce RTX 4060 Laptop GPU (19 - 28, n=53) | |
| Blender / v3.3 Classroom CUDA | |
| Média da turma Multimedia (20 - 186, n=22, últimos 2 anos) | |
| Dell Inspiron 16 Plus 7630 | |
| Asus Vivobook Pro 16X K6604JV-MX016W | |
| Lenovo Yoga Pro 9 16-IRP G8 | |
| Média NVIDIA GeForce RTX 4060 Laptop GPU (39 - 53, n=53) | |
| Honor MagicBook Pro 16 2024 | |
| Schenker VISION 16 Pro (M23) | |
| Blender / v3.3 Classroom CPU | |
| Dell Inspiron 16 Plus 7630 | |
| Média da turma Multimedia (134.5 - 1042, n=63, últimos 2 anos) | |
| Schenker VISION 16 Pro (M23) | |
| Honor MagicBook Pro 16 2024 | |
| Framework Laptop 16 | |
| Média NVIDIA GeForce RTX 4060 Laptop GPU (189 - 452, n=53) | |
| Lenovo Yoga Pro 9 16-IRP G8 | |
| Lenovo ThinkPad Z16 Gen 2 | |
| Asus Vivobook Pro 16X K6604JV-MX016W | |
* ... menor é melhor
Desempenho em jogos
Em suma, o desempenho em jogos é muito bom e é possível jogar jogos exigentes sem problemas a 1080p e com as configurações máximas de detalhes. Em resoluções ainda mais altas ou com ray tracing, não é possível ignorar as tecnologias de upscaling, como o DLSS da Nvidia. Além disso, a tabela a seguir mostra as diferenças entre os dois perfis de energia. Usando o modo inteligente, também é possível, dentro do razoável, jogar sem precisar pegar os fones de ouvido.
| Perfil de energia | Far Cry 5 | Witcher 3 | Cyberpunk 2077 | Modern Warfare 3 | Star Wars Jedi Survivor |
|---|---|---|---|---|---|
| Inteligente | 80fps | 68fps | 36.5fps | 51fps | 30.6fps |
| Alto desempenho | 103fps | 79fps | 46.3fps | 59fps | 33.7fps |
| The Witcher 3 - 1920x1080 Ultra Graphics & Postprocessing (HBAO+) | |
| Schenker VISION 16 Pro (M23) | |
| Asus Vivobook Pro 16X K6604JV-MX016W | |
| Dell Inspiron 16 Plus 7630 | |
| Lenovo Yoga Pro 9 16-IRP G8 | |
| Framework Laptop 16 | |
| Honor MagicBook Pro 16 2024 | |
| Média da turma Multimedia (11 - 121, n=8, últimos 2 anos) | |
| Lenovo ThinkPad Z16 Gen 2 | |
| GTA V - 1920x1080 Highest AA:4xMSAA + FX AF:16x | |
| Lenovo Yoga Pro 9 16-IRP G8 | |
| Asus Vivobook Pro 16X K6604JV-MX016W | |
| Honor MagicBook Pro 16 2024 | |
| Schenker VISION 16 Pro (M23) | |
| Framework Laptop 16 | |
| Média da turma Multimedia (7.92 - 141.6, n=56, últimos 2 anos) | |
| Cyberpunk 2077 - 1920x1080 Ultra Preset (FSR off) | |
| Asus Vivobook Pro 16X K6604JV-MX016W | |
| Média NVIDIA GeForce RTX 4060 Laptop GPU (56.4 - 93.1, n=31) | |
| Framework Laptop 16 | |
| Honor MagicBook Pro 16 2024 | |
| Média da turma Multimedia (6.41 - 112.3, n=71, últimos 2 anos) | |
| Lenovo ThinkPad Z16 Gen 2 | |
| F1 2021 - 1920x1080 Ultra High Preset + Raytracing AA:T AF:16x | |
| Schenker VISION 16 Pro (M23) | |
| Média NVIDIA GeForce RTX 4060 Laptop GPU (109.4 - 146.7, n=5) | |
| Lenovo Yoga Pro 9 16-IRP G8 | |
| Honor MagicBook Pro 16 2024 | |
| F1 23 - 1920x1080 Ultra High Preset AA:T AF:16x | |
| Média NVIDIA GeForce RTX 4060 Laptop GPU (43.8 - 119.9, n=13) | |
| Lenovo Yoga Pro 9 16-IRP G8 | |
| Asus Vivobook Pro 16X K6604JV-MX016W | |
| Honor MagicBook Pro 16 2024 | |
| Média da turma Multimedia (11 - 70.3, n=3, últimos 2 anos) | |
| Call of Duty Modern Warfare 3 2023 - 1920x1080 Ultra Preset | |
| Média NVIDIA GeForce RTX 4060 Laptop GPU (81 - 99, n=5) | |
| Honor MagicBook Pro 16 2024 | |
| Média da turma Multimedia (34 - 127, n=2, últimos 2 anos) | |
| Star Wars Jedi Survivor - 1920x1080 Epic Preset | |
| Schenker VISION 16 Pro (M23) | |
| Lenovo Yoga Pro 9 16-IRP G8 | |
| Média NVIDIA GeForce RTX 4060 Laptop GPU (45.5 - 66.7, n=10) | |
| Asus Vivobook Pro 16X K6604JV-MX016W | |
| Honor MagicBook Pro 16 2024 | |
Witcher 3 FPS diagram
| baixo | média | alto | ultra | QHD | |
|---|---|---|---|---|---|
| GTA V (2015) | 179.2 | 172.9 | 100.4 | 76.4 | |
| The Witcher 3 (2015) | 177 | 81.5 | 68 | ||
| Dota 2 Reborn (2015) | 174 | 155.5 | 149.7 | 139.5 | |
| Final Fantasy XV Benchmark (2018) | 117.3 | 84.3 | 63.9 | ||
| X-Plane 11.11 (2018) | 135.6 | 120.2 | 91.4 | ||
| Far Cry 5 (2018) | 159 | 127 | 119 | 112 | 80 |
| Strange Brigade (2018) | 191 | 165 | 112 | ||
| F1 2021 (2021) | 212 | 109.4 | 78.6 | ||
| F1 22 (2022) | 152.8 | 54.8 | 34.7 | ||
| Star Wars Jedi Survivor (2023) | 60.6 | 53.3 | 50.1 | 47.8 | 30.6 |
| F1 23 (2023) | 149.2 | 45 | 29 | ||
| Cyberpunk 2077 (2023) | 96.7 | 79.6 | 68.6 | 60.1 | 36.7 |
| Call of Duty Modern Warfare 3 2023 (2023) | 116 | 106 | 81 | 75 | 51 |
| Avatar Frontiers of Pandora (2023) | 46 | 36 | 32 | 25 | 17 |
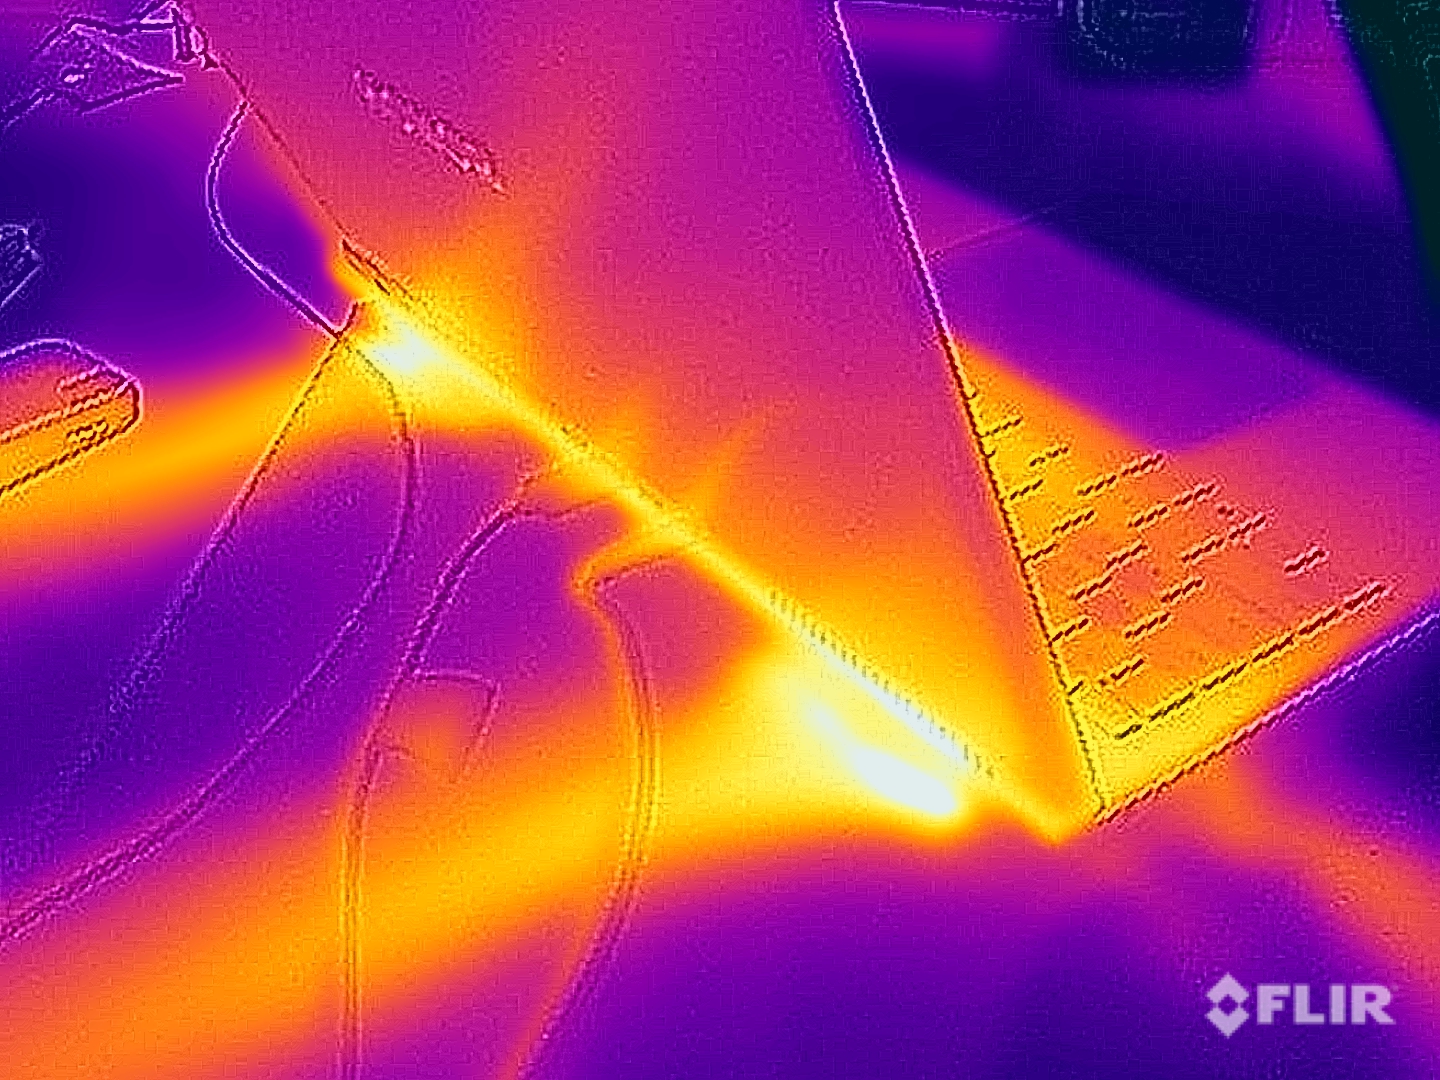
Emissões - O site Honor instalou um poderoso sistema de resfriamento
Emissões de ruído
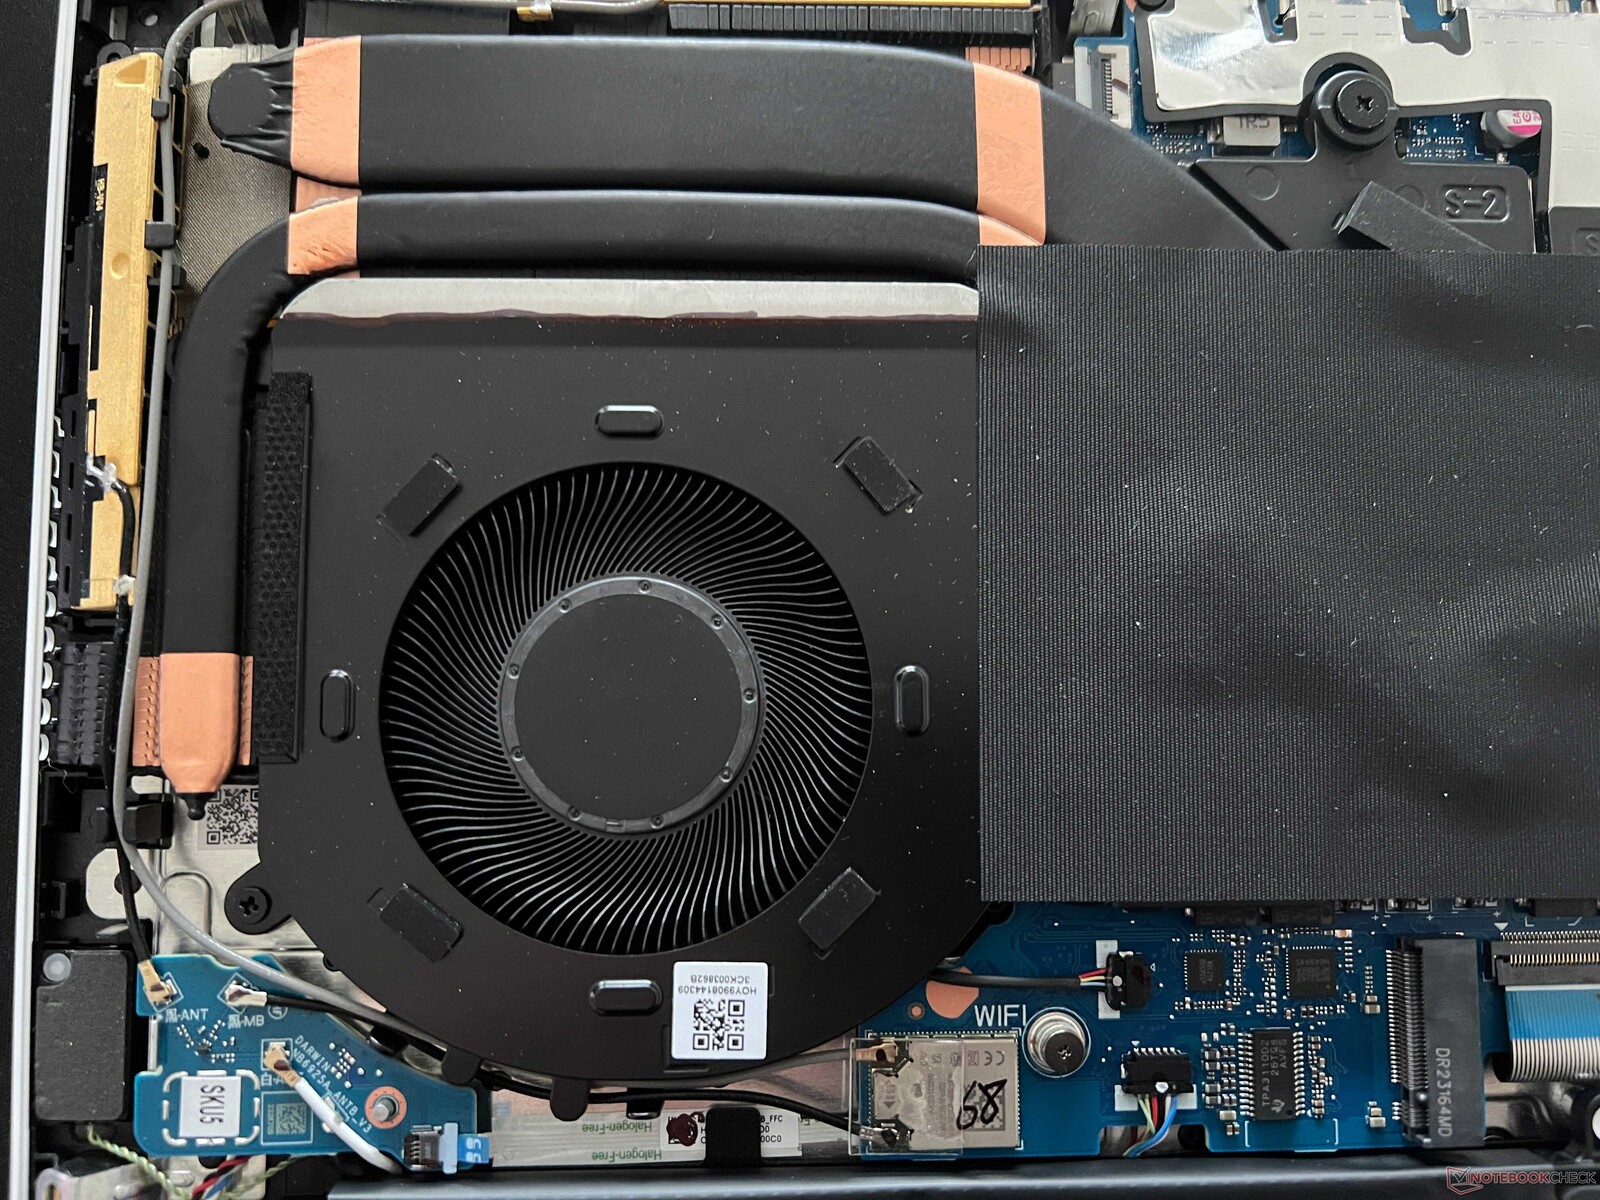
Para seus componentes de resfriamento, o Honor usa vários tubos de calor e dois ventiladores grandes. Em uso ocioso e na execução de tarefas simples, o dispositivo é praticamente silencioso ou apresenta apenas um leve nível de ruído de cerca de 27 dB(A). Em geral, também é possível lidar com breves picos de carga sem que as ventoinhas aumentem de velocidade. Ao jogar e durante o teste de estresse, a 42-45 dB(A), as ventoinhas se fazem ouvir, mas o zumbido não é irritante e, o que é mais importante, elas permanecem constantes. Graças aos bons alto-falantes, o senhor também pode jogar dessa forma sem fones de ouvido. Com 50-53,7 dB(A) no modo de alto desempenho, ele fica significativamente mais alto. Não havia outros ruídos eletrônicos presentes no dispositivo analisado.
| Perfil de energia | 3DMark 06 | Witcher 3 | Cyberpunk 2077 Phantom Liberty | teste de estresse |
|---|---|---|---|---|
| Inteligente | 29 dB(A) | 42,1 dB(A) | 45 dB(A) | 45 dB(A) |
| Alto desempenho | 34,4 dB(A) | 47,2 dB(A) | 50,4 dB(A) | 53,7 dB(A) |
Barulho
| Ocioso |
| 24 / 24 / 27.2 dB |
| Carga |
| 29 / 45 dB |
 | ||
30 dB silencioso 40 dB(A) audível 50 dB(A) ruidosamente alto |
||
min: | ||
| Honor MagicBook Pro 16 2024 GeForce RTX 4060 Laptop GPU, Ultra 7 155H, WD PC SN740 SDDPNQD-1T00 | Framework Laptop 16 Radeon RX 7700S, R9 7940HS, WDC PC SN810 1TB | Lenovo ThinkPad Z16 Gen 2 Radeon RX 6550M, R9 PRO 7940HS, Kioxia XG8 KXG8AZNV1T02 | Dell Inspiron 16 Plus 7630 GeForce RTX 4060 Laptop GPU, i7-13700H, WD PC SN740 SDDPTQD-1T00 | Lenovo Yoga Pro 9 16-IRP G8 GeForce RTX 4060 Laptop GPU, i7-13705H, Samsung PM9A1 MZVL21T0HCLR | Schenker VISION 16 Pro (M23) GeForce RTX 4070 Laptop GPU, i7-13700H, Samsung 990 Pro 1 TB | Asus Vivobook Pro 16X K6604JV-MX016W GeForce RTX 4060 Laptop GPU, i9-13980HX, Solidigm P41 Plus SSDPFKNU010TZ | |
|---|---|---|---|---|---|---|---|
| Noise | -4% | -9% | -6% | -13% | -21% | -24% | |
| desligado / ambiente * (dB) | 24 | 23.8 1% | 22.6 6% | 23.2 3% | 24.7 -3% | 25.9 -8% | 25.2 -5% |
| Idle Minimum * (dB) | 24 | 23.9 -0% | 22.9 5% | 23.2 3% | 24.7 -3% | 25.9 -8% | 26.6 -11% |
| Idle Average * (dB) | 24 | 23.9 -0% | 29.4 -22% | 23.2 3% | 26.2 -9% | 25.9 -8% | 26.6 -11% |
| Idle Maximum * (dB) | 27.2 | 23.9 12% | 29.4 -8% | 23.2 15% | 26.2 4% | 32 -18% | 29.2 -7% |
| Load Average * (dB) | 29 | 28.5 2% | 29.5 -2% | 35.1 -21% | 39.7 -37% | 47.2 -63% | 53.4 -84% |
| Witcher 3 ultra * (dB) | 42.1 | 51.9 -23% | 52 -24% | 52.5 -25% | 53.2 -26% | 53.1 -26% | |
| Load Maximum * (dB) | 45 | 53.7 -19% | 52 -16% | 52.5 -17% | 53.2 -18% | 53.1 -18% | 56.9 -26% |
* ... menor é melhor
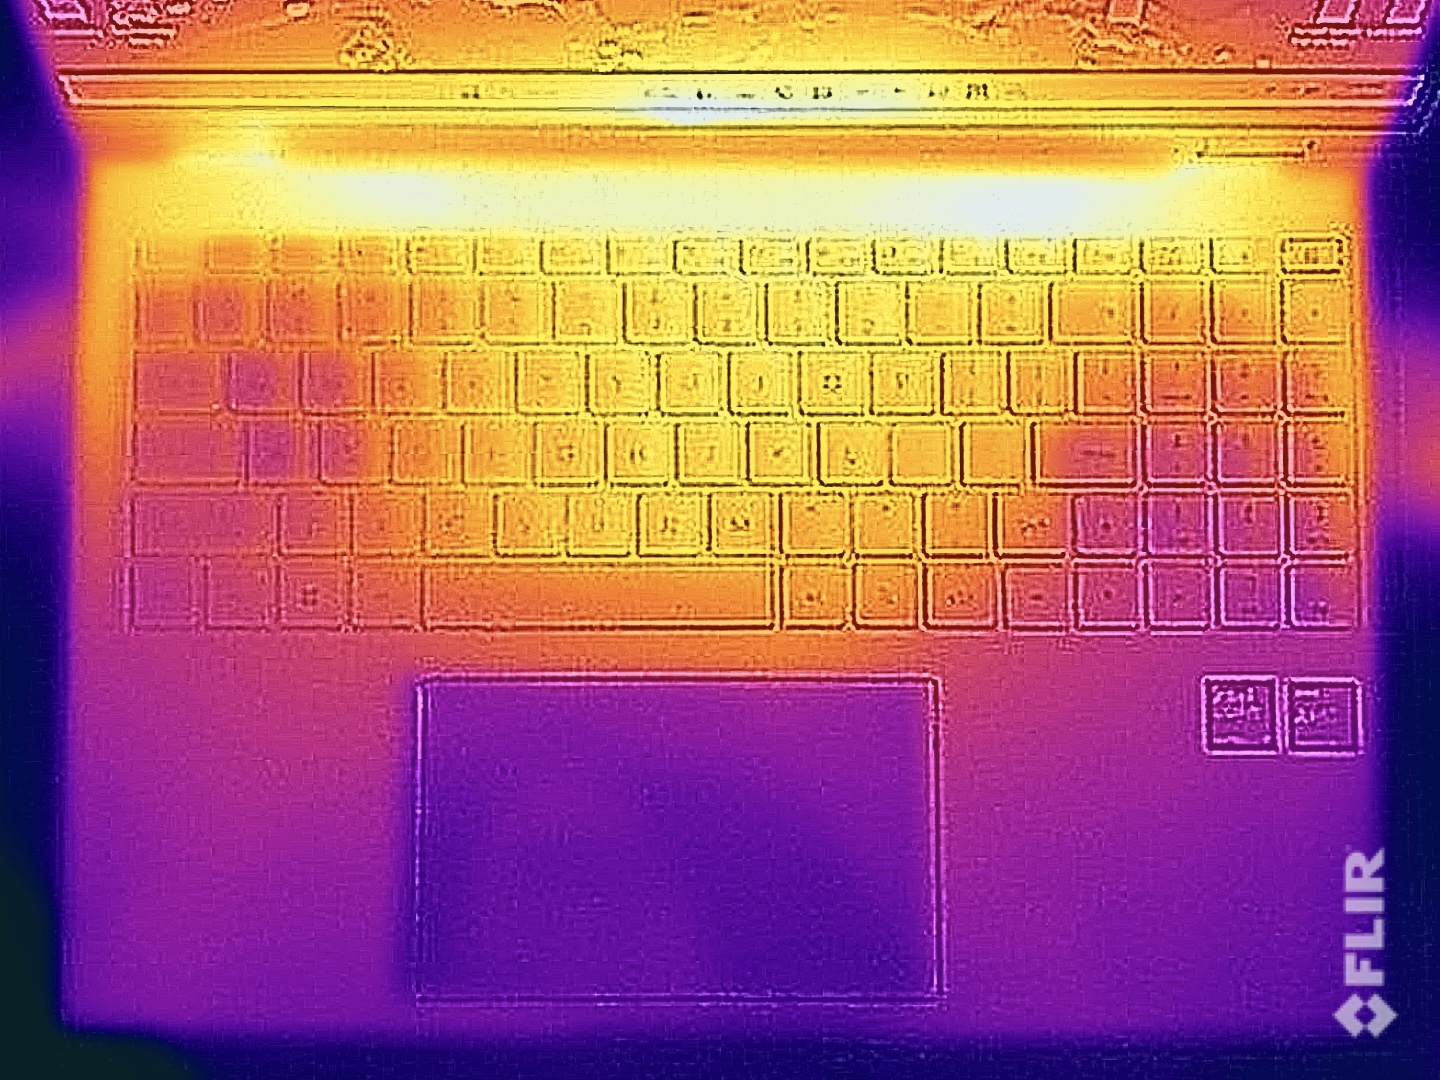
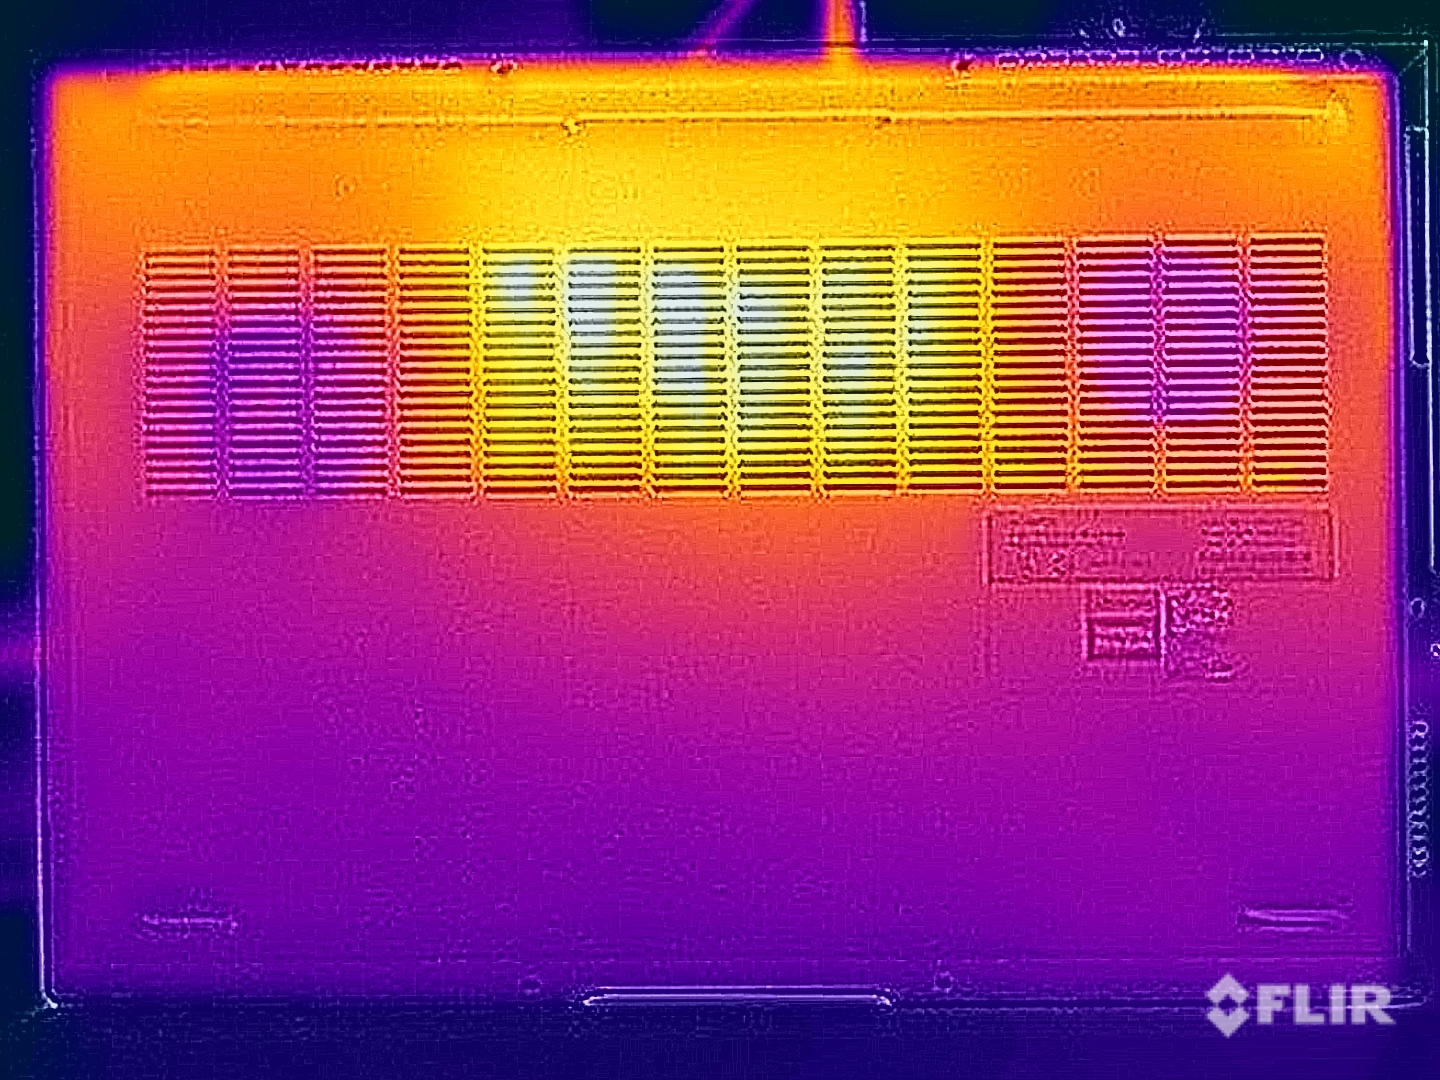
Temperatura
As temperaturas da superfície do MagicBook Pro 16 não são motivo de preocupação. Em uso inativo, o gabinete permanece muito frio e, mesmo sob carga, as temperaturas não excedem 40 °C na parte inferior do dispositivo e são consideravelmente mais baixas do que 40 °C na área do teclado - mais uma vez, não há motivo para preocupação. Também medimos as temperaturas usando o modo opcional de alto desempenho. Embora sejam alguns graus mais altas, elas também podem ser consideradas bons valores, tendo em vista o bom desempenho (consulte a próxima seção).
(+) A temperatura máxima no lado superior é 39.7 °C / 103 F, em comparação com a média de 36.8 °C / 98 F , variando de 21 a 71 °C para a classe Multimedia.
(±) A parte inferior aquece até um máximo de 42.9 °C / 109 F, em comparação com a média de 39.1 °C / 102 F
(+) Em uso inativo, a temperatura média para o lado superior é 22.9 °C / 73 F, em comparação com a média do dispositivo de 31.3 °C / ### class_avg_f### F.
(±) Jogando The Witcher 3, a temperatura média para o lado superior é 32.6 °C / 91 F, em comparação com a média do dispositivo de 31.3 °C / ## #class_avg_f### F.
(+) Os apoios para as mãos e o touchpad são mais frios que a temperatura da pele, com um máximo de 26.3 °C / 79.3 F e, portanto, são frios ao toque.
(+) A temperatura média da área do apoio para as mãos de dispositivos semelhantes foi 28.7 °C / 83.7 F (+2.4 °C / 4.4 F).
Temperatures in high-performance mode
(±) A temperatura máxima no lado superior é 40 °C / 104 F, em comparação com a média de 36.8 °C / 98 F , variando de 21 a 71 °C para a classe Multimedia.
(-) A parte inferior aquece até um máximo de 45.3 °C / 114 F, em comparação com a média de 39.1 °C / 102 F
(+) Os apoios para as mãos e o touchpad são mais frios que a temperatura da pele, com um máximo de 26.8 °C / 80.2 F e, portanto, são frios ao toque.
(±) A temperatura média da área do apoio para as mãos de dispositivos semelhantes foi 28.7 °C / 83.7 F (+1.9 °C / 3.5 F).
| Honor MagicBook Pro 16 2024 Intel Core Ultra 7 155H, NVIDIA GeForce RTX 4060 Laptop GPU | Framework Laptop 16 AMD Ryzen 9 7940HS, AMD Radeon RX 7700S | Lenovo ThinkPad Z16 Gen 2 AMD Ryzen 9 PRO 7940HS, AMD Radeon RX 6550M | Dell Inspiron 16 Plus 7630 Intel Core i7-13700H, NVIDIA GeForce RTX 4060 Laptop GPU | Lenovo Yoga Pro 9 16-IRP G8 Intel Core i7-13705H, NVIDIA GeForce RTX 4060 Laptop GPU | Schenker VISION 16 Pro (M23) Intel Core i7-13700H, NVIDIA GeForce RTX 4070 Laptop GPU | Asus Vivobook Pro 16X K6604JV-MX016W Intel Core i9-13980HX, NVIDIA GeForce RTX 4060 Laptop GPU | |
|---|---|---|---|---|---|---|---|
| Heat | -13% | 4% | -29% | -14% | -18% | -30% | |
| Maximum Upper Side * (°C) | 39.7 | 42.4 -7% | 43 -8% | 47.8 -20% | 41.6 -5% | 46.7 -18% | 39.7 -0% |
| Maximum Bottom * (°C) | 42.9 | 40.8 5% | 41.6 3% | 42.2 2% | 50 -17% | 54.1 -26% | 60 -40% |
| Idle Upper Side * (°C) | 23.7 | 31.4 -32% | 21.2 11% | 35.2 -49% | 26.8 -13% | 26.5 -12% | 30.9 -30% |
| Idle Bottom * (°C) | 23.5 | 27.8 -18% | 21.4 9% | 35 -49% | 27.9 -19% | 26.8 -14% | 34.7 -48% |
* ... menor é melhor
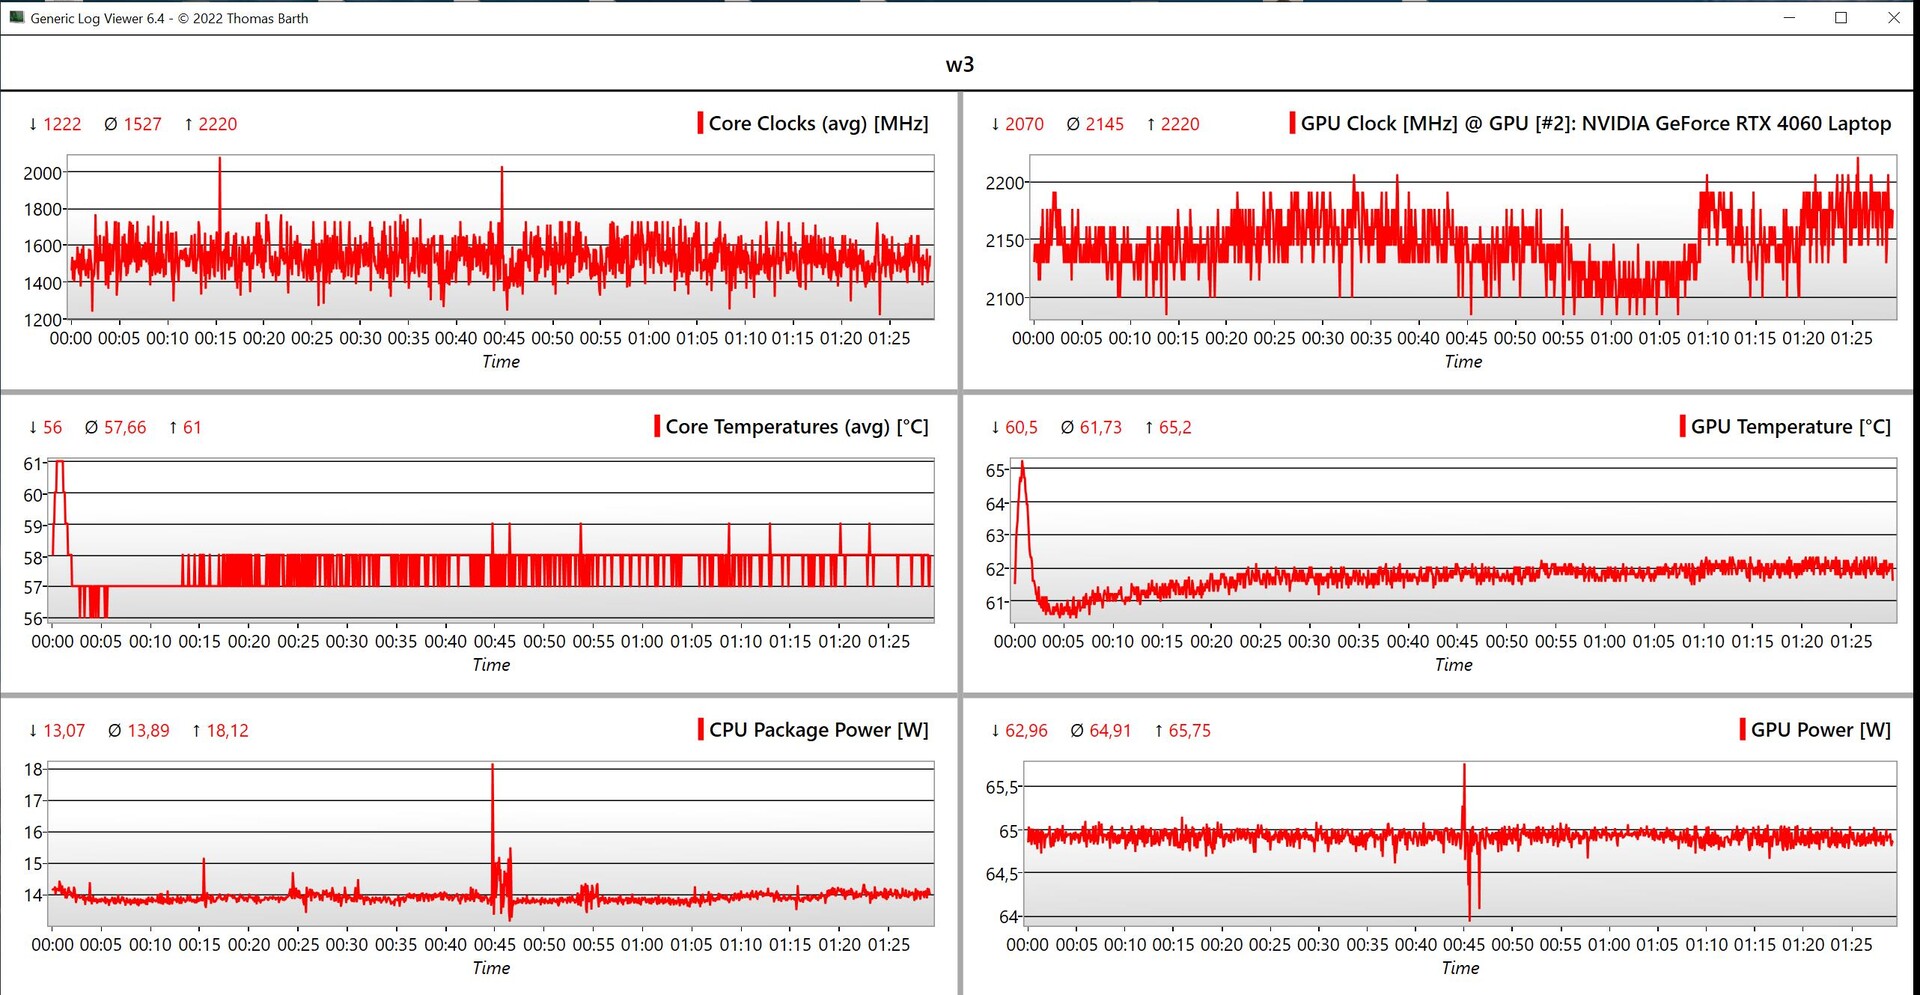
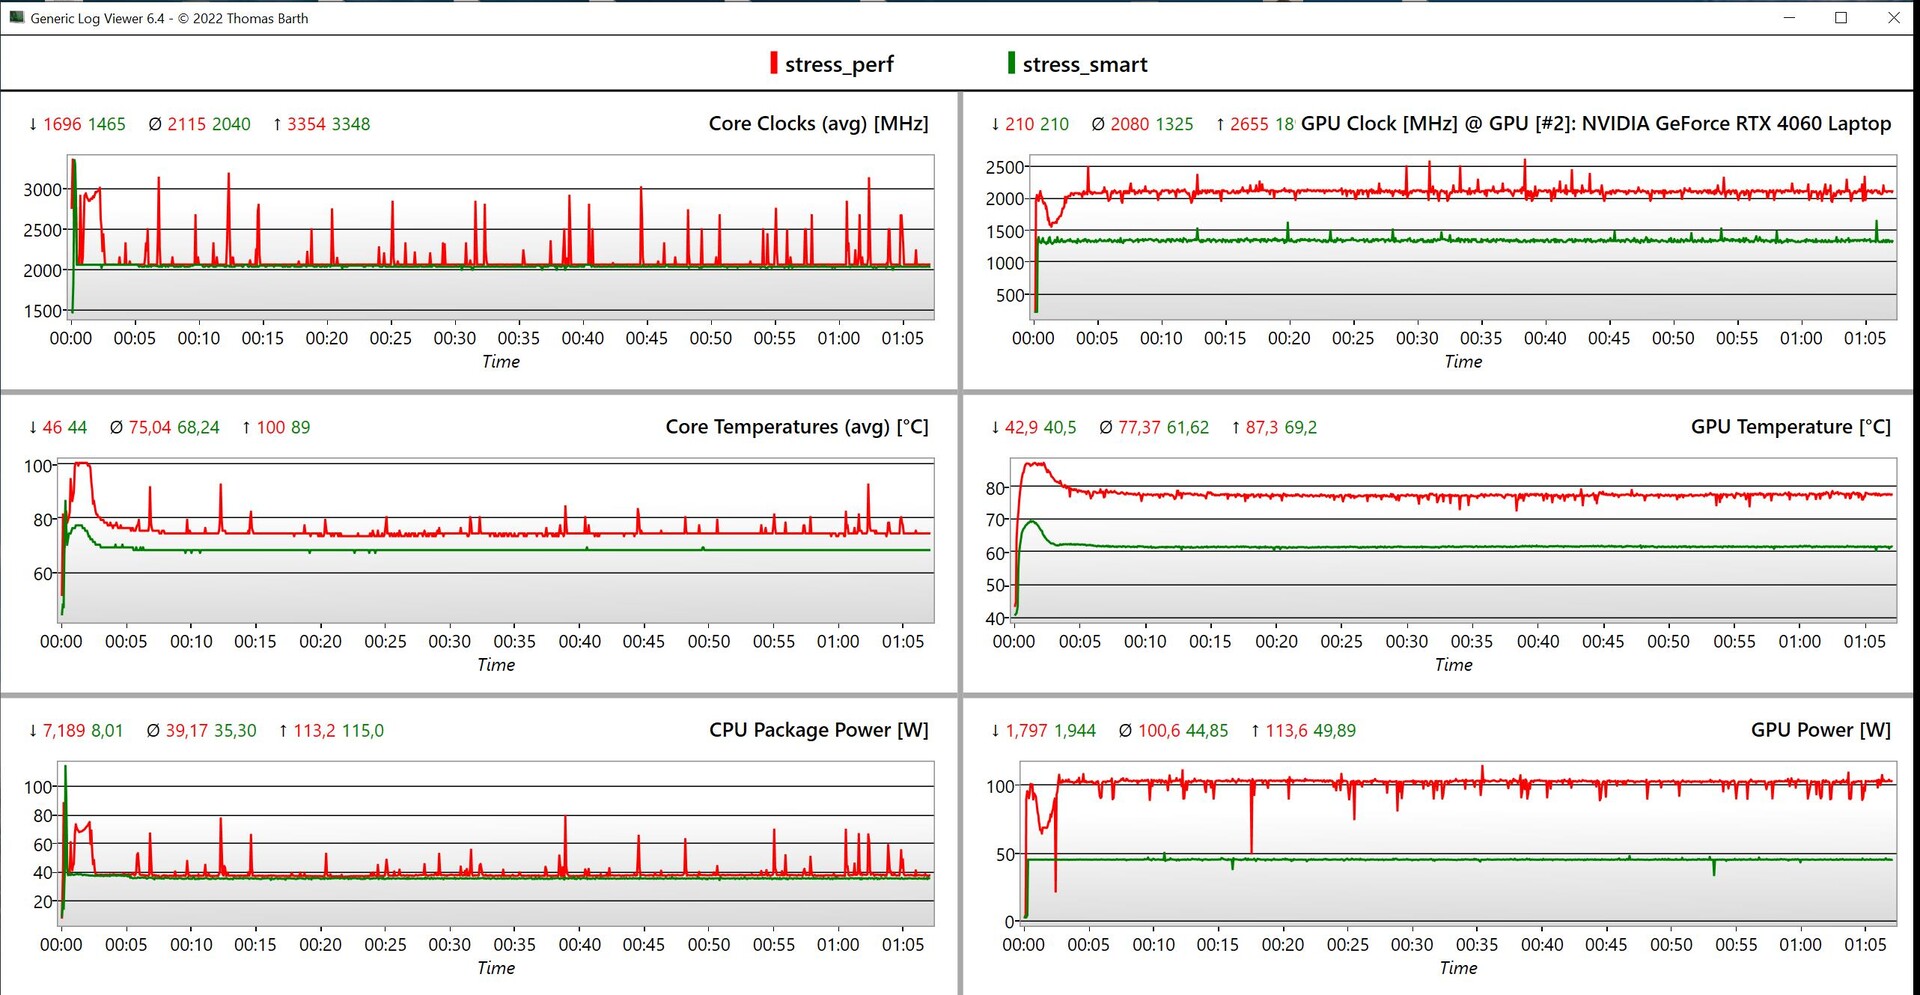
Teste de estresse
No teste de estresse, o MagicBook Pro 16 teve um desempenho muito bom. Usando o modo inteligente, a CPU e a GPU atingiram 35 e 45 watts, respectivamente, e quase 40 watts (CPU) e 100 watts (GPU) no modo de alto desempenho. É claro que, nesse caso, as ventoinhas ficam mais barulhentas, mas as temperaturas permanecem totalmente aceitáveis. No modo de bateria, o consumo do teste de estresse caiu para 25 watts para a CPU e 50 watts para a GPU.
Alto-falantes
O sistema de som é composto por 6 alto-falantes que geralmente proporcionam um bom som e estão no mesmo nível de outros dispositivos multimídia, como o Lenovo Yoga Pro 9 16. É possível fazer mais, especialmente no que diz respeito aos graves, mas isso é um gemido de alto nível
Honor MagicBook Pro 16 2024 análise de áudio
(±) | o volume do alto-falante é médio, mas bom (###valor### dB)
Graves 100 - 315Hz
(±) | graves reduzidos - em média 6.8% menor que a mediana
(±) | a linearidade dos graves é média (9% delta para a frequência anterior)
Médios 400 - 2.000 Hz
(+) | médios equilibrados - apenas 2.1% longe da mediana
(+) | médios são lineares (5.2% delta para frequência anterior)
Altos 2 - 16 kHz
(+) | agudos equilibrados - apenas 2.1% longe da mediana
(+) | os máximos são lineares (6.5% delta da frequência anterior)
Geral 100 - 16.000 Hz
(+) | o som geral é linear (8.7% diferença em relação à mediana)
Comparado com a mesma classe
» 11% de todos os dispositivos testados nesta classe foram melhores, 2% semelhantes, 87% piores
» O melhor teve um delta de 5%, a média foi 17%, o pior foi 45%
Comparado com todos os dispositivos testados
» 3% de todos os dispositivos testados foram melhores, 1% semelhantes, 97% piores
» O melhor teve um delta de 4%, a média foi 23%, o pior foi 134%
Lenovo Yoga Pro 9 16-IRP G8 análise de áudio
(±) | o volume do alto-falante é médio, mas bom (###valor### dB)
Graves 100 - 315Hz
(+) | bons graves - apenas 4.9% longe da mediana
(±) | a linearidade dos graves é média (9.1% delta para a frequência anterior)
Médios 400 - 2.000 Hz
(+) | médios equilibrados - apenas 3.2% longe da mediana
(+) | médios são lineares (6.5% delta para frequência anterior)
Altos 2 - 16 kHz
(+) | agudos equilibrados - apenas 2.9% longe da mediana
(+) | os máximos são lineares (3% delta da frequência anterior)
Geral 100 - 16.000 Hz
(+) | o som geral é linear (8.4% diferença em relação à mediana)
Comparado com a mesma classe
» 9% de todos os dispositivos testados nesta classe foram melhores, 2% semelhantes, 89% piores
» O melhor teve um delta de 5%, a média foi 17%, o pior foi 45%
Comparado com todos os dispositivos testados
» 2% de todos os dispositivos testados foram melhores, 1% semelhantes, 97% piores
» O melhor teve um delta de 4%, a média foi 23%, o pior foi 134%
Gerenciamento de energia - Boa resistência
Consumo de energia
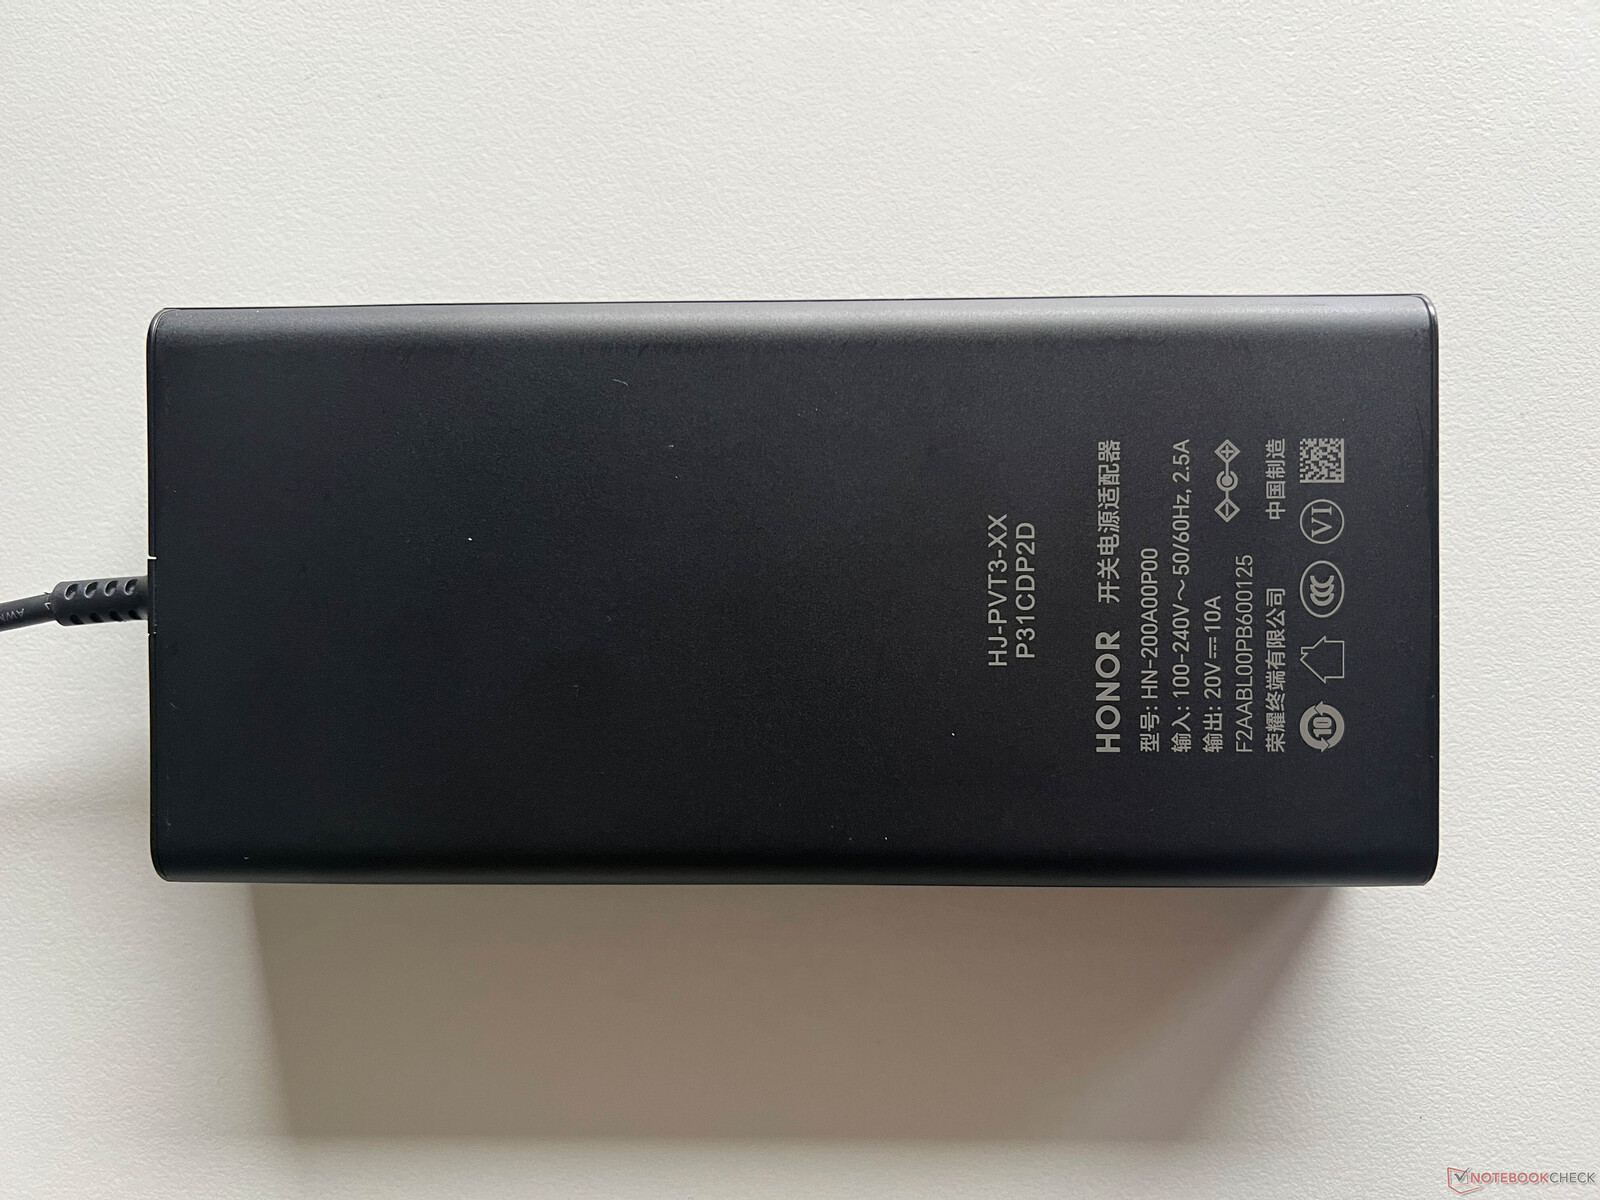
Em modo inativo com brilho total, a tela IPS requer até 15 watts, o que é muito aceitável considerando o alto brilho e a resolução. No teste de estresse, medimos brevemente um máximo de 196 watts, embora esses valores tenham se estabilizado rapidamente em 115 watts. No modo de alto desempenho, também registramos um máximo de 196 watts, mas esse valor permaneceu por mais tempo nesse nível e depois se estabilizou em cerca de 170 watts. Em ambos os casos, a PSU de 200 watts fornecida é mais do que suficiente.
| desligado | |
| Ocioso | |
| Carga |
|
Key:
min: | |
| Honor MagicBook Pro 16 2024 Ultra 7 155H, GeForce RTX 4060 Laptop GPU, WD PC SN740 SDDPNQD-1T00, IPS, 3072x1920, 16" | Framework Laptop 16 R9 7940HS, Radeon RX 7700S, WDC PC SN810 1TB, , 2560x1600, 16" | Lenovo ThinkPad Z16 Gen 2 R9 PRO 7940HS, Radeon RX 6550M, Kioxia XG8 KXG8AZNV1T02, OLED, 3840x2400, 16" | Dell Inspiron 16 Plus 7630 i7-13700H, GeForce RTX 4060 Laptop GPU, WD PC SN740 SDDPTQD-1T00, IPS, 2560x1600, 16" | Lenovo Yoga Pro 9 16-IRP G8 i7-13705H, GeForce RTX 4060 Laptop GPU, Samsung PM9A1 MZVL21T0HCLR, Mini-LED, 3200x2000, 16" | Schenker VISION 16 Pro (M23) i7-13700H, GeForce RTX 4070 Laptop GPU, Samsung 990 Pro 1 TB, IPS, 2560x1600, 16" | Asus Vivobook Pro 16X K6604JV-MX016W i9-13980HX, GeForce RTX 4060 Laptop GPU, Solidigm P41 Plus SSDPFKNU010TZ, OLED, 3200x2000, 16" | Média NVIDIA GeForce RTX 4060 Laptop GPU | Média da turma Multimedia | |
|---|---|---|---|---|---|---|---|---|---|
| Power Consumption | -26% | 7% | -37% | -40% | -5% | -50% | -32% | 24% | |
| Idle Minimum * (Watt) | 5.2 | 9.5 -83% | 7.5 -44% | 15.6 -200% | 10.9 -110% | 8.6 -65% | 13.8 -165% | 11.5 ? -121% | 5.69 ? -9% |
| Idle Average * (Watt) | 14.4 | 17 -18% | 9.6 33% | 17.7 -23% | 22.6 -57% | 12 17% | 16 -11% | 16 ? -11% | 10.2 ? 29% |
| Idle Maximum * (Watt) | 15.4 | 17.2 -12% | 18.5 -20% | 20.6 -34% | 23.5 -53% | 12.4 19% | 19 -23% | 20.3 ? -32% | 12.5 ? 19% |
| Load Average * (Watt) | 105.4 | 96.2 9% | 57.1 46% | 87.4 17% | 84.6 20% | 80 24% | 147 -39% | 92.9 ? 12% | 65.4 ? 38% |
| Witcher 3 ultra * (Watt) | 107.6 | 171.9 -60% | 115.8 -8% | 121.7 -13% | 159.5 -48% | 147.7 -37% | 147.8 -37% | ||
| Load Maximum * (Watt) | 195.2 | 175.7 10% | 131.7 33% | 138 29% | 177.3 9% | 173.1 11% | 244 -25% | 210 ? -8% | 112.9 ? 42% |
* ... menor é melhor
Power consumption Witcher 3 / stress test
Power consumption with an external monitor
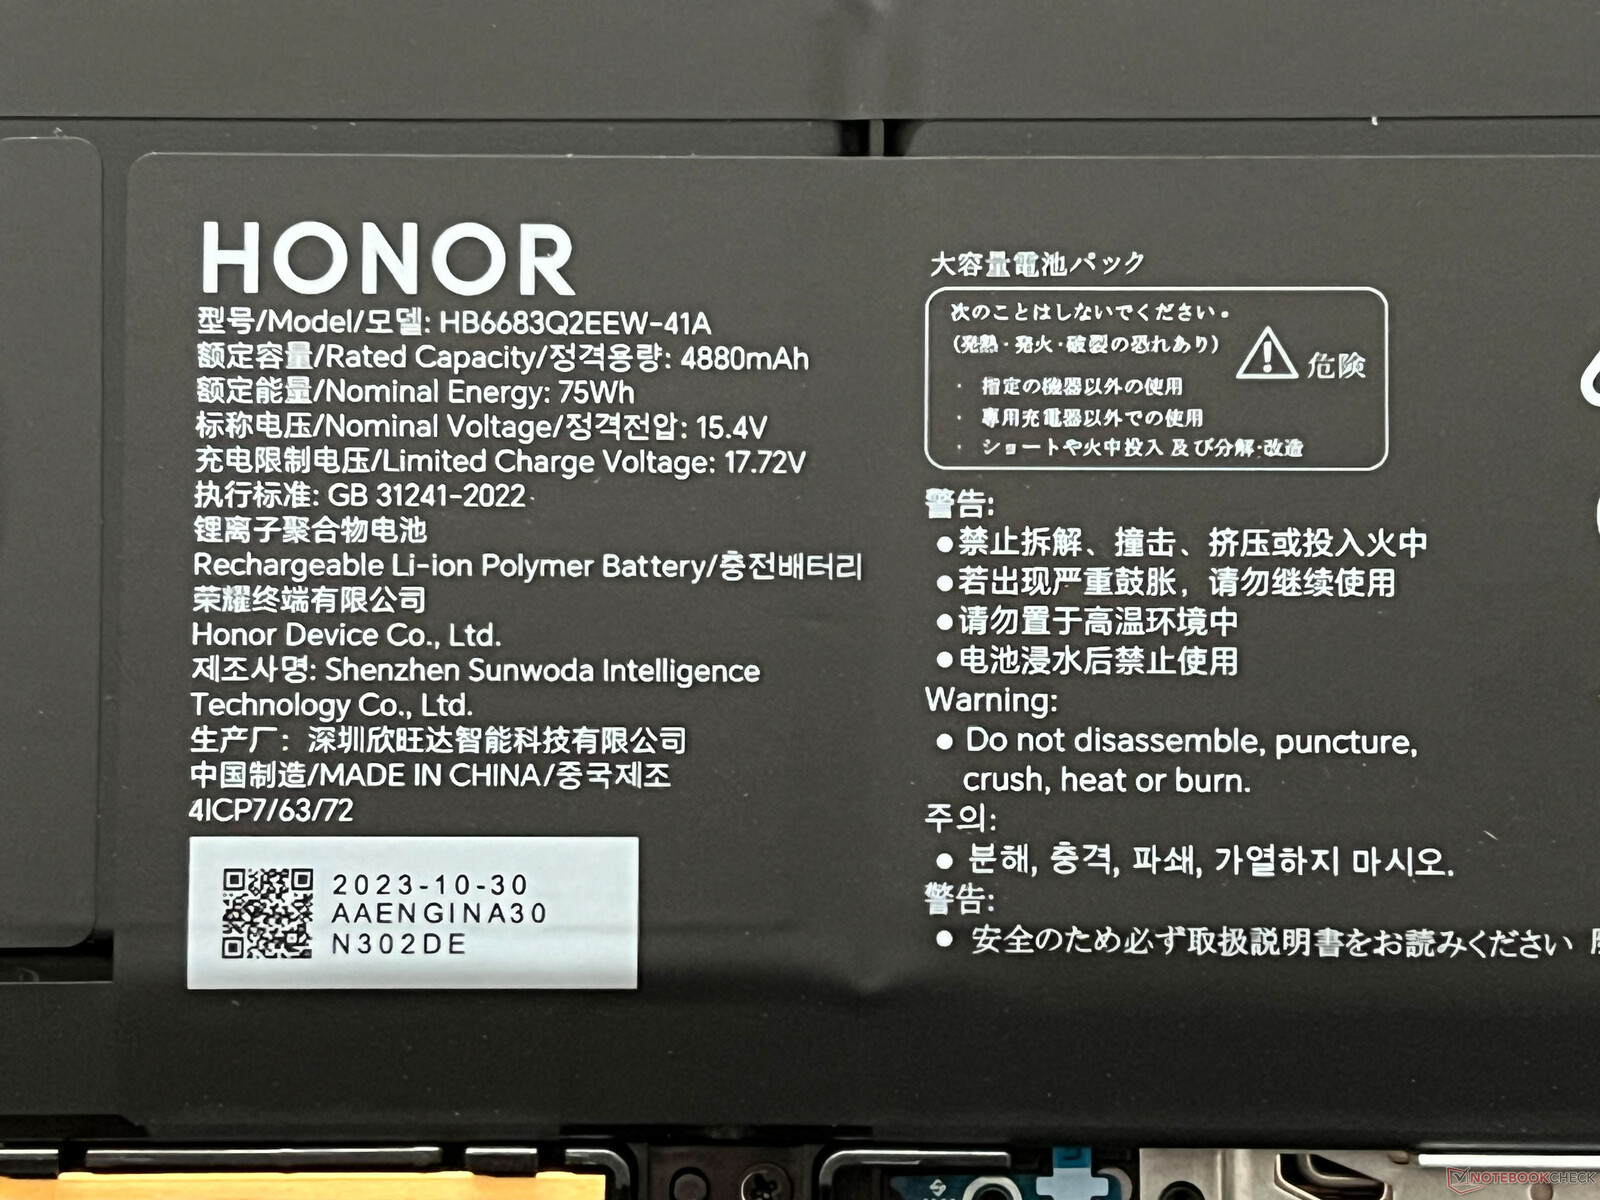
Duração da bateria
A bateria de 75 Wh permite tempos de funcionamento muito bons com o brilho adaptável definido para 150 cd/m² (representando 55% do brilho máximo do dispositivo de análise). A 60 Hz, nosso teste de Wi-Fi funcionou por mais de 12 horas e, a 165 Hz, funcionou por 9 horas e 20 minutos. Se o senhor usar o brilho total da tela, poderá obter cerca de 6 horas e é nesse ponto que a frequência mais alta deixa de ter uma grande influência (359 minutos a 165 Hz). Nosso teste de vídeo (definido para 150 cd/m²) funcionou por mais de 13 horas, mas, sob carga máxima e com brilho total, é possível esgotar completamente a bateria em 58 minutos. Um ciclo de carregamento completo, com o dispositivo ligado, leva apenas 62 minutos e o senhor tem acesso a 80% após apenas 34 minutos.
| Honor MagicBook Pro 16 2024 Ultra 7 155H, GeForce RTX 4060 Laptop GPU, 75 Wh | Framework Laptop 16 R9 7940HS, Radeon RX 7700S, 85 Wh | Lenovo ThinkPad Z16 Gen 2 R9 PRO 7940HS, Radeon RX 6550M, 72 Wh | Dell Inspiron 16 Plus 7630 i7-13700H, GeForce RTX 4060 Laptop GPU, 86 Wh | Lenovo Yoga Pro 9 16-IRP G8 i7-13705H, GeForce RTX 4060 Laptop GPU, 75 Wh | Schenker VISION 16 Pro (M23) i7-13700H, GeForce RTX 4070 Laptop GPU, 80 Wh | Asus Vivobook Pro 16X K6604JV-MX016W i9-13980HX, GeForce RTX 4060 Laptop GPU, 90 Wh | Média da turma Multimedia | |
|---|---|---|---|---|---|---|---|---|
| Duração da bateria | 13% | 10% | 9% | -40% | -15% | -19% | 33% | |
| H.264 (h) | 13.1 | 7.5 -43% | 7.8 -40% | 5.3 -60% | 16.8 ? 28% | |||
| WiFi v1.3 (h) | 12.2 | 9.1 -25% | 6 -51% | 9.4 -23% | 6.4 -48% | 7.8 -36% | 6.5 -47% | 12.2 ? 0% |
| Load (h) | 1 | 1.5 50% | 1.7 70% | 1.4 40% | 0.7 -30% | 1.3 30% | 1.5 50% | 1.7 ? 70% |
Pro
Contra
Veredicto - O MagicBook Pro 16 é um laptop multimídia surpreendentemente bom
Com o novo MagicBook Pro 16, a Honor está abrindo novos caminhos e trazendo ao mercado um poderoso laptop multimídia que é interessante tanto para criadores de conteúdo quanto para jogadores. Em particular, quando se trata de resfriamento, o dispositivo é impressionante, mesmo na primeira execução. Usando o modo inteligente, foi encontrado um bom equilíbrio entre o desempenho e o volume da ventoinha, o que significa que é possível jogar sem fones de ouvido. No modo de alto desempenho, a carga combinada de desempenho da CPU/GPU é muito acentuada e tem o custo do volume da ventoinha. Em ambos os casos, as temperaturas da superfície não são motivo de preocupação. Os títulos mais exigentes se beneficiam da combinação do novo Core Ultra 7 155H e o laptop GeForce Laptop RTX 4060 juntamente com o Advanced Optimus e se adaptam bem a um laptop multimídia.
Em termos de tela, a Honor não optou por mini LED ou OLED, mas sim por um painel IPS clássico com alta resolução de 3.072 x 1.920 pixels. A superfície é fosca e, por isso, as cores não são muito vibrantes, o que significa que o senhor terá que conviver com algumas limitações, especialmente nas áreas de níveis de preto e taxa de contraste. No entanto, a vantagem é que o PWM está ausente e o brilho total do painel de mais de 500 nits é acessível em operação SDR normal. Da mesma forma, os tempos de resposta são agradavelmente rápidos. Quem gosta de editar fotos e vídeos ficará irritado com a ausência do perfil sRGB.
O novo Honor MagicBook Pro 16 é um laptop multimídia muito equilibrado, com componentes potentes e resfriamento eficaz. O painel IPS brilhante e fosco não sofre com o PWM e oferece uma alta frequência de 165 Hz, além de tempos de resposta rápidos.
Outras vantagens são o teclado confortável e seu teclado numérico, o sistema de som com 6 alto-falantes e o desempenho do Wi-Fi, mesmo que o senhor tenha que dispensar os padrões atuais (Wi-Fi 6E, Wi-Fi 7). Em termos de portas, seria possível ter mais portas (por exemplo, HDMI 2.1 com G-Sync), mas, pelo menos com Thunderbolt 4 e HDMI 2.0, os padrões mais importantes estão cobertos. A localização das portas USB-A na parte traseira do dispositivo não é perfeita e elas teriam se encaixado melhor no lado direito do dispositivo.
Também não ficamos totalmente impressionados com a caixa de plástico, pois ela é responsável por alguns ruídos de rangidos, embora a estabilidade em si seja muito boa. Além disso, embora não seja possível expandir a RAM, nossa configuração de análise de 32 GB deve ser suficiente para a maioria dos usuários. Nos testes, em algumas ocasiões, o clickpad não funcionou corretamente, mas como isso só acontece esporadicamente, presumimos que tenha algo a ver com problemas de driver. Esperamos que isso possa ser resolvido antes que o dispositivo chegue ao mercado.
E é aí que chegamos ao nosso próximo problema. Infelizmente, no momento não temos nenhuma informação sobre a disponibilidade (presumivelmente a partir do segundo trimestre) ou o preço, e é por isso que é difícil fazer comparações com dispositivos concorrentes, como o Lenovo Yoga Pro 9i 16, no momento. Adicionaremos as informações assim que possível.
Preço e disponibilidade
Espera-se que o novo Honor MagicBook Pro 16 2024 esteja disponível globalmente a partir do segundo trimestre. No momento, ainda não podemos informar o preço sugerido.
Honor MagicBook Pro 16 2024
- 02/28/2024 v7 (old)
Andreas Osthoff
Transparência
A seleção dos dispositivos a serem analisados é feita pela nossa equipe editorial. A amostra de teste foi fornecida ao autor como empréstimo pelo fabricante ou varejista para fins desta revisão. O credor não teve influência nesta revisão, nem o fabricante recebeu uma cópia desta revisão antes da publicação. Não houve obrigação de publicar esta revisão. Como empresa de mídia independente, a Notebookcheck não está sujeita à autoridade de fabricantes, varejistas ou editores.
É assim que o Notebookcheck está testando
Todos os anos, o Notebookcheck analisa de forma independente centenas de laptops e smartphones usando procedimentos padronizados para garantir que todos os resultados sejam comparáveis. Desenvolvemos continuamente nossos métodos de teste há cerca de 20 anos e definimos padrões da indústria no processo. Em nossos laboratórios de teste, equipamentos de medição de alta qualidade são utilizados por técnicos e editores experientes. Esses testes envolvem um processo de validação em vários estágios. Nosso complexo sistema de classificação é baseado em centenas de medições e benchmarks bem fundamentados, o que mantém a objetividade.Price comparison

