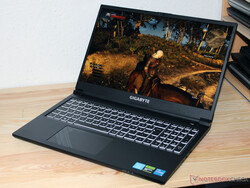
Análise do Gigabyte G5 KF: Laptop para jogos com RTX 4060 por 969 euros
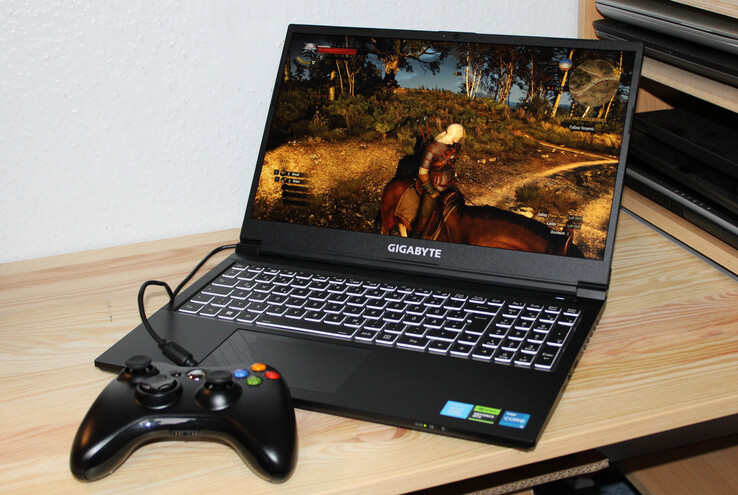
O G5 KF é um laptop para jogos no segmento de preço mais baixo - o dispositivo de 15,6 polegadas custará cerca de € 969 (US$ 1.026). Embora uma licença do Windows não esteja incluída no preço. O laptop da Gigabyte está competindo com modelos como o MSI Cyborg 15 A12VF, Intel NUC X15, Lenovo Legion Slim 5 16APH8eAsus TUF A15 FA507.
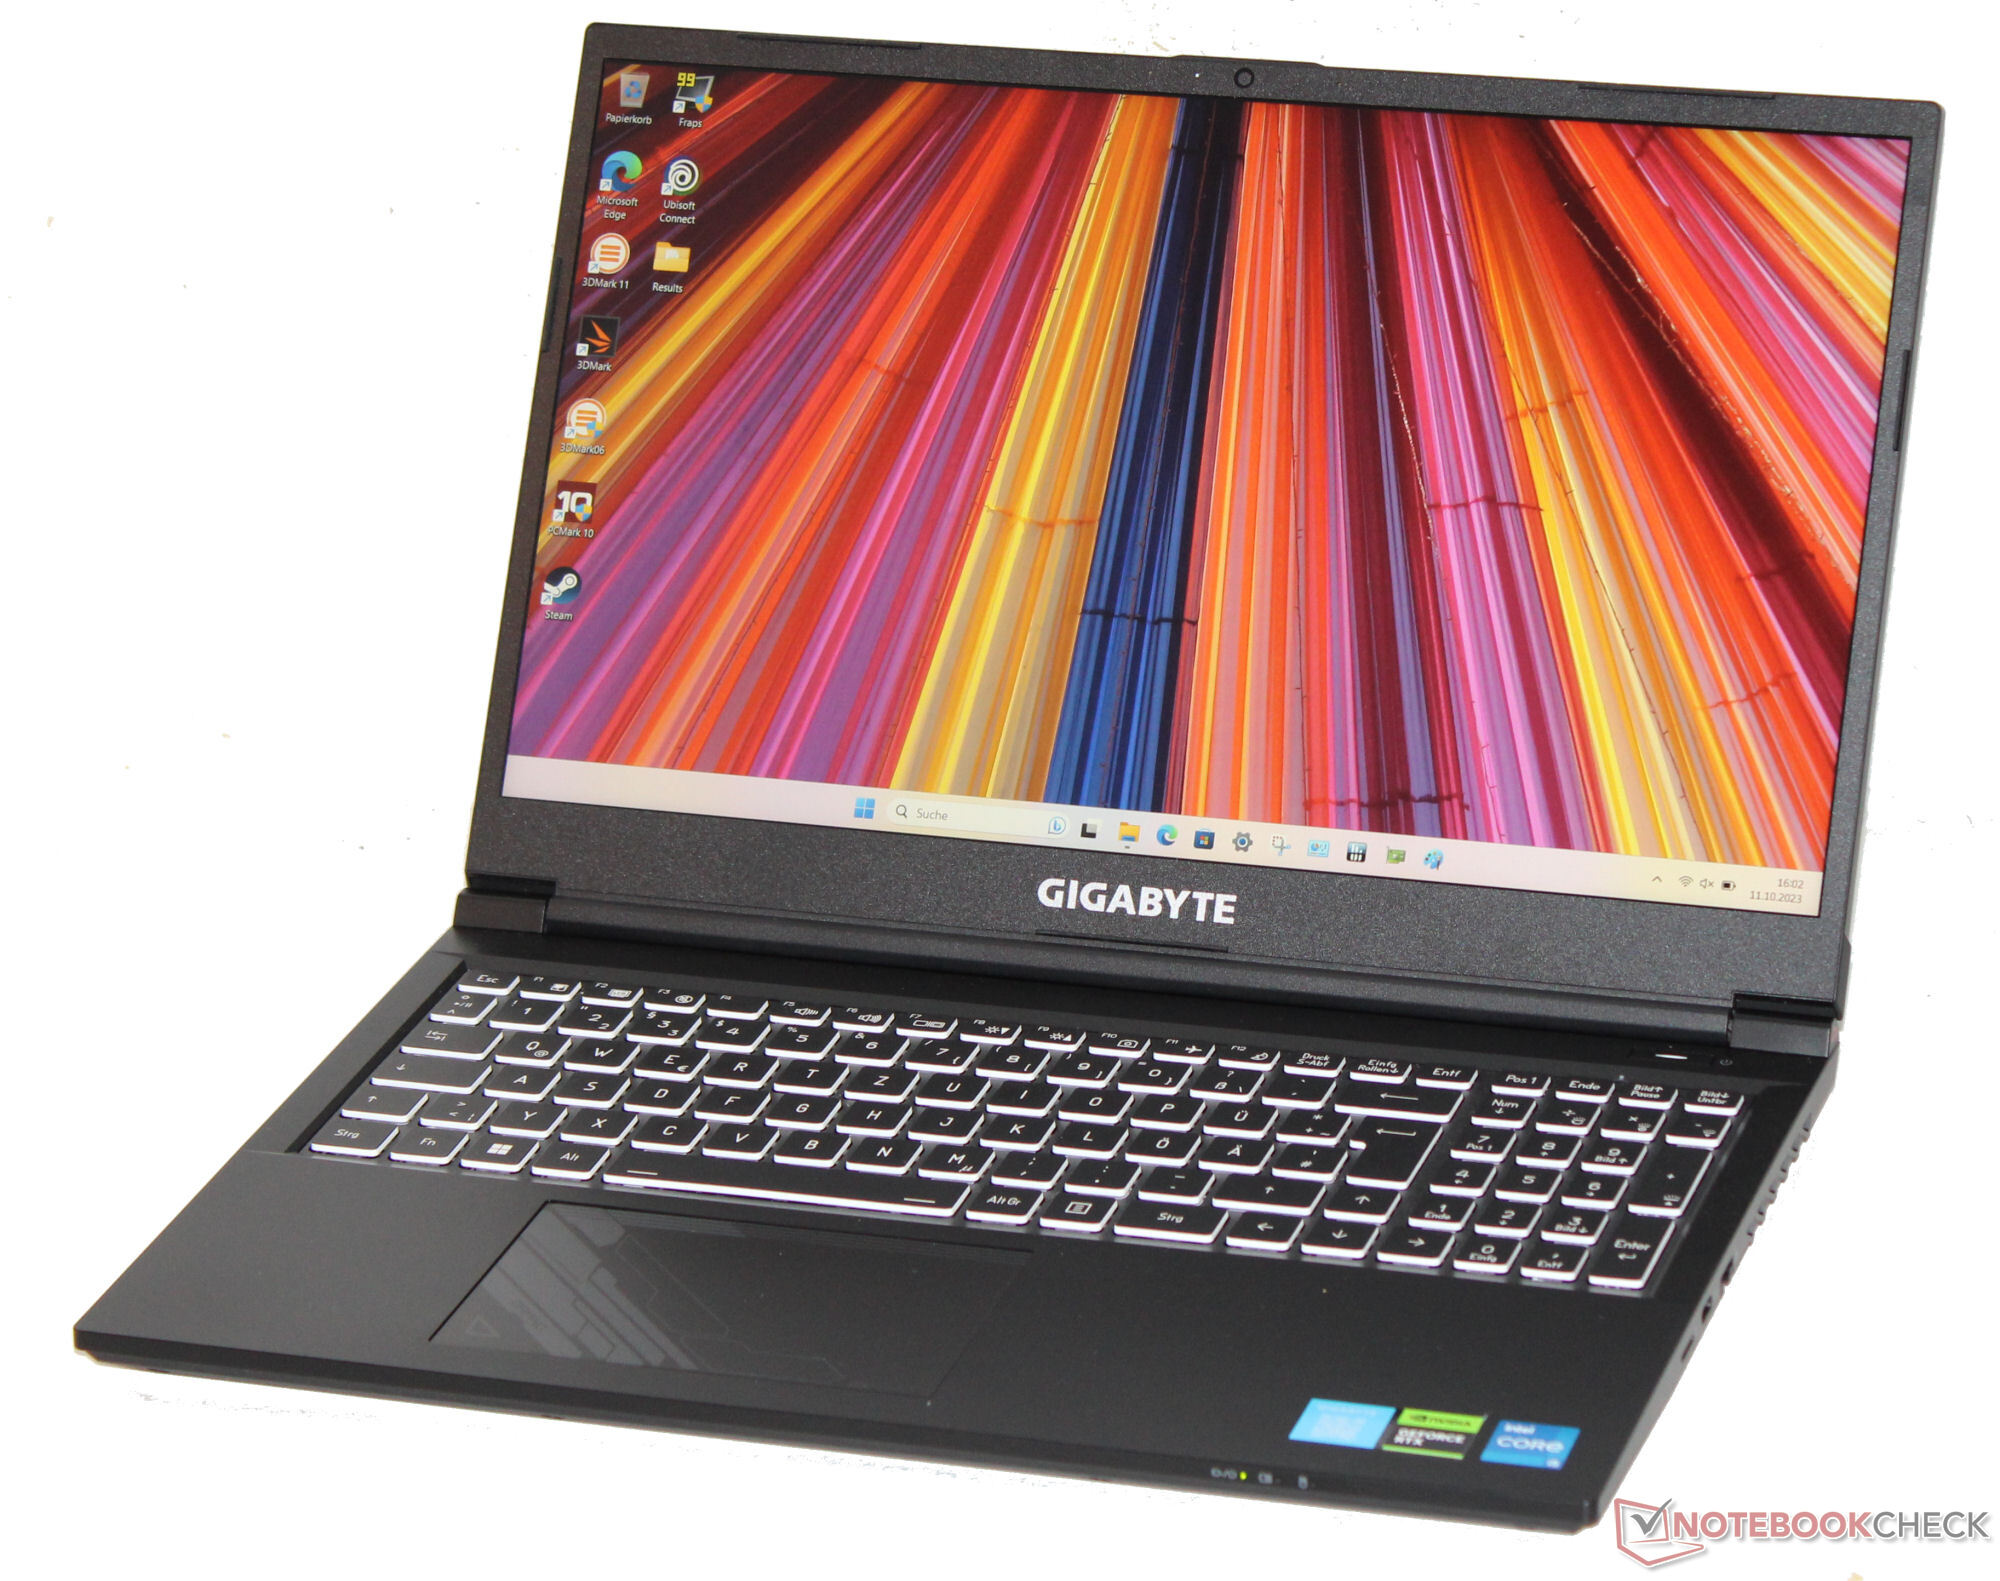
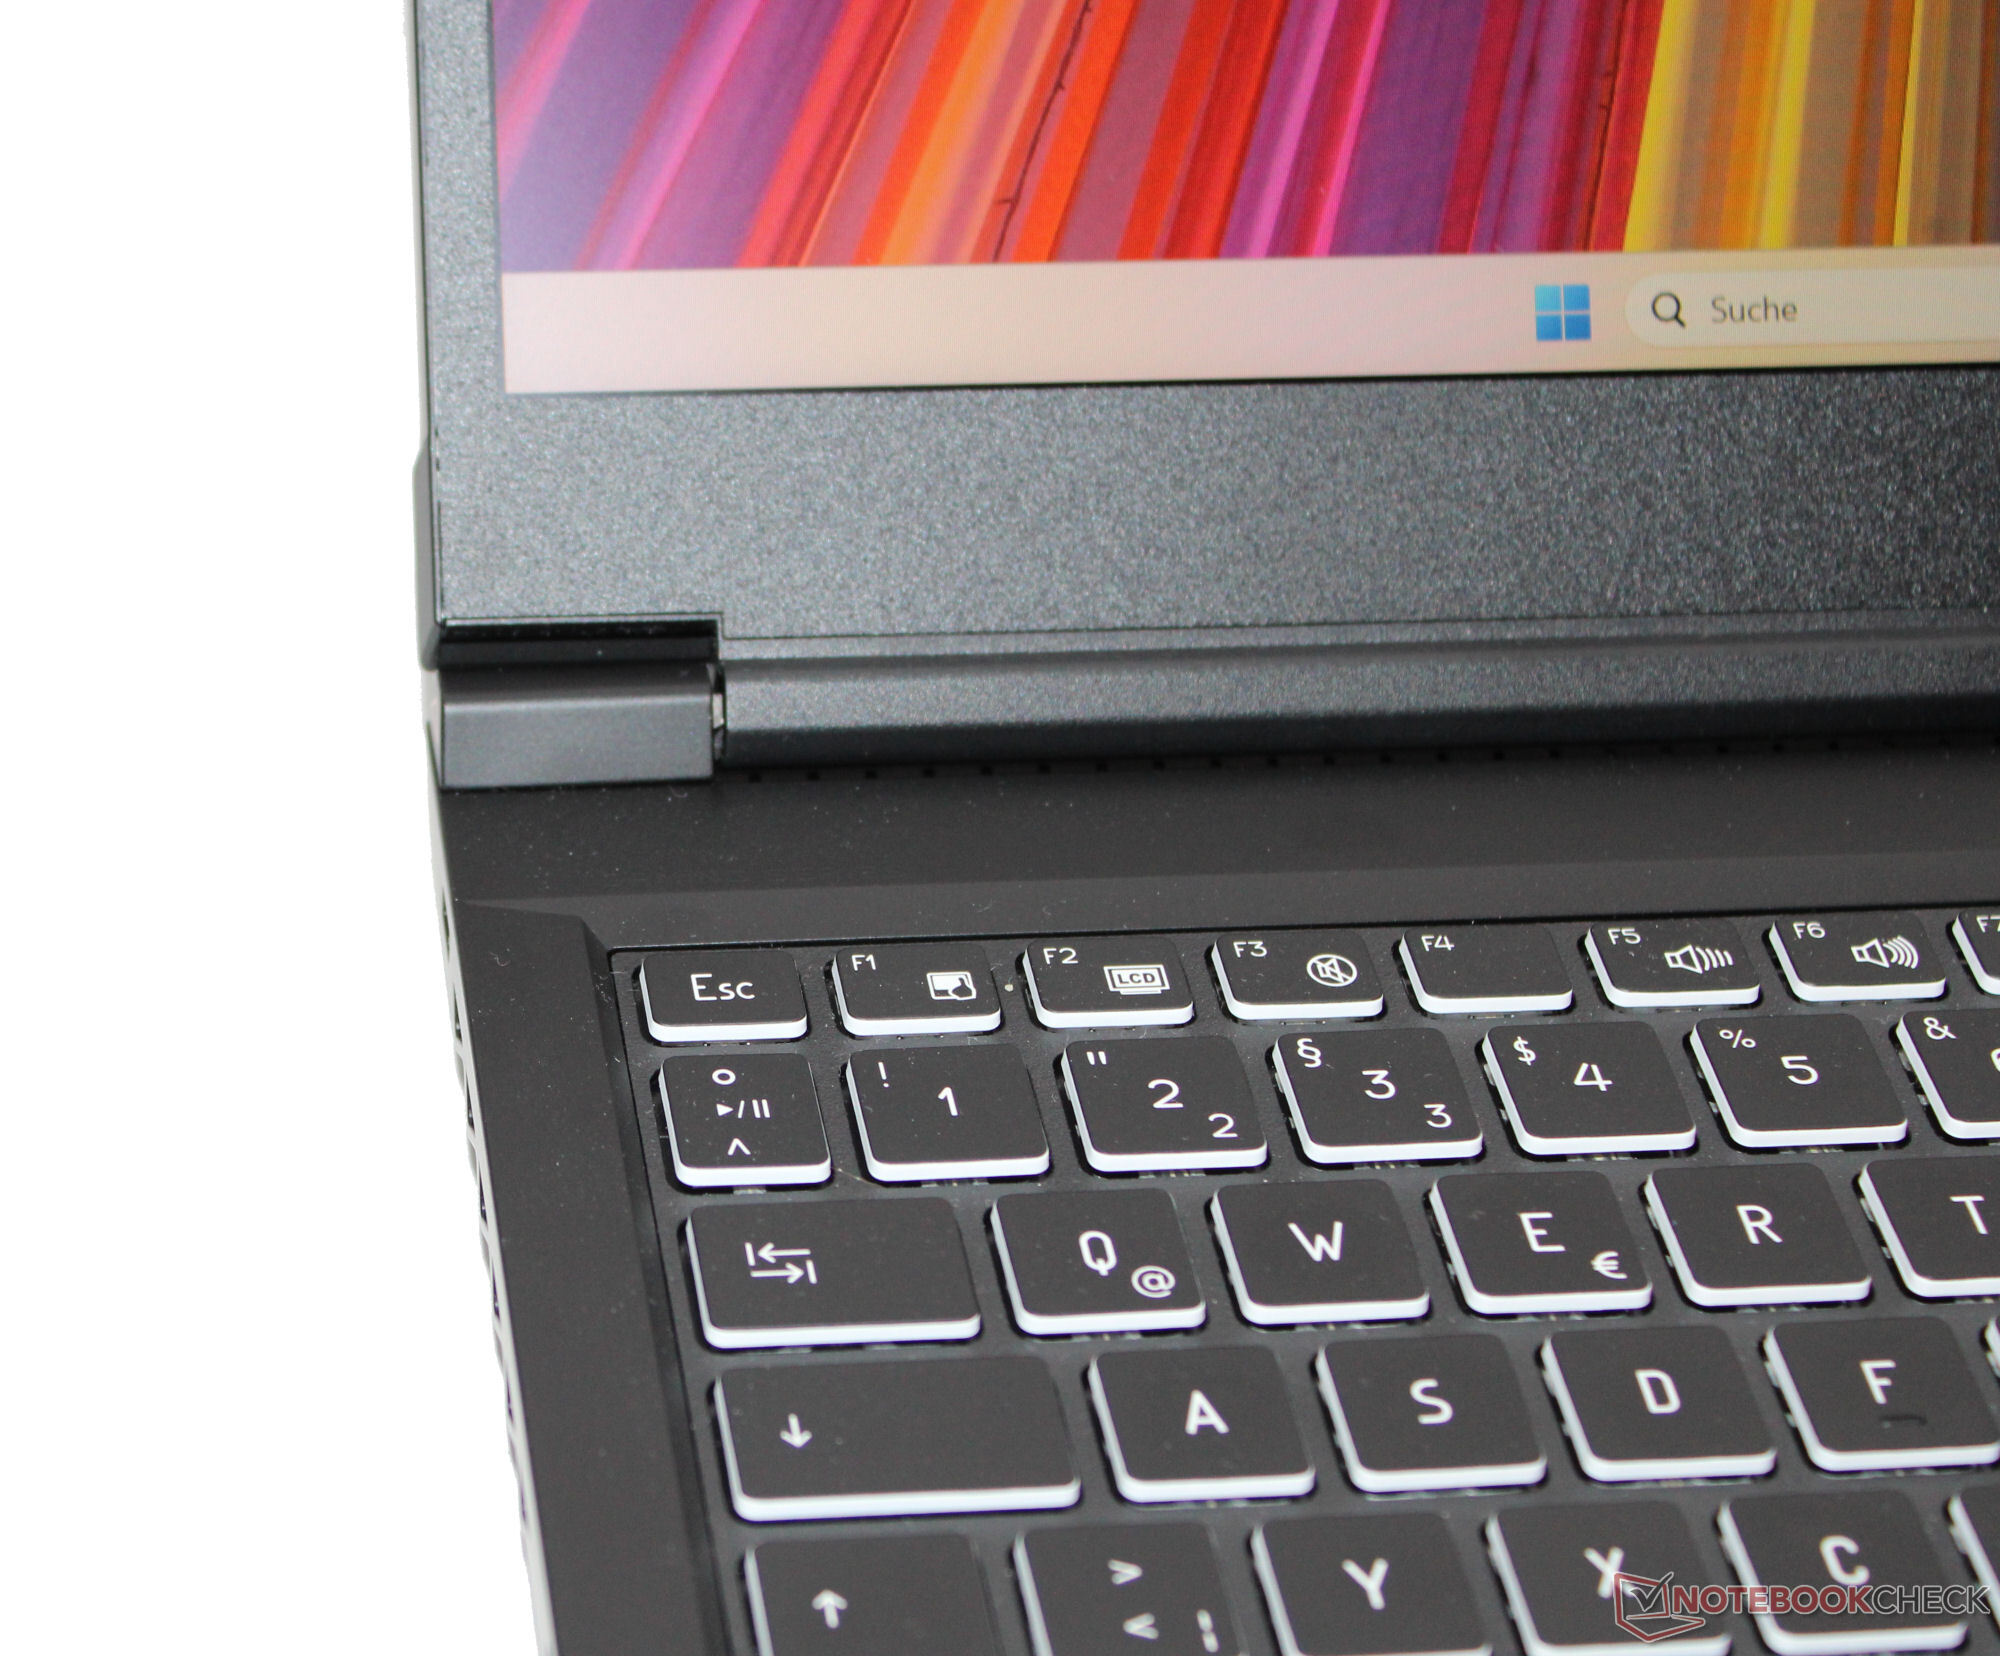
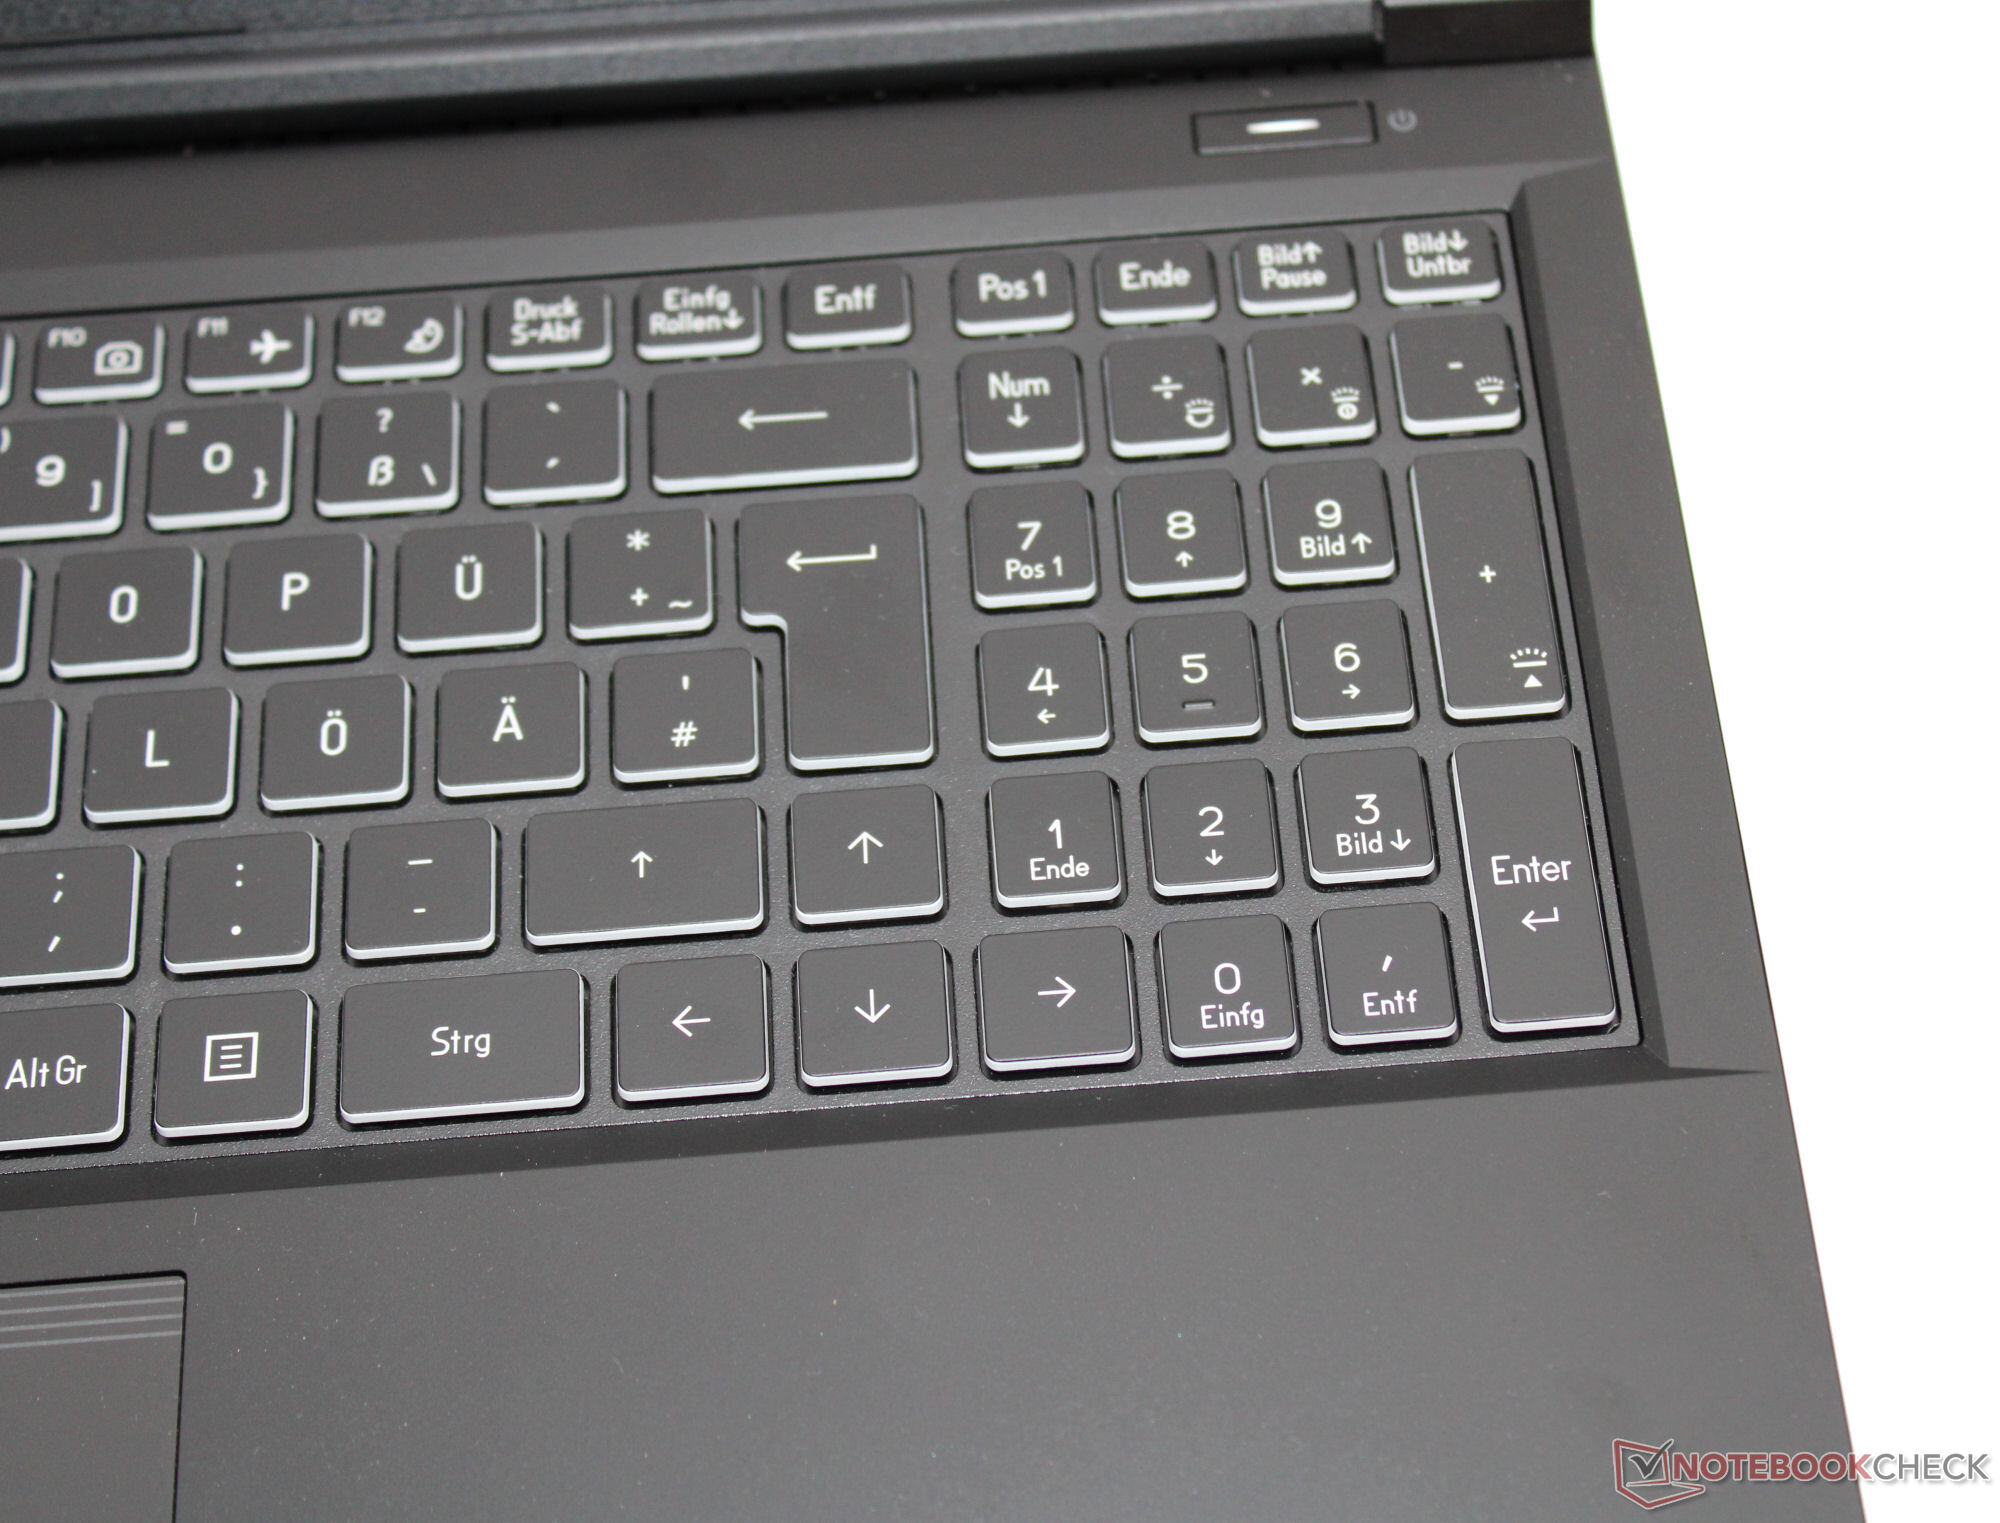
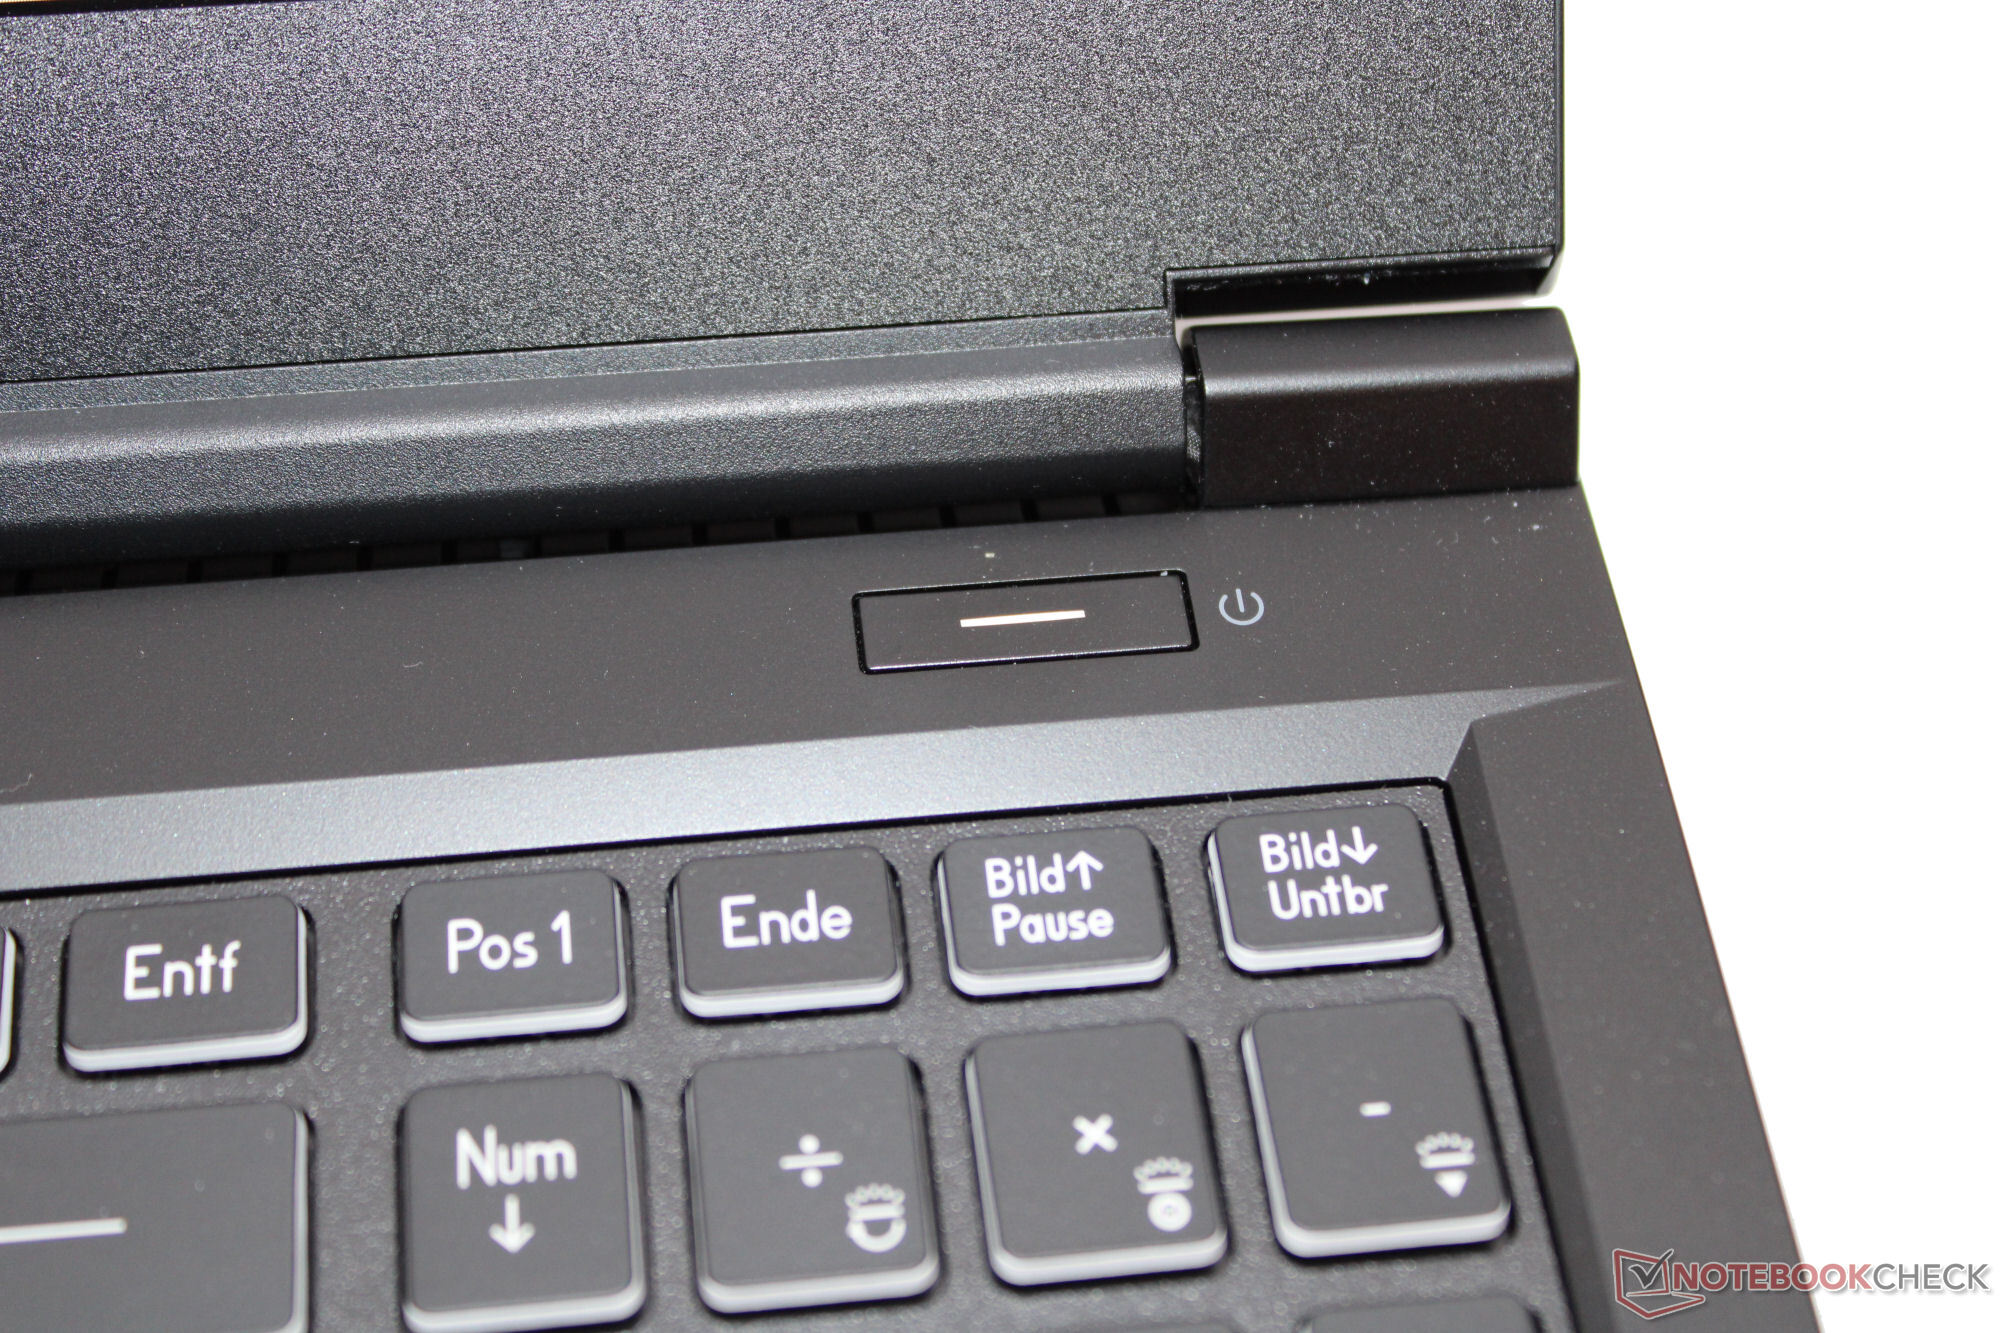
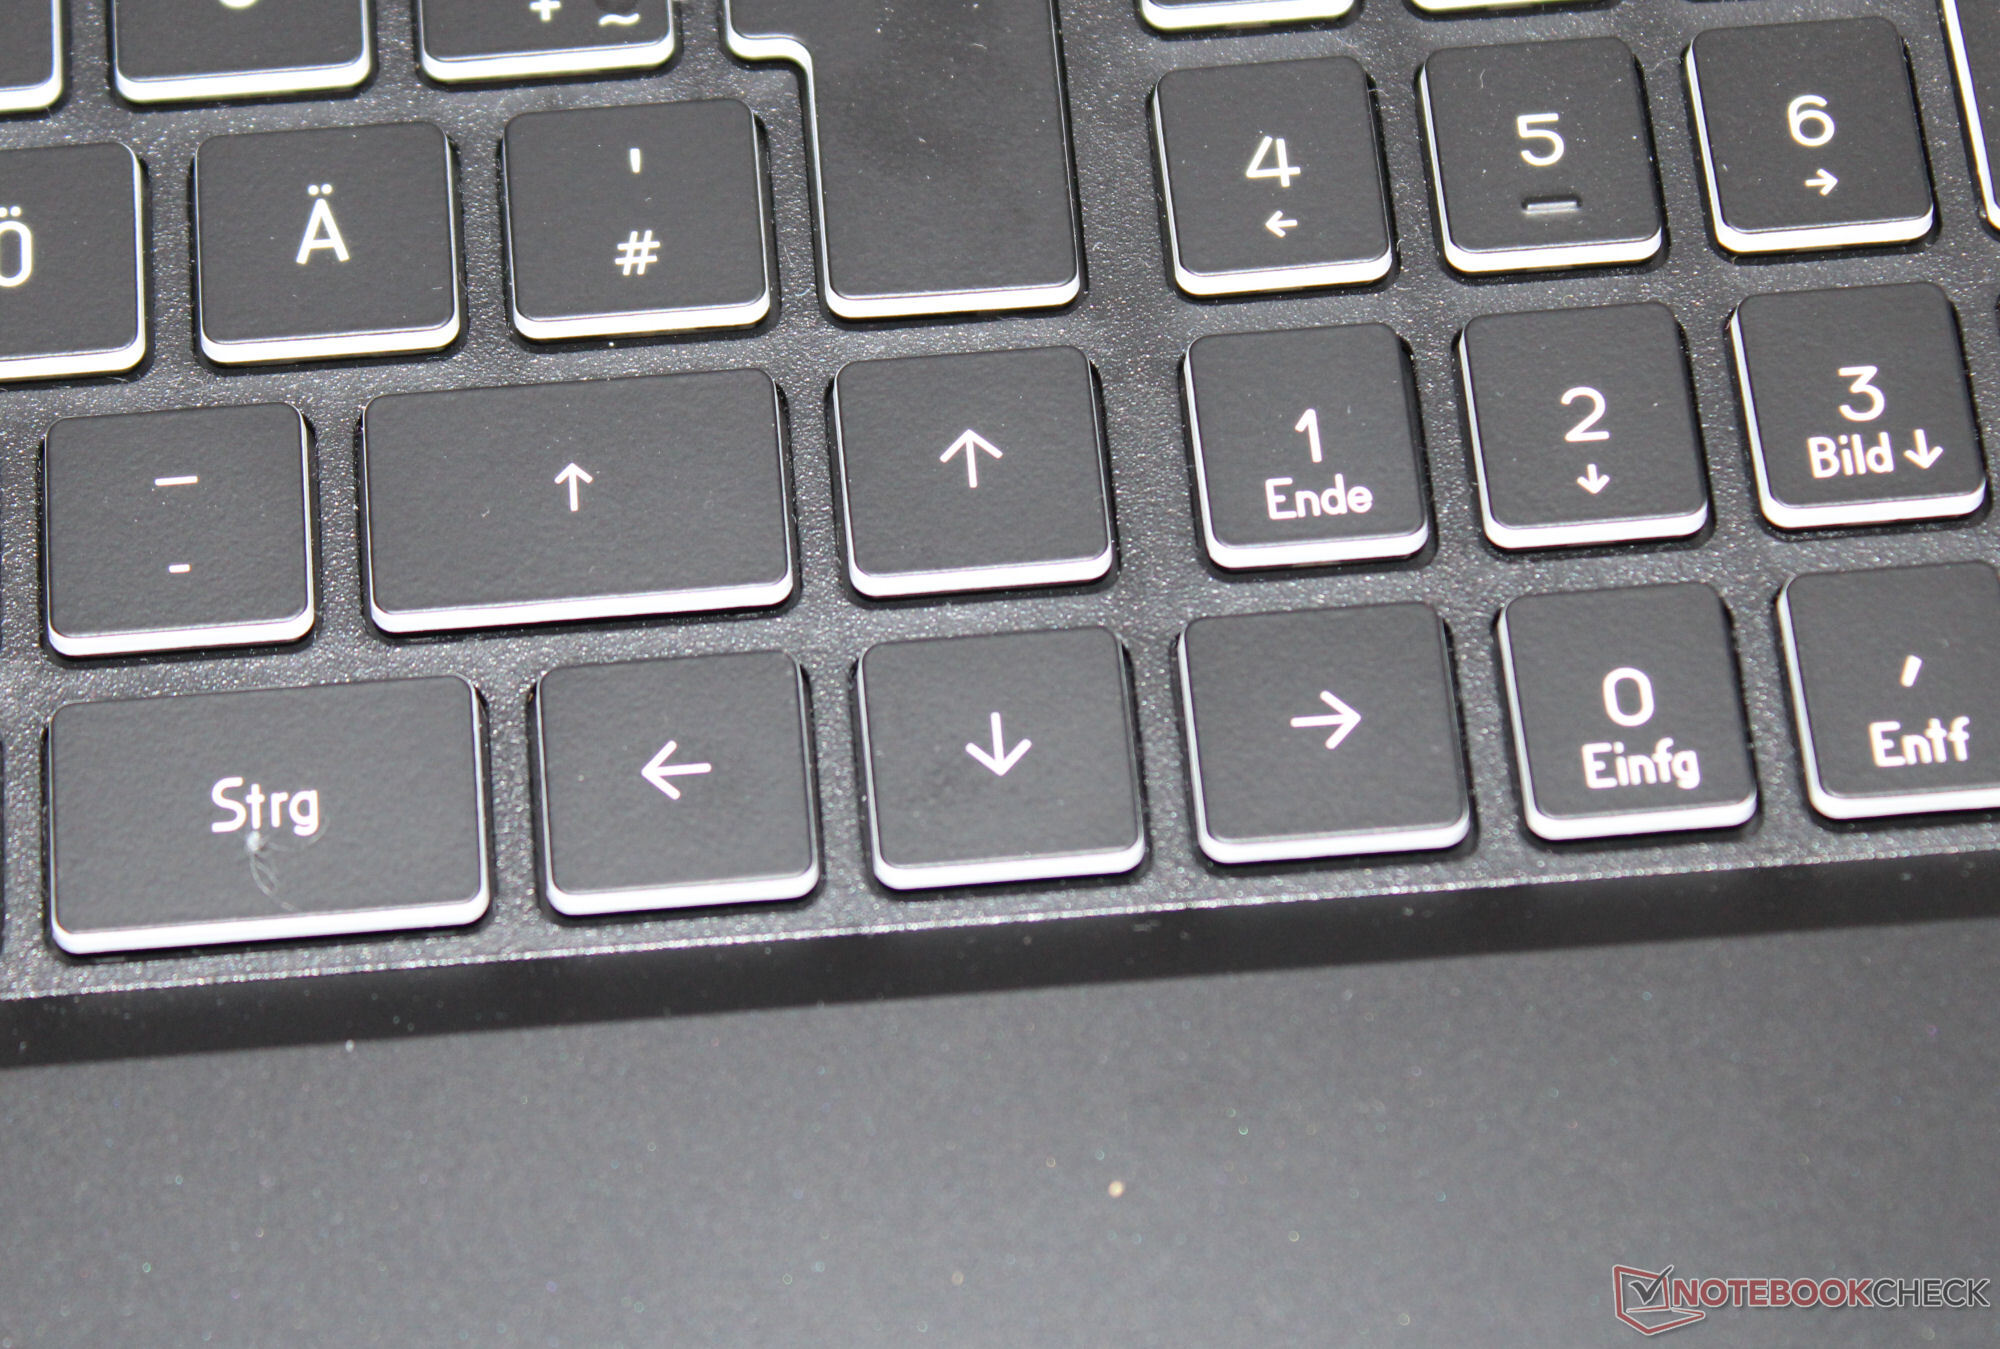
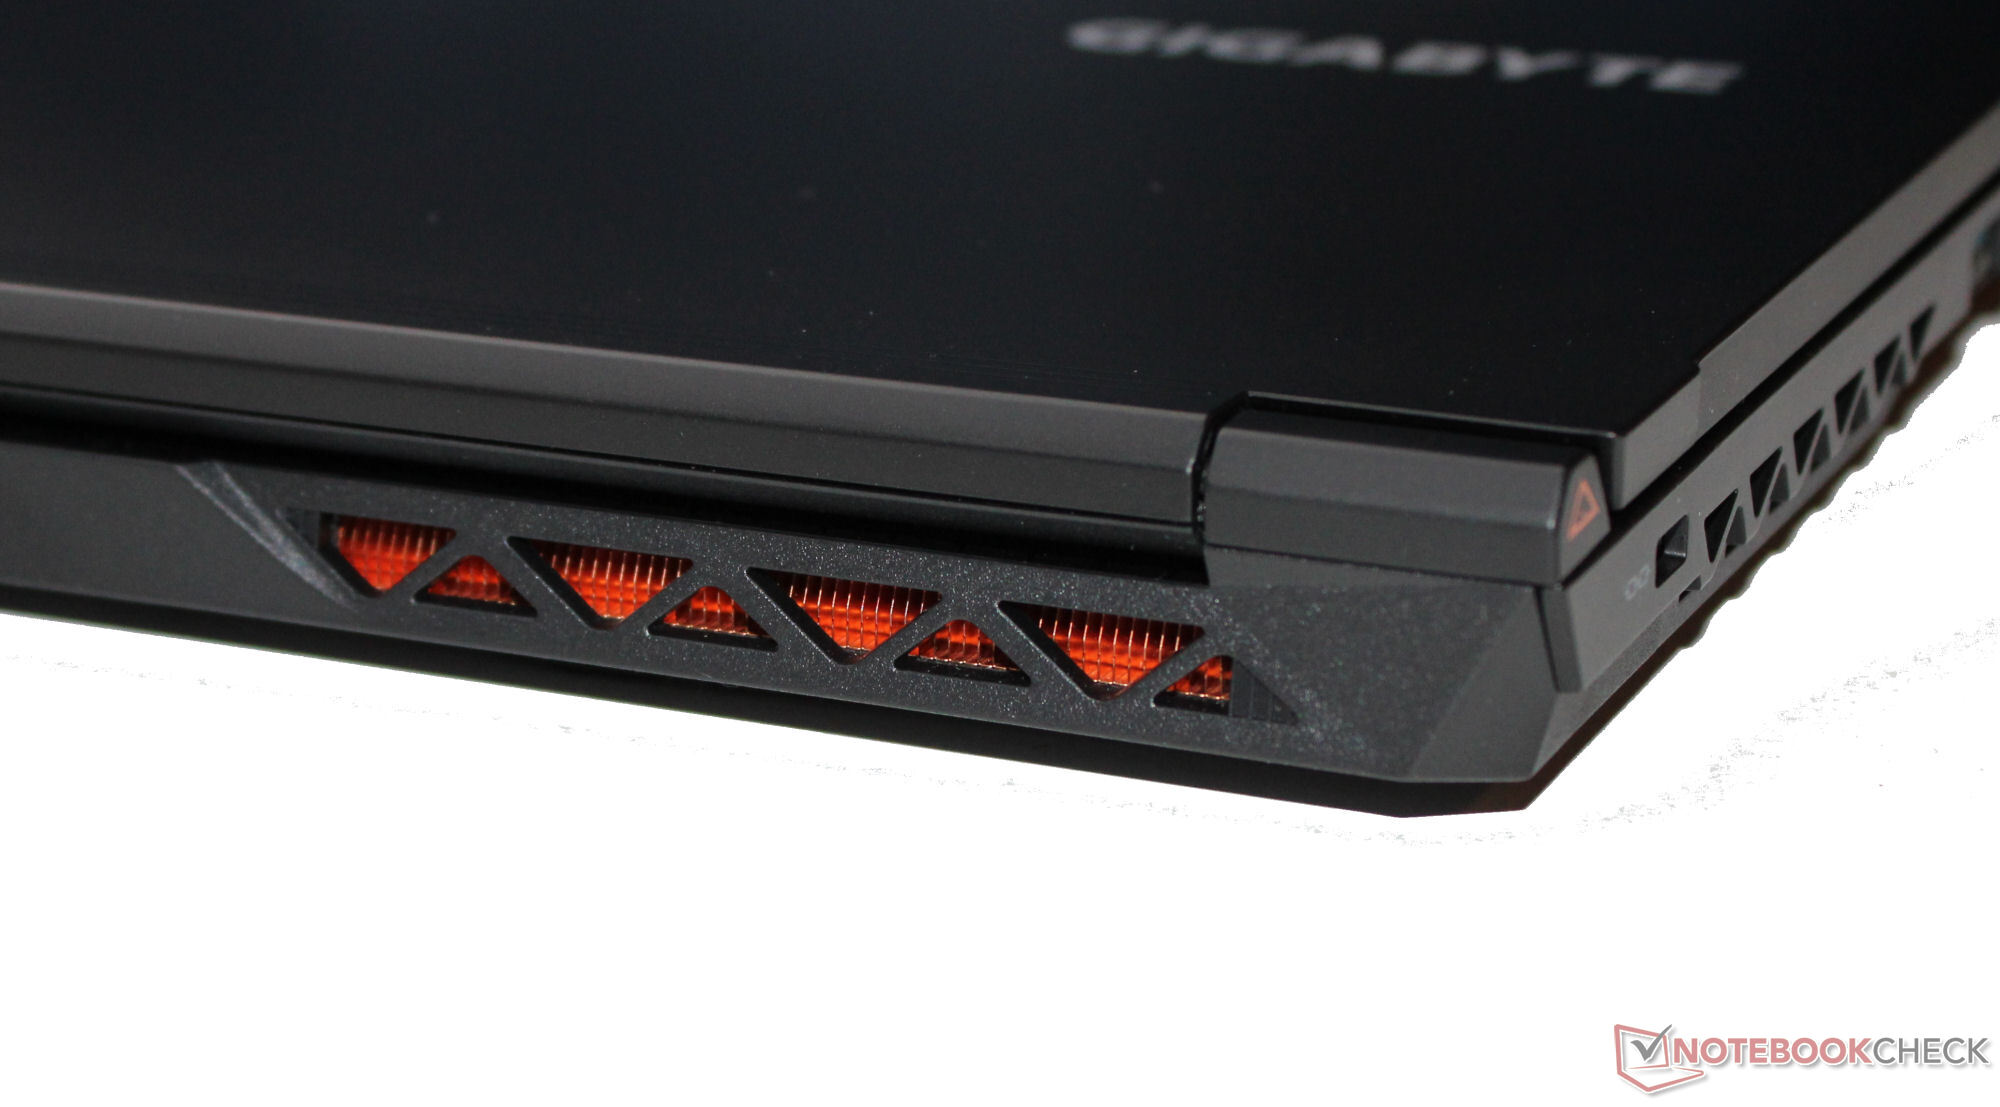
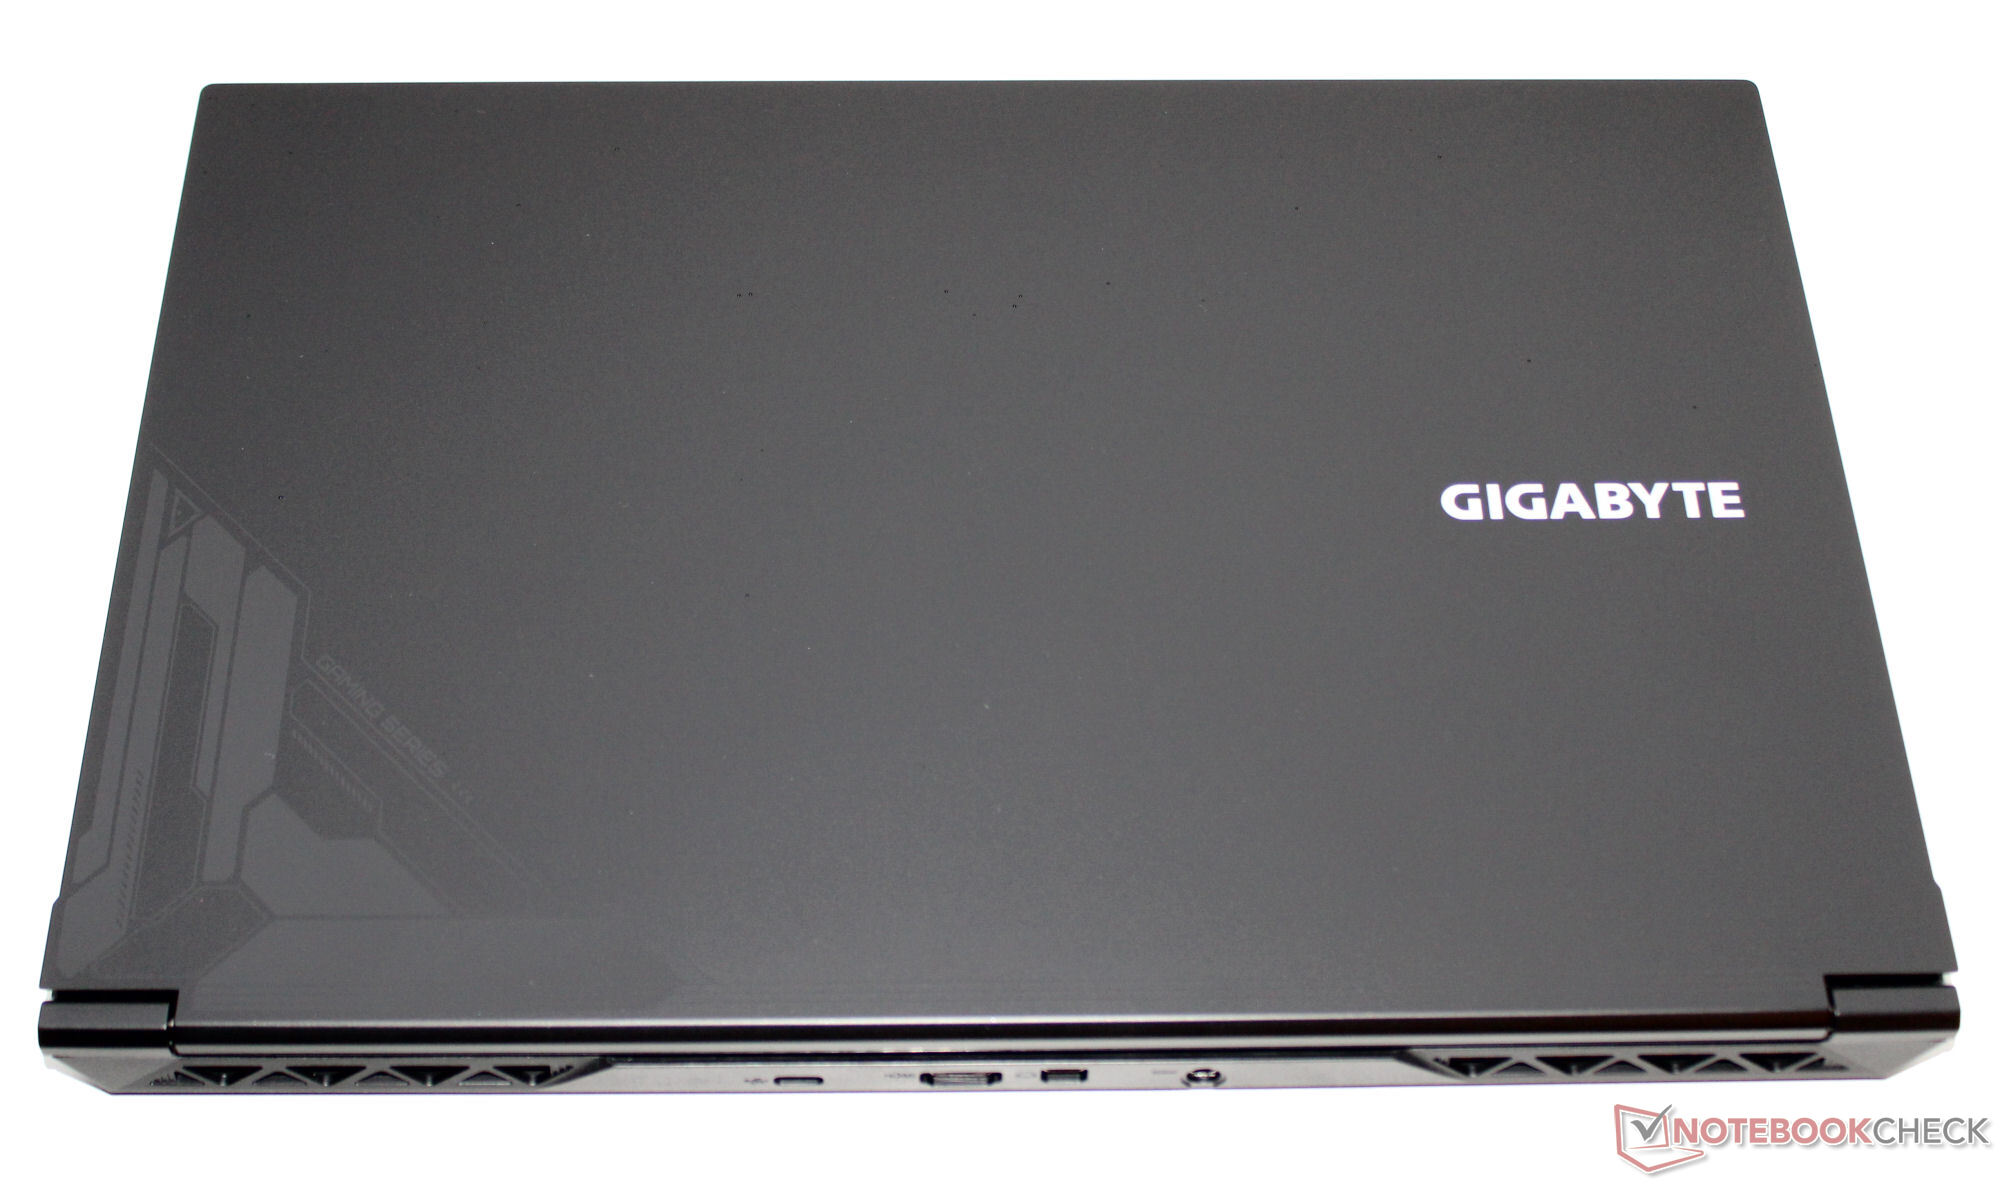
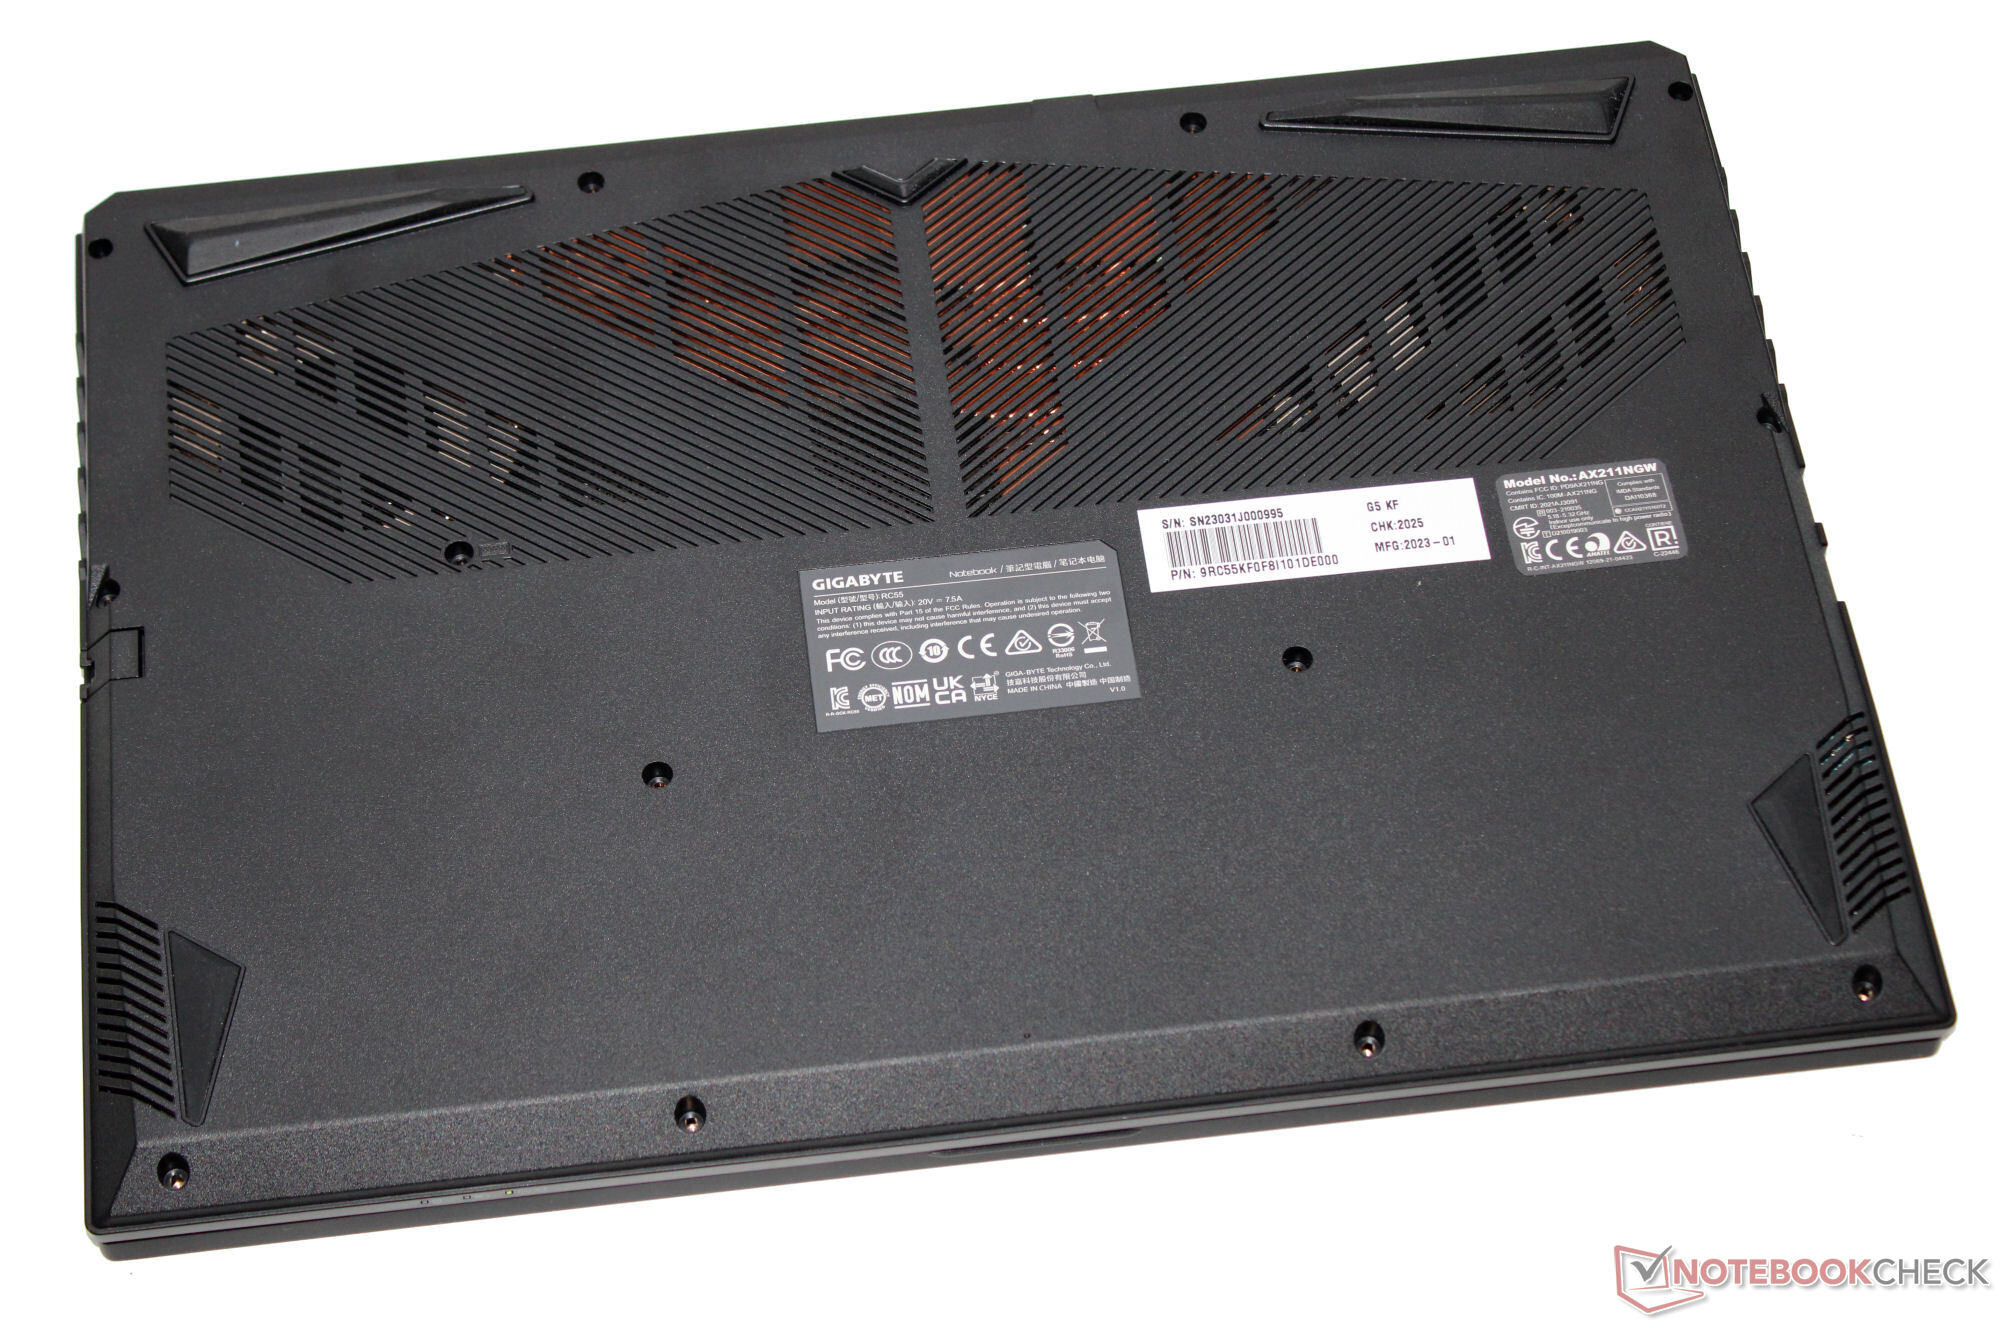
O G5 KF é uma continuação do G5 KE e compartilha o mesmo design físico. Portanto, os senhores podem consultar nossa análise do G5 KE para obter mais informações sobre o chassi, os recursos, os dispositivos de entrada e a tela.
Possíveis concorrentes em comparação
Avaliação | Data | Modelo | Peso | Altura | Size | Resolução | Preço |
|---|---|---|---|---|---|---|---|
| 81.8 % v7 (old) | 10/2023 | Gigabyte G5 KF i5-12500H, GeForce RTX 4060 Laptop GPU | 1.9 kg | 22.7 mm | 15.60" | 1920x1080 | |
| 82.4 % v7 (old) | 04/2023 | MSI Cyborg 15 A12VF i7-12650H, GeForce RTX 4060 Laptop GPU | 2 kg | 22.9 mm | 15.60" | 1920x1080 | |
| 84.4 % v7 (old) | 10/2023 | Intel NUC X15 LAPAC71H i7-12700H, A730M | 2.2 kg | 26.7 mm | 15.60" | 1920x1080 | |
| 86.3 % v7 (old) | 06/2023 | Asus TUF A15 FA507 R7 7735HS, GeForce RTX 4050 Laptop GPU | 2.2 kg | 24.9 mm | 15.60" | 1920x1080 | |
| 87.7 % v7 (old) | 08/2023 | Lenovo Legion Slim 5 16APH8 R7 7840HS, GeForce RTX 4060 Laptop GPU | 2.4 kg | 25.2 mm | 16.00" | 2560x1600 |
| SD Card Reader | |
| average JPG Copy Test (av. of 3 runs) | |
| Média da turma Gaming (20.9 - 210, n=54, últimos 2 anos) | |
| Gigabyte G5 KE (AV PRO microSD 128 GB V60) | |
| Gigabyte G5 KF | |
| Lenovo Legion Slim 5 16APH8 (PNY EliteX-Pro60 V60 256 GB) | |
| maximum AS SSD Seq Read Test (1GB) | |
| Média da turma Gaming (25.5 - 261, n=51, últimos 2 anos) | |
| Gigabyte G5 KE (AV PRO microSD 128 GB V60) | |
| Gigabyte G5 KF | |
| Lenovo Legion Slim 5 16APH8 (PNY EliteX-Pro60 V60 256 GB) | |


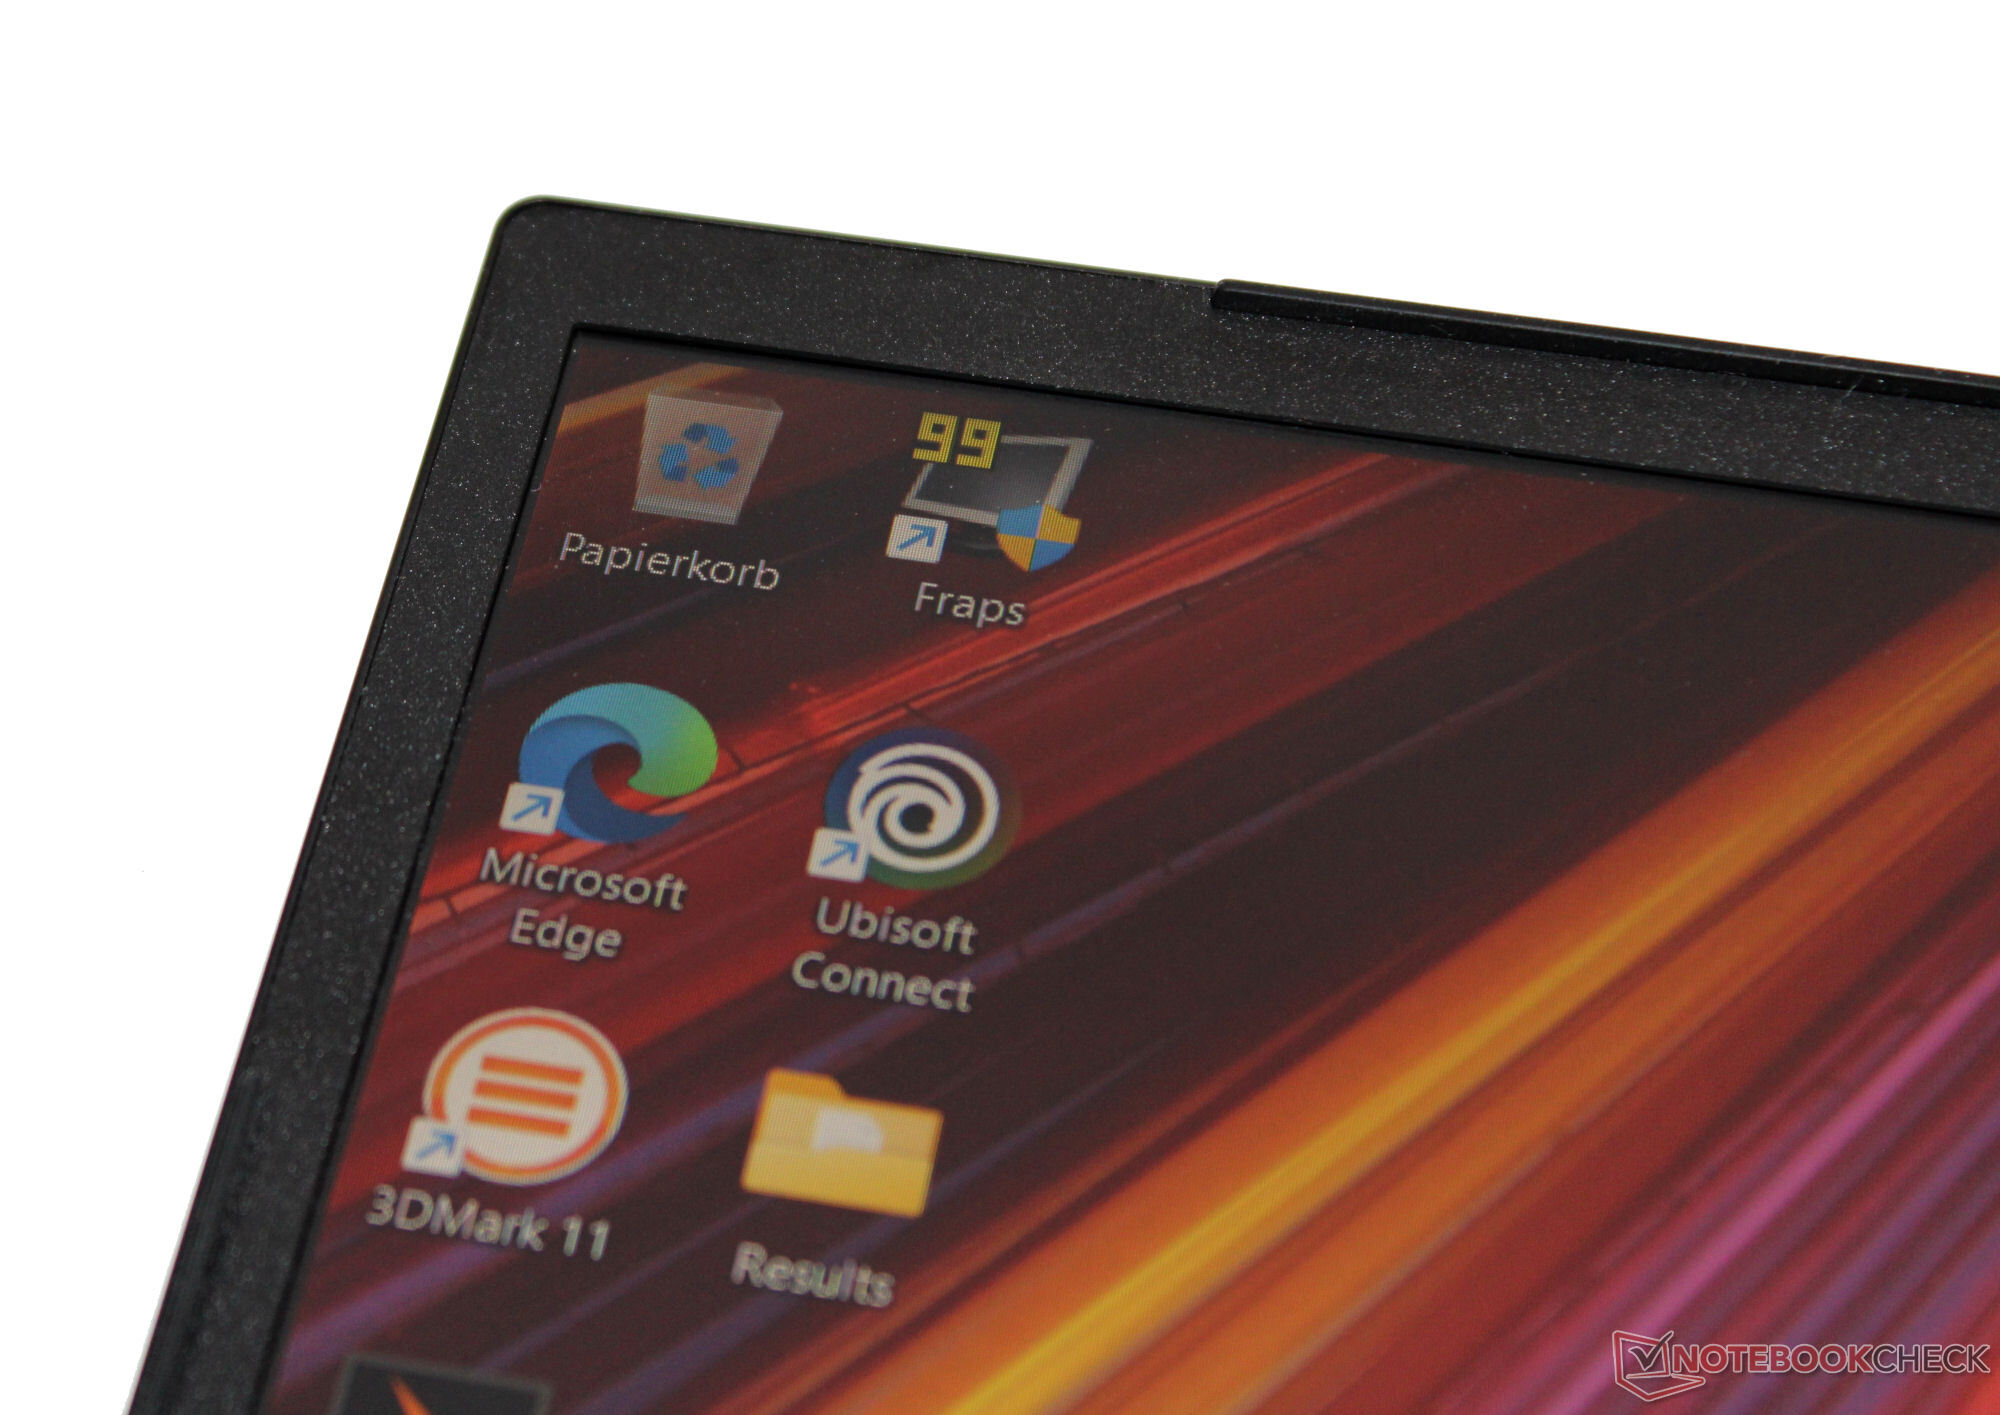
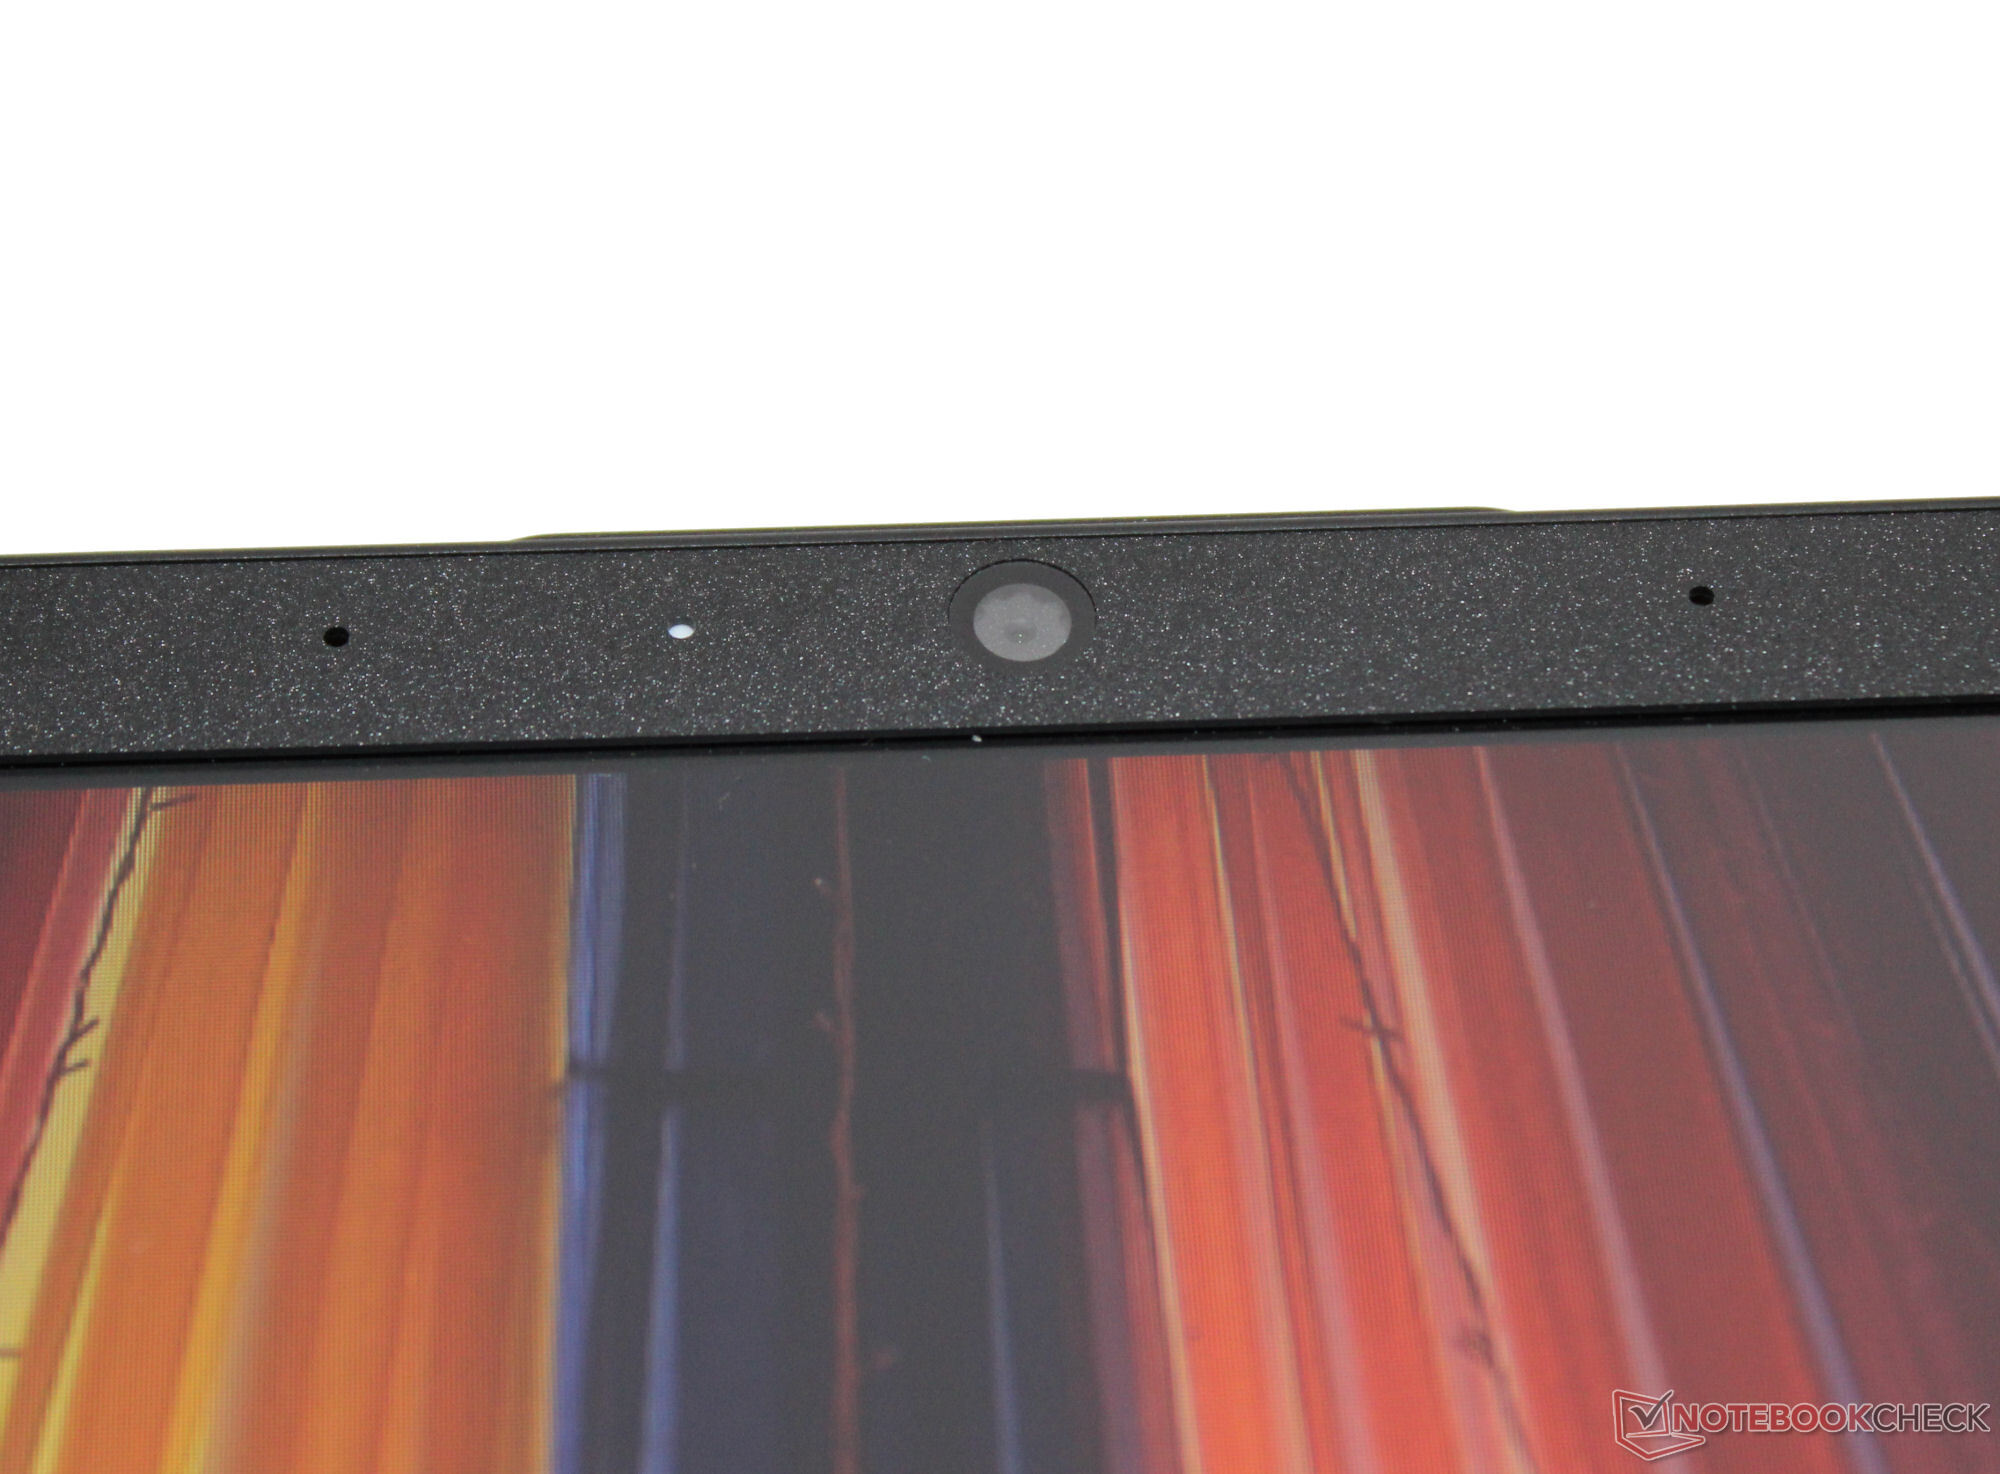
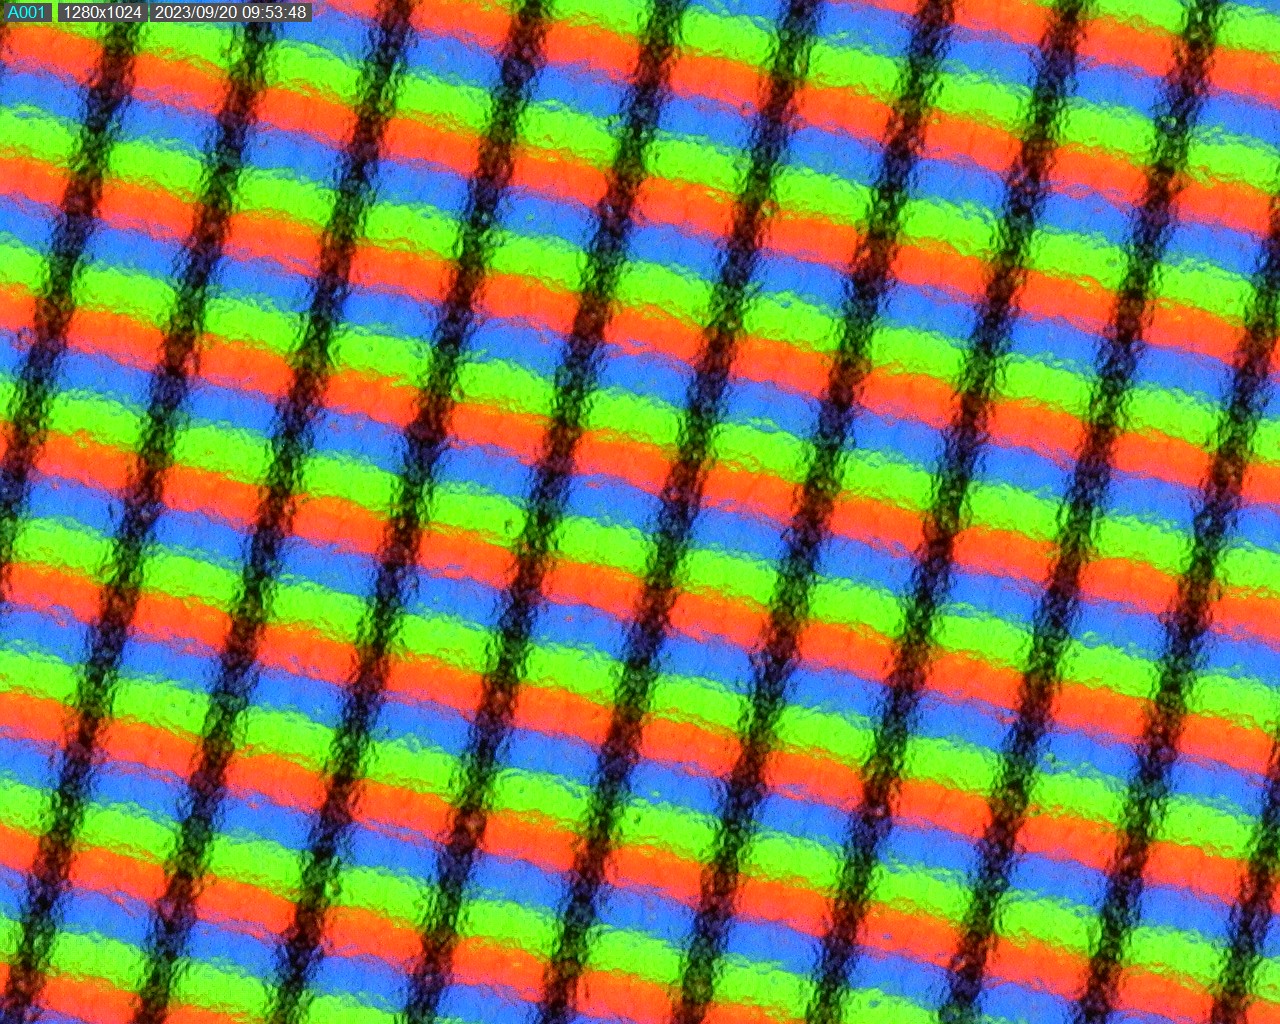
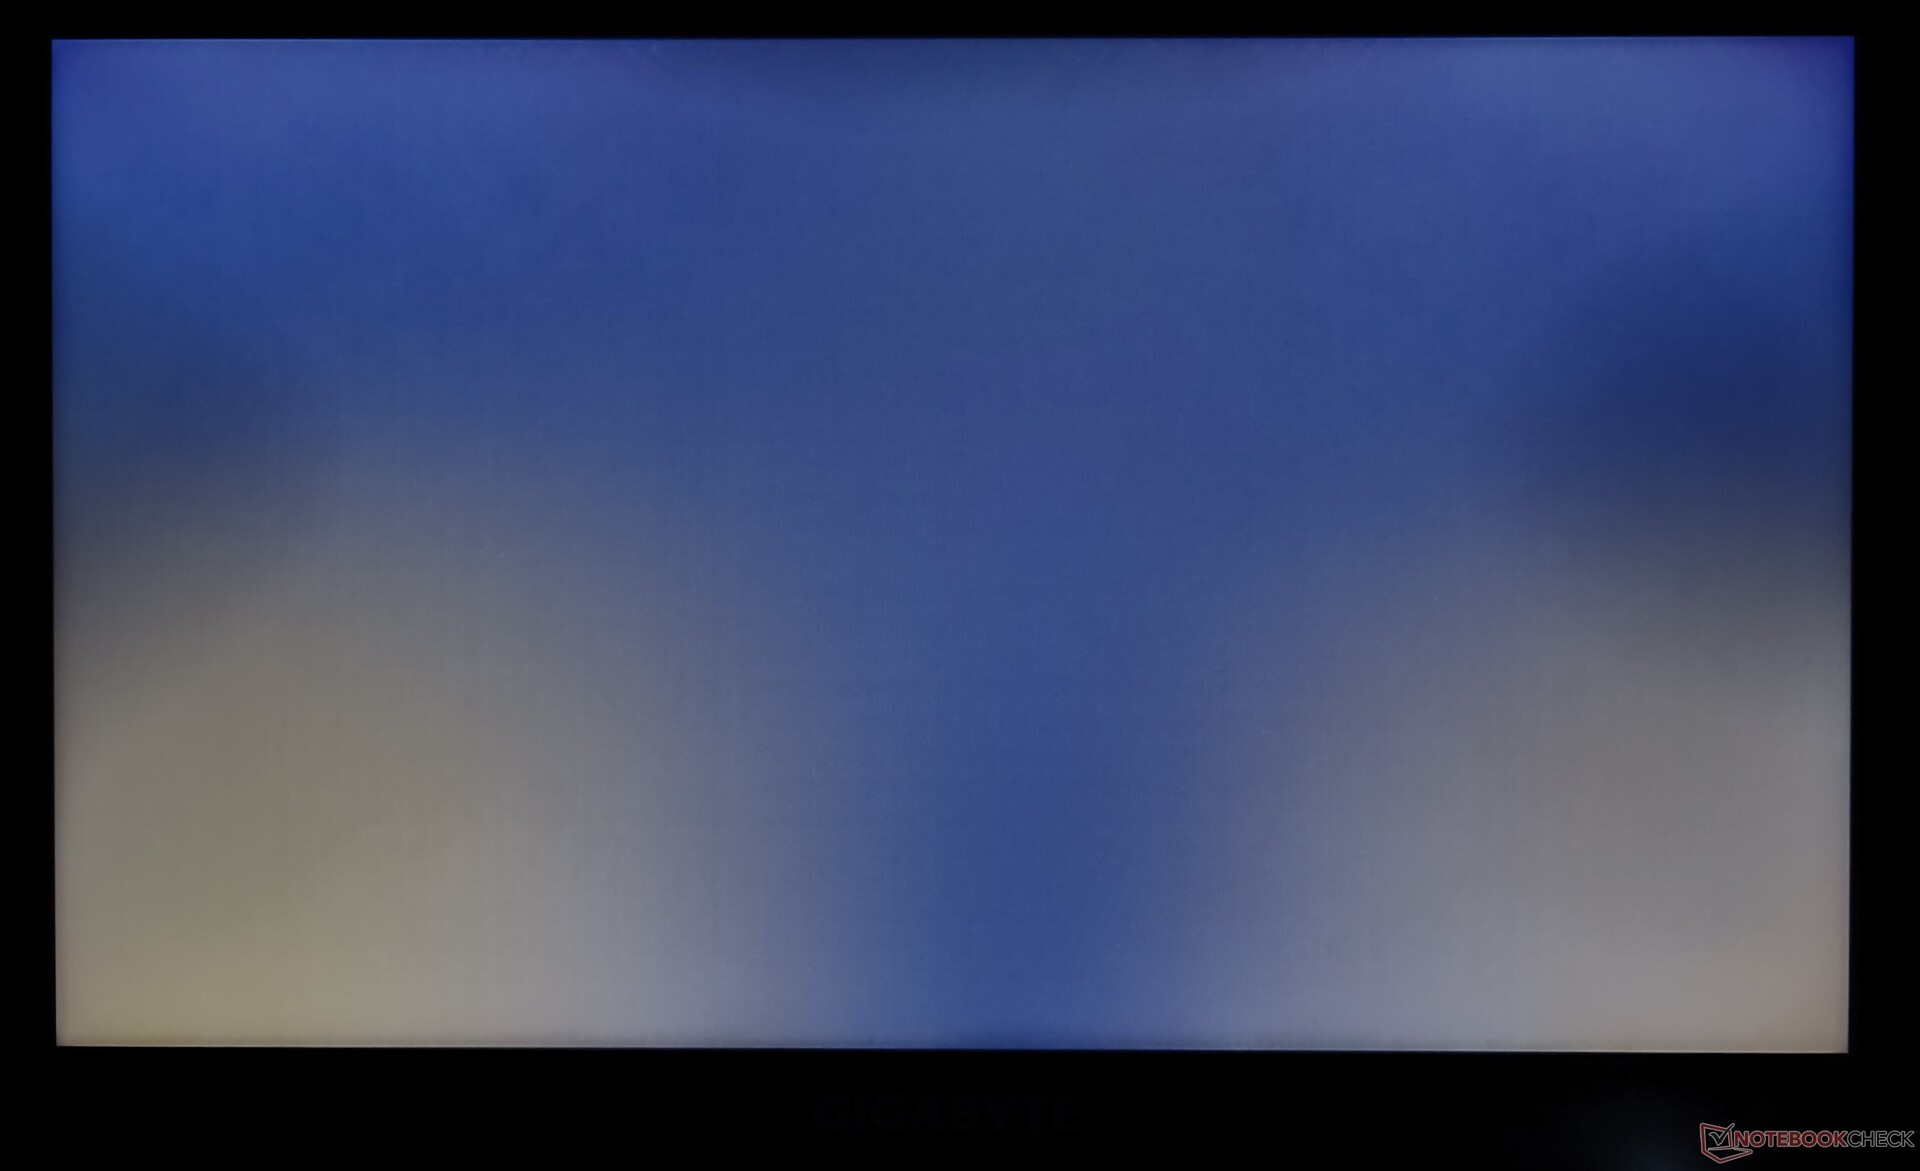
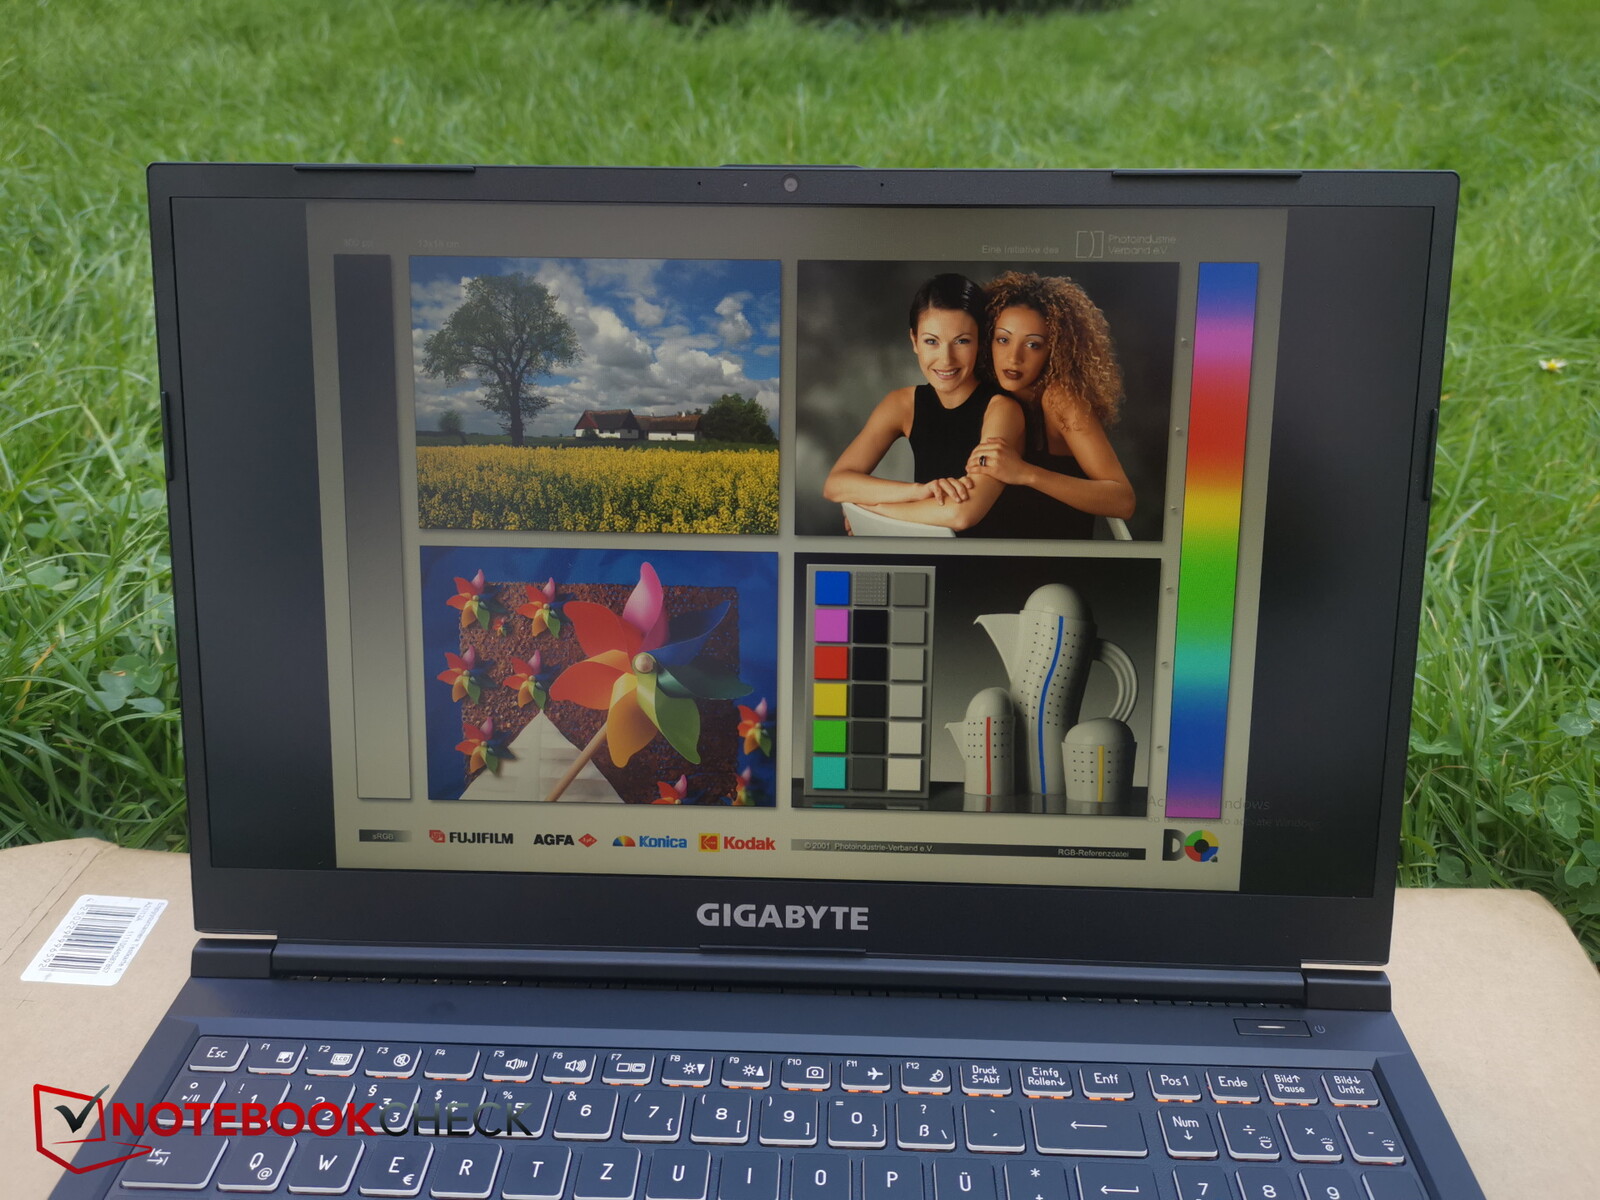
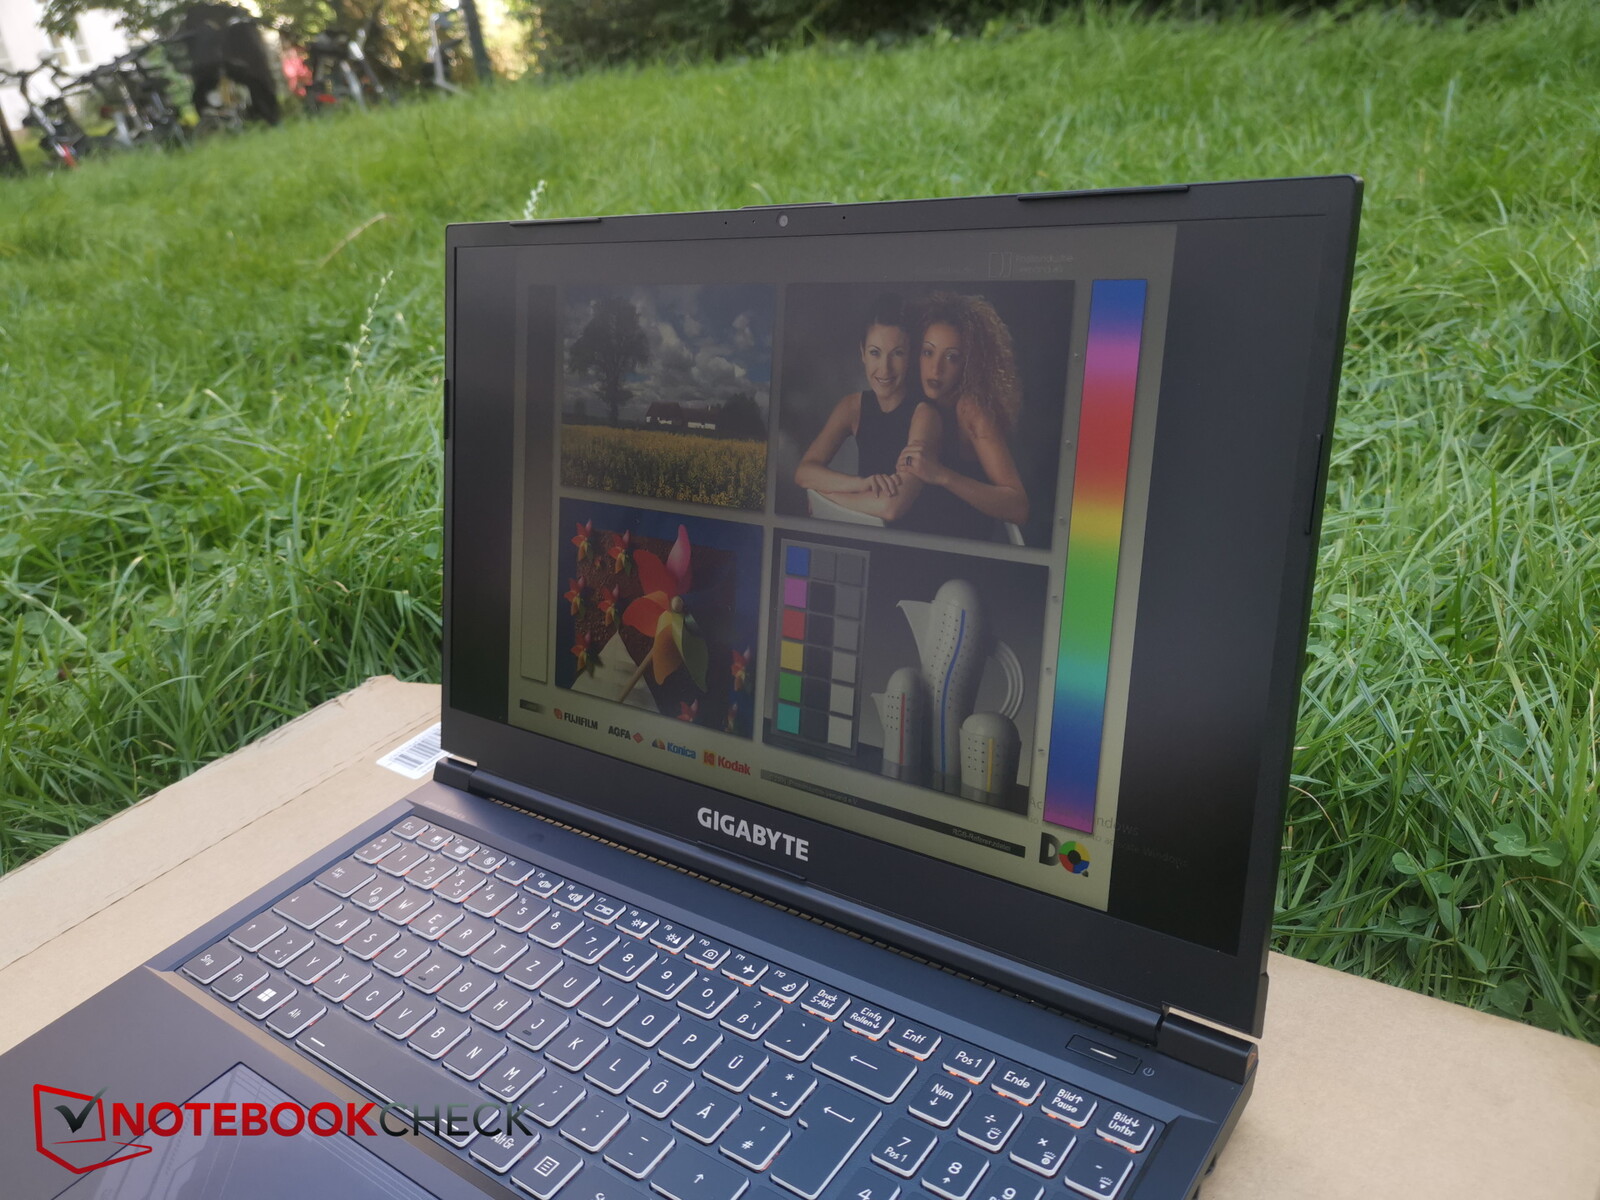
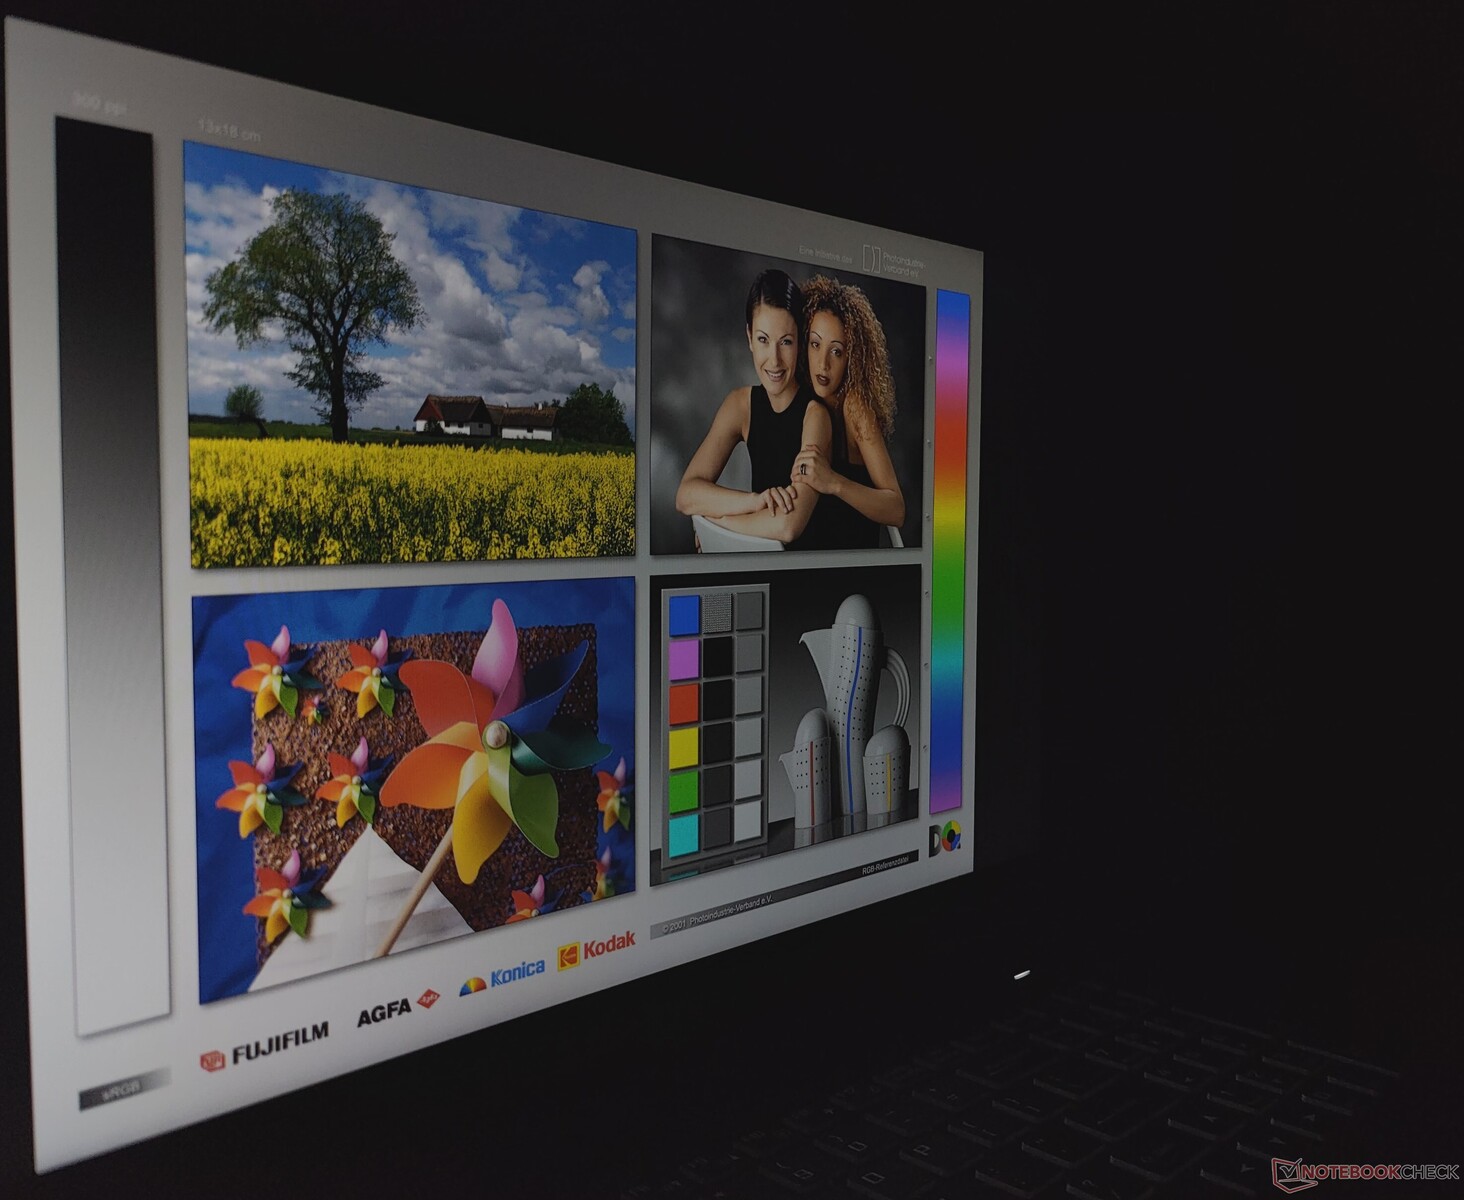
Tela - Painel FHD de 144 Hz
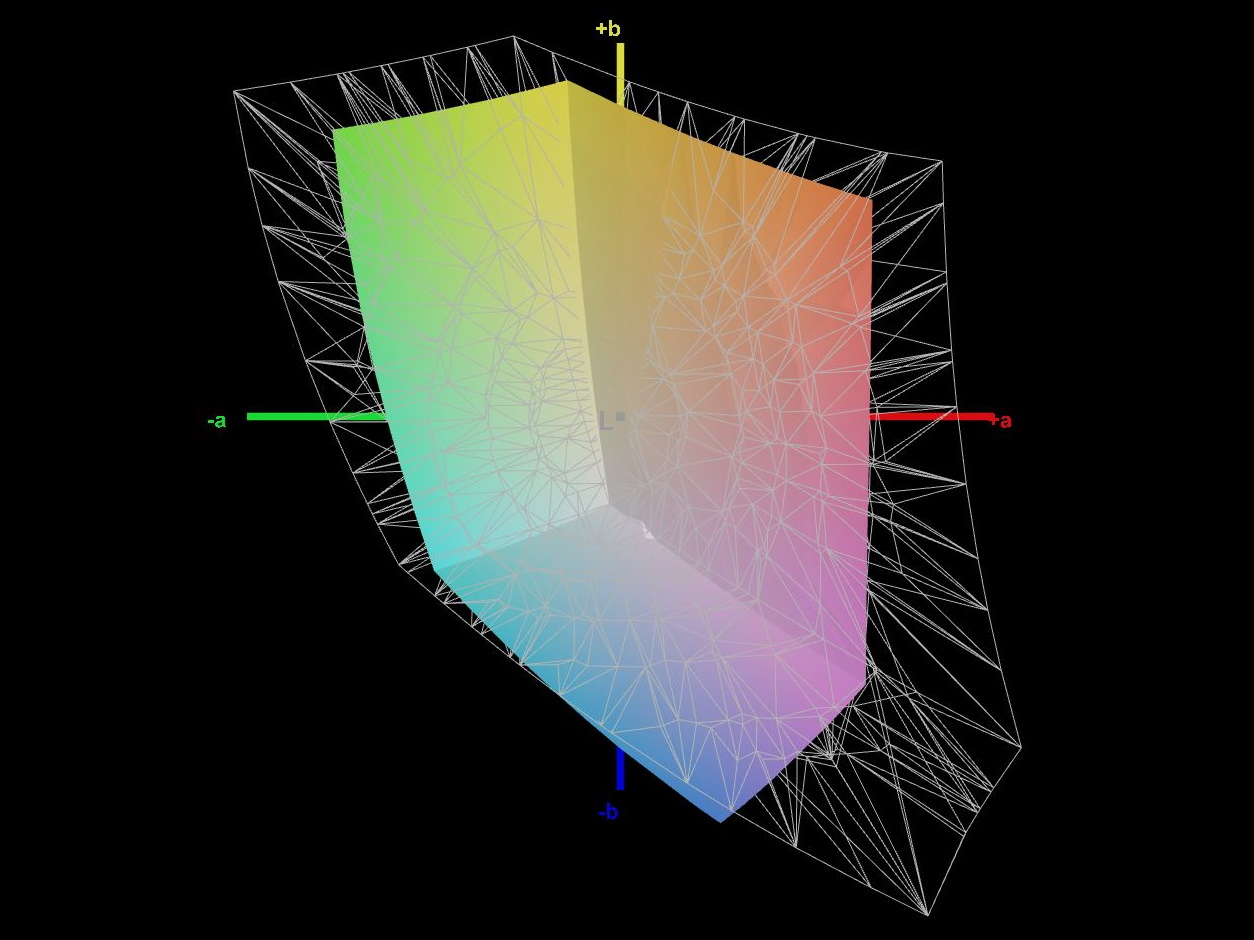
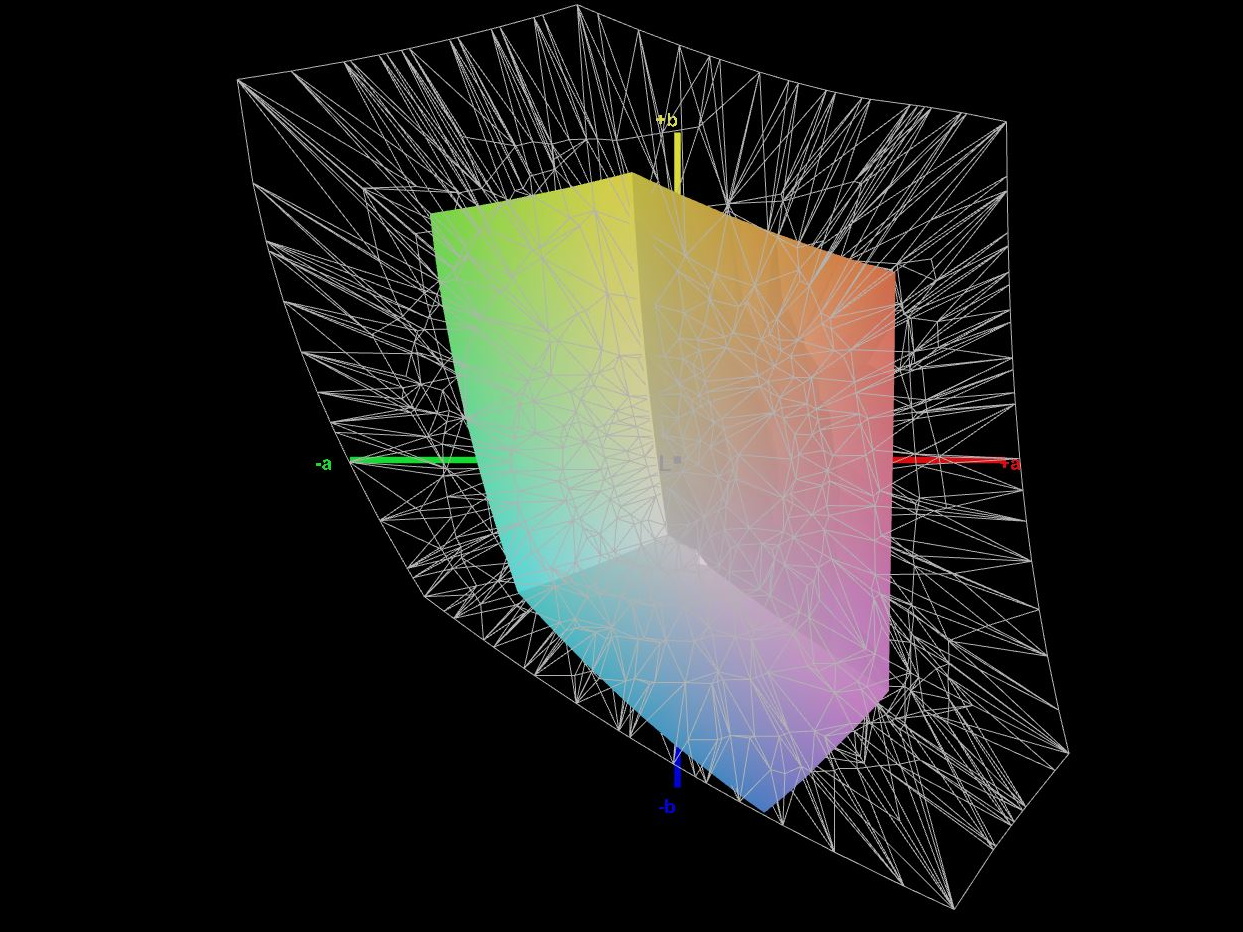
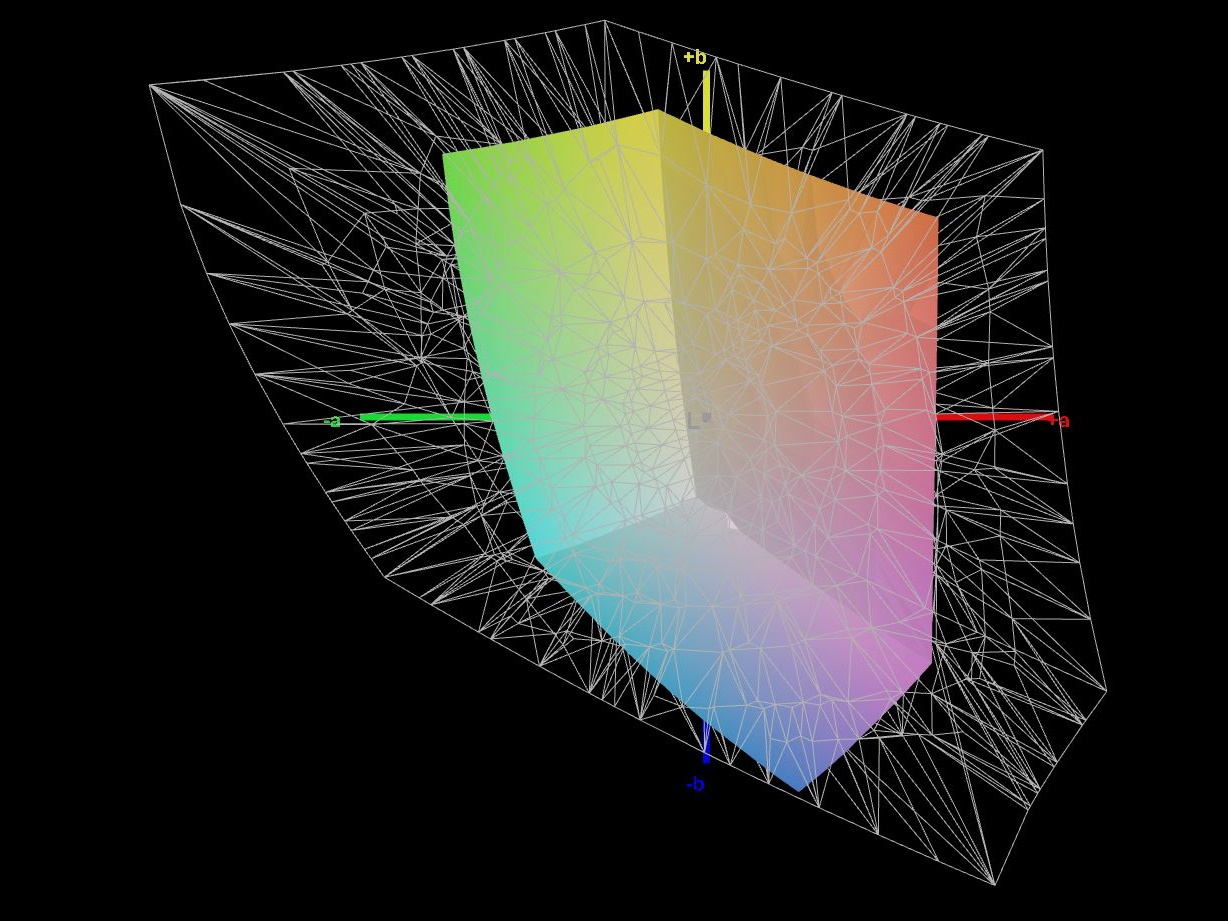
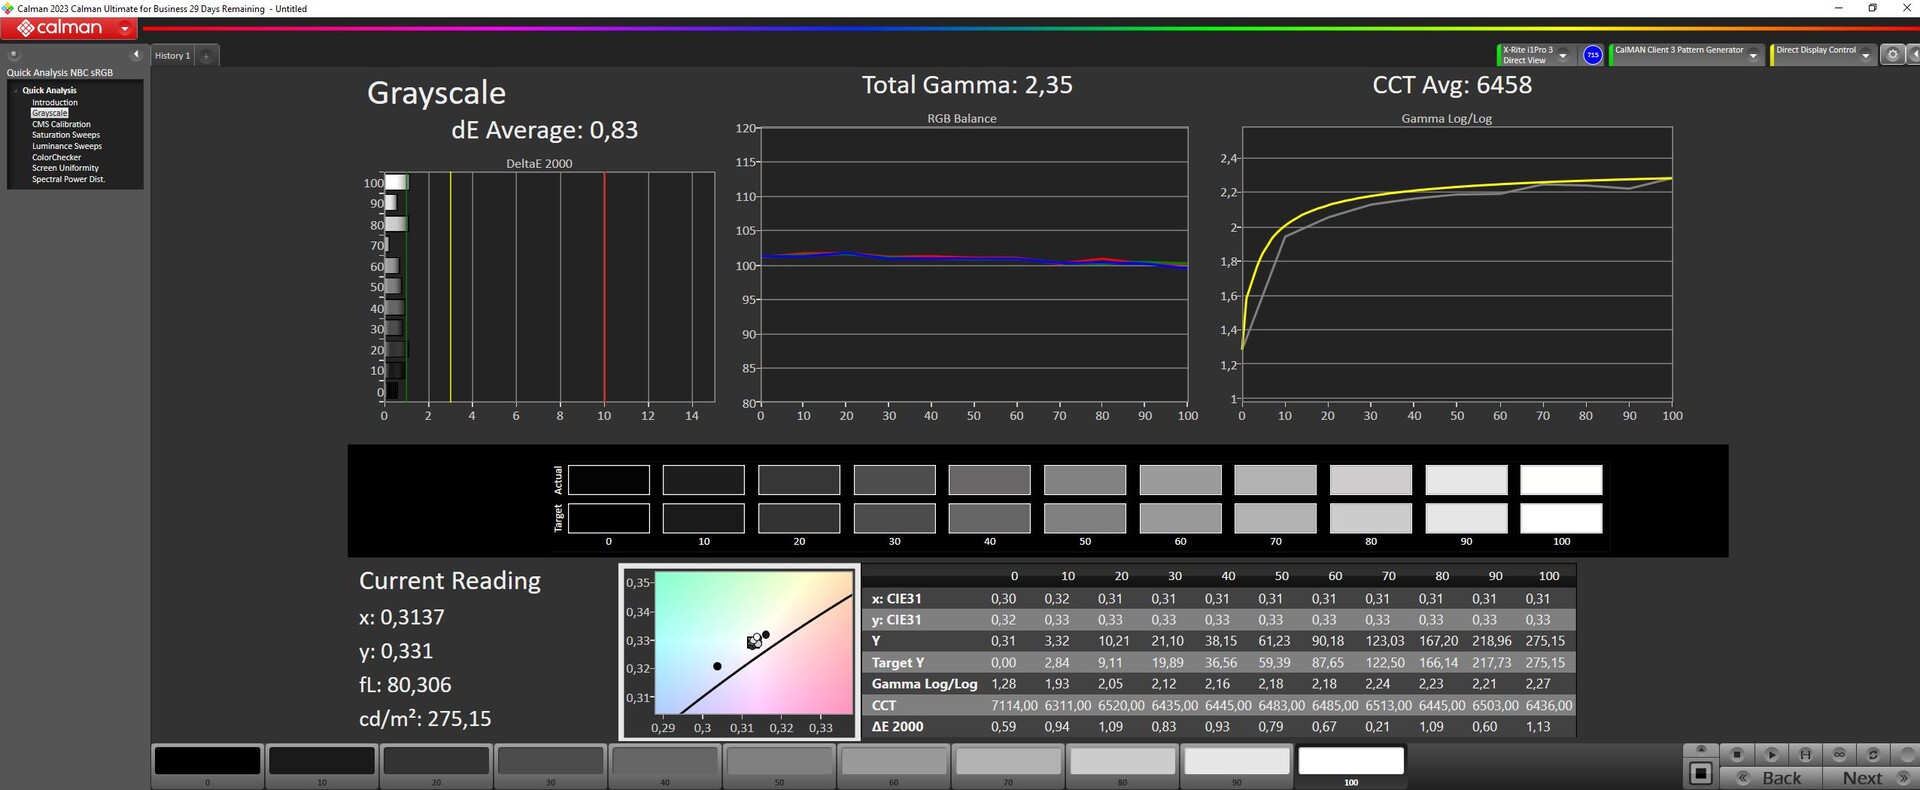
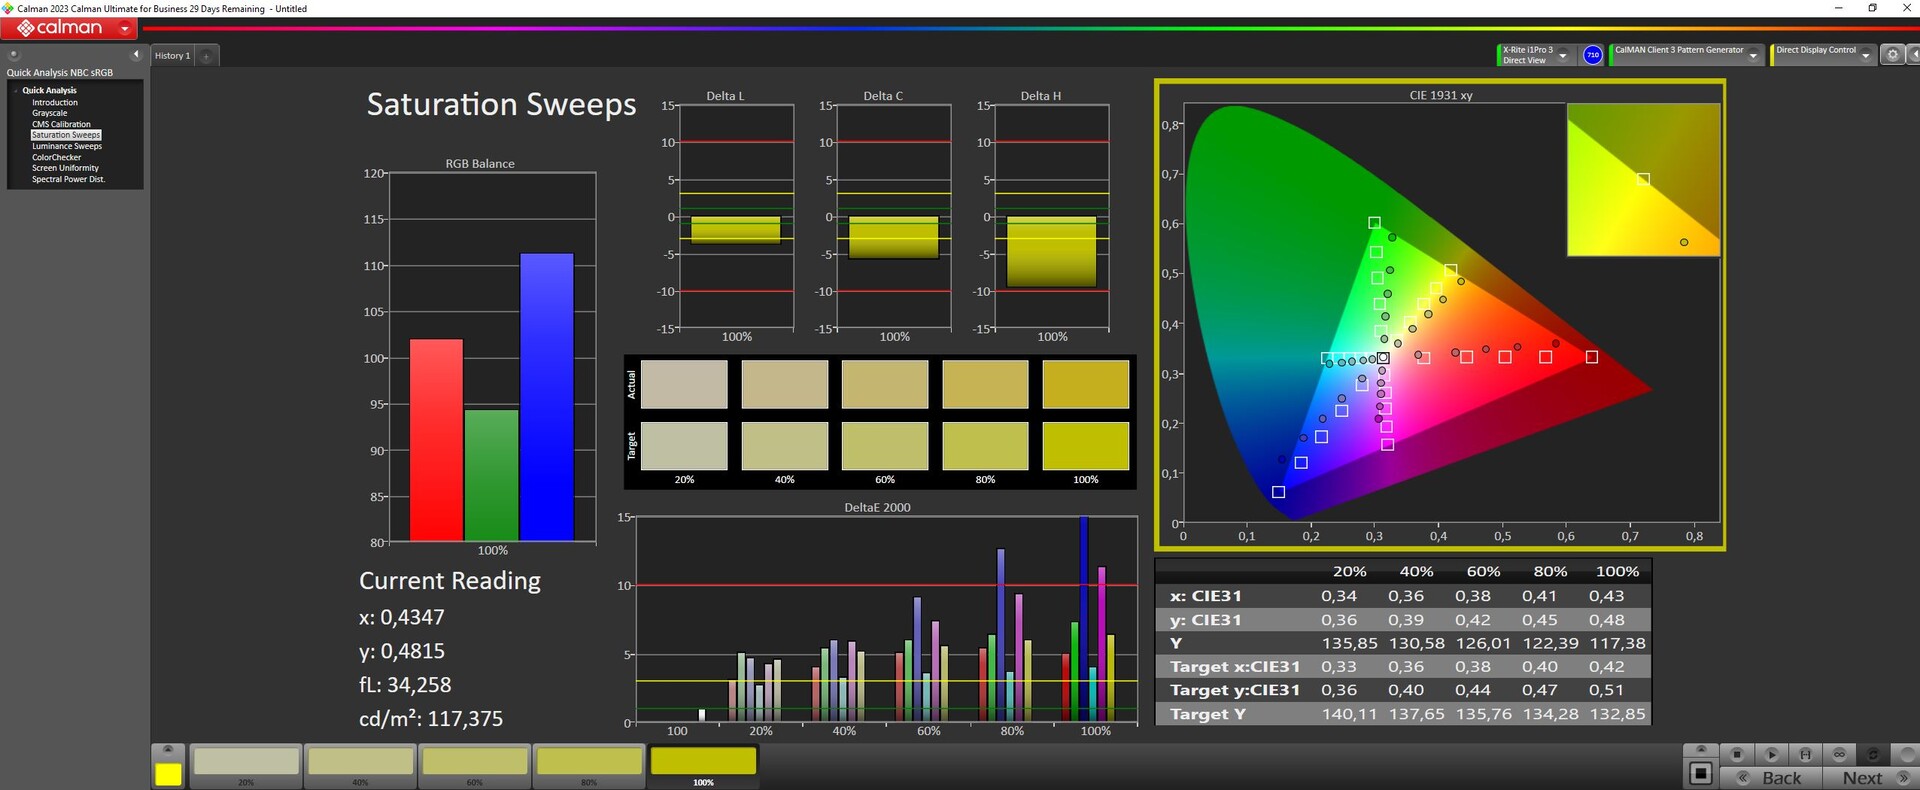
A tela FHD fosca (fabricada pela Chi Mei) foi herdada do G5 KE. Embora tenha um bom ângulo de visão, o painel IPS de 144 Hz não está à altura do padrão quando se trata de brilho e contraste. A tela não é capaz de reproduzir os espaços de cores usuais (sRGB, AdobeRG e DCI-P3). Mas, pelo menos, ele não apresenta cintilação PWM em nenhum nível de brilho. Não há outras opções de painel disponíveis. O Asus TUF A15, Intel NUC X15 e Lenovo Slim 5 16APH8 são todos equipados com telas melhores.
| |||||||||||||||||||||||||
iluminação: 85 %
iluminação com acumulador: 297 cd/m²
Contraste: 874:1 (Preto: 0.34 cd/m²)
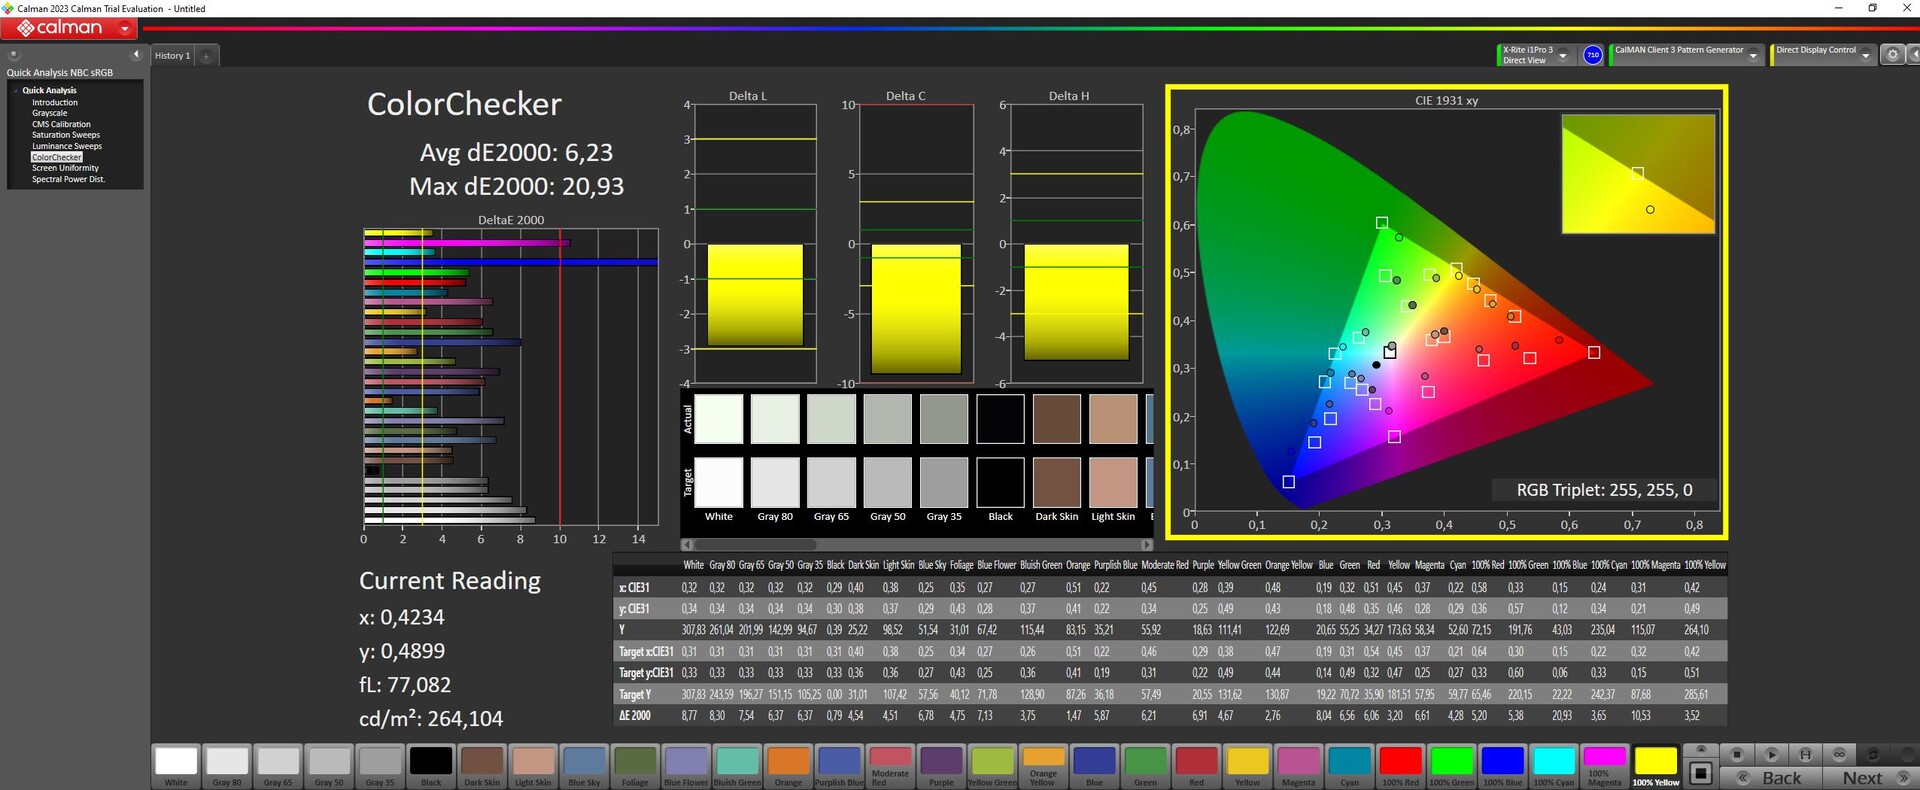
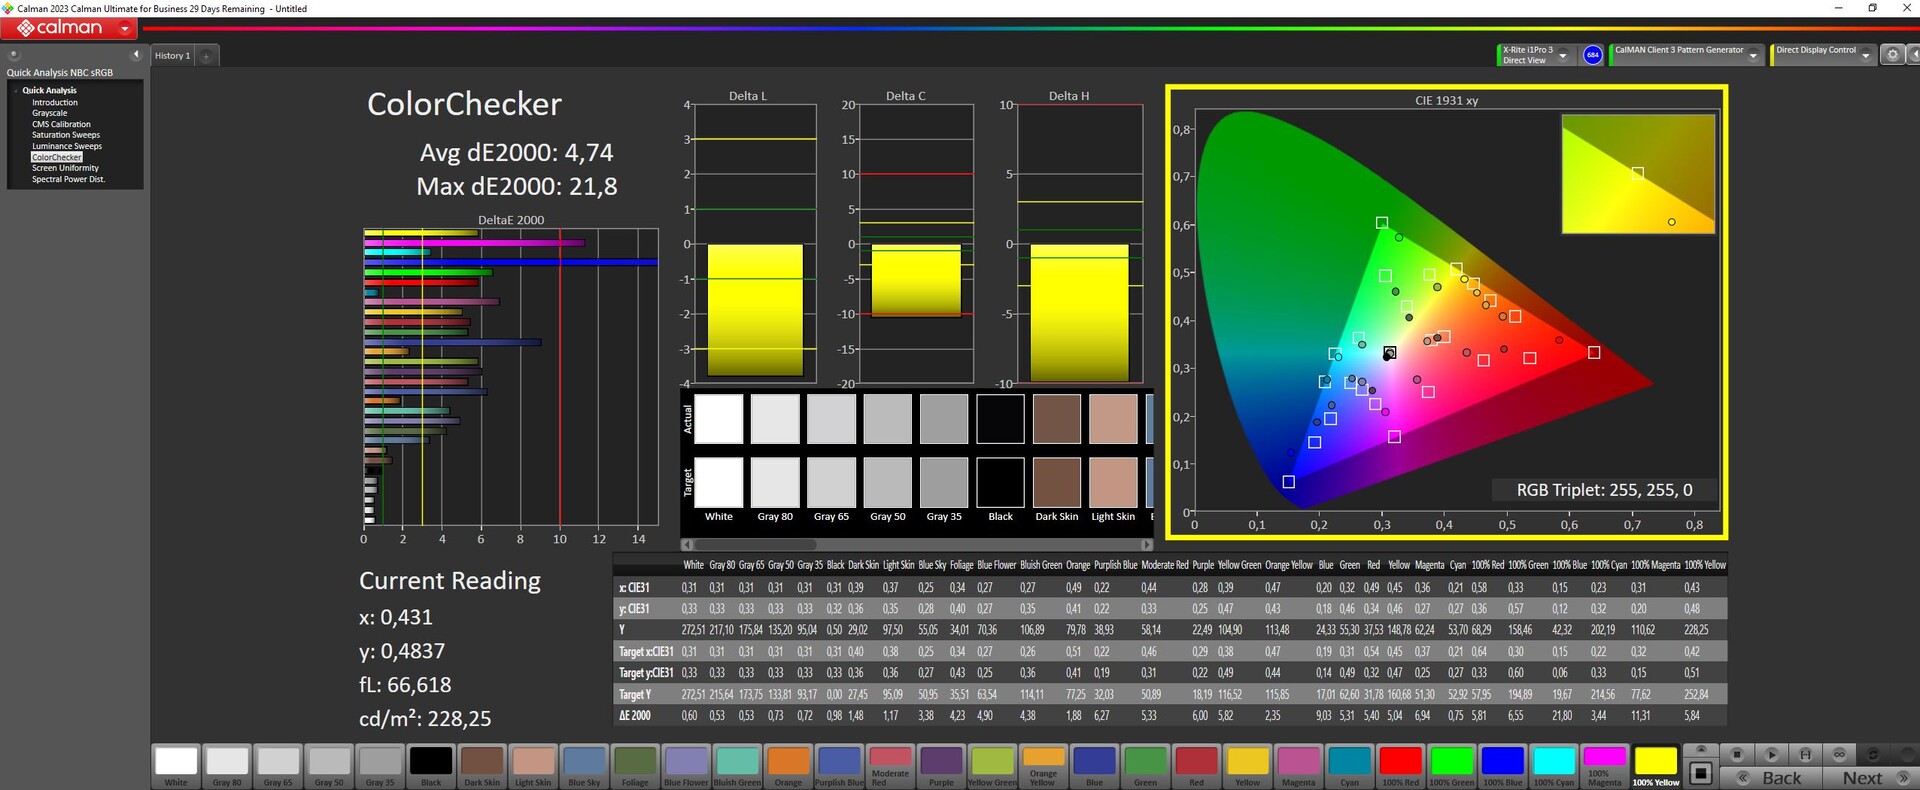
ΔE ColorChecker Calman: 6.23 | ∀{0.5-29.43 Ø4.71}
calibrated: 4.74
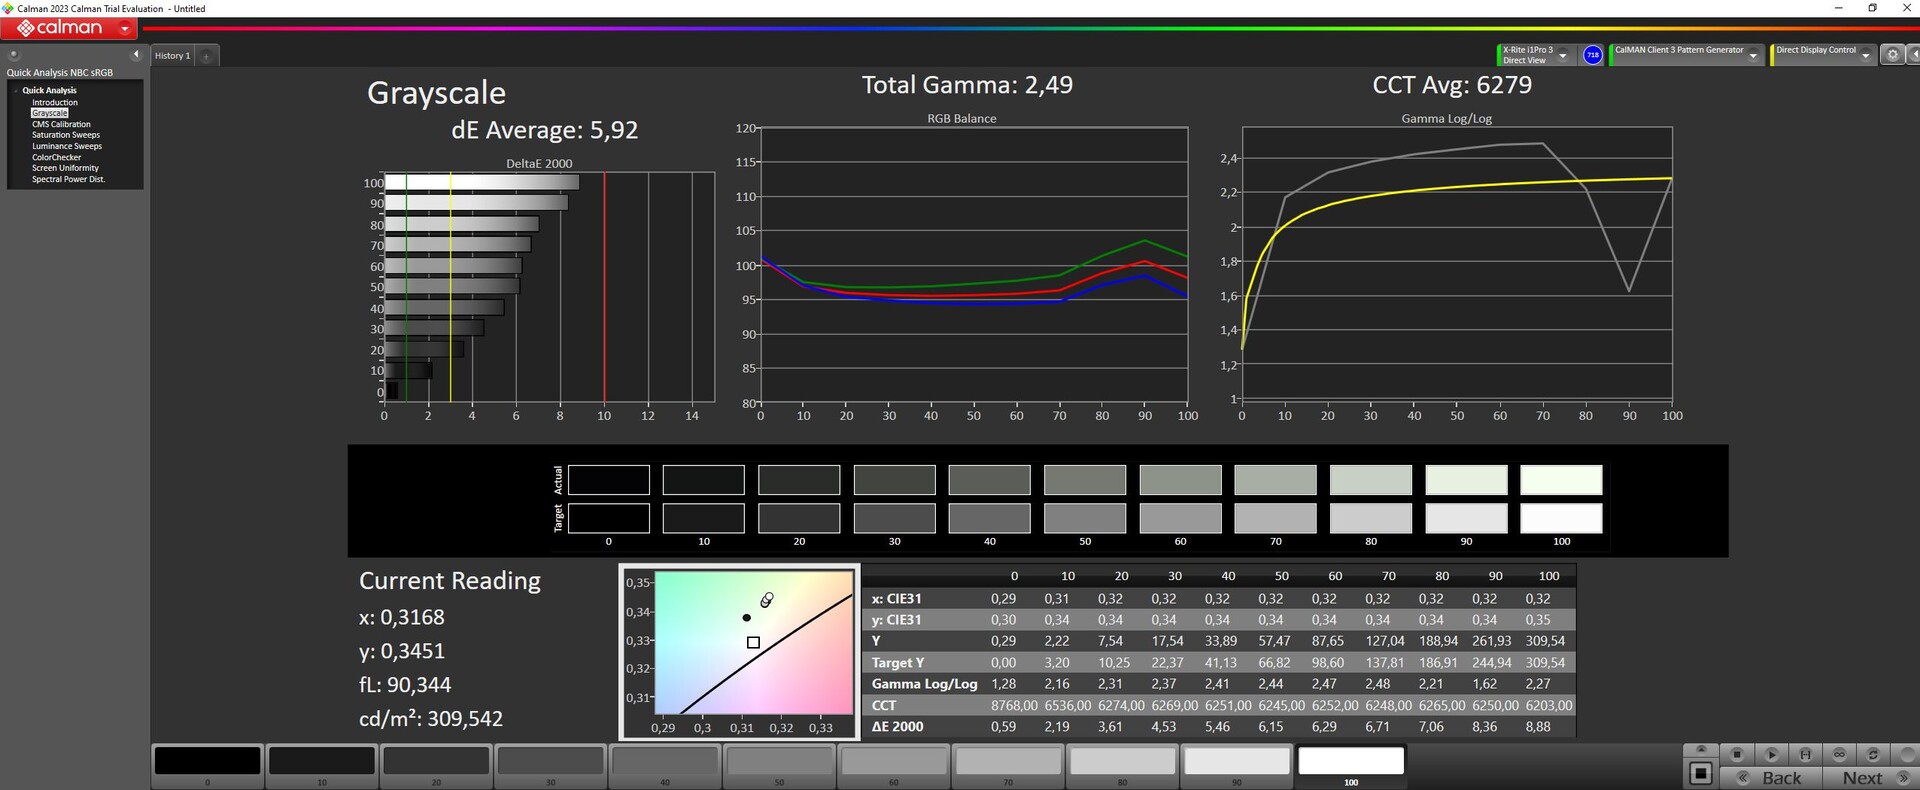
ΔE Greyscale Calman: 5.92 | ∀{0.09-98 Ø4.96}
44.7% AdobeRGB 1998 (Argyll 3D)
64.3% sRGB (Argyll 3D)
43.2% Display P3 (Argyll 3D)
Gamma: 2.49
CCT: 6279 K
| Gigabyte G5 KF Chi Mei N156HRA-EA1, IPS, 1920x1080, 15.6" | MSI Cyborg 15 A12VF AU Optronics B156HAN15.1, IPS, 1920x1080, 15.6" | Intel NUC X15 LAPAC71H BOE HF NV156FHM-N4G, IPS, 1920x1080, 15.6" | Asus TUF A15 FA507 N156HMA-GA1, IPS, 1920x1080, 15.6" | Lenovo Legion Slim 5 16APH8 BOE NJ NE160QDM-NYC, IPS, 2560x1600, 16" | Gigabyte G5 KE Chi Mei N156HRA-EA1, IPS, 1920x1080, 15.6" | |
|---|---|---|---|---|---|---|
| Display | -2% | 47% | 50% | 58% | -6% | |
| Display P3 Coverage (%) | 43.2 | 42.3 -2% | 64.9 50% | 64.9 50% | 69.3 60% | 40.7 -6% |
| sRGB Coverage (%) | 64.3 | 62.6 -3% | 92.6 44% | 96.5 50% | 100 56% | 61 -5% |
| AdobeRGB 1998 Coverage (%) | 44.7 | 43.7 -2% | 66.3 48% | 66.6 49% | 70 57% | 42.1 -6% |
| Response Times | -9% | 51% | -57% | 43% | -40% | |
| Response Time Grey 50% / Grey 80% * (ms) | 25.1 ? | 22 ? 12% | 7.8 ? 69% | 30.4 ? -21% | 10.7 ? 57% | 26.64 ? -6% |
| Response Time Black / White * (ms) | 10.8 ? | 14 ? -30% | 7.3 ? 32% | 20.8 ? -93% | 7.8 ? 28% | 18.65 ? -73% |
| PWM Frequency (Hz) | ||||||
| Screen | 22% | 51% | 48% | 39% | 1% | |
| Brightness middle (cd/m²) | 297 | 247 -17% | 365 23% | 288 -3% | 371.6 25% | 269 -9% |
| Brightness (cd/m²) | 275 | 234 -15% | 356 29% | 271 -1% | 343 25% | 248 -10% |
| Brightness Distribution (%) | 85 | 89 5% | 86 1% | 91 7% | 84 -1% | 85 0% |
| Black Level * (cd/m²) | 0.34 | 0.25 26% | 0.17 50% | 0.17 50% | 0.44 -29% | 0.5 -47% |
| Contrast (:1) | 874 | 988 13% | 2147 146% | 1694 94% | 845 -3% | 538 -38% |
| Colorchecker dE 2000 * | 6.23 | 3.78 39% | 3.51 44% | 1.9 70% | 1.52 76% | 4.54 27% |
| Colorchecker dE 2000 max. * | 20.93 | 6.42 69% | 6.37 70% | 3.3 84% | 2.68 87% | 17.28 17% |
| Colorchecker dE 2000 calibrated * | 4.74 | 3.94 17% | 1.88 60% | 0.9 81% | 0.33 93% | 3.34 30% |
| Greyscale dE 2000 * | 5.92 | 2.16 64% | 3.83 35% | 2.7 54% | 1.2 80% | 3.8 36% |
| Gamma | 2.49 88% | 2.33 94% | 2.47 89% | 2.32 95% | 2.1 105% | 2.17 101% |
| CCT | 6279 104% | 6906 94% | 7362 88% | 6535 99% | 6503 100% | 7408 88% |
| Média Total (Programa/Configurações) | 4% /
13% | 50% /
50% | 14% /
34% | 47% /
44% | -15% /
-6% |
* ... menor é melhor
Exibir tempos de resposta
| ↔ Tempo de resposta preto para branco | ||
|---|---|---|
| 10.8 ms ... ascensão ↗ e queda ↘ combinadas | ↗ 9.9 ms ascensão | 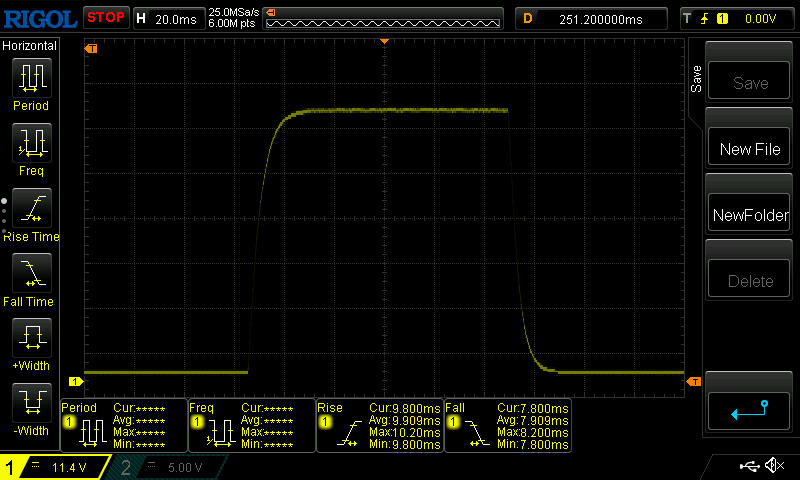 |
| ↘ 7.9 ms queda | ||
| A tela mostra boas taxas de resposta em nossos testes, mas pode ser muito lenta para jogadores competitivos. Em comparação, todos os dispositivos testados variam de 0.1 (mínimo) a 240 (máximo) ms. » 29 % de todos os dispositivos são melhores. Isso significa que o tempo de resposta medido é melhor que a média de todos os dispositivos testados (19.8 ms). | ||
| ↔ Tempo de resposta 50% cinza a 80% cinza | ||
| 25.1 ms ... ascensão ↗ e queda ↘ combinadas | ↗ 11.7 ms ascensão | 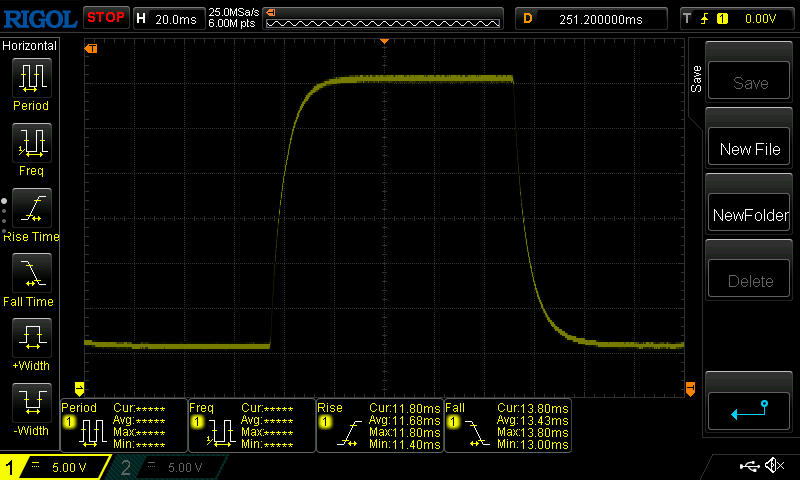 |
| ↘ 13.4 ms queda | ||
| A tela mostra taxas de resposta relativamente lentas em nossos testes e pode ser muito lenta para os jogadores. Em comparação, todos os dispositivos testados variam de 0.165 (mínimo) a 636 (máximo) ms. » 36 % de todos os dispositivos são melhores. Isso significa que o tempo de resposta medido é melhor que a média de todos os dispositivos testados (31 ms). | ||
Cintilação da tela / PWM (modulação por largura de pulso)
| Tela tremeluzindo / PWM não detectado | 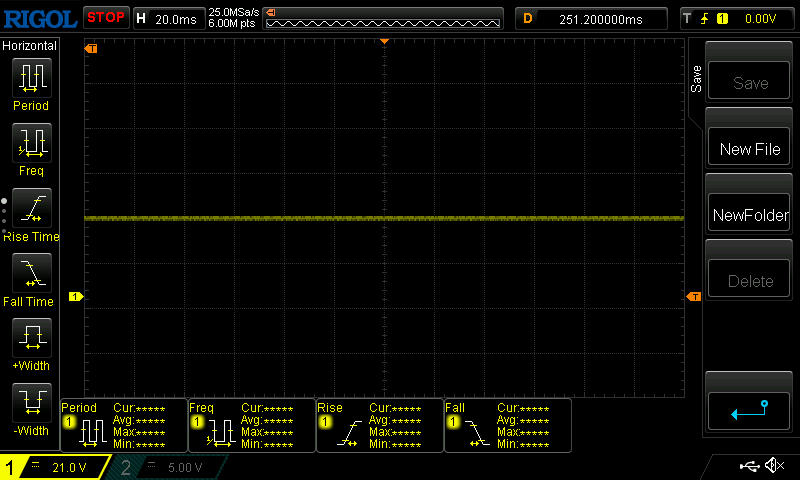 | ||
[pwm_comparison] Em comparação: 52 % de todos os dispositivos testados não usam PWM para escurecer a tela. Se PWM foi detectado, uma média de 7754 (mínimo: 5 - máximo: 343500) Hz foi medida. | |||

Desempenho - Alder Lake encontra Ada Lovelace
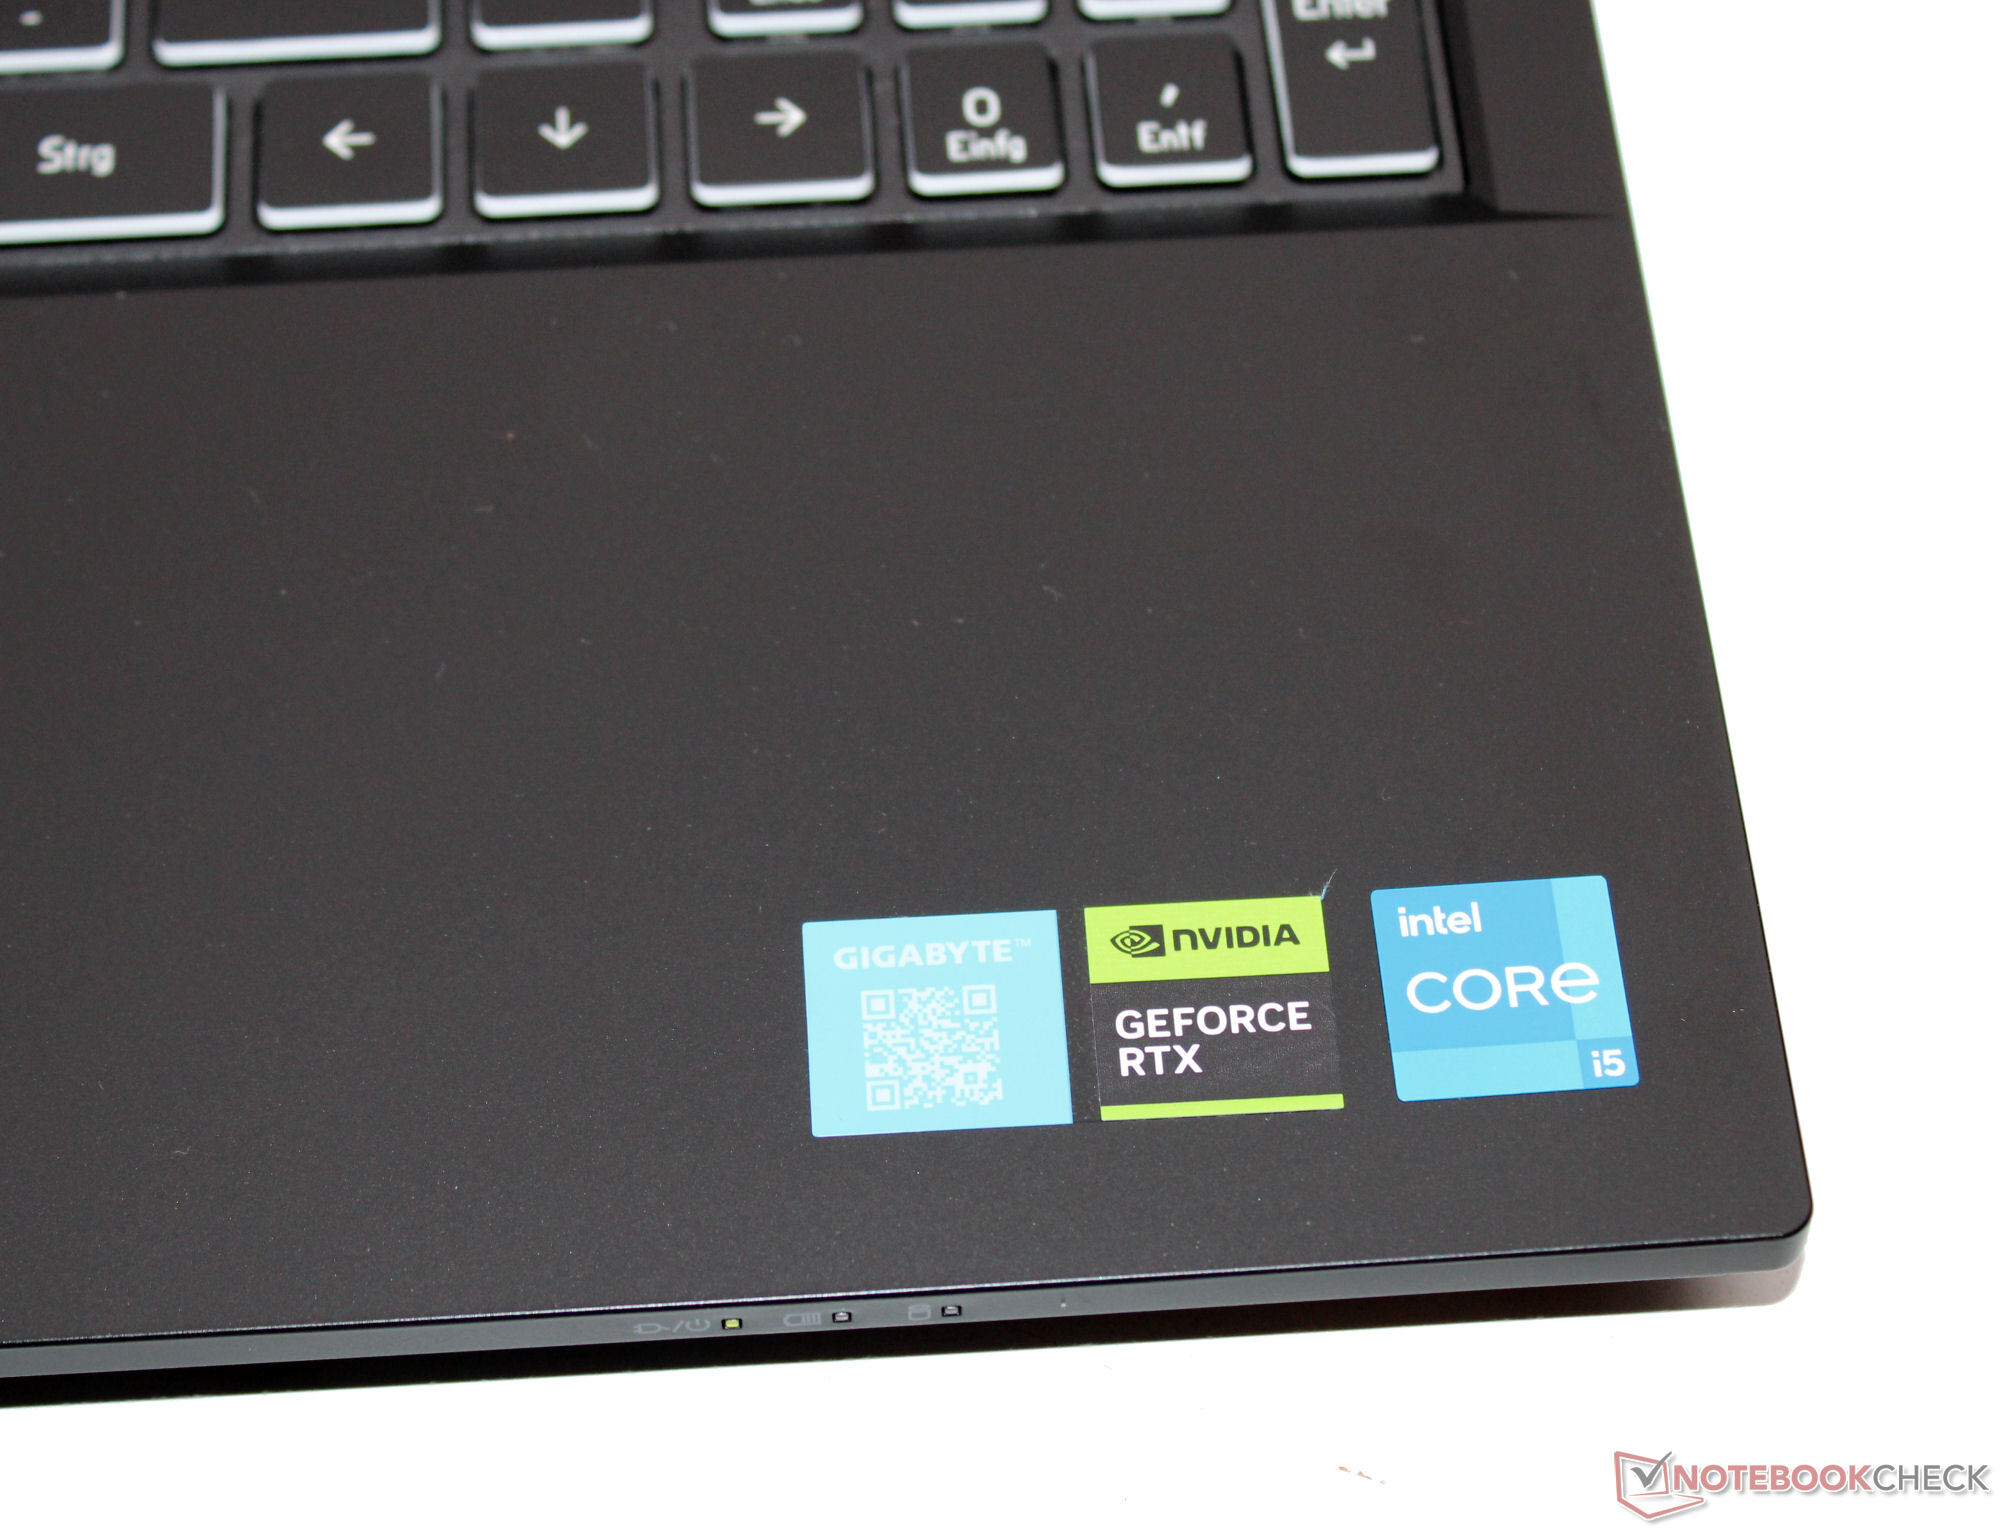
Com o G5 KF, a Gigabyte tem um laptop para jogos FHD relativamente acessível em sua linha de produtos. O laptop tem um processador Core i5-12500H e GeForce RTX 4060e pode ser adquirido por pouco menos de € 1.000 (US$ 1.059). A empresa também oferece modelos mais baratos com a RTX 4050 (G5 MF) ou RTX 3050 (G5 GE).
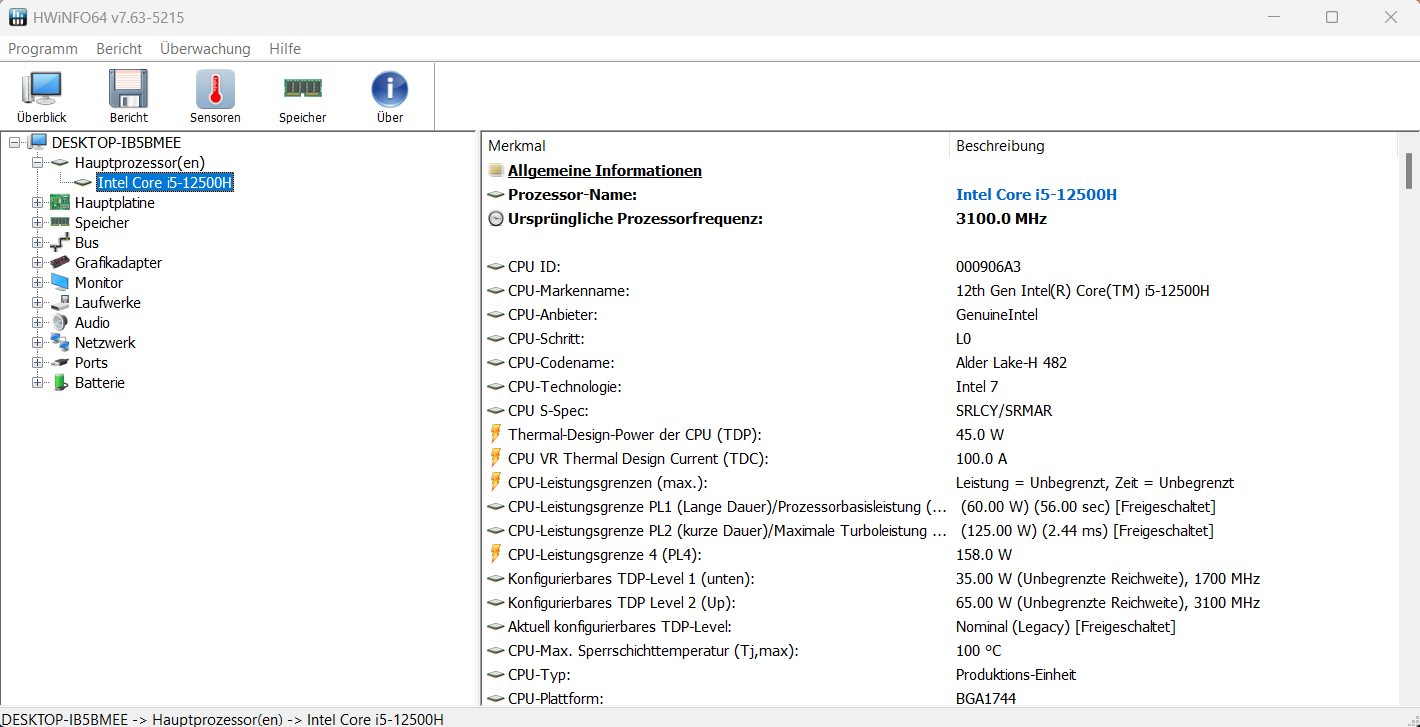
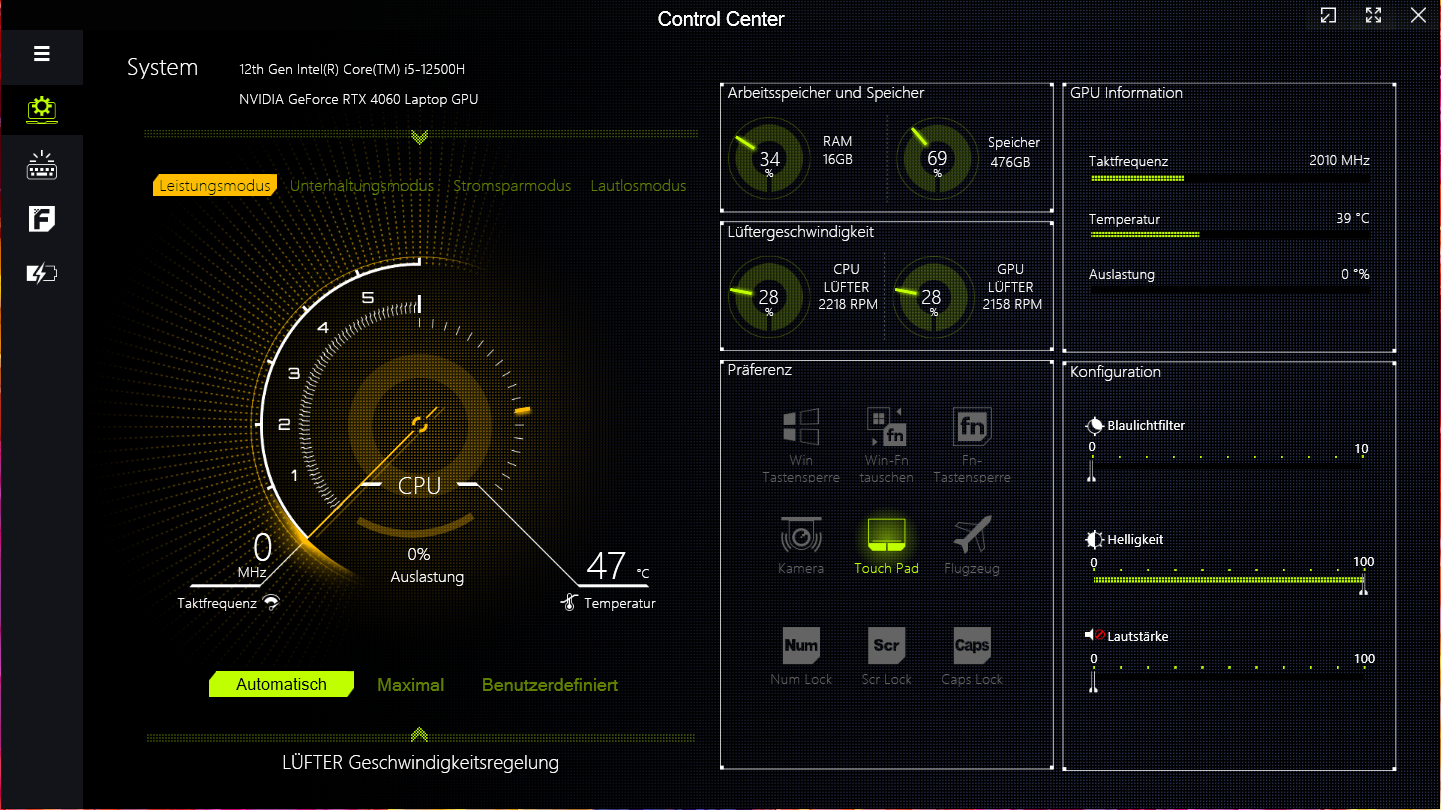
Condições de teste
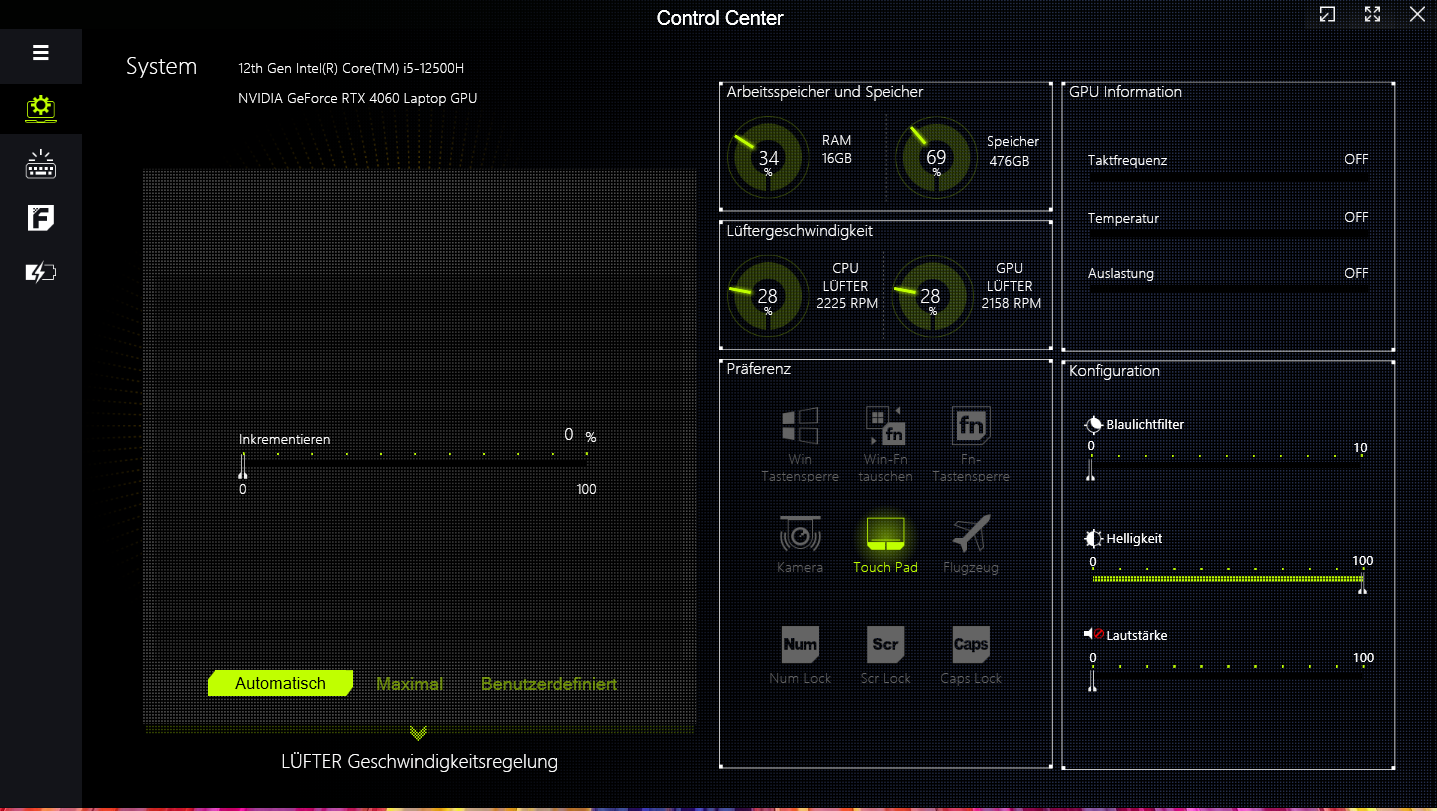
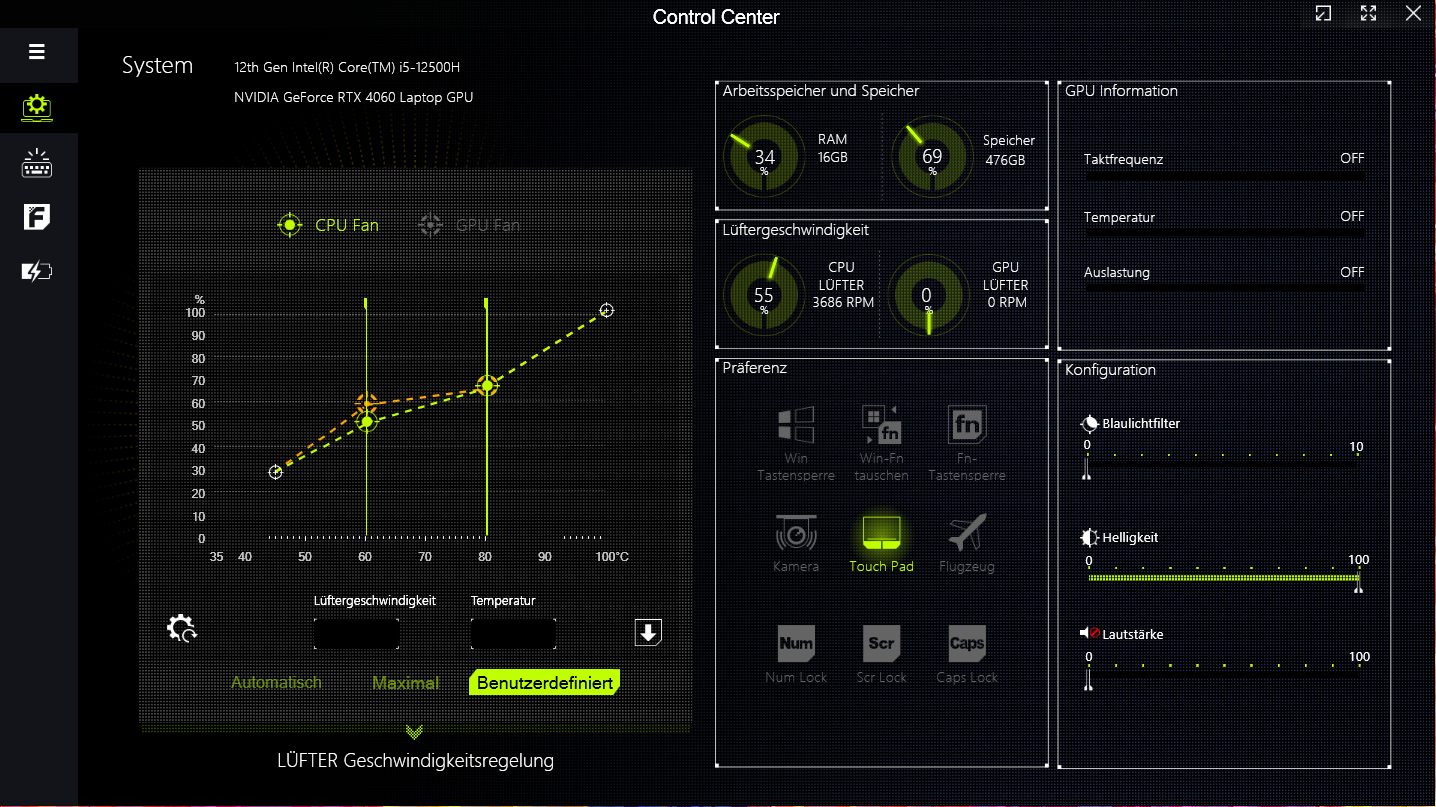
O G5 oferece quatro modos de desempenho especificados pelo fabricante (consulte a tabela). O usuário pode alternar entre eles usando o software Control Center. Usamos o "Modo de desempenho" para nossos benchmarks e o "Modo de economia de energia" para os testes de duração da bateria.
| Modo de desempenho | Modo de entretenimento | Modo de economia de energia | Modo silencioso | |
|---|---|---|---|---|
| Limite de energia 1 (HWInfo) | 60 Watt | 50 Watt | 45 Watt | 15 Watt |
| Limite de energia 2 (HWInfo) | 125 Watt | 115 Watt | 30 Watt | 30 Watt |
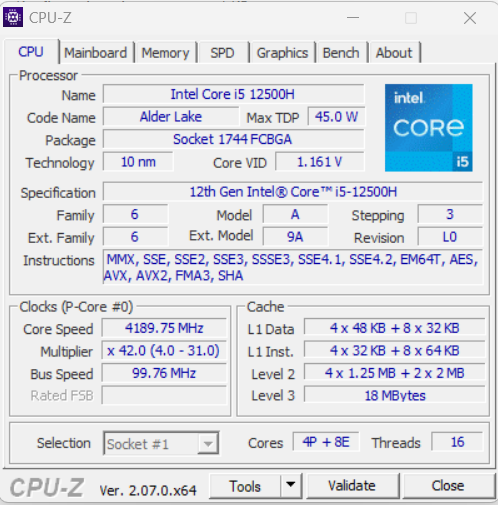
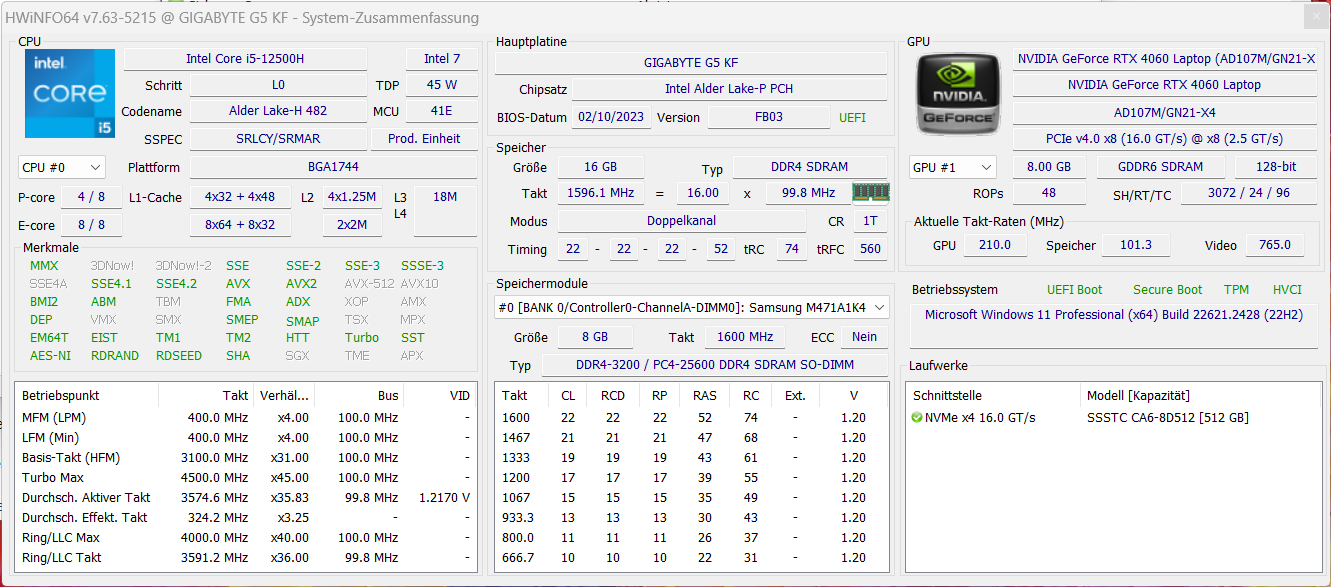
Processador
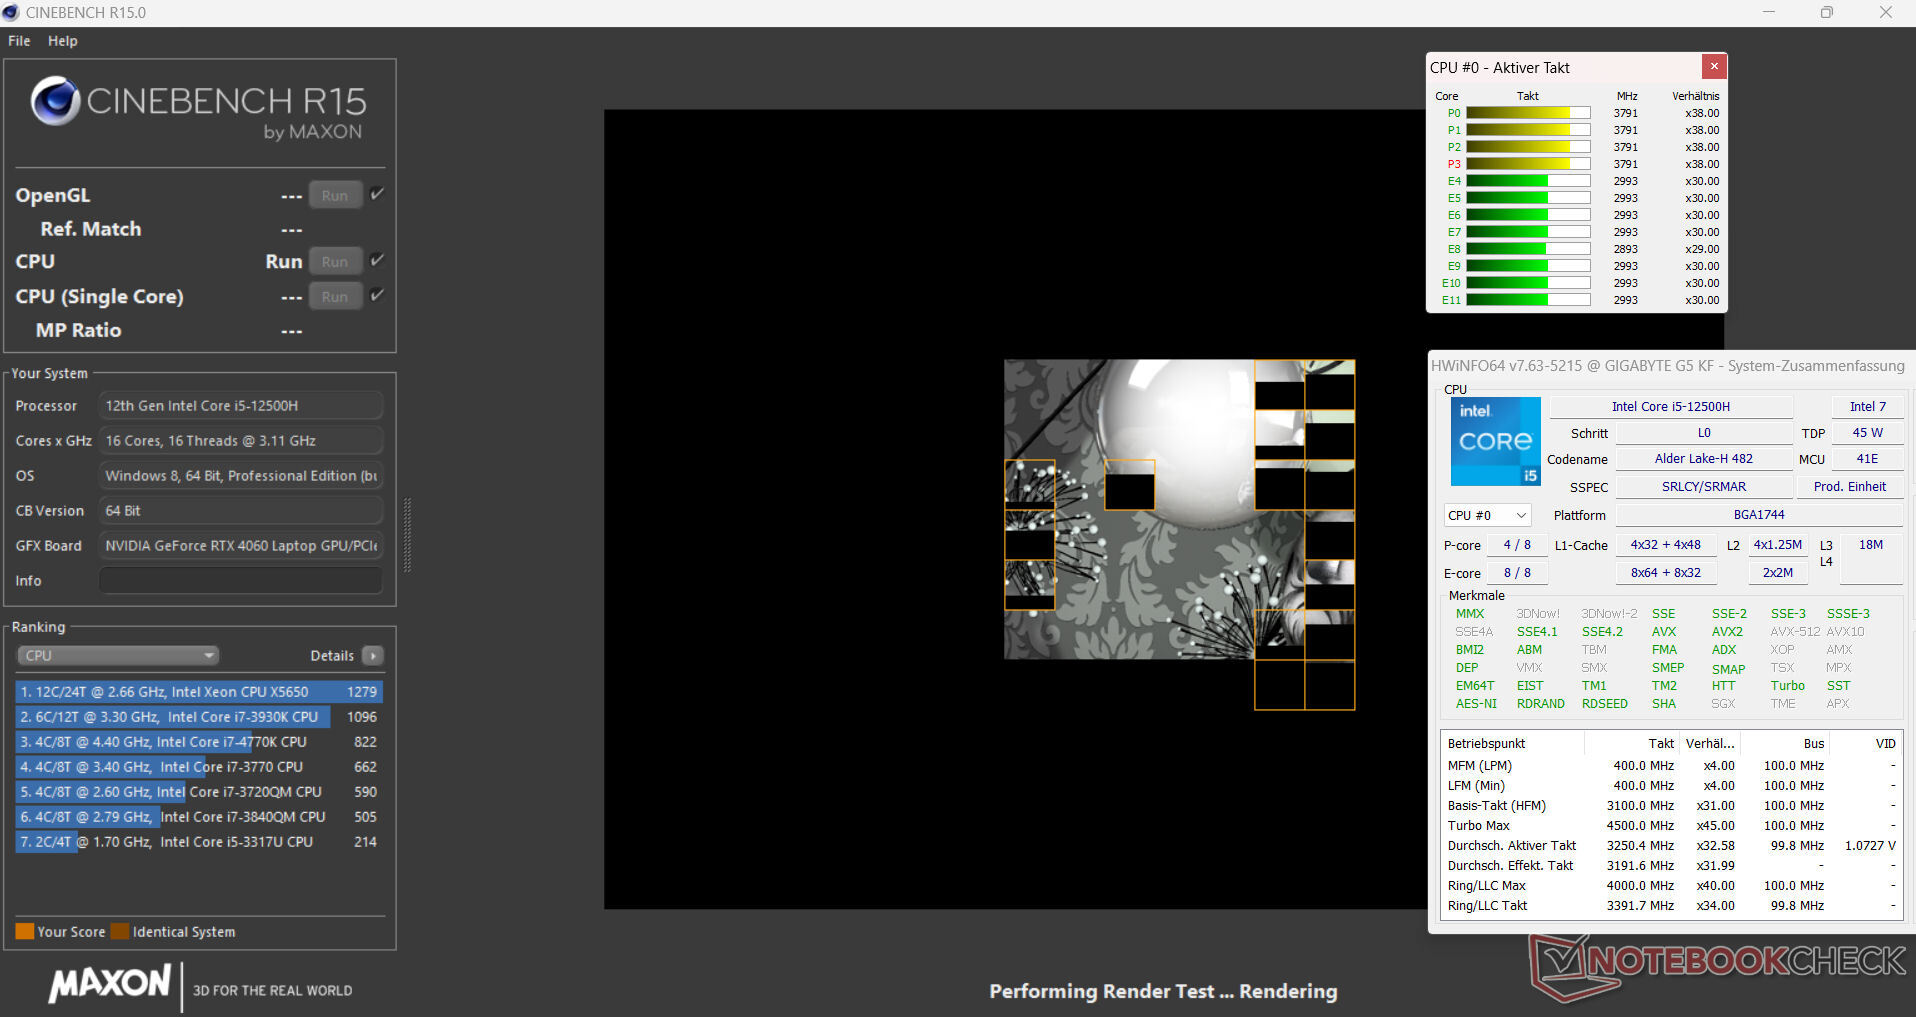
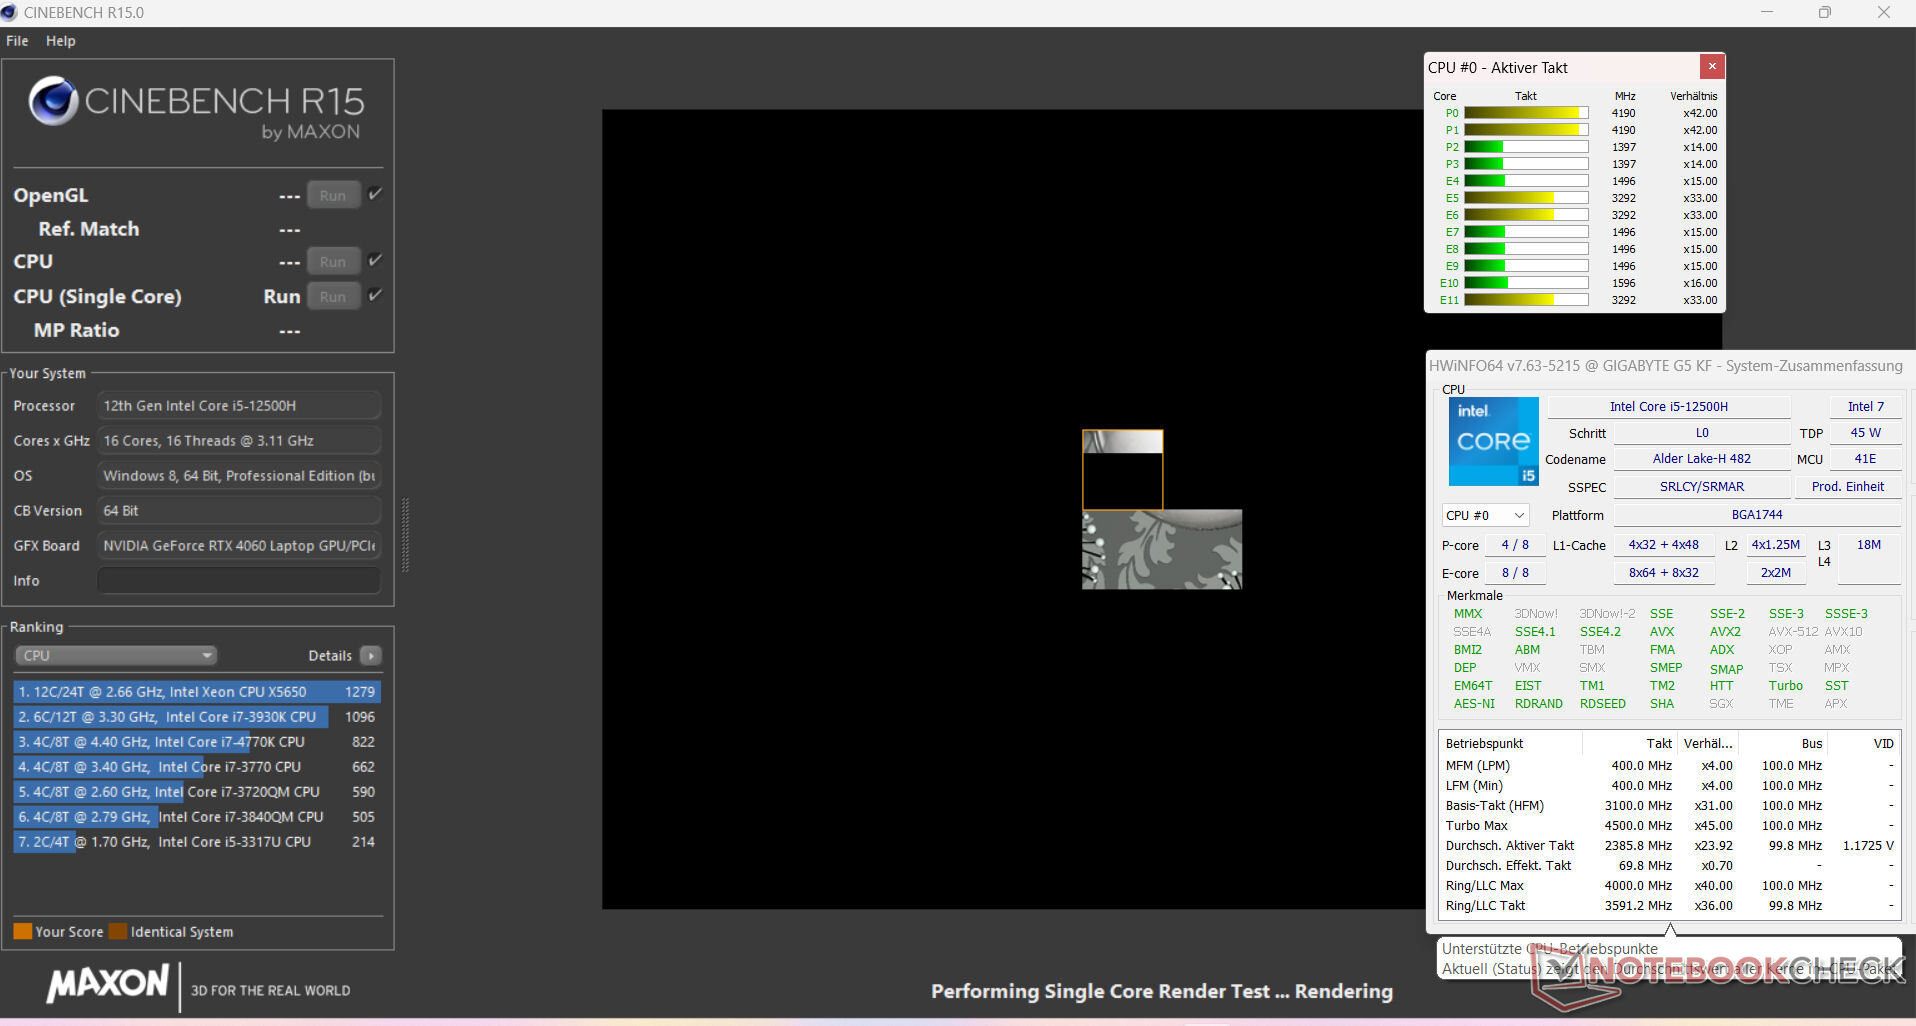
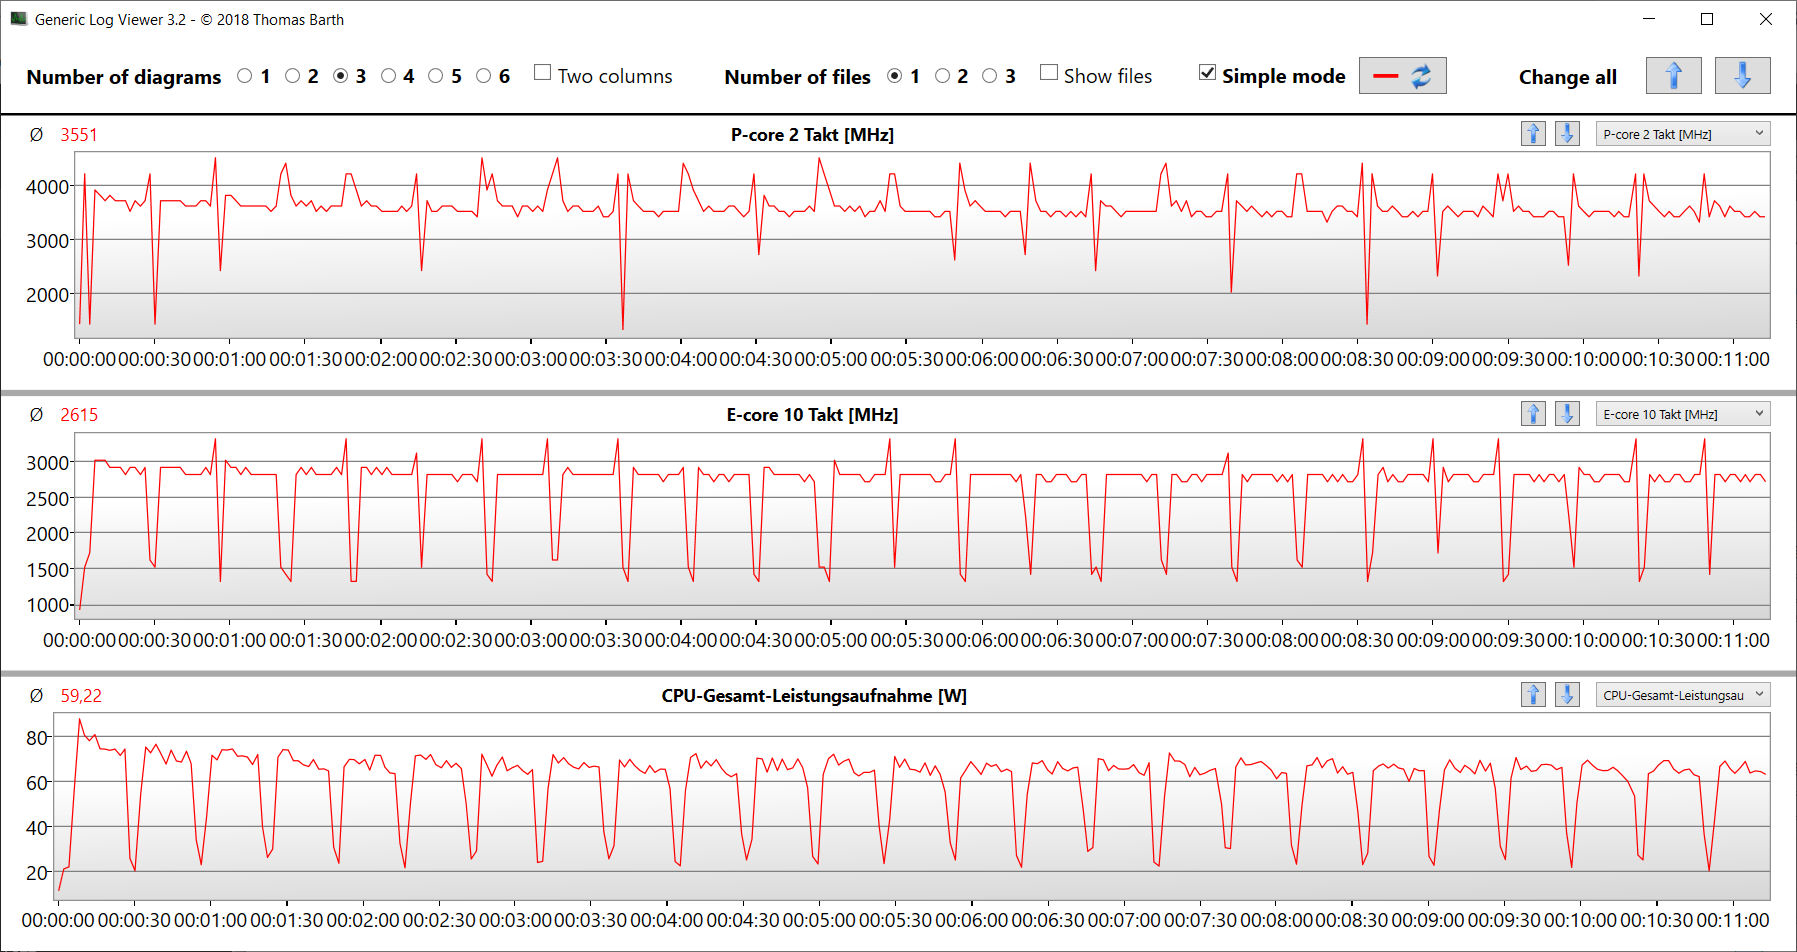
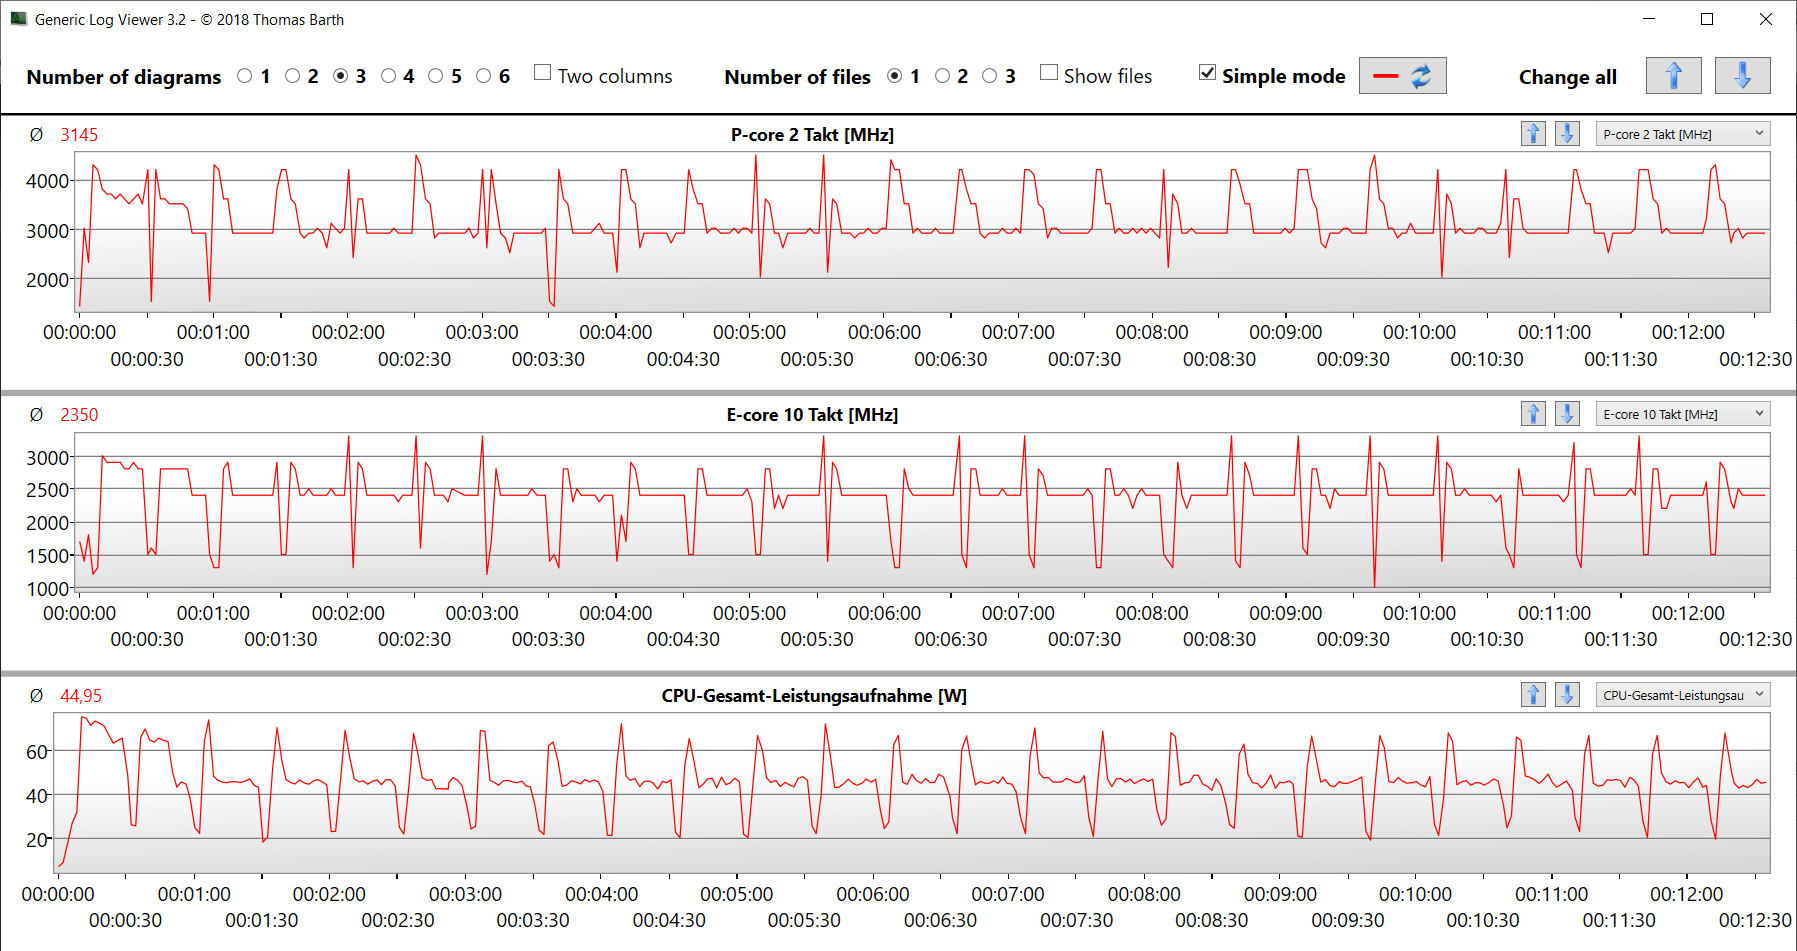
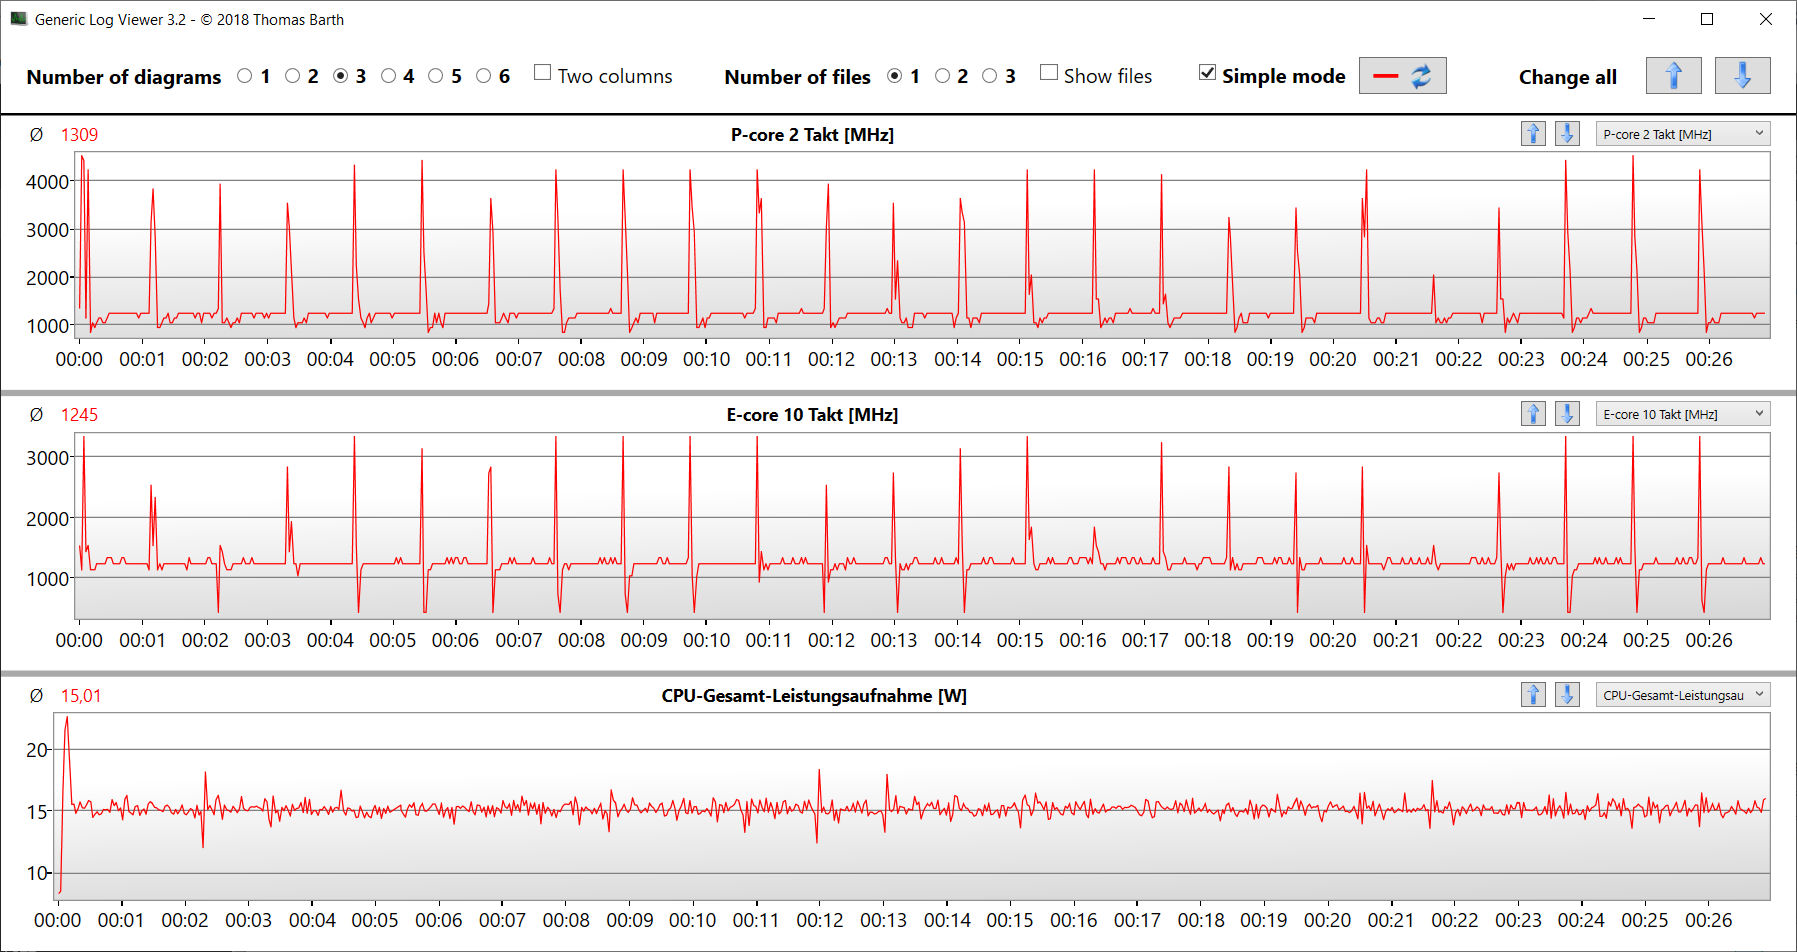
Os 12 núcleos de CPU do Core i5-12500H (4 núcleos P, 8 núcleos E) podem atingir frequências máximas de 4,5 GHz (P) e 3,3 GHz (E). Sob carga sustentada de vários threads (ou seja, CB15 em um loop), a velocidade do clock caiu ligeiramente entre a primeira e a segunda execução e permaneceu em um nível relativamente constante depois disso.
Os resultados do benchmark estão no mesmo nível do que vimos na CPU em média (quando conectada). Com relação à energia da bateria, a pontuação mais relevante do single-thread no CB15 (159 pontos) teve uma redução menor do que a pontuação do multi-thread (741 pontos).
Cinebench R15 Multi Sustained load
| CPU Performance rating - Percent | |
| Média da turma Gaming | |
| Lenovo Legion Slim 5 16APH8 | |
| Intel NUC X15 LAPAC71H | |
| MSI Cyborg 15 A12VF | |
| Asus TUF A15 FA507 | |
| Gigabyte G5 KE | |
| Média Intel Core i5-12500H | |
| Gigabyte G5 KF | |
* ... menor é melhor
AIDA64: FP32 Ray-Trace | FPU Julia | CPU SHA3 | CPU Queen | FPU SinJulia | FPU Mandel | CPU AES | CPU ZLib | FP64 Ray-Trace | CPU PhotoWorxx
| Performance rating | |
| Média da turma Gaming | |
| Lenovo Legion Slim 5 16APH8 | |
| Asus TUF A15 FA507 | |
| Intel NUC X15 LAPAC71H | |
| Gigabyte G5 KE | |
| MSI Cyborg 15 A12VF | |
| Gigabyte G5 KF | |
| Média Intel Core i5-12500H | |
| AIDA64 / FP32 Ray-Trace | |
| Média da turma Gaming (10227 - 85542, n=105, últimos 2 anos) | |
| Lenovo Legion Slim 5 16APH8 | |
| Asus TUF A15 FA507 | |
| Intel NUC X15 LAPAC71H | |
| MSI Cyborg 15 A12VF | |
| Gigabyte G5 KE | |
| Média Intel Core i5-12500H (6851 - 13947, n=9) | |
| Gigabyte G5 KF | |
| AIDA64 / FPU Julia | |
| Média da turma Gaming (51376 - 238426, n=105, últimos 2 anos) | |
| Lenovo Legion Slim 5 16APH8 | |
| Asus TUF A15 FA507 | |
| MSI Cyborg 15 A12VF | |
| Gigabyte G5 KE | |
| Intel NUC X15 LAPAC71H | |
| Gigabyte G5 KF | |
| Média Intel Core i5-12500H (29874 - 68178, n=9) | |
| AIDA64 / CPU SHA3 | |
| Média da turma Gaming (2180 - 10115, n=105, últimos 2 anos) | |
| Lenovo Legion Slim 5 16APH8 | |
| Asus TUF A15 FA507 | |
| Gigabyte G5 KE | |
| Intel NUC X15 LAPAC71H | |
| MSI Cyborg 15 A12VF | |
| Gigabyte G5 KF | |
| Média Intel Core i5-12500H (2287 - 3337, n=9) | |
| AIDA64 / CPU Queen | |
| Lenovo Legion Slim 5 16APH8 | |
| Média da turma Gaming (49785 - 173351, n=90, últimos 2 anos) | |
| Asus TUF A15 FA507 | |
| Intel NUC X15 LAPAC71H | |
| MSI Cyborg 15 A12VF | |
| Gigabyte G5 KE | |
| Gigabyte G5 KF | |
| Média Intel Core i5-12500H (77935 - 80703, n=9) | |
| AIDA64 / FPU SinJulia | |
| Lenovo Legion Slim 5 16APH8 | |
| Média da turma Gaming (4424 - 33636, n=105, últimos 2 anos) | |
| Asus TUF A15 FA507 | |
| MSI Cyborg 15 A12VF | |
| Intel NUC X15 LAPAC71H | |
| Gigabyte G5 KE | |
| Gigabyte G5 KF | |
| Média Intel Core i5-12500H (6590 - 7431, n=9) | |
| AIDA64 / FPU Mandel | |
| Média da turma Gaming (25115 - 128721, n=105, últimos 2 anos) | |
| Lenovo Legion Slim 5 16APH8 | |
| Asus TUF A15 FA507 | |
| Gigabyte G5 KE | |
| Intel NUC X15 LAPAC71H | |
| MSI Cyborg 15 A12VF | |
| Média Intel Core i5-12500H (18252 - 34041, n=9) | |
| Gigabyte G5 KF | |
| AIDA64 / CPU AES | |
| Intel NUC X15 LAPAC71H | |
| Gigabyte G5 KE | |
| Média da turma Gaming (39258 - 247074, n=105, últimos 2 anos) | |
| Gigabyte G5 KF | |
| Média Intel Core i5-12500H (50298 - 111567, n=9) | |
| Lenovo Legion Slim 5 16APH8 | |
| Asus TUF A15 FA507 | |
| MSI Cyborg 15 A12VF | |
| AIDA64 / CPU ZLib | |
| Média da turma Gaming (574 - 2531, n=105, últimos 2 anos) | |
| Lenovo Legion Slim 5 16APH8 | |
| Gigabyte G5 KE | |
| MSI Cyborg 15 A12VF | |
| Média Intel Core i5-12500H (746 - 924, n=9) | |
| Gigabyte G5 KF | |
| Intel NUC X15 LAPAC71H | |
| Asus TUF A15 FA507 | |
| AIDA64 / FP64 Ray-Trace | |
| Média da turma Gaming (5509 - 45446, n=105, últimos 2 anos) | |
| Lenovo Legion Slim 5 16APH8 | |
| Asus TUF A15 FA507 | |
| Gigabyte G5 KE | |
| Intel NUC X15 LAPAC71H | |
| MSI Cyborg 15 A12VF | |
| Média Intel Core i5-12500H (3848 - 7405, n=9) | |
| Gigabyte G5 KF | |
| AIDA64 / CPU PhotoWorxx | |
| Média da turma Gaming (12271 - 89891, n=105, últimos 2 anos) | |
| Intel NUC X15 LAPAC71H | |
| MSI Cyborg 15 A12VF | |
| Lenovo Legion Slim 5 16APH8 | |
| Média Intel Core i5-12500H (13686 - 43813, n=9) | |
| Gigabyte G5 KE | |
| Asus TUF A15 FA507 | |
| Gigabyte G5 KF | |
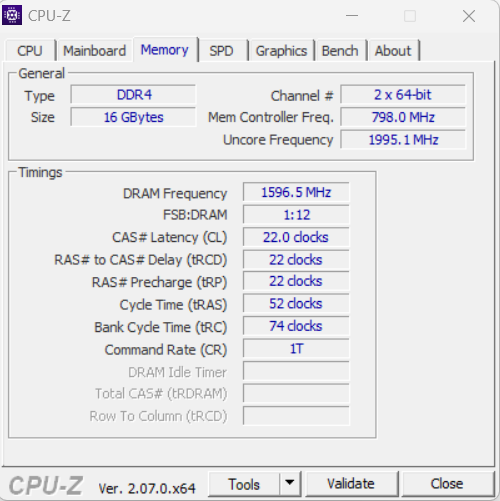
Desempenho do sistema
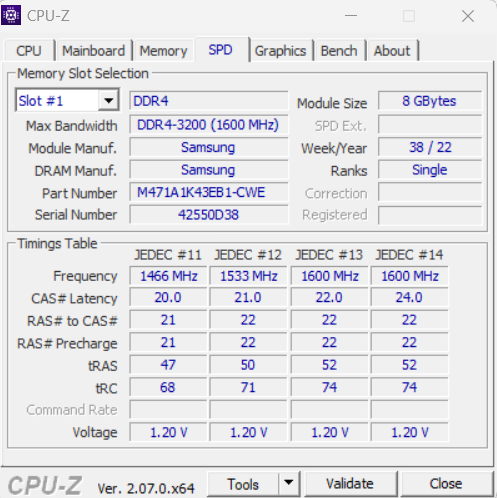
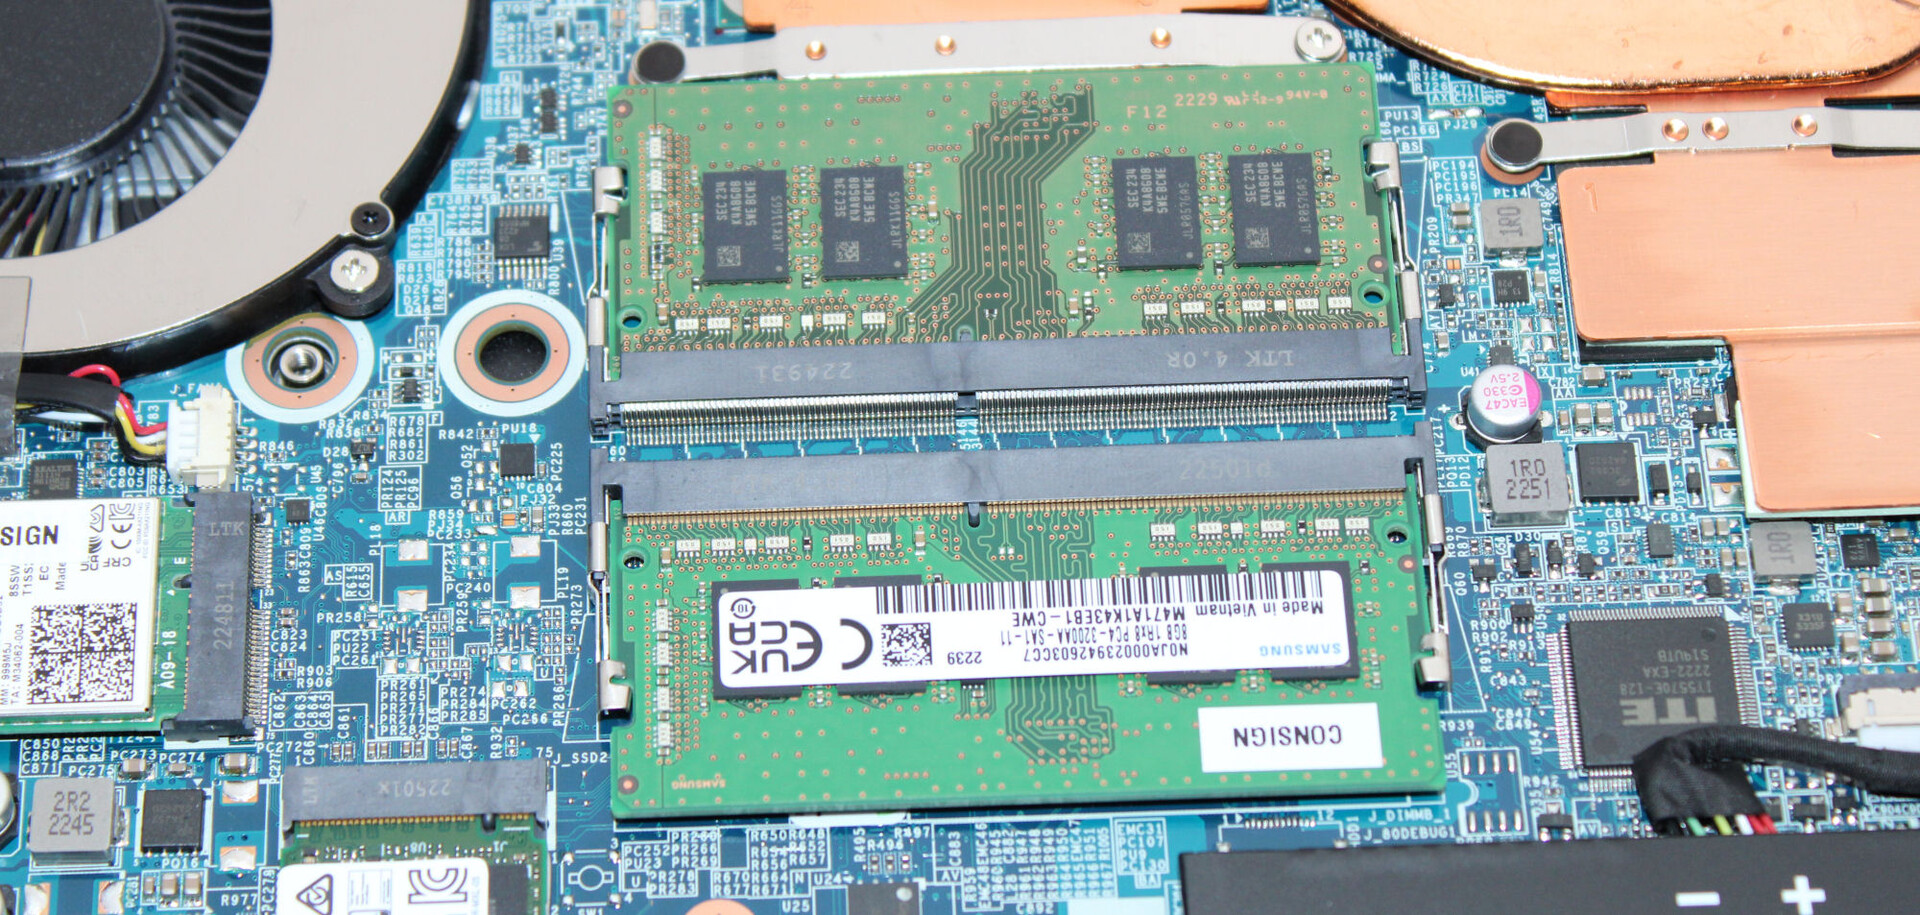
O sistema funciona sem problemas e tem potência suficiente para lidar com aplicativos exigentes, como renderização e jogos. As taxas de transferência da memória são bastante típicas da RAM DDR4-3200.
CrossMark: Overall | Productivity | Creativity | Responsiveness
| PCMark 10 / Score | |
| Média da turma Gaming (5828 - 12414, n=93, últimos 2 anos) | |
| Lenovo Legion Slim 5 16APH8 | |
| Asus TUF A15 FA507 | |
| Gigabyte G5 KE | |
| MSI Cyborg 15 A12VF | |
| Intel NUC X15 LAPAC71H | |
| Gigabyte G5 KF | |
| Média Intel Core i5-12500H, NVIDIA GeForce RTX 4060 Laptop GPU (n=1) | |
| PCMark 10 / Essentials | |
| Lenovo Legion Slim 5 16APH8 | |
| Gigabyte G5 KE | |
| MSI Cyborg 15 A12VF | |
| Média da turma Gaming (8810 - 11935, n=97, últimos 2 anos) | |
| Asus TUF A15 FA507 | |
| Intel NUC X15 LAPAC71H | |
| Gigabyte G5 KF | |
| Média Intel Core i5-12500H, NVIDIA GeForce RTX 4060 Laptop GPU (n=1) | |
| PCMark 10 / Productivity | |
| Média da turma Gaming (6845 - 25323, n=95, últimos 2 anos) | |
| Lenovo Legion Slim 5 16APH8 | |
| MSI Cyborg 15 A12VF | |
| Gigabyte G5 KF | |
| Média Intel Core i5-12500H, NVIDIA GeForce RTX 4060 Laptop GPU (n=1) | |
| Gigabyte G5 KE | |
| Asus TUF A15 FA507 | |
| Intel NUC X15 LAPAC71H | |
| PCMark 10 / Digital Content Creation | |
| Média da turma Gaming (7602 - 19954, n=95, últimos 2 anos) | |
| Lenovo Legion Slim 5 16APH8 | |
| Intel NUC X15 LAPAC71H | |
| Asus TUF A15 FA507 | |
| Gigabyte G5 KE | |
| MSI Cyborg 15 A12VF | |
| Gigabyte G5 KF | |
| Média Intel Core i5-12500H, NVIDIA GeForce RTX 4060 Laptop GPU (n=1) | |
| CrossMark / Overall | |
| Média da turma Gaming (1366 - 2409, n=94, últimos 2 anos) | |
| Intel NUC X15 LAPAC71H | |
| Lenovo Legion Slim 5 16APH8 | |
| MSI Cyborg 15 A12VF | |
| Gigabyte G5 KE | |
| Gigabyte G5 KF | |
| Média Intel Core i5-12500H, NVIDIA GeForce RTX 4060 Laptop GPU (n=1) | |
| Asus TUF A15 FA507 | |
| CrossMark / Productivity | |
| Média da turma Gaming (1386 - 2254, n=94, últimos 2 anos) | |
| Intel NUC X15 LAPAC71H | |
| Lenovo Legion Slim 5 16APH8 | |
| Gigabyte G5 KE | |
| MSI Cyborg 15 A12VF | |
| Gigabyte G5 KF | |
| Média Intel Core i5-12500H, NVIDIA GeForce RTX 4060 Laptop GPU (n=1) | |
| Asus TUF A15 FA507 | |
| CrossMark / Creativity | |
| Média da turma Gaming (1343 - 2786, n=94, últimos 2 anos) | |
| Lenovo Legion Slim 5 16APH8 | |
| Intel NUC X15 LAPAC71H | |
| MSI Cyborg 15 A12VF | |
| Gigabyte G5 KE | |
| Gigabyte G5 KF | |
| Média Intel Core i5-12500H, NVIDIA GeForce RTX 4060 Laptop GPU (n=1) | |
| Asus TUF A15 FA507 | |
| CrossMark / Responsiveness | |
| Intel NUC X15 LAPAC71H | |
| Gigabyte G5 KF | |
| Média Intel Core i5-12500H, NVIDIA GeForce RTX 4060 Laptop GPU (n=1) | |
| Gigabyte G5 KE | |
| Média da turma Gaming (1226 - 2334, n=94, últimos 2 anos) | |
| MSI Cyborg 15 A12VF | |
| Lenovo Legion Slim 5 16APH8 | |
| Asus TUF A15 FA507 | |
| PCMark 10 Score | 6318 pontos | |
Ajuda | ||
| AIDA64 / Memory Copy | |
| Média da turma Gaming (21750 - 129946, n=105, últimos 2 anos) | |
| Intel NUC X15 LAPAC71H | |
| Lenovo Legion Slim 5 16APH8 | |
| MSI Cyborg 15 A12VF | |
| Asus TUF A15 FA507 | |
| Média Intel Core i5-12500H (23850 - 66598, n=9) | |
| Gigabyte G5 KE | |
| Gigabyte G5 KF | |
| AIDA64 / Memory Read | |
| Média da turma Gaming (22956 - 118858, n=105, últimos 2 anos) | |
| Intel NUC X15 LAPAC71H | |
| MSI Cyborg 15 A12VF | |
| Lenovo Legion Slim 5 16APH8 | |
| Média Intel Core i5-12500H (24879 - 68013, n=9) | |
| Asus TUF A15 FA507 | |
| Gigabyte G5 KE | |
| Gigabyte G5 KF | |
| AIDA64 / Memory Write | |
| Lenovo Legion Slim 5 16APH8 | |
| Média da turma Gaming (22297 - 135096, n=105, últimos 2 anos) | |
| Intel NUC X15 LAPAC71H | |
| MSI Cyborg 15 A12VF | |
| Asus TUF A15 FA507 | |
| Média Intel Core i5-12500H (23543 - 58797, n=9) | |
| Gigabyte G5 KE | |
| Gigabyte G5 KF | |
| AIDA64 / Memory Latency | |
| Média da turma Gaming (75.3 - 259, n=105, últimos 2 anos) | |
| Média Intel Core i5-12500H (83.8 - 114.7, n=9) | |
| Gigabyte G5 KE | |
| Lenovo Legion Slim 5 16APH8 | |
| MSI Cyborg 15 A12VF | |
| Intel NUC X15 LAPAC71H | |
| Gigabyte G5 KF | |
| Asus TUF A15 FA507 | |
* ... menor é melhor
Latência DPC
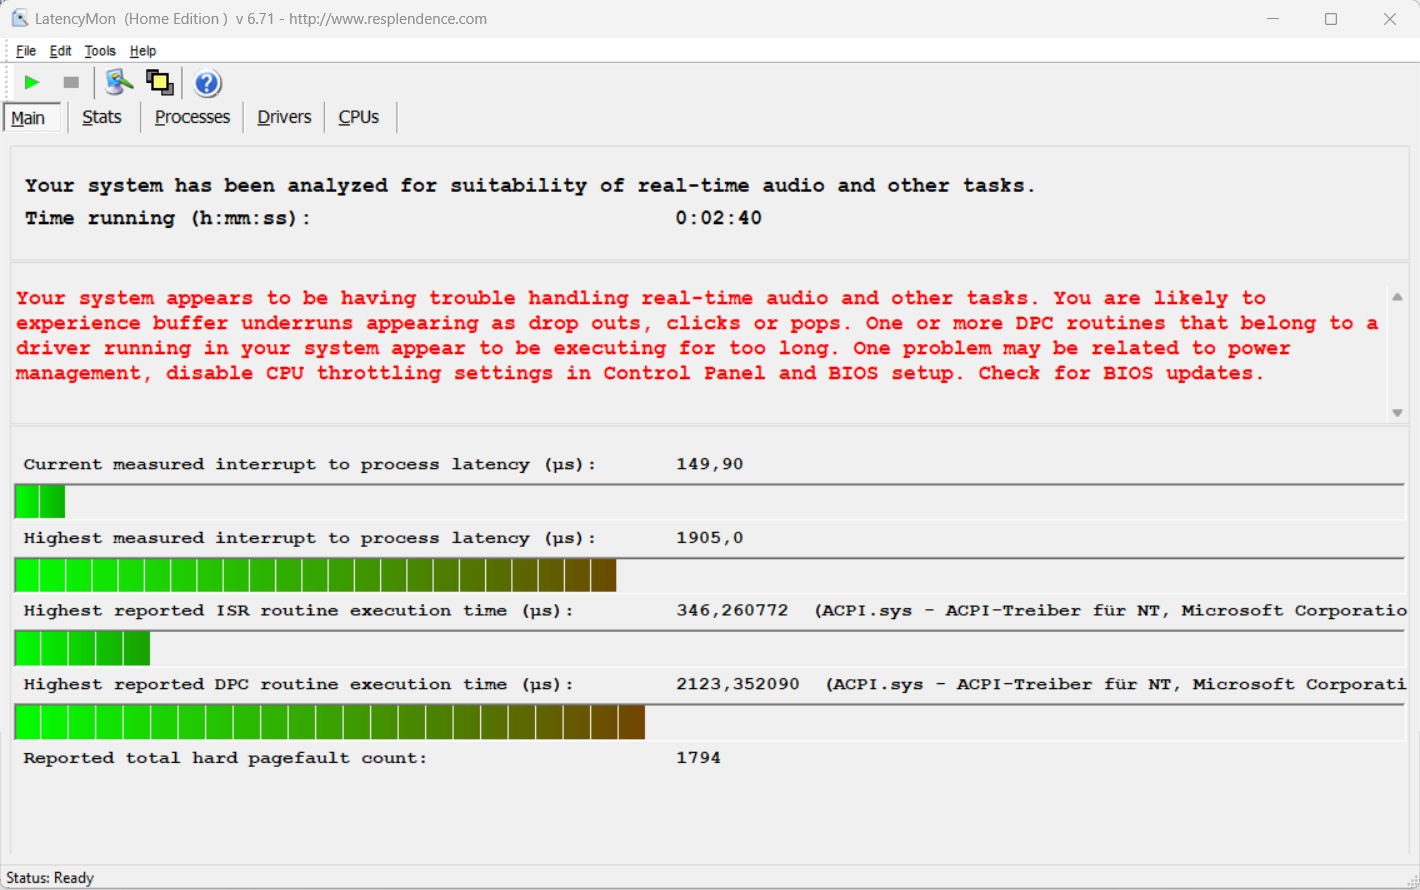
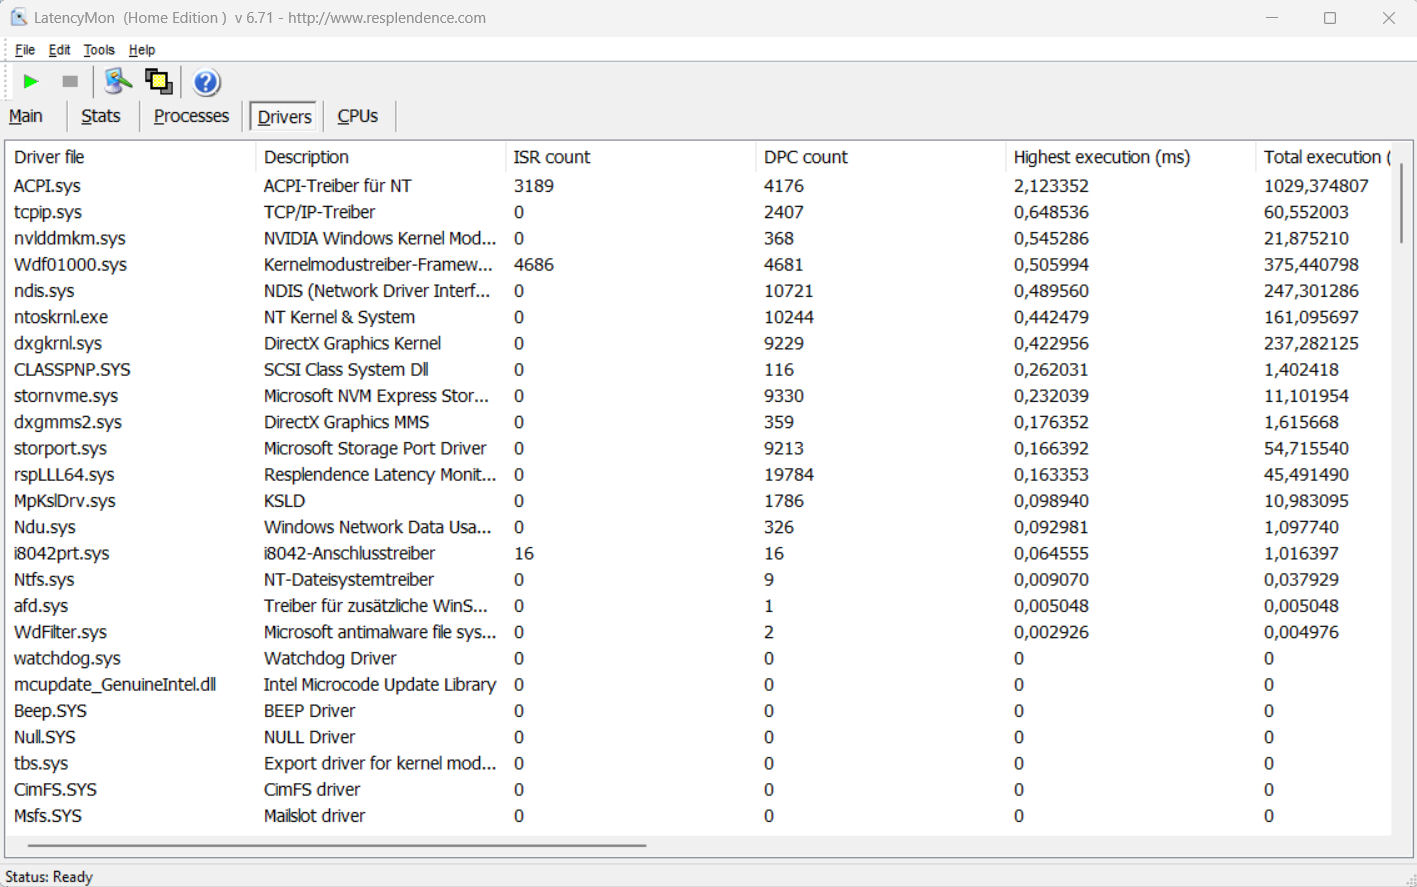
Nosso teste de monitor de latência padronizado (navegação na Web, reprodução de vídeo 4K e alta carga do Prime95) revelou alguns problemas. O sistema não parece ser adequado para o processamento de vídeo e áudio em tempo real. Esperamos que isso possa ser melhorado com futuras atualizações de software.
| DPC Latencies / LatencyMon - interrupt to process latency (max), Web, Youtube, Prime95 | |
| Gigabyte G5 KF | |
| MSI Cyborg 15 A12VF | |
| Lenovo Legion Slim 5 16APH8 | |
| Gigabyte G5 KE | |
| Intel NUC X15 LAPAC71H | |
* ... menor é melhor
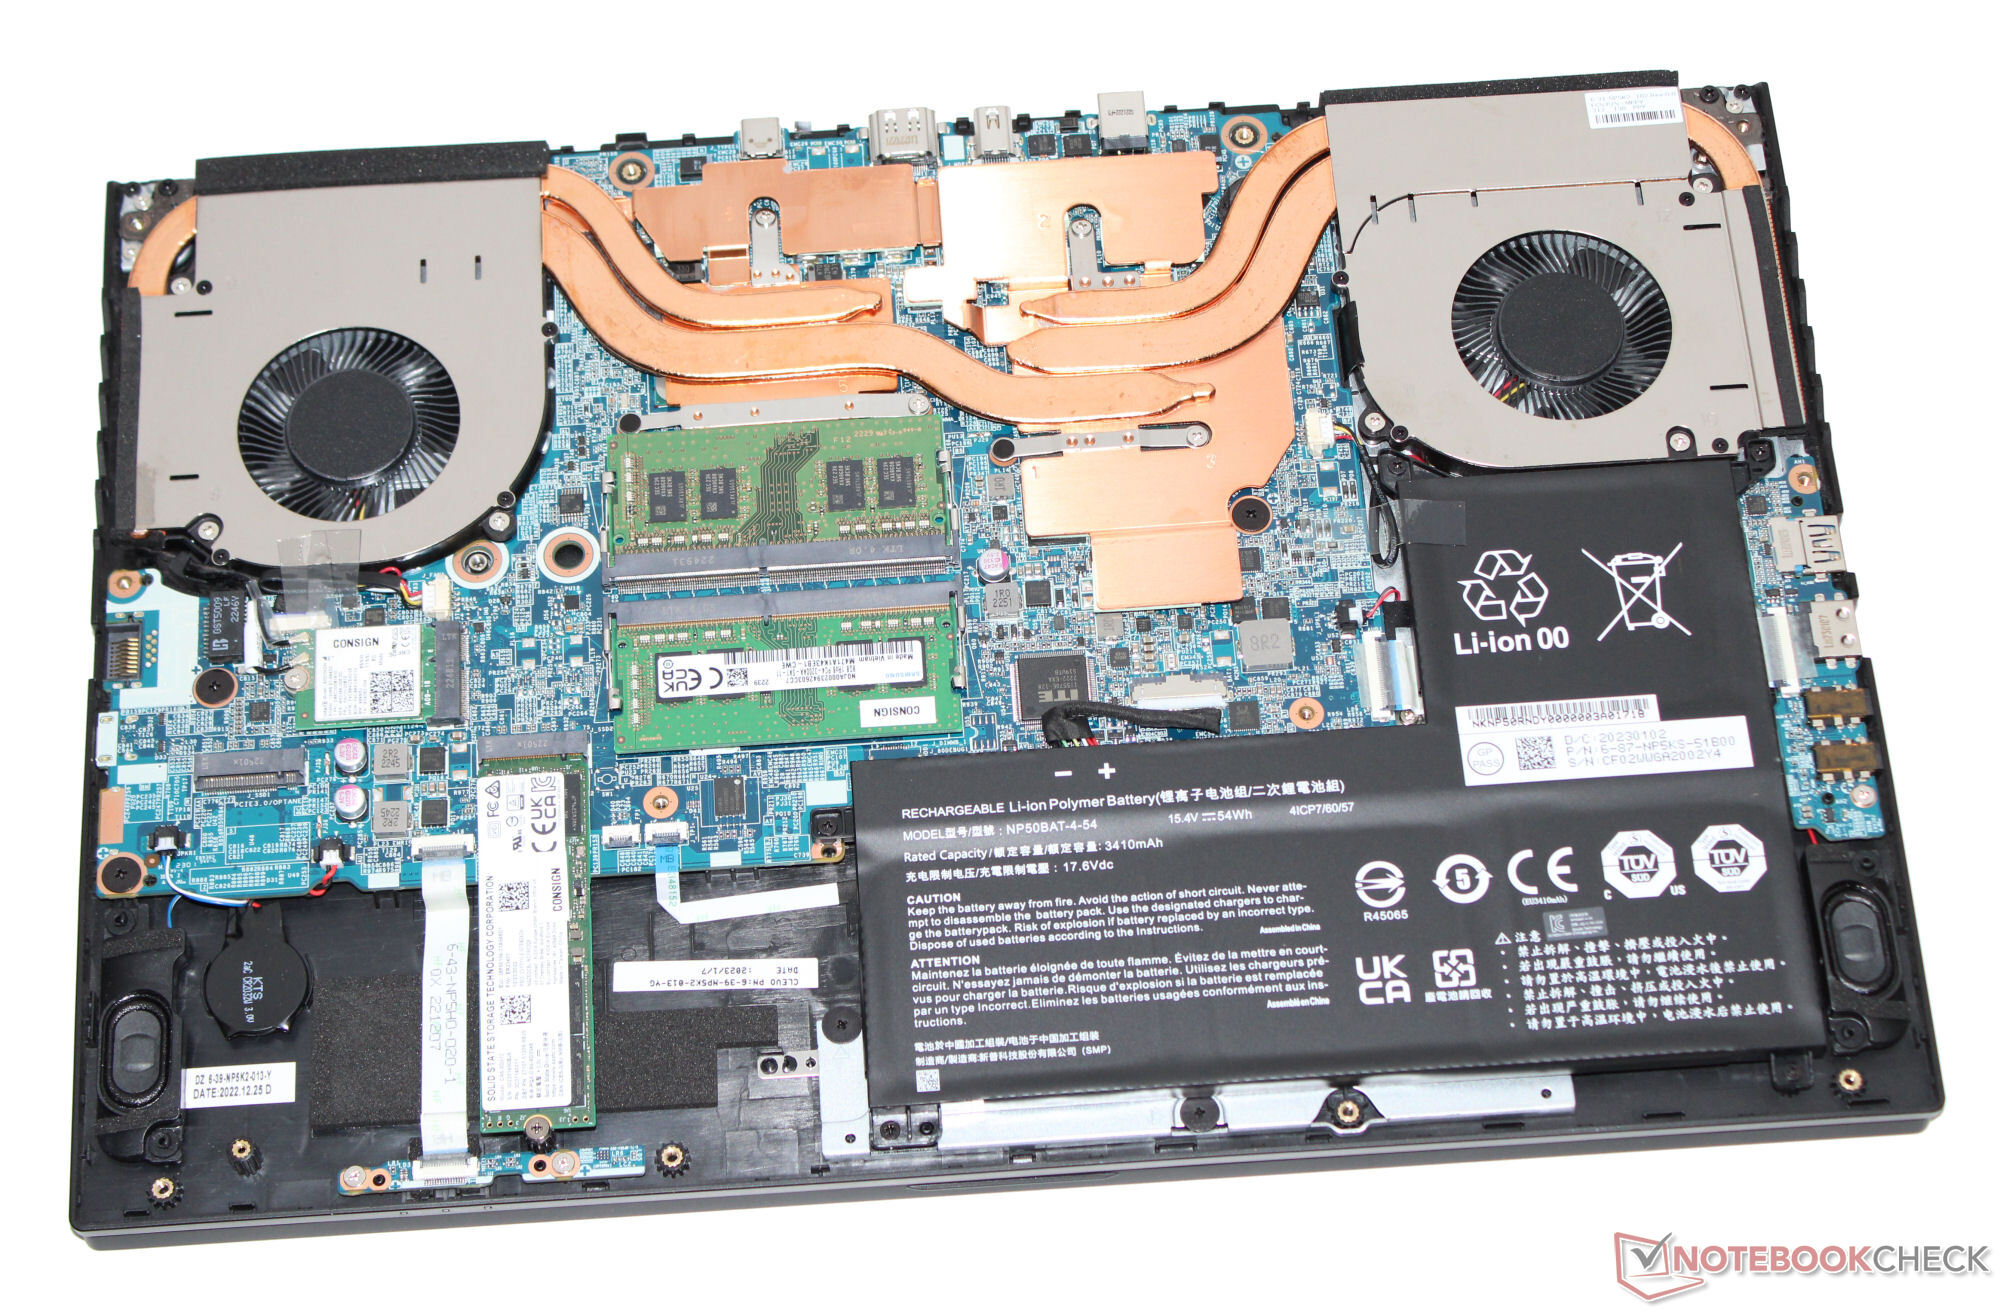
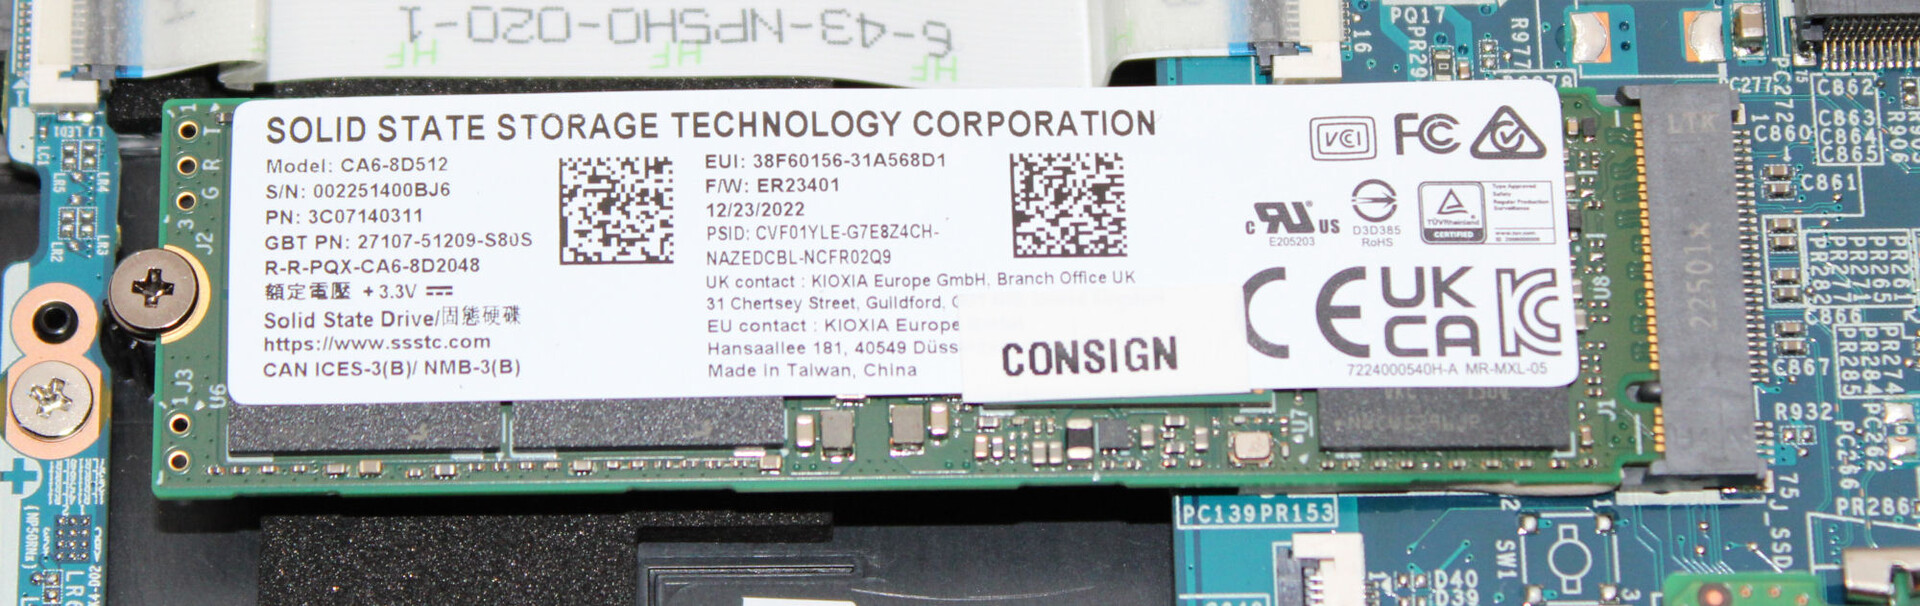
Armazenamento em massa
A Gigabyte equipou o G5 com um SSD de 512 GB (PCIe 4.0, M2. 2280) da SSSTC que oferece grandes velocidades de transferência de dados. Dito isso, ele é propenso a quedas de desempenho causadas por estrangulamento térmico. O notebook também tem um slot PCIe 3.0 para acomodar um segundo SSD M.2 2280.

| Drive Performance rating - Percent | |
| Intel NUC X15 LAPAC71H | |
| Gigabyte G5 KF | |
| Média SSSTC CA6-8D512 | |
| Média da turma Gaming | |
| Lenovo Legion Slim 5 16APH8 | |
| Gigabyte G5 KE | |
| MSI Cyborg 15 A12VF | |
| Asus TUF A15 FA507 | |
* ... menor é melhor
Dauerleistung Lesen: DiskSpd Read Loop, Queue Depth 8
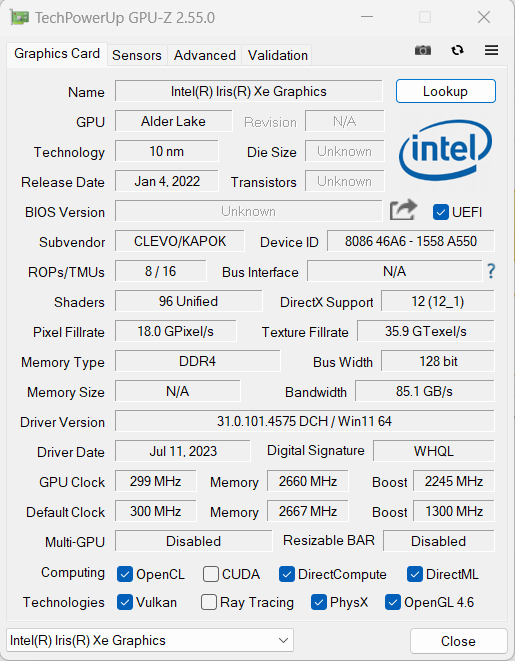
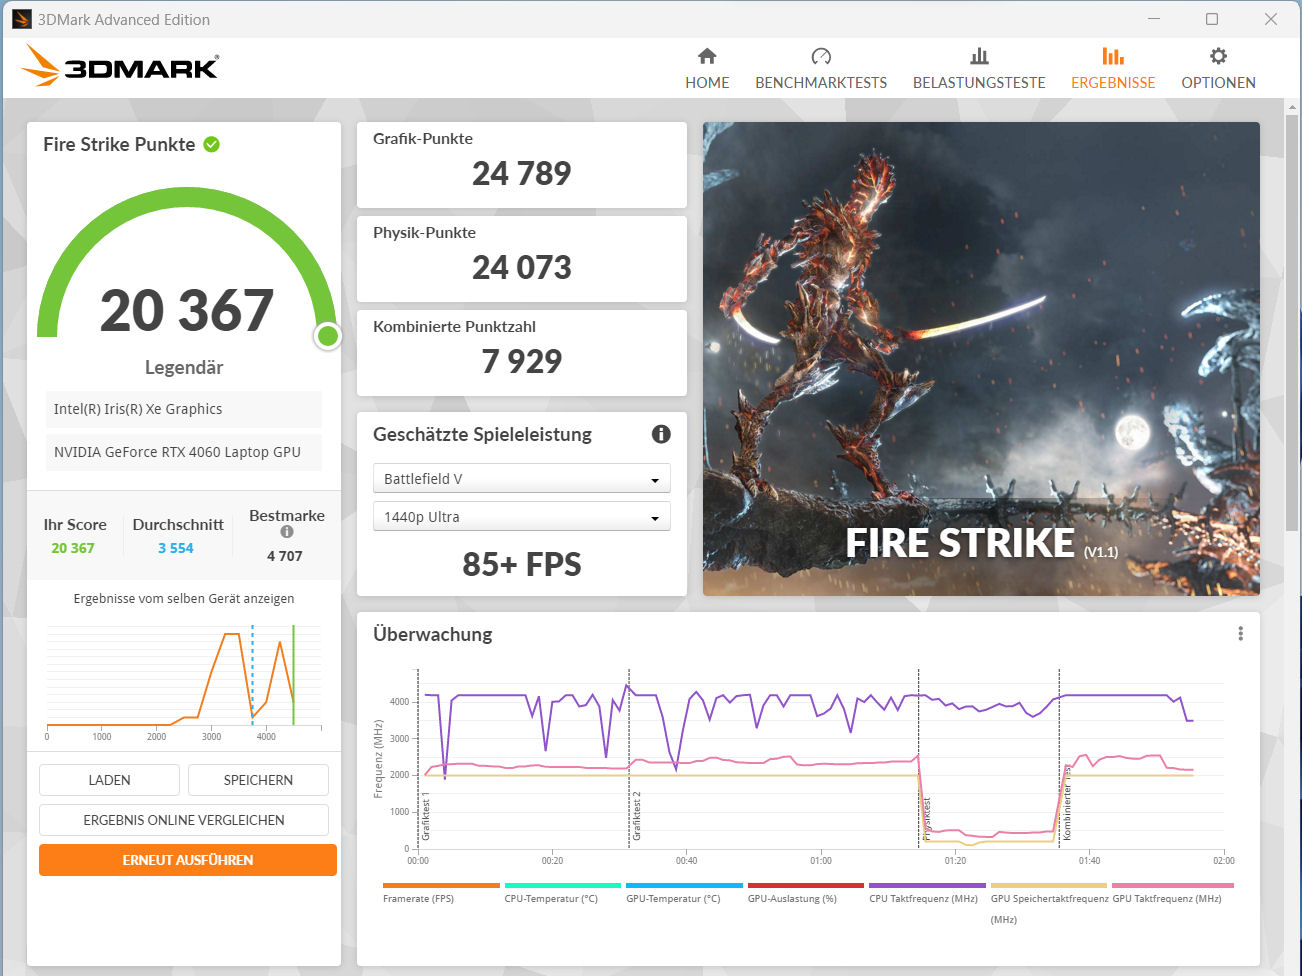
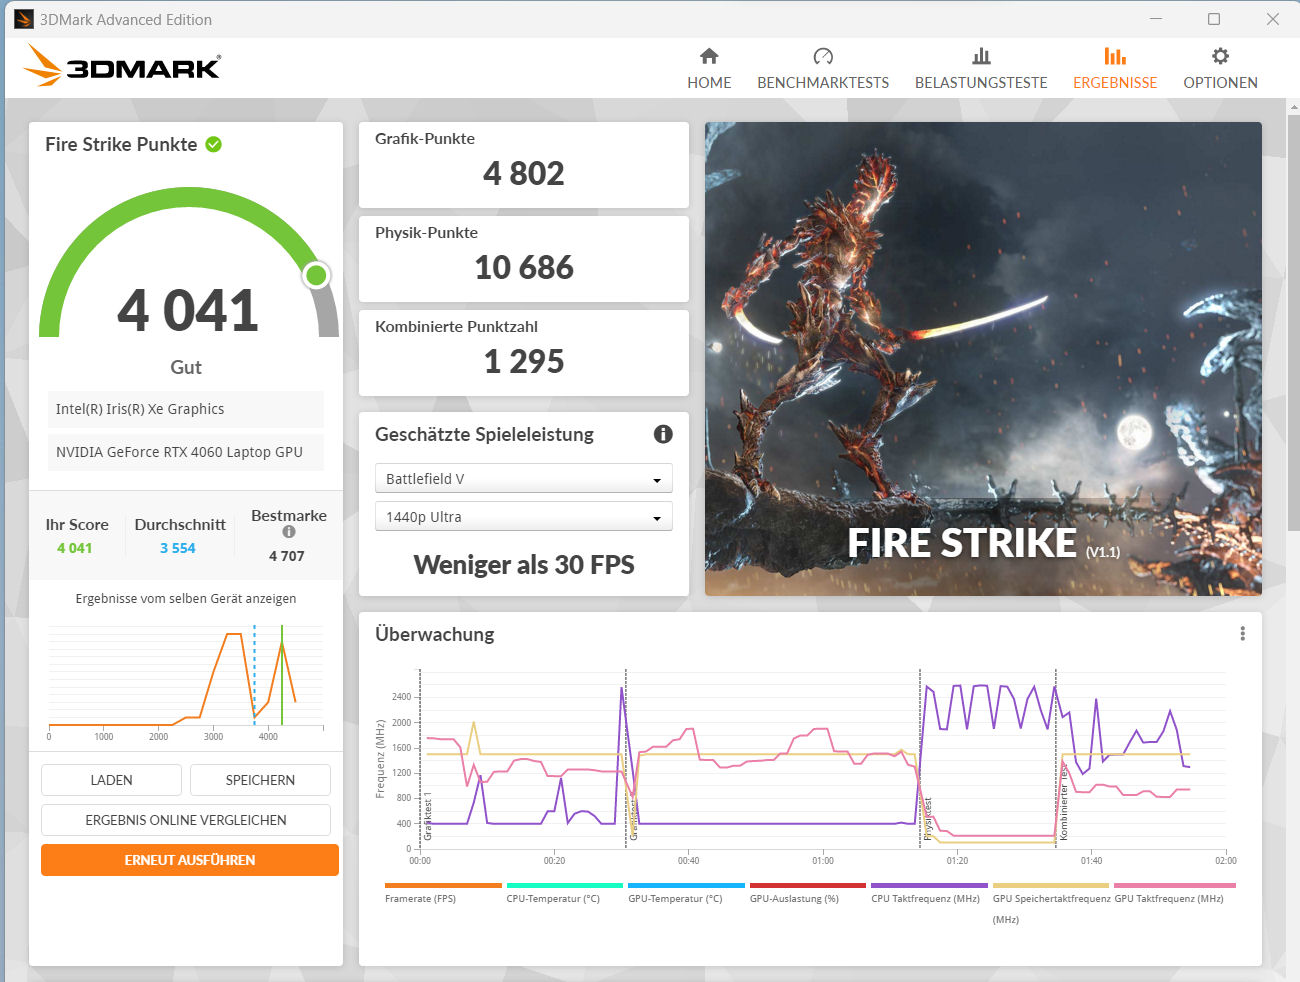
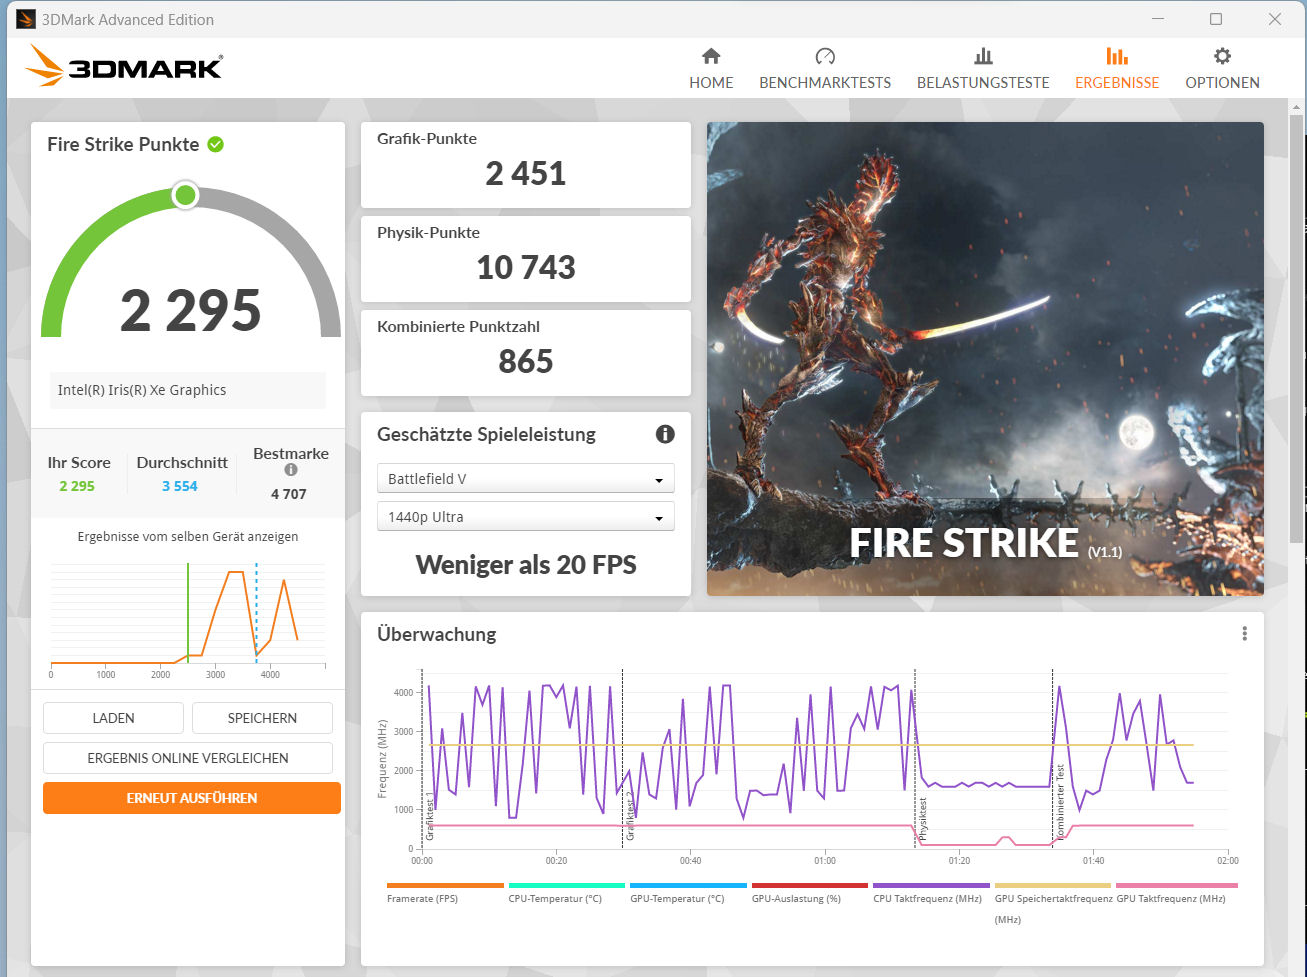
Placa de vídeo
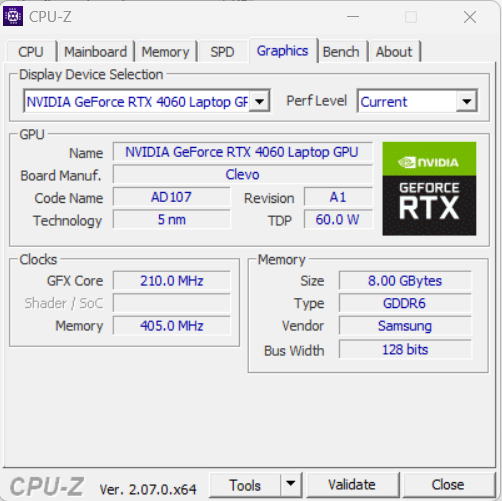
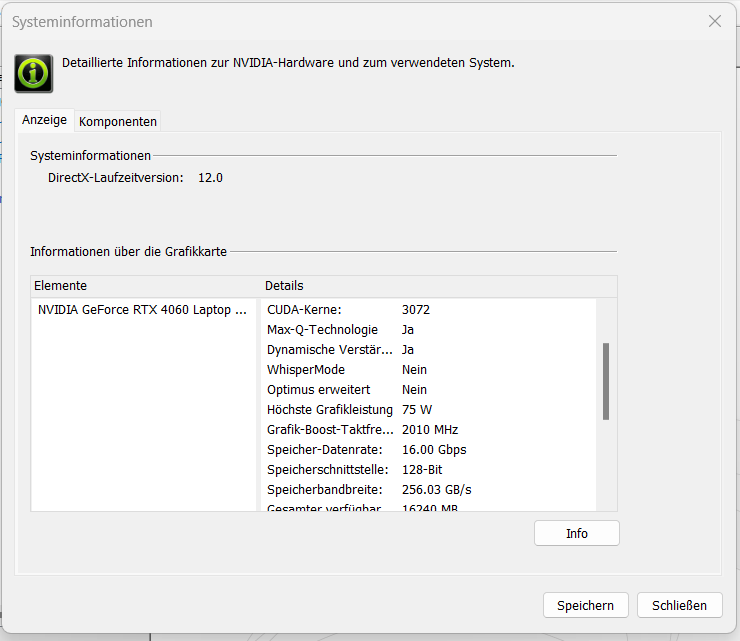
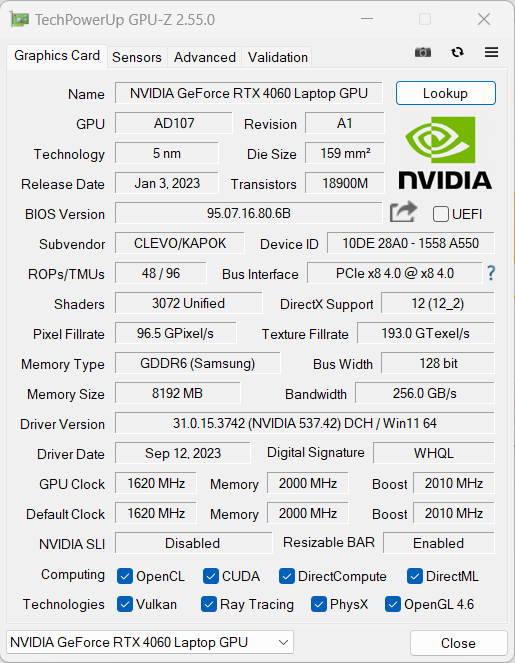
A GeForce RTX 4060 possui 3.072 unidades de sombreamento, um barramento de memória de 128 bits e 8.192 MB de memória de vídeo GDDR6. A Gigabyte especificou um TGP máximo de 75 W, que está na extremidade inferior da faixa média. O TGP foi totalmente utilizado durante nosso teste em Witcher 3.
Os resultados do benchmark estão dentro da média do que vimos da RTX 4060 até agora. Apesar de seu TGP mais baixo, a RTX 4060 tem um desempenho melhor do que a RTX 3060 no teste do G5 KE. Isso ocorre porque a arquitetura Ada Lovelace é mais eficiente. O G5 KF não tem um modo dGPU.


| 3DMark Performance rating - Percent | |
| Média da turma Gaming | |
| Média NVIDIA GeForce RTX 4060 Laptop GPU | |
| Gigabyte G5 KF | |
| Gigabyte G5 KE | |
| MSI Cyborg 15 A12VF | |
| Lenovo Legion Slim 5 16APH8 -1! | |
| Asus TUF A15 FA507 -1! | |
| Intel NUC X15 LAPAC71H | |
| 3DMark 06 Standard Score | 45111 pontos | |
| 3DMark 11 Performance | 28012 pontos | |
| 3DMark Cloud Gate Standard Score | 51746 pontos | |
| 3DMark Fire Strike Score | 20367 pontos | |
| 3DMark Time Spy Score | 9269 pontos | |
Ajuda | ||
* ... menor é melhor
Desempenho em jogos
O notebook da Gigabyte foi projetado para rodar jogos em FHD, bem como em configurações altas ou máximas. É possível usar resoluções mais altas conectando o notebook a um monitor compatível com elas, embora talvez seja necessário reduzir algumas configurações. Em nossos testes, as taxas de quadros ficaram abaixo do que a RTX 4060 pode fazer, em média, e praticamente no mesmo nível do G5 KEdo G5 KE.
| The Witcher 3 - 1920x1080 Ultra Graphics & Postprocessing (HBAO+) | |
| Média da turma Gaming (104.7 - 240, n=7, últimos 2 anos) | |
| Média NVIDIA GeForce RTX 4060 Laptop GPU (77 - 159.7, n=42) | |
| Lenovo Legion Slim 5 16APH8 | |
| Gigabyte G5 KF | |
| Gigabyte G5 KE | |
| Asus TUF A15 FA507 | |
| MSI Cyborg 15 A12VF | |
| Intel NUC X15 LAPAC71H | |
| Final Fantasy XV Benchmark - 1920x1080 High Quality | |
| Média da turma Gaming (41 - 215, n=95, últimos 2 anos) | |
| Média NVIDIA GeForce RTX 4060 Laptop GPU (75.1 - 109.8, n=51) | |
| Lenovo Legion Slim 5 16APH8 | |
| Gigabyte G5 KF | |
| Gigabyte G5 KE | |
| Asus TUF A15 FA507 | |
| MSI Cyborg 15 A12VF | |
| Intel NUC X15 LAPAC71H | |
| Dota 2 Reborn - 1920x1080 ultra (3/3) best looking | |
| Média da turma Gaming (84.8 - 248, n=107, últimos 2 anos) | |
| Média NVIDIA GeForce RTX 4060 Laptop GPU (115 - 183.8, n=53) | |
| Gigabyte G5 KE | |
| Lenovo Legion Slim 5 16APH8 | |
| MSI Cyborg 15 A12VF | |
| Gigabyte G5 KF | |
| Asus TUF A15 FA507 | |
| Intel NUC X15 LAPAC71H | |
| Starfield - 1920x1080 Ultra Preset | |
| Média da turma Gaming (n=1últimos 2 anos) | |
| XMG Pro 15 E23 | |
| Média NVIDIA GeForce RTX 4060 Laptop GPU (39.7 - 41, n=3) | |
| Gigabyte G5 KF | |
| Intel NUC X15 LAPAC71H | |
| Lies of P - 1920x1080 Best Preset | |
| XMG Pro 15 E23 | |
| Média NVIDIA GeForce RTX 4060 Laptop GPU (106.2 - 126.6, n=3) | |
| Gigabyte G5 KF | |
| Intel NUC X15 LAPAC71H | |
| EA Sports FC 24 - 1920x1080 Ultra Preset | |
| Gigabyte G5 KF | |
| XMG Pro 15 E23 | |
| Média NVIDIA GeForce RTX 4060 Laptop GPU (136.9 - 138, n=3) | |
| Intel NUC X15 LAPAC71H | |
| Média da turma Gaming (n=1últimos 2 anos) | |
| Assassin's Creed Mirage - 1920x1080 Ultra High Preset (Adaptive Quality Off) | |
| XMG Pro 15 E23 | |
| Média NVIDIA GeForce RTX 4060 Laptop GPU (65 - 93, n=6) | |
| Gigabyte G5 KF | |
| Intel NUC X15 LAPAC71H | |
| The Crew Motorfest - 1920x1080 Ultra Preset | |
| XMG Pro 15 E23 | |
| Gigabyte G5 KF | |
| Média NVIDIA GeForce RTX 4060 Laptop GPU (60 - 60, n=3) | |
| Intel NUC X15 LAPAC71H | |
| F1 23 - 1920x1080 Ultra High Preset AA:T AF:16x | |
| Média NVIDIA GeForce RTX 4060 Laptop GPU (43.8 - 119.9, n=13) | |
| XMG Pro 15 E23 | |
| Gigabyte G5 KF | |
| Intel NUC X15 LAPAC71H | |
| Baldur's Gate 3 - 1920x1080 Ultra Preset AA:T | |
| Média da turma Gaming (59.4 - 246, n=104, últimos 2 anos) | |
| XMG Pro 15 E23 | |
| Média NVIDIA GeForce RTX 4060 Laptop GPU (66.5 - 105.5, n=19) | |
| Gigabyte G5 KF | |
| Intel NUC X15 LAPAC71H | |
| Diablo 4 - 3840x2160 Ultra Preset | |
| XMG Pro 15 E23 | |
| Média NVIDIA GeForce RTX 4060 Laptop GPU (n=1) | |
| Lords of the Fallen - 1920x1080 Ultra Preset | |
| XMG Pro 15 E23 | |
| Intel NUC X15 LAPAC71H | |
| Média NVIDIA GeForce RTX 4060 Laptop GPU (32.8 - 38.1, n=3) | |
| Gigabyte G5 KF | |
Para verificar se o laptop consegue manter o desempenho por um período mais longo, executamos o "The Witcher 3" por cerca de 60 minutos em Full HD e configurações máximas. O personagem do jogador não foi movido durante esse tempo. As taxas de quadros permaneceram estáveis, mas observamos algumas pequenas quedas ocasionais (aprox. 10 FPS) no estágio final do teste.
Witcher 3 FPS chart
| baixo | média | alto | ultra | |
|---|---|---|---|---|
| GTA V (2015) | 183.5 | 178.3 | 171.5 | 107.6 |
| The Witcher 3 (2015) | 314.3 | 251.1 | 172.8 | 92.5 |
| Dota 2 Reborn (2015) | 158.6 | 146.6 | 137.55 | 131.2 |
| Final Fantasy XV Benchmark (2018) | 186.5 | 126 | 91.9 | |
| X-Plane 11.11 (2018) | 120.4 | 108 | 87.1 | |
| Far Cry 5 (2018) | 151 | 125 | 119 | 110 |
| Strange Brigade (2018) | 379 | 253 | 197.9 | 172.1 |
| Gears Tactics (2020) | 303.9 | 225.6 | 156.5 | 112.2 |
| Cyberpunk 2077 1.6 (2022) | 105.4 | 86.7 | 74.5 | 68.7 |
| Diablo 4 (2023) | 227 | 204 | 180.4 | 151 |
| F1 23 (2023) | 213 | 211 | 157.4 | 51.8 |
| Starfield (2023) | 71.2 | 61.4 | 47 | 39.8 |
| The Crew Motorfest (2023) | 60 | 60 | 60 | 60 |
| Lies of P (2023) | 159.4 | 138.5 | 126.9 | 106.2 |
| Baldur's Gate 3 (2023) | 113.1 | 93.2 | 78 | 75.1 |
| Cyberpunk 2077 (2023) | 105.9 | 91.1 | 78 | 70.5 |
| EA Sports FC 24 (2023) | 198.3 | 172.9 | 142.9 | 138 |
| Assassin's Creed Mirage (2023) | 120 | 115 | 106 | 83 |
| Lords of the Fallen (2023) | 80 | 64.7 | 46.7 | 32.8 |
Emissões - O notebook pode ser bastante barulhento
Emissões de ruído
Durante os jogos, o nível de ruído pode chegar a 55,5 dB(A) no "Performance mode". O senhor pode reduzir a quantidade de ruído mudando para o "Entertainment mode" (Modo de entretenimento) ou, melhor ainda, para o "Silent mode" (Modo silencioso). No uso diário (por exemplo, aplicativos de escritório e navegação na Internet), as duas ventoinhas geralmente giram em baixa velocidade e, ocasionalmente, podem ficar completamente paradas.
Barulho
| Ocioso |
| 23 / 23 / 28 dB |
| Carga |
| 29.94 / 55.5 dB |
 | ||
30 dB silencioso 40 dB(A) audível 50 dB(A) ruidosamente alto |
||
min: | ||
| Gigabyte G5 KF GeForce RTX 4060 Laptop GPU, i5-12500H, SSSTC CA6-8D512 | MSI Cyborg 15 A12VF GeForce RTX 4060 Laptop GPU, i7-12650H, Samsung PM9B1 1024GB MZVL41T0HBLB | Intel NUC X15 LAPAC71H A730M, i7-12700H, Samsung 990 Pro 1 TB | Asus TUF A15 FA507 GeForce RTX 4050 Laptop GPU, R7 7735HS, Micron 2400 MTFDKBA512QFM | Lenovo Legion Slim 5 16APH8 GeForce RTX 4060 Laptop GPU, R7 7840HS, SK hynix PC801 HFS512GEJ9X115N | Gigabyte G5 KE GeForce RTX 3060 Laptop GPU, i5-12500H, Gigabyte AG4512G-SI B10 | |
|---|---|---|---|---|---|---|
| Noise | -37% | -6% | 9% | -1% | -22% | |
| desligado / ambiente * (dB) | 23 | 27 -17% | 23 -0% | 23.3 -1% | 22.9 -0% | 19.52 15% |
| Idle Minimum * (dB) | 23 | 27 -17% | 23 -0% | 23.3 -1% | 23.1 -0% | 31.05 -35% |
| Idle Average * (dB) | 23 | 37.5 -63% | 24 -4% | 23.3 -1% | 23.1 -0% | 31.05 -35% |
| Idle Maximum * (dB) | 28 | 38 -36% | 24 14% | 23.3 17% | 27.7 1% | 31.05 -11% |
| Load Average * (dB) | 29.94 | 56.3 -88% | 50.61 -69% | 29.6 1% | 33.3 -11% | 55.66 -86% |
| Witcher 3 ultra * (dB) | 55.05 | 50.65 8% | 43 22% | 54 2% | 55.7 -1% | |
| Load Maximum * (dB) | 55.5 | 56.3 -1% | 50.89 8% | 43 23% | 54 3% | 55.51 -0% |
* ... menor é melhor
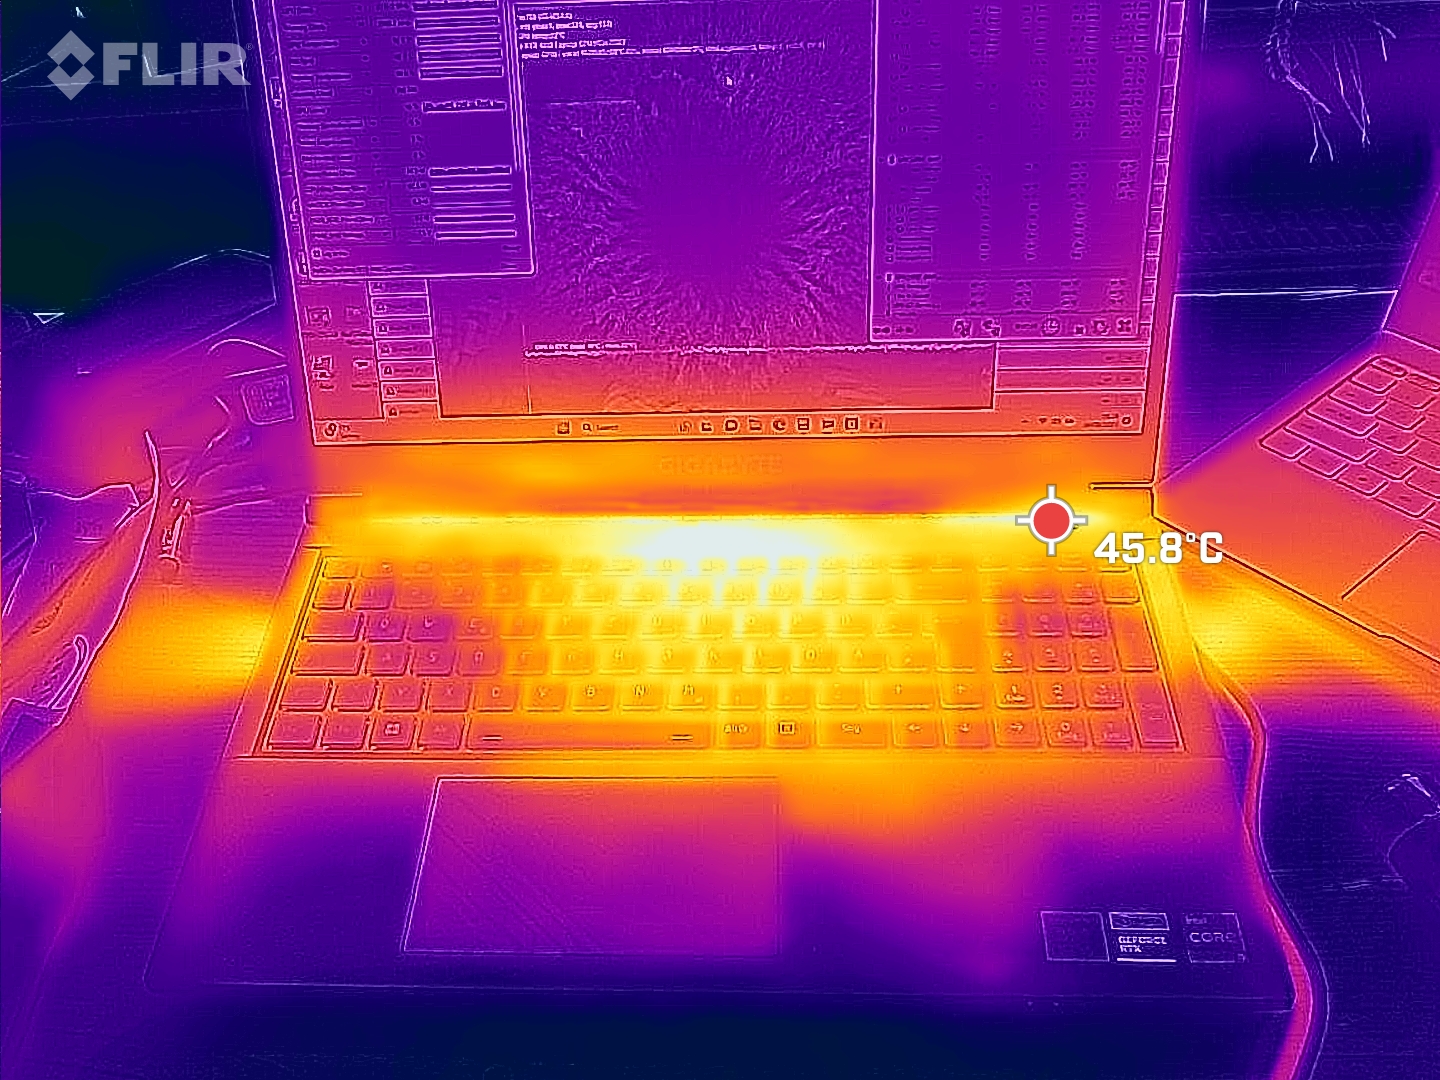
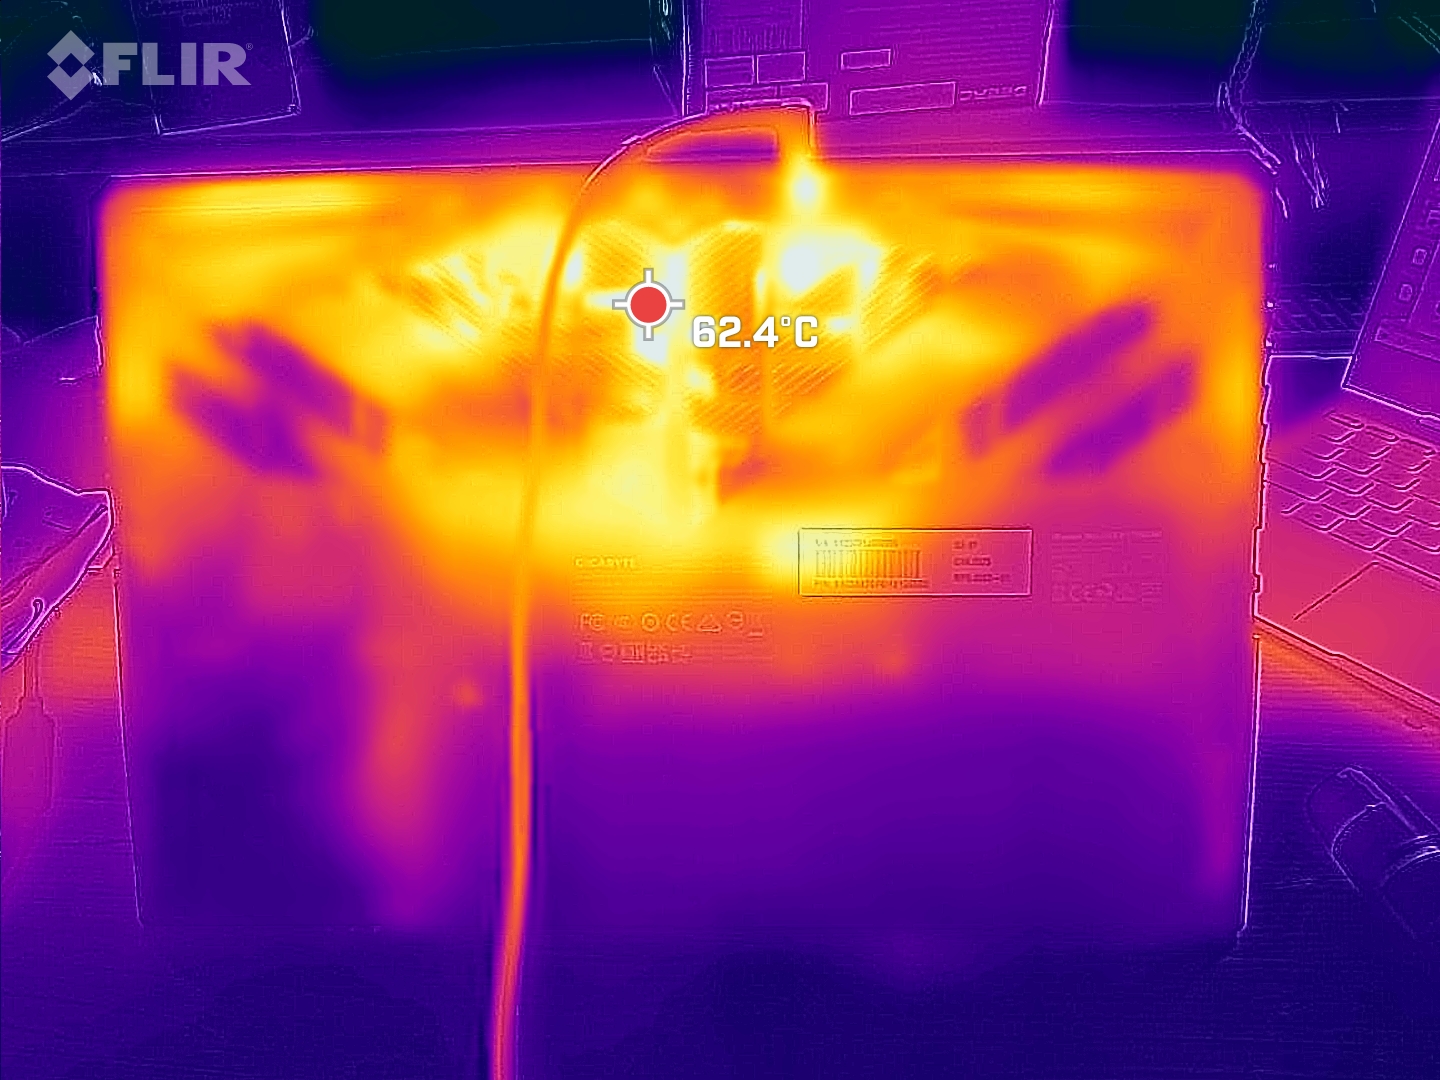
Temperatura
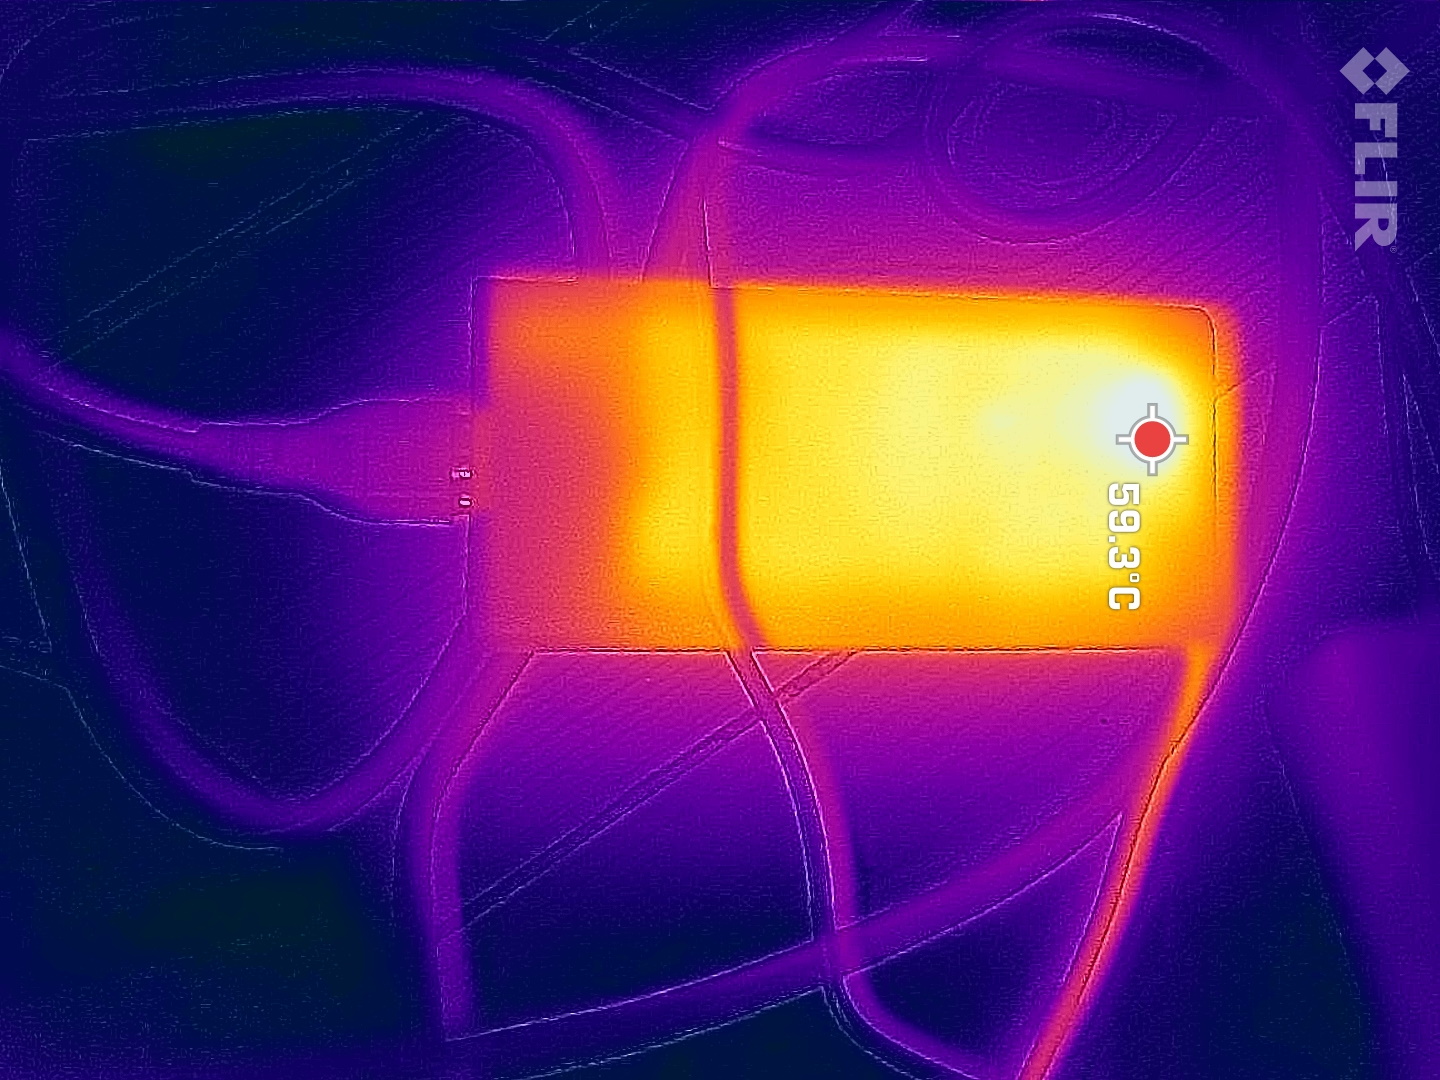
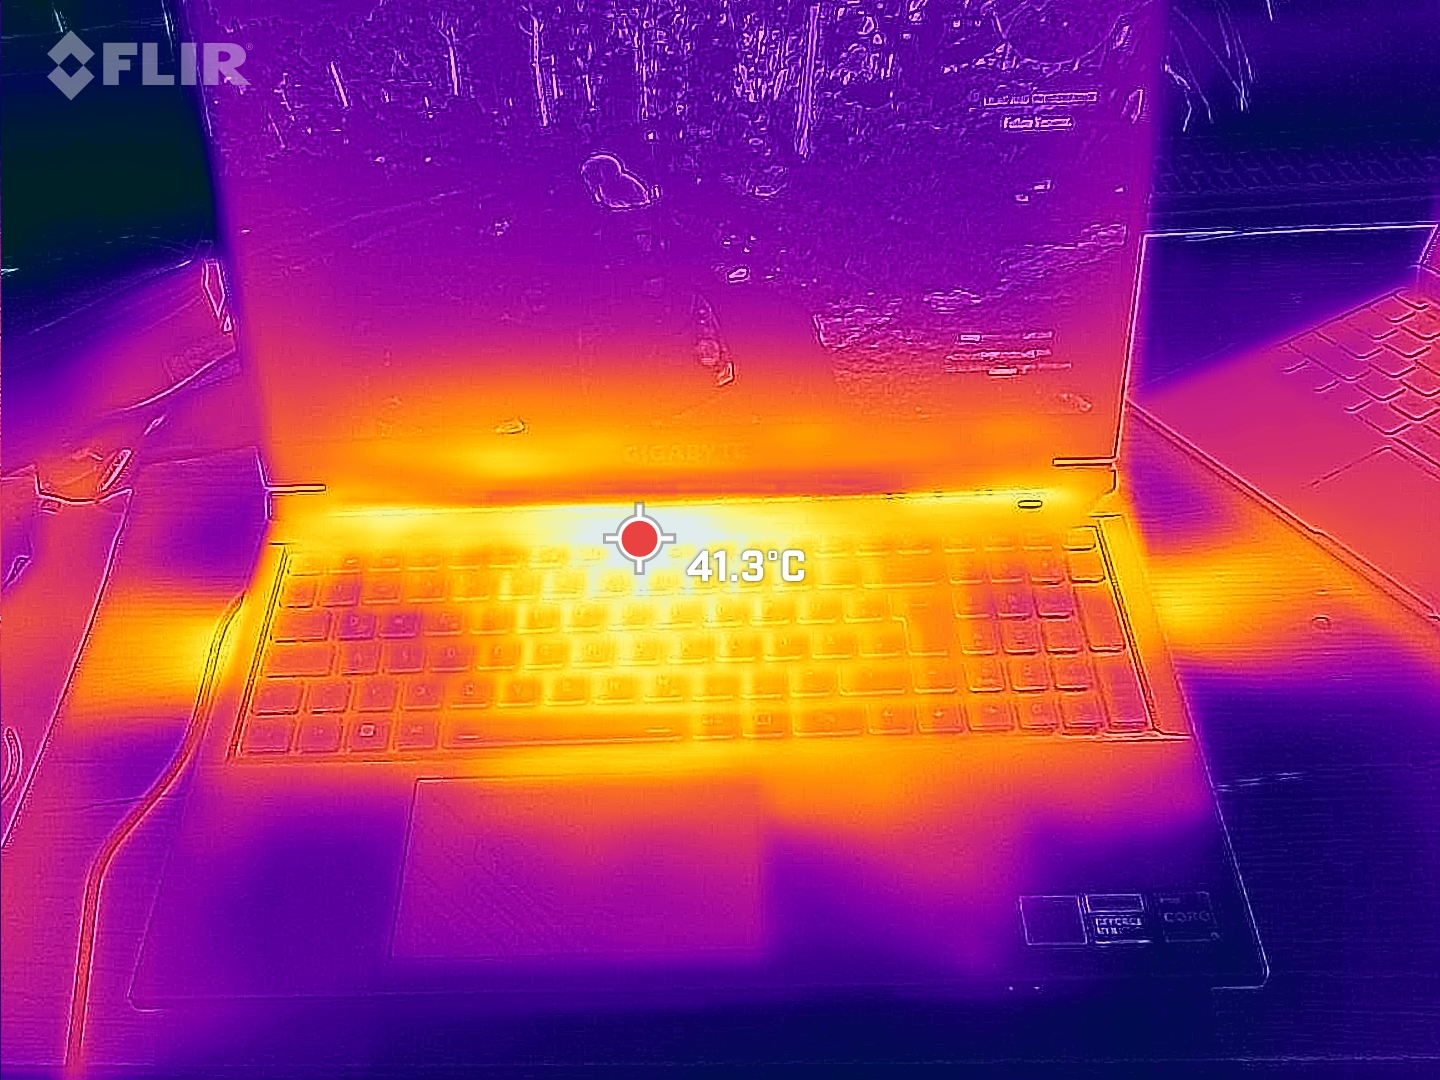
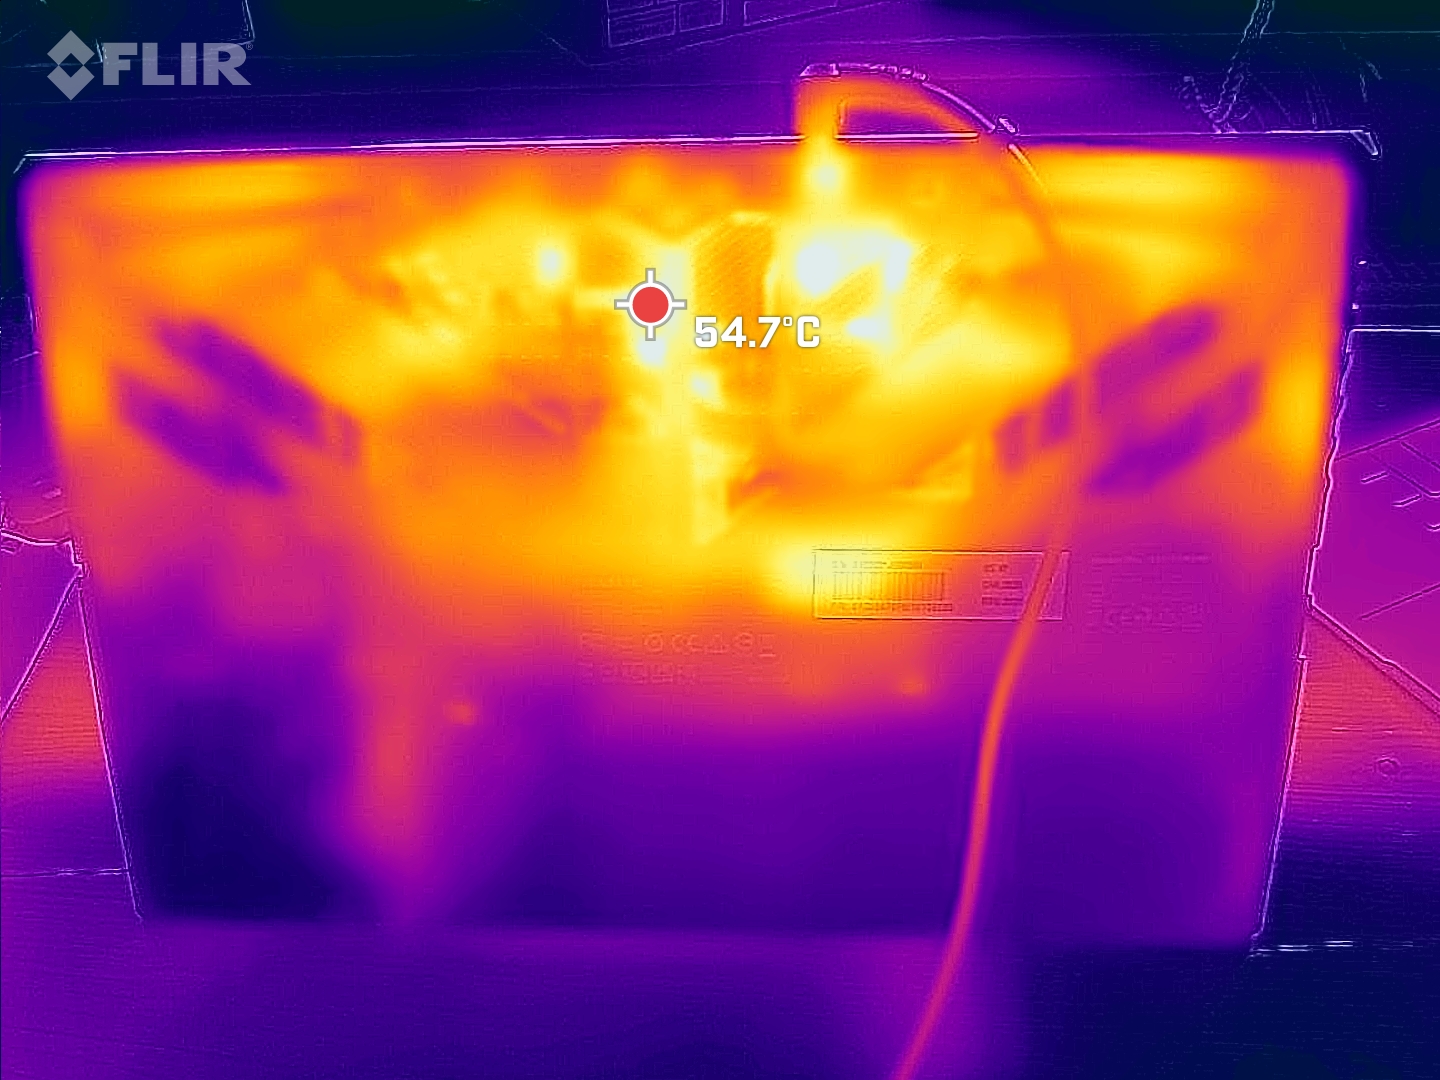
Alguns pontos da superfície do laptop ficam visivelmente quentes sob carga pesada (por exemplo, teste de estresse, teste Witcher 3 ). Por outro lado, as temperaturas do chassi são mais moderadas nos dispositivos concorrentes. Dito isso, as temperaturas da superfície do G5 KF são mantidas dentro de uma faixa aceitável no uso diário (por exemplo, aplicativos de escritório, navegação na Internet).
(-) A temperatura máxima no lado superior é 54 °C / 129 F, em comparação com a média de 40.4 °C / 105 F , variando de 21.2 a 68.8 °C para a classe Gaming.
(-) A parte inferior aquece até um máximo de 61 °C / 142 F, em comparação com a média de 43.2 °C / 110 F
(+) Em uso inativo, a temperatura média para o lado superior é 30.7 °C / 87 F, em comparação com a média do dispositivo de 33.9 °C / ### class_avg_f### F.
(±) Jogando The Witcher 3, a temperatura média para o lado superior é 37.3 °C / 99 F, em comparação com a média do dispositivo de 33.9 °C / ## #class_avg_f### F.
(+) Os apoios para as mãos e o touchpad estão atingindo a temperatura máxima da pele (34 °C / 93.2 F) e, portanto, não estão quentes.
(-) A temperatura média da área do apoio para as mãos de dispositivos semelhantes foi 28.8 °C / 83.8 F (-5.2 °C / -9.4 F).
| Gigabyte G5 KF Intel Core i5-12500H, NVIDIA GeForce RTX 4060 Laptop GPU | MSI Cyborg 15 A12VF Intel Core i7-12650H, NVIDIA GeForce RTX 4060 Laptop GPU | Intel NUC X15 LAPAC71H Intel Core i7-12700H, Intel Arc A730M | Asus TUF A15 FA507 AMD Ryzen 7 7735HS, NVIDIA GeForce RTX 4050 Laptop GPU | Lenovo Legion Slim 5 16APH8 AMD Ryzen 7 7840HS, NVIDIA GeForce RTX 4060 Laptop GPU | Gigabyte G5 KE Intel Core i5-12500H, NVIDIA GeForce RTX 3060 Laptop GPU | |
|---|---|---|---|---|---|---|
| Heat | 23% | 11% | 20% | 25% | 1% | |
| Maximum Upper Side * (°C) | 54 | 47.5 12% | 59 -9% | 48.9 9% | 40.6 25% | 52.6 3% |
| Maximum Bottom * (°C) | 61 | 35.5 42% | 51 16% | 44.6 27% | 42 31% | 62.4 -2% |
| Idle Upper Side * (°C) | 34 | 27.7 19% | 28 18% | 27.1 20% | 27.8 18% | 33.6 1% |
| Idle Bottom * (°C) | 36 | 29.5 18% | 30 17% | 27.5 24% | 26.6 26% | 34.8 3% |
* ... menor é melhor
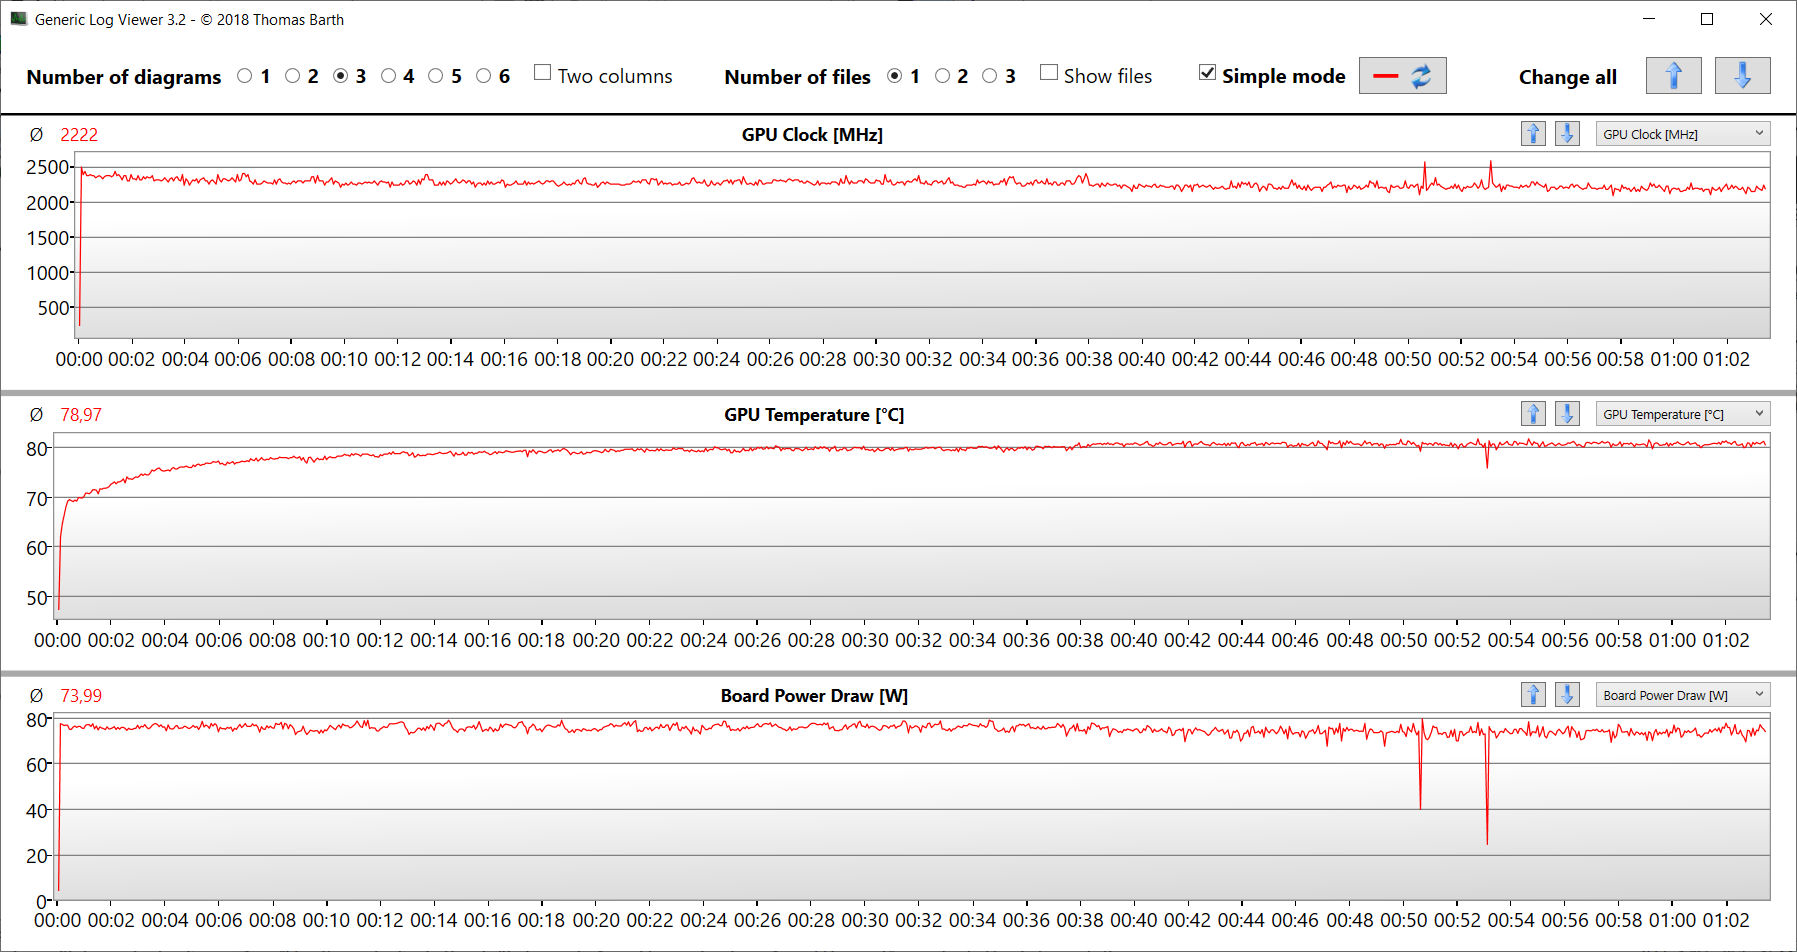
Teste de estresse
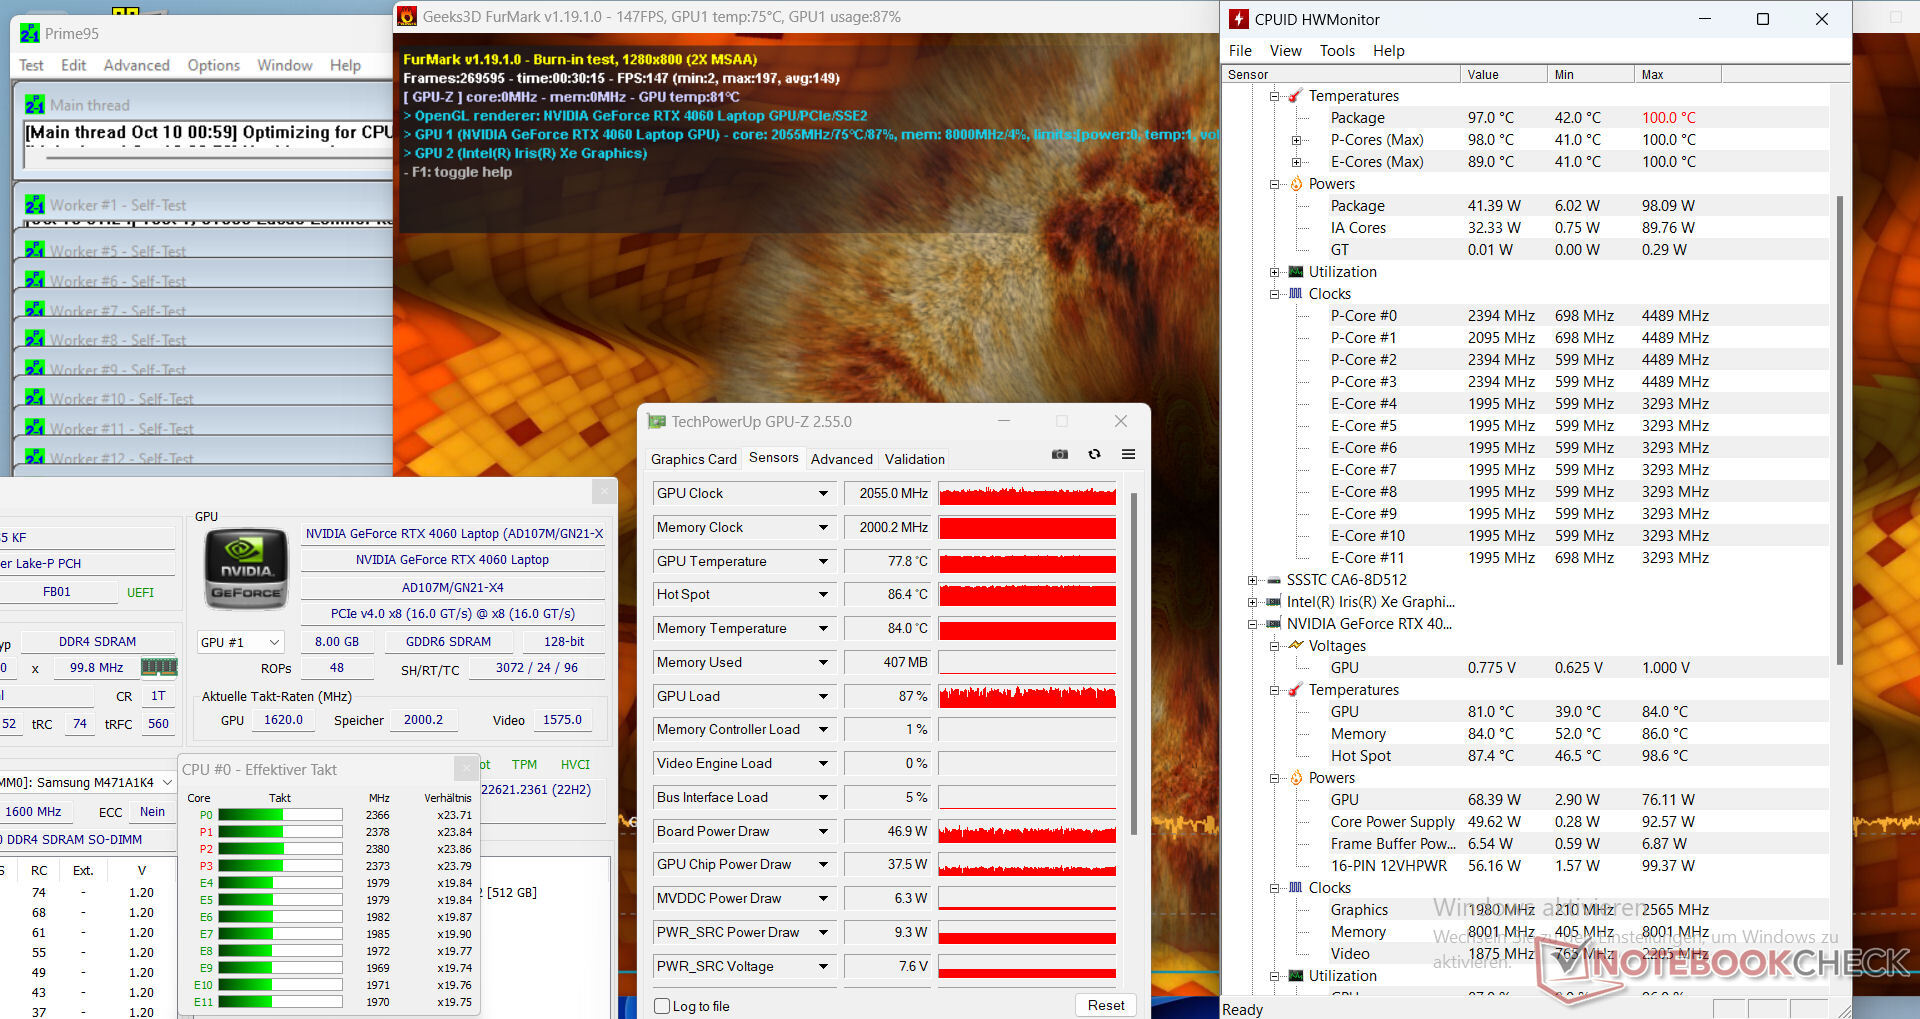
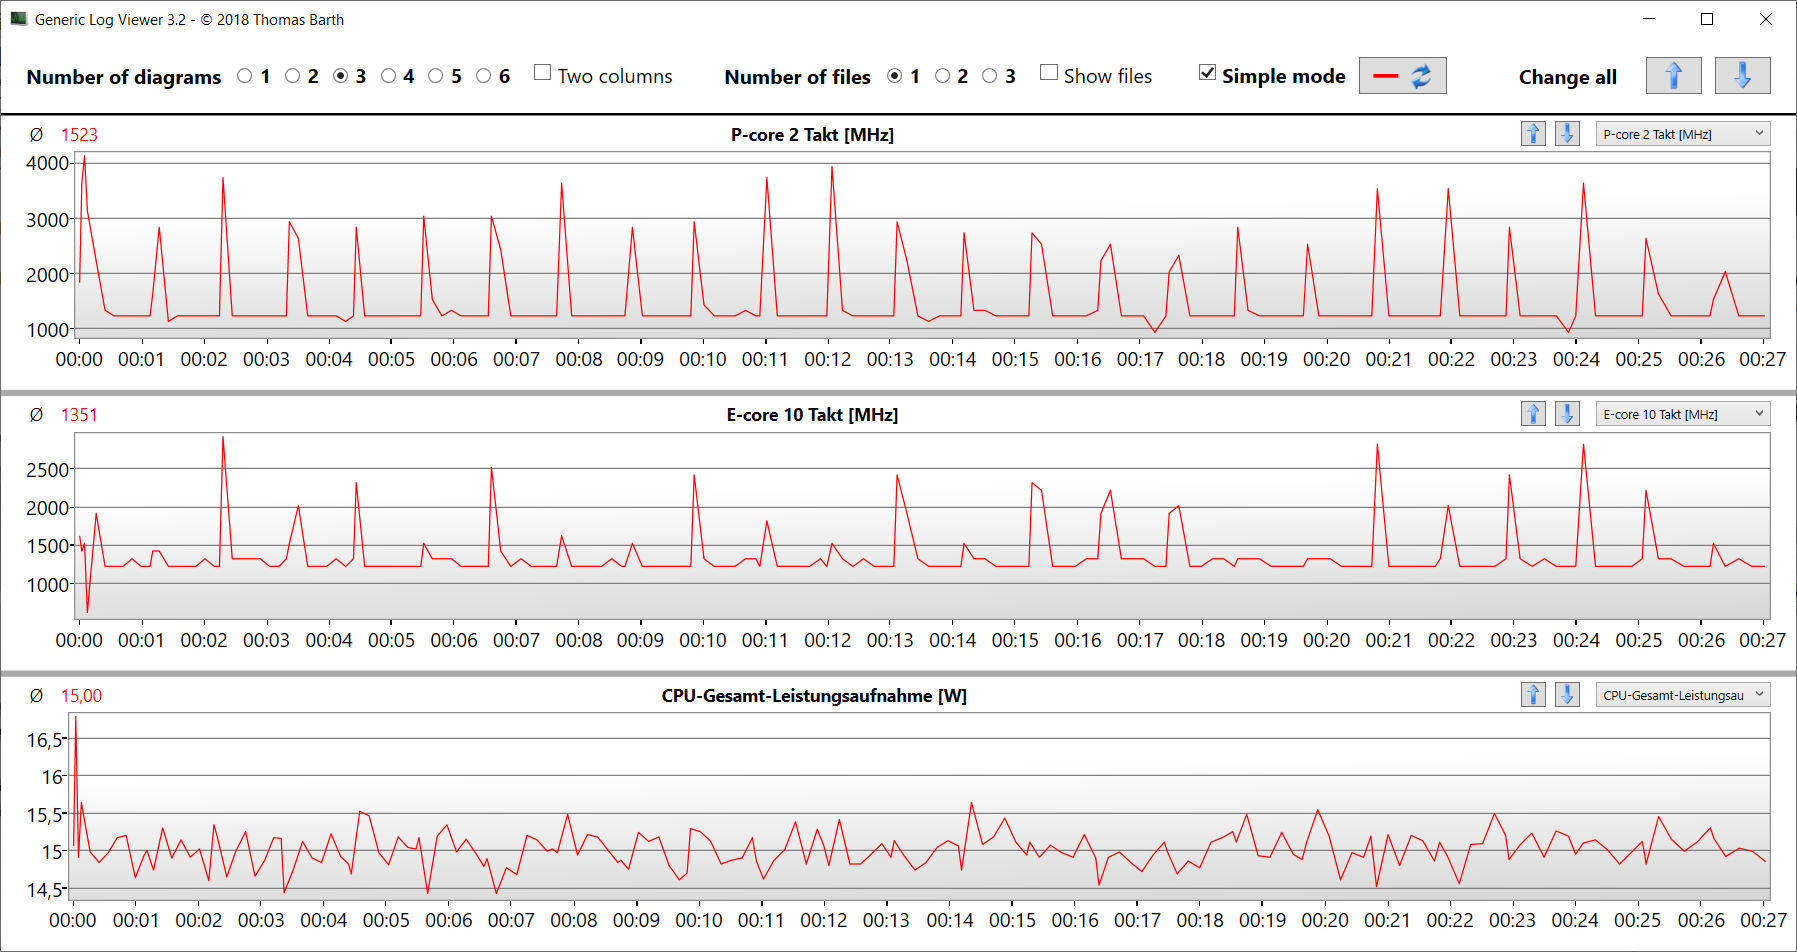
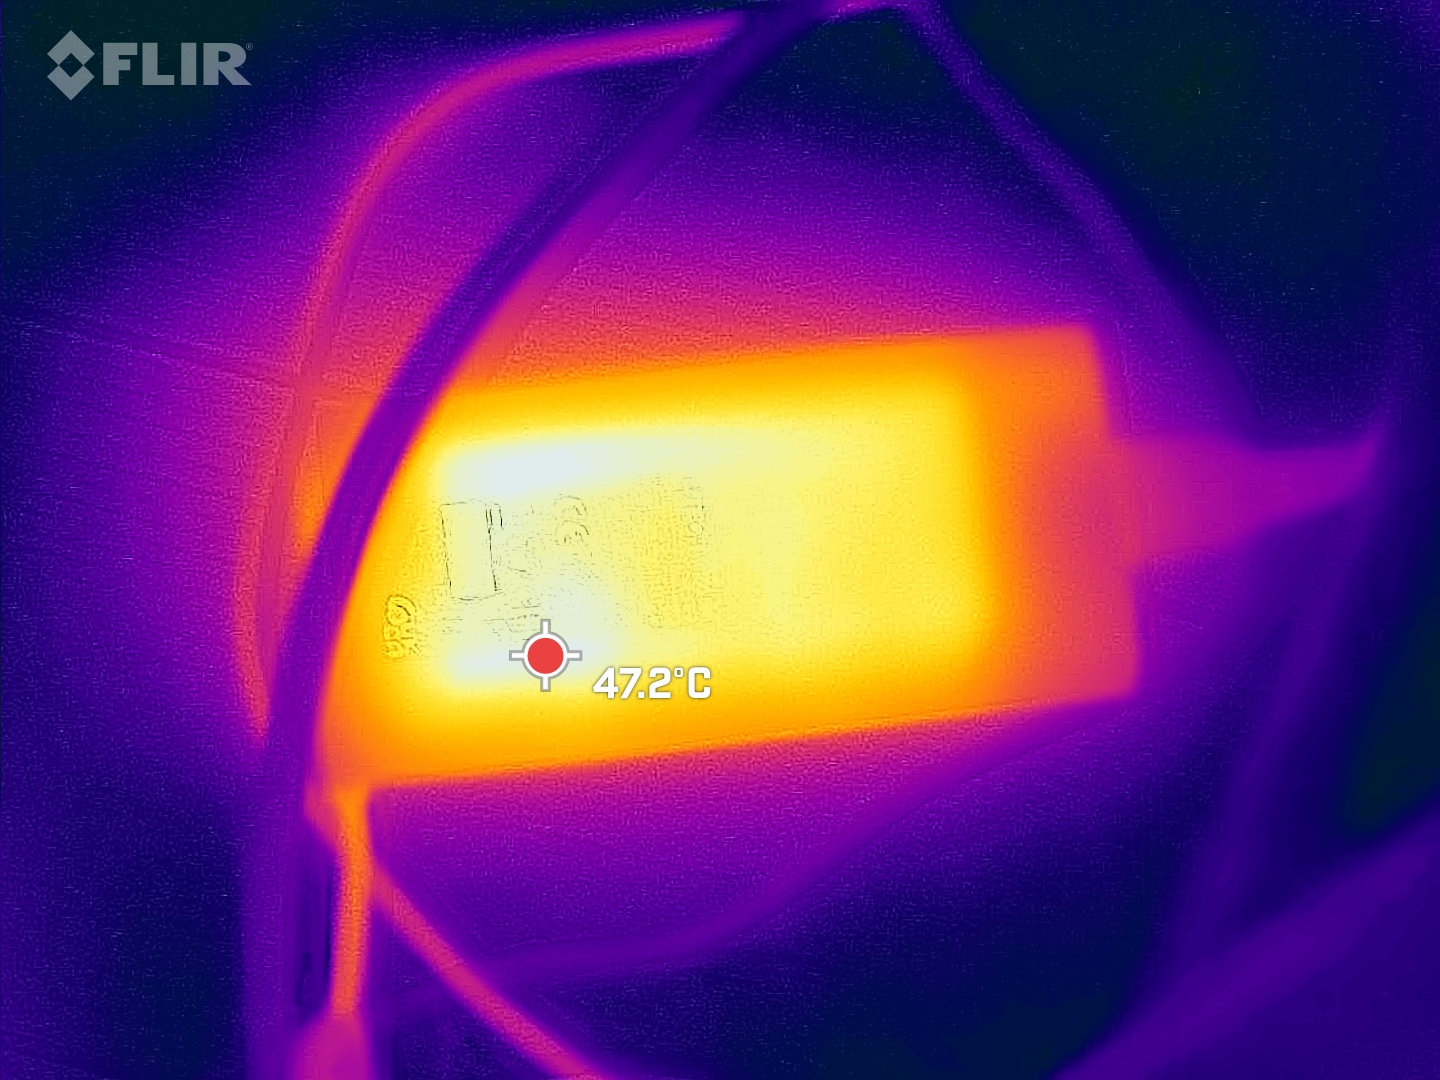
Nosso teste de estresse (executando o Prime95 e o FurMark por um período prolongado) representa um cenário extremo projetado para determinar a estabilidade do sistema em carga total. Depois de começar com altas velocidades de clock, a CPU e a GPU começaram a ficar mais lentas com o decorrer do teste. Cerca de 30 minutos depois, a CPU estava operando aproximadamente em seu clock base, enquanto a GPU estava atingindo cerca de 2 GHz.
O adaptador de energia foi desligado 49 minutos após o início do teste de estresse, com a temperatura da superfície subindo para 68°C (154,4°F). Em um período prolongado, a quantidade de energia exigida pelo hardware parece exceder o que o adaptador de 150 watts pode fornecer. Em casos de uso "típicos" (por exemplo, jogos, aplicativos de escritório), no entanto, não esperamos que a fonte de alimentação se desligue sozinha. O teste de estresse simula uma situação que raramente acontece na vida real (ou seja, a CPU e a GPU funcionando simultaneamente na capacidade máxima).
Alto-falantes
Os alto-falantes estéreo têm um som decente, mas quase não têm graves.
Gigabyte G5 KF análise de áudio
(±) | o volume do alto-falante é médio, mas bom (###valor### dB)
Graves 100 - 315Hz
(-) | quase nenhum baixo - em média 15.6% menor que a mediana
(+) | o baixo é linear (1.7% delta para a frequência anterior)
Médios 400 - 2.000 Hz
(±) | médios mais altos - em média 9.7% maior que a mediana
(±) | a linearidade dos médios é média (10.4% delta para frequência anterior)
Altos 2 - 16 kHz
(+) | agudos equilibrados - apenas 3.2% longe da mediana
(+) | os máximos são lineares (6.9% delta da frequência anterior)
Geral 100 - 16.000 Hz
(±) | a linearidade do som geral é média (22.7% diferença em relação à mediana)
Comparado com a mesma classe
» 82% de todos os dispositivos testados nesta classe foram melhores, 5% semelhantes, 13% piores
» O melhor teve um delta de 6%, a média foi 18%, o pior foi 132%
Comparado com todos os dispositivos testados
» 67% de todos os dispositivos testados foram melhores, 6% semelhantes, 27% piores
» O melhor teve um delta de 4%, a média foi 23%, o pior foi 134%
Asus TUF A15 FA507 análise de áudio
(±) | o volume do alto-falante é médio, mas bom (###valor### dB)
Graves 100 - 315Hz
(±) | graves reduzidos - em média 13.7% menor que a mediana
(+) | o baixo é linear (6.2% delta para a frequência anterior)
Médios 400 - 2.000 Hz
(±) | médios mais altos - em média 7.6% maior que a mediana
(±) | a linearidade dos médios é média (7.3% delta para frequência anterior)
Altos 2 - 16 kHz
(+) | agudos equilibrados - apenas 2.1% longe da mediana
(±) | a linearidade dos máximos é média (7.5% delta para frequência anterior)
Geral 100 - 16.000 Hz
(±) | a linearidade do som geral é média (17.2% diferença em relação à mediana)
Comparado com a mesma classe
» 47% de todos os dispositivos testados nesta classe foram melhores, 11% semelhantes, 42% piores
» O melhor teve um delta de 6%, a média foi 18%, o pior foi 132%
Comparado com todos os dispositivos testados
» 32% de todos os dispositivos testados foram melhores, 8% semelhantes, 60% piores
» O melhor teve um delta de 4%, a média foi 23%, o pior foi 134%
Gerenciamento de energia - O G5 não surpreenderá o senhor com sua resistência
Consumo de energia
Durante todo o nosso teste Witcher 3, o uso de energia do laptop se manteve em um nível estável, que é tão alto quanto o esperado. No entanto, o requisito de energia flutuou durante o teste de estresse; o G5 KF consumiu consistentemente mais energia do que a capacidade do carregador (150 watts). Como resultado, o adaptador se desligou sozinho após cerca de 50 minutos. A fonte de alimentação não parece ter muita margem de manobra. O modelo de 180 watts fornecido com o G5 KE teria sido uma escolha melhor nesse caso.
| desligado | |
| Ocioso | |
| Carga |
|
Key:
min: | |
| Gigabyte G5 KF i5-12500H, GeForce RTX 4060 Laptop GPU, SSSTC CA6-8D512, IPS, 1920x1080, 15.6" | MSI Cyborg 15 A12VF i7-12650H, GeForce RTX 4060 Laptop GPU, Samsung PM9B1 1024GB MZVL41T0HBLB, IPS, 1920x1080, 15.6" | Intel NUC X15 LAPAC71H i7-12700H, A730M, Samsung 990 Pro 1 TB, IPS, 1920x1080, 15.6" | Asus TUF A15 FA507 R7 7735HS, GeForce RTX 4050 Laptop GPU, Micron 2400 MTFDKBA512QFM, IPS, 1920x1080, 15.6" | Lenovo Legion Slim 5 16APH8 R7 7840HS, GeForce RTX 4060 Laptop GPU, SK hynix PC801 HFS512GEJ9X115N, IPS, 2560x1600, 16" | Gigabyte G5 KE i5-12500H, GeForce RTX 3060 Laptop GPU, Gigabyte AG4512G-SI B10, IPS, 1920x1080, 15.6" | Média NVIDIA GeForce RTX 4060 Laptop GPU | Média da turma Gaming | |
|---|---|---|---|---|---|---|---|---|
| Power Consumption | 13% | -30% | -7% | -27% | -27% | -44% | -71% | |
| Idle Minimum * (Watt) | 7 | 6 14% | 7.5 -7% | 8 -14% | 9.4 -34% | 7.66 -9% | 11.5 ? -64% | 13 ? -86% |
| Idle Average * (Watt) | 10.2 | 8.8 14% | 11.9 -17% | 12.1 -19% | 15.5 -52% | 10.3 -1% | 16 ? -57% | 19 ? -86% |
| Idle Maximum * (Watt) | 16.1 | 11.9 26% | 13.9 14% | 12.5 22% | 24.4 -52% | 16.05 -0% | 20.3 ? -26% | 24.6 ? -53% |
| Load Average * (Watt) | 59.3 | 89 -50% | 137 -131% | 74.9 -26% | 74.1 -25% | 115.8 -95% | 92.9 ? -57% | 110.7 ? -87% |
| Witcher 3 ultra * (Watt) | 129 | 90.3 30% | 166 -29% | 136.6 -6% | 112.9 12% | 168.7 -31% | ||
| Load Maximum * (Watt) | 183 | 99 46% | 203 -11% | 185 -1% | 206.5 -13% | 234.6 -28% | 210 ? -15% | 259 ? -42% |
* ... menor é melhor
Energieaufnahme Witcher 3 / Stresstest
Power consumption with external monitor
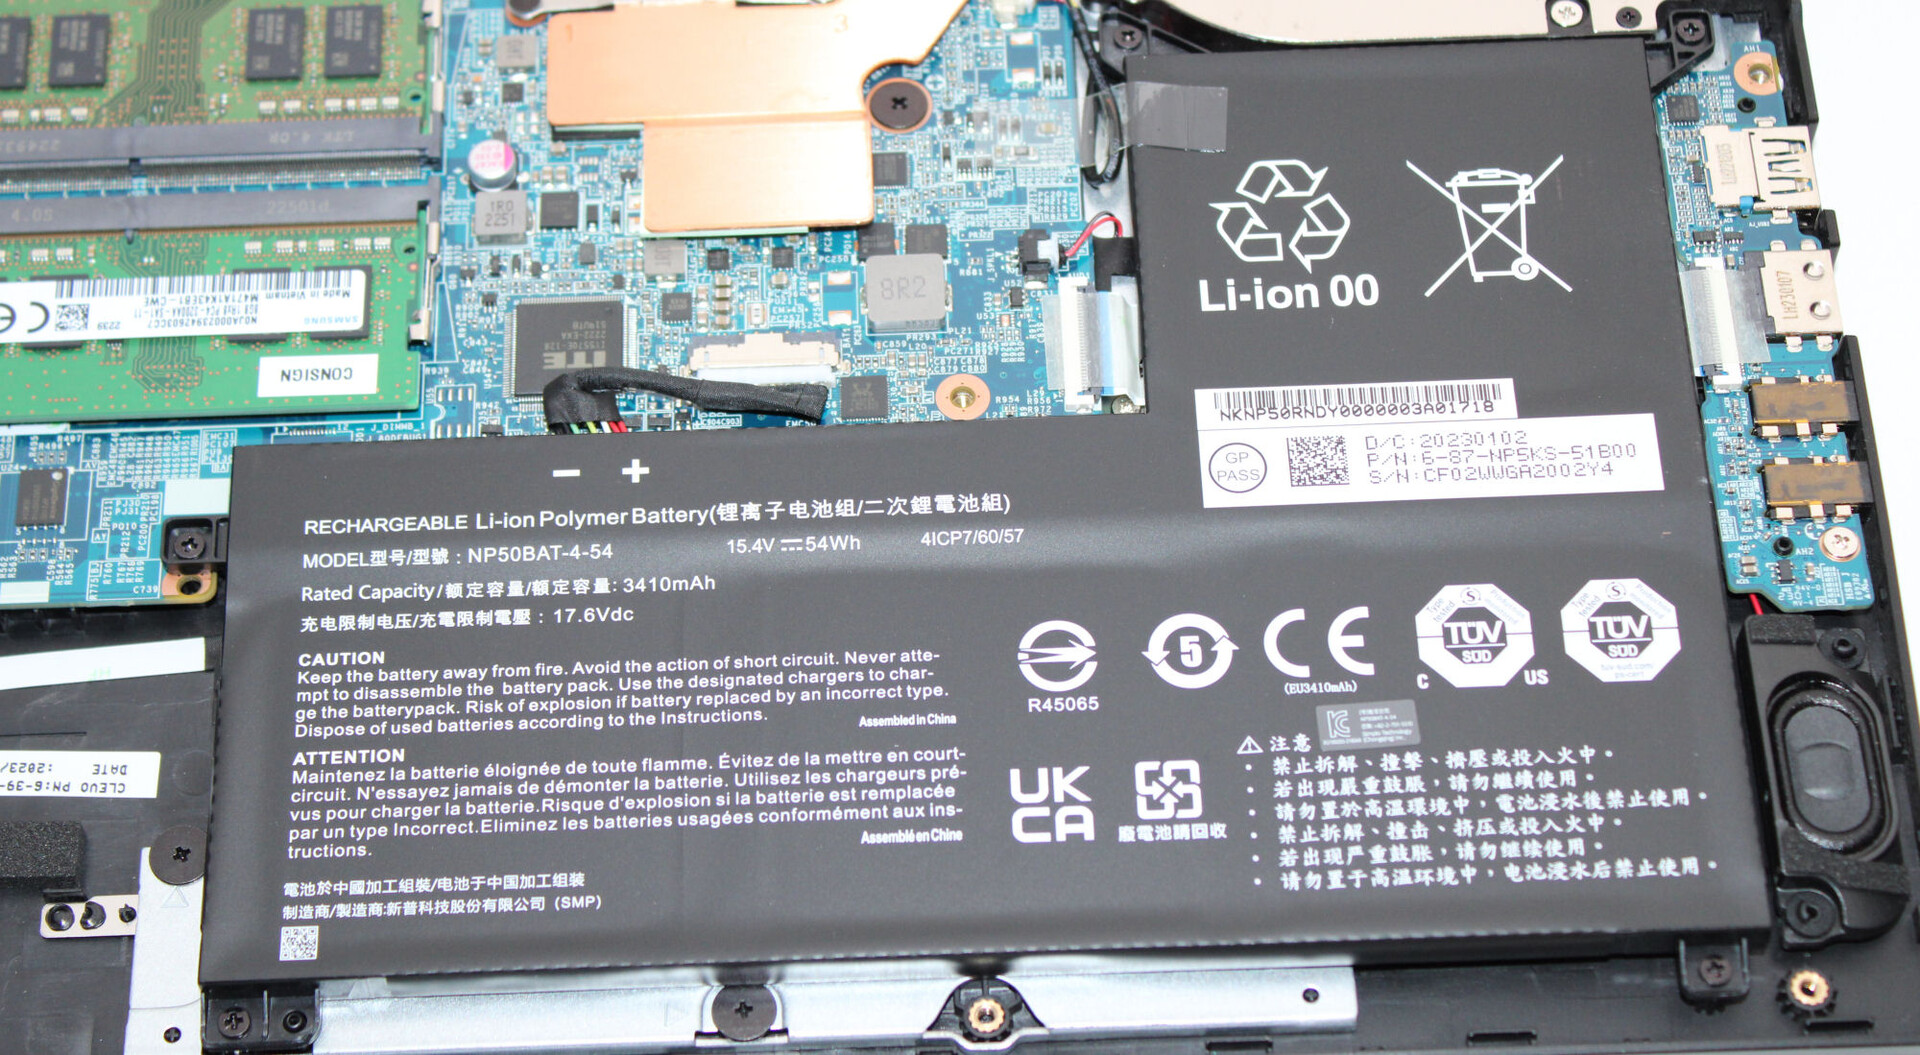
Duração da bateria
O dispositivo de 15,6 polegadas durou 5h 16min e 4h 28min, respectivamente, em nosso teste de Wi-Fi (acessando sites usando um script) e teste de vídeo (reproduzindo o curta-metragem Big Buck Bunny em loop, em FHD e codificado no formato H.264). Durante os testes, o brilho da tela foi definido para cerca de 150 cd/m² e os módulos sem fio foram desativados.
Em termos de duração da bateria, o G5 não teve um bom desempenho em comparação direta com um concorrente como o MSI Cyborg. O laptop MSI pode durar consideravelmente mais do que o G5, embora tenham especificações de hardware comparáveis e capacidade de bateria quase idêntica.
| Gigabyte G5 KF i5-12500H, GeForce RTX 4060 Laptop GPU, 54 Wh | MSI Cyborg 15 A12VF i7-12650H, GeForce RTX 4060 Laptop GPU, 53.5 Wh | Intel NUC X15 LAPAC71H i7-12700H, A730M, 62.3 Wh | Asus TUF A15 FA507 R7 7735HS, GeForce RTX 4050 Laptop GPU, 90 Wh | Lenovo Legion Slim 5 16APH8 R7 7840HS, GeForce RTX 4060 Laptop GPU, 80 Wh | Gigabyte G5 KE i5-12500H, GeForce RTX 3060 Laptop GPU, 54 Wh | Média da turma Gaming | |
|---|---|---|---|---|---|---|---|
| Duração da bateria | 56% | 8% | 87% | 15% | -27% | 27% | |
| Reader / Idle (h) | 8.6 | 13.6 58% | 11.7 36% | 8.27 ? -4% | |||
| H.264 (h) | 4.5 | 8 78% | 12.5 178% | 2.2 -51% | 8.32 ? 85% | ||
| WiFi v1.3 (h) | 5.3 | 7.5 42% | 5.7 8% | 11.7 121% | 7.1 34% | 5.7 8% | 7.11 ? 34% |
| Load (h) | 1.6 | 2.3 44% | 1 -37% | 1.2 -25% | 1 -37% | 1.502 ? -6% | |
| Witcher 3 ultra (h) | 1.3 |
Pro
Contra
Veredicto - Oferta sólida com muito potencial de otimização

Apesar de ter uma GPU mais nova e teoricamente mais potente, o G5 KF "só" consegue oferecer aproximadamente o mesmo desempenho em jogos que o seu antecessorembora consuma muito menos energia. A mais eficiente RTX 4060 (75 W), mais eficiente, opera em um TGP mais baixo do que a RTX 3060 (115 W) no G5 KE. Com o mesmo TGP, o G5 KF tem um desempenho melhor do que o KE.
A Gigabyte entregou um laptop para jogos FHD econômico com o G5 KF. Mas os usuários terão que lidar com uma série de falhas.
O laptop fica visivelmente quente sob carga em algumas áreas e também produz bastante ruído. O senhor pode atenuar o problema do ruído usando os perfis de desempenho fornecidos, mas o desempenho será prejudicado. Infelizmente, o adaptador de energia reduzido (150 watts em vez de 180 watts) não é capaz de lidar com todos os tipos de situações de carga (por exemplo, testes de estresse).
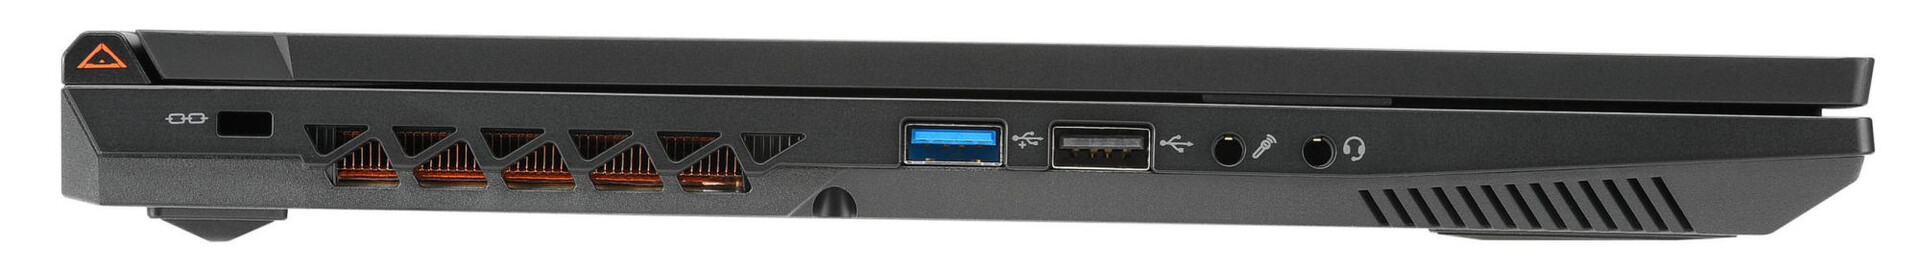
A quantidade de armazenamento integrado (512 GB) parece insignificante para um notebook para jogos. Em termos realistas, o sistema pode durar de 4 a 5,5 horas com uma única carga, o que não vai surpreender ninguém. Além disso, a porta Thunderbolt 4 do G5 KE deu lugar a uma porta USB 3.2 Gen 2. A tela Full HD fosca (15,6 polegadas, IPS, 144 Hz) também não ganhará nenhum prêmio: a cobertura de cores, o brilho e o contraste não estão à altura do padrão. O preço relativamente baixo do laptop também se deve ao fato de que uma licença do Windows não está incluída no sistema.
O Asus TUF A15 FA507 é uma alternativa ao G5 KF. Apesar de ter uma GPU mais fraca no papel, o desempenho gráfico é apenas ligeiramente inferior ao do G5. O A15 também oferece melhor desempenho da CPU, vida útil da bateria significativamente mais longa e uma porta USB4. O TUF A15 pode ser adquirido por €1.099 (cerca de US$1.165) agora mesmo com o Windows 11 incluído.
Preço e disponibilidade
O Gigabyte G5 KF custará cerca de €984 (US$950) em Amazon.de ou Amazon.com. Observe que o modelo na Amazon dos EUA tem apenas 8 GB de RAM, mas vem com o Windows 11. Os preços também podem variar com o tempo. Para quem tem um orçamento limitado, é possível considerar os modelos de especificações mais baixas G5 MF (RTX 4050, 8 GB de RAM) e o G5 GE (RTX 3050, 8 GB de RAM), ambos com o mesmo design físico.
Gigabyte G5 KF
- 10/18/2023 v7 (old)
Sascha Mölck
Transparência
A seleção dos dispositivos a serem analisados é feita pela nossa equipe editorial. A amostra de teste foi fornecida ao autor como empréstimo pelo fabricante ou varejista para fins desta revisão. O credor não teve influência nesta revisão, nem o fabricante recebeu uma cópia desta revisão antes da publicação. Não houve obrigação de publicar esta revisão. Como empresa de mídia independente, a Notebookcheck não está sujeita à autoridade de fabricantes, varejistas ou editores.
É assim que o Notebookcheck está testando
Todos os anos, o Notebookcheck analisa de forma independente centenas de laptops e smartphones usando procedimentos padronizados para garantir que todos os resultados sejam comparáveis. Desenvolvemos continuamente nossos métodos de teste há cerca de 20 anos e definimos padrões da indústria no processo. Em nossos laboratórios de teste, equipamentos de medição de alta qualidade são utilizados por técnicos e editores experientes. Esses testes envolvem um processo de validação em vários estágios. Nosso complexo sistema de classificação é baseado em centenas de medições e benchmarks bem fundamentados, o que mantém a objetividade.Price comparison

