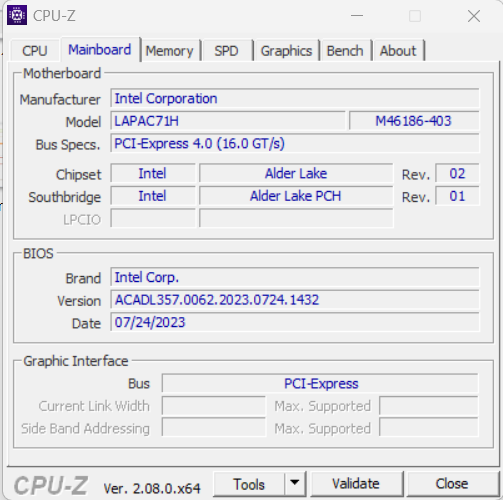
Análise do Intel NUC X15 LAPAC71H: O laptop multimídia com um Intel Arc A730M a partir de US$ 1.050
Depois de ser anunciado para o outono de 2022, o Intel NUC X15 - um laptop para gamers e criadores - finalmente vê a luz do dia um ano depois. Isso deve ser principalmente um caso de se livrar de mercadorias: O X15, assim como a série NUC como um todo, já foi descontinuado pela Intel. O laptop distribuído pela Schenker tem o Core i7-12700H, Arc A730Me o painel FHD são definidos, enquanto a RAM e o(s) SSD(s) podem ser selecionados.
Os concorrentes incluem dispositivos como o Asus TUF A15 FA507, Gigabyte G5 KE, MSI Cyborg 15 A12VF, Dell Inspiron 16 Plus 7630 e o Asus VivoBook Pro 16.
Possíveis concorrentes em comparação
Avaliação | Data | Modelo | Peso | Altura | Size | Resolução | Preço |
|---|---|---|---|---|---|---|---|
| 84.4 % v7 (old) | 10/2023 | Intel NUC X15 LAPAC71H i7-12700H, A730M | 2.2 kg | 26.7 mm | 15.60" | 1920x1080 | |
| 86.3 % v7 (old) | 06/2023 | Asus TUF A15 FA507 R7 7735HS, GeForce RTX 4050 Laptop GPU | 2.2 kg | 24.9 mm | 15.60" | 1920x1080 | |
| 81.8 % v7 (old) | 04/2023 | Gigabyte G5 KE i5-12500H, GeForce RTX 3060 Laptop GPU | 2 kg | 23.9 mm | 15.60" | 1920x1080 | |
| 87.1 % v7 (old) | 08/2023 | Dell Inspiron 16 Plus 7630 i7-13700H, GeForce RTX 4060 Laptop GPU | 2.2 kg | 19.95 mm | 16.00" | 2560x1600 | |
| 86.3 % v7 (old) | 05/2023 | Asus VivoBook Pro 16 i7-12700H, GeForce RTX 3050 Ti Laptop GPU | 1.9 kg | 20 mm | 16.00" | 2560x1600 | |
| 82.4 % v7 (old) | 04/2023 | MSI Cyborg 15 A12VF i7-12650H, GeForce RTX 4060 Laptop GPU | 2 kg | 22.9 mm | 15.60" | 1920x1080 |
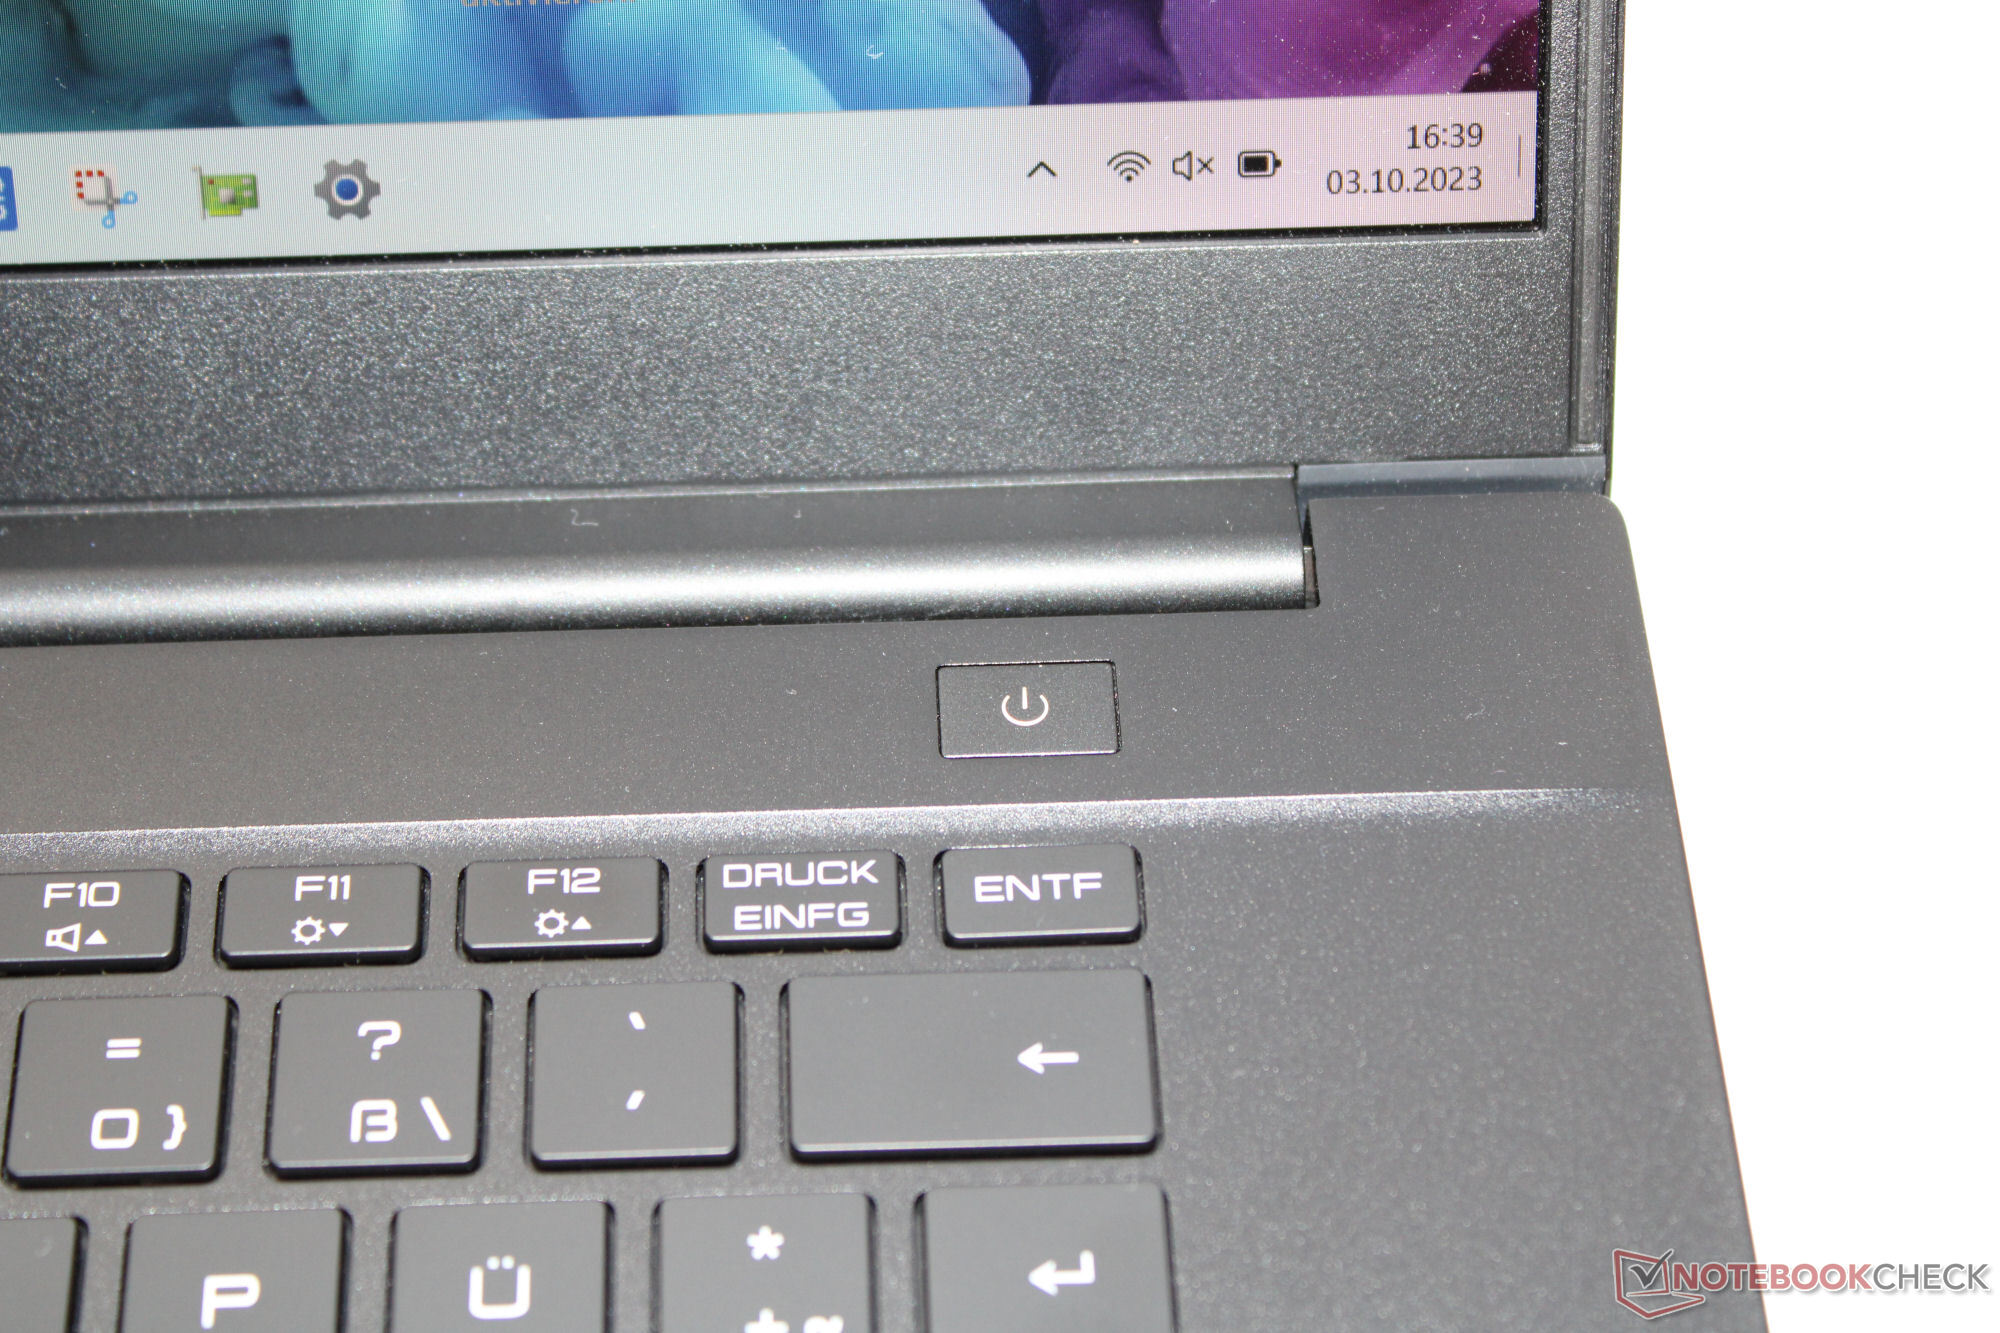
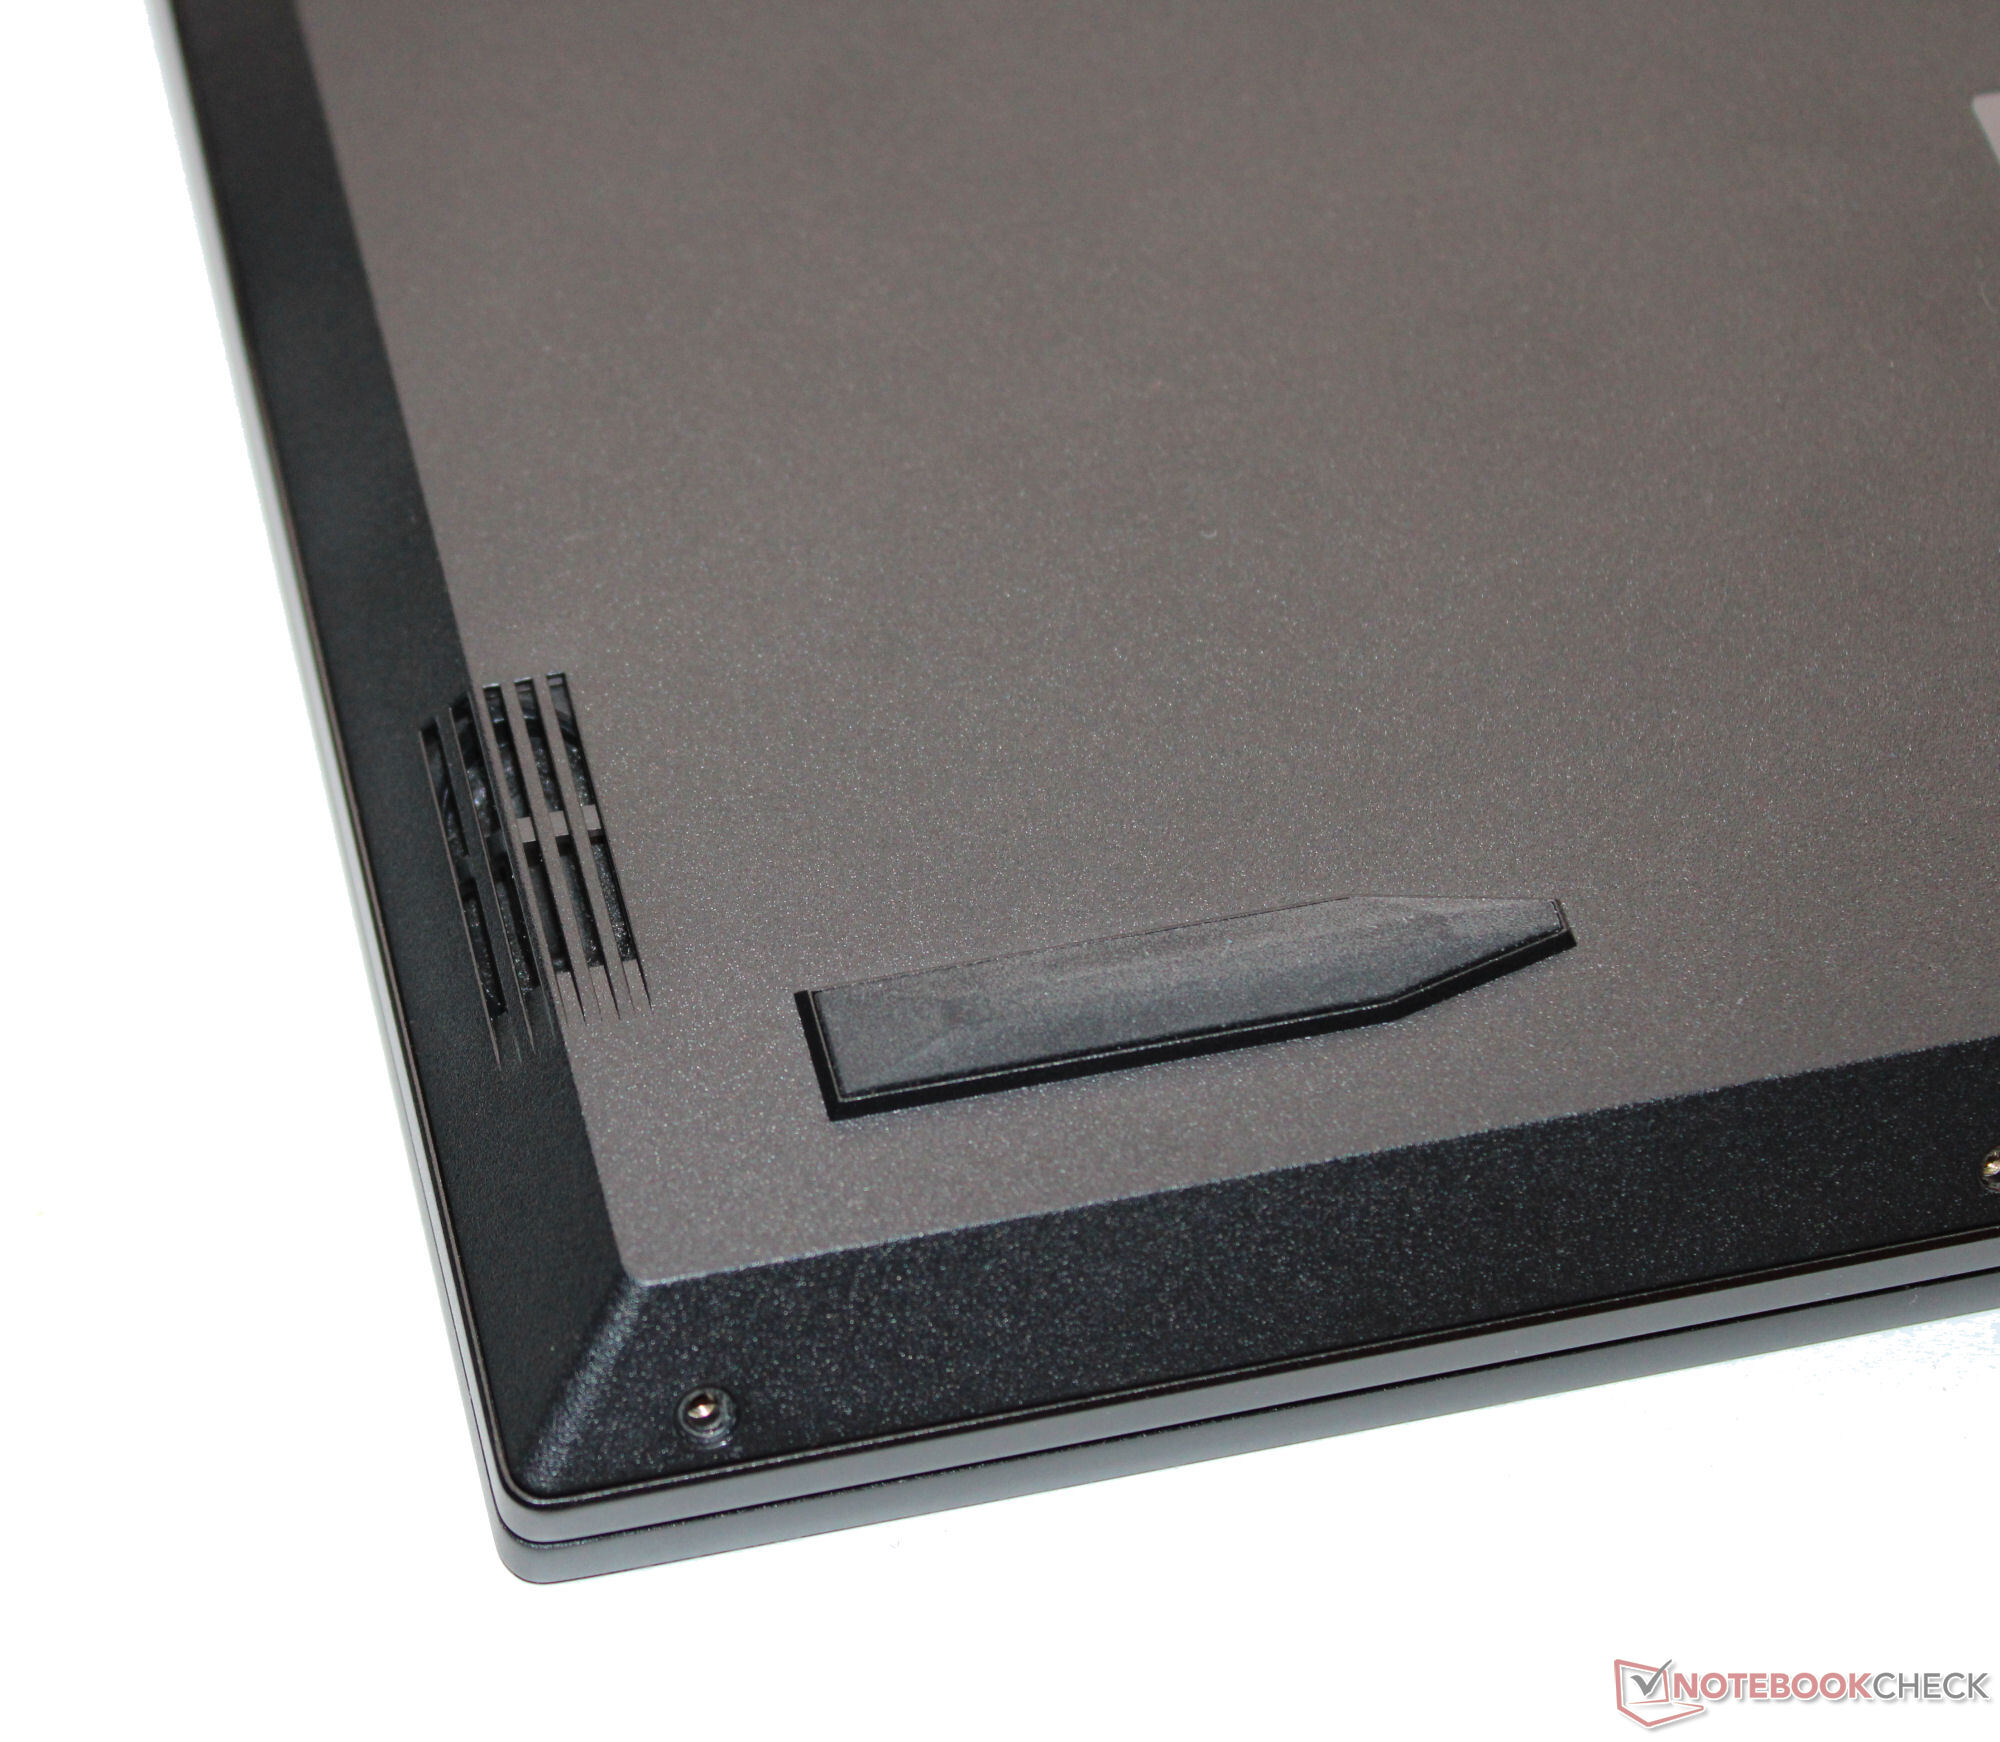
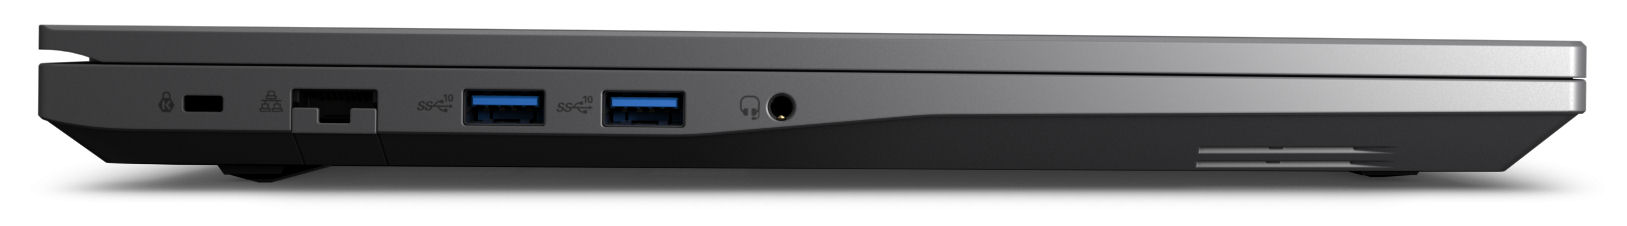
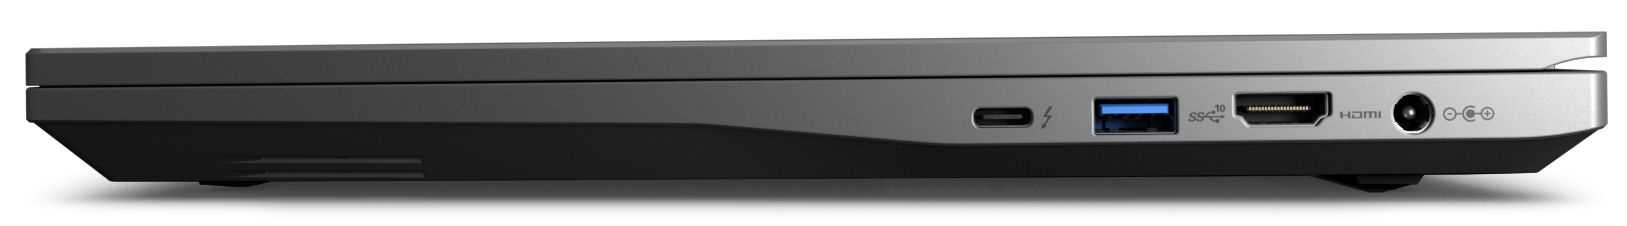
Case e conectividade - O Intel NUC possui Thunderbolt 4
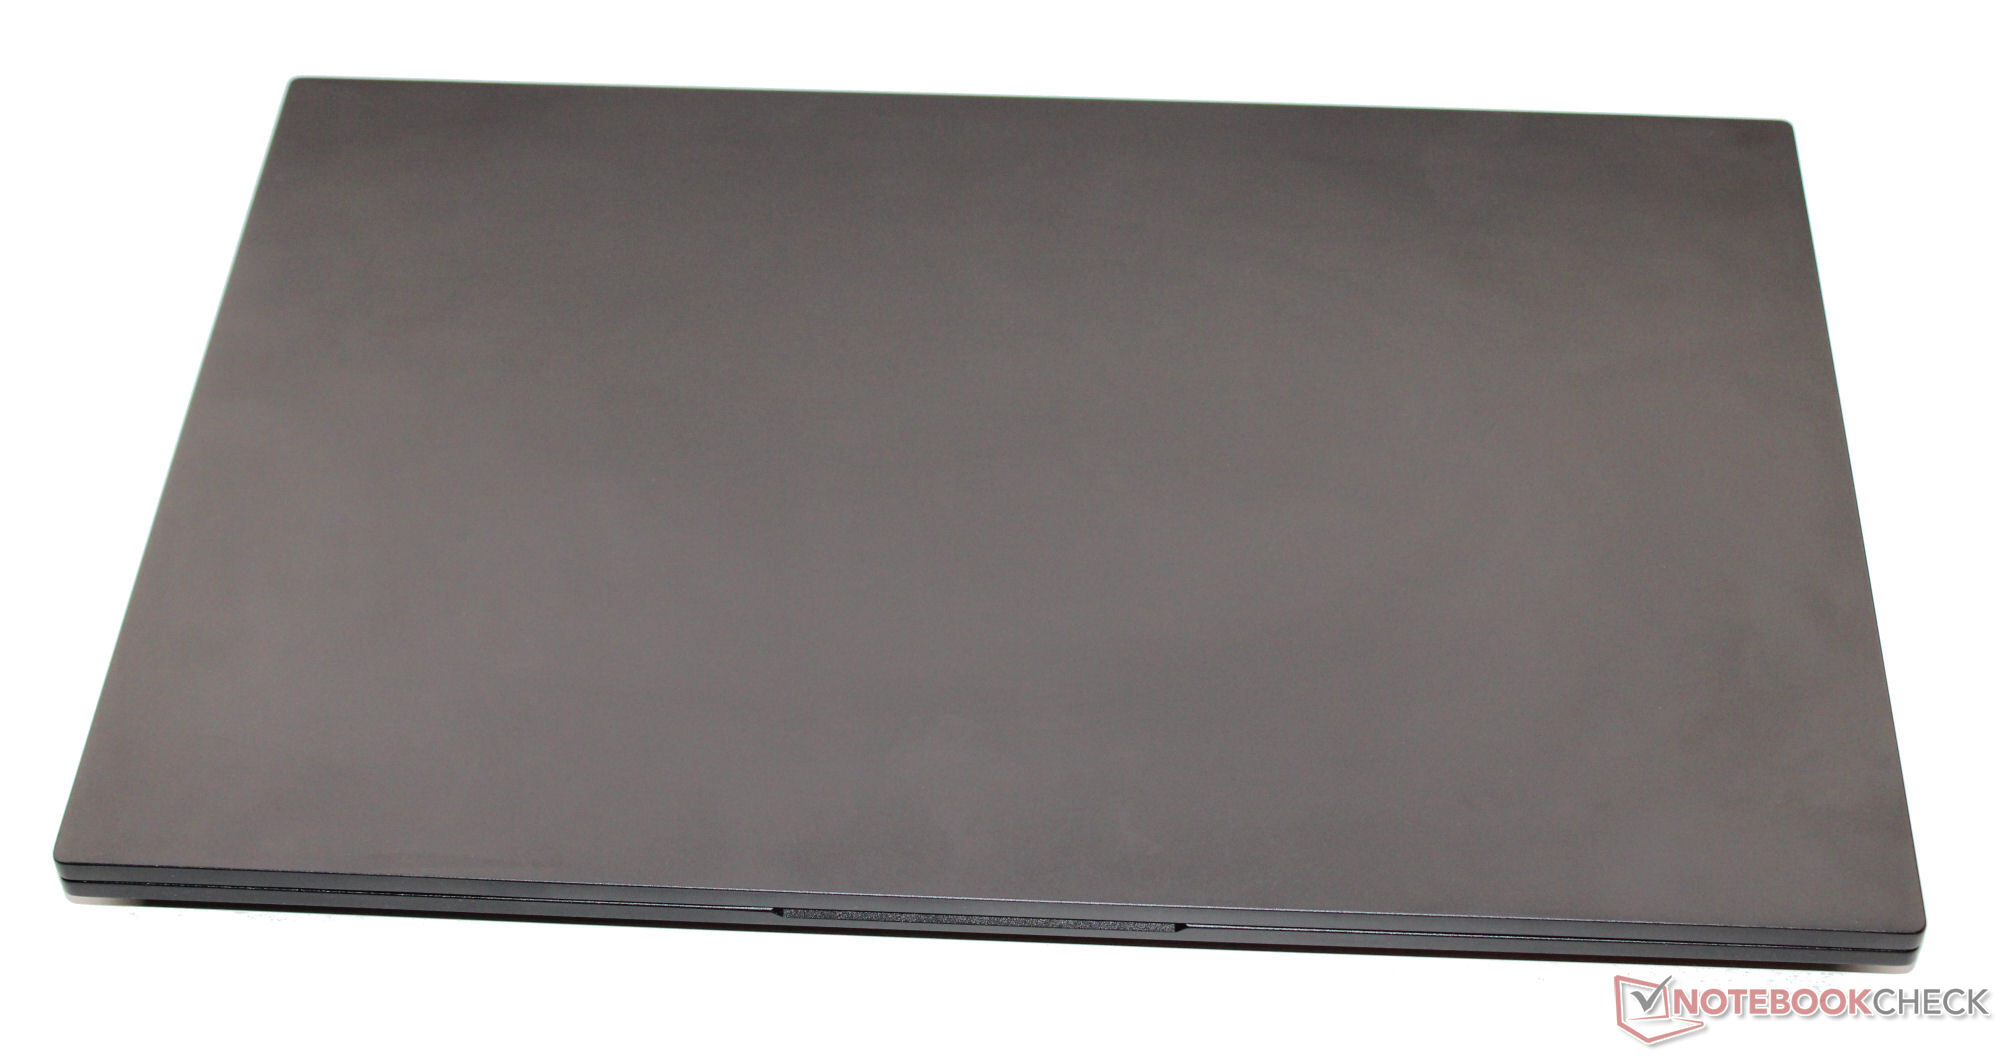
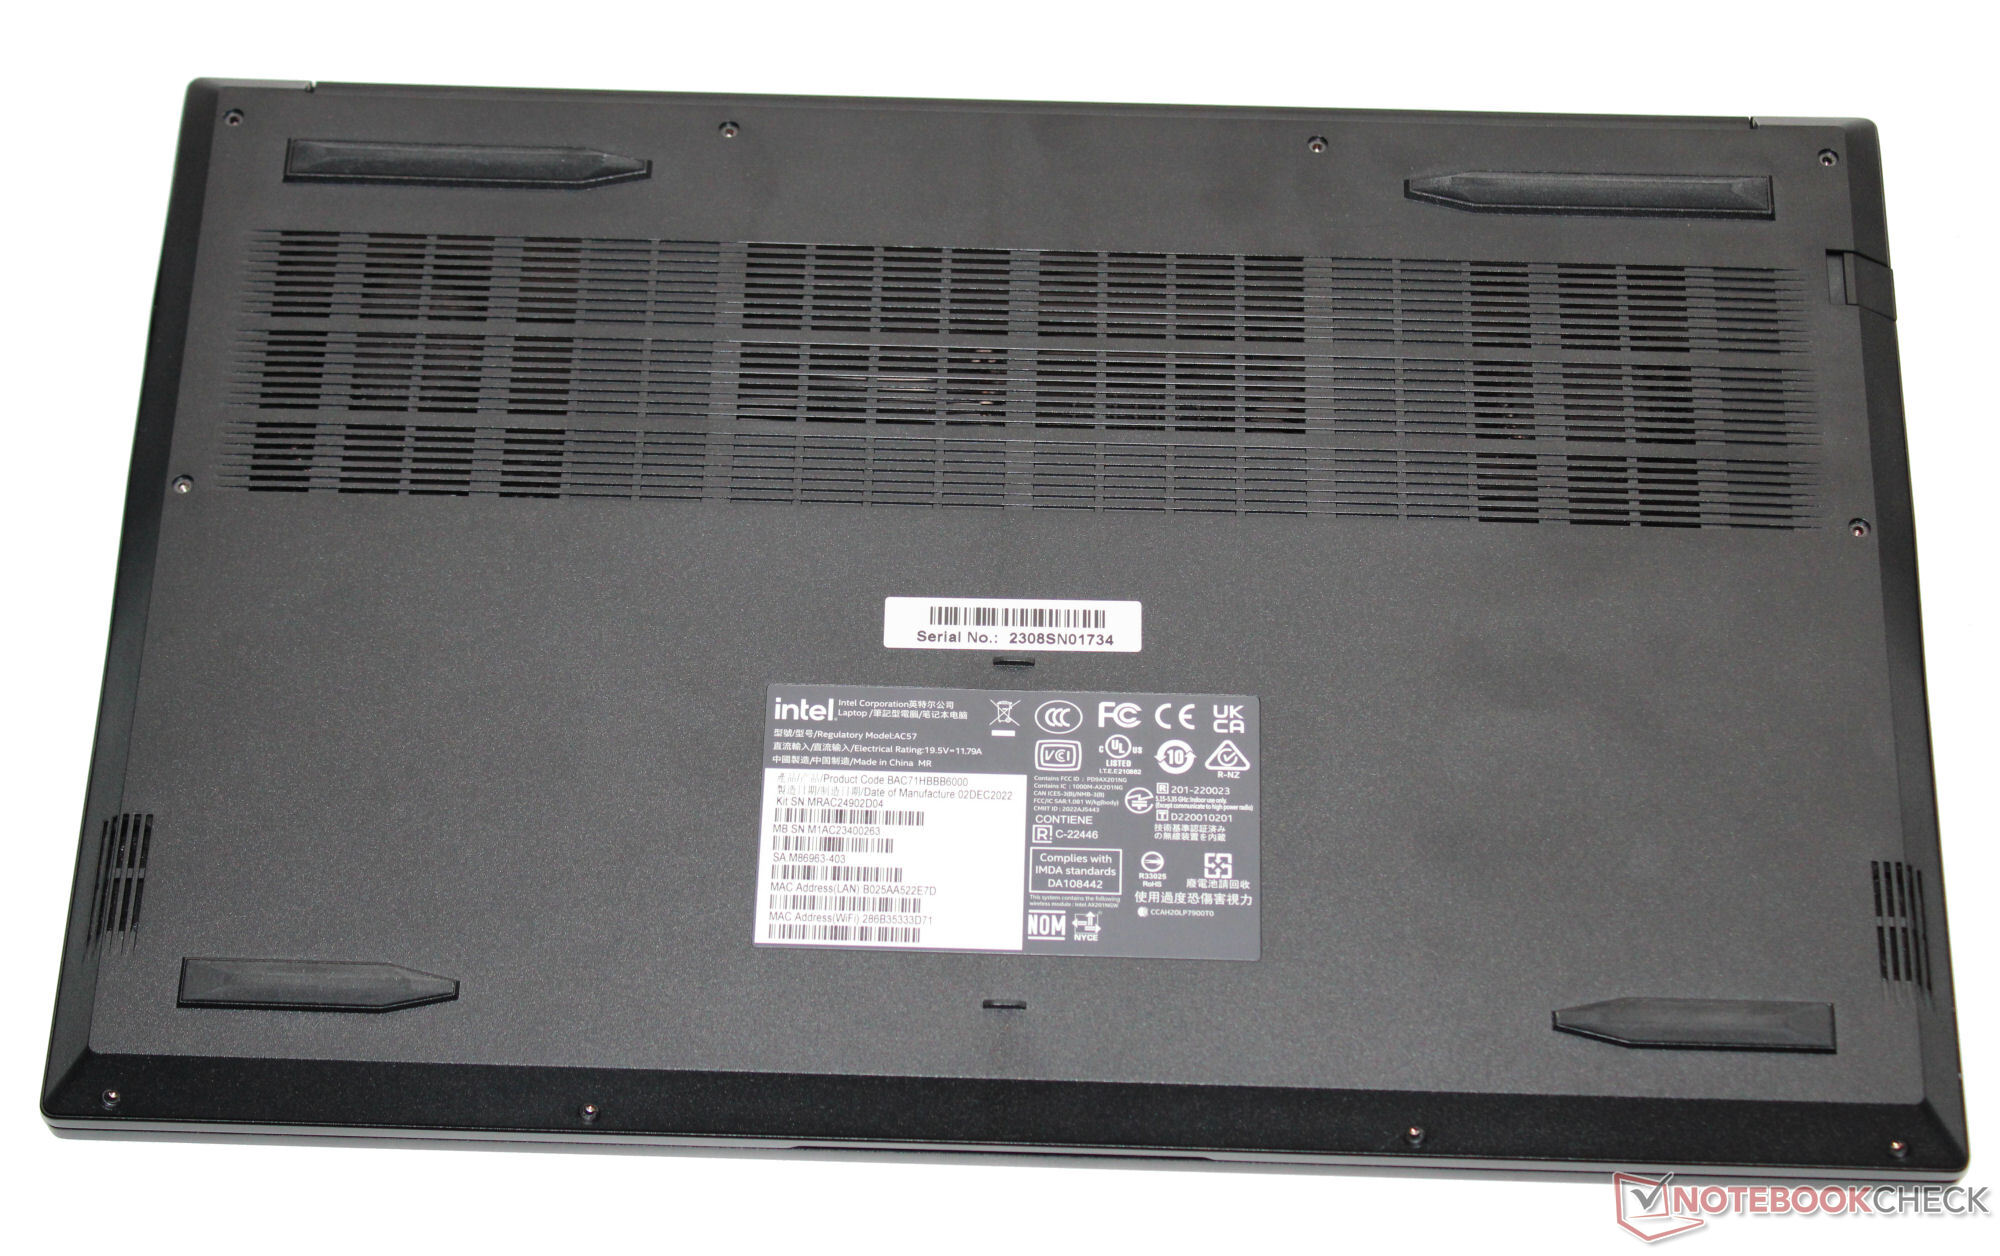
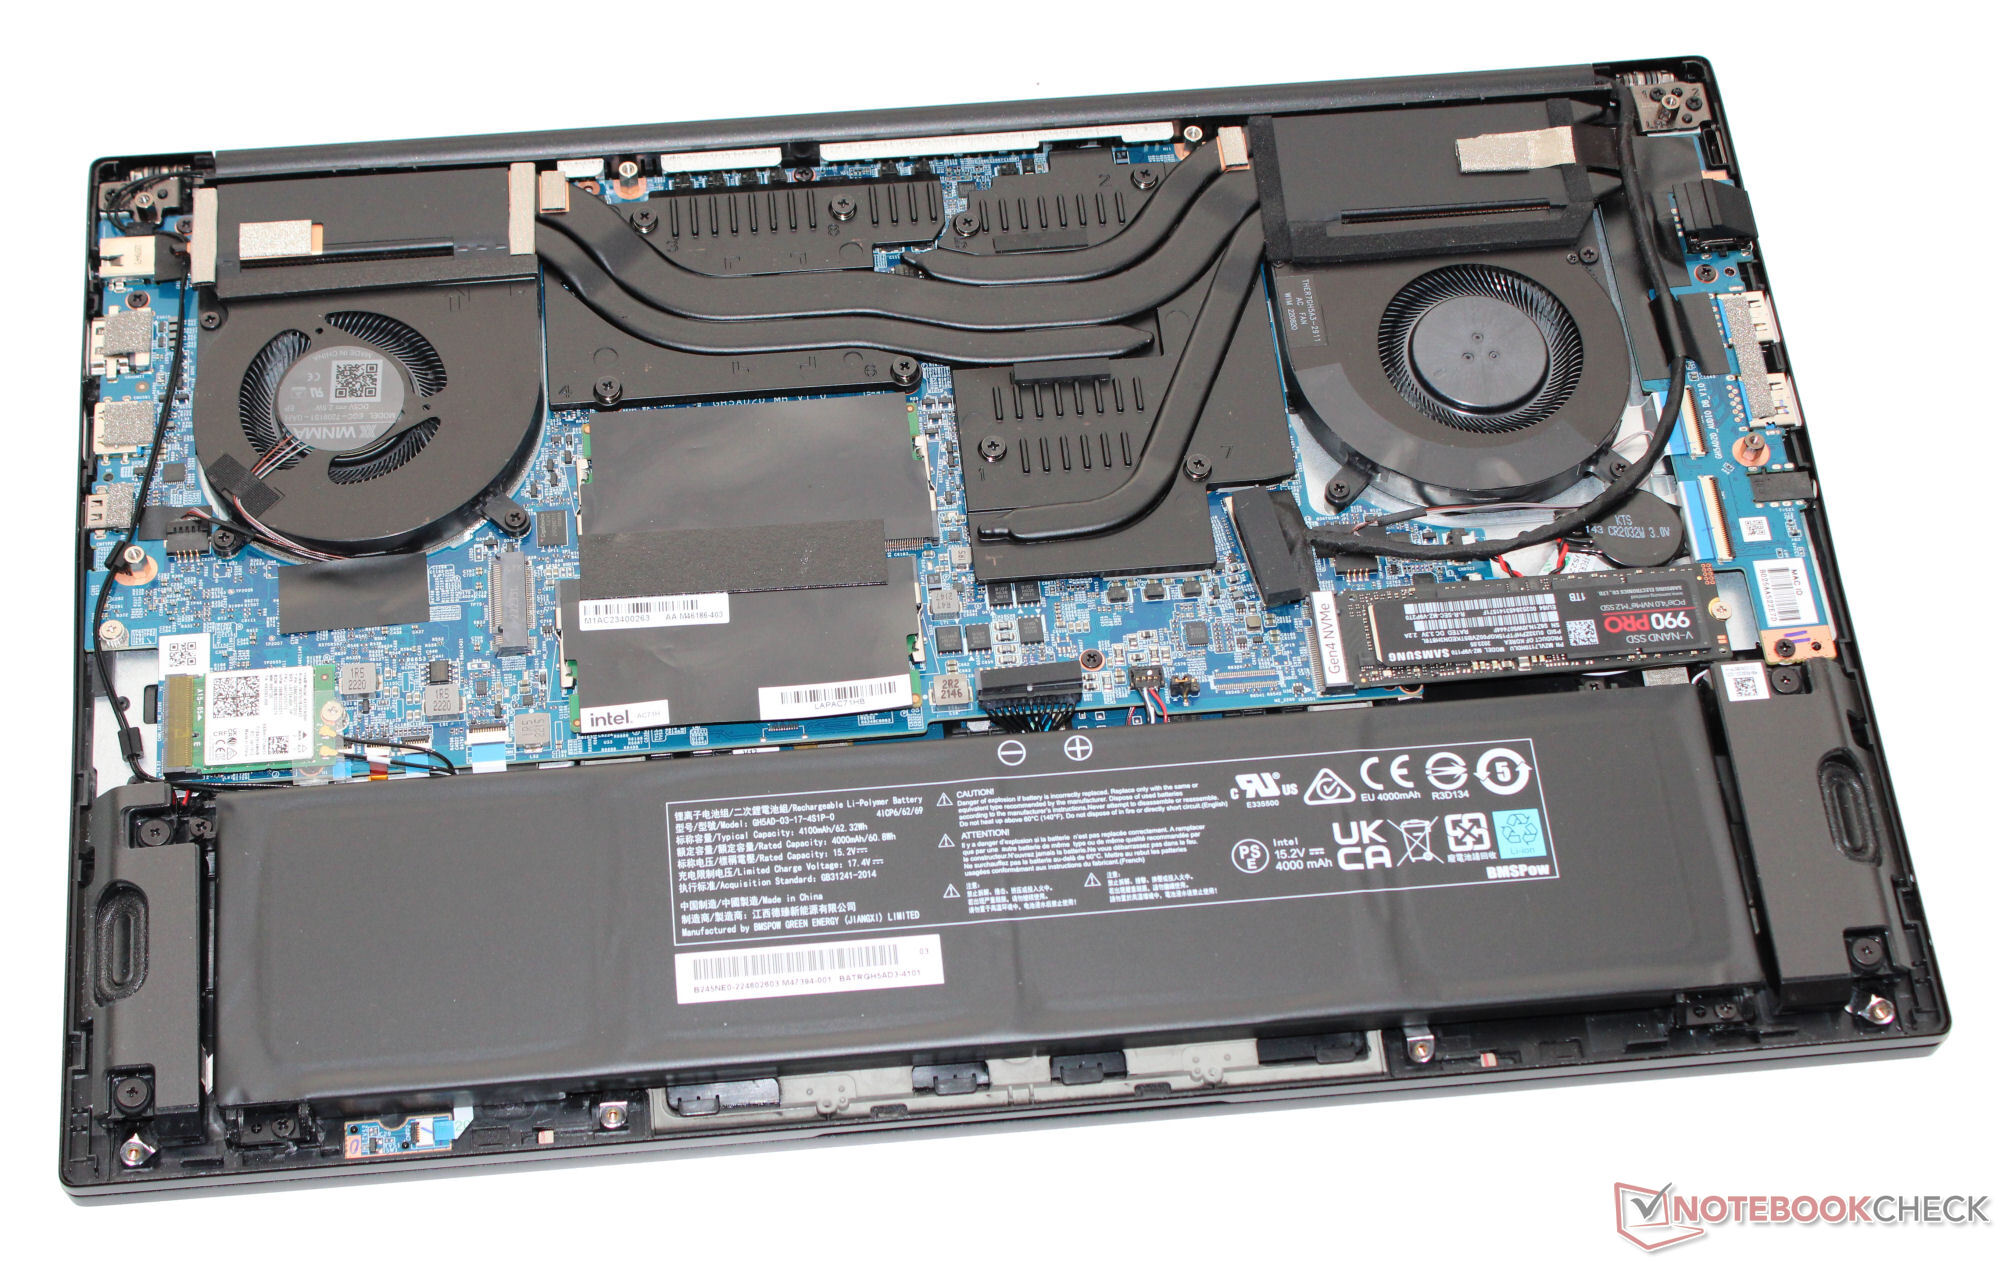
A parte traseira da tampa e a parte superior do gabinete preto fosco são feitas de alumínio, e a parte inferior da moldura da tela é feita de plástico. Não notamos nenhum problema de construção. A Intel conta com um gabinete elegante e despojado que não deve chamar muita atenção em ambientes profissionais. Depois de desmontar a parte inferior do gabinete, o senhor pode acessar a bateria (aparafusada, não colada), bem como o restante das entranhas do laptop.
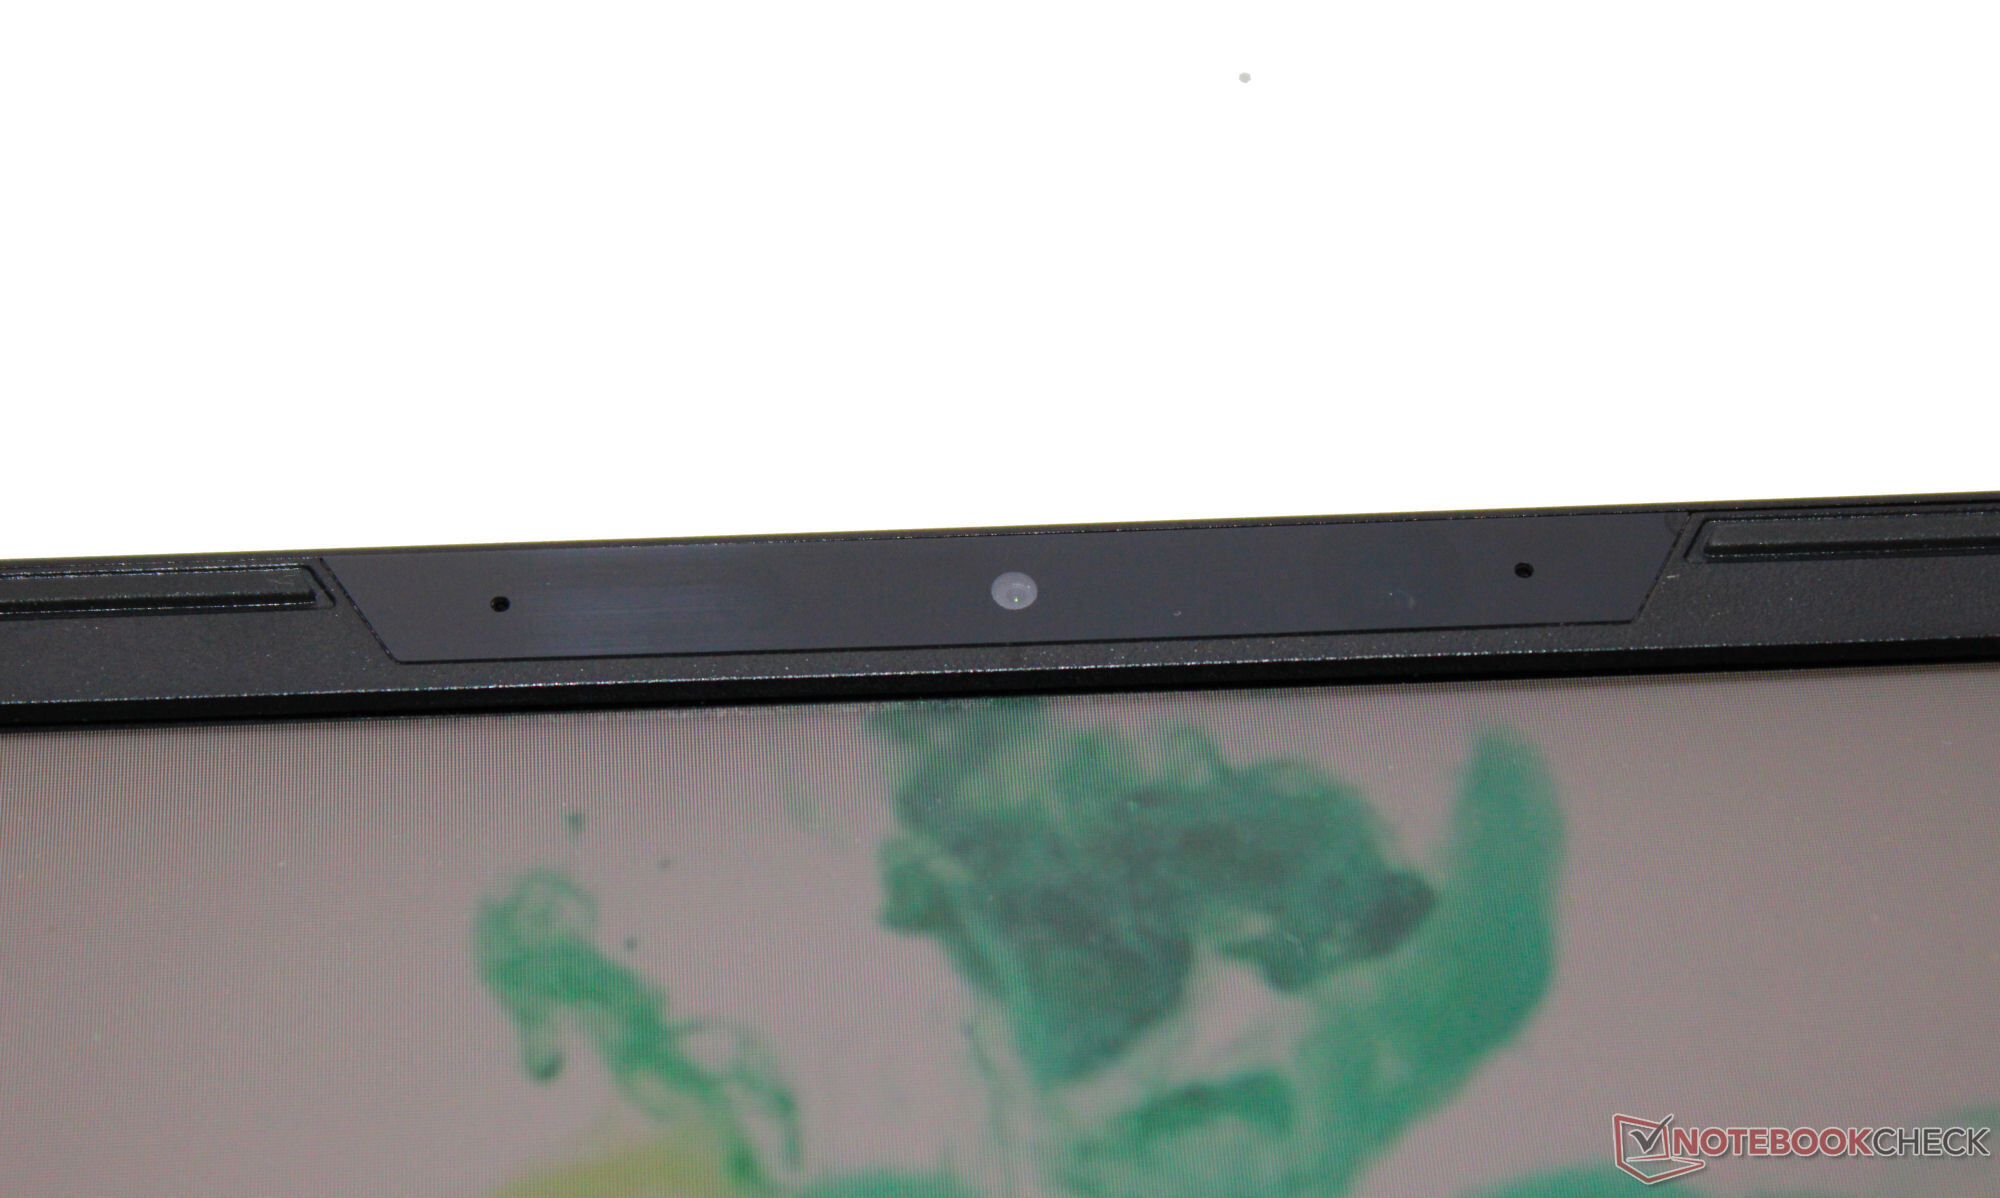
O LAPAC71H possui três portas USB-A (USB 3.2 Gen 1) e uma porta USB-C (Thunderbolt 4/USB 4). A última não é compatível com Power Delivery, mas pode emitir um sinal DisplayPort. No total, o laptop tem duas saídas de vídeo (1x HDMI, 1x DP). A Intel não forneceu ao dispositivo um leitor de cartão SD. Sua webcam (0,9 MP, máx. 1.280 x 720 pixels, sem cobertura) oferece resultados bastante padronizados.
Em condições ideais (sem dispositivos WiFi nas proximidades, curta distância entre o laptop e o PC servidor), ela pode atingir excelentes taxas de dados WiFi. O laptop usa um chip WiFi 6E (Intel AX201). As conexões com fio também são controladas por um controlador Intel (I225-V; 2,5 GBit/s).
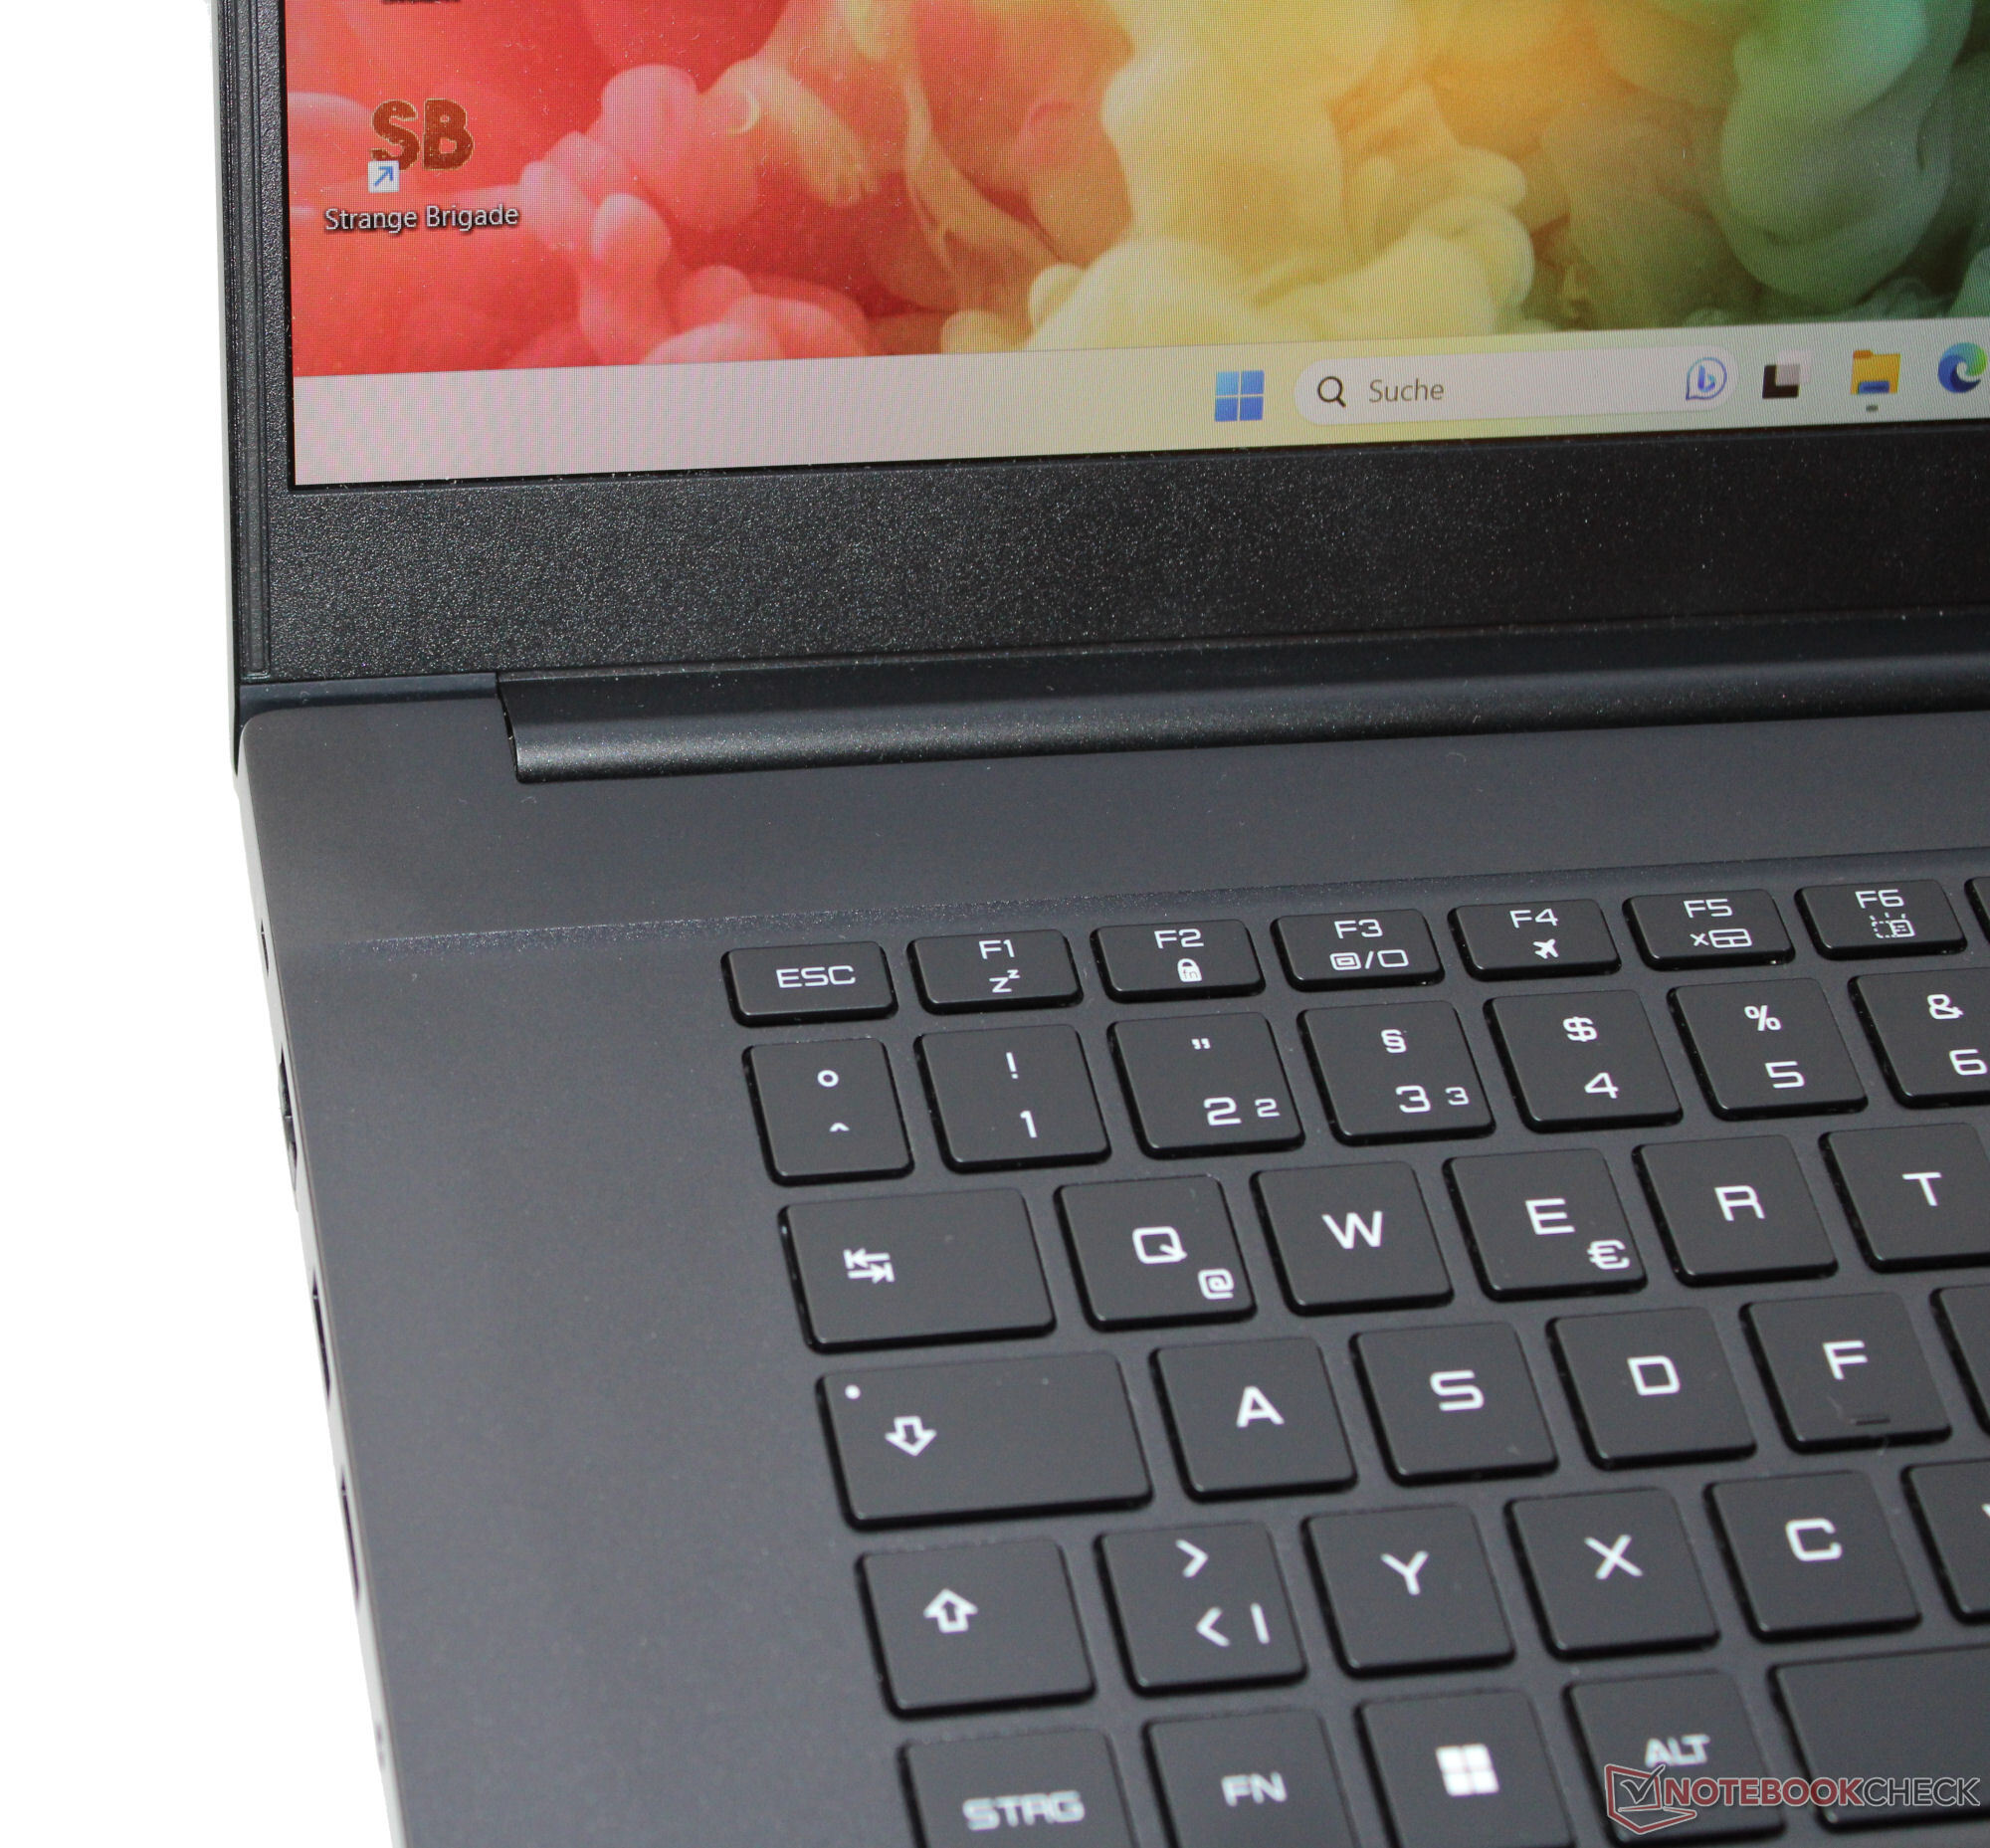
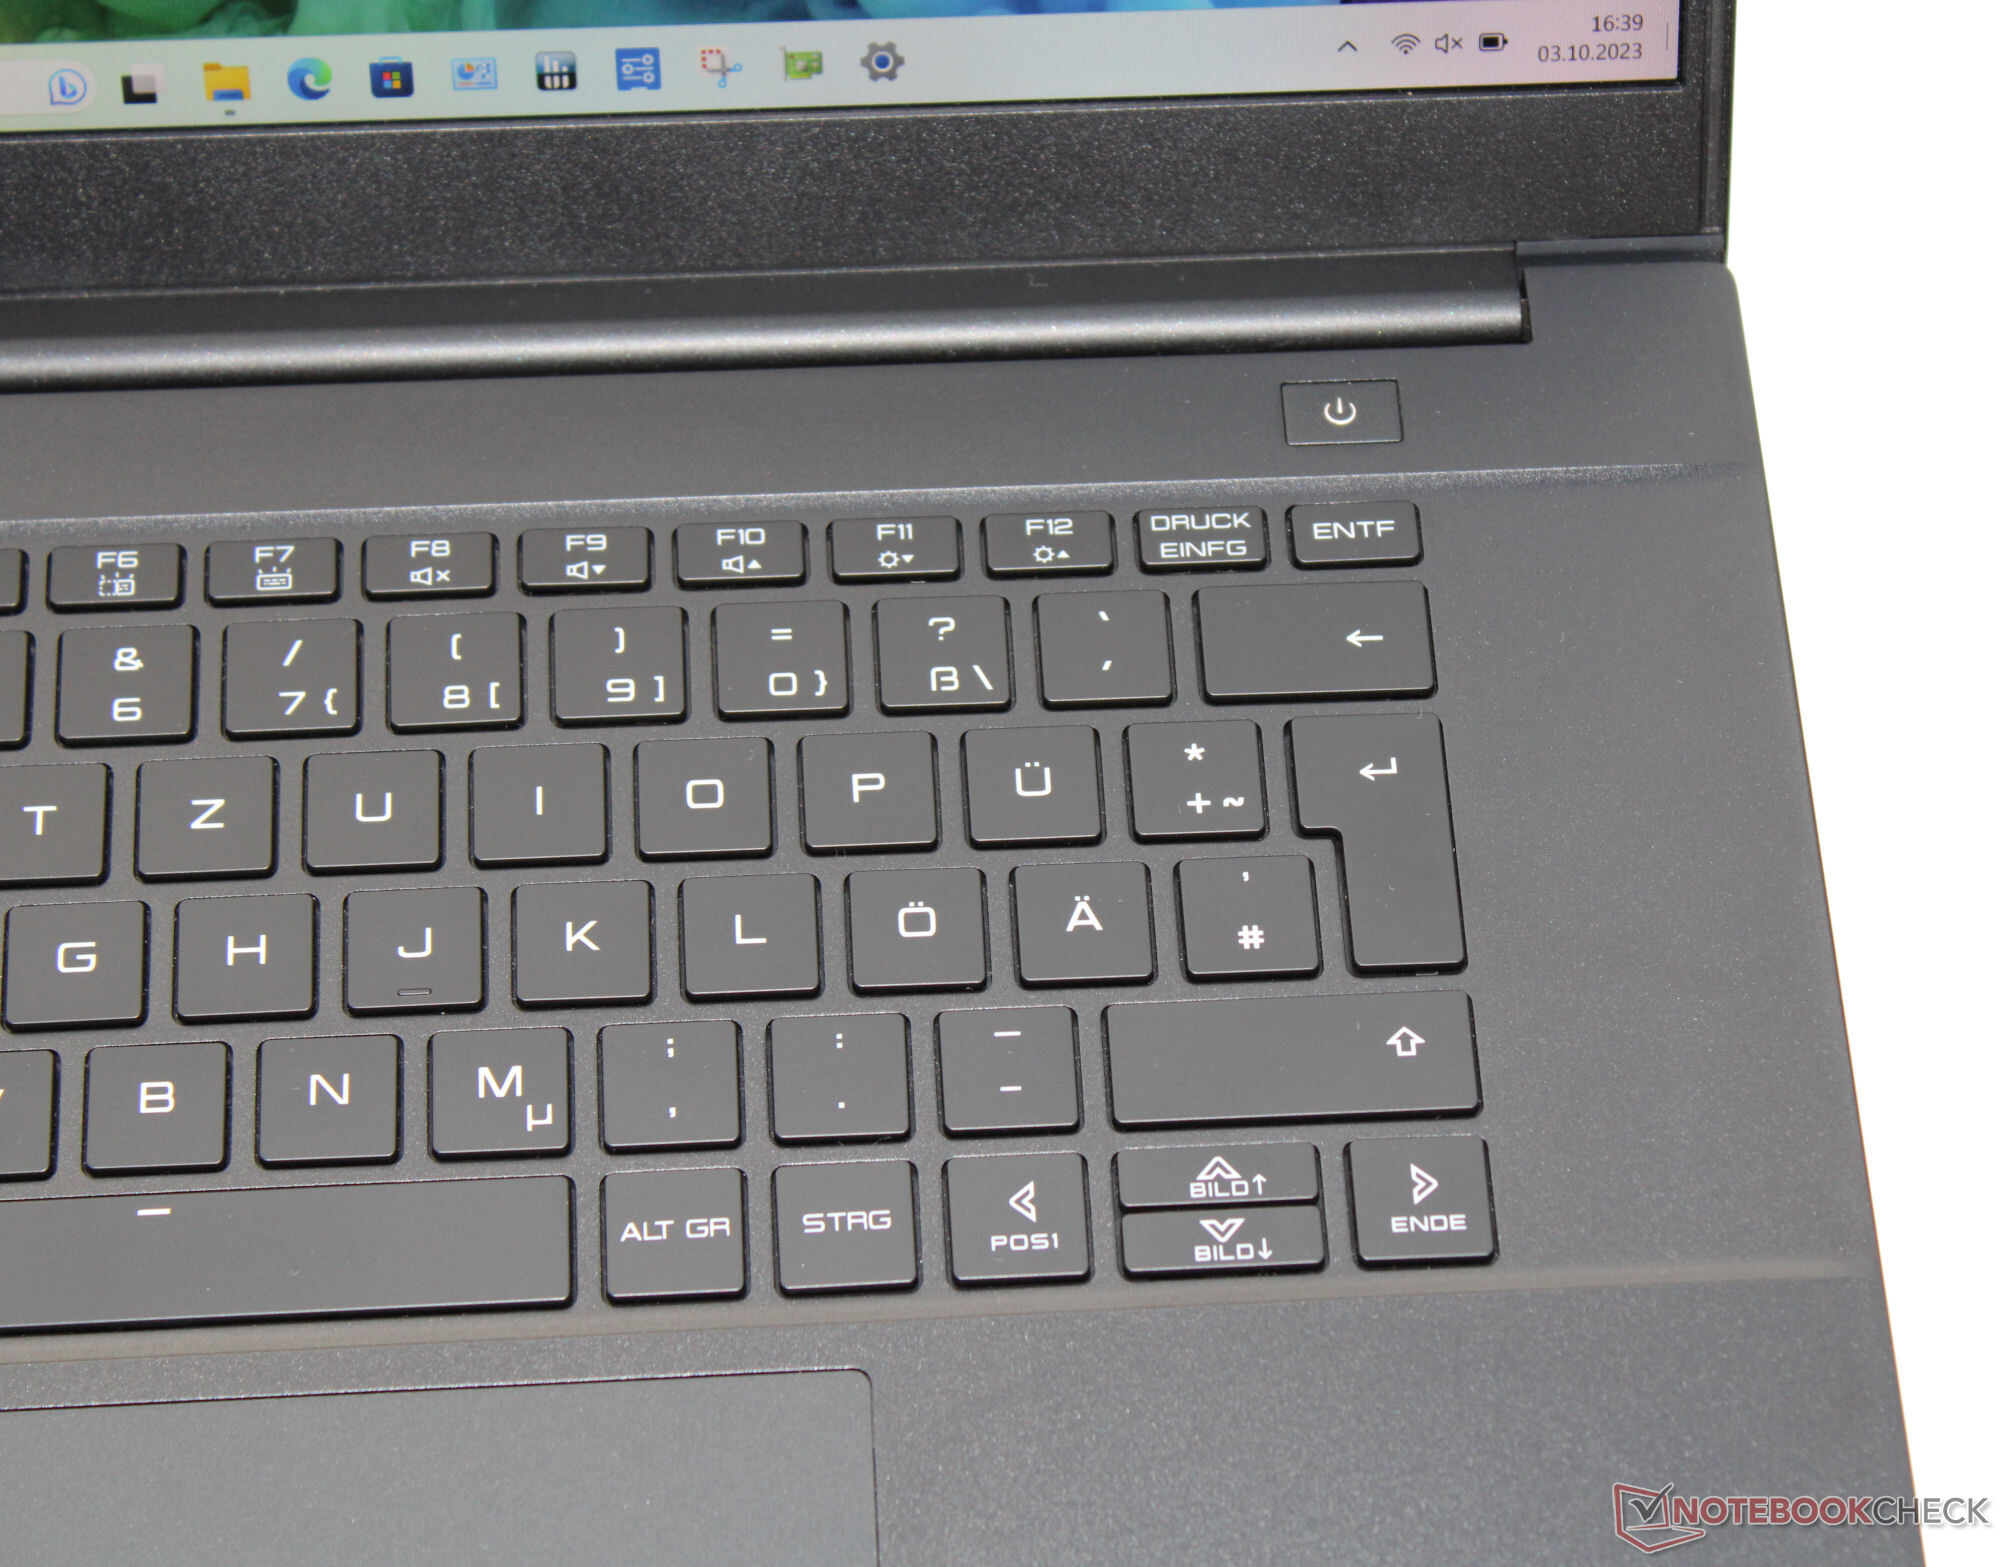
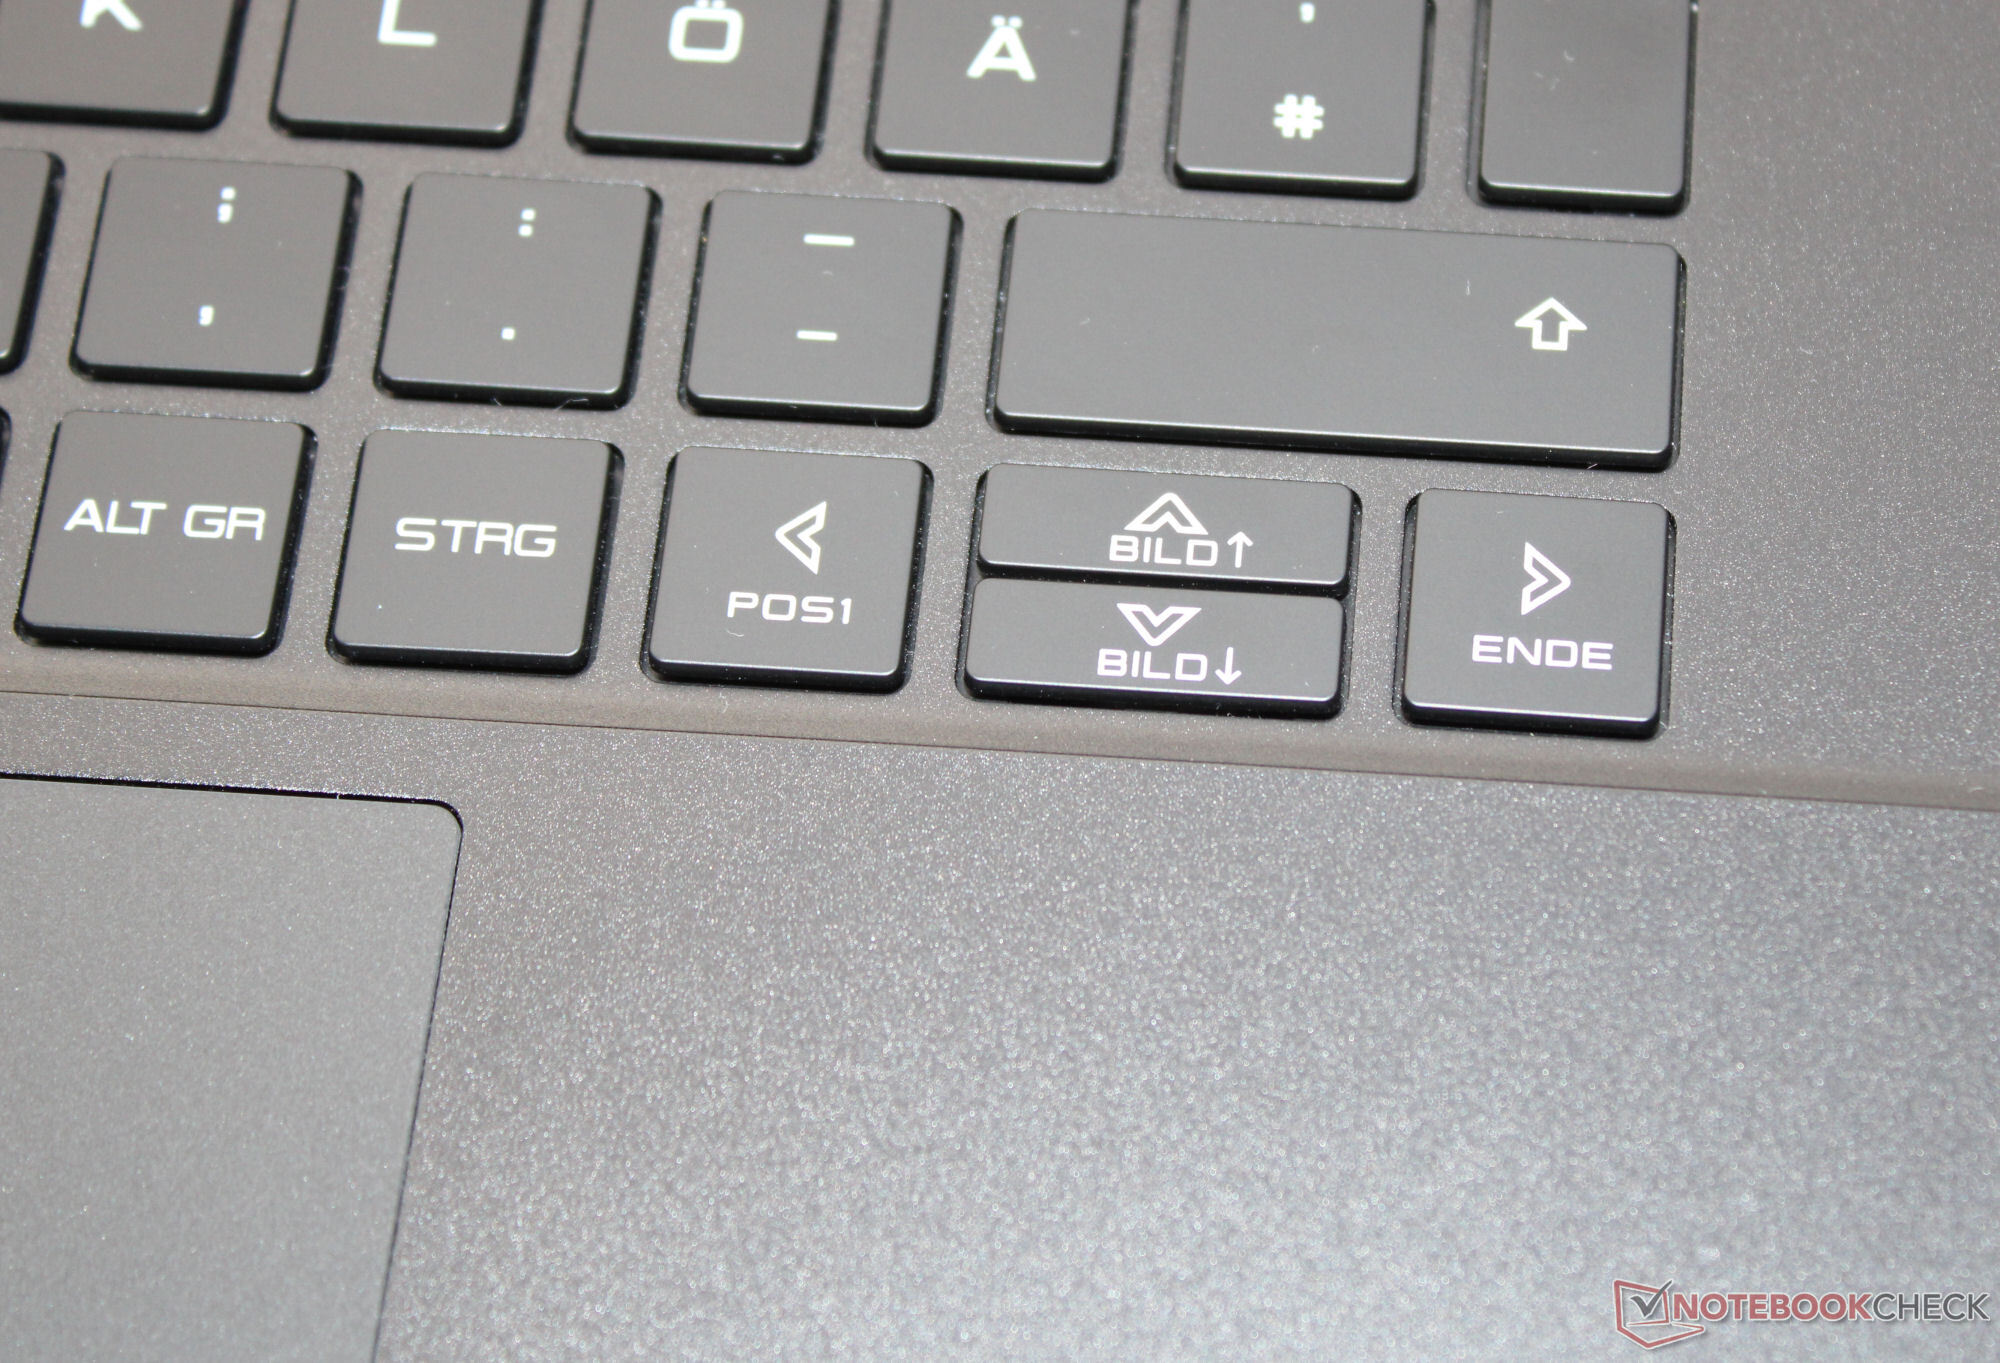


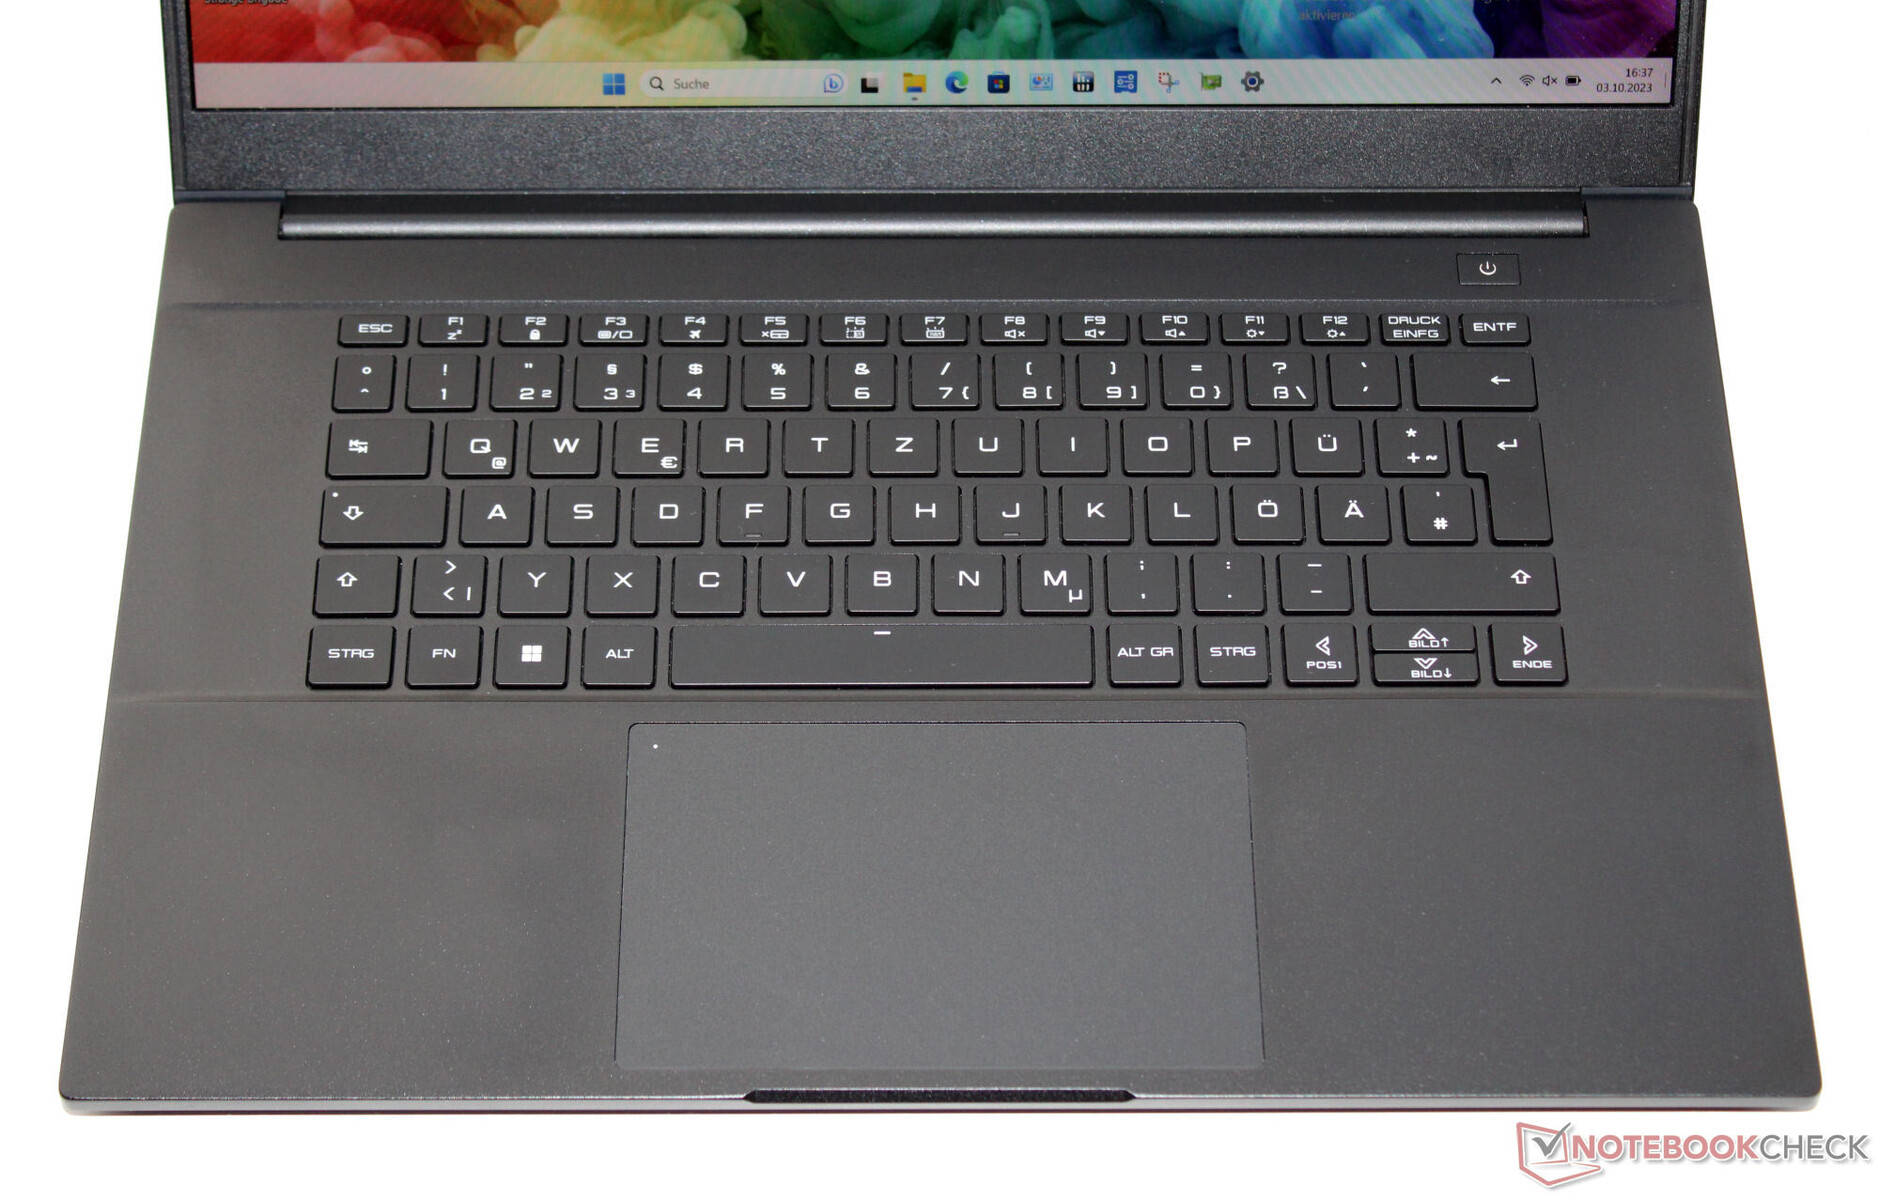
Dispositivos de entrada - Um teclado com iluminação RGB
O teclado chiclet do laptop (iluminação RGB) não apresenta um teclado numérico, embora haja espaço suficiente para um. Suas teclas uniformes e suaves apresentam uma elevação média e um ponto de pressão claro. A resistência das teclas poderia ser um pouco mais nítida. O teclado não se deforma quando o usuário digita nele. No total, a Intel forneceu um teclado adequado para o uso diário. Um clickpad (aprox. 13,3 x 8,3 cm) é instalado como substituto do mouse e apresenta uma elevação curta e um ponto de pressão claro.
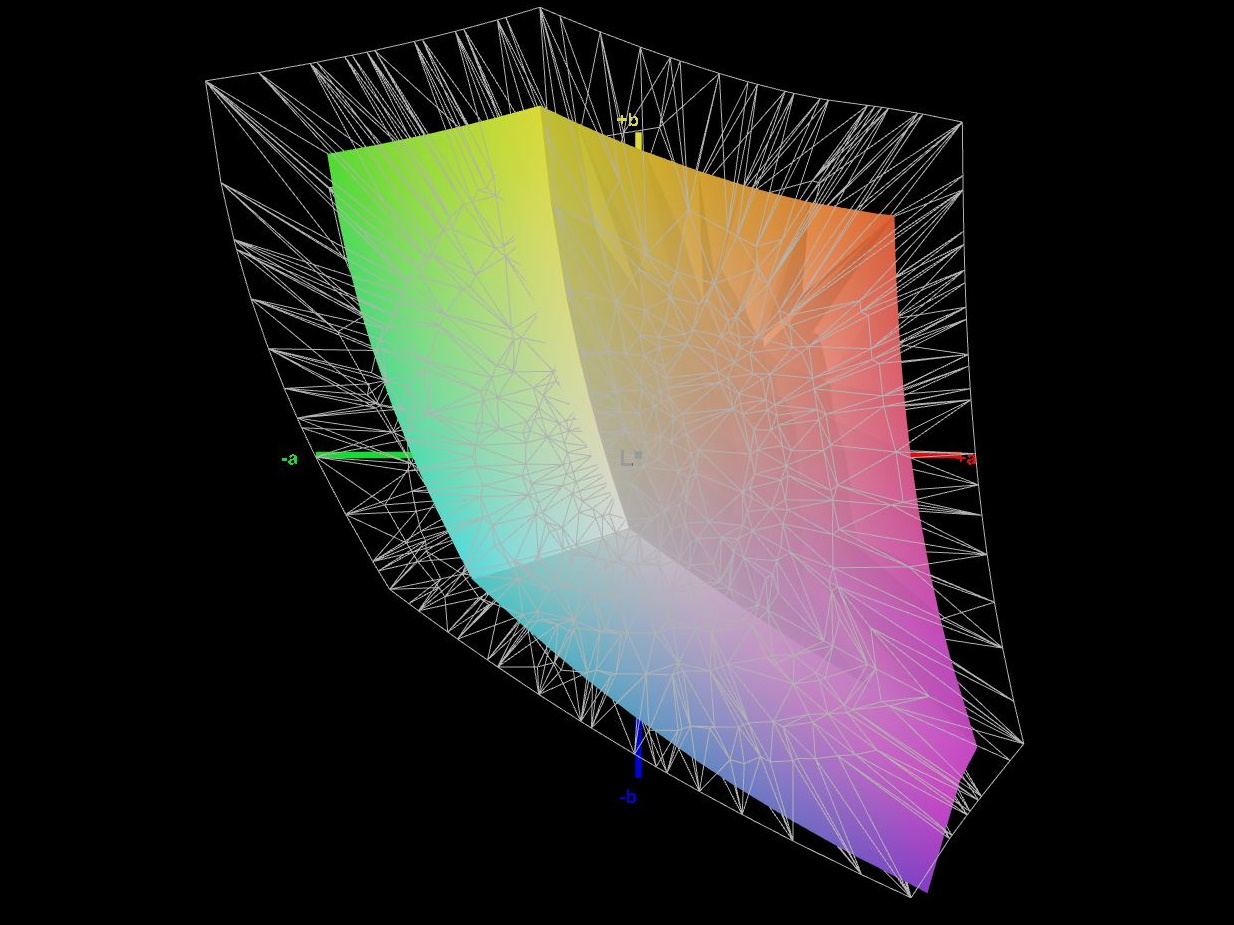
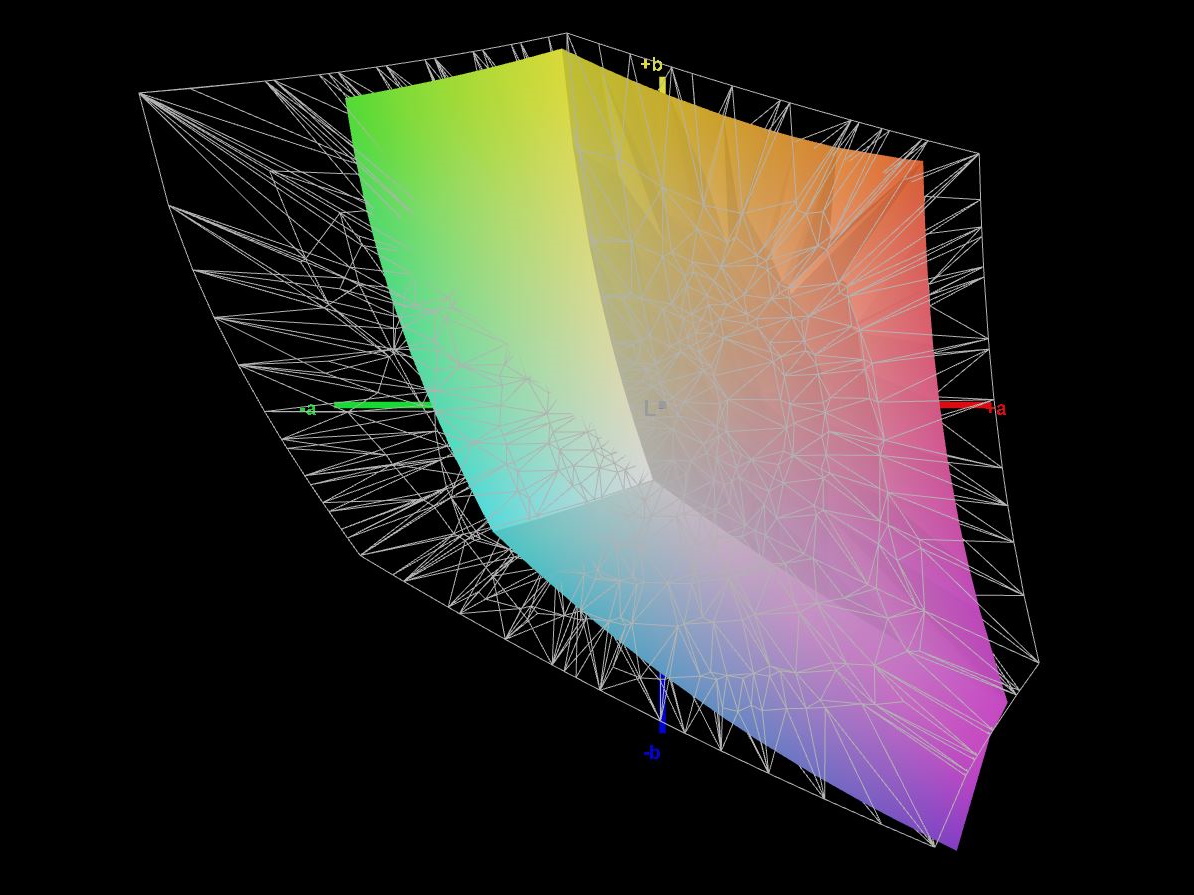
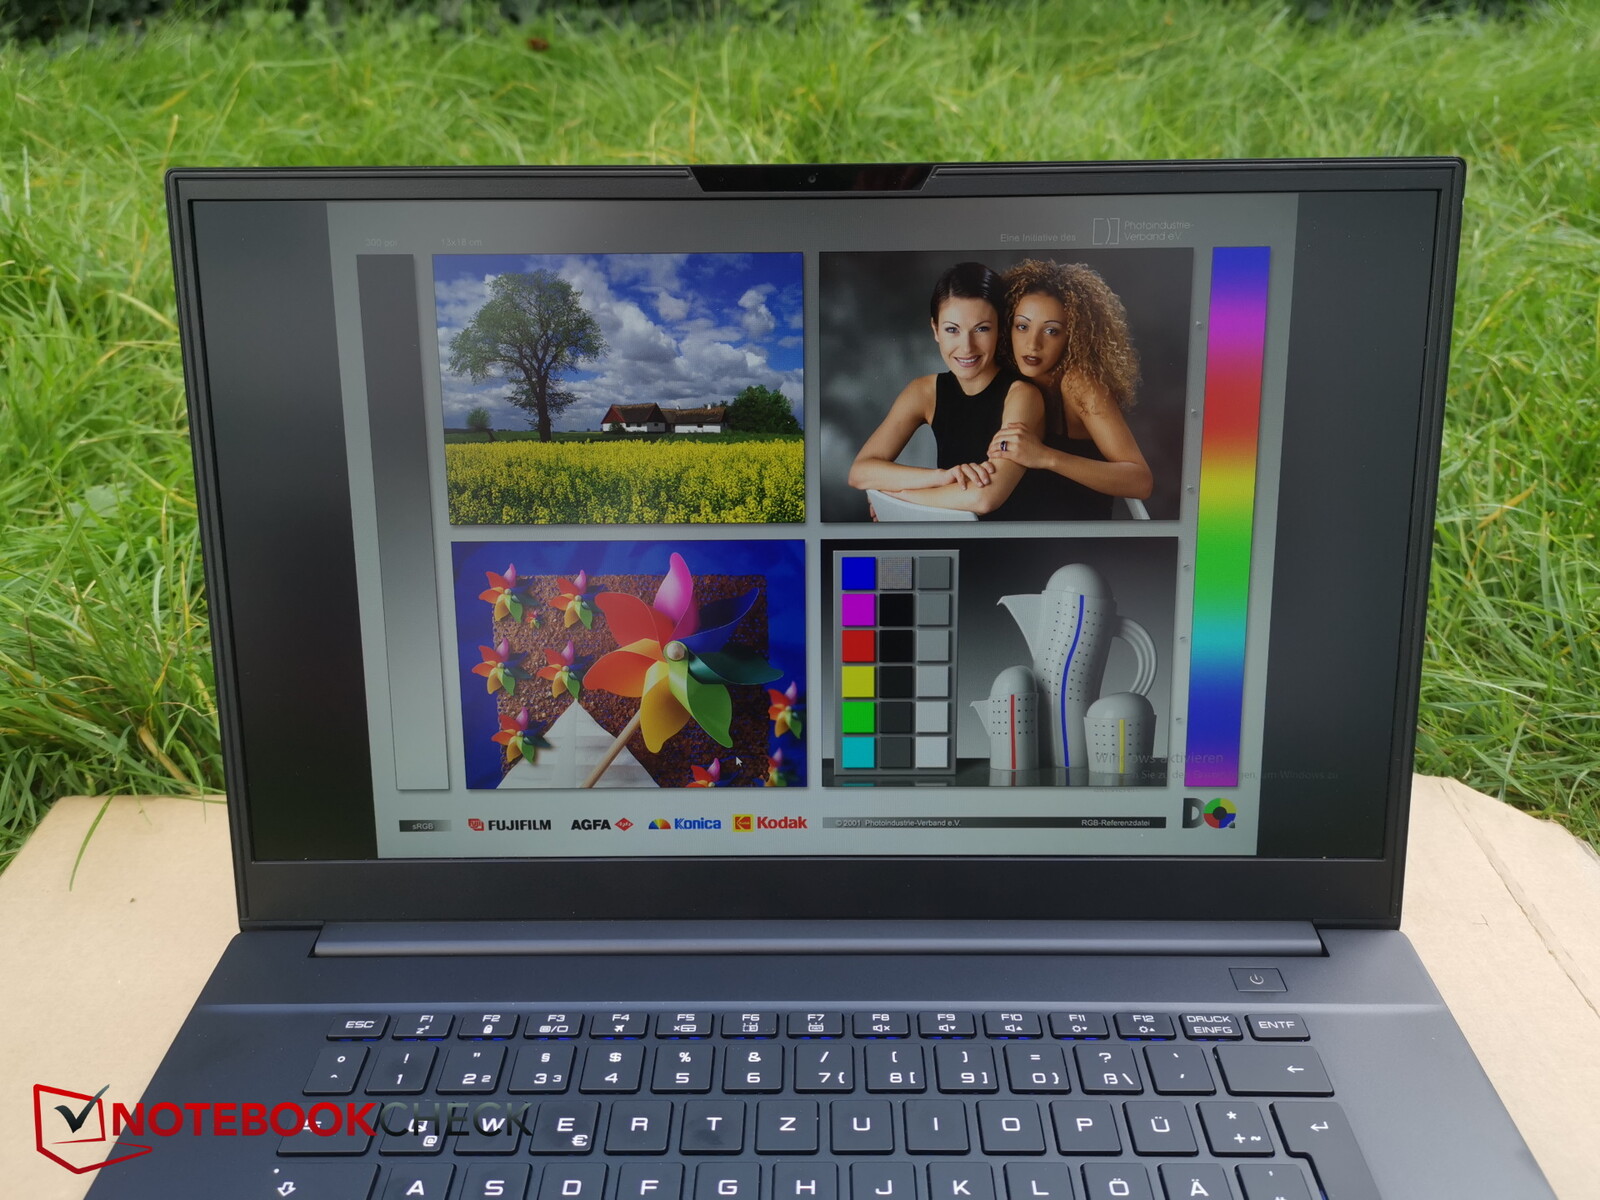
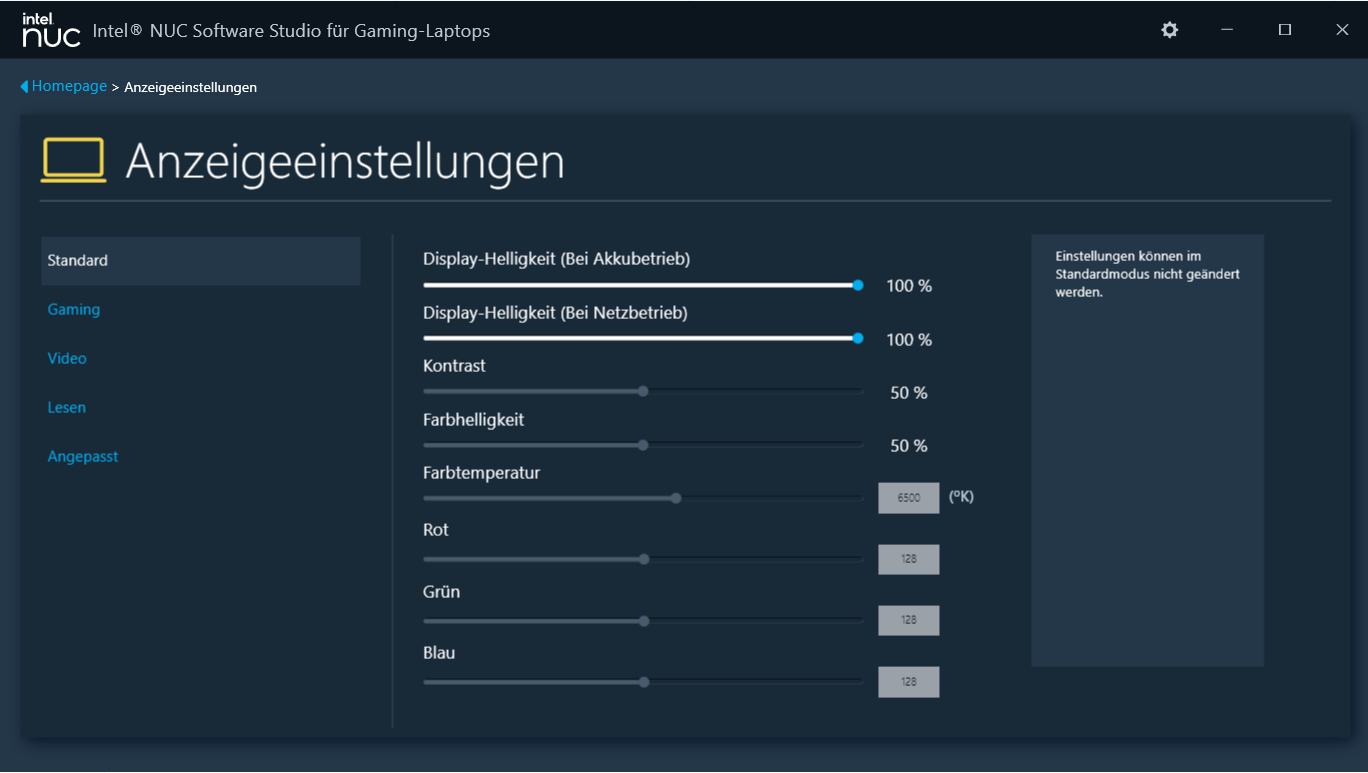
Tela - O LAPAC71H apresenta um painel FHD de alto contraste
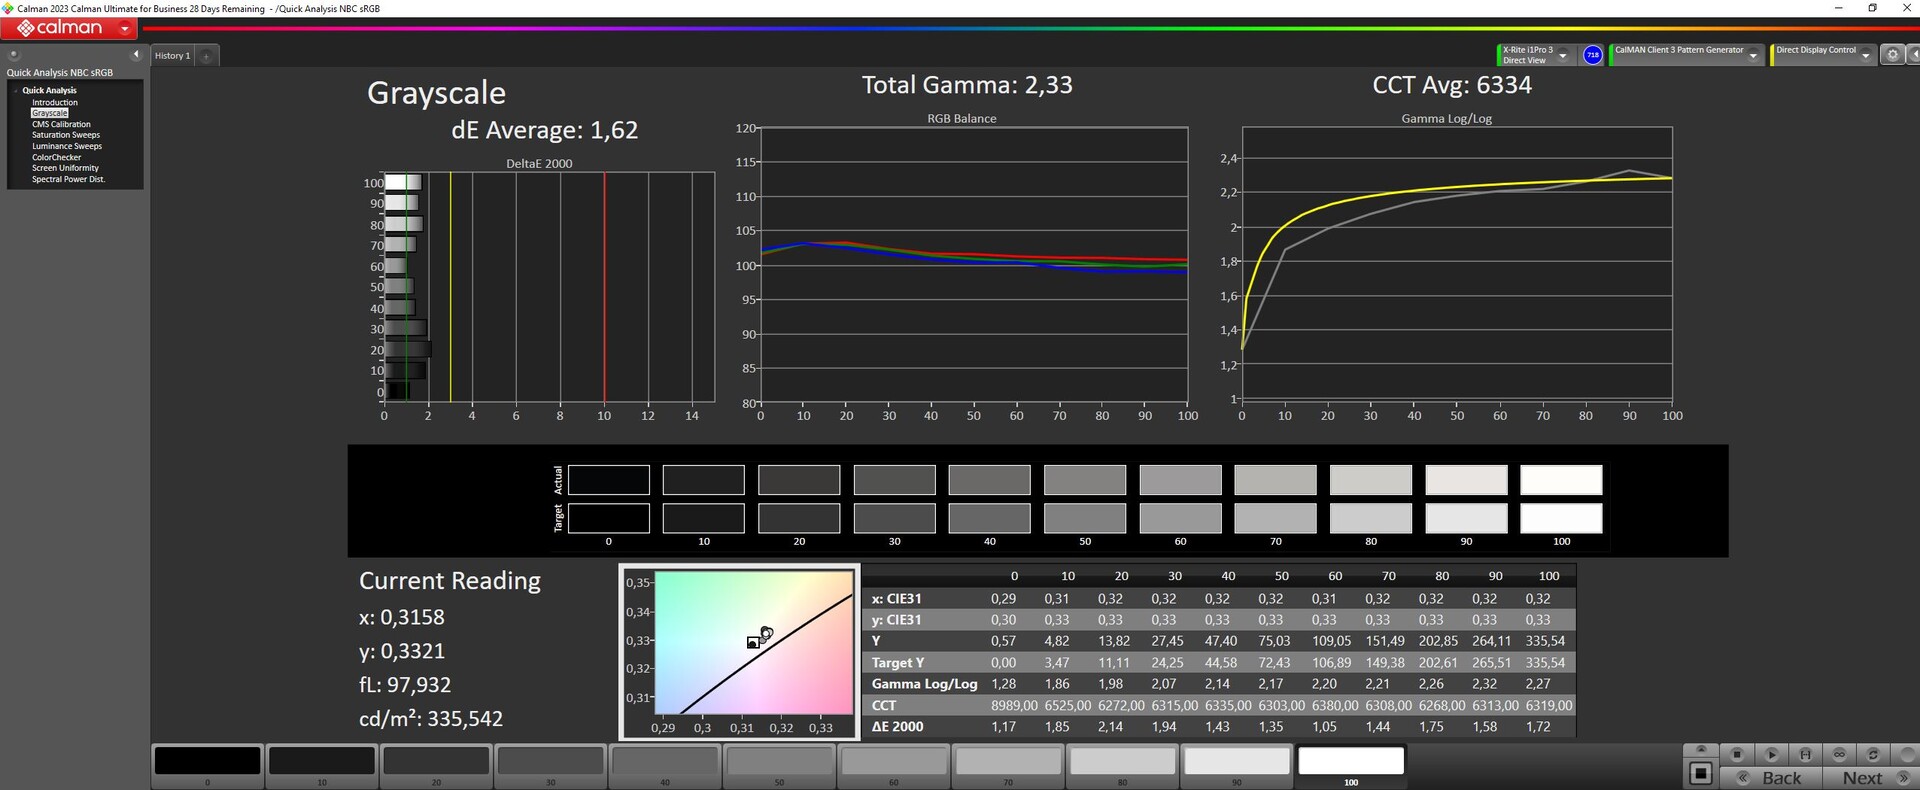
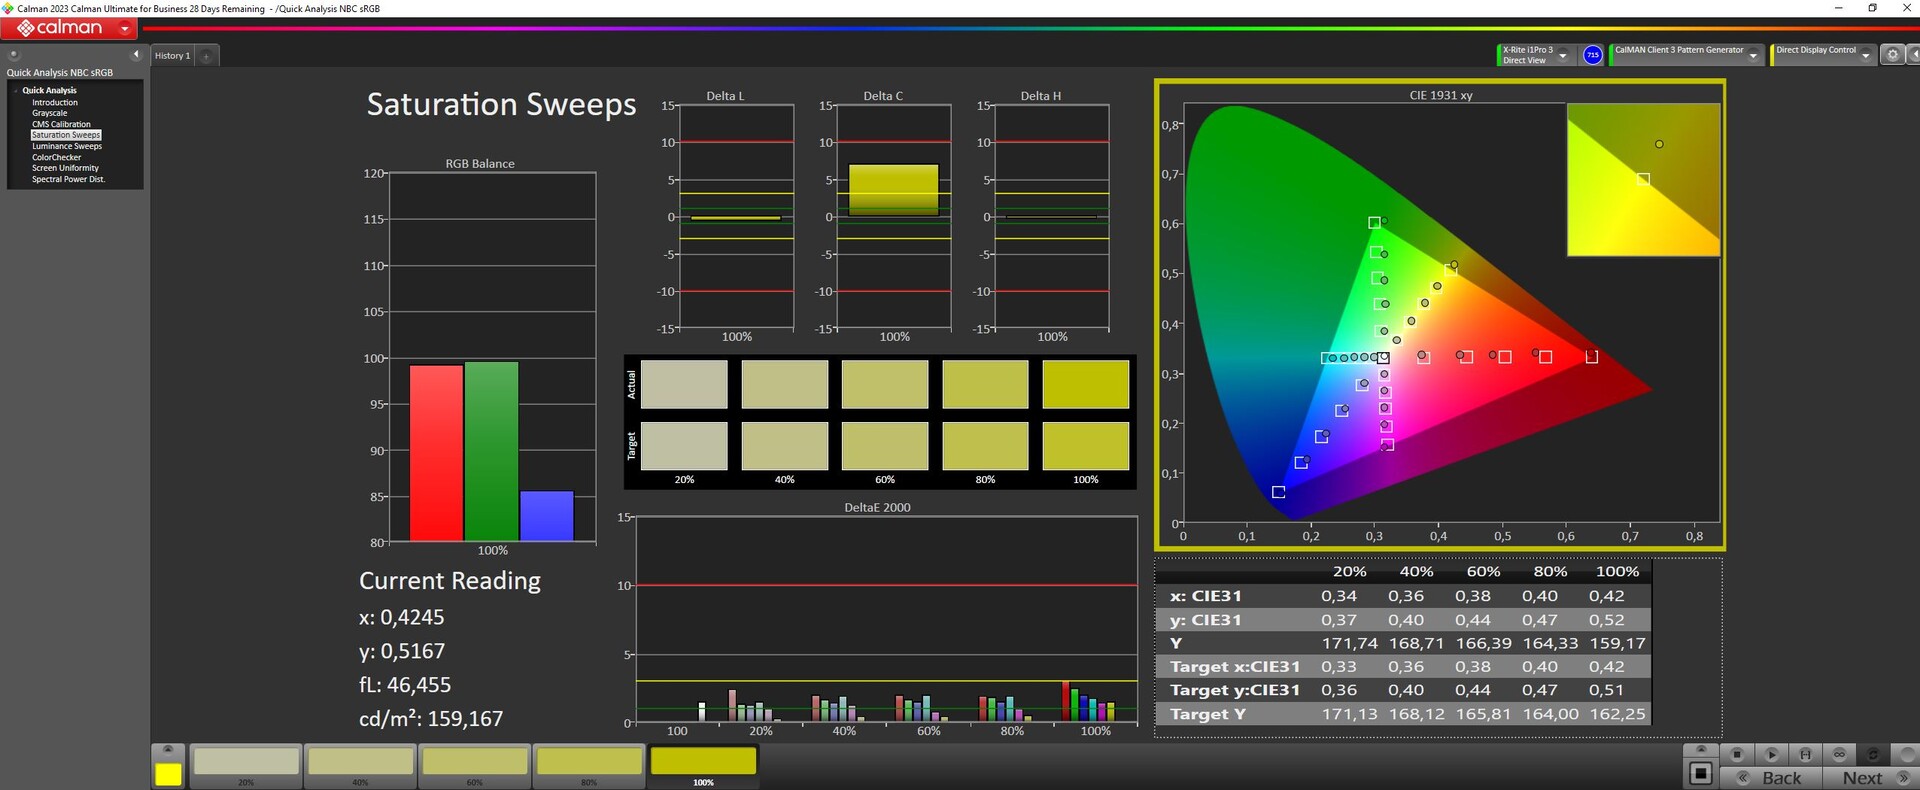
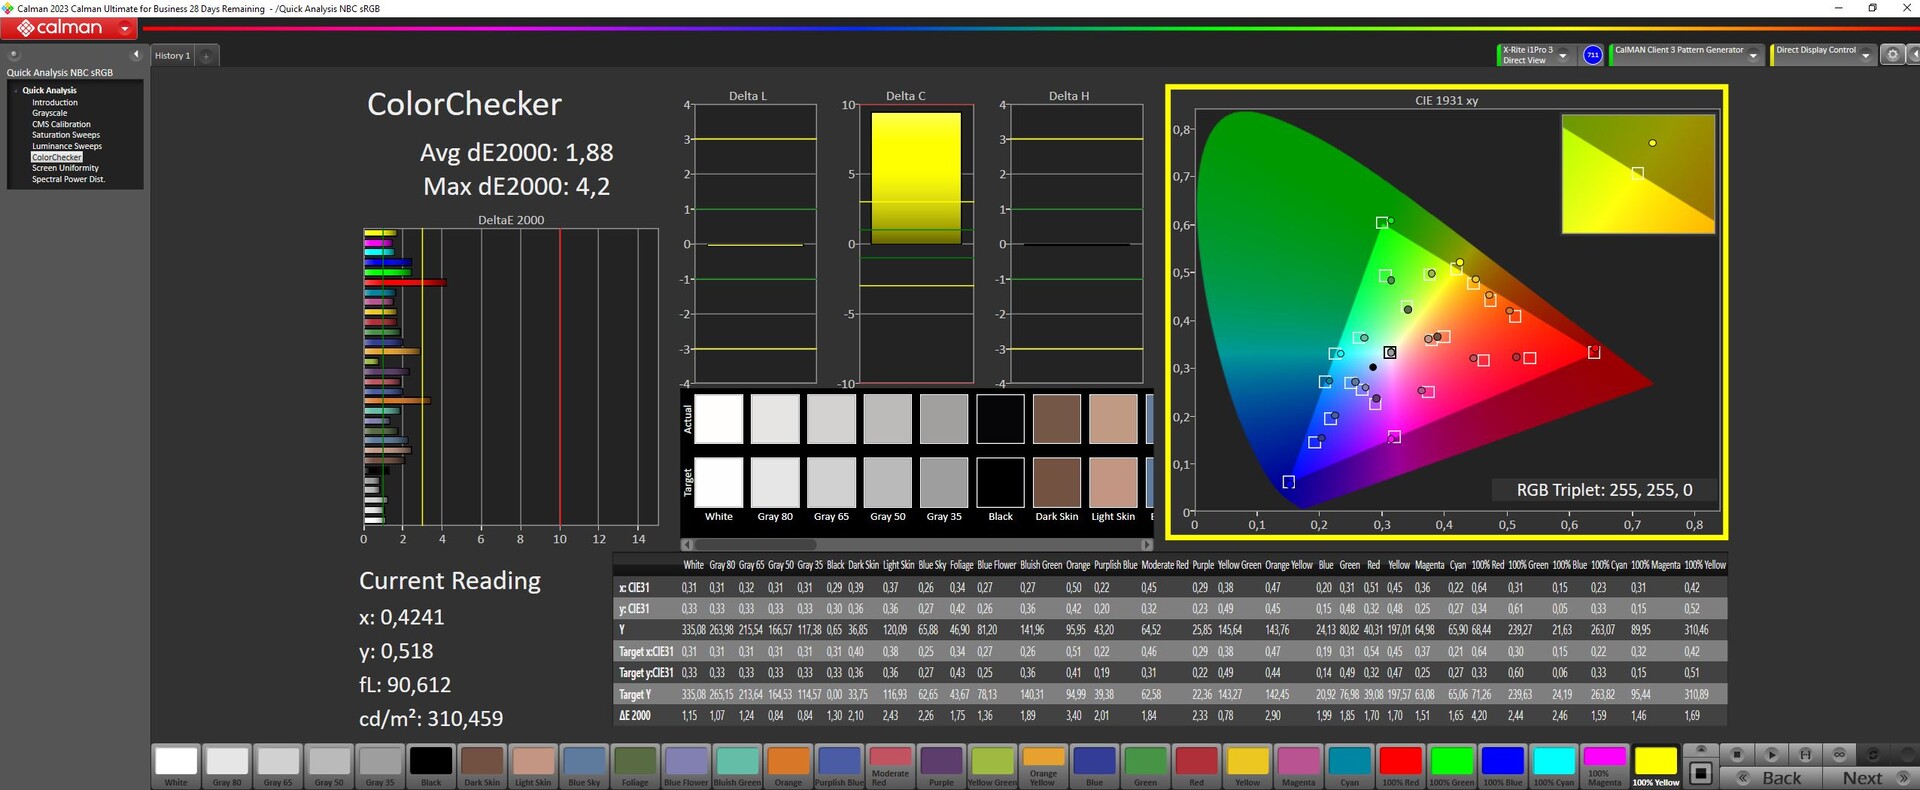
O painel de 144 Hz de reação rápida com uma relação de aspecto de 16:9 não apresenta oscilação de PWM em nenhum nível de brilho. As metas de brilho e contraste da tela de 15,6 polegadas (1.920 x 1.080 pixels) foram atingidas (> 300 cd/m² e 1.000:1). Seu valor de contraste relativamente alto merece ser mencionado. Não estão disponíveis outras opções de tela.
| |||||||||||||||||||||||||
iluminação: 86 %
iluminação com acumulador: 366 cd/m²
Contraste: 2147:1 (Preto: 0.17 cd/m²)
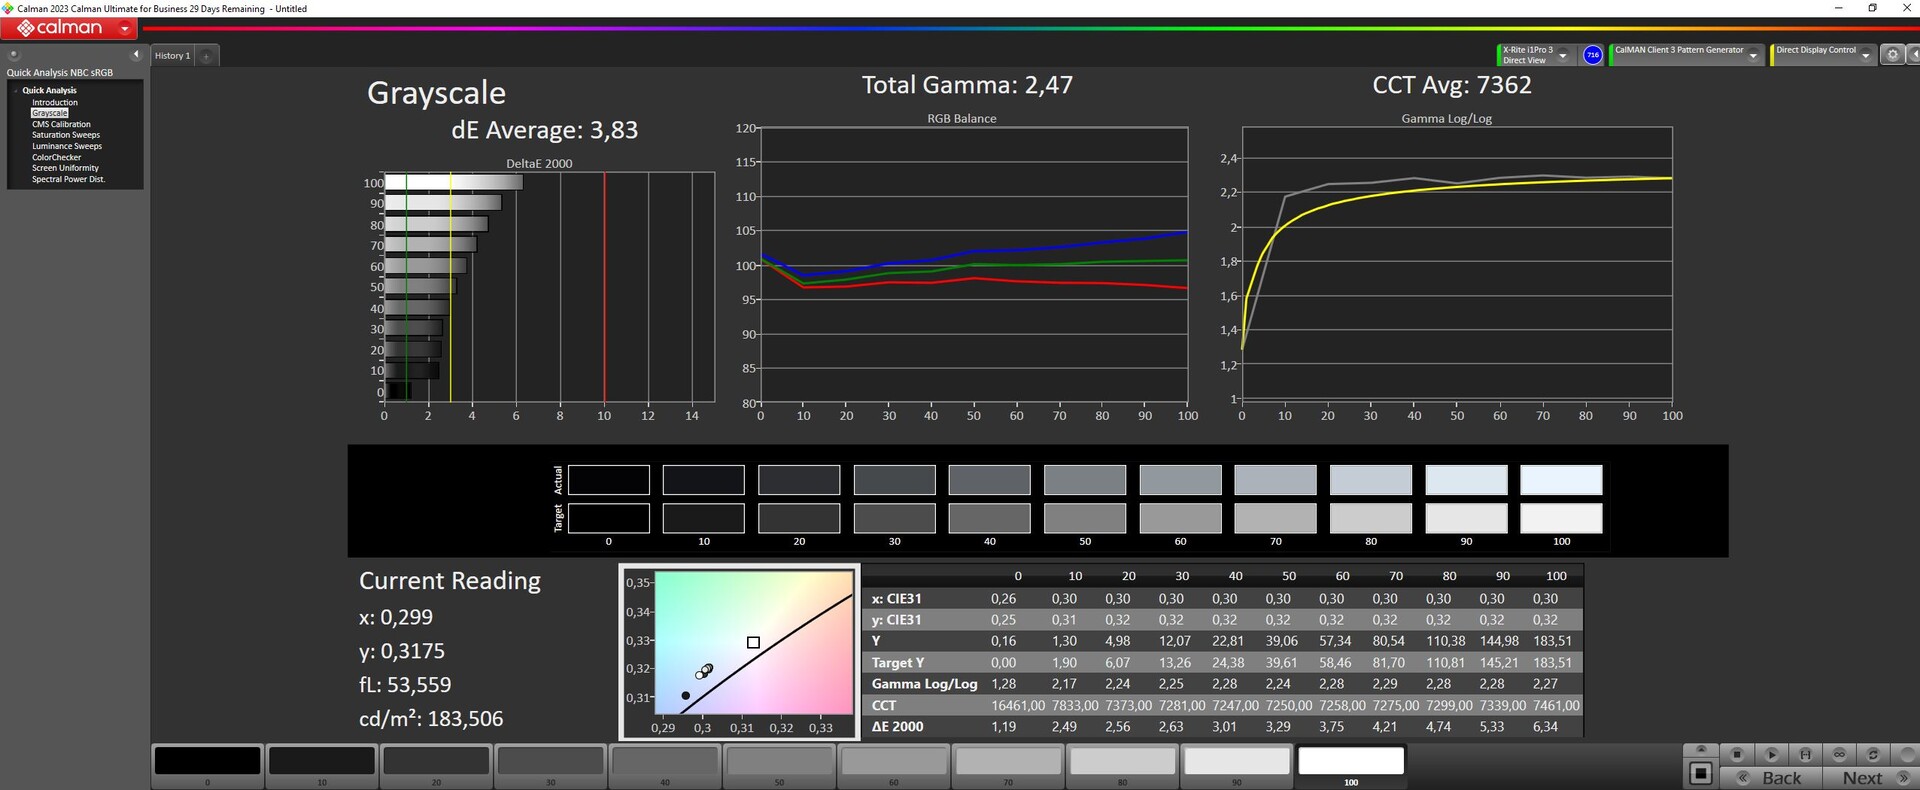
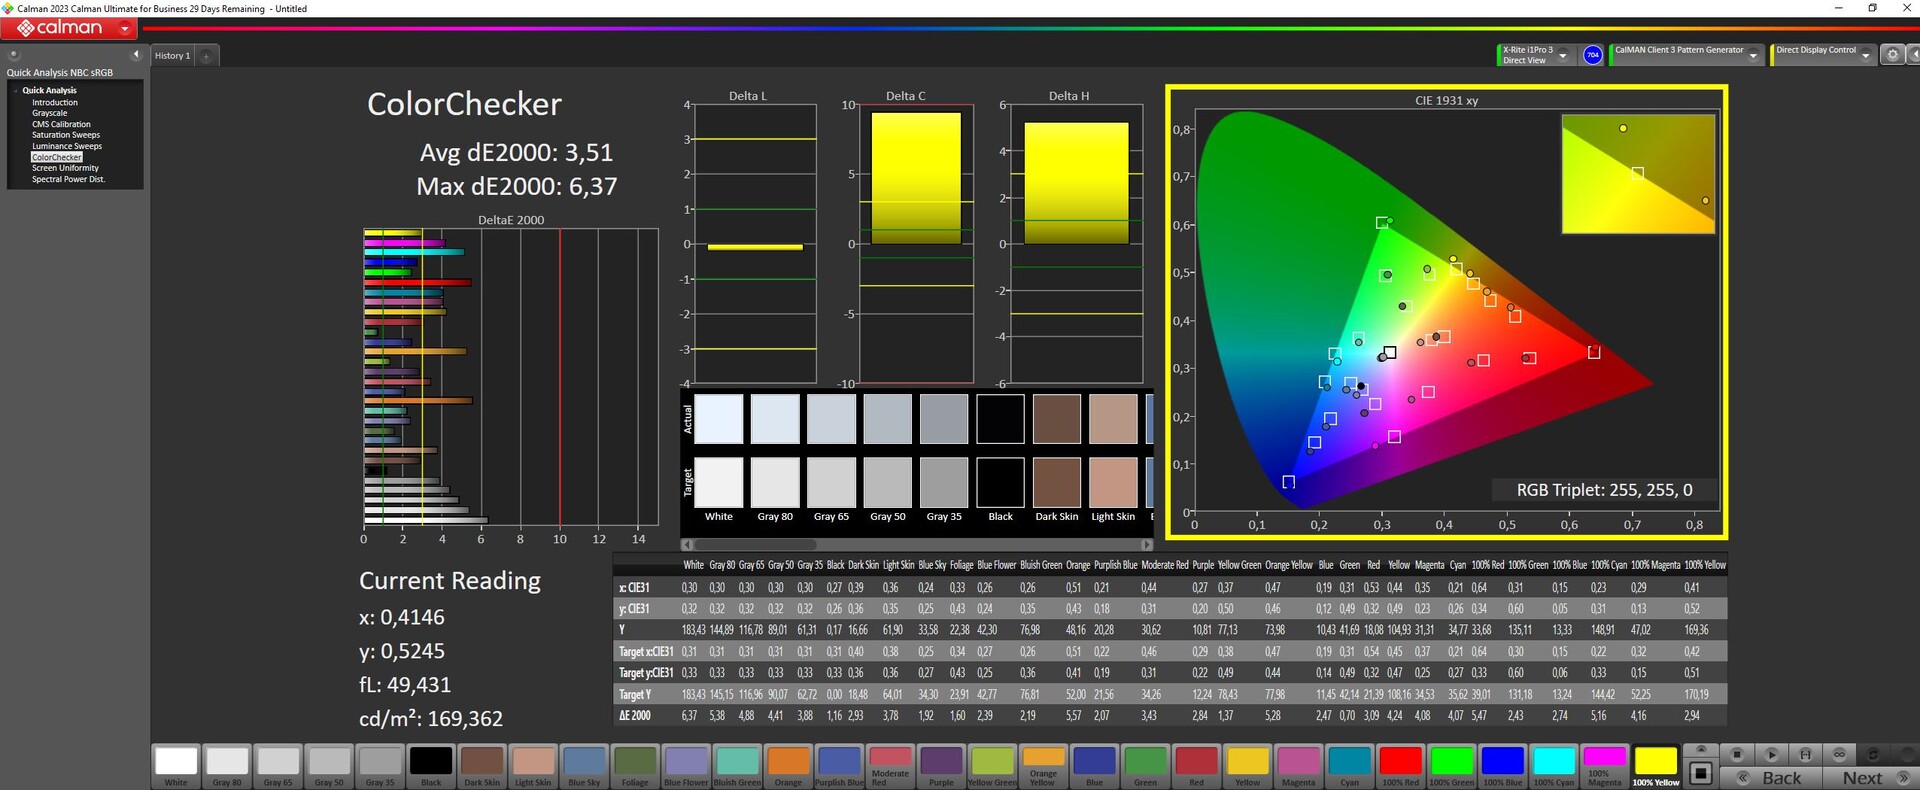
ΔE ColorChecker Calman: 3.51 | ∀{0.5-29.43 Ø4.71}
calibrated: 1.88
ΔE Greyscale Calman: 3.83 | ∀{0.09-98 Ø4.96}
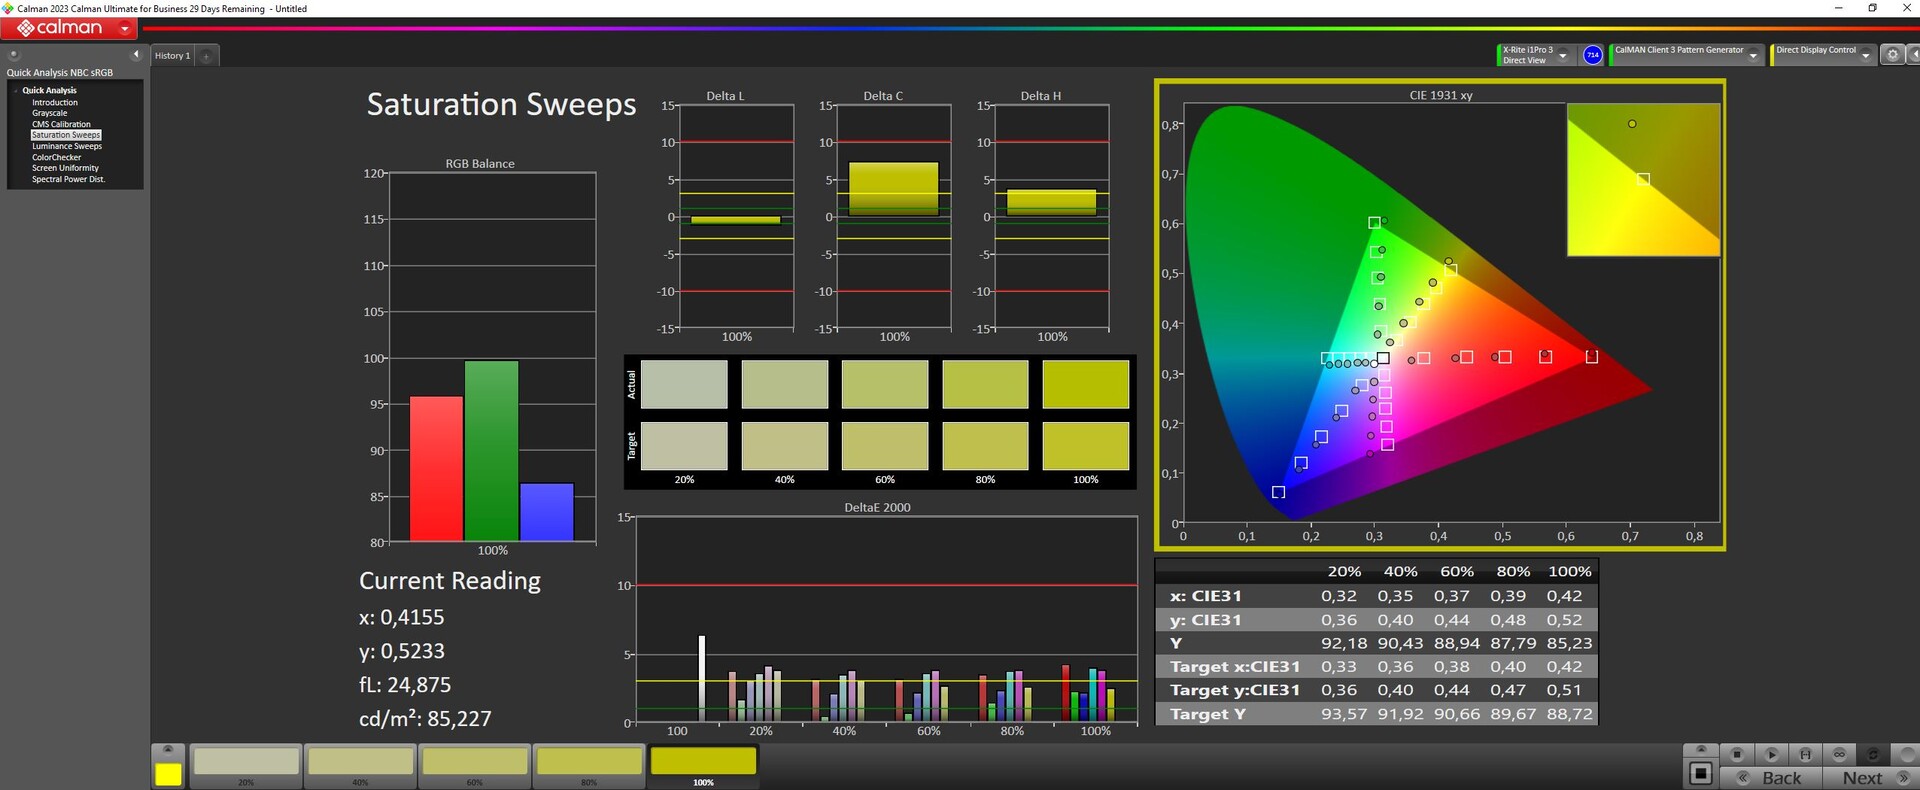
66.3% AdobeRGB 1998 (Argyll 3D)
92.6% sRGB (Argyll 3D)
64.9% Display P3 (Argyll 3D)
Gamma: 2.47
CCT: 7362 K
| Intel NUC X15 LAPAC71H BOE HF NV156FHM-N4G, IPS, 1920x1080, 15.6" | Asus TUF A15 FA507 N156HMA-GA1, IPS, 1920x1080, 15.6" | Gigabyte G5 KE Chi Mei N156HRA-EA1, IPS, 1920x1080, 15.6" | Dell Inspiron 16 Plus 7630 LG Philips 160WQ2, IPS, 2560x1600, 16" | Asus VivoBook Pro 16 Au Optronics B160QAN02.L, IPS, 2560x1600, 16" | MSI Cyborg 15 A12VF AU Optronics B156HAN15.1, IPS, 1920x1080, 15.6" | |
|---|---|---|---|---|---|---|
| Display | 1% | -36% | 8% | 30% | -34% | |
| Display P3 Coverage (%) | 64.9 | 64.9 0% | 40.7 -37% | 70.1 8% | 98.5 52% | 42.3 -35% |
| sRGB Coverage (%) | 92.6 | 96.5 4% | 61 -34% | 99.6 8% | 99.9 8% | 62.6 -32% |
| AdobeRGB 1998 Coverage (%) | 66.3 | 66.6 0% | 42.1 -37% | 72.3 9% | 86.1 30% | 43.7 -34% |
| Response Times | -238% | -199% | -291% | 32% | -137% | |
| Response Time Grey 50% / Grey 80% * (ms) | 7.8 ? | 30.4 ? -290% | 26.64 ? -242% | 35 ? -349% | 2 ? 74% | 22 ? -182% |
| Response Time Black / White * (ms) | 7.3 ? | 20.8 ? -185% | 18.65 ? -155% | 24.2 ? -232% | 8 ? -10% | 14 ? -92% |
| PWM Frequency (Hz) | ||||||
| Screen | 13% | -67% | -10% | 5% | -27% | |
| Brightness middle (cd/m²) | 365 | 288 -21% | 269 -26% | 299.4 -18% | 504 38% | 247 -32% |
| Brightness (cd/m²) | 356 | 271 -24% | 248 -30% | 290 -19% | 465 31% | 234 -34% |
| Brightness Distribution (%) | 86 | 91 6% | 85 -1% | 92 7% | 87 1% | 89 3% |
| Black Level * (cd/m²) | 0.17 | 0.17 -0% | 0.5 -194% | 0.21 -24% | 0.35 -106% | 0.25 -47% |
| Contrast (:1) | 2147 | 1694 -21% | 538 -75% | 1426 -34% | 1440 -33% | 988 -54% |
| Colorchecker dE 2000 * | 3.51 | 1.9 46% | 4.54 -29% | 4.25 -21% | 1.83 48% | 3.78 -8% |
| Colorchecker dE 2000 max. * | 6.37 | 3.3 48% | 17.28 -171% | 6.71 -5% | 5.51 14% | 6.42 -1% |
| Colorchecker dE 2000 calibrated * | 1.88 | 0.9 52% | 3.34 -78% | 0.52 72% | 1.34 29% | 3.94 -110% |
| Greyscale dE 2000 * | 3.83 | 2.7 30% | 3.8 1% | 5.5 -44% | 3.02 21% | 2.16 44% |
| Gamma | 2.47 89% | 2.32 95% | 2.17 101% | 2.35 94% | 2.39 92% | 2.33 94% |
| CCT | 7362 88% | 6535 99% | 7408 88% | 6368 102% | 6688 97% | 6906 94% |
| Média Total (Programa/Configurações) | -75% /
-25% | -101% /
-79% | -98% /
-46% | 22% /
14% | -66% /
-44% |
* ... menor é melhor
Quando o senhor trabalha, a tela mostra uma representação de cores relativamente boa: Com um desvio de cerca de 3,5, a meta (DeltaE < 3) não foi atingida por pouco. A calibração da tela reduz o desvio para 1,9 e resulta em tons de cinza mais equilibrados. O painel pode cobrir quase completamente o espaço de cores sRGB, mas não o AdobeRGB ou o DCI P3. A maioria dos painéis de seus concorrentes apresenta um quadro semelhante. Somente oVivoBookpode cobrir o espaço de cores P3.
Exibir tempos de resposta
| ↔ Tempo de resposta preto para branco | ||
|---|---|---|
| 7.3 ms ... ascensão ↗ e queda ↘ combinadas | ↗ 3.3 ms ascensão | 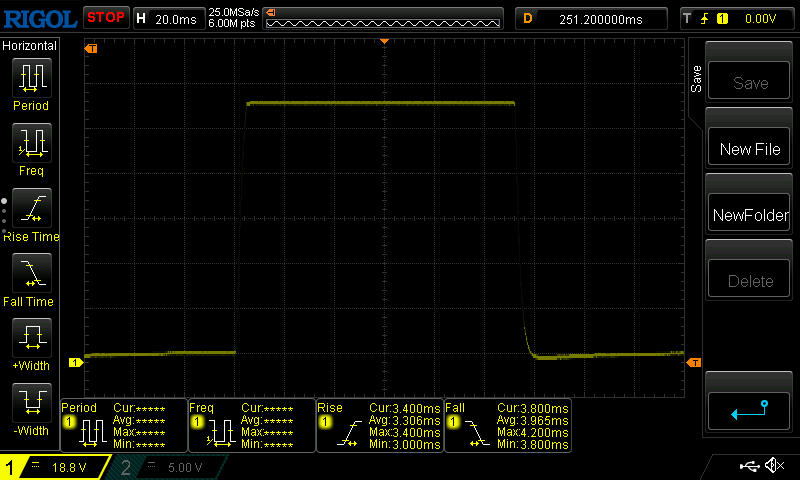 |
| ↘ 4 ms queda | ||
| A tela mostra taxas de resposta muito rápidas em nossos testes e deve ser muito adequada para jogos em ritmo acelerado. Em comparação, todos os dispositivos testados variam de 0.1 (mínimo) a 240 (máximo) ms. » 22 % de todos os dispositivos são melhores. Isso significa que o tempo de resposta medido é melhor que a média de todos os dispositivos testados (19.8 ms). | ||
| ↔ Tempo de resposta 50% cinza a 80% cinza | ||
| 7.8 ms ... ascensão ↗ e queda ↘ combinadas | ↗ 3.9 ms ascensão | 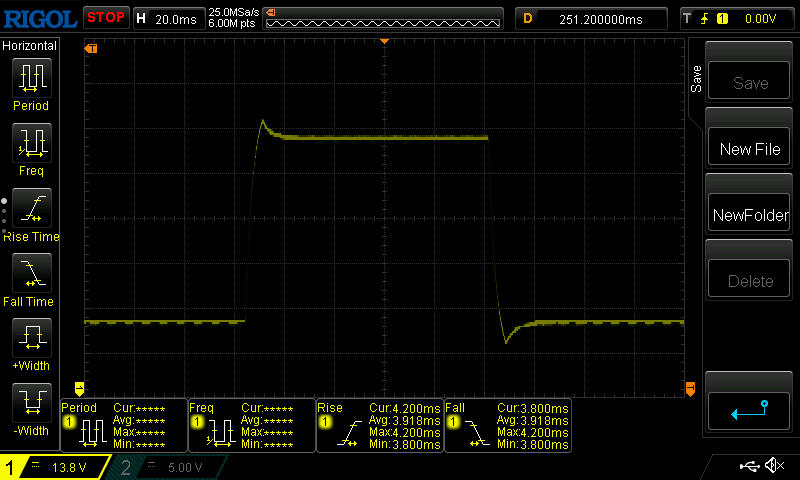 |
| ↘ 3.9 ms queda | ||
| A tela mostra taxas de resposta muito rápidas em nossos testes e deve ser muito adequada para jogos em ritmo acelerado. Em comparação, todos os dispositivos testados variam de 0.165 (mínimo) a 636 (máximo) ms. » 21 % de todos os dispositivos são melhores. Isso significa que o tempo de resposta medido é melhor que a média de todos os dispositivos testados (31 ms). | ||
Cintilação da tela / PWM (modulação por largura de pulso)
| Tela tremeluzindo / PWM não detectado |  | ||
[pwm_comparison] Em comparação: 52 % de todos os dispositivos testados não usam PWM para escurecer a tela. Se PWM foi detectado, uma média de 7757 (mínimo: 5 - máximo: 343500) Hz foi medida. | |||
O painel IPS estável em termos de ângulo de visão permanece legível de todos os ângulos. Ao ar livre, o senhor pode ler na tela, desde que o sol não esteja brilhando muito forte.

Desempenho - O laptop para jogos é alimentado por uma equipe da Intel
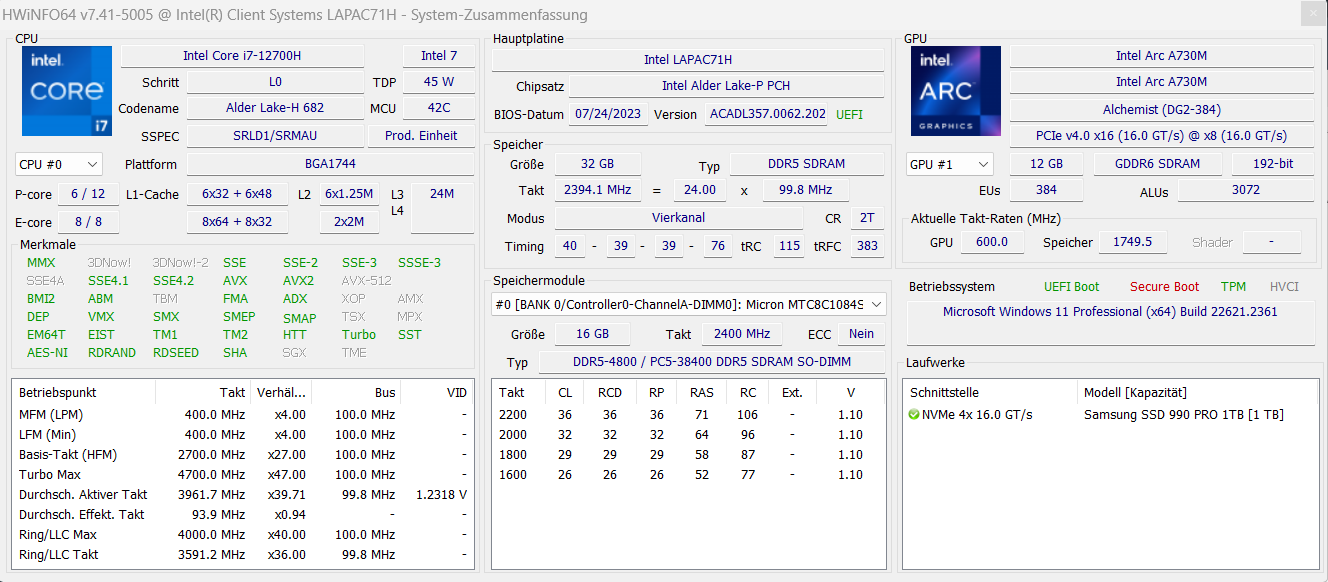
ACore i7-12700He Arc A730Malimentam o Intel NUC X15 LAPAC71H voltado para jogadores e criadores. Não há outras opções disponíveis. O laptop pode ser encontrado atualmente por cerca de US$ 1.050. A variante atual custa cerca de US$ 1.280. É possível que o senhor tenha que levar em conta os custos adicionais para uma licença do Windows.
Condições de teste
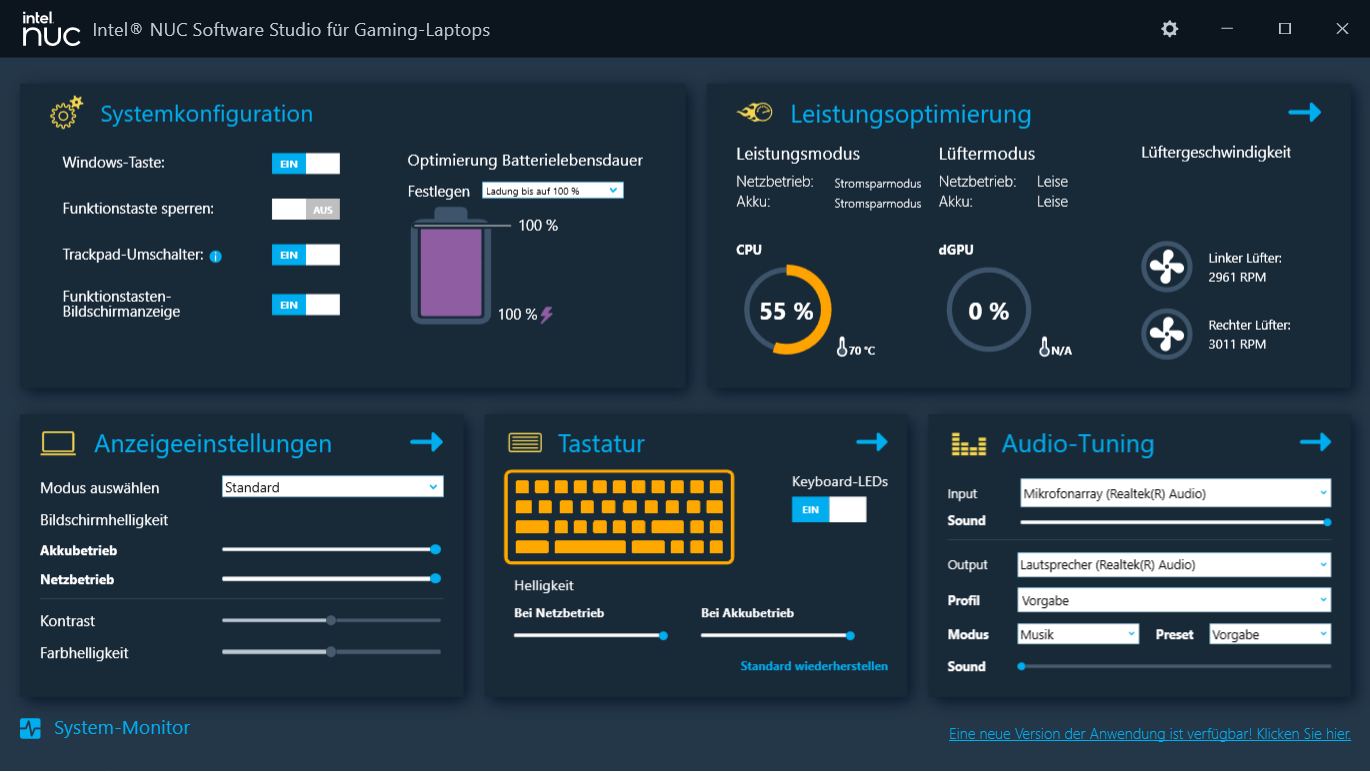
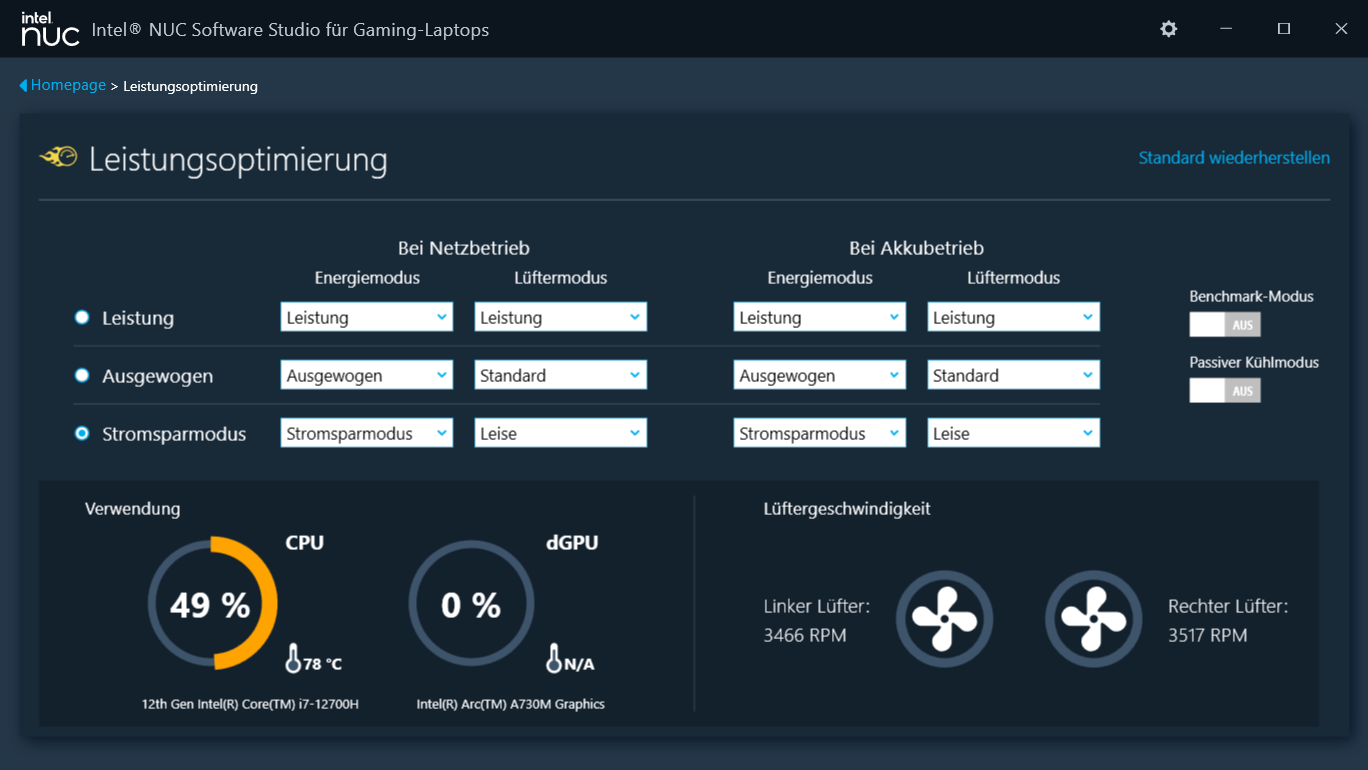
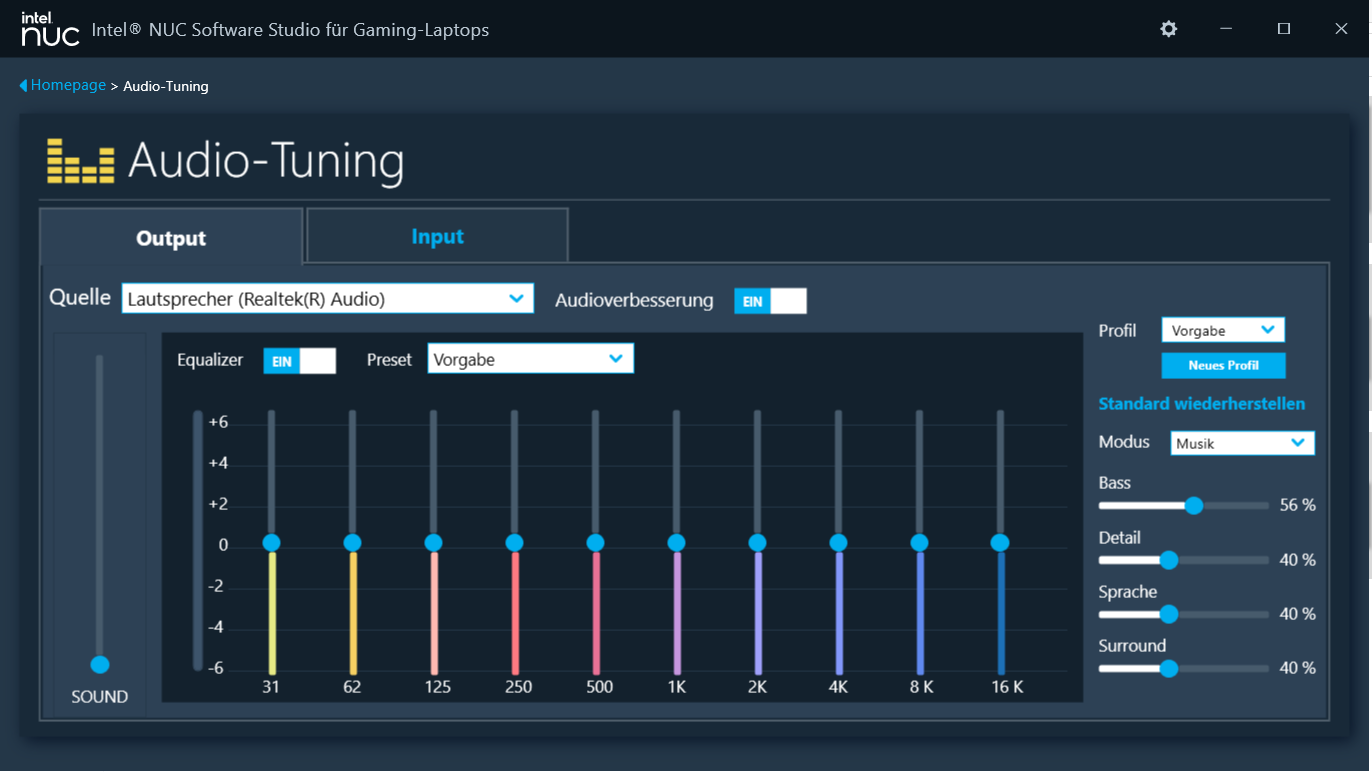
O Intel NUC Software Studio (Control Center) oferece três perfis para influenciar o desempenho e o controle da ventoinha (consulte a tabela). Os perfis "Performance" (benchmarks) e "Power Saving Mode" (testes de bateria) foram usados para realizar este teste. Seu desempenho máximo só está disponível após a ativação da opção "Benchmark Mode". No entanto, os ventiladores também funcionam permanentemente na potência máxima.
| Desempenho | Balanceado | Modo de economia de energia | Modo de referência | |
|---|---|---|---|---|
| Limite de energia 1 (HWInfo) | 45 watts | 35 watts | 35 watts | 45 watts |
| Limite de energia 2 (HWInfo) | 90 watts | 80 watts | 65 watts | 90 watts |
| TGP (Controle de arco) | 75 watts | 65 watts | 55 watts | 85 watts |
Processador
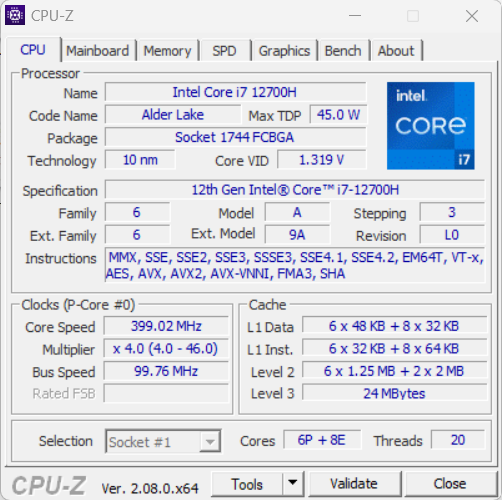
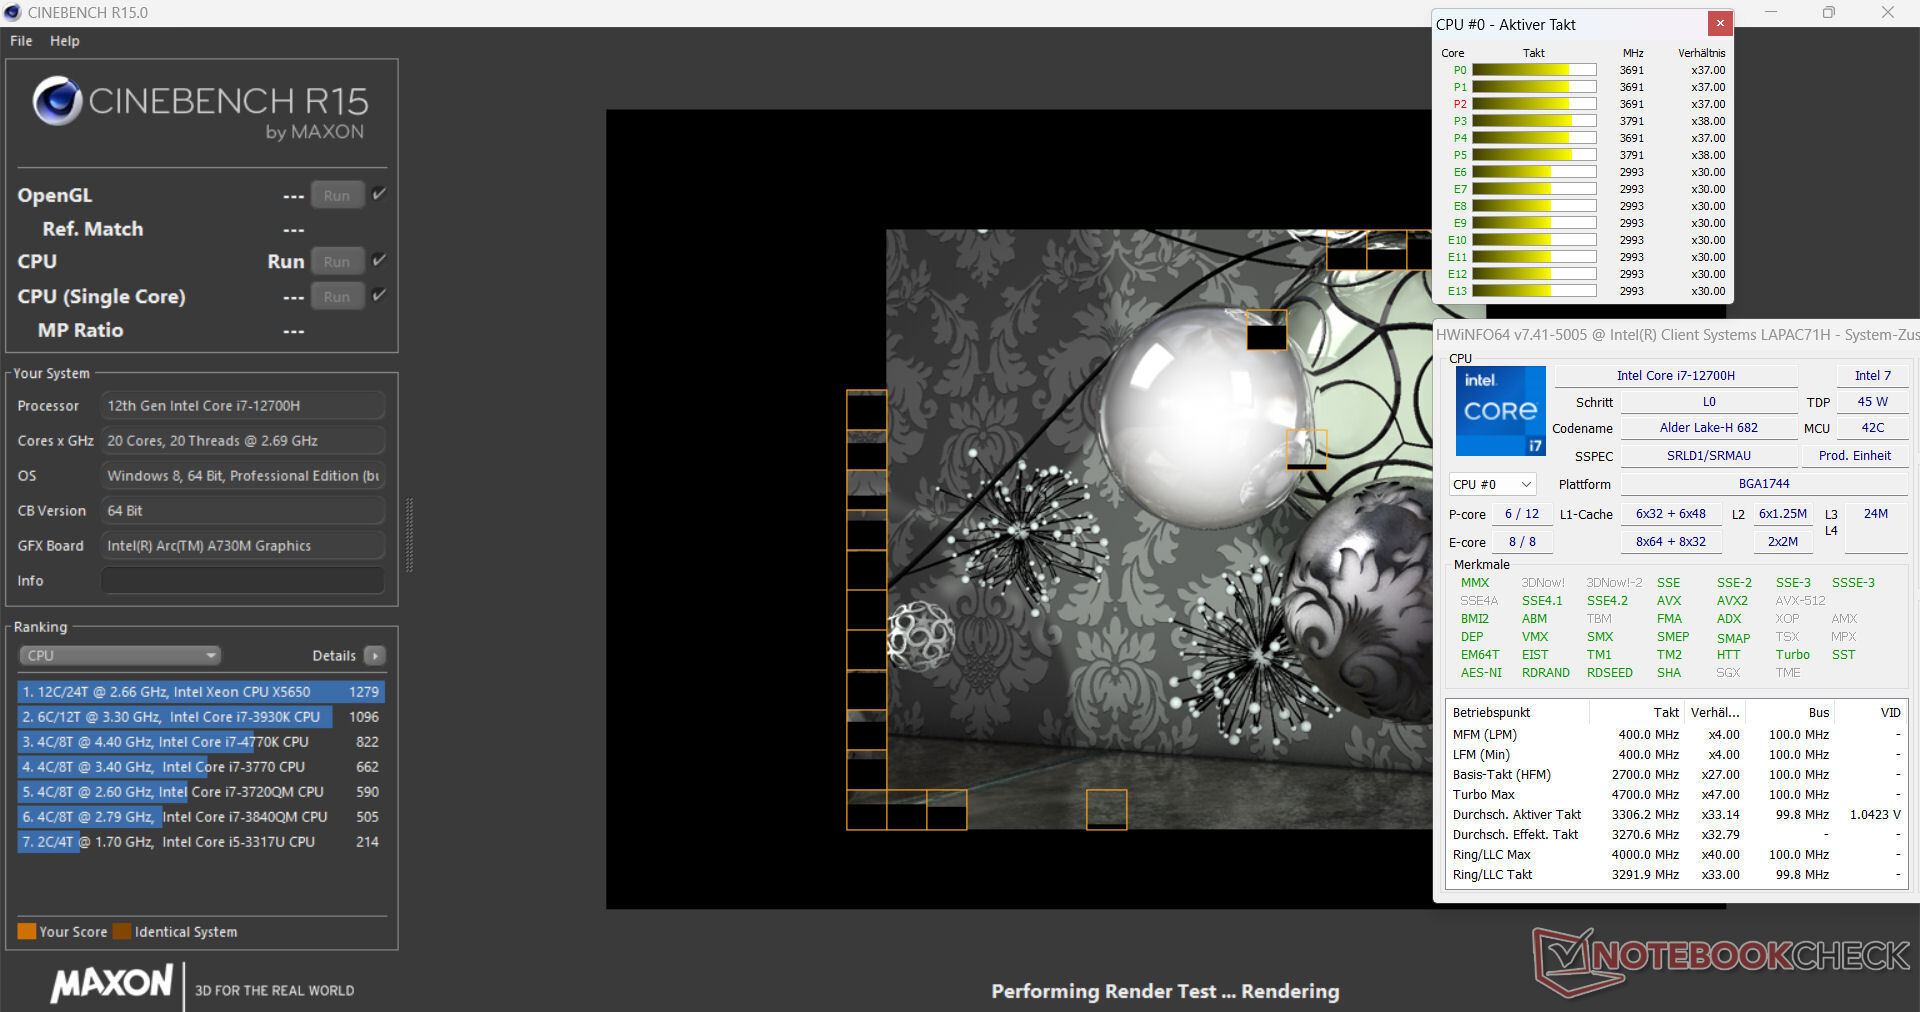
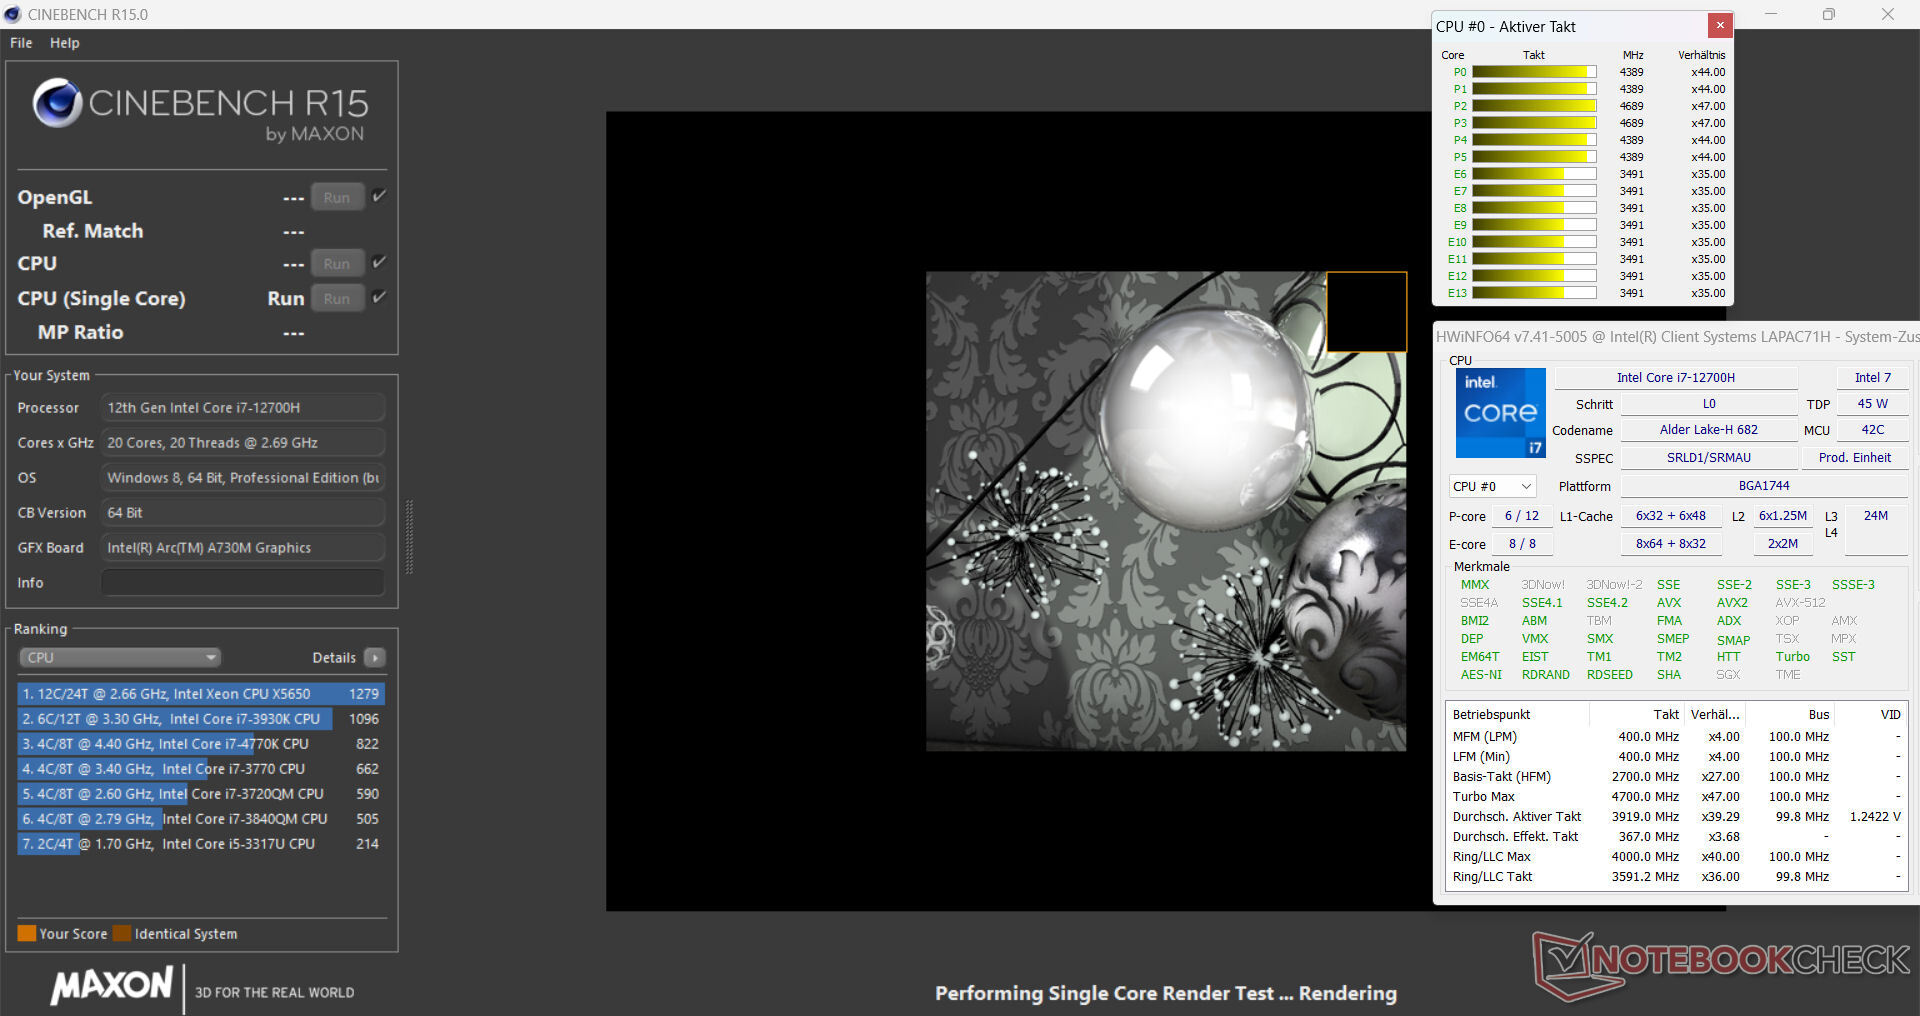
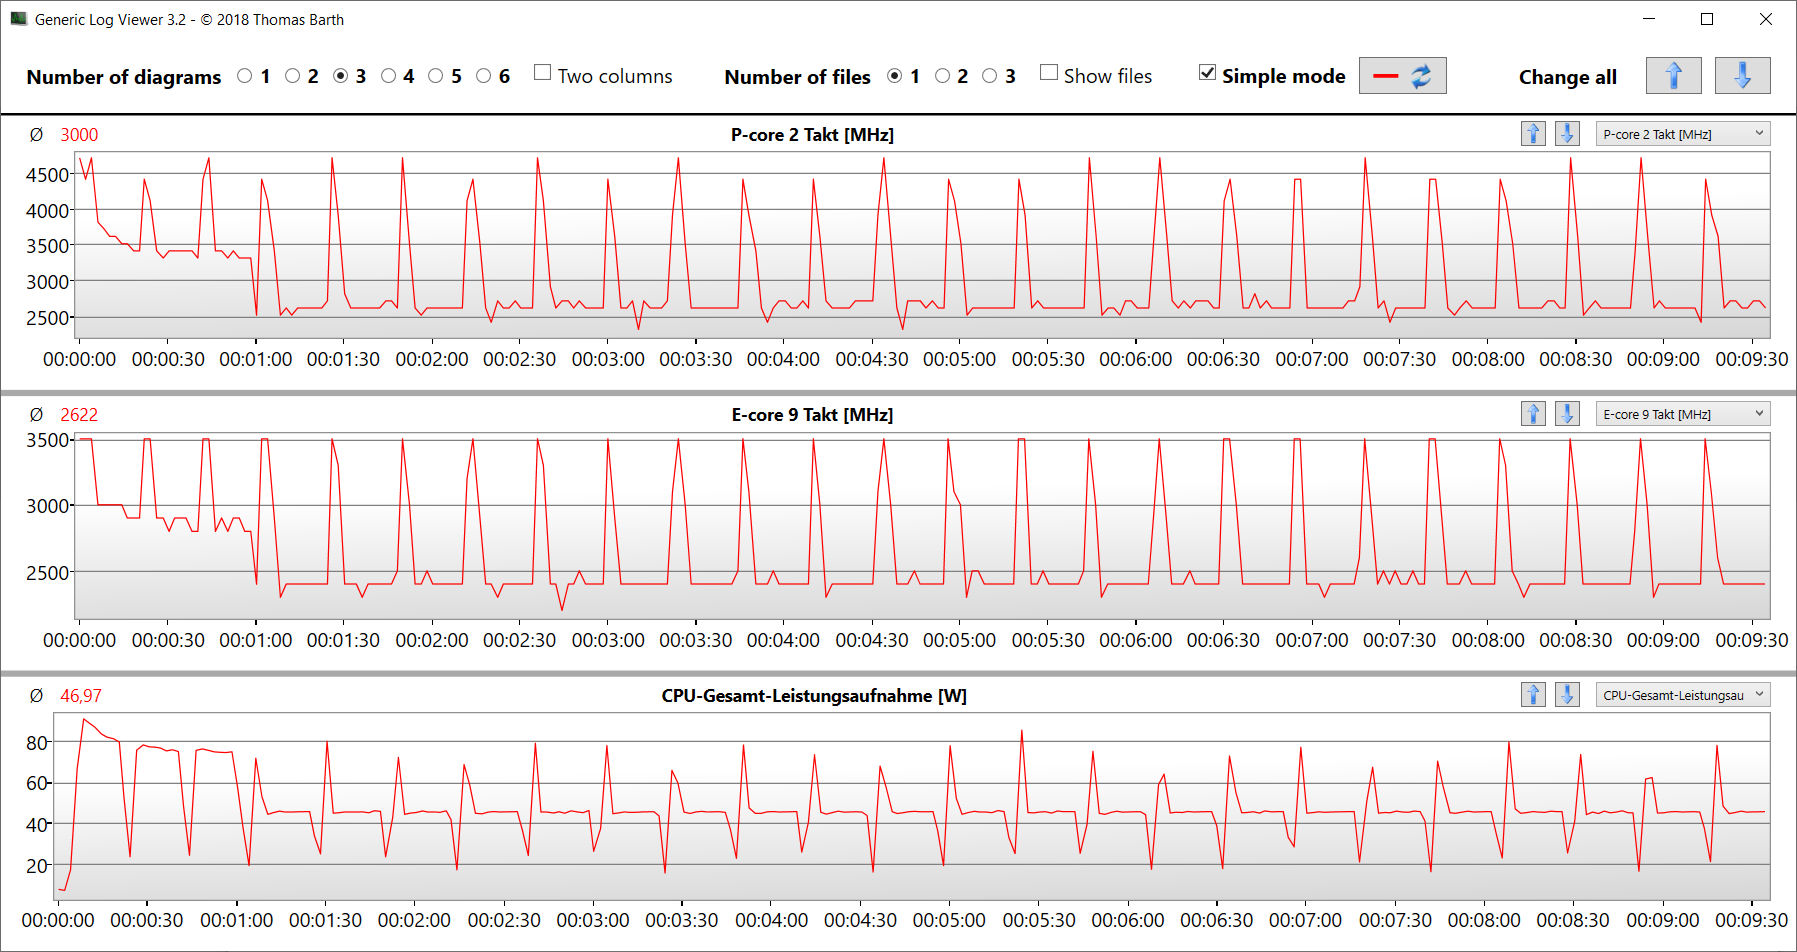
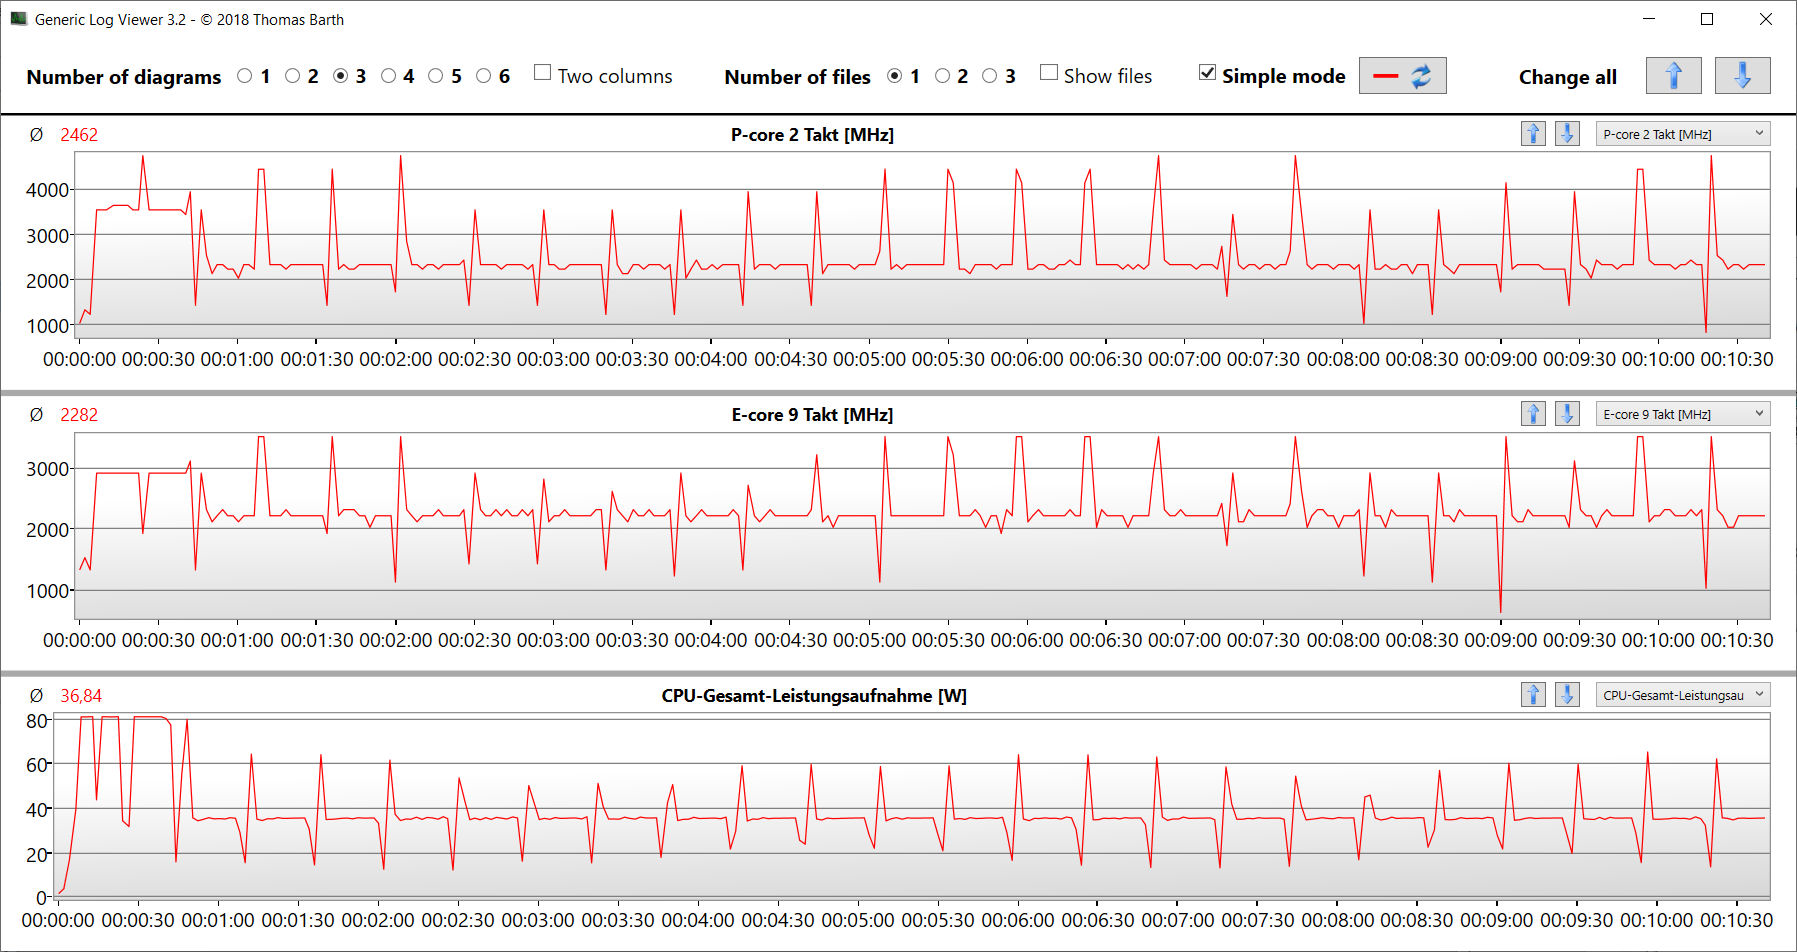
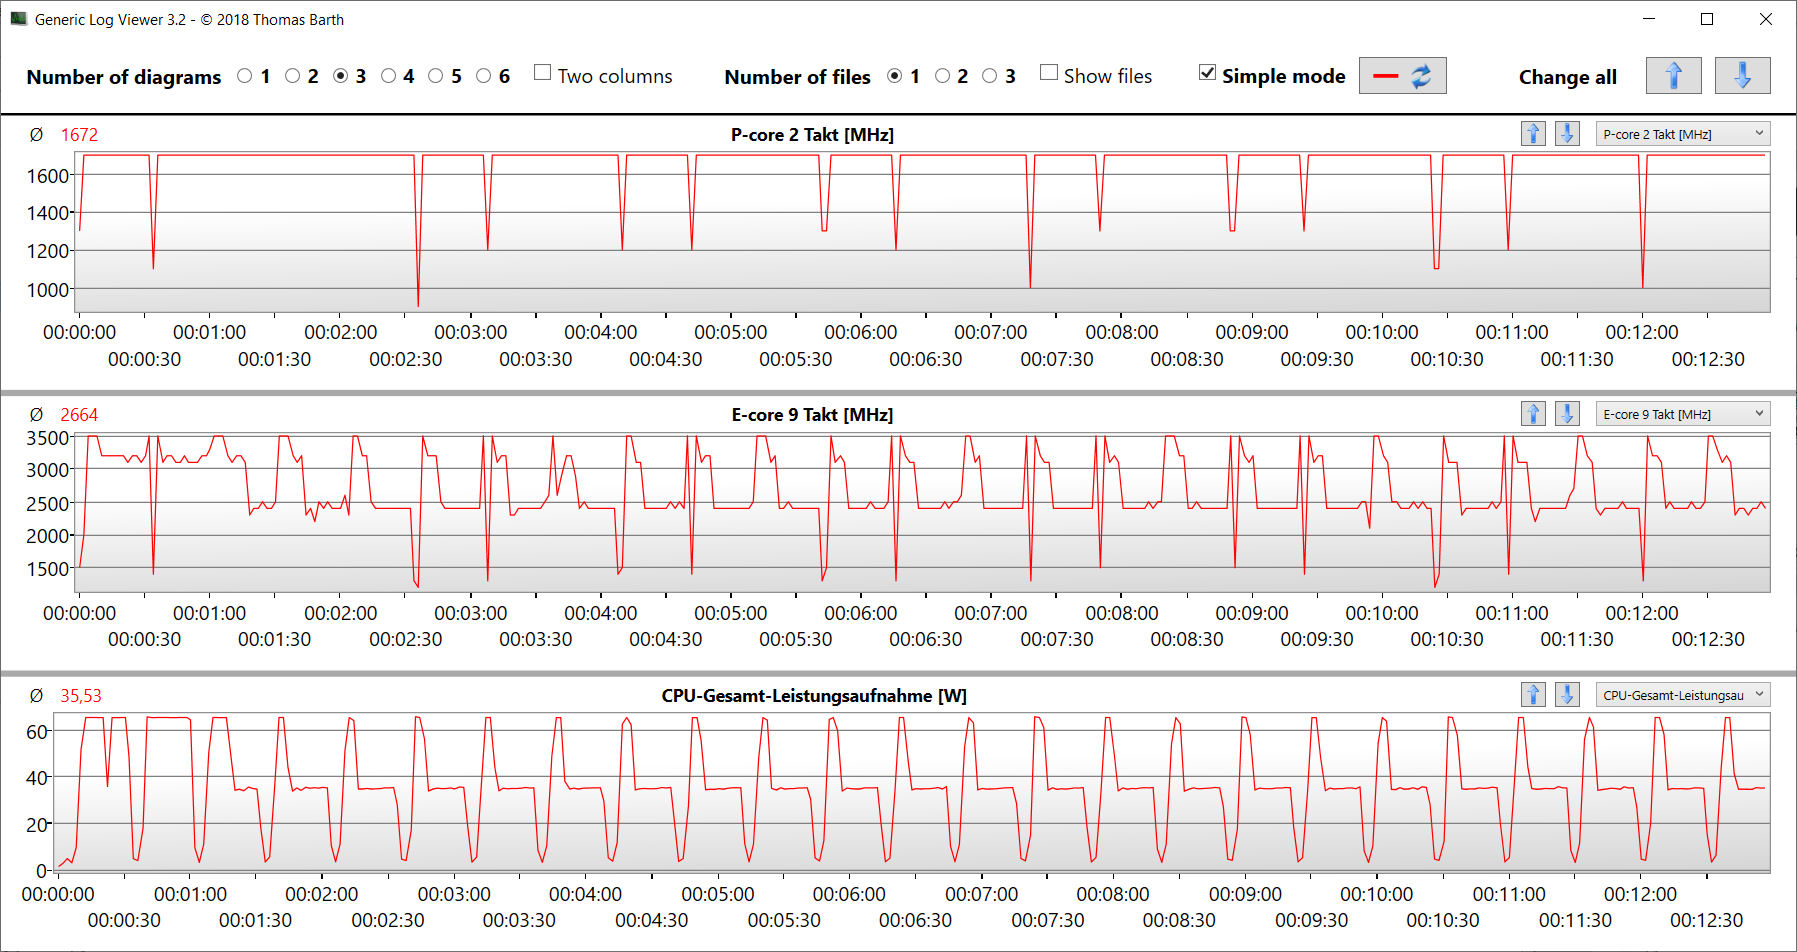
Os 14 núcleos de CPU do Core i7-12700H (6P, 8E) atingem taxas de clock máximas de 4,7 GHz (P) e 3,5 GHz (E). O desempenho contínuo de vários threads (CB15 Loop) levou o clock turbo a diminuir da primeira para a segunda execução. Depois disso, ele permaneceu estável.
Os resultados do benchmark ficaram ligeiramente acima da média da CPU quando conectado à rede elétrica. No modo de bateria, seu desempenho single-thread mais relevante (213 pontos) caiu menos do que seu desempenho multi-thread (1.012 pontos).
Cinebench R15 Multi continuous test
* ... menor é melhor
AIDA64: FP32 Ray-Trace | FPU Julia | CPU SHA3 | CPU Queen | FPU SinJulia | FPU Mandel | CPU AES | CPU ZLib | FP64 Ray-Trace | CPU PhotoWorxx
| Performance rating | |
| Média da turma Multimedia | |
| Asus TUF A15 FA507 | |
| Intel NUC X15 LAPAC71H | |
| Dell Inspiron 16 Plus 7630 | |
| Gigabyte G5 KE | |
| Asus VivoBook Pro 16 | |
| MSI Cyborg 15 A12VF | |
| Média Intel Core i7-12700H | |
| AIDA64 / FP32 Ray-Trace | |
| Média da turma Multimedia (2214 - 50388, n=53, últimos 2 anos) | |
| Asus TUF A15 FA507 | |
| Asus VivoBook Pro 16 | |
| Dell Inspiron 16 Plus 7630 | |
| Intel NUC X15 LAPAC71H | |
| MSI Cyborg 15 A12VF | |
| Gigabyte G5 KE | |
| Média Intel Core i7-12700H (2585 - 17957, n=64) | |
| AIDA64 / FPU Julia | |
| Asus TUF A15 FA507 | |
| Média da turma Multimedia (12867 - 201874, n=54, últimos 2 anos) | |
| Asus VivoBook Pro 16 | |
| MSI Cyborg 15 A12VF | |
| Dell Inspiron 16 Plus 7630 | |
| Gigabyte G5 KE | |
| Intel NUC X15 LAPAC71H | |
| Média Intel Core i7-12700H (12439 - 90760, n=64) | |
| AIDA64 / CPU SHA3 | |
| Média da turma Multimedia (626 - 8623, n=54, últimos 2 anos) | |
| Asus TUF A15 FA507 | |
| Asus VivoBook Pro 16 | |
| Gigabyte G5 KE | |
| Média Intel Core i7-12700H (833 - 4242, n=64) | |
| Dell Inspiron 16 Plus 7630 | |
| Intel NUC X15 LAPAC71H | |
| MSI Cyborg 15 A12VF | |
| AIDA64 / CPU Queen | |
| Dell Inspiron 16 Plus 7630 | |
| Asus TUF A15 FA507 | |
| Asus VivoBook Pro 16 | |
| Intel NUC X15 LAPAC71H | |
| Média Intel Core i7-12700H (57923 - 103202, n=63) | |
| MSI Cyborg 15 A12VF | |
| Gigabyte G5 KE | |
| Média da turma Multimedia (13483 - 181505, n=41, últimos 2 anos) | |
| AIDA64 / FPU SinJulia | |
| Asus TUF A15 FA507 | |
| Média Intel Core i7-12700H (3249 - 9939, n=64) | |
| Asus VivoBook Pro 16 | |
| Dell Inspiron 16 Plus 7630 | |
| Média da turma Multimedia (886 - 28794, n=54, últimos 2 anos) | |
| MSI Cyborg 15 A12VF | |
| Intel NUC X15 LAPAC71H | |
| Gigabyte G5 KE | |
| AIDA64 / FPU Mandel | |
| Asus TUF A15 FA507 | |
| Média da turma Multimedia (6395 - 105740, n=53, últimos 2 anos) | |
| Asus VivoBook Pro 16 | |
| Dell Inspiron 16 Plus 7630 | |
| Gigabyte G5 KE | |
| Intel NUC X15 LAPAC71H | |
| MSI Cyborg 15 A12VF | |
| Média Intel Core i7-12700H (7135 - 44760, n=64) | |
| AIDA64 / CPU AES | |
| Intel NUC X15 LAPAC71H | |
| Gigabyte G5 KE | |
| Média Intel Core i7-12700H (31839 - 144360, n=64) | |
| Asus TUF A15 FA507 | |
| Asus VivoBook Pro 16 | |
| MSI Cyborg 15 A12VF | |
| Média da turma Multimedia (8171 - 126790, n=54, últimos 2 anos) | |
| Dell Inspiron 16 Plus 7630 | |
| AIDA64 / CPU ZLib | |
| Média da turma Multimedia (143.8 - 2022, n=54, últimos 2 anos) | |
| Média Intel Core i7-12700H (305 - 1171, n=64) | |
| Asus VivoBook Pro 16 | |
| Gigabyte G5 KE | |
| MSI Cyborg 15 A12VF | |
| Intel NUC X15 LAPAC71H | |
| Dell Inspiron 16 Plus 7630 | |
| Asus TUF A15 FA507 | |
| AIDA64 / FP64 Ray-Trace | |
| Média da turma Multimedia (1014 - 26875, n=54, últimos 2 anos) | |
| Asus TUF A15 FA507 | |
| Asus VivoBook Pro 16 | |
| Dell Inspiron 16 Plus 7630 | |
| Gigabyte G5 KE | |
| Intel NUC X15 LAPAC71H | |
| MSI Cyborg 15 A12VF | |
| Média Intel Core i7-12700H (1437 - 9692, n=64) | |
| AIDA64 / CPU PhotoWorxx | |
| Média da turma Multimedia (8187 - 88154, n=54, últimos 2 anos) | |
| Intel NUC X15 LAPAC71H | |
| Dell Inspiron 16 Plus 7630 | |
| MSI Cyborg 15 A12VF | |
| Média Intel Core i7-12700H (12863 - 52207, n=64) | |
| Gigabyte G5 KE | |
| Asus TUF A15 FA507 | |
| Asus VivoBook Pro 16 | |
Desempenho do sistema
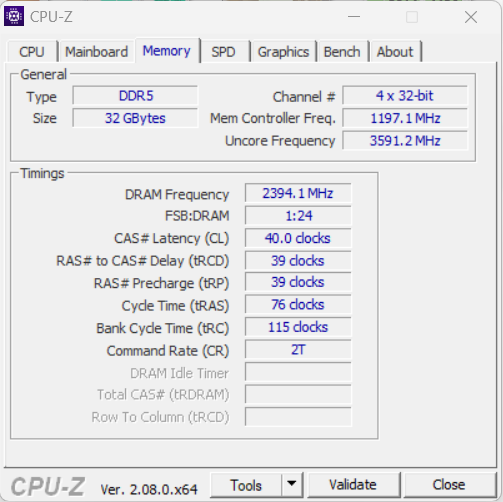
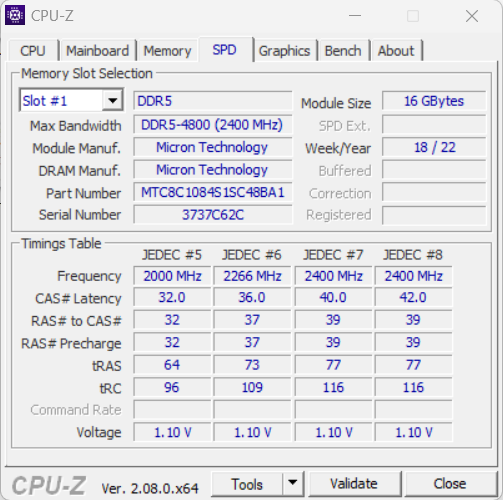
O sistema de funcionamento suave não carece de potência de computação. O laptop lida com jogos, streaming e renderização sem nenhum problema. As taxas de transferência da RAM estão em um nível normal para a RAM DDR5-4800.
CrossMark: Overall | Productivity | Creativity | Responsiveness
| PCMark 10 / Score | |
| Média da turma Multimedia (4325 - 10386, n=52, últimos 2 anos) | |
| Dell Inspiron 16 Plus 7630 | |
| Asus TUF A15 FA507 | |
| Gigabyte G5 KE | |
| MSI Cyborg 15 A12VF | |
| Intel NUC X15 LAPAC71H | |
| Média Intel Core i7-12700H, Intel Arc A730M (6830 - 6845, n=2) | |
| Asus VivoBook Pro 16 | |
| PCMark 10 / Essentials | |
| Dell Inspiron 16 Plus 7630 | |
| Gigabyte G5 KE | |
| Média Intel Core i7-12700H, Intel Arc A730M (10529 - 11116, n=2) | |
| MSI Cyborg 15 A12VF | |
| Asus TUF A15 FA507 | |
| Intel NUC X15 LAPAC71H | |
| Média da turma Multimedia (8025 - 11664, n=51, últimos 2 anos) | |
| Asus VivoBook Pro 16 | |
| PCMark 10 / Productivity | |
| Média da turma Multimedia (7323 - 18233, n=51, últimos 2 anos) | |
| MSI Cyborg 15 A12VF | |
| Gigabyte G5 KE | |
| Dell Inspiron 16 Plus 7630 | |
| Asus TUF A15 FA507 | |
| Asus VivoBook Pro 16 | |
| Média Intel Core i7-12700H, Intel Arc A730M (7070 - 7260, n=2) | |
| Intel NUC X15 LAPAC71H | |
| PCMark 10 / Digital Content Creation | |
| Intel NUC X15 LAPAC71H | |
| Dell Inspiron 16 Plus 7630 | |
| Média Intel Core i7-12700H, Intel Arc A730M (10714 - 11691, n=2) | |
| Média da turma Multimedia (3651 - 16240, n=51, últimos 2 anos) | |
| Asus TUF A15 FA507 | |
| Gigabyte G5 KE | |
| Asus VivoBook Pro 16 | |
| MSI Cyborg 15 A12VF | |
| CrossMark / Overall | |
| Intel NUC X15 LAPAC71H | |
| Média Intel Core i7-12700H, Intel Arc A730M (n=1) | |
| Média da turma Multimedia (866 - 2728, n=60, últimos 2 anos) | |
| Dell Inspiron 16 Plus 7630 | |
| MSI Cyborg 15 A12VF | |
| Gigabyte G5 KE | |
| Asus VivoBook Pro 16 | |
| Asus TUF A15 FA507 | |
| CrossMark / Productivity | |
| Intel NUC X15 LAPAC71H | |
| Média Intel Core i7-12700H, Intel Arc A730M (n=1) | |
| Média da turma Multimedia (931 - 2489, n=60, últimos 2 anos) | |
| Dell Inspiron 16 Plus 7630 | |
| Gigabyte G5 KE | |
| MSI Cyborg 15 A12VF | |
| Asus VivoBook Pro 16 | |
| Asus TUF A15 FA507 | |
| CrossMark / Creativity | |
| Média da turma Multimedia (907 - 3465, n=60, últimos 2 anos) | |
| Dell Inspiron 16 Plus 7630 | |
| Intel NUC X15 LAPAC71H | |
| Média Intel Core i7-12700H, Intel Arc A730M (n=1) | |
| MSI Cyborg 15 A12VF | |
| Gigabyte G5 KE | |
| Asus TUF A15 FA507 | |
| Asus VivoBook Pro 16 | |
| CrossMark / Responsiveness | |
| Intel NUC X15 LAPAC71H | |
| Média Intel Core i7-12700H, Intel Arc A730M (n=1) | |
| Gigabyte G5 KE | |
| Asus VivoBook Pro 16 | |
| MSI Cyborg 15 A12VF | |
| Dell Inspiron 16 Plus 7630 | |
| Média da turma Multimedia (605 - 2024, n=60, últimos 2 anos) | |
| Asus TUF A15 FA507 | |
| PCMark 10 Score | 6845 pontos | |
Ajuda | ||
| AIDA64 / Memory Copy | |
| Média da turma Multimedia (11299 - 132135, n=54, últimos 2 anos) | |
| Intel NUC X15 LAPAC71H | |
| Dell Inspiron 16 Plus 7630 | |
| MSI Cyborg 15 A12VF | |
| Média Intel Core i7-12700H (25615 - 80511, n=64) | |
| Asus TUF A15 FA507 | |
| Gigabyte G5 KE | |
| Asus VivoBook Pro 16 | |
| AIDA64 / Memory Read | |
| Média da turma Multimedia (11624 - 174586, n=54, últimos 2 anos) | |
| Dell Inspiron 16 Plus 7630 | |
| Intel NUC X15 LAPAC71H | |
| MSI Cyborg 15 A12VF | |
| Média Intel Core i7-12700H (25586 - 79442, n=64) | |
| Asus TUF A15 FA507 | |
| Gigabyte G5 KE | |
| Asus VivoBook Pro 16 | |
| AIDA64 / Memory Write | |
| Média da turma Multimedia (11755 - 134998, n=54, últimos 2 anos) | |
| Intel NUC X15 LAPAC71H | |
| Dell Inspiron 16 Plus 7630 | |
| MSI Cyborg 15 A12VF | |
| Asus TUF A15 FA507 | |
| Média Intel Core i7-12700H (23679 - 88660, n=64) | |
| Gigabyte G5 KE | |
| Asus VivoBook Pro 16 | |
| AIDA64 / Memory Latency | |
| Média da turma Multimedia (7 - 535, n=53, últimos 2 anos) | |
| Gigabyte G5 KE | |
| Dell Inspiron 16 Plus 7630 | |
| Asus VivoBook Pro 16 | |
| MSI Cyborg 15 A12VF | |
| Intel NUC X15 LAPAC71H | |
| Asus TUF A15 FA507 | |
| Média Intel Core i7-12700H (76.2 - 133.9, n=62) | |
* ... menor é melhor
Latência DPC
O teste padronizado do monitor de latência (navegação na Web, reprodução de vídeo 4k, alta carga do Prime95) não revelou nenhuma anormalidade. O sistema parece ser adequado para edição de vídeo e áudio em tempo real. Futuras atualizações de software podem levar a melhorias ou até mesmo a degradações.
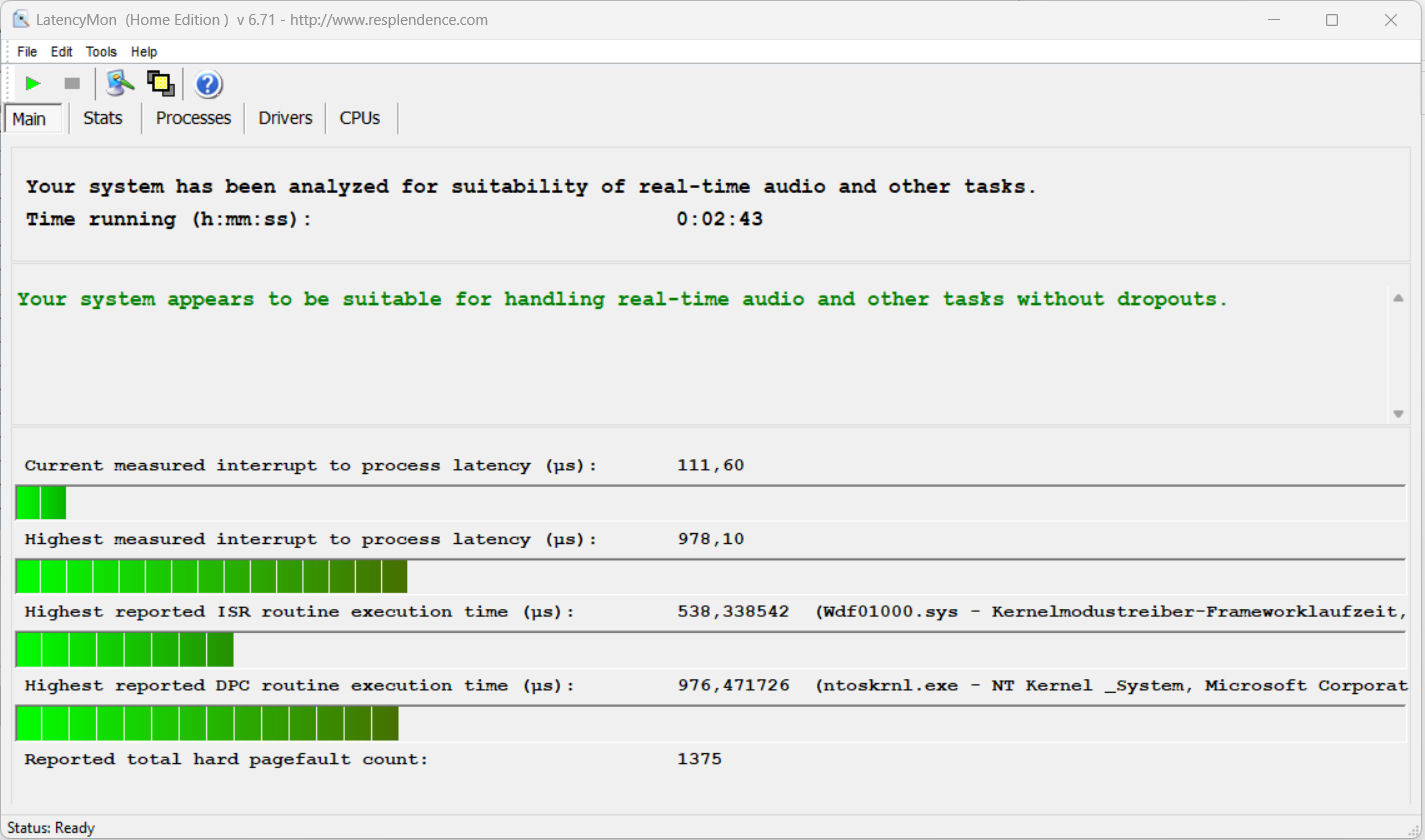
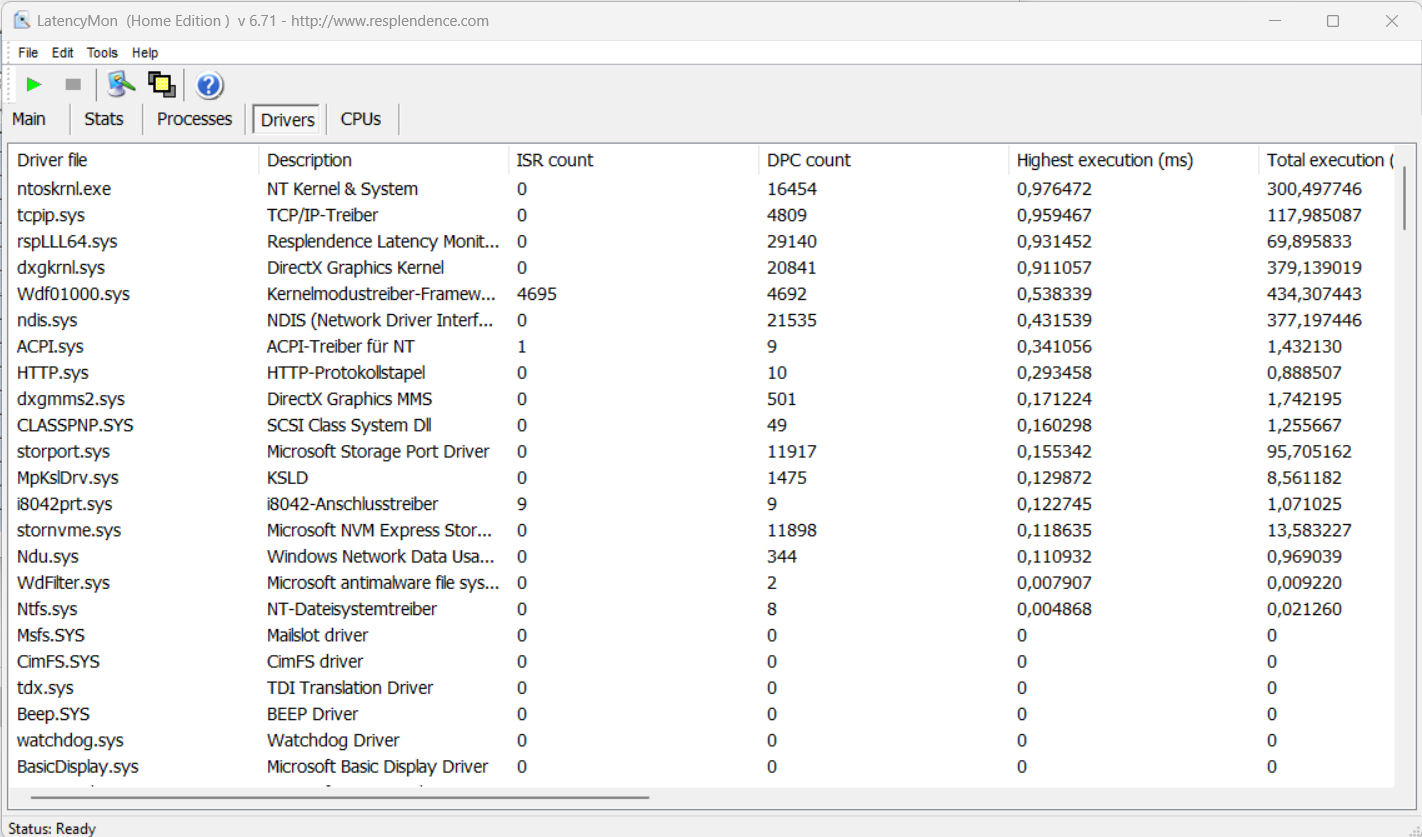
| DPC Latencies / LatencyMon - interrupt to process latency (max), Web, Youtube, Prime95 | |
| Asus VivoBook Pro 16 | |
| MSI Cyborg 15 A12VF | |
| Dell Inspiron 16 Plus 7630 | |
| Gigabyte G5 KE | |
| Intel NUC X15 LAPAC71H | |
* ... menor é melhor
Dispositivos de armazenamento
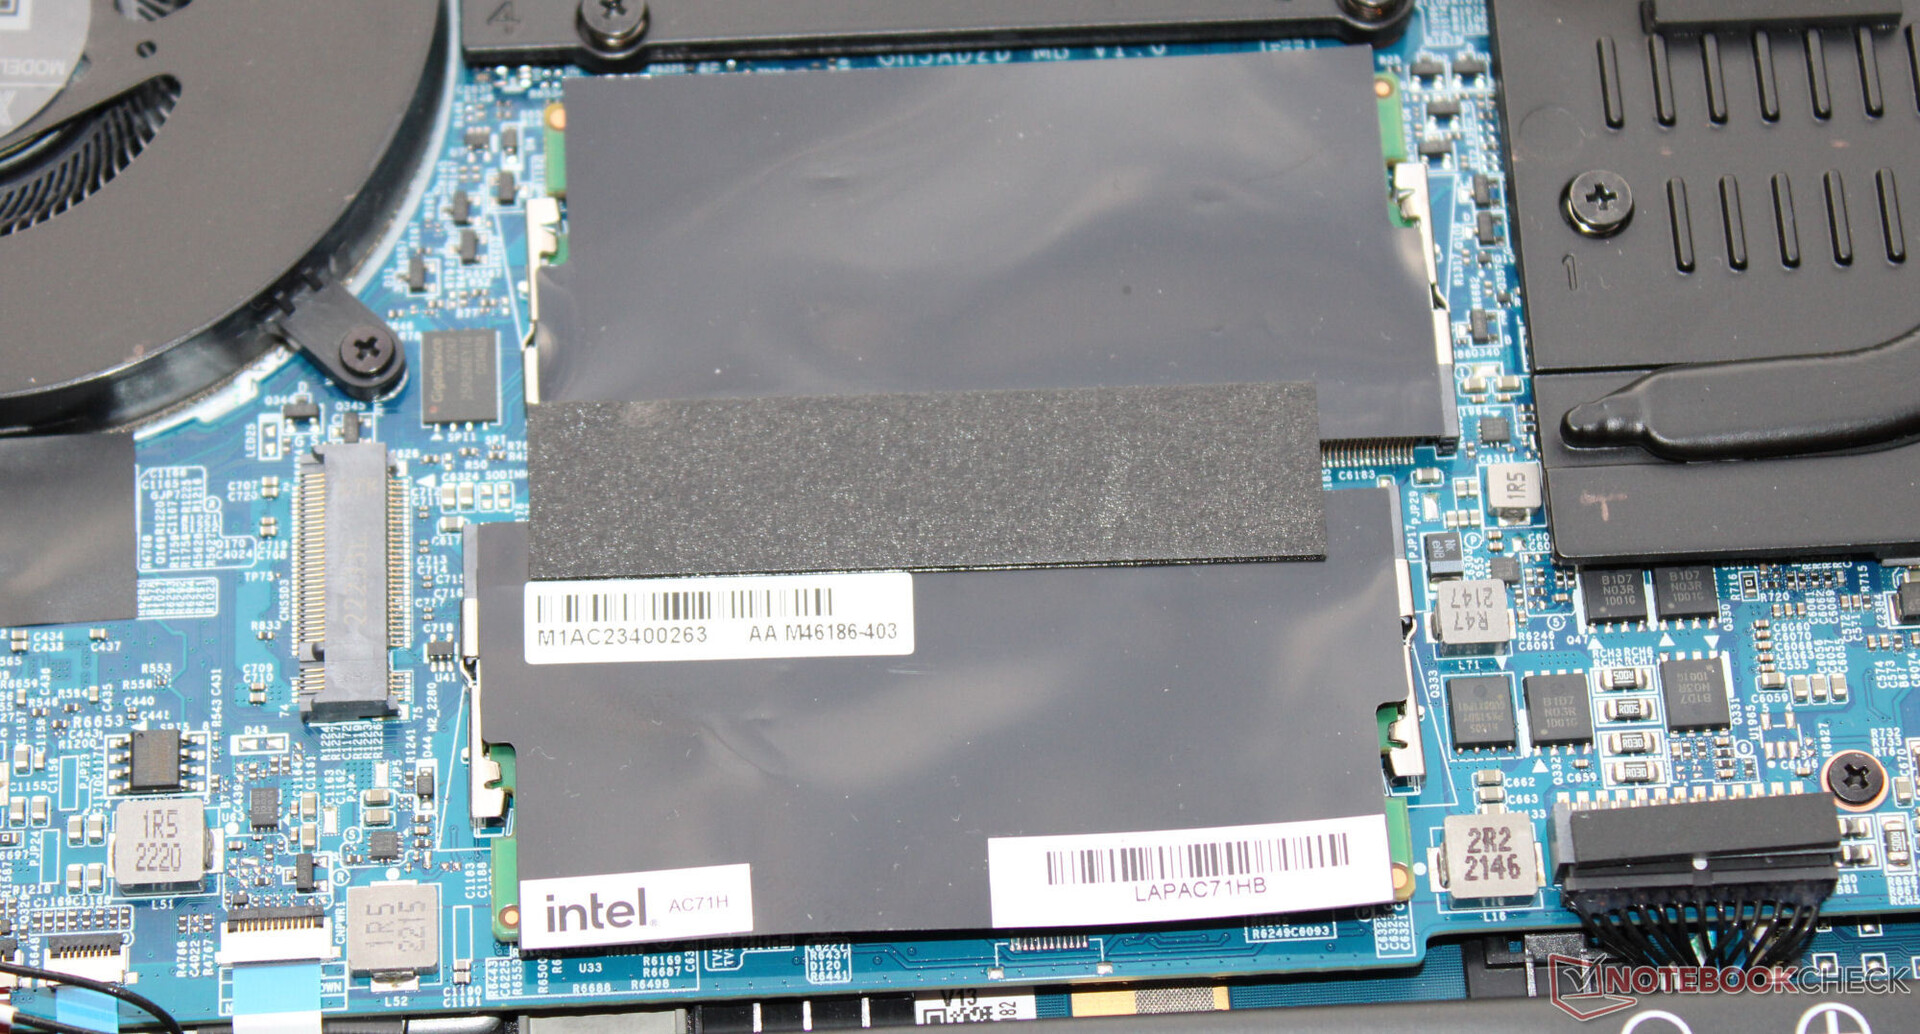
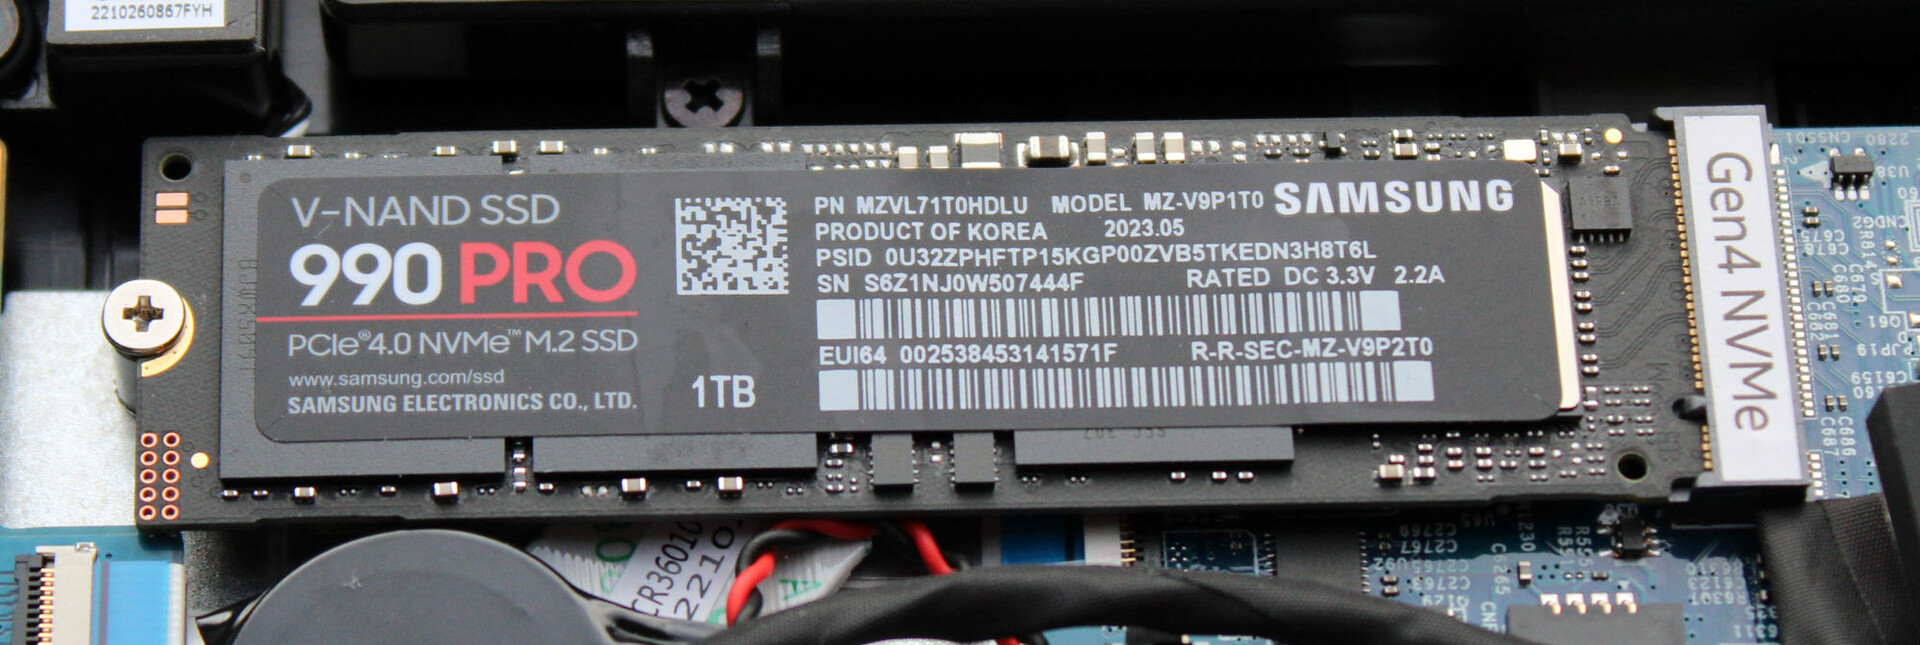
O laptop pode acomodar dois SSDs M.2-2280 (1x PCIe 4.0, 1x PCIe 3.0/SATA). Há suporte para RAID-0/1. O SSD da Samsung (1 TB, PCIe 4, M.2-2280) em nosso dispositivo de teste apresentou excelentes taxas de transferência. Ponto positivo: Não houve estrangulamento térmico.

* ... menor é melhor
Reading continuous performance: DiskSpd Read Loop, Queue Depth 8
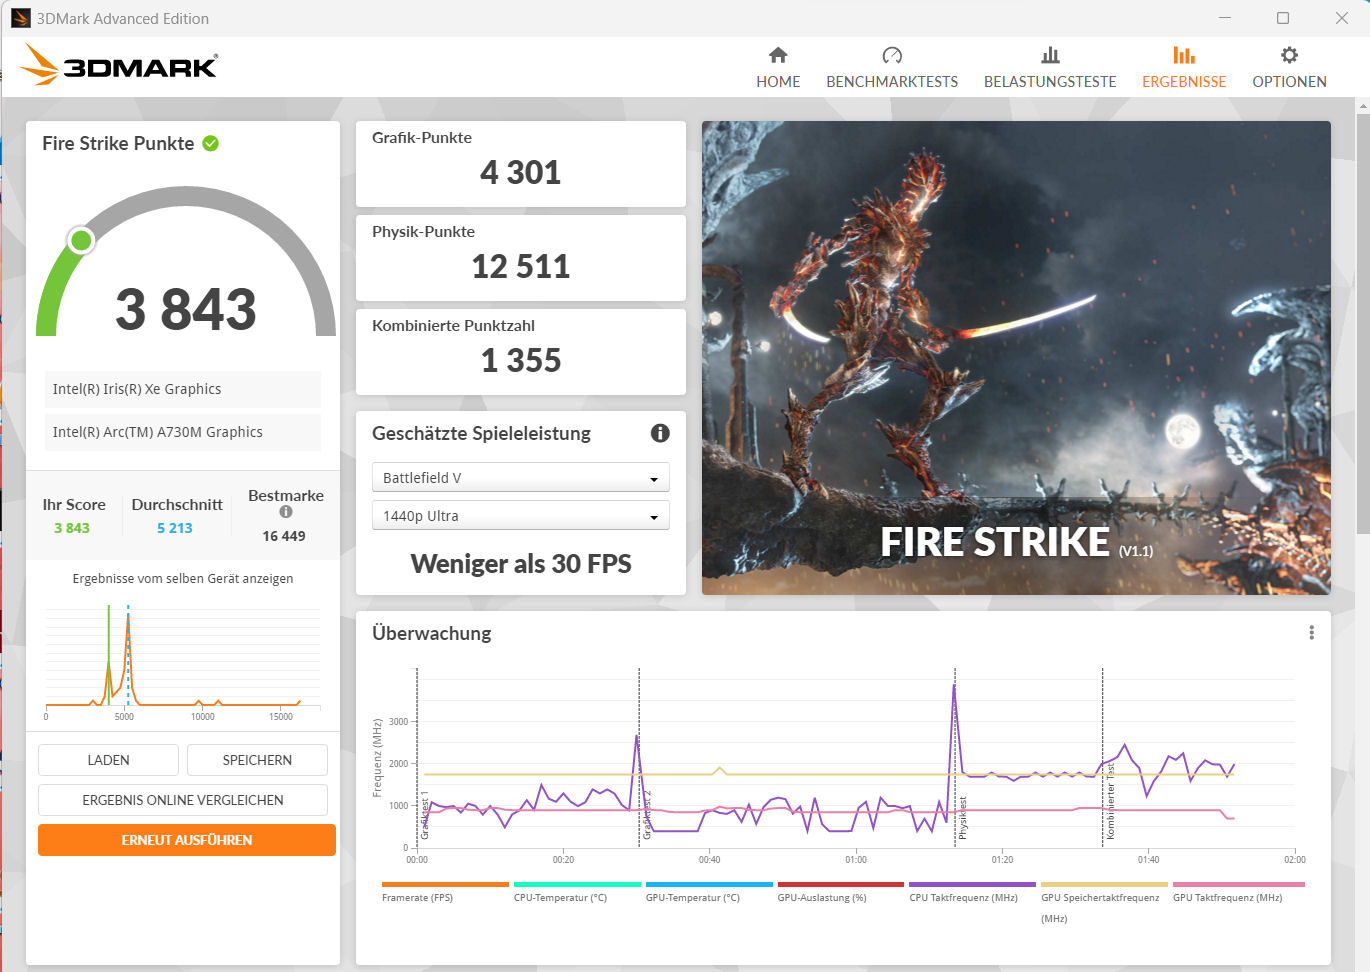
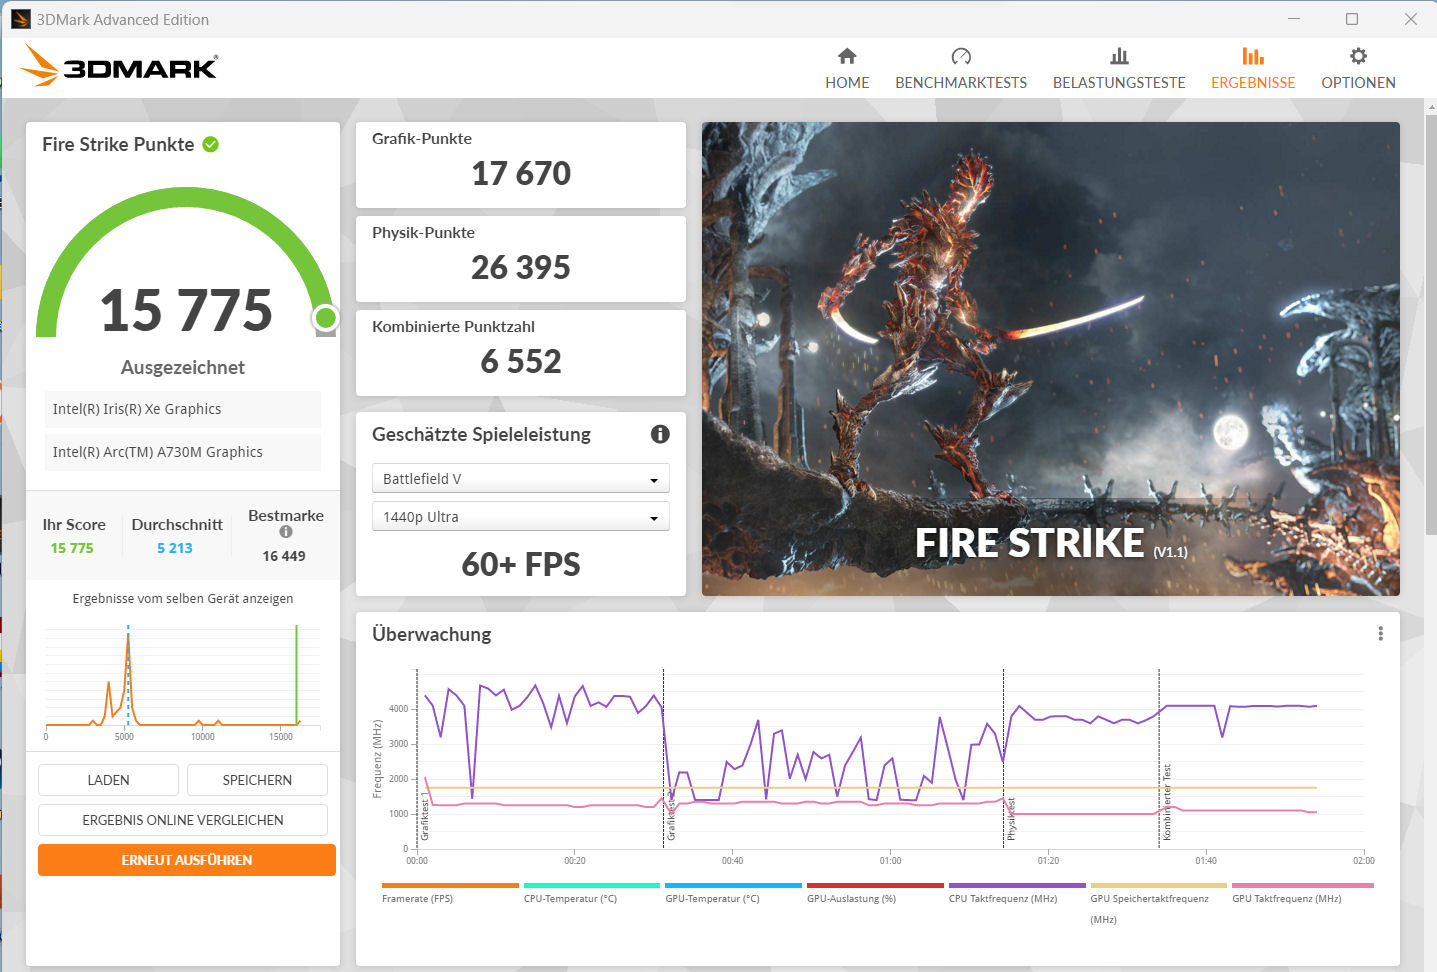
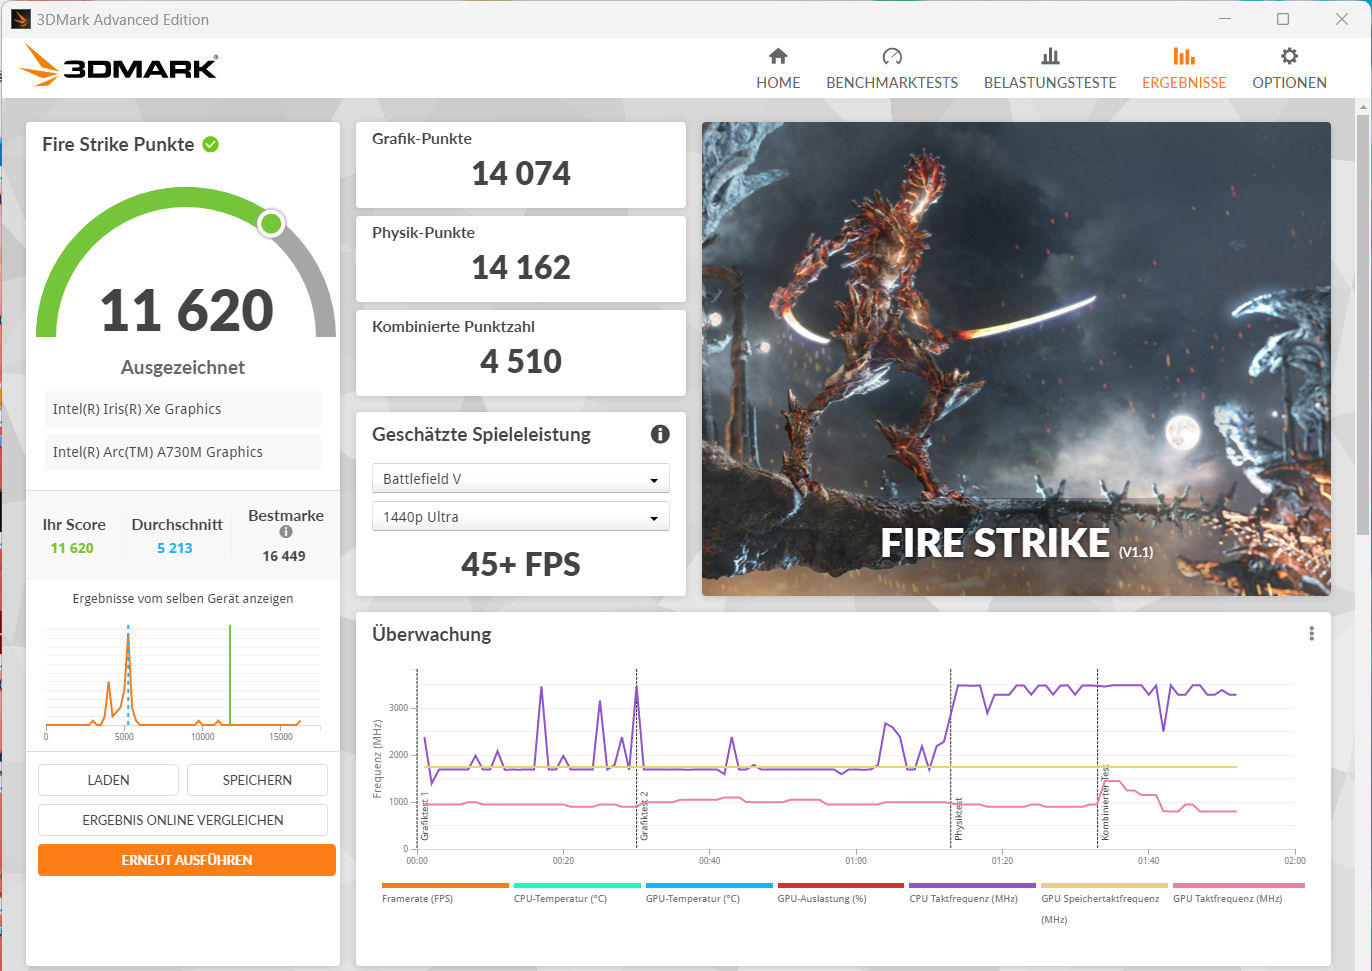
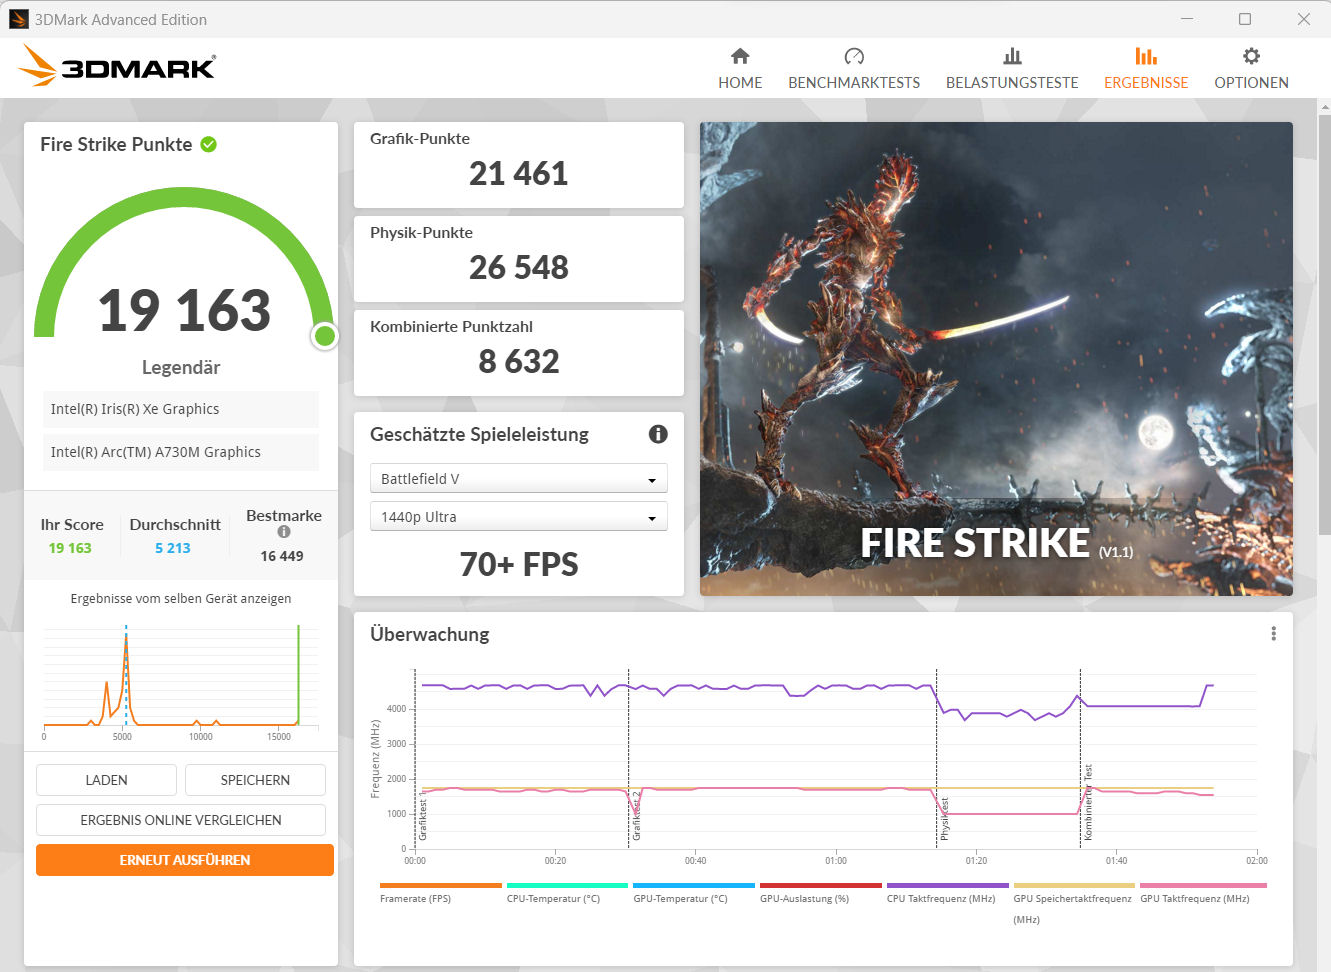
Placa de vídeo
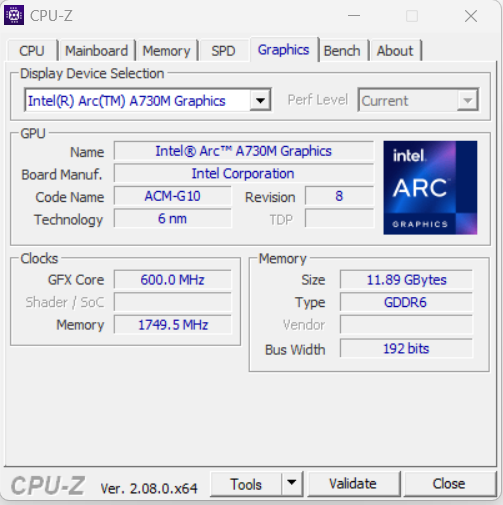
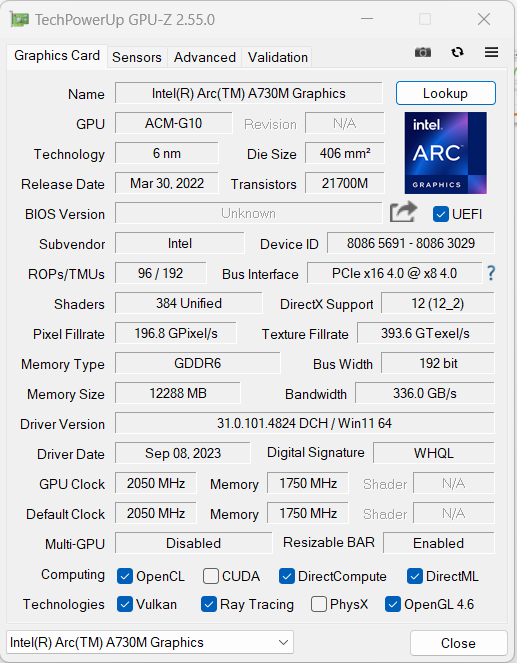
OArc A730M- a segunda DGPU móvel mais potente da Intel - tem um TGP máximo de 85 watts, depende da memória GDDR6 super-rápida (12.288 GB) e pode atingir uma taxa de clock máxima de 2,05 GHz. O núcleo gráfico é adequado para jogos em FHD em configurações médias a altas. Jogos menos exigentes permitem mais.
O desempenho da GPU depende muito de qual modo de desempenho é usado: O perfil "Performance" resultou em resultados de benchmark abaixo (benchmarks sintéticos) ou no mesmo nível (prática de jogos) da média da GPU determinada anteriormente. O desempenho máximo foi alcançado quando o "Modo de referência" estava ativo (TGP: 85 watts). Em suma, a GPU foi classificada entre aGeForce RTX 3050 eRTX 3060 em termos de desempenho.
| 3DMark Performance rating - Percent | |
| Asus TUF A15 FA507 -1! | |
| Gigabyte G5 KE | |
| MSI Cyborg 15 A12VF | |
| Dell Inspiron 16 Plus 7630 -1! | |
| Média Intel Arc A730M | |
| Intel NUC X15 LAPAC71H | |
| Média da turma Multimedia | |
| Asus VivoBook Pro 16 | |
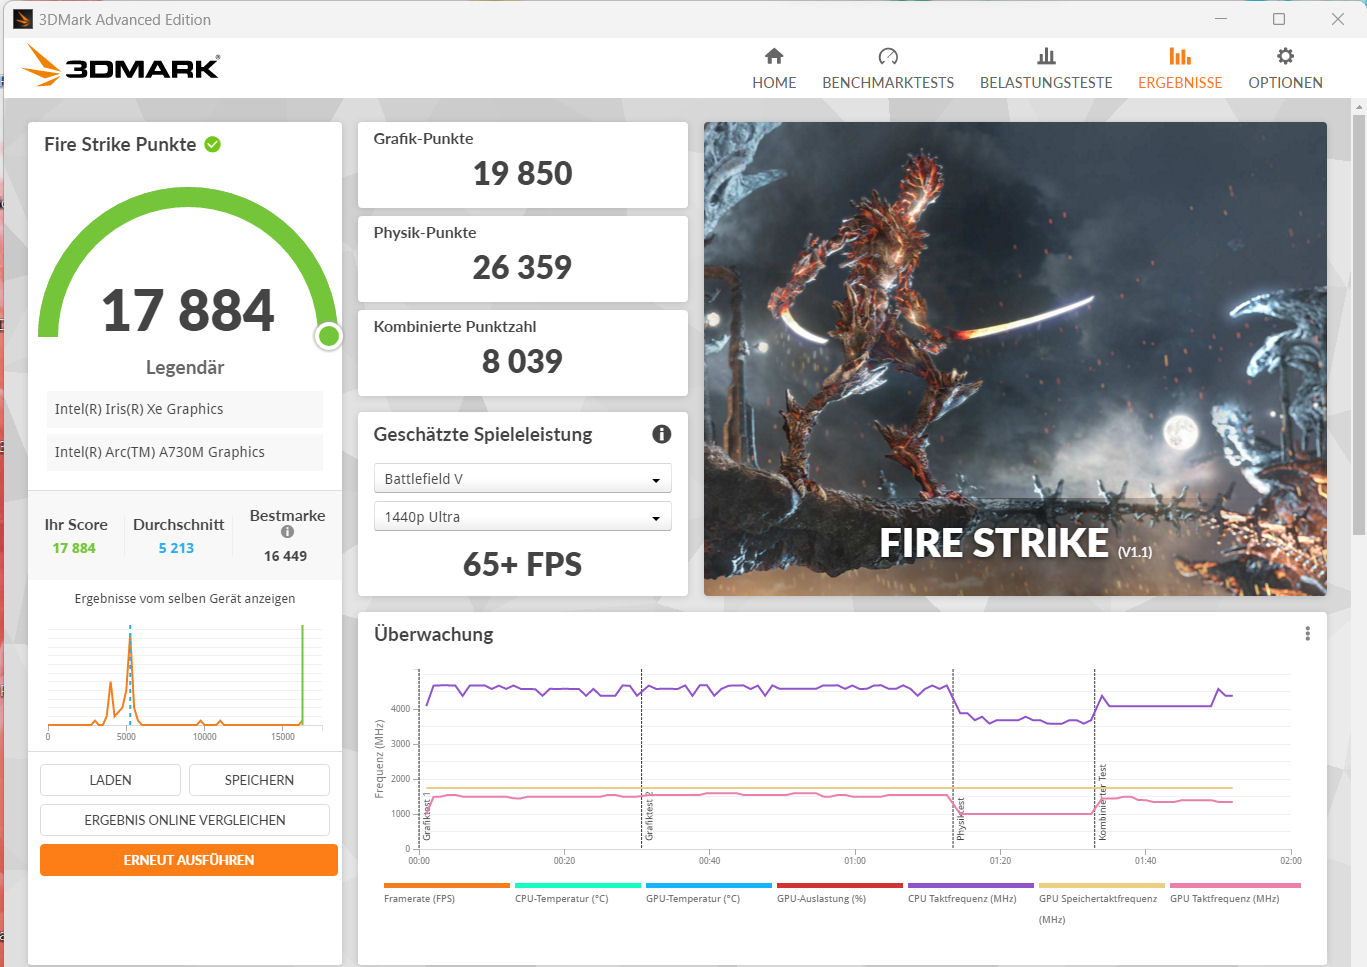
| 3DMark 11 Performance | 23160 pontos | |
| 3DMark Cloud Gate Standard Score | 46415 pontos | |
| 3DMark Fire Strike Score | 17884 pontos | |
| 3DMark Time Spy Score | 7653 pontos | |
Ajuda | ||
* ... menor é melhor
| Performance rating - Percent | |
| Dell Inspiron 16 Plus 7630 -1! | |
| Gigabyte G5 KE | |
| MSI Cyborg 15 A12VF | |
| Asus TUF A15 FA507 | |
| Asus VivoBook Pro 16 | |
| Média da turma Multimedia | |
| Intel NUC X15 LAPAC71H | |
| Média Intel Arc A730M | |
| The Witcher 3 - 1920x1080 Ultra Graphics & Postprocessing (HBAO+) | |
| Dell Inspiron 16 Plus 7630 | |
| Gigabyte G5 KE | |
| Asus TUF A15 FA507 | |
| MSI Cyborg 15 A12VF | |
| Média da turma Multimedia (11 - 121, n=7, últimos 2 anos) | |
| Asus VivoBook Pro 16 | |
| Média Intel Arc A730M (39.8 - 49.4, n=2) | |
| Intel NUC X15 LAPAC71H | |
| GTA V - 1920x1080 Highest AA:4xMSAA + FX AF:16x | |
| Gigabyte G5 KE | |
| MSI Cyborg 15 A12VF | |
| Asus TUF A15 FA507 | |
| Média da turma Multimedia (7.92 - 141.6, n=55, últimos 2 anos) | |
| Asus VivoBook Pro 16 | |
| Média Intel Arc A730M (40.1 - 43.1, n=3) | |
| Intel NUC X15 LAPAC71H | |
| Final Fantasy XV Benchmark - 1920x1080 High Quality | |
| Gigabyte G5 KE | |
| Dell Inspiron 16 Plus 7630 | |
| Asus TUF A15 FA507 | |
| MSI Cyborg 15 A12VF | |
| Média da turma Multimedia (7.61 - 144.4, n=57, últimos 2 anos) | |
| Asus VivoBook Pro 16 | |
| Média Intel Arc A730M (41.1 - 49.7, n=3) | |
| Intel NUC X15 LAPAC71H | |
| Strange Brigade - 1920x1080 ultra AA:ultra AF:16 | |
| Dell Inspiron 16 Plus 7630 | |
| Gigabyte G5 KE | |
| Asus TUF A15 FA507 | |
| MSI Cyborg 15 A12VF | |
| Média Intel Arc A730M (116.6 - 137.7, n=3) | |
| Intel NUC X15 LAPAC71H | |
| Média da turma Multimedia (13.3 - 303, n=57, últimos 2 anos) | |
| Asus VivoBook Pro 16 | |
| Dota 2 Reborn - 1920x1080 ultra (3/3) best looking | |
| Dell Inspiron 16 Plus 7630 | |
| Gigabyte G5 KE | |
| MSI Cyborg 15 A12VF | |
| Asus TUF A15 FA507 | |
| Asus VivoBook Pro 16 | |
| Média da turma Multimedia (29 - 179.9, n=59, últimos 2 anos) | |
| Intel NUC X15 LAPAC71H | |
| Média Intel Arc A730M (80.4 - 91.9, n=3) | |
Witcher 3 FPS diagram
| baixo | média | alto | ultra | |
|---|---|---|---|---|
| GTA V (2015) | 177.4 | 170.6 | 94.3 | 40.1 |
| The Witcher 3 (2015) | 267.3 | 190.3 | 106.9 | 39.8 |
| Dota 2 Reborn (2015) | 102.2 | 101.6 | 96.8 | 91.9 |
| Final Fantasy XV Benchmark (2018) | 98.5 | 67.9 | 41.1 | |
| X-Plane 11.11 (2018) | 70.7 | 55.8 | 47.6 | |
| Strange Brigade (2018) | 377 | 167.8 | 140 | 116.6 |
| Control (2019) | 145.7 | 66 | 51.1 | |
| Flight Simulator 2020 (2020) | 69.3 | 44.2 | 33.7 | 25.7 |
| Cyberpunk 2077 1.6 (2022) | 70.5 | 57.5 | 50.4 | 47 |
| Uncharted Legacy of Thieves Collection (2022) | 31.3 | 35.3 | 27.6 | 26.7 |
| Call of Duty Modern Warfare 2 2022 (2022) | 77 | 65 | 56 | 55 |
| Spider-Man Miles Morales (2022) | 60.5 | 58 | 53.4 | 51.4 |
| The Callisto Protocol (2022) | 80.2 | 72.6 | 67.9 | 47.5 |
| Need for Speed Unbound (2022) | 59.8 | 52.5 | 44.7 | 37.9 |
| High On Life (2023) | 147.9 | 110.1 | 80.9 | 64.7 |
| The Witcher 3 v4 (2023) | 126.2 | 102.8 | 51.2 | 44.4 |
| Dead Space Remake (2023) | 48.2 | 46.7 | 42.2 | 41.3 |
| Hogwarts Legacy (2023) | 69.6 | 48.6 | 43.7 | 34.3 |
| Returnal (2023) | 55 | 53 | 49 | 41 |
| Atomic Heart (2023) | 100.1 | 73.3 | 51.1 | 37.5 |
| Company of Heroes 3 (2023) | 111.3 | 90.6 | 74 | 72.8 |
| Sons of the Forest (2023) | 53.1 | 35.2 | 34.9 | 34.2 |
| Resident Evil 4 Remake (2023) | 86.4 | 64.9 | 60 | 41.3 |
| The Last of Us (2023) | 34.3 | 32.2 | 31.3 | 28.7 |
| Star Wars Jedi Survivor (2023) | 44 | 39.4 | 36.7 | 34.7 |
| Diablo 4 (2023) | 129.7 | 115.6 | 104.5 | 87.8 |
| F1 23 (2023) | 164.9 | 150.3 | 109.6 | 33.1 |
| Ratchet & Clank Rift Apart (2023) | 55.4 | 50.7 | 42.5 | 42.1 |
| Atlas Fallen (2023) | 78 | 74.1 | 70.4 | 59.2 |
| Starfield (2023) | 34 | 30.1 | 24.8 | 22 |
| The Crew Motorfest (2023) | 60 | 57 | 50 | 46 |
| Lies of P (2023) | 97 | 85.8 | 75.1 | 67 |
| Baldur's Gate 3 (2023) | 74.6 | 63 | 55.1 | 52.8 |
| Cyberpunk 2077 (2023) | 71.6 | 57 | 50 | 47.7 |
| EA Sports FC 24 (2023) | 121.8 | |||
| Assassin's Creed Mirage (2023) | 60 | 55 | 55 | 44 |
| Total War Pharaoh (2023) | 207.4 | 121.7 | 74.9 | 60.9 |
| Lords of the Fallen (2023) | 45.1 | 40.1 | 36.8 | 35.4 |
Emissões e energia - O NUC X15 oferece tempos de execução reduzidos
Emissões de ruído
Ao jogar, as emissões de ruído do laptop aumentam até 51 dB(A) ("Desempenho"). o "Modo Benchmark" gera emissões ainda mais altas, pois as ventoinhas funcionam constantemente em velocidade máxima. No modo inativo e no uso diário (escritório, Internet), o NUC é muito mais silencioso. No entanto: Uma das duas ventoinhas funciona constantemente em baixa velocidade. Ao ativar a configuração "Passive Cooling Mode" (Modo de resfriamento passivo) no NUC Software Studio, isso pode ser evitado.
Barulho
| Ocioso |
| 23 / 24 / 24 dB |
| Carga |
| 50.61 / 50.89 dB |
 | ||
30 dB silencioso 40 dB(A) audível 50 dB(A) ruidosamente alto |
||
min: | ||
| Intel NUC X15 LAPAC71H A730M, i7-12700H, Samsung 990 Pro 1 TB | Asus TUF A15 FA507 GeForce RTX 4050 Laptop GPU, R7 7735HS, Micron 2400 MTFDKBA512QFM | Gigabyte G5 KE GeForce RTX 3060 Laptop GPU, i5-12500H, Gigabyte AG4512G-SI B10 | Dell Inspiron 16 Plus 7630 GeForce RTX 4060 Laptop GPU, i7-13700H, WD PC SN740 SDDPTQD-1T00 | Asus VivoBook Pro 16 GeForce RTX 3050 Ti Laptop GPU, i7-12700H, Intel SSD 670p SSDPEKNU010TZ | MSI Cyborg 15 A12VF GeForce RTX 4060 Laptop GPU, i7-12650H, Samsung PM9B1 1024GB MZVL41T0HBLB | |
|---|---|---|---|---|---|---|
| Noise | 11% | -15% | 4% | -10% | -28% | |
| desligado / ambiente * (dB) | 23 | 23.3 -1% | 19.52 15% | 23.2 -1% | 25.2 -10% | 27 -17% |
| Idle Minimum * (dB) | 23 | 23.3 -1% | 31.05 -35% | 23.2 -1% | 25.2 -10% | 27 -17% |
| Idle Average * (dB) | 24 | 23.3 3% | 31.05 -29% | 23.2 3% | 25.2 -5% | 37.5 -56% |
| Idle Maximum * (dB) | 24 | 23.3 3% | 31.05 -29% | 23.2 3% | 25.2 -5% | 38 -58% |
| Load Average * (dB) | 50.61 | 29.6 42% | 55.66 -10% | 35.1 31% | 55.1 -9% | 56.3 -11% |
| Witcher 3 ultra * (dB) | 50.65 | 43 15% | 55.7 -10% | 52.5 -4% | ||
| Load Maximum * (dB) | 50.89 | 43 16% | 55.51 -9% | 52.5 -3% | 61.5 -21% | 56.3 -11% |
* ... menor é melhor
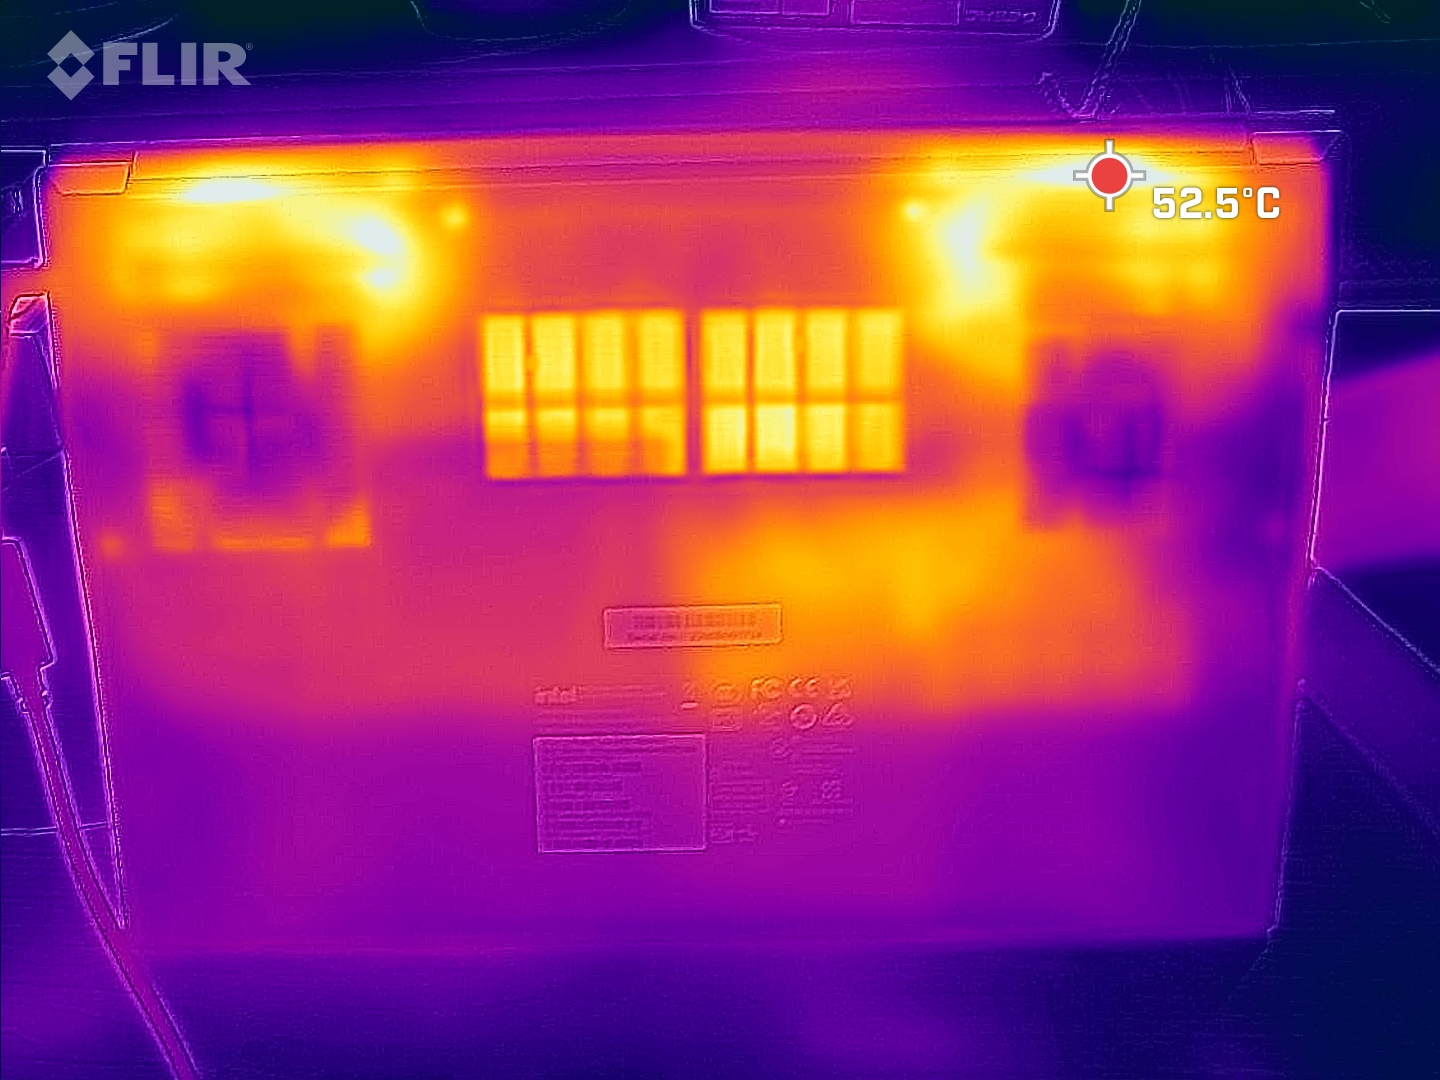
Temperatura
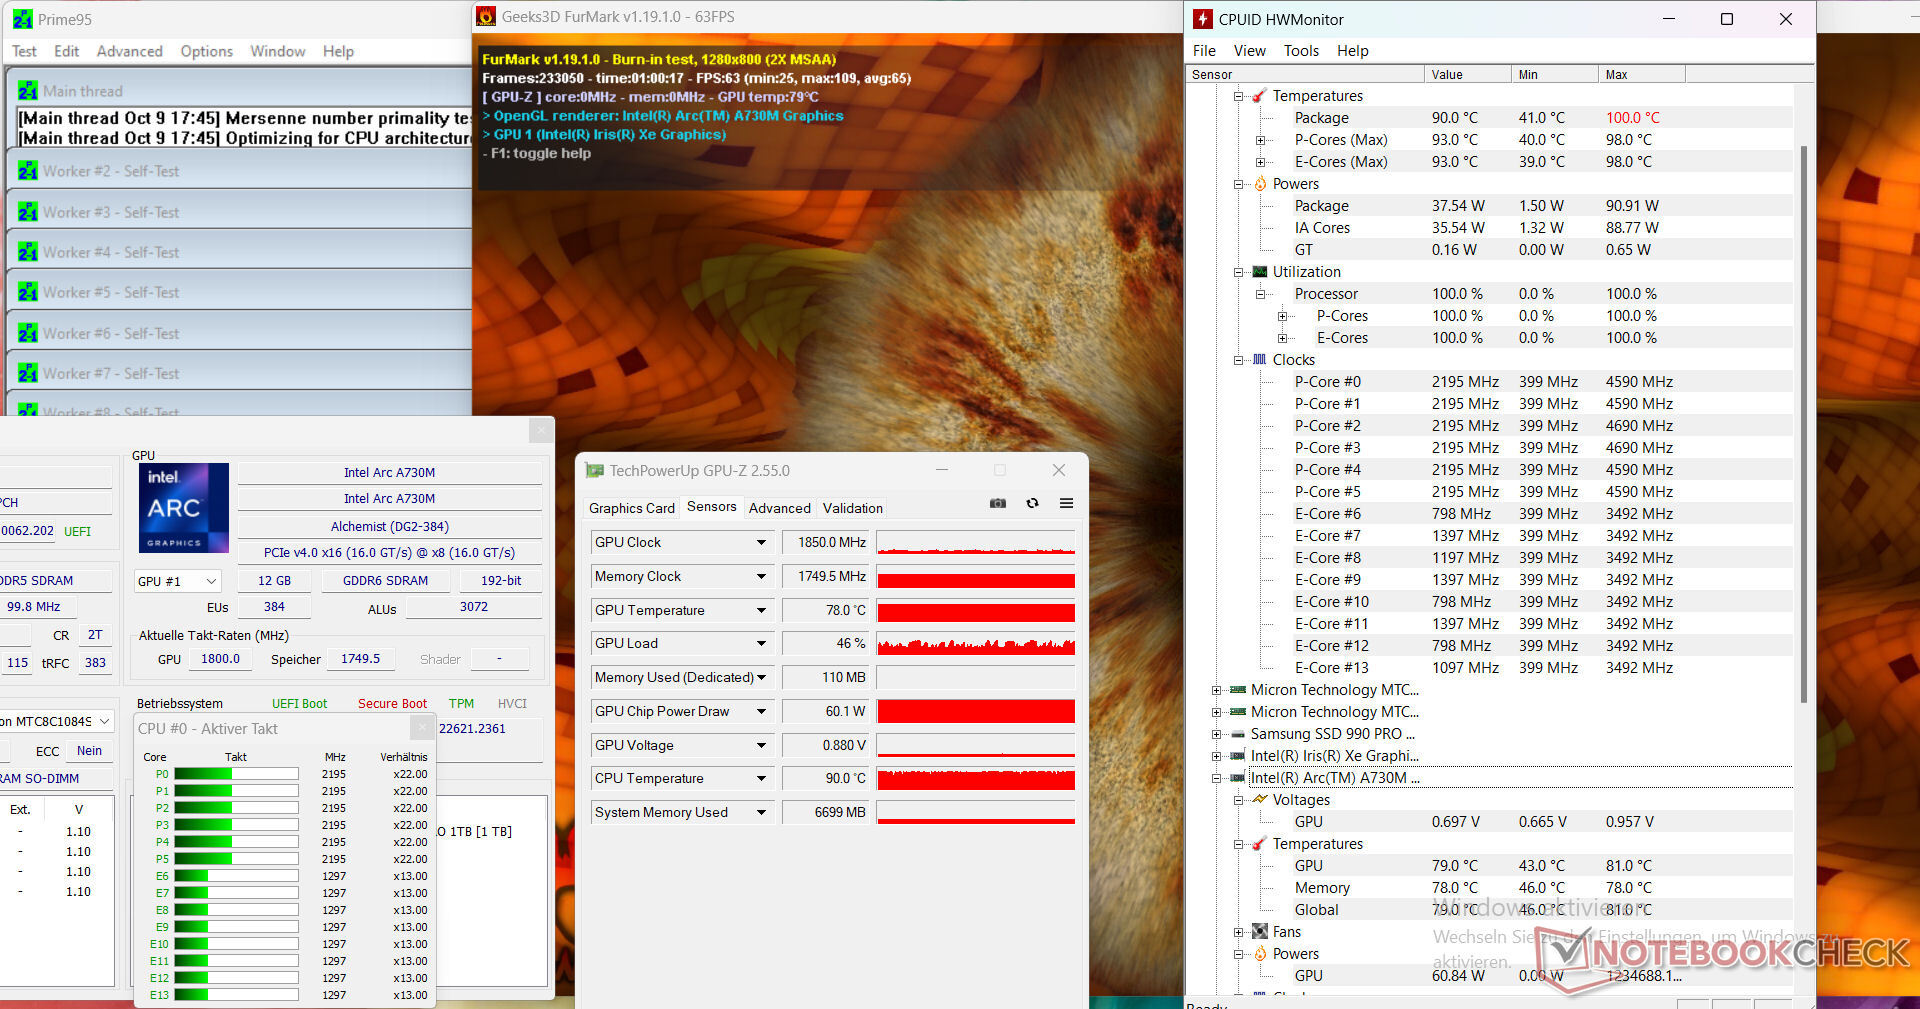
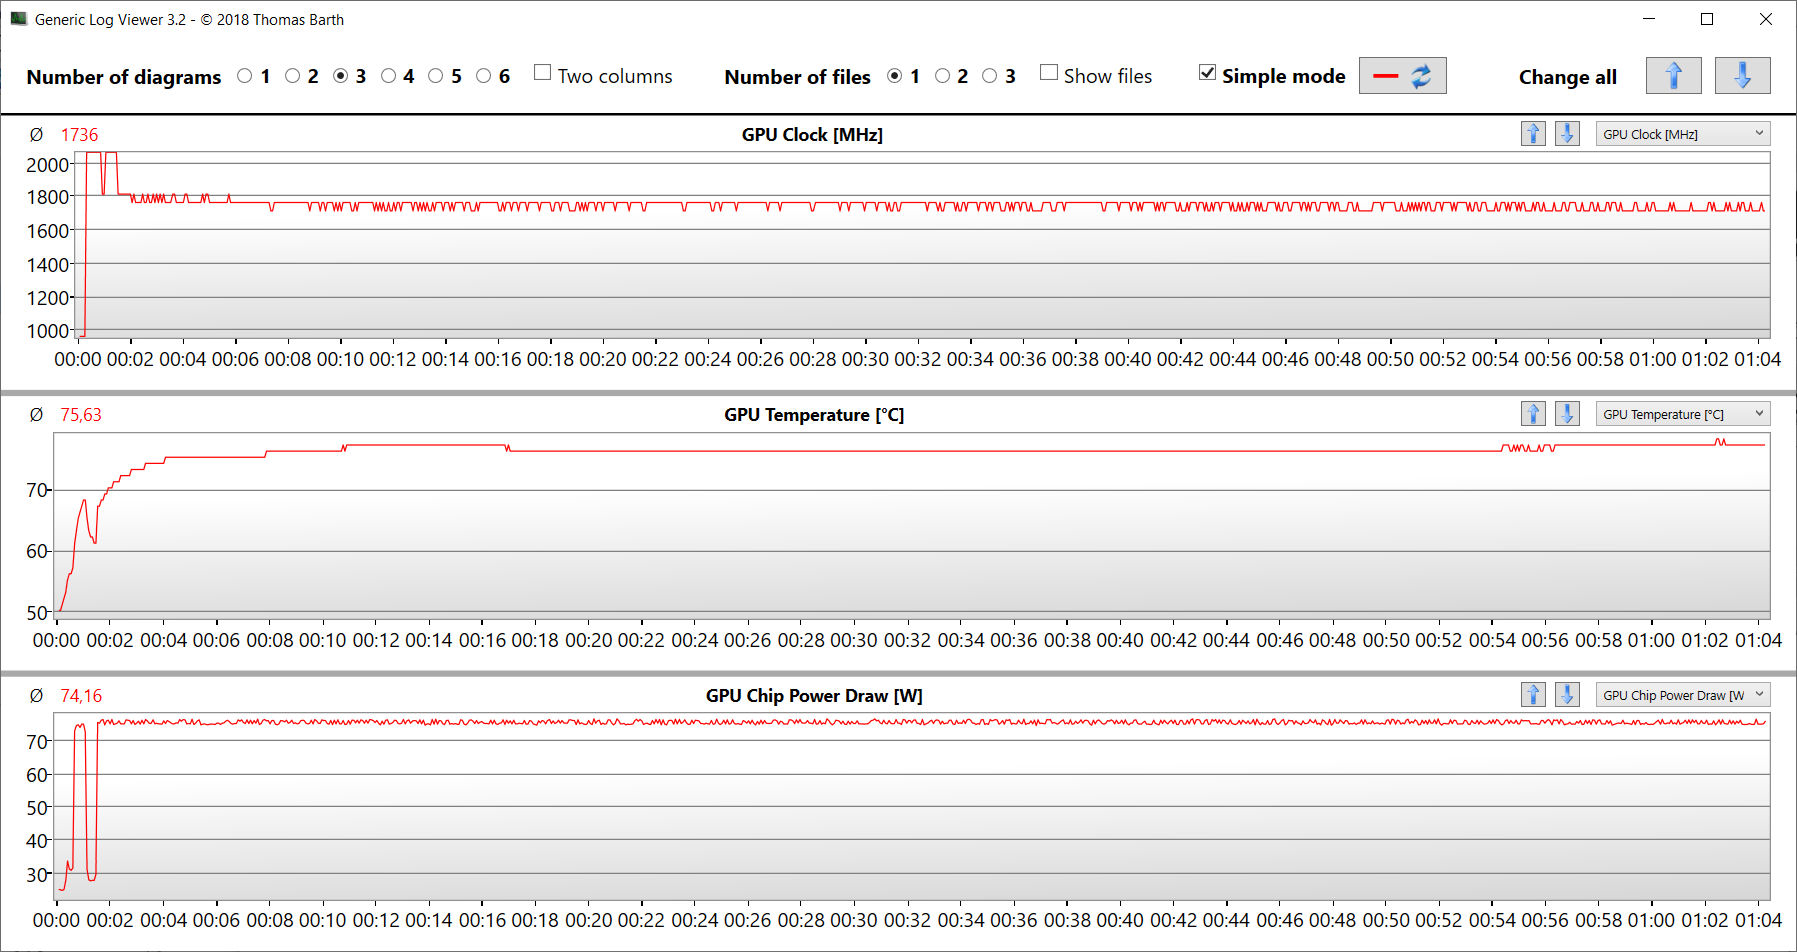
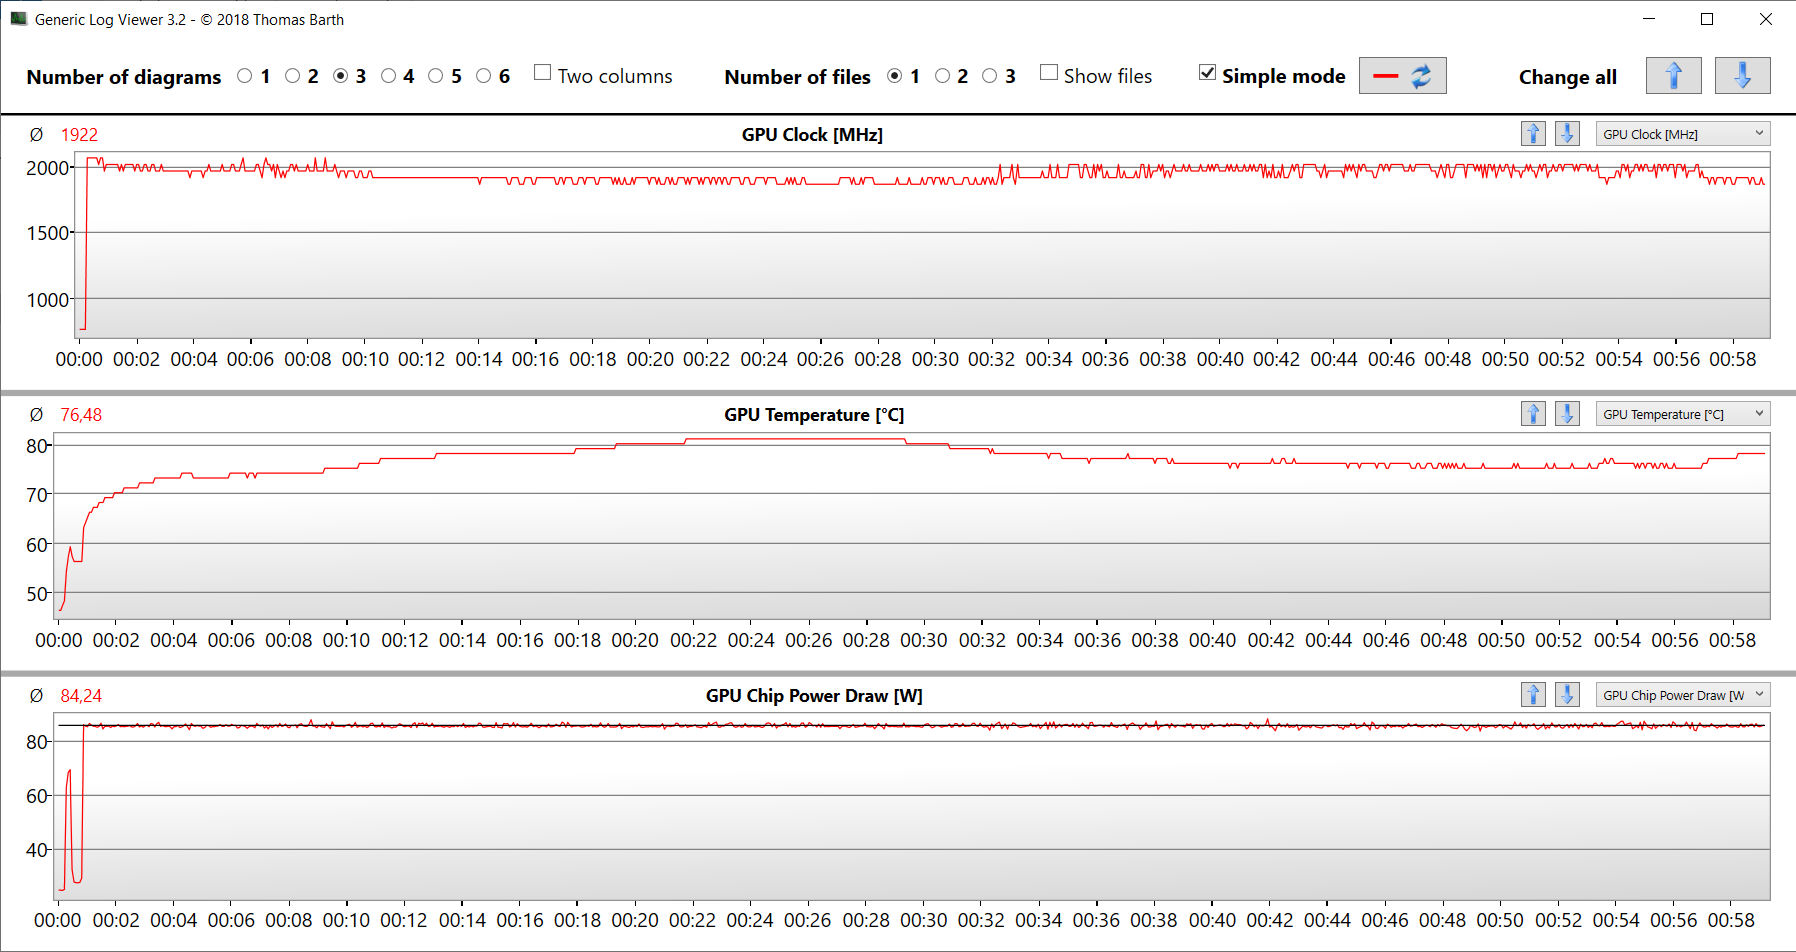
Cargas elevadas (teste de estresse, Witcher 3 teste) fazem com que o laptop aqueça consideravelmente em algumas áreas. Em suma, os valores nunca atingiram níveis críticos. As temperaturas do gabinete permanecem dentro da zona verde no uso diário (escritório, Internet).
O teste de estresse (Prime95 e Furmark em operação contínua) simula um cenário extremo para testar a estabilidade do sistema sob carga total. As taxas de clock da CPU e da GPU flutuaram na faixa média.
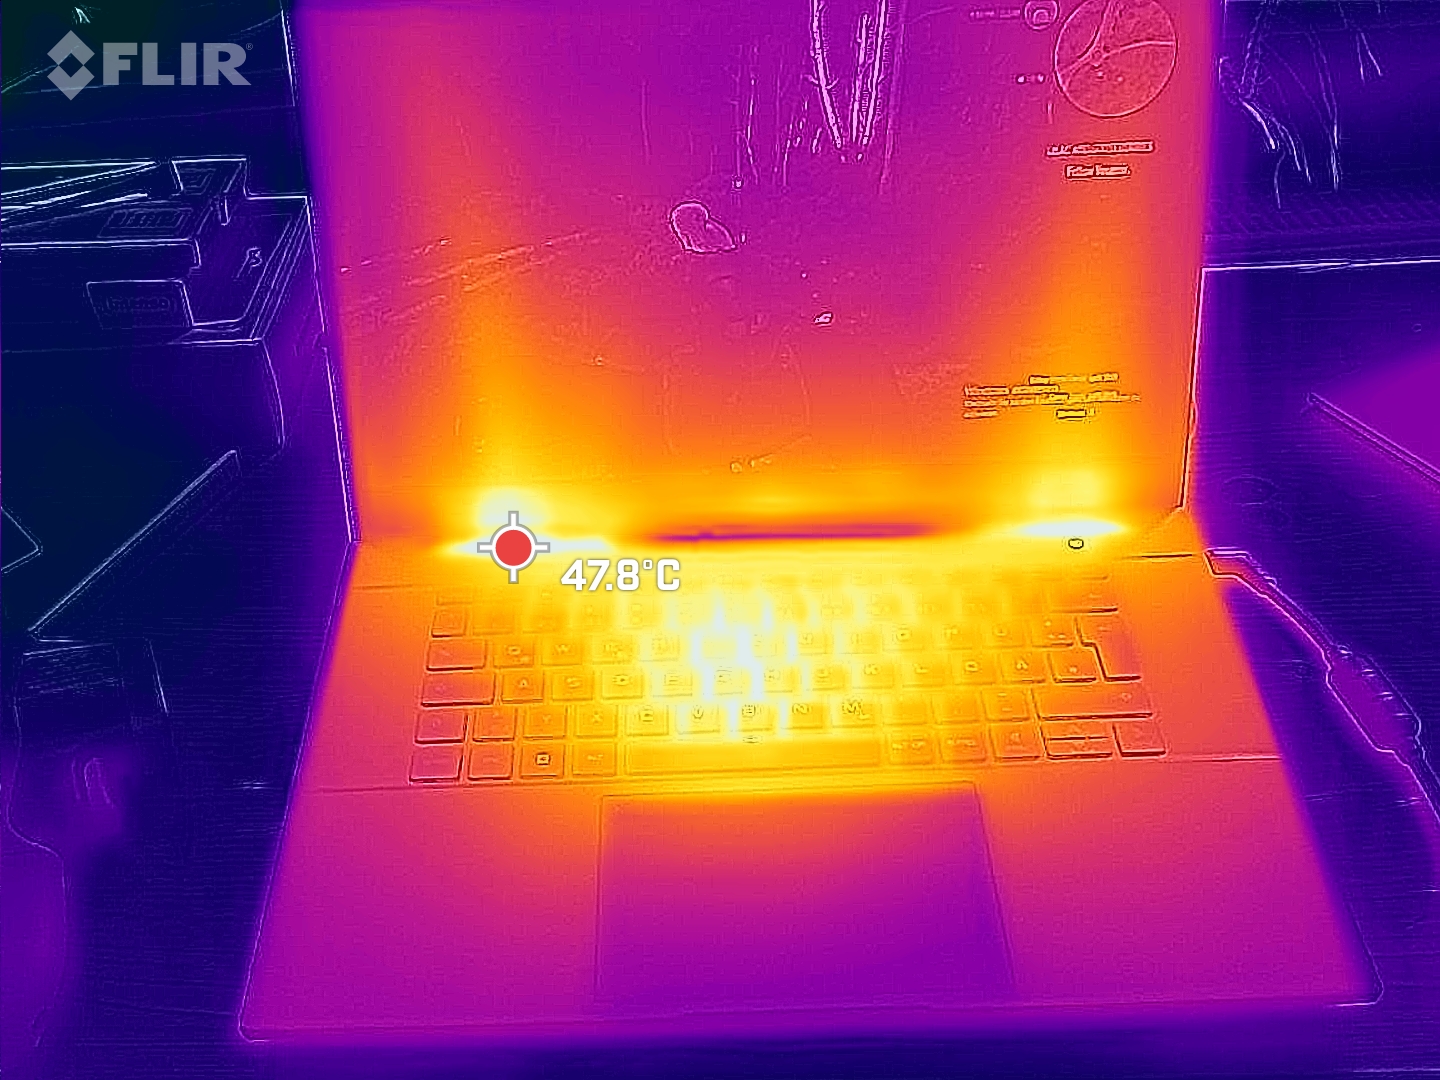
(-) A temperatura máxima no lado superior é 59 °C / 138 F, em comparação com a média de 36.8 °C / 98 F , variando de 21 a 71 °C para a classe Multimedia.
(-) A parte inferior aquece até um máximo de 51 °C / 124 F, em comparação com a média de 39.1 °C / 102 F
(+) Em uso inativo, a temperatura média para o lado superior é 27.3 °C / 81 F, em comparação com a média do dispositivo de 31.3 °C / ### class_avg_f### F.
(-) Jogando The Witcher 3, a temperatura média para o lado superior é 40.9 °C / 106 F, em comparação com a média do dispositivo de 31.3 °C / ## #class_avg_f### F.
(±) Os apoios para as mãos e o touchpad podem ficar muito quentes ao toque, com um máximo de 36 °C / 96.8 F.
(-) A temperatura média da área do apoio para as mãos de dispositivos semelhantes foi 28.7 °C / 83.7 F (-7.3 °C / -13.1 F).
| Intel NUC X15 LAPAC71H Intel Core i7-12700H, Intel Arc A730M | Asus TUF A15 FA507 AMD Ryzen 7 7735HS, NVIDIA GeForce RTX 4050 Laptop GPU | Gigabyte G5 KE Intel Core i5-12500H, NVIDIA GeForce RTX 3060 Laptop GPU | Dell Inspiron 16 Plus 7630 Intel Core i7-13700H, NVIDIA GeForce RTX 4060 Laptop GPU | Asus VivoBook Pro 16 Intel Core i7-12700H, NVIDIA GeForce RTX 3050 Ti Laptop GPU | MSI Cyborg 15 A12VF Intel Core i7-12650H, NVIDIA GeForce RTX 4060 Laptop GPU | |
|---|---|---|---|---|---|---|
| Heat | 10% | -12% | -2% | -6% | 13% | |
| Maximum Upper Side * (°C) | 59 | 48.9 17% | 52.6 11% | 47.8 19% | 44.2 25% | 47.5 19% |
| Maximum Bottom * (°C) | 51 | 44.6 13% | 62.4 -22% | 42.2 17% | 53 -4% | 35.5 30% |
| Idle Upper Side * (°C) | 28 | 27.1 3% | 33.6 -20% | 35.2 -26% | 32.1 -15% | 27.7 1% |
| Idle Bottom * (°C) | 30 | 27.5 8% | 34.8 -16% | 35 -17% | 38.4 -28% | 29.5 2% |
* ... menor é melhor
Alto-falantes
Os alto-falantes estéreo produzem um som decente, mas quase sem graves.
Intel NUC X15 LAPAC71H análise de áudio
(±) | o volume do alto-falante é médio, mas bom (###valor### dB)
Graves 100 - 315Hz
(-) | quase nenhum baixo - em média 17.1% menor que a mediana
(±) | a linearidade dos graves é média (14.2% delta para a frequência anterior)
Médios 400 - 2.000 Hz
(+) | médios equilibrados - apenas 1.7% longe da mediana
(+) | médios são lineares (3.8% delta para frequência anterior)
Altos 2 - 16 kHz
(+) | agudos equilibrados - apenas 2.2% longe da mediana
(+) | os máximos são lineares (5.4% delta da frequência anterior)
Geral 100 - 16.000 Hz
(+) | o som geral é linear (12.1% diferença em relação à mediana)
Comparado com a mesma classe
» 22% de todos os dispositivos testados nesta classe foram melhores, 3% semelhantes, 76% piores
» O melhor teve um delta de 5%, a média foi 17%, o pior foi 45%
Comparado com todos os dispositivos testados
» 10% de todos os dispositivos testados foram melhores, 2% semelhantes, 88% piores
» O melhor teve um delta de 4%, a média foi 23%, o pior foi 134%
Dell Inspiron 16 Plus 7630 análise de áudio
(±) | o volume do alto-falante é médio, mas bom (###valor### dB)
Graves 100 - 315Hz
(-) | quase nenhum baixo - em média 17% menor que a mediana
(±) | a linearidade dos graves é média (8.4% delta para a frequência anterior)
Médios 400 - 2.000 Hz
(±) | médios mais altos - em média 6.3% maior que a mediana
(+) | médios são lineares (6.2% delta para frequência anterior)
Altos 2 - 16 kHz
(+) | agudos equilibrados - apenas 2.2% longe da mediana
(+) | os máximos são lineares (5.6% delta da frequência anterior)
Geral 100 - 16.000 Hz
(±) | a linearidade do som geral é média (15.9% diferença em relação à mediana)
Comparado com a mesma classe
» 40% de todos os dispositivos testados nesta classe foram melhores, 6% semelhantes, 54% piores
» O melhor teve um delta de 5%, a média foi 17%, o pior foi 45%
Comparado com todos os dispositivos testados
» 25% de todos os dispositivos testados foram melhores, 5% semelhantes, 70% piores
» O melhor teve um delta de 4%, a média foi 23%, o pior foi 134%
Consumo de energia
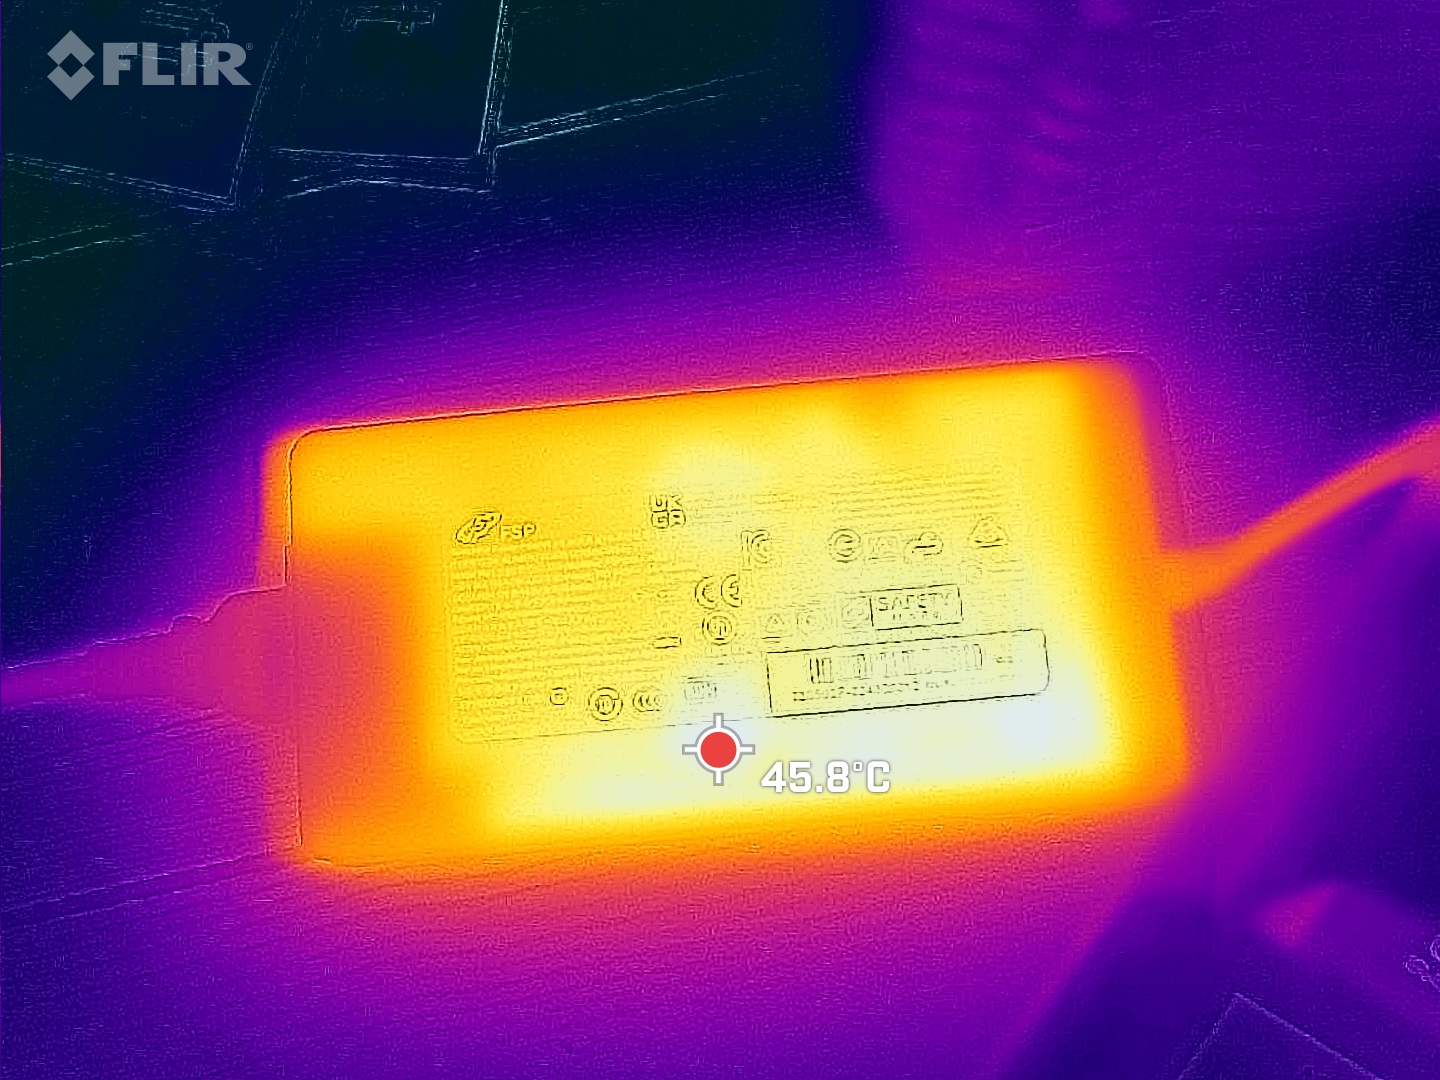
O consumo de energia do laptop está no nível esperado para o hardware instalado. O teste de estresse e o Witcher 3 foram executados com níveis de consumo de energia (ligeiramente) flutuantes. A fonte de alimentação incluída (230 watts) tem tamanho suficiente.
A julgar pelo seu desempenho por watt, o dispositivo consome muita energia. Para comparação: OMSI Cyborg precisa apenas da metade da energia sob carga, mas oferece um desempenho significativamente maior em jogos. OGeForce RTX 4060 no laptop MSI, que é limitado a um TGP de 45 watts, funciona com muito mais eficiência do que o Arc 730M.
| desligado | |
| Ocioso | |
| Carga |
|
Key:
min: | |
| Intel NUC X15 LAPAC71H Intel Core i7-12700H, Intel Arc A730M | Asus TUF A15 FA507 AMD Ryzen 7 7735HS, NVIDIA GeForce RTX 4050 Laptop GPU | Gigabyte G5 KE Intel Core i5-12500H, NVIDIA GeForce RTX 3060 Laptop GPU | Dell Inspiron 16 Plus 7630 Intel Core i7-13700H, NVIDIA GeForce RTX 4060 Laptop GPU | Asus VivoBook Pro 16 Intel Core i7-12700H, NVIDIA GeForce RTX 3050 Ti Laptop GPU | MSI Cyborg 15 A12VF Intel Core i7-12650H, NVIDIA GeForce RTX 4060 Laptop GPU | |
|---|---|---|---|---|---|---|
| Power Consumption | 12% | -1% | -18% | 1% | 32% | |
| Idle Minimum * (Watt) | 7.5 | 8 -7% | 7.66 -2% | 15.6 -108% | 8.7 -16% | 6 20% |
| Idle Average * (Watt) | 11.9 | 12.1 -2% | 10.3 13% | 17.7 -49% | 13.1 -10% | 8.8 26% |
| Idle Maximum * (Watt) | 13.9 | 12.5 10% | 16.05 -15% | 20.6 -48% | 18.3 -32% | 11.9 14% |
| Load Average * (Watt) | 137 | 74.9 45% | 115.8 15% | 87.4 36% | 116 15% | 89 35% |
| Witcher 3 ultra * (Watt) | 166 | 136.6 18% | 168.7 -2% | 121.7 27% | 117.6 29% | 90.3 46% |
| Load Maximum * (Watt) | 203 | 185 9% | 234.6 -16% | 138 32% | 162 20% | 99 51% |
* ... menor é melhor
Power consumption Witcher 3 / stress test
Power consumption with external monitor
Tempos de execução
O dispositivo de 15,6 polegadas alcançou tempos de execução de 5:44 h em nosso teste realista de WLAN (mapeamento da carga ao acessar páginas da Web usando um script) - um valor decente, mas não excelente.
Pro
Contra
Veredicto - Não há nenhuma pechincha a ser feita aqui
Com o NUC X15, a Intel está voltada para gamers e profissionais criativos. Isso significa que a edição de vídeo e imagem, o streaming, a renderização e os jogos fazem parte dos campos de uso do laptop. ACore i7-12700HeArc A730Mfornecem a potência necessária - ambos os chips funcionam com taxas de clock consistentemente altas.
O Intel NUC X15 não impressiona nem decepciona. Entretanto, levando em conta o desempenho da CPU e o alto consumo de energia, o preço do laptop é simplesmente muito alto.
Sua ineficiente GPU Arc oferece menos desempenho por watt em comparação com seus concorrentes comparáveis. Assim como em todas as GPUs atuais (RX7000, RTX 4000), a A730M apresenta núcleos de ray-tracing e suporte a AV1 (decodificação e codificação) - recursos necessários em um laptop para criadores.
As emissões do dispositivo são típicas para essa classe. O tempo de execução prático de quase 6 horas pode ser classificado como decente. Sua porta USB-C (Thunderbolt 4) não é compatível com Power Delivery, mas pode emitir um sinal DisplayPort. Além disso, o laptop apresenta opções de expansão (solução de acoplamento, GPU externa). No geral, a tela FHD instalada (15,6 polegadas, IPS, 144 Hz) nos deixou uma boa impressão.
Uma alternativa poderia ser oAsus VivoBook Pro 16: Ele apresenta um desempenho de computação ligeiramente inferior no total, mas se beneficia de tempos de execução mais longos, Power Delivery e uma tela 16:10. O Aorus 15 9KF-E3DE383SH pode ser uma boa alternativa econômica. Graças ao seu GeForce RTX 4060 (TGP: 140 watts), ele oferece um desempenho muito melhor em jogos do que o X15. Atualmente, o senhor pode encontrá-lo on-line por cerca de US$ 1.040. Já testamos umaversão mais potentedo Aorus 15.
Preço e disponibilidade
O Intel NUC X15 LAPAC71H pode ser configurado individualmente e encomendado por meio da loja on-line da Schenker. O dispositivo de teste atual pode ser adquirido por cerca de US$ 1.280. A variante básica (16 GB de RAM, 500 GB SSD) pode ser adquirida por cerca de US$ 1.050.
Intel NUC X15 LAPAC71H
- 10/13/2023 v7 (old)
Sascha Mölck
Transparência
A seleção dos dispositivos a serem analisados é feita pela nossa equipe editorial. A amostra de teste foi fornecida ao autor como empréstimo pelo fabricante ou varejista para fins desta revisão. O credor não teve influência nesta revisão, nem o fabricante recebeu uma cópia desta revisão antes da publicação. Não houve obrigação de publicar esta revisão. Como empresa de mídia independente, a Notebookcheck não está sujeita à autoridade de fabricantes, varejistas ou editores.
É assim que o Notebookcheck está testando
Todos os anos, o Notebookcheck analisa de forma independente centenas de laptops e smartphones usando procedimentos padronizados para garantir que todos os resultados sejam comparáveis. Desenvolvemos continuamente nossos métodos de teste há cerca de 20 anos e definimos padrões da indústria no processo. Em nossos laboratórios de teste, equipamentos de medição de alta qualidade são utilizados por técnicos e editores experientes. Esses testes envolvem um processo de validação em vários estágios. Nosso complexo sistema de classificação é baseado em centenas de medições e benchmarks bem fundamentados, o que mantém a objetividade.Price comparison

