Análise do Gigabyte G5 KE: Laptop para jogos de médio porte que atende à maioria das necessidades
A Gigabyte oferece várias classes de laptops com base no desempenho e no orçamento. Enquanto as séries Aorus e Aero são voltadas para os segmentos de jogos premium e criação de conteúdo, as variantes tradicionais da Gigabyte, como o G5 e o G7, são voltadas para um público de jogos mais convencional.
Anteriormente, analisamos a placa de vídeo de 17,3 polegadas Gigabyte G7 KE de 17,3 polegadas e agora testamos o Gigabyte G5 KE de 15,6 polegadas com especificações muito semelhantes.
Nossa unidade Gigabyte G5 KE vem equipada com um processador Intel 12ª geração Core i5-12500H de 12ª geração, GPU para laptop Nvidia GeForce RTX 306016 GB de RAM, um SSD de 512 GB e um painel IPS de 15,6 polegadas e 144 Hz.
Essa configuração custará ₹94.990 (US$ 1.155) no mercado indiano. Nesta análise, levamos o Gigabyte G5 KE para dar uma volta e ver se ele está à altura de seus pares do segmento de jogos de médio porte.
Possíveis concorrentes em comparação
Avaliação | Data | Modelo | Peso | Altura | Size | Resolução | Preço |
|---|---|---|---|---|---|---|---|
| 81.8 % v7 (old) | 04/2023 | Gigabyte G5 KE i5-12500H, GeForce RTX 3060 Laptop GPU | 2 kg | 23.9 mm | 15.60" | 1920x1080 | |
| 82.8 % v7 (old) | 10/2022 | Lenovo IdeaPad Gaming 3 15IAH7 i5-12500H, GeForce RTX 3050 Ti Laptop GPU | 2.4 kg | 26 mm | 15.60" | 1920x1080 | |
| 83.3 % v7 (old) | 01/2023 | Gigabyte G7 KE i5-12500H, GeForce RTX 3060 Laptop GPU | 2.6 kg | 25 mm | 17.30" | 1920x1080 | |
| 87.4 % v7 (old) | 09/2022 | Honor MagicBook 14 2022 i5-12500H, GeForce RTX 2050 Mobile | 1.6 kg | 16.9 mm | 14.00" | 2160x1440 | |
| 87.9 % v7 (old) | 01/2023 | Schenker XMG Core 15 (M22) R7 6800H, GeForce RTX 3060 Laptop GPU | 2.1 kg | 23 mm | 15.60" | 2560x1440 | |
| 86.1 % v7 (old) | 10/2022 | Dell G16 7620 i7-12700H, GeForce RTX 3060 Laptop GPU | 2.6 kg | 26.9 mm | 16.00" | 2560x1600 | |
| 82.3 % v7 (old) | 09/2022 | Gigabyte A5 K1 R5 5600H, GeForce RTX 3060 Laptop GPU | 2.2 kg | 34 mm | 15.60" | 1920x1080 | |
| 87.2 % v7 (old) | 03/2022 | Asus TUF Gaming F15 FX507ZM i7-12700H, GeForce RTX 3060 Laptop GPU | 2.1 kg | 24.95 mm | 15.60" | 1920x1080 | |
| 84.3 % v7 (old) | 09/2021 | HP Victus 16-e0179ng R7 5800H, GeForce RTX 3060 Laptop GPU | 2.5 kg | 23.5 mm | 16.10" | 1920x1080 |
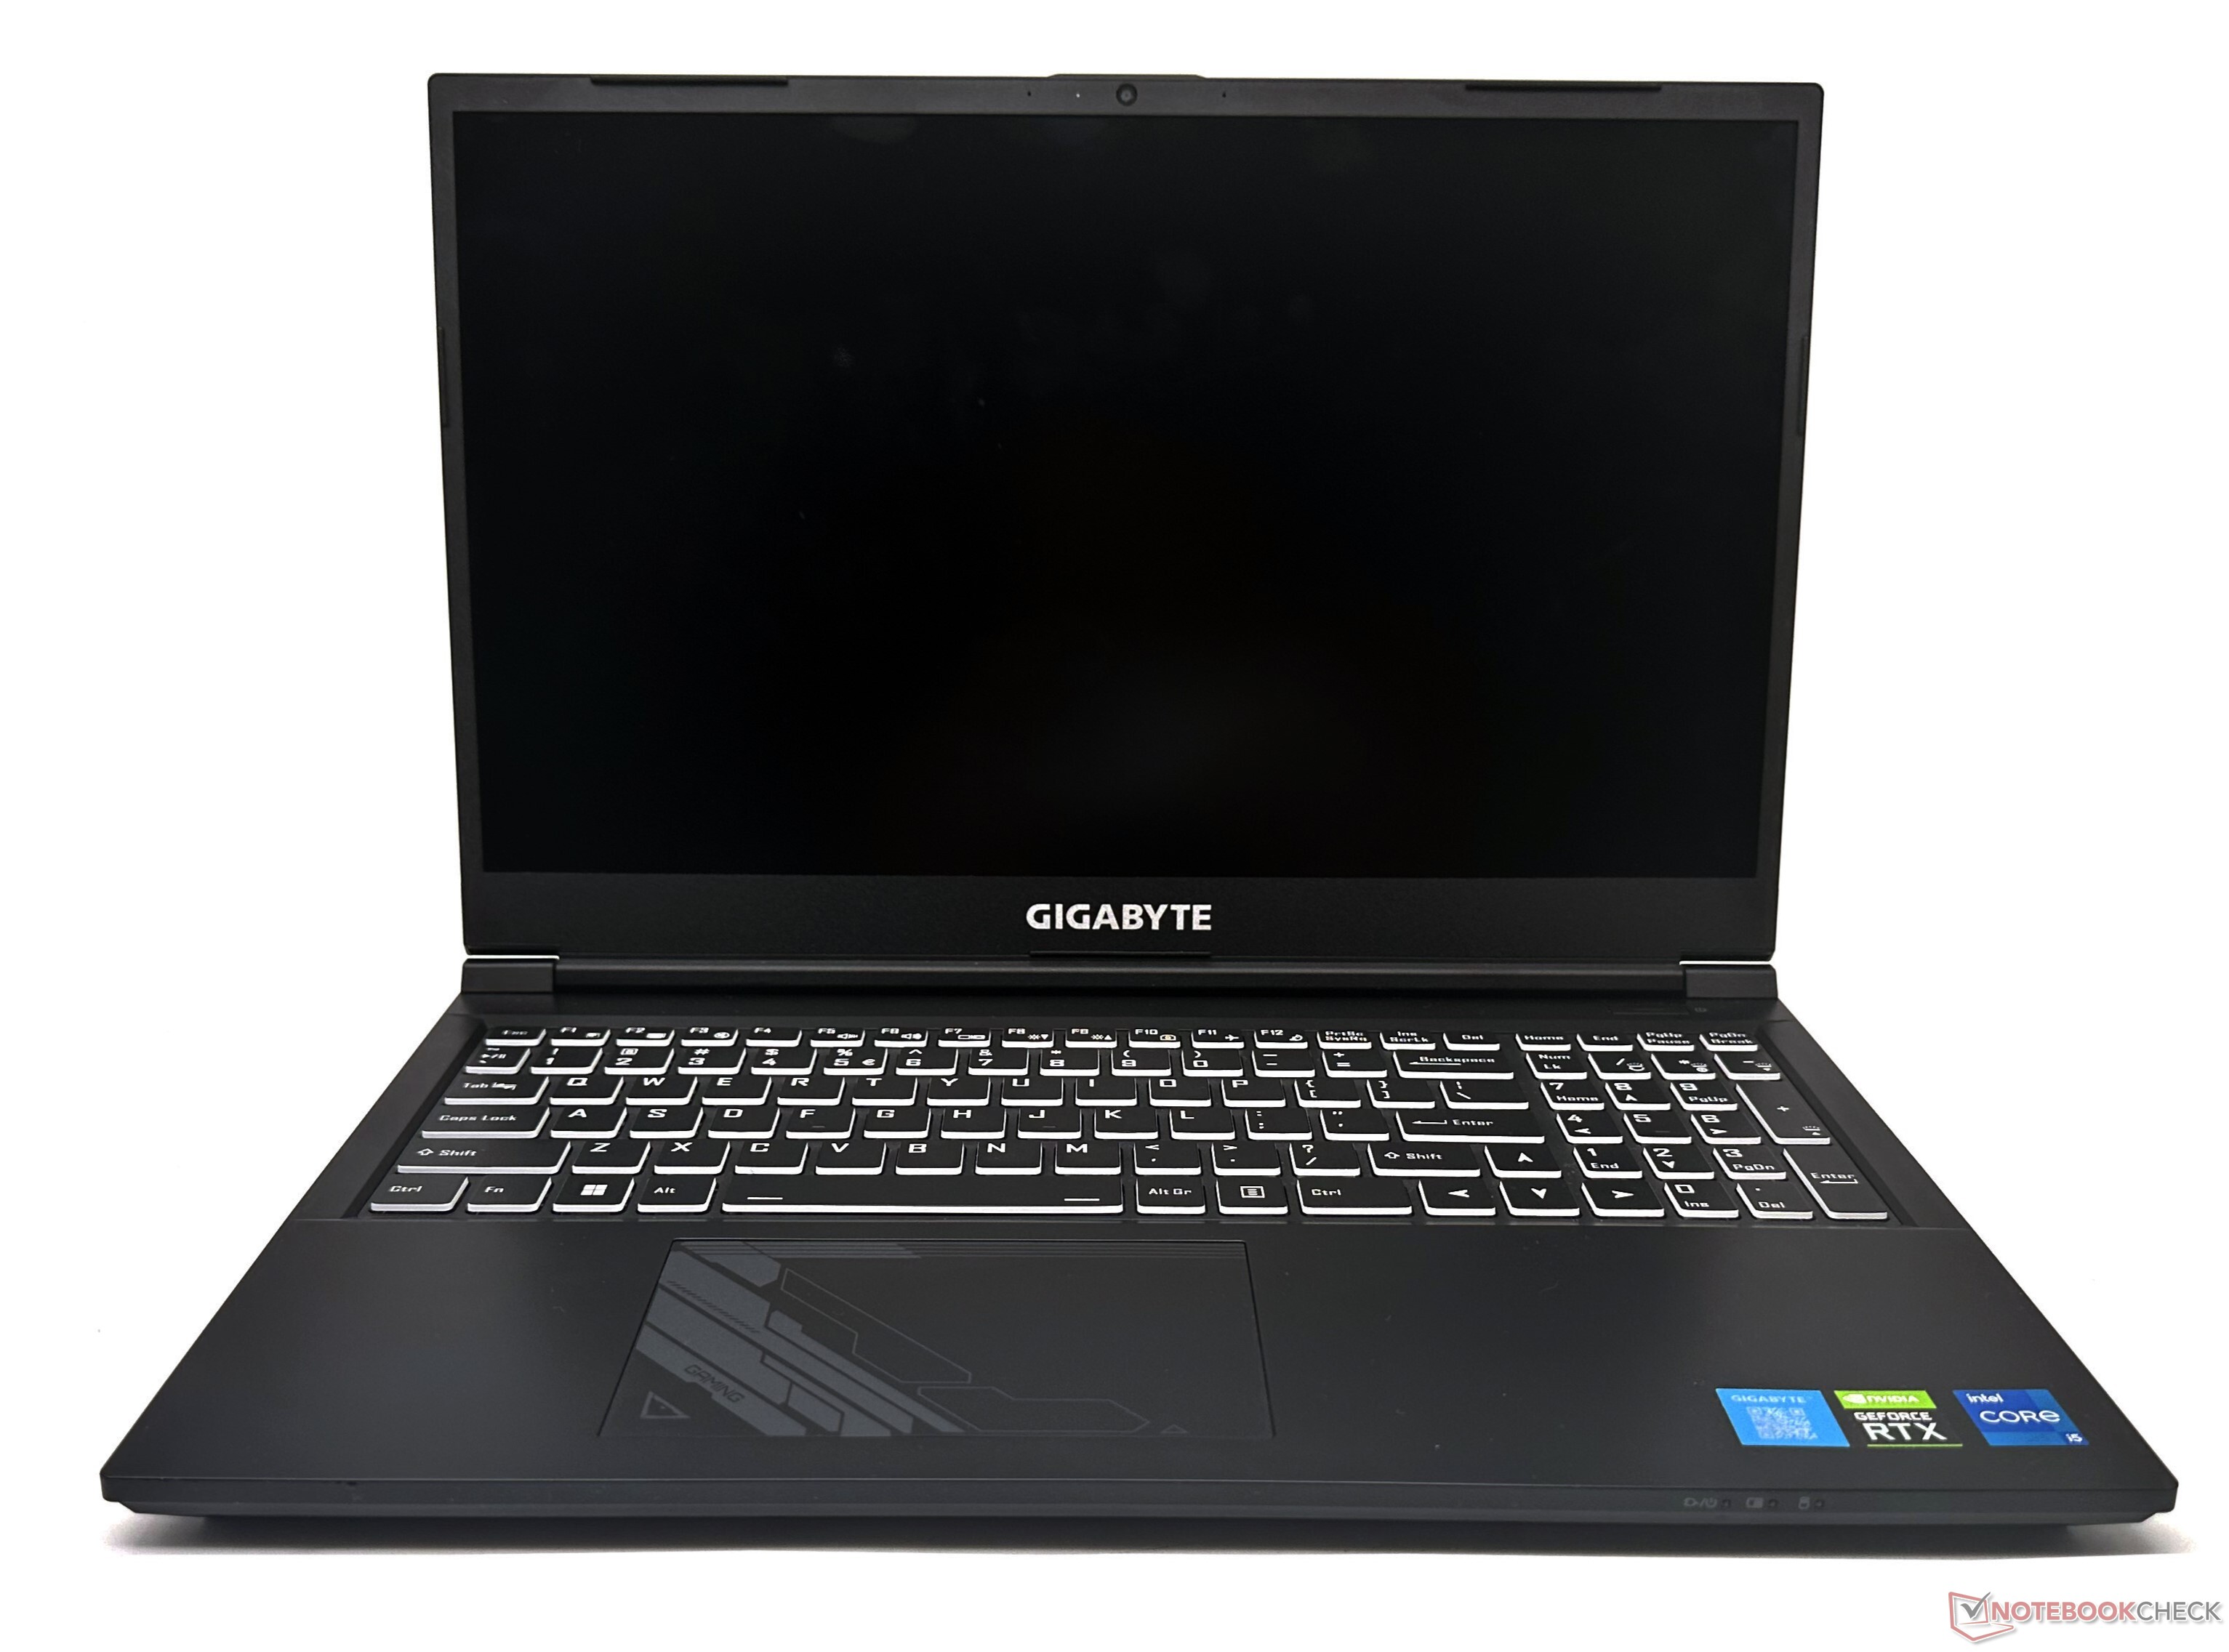
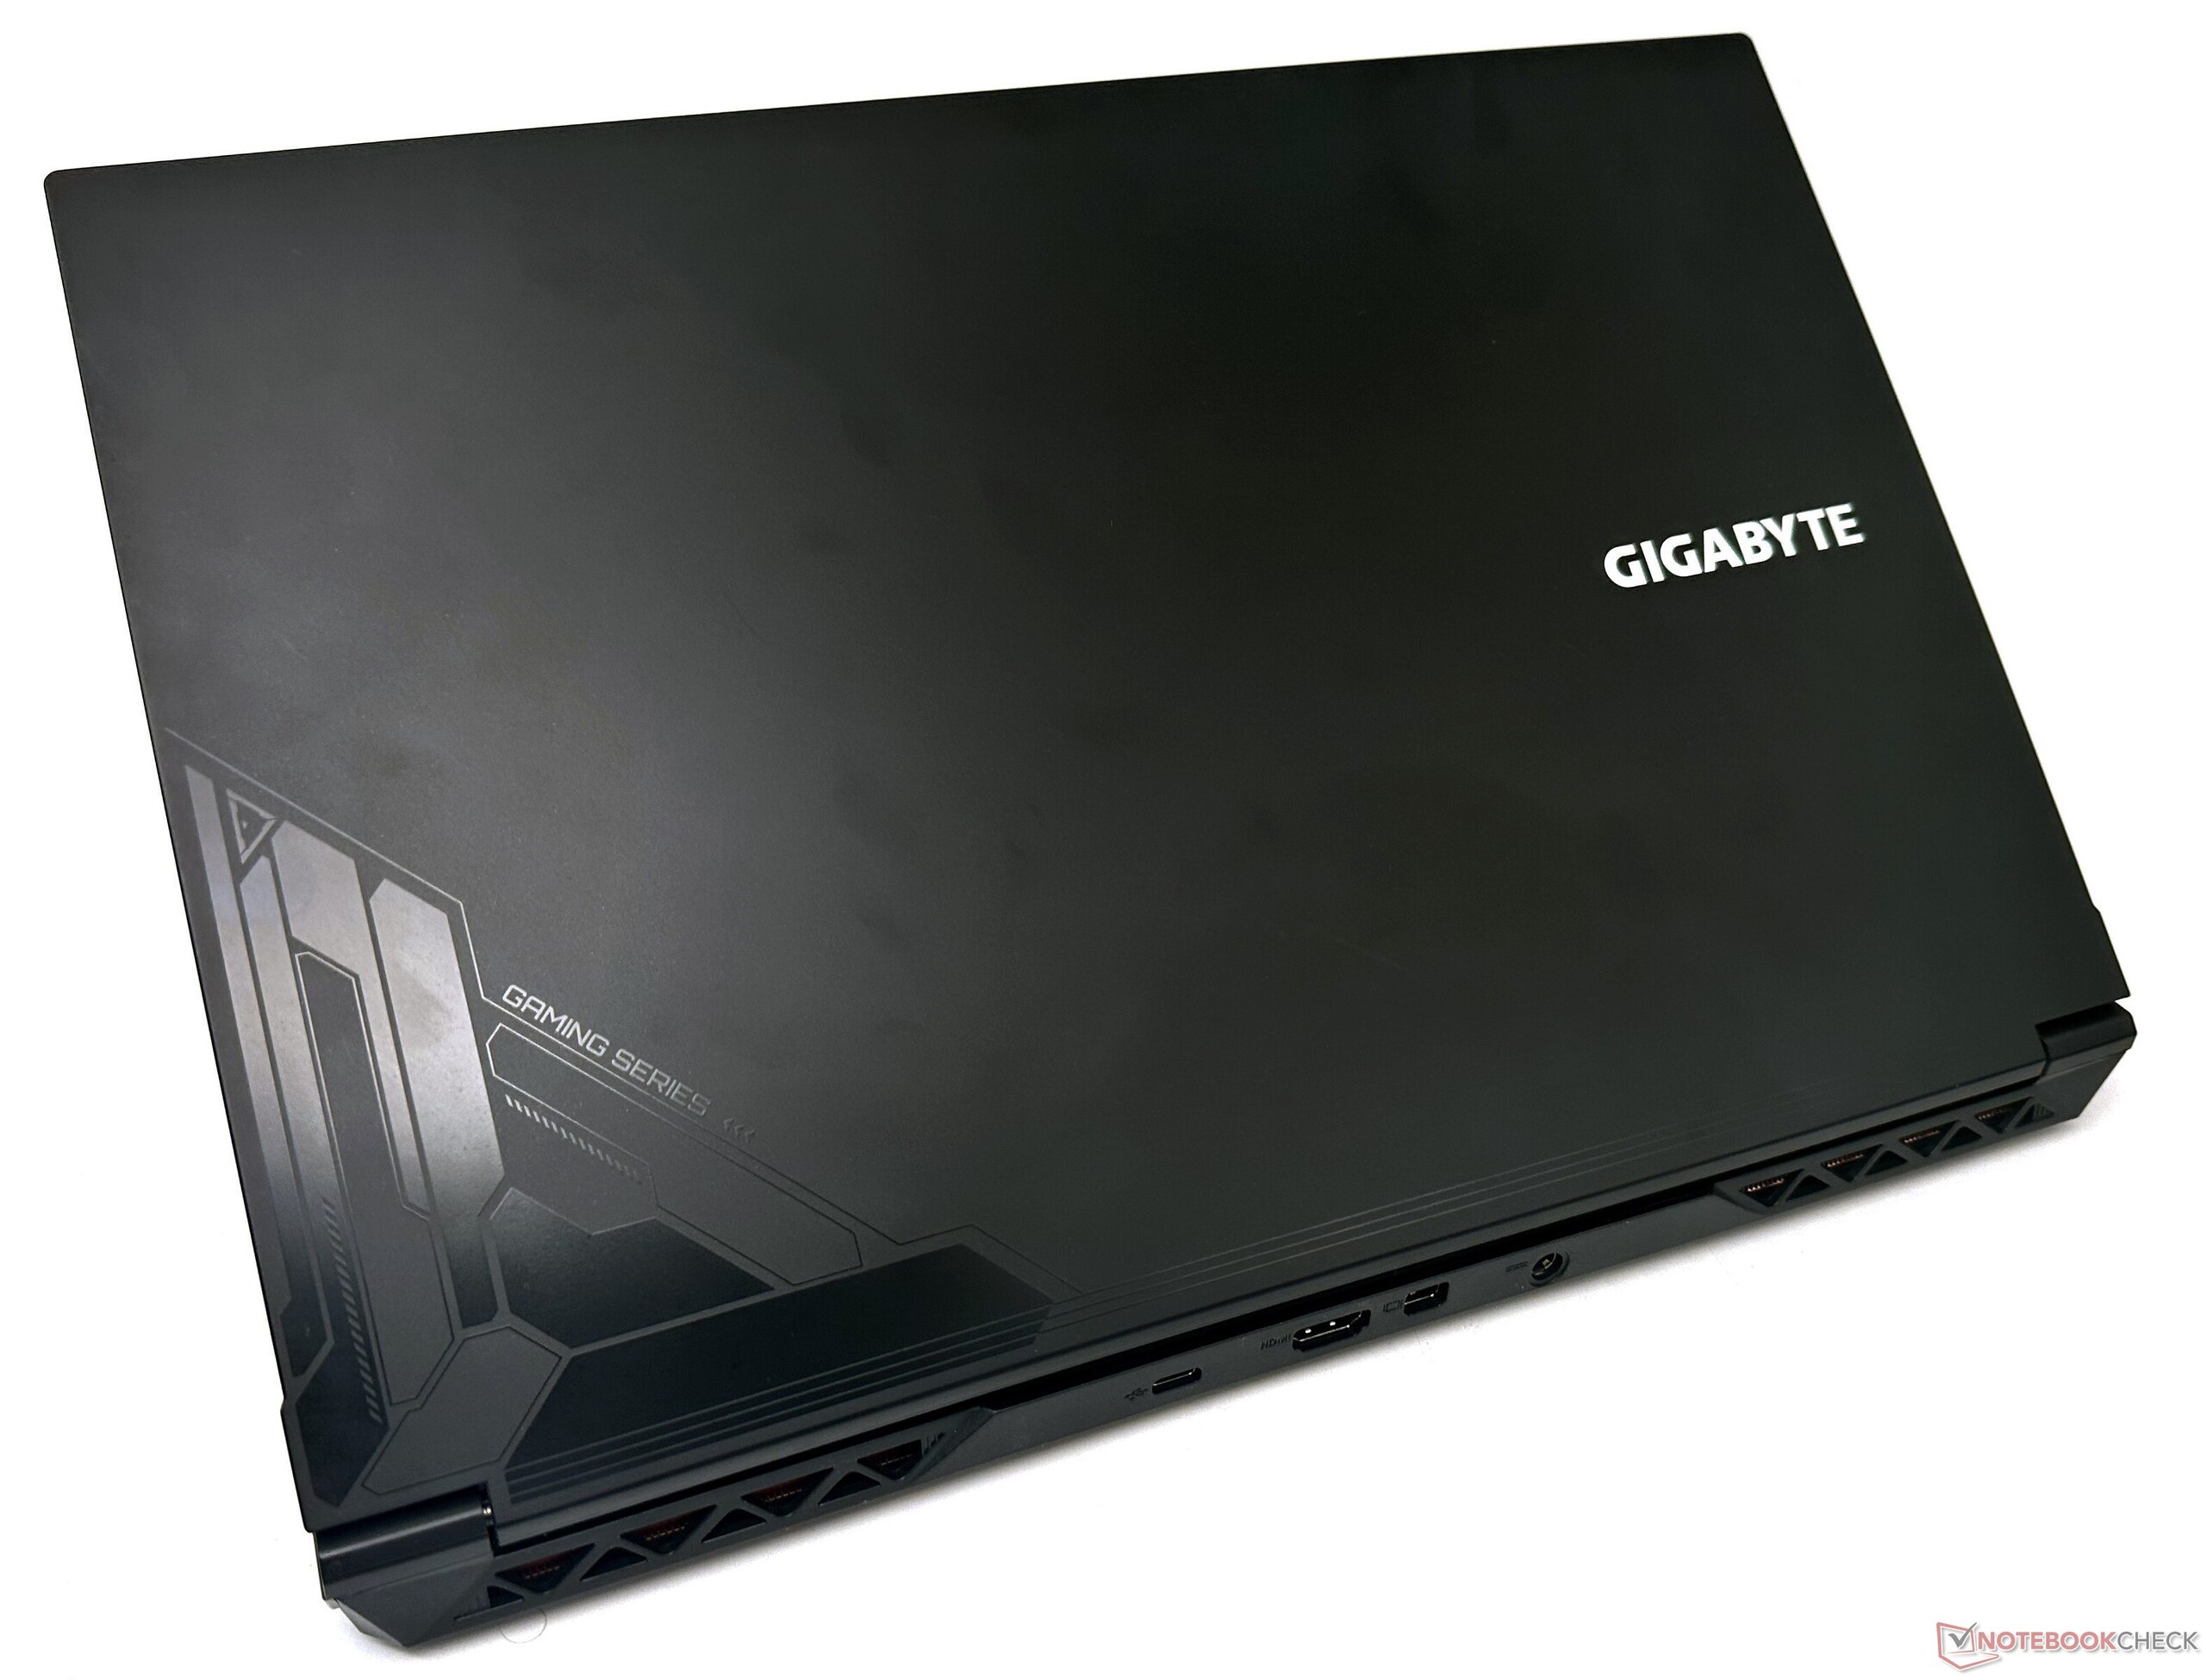
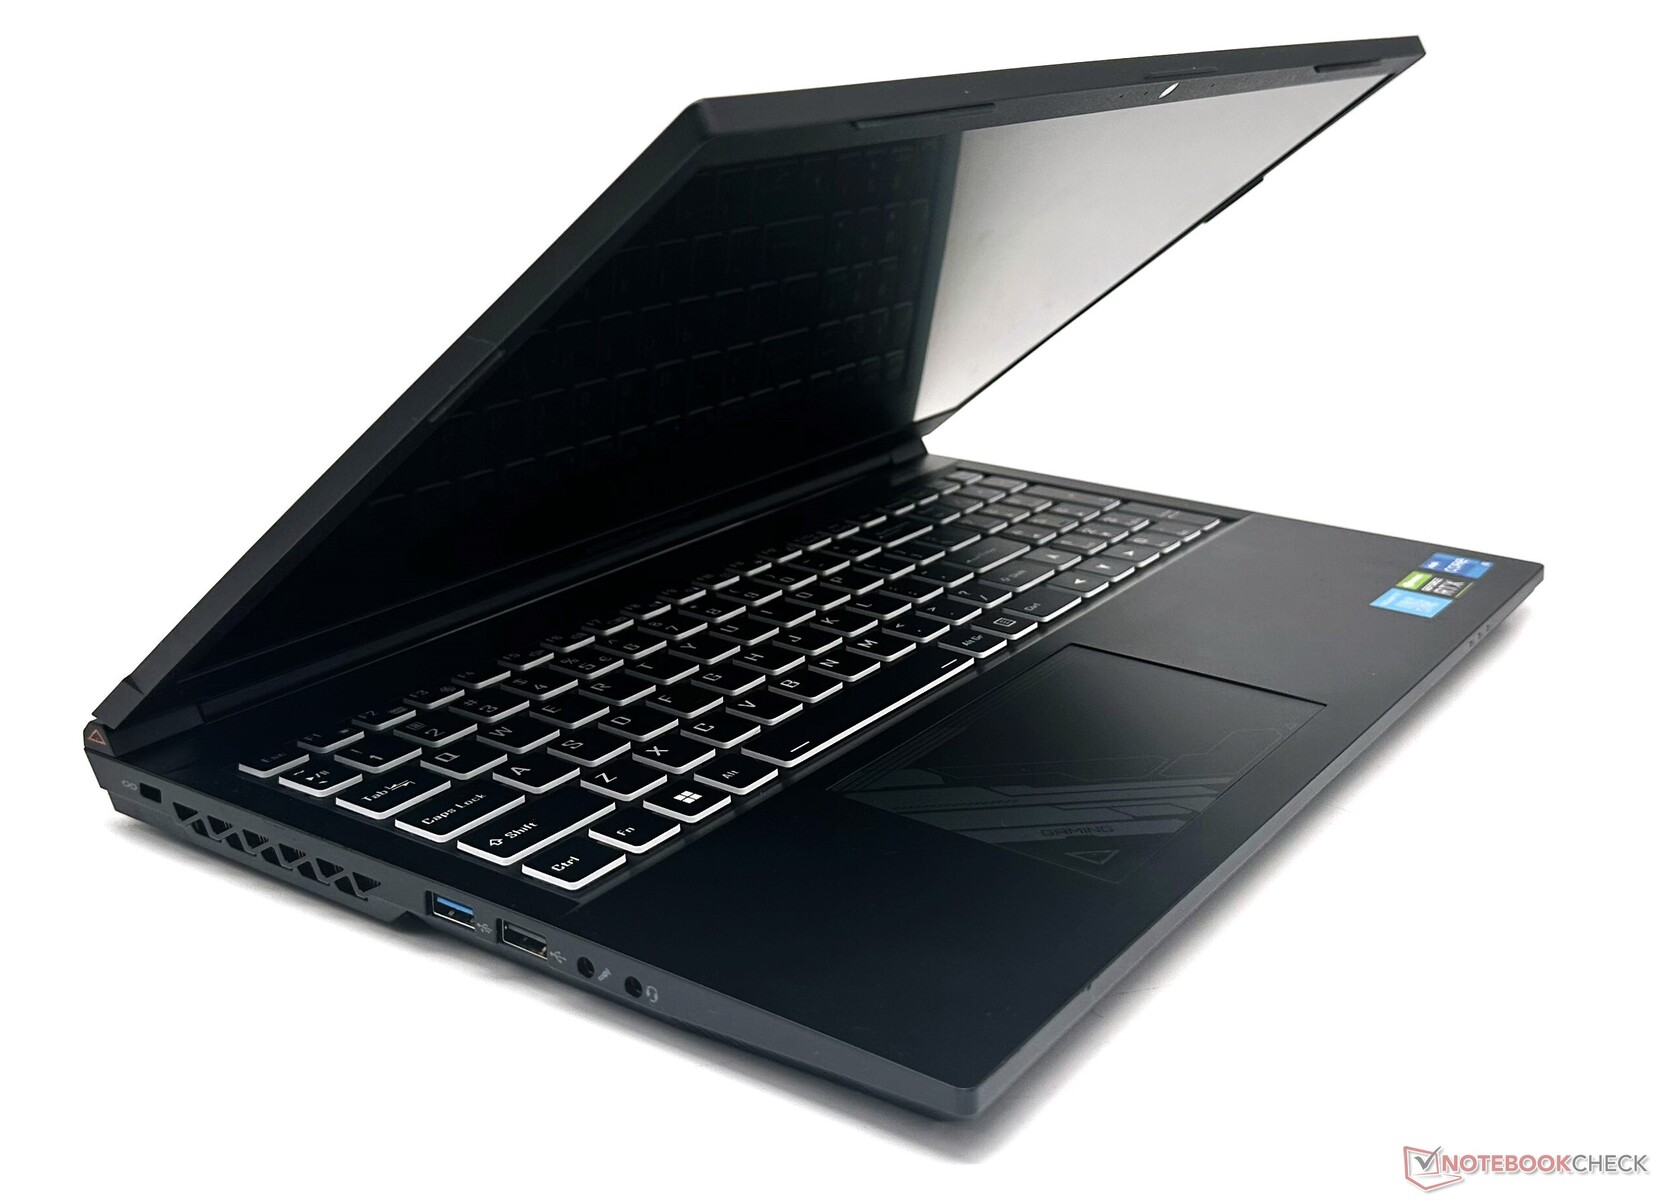
Chassi: Principalmente de plástico com alguma flexibilidade
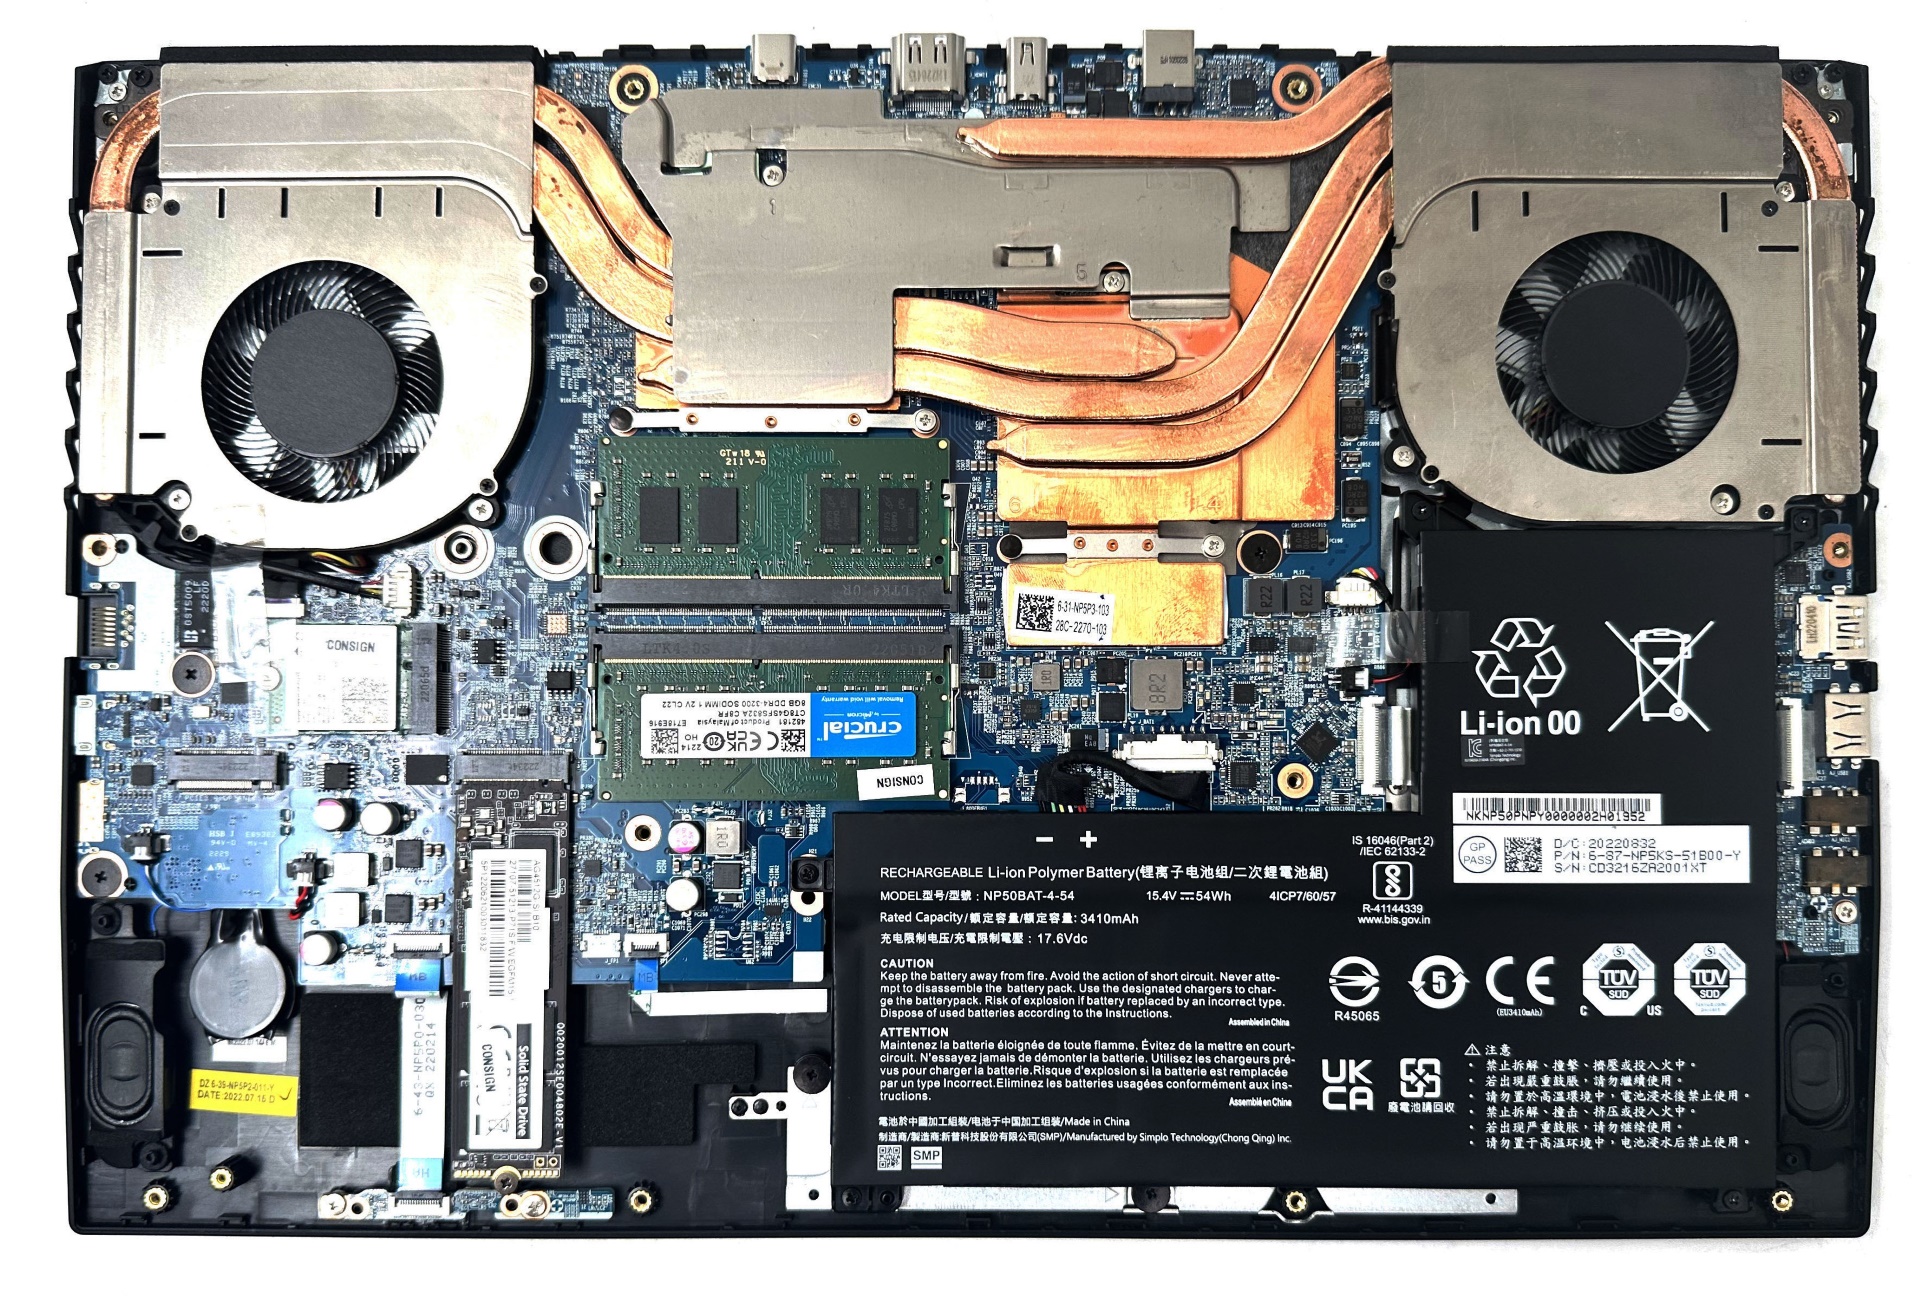
A construção do Gigabyte G5 KE está de acordo com as linhas esperadas nessa faixa de preço. Essencialmente, é um design Clevo que é totalmente construído em plástico com superfícies lisas e foscas com alguns detalhes sutis na parte de trás da tampa e no touchpad.
Com 23,9 mm, a espessura do G5 KE é semelhante à de seus concorrentes nesse segmento, embora seja consideravelmente mais fino do que o Gigabyte A5 K1.
O chassi do G5 KE não é o mais rígido que já vimos - há uma flexão considerável sob pressão na plataforma do teclado e a tampa pode ceder à torção. No entanto, não é provável que os usuários experimentem isso no uso diário.
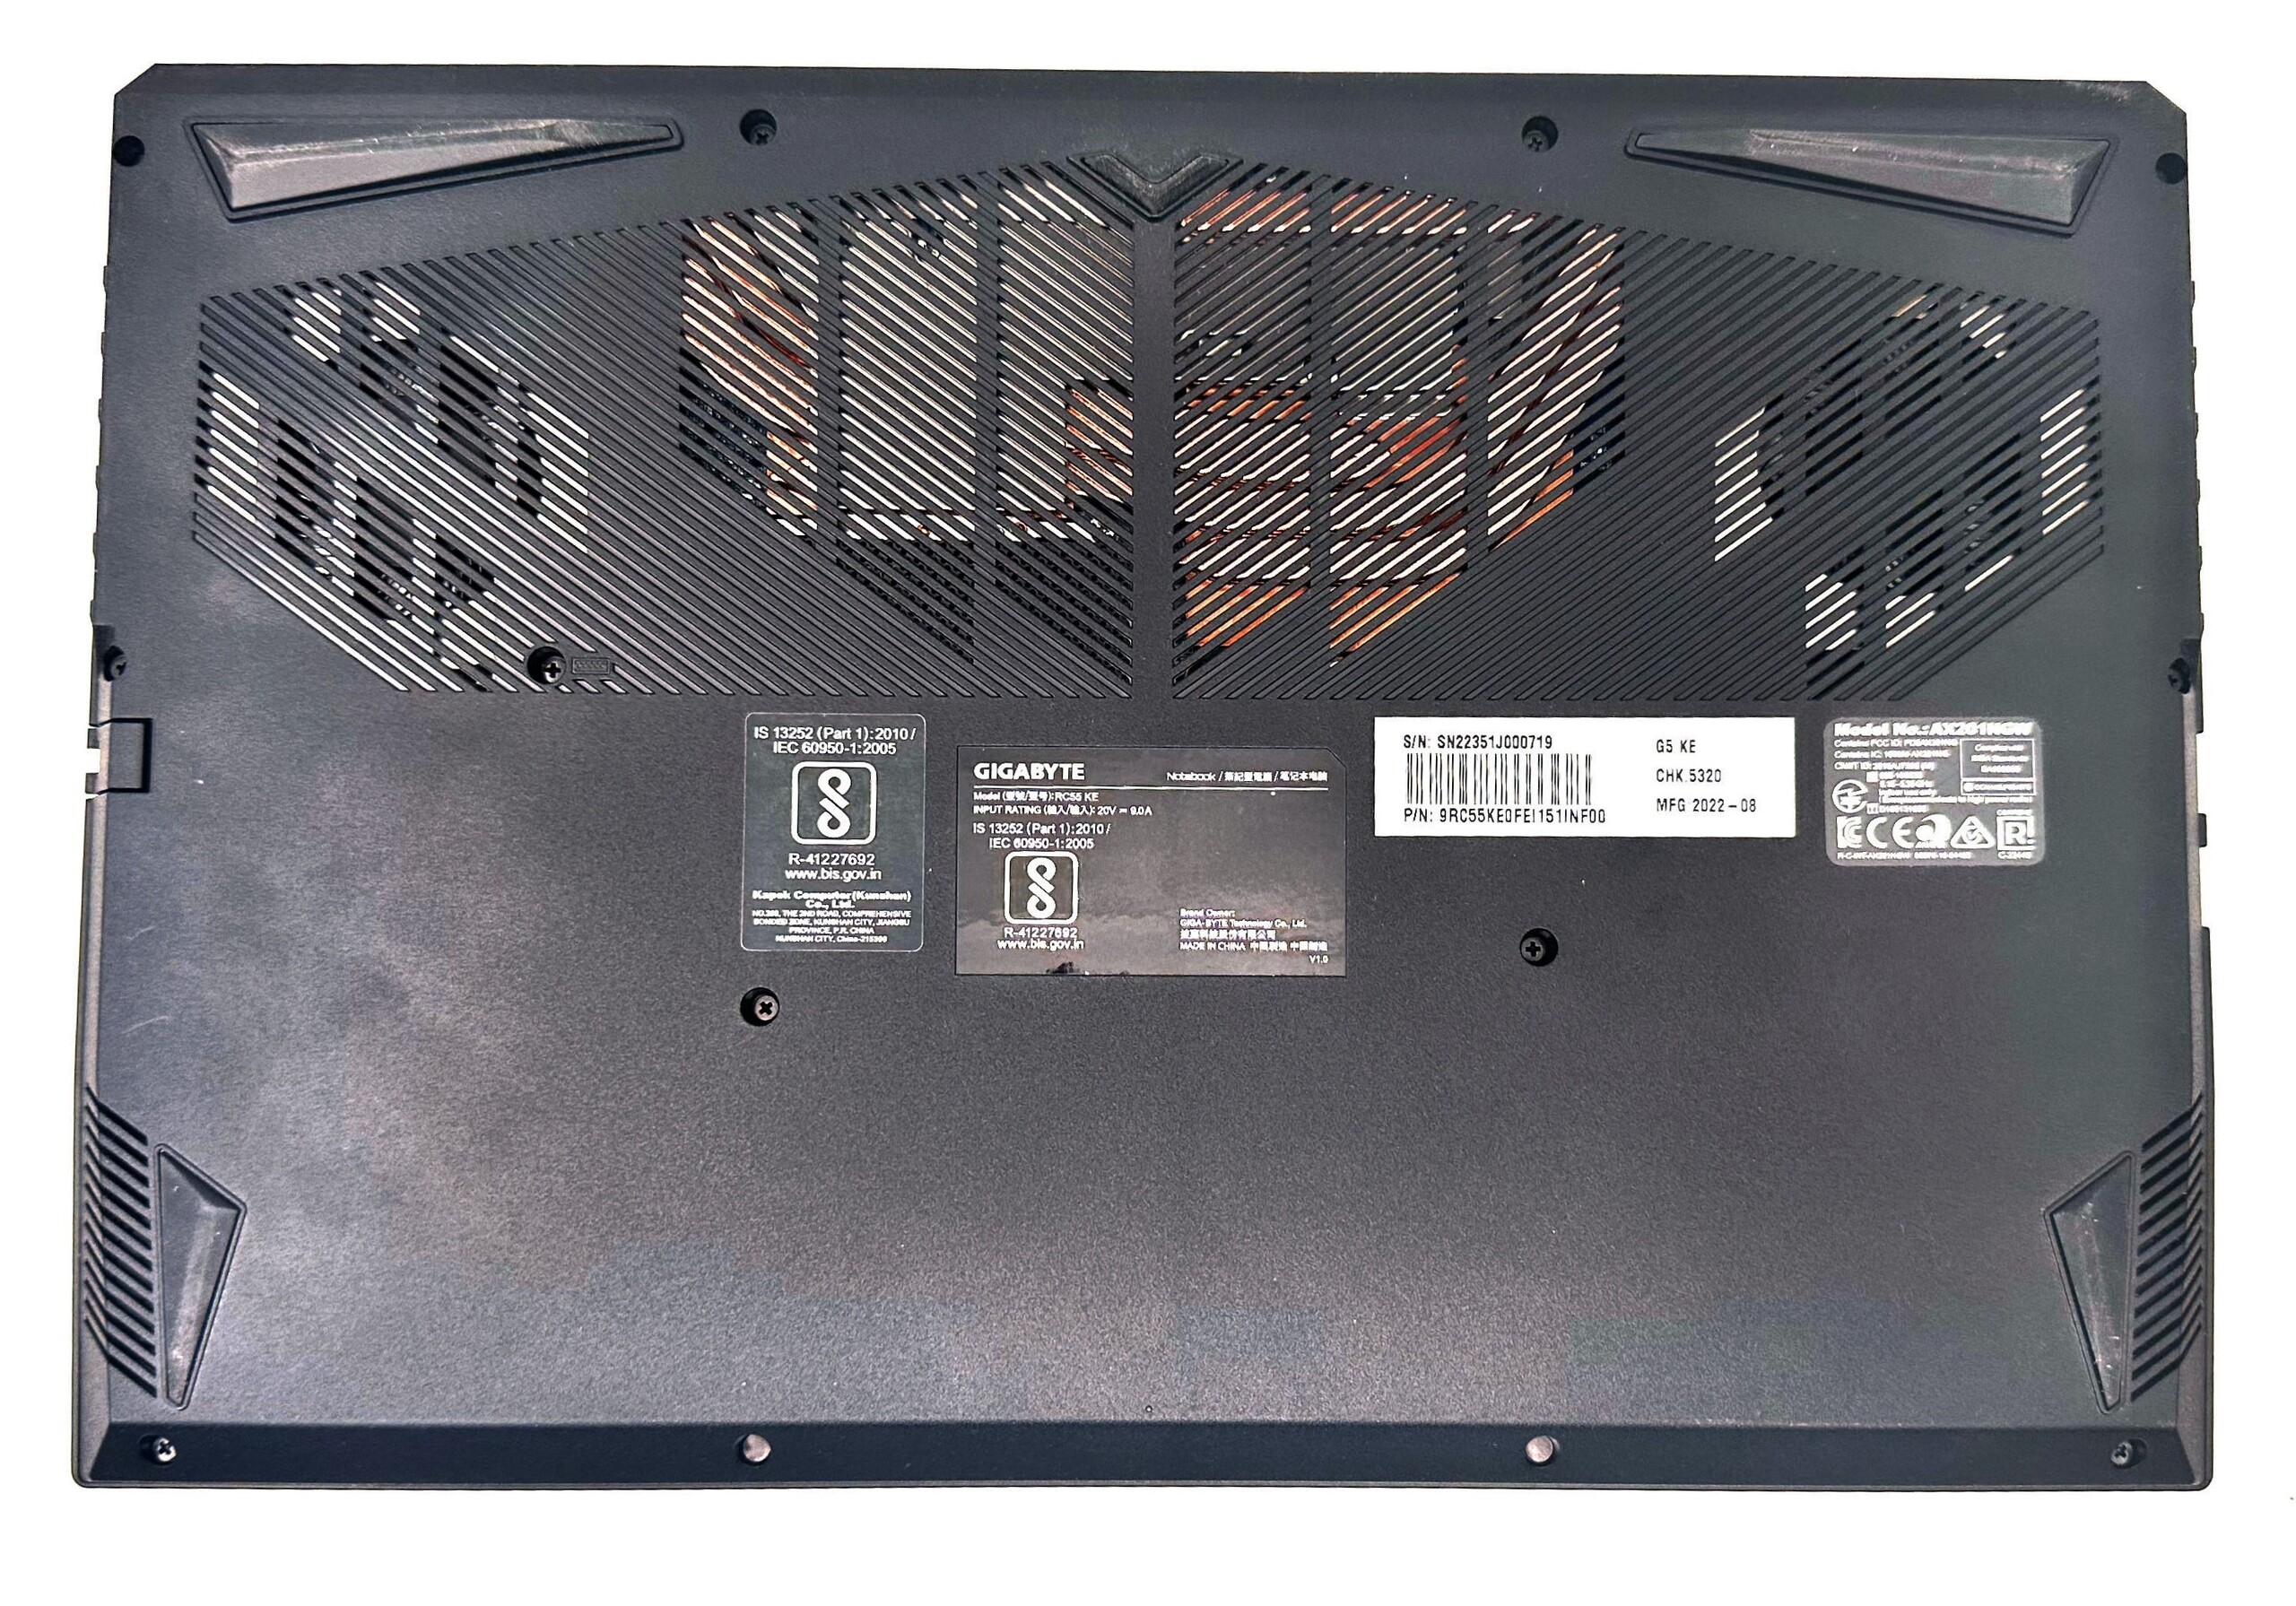
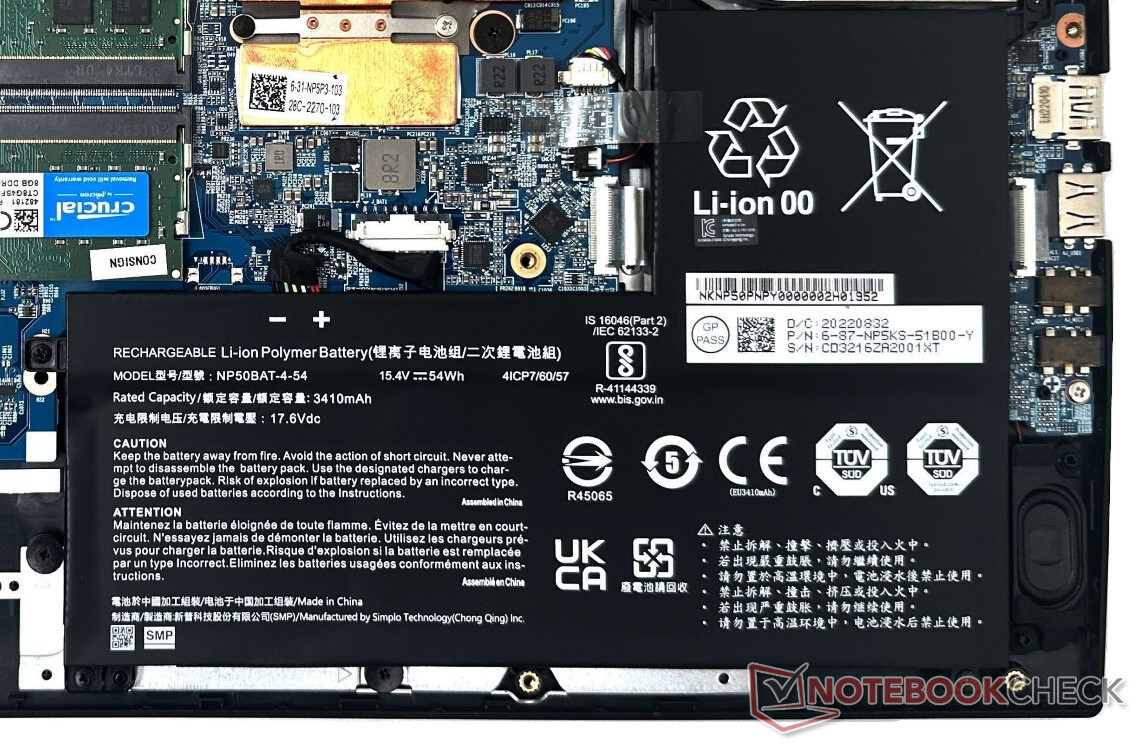
A abertura dos 13 parafusos Philips revela os componentes internos. A RAM DDR4, a placa WLAN e os SSDs podem ser trocados e atualizados, se necessário.

Conectividade: Seleção adequada de portas e Wi-Fi estável
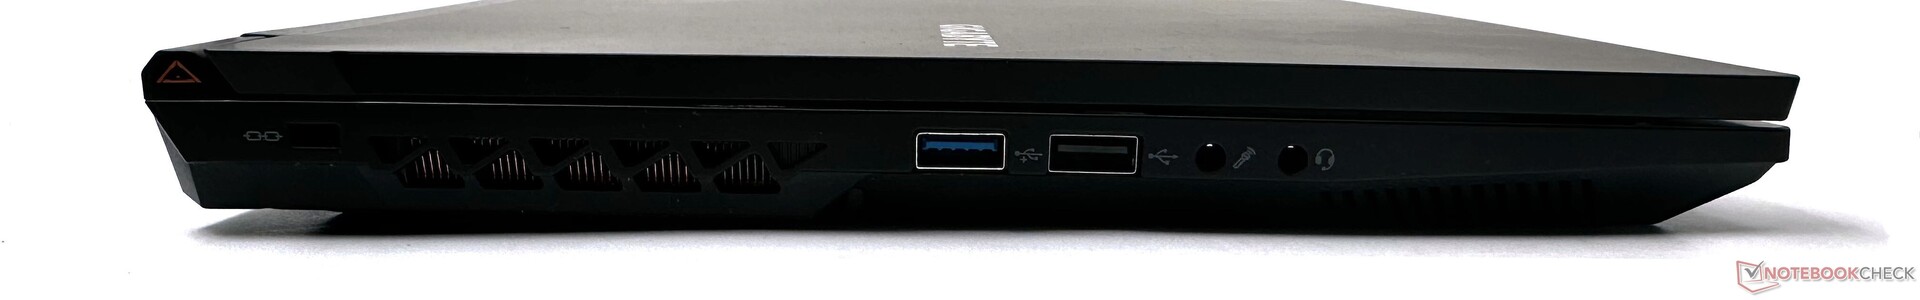
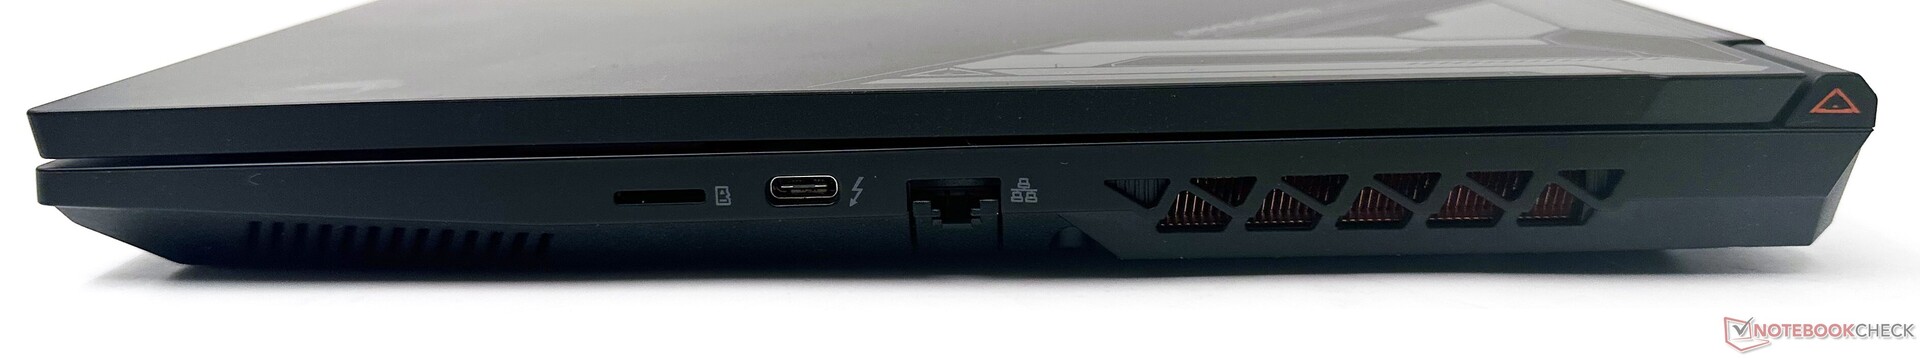
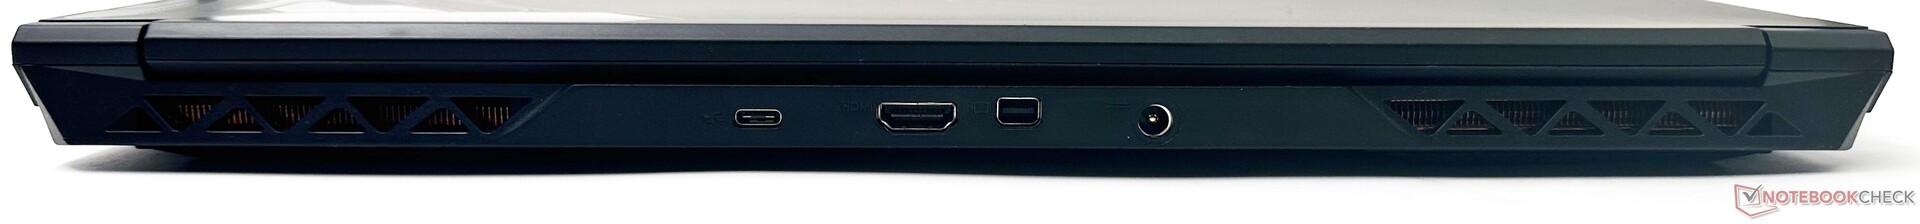
O G5 KE oferece uma seleção completa de portas com uma combinação de portas USB Tipo A e Tipo C, incluindo Thunderbolt 4. A presença de uma mini-DisplayPort 1.4, além da saída HDMI 2.1, ajuda a facilitar a conexão com monitores 4K com altas taxas de atualização.
As portas não representam nenhum obstáculo ao conectar vários dispositivos. Uma porta de entrada de microfone dedicada - uma raridade hoje em dia - é útil para conectar microfones de alta qualidade ou pode ser reconfigurada para suportar áudio multicanal.
A velocidade de leitura do cartão microSD poderia ter sido melhor, mas o G5 KE não tem muita concorrência nesse aspecto.
| SD Card Reader | |
| average JPG Copy Test (av. of 3 runs) | |
| Média da turma Gaming (20.9 - 210, n=54, últimos 2 anos) | |
| Gigabyte G5 KE (AV PRO microSD 128 GB V60) | |
| Schenker XMG Core 15 (M22) (AV PRO microSD 128 GB V60) | |
| HP Victus 16-e0179ng (AV PRO microSD 128 GB V60) | |
| maximum AS SSD Seq Read Test (1GB) | |
| Média da turma Gaming (25.5 - 261, n=51, últimos 2 anos) | |
| Gigabyte G5 KE (AV PRO microSD 128 GB V60) | |
| Gigabyte G7 KE (AV PRO microSD 128 GB V60) | |
| Schenker XMG Core 15 (M22) (AV PRO microSD 128 GB V60) | |
| HP Victus 16-e0179ng (AV PRO microSD 128 GB V60) | |
O G5 KE não oferece Wi-Fi 6E. No entanto, observamos uma taxa de transferência muito boa e bastante consistente na banda de 5 GHz quando testado com nosso roteador de referência Asus ROG Rapture GT-AXE11000.
A webcam de 720p apresenta grandes desvios de cor e as imagens não têm nitidez geral. Ainda assim, ela deve ser útil para uma ou duas chamadas de vídeo.


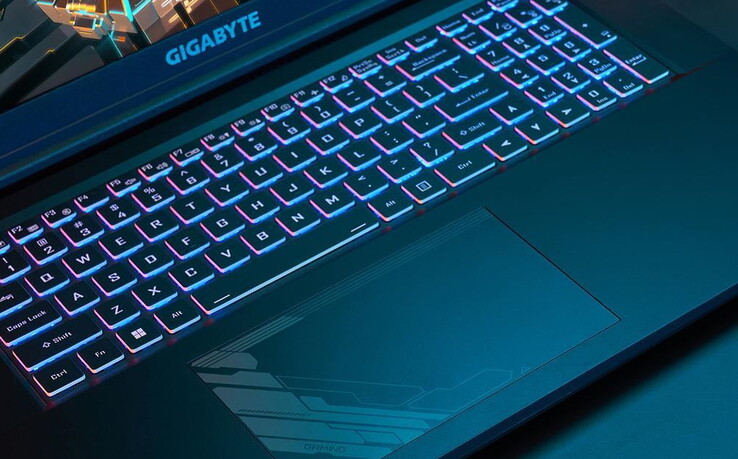
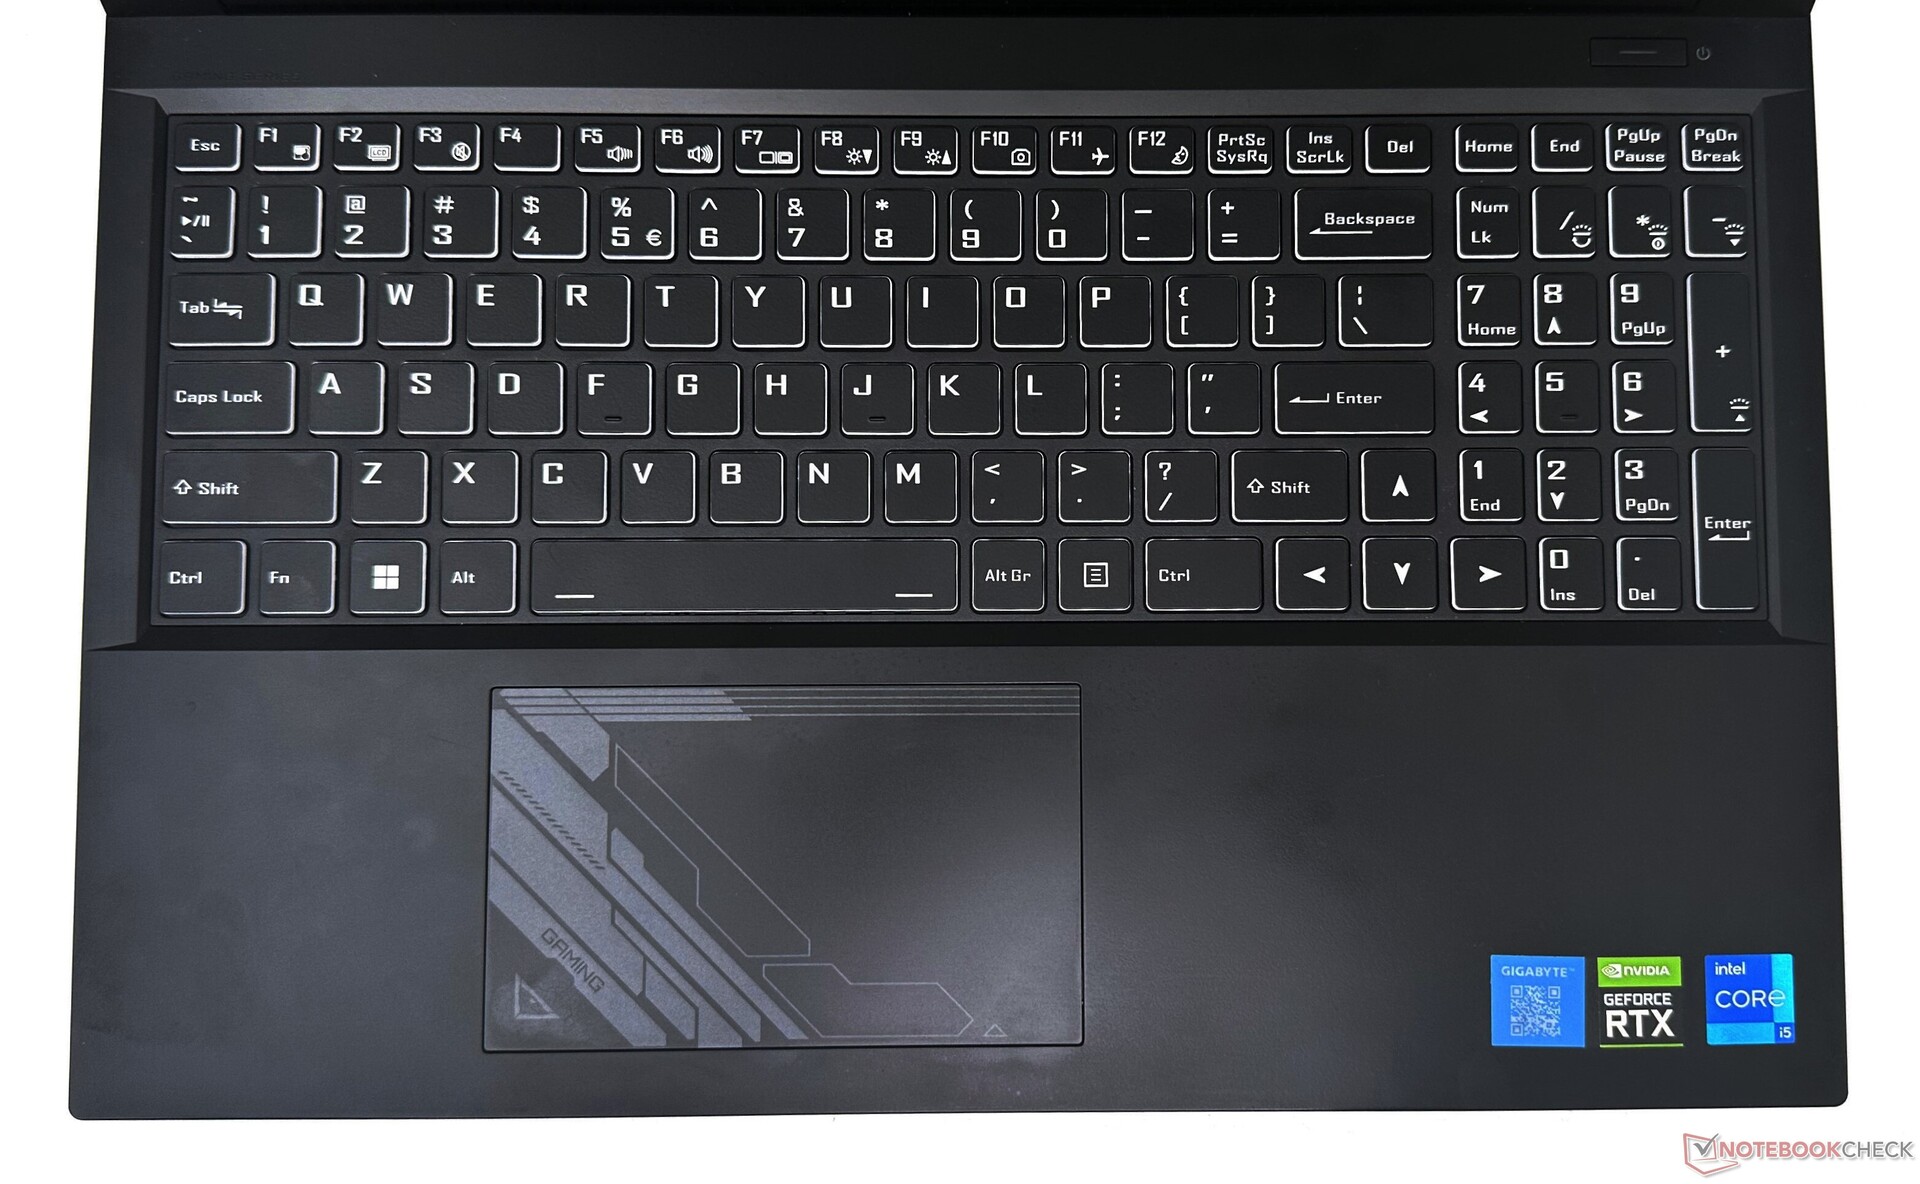
Dispositivos de entrada: Teclas de seta de tamanho normal
O teclado chiclet oferece deslocamento e atuação decentes. No entanto, a digitação parece um pouco mole e o feedback tátil é um pouco insuficiente. As teclas de seta de tamanho normal permitem uma navegação confortável em documentos e planilhas.
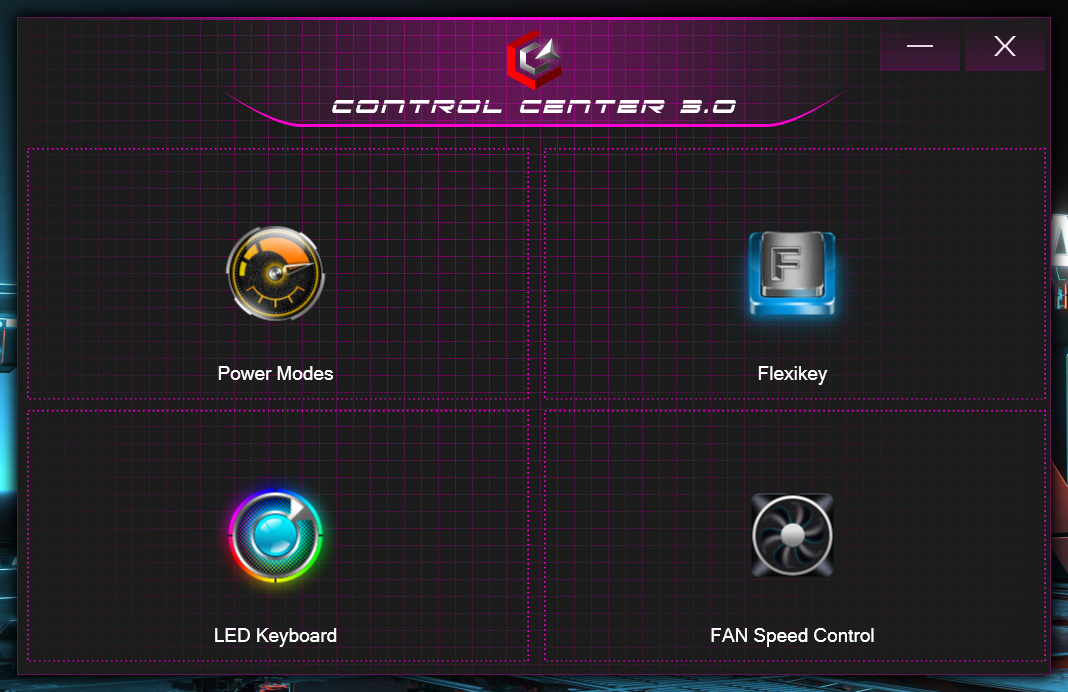
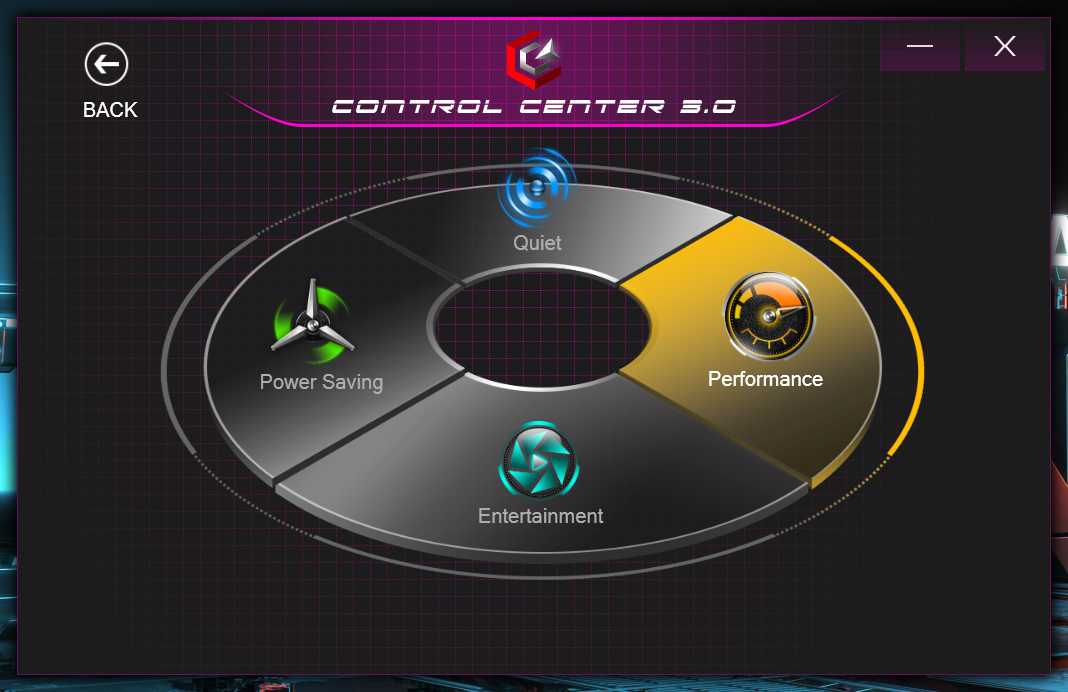
A luz de fundo RGB pode ser ajustada em quatro etapas. Esse não é um teclado RGB multizona, mas é possível fazer algumas personalizações por meio do software Control Center 3.0.
O touchpad de 12 cm x 7,5 cm é suficientemente espaçoso, suporta os gestos do Windows Precision e oferece uma boa experiência de deslizamento com resistência mínima. Toda a superfície funciona como um botão esquerdo do mouse. Os cliques têm um curso curto e boa sensibilidade tátil.
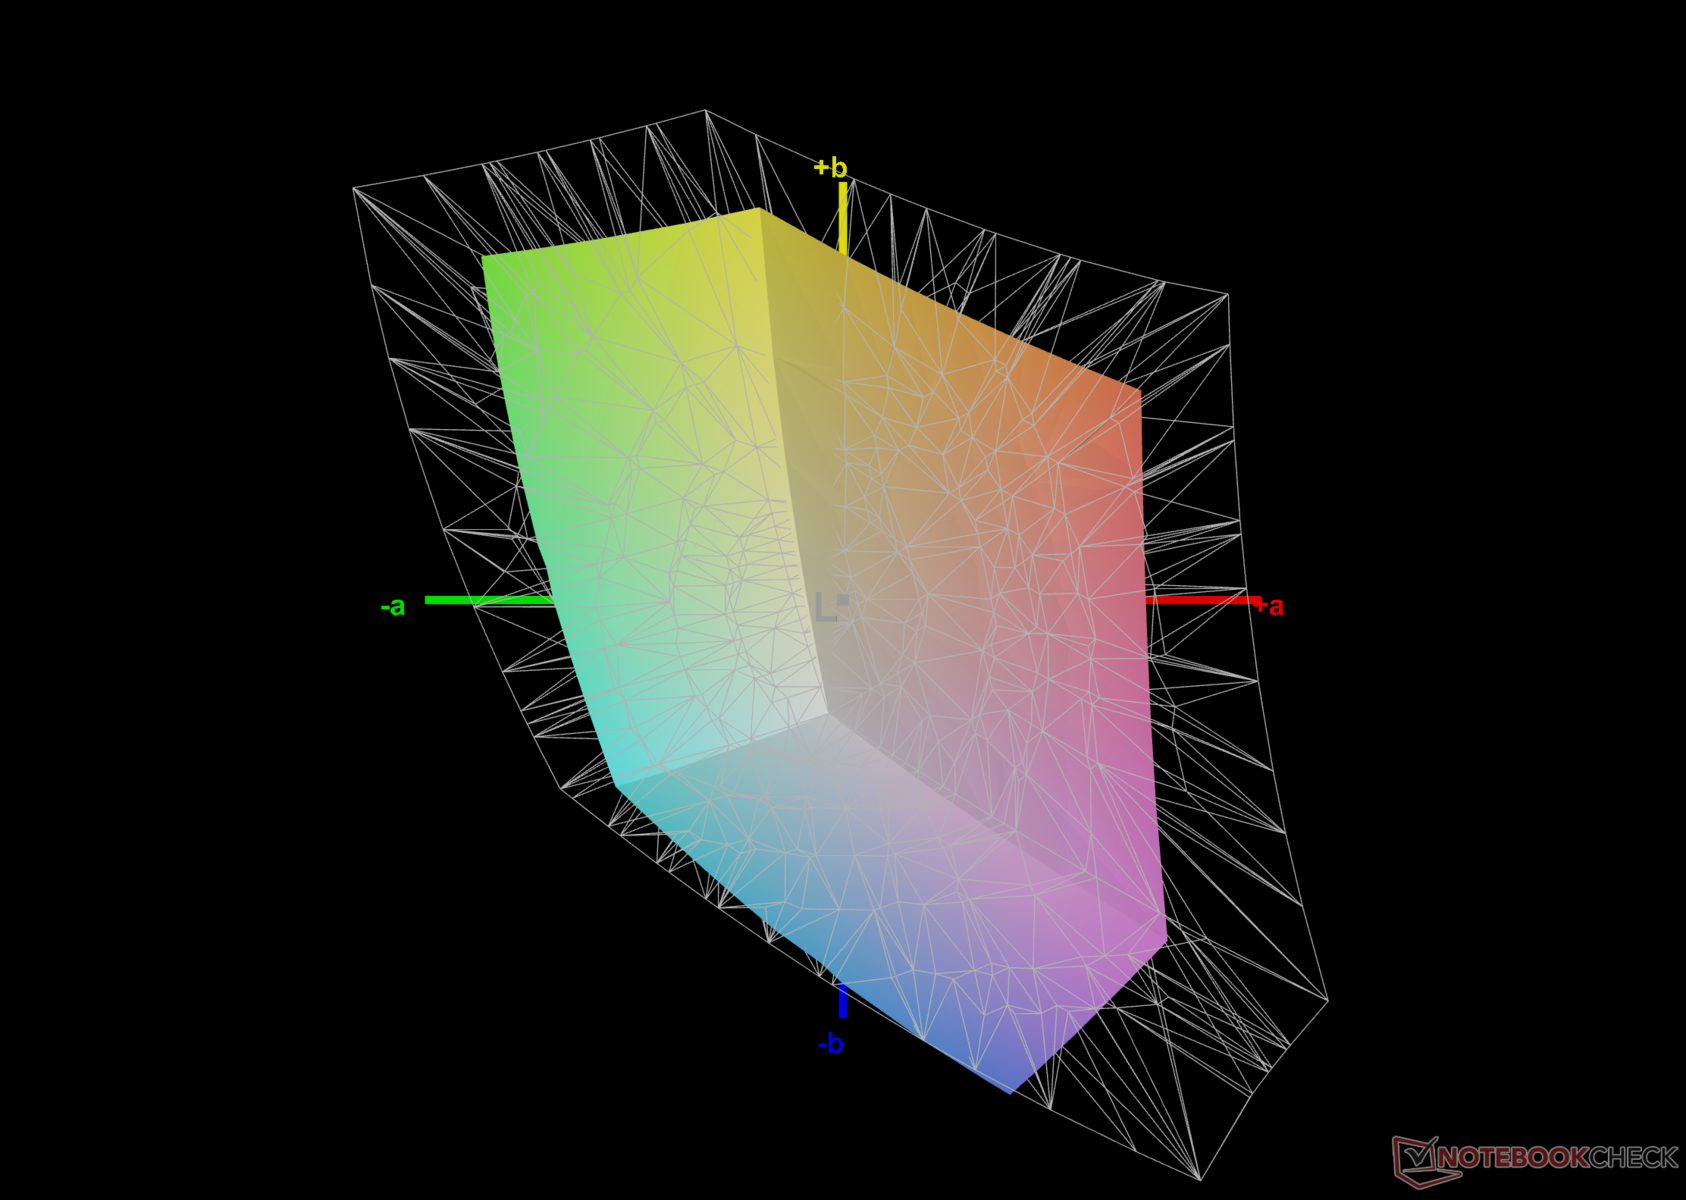
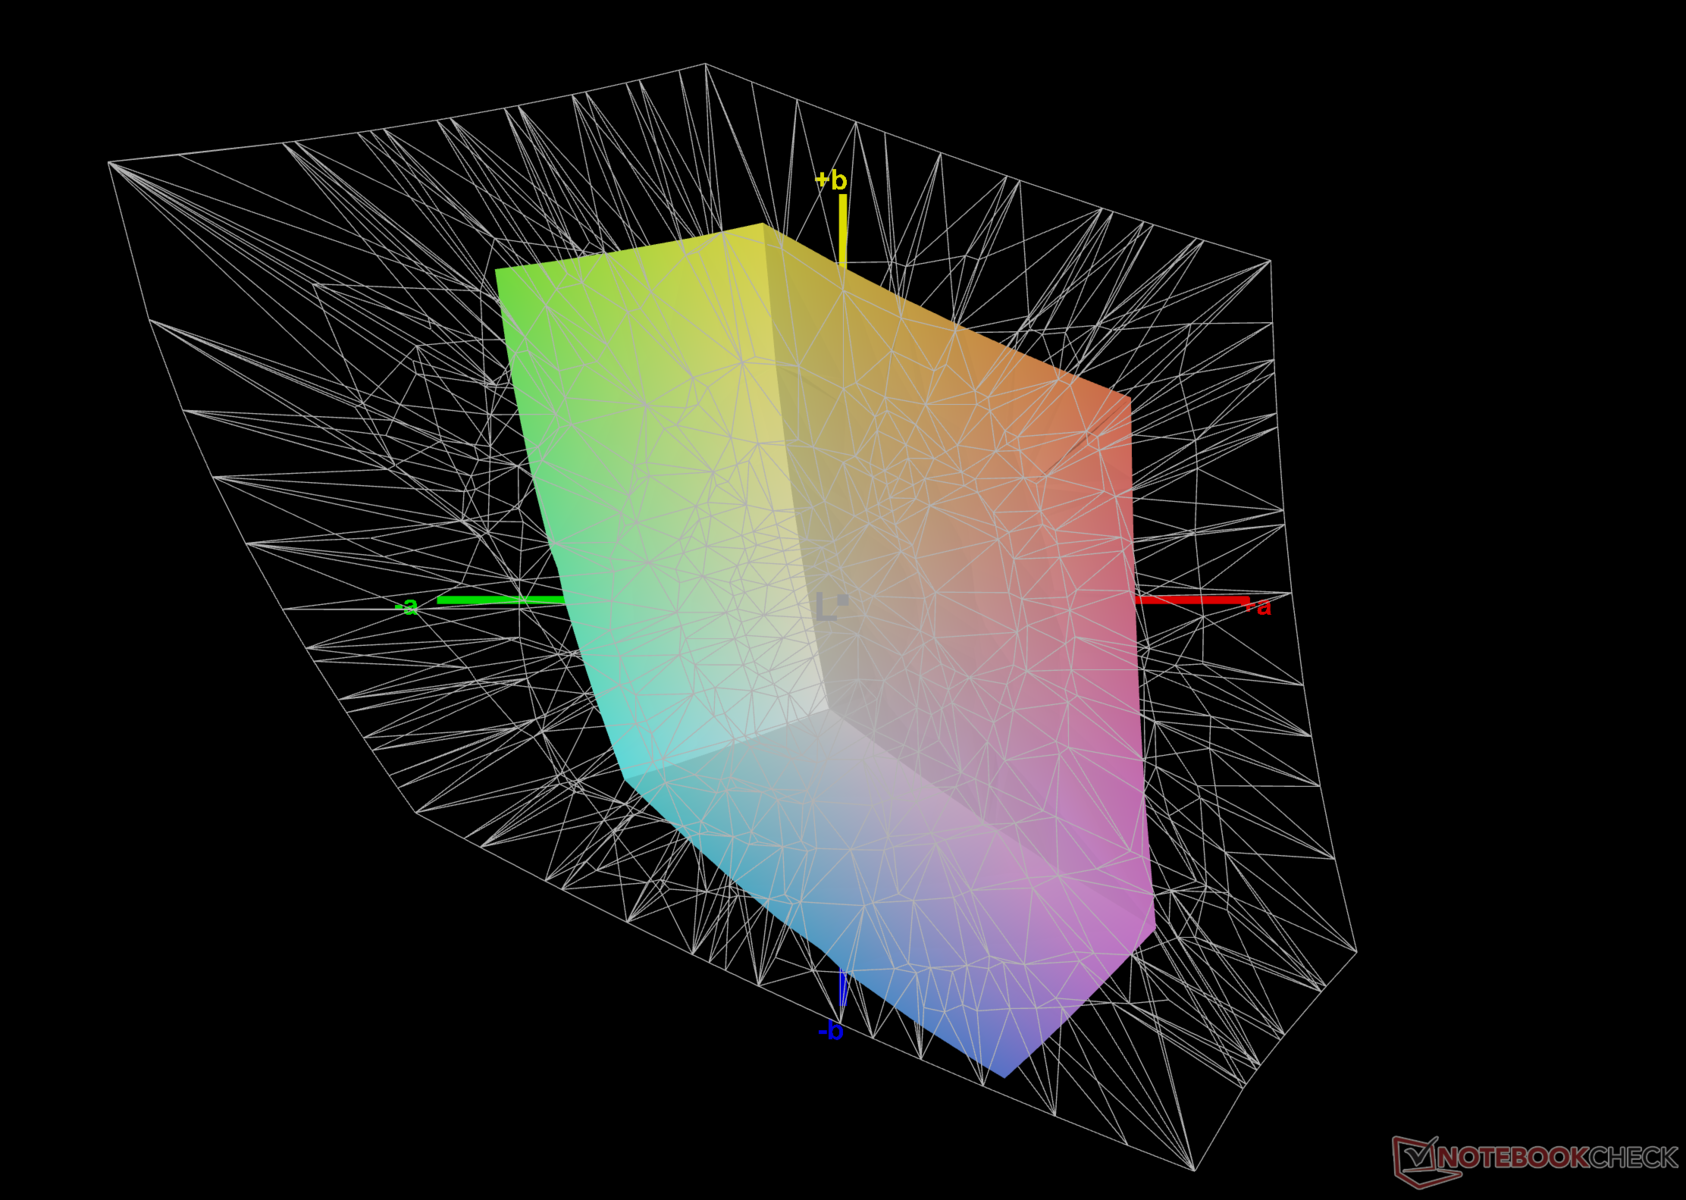
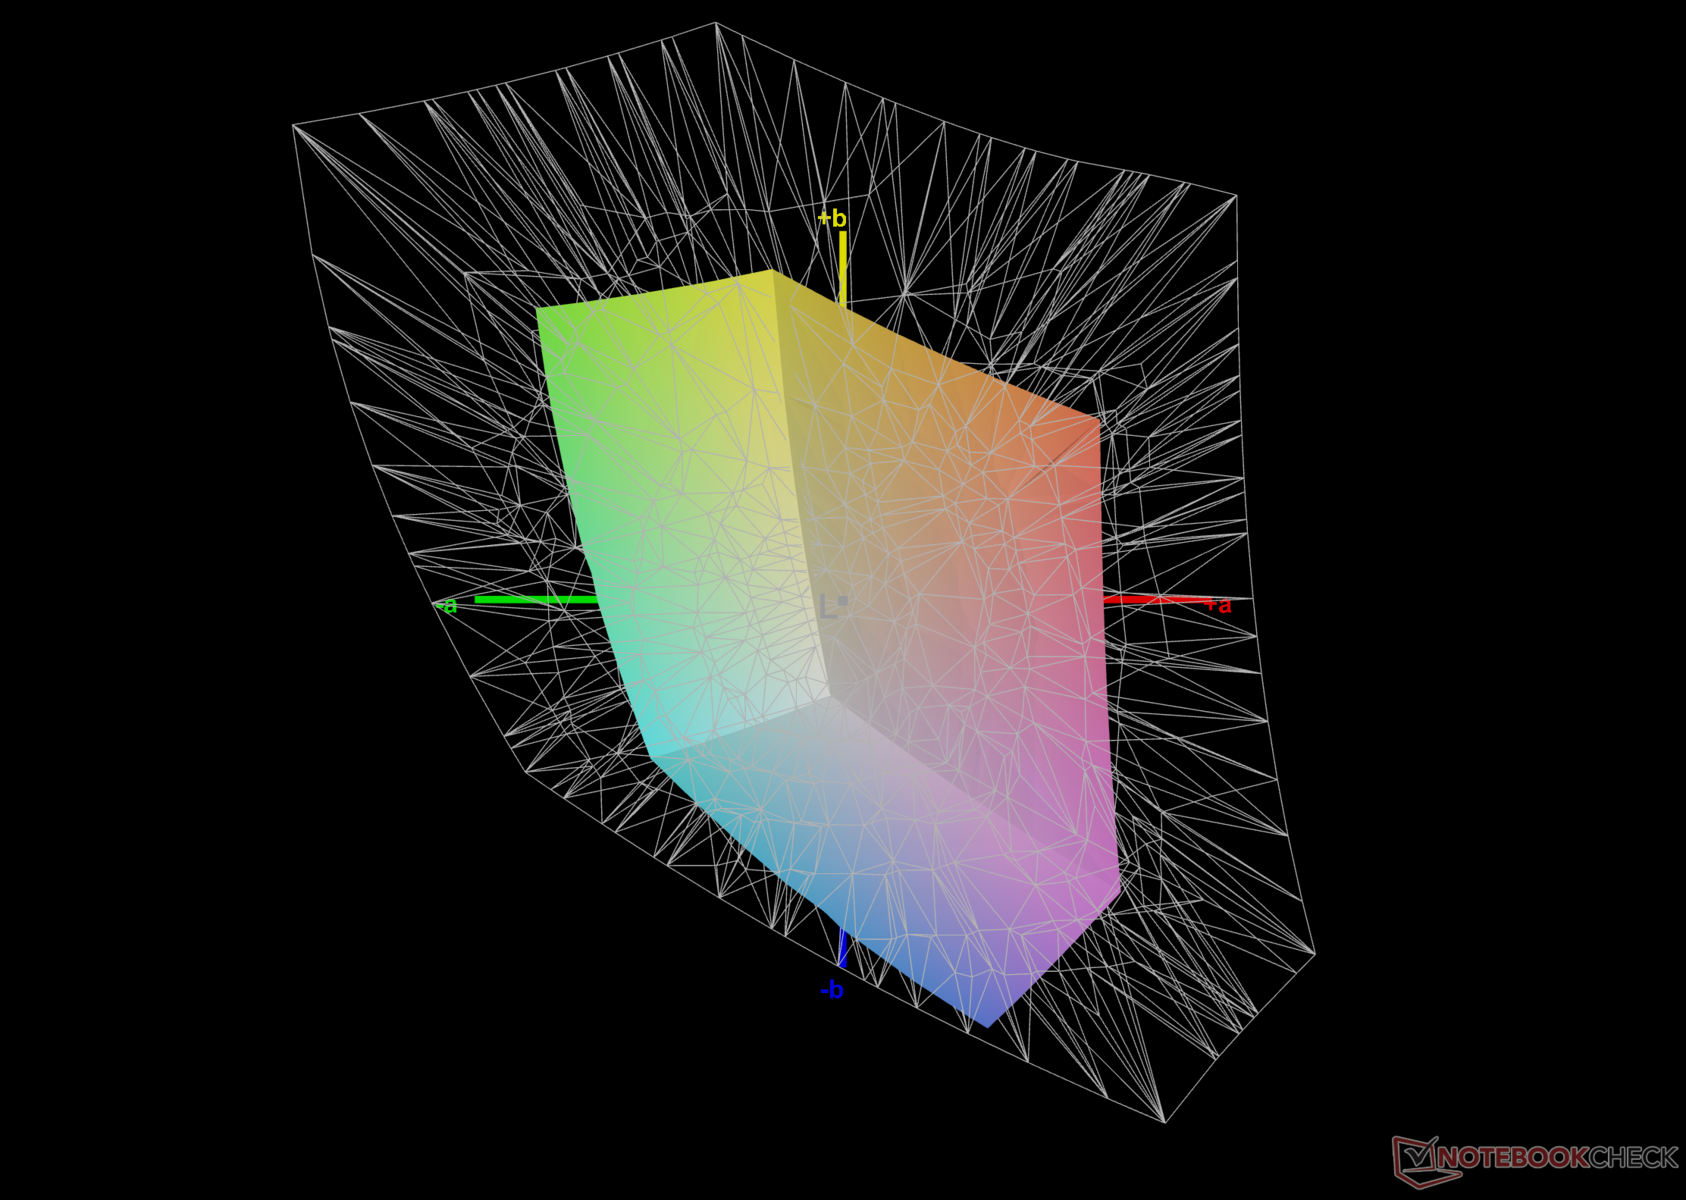
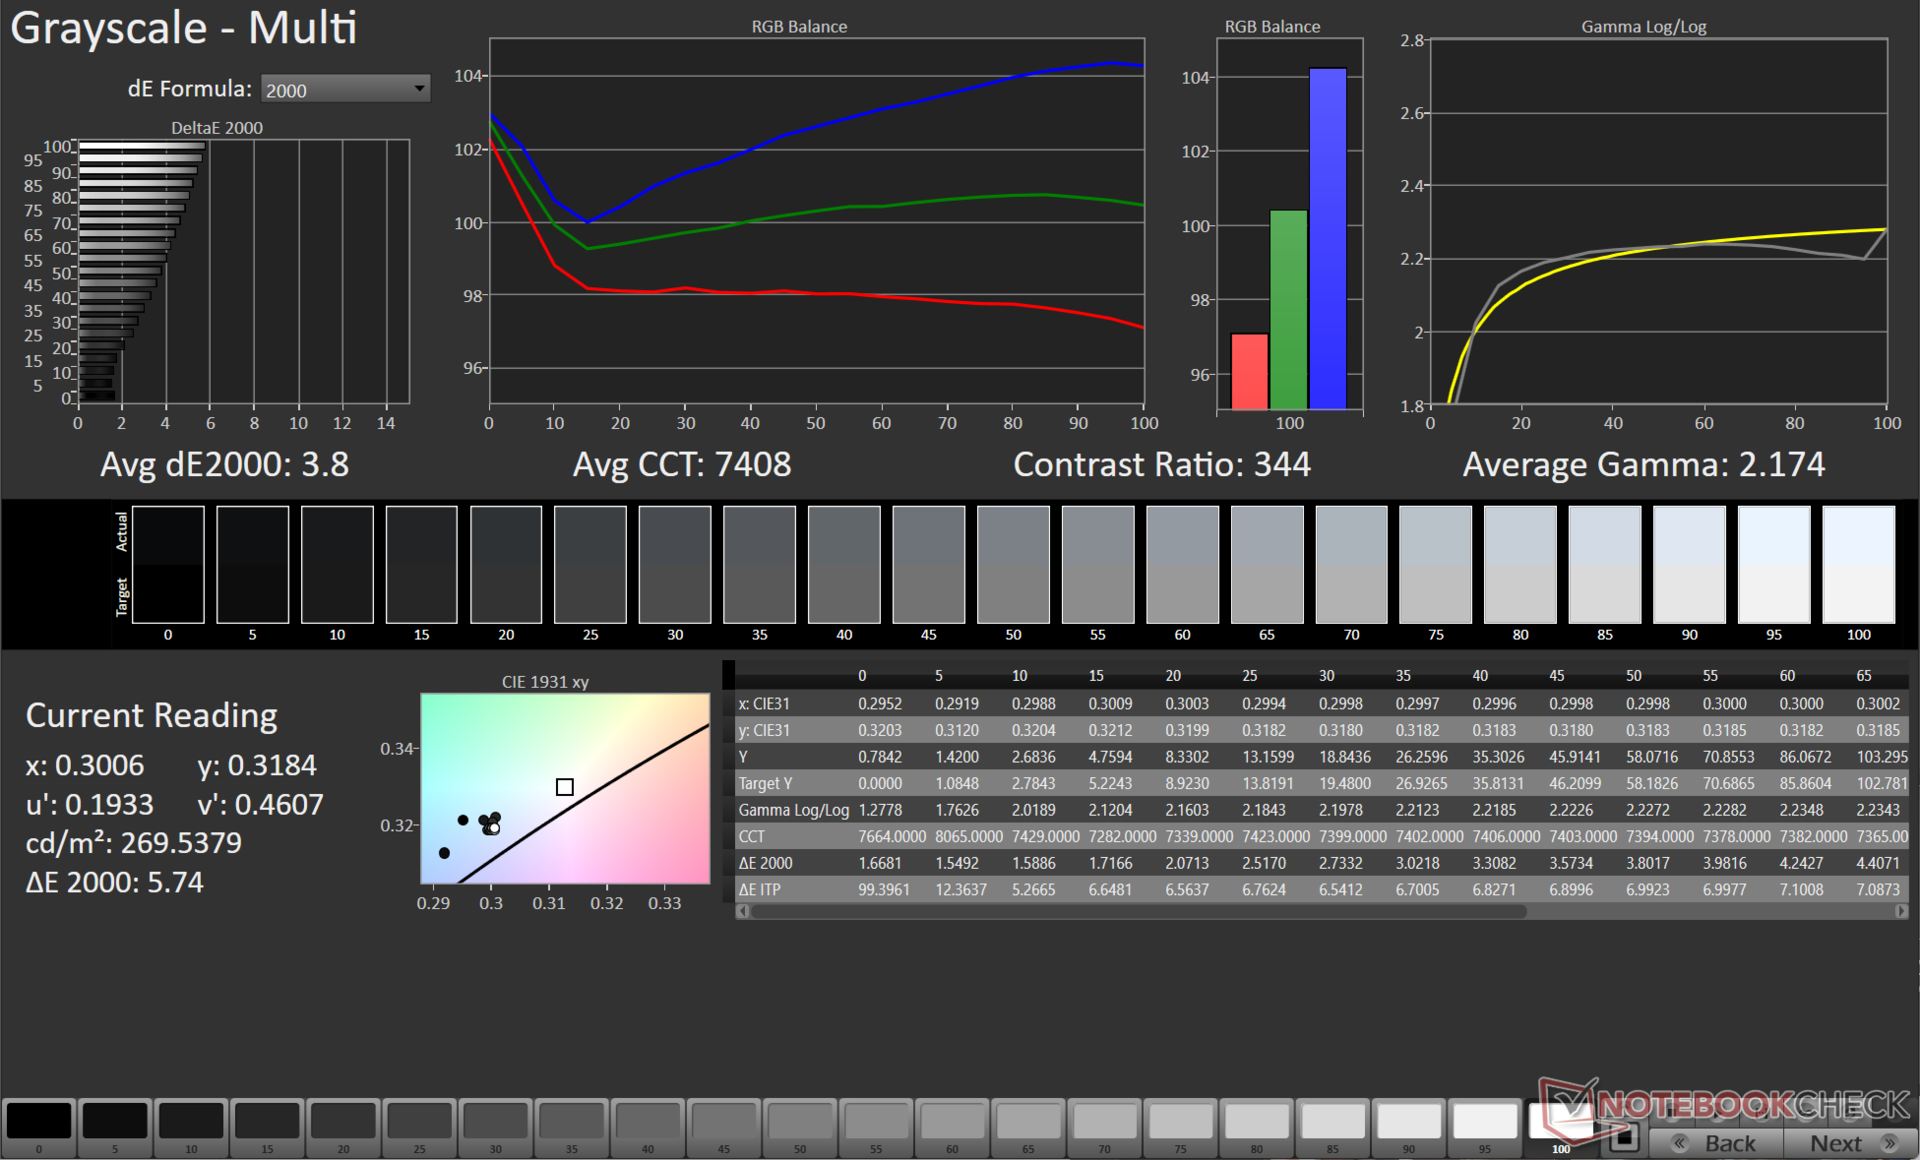
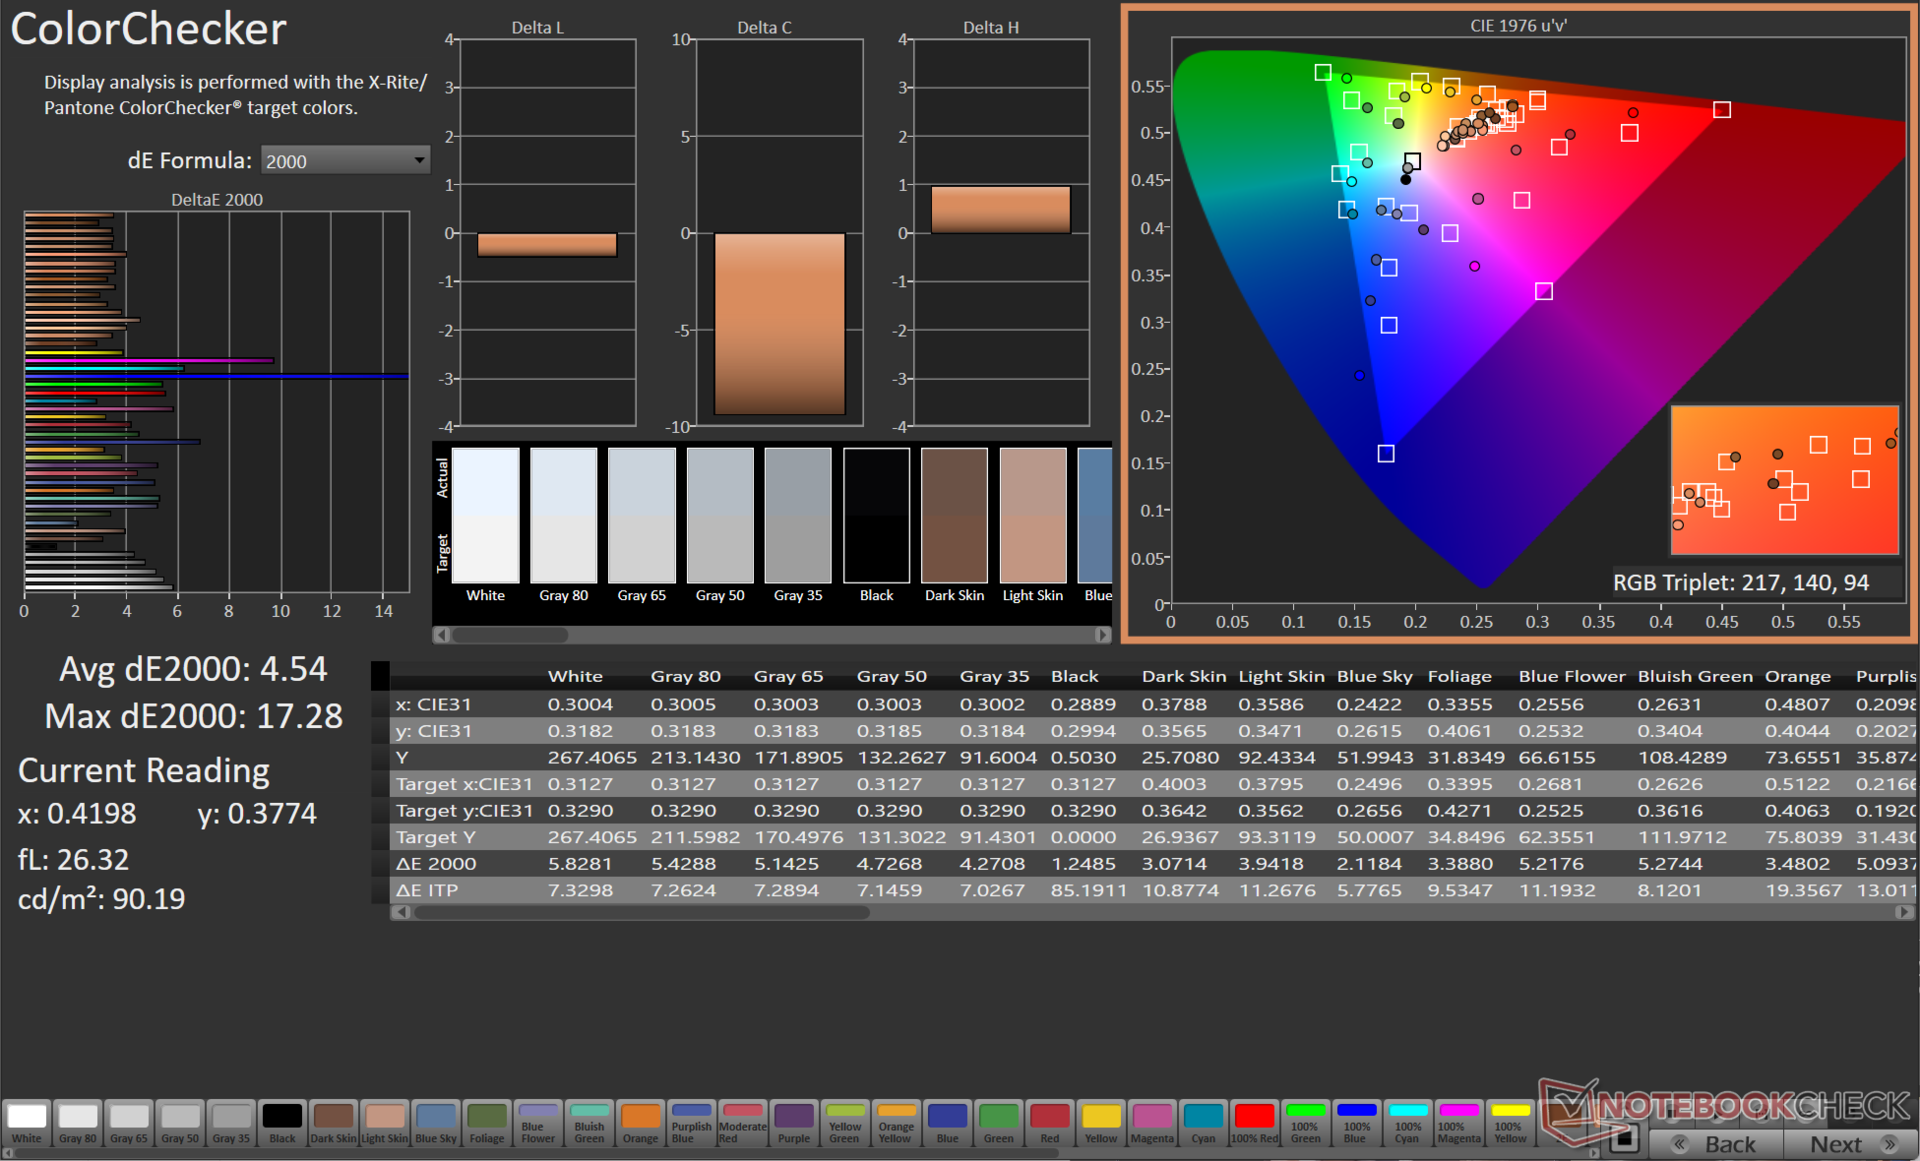
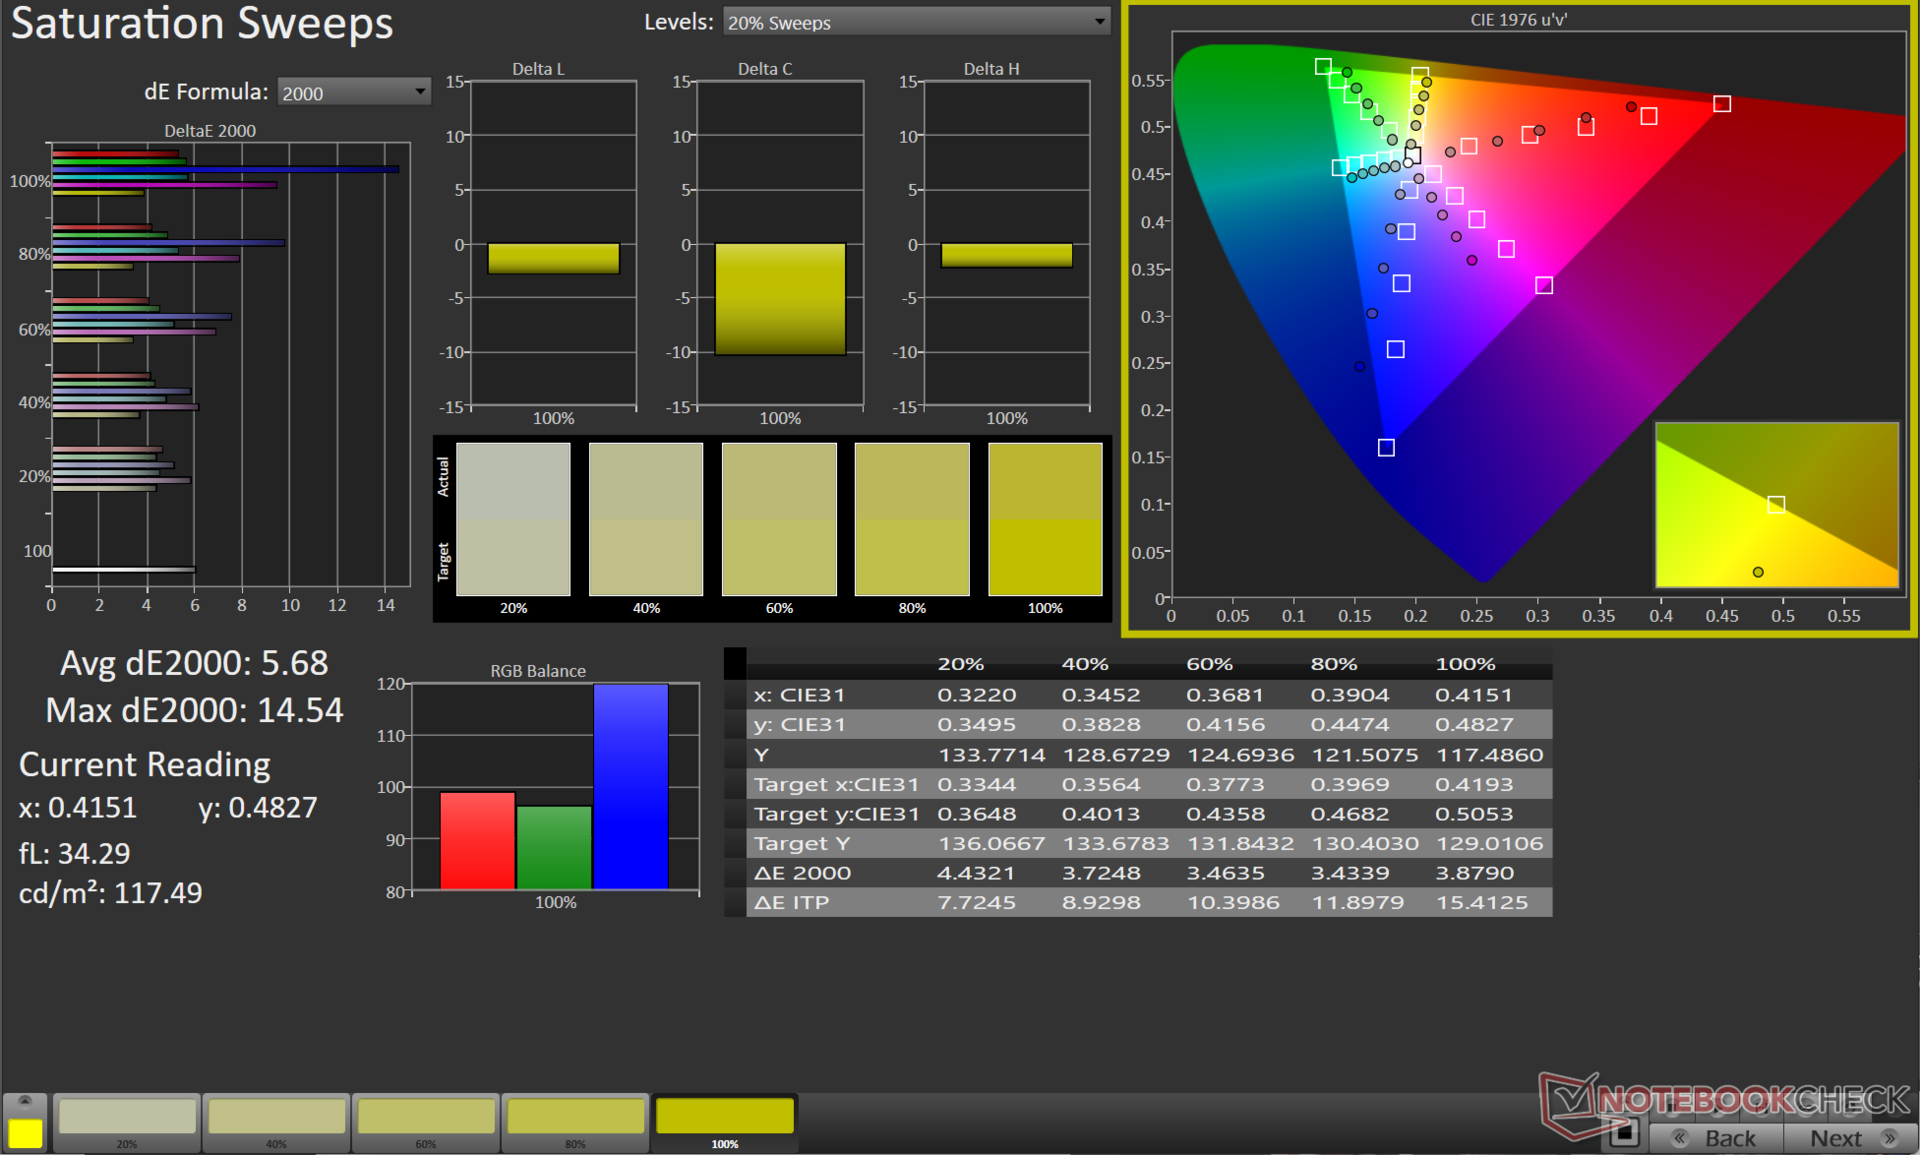
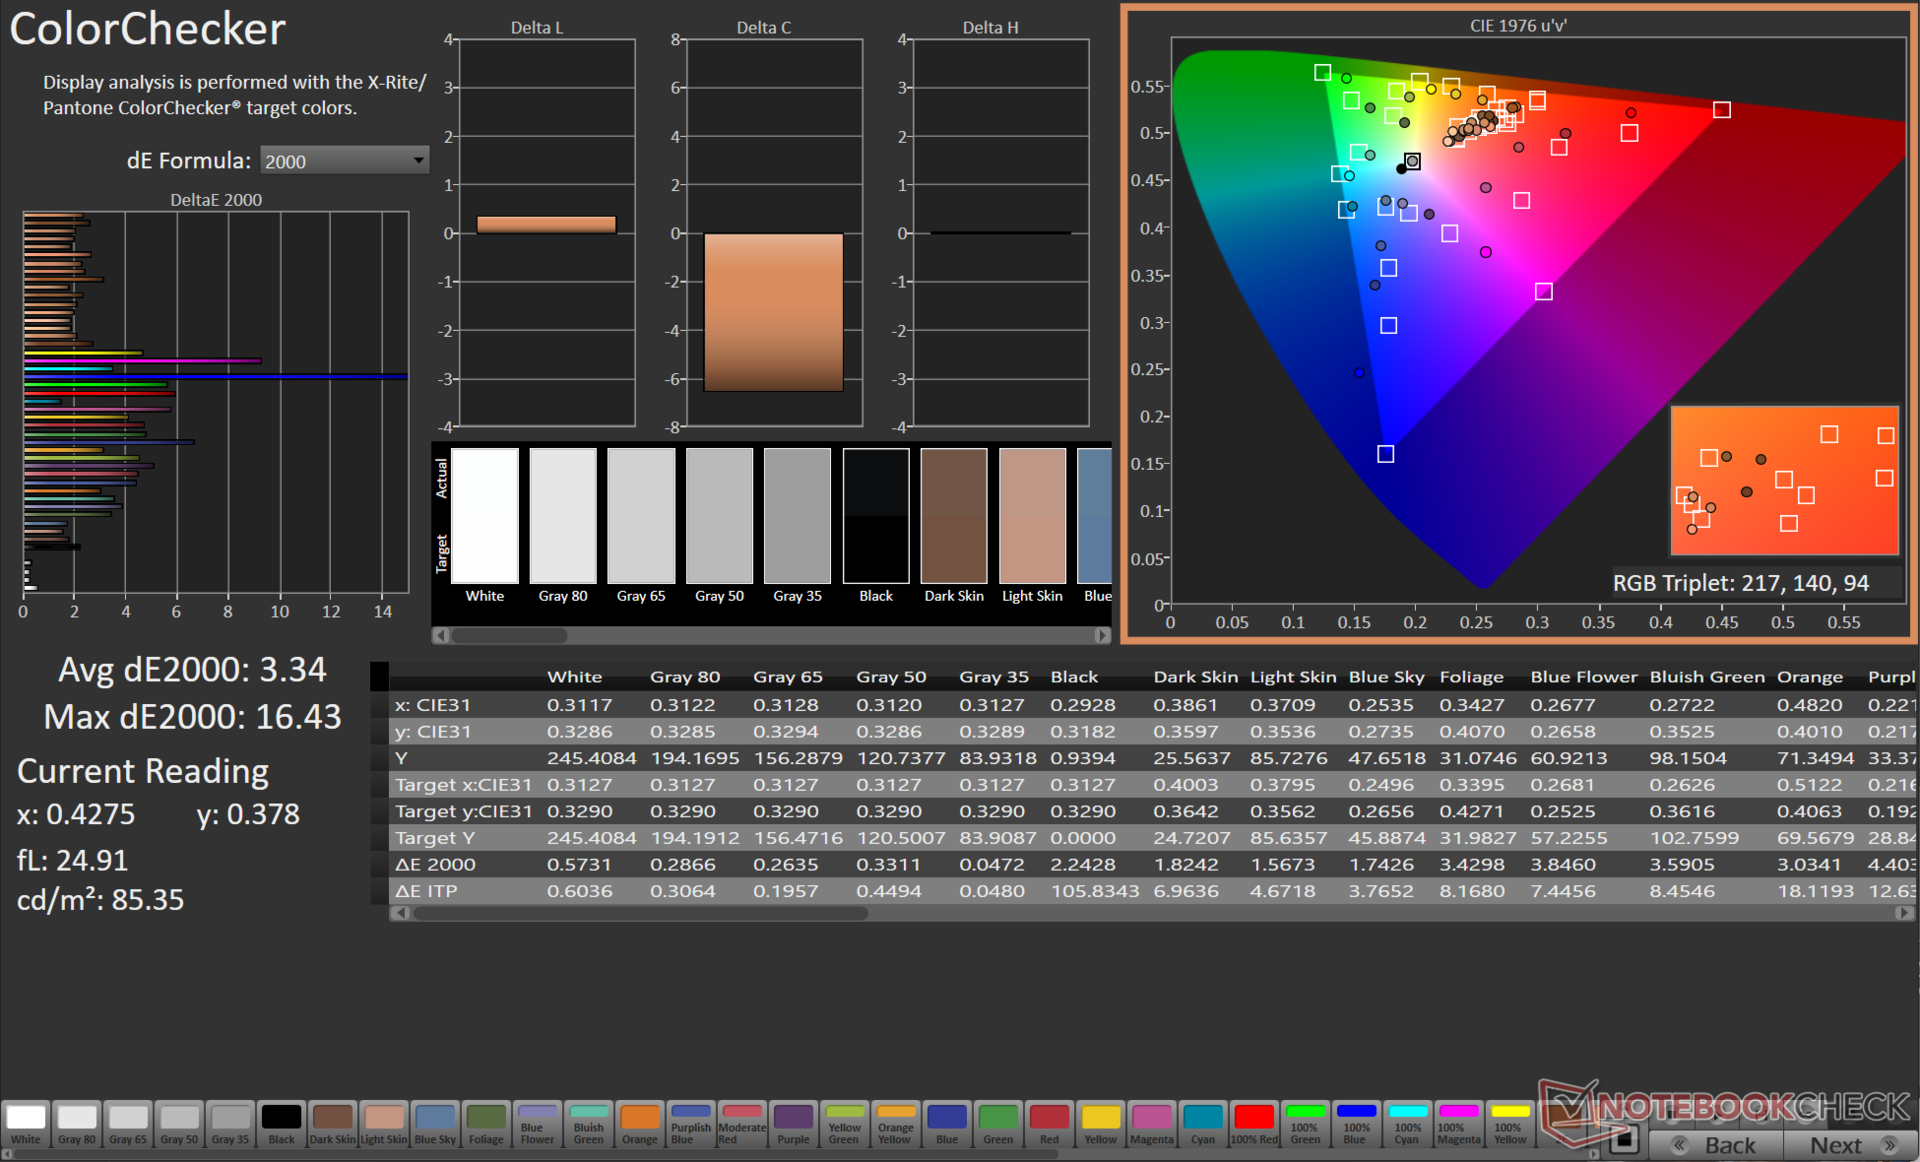
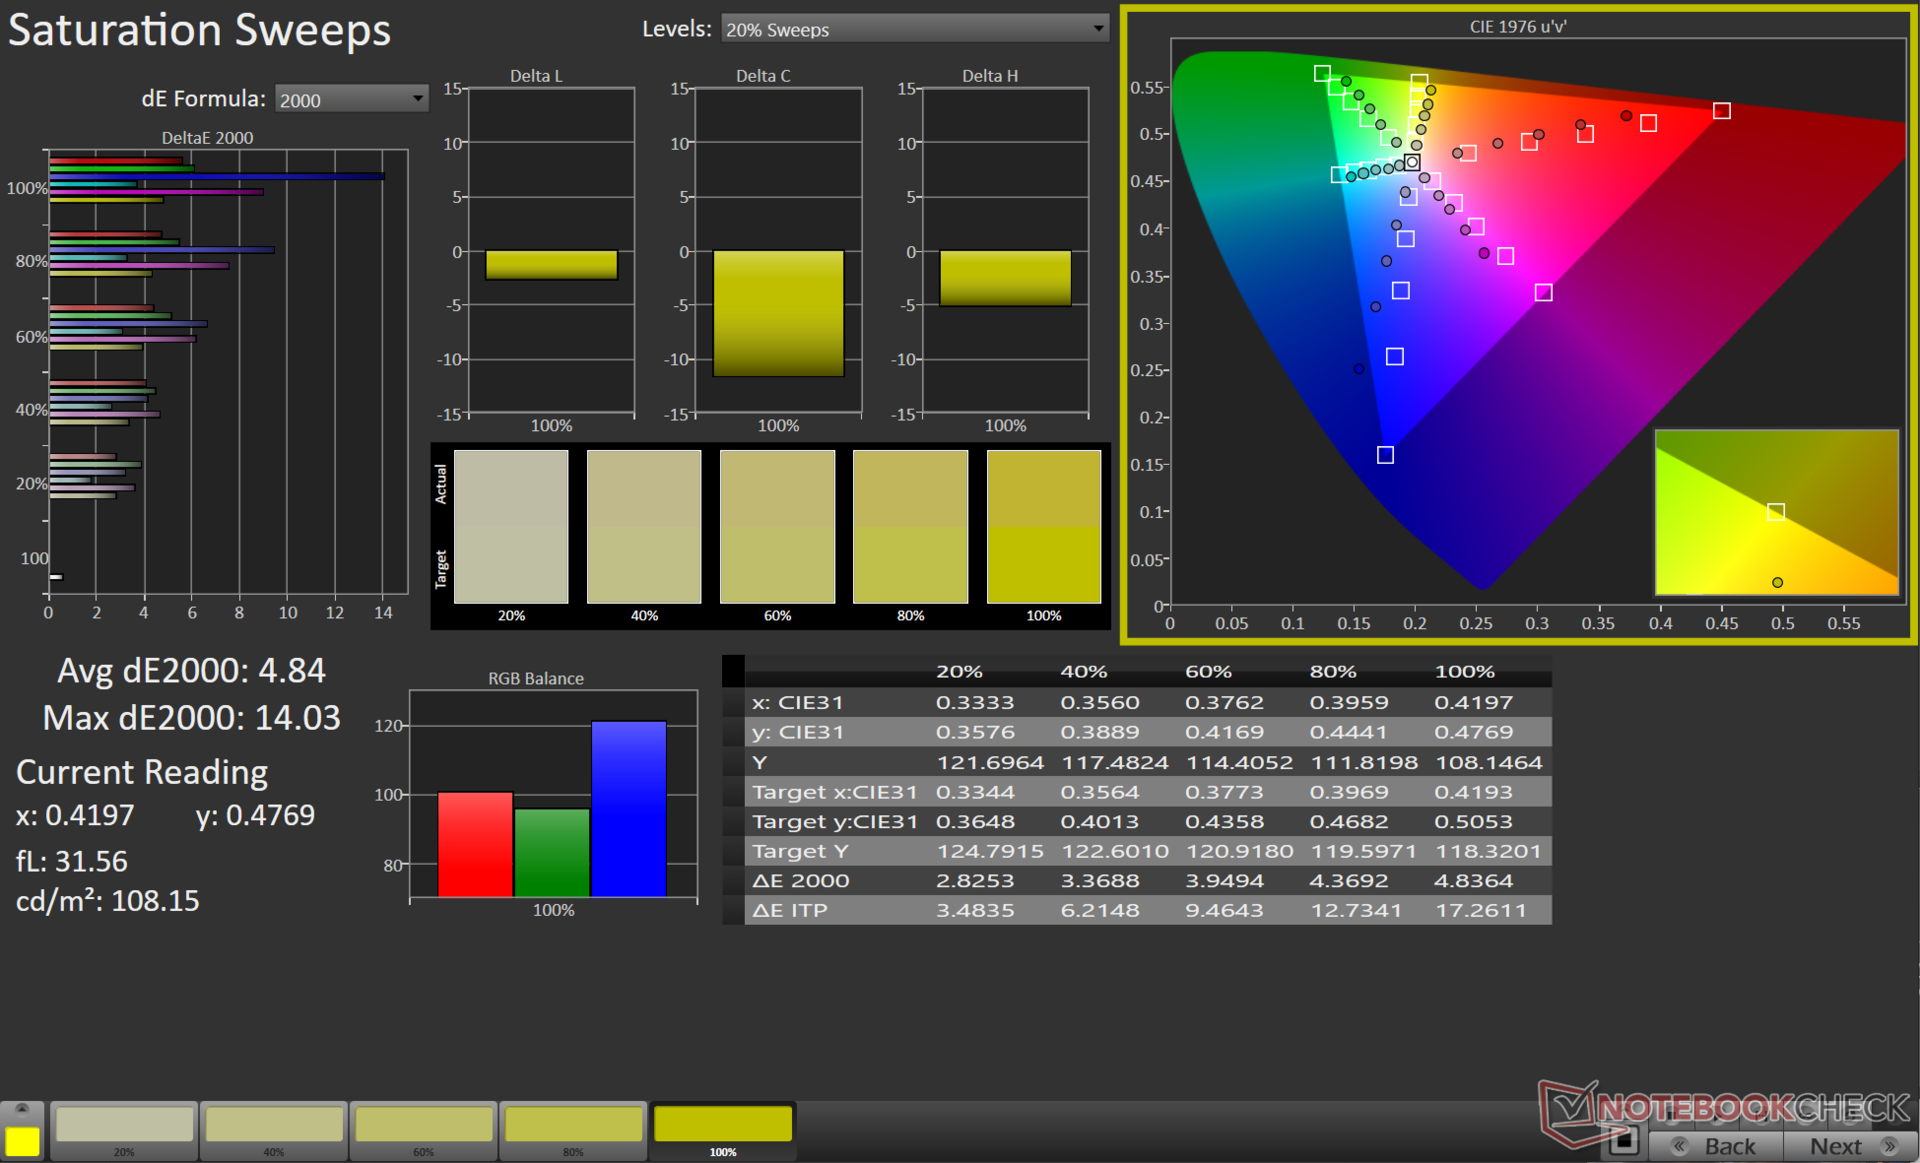
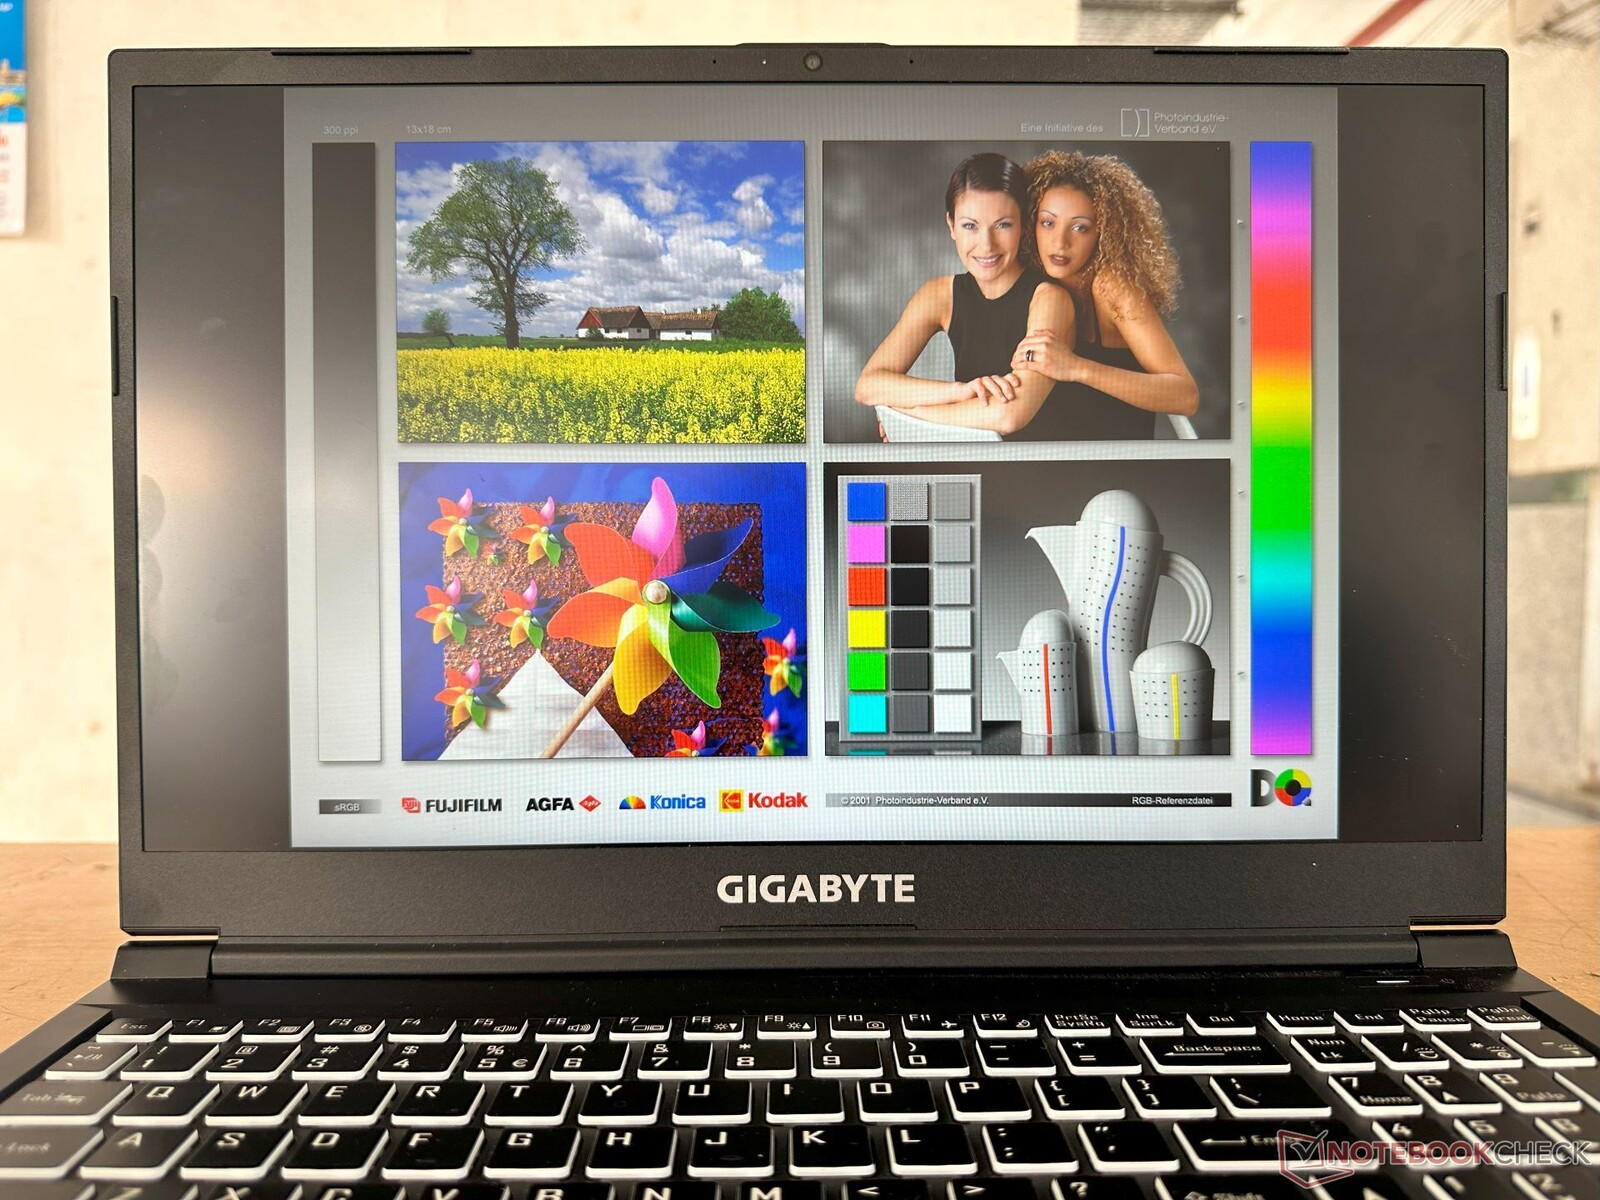
Tela: Fraca cobertura da gama de cores com tempos de resposta elevados e sem PWM
O painel Chi Mei de 1080p 144 Hz do Gigabyte G5 KE está começando a mostrar sua idade. Já vimos esse painel antes no modelo 2021 Gigabyte G5 GD e no Asus TUF Gaming F15 FX506HM. A concorrência passou a usar painéis melhores com uma cobertura de gama de cores muito mais ampla.
A distribuição de brilho é decente, com 85%, mas a gama de cores é ruim para um notebook 2023 com uma cobertura sRGB de apenas 61%.


| |||||||||||||||||||||||||
iluminação: 85 %
iluminação com acumulador: 266 cd/m²
Contraste: 538:1 (Preto: 0.5 cd/m²)
ΔE ColorChecker Calman: 4.54 | ∀{0.5-29.43 Ø4.71}
calibrated: 3.34
ΔE Greyscale Calman: 3.8 | ∀{0.09-98 Ø4.96}
42.1% AdobeRGB 1998 (Argyll 3D)
61% sRGB (Argyll 3D)
40.7% Display P3 (Argyll 3D)
Gamma: 2.17
CCT: 7408 K
| Gigabyte G5 KE Chi Mei N156HRA-EA1, , 1920x1080, 15.6" | Lenovo IdeaPad Gaming 3 15IAH7 Lenovo LEN156FHD, , 1920x1080, 15.6" | Gigabyte G7 KE AU Optronics B173HAN05.1, , 1920x1080, 17.3" | Honor MagicBook 14 2022 HD140ZB-01A, , 2160x1440, 14" | Schenker XMG Core 15 (M22) CSOT MNF601CA1-1, , 2560x1440, 15.6" | Dell G16 7620 BOE NE16QDM, , 2560x1600, 16" | Gigabyte A5 K1 BOEhydis NV156FHM-N4K (BOE08B3), , 1920x1080, 15.6" | Asus TUF Gaming F15 FX507ZM TL156VDXP0101, , 1920x1080, 15.6" | HP Victus 16-e0179ng BOE09BE, , 1920x1080, 16.1" | |
|---|---|---|---|---|---|---|---|---|---|
| Display | 66% | 69% | 64% | 66% | 65% | 56% | 62% | 72% | |
| Display P3 Coverage (%) | 40.7 | 69.1 70% | 70.4 73% | 67.9 67% | 68.8 69% | 68.3 68% | 64.4 58% | 66.4 63% | 72.6 78% |
| sRGB Coverage (%) | 61 | 99.2 63% | 99.8 64% | 98.5 61% | 99.3 63% | 98 61% | 92.5 52% | 97 59% | 100 64% |
| AdobeRGB 1998 Coverage (%) | 42.1 | 69.9 66% | 71.7 70% | 68.7 63% | 69.9 66% | 70.5 67% | 66.1 57% | 68.5 63% | 73.5 75% |
| Response Times | 53% | 68% | -41% | 50% | 56% | 48% | 55% | 44% | |
| Response Time Grey 50% / Grey 80% * (ms) | 26.64 ? | 13 ? 51% | 5 ? 81% | 37.2 ? -40% | 16 ? 40% | 8.6 ? 68% | 14.5 ? 46% | 5.6 ? 79% | 9.6 ? 64% |
| Response Time Black / White * (ms) | 18.65 ? | 8.4 ? 55% | 8.3 ? 55% | 26.3 ? -41% | 7.6 ? 59% | 10.4 ? 44% | 9.5 ? 49% | 12.8 ? 31% | 14.4 ? 23% |
| PWM Frequency (Hz) | 28400 ? | ||||||||
| Screen | 40% | 61% | 57% | 40% | 49% | 31% | 52% | 43% | |
| Brightness middle (cd/m²) | 269 | 338 26% | 307 14% | 330 23% | 378 41% | 369.4 37% | 295 10% | 353.7 31% | 361 34% |
| Brightness (cd/m²) | 248 | 329 33% | 301 21% | 320 29% | 371 50% | 348 40% | 281 13% | 340 37% | 341 38% |
| Brightness Distribution (%) | 85 | 92 8% | 93 9% | 90 6% | 93 9% | 83 -2% | 83 -2% | 89 5% | 88 4% |
| Black Level * (cd/m²) | 0.5 | 0.27 46% | 0.2 60% | 0.21 58% | 0.33 34% | 0.32 36% | 0.29 42% | 0.34 32% | 0.3 40% |
| Contrast (:1) | 538 | 1252 133% | 1535 185% | 1571 192% | 1145 113% | 1154 114% | 1017 89% | 1040 93% | 1203 124% |
| Colorchecker dE 2000 * | 4.54 | 2.88 37% | 1.32 71% | 1.8 60% | 2.84 37% | 1.78 61% | 4.36 4% | 1.74 62% | 2.44 46% |
| Colorchecker dE 2000 max. * | 17.28 | 9.35 46% | 4.6 73% | 4.7 73% | 5.51 68% | 4.41 74% | 6.92 60% | 3.63 79% | 6.37 63% |
| Colorchecker dE 2000 calibrated * | 3.34 | 1.22 63% | 1.03 69% | 1.6 52% | 2.75 18% | 1.22 63% | 1.2 64% | 0.5 85% | 1.26 62% |
| Greyscale dE 2000 * | 3.8 | 5 -32% | 2.1 45% | 3 21% | 4.08 -7% | 3.2 16% | 3.9 -3% | 2.1 45% | 4.6 -21% |
| Gamma | 2.17 101% | 2.162 102% | 2.247 98% | 2.18 101% | 2.4 92% | 2.2 100% | 2.106 104% | 2.3 96% | 2.268 97% |
| CCT | 7408 88% | 7497 87% | 6815 95% | 6697 97% | 5841 111% | 6750 96% | 7300 89% | 6257 104% | 6609 98% |
| Média Total (Programa/Configurações) | 53% /
48% | 66% /
64% | 27% /
45% | 52% /
47% | 57% /
53% | 45% /
39% | 56% /
55% | 53% /
50% |
* ... menor é melhor
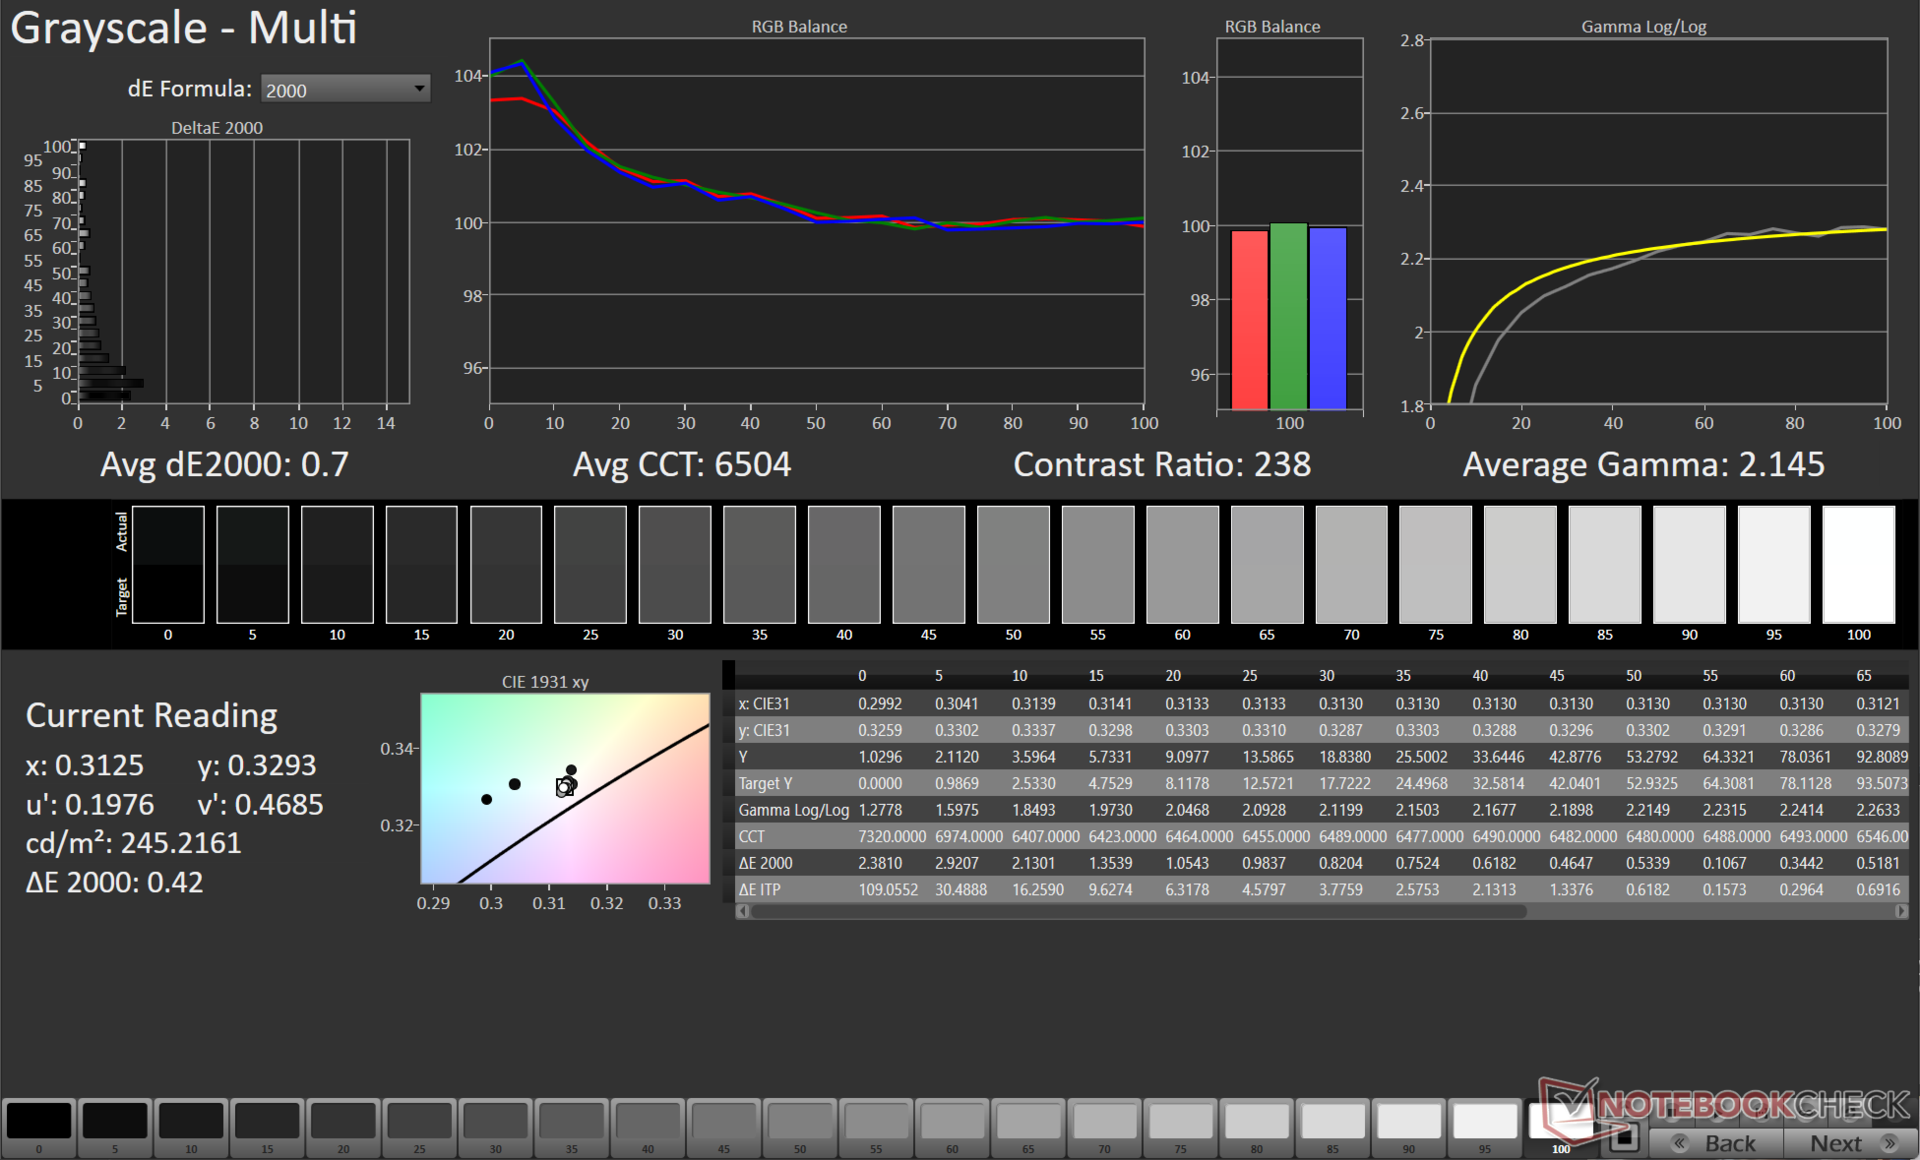
Nossa rotina de calibração usando o espectrofotômetro X-Rite i1Basic Pro 3 e o software de calibração de cores Calman Ultimate da Portrait Displays resulta em um valor Delta E 2000 em escala de cinza significativamente melhor.
Entretanto, não há muito espaço para melhorar os valores do ColorChecker. As cores 100% azul e 100% magenta contribuem para grandes desvios na precisão das cores.
O download do perfil ICC calibrado pode ser feito no link acima.
Exibir tempos de resposta
| ↔ Tempo de resposta preto para branco | ||
|---|---|---|
| 18.65 ms ... ascensão ↗ e queda ↘ combinadas | ↗ 10.83 ms ascensão | 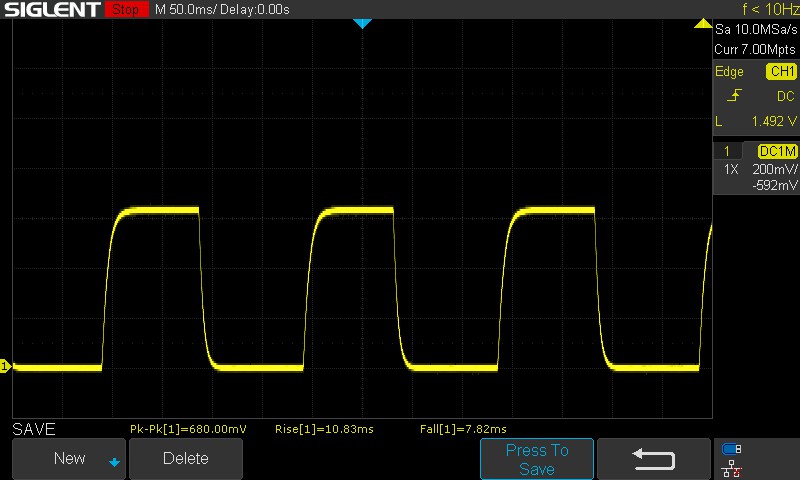 |
| ↘ 7.82 ms queda | ||
| A tela mostra boas taxas de resposta em nossos testes, mas pode ser muito lenta para jogadores competitivos. Em comparação, todos os dispositivos testados variam de 0.1 (mínimo) a 240 (máximo) ms. » 42 % de todos os dispositivos são melhores. Isso significa que o tempo de resposta medido é semelhante à média de todos os dispositivos testados (19.8 ms). | ||
| ↔ Tempo de resposta 50% cinza a 80% cinza | ||
| 26.64 ms ... ascensão ↗ e queda ↘ combinadas | ↗ 12.52 ms ascensão | 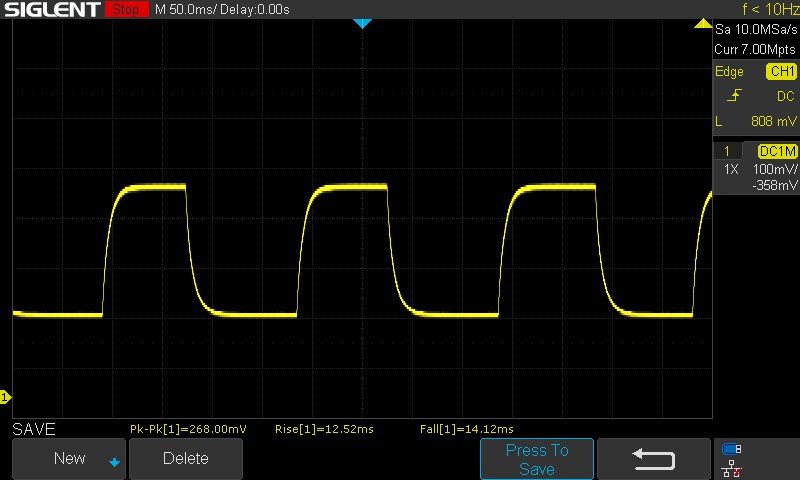 |
| ↘ 14.12 ms queda | ||
| A tela mostra taxas de resposta relativamente lentas em nossos testes e pode ser muito lenta para os jogadores. Em comparação, todos os dispositivos testados variam de 0.165 (mínimo) a 636 (máximo) ms. » 37 % de todos os dispositivos são melhores. Isso significa que o tempo de resposta medido é melhor que a média de todos os dispositivos testados (31 ms). | ||
Cintilação da tela / PWM (modulação por largura de pulso)
| Tela tremeluzindo / PWM não detectado | 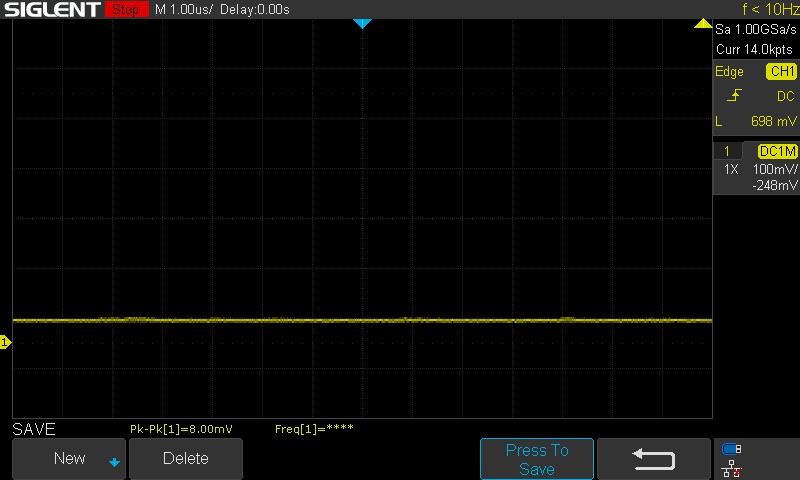 | ||
| ≤ 100 brilho cd/m² | |||
[pwm_comparison] Em comparação: 52 % de todos os dispositivos testados não usam PWM para escurecer a tela. Se PWM foi detectado, uma média de 7757 (mínimo: 5 - máximo: 343500) Hz foi medida. | |||
Os tempos de resposta da tela, especialmente as transições de 50% de cinza para 80% de cinza, são um pouco mais altos para um laptop para jogos. Não observamos nenhum PWM em todos os níveis de brilho testados.
Consulte nosso artigo sobre PWM e também nossa tabela de classificação para obter mais informações e comparações entre os dispositivos testados.
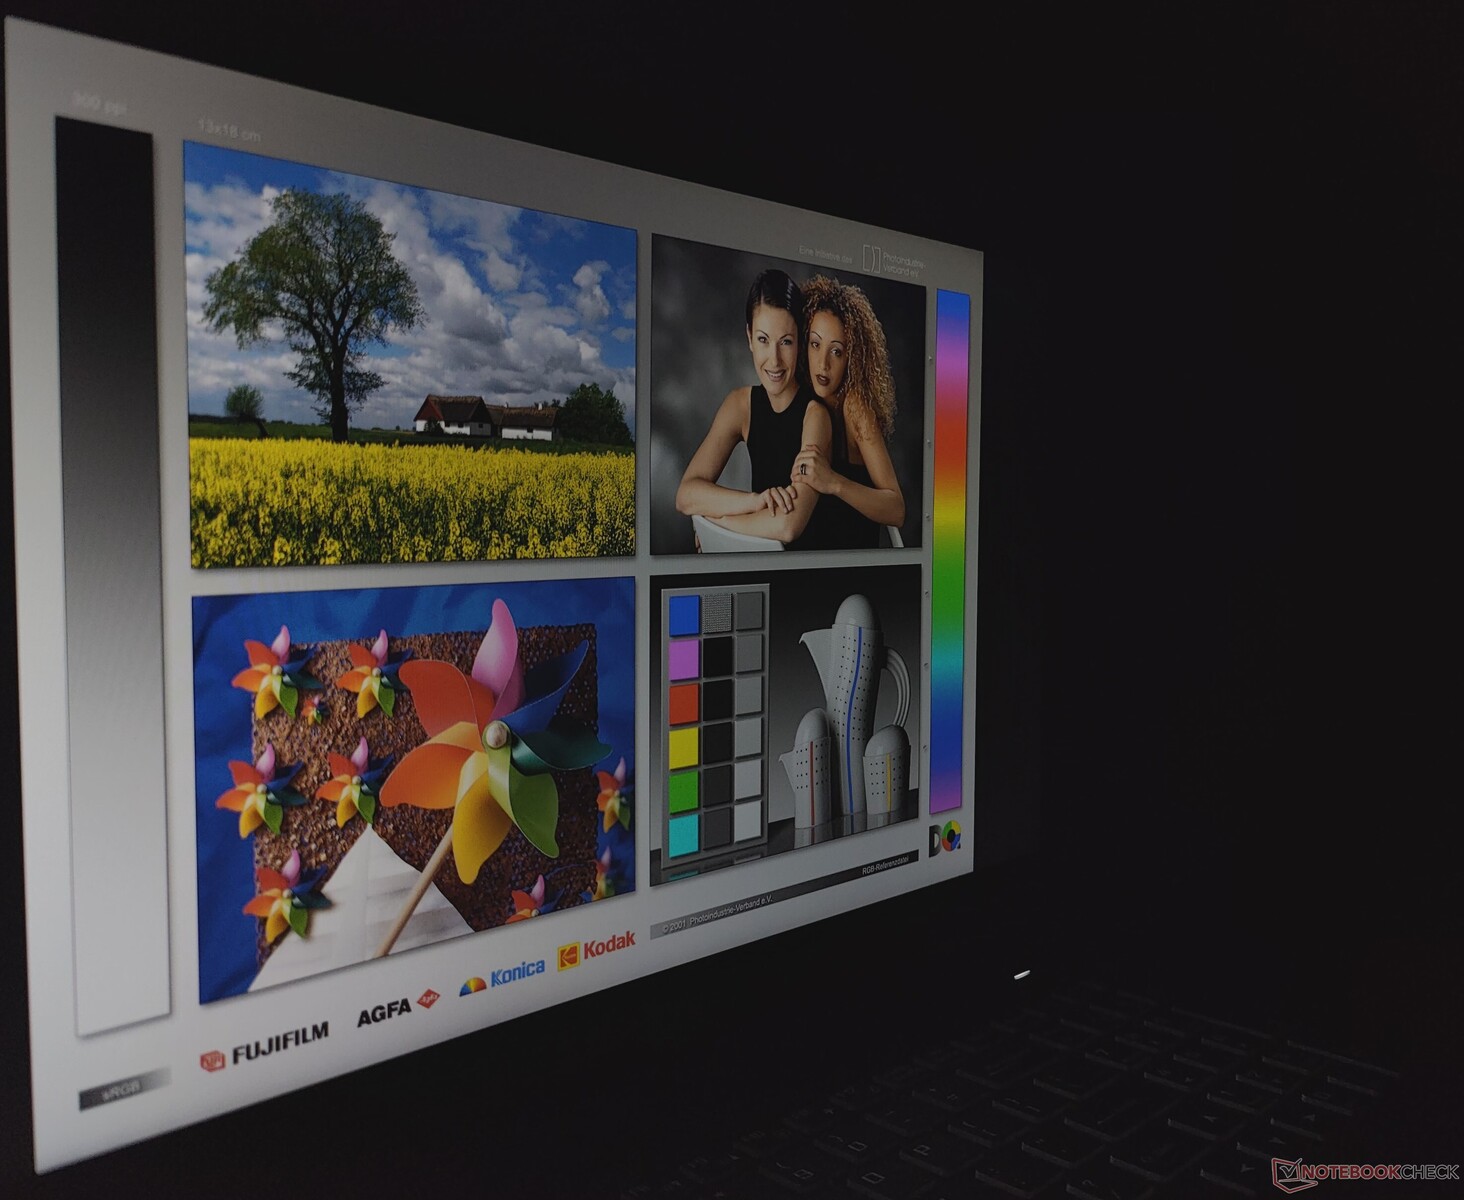
A visualização em ambientes externos é legível, desde que não haja luz solar direta incidindo sobre a tela. Há perda de informações de brilho e cor em ângulos de visualização extremos.


Desempenho: A combinação de Core i5-12500H e RTX 3060 não traz grandes surpresas
A Gigabyte oferece o G5 em duas variantes: o G5 KE e o G5 ME com o 12C/16TIntel Core i5-12500H CPU. Enquanto o G5 KE oferece uma GPU para laptop Nvidia GeForce RTX 3060o G5 ME se contenta com uma GPU para laptop RTX 3050 Ti e não tem uma porta Thunderbolt 4.
O G5 KE oferece quatro modos de desempenho, conforme detalhado na tabela abaixo:
| Modo de desempenho | PL1 (PBP) / Tau | PL2 (MTP) / Tau |
|---|---|---|
| Silencioso | 15 W / 8 s | 30 W / 2,44 ms |
| Economia de energia | 30 W / 8 s | 30 W / 2,44 ms |
| Entretenimento | 50 W / 28 s | 115 W / 2,44 ms |
| Desempenho | 115 W / 80 s | 135 W / 2.44 ms |
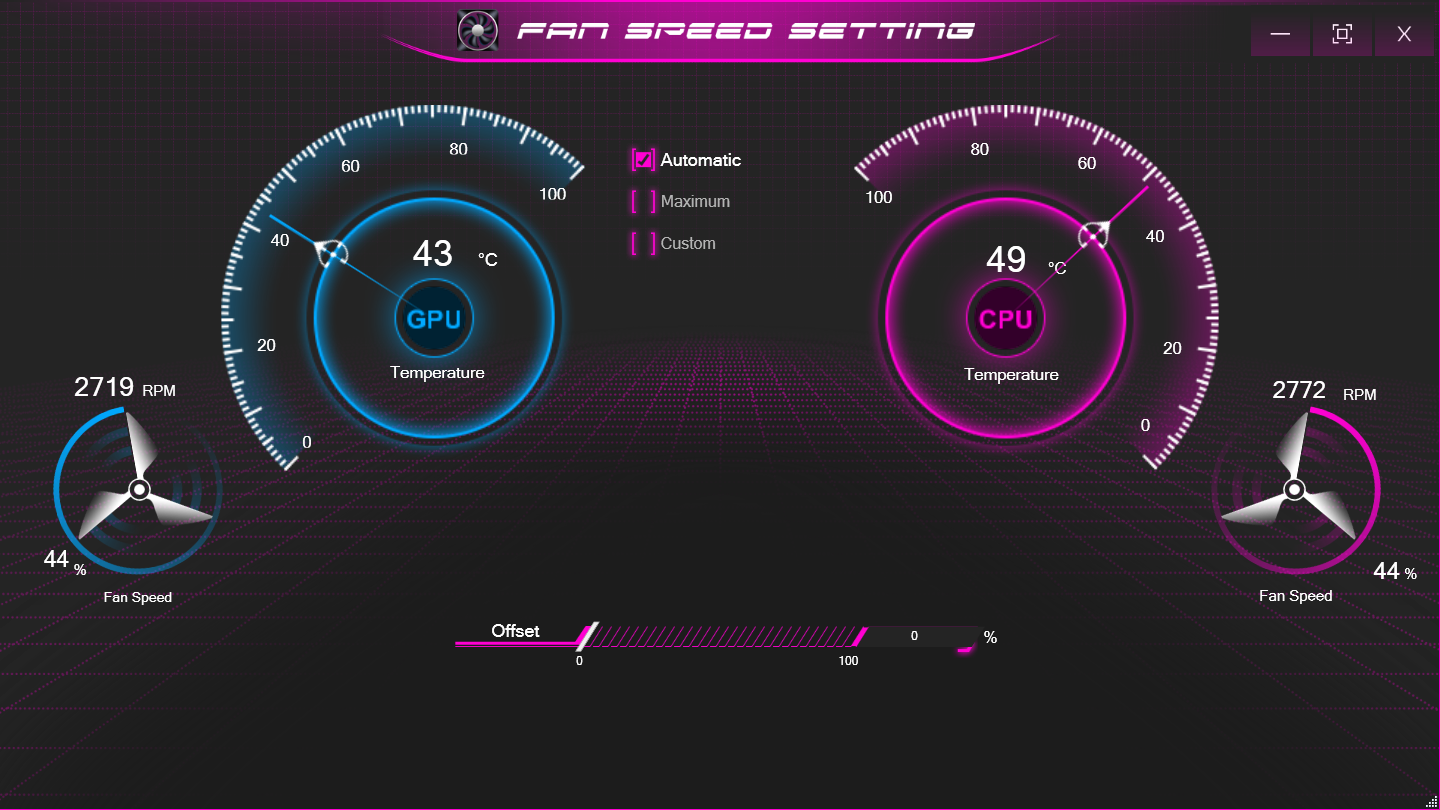
Usamos o perfil de desempenho para todos os benchmarks, enquanto os testes de bateria foram executados no modo de economia de energia. O Control Center 3.0 da Clevo permite a seleção de vários perfis de desempenho e configurações de velocidade da ventoinha.
Processador
O Core i5-12500H do G5 KE está muito próximo ao do G7 KE e também ao do AMD Ryzen 7 6800H no XMG Core 15 (M22) nas pontuações cumulativas da CPU. No entanto, ele fica 15% atrás em comparação com o Core i7-12700H no Asus TUF Gaming F15.
O desempenho sustentado em nosso teste de loop de vários núcleos Cinebench R15 é bom em sua maior parte, exceto por uma queda momentânea mínima nas pontuações no meio da execução.
Cinebench R15 Multi Loop
Cinebench R20: CPU (Single Core) | CPU (Multi Core)
Cinebench R15: CPU Single 64Bit | CPU Multi 64Bit
Blender: v2.79 BMW27 CPU
7-Zip 18.03: 7z b 4 -mmt1 | 7z b 4
Geekbench 5.5: Single-Core | Multi-Core
HWBOT x265 Benchmark v2.2: 4k Preset
LibreOffice : 20 Documents To PDF
R Benchmark 2.5: Overall mean
| CPU Performance rating | |
| Média da turma Gaming | |
| Asus TUF Gaming F15 FX507ZM | |
| Dell G16 7620 | |
| Gigabyte G7 KE | |
| Schenker XMG Core 15 (M22) | |
| Gigabyte G5 KE | |
| Honor MagicBook 14 2022 | |
| Lenovo IdeaPad Gaming 3 15IAH7 | |
| Média Intel Core i5-12500H | |
| HP Victus 16-e0179ng | |
| Gigabyte A5 K1 | |
| Cinebench R20 / CPU (Single Core) | |
| Média da turma Gaming (442 - 913, n=106, últimos 2 anos) | |
| Asus TUF Gaming F15 FX507ZM | |
| Dell G16 7620 | |
| Gigabyte G7 KE | |
| Lenovo IdeaPad Gaming 3 15IAH7 | |
| Honor MagicBook 14 2022 | |
| Média Intel Core i5-12500H (602 - 656, n=9) | |
| Gigabyte G5 KE | |
| Schenker XMG Core 15 (M22) | |
| HP Victus 16-e0179ng | |
| Gigabyte A5 K1 | |
| Cinebench R20 / CPU (Multi Core) | |
| Média da turma Gaming (4029 - 16433, n=106, últimos 2 anos) | |
| Asus TUF Gaming F15 FX507ZM | |
| Dell G16 7620 | |
| Lenovo IdeaPad Gaming 3 15IAH7 | |
| Schenker XMG Core 15 (M22) | |
| Gigabyte G7 KE | |
| Média Intel Core i5-12500H (4687 - 5640, n=9) | |
| Gigabyte G5 KE | |
| Honor MagicBook 14 2022 | |
| HP Victus 16-e0179ng | |
| Gigabyte A5 K1 | |
| Cinebench R15 / CPU Single 64Bit | |
| Média da turma Gaming (188.8 - 350, n=106, últimos 2 anos) | |
| Asus TUF Gaming F15 FX507ZM | |
| Schenker XMG Core 15 (M22) | |
| Gigabyte G7 KE | |
| Lenovo IdeaPad Gaming 3 15IAH7 | |
| Dell G16 7620 | |
| Gigabyte G5 KE | |
| Honor MagicBook 14 2022 | |
| Média Intel Core i5-12500H (220 - 250, n=9) | |
| HP Victus 16-e0179ng | |
| Gigabyte A5 K1 | |
| Cinebench R15 / CPU Multi 64Bit | |
| Média da turma Gaming (1578 - 6330, n=105, últimos 2 anos) | |
| Asus TUF Gaming F15 FX507ZM | |
| Dell G16 7620 | |
| Schenker XMG Core 15 (M22) | |
| Lenovo IdeaPad Gaming 3 15IAH7 | |
| Gigabyte G7 KE | |
| Média Intel Core i5-12500H (1970 - 2283, n=10) | |
| Gigabyte G5 KE | |
| Honor MagicBook 14 2022 | |
| Honor MagicBook 14 2022 | |
| HP Victus 16-e0179ng | |
| Gigabyte A5 K1 | |
| Blender / v2.79 BMW27 CPU | |
| Gigabyte A5 K1 | |
| Honor MagicBook 14 2022 | |
| HP Victus 16-e0179ng | |
| Média Intel Core i5-12500H (223 - 288, n=9) | |
| Gigabyte G5 KE | |
| Gigabyte G7 KE | |
| Lenovo IdeaPad Gaming 3 15IAH7 | |
| Schenker XMG Core 15 (M22) | |
| Dell G16 7620 | |
| Asus TUF Gaming F15 FX507ZM | |
| Média da turma Gaming (79 - 330, n=104, últimos 2 anos) | |
| 7-Zip 18.03 / 7z b 4 -mmt1 | |
| Média da turma Gaming (4199 - 7436, n=105, últimos 2 anos) | |
| Schenker XMG Core 15 (M22) | |
| HP Victus 16-e0179ng | |
| Gigabyte G7 KE | |
| Lenovo IdeaPad Gaming 3 15IAH7 | |
| Gigabyte A5 K1 | |
| Gigabyte G5 KE | |
| Asus TUF Gaming F15 FX507ZM | |
| Dell G16 7620 | |
| Média Intel Core i5-12500H (5151 - 5563, n=9) | |
| Honor MagicBook 14 2022 | |
| 7-Zip 18.03 / 7z b 4 | |
| Média da turma Gaming (33491 - 148086, n=105, últimos 2 anos) | |
| Asus TUF Gaming F15 FX507ZM | |
| Dell G16 7620 | |
| Schenker XMG Core 15 (M22) | |
| HP Victus 16-e0179ng | |
| Gigabyte G5 KE | |
| Gigabyte G7 KE | |
| Honor MagicBook 14 2022 | |
| Média Intel Core i5-12500H (44105 - 54380, n=9) | |
| Gigabyte A5 K1 | |
| Lenovo IdeaPad Gaming 3 15IAH7 | |
| Geekbench 5.5 / Single-Core | |
| Média da turma Gaming (986 - 2474, n=105, últimos 2 anos) | |
| Asus TUF Gaming F15 FX507ZM | |
| Honor MagicBook 14 2022 | |
| Gigabyte G7 KE | |
| Dell G16 7620 | |
| Gigabyte G5 KE | |
| Lenovo IdeaPad Gaming 3 15IAH7 | |
| Média Intel Core i5-12500H (1471 - 1693, n=9) | |
| Schenker XMG Core 15 (M22) | |
| HP Victus 16-e0179ng | |
| Gigabyte A5 K1 | |
| Geekbench 5.5 / Multi-Core | |
| Média da turma Gaming (6460 - 28263, n=105, últimos 2 anos) | |
| Asus TUF Gaming F15 FX507ZM | |
| Dell G16 7620 | |
| Honor MagicBook 14 2022 | |
| Gigabyte G7 KE | |
| Gigabyte G5 KE | |
| Schenker XMG Core 15 (M22) | |
| Média Intel Core i5-12500H (7962 - 10828, n=9) | |
| Lenovo IdeaPad Gaming 3 15IAH7 | |
| HP Victus 16-e0179ng | |
| Gigabyte A5 K1 | |
| HWBOT x265 Benchmark v2.2 / 4k Preset | |
| Média da turma Gaming (11.5 - 44.4, n=105, últimos 2 anos) | |
| Asus TUF Gaming F15 FX507ZM | |
| Dell G16 7620 | |
| Schenker XMG Core 15 (M22) | |
| Gigabyte G7 KE | |
| Gigabyte G5 KE | |
| Lenovo IdeaPad Gaming 3 15IAH7 | |
| HP Victus 16-e0179ng | |
| Média Intel Core i5-12500H (12 - 16.6, n=9) | |
| Honor MagicBook 14 2022 | |
| Gigabyte A5 K1 | |
| LibreOffice / 20 Documents To PDF | |
| Gigabyte A5 K1 | |
| Schenker XMG Core 15 (M22) | |
| Gigabyte G5 KE | |
| HP Victus 16-e0179ng | |
| Dell G16 7620 | |
| Asus TUF Gaming F15 FX507ZM | |
| Média da turma Gaming (33.2 - 88.8, n=105, últimos 2 anos) | |
| Lenovo IdeaPad Gaming 3 15IAH7 | |
| Média Intel Core i5-12500H (40.1 - 58.5, n=9) | |
| Gigabyte G7 KE | |
| Honor MagicBook 14 2022 | |
| R Benchmark 2.5 / Overall mean | |
| Gigabyte A5 K1 | |
| HP Victus 16-e0179ng | |
| Lenovo IdeaPad Gaming 3 15IAH7 | |
| Média Intel Core i5-12500H (0.4748 - 0.535, n=9) | |
| Dell G16 7620 | |
| Honor MagicBook 14 2022 | |
| Gigabyte G5 KE | |
| Schenker XMG Core 15 (M22) | |
| Gigabyte G7 KE | |
| Asus TUF Gaming F15 FX507ZM | |
| Média da turma Gaming (0.3439 - 0.759, n=106, últimos 2 anos) | |
* ... menor é melhor
Nossos produtos dedicados Intel Core i5-12500Hfornece mais informações e comparações de benchmark.
Desempenho do sistema
O desempenho geral do G5 KE no PCMark 10 está no mesmo nível dos notebooks baseados no Core i7-12700H, além de apresentar uma vantagem perceptível no CrossMark em comparação com o Schenker XMG Core 15 (M22) equipado com Ryzen 7 6800H.
CrossMark: Overall | Productivity | Creativity | Responsiveness
| PCMark 10 / Score | |
| Média da turma Gaming (5828 - 12414, n=93, últimos 2 anos) | |
| Asus TUF Gaming F15 FX507ZM | |
| Schenker XMG Core 15 (M22) | |
| Dell G16 7620 | |
| Gigabyte G5 KE | |
| Lenovo IdeaPad Gaming 3 15IAH7 | |
| Média Intel Core i5-12500H, NVIDIA GeForce RTX 3060 Laptop GPU (6126 - 7201, n=2) | |
| HP Victus 16-e0179ng | |
| Honor MagicBook 14 2022 | |
| Gigabyte A5 K1 | |
| Gigabyte G7 KE | |
| PCMark 10 / Essentials | |
| Gigabyte G5 KE | |
| Schenker XMG Core 15 (M22) | |
| Média Intel Core i5-12500H, NVIDIA GeForce RTX 3060 Laptop GPU (10301 - 11150, n=2) | |
| Média da turma Gaming (8810 - 11935, n=97, últimos 2 anos) | |
| Honor MagicBook 14 2022 | |
| Asus TUF Gaming F15 FX507ZM | |
| Gigabyte G7 KE | |
| Dell G16 7620 | |
| Gigabyte A5 K1 | |
| Lenovo IdeaPad Gaming 3 15IAH7 | |
| HP Victus 16-e0179ng | |
| PCMark 10 / Productivity | |
| Média da turma Gaming (6845 - 25323, n=95, últimos 2 anos) | |
| Schenker XMG Core 15 (M22) | |
| Lenovo IdeaPad Gaming 3 15IAH7 | |
| Gigabyte G5 KE | |
| Média Intel Core i5-12500H, NVIDIA GeForce RTX 3060 Laptop GPU (9038 - 9475, n=2) | |
| Asus TUF Gaming F15 FX507ZM | |
| Gigabyte G7 KE | |
| HP Victus 16-e0179ng | |
| Dell G16 7620 | |
| Honor MagicBook 14 2022 | |
| Gigabyte A5 K1 | |
| PCMark 10 / Digital Content Creation | |
| Média da turma Gaming (7602 - 19954, n=95, últimos 2 anos) | |
| Asus TUF Gaming F15 FX507ZM | |
| Dell G16 7620 | |
| Schenker XMG Core 15 (M22) | |
| Gigabyte G5 KE | |
| Lenovo IdeaPad Gaming 3 15IAH7 | |
| HP Victus 16-e0179ng | |
| Média Intel Core i5-12500H, NVIDIA GeForce RTX 3060 Laptop GPU (6703 - 9593, n=2) | |
| Honor MagicBook 14 2022 | |
| Gigabyte A5 K1 | |
| Gigabyte G7 KE | |
| CrossMark / Overall | |
| Média da turma Gaming (1366 - 2409, n=94, últimos 2 anos) | |
| Gigabyte G7 KE | |
| Honor MagicBook 14 2022 | |
| Média Intel Core i5-12500H, NVIDIA GeForce RTX 3060 Laptop GPU (1752 - 1824, n=2) | |
| Dell G16 7620 | |
| Gigabyte G5 KE | |
| Schenker XMG Core 15 (M22) | |
| CrossMark / Productivity | |
| Média da turma Gaming (1386 - 2254, n=94, últimos 2 anos) | |
| Gigabyte G7 KE | |
| Média Intel Core i5-12500H, NVIDIA GeForce RTX 3060 Laptop GPU (1720 - 1804, n=2) | |
| Honor MagicBook 14 2022 | |
| Gigabyte G5 KE | |
| Dell G16 7620 | |
| Schenker XMG Core 15 (M22) | |
| CrossMark / Creativity | |
| Honor MagicBook 14 2022 | |
| Média da turma Gaming (1343 - 2786, n=94, últimos 2 anos) | |
| Dell G16 7620 | |
| Gigabyte G7 KE | |
| Média Intel Core i5-12500H, NVIDIA GeForce RTX 3060 Laptop GPU (1778 - 1800, n=2) | |
| Gigabyte G5 KE | |
| Schenker XMG Core 15 (M22) | |
| CrossMark / Responsiveness | |
| Gigabyte G7 KE | |
| Média Intel Core i5-12500H, NVIDIA GeForce RTX 3060 Laptop GPU (1771 - 1966, n=2) | |
| Gigabyte G5 KE | |
| Honor MagicBook 14 2022 | |
| Média da turma Gaming (1226 - 2334, n=94, últimos 2 anos) | |
| Dell G16 7620 | |
| Schenker XMG Core 15 (M22) | |
| PCMark 8 Home Score Accelerated v2 | 5554 pontos | |
| PCMark 8 Work Score Accelerated v2 | 5937 pontos | |
| PCMark 10 Score | 7201 pontos | |
Ajuda | ||
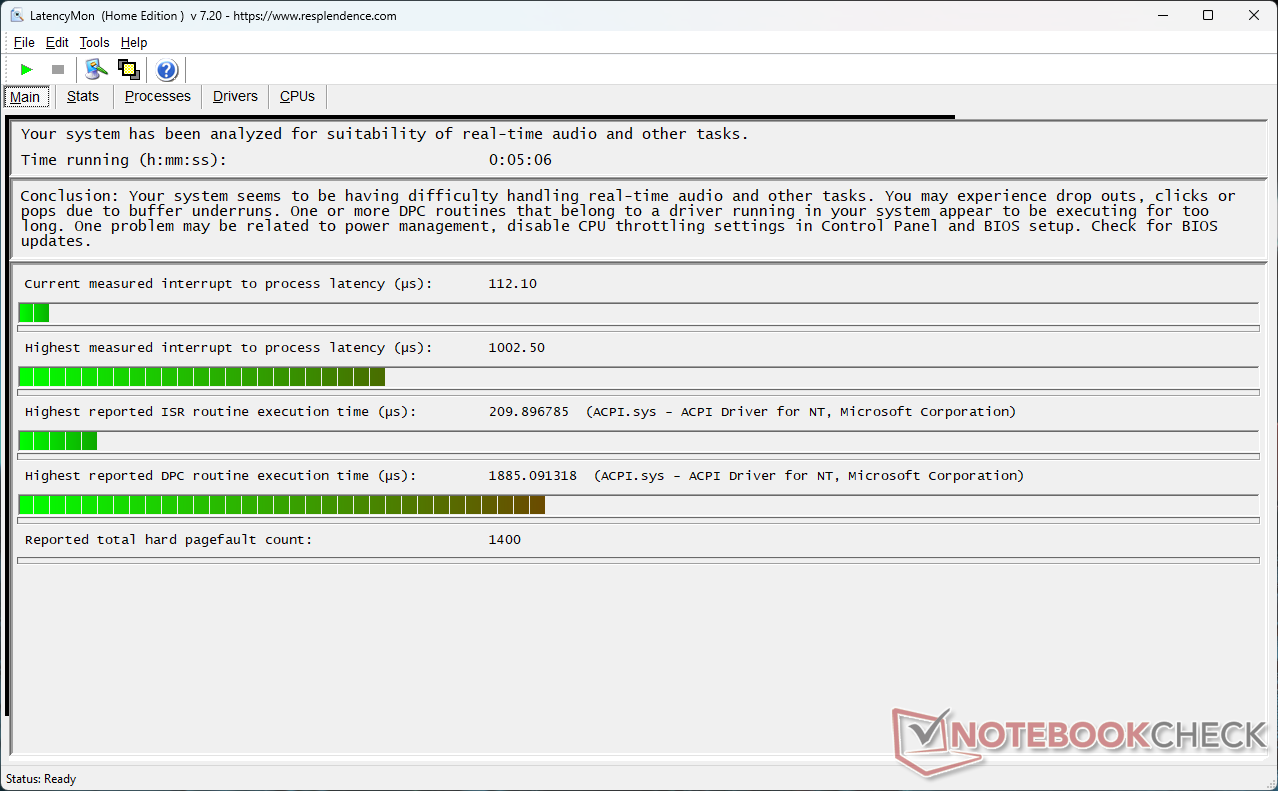
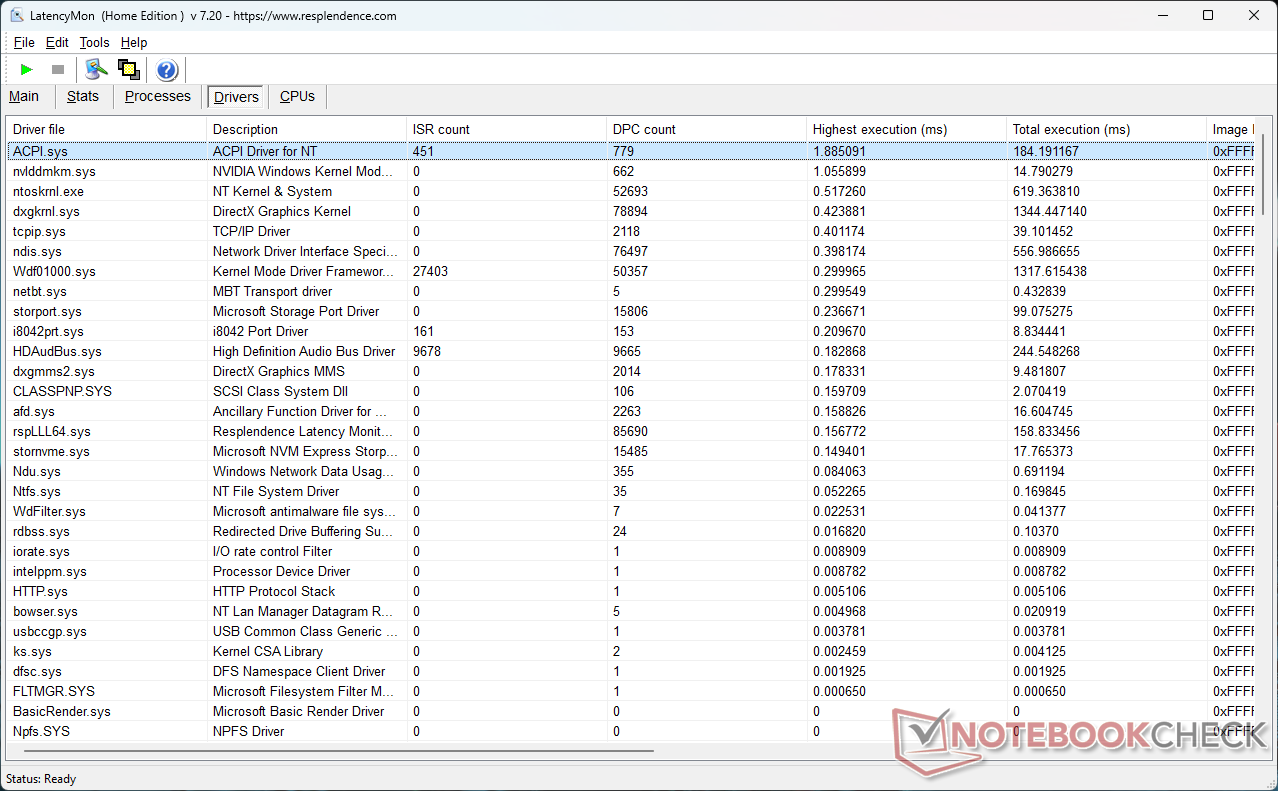
Latência DPC
A latência de DPC do G5 KE é indiscutivelmente melhor do que a da maioria de seus concorrentes, mas os valores ainda são mais altos.
| DPC Latencies / LatencyMon - interrupt to process latency (max), Web, Youtube, Prime95 | |
| Schenker XMG Core 15 (M22) | |
| Gigabyte G7 KE | |
| Lenovo IdeaPad Gaming 3 15IAH7 | |
| HP Victus 16-e0179ng | |
| Gigabyte A5 K1 | |
| Gigabyte G5 KE | |
| Dell G16 7620 | |
| Asus TUF Gaming F15 FX507ZM | |
| Honor MagicBook 14 2022 | |
* ... menor é melhor
Consulte nossa seçãoComparação de latência DPCpara obter mais comparações de latência entre os dispositivos analisados.
Dispositivos de armazenamento
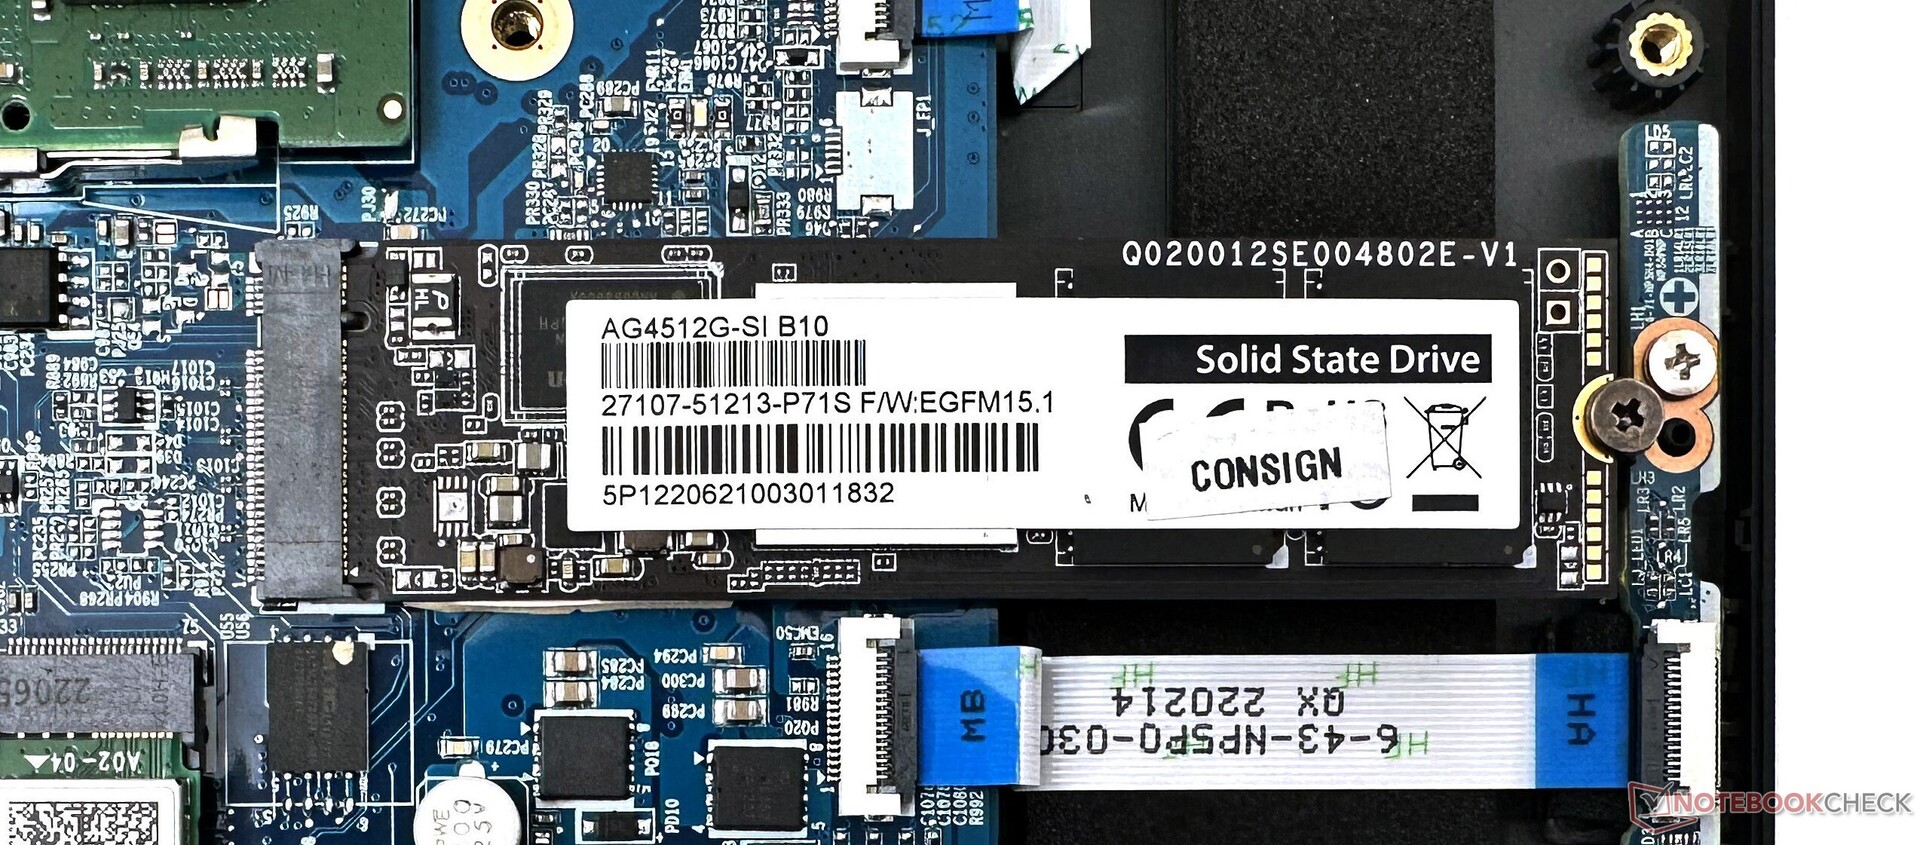
Nossa unidade G5 KE veio com um SSD Gigabyte NVMe de 512 GB. No entanto, achamos que a variante de 1 TB dessa unidade no G7 KE tem uma pontuação melhor em quase todos os aspectos. A SSD sofre uma aceleração drástica em nosso teste de loop de leitura DiskSpd.
É possível instalar um segundo SSD NVMe, mas não há espaço para adicionar uma unidade SATA de 2,5 polegadas.
| Gigabyte G5 KE Gigabyte AG4512G-SI B10 | Lenovo IdeaPad Gaming 3 15IAH7 Intel SSD 660p SSDPEKNW512G8 | Gigabyte G7 KE Gigabyte AG470S1TB-SI B10 | Honor MagicBook 14 2022 Samsung PM9A1 MZVL2512HCJQ | Asus TUF Gaming F15 FX507ZM SK Hynix HFM001TD3JX013N | HP Victus 16-e0179ng WDC PC SN730 SDBPNTY-1T00 | Média Gigabyte AG4512G-SI B10 | Média da turma Gaming | |
|---|---|---|---|---|---|---|---|---|
| CrystalDiskMark 5.2 / 6 | -42% | 22% | 43% | -8% | -16% | 0% | 26% | |
| Write 4K (MB/s) | 303.3 | 64 -79% | 363.1 20% | 229.88 -24% | 217.7 -28% | 157.3 -48% | 303 ? 0% | 199.6 ? -34% |
| Read 4K (MB/s) | 64.25 | 77.05 20% | 59.23 -8% | 91.45 42% | 70.1 9% | 49 -24% | 64.3 ? 0% | 78.6 ? 22% |
| Write Seq (MB/s) | 2258 | 93.07 -96% | 2605 15% | 2844 26% | 2983 32% | 2258 ? 0% | 3758 ? 66% | |
| Read Seq (MB/s) | 2561 | 2570 0% | 2337 -9% | 2492 -3% | 2247 -12% | 2561 ? 0% | 3633 ? 42% | |
| Write 4K Q32T1 (MB/s) | 620.6 | 184.6 -70% | 806.9 30% | 627.94 1% | 408.3 -34% | 395 -36% | 621 ? 0% | 614 ? -1% |
| Read 4K Q32T1 (MB/s) | 866.2 | 461.5 -47% | 1019 18% | 868.92 0% | 524 -40% | 557 -36% | 866 ? 0% | 710 ? -18% |
| Write Seq Q32T1 (MB/s) | 2264.3 | 1659 -27% | 3612 60% | 5118.5 126% | 3011 33% | 3094 37% | 2264 ? 0% | 5333 ? 136% |
| Read Seq Q32T1 (MB/s) | 4717.3 | 2936 -38% | 7067 50% | 6866.5 46% | 3553 -25% | 2871 -39% | 4717 ? 0% | 7102 ? 51% |
| Write 4K Q8T8 (MB/s) | 2239.2 | 2910.25 30% | 2239 ? 0% | 1308 ? -42% | ||||
| Read 4K Q8T8 (MB/s) | 1188.1 | 2687.03 126% | 1188 ? 0% | 1647 ? 39% | ||||
| AS SSD | -48% | 39% | 28% | -23% | -21% | 0% | 21% | |
| Seq Read (MB/s) | 3697.92 | 2432.02 -34% | 4540.75 23% | 5233 42% | 3013 -19% | 2383 -36% | 3698 ? 0% | 5591 ? 51% |
| Seq Write (MB/s) | 2106.21 | 1229.14 -42% | 3805.55 81% | 3857 83% | 2768 31% | 2466 17% | 2106 ? 0% | 3972 ? 89% |
| 4K Read (MB/s) | 82.5 | 75.66 -8% | 99.79 21% | 85.14 3% | 66.9 -19% | 44.14 -46% | 82.5 ? 0% | 71.1 ? -14% |
| 4K Write (MB/s) | 312.09 | 242.19 -22% | 325.41 4% | 216.33 -31% | 184.8 -41% | 117.5 -62% | 312 ? 0% | 215 ? -31% |
| 4K-64 Read (MB/s) | 1675.54 | 441.63 -74% | 2914.54 74% | 2468.58 47% | 1923 15% | 1734 3% | 1676 ? 0% | 1618 ? -3% |
| 4K-64 Write (MB/s) | 1865.08 | 1218.61 -35% | 2915.33 56% | 3003.26 61% | 2198 18% | 2088 12% | 1865 ? 0% | 2935 ? 57% |
| Access Time Read * (ms) | 0.066 | 0.073 -11% | 0.094 -42% | 0.023 65% | 0.03 55% | 0.049 26% | 0.066 ? -0% | 0.06364 ? 4% |
| Access Time Write * (ms) | 0.013 | 0.033 -154% | 0.012 8% | 0.02 -54% | 0.081 -523% | 0.032 -146% | 0.013 ? -0% | 0.03794 ? -192% |
| Score Read (Points) | 2128 | 760 -64% | 3468 63% | 3077 45% | 2291 8% | 2017 -5% | 2128 ? 0% | 2248 ? 6% |
| Score Write (Points) | 2388 | 1584 -34% | 3621 52% | 3605 51% | 2660 11% | 2452 3% | 2388 ? 0% | 3547 ? 49% |
| Score Total (Points) | 5541 | 2702 -51% | 8837 59% | 8195 48% | 6117 10% | 5503 -1% | 5541 ? 0% | 6872 ? 24% |
| Copy ISO MB/s (MB/s) | 1077.37 | 1949.01 81% | 2093.45 94% | 2143 99% | 1077 ? 0% | 3168 ? 194% | ||
| Copy Program MB/s (MB/s) | 827.5 | 1079.42 30% | 447.36 -46% | 871 5% | 828 ? 0% | 981 ? 19% | ||
| Copy Game MB/s (MB/s) | 1460.58 | 2042.84 40% | 1195.09 -18% | 1840 26% | 1461 ? 0% | 2112 ? 45% | ||
| Média Total (Programa/Configurações) | -45% /
-46% | 31% /
33% | 36% /
34% | -16% /
-18% | -19% /
-19% | 0% /
0% | 24% /
23% |
* ... menor é melhor

Disk Throttling: DiskSpd Read Loop, Queue Depth 8
Confira nossos Benchmarks de SSD e HDD para obter mais comparações de dispositivos de armazenamento.
Desempenho da GPU
A GPU de 115 W GPU para laptop Nvidia GeForce RTX 3060 tem o mesmo desempenho nos testes 3DMark. O G5 KE mostra uma boa vantagem sobre o HP Victus em testes sintéticos, devido à configuração TGP de 95 W deste último.
| 3DMark 11 Performance | 26505 pontos | |
| 3DMark Ice Storm Standard Score | 188480 pontos | |
| 3DMark Cloud Gate Standard Score | 53162 pontos | |
| 3DMark Fire Strike Score | 19966 pontos | |
| 3DMark Fire Strike Extreme Score | 10252 pontos | |
| 3DMark Time Spy Score | 8922 pontos | |
Ajuda | ||
Desempenho em jogos
O desempenho em jogos do Gigabyte G5 KE é semelhante ao de outros laptops baseados em RTX 3060 que testamos e até consegue superar o G7 KE com a mesma configuração em vários jogos.
Não notamos nenhuma queda perceptível de quadros ao testar o laptop com The Witcher 3 a 1080p Ultra.
The Witcher 3 FPS Chart
| Cyberpunk 2077 1.6 | |
| 1920x1080 High Preset | |
| Dell G16 7620 | |
| Gigabyte G5 KE | |
| Média NVIDIA GeForce RTX 3060 Laptop GPU (42.2 - 87.7, n=14) | |
| Gigabyte G7 KE | |
| Honor MagicBook 14 2022 | |
| 1920x1080 Ultra Preset | |
| Gigabyte G5 KE | |
| Dell G16 7620 | |
| Média NVIDIA GeForce RTX 3060 Laptop GPU (40 - 78.8, n=16) | |
| Gigabyte G7 KE | |
| Honor MagicBook 14 2022 | |
| F1 2021 | |
| 1920x1080 High Preset AA:T AF:16x | |
| Gigabyte G5 KE | |
| Média NVIDIA GeForce RTX 3060 Laptop GPU (119 - 227, n=9) | |
| Honor MagicBook 14 2022 | |
| 1920x1080 Ultra High Preset + Raytracing AA:T AF:16x | |
| Gigabyte G5 KE | |
| Média NVIDIA GeForce RTX 3060 Laptop GPU (67 - 112.8, n=9) | |
| Honor MagicBook 14 2022 | |
| baixo | média | alto | ultra | |
|---|---|---|---|---|
| GTA V (2015) | 183.4 | 179.9 | 172.8 | 103 |
| The Witcher 3 (2015) | 333 | 255 | 168.7 | 87.6 |
| Dota 2 Reborn (2015) | 168.5 | 153.1 | 144.8 | 137.5 |
| Final Fantasy XV Benchmark (2018) | 179.3 | 118.9 | 90.3 | |
| X-Plane 11.11 (2018) | 118.4 | 105.6 | 86.7 | |
| Far Cry 5 (2018) | 159 | 134 | 129 | 118 |
| Strange Brigade (2018) | 385 | 216 | 175.3 | 153.3 |
| F1 2021 (2021) | 303 | 200 | 177.9 | 105.1 |
| Cyberpunk 2077 1.6 (2022) | 105.4 | 85.3 | 72.5 | 68 |
| F1 22 (2022) | 197 | 189.4 | 153.3 | 55.9 |
Confira nossa GPU para laptop Nvidia GeForce RTX 3060 e também nossa lista exaustiva de comparação de jogos para obter mais informações e comparações de desempenho.
Emissions: High surface temperatures and fan noise under load
Ruído do sistema
No modo de desempenho testado, o ruído do sistema ocioso é um pouco mais alto, cerca de 31 dB(A). O ruído do ventilador atinge a marca de 55 dB(A), independentemente da carga.
A Gigabyte parece ter limitado o ruído do ventilador a menos de 30 dB(A) no perfil Quiet. Somente o teste
Witcher 3 resulta em altas emissões de ruído do ventilador no perfil de economia de energia, conforme ilustrado na tabela abaixo.
| Modo de desempenho | Idle dB(A) | Load average dB(A) | Load maximum dB(A) | The Witcher 3 dB(A) |
|---|---|---|---|---|
| Silencioso | 22,21 | 25,73 | 24,64 | 27,62 |
| Economia de energia | 22,65 | 24,75 | 24,62 | 49,05 |
| Entretenimento | 22,63 | 54,67 | 55,52 | 53,11 |
| Desempenho | 31.05 | 55.66 | 55.51 | 55.65 |
Barulho
| Ocioso |
| 31.05 / 31.05 / 31.05 dB |
| Carga |
| 55.66 / 55.51 dB |
 | ||
30 dB silencioso 40 dB(A) audível 50 dB(A) ruidosamente alto |
||
min: | ||
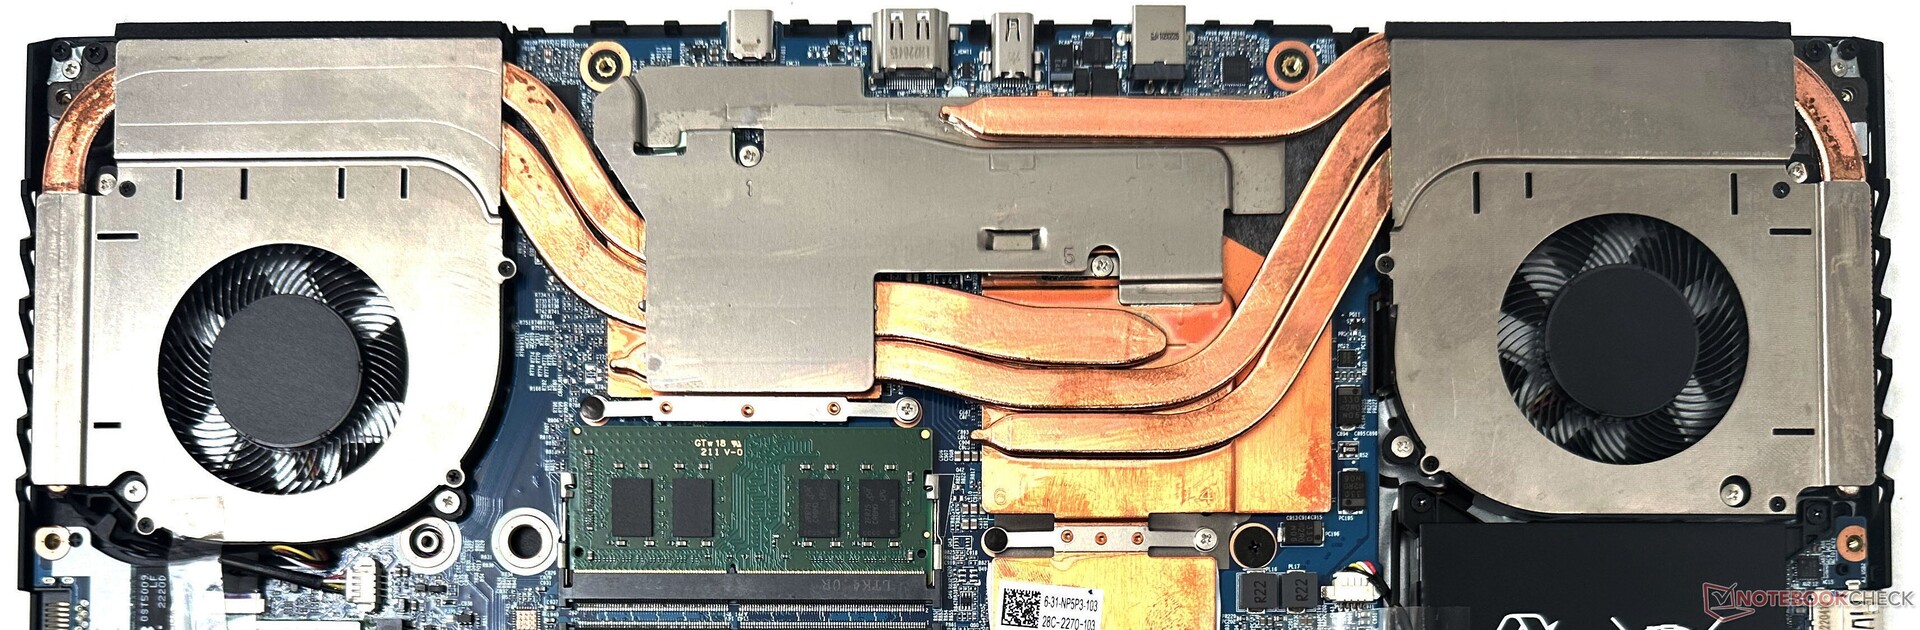
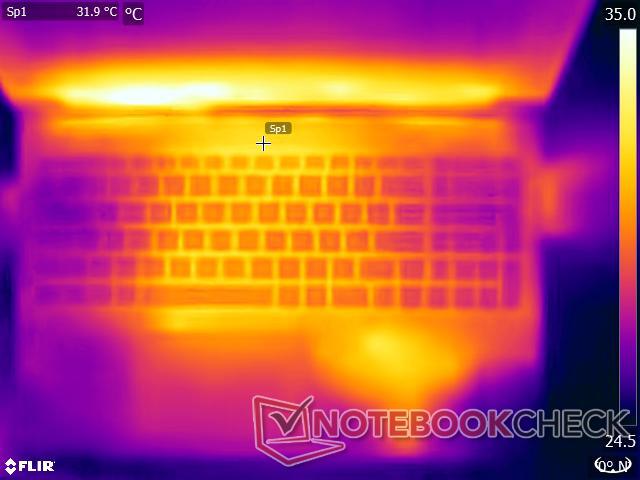
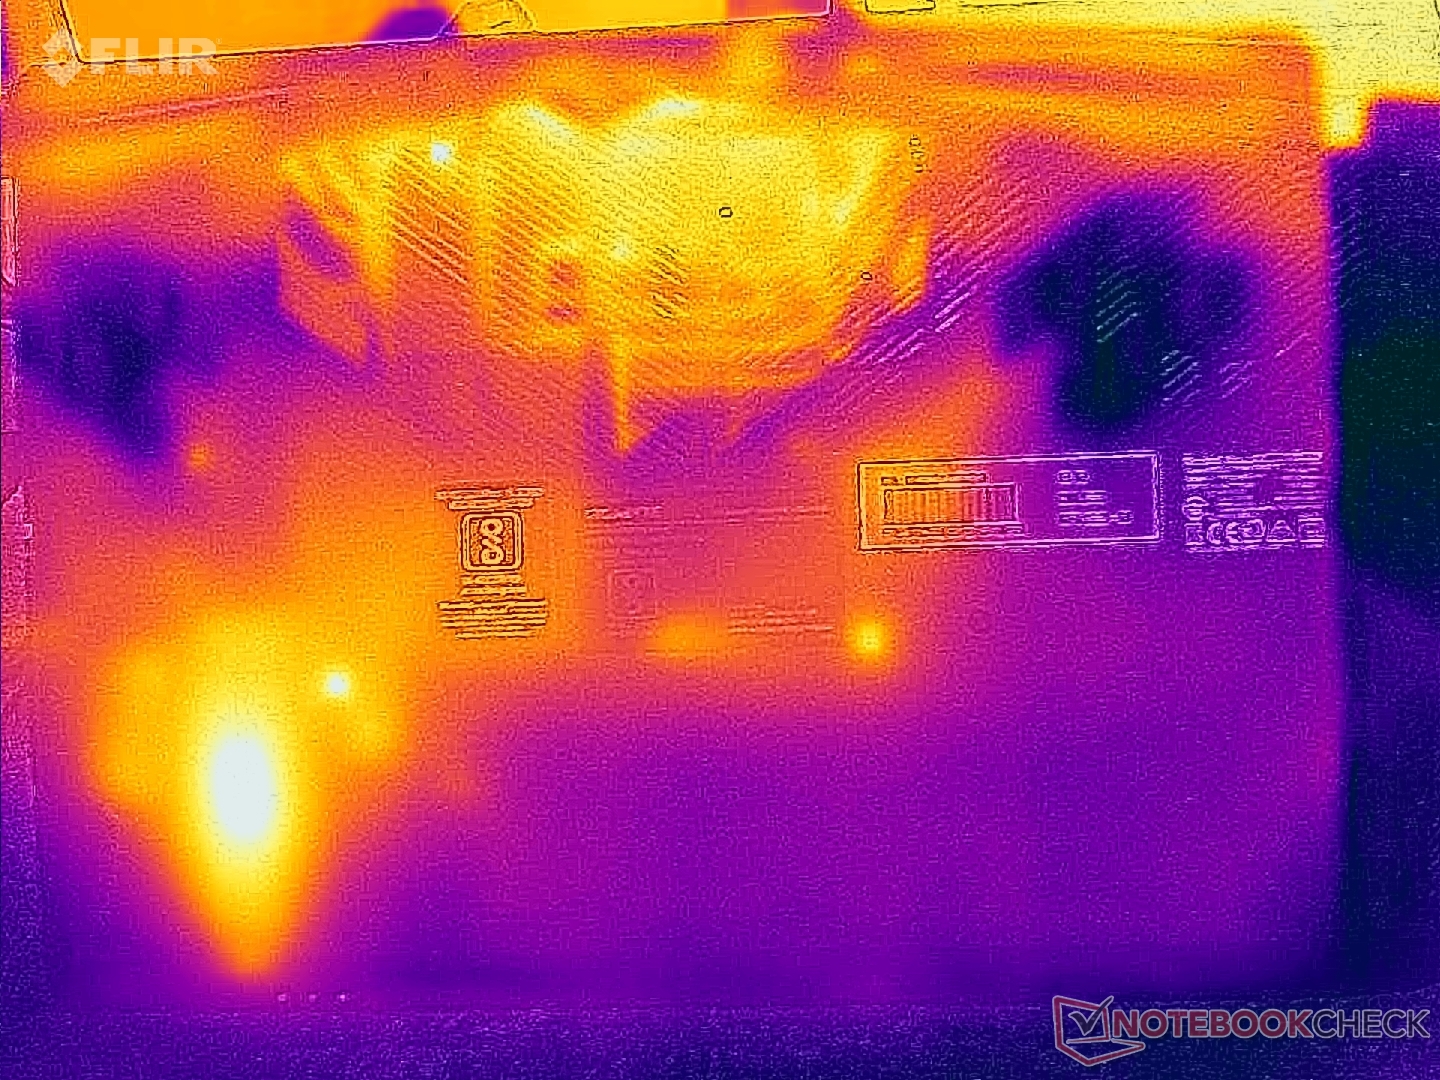
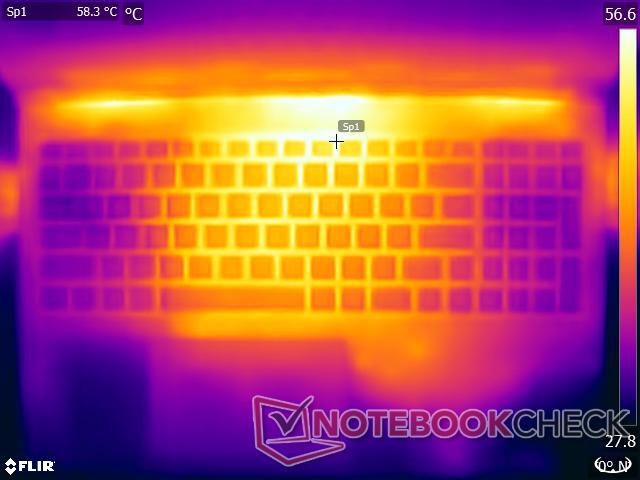
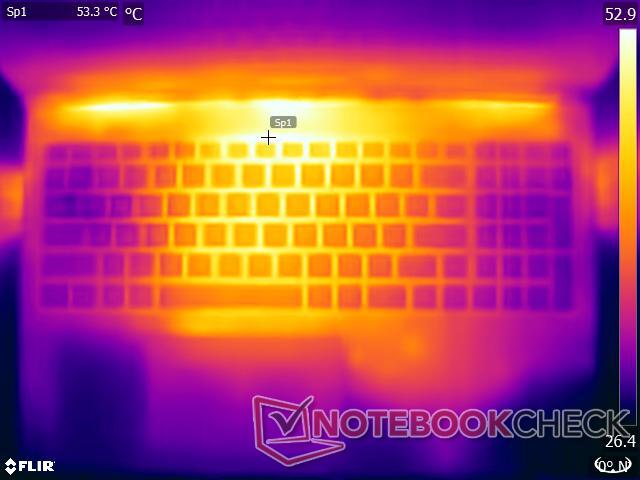
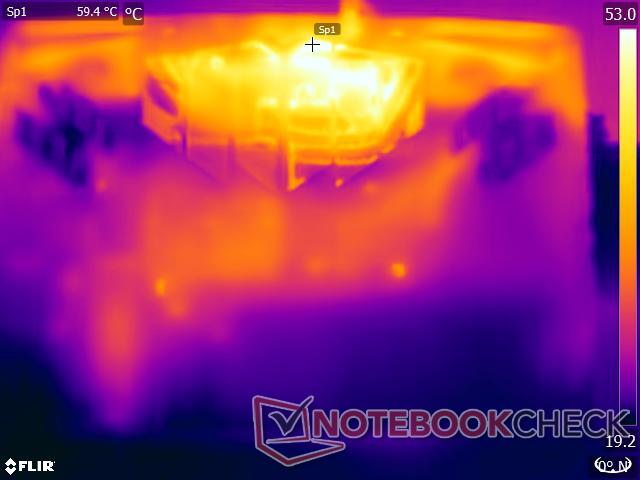
Temperatura
O sistema de ventilador duplo e tubo de calor quádruplo do Gigabyte G5 KE faz um bom trabalho ao manter as temperaturas do núcleo sob controle, mas as temperaturas da superfície podem subir até 52,6 °C na parte superior e até 62,4 °C na parte inferior sob carga pesada.
A área do touchpad também pode ficar bastante quente.
(-) A temperatura máxima no lado superior é 52.6 °C / 127 F, em comparação com a média de 40.4 °C / 105 F , variando de 21.2 a 68.8 °C para a classe Gaming.
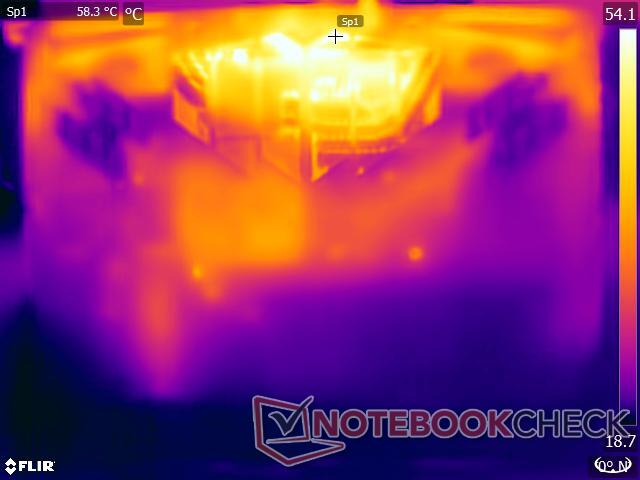
(-) A parte inferior aquece até um máximo de 62.4 °C / 144 F, em comparação com a média de 43.2 °C / 110 F
(±) Em uso inativo, a temperatura média para o lado superior é 32 °C / 90 F, em comparação com a média do dispositivo de 33.9 °C / ### class_avg_f### F.
(-) Jogando The Witcher 3, a temperatura média para o lado superior é 42.9 °C / 109 F, em comparação com a média do dispositivo de 33.9 °C / ## #class_avg_f### F.
(-) Os apoios para as mãos e o touchpad podem ficar muito quentes ao toque, com um máximo de 41.2 °C / 106.2 F.
(-) A temperatura média da área do apoio para as mãos de dispositivos semelhantes foi 28.8 °C / 83.8 F (-12.4 °C / -22.4 F).
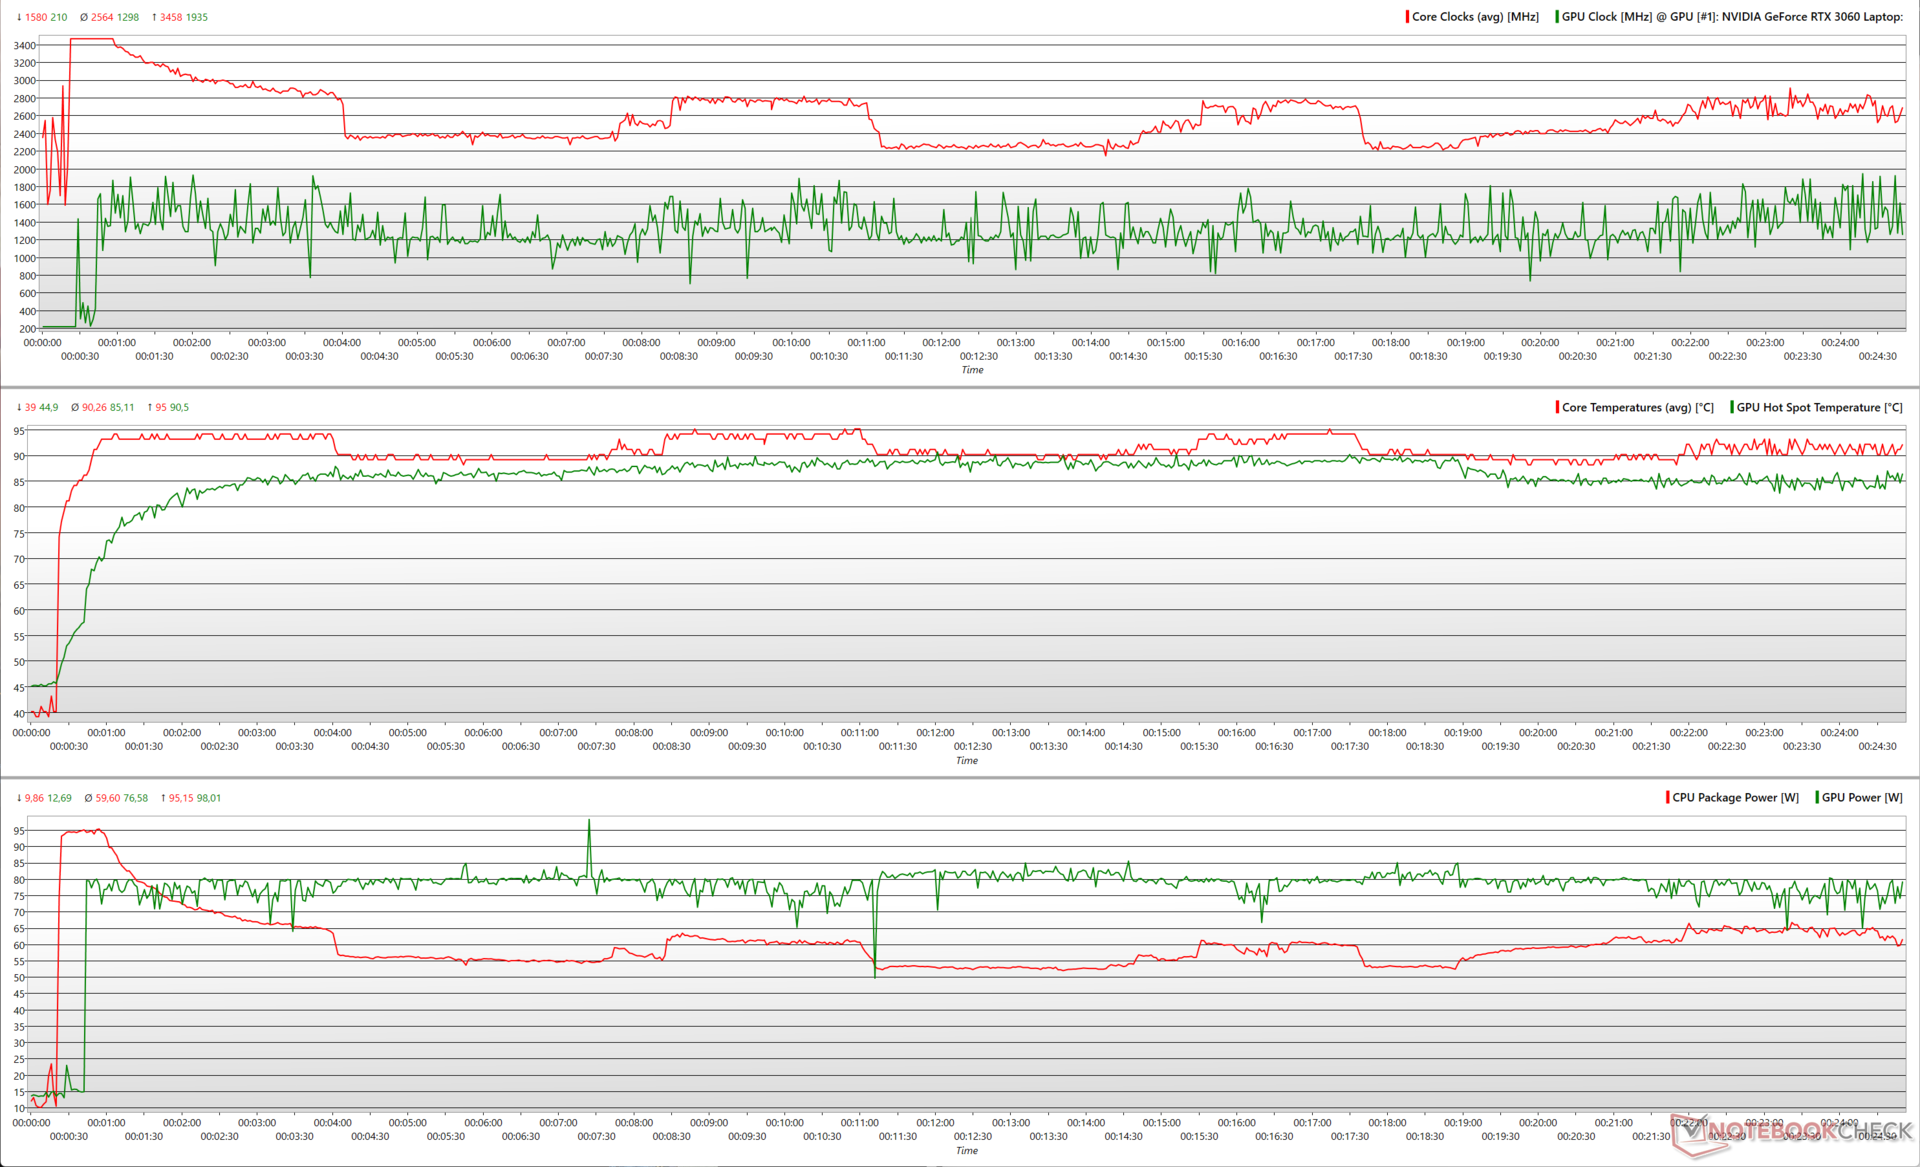
Em um estresse combinado do Prime95 e do FurMark, o Core i5-12500H atinge brevemente um pico de cerca de 3,5 GHz a 95 W antes de se estabilizar em cerca de 2,5 GHz, próximo a 60 W em média. A GPU para laptop RTX 3060 se mantém em cerca de 75,6 W em média, mas atinge um pico de 98 W, resultando em um clock máximo do núcleo de 1,9 GHz.
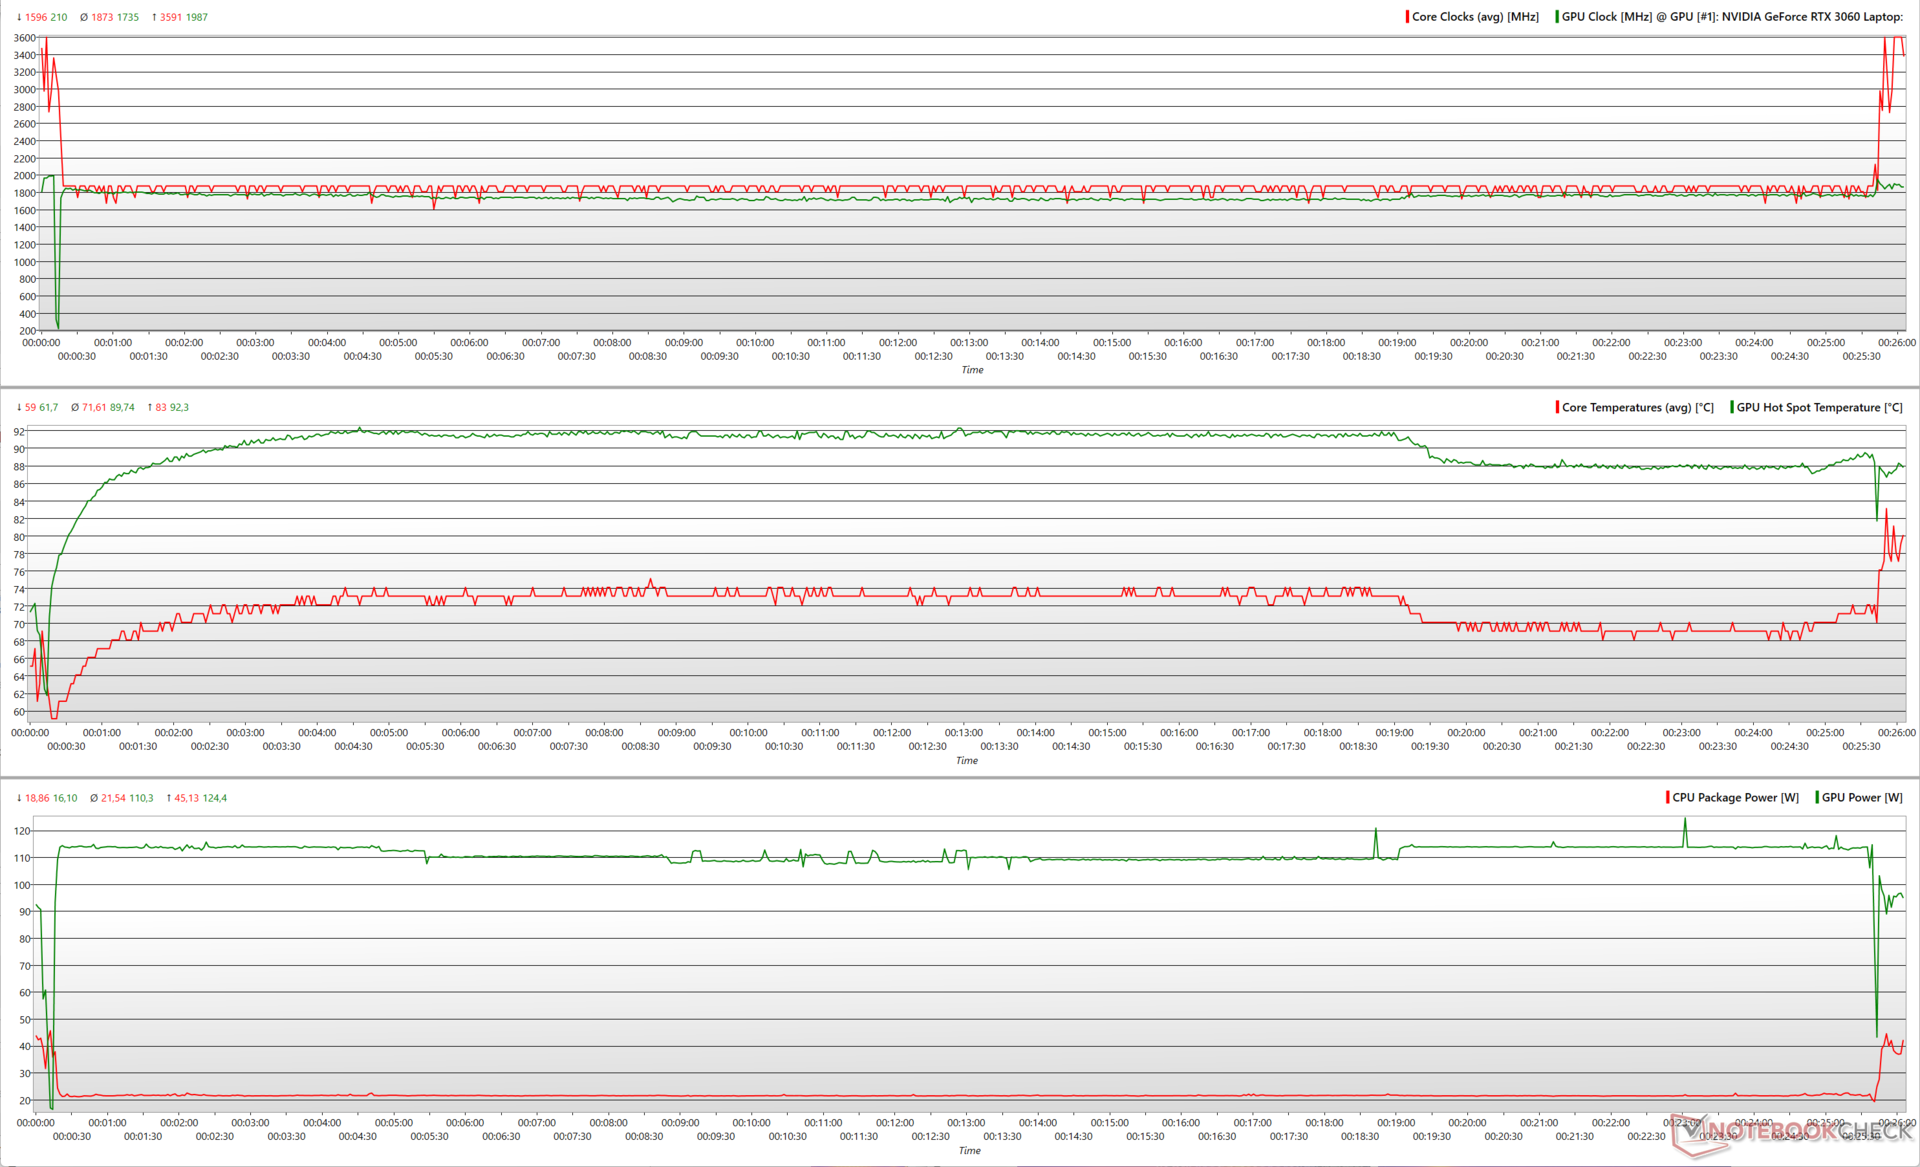
Vemos clocks de pico semelhantes durante o estresse do Witcher 3, mas a potência média do pacote da CPU cai ainda mais para cerca de 21,5 W, permitindo que a RTX 3060 consuma até 110 W em média.
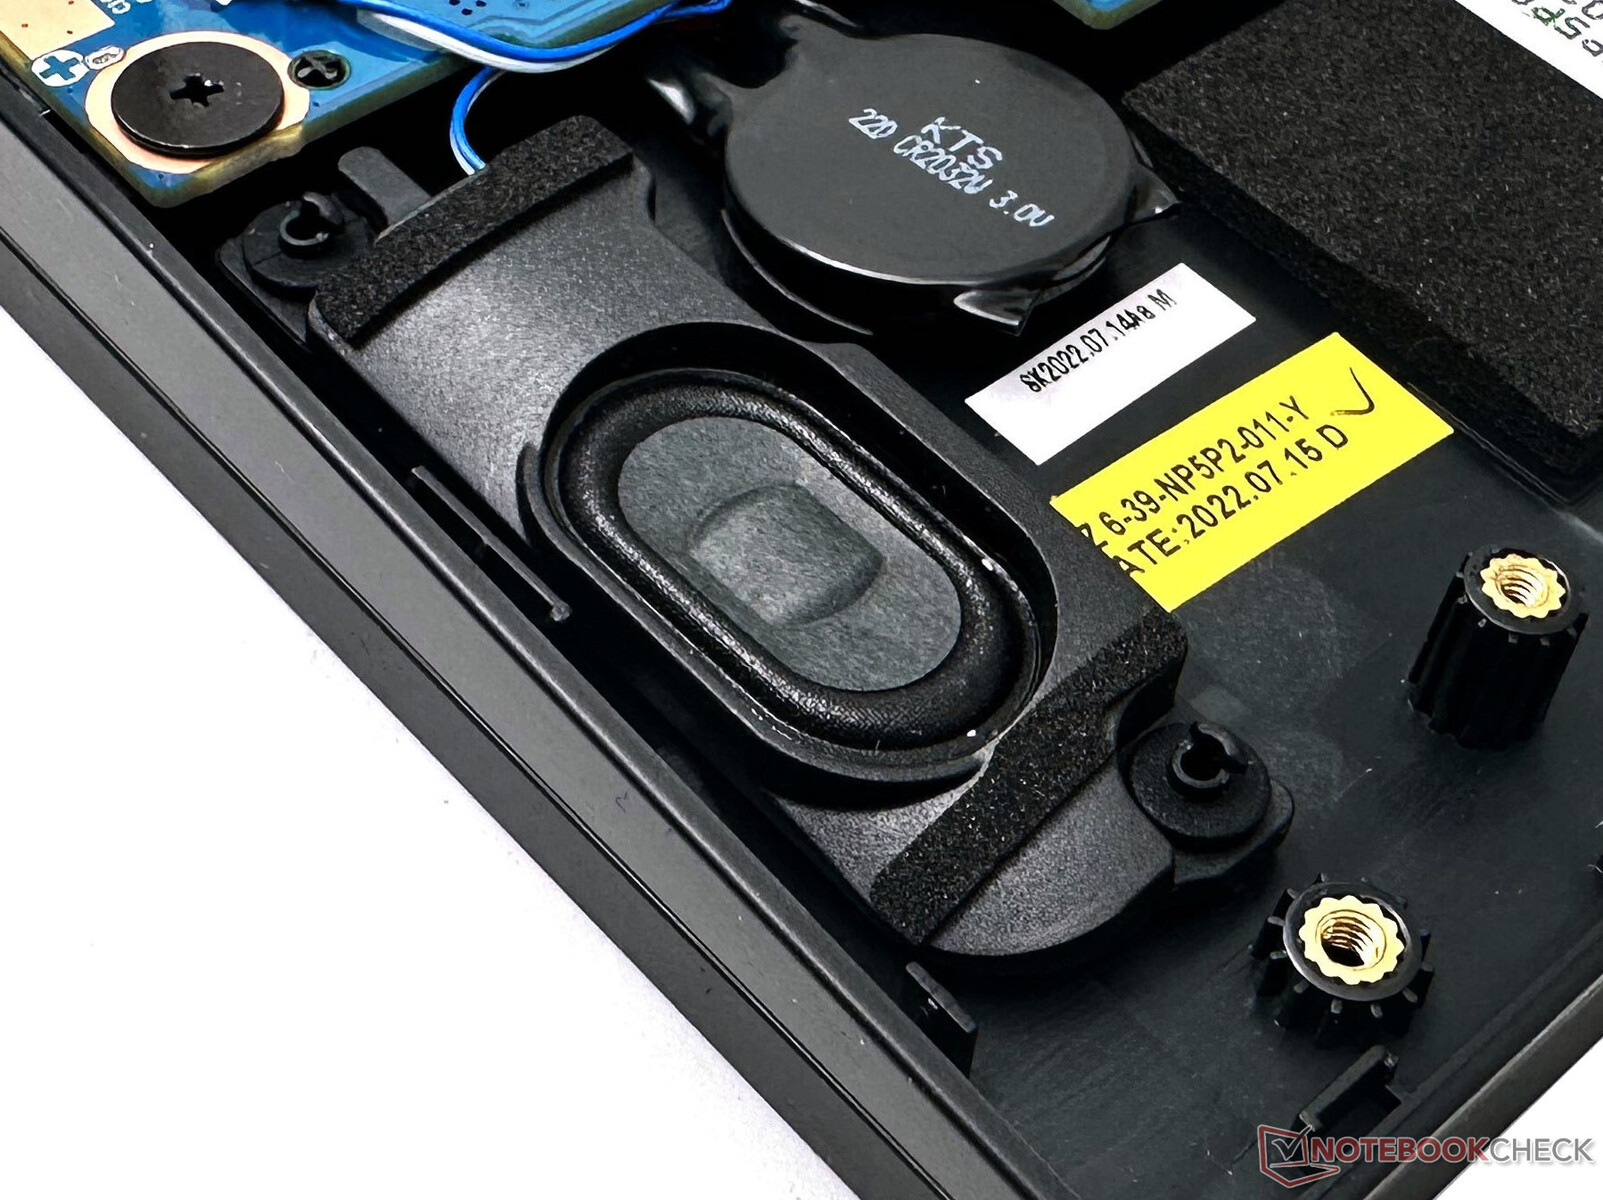
Alto-falantes
Os alto-falantes do G5 KE são bastante úteis na maior parte do tempo, com um volume próximo a 75 dB(A). A resposta de graves é quase inexistente, mas os médios e agudos são reproduzidos de forma decente.
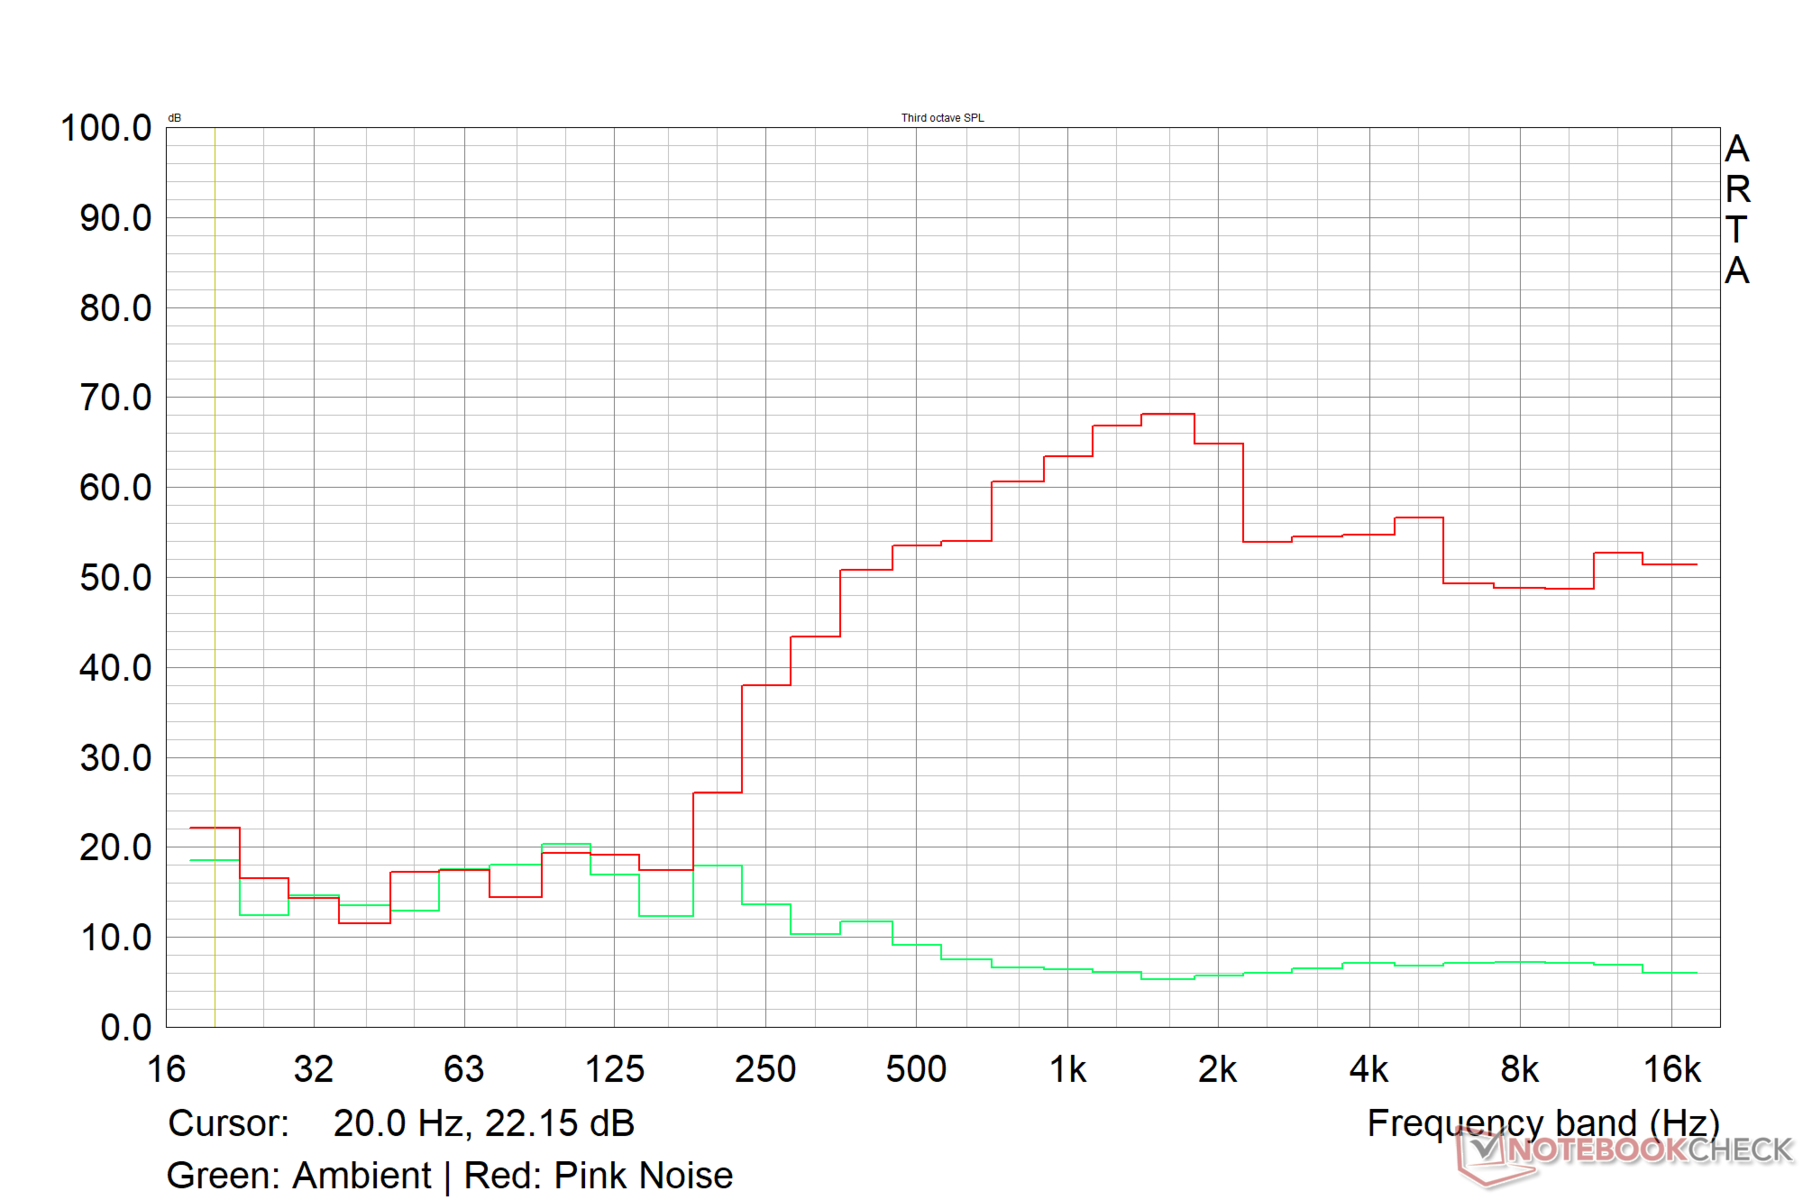
Gigabyte G5 KE análise de áudio
(±) | o volume do alto-falante é médio, mas bom (###valor### dB)
Graves 100 - 315Hz
(-) | quase nenhum baixo - em média 25.5% menor que a mediana
(±) | a linearidade dos graves é média (12% delta para a frequência anterior)
Médios 400 - 2.000 Hz
(±) | médios mais altos - em média 8.1% maior que a mediana
(±) | a linearidade dos médios é média (7.7% delta para frequência anterior)
Altos 2 - 16 kHz
(+) | agudos equilibrados - apenas 2.9% longe da mediana
(+) | os máximos são lineares (6.7% delta da frequência anterior)
Geral 100 - 16.000 Hz
(±) | a linearidade do som geral é média (25.1% diferença em relação à mediana)
Comparado com a mesma classe
» 90% de todos os dispositivos testados nesta classe foram melhores, 3% semelhantes, 7% piores
» O melhor teve um delta de 6%, a média foi 18%, o pior foi 132%
Comparado com todos os dispositivos testados
» 77% de todos os dispositivos testados foram melhores, 5% semelhantes, 18% piores
» O melhor teve um delta de 4%, a média foi 23%, o pior foi 134%
Apple MacBook Pro 16 2021 M1 Pro análise de áudio
(+) | os alto-falantes podem tocar relativamente alto (###valor### dB)
Graves 100 - 315Hz
(+) | bons graves - apenas 3.8% longe da mediana
(+) | o baixo é linear (5.2% delta para a frequência anterior)
Médios 400 - 2.000 Hz
(+) | médios equilibrados - apenas 1.3% longe da mediana
(+) | médios são lineares (2.1% delta para frequência anterior)
Altos 2 - 16 kHz
(+) | agudos equilibrados - apenas 1.9% longe da mediana
(+) | os máximos são lineares (2.7% delta da frequência anterior)
Geral 100 - 16.000 Hz
(+) | o som geral é linear (4.6% diferença em relação à mediana)
Comparado com a mesma classe
» 0% de todos os dispositivos testados nesta classe foram melhores, 0% semelhantes, 100% piores
» O melhor teve um delta de 5%, a média foi 17%, o pior foi 45%
Comparado com todos os dispositivos testados
» 0% de todos os dispositivos testados foram melhores, 0% semelhantes, 100% piores
» O melhor teve um delta de 4%, a média foi 23%, o pior foi 134%
Gerenciamento de energia: Consumo de energia econômico em modo inativo com duração medíocre da bateria
Consumo de energia
O Gigabyte G5 KE é um pouco mais econômico em termos de consumo de energia do que o G7 KE, principalmente no modo inativo.
O Lenovo IdeaPad Gaming 3's RTX 3050 Ti para laptop e a combinação do HP Victus de uma RTX 3060 de 95 W e Ryzen 7 5800H ajudam esses dispositivos a consumir comparativamente menos energia em geral.
| desligado | |
| Ocioso | |
| Carga |
|
Key:
min: | |
| Gigabyte G5 KE i5-12500H, GeForce RTX 3060 Laptop GPU, IPS, 1920x1080, 15.6" | Lenovo IdeaPad Gaming 3 15IAH7 i5-12500H, GeForce RTX 3050 Ti Laptop GPU, IPS, 1920x1080, 15.6" | Gigabyte G7 KE i5-12500H, GeForce RTX 3060 Laptop GPU, IPS, 1920x1080, 17.3" | Schenker XMG Core 15 (M22) R7 6800H, GeForce RTX 3060 Laptop GPU, IPS, 2560x1440, 15.6" | Dell G16 7620 i7-12700H, GeForce RTX 3060 Laptop GPU, IPS, 2560x1600, 16" | Asus TUF Gaming F15 FX507ZM i7-12700H, GeForce RTX 3060 Laptop GPU, IPS, 1920x1080, 15.6" | HP Victus 16-e0179ng R7 5800H, GeForce RTX 3060 Laptop GPU, IPS, 1920x1080, 16.1" | Média NVIDIA GeForce RTX 3060 Laptop GPU | Média da turma Gaming | |
|---|---|---|---|---|---|---|---|---|---|
| Power Consumption | 9% | -33% | -14% | -42% | -8% | 9% | -18% | -43% | |
| Idle Minimum * (Watt) | 7.66 | 8 -4% | 15 -96% | 11.8 -54% | 14.4 -88% | 6.3 18% | 5 35% | 10.4 ? -36% | 13 ? -70% |
| Idle Average * (Watt) | 10.3 | 10 3% | 17 -65% | 14.7 -43% | 17.8 -73% | 9.8 5% | 10 3% | 14.5 ? -41% | 19 ? -84% |
| Idle Maximum * (Watt) | 16.05 | 16 -0% | 24 -50% | 15 7% | 31.5 -96% | 26.5 -65% | 20 -25% | 21.4 ? -33% | 24.6 ? -53% |
| Load Average * (Watt) | 115.8 | 99 15% | 111 4% | 100 14% | 101.2 13% | 103.8 10% | 108 7% | 109.3 ? 6% | 110.7 ? 4% |
| Witcher 3 ultra * (Watt) | 168.7 | 144.6 14% | 174.1 -3% | 184 -9% | 176.9 -5% | 189 -12% | 145 14% | ||
| Load Maximum * (Watt) | 234.6 | 168 28% | 208 11% | 237 -1% | 242.9 -4% | 241.9 -3% | 189 19% | 206 ? 12% | 259 ? -10% |
* ... menor é melhor
Power Consumption: The Witcher 3 / Stress test
Power Consumption: External monitor
Duração da bateria
O tempo de duração da bateria do Gigabyte G5 KE é menor, mesmo com um brilho reduzido de 150 nits. No entanto, isso não é incomum em laptops para jogos.
Semelhante às nossas observações com o G7 KE, notamos um tempo de execução drasticamente baixo de pouco mais de duas horas em nosso teste de loop de reprodução de vídeo H.264 1080p a 150 nits, mesmo com todas as unidades e patches do sistema operacional atualizados.
Pro
Contra
Veredicto: Jogador convencional com compromissos inevitáveis
Embora a Gigabyte vá disponibilizar em breve uma série de laptops Intel de 13ª geração e da série RTX 40 Aorus, Aero e Gigabyte atualizados nas próximas semanas, o G5 KE com um Intel Core i5-12500H E o laptop GPU para laptop Nvidia RTX 3060 ainda é uma boa opção para jogos convencionais.
A Gigabyte faz bom uso da combinação do Core i5-12500H e da GPU para laptop RTX 3060, e não encontramos nenhum problema desagradável com o desempenho geral. O arranjo de resfriamento com ventilador duplo e tubo de calor quádruplo funciona bem para garantir que o hardware subjacente não seja estrangulado sob carga.
O Gigabyte G5 KE é um laptop convencional capaz de jogar em 1080p Ultra com um desempenho muito bom da CPU e da GPU. Entretanto, ele fica aquém em outras áreas que podem ou não ser críticas, dependendo de suas prioridades.
Dito isso, a tela está abaixo da média quando comparada aos padrões de 2023, especialmente quando os dispositivos concorrentes, como o Lenovo IdeaPad Gaming 3, Schenker XMG Core 15 (M22),Asus TUF Gaming F15e o próprio Gigabyte G7 KE da Gigabyte oferecem painéis muito superiores com ampla cobertura de gama de cores e tempos de resposta rápidos.
Outras deficiências importantes incluem um SSD que se acelera drasticamente sob carga, altas temperaturas de superfície, ventiladores barulhentos e pouca duração da bateria durante a reprodução de vídeo.
Se esses compromissos não forem muito importantes para você, o Gigabyte G5 KE é um laptop decente de médio porte para jogos em FHD, do ponto de vista puramente de desempenho, que deverá atendê-lo bem até 2023.
Preço e disponibilidade
Na Índia, a Gigabyte G5 KE está sendo vendida atualmente no Flipkart a um preço com desconto de ₹94.990, enquanto a Amazon India está oferecendo o G5 ME com uma RTX 3050 Ti por ₹95.901.
O G5 KE com uma RTX 3060 é um pouco difícil de encontrar nos mercados internacionais, pois o laptop está sendo substituído por uma configuração baseada em RTX 4050 ou RTX 4060.
Gigabyte G5 KE
- 04/24/2023 v7 (old)
Vaidyanathan Subramaniam
Transparência
A seleção dos dispositivos a serem analisados é feita pela nossa equipe editorial. A amostra de teste foi fornecida ao autor como empréstimo pelo fabricante ou varejista para fins desta revisão. O credor não teve influência nesta revisão, nem o fabricante recebeu uma cópia desta revisão antes da publicação. Não houve obrigação de publicar esta revisão. Como empresa de mídia independente, a Notebookcheck não está sujeita à autoridade de fabricantes, varejistas ou editores.
É assim que o Notebookcheck está testando
Todos os anos, o Notebookcheck analisa de forma independente centenas de laptops e smartphones usando procedimentos padronizados para garantir que todos os resultados sejam comparáveis. Desenvolvemos continuamente nossos métodos de teste há cerca de 20 anos e definimos padrões da indústria no processo. Em nossos laboratórios de teste, equipamentos de medição de alta qualidade são utilizados por técnicos e editores experientes. Esses testes envolvem um processo de validação em vários estágios. Nosso complexo sistema de classificação é baseado em centenas de medições e benchmarks bem fundamentados, o que mantém a objetividade.Price comparison

