Revisão MSI Cyborg 15 A12VF: Laptop para jogos com RTX 4060 de baixa potência

O laptop móvel para jogos da MSI não quer - e também não é capaz - de estabelecer nenhum novo recorde de desempenho. ONúcleo i7-12650He GeForce RTX 4060são executados com limites de potência conservadores e um TGP (45 Watt) baixo, resultando em um consumo de energia bastante baixo. Uma fonte de alimentação de 120 watts é tudo o que é necessário para o laptop. Os concorrentes incluem laptops, tais como o Asus TUF Gaming A16 FA617oAorus 15 XE5oMSI Katana 15 B12VEKoHP Victus 15e o Schenker XMG Fusion 15.
Posibles contendientes en la comparación
Avaliação | Data | Modelo | Peso | Altura | Size | Resolução | Preço |
|---|---|---|---|---|---|---|---|
| 82.4 % v7 (old) | 04/2023 | MSI Cyborg 15 A12VF i7-12650H, GeForce RTX 4060 Laptop GPU | 2 kg | 22.9 mm | 15.60" | 1920x1080 | |
| 86.2 % v7 (old) | 02/2023 | Asus TUF Gaming A16 FA617 R7 7735HS, Radeon RX 7600S | 2.2 kg | 27 mm | 16.00" | 1920x1200 | |
| 85.5 % v7 (old) | 12/2022 | Aorus 15 XE5 i7-12700H, GeForce RTX 3070 Ti Laptop GPU | 2.3 kg | 24 mm | 15.60" | 2560x1440 | |
| 87.4 % v7 (old) | 08/2022 | Schenker XMG Fusion 15 (Mid 22) i7-11800H, GeForce RTX 3070 Laptop GPU | 1.9 kg | 21.65 mm | 15.60" | 2560x1440 | |
| 82.9 % v7 (old) | 03/2023 | MSI Katana 15 B12VEK i7-12650H, GeForce RTX 4050 Laptop GPU | 2.3 kg | 24.9 mm | 15.60" | 1920x1080 | |
| 81 % v7 (old) | 01/2023 | HP Victus 15 fa0020nr i7-12700H, GeForce RTX 3050 Ti Laptop GPU | 2.3 kg | 23.6 mm | 15.60" | 1920x1080 |
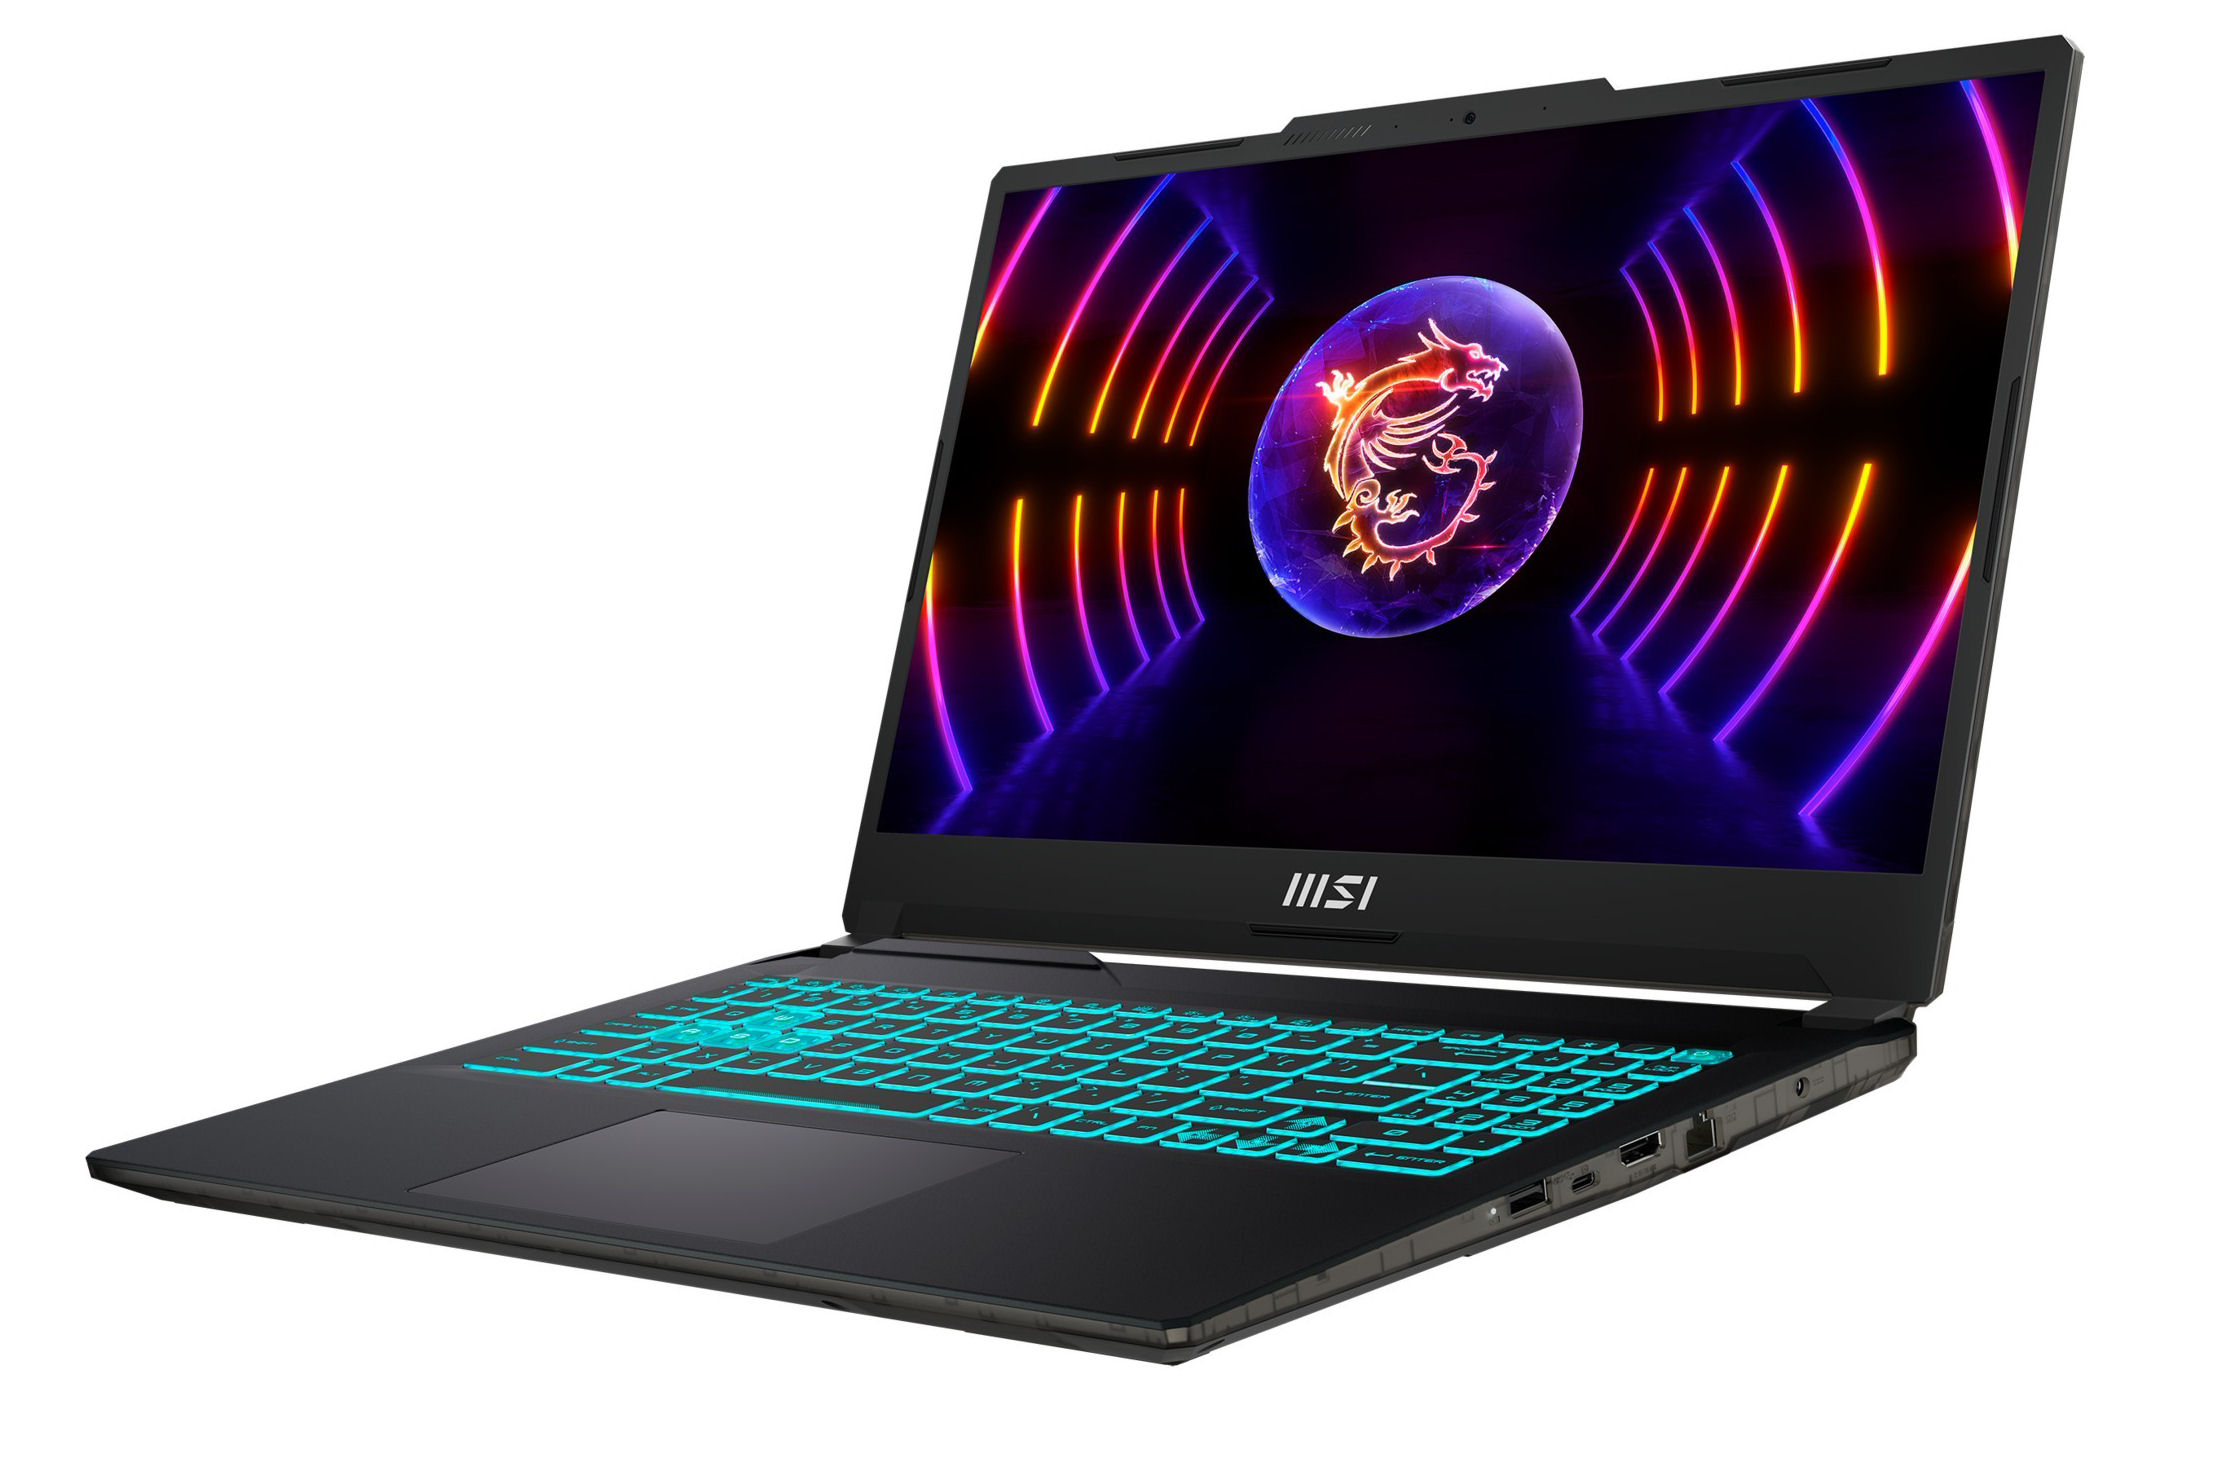
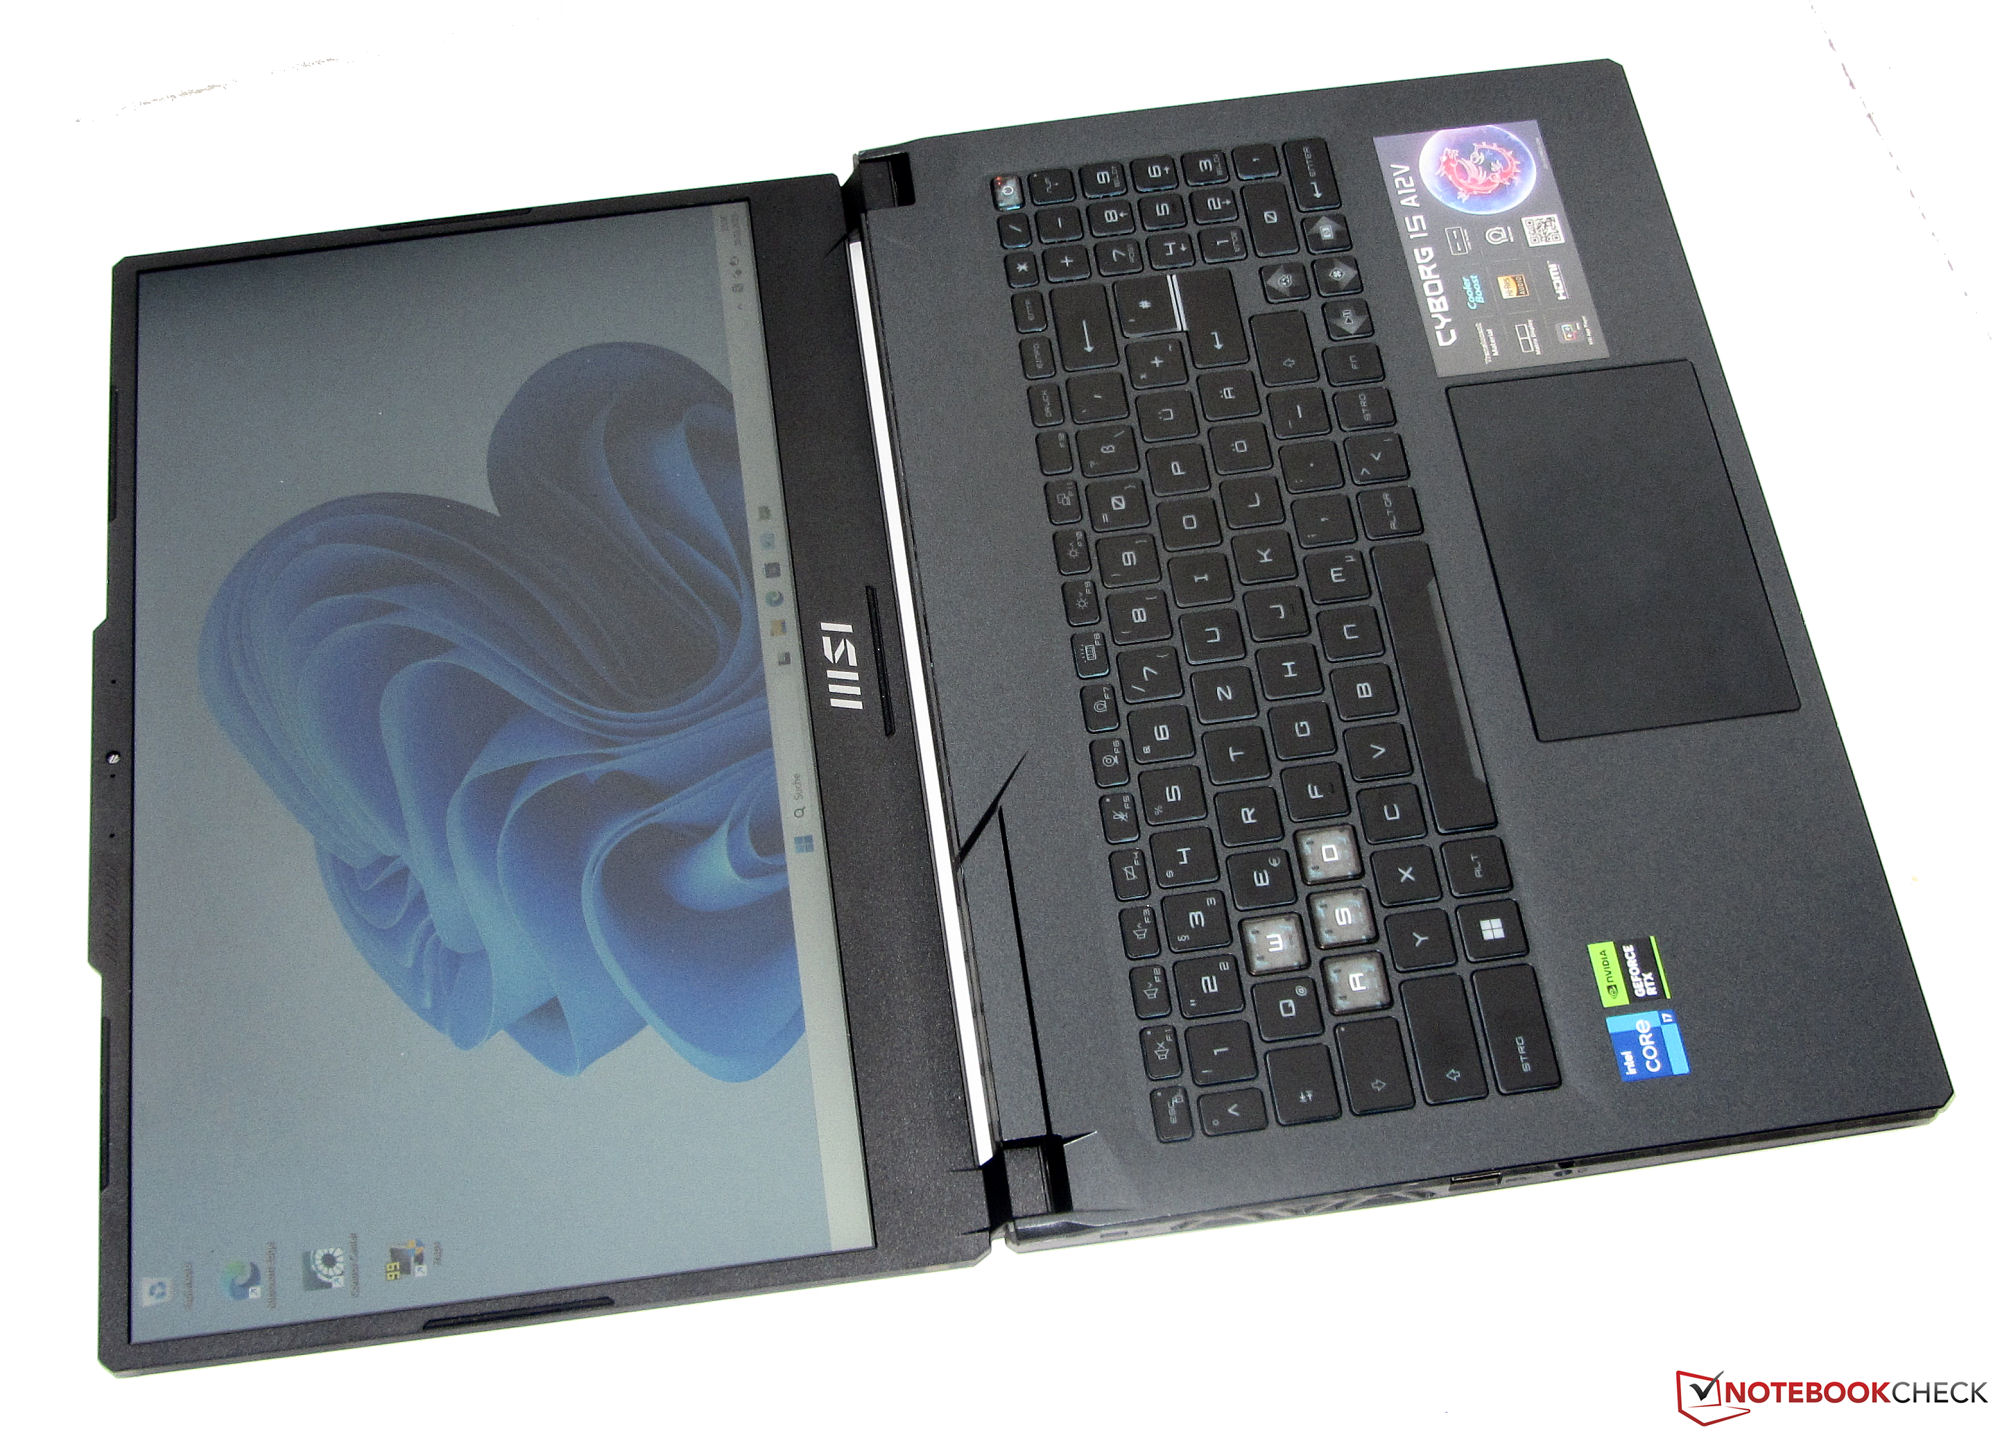
Estojo - A12VF com ângulo de abertura de 180 graus
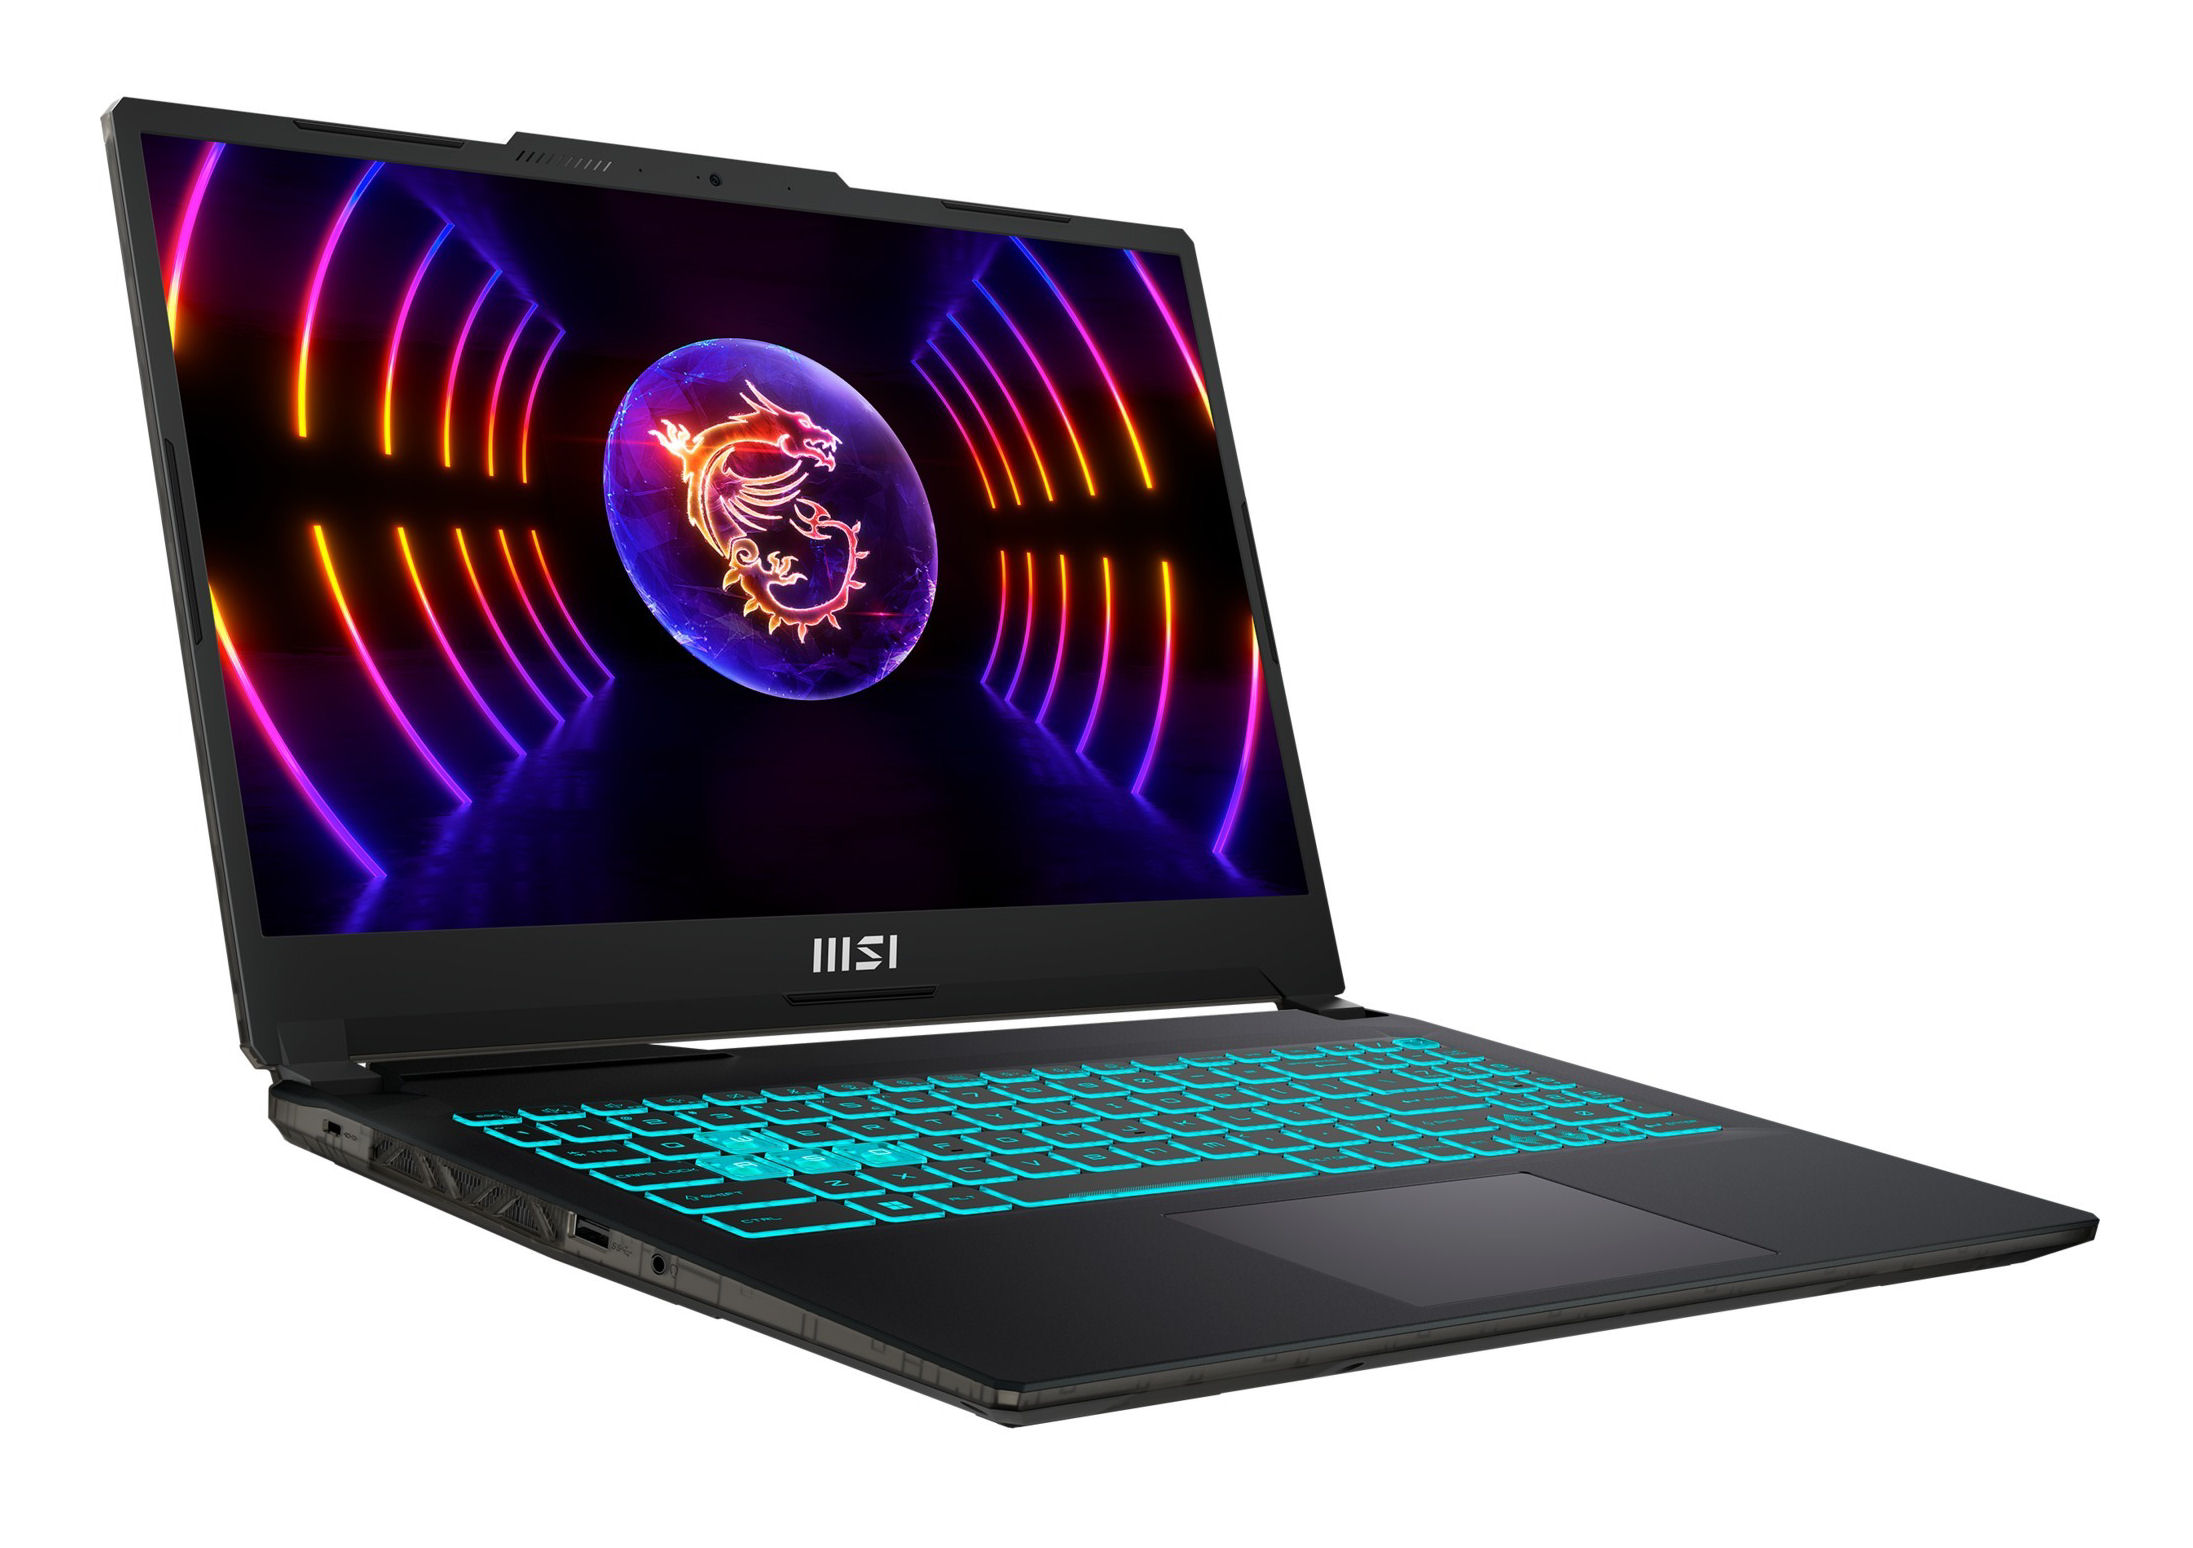
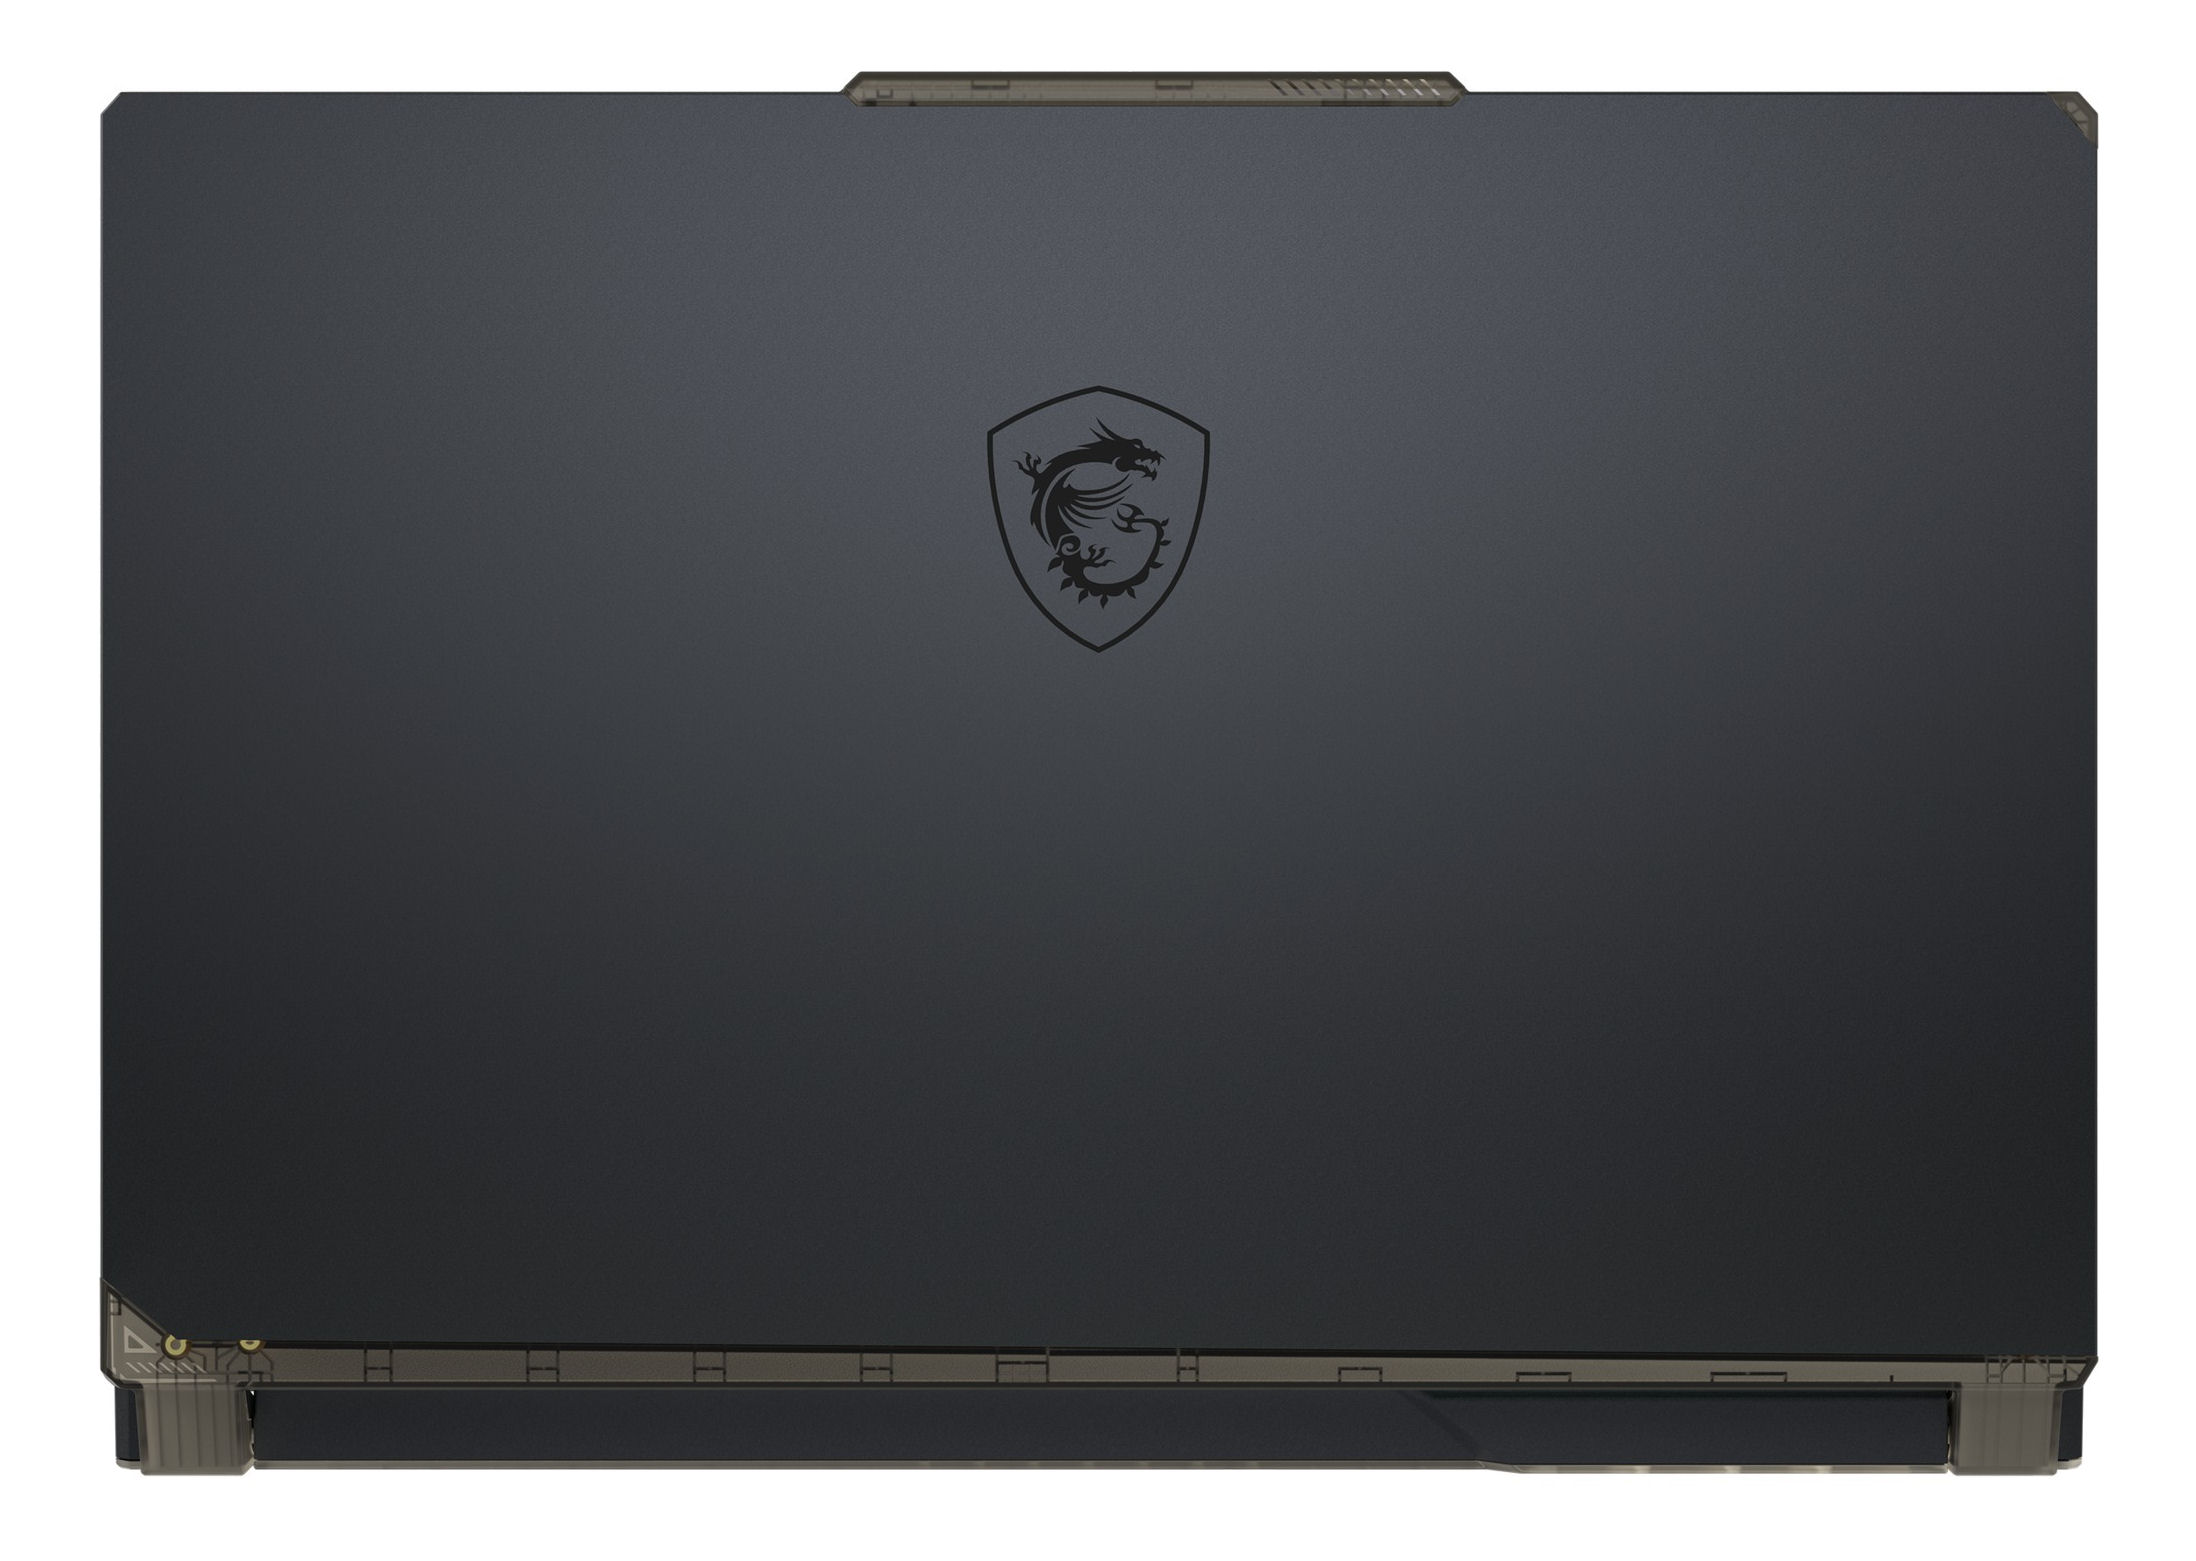
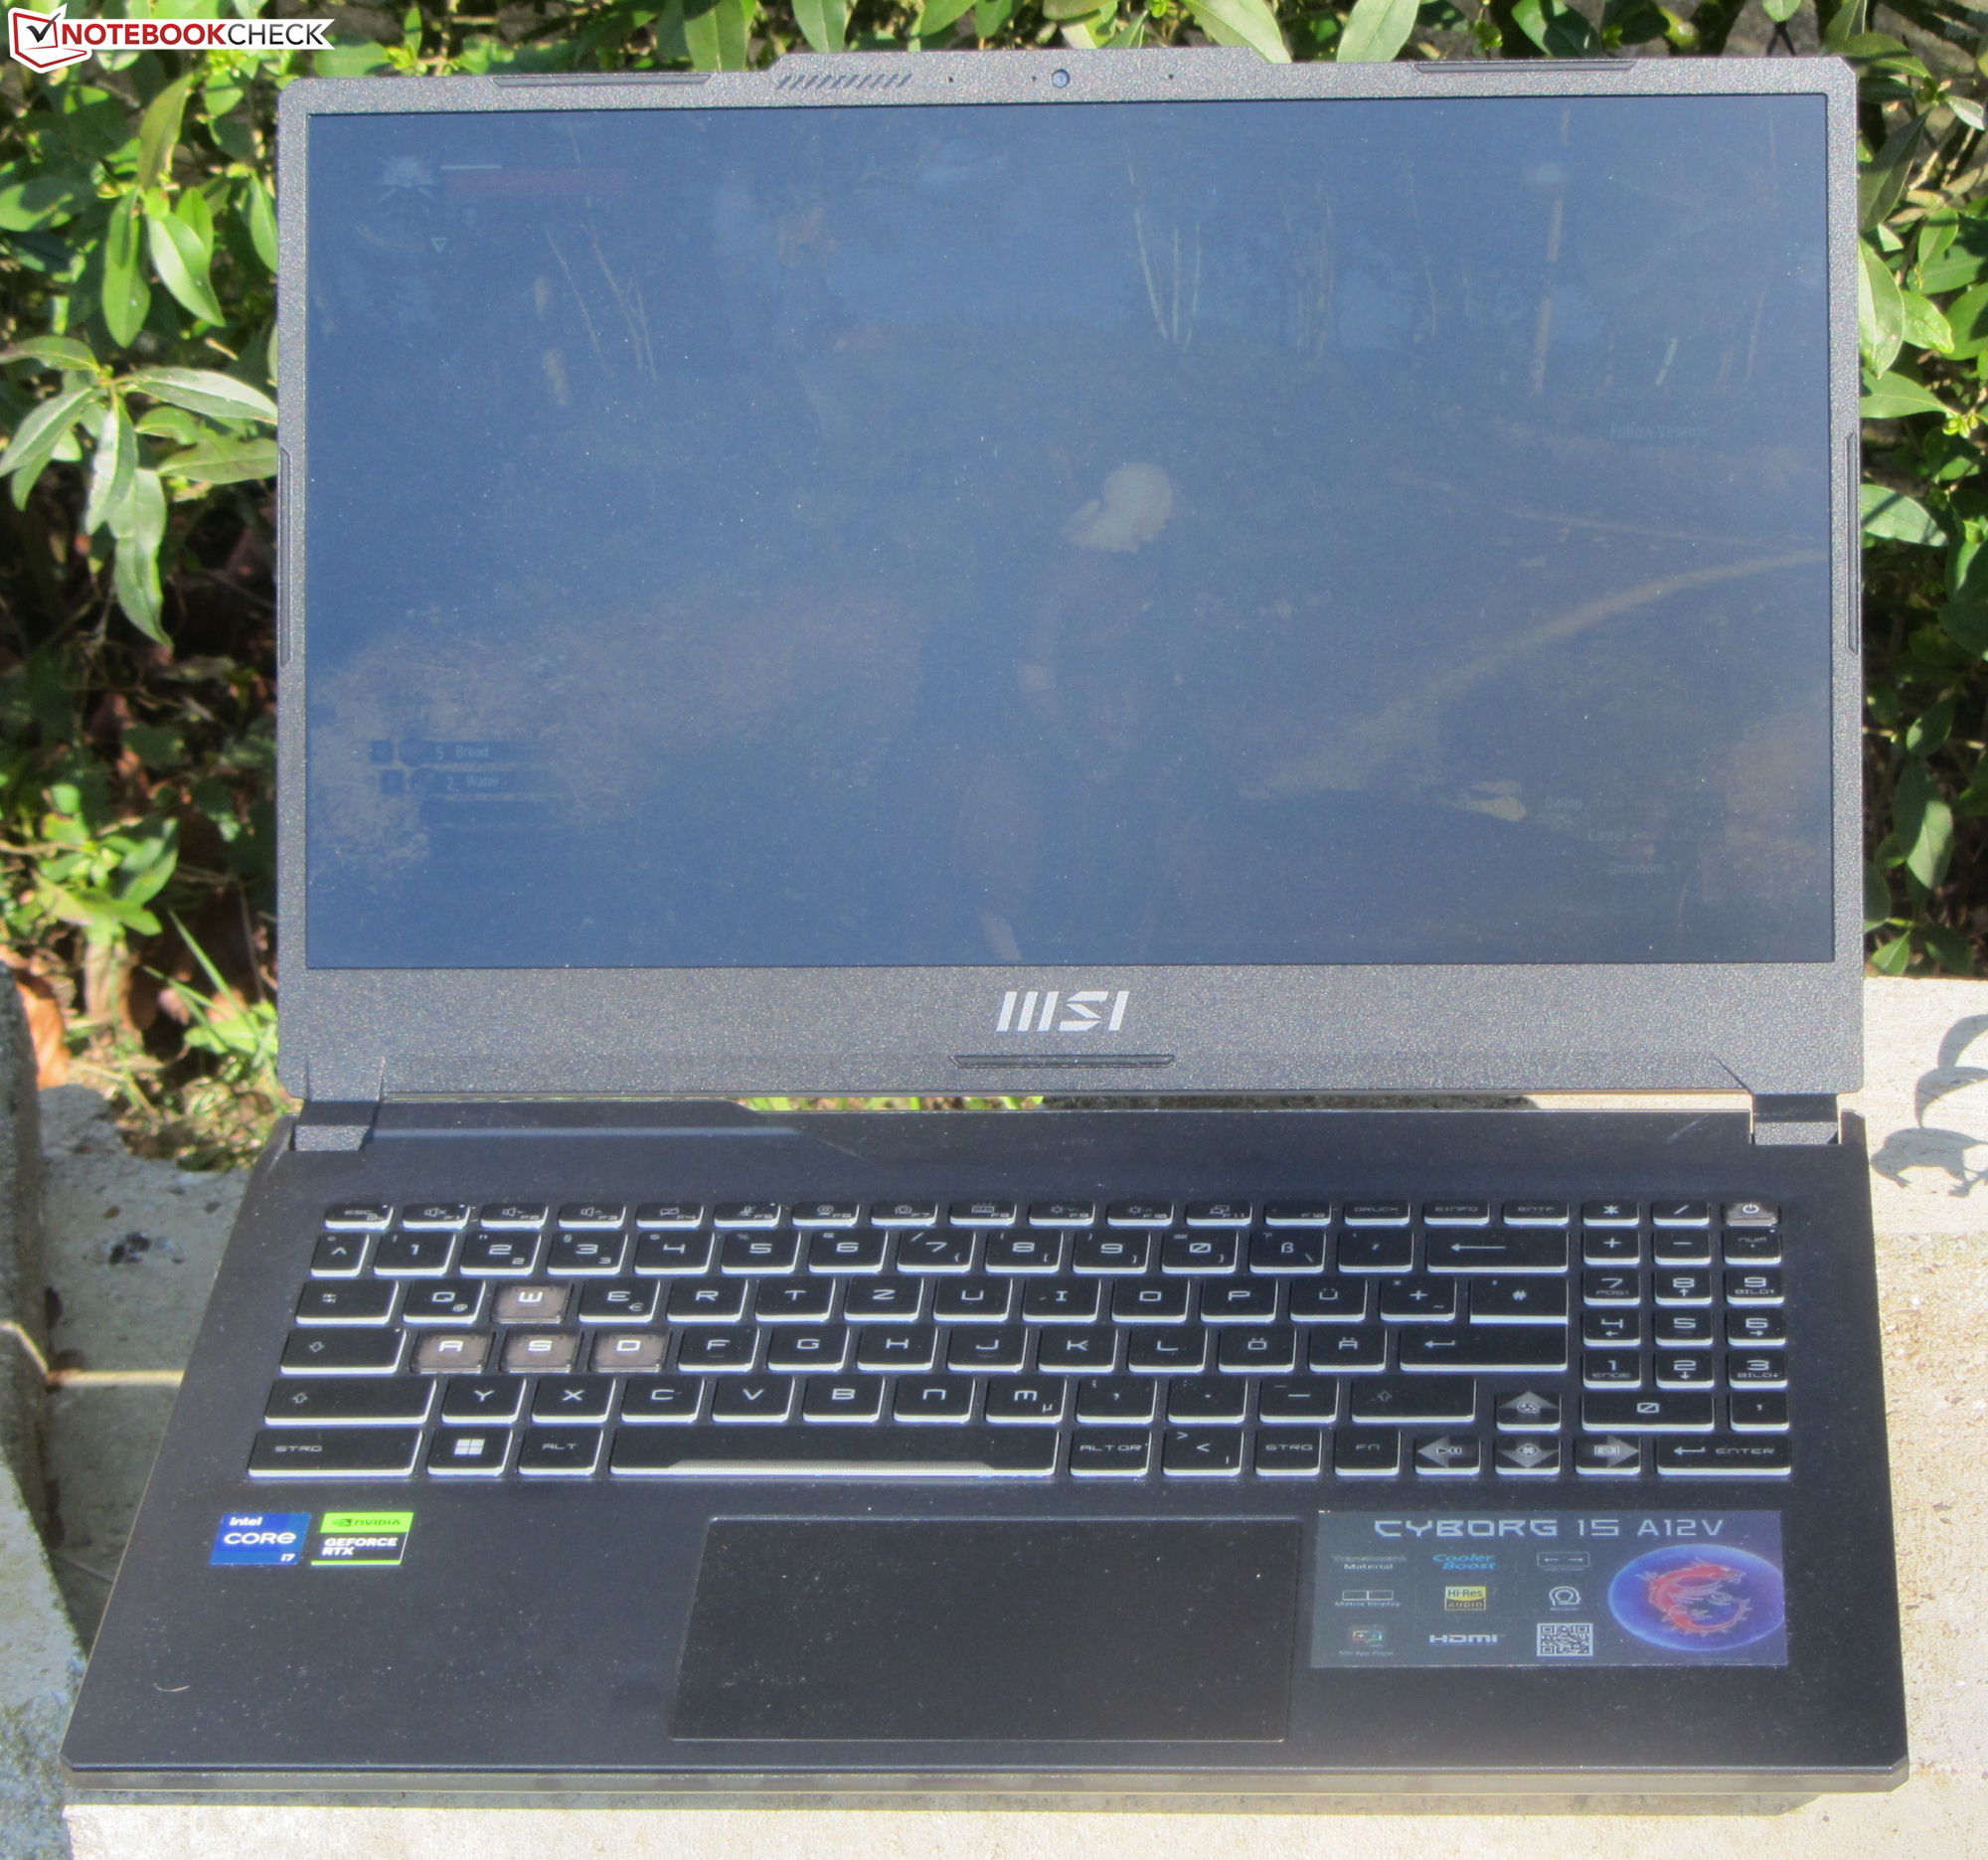
A maioria das partes da caixa compacta é feita de plástico, sendo o metal usado somente na parte de trás da tampa da caixa. A MSI usa um design principalmente discreto, e o laptop não ficaria fora do lugar no ambiente profissional do escritório. A cor da base preta é afrouxada por alguns elementos transparentes da caixa, como o fundo da caixa, com a iluminação do teclado em azul turquesa também acrescentando alguma cor.
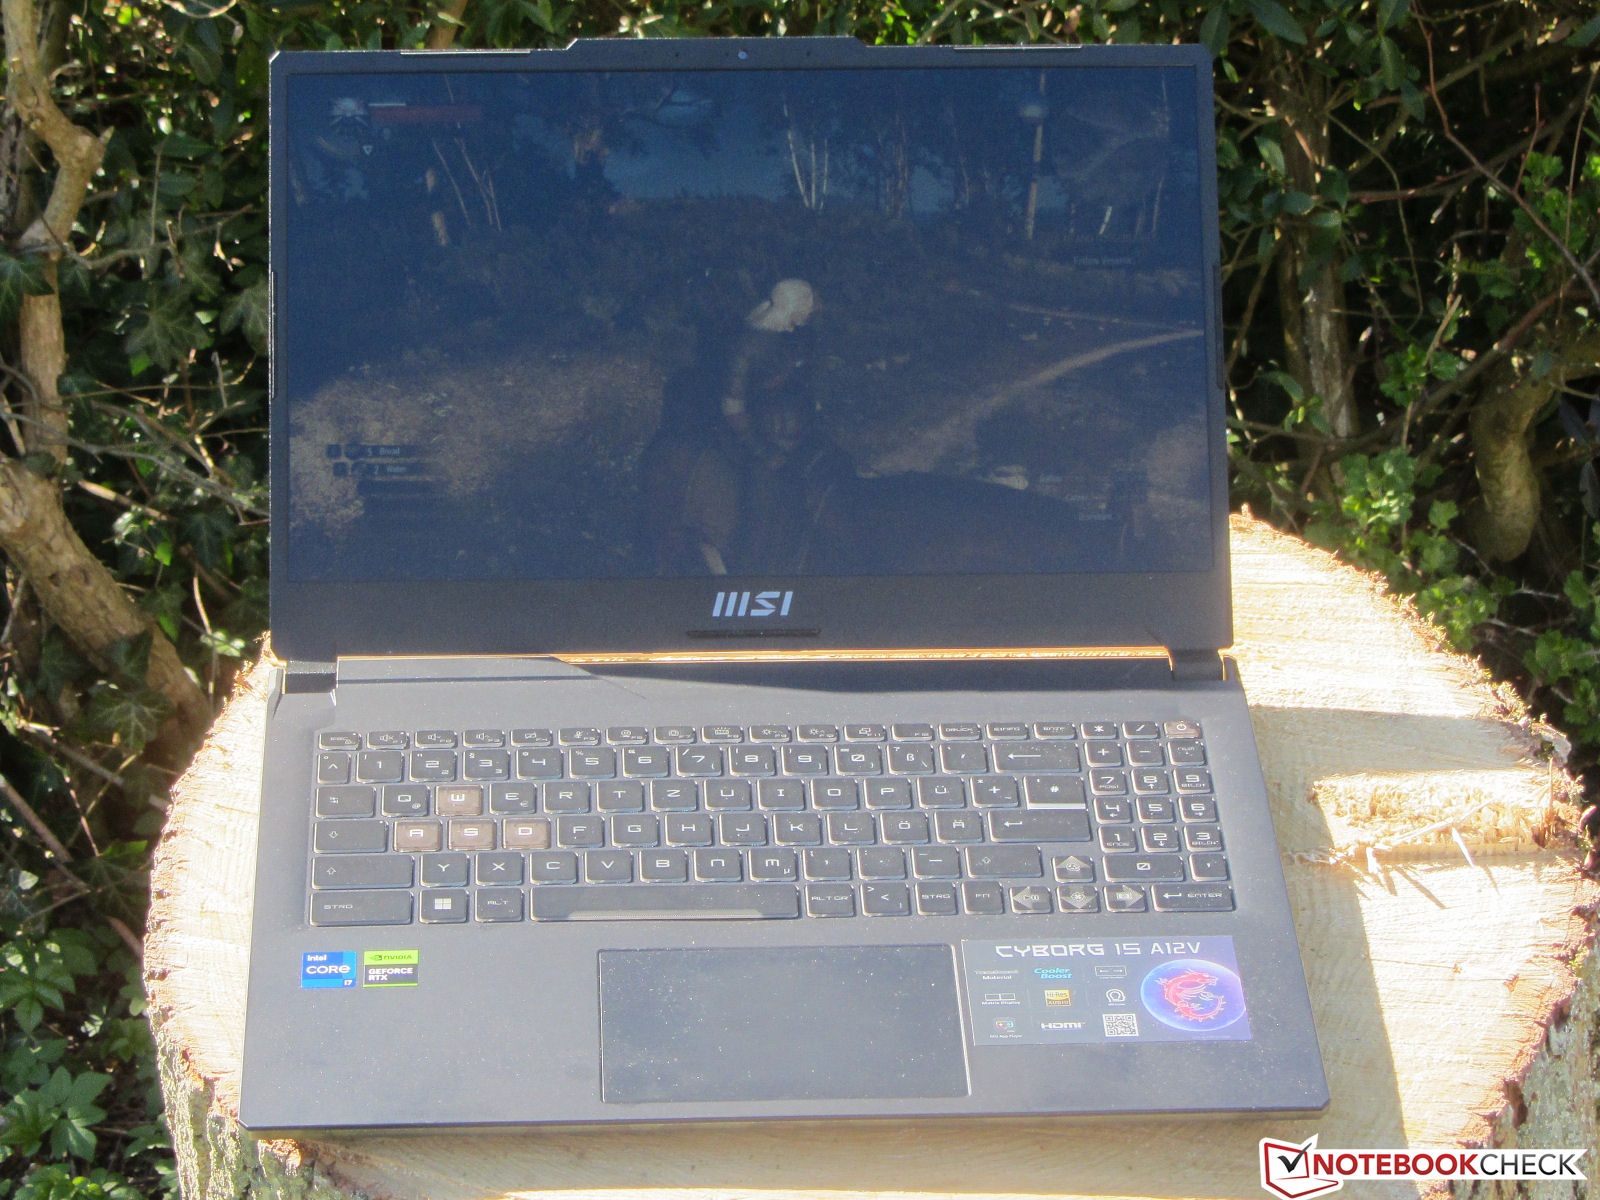
O laptop não revela nenhuma falha no acabamento. As lacunas são uniformes, e não notamos nenhuma protuberância de material. Enquanto a unidade base e a tampa podem ser deformadas, isto permanece dentro dos limites. As dobradiças seguram a tampa firmemente no lugar, com um ângulo máximo de abertura de 180 graus. O laptop pode ser aberto com uma única mão.
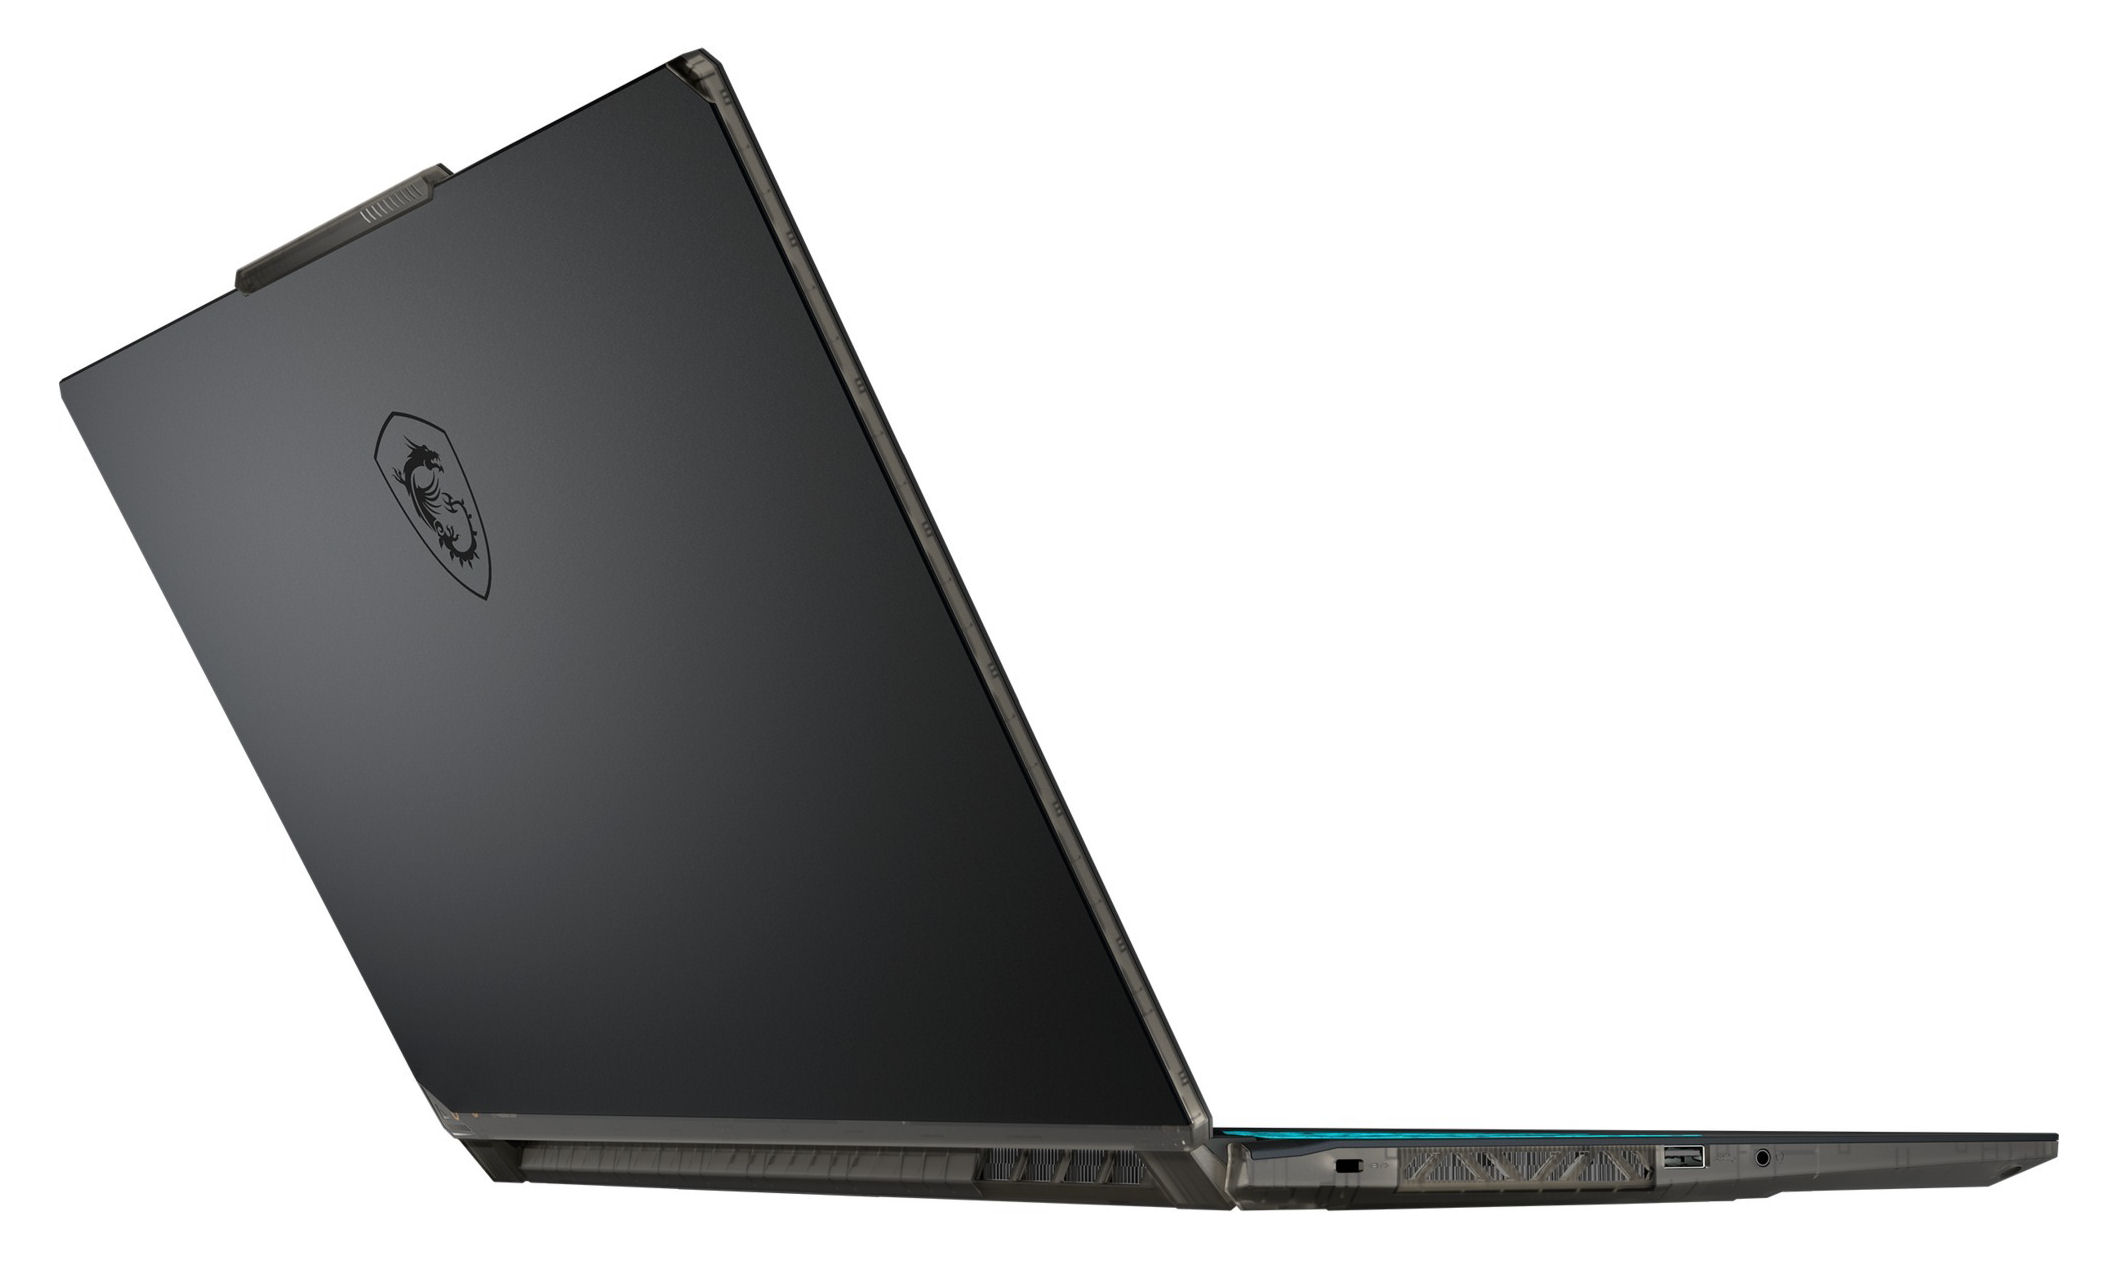
Embora as dimensões do laptop MSI sejam similares às dos concorrentes, ele é um dos laptops mais leves para jogos no formato de 15,6 polegadas.
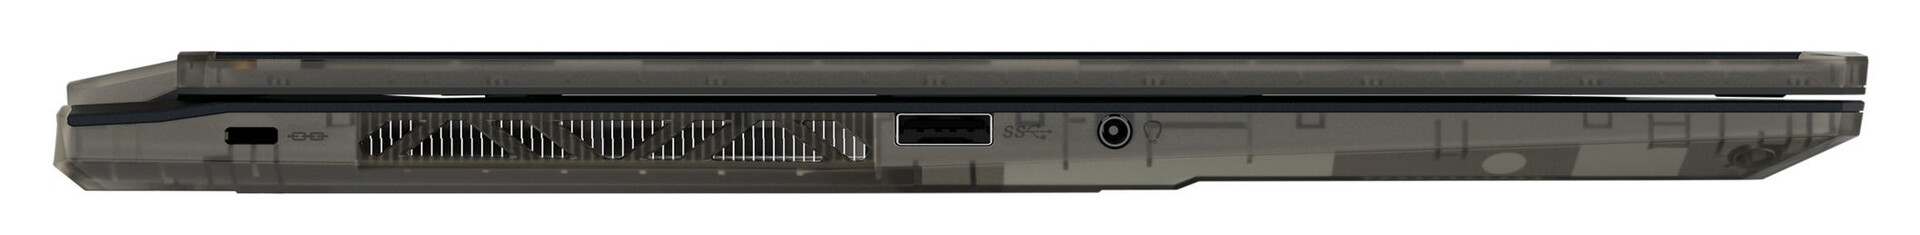
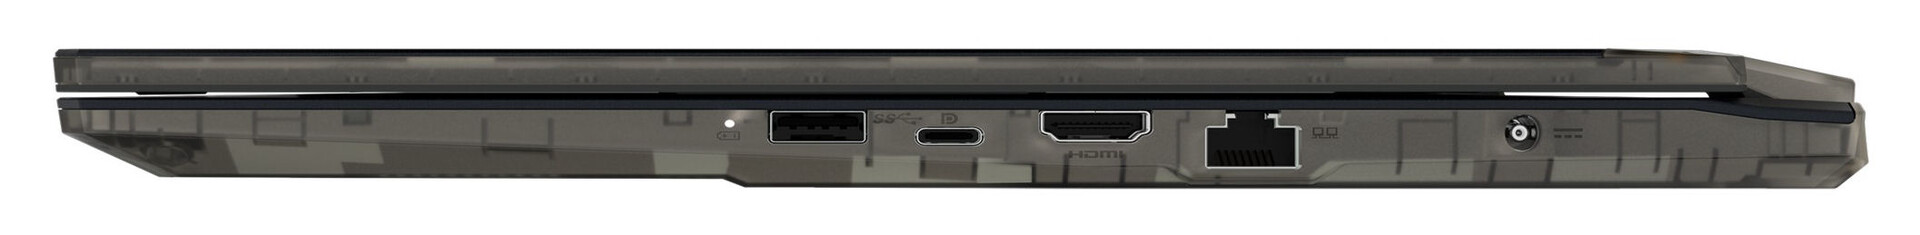
Equipamentos - O laptop MSI não oferece Thunderbolt
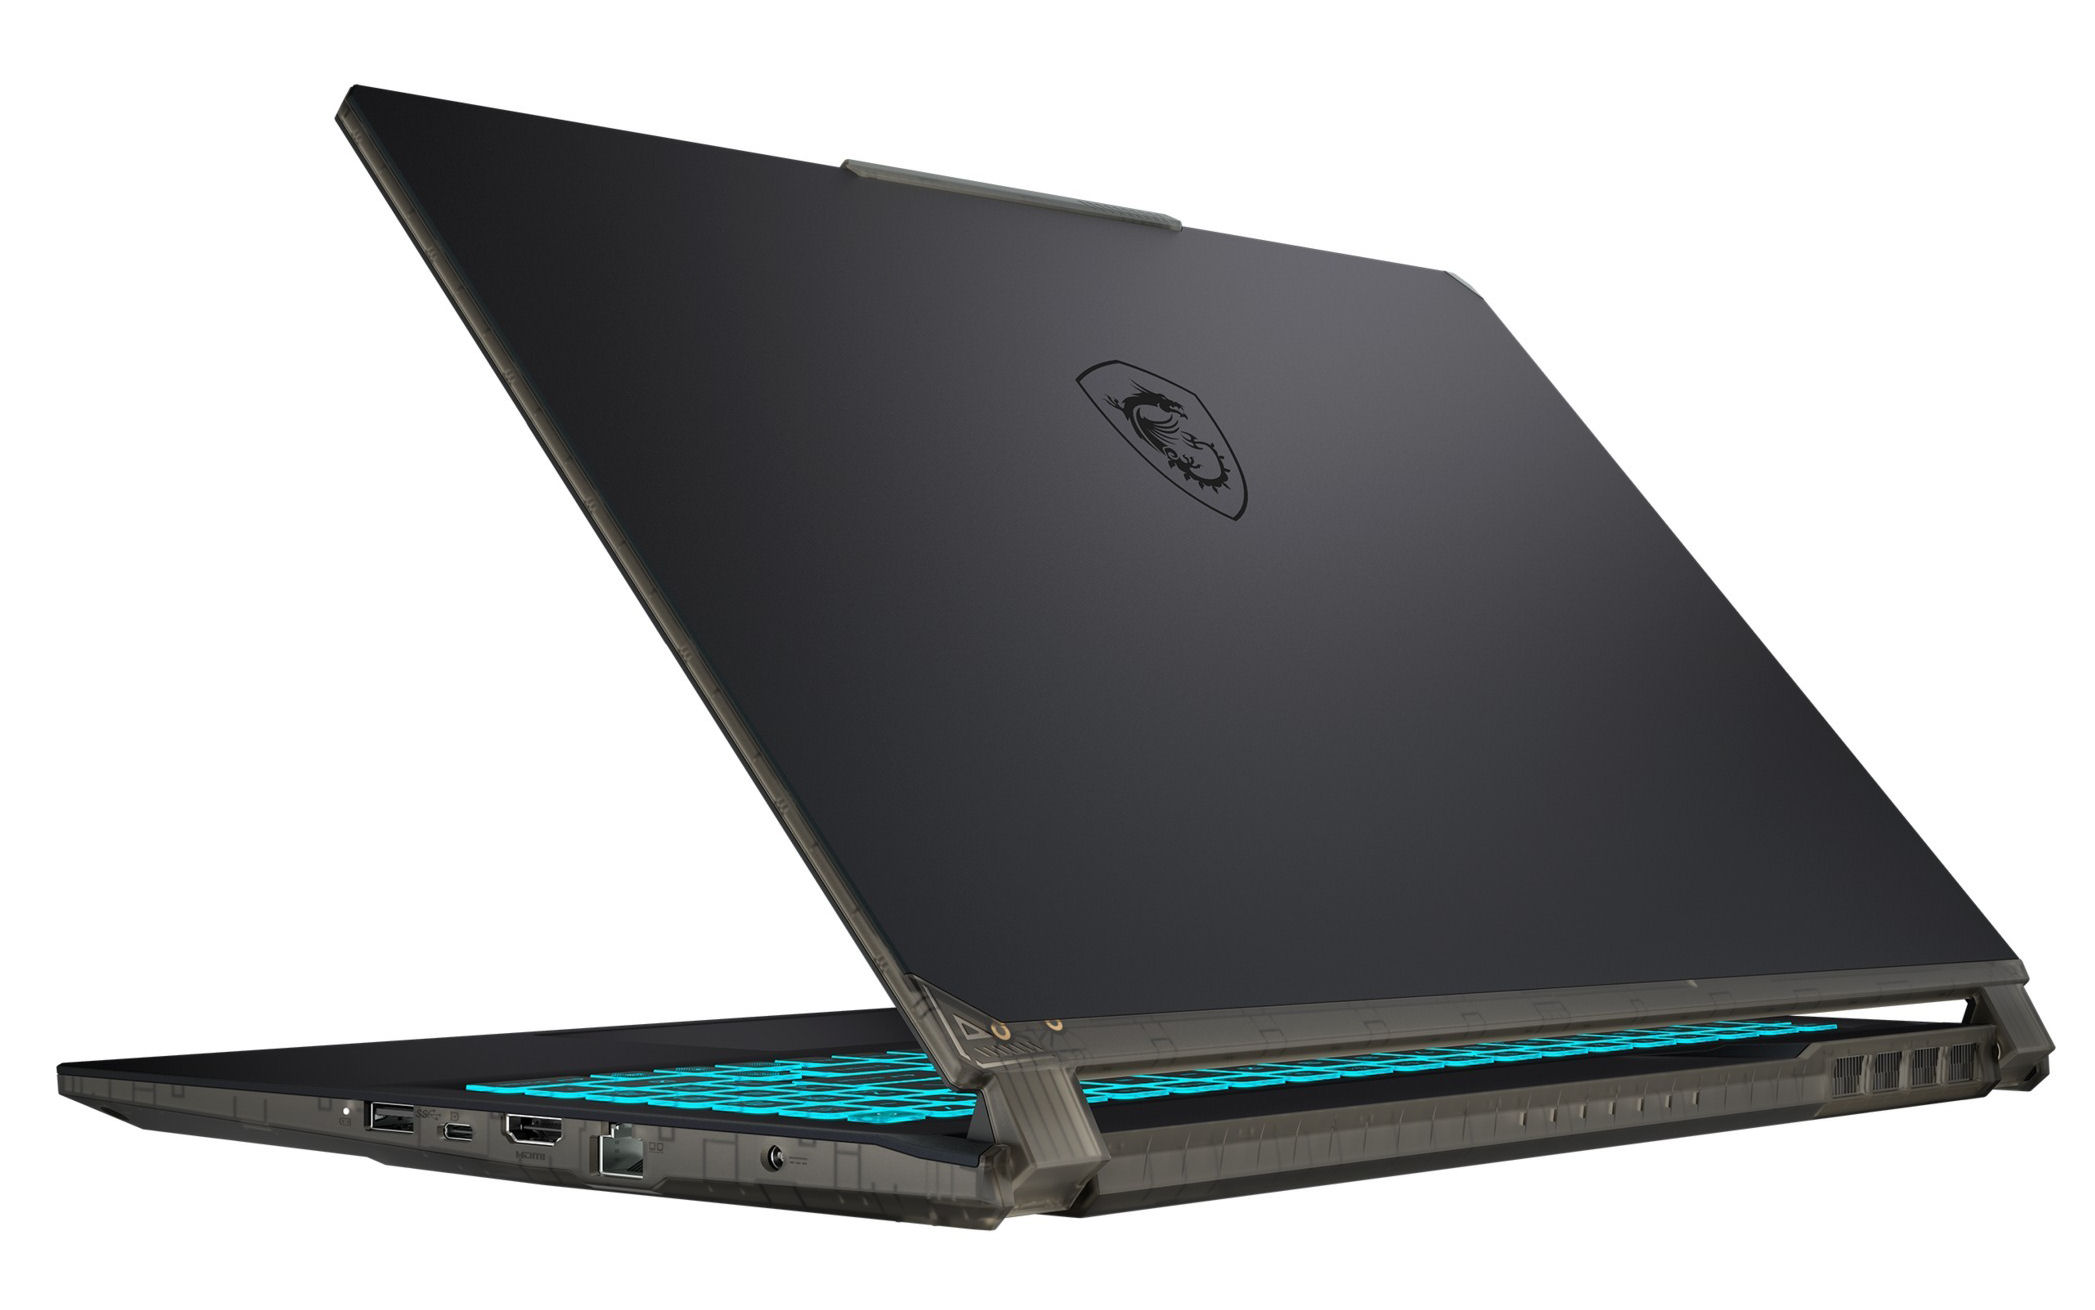
O equipamento de conexão é limitado, com duas portas USB-A disponíveis (USB 3.2 Gen 1) e uma única porta USB-C (USB 3.2 Gen 1). Esta última também suporta DisplayPort. Juntas, há duas opções de saída de vídeo (1x DP, 1x HDMI). Além disso, há uma porta de áudio combinada, uma porta Gigabit Ethernet e uma abertura para um trava de cabo. Um leitor de cartões de armazenamento não está disponível.
Comunicação
As taxas de transferência WLAN determinadas sob condições ótimas (sem dispositivos WLAN adicionais nas proximidades e a uma curta distância entre o laptop e o PC servidor) são excelentes e correspondem às capacidades do chip Wi-Fi (Intel AX201). As conexões de rede com fio são tratadas por um chip Gigabit Ethernet (RTL8168/8111; 1 Gbit/s) da Realtek.
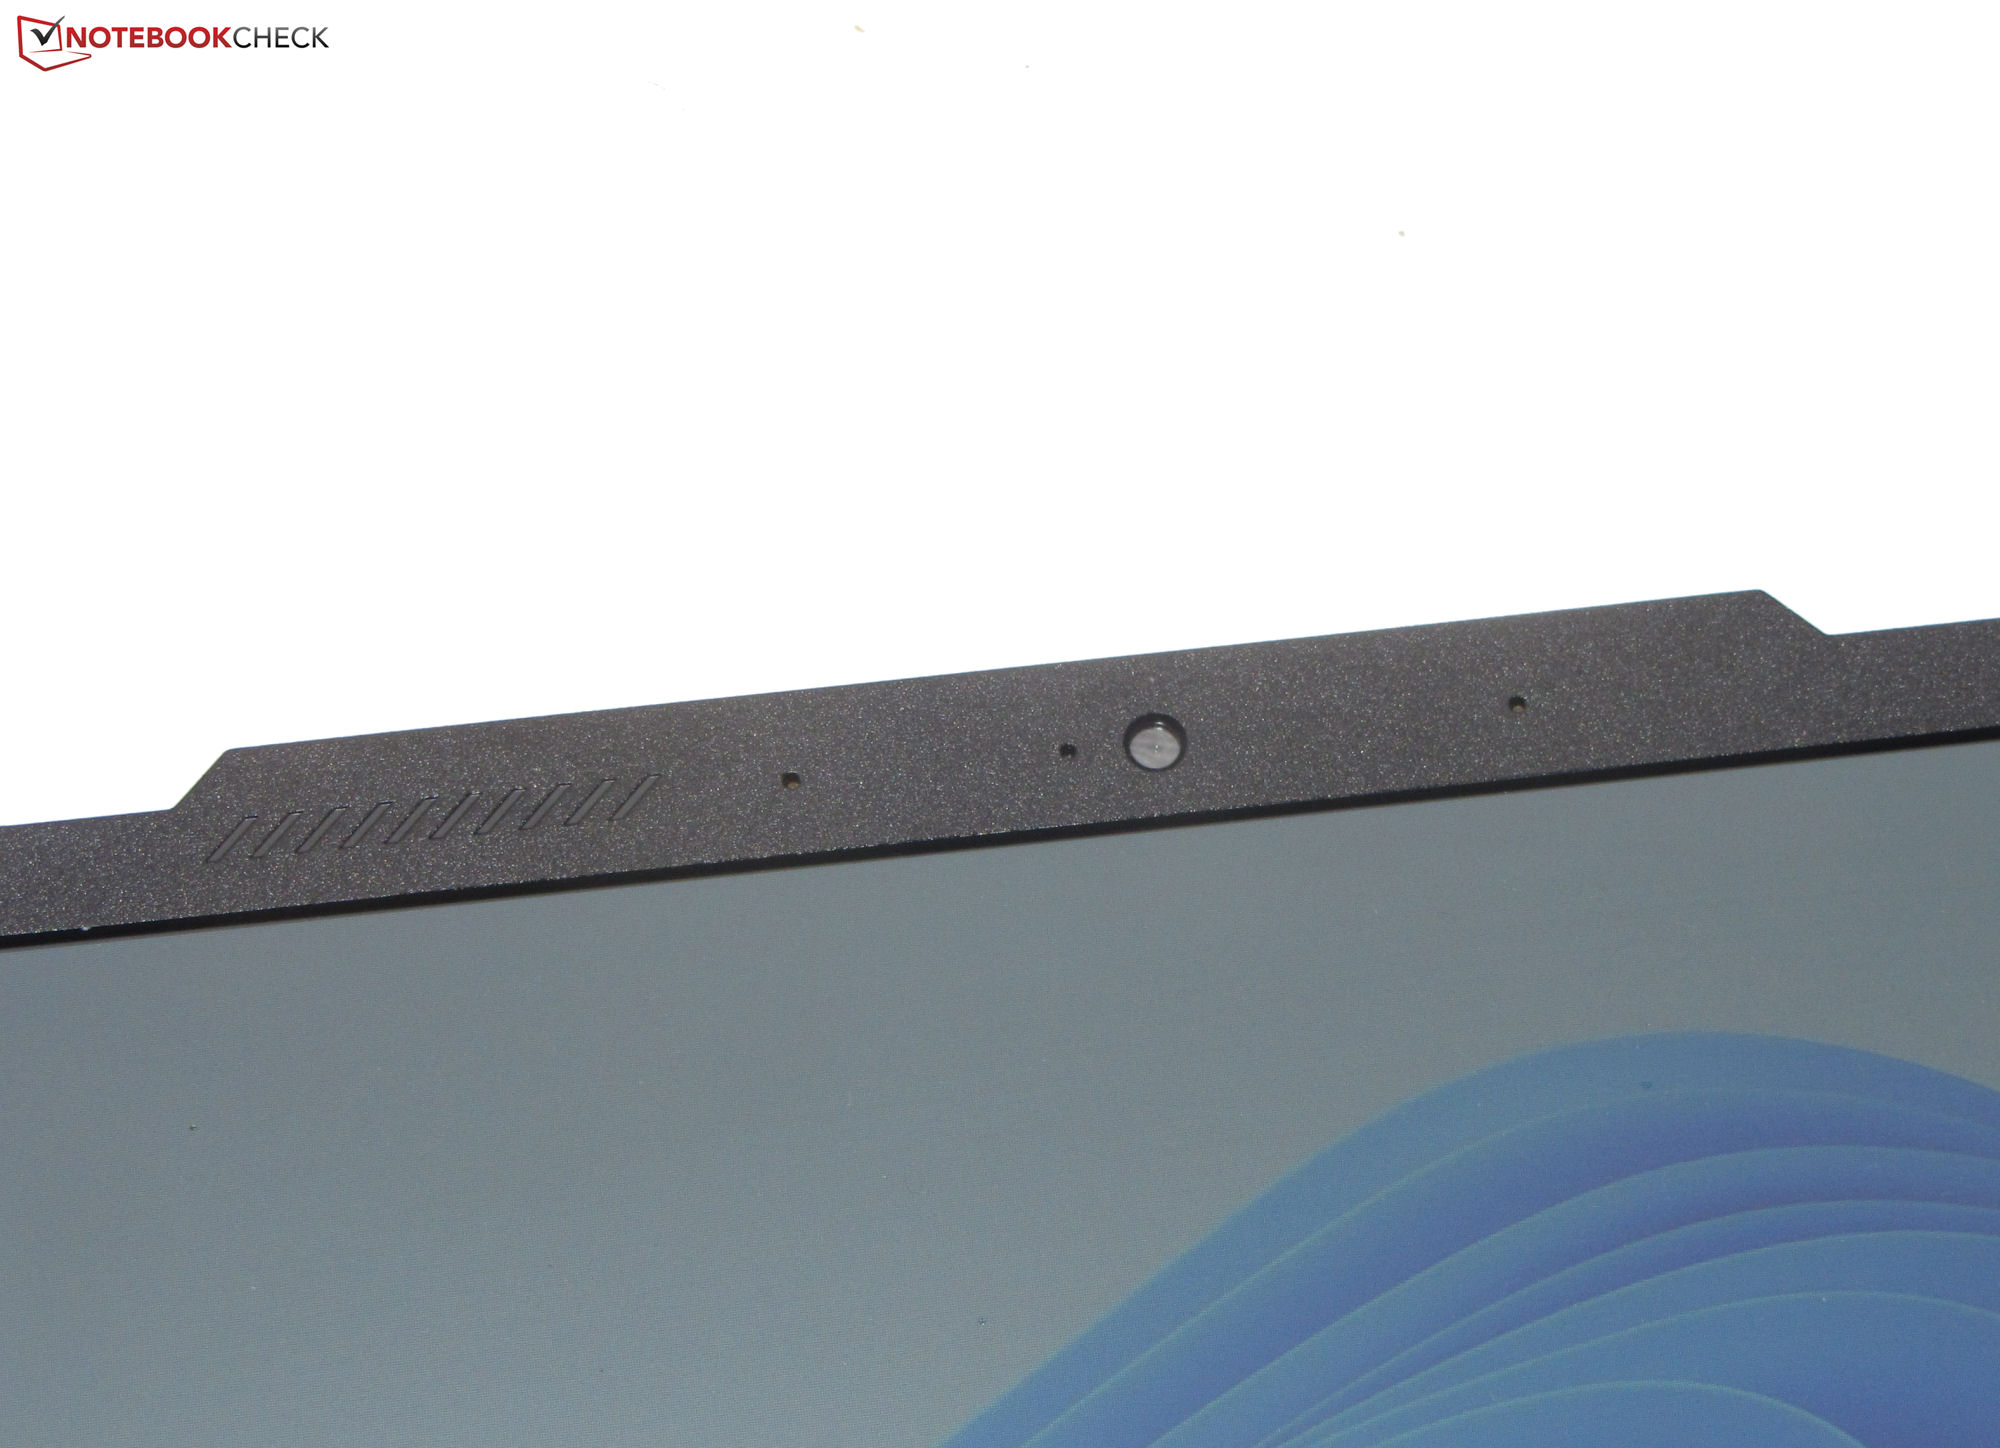
Webcam
A webcam (0,9 MP, máx. 1.280 x 720 pixels) não oferece uma cobertura mecânica. A qualidade que ela oferece é a tarifa padrão. Falta precisão de cor, e com um desvio de cor de cerca de 16, falta o alvo do DeltaE < 3.


Acessórios
O laptop não inclui nenhum acessório adicional além da documentação usual (instruções de início rápido e informações sobre garantia).
Manutenção
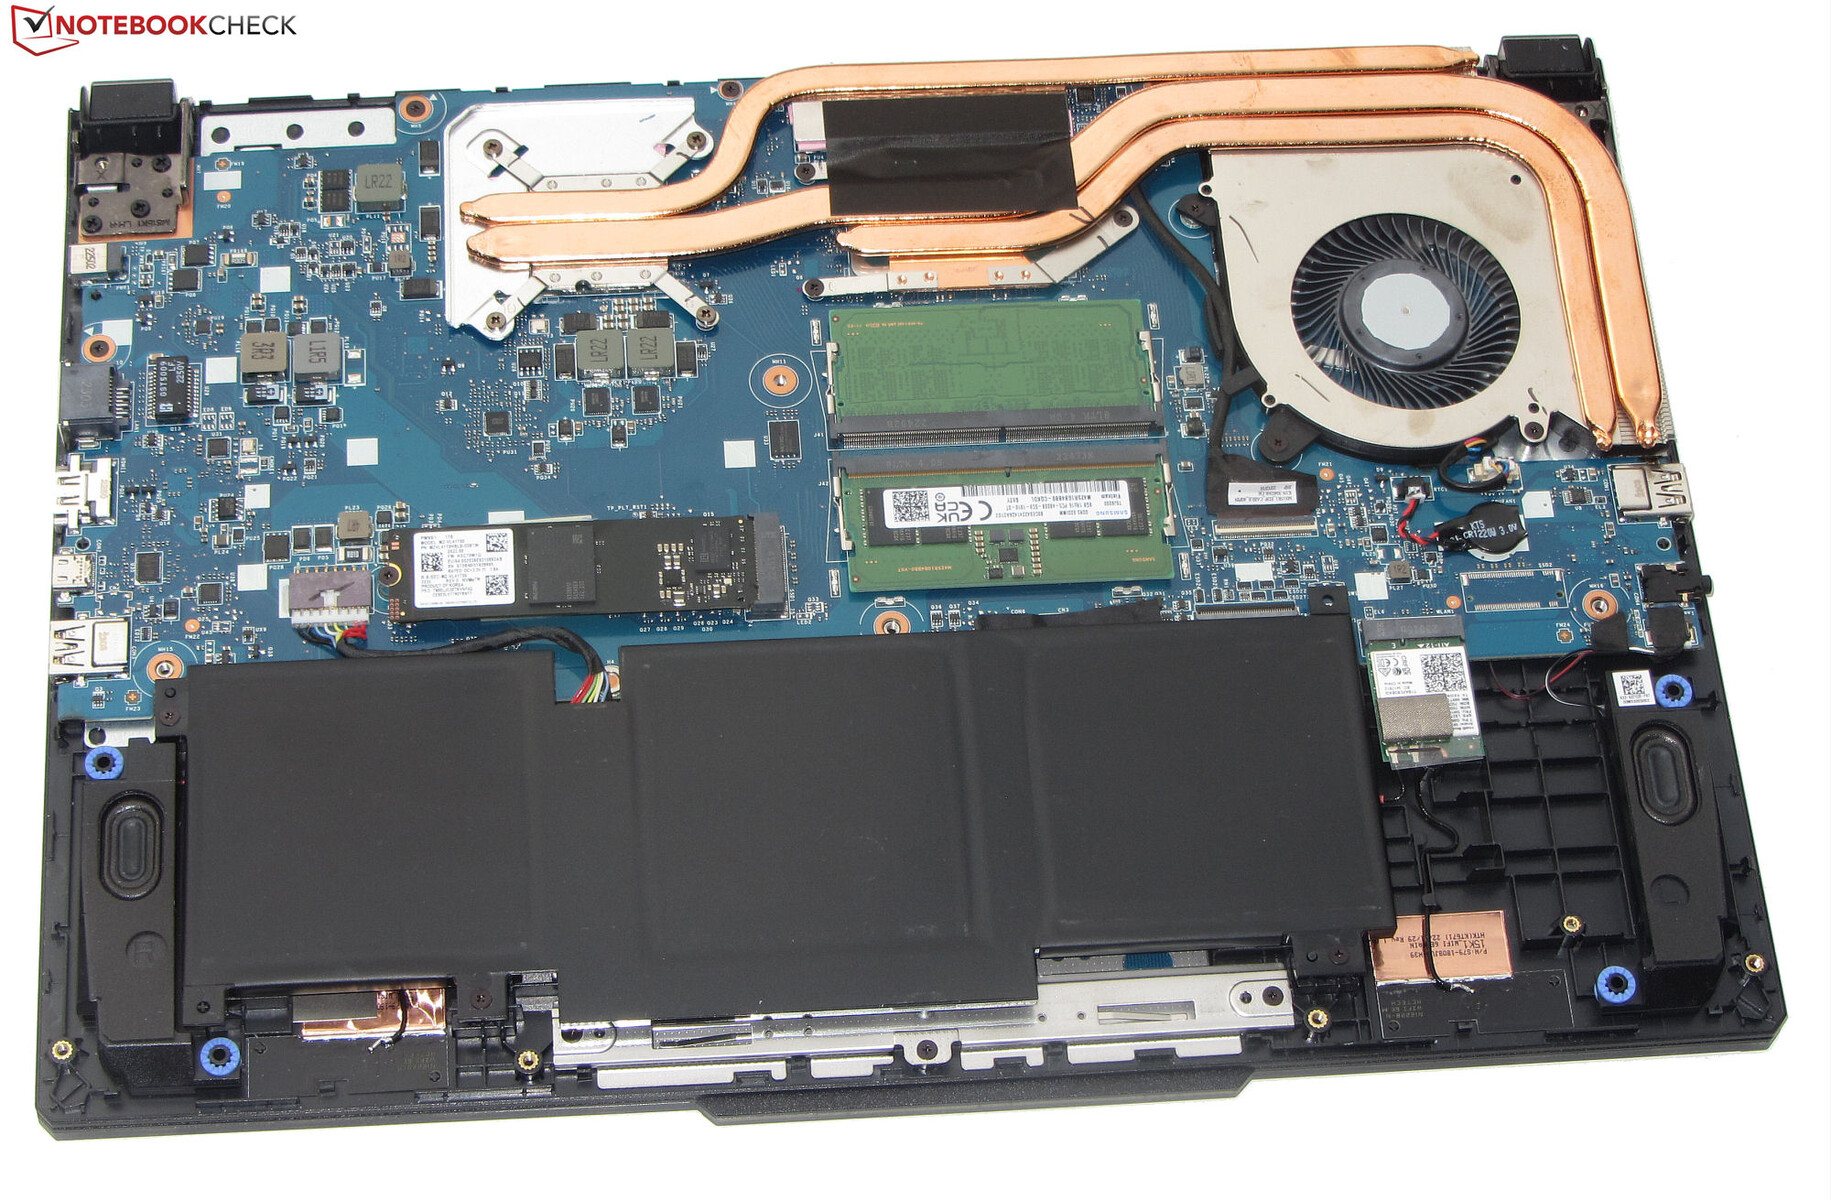
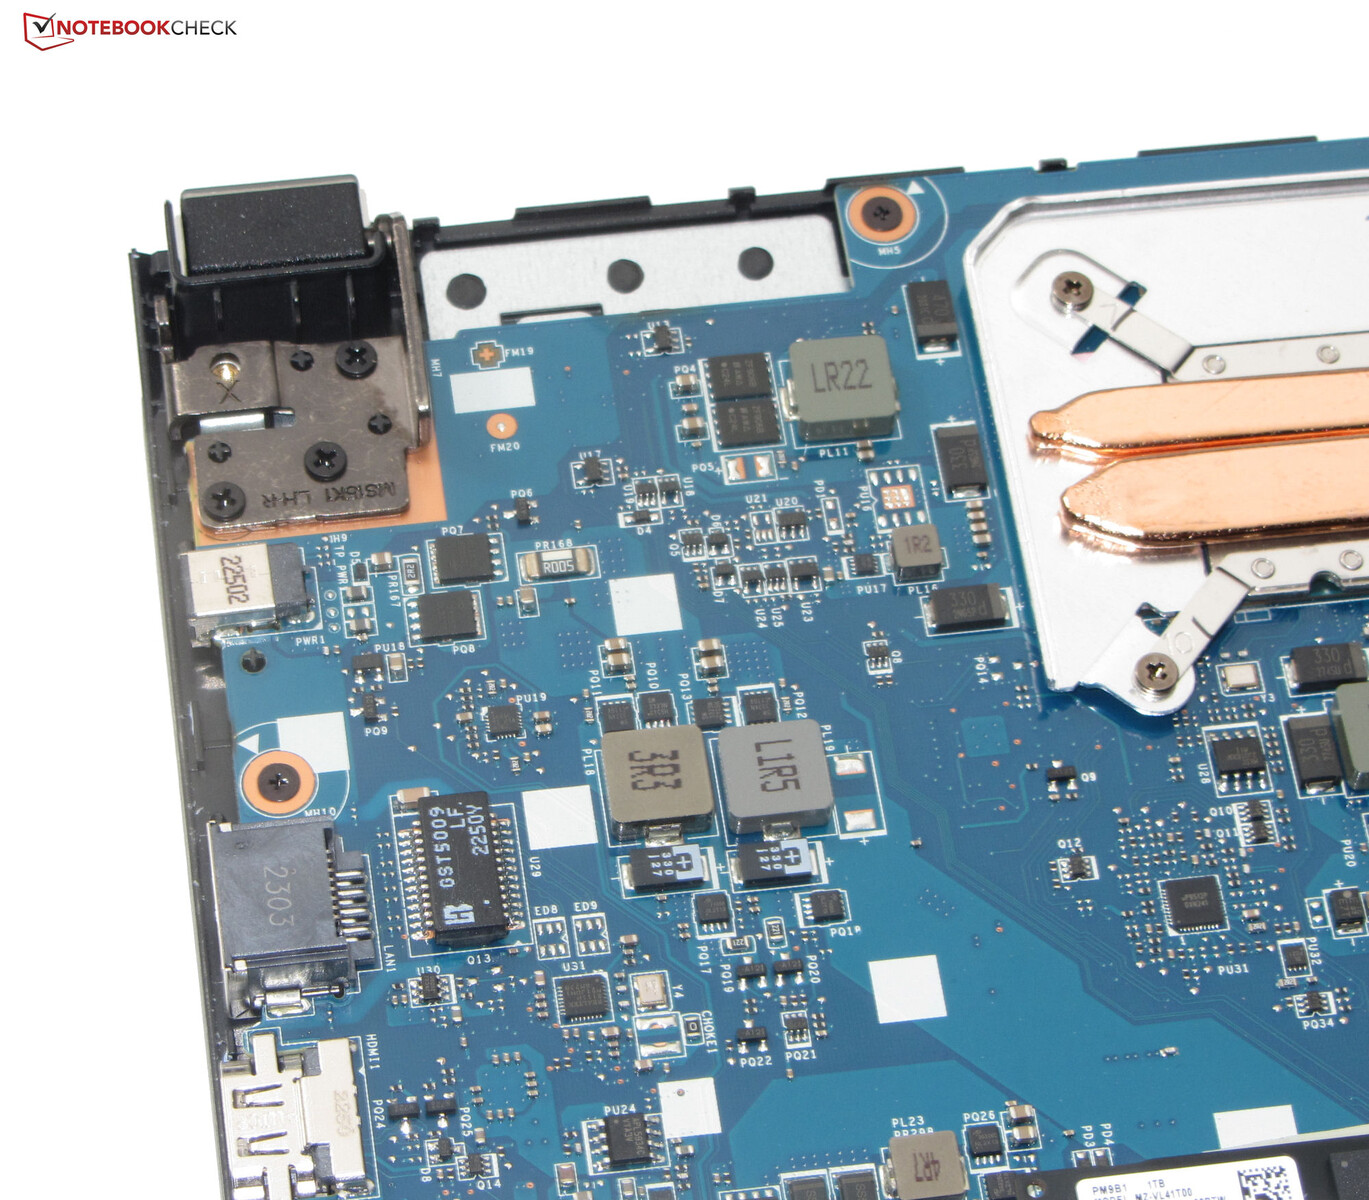
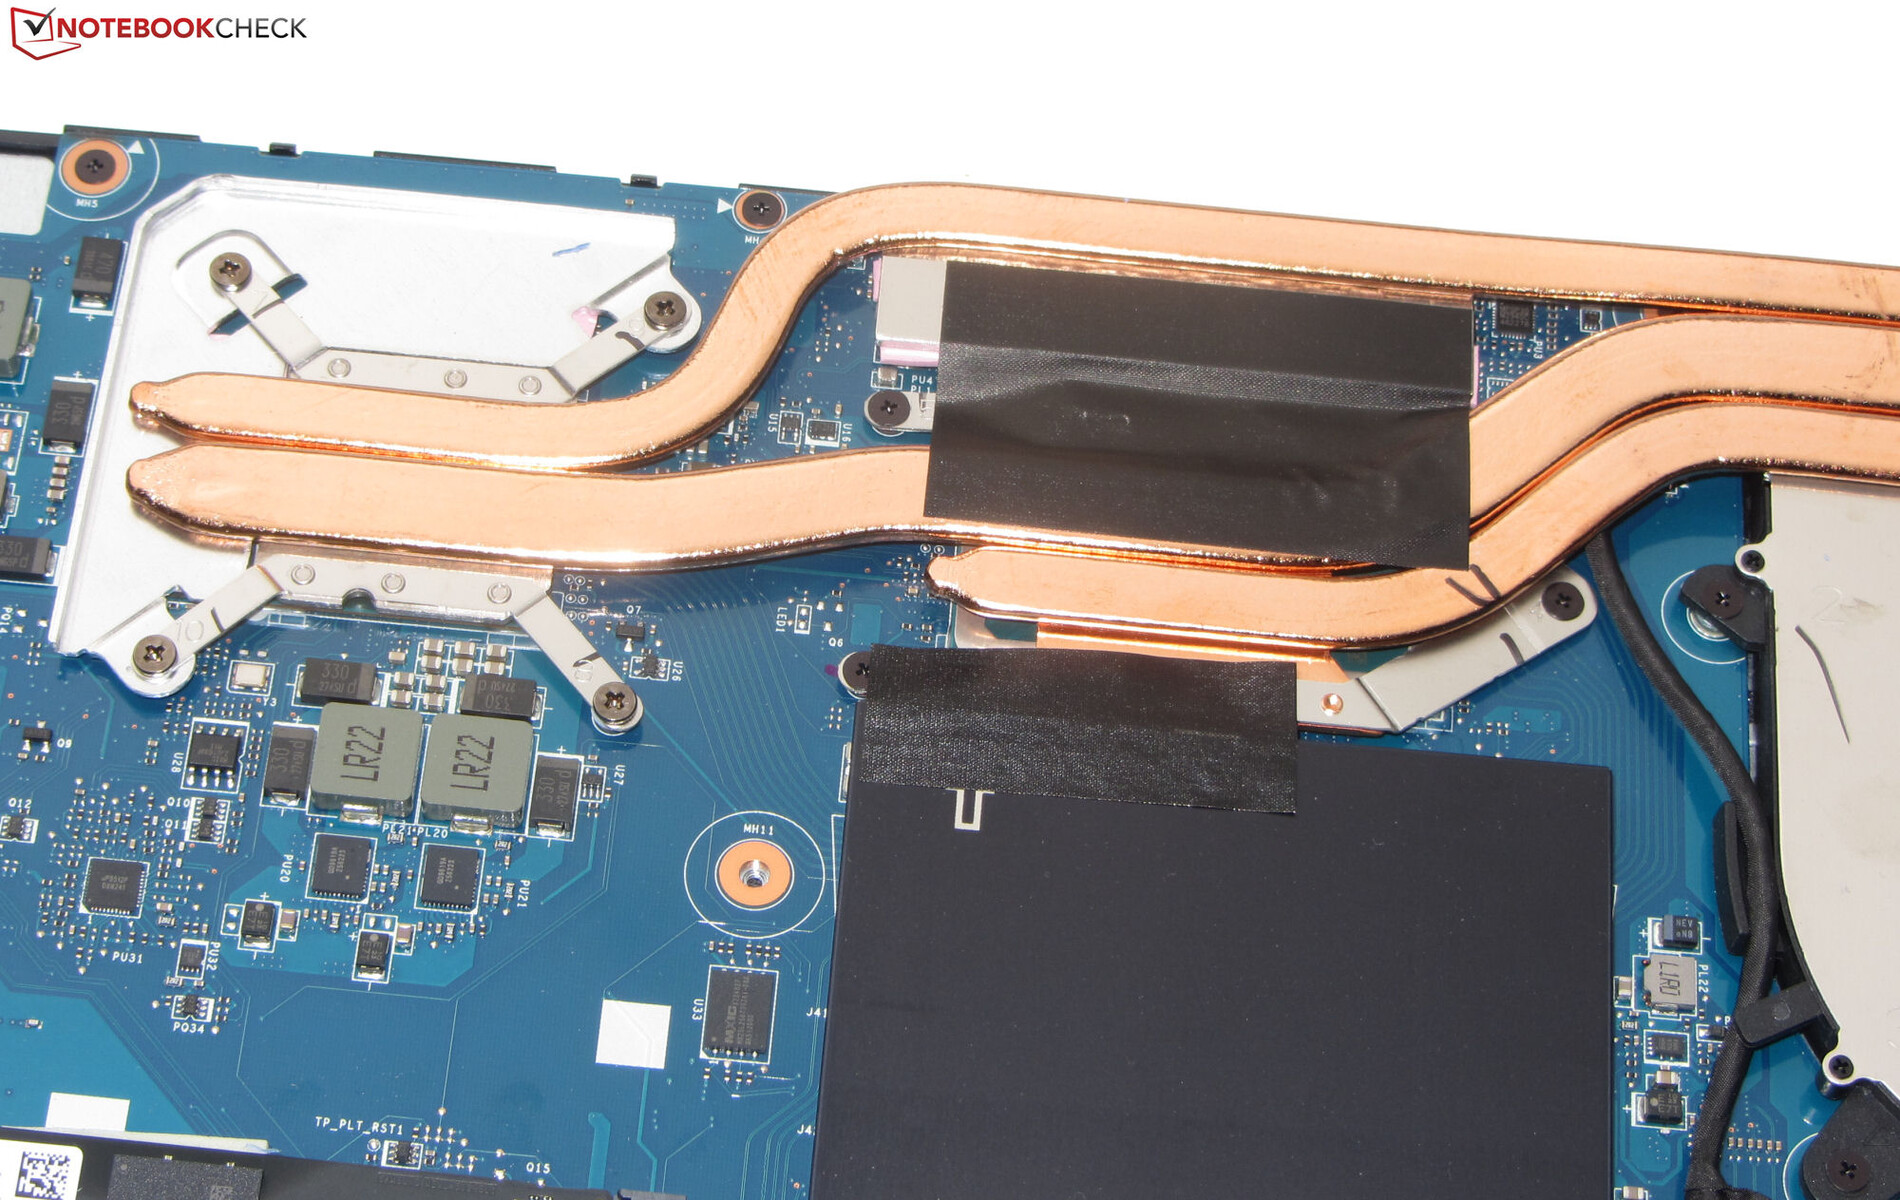
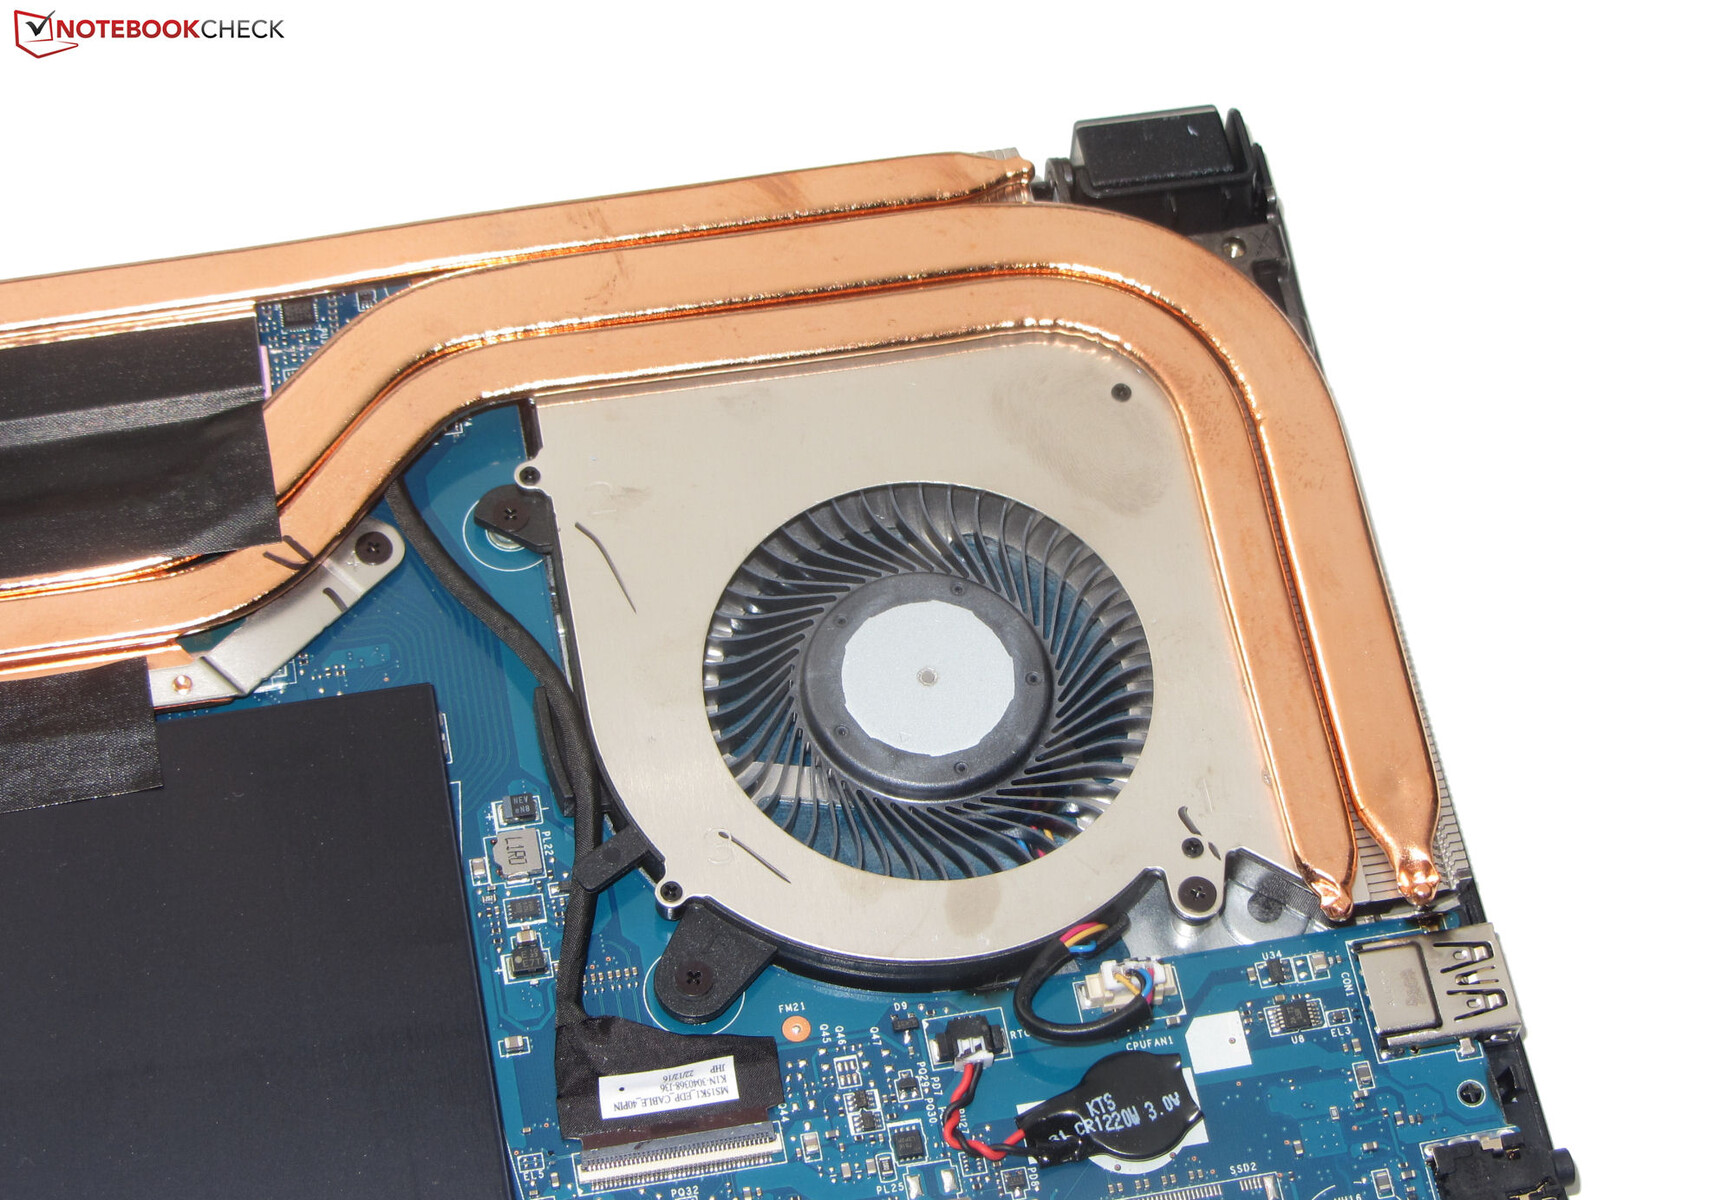
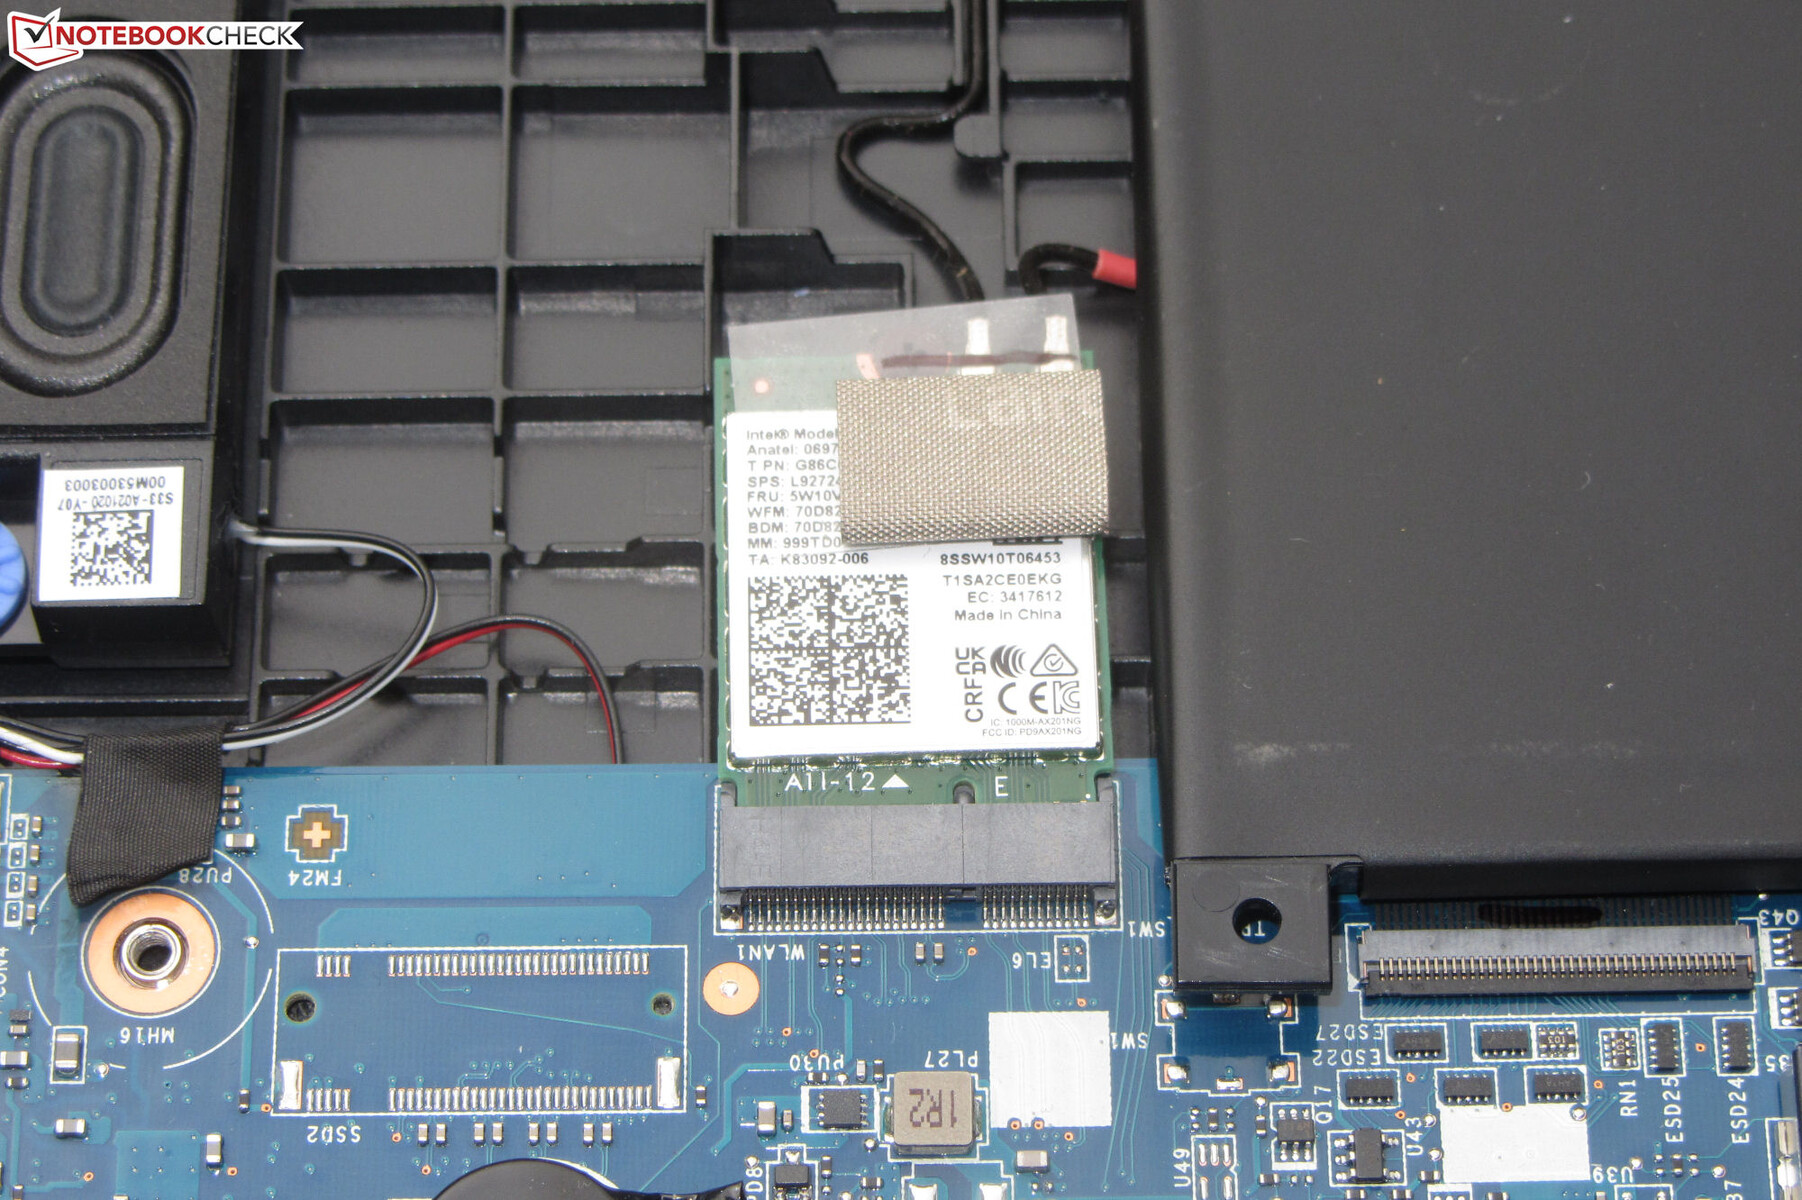
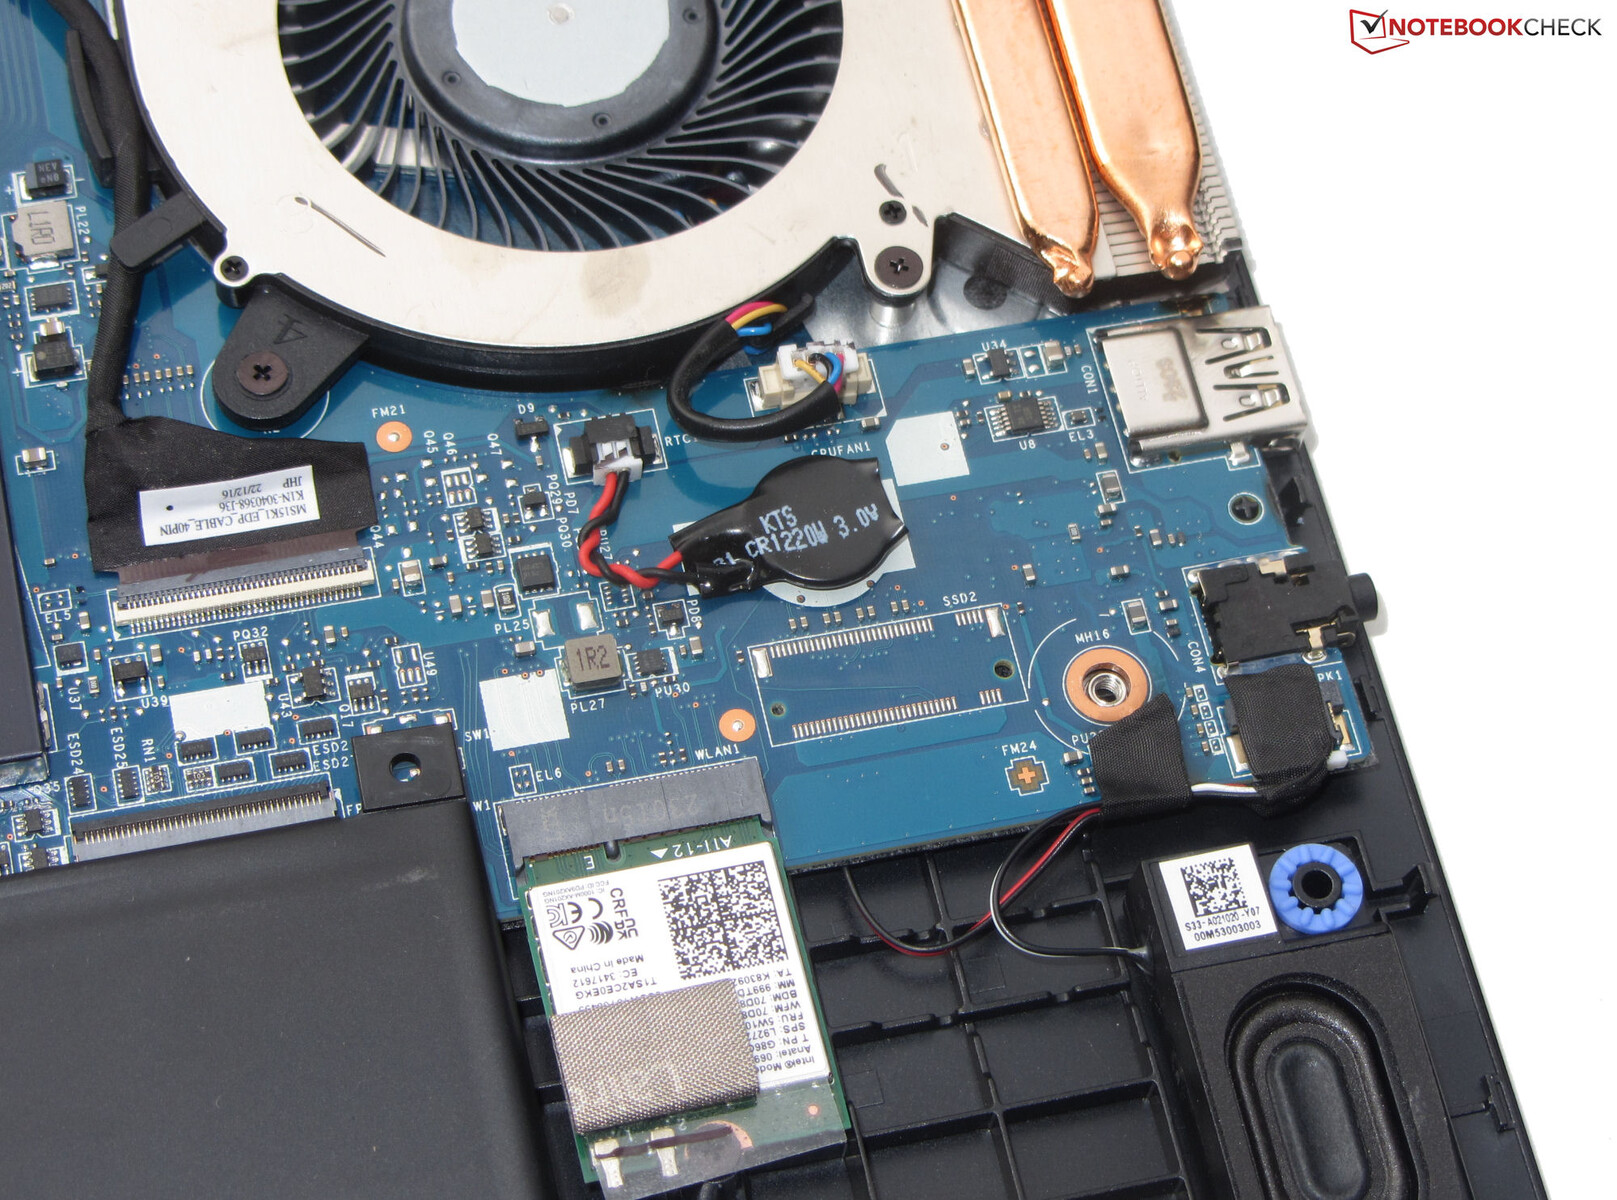
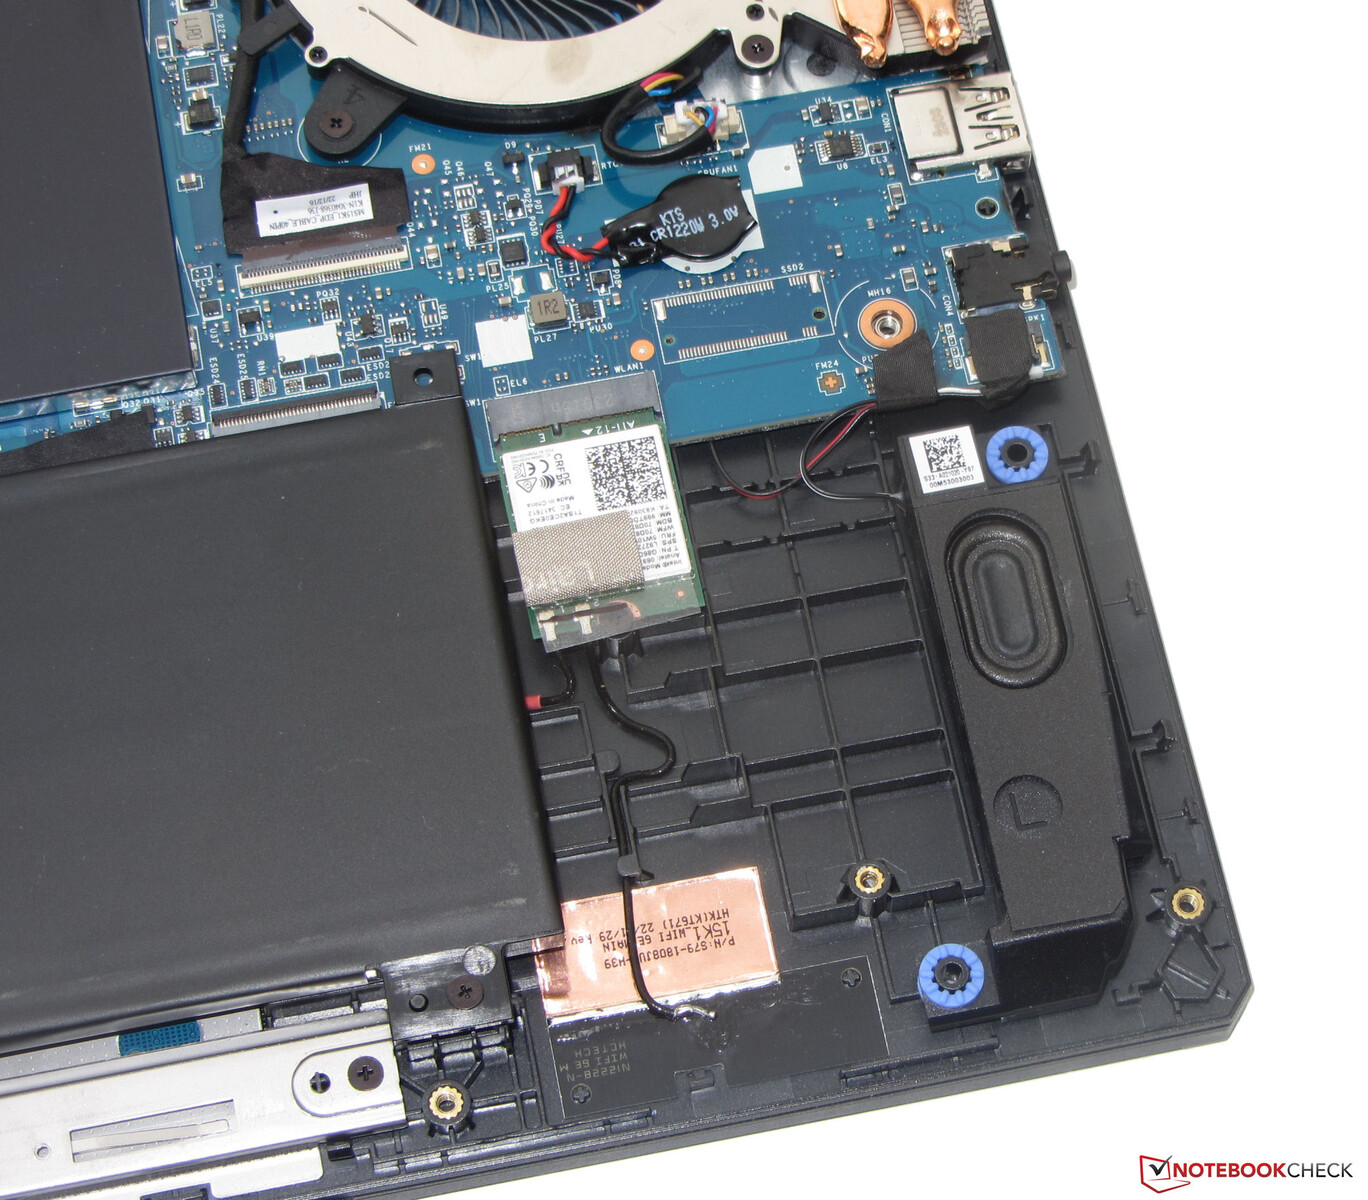
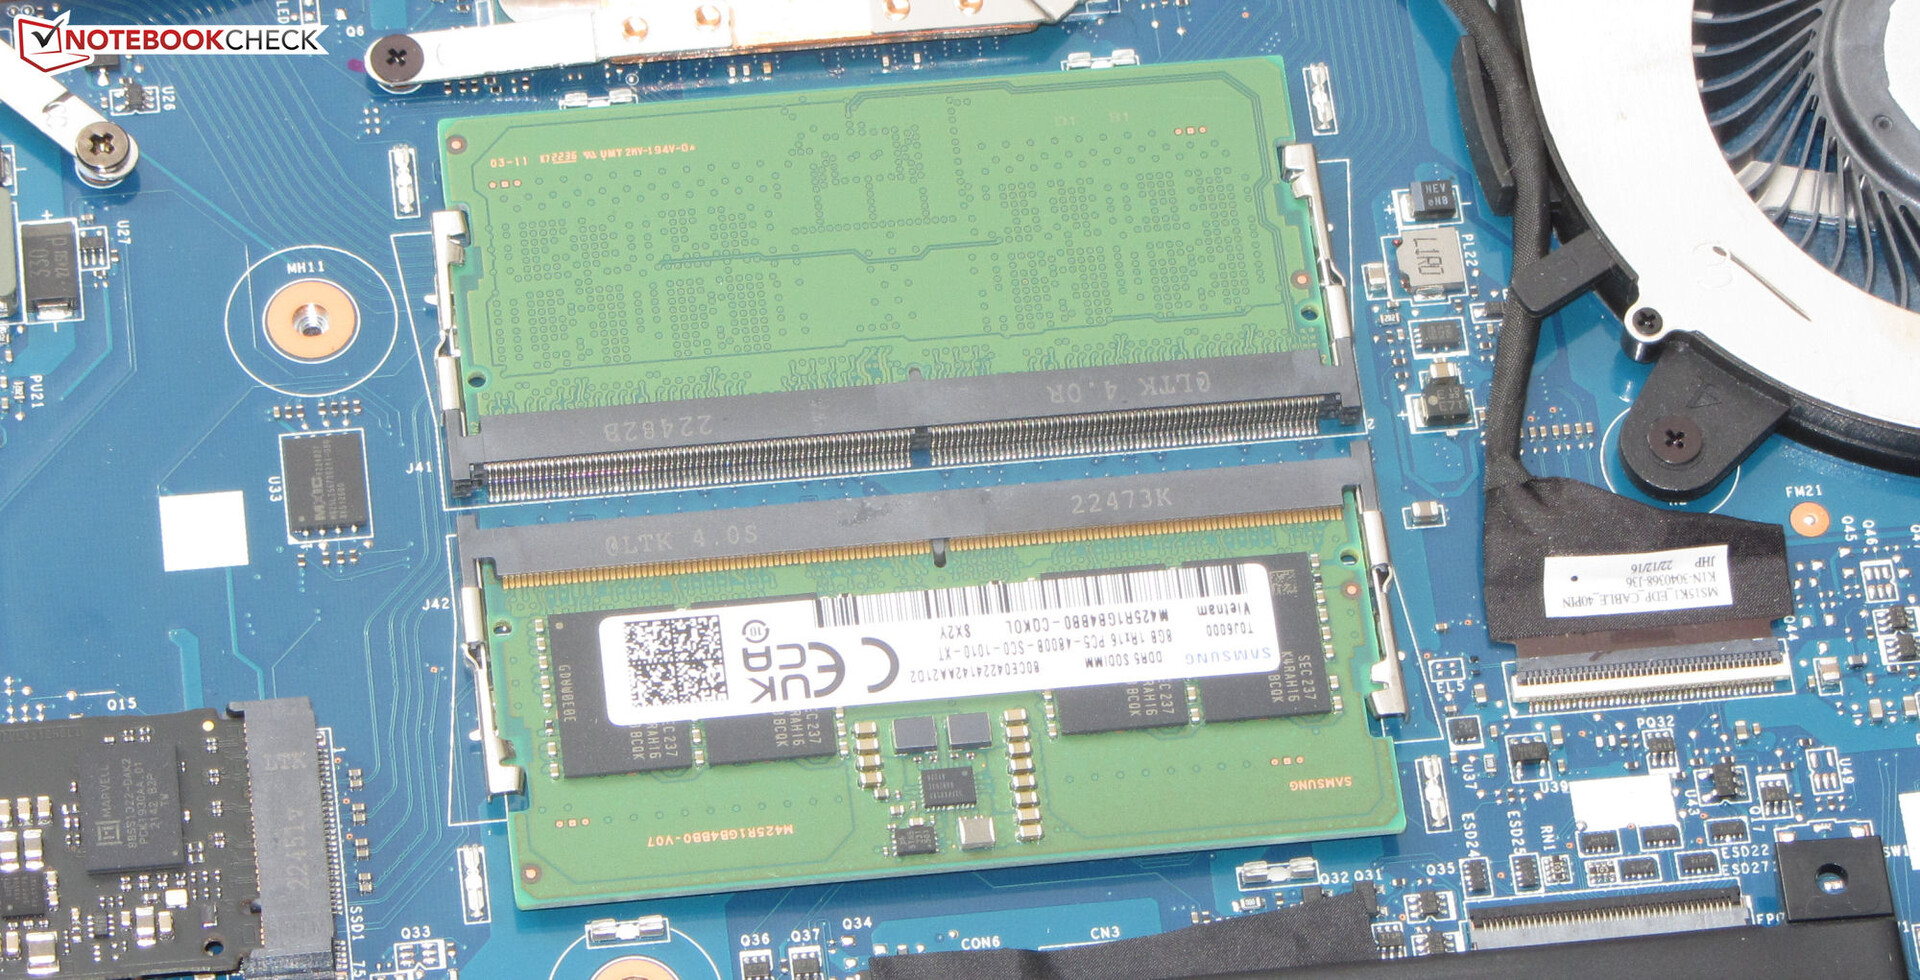
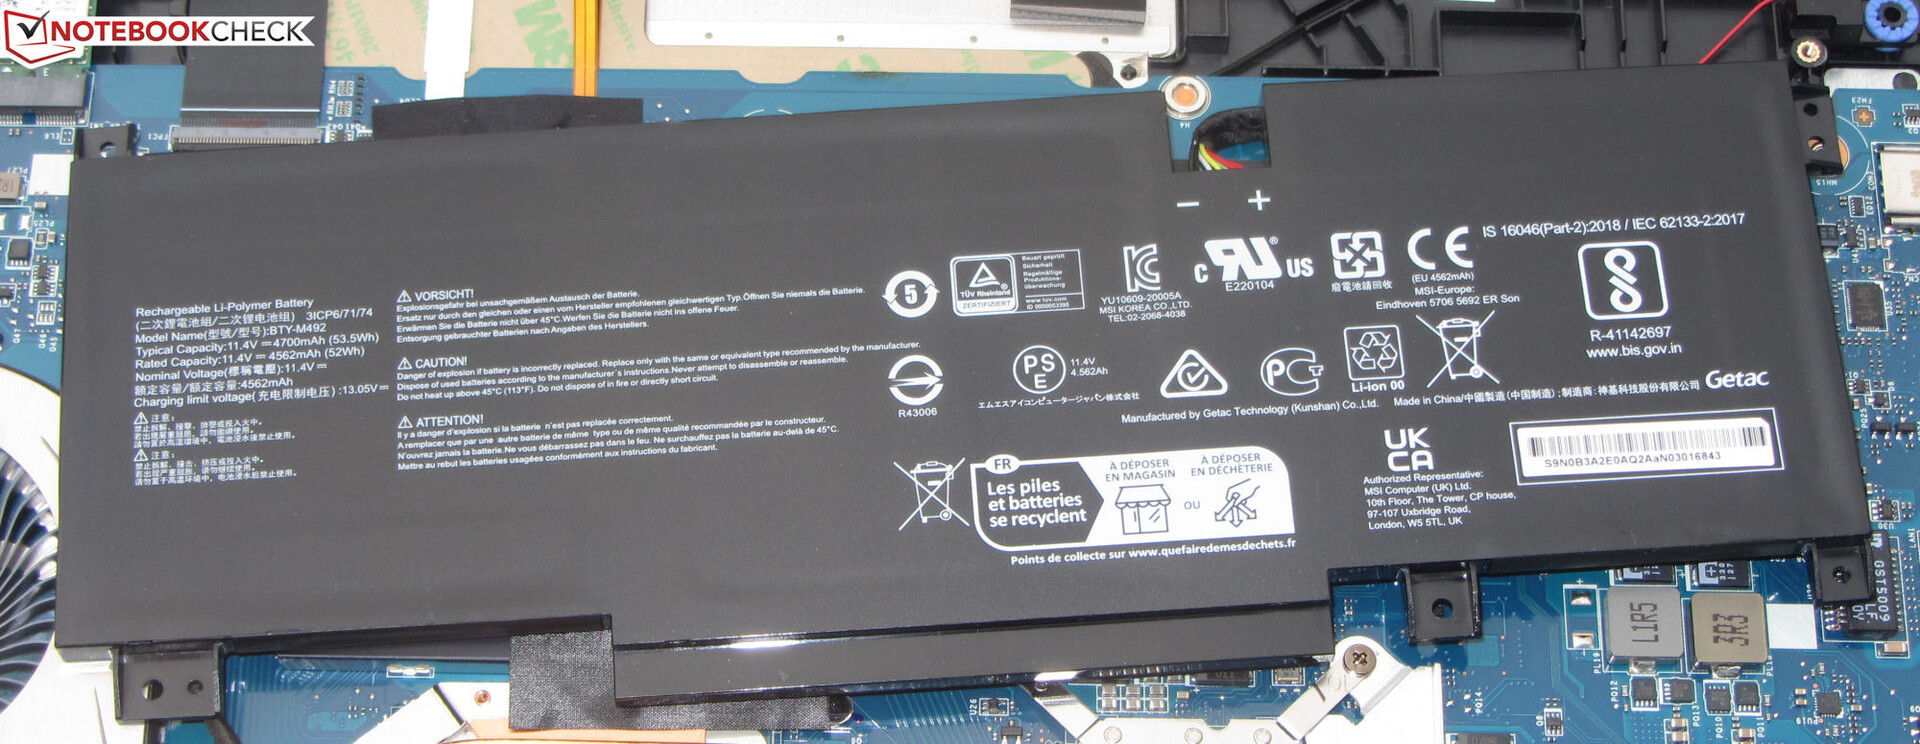
Após remover todos os parafusos no fundo, o fundo da caixa pode ser removido com a ajuda de uma pequena ferramenta ou espátula. Mas é preciso ter cuidado, pois ele é segurado por grampos plásticos bastante apertados. Depois de remover o fundo, você tem acesso aos bancos de memória de trabalho (ambos ocupados), SSD (PCIe 4), bateria BIOS, módulo WLAN, ventilador, alto-falantes e bateria.

Garantia
A MSI oferece um período de garantia de 2 anos para o laptop de 15,6 polegadas na Alemanha. Você também pode adquirir uma extensão de garantia por um ou dois anos por cerca de 120 e 250 euros (~$133 e $276), respectivamente.
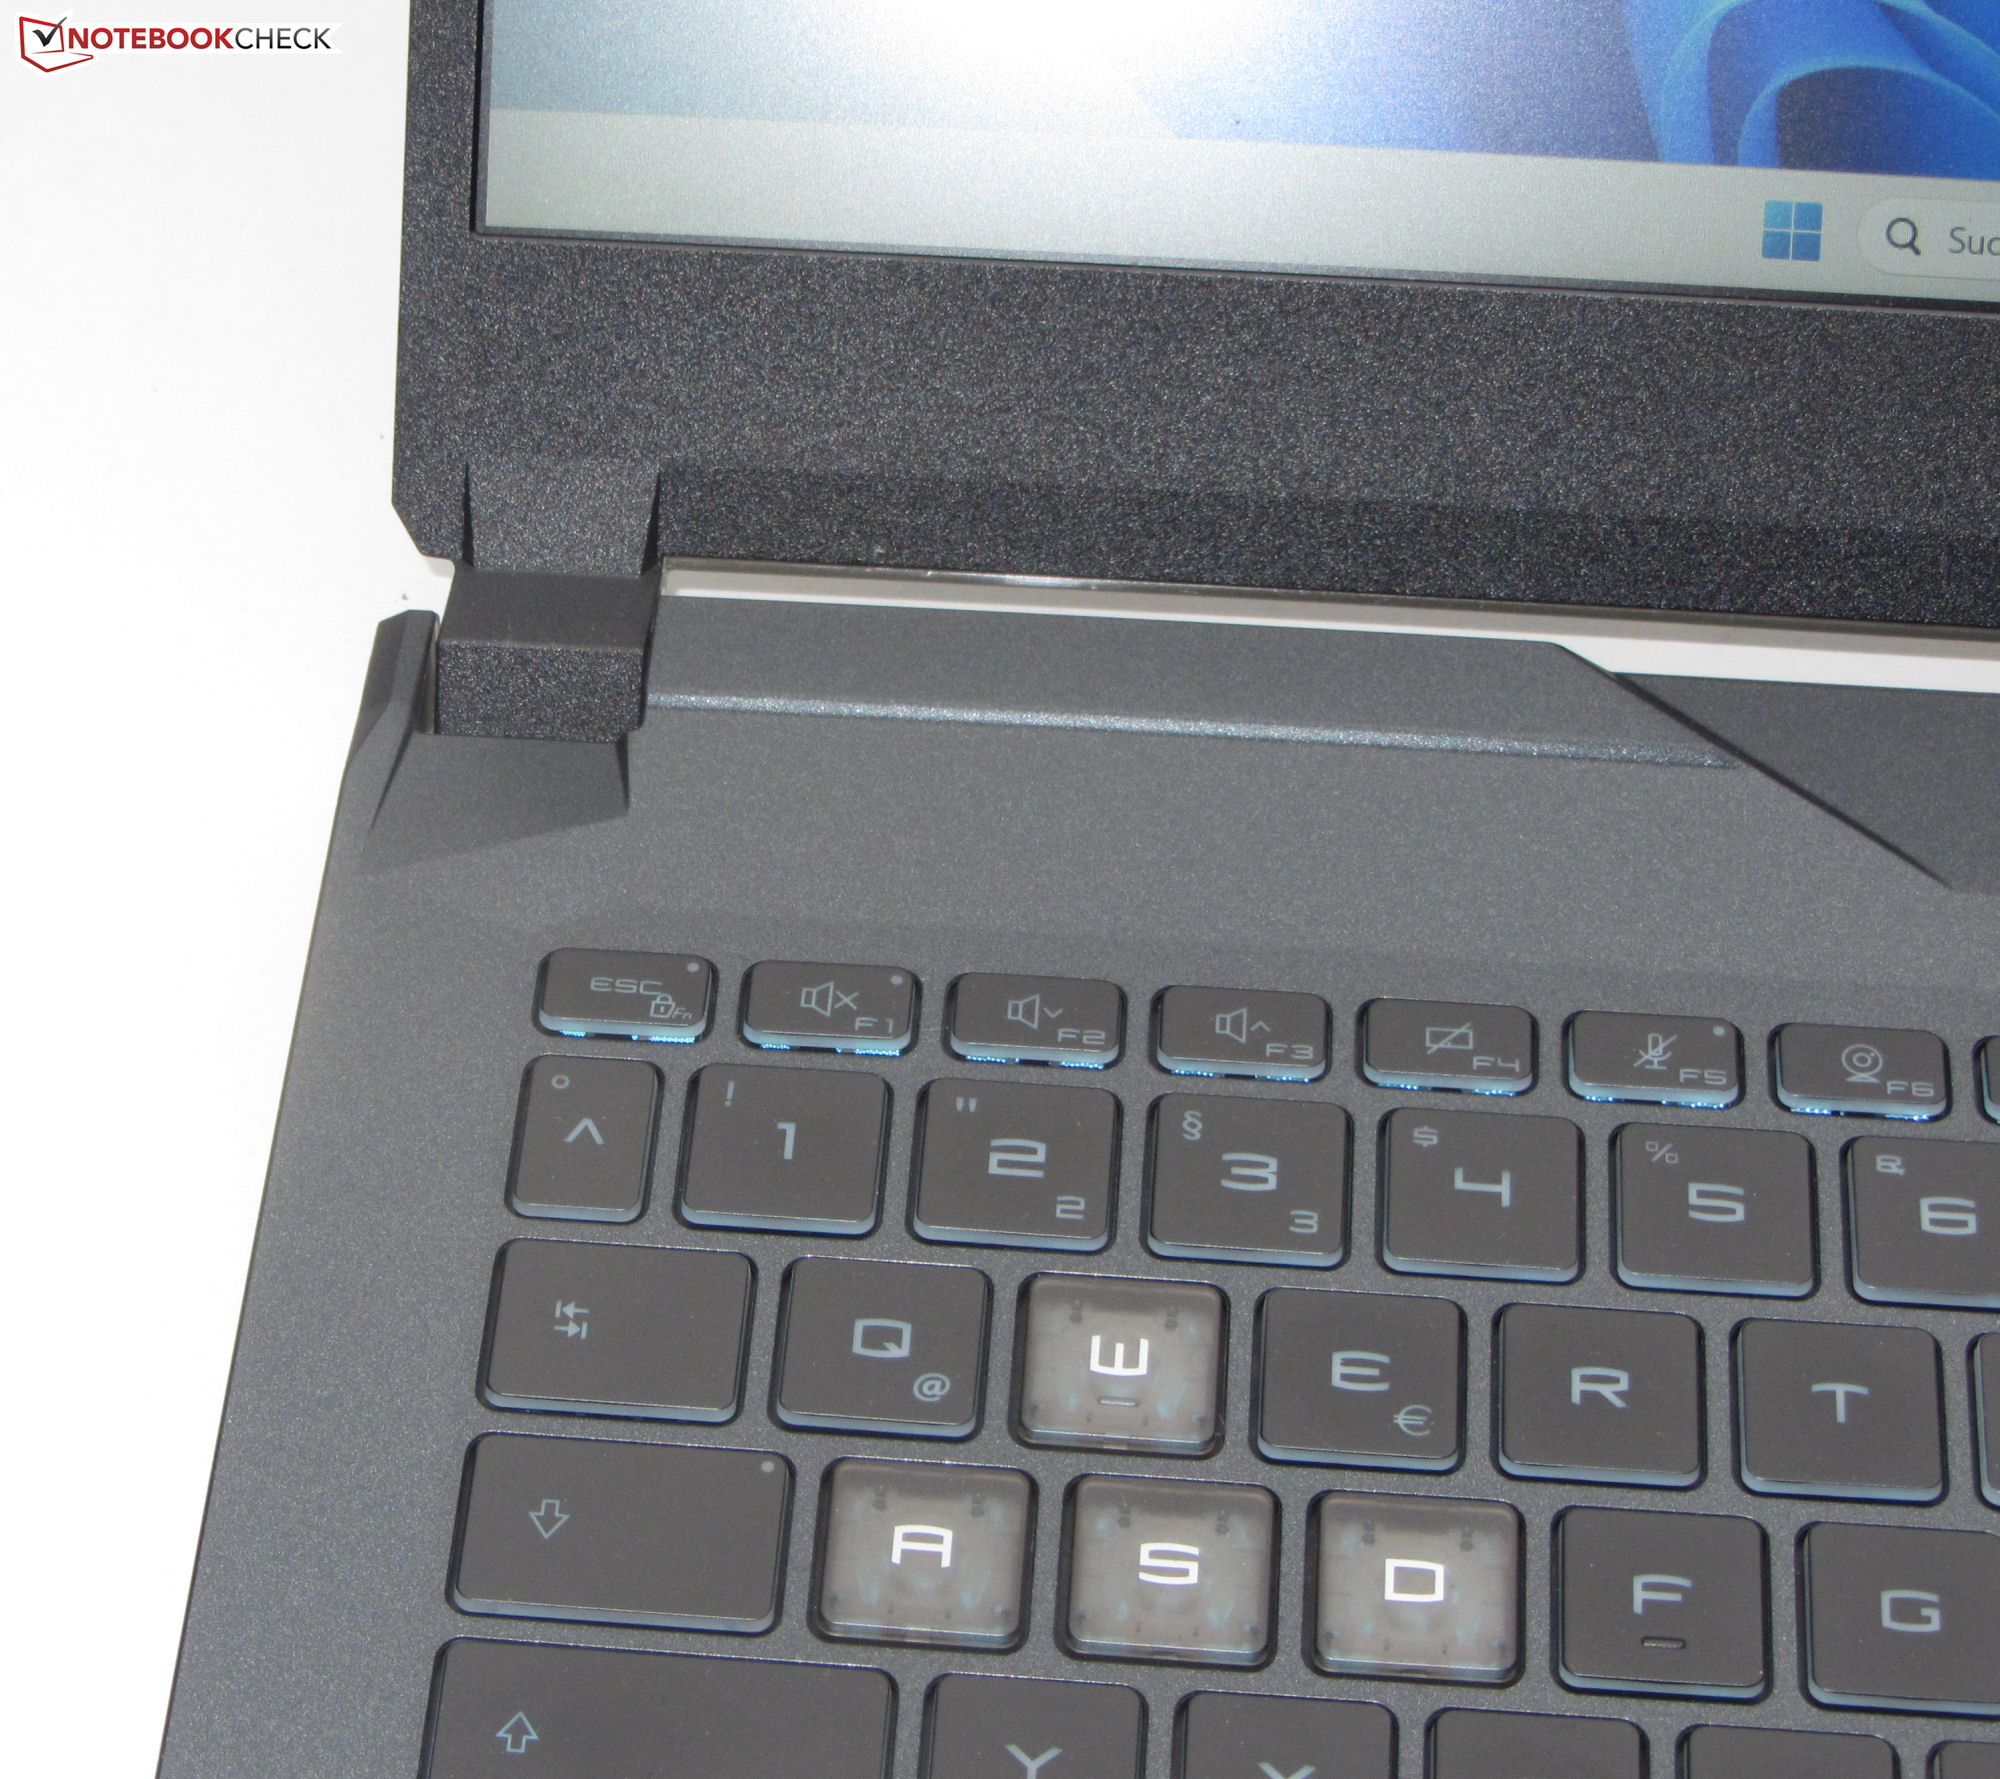
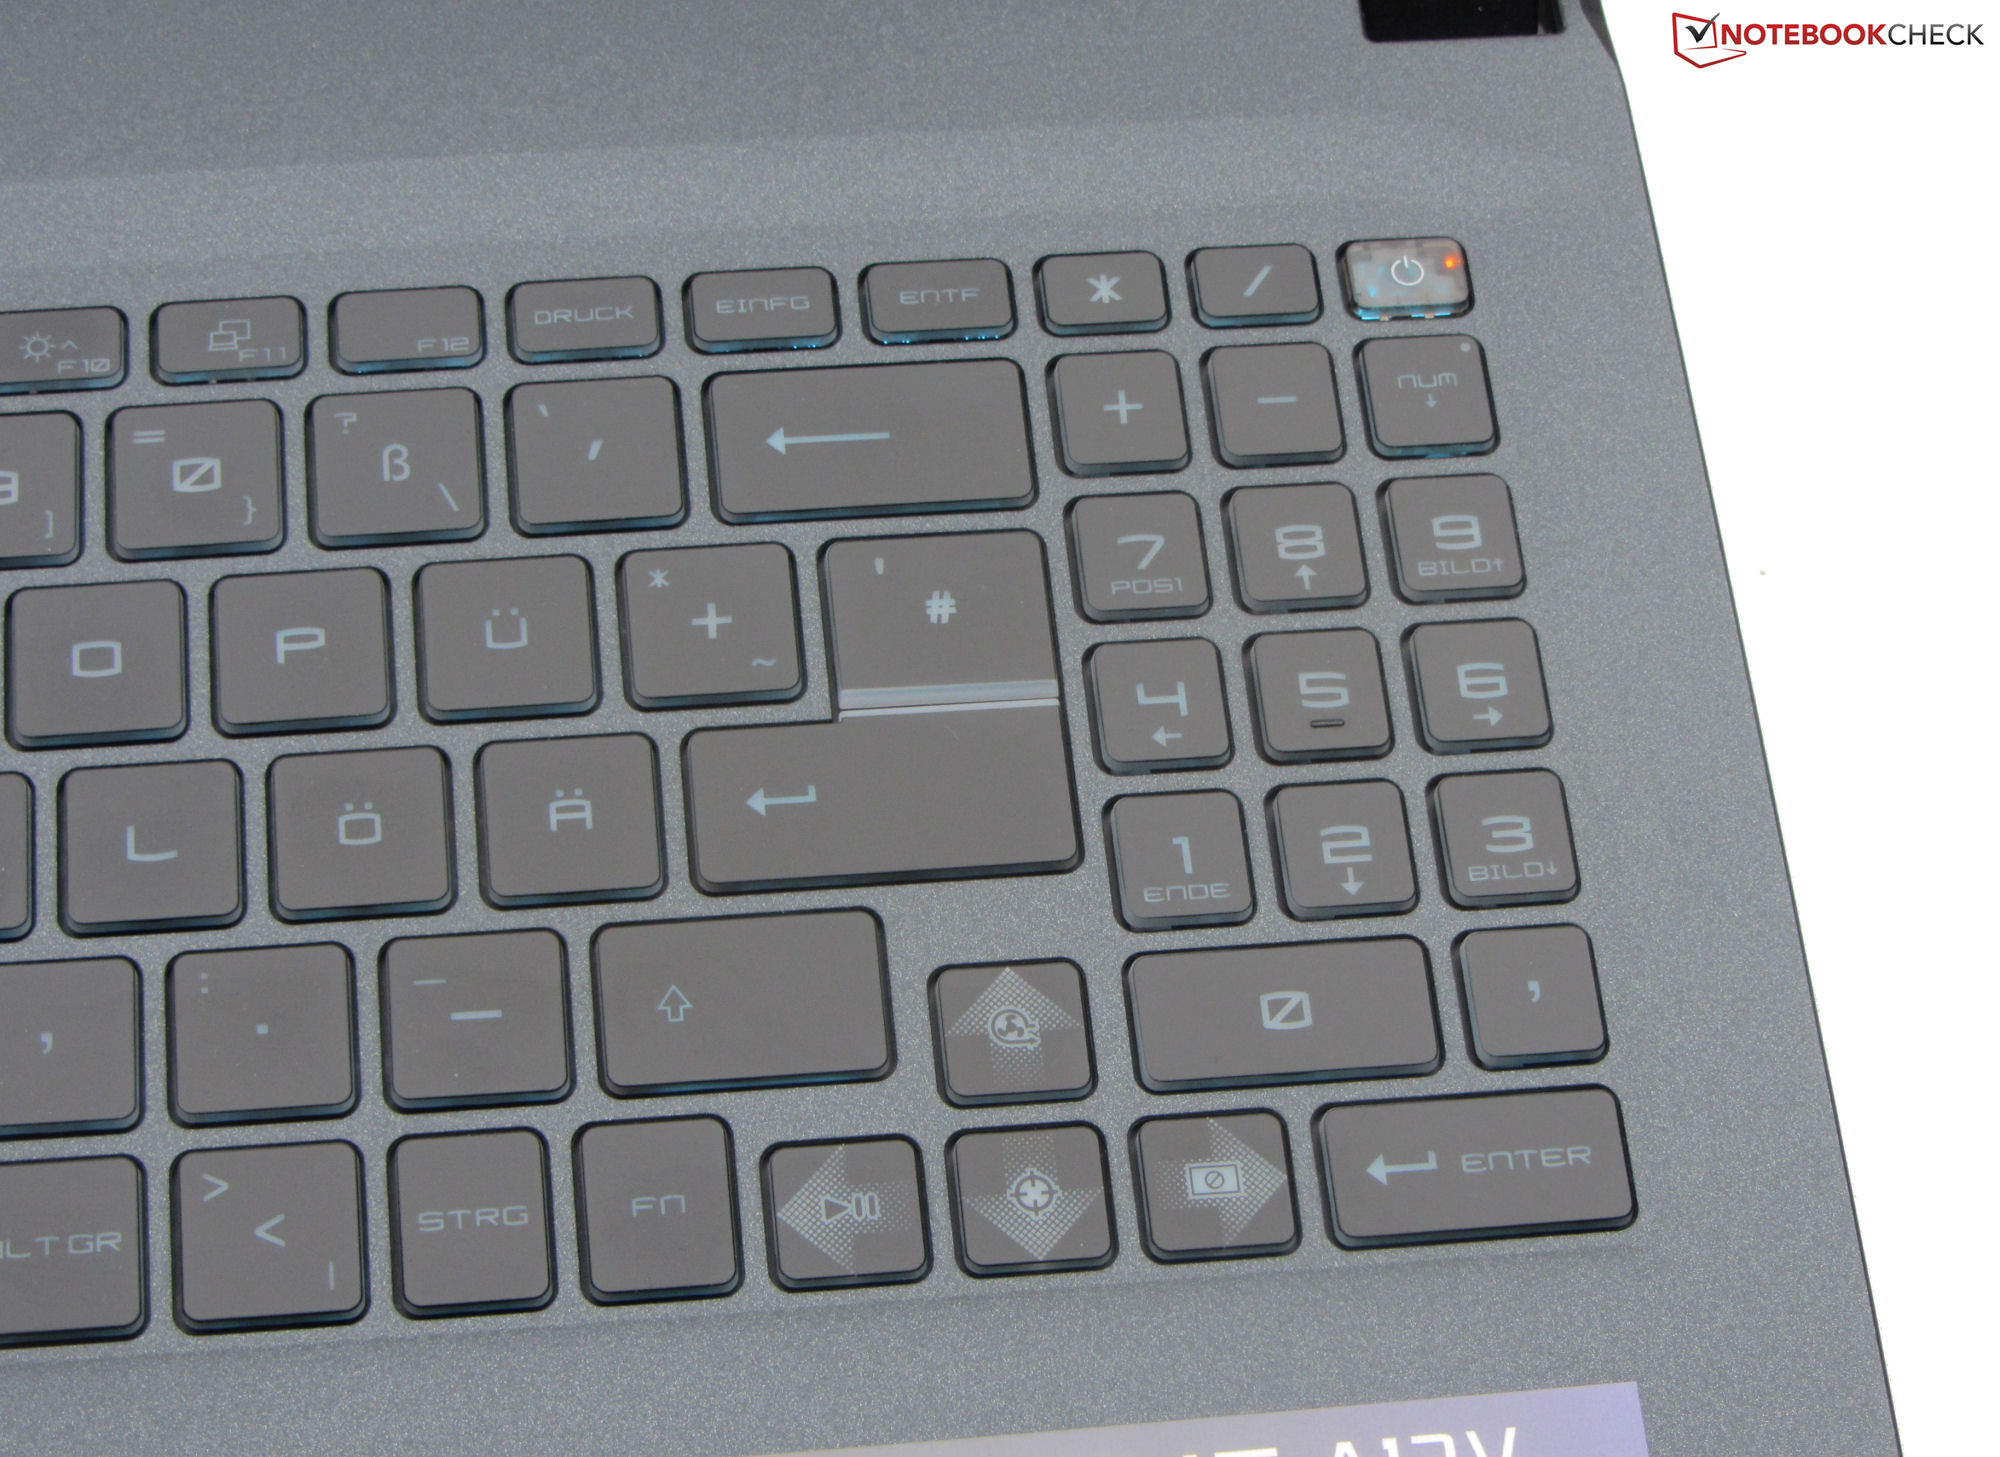
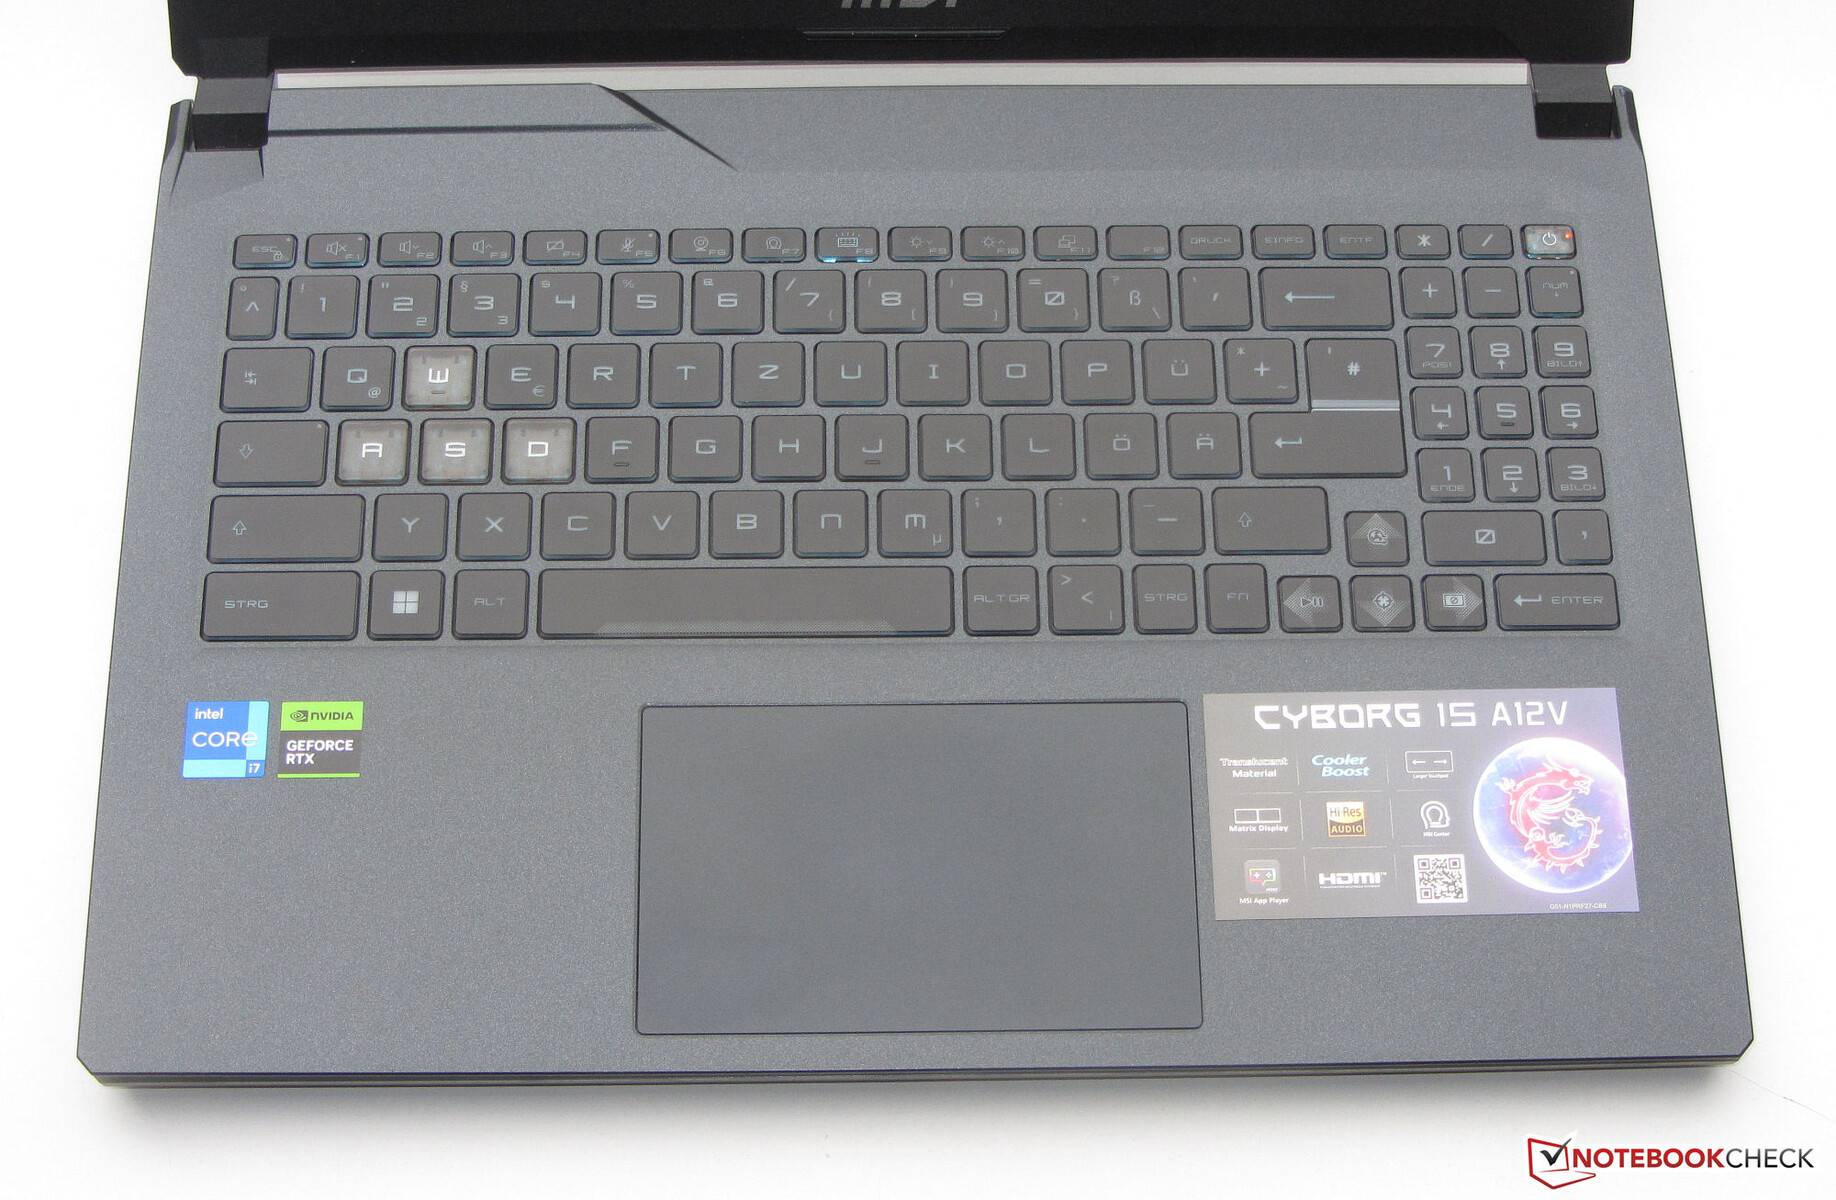
Dispositivos de entrada - O Cyborg distingue as chaves WASD para jogos
Teclado
As teclas planas e suaves do teclado chiclet iluminado oferecem um curso curto e um ponto de pressão claro. A resistência das teclas é decente. O teclado tem um ligeiro toque durante a digitação, mas isto não se torna irritante. Como é típico dos dispositivos MSI, a tecla "Fn" não é colocada na mesma posição que é usual em outros teclados de laptops. A iluminação do teclado monocromática oferece três passos de brilho e é controlada através de uma tecla de função. Em geral, a MSI fornece um teclado que é adequado para a operação diária.
Touchpad
A superfície lisa do Clickpad multitouch capaz (~12 x 7,5 cm, ~4,7 x 2,8 pol.) facilita o deslizamento dos dedos. Ele responde às entradas nos cantos e também oferece um curso curto e um ponto de pressão claro.
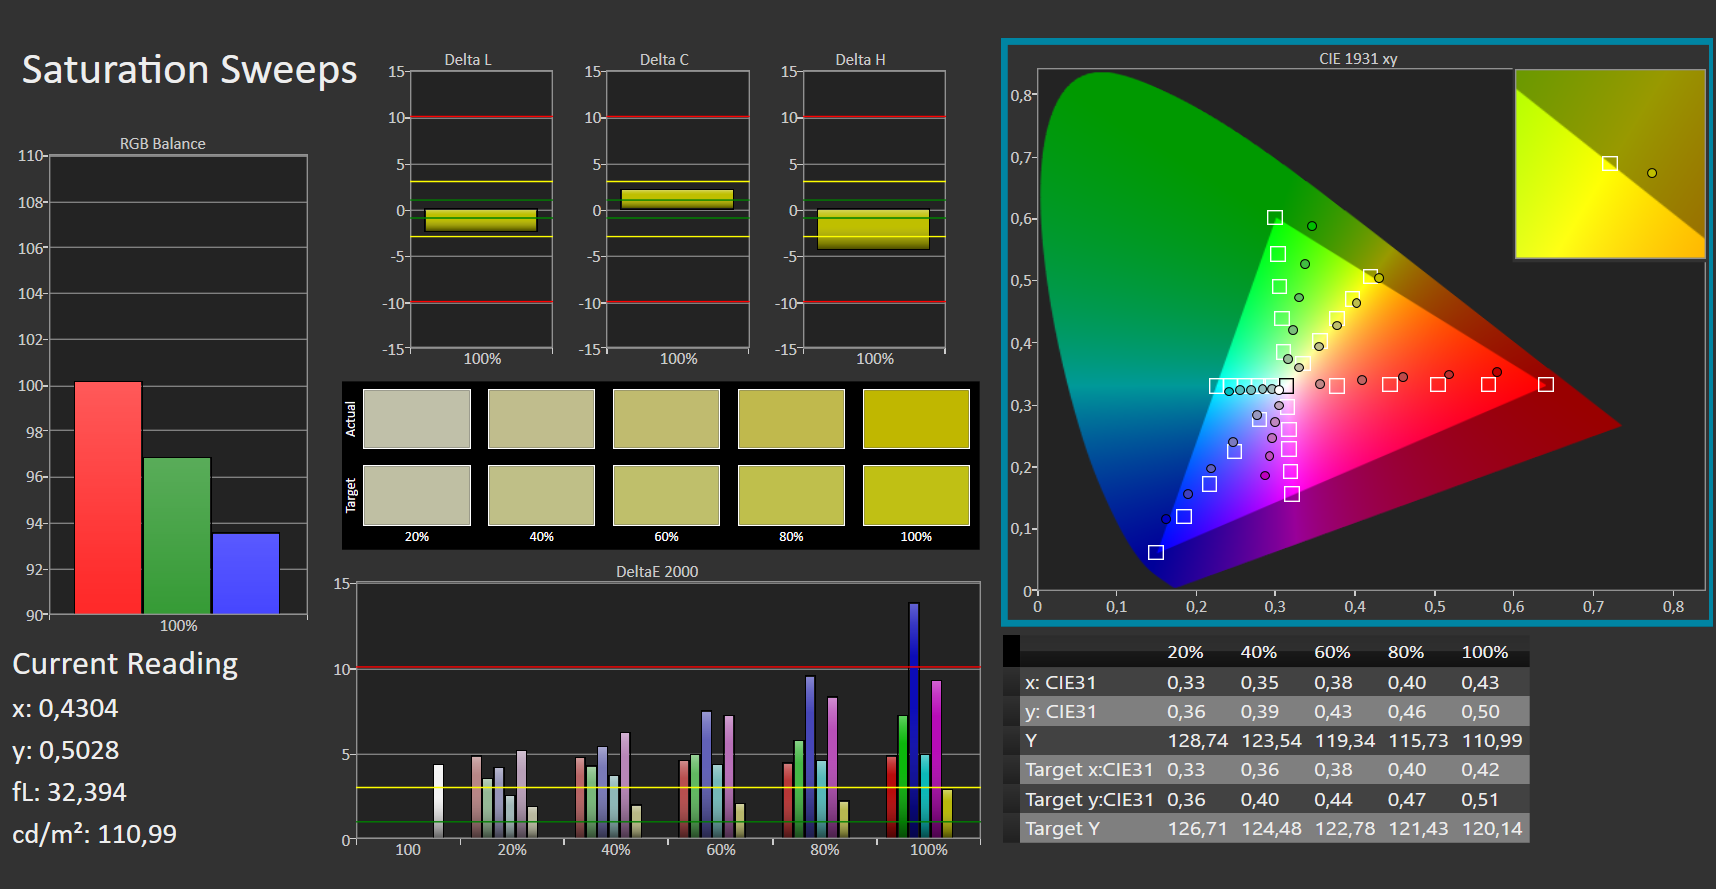
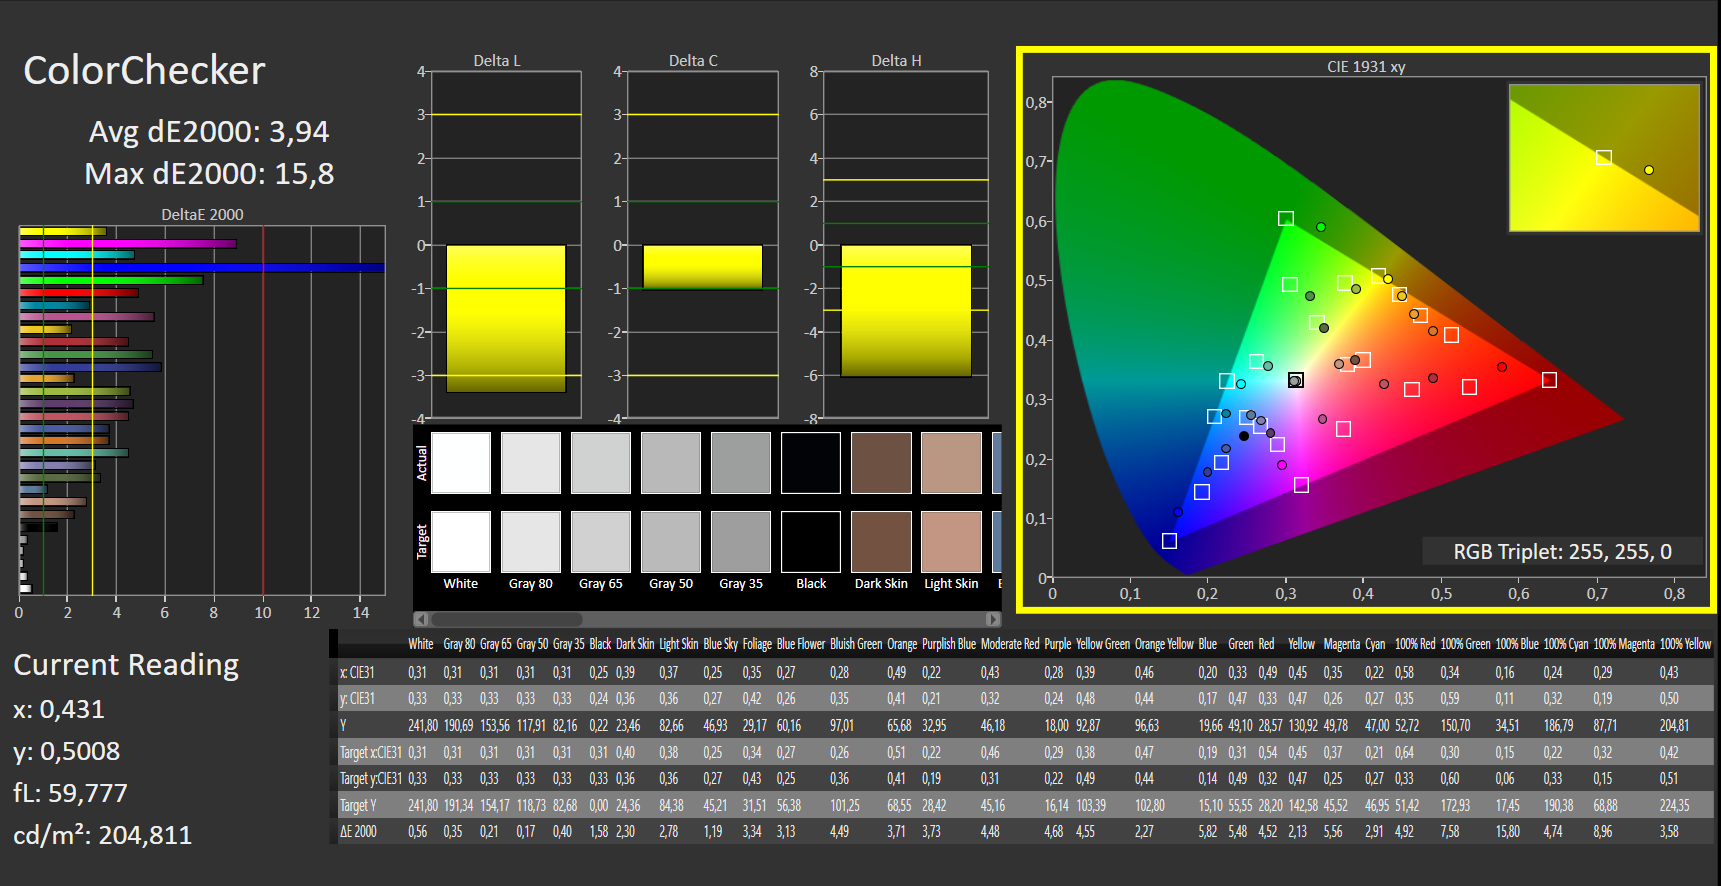
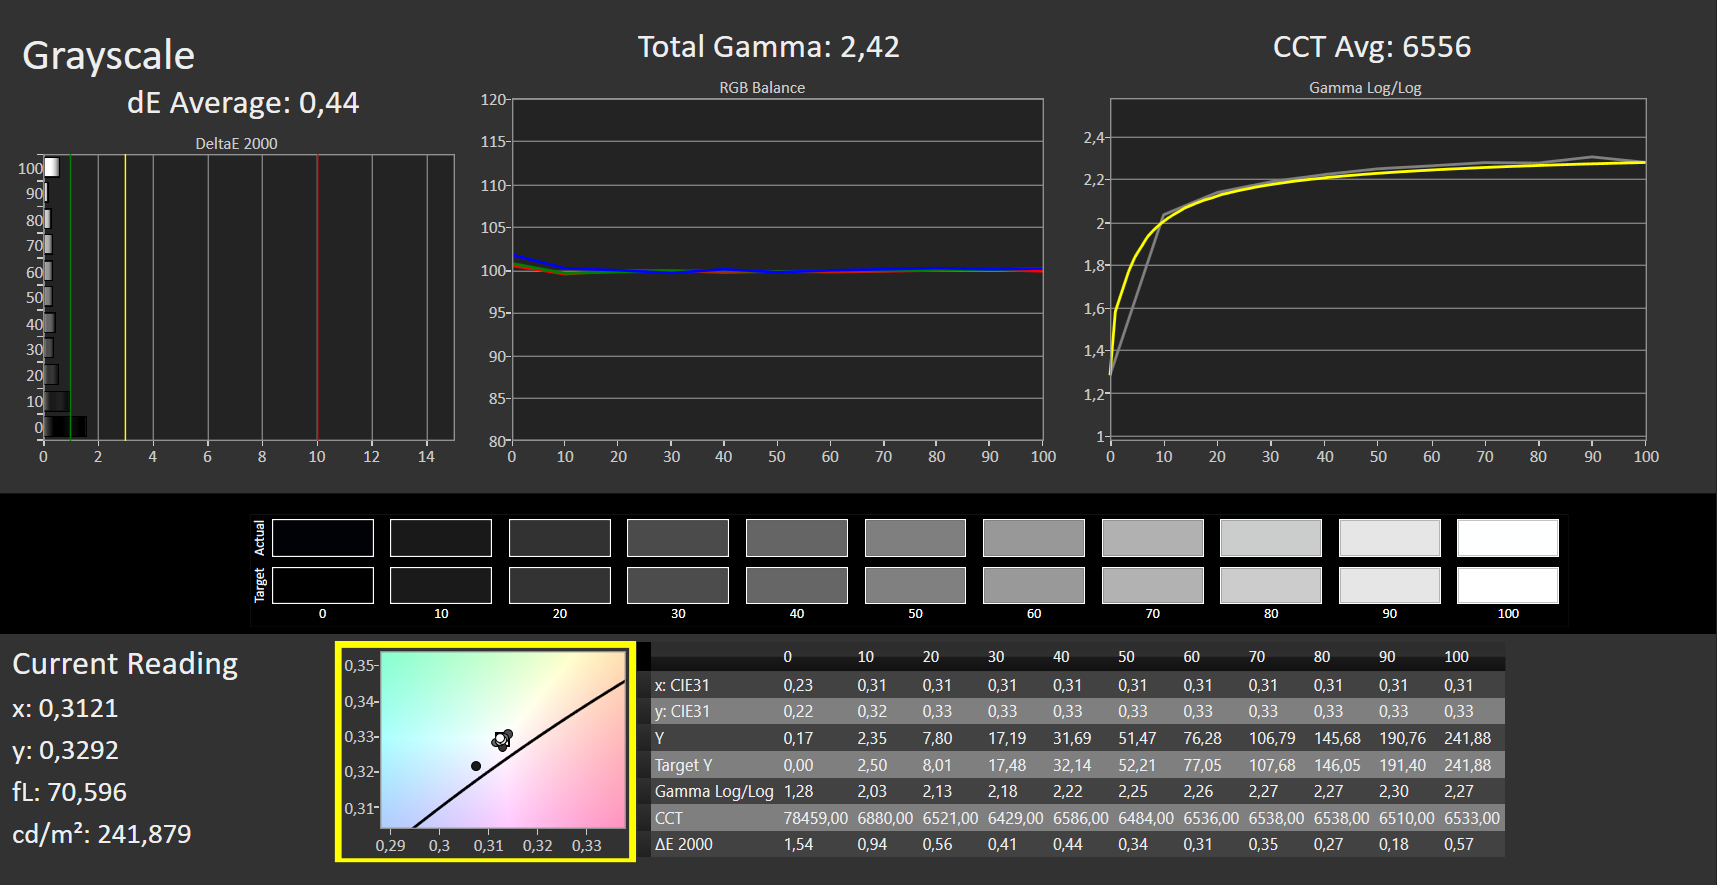
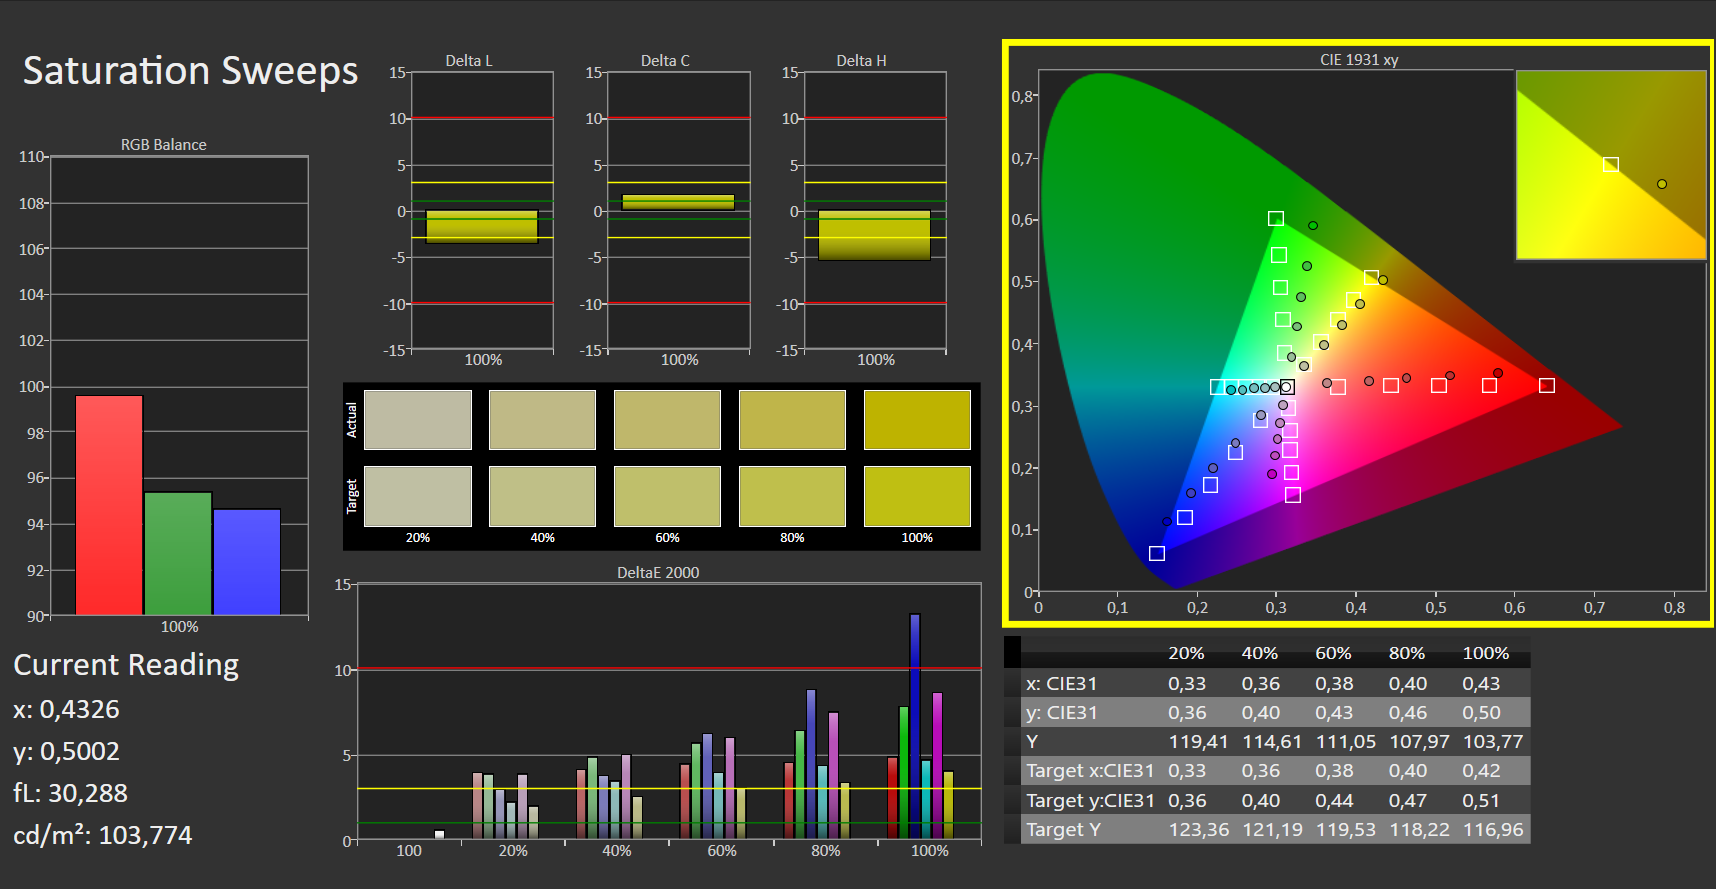
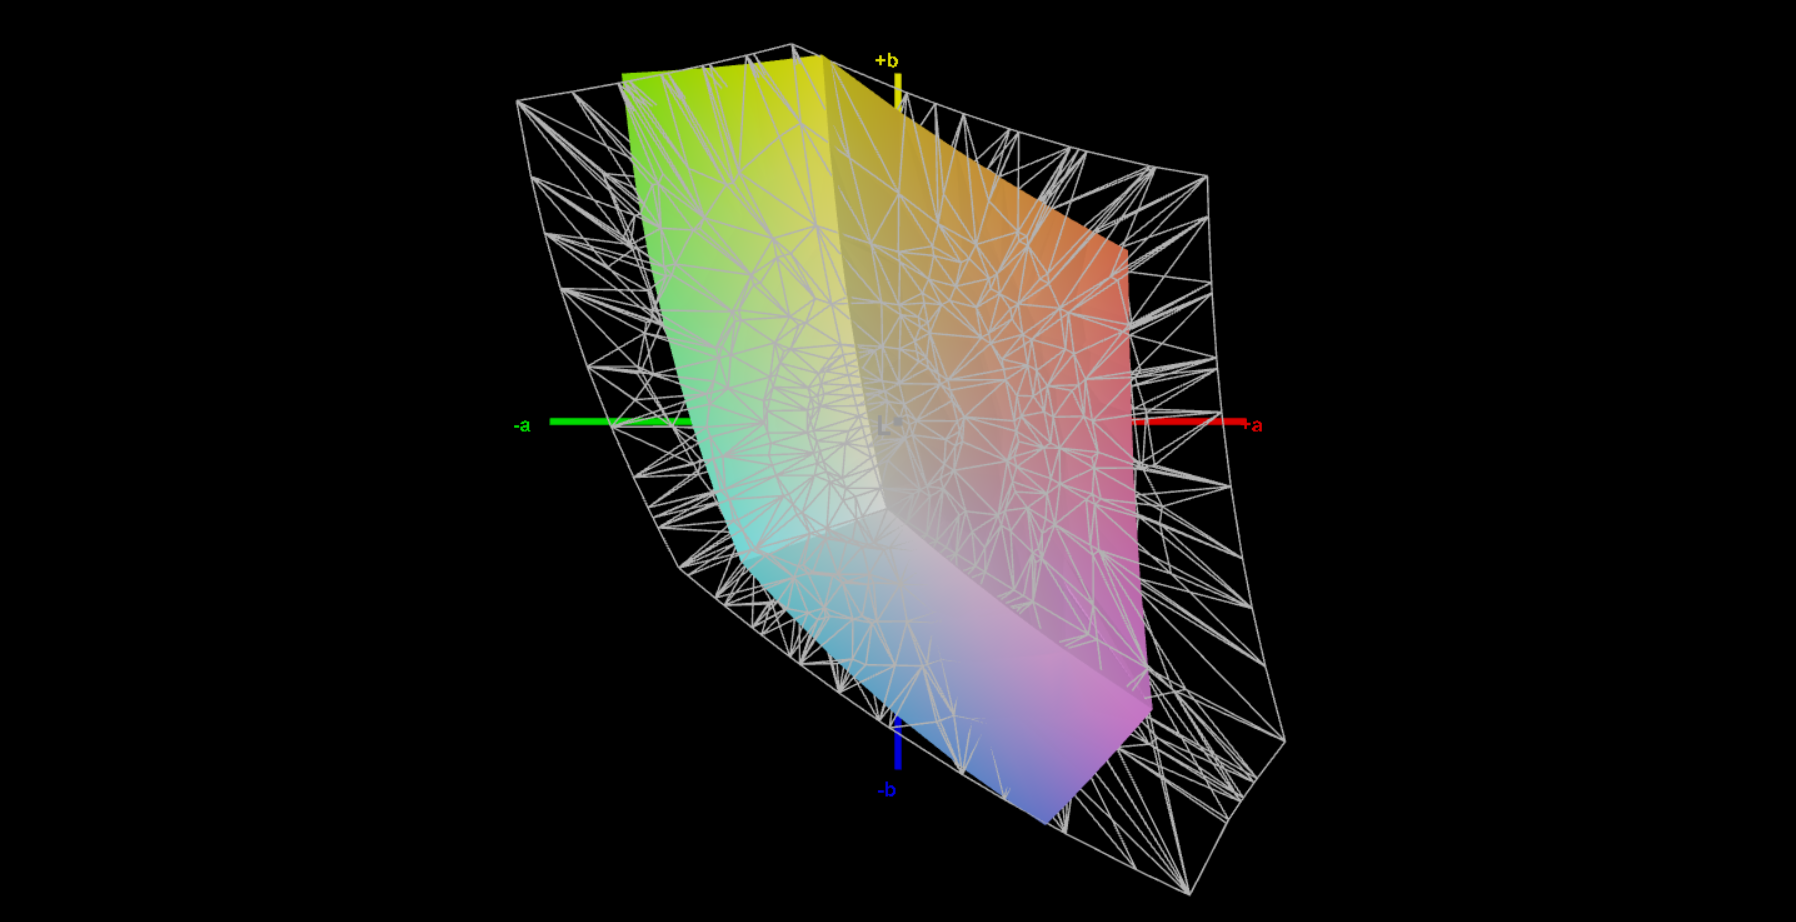
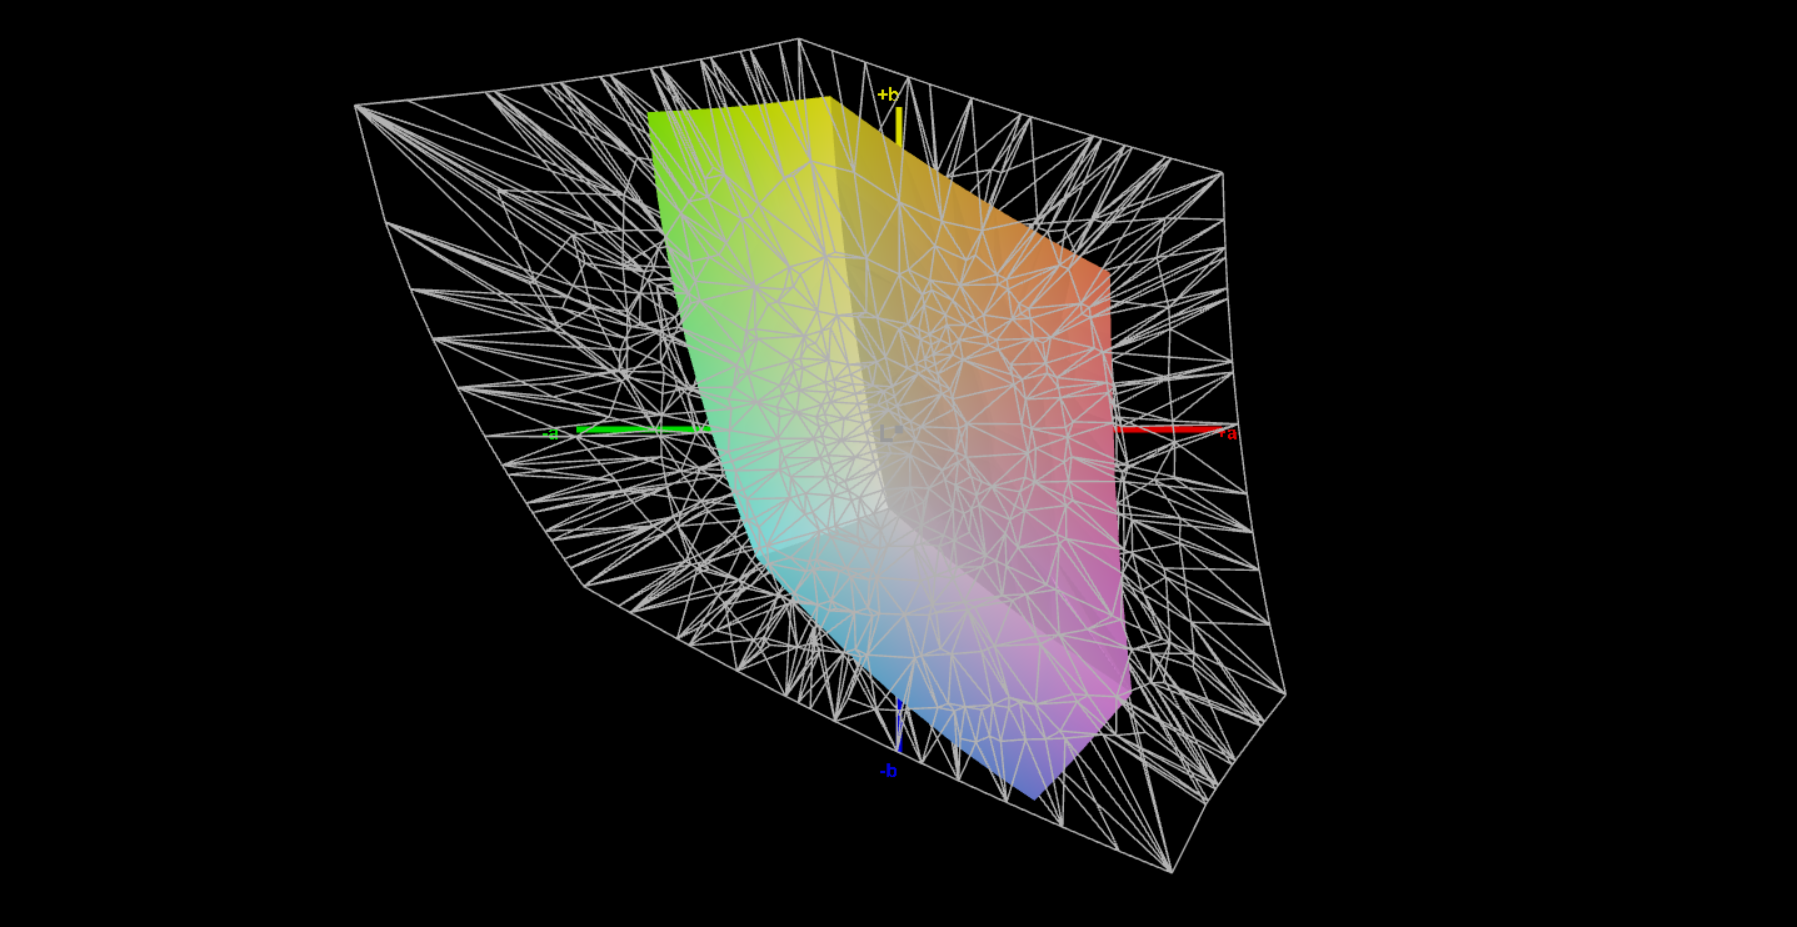
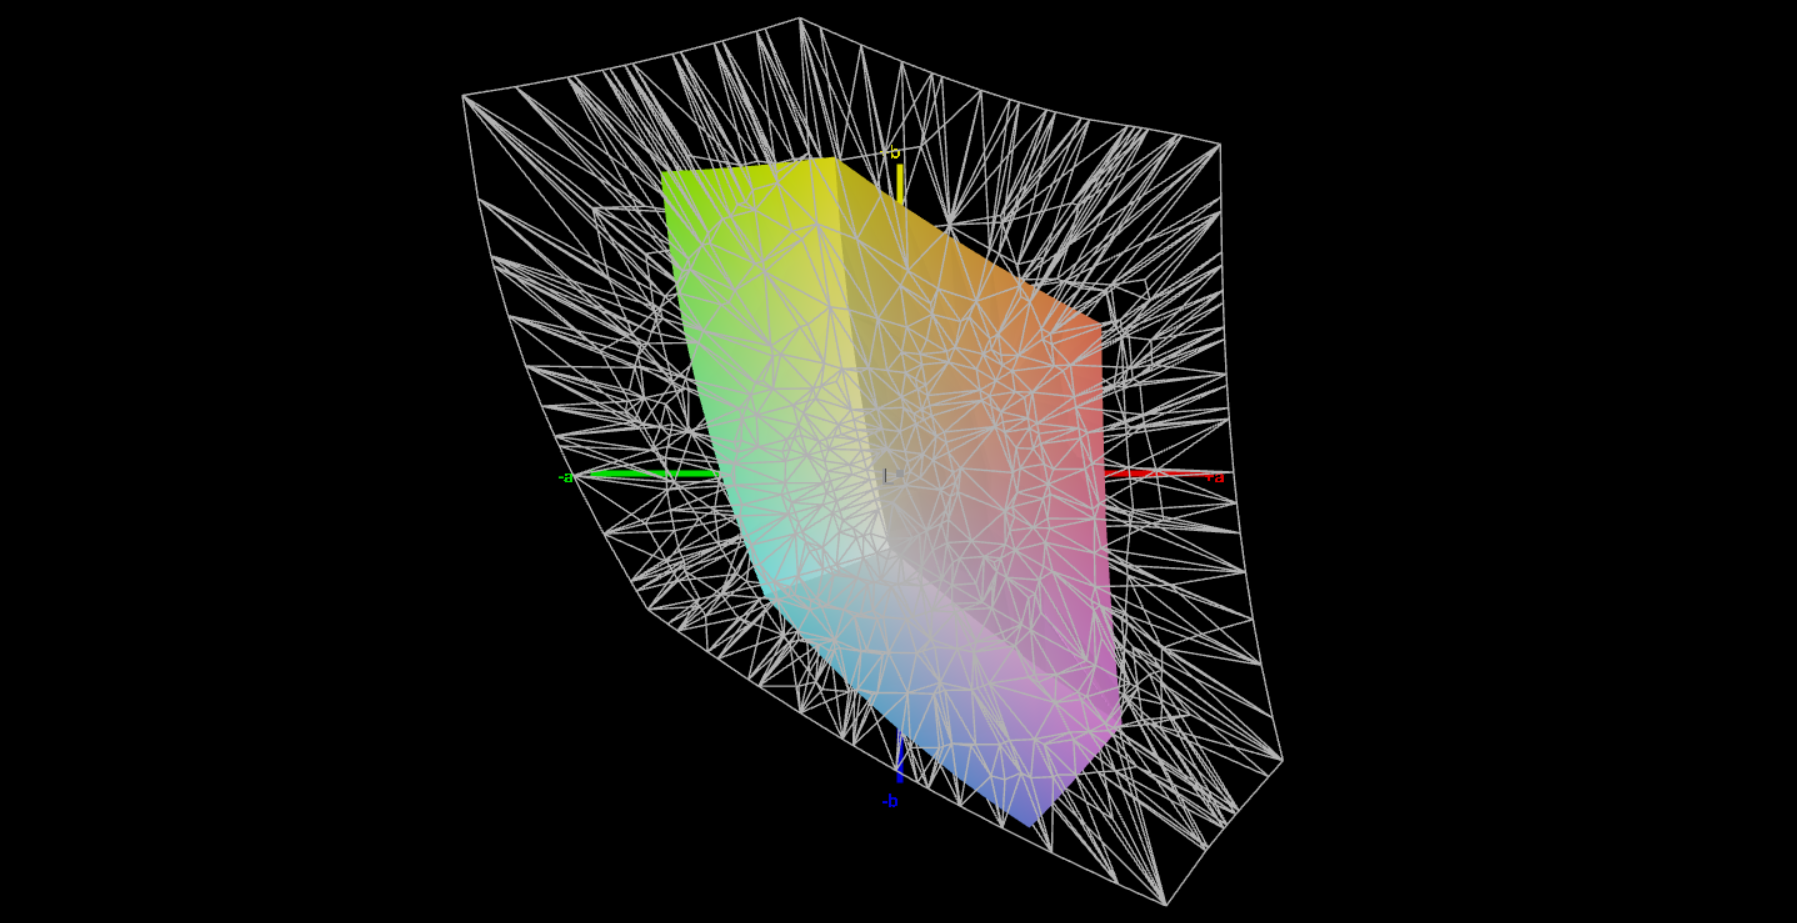
Display - Painel FHD com baixa cobertura de espaço de cor

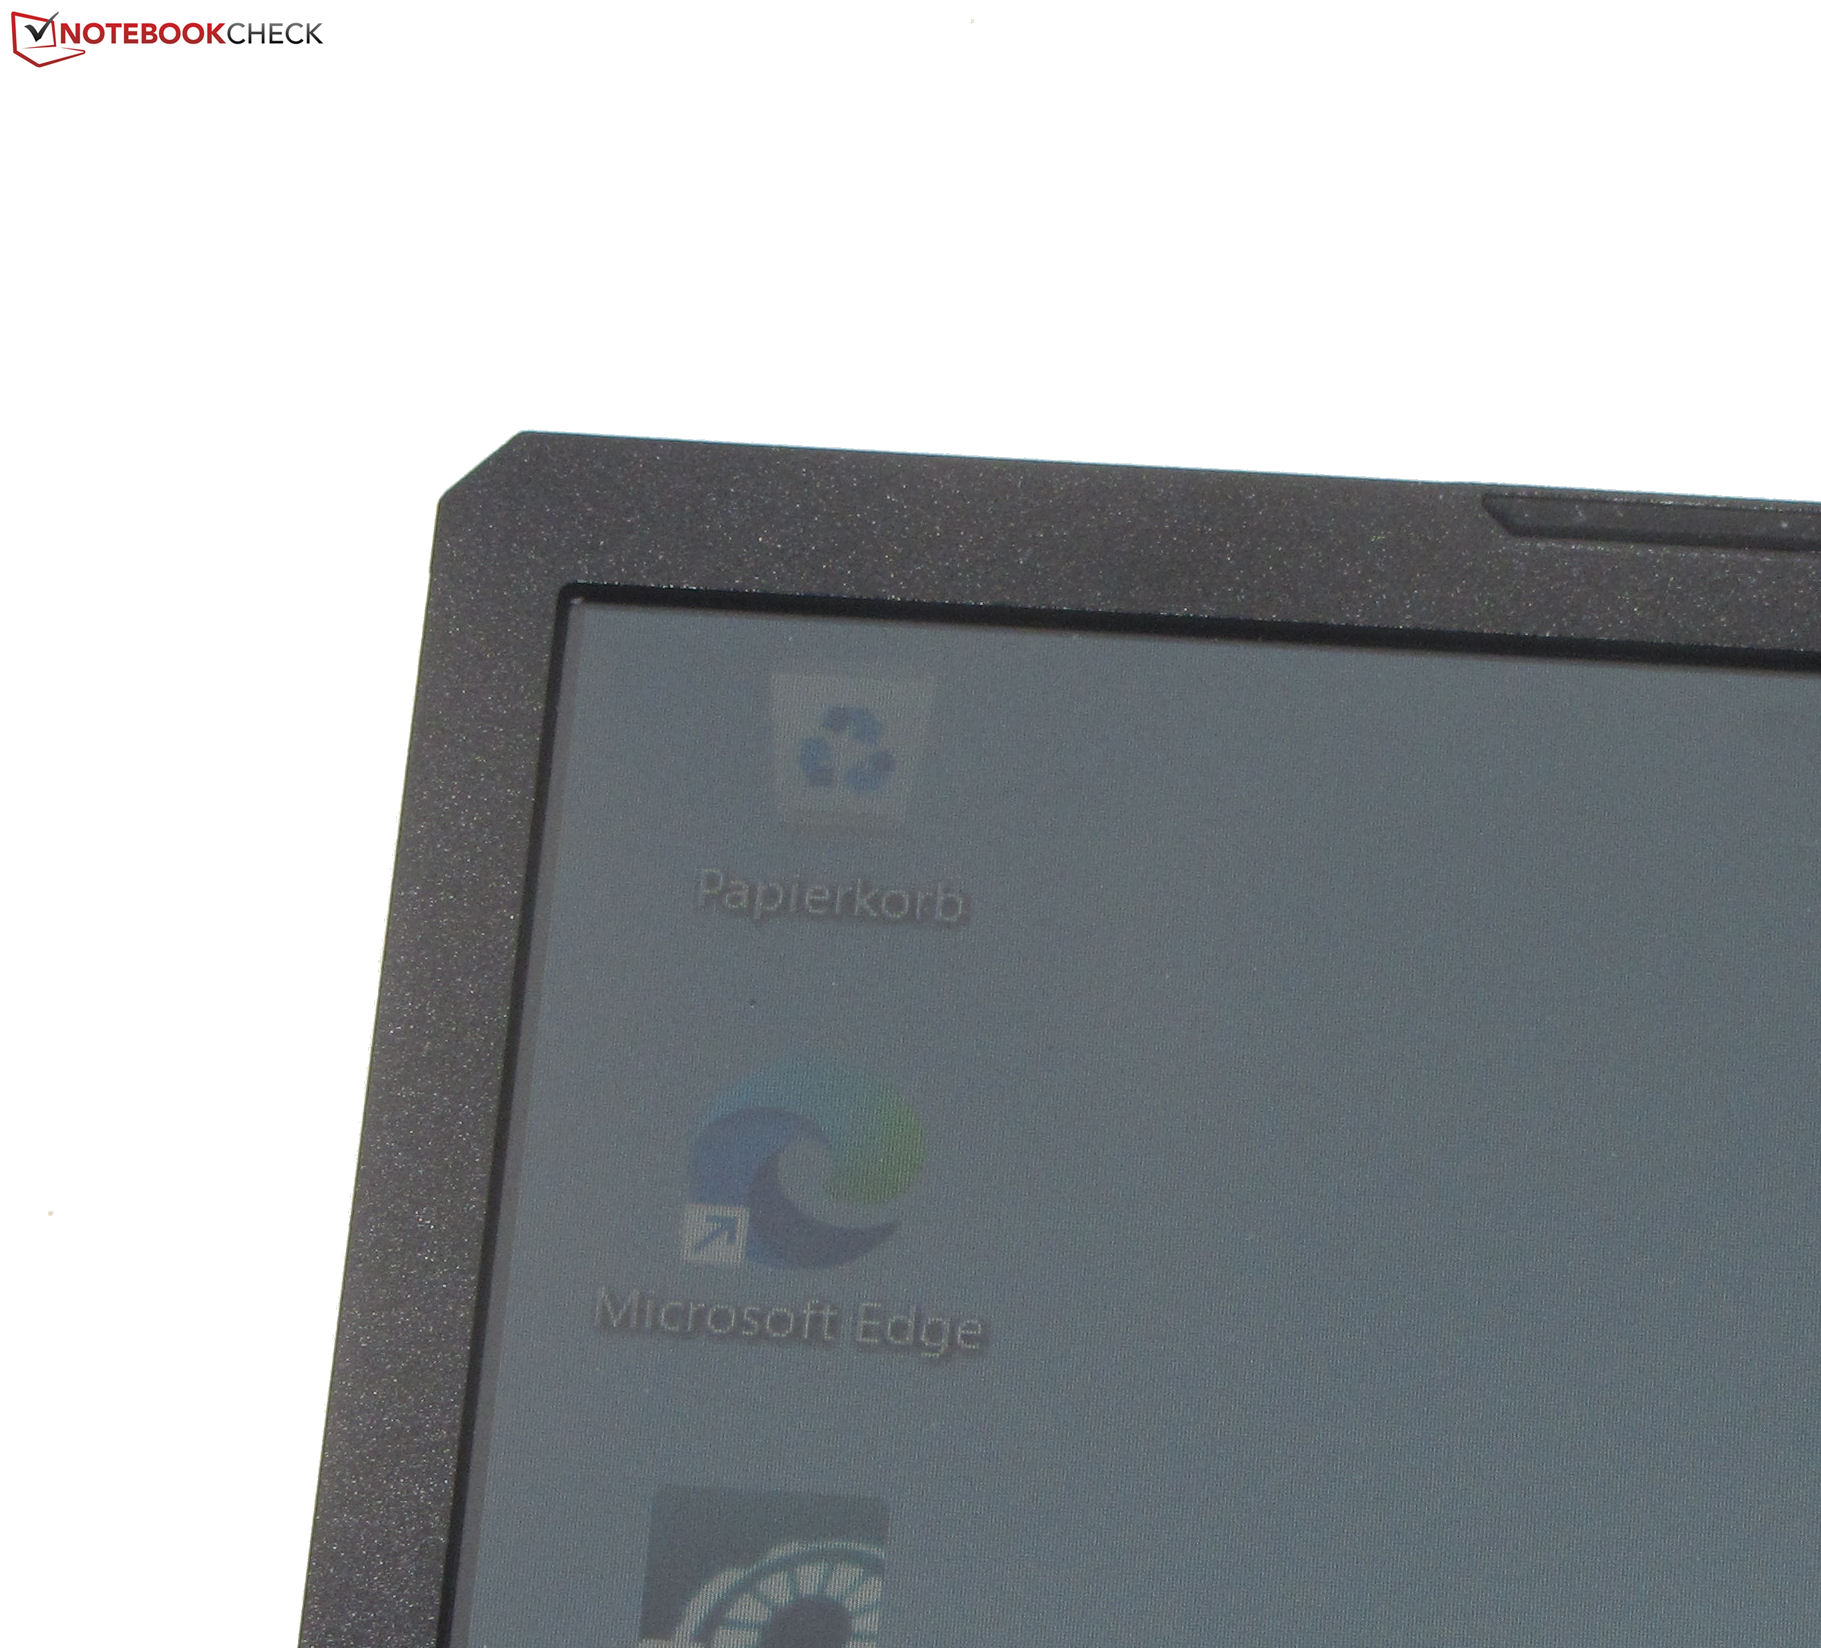
O painel 144-Hz no formato 16:9 oferece apenas tempos de resposta medíocres. Por outro lado, o fato de não mostrar PWM cintilando em qualquer nível de luminosidade é um ponto positivo. O brilho e o contraste do display FHD mate de 15,6 polegadas falham os objetivos correspondentes de >1.000:1 e 300 cd/m² respectivamente, mesmo que o contraste se aproxime.
Os concorrentes fazem um trabalho melhor aqui, e o resto dos dispositivos em nosso campo de comparação têm visores mais brilhantes.
| |||||||||||||||||||||||||
iluminação: 89 %
iluminação com acumulador: 250 cd/m²
Contraste: 988:1 (Preto: 0.25 cd/m²)
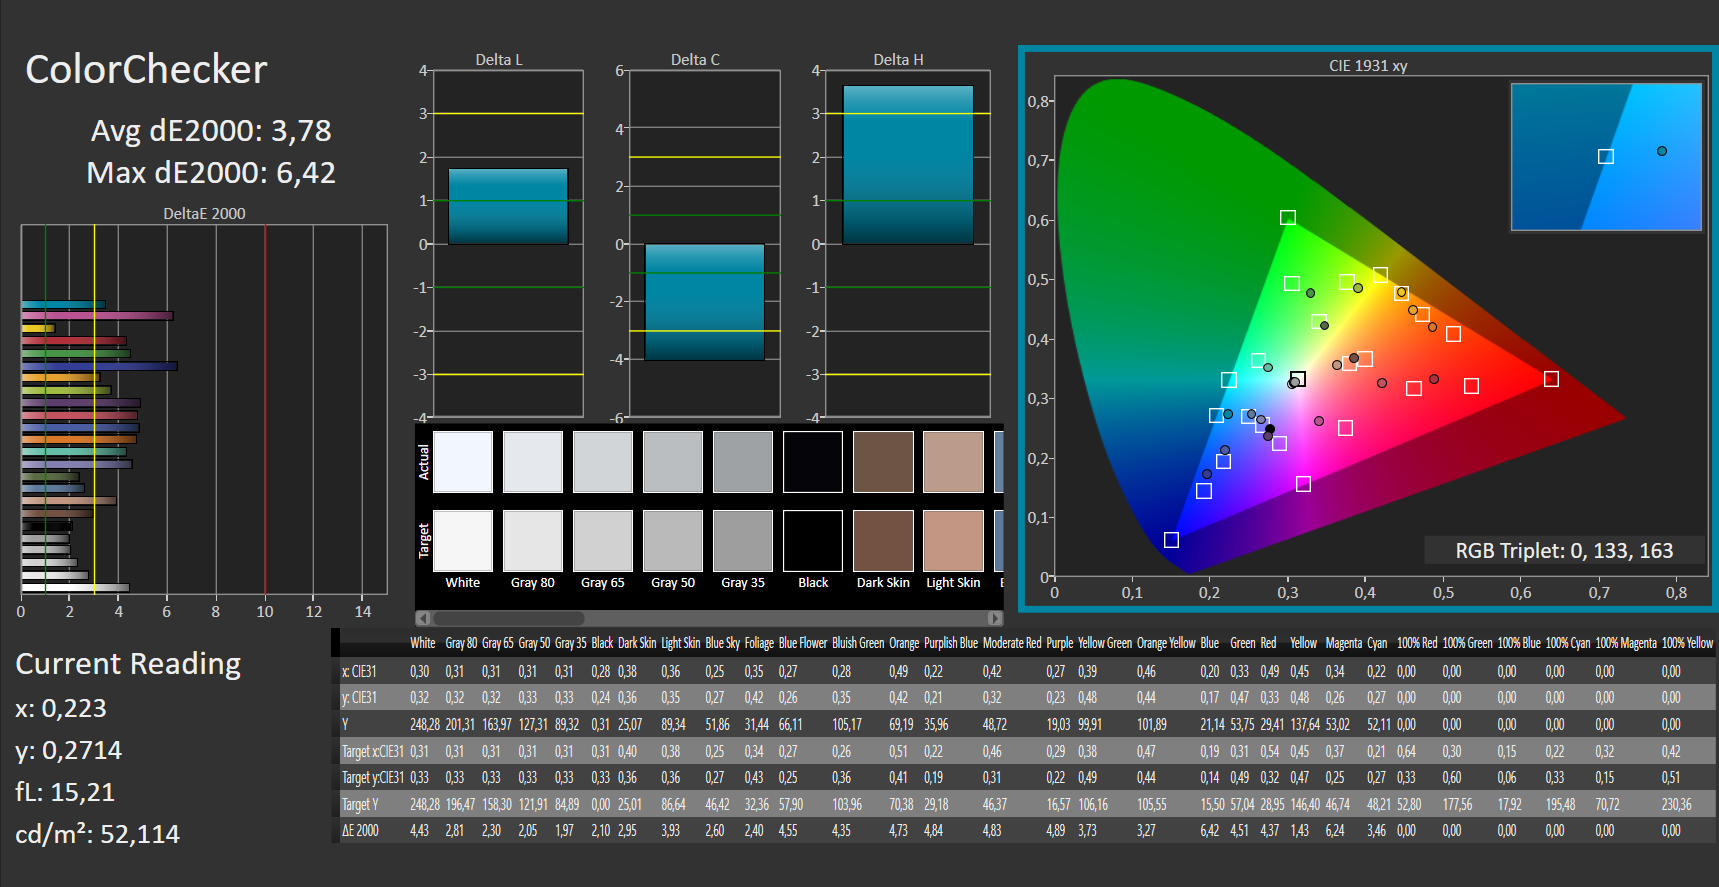
ΔE ColorChecker Calman: 3.78 | ∀{0.5-29.43 Ø4.71}
calibrated: 3.94
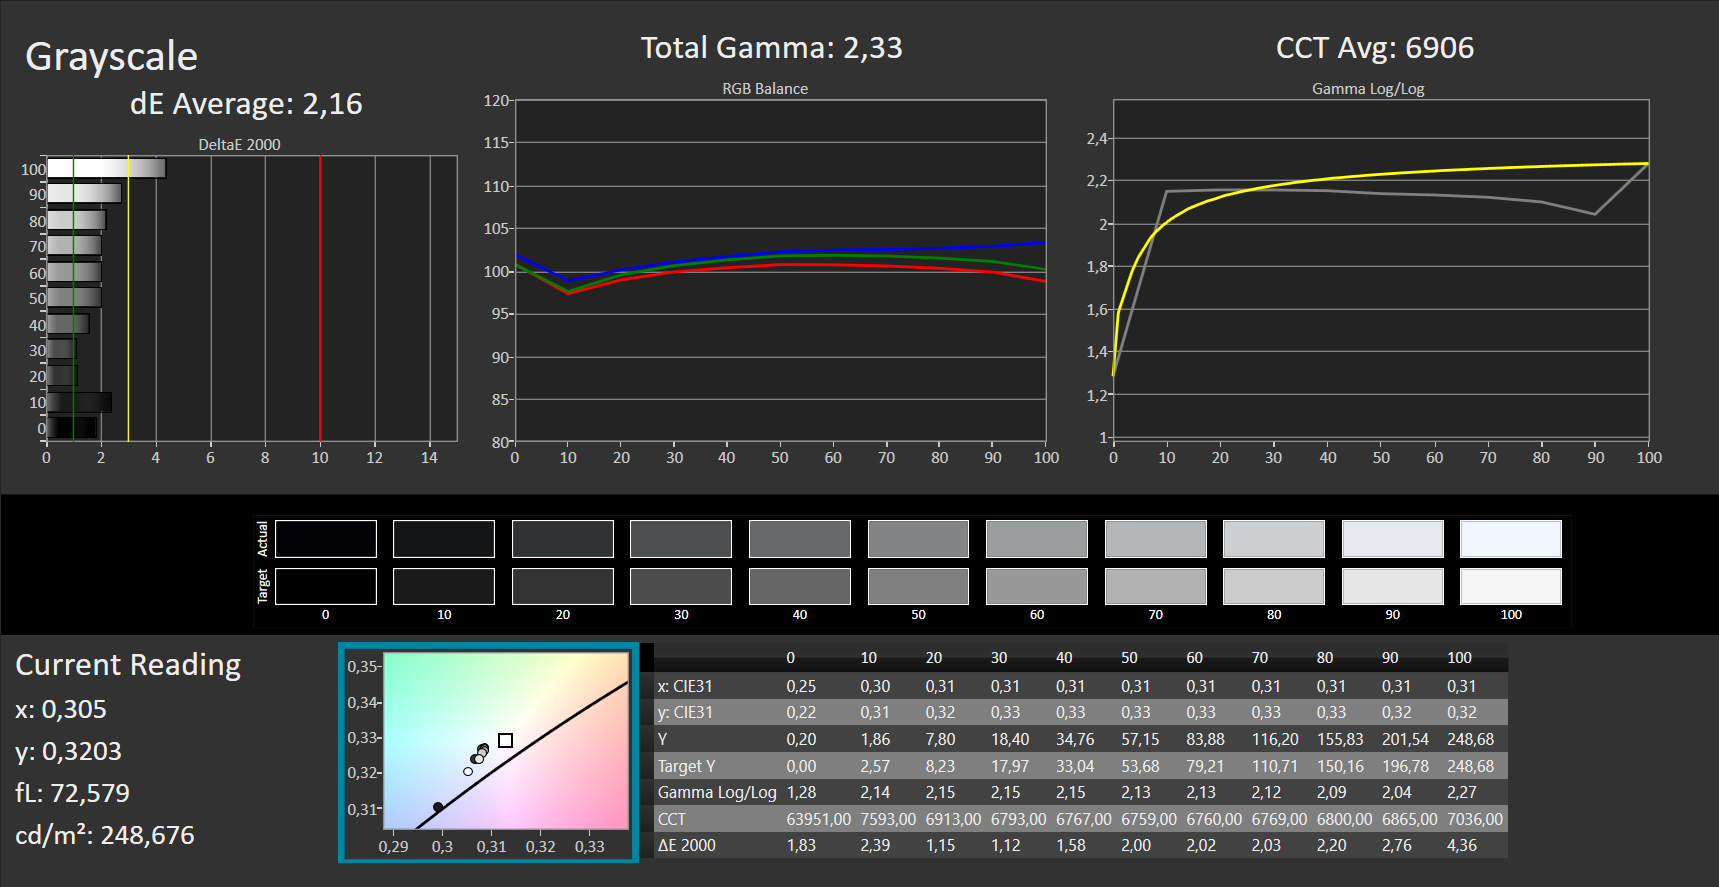
ΔE Greyscale Calman: 2.16 | ∀{0.09-98 Ø4.96}
43.7% AdobeRGB 1998 (Argyll 3D)
62.6% sRGB (Argyll 3D)
42.3% Display P3 (Argyll 3D)
Gamma: 2.33
CCT: 6906 K
| MSI Cyborg 15 A12VF AU Optronics B156HAN15.1, IPS, 1920x1080, 15.6" | Asus TUF Gaming A16 FA617 NE160WUM-NX2 (BOE0B33), IPS-Level, 1920x1200, 16" | Aorus 15 XE5 Chi Mei N156KME-GNA, IPS, 2560x1440, 15.6" | Schenker XMG Fusion 15 (Mid 22) BOE CQ NE156QHM-NY2, IPS, 2560x1440, 15.6" | MSI Katana 15 B12VEK AUOAF90 (B156HAN08.4), IPS, 1920x1080, 15.6" | HP Victus 15 fa0020nr CMN1521, IPS, 1920x1080, 15.6" | |
|---|---|---|---|---|---|---|
| Display | 61% | 93% | 56% | -10% | -1% | |
| Display P3 Coverage (%) | 42.3 | 69.4 64% | 95.2 125% | 67.3 59% | 38.1 -10% | 42 -1% |
| sRGB Coverage (%) | 62.6 | 97.8 56% | 99.9 60% | 96.7 54% | 56.8 -9% | 62.7 0% |
| AdobeRGB 1998 Coverage (%) | 43.7 | 70.9 62% | 84.5 93% | 68.2 56% | 39.3 -10% | 43.4 -1% |
| Response Times | 26% | 37% | 49% | -84% | -77% | |
| Response Time Grey 50% / Grey 80% * (ms) | 22 ? | 17 ? 23% | 14.4 ? 35% | 11.6 ? 47% | 38.8 ? -76% | 35.2 ? -60% |
| Response Time Black / White * (ms) | 14 ? | 10.1 ? 28% | 8.6 ? 39% | 7 ? 50% | 26.8 ? -91% | 27.2 ? -94% |
| PWM Frequency (Hz) | ||||||
| Screen | 31% | 1% | -8% | -28% | -13% | |
| Brightness middle (cd/m²) | 247 | 308 25% | 336 36% | 326 32% | 261 6% | 284.3 15% |
| Brightness (cd/m²) | 234 | 293 25% | 316 35% | 303 29% | 258 10% | 262 12% |
| Brightness Distribution (%) | 89 | 90 1% | 89 0% | 89 0% | 92 3% | 87 -2% |
| Black Level * (cd/m²) | 0.25 | 0.23 8% | 0.34 -36% | 0.33 -32% | 0.19 24% | 0.17 32% |
| Contrast (:1) | 988 | 1339 36% | 988 0% | 988 0% | 1374 39% | 1672 69% |
| Colorchecker dE 2000 * | 3.78 | 1.47 61% | 3.36 11% | 2.73 28% | 5.57 -47% | 4.52 -20% |
| Colorchecker dE 2000 max. * | 6.42 | 2.98 54% | 6.67 -4% | 9.54 -49% | 20.6 -221% | 18.67 -191% |
| Colorchecker dE 2000 calibrated * | 3.94 | 1.02 74% | 0.74 81% | 1.36 65% | 4.63 -18% | 1.55 61% |
| Greyscale dE 2000 * | 2.16 | 2.2 -2% | 4.7 -118% | 5.2 -141% | 3.19 -48% | 4.1 -90% |
| Gamma | 2.33 94% | 2.228 99% | 2.244 98% | 2.074 106% | 2.45 90% | 2.3 96% |
| CCT | 6906 94% | 6228 104% | 6897 94% | 6911 94% | 6146 106% | 6529 100% |
| Média Total (Programa/Configurações) | 39% /
37% | 44% /
26% | 32% /
14% | -41% /
-32% | -30% /
-19% |
* ... menor é melhor
No estado de entrega, a reprodução da cor do display é muito decente, com o desvio de 3,8 apenas faltando o alvo de DeltaE < 3. Enquanto uma calibração aumenta o desvio da cor, ela também garante uma escala de cinza mais equilibrada.
O painel não pode cobrir os espaços de cor AdobeRGB (44%), sRGB (63%), e DCI-P3 (42%). Portanto, ele não é adequado para cenários de aplicação que dependem da precisão da cor. Os concorrentes, tais como o Asus TUF Gaming A16 FA617e XMG Fusion 15são mais adequados aqui, e seus displays são capazes de cobrir o espaço de cor sRGB.
Exibir tempos de resposta
| ↔ Tempo de resposta preto para branco | ||
|---|---|---|
| 14 ms ... ascensão ↗ e queda ↘ combinadas | ↗ 7 ms ascensão |  |
| ↘ 7 ms queda | ||
| A tela mostra boas taxas de resposta em nossos testes, mas pode ser muito lenta para jogadores competitivos. Em comparação, todos os dispositivos testados variam de 0.1 (mínimo) a 240 (máximo) ms. » 34 % de todos os dispositivos são melhores. Isso significa que o tempo de resposta medido é melhor que a média de todos os dispositivos testados (19.8 ms). | ||
| ↔ Tempo de resposta 50% cinza a 80% cinza | ||
| 22 ms ... ascensão ↗ e queda ↘ combinadas | ↗ 9 ms ascensão | 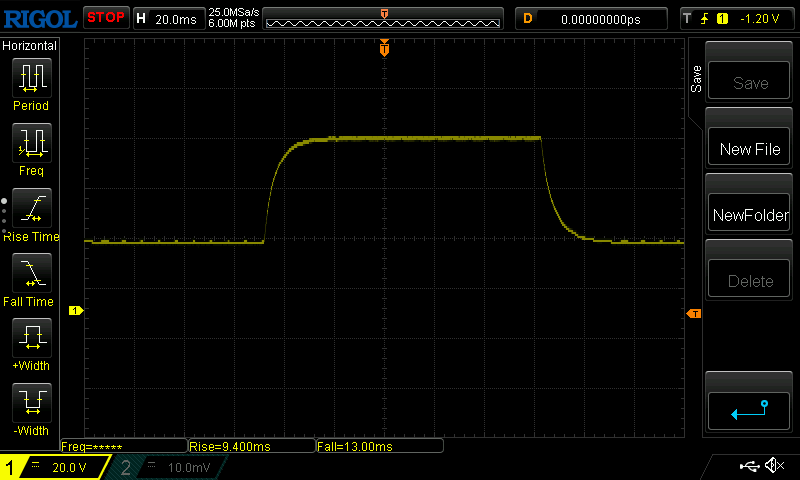 |
| ↘ 13 ms queda | ||
| A tela mostra boas taxas de resposta em nossos testes, mas pode ser muito lenta para jogadores competitivos. Em comparação, todos os dispositivos testados variam de 0.165 (mínimo) a 636 (máximo) ms. » 34 % de todos os dispositivos são melhores. Isso significa que o tempo de resposta medido é melhor que a média de todos os dispositivos testados (31 ms). | ||
Cintilação da tela / PWM (modulação por largura de pulso)
| Tela tremeluzindo / PWM não detectado |  | ||
[pwm_comparison] Em comparação: 52 % de todos os dispositivos testados não usam PWM para escurecer a tela. Se PWM foi detectado, uma média de 7757 (mínimo: 5 - máximo: 343500) Hz foi medida. | |||
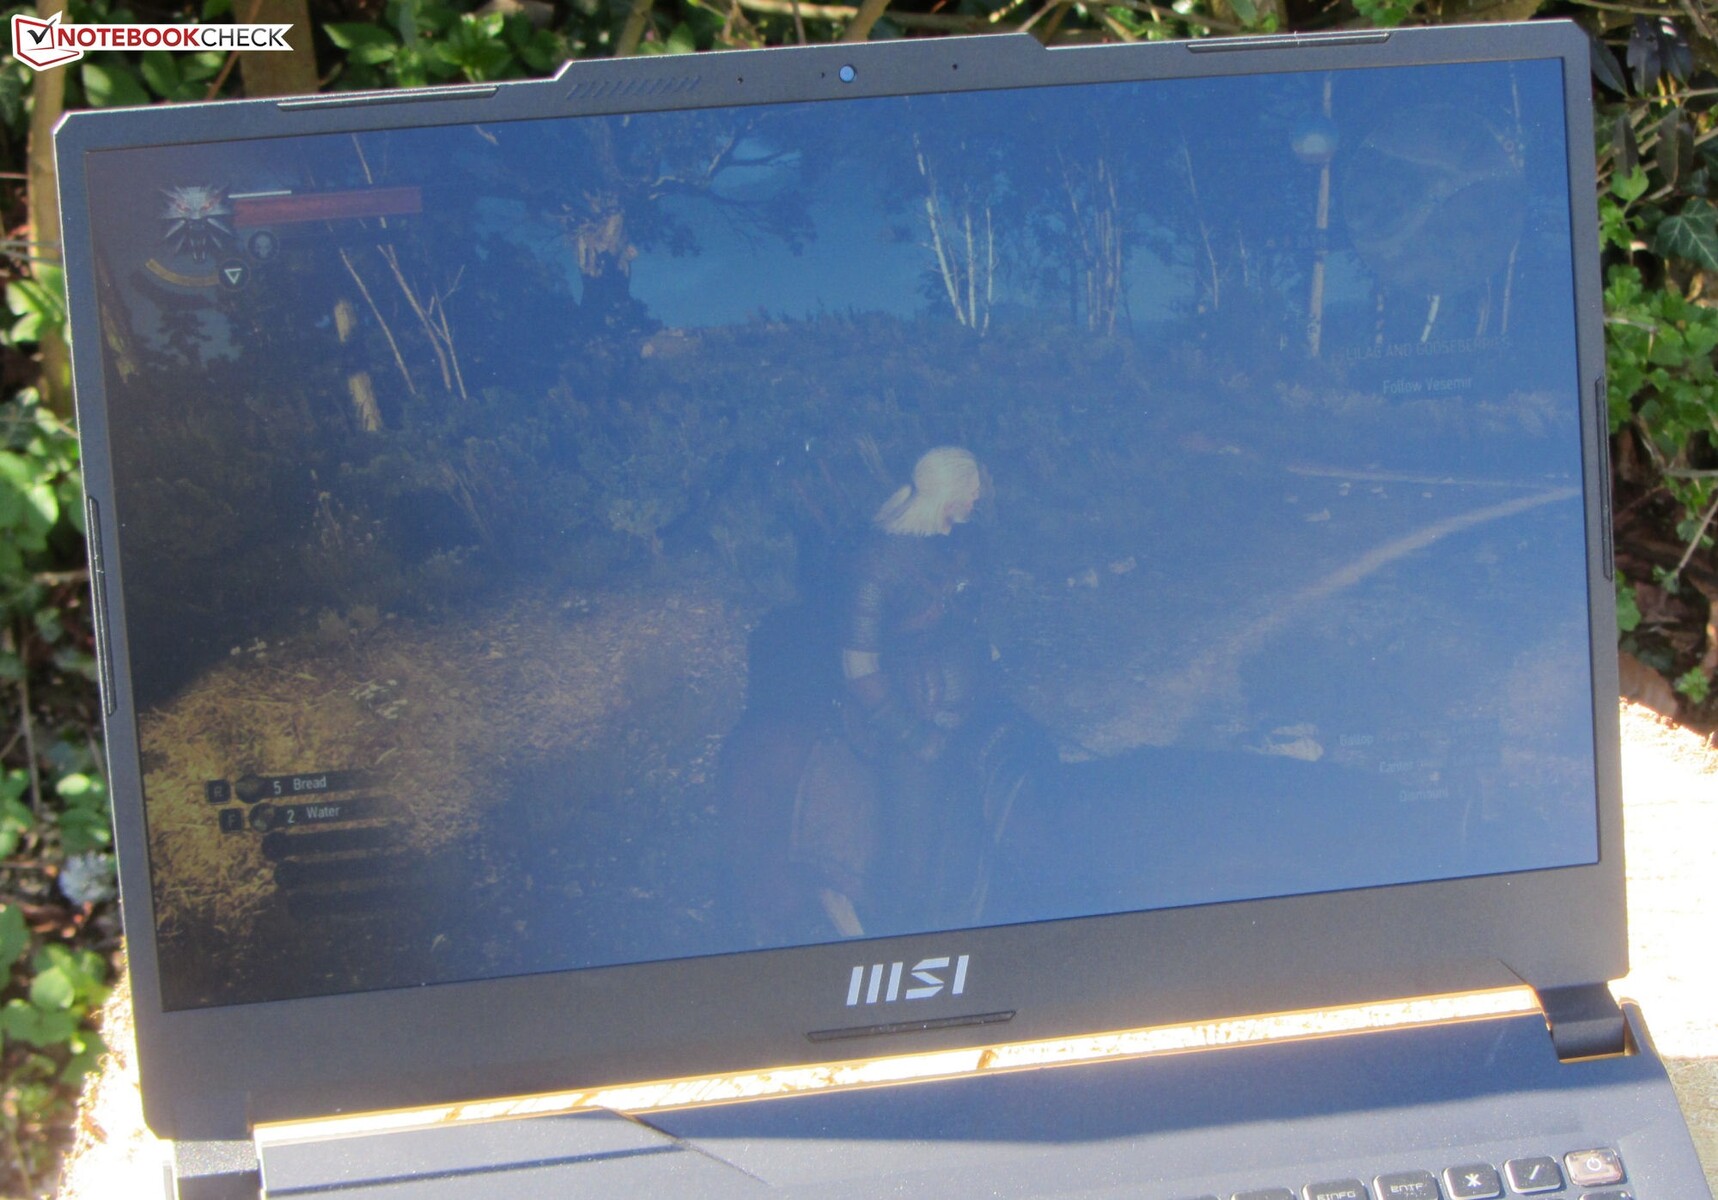
Os ângulos de visão do painel IPS são estáveis, e pode ser lido facilmente de qualquer ângulo. Ao ar livre, o conteúdo do display pode ser lido quando o sol não está muito claro.

Desempenho - Alder Lake e Ada Lovelace em rédea curta
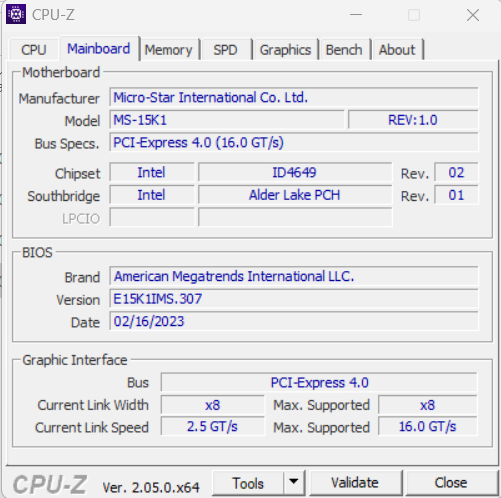
Com a série Cyborg 15 A12VF, a MSI oferece laptops móveis para jogos que utilizam o GeForce Computador portátil RTX 4060núcleo gráfico em uma configuração de baixa potência com um TGP de 45 watts. Isto é acompanhado por processadores Alder Lake da Intel. Os preços dos modelos A12VF disponíveis no momento deste teste variam entre cerca de 1.250 e 1.800 Euros (~$1.382 - $1.989). O preço da nossa unidade de teste está na parte superior desta escala.
Condições de teste
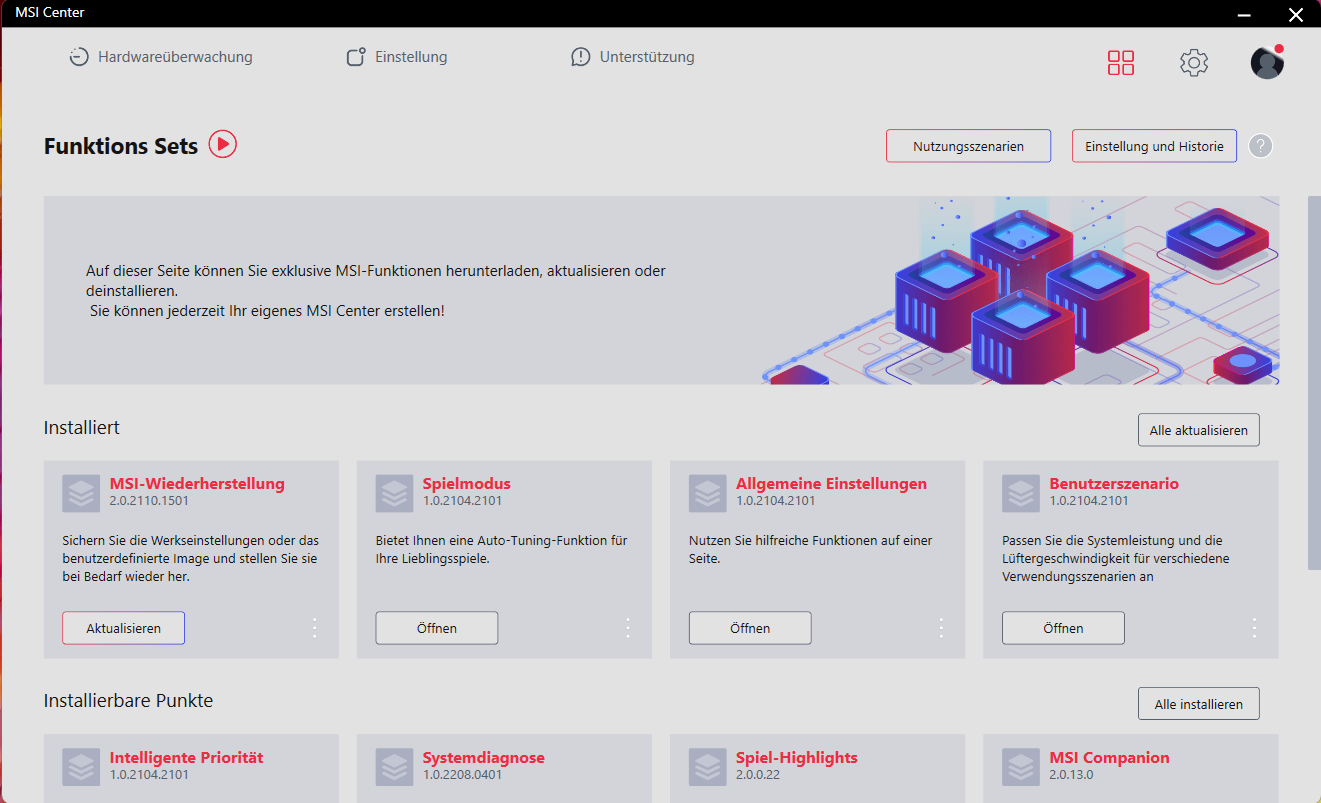
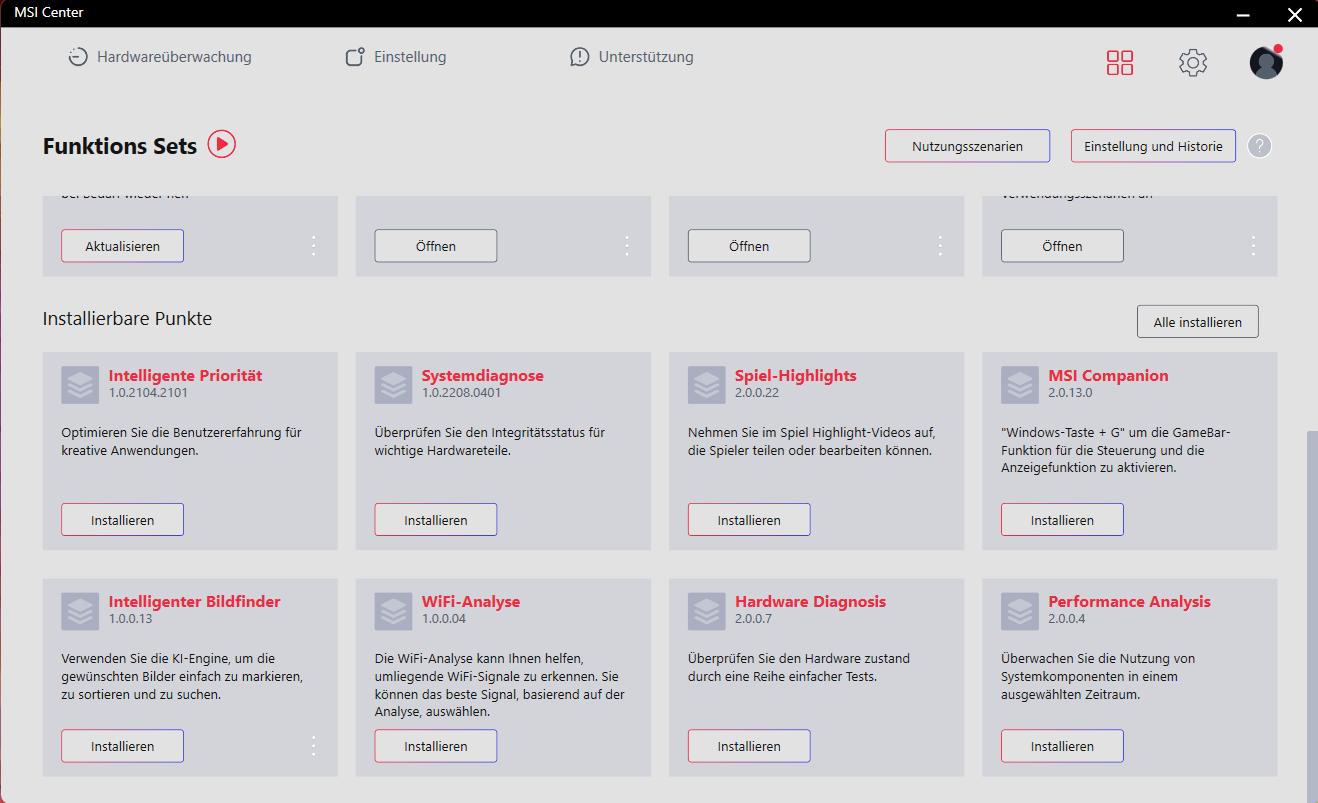
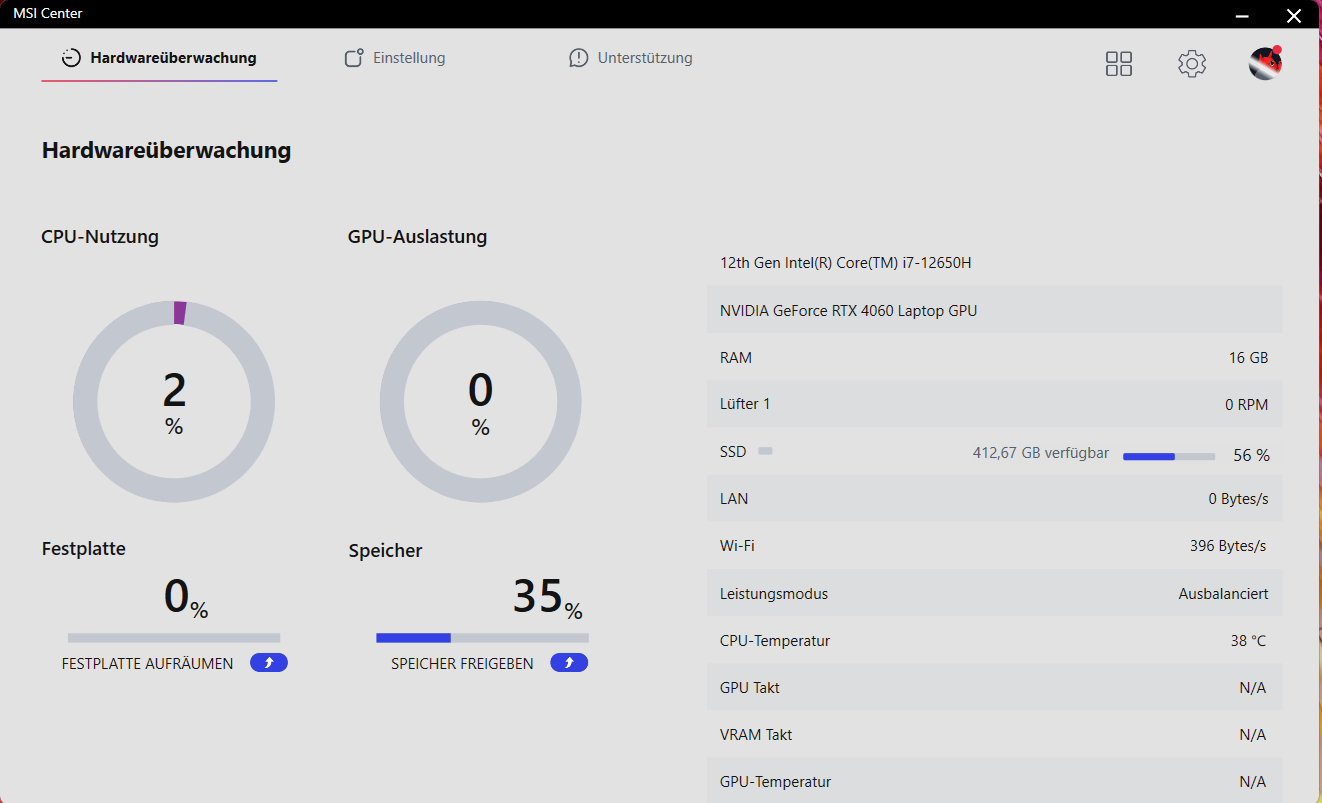
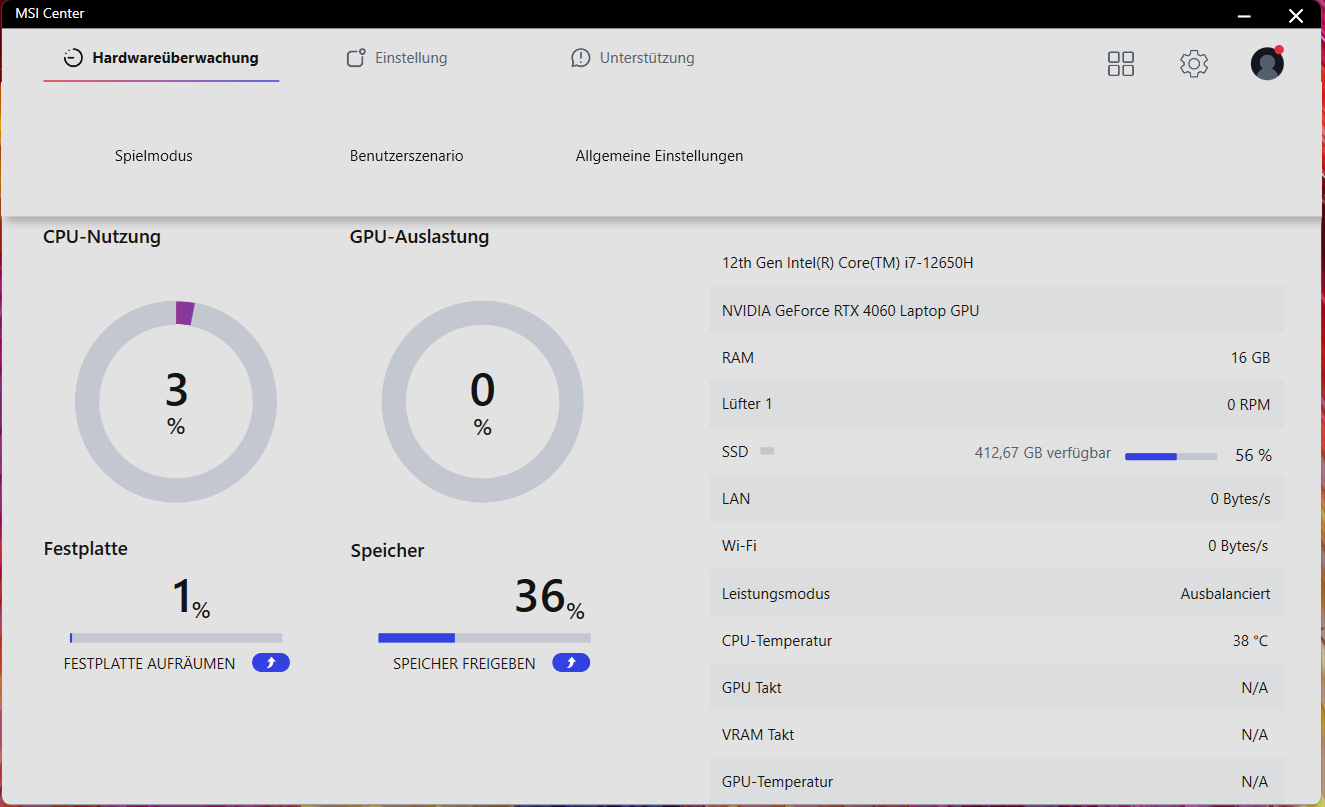
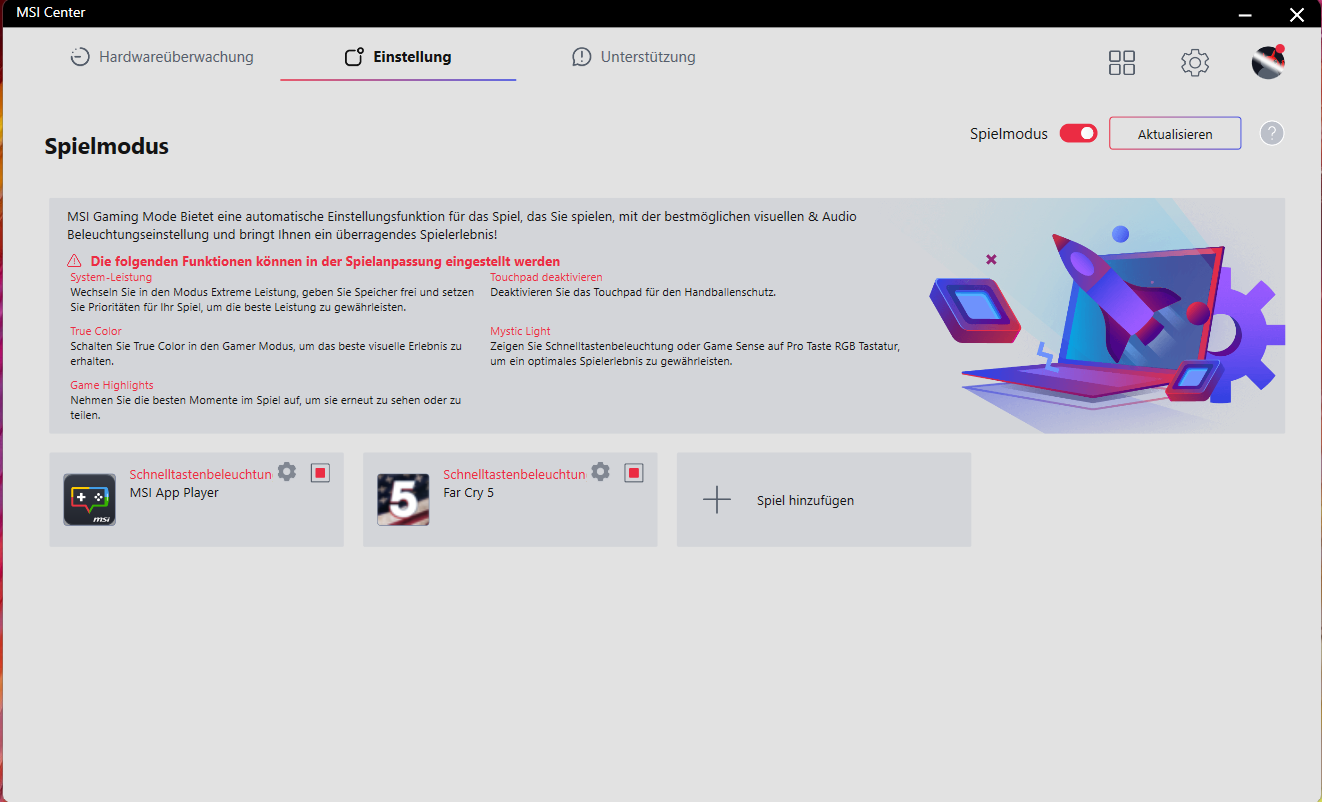
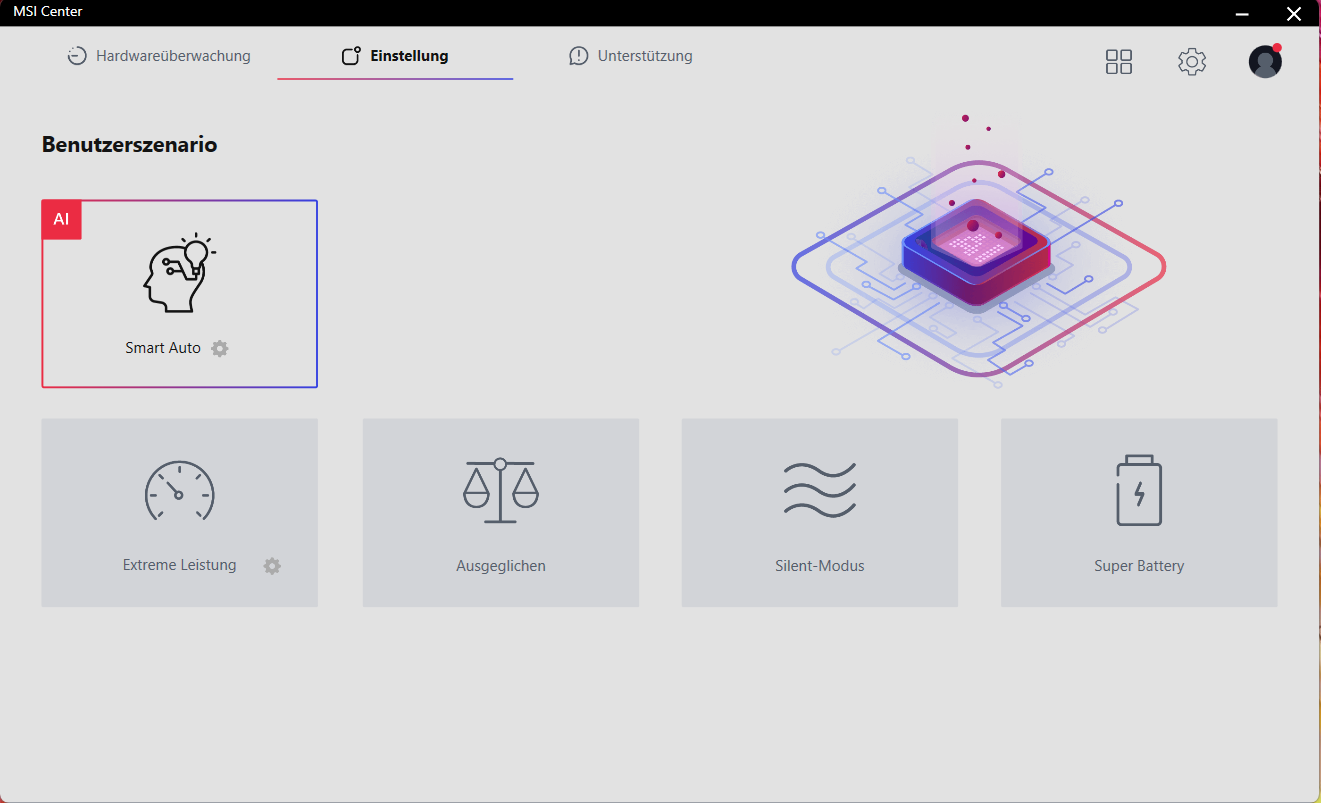
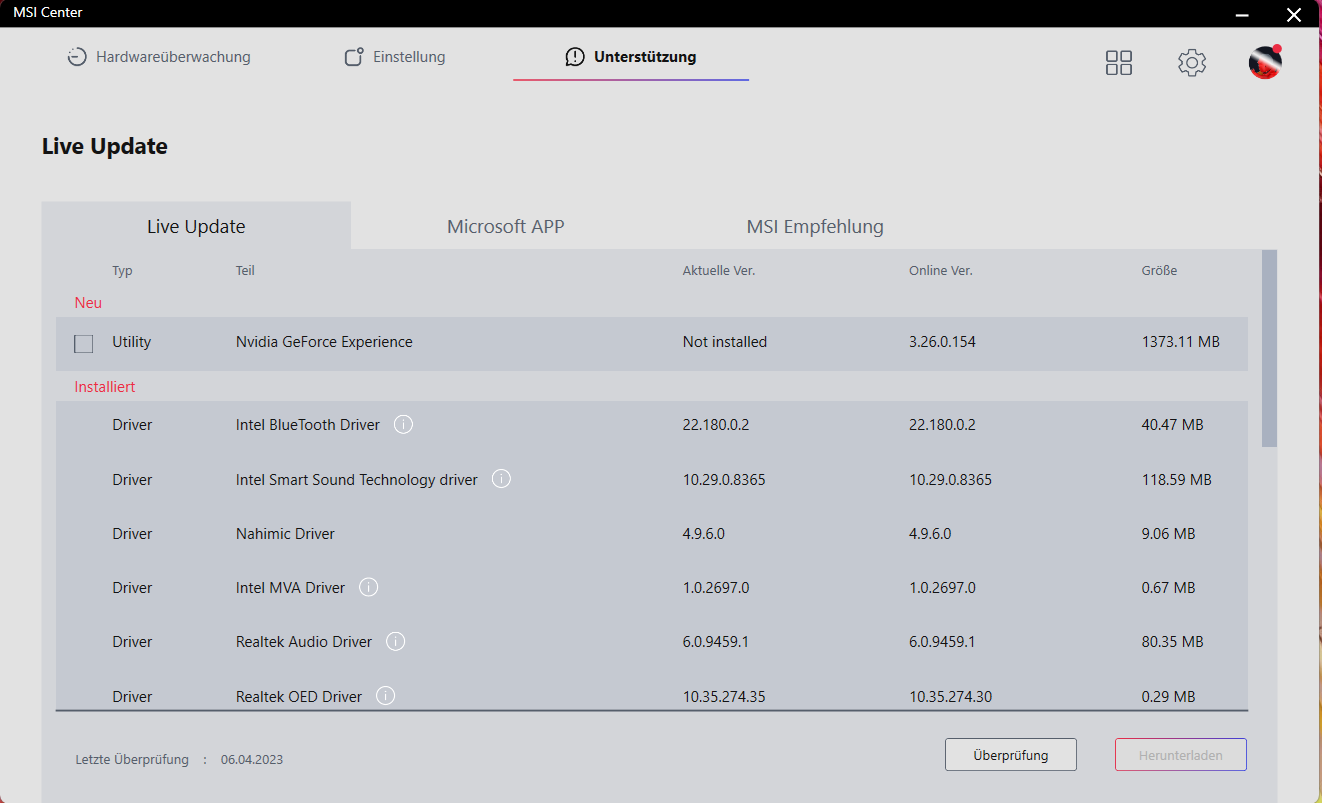
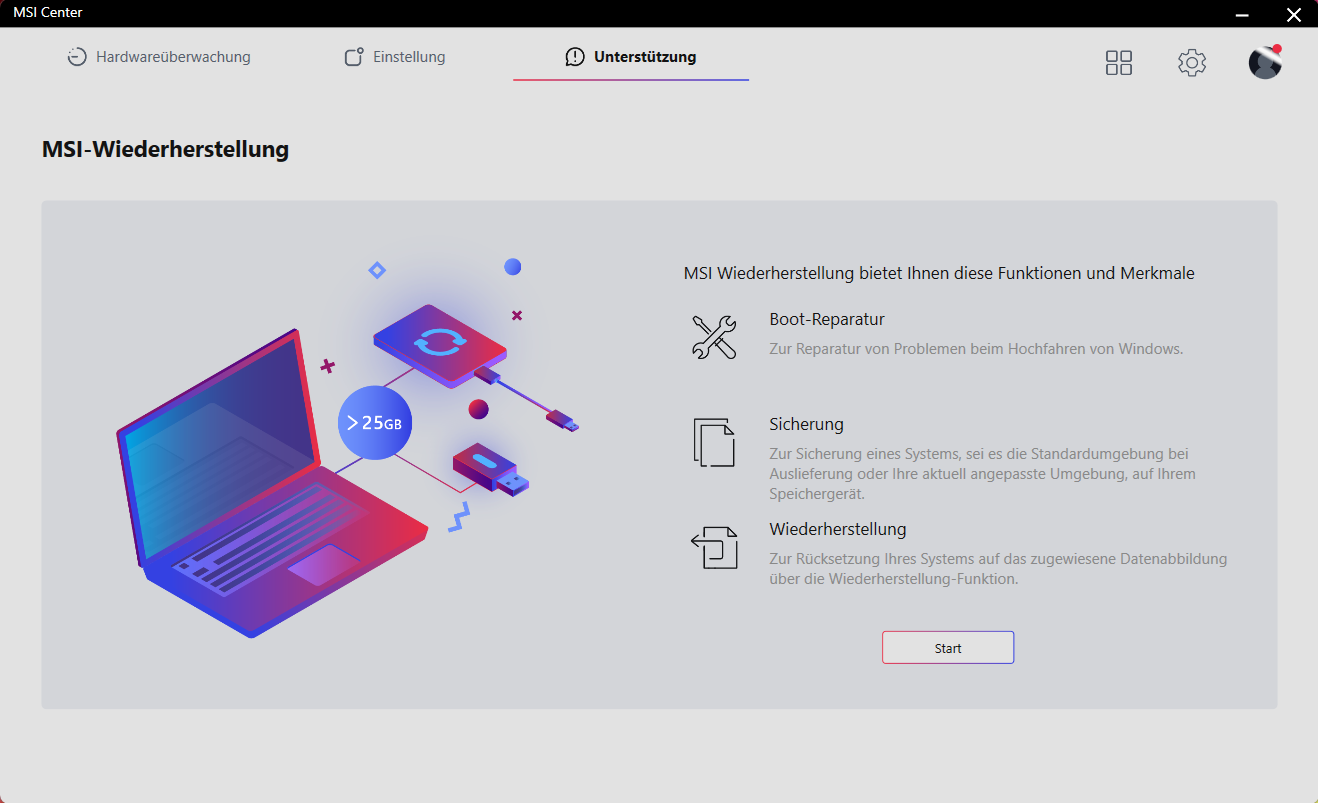
O software pré-instalado MSI Center (ver fotos) ou a combinação de teclas "Fn" + "F7" permite alternar entre os quatro perfis de desempenho (ver tabela abaixo). Utilizamos o perfil "Extreme Performance" para os benchmarks e "Super Battery" para os testes de bateria. Alternativamente, também está disponível uma função "Automático Inteligente" baseada em IA que seleciona automaticamente o perfil que melhor se adapta ao cenário de uso atual.
| Desempenho extremo | Balanceado | Modo Silencioso | Super Bateria | |
|---|---|---|---|---|
| Limite de potência 1 | 55 Watt | 45 Watt | 20 Watt | 15 Watt |
| Limite de potência 2 | 78 Watt | 70 Watt | 20 Watt | 15 Watt |
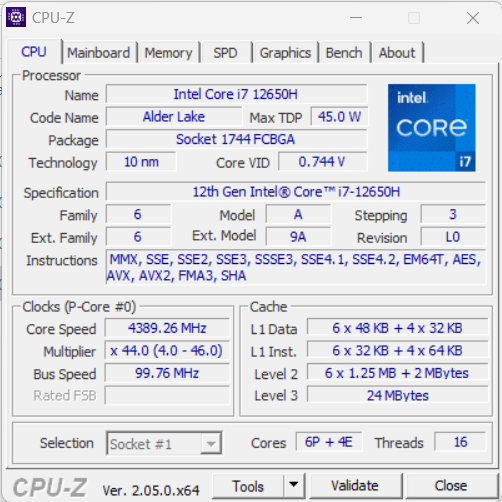
Processador
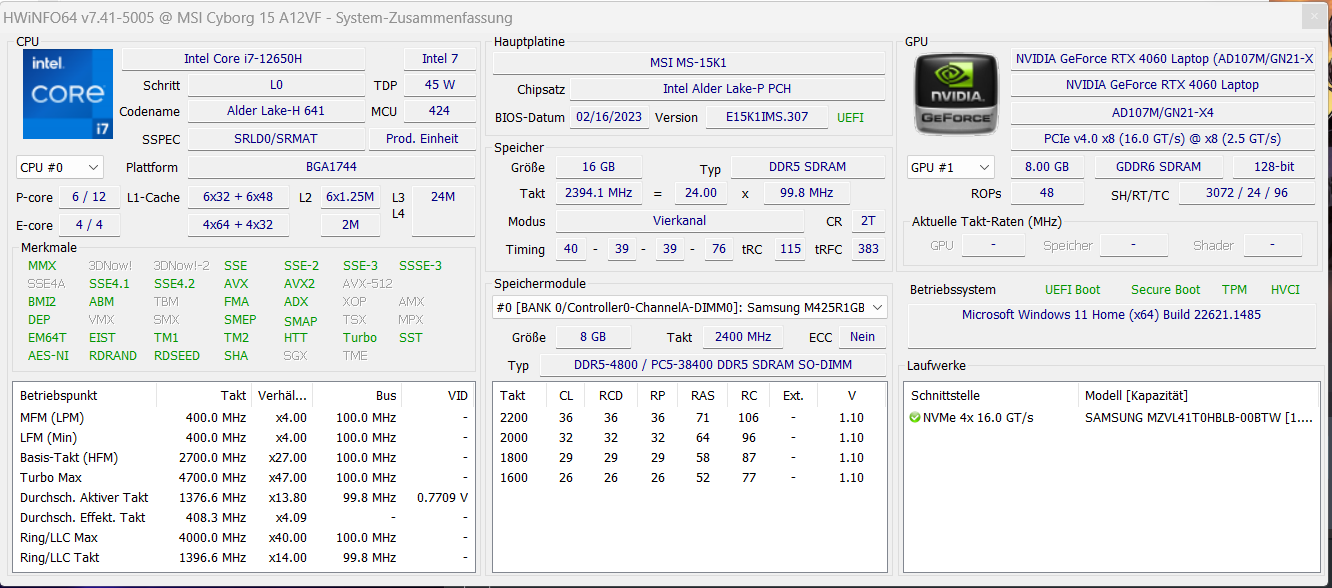
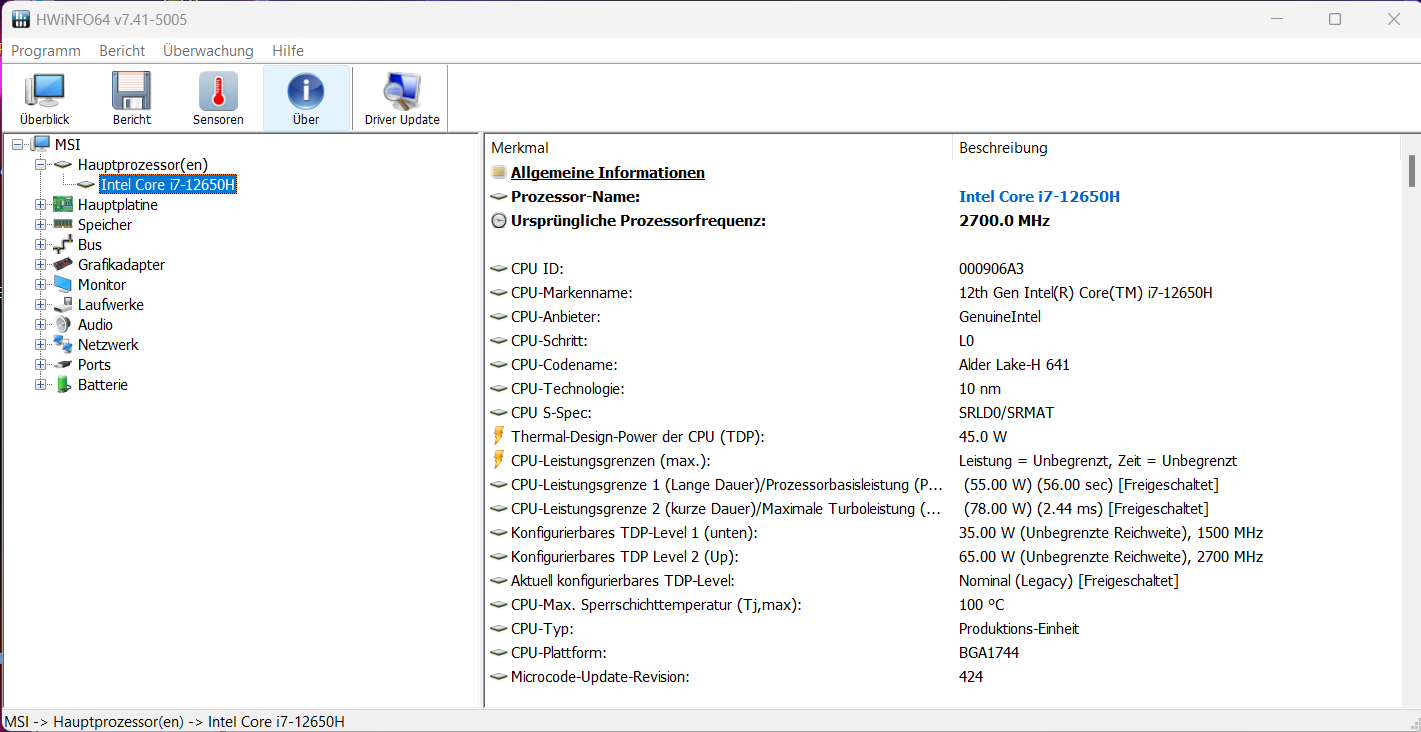
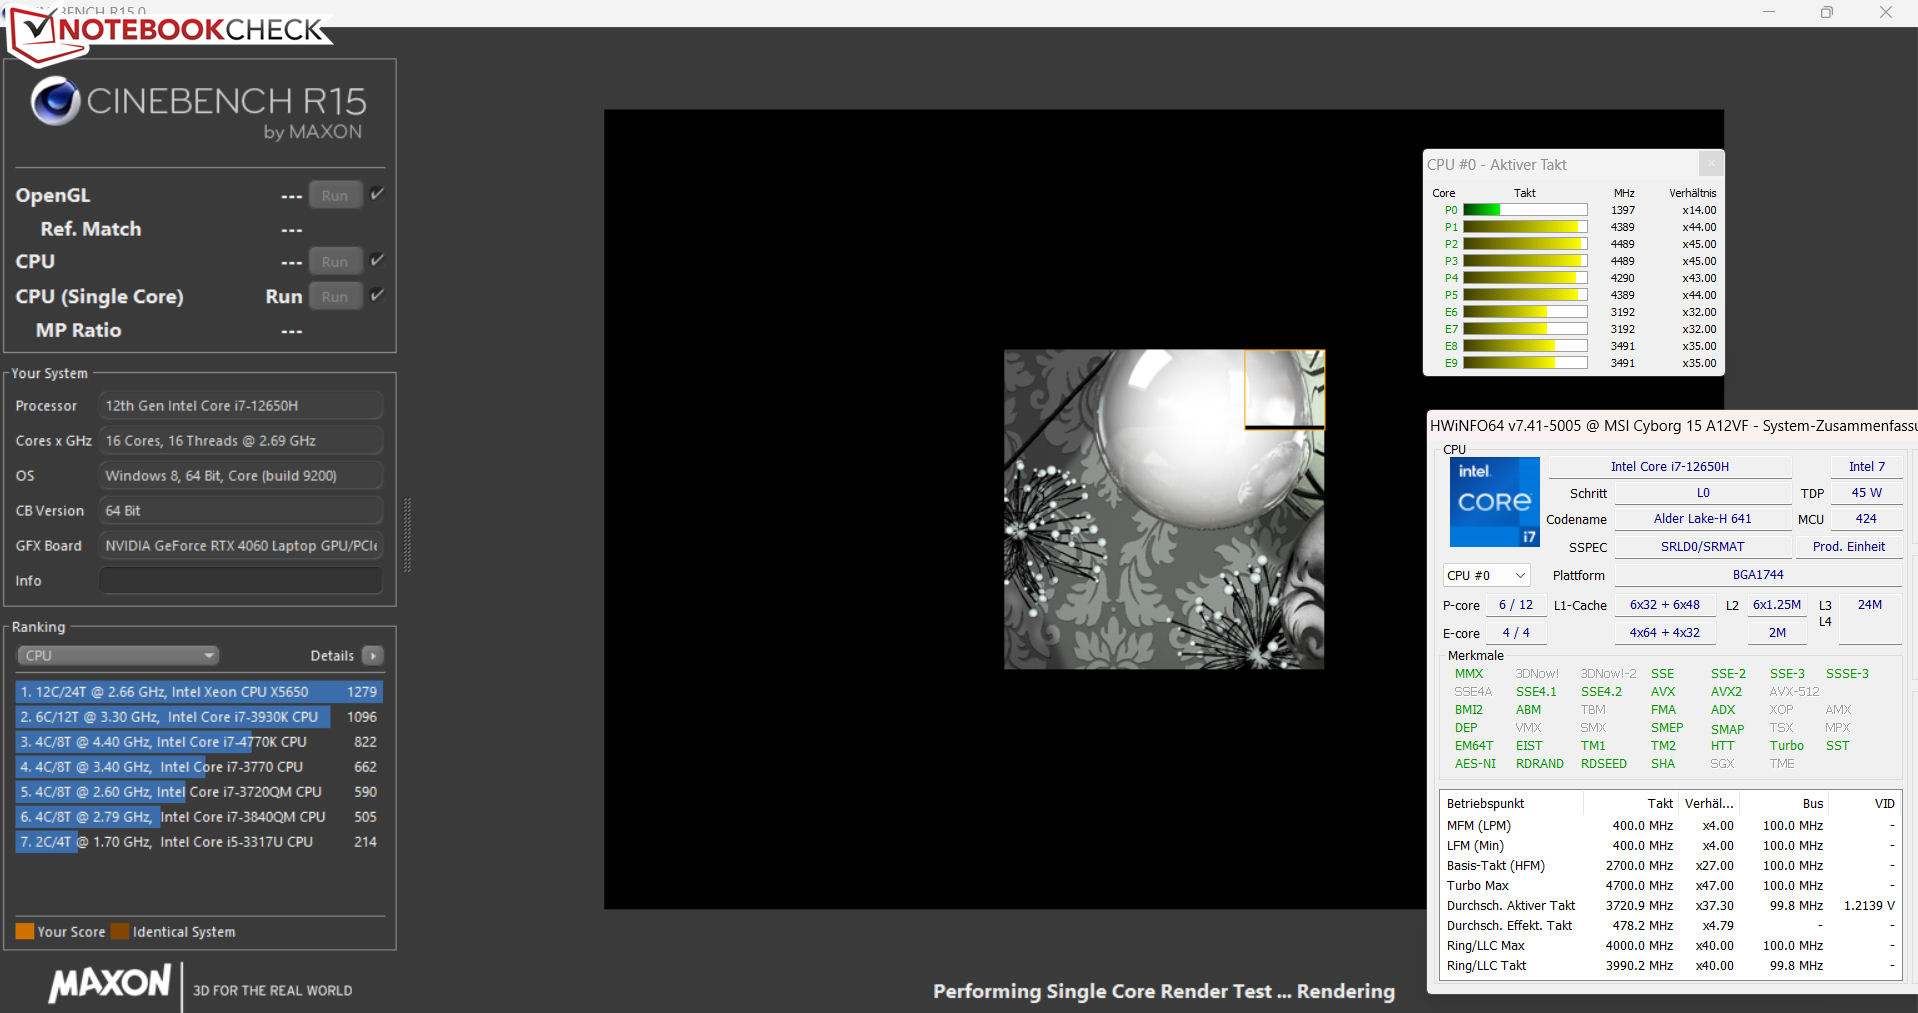
ONúcleo i7-12650Ho processador Alder Lake consiste em seis núcleos de Performance (hyperthreading, 2,3 a 4,7 GHz) e quatro núcleos de Eficiência (sem hyperthreading, 1,7 a 3,5 GHz), resultando em um total de dezesseis núcleos de CPU lógica.
Em operação de rede, a CPU funciona através dos testes da CPU do benchmark Cinebench R15 em velocidades de relógio de média-alta a alta (multi-tarefa) e alta a máxima (mono-fios). Na operação com bateria, o desempenho de rosca única cai ligeiramente (205 pontos), e o desempenho de rosca múltipla cai mais significativamente (994 pontos). De modo geral, os resultados de referência variam ligeiramente acima da média para a CPU que determinamos até agora.
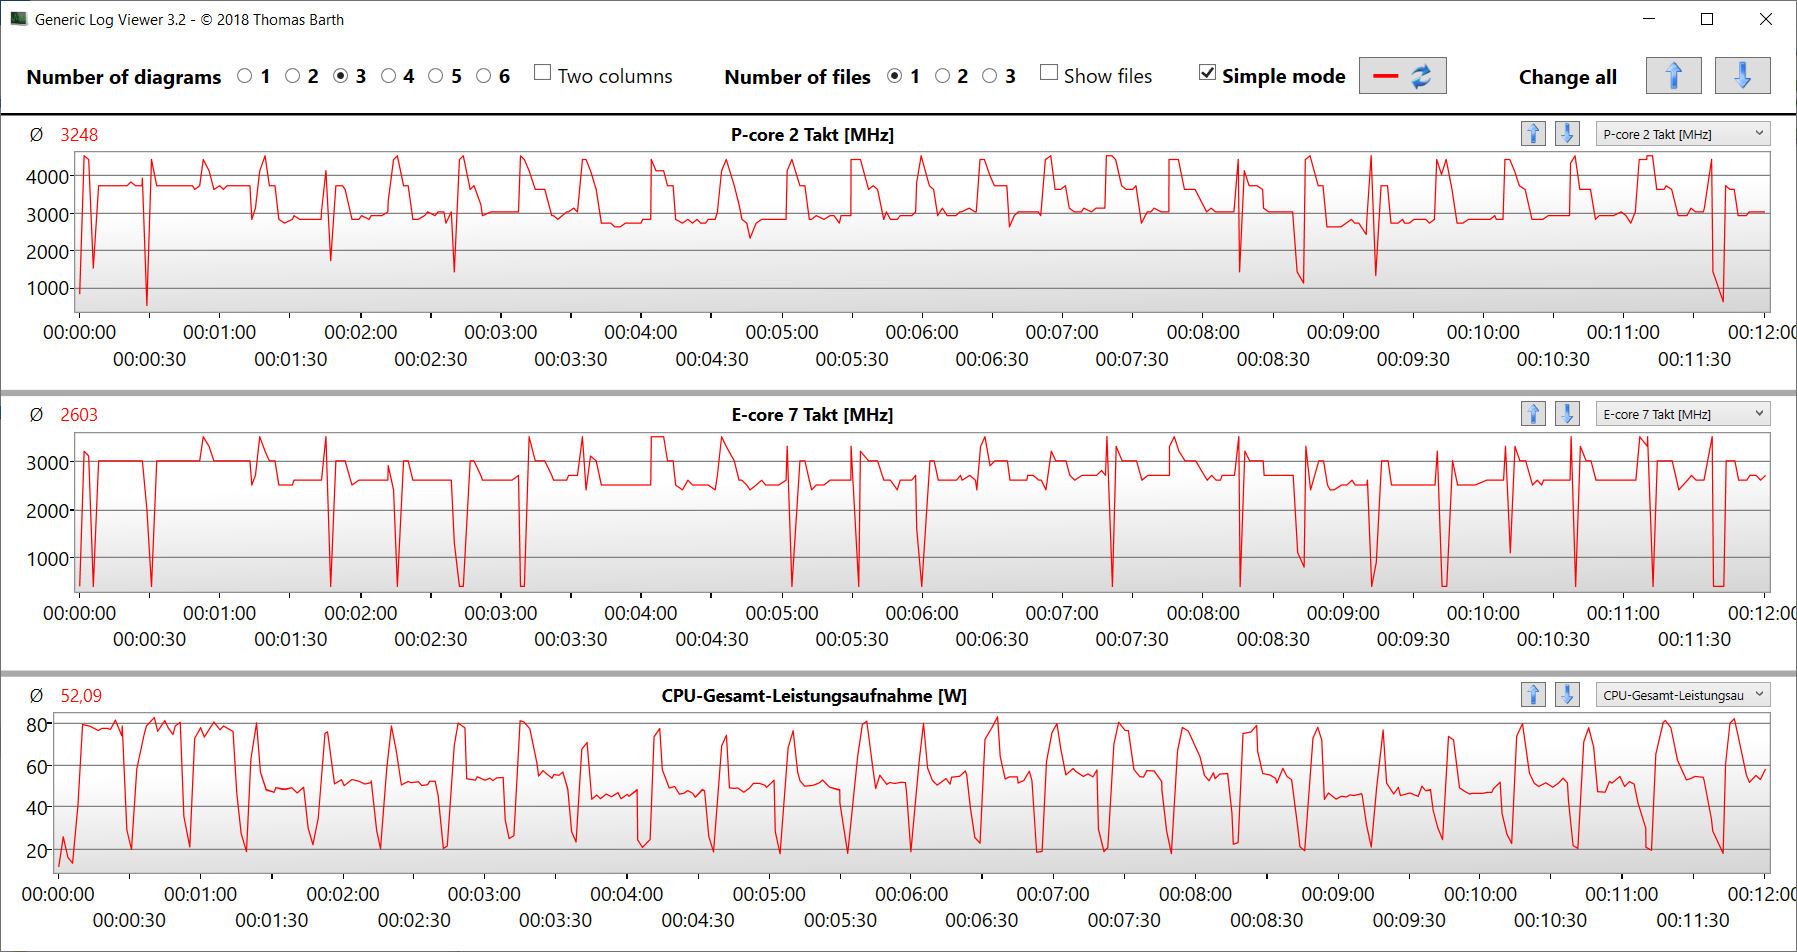
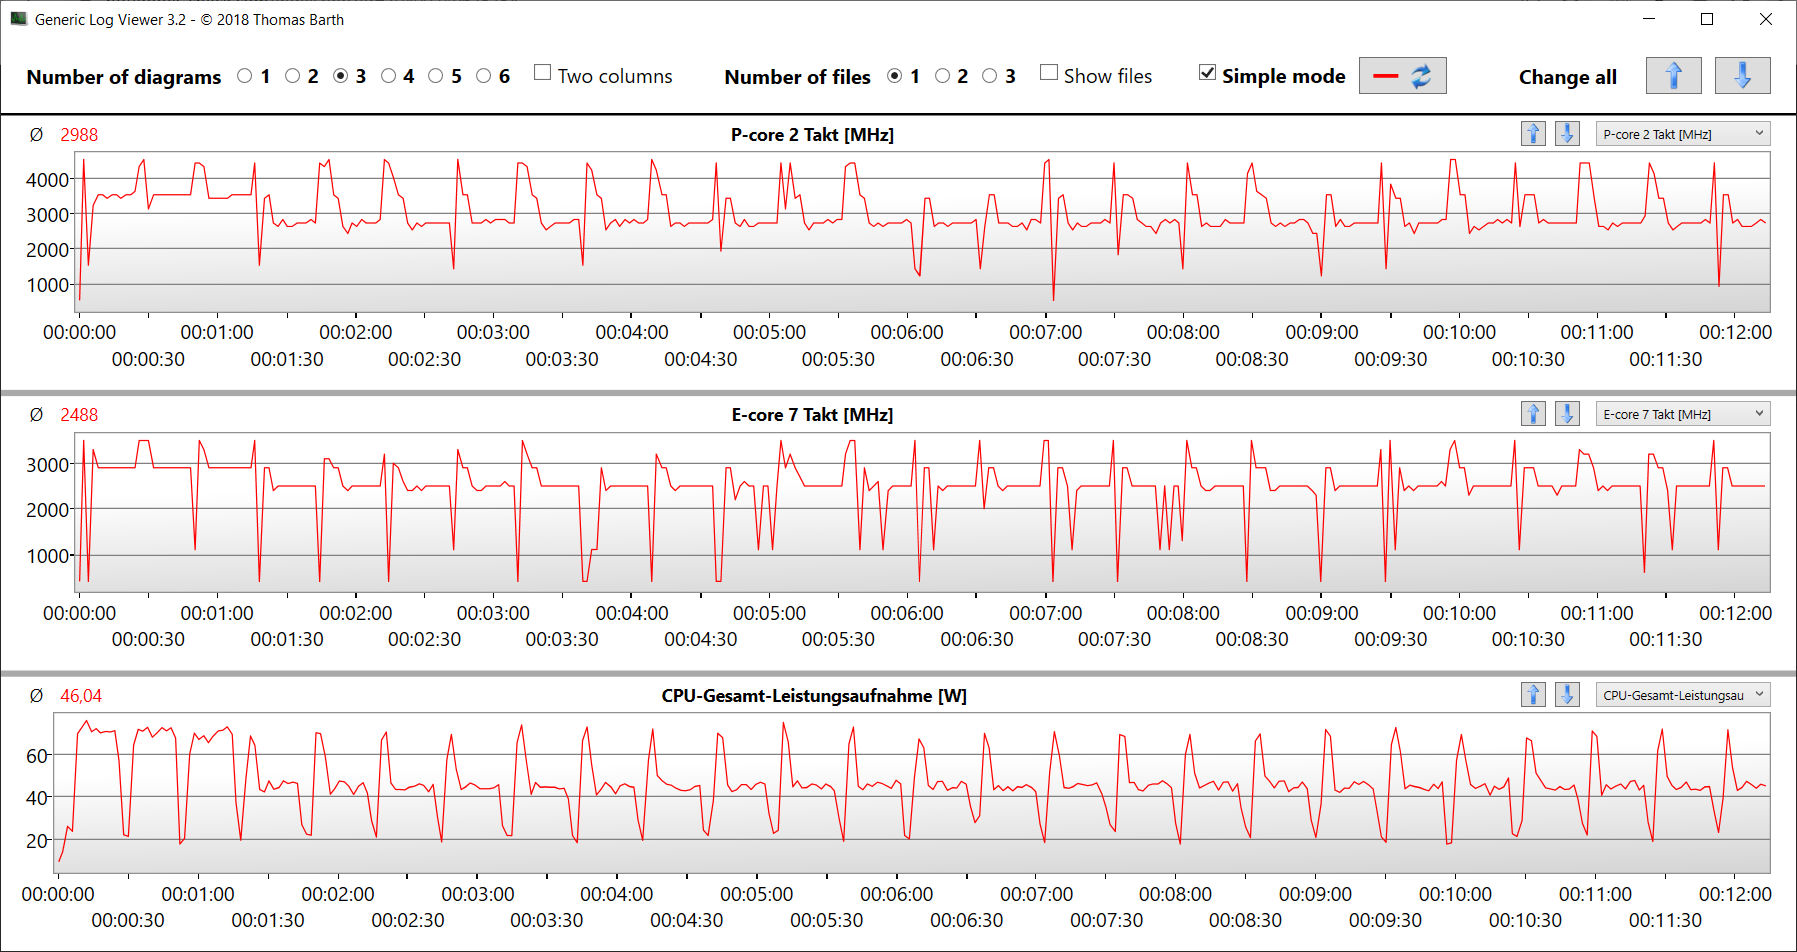
O teste de loop CB15 mostra que a carga multi-tarefa constante faz com que a velocidade do Turbo caia ligeiramente após a segunda corrida e que o processador é incapaz de manter um nível constante.
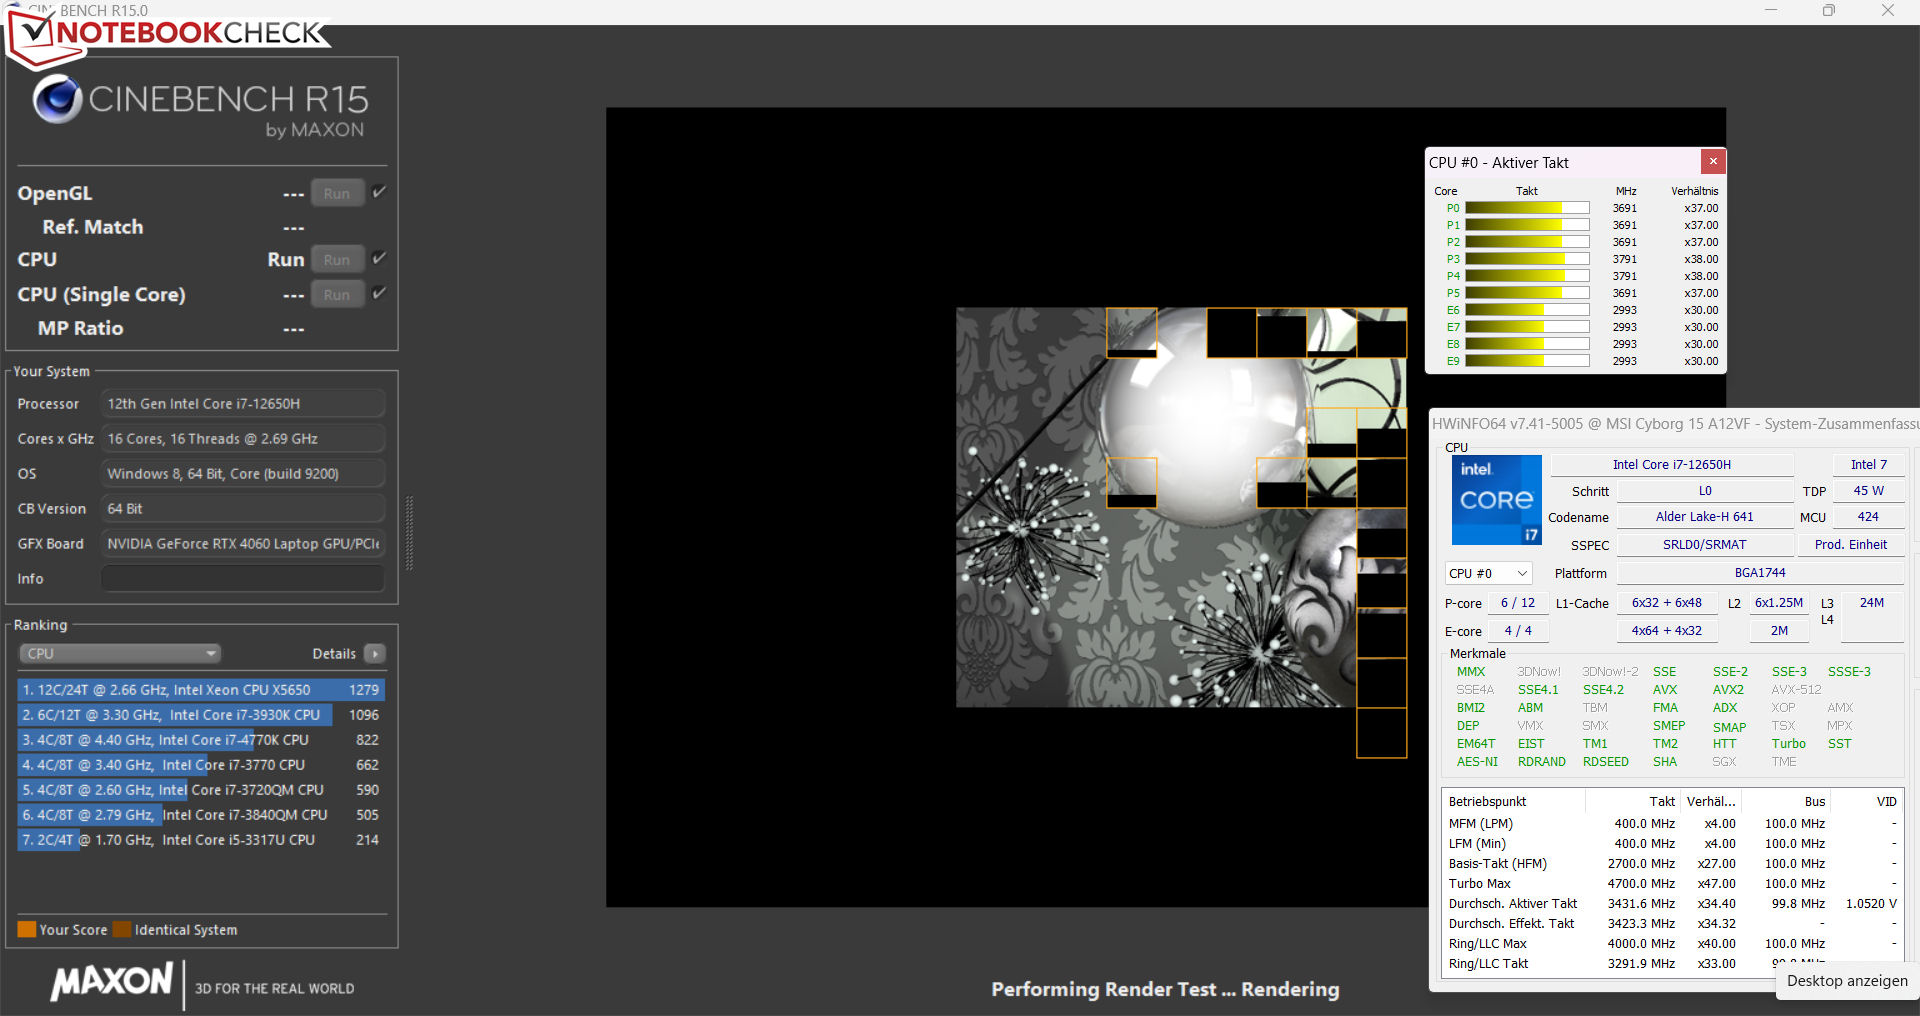
Cinebench R15 Multi Constant Load Test

* ... menor é melhor
AIDA64: FP32 Ray-Trace | FPU Julia | CPU SHA3 | CPU Queen | FPU SinJulia | FPU Mandel | CPU AES | CPU ZLib | FP64 Ray-Trace | CPU PhotoWorxx
| Performance rating | |
| Média da turma Gaming | |
| Asus TUF Gaming A16 FA617 | |
| Aorus 15 XE5 | |
| Schenker XMG Fusion 15 (Mid 22) | |
| MSI Katana 15 B12VEK | |
| MSI Cyborg 15 A12VF | |
| HP Victus 15 fa0020nr | |
| Média Intel Core i7-12650H | |
| AIDA64 / FP32 Ray-Trace | |
| Média da turma Gaming (10227 - 85542, n=105, últimos 2 anos) | |
| Asus TUF Gaming A16 FA617 | |
| MSI Katana 15 B12VEK | |
| Aorus 15 XE5 | |
| HP Victus 15 fa0020nr | |
| Schenker XMG Fusion 15 (Mid 22) | |
| MSI Cyborg 15 A12VF | |
| Média Intel Core i7-12650H (5422 - 15620, n=14) | |
| AIDA64 / FPU Julia | |
| Média da turma Gaming (51376 - 238426, n=105, últimos 2 anos) | |
| Asus TUF Gaming A16 FA617 | |
| MSI Katana 15 B12VEK | |
| MSI Cyborg 15 A12VF | |
| Aorus 15 XE5 | |
| HP Victus 15 fa0020nr | |
| Schenker XMG Fusion 15 (Mid 22) | |
| Média Intel Core i7-12650H (26386 - 76434, n=14) | |
| AIDA64 / CPU SHA3 | |
| Média da turma Gaming (2180 - 10115, n=105, últimos 2 anos) | |
| Schenker XMG Fusion 15 (Mid 22) | |
| Asus TUF Gaming A16 FA617 | |
| MSI Katana 15 B12VEK | |
| Aorus 15 XE5 | |
| MSI Cyborg 15 A12VF | |
| HP Victus 15 fa0020nr | |
| Média Intel Core i7-12650H (1479 - 3244, n=14) | |
| AIDA64 / CPU Queen | |
| Média da turma Gaming (49785 - 173351, n=90, últimos 2 anos) | |
| Asus TUF Gaming A16 FA617 | |
| Aorus 15 XE5 | |
| HP Victus 15 fa0020nr | |
| MSI Katana 15 B12VEK | |
| Schenker XMG Fusion 15 (Mid 22) | |
| MSI Cyborg 15 A12VF | |
| Média Intel Core i7-12650H (59278 - 89537, n=14) | |
| AIDA64 / FPU SinJulia | |
| Média da turma Gaming (4424 - 33636, n=105, últimos 2 anos) | |
| Asus TUF Gaming A16 FA617 | |
| Schenker XMG Fusion 15 (Mid 22) | |
| MSI Katana 15 B12VEK | |
| Aorus 15 XE5 | |
| MSI Cyborg 15 A12VF | |
| HP Victus 15 fa0020nr | |
| Média Intel Core i7-12650H (4690 - 8726, n=14) | |
| AIDA64 / FPU Mandel | |
| Média da turma Gaming (25115 - 128721, n=105, últimos 2 anos) | |
| Asus TUF Gaming A16 FA617 | |
| MSI Katana 15 B12VEK | |
| Schenker XMG Fusion 15 (Mid 22) | |
| HP Victus 15 fa0020nr | |
| MSI Cyborg 15 A12VF | |
| Aorus 15 XE5 | |
| Média Intel Core i7-12650H (15001 - 37738, n=14) | |
| AIDA64 / CPU AES | |
| Schenker XMG Fusion 15 (Mid 22) | |
| Aorus 15 XE5 | |
| Média da turma Gaming (39258 - 247074, n=105, últimos 2 anos) | |
| MSI Katana 15 B12VEK | |
| MSI Cyborg 15 A12VF | |
| Asus TUF Gaming A16 FA617 | |
| HP Victus 15 fa0020nr | |
| Média Intel Core i7-12650H (32702 - 92530, n=14) | |
| AIDA64 / CPU ZLib | |
| Média da turma Gaming (574 - 2531, n=105, últimos 2 anos) | |
| MSI Cyborg 15 A12VF | |
| Asus TUF Gaming A16 FA617 | |
| MSI Katana 15 B12VEK | |
| Aorus 15 XE5 | |
| HP Victus 15 fa0020nr | |
| Média Intel Core i7-12650H (443 - 891, n=14) | |
| Schenker XMG Fusion 15 (Mid 22) | |
| AIDA64 / FP64 Ray-Trace | |
| Média da turma Gaming (5509 - 45446, n=105, últimos 2 anos) | |
| Asus TUF Gaming A16 FA617 | |
| MSI Katana 15 B12VEK | |
| Schenker XMG Fusion 15 (Mid 22) | |
| Aorus 15 XE5 | |
| HP Victus 15 fa0020nr | |
| MSI Cyborg 15 A12VF | |
| Média Intel Core i7-12650H (3096 - 8448, n=14) | |
| AIDA64 / CPU PhotoWorxx | |
| Média da turma Gaming (12271 - 89891, n=105, últimos 2 anos) | |
| MSI Katana 15 B12VEK | |
| MSI Cyborg 15 A12VF | |
| Aorus 15 XE5 | |
| Média Intel Core i7-12650H (22046 - 44164, n=14) | |
| Asus TUF Gaming A16 FA617 | |
| Schenker XMG Fusion 15 (Mid 22) | |
| HP Victus 15 fa0020nr | |
Desempenho do sistema
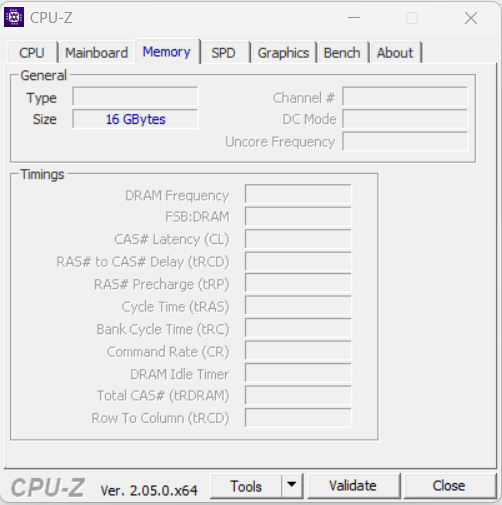
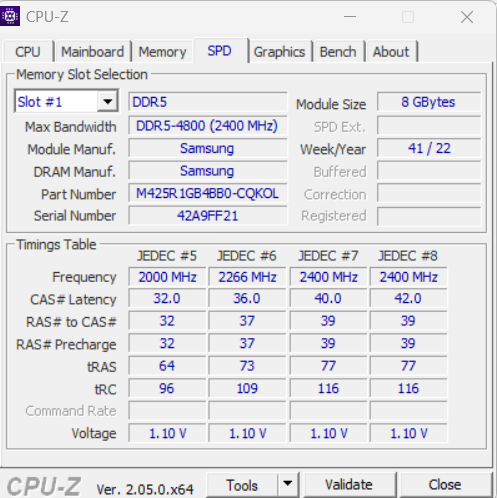
Não se pode esperar um desempenho extremo do sistema que funciona sem problemas, pois ele se concentra mais em outros aspectos como tamanho compacto, mobilidade e um baixo consumo de energia. No entanto, o hardware utilizado é capaz de lidar com áreas de aplicação exigentes, como renderização, processamento de vídeo e jogos. As taxas de transferência da memória de trabalho estão em um nível normal para DDR5-4800 RAM. Elas são acompanhadas de bons resultados PC-Mark.
CrossMark: Overall | Productivity | Creativity | Responsiveness
| PCMark 10 / Score | |
| Média da turma Gaming (5828 - 12414, n=93, últimos 2 anos) | |
| Aorus 15 XE5 | |
| Asus TUF Gaming A16 FA617 | |
| MSI Cyborg 15 A12VF | |
| Média Intel Core i7-12650H, NVIDIA GeForce RTX 4060 Laptop GPU (n=1) | |
| HP Victus 15 fa0020nr | |
| MSI Katana 15 B12VEK | |
| Schenker XMG Fusion 15 (Mid 22) | |
| PCMark 10 / Essentials | |
| Aorus 15 XE5 | |
| MSI Cyborg 15 A12VF | |
| Média Intel Core i7-12650H, NVIDIA GeForce RTX 4060 Laptop GPU (n=1) | |
| Média da turma Gaming (8810 - 11935, n=97, últimos 2 anos) | |
| Asus TUF Gaming A16 FA617 | |
| HP Victus 15 fa0020nr | |
| MSI Katana 15 B12VEK | |
| Schenker XMG Fusion 15 (Mid 22) | |
| PCMark 10 / Productivity | |
| Média da turma Gaming (6845 - 25323, n=95, últimos 2 anos) | |
| Aorus 15 XE5 | |
| MSI Cyborg 15 A12VF | |
| Média Intel Core i7-12650H, NVIDIA GeForce RTX 4060 Laptop GPU (n=1) | |
| MSI Katana 15 B12VEK | |
| Asus TUF Gaming A16 FA617 | |
| HP Victus 15 fa0020nr | |
| Schenker XMG Fusion 15 (Mid 22) | |
| PCMark 10 / Digital Content Creation | |
| Média da turma Gaming (7602 - 19954, n=95, últimos 2 anos) | |
| Aorus 15 XE5 | |
| Asus TUF Gaming A16 FA617 | |
| HP Victus 15 fa0020nr | |
| MSI Cyborg 15 A12VF | |
| Média Intel Core i7-12650H, NVIDIA GeForce RTX 4060 Laptop GPU (n=1) | |
| MSI Katana 15 B12VEK | |
| Schenker XMG Fusion 15 (Mid 22) | |
| CrossMark / Overall | |
| Média da turma Gaming (1366 - 2409, n=94, últimos 2 anos) | |
| Aorus 15 XE5 | |
| MSI Cyborg 15 A12VF | |
| Média Intel Core i7-12650H, NVIDIA GeForce RTX 4060 Laptop GPU (n=1) | |
| MSI Katana 15 B12VEK | |
| Schenker XMG Fusion 15 (Mid 22) | |
| HP Victus 15 fa0020nr | |
| CrossMark / Productivity | |
| Aorus 15 XE5 | |
| Média da turma Gaming (1386 - 2254, n=94, últimos 2 anos) | |
| MSI Cyborg 15 A12VF | |
| Média Intel Core i7-12650H, NVIDIA GeForce RTX 4060 Laptop GPU (n=1) | |
| MSI Katana 15 B12VEK | |
| Schenker XMG Fusion 15 (Mid 22) | |
| HP Victus 15 fa0020nr | |
| CrossMark / Creativity | |
| Média da turma Gaming (1343 - 2786, n=94, últimos 2 anos) | |
| Aorus 15 XE5 | |
| MSI Cyborg 15 A12VF | |
| Média Intel Core i7-12650H, NVIDIA GeForce RTX 4060 Laptop GPU (n=1) | |
| MSI Katana 15 B12VEK | |
| HP Victus 15 fa0020nr | |
| Schenker XMG Fusion 15 (Mid 22) | |
| CrossMark / Responsiveness | |
| Aorus 15 XE5 | |
| Média da turma Gaming (1226 - 2334, n=94, últimos 2 anos) | |
| MSI Cyborg 15 A12VF | |
| Média Intel Core i7-12650H, NVIDIA GeForce RTX 4060 Laptop GPU (n=1) | |
| Schenker XMG Fusion 15 (Mid 22) | |
| MSI Katana 15 B12VEK | |
| HP Victus 15 fa0020nr | |
| PCMark 8 Home Score Accelerated v2 | 5364 pontos | |
| PCMark 8 Work Score Accelerated v2 | 6432 pontos | |
| PCMark 10 Score | 7098 pontos | |
Ajuda | ||
| AIDA64 / Memory Copy | |
| Média da turma Gaming (21750 - 129946, n=105, últimos 2 anos) | |
| MSI Cyborg 15 A12VF | |
| MSI Katana 15 B12VEK | |
| Média Intel Core i7-12650H (43261 - 69735, n=14) | |
| Aorus 15 XE5 | |
| Asus TUF Gaming A16 FA617 | |
| Schenker XMG Fusion 15 (Mid 22) | |
| HP Victus 15 fa0020nr | |
| AIDA64 / Memory Read | |
| Média da turma Gaming (22956 - 118858, n=105, últimos 2 anos) | |
| MSI Katana 15 B12VEK | |
| MSI Cyborg 15 A12VF | |
| Aorus 15 XE5 | |
| Média Intel Core i7-12650H (47313 - 67412, n=14) | |
| Asus TUF Gaming A16 FA617 | |
| Schenker XMG Fusion 15 (Mid 22) | |
| HP Victus 15 fa0020nr | |
| AIDA64 / Memory Write | |
| Média da turma Gaming (22297 - 135096, n=105, últimos 2 anos) | |
| Aorus 15 XE5 | |
| MSI Katana 15 B12VEK | |
| MSI Cyborg 15 A12VF | |
| Asus TUF Gaming A16 FA617 | |
| Média Intel Core i7-12650H (45617 - 59361, n=14) | |
| Schenker XMG Fusion 15 (Mid 22) | |
| HP Victus 15 fa0020nr | |
| AIDA64 / Memory Latency | |
| Média da turma Gaming (75.3 - 259, n=105, últimos 2 anos) | |
| Aorus 15 XE5 | |
| MSI Katana 15 B12VEK | |
| Schenker XMG Fusion 15 (Mid 22) | |
| MSI Cyborg 15 A12VF | |
| Asus TUF Gaming A16 FA617 | |
| Média Intel Core i7-12650H (71.6 - 103.9, n=14) | |
| HP Victus 15 fa0020nr | |
* ... menor é melhor
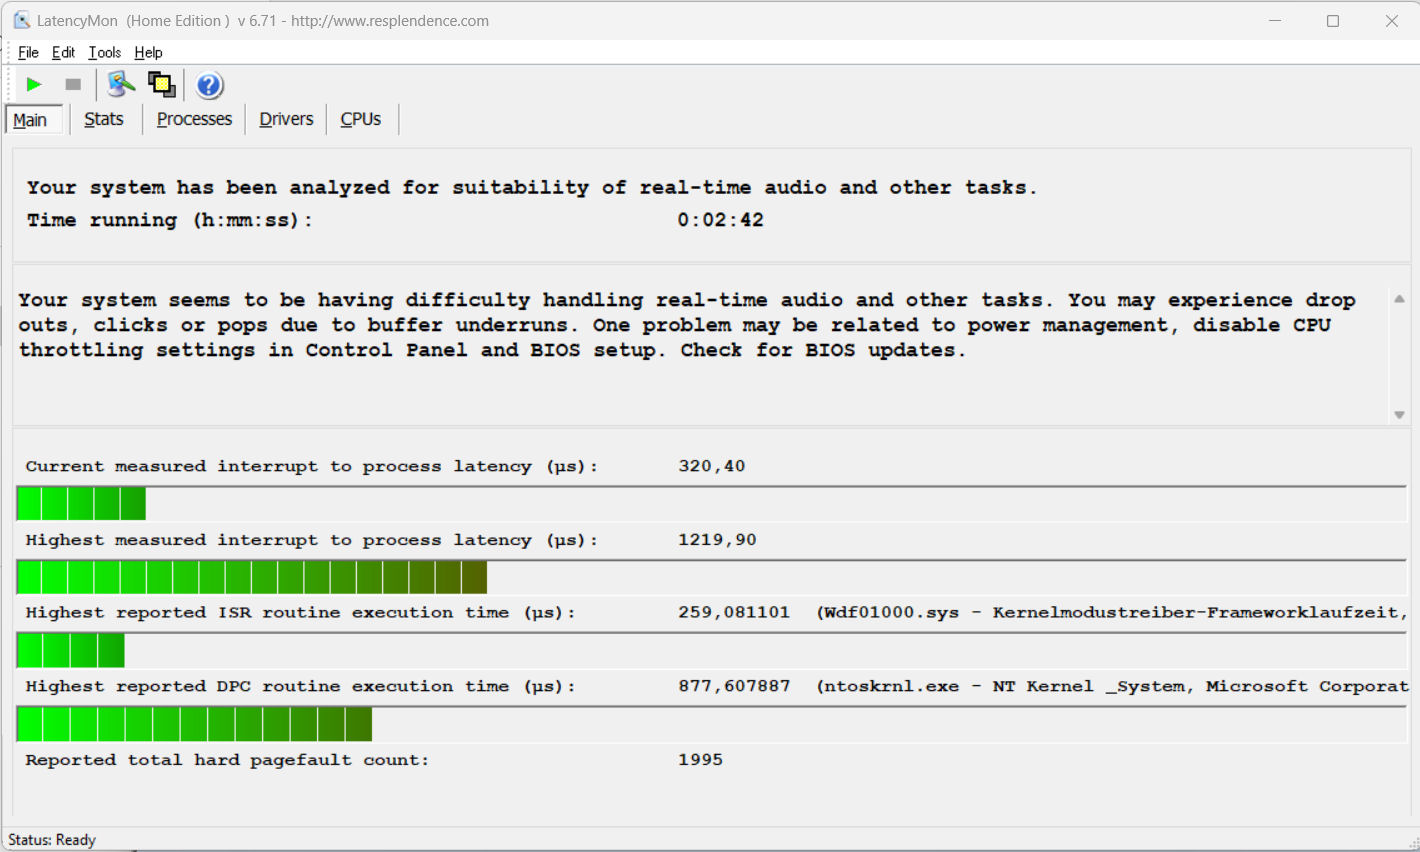
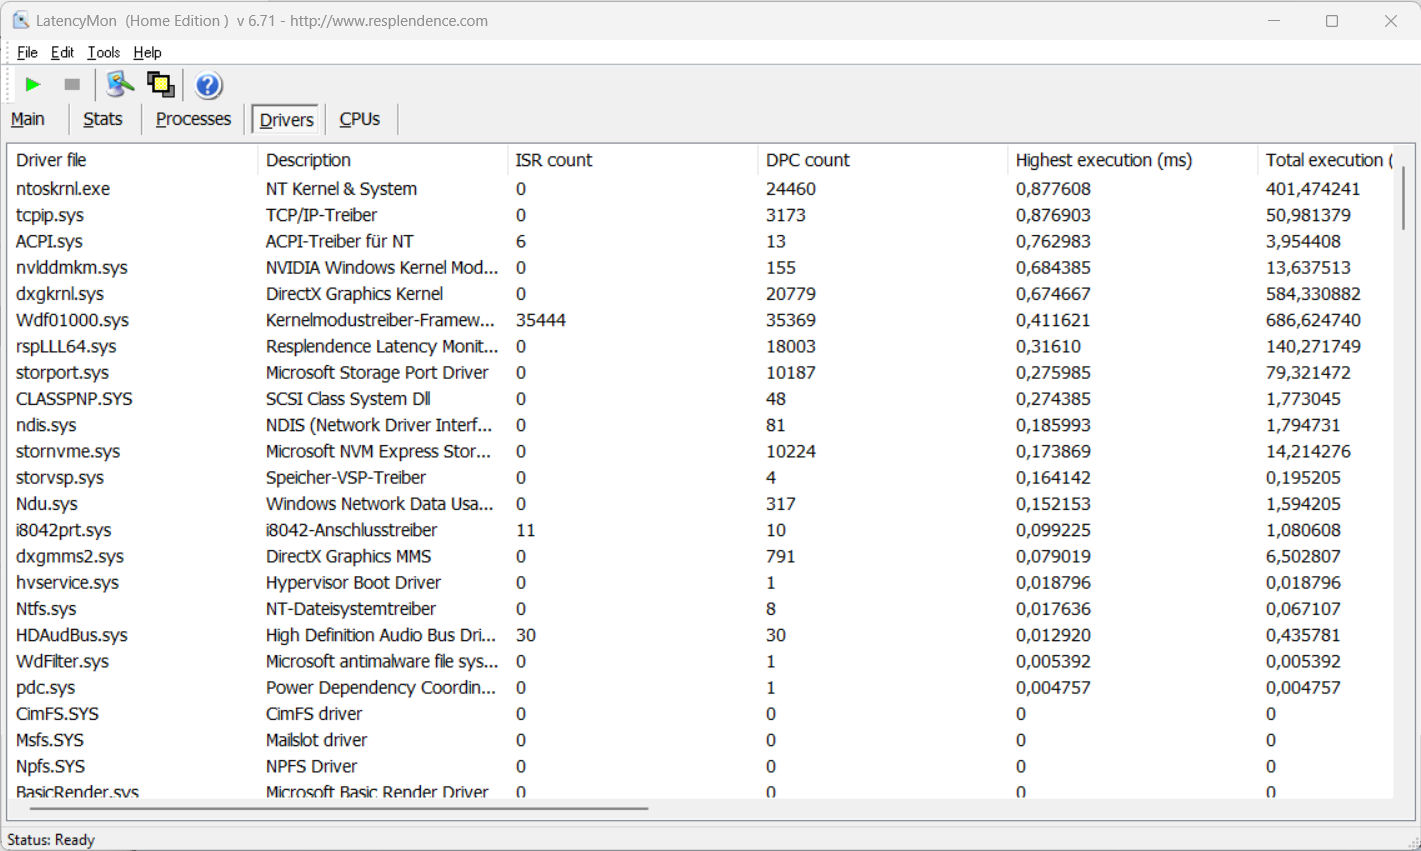
Latências DPC
O teste padronizado do Monitor de Latência (navegação na web, reprodução de vídeo 4k, carga alta Prime95) revela algumas latências notáveis, e o sistema não parece adequado para o processamento de vídeo e áudio em tempo real. Futuras atualizações de software podem levar a algumas melhorias ou mesmo piorar as coisas.
| DPC Latencies / LatencyMon - interrupt to process latency (max), Web, Youtube, Prime95 | |
| MSI Katana 15 B12VEK | |
| Schenker XMG Fusion 15 (Mid 22) | |
| HP Victus 15 fa0020nr | |
| MSI Cyborg 15 A12VF | |
| Aorus 15 XE5 | |
| Asus TUF Gaming A16 FA617 | |
* ... menor é melhor
Solução de armazenamento
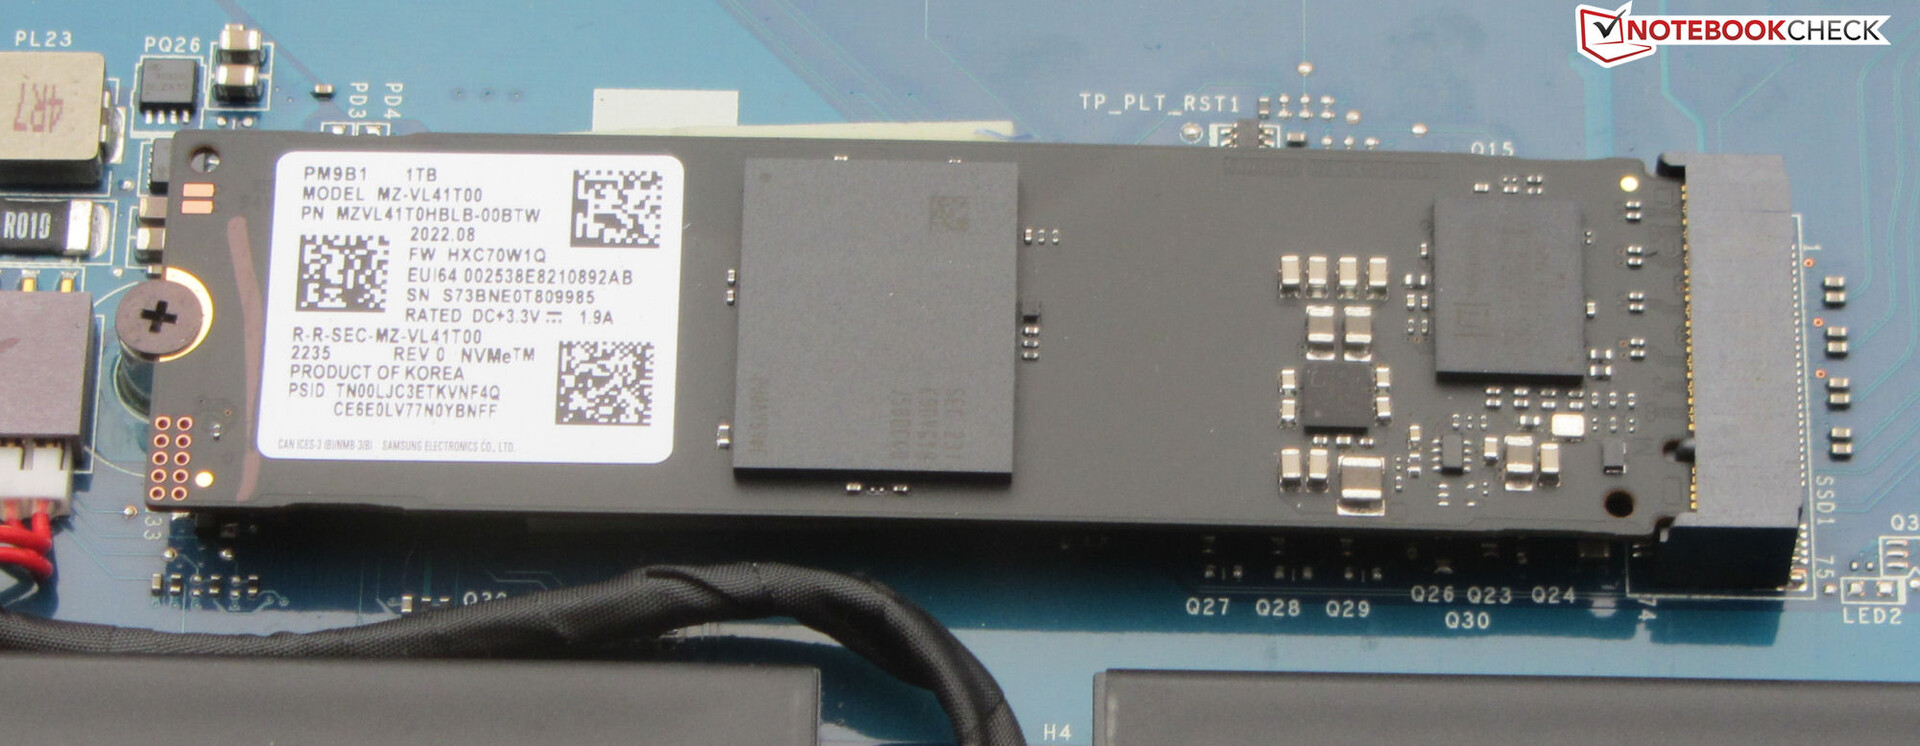
A MSI equipou o Cyborg com um SSD PCIe 4 (M.2-2280) da Samsung que oferece uma capacidade de armazenamento de 1 TB. Apesar de oferecer boas taxas de transferência, não é um dos melhores modelos entre os SSDs.
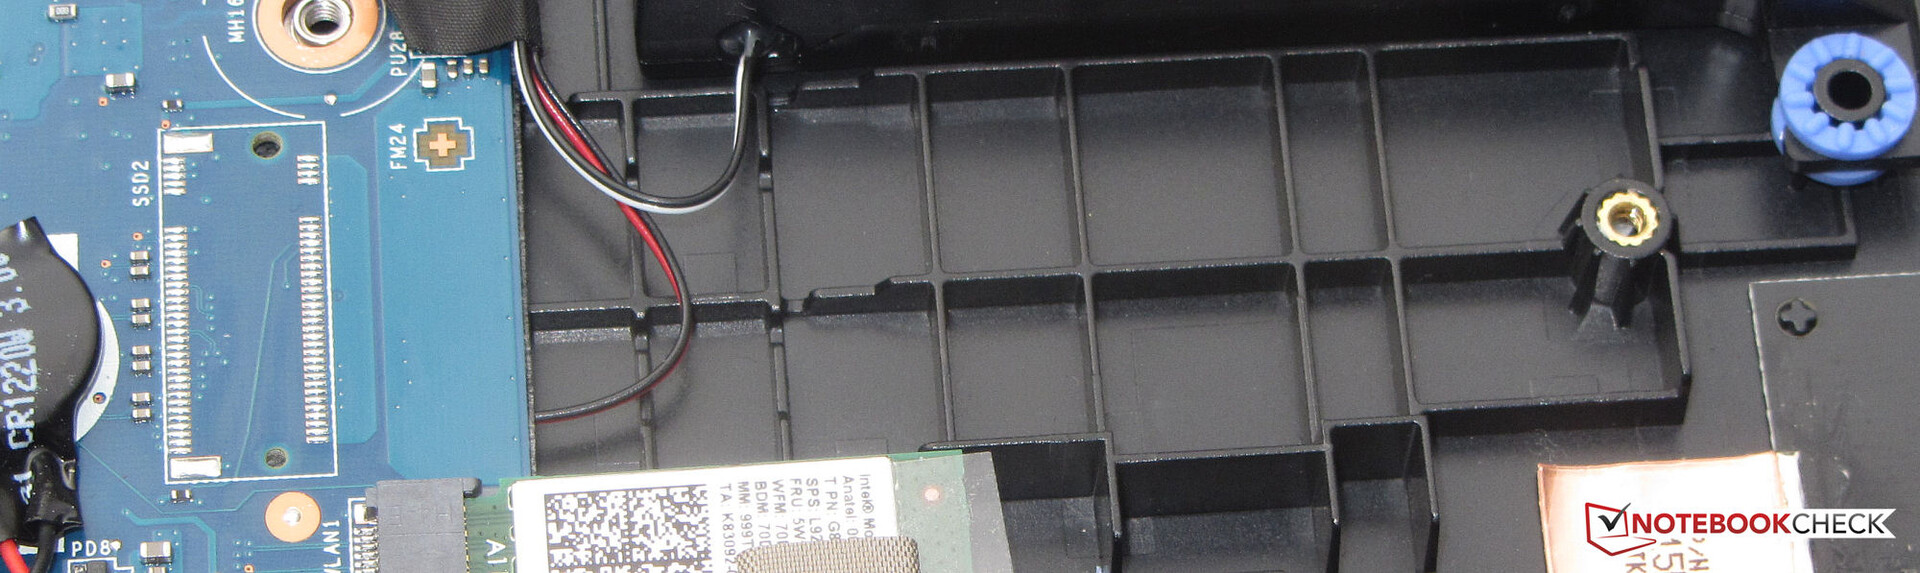
Embora haja espaço para um segundo SSD no laptop, a MSI economiza no slot necessário para conectá-lo. Esta decisão é difícil de justificar em um laptop desta classe de preço. A opção de adicionar um segundo módulo de armazenamento tornou-se padrão neste ponto, particularmente para um laptop de jogos.

* ... menor é melhor
Disk Throttling: DiskSpd Read Loop, Queue Depth 8
Placa Gráfica
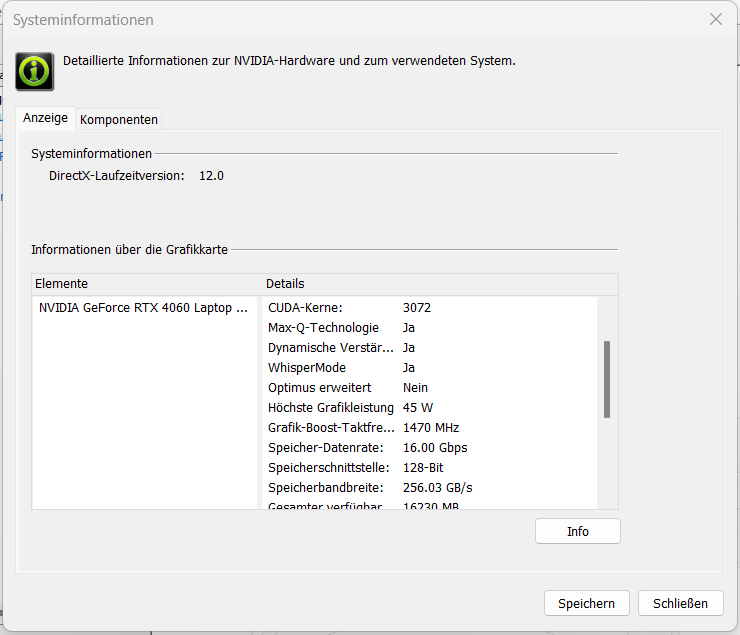
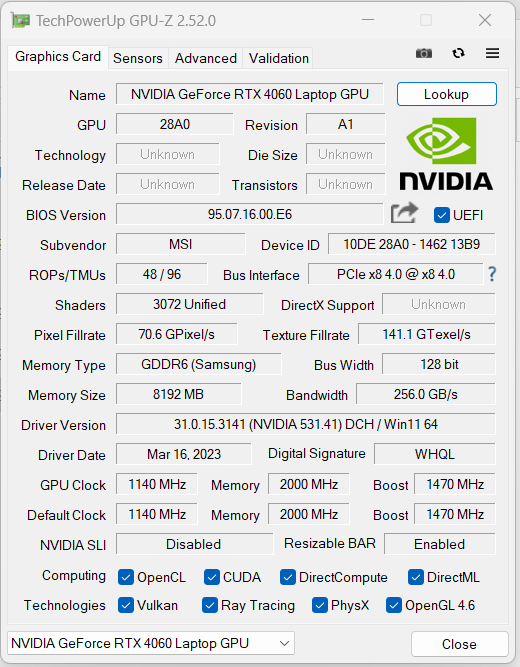
OGeForce Computador portátil RTX 4060a GPU oferece 3.072 shaders, um ônibus de 128 bits e 8.192 MB de memória GDDR6 rápida. A MSI configura um TGP de 45 watts (35 Watt + 10 Watt Dynamic), que é um valor na extremidade inferior de suas capacidades. Mas pelo menos o TGP é totalmente utilizado, de acordo com nosso teste The Witcher 3. O laptop não oferece um modo dGPU.
Não é surpreendente que os resultados de referência fiquem abaixo da média atual das GPUs RTX 4060, mas temos que considerá-los em relação ao consumo de energia. Com um TGP que é mais do dobro da altura, a GPU RTX 4060 (TGP: 105 Watt) doMSI Katana 17atinge resultados que são "apenas" 30 a 40% mais altos em média. Isto significa que o RTX 4060 de 45 watts funciona muito eficientemente aqui.
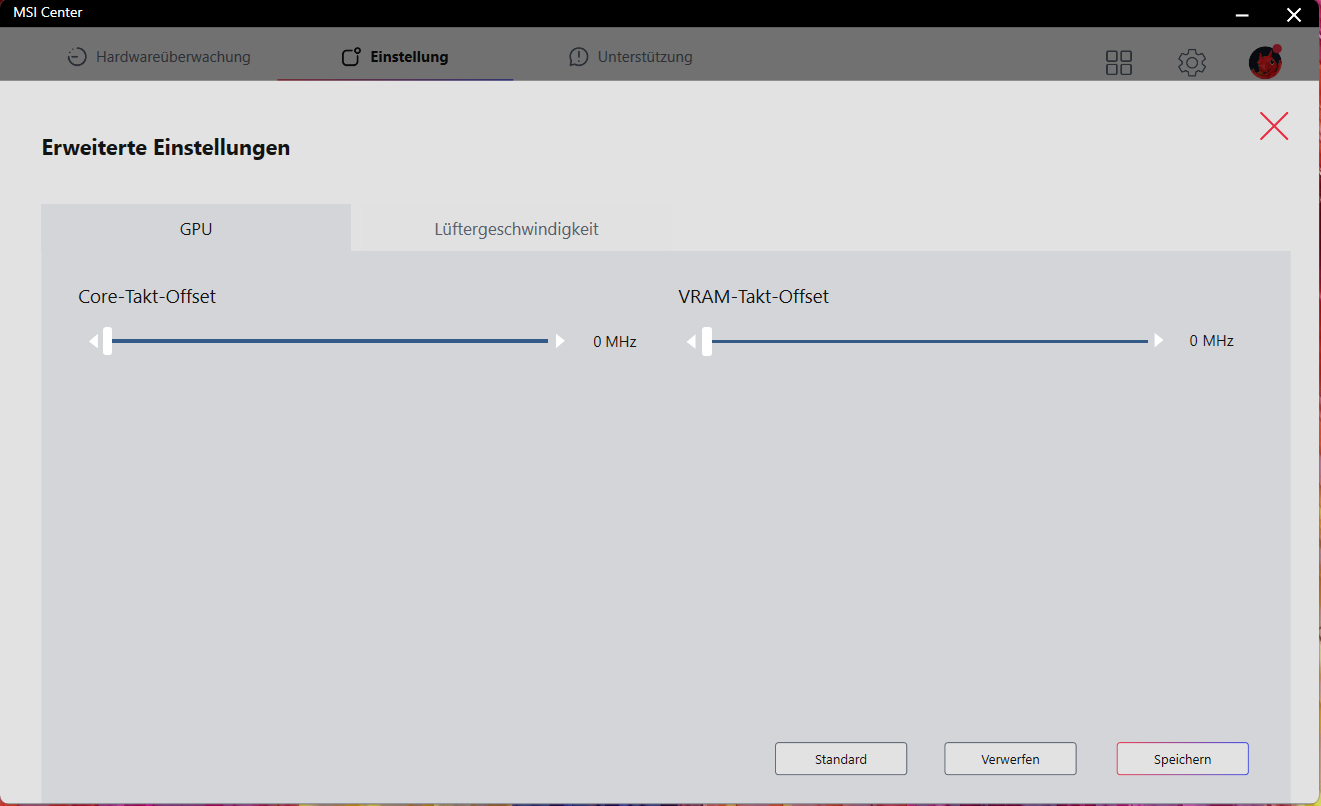
O MSI Center oferece opções de overclocking para GPU e armazenamento de gráficos, mas somente quando o perfil de "Desempenho Extremo" é ativado (você tem que clicar no símbolo da engrenagem). Você sempre usa esta opção por sua própria conta e risco, e se houver alguns problemas ou instabilidades, você tem que remover o overclocking.

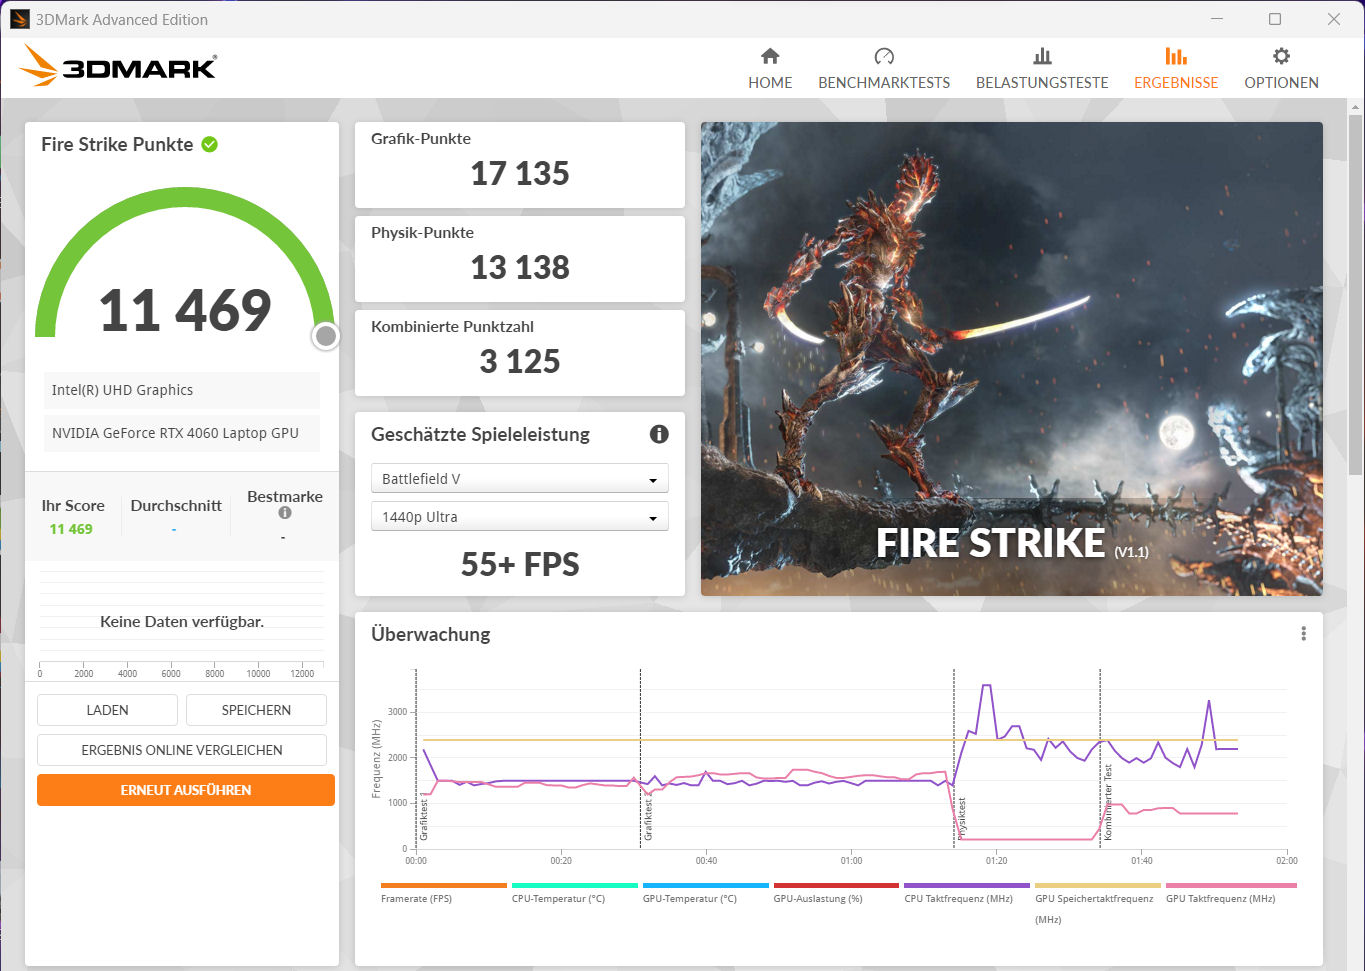
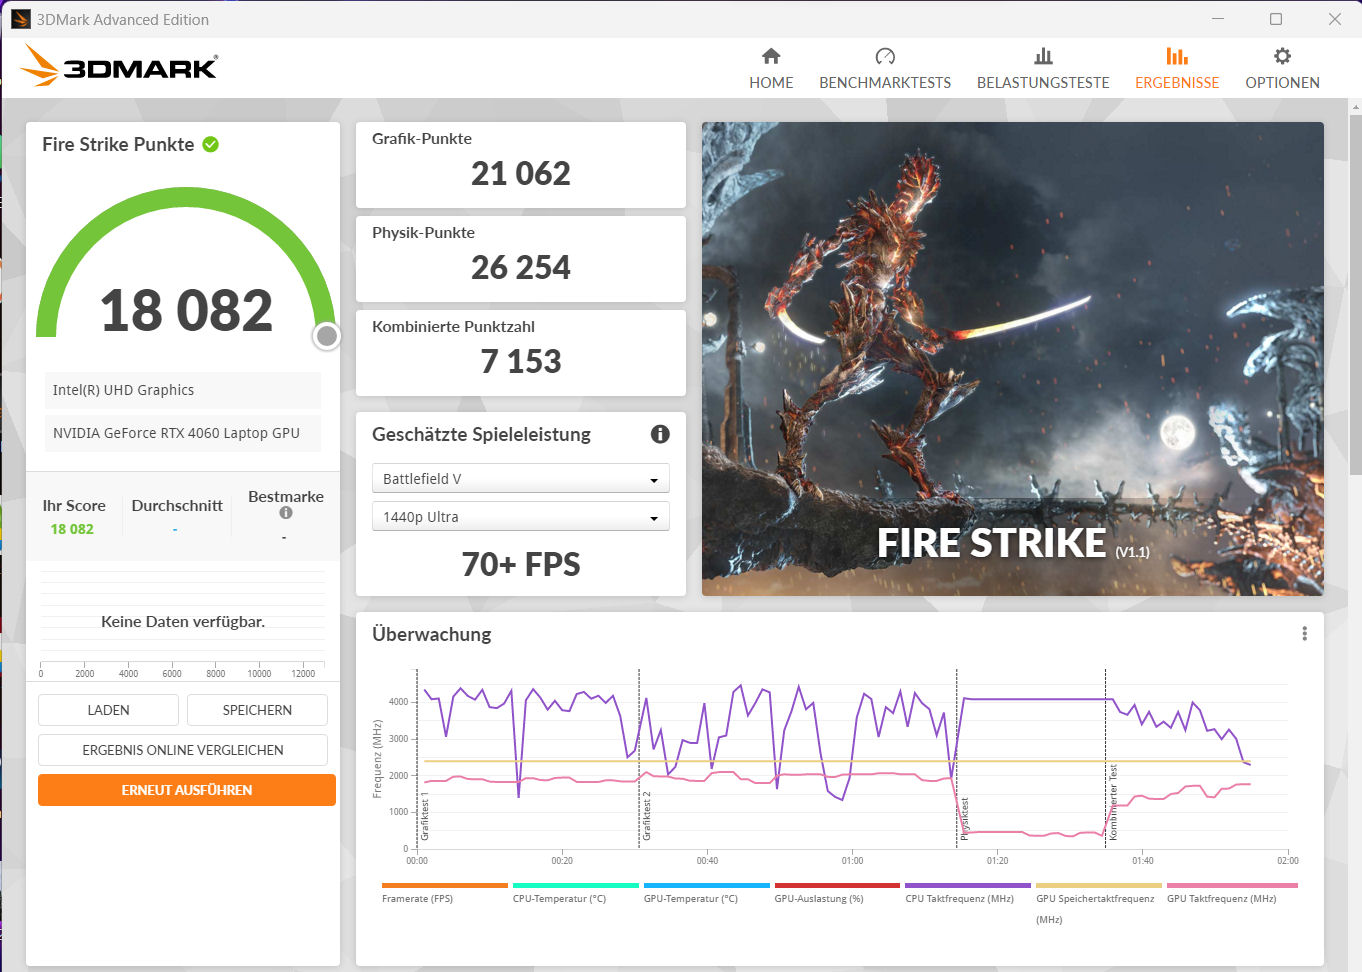
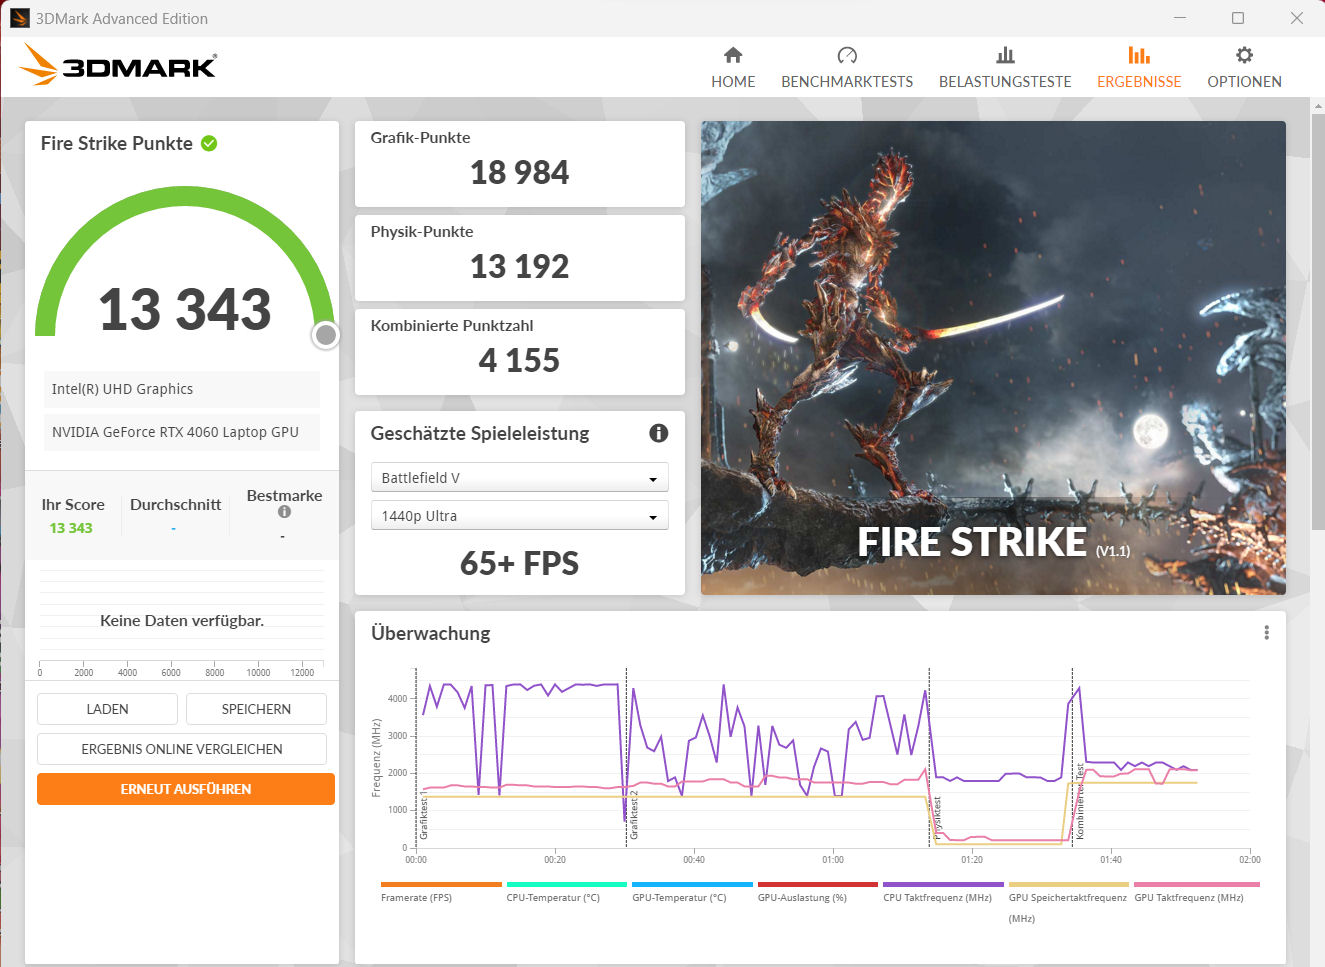
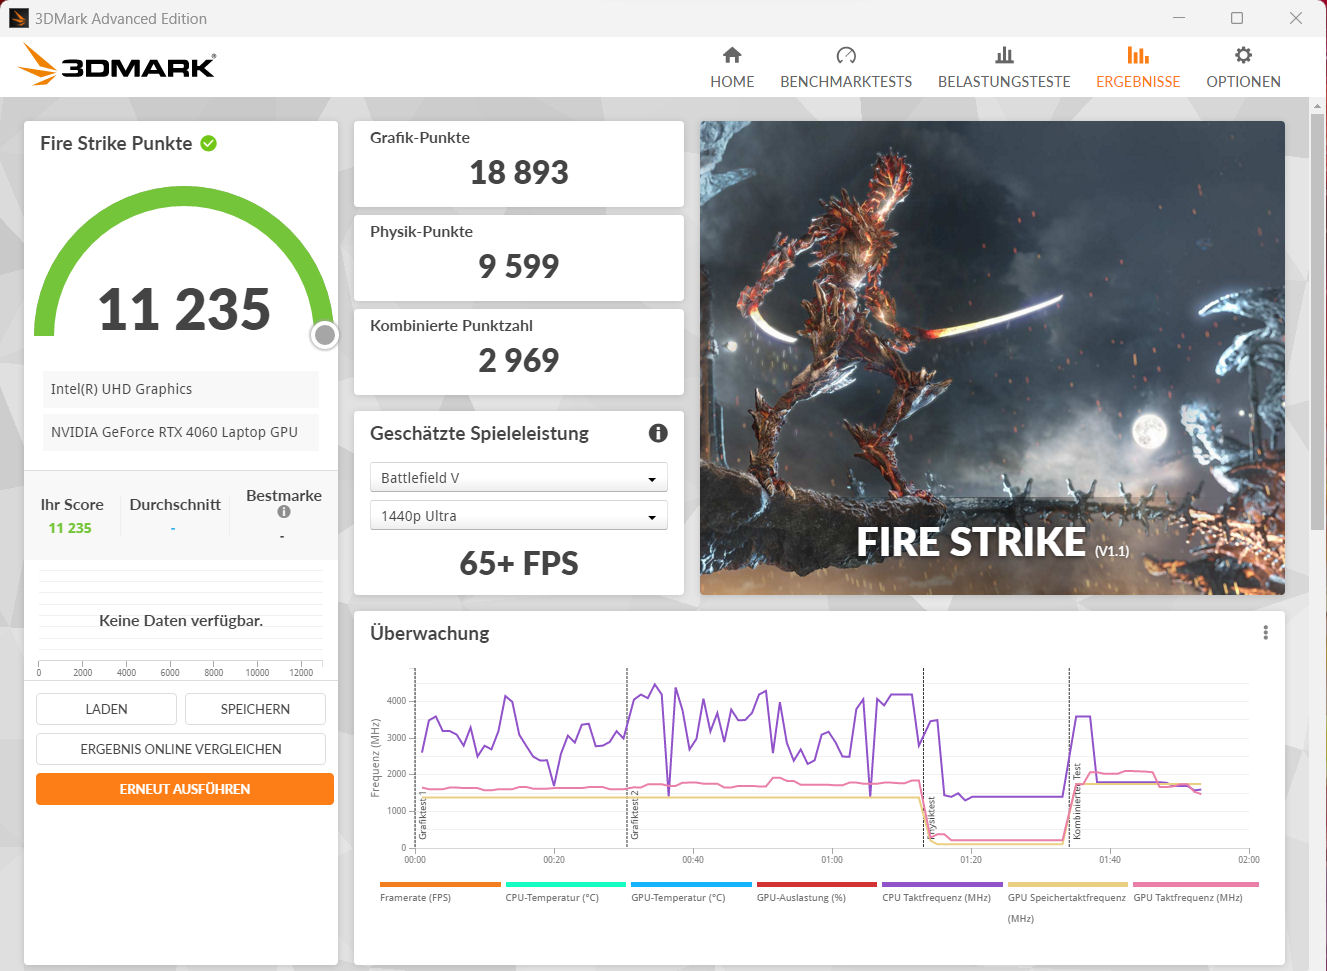
| 3DMark 06 Standard Score | 48240 pontos | |
| 3DMark 11 Performance | 26146 pontos | |
| 3DMark Cloud Gate Standard Score | 57304 pontos | |
| 3DMark Fire Strike Score | 18086 pontos | |
| 3DMark Time Spy Score | 7918 pontos | |
Ajuda | ||
* ... menor é melhor
Desempenho nos jogos
O laptop é projetado para jogos de FHD em configurações altas a máximas. Você pode usar resoluções mais altas se conectar o monitor correspondente - mas apenas em configurações parcialmente reduzidas. As taxas de quadros dos jogos que testamos variam abaixo da média que determinamos para as GPUs RTX 4060.
| The Witcher 3 - 1920x1080 Ultra Graphics & Postprocessing (HBAO+) | |
| Média da turma Gaming (104.7 - 240, n=7, últimos 2 anos) | |
| MSI Katana 17 B13VFK | |
| Média NVIDIA GeForce RTX 4060 Laptop GPU (77 - 159.7, n=42) | |
| Aorus 15 XE5 | |
| Schenker XMG Fusion 15 (Mid 22) | |
| Asus TUF Gaming A16 FA617 | |
| MSI Katana 15 B12VEK | |
| MSI Cyborg 15 A12VF | |
| HP Victus 15 fa0020nr | |
A fim de avaliar se as taxas de quadros permanecem em grande parte constantes durante um longo período de tempo, executamos o jogo "The Witcher 3" por cerca de 60 minutos em resolução Full-HD e em configurações de qualidade máxima. O personagem do jogo não é movido. Não notamos nenhuma queda nas taxas de quadros.
The Witcher 3 FPS Chart
| baixo | média | alto | ultra | |
|---|---|---|---|---|
| GTA V (2015) | 185.8 | 181.5 | 164.9 | 89.3 |
| The Witcher 3 (2015) | 321.6 | 235.7 | 140.7 | 77.4 |
| Dota 2 Reborn (2015) | 161.7 | 152.6 | 140 | 135.4 |
| Final Fantasy XV Benchmark (2018) | 172.8 | 105.6 | 76.9 | |
| X-Plane 11.11 (2018) | 141.3 | 120.8 | 96.8 | |
| Far Cry 5 (2018) | 168 | 116 | 109 | 102 |
| Strange Brigade (2018) | 395 | 206 | 160.5 | 137.3 |
| God of War (2022) | 57.5 | 52 | 41.8 | |
| Rainbow Six Extraction (2022) | 186 | 145 | 141 | 108 |
| Cyberpunk 2077 1.6 (2022) | 88.5 | 72.3 | 63.5 | 57.9 |
| Ghostwire Tokyo (2022) | 114.4 | 113.7 | 112.7 | 108.4 |
| F1 22 (2022) | 169.8 | 162.3 | 124.7 | 48.7 |
| The Quarry (2022) | 116.9 | 88.1 | 72.7 | 57.2 |
| Uncharted Legacy of Thieves Collection (2022) | 71.1 | 70.3 | 67.7 | 65.6 |
| Call of Duty Modern Warfare 2 2022 (2022) | 103 | 93 | 70 | 68 |
| Spider-Man Miles Morales (2022) | 89.2 | 82 | 72.5 | 66.4 |
| The Callisto Protocol (2022) | 112.8 | 82.4 | 77.8 | 54.4 |
| Need for Speed Unbound (2022) | 104.9 | 92.6 | 74.9 | 65 |
| High On Life (2023) | 163.2 | 123 | 92.1 | 71.2 |
| The Witcher 3 v4 (2023) | 148.6 | 117.9 | 59.2 | 50.3 |
| Dead Space Remake (2023) | 62.8 | 61 | 53.7 | 53.3 |
| Hogwarts Legacy (2023) | 108 | 87.7 | 74.2 | 62.5 |
| Returnal (2023) | 84 | 80 | 72 | 62 |
| Atomic Heart (2023) | 133.9 | 103.3 | 62.8 | 49.6 |
| Company of Heroes 3 (2023) | 152.3 | 136.9 | 101.6 | 100 |
| Sons of the Forest (2023) | 78.2 | 61.5 | 59.5 | 58.5 |
| Resident Evil 4 Remake (2023) | 106.9 | 75.9 | 69.4 | 50.9 |
| The Last of Us (2023) | 74.6 | 62.5 | 55.4 | 45.2 |
Emissões - O laptop MSI aquece apenas moderadamente
Níveis de ruídos
O hardware do Cyborg é configurado para um baixo consumo de energia e com isso também para um baixo desenvolvimento térmico. Embora devamos esperar um sistema de resfriamento que funcione silenciosamente aqui, encontramos algum espaço para melhorias a este respeito.
Em média, o desenvolvimento do ruído durante a operação dos jogos varia a um nível moderado. Entretanto, o laptop pode se tornar muito barulhento sob pico de carga. No modo "Extreme Performance", o nível máximo de ruído pode aumentar até 56,3 dB(A). Em termos do desenvolvimento de ruído, o perfil "Equilibrado" pode se recomendar.
O que é mais irritante acaba sendo o comportamento durante a operação ociosa e na operação diária (Escritório, Internet): O ventilador continua funcionando constantemente em uma faixa claramente audível, e medimos níveis de ruído de até 38 dB(A). Isto vale para todos os perfis de desempenho, com exceção do perfil "Super Bateria", que muitas vezes mantém o ventilador desligado.
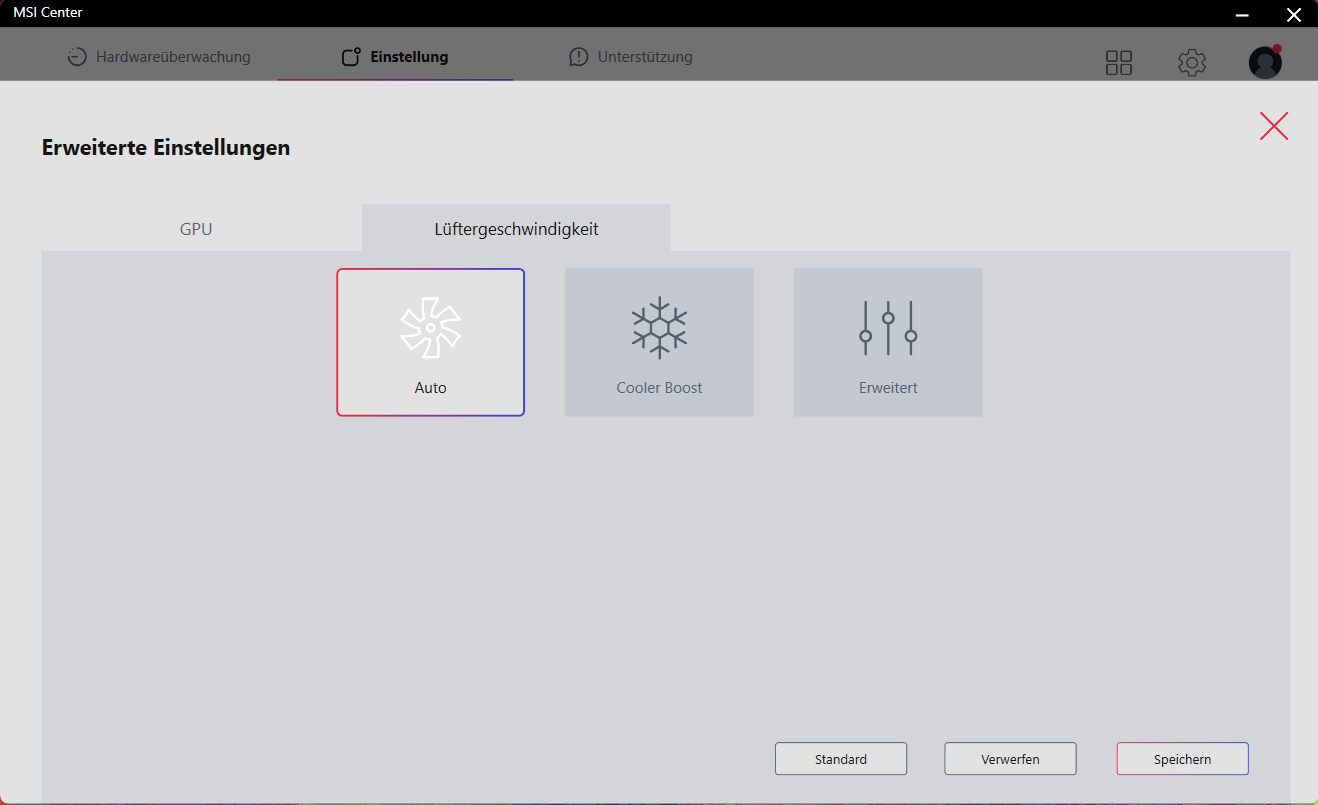
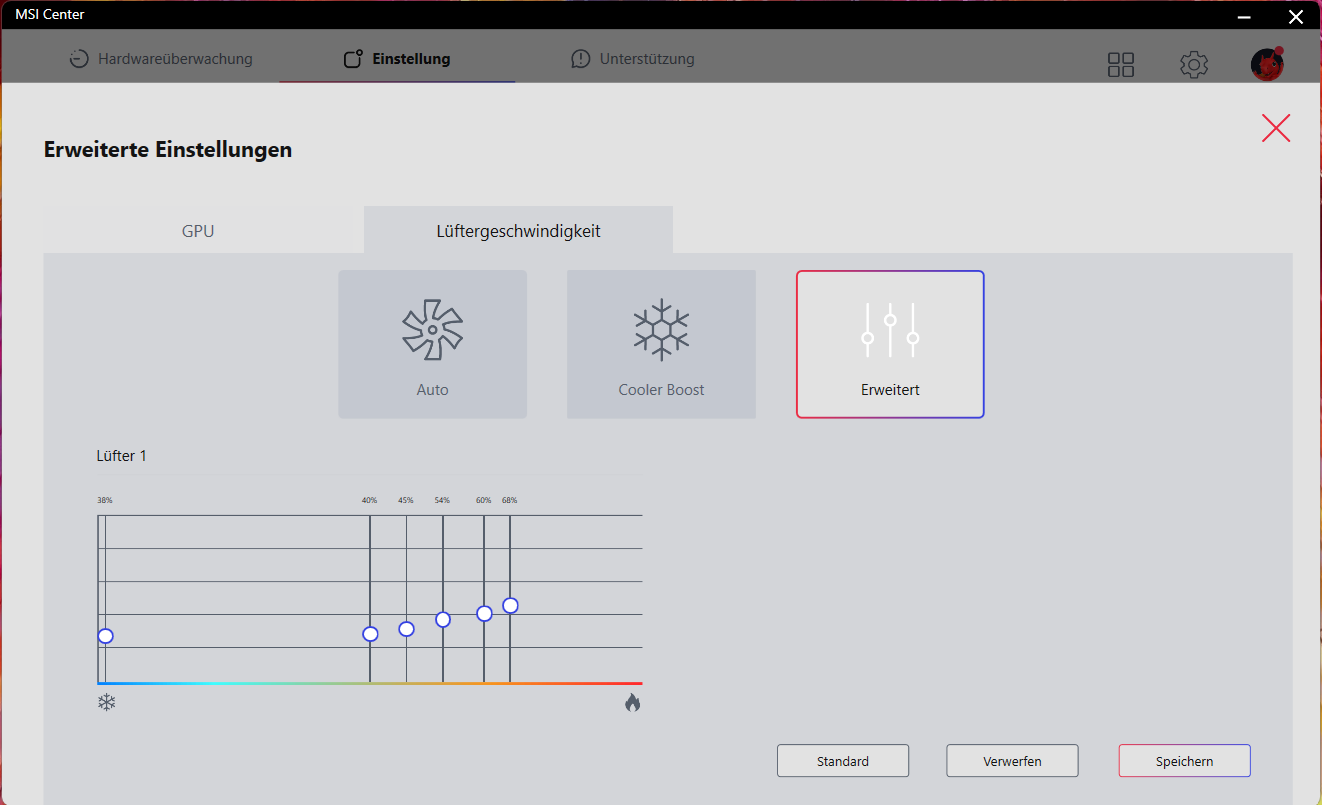
O MSI Center permite algum acesso limitado ao controle do ventilador, mas somente com o perfil "Extreme Performance" ativado (você tem que clicar no símbolo da engrenagem). Os perfis "Auto" e "Cooler Boost" (com o ventilador funcionando constantemente em velocidade máxima) estão disponíveis. Além disso, você também pode ajustar a curva do ventilador.
Barulho
| Ocioso |
| 27 / 37.5 / 38 dB |
| Carga |
| 56.3 / 56.3 dB |
 | ||
30 dB silencioso 40 dB(A) audível 50 dB(A) ruidosamente alto |
||
min: | ||
| MSI Cyborg 15 A12VF GeForce RTX 4060 Laptop GPU, i7-12650H, Samsung PM9B1 1024GB MZVL41T0HBLB | Asus TUF Gaming A16 FA617 Radeon RX 7600S, R7 7735HS, Micron 2400 MTFDKBA1T0QFM | Aorus 15 XE5 GeForce RTX 3070 Ti Laptop GPU, i7-12700H, Gigabyte AG470S1TB-SI B10 | Schenker XMG Fusion 15 (Mid 22) GeForce RTX 3070 Laptop GPU, i7-11800H, Samsung SSD 980 Pro 1TB MZ-V8P1T0BW | MSI Katana 15 B12VEK GeForce RTX 4050 Laptop GPU, i7-12650H, Micron 2400 MTFDKBA1T0QFM | HP Victus 15 fa0020nr GeForce RTX 3050 Ti Laptop GPU, i7-12700H, Samsung PM9A1 MZVL2512HCJQ | |
|---|---|---|---|---|---|---|
| Noise | 20% | 14% | 14% | 22% | 20% | |
| desligado / ambiente * (dB) | 27 | 24 11% | 24 11% | 26 4% | 24 11% | 24.8 8% |
| Idle Minimum * (dB) | 27 | 24 11% | 26 4% | 26 4% | 24 11% | 26.2 3% |
| Idle Average * (dB) | 37.5 | 25 33% | 28 25% | 28 25% | 24 36% | 29.2 22% |
| Idle Maximum * (dB) | 38 | 28 26% | 30 21% | 31 18% | 24 37% | 29.4 23% |
| Load Average * (dB) | 56.3 | 42 25% | 48 15% | 45 20% | 37.71 33% | 29.9 47% |
| Load Maximum * (dB) | 56.3 | 50 11% | 52 8% | 48 15% | 54.55 3% | 45.5 19% |
| Witcher 3 ultra * (dB) | 50 | 52 | 46 | 45.75 | 41.1 |
* ... menor é melhor
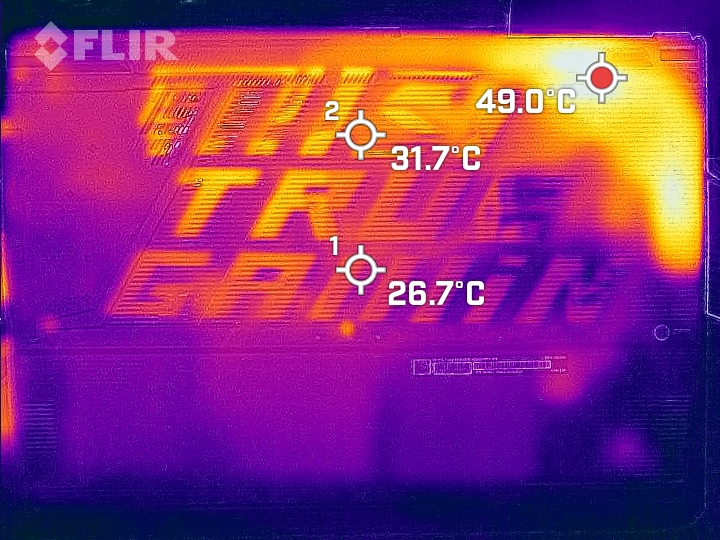
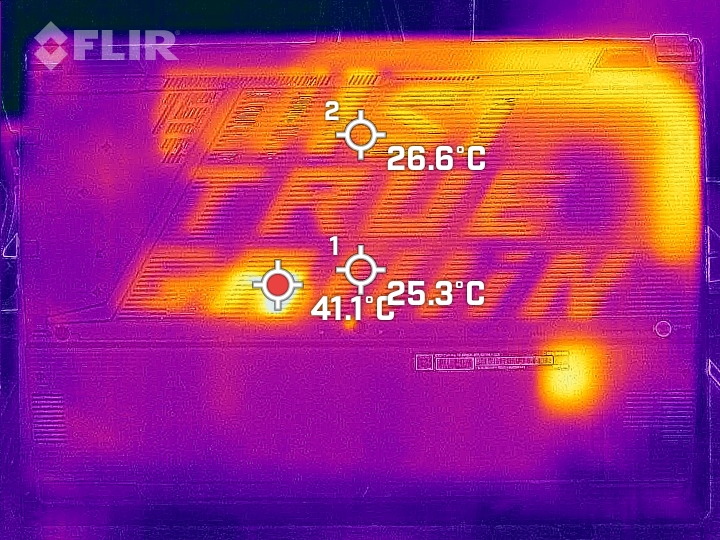
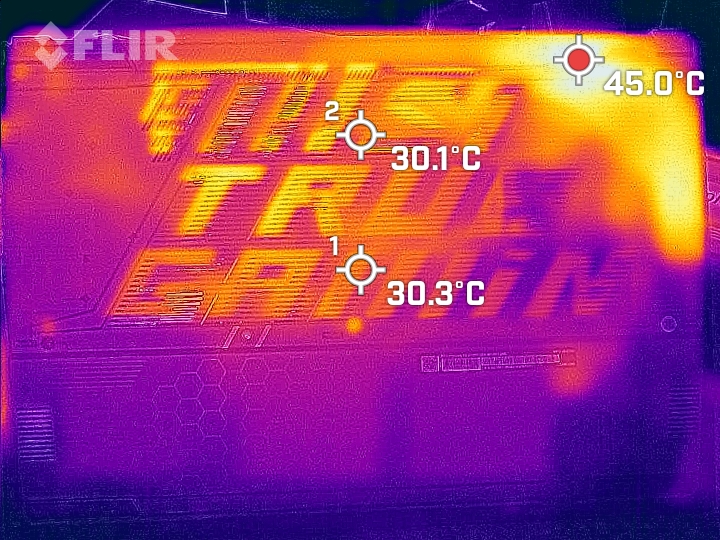
Temperaturas
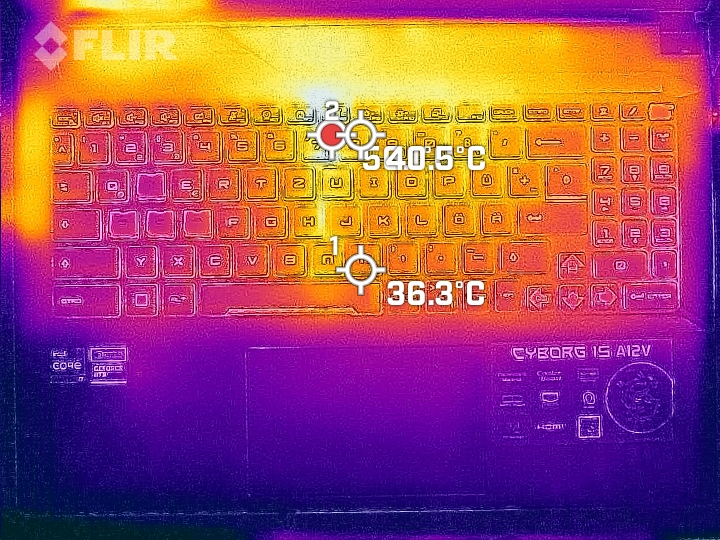
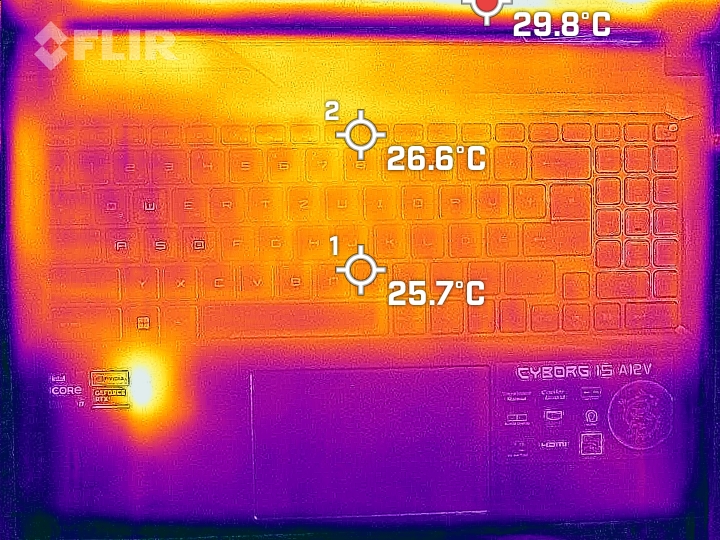
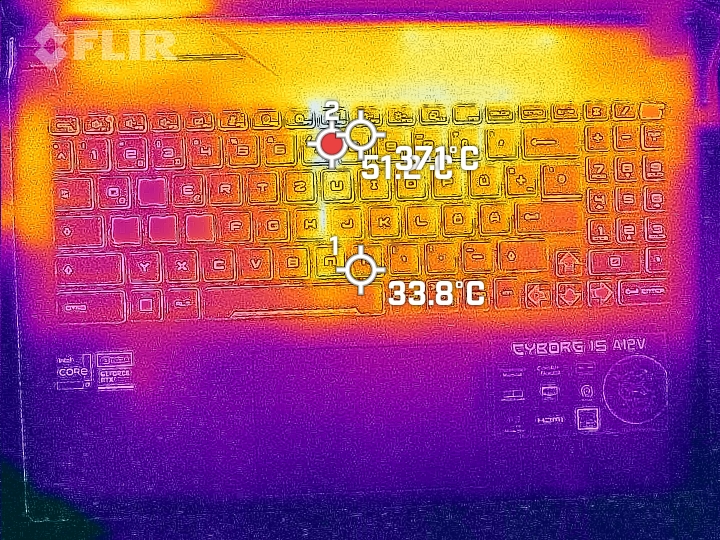
O laptop aquece moderadamente na melhor das hipóteses. As temperaturas mais altas (40 a 47,5 °C, 104 a 117,5 °F) são atingidas em três pontos de medição durante o teste de estresse. Na operação diária, as temperaturas permanecem dentro da faixa verde.
(-) A temperatura máxima no lado superior é 47.5 °C / 118 F, em comparação com a média de 40.4 °C / 105 F , variando de 21.2 a 68.8 °C para a classe Gaming.
(+) A parte inferior aquece até um máximo de 35.5 °C / 96 F, em comparação com a média de 43.2 °C / 110 F
(+) Em uso inativo, a temperatura média para o lado superior é 25.9 °C / 79 F, em comparação com a média do dispositivo de 33.9 °C / ### class_avg_f### F.
(±) Jogando The Witcher 3, a temperatura média para o lado superior é 35.6 °C / 96 F, em comparação com a média do dispositivo de 33.9 °C / ## #class_avg_f### F.
(+) Os apoios para as mãos e o touchpad são mais frios que a temperatura da pele, com um máximo de 27.8 °C / 82 F e, portanto, são frios ao toque.
(±) A temperatura média da área do apoio para as mãos de dispositivos semelhantes foi 28.8 °C / 83.8 F (+1 °C / 1.8 F).
| MSI Cyborg 15 A12VF Intel Core i7-12650H, NVIDIA GeForce RTX 4060 Laptop GPU | Asus TUF Gaming A16 FA617 AMD Ryzen 7 7735HS, AMD Radeon RX 7600S | Aorus 15 XE5 Intel Core i7-12700H, NVIDIA GeForce RTX 3070 Ti Laptop GPU | Schenker XMG Fusion 15 (Mid 22) Intel Core i7-11800H, NVIDIA GeForce RTX 3070 Laptop GPU | MSI Katana 15 B12VEK Intel Core i7-12650H, NVIDIA GeForce RTX 4050 Laptop GPU | HP Victus 15 fa0020nr Intel Core i7-12700H, NVIDIA GeForce RTX 3050 Ti Laptop GPU | |
|---|---|---|---|---|---|---|
| Heat | -32% | -34% | -37% | -22% | 16% | |
| Maximum Upper Side * (°C) | 47.5 | 54 -14% | 46 3% | 52 -9% | 47 1% | 37.2 22% |
| Maximum Bottom * (°C) | 35.5 | 47 -32% | 57 -61% | 63 -77% | 48 -35% | 35.4 -0% |
| Idle Upper Side * (°C) | 27.7 | 40 -44% | 38 -37% | 37 -34% | 35 -26% | 22.4 19% |
| Idle Bottom * (°C) | 29.5 | 40 -36% | 42 -42% | 38 -29% | 38 -29% | 22.6 23% |
* ... menor é melhor
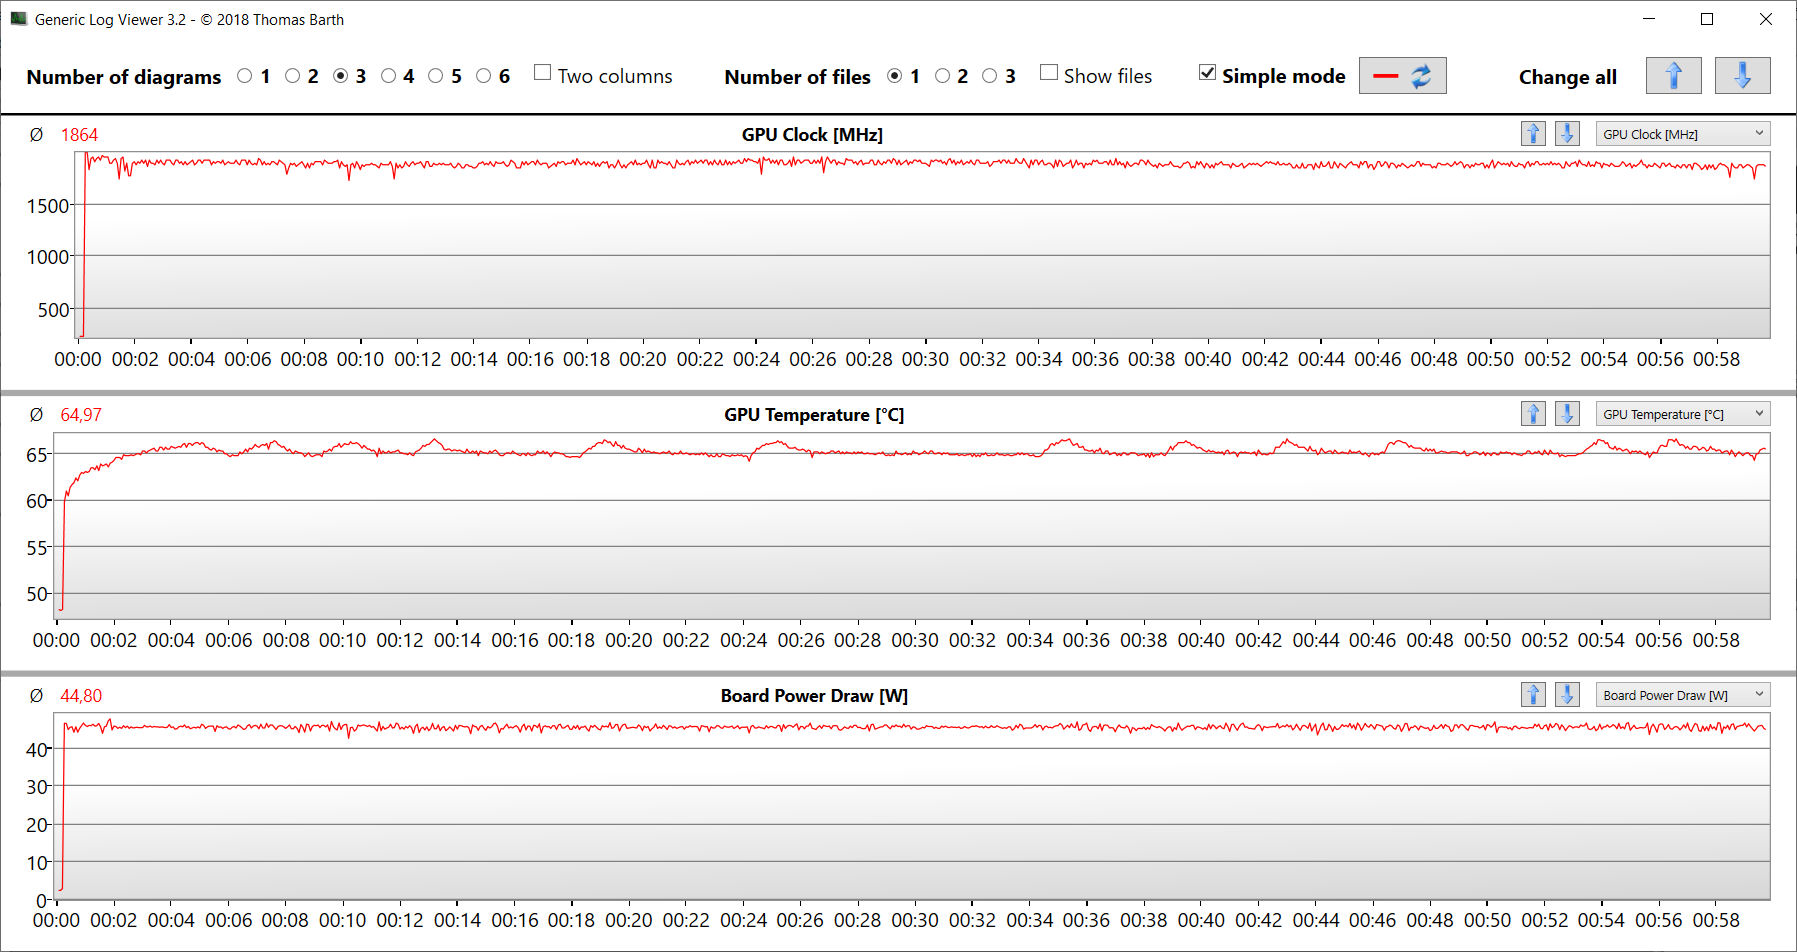
Teste de estresse
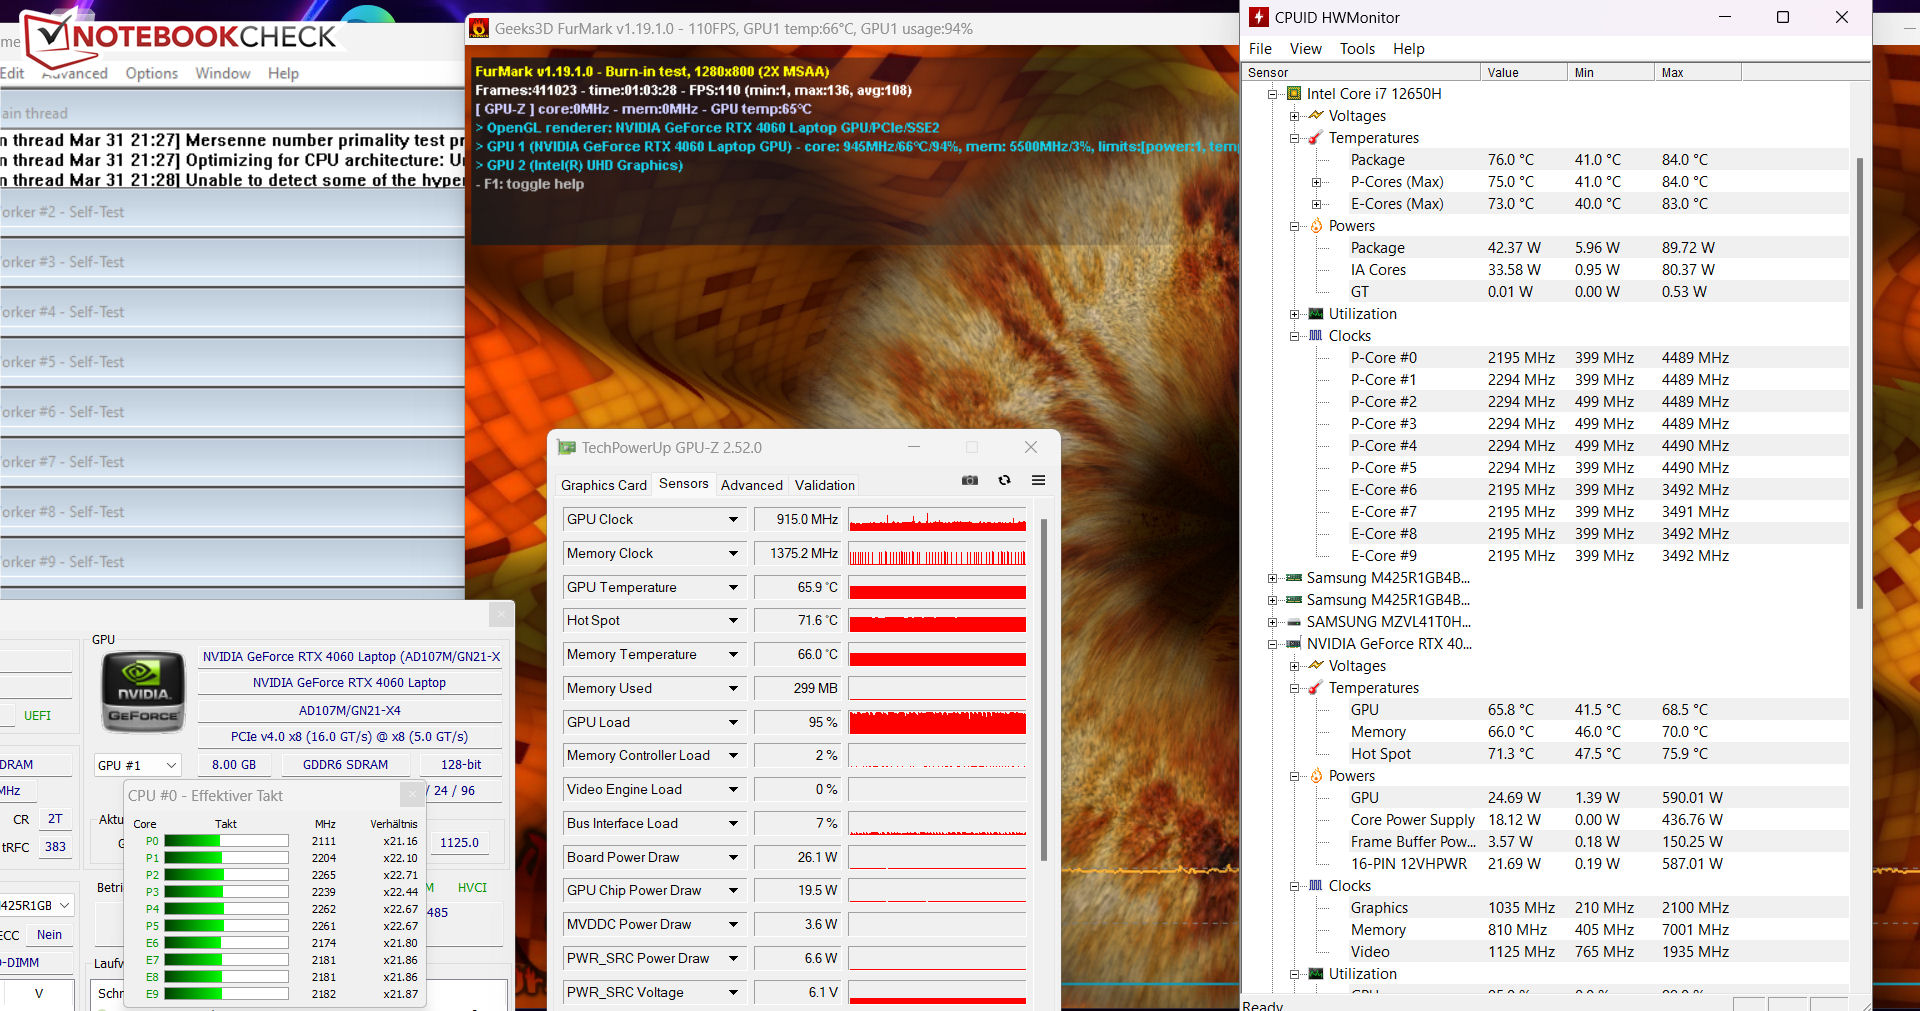
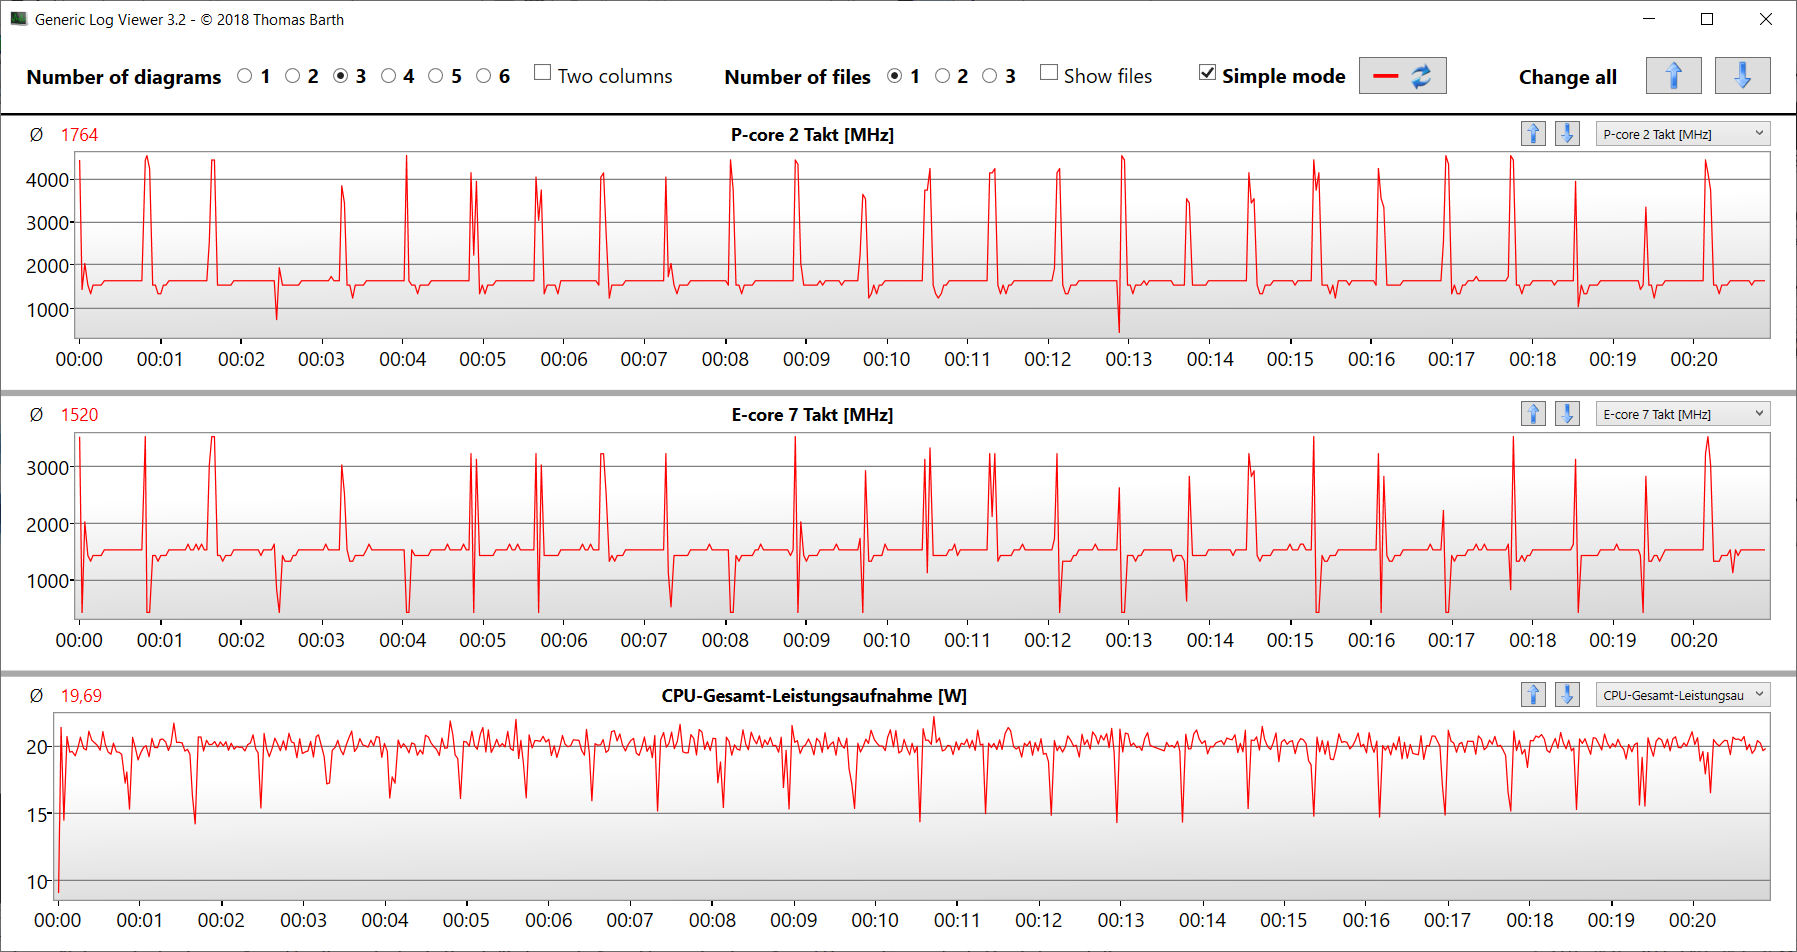
O teste de estresse (com Prime95 e Furmark funcionando constantemente) representa um cenário extremo para avaliar a estabilidade do sistema sob carga total. A CPU (P: 3,3 a 3,5 GHz, E: 2,8 GHz) e GPU (1.000 a 1.500 MHz) iniciam o teste em velocidades de relógio médias-altas, com os valores caindo durante o curso do teste.
Oradores
Os alto-falantes estéreo produzem um som decente, mas quase não contêm nenhum baixo. Para uma melhor experiência sonora, são recomendados fones de ouvido ou alto-falantes externos.
MSI Cyborg 15 A12VF análise de áudio
(±) | o volume do alto-falante é médio, mas bom (###valor### dB)
Graves 100 - 315Hz
(-) | quase nenhum baixo - em média 19.8% menor que a mediana
(±) | a linearidade dos graves é média (12.2% delta para a frequência anterior)
Médios 400 - 2.000 Hz
(+) | médios equilibrados - apenas 1.8% longe da mediana
(+) | médios são lineares (5% delta para frequência anterior)
Altos 2 - 16 kHz
(+) | agudos equilibrados - apenas 4.2% longe da mediana
(+) | os máximos são lineares (3.9% delta da frequência anterior)
Geral 100 - 16.000 Hz
(+) | o som geral é linear (14.2% diferença em relação à mediana)
Comparado com a mesma classe
» 25% de todos os dispositivos testados nesta classe foram melhores, 7% semelhantes, 68% piores
» O melhor teve um delta de 6%, a média foi 18%, o pior foi 132%
Comparado com todos os dispositivos testados
» 17% de todos os dispositivos testados foram melhores, 4% semelhantes, 79% piores
» O melhor teve um delta de 4%, a média foi 23%, o pior foi 134%
Asus TUF Gaming A16 FA617 análise de áudio
(+) | os alto-falantes podem tocar relativamente alto (###valor### dB)
Graves 100 - 315Hz
(±) | graves reduzidos - em média 14.4% menor que a mediana
(±) | a linearidade dos graves é média (8.3% delta para a frequência anterior)
Médios 400 - 2.000 Hz
(±) | médios mais altos - em média 6.5% maior que a mediana
(+) | médios são lineares (3.8% delta para frequência anterior)
Altos 2 - 16 kHz
(±) | máximos reduzidos - em média 6% menor que a mediana
(±) | a linearidade dos máximos é média (10.4% delta para frequência anterior)
Geral 100 - 16.000 Hz
(±) | a linearidade do som geral é média (18.8% diferença em relação à mediana)
Comparado com a mesma classe
» 62% de todos os dispositivos testados nesta classe foram melhores, 8% semelhantes, 30% piores
» O melhor teve um delta de 6%, a média foi 18%, o pior foi 132%
Comparado com todos os dispositivos testados
» 43% de todos os dispositivos testados foram melhores, 8% semelhantes, 49% piores
» O melhor teve um delta de 4%, a média foi 23%, o pior foi 134%
Gerenciamento de energia - Laptop de jogos com uma boa duração da bateria
Consumo de energia
Em geral, o laptop MSI se mostra muito eficiente em termos de consumo de energia. Em toda a faixa de carga, o consumo permanece menor do que o dos concorrentes. Ele passa pelo nosso The Witcher 3 e testes de estresse com um consumo de energia relativamente constante. O fornecimento de energia é suficientemente grande a 120 watts.
| desligado | |
| Ocioso | |
| Carga |
|
Key:
min: | |
| MSI Cyborg 15 A12VF i7-12650H, GeForce RTX 4060 Laptop GPU, Samsung PM9B1 1024GB MZVL41T0HBLB, IPS, 1920x1080, 15.6" | Asus TUF Gaming A16 FA617 R7 7735HS, Radeon RX 7600S, Micron 2400 MTFDKBA1T0QFM, IPS-Level, 1920x1200, 16" | Aorus 15 XE5 i7-12700H, GeForce RTX 3070 Ti Laptop GPU, Gigabyte AG470S1TB-SI B10, IPS, 2560x1440, 15.6" | Schenker XMG Fusion 15 (Mid 22) i7-11800H, GeForce RTX 3070 Laptop GPU, Samsung SSD 980 Pro 1TB MZ-V8P1T0BW, IPS, 2560x1440, 15.6" | MSI Katana 15 B12VEK i7-12650H, GeForce RTX 4050 Laptop GPU, Micron 2400 MTFDKBA1T0QFM, IPS, 1920x1080, 15.6" | HP Victus 15 fa0020nr i7-12700H, GeForce RTX 3050 Ti Laptop GPU, Samsung PM9A1 MZVL2512HCJQ, IPS, 1920x1080, 15.6" | Média NVIDIA GeForce RTX 4060 Laptop GPU | Média da turma Gaming | |
|---|---|---|---|---|---|---|---|---|
| Power Consumption | -42% | -222% | -84% | -30% | -40% | -72% | -105% | |
| Idle Minimum * (Watt) | 6 | 8 -33% | 31 -417% | 12 -100% | 8.5 -42% | 5.1 15% | 11.5 ? -92% | 13 ? -117% |
| Idle Average * (Watt) | 8.8 | 11 -25% | 35 -298% | 17 -93% | 10.2 -16% | 15.1 -72% | 16 ? -82% | 19 ? -116% |
| Idle Maximum * (Watt) | 11.9 | 16 -34% | 46 -287% | 24 -102% | 11.3 5% | 18.9 -59% | 20.3 ? -71% | 24.6 ? -107% |
| Load Average * (Watt) | 89 | 97 -9% | 120 -35% | 106 -19% | 84 6% | 114.5 -29% | 92.9 ? -4% | 110.7 ? -24% |
| Witcher 3 ultra * (Watt) | 90.3 | 161.5 -79% | 202 -124% | 159.9 -77% | 128 -42% | 113.9 -26% | ||
| Load Maximum * (Watt) | 99 | 168 -70% | 268 -171% | 208 -110% | 189 -91% | 165.8 -67% | 210 ? -112% | 259 ? -162% |
* ... menor é melhor
Power Consumption The Witcher 3 / Stress Test
Power Consumption With External Monitor
Vida útil da bateria
No teste WLAN, onde os sites são carregados via roteiro, e no teste de vídeo com o curta-metragem Big Buck Bunny (codificação H.264, FHD) rodando em loop, o laptop de 15,6 polegadas atinge tempos de execução de 7:32 h e 8:00 h, respectivamente. Durante ambos os testes, as funções de economia de energia do laptop são desativadas, e o brilho da tela é reduzido para cerca de 150 cd/m². Para executar o teste de vídeo, os módulos de comunicação sem fio também são desativados.
O laptop MSI oferece uma boa duração geral da bateria, apesar de sua capacidade relativamente pequena, de 53,5 Wh. O fato de ser incapaz de acompanhar o TUF Gaming A16é devido à combinação de uma grande bateria de 90-Wh e uma APU AMD eficiente em termos energéticos oferecida por aquele laptop. Se calcularmos o tempo de execução por Watthour, o Cyborg está à frente.
| MSI Cyborg 15 A12VF i7-12650H, GeForce RTX 4060 Laptop GPU, 53.5 Wh | Asus TUF Gaming A16 FA617 R7 7735HS, Radeon RX 7600S, 90 Wh | Aorus 15 XE5 i7-12700H, GeForce RTX 3070 Ti Laptop GPU, 99 Wh | Schenker XMG Fusion 15 (Mid 22) i7-11800H, GeForce RTX 3070 Laptop GPU, 93.48 Wh | MSI Katana 15 B12VEK i7-12650H, GeForce RTX 4050 Laptop GPU, 53.5 Wh | HP Victus 15 fa0020nr i7-12700H, GeForce RTX 3050 Ti Laptop GPU, 70 Wh | Média da turma Gaming | |
|---|---|---|---|---|---|---|---|
| Duração da bateria | 25% | -19% | -4% | -41% | -68% | -19% | |
| Reader / Idle (h) | 13.6 | 20.2 49% | 10 -26% | 15.5 14% | 2.6 -81% | 8.27 ? -39% | |
| H.264 (h) | 8 | 6.2 -22% | 7.5 -6% | 4.4 -45% | 8.32 ? 4% | ||
| WiFi v1.3 (h) | 7.5 | 12.1 61% | 6.8 -9% | 7.4 -1% | 4.3 -43% | 2.1 -72% | 7.11 ? -5% |
| Load (h) | 2.3 | 1.5 -35% | 1.9 -17% | 1.8 -22% | 1.5 -35% | 1.1 -52% | 1.502 ? -35% |
Pro
Contra
Veredicto - Laptop de jogos com baixo consumo de energia
O foco do MSI Cyborg 15 está em um compromisso de desempenho, mobilidade e consumo de energia. Devido às configurações de desempenho reduzido, o Núcleo i7-12650He GeForce RTX 4060desempenho abaixo de suas capacidades. No entanto, seu poder computacional ainda é suficiente para jogos FHD em configurações altas a máximas, mesmo assim.
Embora gostemos do conceito do Cyborg 15, sua implementação ainda deixa espaço para melhorias. Uma GPU de última geração atual ainda oferece desempenho suficiente para jogos FHD, mesmo com um TGP baixo de 45 watts.
O consumo de energia, que é baixo para um laptop para jogos, pode ser traduzido em uma boa duração da bateria. Valores realistas de 7 a 8 h ainda são possíveis, apesar da capacidade relativamente pequena da bateria de 53,5 Wh. Infelizmente, a porta USB-C não oferece nenhum suporte para o fornecimento de energia, o que seria uma característica sensata no caso do Cyborg.
Embora o laptop não fique particularmente quente, seu nível máximo de ruído está no nível normalmente alto para a classe do laptop. Além disso, o ventilador permanece constantemente audível durante a operação ociosa. Teríamos esperado mais aqui. Este poderia ser o preço da renúncia de um segundo ventilador junto com o tubo de calor correspondente. Além do sistema de refrigeração, a tela (FHD, 144 Hz, IPS) representa outro ponto fraco do laptop, com o brilho e a cobertura do espaço de cor ficando muito baixa.
Uma alternativa poderia ser o Asus TUF Gaming A16 FA617. Ele oferece um desempenho de computação comparável, mas pontua com uma vida útil significativamente maior da bateria, melhor tela e um menor desenvolvimento máximo de ruído. Por outro lado, esse laptop consome significativamente mais energia sob carga do que o Cyborg 15.
Preço e Disponibilidade
MSI Cyborg 15 A12VF
- 04/09/2023 v7 (old)
Sascha Mölck
Transparência
A seleção dos dispositivos a serem analisados é feita pela nossa equipe editorial. A amostra de teste foi fornecida ao autor como empréstimo pelo fabricante ou varejista para fins desta revisão. O credor não teve influência nesta revisão, nem o fabricante recebeu uma cópia desta revisão antes da publicação. Não houve obrigação de publicar esta revisão. Como empresa de mídia independente, a Notebookcheck não está sujeita à autoridade de fabricantes, varejistas ou editores.
É assim que o Notebookcheck está testando
Todos os anos, o Notebookcheck analisa de forma independente centenas de laptops e smartphones usando procedimentos padronizados para garantir que todos os resultados sejam comparáveis. Desenvolvemos continuamente nossos métodos de teste há cerca de 20 anos e definimos padrões da indústria no processo. Em nossos laboratórios de teste, equipamentos de medição de alta qualidade são utilizados por técnicos e editores experientes. Esses testes envolvem um processo de validação em vários estágios. Nosso complexo sistema de classificação é baseado em centenas de medições e benchmarks bem fundamentados, o que mantém a objetividade.Price comparison

