Análise do HP Pavilion Plus 14 Core i7: Intel Raptor Lake ou AMD Zen 4? A escolha é clara

A HP parece ter acertado em cheio com sua recém-lançada linha Pavilion Plus. Já analisamos anteriormente o AMD Ryzen 7 7840U-alimentado Pavilion Plus 14 e agora voltamos nossa atenção para seu irmão baseado em Intel.
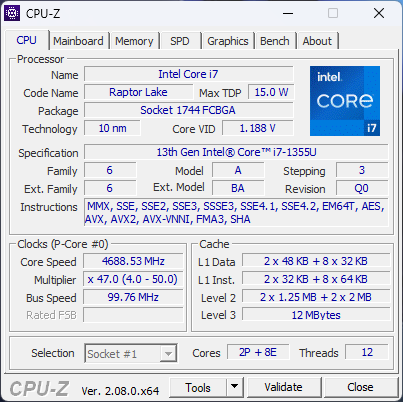
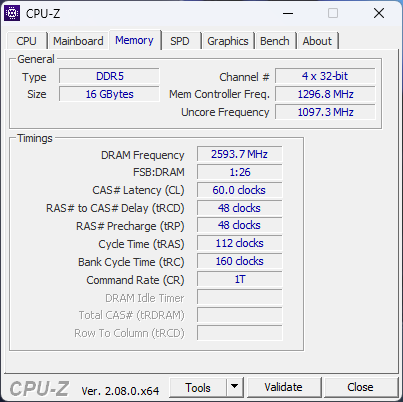
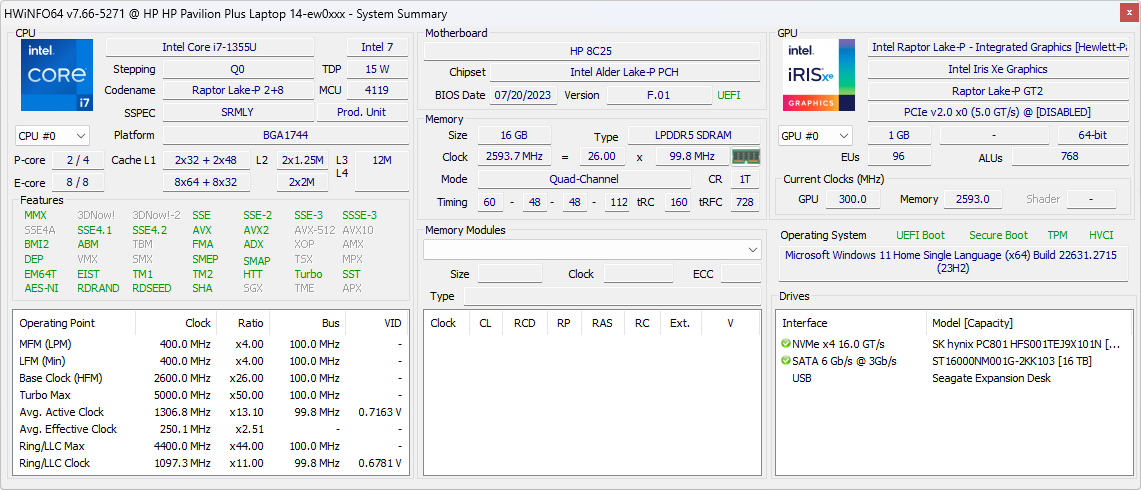
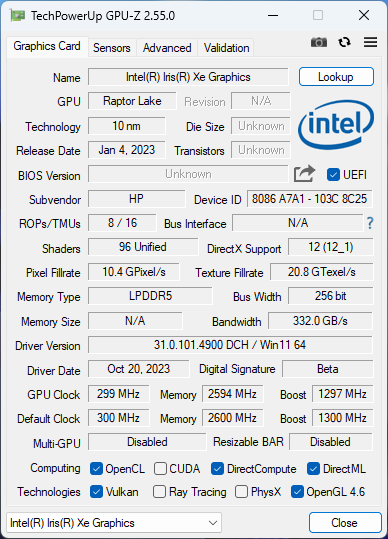
A configuração atual do HP Pavilion Plus 14 é baseada no Intel Core i7-1355U e vem com 16 GB de memória LPDDR5x e 1 TB de armazenamento PCIe NVMe.
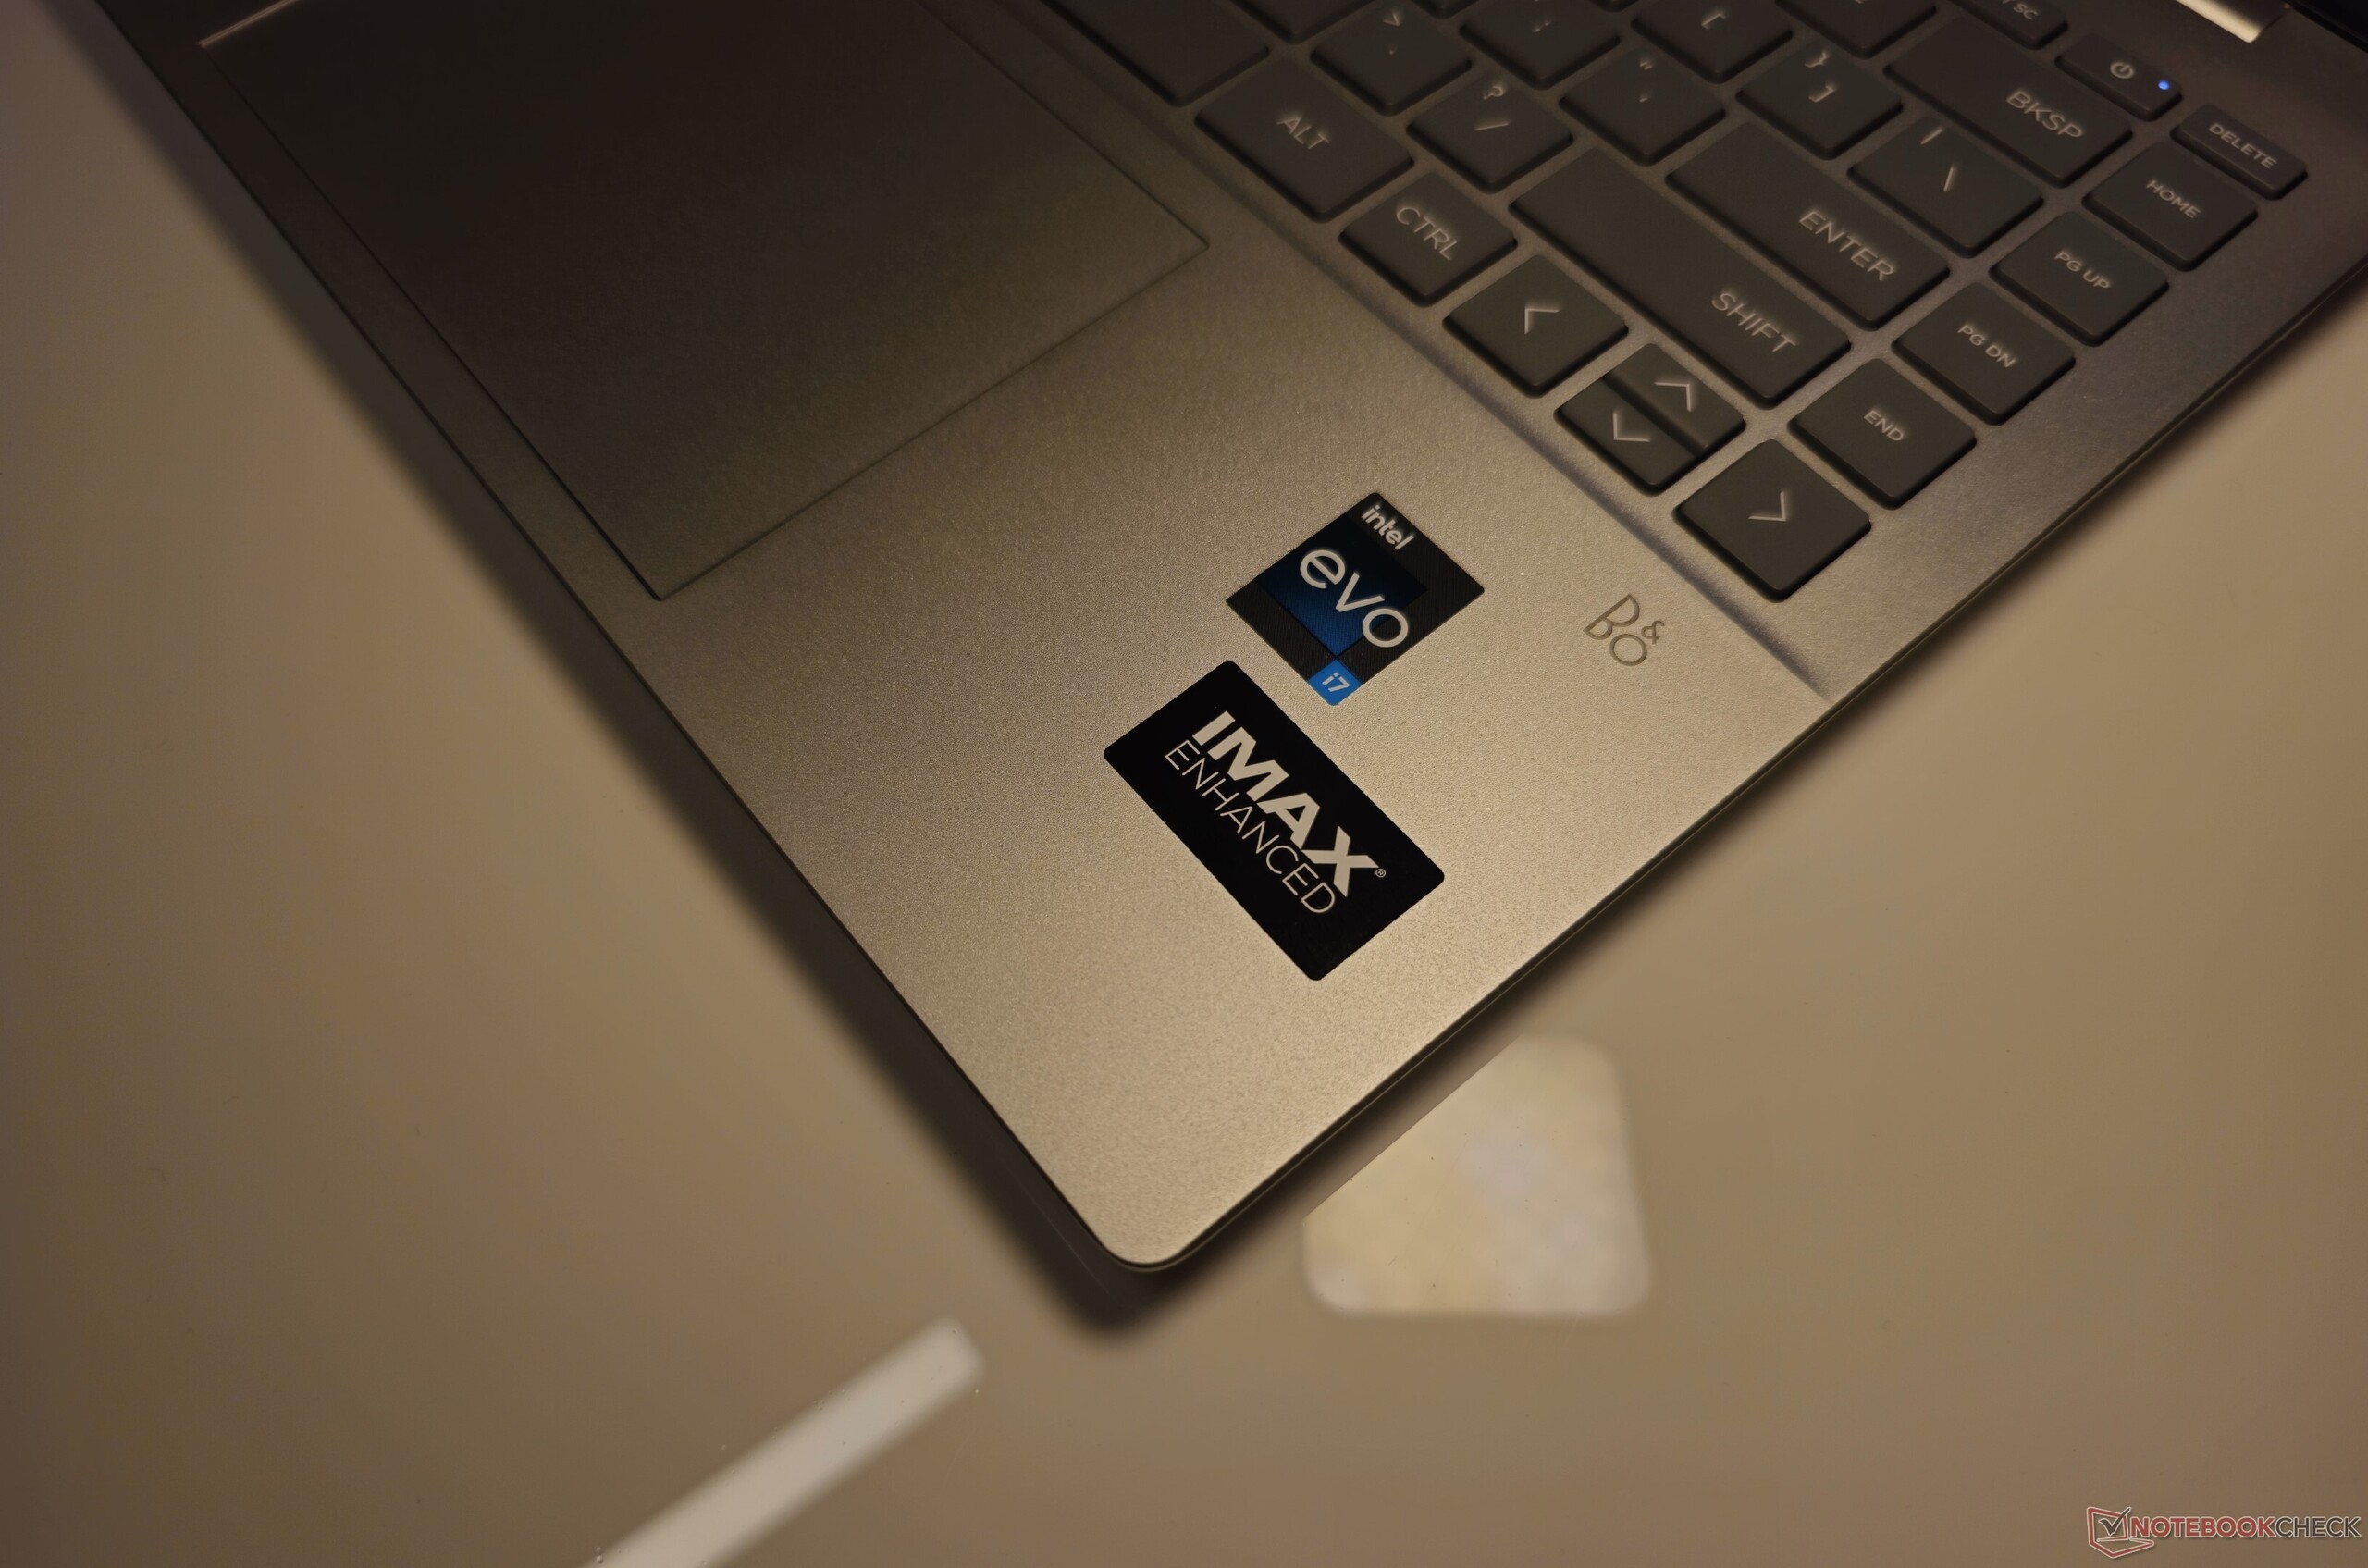
Os dois modelos do Pavilion Plus 14 compartilham vários atributos, incluindo a tela OLED "IMAX Enhanced" 2.8K 120 Hz HDR. Portanto, nesta análise, vamos nos concentrar principalmente nas diferenças de desempenho entre as duas versões.
Nossa configuração é vendida oficialmente por ₹99.999 na Índia, mas pode ser adquirida por cerca de ₹90.000 com várias ofertas de bancos e cartões. Nos EUA, essa SKU está sendo vendida atualmente a um preço com desconto de US$ 1.019,99 na loja oficial da HP.
Possíveis concorrentes em comparação
Avaliação | Data | Modelo | Peso | Altura | Size | Resolução | Preço |
|---|---|---|---|---|---|---|---|
| 87.5 % v7 (old) | 12/2023 | HP Pavilion Plus 14-ew0153TU i7-1355U, Iris Xe G7 96EUs | 1.4 kg | 17.5 mm | 14.00" | 2880x1800 | |
| 87.8 % v7 (old) | 11/2023 | HP Pavilion Plus 14-ey0095cl R7 7840U, Radeon 780M | 1.4 kg | 18.8 mm | 14.00" | 2880x1800 | |
| 88.9 % v7 (old) | 11/2023 | Lenovo ThinkPad T14s G4 i7-1365U i7-1365U, Iris Xe G7 96EUs | 1.4 kg | 16.9 mm | 14.00" | 1920x1200 | |
| 85.6 % v7 (old) | 11/2023 | Acer Swift Go 14 SFG14-71 i5-1335U, Iris Xe G7 80EUs | 1.3 kg | 14.9 mm | 14.00" | 2880x1800 | |
| 91.5 % v7 (old) | 11/2023 | Asus ExpertBook B9 B9403CVA-KM0153X i7-1355U, Iris Xe G7 96EUs | 1 kg | 17.6 mm | 14.00" | 2880x1800 | |
| 89.6 % v7 (old) | 06/2023 | Huawei MateBook X Pro 2023 i7-1360P, Iris Xe G7 96EUs | 1.3 kg | 15.6 mm | 14.20" | 3120x2080 |
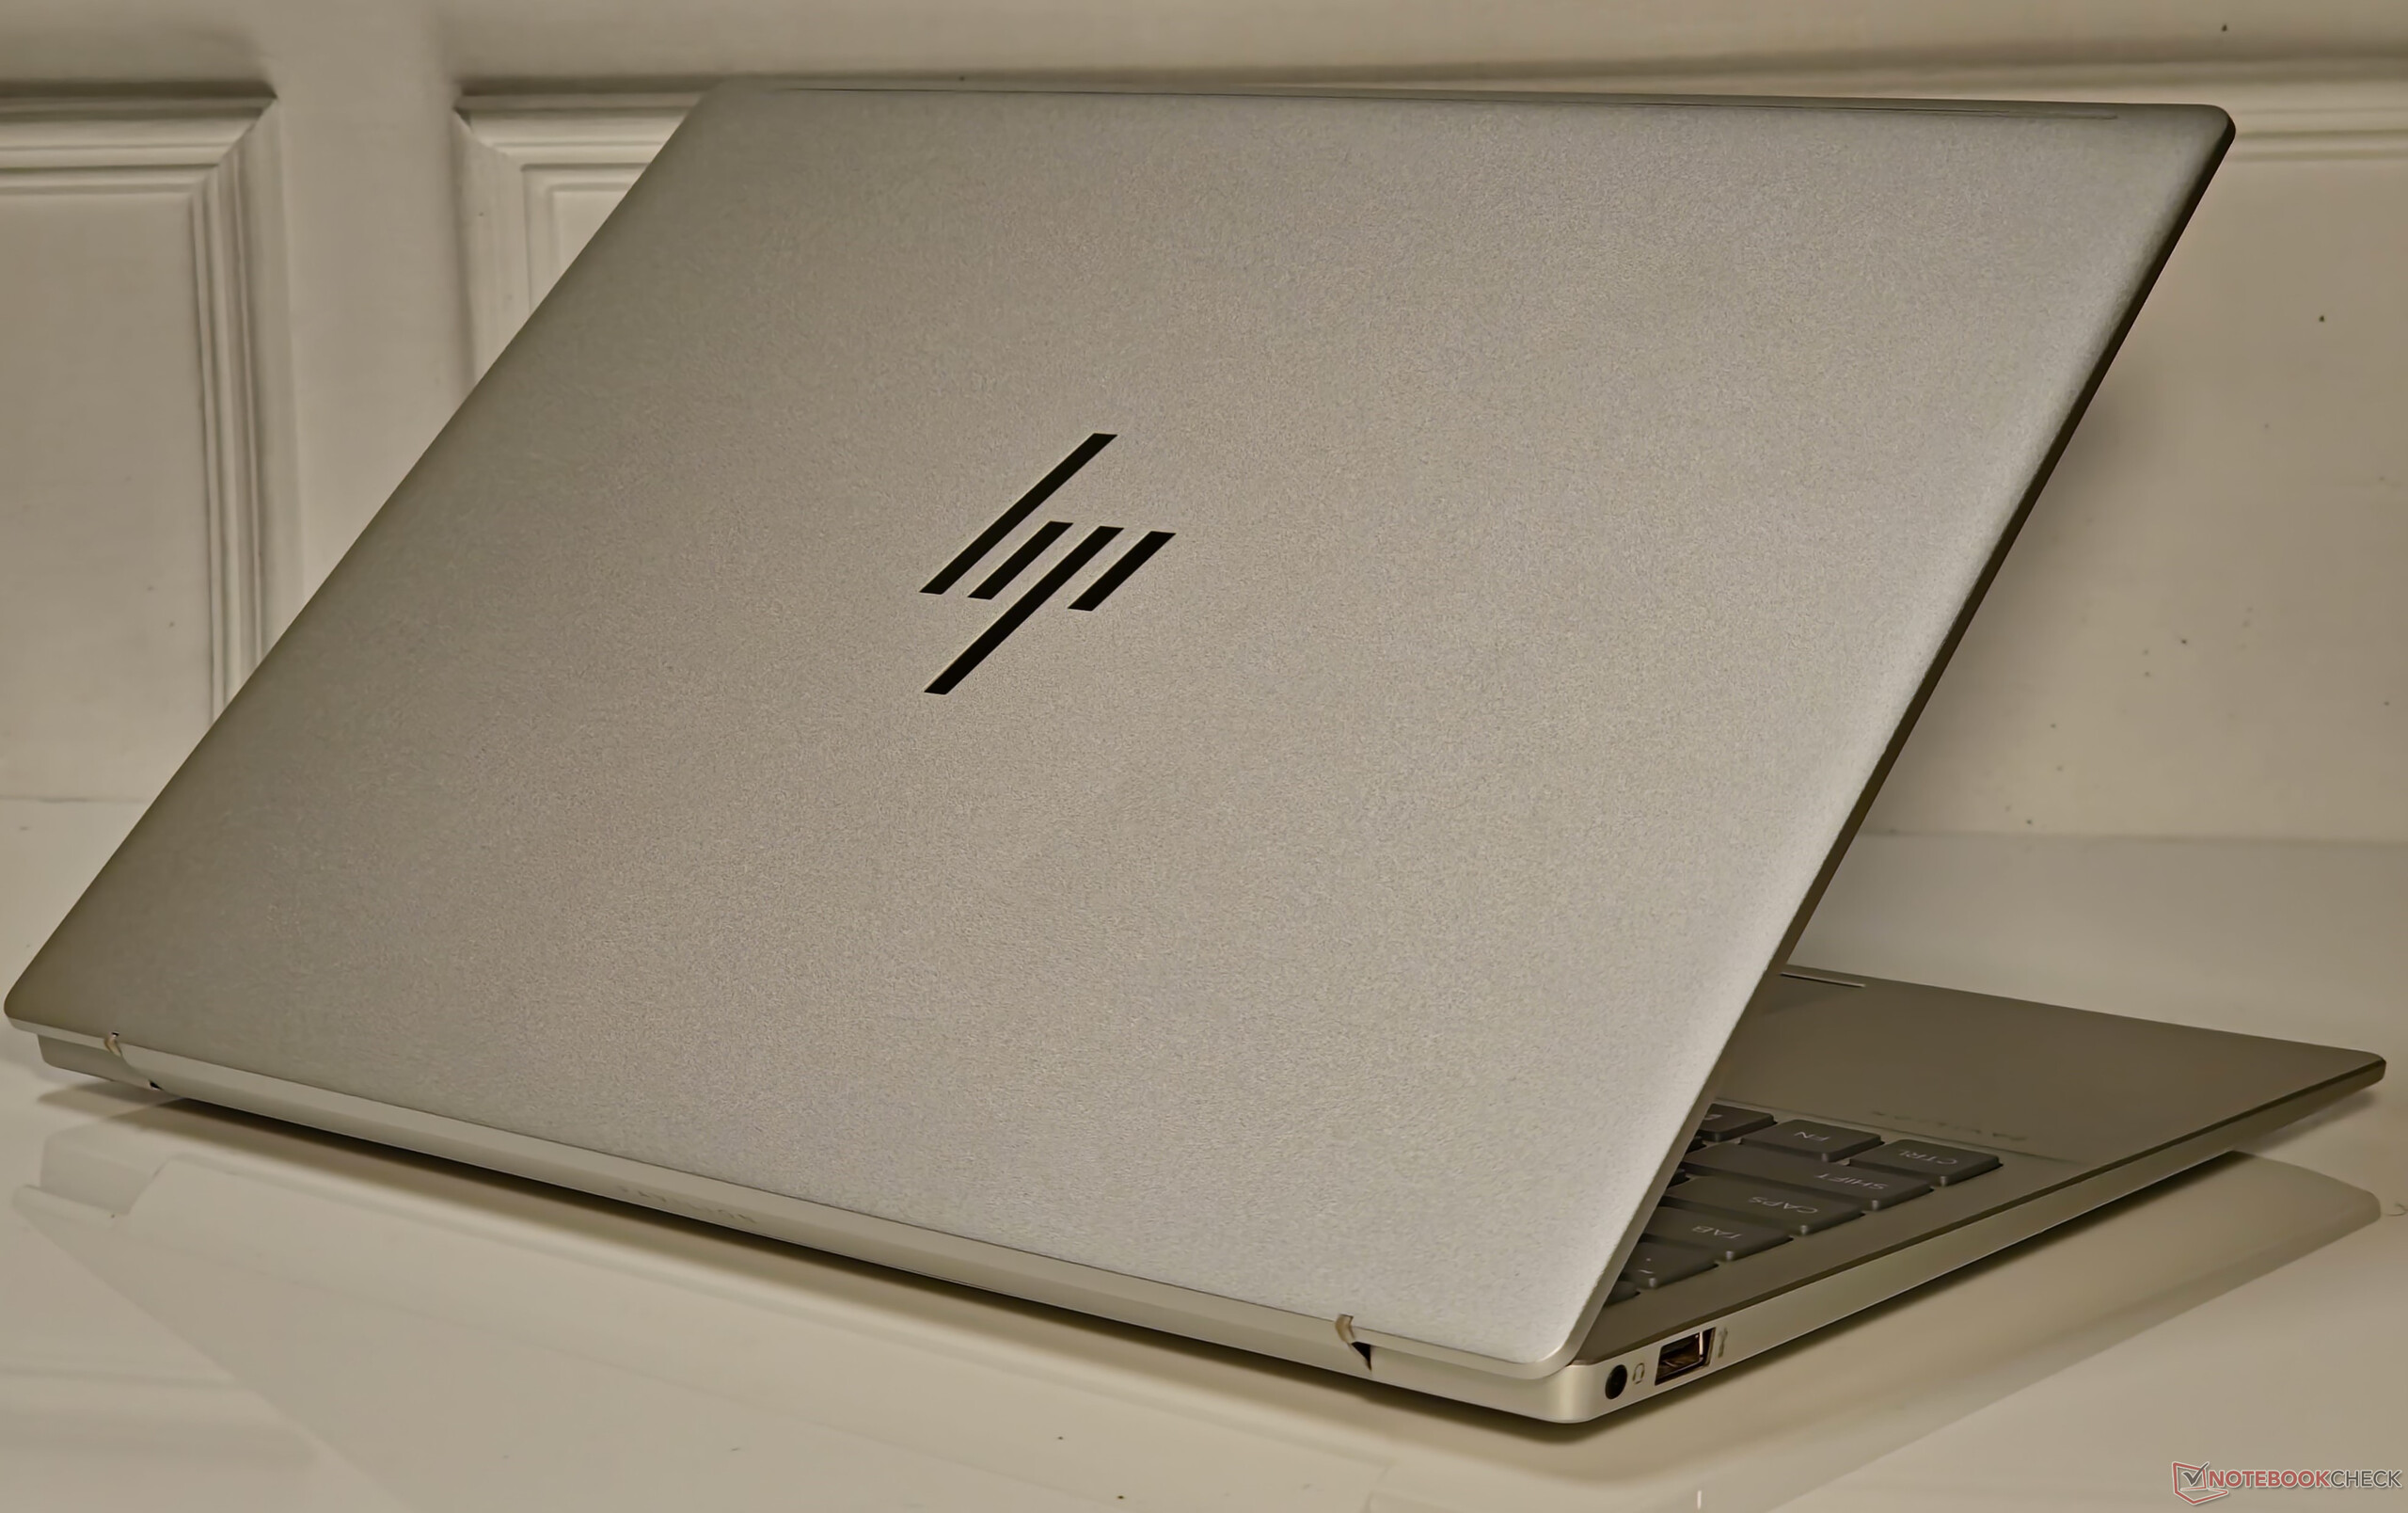
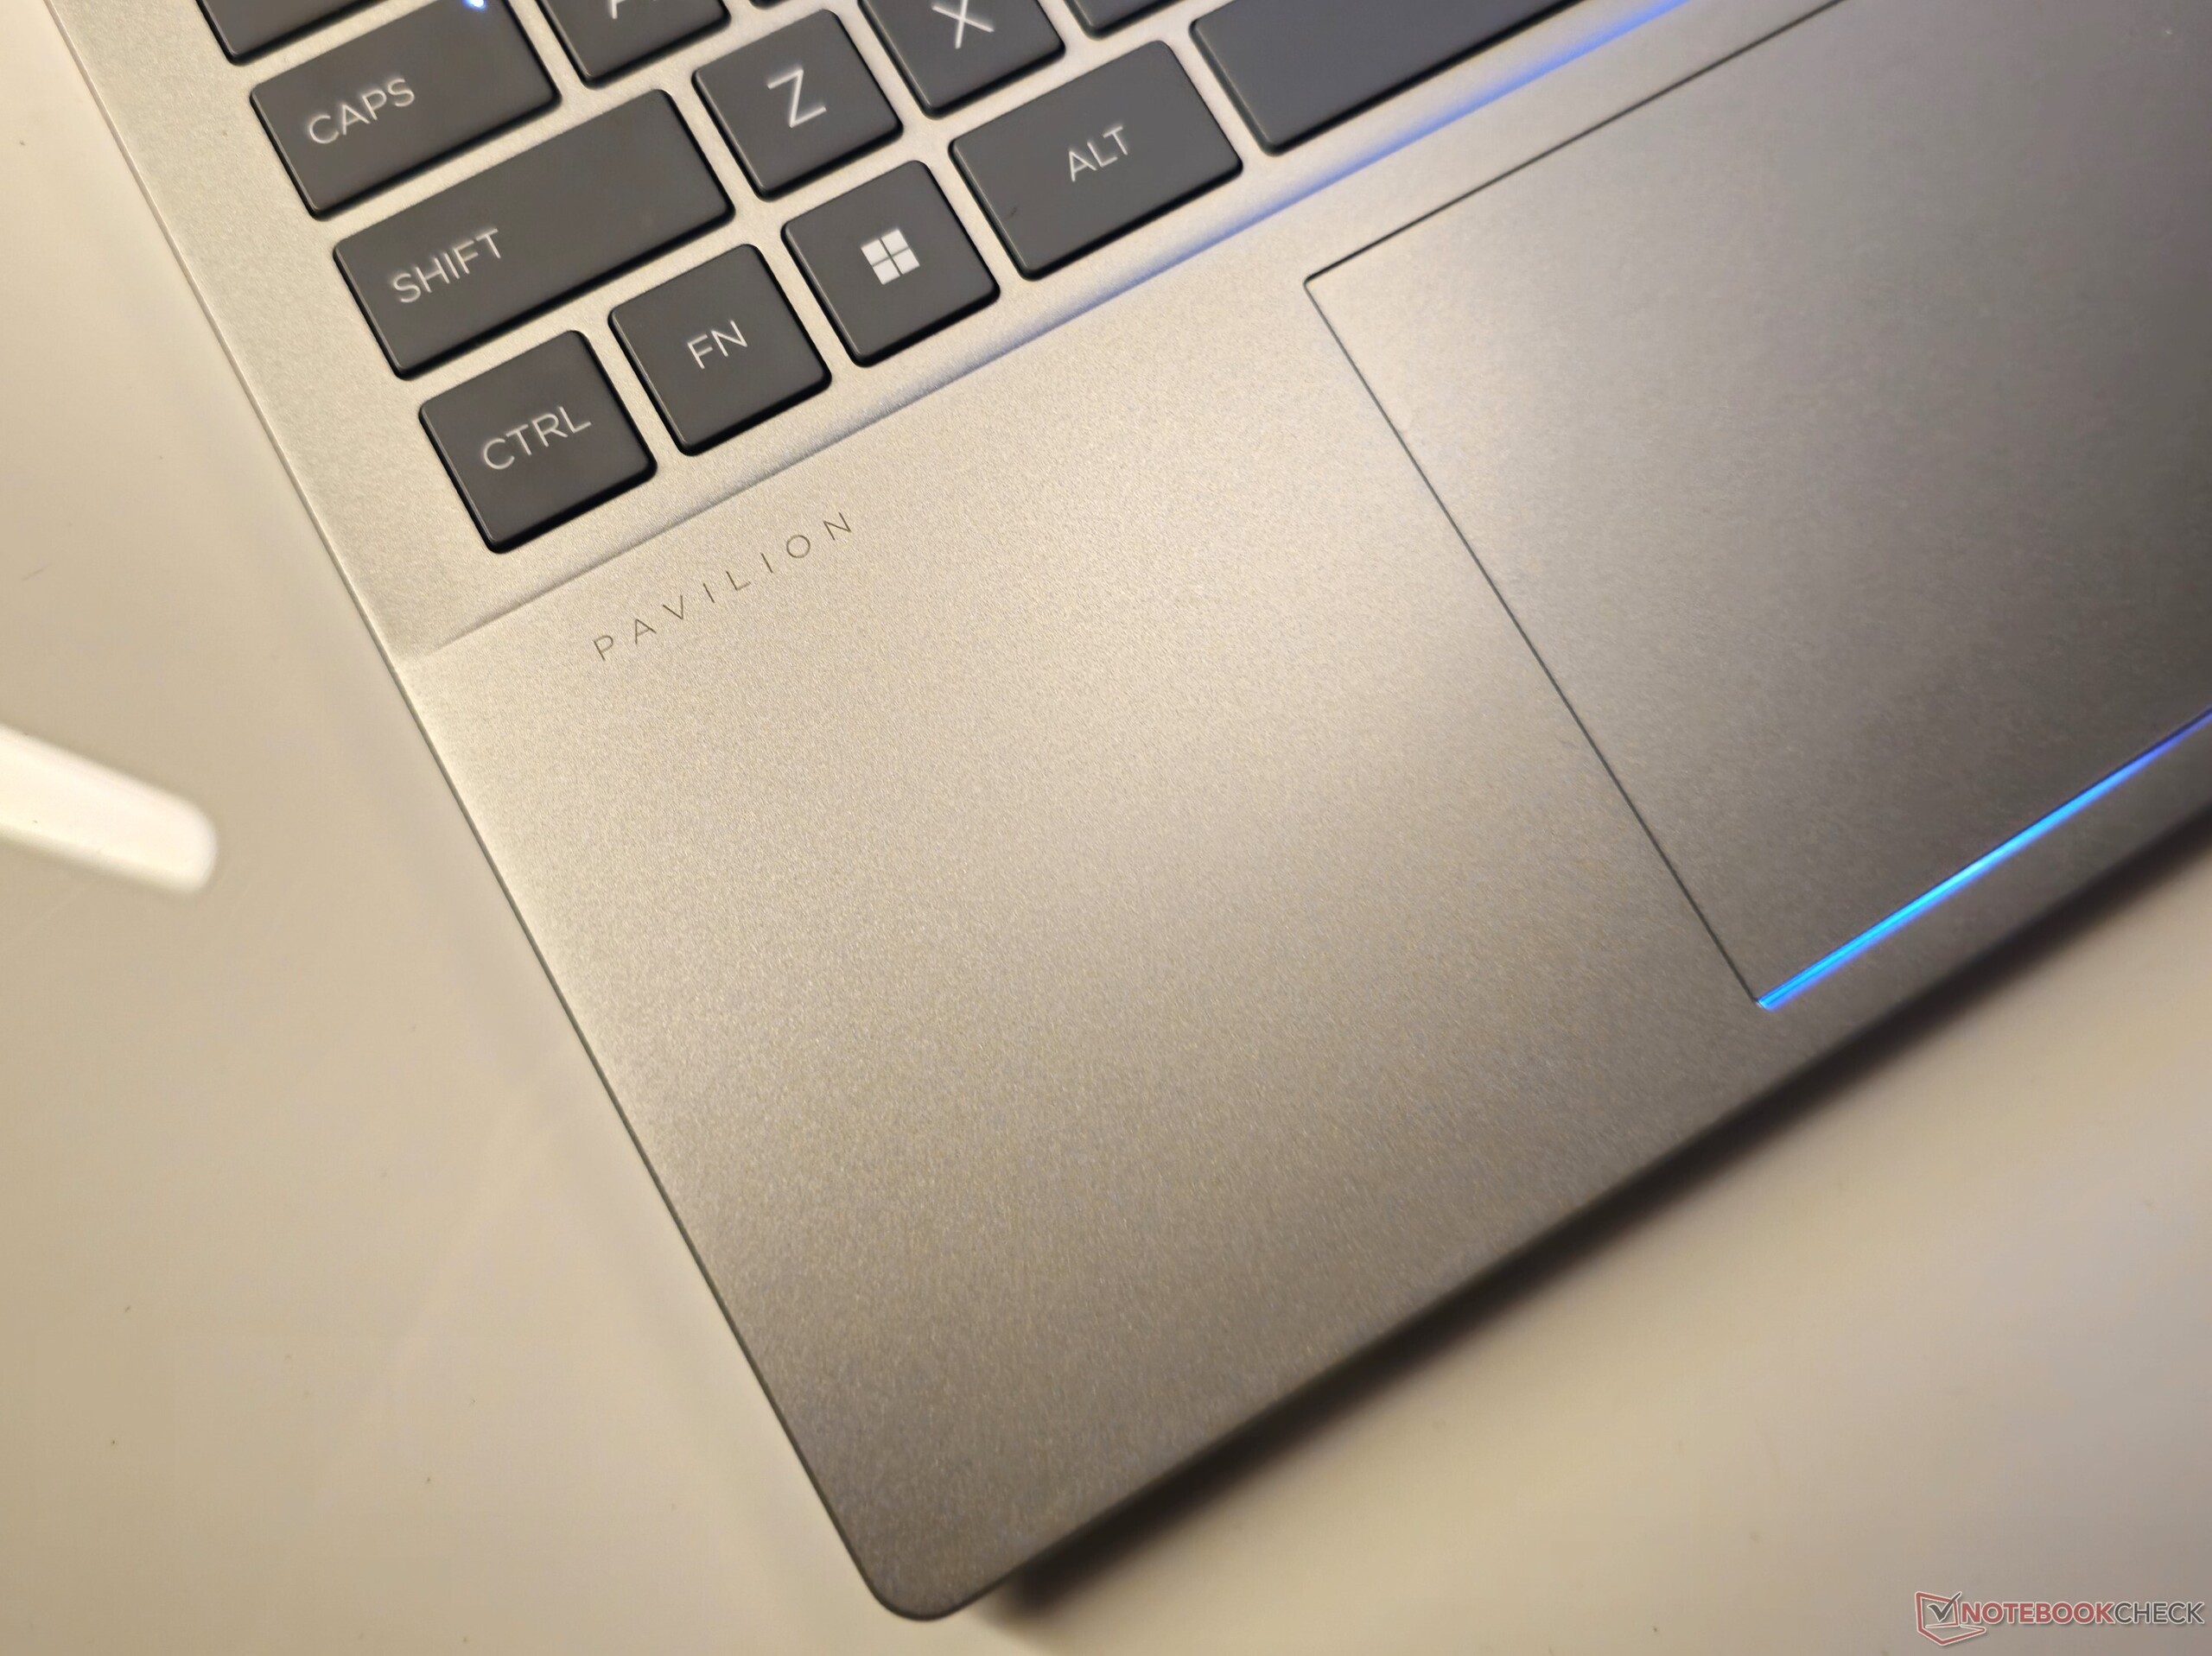
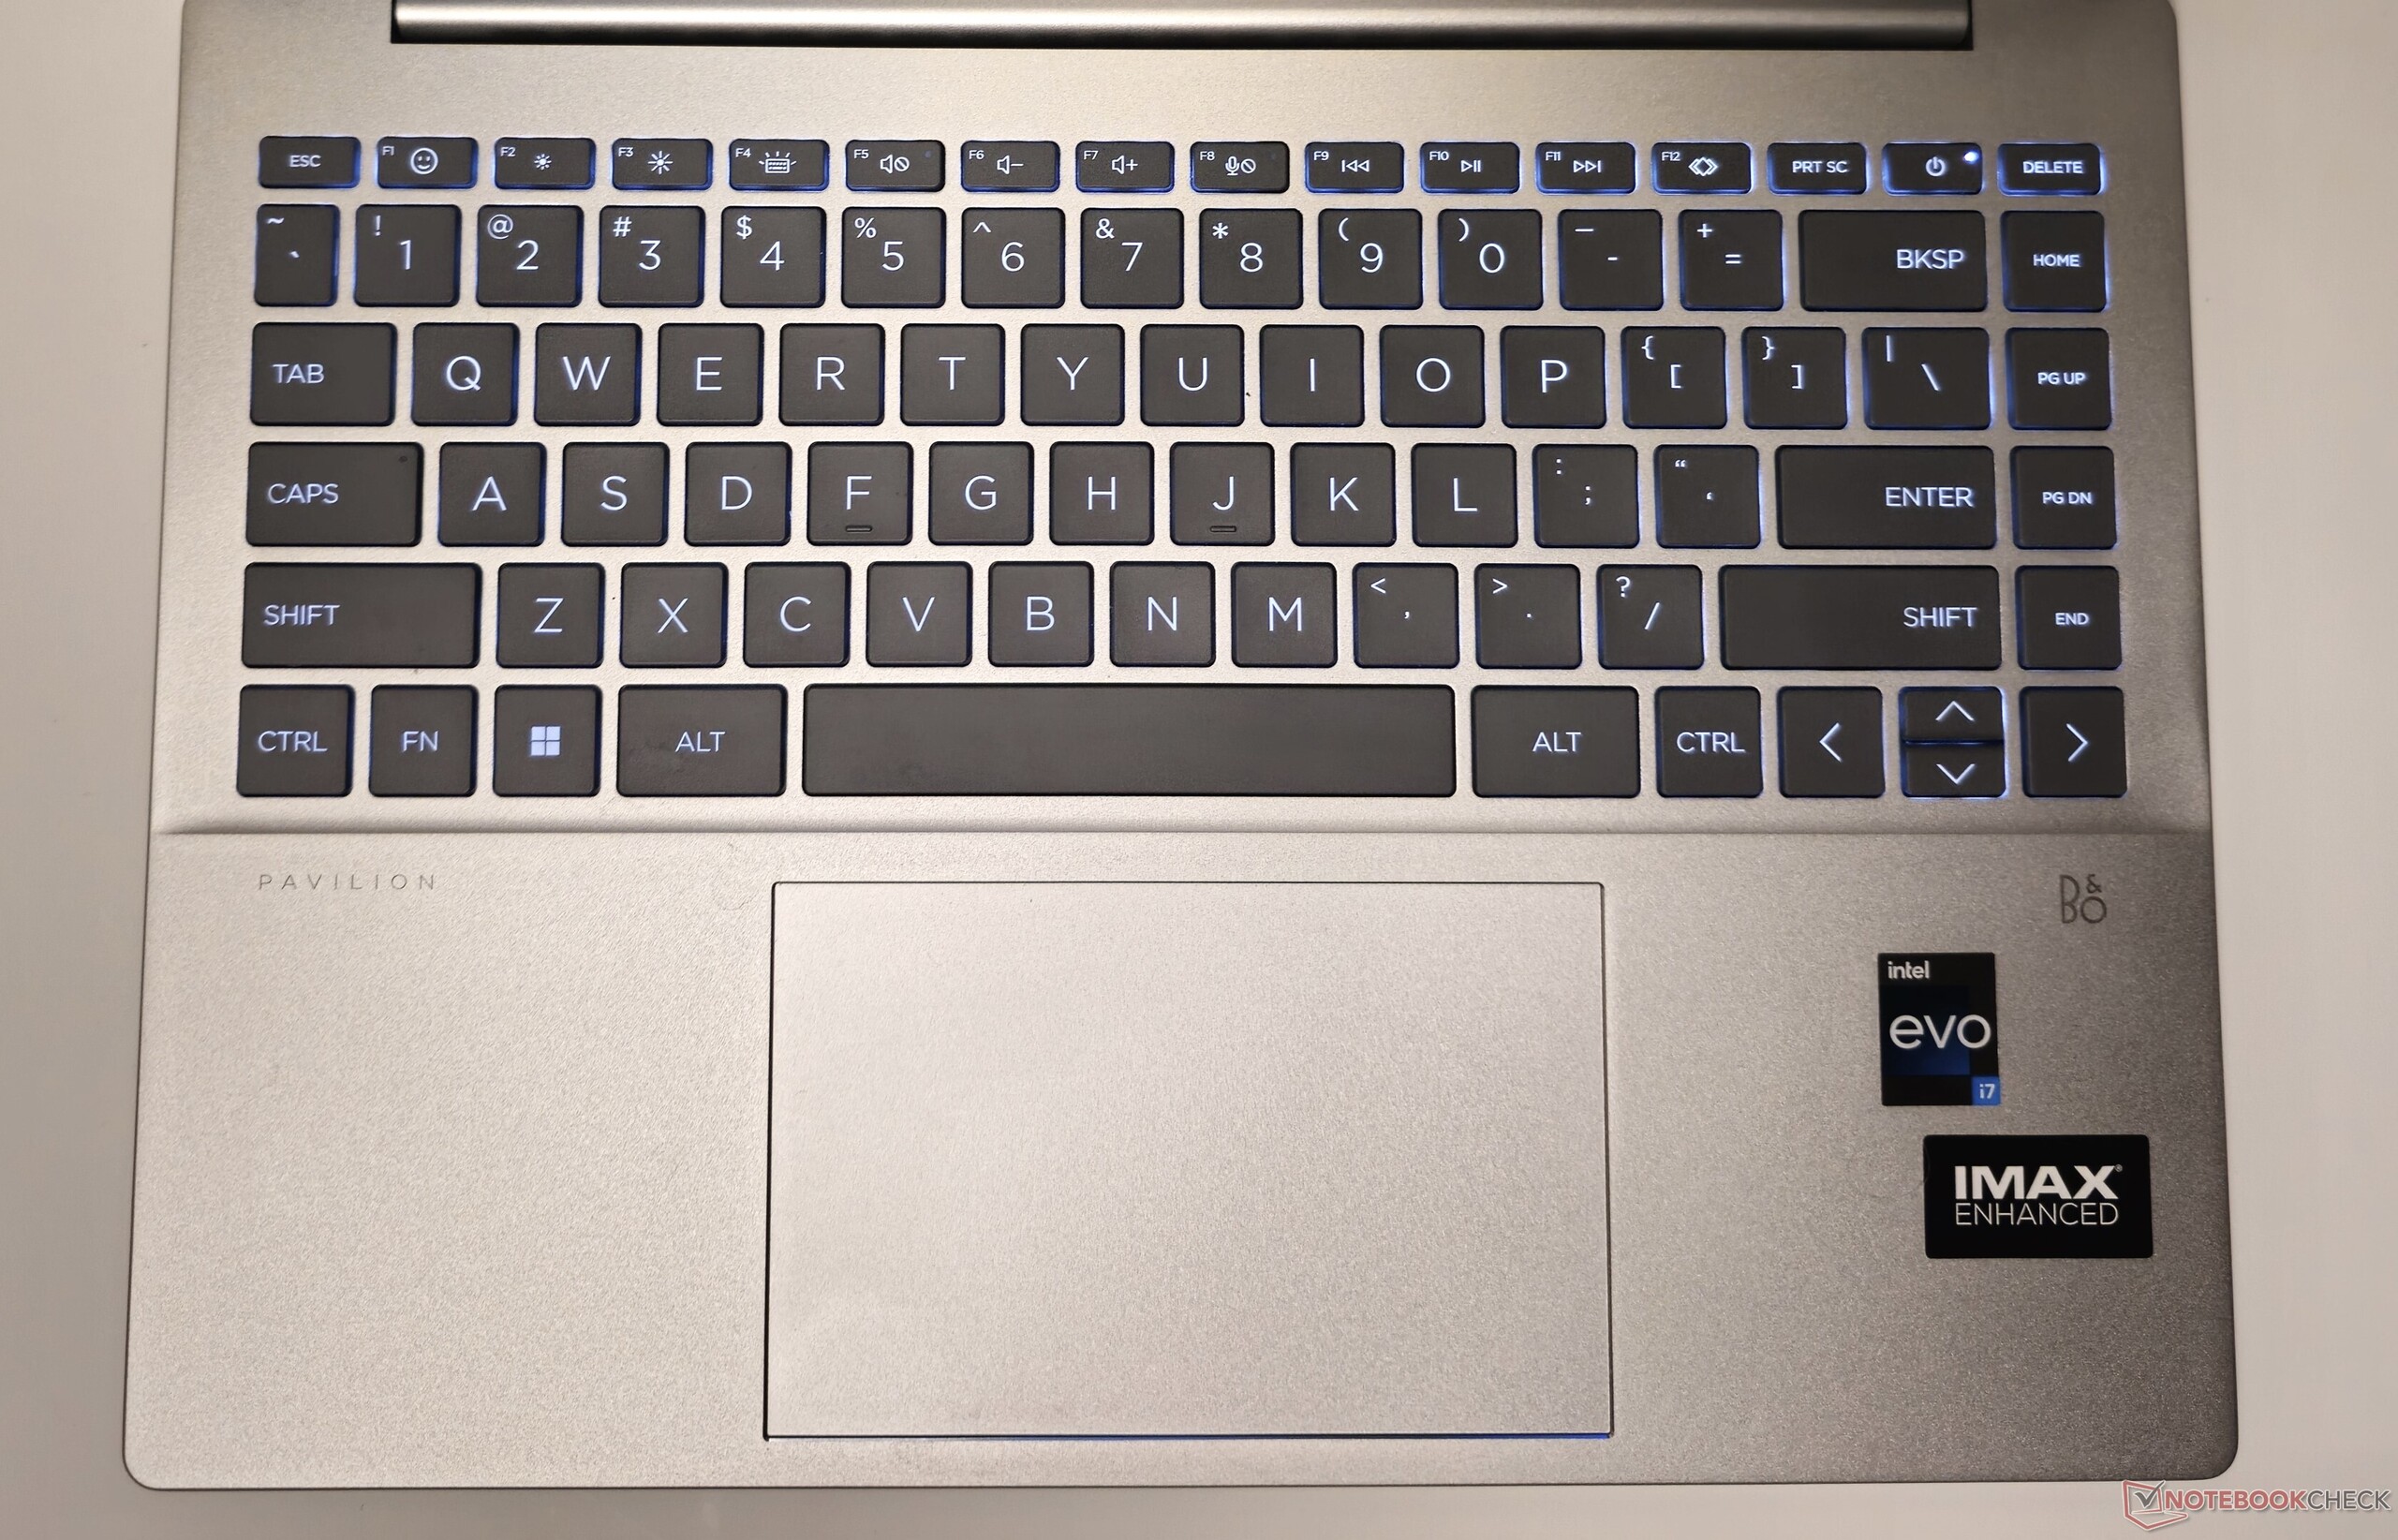
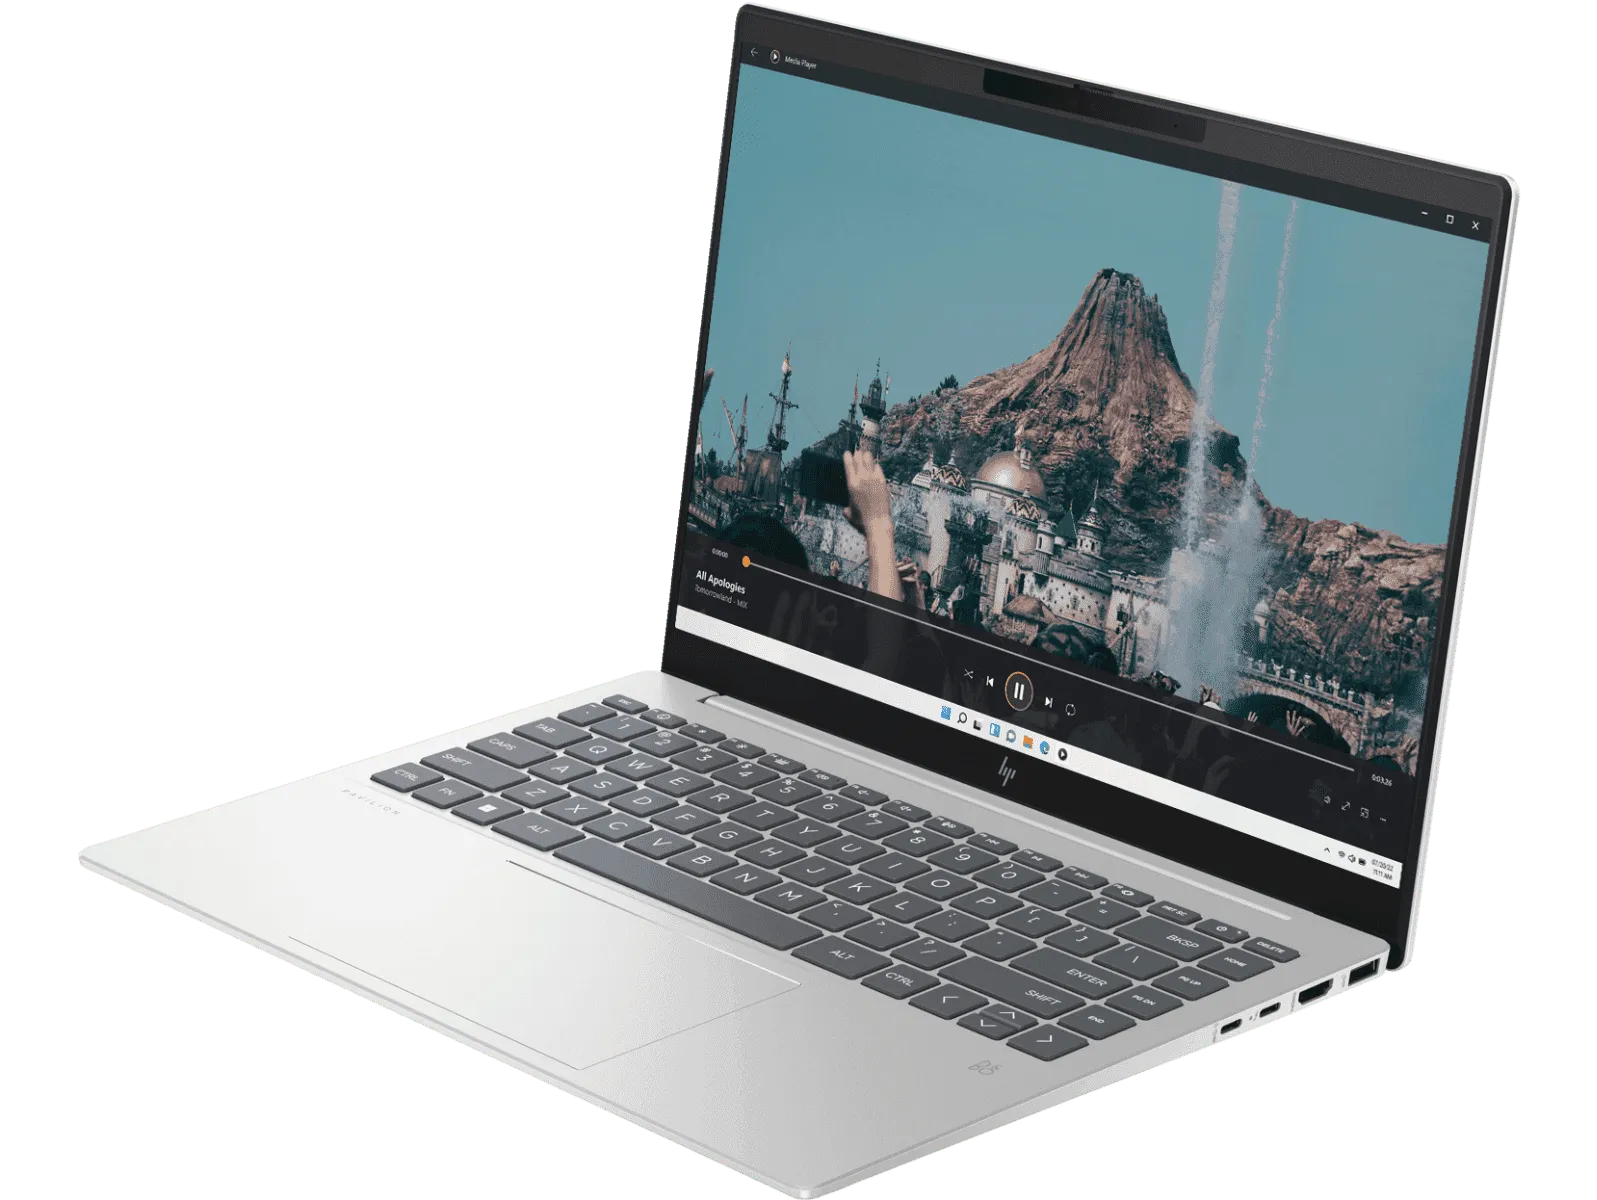
Chassi, manutenção e dispositivos de entrada
Aspectos como o chassi totalmente metálico do laptop, a manutenção e os dispositivos de entrada correspondem ao modelo AMD analisado anteriormente. Confira nossa cobertura anterior para obter mais detalhes sobre esses aspectos.
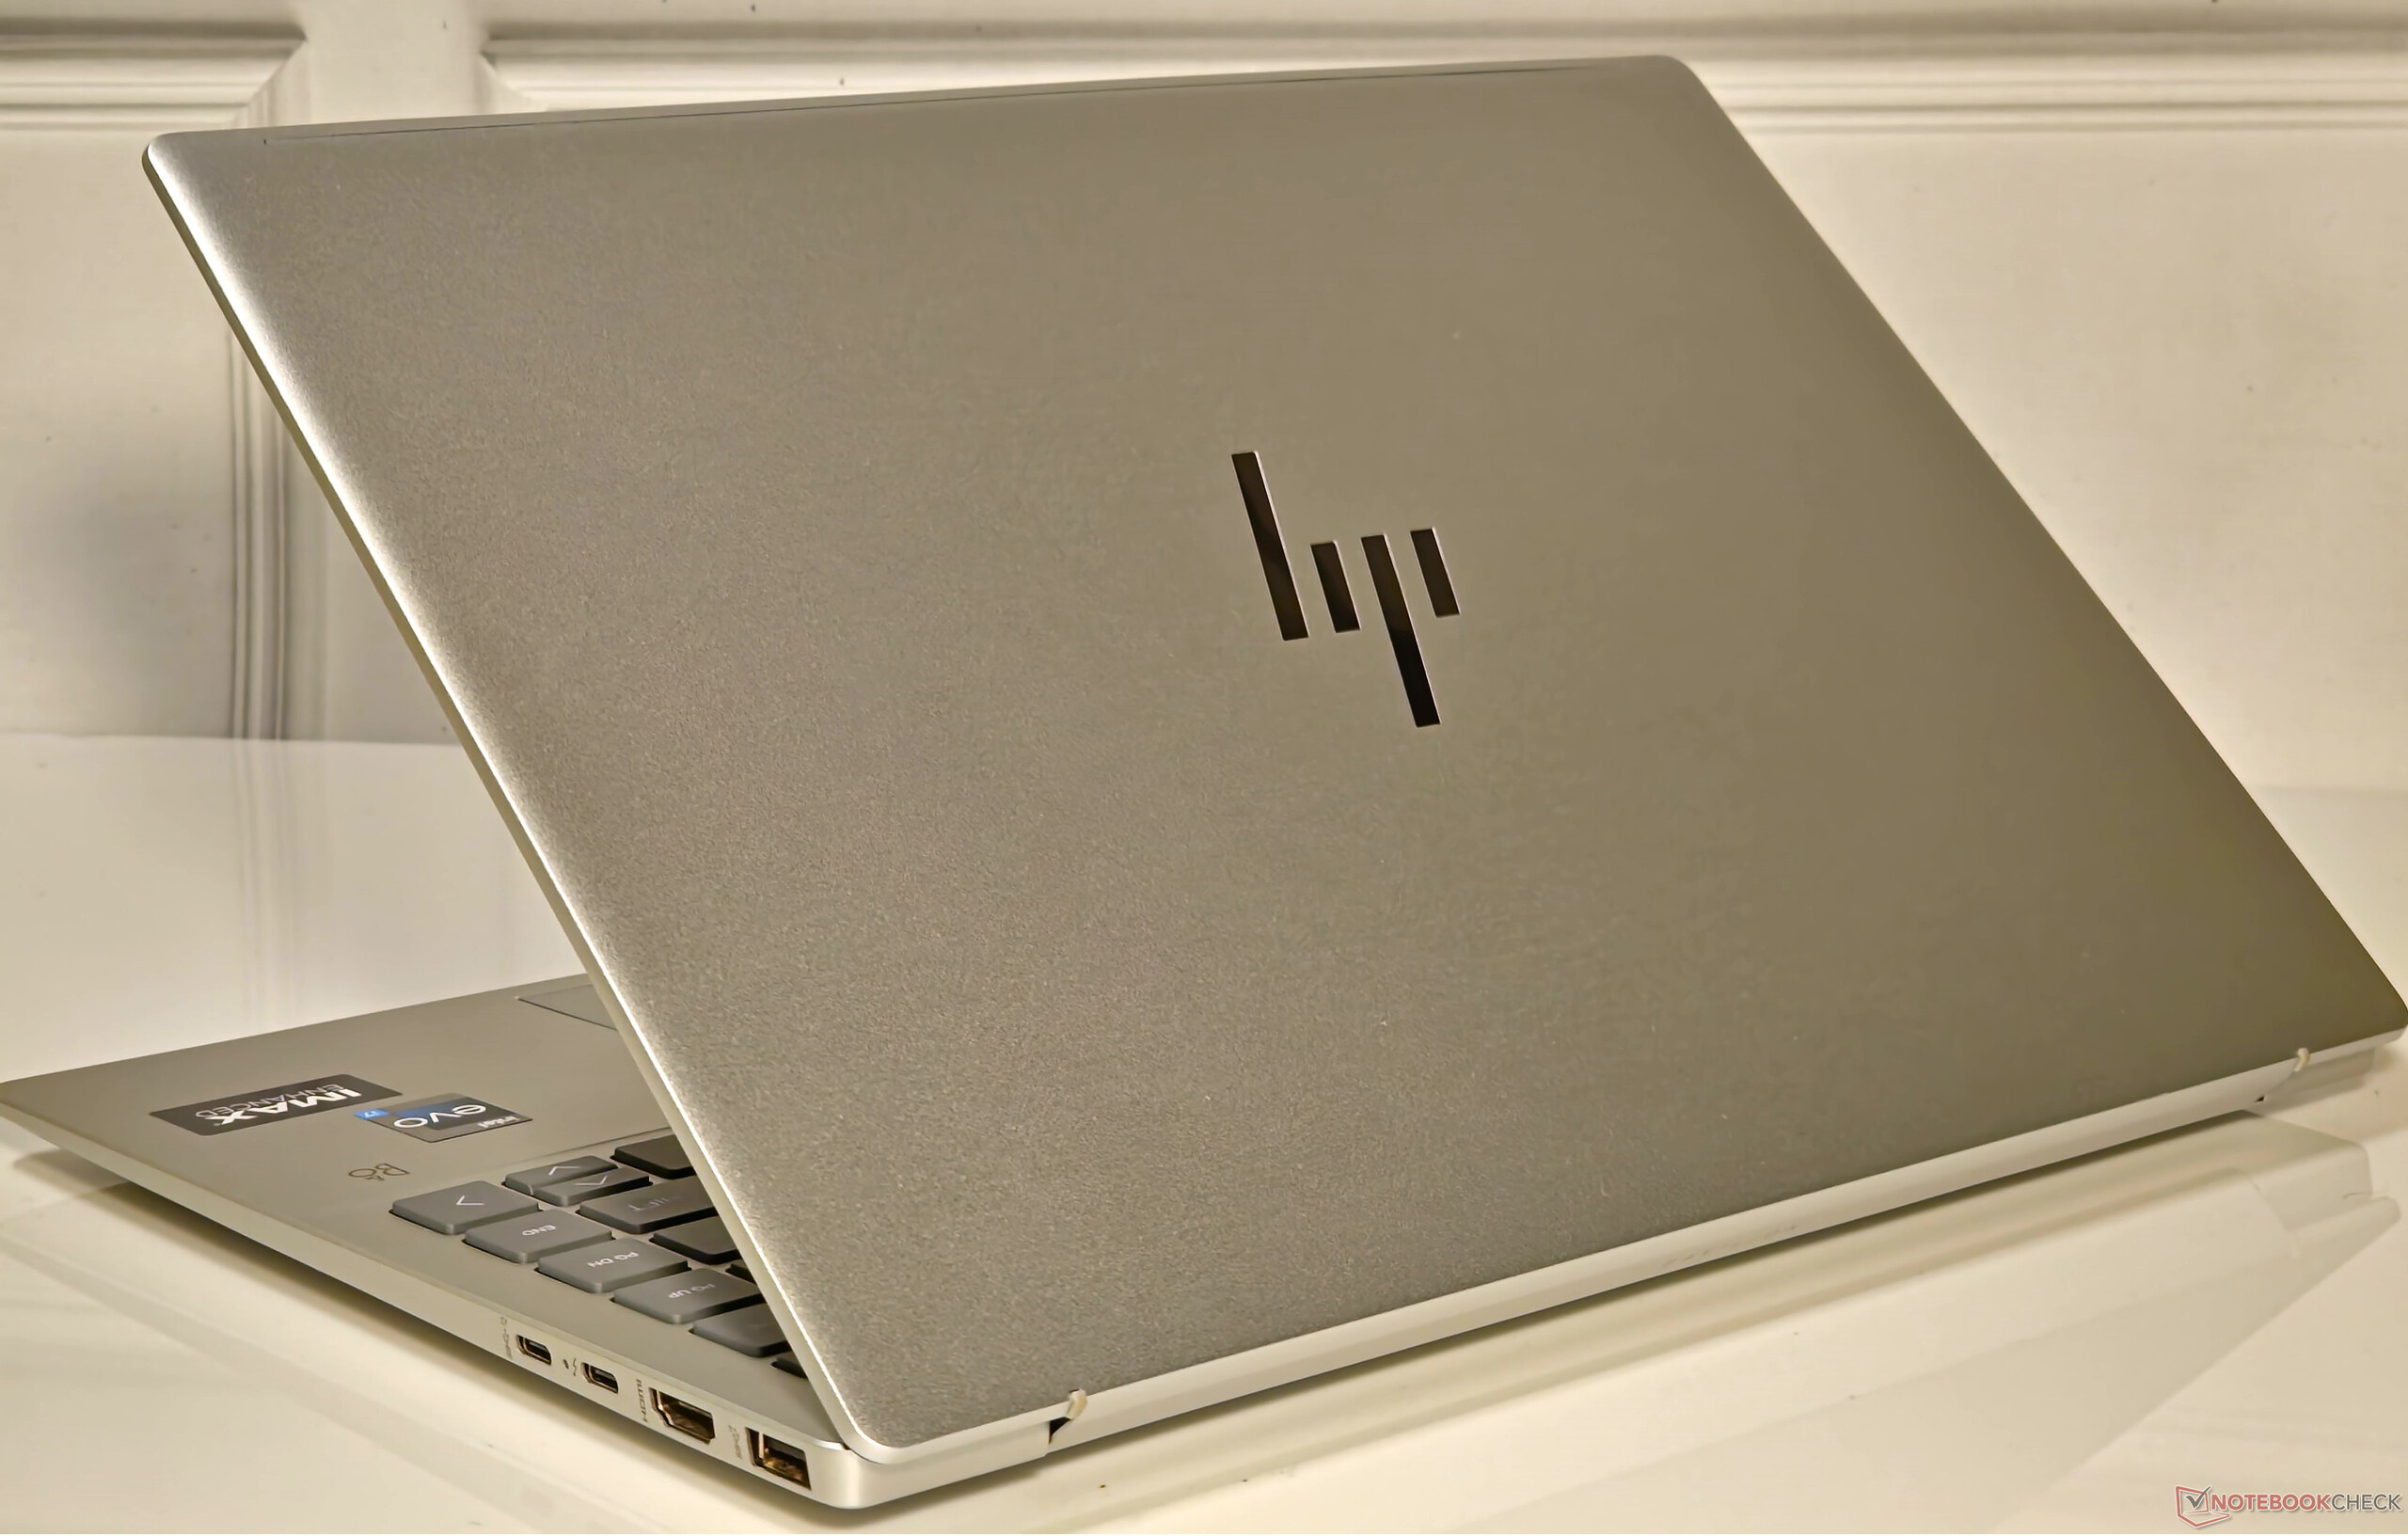
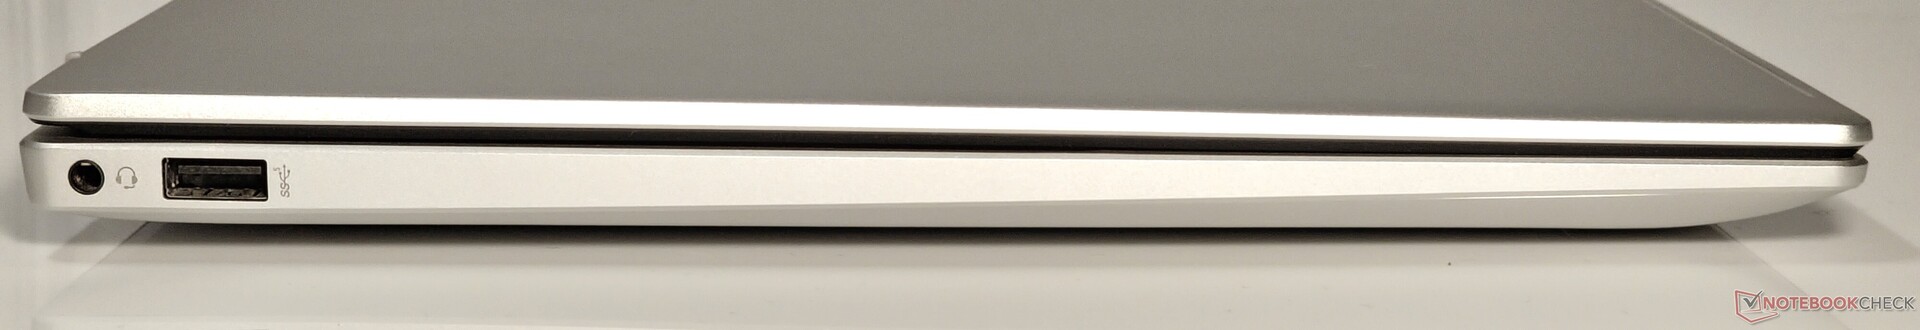
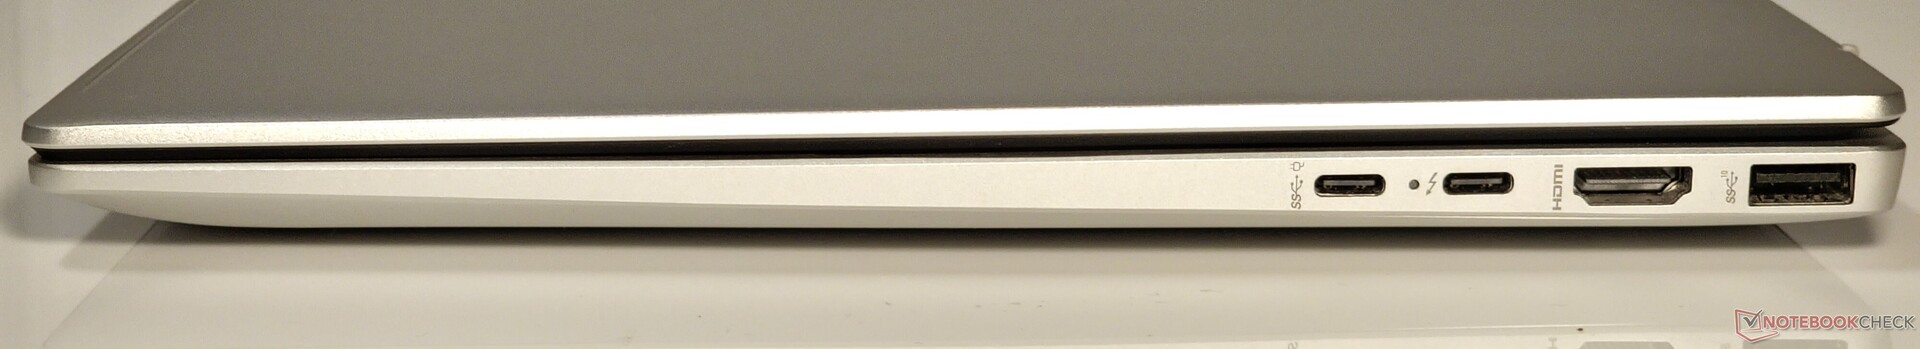
Conectividade: Thunderbolt 4 e velocidades estáveis de Wi-Fi 6E
A seleção de portas no Pavilion Plus 14 é decente. A variante Intel supera sua prima AMD ao oferecer uma porta Thunderbolt 4, enquanto os compradores da última têm que se contentar com apenas uma porta USB 3.2 Type-C no lugar.
Não há entrada CC dedicada, portanto, uma das portas Type-C será ocupada pelo adaptador de alimentação quando conectado.
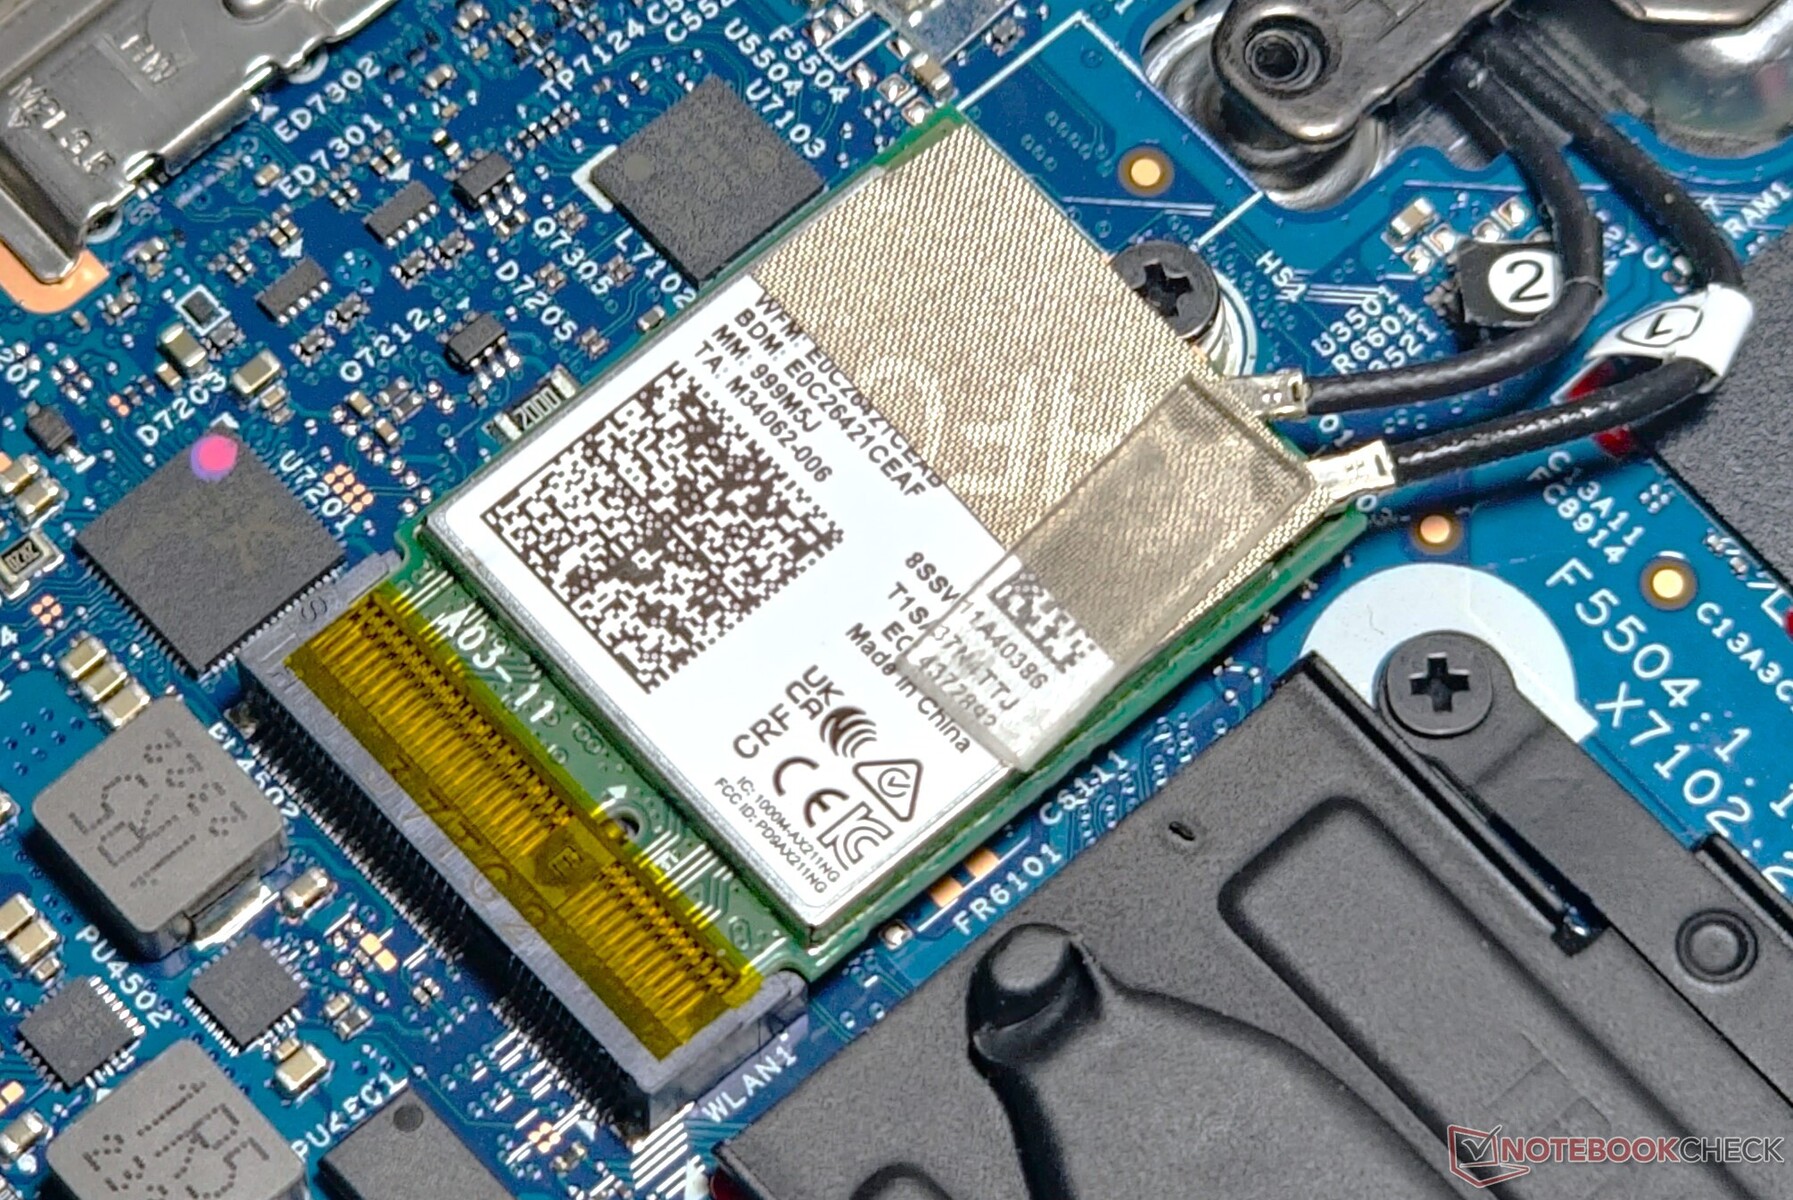
Por ser um design Intel Evo, o Pavilion Plus 14 vem naturalmente com a placa WLAN Intel Wi-Fi 6E AX211. Isso lhe confere uma vantagem de desempenho notável em relação ao MediaTek Wi-Fi 6E MT7922 usado no SKU da AMD, especialmente nos testes de recepção do iPerf3 quando emparelhado com nosso roteador de referência Asus ROG Rapture GT-AXE11000.
A banda de 6 GHz oferece apenas ganhos marginais de taxa de transferência, mas notamos velocidades de transmissão mais estáveis aqui, sem as quedas de desempenho observadas na banda de 5 GHz.
| Networking / iperf3 transmit AXE11000 | |
| HP Pavilion Plus 14-ew0153TU | |
| HP Pavilion Plus 14-ey0095cl | |
| Lenovo ThinkPad T14s G4 i7-1365U | |
| Média da turma Multimedia (606 - 1978, n=54, últimos 2 anos) | |
| Média Intel Wi-Fi 6E AX211 (64 - 1921, n=276) | |
| Asus ExpertBook B9 B9403CVA-KM0153X | |
| Acer Swift Go 14 SFG14-71 | |
| Huawei MateBook X Pro 2023 | |
| Networking / iperf3 receive AXE11000 | |
| HP Pavilion Plus 14-ew0153TU | |
| Média Intel Wi-Fi 6E AX211 (582 - 1890, n=276) | |
| Média da turma Multimedia (682 - 1818, n=54, últimos 2 anos) | |
| Lenovo ThinkPad T14s G4 i7-1365U | |
| HP Pavilion Plus 14-ey0095cl | |
| Huawei MateBook X Pro 2023 | |
| Acer Swift Go 14 SFG14-71 | |
| Asus ExpertBook B9 B9403CVA-KM0153X | |
| Networking / iperf3 transmit AXE11000 6GHz | |
| HP Pavilion Plus 14-ew0153TU | |
| Asus ExpertBook B9 B9403CVA-KM0153X | |
| HP Pavilion Plus 14-ey0095cl | |
| Média da turma Multimedia (869 - 2373, n=23, últimos 2 anos) | |
| Lenovo ThinkPad T14s G4 i7-1365U | |
| Média Intel Wi-Fi 6E AX211 (385 - 1851, n=226) | |
| Huawei MateBook X Pro 2023 | |
| Acer Swift Go 14 SFG14-71 | |
| Networking / iperf3 receive AXE11000 6GHz | |
| Huawei MateBook X Pro 2023 | |
| Média da turma Multimedia (1212 - 2361, n=23, últimos 2 anos) | |
| HP Pavilion Plus 14-ew0153TU | |
| Média Intel Wi-Fi 6E AX211 (700 - 1857, n=226) | |
| Asus ExpertBook B9 B9403CVA-KM0153X | |
| Lenovo ThinkPad T14s G4 i7-1365U | |
| Acer Swift Go 14 SFG14-71 | |
| HP Pavilion Plus 14-ey0095cl | |
Webcam
Ao contrário da versão AMD, não tivemos problemas em tirar fotos de 5 MP com a nossa unidade usando o aplicativo padrão Windows Camera. A qualidade da imagem é uma grande melhoria em comparação com a maioria dos laptops com webcams pedestres de 720p ou 1080p.
Nosso gráfico de teste mostra detalhes amplos e nitidez adequada, mas a precisão das cores deixa muito a desejar. Um obturador físico manual da webcam permite maior privacidade. Os aplicativos HP Enhanced Camera e HP Enhanced Lighting incluídos no pacote oferecem ainda mais recursos de qualidade de vida para videoconferência.


Segurança
O Pavilion Plus 14 vem com um módulo TPM 2.0 de acordo com os requisitos de segurança do Windows 11. Uma câmera IR permite o reconhecimento facial baseado no Windows Hello. Infelizmente, o laptop não possui um slot de trava Kensington.
Acessórios e garantia
A embalagem padrão vem com um adaptador de energia de 65 W e a documentação habitual, sem nenhum acessório.
A HP oferece uma garantia padrão de um ano para o Pavilion Plus 14 na Índia. Os compradores também podem optar por pacotes de cuidados pós-garantia HP elegíveis e proteção contra danos acidentais que variam de um ano (₹10.763) a três anos (até ₹14.459 para o dia útil seguinte no local), em até 90 dias após a compra do produto.
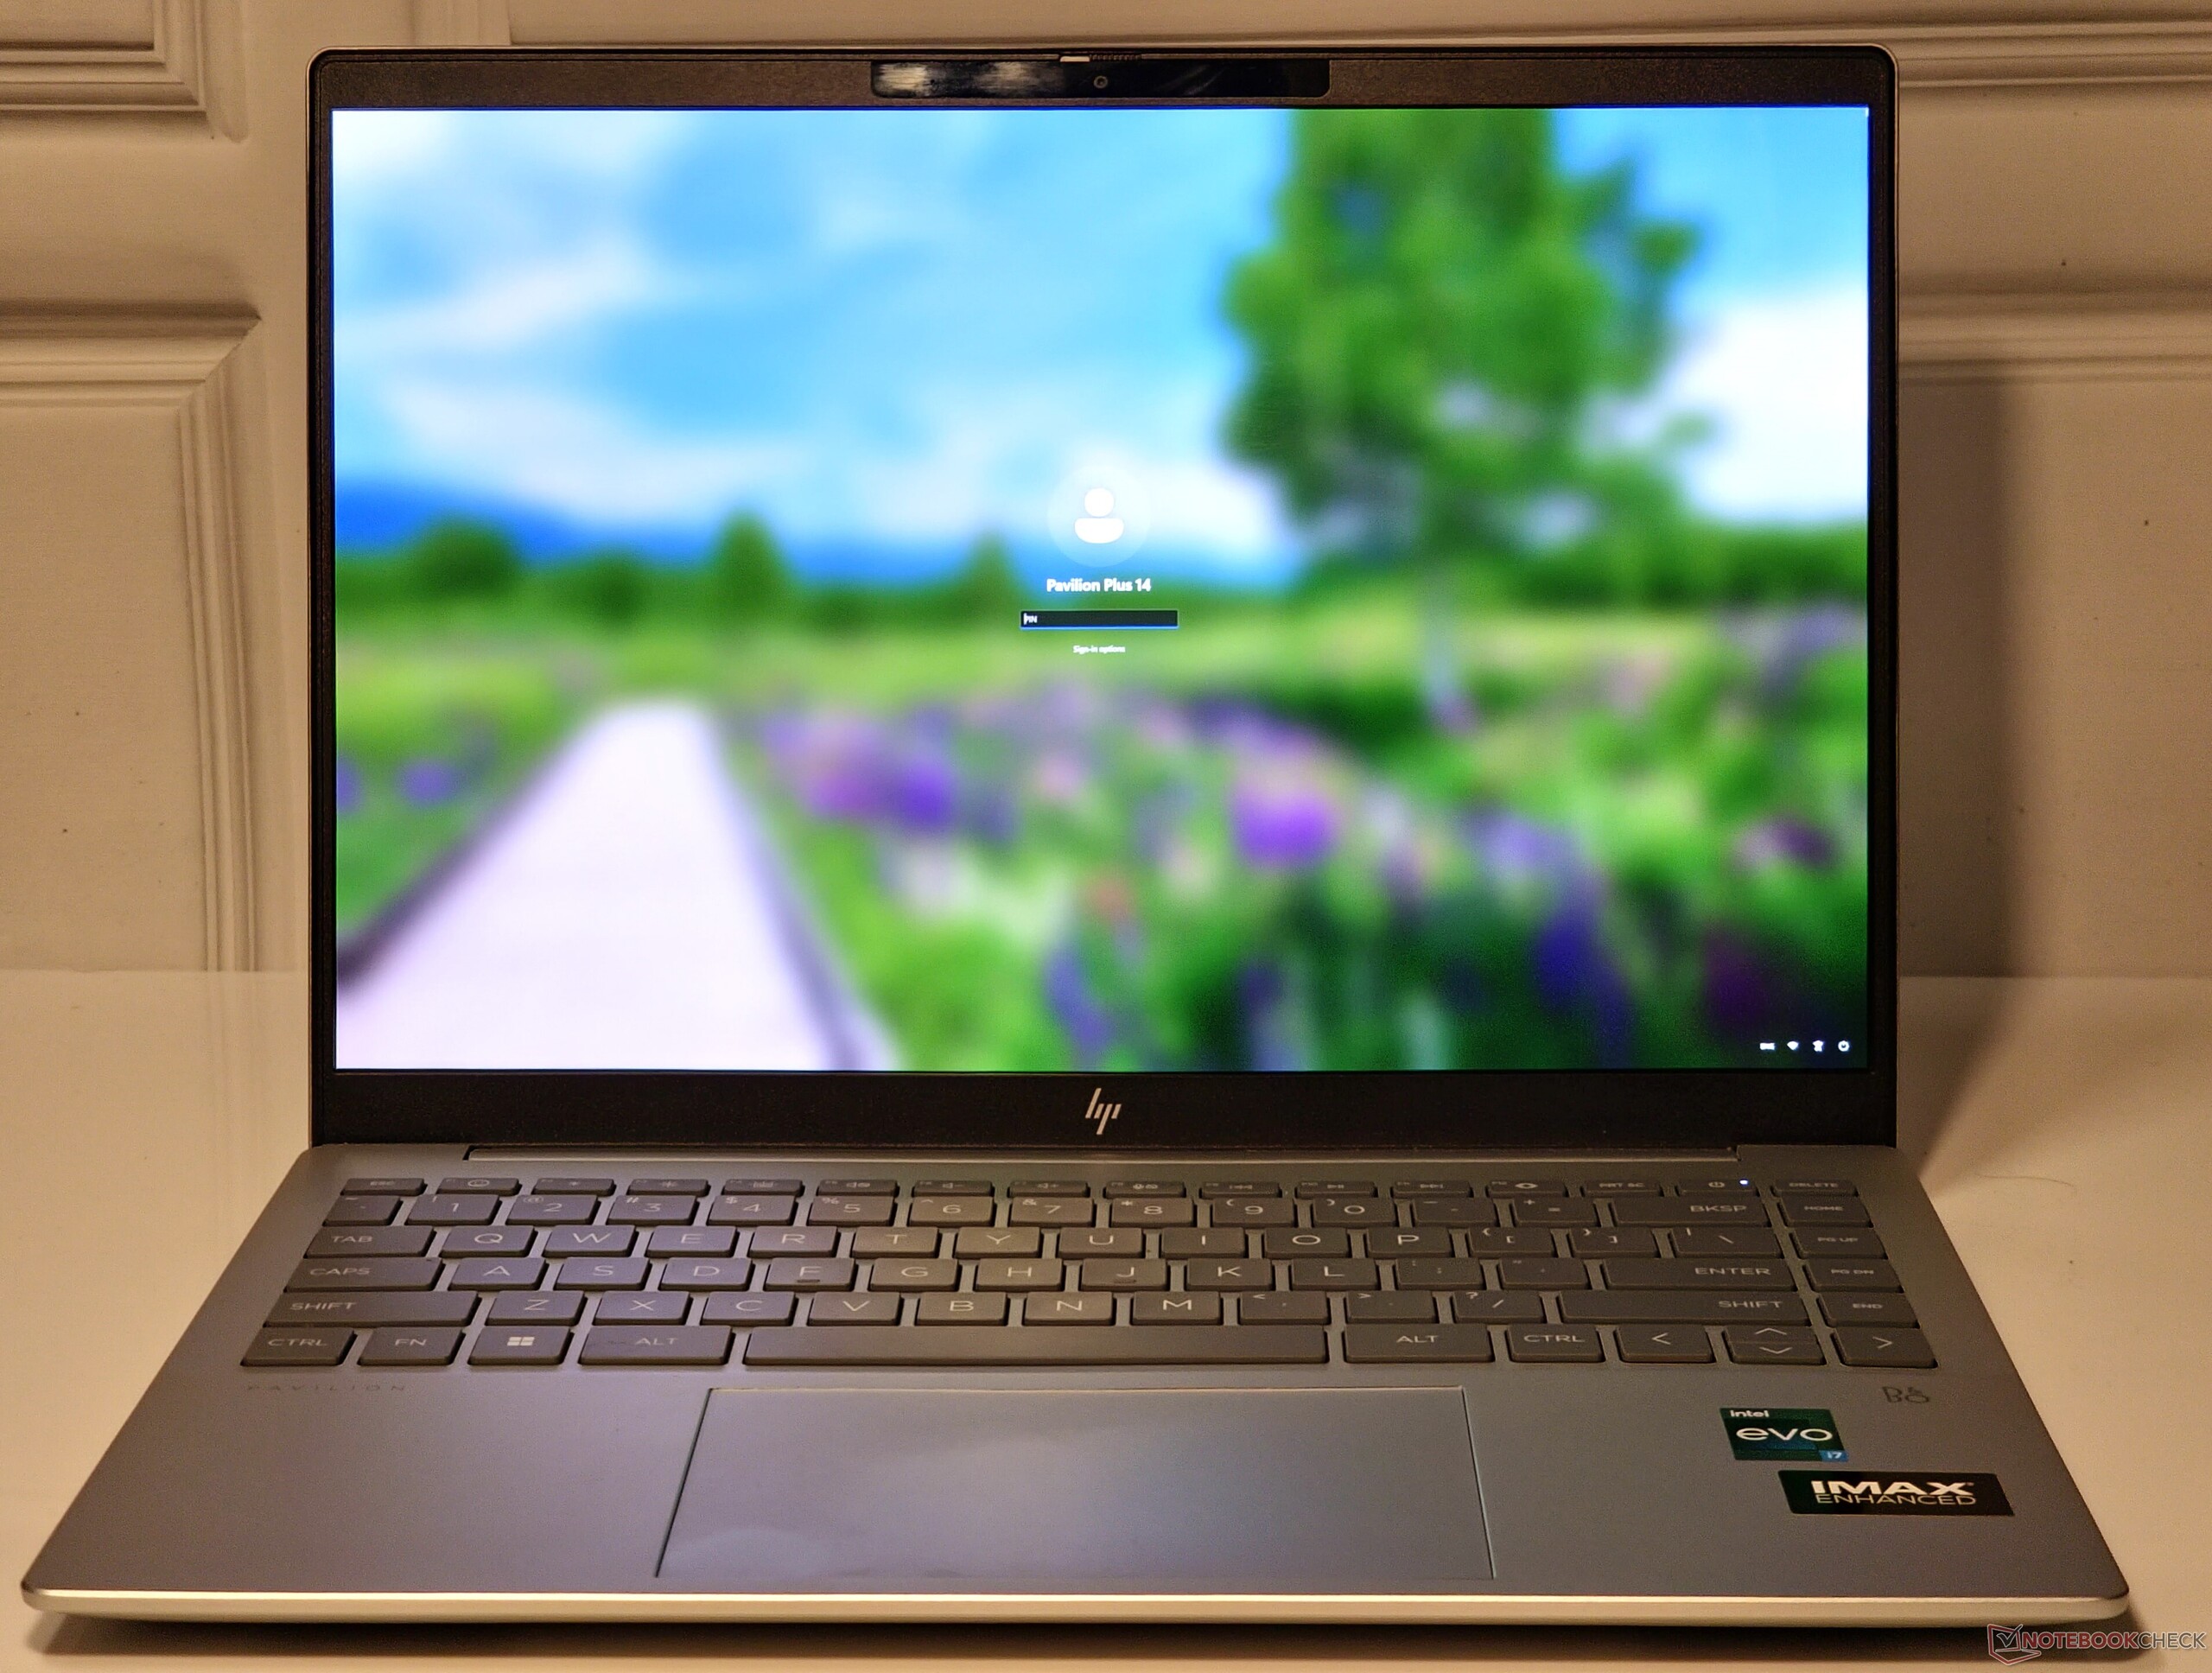
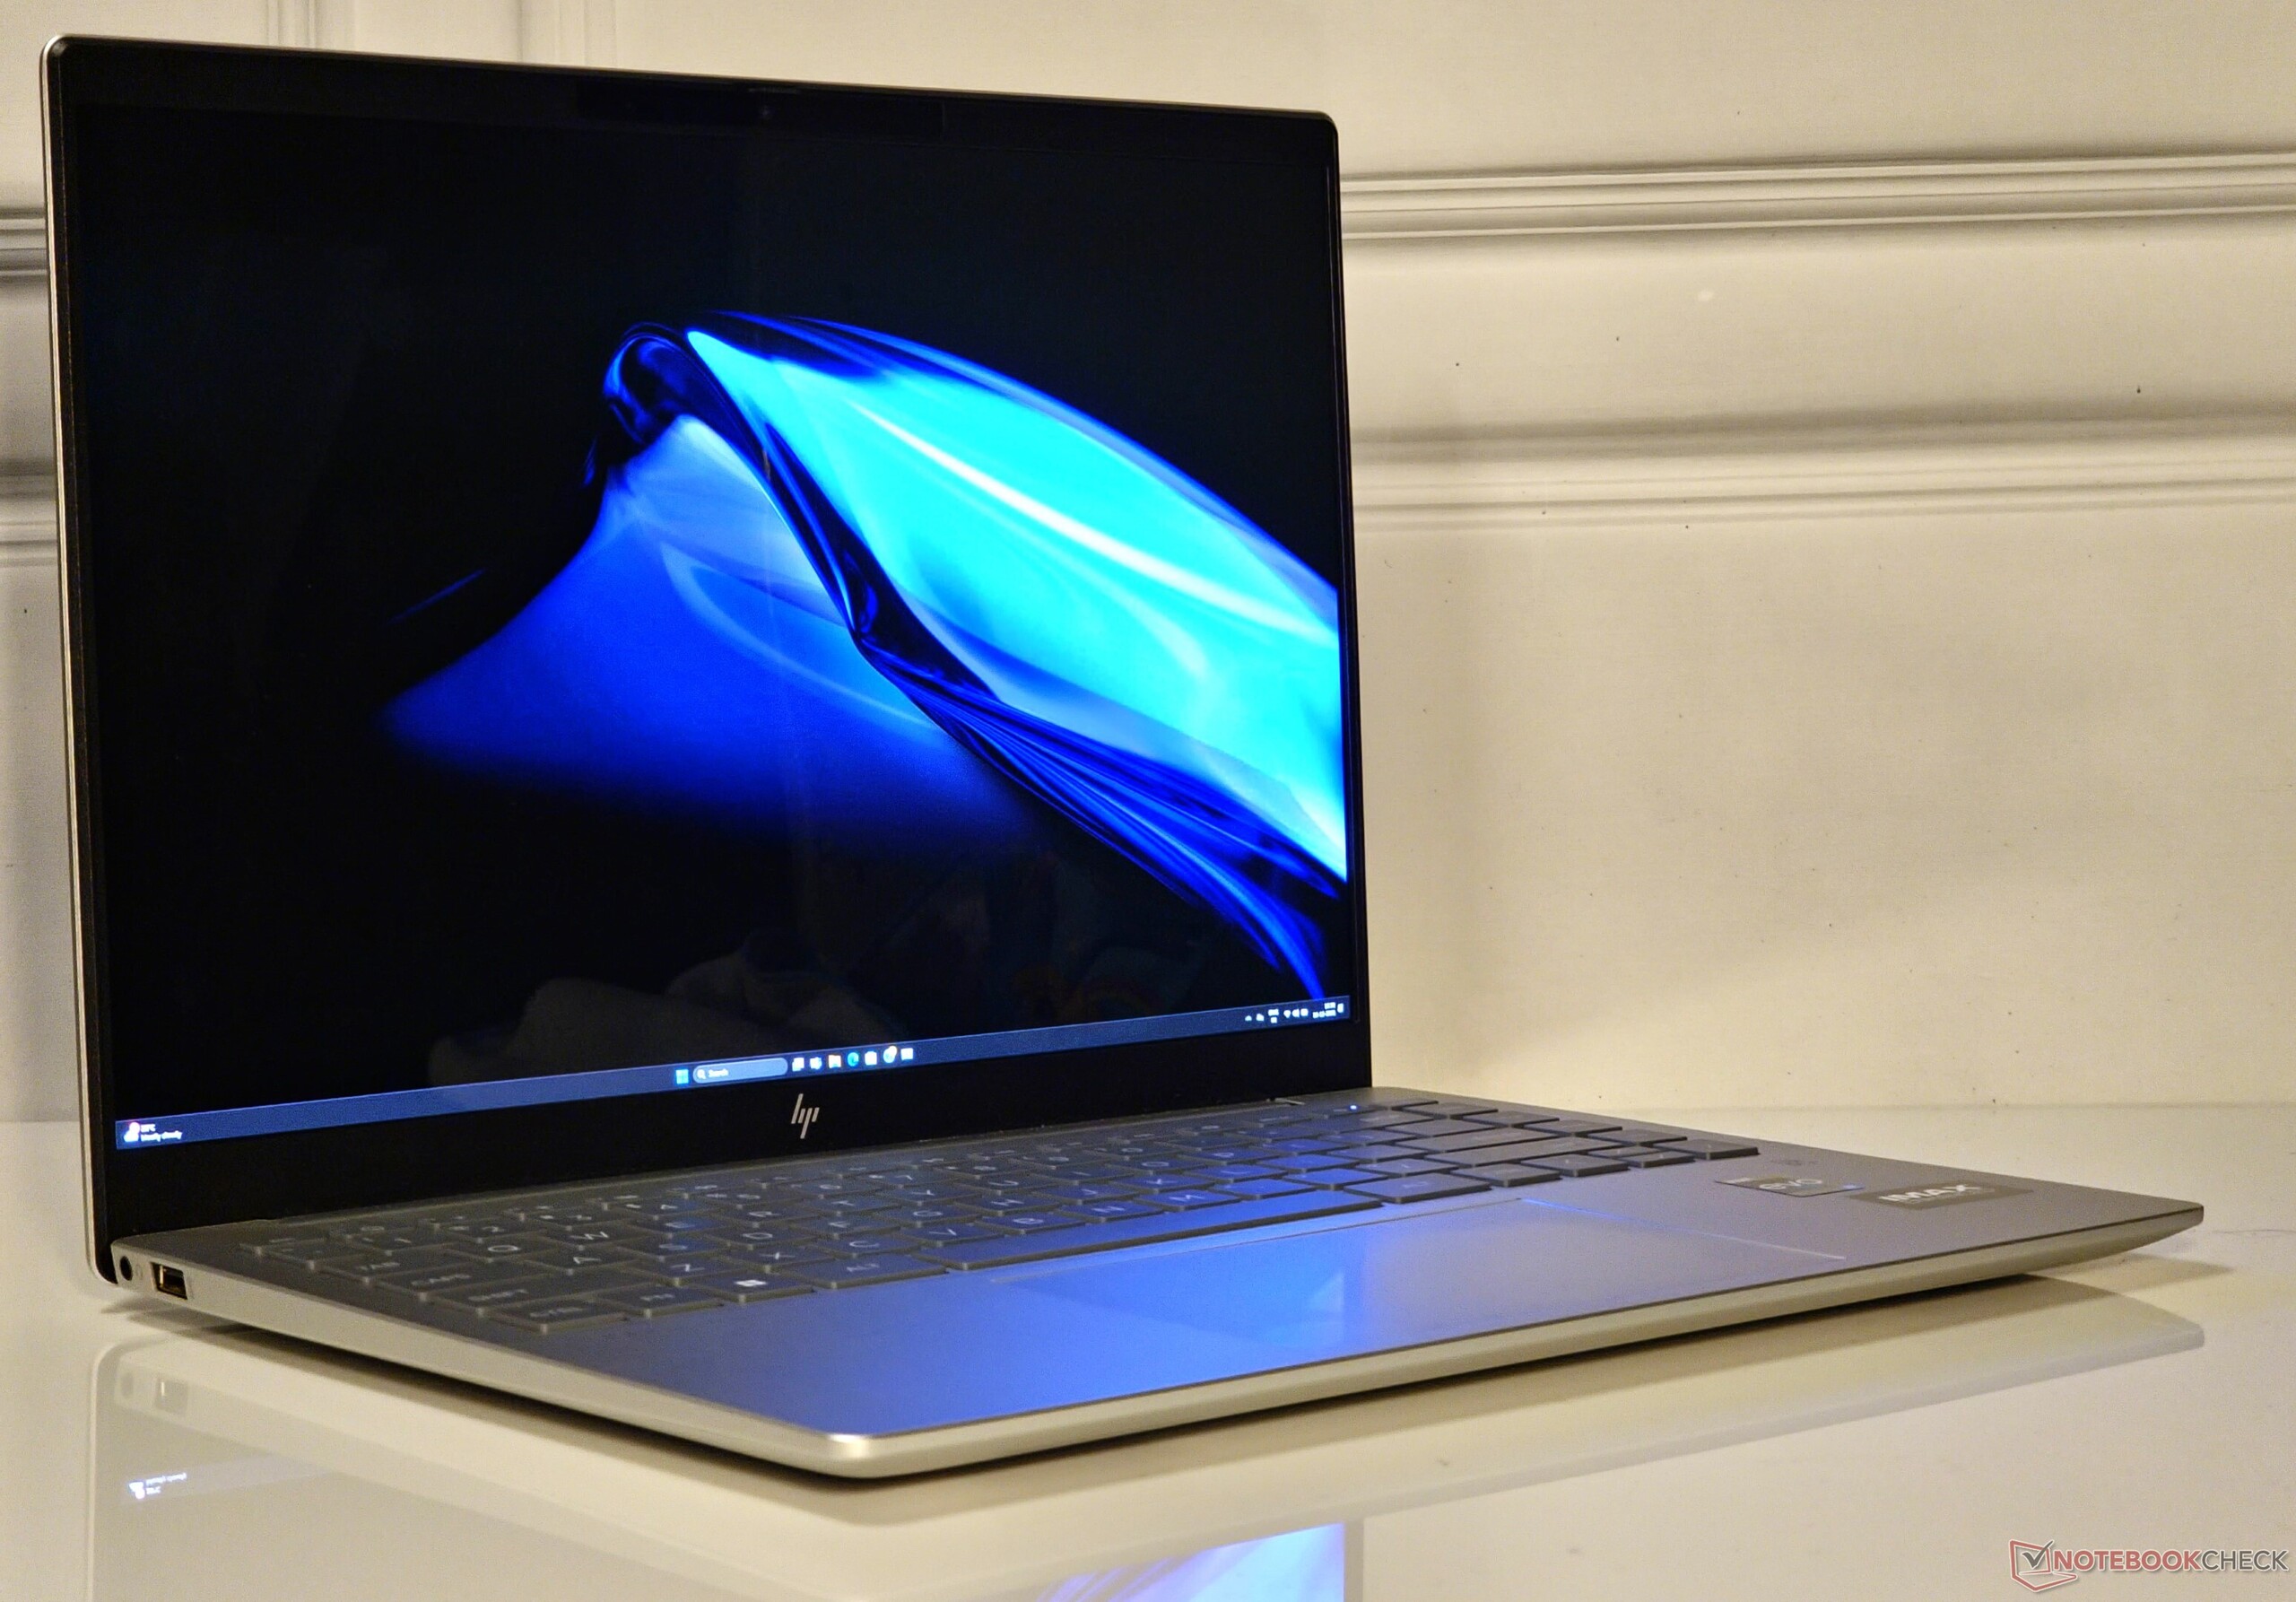
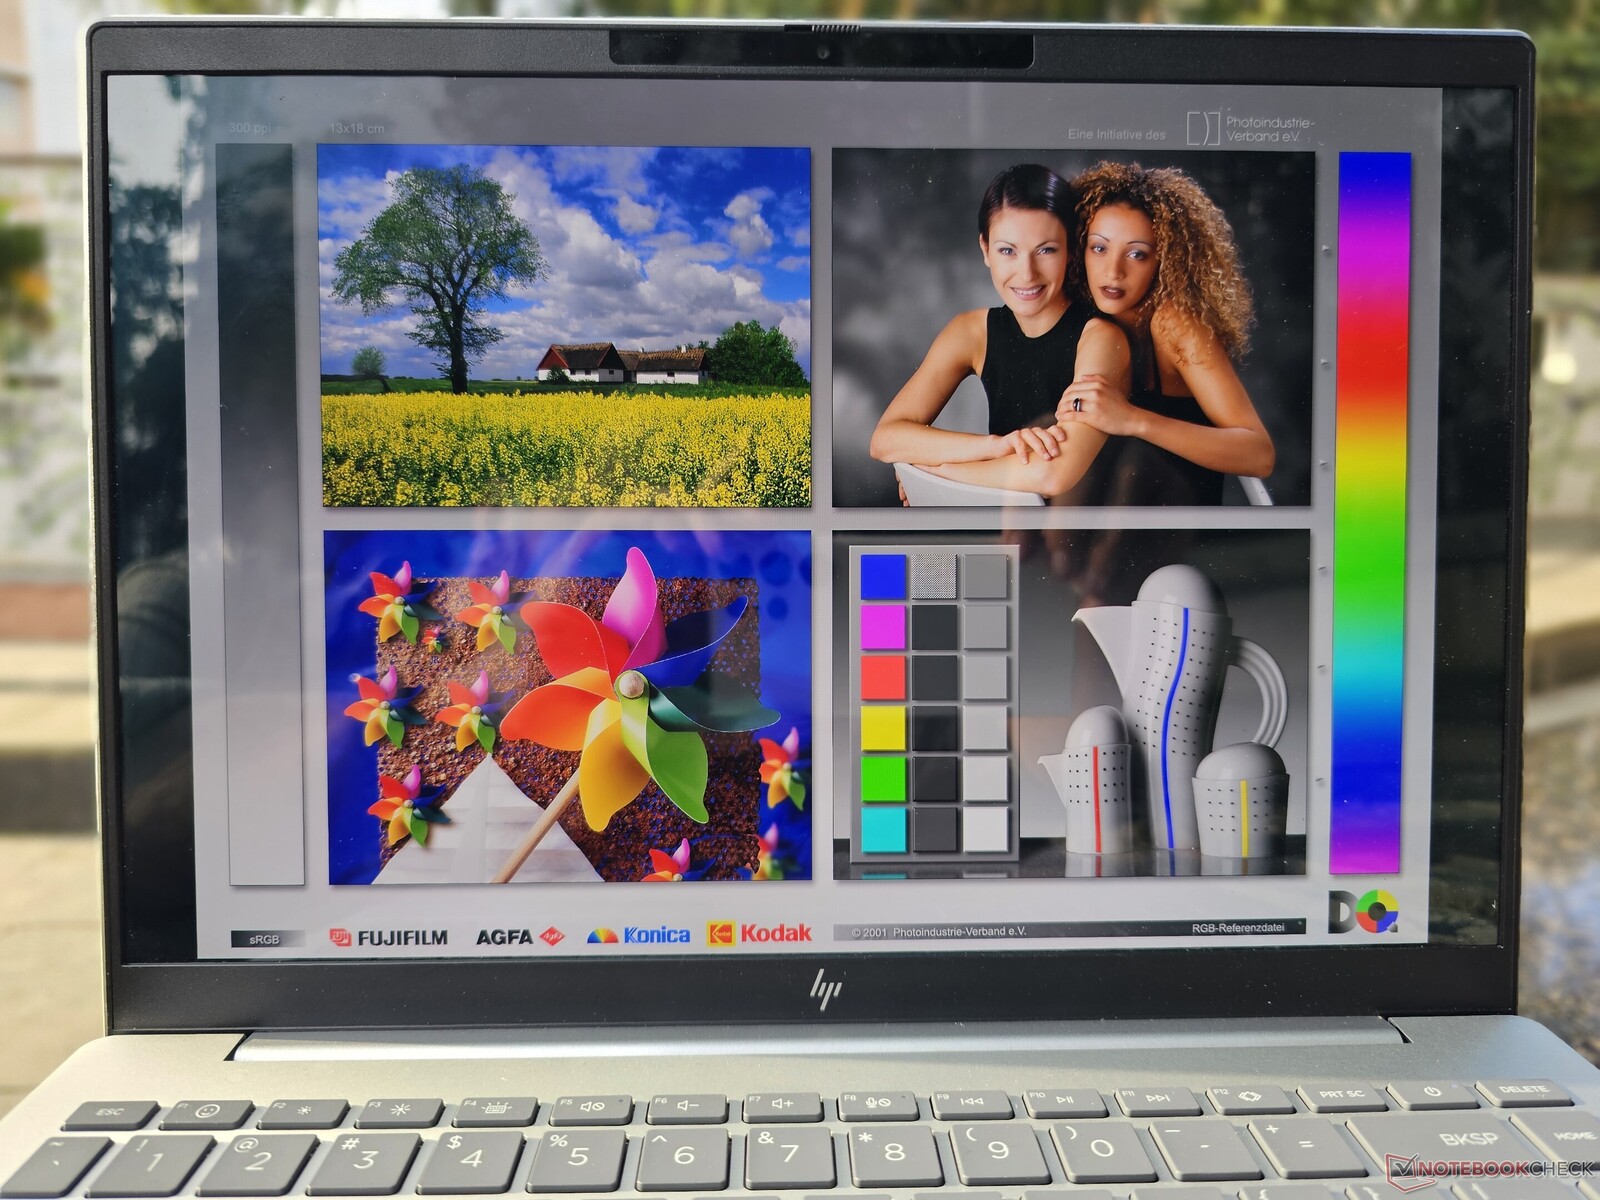
Tela: OLED 2.8K "IMAX Enhanced" com HDR e PWM de 120 Hz

O Pavilion Plus 14, equipado com Core i7, exibe um painel OLED de 14 polegadas de 2880 x 1800 com uma taxa de atualização de 120 Hz e brilho HDR de pico de 500 nits. Isso proporciona uma experiência de visualização subjetivamente imersiva e uma proporção de aspecto mais alta que visa refletir a marca "IMAX Enhanced" do laptop.
Aqueles que optarem pelo modelo Core i5 poderão escolher entre as opções de resolução FHD+ ou QHD+.
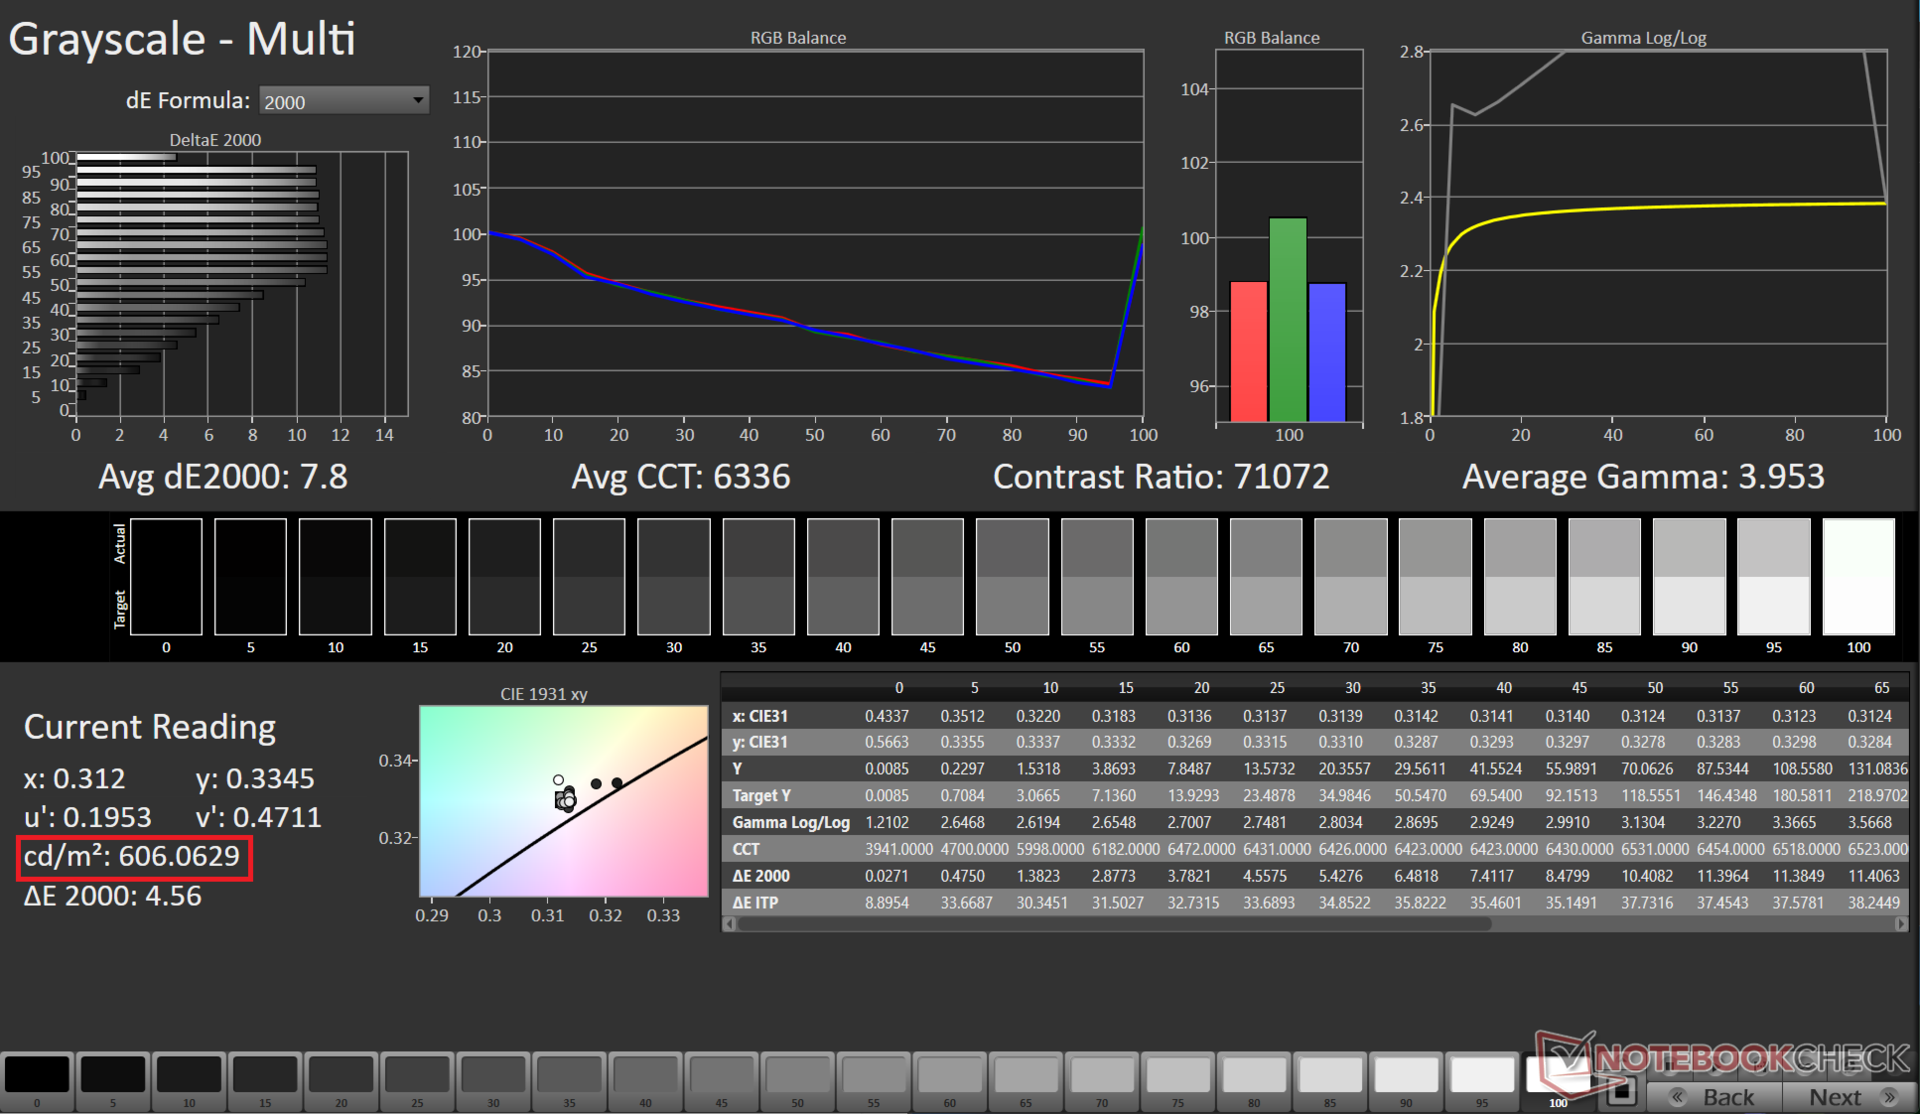
A HP afirma ter 400 nits de brilho SDR de pico, e nossos testes validaram esse número em 392 nits no máximo. O HDR se saiu ainda melhor, registrando uma luminância de pico de 606 nits acima da especificação.
O painel apresenta uma excelente uniformidade de brilho de 97% e uma taxa de contraste quase infinita. Não há vazamento de luz de fundo em virtude de esse ser um painel OLED.
| |||||||||||||||||||||||||
iluminação: 97 %
iluminação com acumulador: 386 cd/m²
Contraste: 38700:1 (Preto: 0.01 cd/m²)
ΔE ColorChecker Calman: 2.03 | ∀{0.5-29.43 Ø4.71}
calibrated: 1.6
ΔE Greyscale Calman: 2.3 | ∀{0.09-98 Ø4.96}
92.1% AdobeRGB 1998 (Argyll 3D)
99.6% sRGB (Argyll 3D)
97.9% Display P3 (Argyll 3D)
Gamma: 2.23
CCT: 6523 K
| HP Pavilion Plus 14-ew0153TU Samsung SDC4197, OLED, 2880x1800, 14" | HP Pavilion Plus 14-ey0095cl Samsung SDC4197, OLED, 2880x1800, 14" | Acer Swift Go 14 SFG14-71 Samsung ATNA40YK11-0, OLED, 2880x1800, 14" | Asus ExpertBook B9 B9403CVA-KM0153X ATNA40YK07-1 SDC4171, OLED, 2880x1800, 14" | Lenovo ThinkPad T14s G4 i7-1365U B140UAK01.2, IPS, 1920x1200, 14" | Huawei MateBook X Pro 2023 TMX1422, IPS, 3120x2080, 14.2" | |
|---|---|---|---|---|---|---|
| Display | 2% | 2% | 1% | -51% | -6% | |
| Display P3 Coverage (%) | 97.9 | 99.8 2% | 99.9 2% | 99.9 2% | 39.9 -59% | 89.8 -8% |
| sRGB Coverage (%) | 99.6 | 100 0% | 100 0% | 100 0% | 59.7 -40% | 99.4 0% |
| AdobeRGB 1998 Coverage (%) | 92.1 | 95.8 4% | 95.4 4% | 93.6 2% | 41.2 -55% | 84.2 -9% |
| Response Times | 91% | 81% | 80% | -114% | -30% | |
| Response Time Grey 50% / Grey 80% * (ms) | 10.8 ? | 0.82 ? 92% | 1.85 ? 83% | 2 ? 81% | 27.7 ? -156% | 20 ? -85% |
| Response Time Black / White * (ms) | 9.29 ? | 0.95 ? 90% | 2 ? 78% | 2 ? 78% | 15.9 ? -71% | 7 ? 25% |
| PWM Frequency (Hz) | 120 ? | 504.7 ? | 357 ? | 360 ? | 156000 ? | |
| Screen | -8% | -78% | -60% | -545% | -276% | |
| Brightness middle (cd/m²) | 387 | 384 -1% | 278 -28% | 389.9 1% | 322.5 -17% | 595 54% |
| Brightness (cd/m²) | 387 | 386 0% | 279 -28% | 390 1% | 296 -24% | 550 42% |
| Brightness Distribution (%) | 97 | 98 1% | 96 -1% | 99 2% | 85 -12% | 85 -12% |
| Black Level * (cd/m²) | 0.01 | 0.04 -300% | 0.0497 -397% | 0.44 -4300% | 0.25 -2400% | |
| Contrast (:1) | 38700 | 6950 -82% | 7845 -80% | 733 -98% | 2380 -94% | |
| Colorchecker dE 2000 * | 2.03 | 4.06 -100% | 3.01 -48% | 2.22 -9% | 3.72 -83% | 2.01 1% |
| Colorchecker dE 2000 max. * | 3.86 | 6.73 -74% | 4.43 -15% | 3.75 3% | 14.68 -280% | 6.9 -79% |
| Colorchecker dE 2000 calibrated * | 1.6 | 0.49 69% | 4.14 -159% | 1.9 -19% | 1.22 24% | |
| Greyscale dE 2000 * | 2.3 | 1.1 52% | 3.2 -39% | 2.4 -4% | 4 -74% | 2.74 -19% |
| Gamma | 2.23 99% | 2.26 97% | 2.194 100% | 2.187 101% | 2.29 96% | 2.4 92% |
| CCT | 6523 100% | 6331 103% | 6126 106% | 6426 101% | 6064 107% | 6319 103% |
| Média Total (Programa/Configurações) | 28% /
11% | 2% /
-38% | 7% /
-25% | -237% /
-378% | -104% /
-183% |
* ... menor é melhor
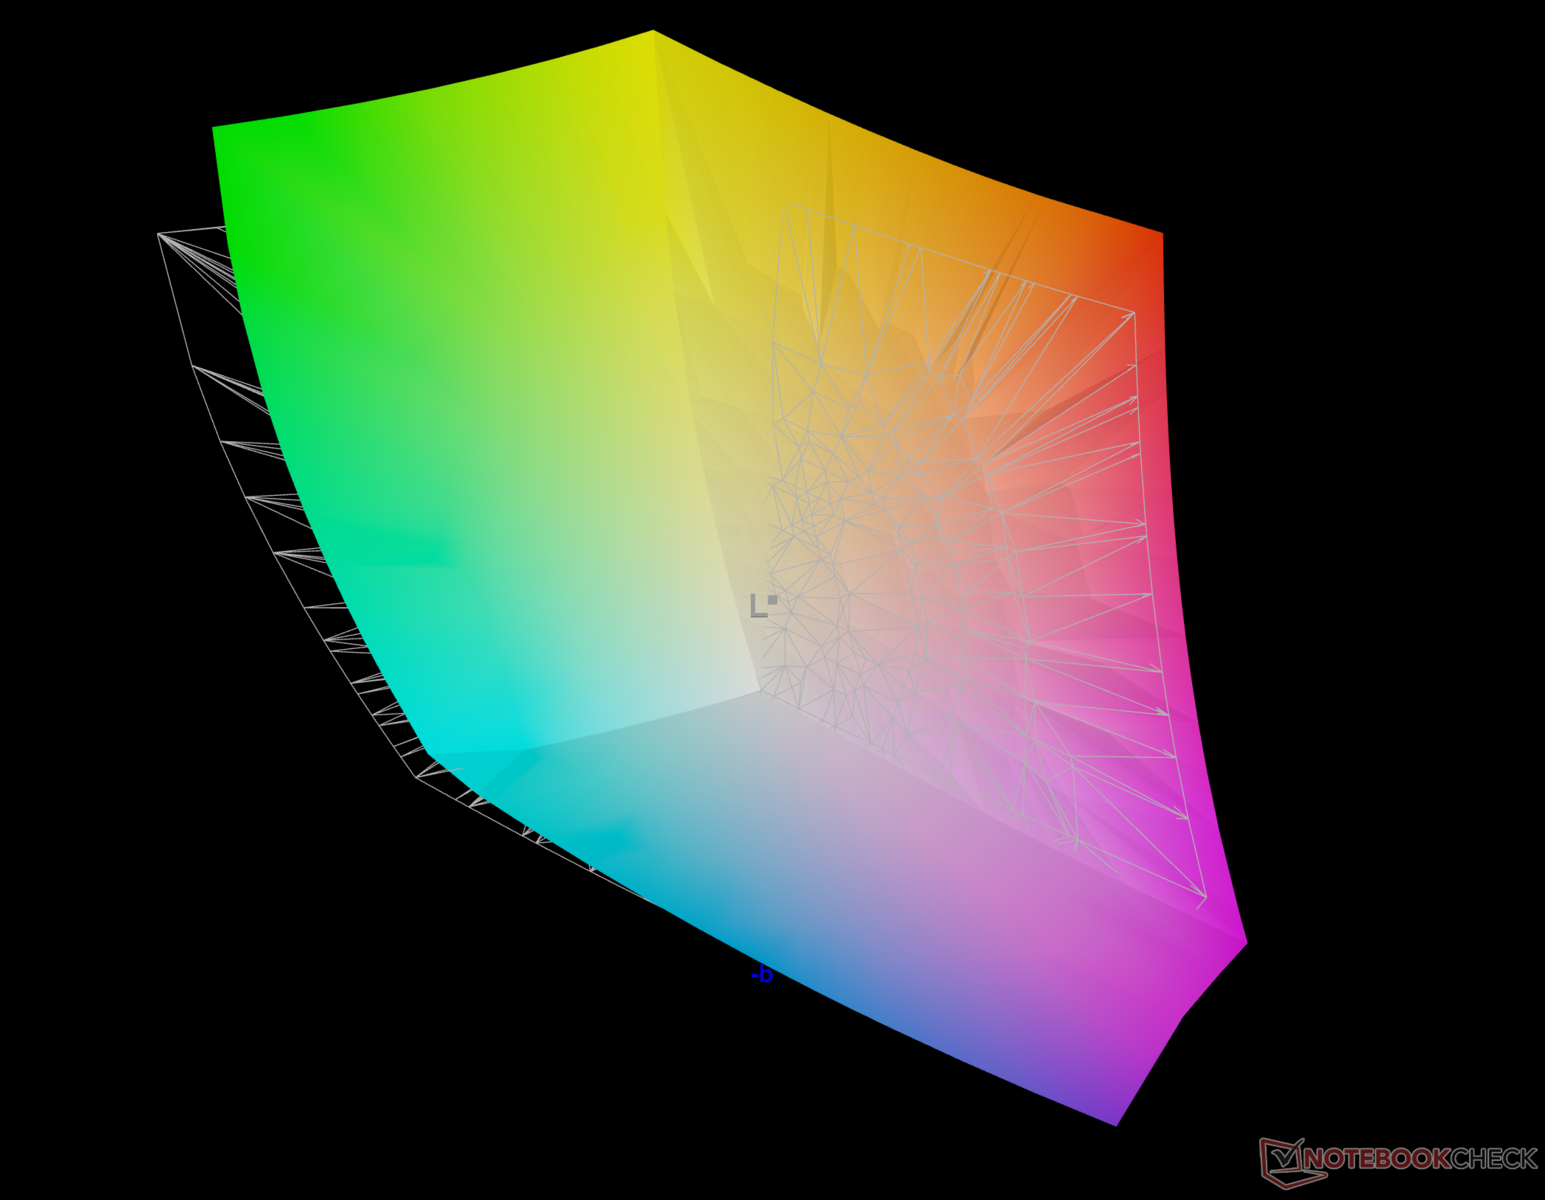
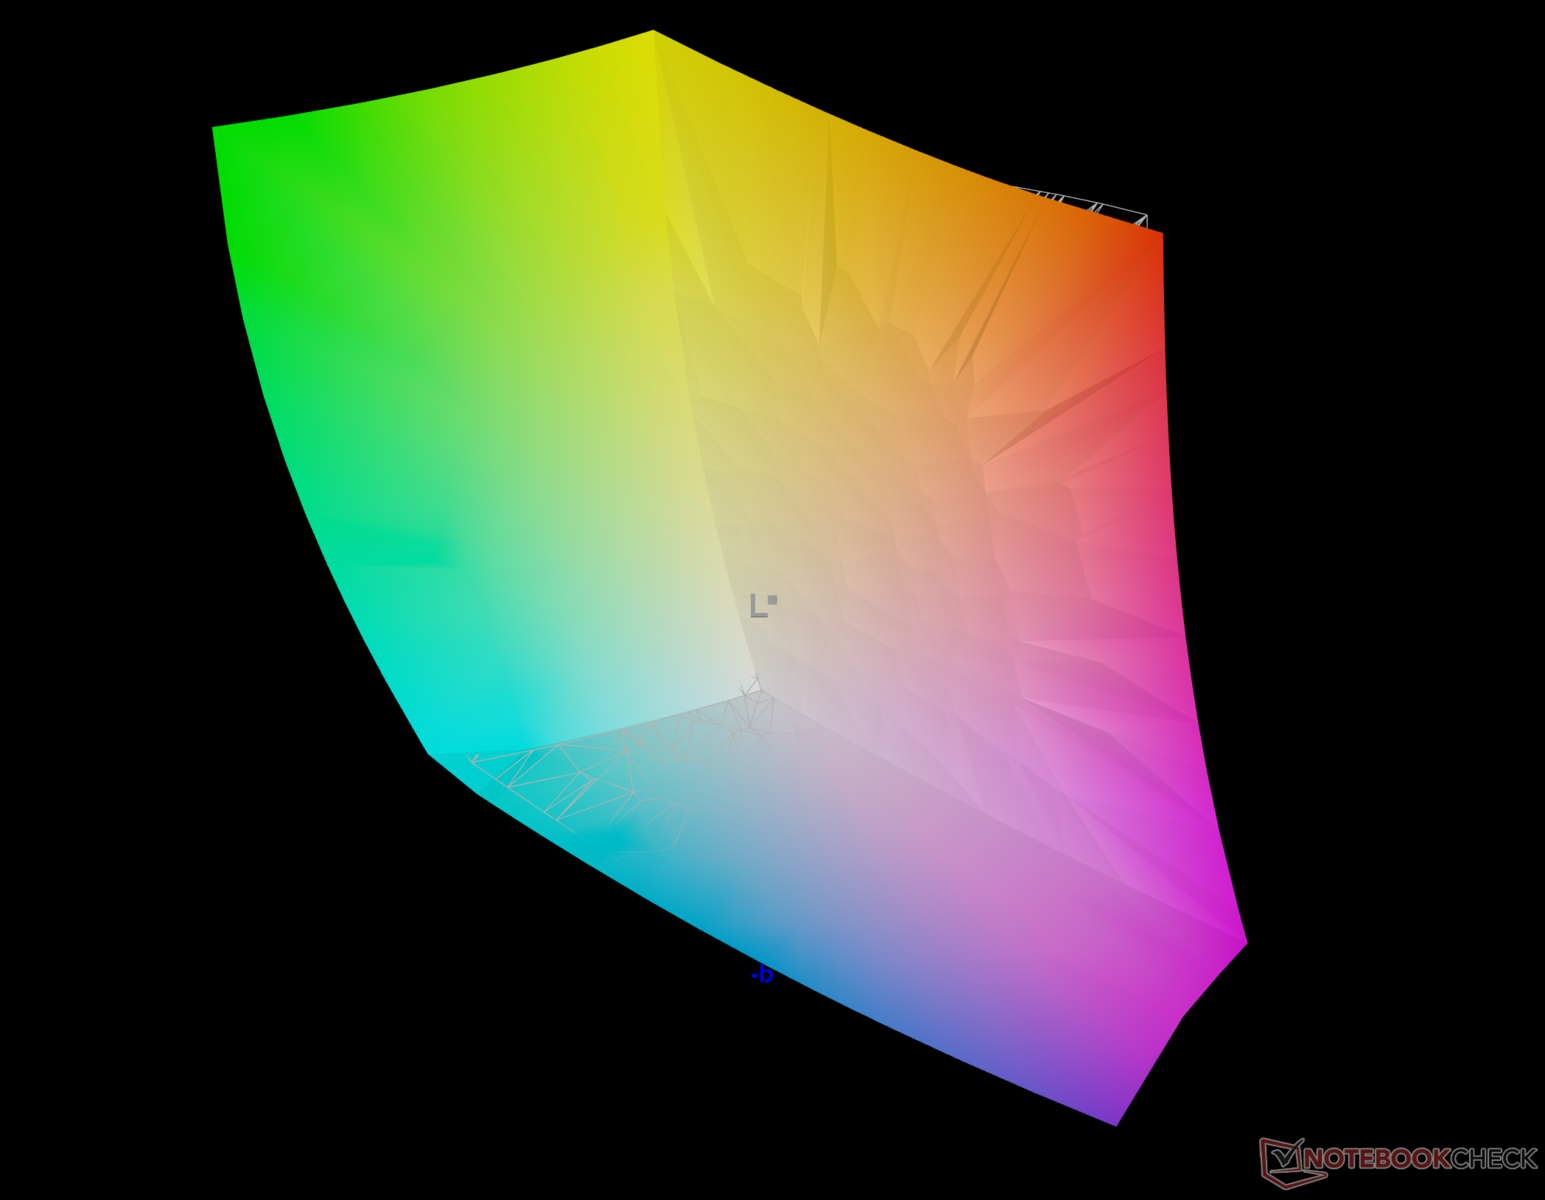
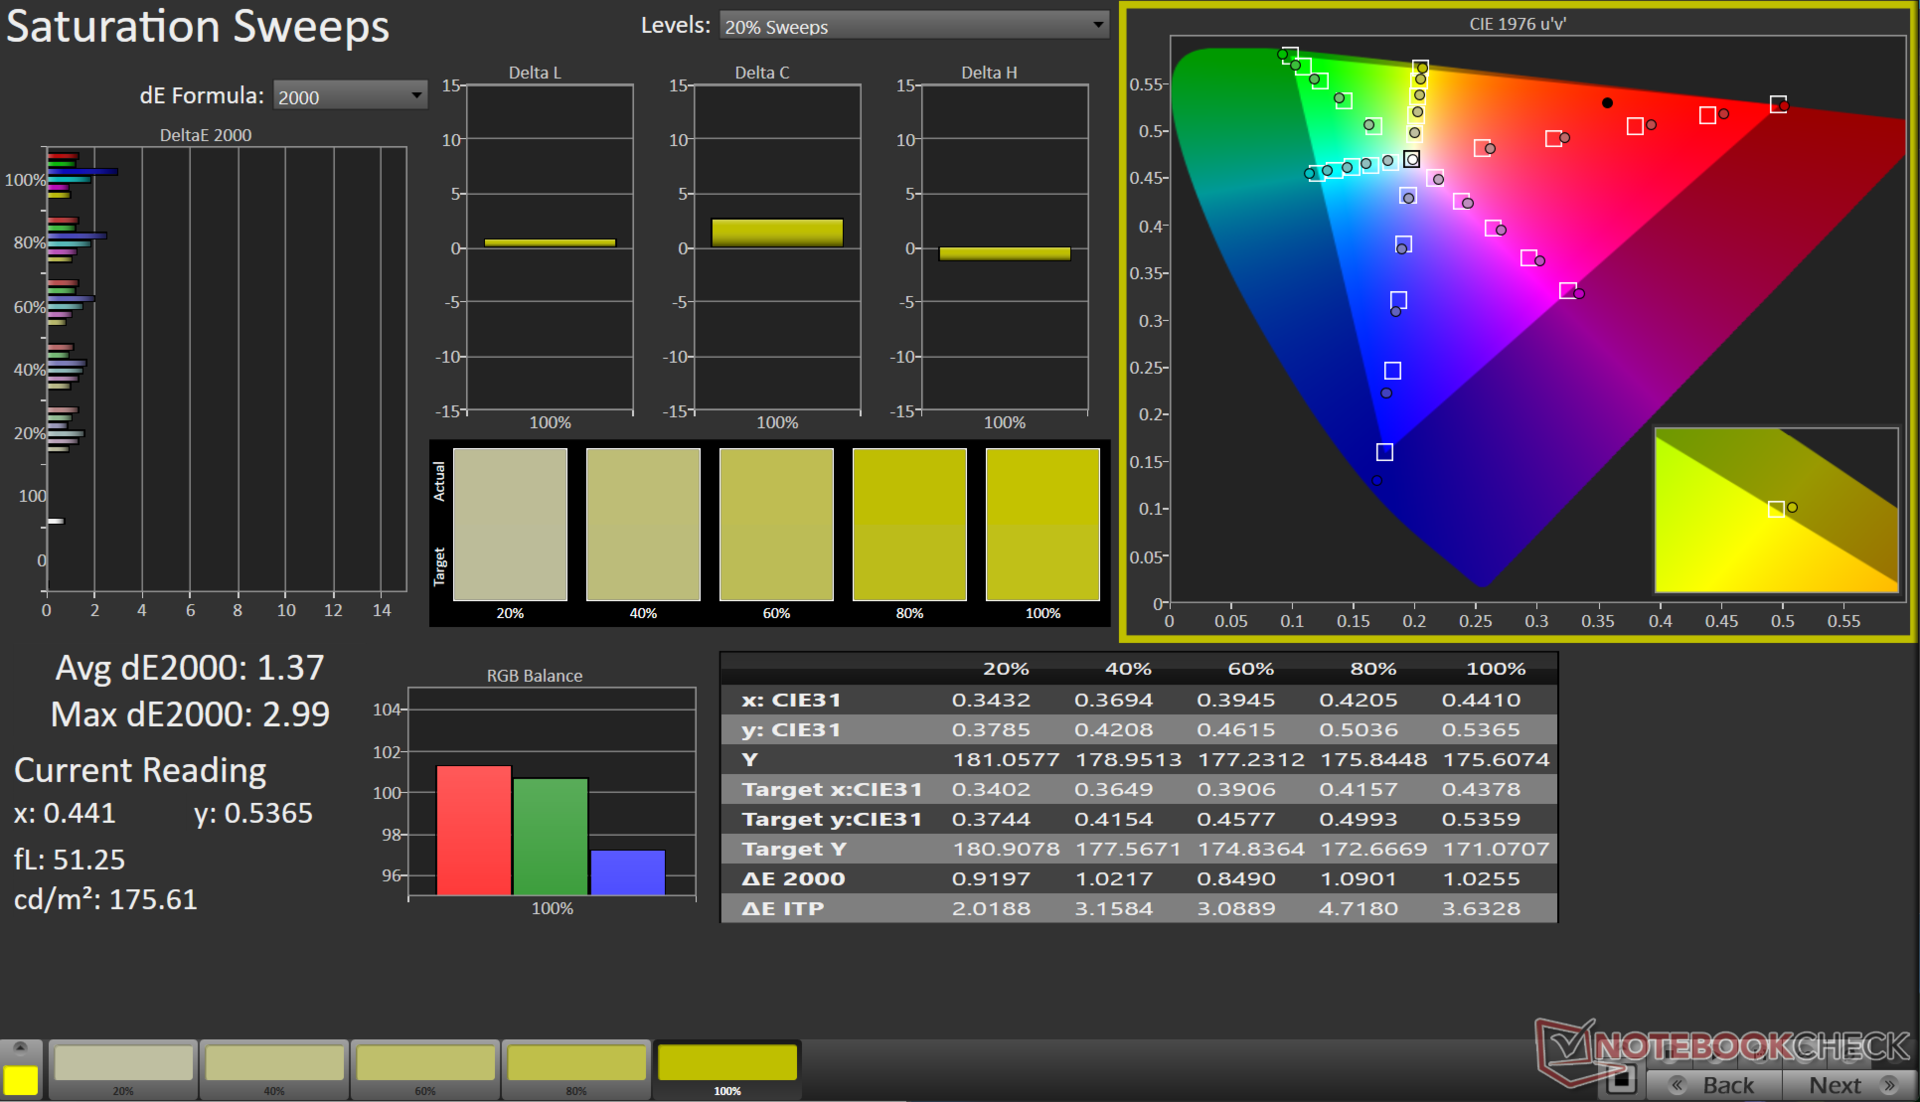
A tela cobre quase 100% dos espaços de cores sRGB e Display P3, além de uma excelente cobertura de 92,1% do Adobe RGB. Isso o torna altamente adequado para edição e consumo de mídia.

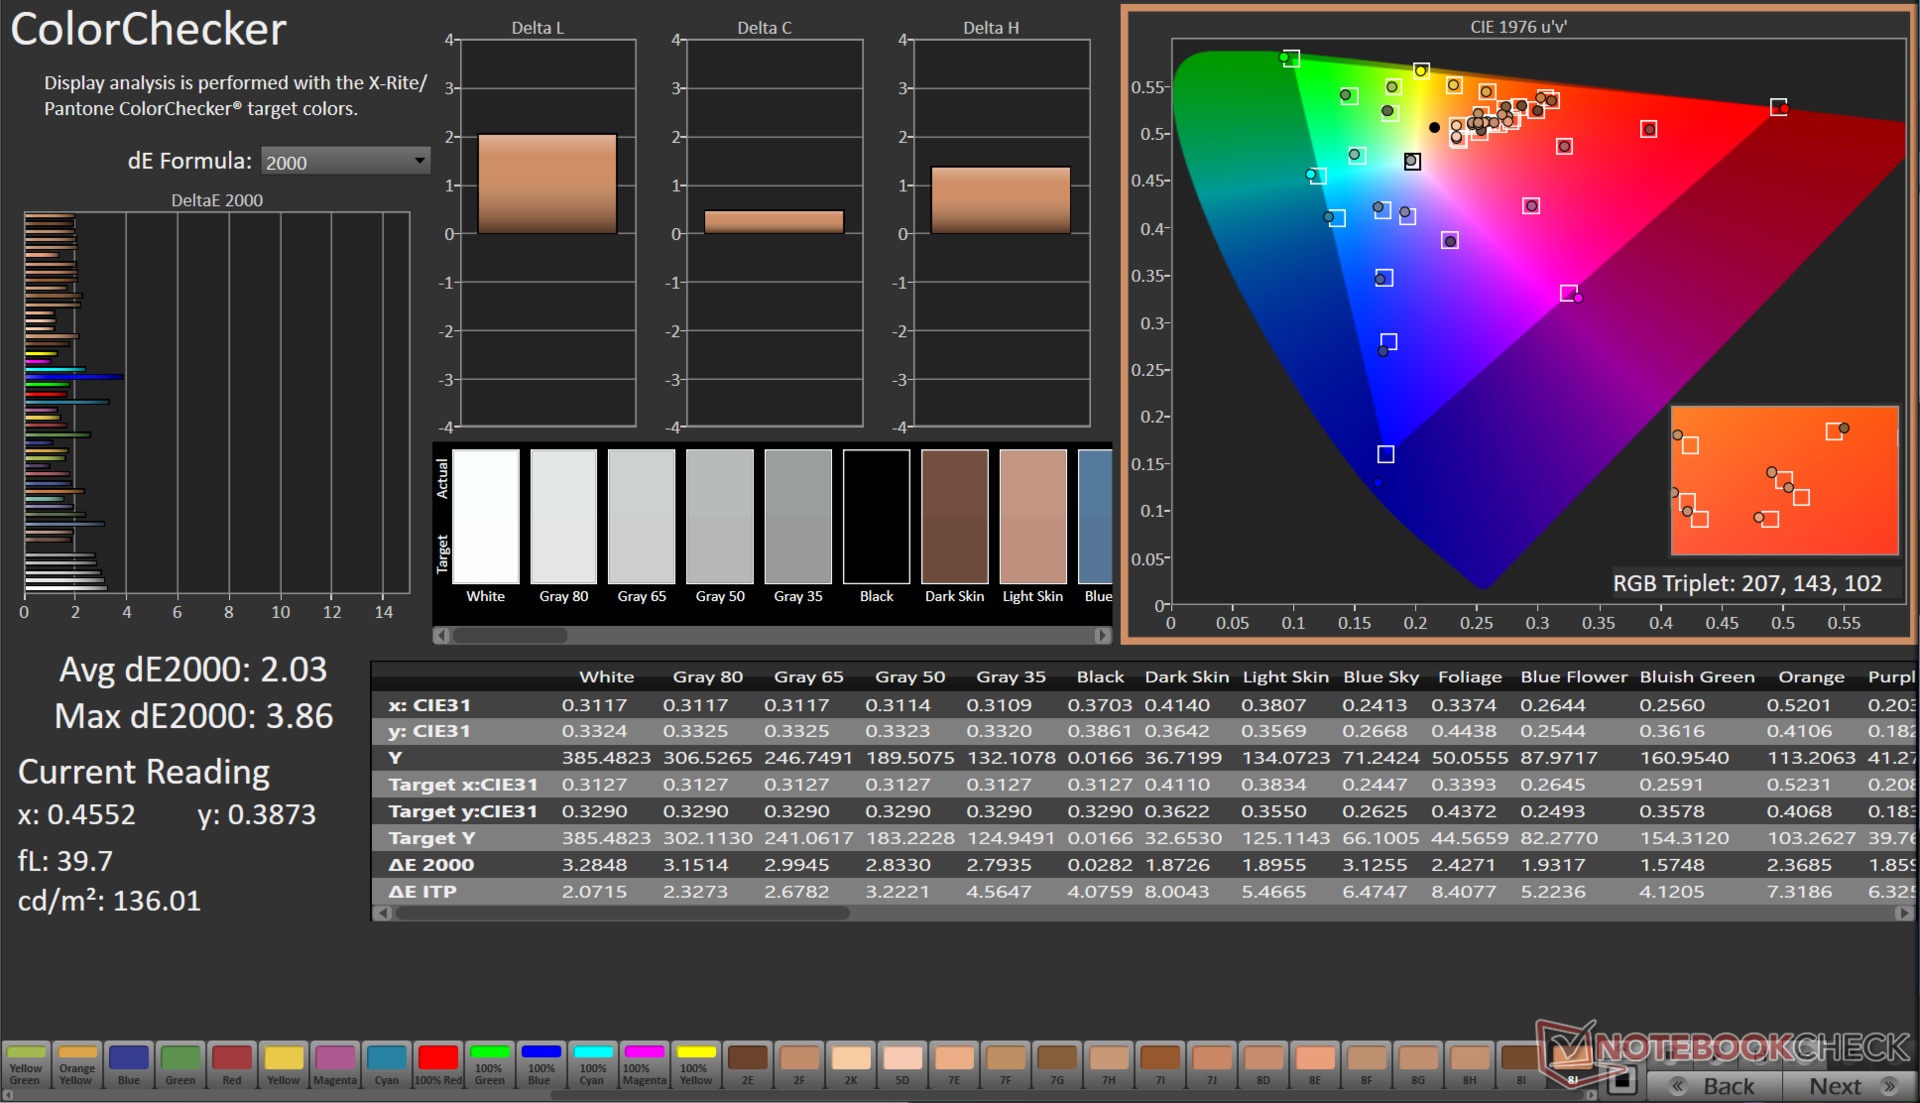
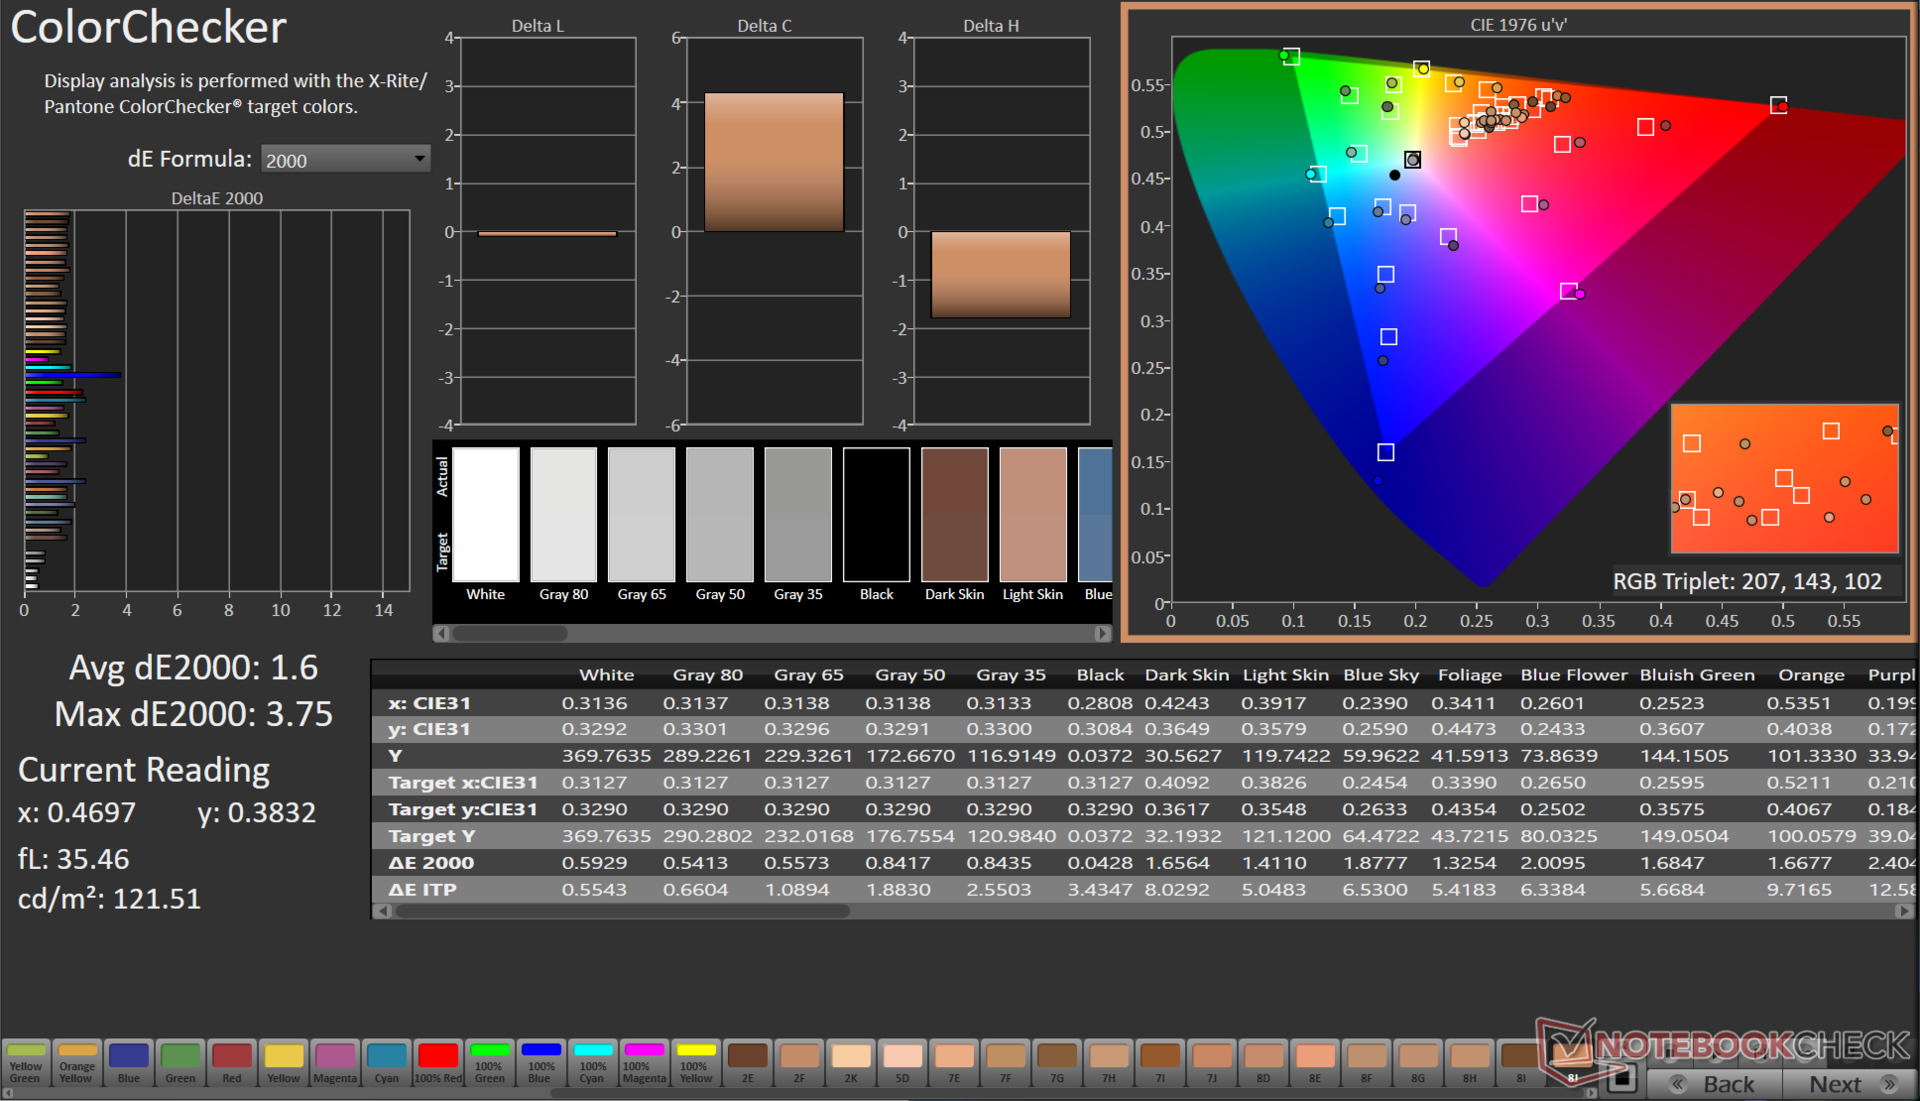
A reprodução de cores pronta para uso é decente, com valores médios de escala de cinza e ColorChecker Delta E 2000 em torno de 2,3 e 2,03, respectivamente.
Nossa rotina de calibração usando o espectrofotômetro X-Rite i1Basic Pro 3 e o software Calman Ultimate da Portrait Displays melhora ainda mais esses valores correspondentes para 0,8 e 1,6.
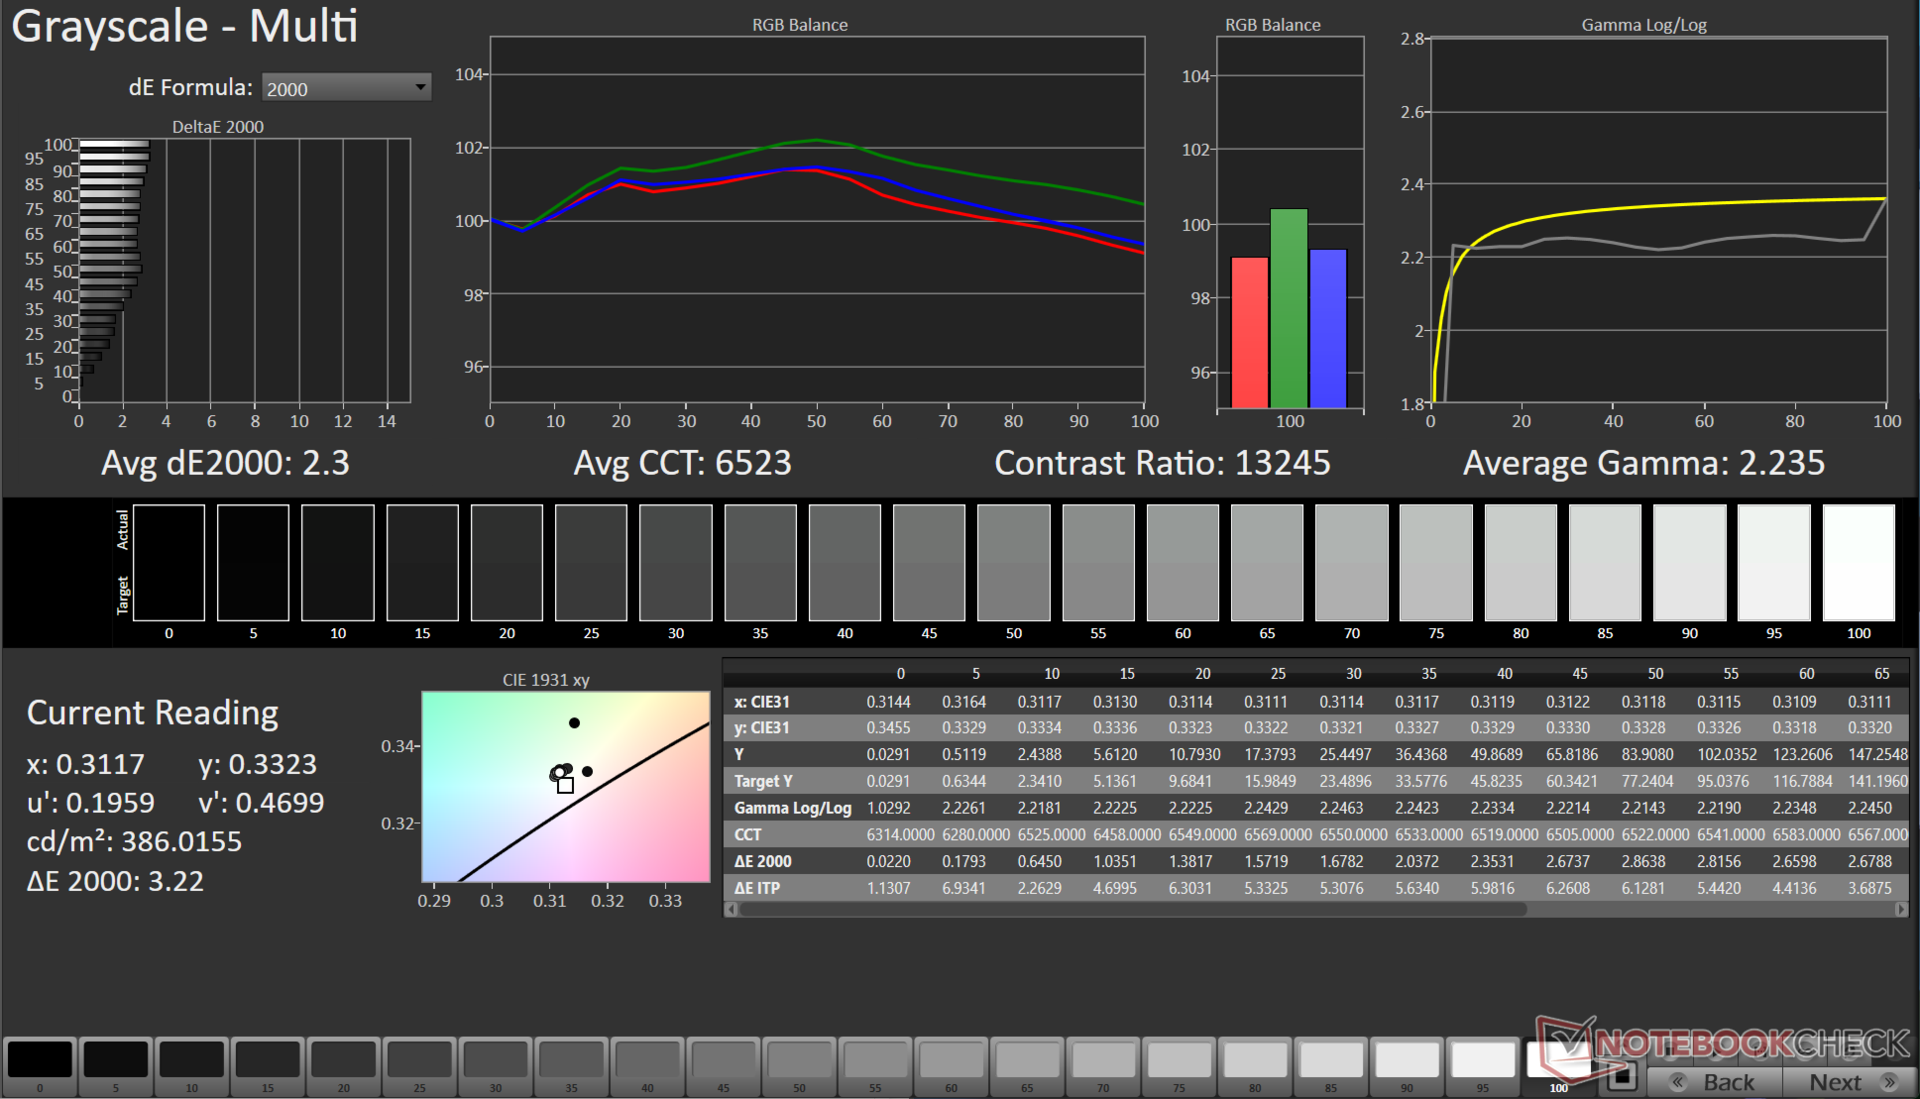
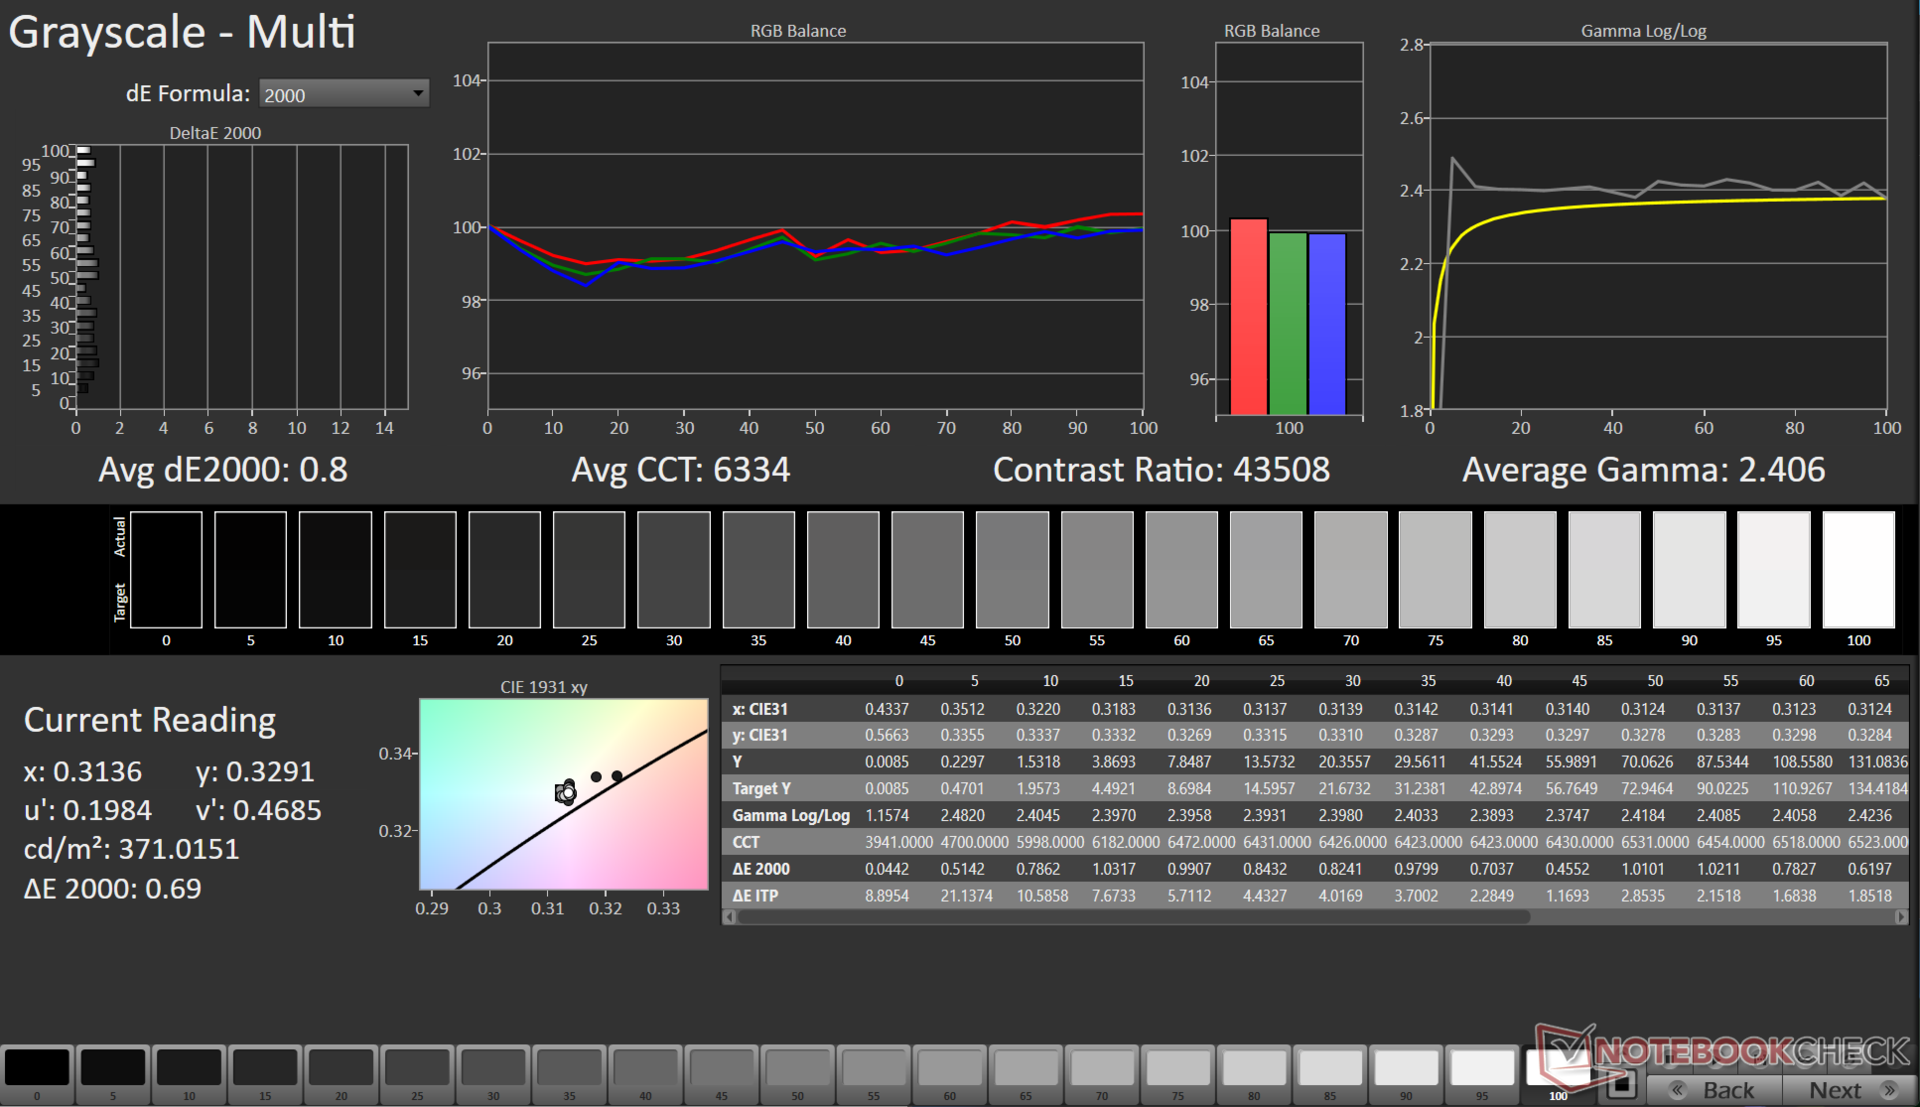
Nosso arquivo ICC calibrado pode ser baixado no link acima.
Exibir tempos de resposta
| ↔ Tempo de resposta preto para branco | ||
|---|---|---|
| 9.29 ms ... ascensão ↗ e queda ↘ combinadas | ↗ 8.79 ms ascensão | 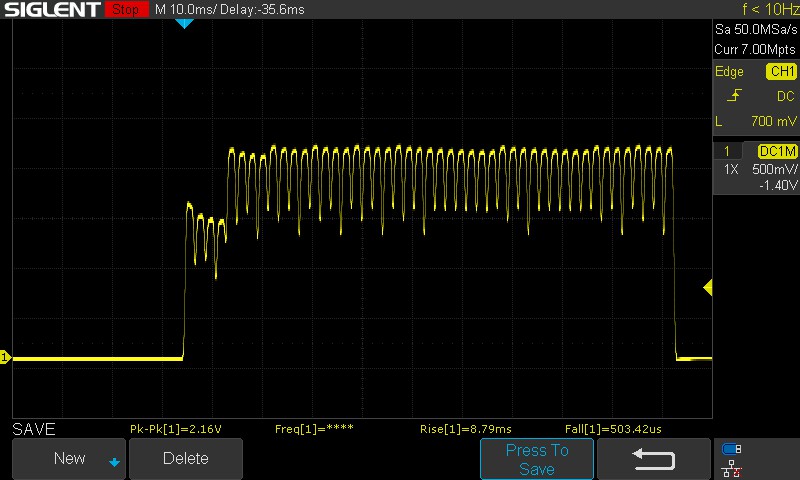 |
| ↘ 0.5 ms queda | ||
| A tela mostra taxas de resposta rápidas em nossos testes e deve ser adequada para jogos. Em comparação, todos os dispositivos testados variam de 0.1 (mínimo) a 240 (máximo) ms. » 26 % de todos os dispositivos são melhores. Isso significa que o tempo de resposta medido é melhor que a média de todos os dispositivos testados (19.8 ms). | ||
| ↔ Tempo de resposta 50% cinza a 80% cinza | ||
| 10.8 ms ... ascensão ↗ e queda ↘ combinadas | ↗ 9.4 ms ascensão | 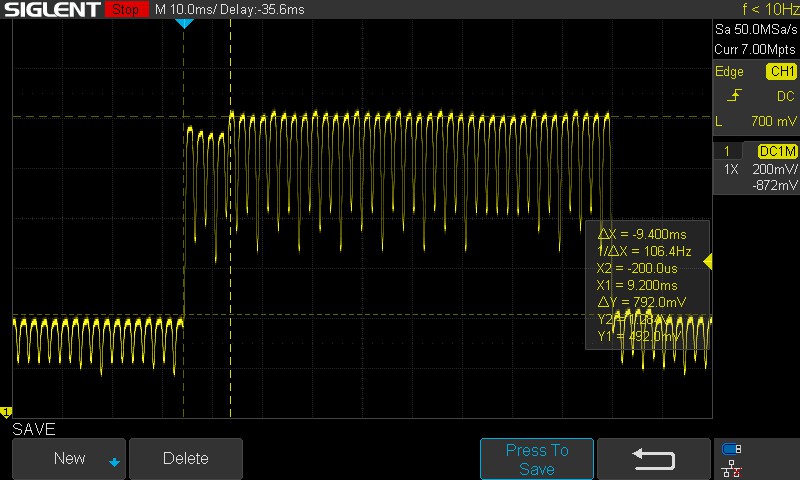 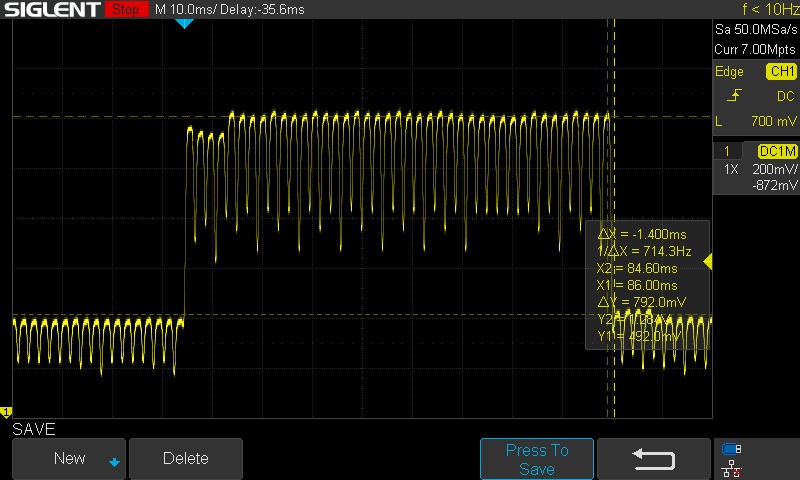 |
| ↘ 1.4 ms queda | ||
| A tela mostra boas taxas de resposta em nossos testes, mas pode ser muito lenta para jogadores competitivos. Em comparação, todos os dispositivos testados variam de 0.165 (mínimo) a 636 (máximo) ms. » 25 % de todos os dispositivos são melhores. Isso significa que o tempo de resposta medido é melhor que a média de todos os dispositivos testados (31 ms). | ||
Os tempos de resposta são decentes, mas poderiam ter sido melhores. Tivemos que estimar manualmente os tempos de resposta de 50% cinza a 80% cinza, pois o padrão mostrou uma queda excepcionalmente acentuada.
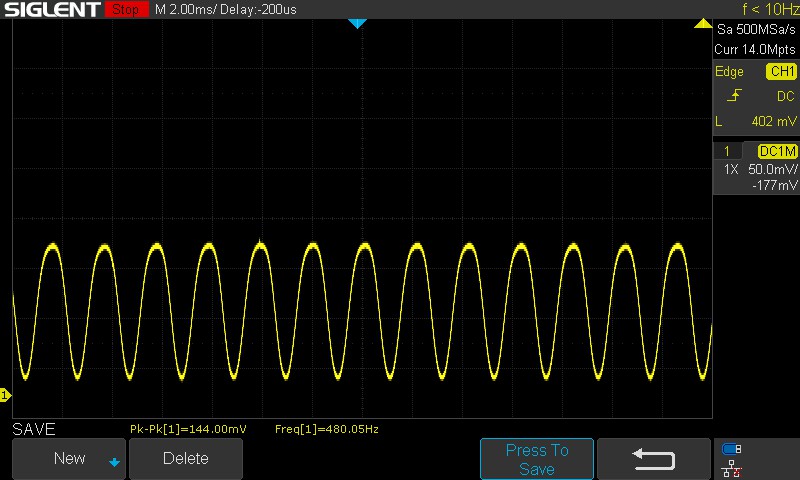
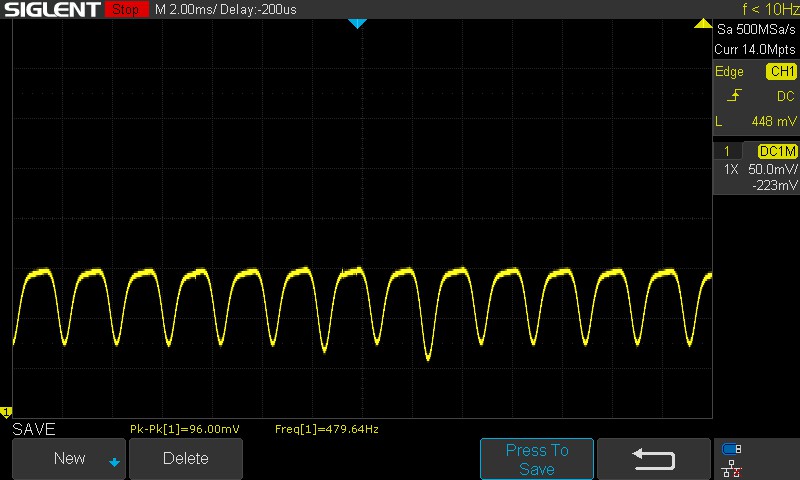
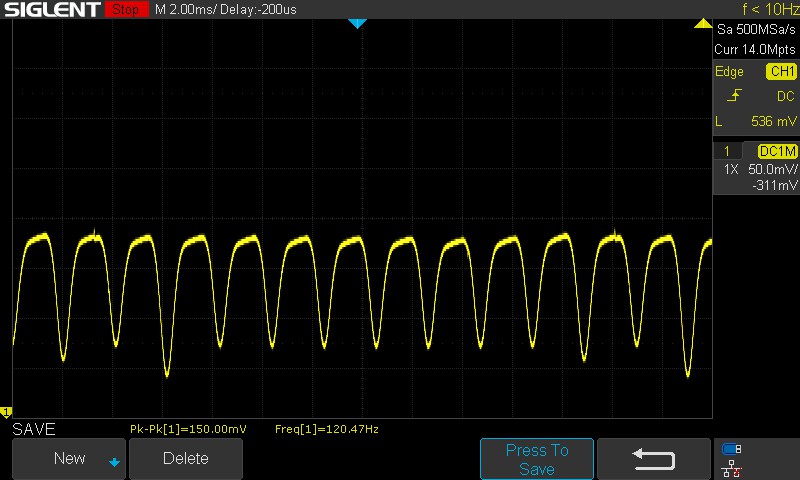
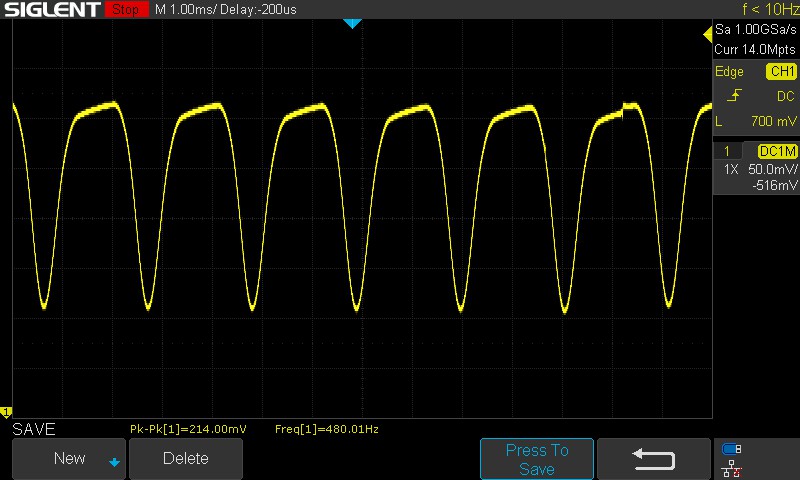
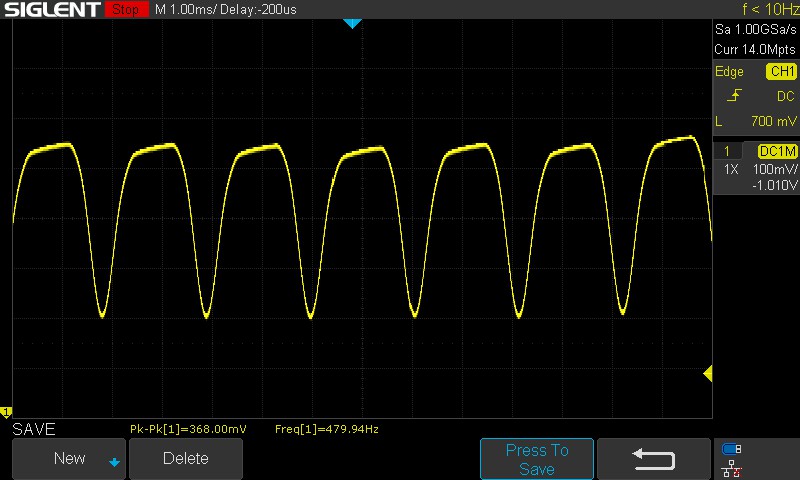
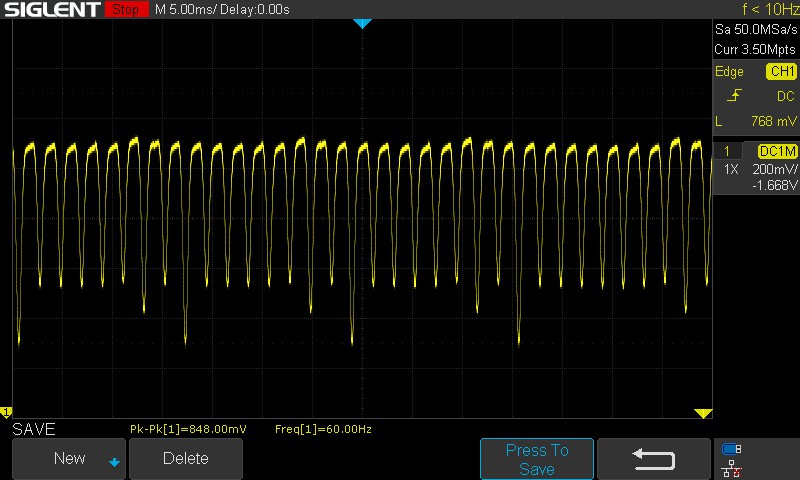
Cintilação da tela / PWM (modulação por largura de pulso)
| Tela tremeluzindo/PWM detectado | 120 Hz | ≤ 100 % configuração de brilho | 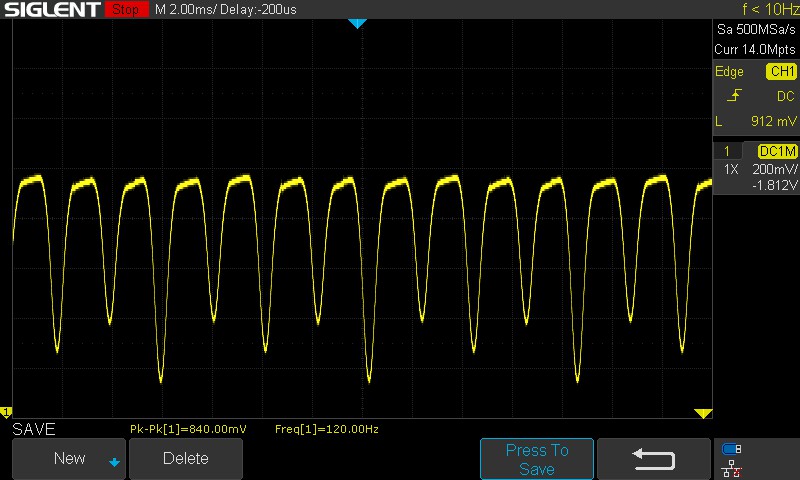 |
A luz de fundo da tela pisca em 120 Hz (pior caso, por exemplo, utilizando PWM) Cintilação detectada em uma configuração de brilho de 100 % e abaixo. Não deve haver cintilação ou PWM acima desta configuração de brilho. A frequência de 120 Hz é muito baixa, portanto a oscilação pode causar fadiga ocular e dores de cabeça após uso prolongado. [pwm_comparison] Em comparação: 52 % de todos os dispositivos testados não usam PWM para escurecer a tela. Se PWM foi detectado, uma média de 7757 (mínimo: 5 - máximo: 343500) Hz foi medida. | |||
Em uma taxa de atualização de 120 Hz, o PWM pode oscilar entre 120 Hz ou múltiplos de até 480 Hz. O PWM cai para 60 Hz na taxa de atualização correspondente.
De qualquer forma, a frequência do PWM é baixa e pode causar problemas para as pessoas sensíveis a ela.
Confira nossa cartilha "Por que o PWM é uma dor de cabeça" para obter mais informações. Uma visão geral do PWM medido nos dispositivos analisados pode ser encontrada em nossa Tabela de classificação de PWM.
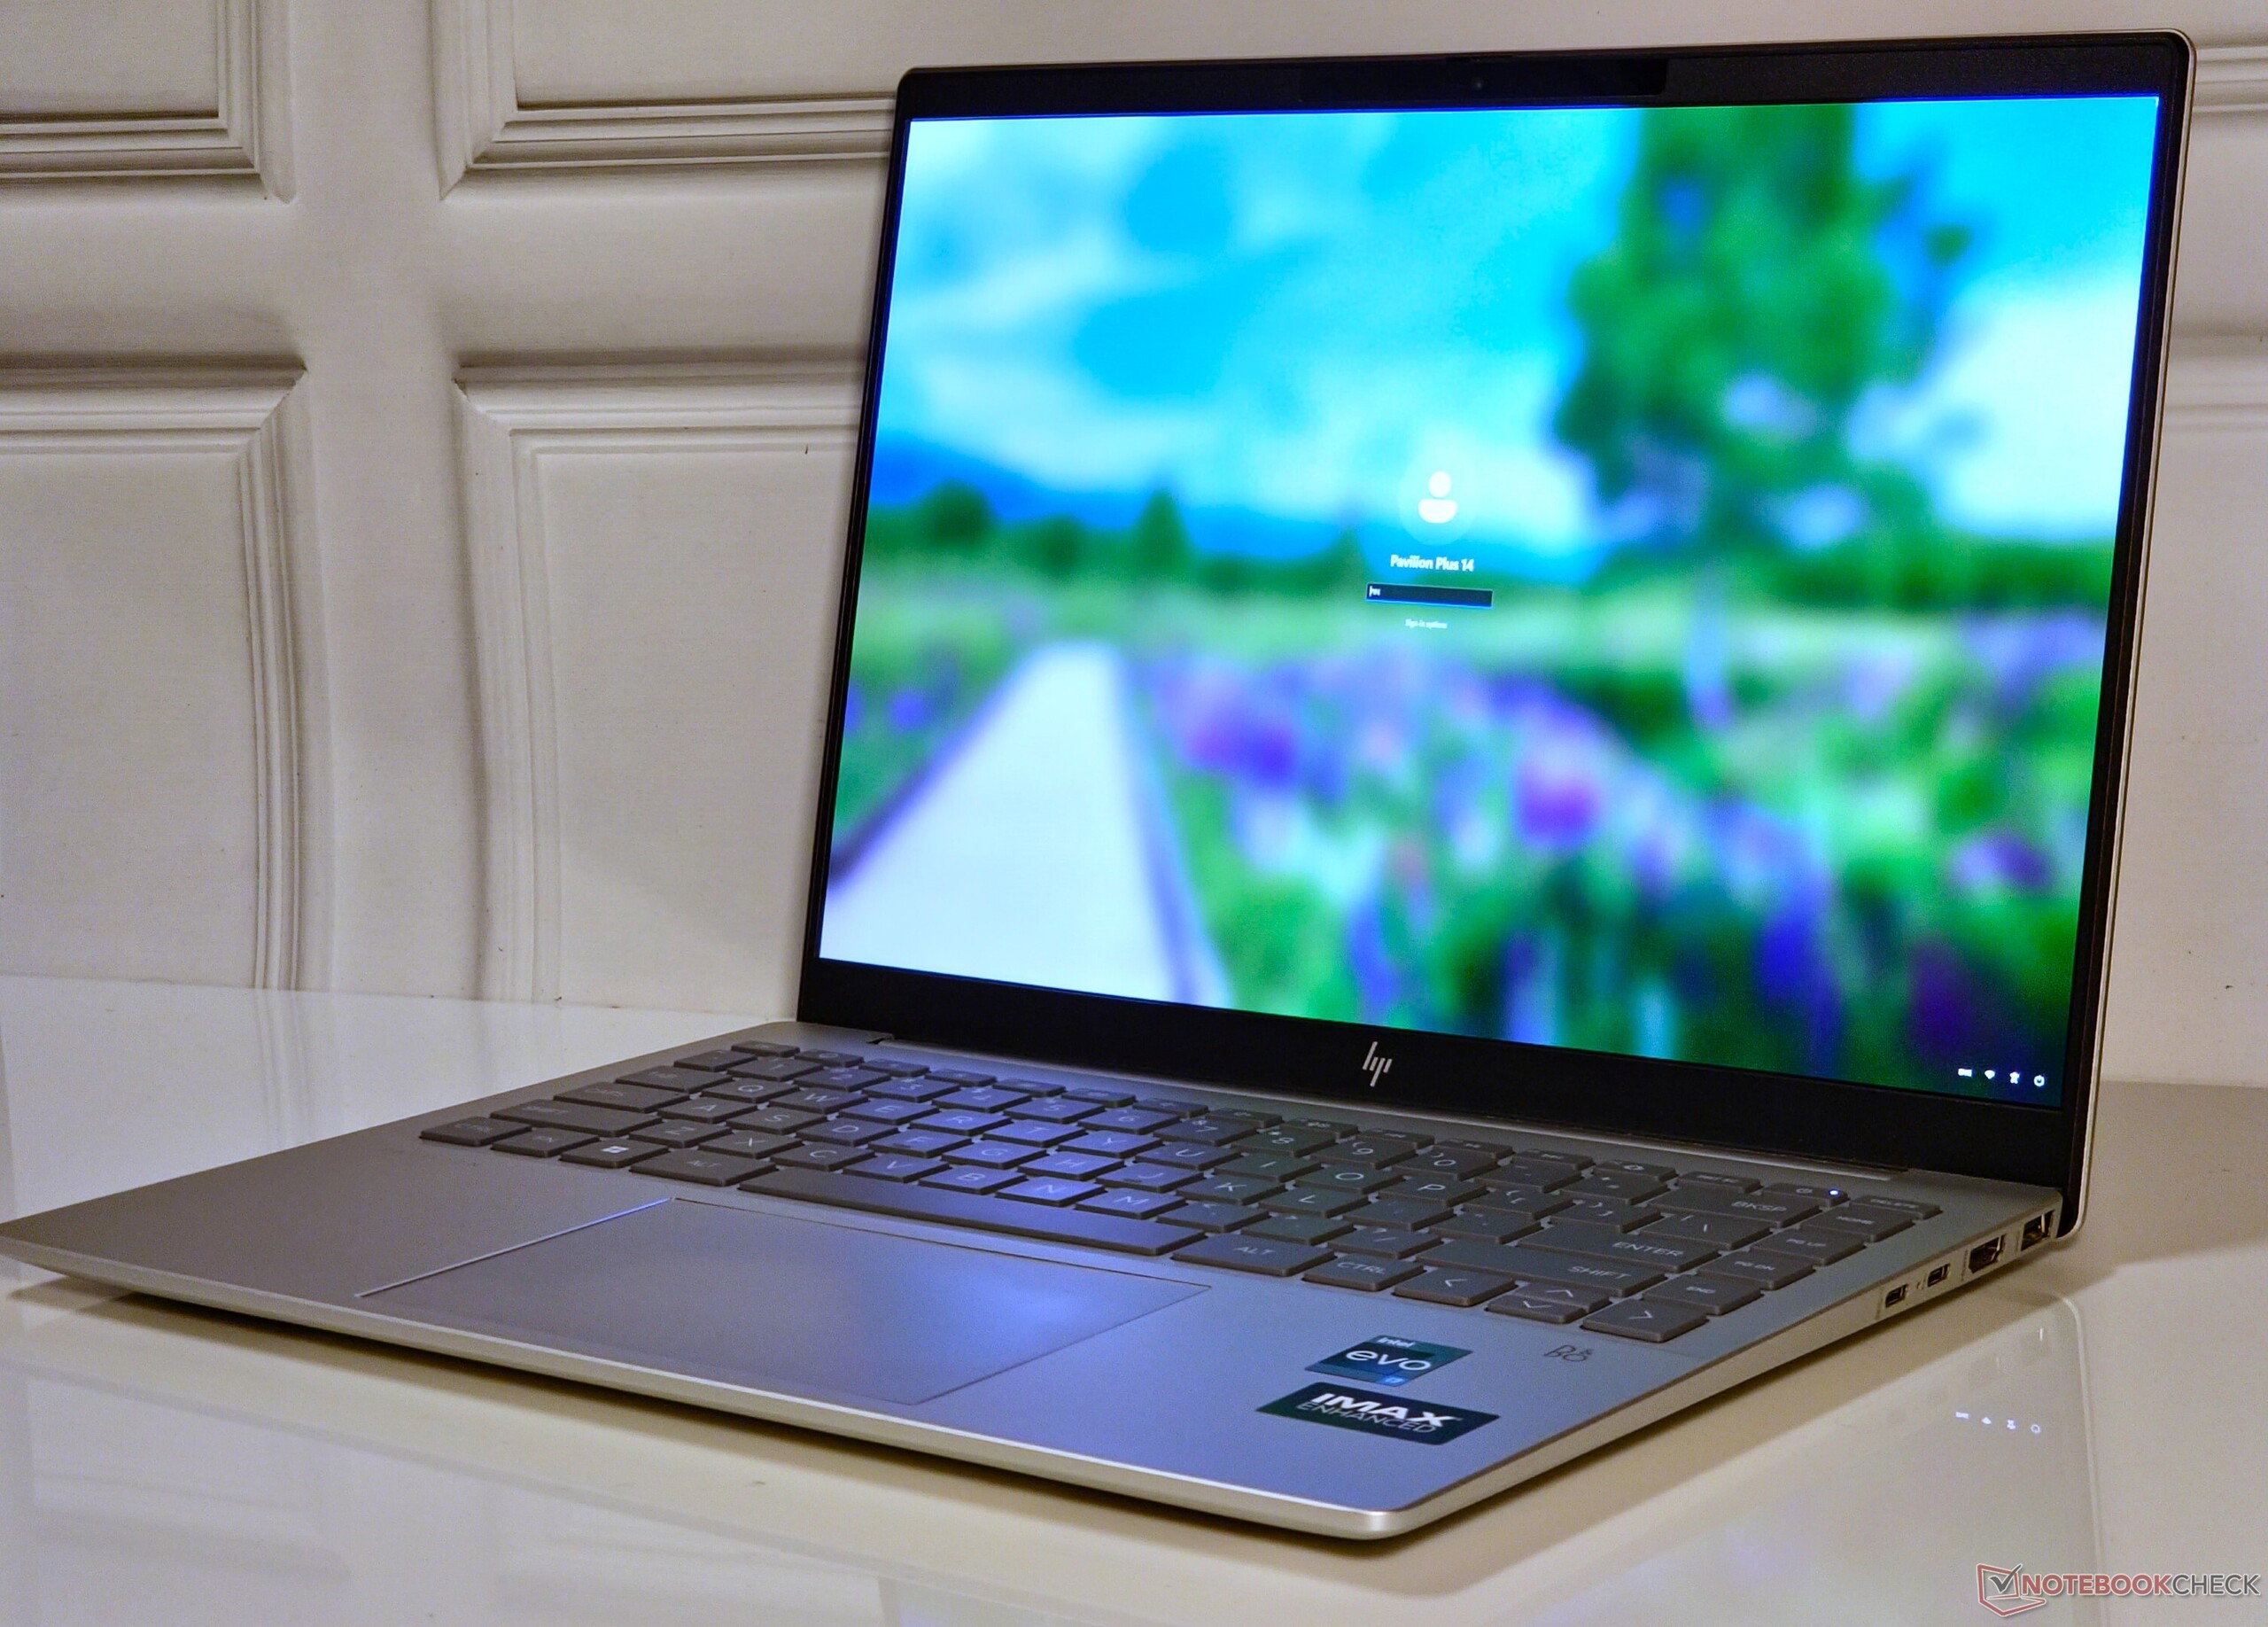
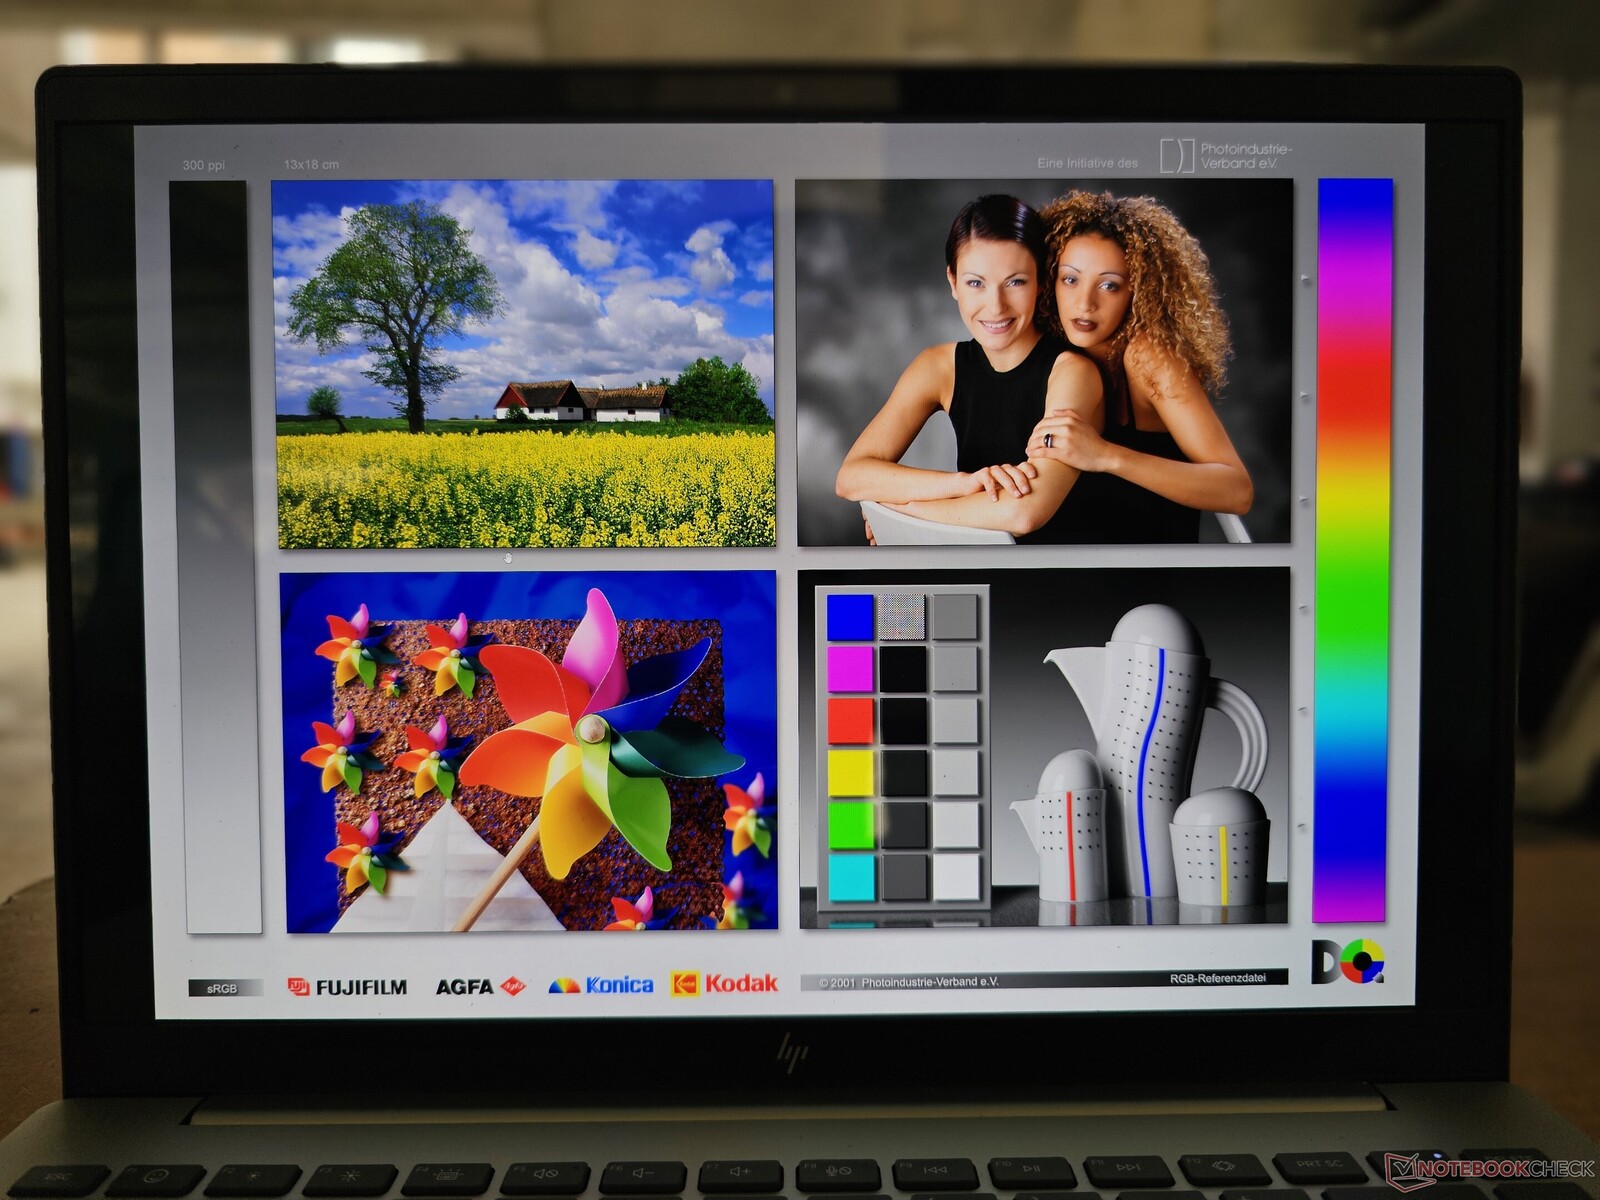
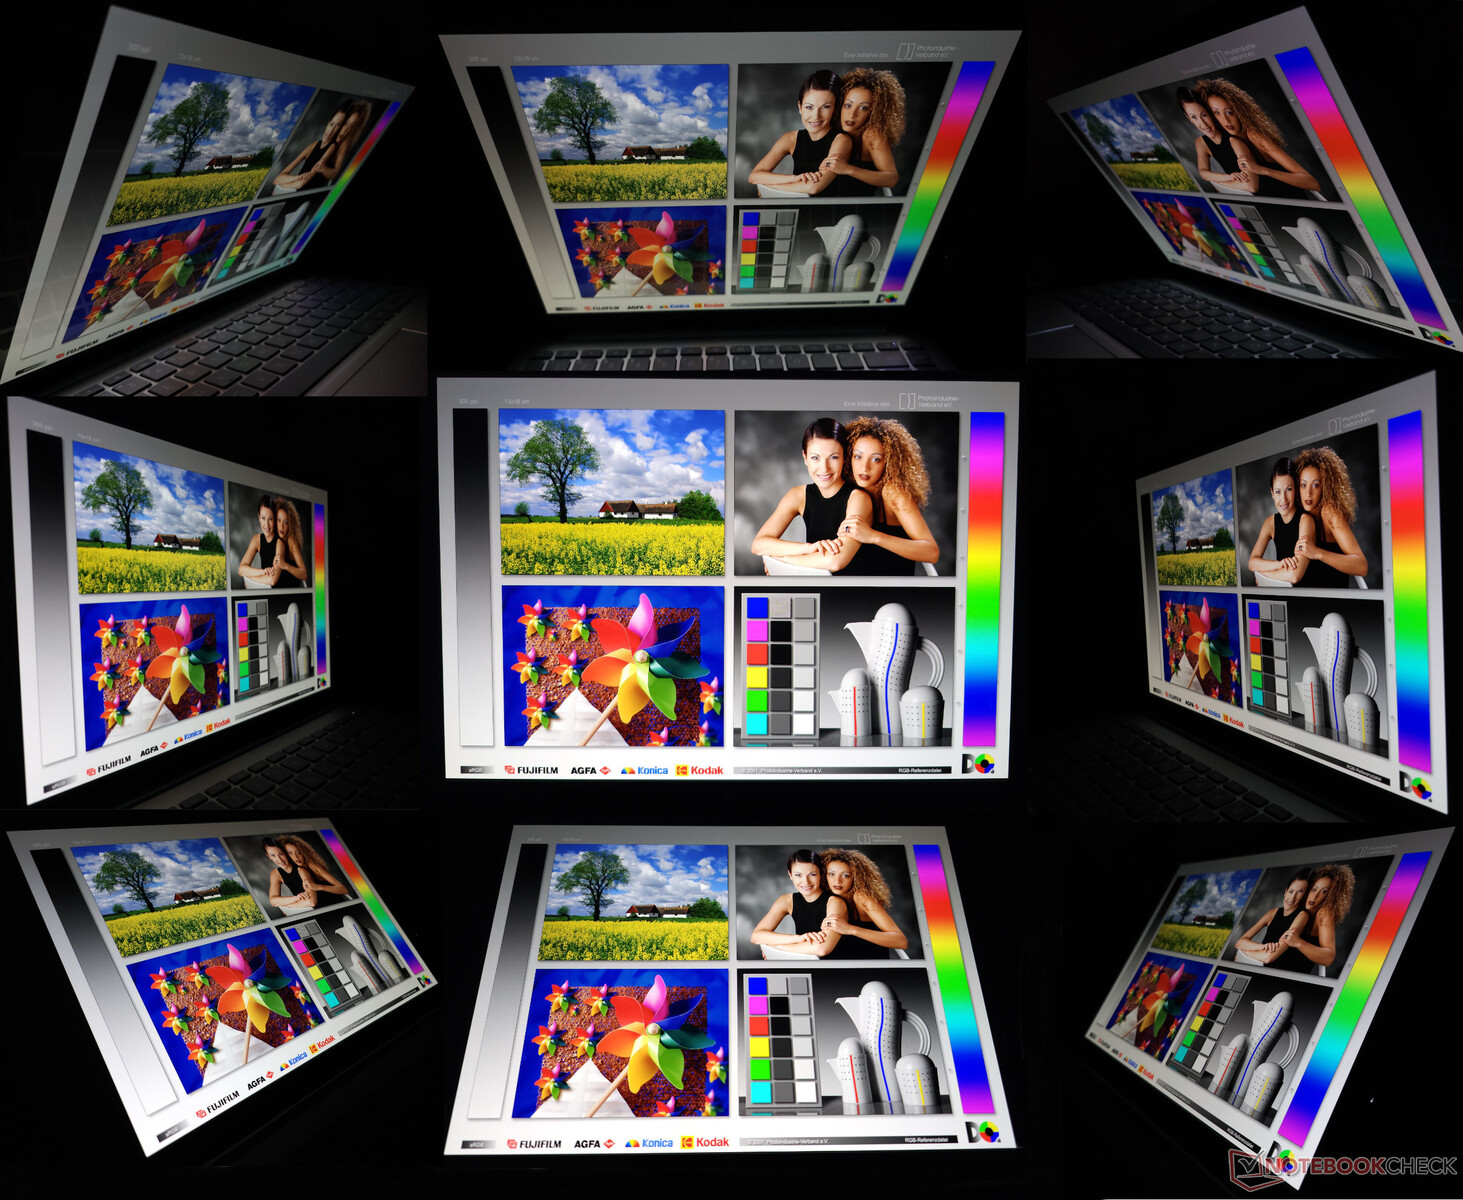
A tela brilhante pode ser desagradável sob luz solar direta. Os ângulos de visão são bastante estáveis, sem perda perceptível de brilho ou cor nos extremos.
Desempenho: Não é páreo para o Pavilion Plus 14 baseado no Ryzen 7 7840U
A HP oferece o Pavilion Plus 14 em ambas as versões Core i5-1335U e Core i7-1355U. O aplicativo myHP oferece apenas um perfil de energia balanceado, portanto, usamos o gerenciamento de energia do Windows definido como Melhor desempenho para todos os benchmarks.
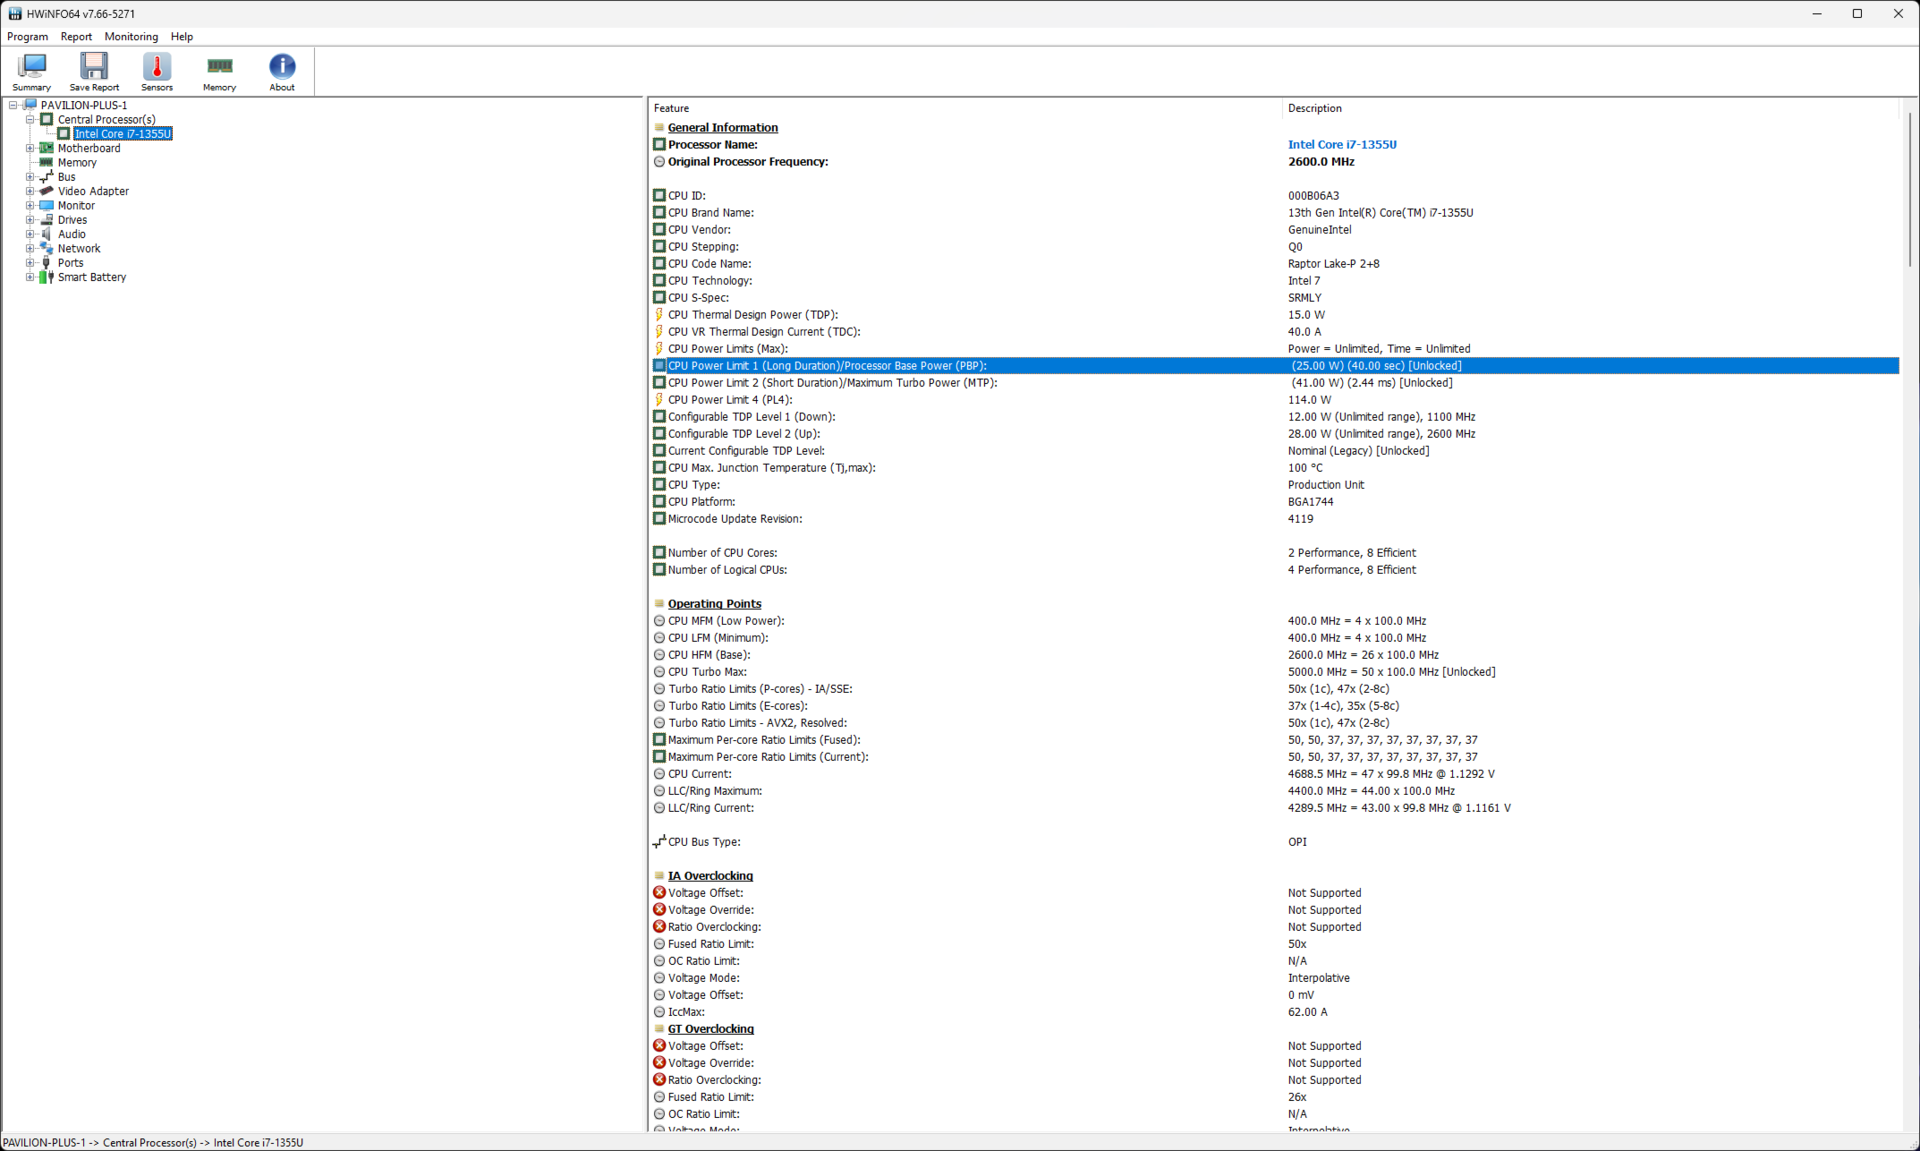
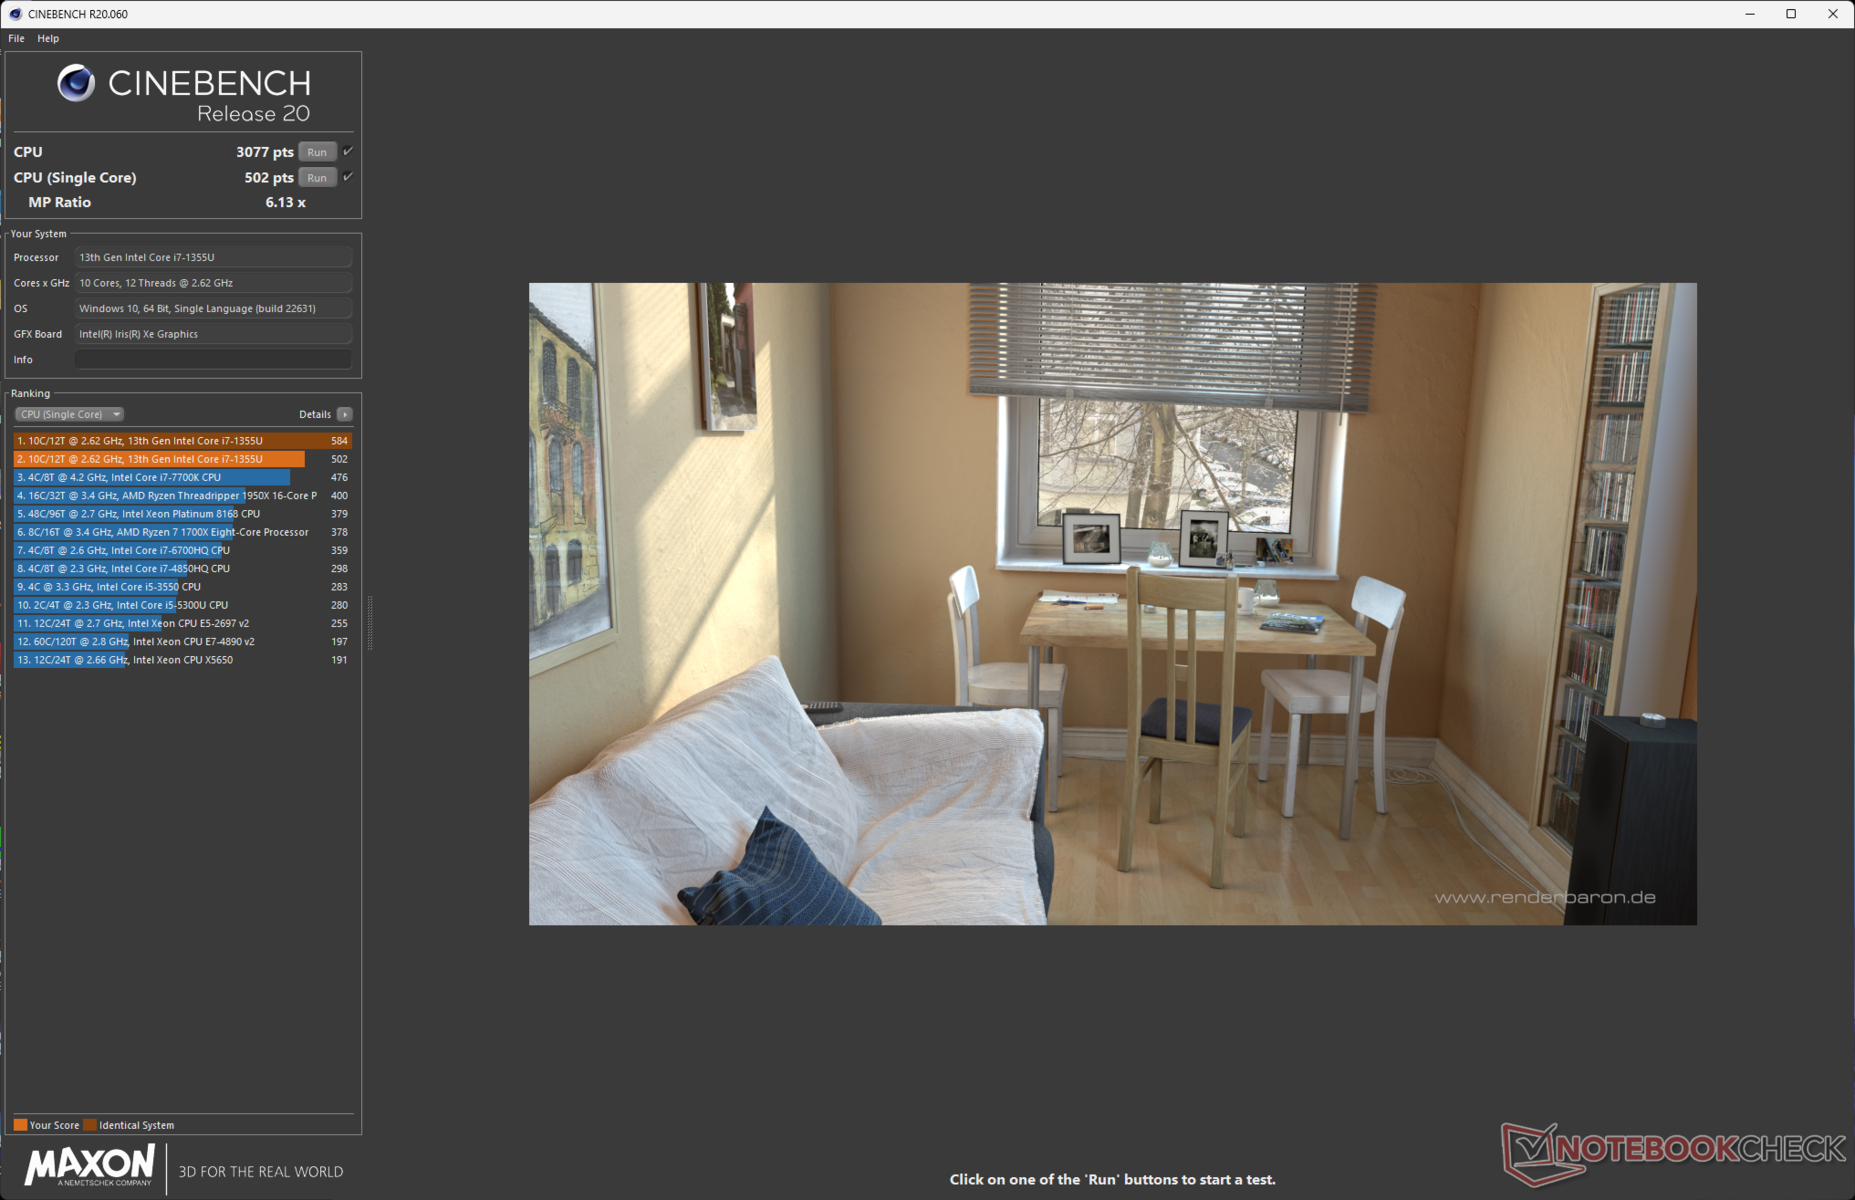
O Core i7-1355U é uma peça de 10 núcleos (2P+8E) e 12 threads que opera com um PL1 de 25 W e um PL2 de 41 W nesse dispositivo.
Processador
O Pavilion Plus 14 Core i7 fica consideravelmente atrás de seu primo equipado com AMD Ryzen 7 7840U nos benchmarks gerais de CPU. Isso está dentro do esperado, pois o Core i7-1355U oferece apenas dois núcleos P com hyperthreading, enquanto o restante são núcleos E.
Isso resulta em um impacto considerável no desempenho de vários núcleos em comparação com o Ryzen 7 7840U 8C/16T, embora as pontuações de núcleo único do Core i7-1355U estejam geralmente no mesmo nível ou ligeiramente à frente, dependendo do benchmark.
Cumulativamente, nossa amostra de análise fica 8% atrás em comparação com as pontuações médias do Core i7-1355U. O PL2 mais baixo também coloca o Pavilion Plus 14 em uma ligeira desvantagem, especialmente em vários núcleos, em comparação com o Asus ExpertBook B9
que usa o mesmo chip, mas com limites de energia um pouco mais altos.<br>Cinebench R15 Multi Loop
Cinebench R23: Multi Core | Single Core
Cinebench R20: CPU (Multi Core) | CPU (Single Core)
Cinebench R15: CPU Multi 64Bit | CPU Single 64Bit
Blender: v2.79 BMW27 CPU
7-Zip 18.03: 7z b 4 | 7z b 4 -mmt1
Geekbench 5.5: Multi-Core | Single-Core
HWBOT x265 Benchmark v2.2: 4k Preset
LibreOffice : 20 Documents To PDF
R Benchmark 2.5: Overall mean
| CPU Performance rating | |
| Média da turma Multimedia | |
| HP Pavilion Plus 14-ey0095cl | |
| Huawei MateBook X Pro 2023 | |
| Lenovo ThinkPad T14s G4 i7-1365U | |
| Média Intel Core i7-1355U | |
| Asus ExpertBook B9 B9403CVA-KM0153X | |
| HP Pavilion Plus 14-ew0153TU | |
| Acer Swift Go 14 SFG14-71 | |
| Cinebench R23 / Multi Core | |
| Média da turma Multimedia (4861 - 33362, n=74, últimos 2 anos) | |
| HP Pavilion Plus 14-ey0095cl | |
| Huawei MateBook X Pro 2023 | |
| Média Intel Core i7-1355U (6936 - 10252, n=18) | |
| Lenovo ThinkPad T14s G4 i7-1365U | |
| Acer Swift Go 14 SFG14-71 | |
| Asus ExpertBook B9 B9403CVA-KM0153X | |
| HP Pavilion Plus 14-ew0153TU | |
| Cinebench R23 / Single Core | |
| Média da turma Multimedia (1128 - 2459, n=66, últimos 2 anos) | |
| Lenovo ThinkPad T14s G4 i7-1365U | |
| Huawei MateBook X Pro 2023 | |
| Média Intel Core i7-1355U (1687 - 1889, n=18) | |
| HP Pavilion Plus 14-ew0153TU | |
| Asus ExpertBook B9 B9403CVA-KM0153X | |
| HP Pavilion Plus 14-ey0095cl | |
| Acer Swift Go 14 SFG14-71 | |
| Cinebench R20 / CPU (Multi Core) | |
| Média da turma Multimedia (1887 - 12912, n=57, últimos 2 anos) | |
| Huawei MateBook X Pro 2023 | |
| HP Pavilion Plus 14-ey0095cl | |
| Média Intel Core i7-1355U (2849 - 3907, n=18) | |
| Lenovo ThinkPad T14s G4 i7-1365U | |
| HP Pavilion Plus 14-ew0153TU | |
| Asus ExpertBook B9 B9403CVA-KM0153X | |
| Acer Swift Go 14 SFG14-71 | |
| Cinebench R20 / CPU (Single Core) | |
| Lenovo ThinkPad T14s G4 i7-1365U | |
| Média da turma Multimedia (425 - 853, n=57, últimos 2 anos) | |
| Huawei MateBook X Pro 2023 | |
| Média Intel Core i7-1355U (654 - 725, n=18) | |
| Asus ExpertBook B9 B9403CVA-KM0153X | |
| HP Pavilion Plus 14-ew0153TU | |
| HP Pavilion Plus 14-ey0095cl | |
| Acer Swift Go 14 SFG14-71 | |
| Cinebench R15 / CPU Multi 64Bit | |
| Média da turma Multimedia (856 - 5224, n=61, últimos 2 anos) | |
| Huawei MateBook X Pro 2023 | |
| HP Pavilion Plus 14-ey0095cl | |
| Média Intel Core i7-1355U (1206 - 1735, n=18) | |
| Lenovo ThinkPad T14s G4 i7-1365U | |
| Acer Swift Go 14 SFG14-71 | |
| Asus ExpertBook B9 B9403CVA-KM0153X | |
| HP Pavilion Plus 14-ew0153TU | |
| Cinebench R15 / CPU Single 64Bit | |
| Média da turma Multimedia (184.8 - 326, n=59, últimos 2 anos) | |
| Huawei MateBook X Pro 2023 | |
| HP Pavilion Plus 14-ey0095cl | |
| Lenovo ThinkPad T14s G4 i7-1365U | |
| Média Intel Core i7-1355U (237 - 267, n=18) | |
| Asus ExpertBook B9 B9403CVA-KM0153X | |
| HP Pavilion Plus 14-ew0153TU | |
| Acer Swift Go 14 SFG14-71 | |
| Blender / v2.79 BMW27 CPU | |
| HP Pavilion Plus 14-ew0153TU | |
| Média Intel Core i7-1355U (328 - 503, n=18) | |
| Asus ExpertBook B9 B9403CVA-KM0153X | |
| Acer Swift Go 14 SFG14-71 | |
| Lenovo ThinkPad T14s G4 i7-1365U | |
| Huawei MateBook X Pro 2023 | |
| HP Pavilion Plus 14-ey0095cl | |
| Média da turma Multimedia (100 - 557, n=58, últimos 2 anos) | |
| 7-Zip 18.03 / 7z b 4 | |
| Média da turma Multimedia (26062 - 130368, n=55, últimos 2 anos) | |
| HP Pavilion Plus 14-ey0095cl | |
| Huawei MateBook X Pro 2023 | |
| Lenovo ThinkPad T14s G4 i7-1365U | |
| Média Intel Core i7-1355U (30255 - 42092, n=18) | |
| Asus ExpertBook B9 B9403CVA-KM0153X | |
| Acer Swift Go 14 SFG14-71 | |
| HP Pavilion Plus 14-ew0153TU | |
| 7-Zip 18.03 / 7z b 4 -mmt1 | |
| HP Pavilion Plus 14-ey0095cl | |
| Média da turma Multimedia (3666 - 7545, n=56, últimos 2 anos) | |
| Lenovo ThinkPad T14s G4 i7-1365U | |
| Huawei MateBook X Pro 2023 | |
| Média Intel Core i7-1355U (5301 - 5911, n=18) | |
| HP Pavilion Plus 14-ew0153TU | |
| Asus ExpertBook B9 B9403CVA-KM0153X | |
| Acer Swift Go 14 SFG14-71 | |
| Geekbench 5.5 / Multi-Core | |
| Média da turma Multimedia (4652 - 20422, n=56, últimos 2 anos) | |
| HP Pavilion Plus 14-ey0095cl | |
| Huawei MateBook X Pro 2023 | |
| Lenovo ThinkPad T14s G4 i7-1365U | |
| Média Intel Core i7-1355U (7507 - 9328, n=18) | |
| HP Pavilion Plus 14-ew0153TU | |
| Acer Swift Go 14 SFG14-71 | |
| Asus ExpertBook B9 B9403CVA-KM0153X | |
| Geekbench 5.5 / Single-Core | |
| Média da turma Multimedia (805 - 2974, n=56, últimos 2 anos) | |
| HP Pavilion Plus 14-ey0095cl | |
| Lenovo ThinkPad T14s G4 i7-1365U | |
| HP Pavilion Plus 14-ew0153TU | |
| Huawei MateBook X Pro 2023 | |
| Média Intel Core i7-1355U (1678 - 1872, n=18) | |
| Asus ExpertBook B9 B9403CVA-KM0153X | |
| Acer Swift Go 14 SFG14-71 | |
| HWBOT x265 Benchmark v2.2 / 4k Preset | |
| Média da turma Multimedia (5.26 - 36.1, n=56, últimos 2 anos) | |
| HP Pavilion Plus 14-ey0095cl | |
| Huawei MateBook X Pro 2023 | |
| Lenovo ThinkPad T14s G4 i7-1365U | |
| Média Intel Core i7-1355U (7.83 - 11.4, n=18) | |
| Acer Swift Go 14 SFG14-71 | |
| HP Pavilion Plus 14-ew0153TU | |
| Asus ExpertBook B9 B9403CVA-KM0153X | |
| LibreOffice / 20 Documents To PDF | |
| Acer Swift Go 14 SFG14-71 | |
| HP Pavilion Plus 14-ew0153TU | |
| Asus ExpertBook B9 B9403CVA-KM0153X | |
| Média Intel Core i7-1355U (41.1 - 108.6, n=18) | |
| HP Pavilion Plus 14-ey0095cl | |
| Média da turma Multimedia (23.9 - 146.7, n=57, últimos 2 anos) | |
| Lenovo ThinkPad T14s G4 i7-1365U | |
| Huawei MateBook X Pro 2023 | |
| R Benchmark 2.5 / Overall mean | |
| Acer Swift Go 14 SFG14-71 | |
| Média Intel Core i7-1355U (0.4481 - 0.832, n=18) | |
| Asus ExpertBook B9 B9403CVA-KM0153X | |
| HP Pavilion Plus 14-ew0153TU | |
| Média da turma Multimedia (0.3604 - 0.947, n=56, últimos 2 anos) | |
| Huawei MateBook X Pro 2023 | |
| HP Pavilion Plus 14-ey0095cl | |
| Lenovo ThinkPad T14s G4 i7-1365U | |
* ... menor é melhor
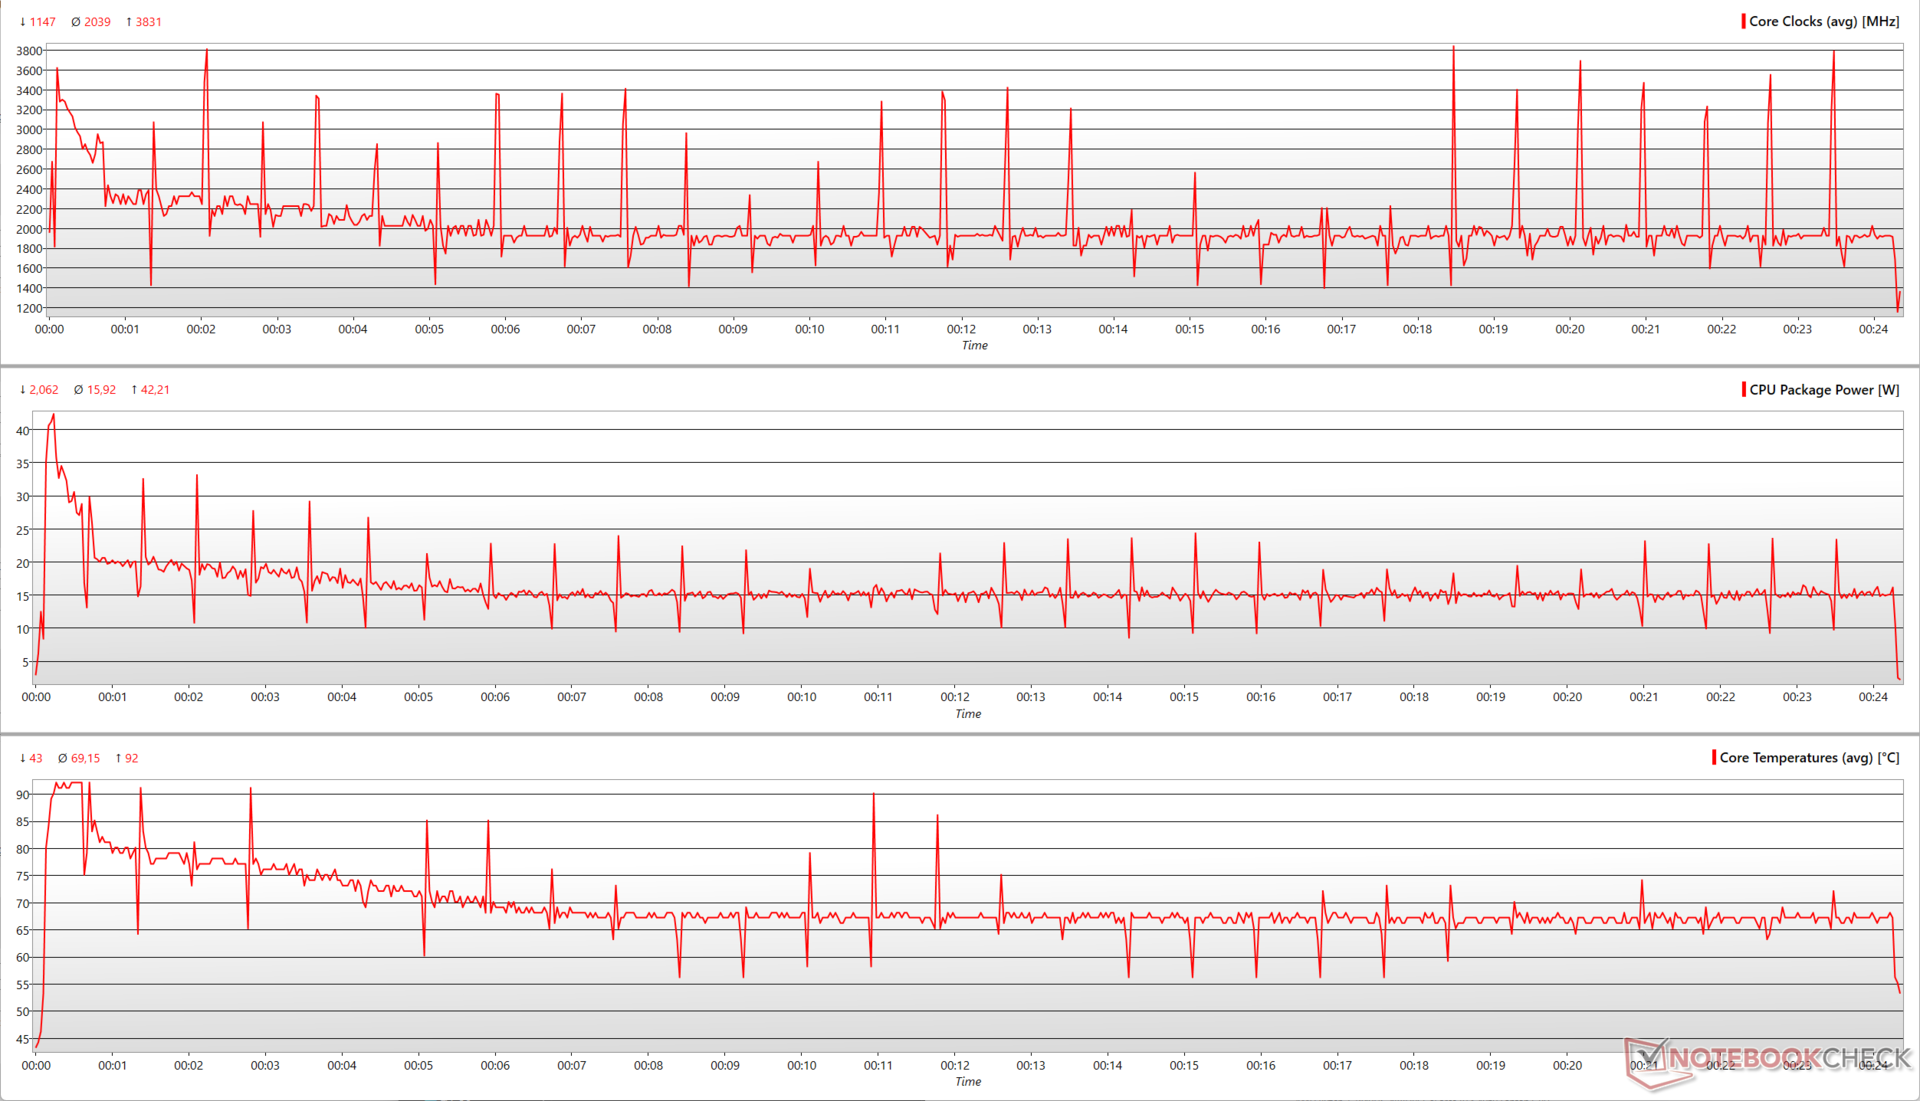
Uma análise de vários parâmetros da CPU durante a execução do loop de vários núcleos do Cinebench R15 mostra que o Core i7-1355U é capaz de atingir um pico de aumento de 3,83 GHz enquanto utiliza 42,2 W. A CPU se mantém em uma média de 2 GHz a 16 W durante a execução.
O Pavilion Plus 14 tem como padrão o Melhor Desempenho quando conectado à tomada e o perfil Equilibrado quando a bateria está ligada. Por alguma razão, o Core i7-1355U apresenta resultados peculiares com o Cinebench com bateria, onde parece favorecer o modo Balanced em comparação com o modo Best Performance.
Dessa forma, enquanto o desempenho de núcleo único do Cinebench R20 cai em cerca de 24%, a pontuação de vários núcleos mostra um aumento interessante de 3% na energia da bateria. Observamos o mesmo resultado anômalo mesmo após várias execuções e também com o Cinebench R23.
AIDA64: FP32 Ray-Trace | FPU Julia | CPU SHA3 | CPU Queen | FPU SinJulia | FPU Mandel | CPU AES | CPU ZLib | FP64 Ray-Trace | CPU PhotoWorxx
| Performance rating | |
| Média da turma Multimedia | |
| HP Pavilion Plus 14-ey0095cl | |
| Huawei MateBook X Pro 2023 | |
| Lenovo ThinkPad T14s G4 i7-1365U | |
| Média Intel Core i7-1355U | |
| Asus ExpertBook B9 B9403CVA-KM0153X | |
| Acer Swift Go 14 SFG14-71 | |
| HP Pavilion Plus 14-ew0153TU | |
| AIDA64 / FP32 Ray-Trace | |
| HP Pavilion Plus 14-ey0095cl | |
| Média da turma Multimedia (2214 - 50388, n=53, últimos 2 anos) | |
| Huawei MateBook X Pro 2023 | |
| Lenovo ThinkPad T14s G4 i7-1365U | |
| Média Intel Core i7-1355U (5673 - 8424, n=18) | |
| Asus ExpertBook B9 B9403CVA-KM0153X | |
| Acer Swift Go 14 SFG14-71 | |
| HP Pavilion Plus 14-ew0153TU | |
| AIDA64 / FPU Julia | |
| Média da turma Multimedia (12867 - 201874, n=54, últimos 2 anos) | |
| HP Pavilion Plus 14-ey0095cl | |
| Huawei MateBook X Pro 2023 | |
| Lenovo ThinkPad T14s G4 i7-1365U | |
| Média Intel Core i7-1355U (29580 - 42706, n=18) | |
| Asus ExpertBook B9 B9403CVA-KM0153X | |
| Acer Swift Go 14 SFG14-71 | |
| HP Pavilion Plus 14-ew0153TU | |
| AIDA64 / CPU SHA3 | |
| Média da turma Multimedia (626 - 8623, n=54, últimos 2 anos) | |
| HP Pavilion Plus 14-ey0095cl | |
| Huawei MateBook X Pro 2023 | |
| Lenovo ThinkPad T14s G4 i7-1365U | |
| Média Intel Core i7-1355U (1529 - 2200, n=18) | |
| Asus ExpertBook B9 B9403CVA-KM0153X | |
| Acer Swift Go 14 SFG14-71 | |
| HP Pavilion Plus 14-ew0153TU | |
| AIDA64 / CPU Queen | |
| HP Pavilion Plus 14-ey0095cl | |
| Huawei MateBook X Pro 2023 | |
| Média da turma Multimedia (13483 - 181505, n=41, últimos 2 anos) | |
| Lenovo ThinkPad T14s G4 i7-1365U | |
| Média Intel Core i7-1355U (21547 - 66907, n=18) | |
| HP Pavilion Plus 14-ew0153TU | |
| Asus ExpertBook B9 B9403CVA-KM0153X | |
| Acer Swift Go 14 SFG14-71 | |
| AIDA64 / FPU SinJulia | |
| HP Pavilion Plus 14-ey0095cl | |
| Média da turma Multimedia (886 - 28794, n=54, últimos 2 anos) | |
| Huawei MateBook X Pro 2023 | |
| Lenovo ThinkPad T14s G4 i7-1365U | |
| Média Intel Core i7-1355U (4045 - 5426, n=18) | |
| Asus ExpertBook B9 B9403CVA-KM0153X | |
| HP Pavilion Plus 14-ew0153TU | |
| Acer Swift Go 14 SFG14-71 | |
| AIDA64 / FPU Mandel | |
| Média da turma Multimedia (6395 - 105740, n=53, últimos 2 anos) | |
| HP Pavilion Plus 14-ey0095cl | |
| Huawei MateBook X Pro 2023 | |
| Lenovo ThinkPad T14s G4 i7-1365U | |
| Média Intel Core i7-1355U (14596 - 21627, n=18) | |
| Asus ExpertBook B9 B9403CVA-KM0153X | |
| Acer Swift Go 14 SFG14-71 | |
| HP Pavilion Plus 14-ew0153TU | |
| AIDA64 / CPU AES | |
| Huawei MateBook X Pro 2023 | |
| Média da turma Multimedia (8171 - 126790, n=54, últimos 2 anos) | |
| HP Pavilion Plus 14-ey0095cl | |
| Média Intel Core i7-1355U (31432 - 75408, n=18) | |
| Lenovo ThinkPad T14s G4 i7-1365U | |
| Asus ExpertBook B9 B9403CVA-KM0153X | |
| Acer Swift Go 14 SFG14-71 | |
| HP Pavilion Plus 14-ew0153TU | |
| AIDA64 / CPU ZLib | |
| Média da turma Multimedia (143.8 - 2022, n=54, últimos 2 anos) | |
| HP Pavilion Plus 14-ey0095cl | |
| Huawei MateBook X Pro 2023 | |
| Lenovo ThinkPad T14s G4 i7-1365U | |
| Média Intel Core i7-1355U (454 - 684, n=18) | |
| Asus ExpertBook B9 B9403CVA-KM0153X | |
| Acer Swift Go 14 SFG14-71 | |
| HP Pavilion Plus 14-ew0153TU | |
| AIDA64 / FP64 Ray-Trace | |
| HP Pavilion Plus 14-ey0095cl | |
| Média da turma Multimedia (1014 - 26875, n=54, últimos 2 anos) | |
| Huawei MateBook X Pro 2023 | |
| Lenovo ThinkPad T14s G4 i7-1365U | |
| Asus ExpertBook B9 B9403CVA-KM0153X | |
| Média Intel Core i7-1355U (2991 - 4453, n=18) | |
| Acer Swift Go 14 SFG14-71 | |
| HP Pavilion Plus 14-ew0153TU | |
| AIDA64 / CPU PhotoWorxx | |
| Média da turma Multimedia (8187 - 88154, n=54, últimos 2 anos) | |
| Huawei MateBook X Pro 2023 | |
| Lenovo ThinkPad T14s G4 i7-1365U | |
| Asus ExpertBook B9 B9403CVA-KM0153X | |
| HP Pavilion Plus 14-ew0153TU | |
| Média Intel Core i7-1355U (21800 - 46154, n=18) | |
| Acer Swift Go 14 SFG14-71 | |
| HP Pavilion Plus 14-ey0095cl | |
Confira nosso site dedicado Intel Core i7-1355U para obter mais informações e comparações de desempenho.
Desempenho do sistema
O Pavilion Plus 14 baseado em AMD leva 19% de vantagem sobre a versão Core i7 nas pontuações totais do PCMark 10. Entretanto, os dois dispositivos estão praticamente empatados nos testes cumulativos do CrossMark. De modo geral, o Pavilion Plus 14 não apresenta problemas para as necessidades diárias de computação e navegação na Web.
CrossMark: Overall | Productivity | Creativity | Responsiveness
AIDA64: Memory Copy | Memory Read | Memory Write | Memory Latency
WebXPRT 3: Overall
WebXPRT 4: Overall
Mozilla Kraken 1.1: Total
| PCMark 10 / Score | |
| Média da turma Multimedia (4325 - 10386, n=52, últimos 2 anos) | |
| HP Pavilion Plus 14-ey0095cl | |
| Lenovo ThinkPad T14s G4 i7-1365U | |
| Asus ExpertBook B9 B9403CVA-KM0153X | |
| Média Intel Core i7-1355U, Intel Iris Xe Graphics G7 96EUs (5455 - 5933, n=15) | |
| Huawei MateBook X Pro 2023 | |
| HP Pavilion Plus 14-ew0153TU | |
| Acer Swift Go 14 SFG14-71 | |
| PCMark 10 / Essentials | |
| Lenovo ThinkPad T14s G4 i7-1365U | |
| Média Intel Core i7-1355U, Intel Iris Xe Graphics G7 96EUs (10203 - 11822, n=15) | |
| Asus ExpertBook B9 B9403CVA-KM0153X | |
| Média da turma Multimedia (8025 - 11664, n=51, últimos 2 anos) | |
| HP Pavilion Plus 14-ew0153TU | |
| Acer Swift Go 14 SFG14-71 | |
| Huawei MateBook X Pro 2023 | |
| HP Pavilion Plus 14-ey0095cl | |
| PCMark 10 / Productivity | |
| Média da turma Multimedia (7323 - 18233, n=51, últimos 2 anos) | |
| HP Pavilion Plus 14-ey0095cl | |
| Lenovo ThinkPad T14s G4 i7-1365U | |
| Asus ExpertBook B9 B9403CVA-KM0153X | |
| Média Intel Core i7-1355U, Intel Iris Xe Graphics G7 96EUs (6763 - 7536, n=15) | |
| Huawei MateBook X Pro 2023 | |
| Acer Swift Go 14 SFG14-71 | |
| HP Pavilion Plus 14-ew0153TU | |
| PCMark 10 / Digital Content Creation | |
| Média da turma Multimedia (3651 - 16240, n=51, últimos 2 anos) | |
| HP Pavilion Plus 14-ey0095cl | |
| Huawei MateBook X Pro 2023 | |
| Lenovo ThinkPad T14s G4 i7-1365U | |
| HP Pavilion Plus 14-ew0153TU | |
| Média Intel Core i7-1355U, Intel Iris Xe Graphics G7 96EUs (5723 - 6712, n=15) | |
| Acer Swift Go 14 SFG14-71 | |
| Asus ExpertBook B9 B9403CVA-KM0153X | |
| CrossMark / Overall | |
| Média da turma Multimedia (866 - 2728, n=60, últimos 2 anos) | |
| Huawei MateBook X Pro 2023 | |
| Lenovo ThinkPad T14s G4 i7-1365U | |
| Média Intel Core i7-1355U, Intel Iris Xe Graphics G7 96EUs (1478 - 1643, n=15) | |
| Asus ExpertBook B9 B9403CVA-KM0153X | |
| HP Pavilion Plus 14-ew0153TU | |
| HP Pavilion Plus 14-ey0095cl | |
| Acer Swift Go 14 SFG14-71 | |
| CrossMark / Productivity | |
| Huawei MateBook X Pro 2023 | |
| Média da turma Multimedia (931 - 2489, n=60, últimos 2 anos) | |
| Lenovo ThinkPad T14s G4 i7-1365U | |
| HP Pavilion Plus 14-ew0153TU | |
| Média Intel Core i7-1355U, Intel Iris Xe Graphics G7 96EUs (1444 - 1665, n=15) | |
| Asus ExpertBook B9 B9403CVA-KM0153X | |
| HP Pavilion Plus 14-ey0095cl | |
| Acer Swift Go 14 SFG14-71 | |
| CrossMark / Creativity | |
| Média da turma Multimedia (907 - 3465, n=60, últimos 2 anos) | |
| Huawei MateBook X Pro 2023 | |
| Lenovo ThinkPad T14s G4 i7-1365U | |
| Asus ExpertBook B9 B9403CVA-KM0153X | |
| HP Pavilion Plus 14-ey0095cl | |
| Média Intel Core i7-1355U, Intel Iris Xe Graphics G7 96EUs (1563 - 1732, n=15) | |
| HP Pavilion Plus 14-ew0153TU | |
| Acer Swift Go 14 SFG14-71 | |
| CrossMark / Responsiveness | |
| Huawei MateBook X Pro 2023 | |
| Média da turma Multimedia (605 - 2024, n=60, últimos 2 anos) | |
| Acer Swift Go 14 SFG14-71 | |
| Lenovo ThinkPad T14s G4 i7-1365U | |
| Média Intel Core i7-1355U, Intel Iris Xe Graphics G7 96EUs (1217 - 1681, n=15) | |
| HP Pavilion Plus 14-ew0153TU | |
| Asus ExpertBook B9 B9403CVA-KM0153X | |
| HP Pavilion Plus 14-ey0095cl | |
| AIDA64 / Memory Copy | |
| Média da turma Multimedia (11299 - 132135, n=54, últimos 2 anos) | |
| HP Pavilion Plus 14-ey0095cl | |
| Huawei MateBook X Pro 2023 | |
| Asus ExpertBook B9 B9403CVA-KM0153X | |
| Média Intel Core i7-1355U, Intel Iris Xe Graphics G7 96EUs (35017 - 71600, n=15) | |
| HP Pavilion Plus 14-ew0153TU | |
| Lenovo ThinkPad T14s G4 i7-1365U | |
| Acer Swift Go 14 SFG14-71 | |
| AIDA64 / Memory Read | |
| Média da turma Multimedia (11624 - 174586, n=54, últimos 2 anos) | |
| Huawei MateBook X Pro 2023 | |
| Média Intel Core i7-1355U, Intel Iris Xe Graphics G7 96EUs (38551 - 58600, n=15) | |
| HP Pavilion Plus 14-ey0095cl | |
| Lenovo ThinkPad T14s G4 i7-1365U | |
| HP Pavilion Plus 14-ew0153TU | |
| Asus ExpertBook B9 B9403CVA-KM0153X | |
| Acer Swift Go 14 SFG14-71 | |
| AIDA64 / Memory Write | |
| HP Pavilion Plus 14-ey0095cl | |
| Huawei MateBook X Pro 2023 | |
| Média da turma Multimedia (11755 - 134998, n=54, últimos 2 anos) | |
| HP Pavilion Plus 14-ew0153TU | |
| Asus ExpertBook B9 B9403CVA-KM0153X | |
| Média Intel Core i7-1355U, Intel Iris Xe Graphics G7 96EUs (35910 - 93342, n=15) | |
| Lenovo ThinkPad T14s G4 i7-1365U | |
| Acer Swift Go 14 SFG14-71 | |
| AIDA64 / Memory Latency | |
| Média da turma Multimedia (7 - 535, n=53, últimos 2 anos) | |
| Média Intel Core i7-1355U, Intel Iris Xe Graphics G7 96EUs (80.3 - 346, n=15) | |
| Acer Swift Go 14 SFG14-71 | |
| HP Pavilion Plus 14-ey0095cl | |
| HP Pavilion Plus 14-ew0153TU | |
| Huawei MateBook X Pro 2023 | |
| Lenovo ThinkPad T14s G4 i7-1365U | |
| Asus ExpertBook B9 B9403CVA-KM0153X | |
| WebXPRT 3 / Overall | |
| Média da turma Multimedia (136.4 - 596, n=63, últimos 2 anos) | |
| Lenovo ThinkPad T14s G4 i7-1365U | |
| HP Pavilion Plus 14-ey0095cl | |
| Asus ExpertBook B9 B9403CVA-KM0153X | |
| HP Pavilion Plus 14-ew0153TU | |
| Média Intel Core i7-1355U, Intel Iris Xe Graphics G7 96EUs (149.2 - 295, n=15) | |
| Acer Swift Go 14 SFG14-71 | |
| WebXPRT 4 / Overall | |
| Média da turma Multimedia (167.3 - 402, n=65, últimos 2 anos) | |
| Lenovo ThinkPad T14s G4 i7-1365U | |
| HP Pavilion Plus 14-ew0153TU | |
| Média Intel Core i7-1355U, Intel Iris Xe Graphics G7 96EUs (94.2 - 256, n=13) | |
| Huawei MateBook X Pro 2023 | |
| HP Pavilion Plus 14-ey0095cl | |
| Mozilla Kraken 1.1 / Total | |
| Huawei MateBook X Pro 2023 | |
| Média Intel Core i7-1355U, Intel Iris Xe Graphics G7 96EUs (507 - 1449, n=15) | |
| HP Pavilion Plus 14-ey0095cl | |
| Acer Swift Go 14 SFG14-71 | |
| Acer Swift Go 14 SFG14-71 | |
| Asus ExpertBook B9 B9403CVA-KM0153X | |
| HP Pavilion Plus 14-ew0153TU | |
| Lenovo ThinkPad T14s G4 i7-1365U | |
| Média da turma Multimedia (228 - 835, n=66, últimos 2 anos) | |
* ... menor é melhor
| PCMark 8 Home Score Accelerated v2 | 5169 pontos | |
| PCMark 8 Work Score Accelerated v2 | 3115 pontos | |
| PCMark 10 Score | 5455 pontos | |
Ajuda | ||
Latência DPC
A latência DPC é melhor do que a de alguns dos concorrentes do Pavilion Plus 14, incluindo a variante AMD, o Lenovo ThinkPad T14se o Huawei MateBook X Pro mas ainda está no lado mais alto.

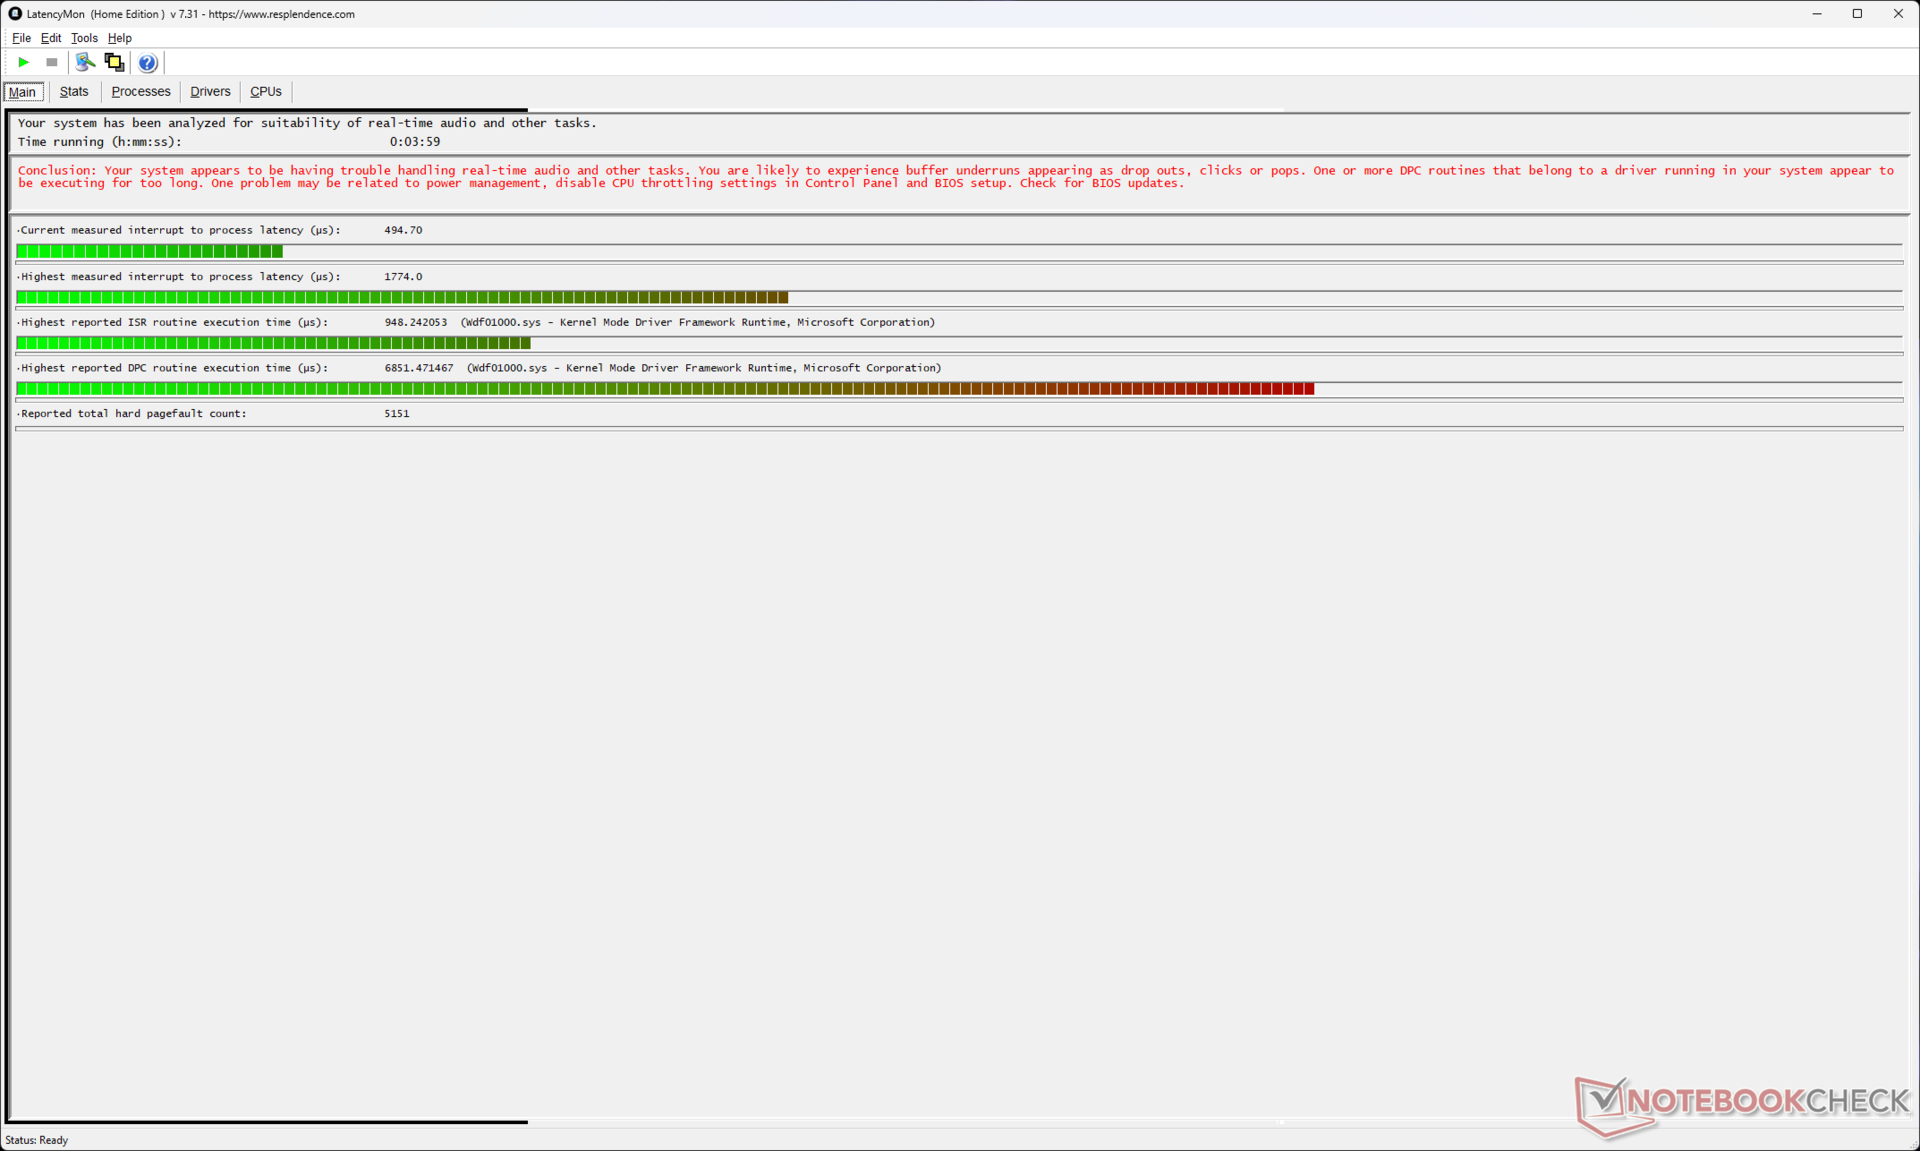
| DPC Latencies / LatencyMon - interrupt to process latency (max), Web, Youtube, Prime95 | |
| Huawei MateBook X Pro 2023 | |
| HP Pavilion Plus 14-ey0095cl | |
| Lenovo ThinkPad T14s G4 i7-1365U | |
| HP Pavilion Plus 14-ew0153TU | |
| Asus ExpertBook B9 B9403CVA-KM0153X | |
| Acer Swift Go 14 SFG14-71 | |
* ... menor é melhor
Nosso Classificação de latência do DPC fornece uma visão geral das leituras medidas do LatencyMon nos dispositivos analisados.
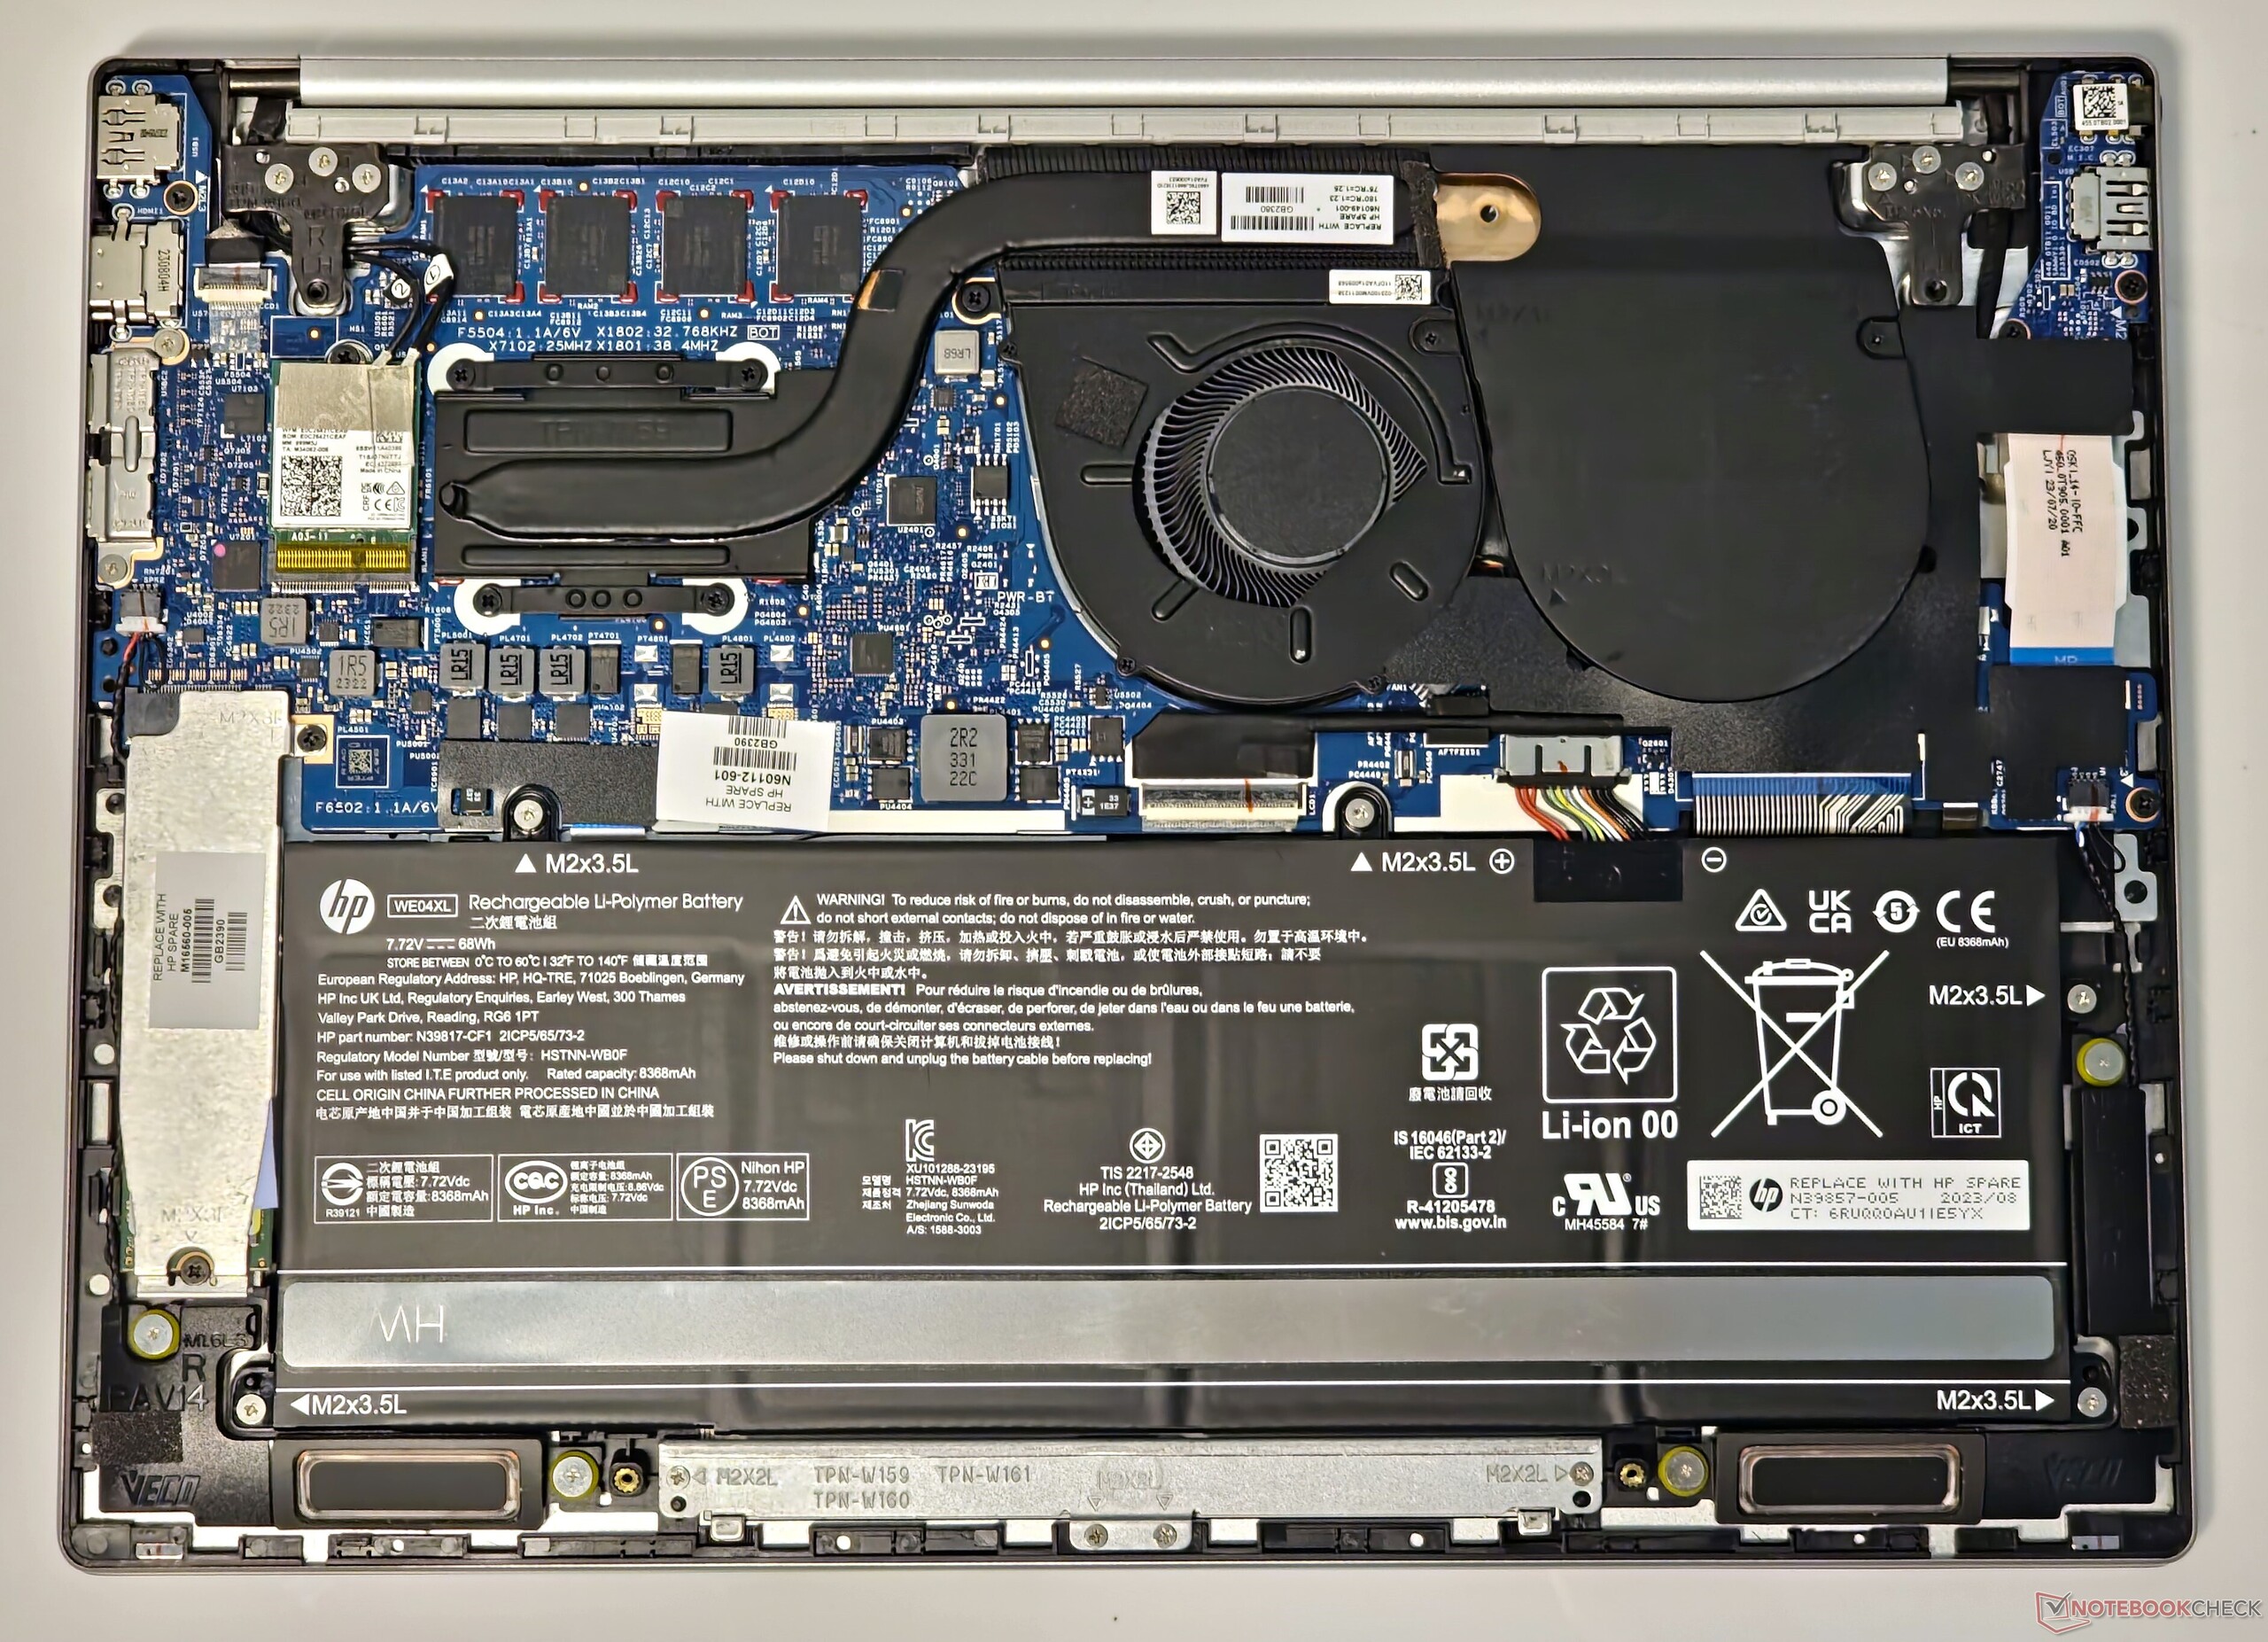
Dispositivos de armazenamento
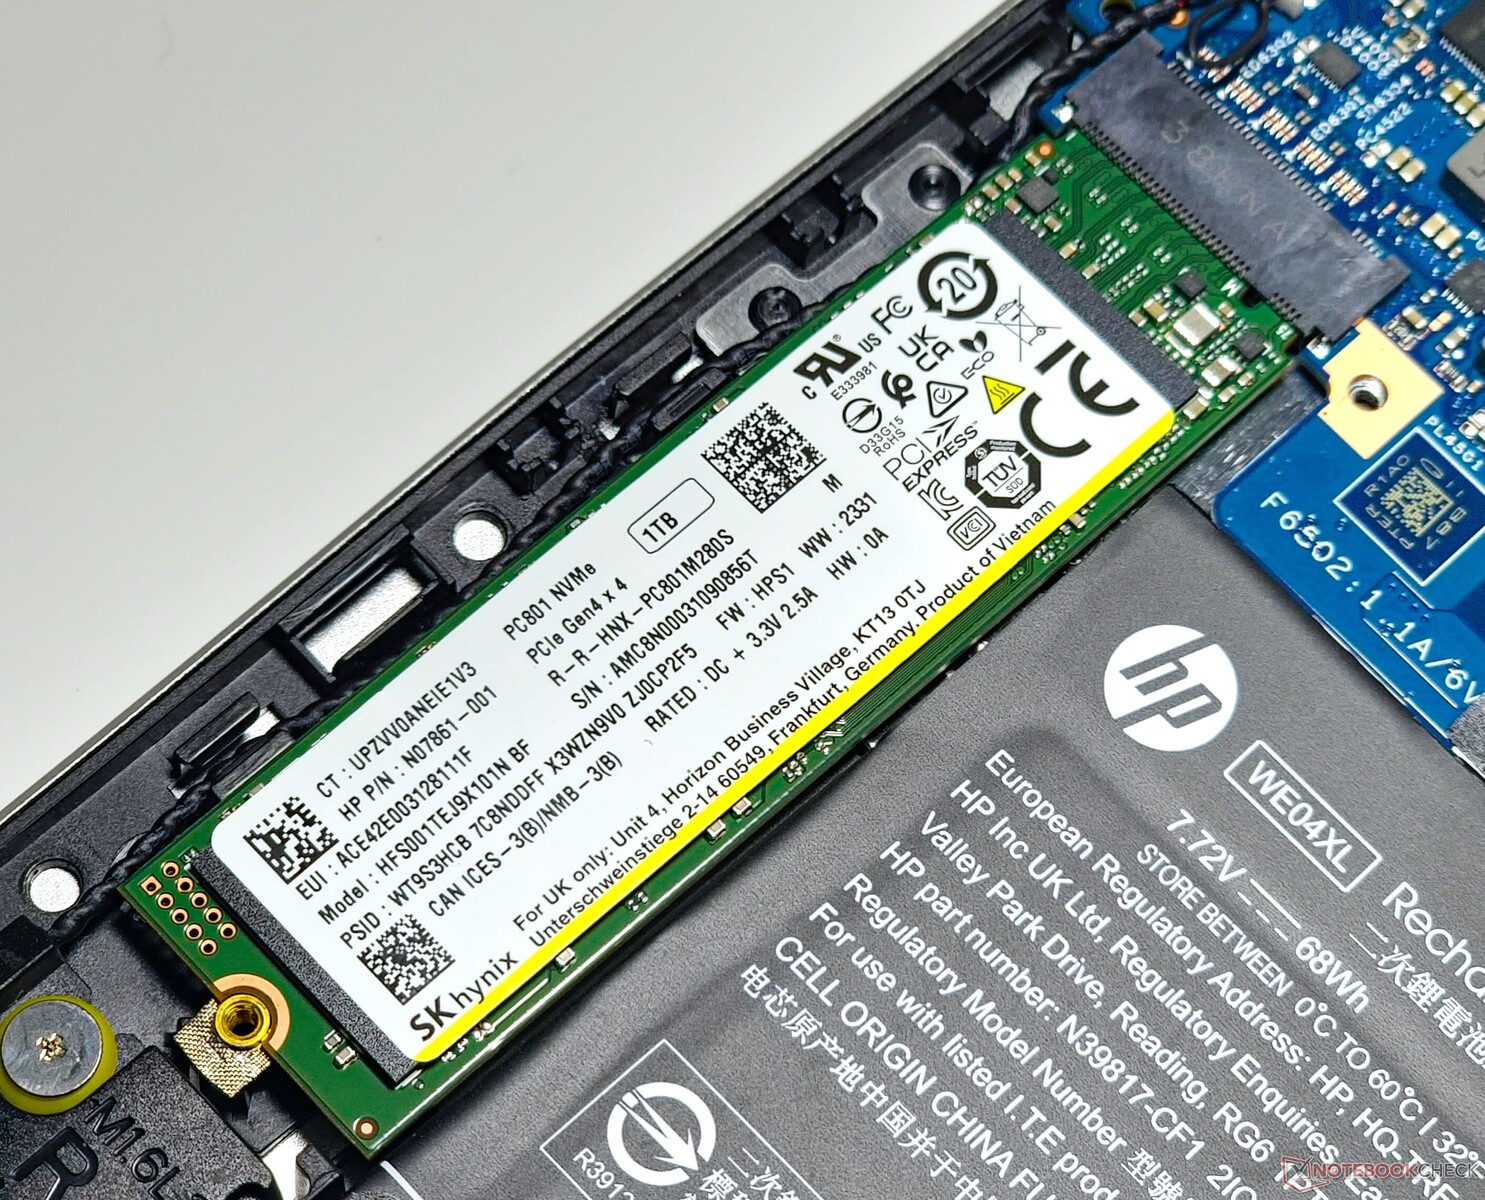
Nossa unidade Pavilion Plus 14 veio equipada com um SSD SK Hynix PC801 PCIe Gen4 NVMe. O desempenho cumulativo é cerca de 26% mais lento do que os resultados médios registrados para essa unidade, mas está bem próximo do WDC PC SN810 usado na versão AMD desse laptop.
O desempenho da unidade é relativamente estável, mas observamos uma queda significativa na velocidade após 20 execuções em nosso teste de loop de leitura DiskSpd com uma profundidade de fila de 8.
Não há possibilidade de expansão adicional do armazenamento interno.

* ... menor é melhor
Disk Throttling: DiskSpd Read Loop, Queue Depth 8
Mais benchmarks de armazenamento podem ser encontrados em nossa Página de comparação de SSDs.
Desempenho da GPU
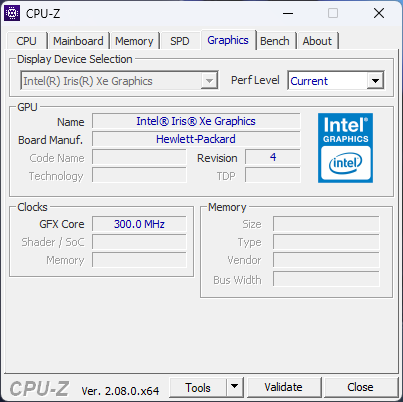
O Pavilion Plus 14 conta com a placa de vídeo Iris Xe Graphics 96 EUs integrada para impulsionar os recursos visuais. O desempenho cumulativo no 3DMark é semelhante ao de outros notebooks com essa iGPU.
No entanto, a variante Intel é superada pelo Pavilion Plus 14, equipado com AMD, com sua muito superior Radeon 780M que apresenta um desempenho 33% maior. A Radeon 780M pode apresentar ganhos de até 86% em testes como o 3DMark 11 Performance GPU.
| 3DMark 11 Performance | 6907 pontos | |
| 3DMark Ice Storm Standard Score | 128665 pontos | |
| 3DMark Cloud Gate Standard Score | 21922 pontos | |
| 3DMark Fire Strike Score | 4926 pontos | |
| 3DMark Fire Strike Extreme Score | 2398 pontos | |
| 3DMark Time Spy Score | 1753 pontos | |
Ajuda | ||
* ... menor é melhor
Desempenho em jogos
O Pavilion Plus 14 não foi projetado para ser um notebook para jogos. A placa de vídeo Iris Xe só pode executar títulos do passado e, na melhor das hipóteses, em configurações muito baixas ou médias.
Embora bastante baixa, a iGPU ainda consegue taxas de quadros relativamente estáveis quando o sistema é sobrecarregado com The Witcher 3 a 1080p Ultra.
| The Witcher 3 - 1920x1080 Ultra Graphics & Postprocessing (HBAO+) | |
| Média da turma Multimedia (11 - 121, n=7, últimos 2 anos) | |
| HP Pavilion Plus 14-ey0095cl | |
| Huawei MateBook X Pro 2023 | |
| Lenovo ThinkPad T14s G4 i7-1365U | |
| Asus ExpertBook B9 B9403CVA-KM0153X | |
| HP Pavilion Plus 14-ew0153TU | |
| Acer Swift Go 14 SFG14-71 | |
The Witcher 3 FPS Chart
| baixo | média | alto | ultra | |
|---|---|---|---|---|
| GTA V (2015) | 88.5 | 74.3 | 22 | 9.38 |
| The Witcher 3 (2015) | 73.5 | 50.8 | 28 | 13.2 |
| Dota 2 Reborn (2015) | 97.7 | 71.7 | 55.2 | 47.1 |
| Final Fantasy XV Benchmark (2018) | 40.6 | 23.7 | 16.8 | |
| X-Plane 11.11 (2018) | 37.1 | 25.6 | 23 | |
| Far Cry 5 (2018) | 40 | 24 | 23 | 21 |
| Strange Brigade (2018) | 88.3 | 38.1 | 30.6 | 23.4 |
| F1 22 (2022) | 37.6 | 33.5 | 25.4 | 19.1 |
Confira nossas Placas gráficas Intel Iris Xe 96 EUs para obter mais informações.
Emissões: Baixas temperaturas de superfície e ruído do ventilador sob carga
Ruído do sistema
A ventoinha do Pavilion Plus 14 baseado em Intel é praticamente inaudível no uso diário. Mesmo sob carga, o ruído da ventoinha fica em torno da marca de 32 db(A). Não notamos nenhum ruído de bobina ou ruídos estranhos no chassi durante o uso.
Barulho
| Ocioso |
| 20.57 / 20.57 / 20.57 dB |
| Carga |
| 32.18 / 32.26 dB |
 | ||
30 dB silencioso 40 dB(A) audível 50 dB(A) ruidosamente alto |
||
min: | ||
| HP Pavilion Plus 14-ew0153TU Iris Xe G7 96EUs, i7-1355U, SK hynix PC801 HFS001TEJ9X101N | HP Pavilion Plus 14-ey0095cl Radeon 780M, R7 7840U, WDC PC SN810 1TB | Lenovo ThinkPad T14s G4 i7-1365U Iris Xe G7 96EUs, i7-1365U | Acer Swift Go 14 SFG14-71 Iris Xe G7 80EUs, i5-1335U, WD PC SN740 SDDQNQD-512G-1014 | Asus ExpertBook B9 B9403CVA-KM0153X Iris Xe G7 96EUs, i7-1355U, Samsung PM9A1 MZVL21T0HCLR | Huawei MateBook X Pro 2023 Iris Xe G7 96EUs, i7-1360P | |
|---|---|---|---|---|---|---|
| Noise | -20% | -10% | -25% | -22% | -30% | |
| desligado / ambiente * (dB) | 19.35 | 23.4 -21% | 23.2 -20% | 24.9 -29% | 24.9 -29% | 25.4 -31% |
| Idle Minimum * (dB) | 20.57 | 24.1 -17% | 23.2 -13% | 24.9 -21% | 24.9 -21% | 25.4 -23% |
| Idle Average * (dB) | 20.57 | 24.1 -17% | 23.2 -13% | 24.9 -21% | 24.9 -21% | 25.4 -23% |
| Idle Maximum * (dB) | 20.57 | 25.3 -23% | 23.6 -15% | 24.9 -21% | 24.9 -21% | 29.6 -44% |
| Load Average * (dB) | 32.18 | 33.4 -4% | 24.3 24% | 31.9 1% | 33 -3% | 42 -31% |
| Witcher 3 ultra * (dB) | 29.44 | 39.4 -34% | 35.7 -21% | 43.2 -47% | ||
| Load Maximum * (dB) | 32.26 | 39.4 -22% | 35.7 -11% | 43.2 -34% | 45 -39% | 40.9 -27% |
* ... menor é melhor
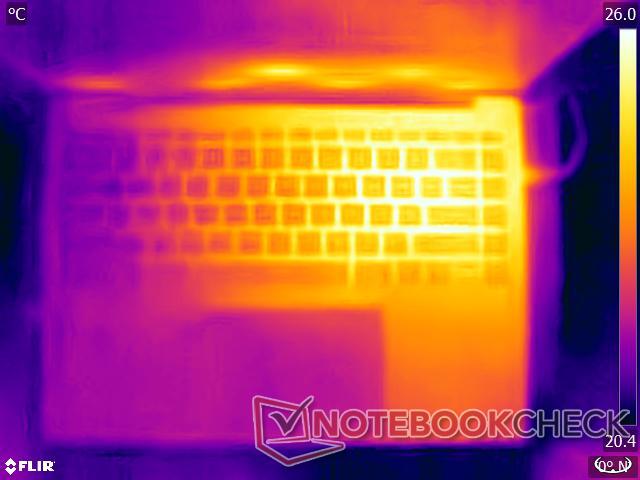
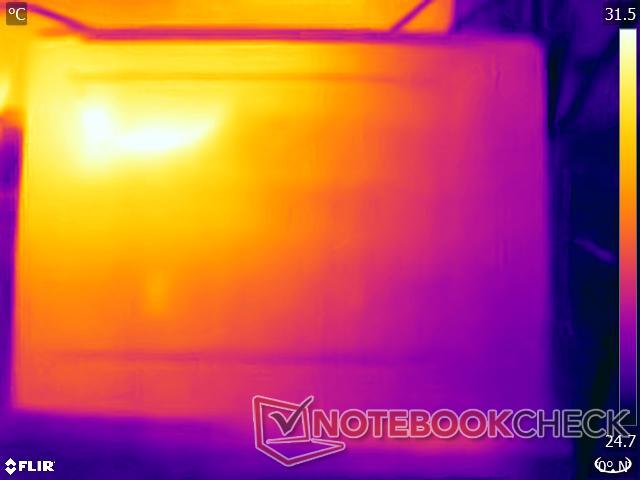
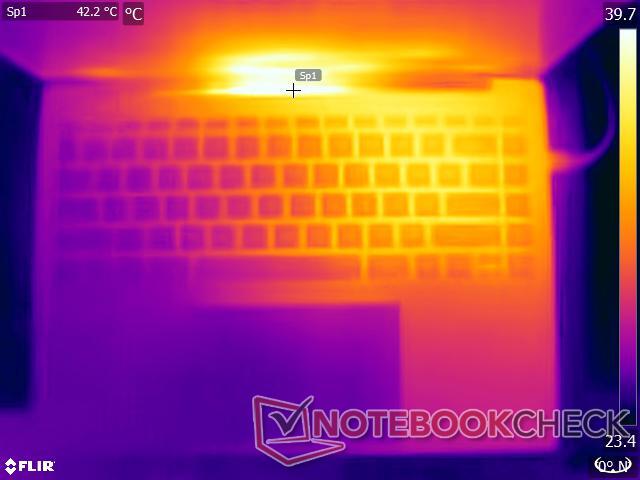
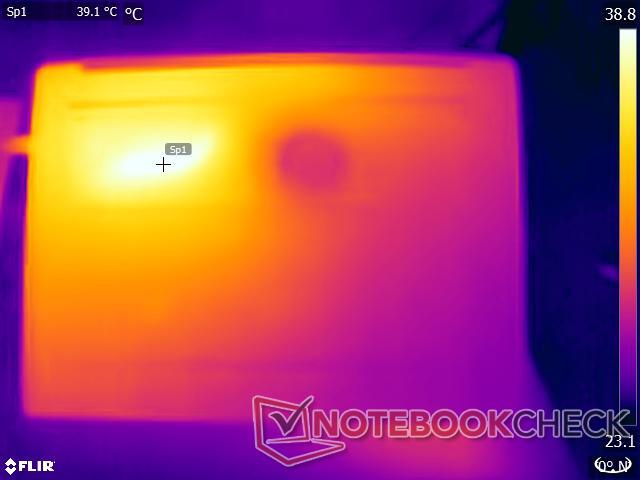
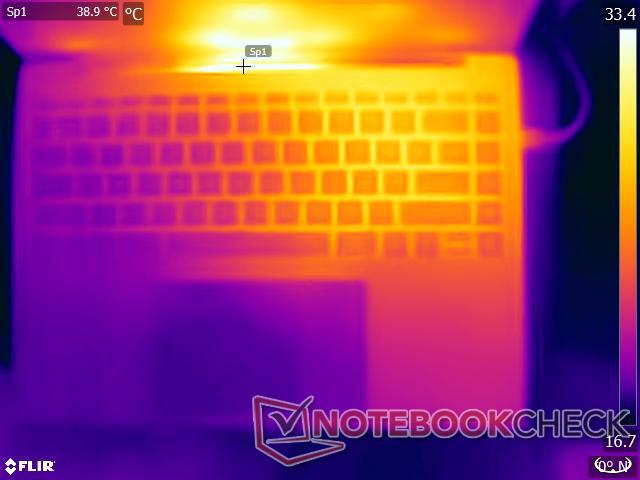
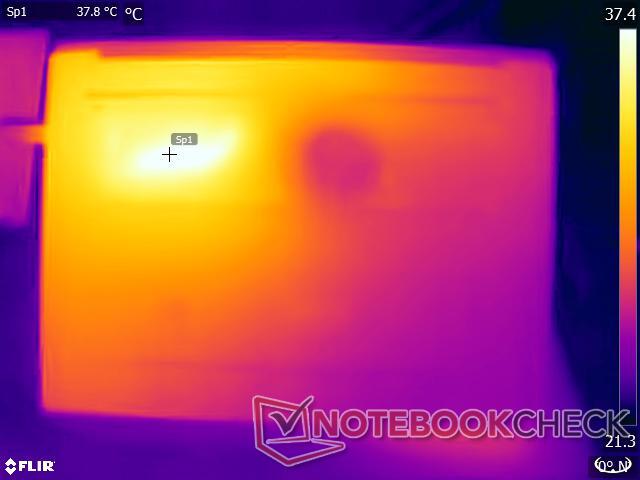
Temperatura
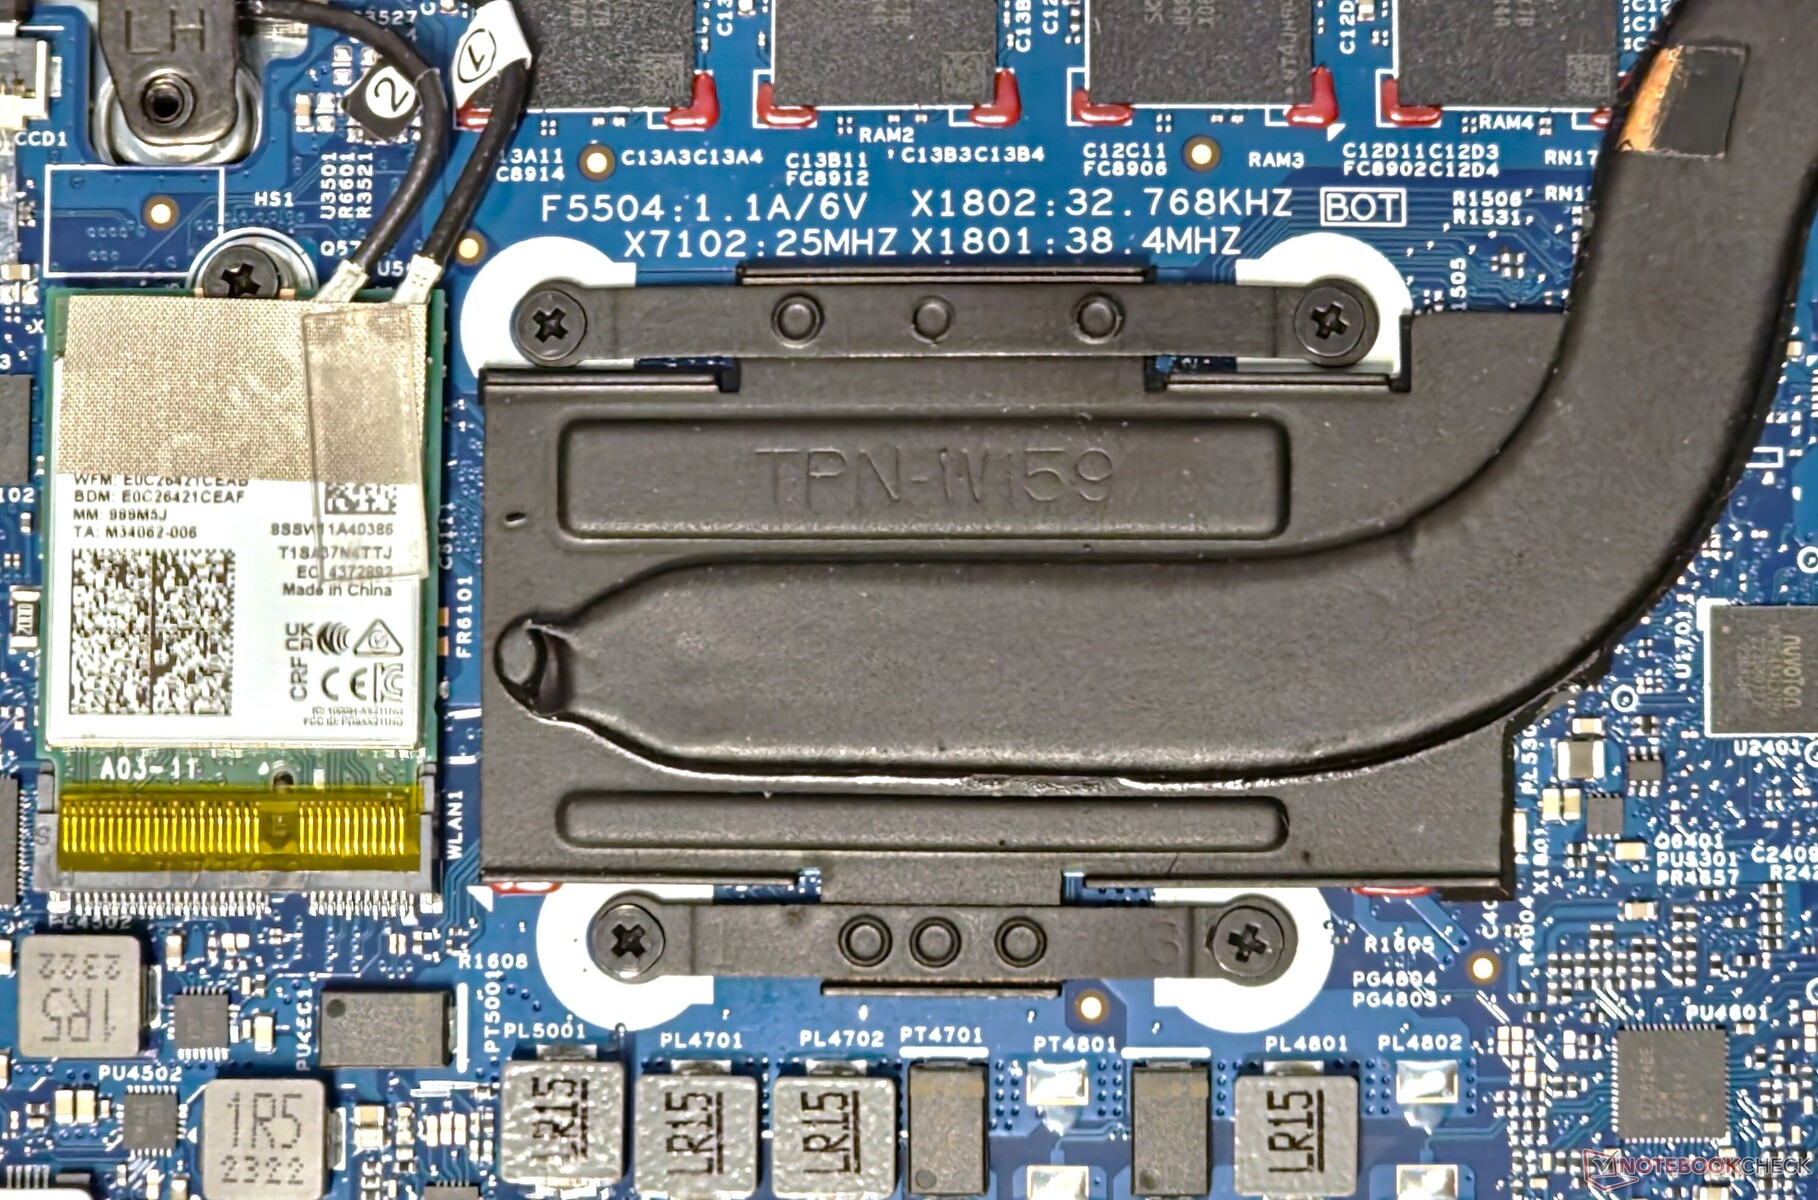
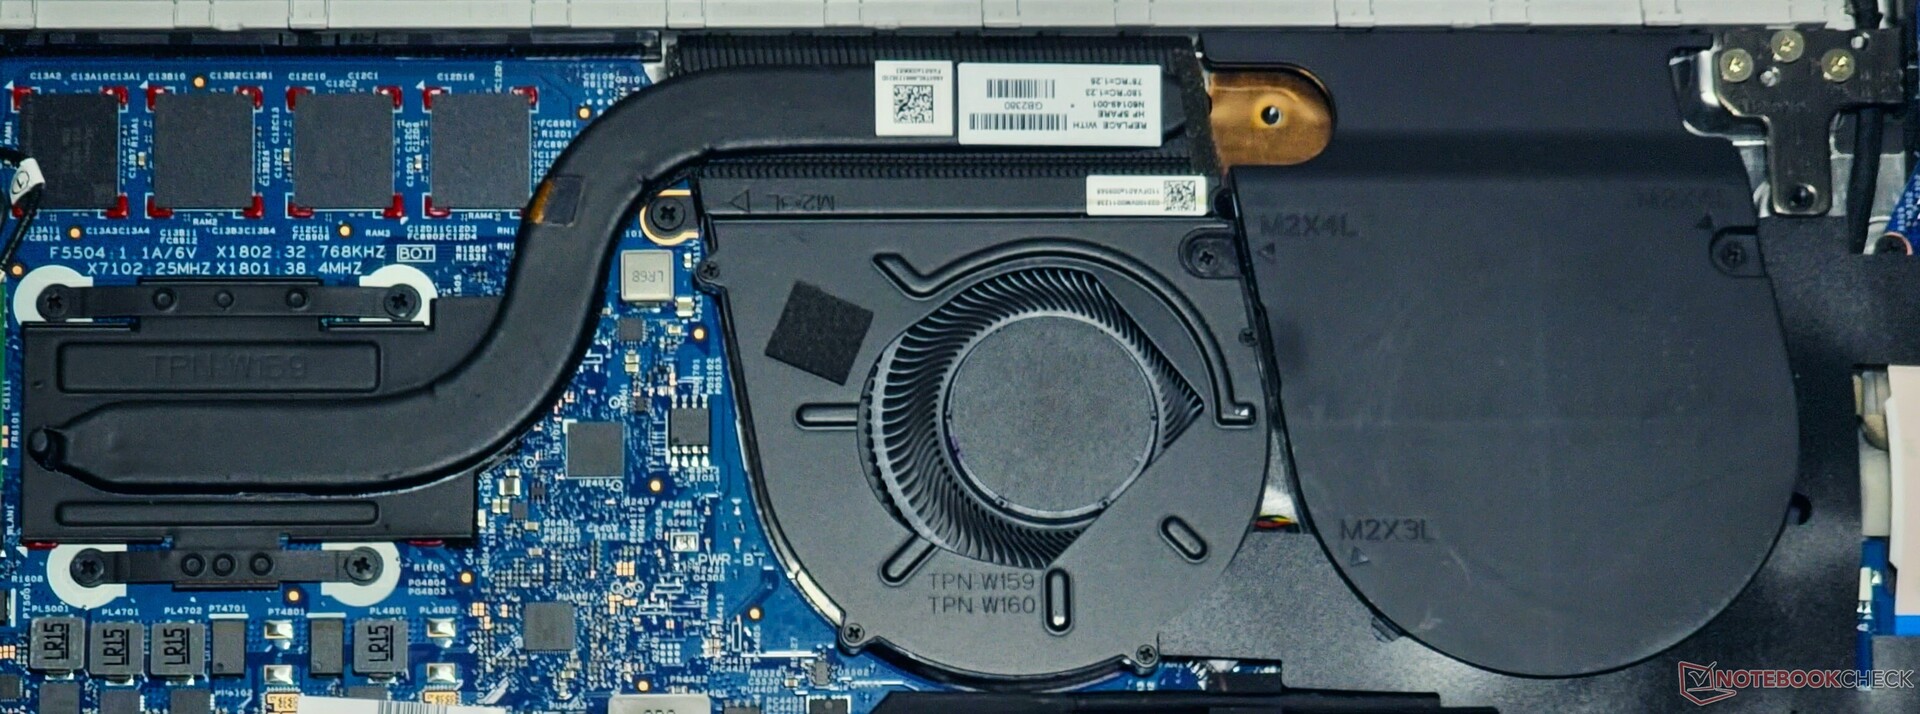
A combinação de ventilador único e tubo de calor único parece adequada para manter temperaturas de superfície gerenciáveis. O ponto de aquecimento máximo que registramos foi de 39 °C na extremidade esquerda do chassi inferior durante o estresse com o The Witcher 3 a 1080p Ultra.
As áreas do touchpad e do apoio para as mãos permanecem frias, independentemente da carga.
(+) A temperatura máxima no lado superior é 36.6 °C / 98 F, em comparação com a média de 36.8 °C / 98 F , variando de 21 a 71 °C para a classe Multimedia.
(+) A parte inferior aquece até um máximo de 37.2 °C / 99 F, em comparação com a média de 39.1 °C / 102 F
(+) Em uso inativo, a temperatura média para o lado superior é 30 °C / 86 F, em comparação com a média do dispositivo de 31.3 °C / ### class_avg_f### F.
(±) Jogando The Witcher 3, a temperatura média para o lado superior é 32.6 °C / 91 F, em comparação com a média do dispositivo de 31.3 °C / ## #class_avg_f### F.
(+) Os apoios para as mãos e o touchpad são mais frios que a temperatura da pele, com um máximo de 31.2 °C / 88.2 F e, portanto, são frios ao toque.
(-) A temperatura média da área do apoio para as mãos de dispositivos semelhantes foi 28.7 °C / 83.7 F (-2.5 °C / -4.5 F).
| HP Pavilion Plus 14-ew0153TU Intel Core i7-1355U, Intel Iris Xe Graphics G7 96EUs | HP Pavilion Plus 14-ey0095cl AMD Ryzen 7 7840U, AMD Radeon 780M | Lenovo ThinkPad T14s G4 i7-1365U Intel Core i7-1365U, Intel Iris Xe Graphics G7 96EUs | Acer Swift Go 14 SFG14-71 Intel Core i5-1335U, Intel Iris Xe Graphics G7 80EUs | Asus ExpertBook B9 B9403CVA-KM0153X Intel Core i7-1355U, Intel Iris Xe Graphics G7 96EUs | Huawei MateBook X Pro 2023 Intel Core i7-1360P, Intel Iris Xe Graphics G7 96EUs | |
|---|---|---|---|---|---|---|
| Heat | 8% | 9% | -5% | -27% | -17% | |
| Maximum Upper Side * (°C) | 36.6 | 39 -7% | 39.8 -9% | 44.8 -22% | 48.8 -33% | 46.5 -27% |
| Maximum Bottom * (°C) | 37.2 | 35.8 4% | 35.2 5% | 34.8 6% | 56.5 -52% | 44.7 -20% |
| Idle Upper Side * (°C) | 31.6 | 25.2 20% | 25.6 19% | 30.7 3% | 33.3 -5% | 34.9 -10% |
| Idle Bottom * (°C) | 30 | 25.6 15% | 24.4 19% | 32.5 -8% | 35 -17% | 32.9 -10% |
* ... menor é melhor
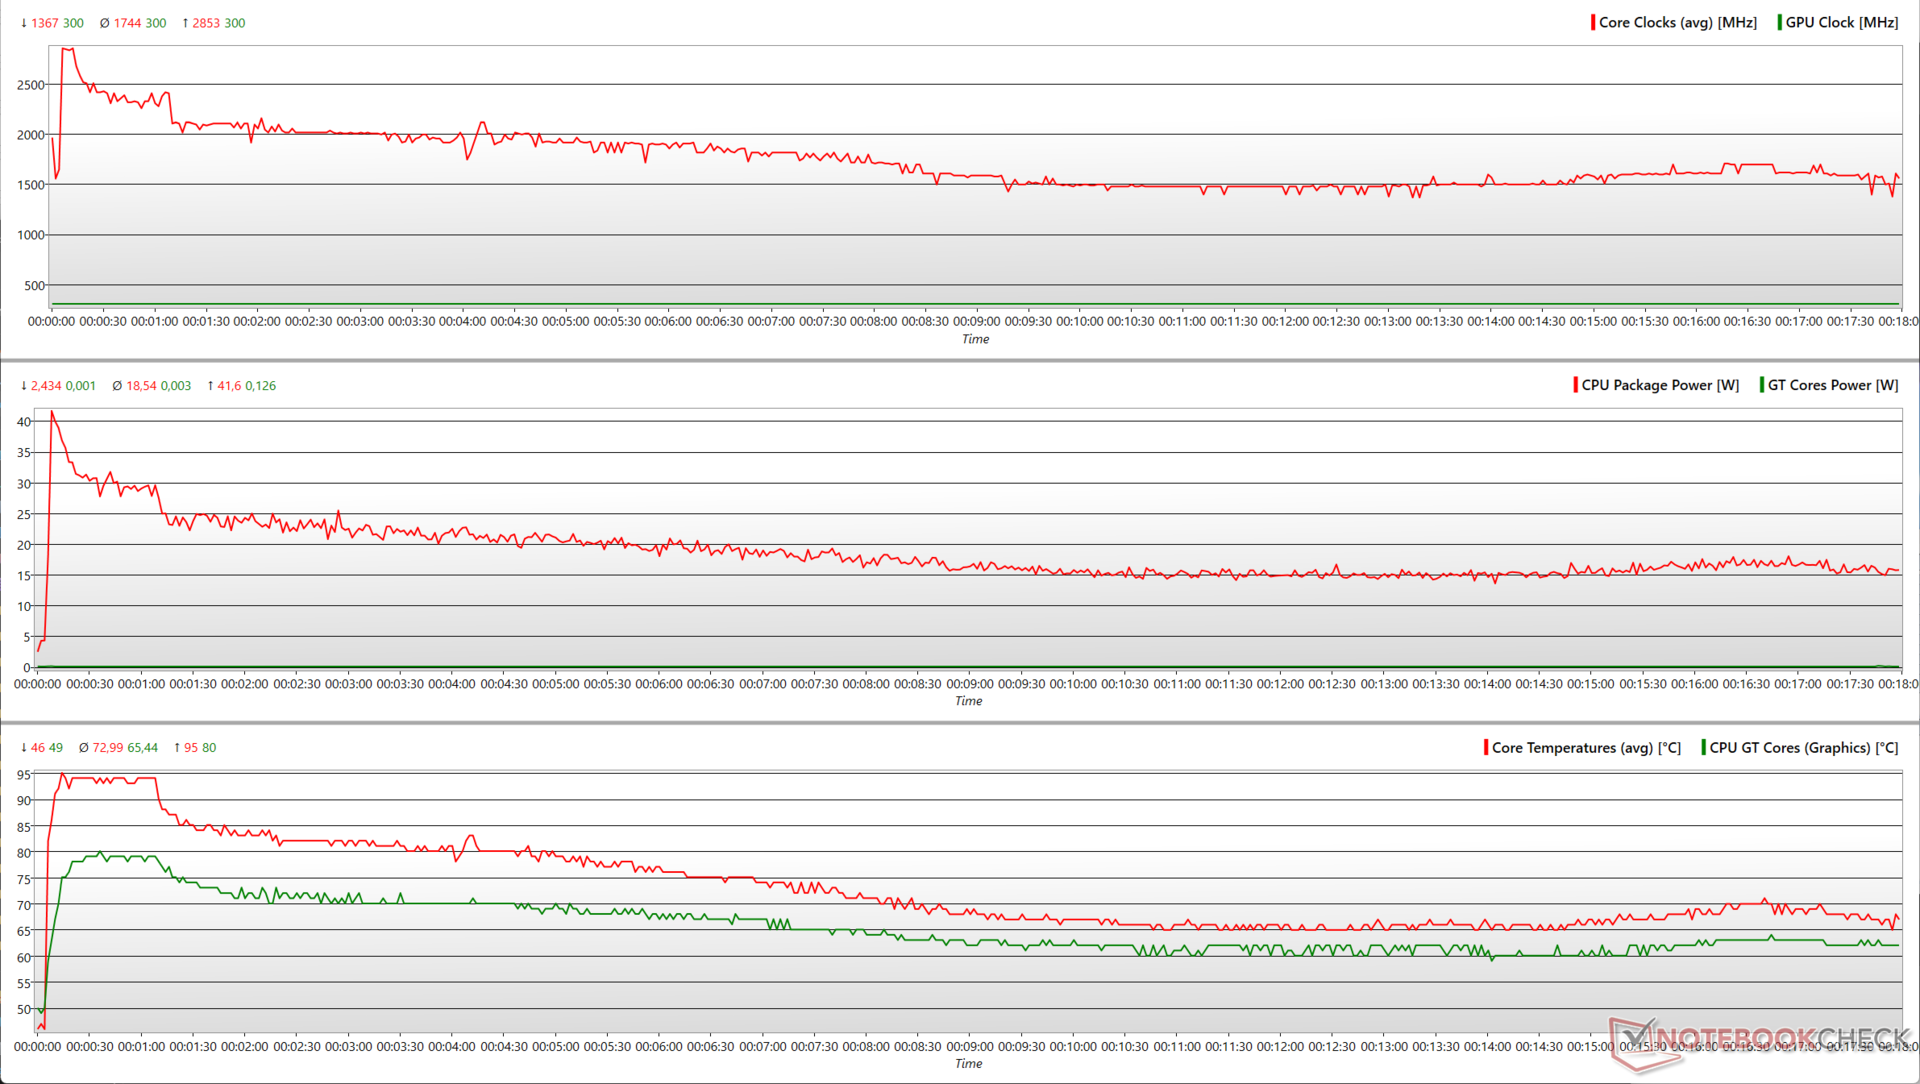
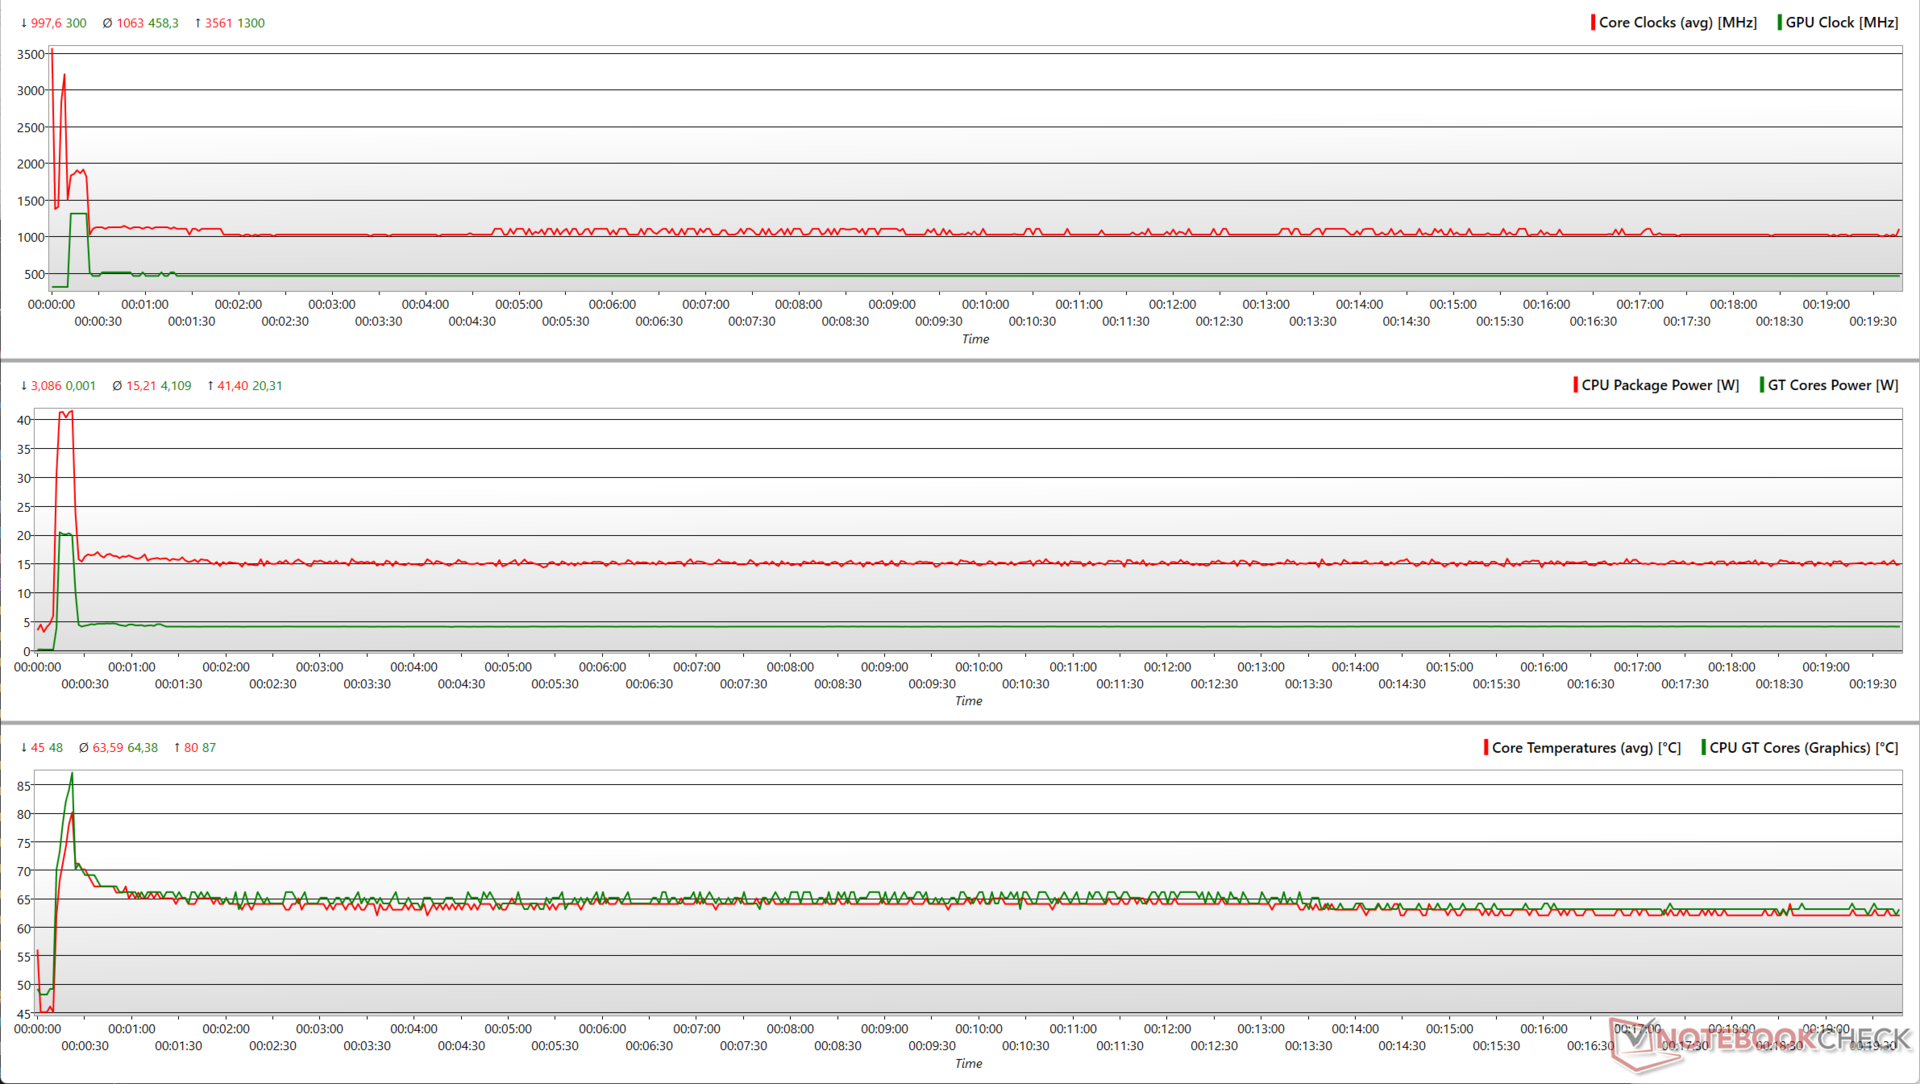
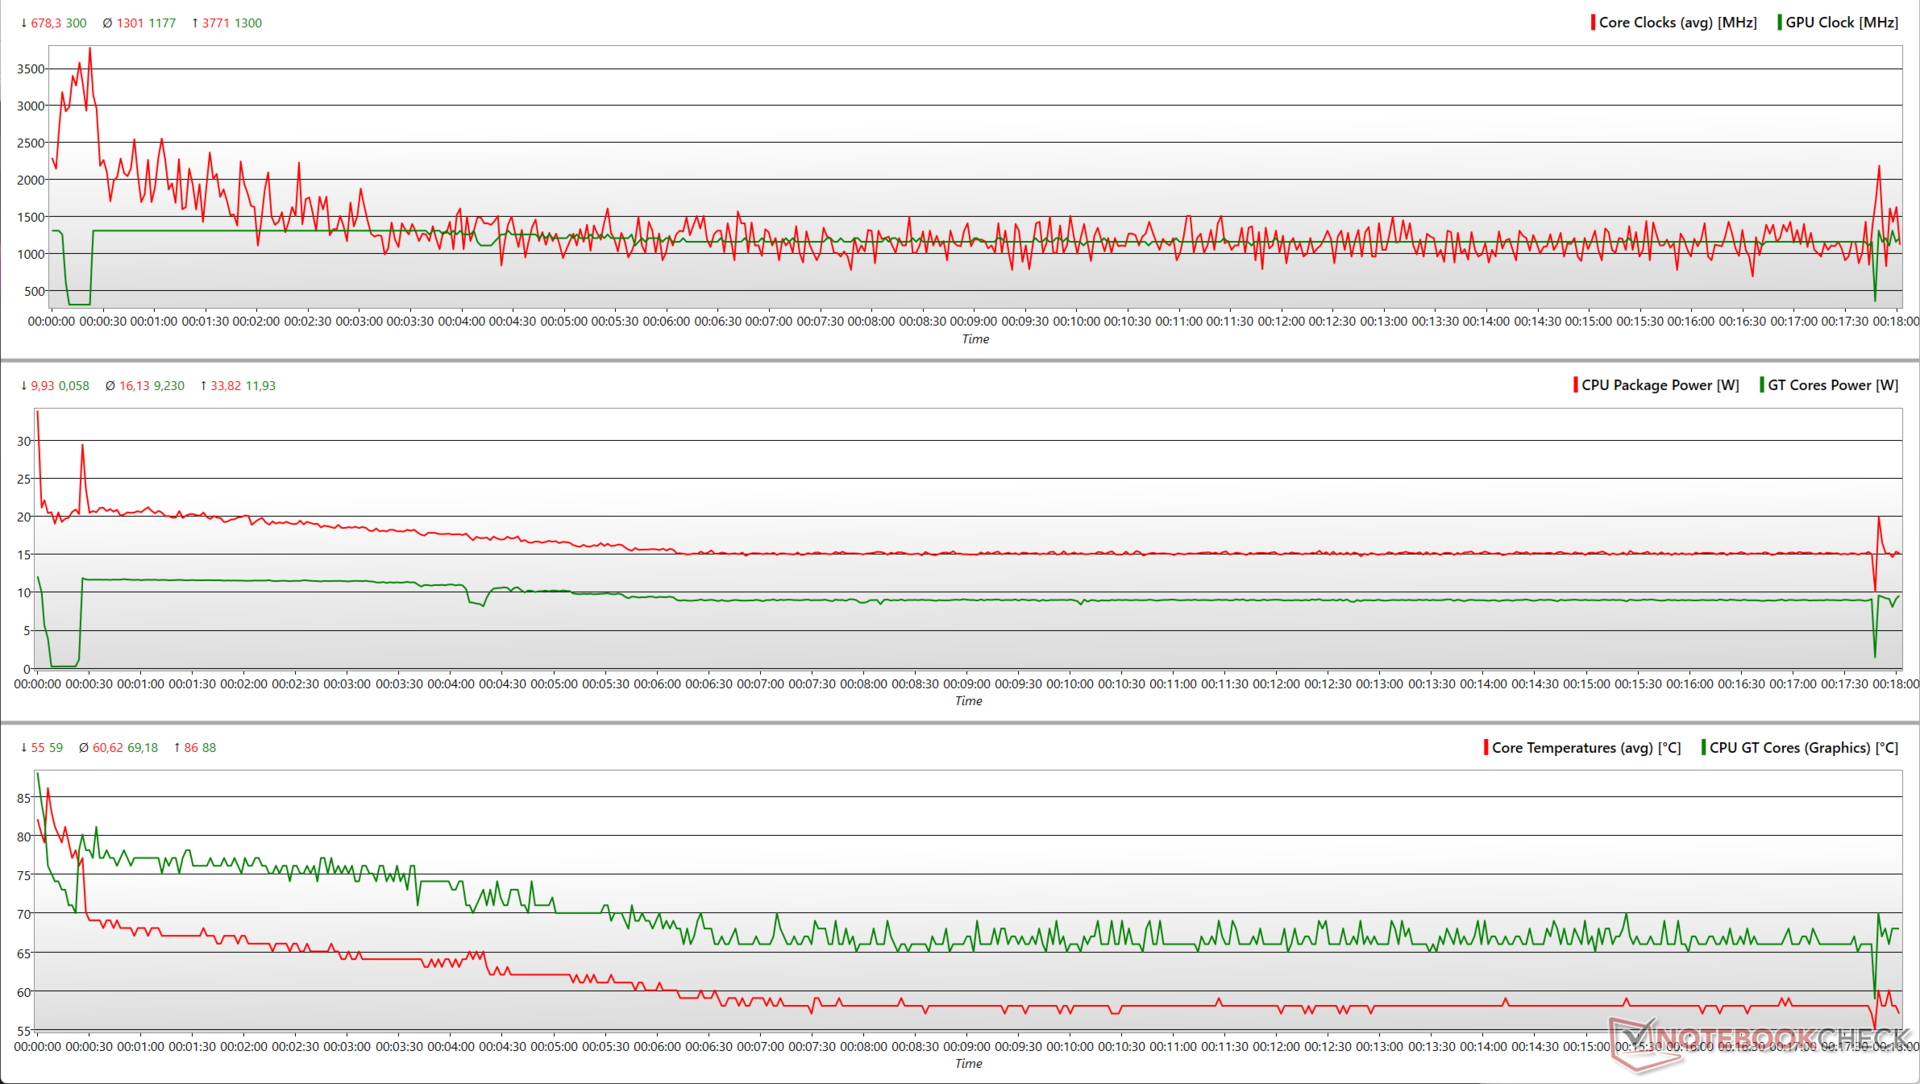
Teste de estresse
O estresse do Pavilion Plus 14 com grandes FFTs in-place do Prime95 mostra que o Core i7-1355U é capaz de atingir 42 W de potência de pico do pacote e um aumento de até 2,85 GHz. Entretanto, esses valores se estabilizam em cerca de 18,5 W e 1,74 GHz em média, respectivamente, durante o teste.
A placa de vídeo Iris Xe integrada pode usar momentaneamente 20,3 W e aumentar até 1.300 MHz ao adicionar o FurMark, mas não pode usar mais de 4 W no total. No entanto, a iGPU pode usar 9,23 W e aumentar até 1.177 MHz em média durante o estresse com o The Witcher 3 a 1080p Ultra.
| Teste de estresse | CPU Clock (GHz) | GPU Clock (MHz) | Temperatura média da CPU (°C) | Temperatura média da GPU (°C) |
| Sistema ocioso | 1.16 | 300 | 43 | 46 |
| Prime95 | 1.55 | 300 | 73 | 62 |
| Prime95 + FurMark | 1.07 | 450 | 63 | 64 |
| O Witcher 3 1080p Ultra | 3.53 | 1.300 | 58 | 66 |
Alto-falantes
Os alto-falantes estéreo sintonizados pela B&O do Pavilion Plus 14 produzem um volume adequado para uma sala de tamanho médio, mas é inferior ao que seu primo com tecnologia AMD pode alcançar. A saída de graves é insuficiente, mas os médios e agudos são bem reproduzidos.
Aqueles que desejam um som melhor podem usar o conector de áudio de 3,5 mm ou o Bluetooth 5.3.
HP Pavilion Plus 14-ew0153TU análise de áudio
(±) | o volume do alto-falante é médio, mas bom (###valor### dB)
Graves 100 - 315Hz
(-) | quase nenhum baixo - em média 15.8% menor que a mediana
(±) | a linearidade dos graves é média (10.7% delta para a frequência anterior)
Médios 400 - 2.000 Hz
(+) | médios equilibrados - apenas 3.2% longe da mediana
(+) | médios são lineares (4.3% delta para frequência anterior)
Altos 2 - 16 kHz
(+) | agudos equilibrados - apenas 4% longe da mediana
(+) | os máximos são lineares (4.8% delta da frequência anterior)
Geral 100 - 16.000 Hz
(+) | o som geral é linear (13.5% diferença em relação à mediana)
Comparado com a mesma classe
» 29% de todos os dispositivos testados nesta classe foram melhores, 4% semelhantes, 67% piores
» O melhor teve um delta de 5%, a média foi 17%, o pior foi 45%
Comparado com todos os dispositivos testados
» 14% de todos os dispositivos testados foram melhores, 4% semelhantes, 82% piores
» O melhor teve um delta de 4%, a média foi 23%, o pior foi 134%
Apple MacBook Pro 16 2021 M1 Pro análise de áudio
(+) | os alto-falantes podem tocar relativamente alto (###valor### dB)
Graves 100 - 315Hz
(+) | bons graves - apenas 3.8% longe da mediana
(+) | o baixo é linear (5.2% delta para a frequência anterior)
Médios 400 - 2.000 Hz
(+) | médios equilibrados - apenas 1.3% longe da mediana
(+) | médios são lineares (2.1% delta para frequência anterior)
Altos 2 - 16 kHz
(+) | agudos equilibrados - apenas 1.9% longe da mediana
(+) | os máximos são lineares (2.7% delta da frequência anterior)
Geral 100 - 16.000 Hz
(+) | o som geral é linear (4.6% diferença em relação à mediana)
Comparado com a mesma classe
» 0% de todos os dispositivos testados nesta classe foram melhores, 0% semelhantes, 100% piores
» O melhor teve um delta de 5%, a média foi 17%, o pior foi 45%
Comparado com todos os dispositivos testados
» 0% de todos os dispositivos testados foram melhores, 0% semelhantes, 100% piores
» O melhor teve um delta de 4%, a média foi 23%, o pior foi 134%
Gerenciamento de energia: Consumo econômico de energia e boa duração da bateria
Consumo de energia
Tanto o Intel quanto o AMD Pavilion Plus 14s apresentam um consumo de energia semelhante em geral. No entanto, a versão da AMD mostra um consumo de energia 18% maior no Witcher 3 a 1080p Ultra devido à Radeon 780M mais capaz.
O Pavilion Plus 14 Core i7 consome o mínimo de energia em modo inativo, o que lhe dá uma vantagem significativa sobre o Asus ExpertBook B9. O adaptador de energia de 65 W fornecido é adequado para alimentar o laptop sob estresse.
| desligado | |
| Ocioso | |
| Carga |
|
Key:
min: | |
| HP Pavilion Plus 14-ew0153TU i7-1355U, Iris Xe G7 96EUs, OLED, 2880x1800, 14" | HP Pavilion Plus 14-ey0095cl R7 7840U, Radeon 780M, OLED, 2880x1800, 14" | Lenovo ThinkPad T14s G4 i7-1365U i7-1365U, Iris Xe G7 96EUs, IPS, 1920x1200, 14" | Acer Swift Go 14 SFG14-71 i5-1335U, Iris Xe G7 80EUs, OLED, 2880x1800, 14" | Asus ExpertBook B9 B9403CVA-KM0153X i7-1355U, Iris Xe G7 96EUs, OLED, 2880x1800, 14" | Huawei MateBook X Pro 2023 i7-1360P, Iris Xe G7 96EUs, IPS, 3120x2080, 14.2" | Média Intel Iris Xe Graphics G7 96EUs | Média da turma Multimedia | |
|---|---|---|---|---|---|---|---|---|
| Power Consumption | 1% | 14% | -3% | -18% | -8% | -1% | -31% | |
| Idle Minimum * (Watt) | 6.7 | 6 10% | 3.1 54% | 6.79 -1% | 4.9 27% | 4.1 39% | 5.51 ? 18% | 5.66 ? 16% |
| Idle Average * (Watt) | 7.16 | 6.5 9% | 6.5 9% | 6.83 5% | 12.5 -75% | 6.6 8% | 8.66 ? -21% | 10.2 ? -42% |
| Idle Maximum * (Watt) | 11.17 | 13.9 -24% | 7.9 29% | 10.5 6% | 16.8 -50% | 8 28% | 10.9 ? 2% | 12.5 ? -12% |
| Load Average * (Watt) | 46.5 | 41.9 10% | 40 14% | 45.9 1% | 43.8 6% | 61 -31% | 45.6 ? 2% | 65.2 ? -40% |
| Witcher 3 ultra * (Watt) | 37.2 | 43.9 -18% | 43.2 -16% | 45.6 -23% | 41.2 -11% | 56 -51% | ||
| Load Maximum * (Watt) | 64.36 | 50.8 21% | 69 -7% | 69.8 -8% | 68.1 -6% | 90 -40% | 67.8 ? -5% | 113.5 ? -76% |
* ... menor é melhor
Power Consumption: The Witcher 3 / Stress test
Power Consumption: External monitor
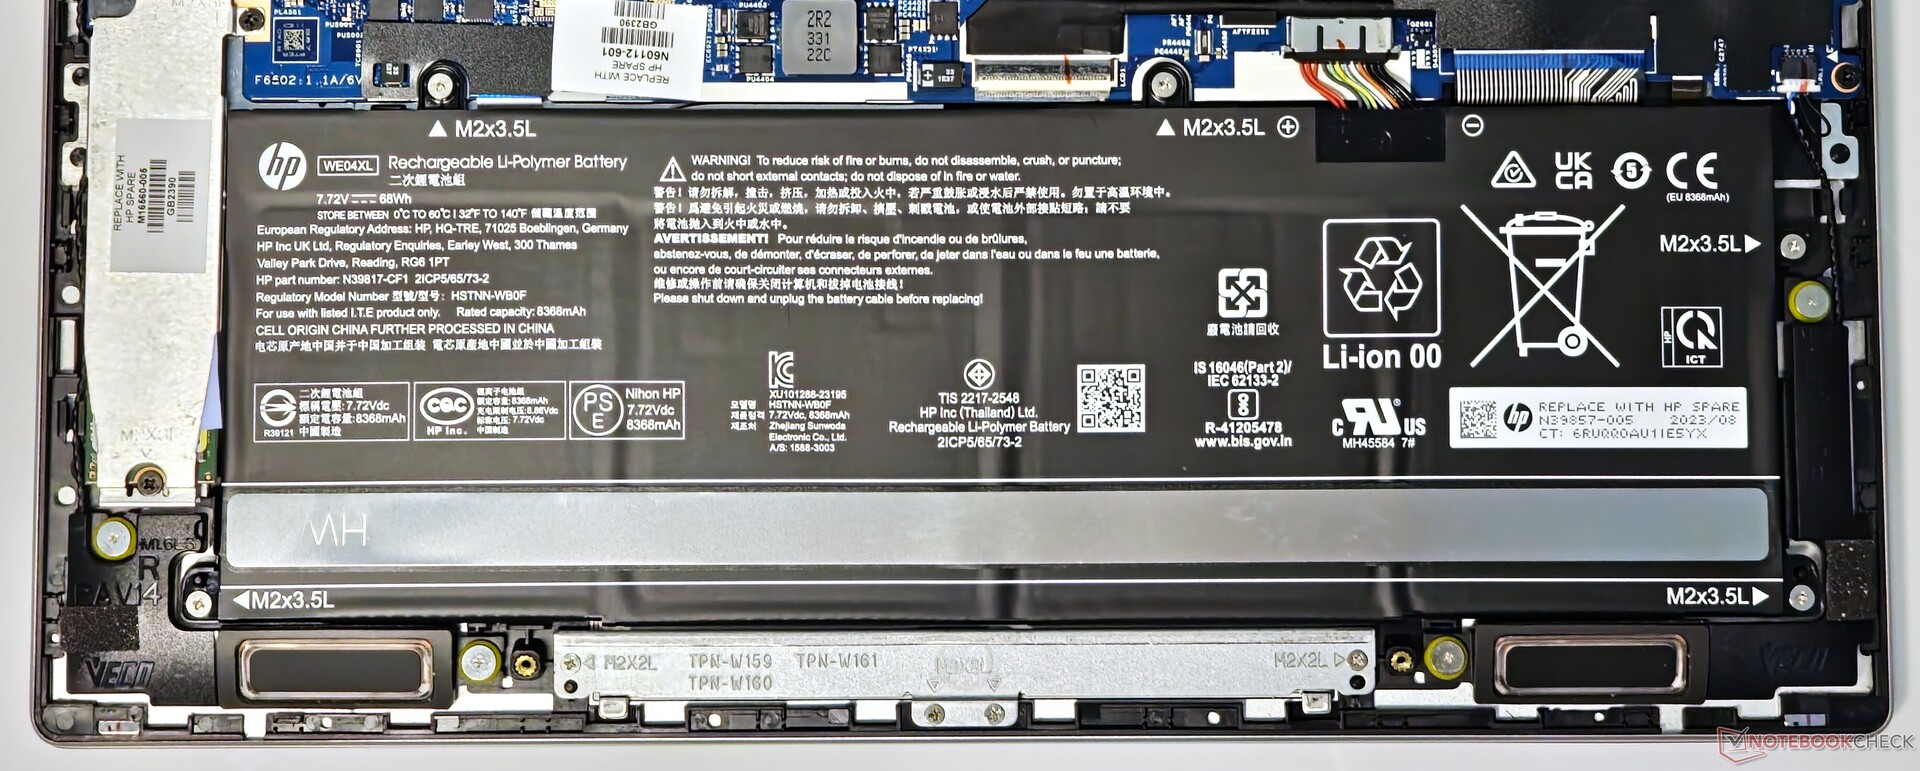
Duração da bateria
A bateria de 68 WHr proporciona bons tempos de funcionamento que podem facilmente durar um dia de trabalho normal. Conseguimos atingir quase 9 horas e 40 minutos de autonomia com nosso script padrão de navegação na Web e 12 horas de reprodução H.264 1080p, ambos a 150 nits.
| HP Pavilion Plus 14-ew0153TU i7-1355U, Iris Xe G7 96EUs, 68 Wh | HP Pavilion Plus 14-ey0095cl R7 7840U, Radeon 780M, 68 Wh | Lenovo ThinkPad T14s G4 i7-1365U i7-1365U, Iris Xe G7 96EUs, 57 Wh | Acer Swift Go 14 SFG14-71 i5-1335U, Iris Xe G7 80EUs, 54.6 Wh | Asus ExpertBook B9 B9403CVA-KM0153X i7-1355U, Iris Xe G7 96EUs, 63 Wh | Huawei MateBook X Pro 2023 i7-1360P, Iris Xe G7 96EUs, 60 Wh | Média da turma Multimedia | |
|---|---|---|---|---|---|---|---|
| Duração da bateria | -11% | -18% | -21% | -5% | -13% | 35% | |
| H.264 (h) | 12 | 10.1 -16% | 8.8 -27% | 17.1 ? 43% | |||
| WiFi v1.3 (h) | 9.6 | 8.5 -11% | 7.9 -18% | 7.6 -21% | 10.2 6% | 9.7 1% | 12.2 ? 27% |
| Reader / Idle (h) | 16.9 | 21.5 | 24.9 ? | ||||
| Load (h) | 2 | 2.3 | 2.1 | 1.664 ? |
Pro
Contra
Veredicto: difícil de vender em relação ao AMD Zen 4
O HP Pavilion Plus 14 é um laptop multimídia decente que pode muito bem ser usado no escritório. Ele é bem construído, tem aparência elegante e oferece conectividade decente, inclusive Thunderbolt 4. Recursos como uma webcam de 5 MP com IR e a vibrante tela OLED 2.8K IMAX Enhanced são compartilhados entre as variantes Intel e AMD de especificações superiores.
Enquanto o Pavilion Plus 14 Intel Core i7-1355U ofereça desempenho adequado para o uso diário, ela fica significativamente atrás da variante Pavilion Plus 14 equipado com o AMD Ryzen 7 7840U. A versão AMD Zen 4 oferece melhor desempenho de CPU e iGPU, o que também o torna adequado para jogos leves.
O HP Pavilion Plus 14 Core i7 é difícil de recomendar, especialmente quando o mesmo laptop está sendo oferecido com uma opção Ryzen 7 mais eficiente, com menor consumo de energia e mais barata.
A variante Ryzen 7 também é mais eficiente em termos de energia e oferece praticamente a mesma duração de bateria. A menos que o senhor realmente precise de uma porta Thunderbolt 4, o Pavilion Plus 14 com AMD Ryzen é uma escolha muito melhor em quase todos os aspectos.
A variante Ryzen 7 é vendida até mesmo por US$ 100 a menos, o que a torna uma proposta de valor muito melhor em comparação com seu primo baseado no Intel Core i7.
Essencialmente, é todo o Lenovo ThinkPad T14s da Lenovo - desta vez com a marca HP.
Preço e disponibilidade
A configuração testada do HP Pavilion Plus 14-ew0153TU pode ser adquirida na loja online da HP Índia por ₹99.999. O Pavilion Plus 14 está disponível na loja americana da HP por US$ 1.020 para a versão Intel Core i7, enquanto a variante AMD Ryzen 7 pode ser adquirida por US$ 920. As opções mais baratas podem ser configuradas diretamente no site da HP.
A Amazon US está oferecendo um SKU Pavilion Plus 14 com o Core i7-1355U e o Nvidia GeForce RTX 2050 dedicado por US$ 1.000.
HP Pavilion Plus 14-ew0153TU
- 12/10/2023 v7 (old)
Vaidyanathan Subramaniam
Transparência
A seleção dos dispositivos a serem analisados é feita pela nossa equipe editorial. A amostra de teste foi fornecida ao autor como empréstimo pelo fabricante ou varejista para fins desta revisão. O credor não teve influência nesta revisão, nem o fabricante recebeu uma cópia desta revisão antes da publicação. Não houve obrigação de publicar esta revisão. Como empresa de mídia independente, a Notebookcheck não está sujeita à autoridade de fabricantes, varejistas ou editores.
É assim que o Notebookcheck está testando
Todos os anos, o Notebookcheck analisa de forma independente centenas de laptops e smartphones usando procedimentos padronizados para garantir que todos os resultados sejam comparáveis. Desenvolvemos continuamente nossos métodos de teste há cerca de 20 anos e definimos padrões da indústria no processo. Em nossos laboratórios de teste, equipamentos de medição de alta qualidade são utilizados por técnicos e editores experientes. Esses testes envolvem um processo de validação em vários estágios. Nosso complexo sistema de classificação é baseado em centenas de medições e benchmarks bem fundamentados, o que mantém a objetividade.Price comparison

